Part 5: Wastewater Management

Welcome message from author
This document is posted to help you gain knowledge. Please leave a comment to let me know what you think about it! Share it to your friends and learn new things together.
Transcript

Part 5: Wastewater Management

Final Report, Volume III Part 5: Wastewater Management Supporting Report Table of Contents
Nippon Koei Co., Ltd The Study on Integrated Management for Ecosystem Conservation of the Anzali Wetland
i
THE STUDY ON INTEGRATED MANAGEMENT FOR ECOSYSTEM CONSERVATION OF THE ANZALI WETLAND
FINAL REPORT
Volume III Supporting Report
TABLE OF CONTENTS
PART 5 WASTEWATER MANAGEMENT
Page
CHAPTER INTRODUCTION.............................................................................. 1-1
1.1 General........................................................................................................... 1-1 1.2 Scope of the Study........................................................................................... 1-1
CHAPTER 2 PRESENT CONDITION OF WASTEWATER MANAGEMENT ...... 2-1
2.1 Pollution Sources in the Basin.......................................................................... 2-1 2.2 Related Organizations and Regulations ............................................................. 2-1
2.2.1 Responsible Organizations for Wastewater Management ................. 2-1 2.2.2 Laws and Regulations related to Wastewater Management............... 2-2
2.3 Domestic Wastewater Management in Urban Areas ........................................... 2-3 2.3.1 Present Situation........................................................................... 2-3 2.3.2 Sewerage Development Plan of NWWEC ...................................... 2-4 2.3.3 NWWEC Sewerage Development Plan .......................................... 2-7
2.4 Domestic Wastewater Management in Rural Areas ............................................ 2-9 2.4.1 Present Situation........................................................................... 2-9 2.4.2 Development Plan for Community Wastewater Treatment
System proposed by RWWC.......................................................... 2-10 2.5 Management of Industrial Effluent ................................................................... 2-11
2.5.1 Present Situation........................................................................... 2-11 2.5.2 Industrial City Development Plan................................................... 2-11
2.6 Management of Livestock Waste ...................................................................... 2-12 2.7 Management of Pollution from Farmland.......................................................... 2-13
CHAPTER 3 WATER POLLUTION LOAD TO ANZALI WETLAND .................. 3-1
3.1 Introduction .................................................................................................... 3-1 3.1.1 Water Degradation in Anzali Wetland ............................................. 3-1

Final Report, Volume III Part 5: Wastewater Management Supporting Report Table of Contents
Nippon Koei Co., Ltd The Study on Integrated Management for Ecosystem Conservation of the Anzali Wetland
ii
3.1.2 Water Quality in Anzali Wetland .................................................... 3-2 3.2 Situation of Pollution Sources in the basin ........................................................ 3-5
3.2.1 Pollution Load Discharged into Anzali Wetland .............................. 3-5 3.2.2 Condition of Each Pollution Source................................................ 3-8
3.3 Estimate of Amount of Pollution Load discharged into Anzali Wetland ............... 3-11 3.3.1 Unit Pollution Load and Discharge Ratio........................................ 3-11 3.3.2 Estimate of Present Pollution Load Amount .................................... 3-12 3.3.3 Prediction of Pollution Load Amount ............................................. 3-14
CHAPTER 4 WASTEWATER MANAGEMENT PLAN ........................................... 4-1
4.1 General........................................................................................................... 4-1 4.2 Objective and Strategies .................................................................................. 4-3
4.2.1 Objectives .................................................................................... 4-3 4.2.2 Strategy........................................................................................ 4-3
4.3 Management of Domestic Wastewater in Urban Area......................................... 4-7 4.3.1 Introduction.................................................................................. 4-7 4.3.2 Sewerage System Development ..................................................... 4-8 4.3.3 Promotion of Individual Wastewater Treatment Facilities outside of
Sewerage Service Areas ................................................................ 4-12 4.3.4 Promotion of Low Phosphorus Detergent Use................................. 4-13
4.4 Management of Domestic Wastewater in Rural Area.......................................... 4-13 4.4.1 Introduction.................................................................................. 4-13 4.4.2 Community Wastewater Treatment System Development ................ 4-14
4.5 Management of Industrial Effluents .................................................................. 4-16 4.5.1 Introduction.................................................................................. 4-16 4.5.2 Centralization of Industrial Factories .............................................. 4-17 4.5.3 Construction of Centralized Wastewater Treatment Systems ............ 4-18 4.5.4 Strengthening of Monitoring Activities by DOE.............................. 4-19
4.6 Management of Livestock Waste ...................................................................... 4-20 4.6.1 Introduction.................................................................................. 4-20 4.6.2 Treatment of Waste from Industrial Animal Husbandry.................... 4-20 4.6.3 Control of Livestock Waste in Grazing Lands in the Plain Area........ 4-21
4.7 Management of Pollution from Farmland.......................................................... 4-22 4.7.1 Introduction.................................................................................. 4-22 4.7.2 Promotion of Farming with Less Input ........................................... 4-23 4.7.3 Coordination between Monitoring and Agricultural Extension ......... 4-25
4.8 Environmental Monitoring for Wastewater Management.................................... 4-25 4.8.1 Introduction.................................................................................. 4-25 4.8.2 Monitoring Programs .................................................................... 4-25
4.9 Institutional Arrangement ................................................................................ 4-27

Final Report, Volume III Part 5: Wastewater Management Supporting Report Table of Contents
Nippon Koei Co., Ltd The Study on Integrated Management for Ecosystem Conservation of the Anzali Wetland
iii
CHAPTER 5 COST ESTIMATE ............................................................................. 5-1
5.1 Summary of Proposed Wastewater Management Plan ........................................ 5-1 5.2 Basic Conditions for Cost Estimate................................................................... 5-3 5.3 Cost Estimate.................................................................................................. 5-4
CHAPTER 6 IMPLEMENTATION PROGRAM .................................................... 6-1
6.1 General........................................................................................................... 6-1 6.2 Evaluation of Proposed Measures for Prioritization ........................................... 6-1
6.2.1 Criteria for Prioritization ............................................................... 6-1 6.2.2 Evaluation of Proposed Measures for Prioritization ......................... 6-3
6.3 Implementation Schedule for Master Plan......................................................... 6-4 6.3.1 Management of Urban Domestic Wastewater.................................. 6-5 6.3.2 Management of Rural Domestic Wastewater................................... 6-7 6.3.3 Management of Industrial Effluent ................................................. 6-7 6.3.4 Management if Livestock Waste..................................................... 6-8 6.3.5 Management of Pollution from Farmland ....................................... 6-8
6.4 Next Five Years Plan for Each Organization...................................................... 6-8 6.4.1 Next Five Years Plan for GWWC................................................... 6-9 6.4.2 Next Five Years Plan for RWWC ................................................... 6-11 6.4.3 Next Five Years Plan for Industrial Wastewater Management ........... 6-12 6.4.4 Next Five Years Plan for MOJA..................................................... 6-13
6.5 Priority Project................................................................................................ 6-14 6.5.1 Selection of Priority Projects ......................................................... 6-14 6.5.2 Rasht Sewerage System Development System (Phase 1).................. 6-14 6.5.3 Anzali Sewerage System Development Project (Phase 1)................. 6-15 6.5.4 Strengthening of Monitoring Activities by DOE.............................. 6-16 6.5.5 Centralized Industrial Wastewater Treatment System
in Rasht Industrial City.................................................................. 6-17
Final Report, Volume III Part 5: Wastewater Management Supporting Report Table of Contents
Nippon Koei Co., Ltd The Study on Integrated Management for Ecosystem Conservation of the Anzali Wetland
iv
List of Tables
Page
Table 2.2.1 Task of Organizations Responsible for Wastewater Management............. 2-2 Table 2.2.2 Summary of Effluent Standard.............................................................. 2-2 Table 2.2.3 Target Wastewater Treatment Ration in Iran........................................... 2-3 Table 2.3.1 List of Planned Projects of Sewerage System Development .................... 2-6 Table 2.3.2 Tentative Implementation Schedule for Sewerage Development.............. 2-7 Table 2.3.3 Sewerage Development Plan in Rasht City ............................................ 2-8
Table 2.3.4 Sewerage Development Plan in Anzali City........................................... 2-8 Table 2.3.5 Sewerage Development Plan in Somehsara City .................................... 2-9 Table 2.5.1 Water Consumption and Wastewater Discharges from Industrial
Factories ............................................................................................. 2-11 Table 2.5.2 Management of Industrial Cities in the Basin......................................... 2-11 Table 2.7.1 Chemical Fertilizer Use in the Paddy Field, 2002................................... 2-14 Table 2.7.2 Main Agricultural Chemicals Use in the Paddy Field, 2002 .................... 2-14 Table 2.7.3 Chemical Control and Biological Control, 2002..................................... 2-15 Table 3.1.1 Distribution of COD Concentrations in the Wetland ............................... 3-3
Table 3.1.2 Total Phosphate Concentrations in Wetland Water .................................. 3-3 Table 3.1.3 Analytical Result of Heavy Metals in Sediment ..................................... 3-4 Table 3.2.1 Sub-basins in the Study Area ................................................................ 3-5 Table 3.2.2 Population Distribution by Sub-basin .................................................... 3-8 Table 3.2.3 Distribution of Industrial Activity by Sub-basin ..................................... 3-8 Table 3.2.4 Numbers of Livestock in Each Township in the Basin ............................ 3-9 Table 3.2.5 Number of Livestock in Each Sub-basin................................................ 3-9 Table 3.2.6 Number of Livestock in Each Sub-basin................................................ 3-10 Table 3.2.7 Agricultural Area in Each Sub-basin ..................................................... 3-10 Table 3.2.8 Average Use of Chemical Fertilizer in Gilan.......................................... 3-10
Table 3.3.1 Estimate of Pollution Load discharged based on Survey Results.............. 3-11 Table 3.3.2 Summary of Unit Pollution Load .......................................................... 3-11 Table 3.3.3 Pollution Load Reduction Ratio of Treatment Process ............................ 3-12 Table 3.3.4 Present Condition of Pollution Sources.................................................. 3-12 Table 3.3.5 Calculation of COD Pollution Load Discharged at Present...................... 3-13 Table 3.3.6 Calculation of T-N Pollution Load Discharged at Present........................ 3-13 Table 3.3.7 Calculation of T-P Pollution Load Discharged at Present ........................ 3-13

Final Report, Volume III Part 5: Wastewater Management Supporting Report Table of Contents
Nippon Koei Co., Ltd The Study on Integrated Management for Ecosystem Conservation of the Anzali Wetland
v
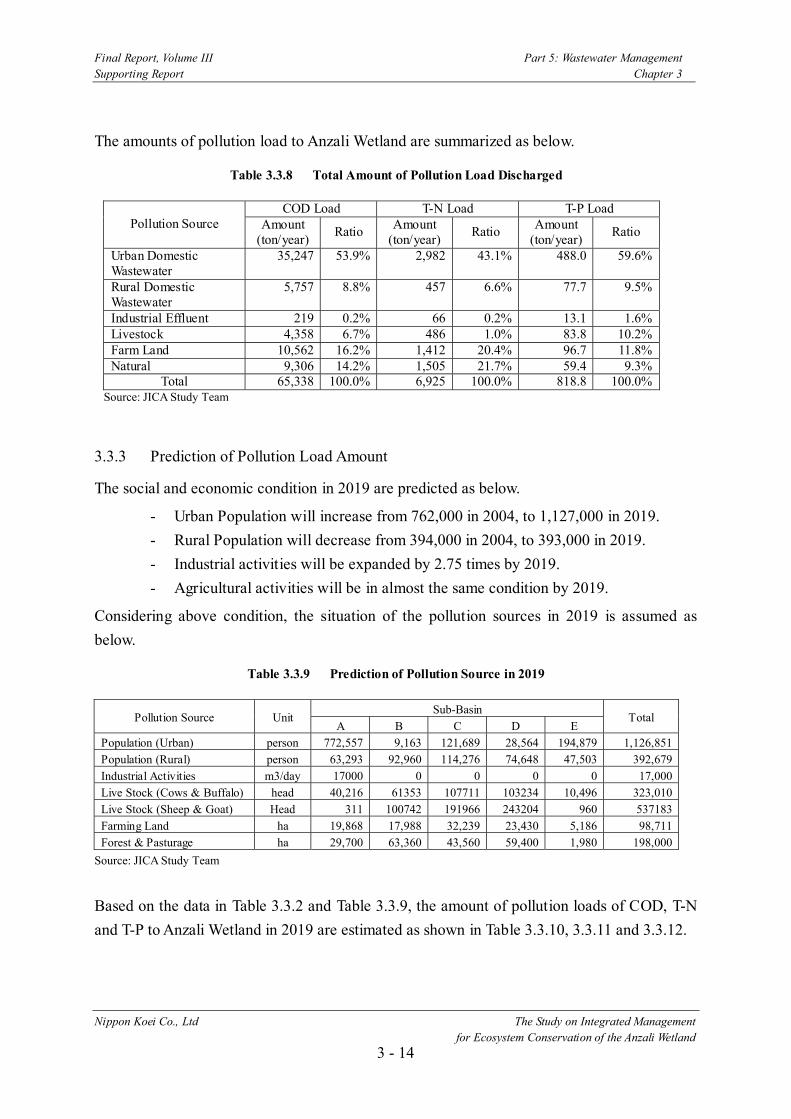
Table 3.3.8 Total Amount of Pollution Load Discharged .......................................... 3-14 Table 3.3.9 Prediction of Pollution Source in 2019 .................................................. 3-14 Table 3.3.10 Prediction of COD Pollution Load Discharged in 2019........................... 3-15 Table 3.3.11 Prediction of T-N Pollution Load Discharged in 2019............................. 3-15 Table 3.3.12 Prediction of T-P Pollution Load Discharged in 2019 ............................. 3-15 Table 3.3.13 Comparison of Pollution Load Amount Discharged in 2003 and 2019 ..... 3-16 Table 4.1.1 Typical Measures of Organic and Nutrient Pollution Load ...................... 4-2 Table 4.1.2 Typical Measures of Wastewater including Toxic Material and Heavy
Metals................................................................................................. 4-2 Table 4.2.1 Target of Water Quality in the Wetland .................................................. 4-3 Table 4.2.2 Targets of Sediment Quality in the Wetland ........................................... 4-4 Table 4.2.3 Target of Sediment Quality in the Wetland............................................. 4-4 Table 4.3.1 Water Quality of Raw Wastewater and Treated Wastewater for Design .... 4-8 Table 4.3.2 List of Planned Projects for Sewerage System Development ................... 4-9 Table 4.3.3 Required O&M Staff for New Sewerage System.................................... 4-11 Table 4.3.4 Service Population and O&M Cost of New Sewerage Systems ............... 4-12 Table 4.3.5 Sewerage Tariff and Sales Revenues from Sewerage Tariff in 2004 ......... 4-12 Table 4.4.1 List of Projects for Community Wastewater Treatment in Seven Villages. 4-15
Table 4.4.2 Service Population by Community Wastewater Treatment System........... 4-16 Table 4.5.1 Wastewater Treatment Systems in Industrial Cities in the Basin .............. 4-19 Table 4.6.1 Measures for Management of Each Group of Livestock.......................... 4-20 Table 4.8.1 Proposed Monitoring Program for Wastewater Management................... 4-26 Table 4.8.2 Monitoring of the Sewerage System...................................................... 4-26 Table 4.8.3 Monitoring of Industrial Factories......................................................... 4-26 Table 4.8.4 Monitoring on Agricultural Activity ...................................................... 4-27 Table 4.8.5 Ambient Water Quality Survey ............................................................. 4-27 Table 4.8.6 Water Pollution Load Discharged to Rivers ........................................... 4-27
Table 5.1.1 List of Proposed Projects and Executing Organizations .......................... 5-1 Table 5.2.1 Data Source for Construction Cost Estimation ....................................... 5-3 Table 5.2.2 Data Source for O&M Cost Estimation ................................................. 5-3 Table 5.2.3 Unit Costs for O&M Cost Estimation.................................................... 5-3 Table 5.3.1 Cost Estimate of Physical Measures for Wastewater Management ........... 5-4 Table 5.3.2 Project Cost of Sewerage System Development in Rasht (Phase1) .......... 5-5 Table 5.3.3 Project Cost of Sewerage System Development in Rasht (Phase2) .......... 5-5

Final Report, Volume III Part 5: Wastewater Management Supporting Report Table of Contents
Nippon Koei Co., Ltd The Study on Integrated Management for Ecosystem Conservation of the Anzali Wetland
vi
Table 5.3.4 Project Cost of Sewerage System Development in Anzali (Phase1) ......... 5-6 Table 5.3.5 Project Cost of Sewerage System Development in Anzali (Phase2) ......... 5-6 Table 5.3.6 Project Cost of Sewerage System Development in Somehsara ................ 5-7 Table 5.3.7 Project Cost of Community Wastewater Treatment System (Phase1) ....... 5-8 Table 5.3.8 Annual Operation and Maintenance Cost of Rasht Sewerage System in
2019 ................................................................................................... 5-9 Table 5.3.9 Annual Operation and Maintenance Cost of Anzali Sewerage System in
2019 ................................................................................................... 5-9 Table 5.3.10 Annual Operation and Maintenance Cost of Somehsara Sewerage
System in 2019 .................................................................................... 5-10 Table 5.3.11 Annual Operation and Maintenance Cost of Community Wastewater
Treatment System (Phase1) .................................................................. 5-10 Table 6.2.1 Evaluation of Proposed Measures for Prioritisation ................................ 6-1 Table 6.2.2 Evaluation of Proposed Measures for Prioritization................................ 6-3 Table 6.4.1 Proposed Projects in the 4th Development Plan and Executing
Organization........................................................................................ 6-9 Table 6.4.2 GWWC Action Plan in Next Five Years ................................................ 6-10 Table 6.4.3 RWWC Action Plan for Next Five Years ............................................... 6-12
Table 6.4.4 Next Five Years Schedule for Industrial Wastewater Management........... 6-13 Table 6.4.5 Next Five Years Schedule for Management of Pollution from Farmland .. 6-13 Table 6.5.1 Present Situation of Rasht Sewerage System (Phase 1)........................... 6-14 Table 6.5.2 Progress of Anzali Sewerage Project (Phase 1)....................................... 6-15 Table 6.5.3 Water Quality of Effluent from Rasht Industrial City.............................. 6-17
Final Report, Volume III Part 5: Wastewater Management Supporting Report Table of Contents
Nippon Koei Co., Ltd The Study on Integrated Management for Ecosystem Conservation of the Anzali Wetland
vii
List of Figures
Page
Figure 2.1.1 Type of Pollution Sources ................................................................... 2-1 Figure 2.3.1 Traditional Drainage System................................................................. 2-3 Figure 2.3.2 Populations and Capacities of Sewerage System Planned by GWWC
(2019) ................................................................................................. 2-5 Figure 2.3.3 Construction Site for Sewerage System ................................................. 2-6 Figure 2.3.4 Forecast of Sewerage Service Population up to 2019.............................. 2-7
Figure 2.4.1 Absorption Tank in Rural Area.............................................................. 2-10 Figure 2.7.1 Organization for Control of Consumption of Fertilizer and Pesticide ....... 2-13 Figure 3.1.1 Mechanisms of Water Quality Deterioration and Ecosystem Degradation 3-1 Figure 3.1.2 COD, T-N and T-P Concentrations (mg/l) in Wetland Water .................... 3-2 Figure 3.2.1 Sub-Basins in the Study Area................................................................ 3-6 Figure 3.2.2 Pollution Load Discharged Mechanism in Anzali Wetland ...................... 3-6 Figure 4.2.1 COD T-N and T-P Pollution Load to Wetland in West and East ............... 4-5 Figure 4.3.1 Outline of Rasht Sewerage System........................................................ 4-10
Figure 4.3.2 Outline of Anzali Sewerage System ...................................................... 4-10 Figure 4.4.1 Locations of Community Wastewater Treatment Systems Proposed by
RWWC ............................................................................................... 4-14 Figure 4.4.2 Image of Community Wastewater Treatment System Proposed by
RWWC ............................................................................................... 4-15 Figure 4.5.1 Location of Existing and Planned Industrial Cities ................................. 4-18 Figure 4.5.2 Image of Centralized Wastewater Treatment System .............................. 4-19 Figure 4.6.1 Image of Management of Livestock Waste in Industrial Animal
Husbandry........................................................................................... 4-21 Figure 4.6.2 Image of Water Points and Dykes.......................................................... 4-22
Figure 5.1.1 Wastewater Management Plan .............................................................. 5-2 Figure 6.3.1 Proposed Implementation Schedule for Wastewater Management ........... 6-5 Figure 6.5.1 Condition of Wastewater Discharge in Anzali ........................................ 6-16

Final Report, Volume III Part 5: Wastewater Management Supporting Report Chapter 1
Nippon Koei Co., Ltd The Study on Integrated Management for Ecosystem Conservation of the Anzali Wetland
1 - 1
CHAPTER 1 INTRODUCTION
1.1 General The wastewater management plan is one of the components of the Master Plan Study on Integrated Management for Ecosystem Conservation of the Anzali Wetland in the Islamic Republic of Iran. Due to lack of suitable wastewater management, water pollution become one of serious problems in the Anzali Wetland. The objective of the wastewater management plan is to improve and maintain the water quality of the Anzali Wetland at a level acceptable for its ecosystem. 1.2 Scope of the Study The study area is the entire basin of the Anzali Wetland. The scope of the study on the wastewater management includes the followings:
- To describe and understand the present condition of wastewater management in the study area
- To evaluate the amount of COD, T-N and T-P pollution load to Anzali Wetland at present, and to predict the pollution load amount in future, 2019
- To propose the projects in the wastewater management plan up to 2019 - To estimate the project cost and O&M cost of the project proposed in the
wastewater management plan - To prepare the implementation program for the wastewater management plan up
to 2019

Final Report, Volume III Part 5: Wastewater Management Supporting Report Chapter 2
Nippon Koei Co., Ltd The Study on Integrated Management for Ecosystem Conservation of the Anzali Wetland
2 - 1
CHAPTER 2 PRESENT CONDITION OF WASTEWATER MANAGEMENT
2.1 Pollution Sources in the Basin The wastewaters discharged to the wetland are generated in the basin of the wetland. The water environment in the wetland has been degraded by continuous wastewater inflow from human activities, such as domestic, industrial and agricultural activities. Major water pollution sources are the urban population (743,000 residents), rural population (395,000 residents), industrial factories, livestock (860,000 head), and farmland (99,000 ha). In addition, the natural environment such as forest/grassland (198,000 ha) also generate water pollution. The composition of water pollution sources are as shown below.
Figure 2.1.1 Type of Pollution Sources
Details of the pollution sources in the basin are described in Chapter 3. 2.2 Related Organizations and Regulations 2.2.1 Responsible Organizations for Wastewater Management The various authorities such as DOE, MOJA, GWWC and RWWC take responsibility for management of the wastewater and pollution sources, and much effort has been put into their management. However, a large part of the wastewater is still discharged without any treatment, and no organization has taken the responsibility for overall management of wastewater in the basin of the wetland. Table 2.2.1 shows responsible organizations for management of each pollution source.
Residents in Urban Area
Residents in Rural Area
Industrial Factories
Livestock
Farmland
Forest/Grassland
Non-point Source
Point Source
Water Pollution Source

Final Report, Volume III Part 5: Wastewater Management Supporting Report Chapter 2
Nippon Koei Co., Ltd The Study on Integrated Management for Ecosystem Conservation of the Anzali Wetland
2 - 2
Table 2.2.1 Task of Organizations Responsible for Wastewater Management
Pollution Source Task Executing Organization
Urban Domestic Wastewater
1) New sewerage system development 2) Management of sewerage system
GWWC
Rural Domestic Wastewater
1) Development of rural wastewater treatment system RWWC
1) Monitoring of Industrial Effluent 2) Permission for construction of industrial factories
DOE Industrial Wastewater
1) Development of industrial cites MOIM Livestock 1) Control of number of livestock in grazing land
2) Permission for engaging in of industrial animal husbandry. MOJA DOE
Pollution from Farm Land
1) Control of agricultural chemical use 2) Control of chemical fertilizer use
MOJA
Source: JICA Study Team
2.2.2 Laws and Regulations related to Wastewater Management The Regulation and Standard of Environment, 1999 describes the effluent standard. According to the standard, all of domestic and industrial wastewater shall be treated properly before discharging to surface water or absorption well. It will take so long time for all polluters to follow the standard. GWWC and RWWC have plans to increase the domestic wastewater treatment ratio, for which some projects have been carried out. DOE conducts control of industrial effluent even by using legal force. The effluent standard stipulates allowable concentrations of 52 water quality parameters in effluent. The major water quality items are as shown below. To follow the standard, Secondary Treatment Level is required.
Table 2.2.2 Summary of Effluent Standard
Item Discharge to Surface Water
Discharge to Absorbent Well (Ground)
Using for Agriculture and Irrigation
BOD 30 30 100 COD 60 60 200
Ammonia (NH4) 2.5 1 - Nitrite (NO2) 10 10 - Nitrate (NO3) 50 10 -
Total Phosphorous 6 6 - Source: Regulation and Standard of Environment, 1999
(1) National Strategy for Wastewater Treatment According to the National Strategy mentioned in the Draft Fourth 5 Years Development Plan prepared by DOE and the Coming 20 year Development Plan, the sewerage service ratio in urban area and the wastewater treatment ratios in rural area are planned to increase gradually as shown in Table 2.2.3.

Final Report, Volume III Part 5: Wastewater Management Supporting Report Chapter 2
Nippon Koei Co., Ltd The Study on Integrated Management for Ecosystem Conservation of the Anzali Wetland
2 - 3
Table 2.2.3 Target Wastewater Treatment Ration in Iran
Item Present Fourth 5 Years Development Plan
Coming 20 Years Development Plan
Sewerage Service Ratio in Urban Area Almost 0% 20 % 60 % Wastewater Treatment Ratio in Rural Area Almost 0% 5 % 30 % Industrial Wastewater Treatment Not clear Basically, all factories follow the effluent
standard. Source: NWWEC, DOE
2.3 Domestic Wastewater Management in Urban Areas 2.3.1 Present Situation GWWC is responsible for the management of domestic wastewater in the urban areas. At present about 762,000 people live in the urban areas of the basin and most of them are connected to the traditional drainage system. This system consists only of combined sewers for storm water and wastewater collection, without any treatment.
There are about 200 outlets from existing sewers along the rivers in Rasht, and about 100 outlets in Anzali. Effluent water quality from these outlets is completely out of compliance with the effluent standard, because of the lack of any treatment. Some parts of the urban area are not connected to the existing sewerage system. The households in these areas discharge wastewater directly to rivers, absorption wells, or surface drains along the streets. The traditional drainage system in Guilan Province is illustrated in Figure 2.3.1.
Figure 2.3.1 Traditional Drainage System
Wastewater & Rain water
River
Rain water

Final Report, Volume III Part 5: Wastewater Management Supporting Report Chapter 2
Nippon Koei Co., Ltd The Study on Integrated Management for Ecosystem Conservation of the Anzali Wetland
2 - 4
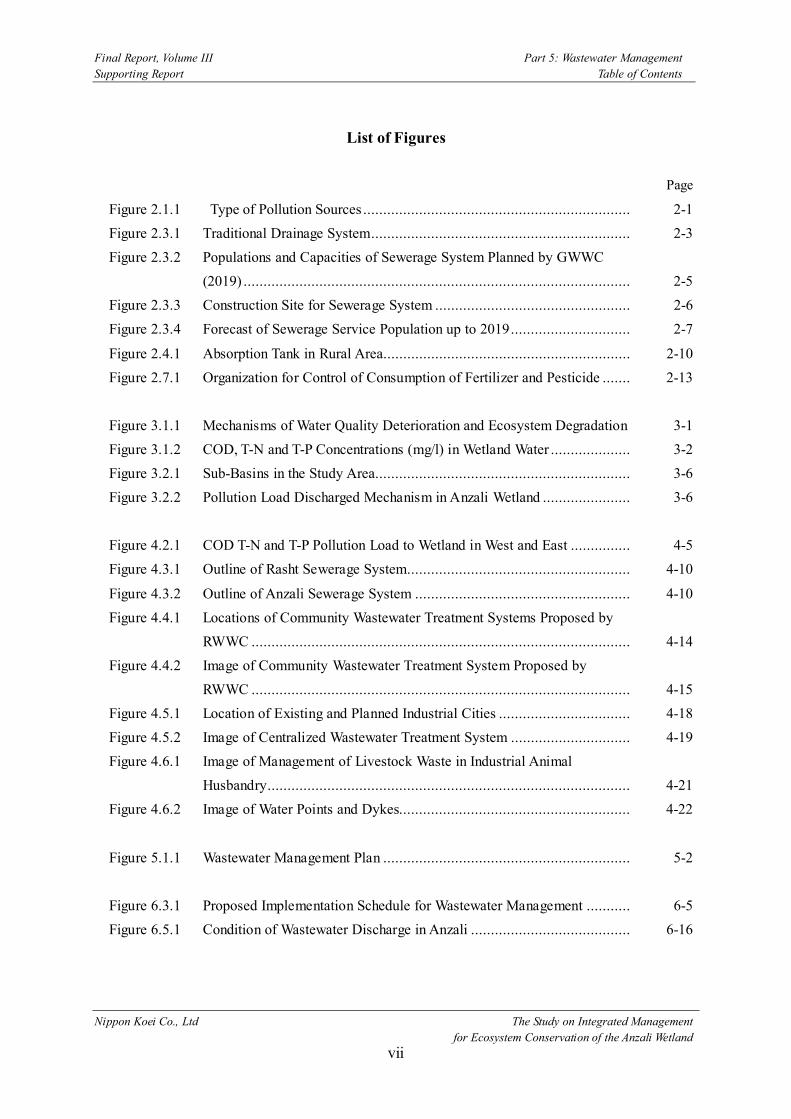
2.3.2 Sewerage Development Plan of NWWEC GWWC has a general long-term goal to develop sewerage systems that meet the effluent standards in all urban areas. Figure 2.3.2 shows the location and the status of sewerage development projects in the cities for which GWWC is responsible. The construction of sewerage systems with secondary treatment (activated sludge process) in Rasht, Anzali and Somehsara has already commenced. Figure 2.3.2 shows location of the planned sewerage area and service populations. Figure 2.3.3 shows situation of the on-going construction works.

Figure 2.3.2Populations and Capacities of SewarageSystems Planned by GWWC (2019)
2 - 5
CASPIAN SEA
NN
555 000 555 101010 15 km15 km15 kmScaleScaleScale
LegendWatershed BoundaryAnzali WetlandAnzali LagoonRiverCity / TownProvincial CapitalRoad
JAPAN INTERNATIONAL COOPERATION AGENCY
The Study on Integrated Management forEcosystem Conservation of the Anzali Wetland
in the Islamic Republic of Iran
E 49o 00' E 49o 30'
N 37o 30'
N 37o 00'
Sewerage System Planned
AnzaliAnzaliAnzali
RashtRashtRasht
KhomamKhomamKhomam
ShaftShaftShaft
FumanFumanFuman
SomehsaraSomehsaraSomehsara
MasalMasalMasal
MasulehMasulehMasuleh
MarjaghalMarjaghalMarjaghal
SangarSangarSangar
Rezvan ShahrRezvan ShahrRezvan Shahr
Siyah MazgiSiyah MazgiSiyah MazgiTo TehranTo Tehran
To KhoshkebijarTo Khoshkebijar
To BahijanTo Bahijan
To AstraTo Astra
To KiyashahrTo Kiyashahr
Rasht787,224 residents190,000 m3/day
Shaft14,357 residents3,200 m3/day
Fuman46,000 residents10,300 m3/day
Masuleh743 residents + tourists
Masal24,762 residents5,600 m3/day
Anzali137,632 residents54,000 m3/day
Somehsara56,980 residents12,700 m3/day
Khoman16,178 residents3,600 m3/day
Fuman46,000 residents10,300 m3/day
Name of City -Service Population in 2019 -
Treatment Capacity in 2019 -
Explanation
Final Report, Volume III Part 5: Wastewater Management Supporting Report Chapter 2
Nippon Koei Co., Ltd The Study on Integrated Management for Ecosystem Conservation of the Anzali Wetland
2 - 6
Figure 2.3.3 Construction Site for Sewerage System
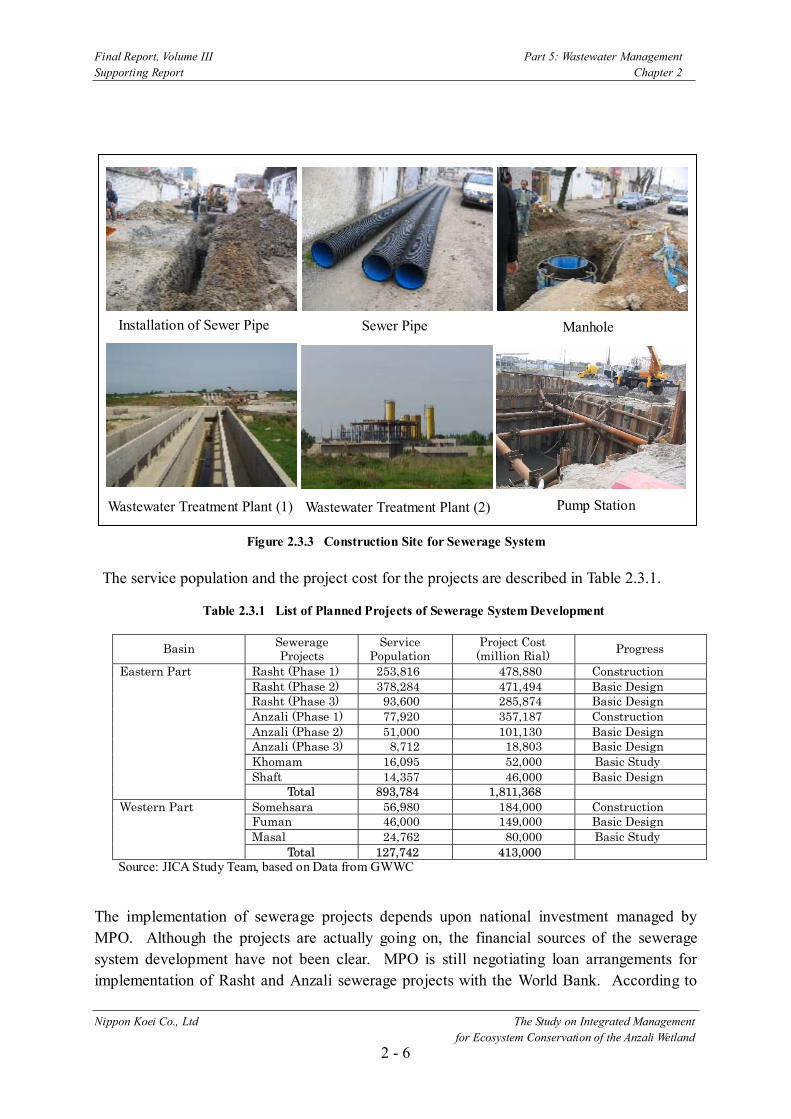
The service population and the project cost for the projects are described in Table 2.3.1.
Table 2.3.1 List of Planned Projects of Sewerage System Development
Basin Sewerage Projects
Service Population
Project Cost (million Rial) Progress
Rasht (Phase 1) 253,816 478,880 Construction Rasht (Phase 2) 378,284 471,494 Basic Design Rasht (Phase 3) 93,600 285,874 Basic Design Anzali (Phase 1) 77,920 357,187 Construction Anzali (Phase 2) 51,000 101,130 Basic Design Anzali (Phase 3) 8,712 18,803 Basic Design Khomam 16,095 52,000 Basic Study Shaft 14,357 46,000 Basic Design
Eastern Part
Total 893,784 1,811,368 Somehsara 56,980 184,000 Construction Fuman 46,000 149,000 Basic Design Masal 24,762 80,000 Basic Study
Western Part
Total 127,742 413,000 Source: JICA Study Team, based on Data from GWWC
The implementation of sewerage projects depends upon national investment managed by MPO. Although the projects are actually going on, the financial sources of the sewerage system development have not been clear. MPO is still negotiating loan arrangements for implementation of Rasht and Anzali sewerage projects with the World Bank. According to
Installation of Sewer Pipe Sewer Pipe Manhole
Pump Station Wastewater Treatment Plant (1) Wastewater Treatment Plant (2)
Final Report, Volume III Part 5: Wastewater Management Supporting Report Chapter 2
Nippon Koei Co., Ltd The Study on Integrated Management for Ecosystem Conservation of the Anzali Wetland
2 - 7
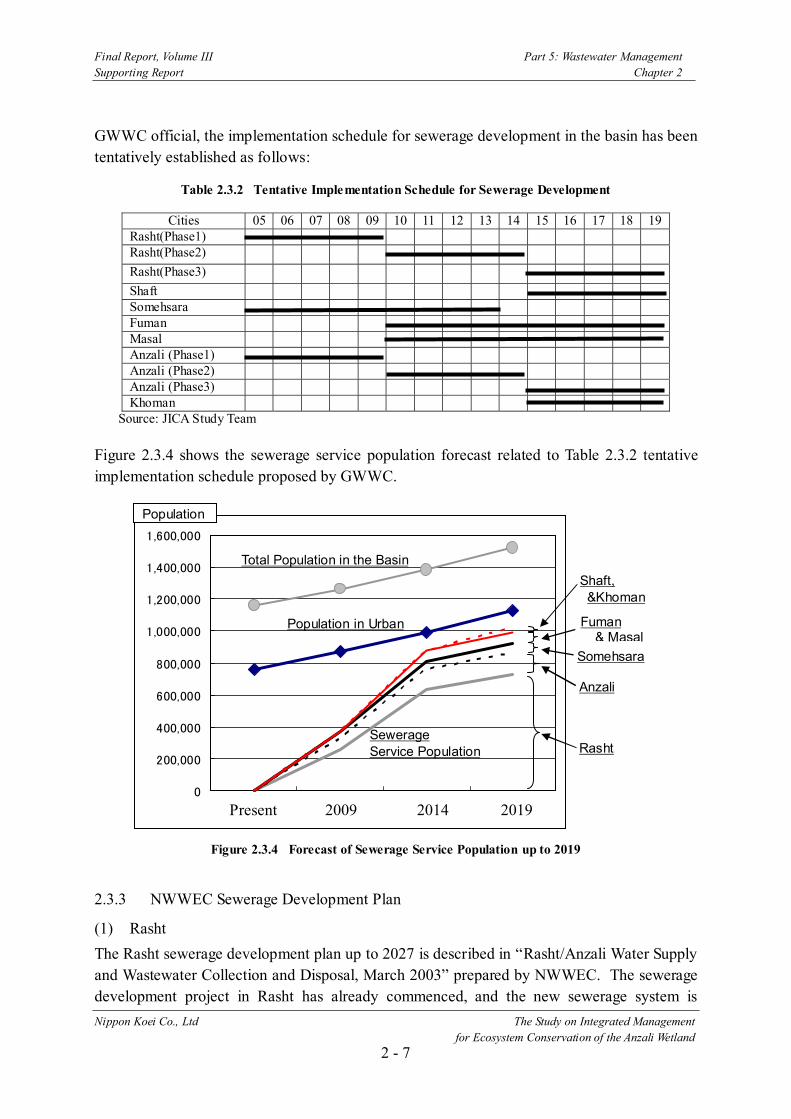
GWWC official, the implementation schedule for sewerage development in the basin has been tentatively established as follows:
Table 2.3.2 Tentative Implementation Schedule for Sewerage Development
Cities 05 06 07 08 09 10 11 12 13 14 15 16 17 18 19 Rasht(Phase1) Rasht(Phase2) Rasht(Phase3) Shaft Somehsara Fuman Masal Anzali (Phase1) Anzali (Phase2) Anzali (Phase3) Khoman
Source: JICA Study Team
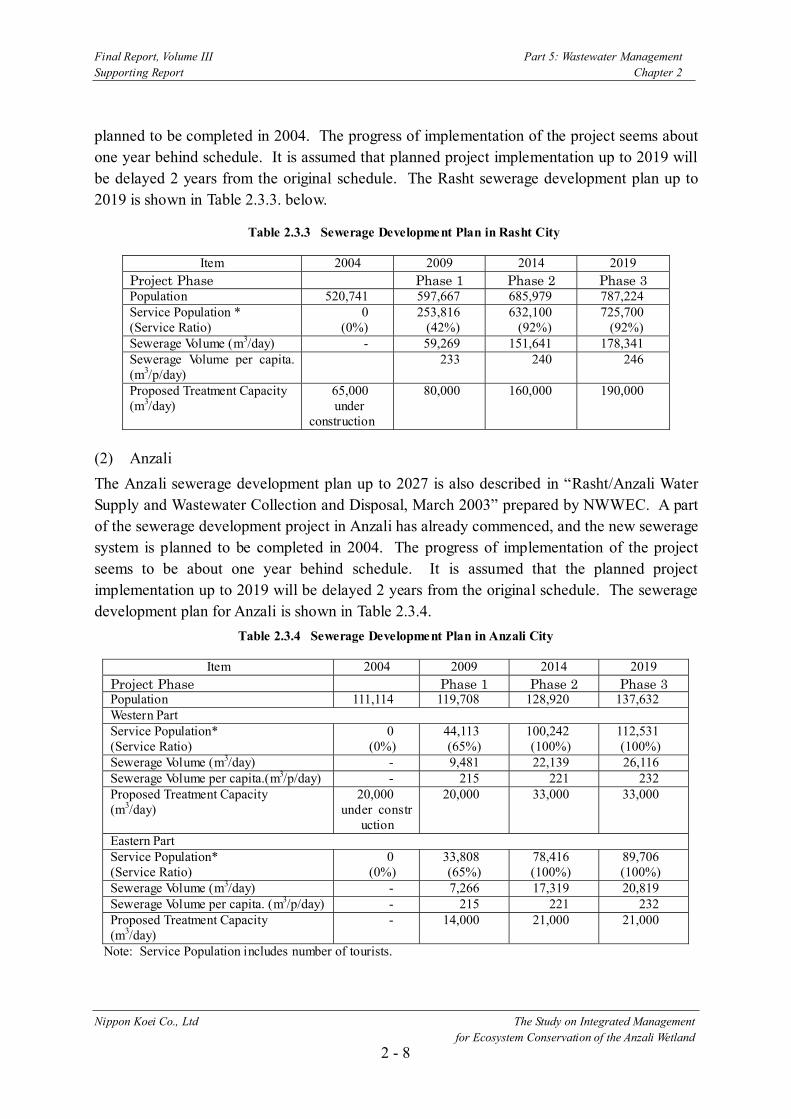
Figure 2.3.4 shows the sewerage service population forecast related to Table 2.3.2 tentative implementation schedule proposed by GWWC.
Figure 2.3.4 Forecast of Sewerage Service Population up to 2019
2.3.3 NWWEC Sewerage Development Plan
(1) Rasht The Rasht sewerage development plan up to 2027 is described in “Rasht/Anzali Water Supply and Wastewater Collection and Disposal, March 2003” prepared by NWWEC. The sewerage development project in Rasht has already commenced, and the new sewerage system is
0
200,000
400,000
600,000
800,000
1,000,000
1,200,000
1,400,000
1,600,000
1 2 3 4
Rasht
Anzali
Somehsara
Fuman & Masal
Shaft, &Khoman
Population in Urban
Total Population in the Basin
Sewerage Service Population
Present 2009 2014 2019
Population
Final Report, Volume III Part 5: Wastewater Management Supporting Report Chapter 2
Nippon Koei Co., Ltd The Study on Integrated Management for Ecosystem Conservation of the Anzali Wetland
2 - 8
planned to be completed in 2004. The progress of implementation of the project seems about one year behind schedule. It is assumed that planned project implementation up to 2019 will be delayed 2 years from the original schedule. The Rasht sewerage development plan up to 2019 is shown in Table 2.3.3. below.
Table 2.3.3 Sewerage Development Plan in Rasht City
Item 2004 2009 2014 2019 Project Phase Phase 1 Phase 2 Phase 3 Population 520,741 597,667 685,979 787,224 Service Population * (Service Ratio)
0 (0%)
253,816 (42%)
632,100 (92%)
725,700 (92%)
Sewerage Volume (m3/day) - 59,269 151,641 178,341 Sewerage Volume per capita. (m3/p/day)
233 240 246
Proposed Treatment Capacity (m3/day)
65,000 under
construction
80,000 160,000 190,000
(2) Anzali The Anzali sewerage development plan up to 2027 is also described in “Rasht/Anzali Water Supply and Wastewater Collection and Disposal, March 2003” prepared by NWWEC. A part of the sewerage development project in Anzali has already commenced, and the new sewerage system is planned to be completed in 2004. The progress of implementation of the project seems to be about one year behind schedule. It is assumed that the planned project implementation up to 2019 will be delayed 2 years from the original schedule. The sewerage development plan for Anzali is shown in Table 2.3.4.
Table 2.3.4 Sewerage Development Plan in Anzali City
Item 2004 2009 2014 2019 Project Phase Phase 1 Phase 2 Phase 3 Population 111,114 119,708 128,920 137,632 Western Part Service Population* (Service Ratio)
0 (0%)
44,113 (65%)
100,242 (100%)
112,531 (100%)
Sewerage Volume (m3/day) - 9,481 22,139 26,116 Sewerage Volume per capita.(m3/p/day) - 215 221 232 Proposed Treatment Capacity (m3/day)
20,000 under constr
uction
20,000 33,000 33,000
Eastern Part Service Population* (Service Ratio)
0 (0%)
33,808 (65%)
78,416 (100%)
89,706 (100%)
Sewerage Volume (m3/day) - 7,266 17,319 20,819 Sewerage Volume per capita. (m3/p/day) - 215 221 232 Proposed Treatment Capacity (m3/day)
- 14,000 21,000 21,000
Note: Service Population includes number of tourists.
Final Report, Volume III Part 5: Wastewater Management Supporting Report Chapter 2
Nippon Koei Co., Ltd The Study on Integrated Management for Ecosystem Conservation of the Anzali Wetland
2 - 9
(3) Somehsara Somehsara sewerage development plan up to 2021 has been prepared by NWWEC. Installation of the trunk main has just started. It is assumed that project implementation up to 2019 will be advanced 2 years from the original schedule. The development plan up to 2019 is presented in Table 2.3.5.
Table 2.3.5 Sewerage Development Plan in Somehsara City
Item 2004 2009 2014 2019 Population 40,417 49,145 59,621 72,449 Service Population (Service Ratio)
0 (0%)
43,230 (88%)
49,631 (83%)
56,980 (79%)
Sewerage Volume (m3/day) - 9,047 12,705
(4) Other Cities Excluding the urban population of Rasht, Anzali and Somehsara, the remaining urban population of the basin is predicted to be about 129,546 in 2019, which is about 11% of the total urban population in the basin.
As shown in Table 2.3.1, NWWEC has started studies and planning on sewerage development for Fuman, Masal, Shaft and Khomam. The design works for Masal, Shaft and Khomam sewerage projects have not yet commenced. The basic design for the Fuman sewerage system has been completed.
2.4 Domestic Wastewater Management in Rural Areas 2.4.1 Present Situation About 394,000 people live in the rural areas. The Rural Water and Wastewater Company, Guilan (RWWC) is responsible for water supply and domestic wastewater management in the rural areas of Guilan. However, RWWC has not conducted any work on wastewater treatment, except for the planning of wastewater treatment systems, because of financial constraints. Most of the houses in rural areas have absorption wells, into which wastewater is discharged directly. These wells, which are constructed by the residents themselves, are the traditional wastewater treatment facilities in Iran. Domestic wastewater in the absorption tank infiltrates the surrounding ground as shown in Figure 2.4.1

Final Report, Volume III Part 5: Wastewater Management Supporting Report Chapter 2
Nippon Koei Co., Ltd The Study on Integrated Management for Ecosystem Conservation of the Anzali Wetland
2 - 10
Figure 2.4.1 Absorption Tank in Rural Area
According to the effluent standard, wastewater discharged into absorption well should be treated to secondary treatment level. However, the wells usually receive wastewater directly from households without any treatment. In order to protect groundwater quality, the standard mentions that installation of an absorption tank is forbidden where the bottom of the tank is to be set less than 2 m above groundwater level. In a large part of Guilan, the groundwater level is generally high, especially in the winter season. In areas with high groundwater, absorption wells work poorly, because wastewater cannot be infiltrated to the ground, and it will overflow to the surface. 2.4.2 Development Plan for Community Wastewater Treatment System proposed by
RWWC According to RWWC, Guilan, the target of wastewater management in the rural areas up to 2022 is to provide wastewater treatment systems consisting of “septic tanks & a secondary treatment process” for 40% of villages that have more than 20 families. The main purpose of improvement of the rural wastewater treatment is to improve sanitary conditions for residents and it will also contribute to the reduction of pollution load on the wetland. This system will enable low-cost treatment of wastewater from rural communities, along with ease of operation.
RWWC has prepared detailed designs for rural wastewater treatment systems for sixteen villages, which include seven villages in the Anzali Wetland basin, Atashgah, Kheshtnasjed, Gasht, Loleman, Norgeston, Sheikhneshin and Aliabad. The service population in the seven villages is planned for 18,325 residents. These projects were planned to be implemented for the Third Five-Year Plan (2000-2004), but the construction works has not been commenced because no budget for the projects has been prepared by the central government.
Toilet
Absorption Well
More than 2 m is required, according to the Effluent Standard

Final Report, Volume III Part 5: Wastewater Management Supporting Report Chapter 2
Nippon Koei Co., Ltd The Study on Integrated Management for Ecosystem Conservation of the Anzali Wetland
2 - 11
2.5 Management of Industrial Effluent 2.5.1 Present Situation According to DOE, Guilan, the amount of industrial effluent from major industries in 2002 is estimated as below.
Table 2.5.1 Water Consumption and Wastewater Discharges from Industrial Factories
(Unit: m3/day)
Item Number of Factories
Water Consumption
Wastewater from human activity
Wastewater from Process
Textile 11 3,757 555 2,852 Foods 15 2,836 87 1,389 Electrical Products 3 1,270 123 605 Ceramics 6 673 127 256 Metals and Machines 5 478 107 297 Chemical 1 320 17 200
1,016 5,599 Total 41 9,334 6,615
Source: DOE
Owners of the factories have the responsibility to treat industrial effluent to meet the effluent standard and DOE has the responsibility for monitoring the effluent from the factories. The industrial factories are located in various places. It is therefore difficult for DOE staff to carry out effective monitoring of the effluent from all of the industrial factories.
As shown in Table 2.5.1, the total amount of industrial effluent discharged in the basin is roughly estimated to be less than 7,000 m3/day. This is estimated to be about 3% of the total wastewater discharge by volume. The pollution load to the wetland from industrial activities, therefore, does not seem to be serious with respect to organics and nutrients. However, the industries may be important sources of heavy metals and other toxic materials. 2.5.2 Industrial City Development Plan There are five existing industrial cities and one planned, in the basin. The management of industrial cities is as described as below.
Table 2.5.2 Management of Industrial Cities in the Basin
Industrial City Area Operating Factories Management
Rasht 420 ha 125 Managed by Semi Private Company Shaft 38 ha 2 Managed by MOIM, New construction Somehsara 100 ha 15 Managed by MOIM Fuman 14 ha -- Managed by MOJA Masal ------- ------- (Planning stage) To be managed by MOIM Anzali 50 ha 34 Managed by MOIM, To be expanded up to 85 ha
Source: MOIM, Gilan

Final Report, Volume III Part 5: Wastewater Management Supporting Report Chapter 2
Nippon Koei Co., Ltd The Study on Integrated Management for Ecosystem Conservation of the Anzali Wetland
2 - 12
Such centralization of industrial factories in certain places is effective for control of the industrial effluent. The Ministry of Industries and Mining is trying to transfer existing large-scale industrial factories and new planned industrial factories to these industrial cities. At present there are no wastewater treatment systems in the industrial cities, except Anzali Industrial City, where a small-scale wastewater treatment system is under construction.
2.6 Management of Livestock Waste About 862,000 livestock are living in the basin. The livestock include about 309,000 cows, 417,000 sheep, 120,000 goats, 17,000 water buffaloes and 47,000 horses and donkeys. The livestock are divided into the following three types of livestock.
(1) Livestock fed by Individual Farmers Out of 268,000 head of cows and buffalo in the basin, about 200,000 head of them are fed by individual farmers in the plain area. Usually one family feed two to ten cows or buffalo near their house or on their farmland. The farmers use livestock waste as manure on their farmland. The effective usage of the fertilizer for the farmland is the only measure for control of pollution, and a large number of the farmers have already carried out the manure use.
(2) Livestock in Rangelands in Mountain Area Out of about 537,000 head of sheep and goats in the basin, most of the sheep and goats stay in 441 km2 of rangelands in the mountain area. Waste from the sheep and goats are spreading over a wide area, because they are moving from place to place. Large parts of the potential pollution load are decomposed in the soil, and only a small amount of pollution load is discharged to the rivers. Under the rangeland management program by NRGO, about 250,000 head of livestock in the rangeland are planned to be removed. This will contribute to reduction of pollution load to the wetland. Livestock waste in the rangelands in the mountain area is not a serious problem to the wetland because the rangelands are far from the wetland.
(3) Livestock in Rangelands near the Wetland About 20,000 head of cows and buffalo are fed in rangeland near the wetland. Wastes from these livestock are spread in the rangeland, and may be discharged to the wetland in rainy season. It may be a serious pollution sources, because it is easy for the waste to reach the wetland.
(4) Livestock in Industrial Animal Husbandries There are about 17 industrial animal husbandries in the basin, where more than 20 head of cows each are kept. Dung from the cows is used as fertilizer in the farmland or feed in fishponds. Liquid waste are discharged to absorption tanks or ponds, and are not treated properly. DOE proposed that industrial animal husbandries to have suitable waste treatment facilities to meet the effluent standard.

Final Report, Volume III Part 5: Wastewater Management Supporting Report Chapter 2
Nippon Koei Co., Ltd The Study on Integrated Management for Ecosystem Conservation of the Anzali Wetland
2 - 13
Before authorizing construction of a new animal husbandry building, DOE should evaluate whether it will have a suitable waste management system in the building. For the waste management, the building is required to have a storage facility for livestock manure, and a wastewater treatment facility. However, there is no standard design for the waste management system for animal husbandry at present. 2.7 Management of Pollution from Farmland In the Anzali Wetland basin, there are 98,700 ha of farmlands, which consist of 81,200 ha of paddy fields and 17,500 ha of other farmlands. A portion of the fertilizers, pesticides and manure used in the farmland is discharged into the wetland as a pollution load. MOJA has an important role in guiding farmers on the control of pollution from agricultural activities. For the control of consumption of fertilizers, pesticides and herbicides, MOJA gives advice to farmers through the Agricultural Service Centers and Township Cooperative Offices as shown in Figure 2.7.1.
Figure 2.7.1 Organization for Control of Consumption of Fertilizer and Pesticide
(1) Chemical Fertilizers On average, 75 kg of nitrogen, 4 kg of phosphorous and 26 kg of potassium were applied for one hectare of paddy fields in 2002 based on the data given by MOJA. The dosages for nitrogen and phosphorous are more or less equal with those recommended by MOJA, while that for potassium is significantly lower than the MOJA’s recommendation1. The yield of rice has increased owing to stable application of fertilizer and improvement of rice varieties. At present, fertilizers are subsidized by the Government and provided to farmers through cooperatives. It is speculated that large quantities of fertilizers could be applied by farmers unless the agricultural extension work of MOJA functioned well. 1 Recommended dosage per hectare for traditional rice is 55 kg of Nitrogen (N), 0 kg of Phosphate (P) and 60 kg of Potassium (K), while the recommendation for the improved variety is 83 kg (N), 0 kg (P), and 120 kg (K).
Agricultural Service Center
(Several centers in each Township) Township Cooperative
(One main office in each township, many representative shops)
FARMERS
MOJA
Rural Cooperative Organization Center
Procurement of Fertilizer and Pesticide
Instruction and Technical Advice
Control for Procurement of Fertilizer and Pesticide

Final Report, Volume III Part 5: Wastewater Management Supporting Report Chapter 2
Nippon Koei Co., Ltd The Study on Integrated Management for Ecosystem Conservation of the Anzali Wetland
2 - 14
The soil laboratory of MOJA conducts soil analyses every year to determine the optimal dosage of fertilizers based on the soil analysis and give farmers recommendations on appropriate dosage to reduce the quantities applied. Through these activities, MOJA has been successfully in reducing average phosphorous consumption, from 36 kg/ha/year in 1992 to 4 kg/ha/year in 2002.as shown in Table 2.7.1.
Table 2.7.1 Chemical Fertilizer Use in the Paddy Field, 2002
(Unit: kg/ha) Year Average of Nitrogen Average of Phosphate Average of Potassium 1992 148 121 30 1999 149 36 59 2000 148 39 26 2001 135 13 66 2002 164 13 51
Source: Watershed Management Deputy in Guilan, MOJA
(2) Agricultural Chemical (Pesticide and Herbicide) The kinds and the amount of the main agricultural chemicals used for rice farming in the study area are summarized in the following table. On average, 4.5 kg/ha of pesticide, 0.1 lit/ha of fungicide and 2.5 kg/ha of herbicide are used per cropping.
Table 2.7.2 Main Agricultural Chemicals Use in the Paddy Field, 2002
Insecticide Fungicide Herbicide Diazinon Rident Padan Hinozan Beem Township
Cultivated
area (ha) (kg) (kg) (kg) (liter) (kg) (kg)
Anzali 4,200 10,000 10,450 2,200 450 50 10,500 Rasht * 15,500 67,500 20,000 17,500 1,875 500 38,750 Shaft 14,330 10,409 29,650 - 1,000 1,000 35,800 Fuman 13,870 38,325 3,825 12,150 500 500 34,400 Somehsara 27,150 86,369 29,004 12,430 1,500 1,500 67,800 Masal 6,150 15,000 2,000 - 300 500 15,300 Total 81,200 227,603 94,929 44,280 5,625 4,050 202,550
Source: Horticulture and Agriculture Organization in Guilan, MOJA (Data of Chemical Consumption), JICA Study Team, based on the data from Statistic Data Book in Gilan Province, 1997 (Data of farmland area) Note: The value shown in the cell “Rasht” is chemical consumption in the part of Rasht, which is in the basin of
the wetland. It is assumed that 25 % of chemical amount in Rasht is used in the basin of the wetland.

Final Report, Volume III Part 5: Wastewater Management Supporting Report Chapter 2
Nippon Koei Co., Ltd The Study on Integrated Management for Ecosystem Conservation of the Anzali Wetland
2 - 15
The agricultural minister mandated a reduction in the quantity of agricultural chemical use in 1994. Accordingly, MOJA has instructed farmers through cooperatives to reduce the frequency of chemical application and implemented the IPM (Integrated Pest Management) program to enable farmers to minimize their chemical use. In fact, the consumption of chemicals has decreased to one third of the previous levels over the last decade at the national level. Biological control, which is an insect control technology that uses the natural enemy of insects, such as the egg parasitism bee, was introduced about 20 years ago in the country. MOJA has also promoted biological control since 1994 when the minister directed curtailment of agricultural chemicals. Through the efforts of MOJA, it has been spreading quickly in recent years and produced a certain effect to reduce agricultural chemical use.
Table 2.7.3 Chemical Control and Biological Control, 2002
Township Farmland (ha)
Biological Control (ha)
Anzali 5,186 390 Rasht * 16,557 4,650 Shaft 14,677 3,565 Fuman 34,478 3,371 Somehsara 14,440 5,434 Masal 6,751 2,500 Total 141,759 19,910
Source: JICA Study Team, based on the data from Statistic Data Book in Gilan Province, 1997 (Data for Farmland Area), Horticulture and Agriculture Organization in Guilan, MOJA (Data of Biological Control Area)
Notes: The cell “Rasht” shows the values in the part of Rasht, which is in the basin of the wetland. The area of Rasht in the basin is assumed 25 % of overall Rasht.

Final Report, Volume III Part 5: Wastewater Management Supporting Report Chapter 3
Nippon Koei Co., Ltd The Study on Integrated Management for Ecosystem Conservation of the Anzali Wetland
3 - 1
CHAPTER 3 WATER POLLUTION LOAD TO ANZALI WETLAND
3.1 Introduction
3.1.1 Water Degradation in Anzali Wetland
It is generally believed that large pollution loads impact upon the ecosystem of Anzali Wetland. Certain phenomena in the wetland are reported, such as excessive growth of Azolla and Phragmites, and anaerobic conditions in the bed of the wetland. These phenomena may be related to the inflow of excessive amounts of COD, T-N and T-P. The mechanism of water quality degradation in the wetland is shown in Figure 3.1.1.
Figure 3.1.1 Mechanisms of Water Quality Deterioration and Ecosystem Degradation
(1) Cause of High Concentration of Nutrient
Comparing the concentrations of nutrients (T-N and T-P) with several eutrophication criteria, it can be said that water quality in Anzali Wetland is between the upper limit of the mesotrophic condition and the eutrophic condition. One of the potential problems associated with eutrophic conditions is the excessive growth of specific plankton and/or macrophytes. The recent spreading of Azolla and the luxuriant growth of reeds may be related to the eutrophication of the water.
High Concentration of Nutrients (T-N, T-P)
High Concentration of Organic Substances (COD)
Excessive Increase of Azolla and Reed Area
Excessive Increase of Plankton and Macrophytes
Excessive Amount of Organic Sediment
Increase of Area of Anaerobic Conditions
Un-treated Domestic Wastewater
Waste from Large Numbers of Livestock
Pollution from Large Areas of Farmland
Wetland Basin

Final Report, Volume III Part 5: Wastewater Management Supporting Report Chapter 3
Nippon Koei Co., Ltd The Study on Integrated Management for Ecosystem Conservation of the Anzali Wetland
3 - 2
(2) Causes of High Concentration of Organic Pollution
COD is an indicator of organic pollution, which is caused by the inflow of organic pollutants, and results in the excessive growth of plants. The US EPA water quality guidelines, indicates highly eutrophic conditions, or in this case, high organic pollution, with more than 30 mg/L of COD. As the organic pollution progresses, the level of dissolved oxygen generally decreases, and anaerobic conditions in the bottom water are reported in Siakisim, Anzali Port and downstream of Pirbazar River.
3.1.2 Water Quality in Anzali Wetland
(1) COD, T-N and T-P
Water quality surveys conducted in the wetland three times between September and December, 2003, indicate the distribution of COD, T-N and T-P concentrations shown in Figure 3.1.2.
Figure 3.1.2 COD, T-N and T-P Concentrations (mg/l) in Wetland Water
High values of COD, T-N and T-P were recorded especially in eastern part of the wetland, although the recorded values differ from point to point.
Legend
● Sampling point 1 5km
1
2
3 45
6
7
8
9
10
11
12
1314
16
15
CODT-NT-P
mim.-max.mim.-max.mim.-max.
13-420.20-3.250.08-0.24
Concentration ofCOD, T-N and T-P
42-590.63-1.830.04-0.06
31-630.17-3.260.06-0.10
25-500.34-1.85
0.08 - 0.19
20-350.29-1.330.11-0.20
15-210.21-1.310.08-0.21
25-670.56-3.050.06-0.10
26-1070.38-2.630.11-0.30
12-190.73-1.460.15-0.22
17-591.12-2.080.15-0.28
40-1950.75-2.200.21-0.44
13-331.97-2.580.24-0.42
18-232.03-2.310.32-0.50
22-610.65-2.610.19-0.22
22-330.36-1.630.17-0.33
30-540.46-1.740.28-0.37

Final Report, Volume III Part 5: Wastewater Management Supporting Report Chapter 3
Nippon Koei Co., Ltd The Study on Integrated Management for Ecosystem Conservation of the Anzali Wetland
3 - 3
(a) Organic Pollution
Table 3.1.1 shows the distribution of COD concentrations in the wetland, and US EPA eutrophication criteria for comparison. According to the criteria, most of the wetland except for Siahkesim can be classified as highly polluted water.
Table 3.1.1 Distribution of COD Concentrations in the Wetland
(Unit: mg/L)
Area Eastern part of wetland
Central Part of wetland
Environs of Anzali city Siahkeshim Lagoon
area Average
Average 37 39 43 27 44 38 Range 22 - 61 12 - 107 13 - 195 15 - 50 13 - 67 12.9 – 67.2
Criteria of Eutrophic Condition (US EPA)
High: COD >30 mg/L, Moderate: COD 20 -30 mg/L Slight: COD 10 – 20 mg/L, Minimal: COD <10 mg/L
Source: JICA Study Team
High COD values are recorded in the eastern part and in the environs of Anzali city, which have the highest recorded COD concentrations. According to DOE officials, there is an anaerobic zone at the bottom of Siahkesim, although the average recorded COD is relatively low.
(b) Nutrients
Table 3.1.2 shows the distribution of T-P concentrations in the wetland, and three international eutrophication criteria for comparison.
Table 3.1.2 Total Phosphate Concentrations in Wetland Water (Unit: mg/L)
Area Eastern part of wetland
Central Part of wetland
Environs of Anzali city Siahkeshim Lagoon
area Average
Average 0.28 0.20 0.32 0.17 0.09 0.20 Range 0.17 –0.42 0.11 – 0.30 0.15 – 0.50 0.08 – 0.29 0.04 – 0.24 0.04 – 0.50
Vollenweider 0.03 – 0.1 mg/L US EPA > 0.02 mg/L
Criteria of Eutrophic Condition OECD1 0.035 – 0.1 mg/L Source: JICA Study Team
The environs of Anzali city are recorded as having the highest T-P values. The T-P concentrations in the western part are also high, whilst the values in Siahkesim and the Lagoon are recorded as being relatively low.
1 Fixed Boundary System, OECD Trophic Terminology and Prediction, see
http://lakes.chebuoto.org/TPMODELS/OECD/trophic.htm

Final Report, Volume III Part 5: Wastewater Management Supporting Report Chapter 3
Nippon Koei Co., Ltd The Study on Integrated Management for Ecosystem Conservation of the Anzali Wetland
3 - 4
(2) Heavy Metal and Other Toxic Materials
(a) Heavy Metals in Sediment
There is no significant difference in the concentrations of heavy metals in the sediments of the wetland and of the rivers, and those values are less than the international standards shown in Table 3.1.3. This means that there is not a heavy metal pollution problem in the wetland.
Table 3.1.3 Analytical Result of Heavy Metals in Sediment
(Unit: mg/kg) Area Cd Pb Cr6+ As Cu Zn
Wetland n.d. - 0.2 n.d. - 50.9 4.3. - 40.6 0.002 – 0.102 18.8 - 86.4 31.9 - 221.5 River n.d. - 0.2 11.2 - 43.4 3.2. - 39.0 0.012 – 0.257 36.4 - 63.8 49.3 - 144.8
Canadian Criteria for aquatic life*
3.5 913.0 90.0 17.0 197.0 315.0
Source: JICA Study Team Note: Probable Effect Level, Canadian Sediment Quality Guidelines for the Protection of Aquatic Life, 1999
(b) Pesticide and Herbicide
Pesticides and herbicides, such as diazinon and paraquat, are widely used in the basin, though little is known about their environmental impacts. Apparently birds and fish are quite susceptible to diazinon2, while the concentrations of diazinon at 16 points in the wetland were recorded as between 14 and 143 µg/L in the water quality survey of September, 2003. Paraquat is moderately toxic to birds and fish 3 , and the concentration of paraquat was recorded as between 18 and 199 µg/L at the same points and time. The field survey results must therefore be suspect. It is not clear whether this is due to point sources of pollution or other reasons, such as analytical and reporting errors. Evaluation of the pesticide and herbicide results is still on-going. Meanwhile, a detailed monitoring of agricultural chemical use and environmental concentrations of such chemicals, both with chemical analysis of biological assay, should be established.
2 Reported LD50 (lethal doze) of diazinon for birds rages of 2.8-41 mg/kg, and the reported LC50 (lethal
concentration in water) for fish are 80-3,200 µg/L for rainbow trout, 52 µg/L for bluegill, 30 µg/L for loach (EXTOXNET, 1996; Kyoto Univ., 1997).
3 Reported LD50 of paraquat for birds is 970-981 mg/kg (bobwhite, Japanese quail), and the LC50 for trout is 13-32 mg/L (EXTOXNET, 1996).
Final Report, Volume III Part 5: Wastewater Management Supporting Report Chapter 3
Nippon Koei Co., Ltd The Study on Integrated Management for Ecosystem Conservation of the Anzali Wetland
3 - 5
3.2 Situation of Pollution Sources in the basin
3.2.1 Pollution Load Discharged into Anzali Wetland
(1) Water Flows in Anzali Wetland
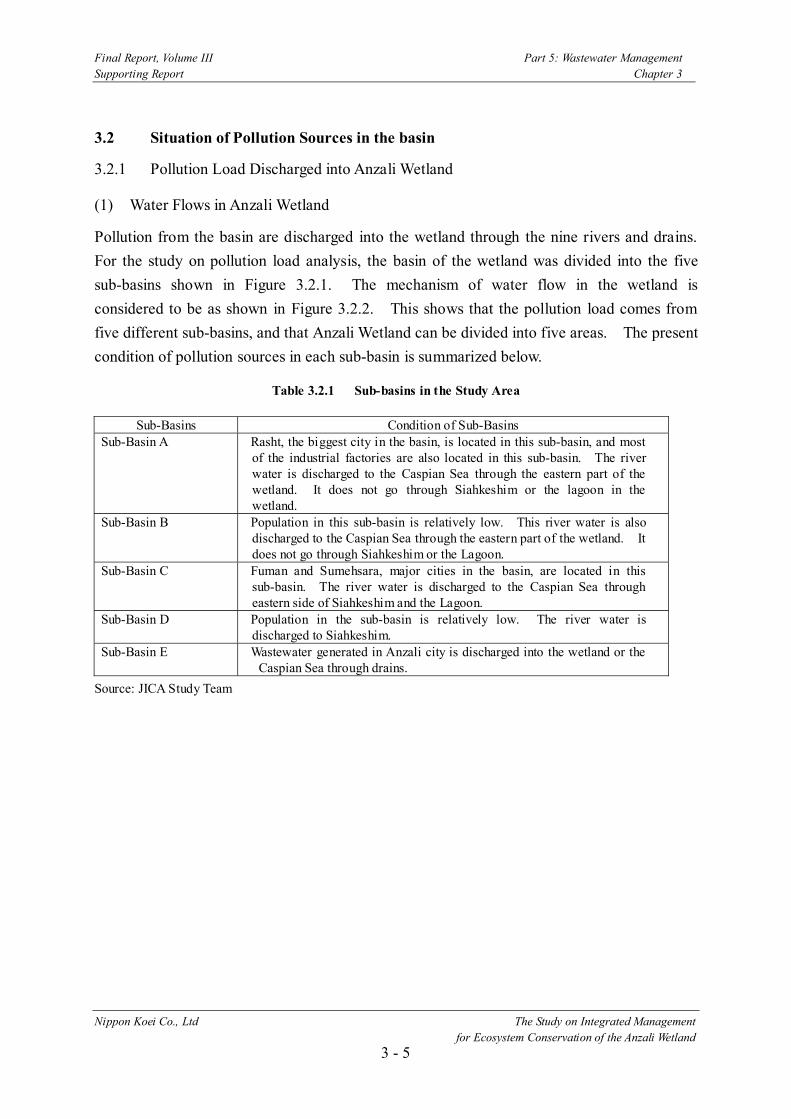
Pollution from the basin are discharged into the wetland through the nine rivers and drains. For the study on pollution load analysis, the basin of the wetland was divided into the five sub-basins shown in Figure 3.2.1. The mechanism of water flow in the wetland is considered to be as shown in Figure 3.2.2. This shows that the pollution load comes from five different sub-basins, and that Anzali Wetland can be divided into five areas. The present condition of pollution sources in each sub-basin is summarized below.
Table 3.2.1 Sub-basins in the Study Area
Sub-Basins Condition of Sub-Basins Sub-Basin A Rasht, the biggest city in the basin, is located in this sub-basin, and most
of the industrial factories are also located in this sub-basin. The river water is discharged to the Caspian Sea through the eastern part of the wetland. It does not go through Siahkeshim or the lagoon in the wetland.
Sub-Basin B Population in this sub-basin is relatively low. This river water is also discharged to the Caspian Sea through the eastern part of the wetland. It does not go through Siahkeshim or the Lagoon.
Sub-Basin C Fuman and Sumehsara, major cities in the basin, are located in this sub-basin. The river water is discharged to the Caspian Sea through eastern side of Siahkeshim and the Lagoon.
Sub-Basin D Population in the sub-basin is relatively low. The river water is discharged to Siahkeshim.
Sub-Basin E Wastewater generated in Anzali city is discharged into the wetland or the Caspian Sea through drains.
Source: JICA Study Team

Final Report, Volume III Part 5: Wastewater Management Supporting Report Chapter 3
Nippon Koei Co., Ltd The Study on Integrated Management for Ecosystem Conservation of the Anzali Wetland
3 - 6
Sub-basin A
Sub-basin B
Sub-basin C
Sub-basin D
Sub-basin E
Figure 3.2.1 Sub-Basins in the Study Area
Figure 3.2.2 Pollution Load Discharged Mechanism in Anzali Wetland
CASPIAN SEA
Siahkeshim
Lagoon
Sub-basin C Sub-basin B
Sub-basin D
Environs of Anzali City
Eastern Part of Wetland
Sub-basin E
Central Part of Wetland y
Sub-basin A

Final Report, Volume III Part 5: Wastewater Management Supporting Report Chapter 3
Nippon Koei Co., Ltd The Study on Integrated Management for Ecosystem Conservation of the Anzali Wetland
3 - 7
The characteristics of each sub-basin are described below.
1) Sub-basin A includes the most urbanized area, the biggest city, Rasht, and several factories. More than half of the population (i.e. 569,697 people) of the basin live in this sub-basin.
2) Sub-basin B also discharges river water to the eastern part of the wetland. Only one small urban area, Shaft, and a large forest area are located in the basin. Only 10% of the total basin population lives in this sub-basin.
3) It is estimated that more than half of the pollution load in the basin is discharged from sub-basins A & B through the eastern part of the wetland to the northern part of the wetland. Anaerobic zones at the bottom are found at several points in the eastern part. Hosein Bekandeh Non-hunting Area and Chokam Non-hunting Area are located in eastern part of the wetland.
4) Urban area, Fuman and Somehsara are located in sub-basin C. It is estimated that 20 % of the basin residents and 28% of the livestock live in this sub-basin. The pollution load from sub-basin C is discharged directly to Sorkhankol Wildlife Refuge. Selke Wildlife Refuge is located near Sorkhankol Wildlife Refuge. Large amounts of Azolla occur in Selke all year.
5) Sub-basin D has only one small urban area, Masal. Most of the population lives in the rural areas. The number of livestock is greater than the human population of the sub-basin. Most of the pollution load is discharged directly to Siahkesim Protected Area. It is reported that anaerobic conditions are found in several parts of Siahkesim Protected Area. Only one small river in sub-basin D, the Chafrud River, discharges into the “Lagoon”. The lagoon seems to have a long water retention time.
6) Sub-basin E includes the second biggest city, Anzali. There is only a small land area in this sub-basin. Wastewater generated in Anzali city is discharged into the wetland or the Caspian Sea through drains. Owing to the direct discharge of untreated wastewater from Anzali, the water near Anzali Port is recognized as some of most polluted areas in the wetland.

Final Report, Volume III Part 5: Wastewater Management Supporting Report Chapter 3
Nippon Koei Co., Ltd The Study on Integrated Management for Ecosystem Conservation of the Anzali Wetland
3 - 8
3.2.2 Condition of Each Pollution Source
1) Domestic Wastewater
The pollution load from domestic wastewater depends on population. The 980,000 population in the basin is divided into five (5) sub-basins as shown below.
Table 3.2.2 Population Distribution by Sub-basin
Sub-Basin Population Overall Percentage Urban
Population Non-urban Population
Sub-Basin A 489,000 50% 360,090 58,455 Sub-Basin B 87,000 9% 122,731 66,826 Sub-Basin C 197,000 20% 34,267 74,830 Sub-Basin D 89,000 9% 51,404 101,534 Sub-Basin E 120,000 12% 101,534 21,927 Total 982,000 100% 670,026 306,844
Source: JICA Study Team, based on the data from Statistic Data Book in Gilan Province, 1997
The condition of wastewater management is described in Chapter 2.
2) Industrial Wastewater
The total amount of industrial effluent discharged in the basin is roughly estimated to be less than 7,000 m3/day. as shown in Table 2.5.1. Distribution of industrial activities is summarized as below.
Table 3.2.3 Distribution of Industrial Activity by Sub-basin
Sub-Basin Industrial City Area Operating Factories Sub-Basin A Rasht 420 ha 125 Sub-Basin B Shaft 38 ha 2 Sub-Basin C Fuman 14 ha - Sub-Basin D Somehsara 100 ha 15 Sub-Basin E Anzali 50 ha 34
Source: MOIM, Gilan
The pollution load of industrial activities to the wetland therefore seems not to be serious with respect to organics and nutrients. However, the industries may be important sources of heavy metals and toxic materials. At present, there is not any monitoring activity for toxic substances like heavy metals in industrial effluent. The monitoring of these substances is required for protection of the wetland from toxic material pollution.
Final Report, Volume III Part 5: Wastewater Management Supporting Report Chapter 3
Nippon Koei Co., Ltd The Study on Integrated Management for Ecosystem Conservation of the Anzali Wetland
3 - 9
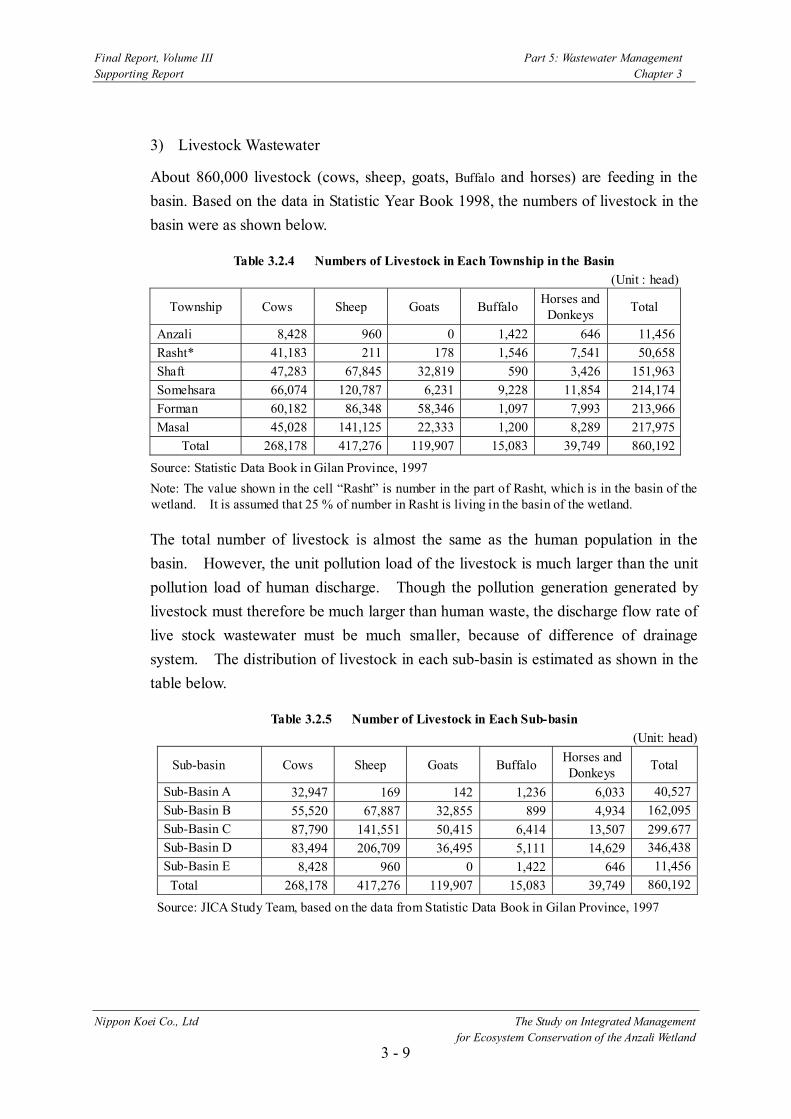
3) Livestock Wastewater
About 860,000 livestock (cows, sheep, goats, Buffalo and horses) are feeding in the basin. Based on the data in Statistic Year Book 1998, the numbers of livestock in the basin were as shown below.
Table 3.2.4 Numbers of Livestock in Each Township in the Basin (Unit : head)
Township Cows Sheep Goats Buffalo Horses and Donkeys Total
Anzali 8,428 960 0 1,422 646 11,456 Rasht* 41,183 211 178 1,546 7,541 50,658 Shaft 47,283 67,845 32,819 590 3,426 151,963 Somehsara 66,074 120,787 6,231 9,228 11,854 214,174 Forman 60,182 86,348 58,346 1,097 7,993 213,966 Masal 45,028 141,125 22,333 1,200 8,289 217,975
Total 268,178 417,276 119,907 15,083 39,749 860,192
Source: Statistic Data Book in Gilan Province, 1997 Note: The value shown in the cell “Rasht” is number in the part of Rasht, which is in the basin of the wetland. It is assumed that 25 % of number in Rasht is living in the basin of the wetland.
The total number of livestock is almost the same as the human population in the basin. However, the unit pollution load of the livestock is much larger than the unit pollution load of human discharge. Though the pollution generation generated by livestock must therefore be much larger than human waste, the discharge flow rate of live stock wastewater must be much smaller, because of difference of drainage system. The distribution of livestock in each sub-basin is estimated as shown in the table below.
Table 3.2.5 Number of Livestock in Each Sub-basin (Unit: head)
Sub-basin Cows Sheep Goats Buffalo Horses and Donkeys Total
Sub-Basin A 32,947 169 142 1,236 6,033 40,527 Sub-Basin B 55,520 67,887 32,855 899 4,934 162,095 Sub-Basin C 87,790 141,551 50,415 6,414 13,507 299.677 Sub-Basin D 83,494 206,709 36,495 5,111 14,629 346,438 Sub-Basin E 8,428 960 0 1,422 646 11,456 Total 268,178 417,276 119,907 15,083 39,749 860,192
Source: JICA Study Team, based on the data from Statistic Data Book in Gilan Province, 1997

Final Report, Volume III Part 5: Wastewater Management Supporting Report Chapter 3
Nippon Koei Co., Ltd The Study on Integrated Management for Ecosystem Conservation of the Anzali Wetland
3 - 10
Table 3.2.6 Number of Livestock in Each Sub-basin (Unit: head)
Type Caw Sheep Goat Buffalo Horses and Donkeys Total
Fed by Farmers in the Plain Area 221,578 12,083 13,200 330,000
In Grazing Land of the Plain 26,800
27,276 29,907 3,000 13,200 37,000
In Grazing Land of the Mountain Area 6,800 390,000 90,000 0 13,349 500,000
Industrial Animal Husbandries 3,000 0 0 0 0 3,000
Total 268,178 417,276 119,907 15,083 39,749 860,192 Source: JICA Study Team, based on questionnaire survey results
4) Non-point Pollution Source
The distribution of agricultural area in the basin is as shown below.
Table 3.2.7 Agricultural Area in Each Sub-basin (Unit: ha)
Sub-basin Rice Tea Others Total Sub-Basin A 12,196 299 7,373 19,868 Sub-Basin B 17,364 75 550 17,989 Sub-Basin C 27,360 1,975 2,904 32,239 Sub-Basin D 19,765 1,316 2,349 23,430 Sub-Basin E 4,200 0 986 5,186 Total 80,983 3,665 14,162 98,810
Source: JICA Study Team, based on the data from Statistic Data Book in Gilan Province, 1997
Unit pollution load of farming land depends on mainly consumption of fertilizer. MOJA, Gilan has announced the suitable amount of fertilizer use in order to avoid wasteful use of fertilizer. Because of the high concentration of phosphate in the soil in the basin, the consumption of phosphate fertilizer has been reduced in Gilan as shown in Table3.2.8.
Table 3.2.8 Average Use of Chemical Fertilizer in Gilan (Unit: kg/ha)
Source: MOJA, Gilan
Item 1992 1999 2002 Nitrogen 148 149 164 Phosphate 121 36 13 Potassium 30 59 51 Total 299 244 228

Final Report, Volume III Part 5: Wastewater Management Supporting Report Chapter 3
Nippon Koei Co., Ltd The Study on Integrated Management for Ecosystem Conservation of the Anzali Wetland
3 - 11
3.3 Estimate of Amount of Pollution Load discharged into Anzali Wetland
3.3.1 Unit Pollution Load and Discharge Ratio
Based on the results of the water quality analysis and river flow surveys, the amount of pollution load to the wetland is calculated as show in Table 3.3.1. Detail of the water quality analysis are described in Databook 1 Water Quality and Bottom Sediment Survey.
Table 3.3.1 Estimate of Pollution Load discharged based on Survey Results
Item Aug, 2003 Oct, 2003
1. Result of the Survey on a per Daily Basis
1) Total COD Pollution Load 66,681 kg/day 71,449 kg/day
2) Total T-P Pollution Load 1,036 kg/day 1,446 kg/day
3) Total River Discharge 26.32 m3/s 44.02 m3/s
2. Evaluation of Yearly Amount
1) Total COD Pollution Load 61,637 ton/year 39,485 ton/year
2) Total T-P Pollution Load 958 ton/year 799 ton/year
3) Total River Discharge 2,102 million m3/year Source: JICA Study Team
Table 3.3.2 shows the values of units pollution loads for the total pollution load estimate in the Study. The values of units pollution loads are estimated by considering the above results and the unit pollution load adopted in Japan, which is also described in Table 3.3.2.
Table 3.3.2 Summary of Unit Pollution Load
Pollution Load Case COD Mn COD Cr T-N T-P Typical Vales in Japan 26.0 (130) 11 1.20 Vales in Lake Biwa 29.3 (146.5) ---- 1.17
Domestic Wastewater (g/person/day) Vales in the Study 130 11 1.80
Typical Vales in Japan 530.0 (2650) 290 50.00 Vales in Lake Biwa 53.0 (265) 290 0.65
Livestock, Cow (g/head/day)
Vales in the Study ---- 26 2.9 0.50 Typical Vales in Japan 111.1 (555.5) ---- 1.65 Vales in Lake Biwa 43 (215) 14.3 0.98
Paddy Field (kg/ha/year)
Vales in the Study --- 107 14.3 0.98 Typical Vales in Japan 25.4 (127) ---- 0.300 Vales in Lake Biwa 18.8 (94) 7.57 0.142
Forest & Grass Land (kg/ha/year)
Vales in the Study 47 7.57 0.300 Source: JICA Study Team Note 1: Discharge ratio of livestock waste in case of Lake Biwa adopted COD: 10%, T-N:10% T-P: 1.3 %. Discharge ratio
of livestock waste in case of the Study adopted COD: 1%, T-N:1% T-P: 1% 2: Figures in brackets shows estimated COD Cr values which are 5 times of COD Mn.

Final Report, Volume III Part 5: Wastewater Management Supporting Report Chapter 3
Nippon Koei Co., Ltd The Study on Integrated Management for Ecosystem Conservation of the Anzali Wetland
3 - 12
Table 3.3.3 shows the pollution load reduction ratio adopted for the pollution load prediction in the Study.
Table 3.3.3 Pollution Load Reduction Ratio of Treatment Process
Case Treatment Process COD T-N T-P Sewerage in Rural Area 85% 60% 60% In case of
Lake Biwa Gappei Jokasou 75% 50% 40% WWTP (Secondary Treatment Process) 90% 60% 60% WWTP (Advanced Treatment Process) 90% 60% 90% Preliminary Treatment in Rural 60% 60% 60%
Adopted in the Study
Community Wastewater Treatment 90% 60% 60% Source: JICA Study Team
3.3.2 Estimate of Present Pollution Load Amount
The distribution of the pollution sources at present are summarized in Table 3.3.4.
Table 3.3.4 Present Condition of Pollution Sources
Sub-Basin Pollution Source Unit A B C D E Total
Population (Urban) person 515,012 7,673 82,188 18,076 119,870 742,819 Population (Rural) person 66,541 94,992 111,374 73,870 47,522 394,299 Industrial Activities m3/day 7,000 0 0 0 0 7,000 Live Stock (Cows & Buffalo) head 40,216 63,170 107,711 103,234 10,496 324,827 Live Stock (Sheep & Goat) head 311 100,820 191,966 243,204 960 537,261 Farming Land ha 19,868 17,988 32,239 23,430 5,186 98,711 Forest & Pasturage ha 29,700 63,360 43,560 59,400 1,980 198,000
Source: JICA Study Team
Based on the data in Table 3.3.2 and Table 3.3.4, the amounts of pollution loads of COD, T-N and T-P to Anzali Wetland at present are estimated as shown in Table 3.3.5, 3.3.6 and 3.3.7.

Final Report, Volume III Part 5: Wastewater Management Supporting Report Chapter 3
Nippon Koei Co., Ltd The Study on Integrated Management for Ecosystem Conservation of the Anzali Wetland
3 - 13
Table 3.3.5 Calculation of COD Pollution Load Discharged at Present (Unit: ton/year)
Sub-Basin COD Load Unit Pollution Load A B C D E
Total
Population (Urban) g/p/day 130 24,437 364 3,900 858 5,688 35,247 Population (Rural) g/p/day 40 971 1,387 1,626 1,079 694 5,757 Industrial Activities mg/L 50 110 0 0 0 0 110 Live Stock (Cow & Baffallo) g/p/day 26 382 599 1,022 980 100 3,083 Live Stock (Sheep & Goat) g/p/day 6.5 1 239 455 577 2 1,275 Farming Land kg/ha/year 107 2,126 1,925 3,450 2,507 555 10,562 Forest & Pasturage kg/ha/year 47 1,396 2,978 2,047 2,792 93 9,306
Total 29,422 7,492 12,500 8,792 7,131 65,338
Source: JICA Study Team
Table 3.3.6 Calculation of T-N Pollution Load Discharged at Present (Unit: ton/year)
Sub-Basin T-N Load Unit Pollution Load A B C D E
Total
Population (Urban) g/p/day 11.0 2,068 31 330 73 481 2,982 Population (Rural) g/p/day 3.3 80 114 134 89 57 475 Industrial Activities mg/L 30.0 66 0 0 0 0 66 Live Stock (Cow & Baffallo) g/p/day 2.90 43 67 114 109 11 344 Live Stock (Sheep & Goat) g/p/day 0.73 0 27 51 64 0 142 Farming Land kg/ha/year 14.3 284 257 461 335 74 1,412 Forest & Pasturage kg/ha/year 7.6 226 482 331 451 15 1,505
Total 2,766 978 1,421 1,122 639 6,925
Source: JICA Study Team
Table 3.3.7 Calculation of T-P Pollution Load Discharged at Present (Unit: ton/year)
Sub-Basin T-P Load Unit Pollution Load A B C D E
Total
Population (Urban) g/p/day 1.8 338.4 5.0 54.0 11.9 78.8 488.0 Population (Rural) g/p/day 0.5 13.1 18.7 22.0 14.6 9.4 77.7 Industrial Activities mg/L 6.0 13.1 0.0 0.0 0.0 0.0 13.1 Live Stock (Cow & Baffallo) g/p/day 0.50 7.3 11.5 19.7 18.8 1.9 59.3 Live Stock (Sheep & Goat) g/p/day 0.125 0.0 4.6 8.8 11.1 0.0 24.5 Farming Land kg/ha/year 0.98 19.5 17.6 31.6 23.0 5.1 96.7 Forest & Pasturage kg/ha/year 0.3 8.9 19.0 13.1 17.8 0.6 59.4
Total 400.4 76.5 149.0 97.2 95.8 818.8 Source: JICA Study Team
Final Report, Volume III Part 5: Wastewater Management Supporting Report Chapter 3
Nippon Koei Co., Ltd The Study on Integrated Management for Ecosystem Conservation of the Anzali Wetland
3 - 14
The amounts of pollution load to Anzali Wetland are summarized as below.
Table 3.3.8 Total Amount of Pollution Load Discharged
COD Load T-N Load T-P Load Pollution Source Amount
(ton/year) Ratio Amount (ton/year) Ratio Amount
(ton/year) Ratio
Urban Domestic Wastewater
35,247 53.9% 2,982 43.1% 488.0 59.6%
Rural Domestic Wastewater
5,757 8.8% 457 6.6% 77.7 9.5%
Industrial Effluent 219 0.2% 66 0.2% 13.1 1.6% Livestock 4,358 6.7% 486 1.0% 83.8 10.2% Farm Land 10,562 16.2% 1,412 20.4% 96.7 11.8% Natural 9,306 14.2% 1,505 21.7% 59.4 9.3%
Total 65,338 100.0% 6,925 100.0% 818.8 100.0% Source: JICA Study Team
3.3.3 Prediction of Pollution Load Amount
The social and economic condition in 2019 are predicted as below.
- Urban Population will increase from 762,000 in 2004, to 1,127,000 in 2019. - Rural Population will decrease from 394,000 in 2004, to 393,000 in 2019. - Industrial activities will be expanded by 2.75 times by 2019. - Agricultural activities will be in almost the same condition by 2019.
Considering above condition, the situation of the pollution sources in 2019 is assumed as below.
Table 3.3.9 Prediction of Pollution Source in 2019
Sub-Basin Pollution Source Unit
A B C D E Total
Population (Urban) person 772,557 9,163 121,689 28,564 194,879 1,126,851 Population (Rural) person 63,293 92,960 114,276 74,648 47,503 392,679 Industrial Activities m3/day 17000 0 0 0 0 17,000 Live Stock (Cows & Buffalo) head 40,216 61353 107711 103234 10,496 323,010 Live Stock (Sheep & Goat) Head 311 100742 191966 243204 960 537183 Farming Land ha 19,868 17,988 32,239 23,430 5,186 98,711 Forest & Pasturage ha 29,700 63,360 43,560 59,400 1,980 198,000
Source: JICA Study Team
Based on the data in Table 3.3.2 and Table 3.3.9, the amount of pollution loads of COD, T-N and T-P to Anzali Wetland in 2019 are estimated as shown in Table 3.3.10, 3.3.11 and 3.3.12.

Final Report, Volume III Part 5: Wastewater Management Supporting Report Chapter 3
Nippon Koei Co., Ltd The Study on Integrated Management for Ecosystem Conservation of the Anzali Wetland
3 - 15
Table 3.3.10 Prediction of COD Pollution Load Discharged in 2019 (Unit: ton/year)
COD Load Unit Pollution Load Sub-Basin Total A B C D E
Population (Urban) g/p/day 130 36,658 435 5,774 1,355 9,247 53,469 Population (Rural) g/p/day 40 924 1,357 1,668 1,090 694 5,733 Industrial Activities mg/L 600 3,723 0 0 0 0 3,723 Live Stock (Cows & Buffalo) g/p/day 26 382 599 1,022 980 100 3,083 Live Stock (Sheep & Goats) g/p/day 6.5 1 239 455 577 2 1,275 Farming Land kg/ha/year 107 2,126 1,925 3,450 2,507 555 10,562 Forest & Pasturage kg/ha/year 47 1,396 2,978 2,047 2,792 93 9,306
Total 45,209 7,533 14,417 9,301 10,690 87,151 Source: JICA Study Team
Table 3.3.11 Prediction of T-N Pollution Load Discharged in 2019 (Unit: ton/year)
T-N Load Unit Pollution Load Sub-Basin Total
A B C D E Population (Urban) g/p/day 11.0 3,101.8 36.8 488.6 114.7 782.4 4,524 Population (Rural) g/p/day 3.3 76.2 112.0 137.6 89.9 57.2 473 Industrial Activities mg/L 30.0 186.2 0.0 0.0 0.0 0.0 186 Live Stock (Cows & Buffalo) g/p/day 2.90 42.6 66.9 114.0 109.3 11.1 344 Live Stock (Sheep & Goats) g/p/day 0.725 0.1 26.7 50.8 64.4 0.3 142 Farming Land kg/ha/year 14.30 284.1 257.2 461.0 335.0 74.2 1,412 Forest & Pasturage kg/ha/year 7.6 225.7 481.5 331.1 451.4 15.0 1,505
Total 3,917 981 1,583 1,165 940 8,586 Source: JICA Study Team
Table 3.3.12 Prediction of T-P Pollution Load Discharged in 2019
(Unit: ton/year)
T-P Load Unit Pollution Load Sub-Basin Total
A B C D E Population (Urban) g/p/day 1.8 507.6 6.0 79.9 18.8 128.0 740.3 Population (Rural) g/p/day 0.5 12.5 18.3 22.5 14.7 9.4 77.4 Industrial Activities mg/L 10.0 62.1 0.0 0.0 0.0 0.0 62.1 Live Stock (Cows & Buffalo) g/p/day 0.50 7.3 11.5 19.7 18.8 1.9 59.3 Live Stock (Sheep & Goats) g/p/day 0.125 0.0 4.6 8.8 11.1 0.0 24.5 Farming Land kg/ha/year 0.98 19.5 17.6 31.6 23.0 5.1 96.7 Forest & Pasturage kg/ha/year 0.3 8.9 19.0 13.1 17.8 0.6 59.4
Total 617.8 77.1 175.6 104.2 145.0 1,119.7 Source: JICA Study Team
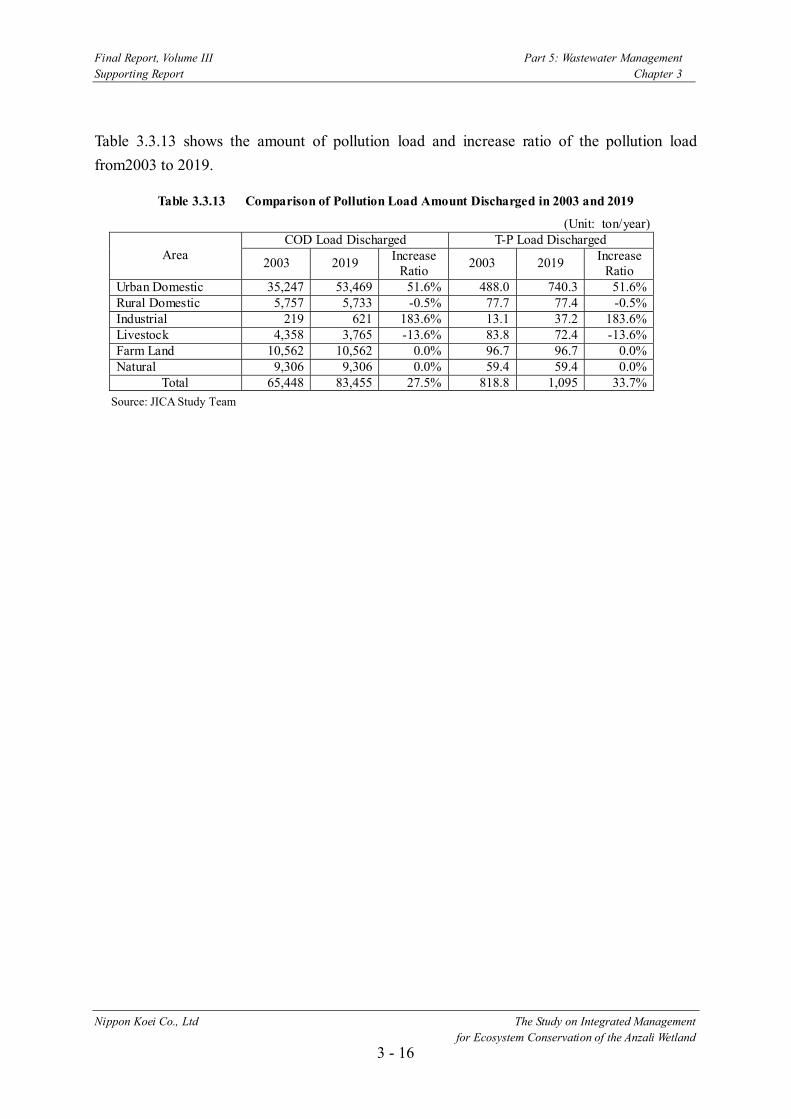
Final Report, Volume III Part 5: Wastewater Management Supporting Report Chapter 3
Nippon Koei Co., Ltd The Study on Integrated Management for Ecosystem Conservation of the Anzali Wetland
3 - 16
Table 3.3.13 shows the amount of pollution load and increase ratio of the pollution load from2003 to 2019.
Table 3.3.13 Comparison of Pollution Load Amount Discharged in 2003 and 2019
(Unit: ton/year) COD Load Discharged T-P Load Discharged
Area 2003 2019 Increase Ratio 2003 2019 Increase
Ratio Urban Domestic 35,247 53,469 51.6% 488.0 740.3 51.6% Rural Domestic 5,757 5,733 -0.5% 77.7 77.4 -0.5% Industrial 219 621 183.6% 13.1 37.2 183.6% Livestock 4,358 3,765 -13.6% 83.8 72.4 -13.6% Farm Land 10,562 10,562 0.0% 96.7 96.7 0.0% Natural 9,306 9,306 0.0% 59.4 59.4 0.0%
Total 65,448 83,455 27.5% 818.8 1,095 33.7% Source: JICA Study Team

Final Report, Volume III Part 5: Wastewater Management Supporting Report Chapter 4
Nippon Koei Co. Ltd. The Study on Integrated Management for Ecosystem Conservation of the Anzali Wetland
4 - 1
CHAPTER 4 WASTEWATER MANAGEMENT PLAN
4.1 General
As discussed in Chapter 2, water pollution is one of the serious environmental problems in the Anzali Wetland, and it is affecting the entire ecosystem of the wetland. In order to control water pollution, the various organizations like DOE, MOJA and GWWC are making efforts in managing wastewater generated from domestic, industrial and agricultural activities. However, the greater part of the wastewater is still discharged without any treatment. Though the effluent standard for wastewater discharged are established, it seems to take a long time to achieve the level of the standard for most of the polluters in the basin.
Moreover, there is no overall plan for wastewater management in the basin, and the tasks and duties of the related organizations have not been clarified. The target water level of Anzali Wetland has not been established, and the target for pollution load reduction has not been identified either. Therefore, to mitigate the environmental impact of water pollution on the eco-system of the wetland, a comprehensive wastewater management plan is needed with the co-operation of various authorities. In addition, it is important that the related organizations understand and complete their own tasks and duties in order to achieve the targets.
Though there are numerous ways to reduce pollution loads from the basin, practical measures are limited because such measures should satisfy a number of requirements to be sustainable. For example, they have to be (i) cost effective to control environmental pollution and sanitation problems, (ii) implemented within reasonable initial investment and O&M cost limits, (iii) easy to maintain, and (iv) socially and environmentally acceptable. Tables 4.1.1 and 4.1.2 show examples of typical measures of wastewater control widely accepted in the world.

Final Report, Volume III Part 5: Wastewater Management Supporting Report Chapter 4
Nippon Koei Co. Ltd. The Study on Integrated Management for Ecosystem Conservation of the Anzali Wetland
4 - 2
Table 4.1.1 Typical Measures of Organic and Nutrient Pollution Load
Source of Pollution
Type of Pollution Measures to treat wastewater Measure to reduce pollution
load at source Other
Organic 1) New sewerage system development
2) Installation of individual treatment facilities
1) Control of population increase
Urban Domestic Wastewater
Nutrient 1) Installation of advanced treatment system
2) Use of detergent with low phosphorous contents
Organic 1) Installation of individual treatment facilities
2) Community wastewater treatment system development
1) Control of population increase
Rural Domestic Wastewater
Nutrient 1) Installation of advanced treatment system
2) Use of detergent with low phosphorous contents
1) Direct wastewater discharge to Caspian sea
Organic 1) Centralized wastewater treatment system
2) Individual wastewater treatment facility
Industrial Effluent
Nutrient 1) Installation of advanced treatment system
1) Restriction of number of factories in the basin
1) Centralization of factories in industrial cities
Organic Livestock Waste Nutrient
1) Installation of wastewater treatment facilities and storage tanks for manure
1) Decrease of number of livestock
1) Measures to protect river from ingress of livestock waste
Organic 1) Decrease of agricultural area
Pollution from Farmland Nutrient
1) Dilution
2) Control of consumption of chemical fertilizer
1) Improvement of irrigation system
Table 4.1.2 Typical Measures of Wastewater including Toxic Material and Heavy Metals
Source of Pollution Measures to treat wastewater Measure to reduce pollution load
at source Other
Industrial Effluent
1) Individual wastewater treatment facilities
1) Restriction of construction of factories that discharge toxic material or heavy metals into the basin
1) Centralization of factories in industrial cities
Pollution from Farmland
1) Dilution 2) Decrease of consumption of agricultural chemical
1) Improvement of irrigation system

Final Report, Volume III Part 5: Wastewater Management Supporting Report Chapter 4
Nippon Koei Co. Ltd. The Study on Integrated Management for Ecosystem Conservation of the Anzali Wetland
4 - 3
4.2 Objective and Strategies
4.2.1 Objectives
The objectives of the wastewater management plan are as follows: - To improve and maintain the water quality of the Anzali Wetland at a level
acceptable for its ecosystem by implementing affordable and effective wastewater management,
4.2.2 Strategy
(1) Setting of Targets
For the wastewater management plan, the targets on ambient water quality in Anzali Wetland and amount of pollution load reduction to the wetland are set up as below.
1) Target of Ambient Water Quality and Sediment Quality
For the management of the wetland conservation, the tentative targets of ambient water quality in Anzali Wetland are set as COD 30 mg/L, T-N 2.0 mg/L and T-P 0.20 mg/L for organic and nutrient pollution considering prevention of eutrophication. The targets of sediment quality are set as Cd: 3.5 mg/kg, Pb: 91 mg/kg, Cr: 60 mg/kg, Cu: 197 mg/kg, Zn: 315 mg/kg for environmental risk management of heavy metal pollution, which are based on Canadian Environmental Quality Guidelines, 2002.
It should be noted that the wetland ecosystem is influenced by various factors and it is not easy to know the water quality level acceptable to a given species or ecosystem. The selected parameters are COD, T-N, T-P and heavy metals as these are the most relevant to the water pollution of the Anzali Wetland, i.e., organic pollution, eutrophication1, and environmental risks of heavy metals to the wetland ecosystem.
Table 4.2.1 shows the target values and actual water quality records on COD T-N and T-P.
Table 4.2.1 Target of Water Quality in the Wetland
Parameter Target to 2019 Records in 2004 COD
(mg/L) 30 Eastern Area (Eastern Part): Average 37 (22-61)
Western Area (Siahkeshim): Average 27 (15-50) T-N
(mg/L) 2.0
Eastern Area (Eastern Part): Average 2.2 (1.4-3.7) Western Area (Siahkeshim): Average 1.8 (1.1-2.3)
T-P (mg/L)
0.20
Eastern Area (Eastern Part): Average 0.28 (0.17 – 0.42) Western Area (Siahkeshim): Average 0.17 (0.08-0.29)
1 Phosphorous is believed to be one of the main determining factors of eutrophication in the wetland.

Final Report, Volume III Part 5: Wastewater Management Supporting Report Chapter 4
Nippon Koei Co. Ltd. The Study on Integrated Management for Ecosystem Conservation of the Anzali Wetland
4 - 4
Regarding the eastern side of Anzali Wetland, the average values of COD exceeded the target by about 20 %, the average values of T-N exceeded the target by about 10 %, and the average of T-P values exceed the target by 40 %. On the other hand, the average values of COD T-N and T-P in the western side of Anzali Wetland do not exceed the target. Table 4.2.2 shows that the values of heavy metals do not exceed the target.
Table 4.2.2 Targets of Sediment Quality in the Wetland
Parameter Targets Records in 2004 Heavy Metals
(mg/kg) Cd: 3.5, Pb: 91, Cr: 60, Cu: 197, Zn: 315
Cd: n.d. – 0.2, Pb: n.d. – 51, Cr6+: 4 – 41 Cu: 19 – 86, Zn: 32 - 222
2) Target of Pollution Load Reduction on COD, T-N and T-P
In order to achieve the target of ambient water quality overall the wetland, the targets of pollution load reduction in the eastern part of the basin are set up as 20% reduction in COD, 10% reduction in T-N and 30% reduction in T-P from the 2003 level, which are equivalent to as 44% reduction in COD (28,196 ton/year), 32% reduction in T-N (1,893 ton/year) and 52% reduction in T-P (439 ton/year) from the forecast 2019 level. Regarding the west side, the tentative targets have been achieved, and the target in 2019 is to make some improvement from the present condition in 2003, which is 1,945 ton/year, 205 ton/year and 25 ton/year for COD, T-N and T-P respectively from the forecast 2019 level.
Table 4.2.3 Target of Sediment Quality in the Wetland (Unit: ton/year)
Item Western Side Eastern Side Total COD Future Prediction 23,718 63,433 87,151
Target Level 21,292 35,237 56,529 Required Reduction 1,945 28,196 30,141
T-N Future Prediction 2,748 5,838 8,586 Target Level 2,543 3,945 6,488 Required Reduction 205 1,893 2,098
T-P Future Prediction 271 840 1,111 Target Level 246 401 647 Required Reduction 25 441 466
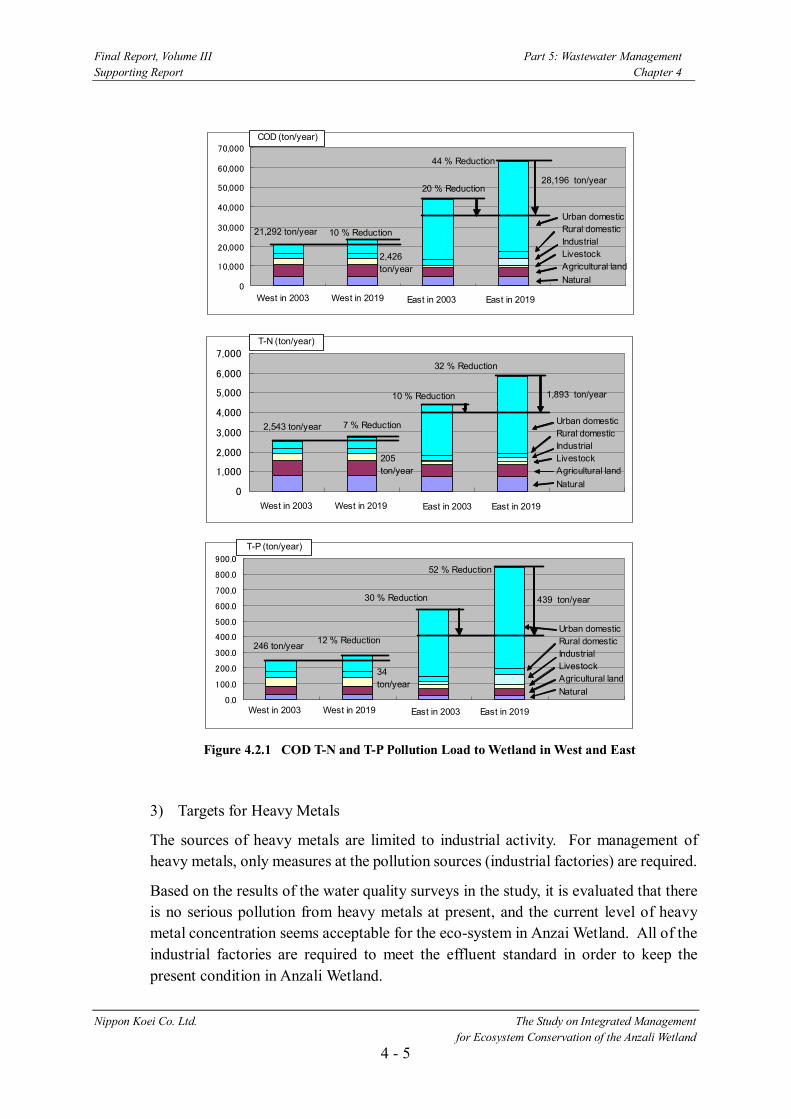
Final Report, Volume III Part 5: Wastewater Management Supporting Report Chapter 4
Nippon Koei Co. Ltd. The Study on Integrated Management for Ecosystem Conservation of the Anzali Wetland
4 - 5
Figure 4.2.1 COD T-N and T-P Pollution Load to Wetland in West and East
3) Targets for Heavy Metals
The sources of heavy metals are limited to industrial activity. For management of heavy metals, only measures at the pollution sources (industrial factories) are required.
Based on the results of the water quality surveys in the study, it is evaluated that there is no serious pollution from heavy metals at present, and the current level of heavy metal concentration seems acceptable for the eco-system in Anzai Wetland. All of the industrial factories are required to meet the effluent standard in order to keep the present condition in Anzali Wetland.
0
10,000
20,000
30,000
40,000
50,000
60,000
70,000
1 2 3 4 5
0.0
100.0
200.0
300.0
400.0
500.0
600.0
700.0
800.0
900.0
1 2 3 4 5
Urban domesticRural domesticIndustrialLivestockAgricultural landNatural
21,292 ton/year
34ton/year
246 ton/year
10 % Reduction
20 % Reduction
44 % Reduction
30 % Reduction
52 % Reduction
12 % ReductionUrban domesticRural domesticIndustrialLivestockAgricultural landNatural
East in 2003 East in 2019West in 2003 West in 2019
East in 2003 East in 2019West in 2003 West in 2019
28,196 ton/year
439 ton/year
2,426ton/year
0
1,000
2,000
3,000
4,000
5,000
6,000
7,000
1 2 3 4 5
32 % Reduction
1,893 ton/year
East in 2003 East in 2019West in 2003 West in 2019
COD (ton/year)
T-P (ton/year)
T-N (ton/year)
Urban domesticRural domesticIndustrialLivestockAgricultural landNatural
7 % Reduction
205ton/year
10 % Reduction
2,543 ton/year

Final Report, Volume III Part 5: Wastewater Management Supporting Report Chapter 4
Nippon Koei Co. Ltd. The Study on Integrated Management for Ecosystem Conservation of the Anzali Wetland
4 - 6
(2) Measures for Each Pollution Source
In order to improve and maintain the water quality of Anzali Wetland, it is required to implement suitable wastewater management for all pollution sources in the basin. The management shall be considered for each pollution source. The following five sub-components of the management plans are prepared separately in the wastewater management plan, because required measures are different depending on the pollution sources and responsible organization.
1) Management of Domestic Wastewater in Urban Area
Domestic wastewater in the urban areas is the biggest pollution source of COD, T-N and T-P to the wetland. Drastic decreases in the pollution loads are therefore required in order to achieve the targets. Existing plans for sewerage system development in the basin are highly appreciated for Anzali Wetland Conservation. The measures for wastewater treatment shall be considered separately for application with inside the sewerage service area and outside of the service area. In addition to the wastewater treatment, measures for pollution source control shall be considered for phosphorous reduction, because conventional wastewater treatment is not effective for phosphorus removal.
2) Management of Domestic Wastewater in Rural Area
The pollution load in the rural area is not expected to have a serious impact on the wetland. Even if the measures for the rural wastewater are not necessary to achieve the target values, expansion of wastewater treatment in the rural area is required for continuous pollution load reduction to the wetland and for improvement of living condition in the basin. Wastewater treatment shall be developed within affordable financial parameters.
3) Management of Industrial Effluent
Industrial activities are expected to develop rapidly in the future. Even if all of the industrial factories meet the effluent standard in 2019, pollution load of the industrial activities is expected to increase by 2.75 times the current level. If the measures are not implemented, the pollution load will be increased by more than 20 times, and may include large amount of heavy metals and toxic materials. The basic strategy of the management of industrial effluent is that all industrial factories should take necessary measures to keep the effluent standard.
4) Management of Livestock
There are about 860,000 head of livestock in the basin. These animals are kept in four ways, i.e., fed: by Individual Farmers in the Plain, in the Grazing Land of the Mountain Area, in the Grazing Land of the Plain and in Industrial Animal Husbandries. The measures shall be considered on livestock for each category.
Final Report, Volume III Part 5: Wastewater Management Supporting Report Chapter 4
Nippon Koei Co. Ltd. The Study on Integrated Management for Ecosystem Conservation of the Anzali Wetland
4 - 7
5) Management of Pollution from the Farmland
Although the present application rates of chemical fertilizers and agricultural chemicals in the study area seem low, there is a possibility that applied fertilizers and agrochemicals could be discharged into the wetland with drainage water due to improper application and/or improper water management. Therefore, the aims of this master plan are to minimize as many pollution loads from farmlands as possible by letting farmers adopt proper and environmentally-friendly farming practices. As described in sub-section 2.7, the present extension works (programs) of MOJA have a certain effect on reducing the uses of farm inputs (fertilizers and agricultural chemicals). Hence, the proposed measure focuses on further strengthening the present extension activities of MOJA and improving the coordination between monitoring of pollution loads from farmlands and extension activities at the field level to avoid irretrievable damage to the wetland environment.
4.3 Management of Domestic Wastewater in Urban Area
4.3.1 Introduction It is estimated that urban domestic wastewater is the biggest pollution source and will account for 60 - 70 % of the total pollution load in 2019. Measures for urban domestic wastewater should be considered as a high priority. If reduction of pollution load on the wetland is the only goal, measures such as “diverting and discharging wastewater directly to the Caspian Sea”, are potential alternatives. However, such measures are not environmentally acceptable from the view point of protecting the Caspian Sea from pollution. NWWEC have several sewerage development plans in seven cities, which can treat wastewater generated by more than 90 % of the urban population in 2019. However, it seems difficult to implement all of the projects, because of financial constrain. To achieve the target on COD and T-N, it is required to implement some of the projects. To achieve the target on T-P, it is required to add other measures, such as introduction of advanced wastewater treatment process to wastewater treatment plant and introduction of use of low phosphorous detergent, because conventional treatment process of the sewerage system can hardly reduce enough phosphorous to achieve the target.
The following measures are proposed for management of domestic wastewater in the urban area.
1) Implementation of some of the sewerage development projects planned by NWWEC, and introduction of advanced treatment process.
2) Other measures for outside of the sewerage service area 3) Promotion of use of low phosphorous detergent
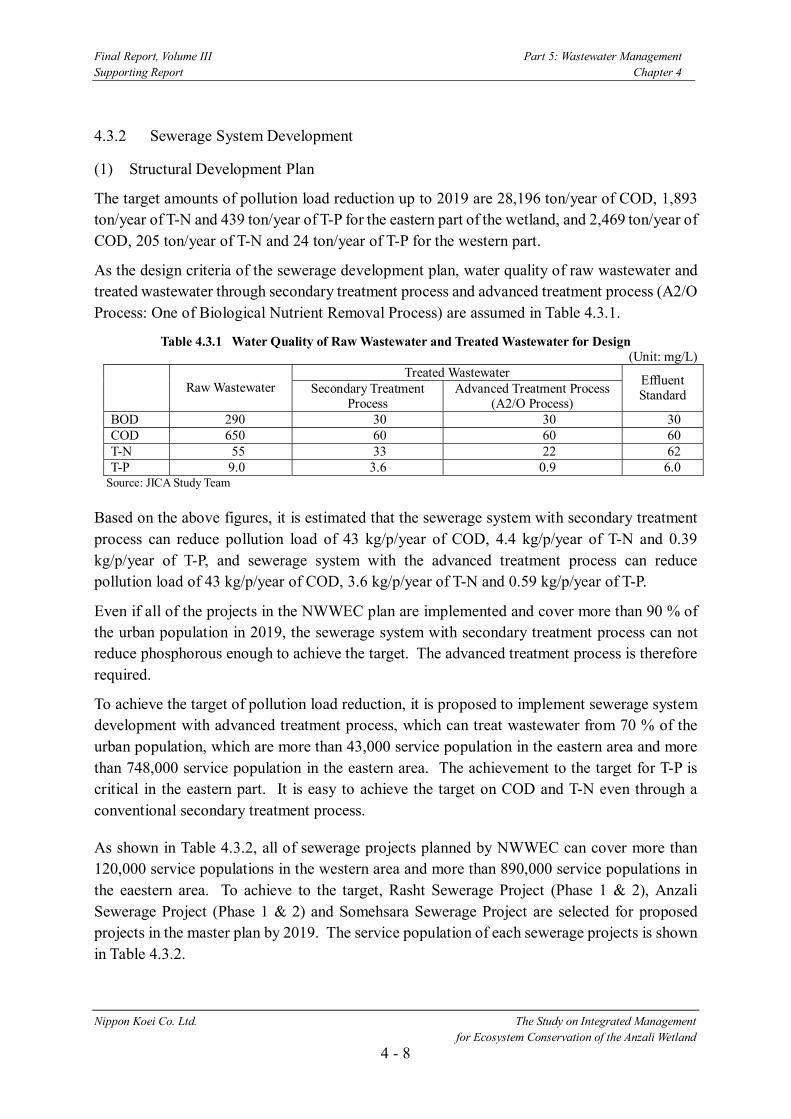
Final Report, Volume III Part 5: Wastewater Management Supporting Report Chapter 4
Nippon Koei Co. Ltd. The Study on Integrated Management for Ecosystem Conservation of the Anzali Wetland
4 - 8
4.3.2 Sewerage System Development
(1) Structural Development Plan
The target amounts of pollution load reduction up to 2019 are 28,196 ton/year of COD, 1,893 ton/year of T-N and 439 ton/year of T-P for the eastern part of the wetland, and 2,469 ton/year of COD, 205 ton/year of T-N and 24 ton/year of T-P for the western part.
As the design criteria of the sewerage development plan, water quality of raw wastewater and treated wastewater through secondary treatment process and advanced treatment process (A2/O Process: One of Biological Nutrient Removal Process) are assumed in Table 4.3.1.
Table 4.3.1 Water Quality of Raw Wastewater and Treated Wastewater for Design (Unit: mg/L)
Treated Wastewater Raw Wastewater Secondary Treatment
Process Advanced Treatment Process
(A2/O Process)
Effluent Standard
BOD 290 30 30 30 COD 650 60 60 60 T-N 55 33 22 62 T-P 9.0 3.6 0.9 6.0
Source: JICA Study Team
Based on the above figures, it is estimated that the sewerage system with secondary treatment process can reduce pollution load of 43 kg/p/year of COD, 4.4 kg/p/year of T-N and 0.39 kg/p/year of T-P, and sewerage system with the advanced treatment process can reduce pollution load of 43 kg/p/year of COD, 3.6 kg/p/year of T-N and 0.59 kg/p/year of T-P.
Even if all of the projects in the NWWEC plan are implemented and cover more than 90 % of the urban population in 2019, the sewerage system with secondary treatment process can not reduce phosphorous enough to achieve the target. The advanced treatment process is therefore required.
To achieve the target of pollution load reduction, it is proposed to implement sewerage system development with advanced treatment process, which can treat wastewater from 70 % of the urban population, which are more than 43,000 service population in the eastern area and more than 748,000 service population in the eastern area. The achievement to the target for T-P is critical in the eastern part. It is easy to achieve the target on COD and T-N even through a conventional secondary treatment process.
As shown in Table 4.3.2, all of sewerage projects planned by NWWEC can cover more than 120,000 service populations in the western area and more than 890,000 service populations in the eaestern area. To achieve to the target, Rasht Sewerage Project (Phase 1 & 2), Anzali Sewerage Project (Phase 1 & 2) and Somehsara Sewerage Project are selected for proposed projects in the master plan by 2019. The service population of each sewerage projects is shown in Table 4.3.2.

Final Report, Volume III Part 5: Wastewater Management Supporting Report Chapter 4
Nippon Koei Co. Ltd. The Study on Integrated Management for Ecosystem Conservation of the Anzali Wetland
4 - 9
Table 4.3.2 List of Planned Projects for Sewerage System Development
Service Population (Unit: persons) Basin Sewerage
Projects Status Planned by GWWC
Proposed in the Study
Rasht (Phase 1) Construction 253,816 253,816 Rasht (Phase 2) Basic Design 378,284 378,284 Rasht (Phase 3) Basic Design 93,600 Anzali (Phase 1) Construction 77,920 77,920 Anzali (Phase 2) Basic Design 51,000 51,000 Anzali (Phase 3) Basic Design 8,712 Khomam Basic Study 16,095 Shaft Basic Design 14,357
Eastern Part
Sub-total 893,784 761,020 Somehsara Construction 56,980 56,980 Fuman Basic Design 46,000 Masal Basic Study 24,762
Western Part
Sub-total 127,742 56,980 Total 1,021,526 818,000
Source: JICA Study Team
To achieve the target of phosphorous reduction, an advanced treatment process should be installed in wastewater treatment plants in all of the proposed projects. However, two new wastewater treatment plants under construction in Rasht and Anzali cities do not have advanced treatment process to remove phosphorous. Additional construction works are required for them.
The outline of the proposed sewerage system in Rasht is described in Figure 4.3.1. The service area is divided into the central area, the eastern area and the western area. Some parts of the sewerage system in the central area are under construction, and the sewerage systems in the eastern and western areas are planned to be developed by the World Bank fund.

Final Report, Volume III Part 5: Wastewater Management Supporting Report Chapter 4
Nippon Koei Co. Ltd. The Study on Integrated Management for Ecosystem Conservation of the Anzali Wetland
4 - 10
Eastern Area
Western Area
Central Area
WWTP
5 km
Figure 4.3.1 Outline of Rasht Sewerage System
The outline of the proposed sewerage service system in Anzali is described in Figure 4.3.2. The service area is divided into the eastern area and the western area. Some parts of the sewerage system in the western area are under construction, and the sewerage system in the eaestern area is planned to be developed by the World Bank fund.
WWTP
WWTP
Eastern AreaWestern Area
5 km
Figure 4.3.2 Outline of Anzali Sewerage System
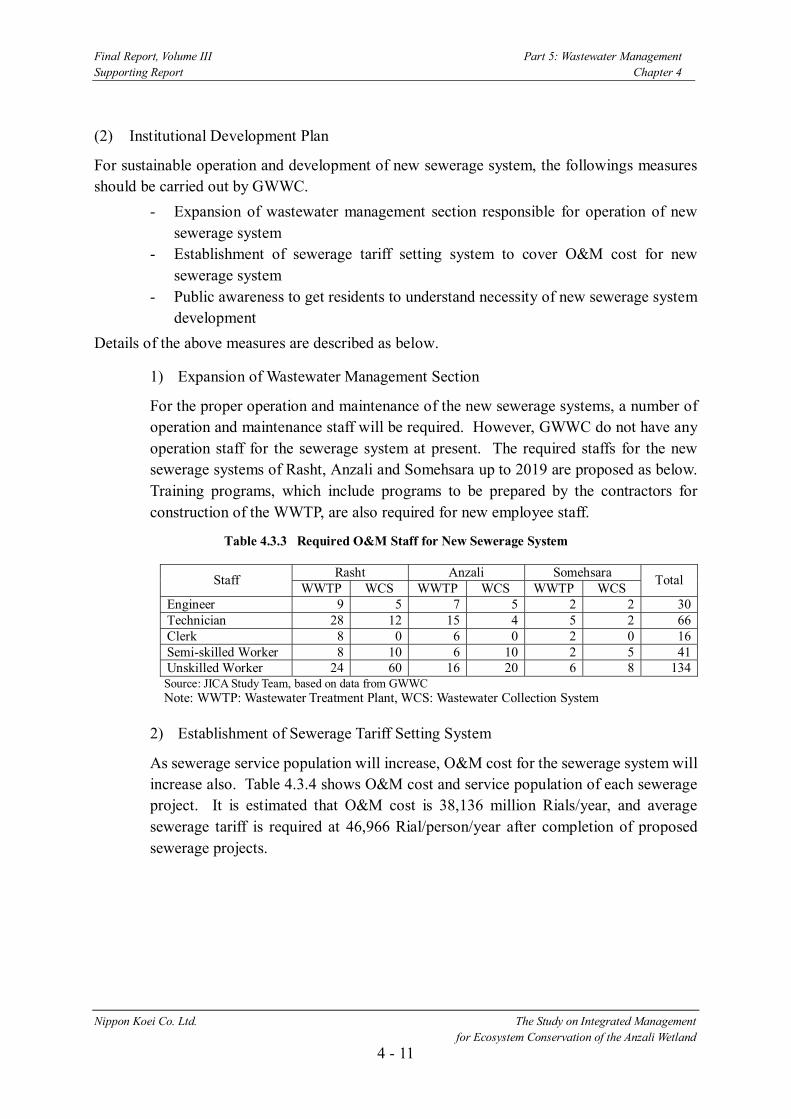
Final Report, Volume III Part 5: Wastewater Management Supporting Report Chapter 4
Nippon Koei Co. Ltd. The Study on Integrated Management for Ecosystem Conservation of the Anzali Wetland
4 - 11
(2) Institutional Development Plan
For sustainable operation and development of new sewerage system, the followings measures should be carried out by GWWC.
- Expansion of wastewater management section responsible for operation of new sewerage system
- Establishment of sewerage tariff setting system to cover O&M cost for new sewerage system
- Public awareness to get residents to understand necessity of new sewerage system development
Details of the above measures are described as below.
1) Expansion of Wastewater Management Section
For the proper operation and maintenance of the new sewerage systems, a number of operation and maintenance staff will be required. However, GWWC do not have any operation staff for the sewerage system at present. The required staffs for the new sewerage systems of Rasht, Anzali and Somehsara up to 2019 are proposed as below. Training programs, which include programs to be prepared by the contractors for construction of the WWTP, are also required for new employee staff.
Table 4.3.3 Required O&M Staff for New Sewerage System
Rasht Anzali Somehsara Staff WWTP WCS WWTP WCS WWTP WCS Total
Engineer 9 5 7 5 2 2 30Technician 28 12 15 4 5 2 66Clerk 8 0 6 0 2 0 16Semi-skilled Worker 8 10 6 10 2 5 41Unskilled Worker 24 60 16 20 6 8 134Source: JICA Study Team, based on data from GWWC Note: WWTP: Wastewater Treatment Plant, WCS: Wastewater Collection System
2) Establishment of Sewerage Tariff Setting System
As sewerage service population will increase, O&M cost for the sewerage system will increase also. Table 4.3.4 shows O&M cost and service population of each sewerage project. It is estimated that O&M cost is 38,136 million Rials/year, and average sewerage tariff is required at 46,966 Rial/person/year after completion of proposed sewerage projects.

Final Report, Volume III Part 5: Wastewater Management Supporting Report Chapter 4
Nippon Koei Co. Ltd. The Study on Integrated Management for Ecosystem Conservation of the Anzali Wetland
4 - 12
Table 4.3.4 Service Population and O&M Cost of New Sewerage Systems
Project
Service Population
O&M Cost (million
Rials/year)
O&M cost per person
(Rials/year) Rasht Sewerage System (Phase 1&2) 632,000 25,617 40,533 Anzali Sewerage System (Phase 1&2) 129,000 8,443 65,450 Somehsara Sewerage System 57,000 4,076 79,921
Total 818,000 38,136 46,966 Source: JICA Study Team, based on data from GWWC
Table 4.3.5 shows average sewerage tariff and annual revenue of GWWC from sewerage tariff in 2004. Total revenue from the sewerage tariff is 17,668 million Rials/year. Average expenditure to sewerage tariff is estimated at 23,506 Rials/person/year (200 L/p/day , 73 m3/p/year). It is required to increase sewerage tariff by about 2 times unitl 2009, except for consideration of price escalation.
Table 4.3.5 Sewerage Tariff and Sales Revenues from Sewerage Tariff in 2004
Consumer Average Tariff (Rials/m3)
Revenue from Sewerage Tariff (million Rials/year) Ratio
Domestic 322 11,926 67.5% Commercial 1,587 2,495 14.1% Industrial 1,602 217 1.2% Government 1,572 2,005 11.3% Other 399 1,026 5.8%
Total 17,668 100.0% Source: JICA Study Team, based on data from GWWC
GWWC makes a plan increase the sewerage tariff by about 30%, which is from 70 % of water tariff to 90%, after commencement of operation of the WWTP. It is reasonable as first step of the sewerage tariff increase.
1) Public Awareness
The sewerage system operation will depend on revenue of sewerage tariff from residents, and raising the sewerage tariff will be required to cover O&M cost for new sewerage system. It is therefore necessary to get the residents to understand necessity of new sewerage system development. Public awareness program is required. WWTP Site visit with lecture seems one of effective program.
4.3.3 Promotion of Individual Wastewater Treatment Facilities outside of Sewerage Service
Areas
Since proposed sewerage service area is not expected to cover the whole urban area, some wastewater will continue to be drained out without treatment. A regulation requiring the installation of individual wastewater treatment facilities may, therefore, be valuable for areas outside the wastewater treatment service areas. It is not only for the wetland conservation but

Final Report, Volume III Part 5: Wastewater Management Supporting Report Chapter 4
Nippon Koei Co. Ltd. The Study on Integrated Management for Ecosystem Conservation of the Anzali Wetland
4 - 13
also for improvement of living conditions. It is estimated thatof the urban population, about 5%, which will be 113,000 residents in 2019, will not be in the wastewater treatment service area. Assuming one individual wastewater treatment facility for five residents, about 22,600 sets of treatment facilities need to be installed in the urban area up to 2019. 4.3.4 Promotion of Low Phosphorus Detergent Use
Eutrophication is a major problem in the Anzali Wetland, and it is therefore important to control the inflow of nutrients. The removal of phosphorus as a stage of wastewater treatment is possible using advanced treatment process such as the Biological Nutrient Removal Process, and this is considered in the sewerage plan proposed by NWWC. However, it is well-known that the removal of phosphorus in wastewater treatment is costly. In many countries, such as EU countries, USA and Japan, the pollution load of phosphorus was reduced by promoting phosphorus-free detergents, and this approach is recommended for Guilan Province, also.
According to the results of the water quality survey between September and December 2003, it is estimated that most of the phosphorus pollution load is derived from domestic wastewater. Phosphorus in detergent seems to be one of the major sources. The wastewater treatment plants in Rasht and Anzali cities are expected to reduce the phosphorous content after installation of the advanced treatment process. In addition to sewerage system development, research and development of “Low Phosphorus Detergent” is proposed for the reduction of phosphorus discharged into the wetland.
It is expected to takes a long time to promote use of the low phosphorous detergent, because the low phosphorous detergent has not been manufactured in Iran, and has not been distributed on the market. Moreover, the importance and effectiveness of use of the low phosphorous detergent have not been considered in Iran. As first step of the procedure, research works on the low phosphorous detergent is proposed, and a campaign of trial sales and use of the detergent is proposed as second step of the procedure. Finally, before introduction of the law to forbid sale and use of detergent with high contents of phosphorous, it is proposed to promote voluntary use of the detergent with low phosphorus. 4.4 Management of Domestic Wastewater in Rural Area
4.4.1 Introduction
For improvement of living conditions in the rural area, the development plans for wastewater treatment systems were prepared by RWWC. The plan seems effective for pollution control also. Households in rural area usually have absorption tanks. The absorption tanks cause the following problems that deteriorate living conditions.
- Seepage wastewater from the absorption tanks flows into groundwater. - In case of high groundwater level, the wastewater cannot infiltrate into
underground and overflows to the surface from the absorption tank.

Final Report, Volume III Part 5: Wastewater Management Supporting Report Chapter 4
Nippon Koei Co. Ltd. The Study on Integrated Management for Ecosystem Conservation of the Anzali Wetland
4 - 14
To solve the above problems, wastewater in the rural area shall be collected, treated and discharged out of the residential area. One of possible measures is development of sewerage systems. However it seems be unaffordable in the rural area from the financial point of view. Considering these constraints, development of low-cost community-level wastewater treatment systems based on a sewer network, septic tanks and secondary treatment process is recommended for rural communities. Currently, there is no such community wastewater treatment facility in the rural area, but designs of community wastewater treatment systems have been prepared for seven villages. 4.4.2 Community Wastewater Treatment System Development
(1) RWWC Plan
RWWC has prepared detailed designs for the community wastewater treatment systems of sixteen villages in the Guilan Province to be developed during the period of the Fourth Five Year Plan (2005-2009). Out of the sixteen villages, seven villages are located in the Anzali Wetland basin as shown in Figure 4.4.1. The corresponding service population comes to 18,325 and that corresponds to 5 % of the rural population of 393,000 in the Anzali wetland basin.
Figure 4.4.1 Locations of Community Wastewater Treatment Systems Proposed by RWWC
The type of wastewater treatment system proposed by RWWC is illustrated in Figure 4.4.2.
Aliabad 1,417 (plan)
Sheikhneshin 1,370 (plan)
Nargeston 1,988 (plan)
Loleman 999 (plan)
Gasht 3,402 (plan) Atashgah
4,353 (plan)
Name of Town Service Population
Kheshtnasjed 4,796 (plan)

Final Report, Volume III Part 5: Wastewater Management Supporting Report Chapter 4
Nippon Koei Co. Ltd. The Study on Integrated Management for Ecosystem Conservation of the Anzali Wetland
4 - 15
Figure 4.4.2 Image of Community Wastewater Treatment System Proposed by RWWC
Table 4.4.1 List of Projects for Community Wastewater Treatment in Seven Villages
Sub- basin Village Township Service
Population
Number of
Septic Tank
Pipe Line (m)
Required Land for
Additional Treatment
Type
A Atashgah Rasht 4,353 339 9,200 2.7ha SDGS B Kheshtnasjed Rasht 4,796 - 10,900 2.7ha SS
Gasht Fuman 3,402 470 23,000 1.2ha SDGS C Loleman Fuman 999 25 3,700 1.2ha SDGS
Norgeston Somehsara 1,988 246 8,900 1.2ha SDGS D Sheikhneshin Masal 1,370 138 12,700 1.3ha SDGS
E Aliabad Anzali 1,417 - 5,300 1.2ha SS Source: RWWC Notes: SDGS: Small Diameter Gravity System, SS: Simplified System
(2) Proposed Plan
As mentioned in Chapter 2, RWWC’s target is to achieve the service coverage ratio of 40% by 2022. However, due to financial constraints, RWWC’s plan to construct community wastewater treatment systems in sixteen villages could not be commenced within the Third Five Year Plan (2000-2004) and is expected to be started in the period of the Fourth Five Year Plan (2005-2009). To attain the original target of RWWC, the service coverage ratio has to be increased by more than 15% for every 5-years. Considering the financial conditions of RWWC and the delay of the commencement of the RWWC’s plan, it may be unrealistic for RWWC to meet the original target. Therefore, the present master plan employs 5% increase for every Five Year Plan. The service population by 2019 will increase as shown in Table 4.4.2.
Reed Bed
Aeration Tank
Septic Tank
Septic Tank
Septic TankSeptic Tank
OR
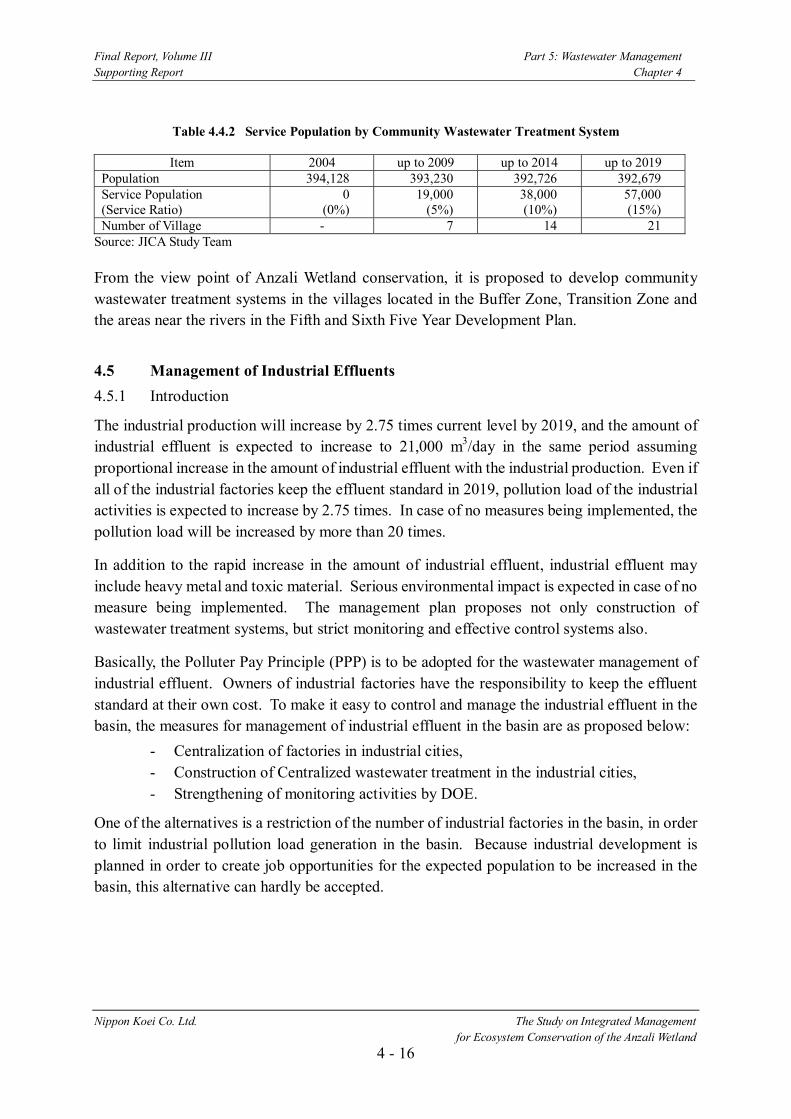
Final Report, Volume III Part 5: Wastewater Management Supporting Report Chapter 4
Nippon Koei Co. Ltd. The Study on Integrated Management for Ecosystem Conservation of the Anzali Wetland
4 - 16
Table 4.4.2 Service Population by Community Wastewater Treatment System
Item 2004 up to 2009 up to 2014 up to 2019 Population 394,128 393,230 392,726 392,679 Service Population (Service Ratio)
0 (0%)
19,000 (5%)
38,000 (10%)
57,000 (15%)
Number of Village - 7 14 21 Source: JICA Study Team
From the view point of Anzali Wetland conservation, it is proposed to develop community wastewater treatment systems in the villages located in the Buffer Zone, Transition Zone and the areas near the rivers in the Fifth and Sixth Five Year Development Plan. 4.5 Management of Industrial Effluents 4.5.1 Introduction
The industrial production will increase by 2.75 times current level by 2019, and the amount of industrial effluent is expected to increase to 21,000 m3/day in the same period assuming proportional increase in the amount of industrial effluent with the industrial production. Even if all of the industrial factories keep the effluent standard in 2019, pollution load of the industrial activities is expected to increase by 2.75 times. In case of no measures being implemented, the pollution load will be increased by more than 20 times.
In addition to the rapid increase in the amount of industrial effluent, industrial effluent may include heavy metal and toxic material. Serious environmental impact is expected in case of no measure being implemented. The management plan proposes not only construction of wastewater treatment systems, but strict monitoring and effective control systems also.
Basically, the Polluter Pay Principle (PPP) is to be adopted for the wastewater management of industrial effluent. Owners of industrial factories have the responsibility to keep the effluent standard at their own cost. To make it easy to control and manage the industrial effluent in the basin, the measures for management of industrial effluent in the basin are as proposed below:
- Centralization of factories in industrial cities, - Construction of Centralized wastewater treatment in the industrial cities, - Strengthening of monitoring activities by DOE.
One of the alternatives is a restriction of the number of industrial factories in the basin, in order to limit industrial pollution load generation in the basin. Because industrial development is planned in order to create job opportunities for the expected population to be increased in the basin, this alternative can hardly be accepted.

Final Report, Volume III Part 5: Wastewater Management Supporting Report Chapter 4
Nippon Koei Co. Ltd. The Study on Integrated Management for Ecosystem Conservation of the Anzali Wetland
4 - 17
4.5.2 Centralization of Industrial Factories
There are five existing industrial cities, and one planned, in the basin as shown in Figure 4.5.1. DOE and MOIM have already considered transferring major industrial factories to these industrial cities. For an effective procedure for the centralization, a guideline for centralization is proposed. First of all, criteria for the industrial factories to be transferred to the industrial cities should be clear. It is not necessary to transfer all industrial factories as some may have no effluent and no emission. The following process is recommended for the transfer of factories to the industrial cities.
- Basically new industrial factories, which have an environmental impact such as discharging effluent and emission, should be constructed in the industrial cities,
- Existing factories, which have the environmental impact, should be transferred to the industrial cities within a certain period to be fixed, such as 5-10 years, or should have a complete wastewater treatment system.
In the case of Japan, industrial factories that meet the criteria of industrial factory in, by law, cannot be constructed near residential areas. This provides environmental protection for living, and centralization of industrial factories is promoted for effective development of industrial activities and environmental conservation. The criteria in Japan are defined for each industrial factory by “Type of manufacture”, “Floor area”, “Type of material to be used for factories”, etc.
For promotion of the centralization some incentives need to be prepared. The following privileges have already been prepared for factories to be constructed in the industrial cities.
- Four year exemption of municipality taxes, - Installment payments for land acquisition, - Financial assistance from the government.

Final Report, Volume III Part 5: Wastewater Management Supporting Report Chapter 4
Nippon Koei Co. Ltd. The Study on Integrated Management for Ecosystem Conservation of the Anzali Wetland
4 - 18
Figure 4.5.1 Location of Existing and Planned Industrial Cities
4.5.3 Construction of Centralized Wastewater Treatment Systems
Central wastewater treatment systems are proposed for the effective management of wastewater in the industrial cities. In the wastewater management plan, it is proposed to construct centralized wastewater treatment systems with treatment capacity to meet 21,000 m3/day of the total industrial effluent predicted in the basin. At present, there are no wastewater treatment systems in the industrial cities, though as a first step, a small-scale wastewater treatment system with a treatment capacity of 100 m3/day is under construction in Anzali Industrial City. Rasht Industrial City Company is considering a plan for construction of a wastewater treatment system. Based on discussions with relevant organizationss, the proposed wastewater treatment capacity for each industrial city is tentatively estimated as shown in Table 4.5.1. At present, there is no plan to construct any wastewater treatment systems except for the Rasht and Anzali industrial cities.
.
Rasht Industrial City Area: 420 ha 25 km from the City
Somehsara Industrial City Area: 100 ha 25 km from the City
Masal Industrial City Area: 20 ha (Under planning) 2 km from the City
Anzali Industrial City Area: 50 ha (+35ha plan) 10 km from the City
Fuman Industrial City Area: 14 ha 11 km from the City
Shaft Industrial City Area: 38 ha 6 km from the City

Final Report, Volume III Part 5: Wastewater Management Supporting Report Chapter 4
Nippon Koei Co. Ltd. The Study on Integrated Management for Ecosystem Conservation of the Anzali Wetland
4 - 19
Table 4.5.1 Wastewater Treatment Systems in Industrial Cities in the Basin
Industrial City
Treatment Capacity by 2019 Owner Present Situation
Rasht 14,000 m3/day Rasht Industrial
City Company
There is a plan for construction of the treatment system. Rasht Industrial City Company is looking for funds for design and construction of a wastewater treatment system.
Shaft 500 m3/day MOIM No plan Somehsara 500 m3/day MOIM No plan Fuman 500 m3/day MOIM Noplan Masal 500 m3/day MOIM No plan Anzali 5,000 m3/day MOIM A treatment plant with a treatment capacity of 100 m3/day
is under construction. Expansion of the treatment capacity is required, but no plan for the expansion is prepared.
The image of the centralized wastewater treatment system is as shown in Figure 4.5.2.
Figure 4.5.2 Image of Centralized Wastewater Treatment System
4.5.4 Strengthening of Monitoring Activities by DOE
DOE, Human Environmental Department is expected to play an important role to improve condition of industrial effluent from each industrial factory. The following activities are proposed for strengthening of DOE activities for industrial effluent control
(1) Expansion of Monitoring Activity
Current monitoring of DOE is only carried out on major industrial factories several times per year. If any problem is found from the monitoring, DOE Guilan issues an order to improve the effluent system in the factory. There are about 50 water quality parameters in the effluent standards, including heavy metals and other toxic materials. However, monitoring by DOE Guilan only covers 30 parameters, and those do not include heavy metals or other toxic materials. Monitoring including these substances is proposed for all of industrial factories in the basin. As mentioned in section 4.8.2, it is proposed to monitor activities of the industrial factories in the basin and make a data base. The data base shall be revised once a year based on new monitoring data.
Wastewater Treatment Facility

Final Report, Volume III Part 5: Wastewater Management Supporting Report Chapter 4
Nippon Koei Co. Ltd. The Study on Integrated Management for Ecosystem Conservation of the Anzali Wetland
4 - 20
(2) Expansion of Human Environmental Department
For expansion of industrial monitoring activities, a new water quality laboratory with an atomic absorption spectrophotometer is under construction for heavy metal analysis in DOE, Guilan headquarters. It is also proposed to increase technical staff for environmental monitoring and inspection of industrial factories. 4.6 Management of Livestock Waste
4.6.1 Introduction
There are about 860,000 head of cows, buffaloes, sheep and goats overall the basin. These animals are kept in four ways, i.e., .fed by Individual Farmers in the Plain, in Grazing Land of the Mountain Area, in Grazing Land of the Plain and in Industrial Animal Husbandry. It is evaluated that livestock fed by Individual Farmers in the Plain and in Grazing Land of the Mountain Area have no serious impact of Anzali Wetland, because waste from livestock fed by the farmers have been managed, and waste from livestock in the grazing land of the mountain area can hardly reach to the wetland. With the removal of 250,000 heads of livestock under the rangeland management by NRGO, about 13 % of the pollution load from the livestock is expected to be eliminated without any futher measures. The following measures are proposed for management of livestock waste.
Table 4.6.1 Measures for Management of Each Group of Livestock
Group Measures 1) Livestock in Industrial Animal Husbandries Installation of treatment facilities for waste from industrial
animal husbandry 2) Livestock Grazing in Plain Area Installation of Water Points and dykes to prevent livestock
waste discharging directly to rivers 4.6.2 Treatment of Waste from Industrial Animal Husbandry
A building for industrial animal husbandry is a point source like an industrial factory. Waste from industrial animal husbandry should be managed same as industrial effluent, according to the bylaw. As shown in Figure 4.6.1, a building for industrial animal husbandry is required to install storage for livestock manure and a wastewater treatment facility. A re-use plan for livestock manure shall be prepared.
Industrial animal husbandries, which feed more than 20 head of cows, feed about 3,000 heads at seventeen sites in the basin. At present there is not any wastewater treatment facility for industrial animal husbandry in the basin. Wastewater treatment system and storage for livestock manure shall be installed in all the industrial animal husbandry facilities.
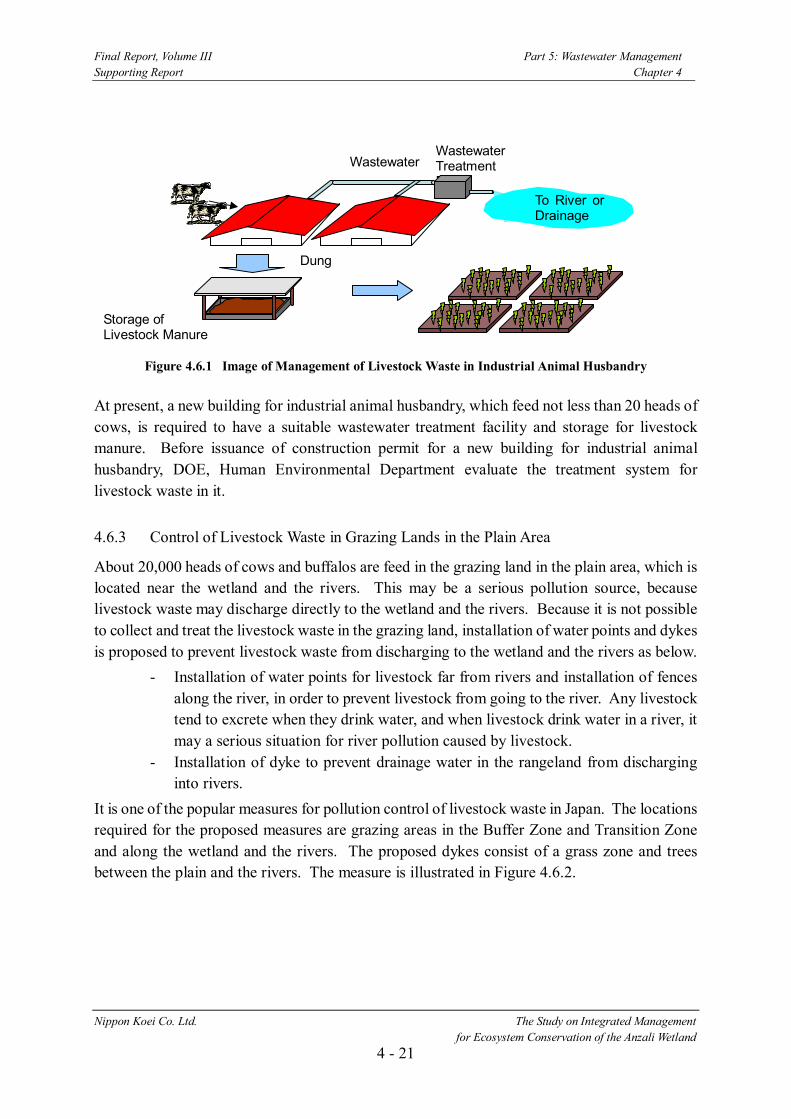
Final Report, Volume III Part 5: Wastewater Management Supporting Report Chapter 4
Nippon Koei Co. Ltd. The Study on Integrated Management for Ecosystem Conservation of the Anzali Wetland
4 - 21
Figure 4.6.1 Image of Management of Livestock Waste in Industrial Animal Husbandry
At present, a new building for industrial animal husbandry, which feed not less than 20 heads of cows, is required to have a suitable wastewater treatment facility and storage for livestock manure. Before issuance of construction permit for a new building for industrial animal husbandry, DOE, Human Environmental Department evaluate the treatment system for livestock waste in it. 4.6.3 Control of Livestock Waste in Grazing Lands in the Plain Area
About 20,000 heads of cows and buffalos are feed in the grazing land in the plain area, which is located near the wetland and the rivers. This may be a serious pollution source, because livestock waste may discharge directly to the wetland and the rivers. Because it is not possible to collect and treat the livestock waste in the grazing land, installation of water points and dykes is proposed to prevent livestock waste from discharging to the wetland and the rivers as below.
- Installation of water points for livestock far from rivers and installation of fences along the river, in order to prevent livestock from going to the river. Any livestock tend to excrete when they drink water, and when livestock drink water in a river, it may a serious situation for river pollution caused by livestock.
- Installation of dyke to prevent drainage water in the rangeland from discharging into rivers.
It is one of the popular measures for pollution control of livestock waste in Japan. The locations required for the proposed measures are grazing areas in the Buffer Zone and Transition Zone and along the wetland and the rivers. The proposed dykes consist of a grass zone and trees between the plain and the rivers. The measure is illustrated in Figure 4.6.2.
Storage of Livestock Manure
Wastewater Treatment F ilit
Dung
Wastewater
To River or Drainage
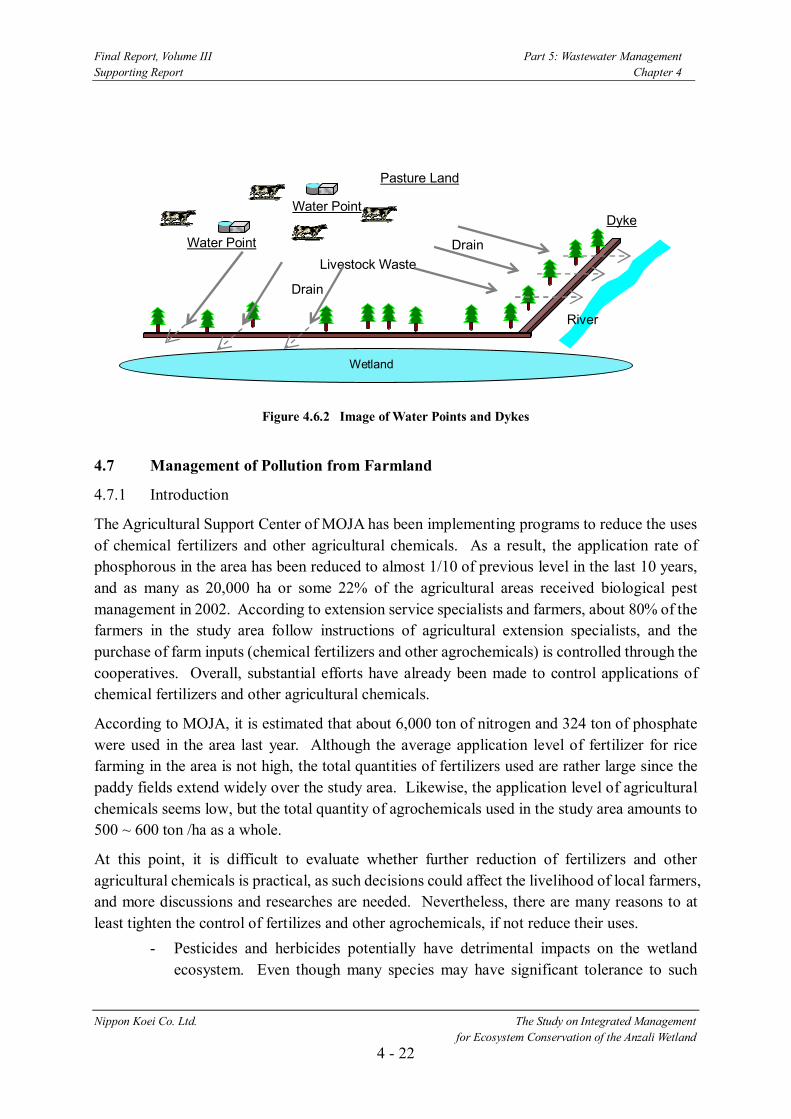
Final Report, Volume III Part 5: Wastewater Management Supporting Report Chapter 4
Nippon Koei Co. Ltd. The Study on Integrated Management for Ecosystem Conservation of the Anzali Wetland
4 - 22
Figure 4.6.2 Image of Water Points and Dykes
4.7 Management of Pollution from Farmland
4.7.1 Introduction
The Agricultural Support Center of MOJA has been implementing programs to reduce the uses of chemical fertilizers and other agricultural chemicals. As a result, the application rate of phosphorous in the area has been reduced to almost 1/10 of previous level in the last 10 years, and as many as 20,000 ha or some 22% of the agricultural areas received biological pest management in 2002. According to extension service specialists and farmers, about 80% of the farmers in the study area follow instructions of agricultural extension specialists, and the purchase of farm inputs (chemical fertilizers and other agrochemicals) is controlled through the cooperatives. Overall, substantial efforts have already been made to control applications of chemical fertilizers and other agricultural chemicals.
According to MOJA, it is estimated that about 6,000 ton of nitrogen and 324 ton of phosphate were used in the area last year. Although the average application level of fertilizer for rice farming in the area is not high, the total quantities of fertilizers used are rather large since the paddy fields extend widely over the study area. Likewise, the application level of agricultural chemicals seems low, but the total quantity of agrochemicals used in the study area amounts to 500 ~ 600 ton /ha as a whole.
At this point, it is difficult to evaluate whether further reduction of fertilizers and other agricultural chemicals is practical, as such decisions could affect the livelihood of local farmers, and more discussions and researches are needed. Nevertheless, there are many reasons to at least tighten the control of fertilizes and other agrochemicals, if not reduce their uses.
- Pesticides and herbicides potentially have detrimental impacts on the wetland ecosystem. Even though many species may have significant tolerance to such
Water Point Drain
Drain
Livestock Waste
Water Point
River
Dyke
Pasture Land
Wetland

Final Report, Volume III Part 5: Wastewater Management Supporting Report Chapter 4
Nippon Koei Co. Ltd. The Study on Integrated Management for Ecosystem Conservation of the Anzali Wetland
4 - 23
chemicals, there are susceptible species2, and loss of these species could affect the entire ecological balance of the region.
- It is generally desirable to minimize the amounts of agrochemicals in agricultural products from the perspective of food safety.
- Groundwater pollution by nitrate has been reported in the plain areas of the northern provinces, which may be partially attributed to excessive use of chemical fertilizers.
Considering the need to balance the production and environmental conservation, the master plan proposes the following programs. 4.7.2 Promotion of Farming with Less Input
(1) Promotion of use of compost such as livestock manure and/or Azolla
Traditionally, farmers use livestock waste as one of farm inputs in the study area. Although it might possibly cause water pollution by COD, T-N and T-P if it is excessively dosed, livestock waste-based compost should be further promoted to minimize the use of chemical fertilizers, especially nitrogen-based ones (e.g., urea, ammonium sulfate, etc.). Application of organic materials can make soil healthy and help to minimize an outbreak of diseases and pest infestation if it is properly treated. The Agricultural Service Center needs to disseminate information regarding proper application of organic materials as well as appropriate application levels of chemical fertilizers based on the dosage of organic materials.
The following actions should be considered to promote the use of compost. - to provide subsidy for using organic materials - to give added value to products organically grown (e.g., promotion of the product
brand “Organic Rice from Guilan Province”) - to develop a network with industrial livestock raisers to encourage recycling
livestock waste As discussed in Chapter 4, the use of compost/organic materials should first focus on the buffer zone to minimize the pollution load to the wetland.
(2) Expansion of Integrated Pest Management through Farmer Field School
Integrated pest management (IPM) has been promoted by MOJA as one of their extension programs. The main principle of IPM is to increase the profit of individual farmers by reducing the expenses for external farm inputs while maintaining the productivity. Major practices taken under IPM are i) identification and predition of pests, ii) determination of whether pest populations will reach a level that could cause economic damage, iii) application of agricultural chemicals in case the situation is severe, and iv) maintenance of crop health. The Farmer Field
2 For example, crustaceans and some fish species are sensitive to diazinon, a pesticide widely used in the area. The reported PNEC (predicted no effect concentration) for aquatic species is as low as 0.00026 ug/L (Ministry of Environment, Japan, 2003).

Final Report, Volume III Part 5: Wastewater Management Supporting Report Chapter 4
Nippon Koei Co. Ltd. The Study on Integrated Management for Ecosystem Conservation of the Anzali Wetland
4 - 24
School (FFS), which is a training course composed of guidance and practical sessions in the field, has been a major tool for the promotion of IPM. Since all the practices from identification to chemical application should be done by farmers themselves, the capacity development of farmers is essential for the implementation of IPM. In general, the FFS for rice farming organizes a field session per week and lasts for one cropping season.
Although MOJA has conducted the IPM program since 1999, the coverage of the activity is limited and the IPM practices seem unfamiliar to farmers in the study area. It is, therefore, proposed that two groups of two experts on IPM conducts 10 FFSs every year at different sites, and give guidance to about ten families of farmers at each school for several months. The experts on IPM need to keep close relation with the farmers and give technical guidance to farmers to enable them to use the proposed practices. As a result of 10 FFSs, about one hundred families of farmers can get guidance for about 200 ha of farmland every year. The farmers who get the guidance are expected to be trainers and disseminate their knowledge to their neighbors. FFS includes the following guidance:
- Guidance on identification and prediction of insects / pests to be controlled - Guidance on methods of pesticide use with suitable types and amounts of pesticide
to meet the site conditions - Guidance for biological control of insect pests in order to reduce pesticide
consumption - Guidance for methods of herbicide reduction
The proposed IPM program should be concentrated on the buffer zone at the beginning of the master plan, and thence, it will expand its activity to the transition zone gradually.
(3) Promotion of proper farming practice
Farming practices on farm input application and water management are crucial for the control of pollution loads from farmlands. Draining irrigation water soon after application of farm inputs (fertilizers / agricultural chemicals) results in the discharge of highly polluted water with nitrogen, phosphorous or toxic materials to rivers as well as the wetland. Needless to say, over-dosage can easily cause contamination of drainage water.
As shown in Section 2.7.2, Diazinon is the main agricultural chemical presently used in the area. Since it has the property of being easily hydrolyzed and reduced in paddy fields, the water retention for a certain period after application is very important. Due attention should be paid to water management to minimize the discharge of pollution loads to river systems. Therefore, the Agricultural Service Center should also emphasize water management at the field level in addition to the extension works on the uses of agricultural chemicals and fertilizers.

Final Report, Volume III Part 5: Wastewater Management Supporting Report Chapter 4
Nippon Koei Co. Ltd. The Study on Integrated Management for Ecosystem Conservation of the Anzali Wetland
4 - 25
4.7.3 Coordination between Monitoring and Agricultural Extension
The polluted level of river water caused by farm inputs should be monitored periodically, especially in the months when farmers apply agricultural chemicals and fertilizers on their farms. It is also important to feed back the findings of monitoring to decision makers for remedial actions to prevent further environmental degradation of the wetland.
Monitoring of water quality will be undertaken by DOE and MOE as described in the succeeding section 4.8 “Environmental Monitoring for Wastewater Management”. Therefore, the close coordination between them (DOE and MOE) and MOJA, who are responsible for agricultural extension works, is necessary to improve and maintain the wetland environment. 4.8 Environmental Monitoring for Wastewater Management
4.8.1 Introduction
The wastewater management plan was prepared based on available data on the environmental condition of Anzali Wetland and the situation of pollution sources in the basin. During development of the wastewater management plan, the management plan shall be revised to meet actual future situation regarding the following items.
1) Changing water quality in Anzali Wetland and the rivers following to the wetland 2) Changing amount of pollution load generation in the basin 3) Progress of implementation of proposed projects in the wastewater management
plan 4) Operational condition of proposed projects in the wastewater management plan
It is proposed that every 5 years the wastewater management plan should be revised based on the monitoring data showing the above situation. 4.8.2 Monitoring Programs
Since monitoring on Ambient Water Quality in Anzali Wetland is proposed in the Wetland Ecological Management Plan, the following 6 programs are proposed for monitoring of wastewater management.

Final Report, Volume III Part 5: Wastewater Management Supporting Report Chapter 4
Nippon Koei Co. Ltd. The Study on Integrated Management for Ecosystem Conservation of the Anzali Wetland
4 - 26
Table 4.8.1 Proposed Monitoring Program for Wastewater Management
Monitoring Organization Purpose 1) On Domestic Wastewater Treatment
GWWC, RWWC
- Preparation of data for revising the management plan for domestic wastewater in urban area and rural area
2) On Industrial Factories DOE - Preparation of data for revising the management plan for industrial effluent
3) On Agricultural Activity MOJA - Preparation of data for revising the management plan for livestock waste and pollution from farmland
4) On pollution load to the wetland DOE - Preparation of data for revising the overall the wastewater management plan
5) On Ambient Water Quality DOE and MOE - Preparation of data for revising the overall the wastewater management plan
The details of the above 6 programs are as described as below.
Table 4.8.2 Monitoring of the Sewerage System
Objective To monitor the condition of domestic wastewater treatment Organization GWWC, RWWC Monitoring Program - Influent/Effluent General Parameters (discharge rate, Temp., BOD, COD, T-N, T-P, SS), each
Wastewater Treatment Plant, One time/day Toxic Parameters (heavy metals, pesticides), 1 time/month
- Development of Sewerage System
Length of Sewer Pipes by each diameter, once a year Total Operational Capacity of Wastewater Treatment
- Condition of Wastewater Treatment
Sewerage Service Population, once a year Service Population of Individual Wastewater Treatment Facility, once a year Service Population of Community Wastewater Treatment System, once a year
Analysis and Storage of Information
Every year, GWWC compiles the findings into a report.
Table 4.8.3 Monitoring of Industrial Factories
Objective To inspect compliance of industries with effluent standards. Organization DOE and IMO Monitoring Program - Industrial Activity Basic Data (Type of industry, production amount, water consumption, number of
employees, location, etc.), all industrial factories, updated once a year - Industrial Wastewater
General Parameters (discharge rate, Temp., BOD, COD, TDS, T-N, T-P, SS), 40 locations, 1 time/year, Toxic Parameters (heavy metals, pesticides); 40 locations; 1 time/year
Analysis and Storage of Information
Every year, DOE compiles the finding into a technical report.

Final Report, Volume III Part 5: Wastewater Management Supporting Report Chapter 4
Nippon Koei Co. Ltd. The Study on Integrated Management for Ecosystem Conservation of the Anzali Wetland
4 - 27
Table 4.8.4 Monitoring on Agricultural Activity
Objective To monitor the condition of pollution sources in agricultural activities Organization MOJA Monitoring Program - Livestock Number of cows, buffalo, sheep and goats, once a year
Information of Industrial Animal Husbandry (location, number of livestock, situation of management of livestock waste), once a year, updated
- Activity in Farmland
Total area of agricultural land Total consumption of chemical fertilizers, Total consumption of pesticides and herbicide and other agricultural chemicals, once a year
- Analysis and Storage of Information
Every year, MOJA compiles the finding into a technical report.
Table 4.8.5 Ambient Water Quality Survey
Objective To monitor ambient water quality of rivers and groundwater. The water quality of the wetland is monitored under a different program.
Organization DOE and MOE Monitoring Program - Water Quality General Parameters (Temp., DO, BOD, COD, T-N, T-P, SS, transparency), 20
locations, 4 times (spring, summer, fall, winter) Toxic Parameters (heavy metals, pesticides, herbicides); 20 locations; 3 times/year
- Sediment Quality General parameters (depth, texture, organic carbon, T-N, T-P), Toxic parameters (heavy metals, pesticides); 10 locations; 1 time/year
- Groundwater General Parameters (Temp., MnO2 demand, NO3, NH4, T-P, turbidity, TDS, others), 10 locations, 4 times (spring, summer, fall, winter) Toxic Parameters (heavy metals, pesticides); 10 locations; 1 times/year
Analysis and Storage of Information
DOE compiles the findings into a technical report. A database of river water quality should be developed by DOE.
Table 4.8.6 Water Pollution Load Discharged to Rivers
Objective To monitor ambient water quality of rivers and groundwater. The water quality of the wetland is monitored under a different program.
Organization DOE and MOE Monitoring Program - Water Quality and River Discharge
General Parameters (Flow rate, BOD, COD, T-N, T-P, SS), 7 locations, 4 times/year (spring, summer, fall, winter)
Analysis and Storage of Information
DOE compiles the findings into a technical report. A database of river water quality should be developed by DOE.
For dissemination of all information from the above monitoring, the report will be distributed to DOE, MOE, GWWC, RWWC and other interested parties. 4.9 Institutional Arrangement
In order to effectively implement the proposed wastewater management plan, the following institutional arrangement is proposed.

Final Report, Volume III Part 5: Wastewater Management Supporting Report Chapter 4
Nippon Koei Co. Ltd. The Study on Integrated Management for Ecosystem Conservation of the Anzali Wetland
4 - 28
(1) Revision of Regulations related to Effluent Standard
There appear to be conflicting regulations about the effluent standard, pollution charges related to effluent, pollution tax on industry, and fines and punitive measures associated with pollution. These regulations should be clarified and unified under a clear legal framework for pollution control.
(2) Establishment of Ambient Water Standard
Iran has no standards or guidelines for ambient water quality. It is recommended that ambient water quality standards should be established for different water bodies (rivers, lakes, coastal wetlands, etc.) taking into consideration the ideal water quality, the current situation and uses of the water bodies.

Final Report, Volume III Part 5: Wastewater Management Supporting Report Chapter 5
Nippon Koei Co., Ltd The Study on Integrated Management for Ecosystem Conservation of the Anzali Wetland
5 - 1
CHAPTER 5 COST ESTIMATE
5.1 Summary of Proposed Wastewater Management Plan The summaries of the proposed projects in the wastewater management plan are as shown in Table 5.1.1 and Figure 5.1.1.
Table 5.1.1 List of Proposed Projects and Executing Organizations
Sub-Components Proposed Projects/Measures Executing Organizations
(1) Rasht Sewerage System Development Project Phase 1 Service Population: 253,816 residents Treatment Capacity: 80,000 m3/d Phase 2 Service Population: 378,284 residents Treatment Capacity: 80,000 m3/d
GWWC
(2) Anzali Sewerage System Development Project Phase 1 Service Population: 77,920 residents Treatment Capacity: 34,000 m3/d Phase 2 Service Population: 51,000 residents Treatment Capacity: 20,000 m3/d
GWWC
(3) Somehsara Sewerage System Development Project Service Population: 56,980 residents Treatment Capacity: 12,700 m3/d
GWWC
(4) Promotion of Individual Wastewater Treatment Facilities outside of Sewerage Service Area Target Population: 113,000 residents Number of Septic Tank Installation: 22,600 units
DOE
Management of Domestic Wastewater in Urban Area
(5) Promotion of Low Phosphorous Detergent Use DOE Management of Domestic Wastewater in Rural Area
(1) Community Wastewater Treatment System Development Service Population: 57,000 residents Sites: 21 villages
RWWC
(1) Centralization of Industrial Factories Sites: Six Industrial Cities (Anzali, Rasht, Somehsara, Fuman, Shaft and Masal)
DOE/MOIE
(2) Construction of Centralized Wastewater Treatment System Sites: Six Industrial Cities (Anzali, Rasht, Somehsara, Fuman, Shaft and Masal) Total Treatment Capacity: 21,000 m3/day
DOE/MOIE/ Private company
Management of Industrial Effluent
(3) Strengthening of Monitoring Activities by DOE DOE (1) Treatment of livestock waste from industrial animal husbandry
Sites: 17 sites of existing industrial animal husbandries DOE Management of
Livestock Waste (2) Control of livestock waste in grazing lands in the plain area DOE
Management of Pollution from Farmland
(1) Promotion of farming with less input 1) Promotion of use of compost such as livestock manure and/or
Azolla 2) Expansion of Integrated Pest Management through Farmer Field
School 3) Promotion of Proper Farming Practice
MOJA
Source: JICA Study Team

Morghak River
Bahmbar River
Chafroud River
Chob
ar R
iver
Goh
arro
ud R
iver
Pasik
han
Rive
r
Shak
hraz
Rive
r
Masule
hroud
khan
Rive
r
Siav
arou
d Ri
ver
Palangvar Rive
r
Manbarruod River
Siahmazgiruod
Gashteroudkhan
Nazaralat River
Poshtemaleh River
Hyda
rAlat
Rive
r
Gazruodbar River
Khalkai R
iver
Shanderman River
Pirb
azer
Gha
lero
udkh
an
Jirdeh River
Manba
t Rive
rTeniyan River
Gorkash Rive
r
Siah
roud
Rive
r
555 000 555 101010 15 km15 km15 kmScaleScaleScale
N
JAPAN INTERNATIONAL COOPERATION AGENCY
The Study on Integrated Management forEcosystem Conservation of the Anzali Wetland
in the Islamic Republic of Iran
E 49o 00' E 49o 30'
N 37o 30' AnzaliAnzaliAnzali
RashtRashtRasht
KhomamKhomamKhomam
ShaftShaftShaft
FumanFumanFuman
SomehsaraSomehsaraSomehsara
MasalMasalMasal
MasulehMasulehMasuleh
MarjaghalMarjaghalMarjaghal
SangarSangarSangar
Rezvan ShahrRezvan ShahrRezvan Shahr
Siyah MazgiSiyah MazgiSiyah MazgiTo TehranTo Tehran
To KhoshkebijarTo Khoshkebijar
To BahijanTo Bahijan
To AstraTo Astra
To KiyashahrTo Kiyashahr
Figure 5.1.1
Wastewater Management Plan
LegendWatershed BoundaryAnzali WetlandAnzali LagoonRiverCity / TownProvincial CapitalRoad
Proposed Projects/Measures
5 - 2
1. Management of Domestic Wastewater in Urban Area (1) Rasht Sewerage System Development Project ( )
(2) Anzali Sewerage System Development Project ( )
(3) Somehsara Sewerage System Development Project ( )
(4) Promotion of Individual Wastewater Treatment Facilities outside Sewerage Service Area
(5) Promotion of Low Phosphorous Detergent Use
2. Management of Domestic Wastewater in Rural Area (1) Community Wastewater Treatment System Development The designs for seven villages ( ) were completed.
3. Management of Industrial Effluent (1) Centralization of Industrial Factories ( )
(2) Construction of Centralized Wastewater Treatment System
(3) Strengthening of Monitoring Activities by DOE
4. Management of Livestock Waste (1) Treatment of Livestock Waste from Industrial Animal Husbandry (2) Control of Livestock Waste in Grazing Lands in the Plain Area
5. Management of Pollution from Farmland ( ) (1) Promotion of Farming with Less Input
(2) Coordination between Monitoring and Agricultural
Extension
6. Environmental Monitoring for Wastewater Management Monitoring of Domestic Wastewater Treatment, Industrial Factories, Agricultural Activity, Pollution Loads to the wetland, and Ambient Water Quality
Proposed Projects/Measures
CASPIAN SEA

Final Report, Volume III Part 5: Wastewater Management Supporting Report Chapter 5
Nippon Koei Co., Ltd The Study on Integrated Management for Ecosystem Conservation of the Anzali Wetland
5 - 3
5.2 Basic Conditions for Cost Estimate Rough project costs for the proposed projects are estimated in principal under the following conditions:
(1) Construction Cost The cost estimates for the following projects are calculated based on the following data. The breakdowns of each project costs are described in Table 5.3.2.
Table 5.2.1 Data Source for Construction Cost Estimation
Project Data Source Rasht Sewerage System Development
Based on Rasht Water Supply and Wastewater Collection and Disposal, Feasibility Studies (Final Report) in August 2004
Anzali Sewerage System Development
Based on Rasht/Anzali Water Supply and Wastewater Collection and Disposal, Feasibility Studies (Draft Report) in March 2003, the units prices were modified considering price escalation up to 2004. The cost of WWTP is estimated by JICA Study Team.
Somehsara Sewerage System Development
Based on the data from GWWC
Development of Community Wastewater Treatment System
Based on the data from RWWC, Gilan,
Source: JICA Study Team
(2) Operation and Maintenance Cost The O & M cost estimates for the following projects are calculated based on the following data. The breakdowns of O&M cost of the project costs are described in Table 5.3.2.
Table 5.2.2 Data Source for O&M Cost Estimation
Project Data Source Rasht and Anzali Sewerage System Development
Based on Rasht/Anzali Water Supply and Wastewater Collection and Disposal, Feasibility Studies (Draft Report) in March 2003, the units prices were modified considering price escalation up to 2004. The cost of WWTP is estimated by JICA Study Team.
Somehsara Sewerage System Development
Based on the data in 2004 from GWWC.
Development of Community Wastewater Treatment System
Based on the data prepared by RWWC, Gilan in 2001, the unit prices were modified based on RWWC suggestions.
Source: JICA Study Team
The following unit costs are used for the O & M cost estimations. Table 5.2.3 Unit Costs for O&M Cost Estimation
Items Unit Cost Staff Expenditures
Engineer: 36 million Rial/p/y, Technical/Clerk: 24 million Rial/p/y Semi-skilled Workers: 17 million Rial/p/y, Laborers: 15 million Rial/p/y
Electricity 500 Rial/KWH Chemical Chlorine: 1,500 Rial/kg, Lime: 400 Rial/kg, Polyelectrolutes: 25,000 Rial/kg Repair and Maintenances
1 % of Construction Cost per year
Source: JICA Study Team

Final Report, Volume III Part 5: Wastewater Management Supporting Report Chapter 5
Nippon Koei Co., Ltd The Study on Integrated Management for Ecosystem Conservation of the Anzali Wetland
5 - 4
5.3 Cost Estimate Table 5.3.1 shows the estimate of total investment cost and O&M cost of the proposed projects. Total investment cost is estimated about 2,449,866 million Rials, and average annual O&M cost for the proposed projects are estimated 42,634 million Rials/year. The cost breakdowns are described from Table 5.3.2 to Table 5.3.11.
Table 5.3.1 Cost Estimate of Physical Measures for Wastewater Management
O&M Cost
Proposed Projects/Measures Project Cost (million Rials)
Overall (million Rials)
Average Annual (million
Rials/year) 1. Management of Domestic Wastewater in Urban Areas (1) Rasht Sewerage System Development Project
1) Rasht sewerage (Phase 1), for 253,816 residents 741,088 2) Rasht sewerage (Phase 2), for 378,284 residents 588,426 274,218 25,810
(2) Anzali Sewerage System Development Project 1) Anzali sewerage (Phase 1), for 77,920 residents 510,018 2) Anzali sewerage (Phase 2), for 51,000 residents 177,633 90,161 8,443
(3) Somehsara Sewerage System Development Project for 56,980 residents 214,380 33,984 4,076
(4) Promotion of Individual Wastewater Treatment 28,250 283 283 (5) Promotion of Low Phosphorous Detergent 0 1,940 194
Sub-total 2,259,795 400,586 38,806 2. Management of Domestic Wastewater in Rural Areas (1) Community Wastewater Treatment System
Development
1) Initial Stage for Seven Villages 19,830 2) Second Stage 19,830 3) Third Stage 19,830
8,349 1,089
Sub-total 59,490 8,349 1,089 3. Management of Industrial Effluent (1) Centralization of Industrial Factories 1,330 0 0 (2) Construction of Centralized Wastewater Treatment System
1) Rasht industrial city 67,500 2) Anzali, Somehsara, Fuman and other industrial cities 60,750 17,249 2,052
(3) Strengthening of Monitoring Activities by DOE 0 4,095 273 Sub-total 129,580 21,344 2,325
4. Management of Livestock Waste (1) Treatment of Livestock Waste from Industrial Animal
Husbandry 500 260 20
(2) Control of Livestock Waste in Grazing Lands in the Plain Area 500 300 84
5. Management of Pollution from Farmland (1) Promotion of Farming with Less Input 1) Expansion of use of compost such as livestock
manure and/or Azolla 2) Expansion of integrated pest management through
farmer field school 3) Promotion of Proper Farming Practice
0 3,960 402
6. Environmental Monitoring 0 5,250 350 Total 2,449,866 439,766 42,634
Source: JICA Study Team

Final Report, Volume III Part 5: Wastewater Management Supporting Report Chapter 5
Nippon Koei Co., Ltd The Study on Integrated Management for Ecosystem Conservation of the Anzali Wetland
5 - 5
Table 5.3.2 Project Cost of Sewerage System Development in Rasht (Phase1) (Unit: Million Rials)
Cost Item Unit Unit Price Quantity Amount1. Construction Cost1.1 Sewer Pipes (Dia. 200mm) km 415.8 104.1 43,2861.2 Intercepter (Dia. 250-500mm) km 424.7 408.5 173,4831.3 House Connection (Dia. 160mm) km 427.6 341.9 146,1901.4 Trunk Main (Dia. 600-1400mm) km 1,606.3 31 49,7961.5 Pumping Station (15 stations) ls 96,199 1 96,1991.6 Advanced Traetment for WWTP ls 40,000 1 40,000Sub-Total 548,954
2. Land Acquisition m2 03. Compensation 04. Administration Cost (5% of 1.) ls 27,4485. Engineering Cost (10% of 1.) ls 54,8956. Physical Contingency ls 109,791 (20% of 1. to 3.)
Total of 1. to 6. 741,088
Source: JICA Study Team
Table 5.3.3 Project Cost of Sewerage System Development in Rasht (Phase2) (Unit: Million Rials)
Cost Item Unit Unit Price Quantity Amount1. Construction Cost1.1 Sewer Pipes (Dia. 200mm) km 300.4 104.1 31,2681.2 Intercepter (Dia. 250-500mm) km 274.4 408.5 112,1001.3 House Connection (Dia. 160mm) km 196.3 341.9 67,1101.4 Trunk Main (Dia. 600-1400mm) km 721 31 22,3501.5 Pumping Station (15 stations) ls 32,043 1 32,0431.6 Advanced Traetment for WWTP ls 20,000 1 20,0001.7 WWTP (Capa. 80,000 m3/day) ls 150,000 1 150,0001.8 Power Transmission ls 1,000 1 1,000Sub-Total 435,871
2. Land Acquisition m2 03. Compensation 04. Administration Cost (5% of 1.) ls 21,7945. Engineering Cost (10% of 1.) ls 43,5876. Physical Contingency ls 87,174 (20% of 1. to 3.)
Total of 1. to 6. 588,426
Source: JICA Study Team

Final Report, Volume III Part 5: Wastewater Management Supporting Report Chapter 5
Nippon Koei Co., Ltd The Study on Integrated Management for Ecosystem Conservation of the Anzali Wetland
5 - 6
Table 5.3.4 Project Cost of Sewerage System Development in Anzali (Phase1) (Unit: Million Rials)
Cost Item Unit Unit Price Quantity Amount1. Construction Cost1.1 Sewer Pipes (Dia. 200mm) km 372 171 63,6121.2 Intercepter (Dia. 250-500mm) km 704.4 132 92,9811.3 House Connection (Dia. 160mm) km 274.8 65.5 17,9991.4 Trunk Main (Dia. 600-1400mm) km 2187.6 18.1 39,5961.5 Trunk Main (Dia. 1400mm) in Wes km 3429.6 3.5 12,0041.6 Pumping Station ls 4800 18 86,4001.7 Advanced Treatment for WWTP ls 10000 1 10,0001.8 WWTP (Capa. 14,000m3day) ls 54000 1 54,0001.9 Power Trasmission Line for Plant ls 1200 1 1,200Sub-Total 377,791
2. Land Acquisition m2 03. Compensation 04. Administration Cost (5% of 1.) ls 18,8905. Engineering Cost (10% of 1.) ls 37,7796. Physical Contingency ls 75,558 (20% of 1. to 3.)
Total of 1. to 6. 510,018
Source: JICA Study Team
Table 5.3.5 Project Cost of Sewerage System Development in Anzali (Phase2) (Unit: Million Rials)
Cost Item Unit Unit Price Quantity Amount1. Construction Cost1.1 Pipes (Dia. 160-500mm) km 300 176 52,8001.4 Trunk Main (Dia. 600-1400mm) km 2400 2.2 5,2801.6 WWTP (Capa. 13,000m3day) Units 49500 1 49,5001.8 WWTP (Capa. 7,000m3day) Unit 24000 1 24,000Sub-Total 131,580
2. Land Acquisition m2 03. Compensation 04. Administration Cost (5% of 1.) ls 6,5795. Engineering Cost (10% of 1.) ls 13,1586. Physical Contingency ls 26,316 (20% of 1. to 3.)
Total of 1. to 6. 177,633
Source: JICA Study Team

Final Report, Volume III Part 5: Wastewater Management Supporting Report Chapter 5
Nippon Koei Co., Ltd The Study on Integrated Management for Ecosystem Conservation of the Anzali Wetland
5 - 7
Table 5.3.6 Project Cost of Sewerage System Development in Somehsara (Unit: Million Rials)
Cost Item Unit Unit Price Quantity Amount1. Construction Cost1.1 Pipes (Dia. 225-600mm) km 500 87 43,5001.2 Trunk Main (Dia. 800mm) km 2200 2 4,4001.3 House Connection (Dia. 160mm) km 350 78 27,3001.4 Pumping Station Units 15000 1 15,0001.5 WWTP (Capa. 12,700m3day) Unit 39600 1 39,6001.6 Miscellaneous 29,000Sub-Total 158,800
2. Land Acquisition m2 03. Compensation 04. Administration Cost ls 7,940 (5% of 1.)5. Engineering Cost ls 15,880 (10% of 1.)6. Physical Contingency ls 31,760 (20% of 1. to 3.)
Total of 1. to 6. 214,380
Source: JICA Study Team

Final Report, Volume III Part 5: Wastewater Management Supporting Report Chapter 5
Nippon Koei Co., Ltd The Study on Integrated Management for Ecosystem Conservation of the Anzali Wetland
5 - 8
Table 5.3.7 Project Cost of Community Wastewater Treatment System (Phase1) (Unit: Million Rials)
Cost Item Unit Unit Price Quantity Amount1. Construction Cost1.1 Atashgah a. Septic tanks units 3 339 1,017 b. Pipes m 0.1 9200 920 c. Additional Treatment residents 0.2 4353 871 Sub-total 2,8081.2 Kheshtnasjed a. Septic tanks units 3 0 0 b. Pipes m 0.1 10900 1,090 c. Additional Treatment residents 0.2 4796 959 Sub-total 2,0491.3 Gasht a. Septic tanks units 3 470 1,410 b. Pipes m 0.1 23000 2,300 c. Additional Treatment residents 0.2 3402 680 Sub-total 4,3901.4 Loleman a. Septic tanks units 3 25 75 b. Pipes m 0.1 3700 370 c. Additional Treatment residents 0.2 999 200 Sub-total 6451.5 Nageston a. Septic tanks units 3 246 738 b. Pipes m 0.1 8900 890 c. Additional Treatment residents 0.2 1988 398 Sub-total 2,0261.6 Sheikhneshin a. Septic tanks units 3 138 414 b. Pipes m 0.1 12700 1,270 c. Additional Treatment residents 0.2 1370 274 Sub-total 1,9581.7 Aliabad a. Septic tanks units 3 0 0 b. Pipes m 0.1 5300 530 c. Additional Treatment residents 0.2 1417 283 Sub-total 813 Total of 1. 14,6892. Land Acquisition m2 03. Compensation 04. Administration Cost ls 734 (5% of 1.)5. Engineering Cost ls 1,469 (10% of 1.)6. Physical Contingency ls 2,938 (20% of 1. to 3.)
Total of 1. to 6. 19,830Source: JICA Study Team

Final Report, Volume III Part 5: Wastewater Management Supporting Report Chapter 5
Nippon Koei Co., Ltd The Study on Integrated Management for Ecosystem Conservation of the Anzali Wetland
5 - 9
Table 5.3.8 Annual Operation and Maintenance Cost of Rasht Sewerage System in 2019 (Unit: Million Rials)
Cost Item Unit Unit Price Quantity Amount1. Personnel Cost1.1 Engineer person 36 14 5041.2 Technicial/Cleark person 24 48 1,1521.3 Semi-skilled Workers person 17 18 3061.3 Labours person 15 84 1,260
3,2222. Expenses2.1 Electric Power kWH 0.0005 24,550,764 12,2752.2 Chemical a. Chlorine ton 1.8 451 811 b. Lime ton 0.5 2,669 1,335 c. Polyelectrolytes ton 30 30 8902.3 Maintenance and Repair Cost ls 7,276
(1% of Costruction Cost)
Total of 1. to 2. 25,809
Annual Cost per Person (Rials/year): 40,831Source: JICA Study Team
Table 5.3.9 Annual Operation and Maintenance Cost of Anzali Sewerage System in 2019 (Unit: Million Rials)
Cost Item Unit Unit Price Quantity Amount1. Personnel Cost1.1 Engineer person 36 12 4321.2 Technicial/Cleark person 24 25 6001.3 Semi-skilled Workers person 17 16 2721.3 Labours person 15 36 540
1,8442. Expenses2.1 Electric Power kWH 0.0005 4,543,141 2,2722.2 Chemical a. Chlorine ton 1.8 90 162 b. Lime ton 0.5 534 267 c. Polyelectrolytes ton 30 6 1782.3 Maintenance and Repair Cost ls 3,720
(1% of Costruction Cost)
Total of 1. to 2. 8,443
Annual Cost per Person (Rials/year): 65,488Source: JICA Study Team

Final Report, Volume III Part 5: Wastewater Management Supporting Report Chapter 5
Nippon Koei Co., Ltd The Study on Integrated Management for Ecosystem Conservation of the Anzali Wetland
5 - 10
Table 5.3.10 Annual Operation and Maintenance Cost of Somehsara Sewerage System in 2019 (Unit: Million Rials)
Cost Item Unit Unit Price Quantity Amount1. Personnel Cost1.1 Engineer person 36 4 1441.2 Technicial/Cleark person 24 9 2161.3 Semi-skilled Workers person 17 7 1191.3 Labours person 15 14 210
6892. Expenses2.1 Electric Power kWH 0.0005 2,213,103 1,1072.2 Chemical a. Chlorine ton 1.8 42 75 b. Lime ton 0.5 246 123 c. Polyelectrolytes ton 30 3 822.3 Maintenance and Repair Cost ls 2,000
(1% of Costruction Cost)
Total of 1. to 2. 4,076
Annual Cost per Person (Rials/year): 71,505Source: JICA Study Team
Table 5.3.11 Annual Operation and Maintenance Cost of Community Wastewater Treatment System (Phase1)
(Unit: Million Rials)Cost Item Unit Unit Price Quantity Amount
1. Personnel Cost1.1 Engineer person 36 1 361.2 Technicial/Cleark person 24 1 241.3 Semi-skilled Workers person 17 0 01.3 Labours person 15 7 105
1652. Expenses2.1 Electric Power kWH 0.0005 0 02.2 Chemical a. Chlorine ton 1.8 0 0 b. Lime ton 0.5 0 0 c. Polyelectrolytes ton 30 0 02.3 Maintenance and Repair Cost ls 198
(1% of Costruction Cost)
Total of 1. to 2. 363
Annual Cost per Person (Rials/year): 20,167Source: JICA Study Team
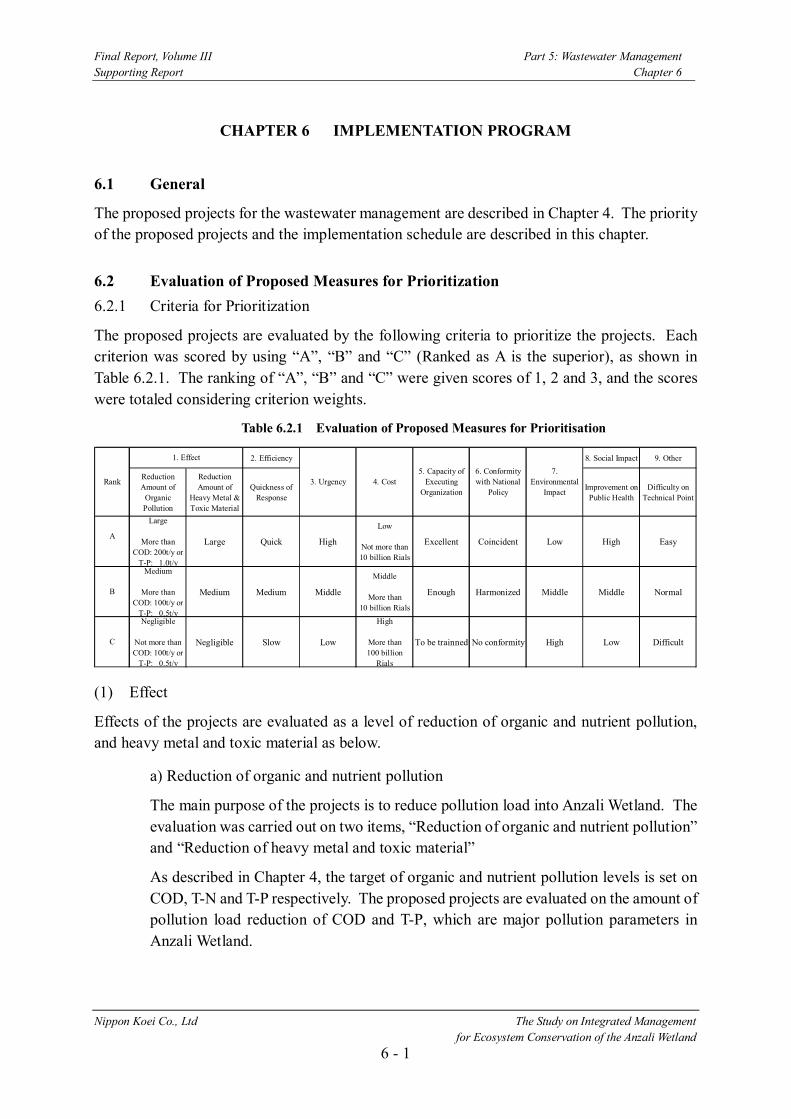
Final Report, Volume III Part 5: Wastewater Management Supporting Report Chapter 6
Nippon Koei Co., Ltd The Study on Integrated Management for Ecosystem Conservation of the Anzali Wetland
6 - 1
CHAPTER 6 IMPLEMENTATION PROGRAM
6.1 General
The proposed projects for the wastewater management are described in Chapter 4. The priority of the proposed projects and the implementation schedule are described in this chapter. 6.2 Evaluation of Proposed Measures for Prioritization 6.2.1 Criteria for Prioritization
The proposed projects are evaluated by the following criteria to prioritize the projects. Each criterion was scored by using “A”, “B” and “C” (Ranked as A is the superior), as shown in Table 6.2.1. The ranking of “A”, “B” and “C” were given scores of 1, 2 and 3, and the scores were totaled considering criterion weights.
Table 6.2.1 Evaluation of Proposed Measures for Prioritisation
2. Efficiency 8. Social Impact 9. Other
ReductionAmount of
OrganicPollution
ReductionAmount of
Heavy Metal &Toxic Material
Quickness ofResponse
Improvement onPublic Health
Difficulty onTechnical Point
Large
More thanCOD: 200t/y or
T-P: 1.0t/y
Large Quick High
Low
Not more than10 billion Rials
Excellent Coincident Low High Easy
Medium
More thanCOD: 100t/y or
T-P: 0.5t/y
Medium Medium Middle
Middle
More than10 billion Rials
Enough Harmonized Middle Middle Normal
Negligible
Not more thanCOD: 100t/y or
T-P: 0.5t/y
Negligible Slow Low
High
More than100 billion
Rials
To be trainned No conformity High Low Difficult
3. Urgency 4. Cost5. Capacity of
ExecutingOrganization
A
B
C
1. Effect
7.Environmental
ImpactRank
6. Conformitywith National
Policy
(1) Effect
Effects of the projects are evaluated as a level of reduction of organic and nutrient pollution, and heavy metal and toxic material as below.
a) Reduction of organic and nutrient pollution
The main purpose of the projects is to reduce pollution load into Anzali Wetland. The evaluation was carried out on two items, “Reduction of organic and nutrient pollution” and “Reduction of heavy metal and toxic material”
As described in Chapter 4, the target of organic and nutrient pollution levels is set on COD, T-N and T-P respectively. The proposed projects are evaluated on the amount of pollution load reduction of COD and T-P, which are major pollution parameters in Anzali Wetland.
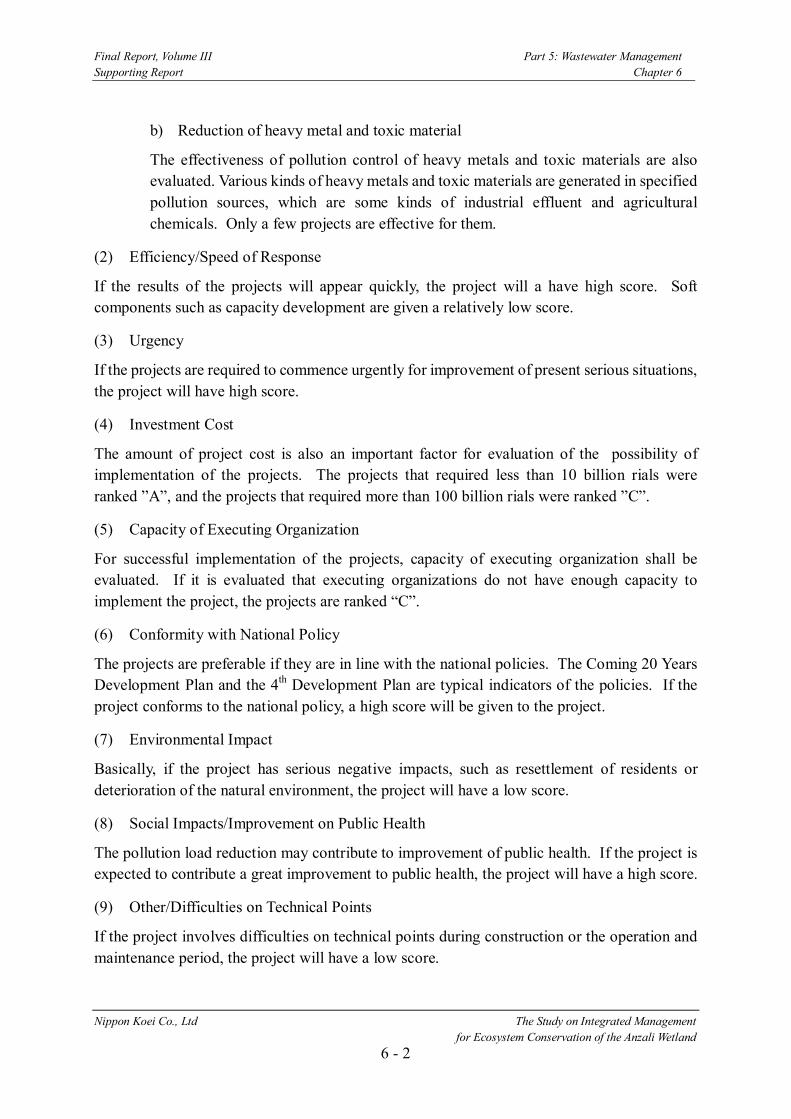
Final Report, Volume III Part 5: Wastewater Management Supporting Report Chapter 6
Nippon Koei Co., Ltd The Study on Integrated Management for Ecosystem Conservation of the Anzali Wetland
6 - 2
b) Reduction of heavy metal and toxic material
The effectiveness of pollution control of heavy metals and toxic materials are also evaluated. Various kinds of heavy metals and toxic materials are generated in specified pollution sources, which are some kinds of industrial effluent and agricultural chemicals. Only a few projects are effective for them.
(2) Efficiency/Speed of Response
If the results of the projects will appear quickly, the project will a have high score. Soft components such as capacity development are given a relatively low score.
(3) Urgency
If the projects are required to commence urgently for improvement of present serious situations, the project will have high score.
(4) Investment Cost
The amount of project cost is also an important factor for evaluation of the possibility of implementation of the projects. The projects that required less than 10 billion rials were ranked ”A”, and the projects that required more than 100 billion rials were ranked ”C”.
(5) Capacity of Executing Organization
For successful implementation of the projects, capacity of executing organization shall be evaluated. If it is evaluated that executing organizations do not have enough capacity to implement the project, the projects are ranked “C”.
(6) Conformity with National Policy
The projects are preferable if they are in line with the national policies. The Coming 20 Years Development Plan and the 4th Development Plan are typical indicators of the policies. If the project conforms to the national policy, a high score will be given to the project.
(7) Environmental Impact
Basically, if the project has serious negative impacts, such as resettlement of residents or deterioration of the natural environment, the project will have a low score.
(8) Social Impacts/Improvement on Public Health
The pollution load reduction may contribute to improvement of public health. If the project is expected to contribute a great improvement to public health, the project will have a high score.
(9) Other/Difficulties on Technical Points
If the project involves difficulties on technical points during construction or the operation and maintenance period, the project will have a low score.

Final Report, Volume III Part 5: Wastewater Management Supporting Report Chapter 6
Nippon Koei Co., Ltd The Study on Integrated Management for Ecosystem Conservation of the Anzali Wetland
6 - 3
6.2.2 Evaluation of Proposed Measures for Prioritization
The results of the evaluation for prioritization are described in Table 6.2.2.
Table 6.2.2 Evaluation of Proposed Measures for Prioritization
1 2 8 9 Criteria
Proposed Projects/Measures a b a 3 4 5 6 7
a a
Overall Evaluation
1.Management of Domestic Wastewater in Urban Areas
(1)Rasht Sewerage System Development Project A C A A C B A A A B A (21)
(2)Anzali Sewerage System Development Project A C A A C B A A A B A (21)
(3)Somehsara Sewerage System Development Project B C A B C B A A A B A (17)
(4)Promotion of Individual Wastewater Treatment B C B C C C C A B C C (6)
(5)Promotion of Low Phosphorous Detergent A C A B B C C A C C B (11)
2.Management of Domestic Wastewater in Rural Areas
(1)Community Wastewater Treatment System Development B C B B B B A A A B A (17)
3.Management of Industrial Effluent
(1)Centralization of Industrial Factories B B C B B B A A A A A (19)
(2)Construction of Centralized Wastewater Treatment System
1)Rasht A B A A B B B A B B A (21)
2)Others B B B C B B B A B B B (14)
(3)Strengthening of Monitoring Activities by DOE B A B A A B B A B B A (21)
4.Management of Livestock Waste
(1)Treatment of Livestock Waste from Industrial Animal Husbandry
B C B A B B B A B B A (16)
(2)Control of Livestock Waste in Grazing Lands in the Plain Area B C B C B C C A B A C (9)
5.Management of Pollution from Farmland
(1)Promotion of Low External Input Farming B B B B A A B A B B A (19)
Weight 2 2 1 2 1 2 2 1 1 1 -
Note: Criteria 1= Effect, a. Reduction of organic pollution, b. Reduction of heavy metals and toxic materials 2= Efficiency, a. speed of response, 3= Urgency, 4= Cost, 5= Capacity of executing organization, 6= Conformity with national policy, 7= Environmental impact, 8= Social impact, a. Improvement of public health 9= Other criteria, a. technical difficulty
Score A=2, B=1, C=0, Overall Evaluation, A: more than 30, B: 20-30, C: less than 20 Source: JICA Study Team
(1) Effects
Sewerage system development projects are given high scores, because it is evaluated that urban domestic wastewater is the highest pollution source for the wetland, and a sewerage system is most effective measure to reduce the pollution load. Promotion of low phosphorous detergent

Final Report, Volume III Part 5: Wastewater Management Supporting Report Chapter 6
Nippon Koei Co., Ltd The Study on Integrated Management for Ecosystem Conservation of the Anzali Wetland
6 - 4
has also a high score for phosphorous reduction. Regarding to control of toxic materials and heavy metal pollution, Strengthening of DOE, Human Environmental Department and measures for agricultural activities is ranked high,
(2) Conformity with National Policy
Sewerage system development projects, and strengthening of DOE are also evaluated as high priorities. However, promotion of low phosphorous detergent is ranked low score.
(3) Environmental and Social Impact
It is evaluated that none of the proposed projects have serious negative environmental impacts, and most of the projects are expected to contribute to improvement of public health. 6.3 Implementation Schedule for Master Plan
It is proposed that the wastewater management plan be implemented by 2019, as shown in Figure6.3.1. However, the implementation will be dependent upon national budget preparation.
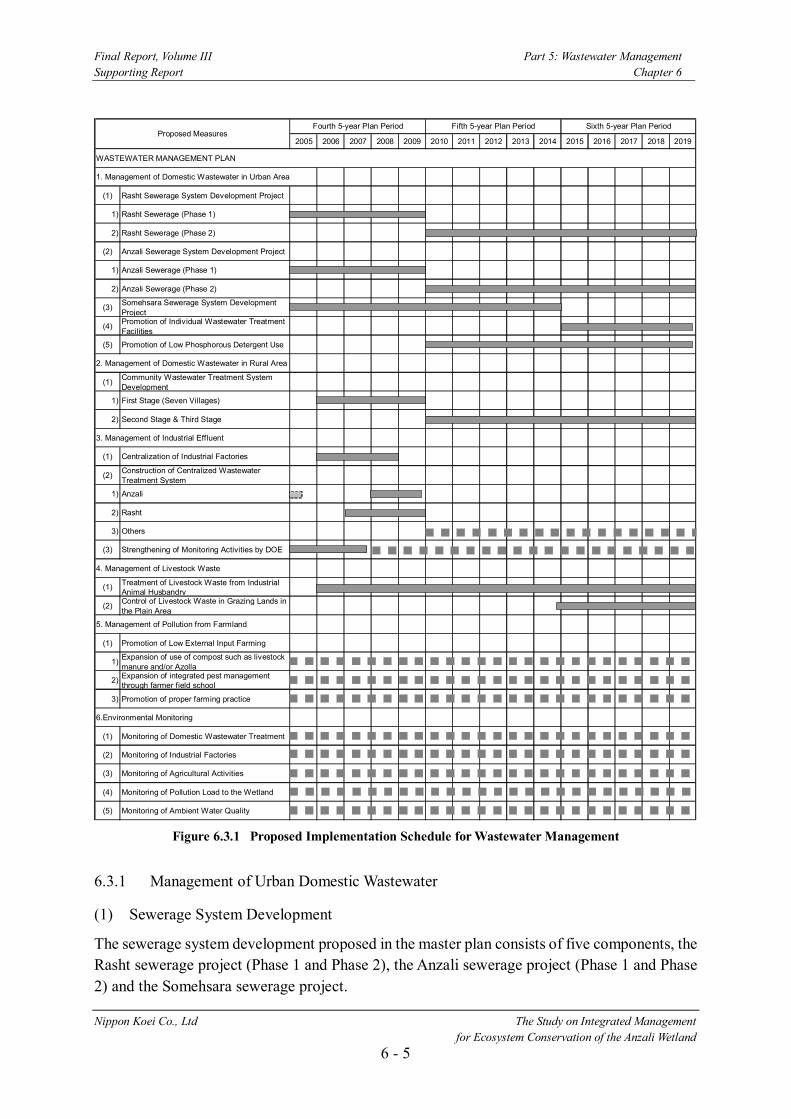
Final Report, Volume III Part 5: Wastewater Management Supporting Report Chapter 6
Nippon Koei Co., Ltd The Study on Integrated Management for Ecosystem Conservation of the Anzali Wetland
6 - 5
2005 2006 2007 2008 2009 2010 2011 2012 2013 2014 2015 2016 2017 2018 2019
WASTEWATER MANAGEMENT PLAN
1. Management of Domestic Wastewater in Urban Area
(1) Rasht Sewerage System Development Project
1) Rasht Sewerage (Phase 1)
2) Rasht Sewerage (Phase 2)
(2) Anzali Sewerage System Development Project
1) Anzali Sewerage (Phase 1)
2) Anzali Sewerage (Phase 2)
(3) Somehsara Sewerage System DevelopmentProject
(4) Promotion of Individual Wastewater TreatmentFacilities
(5) Promotion of Low Phosphorous Detergent Use
2. Management of Domestic Wastewater in Rural Area
(1) Community Wastewater Treatment SystemDevelopment
1) First Stage (Seven Villages)
2) Second Stage & Third Stage
3. Management of Industrial Effluent
(1) Centralization of Industrial Factories
(2) Construction of Centralized WastewaterTreatment System
1) Anzali
2) Rasht
3) Others
(3) Strengthening of Monitoring Activities by DOE
4. Management of Livestock Waste
(1) Treatment of Livestock Waste from IndustrialAnimal Husbandry
(2) Control of Livestock Waste in Grazing Lands inthe Plain Area
5. Management of Pollution from Farmland
(1) Promotion of Low External Input Farming
1) Expansion of use of compost such as livestockmanure and/or Azolla
2) Expansion of integrated pest managementthrough farmer field school
3) Promotion of proper farming practice
6.Environmental Monitoring
(1) Monitoring of Domestic Wastewater Treatment
(2) Monitoring of Industrial Factories
(3) Monitoring of Agricultural Activities
(4) Monitoring of Pollution Load to the Wetland
(5) Monitoring of Ambient Water Quality
Proposed MeasuresFourth 5-year Plan Period Fifth 5-year Plan Period Sixth 5-year Plan Period
Figure 6.3.1 Proposed Implementation Schedule for Wastewater Management
6.3.1 Management of Urban Domestic Wastewater
(1) Sewerage System Development
The sewerage system development proposed in the master plan consists of five components, the Rasht sewerage project (Phase 1 and Phase 2), the Anzali sewerage project (Phase 1 and Phase 2) and the Somehsara sewerage project.

Final Report, Volume III Part 5: Wastewater Management Supporting Report Chapter 6
Nippon Koei Co., Ltd The Study on Integrated Management for Ecosystem Conservation of the Anzali Wetland
6 - 6
Some parts of the Rasht sewerage project (Phase 1), Anzali sewerage project (Phase 1) and Somehsara sewerage project are under construction. Rasht sewerage project (Phase 1) and Anzali sewerage project (Phase 1) are planned to be completed in the 4th Development Plan, and Somehsara sewerage project is planned to be completed in the 5th Development Plan. Some parts of Rasht sewerage project (Phase 1) and Anzali sewerage project (Phase 1) are planned to be financed by WB. According to the original plan prepared by NWWEC, Rasht sewerage project (Phase 2), and Anzali sewerage project (Phase 2) were planned to be completed in the 5th Development Plan. However, from a financial point of view, it is proposed in the master plan that both the Phase 2 projects be implemented in the 5th and 6th Development Plans.
In order to operate the sewerage system properly, capacity development of GWWC is also required to facilitate sewerage system development.
(2) Individual Wastewater Treatment
Outside of sewerage service areas, installation of individual wastewater treatment facilities with secondary treatment process is required to meet the effluent standard. However, individual wastewater treatment is expensive comparing with sewerage system. Installation of individual wastewater treatment in urban area is proposed to commence in 6th Development Plan, because the priority is relatively low as shown in Table 6.2.2.
(3) Promotion of Low Phosphorous Detergent
For reduction of the amount of phosphorous discharged to Anzali Wetland, the promotion of low phosphorous detergent is evaluated to be a very effective measure. However, the measure can not commenced soon, because of following reasons
- At present, no organization has considered a plan for this measure. - No manufacturers in Iran have produce the low phosphorous detergent.
First of all, the residents should know why low phosphorous detergent is good for Anzali Wetland conservation, and should have the opportunity to use low phosphorous detergent which may be imported. In case in Japan, NGOs played an important role in the promotion. In the master plan, an environmental education program shall contribute to these activities in the 4th Development Plan
In the 5th Five Year Development Plan, DOE will promote consumption of low phosphorous detergent. After the low phosphorous detergent becomes popular, it will be possible to establish a regulation and law on usage of low phosphorous detergent. After that, it will be required to construct new industrial factories for manufacture of low phosphorous detergent or to import them with private funds. It is proposed that promotion of low phosphorous detergent will be commenced in the Fifth Five Years Development Plan.
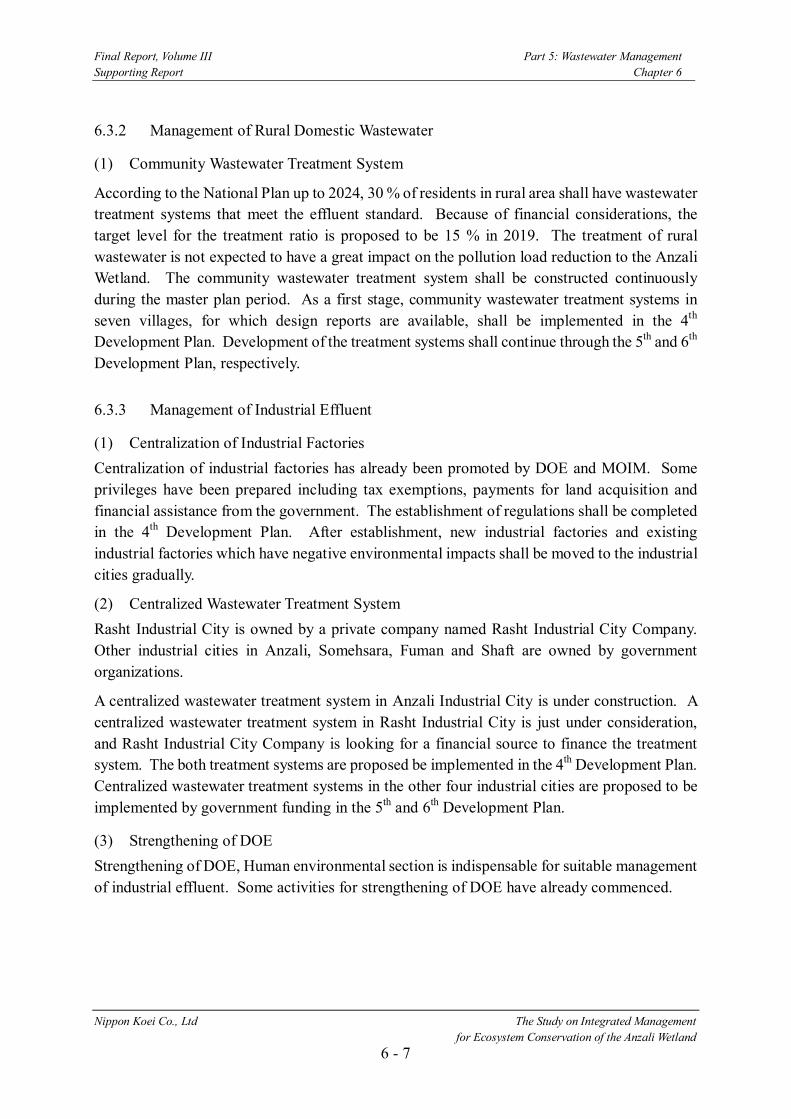
Final Report, Volume III Part 5: Wastewater Management Supporting Report Chapter 6
Nippon Koei Co., Ltd The Study on Integrated Management for Ecosystem Conservation of the Anzali Wetland
6 - 7
6.3.2 Management of Rural Domestic Wastewater
(1) Community Wastewater Treatment System
According to the National Plan up to 2024, 30 % of residents in rural area shall have wastewater treatment systems that meet the effluent standard. Because of financial considerations, the target level for the treatment ratio is proposed to be 15 % in 2019. The treatment of rural wastewater is not expected to have a great impact on the pollution load reduction to the Anzali Wetland. The community wastewater treatment system shall be constructed continuously during the master plan period. As a first stage, community wastewater treatment systems in seven villages, for which design reports are available, shall be implemented in the 4th Development Plan. Development of the treatment systems shall continue through the 5th and 6th Development Plan, respectively. 6.3.3 Management of Industrial Effluent
(1) Centralization of Industrial Factories Centralization of industrial factories has already been promoted by DOE and MOIM. Some privileges have been prepared including tax exemptions, payments for land acquisition and financial assistance from the government. The establishment of regulations shall be completed in the 4th Development Plan. After establishment, new industrial factories and existing industrial factories which have negative environmental impacts shall be moved to the industrial cities gradually.
(2) Centralized Wastewater Treatment System Rasht Industrial City is owned by a private company named Rasht Industrial City Company. Other industrial cities in Anzali, Somehsara, Fuman and Shaft are owned by government organizations.
A centralized wastewater treatment system in Anzali Industrial City is under construction. A centralized wastewater treatment system in Rasht Industrial City is just under consideration, and Rasht Industrial City Company is looking for a financial source to finance the treatment system. The both treatment systems are proposed be implemented in the 4th Development Plan. Centralized wastewater treatment systems in the other four industrial cities are proposed to be implemented by government funding in the 5th and 6th Development Plan.
(3) Strengthening of DOE Strengthening of DOE, Human environmental section is indispensable for suitable management of industrial effluent. Some activities for strengthening of DOE have already commenced.

Final Report, Volume III Part 5: Wastewater Management Supporting Report Chapter 6
Nippon Koei Co., Ltd The Study on Integrated Management for Ecosystem Conservation of the Anzali Wetland
6 - 8
6.3.4 Management of Livestock Waste
(1) Industrial Animal Husbandry
Industrial animal husbandry is one of the pollution sources regulated in the effluent standard as well as industrial factories. Compared with livestock in grazing land or owned by individual farmers, the treatment system for waste from industrial animal husbandry is more important. At present, there are only about only 3,000 cows in 16 sites of industrial animal husbandry sites in the Study Area. Installation of wastewater treatment facilities and storage of livestock manure shall be completed for all of Industrial Animal Husbandry sites in the Study Area in the 4th Development Plan.
(2) Livestock in Grazing Land
Measure for handling livestock waste in grazing land is a low priority, because of the low effect it would have on the pollution load and the difficulty of implementation. In addition, the number of livestock in the grazing land is expected to decrease. However, the pollution load is still not negligible. This measure is to be implemented in the 6th Development Plan. 6.3.5 Management of Pollution from Farmland
For management of pollution from farmland, the promotion of farming with low input is proposed. The program for the low external input farming consists of 1) Expansion of use of compost such as livestock manure and/or Azolla, 2) Expansion of integrated pest management through farmer field school and 3) promotion of proper farming practice.
The MOJA extension system has advised farmers on the suitable use of chemical fertilizers, and suitable use of livestock manure and suitable use of pesticide and herbicides. The system has worked effectively to reduce consumption amount of chemical fertilizers and agricultural chemicals in the last ten years, and is expected to operate continuously. The program is proposed to be commenced in the 4th Development Plan. 6.4 Next Five Years Plan for Each Organization
As a results of section 6.3, the following eight (8) projects are proposed to commence in the 4th Development Plan. Table 6.4.1 shows the executing organizations for the projects. Action plans in the Next Five Years Plan (4th Development Plan) for the organizations are described in this section.

Final Report, Volume III Part 5: Wastewater Management Supporting Report Chapter 6
Nippon Koei Co., Ltd The Study on Integrated Management for Ecosystem Conservation of the Anzali Wetland
6 - 9
Table 6.4.1 Proposed Projects in the 4th Development Plan and Executing Organization
Executing Organization Implementation of Proposed Project in the 4th Development Plan 1) Rasht Sewerage Project (Phase 1) 2) Anzali Sewerage Project (Phase 1)
1) GWWC
3) Somehsara Sewerage Project 2) RWWC 4) Community Wastewater Treatment System (First Stage)
5) Installation of Wastewater Treatment Facilities for Industrial Animal Husbandry 3) DOE 6) Strengthening of Monitoring Activities by DOE
3) MOJA 7) Introduction of integrated pest management and farmer field schools 4) Others 8) Centralized Wastewater Treatment (Rasht and Anzali)
6.4.1 Next Five Years Plan for GWWC
(1) Tasks and Duties of GWWC in the 4th Development Plan
Tasks and duties of GWWC in the 4th Development Plan are proposed as below - Completion of construction works of Rasht Sewerage Project (Phase 1) and Anzali
Sewerage Project (Phase 1) - Commencement of successful operation of sewerage system to be constructed
under Rasht Sewerage Project (Phase 1) and Anzali Sewerage Project (Phase 1) - Implementation of part of construction works of Somehsara Sewerage Project - Establishment of sewerage sector in GWWC for suitable operation of the sewerage
systems (2) Action Plan for the Next Five Years GWWC action plan for implementation of the proposed projects is described in Table 6.4.2.
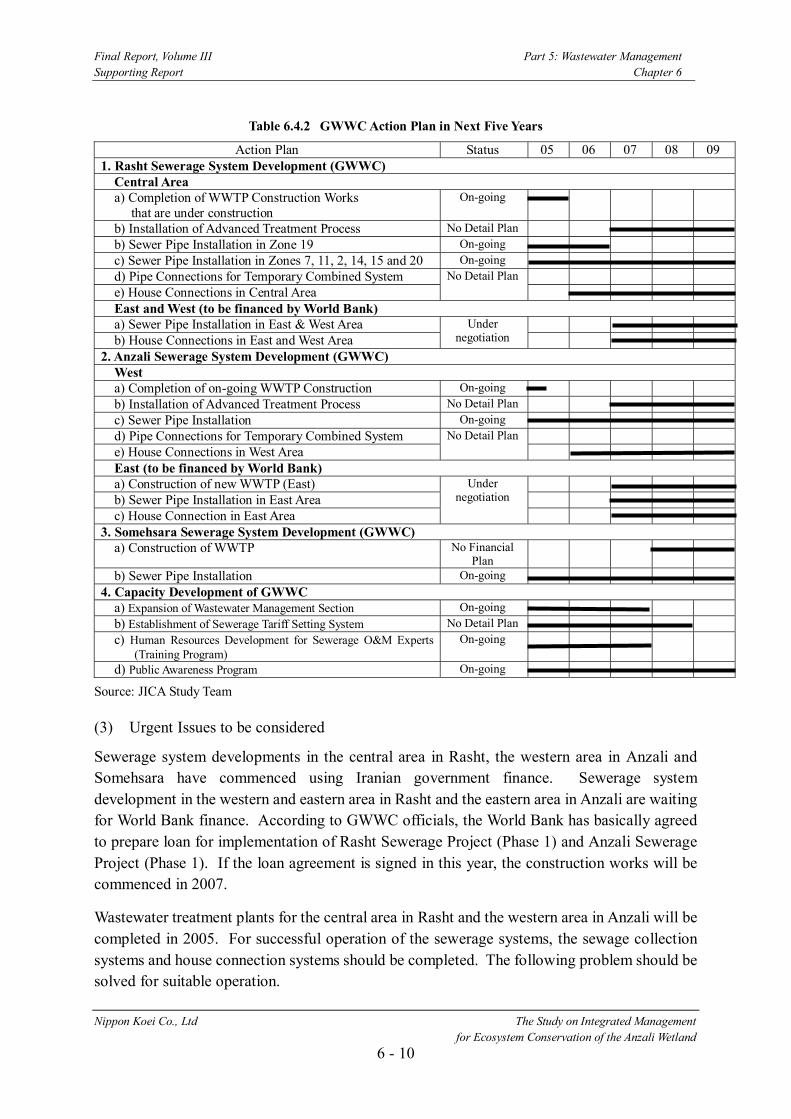
Final Report, Volume III Part 5: Wastewater Management Supporting Report Chapter 6
Nippon Koei Co., Ltd The Study on Integrated Management for Ecosystem Conservation of the Anzali Wetland
6 - 10
Table 6.4.2 GWWC Action Plan in Next Five Years
Action Plan Status 05 06 07 08 09 1. Rasht Sewerage System Development (GWWC)
Central Area a) Completion of WWTP Construction Works that are under construction
On-going
b) Installation of Advanced Treatment Process No Detail Plan b) Sewer Pipe Installation in Zone 19 On-going c) Sewer Pipe Installation in Zones 7, 11, 2, 14, 15 and 20 On-going d) Pipe Connections for Temporary Combined System e) House Connections in Central Area
No Detail Plan
East and West (to be financed by World Bank) a) Sewer Pipe Installation in East & West Area b) House Connections in East and West Area
Under negotiation
2. Anzali Sewerage System Development (GWWC) West a) Completion of on-going WWTP Construction On-going b) Installation of Advanced Treatment Process No Detail Plan c) Sewer Pipe Installation On-going d) Pipe Connections for Temporary Combined System e) House Connections in West Area
No Detail Plan
East (to be financed by World Bank) a) Construction of new WWTP (East) b) Sewer Pipe Installation in East Area c) House Connection in East Area
Under negotiation
3. Somehsara Sewerage System Development (GWWC)
a) Construction of WWTP No Financial Plan
b) Sewer Pipe Installation On-going 4. Capacity Development of GWWC
a) Expansion of Wastewater Management Section On-going b) Establishment of Sewerage Tariff Setting System No Detail Plan c) Human Resources Development for Sewerage O&M Experts
(Training Program) On-going
d) Public Awareness Program On-going Source: JICA Study Team
(3) Urgent Issues to be considered
Sewerage system developments in the central area in Rasht, the western area in Anzali and Somehsara have commenced using Iranian government finance. Sewerage system development in the western and eastern area in Rasht and the eastern area in Anzali are waiting for World Bank finance. According to GWWC officials, the World Bank has basically agreed to prepare loan for implementation of Rasht Sewerage Project (Phase 1) and Anzali Sewerage Project (Phase 1). If the loan agreement is signed in this year, the construction works will be commenced in 2007.
Wastewater treatment plants for the central area in Rasht and the western area in Anzali will be completed in 2005. For successful operation of the sewerage systems, the sewage collection systems and house connection systems should be completed. The following problem should be solved for suitable operation.

Final Report, Volume III Part 5: Wastewater Management Supporting Report Chapter 6
Nippon Koei Co., Ltd The Study on Integrated Management for Ecosystem Conservation of the Anzali Wetland
6 - 11
- For transport of wastewater to the WWTP, the house connection works with sewer pipes are indispensable. However, no financial arrangement has been planned for the implementation of the house connection works.
- Phosphorous reduction is one of the most effective measures to prevent eutrophication of Anzali Wetland. However, the two WWTPs in Rasht and Anzali under construction do not have advanced treatment processes to reduce phosphorous load. The installations of advanced treatment processes are planned by GWWC. However, financial arrangement has not been planned.
- After completion of the WWTP, the contractor will take the responsibility to operate the WWTPs for one year and train GWWC staff on technical. One year after the completion, GWWC will have full responsibility for the operation. GWWC should expand O&M staff for sewerage system now.
To solve the above problems, the priority projects should include the following works. - House connection works in the central area in Rasht, and the western area in
Anzali. - Installation of advanced treatment system in the WWTPs under construction in
Rasht and Anzali as “Mitigation Measures for Environmental Impact of Discharge of Treated Wastewater in Anzali Wetland”
6.4.2 Next Five Years Plan for RWWC
(1) Tasks and Duties in 4th Development Plan
Tasks and duties of RWWC in 4th Development Plan are as below - Completion of construction works for community wastewater treatment systems in
seven villages, of which detailed design reports have already been prepared. - Commencement of successful operation of the community wastewater treatment
systems. - Preparation of a master plan and detailed design for the 5th Development Plan for
community wastewater treatment systems - Establishment of a wastewater treatment sector in RWWC
(2) Action Plan for the Next Five Years
The RWWC action plan for implementation of the proposed projects is described in Table 6.4.3.
Final Report, Volume III Part 5: Wastewater Management Supporting Report Chapter 6
Nippon Koei Co., Ltd The Study on Integrated Management for Ecosystem Conservation of the Anzali Wetland
6 - 12
Table 6.4.3 RWWC Action Plan for Next Five Years
Action Plan Status 05 06 07 08 09 1. Development of Community Wastewater Treatment Systems (RWWC)
a) Construction of the treatment systems in 7 villages
No Financial Plan
b)Preparation of a Master Plan c) Execute of D/D for other 7 more Villages
No Plan
2. Capacity Development of RWWC a) Expansion of Wastewater Management Section b) Establishment of Tariff Setting System c) Public Awareness Program
No Plan
Source: JICA Study Team 6.4.3 Next Five Years Plan for Industrial Wastewater Management
(1) Tasks and Duties of DOE, MOIE and Others in 4th Development Plan
Tasks and duties of DOE in the 4th Development Plan are as below - Establishment of a control system of Industrial Effluent (including industrial
animal husbandries) - Execution of EIA for sewerage system development - Research on low phosphorous detergent
Management of industrial effluent shall be carried out by MOIM, DOE and Others. In addition duties of DOE in the 4th Development Plan are as below also.
- Promotion of centralization of industrial factories - Completion of wastewater treatments system in Anzali and Rasht Industrial Cities
(2) Action Plan for the Next Five Years
The implementation schedule for proposed projects to be carried out by DOE, MOIE and Other organizations for the Industrial Wastewater Management is described in Table 6.4.4.

Final Report, Volume III Part 5: Wastewater Management Supporting Report Chapter 6
Nippon Koei Co., Ltd The Study on Integrated Management for Ecosystem Conservation of the Anzali Wetland
6 - 13
Table 6.4.4 Next Five Years Schedule for Industrial Wastewater Management
Action Plan Status 05 06 07 08 09 Management of Industrial Factory 1. Centralization of Industrial Factories
a) Promotion of Centralization On-going 2. Construction of Centralized Wastewater Treatment System
a) Construction in Anzali Industrial City On-going b) Expansion in Anzali Industrial City No Plan b) Planning and Financial Arrangement
for Rasht Industrial City Under
Discussion
c) Construction in Rasht Industrial City No Financial Plan
3. Capacity Development of DOE, Gilan a) Expansion of Human Environmental Department b) Establishment of New Laboratory d) Education Program for Industrial Factories e) Establishment of Consultant Engineering Company List f
On-going
f) Establishment of Data Base of Industrial Factories g)Research on Low Phosphorous Detergent
No Detail Plan
Management of Industrial Animal Husbandry 1. Installation of Wastewater Treatment Facilities in Industrial Animal Husbandry sites
a) Installation of the facilities No Detail Plan Source: JICA Study Team 6.4.4 Next Five Years Plan for MOJA
(1) Tasks and Duties in 4th Development Plan
For promotion of farming with less input, tasks and duties of MOJA in 4th Development Plan are as below
- Strengthening of MOJA extension system - Promotion of Integrated pest management - Establishment of Farmer Field School
(2) Action Plan in Next Five Years
MOJA has contributed to wastewater management. The MOJA Extension system is expected to continue to contribute to promotion of farming with less input for pollution control in the farmland. The MOJA action plan for implementation of the proposed projects is described in Table 6.4.5.
Table 6.4.5 Next Five Years Schedule for Management of Pollution from Farmland
Action Plan Status 05 06 07 08 09 1. Promotion of Farming with Less Input
a)Expansion of use of compost such as livestock manure b) Expansion of Integrated Pest Management through
Farmer Field School
c)Promotion of Proper Farming Practice
On-going
Source: JICA Study Team

Final Report, Volume III Part 5: Wastewater Management Supporting Report Chapter 6
Nippon Koei Co., Ltd The Study on Integrated Management for Ecosystem Conservation of the Anzali Wetland
6 - 14
6.5 Priority Project
6.5.1 Selection of Priority Projects
It is defined that the priority projects are parts of proposed projects in 4th Development Plan, which are proposed to be carried out urgently. As the results of consideration in section 6.2, two projects for the management of urban domestic wastewater and two projects for the management of industrial effluent are selected as the priority projects as shown below.
1) Rasht Sewerage System Development Project (Phase 1) 2) Anzali Sewerage System Development Project (Phase 1) 3) Strengthening of Monitoring Activities by DOE 4) Centralized Wastewater Treatment in Rasht Industrial Cities
6.5.2 Rasht Sewerage System Development System (Phase 1)
The sewerage system can start to operate, after completion of the “Wastewater treatment plan (WWTP)”, “Sewer pipe network” and “House connection works with sewer pipe”. Table 6.5.1 shows the present situation of each component of . Rasht Sewerage System Development Project (Phase 1).
Table 6.5.1 Present Situation of Rasht Sewerage System (Phase 1)
Area Component Present Situation
WWTP Capacity: 65,625 m3/d of WWTP is under construction Advanced treatment process and expansion works are to be financed by the central government
Sewer Network Some parts are under construction, remaining parts are to be financed by the central government.
Central Area
House Connection No Plan Sewer Network Western &
Eastern Area House Connection To be financed by WB, under negotiation
As shown in Table 6.5.1, the WWTP and installation of the sewer pipe network in the central area are under construction, and the sewerage system in the west and east area are planed to be financed by WB. On the other hand, there is no plan for house connection works in the central area. The WWTP is planned to be completed in 2005. However, if the house connection works is not commenced, no wastewater will reach the WWTP.
Rasht Sewerage Project (Phase 1) will be implemented following the three steps shown below. Step 1: Commencement of operation of the sewerage system in the central area, after
completion of the sewerage system. Step 2: Installation of an advanced wastewater treatment process and expansion of the WWTP Step 3: Completion of the sewerage system in the western and eastern area. Completion of house connection works takes a long time. In order to implement early operation of the WWTP, introduction of temporary combined sewer system are recommended.

Final Report, Volume III Part 5: Wastewater Management Supporting Report Chapter 6
Nippon Koei Co., Ltd The Study on Integrated Management for Ecosystem Conservation of the Anzali Wetland
6 - 15
6.5.3 Anzali Sewerage System Development Project (Phase 1)
(1) Commencement of Suitable Operation
Table 6.5.2 shows the present condition of each component of Anzali Sewerage System (Phase 1).
Table 6.5.2 Progress of Anzali Sewerage Project (Phase 1)
Area Component Present Situation
WWTP Capacity 20,000 m3/d of WWTP is under construction Advanced treatment process is to be financed by the central government
Sewer Network Some parts are under construction, the remaining parts are to be financed by the provincial government
Western Area
House Connection Some parts are under construction and the remaining parts have no plan.
WWTP Sewer Network Eastern
Area House Connection
To be financed by WB, under negotiation
As shown in Table 6.5.2, the WWTP and installation of the sewer pipe network in the west area are under construction, and the sewerage system in the east area is planed to be financed by WB. On the other hand, in Anzali there is a plan for house connection works for only a limited area in the west. The WWTP is planned to be completed by the beginning of 2005.
Anzali Sewerage Project (Phase 1) will be implemented following the three steps as shown below.
Step 1: Completion of construction works of the sewerage system in the western area and Commencement of operation of the sewerage system in the western area.
Step 2: Installation of an advanced wastewater treatment process in the WWTP Step 3: Completion of sewer networks and house connection works in the eastern area.
Completion of house connection works takes a long time in Anzali also. In order to implement early operation of the WWTP, introduction of temporary combined sewer systems are recommended. (2) Environmental Impact of WWTP under Construction
Reduction of phosphorous discharge amount is one of the most important part of pollution control in Anzali Wetland. After completion of the sewerage system in the western part of Anzali, the lagoon of Anzali Wetland may get larger amounts of phosphorous than under the present condition, because of the following reasons.

Final Report, Volume III Part 5: Wastewater Management Supporting Report Chapter 6
Nippon Koei Co., Ltd The Study on Integrated Management for Ecosystem Conservation of the Anzali Wetland
6 - 16
- At present, wastewater is discharged from many outfalls to Anzali Wetland. After completion of the WWTP, all wastewater collected by sewer pipes is to be discharged from one outlet.
- The WWPT do not have advanced treatment process to reduce phosphorous contents.
Figure 6.5.1 Condition of Wastewater Discharge in Anzali
In order to reduce the environmental impact of discharging phosphorous to the wetland, it is necessary to install an advanced wastewater treatment process in the WWTP. In addition, it is recommended that discharge point of the treated wastewater is to be considered as a measure to reduce the environmental impact.
6.5.4 Strengthening of Monitoring Activities by DOE
The following works are required for DOE, Human Environmental Department, and Strengthening of Monitoring Activities by DOE, which are Items a) and b), are proposed for the priority project.
a) Expansion of the Human Environmental Department b) Establishment of a New Laboratory d) Public Awareness Program and Education Program for Industrial Factories
Before Construction
Legend
Wastewater Discharge Treated Water Discharge
WWTP
After Construction
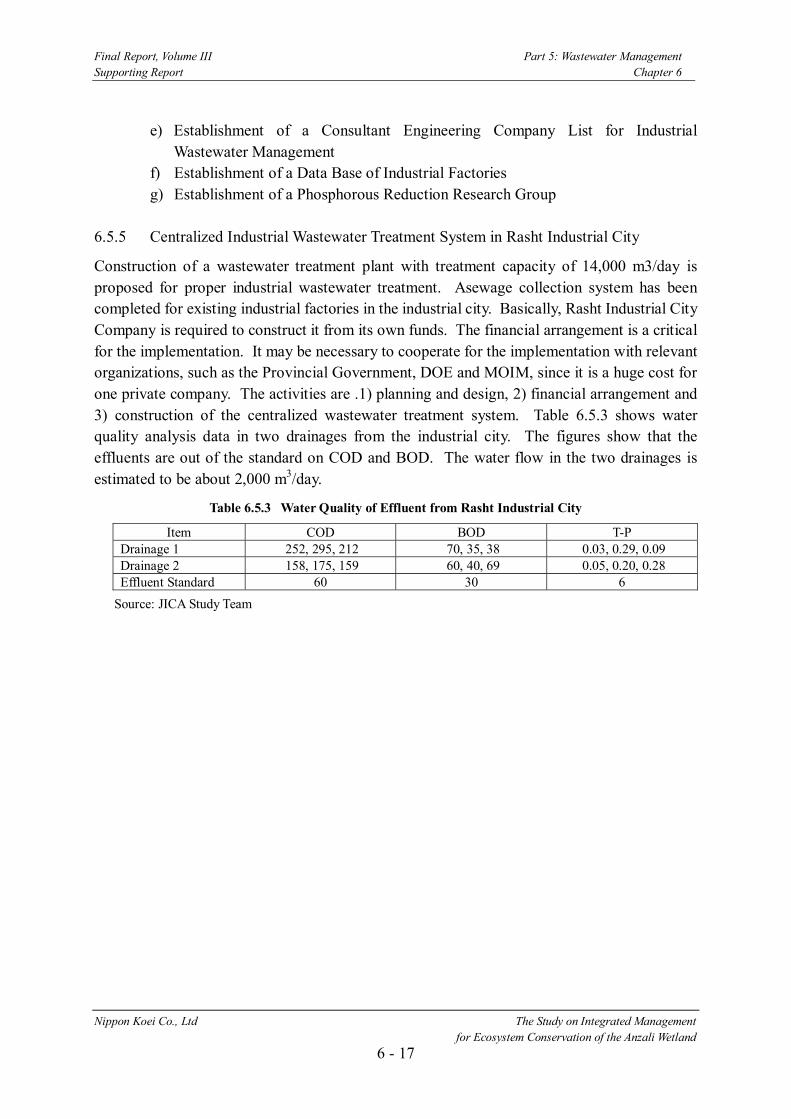
Final Report, Volume III Part 5: Wastewater Management Supporting Report Chapter 6
Nippon Koei Co., Ltd The Study on Integrated Management for Ecosystem Conservation of the Anzali Wetland
6 - 17
e) Establishment of a Consultant Engineering Company List for Industrial Wastewater Management
f) Establishment of a Data Base of Industrial Factories g) Establishment of a Phosphorous Reduction Research Group
6.5.5 Centralized Industrial Wastewater Treatment System in Rasht Industrial City
Construction of a wastewater treatment plant with treatment capacity of 14,000 m3/day is proposed for proper industrial wastewater treatment. Asewage collection system has been completed for existing industrial factories in the industrial city. Basically, Rasht Industrial City Company is required to construct it from its own funds. The financial arrangement is a critical for the implementation. It may be necessary to cooperate for the implementation with relevant organizations, such as the Provincial Government, DOE and MOIM, since it is a huge cost for one private company. The activities are .1) planning and design, 2) financial arrangement and 3) construction of the centralized wastewater treatment system. Table 6.5.3 shows water quality analysis data in two drainages from the industrial city. The figures show that the effluents are out of the standard on COD and BOD. The water flow in the two drainages is estimated to be about 2,000 m3/day.
Table 6.5.3 Water Quality of Effluent from Rasht Industrial City
Item COD BOD T-P Drainage 1 252, 295, 212 70, 35, 38 0.03, 0.29, 0.09 Drainage 2 158, 175, 159 60, 40, 69 0.05, 0.20, 0.28 Effluent Standard 60 30 6
Source: JICA Study Team

Part 6: Solid Waste Management

Final Report, Volume III Part 6: Solid Waste Management Supporting Report Table of Contents
Nippon Koei Co., Ltd The Study on Integrated Management for Ecosystem Conservation of the Anzali Wetland
i
THE STUDY ON INTEGRATED MANAGEMENT FOR ECOSYSTEM CONSERVATION OF THE ANZALI WETLAND
FINAL REPORT
Volume III Supporting Report
TABLE OF CONTENTS
PART 6 SOLID WASTE MANAGEMENT
Page
CHAPTER 1 PRESENT CONDITIONS ....................................................................... 1-1
1.1 Outline..................................................................................................................... 1-1 1.1.1 Municipal Solid Waste......................................................................... 1-1 1.1.2 Industrial and Infectious Solid Waste .................................................. 1-1
1.2 Laws/Regulations and Responsibility ..................................................................... 1-2 1.2.1 Waste Management Law ..................................................................... 1-2 1.2.2 Municipal Solid Waste......................................................................... 1-2 1.2.3 Industrial and Infectious Solid Waste .................................................. 1-5
1.3 Municipal Waste Management in the Study Area ................................................... 1-5 1.3.1 Waste Flow .......................................................................................... 1-5 1.3.2 Waste Generation................................................................................. 1-6 1.3.3 Waste Collection.................................................................................. 1-8 1.3.4 Compositing Plant ............................................................................... 1-10 1.3.5 Final Disposal Sites ............................................................................. 1-13 1.3.6 Solid Waste Management Cost............................................................ 1-16
1.4 Industrial and Medical Solid Waste Management in the Study Area ...................... 1-17 1.4.1 Industrial Solid Waste.......................................................................... 1-17 1.4.2 Infectious Solid Waste ......................................................................... 1-18
CHAPTER 2 PRESENT ISSUES ................................................................................... 2-1
2.1 Impact to the Wetland.............................................................................................. 2-1 2.1.1 Solid Waste in the Wetland.................................................................. 2-1 2.1.2 Source of Solid Waste in the Wetland ................................................. 2-1 2.1.3 Reason of Illegal Dumping.................................................................. 2-4 2.1.4 Amount of Dumped Waste .................................................................. 2-5
2.2 Present Issues .......................................................................................................... 2-7 2.2.1 Issues Related to the Conservation of the Wetland ............................. 2-7
Final Report, Volume III Part 6: Solid Waste Management Supporting Report Table of Contents
Nippon Koei Co., Ltd The Study on Integrated Management for Ecosystem Conservation of the Anzali Wetland
ii
2.2.2 Issues for Municipal Solid Waste ........................................................ 2-7 2.2.3 Issues of Industrial and Medical Solid Waste...................................... 2-8
CHAPTER 3 SOLUTIONS AND ALTERNATIVES .................................................... 3-1
3.1 Seeking Solutions for Each Issue ............................................................................ 3-1 3.2 Development of Simulation Model to Estimate SWM Cost ................................... 3-4
3.2.1 Collection Cost for Municipal Solid Waste ......................................... 3-4 3.2.2 Composting for Municipal Solid Waste .............................................. 3-9 3.2.3 Landfill for Municipal Solid Waste ..................................................... 3-10
3.3 Estimation of Solid Waste Collection Service......................................................... 3-12 3.3.1 Estimated Cases................................................................................... 3-12 3.3.2 Condition of Estimations..................................................................... 3-13 3.3.3 Results ................................................................................................. 3-14 3.3.4 Conclusion........................................................................................... 3-16
3.2 Evaluation on Grouping of Municipalities for Municipal Solid Waste Disposal .... 3-16 3.4.1 Alternatives ......................................................................................... 3-16 3.4.2 Conditions ........................................................................................... 3-17 3.4.3 Result of Cost Simulation.................................................................... 3-18 3.4.4 Conclusion........................................................................................... 3-21
CHAPTER 4 SOLID WASTE MANAGEMENT PLAN .............................................. 4-1
4.1 General .................................................................................................................... 4-1 4.2 Objectives and Strategies ........................................................................................ 4-1
4.2.1 Objectives............................................................................................ 4-1 4.2.2 Strategies ............................................................................................. 4-2
4.3 Municipal Solid Waste Management....................................................................... 4-4 4.3.1 Environmental Awareness Raising ...................................................... 4-4 4.3.2 Provision of Efficient Municipal Waste Collection Service
to the Whole Area................................................................................ 4-5 4.3.3 Proper Disposal of Municipal Solid Waste.......................................... 4-8
4.4 Industrial and Medical Solid Waste Management ................................................... 4-17 4.4.1 Proper Treatment of Hazardous Solid Waste....................................... 4-17 4.4.2 Non-hazardous Industrial Solid Waste Management .......................... 4-18
4.5 Environmental Monitoring ...................................................................................... 4-20 4.5.1 Monitoring of Municipal Waste Management in Urban Areas............ 4-21 4.5.2 Monitoring of Municipal Waste Management in Rural Areas............. 4-21 4.5.3 Monitoring of Recycling Activities ..................................................... 4-21 4.5.4 Monitoring of Leachate ....................................................................... 4-22 4.5.5 Monitoring of Industrial and Medical Waste....................................... 4-22

Final Report, Volume III Part 6: Solid Waste Management Supporting Report Table of Contents
Nippon Koei Co., Ltd The Study on Integrated Management for Ecosystem Conservation of the Anzali Wetland
iii
4.6 Institutional and Organizational Arrangements ....................................................... 4-23 4.6.1 Implication to Charging Fee................................................................ 4-23 4.6.2 Proposed Organization ........................................................................ 4-24
4.7 Summary of Proposed Solid Waste Management Plan ........................................... 4-25 4.8 Cost Estimation ....................................................................................................... 4-28
4.8.1 Conditions for Estimation ................................................................... 4-28 4.8.2 Project Cost ......................................................................................... 4-30 4.8.3 Operation and Maintenance Cost ........................................................ 4-30
4.9 Implementation Program......................................................................................... 4-31 4.9.1 Implementing Organizations ............................................................... 4-31 4.9.2 Criteria for Prioritization ..................................................................... 4-31 4.9.3 Evaluation of Proposed Projects.......................................................... 4-31 4.9.4 Implementation Schedule .................................................................... 4-33
4.10 Anticipated Environmental Benefit of the Plan....................................................... 4-37 4.10.1 Factors to be Considered ..................................................................... 4-37 4.10.2 Evaluation............................................................................................ 4-37
CHAPTER 5 PRIORITY PROJECTS........................................................................... 5-1
5.1 Priority Projects....................................................................................................... 5-1 5.2 Participatory Recycling Activity ............................................................................. 5-1 5.3 Provision of Waste Collection Service to Villages .................................................. 5-3 5.4 Composting of Municipal Solid Waste.................................................................... 5-5 5.5 Construction of Pre-treatment Facility for Solid Waste Containing Heavy Metals. 5-8 5.6 Establishment of Separation and Collection System for Infectious Waste.............. 5-9
APPENDIX
APPENDIX 1 DISBURSEMENT PLAN ..................................................................... A1-1

Final Report, Volume III Part 6: Solid Waste Management Supporting Report Table of Contents
Nippon Koei Co., Ltd The Study on Integrated Management for Ecosystem Conservation of the Anzali Wetland
iv
List of Tables
Page
Table 1.3.1 Factors of Collection Systems in Municipalities ........................................ 1-10
Table 1.3.2 Construction Cost of Centralized Composting Plant .................................. 1-12
Table 1.3.3 Operation Cost of Centralized Composting Plant....................................... 1-12 Table 1.3.4 Present Cost of Solid Waste Management in Rasht Municipality .............. 1-16
Table 1.4.1 Hazardous Industrial Waste in the Study Area............................................ 1-17
Table 1.4.2 Number of Hospitals in the Study Area and Their Disposal Methods........ 1-18
Table 2.1.1 Negative Impact to the Wetland by Solid Waste......................................... 2-1
Table 3.1.1 Environmental Education Programs in a Municipality in Japan ................ 3-2
Table 3.2.1 Data for Simulation of Municipal Waste (Each Municipality) ................... 3-6
Table 3.2.2 Transport Distance from Each Municipality (Present) ............................... 3-6
Table 3.2.3 Data for Simulation of Municipal Waste (Common to Municipalities)...... 3-7
Table 3.2.4 Actual Number of Collection Vehicles in Each Municipality..................... 3-9
Table 3.2.5 Composting Data for Simulations............................................................... 3-10 Table 3.2.6 Landfill Data for Simulations ..................................................................... 3-11
Table 3.4.1 Transportation Distance between Municipalities and Disposal Sites in
Each Alternative.......................................................................................... 3-18
Table 3.4.2 Evaluation on Alternatives of “without” or “with” Composting ................ 3-22
Table 3.4.3 Evaluation on Alternatives of Combinations of Municipalities (with
Composting) ............................................................................................... 3-23
Table 4.3.1 Evaluation on Alternatives of “without” or “with” Composting ................ 4-9
Table 4.3.2 Evaluation on Alternatives of Combinations of Municipalities (with
Composting) ............................................................................................... 4-11
Table 4.3.3 Three Composting Plants required in the Study Area................................. 4-12
Table 4.3.4 Capacities of Landfill Sites to be Constructed............................................ 4-14 Table 4.5.1 Monitoring of Municipal Waste Management in Urban Areas................... 4-21
Table 4.5.2 Monitoring of Municipal Waste Management in Rural Areas .................... 4-21
Table 4.5.3 Monitoring of Recycling Activity............................................................... 4-22
Table 4.5.4 Monitoring of Leachate .............................................................................. 4-22
Table 4.5.5 Monitoring of Industrial Solid Waste Management.................................... 4-23
Table 4.5.6 Monitoring of Medical Waste Management ............................................... 4-23

Final Report, Volume III Part 6: Solid Waste Management Supporting Report Table of Contents
Nippon Koei Co., Ltd The Study on Integrated Management for Ecosystem Conservation of the Anzali Wetland
v
Table 4.6.1 Alternative Charging Fee Rate per Household with 4 Persons................... 4-24 Table 4.7.1 Summary of Proposed Solid Waste Management Plan............................... 4-26
Table 4.8.1 Solidification Data for Hazardous Industrial Solid Waste .......................... 4-29
Table 4.8.2 Incineration Data for Infectious Solid Waste.............................................. 4-29
Table 4.8.3 Total Project Cost and Operation and Maintenance Cost between 2005
and 2019 ..................................................................................................... 4-30 Table 4.9.1 Criteria for Prioritization of Proposed Measures of the Solid Waste
Management Plan ....................................................................................... 4-31
Table 4.9.2 Evaluation of Proposed Projects ................................................................. 4-33
Table 4.9.3 Implementation Schedule ........................................................................... 4-36
Table 4.10.1 Anticipated Benefits of Solid Waste Management Plan ............................. 4-38

Final Report, Volume III Part 6: Solid Waste Management Supporting Report Table of Contents
Nippon Koei Co., Ltd The Study on Integrated Management for Ecosystem Conservation of the Anzali Wetland
vi
List of Figures
Page
Figure 1.2.1 Structure of Local Governments................................................................. 1-2
Figure 1.2.2 Location of Municipalities in the Study Area ............................................. 1-4
Figure 1.3.1 Waste Flow in the Study Area..................................................................... 1-6 Figure 1.3.2 Daily Amount Waste Discharged from Each Township in the Study Area. 1-7
Figure 1.3.3 Daily Amount per Capita of Waste Collected in Each Township in the
Study Area .................................................................................................. 1-7
Figure 1.3.4 Average Waste Composition....................................................................... 1-8
Figure 1.3.5 Ratio of Collection Service Area of Each Township in the Study Area...... 1-9
Figure 1.3.6 Photograph of Waste Discharged in Rasht Municipality ............................ 1-9 Figure 1.3.7 Process Flow of Composting Plant in Rasht............................................... 1-11
Figure 1.3.8 Photographs of Composting Plant in Rasht ................................................ 1-11
Figure 1.3.9 Locations of Open Dumping Sites.............................................................. 1-14
Figure 1.3.10 Panoramic View of Dumping Site at Sarawan............................................ 1-15
Figure 1.3.11 Compaction (left) and View from the Bottom (right) ................................. 1-15
Figure 1.3.12 Open Dumping Site in Anzali Municipality ............................................... 1-15 Figure 1.3.13 Photograph of a Sweeper ............................................................................ 1-17
Figure 1.4.1 Photographs of Industrial Wastes in a Car Parts Factory............................ 1-18
Figure 1.4.2 Hospital Waste in Yellow Bags (left) and Incinerator (right)...................... 1-19
Figure 1.4.3 Separation (upper left), and Incineration Plant (upper right and lower)..... 1-19
Figure 1.4.4 New Incinerator for Infectious Waste in Rasht ........................................... 1-20
Figure 2.1.1 Solid Waste observed in the Wetland.......................................................... 2-1
Figure 2.1.2 Scenes of Waste Dumping to Rivers........................................................... 2-3
Figure 2.1.3 Distribution Map of Waste Dumping to Rivers .......................................... 2-4
Figure 2.1.4 Reasons for Waste Dumping into Rivers .................................................... 2-5
Figure 2.1.5 Disposal Method of Solid Waste (Left in Municipality, Right in Village) . 2-6
Figure 2.1.6 Amount of Wastes Dumped into Rivers ..................................................... 2-6
Figure 3.1.1 Seeking Solutions for Each Issue................................................................ 3-1
Figure 3.2.1 Structure of Simulation Model for Collection; “GRID CITY MODEL”.... 3-5
Figure 3.2.2 Road Network Model Considering Size of Municipalities......................... 3-8
Figure 3.2.3 Number of Required Collection Vehicles for Each Alternative.................. 3-9
Figure 3.2.4 Expense for Landfill Construction.............................................................. 3-12

Final Report, Volume III Part 6: Solid Waste Management Supporting Report Table of Contents
Nippon Koei Co., Ltd The Study on Integrated Management for Ecosystem Conservation of the Anzali Wetland
vii
Figure 3.2.5 Required Number of Persons to Landfill .................................................... 3-12 Figure 3.3.1 Average Waste Composition....................................................................... 3-14
Figure 3.3.2 Required Number of Collection Vehicles to Provide Collection Service
to Villages ................................................................................................... 3-15
Figure 3.3.3 Required Collection Costs to Provide the Collection Service to Villages .. 3-15
Figure 3.3.4 Required Collection Costs per Ton to Provide Collection Service to Villages ....................................................................................................... 3-16
Figure 3.4.1 Alternatives Configurations for the Sharing of Landfill Sites or
Composting Plants ...................................................................................... 3-17
Figure 3.4.2 Total Cost of Alternatives (Without Composting) ...................................... 3-19
Figure 3.4.3 Total Cost per ton of Alternatives (Without Composting) .......................... 3-19
Figure 3.4.4 Total Cost of Alternatives (With Composting) ........................................... 3-20 Figure 3.4.5 Total Cost per ton of Alternatives (With Composting) ............................... 3-21
Figure 4.3.1 Number of Required Vehicles..................................................................... 4-6
Figure 4.3.2 Required Collection Costs .......................................................................... 4-6
Figure 4.3.3 Required Collection Costs per Ton ............................................................. 4-7
Figure 4.3.4 Illustration of Change of Collection Frequency and Collection Points ...... 4-8 Figure 4.3.5 Composting Process.................................................................................... 4-10
Figure 4.3.6 Required Cost for Composting and Landfill............................................... 4-12
Figure 4.3.7 Conceptual Illustration of Fukuoka Method............................................... 4-13
Figure 4.3.8 Sanitary Landfill by Fukuoka Method at Rostamabad ............................... 4-14
Figure 4.3.9 Proposed Sites for Landfills........................................................................ 4-16
Figure 4.3.10 Planned Construction Site in Anzali for Composting and Landfill ............ 4-17 Figure 4.6.1 Framework of Executing Organizations for Solid Waste Management...... 4-25
Figure 4.7.1 Solid Waste Management Plan ................................................................... 4-27
Figure 4.8.1 Future Trend of Waste Generation Rate...................................................... 4-28
Figure 5.2.1 Illustration of Participatory Recycling Activity.......................................... 5-2
Figure 5.3.1 Co-disposal System for Wastes from Villages ............................................ 5-4 Figure 5.4.1 Proposed Sites for Composting Plants........................................................ 5-7
Figure 5.5.1 Solidification of Hazardous Industrial Waste ............................................. 5-8

Final Report, Volume III Part 6: Solid Waste Management Supporting Report Chapter 1
Nippon Koei Co., Ltd. The Study on Integrated Management for Ecosystem Conservation of the Anzali Wetland
1 - 1
CHAPTER 1 PRESENT CONDITIONS
1.1 Outline
1.1.1 Municipal Solid Waste
Municipal solid waste should be managed by cities, as regulated by the Municipal Law.
A total of 791 tons of waste are generated daily in the study area. Of this, 670 tons are collected by municipalities 6 or 7 days in a week from every house. This is generated by 744,000 persons1 at a rate of about 900 g/person/day. The remaining 121 tons generated in villages are not collected, but disposed of informally around the communities. The collection service coverage rates are about 65% on a population basis and about 86% on a waste amount basis. Recycling is not practiced in urban areas or villages.
Almost all waste collected from the urban areas is taken to a dumping site located in Rasht township. This has been used without any liner or leachate treatment for many years.
A composting facility was constructed in 2002 in Rasht Township with support from the central government. At present, around 200 tons of waste per day are treated in this facility.
1.1.2 Industrial and Infectious Solid Waste
Non-hazardous industrial solid wastes (ISW) are managed by the factories that transport their wastes to municipal landfill sites themselves or use private contractors.
Hazardous ISW is only generated by five factories in the Study area, according to a research questionnaire conducted by “Jahad Daneshgahi Guilan”. The total amount of hazardous ISW is estimated at only 50 ton/year, and almost all of this is sludge from plating processes containing chromium. There is no official disposal site for hazardous ISW, so factories retain the hazardous ISW inside their factories. This is clearly not a sustainable situation.
Infectious waste from hospitals, clinics, laboratories, etc, is another important hazardous waste. Some public hospitals incinerate their infectious waste in on-site incinerators or in a public incinerator.
1 MPO, 2003

Final Report, Volume III Part 6: Solid Waste Management Supporting Report Chapter 1
Nippon Koei Co., Ltd. The Study on Integrated Management for Ecosystem Conservation of the Anzali Wetland
1 - 2
1.2 Laws/Regulations and Responsibility
1.2.1 Waste Management Law
The Waste Management Law was enacted in June of 2004. This comprehensive law covers all wastes, including municipal wastes, industrial wastes, hazardous and infectious wastes. The major contents of the law are:
- The role of the Ministry of Interior to establish an ordinance to set strategies - The role of Department of the Environment (DOE) to establish regulations to
put the law into practice - Solid Waste Management (SWM) fee to cover the total cost as much as
possible - A strict penalty system
1.2.2 Municipal Solid Waste
(1) Structure of Local Government
As illustrated in Figure 1.2.1, a township (“Shaharestan”) is composed of some counties (“Bakhsh”). A county is composed of municipality (“Shahr”) and villages (“Dehestan”).*) See Main Report, Section 2.1 for the list of Shahrestans, Bakhshes and Shahrs in the study area.
Township
(Shahrestan)
County(Bakhsh)
County
County
Municipality(Shahr)
Village(Dehestan)
Figure 1.2.1 Structure of Local Governments
*) In this report, “Shahr” and “Dehestan” will be called as “Municipality” and “Village” respectively.

Final Report, Volume III Part 6: Solid Waste Management Supporting Report Chapter 1
Nippon Koei Co., Ltd. The Study on Integrated Management for Ecosystem Conservation of the Anzali Wetland
1 - 3
(2) Laws/Regulations
The SWM law provides that the responsible organizations in municipalities (Shahrs) and villages (Dehestans) are the Governor of the Baksh (county). Especially, the responsibility of the Governor is newly provided and very important because for a long time, there was no legal responsibility for solid waste management in villages.
(3) Related Organizations
The following ten municipalities take responsibility in the study area. The locations are shown in Figure 1.2.2.
1. Rasht 2. Anzali 3. Fuman 4. Somehsara 5. Tolam 6. Khomam 7. Shaft 8. Sangar 9. Masal 10. Masuleh
In the municipalities, there is no hierarchical department or division for SWM, though a person to be in charge of public services is appointed by the Mayor. This person acts as the department director responsible for public services including, SWM and road sweeping services.

Final Report, Volume III Part 6: Solid Waste Management Supporting Report Chapter 1
Nippon Koei Co., Ltd. The Study on Integrated Management for Ecosystem Conservation of the Anzali Wetland
1 - 4
Note: The size of each circle shows the amount of waste in each municipality.
Figure 1.2.2 Location of Municipalities in the Study Area

Final Report, Volume III Part 6: Solid Waste Management Supporting Report Chapter 1
Nippon Koei Co., Ltd. The Study on Integrated Management for Ecosystem Conservation of the Anzali Wetland
1 - 5
1.2.3 Industrial and Infectious Solid Waste
(1) Laws/Regulations
DOE has jurisdiction and power to recommend standards and criteria to any companies/institutions under the “Environmental Protection and Enhancement Act” (1974). In 2001, DOE defined pollution in the Executive Bylaw for Paragraph (C) of Article 104 of the Law of the Third Plan of Economic, Social and Cultural Development. This bylaw also provided the classification of waste material based on the contents of toxic substances in the waste and the method to estimate environmental fines for the improper disposal of solid waste. However, judging from the meager analytical capability of the DOE laboratory in Rasht, it will be difficult to enforce such regulations.
In addition, the new SWM law was enacted, as already mentioned. The law requires the dischargers to reduce and recycle their wastes so as to satisfy the regulations to be established the near future.
(2) Responsibility
Discharging factories are responsible for their own industrial wastes, including hazardous wastes, under control of DOE.
1.3 Municipal Waste Management in the Study Area
1.3.1 Waste Flow
Figure 1.3.1 shows the flow of municipal waste in the study area. The salient features are as follows.
- The collected waste is transported and eventually open dumped at one of the solid waste dumping sites, where environmental management measures are minimal.
- Some municipal waste is brought to a pilot compost plant, and separated for recyclables, organic waste for compost and remaining waste. However, high operation cost is preventing efficient use of the plant.
- All municipalities appear to be suffering from budget constraints and some municipalities charge residents for solid waste collection services.

Final Report, Volume III Part 6: Solid Waste Management Supporting Report Chapter 1
Nippon Koei Co., Ltd. The Study on Integrated Management for Ecosystem Conservation of the Anzali Wetland
1 - 6
Composting Plant
194t/d
SarawanDumping Site
519t/d
Somehsara50t/d
Recyclable4t/d
Masuleh0t/d (No Service)
Masal15t/d
Anzali100t/d
Sangar9t/d
Khomam15t/d
Rasht450t/d
Fuman20t/d
Shaft5t/d
476t/d
Compost39-58t/d
43t/dToolem6t/d
MasalDumping Site
Note: No waste collection service is done in Masuleh.
Figure 1.3.1 Waste Flow in the Study Area
1.3.2 Waste Generation
(1) Amount of Waste
Figure 1.3.2 shows the amount of wastes discharged from each Township in the study area. The daily amount of waste generated is 791 ton per day. Out of this, 670 tons per day of waste are collected. The amount of waste from Rasht Township accounts for 64 % of the total. The amount of waste from Anzali Township corresponds to 14 % of the total waste. Up to 78% of waste is produced by these two townships.
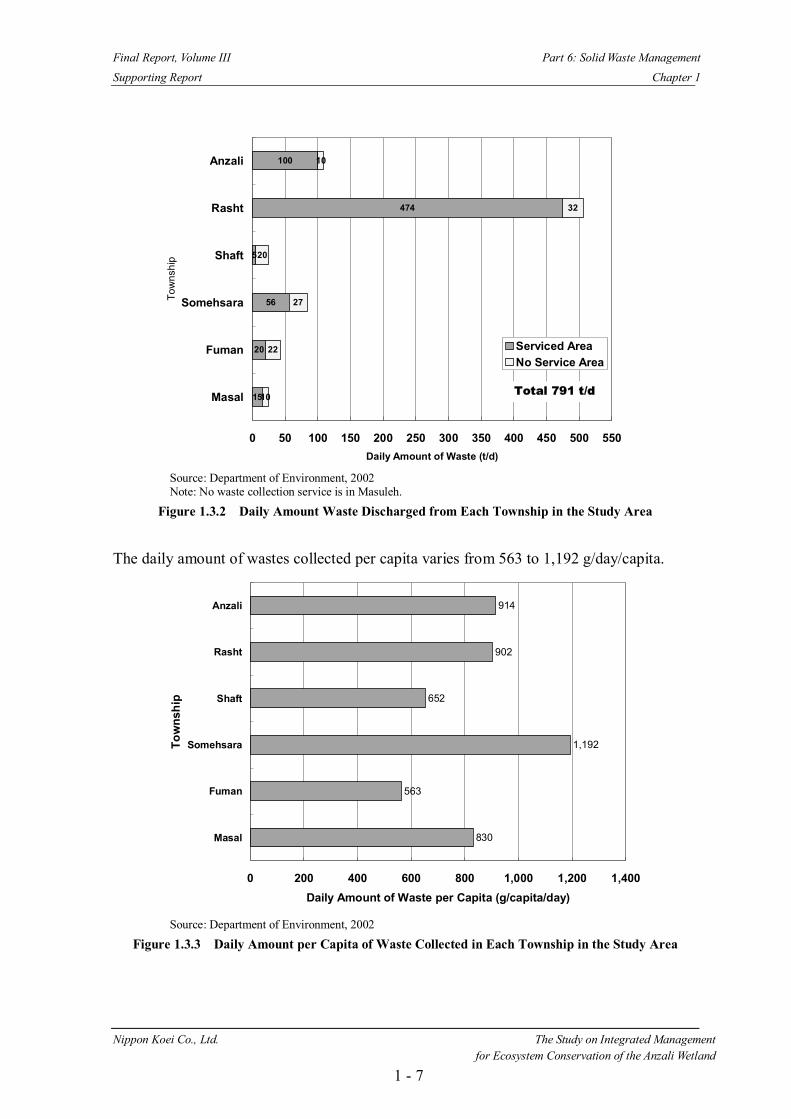
Final Report, Volume III Part 6: Solid Waste Management Supporting Report Chapter 1
Nippon Koei Co., Ltd. The Study on Integrated Management for Ecosystem Conservation of the Anzali Wetland
1 - 7
100
474
5
56
20
15
10
32
20
27
22
10
0 50 100 150 200 250 300 350 400 450 500 550
Anzali
Rasht
Shaft
Somehsara
Fuman
Masal
Tow
nshi
p
Daily Amount of Waste (t/d)
Serviced AreaNo Service Area
Total 791 t/d
Source: Department of Environment, 2002 Note: No waste collection service is in Masuleh.
Figure 1.3.2 Daily Amount Waste Discharged from Each Township in the Study Area
The daily amount of wastes collected per capita varies from 563 to 1,192 g/day/capita.
914
902
652
1,192
563
830
0 200 400 600 800 1,000 1,200 1,400
Anzali
Rasht
Shaft
Somehsara
Fuman
Masal
Tow
nshi
p
Daily Amount of Waste per Capita (g/capita/day)
Source: Department of Environment, 2002
Figure 1.3.3 Daily Amount per Capita of Waste Collected in Each Township in the Study Area
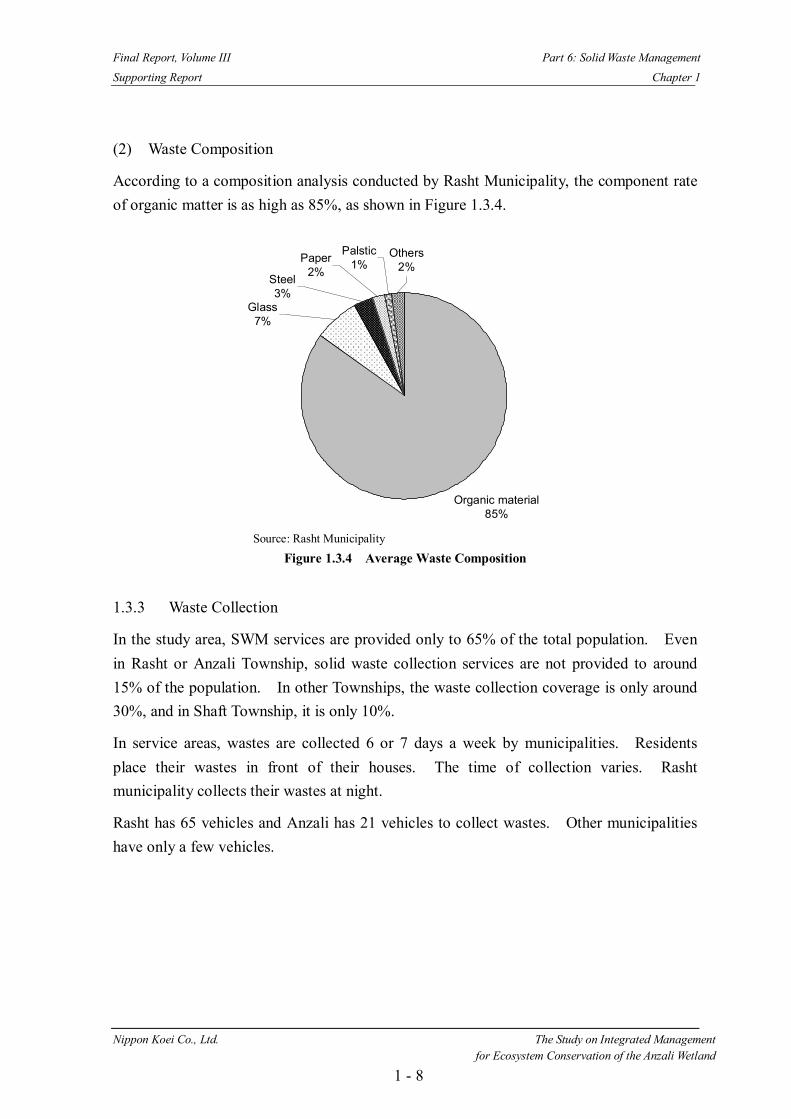
Final Report, Volume III Part 6: Solid Waste Management Supporting Report Chapter 1
Nippon Koei Co., Ltd. The Study on Integrated Management for Ecosystem Conservation of the Anzali Wetland
1 - 8
(2) Waste Composition
According to a composition analysis conducted by Rasht Municipality, the component rate of organic matter is as high as 85%, as shown in Figure 1.3.4.
Organic material85%
Glass7%
Steel3%
Paper2%
Palstic1%
Others2%
Source: Rasht Municipality
Figure 1.3.4 Average Waste Composition
1.3.3 Waste Collection
In the study area, SWM services are provided only to 65% of the total population. Even in Rasht or Anzali Township, solid waste collection services are not provided to around 15% of the population. In other Townships, the waste collection coverage is only around 30%, and in Shaft Township, it is only 10%.
In service areas, wastes are collected 6 or 7 days a week by municipalities. Residents place their wastes in front of their houses. The time of collection varies. Rasht municipality collects their wastes at night.
Rasht has 65 vehicles and Anzali has 21 vehicles to collect wastes. Other municipalities have only a few vehicles.

Final Report, Volume III Part 6: Solid Waste Management Supporting Report Chapter 1
Nippon Koei Co., Ltd. The Study on Integrated Management for Ecosystem Conservation of the Anzali Wetland
1 - 9
84
83
10
34
33
35
0 20 40 60 80 100
Anzali
Rasht
Shaft
Somehsara
Fuman
Masal
Tow
nshi
p
Ratio of Servicing Area (%)
Average 65%
Source: Department of Environment, 2002
Figure 1.3.5 Ratio of Collection Service Area of Each Township in the Study Area
Figure 1.3.6 Photograph of Waste Discharged in Rasht Municipality

Final Report, Volume III Part 6: Solid Waste Management Supporting Report Chapter 1
Nippon Koei Co., Ltd. The Study on Integrated Management for Ecosystem Conservation of the Anzali Wetland
1 - 10
Table 1.3.1 Factors of Collection Systems in Municipalities
Collection Transportation Composting
City
Number of collecting days per week (days/week)
Number using collection trucks
Typical volume of a collection truck (m3)
Distance to landfill site (or composting plant) (km)
Number of average daily trips (times/day)
Use of composting plant in Rasht
Rasht 7 65 2 35 4 Anzali 7 21 3-10 Anzali10km
Rasht55km Anzali4 Rasht1
Fuman 7 3 4 42 2 Somehsara 7 4 3 45 3 Tolam - - - - - Khomam 4 4 3 25 2 Shaft 5 2 4 35 1 Sangar 7 2 2 10-12 2 Masal 6 4 2 2 3 Masuleh No Service Source: Questionnaire Survey to Municipalities by JICA Study Team
1.3.4 Compositing Plant
(1) Material Balance
A composting plant was constructed and opened in 2002 in Rasht as a pilot plant. Figure 1.3.7 and 1.3.8 show the processes of the compost plant. At this time, 194 tons of wastes are carried each day for 6 days a week from the following 11 municipalities and 40-60 tons of compost are produced daily.

Final Report, Volume III Part 6: Solid Waste Management Supporting Report Chapter 1
Nippon Koei Co., Ltd. The Study on Integrated Management for Ecosystem Conservation of the Anzali Wetland
1 - 11
Note: *) Wastes from Lashteneshaa, Kochesfehan and Khooshkoejar are not included.
Figure 1.3.7 Process Flow of Composting Plant in Rasht
Note: Manual Sorting Stage (upper left); 1st Fermentation Stage (upper right)
2nd Fermentation Stage (lower left); and Produced Compost (lower right)
Figure 1.3.8 Photographs of Composting Plant in Rasht
Waste (Not Separated)
Trommel 1
Manual Sorting by 12 persons
Recyclables (Steel, Plastic
etc)
over 30mm
Dumped waste
Trommel 2
under 30mm
Magnetic Sorting
Magnetic Sorting
The 1st stage Fermentation
(21days)
The 2nd stage Fermentation
(45days)
Screening
Compost (20-30% of Input)
air
194t/d*
4t/d
39-58t/d
43t/d
over 70mm under 70mm

Final Report, Volume III Part 6: Solid Waste Management Supporting Report Chapter 1
Nippon Koei Co., Ltd. The Study on Integrated Management for Ecosystem Conservation of the Anzali Wetland
1 - 12
(2) Cost
The construction cost of the plant was 12 billion Rial. Approximately 75% of the construction cost, 9 billion Rial was provided by the Ministry of Interior through the provincial government, and the remaining 25% was borrowed from a bank in Iran. The annual operation cost is about 2,400 million. Rial, which corresponds to 38,000 Rial/ton of waste.
Table 1.3.2 Construction Cost of Centralized Composting Plant
(Unit: Mil Rial) Item Amount
Office 70Warehouse 330Machinery 11,010Green Space 200Others 113Total 11,723
Table 1.3.3 Operation Cost of Centralized Composting Plant
Item Quantity Unit Price Amount (million
Rial/year) Wage Manager &
Engineer 10 Persons 3,500,000 Rial/month 420
Worker 38 Persons 2,000,000 Rial.month 912Electricity 4,006,400 kWh/year 120 Rial/kWh 481Water 2,500 M3/year (1,600 kW*8hr*
313 day) 300 Rial/m3 1
Fuel (diesel) 400,000 Liter/year 170 Rial/liter 68Indirect Cost 25% 470Total 2,352Note: Estimation from the number of persons and amount of utilities
(3) Income
The price of composts is 150-200 Rial/kg, however there are few users. So the municipalities pay the whole cost according to the amount of wastes they carried.
(4) Future Plan to Construct Composting Plant
Bandar Anzali municipality has a plan to construct a composting plant in Ab Kenar. The capacity is 300 ton per day and the municipality has already bought the site located in the Buffer zone of the Wetland with the agreement of DOE. This will be opened in 2006 and Somehsara and Fuman municipality are scheduled to use this plant.

Final Report, Volume III Part 6: Solid Waste Management Supporting Report Chapter 1
Nippon Koei Co., Ltd. The Study on Integrated Management for Ecosystem Conservation of the Anzali Wetland
1 - 13
1.3.5 Final Disposal Sites
(1) Final Disposal Sites in the Study area
Figure 1.3.9 shows the locations of the final disposal sites in the study area. There are relatively large dumping sites in Sarawan and Anzali. In addition, there are smaller sites in Masal.

Final Report, Volume III Part 6: Solid Waste Management Supporting Report Chapter 1
Nippon Koei Co., Ltd. The Study on Integrated Management for Ecosystem Conservation of the Anzali Wetland
1 - 14
Note1: A part of wastes dumped in the Rasht dumping site is composted. Note2: The area of circles shows the amount of waste discharged. Note3: Masal has its own dumping site. Masuleh does not provide any waste management service in its area.
Figure 1.3.9 Locations of Open Dumping Sites
7
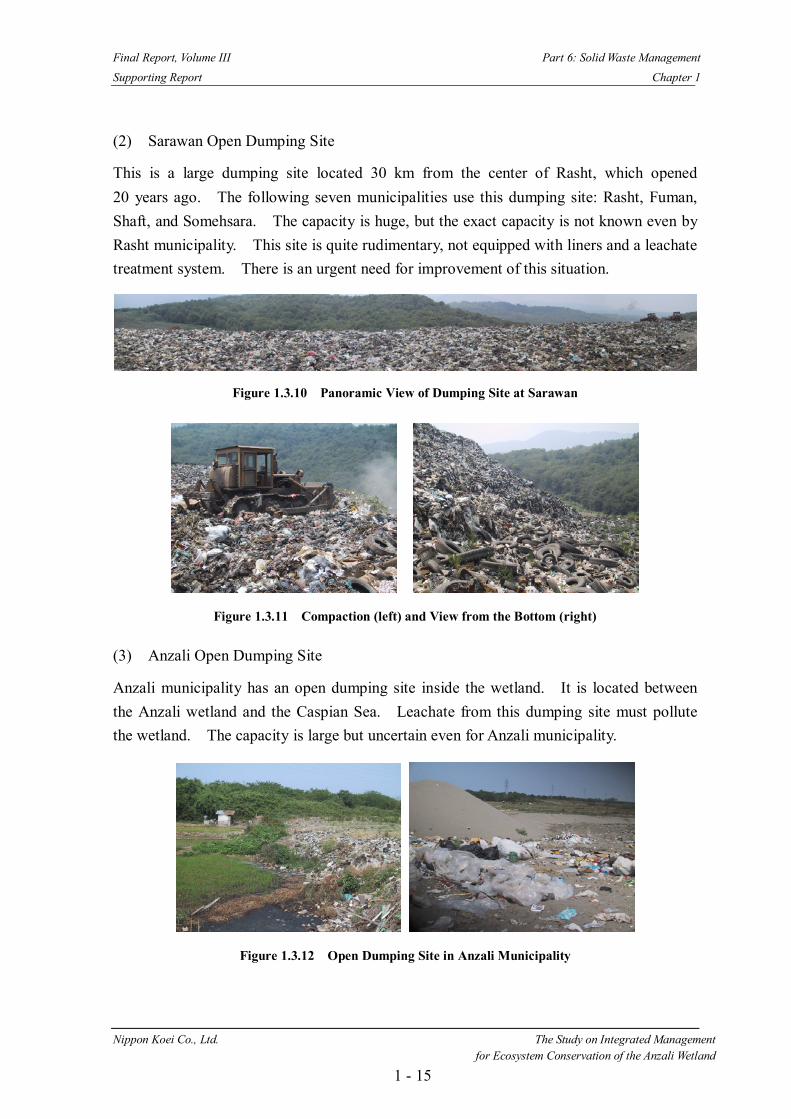
Final Report, Volume III Part 6: Solid Waste Management Supporting Report Chapter 1
Nippon Koei Co., Ltd. The Study on Integrated Management for Ecosystem Conservation of the Anzali Wetland
1 - 15
(2) Sarawan Open Dumping Site
This is a large dumping site located 30 km from the center of Rasht, which opened 20 years ago. The following seven municipalities use this dumping site: Rasht, Fuman, Shaft, and Somehsara. The capacity is huge, but the exact capacity is not known even by Rasht municipality. This site is quite rudimentary, not equipped with liners and a leachate treatment system. There is an urgent need for improvement of this situation.
Figure 1.3.10 Panoramic View of Dumping Site at Sarawan
Figure 1.3.11 Compaction (left) and View from the Bottom (right)
(3) Anzali Open Dumping Site
Anzali municipality has an open dumping site inside the wetland. It is located between the Anzali wetland and the Caspian Sea. Leachate from this dumping site must pollute the wetland. The capacity is large but uncertain even for Anzali municipality.
Figure 1.3.12 Open Dumping Site in Anzali Municipality

Final Report, Volume III Part 6: Solid Waste Management Supporting Report Chapter 1
Nippon Koei Co., Ltd. The Study on Integrated Management for Ecosystem Conservation of the Anzali Wetland
1 - 16
(4) Other Dumping Site
In Masal, there is no controlled dumping site. Wastes in Masal are dumped in the site beside a river. No compaction is done.
1.3.6 Solid Waste Management Cost
(1) Cost for Solid Waste Management
In the study area, over 45 billion Rial are used for SWM every year according to a questionnaire survey to municipalities. The annual costs in Rasht municipality and Anzali municipality are 30 and 14 billion Rial respectively, which cover almost all of costs used in the study area.
In Rasht municipality, the cost structure is known. The total annual cost for SWM of 30 billion Rial includes the road sweeping service. 90% of the total cost is for the collection. The component ratio of this cost is unsure. However, the simulation model mentioned in Chapter 2 revealed that the cost for waste collection is half of the total cost of road sweeping and waste collection. It amounts to 14 billion Rial per year. Thus, the cost for only solid waste management will be 17 billion Rial per year. The cost per ton is 98,000 Rial in Rasht.
(2) Budget Source
There is no direct charging systems for municipal solid waste (MSW) management. The budget for MSW management is allocated from the annual budget of each municipality.
Table 1.3.4 Present Cost of Solid Waste Management in Rasht Municipality
Stage Amount (billion Rial/year)
Component Rate (%)
1) Collection 27 90 Road Sweeping (13) (43) Waste Collection & Transportation (14) (47) 2) Disposal (Landfill) 3 10
Total 30 100 Note: The amounts of the breakdown of the collection cost are estimated by assuming that the road sweeping
cost is around half of the total collection cost. Source: Rasht Municipality (Values with parenthesis are assumed by the Study Team through interview with
Rasht municipality.)

Final Report, Volume III Part 6: Solid Waste Management Supporting Report Chapter 1
Nippon Koei Co., Ltd. The Study on Integrated Management for Ecosystem Conservation of the Anzali Wetland
1 - 17
Figure 1.3.13 Photograph of a Sweeper
1.4 Industrial and Medical Solid Waste Management in the Study Area
1.4.1 Industrial Solid Waste
The amount of industrial wastes is not monitored by DOE. They are transported to the municipal dumping site by the industries themselves or SWM companies. Only hazardous wastes are monitored by DOE. However, the amount is not known.
The Jahad Daneshgahi Guilan in Guilan University once studied hazardous industrial wastes in 2002. According to the report, there are five factories generating wastes containing heavy metals such as Chromium and the total amount is 37 tons per year, as shown in Table 1.4.1. The major source of hazardous waste at present is plating factories.
However, there is no landfill site in the study area designed for hazardous wastes. So DOE recommends storage of the hazardous wastes for now, and at least some of the hazardous wastes are stored inside factories, as shown in Figure 1.4.1.
Table 1.4.1 Hazardous Industrial Waste in the Study Area
Factory Process Discharged Hazardous Waste Amount of Hazardous Waste (kg/year)
1 Metal Plating Chromium, Copper 12,000 2 Fluorescent Lamp
Manufacture Mercury, Molybdenum 1,500
3 Natural Gas Power Plant Chromium 7,000 4 Metal Plating Chromium 1,500 5 Metal Plating Chromium 15,000
Total 37,000 Source: Ghavidel, A. et al: “Evaluation of Industrial Hazardous Waste in Guilan Province in 2002”
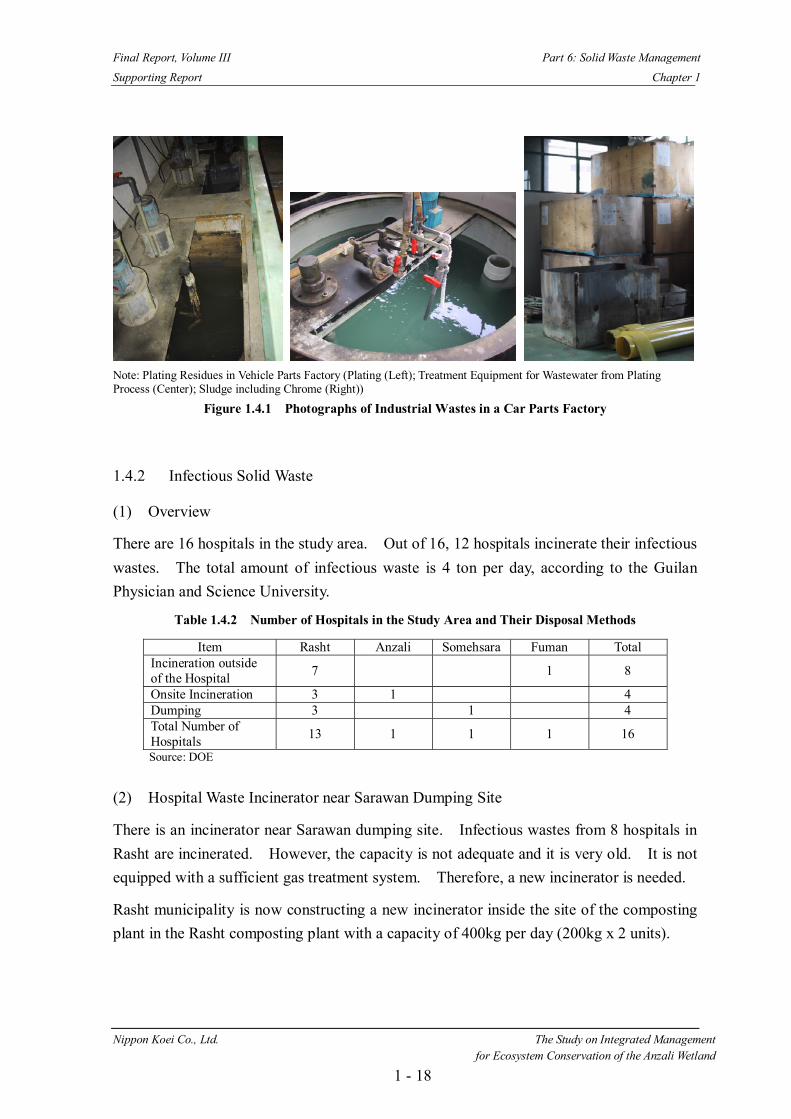
Final Report, Volume III Part 6: Solid Waste Management Supporting Report Chapter 1
Nippon Koei Co., Ltd. The Study on Integrated Management for Ecosystem Conservation of the Anzali Wetland
1 - 18
Note: Plating Residues in Vehicle Parts Factory (Plating (Left); Treatment Equipment for Wastewater from Plating Process (Center); Sludge including Chrome (Right))
Figure 1.4.1 Photographs of Industrial Wastes in a Car Parts Factory
1.4.2 Infectious Solid Waste
(1) Overview
There are 16 hospitals in the study area. Out of 16, 12 hospitals incinerate their infectious wastes. The total amount of infectious waste is 4 ton per day, according to the Guilan Physician and Science University.
Table 1.4.2 Number of Hospitals in the Study Area and Their Disposal Methods
Item Rasht Anzali Somehsara Fuman Total Incineration outside of the Hospital 7 1 8
Onsite Incineration 3 1 4 Dumping 3 1 4 Total Number of Hospitals 13 1 1 1 16
Source: DOE
(2) Hospital Waste Incinerator near Sarawan Dumping Site
There is an incinerator near Sarawan dumping site. Infectious wastes from 8 hospitals in Rasht are incinerated. However, the capacity is not adequate and it is very old. It is not equipped with a sufficient gas treatment system. Therefore, a new incinerator is needed.
Rasht municipality is now constructing a new incinerator inside the site of the composting plant in the Rasht composting plant with a capacity of 400kg per day (200kg x 2 units).

Final Report, Volume III Part 6: Solid Waste Management Supporting Report Chapter 1
Nippon Koei Co., Ltd. The Study on Integrated Management for Ecosystem Conservation of the Anzali Wetland
1 - 19
Figure 1.4.2 Hospital Waste in Yellow Bags (left) and Incinerator (right)
(3) Incinerator inside Hospitals
Figure 1.4.3 shows one of the incinerators inside hospitals. This hospital, with 200 beds, was established in June 2000. In this hospital, separation at the source is practiced. Wastes are divided into infectious and non-infectious. Infectious wastes are discharged into yellow bags. The amount of infectious wastes is 250 kg/day. The incinerator is operated three days a week.
Figure 1.4.3 Separation (upper left), and Incineration Plant (upper right and lower)

Final Report, Volume III Part 6: Solid Waste Management Supporting Report Chapter 1
Nippon Koei Co., Ltd. The Study on Integrated Management for Ecosystem Conservation of the Anzali Wetland
1 - 20
(4) New Incinerator Construction
Rasht municipality is now constructing two new incinerators for infectious waste inside the composting plant, as shown in Figure 1.4.4. The capacity is 200kg per hour each. These incinerators will incinerate infectious wastes from hospitals and private clinics.
They will be opened soon (As of September 2004).
Figure 1.4.4 New Incinerator for Infectious Waste in Rasht
Related Documents