Application for Approval of Annual Performance Review for FY-18 and Approval for ARR & ERC under MYT period FY-20-22 and ERC and Tariff Filing for FY-20. Part 3 ANNUAL PERFORMANCE REVIEW FOR FY 18 Page 49 ANNUAL PERFORMANCE REVIEW FOR FY-18 In accordance with clause 2.8 of MYT regulations, the distribution licensee is subject to an Annual Performance Review (APR). HESCOM is submitting its application to the Hon’ble Commission for approval of Annual Performance Review for FY-18 along with relevant formats as specified under regulations & audited accounts for FY-18. The Hon’ble Commission had issued the tariff order Dtd: 30.03.2016 under MYT frame work duly approving the MYT for the period from FY-17 to FY-19 and retail supply tariff for FY-18 and approval for Annual Performance Review for FY-17. The Hon’ble Commission had also issued a tariff order Dtd: 14.05.2018 duly approving the Annual Performance Review for FY-17 and approval of ARR for FY-19 and retail supply tariff for FY-19. The HESCOM submits to the Hon’ble Commission to carry out the Annual Performance Review for FY-18 in accordance with the principles laid down in KERC (Tariff) Regulations 2000 as amended from time to time and KERC (Tariff) regulations 2006, duly considering the actual expenditure as per the audited accounts for FY-18 and the approved expenditure as per the Commission’s order Dtd: 11.04.2017.

Welcome message from author
This document is posted to help you gain knowledge. Please leave a comment to let me know what you think about it! Share it to your friends and learn new things together.
Transcript
Application for Approval of Annual Performance Review for FY-18 and Approval for ARR & ERC under MYT period FY-20-22 and ERC and Tariff Filing for FY-20.
Part 3 ANNUAL PERFORMANCE REVIEW FOR FY 18 Page 49
ANNUAL PERFORMANCE REVIEW FOR FY-18
In accordance with clause 2.8 of MYT regulations, the distribution licensee is subject
to an Annual Performance Review (APR). HESCOM is submitting its application to the
Hon’ble Commission for approval of Annual Performance Review for FY-18 along with
relevant formats as specified under regulations & audited accounts for FY-18.
The Hon’ble Commission had issued the tariff order Dtd: 30.03.2016 under MYT frame
work duly approving the MYT for the period from FY-17 to FY-19 and retail supply tariff for
FY-18 and approval for Annual Performance Review for FY-17.
The Hon’ble Commission had also issued a tariff order Dtd: 14.05.2018 duly approving
the Annual Performance Review for FY-17 and approval of ARR for FY-19 and retail supply
tariff for FY-19.
The HESCOM submits to the Hon’ble Commission to carry out the Annual Performance
Review for FY-18 in accordance with the principles laid down in KERC (Tariff) Regulations
2000 as amended from time to time and KERC (Tariff) regulations 2006, duly considering
the actual expenditure as per the audited accounts for FY-18 and the approved expenditure
as per the Commission’s order Dtd: 11.04.2017.
Application for Approval of Annual Performance Review for FY-18 and Approval for ARR & ERC under MYT period FY-20-22 and ERC and Tariff Filing for FY-20.
Part 3 ANNUAL PERFORMANCE REVIEW FOR FY 18 Page 50
HHEESSCCOOMM’’ss FFiinnaanncciiaall PPeerrffoorrmmaannccee iinn FFYY--1188
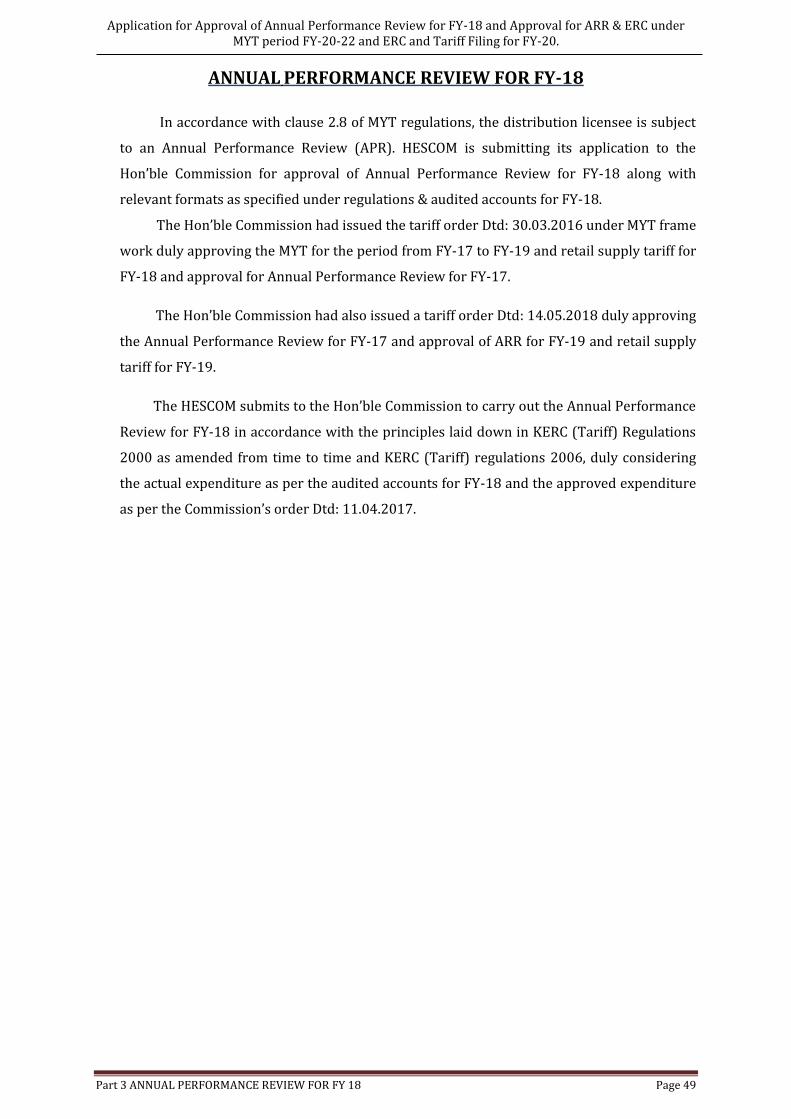
As per the audited accounts of HESCOM for FY-18, HESCOM submits to the Hon’ble Commission,
an over view of the Financial Performance of HESCOM for FY-18 as under.
Rs. In Crs
Financial Performance of HESCOM for FY-18:
Sl.
No
Particulars
FY18
As per filing
dated
30.11.2016
Approved Vide Order
Dtd : 11.04.2018
As per the
Audited Acts
Revenue at existing tariff in Rs. Crores
1 Revenue from tariff and
Miscellaneous Charges
2717.81 2843.85 3592.05
2 Tariff Subsidy to BJ/KJ 53.30 117.87 119.95
3 Tariff Subsidy to IP 3321.76 3321.76 3175.54
4 Total Existing Revenue 6092.87 6283.47 6887.54
Expenditure in Rs. Crores
5 Power Purchase Cost 4780.41 4966.95 5803.83
6 Transmission charges of KPTCL 589.72 535.48 535.48
7 SLDC Charges 4.80 5.39 5.54
8 Power Purchase Cost including cost of
transmission
5374.93 5507.82 6344.85
9 Employee Cost 637.68 687.72
10 Repairs & Maintenance 67.37 58.49
11 Admin & General Expenses 92.36 127.88
12 Total O&M Expenses 797.41 744.36 874.09
13 Depreciation 152.91 130.04 149.03
Interest & Finance charges
14 Interest on Capital Loans 306.31 180.23 291.27
15 Interest on Working capital loans 134.73 126.71 38.57
16 Interest on belated payment on PP Cost 0.00 0.00 115.42
17 Interest on consumer security deposits 55.91 49.01 43.30 18 Other Interest & Finance charges 0.00 0.00
19 Less interest & other expenses capitalized 0.00 0.00
20 Total Interest & Finance charges 496.95 355.95 488.56
21 Other Debits 13.09 0.00 25.48
22 Extraordinary item (Adjustment of excess
subsidy amount as per KERC Order)
102.90 0.00 102.90
23 Return on Equity 0.00 0.00
24 Funds towards Consumer
Relations/Consumer Education
0.50 0.50 0.01
25 Other Income 154.37 170.73 120.07
26 ARR 6784.32 6567.94 7864.85
27 Deficit for FY16 carried forward -372.73 -223.23
28 Distribution loss reduction incentive 24.31
29 Contribution to P&G Trust (as per
GoK directions)
448.27
30 Net ARR 7629.63 6791.16 7864.85
31 Deficit for FY-19 as per audited accounts 977.31
Application for Approval of Annual Performance Review for FY-18 and Approval for ARR & ERC under MYT period FY-20-22 and ERC and Tariff Filing for FY-20.
Part 3 ANNUAL PERFORMANCE REVIEW FOR FY 18 Page 51
Note : Expenses towards DSM activities of Rs.0.01 Crs was booked under account head
76-193 and included in A & G expenses which is bifurcated from O & M expenses and
shown separately vide Sl No : 25 of the above table.
As per the audited accounts of the HESCOM there is deficit of Rs. 977.31 Crs for
FY-19 as indicated above.
The item wise explanation of the actual performance as per the audited accounts
vis-à-vis the expenses approved as per the tariff order Dtd: 30.03.2016 is indicated as
noted below.
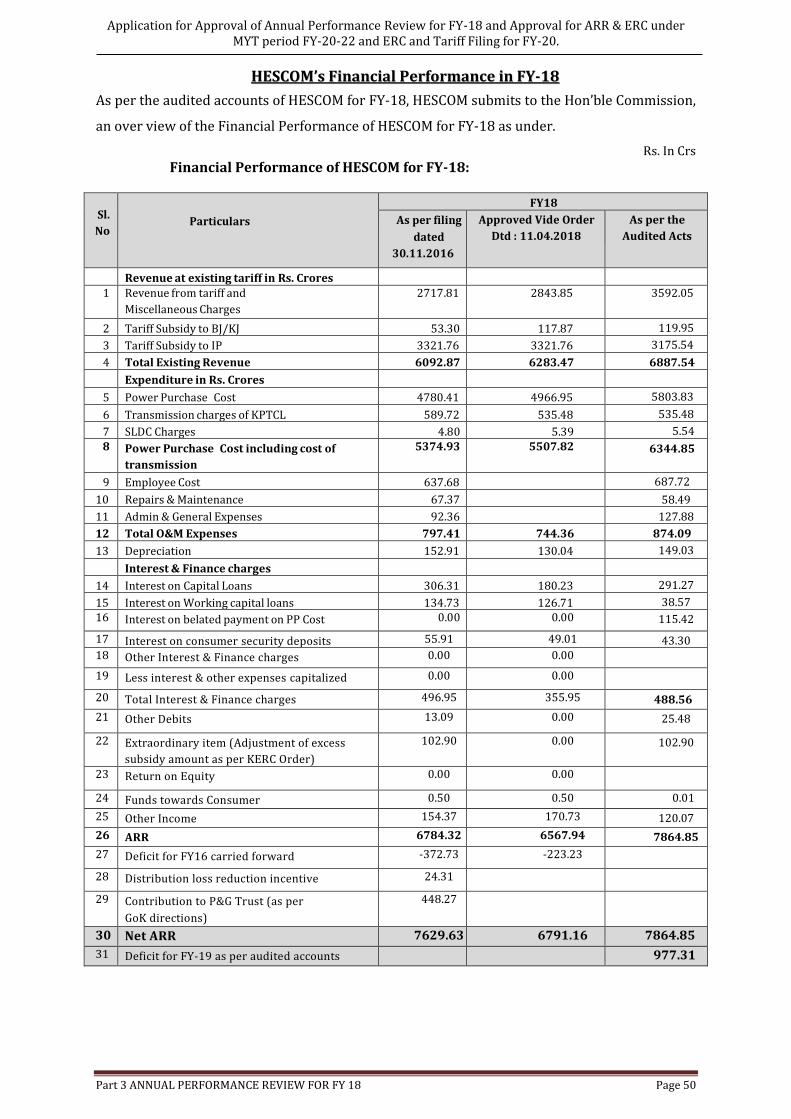
Sales for FY-18 :
The Hon’ble Commission had approved 10569.56 Mu as sales for FY-18, excluding the
energy sold to HRECS and SEZ vide Tariff Order Dtd: 11.04.2017.
As per the audited accounts and DCB of HESCOM the sales for FY-18 is as indicated
below.
Sales & No of Installation for FY-18 :
Tariff No of installations Sales in MUs
Filed Approved Actual Differe
nce Filed
Approved
Actual Differenc
e a b c d c-d e f g f-g
LT 2(a) 2520585 2519639 2537347 -17708 1531.53 1531.53 1,412.32 119.21 LT 2(b) 6683 6785 6653 132 21.84 20.96 18.5 2.46 LT 3 351339 351966 355003 -3037 463.51 470.9 447.73 23.17 LT 4 (b) 848 848 856 -8 15.59 16.79 17.43 -0.64 LT 4 (c) 373 373 356 17 0.98 0.98 0.84 0.14 LT 5 113341 113341 113582 -241 327.57 322.3 320.43 1.87 LT 6 40383 40383 42618 -2235 299.64 280.24 277.19 3.05 LT 6 21934 22039 22823 -784 149.86 141.4 149.38 -7.98 LT 7 51236 51236 66658 -15422 26.37 26.37 28.25 -1.88 HT 1 292 296 318 -22 213.84 224.66 234.01 -9.35 HT 2(a) 1484 1516 1586 -70 764.17 913.15 1,005.39 -92.24 HT 2(b) 525 526 578 -52 130.59 130.59 121.8 8.79 HT 2 (c) 331 331 299 32 88.59 88.59 74.14 14.45 HT 3 (a) (b) 267 268 259 9 101.74 181.27 255.87 -74.6 HT 4 31 28 32 -4 14.64 13.55 14.59 -1.04 HT 5 80 80 49 31 34.8 34.8 21.81 12.99 Sub Total 3109732 3109655 3149017 -39362 4185.26 4398.07 4,399.68 -1.6
LT-1 777402 777402 759934 17468 189.48 197.11 245.48 -48.37 LT 4 (a) 734778 734778 696647 38131 5974.38 5974.38 6,054.12 -79.74 Sub Total 1512180 1512180 1456581 55599 6163.86 6171.49 6,299.60 -128.11 Total 4621912 4621835 4605598 16237 10349.12 10569.56 10,699.28 -129.72
HESCOM has registered total sales of 10,699.28 MU as against the KERC
approved sales of 10569.56 MU for FY-18, thus showing an increase in the sales of
129.72 MU in FY-18.
A major variation in the energy sales, compared to the energy sales approved in
the Tariff Order 2017, Dtd : 11.04.2017 is observed as below.
No. of installations:
There is an increase in the No. of installations in respect of the following
categories when compared to the approved figures of FY-17.
Application for Approval of Annual Performance Review for FY-18 and Approval for ARR & ERC under MYT period FY-20-22 and ERC and Tariff Filing for FY-20.
Part 3 ANNUAL PERFORMANCE REVIEW FOR FY 18 Page 52
LT-2 (a) :- There is increase in number of installations by 17,708 Nos as compared to
the approved figures. However, there is an increase by 1,11,056 Nos over the figures of
FY-17 (FY-18 – 25,37,347 Nos, FY-17 – 24,26,291 Nos). The approval of 25,19,639
installations seems to be on the lower side.
LT-3 :- There is increase in number of installations by 3037 Nos as compared to the
approved figures. However, there is an increase by 18153 Nos over the figures of FY-17
(FY-18 – 355003 Nos, FY-17 – 336850 Nos).
LT-4(b) :- There is increase in number of installations by 8 Nos as compared to the
approved figures. However, there is a decrease by 420 Nos over the figures of FY-17
(FY-18 – 856 Nos, FY-17 – 1276 Nos).
LT-5 :- There is increase in number of installations by 241 Nos as compared to the
approved figures. However, there is an increase by 5781 Nos over the figures of FY-17
(FY-18 – 113582 Nos, FY-17 – 107801Nos).
LT-6(a) :- There is increase in number of installations by 2235 Nos as compared to the
approved figures. However, there is an increase by 4389 Nos over the figures of FY-17
(FY-18 – 42618 Nos, FY-17 – 38229 Nos).
LT-6(b) :- There is increase in number of installations by 784 Nos as compared to the
approved figures. However, there is an increase by 1278 Nos over the figures of FY-17
(FY-18 – 22823 Nos, FY-17 – 21545 Nos).
LT-7 :- There is increase in number of installations by 15422 Nos as compared to the
approved figures. However, there is an increase by 23289 Nos over the figures of FY-17
(FY-18 – 66658 Nos, FY-17 – 43369 Nos).
HT-1 :- There is increase in number of installations by 22 Nos as compared to the
approved figures. However, there is an increase by 43 Nos over the figures of FY-17
(FY-18 – 318 Nos, FY-17 – 275 Nos).
HT-2(a) :- There is increase in number of installations by 70 Nos as compared to the
approved figures. However, there is an increase by 165 Nos over the figures of FY-17
(FY-18 – 1586 Nos, FY-17 – 1421 Nos).
HT-2(b):- There is increase in number of installations by 52 Nos as compared to the
approved figures. However, there is an increase by 64 Nos over the figures of FY-17
(FY-18 – 578 Nos, FY-17 – 514 Nos).
HT-4:- There is increase in number of installations by 4 Nos as compared to the
approved figures. However, there is an increase by 2 Nos over the figures of FY-17
(FY-18 – 32 Nos, FY-17 – 30 Nos).
The reasons for the increase in number of installations in comparison with the approval
figures cannot be precisely ascertained in view of diversity of Geographical nature of the
Application for Approval of Annual Performance Review for FY-18 and Approval for ARR & ERC under MYT period FY-20-22 and ERC and Tariff Filing for FY-20.
Part 3 ANNUAL PERFORMANCE REVIEW FOR FY 18 Page 53
area under HESCOM’s jurisdiction. For the temporary installations precise reasons
cannot be attributed.
There is a decrease in the No. of installations in respect of the following categories when
compared to the approved figures of FY-17.
LT-2 (b) :- There is decrease in number of installations by 132 Nos as compared to the
approved figures. However, there is an increase by 444 Nos over the figures of FY-17
(FY-18 – 6653 Nos, FY-17 – 6209Nos).
LT-4 (c) :- There is decrease in number of installations by 17 Nos as compared to the
approved figures. However, there is an increase by 29 Nos over the figures of FY-17 (FY-
18 – 356 Nos, FY-17 – 327Nos).
HT-2(c):- There is decrease in number of installations by 32 Nos as compared to the
approved figures. However, there is an increase by 26 Nos over the figures of FY-17 (FY-
18 – 299 Nos, FY-17 – 273 Nos).
HT-3:- There is decrease in number of installations by 9 Nos as compared to the
approved figures. However, there is an increase by 33 Nos over the figures of FY-17 (FY-
18 – 259 Nos, FY-17 – 226 Nos).
HT-5:- There is decrease in number of installations by 31 Nos as compared to the
approved figures and decrease by 3 Nos over the figures of FY-17 (FY-18 – 49 Nos,
FY-17 – 52 Nos).
There is decrease in No. of installations in respect of HT-5 by 3 Nos. when compared to
FY-17. In view of the temporary nature precise reasons cannot be attributed.
In respect of subsidized categories, there is decrease in No. of installations by 17468 Nos
compared to approved figures and there is an increase in No. of installation by 3448 Nos
under LT-1/Bhagya Jyoti and Kutir Jyoti. The consumers using more than 18 units are
759934 Nos in FY18, whereas there were 763382 consumers in FY17.
In respect of subsidized categories, LT-4 (a) there is decrease in No. of installations by
38131 Nos compared to approved figures and there is an increase in No. of installation
by 33636 Nos under LT-4 (a). There are 696647 Nos consumers in FY18, whereas there
were 663011 Nos consumers in FY17.
Over all there is decrease in No. of installations by 16237 Nos when compared to the
approved figures for FY-18. However, there is increase in the total No. of installations by
194517 over the figures of FY-17, thus showing the growth of 4.41%.
Application for Approval of Annual Performance Review for FY-18 and Approval for ARR & ERC under MYT period FY-20-22 and ERC and Tariff Filing for FY-20.
Part 3 ANNUAL PERFORMANCE REVIEW FOR FY 18 Page 54
Sales :
LT-2 (a) :- Under domestic category, there is decrease in consumption by 119.21 MUs
when compared to approved sales for FY-18. However, there is decrease in the sales by
57.35 MUs when compared to the sales in FY-17.
LT-2 (b) :- Under domestic category, there is decrease in consumption by 2.46MUs
when compared to approved sales for FY-18. However, there is increase in the sales by
1.69MUs when compared to the sales in FY-17.
LT-3 :- Under Commercial category there is decrease in sales by 23.17MUs when
compared to the approved sales for FY-18. However, there is increase in the sales by
22.02 MUs, when compared to the sales in FY-17.
In respect of LT-4 (b), there is increase by 0.64 MU when compared to the approved
sales for FY-18. However, there is increase in the sales by 1.42 MUs, when compared to
the sales in FY-17.
In respect of LT-4 (c), there is decrease by 0.14 MU when compared to the approved
sales for FY-18. However, there is increase in the sales by 0.06 MUs, when compared to
the sales in FY-17.
In respect of LT-5, there is decrease by 1.87 MU when compared to the approved sales
for FY-18. However, there is increase in the sales by 4.09 MUs, when compared to the
sales in FY-17.
In respect of LT-6 (a), there is decrease by 3.05 MU when compared to the approved
sales for FY-18. However, there is increase in the sales by 5.33 MUs, when compared to
the sales in FY-17.
In respect of LT-6 (b), there is increase by 7.98 MU when compared to the approved
sales for FY-18. However, there is increase in the sales by 2.65 MUs, when compared to
the sales in FY-17.
In respect of LT-7, there is increase by 1.88 MU when compared to the approved sales
for FY-18. However, there is increase in the sales by 2.22 MUs, when compared to the
sales in FY-17.
The sales in respect of these categories is also slightly lesser than the Sales in FY-17.
The precise reasons cannot be ascertained in view of diversified nature of HESCOM area.
HT-1 :- There is increase in the Sales by 9.35 MUs when compared to approved Sales for
FY-18. However there is increase in the Sales under this category by 18.57MU when
compared to the Sales of FY-17.
Application for Approval of Annual Performance Review for FY-18 and Approval for ARR & ERC under MYT period FY-20-22 and ERC and Tariff Filing for FY-20.
Part 3 ANNUAL PERFORMANCE REVIEW FOR FY 18 Page 55
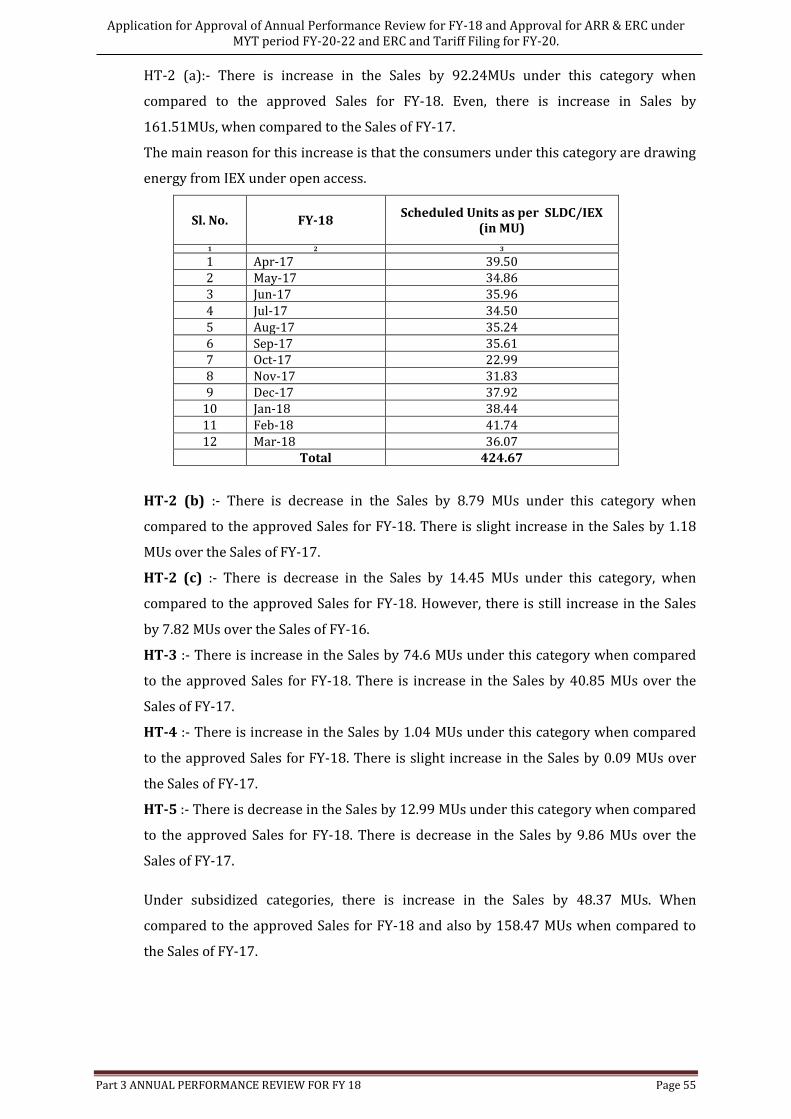
HT-2 (a):- There is increase in the Sales by 92.24MUs under this category when
compared to the approved Sales for FY-18. Even, there is increase in Sales by
161.51MUs, when compared to the Sales of FY-17.
The main reason for this increase is that the consumers under this category are drawing
energy from IEX under open access.
Sl. No. FY-18 Scheduled Units as per SLDC/IEX
(in MU)
1 2 3
1 Apr-17 39.50 2 May-17 34.86 3 Jun-17 35.96
4 Jul-17 34.50 5 Aug-17 35.24 6 Sep-17 35.61 7 Oct-17 22.99 8 Nov-17 31.83 9 Dec-17 37.92
10 Jan-18 38.44 11 Feb-18 41.74 12 Mar-18 36.07
Total 424.67
HT-2 (b) :- There is decrease in the Sales by 8.79 MUs under this category when
compared to the approved Sales for FY-18. There is slight increase in the Sales by 1.18
MUs over the Sales of FY-17.
HT-2 (c) :- There is decrease in the Sales by 14.45 MUs under this category, when
compared to the approved Sales for FY-18. However, there is still increase in the Sales
by 7.82 MUs over the Sales of FY-16.
HT-3 :- There is increase in the Sales by 74.6 MUs under this category when compared
to the approved Sales for FY-18. There is increase in the Sales by 40.85 MUs over the
Sales of FY-17.
HT-4 :- There is increase in the Sales by 1.04 MUs under this category when compared
to the approved Sales for FY-18. There is slight increase in the Sales by 0.09 MUs over
the Sales of FY-17.
HT-5 :- There is decrease in the Sales by 12.99 MUs under this category when compared
to the approved Sales for FY-18. There is decrease in the Sales by 9.86 MUs over the
Sales of FY-17.
Under subsidized categories, there is increase in the Sales by 48.37 MUs. When
compared to the approved Sales for FY-18 and also by 158.47 MUs when compared to
the Sales of FY-17.
Application for Approval of Annual Performance Review for FY-18 and Approval for ARR & ERC under MYT period FY-20-22 and ERC and Tariff Filing for FY-20.
Part 3 ANNUAL PERFORMANCE REVIEW FOR FY 18 Page 56
There is an increase in LT-4 (a) category by 79.74 MUs when compared to the approved
Sales for FY-18 whereas there is an increase in Sales by 72.99 Mus over the Sales of
FY-17.
It is submitted that as against approved sales of 4398.07 MUs to categories other than
BJ/KJ and IP Set categories, the actual sale achieved by HESCOM is 4399.68 MUs,
resulting in the shortfall in sales to these categories by 1.61 MUs. Whereas HESCOM has
registered 6299.60 MUs to BJ/KJ and IP Set categories as against approved sales of
6171.49 MUs resulting in increased sales to these categories by 128.11 MUs. The actual
share of sales to categories other than BJ/KJ and IP Set categories is 59.94% as against
the estimated share of 58.39% resulting in 0.49 % increase share to these categories
and the actual share of sales to BJ/KJ and IP Sets categories has increased by the same
percentage.
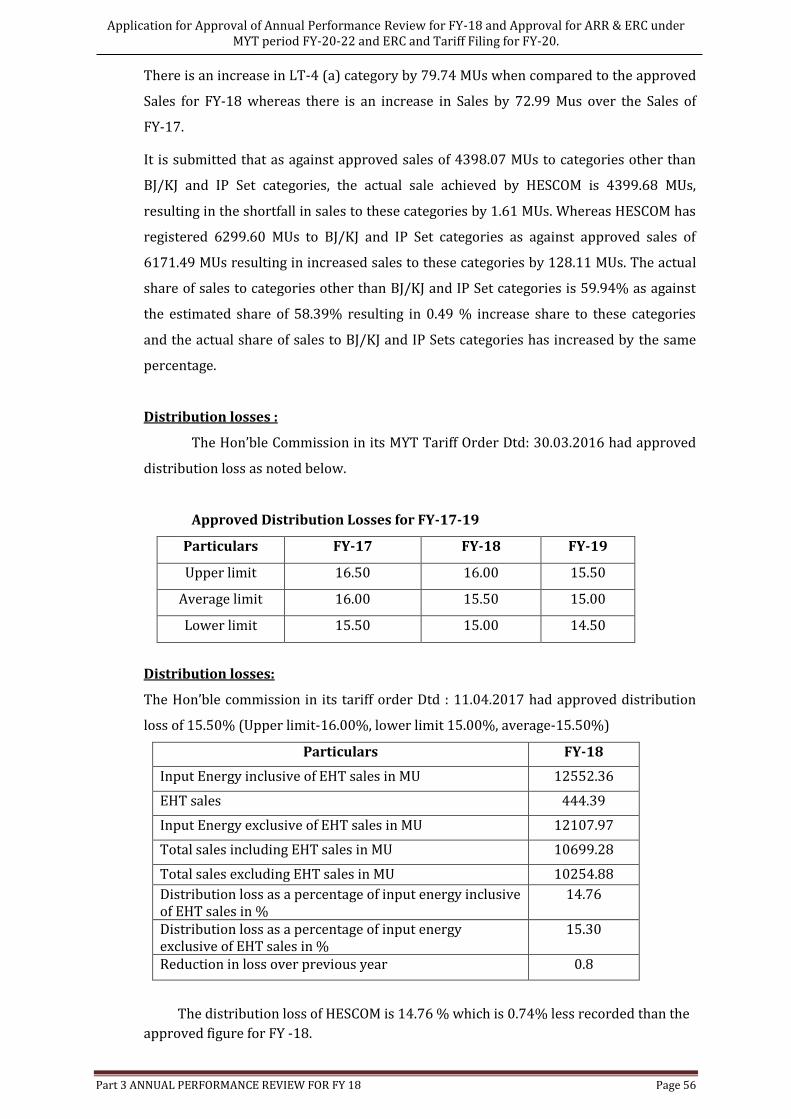
Distribution losses :
The Hon’ble Commission in its MYT Tariff Order Dtd: 30.03.2016 had approved
distribution loss as noted below.
Approved Distribution Losses for FY-17-19
Particulars FY-17 FY-18 FY-19
Upper limit 16.50 16.00 15.50
Average limit 16.00 15.50 15.00
Lower limit 15.50 15.00 14.50
Distribution losses:
The Hon’ble commission in its tariff order Dtd : 11.04.2017 had approved distribution
loss of 15.50% (Upper limit-16.00%, lower limit 15.00%, average-15.50%)
Particulars FY-18
Input Energy inclusive of EHT sales in MU 12552.36
EHT sales 444.39
Input Energy exclusive of EHT sales in MU 12107.97
Total sales including EHT sales in MU 10699.28
Total sales excluding EHT sales in MU 10254.88
Distribution loss as a percentage of input energy inclusive of EHT sales in %
14.76
Distribution loss as a percentage of input energy exclusive of EHT sales in %
15.30
Reduction in loss over previous year 0.8
The distribution loss of HESCOM is 14.76 % which is 0.74% less recorded than the
approved figure for FY -18.
Application for Approval of Annual Performance Review for FY-18 and Approval for ARR & ERC under MYT period FY-20-22 and ERC and Tariff Filing for FY-20.
Part 3 ANNUAL PERFORMANCE REVIEW FOR FY 18 Page 57
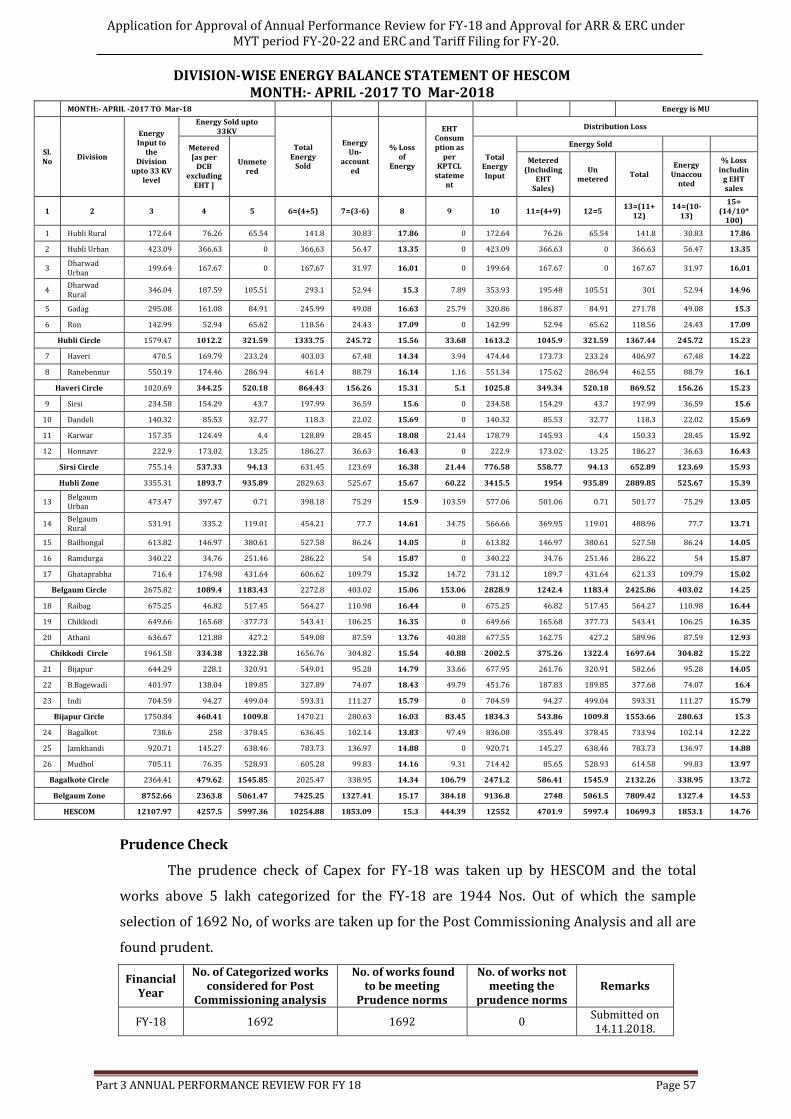
DIVISION-WISE ENERGY BALANCE STATEMENT OF HESCOM MONTH:- APRIL -2017 TO Mar-2018
MONTH:- APRIL -2017 TO Mar-18 Energy is MU
Sl. No
Division
Energy Input to
the Division
upto 33 KV level
Energy Sold upto 33KV
Total Energy
Sold
Energy Un-
accounted
% Loss of
Energy
EHT Consumption as
per KPTCL
statement
Distribution Loss
Metered [as per
DCB excluding
EHT ]
Unmetered
Total Energy Input
Energy Sold
Metered (Including
EHT Sales)
Un metered
Total Energy
Unaccounted
% Loss includin
g EHT sales
1 2 3 4 5 6=(4+5) 7=(3-6) 8 9 10 11=(4+9) 12=5 13=(11+
12) 14=(10-
13)
15= (14/10*
100)
1 Hubli Rural 172.64 76.26 65.54 141.8 30.83 17.86 0 172.64 76.26 65.54 141.8 30.83 17.86
2 Hubli Urban 423.09 366.63 0 366.63 56.47 13.35 0 423.09 366.63 0 366.63 56.47 13.35
3 Dharwad Urban
199.64 167.67 0 167.67 31.97 16.01 0 199.64 167.67 0 167.67 31.97 16.01
4 Dharwad Rural
346.04 187.59 105.51 293.1 52.94 15.3 7.89 353.93 195.48 105.51 301 52.94 14.96
5 Gadag 295.08 161.08 84.91 245.99 49.08 16.63 25.79 320.86 186.87 84.91 271.78 49.08 15.3
6 Ron 142.99 52.94 65.62 118.56 24.43 17.09 0 142.99 52.94 65.62 118.56 24.43 17.09
Hubli Circle 1579.47 1012.2 321.59 1333.75 245.72 15.56 33.68 1613.2 1045.9 321.59 1367.44 245.72 15.23
7 Haveri 470.5 169.79 233.24 403.03 67.48 14.34 3.94 474.44 173.73 233.24 406.97 67.48 14.22
8 Ranebennur 550.19 174.46 286.94 461.4 88.79 16.14 1.16 551.34 175.62 286.94 462.55 88.79 16.1
Haveri Circle 1020.69 344.25 520.18 864.43 156.26 15.31 5.1 1025.8 349.34 520.18 869.52 156.26 15.23
9 Sirsi 234.58 154.29 43.7 197.99 36.59 15.6 0 234.58 154.29 43.7 197.99 36.59 15.6
10 Dandeli 140.32 85.53 32.77 118.3 22.02 15.69 0 140.32 85.53 32.77 118.3 22.02 15.69
11 Karwar 157.35 124.49 4.4 128.89 28.45 18.08 21.44 178.79 145.93 4.4 150.33 28.45 15.92
12 Honnavr 222.9 173.02 13.25 186.27 36.63 16.43 0 222.9 173.02 13.25 186.27 36.63 16.43
Sirsi Circle 755.14 537.33 94.13 631.45 123.69 16.38 21.44 776.58 558.77 94.13 652.89 123.69 15.93
Hubli Zone 3355.31 1893.7 935.89 2829.63 525.67 15.67 60.22 3415.5 1954 935.89 2889.85 525.67 15.39
13 Belgaum Urban
473.47 397.47 0.71 398.18 75.29 15.9 103.59 577.06 501.06 0.71 501.77 75.29 13.05
14 Belgaum Rural
531.91 335.2 119.01 454.21 77.7 14.61 34.75 566.66 369.95 119.01 488.96 77.7 13.71
15 Bailhongal 613.82 146.97 380.61 527.58 86.24 14.05 0 613.82 146.97 380.61 527.58 86.24 14.05
16 Ramdurga 340.22 34.76 251.46 286.22 54 15.87 0 340.22 34.76 251.46 286.22 54 15.87
17 Ghataprabha 716.4 174.98 431.64 606.62 109.79 15.32 14.72 731.12 189.7 431.64 621.33 109.79 15.02
Belgaum Circle 2675.82 1089.4 1183.43 2272.8 403.02 15.06 153.06 2828.9 1242.4 1183.4 2425.86 403.02 14.25
18 Raibag 675.25 46.82 517.45 564.27 110.98 16.44 0 675.25 46.82 517.45 564.27 110.98 16.44
19 Chikkodi 649.66 165.68 377.73 543.41 106.25 16.35 0 649.66 165.68 377.73 543.41 106.25 16.35
20 Athani 636.67 121.88 427.2 549.08 87.59 13.76 40.88 677.55 162.75 427.2 589.96 87.59 12.93
Chikkodi Circle 1961.58 334.38 1322.38 1656.76 304.82 15.54 40.88 2002.5 375.26 1322.4 1697.64 304.82 15.22
21 Bijapur 644.29 228.1 320.91 549.01 95.28 14.79 33.66 677.95 261.76 320.91 582.66 95.28 14.05
22 B.Bagewadi 401.97 138.04 189.85 327.89 74.07 18.43 49.79 451.76 187.83 189.85 377.68 74.07 16.4
23 Indi 704.59 94.27 499.04 593.31 111.27 15.79 0 704.59 94.27 499.04 593.31 111.27 15.79
Bijapur Circle 1750.84 460.41 1009.8 1470.21 280.63 16.03 83.45 1834.3 543.86 1009.8 1553.66 280.63 15.3
24 Bagalkot 738.6 258 378.45 636.45 102.14 13.83 97.49 836.08 355.49 378.45 733.94 102.14 12.22
25 Jamkhandi 920.71 145.27 638.46 783.73 136.97 14.88 0 920.71 145.27 638.46 783.73 136.97 14.88
26 Mudhol 705.11 76.35 528.93 605.28 99.83 14.16 9.31 714.42 85.65 528.93 614.58 99.83 13.97
Bagalkote Circle 2364.41 479.62 1545.85 2025.47 338.95 14.34 106.79 2471.2 586.41 1545.9 2132.26 338.95 13.72
Belgaum Zone 8752.66 2363.8 5061.47 7425.25 1327.41 15.17 384.18 9136.8 2748 5061.5 7809.42 1327.4 14.53
HESCOM 12107.97 4257.5 5997.36 10254.88 1853.09 15.3 444.39 12552 4701.9 5997.4 10699.3 1853.1 14.76
Prudence Check
The prudence check of Capex for FY-18 was taken up by HESCOM and the total
works above 5 lakh categorized for the FY-18 are 1944 Nos. Out of which the sample
selection of 1692 No, of works are taken up for the Post Commissioning Analysis and all are
found prudent.
Financial Year
No. of Categorized works considered for Post
Commissioning analysis
No. of works found to be meeting
Prudence norms
No. of works not meeting the
prudence norms Remarks
FY-18 1692 1692 0 Submitted on 14.11.2018.
Application for Approval of Annual Performance Review for FY-18 and Approval for ARR & ERC under MYT period FY-20-22 and ERC and Tariff Filing for FY-20.
Part 3 ANNUAL PERFORMANCE REVIEW FOR FY 18 Page 58
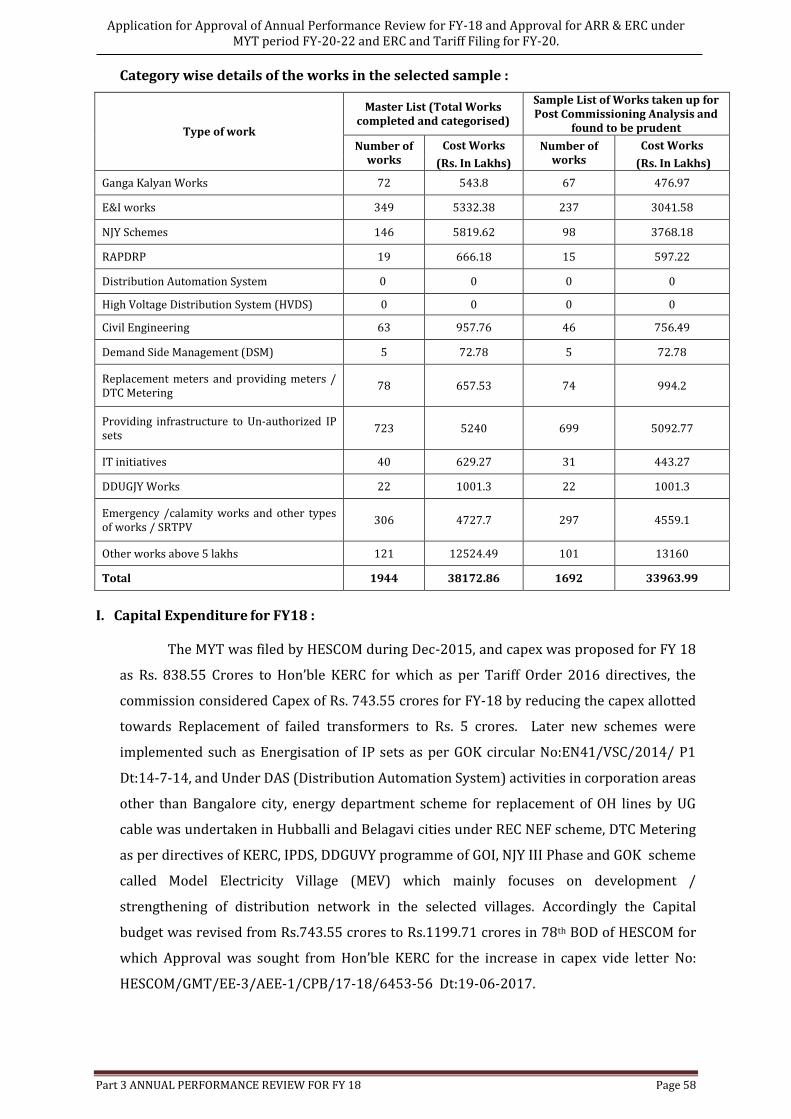
Category wise details of the works in the selected sample :
Type of work
Master List (Total Works completed and categorised)
Sample List of Works taken up for Post Commissioning Analysis and
found to be prudent
Number of works
Cost Works Number of works
Cost Works
(Rs. In Lakhs) (Rs. In Lakhs)
Ganga Kalyan Works 72 543.8 67 476.97
E&I works 349 5332.38 237 3041.58
NJY Schemes 146 5819.62 98 3768.18
RAPDRP 19 666.18 15 597.22
Distribution Automation System 0 0 0 0
High Voltage Distribution System (HVDS) 0 0 0 0
Civil Engineering 63 957.76 46 756.49
Demand Side Management (DSM) 5 72.78 5 72.78
Replacement meters and providing meters / DTC Metering
78 657.53 74 994.2
Providing infrastructure to Un-authorized IP sets
723 5240 699 5092.77
IT initiatives 40 629.27 31 443.27
DDUGJY Works 22 1001.3 22 1001.3
Emergency /calamity works and other types of works / SRTPV
306 4727.7 297 4559.1
Other works above 5 lakhs 121 12524.49 101 13160
Total 1944 38172.86 1692 33963.99
I. Capital Expenditure for FY18 :
The MYT was filed by HESCOM during Dec-2015, and capex was proposed for FY 18
as Rs. 838.55 Crores to Hon’ble KERC for which as per Tariff Order 2016 directives, the
commission considered Capex of Rs. 743.55 crores for FY-18 by reducing the capex allotted
towards Replacement of failed transformers to Rs. 5 crores. Later new schemes were
implemented such as Energisation of IP sets as per GOK circular No:EN41/VSC/2014/ P1
Dt:14-7-14, and Under DAS (Distribution Automation System) activities in corporation areas
other than Bangalore city, energy department scheme for replacement of OH lines by UG
cable was undertaken in Hubballi and Belagavi cities under REC NEF scheme, DTC Metering
as per directives of KERC, IPDS, DDGUVY programme of GOI, NJY III Phase and GOK scheme
called Model Electricity Village (MEV) which mainly focuses on development /
strengthening of distribution network in the selected villages. Accordingly the Capital
budget was revised from Rs.743.55 crores to Rs.1199.71 crores in 78th BOD of HESCOM for
which Approval was sought from Hon’ble KERC for the increase in capex vide letter No:
HESCOM/GMT/EE-3/AEE-1/CPB/17-18/6453-56 Dt:19-06-2017.
Application for Approval of Annual Performance Review for FY-18 and Approval for ARR & ERC under MYT period FY-20-22 and ERC and Tariff Filing for FY-20.
Part 3 ANNUAL PERFORMANCE REVIEW FOR FY 18 Page 59
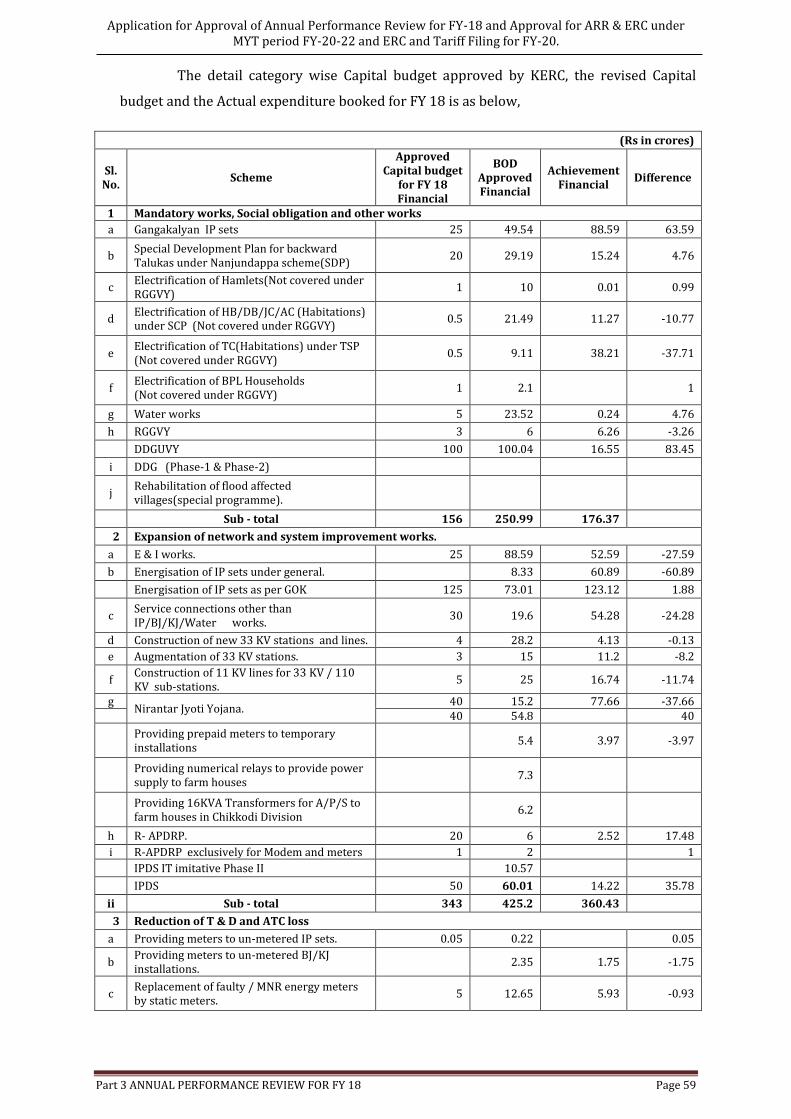
The detail category wise Capital budget approved by KERC, the revised Capital
budget and the Actual expenditure booked for FY 18 is as below,
(Rs in crores)
Sl. No.
Scheme
Approved Capital budget
for FY 18 Financial
BOD Approved Financial
Achievement Financial
Difference
1 Mandatory works, Social obligation and other works
a Gangakalyan IP sets 25 49.54 88.59 63.59
b Special Development Plan for backward Talukas under Nanjundappa scheme(SDP)
20 29.19 15.24 4.76
c Electrification of Hamlets(Not covered under RGGVY)
1 10 0.01 0.99
d Electrification of HB/DB/JC/AC (Habitations) under SCP (Not covered under RGGVY)
0.5 21.49 11.27 -10.77
e Electrification of TC(Habitations) under TSP (Not covered under RGGVY)
0.5 9.11 38.21 -37.71
f Electrification of BPL Households (Not covered under RGGVY)
1 2.1 1
g Water works 5 23.52 0.24 4.76
h RGGVY 3 6 6.26 -3.26
DDGUVY 100 100.04 16.55 83.45
i DDG (Phase-1 & Phase-2)
j Rehabilitation of flood affected villages(special programme).
Sub - total 156 250.99 176.37
2 Expansion of network and system improvement works.
a E & I works. 25 88.59 52.59 -27.59
b Energisation of IP sets under general. 8.33 60.89 -60.89
Energisation of IP sets as per GOK 125 73.01 123.12 1.88
c Service connections other than IP/BJ/KJ/Water works.
30 19.6 54.28 -24.28
d Construction of new 33 KV stations and lines. 4 28.2 4.13 -0.13
e Augmentation of 33 KV stations. 3 15 11.2 -8.2
f Construction of 11 KV lines for 33 KV / 110 KV sub-stations.
5 25 16.74 -11.74
g Nirantar Jyoti Yojana.
40 15.2 77.66 -37.66 40 54.8 40
Providing prepaid meters to temporary installations
5.4 3.97 -3.97
Providing numerical relays to provide power supply to farm houses
7.3
Providing 16KVA Transformers for A/P/S to farm houses in Chikkodi Division
6.2
h R- APDRP. 20 6 2.52 17.48
i R-APDRP exclusively for Modem and meters 1 2 1
IPDS IT imitative Phase II 10.57
IPDS 50 60.01 14.22 35.78
ii Sub - total 343 425.2 360.43
3 Reduction of T & D and ATC loss
a Providing meters to un-metered IP sets. 0.05 0.22 0.05
b Providing meters to un-metered BJ/KJ installations.
2.35 1.75 -1.75
c Replacement of faulty / MNR energy meters by static meters.
5 12.65 5.93 -0.93
Application for Approval of Annual Performance Review for FY-18 and Approval for ARR & ERC under MYT period FY-20-22 and ERC and Tariff Filing for FY-20.
Part 3 ANNUAL PERFORMANCE REVIEW FOR FY 18 Page 60
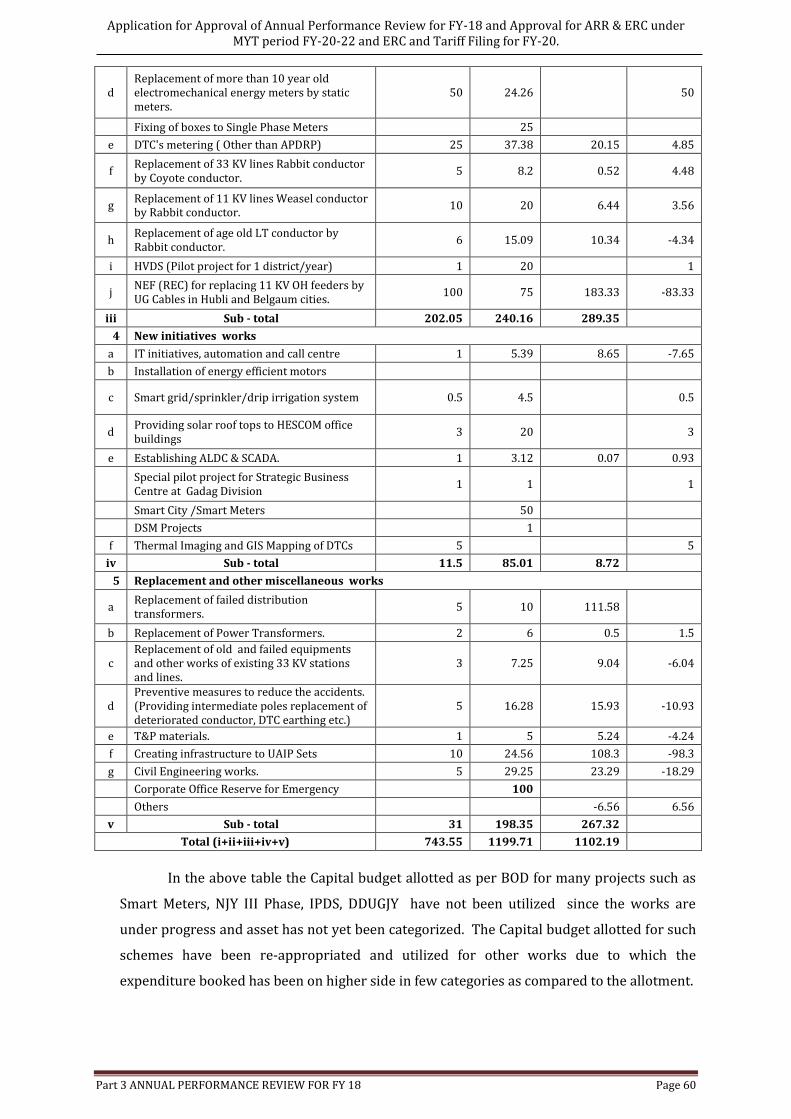
d Replacement of more than 10 year old electromechanical energy meters by static meters.
50 24.26 50
Fixing of boxes to Single Phase Meters 25
e DTC's metering ( Other than APDRP) 25 37.38 20.15 4.85
f Replacement of 33 KV lines Rabbit conductor by Coyote conductor.
5 8.2 0.52 4.48
g Replacement of 11 KV lines Weasel conductor by Rabbit conductor.
10 20 6.44 3.56
h Replacement of age old LT conductor by Rabbit conductor.
6 15.09 10.34 -4.34
i HVDS (Pilot project for 1 district/year) 1 20 1
j NEF (REC) for replacing 11 KV OH feeders by UG Cables in Hubli and Belgaum cities.
100 75 183.33 -83.33
iii Sub - total 202.05 240.16 289.35
4 New initiatives works
a IT initiatives, automation and call centre 1 5.39 8.65 -7.65
b Installation of energy efficient motors
c Smart grid/sprinkler/drip irrigation system 0.5 4.5 0.5
d Providing solar roof tops to HESCOM office buildings
3 20 3
e Establishing ALDC & SCADA. 1 3.12 0.07 0.93
Special pilot project for Strategic Business Centre at Gadag Division
1 1 1
Smart City /Smart Meters 50
DSM Projects 1
f Thermal Imaging and GIS Mapping of DTCs 5 5
iv Sub - total 11.5 85.01 8.72
5 Replacement and other miscellaneous works
a Replacement of failed distribution transformers.
5 10 111.58
b Replacement of Power Transformers. 2 6 0.5 1.5
c Replacement of old and failed equipments and other works of existing 33 KV stations and lines.
3 7.25 9.04 -6.04
d Preventive measures to reduce the accidents. (Providing intermediate poles replacement of deteriorated conductor, DTC earthing etc.)
5 16.28 15.93 -10.93
e T&P materials. 1 5 5.24 -4.24
f Creating infrastructure to UAIP Sets 10 24.56 108.3 -98.3
g Civil Engineering works. 5 29.25 23.29 -18.29
Corporate Office Reserve for Emergency 100
Others -6.56 6.56
v Sub - total 31 198.35 267.32
Total (i+ii+iii+iv+v) 743.55 1199.71 1102.19
In the above table the Capital budget allotted as per BOD for many projects such as
Smart Meters, NJY III Phase, IPDS, DDUGJY have not been utilized since the works are
under progress and asset has not yet been categorized. The Capital budget allotted for such
schemes have been re-appropriated and utilized for other works due to which the
expenditure booked has been on higher side in few categories as compared to the allotment.
Application for Approval of Annual Performance Review for FY-18 and Approval for ARR & ERC under MYT period FY-20-22 and ERC and Tariff Filing for FY-20.
Part 3 ANNUAL PERFORMANCE REVIEW FOR FY 18 Page 61
The additional Capital budget to various works was allotted by
re-appropriating the unutilized Capital budget from different categories.
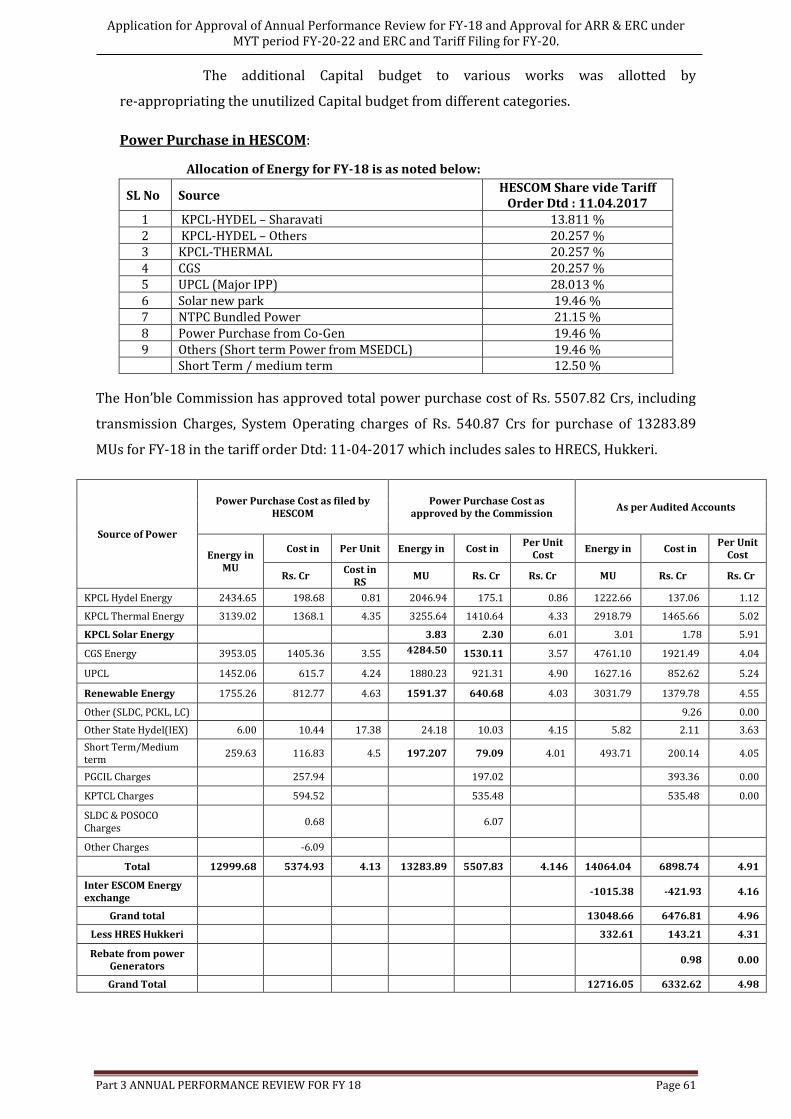
Power Purchase in HESCOM:
Allocation of Energy for FY-18 is as noted below:
SL No Source HESCOM Share vide Tariff
Order Dtd : 11.04.2017 1 KPCL-HYDEL – Sharavati 13.811 % 2 KPCL-HYDEL – Others 20.257 % 3 KPCL-THERMAL 20.257 % 4 CGS 20.257 % 5 UPCL (Major IPP) 28.013 % 6 Solar new park 19.46 % 7 NTPC Bundled Power 21.15 % 8 Power Purchase from Co-Gen 19.46 % 9 Others (Short term Power from MSEDCL) 19.46 % Short Term / medium term 12.50 %
The Hon’ble Commission has approved total power purchase cost of Rs. 5507.82 Crs, including
transmission Charges, System Operating charges of Rs. 540.87 Crs for purchase of 13283.89
MUs for FY-18 in the tariff order Dtd: 11-04-2017 which includes sales to HRECS, Hukkeri.
Source of Power
Power Purchase Cost as filed by HESCOM
Power Purchase Cost as approved by the Commission
As per Audited Accounts
Energy in MU
Cost in Per Unit Energy in Cost in Per Unit
Cost Energy in Cost in
Per Unit Cost
Rs. Cr Cost in
RS MU Rs. Cr Rs. Cr MU Rs. Cr Rs. Cr
KPCL Hydel Energy 2434.65 198.68 0.81 2046.94 175.1 0.86 1222.66 137.06 1.12
KPCL Thermal Energy 3139.02 1368.1 4.35 3255.64 1410.64 4.33 2918.79 1465.66 5.02
KPCL Solar Energy 3.83 2.30 6.01 3.01 1.78 5.91
CGS Energy 3953.05 1405.36 3.55 4284.50
1530.11 3.57 4761.10 1921.49 4.04
UPCL 1452.06 615.7 4.24 1880.23 921.31 4.90 1627.16 852.62 5.24
Renewable Energy 1755.26 812.77 4.63 1591.37 640.68 4.03 3031.79 1379.78 4.55
Other (SLDC, PCKL, LC) 9.26 0.00
Other State Hydel(IEX) 6.00 10.44 17.38 24.18 10.03 4.15 5.82 2.11 3.63
Short Term/Medium term
259.63 116.83 4.5 197.207 79.09 4.01 493.71 200.14 4.05
PGCIL Charges 257.94 197.02 393.36 0.00
KPTCL Charges 594.52 535.48 535.48 0.00
SLDC & POSOCO Charges
0.68 6.07
Other Charges -6.09
Total 12999.68 5374.93 4.13 13283.89 5507.83 4.146 14064.04 6898.74 4.91
Inter ESCOM Energy exchange
-1015.38 -421.93 4.16
Grand total 13048.66 6476.81 4.96
Less HRES Hukkeri 332.61 143.21 4.31
Rebate from power Generators
0.98 0.00
Grand Total 12716.05 6332.62 4.98
Application for Approval of Annual Performance Review for FY-18 and Approval for ARR & ERC under MYT period FY-20-22 and ERC and Tariff Filing for FY-20.
Part 3 ANNUAL PERFORMANCE REVIEW FOR FY 18 Page 62
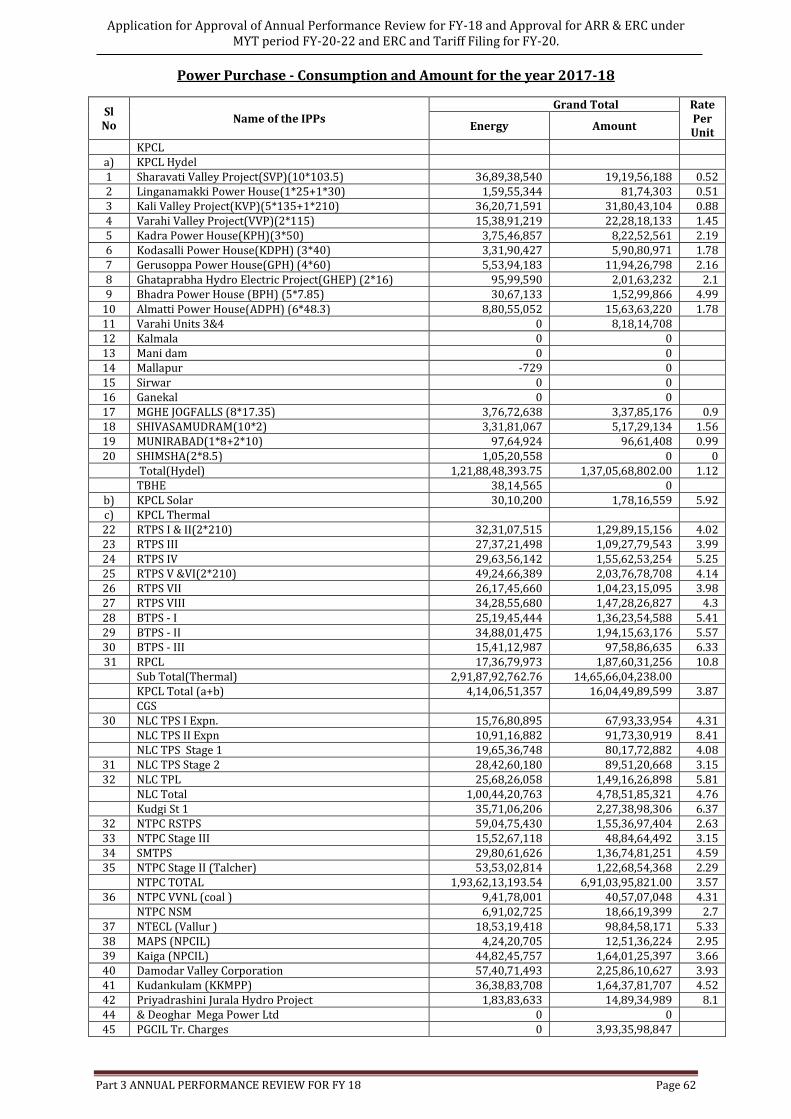
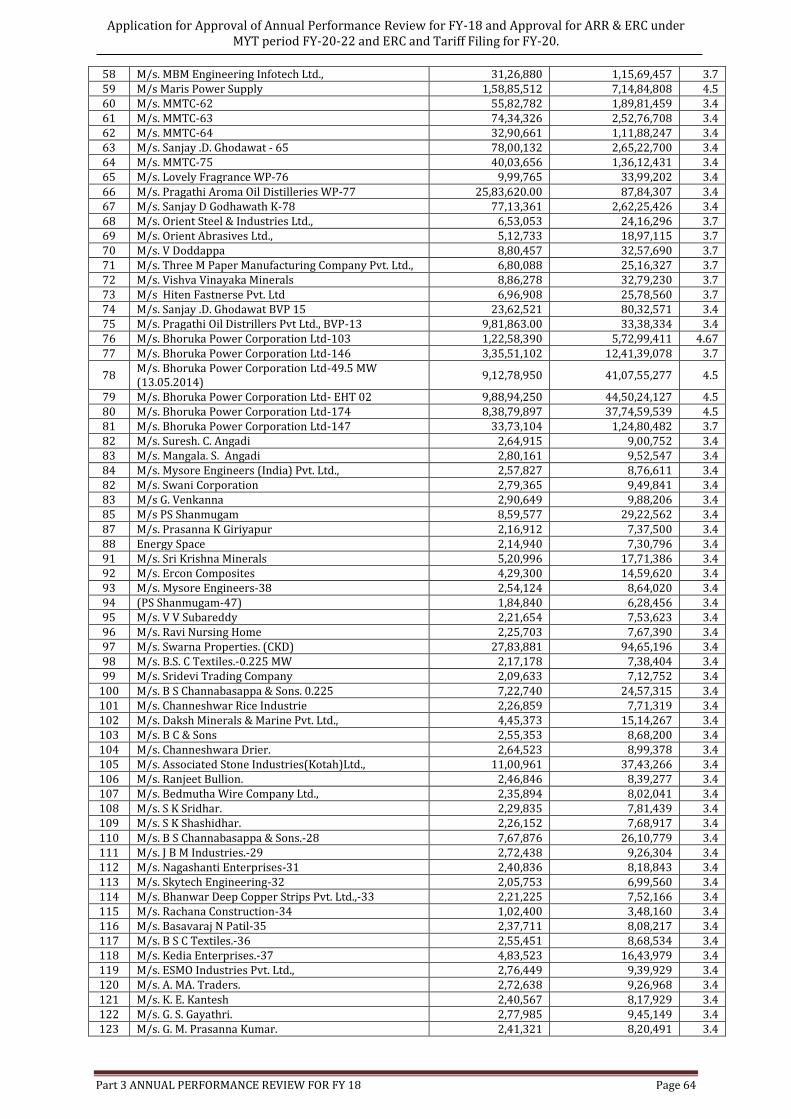
Power Purchase - Consumption and Amount for the year 2017-18
Sl No
Name of the IPPs Grand Total Rate
Per Unit
Energy Amount
KPCL a) KPCL Hydel 1 Sharavati Valley Project(SVP)(10*103.5) 36,89,38,540 19,19,56,188 0.52 2 Linganamakki Power House(1*25+1*30) 1,59,55,344 81,74,303 0.51 3 Kali Valley Project(KVP)(5*135+1*210) 36,20,71,591 31,80,43,104 0.88 4 Varahi Valley Project(VVP)(2*115) 15,38,91,219 22,28,18,133 1.45 5 Kadra Power House(KPH)(3*50) 3,75,46,857 8,22,52,561 2.19 6 Kodasalli Power House(KDPH) (3*40) 3,31,90,427 5,90,80,971 1.78 7 Gerusoppa Power House(GPH) (4*60) 5,53,94,183 11,94,26,798 2.16 8 Ghataprabha Hydro Electric Project(GHEP) (2*16) 95,99,590 2,01,63,232 2.1 9 Bhadra Power House (BPH) (5*7.85) 30,67,133 1,52,99,866 4.99
10 Almatti Power House(ADPH) (6*48.3) 8,80,55,052 15,63,63,220 1.78 11 Varahi Units 3&4 0 8,18,14,708 12 Kalmala 0 0 13 Mani dam 0 0 14 Mallapur -729 0 15 Sirwar 0 0 16 Ganekal 0 0 17 MGHE JOGFALLS (8*17.35) 3,76,72,638 3,37,85,176 0.9 18 SHIVASAMUDRAM(10*2) 3,31,81,067 5,17,29,134 1.56 19 MUNIRABAD(1*8+2*10) 97,64,924 96,61,408 0.99 20 SHIMSHA(2*8.5) 1,05,20,558 0 0 Total(Hydel) 1,21,88,48,393.75 1,37,05,68,802.00 1.12 TBHE 38,14,565 0
b) KPCL Solar 30,10,200 1,78,16,559 5.92 c) KPCL Thermal 22 RTPS I & II(2*210) 32,31,07,515 1,29,89,15,156 4.02 23 RTPS III 27,37,21,498 1,09,27,79,543 3.99 24 RTPS IV 29,63,56,142 1,55,62,53,254 5.25 25 RTPS V &VI(2*210) 49,24,66,389 2,03,76,78,708 4.14 26 RTPS VII 26,17,45,660 1,04,23,15,095 3.98 27 RTPS VIII 34,28,55,680 1,47,28,26,827 4.3 28 BTPS - I 25,19,45,444 1,36,23,54,588 5.41 29 BTPS - II 34,88,01,475 1,94,15,63,176 5.57 30 BTPS - III 15,41,12,987 97,58,86,635 6.33 31 RPCL 17,36,79,973 1,87,60,31,256 10.8
Sub Total(Thermal) 2,91,87,92,762.76 14,65,66,04,238.00 KPCL Total (a+b) 4,14,06,51,357 16,04,49,89,599 3.87 CGS
30 NLC TPS I Expn. 15,76,80,895 67,93,33,954 4.31 NLC TPS II Expn 10,91,16,882 91,73,30,919 8.41 NLC TPS Stage 1 19,65,36,748 80,17,72,882 4.08
31 NLC TPS Stage 2 28,42,60,180 89,51,20,668 3.15 32 NLC TPL 25,68,26,058 1,49,16,26,898 5.81 NLC Total 1,00,44,20,763 4,78,51,85,321 4.76 Kudgi St 1 35,71,06,206 2,27,38,98,306 6.37
32 NTPC RSTPS 59,04,75,430 1,55,36,97,404 2.63 33 NTPC Stage III 15,52,67,118 48,84,64,492 3.15 34 SMTPS 29,80,61,626 1,36,74,81,251 4.59 35 NTPC Stage II (Talcher) 53,53,02,814 1,22,68,54,368 2.29 NTPC TOTAL 1,93,62,13,193.54 6,91,03,95,821.00 3.57
36 NTPC VVNL (coal ) 9,41,78,001 40,57,07,048 4.31 NTPC NSM 6,91,02,725 18,66,19,399 2.7
37 NTECL (Vallur ) 18,53,19,418 98,84,58,171 5.33 38 MAPS (NPCIL) 4,24,20,705 12,51,36,224 2.95 39 Kaiga (NPCIL) 44,82,45,757 1,64,01,25,397 3.66 40 Damodar Valley Corporation 57,40,71,493 2,25,86,10,627 3.93 41 Kudankulam (KKMPP) 36,38,83,708 1,64,37,81,707 4.52 42 Priyadrashini Jurala Hydro Project 1,83,83,633 14,89,34,989 8.1 44 & Deoghar Mega Power Ltd 0 0 45 PGCIL Tr. Charges 0 3,93,35,98,847
Application for Approval of Annual Performance Review for FY-18 and Approval for ARR & ERC under MYT period FY-20-22 and ERC and Tariff Filing for FY-20.
Part 3 ANNUAL PERFORMANCE REVIEW FOR FY 18 Page 63
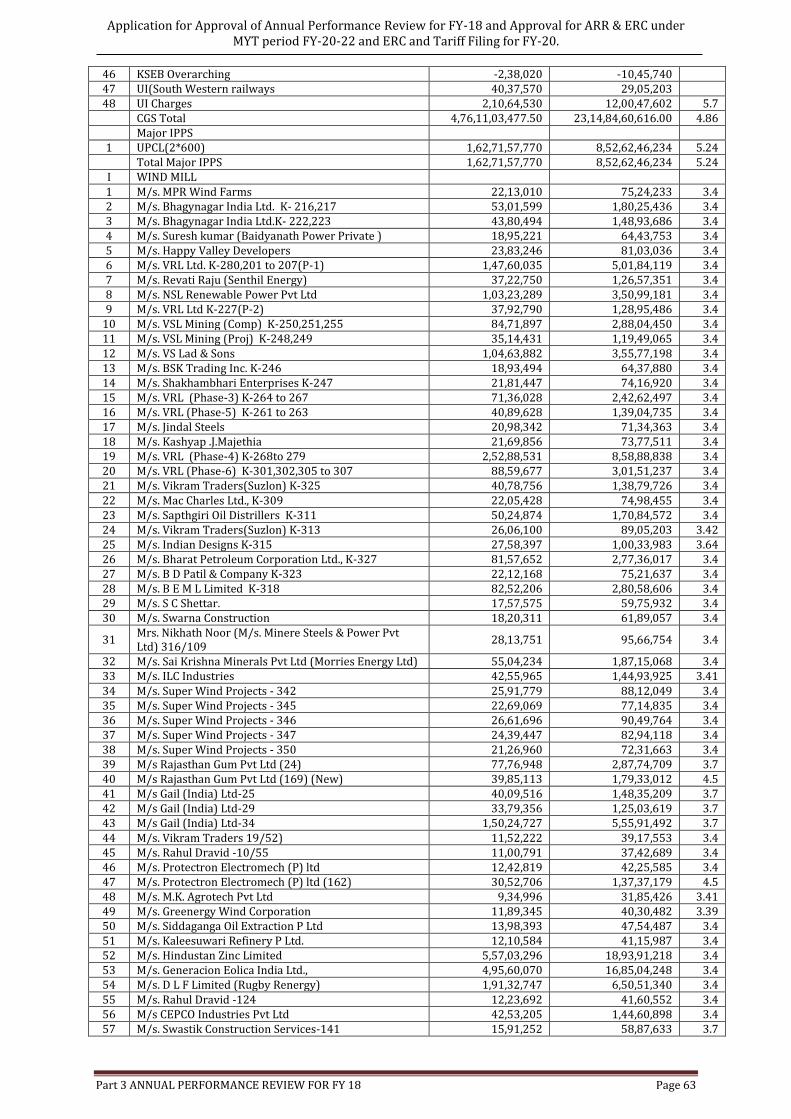
46 KSEB Overarching -2,38,020 -10,45,740 47 UI(South Western railways 40,37,570 29,05,203 48 UI Charges 2,10,64,530 12,00,47,602 5.7 CGS Total 4,76,11,03,477.50 23,14,84,60,616.00 4.86 Major IPPS 1 UPCL(2*600) 1,62,71,57,770 8,52,62,46,234 5.24 Total Major IPPS 1,62,71,57,770 8,52,62,46,234 5.24 I WIND MILL 1 M/s. MPR Wind Farms 22,13,010 75,24,233 3.4 2 M/s. Bhagynagar India Ltd. K- 216,217 53,01,599 1,80,25,436 3.4 3 M/s. Bhagynagar India Ltd.K- 222,223 43,80,494 1,48,93,686 3.4 4 M/s. Suresh kumar (Baidyanath Power Private ) 18,95,221 64,43,753 3.4 5 M/s. Happy Valley Developers 23,83,246 81,03,036 3.4 6 M/s. VRL Ltd. K-280,201 to 207(P-1) 1,47,60,035 5,01,84,119 3.4 7 M/s. Revati Raju (Senthil Energy) 37,22,750 1,26,57,351 3.4 8 M/s. NSL Renewable Power Pvt Ltd 1,03,23,289 3,50,99,181 3.4 9 M/s. VRL Ltd K-227(P-2) 37,92,790 1,28,95,486 3.4
10 M/s. VSL Mining (Comp) K-250,251,255 84,71,897 2,88,04,450 3.4 11 M/s. VSL Mining (Proj) K-248,249 35,14,431 1,19,49,065 3.4 12 M/s. VS Lad & Sons 1,04,63,882 3,55,77,198 3.4 13 M/s. BSK Trading Inc. K-246 18,93,494 64,37,880 3.4 14 M/s. Shakhambhari Enterprises K-247 21,81,447 74,16,920 3.4 15 M/s. VRL (Phase-3) K-264 to 267 71,36,028 2,42,62,497 3.4 16 M/s. VRL (Phase-5) K-261 to 263 40,89,628 1,39,04,735 3.4 17 M/s. Jindal Steels 20,98,342 71,34,363 3.4 18 M/s. Kashyap .J.Majethia 21,69,856 73,77,511 3.4 19 M/s. VRL (Phase-4) K-268to 279 2,52,88,531 8,58,88,838 3.4 20 M/s. VRL (Phase-6) K-301,302,305 to 307 88,59,677 3,01,51,237 3.4 21 M/s. Vikram Traders(Suzlon) K-325 40,78,756 1,38,79,726 3.4 22 M/s. Mac Charles Ltd., K-309 22,05,428 74,98,455 3.4 23 M/s. Sapthgiri Oil Distrillers K-311 50,24,874 1,70,84,572 3.4 24 M/s. Vikram Traders(Suzlon) K-313 26,06,100 89,05,203 3.42 25 M/s. Indian Designs K-315 27,58,397 1,00,33,983 3.64 26 M/s. Bharat Petroleum Corporation Ltd., K-327 81,57,652 2,77,36,017 3.4 27 M/s. B D Patil & Company K-323 22,12,168 75,21,637 3.4 28 M/s. B E M L Limited K-318 82,52,206 2,80,58,606 3.4 29 M/s. S C Shettar. 17,57,575 59,75,932 3.4 30 M/s. Swarna Construction 18,20,311 61,89,057 3.4
31 Mrs. Nikhath Noor (M/s. Minere Steels & Power Pvt Ltd) 316/109
28,13,751 95,66,754 3.4
32 M/s. Sai Krishna Minerals Pvt Ltd (Morries Energy Ltd) 55,04,234 1,87,15,068 3.4 33 M/s. ILC Industries 42,55,965 1,44,93,925 3.41 34 M/s. Super Wind Projects - 342 25,91,779 88,12,049 3.4 35 M/s. Super Wind Projects - 345 22,69,069 77,14,835 3.4 36 M/s. Super Wind Projects - 346 26,61,696 90,49,764 3.4 37 M/s. Super Wind Projects - 347 24,39,447 82,94,118 3.4 38 M/s. Super Wind Projects - 350 21,26,960 72,31,663 3.4 39 M/s Rajasthan Gum Pvt Ltd (24) 77,76,948 2,87,74,709 3.7 40 M/s Rajasthan Gum Pvt Ltd (169) (New) 39,85,113 1,79,33,012 4.5 41 M/s Gail (India) Ltd-25 40,09,516 1,48,35,209 3.7 42 M/s Gail (India) Ltd-29 33,79,356 1,25,03,619 3.7 43 M/s Gail (India) Ltd-34 1,50,24,727 5,55,91,492 3.7 44 M/s. Vikram Traders 19/52) 11,52,222 39,17,553 3.4 45 M/s. Rahul Dravid -10/55 11,00,791 37,42,689 3.4 46 M/s. Protectron Electromech (P) ltd 12,42,819 42,25,585 3.4 47 M/s. Protectron Electromech (P) ltd (162) 30,52,706 1,37,37,179 4.5 48 M/s. M.K. Agrotech Pvt Ltd 9,34,996 31,85,426 3.41 49 M/s. Greenergy Wind Corporation 11,89,345 40,30,482 3.39 50 M/s. Siddaganga Oil Extraction P Ltd 13,98,393 47,54,487 3.4 51 M/s. Kaleesuwari Refinery P Ltd. 12,10,584 41,15,987 3.4 52 M/s. Hindustan Zinc Limited 5,57,03,296 18,93,91,218 3.4 53 M/s. Generacion Eolica India Ltd., 4,95,60,070 16,85,04,248 3.4 54 M/s. D L F Limited (Rugby Renergy) 1,91,32,747 6,50,51,340 3.4 55 M/s. Rahul Dravid -124 12,23,692 41,60,552 3.4 56 M/s CEPCO Industries Pvt Ltd 42,53,205 1,44,60,898 3.4 57 M/s. Swastik Construction Services-141 15,91,252 58,87,633 3.7
Application for Approval of Annual Performance Review for FY-18 and Approval for ARR & ERC under MYT period FY-20-22 and ERC and Tariff Filing for FY-20.
Part 3 ANNUAL PERFORMANCE REVIEW FOR FY 18 Page 64
58 M/s. MBM Engineering Infotech Ltd., 31,26,880 1,15,69,457 3.7 59 M/s Maris Power Supply 1,58,85,512 7,14,84,808 4.5 60 M/s. MMTC-62 55,82,782 1,89,81,459 3.4 61 M/s. MMTC-63 74,34,326 2,52,76,708 3.4 62 M/s. MMTC-64 32,90,661 1,11,88,247 3.4 63 M/s. Sanjay .D. Ghodawat - 65 78,00,132 2,65,22,700 3.4 64 M/s. MMTC-75 40,03,656 1,36,12,431 3.4 65 M/s. Lovely Fragrance WP-76 9,99,765 33,99,202 3.4 66 M/s. Pragathi Aroma Oil Distilleries WP-77 25,83,620.00 87,84,307 3.4 67 M/s. Sanjay D Godhawath K-78 77,13,361 2,62,25,426 3.4 68 M/s. Orient Steel & Industries Ltd., 6,53,053 24,16,296 3.7 69 M/s. Orient Abrasives Ltd., 5,12,733 18,97,115 3.7 70 M/s. V Doddappa 8,80,457 32,57,690 3.7 71 M/s. Three M Paper Manufacturing Company Pvt. Ltd., 6,80,088 25,16,327 3.7 72 M/s. Vishva Vinayaka Minerals 8,86,278 32,79,230 3.7 73 M/s Hiten Fastnerse Pvt. Ltd 6,96,908 25,78,560 3.7 74 M/s. Sanjay .D. Ghodawat BVP 15 23,62,521 80,32,571 3.4 75 M/s. Pragathi Oil Distrillers Pvt Ltd., BVP-13 9,81,863.00 33,38,334 3.4 76 M/s. Bhoruka Power Corporation Ltd-103 1,22,58,390 5,72,99,411 4.67 77 M/s. Bhoruka Power Corporation Ltd-146 3,35,51,102 12,41,39,078 3.7
78 M/s. Bhoruka Power Corporation Ltd-49.5 MW (13.05.2014)
9,12,78,950 41,07,55,277 4.5
79 M/s. Bhoruka Power Corporation Ltd- EHT 02 9,88,94,250 44,50,24,127 4.5 80 M/s. Bhoruka Power Corporation Ltd-174 8,38,79,897 37,74,59,539 4.5 81 M/s. Bhoruka Power Corporation Ltd-147 33,73,104 1,24,80,482 3.7 82 M/s. Suresh. C. Angadi 2,64,915 9,00,752 3.4 83 M/s. Mangala. S. Angadi 2,80,161 9,52,547 3.4 84 M/s. Mysore Engineers (India) Pvt. Ltd., 2,57,827 8,76,611 3.4 82 M/s. Swani Corporation 2,79,365 9,49,841 3.4 83 M/s G. Venkanna 2,90,649 9,88,206 3.4 85 M/s PS Shanmugam 8,59,577 29,22,562 3.4 87 M/s. Prasanna K Giriyapur 2,16,912 7,37,500 3.4 88 Energy Space 2,14,940 7,30,796 3.4 91 M/s. Sri Krishna Minerals 5,20,996 17,71,386 3.4 92 M/s. Ercon Composites 4,29,300 14,59,620 3.4 93 M/s. Mysore Engineers-38 2,54,124 8,64,020 3.4 94 (PS Shanmugam-47) 1,84,840 6,28,456 3.4 95 M/s. V V Subareddy 2,21,654 7,53,623 3.4 96 M/s. Ravi Nursing Home 2,25,703 7,67,390 3.4 97 M/s. Swarna Properties. (CKD) 27,83,881 94,65,196 3.4 98 M/s. B.S. C Textiles.-0.225 MW 2,17,178 7,38,404 3.4 99 M/s. Sridevi Trading Company 2,09,633 7,12,752 3.4
100 M/s. B S Channabasappa & Sons. 0.225 7,22,740 24,57,315 3.4 101 M/s. Channeshwar Rice Industrie 2,26,859 7,71,319 3.4 102 M/s. Daksh Minerals & Marine Pvt. Ltd., 4,45,373 15,14,267 3.4 103 M/s. B C & Sons 2,55,353 8,68,200 3.4 104 M/s. Channeshwara Drier. 2,64,523 8,99,378 3.4 105 M/s. Associated Stone Industries(Kotah)Ltd., 11,00,961 37,43,266 3.4 106 M/s. Ranjeet Bullion. 2,46,846 8,39,277 3.4 107 M/s. Bedmutha Wire Company Ltd., 2,35,894 8,02,041 3.4 108 M/s. S K Sridhar. 2,29,835 7,81,439 3.4 109 M/s. S K Shashidhar. 2,26,152 7,68,917 3.4 110 M/s. B S Channabasappa & Sons.-28 7,67,876 26,10,779 3.4 111 M/s. J B M Industries.-29 2,72,438 9,26,304 3.4 112 M/s. Nagashanti Enterprises-31 2,40,836 8,18,843 3.4 113 M/s. Skytech Engineering-32 2,05,753 6,99,560 3.4 114 M/s. Bhanwar Deep Copper Strips Pvt. Ltd.,-33 2,21,225 7,52,166 3.4 115 M/s. Rachana Construction-34 1,02,400 3,48,160 3.4 116 M/s. Basavaraj N Patil-35 2,37,711 8,08,217 3.4 117 M/s. B S C Textiles.-36 2,55,451 8,68,534 3.4 118 M/s. Kedia Enterprises.-37 4,83,523 16,43,979 3.4 119 M/s. ESMO Industries Pvt. Ltd., 2,76,449 9,39,929 3.4 120 M/s. A. MA. Traders. 2,72,638 9,26,968 3.4 121 M/s. K. E. Kantesh 2,40,567 8,17,929 3.4 122 M/s. G. S. Gayathri. 2,77,985 9,45,149 3.4 123 M/s. G. M. Prasanna Kumar. 2,41,321 8,20,491 3.4
Application for Approval of Annual Performance Review for FY-18 and Approval for ARR & ERC under MYT period FY-20-22 and ERC and Tariff Filing for FY-20.
Part 3 ANNUAL PERFORMANCE REVIEW FOR FY 18 Page 65
124 M/s. G. M. Lingaraju. 2,68,727 9,13,671 3.4 125 M/s. AAA & Sons Enterprises Pvt. Ltd., 10,74,742 36,54,123 3.4 126 M/s Swami Samarth Engineers 1,36,875 4,65,375 3.4 127 M/s Oswal Woolen Mills Ltd (RR No 1) 10,61,569 39,27,808 3.7 128 M/s Oswal Woolen Mills Ltd (RR No 2) 11,84,911 43,84,171 3.7
129 M/s. NSB Infrastucture &Project Pvt. Ltd, - Greenergy WindCPL
13,04,878 48,28,049 0
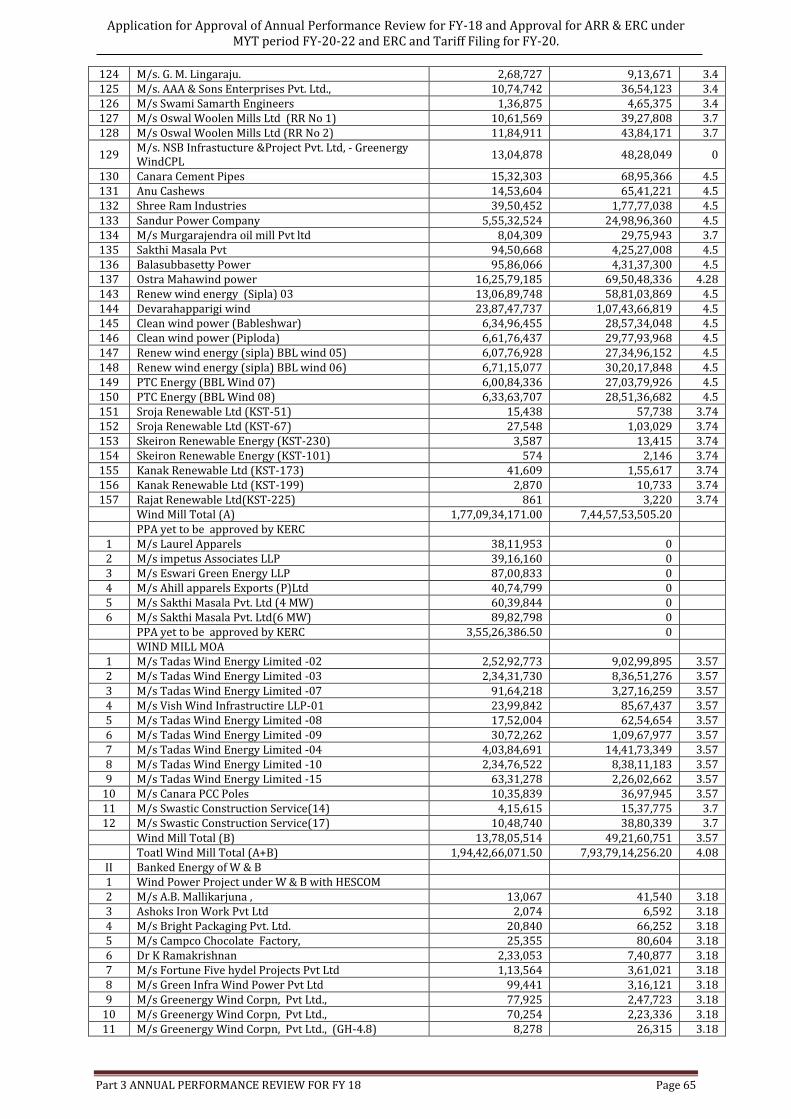
130 Canara Cement Pipes 15,32,303 68,95,366 4.5 131 Anu Cashews 14,53,604 65,41,221 4.5 132 Shree Ram Industries 39,50,452 1,77,77,038 4.5 133 Sandur Power Company 5,55,32,524 24,98,96,360 4.5 134 M/s Murgarajendra oil mill Pvt ltd 8,04,309 29,75,943 3.7 135 Sakthi Masala Pvt 94,50,668 4,25,27,008 4.5 136 Balasubbasetty Power 95,86,066 4,31,37,300 4.5 137 Ostra Mahawind power 16,25,79,185 69,50,48,336 4.28 143 Renew wind energy (Sipla) 03 13,06,89,748 58,81,03,869 4.5 144 Devarahapparigi wind 23,87,47,737 1,07,43,66,819 4.5 145 Clean wind power (Bableshwar) 6,34,96,455 28,57,34,048 4.5 146 Clean wind power (Piploda) 6,61,76,437 29,77,93,968 4.5 147 Renew wind energy (sipla) BBL wind 05) 6,07,76,928 27,34,96,152 4.5 148 Renew wind energy (sipla) BBL wind 06) 6,71,15,077 30,20,17,848 4.5 149 PTC Energy (BBL Wind 07) 6,00,84,336 27,03,79,926 4.5 150 PTC Energy (BBL Wind 08) 6,33,63,707 28,51,36,682 4.5 151 Sroja Renewable Ltd (KST-51) 15,438 57,738 3.74 152 Sroja Renewable Ltd (KST-67) 27,548 1,03,029 3.74 153 Skeiron Renewable Energy (KST-230) 3,587 13,415 3.74 154 Skeiron Renewable Energy (KST-101) 574 2,146 3.74 155 Kanak Renewable Ltd (KST-173) 41,609 1,55,617 3.74 156 Kanak Renewable Ltd (KST-199) 2,870 10,733 3.74 157 Rajat Renewable Ltd(KST-225) 861 3,220 3.74
Wind Mill Total (A) 1,77,09,34,171.00 7,44,57,53,505.20 PPA yet to be approved by KERC 1 M/s Laurel Apparels 38,11,953 0 2 M/s impetus Associates LLP 39,16,160 0 3 M/s Eswari Green Energy LLP 87,00,833 0 4 M/s Ahill apparels Exports (P)Ltd 40,74,799 0 5 M/s Sakthi Masala Pvt. Ltd (4 MW) 60,39,844 0 6 M/s Sakthi Masala Pvt. Ltd(6 MW) 89,82,798 0 PPA yet to be approved by KERC 3,55,26,386.50 0 WIND MILL MOA 1 M/s Tadas Wind Energy Limited -02 2,52,92,773 9,02,99,895 3.57 2 M/s Tadas Wind Energy Limited -03 2,34,31,730 8,36,51,276 3.57 3 M/s Tadas Wind Energy Limited -07 91,64,218 3,27,16,259 3.57 4 M/s Vish Wind Infrastructire LLP-01 23,99,842 85,67,437 3.57 5 M/s Tadas Wind Energy Limited -08 17,52,004 62,54,654 3.57 6 M/s Tadas Wind Energy Limited -09 30,72,262 1,09,67,977 3.57 7 M/s Tadas Wind Energy Limited -04 4,03,84,691 14,41,73,349 3.57 8 M/s Tadas Wind Energy Limited -10 2,34,76,522 8,38,11,183 3.57 9 M/s Tadas Wind Energy Limited -15 63,31,278 2,26,02,662 3.57
10 M/s Canara PCC Poles 10,35,839 36,97,945 3.57 11 M/s Swastic Construction Service(14) 4,15,615 15,37,775 3.7 12 M/s Swastic Construction Service(17) 10,48,740 38,80,339 3.7 Wind Mill Total (B) 13,78,05,514 49,21,60,751 3.57 Toatl Wind Mill Total (A+B) 1,94,42,66,071.50 7,93,79,14,256.20 4.08 II Banked Energy of W & B 1 Wind Power Project under W & B with HESCOM 2 M/s A.B. Mallikarjuna , 13,067 41,540 3.18 3 Ashoks Iron Work Pvt Ltd 2,074 6,592 3.18 4 M/s Bright Packaging Pvt. Ltd. 20,840 66,252 3.18 5 M/s Campco Chocolate Factory, 25,355 80,604 3.18 6 Dr K Ramakrishnan 2,33,053 7,40,877 3.18 7 M/s Fortune Five hydel Projects Pvt Ltd 1,13,564 3,61,021 3.18 8 M/s Green Infra Wind Power Pvt Ltd 99,441 3,16,121 3.18 9 M/s Greenergy Wind Corpn, Pvt Ltd., 77,925 2,47,723 3.18
10 M/s Greenergy Wind Corpn, Pvt Ltd., 70,254 2,23,336 3.18 11 M/s Greenergy Wind Corpn, Pvt Ltd., (GH-4.8) 8,278 26,315 3.18
Application for Approval of Annual Performance Review for FY-18 and Approval for ARR & ERC under MYT period FY-20-22 and ERC and Tariff Filing for FY-20.
Part 3 ANNUAL PERFORMANCE REVIEW FOR FY 18 Page 66
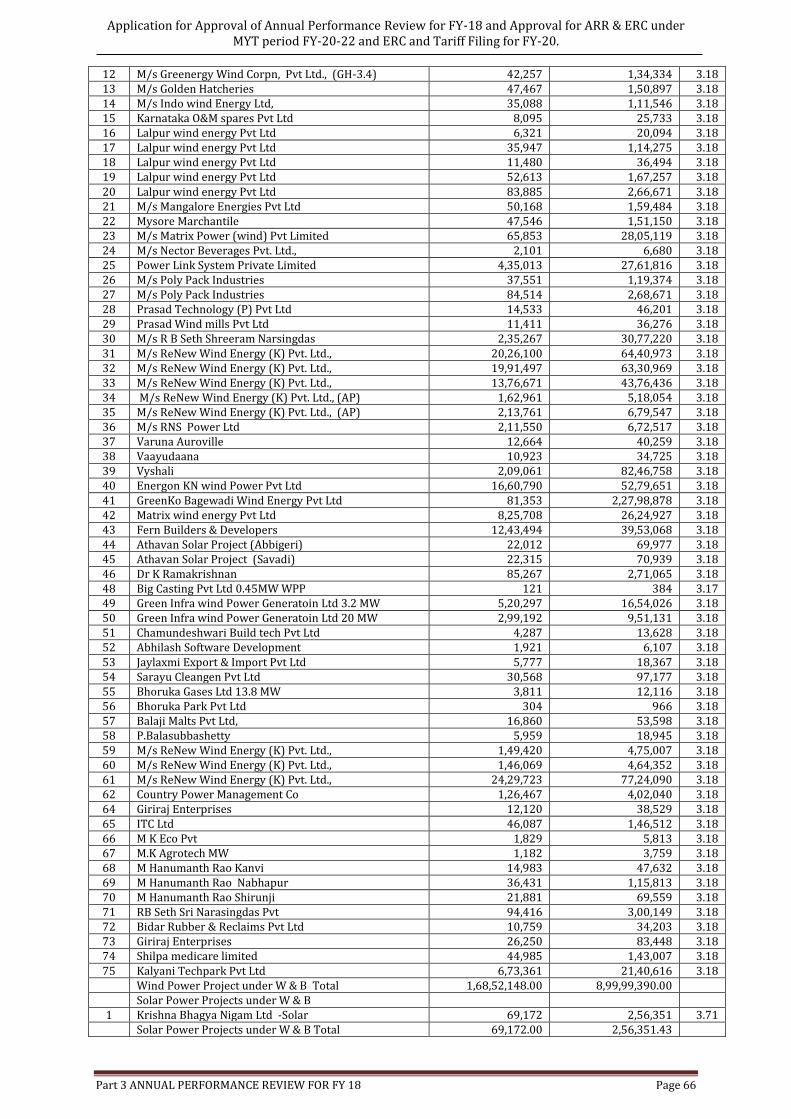
12 M/s Greenergy Wind Corpn, Pvt Ltd., (GH-3.4) 42,257 1,34,334 3.18 13 M/s Golden Hatcheries 47,467 1,50,897 3.18 14 M/s Indo wind Energy Ltd, 35,088 1,11,546 3.18 15 Karnataka O&M spares Pvt Ltd 8,095 25,733 3.18 16 Lalpur wind energy Pvt Ltd 6,321 20,094 3.18 17 Lalpur wind energy Pvt Ltd 35,947 1,14,275 3.18 18 Lalpur wind energy Pvt Ltd 11,480 36,494 3.18 19 Lalpur wind energy Pvt Ltd 52,613 1,67,257 3.18 20 Lalpur wind energy Pvt Ltd 83,885 2,66,671 3.18 21 M/s Mangalore Energies Pvt Ltd 50,168 1,59,484 3.18 22 Mysore Marchantile 47,546 1,51,150 3.18 23 M/s Matrix Power (wind) Pvt Limited 65,853 28,05,119 3.18 24 M/s Nector Beverages Pvt. Ltd., 2,101 6,680 3.18 25 Power Link System Private Limited 4,35,013 27,61,816 3.18 26 M/s Poly Pack Industries 37,551 1,19,374 3.18 27 M/s Poly Pack Industries 84,514 2,68,671 3.18 28 Prasad Technology (P) Pvt Ltd 14,533 46,201 3.18 29 Prasad Wind mills Pvt Ltd 11,411 36,276 3.18 30 M/s R B Seth Shreeram Narsingdas 2,35,267 30,77,220 3.18 31 M/s ReNew Wind Energy (K) Pvt. Ltd., 20,26,100 64,40,973 3.18 32 M/s ReNew Wind Energy (K) Pvt. Ltd., 19,91,497 63,30,969 3.18 33 M/s ReNew Wind Energy (K) Pvt. Ltd., 13,76,671 43,76,436 3.18 34 M/s ReNew Wind Energy (K) Pvt. Ltd., (AP) 1,62,961 5,18,054 3.18 35 M/s ReNew Wind Energy (K) Pvt. Ltd., (AP) 2,13,761 6,79,547 3.18 36 M/s RNS Power Ltd 2,11,550 6,72,517 3.18 37 Varuna Auroville 12,664 40,259 3.18 38 Vaayudaana 10,923 34,725 3.18 39 Vyshali 2,09,061 82,46,758 3.18 40 Energon KN wind Power Pvt Ltd 16,60,790 52,79,651 3.18 41 GreenKo Bagewadi Wind Energy Pvt Ltd 81,353 2,27,98,878 3.18 42 Matrix wind energy Pvt Ltd 8,25,708 26,24,927 3.18 43 Fern Builders & Developers 12,43,494 39,53,068 3.18 44 Athavan Solar Project (Abbigeri) 22,012 69,977 3.18 45 Athavan Solar Project (Savadi) 22,315 70,939 3.18 46 Dr K Ramakrishnan 85,267 2,71,065 3.18 48 Big Casting Pvt Ltd 0.45MW WPP 121 384 3.17 49 Green Infra wind Power Generatoin Ltd 3.2 MW 5,20,297 16,54,026 3.18 50 Green Infra wind Power Generatoin Ltd 20 MW 2,99,192 9,51,131 3.18 51 Chamundeshwari Build tech Pvt Ltd 4,287 13,628 3.18 52 Abhilash Software Development 1,921 6,107 3.18 53 Jaylaxmi Export & Import Pvt Ltd 5,777 18,367 3.18 54 Sarayu Cleangen Pvt Ltd 30,568 97,177 3.18 55 Bhoruka Gases Ltd 13.8 MW 3,811 12,116 3.18 56 Bhoruka Park Pvt Ltd 304 966 3.18 57 Balaji Malts Pvt Ltd, 16,860 53,598 3.18 58 P.Balasubbashetty 5,959 18,945 3.18 59 M/s ReNew Wind Energy (K) Pvt. Ltd., 1,49,420 4,75,007 3.18 60 M/s ReNew Wind Energy (K) Pvt. Ltd., 1,46,069 4,64,352 3.18 61 M/s ReNew Wind Energy (K) Pvt. Ltd., 24,29,723 77,24,090 3.18 62 Country Power Management Co 1,26,467 4,02,040 3.18 64 Giriraj Enterprises 12,120 38,529 3.18 65 ITC Ltd 46,087 1,46,512 3.18 66 M K Eco Pvt 1,829 5,813 3.18 67 M.K Agrotech MW 1,182 3,759 3.18 68 M Hanumanth Rao Kanvi 14,983 47,632 3.18 69 M Hanumanth Rao Nabhapur 36,431 1,15,813 3.18 70 M Hanumanth Rao Shirunji 21,881 69,559 3.18 71 RB Seth Sri Narasingdas Pvt 94,416 3,00,149 3.18 72 Bidar Rubber & Reclaims Pvt Ltd 10,759 34,203 3.18 73 Giriraj Enterprises 26,250 83,448 3.18 74 Shilpa medicare limited 44,985 1,43,007 3.18 75 Kalyani Techpark Pvt Ltd 6,73,361 21,40,616 3.18 Wind Power Project under W & B Total 1,68,52,148.00 8,99,99,390.00 Solar Power Projects under W & B 1 Krishna Bhagya Nigam Ltd -Solar 69,172 2,56,351 3.71 Solar Power Projects under W & B Total 69,172.00 2,56,351.43
Application for Approval of Annual Performance Review for FY-18 and Approval for ARR & ERC under MYT period FY-20-22 and ERC and Tariff Filing for FY-20.
Part 3 ANNUAL PERFORMANCE REVIEW FOR FY 18 Page 67
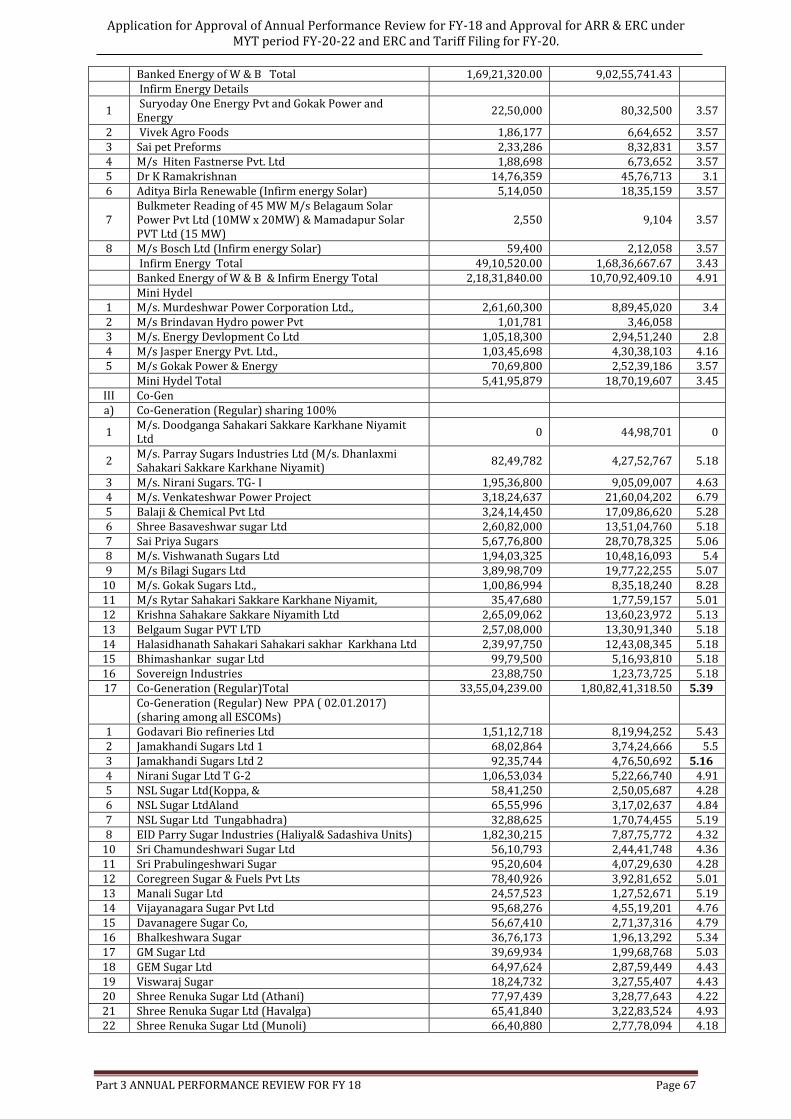
Banked Energy of W & B Total 1,69,21,320.00 9,02,55,741.43 Infirm Energy Details
1 Suryoday One Energy Pvt and Gokak Power and Energy
22,50,000 80,32,500 3.57
2 Vivek Agro Foods 1,86,177 6,64,652 3.57 3 Sai pet Preforms 2,33,286 8,32,831 3.57 4 M/s Hiten Fastnerse Pvt. Ltd 1,88,698 6,73,652 3.57 5 Dr K Ramakrishnan 14,76,359 45,76,713 3.1 6 Aditya Birla Renewable (Infirm energy Solar) 5,14,050 18,35,159 3.57
7 Bulkmeter Reading of 45 MW M/s Belagaum Solar Power Pvt Ltd (10MW x 20MW) & Mamadapur Solar PVT Ltd (15 MW)
2,550 9,104 3.57
8 M/s Bosch Ltd (Infirm energy Solar) 59,400 2,12,058 3.57 Infirm Energy Total 49,10,520.00 1,68,36,667.67 3.43 Banked Energy of W & B & Infirm Energy Total 2,18,31,840.00 10,70,92,409.10 4.91 Mini Hydel 1 M/s. Murdeshwar Power Corporation Ltd., 2,61,60,300 8,89,45,020 3.4 2 M/s Brindavan Hydro power Pvt 1,01,781 3,46,058 3 M/s. Energy Devlopment Co Ltd 1,05,18,300 2,94,51,240 2.8 4 M/s Jasper Energy Pvt. Ltd., 1,03,45,698 4,30,38,103 4.16 5 M/s Gokak Power & Energy 70,69,800 2,52,39,186 3.57 Mini Hydel Total 5,41,95,879 18,70,19,607 3.45
III Co-Gen a) Co-Generation (Regular) sharing 100%
1 M/s. Doodganga Sahakari Sakkare Karkhane Niyamit Ltd
0 44,98,701 0
2 M/s. Parray Sugars Industries Ltd (M/s. Dhanlaxmi Sahakari Sakkare Karkhane Niyamit)
82,49,782 4,27,52,767 5.18
3 M/s. Nirani Sugars. TG- I 1,95,36,800 9,05,09,007 4.63 4 M/s. Venkateshwar Power Project 3,18,24,637 21,60,04,202 6.79 5 Balaji & Chemical Pvt Ltd 3,24,14,450 17,09,86,620 5.28 6 Shree Basaveshwar sugar Ltd 2,60,82,000 13,51,04,760 5.18 7 Sai Priya Sugars 5,67,76,800 28,70,78,325 5.06 8 M/s. Vishwanath Sugars Ltd 1,94,03,325 10,48,16,093 5.4 9 M/s Bilagi Sugars Ltd 3,89,98,709 19,77,22,255 5.07
10 M/s. Gokak Sugars Ltd., 1,00,86,994 8,35,18,240 8.28 11 M/s Rytar Sahakari Sakkare Karkhane Niyamit, 35,47,680 1,77,59,157 5.01 12 Krishna Sahakare Sakkare Niyamith Ltd 2,65,09,062 13,60,23,972 5.13 13 Belgaum Sugar PVT LTD 2,57,08,000 13,30,91,340 5.18 14 Halasidhanath Sahakari Sahakari sakhar Karkhana Ltd 2,39,97,750 12,43,08,345 5.18 15 Bhimashankar sugar Ltd 99,79,500 5,16,93,810 5.18 16 Sovereign Industries 23,88,750 1,23,73,725 5.18 17 Co-Generation (Regular)Total 33,55,04,239.00 1,80,82,41,318.50 5.39
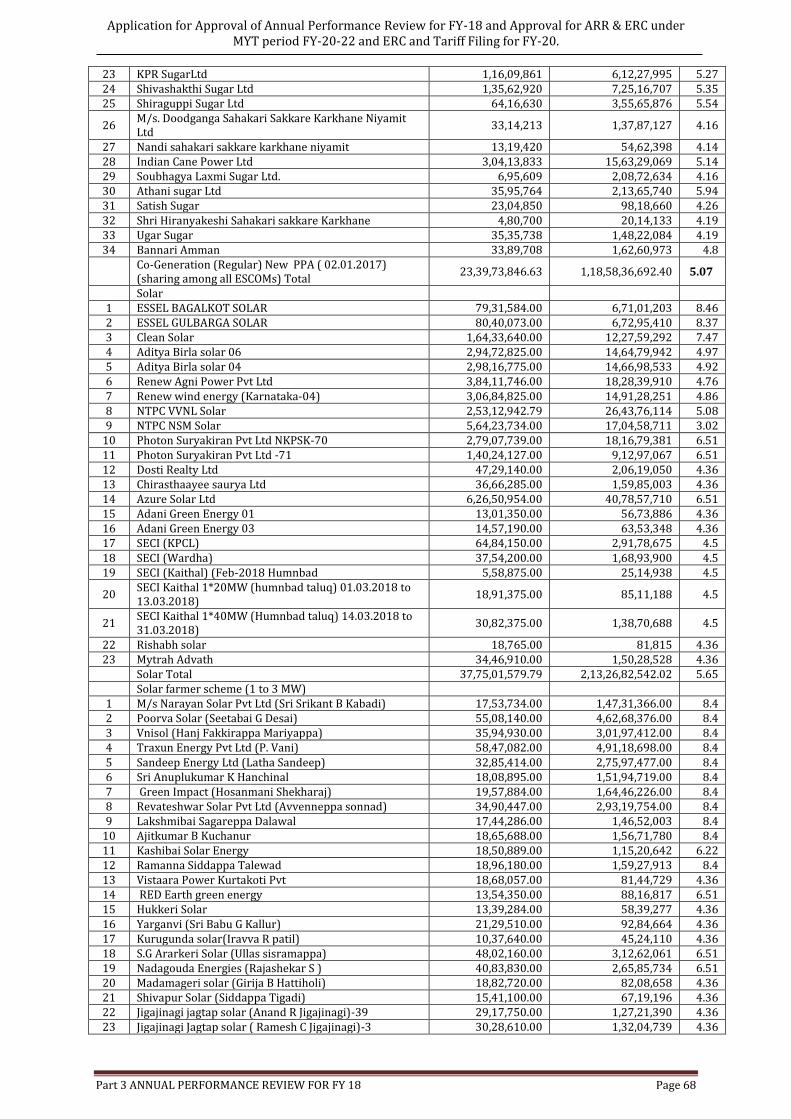
Co-Generation (Regular) New PPA ( 02.01.2017) (sharing among all ESCOMs)
1 Godavari Bio refineries Ltd 1,51,12,718 8,19,94,252 5.43 2 Jamakhandi Sugars Ltd 1 68,02,864 3,74,24,666 5.5 3 Jamakhandi Sugars Ltd 2 92,35,744 4,76,50,692 5.16 4 Nirani Sugar Ltd T G-2 1,06,53,034 5,22,66,740 4.91 5 NSL Sugar Ltd(Koppa, & 58,41,250 2,50,05,687 4.28 6 NSL Sugar LtdAland 65,55,996 3,17,02,637 4.84 7 NSL Sugar Ltd Tungabhadra) 32,88,625 1,70,74,455 5.19 8 EID Parry Sugar Industries (Haliyal& Sadashiva Units) 1,82,30,215 7,87,75,772 4.32
10 Sri Chamundeshwari Sugar Ltd 56,10,793 2,44,41,748 4.36 11 Sri Prabulingeshwari Sugar 95,20,604 4,07,29,630 4.28 12 Coregreen Sugar & Fuels Pvt Lts 78,40,926 3,92,81,652 5.01 13 Manali Sugar Ltd 24,57,523 1,27,52,671 5.19 14 Vijayanagara Sugar Pvt Ltd 95,68,276 4,55,19,201 4.76 15 Davanagere Sugar Co, 56,67,410 2,71,37,316 4.79 16 Bhalkeshwara Sugar 36,76,173 1,96,13,292 5.34 17 GM Sugar Ltd 39,69,934 1,99,68,768 5.03 18 GEM Sugar Ltd 64,97,624 2,87,59,449 4.43 19 Viswaraj Sugar 18,24,732 3,27,55,407 4.43 20 Shree Renuka Sugar Ltd (Athani) 77,97,439 3,28,77,643 4.22 21 Shree Renuka Sugar Ltd (Havalga) 65,41,840 3,22,83,524 4.93 22 Shree Renuka Sugar Ltd (Munoli) 66,40,880 2,77,78,094 4.18
Application for Approval of Annual Performance Review for FY-18 and Approval for ARR & ERC under MYT period FY-20-22 and ERC and Tariff Filing for FY-20.
Part 3 ANNUAL PERFORMANCE REVIEW FOR FY 18 Page 68
23 KPR SugarLtd 1,16,09,861 6,12,27,995 5.27 24 Shivashakthi Sugar Ltd 1,35,62,920 7,25,16,707 5.35 25 Shiraguppi Sugar Ltd 64,16,630 3,55,65,876 5.54
26 M/s. Doodganga Sahakari Sakkare Karkhane Niyamit Ltd
33,14,213 1,37,87,127 4.16
27 Nandi sahakari sakkare karkhane niyamit 13,19,420 54,62,398 4.14 28 Indian Cane Power Ltd 3,04,13,833 15,63,29,069 5.14 29 Soubhagya Laxmi Sugar Ltd. 6,95,609 2,08,72,634 4.16 30 Athani sugar Ltd 35,95,764 2,13,65,740 5.94 31 Satish Sugar 23,04,850 98,18,660 4.26 32 Shri Hiranyakeshi Sahakari sakkare Karkhane 4,80,700 20,14,133 4.19 33 Ugar Sugar 35,35,738 1,48,22,084 4.19 34 Bannari Amman 33,89,708 1,62,60,973 4.8
Co-Generation (Regular) New PPA ( 02.01.2017) (sharing among all ESCOMs) Total
23,39,73,846.63 1,18,58,36,692.40 5.07
Solar 1 ESSEL BAGALKOT SOLAR 79,31,584.00 6,71,01,203 8.46 2 ESSEL GULBARGA SOLAR 80,40,073.00 6,72,95,410 8.37 3 Clean Solar 1,64,33,640.00 12,27,59,292 7.47 4 Aditya Birla solar 06 2,94,72,825.00 14,64,79,942 4.97 5 Aditya Birla solar 04 2,98,16,775.00 14,66,98,533 4.92 6 Renew Agni Power Pvt Ltd 3,84,11,746.00 18,28,39,910 4.76 7 Renew wind energy (Karnataka-04) 3,06,84,825.00 14,91,28,251 4.86 8 NTPC VVNL Solar 2,53,12,942.79 26,43,76,114 5.08 9 NTPC NSM Solar 5,64,23,734.00 17,04,58,711 3.02
10 Photon Suryakiran Pvt Ltd NKPSK-70 2,79,07,739.00 18,16,79,381 6.51 11 Photon Suryakiran Pvt Ltd -71 1,40,24,127.00 9,12,97,067 6.51 12 Dosti Realty Ltd 47,29,140.00 2,06,19,050 4.36 13 Chirasthaayee saurya Ltd 36,66,285.00 1,59,85,003 4.36 14 Azure Solar Ltd 6,26,50,954.00 40,78,57,710 6.51 15 Adani Green Energy 01 13,01,350.00 56,73,886 4.36 16 Adani Green Energy 03 14,57,190.00 63,53,348 4.36 17 SECI (KPCL) 64,84,150.00 2,91,78,675 4.5 18 SECI (Wardha) 37,54,200.00 1,68,93,900 4.5 19 SECI (Kaithal) (Feb-2018 Humnbad 5,58,875.00 25,14,938 4.5
20 SECI Kaithal 1*20MW (humnbad taluq) 01.03.2018 to 13.03.2018)
18,91,375.00 85,11,188 4.5
21 SECI Kaithal 1*40MW (Humnbad taluq) 14.03.2018 to 31.03.2018)
30,82,375.00 1,38,70,688 4.5
22 Rishabh solar 18,765.00 81,815 4.36 23 Mytrah Advath 34,46,910.00 1,50,28,528 4.36 Solar Total 37,75,01,579.79 2,13,26,82,542.02 5.65 Solar farmer scheme (1 to 3 MW) 1 M/s Narayan Solar Pvt Ltd (Sri Srikant B Kabadi) 17,53,734.00 1,47,31,366.00 8.4 2 Poorva Solar (Seetabai G Desai) 55,08,140.00 4,62,68,376.00 8.4 3 Vnisol (Hanj Fakkirappa Mariyappa) 35,94,930.00 3,01,97,412.00 8.4 4 Traxun Energy Pvt Ltd (P. Vani) 58,47,082.00 4,91,18,698.00 8.4 5 Sandeep Energy Ltd (Latha Sandeep) 32,85,414.00 2,75,97,477.00 8.4 6 Sri Anuplukumar K Hanchinal 18,08,895.00 1,51,94,719.00 8.4 7 Green Impact (Hosanmani Shekharaj) 19,57,884.00 1,64,46,226.00 8.4 8 Revateshwar Solar Pvt Ltd (Avvenneppa sonnad) 34,90,447.00 2,93,19,754.00 8.4 9 Lakshmibai Sagareppa Dalawal 17,44,286.00 1,46,52,003 8.4
10 Ajitkumar B Kuchanur 18,65,688.00 1,56,71,780 8.4 11 Kashibai Solar Energy 18,50,889.00 1,15,20,642 6.22 12 Ramanna Siddappa Talewad 18,96,180.00 1,59,27,913 8.4 13 Vistaara Power Kurtakoti Pvt 18,68,057.00 81,44,729 4.36 14 RED Earth green energy 13,54,350.00 88,16,817 6.51 15 Hukkeri Solar 13,39,284.00 58,39,277 4.36 16 Yarganvi (Sri Babu G Kallur) 21,29,510.00 92,84,664 4.36 17 Kurugunda solar(Iravva R patil) 10,37,640.00 45,24,110 4.36 18 S.G Ararkeri Solar (Ullas sisramappa) 48,02,160.00 3,12,62,061 6.51 19 Nadagouda Energies (Rajashekar S ) 40,83,830.00 2,65,85,734 6.51 20 Madamageri solar (Girija B Hattiholi) 18,82,720.00 82,08,658 4.36 21 Shivapur Solar (Siddappa Tigadi) 15,41,100.00 67,19,196 4.36 22 Jigajinagi jagtap solar (Anand R Jigajinagi)-39 29,17,750.00 1,27,21,390 4.36 23 Jigajinagi Jagtap solar ( Ramesh C Jigajinagi)-3 30,28,610.00 1,32,04,739 4.36
Application for Approval of Annual Performance Review for FY-18 and Approval for ARR & ERC under MYT period FY-20-22 and ERC and Tariff Filing for FY-20.
Part 3 ANNUAL PERFORMANCE REVIEW FOR FY 18 Page 69
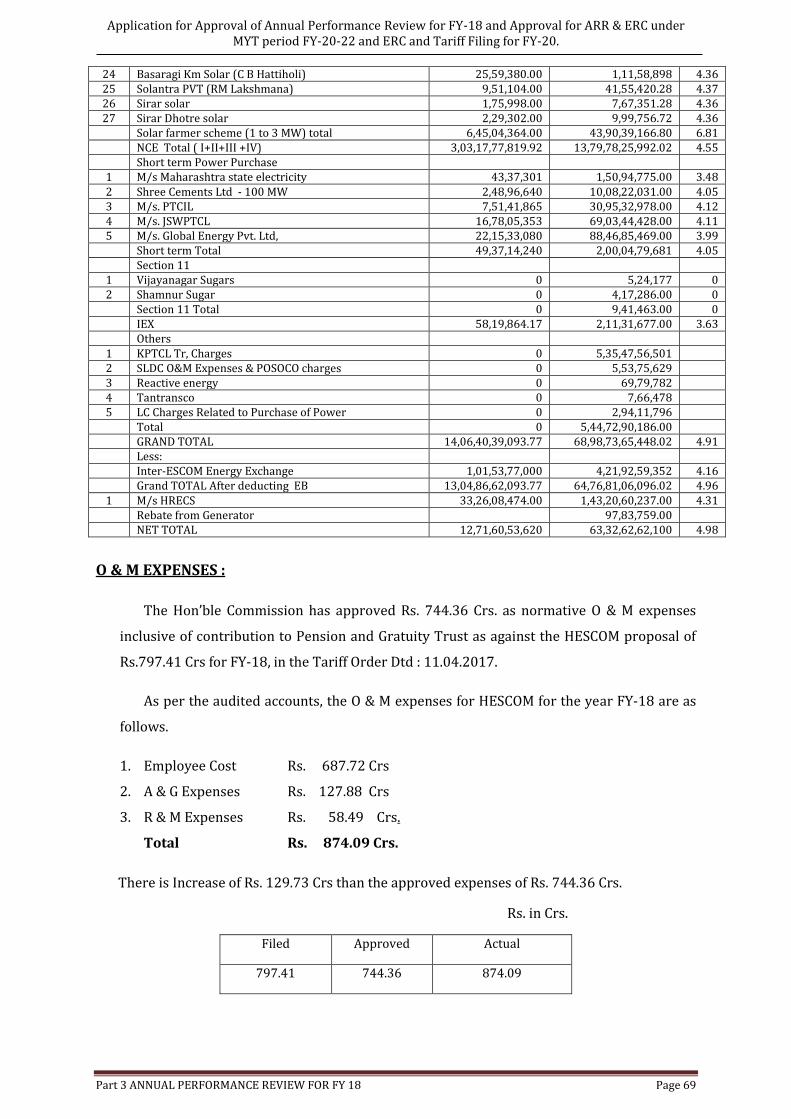
24 Basaragi Km Solar (C B Hattiholi) 25,59,380.00 1,11,58,898 4.36 25 Solantra PVT (RM Lakshmana) 9,51,104.00 41,55,420.28 4.37 26 Sirar solar 1,75,998.00 7,67,351.28 4.36 27 Sirar Dhotre solar 2,29,302.00 9,99,756.72 4.36 Solar farmer scheme (1 to 3 MW) total 6,45,04,364.00 43,90,39,166.80 6.81 NCE Total ( I+II+III +IV) 3,03,17,77,819.92 13,79,78,25,992.02 4.55 Short term Power Purchase 1 M/s Maharashtra state electricity 43,37,301 1,50,94,775.00 3.48 2 Shree Cements Ltd - 100 MW 2,48,96,640 10,08,22,031.00 4.05 3 M/s. PTCIL 7,51,41,865 30,95,32,978.00 4.12 4 M/s. JSWPTCL 16,78,05,353 69,03,44,428.00 4.11 5 M/s. Global Energy Pvt. Ltd, 22,15,33,080 88,46,85,469.00 3.99 Short term Total 49,37,14,240 2,00,04,79,681 4.05 Section 11 1 Vijayanagar Sugars 0 5,24,177 0 2 Shamnur Sugar 0 4,17,286.00 0 Section 11 Total 0 9,41,463.00 0 IEX 58,19,864.17 2,11,31,677.00 3.63 Others 1 KPTCL Tr, Charges 0 5,35,47,56,501 2 SLDC O&M Expenses & POSOCO charges 0 5,53,75,629 3 Reactive energy 0 69,79,782 4 Tantransco 0 7,66,478 5 LC Charges Related to Purchase of Power 0 2,94,11,796 Total 0 5,44,72,90,186.00 GRAND TOTAL 14,06,40,39,093.77 68,98,73,65,448.02 4.91 Less: Inter-ESCOM Energy Exchange 1,01,53,77,000 4,21,92,59,352 4.16 Grand TOTAL After deducting EB 13,04,86,62,093.77 64,76,81,06,096.02 4.96 1 M/s HRECS 33,26,08,474.00 1,43,20,60,237.00 4.31 Rebate from Generator 97,83,759.00 NET TOTAL 12,71,60,53,620 63,32,62,62,100 4.98
O & M EXPENSES :
The Hon’ble Commission has approved Rs. 744.36 Crs. as normative O & M expenses
inclusive of contribution to Pension and Gratuity Trust as against the HESCOM proposal of
Rs.797.41 Crs for FY-18, in the Tariff Order Dtd : 11.04.2017.
As per the audited accounts, the O & M expenses for HESCOM for the year FY-18 are as
follows.
1. Employee Cost Rs. 687.72 Crs
2. A & G Expenses Rs. 127.88 Crs
3. R & M Expenses Rs. 58.49 Crs.
Total Rs. 874.09 Crs.
There is Increase of Rs. 129.73 Crs than the approved expenses of Rs. 744.36 Crs.
Rs. in Crs.
Filed Approved Actual
797.41 744.36 874.09
Application for Approval of Annual Performance Review for FY-18 and Approval for ARR & ERC under MYT period FY-20-22 and ERC and Tariff Filing for FY-20.
Part 3 ANNUAL PERFORMANCE REVIEW FOR FY 18 Page 70
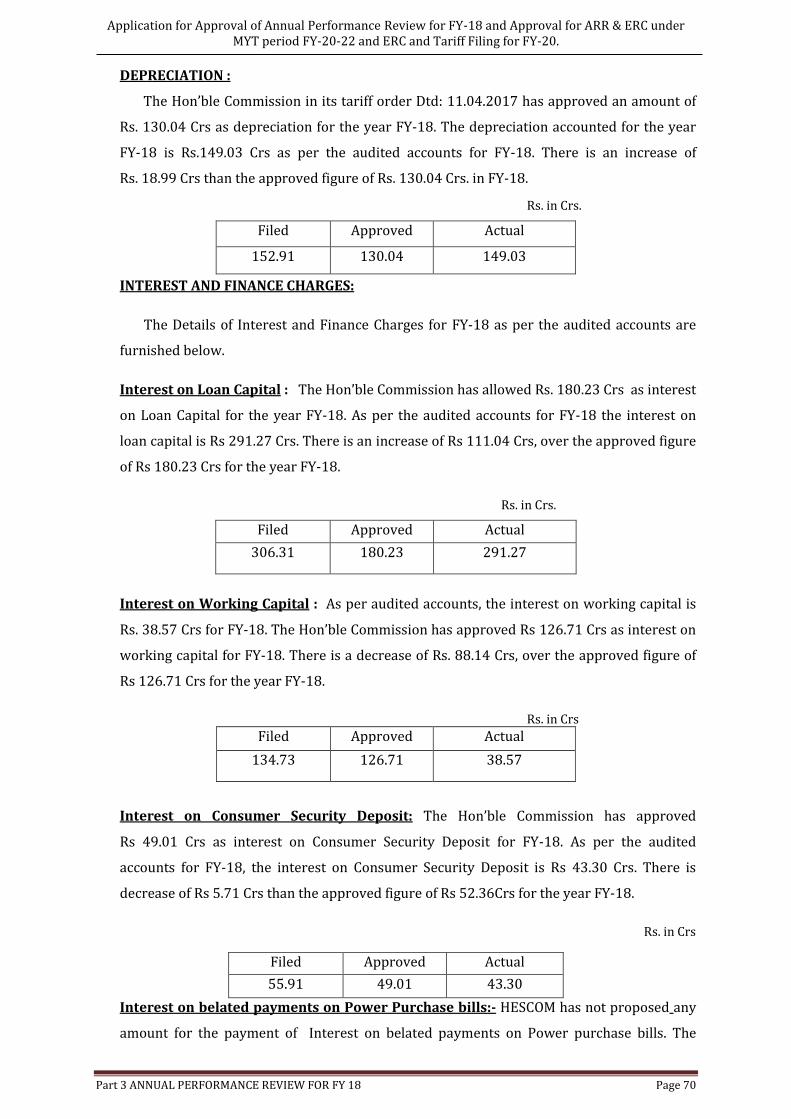
DEPRECIATION :
The Hon’ble Commission in its tariff order Dtd: 11.04.2017 has approved an amount of
Rs. 130.04 Crs as depreciation for the year FY-18. The depreciation accounted for the year
FY-18 is Rs.149.03 Crs as per the audited accounts for FY-18. There is an increase of
Rs. 18.99 Crs than the approved figure of Rs. 130.04 Crs. in FY-18.
Rs. in Crs.
Filed Approved Actual
152.91 130.04 149.03
INTEREST AND FINANCE CHARGES:
The Details of Interest and Finance Charges for FY-18 as per the audited accounts are
furnished below.
Interest on Loan Capital : The Hon’ble Commission has allowed Rs. 180.23 Crs as interest
on Loan Capital for the year FY-18. As per the audited accounts for FY-18 the interest on
loan capital is Rs 291.27 Crs. There is an increase of Rs 111.04 Crs, over the approved figure
of Rs 180.23 Crs for the year FY-18.
Rs. in Crs.
Filed Approved Actual
306.31 180.23 291.27
Interest on Working Capital : As per audited accounts, the interest on working capital is
Rs. 38.57 Crs for FY-18. The Hon’ble Commission has approved Rs 126.71 Crs as interest on
working capital for FY-18. There is a decrease of Rs. 88.14 Crs, over the approved figure of
Rs 126.71 Crs for the year FY-18.
Rs. in Crs
Filed Approved Actual
134.73 126.71 38.57
Interest on Consumer Security Deposit: The Hon’ble Commission has approved
Rs 49.01 Crs as interest on Consumer Security Deposit for FY-18. As per the audited
accounts for FY-18, the interest on Consumer Security Deposit is Rs 43.30 Crs. There is
decrease of Rs 5.71 Crs than the approved figure of Rs 52.36Crs for the year FY-18.
Rs. in Crs
Filed Approved Actual
55.91 49.01 43.30
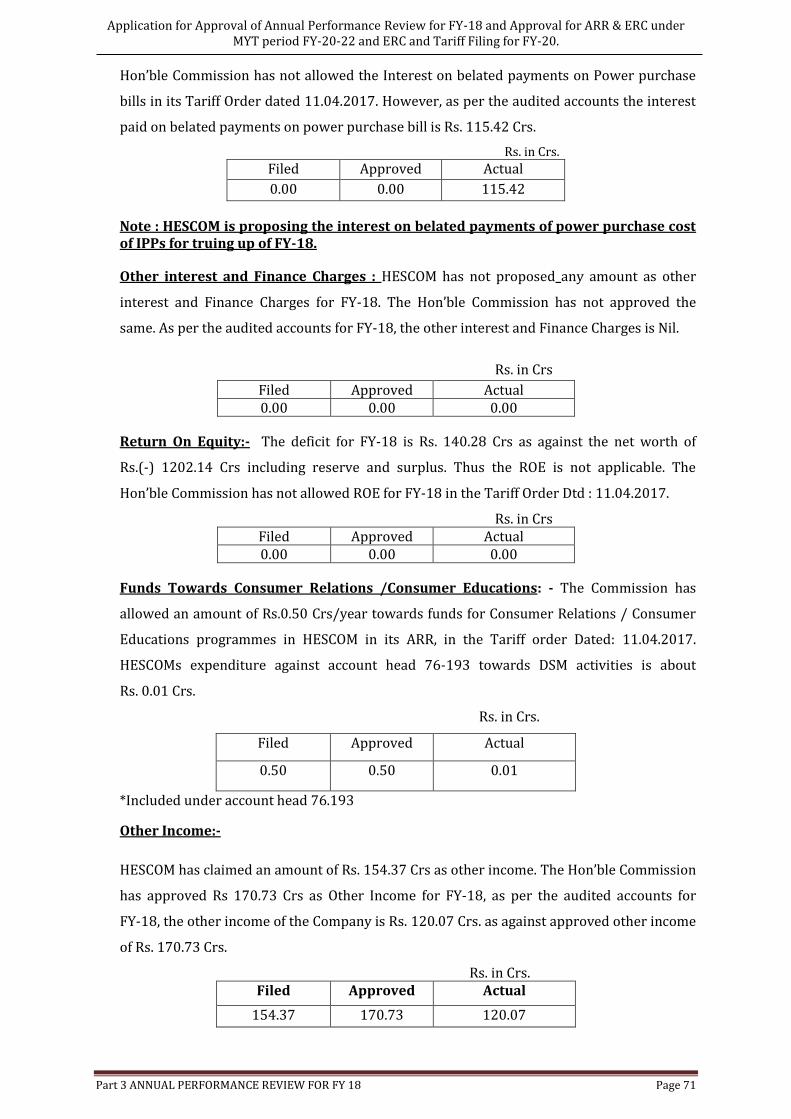
Interest on belated payments on Power Purchase bills:- HESCOM has not proposed any
amount for the payment of Interest on belated payments on Power purchase bills. The
Application for Approval of Annual Performance Review for FY-18 and Approval for ARR & ERC under MYT period FY-20-22 and ERC and Tariff Filing for FY-20.
Part 3 ANNUAL PERFORMANCE REVIEW FOR FY 18 Page 71
Hon’ble Commission has not allowed the Interest on belated payments on Power purchase
bills in its Tariff Order dated 11.04.2017. However, as per the audited accounts the interest
paid on belated payments on power purchase bill is Rs. 115.42 Crs.
Rs. in Crs.
Filed Approved Actual
0.00 0.00 115.42
Note : HESCOM is proposing the interest on belated payments of power purchase cost of IPPs for truing up of FY-18.
Other interest and Finance Charges : HESCOM has not proposed any amount as other
interest and Finance Charges for FY-18. The Hon’ble Commission has not approved the
same. As per the audited accounts for FY-18, the other interest and Finance Charges is Nil.
Rs. in Crs
Filed Approved Actual 0.00 0.00 0.00
Return On Equity:- The deficit for FY-18 is Rs. 140.28 Crs as against the net worth of
Rs.(-) 1202.14 Crs including reserve and surplus. Thus the ROE is not applicable. The
Hon’ble Commission has not allowed ROE for FY-18 in the Tariff Order Dtd : 11.04.2017.
Rs. in Crs Filed Approved Actual 0.00 0.00 0.00
Funds Towards Consumer Relations /Consumer Educations: - The Commission has
allowed an amount of Rs.0.50 Crs/year towards funds for Consumer Relations / Consumer
Educations programmes in HESCOM in its ARR, in the Tariff order Dated: 11.04.2017.
HESCOMs expenditure against account head 76-193 towards DSM activities is about
Rs. 0.01 Crs.
Rs. in Crs.
Filed Approved Actual
0.50 0.50 0.01
*Included under account head 76.193
Other Income:-
HESCOM has claimed an amount of Rs. 154.37 Crs as other income. The Hon’ble Commission
has approved Rs 170.73 Crs as Other Income for FY-18, as per the audited accounts for
FY-18, the other income of the Company is Rs. 120.07 Crs. as against approved other income
of Rs. 170.73 Crs.
Rs. in Crs. Filed Approved Actual
154.37 170.73 120.07
Application for Approval of Annual Performance Review for FY-18 and Approval for ARR & ERC under MYT period FY-20-22 and ERC and Tariff Filing for FY-20.
Part 3 ANNUAL PERFORMANCE REVIEW FOR FY 18 Page 72
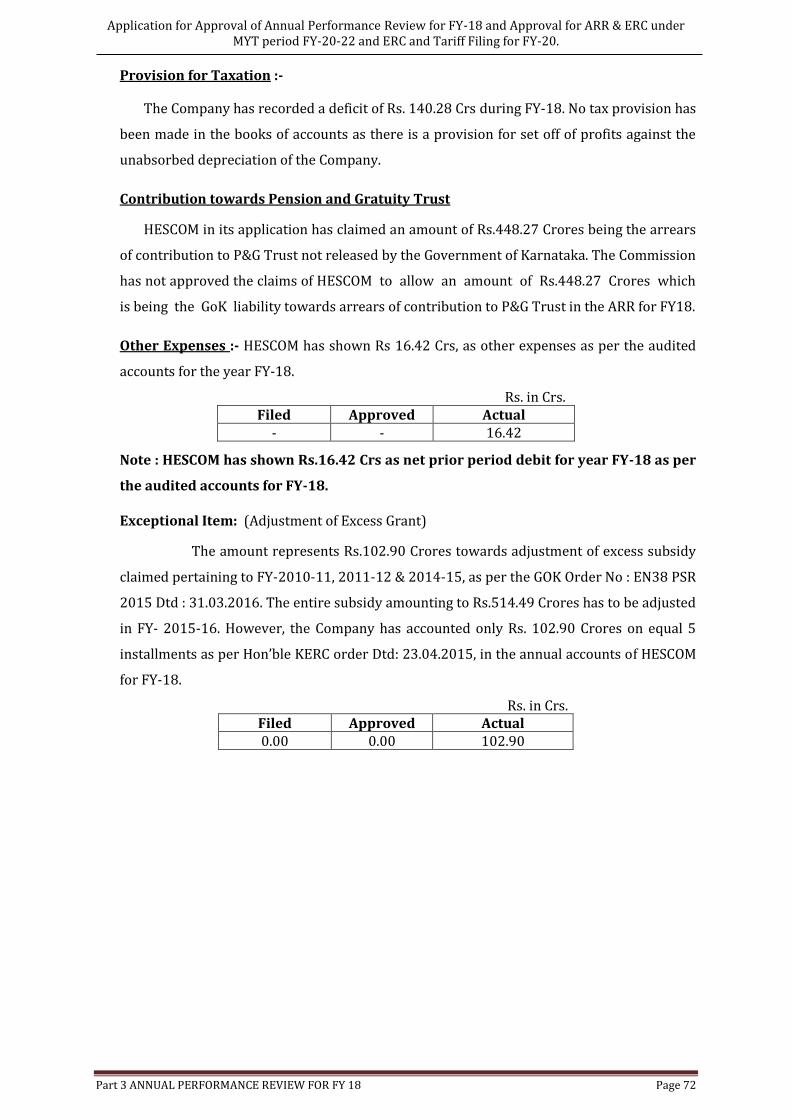
Provision for Taxation :-
The Company has recorded a deficit of Rs. 140.28 Crs during FY-18. No tax provision has
been made in the books of accounts as there is a provision for set off of profits against the
unabsorbed depreciation of the Company.
Contribution towards Pension and Gratuity Trust
HESCOM in its application has claimed an amount of Rs.448.27 Crores being the arrears
of contribution to P&G Trust not released by the Government of Karnataka. The Commission
has not approved the claims of HESCOM to allow an amount of Rs.448.27 Crores which
is being the GoK liability towards arrears of contribution to P&G Trust in the ARR for FY18.
Other Expenses :- HESCOM has shown Rs 16.42 Crs, as other expenses as per the audited
accounts for the year FY-18.
Rs. in Crs. Filed Approved Actual
- - 16.42
Note : HESCOM has shown Rs.16.42 Crs as net prior period debit for year FY-18 as per
the audited accounts for FY-18.
Exceptional Item: (Adjustment of Excess Grant)
The amount represents Rs.102.90 Crores towards adjustment of excess subsidy
claimed pertaining to FY-2010-11, 2011-12 & 2014-15, as per the GOK Order No : EN38 PSR
2015 Dtd : 31.03.2016. The entire subsidy amounting to Rs.514.49 Crores has to be adjusted
in FY- 2015-16. However, the Company has accounted only Rs. 102.90 Crores on equal 5
installments as per Hon’ble KERC order Dtd: 23.04.2015, in the annual accounts of HESCOM
for FY-18.
Rs. in Crs. Filed Approved Actual 0.00 0.00 102.90
Application for Approval of Annual Performance Review for FY-18 and Approval for ARR & ERC under MYT period FY-20-22 and ERC and Tariff Filing for FY-20.
Part 3 ANNUAL PERFORMANCE REVIEW FOR FY 18 Page 73
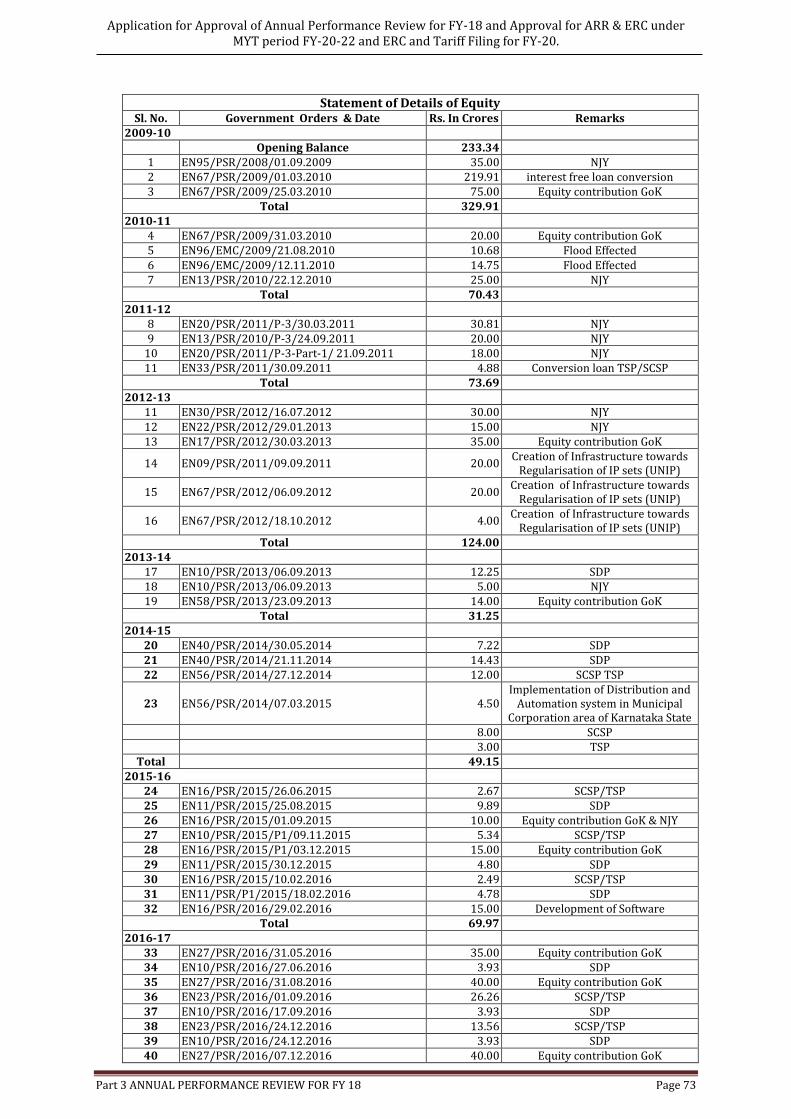
Statement of Details of Equity Sl. No. Government Orders & Date Rs. In Crores Remarks
2009-10 Opening Balance 233.34
1 EN95/PSR/2008/01.09.2009 35.00 NJY 2 EN67/PSR/2009/01.03.2010 219.91 interest free loan conversion 3 EN67/PSR/2009/25.03.2010 75.00 Equity contribution GoK
Total 329.91 2010-11
4 EN67/PSR/2009/31.03.2010 20.00 Equity contribution GoK 5 EN96/EMC/2009/21.08.2010 10.68 Flood Effected 6 EN96/EMC/2009/12.11.2010 14.75 Flood Effected 7 EN13/PSR/2010/22.12.2010 25.00 NJY
Total 70.43 2011-12
8 EN20/PSR/2011/P-3/30.03.2011 30.81 NJY 9 EN13/PSR/2010/P-3/24.09.2011 20.00 NJY
10 EN20/PSR/2011/P-3-Part-1/ 21.09.2011 18.00 NJY 11 EN33/PSR/2011/30.09.2011 4.88 Conversion loan TSP/SCSP
Total 73.69 2012-13
11 EN30/PSR/2012/16.07.2012 30.00 NJY 12 EN22/PSR/2012/29.01.2013 15.00 NJY 13 EN17/PSR/2012/30.03.2013 35.00 Equity contribution GoK
14 EN09/PSR/2011/09.09.2011 20.00 Creation of Infrastructure towards
Regularisation of IP sets (UNIP)
15 EN67/PSR/2012/06.09.2012 20.00 Creation of Infrastructure towards
Regularisation of IP sets (UNIP)
16 EN67/PSR/2012/18.10.2012 4.00 Creation of Infrastructure towards
Regularisation of IP sets (UNIP) Total 124.00
2013-14 17 EN10/PSR/2013/06.09.2013 12.25 SDP 18 EN10/PSR/2013/06.09.2013 5.00 NJY 19 EN58/PSR/2013/23.09.2013 14.00 Equity contribution GoK
Total 31.25 2014-15
20 EN40/PSR/2014/30.05.2014 7.22 SDP 21 EN40/PSR/2014/21.11.2014 14.43 SDP 22 EN56/PSR/2014/27.12.2014 12.00 SCSP TSP
23 EN56/PSR/2014/07.03.2015 4.50 Implementation of Distribution and
Automation system in Municipal Corporation area of Karnataka State
8.00 SCSP 3.00 TSP
Total 49.15 2015-16
24 EN16/PSR/2015/26.06.2015 2.67 SCSP/TSP 25 EN11/PSR/2015/25.08.2015 9.89 SDP 26 EN16/PSR/2015/01.09.2015 10.00 Equity contribution GoK & NJY 27 EN10/PSR/2015/P1/09.11.2015 5.34 SCSP/TSP 28 EN16/PSR/2015/P1/03.12.2015 15.00 Equity contribution GoK 29 EN11/PSR/2015/30.12.2015 4.80 SDP 30 EN16/PSR/2015/10.02.2016 2.49 SCSP/TSP 31 EN11/PSR/P1/2015/18.02.2016 4.78 SDP 32 EN16/PSR/2016/29.02.2016 15.00 Development of Software
Total 69.97 2016-17
33 EN27/PSR/2016/31.05.2016 35.00 Equity contribution GoK 34 EN10/PSR/2016/27.06.2016 3.93 SDP 35 EN27/PSR/2016/31.08.2016 40.00 Equity contribution GoK 36 EN23/PSR/2016/01.09.2016 26.26 SCSP/TSP 37 EN10/PSR/2016/17.09.2016 3.93 SDP 38 EN23/PSR/2016/24.12.2016 13.56 SCSP/TSP 39 EN10/PSR/2016/24.12.2016 3.93 SDP 40 EN27/PSR/2016/07.12.2016 40.00 Equity contribution GoK
Application for Approval of Annual Performance Review for FY-18 and Approval for ARR & ERC under MYT period FY-20-22 and ERC and Tariff Filing for FY-20.
Part 3 ANNUAL PERFORMANCE REVIEW FOR FY 18 Page 74
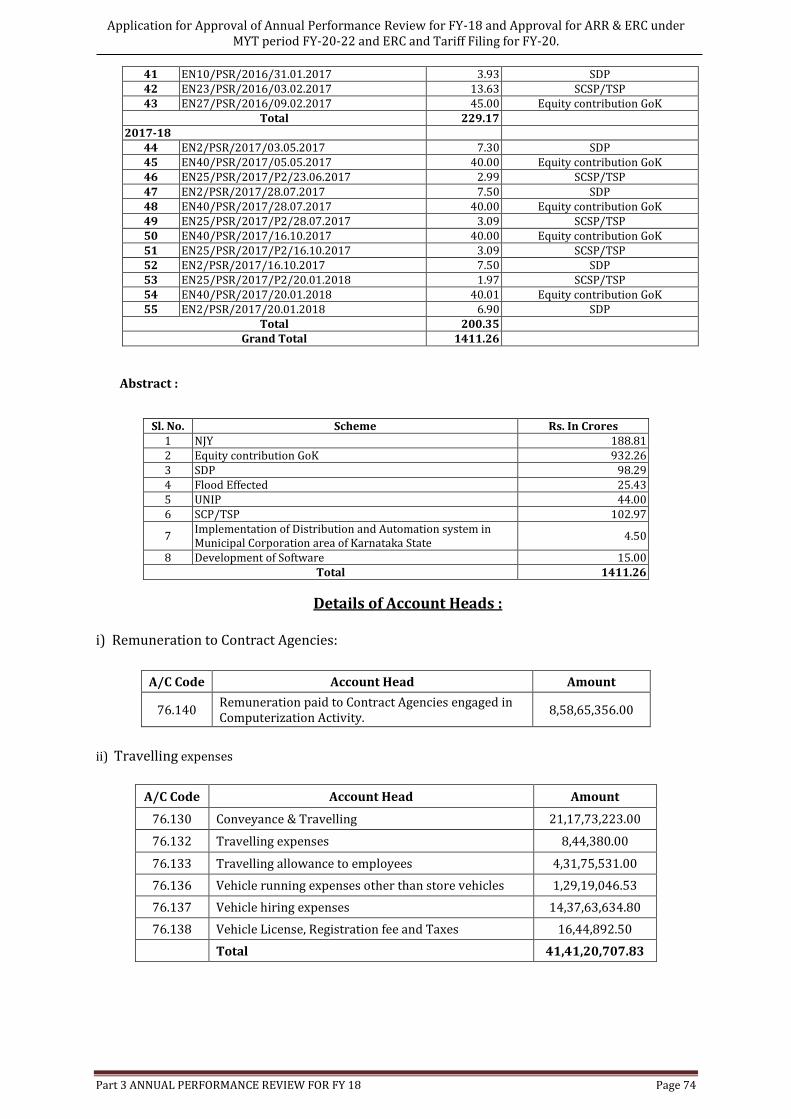
Abstract :
Details of Account Heads :
i) Remuneration to Contract Agencies:
A/C Code Account Head Amount
76.140 Remuneration paid to Contract Agencies engaged in Computerization Activity.
8,58,65,356.00
ii) Travelling expenses
A/C Code Account Head Amount
76.130 Conveyance & Travelling 21,17,73,223.00
76.132 Travelling expenses 8,44,380.00
76.133 Travelling allowance to employees 4,31,75,531.00
76.136 Vehicle running expenses other than store vehicles 1,29,19,046.53
76.137 Vehicle hiring expenses 14,37,63,634.80
76.138 Vehicle License, Registration fee and Taxes 16,44,892.50
Total 41,41,20,707.83
41 EN10/PSR/2016/31.01.2017 3.93 SDP 42 EN23/PSR/2016/03.02.2017 13.63 SCSP/TSP 43 EN27/PSR/2016/09.02.2017 45.00 Equity contribution GoK
Total 229.17 2017-18
44 EN2/PSR/2017/03.05.2017 7.30 SDP 45 EN40/PSR/2017/05.05.2017 40.00 Equity contribution GoK 46 EN25/PSR/2017/P2/23.06.2017 2.99 SCSP/TSP 47 EN2/PSR/2017/28.07.2017 7.50 SDP 48 EN40/PSR/2017/28.07.2017 40.00 Equity contribution GoK 49 EN25/PSR/2017/P2/28.07.2017 3.09 SCSP/TSP 50 EN40/PSR/2017/16.10.2017 40.00 Equity contribution GoK 51 EN25/PSR/2017/P2/16.10.2017 3.09 SCSP/TSP 52 EN2/PSR/2017/16.10.2017 7.50 SDP 53 EN25/PSR/2017/P2/20.01.2018 1.97 SCSP/TSP 54 EN40/PSR/2017/20.01.2018 40.01 Equity contribution GoK 55 EN2/PSR/2017/20.01.2018 6.90 SDP
Total 200.35 Grand Total 1411.26
Sl. No. Scheme Rs. In Crores 1 NJY 188.81 2 Equity contribution GoK 932.26 3 SDP 98.29 4 Flood Effected 25.43 5 UNIP 44.00 6 SCP/TSP 102.97
7 Implementation of Distribution and Automation system in Municipal Corporation area of Karnataka State
4.50
8 Development of Software 15.00 Total 1411.26
Application for Approval of Annual Performance Review for FY-18 and Approval for ARR & ERC under MYT period FY-20-22 and ERC and Tariff Filing for FY-20.
Part 3 ANNUAL PERFORMANCE REVIEW FOR FY 18 Page 75
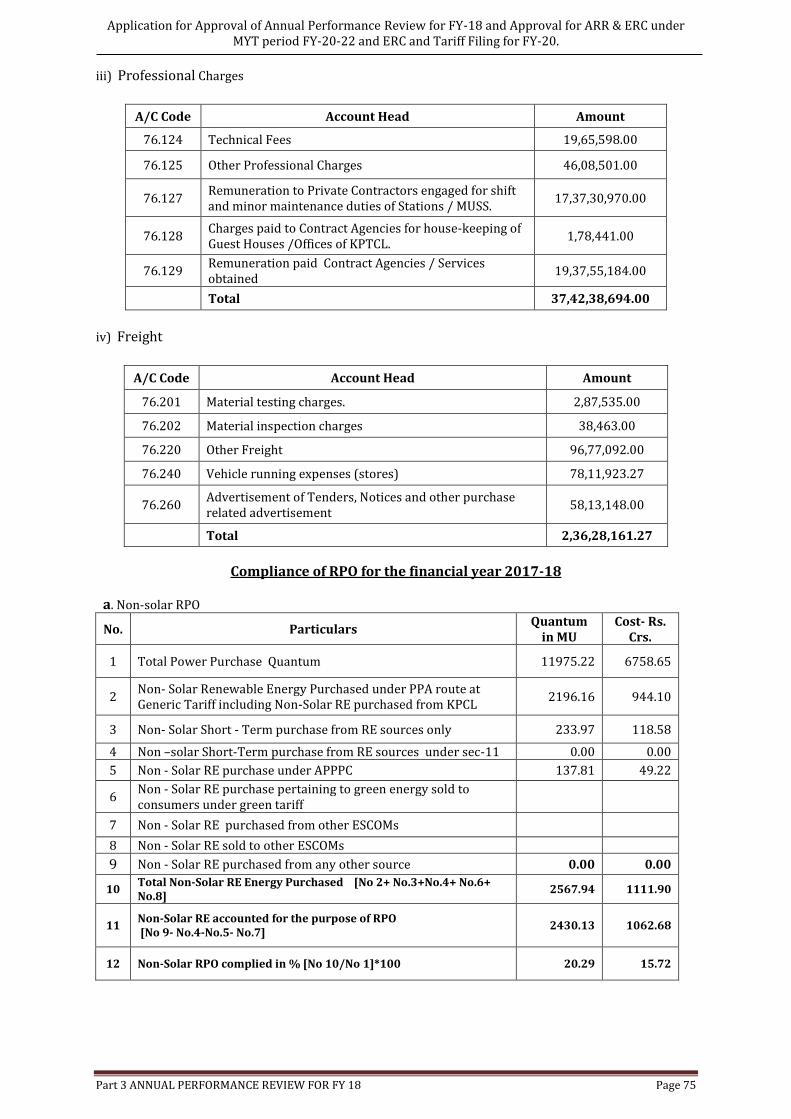
iii) Professional Charges
A/C Code Account Head Amount
76.124 Technical Fees 19,65,598.00
76.125 Other Professional Charges 46,08,501.00
76.127 Remuneration to Private Contractors engaged for shift and minor maintenance duties of Stations / MUSS.
17,37,30,970.00
76.128 Charges paid to Contract Agencies for house-keeping of Guest Houses /Offices of KPTCL.
1,78,441.00
76.129 Remuneration paid Contract Agencies / Services obtained
19,37,55,184.00
Total 37,42,38,694.00
iv) Freight
A/C Code Account Head Amount
76.201 Material testing charges. 2,87,535.00
76.202 Material inspection charges 38,463.00
76.220 Other Freight 96,77,092.00
76.240 Vehicle running expenses (stores) 78,11,923.27
76.260 Advertisement of Tenders, Notices and other purchase related advertisement
58,13,148.00
Total 2,36,28,161.27
Compliance of RPO for the financial year 2017-18
a. Non-solar RPO
No. Particulars Quantum
in MU Cost- Rs.
Crs.
1 Total Power Purchase Quantum 11975.22 6758.65
2 Non- Solar Renewable Energy Purchased under PPA route at Generic Tariff including Non-Solar RE purchased from KPCL
2196.16 944.10
3 Non- Solar Short - Term purchase from RE sources only 233.97 118.58
4 Non –solar Short-Term purchase from RE sources under sec-11 0.00 0.00
5 Non - Solar RE purchase under APPPC 137.81 49.22
6 Non - Solar RE purchase pertaining to green energy sold to consumers under green tariff
7 Non - Solar RE purchased from other ESCOMs
8 Non - Solar RE sold to other ESCOMs
9 Non - Solar RE purchased from any other source 0.00 0.00
10 Total Non-Solar RE Energy Purchased [No 2+ No.3+No.4+ No.6+ No.8]
2567.94 1111.90
11 Non-Solar RE accounted for the purpose of RPO [No 9- No.4-No.5- No.7]
2430.13 1062.68
12 Non-Solar RPO complied in % [No 10/No 1]*100 20.29 15.72
Application for Approval of Annual Performance Review for FY-18 and Approval for ARR & ERC under MYT period FY-20-22 and ERC and Tariff Filing for FY-20.
Part 3 ANNUAL PERFORMANCE REVIEW FOR FY 18 Page 76
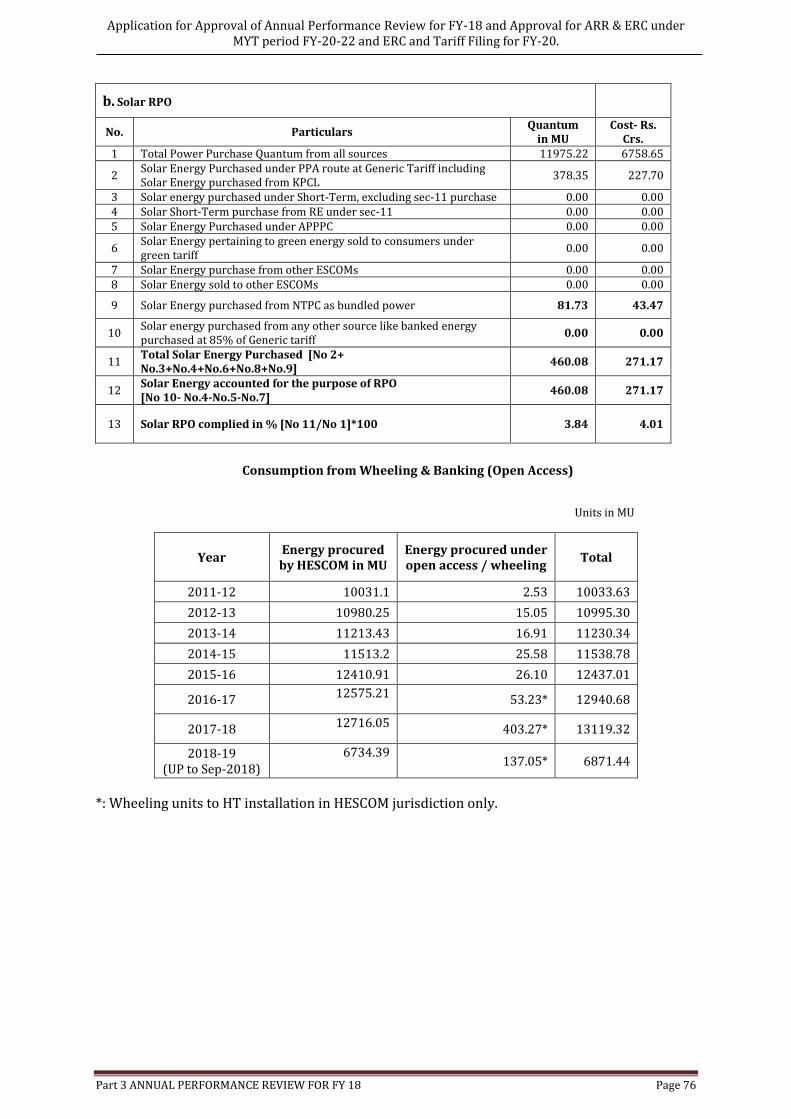
b. Solar RPO
No. Particulars Quantum
in MU Cost- Rs.
Crs. 1 Total Power Purchase Quantum from all sources 11975.22 6758.65
2 Solar Energy Purchased under PPA route at Generic Tariff including Solar Energy purchased from KPCL
378.35 227.70
3 Solar energy purchased under Short-Term, excluding sec-11 purchase 0.00 0.00 4 Solar Short-Term purchase from RE under sec-11 0.00 0.00 5 Solar Energy Purchased under APPPC 0.00 0.00
6 Solar Energy pertaining to green energy sold to consumers under green tariff
0.00 0.00
7 Solar Energy purchase from other ESCOMs 0.00 0.00 8 Solar Energy sold to other ESCOMs 0.00 0.00
9 Solar Energy purchased from NTPC as bundled power 81.73 43.47
10 Solar energy purchased from any other source like banked energy purchased at 85% of Generic tariff
0.00 0.00
11 Total Solar Energy Purchased [No 2+ No.3+No.4+No.6+No.8+No.9]
460.08 271.17
12 Solar Energy accounted for the purpose of RPO [No 10- No.4-No.5-No.7]
460.08 271.17
13 Solar RPO complied in % [No 11/No 1]*100 3.84 4.01
Consumption from Wheeling & Banking (Open Access)
Units in MU
Year Energy procured by HESCOM in MU
Energy procured under open access / wheeling
Total
2011-12 10031.1 2.53 10033.63
2012-13 10980.25 15.05 10995.30
2013-14 11213.43 16.91 11230.34
2014-15 11513.2 25.58 11538.78
2015-16 12410.91 26.10 12437.01
2016-17 1.1. 12575.21 53.23* 12940.68
2017-18 1.2. 12716.05 403.27* 13119.32
2018-19 (UP to Sep-2018)
1.3. 6734.39 137.05* 6871.44
*: Wheeling units to HT installation in HESCOM jurisdiction only.
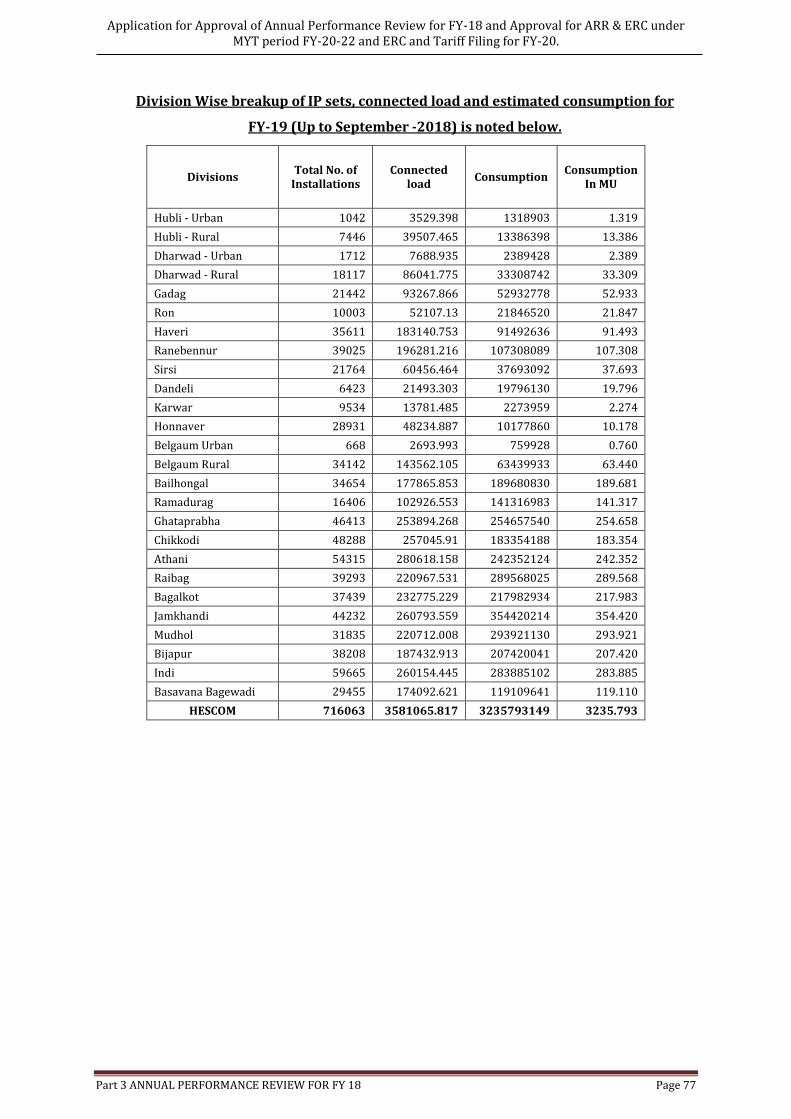
Application for Approval of Annual Performance Review for FY-18 and Approval for ARR & ERC under MYT period FY-20-22 and ERC and Tariff Filing for FY-20.
Part 3 ANNUAL PERFORMANCE REVIEW FOR FY 18 Page 77
Division Wise breakup of IP sets, connected load and estimated consumption for
FY-19 (Up to September -2018) is noted below.
Divisions Total No. of
Installations Connected
load Consumption
Consumption In MU
Hubli - Urban 1042 3529.398 1318903 1.319
Hubli - Rural 7446 39507.465 13386398 13.386
Dharwad - Urban 1712 7688.935 2389428 2.389
Dharwad - Rural 18117 86041.775 33308742 33.309
Gadag 21442 93267.866 52932778 52.933
Ron 10003 52107.13 21846520 21.847
Haveri 35611 183140.753 91492636 91.493
Ranebennur 39025 196281.216 107308089 107.308
Sirsi 21764 60456.464 37693092 37.693
Dandeli 6423 21493.303 19796130 19.796
Karwar 9534 13781.485 2273959 2.274
Honnaver 28931 48234.887 10177860 10.178
Belgaum Urban 668 2693.993 759928 0.760
Belgaum Rural 34142 143562.105 63439933 63.440
Bailhongal 34654 177865.853 189680830 189.681
Ramadurag 16406 102926.553 141316983 141.317
Ghataprabha 46413 253894.268 254657540 254.658
Chikkodi 48288 257045.91 183354188 183.354
Athani 54315 280618.158 242352124 242.352
Raibag 39293 220967.531 289568025 289.568
Bagalkot 37439 232775.229 217982934 217.983
Jamkhandi 44232 260793.559 354420214 354.420
Mudhol 31835 220712.008 293921130 293.921
Bijapur 38208 187432.913 207420041 207.420
Indi 59665 260154.445 283885102 283.885
Basavana Bagewadi 29455 174092.621 119109641 119.110
HESCOM 716063 3581065.817 3235793149 3235.793
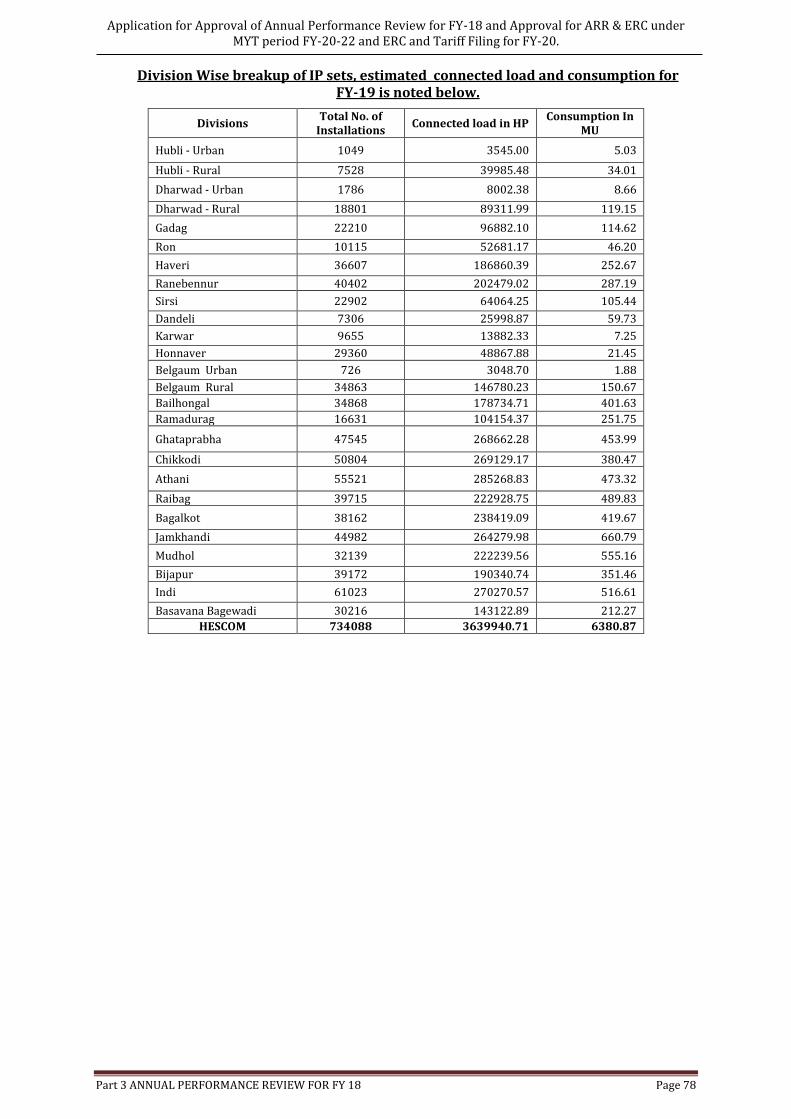
Application for Approval of Annual Performance Review for FY-18 and Approval for ARR & ERC under MYT period FY-20-22 and ERC and Tariff Filing for FY-20.
Part 3 ANNUAL PERFORMANCE REVIEW FOR FY 18 Page 78
Division Wise breakup of IP sets, estimated connected load and consumption for FY-19 is noted below.
Divisions Total No. of
Installations Connected load in HP
Consumption In MU
Hubli - Urban 1049 3545.00 5.03
Hubli - Rural 7528 39985.48 34.01
Dharwad - Urban 1786 8002.38 8.66
Dharwad - Rural 18801 89311.99 119.15
Gadag 22210 96882.10 114.62
Ron 10115 52681.17 46.20
Haveri 36607 186860.39 252.67
Ranebennur 40402 202479.02 287.19
Sirsi 22902 64064.25 105.44
Dandeli 7306 25998.87 59.73
Karwar 9655 13882.33 7.25
Honnaver 29360 48867.88 21.45
Belgaum Urban 726 3048.70 1.88
Belgaum Rural 34863 146780.23 150.67
Bailhongal 34868 178734.71 401.63
Ramadurag 16631 104154.37 251.75
Ghataprabha 47545 268662.28 453.99
Chikkodi 50804 269129.17 380.47
Athani 55521 285268.83 473.32
Raibag 39715 222928.75 489.83
Bagalkot 38162 238419.09 419.67
Jamkhandi 44982 264279.98 660.79
Mudhol 32139 222239.56 555.16
Bijapur 39172 190340.74 351.46
Indi 61023 270270.57 516.61
Basavana Bagewadi 30216 143122.89 212.27
HESCOM 734088 3639940.71 6380.87
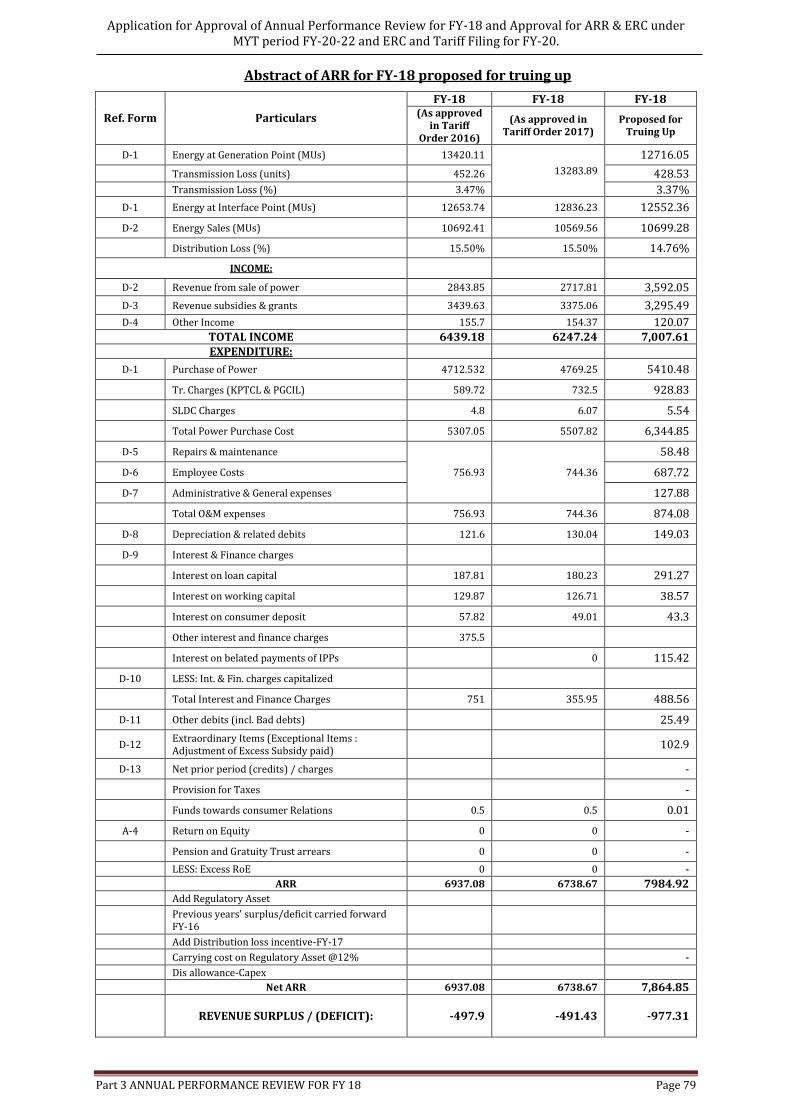
Application for Approval of Annual Performance Review for FY-18 and Approval for ARR & ERC under MYT period FY-20-22 and ERC and Tariff Filing for FY-20.
Part 3 ANNUAL PERFORMANCE REVIEW FOR FY 18 Page 79
Abstract of ARR for FY-18 proposed for truing up
Ref. Form Particulars
FY-18 FY-18 FY-18 (As approved
in Tariff Order 2016)
(As approved in Tariff Order 2017)
Proposed for Truing Up
D-1 Energy at Generation Point (MUs) 13420.11
13283.89
12716.05
Transmission Loss (units) 452.26 428.53
Transmission Loss (%) 3.47% 3.37%
D-1 Energy at Interface Point (MUs) 12653.74 12836.23 12552.36
D-2 Energy Sales (MUs) 10692.41 10569.56 10699.28
Distribution Loss (%) 15.50% 15.50% 14.76%
INCOME:
D-2 Revenue from sale of power 2843.85 2717.81 3,592.05
D-3 Revenue subsidies & grants 3439.63 3375.06 3,295.49
D-4 Other Income 155.7 154.37 120.07 TOTAL INCOME 6439.18 6247.24 7,007.61 EXPENDITURE:
D-1 Purchase of Power 4712.532 4769.25 5410.48
Tr. Charges (KPTCL & PGCIL) 589.72 732.5 928.83
SLDC Charges 4.8 6.07 5.54
Total Power Purchase Cost 5307.05 5507.82 6,344.85
D-5 Repairs & maintenance
756.93 744.36
58.48
D-6 Employee Costs 687.72
D-7 Administrative & General expenses 127.88
Total O&M expenses 756.93 744.36 874.08
D-8 Depreciation & related debits 121.6 130.04 149.03
D-9 Interest & Finance charges
Interest on loan capital 187.81 180.23 291.27
Interest on working capital 129.87 126.71 38.57
Interest on consumer deposit 57.82 49.01 43.3
Other interest and finance charges 375.5
Interest on belated payments of IPPs 0 115.42
D-10 LESS: Int. & Fin. charges capitalized
Total Interest and Finance Charges 751 355.95 488.56
D-11 Other debits (incl. Bad debts) 25.49
D-12 Extraordinary Items (Exceptional Items : Adjustment of Excess Subsidy paid)
102.9
D-13 Net prior period (credits) / charges -
Provision for Taxes -
Funds towards consumer Relations 0.5 0.5 0.01
A-4 Return on Equity 0 0 -
Pension and Gratuity Trust arrears 0 0 -
LESS: Excess RoE 0 0 - ARR 6937.08 6738.67 7984.92 Add Regulatory Asset
Previous years' surplus/deficit carried forward FY-16
Add Distribution loss incentive-FY-17
Carrying cost on Regulatory Asset @12% -
Dis allowance-Capex Net ARR 6937.08 6738.67 7,864.85
REVENUE SURPLUS / (DEFICIT): -497.9 -491.43
-977.31
Application for Approval of Annual Performance Review for FY-18 and Approval for ARR & ERC under MYT period FY-20-22 and ERC and Tariff Filing for FY-20.
Part 3 ANNUAL PERFORMANCE REVIEW FOR FY 18 Page 80
As per the proposal of HESCOM for truing up of FY-18 with reference to audited accounts of
the HESCOM there is deficit of Rs. 977.31 Crs for FY-18.
HESCOM prays the Hon’ble Commission to true up the expenditure as per audited accounts.
Related Documents