PART 2 SUPPLY AND DEMAND I: HOW MARKETS WORK

PART 2 SUPPLY AND DEMAND I: HOW MARKETS WORK. Copyright © 2006 Nelson, a division of Thomson Canada Ltd. 4 The Market Forces of Supply and Demand.
Dec 14, 2015
Welcome message from author
This document is posted to help you gain knowledge. Please leave a comment to let me know what you think about it! Share it to your friends and learn new things together.
Transcript
PART 2
SUPPLY AND DEMAND I: HOW MARKETS WORK
Copyright © 2006 Nelson, a division of Thomson Canada Ltd.
44The Market Forces of Supply and Demand
Copyright © 2006 Nelson, a division of Thomson Canada Ltd.
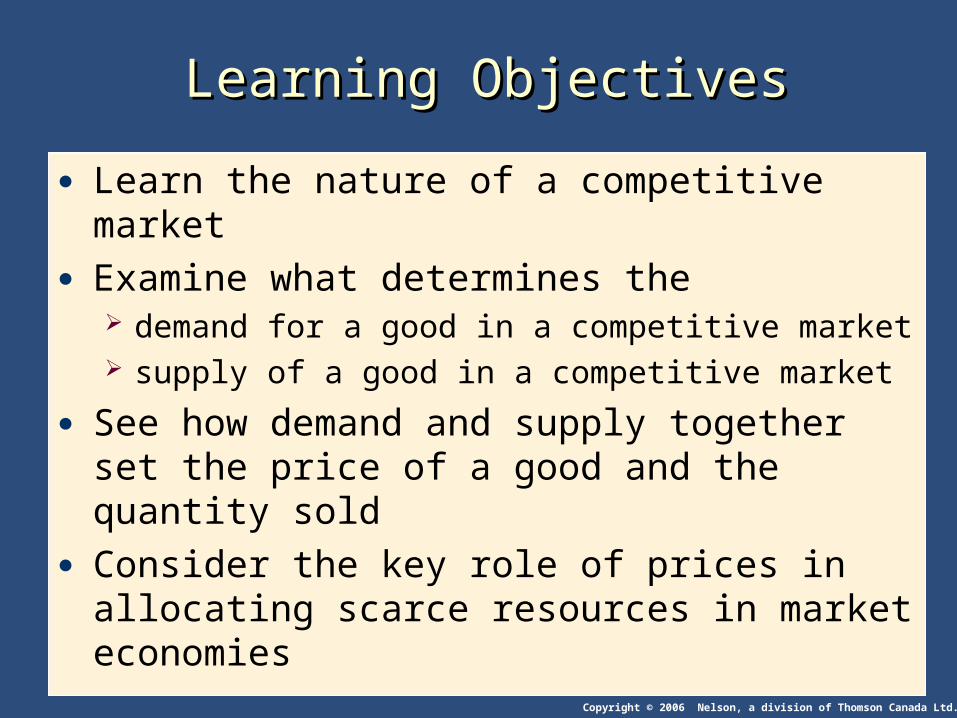
Learning ObjectivesLearning Objectives
● Learn the nature of a competitive market● Examine what determines the
demand for a good in a competitive market supply of a good in a competitive market
● See how demand and supply together set the price of a good and the quantity sold
● Consider the key role of prices in allocating scarce resources in market economies

Copyright © 2006 Nelson, a division of Thomson Canada Ltd.
MARKETS AND COMPETITIONMARKETS AND COMPETITION
● Supply and demand are the two words that economists use most often.
● Supply and demand are the forces that make market economies work.
● Modern microeconomics is about supply, demand, and market equilibrium.
Copyright © 2006 Nelson, a division of Thomson Canada Ltd.
● A marketmarket is a group of buyers and sellers of a particular good or service.
● The terms supplysupply and demanddemand refer to the behavior of people . . . as they interact with one another in markets.
MARKETS AND COMPETITION MARKETS AND COMPETITION

Copyright © 2006 Nelson, a division of Thomson Canada Ltd.
MARKETS AND COMPETITION MARKETS AND COMPETITION
● Buyers determine demanddemand.
● Sellers determine supplysupply
Copyright © 2006 Nelson, a division of Thomson Canada Ltd.
Market Demand versus Individual DemandMarket Demand versus Individual Demand
● Market demandMarket demand refers to the sum of all individual demands for a particular good or service.
● Graphically, individual demand curves are summed horizontally to obtain the market demand curve.
Copyright © 2006 Nelson, a division of Thomson Canada Ltd.
Shifts in the Demand CurveShifts in the Demand Curve
● Change in Quantity Demanded Movement along the demand curve. Caused by a change in the price of the product.

Copyright © 2006 Nelson, a division of Thomson Canada Ltd.
0
D
Price of Ice-Cream Cones
Quantity of Ice-Cream Cones
A tax that raises the price of ice-cream cones results in a
movement along the demand curve.
A
B
8
1.00
$2.00
4
Changes in Quantity DemandedChanges in Quantity Demanded
Copyright © 2006 Nelson, a division of Thomson Canada Ltd.
Shifts in the Demand CurveShifts in the Demand Curve
Consumer income Prices of related goods Tastes Expectations Number of buyers
Copyright © 2006 Nelson, a division of Thomson Canada Ltd.
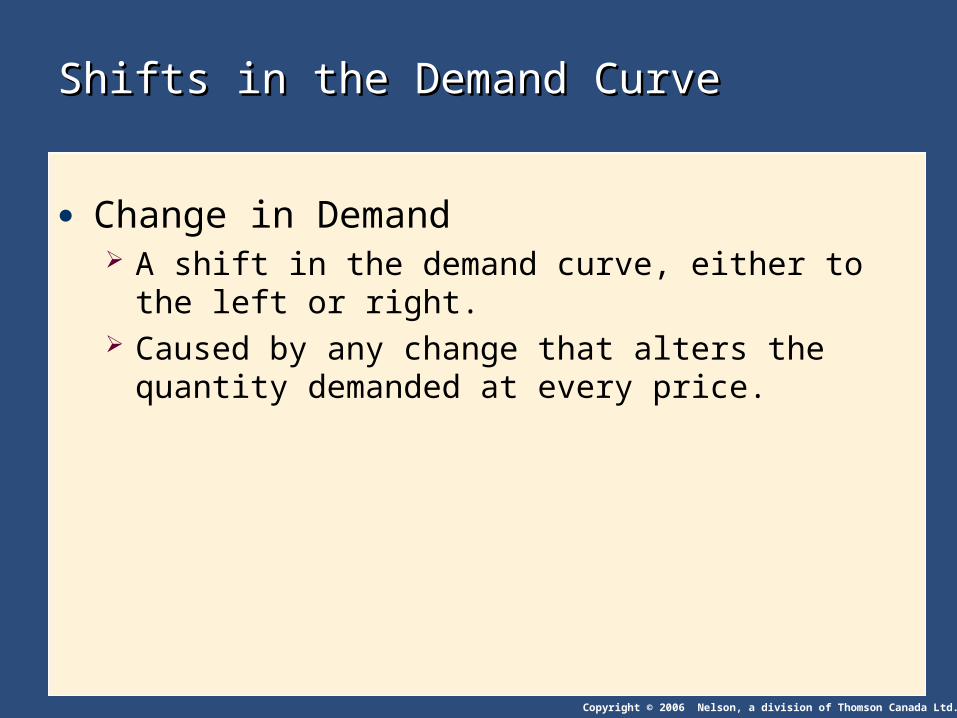
Shifts in the Demand CurveShifts in the Demand Curve
● Change in Demand A shift in the demand curve, either to the left or right. Caused by any change that alters the quantity
demanded at every price.
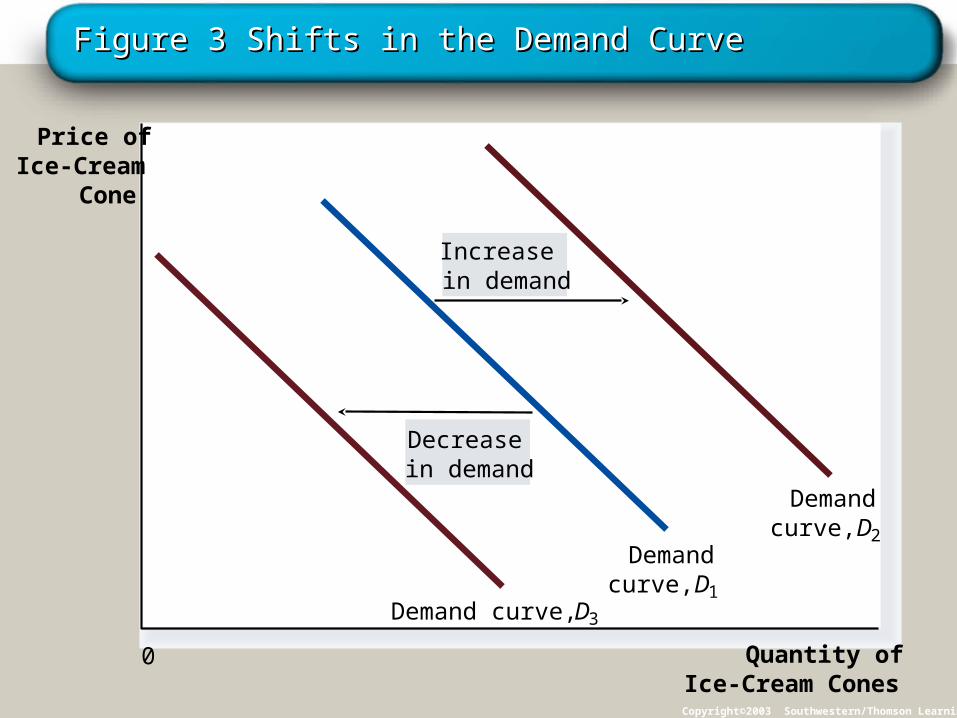
Figure 3 Shifts in the Demand CurveFigure 3 Shifts in the Demand Curve
Copyright©2003 Southwestern/Thomson Learning
Price ofIce-Cream
Cone
Quantity ofIce-Cream Cones
Increasein demand
Decreasein demand
Demand curve, D3
Demandcurve, D1
Demandcurve, D2
0

Copyright © 2006 Nelson, a division of Thomson Canada Ltd.
Shifts in the Demand CurveShifts in the Demand Curve
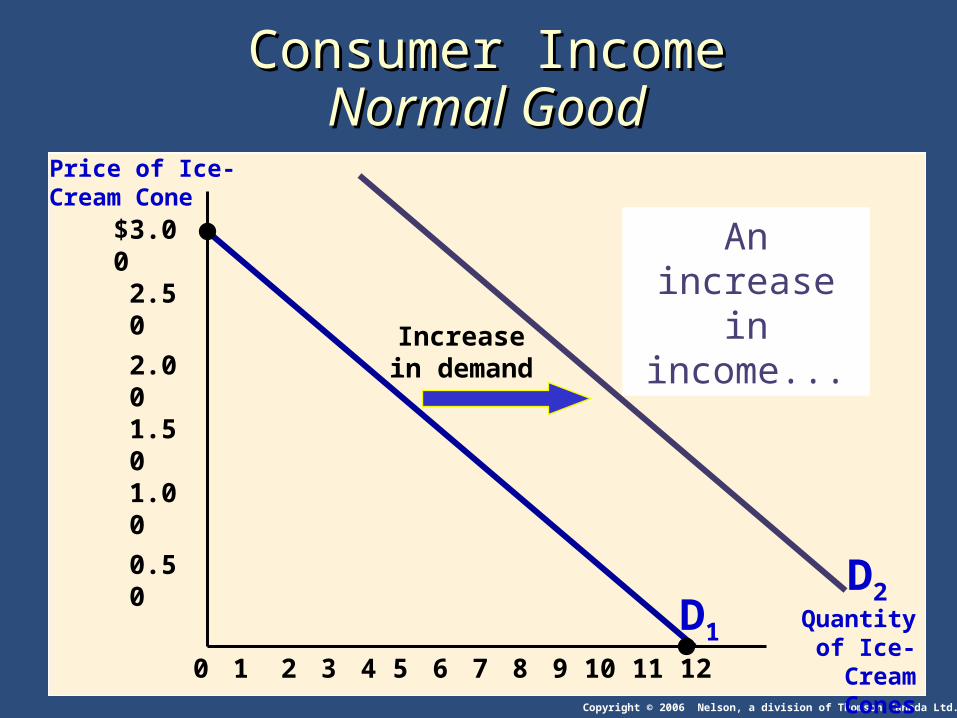
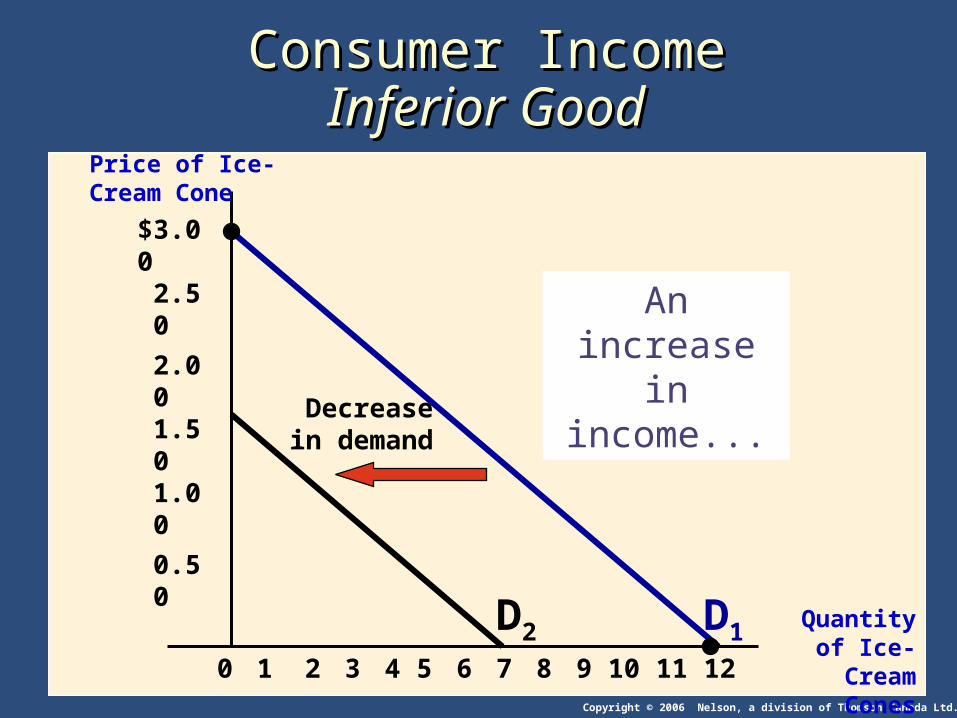
● Consumer Income As income increases the demand for a normal goodnormal good
will increase. As income increases the demand for an inferior goodinferior good
will decrease.
Copyright © 2006 Nelson, a division of Thomson Canada Ltd.
$3.002.50
2.001.501.00
0.50
21 3 4 5 6 7 8 9 10 1211
Price of Ice-Cream Cone
Quantity of Ice-Cream Cones
0
Increasein demand
An increase in income...
D1D2
Consumer IncomeConsumer IncomeNormal GoodNormal Good
Copyright © 2006 Nelson, a division of Thomson Canada Ltd.
$3.002.50
2.001.501.00
0.50
21 3 4 5 6 7 8 9 10 1211
Price of Ice-Cream Cone
Quantity of Ice-Cream
Cones0
Decreasein demand
An increase in income...
D1D2
Consumer IncomeConsumer IncomeInferior GoodInferior Good

Copyright © 2006 Nelson, a division of Thomson Canada Ltd.
Shifts in the Demand CurveShifts in the Demand Curve
● Prices of Related Goods When a fall in the price of one good reduces the
demand for another good, the two goods are called substitutessubstitutes..
When a fall in the price of one good increases the demand for another good, the two goods are called complementscomplements.
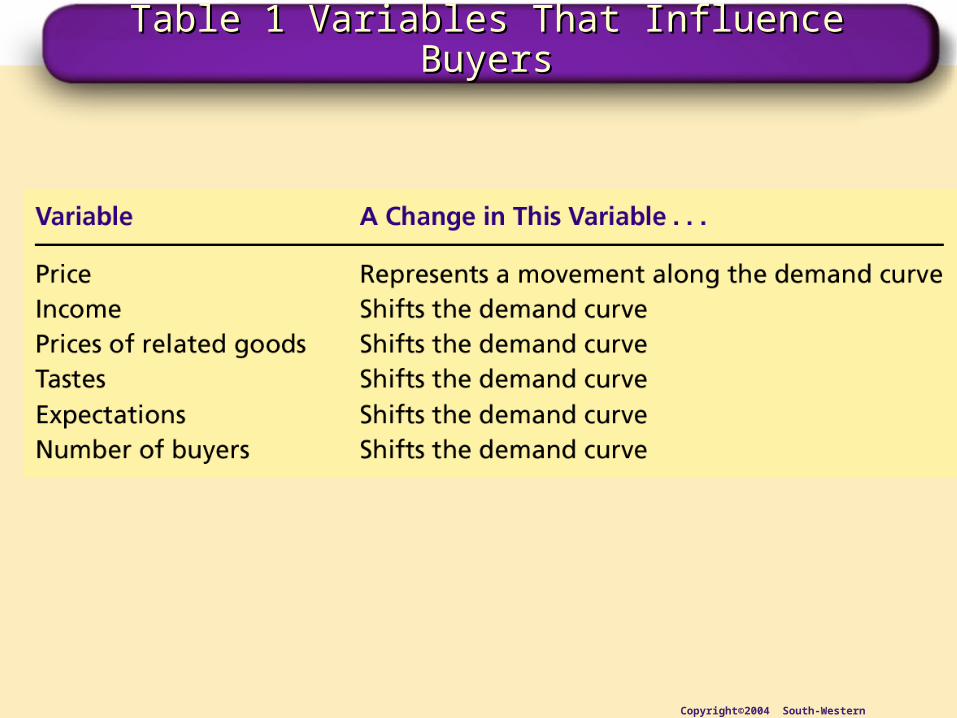
Table 1 Variables That Influence BuyersTable 1 Variables That Influence Buyers
Copyright©2004 South-Western

Copyright © 2006 Nelson, a division of Thomson Canada Ltd.
SUPPLYSUPPLY
● Quantity suppliedQuantity supplied is the amount of a good that sellers are willing and able to sell.
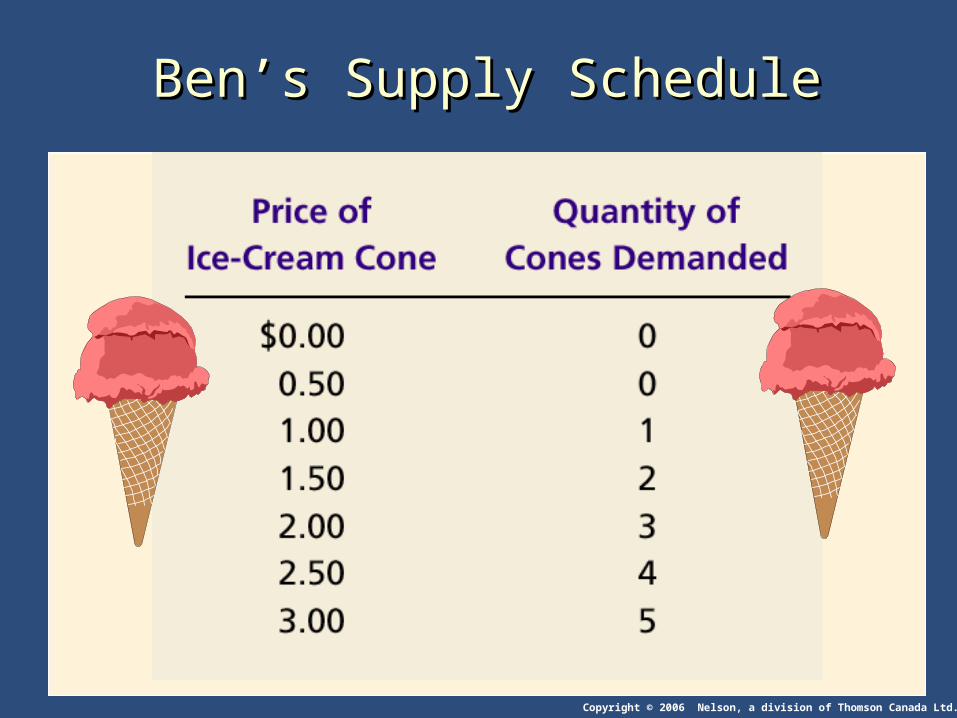
● Law of Supply The law of supplylaw of supply states that, other things equal, the
quantity supplied of a good rises when the price of the good rises.
Copyright © 2006 Nelson, a division of Thomson Canada Ltd.
The Supply Curve: The Relationship between The Supply Curve: The Relationship between Price and Quantity SuppliedPrice and Quantity Supplied
● Supply Schedule The supply schedulesupply schedule is a table that shows the
relationship between the price of the good and the quantity supplied.
Copyright © 2006 Nelson, a division of Thomson Canada Ltd.
Ben’s Supply ScheduleBen’s Supply Schedule

Copyright © 2006 Nelson, a division of Thomson Canada Ltd.
The Supply Curve: The Relationship between The Supply Curve: The Relationship between Price and Quantity SuppliedPrice and Quantity Supplied ● Supply Curve
The supplysupply curvecurve is the graph of the relationship between the price of a good and the quantity supplied.
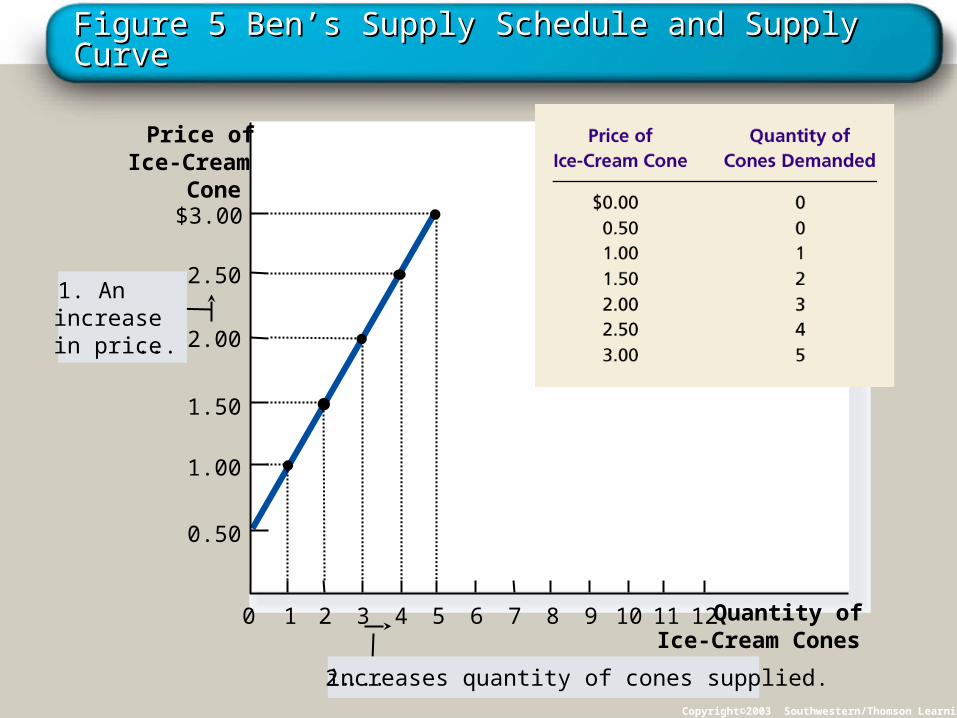
Figure 5 Ben’s Supply Schedule and Supply CurveFigure 5 Ben’s Supply Schedule and Supply Curve
Copyright©2003 Southwestern/Thomson Learning
Price ofIce-Cream
Cone
0
2.50
2.00
1.50
1.00
1 2 3 4 5 6 7 8 9 10 11 Quantity ofIce-Cream Cones
$3.00
12
0.50
1. Anincrease in price ...
2. ... increases quantity of cones supplied.
Copyright © 2006 Nelson, a division of Thomson Canada Ltd.
Market Supply versus Individual SupplyMarket Supply versus Individual Supply
● Market supply refers to the sum of all individual supplies for all sellers of a particular good or service.
● Graphically, individual supply curves are summed horizontally to obtain the market supply curve.

Copyright © 2006 Nelson, a division of Thomson Canada Ltd.
Shifts in the Supply CurveShifts in the Supply Curve
● Input prices● Technology● Expectations ● Number of sellers

Copyright © 2006 Nelson, a division of Thomson Canada Ltd.
Shifts in the Supply CurveShifts in the Supply Curve
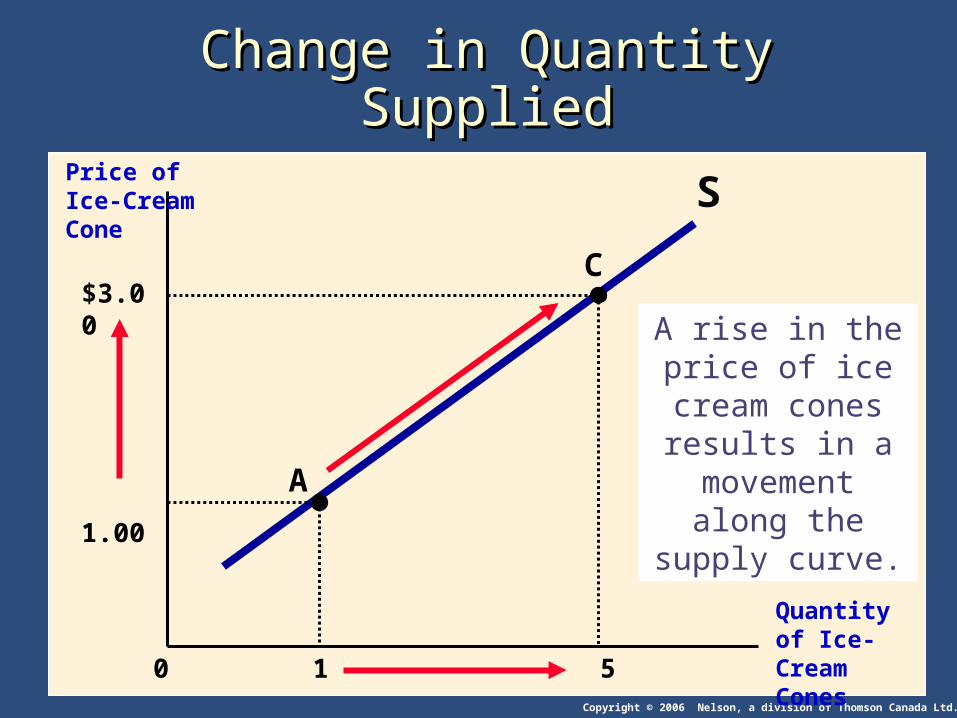
● Change in Quantity Supplied Movement along the supply curve. Caused by a change in anything that alters the quantity
supplied at each price.
Copyright © 2006 Nelson, a division of Thomson Canada Ltd.
1 5
Price of Ice-Cream Cone
Quantity of Ice-Cream Cones0
S
1.00A
C$3.00 A rise in the price
of ice cream cones results in a movement along the supply curve.
Change in Quantity SuppliedChange in Quantity Supplied
Copyright © 2006 Nelson, a division of Thomson Canada Ltd.
Shifts in the Supply CurveShifts in the Supply Curve
● Change in Supply A shift in the supply curve, either to the left or right. Caused by a change in a determinant other than price.
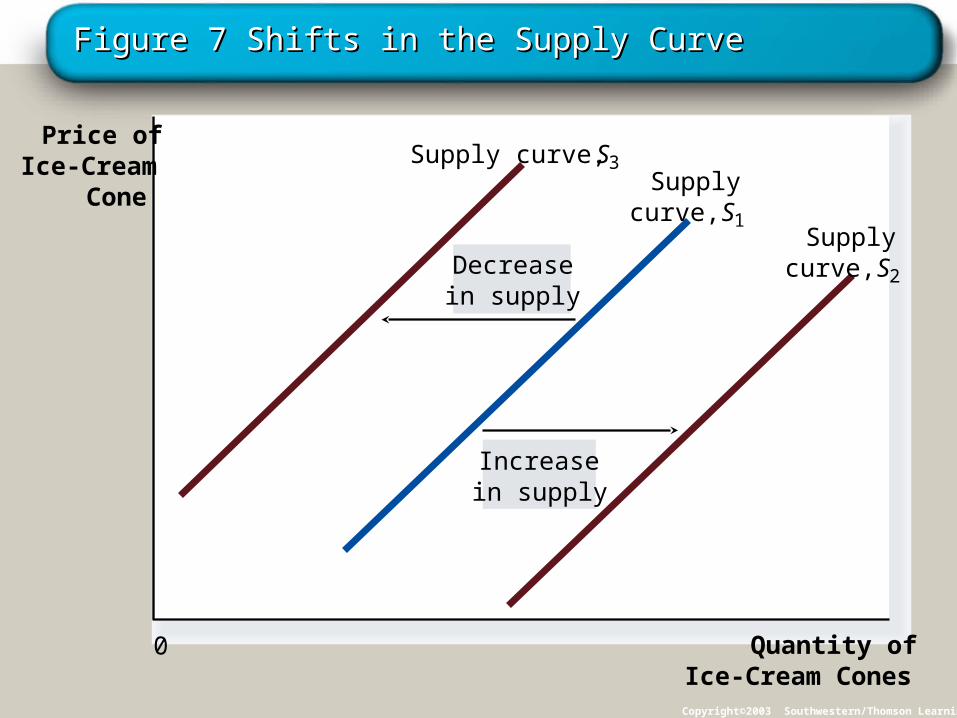
Figure 7 Shifts in the Supply CurveFigure 7 Shifts in the Supply Curve
Copyright©2003 Southwestern/Thomson Learning
Price ofIce-Cream
Cone
Quantity ofIce-Cream Cones
0
Increasein supply
Decreasein supply
Supply curve, S3
curve, Supply
S1Supply
curve, S2

Table 2 Variables That Influence SellersTable 2 Variables That Influence Sellers
Copyright©2004 South-Western

Copyright © 2006 Nelson, a division of Thomson Canada Ltd.
SUPPLY AND DEMAND TOGETHERSUPPLY AND DEMAND TOGETHER
● EquilibriumEquilibrium refers to a situation in which the price has reached the level where quantity supplied equals quantity demanded.

Copyright © 2006 Nelson, a division of Thomson Canada Ltd.
SUPPLY AND DEMAND SUPPLY AND DEMAND TOGETHERTOGETHER
● Equilibrium PriceEquilibrium Price The price that balances quantity supplied and quantity
demanded. On a graph, it is the price at which the supply and
demand curves intersect.
● Equilibrium QuantityEquilibrium Quantity The quantity supplied and the quantity demanded at
the equilibrium price. On a graph it is the quantity at which the supply and
demand curves intersect.
Copyright © 2006 Nelson, a division of Thomson Canada Ltd.
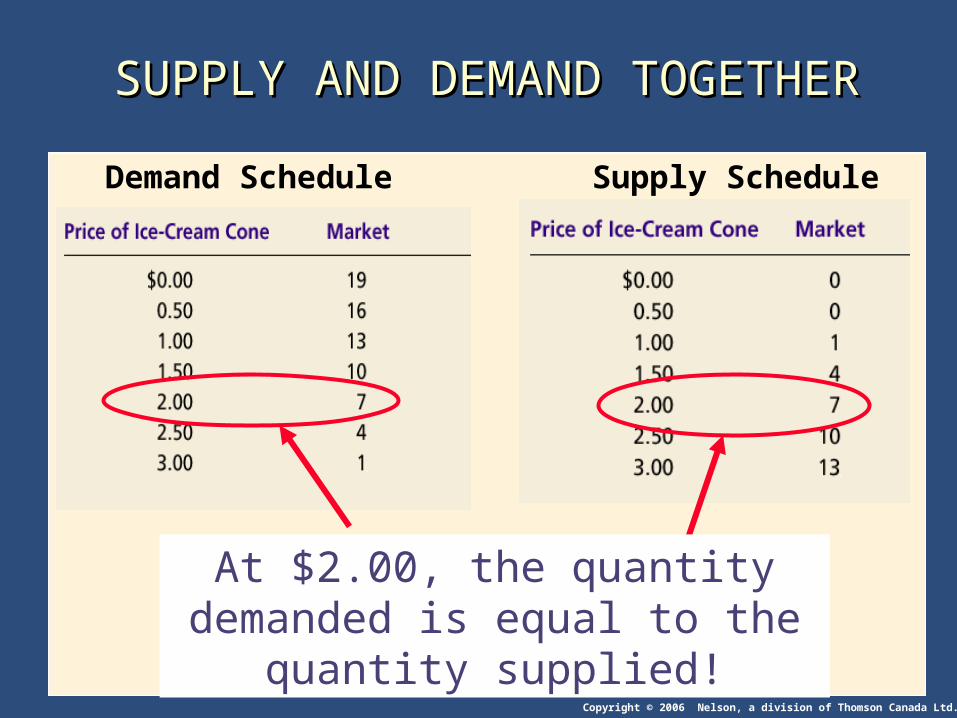
At $2.00, the quantity demanded is equal to the quantity supplied!
SUPPLY AND DEMAND TOGETHERSUPPLY AND DEMAND TOGETHER
Demand Schedule
Supply Schedule

Figure 8 The Equilibrium of Supply and DemandFigure 8 The Equilibrium of Supply and Demand
Copyright©2003 Southwestern/Thomson Learning
Price ofIce-Cream
Cone
0 1 2 3 4 5 6 7 8 9 10 11 12Quantity of Ice-Cream Cones
13
Equilibriumquantity
Equilibrium price Equilibrium
Supply
Demand
$2.00

Figure 9 Markets Not in EquilibriumFigure 9 Markets Not in Equilibrium
Copyright©2003 Southwestern/Thomson Learning
Price ofIce-Cream
Cone
0
Supply
Demand
(a) Excess Supply
Quantitydemanded
Quantitysupplied
Surplus
Quantity ofIce-Cream
Cones
4
$2.50
10
2.00
7

Copyright © 2006 Nelson, a division of Thomson Canada Ltd.
EquilibriumEquilibrium
● SurplusSurplus When price > equilibrium price, then quantity supplied
> quantity demanded. • There is excess supply or a surplus. • Suppliers will lower the price to increase sales,
thereby moving toward equilibrium.
Copyright © 2006 Nelson, a division of Thomson Canada Ltd.
EquilibriumEquilibrium
● ShortageShortage When price < equilibrium price, then quantity
demanded > the quantity supplied. • There is excess demand or a shortage. • Suppliers will raise the price due to too many
buyers chasing too few goods, thereby moving toward equilibrium.

Figure 9 Markets Not in EquilibriumFigure 9 Markets Not in Equilibrium
Copyright©2003 Southwestern/Thomson Learning
Price ofIce-Cream
Cone
0 Quantity ofIce-Cream
Cones
Supply
Demand
(b) Excess Demand
Quantitysupplied
Quantitydemanded
1.50
10
$2.00
74
Shortage

Copyright © 2006 Nelson, a division of Thomson Canada Ltd.
EquilibriumEquilibrium
● Law of supply and demandLaw of supply and demand The claim that the price of any good adjusts to bring
the quantity supplied and the quantity demanded for that good into balance.
Copyright © 2006 Nelson, a division of Thomson Canada Ltd.
Three Steps to Analyzing Changes in Three Steps to Analyzing Changes in EquilibriumEquilibrium
● Decide whether the event shifts the supply or demand curve (or both).
● Decide whether the curve(s) shift(s) to the left or to the right.
● Use the supply-and-demand diagram to see how the shift affects equilibrium price and quantity.

Figure 10 How an Increase in Demand Affects the Figure 10 How an Increase in Demand Affects the EquilibriumEquilibrium
Copyright©2003 Southwestern/Thomson Learning
Price ofIce-Cream
Cone
0 Quantity of Ice-Cream Cones
Supply
Initialequilibrium
D
D
3. . . . and a higherquantity sold.
2. . . . resultingin a higherprice . . .
1. Hot weather increasesthe demand for ice cream . . .
2.00
7
New equilibrium$2.50
10

Copyright © 2006 Nelson, a division of Thomson Canada Ltd.
Three Steps to Analyzing Changes in Three Steps to Analyzing Changes in EquilibriumEquilibrium ● Shifts in Curves versus Movements along Curves
A shift in the supply curve is called a change in supply. A movement along a fixed supply curve is called a
change in quantity supplied. A shift in the demand curve is called a change in
demand. A movement along a fixed demand curve is called a
change in quantity demanded.

Figure 11 How a Decrease in Supply Affects the Figure 11 How a Decrease in Supply Affects the EquilibriumEquilibrium
Copyright©2003 Southwestern/Thomson Learning
Price ofIce-Cream
Cone
0 Quantity of Ice-Cream Cones
Demand
Newequilibrium
Initial equilibrium
S1
S2
2. . . . resultingin a higherprice of icecream . . .
1. An increase in theprice of sugar reducesthe supply of ice cream. . .
3. . . . and a lowerquantity sold.
2.00
7
$2.50
4

Table 4 What Happens to Price and Quantity When Supply Table 4 What Happens to Price and Quantity When Supply or Demand Shifts?or Demand Shifts?
Copyright©2004 South-Western

Figure 12 A Shift in Both Supply and DemandFigure 12 A Shift in Both Supply and Demand
Copyright©2003 Southwestern/Thomson Learning
Copyright © 2006 Nelson, a division of Thomson Canada Ltd.
SummarySummary
● Economists use the model of supply and demand to analyze competitive markets.
● In a competitive market, there are many buyers and sellers, each of whom has little or no influence on the market price.
Copyright © 2006 Nelson, a division of Thomson Canada Ltd.
SummarySummary
● The demand curve shows how the quantity of a good depends upon the price. According to the law of demand, as the price of a good
falls, the quantity demanded rises. Therefore, the demand curve slopes downward.
In addition to price, other determinants of how much consumers want to buy include income, the prices of complements and substitutes, tastes, expectations, and the number of buyers.
If one of these factors changes, the demand curve shifts.
Copyright © 2006 Nelson, a division of Thomson Canada Ltd.
SummarySummary
● The supply curve shows how the quantity of a good supplied depends upon the price. According to the law of supply, as the price of a good
rises, the quantity supplied rises. Therefore, the supply curve slopes upward.
In addition to price, other determinants of how much producers want to sell include input prices, technology, expectations, and the number of sellers.
If one of these factors changes, the supply curve shifts.

Copyright © 2006 Nelson, a division of Thomson Canada Ltd.
SummarySummary
● Market equilibrium is determined by the intersection of the supply and demand curves.
● At the equilibrium price, the quantity demanded equals the quantity supplied.
● The behavior of buyers and sellers naturally drives markets toward their equilibrium.
Copyright © 2006 Nelson, a division of Thomson Canada Ltd.
SummarySummary
● To analyze how any event influences a market, we use the supply-and-demand diagram to examine how the even affects the equilibrium price and quantity.
● In market economies, prices are the signals that guide economic decisions and thereby allocate resources.
Related Documents