o te technical note technic a The 2001 Integrated Turbulence Forecasting Algorithm (ITFA) Meteorological Evaluation Report Part 2: Performance of Indices Danny Sims Jeffrey Weinrich August 2004 DOT/FAA/CT-TN03/21 U.S. Department of Transportation Federal Aviation Administration

Welcome message from author
This document is posted to help you gain knowledge. Please leave a comment to let me know what you think about it! Share it to your friends and learn new things together.
Transcript

ote
tech
nica
l not
e te
chni
ca The 2001 Integrated Turbulence Forecasting Algorithm (ITFA) Meteorological Evaluation Report Part 2: Performance of Indices Danny Sims Jeffrey Weinrich August 2004 DOT/FAA/CT-TN03/21
U.S. Department of Transportation Federal Aviation Administration

NOTICE
This document is disseminated under the sponsorship of the U.S. Department of Transportation in the interest of information exchange. The United States Government assumes no liability for the contents or use thereof. The United States Government does not endorse products or manufacturers. Trade or manufacturer's names appear herein solely because they are considered essential to the objective of this report. This document does not constitute FAA certification policy. This report is available at the Federal Aviation Administration William J. Hughes Technical Center’s Full-Text Technical Reports page: http://actlibrary.faa.gov in Adobe Acrobat portable document format (PDF) form.

Technical Report Documentation Page 1. Report No. 2. Government Accession No. 3. Recipient’s Catalog No.
DOT/FAA/CT-TN03/21 4. Title and Subtitle 5. Report Date
THE 2001 INTEGRATED TURBULENCE FORECASTING ALGORITHM August 2004 (ITFA) METEOROLOGICAL EVAUATION REPORT 6. Performing Organization Code PART 2: PERFORMANCE OF INDICES ACB-630 7. Author(s) 8. Performing Organization Report No.
Danny Sims, ACB-630; Jeffrey Weinrich, Titan Systems Corporation DOT/FAA/CT-TN03/21
9. Performing Organization Name and Address 10. Work Unit No. (TRAIS)
U.S. Department of Transportation Federal Aviation Administration 11. Contract or Grant No. William J. Hughes Technical Center Atlantic City International Airport, NJ 08405 13. Type of Report and Period Covered 12. Sponsoring Agency Name and Address Technical Note 14. Sponsoring Agency Code 15. Supplementary Notes
16. Abstract
This report summarizes the 2001 Integrated Turbulence Forecasting Algorithm (ITFA) Meteorological Evaluation conducted by ACB-630. The ITFA, developed at the National Center for Atmospheric Research (NCAR), combines several turbulence forecasting techniques into a single algorithm that produces a forecast of the potential for high-level, clear-air turbulence. The purpose of the evaluation was to provide a subjective assessment of the performance, characteristic and trends of the ITFA before and during periods of widespread, significant turbulence. The turbulence events used in the evaluation were from an evaluation of an earlier version of ITFA, which was conducted in 2000. The 2001 version of ITFA was analyzed for the same turbulence events and compared to the performance of the 2000 version. Part 1 of the evaluation focused on the comparison of ITFA 2000 and 2001. Those results indicated that there was an increase in the overall forecast values in 2001 for both area coverage and intensity. Part 2 of the evaluation, which is the subject of this report, focused on the performance of the individual turbulence indices which comprised ITFA. Results indicated that output from the individual indices tended to fall into one of four categories: (1) those similar to the overall ITFA output, (2) forecasts that were too widespread, (3) forecasts with broad areas of high intensity, and (4) forecasts with scattered pockets of high intensity.
17. Key Words 18. Distribution Statement
Integrated Turbulence Forecasting Algorithm (ITFA) This document is available to the public through the National Center for Atmospheric Research (NCAR) Technical Center's Full-Text Technical Reports page: Aviation Weather Research Program (AWRP) http://actlibrary.tc.faa.gov Turbulence 19. Security Classif. (of this report) 20. Security Classif. (of this page) 21. No. of Pages 22. Price
Unclassified Unclassified 51
Form DOT F 1700.7 (8-72) Reproduction of completed page authorized

ACKNOWLEDGEMENTS
The authors wish to acknowledge the National Center for Atmospheric Research for their support of this project, especially the contributions and assistance of Bob Sharman, Celia Chen, and Jamie Vogt of the Research Applications Program. Appreciation is extended to the Federal Aviation Administration's Aviation Weather Research Program for funding and direction.
TABLE OF CONTENTS
Page
EXECUTIVE SUMMARY vii 1. INTRODUCTION 1
1.1 Background 1 1.2 Purpose of Report 2
2. REFERENCE DOCUMENTS 2 3. PRODUCT OVERVIEW 3
3.1 ITFA Input 3 3.2 ITFA Output 3 3.3 Index Output 5
4. METEOROLOGICAL EVALUATION DESCRIPTION 5
4.1 Schedule and Location 5 4.2 Approach 5 4.3 Meteorological Evaluation Tools 6 4.4 Meteorological Evaluation Objectives 6 4.5 Meteorological Evaluation Description and Methodology 6 4.6 Data Collection and Analysis 7
4.6.1 Index Evaluation Defined 7 4.6.2 Meteorological Evaluation Procedures 7
5. RESULTS AND DISCUSSION 7
5.1 Brown 2 Index 8 5.2 Colson-Panofsky 10 5.3 Ellrod 1 and Ellrod 2 12 5.4 Richardson Number 14 5.5 DTF3 and DTF5 16 5.6 Endlich Empirical Wind Index 18 5.7 NGM 1 Predictor 20 5.8 Vertical Wind Shear 22 5.9 Horizontal Shear 25 5.10 Vorticity Squared 26 5.11 Potential Vorticity 28 5.12 Absia 31 5.13 Anomalous Gradient 34 5.14 Divergence 36
iii
6. Conclusions 38 6.1 Brown 2 38 6.2 Colson-Panofsky 39 6.3 Ellrod 1 and 2 39 6.4 Richardson Number 39 6.5 DTF3 and DTF5 39 6.6 Endlich 39 6.7 NGM 1 Predictor 39 6.8 Vertical Wind Shear 39 6.9 Horizontal Shear 40 6.10 Vorticity Squared 40 6.11 Potential Vorticity 40 6.12 Absia 40 6.13 Anomalous Gradient 40 6.14 Divergence 40
7. RECOMMENDATIONS 40 8. ACRONYMS 41
LIST OF TABLES
Table Page 1. ITFA 2001 Resident Indices 3
2. ITFA Color Legend and Relationship of ITFA Predictions to Turbulence Intensities 4
3. ITFA Indices Color Legend 5
LIST OF FIGURES
Figure Page 1. Sample ITFA Output 4
2. PIREP Turbulence Symbols and Meanings 5
3a-b. Initial (a) and Amended (b) SIGMET Areas for Event 4 8
4a-d. From Event 4, 1800 UTC 0-Hour Forecast Products Valid for 1800 UTC for (a) Brown 2 25,000-30,000 ft, (b) ITFA 25,000-30,000 ft, (c) Brown 2 30,000-35,000 ft, and (d) ITFA 30,000-35,000 ft 9
iv

5. Initial SIGMET Area for Event 1 10
6a-d. From Event 1, 0000 UTC 12-Hour Forecast Products Valid for 1200 UTC for (a) Colson-Panofsky 25,000-30,000 ft, (b) ITFA 25,000-30,000 ft, (c) Colson-Panofsky 30,000-35,000 ft, and (d) ITFA 30,000-35,000 ft 11
7. Initial SIGMET Area for Event 3 12
8a-d. From Event 3, 0000 UTC 0-Hour Forecast Products Valid for 0000 UTC for (a) Ellrod 1 20,000-25,000 ft, (b) Ellrod 1 25,000-30,000 ft, (c) Ellrod 2 20,000-25,000 ft, and (d) Ellrod 2 25,000-30,000 ft 13
9a-b. From Event 3, 0000 UTC 0-Hour Forecast Products Valid for 0000 UTC for (a) ITFA 20,000-25,000 ft and (b) ITFA 25,000-30,000 ft 14
10a-b. Initial (a) and Amended (b) SIGMET Areas for Event 5 15
11a-d. From Event 10, 0000 UTC 0-Hour Forecast Products Valid for 0000 UTC for (a) Richardson Number 20,000-25,000 ft, (b) ITFA 20,000-25,000 ft, (c) Richardson Number 25,000-30,000 ft, and (d) ITFA 25,000-30,000 ft 15
12a-b. Initial (a) and Amended (b) SIGMET Areas for Event 4 16
13a-d. From Event 4, 1800 UTC 0-Hour Forecast Products Valid for 1800 UTC for (a) DTF3 20,000-25,000 ft, (b) DTF3 25,000-30,000 ft, (c) DTF5 20,000-25,000 ft, and (d) DTF5 25,000-30,000 ft 17
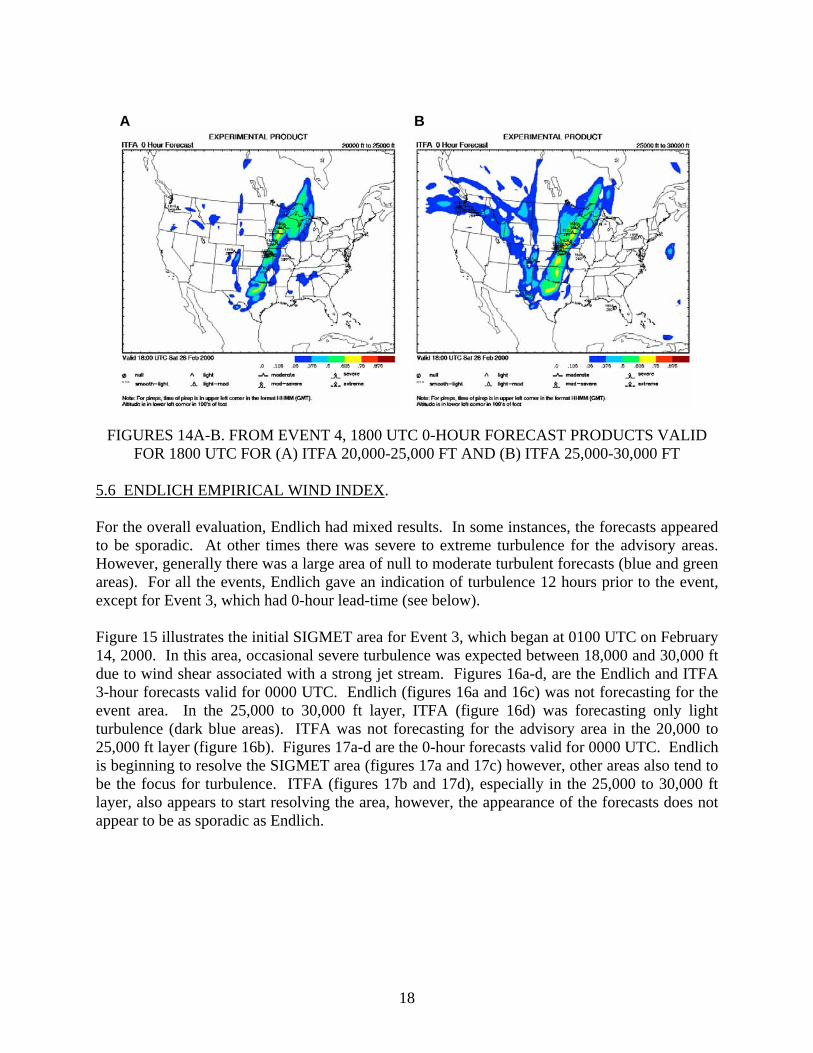
14a-b. From Event 4, 1800 UTC 0-Hour Forecast Products Valid for 1800 UTC for (a) ITFA 20,000-25,000 ft and (b) ITFA 25,000-30,000 ft 18
15. Initial SIGMET Area for Event 3 19
16a-d. From Event 3, 2100 UTC 3-Hour Forecast Products Valid for 0000 UTC for (a) Endlich 20,000-25,000 ft, (b) ITFA 20,000-25,000 ft, (c) Endlich 25,000-30,000 ft, and (d) ITFA 25,000-30,000 ft 19
17a-d. From Event 3, 0000 UTC 0-Hour Forecast Products Valid for 0000 UTC for (a) Endlich 20,000-25,000 ft, (b) ITFA 20,000-25,000 ft, (c) Endlich 25,000-30,000 ft, and (d) ITFA 25,000-30,000 ft 20
18a-b. Initial (a) and Amended (b) SIGMET Areas for Event 10 21
19a-d. From Event 10, 2100 UTC 0-Hour Forecast Products Valid for 2100 UTC for (a) NGM 1 20,000-25,000 ft, (b) ITFA 20,000-25,000 ft, (c) NGM 1 25,000-30,000 ft, and (d) ITFA 25,000-30,000 ft 22
20. Initial SIGMET Area for Event 1 23
v
21a-d. From Event 1, 0300 UTC 12-Hour Forecast Products Valid for 1500 UTC for (a) Vertical Wind Shear 25,000-30,000 ft, (b) ITFA 25,000-30,000 ft, (c) Vertical Wind Shear 30,000-35,000 ft, and (d) ITFA 30,000-35,000 ft 24
22a-b. Initial (a) and Amended (b) SIGMET Areas for Event 4 25
23a-d. From Event 4, 1500 UTC 0-Hour Forecast Products Valid for 1500 UTC for (a) Horizontal Shear 20,000-25,000 ft, (b) ITFA 20,000-25,000 ft, (c) Horizontal Shear 25,000-30,000 ft, and (d) ITFA 25,000-30,000 ft 26
24a-b. Initial (a) and Amended (b) SIGMET Areas for Event 4 27
25a-d. From Event 4, 1500 UTC 0-Hour Forecast Products Valid for 1500 UTC for (a) Vorticity Squared 25,000-30,000 ft, (b) ITFA 25,000-30,000 ft, (c) Vorticity Squared 30,000-35,000 ft, and (d) ITFA 30,000-35,000 ft 28
26. Initial SIGMET Area for Event 7 29
27a-d. From Event 7, 0900 UTC 12-Hour Forecast Products Valid at 2100 UTC for (a) Potential Vorticity 30,000-35,000 ft, (b) ITFA 30,000-35,000 ft, (c) Potential Vorticity 35,000-40,000 ft, and (d) ITFA 35,000-40,000 ft 30
28a-d. From Event 7, 2100 UTC 0-Hour Forecast Products Valid at 2100 UTC for (a) Potential Vorticity 30,000-35,000 ft, (b) ITFA 30,000-35,000 ft, (c) Potential Vorticity 35,000-40,000 ft, and (d) ITFA 35,000-40,000 ft 31
29a-b. Initial (a) and Amended (b) SIGMET Areas for Event 4 32
30a-d. From Event 4, 1500 UTC 0-Hour Forecast Products Valid for 1500 UTC for (a) ABSIA 25,000-30,000 ft, (b) ITFA 25,000-30,000 ft, (c) ABSIA 30,000-35,000 ft, and (d) ITFA 30,000-35,000 ft 33
31a-b. Initial (a) and Amended (b) SIGMET Areas for Event 7 34
32a-d. From Event 7, 0000 UTC 0-Hour Forecast Products Valid for 0000 UTC for (a) Anomalous Gradient 30,000-35,000 ft, (b) ITFA 30,000-35,000 ft, (c) Anomalous Gradient 35,000-40,000 ft, and (d) ITFA 35,000-40,000 ft 35
33a-b. Initial (a) and Amended (b) SIGMET Area for Event 10 36
34a-d. From Event 10, 2100 UTC 0-Hour Forecast Products Valid for 2100 UTC for (a) Divergence 20,000-25,000 ft, (b) ITFA 20,000-25,000 ft, (c) Divergence 25,000-30,000 ft, and (d) ITFA 25,000-30,000 ft 37
vi

EXECUTIVE SUMMARY This report summarizes the 2001 Integrated Turbulence Forecasting Algorithm (ITFA) Meteorological Evaluation, Part 2: Performance of Indices that was conducted at the Federal Aviation Administration (FAA) William J. Hughes Technical Center (hereafter referred to as Technical Center) from January until November 2001. Specific results, conclusions, and recommendations for the evaluation are detailed in this report. The Research Applications Program at the National Center for Atmospheric Research has developed the ITFA by combining several turbulence forecast techniques into a single algorithm that produces a forecast of turbulence potential. The ITFA uses numerical weather prediction output to calculate individual turbulence indices while turbulence observations obtained from Pilot Reports are used to weight the different outputs before they are integrated into a single forecast. The algorithm output consists of six layered products and a composite product that graphically depict the ITFA forecasts of turbulence potential for altitudes above 15,000 ft. The Weather Processors and Sensors Group (ACB-630) at the Technical Center conducted the meteorological evaluation. Rather than providing a purely statistical measure of algorithm performance, the evaluation focused on providing a subjective assessment of the performance, characteristics and trends of ITFA and its individual indices. The evaluation results indicate that the ITFA indices tend to fall into four categories: (1) forecasts similar to the overall ITFA forecasts and matching the actual observed turbulence; (2) forecasts that were too widespread; (3) forecasts that covered the observed turbulence with broad areas of high intensity; and (4) forecasts that tended to have scattered pockets of high intensity. Based on the evaluation results, recommendations were made to investigate indices that were too widespread in order to see if they should be retained; investigate the threshold values for indices that have widespread and broad forecasts; and consider a greater weighting to the indices that appeared to provide the best forecasts for jet stream and wind shear induced clear air turbulence.
vii
1. INTRODUCTION. 1.1 BACKGROUND. The Federal Aviation Administration (FAA) Aviation Weather Research Program (AWRP) has provided funding to the Research Applications Program at the National Center for Atmospheric Research (NCAR/RAP) to develop a forecasting tool to identify clear air turbulence (CAT). This effort falls within the domain of the Turbulence Product Development Team (PDT). The Turbulence PDT is made up of meteorological experts from private, government and academic organizations and receives its overall funding and direction from the AWRP. In response to the direction provided, NCAR/RAP has developed the Integrated Turbulence Forecasting Algorithm (ITFA), which produces turbulence forecasts for the contiguous United States. In support of the ITFA development, in 2000 the Technical Center's Weather Processors and Sensors Group (ACB-630) performed an event-driven meteorological evaluation of the ITFA using data from January 1 through April 30, 2000. Rather than provide a purely statistical measure of algorithm performance, the evaluation focused on providing a subjective assessment of the performance, characteristics and trends of the ITFA before and during periods of widespread, significant turbulence. Results from this evaluation indicated ITFA has the potential to be a useful tool for the detection and prediction of jet-stream and wind shear induced upper-level turbulence. For instance, ITFA displayed skill in forecasting the onset and end of the identified turbulence events while also showing that each identified event was resolved better over time. The evaluation also produced several recommendations provided to NCAR/RAP for improving the ITFA. Improving the mapping of the ITFA diagnostics to turbulence potential, which would result in a more accurate correlation of ITFA forecast values to observed conditions, was one recommendation. Another was to investigate whether adding additional indices to ITFA that are designed to detect regions of directional shear would result in ITFA better resolving regions of turbulence produced by upper low pressure systems. Additional recommendations included investigating a possible under forecast bias in ITFA 1200 UTC (Universal Time Coordinated) products and finding more efficient ways to incorporate turbulence reports into ITFA processing. After presenting the results and recommendations to NCAR/RAP and the AWRP, additional funding and direction were provided by the AWRP for ACB-630 to continue to evaluate the ITFA in 2001. Based upon decisions between ACB-630 and NCAR/RAP, the 2001 ITFA Meteorological Evaluation focused on ACB-630 subjectively analyzing output from the latest version of the ITFA, which was reran for the events identified during the 2000 ITFA Meteorological Evaluation. The purpose of this 2001 evaluation was to determine how the performance, characteristics and trends of the latest version of ITFA compared to the 2000 ITFA. Results of this comparison were documented in The 2001 Integrated Turbulence Forecasting Algorithm (ITFA) Meteorological Evaluation Report, Part 1: Comparison of ITFA 2000 and 2001 (available from ACB-630). In addition to the 2000 and 2001 comparison, the performances of the individual indices that comprise the ITFA were examined. The results of this aspect of the evaluation (i.e., Part 2: Performance of Indices) are the focus of this report.
1

1.2 PURPOSE OF REPORT. The purpose of this report is to document activities, results, conclusions, and recommendations from the ITFA Meteorological Evaluation, Part 2: Performance of Indices. This report will be used to assist with future development of the ITFA. NCAR/RAP and the National Oceanic and Atmospheric Administration Forecast Systems Laboratory are conducting separate verification activities to measure the quantitative performance of ITFA, and they will be responsible for issuing results on their verification work. 2. REFERENCE DOCUMENTS.
a. Acquisition Management System Test and Evaluation Process Guidelines, FAA, July 2001.
b. Benjamin, S., et al., 1999: Aviation Forecasts from the RUC. The 8th Conference on
Aviation, Range, and Aerospace Meteorology, American Meteorological Society, Dallas. c. Benjamin, S., et al., 1998: The Operational RUC. The 16th Conference on Weather
Analysis and Forecasting, American Meteorological Society, Phoenix. d. FAA Order 7110.65M, Air Traffic Control e. Gleim, I., 1999: Aviation Weather and Weather Services. 247-288. f. Sharman, R., B. Brown, and S. Dettling, 2000: Preliminary Results of the NCAR
Integrated Turbulence Forecasting Algorithm (ITFA) to Forecast CAT. The 9th Conference on Aviation, Range, and Aerospace Meteorology, American Meteorological Society, Orlando.
g. Sharman, R. and L. Coleman, 1998: An Integrated Approach to Clear-Air Turbulence
Prediction. American Institute of Aeronautics and Astronautics, 98, 1-6. h. Sharman, R., C. Tebaldi, and B. Brown: An Integrated Approach to Clear-Air Turbulence
Forecasting. National Center for Atmospheric Research, 1-4. i. Sims, D., V. Passetti, and J. Weinrich, 2002: The Integrated Turbulence Forecasting
Algorithm (ITFA) Meteorological Evaluation Final Report. FAA William J. Hughes Technical Center, ACB-630.
j. Sims, D. and J. Weinrich, 2002: The 2001 Integrated Turbulence Forecasting Algorithm
(ITFA) Meteorological Evaluation Report, Part 1: Comparison of 2000 and 2001. FAA William J. Hughes Technical Center, ACB-630.
2
3. PRODUCT OVERVIEW. The ITFA produces forecasts of turbulence by integrating the weighted output of several algorithms and indices that have proven strengths as turbulence predictors. The weightings are determined by comparing the output of the algorithms and indices to turbulence observations deduced from pilot reports (PIREPs). Table 1 contains the meteorological indices and algorithms that were included in the 2001 version of ITFA and that were examined as part of the evaluation. For further information on the individual indices, NCAR/RAP should be contacted (see http://www.rap.ucar.edu).
TABLE 1. ITFA 2001 RESIDENT INDICES
1. Brown 2 Index 2. Colson-Panofsky Index
3. Ellrod 1 Index 4. Ellrod 2 Index
5. Richardson Number 6. DTF3 7. DTF5
8. Endlich Empirical Wind Index 9. NGM 1 Predictor
10. Vertical Wind Shear 11. Horizontal Shear 12. Vorticity Squared
13. Potential Vorticity Gradient 14. ABSIA
15. Anomalous Gradient Index 16. Divergence
3.1 ITFA INPUT. ITFA input is the Rapid Update Cycle (RUC) weather prediction output and turbulence reports from PIREPs. For further information, reference the Part 1 report. 3.2 ITFA OUTPUT. The ITFA is executed every three hours in conjunction with the RUC 12-hour model run. Algorithm output consists of turbulence forecasts presented on a map of the contiguous United States that coincides with the RUC model domain. An example of an ITFA forecast product is presented as figure 1. The algorithm generates 0, 3, 6, 9 and 12-hour forecasts for 5,000 ft layers between 15,000 and 45,000 ft. The forecast hour and the forecast layer are displayed in the upper-left and upper-right corners of the product, respectively. In the lower left corner is the forecast valid time and date for the particular product. A color legend is presented at the lower-right quadrant of the product, and at the bottom is a PIREP legend.
3

The ITFA forecast output ranges from 0.0 to 1.0. Table 2, as provided by NCAR/RAP, gives the correlation of ITFA forecasts to operational turbulence interpretations. The representative color scheme employed to represent the turbulence forecasts ranges from no coloring for negligible turbulence, to blues for light turbulence potential, greens and yellows for moderate, and reds for greater than moderate. Symbols that represent turbulence observations obtained from PIREP data are overlaid on ITFA products. This information is based on data that are not more than 90 minutes old at the generation time of the ITFA. Turbulence observations derived from PIREPs are presented using the traditional turbulence symbols shown in figure 2.
FIGURE 1. SAMPLE ITFA OUTPUT
TABLE 2. ITFA COLOR LEGEND AND RELATIONSHIP OF ITFA PREDICTIONS TO
TURBULENCE INTENSITIES
ITFA Prediction (0.0 to 1.0) Turbulence Interpretation 0.0 to 0.25 No Turbulence Likely 0.25 to 0.5 At Least Light Turbulence Likely 0.5 to 0.75 At Least Moderate Turbulence Likely 0.75 to 1.0 At Least Some Moderate or Greater
Turbulence Likely
4

e t e
3.3 INDEX O Graphical outpresented on aIndices were lindex, numeriwas used for e
Color None Blue Green Yellow Red
4. METEORO 4.1 SCHEDU The 2001 ITFdata collectioactivities perf 4.2 APPROA The 2001 ITFindices that aindividual indprovided this
Negligibl
t
FIGURE 2. PIREP
UTPUT.
put of the individu map of the contiguabeled in the upper-cal values differed fach product (see tab
TABLE 3
LOGICAL EVALU
LE AND LOCATIO
A Meteorological En taking place fromormed from June to N
CH.
A Meteorological Ere incorporated in Iices for the turbulendata to ACB-630.
Ligh
e Mod
TURBULENCE SY
al ITFA indices waous United States thleft corner of the prorom one index to anle 3).
. ITFA INDICES C
TurbNo TNullLighModSeve
ATION DESCRIPT
N.
valuation, Part 2 wa January to Marcovember 2001.
valuation, Part 2 invTFA. NCAR/RAPce events during the The evaluation focu
5
Moderat
erate - Severe
MBOLS AND MEAN
s provided by NCARat coincided with theduct. Due to the diffother. However, a c
OLOR LEGEND
ulence Interpretation urbulence Likely
to Light Turbulence t to Moderate Turbuleerate to Severe Turbure to Extreme Turbule
ION.
s conducted at the Th 2001 and data red
olved the analysis of reran the 2001 vers2000 ITFA Meteorolosed on subjectively
Severe
e
Smooth - Ligh Light - Moderat ExtremINGS
/RAP. Output was overall ITFA output. erent criteria of each ommon color legend
nce lence nce
echnical Center, with uction and analysis
output of the sixteen ion of ITFA and the gical Evaluation and
determining how the
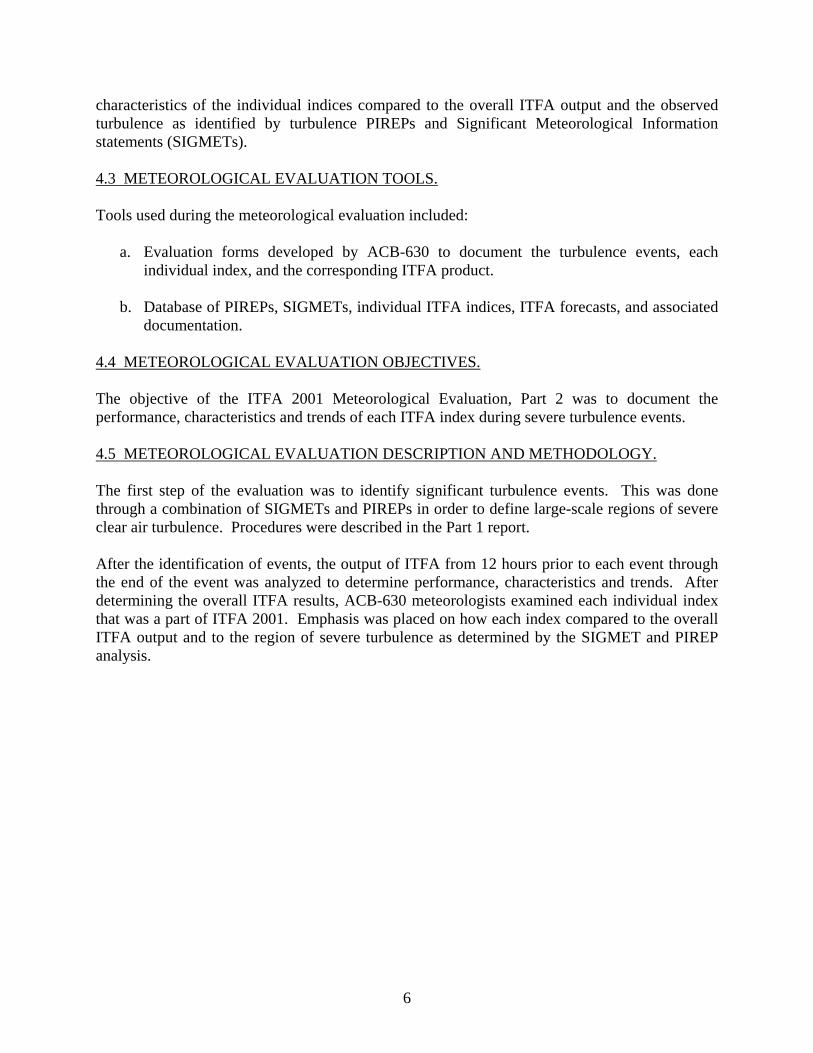
characteristics of the individual indices compared to the overall ITFA output and the observed turbulence as identified by turbulence PIREPs and Significant Meteorological Information statements (SIGMETs). 4.3 METEOROLOGICAL EVALUATION TOOLS. Tools used during the meteorological evaluation included:
a. Evaluation forms developed by ACB-630 to document the turbulence events, each individual index, and the corresponding ITFA product.
b. Database of PIREPs, SIGMETs, individual ITFA indices, ITFA forecasts, and associated
documentation. 4.4 METEOROLOGICAL EVALUATION OBJECTIVES. The objective of the ITFA 2001 Meteorological Evaluation, Part 2 was to document the performance, characteristics and trends of each ITFA index during severe turbulence events. 4.5 METEOROLOGICAL EVALUATION DESCRIPTION AND METHODOLOGY. The first step of the evaluation was to identify significant turbulence events. This was done through a combination of SIGMETs and PIREPs in order to define large-scale regions of severe clear air turbulence. Procedures were described in the Part 1 report. After the identification of events, the output of ITFA from 12 hours prior to each event through the end of the event was analyzed to determine performance, characteristics and trends. After determining the overall ITFA results, ACB-630 meteorologists examined each individual index that was a part of ITFA 2001. Emphasis was placed on how each index compared to the overall ITFA output and to the region of severe turbulence as determined by the SIGMET and PIREP analysis.
6

4.6 DATA COLLECTION AND ANALYSIS. 4.6.1 Index Evaluation Defined. Ten severe turbulence events and corresponding meteorological conditions were identified in the 2000 ITFA Meteorological Evaluation (see the Part 1 report for a description of each event). The performance of ITFA in forecasting turbulence for these ten events was determined in the 2000 evaluation. In 2001, the latest version of ITFA (ITFA 2001) was examined in regards to its performance in the ten events and was compared to the 2000 results. After the determination of the actual events and ITFA performance in 2000 and 2001, the individual indices of ITFA 2001 were examined to determine how well each index represented the identified conditions for each turbulence event. After the index determination was completed for each event, the results were compared to determine overall performance issues, characteristics and trends for each index. 4.6.2 Meteorological Evaluation Procedures. Individual index forecasts were examined both before, at the onset, as well as 3 and 6 hours into each turbulence event. Due to the large amount of data, the analysis was limited to only these time periods. The evaluation focused on providing a subjective assessment of each indices' performance, characteristics and trends, especially in regards to the performance of the overall ITFA forecasts. Therefore, the analysis compared each index to the corresponding ITFA output. Emphasis was placed on the lead-time given by an index in forecasting the start of the event and on the forecasted versus observed turbulence. 5. RESULTS AND DISCUSSION. This section presents the results of the 2001 ITFA Meteorological Evaluation, Part 2: Performance of Indices. Each individual ITFA index’s overall results are discussed. The following sections will give summaries into how indices performed compared to the ITFA output and to PIREPs. Included are examples for each of the indices that are integrated into ITFA.
7

5.1 BROWN 2 INDEX.
Overall, Brown 2 results showed that the index tended to forecast severe to extreme turbulence (red areas) for most of the advisory areas. However, for most of the events, Brown 2 tended to forecast areas too large. In some instances, the forecasts were so widespread that no localized area of turbulence could be noted. This generally occurred when ITFA forecast values were greater than 0.375. With regard to light ITFA forecast values (i.e., values less than 0.375), Brown 2 indicated lower values, and at times represented a similar shape to the overall ITFA shape. For the evaluation period, Brown 2 lead times were 12 hours, however, this is likely due to the widespread nature of the forecasts. As forecasts approached the start of the event, the forecast area and intensity often increased and became too large. As an example, figures 3a-b illustrates the initial and amended SIGMET area for Event 4, which began at 1530 UTC on February 26, 2000. In these areas, occasional severe turbulence was expected between 20,000 and 35,000 ft, due to wind shear associated with the jet stream. Figures 4a-d contains Brown 2 and ITFA 0-hour forecast products for 25,000 to 30,000 ft and 30,000 to 35,000 ft, valid for 1800 UTC. Examining the forecasts in figures 4a and 4c for the event area, it is seen that severe to extreme turbulence (red areas) is forecasted. This indication, however, extends to include a major portion of the Central and Northwestern United States. As seen in figures 4b and 4d, the ITFA forecast of 0.625 to 0.75 (yellow areas) correlated well with the PIREPs and the event area. ITFA better defined the localized area of turbulence than Brown 2.
A
B
FIGURES 3A-B. INITIAL (A) AND AMENDED (B) SIGMET AREAS FOR EVENT 4
8

A B
C D
FIGURES 4A-D. FROM EVENT 4, 1800 UTC 0-HOUR FORECAST PRODUCTS VALID
FOR 1800 UTC FOR (A) BROWN 2 25,000-30,000 FT, (B) ITFA 25,000-30,000 FT, (C) BROWN 2 30,000-35,000 FT, AND (D) ITFA 30,000-35,000 FT
9
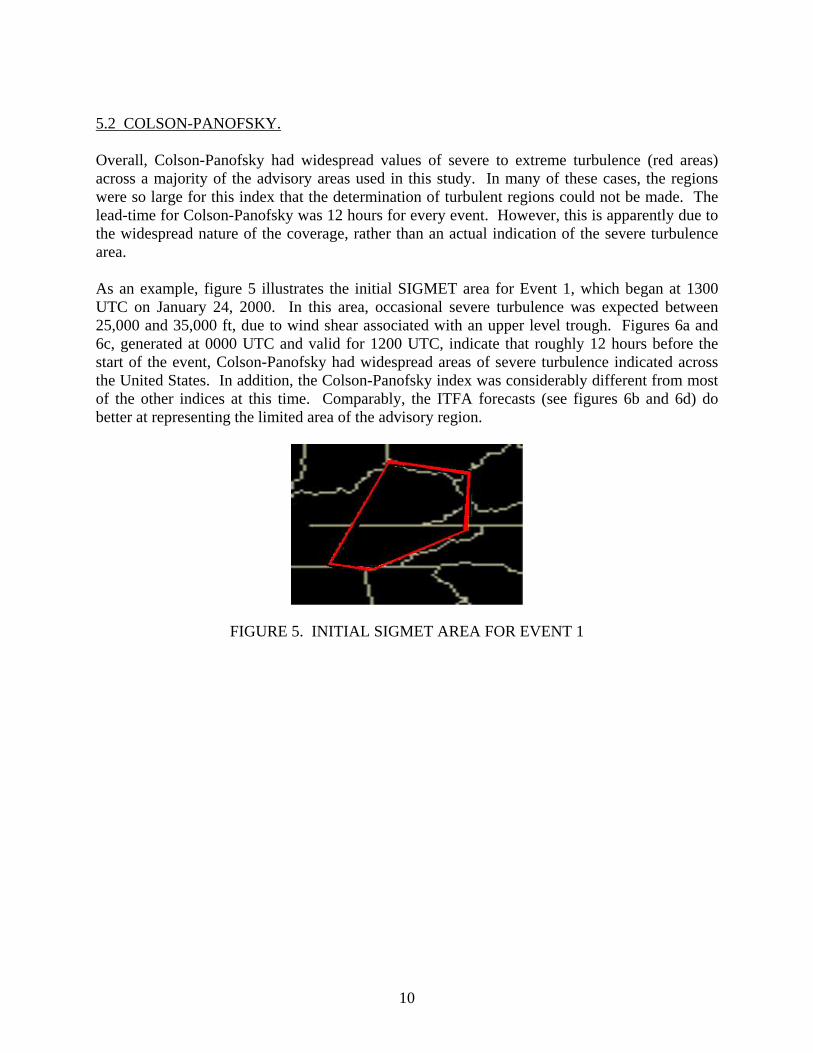
5.2 COLSON-PANOFSKY. Overall, Colson-Panofsky had widespread values of severe to extreme turbulence (red areas) across a majority of the advisory areas used in this study. In many of these cases, the regions were so large for this index that the determination of turbulent regions could not be made. The lead-time for Colson-Panofsky was 12 hours for every event. However, this is apparently due to the widespread nature of the coverage, rather than an actual indication of the severe turbulence area. As an example, figure 5 illustrates the initial SIGMET area for Event 1, which began at 1300 UTC on January 24, 2000. In this area, occasional severe turbulence was expected between 25,000 and 35,000 ft, due to wind shear associated with an upper level trough. Figures 6a and 6c, generated at 0000 UTC and valid for 1200 UTC, indicate that roughly 12 hours before the start of the event, Colson-Panofsky had widespread areas of severe turbulence indicated across the United States. In addition, the Colson-Panofsky index was considerably different from most of the other indices at this time. Comparably, the ITFA forecasts (see figures 6b and 6d) do better at representing the limited area of the advisory region.
FIGURE 5. INITIAL SIGMET AREA FOR EVENT 1
10

A B
C
D
FIGURES 6A-D. FROM EVENT 1, 0000 UTC 12-HOUR FORECAST PRODUCTS VALID
FOR 1200 UTC FOR (A) COLSON-PANOFSKY 25,000-30,000 FT, (B) ITFA 25,000-30,000 FT, (C) COLSON-PANOFSKY 30,000-35,000 FT, AND (D) ITFA 30,000-35,000 FT
11

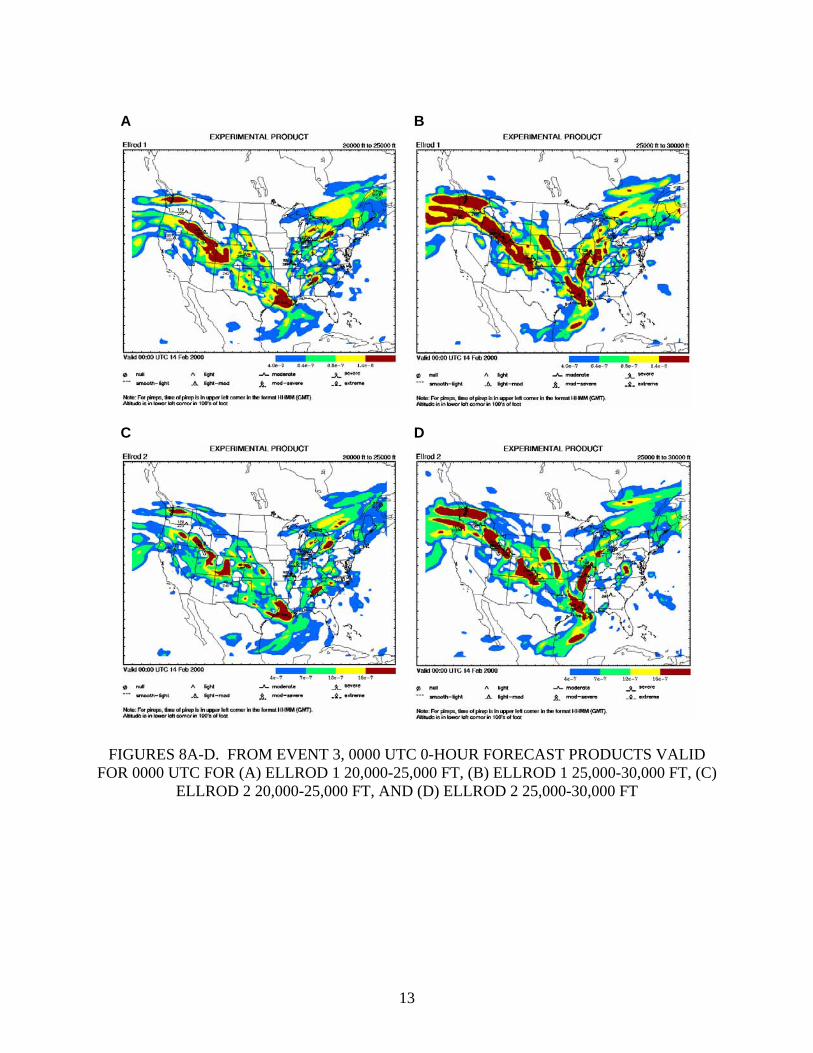
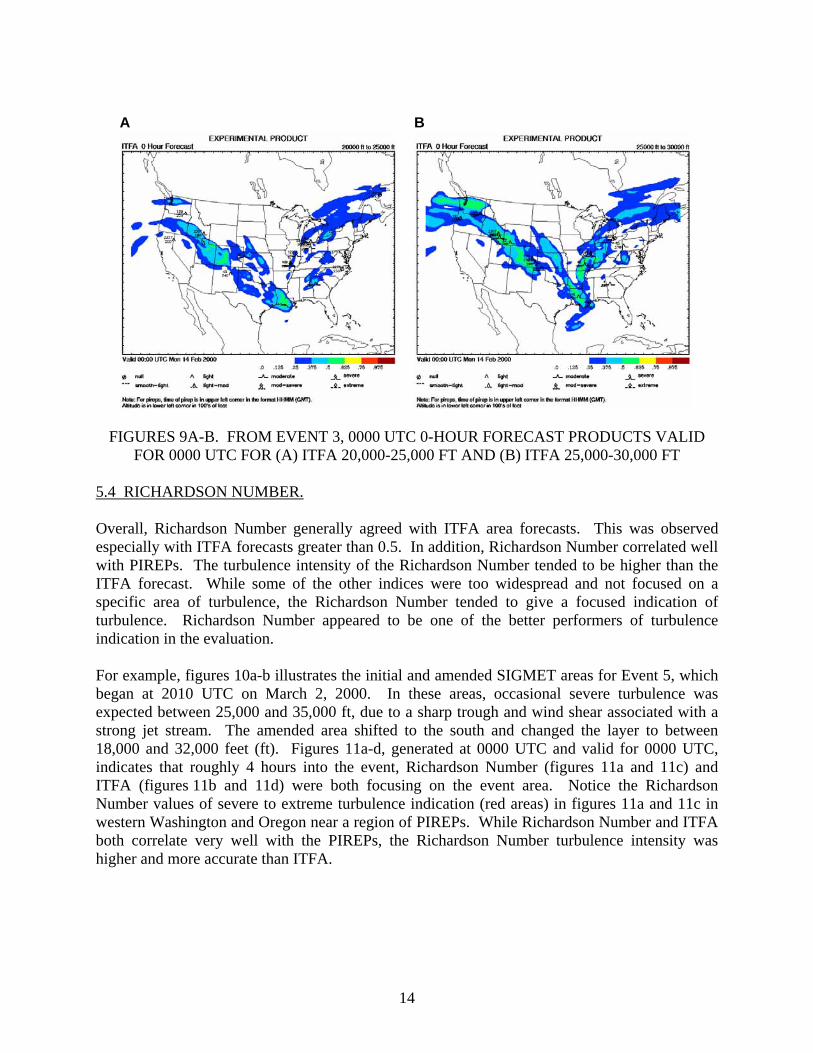
5.3 ELLROD 1 AND ELLROD 2. The Ellrod 1 and Ellrod 2 indices are similar with the difference being that Ellrod 2 includes convergence. Although the output of the indices was generally similar, Ellrod 2 had tighter gradients of the threshold values. It further appeared that areas of moderate to severe values (yellow areas) in Ellrod 1 were substituted by areas of light to moderate values (green areas) in Ellrod 2. Other than these two observations, Ellrod 1 and 2 were very similar in regions of coverage. For all the events, the Ellrod indices gave an indication of turbulence 12 hours in advance. Generally, however, Ellrod 1 and Ellrod 2 had higher turbulence values than ITFA and gave broad indications of possible turbulence areas. As an example, figure 7 illustrates the initial SIGMET area for Event 3, which began at 0100 UTC on February 14, 2000. In this area, occasional severe turbulence was expected between 18,000 and 30,000 ft due to wind shear associated with a strong jet stream. Figures 8a-d, generated at 0000 UTC and valid for 0000 UTC (1 hour prior to the start of the event), shows the Ellrod 1 and Ellrod 2 predictions. Both indices are indicating severe to extreme turbulence (red areas) at 25,000 to 30,000 ft (figures 8b and 8d) in a portion of the advisory area near the region of PIREPs. The corresponding ITFA forecasts (see figures 9a-b) have lower indications of turbulence in the advisory region.
FIGURE 7. INITIAL SIGMET AREA FOR EVENT 3
12
A
B
C
D
FIGURES 8A-D. FROM EVENT 3, 0000 UTC 0-HOUR FORECAST PRODUCTS VALID
FOR 0000 UTC FOR (A) ELLROD 1 20,000-25,000 FT, (B) ELLROD 1 25,000-30,000 FT, (C) ELLROD 2 20,000-25,000 FT, AND (D) ELLROD 2 25,000-30,000 FT
13
A
B
FIGURES 9A-B. FROM EVENT 3, 0000 UTC 0-HOUR FORECAST PRODUCTS VALID FOR 0000 UTC FOR (A) ITFA 20,000-25,000 FT AND (B) ITFA 25,000-30,000 FT
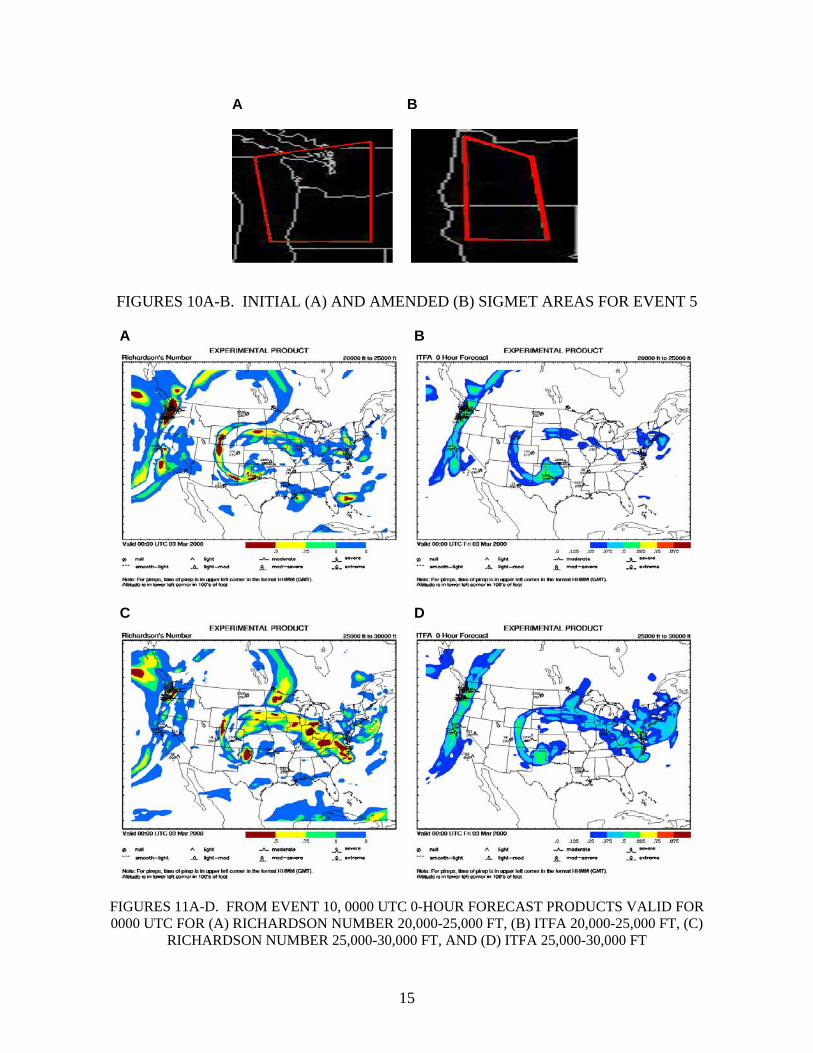
5.4 RICHARDSON NUMBER. Overall, Richardson Number generally agreed with ITFA area forecasts. This was observed especially with ITFA forecasts greater than 0.5. In addition, Richardson Number correlated well with PIREPs. The turbulence intensity of the Richardson Number tended to be higher than the ITFA forecast. While some of the other indices were too widespread and not focused on a specific area of turbulence, the Richardson Number tended to give a focused indication of turbulence. Richardson Number appeared to be one of the better performers of turbulence indication in the evaluation. For example, figures 10a-b illustrates the initial and amended SIGMET areas for Event 5, which began at 2010 UTC on March 2, 2000. In these areas, occasional severe turbulence was expected between 25,000 and 35,000 ft, due to a sharp trough and wind shear associated with a strong jet stream. The amended area shifted to the south and changed the layer to between 18,000 and 32,000 feet (ft). Figures 11a-d, generated at 0000 UTC and valid for 0000 UTC, indicates that roughly 4 hours into the event, Richardson Number (figures 11a and 11c) and ITFA (figures 11b and 11d) were both focusing on the event area. Notice the Richardson Number values of severe to extreme turbulence indication (red areas) in figures 11a and 11c in western Washington and Oregon near a region of PIREPs. While Richardson Number and ITFA both correlate very well with the PIREPs, the Richardson Number turbulence intensity was higher and more accurate than ITFA.
14
A
B
FIGURES 10A-B. INITIAL (A) AND AMENDED (B) SIGMET AREAS FOR EVENT 5
A B
C
D
FIGURES 11A-D. FROM EVENT 10, 0000 UTC 0-HOUR FORECAST PRODUCTS VALID FOR 0000 UTC FOR (A) RICHARDSON NUMBER 20,000-25,000 FT, (B) ITFA 20,000-25,000 FT, (C)
RICHARDSON NUMBER 25,000-30,000 FT, AND (D) ITFA 25,000-30,000 FT
15

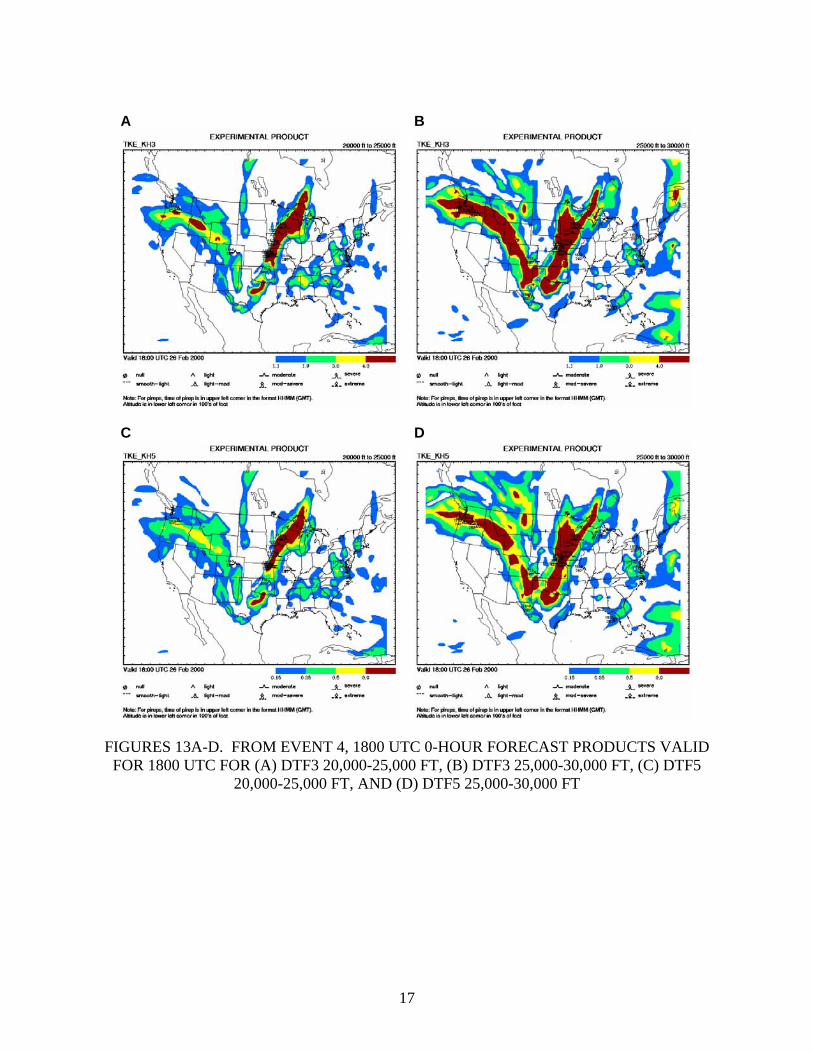
5.5 DTF3 AND DTF5. DTF3 and DTF5 gave broad indications of where turbulent conditions were possible. At times, DTF3 and DTF5 would over forecast. In almost every instance, DTF3 and DTF5 turbulence intensities were higher than ITFA. The lead-time for DTF3 and DTF5 was 12 hours for 9 of the 10 events. The only event that did not have a 12-hour lead-time for these indices was Event 3, which had a 6-hour lead-time. Generally, DTF3 and DTF5 resolved the advisory area better as it approached the beginning of the event, and was better correlated with PIREPs in the 0-hour forecasts than with the preceding forecasts. For example, figures 12a-b illustrates the initial and amended SIGMET areas for Event 4, which began at 1530 UTC on February 26, 2000. In these areas, occasional severe turbulence was expected between 20,000 and 35,000 ft due to strong jet stream wind shear. Figures 13a-d, generated at 1800 UTC and valid for 1800 UTC, indicates that 3 hours into the event, DTF3 and DTF5 values of severe to extreme turbulence (red areas) were in the SIGMET area near a region of PIREPs. However, the overall red areas covered a much larger region, especially in the 25,000 to 30,000 ft layer. In comparison, ITFA (figures 14a-b) focused on the SIGMET area, but with lower values.
A
B
FIGURES 12A-B. INITIAL (A) AND AMENDED (B) SIGMET AREAS FOR EVENT 4
16
A B
C
D
FIGURES 13A-D. FROM EVENT 4, 1800 UTC 0-HOUR FORECAST PRODUCTS VALID
FOR 1800 UTC FOR (A) DTF3 20,000-25,000 FT, (B) DTF3 25,000-30,000 FT, (C) DTF5 20,000-25,000 FT, AND (D) DTF5 25,000-30,000 FT
17
A
B
FIGURES 14A-B. FROM EVENT 4, 1800 UTC 0-HOUR FORECAST PRODUCTS VALID FOR 1800 UTC FOR (A) ITFA 20,000-25,000 FT AND (B) ITFA 25,000-30,000 FT
5.6 ENDLICH EMPIRICAL WIND INDEX. For the overall evaluation, Endlich had mixed results. In some instances, the forecasts appeared to be sporadic. At other times there was severe to extreme turbulence for the advisory areas. However, generally there was a large area of null to moderate turbulent forecasts (blue and green areas). For all the events, Endlich gave an indication of turbulence 12 hours prior to the event, except for Event 3, which had 0-hour lead-time (see below). Figure 15 illustrates the initial SIGMET area for Event 3, which began at 0100 UTC on February 14, 2000. In this area, occasional severe turbulence was expected between 18,000 and 30,000 ft due to wind shear associated with a strong jet stream. Figures 16a-d, are the Endlich and ITFA 3-hour forecasts valid for 0000 UTC. Endlich (figures 16a and 16c) was not forecasting for the event area. In the 25,000 to 30,000 ft layer, ITFA (figure 16d) was forecasting only light turbulence (dark blue areas). ITFA was not forecasting for the advisory area in the 20,000 to 25,000 ft layer (figure 16b). Figures 17a-d are the 0-hour forecasts valid for 0000 UTC. Endlich is beginning to resolve the SIGMET area (figures 17a and 17c) however, other areas also tend to be the focus for turbulence. ITFA (figures 17b and 17d), especially in the 25,000 to 30,000 ft layer, also appears to start resolving the area, however, the appearance of the forecasts does not appear to be as sporadic as Endlich.
18

FIGURE 15. INITIAL SIGMET AREA FOR EVENT 3
A
B
C
D
FIGURES 16A-D. FROM EVENT 3, 2100 UTC 3-HOUR FORECAST PRODUCTS VALID
FOR 0000 UTC FOR (A) ENDLICH 20,000-25,000 FT, (B) ITFA 20,000-25,000 FT, (C) ENDLICH 25,000-30,000 FT, AND (D) ITFA 25,000-30,000 FT
19

A B
C
D
FIGURES 17A-D. FROM EVENT 3, 0000 UTC 0-HOUR FORECAST PRODUCTS VALID
FOR 0000 UTC FOR (A) ENDLICH 20,000-25,000 FT, (B) ITFA 20,000-25,000 FT, (C) ENDLICH 25,000-30,000 FT, AND (D) ITFA 25,000-30,000 FT
5.7 NGM 1 PREDICTOR. NGM 1 Predictor tended to produce some of the more widespread forecasts in ITFA 2001. For 8 of the 10 events, severe to extreme turbulence was present for all of the hours analyzed. This included not only the advisory area, but expanded well beyond into other areas. For most of the hours, the advisory area could not be identified from other areas due to the widespread forecasts. As a result of the forecasts, NGM 1 had indications of turbulence in the advisory area (and elsewhere) 12 hours in advance of all the events. 20

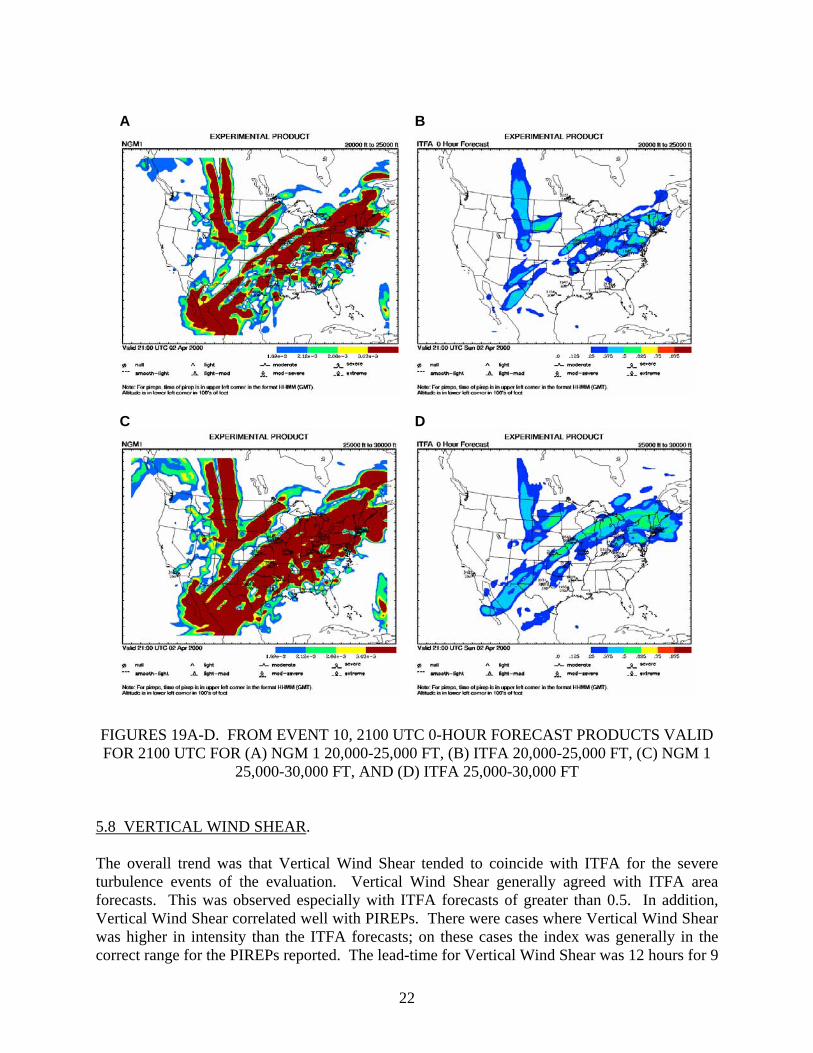
Figures 18a-b illustrates the initial and amended SIGMET areas for Event 10, which began at 1525 UTC on April 2, 2000. In these areas, occasional severe turbulence was expected between 20,000 and 30,000 ft due to strong jet stream wind shear. Figures 19a-d are the NGM 1 and ITFA 0-hour forecasts valid at 2100 UTC (approximately 6 hours into the event). Figures 19a and c indicate that NGM 1 covered the event area with severe turbulence (red areas), but was also indicating severe turbulence over a widespread region. This is an anomaly from most of the other indices at this time. Comparably, the ITFA forecasts (figures 19b and 19d) tended to better represent the advisory areas.
A
B
FIGURES 18A-B. INITIAL (A) AND AMENDED (B) SIGMET AREAS FOR EVENT 10
21
A B
C
D
FIGURES 19A-D. FROM EVENT 10, 2100 UTC 0-HOUR FORECAST PRODUCTS VALID FOR 2100 UTC FOR (A) NGM 1 20,000-25,000 FT, (B) ITFA 20,000-25,000 FT, (C) NGM 1
25,000-30,000 FT, AND (D) ITFA 25,000-30,000 FT 5.8 VERTICAL WIND SHEAR. The overall trend was that Vertical Wind Shear tended to coincide with ITFA for the severe turbulence events of the evaluation. Vertical Wind Shear generally agreed with ITFA area forecasts. This was observed especially with ITFA forecasts of greater than 0.5. In addition, Vertical Wind Shear correlated well with PIREPs. There were cases where Vertical Wind Shear was higher in intensity than the ITFA forecasts; on these cases the index was generally in the correct range for the PIREPs reported. The lead-time for Vertical Wind Shear was 12 hours for 9
22

of the 10 events; the only exception was Event 3, which had a 6-hour lead-time. Vertical Wind Shear gave a more specific focus than all of the other indices in this study. For example, figure 20 illustrates the initial SIGMET area for Event 1, which began at 1300 UTC on January 24, 2000. In this area, occasional severe turbulence was expected between 25,000 and 35,000 ft due to wind shear associated with an upper level trough. Figures 21a-d are the Vertical Wind Shear and ITFA 12-hour forecasts valid for 1500 UTC. The forecasts for two hours into the event show that Vertical Wind Shear and ITFA were focusing on the event area especially in the 25,000 to 30,000 ft layer. For example, note the Vertical Wind Shear values of moderate to severe turbulence (yellow areas), in figure 21a. ITFA shows similar indications and area with a forecast of 0.625 to 0.75 (yellow areas) in figures 21b and 21d.
FIGURE 20. INITIAL SIGMET AREA FOR EVENT 1
23

A
B
C
D
FIGURES 21A-D. FROM EVENT 1, 0300 UTC 12-HOUR FORECAST PRODUCTS VALID
FOR 1500 UTC FOR (A) VERTICAL WIND SHEAR 25,000-30,000 FT, (B) ITFA 25,000-30,000 FT, (C) VERTICAL WIND SHEAR 30,000-35,000 FT, AND (D) ITFA 30,000-
35,000 FT
24

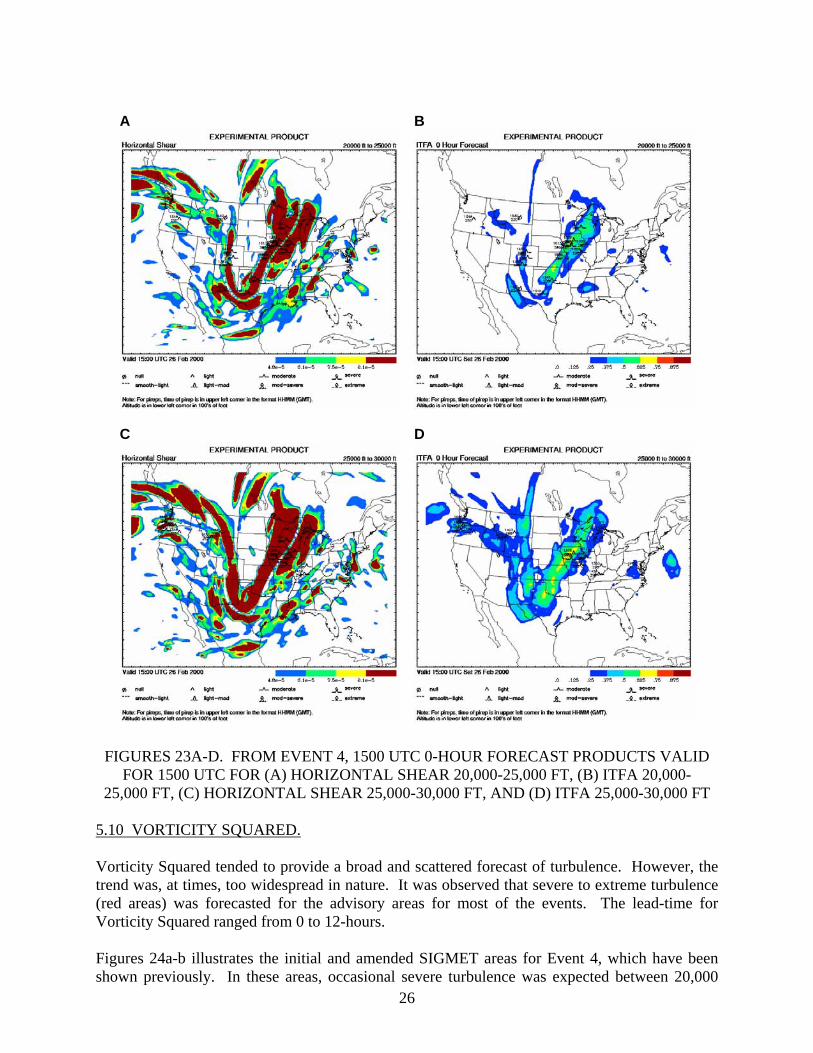
5.9 HORIZONTAL SHEAR. Horizontal Shear tended to provide a broad indication of turbulence. It was generally observed that severe to extreme turbulence (red areas) occurred for most of the advisory areas. However, at times this trend continued outside of the advisory area thus nullifying any possible focusing of the turbulence area. Overall, Horizontal Shear tended to forecast higher intensity and larger areas than ITFA. Figures 22a-b illustrates the initial and amended SIGMET areas for Event 4, which began at 1530 UTC on February 26, 2000. In these areas, occasional severe turbulence was expected between 20,000 and 35,000 ft due to wind shear associated with the jet stream. Horizontal Shear indicated severe to extreme turbulence (red areas) for most of the advisory area (see figures 23a and 23c). However, many other areas from the Northwest into the Central United States and back up into the SIGMET areas were also forecasted to have severe to extreme turbulence. In contrast, the ITFA forecasts (figures 23b and 23d) gave a focused indication of turbulence that tended to coincide with the SIGMET areas.
A
B
FIGURES 22A-B. INITIAL (A) AND AMENDED (B) SIGMET AREAS FOR EVENT 4
25
A B
C
D
FIGURES 23A-D. FROM EVENT 4, 1500 UTC 0-HOUR FORECAST PRODUCTS VALID
FOR 1500 UTC FOR (A) HORIZONTAL SHEAR 20,000-25,000 FT, (B) ITFA 20,000-25,000 FT, (C) HORIZONTAL SHEAR 25,000-30,000 FT, AND (D) ITFA 25,000-30,000 FT
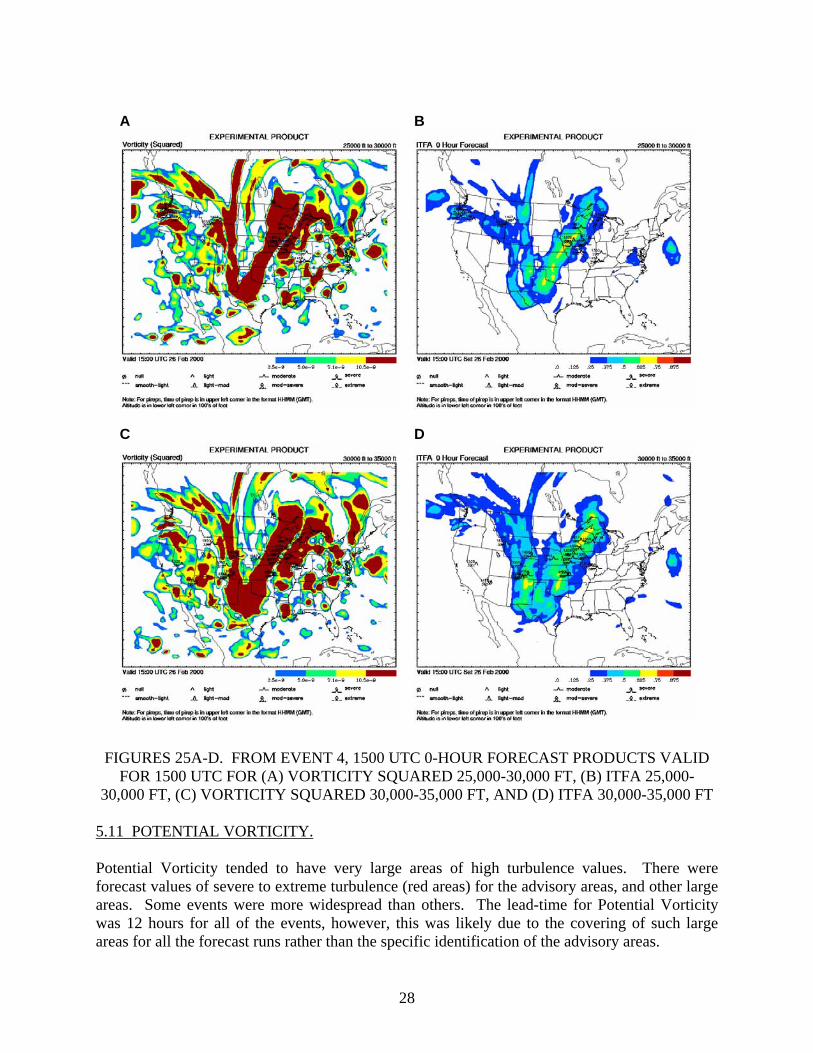
5.10 VORTICITY SQUARED. Vorticity Squared tended to provide a broad and scattered forecast of turbulence. However, the trend was, at times, too widespread in nature. It was observed that severe to extreme turbulence (red areas) was forecasted for the advisory areas for most of the events. The lead-time for Vorticity Squared ranged from 0 to 12-hours. Figures 24a-b illustrates the initial and amended SIGMET areas for Event 4, which have been shown previously. In these areas, occasional severe turbulence was expected between 20,000 26

and 35,000 ft due to wind shear associated with the jet stream. Figures 25a-d are the Vorticity Squared and ITFA 0-hour forecasts valid for 1500 UTC on February 26, 2000. Vorticity Squared showed severe to extreme turbulence (red areas) in the advisory areas, however, similar to some of the other indices, other areas throughout the United States indicate severe to extreme turbulence (see Figures 25a and 25c). Comparably, ITFA (figures 25b and 25d) had more narrowly defined regions of moderate turbulence (green and yellow areas) in the advisory areas.
A
B
FIGURES 24A-B. INITIAL (A) AND AMENDED (B) SIGMET AREAS FOR EVENT 4
27
A B
C
D
FIGURES 25A-D. FROM EVENT 4, 1500 UTC 0-HOUR FORECAST PRODUCTS VALID
FOR 1500 UTC FOR (A) VORTICITY SQUARED 25,000-30,000 FT, (B) ITFA 25,000-30,000 FT, (C) VORTICITY SQUARED 30,000-35,000 FT, AND (D) ITFA 30,000-35,000 FT
5.11 POTENTIAL VORTICITY. Potential Vorticity tended to have very large areas of high turbulence values. There were forecast values of severe to extreme turbulence (red areas) for the advisory areas, and other large areas. Some events were more widespread than others. The lead-time for Potential Vorticity was 12 hours for all of the events, however, this was likely due to the covering of such large areas for all the forecast runs rather than the specific identification of the advisory areas.
28
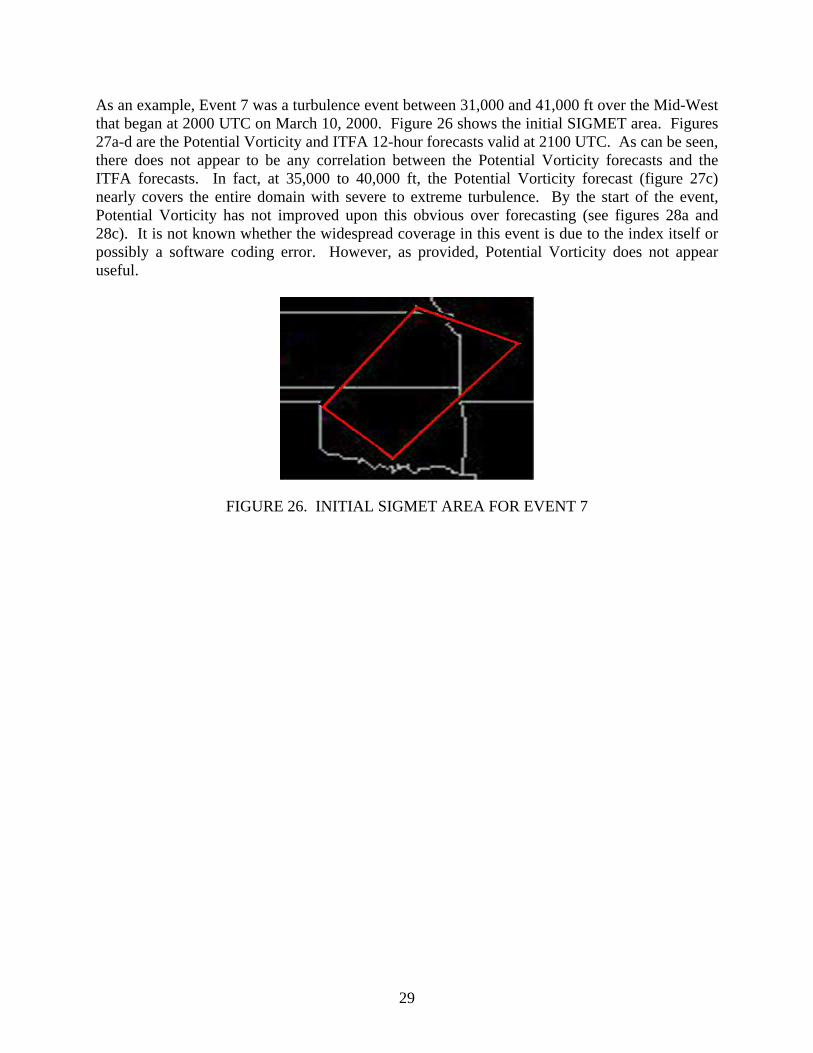
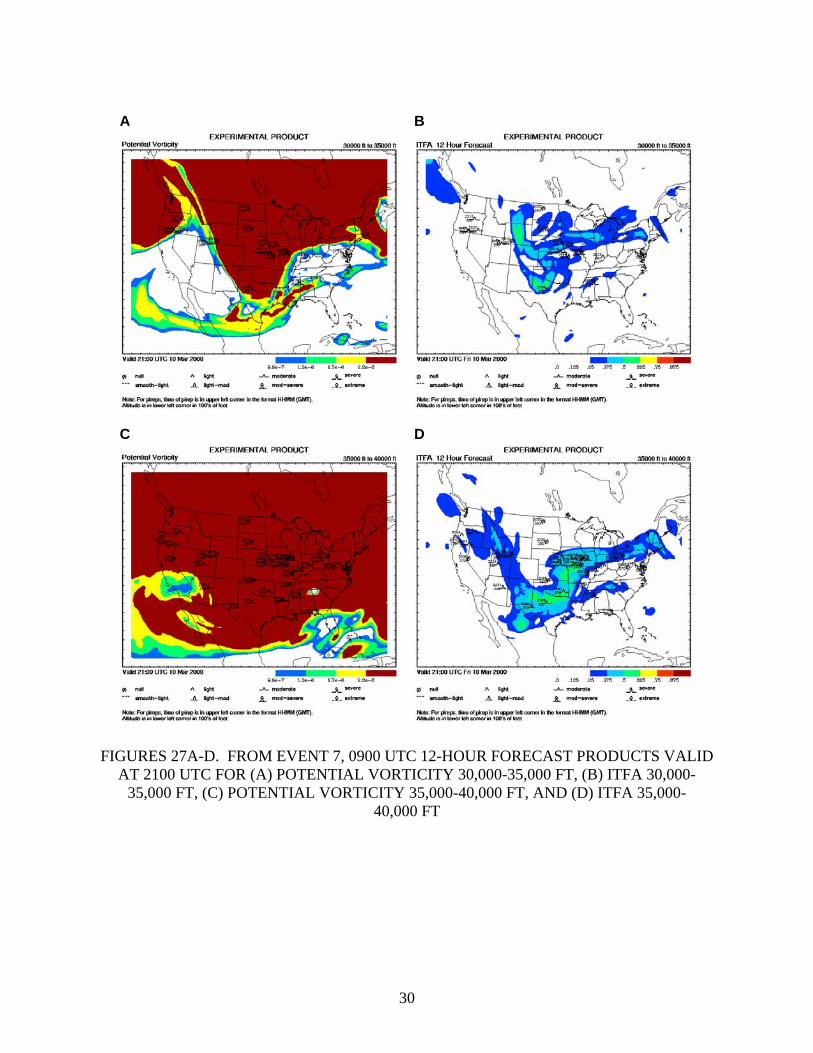
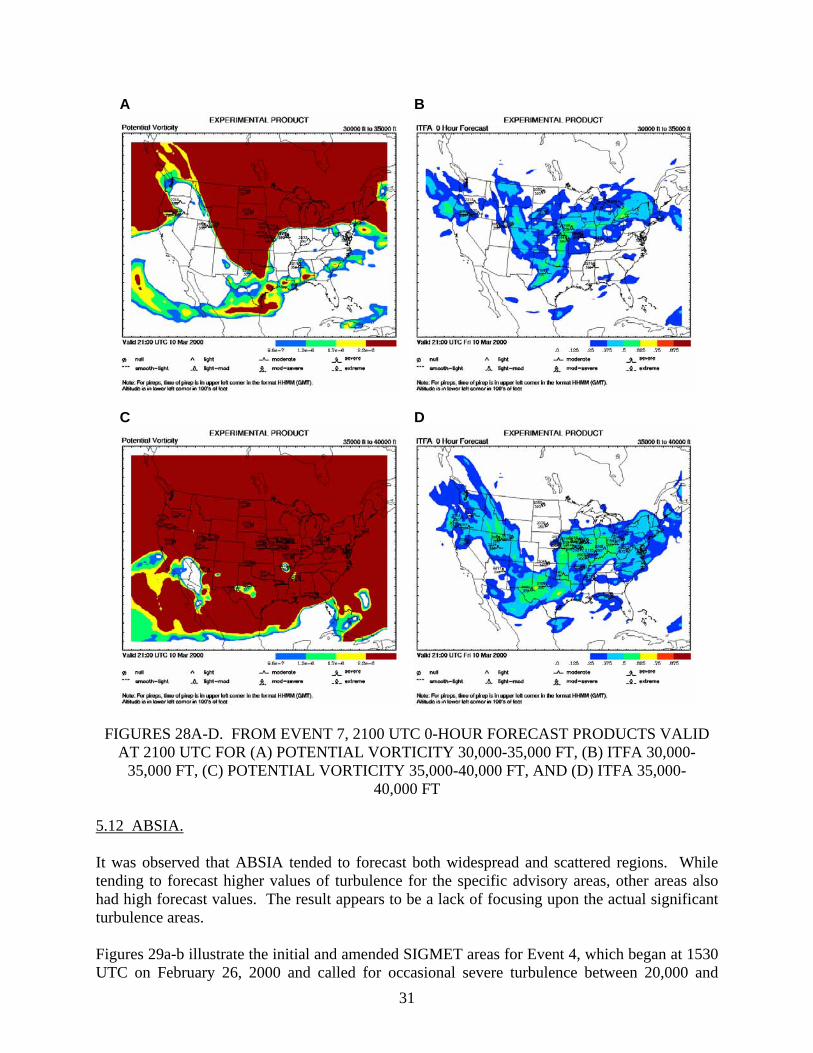
As an example, Event 7 was a turbulence event between 31,000 and 41,000 ft over the Mid-West that began at 2000 UTC on March 10, 2000. Figure 26 shows the initial SIGMET area. Figures 27a-d are the Potential Vorticity and ITFA 12-hour forecasts valid at 2100 UTC. As can be seen, there does not appear to be any correlation between the Potential Vorticity forecasts and the ITFA forecasts. In fact, at 35,000 to 40,000 ft, the Potential Vorticity forecast (figure 27c) nearly covers the entire domain with severe to extreme turbulence. By the start of the event, Potential Vorticity has not improved upon this obvious over forecasting (see figures 28a and 28c). It is not known whether the widespread coverage in this event is due to the index itself or possibly a software coding error. However, as provided, Potential Vorticity does not appear useful.
FIGURE 26. INITIAL SIGMET AREA FOR EVENT 7
29
A B
C
D
FIGURES 27A-D. FROM EVENT 7, 0900 UTC 12-HOUR FORECAST PRODUCTS VALID
AT 2100 UTC FOR (A) POTENTIAL VORTICITY 30,000-35,000 FT, (B) ITFA 30,000-35,000 FT, (C) POTENTIAL VORTICITY 35,000-40,000 FT, AND (D) ITFA 35,000-
40,000 FT
30
A B
C
D
FIGURES 28A-D. FROM EVENT 7, 2100 UTC 0-HOUR FORECAST PRODUCTS VALID
AT 2100 UTC FOR (A) POTENTIAL VORTICITY 30,000-35,000 FT, (B) ITFA 30,000-35,000 FT, (C) POTENTIAL VORTICITY 35,000-40,000 FT, AND (D) ITFA 35,000-
40,000 FT 5.12 ABSIA. It was observed that ABSIA tended to forecast both widespread and scattered regions. While tending to forecast higher values of turbulence for the specific advisory areas, other areas also had high forecast values. The result appears to be a lack of focusing upon the actual significant turbulence areas. Figures 29a-b illustrate the initial and amended SIGMET areas for Event 4, which began at 1530 UTC on February 26, 2000 and called for occasional severe turbulence between 20,000 and 31
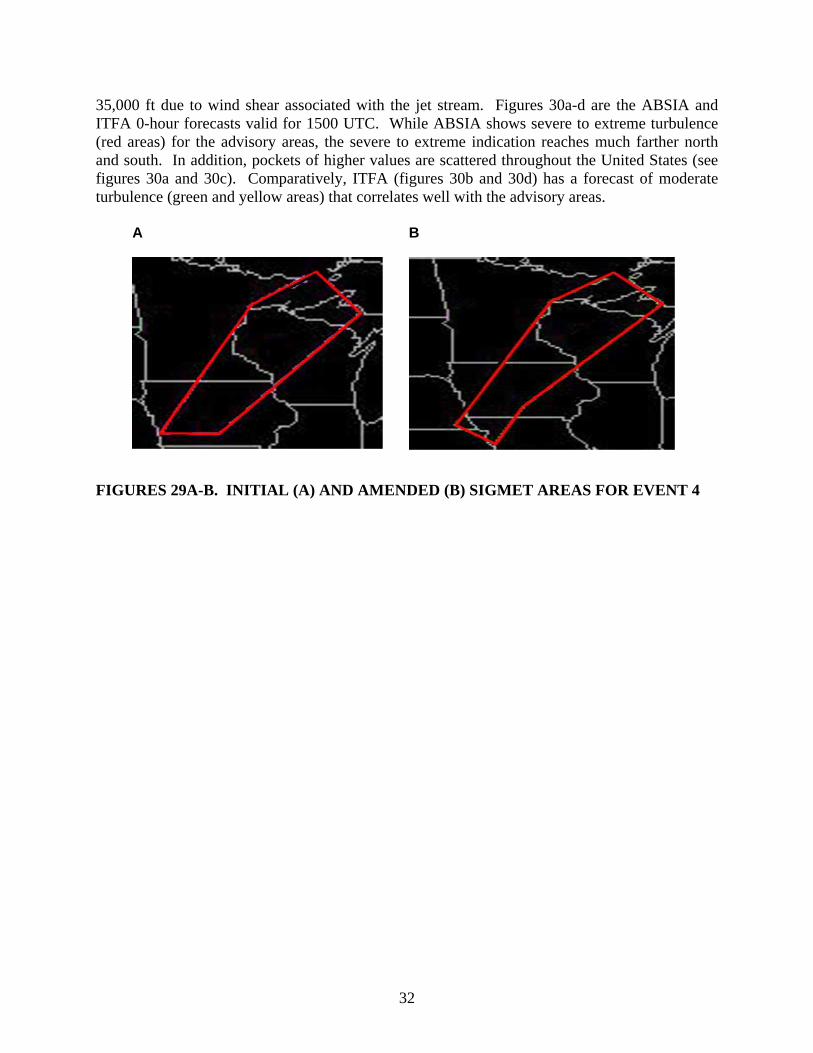
35,000 ft due to wind shear associated with the jet stream. Figures 30a-d are the ABSIA and ITFA 0-hour forecasts valid for 1500 UTC. While ABSIA shows severe to extreme turbulence (red areas) for the advisory areas, the severe to extreme indication reaches much farther north and south. In addition, pockets of higher values are scattered throughout the United States (see figures 30a and 30c). Comparatively, ITFA (figures 30b and 30d) has a forecast of moderate turbulence (green and yellow areas) that correlates well with the advisory areas.
A
B
FIGURES 29A-B. INITIAL (A) AND AMENDED (B) SIGMET AREAS FOR EVENT 4
32

A B
C
D
FIGURES 30A-D. FROM EVENT 4, 1500 UTC 0-HOUR FORECAST PRODUCTS VALID FOR 1500 UTC FOR (A) ABSIA 25,000-30,000 FT, (B) ITFA 25,000-30,000 FT, (C) ABSIA
30,000-35,000 FT, AND (D) ITFA 30,000-35,000 FT
33

5.13 ANOMALOUS GRADIENT. Anomalous Gradient appeared to not correlate well with ITFA, the other indices, or PIREPs. The area and intensity coverage by this index was usually different than ITFA and the other indices. In cases where there were similar indications, Anomalous Gradient still tended to focus on other regions. Figures 31a-b illustrate the initial and amended SIGMET areas for Event 7, which began at 1945 UTC on March 10, 2000. In this area, occasional severe turbulence was expected between 31,000 and 41,000 ft due to wind shear. Figures 32a-d are the Anomalous Gradient and ITFA 0-hour forecasts valid for 0000 UTC, roughly 4 hours into the event. The Anomalous Gradient forecasts (figures 32a and 32c) tend to have a southeast to northwest orientation through Oklahoma and Kansas which conflicts with the orientation of the SIGMETs (figures 31a-b) and the ITFA forecasts (figures 32b and 32d). A
B
FIGURES 31A-B. INITIAL (A) AND AMENDED (B) SIGMET AREAS FOR EVENT 7
34

A B
C
D
FIGURES 32A-D. FROM EVENT 7, 0000 UTC 0-HOUR FORECAST PRODUCTS VALID FOR 0000 UTC FOR (A) ANOMALOUS GRADIENT 30,000-35,000 FT, (B) ITFA 30,000-
35,000 FT, (C) ANOMALOUS GRADIENT 35,000-40,000 FT, AND (D) ITFA 35,000-40,000 FT
35

5.14 DIVERGENCE. For the overall evaluation period, Divergence was very scattered and widespread in nature. For the most part, Divergence did not correlate with ITFA or the other indices. Some cases were more widespread than others. In general, Divergence did not focus on either PIREPs or the advisory areas. Figures 33a-b illustrate the initial and amended SIGMET areas for Event 10, which began at 1525 UTC on April 2, 2000. In these areas, occasional severe turbulence was expected between 20,000 and 30,000 ft due to strong jet stream wind shear. The Divergence and ITFA 0-hour forecasts valid for 2100 UTC (figures 34a-d) indicate that roughly 6 hours into the event, Divergence was not focusing on any specific area, but instead indicates a scattered, widespread region of high turbulence indication. This is a departure from most of the other indices at this time. Comparably, the ITFA forecast (figures 34b and 34d) indicated moderate turbulence for the advisory area. A
B
FIGURES 33A-B. INITIAL (A) AND AMENDED (B) SIGMET AREA FOR EVENT 10
36

A B
C
D
FIGURES 34A-D. FROM EVENT 10, 2100 UTC 0-HOUR FORECAST PRODUCTS VALID FOR 2100 UTC FOR (A) DIVERGENCE 20,000-25,000 FT, (B) ITFA 20,000-25,000 FT, (C)
DIVERGENCE 25,000-30,000 FT, AND (D) ITFA 25,000-30,000 FT
37
38
6. CONCLUSIONS. The Federal Aviation Administration (FAA) Aviation Weather Research Program (AWRP) has provided funding to National Center for Atmospheric Research (NCAR)/Research Applications Program (RAP) to develop a forecasting tool to identify clear air turbulence. In response, NCAR/RAP has developed the Integrated Turbulence Forecasting Algorithm (ITFA), which produces turbulence forecasts for the contiguous United States. In support of ITFA development, the Weather Branch at the Technical Center performed two evaluations of ITFA. The first evaluation was conducted in 2000 and focused on providing a subjective assessment of the performance, characteristics, and trends of ITFA. In 2001, a second evaluation was performed that compared the latest version of ITFA (i.e., ITFA 2001) to the 2000 version. Results of that evaluation are documented in a separate ACB-630 report. In addition to the 2001 and 2000 comparison, the performances of the individual indices that comprise ITFA 2001 were examined to identify characteristics of each index during widespread severe turbulence events. Performance issues that were evaluated included lead-time, forecast versus observed conditions, and comparison to the overall ITFA forecast. The sixteen indices that comprise ITFA were examined for ten turbulence events that were characterized by numerous severe Pilot Reports (PIREPs). Evaluation results indicated that the indices tended to fall into four categories: (1) forecasts that were similar to the overall ITFA forecasts and matched the actual observed turbulence areas (i.e., Richardson Number and Vertical Wind Shear); (2) forecasts that were too widespread, covering large areas of the forecast domain and gave no indication of the specific areas of turbulence (e.g., Potential Vorticity); (3) forecasts that covered the observed turbulence areas, but had broad areas of high intensity, thus identification of the observed turbulence area was not possible (e.g., Ellrod 1 and 2); or (4) forecasts that tended to have scattered pockets of high intensity making identification of the specific turbulence areas difficult (e.g., Divergence). All of the indices tended to forecast higher values of turbulence than the overall ITFA products. It may be that the threshold values in the indices are too low. Raising the threshold values could possible eliminate the apparent over forecasting exhibited by many of the indices. While many of the ITFA indices clearly appeared to over forecast turbulence, as indicated by broad or widespread coverage, it should be noted that the overall ITFA forecasts tended to be more concentrated and focused upon specific areas. Thus, it appears that the ITFA processing is, in part, effectively removing the expanded coverage of the indices. However, it needs to be addressed whether indices with expanded coverage are indeed contributing to the overall product. If not, then their inclusion is unnecessary and could potentially lead to false alarms if not removed by the ITFA processing. Specific conclusions for each individual index are presented in the following sections. 6.1 BROWN 2. Overall, Brown 2 was found to have severe to extreme turbulence for most of the advisory areas. However, often the forecasts tended to be widespread so that localized areas of turbulence could not be identified. For most of the events, Brown 2 tended to forecast areas too large, leading to possible over-forecasting.

39
6.2 COLSON-PANOFSKY. Overall, Colson-Panofsky was found to have widespread areas of severe to extreme turbulence. In many cases, the determination of specific turbulence areas could not be made. 6.3 ELLROD 1 AND 2. Ellrod 1 and Ellrod 2 were very similar in regions of coverage. The primary difference between the two indices was that Ellrod 2 had tighter gradients and lower values than Ellrod 1. Generally, Ellrod 1 and 2 had higher turbulence values than ITFA and gave broad indications of possible turbulence areas. 6.4 RICHARDSON NUMBER. Overall, the Richardson Number forecasts generally agreed with the observed PIREPs and the ITFA area forecasts. While some of the other indices were too widespread and not focused on a specific area of turbulence, the Richardson Number tended to give a focused indication of turbulence. The intensity of Richardson Number forecasts tended to be higher than the ITFA forecasts. 6.5 DTF3 AND DTF5. DTF3 and DTF5 were similar in that both gave broad indications of turbulence potential. The indices were generally higher in turbulence intensity than ITFA. Generally DTF3 and DTF5 resolved the advisory area better as they approached the beginning of the event, and were better correlated with PIREPs in the 0-hour forecasts than with the preceding forecasts. 6.6 ENDLICH. Endlich had mixed results from event to event. In some events, the forecasts appeared sporadic while at other times, there were severe to extreme forecasts for the advisory areas. However, in general there were large areas of null to moderate turbulence forecasted. 6.7 NGM 1 PREDICTOR. NGM 1 Predictor had widespread severe to extreme turbulence indications and was not very useful in determining turbulence regions. It appears the thresholds for NGM 1 Predictor are too low. 6.8 VERTICAL WIND SHEAR. Vertical Wind Shear tended to coincide with the overall ITFA output, as well as appearing to be correlated with the observed PIREPs. There were cases where Vertical Wind Shear was higher in intensity than the ITFA forecast, but these higher values tended to be in the correct range for the observed PIREPs. It was observed that most of the forecasts focused on the appropriate advisory region and did not have the widespread indication of some of the other indices.
40
6.9 HORIZONTAL SHEAR. Horizontal Shear tended to provide broad indications of turbulence. Severe to extreme turbulence occurred for most of the advisory areas. However, these high values often continued outside of the advisory areas, thus a focusing of the turbulence areas were not possible. Overall, Horizontal Shear forecasted higher intensities and larger areas than ITFA. 6.10 VORTICITY SQUARED. Vorticity Squared gave broad and scattered indications of turbulence. The forecast trend appeared to be too widespread. 6.11 POTENTIAL VORTICITY. Potential Vorticity tended to be too widespread with very large areas. Forecasts for severe to extreme turbulence covered large areas, at times, nearly the entire domain. The forecasts did not appear to be correlated well with ITFA, PIREPs, or the other indices. It appears the thresholds for Potential Vorticity are too low and the index does not appear to be contributing to the overall ITFA output. 6.12 ABSIA. ABSIA tended to forecast both widespread and scattered areas. High values were forecasted for the advisory areas, however, other areas also had high values. Thus, it was not possible to identify the specific advisory areas. 6.13 ANOMALOUS GRADIENT. It was observed that Anomalous Gradient did not appear to be correlated with ITFA, PIREPs, or the other indices. The area and intensity were usually different. In cases where there were similar indications, Anomalous Gradient tended to focus on other regions. This index was "anomalous." 6.14 DIVERGENCE. Divergence forecasts were very scattered and widespread. The index did not appear to be correlated with ITFA, PIREPs, or the other indices. 7. RECOMMENDATIONS. The meteorological evaluation of the Integrated Turbulence Forecasting Algorithm (ITFA) indices demonstrated that the various indices have distinct characteristics. Further ITFA development should address the following:
a. Indices that appear to be too widespread and not contributing to the overall ITFA output should be investigated for retention. The number of ITFA indices should be reduced if certain indices are not effective in indicating turbulence.

41
b. The threshold values for indices should be investigated. It appears that consideration
should be given for changing the values in order to avoid widespread and broad turbulence indications.
c. Since Vertical Wind Shear and Richardson Number appeared to be the best indices for
forecasting turbulence in the events used in the evaluation, it is recommended that consideration be given to a greater weighting of these indices for jet stream and wind shear induced clear air turbulence.
8. ACRONYMS. ACB-630 Weather Processors and Sensors Group AWRP Aviation Weather Research Program CAT Clear Air Turbulence ft feet FAA Federal Aviation Administration ITFA Integrated Turbulence Forecasting Algorithm NCAR National Center for Atmospheric Research PDT Product Development Team RAP Research Applications Program RUC Rapid Update Cycle SIGMET Significant Meteorological Information PIREP Pilot Report UTC Universal Time Coordinated
Related Documents