Part 1: Prologue & Earth’s Dimensions ANSWER KEY Page 1 Name: Answer Key Date: Earth Science Period:

Welcome message from author
This document is posted to help you gain knowledge. Please leave a comment to let me know what you think about it! Share it to your friends and learn new things together.
Transcript
Part 1: Prologue & Earth’s Dimensions
ANSWER KEY Page 1
Name: Answer Key Date: Earth Science Period:
Part 1: Prologue & Earth’s Dimensions
ANSWER KEY Page 2
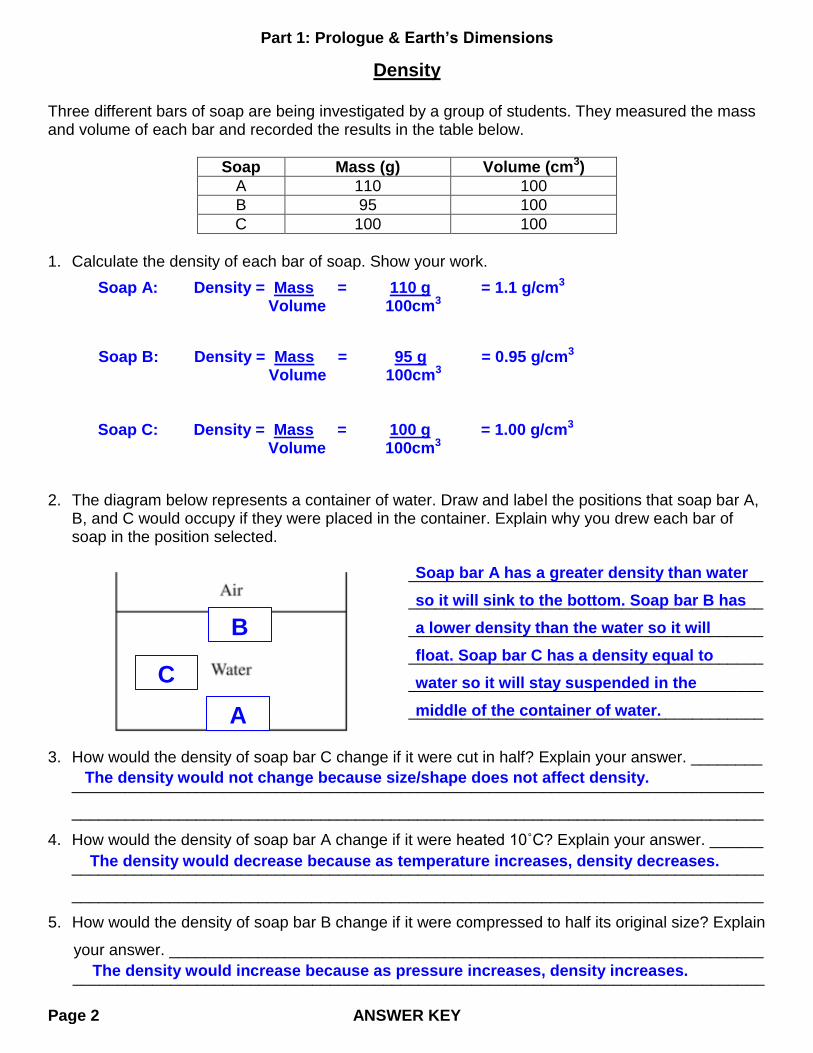
Density Three different bars of soap are being investigated by a group of students. They measured the mass and volume of each bar and recorded the results in the table below.
Soap Mass (g) Volume (cm3)
A 110 100
B 95 100
C 100 100
1. Calculate the density of each bar of soap. Show your work. 2. The diagram below represents a container of water. Draw and label the positions that soap bar A,
B, and C would occupy if they were placed in the container. Explain why you drew each bar of soap in the position selected.
________________________________________
________________________________________
________________________________________
________________________________________
________________________________________
________________________________________
3. How would the density of soap bar C change if it were cut in half? Explain your answer. ________
______________________________________________________________________________
______________________________________________________________________________
4. How would the density of soap bar A change if it were heated 10˚C? Explain your answer. ______
______________________________________________________________________________
______________________________________________________________________________
5. How would the density of soap bar B change if it were compressed to half its original size? Explain
your answer. ___________________________________________________________________
______________________________________________________________________________
Soap A: Density = Mass = 110 g = 1.1 g/cm3 Volume 100cm3
Soap B: Density = Mass = 95 g = 0.95 g/cm3 Volume 100cm3
Soap bar A has a greater density than water
so it will sink to the bottom. Soap bar B has
a lower density than the water so it will
float. Soap bar C has a density equal to
water so it will stay suspended in the
middle of the container of water.
A
B
Soap C: Density = Mass = 100 g = 1.00 g/cm3 Volume 100cm3
C
The density would not change because size/shape does not affect density.
The density would decrease because as temperature increases, density decreases.
The density would increase because as pressure increases, density increases.
Part 1: Prologue & Earth’s Dimensions
ANSWER KEY Page 3
Graphing
A B C D
1. Identify the relationship shown in each graph above: A. ______________________________ B. ______________________________ C. ______________________________ D. ______________________________ 2. Provide two examples in nature that when plotted on a grid would have a similar graph to D.
1. ______________________________ 2. ______________________________
3. Base your answer to the following question on the hardness of the minerals talc (1), quartz (7), halite (2.5), sulfur (2), and fluorite(4). On the grid below, construct a bar graph to represent the hardness of these minerals.
Direct
Indirect
Direct Static
Cyclic
Phases of the Moon
Ocean tides
Part 1: Prologue & Earth’s Dimensions
ANSWER KEY Page 4
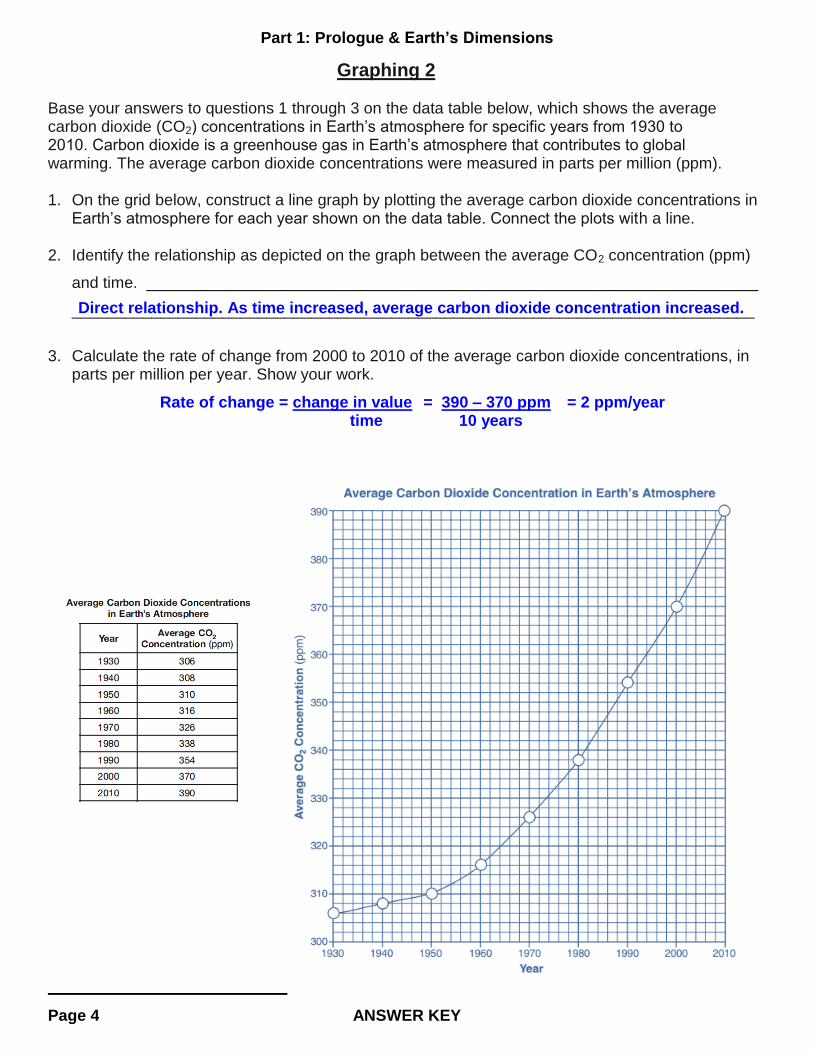
Graphing 2 Base your answers to questions 1 through 3 on the data table below, which shows the average carbon dioxide (CO2) concentrations in Earth’s atmosphere for specific years from 1930 to 2010. Carbon dioxide is a greenhouse gas in Earth’s atmosphere that contributes to global warming. The average carbon dioxide concentrations were measured in parts per million (ppm). 1. On the grid below, construct a line graph by plotting the average carbon dioxide concentrations in
Earth’s atmosphere for each year shown on the data table. Connect the plots with a line. 2. Identify the relationship as depicted on the graph between the average CO2 concentration (ppm)
and time. _____________________________________________________________________
_____________________________________________________________________________
3. Calculate the rate of change from 2000 to 2010 of the average carbon dioxide concentrations, in
parts per million per year. Show your work.
Direct relationship. As time increased, average carbon dioxide concentration increased.
Rate of change = change in value = 390 – 370 ppm = 2 ppm/year time 10 years
Part 1: Prologue & Earth’s Dimensions
ANSWER KEY Page 5
Earth’s Spheres 1. State the two most abundant elements, by volume, in the following locations:
a. Hydrosphere: _____________________________ & ______________________________
b. Crust: _____________________________ & ______________________________
c. Troposphere: _____________________________ & ______________________________
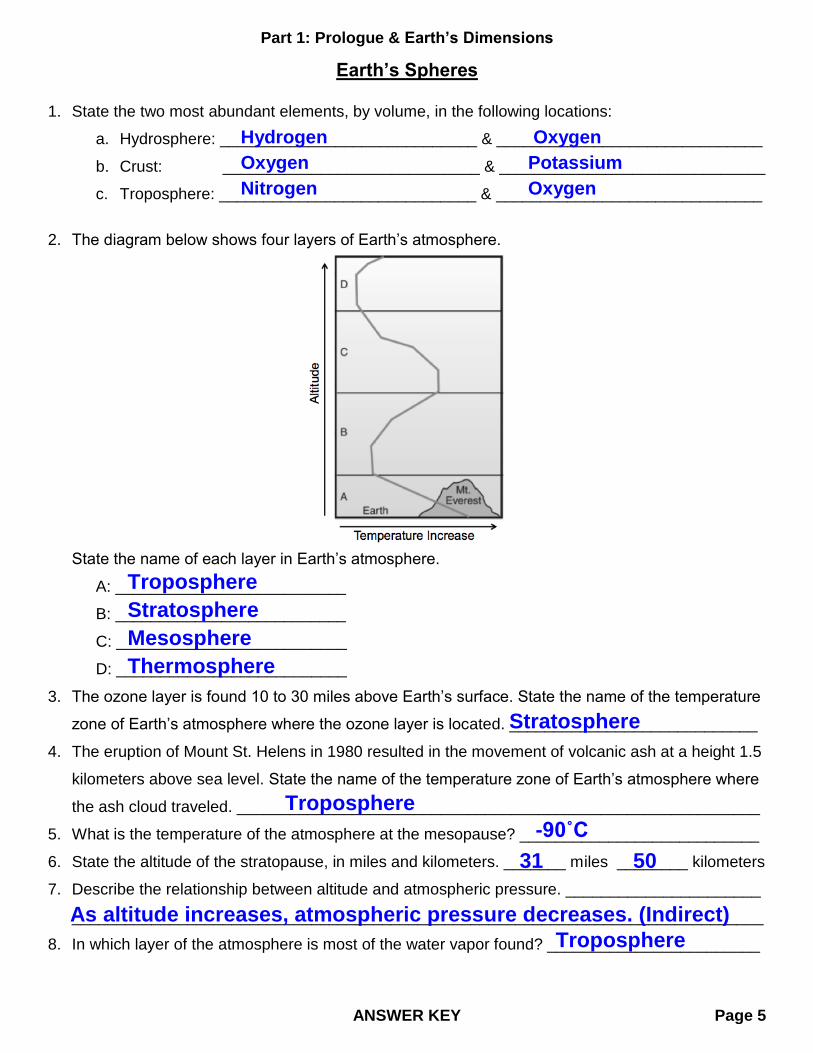
2. The diagram below shows four layers of Earth’s atmosphere.
State the name of each layer in Earth’s atmosphere.
A: __________________________
B: __________________________
C: __________________________
D: __________________________
3. The ozone layer is found 10 to 30 miles above Earth’s surface. State the name of the temperature
zone of Earth’s atmosphere where the ozone layer is located. ____________________________
4. The eruption of Mount St. Helens in 1980 resulted in the movement of volcanic ash at a height 1.5
kilometers above sea level. State the name of the temperature zone of Earth’s atmosphere where
the ash cloud traveled. ___________________________________________________________
5. What is the temperature of the atmosphere at the mesopause? ___________________________
6. State the altitude of the stratopause, in miles and kilometers. _______ miles ________ kilometers
7. Describe the relationship between altitude and atmospheric pressure. ______________________
______________________________________________________________________________
8. In which layer of the atmosphere is most of the water vapor found? ________________________
Hydrogen Oxygen
Oxygen Potassium
Nitrogen Oxygen
Troposphere
Stratosphere
Mesosphere
Thermosphere
Stratosphere
Troposphere
-90˚C
31 50
As altitude increases, atmospheric pressure decreases. (Indirect)
Troposphere
Part 1: Prologue & Earth’s Dimensions
ANSWER KEY Page 6
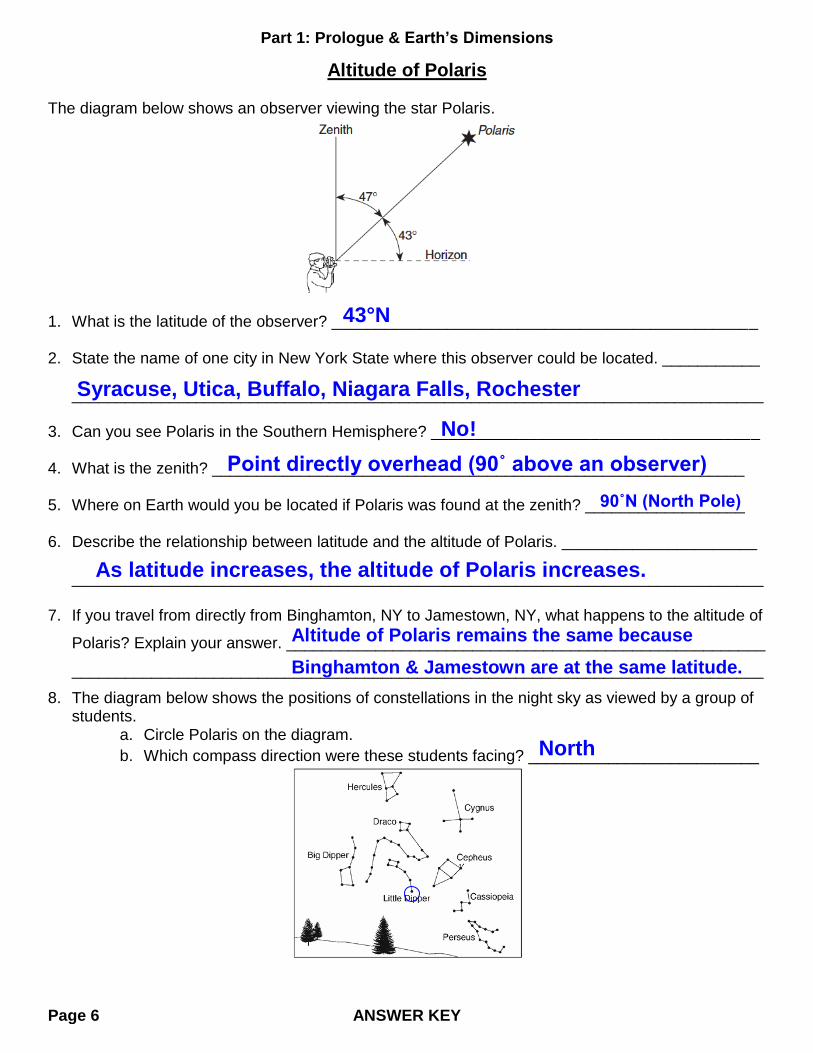
Altitude of Polaris The diagram below shows an observer viewing the star Polaris.
1. What is the latitude of the observer? ________________________________________________
2. State the name of one city in New York State where this observer could be located. ___________
______________________________________________________________________________
3. Can you see Polaris in the Southern Hemisphere? _____________________________________
4. What is the zenith? ____________________________________________________________
5. Where on Earth would you be located if Polaris was found at the zenith? __________________
6. Describe the relationship between latitude and the altitude of Polaris. ______________________
______________________________________________________________________________
7. If you travel from directly from Binghamton, NY to Jamestown, NY, what happens to the altitude of
Polaris? Explain your answer. ______________________________________________________
______________________________________________________________________________
8. The diagram below shows the positions of constellations in the night sky as viewed by a group of students.
a. Circle Polaris on the diagram.
b. Which compass direction were these students facing? __________________________
43°N
No!
Point directly overhead (90˚ above an observer)
As latitude increases, the altitude of Polaris increases.
Altitude of Polaris remains the same because
Binghamton & Jamestown are at the same latitude.
90˚N (North Pole)
Syracuse, Utica, Buffalo, Niagara Falls, Rochester
North
Part 1: Prologue & Earth’s Dimensions
ANSWER KEY Page 7
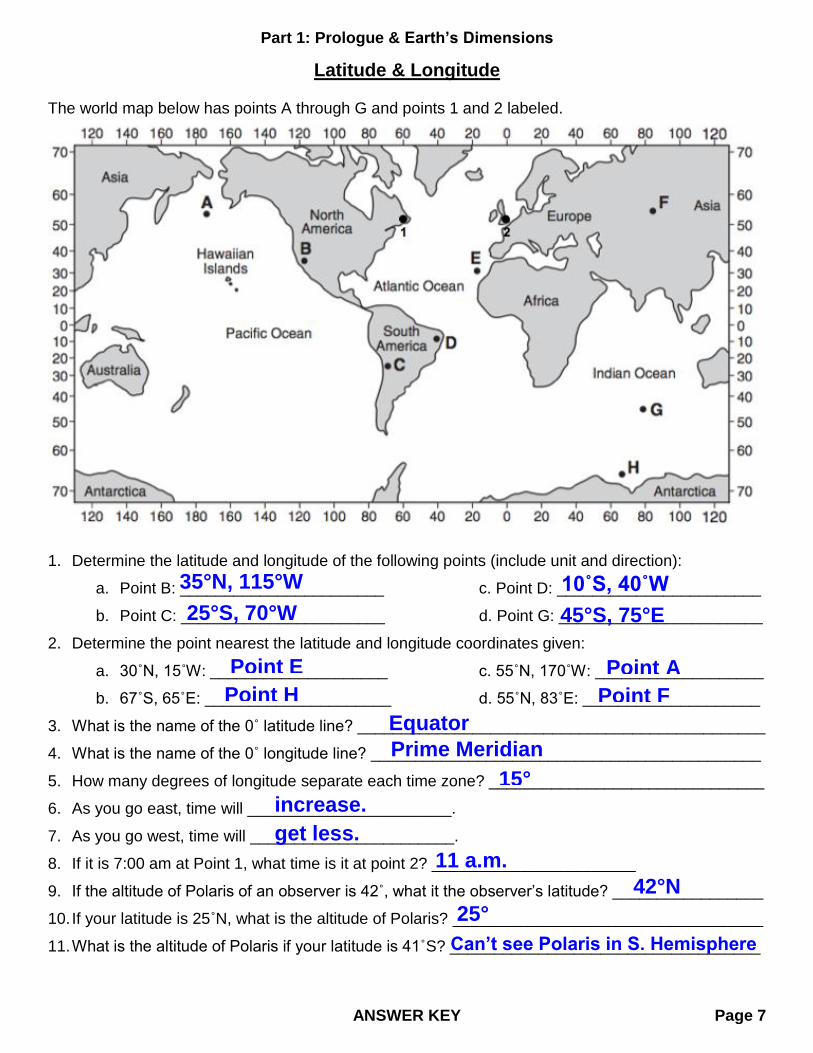
Latitude & Longitude The world map below has points A through G and points 1 and 2 labeled.
1. Determine the latitude and longitude of the following points (include unit and direction):
a. Point B: _______________________ c. Point D: _______________________
b. Point C: _______________________ d. Point G: _______________________
2. Determine the point nearest the latitude and longitude coordinates given:
a. 30˚N, 15˚W: ____________________ c. 55˚N, 170˚W: ___________________
b. 67˚S, 65˚E: _____________________ d. 55˚N, 83˚E: ____________________
3. What is the name of the 0˚ latitude line? ______________________________________________
4. What is the name of the 0˚ longitude line? ____________________________________________
5. How many degrees of longitude separate each time zone? _______________________________
6. As you go east, time will _______________________.
7. As you go west, time will _______________________.
8. If it is 7:00 am at Point 1, what time is it at point 2? _______________________
9. If the altitude of Polaris of an observer is 42˚, what it the observer’s latitude? _________________
10. If your latitude is 25˚N, what is the altitude of Polaris? ___________________________________
11. What is the altitude of Polaris if your latitude is 41˚S? ___________________________________
15°
35°N, 115°W increase.
get less.
11 a.m.
42°N
25°
Can’t see Polaris in S. Hemisphere
35°N, 115°W
25°S, 70°W 45°S, 75°E
10˚S, 40˚W
Point E
Point H
Point A
Point F
Equator
Prime Meridian
Part 1: Prologue & Earth’s Dimensions
ANSWER KEY Page 8
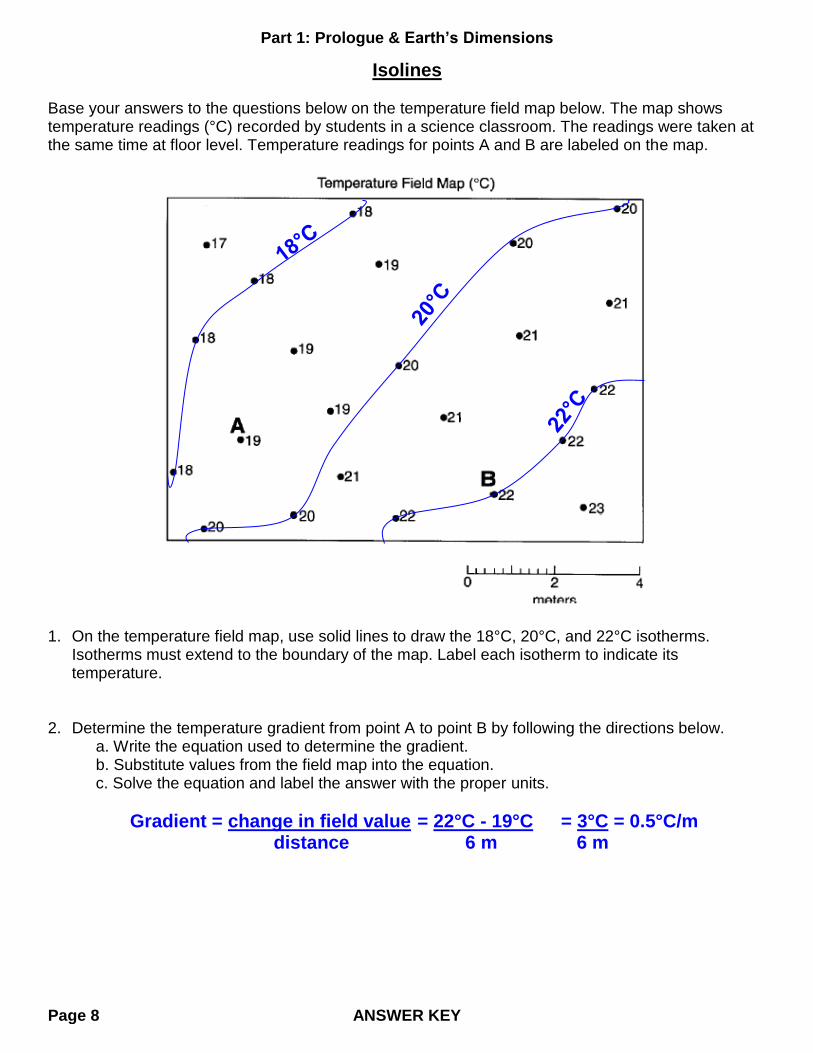
Isolines
Base your answers to the questions below on the temperature field map below. The map shows temperature readings (°C) recorded by students in a science classroom. The readings were taken at the same time at floor level. Temperature readings for points A and B are labeled on the map.
1. On the temperature field map, use solid lines to draw the 18°C, 20°C, and 22°C isotherms.
Isotherms must extend to the boundary of the map. Label each isotherm to indicate its temperature.
2. Determine the temperature gradient from point A to point B by following the directions below.
a. Write the equation used to determine the gradient. b. Substitute values from the field map into the equation. c. Solve the equation and label the answer with the proper units.
Gradient = change in field value = 22°C - 19°C = 3°C = 0.5°C/m distance 6 m 6 m
Part 1: Prologue & Earth’s Dimensions
ANSWER KEY Page 9
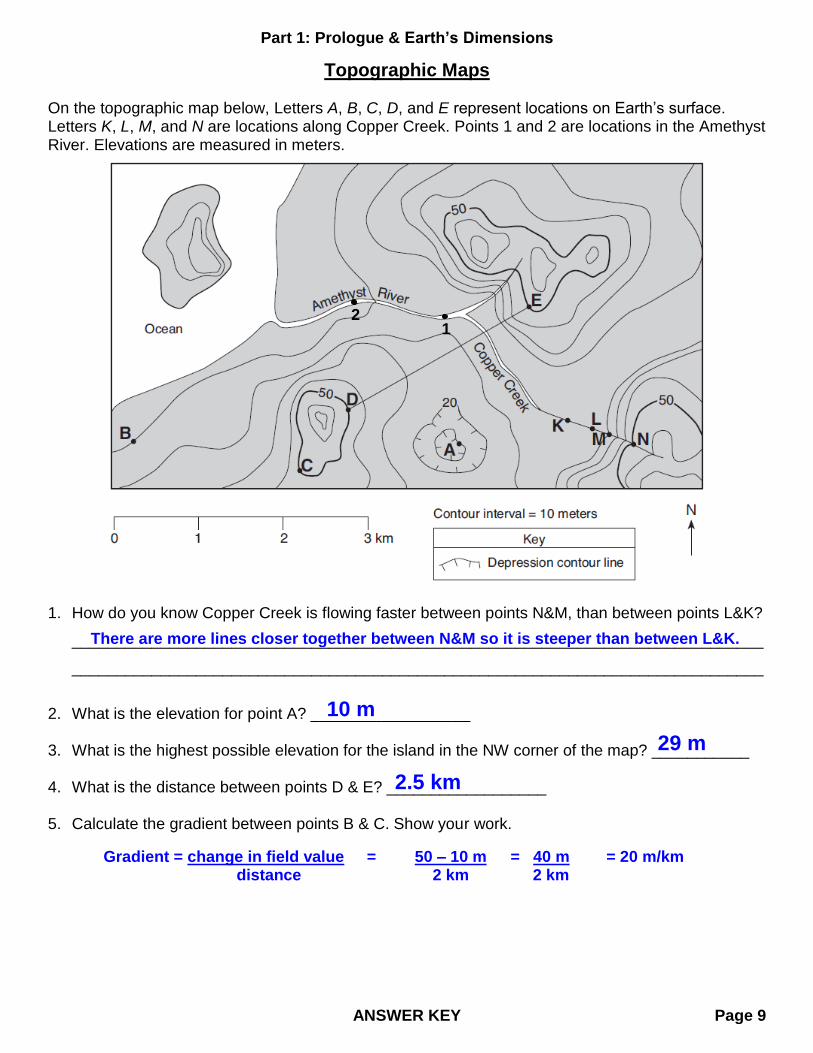
Topographic Maps On the topographic map below, Letters A, B, C, D, and E represent locations on Earth’s surface. Letters K, L, M, and N are locations along Copper Creek. Points 1 and 2 are locations in the Amethyst River. Elevations are measured in meters.
1. How do you know Copper Creek is flowing faster between points N&M, than between points L&K?
______________________________________________________________________________
______________________________________________________________________________
2. What is the elevation for point A? __________________ 3. What is the highest possible elevation for the island in the NW corner of the map? ___________ 4. What is the distance between points D & E? __________________ 5. Calculate the gradient between points B & C. Show your work.
1 2
10 m
29 m
2.5 km
There are more lines closer together between N&M so it is steeper than between L&K.
Gradient = change in field value = 50 – 10 m = 40 m = 20 m/km distance 2 km 2 km
Part 1: Prologue & Earth’s Dimensions
ANSWER KEY Page 10
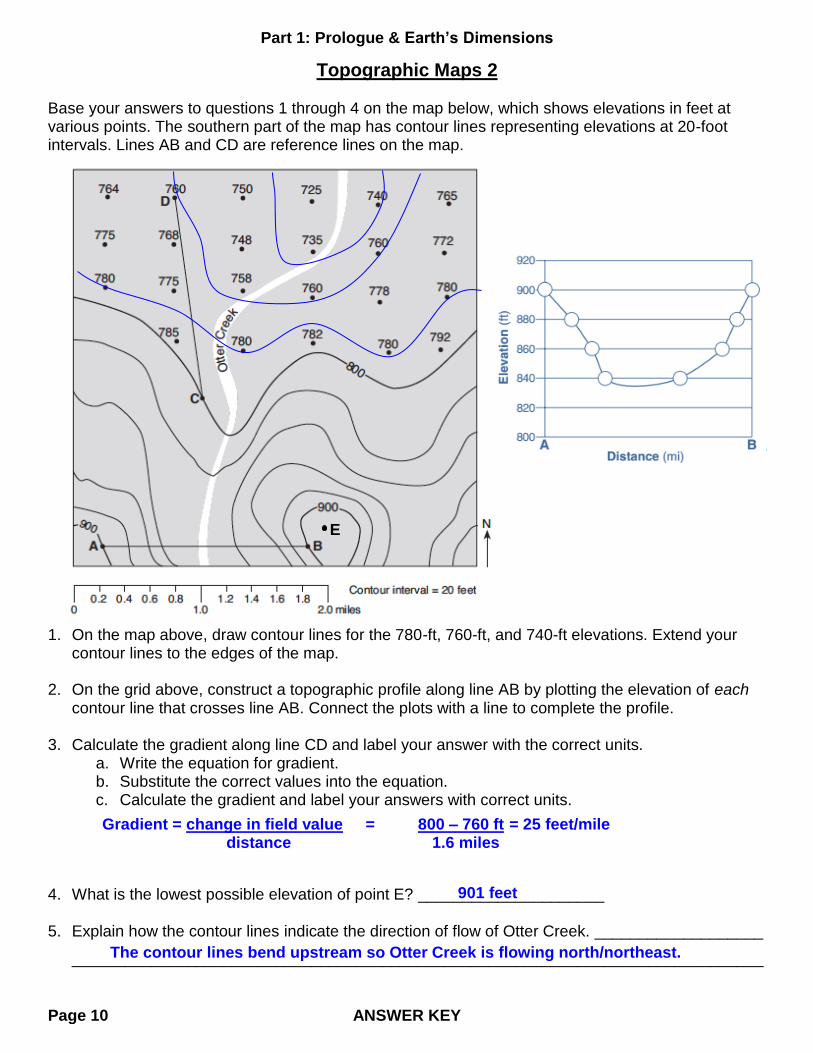
Topographic Maps 2 Base your answers to questions 1 through 4 on the map below, which shows elevations in feet at various points. The southern part of the map has contour lines representing elevations at 20-foot intervals. Lines AB and CD are reference lines on the map.
1. On the map above, draw contour lines for the 780-ft, 760-ft, and 740-ft elevations. Extend your
contour lines to the edges of the map.
2. On the grid above, construct a topographic profile along line AB by plotting the elevation of each contour line that crosses line AB. Connect the plots with a line to complete the profile.
3. Calculate the gradient along line CD and label your answer with the correct units.
a. Write the equation for gradient. b. Substitute the correct values into the equation. c. Calculate the gradient and label your answers with correct units.
4. What is the lowest possible elevation of point E? _____________________ 5. Explain how the contour lines indicate the direction of flow of Otter Creek. ___________________
______________________________________________________________________________
E
Gradient = change in field value = 800 – 760 ft = 25 feet/mile distance 1.6 miles
901 feet
The contour lines bend upstream so Otter Creek is flowing north/northeast.
Related Documents