Tri-Municipal Region: Labour Market Profile - Parkland County Municipal Report Applications Management Consulting Ltd. 1 of 49 Parkland County Labour Market Profile December 2017 Detailed Labour Market Profile for Parkland County, Alberta. One of a series of four reports on the Tri-Municipal Region labour market. Suite 2220 Sun Life Place 10123 - 99 Street Edmonton, AB T5J 3H1 (780) 425 6741 [email protected] www.applmgt.com

Welcome message from author
This document is posted to help you gain knowledge. Please leave a comment to let me know what you think about it! Share it to your friends and learn new things together.
Transcript
Tri-Municipal Region: Labour Market Profile - Parkland County Municipal Report
Applications Management Consulting Ltd. 1 of 49
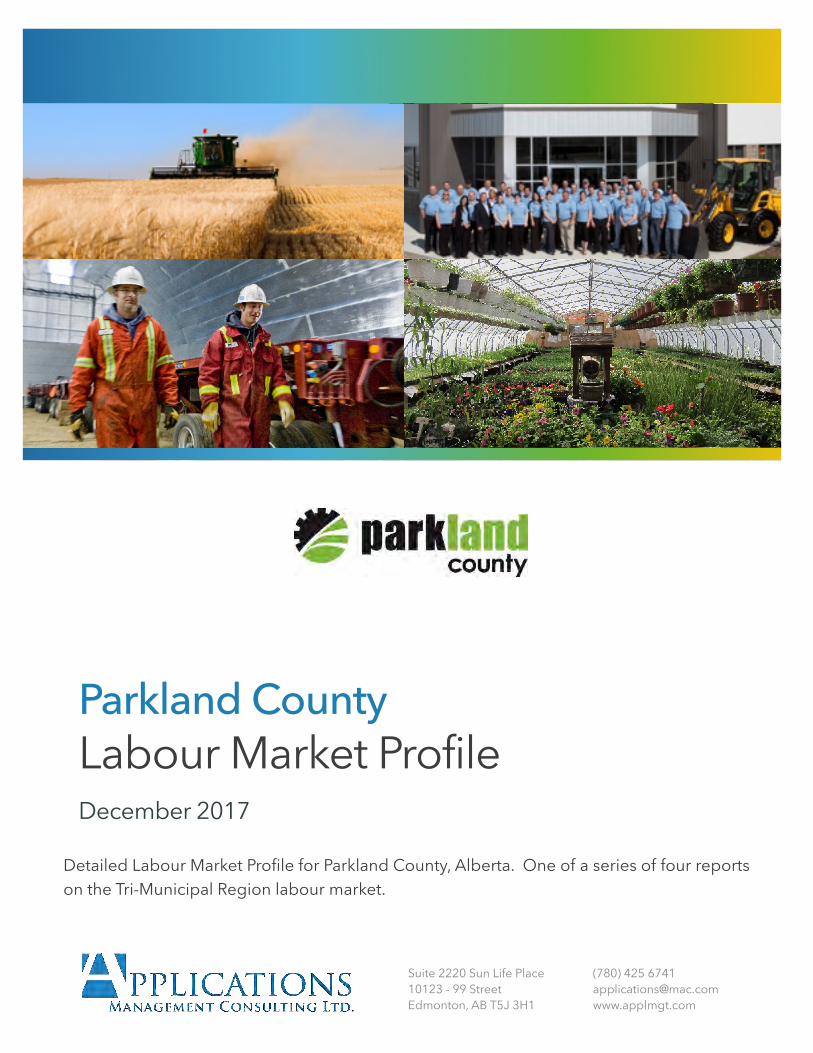
Parkland CountyLabour Market ProfileDecember 2017
Detailed Labour Market Profile for Parkland County, Alberta. One of a series of four reports on the Tri-Municipal Region labour market.
Suite 2220 Sun Life Place10123 - 99 StreetEdmonton, AB T5J 3H1
(780) 425 [email protected]

Table of Contents1. ....................................................................................................................Introduction! 4
1.1. .......................................................................................................Purpose of the Study ! 41.2. ..............................................................................Organization of the Phase 1 Analysis! 5
2. ......................................................................Labour Market Profile: Parkland County! 62.1. ........................................................................................................................Population! 6
2.1.1. ..........................................................................................................Population Growth! 6
2.1.2. ...............................................................................................Population by Age Group ! 7
2.1.3. ........................................................................................................Family Composition! 9
2.2. ....................................................................................................................Labour Force! 102.2.1. .................................................................................................Working Age Population! 10
2.2.2. ................................................................................................Labour Force by Gender! 11
2.2.3. ....................................................................................Labour Force Participation Rate! 12
2.2.4. ...........................................................................................................Employment Rate! 13
2.2.5. ...................................................................................................................Employment! 14
2.2.6. ..................................................................................Full Time / Part Time Employment! 15
2.2.7. ......................................................................................................Unemployment Rate ! 16
2.3. ..................................................................................................Employment by Industry ! 172.3.1. ..................................................................................................Industry (2 digit NAICS)! 17
2.3.2. ....................................................................................Work at Home by Major Industry! 19
2.4. .............................................................................................Employment by Occupation! 212.4.1. ......................................................................................Major Occupation (1 digit NOC)! 22
2.4.2. ....................................................................Major Occupation by Gender (1 digit NOC)! 23
2.4.3. .................................................................................Detailed Occupation (4 digit NOC)! 24
2.5. ..................................................................................................................Labour Supply ! 262.5.1. ........................................................Highest Level of Educational Attainment Overview! 26
2.5.2. .............................................................................................Post Secondary Education! 27
2.5.3. .......................................................................................Post Secondary Field of Study! 28
2.5.4. ......................................................................................................................Skill Levels! 29
2.5.5. ........................................................................Work to Home by Municipality Overview! 30
2.5.6. ........................................................................................Work to Home by Municipality! 31
2.5.7. ..........................................................................Work to Home by Mode of Commuting! 33
2.5.8. ...............................................................................................Local Labour Market Gap ! 34
Tri-Municipal Region: Labour Market Profile - Parkland County Municipal Report
Applications Management Consulting Ltd. 2 of 49
2.5.9. ................................................................................Underemployed Labour Resources! 35
2.6. ......................................................................................................Income & Affordability ! 372.6.1. .............................................................................................Median Household Income! 37
2.6.2. .......................................................................................Household Income Distribution! 38
2.6.3. .......................................................................................Income by Family Composition! 39
2.6.4. ..................................................................................................................Farm Income! 40
2.6.5. .............................................................................Economic Family Income Distribution! 41
2.6.6. .......................................................................................................Housing Affordability! 42
2.6.7. ..............................................................................................................Housing Tenure! 43
2.6.8. ....................................................................................................Monthly Shelter Costs! 44
2.6.9. ......................................................................................Low Income Measure After Tax! 45
2.6.10. ......................................................................................................................Child Care! 46
2.6.11. .......................................................................................................................Employers! 47
3. ........................................................................................................Technical Appendix! 48
Tri-Municipal Region: Labour Market Profile - Parkland County Municipal Report
Applications Management Consulting Ltd. 3 of 49
1. IntroductionLabour Market Information emerges as key to helping governments, businesses, non-govern- mental organizations and individuals respond to the changes that are happening throughout the economy. Understanding labour patterns and trends is essential to remain competitive in an economy and labour market that has changed in terms of demographics, occupation skills required, technological advances and future training demands.
In an age when careers and occupations are changing rapidly, timely and accurate labour market information is essential for informed decision-making by businesses, governments, non-
governmental organizations and individuals.
1.1. Purpose of the StudyLabour market information covers the principal elements of the labour market and its operations. The principal elements are the demand for labour and the supply of labour. The purpose of the 2-phase comprehensive study is to provide relevant, timely, and accurate labour market information to stakeholders, including job seekers, employers, industry, post secondary institutions, and government agencies. This study is designed to inform people of employment opportunities, assist in career planning for residents and migrants to the Region, help attract newcomers to existing and emerging opportunities, and respond to current and future labour market realities within the Region.
The purpose of this series of reports in the Phase 1 Labour Market Profile is to provide detailed labour market analysis for:
The Tri-Municipal Region;The three participating municipalities that comprise the Tri-Municipal Region: City of Spruce Grove, Town of Stony Plain and Parkland County; andThe two indigenous communities within the Tri-Municipal Region: Paul First Nation and Enoch Cree Nation.
The detailed labour market analysis within Phase 1 will inform the development of Phase 2. The Phase 2 Labour Market Survey will provide a more in depth understanding of the Tri-Municipal Region labour force, identify gaps and issues, and deliver methods to potentially address these gaps and issues.
Labour market information needs to be presented in a clear, understandable and useable form and support evidence-based
decision-making in both the workplace and career planning.
Tri-Municipal Region: Labour Market Profile - Parkland County Municipal Report
Applications Management Consulting Ltd. 4 of 49
1.2. Organization of the Phase 1 AnalysisThe Phase 1 analysis is organized into four reports, each under separate cover, as follows:
Summary Report: This report provides an overview of the detailed labour market analysis for the Tri-Municipal Region and includes summary statistics and analysis of how the Tri-Municipal Region compares to the Edmonton Metropolitan Region and Province of Alberta.Municipal Reports (3): A municipal report containing detailed labour market information and analysis for each participating municipality: City of Spruce Grove, Town of Stony Plain and Parkland County.
Tri-Municipal Region: Labour Market Profile - Parkland County Municipal Report
Applications Management Consulting Ltd. 5 of 49
2. Labour Market Profile: Parkland CountyParkland County is Alberta’s 3rd largest County, located in the Edmonton Metropolitan Region. The County includes the City of Spruce Grove and Town of Stony Plain. These three municipalities are the Tri-Municipal Region.
2.1. PopulationIn 2016, Parkland County’s population totalled 32,097. The local population is directly related to the local workforce. It also has a direct connection to the number and types of businesses and other employers located in the community and the workforce requirements of those enterprises.
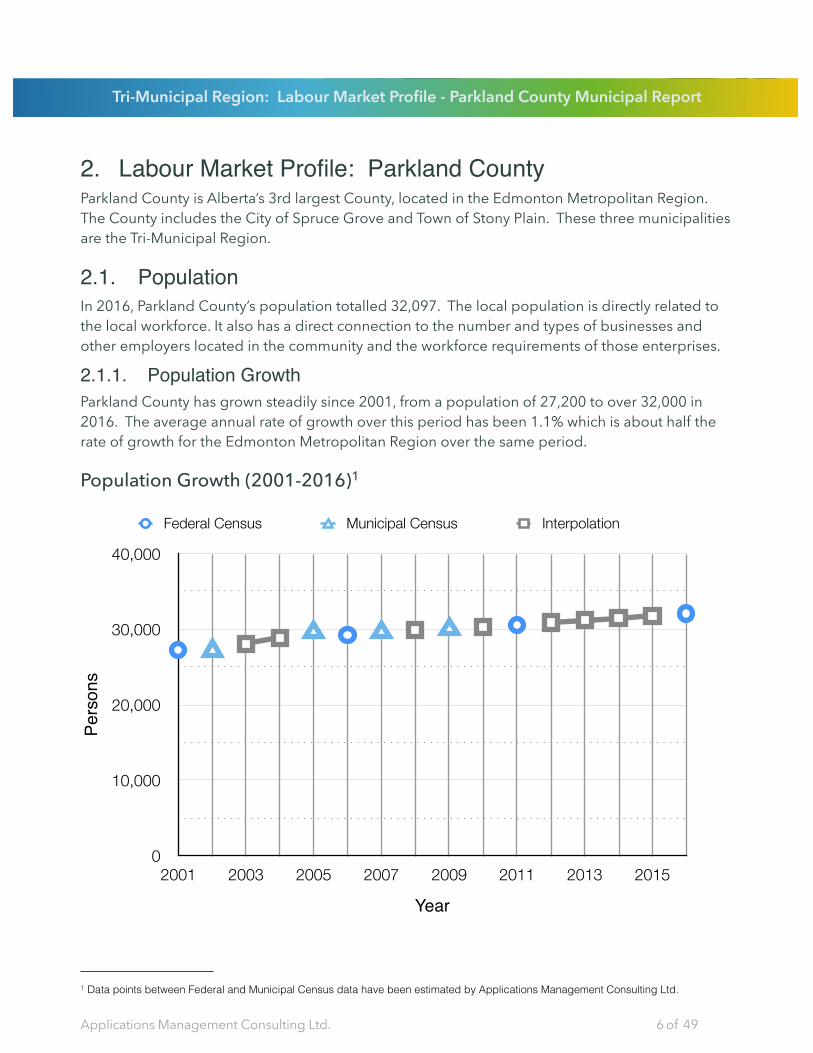
2.1.1. Population GrowthParkland County has grown steadily since 2001, from a population of 27,200 to over 32,000 in 2016. The average annual rate of growth over this period has been 1.1% which is about half the rate of growth for the Edmonton Metropolitan Region over the same period.
Population Growth (2001-2016)1
Federal Census Municipal Census Interpolation
0
10,000
20,000
30,000
40,000
2001 2003 2005 2007 2009 2011 2013 2015
Pers
ons
Year
Tri-Municipal Region: Labour Market Profile - Parkland County Municipal Report
Applications Management Consulting Ltd. 6 of 49
1 Data points between Federal and Municipal Census data have been estimated by Applications Management Consulting Ltd.

2.1.2. Population by Age GroupParkland County’s age distribution has shifted over the past 15 years. In 2001, the median age of the population was 37.6 years, with men averaging 37.8 years and women 37.3 years. In 2001 the County’s population was concentrated in the 35-49 year and 10-14 year age categories.
By 2016 the median age increased slightly to 38.2 years with the median age of men decreasing to 36.7 and women increasing to 39.7 years. In spite of the increase in median age, the population has become more concentrated in both younger children and younger adults. Increase in median age is largely a result of the aging in place of those 35-49 years in 2001 to the 45-64 years age cohorts in 2016.
Population Distribution by Age (2001-2016)
Tri-Municipal Region: Labour Market Profile - Parkland County Municipal Report
Applications Management Consulting Ltd. 7 of 49
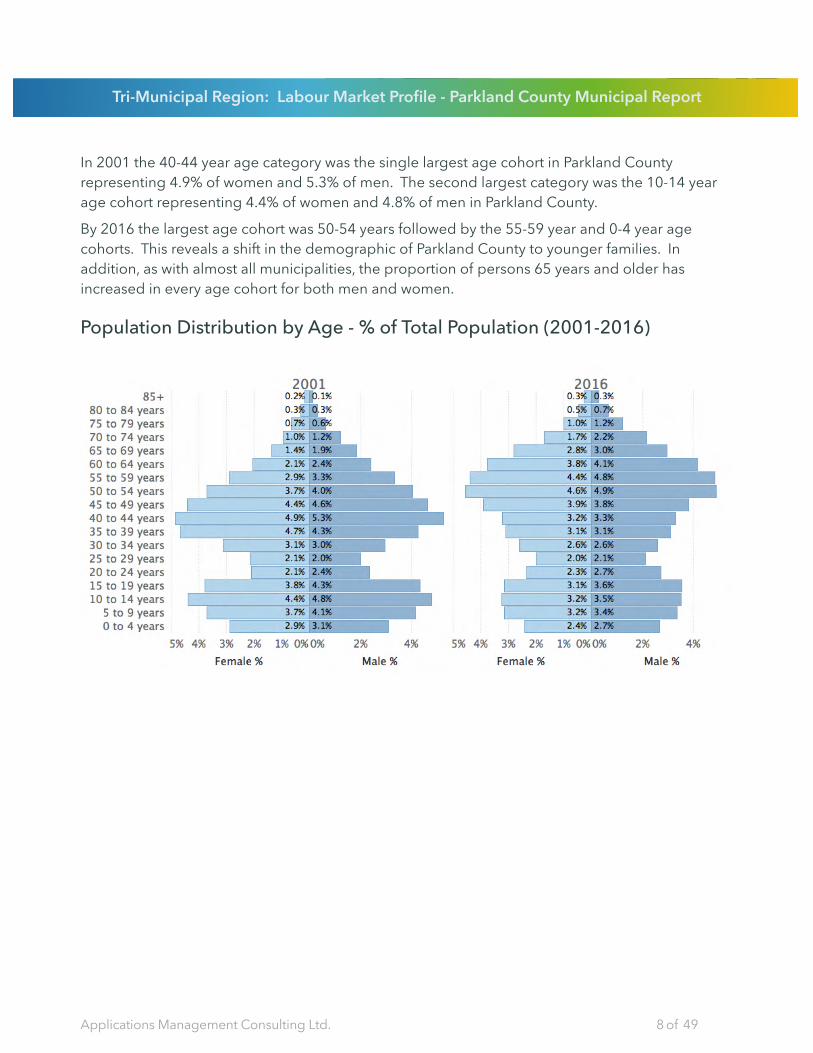
In 2001 the 40-44 year age category was the single largest age cohort in Parkland County representing 4.9% of women and 5.3% of men. The second largest category was the 10-14 year age cohort representing 4.4% of women and 4.8% of men in Parkland County.
By 2016 the largest age cohort was 50-54 years followed by the 55-59 year and 0-4 year age cohorts. This reveals a shift in the demographic of Parkland County to younger families. In addition, as with almost all municipalities, the proportion of persons 65 years and older has increased in every age cohort for both men and women.
Population Distribution by Age - % of Total Population (2001-2016)
Tri-Municipal Region: Labour Market Profile - Parkland County Municipal Report
Applications Management Consulting Ltd. 8 of 49

2.1.3. Family CompositionStatistics Canada defines families based on the relationships among the people who live in the household. The Economic Family Structure defines four family types as follows:
Couple Families With Children (37%) is the largest family category in Parkland County. This is followed closely by Couple Only Families (36%). Individuals Not In Families and Lone Parent Families represent 21% and 6% of the County’s families, respectively.
Between 2011 and 2016 Couple Families With Children declined while each of the other family categories experienced an increase.
Family Composition (2016)2
Couple families with children
Couple only families
Lone parent families
Individuals not in families
1,000 2,000 3,000 4,000 5,000
2001 20062011 20164,345 Couple
families with children
37%
4,305 Couple only families
36%
740 Lone parent families
6%
2,500 Individuals not in families
21%
Tri-Municipal Region: Labour Market Profile - Parkland County Municipal Report
Applications Management Consulting Ltd. 9 of 49
2 Data for Family Composition is not available in 2001 and 2006.
2.2. Labour ForceThe Working Age Population is defined as those persons aged 15 years and older. The Labour Force is a subset of the Working Age Population, and is defined as persons having a job or business and unemployed persons who are available for work and are actively seeking employment. Those deemed to be Not In The Labour Force represent the rest of the Working Age Population.3
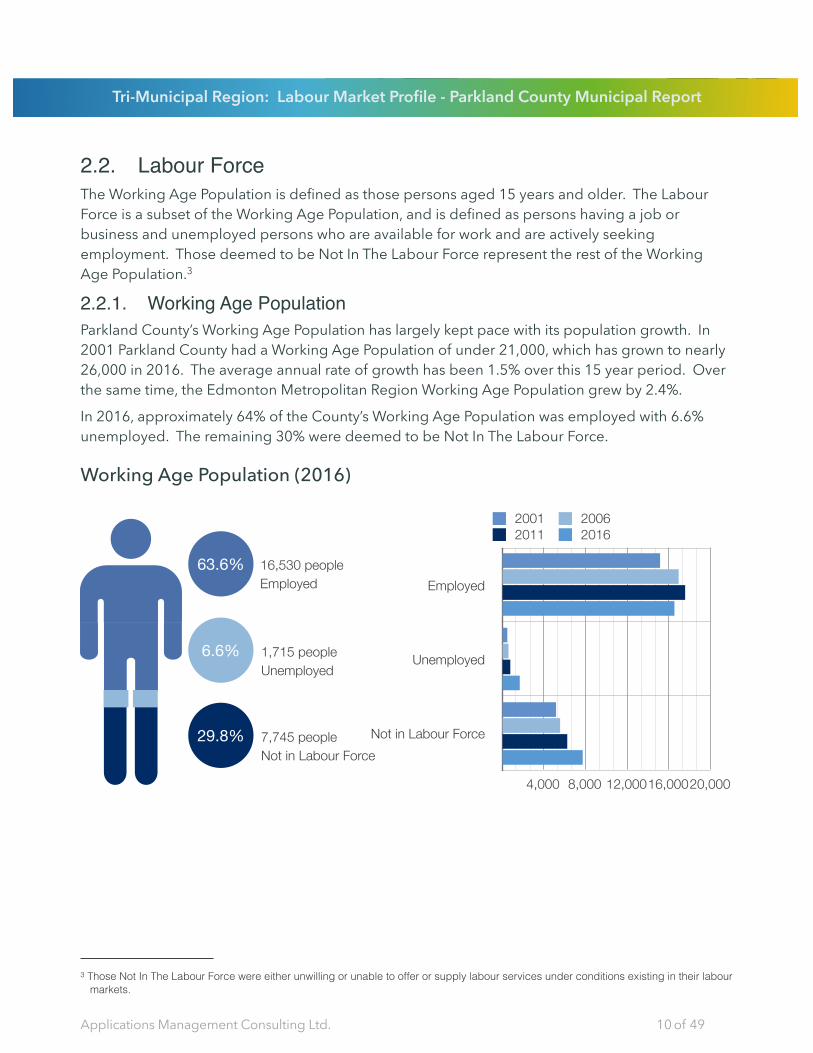
2.2.1. Working Age PopulationParkland County’s Working Age Population has largely kept pace with its population growth. In 2001 Parkland County had a Working Age Population of under 21,000, which has grown to nearly 26,000 in 2016. The average annual rate of growth has been 1.5% over this 15 year period. Over the same time, the Edmonton Metropolitan Region Working Age Population grew by 2.4%.
In 2016, approximately 64% of the County’s Working Age Population was employed with 6.6% unemployed. The remaining 30% were deemed to be Not In The Labour Force.
Working Age Population (2016)
Employed
Unemployed
Not in Labour Force
4,000 8,000 12,00016,00020,000
2001 20062011 2016
16,530 people Employed
1,715 people Unemployed
7,745 people Not in Labour Force
29.8%
6.6%
63.6%
Tri-Municipal Region: Labour Market Profile - Parkland County Municipal Report
Applications Management Consulting Ltd. 10 of 49
3 Those Not In The Labour Force were either unwilling or unable to offer or supply labour services under conditions existing in their labour markets.
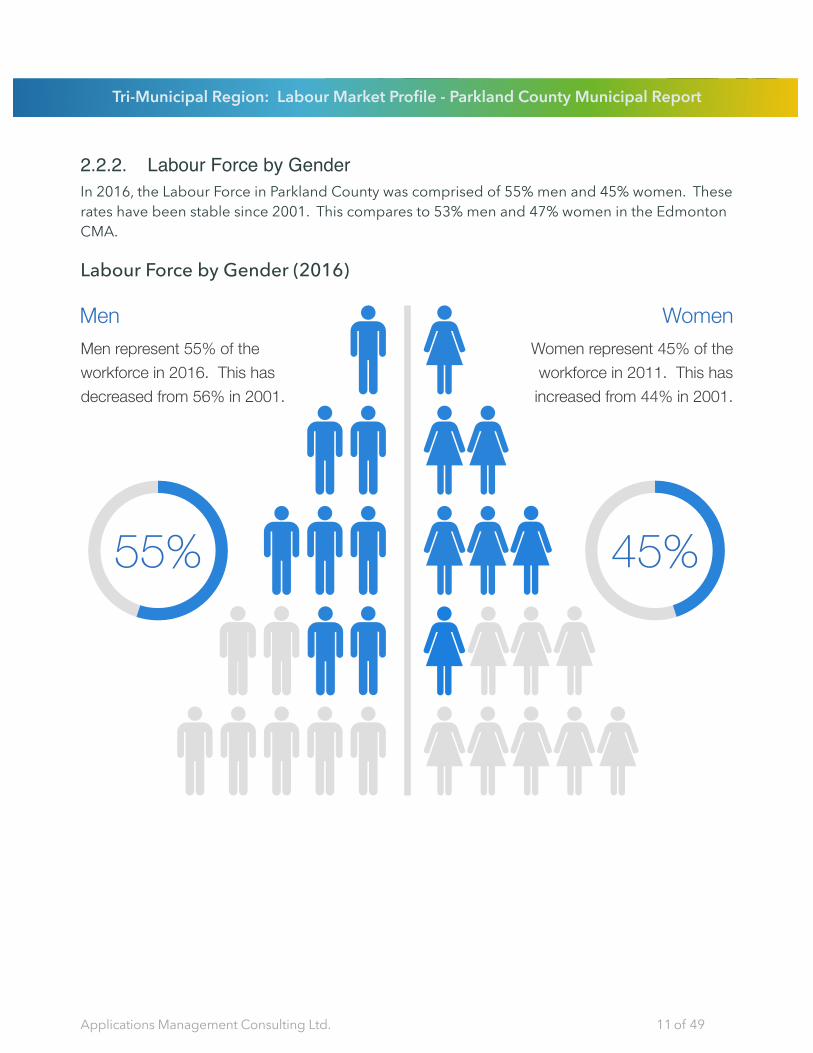
2.2.2. Labour Force by GenderIn 2016, the Labour Force in Parkland County was comprised of 55% men and 45% women. These rates have been stable since 2001. This compares to 53% men and 47% women in the Edmonton CMA.
Labour Force by Gender (2016)
55%
Men represent 55% of the workforce in 2016. This has decreased from 56% in 2001.
Men
45%
Women represent 45% of the workforce in 2011. This has increased from 44% in 2001.
Women
Tri-Municipal Region: Labour Market Profile - Parkland County Municipal Report
Applications Management Consulting Ltd. 11 of 49

2.2.3. Labour Force Participation RateThe Participation Rate measures the total Labour Force (comprised of those who are employed and unemployed) relative to the size of the Working Age Population.4
The Labour Force Participation Rate in Parkland County has remained close to the 75% level through most of the period of analysis. This rate is consistently higher than the average for Alberta which has ranged between 72% and 74%.
Parkland County’s Labour Force Participation Rate decreased to 70% by 2016 as a result of the economic downturn that resulted from the oil price drop beginning in the fall of 2014.
Labour Force Participation Rate (2001-2016)5
Federal Census Interpolation Alberta
0%
20%
40%
60%
80%
100%
2001 2003 2005 2007 2009 2011 2013 2015
Parti
cipa
tion
Rat
e (%
)
Year
Tri-Municipal Region: Labour Market Profile - Parkland County Municipal Report
Applications Management Consulting Ltd. 12 of 49
4 Federal Census data is available for 2001, 2006, 2011 and 2016. 2011 data is from the National Household Survey Community Profile data. All other data points have been estimated by Applications Management Consulting based on an analysis of regional labour market trends using Edmonton CMA Labour Force Survey Estimates for the period 2007 to 2016.
5 The estimated data points between the Federal Census data are estimates provided by Applications Management Consulting Ltd.

2.2.4. Employment RateThe Employment Rate refers to the number of workers employed expressed as a percentage of the total population 15 years of age and over. 6
Between 2001 and 2011 the Employment Rate for Parkland County hovered around 72%. It increased in 2012 through 2015 then fell to 64% in 2016 following the economic downturn. This recent decrease reflects the provincial trend as reported by the Labour Force Survey.
Employment Rate (2001-2016)7
Federal Census Interpolation Alberta
0%
20%
40%
60%
80%
100%
2001 2003 2005 2007 2009 2011 2013 2015
Empl
oym
ent R
ate
(%)
Year
Tri-Municipal Region: Labour Market Profile - Parkland County Municipal Report
Applications Management Consulting Ltd. 13 of 49
6 Federal Census data is available for 2001, 2006, 2011 and 2016. 2011 data is from the National Household Survey Community Profile data. All other data points have been estimated by Applications Management Consulting based on an analysis of regional labour market trends using Edmonton CMA Labour Force Survey Estimates for the period 2007 to 2016.
7 The estimated data points between the Federal Census data are estimates provided by Applications Management Consulting Ltd.
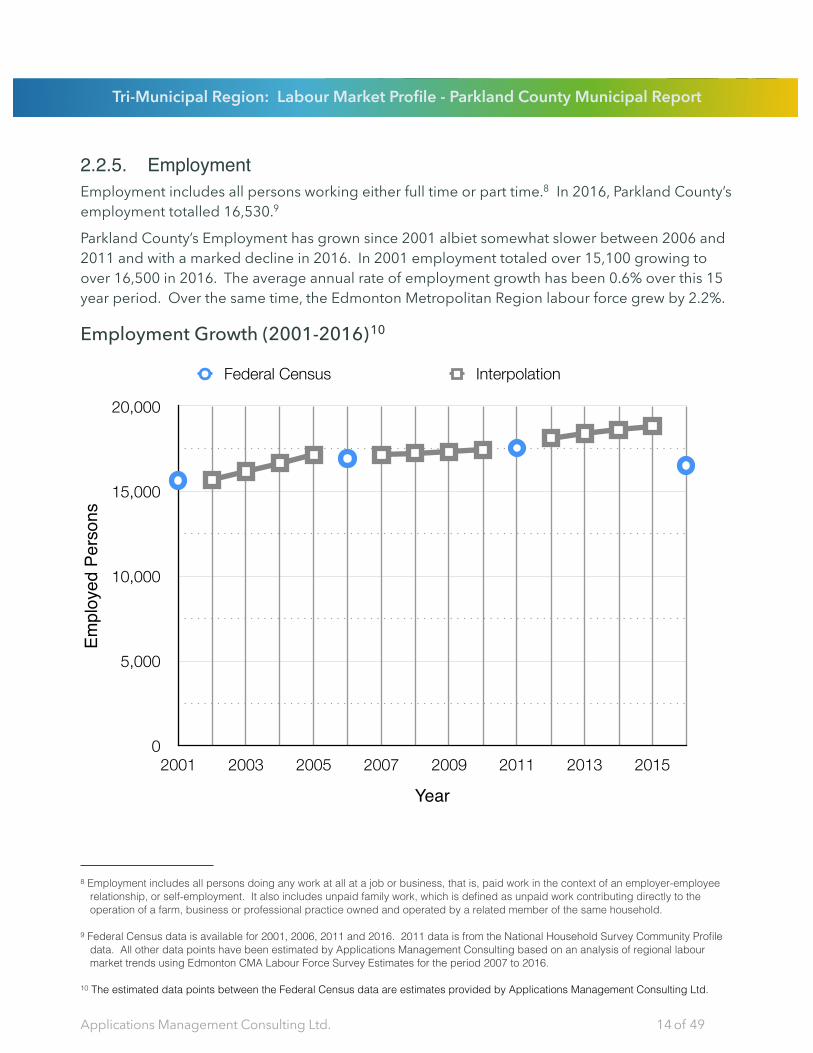
2.2.5. EmploymentEmployment includes all persons working either full time or part time.8 In 2016, Parkland County’s employment totalled 16,530.9
Parkland County’s Employment has grown since 2001 albiet somewhat slower between 2006 and 2011 and with a marked decline in 2016. In 2001 employment totaled over 15,100 growing to over 16,500 in 2016. The average annual rate of employment growth has been 0.6% over this 15 year period. Over the same time, the Edmonton Metropolitan Region labour force grew by 2.2%.
Employment Growth (2001-2016)10
Federal Census Interpolation
0
5,000
10,000
15,000
20,000
2001 2003 2005 2007 2009 2011 2013 2015
Empl
oyed
Per
sons
Year
Tri-Municipal Region: Labour Market Profile - Parkland County Municipal Report
Applications Management Consulting Ltd. 14 of 49
8 Employment includes all persons doing any work at all at a job or business, that is, paid work in the context of an employer-employee relationship, or self-employment. It also includes unpaid family work, which is defined as unpaid work contributing directly to the operation of a farm, business or professional practice owned and operated by a related member of the same household.
9 Federal Census data is available for 2001, 2006, 2011 and 2016. 2011 data is from the National Household Survey Community Profile data. All other data points have been estimated by Applications Management Consulting based on an analysis of regional labour market trends using Edmonton CMA Labour Force Survey Estimates for the period 2007 to 2016.
10 The estimated data points between the Federal Census data are estimates provided by Applications Management Consulting Ltd.

2.2.6. Full Time / Part Time EmploymentFull-time employment consists of people who usually work 30 hours or more per week at their main or only job. Part-time employment consists of people who usually work less than 30 hours per week at their main or only job.
The 2015 full-time work is estimated to have increased to 80%, an increase from the 2000 rate of 77%.
Full Time / Part Time Employment (2000-2015)11
2000 2005 2010 2015
77% 76% 79% 80%
15,246 people worked full-time
14,060 people worked full-time
14,070 people worked full-time
12,760 people worked full-time
23% 24% 21% 20%3,811 people
worked part-time3,685 people
worked part-time4,500 people
worked part-time3,795 people
worked part-time
Full Time
Part Time
Tri-Municipal Region: Labour Market Profile - Parkland County Municipal Report
Applications Management Consulting Ltd. 15 of 49
11 Federal Census data is available for 2000, 2005, 2010 and 2015. 2010 data is from the National Household Survey Community Profile data. For the Federal Census, the reference year for full time / part time data is the previous calendar year. Federal Census data for 2015 is currently available for Edmonton CMA and Alberta. Tri-Municipal Region data for 2015 has been estimated by Applications Management Consulting Ltd.

2.2.7. Unemployment RateThe Unemployment Rate refers to the number of workers employed expressed as a percentage of the total population 15 years of age and over. Parkland County’s unemployment rate was 9.4% in 2016.12
The Unemployment Rate for Parkland County has been estimated to remain below the provincial average for most of the period of analysis. Until 2009 the County’s unemployment rate remained below 4% and then with the economic downturn increased to rates below 5% and dropping below 4% again in 2012. With the recent economic downturn in Alberta due to the energy price shock in 2014, unemployment rates in Parkland County have increased to over 9% in 2016.
Unemployment Rate (2001-2016)13
Federal Census Interpolation Alberta
0%
2%
4%
6%
8%
10%
2001 2003 2005 2007 2009 2011 2013 2015
Une
mpl
oym
ent R
ate
(%)
Year
Tri-Municipal Region: Labour Market Profile - Parkland County Municipal Report
Applications Management Consulting Ltd. 16 of 49
12 Federal Census data is available for 2001, 2006, 2011 and 2016. 2011 data is from the National Household Survey Community Profile data. All other data points have been estimated by Applications Management Consulting based on an analysis of regional labour market trends using Edmonton CMA Labour Force Survey Estimates for the period 2007 to 2016.
13 The estimated data points between the Federal Census data are estimates provided by Applications Management Consulting Ltd.

2.3. Employment by IndustryThis section defines the industry sectors that Parkland County residents are employed.
2.3.1. Industry (2 digit NAICS)14
More employed Parkland County residents work in the Construction sector than any other at over 17% of total employment. This is followed by Retail trade and Health care and social assistance representing 9.3% and 7.7% of total employment respectively.
Employment by Industry (2016)
Tri-Municipal Region: Labour Market Profile - Parkland County Municipal Report
Applications Management Consulting Ltd. 17 of 49
14 NAICS (North America Industrial Classification System) is a standardized way of classifying employment establishments for the purpose of collecting, analyzing, and publishing statistical data related to the economy and labour force. http://www23.statcan.gc.ca/imdb/p3VD.pl?Function=getVD&TVD=118464

The Construction sector exhibited the largest growth in employment among Parkland County workers since 2001, adding over 1,000 jobs over the past 15 years. Professional, scientific and technical services and Health care and social assistance added 495 and 365 jobs over the same period, respectively. Manufacturing employment decreased significantly in 2011 and rebounded in 2016, but was not back to pre 2011 levels.
Employment by Industry 2001-2016 (2 digit NAICS)15
IndustryIndustry2001 2006 2011 20162016
# # # # %
11 Agriculture, forestry, fishing and hunting
21 Mining, quarrying, and oil and gas extraction
22 Utilities
23 Construction
31-33 Manufacturing
41 Wholesale trade
44-45 Retail trade
48-49 Transportation and warehousing
51 Information and cultural industries
52 Finance and insurance
53 Real estate and rental and leasing
54 Professional, scientific and technical services
55 Management of companies and enterprises
56 Administrative and support, waste management and remediation services
61 Educational services
62 Health care and social assistance
71 Arts, entertainment and recreation
72 Accommodation and food services
81 Other services (except public administration)
91 Public administration
1,180 773 790 750 4.2%
720 1,135 1,160 980 5.5%
415 391 400 395 2.2%
2,060 2,520 2,935 3,125 17.4%
1,130 1,395 790 985 5.5%
805 895 955 845 4.7%
1,425 1,745 1,720 1,665 9.3%
1,235 1,117 1,265 1,085 6.0%
190 181 205 135 0.8%
480 502 505 495 2.8%
385 343 345 320 1.8%
755 1,011 1,145 1,250 7.0%
15 22 25 40 0.2%
460 459 520 650 3.6%
845 1,045 990 825 4.6%
1,025 1,180 1,290 1,390 7.7%
245 251 290 315 1.8%
680 631 730 695 3.9%
920 1,029 1,190 1,070 6.0%
645 874 1,010 950 5.3%
Total 15,615 17,505 18,260 17,965 100.0%
Tri-Municipal Region: Labour Market Profile - Parkland County Municipal Report
Applications Management Consulting Ltd. 18 of 49
15 2006 data estimated by Applications Management Consulting Ltd.
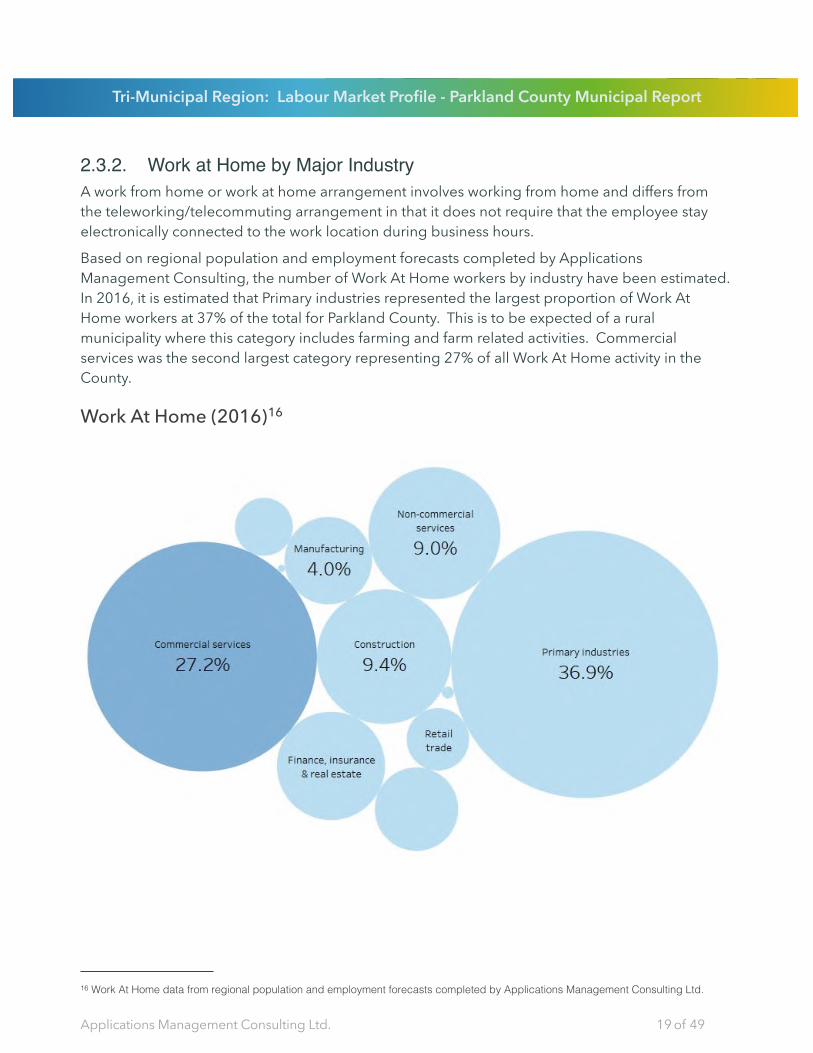
2.3.2. Work at Home by Major IndustryA work from home or work at home arrangement involves working from home and differs from the teleworking/telecommuting arrangement in that it does not require that the employee stay electronically connected to the work location during business hours.
Based on regional population and employment forecasts completed by Applications Management Consulting, the number of Work At Home workers by industry have been estimated. In 2016, it is estimated that Primary industries represented the largest proportion of Work At Home workers at 37% of the total for Parkland County. This is to be expected of a rural municipality where this category includes farming and farm related activities. Commercial services was the second largest category representing 27% of all Work At Home activity in the County.
Work At Home (2016)16
Tri-Municipal Region: Labour Market Profile - Parkland County Municipal Report
Applications Management Consulting Ltd. 19 of 49
16 Work At Home data from regional population and employment forecasts completed by Applications Management Consulting Ltd.

Work at Home by Major Industry (2001-2016)17
IndustryIndustry2001 2006 2011 20162016
# # # # %
Primary industries (Note 1)
Manufacturing (NAICS 31-33)
Construction (NAICS 23)
Utilities (NAICS 22)
Transportation, storage and communication (Note 2)
Wholesale trade (NAICS 42)
Retail trade (NAICS 44-45)
Finance, insurance and real estate (Note 3)
Commercial services (Note 4)
Non-commercial services (Note 5)
Public administration (NAICS 92)
405 36.9%
43 3.9%
103 9.4%
0 0.0%
40 3.6%
19 1.7%
22 2.0%
67 6.1%
299 27.2%
99 9.0%
1 0.1%
Total N/A N/A N/A 1,098 100.0%
Notes:(1) Includes Agriculture, forestry, fishing and hunting (NAICS 11) and Mining (NAICS 21)(2) Includes Transportation and warehousing (NAICS 48-49) and Information (NAICS 51)(3) Includes Finance and insurance (NAICS 53) and Real estate, rental and leasing (NAICS 53) (4) Includes Professional, scientific and technical services (NAICS 54), Management of companies and enterprises (NAICS 55), Administrative support, waste management and remediation services (NAICS 56), Arts, entertainment and recreation (NAICS 71), Accommodation and food services (NAICS 81), and Other services (NAICS 81)(5) Includes Education services (NAICS 61) and Health care and social assistance (NAICS 62)
Tri-Municipal Region: Labour Market Profile - Parkland County Municipal Report
Applications Management Consulting Ltd. 20 of 49
17 Work At Home data is not available for 2001.

2.4. Employment by OccupationThe majority of employed Parkland County residents work in four Major Occupation groups, including Trades, transport and equipment operators (26%); Business, finance and administration (16%); Sales and service (16%); and Management (15%). The remaining Major Occupation categories comprise 27% of the workforce.
Employment by Major Occupation (2016)
Tri-Municipal Region: Labour Market Profile - Parkland County Municipal Report
Applications Management Consulting Ltd. 21 of 49
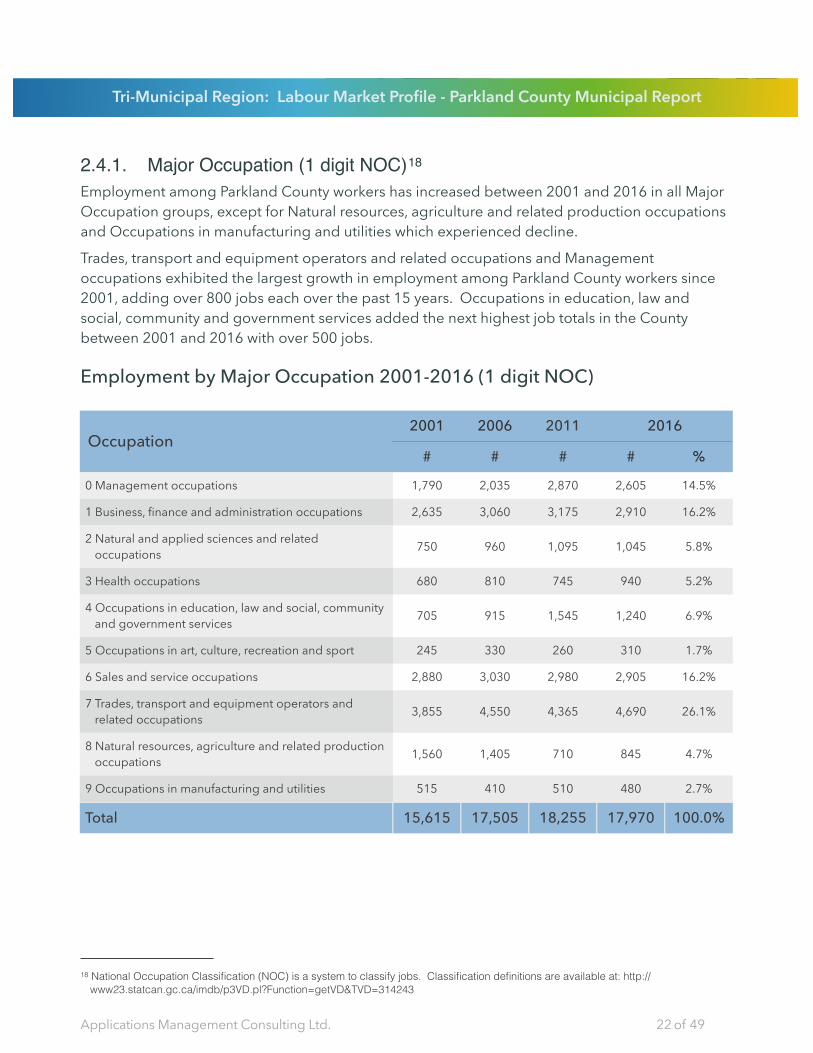
2.4.1. Major Occupation (1 digit NOC)18
Employment among Parkland County workers has increased between 2001 and 2016 in all Major Occupation groups, except for Natural resources, agriculture and related production occupations and Occupations in manufacturing and utilities which experienced decline.
Trades, transport and equipment operators and related occupations and Management occupations exhibited the largest growth in employment among Parkland County workers since 2001, adding over 800 jobs each over the past 15 years. Occupations in education, law and social, community and government services added the next highest job totals in the County between 2001 and 2016 with over 500 jobs.
Employment by Major Occupation 2001-2016 (1 digit NOC)
OccupationOccupation2001 2006 2011 20162016
# # # # %
0 Management occupations
1 Business, finance and administration occupations
2 Natural and applied sciences and related occupations
3 Health occupations
4 Occupations in education, law and social, community and government services
5 Occupations in art, culture, recreation and sport
6 Sales and service occupations
7 Trades, transport and equipment operators and related occupations
8 Natural resources, agriculture and related production occupations
9 Occupations in manufacturing and utilities
1,790 2,035 2,870 2,605 14.5%
2,635 3,060 3,175 2,910 16.2%
750 960 1,095 1,045 5.8%
680 810 745 940 5.2%
705 915 1,545 1,240 6.9%
245 330 260 310 1.7%
2,880 3,030 2,980 2,905 16.2%
3,855 4,550 4,365 4,690 26.1%
1,560 1,405 710 845 4.7%
515 410 510 480 2.7%
Total 15,615 17,505 18,255 17,970 100.0%
Tri-Municipal Region: Labour Market Profile - Parkland County Municipal Report
Applications Management Consulting Ltd. 22 of 49
18 National Occupation Classification (NOC) is a system to classify jobs. Classification definitions are available at: http://www23.statcan.gc.ca/imdb/p3VD.pl?Function=getVD&TVD=314243

2.4.2. Major Occupation by Gender (1 digit NOC)Gender equality in the workforce in Parkland County has generally has not changed between 2001 and 2016. However, there have been minor shifts in the proportion of men and women working in some Major Occupation groups. For example, the proportion of women has increased from 62% to 70% in Education, law and social, community and government services. All other changes in gender mix have been smaller than this for Parkland County between 2001 and 2016.
Employment by Major Occupation by Gender 2001-2016 (1 digit NOC)
2001 2016
0% 25% 50% 75% 100%
16%
24%
8%
69%
65%
70%
86%
22%
82%
34%
83%
76%
92%
31%
36%
30%
14%
79%
18%
66%
0% 25% 50% 75% 100%
22%
27%
8%
64%
63%
62%
89%
16%
86%
34%
79%
73%
92%
37%
35%
39%
11%
84%
15%
66%0 Management
3 Health
2 Natural and applied sciences and related
1 Business, finance and administration
4 Education, law and social, community and government
services
5 Art, culture, recreation and sport
6 Sales and service
7 Trades, transport and equipment operators and related
8 Natural resources, agriculture and related production
9 Manufacturing and utilities
Tri-Municipal Region: Labour Market Profile - Parkland County Municipal Report
Applications Management Consulting Ltd. 23 of 49

Employment by Major Occupation by Gender 2001-2016 (1 digit NOC)
OccupationOccupationOccupation
20012001 2016201620162016
Male Female MaleMale FemaleFemale
# # # % # %
0 Management occupations
1 Business, finance and administration occupations
2 Natural and applied sciences and related occupations
3 Health occupations
4 Occupations in education, law and social, community and government services
5 Occupations in art, culture, recreation and sport
6 Sales and service occupations
7 Trades, transport and equipment operators and related occupations
8 Natural resources, agriculture and related production occupations
9 Occupations in manufacturing and utilities
1,185 605 1,715 66% 885 34%
385 2,255 515 18% 2,395 82%
630 120 820 78% 225 22%
75 605 130 14% 810 86%
275 435 375 30% 865 70%
85 155 110 35% 200 65%
1,050 1,830 900 31% 2,005 69%
3,540 315 4,320 92% 365 8%
1,140 420 645 76% 205 24%
405 115 400 84% 75 16%
Total 8,770 6,855 9,930 55% 8,030 45%
2.4.3. Detailed Occupation (4 digit NOC)19
Employment by occupation has been estimated for workers living in Parkland County. The top 20 most numerous occupations for 2016 are listed in the table below. In addition, the rank of each top 20 2016 occupation and number of Parkland County residents employed in that occupation has been provided for 2001.
There have been some significant shifts in the top occupations of Parkland County residents. Most notably, Light duty cleaners (NOC 6731), Janitors, caretakers and building superintendents (NOC 6733) and Accounting technicians and bookkeepers (NOC 1311) were not in the top 20 occupations in Parkland County in 2001.
Tri-Municipal Region: Labour Market Profile - Parkland County Municipal Report
Applications Management Consulting Ltd. 24 of 49
19 Detailed occupation (4 digit NOC) data has been estimated by Applications Management Consulting Ltd. National Occupation Classification (NOC) is a system to classify jobs. Classification definitions are available at: http://www23.statcan.gc.ca/imdb/p3VD.pl?Function=getVD&TVD=314243
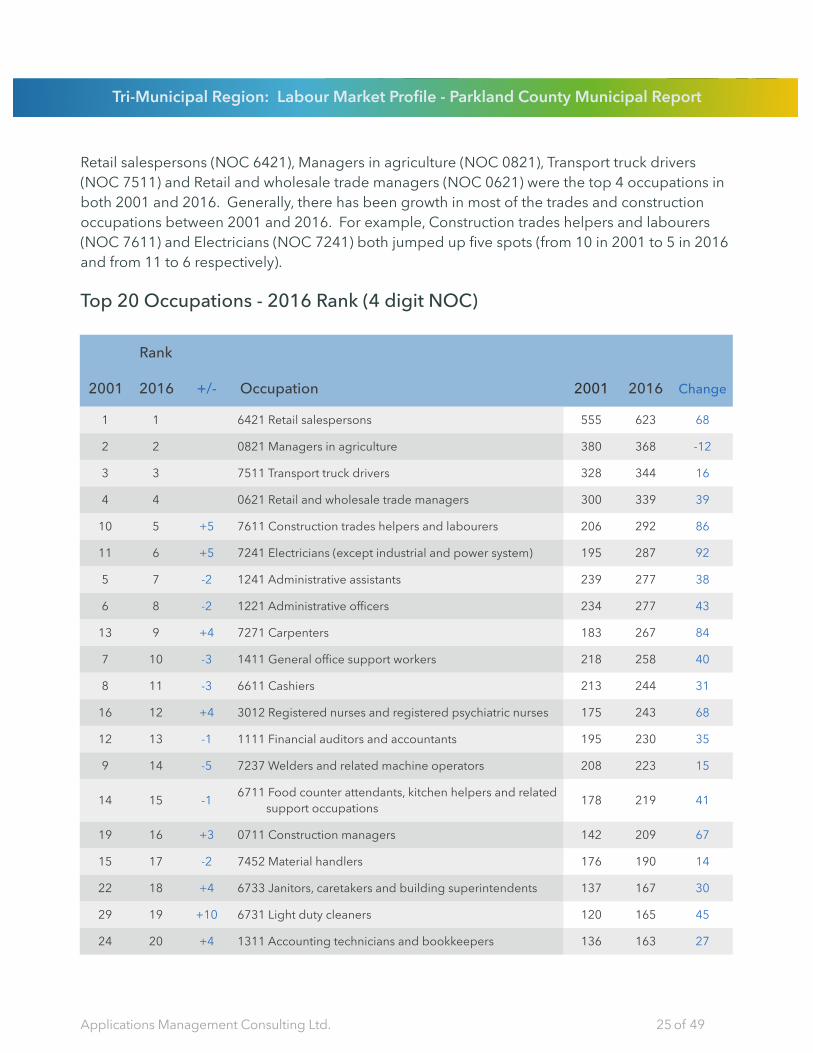
Retail salespersons (NOC 6421), Managers in agriculture (NOC 0821), Transport truck drivers (NOC 7511) and Retail and wholesale trade managers (NOC 0621) were the top 4 occupations in both 2001 and 2016. Generally, there has been growth in most of the trades and construction occupations between 2001 and 2016. For example, Construction trades helpers and labourers (NOC 7611) and Electricians (NOC 7241) both jumped up five spots (from 10 in 2001 to 5 in 2016 and from 11 to 6 respectively).
Top 20 Occupations - 2016 Rank (4 digit NOC)
RankRankRank
2001 2016 +/- Occupation 2001 2016 Change
1 1 6421 Retail salespersons
2 2 0821 Managers in agriculture
3 3 7511 Transport truck drivers
4 4 0621 Retail and wholesale trade managers
10 5 +5 7611 Construction trades helpers and labourers
11 6 +5 7241 Electricians (except industrial and power system)
5 7 -2 1241 Administrative assistants
6 8 -2 1221 Administrative officers
13 9 +4 7271 Carpenters
7 10 -3 1411 General office support workers
8 11 -3 6611 Cashiers
16 12 +4 3012 Registered nurses and registered psychiatric nurses
12 13 -1 1111 Financial auditors and accountants
9 14 -5 7237 Welders and related machine operators
14 15 -1 6711 Food counter attendants, kitchen helpers and related support occupations
19 16 +3 0711 Construction managers
15 17 -2 7452 Material handlers
22 18 +4 6733 Janitors, caretakers and building superintendents
29 19 +10 6731 Light duty cleaners
24 20 +4 1311 Accounting technicians and bookkeepers
555 623 68
380 368 -12
328 344 16
300 339 39
206 292 86
195 287 92
239 277 38
234 277 43
183 267 84
218 258 40
213 244 31
175 243 68
195 230 35
208 223 15
178 219 41
142 209 67
176 190 14
137 167 30
120 165 45
136 163 27
Tri-Municipal Region: Labour Market Profile - Parkland County Municipal Report
Applications Management Consulting Ltd. 25 of 49

2.5. Labour SupplyThe workforce living in Parkland County has been evaluated across a variety of parameters, including education attainment, skill levels, work to home trips and available workers in traditional underemployed worker categories.
2.5.1. Highest Level of Educational Attainment OverviewThe workforce in Parkland County has seen an increase in the proportion of the workforce having completed High School and Post Secondary education. The number of workers not having completed High School has declined markedly since 2001.
Highest Level of Educational Attainment Overview (2016)
No high school18%
High school29%
Post-secondary52%
No high school
High school
Post-secondary
5,000 10,000 15,000
2001 20062011 2016
Tri-Municipal Region: Labour Market Profile - Parkland County Municipal Report
Applications Management Consulting Ltd. 26 of 49
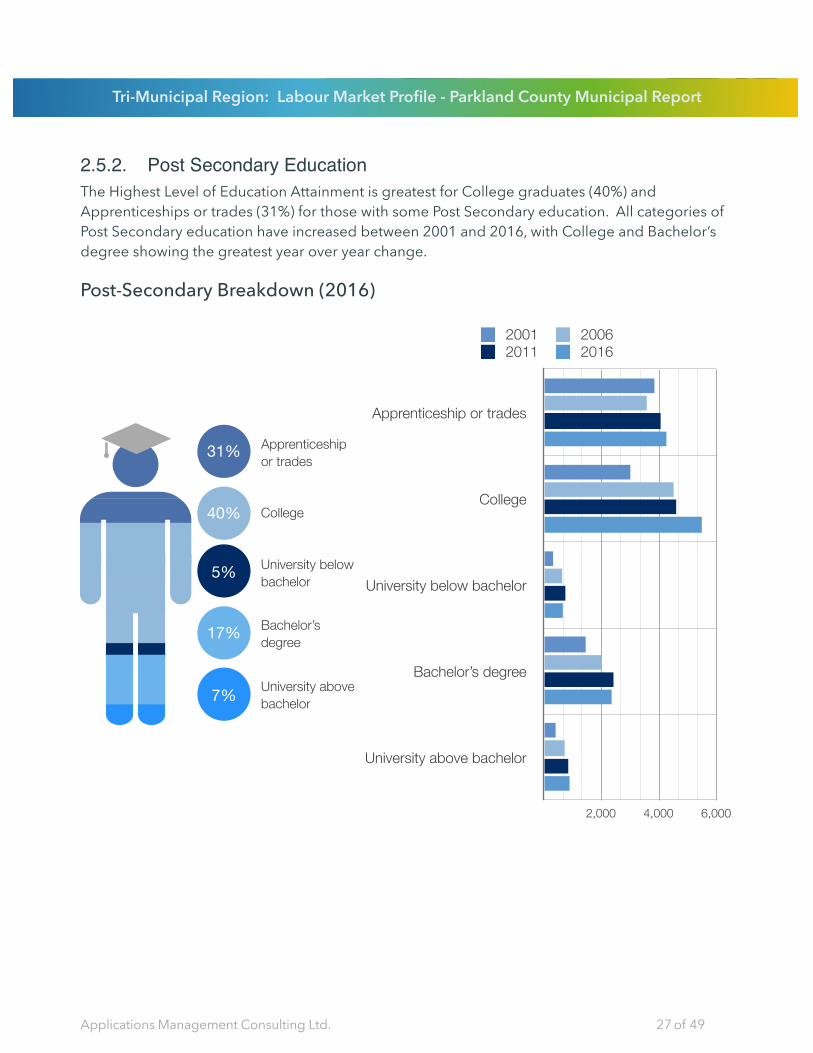
2.5.2. Post Secondary EducationThe Highest Level of Education Attainment is greatest for College graduates (40%) and Apprenticeships or trades (31%) for those with some Post Secondary education. All categories of Post Secondary education have increased between 2001 and 2016, with College and Bachelor’s degree showing the greatest year over year change.
Post-Secondary Breakdown (2016)
Apprenticeship or trades
College
University below bachelor
Bachelor’s degree
University above bachelor
2,000 4,000 6,000
2001 20062011 2016
Apprenticeship or trades31%
College40%
University below bachelor5%
Bachelor’s degree17%
University above bachelor7%
Tri-Municipal Region: Labour Market Profile - Parkland County Municipal Report
Applications Management Consulting Ltd. 27 of 49
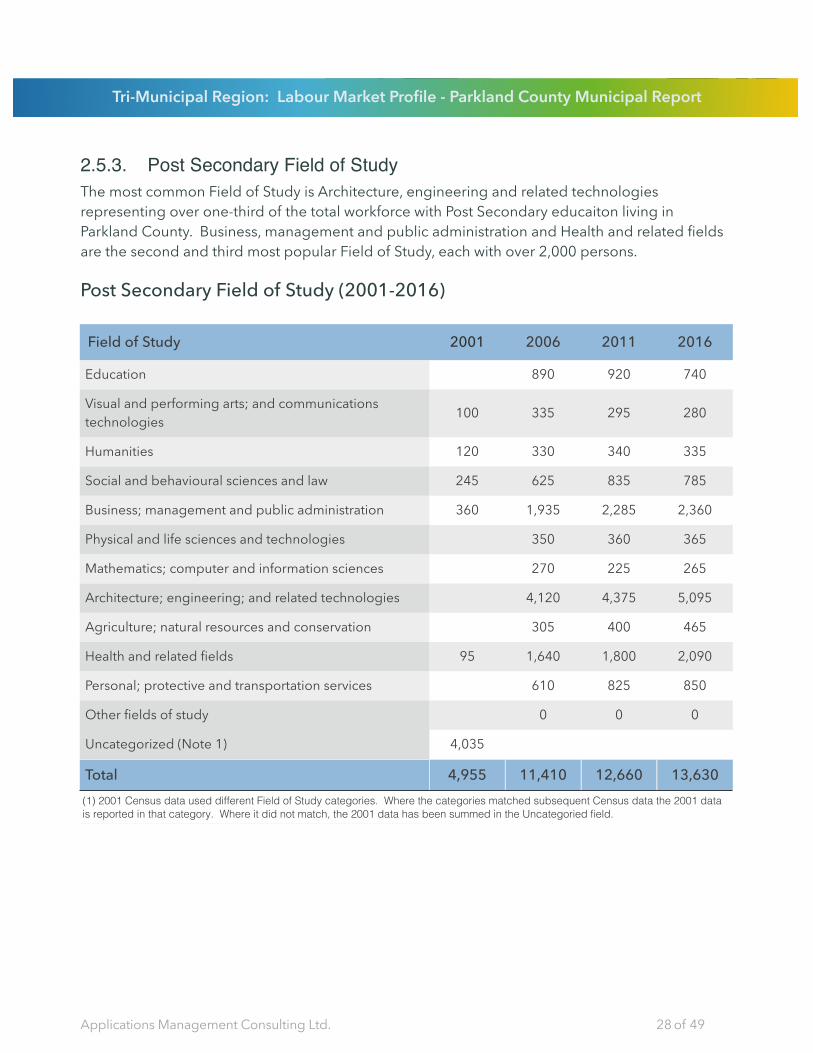
2.5.3. Post Secondary Field of StudyThe most common Field of Study is Architecture, engineering and related technologies representing over one-third of the total workforce with Post Secondary educaiton living in Parkland County. Business, management and public administration and Health and related fields are the second and third most popular Field of Study, each with over 2,000 persons.
Post Secondary Field of Study (2001-2016)
Field of Study 2001 2006 2011 2016
Education
Visual and performing arts; and communications technologies
Humanities
Social and behavioural sciences and law
Business; management and public administration
Physical and life sciences and technologies
Mathematics; computer and information sciences
Architecture; engineering; and related technologies
Agriculture; natural resources and conservation
Health and related fields
Personal; protective and transportation services
Other fields of study
Uncategorized (Note 1)
890 920 740
100 335 295 280
120 330 340 335
245 625 835 785
360 1,935 2,285 2,360
350 360 365
270 225 265
4,120 4,375 5,095
305 400 465
95 1,640 1,800 2,090
610 825 850
0 0 0
4,035
Total(1) 2001 Census data used different Field of Study categories. Where the categories matched subsequent Census data the 2001 data is reported in that category. Where it did not match, the 2001 data has been summed in the Uncategoried field.
4,955 11,410 12,660 13,630(1) 2001 Census data used different Field of Study categories. Where the categories matched subsequent Census data the 2001 data is reported in that category. Where it did not match, the 2001 data has been summed in the Uncategoried field.(1) 2001 Census data used different Field of Study categories. Where the categories matched subsequent Census data the 2001 data is reported in that category. Where it did not match, the 2001 data has been summed in the Uncategoried field.(1) 2001 Census data used different Field of Study categories. Where the categories matched subsequent Census data the 2001 data is reported in that category. Where it did not match, the 2001 data has been summed in the Uncategoried field.(1) 2001 Census data used different Field of Study categories. Where the categories matched subsequent Census data the 2001 data is reported in that category. Where it did not match, the 2001 data has been summed in the Uncategoried field.
Tri-Municipal Region: Labour Market Profile - Parkland County Municipal Report
Applications Management Consulting Ltd. 28 of 49
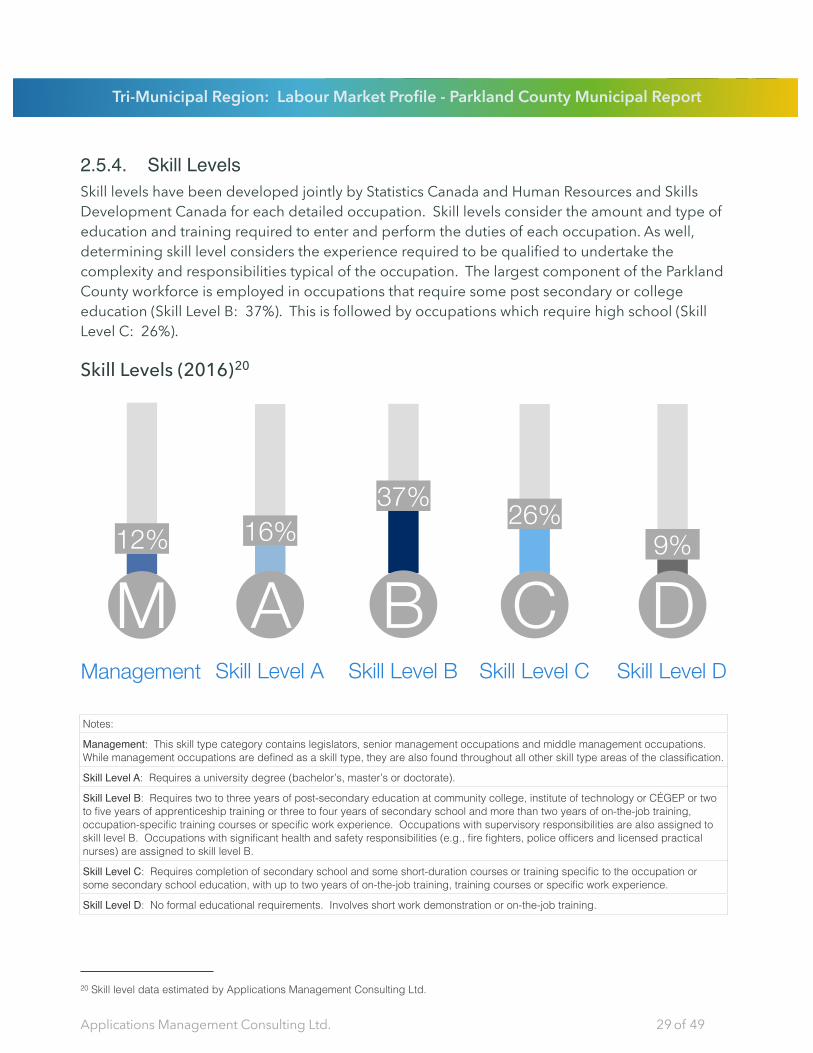
2.5.4. Skill LevelsSkill levels have been developed jointly by Statistics Canada and Human Resources and Skills Development Canada for each detailed occupation. Skill levels consider the amount and type of education and training required to enter and perform the duties of each occupation. As well, determining skill level considers the experience required to be qualified to undertake the complexity and responsibilities typical of the occupation. The largest component of the Parkland County workforce is employed in occupations that require some post secondary or college education (Skill Level B: 37%). This is followed by occupations which require high school (Skill Level C: 26%).
Skill Levels (2016)20
Management
12%
M16%
A
37%
B26%
C9%
DSkill Level A Skill Level B Skill Level C Skill Level D
Notes:
Management: This skill type category contains legislators, senior management occupations and middle management occupations. While management occupations are defined as a skill type, they are also found throughout all other skill type areas of the classification.
Skill Level A: Requires a university degree (bachelor’s, master’s or doctorate).
Skill Level B: Requires two to three years of post-secondary education at community college, institute of technology or CÉGEP or two to five years of apprenticeship training or three to four years of secondary school and more than two years of on-the-job training, occupation-specific training courses or specific work experience. Occupations with supervisory responsibilities are also assigned to skill level B. Occupations with significant health and safety responsibilities (e.g., fire fighters, police officers and licensed practical nurses) are assigned to skill level B.
Skill Level C: Requires completion of secondary school and some short-duration courses or training specific to the occupation or some secondary school education, with up to two years of on-the-job training, training courses or specific work experience.
Skill Level D: No formal educational requirements. Involves short work demonstration or on-the-job training.
Tri-Municipal Region: Labour Market Profile - Parkland County Municipal Report
Applications Management Consulting Ltd. 29 of 49
20 Skill level data estimated by Applications Management Consulting Ltd.
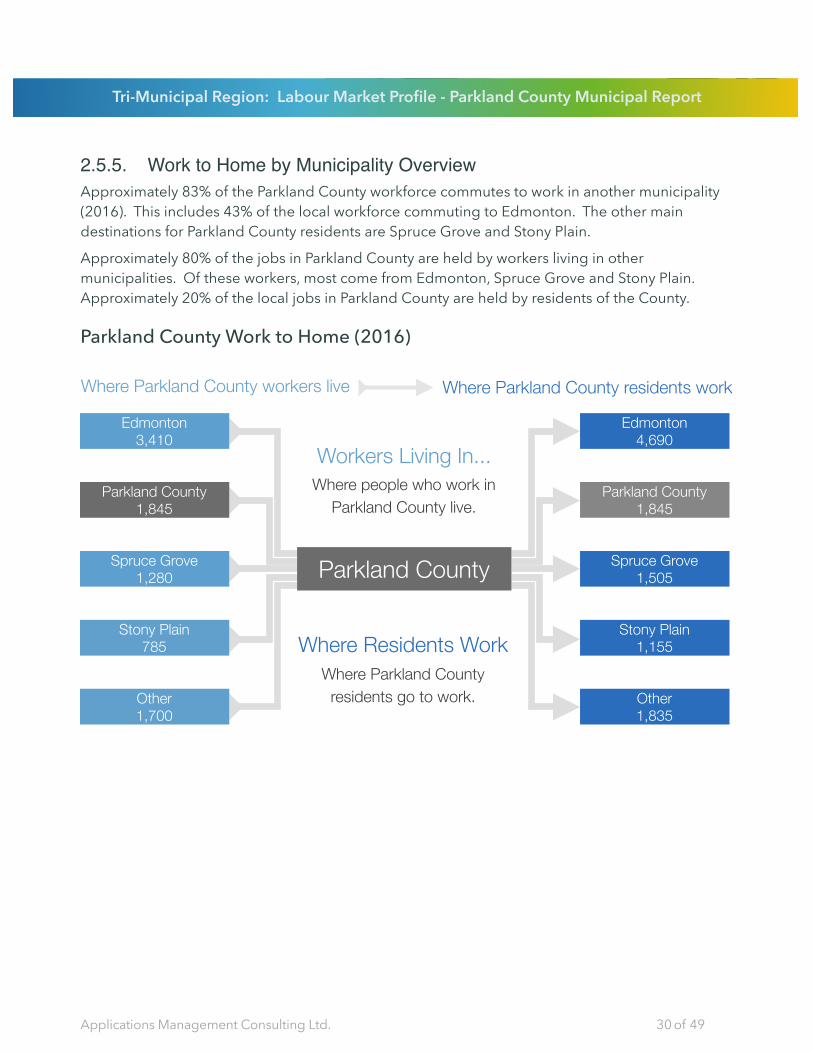
2.5.5. Work to Home by Municipality OverviewApproximately 83% of the Parkland County workforce commutes to work in another municipality (2016). This includes 43% of the local workforce commuting to Edmonton. The other main destinations for Parkland County residents are Spruce Grove and Stony Plain.
Approximately 80% of the jobs in Parkland County are held by workers living in other municipalities. Of these workers, most come from Edmonton, Spruce Grove and Stony Plain. Approximately 20% of the local jobs in Parkland County are held by residents of the County.
Parkland County Work to Home (2016)
Where Parkland County residents go to work.
Where Residents Work
Spruce Grove1,280
Parkland County1,845
Stony Plain785
Other1,700
Edmonton3,410
Spruce Grove1,505
Parkland County1,845
Stony Plain1,155
Other1,835
Edmonton4,690
Parkland County
Where Parkland County workers live Where Parkland County residents work
Workers Living In...Where people who work in
Parkland County live.
Tri-Municipal Region: Labour Market Profile - Parkland County Municipal Report
Applications Management Consulting Ltd. 30 of 49

2.5.6. Work to Home by MunicipalityThe proportion of the Parkland County workforce working in the County has increased from 11% in 2001 to 17% in 2016. The proportion of the local workforce commuting to Edmonton has declined somewhat from 51% in 2001 to 42% in 2016.
Where Parkland County Residents Work (2001-2016)
Live in Parkland County---> Work in ______ 2001 2006 2011 2016
Edmonton
Parkland County
Spruce Grove
Stony Plain
Leduc County
Drayton Valley
St. Albert
Strathcona County
Wood Buffalo
Devon
Sturgeon County
Yellowhead County
Leduc
Lac Ste. Anne County
Onoway
Redwater
Morinville
Calgary
Wabamun
Others
5,115 5,355 5,630 4,690
1,145 1,315 1,820 1,845
1,095 1,560 1,465 1,505
1,110 1,075 1,250 1,155
325 255 265 315
295 370 345 300
100 110 200 180
105 150 80 170
70 95 255 145
160 190 140 120
30 75 60 100
110 125 125 95
60 115 75 80
30 60
35 55 100 50
40
20 35
45 55 25 30
55 140 45 25
195 235 90 90
Total 10,050 11,325 11,970 11,030
Tri-Municipal Region: Labour Market Profile - Parkland County Municipal Report
Applications Management Consulting Ltd. 31 of 49

The proportion of the Parkland County workforce filling local jobs has gradually decreased over the period 2001 to 2016, from 35% to 20%. Local jobs in Parkland County are generally being filled by Tri-Municipal workers, with the proportion of workers commuting the Parkland County to work as a share of total jobs in the County decreasing from 56% in 2001 to 43% in 2016. The number of local jobs filled by Edmonton residents increased from 25% in 2001 to 38% in 2016.
Where Parkland County Workers Live (2001-2016)
Work in Parkland County ---> Live in ______ 2001 2006 2011 2016
Edmonton
Parkland County
Spruce Grove
Stony Plain
St. Albert
Lac Ste. Anne County
Strathcona County
Sturgeon County
Yellowhead County
Devon
Leduc
Leduc County
Wabamun
Beaumont
Spring Lake
Wabamun 133A, IRI (Paul)
Fort Saskatchewan
Morinville
Calgary
Alberta Beach
Others
830 1,200 1,990 3,410
1,145 1,315 1,820 1,845
380 540 960 1,280
310 405 610 785
105 80 245 340
100 100 145 250
45 80 235 170
35 30 95 140
145 125 125 125
50 70 90 115
45 80
70
85 50 55
20 45
45
45
25 275 35
70 35
35
30
55 100 20 85
Total 3,285 4,120 6,745 9,020
Tri-Municipal Region: Labour Market Profile - Parkland County Municipal Report
Applications Management Consulting Ltd. 32 of 49
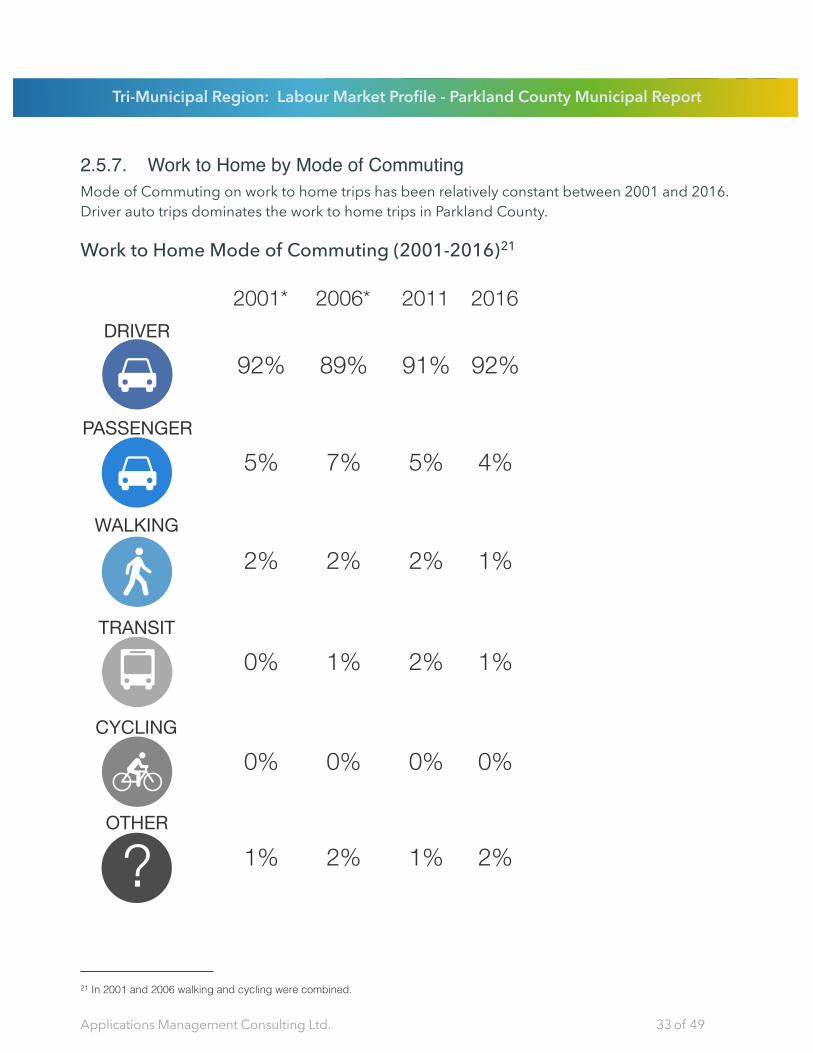
2.5.7. Work to Home by Mode of CommutingMode of Commuting on work to home trips has been relatively constant between 2001 and 2016. Driver auto trips dominates the work to home trips in Parkland County.
Work to Home Mode of Commuting (2001-2016)21
CYCLING
PASSENGER
TRANSIT
WALKING
DRIVER
OTHER
?
2001* 2006* 2011 2016
91%
5%
2%
2%
0%
1%
89%
7%
2%
1%
0%
2%
92%
5%
2%
0%
0%
1%
92%
4%
1%
1%
0%
2%
Tri-Municipal Region: Labour Market Profile - Parkland County Municipal Report
Applications Management Consulting Ltd. 33 of 49
21 In 2001 and 2006 walking and cycling were combined.
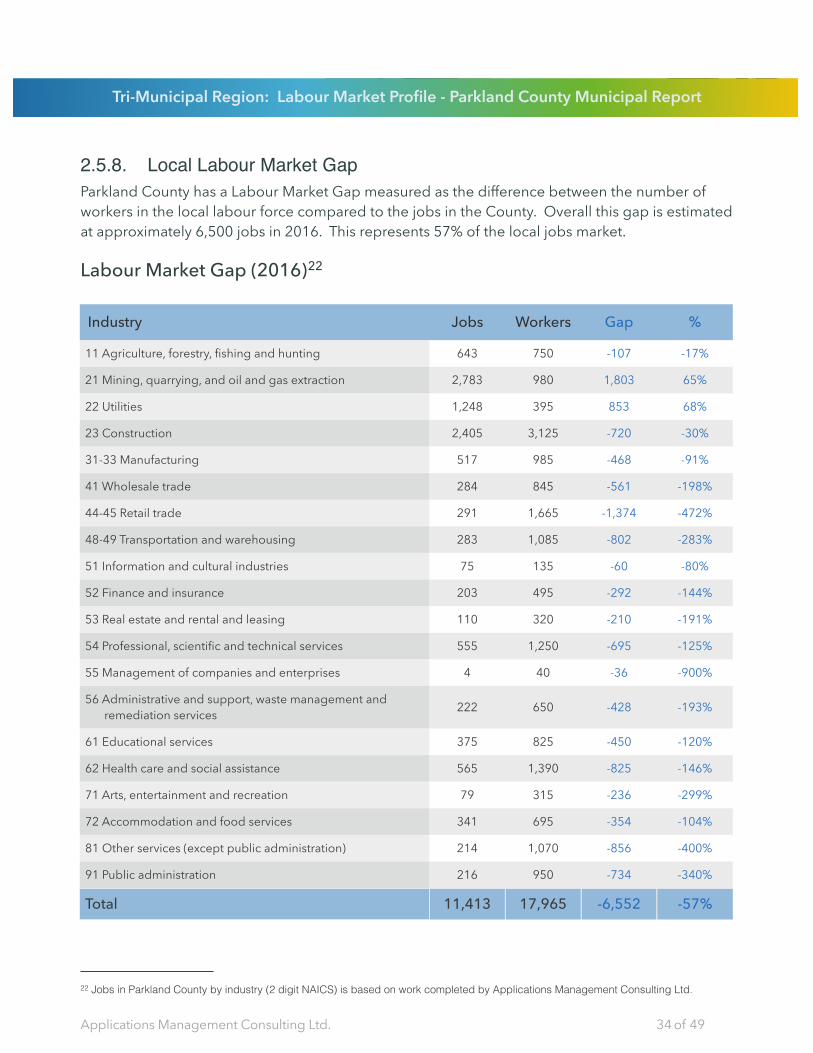
2.5.8. Local Labour Market GapParkland County has a Labour Market Gap measured as the difference between the number of workers in the local labour force compared to the jobs in the County. Overall this gap is estimated at approximately 6,500 jobs in 2016. This represents 57% of the local jobs market.
Labour Market Gap (2016)22
Industry Jobs Workers Gap %
11 Agriculture, forestry, fishing and hunting
21 Mining, quarrying, and oil and gas extraction
22 Utilities
23 Construction
31-33 Manufacturing
41 Wholesale trade
44-45 Retail trade
48-49 Transportation and warehousing
51 Information and cultural industries
52 Finance and insurance
53 Real estate and rental and leasing
54 Professional, scientific and technical services
55 Management of companies and enterprises
56 Administrative and support, waste management and remediation services
61 Educational services
62 Health care and social assistance
71 Arts, entertainment and recreation
72 Accommodation and food services
81 Other services (except public administration)
91 Public administration
643 750 -107 -17%
2,783 980 1,803 65%
1,248 395 853 68%
2,405 3,125 -720 -30%
517 985 -468 -91%
284 845 -561 -198%
291 1,665 -1,374 -472%
283 1,085 -802 -283%
75 135 -60 -80%
203 495 -292 -144%
110 320 -210 -191%
555 1,250 -695 -125%
4 40 -36 -900%
222 650 -428 -193%
375 825 -450 -120%
565 1,390 -825 -146%
79 315 -236 -299%
341 695 -354 -104%
214 1,070 -856 -400%
216 950 -734 -340%
Total 11,413 17,965 -6,552 -57%
Tri-Municipal Region: Labour Market Profile - Parkland County Municipal Report
Applications Management Consulting Ltd. 34 of 49
22 Jobs in Parkland County by industry (2 digit NAICS) is based on work completed by Applications Management Consulting Ltd.
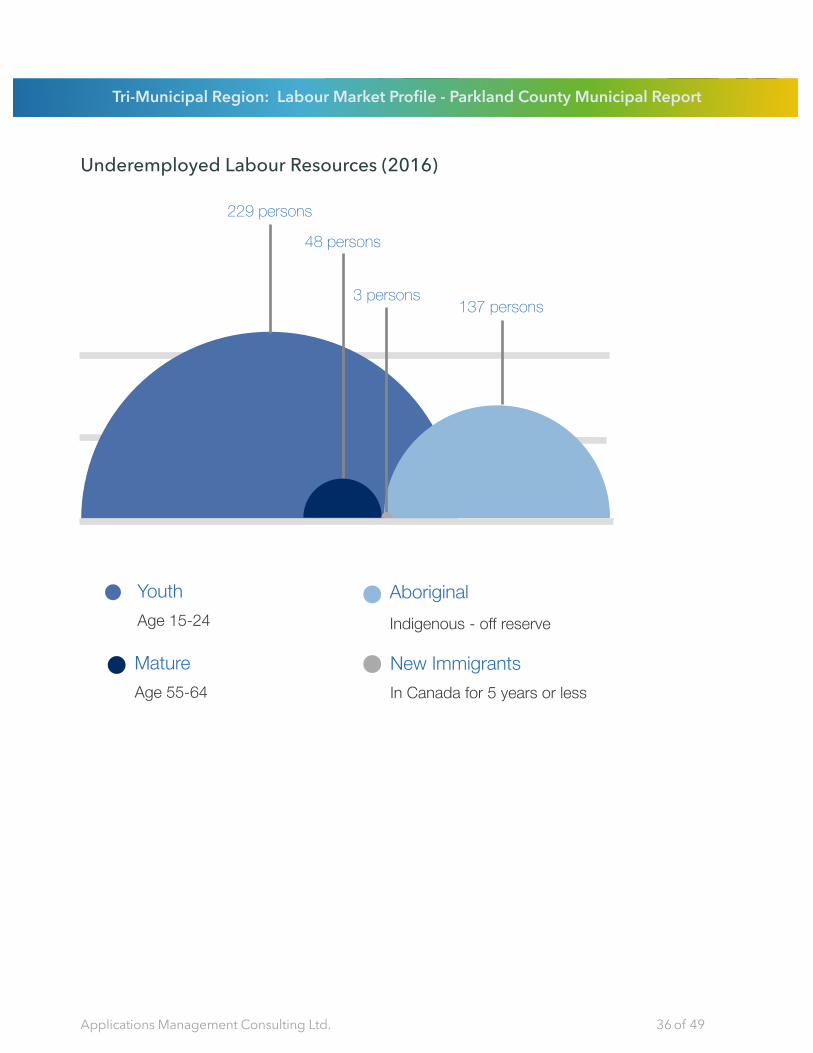
2.5.9. Underemployed Labour ResourcesIt is generally acknowledged that some segments of the labour force remain underemployed as compared to the general population of workers.
Aboriginal: Indigenous people living off-reserve have significantly higher rates of unemployment than the general work force. In 2016, the Alberta unemployment rate for Indigenous men was 15.0% compared to the provincial rate for men at 8.9%. Indigenous women had an unemployment rate of 12.5% compared to 7.3% for Alberta women.Youth: Young adults (age 15-24 years) in the workforce also had significantly higher unemployment rates than the average for Alberta men and women, 14.2% and 11.8% respectively.Mature: Mature workers (age 55-64) had higher unemployment rates, averaging 0.5% higher than the average for the workforce as a whole.New Immigrants:23 The unemployment rate for new immigrants was significantly higher than the average for the general workforce in Alberta, almost 5.0% higher than the provincial average.24
Based on the demographic composition of Parkland County in 2016, it is estimated that the number of underemployed labour resources associated with the noted groups represents approximately 417 workers, or 24% of the number of unemployed persons in the County in 2016.
The breakdown of underemployed workforce resources in Parkland County is provided below.
Tri-Municipal Region: Labour Market Profile - Parkland County Municipal Report
Applications Management Consulting Ltd. 35 of 49
23 New immigrants are defined as those who have been in Canada for 5 years or less.
24 Immigrants who have been in Canada for more than 5 years tend to have average or below average rates of unemployment when compared to the general workforce.
Underemployed Labour Resources (2016)
New ImmigrantsIn Canada for 5 years or less
MatureAge 55-64
YouthAge 15-24
AboriginalIndigenous - off reserve
229 persons
48 persons
3 persons137 persons
Tri-Municipal Region: Labour Market Profile - Parkland County Municipal Report
Applications Management Consulting Ltd. 36 of 49

2.6. Income & AffordabilityThe available supply of workers in the local economy depends on a number of variables, including income and cost of living factors.
2.6.1. Median Household Income25
The Median Household Income of Parkland County residents has climbed steadily over the period of analysis. Based on 2015 data, Parkland County residents Median Household Income is above the median for the Edmonton CMA of $94,500.
Median Household Total Income (2000-2015)26
$0
$20,000
$40,000
$60,000
$80,000
$100,000
$120,000
2000 2005 2010 2015
$115,005
$100,023
$81,904
$62,417
Med
ian
Hou
seho
ld T
otal
Inco
me
($)
Year
Tri-Municipal Region: Labour Market Profile - Parkland County Municipal Report
Applications Management Consulting Ltd. 37 of 49
25 The median income of a specified group is the amount that divides the income distribution of that group into two halves, i.e., the incomes of half of the units in that group are below the median, while those of the other half are above the median. Median incomes of households are calculated for all units, whether or not they had income.
26 For the Federal Census, the reference year for all income data is the previous calendar year.

2.6.2. Household Income Distribution27
Total income refers to receipts from certain sources of all household members, before income taxes and deductions, during a specified reference period.
Over half (57%) of all households in Parkland County had a total income greater than $100,000 in 2015. This compares favourably to the Edmonton CMA where 47% of all households had a total income of more than $100,000.
Household Income Distribution by Income Band (2015)28
Tri-Municipal Region: Labour Market Profile - Parkland County Municipal Report
Applications Management Consulting Ltd. 38 of 49
27 Total income includes: employment income from wages, salaries, tips, commissions and net income from self-employment (for both unincorporated farm and non-farm activities); income from investment sources, such as dividends and interest on bonds, accounts, guaranteed investment certificates (GICs) and mutual funds; income from employer and personal pension sources, such as private pensions and payments from annuities and registered retirement income funds (RRIFs); other regular cash income, such as child support payments received, spousal support payments (alimony) received and scholarships; income from government sources, such as social assistance, child benefits, Employment Insurance benefits, Old Age Security benefits, Canada Pension Plan and Québec Pension Plan benefits and disability income.
28 For the 2016 Federal Census, the reference year for all income data is the previous calendar year 2015.

2.6.3. Income by Family CompositionThe distribution of household income varies significantly depending on family composition. Particularly whether the household has one or two income earners as well as the number of dependents in the household.
Among family types within Parkland County, Couple Families With Children have the highest Median Total Income. Total income for this group also grew the fastest between 2010 and 2015. Individuals Not In Families (without children) had the lowest Median Total Income of approximately $44,000 in 2015.
Median Total Income by Family Composition (2015)29
Couple families with children
Couple only families
Lone parent families
Individuals not in families
60,000 120,000 180,000
2000 20052010 2015Couple families
with children
$158,790
Couple only families
$106,971
Lone parent families
$71,424
Individuals not in families
$44,134
Tri-Municipal Region: Labour Market Profile - Parkland County Municipal Report
Applications Management Consulting Ltd. 39 of 49
29 For the Federal Census, the reference year for all income data is the previous calendar year. Data for Economic Family Income is not available in 2000 and 2005.
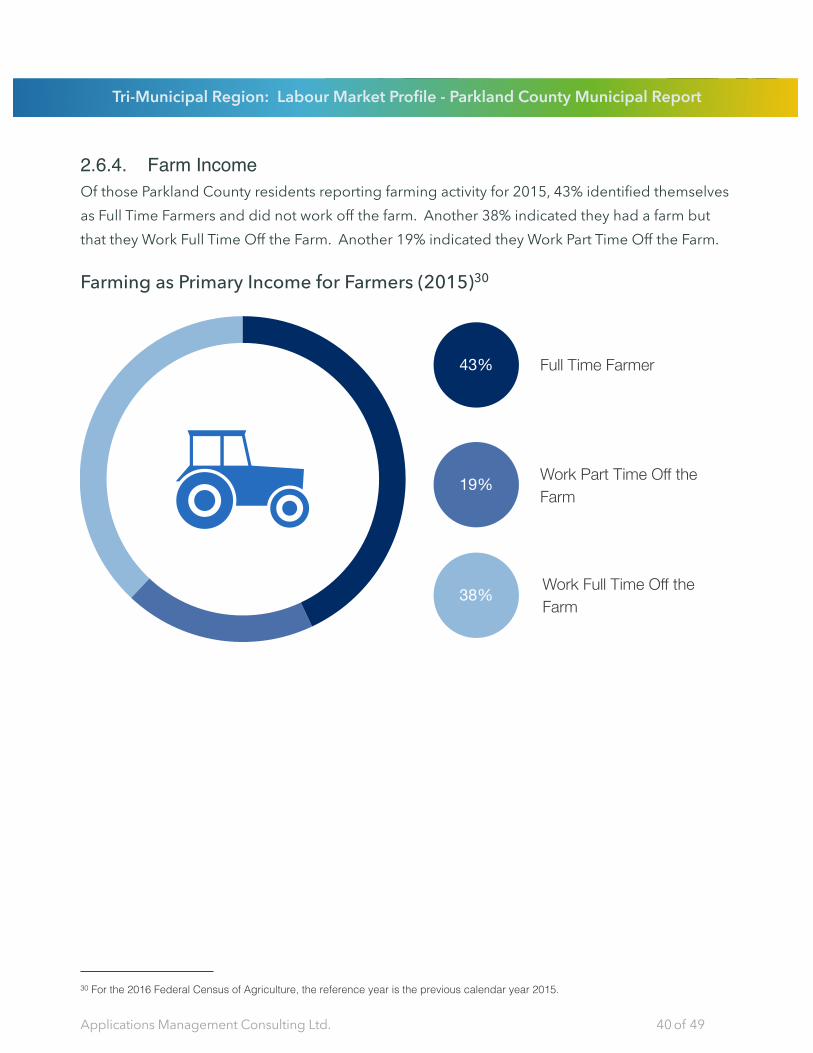
2.6.4. Farm IncomeOf those Parkland County residents reporting farming activity for 2015, 43% identified themselves as Full Time Farmers and did not work off the farm. Another 38% indicated they had a farm but that they Work Full Time Off the Farm. Another 19% indicated they Work Part Time Off the Farm.
Farming as Primary Income for Farmers (2015)30
Full Time Farmer43%
Work Part Time Off the Farm
19%
Work Full Time Off the Farm
38%
Tri-Municipal Region: Labour Market Profile - Parkland County Municipal Report
Applications Management Consulting Ltd. 40 of 49
30 For the 2016 Federal Census of Agriculture, the reference year is the previous calendar year 2015.

2.6.5. Economic Family Income DistributionPresented below is the relative position of families in Parkland County based on their relative position to the national distribution of family income. The number of Parkland County families in each year is presented for each decile ranked by after tax family income. The proportion of Parkland County residents with an above average income increased somewhat from 70% in 2010 to 71% in 2015.
Family Income After Tax by Decile (2010-2015)31
2010
21,335 people are in the top half of the distribution.
Above Average
70%
9,100 people are in the bottom half of the distribution.
Below Average
30%
7,630 people
1,615 people
4,425 people
3,850 people
2,640 people
2,790 people
1,195 people
1,585 people
2,375 people
2,325 people
2015
22,710 people are in the top half of the distribution.
Above Average
71%
9,120 people are in the bottom half of the distribution.
Below Average
29%
8,020 people
1,610 people
5,135 people
3,930 people
3,020 people
2,605 people
1,320 people
1,770 people
2,015 people
2,410 people
Tri-Municipal Region: Labour Market Profile - Parkland County Municipal Report
Applications Management Consulting Ltd. 41 of 49
31 For the Federal Census, the reference year for all income data is the previous calendar year. Adjusted after-tax income of economic families for all persons in private households.
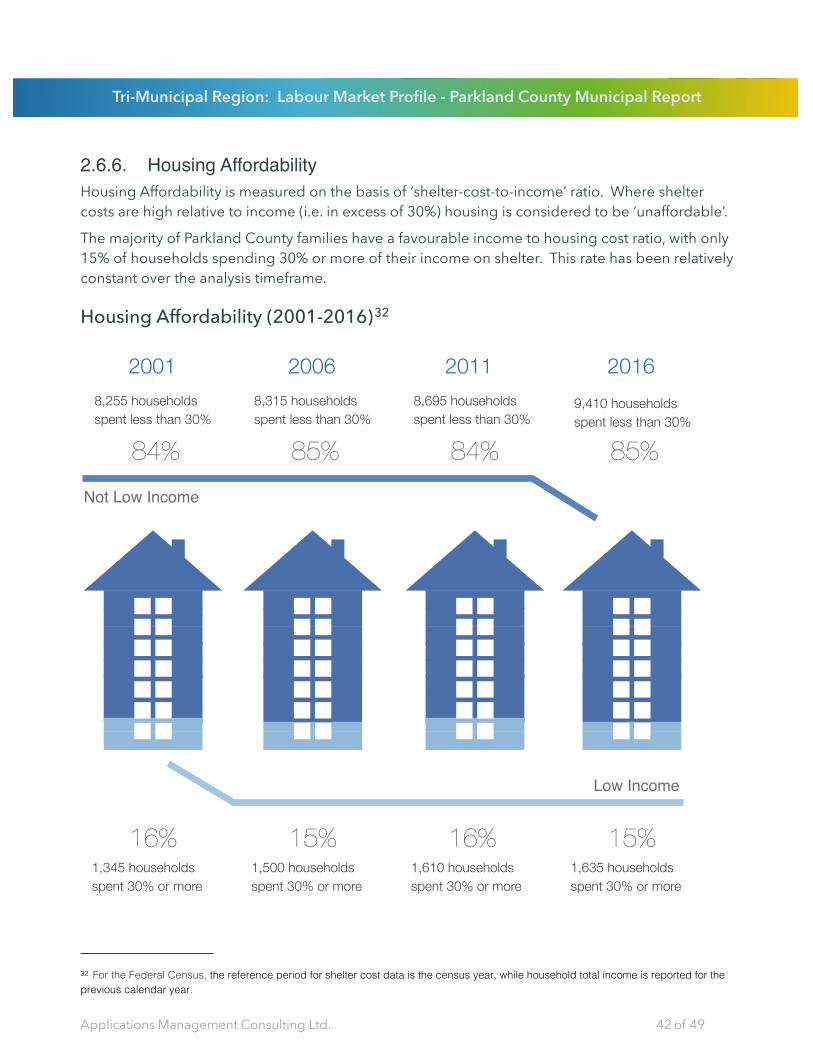
2.6.6. Housing AffordabilityHousing Affordability is measured on the basis of ‘shelter-cost-to-income’ ratio. Where shelter costs are high relative to income (i.e. in excess of 30%) housing is considered to be ‘unaffordable’.
The majority of Parkland County families have a favourable income to housing cost ratio, with only 15% of households spending 30% or more of their income on shelter. This rate has been relatively constant over the analysis timeframe.
Housing Affordability (2001-2016)32
2001 2006 2011 2016
84% 85% 84% 85%
9,410 households spent less than 30%
8,695 households spent less than 30%
8,315 households spent less than 30%
8,255 households spent less than 30%
16% 15% 16% 15%1,635 households spent 30% or more
1,610 households spent 30% or more
1,500 households spent 30% or more
1,345 households spent 30% or more
Not Low Income
Low Income
Tri-Municipal Region: Labour Market Profile - Parkland County Municipal Report
Applications Management Consulting Ltd. 42 of 49
32 For the Federal Census, the reference period for shelter cost data is the census year, while household total income is reported for the previous calendar year.
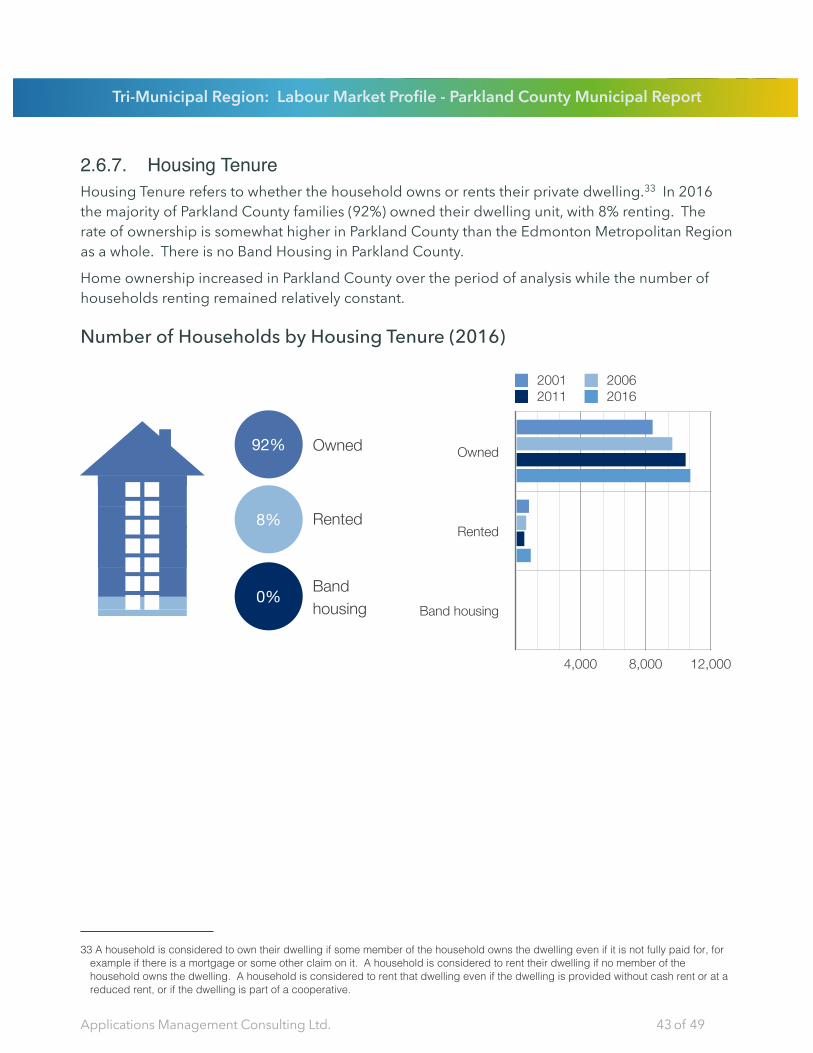
2.6.7. Housing TenureHousing Tenure refers to whether the household owns or rents their private dwelling.33 In 2016 the majority of Parkland County families (92%) owned their dwelling unit, with 8% renting. The rate of ownership is somewhat higher in Parkland County than the Edmonton Metropolitan Region as a whole. There is no Band Housing in Parkland County.
Home ownership increased in Parkland County over the period of analysis while the number of households renting remained relatively constant.
Number of Households by Housing Tenure (2016)
Owned92%
Rented8%
Band housing
0%
Owned
Rented
Band housing
4,000 8,000 12,000
2001 20062011 2016
Tri-Municipal Region: Labour Market Profile - Parkland County Municipal Report
Applications Management Consulting Ltd. 43 of 49
33 A household is considered to own their dwelling if some member of the household owns the dwelling even if it is not fully paid for, for example if there is a mortgage or some other claim on it. A household is considered to rent their dwelling if no member of the household owns the dwelling. A household is considered to rent that dwelling even if the dwelling is provided without cash rent or at a reduced rent, or if the dwelling is part of a cooperative.
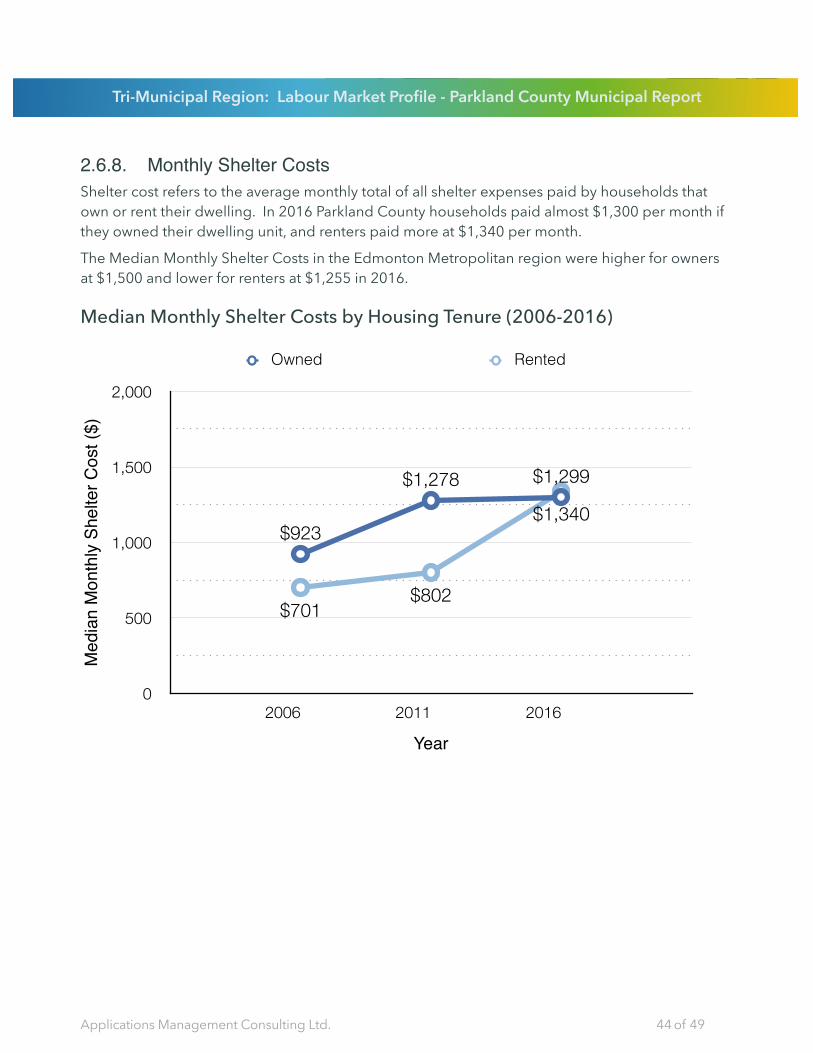
2.6.8. Monthly Shelter CostsShelter cost refers to the average monthly total of all shelter expenses paid by households that own or rent their dwelling. In 2016 Parkland County households paid almost $1,300 per month if they owned their dwelling unit, and renters paid more at $1,340 per month.
The Median Monthly Shelter Costs in the Edmonton Metropolitan region were higher for owners at $1,500 and lower for renters at $1,255 in 2016.
Median Monthly Shelter Costs by Housing Tenure (2006-2016)
Owned Rented
0
500
1,000
1,500
2,000
2006 2011 2016
$701$802
$1,340$923
$1,278 $1,299
Med
ian
Mon
thly
She
lter C
ost (
$)
Year
Tri-Municipal Region: Labour Market Profile - Parkland County Municipal Report
Applications Management Consulting Ltd. 44 of 49
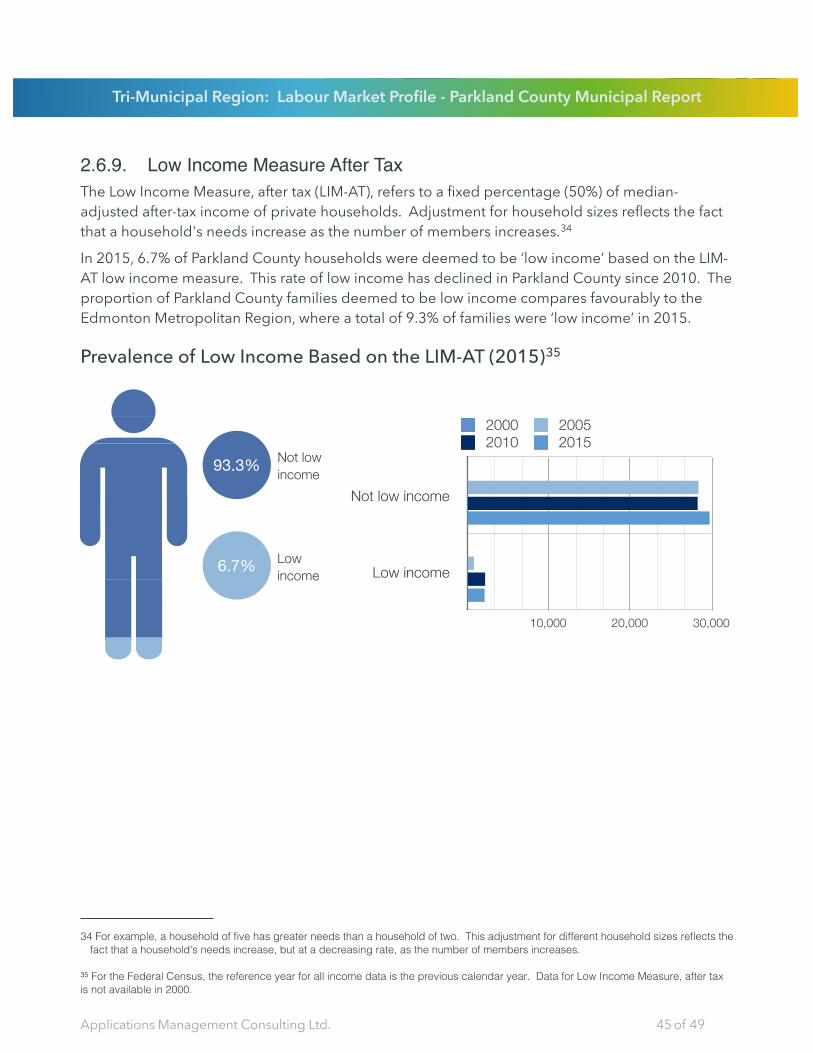
2.6.9. Low Income Measure After TaxThe Low Income Measure, after tax (LIM-AT), refers to a fixed percentage (50%) of median-adjusted after-tax income of private households. Adjustment for household sizes reflects the fact that a household's needs increase as the number of members increases.34
In 2015, 6.7% of Parkland County households were deemed to be ‘low income’ based on the LIM-AT low income measure. This rate of low income has declined in Parkland County since 2010. The proportion of Parkland County families deemed to be low income compares favourably to the Edmonton Metropolitan Region, where a total of 9.3% of families were ‘low income’ in 2015.
Prevalence of Low Income Based on the LIM-AT (2015)35
Not low income93.3%
Low income6.7%
Not low income
Low income
10,000 20,000 30,000
2000 20052010 2015
Tri-Municipal Region: Labour Market Profile - Parkland County Municipal Report
Applications Management Consulting Ltd. 45 of 49
34 For example, a household of five has greater needs than a household of two. This adjustment for different household sizes reflects the fact that a household's needs increase, but at a decreasing rate, as the number of members increases.
35 For the Federal Census, the reference year for all income data is the previous calendar year. Data for Low Income Measure, after tax is not available in 2000.

2.6.10. Child CareThe availability of a large segment of the workforce depends on the availability of affordable quality child care. In Parkland County, 43% of families have children, of which 6% are lone parents.
Licensed child care spaces as approved by the Province represent one, albeit important, segment of formal child care. Parkland County has a limited number of licensed child care spaces, which has not changed between 2011 and 2016.36
The number of children aged 0-12 years per licensed space has remained the same over the period of analysis at 125. These rates are significantly higher than the average for the Edmonton Metropolitan Region which averaged 5.8 and 5.3 children aged 0-12 per licensed space in 2011 and 2016 respectively.37
Children Aged 0-12 Per Licensed Child Care Spaces (2011-2016)
1252016125
2011
40 licensed child care spaces - 125 children aged 0-12 per space
2011
40 licensed child care spaces - 125 children aged 0-12 per space
2016
Tri-Municipal Region: Labour Market Profile - Parkland County Municipal Report
Applications Management Consulting Ltd. 46 of 49
36 Licensed child care spaces include those in the following programs: Daycare Program, Family Day Home Program, Out of School Care and Pre-School Program. More information is available at: https://open.alberta.ca/opendata/childcareinformation
37 A lower number of children per licensed space is better as it indicates a greater availability of formal child care.
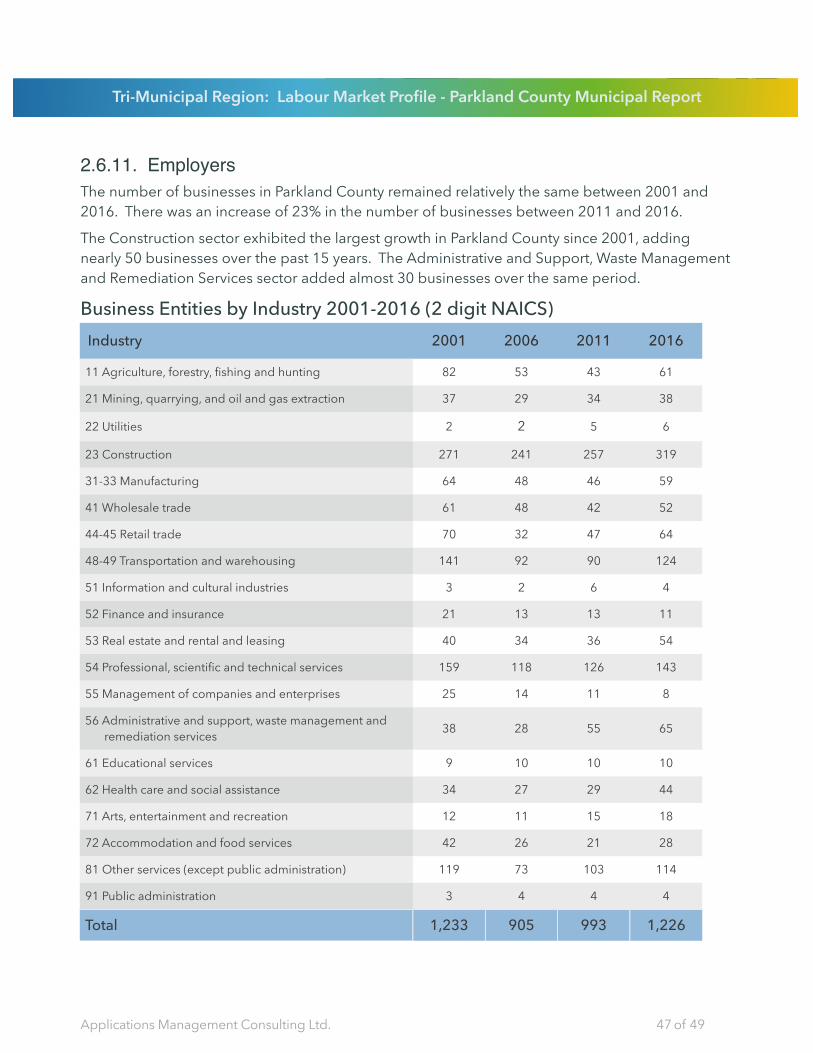
2.6.11. EmployersThe number of businesses in Parkland County remained relatively the same between 2001 and 2016. There was an increase of 23% in the number of businesses between 2011 and 2016.
The Construction sector exhibited the largest growth in Parkland County since 2001, adding nearly 50 businesses over the past 15 years. The Administrative and Support, Waste Management and Remediation Services sector added almost 30 businesses over the same period.
Business Entities by Industry 2001-2016 (2 digit NAICS)Industry 2001 2006 2011 2016
11 Agriculture, forestry, fishing and hunting
21 Mining, quarrying, and oil and gas extraction
22 Utilities
23 Construction
31-33 Manufacturing
41 Wholesale trade
44-45 Retail trade
48-49 Transportation and warehousing
51 Information and cultural industries
52 Finance and insurance
53 Real estate and rental and leasing
54 Professional, scientific and technical services
55 Management of companies and enterprises
56 Administrative and support, waste management and remediation services
61 Educational services
62 Health care and social assistance
71 Arts, entertainment and recreation
72 Accommodation and food services
81 Other services (except public administration)
91 Public administration
82 53 43 61
37 29 34 38
2 2 5 6
271 241 257 319
64 48 46 59
61 48 42 52
70 32 47 64
141 92 90 124
3 2 6 4
21 13 13 11
40 34 36 54
159 118 126 143
25 14 11 8
38 28 55 65
9 10 10 10
34 27 29 44
12 11 15 18
42 26 21 28
119 73 103 114
3 4 4 4
Total 1,233 905 993 1,226
Tri-Municipal Region: Labour Market Profile - Parkland County Municipal Report
Applications Management Consulting Ltd. 47 of 49

3. Technical AppendixApplications Management Consulting Ltd has an Employment Demand and Supply Model that projects employment by detailed industry and ocupation. This model, in conjunction with our regional population forecasting model have been used to estimate where the data is not available.
This includes the following information contained in this report:
Population Growth (page 6): Where census information is not available, Applications has estimated the intervening years using our Population Employment Forecasting Model. This model calibrates historic municipal population and employment data to regional (Census Metropolitan Area - CMA) totals.Labour Force Participation Rates (page 12): Data for non-census years has been estimated from annual Labour Force Data at the regional CMA level and allocated to municipalities within the region.Employment Rates (page 13): Data for non-census years has been estimated from annual Labour Force Data at the regional CMA level and allocated to municipalities within the region.Employment Growth (page 14): Data for non-census years has been estimated from annual Labour Force Data at the regional CMA level and allocated to municipalities within the region.Full Time / Part Time Employment (page 15): Data for 2015 has been estimated from annual Labour Force Data at the regional CMA level and allocated to municipalities within the region.Unemployment Rates (page 16): Data for non-census years has been estimated from annual Labour Force Data at the regional CMA level and allocated to municipalities within the region.Employment by Industry (page 18): 2006 employment by industry data was not available at the same level of industry data as 2011 and 2016. This data was estimated from the available industry categories and disaggregated to 2 digit NAICS using Labour Force Data at the regional CMA level for the affected industries. Work At Home by Industry (page 20): This data was taken from work Applications’ completed for Alberta Transportation where regional population and employment estimates were made for over 1,300 Traffic Zones. This data included an estimate of employment associated with ‘work at home’ by 2 digit NAICS. These ‘work at home’ estimates are based on a special run of this data from Statistics Canada census and advanced to 2016.Detailed 4 Digit NOC (page 25): Applications’ Employment Demand and Supply Model works at a 4 digit NOC level. The industry employment levels for each municipality have been run through this model to estimate the occupational employment by industry and by detailed occupation. Skill Level (page 29): Skill levels are assigned to each 4 digit NOC. Once the detailed NOC analysis was completed, skill levels were assigned to estimate the total number of workers in each skill level group.
Tri-Municipal Region: Labour Market Profile - Parkland County Municipal Report
Applications Management Consulting Ltd. 48 of 49

Tri-Municipal Region: Labour Market Profile - Parkland County Municipal Report
Applications Management Consulting Ltd. 49 of 49
Suite 2220 Sun Life Place10123 - 99 StreetEdmonton, AB T5J 3H1
(780) 425 [email protected]
Related Documents


