Parks Master Plan Phase II - December 2015 | 133 PARK SECTOR 6

Welcome message from author
This document is posted to help you gain knowledge. Please leave a comment to let me know what you think about it! Share it to your friends and learn new things together.
Transcript
Parks Master Plan Phase II - December 2015 | 133
PARK SECTOR
6
134 | Parks Master Plan Phase II - December 2015
PARK SECTOR 6 PRIORITIES
RECOMMENDATIONS
PARK SECTOR 6 SUMMARY
These priorities were developed by using condition assessment information from site visits, standard-based needs analysis (NRPA standards and data provided by the Trust for Public Land ParkScore™ Project), and public input via an online survey, park user interviews, community events and Capital Improvement Plan (CIP) meetings.
1. Revitalize existing parks2. Develop Neighborhood connections to parks and trails3. Preserve environmentally sensitive areas4. Develop partnerships with the school system and other entities5. Acquire new parkland6. Develop new park facilities
The parks in Park Sector 6 that have the highest need for redevelopment are from greatest to least: Gulf Palm Park, Park Place Park, and Ray (Marguerite) Park.
In this Park Sector 13.5 acres of parkland are needed. The areas with the most need in this Park Sector are those closest to I-610 and I-45 and in the southern area by Beltway 8. Schools not participating in the SPARK School Park Program (Non-SPARK schools) should be explored as potential future partnerships for park space. Additionally, almost 60% of the population in this Park Sector has incomes considered to be low to moderate. Pursuing Community Development Block Grants (CDBG) for park improvements should be a priority. In addition, CDBG funding could be considered in partnership with the SPARK program to add park space to the system and provide improvements at non-SPARK schools. As there is little redevelopment occurring in this Park Sector, this Park Sector should be targeted for CIP and bond funds for future development and land acquisition. This Park Sector is deficient in playgrounds, picnic shelters, trails, dog parks, skate parks, and spraygrounds.
A trail along Sims Bayou west I-45 South is planned to be almost 14 miles long. Additional north-south connections need to be explored in this Park Sector. In the 2014 survey, the top three priorities of residents in Park Sector 6 when asked what recreational needs existed in their Neighborhood were: upgraded community centers, hike, bike and walk trails, and playground areas. In the write-in portion of the survey residents asked for senior programming, fitness classes, swim lessons and arts and crafts programs, adult tennis programs, and dance and theater programs. The Health of Houston survey revealed that 40.3% of the population is obese in this Park Sector (the City of Houston level is 30.8%). Based on this health profile, partnerships focused on increasing physical activity levels and programming that promote healthy living should be explored.
Sources: 2010 Census, 2010 Health of Houston Survey, American Community Survey 2013, Houston Parks Board, HPARD 2014 Survey, Trust for Public Land ParkScore™ Project, 2040 H-GAC population projections by Park Sector
Parks Master Plan Phase II - December 2015 | 135
136 | Parks Master Plan Phase II - December 2015
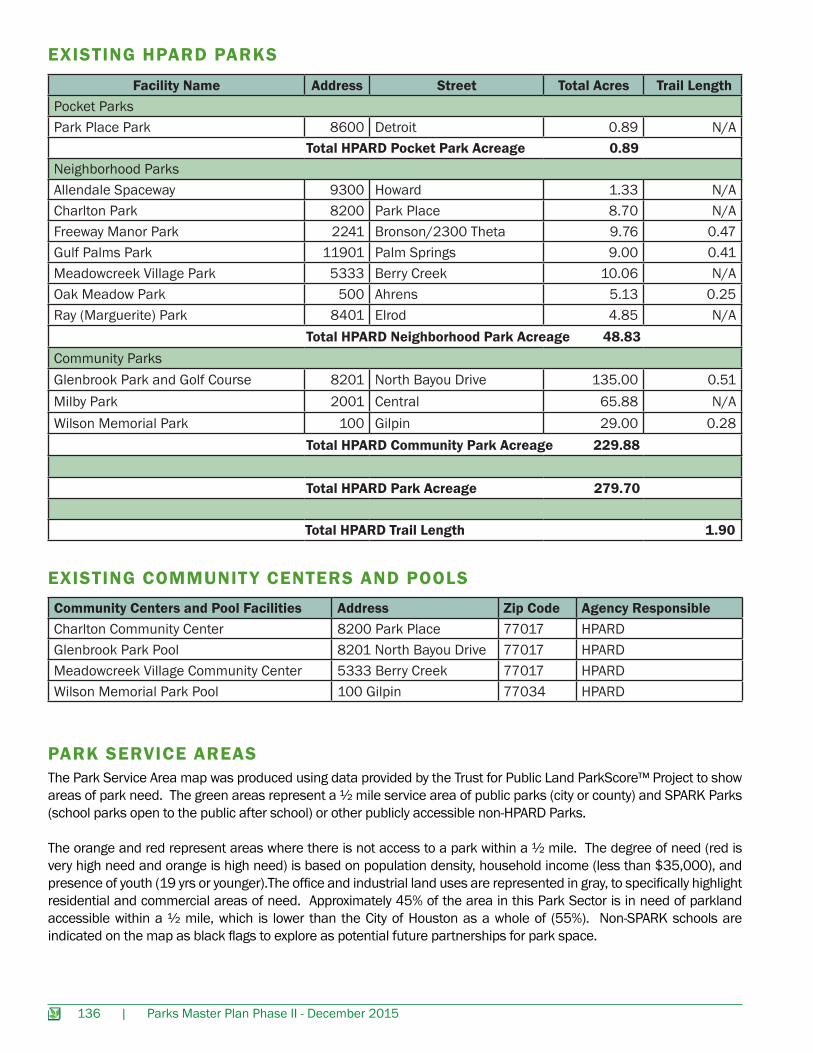
Facility Name Address Street Total Acres Trail LengthPocket ParksPark Place Park 8600 Detroit 0.89 N/A Total HPARD Pocket Park Acreage 0.89Neighborhood ParksAllendale Spaceway 9300 Howard 1.33 N/ACharlton Park 8200 Park Place 8.70 N/AFreeway Manor Park 2241 Bronson/2300 Theta 9.76 0.47Gulf Palms Park 11901 Palm Springs 9.00 0.41Meadowcreek Village Park 5333 Berry Creek 10.06 N/AOak Meadow Park 500 Ahrens 5.13 0.25Ray (Marguerite) Park 8401 Elrod 4.85 N/A Total HPARD Neighborhood Park Acreage 48.83Community ParksGlenbrook Park and Golf Course 8201 North Bayou Drive 135.00 0.51Milby Park 2001 Central 65.88 N/AWilson Memorial Park 100 Gilpin 29.00 0.28 Total HPARD Community Park Acreage 229.88
Total HPARD Park Acreage 279.70
Total HPARD Trail Length 1.90
EXISTING HPARD PARKS
EXISTING COMMUNIT Y CENTERS AND POOLSCommunity Centers and Pool Facilities Address Zip Code Agency ResponsibleCharlton Community Center 8200 Park Place 77017 HPARDGlenbrook Park Pool 8201 North Bayou Drive 77017 HPARDMeadowcreek Village Community Center 5333 Berry Creek 77017 HPARDWilson Memorial Park Pool 100 Gilpin 77034 HPARD
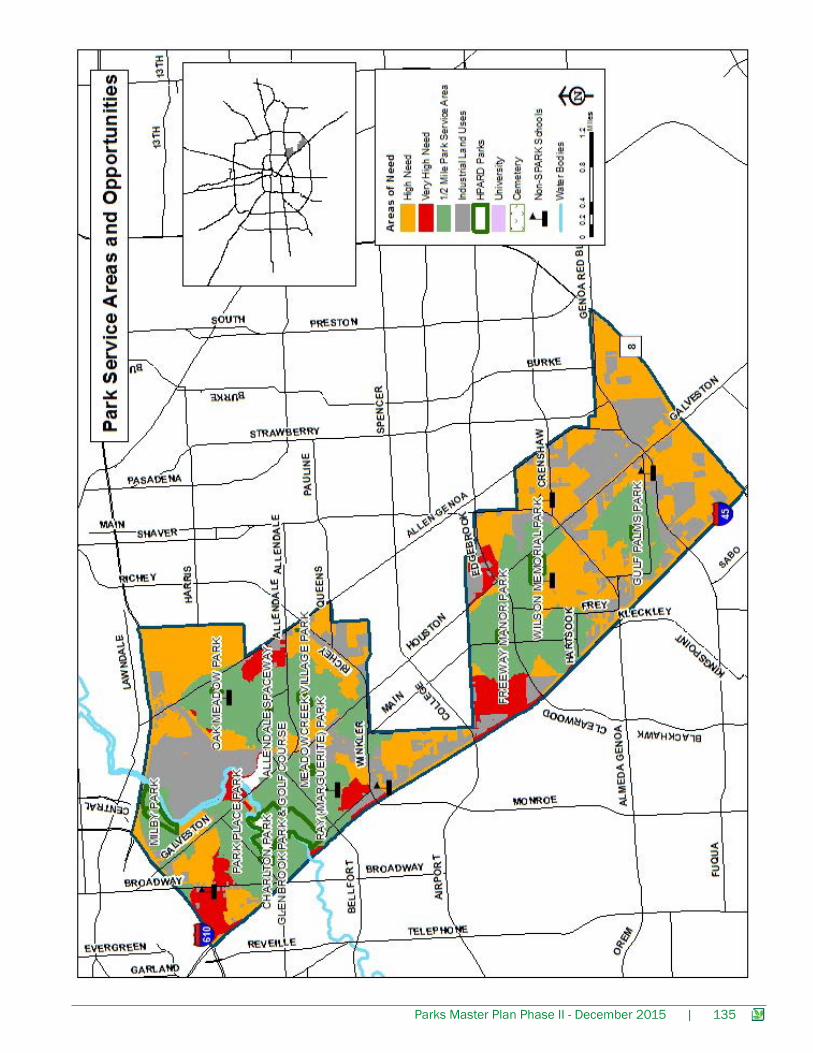
PARK SERVICE AREASThe Park Service Area map was produced using data provided by the Trust for Public Land ParkScore™ Project to show areas of park need. The green areas represent a ½ mile service area of public parks (city or county) and SPARK Parks (school parks open to the public after school) or other publicly accessible non-HPARD Parks.
The orange and red represent areas where there is not access to a park within a ½ mile. The degree of need (red is very high need and orange is high need) is based on population density, household income (less than $35,000), and presence of youth (19 yrs or younger).The office and industrial land uses are represented in gray, to specifically highlight residential and commercial areas of need. Approximately 45% of the area in this Park Sector is in need of parkland accessible within a ½ mile, which is lower than the City of Houston as a whole of (55%). Non-SPARK schools are indicated on the map as black flags to explore as potential future partnerships for park space.
Parks Master Plan Phase II - December 2015 | 137
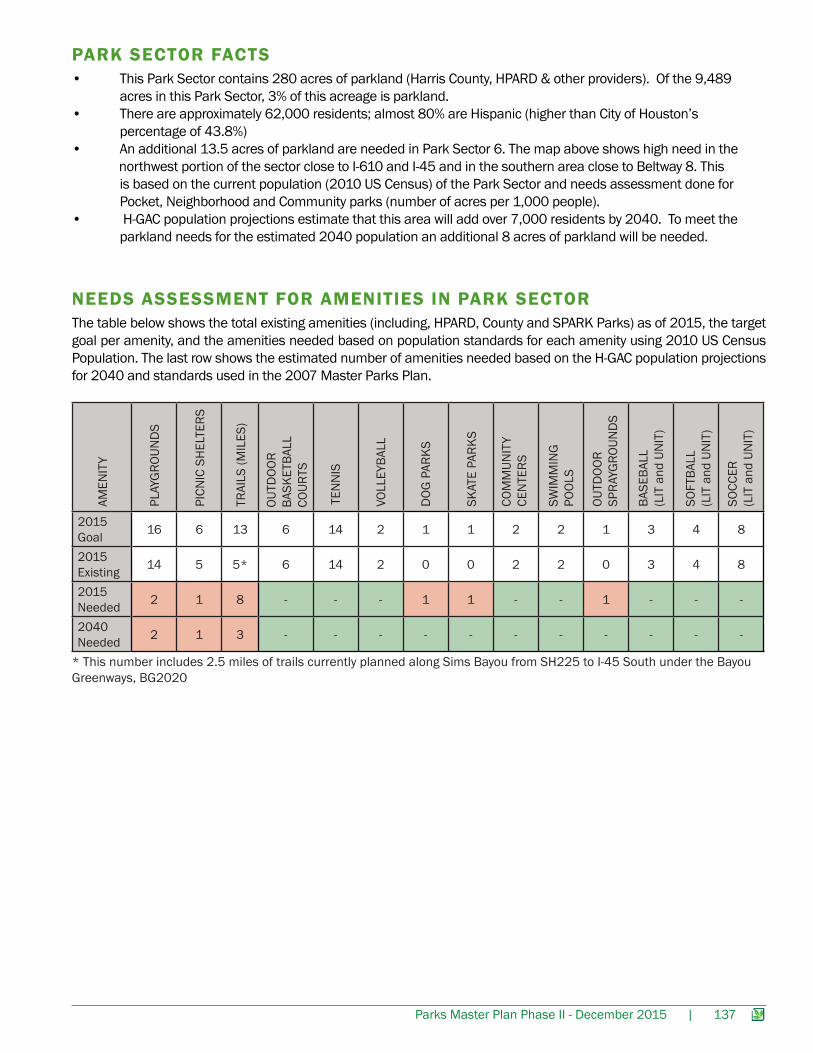
NEEDS ASSESSMENT FOR AMENITIES IN PARK SECTOR
PARK SECTOR FACTS
The table below shows the total existing amenities (including, HPARD, County and SPARK Parks) as of 2015, the target goal per amenity, and the amenities needed based on population standards for each amenity using 2010 US Census Population. The last row shows the estimated number of amenities needed based on the H-GAC population projections for 2040 and standards used in the 2007 Master Parks Plan.
• This Park Sector contains 280 acres of parkland (Harris County, HPARD & other providers). Of the 9,489 acres in this Park Sector, 3% of this acreage is parkland. • There are approximately 62,000 residents; almost 80% are Hispanic (higher than City of Houston’s percentage of 43.8%) • An additional 13.5 acres of parkland are needed in Park Sector 6. The map above shows high need in the northwest portion of the sector close to I-610 and I-45 and in the southern area close to Beltway 8. This is based on the current population (2010 US Census) of the Park Sector and needs assessment done for Pocket, Neighborhood and Community parks (number of acres per 1,000 people).• H-GAC population projections estimate that this area will add over 7,000 residents by 2040. To meet the parkland needs for the estimated 2040 population an additional 8 acres of parkland will be needed.
2015 Goal 16 6 13 6 14 2 1 1 2 2 1 3 4 8
2015 Existing 14 5 5* 6 14 2 0 0 2 2 0 3 4 8
2015 Needed 2 1 8 - - - 1 1 - - 1 - - -
2040 Needed 2 1 3 - - - - - - - - - - -
AMEN
ITY
PLAY
GRO
UND
S
PICN
IC S
HEL
TERS
TRAI
LS (M
ILES
)
TEN
NIS
VOLL
EYBA
LL
DOG
PAR
KS
SKAT
E PA
RKS
SWIM
MIN
GPO
OLS
OUTD
OOR
SPRA
YGRO
UND
S
BASE
BALL
(L
IT a
nd U
NIT
)
SOFT
BALL
(L
IT a
nd U
NIT
)
SOCC
ER(L
IT a
nd U
NIT
)
COM
MUN
ITY
CEN
TERS
OUTD
OOR
BASK
ETBA
LL
COUR
TS
* This number includes 2.5 miles of trails currently planned along Sims Bayou from SH225 to I-45 South under the Bayou Greenways, BG2020
138 | Parks Master Plan Phase II - December 2015
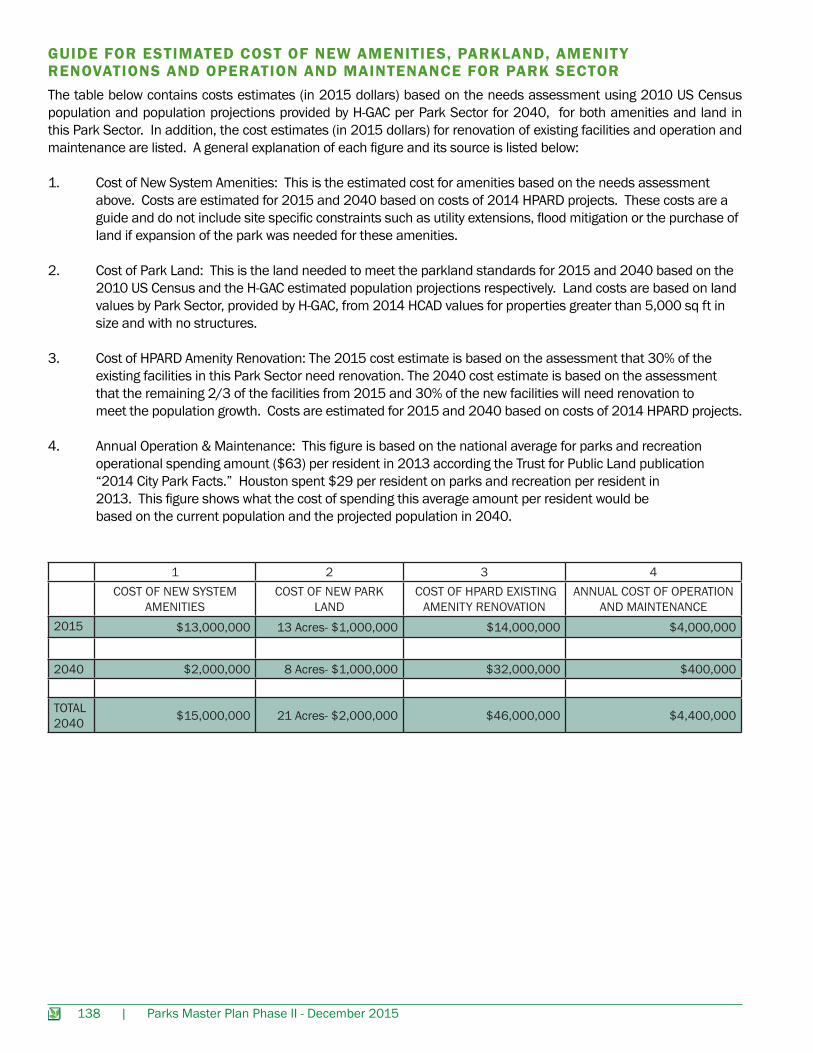
GUIDE FOR ESTIMATED COST OF NEW AMENITIES, PARKLAND, AMENIT Y RENOVATIONS AND OPERATION AND MAINTENANCE FOR PARK SECTORThe table below contains costs estimates (in 2015 dollars) based on the needs assessment using 2010 US Census population and population projections provided by H-GAC per Park Sector for 2040, for both amenities and land in this Park Sector. In addition, the cost estimates (in 2015 dollars) for renovation of existing facilities and operation and maintenance are listed. A general explanation of each figure and its source is listed below:
1. Cost of New System Amenities: This is the estimated cost for amenities based on the needs assessment above. Costs are estimated for 2015 and 2040 based on costs of 2014 HPARD projects. These costs are a guide and do not include site specific constraints such as utility extensions, flood mitigation or the purchase of land if expansion of the park was needed for these amenities.
2. Cost of Park Land: This is the land needed to meet the parkland standards for 2015 and 2040 based on the 2010 US Census and the H-GAC estimated population projections respectively. Land costs are based on land values by Park Sector, provided by H-GAC, from 2014 HCAD values for properties greater than 5,000 sq ft in size and with no structures.
3. Cost of HPARD Amenity Renovation: The 2015 cost estimate is based on the assessment that 30% of the existing facilities in this Park Sector need renovation. The 2040 cost estimate is based on the assessment that the remaining 2/3 of the facilities from 2015 and 30% of the new facilities will need renovation to meet the population growth. Costs are estimated for 2015 and 2040 based on costs of 2014 HPARD projects.
4. Annual Operation & Maintenance: This figure is based on the national average for parks and recreation operational spending amount ($63) per resident in 2013 according the Trust for Public Land publication “2014 City Park Facts.” Houston spent $29 per resident on parks and recreation per resident in 2013. This figure shows what the cost of spending this average amount per resident would be based on the current population and the projected population in 2040.
1 2 3 4COST OF NEW SYSTEM
AMENITIES COST OF NEW PARK
LAND COST OF HPARD EXISTING
AMENITY RENOVATIONANNUAL COST OF OPERATION
AND MAINTENANCE2015 $13,000,000 13 Acres- $1,000,000 $14,000,000 $4,000,000
2040 $2,000,000 8 Acres- $1,000,000 $32,000,000 $400,000
TOTAL 2040 $15,000,000 21 Acres- $2,000,000 $46,000,000 $4,400,000

Parks Master Plan Phase II - December 2015 | 139
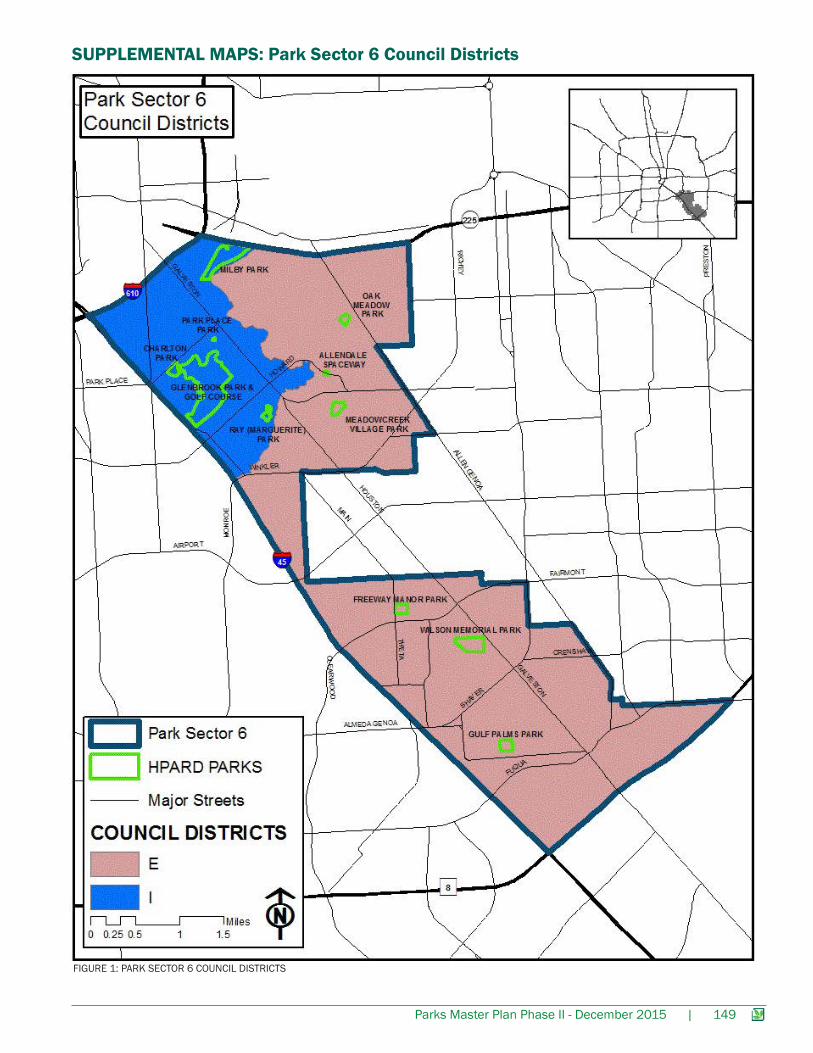
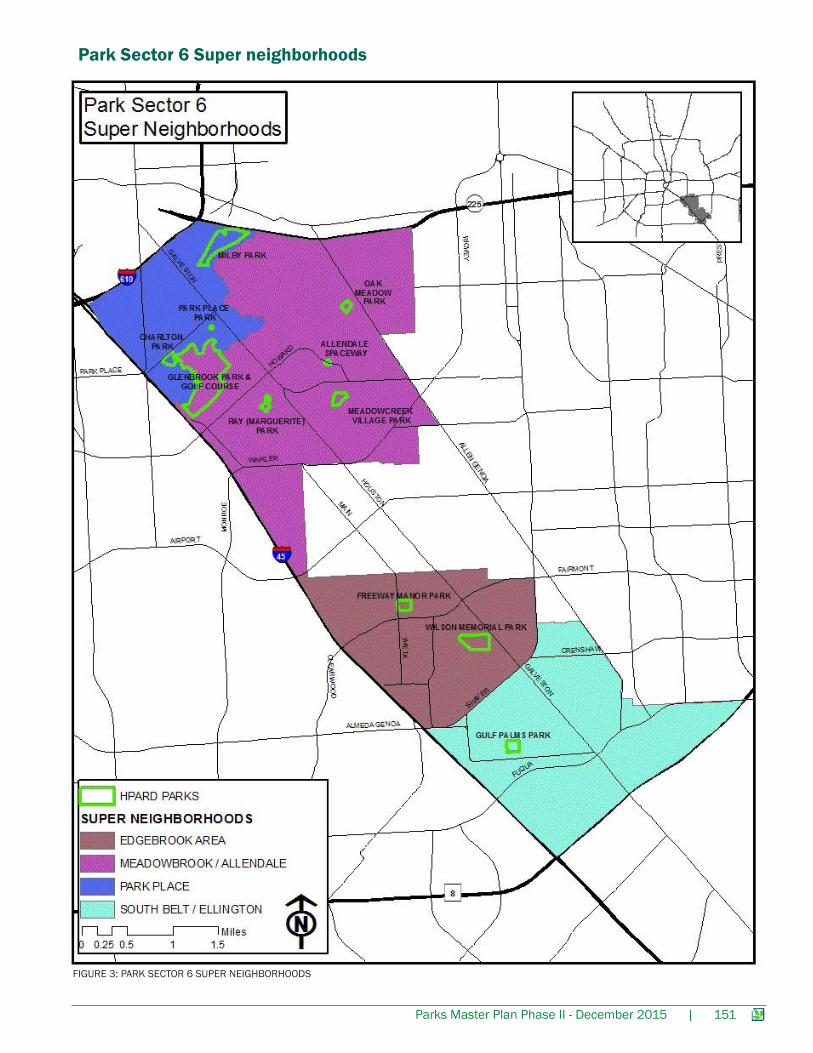
PARK SECTOR PROFILE 6LOCATION AND POLITICAL BOUNDARIESPark Sector 6 is located east of 45, northwest of Beltway 8, south of SH 225, and southeast of 610.Park Sector Size: 9,489 acres or 15 square milesPopulation: 62,305 people, Density: 4,210 persons/sq. mi. Political Boundaries within Park Sector 6:• Council Districts: I and E• Super neighborhoods contained in this Park Sector: Park Place, Meadowbrook/Allendale, Edgebrook Area, and South Belt/ Ellington• TIRZ: Eastside• Management Districts: N/A
FIGURE 1. PARK SECTOR 6 BOUNDARY AND HPARD PARKS

140 | Parks Master Plan Phase II - December 2015
DEMOGRAPHIC PROFILE
Park Sector 6Population
Park Sector 6 Percent of
TotalHouston
PopulationHouston
Percent of Total
Total Population 62,305 - 2,119,831 -
Hispanic or Latino 48,571 78.0% 919,668 43.8%
Non-Hispanic White 7,662 12.3% 537,901 25.6%
Non-Hispanic Black 3,491 5.6% 485,956 23.1%
Non-Hispanic American-Indian 93 0.1%
126,098 6.1%Non-Hispanic Asian 2,128 3.4%
Non-Hispanic Hawaiian or Pacific Islander 19 0.0%
Non-Hispanic Some Other Race 341 0.6% 26,828 1.3%TABLE 1. PARK SECTOR 6 ETHNICITY (2010 CENSUS & CITY OF HOUSTON PLANNING AND DEVELOPMENT DEMOGRAPHIC DATA)
This Park Sector contains 2.9% of the population of Houston. The majority (78.0%) of residents are Hispanic/Latinos, followed by Non-Hispanic Whites (12.3%), Non-Hispanic Blacks (5.6%), and Non-Hispanic Asians (3.4%). The majority of the population lives in the areas closest to IH-45, while the areas further east towards the Houston Ship Channel are less populated.
Breakdown of the age groups, as shown in Figure 2., reveals that the percent of youth 5-19 yrs (26%) is higher than the rest of the City of Houston (20%). There are less (15%) people 55+ years than the rest of the City of Houston (19%). These demographic trends can help inform future programming and park improvements.
City of HoustonPark Sector 6
Seniors 55 yrs+ 19%
15%
52%50%
20%26%
9%8%
Adults20-54 yrs
Youth5-19 yrs
Children0-4 yrs
FIGURE 2. CITY OF HOUSTON VS. PARK SECTOR 6 AGE CITY OF HOUSTON ORTS BY HPARD PROGRAM AGES (2011 AMERICAN COMMUNITY SURVEY, CITY OF HOUSTON PD)
ProgramGroup
Age Groups
PS 6Population
PS 6 Percent of
TotalProgram
Age GroupCity of
Houston Population
City of Houston
Percent of Total
Program Age Group
Children 0-4 yrs 5,911 9% 9% 166,066 8% 8%
Youth5-9 yrs 5,703 9%
26%148,843 7%
21%10-14 yrs 5,372 8% 135,622 7%15-19 yrs 5,238 8% 140,673 7%
Adults20-34 yrs 15,163 24%
50% 539,348 26%
52%35-44 yrs 8,810 14% 286,117 14%45-54 yrs 7,455 12% 265,060 13%
Senior55-64 yrs 5,030 8%
15%204,852 10%
19%65 yrs + 4,661 7% 192,689 9%
TABLE 2. CITY OF HOUSTON VS. PARK SECTOR 6 AGE CITY OF HOUSTON ORTS WITH FURTHER BREAKDOWN FOR ALL PROGRAM AGE GROUPS
Ethnicity
Population by Age

Parks Master Plan Phase II - December 2015 | 141
Housing
Income
Educational Attainment
There are a total of 18,837 housing units in this Park Sector. The percent of vacant housing in Park Sector 6 (11.5%) is slightly lower than that of the vacancy rates for the entire city (12.3%). Home ownership for this Park Sector (47.4%) is higher than that of the City of Houston (39.7%); conversely, the share of renters (41%) is lower than the city’s as a whole (47.1%).
The median household income for this Park Sector ($38,717) is lower than that of the City of Houston ($48,322). Sixty-three (63%) of people in this area have an income below the Houston median household income, which would make this are eligible for Community Development Block Grant (CDBG) funding.
Within Park Sector 6 the percent (10%) of individuals 25+ years of age with a Bachelor’s degree is significantly lower than the relative percent for the entire City of Houston (28%). Conversely, the percentage of those within this Park Sector with only a high school degree (29%) is higher than the same population for the City of Houston (23%).
EDUCATIONAL ATTAINMENT FOR THE POPULATION 25 YRS +City of HoustonPark Sector 6
Bachelor’s Degree or Above 28%10%
4%5%
18%18%
23%29%
11%17%
9%13%
3%4%
4%2%
Associate Degree
Some College
High School Graduate, GED, or Alternative
9th-12th Grade (No Diploma)
5th-8th Grade
Less than 5th Grade
No Schooling Completed
FIGURE 3. EDUCATIONAL ATTAINMENT (2011 CITY OF HOUSTON PD)
Community HealthThe Health of Houston Survey 2010 data (aggregated by Park Sector by the Houston Department of Health and Human Services) shows that 40.3% of the adult population in this Park Sector is considered obese, as compared to 30.8% for the entire population of the City of Houston. The survey also showed that 5.3% of the adult population received a diagnosis of diabetes by a professional, which is below the level for the entire city (11.4%). In addition, this survey inquired about physical activity level and the results indicate that over 28% of the respondents in this Park Sector engage in a moderate physical activity for 5 or more days a week, which is slightly lower than that of the entire city (32%). The national initiative, Healthy People 2020, has a goal to increase the amount of adults who engage in moderate physical activity for at least 5 days a week for 30 minutes to 47.9% of the population. The current national average of adults engaging in this level of aerobic activity is 43.5%. Finally, the survey shows that over a quarter of the population (27.1%) does not engage in moderate physical activity at all, which is higher than the rate for the entire city (21.2%). As HPARD plans and prioritizes investments for future parks and trails, it should take into account the accessibility of parks, amenities provided and the impact to the health of the community in the long term. HPARD is an active participant in the Healthy Communities Initiative, Community Transformation Initiative, Healthy Kids Houston, and the Sustainable Communities Houston-Galveston Regional Plan, among other efforts. This involvement should continue with an emphasis on partnerships, measurable outcomes, and engagement with the community to encourage physical activity and help identify physical barriers to park access.
Normal Weight25.1%
Overweight34.6%
Obese40.3%
ADULT BMI CATEGORY FOR PARK SECTOR 6(SOUTHEAST SIDE)
Moderate Physical Activity in the Last Seven Days Percentage (%)
0 27.101 2.902 16.503 15.504 9.905 12.306 0.607 15.30
FIGURE 4. HEALTH OF HOUSTON SURVEY (2010)- ADULT BODY MASS INDEX TABLE 3. HEALTH OF HOUSTON SURVEY (2010)- MODERATE PHYSICAL ACTIVITY
142 | Parks Master Plan Phase II - December 2015
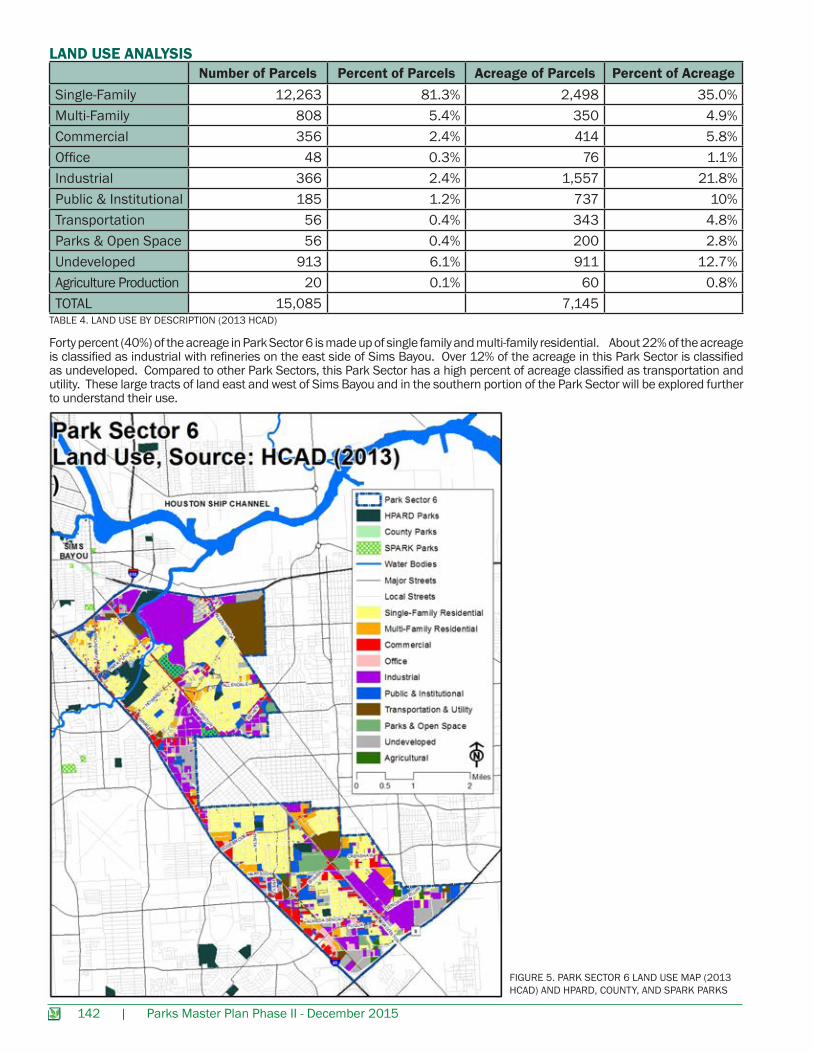
LAND USE ANALYSISNumber of Parcels Percent of Parcels Acreage of Parcels Percent of Acreage
Single-Family 12,263 81.3% 2,498 35.0%Multi-Family 808 5.4% 350 4.9%Commercial 356 2.4% 414 5.8%Office 48 0.3% 76 1.1%Industrial 366 2.4% 1,557 21.8%Public & Institutional 185 1.2% 737 10%Transportation 56 0.4% 343 4.8%Parks & Open Space 56 0.4% 200 2.8%Undeveloped 913 6.1% 911 12.7%Agriculture Production 20 0.1% 60 0.8%TOTAL 15,085 7,145
TABLE 4. LAND USE BY DESCRIPTION (2013 HCAD)
Forty percent (40%) of the acreage in Park Sector 6 is made up of single family and multi-family residential. About 22% of the acreage is classified as industrial with refineries on the east side of Sims Bayou. Over 12% of the acreage in this Park Sector is classified as undeveloped. Compared to other Park Sectors, this Park Sector has a high percent of acreage classified as transportation and utility. These large tracts of land east and west of Sims Bayou and in the southern portion of the Park Sector will be explored further to understand their use.
FIGURE 5. PARK SECTOR 6 LAND USE MAP (2013 HCAD) AND HPARD, COUNTY, AND SPARK PARKS

Parks Master Plan Phase II - December 2015 | 143
Facility Name Address Street Total Acres Trail LengthPocket ParksPark Place 8600 Detroit 0.89 N/ATotal HPARD Pocket Park Acreage 0.89Neighborhood ParksAllendale Spaceway 9300 Howard 1.33 N/ACharlton Park 8200 Park Place 8.70 N/AFreeway Manor Park 2241 Bronson/2300 Theta 9.76 0.47Gulf Palms Park 11901 Palm Springs 9.00 0.41Meadowcreek Village Park 5333 Berry Creek 10.06 N/AOak Meadow Park 500 Ahrens 5.13 0.25Ray (Marguerite) Park 8401 Elrod 4.85 N/ATotal HPARD Neighborhood Park Acreage 48.83Community ParksGlenbrook Park and Golf Course 8201 North Bayou Drive 135.00 0.51
Milby Park 2001 Central 65.88 N/A
Wilson Memorial Park 100 Gilpin 29.00 0.28
Total HPARD Community Park Acreage 229.88
Total HPARD Park Acreage 279.7
Total HPARD Trail Length 1.9
HPARD PARKS AND TRAILS
TABLE 5. HPARD PARKS, ACREAGE, AND TRAILS INTERNAL TO HPARD PARKS, BAYOU AND URBAN/SHARED USE TRAILS IN PARK SECTOR 6
144 | Parks Master Plan Phase II - December 2015
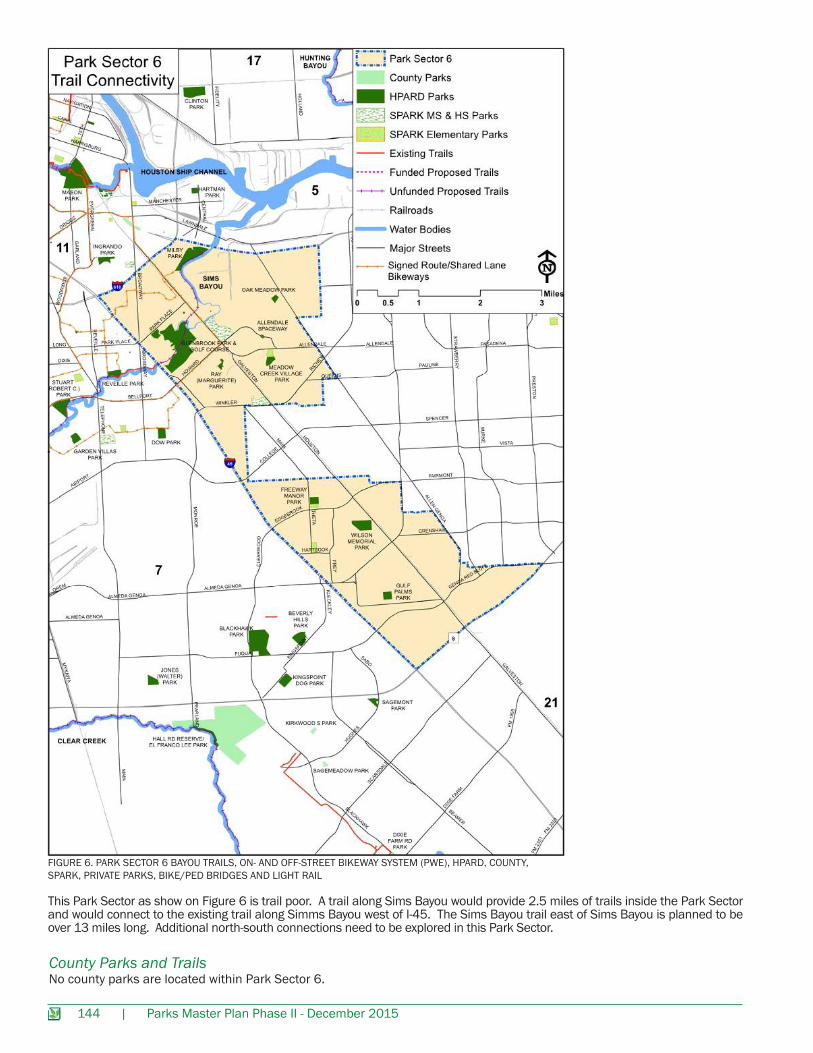
FIGURE 6. PARK SECTOR 6 BAYOU TRAILS, ON- AND OFF-STREET BIKEWAY SYSTEM (PWE), HPARD, COUNTY, SPARK, PRIVATE PARKS, BIKE/PED BRIDGES AND LIGHT RAIL
No county parks are located within Park Sector 6.County Parks and Trails
This Park Sector as show on Figure 6 is trail poor. A trail along Sims Bayou would provide 2.5 miles of trails inside the Park Sector and would connect to the existing trail along Simms Bayou west of I-45. The Sims Bayou trail east of Sims Bayou is planned to be over 13 miles long. Additional north-south connections need to be explored in this Park Sector.
Parks Master Plan Phase II - December 2015 | 145
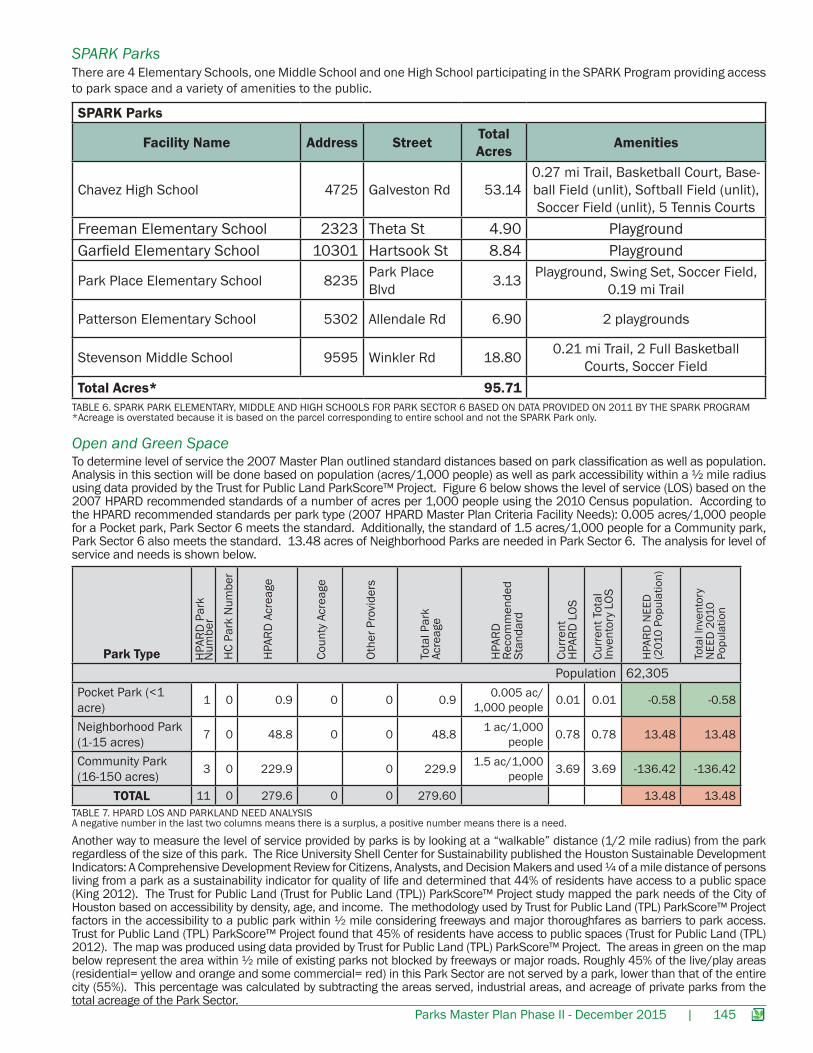
Open and Green SpaceTo determine level of service the 2007 Master Plan outlined standard distances based on park classification as well as population. Analysis in this section will be done based on population (acres/1,000 people) as well as park accessibility within a ½ mile radius using data provided by the Trust for Public Land ParkScore™ Project. Figure 6 below shows the level of service (LOS) based on the 2007 HPARD recommended standards of a number of acres per 1,000 people using the 2010 Census population. According to the HPARD recommended standards per park type (2007 HPARD Master Plan Criteria Facility Needs): 0.005 acres/1,000 people for a Pocket park, Park Sector 6 meets the standard. Additionally, the standard of 1.5 acres/1,000 people for a Community park, Park Sector 6 also meets the standard. 13.48 acres of Neighborhood Parks are needed in Park Sector 6. The analysis for level of service and needs is shown below.
Park Type
Population 62,305Pocket Park (<1 acre) 1 0 0.9 0 0 0.9 0.005 ac/
1,000 people 0.01 0.01 -0.58 -0.58
Neighborhood Park (1-15 acres) 7 0 48.8 0 0 48.8 1 ac/1,000
people 0.78 0.78 13.48 13.48
Community Park (16-150 acres) 3 0 229.9 0 229.9 1.5 ac/1,000
people 3.69 3.69 -136.42 -136.42
TOTAL 11 0 279.6 0 0 279.60 13.48 13.48
HPA
RD P
ark
Num
ber
HC
Park
Num
ber
HPA
RD A
crea
ge
Coun
ty A
crea
ge
Othe
r Pro
vide
rs
Tota
l Par
k Ac
reag
e
Curr
ent
HPA
RD L
OS
Curr
ent T
otal
Inve
ntor
y LO
S
Tota
l Inv
ento
ry
NEE
D 2
010
Popu
latio
n
HPA
RD N
EED
(2
010
Popu
latio
n)
HPA
RD
Reco
mm
ende
d St
anda
rd
TABLE 7. HPARD LOS AND PARKLAND NEED ANALYSISA negative number in the last two columns means there is a surplus, a positive number means there is a need.
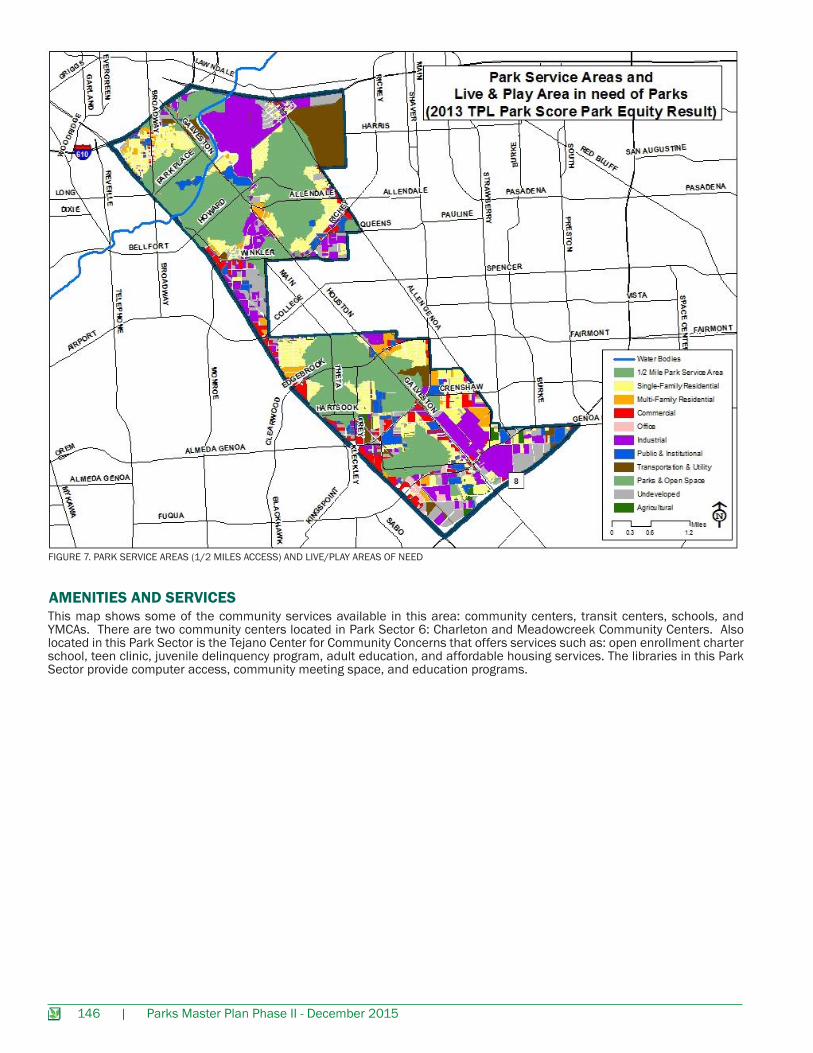
Another way to measure the level of service provided by parks is by looking at a “walkable” distance (1/2 mile radius) from the park regardless of the size of this park. The Rice University Shell Center for Sustainability published the Houston Sustainable Development Indicators: A Comprehensive Development Review for Citizens, Analysts, and Decision Makers and used ¼ of a mile distance of persons living from a park as a sustainability indicator for quality of life and determined that 44% of residents have access to a public space (King 2012). The Trust for Public Land (Trust for Public Land (TPL)) ParkScore™ Project study mapped the park needs of the City of Houston based on accessibility by density, age, and income. The methodology used by Trust for Public Land (TPL) ParkScore™ Project factors in the accessibility to a public park within ½ mile considering freeways and major thoroughfares as barriers to park access. Trust for Public Land (TPL) ParkScore™ Project found that 45% of residents have access to public spaces (Trust for Public Land (TPL) 2012). The map was produced using data provided by Trust for Public Land (TPL) ParkScore™ Project. The areas in green on the map below represent the area within ½ mile of existing parks not blocked by freeways or major roads. Roughly 45% of the live/play areas (residential= yellow and orange and some commercial= red) in this Park Sector are not served by a park, lower than that of the entire city (55%). This percentage was calculated by subtracting the areas served, industrial areas, and acreage of private parks from the total acreage of the Park Sector.
There are 4 Elementary Schools, one Middle School and one High School participating in the SPARK Program providing access to park space and a variety of amenities to the public.
SPARK Parks
SPARK Parks
Facility Name Address Street Total Acres Amenities
Chavez High School 4725 Galveston Rd 53.140.27 mi Trail, Basketball Court, Base-ball Field (unlit), Softball Field (unlit), Soccer Field (unlit), 5 Tennis Courts
Freeman Elementary School 2323 Theta St 4.90 PlaygroundGarfield Elementary School 10301 Hartsook St 8.84 Playground
Park Place Elementary School 8235 Park Place Blvd 3.13 Playground, Swing Set, Soccer Field,
0.19 mi Trail
Patterson Elementary School 5302 Allendale Rd 6.90 2 playgrounds
Stevenson Middle School 9595 Winkler Rd 18.80 0.21 mi Trail, 2 Full Basketball Courts, Soccer Field
Total Acres* 95.71TABLE 6. SPARK PARK ELEMENTARY, MIDDLE AND HIGH SCHOOLS FOR PARK SECTOR 6 BASED ON DATA PROVIDED ON 2011 BY THE SPARK PROGRAM*Acreage is overstated because it is based on the parcel corresponding to entire school and not the SPARK Park only.
146 | Parks Master Plan Phase II - December 2015
This map shows some of the community services available in this area: community centers, transit centers, schools, and YMCAs. There are two community centers located in Park Sector 6: Charleton and Meadowcreek Community Centers. Also located in this Park Sector is the Tejano Center for Community Concerns that offers services such as: open enrollment charter school, teen clinic, juvenile delinquency program, adult education, and affordable housing services. The libraries in this Park Sector provide computer access, community meeting space, and education programs.
AMENITIES AND SERVICES
FIGURE 7. PARK SERVICE AREAS (1/2 MILES ACCESS) AND LIVE/PLAY AREAS OF NEED
Parks Master Plan Phase II - December 2015 | 147
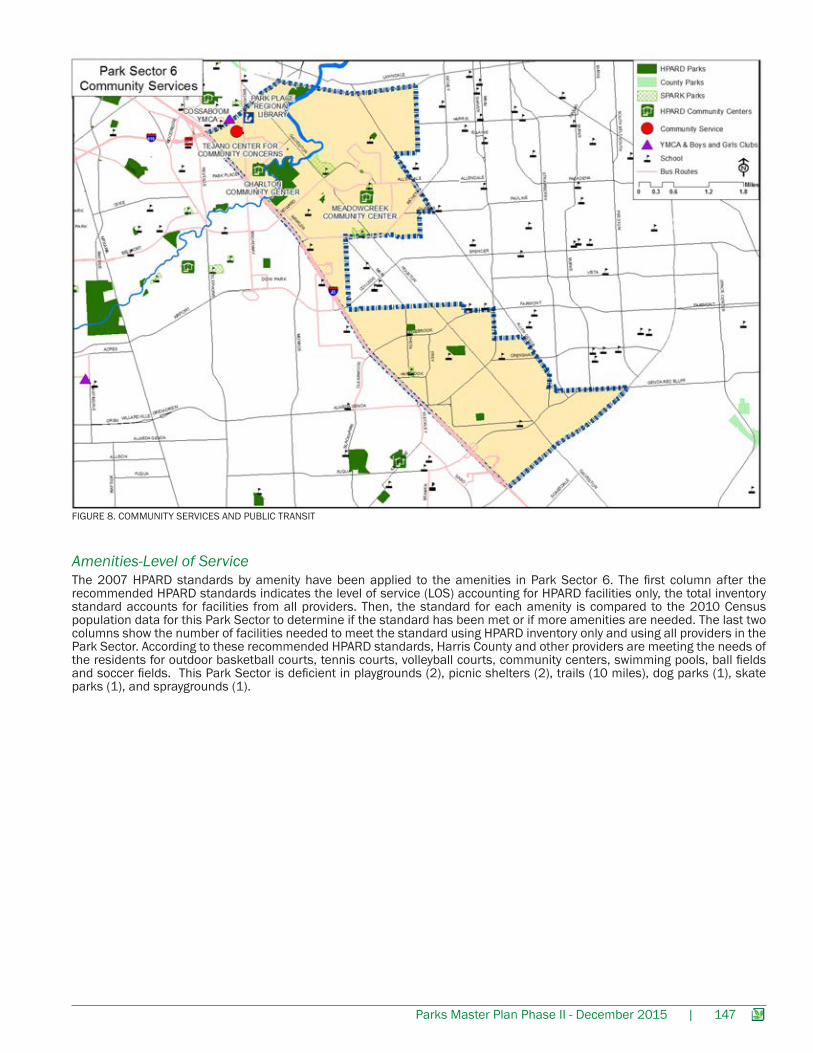
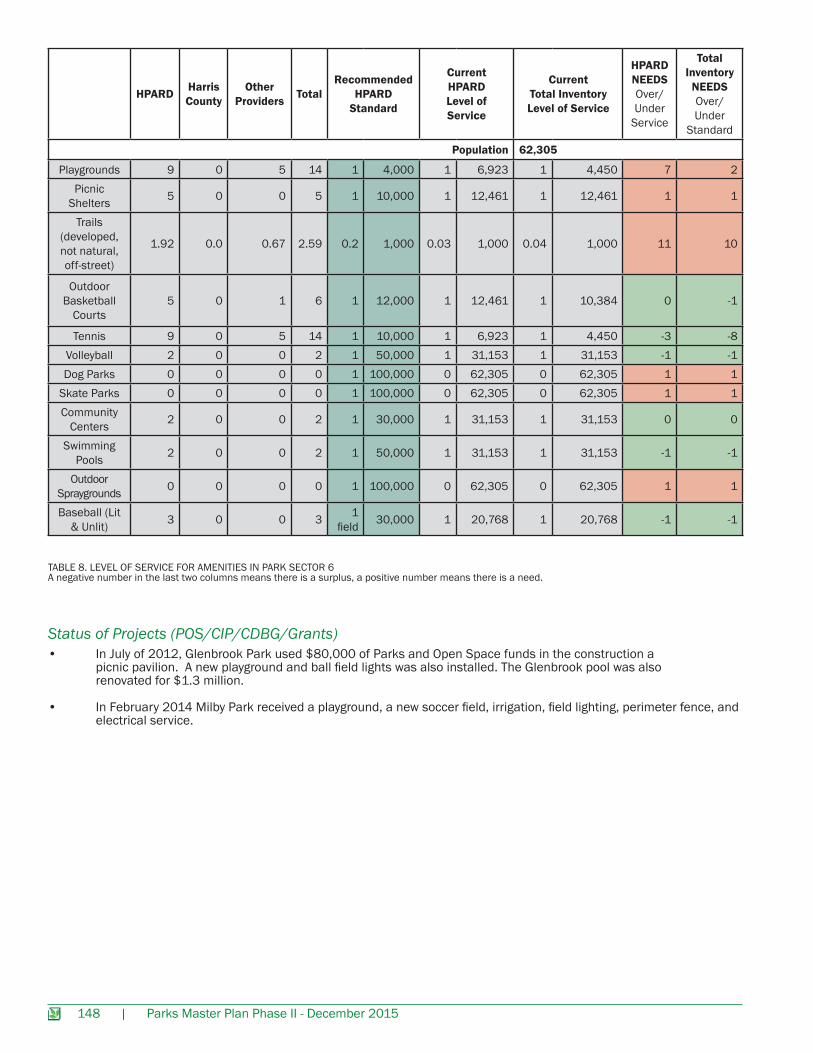
The 2007 HPARD standards by amenity have been applied to the amenities in Park Sector 6. The first column after the recommended HPARD standards indicates the level of service (LOS) accounting for HPARD facilities only, the total inventory standard accounts for facilities from all providers. Then, the standard for each amenity is compared to the 2010 Census population data for this Park Sector to determine if the standard has been met or if more amenities are needed. The last two columns show the number of facilities needed to meet the standard using HPARD inventory only and using all providers in the Park Sector. According to these recommended HPARD standards, Harris County and other providers are meeting the needs of the residents for outdoor basketball courts, tennis courts, volleyball courts, community centers, swimming pools, ball fields and soccer fields. This Park Sector is deficient in playgrounds (2), picnic shelters (2), trails (10 miles), dog parks (1), skate parks (1), and spraygrounds (1).
Amenities-Level of Service
FIGURE 8. COMMUNITY SERVICES AND PUBLIC TRANSIT
148 | Parks Master Plan Phase II - December 2015
TABLE 8. LEVEL OF SERVICE FOR AMENITIES IN PARK SECTOR 6A negative number in the last two columns means there is a surplus, a positive number means there is a need.
HPARD Harris County
Other Providers Total
Recommended HPARD
Standard
Current HPARD Level of Service
Current Total Inventory Level of Service
HPARD NEEDS Over/Under
Service
Total Inventory
NEEDS Over/Under
Standard
Population 62,305
Playgrounds 9 0 5 14 1 4,000 1 6,923 1 4,450 7 2Picnic
Shelters 5 0 0 5 1 10,000 1 12,461 1 12,461 1 1
Trails (developed, not natural, off-street)
1.92 0.0 0.67 2.59 0.2 1,000 0.03 1,000 0.04 1,000 11 10
Outdoor Basketball
Courts5 0 1 6 1 12,000 1 12,461 1 10,384 0 -1
Tennis 9 0 5 14 1 10,000 1 6,923 1 4,450 -3 -8Volleyball 2 0 0 2 1 50,000 1 31,153 1 31,153 -1 -1Dog Parks 0 0 0 0 1 100,000 0 62,305 0 62,305 1 1
Skate Parks 0 0 0 0 1 100,000 0 62,305 0 62,305 1 1Community
Centers 2 0 0 2 1 30,000 1 31,153 1 31,153 0 0
Swimming Pools 2 0 0 2 1 50,000 1 31,153 1 31,153 -1 -1
Outdoor Spraygrounds 0 0 0 0 1 100,000 0 62,305 0 62,305 1 1
Baseball (Lit & Unlit) 3 0 0 3 1
field 30,000 1 20,768 1 20,768 -1 -1
• In July of 2012, Glenbrook Park used $80,000 of Parks and Open Space funds in the construction a picnic pavilion. A new playground and ball field lights was also installed. The Glenbrook pool was also renovated for $1.3 million.
• In February 2014 Milby Park received a playground, a new soccer field, irrigation, field lighting, perimeter fence, and electrical service.
Status of Projects (POS/CIP/CDBG/Grants)
Parks Master Plan Phase II - December 2015 | 149
HPARD Harris County
Other Providers Total
Recommended HPARD
Standard
Current HPARD Level of Service
Current Total Inventory Level of Service
HPARD NEEDS Over/Under
Service
Total Inventory
NEEDS Over/Under
Standard
Population 62,305
Playgrounds 9 0 5 14 1 4,000 1 6,923 1 4,450 7 2Picnic
Shelters 5 0 0 5 1 10,000 1 12,461 1 12,461 1 1
Trails (developed, not natural, off-street)
1.92 0.0 0.67 2.59 0.2 1,000 0.03 1,000 0.04 1,000 11 10
Outdoor Basketball
Courts5 0 1 6 1 12,000 1 12,461 1 10,384 0 -1
Tennis 9 0 5 14 1 10,000 1 6,923 1 4,450 -3 -8Volleyball 2 0 0 2 1 50,000 1 31,153 1 31,153 -1 -1Dog Parks 0 0 0 0 1 100,000 0 62,305 0 62,305 1 1
Skate Parks 0 0 0 0 1 100,000 0 62,305 0 62,305 1 1Community
Centers 2 0 0 2 1 30,000 1 31,153 1 31,153 0 0
Swimming Pools 2 0 0 2 1 50,000 1 31,153 1 31,153 -1 -1
Outdoor Spraygrounds 0 0 0 0 1 100,000 0 62,305 0 62,305 1 1
Baseball (Lit & Unlit) 3 0 0 3 1
field 30,000 1 20,768 1 20,768 -1 -1
SUPPLEMENTAL MAPS: Park Sector 6 Council Districts
FIGURE 1: PARK SECTOR 6 COUNCIL DISTRICTS

150 | Parks Master Plan Phase II - December 2015
FIGURE 2: PARK SECTOR 6 MANAGEMENT DISTRICTS AND TIRZS
Park Sector 6 Tax Increment Reinvestment Zone (TIRZs) and Management Districts
Parks Master Plan Phase II - December 2015 | 151
FIGURE 3: PARK SECTOR 6 SUPER NEIGHBORHOODS
Park Sector 6 Super neighborhoods
152 | Parks Master Plan Phase II - December 2015
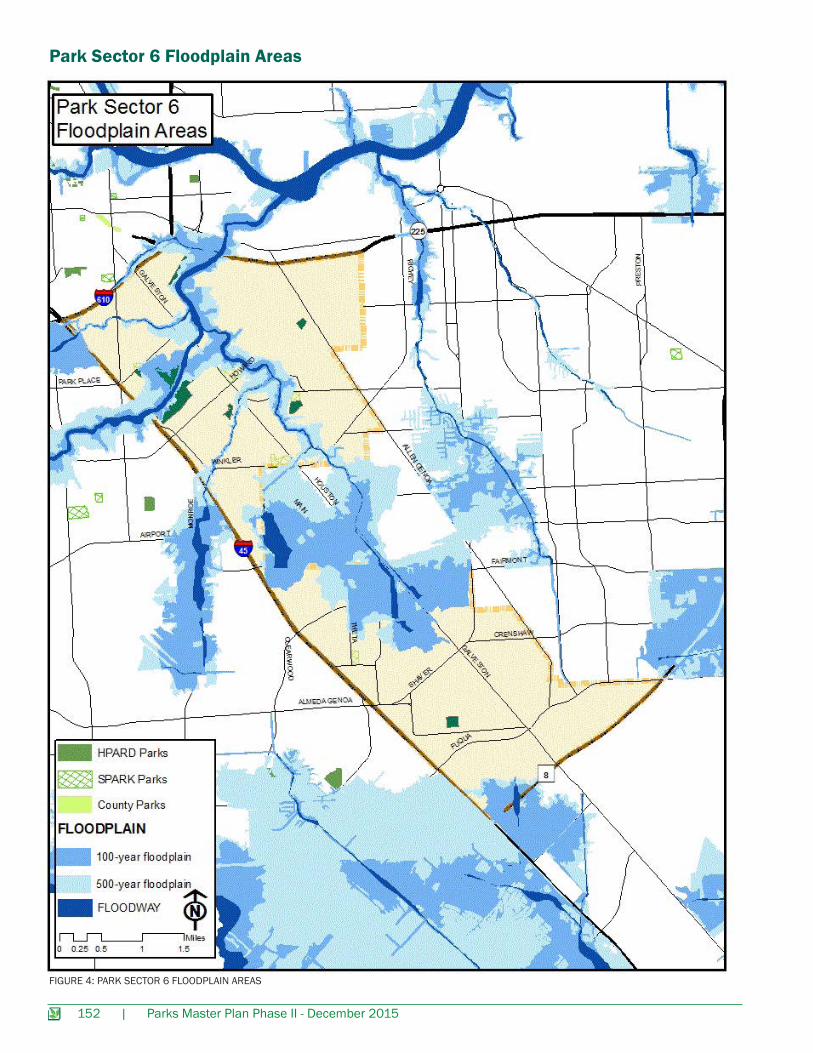
FIGURE 4: PARK SECTOR 6 FLOODPLAIN AREAS
Park Sector 6 Floodplain Areas
Related Documents


