Scuola Internazionale Superiore di Studi Avanzati Trieste PARIETAL LOBE CONTRIBUTION TO SPATIAL PROCESSING: Evidence from brain tumour patients CANDIDATE Tania Buiatti SUPERVISOR Professor Tim Shallice Thesis submitted for the degree of Philosophiae Doctor in Cognitive Neuroscience at International School for Advanced Studies, Trieste, Italy SISSA - Via Bonomea 265 – 34136 TRIESTE,

Welcome message from author
This document is posted to help you gain knowledge. Please leave a comment to let me know what you think about it! Share it to your friends and learn new things together.
Transcript

1
Scuola Internazionale Superiore di Studi Avanzati
Trieste
PARIETAL LOBE CONTRIBUTION TO SPATIAL PROCESSING:
Evidence from brain tumour patients
CANDIDATE Tania Buiatti
SUPERVISOR Professor Tim Shallice
Thesis submitted for the degree of Philosophiae Doctor in Cognitive Neuroscience at
International School for Advanced Studies, Trieste, Italy
SISSA - Via Bonomea 265 – 34136 TRIESTE,

2
The research presented in this thesis was carried out at the ‗Scuola Internazionale Superiore di Studi
Avanzati – SISSA, Cognitive Neuroscience Sector, Trieste, Italy, in collaboration with the Neurosurgery
Department of the ‗Santa Maria della Misericordis‘ hospital, Udine, Italy.
© Tania Buiatti, 2011
All rights reserved. No part of this publication may be reproduced or transmitted in any form or by any
means, without the permission from the author

3
“Among other things, you'll find that you're not the first person who was ever confused and frightened and even sickened by human behavior. You're by no means alone on that score, you'll be excited and stimulated to know. Many, many men have been just as troubled morally and spiritually as you are right now. Happily, some of them kept records of their troubles. You'll learn from them - if you want to. Just as someday, if you have something to offer, someone will learn something from you. It's a beautiful reciprocal arrangement. And it isn't education. It's history. It's poetry.”
- The Catcher in the Rye (J.D. Salinger) -

4

5
Parietal lobe contribution to spatial processing:
Evidence from brain tumour patients
CANDIDATE
Tania Buiatti
SUPERVISOR
Prof. Tim Shallice
MANUSCRIPT COMMITTEE:
Roberto Caminiti
Vincent Walsh
Mathew Diamond
Raffaella Rumiati
Tim Shallice
Antonino Vallesi
2011

6

7
SUMMARY
Summary ___________________________________________________ 7
Acknowledgements __________________________________________ 11
Abstract ___________________________________________________ 13
Chapter 1: General Introduction__________________________________ 17
1.1 Introduction _____________________________________________ 19
1.2 The neurobiological basis of spatial cognition: anatomical and
functional considerations of the parietal cortex ____________________ 20
1.2.1 Anatomy _______________________________________________ 20
1.2.2 Neurophysiological studies ___________________________________ 21
1.2.3 Brain imaging studies _______________________________________ 24
1.2.4 Neuropsychological studies___________________________________ 25
1.3 Functional relevance of spatial representations in brain damaged
populations ________________________________________________ 26
1.3.1 Viewer-centered/egocentric frames of reference ____________________ 26
1.3.1.1 Optic ataxia ____________________________________________ 27
1.3.1.2 Spatio-temporal integration _________________________________ 31
1.3.2 Object-centered/allocentric frames of reference ____________________ 33
1.3.2.1 Mental rotation _________________________________________ 34
1.3.2.2 Phonological alexia _______________________________________ 38
1.4 Using brain tumours in neuropsychological studies ______________ 40
1.5 Aim of the thesis _________________________________________ 42
Chapter 2: Reaching a moving target: dissociations in brain
tumour patients _________________________________________________ 45
2.1 Introduction _____________________________________________ 47
2.2 Experiment 1: Pointing to the periphery _______________________ 48
2.2.1 Materials and Methods _____________________________________ 48
2.2.2 Results _________________________________________________ 52
8
2.2.3 Discussion ______________________________________________ 54
2.3 Experiment 2: Automatic Pilot _______________________________ 55
2.3.1 Materials and methods _____________________________________ 55
2.3.2 Results _________________________________________________ 58
2.3.3 Discussion ______________________________________________ 61
2.4 Pointing to the periphery vs. Automatic Pilot ___________________ 61
2.4.1 Pointing to the periphery vs. Shift costs __________________________ 63
2.4.2 Non-shift pointing vs. Shift costs _______________________________ 63
2.4.3 Pointing to the periphery vs. Non-shift pointing _____________________ 64
2.5 More specific anatomical corrispondences _____________________ 64
2.5.1 VLSM analyses ___________________________________________ 64
2.5.2 Overalpping lesions of the critical parietal patients __________________ 66
2.6 Hemispace vs. Hand effects _________________________________ 66
2.7 General Discussion ________________________________________ 69
Chapter 3: Hemispatial effects on spatio-temporal integration ___ 77
3.1 Introduction _____________________________________________ 79
3.2 Experiment 1 ____________________________________________ 81
3.2.1 Methods _______________________________________________ 81
3.2.2 Results _________________________________________________ 83
3.2.3 Discussion ______________________________________________ 86
3.3 Experiment 2 ____________________________________________ 88
3.3.1 Methods _______________________________________________ 88
3.3.2 Results _________________________________________________ 89
3.3.3 Discussion ______________________________________________ 90
3.4 Experiment 3 ____________________________________________ 90
3.4.1 Methods _______________________________________________ 90
3.4.2 Results _________________________________________________ 91
3.4.3 Discussion ______________________________________________ 92
3.5 General discussion ________________________________________ 93

9
Chapter 4: Hemispatial effects on spatio-temporal integration:
evidence from brain tumour patients ____________________________ 95
4.1 Introduction _____________________________________________ 97
4.2 Methods ________________________________________________ 98
4.3 Results ________________________________________________ 102
4.4 Discussion ______________________________________________ 106
Chapter 5: Two qualitatively different impairments in making
rotation operation ______________________________________________ 109
5.1 Introduction ____________________________________________ 111
5.2 Methods _______________________________________________ 111
5.3 Results ________________________________________________ 119
5.4 Discussion ______________________________________________ 125
5.4.1 Right parietal group _______________________________________ 126
5.4.2 Left prefrontal group ______________________________________ 130
Chapter 6: Phnological dyslexia following left and right parietal
lesions __________________________________________________________ 133
6.1 Introduction ____________________________________________ 135
6.2 Materials and Methods ___________________________________ 138
6.3 Results ________________________________________________ 141
6.4 Discussion ______________________________________________ 148
Chapter 7: General discussion ___________________________________ 153
7.1 Summary of the project ___________________________________ 155
7.1.1 Reaching in near space _____________________________________ 156
7.1.1.1 Suggestions for future research _____________________________ 159
7.1.2 Brain correlates of spatio-temporal integration ____________________ 160
7.1.2.1 Suggestions for future research _____________________________ 161
7.1.3 Mental transformations in space ______________________________ 162
7.1.3.1 Suggestions for future research _____________________________ 163

10
7.1.4 Phonological dyslexia: the role of the right posterior cortex ___________ 164
7.1.4.1 Suggestions for future research _____________________________ 165
7.2 Discussion of the overall project ____________________________ 166
7.3 Conclusion _____________________________________________ 170
References ________________________________________________ 171
Appendix _________________________________________________ 191

11
Acknowledgements
I would like to thank a number of people who have supported me during my PhD
course.
First of all, I am particularly grateful to my supervisor, prof. Tim Shallice, for his
thoughtful and creative comments, and more generally for his assistance and
psychological support during the thesis. I am deeply indebted to him for embarking
with me on this thesis journey. I could not have wished for a better coach. Working
with him has been really a privilege.
A never-ending thanks to all the staff of the Neurosurgical department, in particular to
Raffaella, Marilina, Paola, dr Skrap and to all the patients I tested during my PhD. This
work would have never been possible without them.
I am grateful to prof Caminiti and prof. Walsh for their criticisms and suggestions. They
helped to greatly improve the text.
A very special thanks goes out to Dr. Pittaro, without whose motivation and
encouragement I would not have considered a career in psychological research. It was
though his persistence, understanding and kindness that I completed my undergraduate
degree and was encouraged to apply for a PhD training.
I cannot forget to express my deep thanks to Alessandro Mussoni, who collaborated to
the project and left us so early. Many thanks to Alessio Toraldo, Paolo Bernardis and
Antonio Vallesi for the inspiring chats we had.
Thanks to all the colleagues I met during these years, in particular Claudia, Cristiano,
Eleonora, Federico, Liuba, Natalia, Olga, Paola, Shima, Valentina (note the alphabetic
order!). Your friendship and professional collaboration meant a great deal to me. I will
never forget the time spent in editing some important works such as ‗Neuroscience who
cares‘ and the eclectic chats at the cafeteria.
I‘m very greatful to Barbara and Lisa, my flatmates. They provided material and
spiritual support at critical and opportune times. Many thanks, girls!
I want to thank Alessio Isaja. A fine technician who helped me a lot in setting the
machines and prontly supported me when the pc, printer, usb key, external hard disk,
laptop, touch screen etc. crashed without any reason.
I cannot leave Trieste without mentioning Andrea Sciarrone. Many thanks for being just
wonderful and for having decided for a tango lesson instead of a nice tea and cake!
I would also like to thank my parents for creating an environment in which following
this path seemed so natural.
Thanks to my sister Giada, just for being so special. I wish nothing but the best for you.
And last but not least thanks to Mauro for the very special person he is. And for the
incredible amount of patience he has every single day with me.

12
13
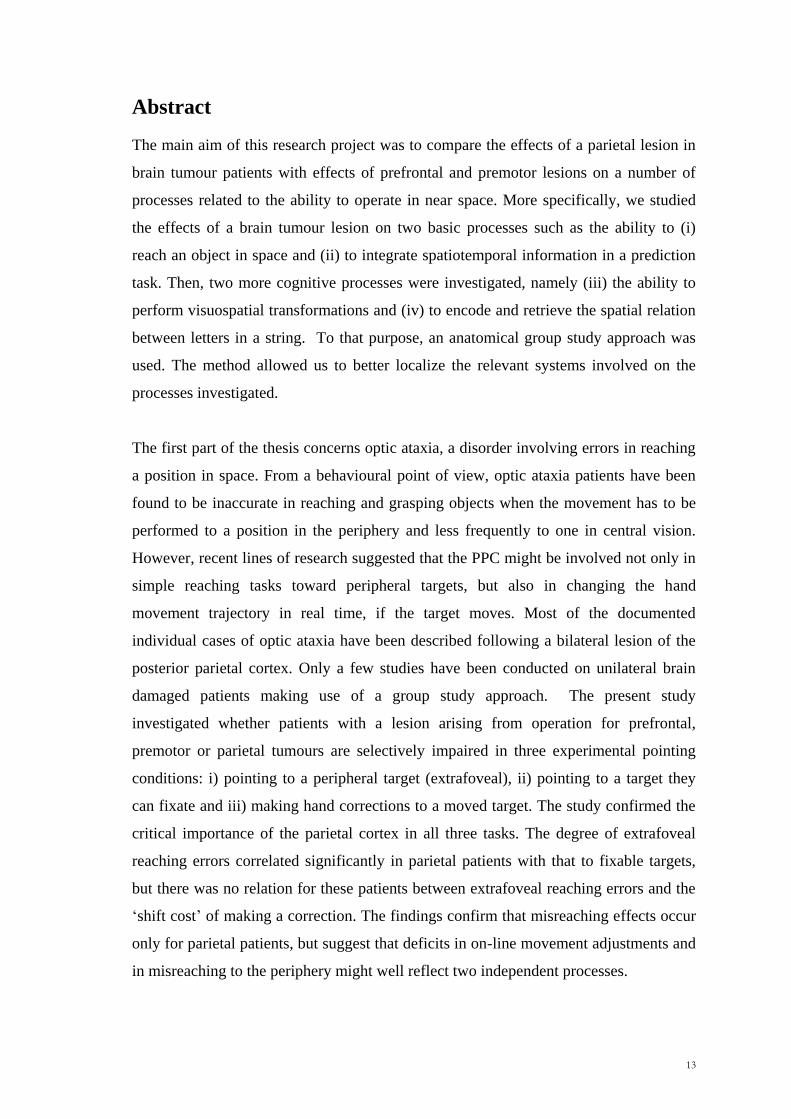
Abstract
The main aim of this research project was to compare the effects of a parietal lesion in
brain tumour patients with effects of prefrontal and premotor lesions on a number of
processes related to the ability to operate in near space. More specifically, we studied
the effects of a brain tumour lesion on two basic processes such as the ability to (i)
reach an object in space and (ii) to integrate spatiotemporal information in a prediction
task. Then, two more cognitive processes were investigated, namely (iii) the ability to
perform visuospatial transformations and (iv) to encode and retrieve the spatial relation
between letters in a string. To that purpose, an anatomical group study approach was
used. The method allowed us to better localize the relevant systems involved on the
processes investigated.
The first part of the thesis concerns optic ataxia, a disorder involving errors in reaching
a position in space. From a behavioural point of view, optic ataxia patients have been
found to be inaccurate in reaching and grasping objects when the movement has to be
performed to a position in the periphery and less frequently to one in central vision.
However, recent lines of research suggested that the PPC might be involved not only in
simple reaching tasks toward peripheral targets, but also in changing the hand
movement trajectory in real time, if the target moves. Most of the documented
individual cases of optic ataxia have been described following a bilateral lesion of the
posterior parietal cortex. Only a few studies have been conducted on unilateral brain
damaged patients making use of a group study approach. The present study
investigated whether patients with a lesion arising from operation for prefrontal,
premotor or parietal tumours are selectively impaired in three experimental pointing
conditions: i) pointing to a peripheral target (extrafoveal), ii) pointing to a target they
can fixate and iii) making hand corrections to a moved target. The study confirmed the
critical importance of the parietal cortex in all three tasks. The degree of extrafoveal
reaching errors correlated significantly in parietal patients with that to fixable targets,
but there was no relation for these patients between extrafoveal reaching errors and the
‗shift cost‘ of making a correction. The findings confirm that misreaching effects occur
only for parietal patients, but suggest that deficits in on-line movement adjustments and
in misreaching to the periphery might well reflect two independent processes.

14
In the second part of the thesis we examined a possibly related process, presumed to be
localised in the parietal cortex, namely the integration of spatial and temporal
information. We carried out two studies on this topic. In the first of these (three
experiments), we asked a group of healthy volunteers to predict the position of a
moving target after it has suddenly disappeared for a short time. We found that subjects
were more accurate in guessing the position of a moving invisible target when the
prediction had to be made in the left hemispace, irrespective of the direction of the
movement and the hand used. We explained the results in terms of a right hemisphere
advantage in coordinating spatial and temporal information. The same prediction task
was used with brain tumour patients. In line with the previous study, in this second
work we found the same lateralization effects as in normal subjects in patients with
lesions involving the left anterior, right anterior and left posterior cortices. By contrast,
no lateralization effects were observed for the right posterior group.
In addition, the role of the posterior parietal cortex was investigated in how visuospatial
transformations, such as rotating an object in space, are carried out. Mental rotation is a
cognitive process, which engages a distributed cortical network including the frontal,
premotor and parietal regions. Like other visual-spatial transformations it could require
operations on both metric (e.g. distances and angles) and categorical (e.g. left, right,
above, below) spatial representations. Previous reports based on behavioural studies of
normal subjects have suggested that the right hemisphere is involved in metric
processing and the left hemisphere in categorical processing. Our study suggests that
this is not the case. We found that patients with a brain tumour involving the right
parietal and the left prefrontal cortices made a significantly higher number of errors
than the other patients. In particular, whereas the right parietal group made poor use of
categorical information, the left prefrontal patients showed a broader mental rotation
impairment with a significant number of metric errors. The results are discussed in
terms of the model of Kosslyn et al. (1989) of the mental transformation Processes.
The last part of the project aimed at extending the results about the critical role of the
parietal cortex in acting in near space to a domain, which apparently seems different
from those discussed before. The last experiment concerns phonological dyslexia, a
reading disorder in which patients can read familiar words well, but they show
impairments in reading non-words. Phonological alexia is frequently associated with

15
damage to the left hemisphere, even if few cases of a right hemisphere involvement in
left-handed patients have been also reported. The present work was based on the
possibility that a right posterior lesion could lead a difficulty in reading pronounceable
nonword strings, because of a difficulty in structuring the relation of its component
objects (letters) in space. In accord with our hypothesis we observed that together with
the left posterior group, also the right posterior group showed a significant impairment
in reading nonwords, with no effect for the word material. The left posterior group
made a higher number of substitution errors, whereas the right posterior group made
more positional errors (errors in which letters occur in inappropriate parts of the string).
In conclusion, with an anatomically group study approach with brain tumour patients
we were able to confirm the important role played by the parietal cortex in a number of
spatial processing. A variety of spatial tasks were used to pursuit our aims. Critically,
we showed that the development of well-specified models of normal cognition allows
linking findings from cognitive neuropsychology.

16

17
Chapter 1
General Introduction

18
19
1.1 Introduction
One of the central issues in neuroscience is how humans represent and process spatial
information. Many of the everyday actions such as picking up a cup of tea, judging the
distance between two objects, catching a ball, representing a place on a map, are all
examples of human spatial abilities. Even if many of these actions are performed
without effort, the cognitive system is faced with several problems in the spatial
domain, which have to be promptly solved. For example, reaching for a cup of tea
requires not only that one attends the object and directs the hand toward it, but also that
one ignores other objects on the table (e.g. you do not take the cup of a friend),
coordinates the hand movement with those of the eyes and the head, and is able to act
on the cup from different directions. Similarly, catching a ball implies not only that one
represents the object in the environment, but also that one determines the future
trajectory of the ball, judges accurately where and when it will reach one.
Historically speaking scientific interest on spatial functions and their relative disorders
developed after the first War World, when soldiers with brain injuries were examined
(Holmes, 1918). These pioneering studies suggested that damage to the parietal cortex
could specifically affect the way in which one processes and integrates spatial aspects
of the environment, such as the location of objects and their spatial relationships or the
ability to accurately reach on object in space. However, it was not until Zangwill and
his colleagues published a series of papers on groups of patients that the crucial role of
the right hemisphere in spatial disorders was emphasized (Patterson & Zangwill, 1944;
Ettlinger et al., 1957). In subsequent years a number of visuomotor and visuospatial
disorders such as optic ataxia, constructional apraxia, hemispatial neglect have been
described after parietal damage and several attempts were made to create an integrative
framework in which the spatial properties of the parietal cortex can be combined.
Moreover, Critchley (1953) remarked how symptoms of parietal lesions can differ
widely, with some patients showing only few abnormal signs, while others showing an
intricate clinical picture of symptoms.
The purpose of this project is to provide an overview of the possible effects of a brain
tumour lesion on the ability of representing and processing spatial information, as
required on different experimental spatial tasks. The thesis can be broadly divided in
20
two sections. In the first section (Chapter 2, 3 and 4) we will focus on some basic
mechanisms underlying the ability of people to act in near space, such as reaching and
integrating spatial and temporal information. The second section (Chapter 5 and 6) will
focus on constructing and using visuospatial mental representations as is required in
more cognitive processes such as mental rotation and reading. Before describing the
experimental work in the next chapters, this Introduction provides some background
information about the anatomo-functional aspects of the parietal cortex and some of the
possible spatial disorders, which can arise after a lesion of it.
1.2 The neurobiological basis of spatial cognition: anatomical
and functional considerations of the parietal cortex
1.2.1Anatomy
The part of the brain which we call parietal cortex can be delimited by three anatomical
boundaries: (i) the Rolandic fissure, which defines the anterior part of the parietal
cortex and separate it from the frontal lobe, (ii) the parieto-occipital solcus which
defines the posterior limit of the parietal lobe and separate it from the occipital one, and
(iii) the Sylvian fissure which defines the lateral boundary and separates the parietal
from the temporal cortex. Generally speaking, the anterior part of the parietal cortex
(the primary somatosensory cortex, Broadmann‘s areas 1, 2 and 3) is mainly involved
in the processing of information from the body parts based on the degree of sensory
innervations, whereas the posterior one (posterior parietal cortex, PPC) is involved with
the integration of multimodal information for constructing a spatial representation of
the external world, planning and executing object-centred movements and attention
processes (Mountcastle et al, 1975; Culham & Kanwisher, 2001). The PPC itself can be
broadly subdivided into two major sections, the inferior parietal lobe (IPL), which plays
an important role in attention, visual awareness and in generating object-related actions
(Driver & Mattingley, 1998; Fogassi, 2005), and the superior parietal lobe (SPL), which
is thought to be important for the control of visually guided actions (Connolly,
Andersen, & Goodale, 2003; Culham, Cavina-Pratesi, & Singhal, 2006; Goodale &
Milner, 1992; Milner & Goodale 2006; Caminiti et al., 1996). The SPL and the IPL are
separated by the intraparietal solcus (IPS), which is in turn surrounded by a number of
21
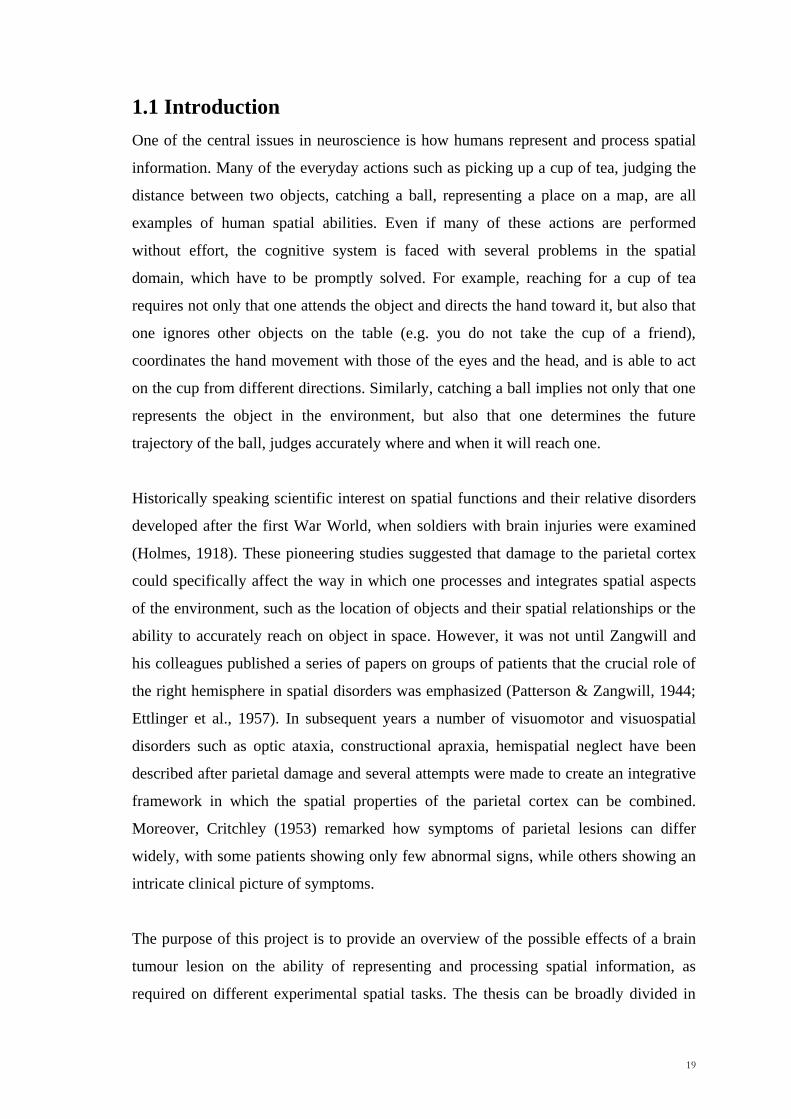
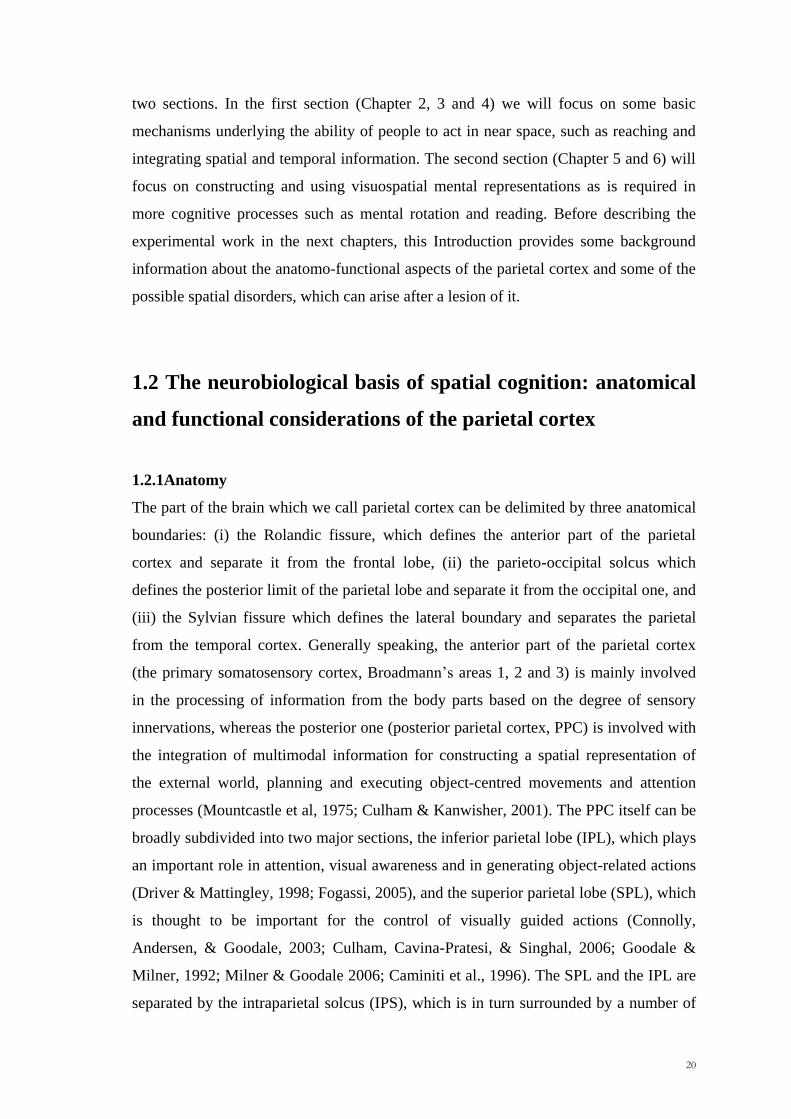
functionally relevant subregions integrating neural signals from different sensory
modalities and controlling action in space (Figure 1A).
Figure 1: Organization of the human (A) and primate (B) posterior parietal cortex (PPC). Superior
parietal lobule=SPL, inferior parietal lobule=IPL, intraparietal solcus =IPS, medial intraparietal
region=MIP, ventral intraparietal region=VIP, lateral intraparietal region=LIP, anterior intraparietal
region=AIP (adapted from Bisley and Goldberg, 2010).
1.2.2 Neurophysiological studies
In monkeys, much research has been done on the anatomo-functional organization of
IPS and areas surrounding it (Figure 1B). Each of these areas has been held to be
concerned with particular subfunctions within the visuomotor processes. Thus, earlier
physiological studies have suggested that the lateral intraparietal (LIP) area is
concerned with the control of eye-movements and peripheral attention (Andersen et al.,
2004); the anterior intraparietal area (AIP) with preshaping of grasping (Murata et al.,
2000), the medial intraparietal area (MIP) and area V6A with reaching movements
(Snyder et al., 2000; Battaglini et al., 2002) the ventral parietal area (VIP) with the
multimodal encoding of the space and the movements towards the head (Colby et al.,
1993).
Anatomically, these areas are interconnected in a set of neural circuits comprising
motor areas in the frontal cortex and visual areas in the occipital one (Rizzolatti et al.
1998, Averbeck et al., 2009) (Figure 2).
A B IPS
SPL
IPL

22
Figure 2. Overview of the projections from the posterior parietal cortex. The dorsal stream is here
depicted in plain lines, wheres dotted lines represent the ventral stream Abbreviations: AIP: anterior
intraparietal area; BS: brainstem; Cing. Cingulate motor areas; d: dorsal; FEF: frontal eye field; FST:
floor of the superior temporal sulcus; Hipp.: Hippocampus; LIP: lateral intraparietal area; M1: primary
motor cortex; MIP: mesial intraparietal area; PIP: posterior intraparietal area; MST: medial superior
temporal area; MT: mediotemporal area; PF: prefrontal cortex; PM: premotor cortex; SC: superior
colliculus; SEF: supplementary eye field; SMA: supplementary motor area; STS: superior temporal
sulcus, STP: superior temporal polysensory area; TE: temporal area; TEO: temporo-occipital area; v:
ventral; V1: primary visual cortex, VIP: ventral intraparietal area. (Adapted from Rossetti and Pisella,
2002)
Therefore, the posterior parietal cortex (PPC) can be considered as an early and
intermediate stage in the process leading from vision to movement, where a variety of
signals (e.g. visual, somatosensory, attentional, and auditory) are processed and
integrated. When the functional organization of the parietal and frontal areas is
contrasted with their pattern of cortico-cortical connections, a reciprocal distributed
system emerges (Figure 3A and 3B).

23
More recent work (Averbeck et al., 2009) using cluster analysis showed four
statistically significant cluster areas in the parietal cortex and six in the frontal region.
These clusters are composed of a set of adjacent areas. Thus, regarding the parietal
region, the authors define a the dorsal-parietal cluster (PAR-d), which includes areas
MIP, PEc and Pea; the somatosensory cluster (SS), which is formed by SI, SII and PE;
the ventral-parietal cluster (PAR-v) that consists of PF, PFG, PG and AIP and the
medio-lateral parietal cluster (PAR-ml), which includes PGm, V6A, LIP, VIP and Opt).
A similar analysis on the frontal region revealed the existence of a dorsal premotor
(PMd, consisting of F2-vr, F2 pre-cd, F3, F6 and F7), ventral premotor (PMv, including
F4 and F5), primary motor (MI), cingular (CING, formed by 23 a, b, c and 24 a, b, c),
prefrontal ventral (PFCv, consisting of 45v, 46 a,b and F7-SEF) and prefrontal dorsal
(PFCd, formed by 46d, 8A and 8B) clusters. The topographic, reciprocal connections
between these frontal and the parietal clusters suggest the existence of a ‗privileged,
although not private, routes of information flow between the parietal and the frontal
cortex‘ (Caminiti et al., 2010). Functionally speaking, the PAR-d and PM-d clusters are
Figure 3: Cortico-cortical
connections of the primate
frontal and parietal lobes.
Fronto-parietal circuits
involved in visuomotor control
in monkeys. Blue arrows
indicate cortico-cortical
connections between frontal
and parietal regions.
(A) Lateral view of the brain.
(B) Lateral view of the
hemisphere where parts of the
parietal and occipital lobes have
been removed to show the
location of the areas buried in
the medial bank of the
intraparietal sulcus and in the
rostral bank of the parieto-
occipital sulcus.
(Adapted from Battaglia-Mayer
& Caminiti, 2002; Battaglia-
Mayer, Archambault &
Caminiti, 2006)
SUPERIOR PARIETAL LOBE

24
important for the integration of visual and somatic information necessary for reaching
(Georgopoulos et al., 1984; Colby & Duhamel, 1991; Battaglia-Mayer et al., 2000); the
PAR-v and PM-v are involved in the hand-object interaction for grasping (Taira et a.,
1990; Rizzolatti & Matelli, 2003) and PAR-ml and its prefrontal counterpart are
involved in the early stages of eye-hand coordination for reaching (Battaglia-Mayer et
al, 2000,2001, 2005;2007).
A complementary way of viewing the network is in terms of a gradient-like functional
architecture with a gradual transition of the functional properties of the neurons across
the parietal-frontal system along a rostrocaudal dimension (Johnson et al., 1996;
Battaglia-Mayer et al., 2001; Caminiti et al., 2010). In particular, whereas visual
information predominates in the caudal pole of the network (e.g. area V6A), the hand
ones predominate in the rostralmost part of the superior parietal lobe, with the
visuomotor cells coexisting in the intermediate parietal regions (e.g. area MIP)
(Battaglia-Mayer et al., 2005 for a review).
1.2.3 Brain imaging studies
Even though functional homologies between macaque and human PPC are difficult to
determine, human neuroimaging studies suggested a similar mosaic of specialized
parietal areas (Culham and Kanwhisher, 2001, Culham et al., 2006). In particular, there
are many regions that demonstrate similar functional properties in both humans and
monkeys. Since it is activated by both saccades and peripheral attention, the parietal eye
fields (PEF) area has been proposed as the human homologue of LIP (Muri et al.,
1996), whereas the human homologue of AIP is located at the junction between the
anterior portion of the IPS and the inferior postcentral solcus (Binkofski et al., 1998;
Culham, Cavina Pratesi, & Goodale, 2004; Faillenot, Sakata, Costes, Decety, &
Jeannerod, 1997). A human area functional similar to MIP and V6A is located in the
medial intraparietal solcus (mIPS) and the precuneus (PCu) (Grefkes & Fink, 2005;
Connolly, Andersen, & Goodale, 2003; Prado et al., 2005). Finally, regarding the
possible candidates for the VIP area, mixed results have been reported. Some studies
reported activation in the fundus of the human IPS (Bremmer, Schlack, Shah et al.,
2001), whereas others argue for the postcentral solcus (Huang and Sereno, 2005).

25
1.2.4 Neuropsychological studies
Neuroimaging studies on human brain functions are also likely to benefit from crosstalk
with related approaches, such as the neuropsychological one. In particular, given the
methodological difficulties related to the study of arm movements in the fMRI
environment (e.g. the movement needs to be physically limited and this can induce
artefacts), the neuropsychological method has frequently been used in tasks involving
actions in near space. The neuropsychological approach takes advantages of the insights
of both the lesion method and cognitive psychology.
The logic of the lesion method is straightforward. If a brain region contains processing
units or connections, which contribute critically to carrying out a task, then damage to
that region will impair the performance of that task, resulting in a set of behavioural
deficits. Neuropsychological data has demonstrated many different types of spatial
deficits in patients following parietal lesions. One of the most striking features of the
work on spatial cognition is the diversity and complexity of the possible dysfunctions to
which a parietal lesion can give rise. Since lesions affecting the parietal lobe can be
large in size, in many patients a combination of these disorders was observed.
Nevertheless, many dysfunctions may manifest in dissociated and partial forms. For
instance, damage to the IPL or the superior temporal gyrus (STG) of the right
hemisphere commonly leads to hemispatial neglect (Husain& Rorden, 2003; Mesulam,
1999; Karnath, Ferber, & Himmelbach, 2001; Mort et al., 2003; Vallar & Perani, 1986)
and to directional hypokinesia (Mattingley et al., 1992, 1998). In both cases, patients
might exhibit deficits in representing and acting in the contralesional space. Other
parietal patients, particularly those with damage to the SPL, IPS and the parieto-
occipital junction (POJ), often misreach objects in the periphery, so-called optic ataxia
(Perenin and Vighetto, 1988; Karnath & Perenin, 2005).
However, neuropsychology is much more than just a list of possible cognitive
impairments, which a dysfunctional brain structure can give rise. Indeed, cognitive
neuropsychologists argue that by investigating the behaviour of people with brain
damage, it is also possible to identify separable cognitive subsystems and to infer the
way in which the normal cognitive processes are organized (Shallice, 1988). Models of
normal cognitive functions can be used to understand impaired performance in patients
with brain lesions and findings of impaired performance can offer evidence to support,
26
reject or further integrate current theories of normal processing (Coltheart, 1985; Ellis
& Young, 1988). Disorders such hemispatial neglect and optic ataxia, but also other
spatial symptoms such as mental rotation deficits, inaccuracy in correctly processing
spatial relationships between objects, spatial-temporal integration disorders, all
represent illustrative examples of how cognitive neuropsychology can been applied
successfully to comprehend complex cognitive functions.
1.3 Functional relevance of spatial representations in brain
damaged populations
By studying people with selective disorders of cognition in the spatial domain we can
make inferences about the nature and the structure of how people represent and process
spatial information. Generally speaking, spatial representations involve different
parameters and operations, such geometrical and physical properties, reference frames,
perspective taking, relations between objects. Brain damage may result in the selective
loss of certain systems, while leaving others intact. The contrast between intact and
damaged aspects of spatial representation may differ between individuals, producing
different patterns of spatial disorder. In this way we can build models of normal spatial
functioning by studying patients with brain lesions.
Spatial representation is not a unitary concept. Rather, there are different types of
spatial processes, depending on the function that spatial information serves. Thus, an
object can be represented in terms of its relations to multiple frames of references. We
will further examine the primary role that egocentric and allocentric frames of
references play in spatial cognition.
1.3.1 Viewer-centered/egocentric frames of reference
One type of spatial representation is the viewer-centered/egocentric frame of reference,
where the location of the object is represented with respect to the viewer. In such a
frame of reference, spatial properties such as distance and the terms ‗left‘ and ‗right‘
refer to the position of the object with respect to the observer. A typical example in
which the spatial information is specified in an egocentric frame of reference is
reaching. In order to reach an object, the brain needs to compute aspects of the space as

27
accurately as possible. Thus, to carry out a simple hand movement, such as reaching, it
seems natural that the brain would represent the position of the target in a quantitative,
fine-grained metric format, such as distance and angles. This occurs independently of
whether the target is directly fixated with the eyes (foveal condition) or from the
periphery (extrafoveal condition). There is an extensive scientific literature suggesting
that metric information can be represented in terms of multiple egocentric frames of
reference, such as relative to the position of the eyes (eye-centered coordinates), the
head (head-centered coordinates), the shoulder (shoulder-centered coordinates) and the
hand (hand-centered coordinates) (Mountcastle et al., 1975; Buneo et al., 2002; Buneo
& Andersen, 2006; Battaglia-Mayer et al., 2000). This raises the issue of how the
different egocentric spatial representations might be transformed in order to accurately
reach an object in space. It has been argued that the posterior parietal cortex has a
crucial role in performing sensorimotor transformations (Andersen, Essick & Siegel,
1987) and that damage to that brain area can lead to visuomotor transformation deficits,
such as optic ataxia (Buxbaum and Coslett, 1998; Rossetti et al., 2003).
1.3.1.1 Optic ataxia
It has long been known that damage to the posterior parietal cortex (PPC) can lead to
optic ataxia (OA) (Balint, 1909; Ratcliff and Davies-Jones, 1972; Pisella et al, 2008).
Patients with OA display impairments in the visuomotor domain, especially when they
are required to perform reaching and pointing movements in extrafoveal conditions
(Battaglia-Mayer et al., 2002; Glover, 2003). Misreaching errors in OA patients are
usually found to be independent of any primary motor, sensory, praxis or attentional
deficit (Balint, 1909; Perenin and Vighetto, 1988; Coulthard et al., 2006; Striemer et al.,
2009).
In a pioneering study Perenin and Vighetto (1988) analysed the performance of stroke
patients with parietal lesions (three right and seven left), while they were performing a
simple reaching task. Patients with a unilateral lesion of the right parietal cortex were
found to be more inaccurate when they had to reach for an object presented in their
contralesional left visual field, independently of the hand used. On the other hand, in
addition to the contralateral visual field impairment, patients with a unilateral lesion of
the left parietal cortex showed a significantly higher number of misreaching errors
when they were asked to reach to the objects with their contralesional right hand. These

28
different hemispherical effects have been classically called ‗visual field effects‘ and
‗hand effects‘ respectively. Moreover, three out of the seven left parietal patients were
also found to be impaired in the central visual field condition when using the right hand.
Figure 4. Visual field and hand effects for right hemisphere damaged (A), left hemisphere damaged
(B) patients and the control group (C). The figures represent the petcentage of errors when patients
pointed to the left visual field (LVF), right visual field (RVF) and in central vision (CVF), with the left
and the right hand (From Perenin and Vighetto, 1988).
Studies investigating the visual and the hand effects have mainly being conducted in
extrafoveal conditions, where the stimuli to be reached are presented in the visual
periphery. In these experimental conditions, OA patients produce inaccurate reaching
endpoints (Garcin et al., 1967; Perenin and Vighetto, 1988; Pisella et al., 2000). In
contrast, most OA patients are usually good in reaching for objects presented in the
central vision space, although a few cases of foveal optic ataxia have been observed
(Rondot et al., 1977; Perinin and Vighetto, 1988; Buxbaum and Coslett, 1998; Rossetti
et al., 2003). In the case of foveal optic ataxia, the patients exhibit misreaching errors in
both the central and the peripheral visual fields.
The observation that OA patients are usually found to be inaccurate in reaching for
objects in the periphery and less frequently in the central visual field might just be a
reflection of the lower spatial resolution of peripheral vision. Moreover, since both

29
hemispheres process the target position in central vision, good performance in this
experimental condition could also reflect the activity of the spared hemisphere.
However, OA patients with bilateral lesions often show good performance in foveal
reaching tasks (Milner et al., 1999; Gréa et al., 2002). Therefore the existence of
distinct cortical networks subserving central and peripheral reaching cannot be
excluded. Indeed, more recently, a brain imaging study of Prado et al. (2005) provided
some evidence for this hypothesis. The investigators explored whether the fronto-
parietal reaching network could have been differently activated in two reaching
conditions, namely foveal vs. extrafoveal. Using fMRI, they demonstrated that reaching
in central vision activated a network including the medial intraparietal solcus (mIPS)
and the caudal part of the dorsal premotor cortex (PMd). By contrast, reaching in
peripheral vision activated a more extensive area. In addition to the mIPS and the
caudal part of the PMd, reaching in the periphery also activated the rostral part of the
PMd and the medial part of the parieto-occipital junction (POJ).
One widely accepted claim is that the posterior parietal cortex (PPC) is not just
involved in simple reaching tasks toward peripheral targets, but is also a key structure
for adjusting the hand movement trajectory in real time, a condition which usually
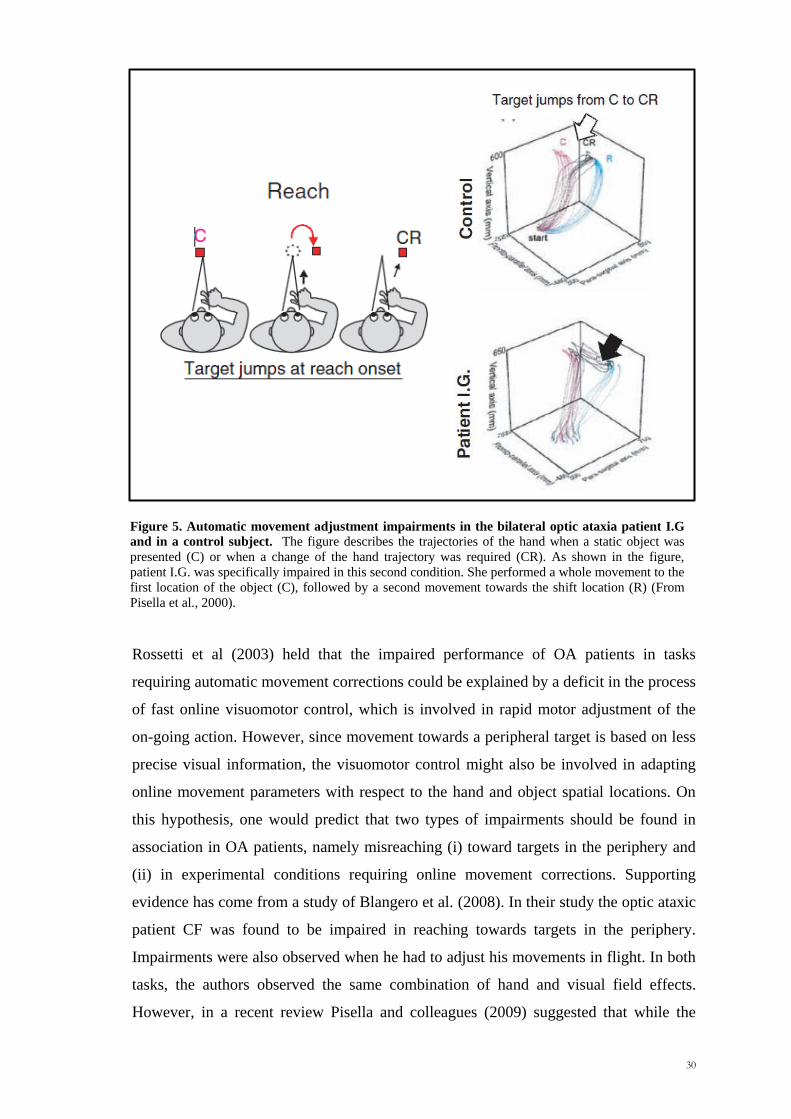
occurs in central vision (Pisella et al., 2000; Gréa et al., 2002). For instance, when
patients must point to a stationary target which suddenly changes position at the time of
movement onset on 30% of the trials, Pisella and colleagues (2000) observed that the
optic ataxic patient IG was impaired in performing online movement corrections in the
shift condition only (Figure 5).
Converging evidence about the role of the PPC in fast online movement adjustments
has also been obtained from a transcranial magnetic stimulation (TMS) study in healthy
subjects (Desmurget, 1999). Moreover, a recent neurophysiological study with monkeys
provided evidence of the importance of area 5 in the superior parietal lobe (SPL) in
making fast in-flight corrections of hand trajectories (Archambault et al., 2009).
30
Rossetti et al (2003) held that the impaired performance of OA patients in tasks
requiring automatic movement corrections could be explained by a deficit in the process
of fast online visuomotor control, which is involved in rapid motor adjustment of the
on-going action. However, since movement towards a peripheral target is based on less
precise visual information, the visuomotor control might also be involved in adapting
online movement parameters with respect to the hand and object spatial locations. On
this hypothesis, one would predict that two types of impairments should be found in
association in OA patients, namely misreaching (i) toward targets in the periphery and
(ii) in experimental conditions requiring online movement corrections. Supporting
evidence has come from a study of Blangero et al. (2008). In their study the optic ataxic
patient CF was found to be impaired in reaching towards targets in the periphery.
Impairments were also observed when he had to adjust his movements in flight. In both
tasks, the authors observed the same combination of hand and visual field effects.
However, in a recent review Pisella and colleagues (2009) suggested that while the
Figure 5. Automatic movement adjustment impairments in the bilateral optic ataxia patient I.G
and in a control subject. The figure describes the trajectories of the hand when a static object was
presented (C) or when a change of the hand trajectory was required (CR). As shown in the figure,
patient I.G. was specifically impaired in this second condition. She performed a whole movement to the
first location of the object (C), followed by a second movement towards the shift location (R) (From
Pisella et al., 2000).

31
visual field effects might indeed reflect a deficit in the spatial processing of visual
inputs, the hand effects (even in central vision) might be a consequence of a deficit in
the spatial processing of the proprioceptive information from the ataxic hand. In the
first case, the impairment would result from damage to the parieto-occipital junction
(POJ). In the second, the hand effects would be due to a lesion of the medial part of the
intraparietal sulcus (mIPS).
Much of our knowledge about reaching impairments in OA patients has come from
neuropsychological studies, which made use of the methodologies of single case and
selected case series. However, this method is not ideal for the localization of relevant
systems and for this an anatomically based group study approach is most appropriate.
Recently, a group study of Shallice and colleagues (2010) on OA replicated the visual
field effects for reaching towards peripheral targets observed by Perenin and Vighetto
(1988). The parieto-occipital group was significantly less accurate compared with other
patient groups with the impairment affecting specifically the contralateral visual field.
The behavioural findings were corroborated by an anatomical analysis, which showed
an involvement of the superior parietal lobe (SPL). The results were consistent with
localizations found in earlier studies using other techniques (but see Karnath and
Steinbach, in press; Shallice and Skrap, in press). To our knowledge no studies have
examined a series of patients with the ‗automatic pilot‘ task.
In the present thesis (Chapter 2) we made used of an anatomical based group study
approach in order to consider the processes required (a) for pointing toward targets in
the periphery, (b) toward stationary targets (with patients allowed to look at targets
before pointing) and (c) for correcting movements in flight. We investigated whether
these processes are behaviourally and anatomically dissociable and what are the critical
brain areas involved.
1.3.1.2 Spatio-temporal integration
In the previous paragraph (1.3.1.1), we provided an example of how damage to the
posterior parietal cortex can severely affect the way in which people use egocentric
metric information in order to act in peripersonal space. There are, however, more
complex situations than reaching, which involve the processing of objects in space. One
is that of predicting the future position of moving target or its current position if it is
passing behind an object. In this condition, a simple viewer-centered reference frame

32
account would probably be insufficient. Since the image of the object does not move
across the retina at a constant speed, the retinal motion information might need to be
supplemented by allocentric information such as the position of the object in time with
respect to the surrounding space (e.g. a monitor).
In dynamic environments the integration of spatial and temporal information is a
frequently used process. Visuomotor tasks such as avoiding vehicles when walking
across a road, passing the ball to a teammate and catching a flying mosquito are all
examples. To successfully predict the position of a moving target it is necessary to take
into account that the target is moving during the time and to estimate its trajectory and
speed on the basis of the preceding spatial information. There is growing interest in
where in the brain the integration of temporal and spatial information might occur.
Walsh (2003) has recently claimed that a common processing system for space, time
and numbers exists (A Theory of Magnitude, ATOM), which may be located in the
inferior parietal cortex. In particular, he suggested that the right parietal cortex might be
critical. Several studies support the idea that the parietal cortex, particularly the right,
plays a crucial role in the integration of spatial and temporal information. For example,
in a brain-imaging study with healthy subjects performing a detection task, Coull and
Nobre (1998) observed that the parietal cortex, mainly on the right, was largely
activated when subjects directed their attention to both spatial and temporal cues, as
compared with either dimension alone. Similarly, by using an integrated
neuropsychological and repetitive transcranial magnetic stimulation (rTMS) approach,
Olivieri et al. (2009) tested whether the contribution of the right parietal cortex becomes
critical for the execution of both spatial and timing bisection tasks. In these
experiments, the healthy subjects were presented with a target with a variable duration
(timing task) or with a virtual line segment with a variable length (spatial task). In the
retrieval phase, they were then asked to press a response button when they thought that
the same (reproduction task) or the half (bisection task) of the previous temporal or
spatial interval had elapsed or been covered. Repetitive transcranial magnetic
stimulation applied on the right parietal cortex but not on the left one of the healthy
subjects during the retrieval phase caused a lateralized bias during both the tasks. For
the timing task, similar effects were found in right brain damaged patients with spatial
neglect. The authors concluded that the right posterior parietal cortex might reflect a
possible neural correlate of spatial-temporal interaction. This issue was also

33
investigated in an experiment of Boulinguez at al. (2003). By using a task in which
subjects were required to predict object trajectories, the authors found that the response
times were shorter when the targets moved in the left visual field, regardless of which
hand was used for responding. The authors interpreted these hemispatial effects by
arguing that the right hemisphere might be critically involved in tasks requiring spatio-
temporal processing. However, this hemisphere interpretation contrasts with that made
from fMRI studies (Assmus et al. 2003, 2005; Coull et al., 2008) where subjects were
asked whether a collision between two targets would occur or not. Instead, these
authors observed that the brain region activated during such a kind of tasks (where
spatiotemporal integrations are required) was the left inferior parietal cortex
(supramarginal gyrus), not the right. Therefore, whether the integration of the spatial
and temporal information occurs in the right or in the left hemisphere is still an open
issue in neuroscience and it will be investigated in the present thesis (Chapter 3 and 4).
1.3.2 Object-centered/allocentric frames of reference
In the case of an object-centered reference frame, the object is represented with respect
to its own spatial properties and its spatial relation to other objects. According to
Kosslyn et al. (1989), spatial relations can be depicted at two levels of abstraction, such
as categorical and metric aspects. In the categorical analysis, the spatial relations
among objects in scenes are represented in qualitative terms (as is captured by an
expression such as ‗the pen is near the big cup on the desk‘). In the metric/coordinate
analysis, spatial relationships are represented in terms of quantitative distances and
angles. In this case, metric aspects - such as distances - and the categorical/qualitative
terms - such as left, right, top and bottom - refer to the object itself and its spatial
relation with other objects. They are independent of the observer. Evidence from brain
imaging and neuropsychological studies seem to confirm the central role of the
posterior parietal cortex in encoding categorical and metric spatial information
(Ratcliff, 1979; Ditunno and Mann, 1990; Harris et al., 2000; Kosslyn et al., 1998;
Zacks, 2008, Martin et al., 2008), even if controversies about which hemisphere, the left
or the right, is mainly involved in the two processes still exist. Object-centered
mechanism might obviously influence a variety of visuospatial tasks, such as mental
rotation, which requires operations on both categorical and metric representations of
objects. Another typical example for objects with well-defined intrinsic categorical
spatial relations is letters, which are part of a word.
34
1.3.2.1 Mental rotation
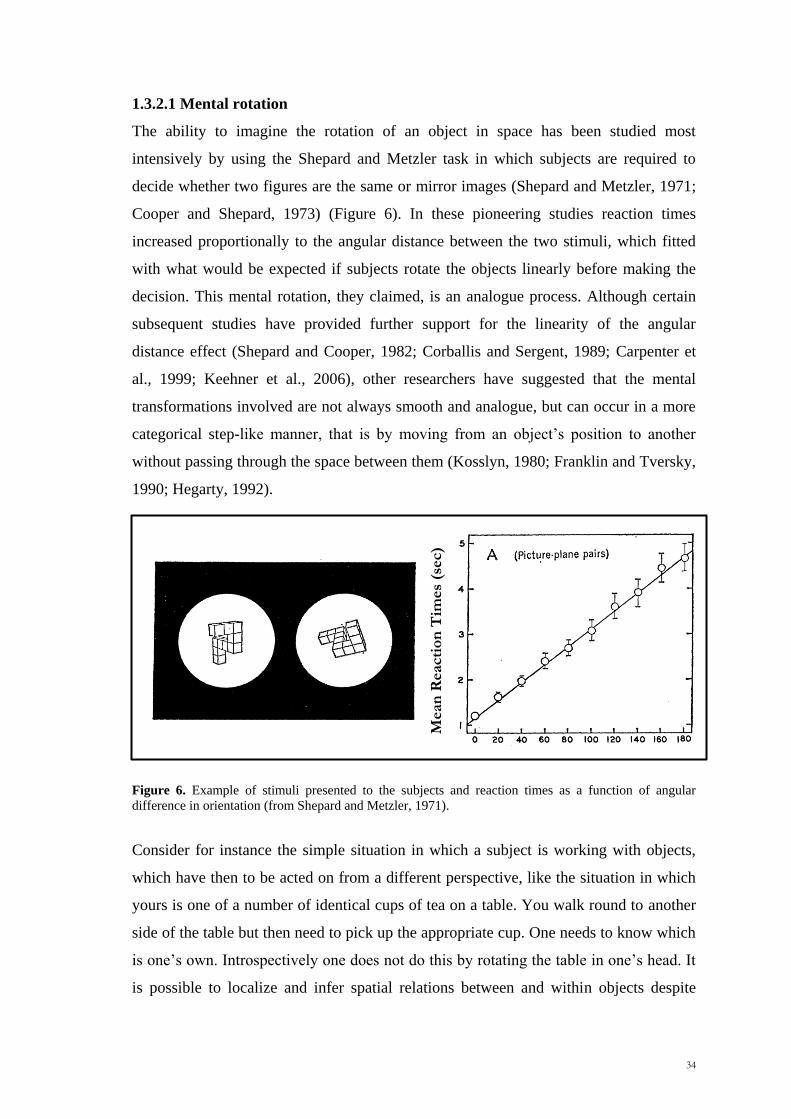
The ability to imagine the rotation of an object in space has been studied most
intensively by using the Shepard and Metzler task in which subjects are required to
decide whether two figures are the same or mirror images (Shepard and Metzler, 1971;
Cooper and Shepard, 1973) (Figure 6). In these pioneering studies reaction times
increased proportionally to the angular distance between the two stimuli, which fitted
with what would be expected if subjects rotate the objects linearly before making the
decision. This mental rotation, they claimed, is an analogue process. Although certain
subsequent studies have provided further support for the linearity of the angular
distance effect (Shepard and Cooper, 1982; Corballis and Sergent, 1989; Carpenter et
al., 1999; Keehner et al., 2006), other researchers have suggested that the mental
transformations involved are not always smooth and analogue, but can occur in a more
categorical step-like manner, that is by moving from an object‘s position to another
without passing through the space between them (Kosslyn, 1980; Franklin and Tversky,
1990; Hegarty, 1992).
Figure 6. Example of stimuli presented to the subjects and reaction times as a function of angular
difference in orientation (from Shepard and Metzler, 1971).
Consider for instance the simple situation in which a subject is working with objects,
which have then to be acted on from a different perspective, like the situation in which
yours is one of a number of identical cups of tea on a table. You walk round to another
side of the table but then need to pick up the appropriate cup. One needs to know which
is one‘s own. Introspectively one does not do this by rotating the table in one‘s head. It
is possible to localize and infer spatial relations between and within objects despite
Mean
Reacti
on
Tim
es
(sec)

35
changes of the direction from which they are viewed (Corballis, 1988; Marr, 1980), and
not necessarily by using continuous transformations through intermediate positions. In
these situations other cognitive strategies can be used, such as using categorical
representations of the objects in relation to stored spatial frames. On the other hand,
when subjects are required to perform an object recognition task (e.g. by comparing two
objects and deciding whether they are equal or different) they could use a ‗matching‘
strategy, in which they retain in memory the initial orientation of one object and rotate
it until aligned with the other one. From this perspective, as suggested by Pylyshyn
(2002), the evidence favoring the linearity of the angular distance effect may be specific
to the task used. It remains possible that linearity and the use of analogue
transformation are not principles, which govern mental rotation in all situations.
A related project is the attempt to isolate the subsystems and their neural basis involved
in mental rotation. In monkeys, for instance, it has been shown that lesions to the
inferior temporal cortex impair the ability to discriminate two 3D rotated objects when
the rotation difference is less than 60°, whereas they are basically good in
discriminating between identical shapes rotated by 60° or more (Holmes and Gross,
1984). These results have some parallels with the study of Jolicoeur in humans
(Jolicoeur et al., 1985), who showed that reaction times in discriminating 2D and 3D
objects changed with respect to the rotation amount, with 60° representing the boundary
for two possible underlining strategies. When small rotation differences are used, the
object could be identified and rotated as a whole through the angular difference. On the
other hand, for larger differences in rotation, the salient feature are extracted from the
shape and a location to it is than assigned (e.g. the salient feature is on the left).
As far as brain processes in humans are concerned, the parietal cortex seems to have a
critical role in locating features and rotating objects. Parietal damage can produce
significant impairments in mental rotation tasks. This has been observed, for instance,
in the pioneering study of Ratcliff (1979) in brain-damaged patients. In this experiment
patients were presented with a schematic drawing of a man with one marked hand. On
each trial this figure was presented in an upright or an inverted position and participants
were required to say which of the two hands was marked – the left or the right hand
(Figure 7). The authors found that patients with right parietal lesions made more errors

36
in the inverted condition, which required a mental re-orientation of the stimulus, in
comparison to patients with left hemisphere and bilateral lesions.
The involvement of the right parietal cortex in the mental rotation processing has been
further supported using different experimental methodologies including
neuropsychological (Ditunno and Mann, 1990), brain imaging (Deutsch et al., 1988;
Carpenter et al., 1999; Harris et al., 2000), topographical ERPs (Yoshino et al., 2000)
and TMS (Harris and Miniussi, 2003) studies. However, other research has provided
evidence that rotation may also involve left hemisphere neural activation depending on
the stimuli and the tasks used (Kosslyn et al., 1998; Vingerhoets et al., 2001; Jordan et
al., 2001; Tomasino et al., 2003). In addition, some functional imaging studies have
also obtained activations in the premotor and supplementary motor areas while
performing mental rotation tasks (Cohen and Bookheimer, 1994; Richter et al., 2000;
Lamm et al., 2007; de Lange et al., 2005). These results led researchers to claim that
motor simulation could be used to solve mental rotation tasks. Moreover, a recent meta-
analysis (Zacks, 2008) showed that brain regions that were mainly activated during
mental spatial transformations included frontal and inferotemporal areas. More
specifically, although the brain was bilaterally activated in most regions, these studies
stressed a major involvement of the right parietal cortex (Harris et al., 2000; Halari et
al., 2006) and an involvement of the left prefrontal cortex (Johnston et al., 2004;
Kosslyn et al., 2001; Zacks et al., 1999).
Another important issue related to mental rotation and its neural substrates concerns the
model put forward by Kosslyn et al. (1989). They argued that creating the
Figure 7. Types of stimuli
used by Ratcliff (1979).
Participants judged whether
a picture of a human body
had its right or left arm
marked.

37
representation of the spatial context in which objects lie involves at least two distinct
processes. The first involves a categorical analysis in which the spatial relations among
objects in scenes are represented in qualitative terms (as is captured by an expression
such as ‗the pen lies on the left side of the desk‘). The second involves a metric analysis
of the vector spatial relationships in terms of quantitative distances and angles, which
they called coordinate representations. Kosslyn et al. (1989) argued that while metric
spatial processing engages the right hemisphere, categorical processing involves the
left. The latter would follow if categorical processing relates to language processes. On
this approach, mental rotation transformations, like many other visuo-spatial processing
could require operations on both metric and categorical representations of objects.
Following the ideas of Kosslyn, it is possible that these two processes might be
selectively impaired and so cause different types of mental rotation deficits according to
the side of the lesion: a lesion of the left hemisphere would impair categorical
representations, whereas the metric analyses will be disrupted by a lesion of the right
hemisphere.
The anatomical basis of the theoretical framework of Kosslyn et al. (1989) was
questioned in the work of Bricolo et al. (2000). They described a patient (PAO) who
had sustained a right parietal lesion, but despite that, had relatively good performance in
object recognition and in several visuo-spatial tasks. However, he was grossly impaired
in any task involving rotation such as Kohs's Blocks. A specific rotation task was
investigated in more detail. PAO was presented with a dot inside a tilted square frame
of reference and had to reproduce its position, relative to the square, after the square
had been rotated to the vertical. If his attempt was in the vicinity of the correct
response, then his psychophysical accuracy curve was as good as that of normal
controls. However, a high proportion of his attempts were in completely inappropriate
parts of the square. His performance was interpreted as preserving metric operations,
but with categorical ones impaired. Thus in his case a specific disorder of categorical
operations appeared to follow a right hemisphere lesion. This idea has subsequently
been supported by the work of Toraldo and Shallice (2004) who found similar
impairments of categorical spatial representations in another right hemisphere patient
(VQ). However, both these studies used single case methodology, which is not
sufficient for proper localization of relevant lesion sites.
38
In the categorical-metric coding debate, a different hypothesis has been recently
proposed by Martin et al. (2008) on the basis of their fMRI study. The authors claimed
that both the right and the left hemisphere are activated in coding categorical as well as
metric positions. Indeed, when using working-memory tasks in which the coding of
categorical or metric spatial relations was required, the authors failed to find a strong
hemispheric specialization. Both categorical and metric tasks evoked activity in a
similar fronto-parieto-occipital neural network and the differences were more of a
quantitative than of a qualitative nature. Moreover, a significant activation was found in
the dorsolateral prefrontal cortex when no visible space categorization was given
(coordinate task) or when more than three elements had to be coded. Martin et al.
interpreted their data as supporting the ‗Continuous Spatial Coding’ (CSC) hypothesis,
according to which there might be ―continuity between categorical and coordinate
spatial relations along a complexity dimension‖ and both hemispheres might be
implicated in both types of spatial relation coding.
As it will be discussed in Chapter 5, we attempted to establish the critical regions of the
prefrontal, premotor and parietal cortex involved in mental rotation transformations. In
particular, we will focus on the open debate about the hemispherical specialization for
categorical and metric/coordinate operations.
1.3.2.2 Phonological alexia
The proposed framework of a qualitative (categorical) representation of spatial position
may be relevant for performance in many other spatial contexts and so might be also
extended to tasks which are less intuitively related to space, such as reading. Normal
reading is a complex componential skill that is susceptible to particular patterns of
breakdown after damage in relative isolation from other deficits. Because reading
encompasses visual processing as well as linguistic analysis, deficits in any of these
processes could give rise to reading disorder, such as visual dyslexia (Marshall &
Newcombe, 1973; Lambon Ralph & Ellis, 1997), neglect dyslexia (Kinsbourne &
Warrington, 1962; Ellis, Flude & Young, 1987; Behrmann et al., 1990), phonological
alexia (Derouesne & Beauvois, 1979; Funnel, 1983; Patterson, 1982), surface (Marshall
& Newcombe, 1973; Coltheart et al., 1983) and deep dyslexia (Marshall & Newcombe,
1973; Coltheart et al., 1980) etc. With respect to the possible role of spatial processing,
we will focus on phonological alexia.
39
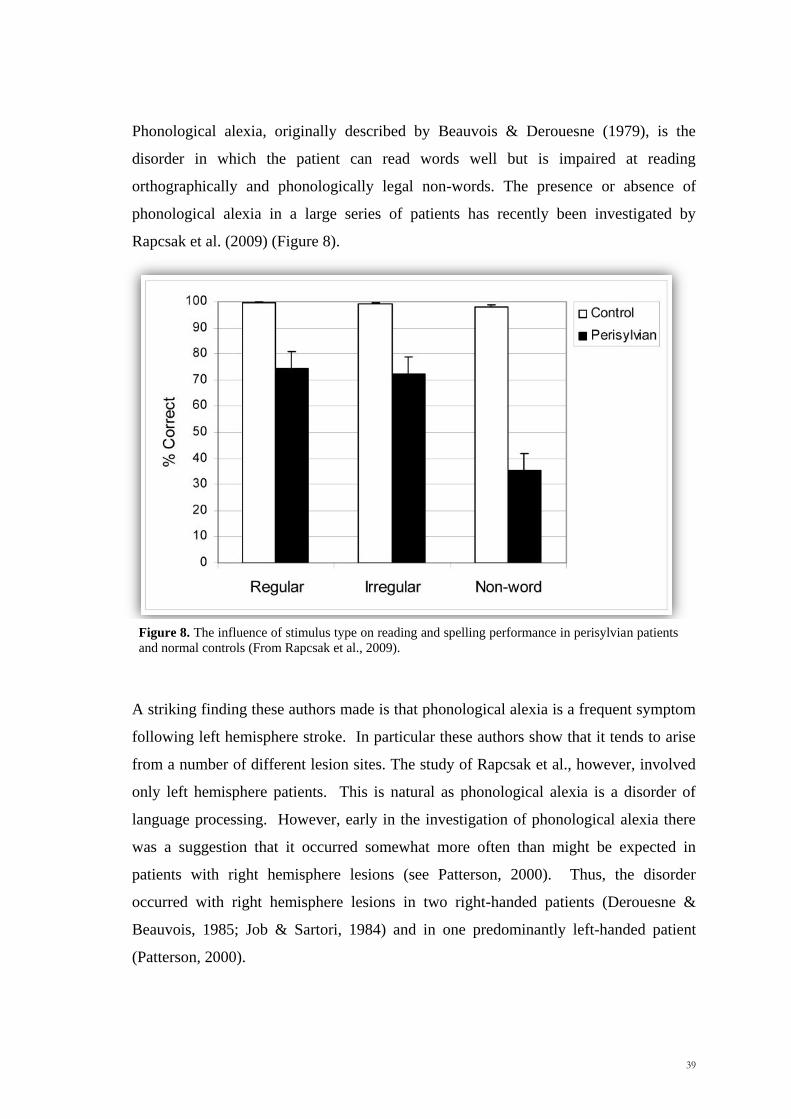
Phonological alexia, originally described by Beauvois & Derouesne (1979), is the
disorder in which the patient can read words well but is impaired at reading
orthographically and phonologically legal non-words. The presence or absence of
phonological alexia in a large series of patients has recently been investigated by
Rapcsak et al. (2009) (Figure 8).
A striking finding these authors made is that phonological alexia is a frequent symptom
following left hemisphere stroke. In particular these authors show that it tends to arise
from a number of different lesion sites. The study of Rapcsak et al., however, involved
only left hemisphere patients. This is natural as phonological alexia is a disorder of
language processing. However, early in the investigation of phonological alexia there
was a suggestion that it occurred somewhat more often than might be expected in
patients with right hemisphere lesions (see Patterson, 2000). Thus, the disorder
occurred with right hemisphere lesions in two right-handed patients (Derouesne &
Beauvois, 1985; Job & Sartori, 1984) and in one predominantly left-handed patient
(Patterson, 2000).
Figure 8. The influence of stimulus type on reading and spelling performance in perisylvian patients
and normal controls (From Rapcsak et al., 2009).

40
Why might this be? One possibility is straightforward. Neglect dyslexia has been
extensively described following right hemisphere lesions (e.g. Ellis, Flude & Young,
1987; Behrmann et al., 1990). Moreover in a study of Ladavas, Shallice & Zanella
(1997a) of 23 Italian patients with right hemisphere lesions selected for the occurrence
of neglect on standard tests, four presented with a neglect dyslexia for both words and
non-words, but nearly all the others presented with a dyslexia principally affecting non-
words, that is a form of phonological alexia. There is, however, at least one other
possibility. As we reported before (paragraph 1.3.2.1), it has been argued by Bricolo et
al. (2000) and Toraldo et al. (2004) that one aspect of spatial agnosia following right
hemisphere lesions involves the inability to qualitatively structure the relation between
objects in space. In processing a word, any putative ordering can be supported by units
that categorise the word-form as a whole (Morton, 1969; McClelland & Rumelhart,
1981), but in pronounceable nonwords the ordering of letters lacks this top-down
support. Could right hemisphere lesions disturb this process? We will further
investigate this issue in Chapter 6.
1.4 Using brain tumours in neuropsychological studies
In the previous sections we have provided an introduction to the types of the spatial
disorders to which a parietal lesion can give rise and how cognitive neuropsychology
can help at understanding the functioning of normal processes. As far as the
neuropsychological method is concerned, a wide range of conditions such as tumours
(gliomas, astrcytomas, metastases and meningiomas), traumatic head injuries, vascular
accidents (ischaemias and hasemorrhages) and dementing conditions might affect
cognitive functioning. A detailed consideration of the theoretical difficulties in
comparing neuropsychological studies, which make use of different lesion types, is not
the scope of this thesis. However, if one turns instead to issue of using brain damage to
identify the critical brain region associated to certain brain functions, it is clear that
each of these methods has been proved to be useful for the localisation of a cognitive
function, in most cases providing converging results. Nevertheless, while strokes are
generally assumed to produce focal effects, with the potential for selective cognitive
impairments, this is not univocally accepted for brain tumours. Within the

41
neuroscientific literature, brain tumours have been recently criticised as a method for
localizing critical regions for cognitive deficits (Karnath and Steinbach, 2011).
The scepticism is related to some problematic aspects of brain tumour. One of the main
criticisms is related to possible difficulties in determining the boundaries of the injured
brain tissue in brain tumours. Karnath and Steinbach (2011) claim that since the tumour
might extend far beyond the damaged visible area on MR scans, what appears as
normal in MR imaging, might be functionally impaired. Another aspect arguing again
the use of brain tumours for localizing cognitive processes is the possible functional
reorganization, which might follow low-grade gliomas. Thus, according to the authors,
the remodelling of the function might start even long before the tumour is diagnosed
and could lead to errors in the interpretations of the anatomo-functional relationship.
Finally, the cognitive effects could be weaker in comparison to those observed in
patients with stroke. All these methodological limits related to the tumour approach
drive Karnath and Steinbach (2011) to object the validity of the method in the
localization of cognitive processes. However, the claim that brain tumours are not a
valid method in the localisation of cognitive functions is for many aspects questionable
and it can be generalized to other lesion methods, such as vascular diseases (see
Shallice & Skrap, 2011; Duffau, 2011 and Bartolomeo, 2011; Bizzi, 2011; for a detail
discussion on the topic). Thus, neuropsychological studies with stroke patients can
suffer from different methodological limits ranging from possible neuroplasticity
mechanism to ‗invisible effects‘ in distant brain regions, as well as differences in
vascular territories. Vascular diseases usually affect older brains, which might altered
by a widespread disease process. Moreover, given the gross impairments which can
follow a stroke lesion, patients are frequently tested in a chronic phase, where
compensation strategies are, however, likely to occur (Bartolomeo, 1997). Finally, the
argument that brain tumours can give rise to invisible effects in brain region which
appear normal on MRI can be likely extended to stroke lesions too (Alexander et al.,
2010).
In certain cases, the occurrence of cognitive deficits following brain tumours
anticipated by many years those observed with stroke patients. Thus, some of the early
accounts of spatial disorders following brain damage were based on brain tumours. For
instance, Jackson (1876) observed that a patient following a right occipito-temporo-

42
parietal glioma extending to the hippocampus showed difficulties in route finding,
reading and face recognition. Based on this evidence, he argued a special role for the
posterior right hemisphere in recognition of objects, places and persons. The years that
followed brought further reports linking these cognitive processes to the right
hemisphere, in patients suffering from strokes (e.g. Dunn, 1895 p.54). Another possible
example comes from the study of Brain (1941), who discussed a patient with a tumour
in the right hemisphere. This patient showed impairments in localizing objects in near
space, but was accurate in estimate distance in near space. The result was nicely
replicated with stroke patients in more recent years (e.g. Berti and Frassinetti, 2000).
Moreover, what Karnath and Steinbach failed to confront is that studies with brain
tumour patients are consistent in the localisation of their cognitive effects with those
observed in previous works with different aetiologies (Shallice et al., 2010; Campanella
et al., 2010), demonstrating that they are useful for localizing cognitive functions. In
particular, in a recent study Shallice et al. (2010) demonstrated that the critical lesion
sites for recognition of Fragmented Letters (Warrington & James, 1991) and for optic
ataxia results nicely fit, regarding to the localization aspect, with previous brain
imaging (Fink et al., 1999) and neuropsychological studies with stroke patients (Perenin
and Vighetto, 1988; Karnath and Perenin, 1995). Similarly, a study with brain tumour
patients of Campanella et al. (2010) corroborated the findings of a voxel-based
morphometry work on patients with dementia (Brambati et al., 2006). Both studies
showed that the left posterior middle temporal regions could lead to deficits in naming
artefacts.
In summary, it is natural that each of the methods used in cognitive neuroscience have
their own strengths and weakness. Cognitive science is multidisciplinary in nature and
each of single approaches provides additional fodder for theories of brain function. If
one is aware of the possible limits of the method and the theoretical framework in
which the results stand, there is no reason to refrain from avoid one or another.
1.5 Aim of the thesis
Thus, to summarize, evidence from lesion studies on animals and humans confirm the
role of the posterior parietal cortex in representing and integrating spatial information
43
for acting in nearby space. But impairments in the spatial domain can be observed in
more complex spatial abilities such as mentally transforming objects in space or
predicting the spatial position of an invisible moving target.
Consistent with these themes, the present thesis will examine how damage to the
posterior parietal cortex can give rise to a complex set of spatial and action-related
disorders, compromising the ability to move around and think about space. In
particular, the current work will summarize four of the possible disruptive spatial
processing deficits arising from a brain tumour lesion, outlining what each syndrome
can tell us about the functional organization of the parietal cortex. More specifically,
the thesis will be focused on optic ataxia and possible functional dissociation among
reaching conditions (Chapter 2), hemispatial effects in integrating spatial and temporal
information in healthy subjects (Chapter 3) and after a parietal damage (Chapter 4),
mental transformation impairments as reflected by deficits in categorical and metric
processing (Chapter 5) and phonological dyslexia (Chapter 6).
From a methodological point of view, in this work we made use of an anatomically
based group study approach, comparing the performance of patients with lesions
occurring in different parts of the brain. In order to evaluate whether the performance of
the patients is significantly impaired, neuropsychological studies have traditionally
made use of both healthy controls (matched for age, education and gender) as well as
patients with the same or different aetiologies. However, in some studies, as when
dealing with patients following operations for brain tumours in the acute phase, healthy
subjects do not always represent the first choice for control and different approaches
can be adopted. This is because there are some factors that cannot be matched to the
healthy controls. Thus, having very recently had brain surgery produces psychological
and physiological stresses, which are not present in the normal population. Since it is
not always possible or easy to eliminate such confounding, in the thesis most analyses
were performed contrasting lesion groups. In particular, after selecting and dividing
patient according to the localization and the side of the tumour (e.g. prefrontal,
premotor, parietal), we first compared the performance across these groups. If a
significant effect was observed, we then compared the performance of each group of
patients with the others combined, thus providing evidence as to which is the critical
impaired group.

44

45
Chapter 2
Reaching a moving target: dissociations in brain tumour patients

46

47
2.1 Introduction
The general aim of this chapter is to investigate the ability to reach an object in
peripersonal space in three experimental conditions, namely (i) when patients can
directly fixate the static target with the eyes (foveal condition), (ii) when they have to
reach it in the periphery (extrafoveal condition) and (ii) when they have to adapt the
hand trajectory in flight with respect to a target shift (automatic pilot task). Specifically,
the first purpose of these next two experiments is to assess whether damage to the
posterior parietal cortex might specifically affect the ability to accurately reach an
object in space, leading to well-known reaching disorders such as optic ataxia (see
paragraph 1.3.1.1). As we mentioned before, since well-known cortico-cortical
connections between the parietal and the frontal regions exist (Battaglia-Mayer &
Caminiti, 2002; Averbeck et al., 2009), one might expect possible spatial impairments
also in patients following damage to other parts of the brain, such as the premotor one.
Moreover, these deficits might arise not only after bilateral damage as frequently
reported (Jackson et al., 2005; Pisella et al., 2000; Blangero et al., 2008), but also with
unilateral lesions (Perenin & Vighetto, 1988; Ratcliff and Davies-Jones, 1972). In the
present studies an anatomically based group study approach with unilateral brain
tumours affecting the left and right hemisphere of the prefrontal, premotor and parietal
cortex was used.
However, a more crucial purpose of these two first experiments is the assessment of
possible anatomical and behavioural dissociations among three of the more frequently
observed reaching impairments in optic ataxia, namely extrafoveal and foveal
misreaching and the inability to perform automatically movement adjustments (Pisella
et al., 2000; Grea et al., 2002; Blangero et al., 2008). At an individual level, the pattern
of single and double dissociations (Shallice, 1988) might support the existence of
separable components necessary to accurately act in near space, shedding light on the
possible cognitive mechanisms responsible for optic ataxia.

48
2.2 Experiment 1: Pointing to the periphery
In Experiment 1 we used a pointing task in which the patients were required to point as
quickly and accurately as possible toward a target in the periphery. The aim of the
current experiment was to test whether the patients suffered from OA.
2.2.1 Materials and Methods
Patients
53 patients less than 70 years old who were being operated on a cerebral tumour in the
left or right prefrontal, premotor and parietal cortex were tested in the Neurosurgery
Department (Santa Maria della Misericordia Hospital, Udine). In all patients the tumour
macroscopically determined in the MRI scan was removed. Of these 53 patients, 11
were excluded for the following reasons: (i) presence of multiple or bilateral lesions
(n=1), (ii) recurrence of the tumour (n=1), (iii) more than 40% of the lesion involved a
second relevant brain region (prefrontal, premotor or parietal) (n=5), (iv) eye-capturing
on more than 4 trials (n=6). All the remaining 42 patients underwent the experimental
assessment within one week of their operation. In this patient group, 18 patients had a
predominantly prefrontal lesion (8 right prefrontal, 10 left prefrontal), 9 a
predominantly premotor lesion (5 right premotor, 4 left premotor), and 15 a
predominantly parietal lesion (9 right parietal, 6 left parietal). A display of the
overlapping regions is shown in Figure 1. Patients were between 17 and 69 years of age
(mean age=46.55 years; SD=14.41 years). The mean educational level was 12.69 years,
SD 4.70 years. The mean lesion size was 41.40 ml (SD=32.61).

49
A - FRONTAL
B - PREMOTOR
C – PARIETAL
Figure 1. Overlapping lesion reconstructions for each of the prefrontal (A), premotor (B) and
parietal (C) brain tumour patients in Experiment 1 (extrafoveal task). The number of overlapping
lesions is illustrated by different colors coding increasing frequencies from violet (n = 1) to red (n = max.
number of subjects in the respective group).

50
Procedure and Stimuli
A 15-inch resistive high-resolution touch screen (3M) and a PC (Pentium 4, 3 GHz)
were used for the presentation of stimuli and to record the response of participants. All
patients sat in a normally lit room at a viewing distance of 50 cm from the display. The
starting hand position was aligned to the center of the display and located 40 cm away
from it. Each trial began with the presentation of a cross, which the patients were asked
to fixate. Randomly 1 or 3 s later, a white filled circle of 1.2 cm of diameter (target)
was presented on a black background. Patients were required to point as quickly and
accurately as possible to the target, while continuing to fixate the cross at the center of
the display (Figure 2). They were not allowed to move the head. Targets could appear
on the left or the right side of the fixation point with a horizontal visual angle ranging
from 2 to 20 degrees.
Figure 2. Experimental procedure. In all the trials patients were required to point as quickly as possible
to a target in the periphery, while keep fixating to the cross at the center of the dislay.
The target remained visible until the patient made a response and the next trial began
when the patient pressed the response pad. Patients were required to perform four
blocks of trials counterbalanced for hand (ABBA design, 48 trials in total). The same
number of targets was presented in both the left and right sides of the screen
(respectively left and right hemispace). Since patients were asked to fixate the center of
the screen and to point to the target in peripheral vision, in this task the left and the right
+
1s or 3s

51
hemispace also coincide with the left and the right visual field. Each session began with
a short practice (6 trials for the right hand and 6 trials for the left hand). During the task
the experimenter constantly monitored patients‘ eye movements in order to check for
breaks in fixation. Patients were discarded from the statistical analyses if they foveated
the target on more than four trials. Moreover, for each parietal patient the standard
clinical procedure for testing gaze apraxia was used. Patients were asked first to fixate
the examiner‘s finger and then to track with their eyes the movement direction of the
examiner‘s finger, which was moved from left to right and right to left. Since the time
available to test patients close to operation was severely limited, it was not practicable
to use eye tracking or hand monitoring apparatus, because they require much time to be
calibrated. In addition, fixing the head was not possible for clinical reasons.
Data analysis
Behavioral data
For each participant we calculated the mean Reaction Times (RTs), Movement Times
(MTs) and the accuracy. RTs were measured from the onset of the target to the release
of the response pad. MTs were measured from the release of the contact switch to the
moment at which patients touched the touch-screen. Accuracy was calculated as the
absolute distance in millimeters between the center of the target and the point of contact
on the touch screen. Trials were discarded if the RTs and accuracy were four SDs below
or above the grand mean of each participant or if the touch screen failed to record the
response of the patient. For all patients this accounted for less than 5% of trials.
For all the measures, we used the same statistical procedure, which involved three
levels of analysis:
1. We first selected and divided patients into three groups according to the
predominant location of the brain tumour (prefrontal, PreF; premotor, PreM,
parietal, Pa) and we compared the performance among the three groups.
2. If a significant overall effect was observed, we compared the performance of each
group of patients with those of the other two groups combined (e.g. Pa vs PreF
and PreM combined; in other words, Pa vs NonPa).
3. The same procedure was used in order to check for any possible hemispace/visual
field and hand effects, by considering the difference in terms of RTs, MTs and

52
accuracy between the controlateral hemispace or hand minus the ipsilateral
hemispace or hand (hemispace effect= C/I hemispace; hand effect= C/I hand).
4. Given the robust neuroscientific evidence about the role of the parietal cortex in
the online movement adjustments, we considered the parietal as the critical group
and we always check for laterality effects with this group. In other words we
always carry out a further analysis in what the performance of the left and the
right parietal patients are treated separately.
The raw data were first checked for normality using the Kolmogorov-Smirnov test and
for homogeneity of variance by applying the Levene test. As the data were not normally
distributed, non-parametric tests were used. The results were considered significant if
the P value was < 0.05 all the significant tests were two-tailed.
Anatomical data
The location and the extension of the tumour were carried out using a digital format
contrast-enhanced t1-weighted MRI scans obtained 1-7 days before operation using a
1.5T machine. The preoperative MRI scans were selected, as they are the scans
generally used by the neurosurgeon during the operation with the Neuronavigator as the
best indicator of macroscopic tumour extent. This allowed us to avoid any possible
confusion in draw lesions due to the replacement of neural brain tissue that occurs after
surgical removal. MRicro reconstructional software was used to extrapolate a 3D
representation of the lesion from digital MR scans (Rorden and Brett, 2000). The scans
and ROIs were normalized to the Montreal Neurological Institute template by using
SPM05b with 12 affine transformations and 7 x 9 x 7 basis functions.
2.2.2 Results
Absolute accuracy
First, a non parametric ANOVA across all the three groups on the average absolute
accuracy revealed that the three groups differed significantly [Kruskal-Wallis; x2
=21.09, P <.001] (See Figure 5). In order to identify a possible candidate impaired
group, we then contrasted the performance of each group of patients with the other two
groups combined. The parietal group was significantly less accurate than the other two
groups combined [Pa vs Non-Pa: U= 28, P <.001, Mann-Whitney test]. The prefrontal

53
group was significantly more accurate than the non-prefrontal patients [PreF vs Non-
PreF: U= 90, P =.001, Mann-Whitney test]. No significant differences in terms of
accuracy were observed between the premotor and the non-premotor group [PreM vs
Non-PreM: U= 100, P >.1, Mann-Whitney test]. No significant differences were found
for accuracy in pointing between left and right parietal patients [Mann-Whitney test, U=
23, P >.6]. The parietal group is clearly the critical group.
A non parametric ANOVAs contrasting the three group of patients was run to test
whether they differed in the degree to which they showed C/I hemispace and hand
effects for accuracy. The three groups differed in the degree of their C/I hemispace
effects [Kruskal-Wallis; x2 = 18.58, P <.001], but showed no differences in the C/I hand
effects [Kruskal-Wallis; x2 = 1.82, P >.4]. In particular, the parietal group was less
accurate than the non-parietal patients in pointing to the stimuli in the contralateral
hemispace [Mann-Whitney test, Pa vs Non-Pa, U= 39, P <.001]. Conversely, the
prefrontal and the premotor patient showed smaller C/I hemispace effects than the non-
prefrontal and non-premotor patients respectively [Mann-Whitney test, PreF vs Non-
PreF, U= 119, P <.02; PreM vs Non-PreM, U= 82, P <.05]. Again, the parietal group is
the critical group.
No lateralization effects in the C/I measure were observed when the parietal groups
were contrasted [Mann-Whitney test, U= 23, P >.6]. Thus, when accuracy in the left vs
the right hemispace was compared among the parietal patients, it was found that the left
parietal group was significantly less accurate in the right hemispace [Wilcoxon test, z= -
2.20, P <.05], whereas the right parietal patients were less accurate in the hemispace
[Wilcoxon test, z= -2.67, P <.01]. In addition, on comparing the performance of the
parietal patients when using the left or the right hand, only the right parietal patients
showed a hand difference being less accurate with the left hand [Wilcoxon test, z= -
2.43, P <.02]. A summary of the main results of the C/I hemispace and hand effects is
given in Table 1.

54
Reaction Times and Movement Times
RTs and MTs did not differ significantly across the three patient groups [Kruskal-
Wallis, RTs: x2 =.54, P >.7; MTs: x
2 =.39, P >.8] and no relevant hand and hemispace
effects were observed.
2.2.3 Discussion
The analyses on pointing accuracy showed that the parietal group was less accurate than
the non-parietal patients in pointing to targets to the periphery. Moreover, the parietal
patients showed a significantly greater hemispace effect of the contralateral over the
ipsilateral hemispace, but did not show an equivalent hand effect. Right parietal patients
were also less accurate when pointing to the left than the right hemispace and when
using the left rather than the right hand. The left parietal group was also more impaired
in the right than the left hemispace, but there was no significant difference for them

55
regarding the hand used. In line with the recent literature on optic ataxia, these findings
support the idea that the parietal group can be treated as the critical group.
2.3 Experiment 2: Automatic Pilot
In the second experiment we attempted to establish the cortical regions responsible for
correcting hand movements in flight. Each participant performed a simple pointing task
toward a stationary target, but on 33% of the trials the target moved to an unpredictable
position.
2.3.1 Materials and methods
Patients
A total of 52 patients less than 70 years old and hospitalized for an operation of a
cerebral tumour in the left or right prefrontal, premotor and parietal cortex were tested
in the Neurosurgery Department (Santa Maria della Misericordia Hospital, Udine). Of
these 52 patients, 6 were excluded for the following reasons: (i) multiple or bilateral
lesions (n=1); (ii) recurrence of the tumour (n=1); (iii) more than 40% of the lesion
involved a second relevant brain region (prefrontal, premotor or parietal) (n=4). All the
remaining 46 patients underwent the experimental assessment within one week of their
operation. In this patient group, 18 patients had a predominantly prefrontal lesion (11
left prefrontal, 7 right prefrontal,), 10 a predominantly premotor lesion (4 left premotor,
6 right premotor), and 18 a predominantly parietal lesion (6 left parietal, 12 right
parietal). A display of the overlapping regions is shown in Figure 3. Patients were
between 17 and 69 years of age (mean age= 47.85 years; SD= 14.43 years). The mean
educational level was 12.28 years, SD 4.93 years. The mean lesion size was 42.33 ml
(SD= 34.57). For each parietal patient the standard clinical procedure for testing gaze
apraxia was used (see p.51). On clinical testing no patient had problems in changing
fixation appropriately with the exception of slight vertical deviations in patient LPa5.

56
A - FRONTAL
B- PREMOTOR
C- PARIETAL
Figure 3. Overlapping lesion reconstructions for each of the prefrontal (A), premotor (B) and
parietal (C) brain tumour patients in Experiment 2 (automatic pilot task). The number of
overlapping lesions is illustrated by different colors coding increasing frequencies from violet (n = 1) to
red (n = max. number of subjects in the respective group).

57
Procedure and Stimuli
The apparatus was the same as that used for Experiment 1. The starting hand position
was aligned to the center of the display and located 40 cm away from it. Each trial
began with the presentation of the target, a white filled circle (1.2 cm diameter)
presented on a black background and randomly located on the display. After 1 second, a
sound warned the participants to point as quickly and accurately as possible to the
target, which remained visible until the patient touched it. In order to avoid slow
movements, a time constraint of 1.2 s was used after which the target disappeared.
Patients performed four sessions, in which the right and the left hand were used in an
ABBA order. A session was composed of 112 trials in which 56 trials were in the left
hemispace and 56 trials in the right hemispace, randomly presented. In 32 trials (16
trials for the left hand and 16 trials for the right hand; about 30% of the total for each
hand condition) the position of the target was randomly moved about 5 degrees to the
left, to the right, up or down from its initial position (Figure 4). In line with the
pioneering study of Pisella et al. (2000), the shift of the target was made at the
movement onset. Each session began with short practice trials (3 trials for each hand).
During the practice session, there were no shift trials. However, before starting the
experimental session, patients were informed that on some trials the target could move
to a new position and that they would need to adapt their ongoing movement to this
second new position. The eyes of the patients were positioned at the level of the center
of the display. Patients were informed that they were allowed to look at the stimuli and
to follow its movement with the eyes.
Figure 4. Schematic representation of the task in Experiment 2.
T
TARGET
WARNING SOUND
SHIFT (movement onset)
TIME

58
Data analysis
For all the measures, the same statistical procedures of Experiment 1 were used.
2.3.2 Results
Absolute accuracy
First, a non parametric ANOVA across all the three lesion groups on the absolute
accuracy in the non-shift condition revealed that the groups differed significantly
[Kruskal-Wallis; x2
= 6.13, P <.05]. In order to identify a possible candidate impaired
group, the performance of each group of patients was then contrasted with the other two
groups combined. The parietal group was significantly less accurate compared to the
other two groups combined [Pa vs Non-Pa: U = 142, P <.02; PreF vs Non-PreF: U =
183, P >.1; PreM vs Non-PreM: U = 139, P >.2; Mann-Whitney test]. Restricting
attention to the critical parietal group, the statistical analysis revealed no significant
differences in terms of accuracy in the non-shift condition between the left and right
parietal patients [Mann-Whitney test, U= 19, P >.1]. Regarding the C/I hemispace and
hand effects, only a hand effect was found when comparing the three groups of patients
[Kruskal-Wallis: x2 = 9.82, P <.01], but there was only a strong trend when the parietal
and the non-parietal patients were compared [Mann-Whitney test, U= 169, P <.07].
Second, we analyzed the accuracy shift costs across the three groups, which we defined
as the difference in terms of accuracy between the shift and the non-shift conditions.
Again, a statistically significant difference was found between these groups [Kruskal-
Wallis; x2 = 7.44, P <.05]. Using the same procedure as before we observed a
significant effect for the premotor group [PreM vs Non-PreM: Mann-Whitney test, U=
82, P <.01], with the premotor patients showing reduced shift costs effects with respect
to the non-premotor. There was a strong trend for the parietal group to show larger shift
costs than the non-parietal patients [Pa vs Non-Pa: Mann-Whitney test, U= 171, P
<.07]. No significant effects were found for the prefrontal group [PreF vs Non-PreF:
Mann-Whitney test, U= 235, P >.7]. When we compared the accuracy in the shift and
non-shift condition for each of the three patient groups, a significant difference was
found for the premotor group who were better in the shift condition [Wilcoxon test, z= -
2.50, P <.02]. No difference was found for either the prefrontal or the parietal patients
[Wilcoxon test, PreF: z= -0.59, P >.5; Pa: z= -1.41, P >.1]. An overview of the mean

59
accuracy of the prefrontal, premotor and parietal groups in Experiment 1 and
Experiment 2 is shown in Figure 5.
We also investigated whether the incidence of abnormal shift costs was affected by
hemispace and hand. On the basis of the distribution of shift costs for non-parietal
patients, the incidence of patients having abnormal shift costs in the left hemispace was
significantly higher for right parietal patients (5/12) than for the other five groups
combined (2/34) [Fisher‘s exact test, P <.01], but there were no equivalent effects for
the left parietal patients in the right hemispace (1/6) [Fisher‘s exact test, P >.3]. With
respect to the hand effects, the incidence of abnormal shift costs was significantly
higher in the right parietal patients only when the left hand was used (5/12) [Fisher‘s
exact test, right hand: P >.1; left hand: P < 0.05]. No hand effects were conversely
observed for the left parietal group with respect to the others combined [P >.1].
Figure 5. Absolute accuracy (means and standard errors) as a function of condition (pointing to the
periphery, non-shift accuracy and shift costs) and patient group. LPreF=left prefrontal; RPref=right
prefrontal; LPreM=left premotor; RPreM=right premotor; LPa= left parietal; RPa=right parietal).

60
In order to check for a possible relationship between the accuracy in the non-shift
condition and the accuracy shift costs a non-parametric correlation analysis was carried
out within each group of patients. A significant effect was observed for the parietal
group [Spearman‘s rho= 0.48; P <.05], but not for the prefrontal or the premotor groups
[Spearman‘s rho= 0.12 P >.1 and Spearman‘s rho=-.27 P >.2, respectively].
Considering the two parietal groups separately, the effects approached significance for
the right parietal [Spearman‘s rho= 0.56 P <.06], but not for the left [Spearman‘s rho=
0.31 P >.5].
Reaction Times and Movement Times
RTs did not differ significantly across the three patient groups [Kruskal-Wallis, x2 =
3.13, P >.2] and this was also true for the MTs in the non-shift condition [Kruskal-
Wallis; x2 = 1.27, P >.5]. There was, however, a significant difference between these
patient groups for the MTs shift costs [Kruskal-Wallis; x2 = 9.11, P <.02]. We therefore
contrasted the performance of each group of patients for this measure with that of the
other two groups combined. A significant difference was found between the prefrontal
and non-prefrontal patients [Mann-Whitney test, U= 134, P <.01], with the prefrontal
having the smaller MTs shift costs [PreF: mean= 6.53 msec, SD= 33.15 msec; Non-
PreF: mean= 7.96, SD= 32.26]. Conversely, the premotor group was found to have
higher MTs shift costs compared to the other two groups combined [PreM: mean=
39.61, SD= 14.99, Non-PreM: mean= 14.01, SD= 35.72; Mann-Whitney test, U= 89, P
<.02]. No significant differences were observed by comparing the MTs shift costs of the
parietal group with the non-parietal [Mann-Whitney test, U= 225, P >.5]. No laterality
effect was found in MTs shift costs in any patient group. No contralateral/ipsilateral
hand and hemispace effects were observed among the three groups of patients when we
considered the MTs shift costs.
When we compared the MTs for the shift compared with the non-shift conditions for
each of the three groups, we observed that the MTs were significantly slower in the
shift condition in both the premotor [Wilcoxon Signed Ranks Test, z= -2.80, P <.01]
and the parietal groups [Wilcoxon Signed Ranks Test, z= -2.55, P <.02], but not in the
prefrontal groups [Wilcoxon Signed Ranks Test, z= -.85, P >.3]. In other words, the
prefrontal patients failed to adapt the duration of their ongoing movements to the
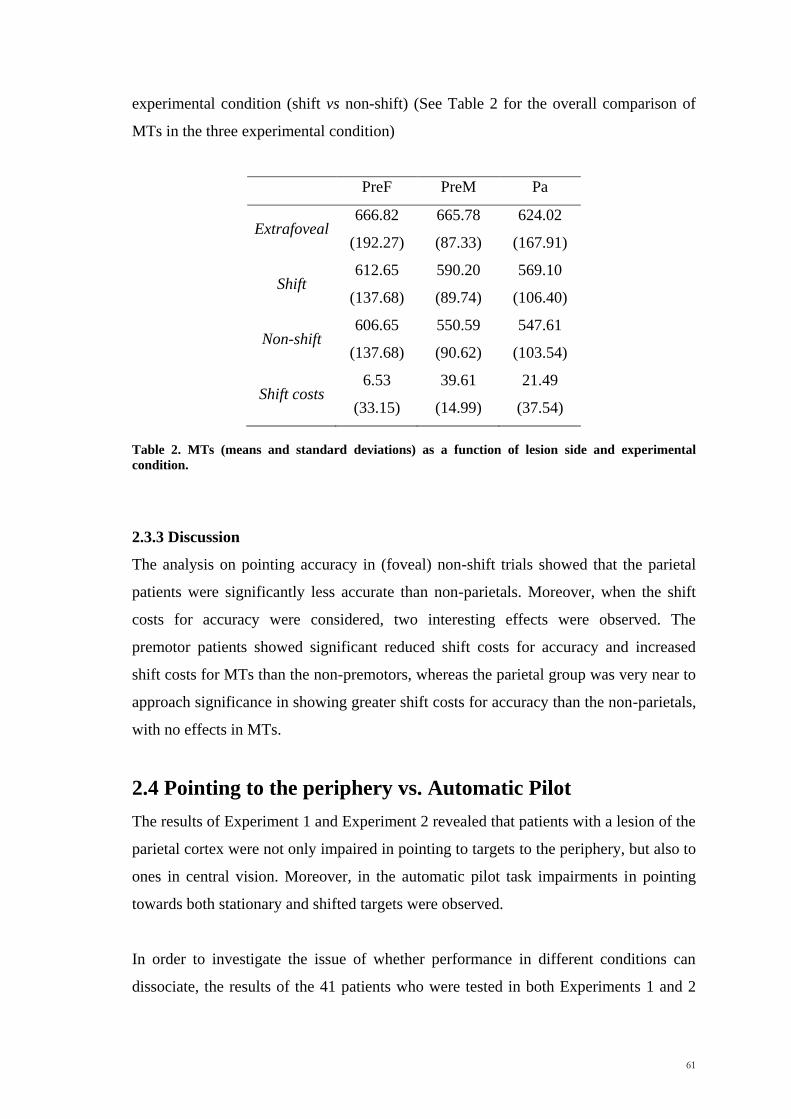
61
experimental condition (shift vs non-shift) (See Table 2 for the overall comparison of
MTs in the three experimental condition)
PreF PreM Pa
Extrafoveal 666.82
(192.27)
665.78
(87.33)
624.02
(167.91)
Shift 612.65
(137.68)
590.20
(89.74)
569.10
(106.40)
Non-shift 606.65
(137.68)
550.59
(90.62)
547.61
(103.54)
Shift costs 6.53
(33.15)
39.61
(14.99)
21.49
(37.54)
Table 2. MTs (means and standard deviations) as a function of lesion side and experimental
condition.
2.3.3 Discussion
The analysis on pointing accuracy in (foveal) non-shift trials showed that the parietal
patients were significantly less accurate than non-parietals. Moreover, when the shift
costs for accuracy were considered, two interesting effects were observed. The
premotor patients showed significant reduced shift costs for accuracy and increased
shift costs for MTs than the non-premotors, whereas the parietal group was very near to
approach significance in showing greater shift costs for accuracy than the non-parietals,
with no effects in MTs.
2.4 Pointing to the periphery vs. Automatic Pilot
The results of Experiment 1 and Experiment 2 revealed that patients with a lesion of the
parietal cortex were not only impaired in pointing to targets to the periphery, but also to
ones in central vision. Moreover, in the automatic pilot task impairments in pointing
towards both stationary and shifted targets were observed.
In order to investigate the issue of whether performance in different conditions can
dissociate, the results of the 41 patients who were tested in both Experiments 1 and 2
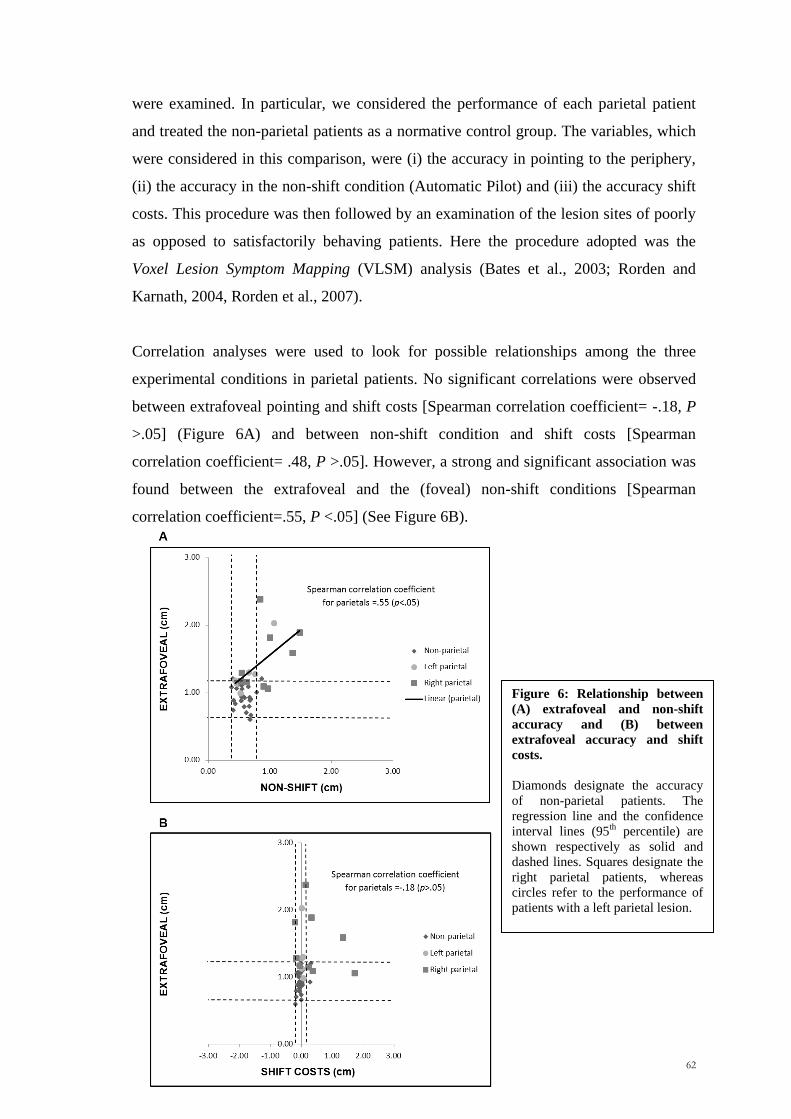
62
were examined. In particular, we considered the performance of each parietal patient
and treated the non-parietal patients as a normative control group. The variables, which
were considered in this comparison, were (i) the accuracy in pointing to the periphery,
(ii) the accuracy in the non-shift condition (Automatic Pilot) and (iii) the accuracy shift
costs. This procedure was then followed by an examination of the lesion sites of poorly
as opposed to satisfactorily behaving patients. Here the procedure adopted was the
Voxel Lesion Symptom Mapping (VLSM) analysis (Bates et al., 2003; Rorden and
Karnath, 2004, Rorden et al., 2007).
Correlation analyses were used to look for possible relationships among the three
experimental conditions in parietal patients. No significant correlations were observed
between extrafoveal pointing and shift costs [Spearman correlation coefficient= -.18, P
>.05] (Figure 6A) and between non-shift condition and shift costs [Spearman
correlation coefficient= .48, P >.05]. However, a strong and significant association was
found between the extrafoveal and the (foveal) non-shift conditions [Spearman
correlation coefficient=.55, P <.05] (See Figure 6B).
Figure 6: Relationship between
(A) extrafoveal and non-shift
accuracy and (B) between
extrafoveal accuracy and shift
costs.
Diamonds designate the accuracy
of non-parietal patients. The
regression line and the confidence
interval lines (95th percentile) are
shown respectively as solid and
dashed lines. Squares designate the
right parietal patients, whereas
circles refer to the performance of
patients with a left parietal lesion.

63
Using the dissociation framework of Shallice (1988), patients were classified as
displaying (i) a classical dissociation, if the patients were impaired in one variable, but
performed normally in the other, with a significant discrepancy on the RSDT between
performance on the two measures (eg. patient impaired in Task 1 and normal
performance in Task 2) or (ii) a strong dissociation, if they were impaired in both
variables but performed significantly better in one with respect to the other (eg.
impairment in both Task 1 and Task 2, but with patient being significantly worse in task
1). In the non-parietal groups, only one right prefrontal patient showed a classical
dissociation between the accuracy in the non-shift condition and the shift costs. The
performance of the parietal patents is shown in Appendix (Table 1).
Making statistical comparisons between the three experimental measures, we observed
a set of complementary double dissociations, which will be considered in turn.
2.4.1 Pointing to the periphery vs. Shift costs
Patients LPa5, RPa1, RPa7 and RPa8 showed a classical dissociation of impaired
pointing to the periphery and normal shift costs, whereas patient RPa 5 showed the
complementary classical dissociation performing normally in pointing to the periphery
but with increased shift costs. Complementary strong dissociations were also observed
between the two measures for patients RPa3 and RPa4, who showed a larger
impairment in pointing to the periphery (RPa3) than for shift costs (RPa4) respectively.
2.4.2 Non-shift pointing vs. Shift costs
When comparing accuracy in the non-shift condition and shift costs, again both
classical and strong dissociations were observed. Patients LPa5 and RaP8 exhibited
classical dissociations with increased misreaching in the non-shift condition compared
with normal shift costs. Patient RPa3 was significantly more impaired in the non-shift
condition than for shift costs. By contrast, patients RaP4 and RaP5 exhibited the
complementary strong dissociation, both being significantly more impaired for shift
costs than in misreaching in the non-shift condition.
For this particular comparison one can also examine the accuracy in the two conditions
directly. Thus, in each parietal patient we compared the difference in accuracy between
the shift and non-shift condition using the Wilcoxon Signed Ranks Test on individual

64
trials. RPa3 was found to be much more impaired in the non-shift condition than the
shift one [Wilcoxon Signed Ranks Test, z= -2.94, P <.005], whereas the reversed
pattern was observed for RPa4 and RaP5 [Wilcoxon Signed Ranks Test, RPa4: z= -
2.94, P <.005; RPa5: z= -4.31, P <.001, respectively]. No significant effects were
observed for patients LPa5 and RPa8 (See Table 1, Appendix).
2.4.3 Pointing to the periphery vs. Non-shift pointing
What should probably be considered as a trend dissociation has also been found
between pointing to the periphery and the non-shift condition (Shallice, 1988). Patients
RPa7 and RPa8 were significantly more impaired in the former condition. However, the
patients were impaired in both.
2.5. More specific anatomical corrispondences
2.5.1 VLSM analyses
With VLSM analyses we were able to provide evidence concerning the anatomically
location of the brain areas responsible for the reaching deficits without any a priori
grouping method. For the extrafoveal condition the main lesion responsible for reaching
impairments was quite extensive running from very superior parts of the posterior
parietal cortex to the white matter. (Figure 7B). This result is very similar to the results
of Shallice et al., (2010) with exception that in our work, the superior parietal cortex
involved is more lateral (see Figure 7A for comparison). On the other hand, the
common area for the shift costs was the precuneus and the white matter (Figure 7C). An
involvement of the more anterior white matter was observed for the non-shift condition
(Figure 7D). All these anatomical loci survived Bonferroni corrections.

65
A
B
C
D
A
Fig
ure
7:
(A)
Cri
tica
l ar
eas
der
ived
fro
m t
he
VL
SM
an
alyse
s fo
r th
e ex
traf
ov
eal
op
tic
atax
ia t
ask
(b
lue
and
vio
let
reg
ion
s),
fro
m S
hal
lice
et
al.,
20
10
;
and f
rom
our
stud
y i
n t
he
thre
e re
ach
ing
co
nd
itio
n, n
amel
y (
B)
Ex
traf
ov
eal
reac
hin
g,
(C)
Sh
ift
cost
s an
d (
D)
No
n-s
hif
t (f
ov
eal)
co
nd
itio
n.

66
2.5.2 Overlapping lesions of the critical parietal patients.
Considering the overlap of lesions of the critical patients for whom pointing to the
periphery is relatively speaking worse than their shift costs (Figure 8A), the cortical
structures damaged were the superior parietal lobe (SPL), the intraparietal sulcus (IPS)
and the angular gyrus. On the other hand when considering the overlap of lesions of
patients less impaired in pointing to the periphery compared with increased shift costs,
the cortical structures damaged were the precuneus (RPa5), the angular gyrus and the
inferior parietal cortex (RPa4) (Figure 8B).
Figure 8: Overlapping lesion reconstructions for each of the five parietal patients showing (A) greater
misreaching to the periphery than shift costs (LPa5=violet; RPa1=blue; RPa3=red; RPa7=cyan;
RPa8=green) and (B) greater shift costs than misreaching to the periphery (RPa4=red; RPa5=blue).
2.6 Hemispace vs. Hand effects
An approach similar to that used for detecting dissociations between experimental
conditions was also adopted for hemispace and hand effects. On this approach, for each
of the three experimental conditions we assessed the difference of the performance of
the individual patients on C/I hemispace and hand effects. This has been done first by
using the Revised Standardized Difference Test for the overall comparisons across
conditions for each patient; secondly a 2x2 (hemispatial x hand) ANOVA was run
within patients on the individual trials. Only if both types of analyses gave a significant
result, the effect was treated as real. As can be seen from Appendix (Table 2), we found

67
that two parietal patients (LPa5 or RPa3) consistently showed hand effects in the non-
shift condition (see Figure 9 for a pictorial representation).
Figure 9: Stimuli and reaching response of patient LPa5 (left and right hand) in the non-shift
condition (Experiment 2). Note the greater inaccuracies with the right hand independently of the visual
field.
Hemispace effects were conversely observed in pointing to the periphery for RPa8
(Figure 10) and in the shift costs for RPa4 (Figure 11). Moreover, looking in detail at
the performance of RPa4 in the shifted condition, no qualitative difference was
observed when the target shift to the left or to the right (left and right hemispaces
combined) (See Figure 12). In other words, the patient was less accurate in correcting
the hand trajectory in flight, independently of the visual field in which the target moved.
Figure 10: Stimuli and reaching response of patient RpA8 (left and right hand) in the extrafoveal
condition (Exp. 2). Dashes lines represent the left visual field, where there was the greater inaccuracy.
Left Hand Right Hand
PIXELS PIXELS
PIXELS PIXELS
Left Hand Right Hand
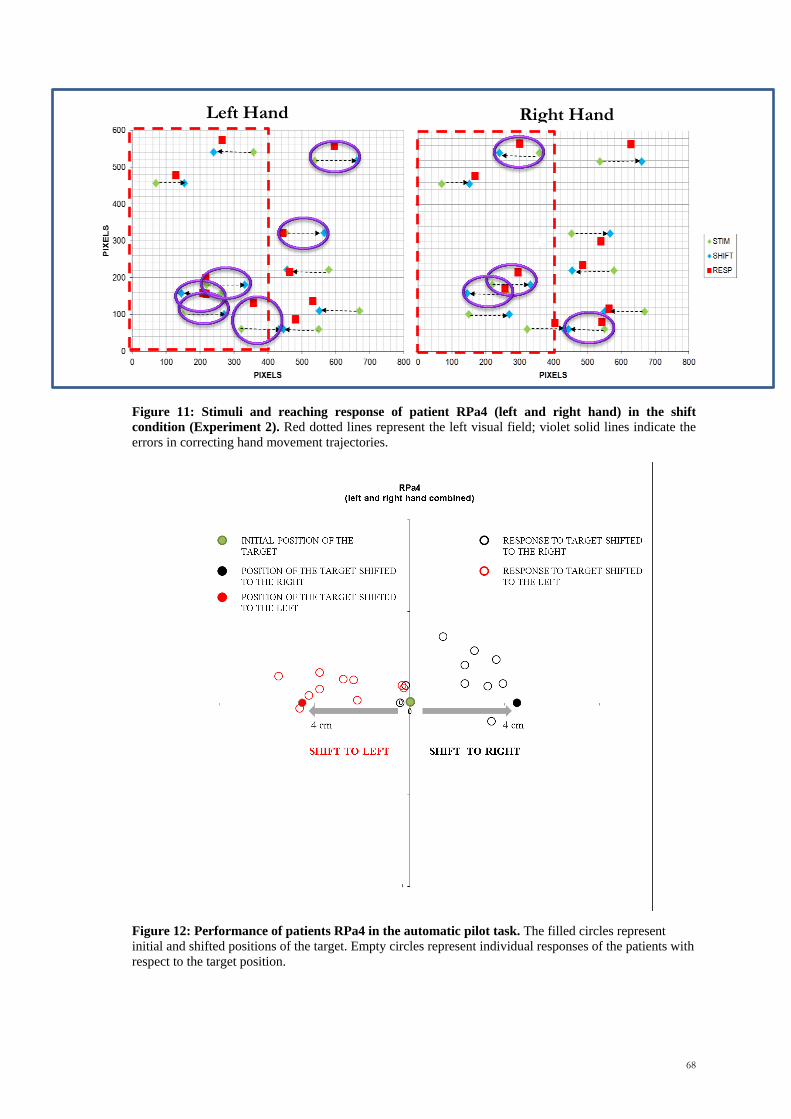
68
Figure 11: Stimuli and reaching response of patient RPa4 (left and right hand) in the shift
condition (Experiment 2). Red dotted lines represent the left visual field; violet solid lines indicate the
errors in correcting hand movement trajectories.
Figure 12: Performance of patients RPa4 in the automatic pilot task. The filled circles represent
initial and shifted positions of the target. Empty circles represent individual responses of the patients with
respect to the target position.
Left Hand Right Hand

69
2.7 General Discussion
In this study we aimed at investigating the role of the prefrontal, premotor and parietal
cortices in three experimental conditions concerned with reaching: i) pointing to the
periphery, ii) non-shift pointing toward stationary targets and iii) automatic hand
movement corrections (shift costs). It has long known that patients with a lesion of the
parietal cortex can develop OA. Most of the previous studies in the field have used
single-case methodology in patients having chronic bilateral lesions of the parietal
cortex and the performance of patients with frontal and premotor lesions has normally
not been assessed.
With respect to OA, it has frequently been observed that a lesion of the PPC might lead
to misreaching deficits, especially when the movement is performed in peripheral
vision. Moreover, several studies have suggested that the PPC is also a key structure for
performing fast movement corrections in flight, even in central vision (Desmurget et al.,
1999; Pisella et al., 2000; Grea et al., 2002; Blangero et al., 2008, Archambault et al.,
2009). However, only one study compared the performance of a single patient in both
extrafoveal and ‗automatic pilot‘ tasks (Blangero et al., 2008). Using an anatomical
group-study approach with patients having unilateral lesions of the prefrontal, premotor
and the parietal cortex we were able to confirm that misreaching effects occurs only for
patients with a parietal lesion. The parietal group has been found to be more inaccurate
than the non-parietal group on the two basic accuracy measures, namely in pointing to
the periphery (Experiment 1, paragraph 2.2, Chapter 2) and to non-shift targets
(Experiment 2, paragraph 2.3, Chapter 2). There was also a strong trend for them to be
more impaired when a fast correction of the movement trajectory was required
(Experiment 2, shift costs). Moreover, right parietal patients showed significantly
greater shift costs in the left hemispace and when the left hand was used. These results
are clearly in line with the extensive scientific literature on the importance of the
parietal lobe for visuomotor processing (Perenin and Vighetto, 1988; Buxbaum and
Coslett, 1998; Desmurget et al., 1999; Jackson et al., 2005; Pisella et al., 2000;
Archambault et al., 2009).
From a theoretical point of view, several hypotheses have been proposed to explain the
misreaching deficits in patients with a lesion of the parietal cortex. Based on results of a

70
single-case study they conducted, Pisella and colleagues (2000) suggested that the
parietal cortex is the key structure for performing fast movement corrections and that
OA can be related to a disruption of automatic hand guidance. From this perspective,
Blangero and colleagues (2008) developed a possible model of visuomotor
transformations in which the adjustment of the movement in flight is held to rely on two
independent spatial representations, that of the target (target representation) and that of
the hand location (hand location representation). The representation of the target would
be coded first in retino-centric coordinates and then used to update the planning of the
movement of the hand. The model predicts that somewhat different patterns of visual
field and hand effects can occur across different subjects, with visual field effects in
extrafoveal pointing arising from unilateral damage to the target representation
‗module‘ and hand effects to a hand location ‗module‘. In addition, non-shift pointing
impairments would be expected only when the system representing hand position is
damaged, since in that condition patients normally foveate before initiating reaching.
From this model, using the fMRI results of Prado (2005), Blangero et al. (2008) and
Pisella et al. (2009) made the following anatomical predictions, namely that (i) damage
to the target representation (located in the POJ) should lead to misreaching in peripheral
vision and also when the target suddenly jumps to the periphery, whereas (ii) damage to
the hand location representation (located in the mIPS) would produce errors in central
vision (in the absence of visual feedback of the hand).
Following the predictions of the Lyon group, one would therefore expect a significant
correlation between pointing to the periphery and shift costs and no correlation between
extrafoveal and (foveal) non-shift conditions. However, what the results of the present
work suggest is exactly the opposite. The results we observed in our parietal population
do not provide clear support for the model proposed by Blangero and colleagues (2008).
Correcting the hand trajectory in flight and extrafoveal reaching showed a
complementary classical double dissociation and no signs of significant correlation. By
contrast, when examining if associations were present between extrafoveal and foveal
(non-shift) reaching, a strong and significant correlation was observed. Moreover, no
patient exhibited a classical dissociation between the two conditions. There were two
patients who showed significant differences between the tasks (RPa7 and RPa8).
However, in both it was of the more over the less difficult condition. In other words,
there was no evidence that they do involve different processes.

71
The model proposed by Blangero and colleagues (2008) also faces some complications
regarding the visual field and hand effect in individual patients. Thus, for instance,
patient RPa8 shows an effect of visual field not only when pointing to the periphery,
which is expected from the model, but he also showed a hemispace effect in the non-
shift condition, which on the argument above should only give rise to a hand effect (see
Appendix). However, it may be possible to consider this patient as a different type as he
was one of only two to show evidence of magnetic misreaching (Carey et al., 1997,
Jackson et al., 2005). The possibility that the patient was affected by an eye-movement
disorder also cannot be completely excluded. However, one would then expect RPa8 to
be worse in the non-shift condition where an eye movement should occur compared to
the extrafoveal condition where it could not; in fact RPa8 showed the opposite pattern.
Moreover, none of the above patients showed neglect or spatial motor errors in clinical
tests such as Star Cancellation (Wilson et al., 1987), Matrix test performance (Spinnler
and Tognoni, 1987) and the Trail Making test (AITB, 1944), with the minor exception
of LPa5 on some Star Cancellation stimuli. More critically, patient LPa1 shows a hand
effect for shift costs but not in the non-shift condition, where it should primarily have
occurred on the model.
Moreover neurophysiological studies suggest that superior parietal neurons are
influenced by both eye-related and hand-related signals, although with a different
strength along the rostro-caudal dimension (Battaglia-Mayer et al., 2001, 2003; Ferraina
et al., 2001, 2009). According to this view, when a lesion in the neurons of the superior
parietal cortex occurs, what it is lost is not the eye- or the hand-related signal per se, but
the combinatorial property of the parietal neurons. From an anatomical point of view,
the results of the VLSM analyses strengthen the hypothesis according to which optic
ataxia, and in particular misreaching to the periphery, is mostly observed after lesions
of the SPL (Perenin & Vighetto, 1988; Shallice et al., 2010).
With respect to the misreaching deficits following parietal lesions, alternative
hypotheses have been proposed. For instance, Buxbaum and Coslett (1998) on the basis
of the reaching impairments of two OA patients held to be of foveal and non-foveal
subtypes claimed that the disorder can be explained by a failure of the visuomotor
transformation processes, which they held may be based on many different types of
representation frames (eg. eye-centred, hand-centred). However, damage to any

72
individual reference frame of this type, such as shoulder-centred, could not by itself
explain the existence of the common ‗non-foveal‘ subtype. They therefore propose an
additional assumption. ‗The actions of the eye and the hand may be linked by a
common system of spatio-motor coordinates‘, which could be damaged in non-foveal
OA (see also Carey et al., 2002).
Our results, however, throw light on a neglected point. Typically ‗non-foveal OA‘
relates to absolutely better performance at the fovea when accuracy is tested rather
crudely (eg. by the ability to grasp an object). However, control subjects are more
accurate at reaching to foveally represented than to non-foveal targets. When this
difference in the performance of control subjects is taken into account by the use of z-
scores, there are almost as many patients with impaired performance for foveal reaching
as for extrafoveal. As we mentioned before, classical dissociations between the two
types do not occur in our series. Instead what classically dissociates is the shift cost
from extrafoveal accuracy. The fact that what dissociates is the performance in the two
last conditions is intriguing because it suggests that two independent mechanisms might
be involved in reaching to the periphery and in adapting the motor trajectory on-line.
In parallel to the study of neurological patients, Archambault et al. (2011) investigated
the possible mechanism responsible for the online corrections of hand trajectories using
a multiple cell recording in monkeys. The authors examined the hand trajectories of
monkeys during (i) direct reaches and (ii) when an updating of the movement trajectory
was required (namely when the target was replaced by a second shifted target). The
authors observed that when asked to reach to a target, which suddenly jumps to another
spatial location at the movement onset, as in our study, the PPC was directly involved
in the implementation of the on-line movement adjustments. Moreover, time lags in the
neural activity led to the suggestion that the premotor cortex first encodes the command
for the correction of the motor plan, and then the parietal cortex estimates the
kinematics of the movement. In other words the parietal cortex implements the
trajectory, whereas the premotor cortex would have the important role of signaling the
need to update the hand trajectory. By contrast, we hypothesize that when asked to
reach for a stationary target, the involvement of the premotor cortex would not be
critical; subcortical structures could initiate the operation.
73
The existence of such an overall system could explain the dissociations observed
between intact pointing to the periphery and impaired shift costs. The premotor process
might involve the suppression of the initiated motor trajectory as suggested by
experiments with monkeys (Mostofsky and Simmonds, 2008) and on humans (Logan,
1994; Buch et al., 2010). Alternatively, it might simply signal to the PPC the need to
update the hand trajectory.
A quite common pattern of response in our study is a somewhat greater impairment in
misreaching in the periphery than in the non-shift condition and particularly in shift
costs. If the system determining the trajectory in the superior posterior parietal cortex is
damaged, one would expect that the determination of the movement trajectory would be
impaired in both non-shift conditions and when one points to the periphery and this is
frequently found in the parietal group. The occurrence of inaccurate pointing to the
periphery without either non-shift misreaching or greater shift costs could be explained
by somewhat reduced resources being available to the trajectory setting system. Indeed,
when performing a reaching movement to the periphery the spatial resolution is much
lower than in central vision; consequently greater resources would be required to set the
trajectory. If only reduced resources are available this could result in inaccurate
peripheral reaching. As far as the shift condition is concerned, the position of the target
was moved by only five degrees, a much smaller distance than for the more extreme
positions of the stimuli used in pointing to the periphery. Thus, the resources required
by the trajectory setting system in the shift situation would be much closer to those
needed in the non-shift condition. A somewhat reduced accuracy in both shift and non-
shift conditions would therefore be predicted with milder damage to the trajectory
setting system, but with a relatively small increase in the difference between them.
Therefore, when the trajectory setting system is damaged, impairment in misreaching is
more likely to be observed in pointing to the periphery than in shift costs, and this so for
5 parietal patients.
In the current study the complementary pattern also occurred. Two right parietal
patients were found to be more impaired in adjusting the hand trajectory online than in
pointing to the periphery. The behavior of one (RPa5) who had significantly greater
shift costs but no problem in pointing to the periphery should probably be distinguished
from that of other parietal patients having increased shift costs, from both the
74
anatomical and behavioral points of view. His increased shift costs were abnormal only
in the vertical dimension even for horizontal shifts of the target. The damaged cortical
region of RPa5 was centered on the right precuneus. However, RPa4, whose lesion
involved mainly the white matter underlying the inferior parietal lobe, showed a strong
dissociation between the two experimental conditions, with the shift cost impairment
being the more severe. His difficulties would fit with a disconnection of the
suppression/updating central system from that for the setting of the trajectory. A further
finding which fits the account we have just given based on the conceptual framework of
Archambault et al. (2011) is that patients with a premotor lesion were found to have
slower movement times in the shift condition compared with the non-parietal groups.
This slowing in movement times occurs only when top-down control is required, as
expected on the hypothesis.
There are some undoubted limitations in our study design. The approach adopted was
the study of patients very shortly after operation, as selective deficits resulting from the
operation can be most easly observed at such time (Shallice et al., 2010; Battaglini et
al., 1998). Due to the difficulties in carrying out studies with acute neurosurgical
patients who were just recovering from skull surgery, eye-tracker and motion-tracker
devices were not used in the current research. Then, also extensive calibration processes
would not be practicable with acute neurosurgical patients. Fixing the head is also not
clinically practicable. Thus, we were not able to assess important variables such as the
eye- and hand- trajectory and their spatial relations. However, the lack of quantitative
measurement of these variables did not allow us to investigate critical questions, such as
when and how the hand changed its trajectory with respect to the shift of the target and
also what role was played by the movement of the eyes. Moreover, in the absence of a
motion-tracker device, it is possible that we underestimated the number of patients
showing impairments in hand corrections, this can be also carried out by an explicity
two-step hand path (eg. Pointing to first target and only when close in time to it) In this
case, however, we should observe longer MTs, and we did not, with the exception of
the premotor patients) (See Table 2).
We were also not able to establish whether the time at which the target shifts to a new
position could reveal whether different cortical regions were important at different

75
stages of the trajectory correction processes across task epochs. By evaluating the
correlations in cell firing frequency in a single-step and a double-step reaching task,
Archambault et al. (2009) observed that a signal concerning the specification of the
future hand movement trajectory seems to emerge between 150 msec following the
presentation of the target and the shift in hand movement. Therefore, it would be
interesting to check the effects on the shift costs when the target shift is made during the
RTs and not only at movement onset.
Despite these potentially complications, we have shown that a variety of patterns of
misreaching can occur in parietal patients when pointing to the periphery and online
movement adjustments are considered. Our overall interpretation aims to combine the
approaches of Blangero et al. (2008) and of Archambault et al. (2011).

76

77
Chapter 3
Hemispatial effects on spatio-temporal integration

78

79
3.1 Introduction
Tracking and estimating the position of a moving target is a frequently used process.
Avoiding vehicles when walking across a road, passing the ball to a teammate and
catching a flying mosquito are all examples. To successfully predict the position of a
moving target both spatial and temporal processing are required. In particular, since the
prediction of the distance (s) covered by the target has to be made after extrapolating
the movement speed (v) and movement duration (t), a spatial-temporal computation (s=
v ∙ t) is needed. There is growing interest in where in the brain temporal and spatial
integration are represented and where spatio-temporal integration might occur.
There is scientific agreement about the critical role played by the right parietal cortex in
spatial processing. This idea has been confirmed by many neuropsychological studies,
which showed that patients following damage to the right parietal cortex can exhibit a
variety of impairment in the spatial domain (e.g. line orientation detection, mental
rotation, attention to the left hemispace). On the other hand, previous studies suggest
that different cortical structures can contribute to temporal processing. In particular, the
involvement of a specific brain region in time perception seems to strictly depend on
different experimental variables such as the task, the stimulus modality and the duration
of the temporal range. Previous lines of evidence suggest that brain structures such as
the prefrontal, the motor and the parietal cortex, as well as basal ganglia and the
cerebellum, are crucial for temporal processing ranging from millisecond to seconds
(Ivry, 1996; Rao et al., 2001; Lewis and Miall, 2003).
Clinically, temporal processing deficts are less common than spatial ones. However, as
Critchley nicely marked in the early ‗50s, impairements in both spatial and temporal
dimensions can emerge following a lesion of the parietal cortex. However, from an
anatomical point of view, the results of a previous neuropsychological study suggested
that the right hemisphere, and in particular the inferior parietal cortex as well as the
right prefrontal and premotor areas are necessarily implicated in time perception
(Harrington et al., 1998).
As far as spatial and temporal processing is concerned, another important issue is
whether different effects can be observed with respect to the side of space on which a

80
stimulus is presented. Perhaps the most dramatic examples can be found in studies
dealing with visuospatial attention and in particular with hemispatial neglect, a
syndrome in which patients fail to respond and orient to stimuli presented in the
contralesional hemispace. Lesions responsible for neglect usually involve the right
parietal lobe and can give rise to a defective accuracy when the spatial response has to
be made in the hemispace contralateral to the brain lesion. This impairment is strongly
related to the side in which the stimulus is presented and this can also be evident in
conditions in which patients are free to move their eyes, as when they read words on a
screen or when required to describe and mentally scan objects in the left part of a scene
as in the cloud experiments of Bisiach and Luzzatti (1978). A large number of findings
suggested that the boundaries of the neglected space are not only influenced by the
retinotopic reference frame, but also by other egocentric (e.g. head, trunk) and
allocentric (e.g. environment and object centred) coordinate systems. In particular, in a
pioneering study, Ladavas (1987) reported that patients with a right parietal lesion
showed a reduced responsivity and accuracy to stimuli that appear in a relative left
position, no matter which visual field was stimulated. In other words laterality effects in
neglect and healthy subjects not only relate to the visual field investigated but also to
the hemispace in which the response has to be made (Bächtold et al. 2000; Bowers and
Heilman 1980; Olivieri et al., 2009; Riddoch and Humphreys 1987). The hemispatial
effects not only relate to the representation of space, but can also be observed even for
magnitudes such as numbers and time. Thus it has been observed that low numbers are
associated with the left side of space and higher numbers with the right side of space
(Fisher et al., 2003; Casarotti et al., 2007). Similarly, temporal information seems to be
represented through an internal spatial reference frame, in which short durations are
processed faster for stimuli in the left side of space, whereas the longer ones are
processed faster for stimuli in the right hemispace (Vallesi et al., 2008; Ishihara et al.,
2008; Torralbo et al., 2006). However, wheter such effects arise from differences in
anatomical localisation of functions remains to be established.
Could the hemispatial effects also be extended to conditions involving spatio-temporal
integration? As we discussed previously (paragraph 1.3.1.2, Chapter 1), the question of
where in the brain spatio-temporal integration occurs has captured the attention of many
researchers. An increasing number of studies on this topic have appeared in the
neuroscientific literature in the last ten years. In particular, there are works supporting

81
the idea of a right parietal cortex superiority for a such kind of processes (Boulinguez et
al., 2003; Olivieri et al., 2009), whereas others claim that is the left parietal and not the
right which plays a critical role (Assmus et al. 2003, 2005; Coull et al., 2008).
Therefore, whether the integration of the spatial and temporal information occurs
predominantly in the right or in the left hemisphere or both is still an open issue. The
use of different experiment designs could partly account for the inconsistencies in the
previous results. In particular, experiments in which one has to be estimate whether a
collision would occur, such as the studies of Assmus et al. (2005) and Coull et al.
(2008), could require additional categorical cognitive processing, not only spatio-
temporal integration.
The aim of this study was to investigate further the issues of whether spatio-temporal
integration can take advantage from the hemispace in which it occurs. Unlike previous
studies, which make use of perceptual judgments such as decisions about collision
events or trajectory, we examined whether subjects can actively predict the position of
an invisible moving object, controlling for possible effects due to the direction of the
moving target and for the hand used. Moreover, this study has been conducted in
parallel with a neuropsychological one to examine the lesion site critical for the process
(Chapter 4).
3.2 Experiment 1
3.2.1 Methods
Participants
Three sets of sixteen healthy right-handed subjects were recruited for Task 1, Task 2
and Task 3. The ages ranged from 18 to 34 years. All the volunteers had normal or
corrected-to-normal vision, no past neurological or psychiatric history and used no
medication.
Apparatus and Stimuli
A schematic view of the apparatus is shown in Figure 1. The stimuli were presented on
a 19-inch resistive high-resolution touch screen (Elo). The monitor resolution was set to
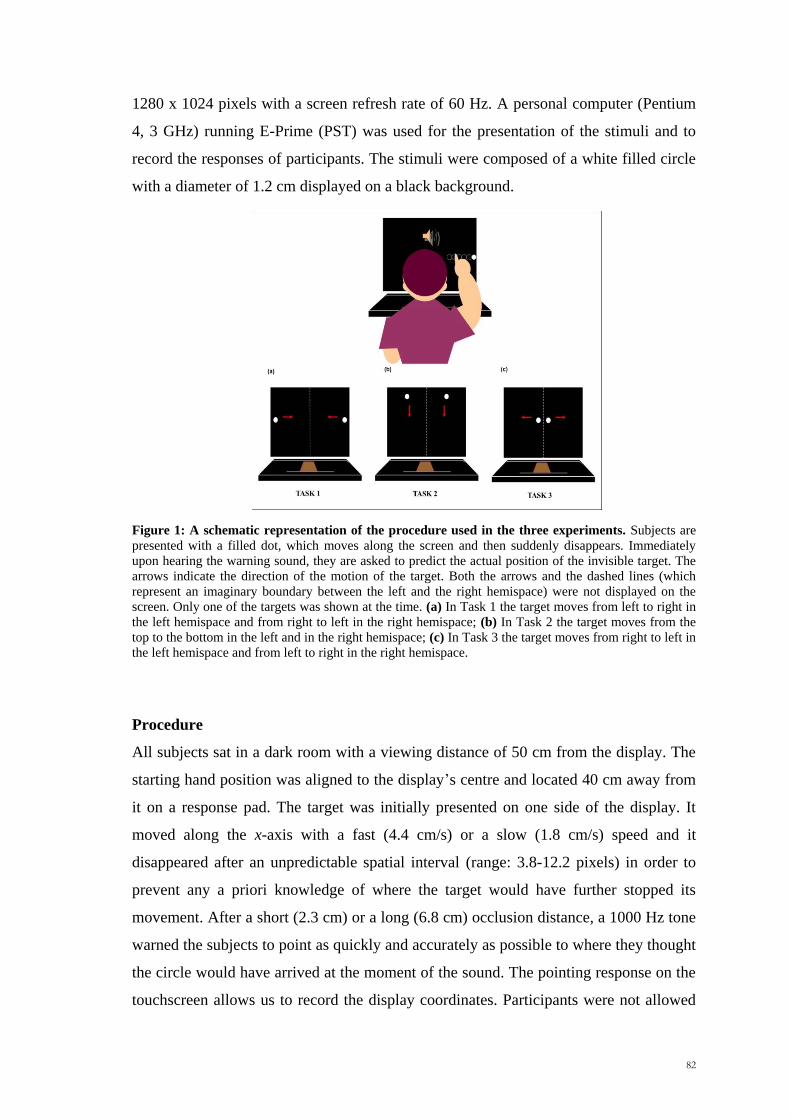
82
1280 x 1024 pixels with a screen refresh rate of 60 Hz. A personal computer (Pentium
4, 3 GHz) running E-Prime (PST) was used for the presentation of the stimuli and to
record the responses of participants. The stimuli were composed of a white filled circle
with a diameter of 1.2 cm displayed on a black background.
Figure 1: A schematic representation of the procedure used in the three experiments. Subjects are
presented with a filled dot, which moves along the screen and then suddenly disappears. Immediately
upon hearing the warning sound, they are asked to predict the actual position of the invisible target. The
arrows indicate the direction of the motion of the target. Both the arrows and the dashed lines (which
represent an imaginary boundary between the left and the right hemispace) were not displayed on the
screen. Only one of the targets was shown at the time. (a) In Task 1 the target moves from left to right in
the left hemispace and from right to left in the right hemispace; (b) In Task 2 the target moves from the
top to the bottom in the left and in the right hemispace; (c) In Task 3 the target moves from right to left in
the left hemispace and from left to right in the right hemispace.
Procedure
All subjects sat in a dark room with a viewing distance of 50 cm from the display. The
starting hand position was aligned to the display‘s centre and located 40 cm away from
it on a response pad. The target was initially presented on one side of the display. It
moved along the x-axis with a fast (4.4 cm/s) or a slow (1.8 cm/s) speed and it
disappeared after an unpredictable spatial interval (range: 3.8-12.2 pixels) in order to
prevent any a priori knowledge of where the target would have further stopped its
movement. After a short (2.3 cm) or a long (6.8 cm) occlusion distance, a 1000 Hz tone
warned the subjects to point as quickly and accurately as possible to where they thought
the circle would have arrived at the moment of the sound. The pointing response on the
touchscreen allows us to record the display coordinates. Participants were not allowed
83
to trace the target with the finger on the screen, but they were free to follow the target
with the eyes. Once they touched the screen, they were required to place the hand back
on the starting position. No response was collected if the hand left the response pad
before the tone. Apparatus, stimuli and design were the same in all three tasks, with the
exception of the direction of the moving stimuli. In Task 1 the target moved from left to
right in left hemispace and from right to left in right hemispace. In Task 2 the dot
moved from top to bottom in left or right hemispace. Finally, in Task 3 the target could
move from center to left or right, respectively in the left and the right hemispace. For
each individual task the same final positions of the moving targets were used, both for
the left and the right hemispace.
For each task, two separate block conditions were used in an ABAB design
counterbalanced over subjects: in one condition the circle moved in the left hemispace
and in the other condition the circle moved in the right hemispace. Subjects were not
aware of the fact that the target‘s final position was blocked for hemispace. Within the
block (Left or Right Hemispace), the two other variables (Occlusion distance: short or
long; Speed: fast or slow) were presented in a pseudo-randomized order. In total
subjects received 8 practice and 64 experimental trials. The approximate total duration
of each task was about 20 minutes. Feedback was provided about the position of the
target only during the practice session. No eye movement instructions were given.
Data Analyses
The raw data were first checked for normality using the Kolmogorov–Smirnov test and
for homogeneity of variance by the Levene test. When the data were not normally
distributed, non-parametric tests were used. The results were considered significant if
the p value was <.05. All the significant tests were two-tailed.
3.2.2 Results
RTs
In all the three tasks the analysis of response times indicated that the mean RTs were
shorter for long occlusion distances than for short (Wilcoxon Signed Rank Test, Task 1:
z = -3.10, p <.003; Task 2: z = -3.52, p <.001, Task 3: z = -3.36, p <.001). No other
significant main effects and interactions were observed (see Table 1 for comparison).

84
Absolute Accuracy
Absolute accuracy refers to the distance in cm between the position pointed to and the
position that the invisible target would have occupied at the moment of the warning
sound, given the constant speed and direction. In all the three tasks we found a main
effect for hemispace, with subjects being more accurate in the left than in the right
hemispace (Wilcoxon Signed Rank Test, Task 1: z = -2.17, p <.03; Task 2: z = -2.12, p
<.03; Task 3: z = -2.79, p <.005). In neither Task 1 nor Task 2 significant effects were
observed for the type of occlusion distance (Wilcoxon Signed Rank Test, Task 1: z = -
0.88, p >.30; Task 2: z = - 0.62, p >.50), whereas a significant difference was found
between the fast and slow speeds (Wilcoxon Signed Rank Test, Task 1: z = -2.82, p
<.005; Task 2: z = -1.97, p <.05), with subjects being more accurate in guessing the
position of the target when a slow speed was used. In these respects, the situation was
different in Task 3. The occlusion distance was found to affect the accuracy of the
subjects; they were more accurate in estimating the position of the target after a long
occlusion distance (mean: 1.21 cm, SD= 0.36 cm) than a shorter one (mean: 1.80 cm,
SD= 0.72) (Wilcoxon Signed Rank Test, z = -2.64, p <.010). In addition, no significant
difference was found between fast and slow speeds (Wilcoxon Signed Rank Test, z = -
.57, p >.50). See Table 2 for the overall results.

85
Under/Overestimations
The responses of the subjects were also considered in terms of overshooting (positive
sign, when pointing too far) or undershooting (negative sign). For all the three tasks, a
repeated measures analysis of the variance (ANOVA) showed a significant difference
between the two occlusion distances (Task 1: F1,15 =516.94, p<.001; Task 2: F1,15
=77.72, p<.001; Task 3: F1,15 =70.79, p<.001) with overestimation in the short
occlusion condition and underestimation in the long one. Moreover, in all the three
Tasks we found a significant Speed by Occlusion interaction (Task 1: F1,15 =18.48,
p<.003; Task 2: F1,15 =7.08, p<.03; Task 3: F1,15 =8.55, p<.03), with underestimations
being larger for fast speeds when long occlusions were used.
In Task 1 we also observed a significant Hemispace by Occlusion and Hemispace by
Speed interaction (respectively, F1,15 =25.68, p<.001 and F1,15 =23.45, p<.001), with
underestimations being larger for long occlusions and slow speeds when subjects made
the prediction in the right hemispace. Finally, in Task 1 we found a significant triple
interaction Hemispace x Occlusion x Speed (F1,15=6.88, p<.03) arising from the
Occlusion x Speed interaction being significant in the right hemispace (F1,15 =17.08,
p<.003) but not in in the left (F1,15 =4.00, p>.05). All the results are shown in Figure 2.

86
Figure 2: Under- and Over-shooting (mean and standard errors) for Task 1, Task 2 and Task 3. Negative errors represent underestimations, while positive errors represent overestimations. LHsp= left
hemispace, RHsp= right hemispace, Short= short occlusion distance, Long= long occlusion distance,
Fast= fast speed, Slow= slow speed.
3.2.3 Discussion
There were four main findings in the three tasks of Experiment 1.
First, the results showed that subjects were significantly better in estimating the
position of the target in left hemispace than in right, independently of the direction of
the movement of the target. The size effect was similar across the three studies. A
Kruskal-Wallis test comparing the size of the hemispace effect across the three tasks
was completely insignificant (p > 0.50). Moreover, since the target moved from left-to-
right in the left hemispace (Task 1), and also top-to-bottom (Task 2) and right-to-left
(Task 3), the left-to right reading habits of subjects cannot be the cause of the
hemispatial effects we observed in all the three tasks.
Second, in both Tasks 1 and 2 subjects were observed to be more accurate in estimating
the future position of the target when it moved with a slow speed. This result is in
accordance with previous studies suggesting that tracking slower moving objects is
easier than tracking fast moving ones (Franconeri et al., 2008). However, this sort of
effect was not found in Task 3, where subjects were equally good at predicting the
position of the target at different speeds. In addition, in Task 3 a significantly better
performance was observed when subjects predicted the final position after a long
occlusion distance, where the RTs of the subjects were also found to be significantly

87
faster. In Tasks 1 and 2 such an effect was not observed. The different effects of the
speed and the occlusion distance can be explained by methodological differences in the
three tasks. In Task 3 the target moved from the center to the left or to the right side of
the screen, covering the same spatial distance we used in the previous tasks. However,
unlike Tasks 1 and 2, the space available for placing the mark was smaller than in the
previous tasks. In other words, due to moving from the centre of the screen toward the
horizontal edges, the prediction is made from a smaller range. Therefore it seems
plausible that in Task 3 subjects were less error-prone when the invisible target moved
for a long occlusion distance, independently of the speed used.
Third, we found that the subjects were faster at estimating the position of the invisible
target when a long rather than a short occlusion distance was used. This result can be
explained in terms of a Variable Foreperiod (FP) effect, which relates to the readiness
of the subjects to respond to a GO signal. Many studies indicate that RTs are faster for
longer FPs than for shorter ones when they vary within a block (Karlin 1959; Vallesi et
al. 2007; Woodrow, 1914).
Fourth, we observed a general tendency of the subjects to overestimate the position of
the target for short occlusion distances and to underestimate it when long occlusions
were used, especially for fast speeds. A possible explanation for the overestimation of
the position of the target in the short occlusion condition might be in terms of
anticipatory smooth pursuit eye movements. Predictive eye movements anticipating the
motion of a pursued target have been documented in several studies (e.g. Kerzel et al.,
2001). Moreover, since the invisible target moved with a predictable direction and
speed, a smooth pursuit eye movement account might also explain the undershooting
for long occlusion distances. Indeed, it has previously been observed that when the
tracked target disappeared, the pursuit eye velocity of the subject decreases (Becker and
Fuchs, 1985). However, we cannot exclude other possible interpretations of the results,
such as an explanation in terms of an adaptation level effect. The adaptation level
theory (Helson, 1948) suggests that subjects judge stimuli, such as the occlusion
distance, in relation to an existing internal reference standard developed from the
preceding stimuli. The occlusion distance is therefore judged as long or short with
respect to the adaptation level. Moreover, stimuli that deviate in the opposite directions
from the adaptation level (long vs. short occlusion distance) are assumed to elicit the

88
opposite type of responses, one leading to underestimation and the other to an
overshoot. Responses are skewed by the context in which the stimuli are presented. In a
positively skewed context (where short occlusion distances occurred more often),
subjects can place the mark ahead of the actual position of the target. Conversely, in a
negative skewed context (long occlusions) they can place the mark behind (Parducci
and Wedell, 1986).
From the results of the three tasks, two other important questions arise:
1. Could all these effects depend upon the hand used to place the mark?
2. Do the laterality effects truly reflect a right hemisphere superiority in integrating
spatial and temporal information or are they related only to spatial processing?
We investigated these questions in Experiment 2 (paragraph 3.3) and Experiment 3
(paragraph 3.4) respectively. In Experiment 2 we asked subjects to perform the same as
Task 1 of Experiment 1, but using the left (non-dominant) hand. In Experiment 3 we
developed a pure spatial task in which subjects were required to remember the last
spatial position of a moving target after it disappeared for a short (1 s) or a long (3 sec)
temporal interval.
3.3 Experiment 2
3.3.1 Methods
Participants
Sixteen healthy right-handed subjects participated in Experiment 2 (9 males and 7
females, aged between 17 and 31 years). All had normal or corrected-to-normal vision,
no past neurological or psychiatric history and used no medication.
Apparatus, Stimuli and Design
Apparatus, stimuli, design and data analysis procedures were the same as Task 1 of
Experiment 1, with the exception of the hand used to place the mark. In this experiment
the subjects were required to use the left (non-dominant) hand.
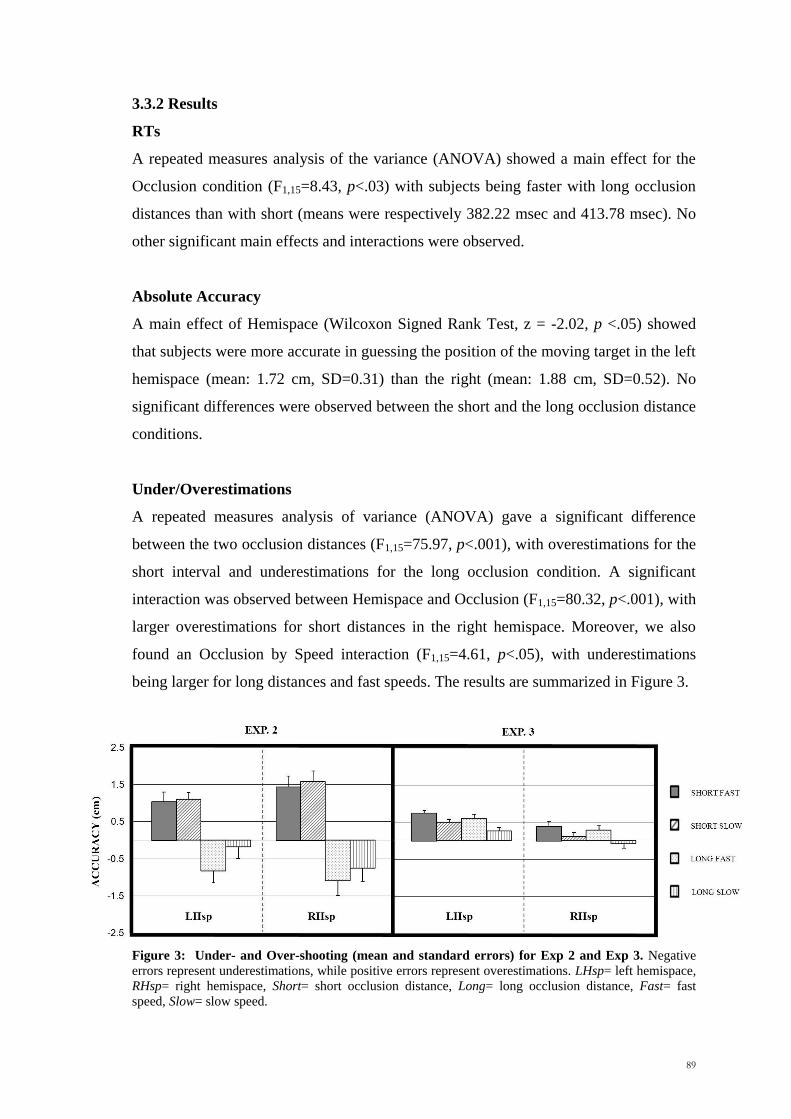
89
3.3.2 Results
RTs
A repeated measures analysis of the variance (ANOVA) showed a main effect for the
Occlusion condition (F1,15=8.43, p<.03) with subjects being faster with long occlusion
distances than with short (means were respectively 382.22 msec and 413.78 msec). No
other significant main effects and interactions were observed.
Absolute Accuracy
A main effect of Hemispace (Wilcoxon Signed Rank Test, z = -2.02, p <.05) showed
that subjects were more accurate in guessing the position of the moving target in the left
hemispace (mean: 1.72 cm, SD=0.31) than the right (mean: 1.88 cm, SD=0.52). No
significant differences were observed between the short and the long occlusion distance
conditions.
Under/Overestimations
A repeated measures analysis of variance (ANOVA) gave a significant difference
between the two occlusion distances (F1,15=75.97, p<.001), with overestimations for the
short interval and underestimations for the long occlusion condition. A significant
interaction was observed between Hemispace and Occlusion (F1,15=80.32, p<.001), with
larger overestimations for short distances in the right hemispace. Moreover, we also
found an Occlusion by Speed interaction (F1,15=4.61, p<.05), with underestimations
being larger for long distances and fast speeds. The results are summarized in Figure 3.
Figure 3: Under- and Over-shooting (mean and standard errors) for Exp 2 and Exp 3. Negative
errors represent underestimations, while positive errors represent overestimations. LHsp= left hemispace,
RHsp= right hemispace, Short= short occlusion distance, Long= long occlusion distance, Fast= fast
speed, Slow= slow speed.

90
3.3.3 Discussion
In line with the findings from the previous tasks we observed that subjects were more
accurate in guessing the position of an invisible moving target when the prediction had
to be made in the left rather than the right hemispace. Moreover, when we looked at the
qualitative nature of such errors (under- and over-estimations) we again observed a
main effect for Occlusion and a significant Occlusion by Speed interaction. The
subjects overestimated the position of the target for short occlusions and underestimated
for long occlusion distance, with the undershooting being larger for fast speeds. Since
the subject used the left and not the right (dominant) hand in the present study, we can
conclude that all these effects cannot be just be explained by the hand used to reach the
target.
3.4 Experiment 3
3.4.1 Methods
Participants
Sixteen healthy right-handed subjects participated in Experiment 3 (11 males and 5
females, aged between 21 and 32 years). All had normal or corrected-to-normal vision,
no past neurological or psychiatric history and used no medication.
Apparatus, Stimuli and Design
In Experiment 3 we used the same apparatus, stimuli and data analysis procedure used
in Task 1 of Experiment 1. The target appeared at one side of the screen and moved
along the x-axis with a fast (4.4 cm/s) or a slow (1.8 cm/s) speed. After an unpredictable
spatial interval the target disappeared for a short (1 sec) or a long (3 sec) retention
interval. Then, a 1000 Hz tone warned the subjects to point as quickly and accurately as
possible to where they thought the target had disappeared. As in the previous tasks, two
separate block conditions were used in an ABAB design counterbalanced over subjects:
in one condition the circle moved from left to right in the left hemispace and in the
other condition the circle moved from right to left in the right hemispace.
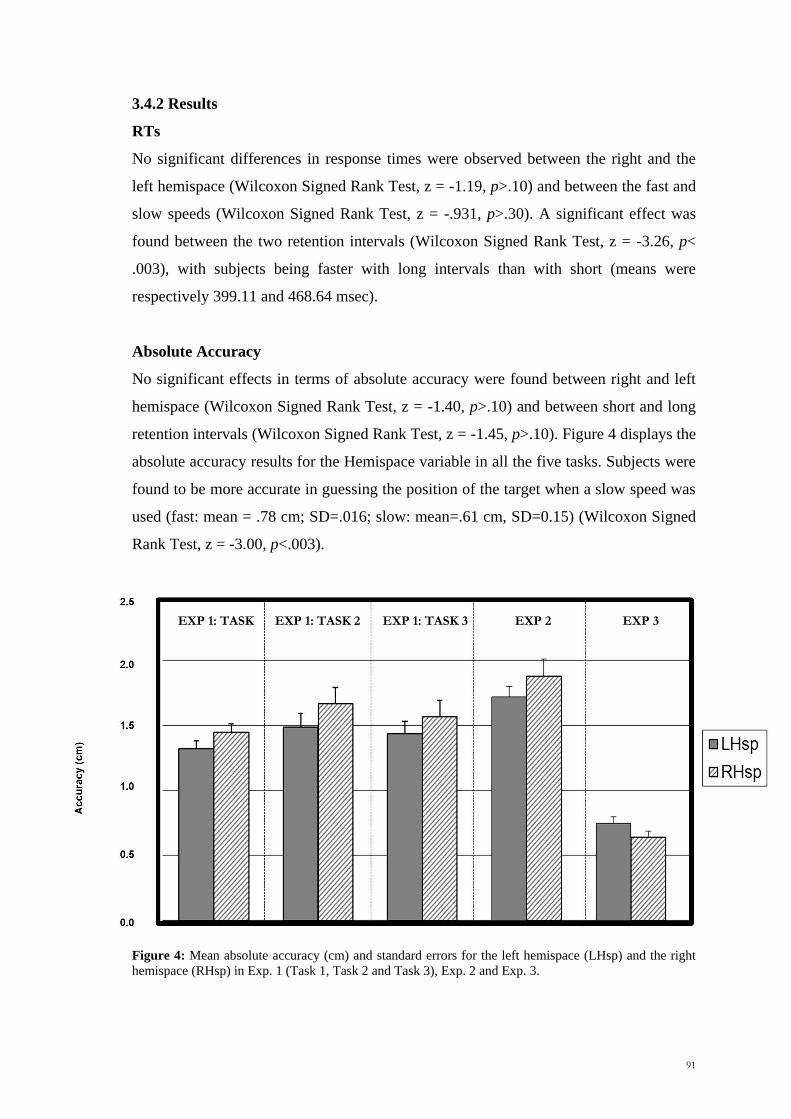
91
3.4.2 Results
RTs
No significant differences in response times were observed between the right and the
left hemispace (Wilcoxon Signed Rank Test, z = -1.19, p>.10) and between the fast and
slow speeds (Wilcoxon Signed Rank Test, z = -.931, p>.30). A significant effect was
found between the two retention intervals (Wilcoxon Signed Rank Test, z = -3.26, p<
.003), with subjects being faster with long intervals than with short (means were
respectively 399.11 and 468.64 msec).
Absolute Accuracy
No significant effects in terms of absolute accuracy were found between right and left
hemispace (Wilcoxon Signed Rank Test, z = -1.40, p>.10) and between short and long
retention intervals (Wilcoxon Signed Rank Test, z = -1.45, p>.10). Figure 4 displays the
absolute accuracy results for the Hemispace variable in all the five tasks. Subjects were
found to be more accurate in guessing the position of the target when a slow speed was
used (fast: mean = .78 cm; SD=.016; slow: mean=.61 cm, SD=0.15) (Wilcoxon Signed
Rank Test, z = -3.00, p<.003).
Figure 4: Mean absolute accuracy (cm) and standard errors for the left hemispace (LHsp) and the right
hemispace (RHsp) in Exp. 1 (Task 1, Task 2 and Task 3), Exp. 2 and Exp. 3.
EXP 1: TASK 1
EXP 1: TASK 2 EXP 1: TASK 3 EXP 2 EXP 3

92
Underestimation/Overestimations
As did for the previous tasks, also in Experiment 3 we looked at the existence of
possible directional errors (Results shown in Figure 3). In other words we checked
whether the response of the subject was directed towards the centre of the screen
(pointing forward with respect to the direction of the target) or away from the centre
(pointing backward). A repeated measures analyses of the variance (ANOVA) showed a
main effect for Hemispace, suggesting that the overestimations were larger in the left
than the right hemispace (F1,15=7.08, p<.03), namely when the dot moved from the left
to the right. Main effects were observed also for retention intervals (F1,15=21.04, p
<.001) and Speed (F1,15=48.62, p <.001). Subjects have been found to show larger
overshooting for short retention intervals and fast speeds.
3.4.3 Discussion
The main result of Experiment 3 was the lack of a laterality effect for absolute
accuracy. In other words, the subjects showed no significant differences in accuracy
between the left and the right hemispace, when required to perform a purely spatial task
such as remembering the last spatial position of a target. This ‗negative‘ result is in
contrast with any hypothesis that the results of Experiment 1 and 2 could be explained
just in terms of spatial processing per se and not by the need to produce spatio-temporal
integration. Interestingly, for long occlusions intervals the RTs to respond were over
100 msec slower in Experiment 3 than in the three conditions of Experiment 1. Thus,
the lack of better performance in the left hemispace could therefore also represent a
possible dissociation between responses mediated by the dorsal stream (Experiment 1)
and ones based partially on conscious judgements (possibly Experiment 3). In other
words, the right hemispare might have a critical role especially when an immediate
action response in a spatial task is required. Moreover, in contrast with the previous
tasks, we observed a general tendency to overestimate the position of the target with
errors being larger in the left hemispace, for short retention intervals and fast speeds.
The results can be explained in terms of a Representational Momentum Effect, a
memory distortion which has been first reported by Freyd and Finke (1984). When
observers are first presented with a stationary or moving target that vanishes without
warning and then asked to judge where the target has disappeared, observers have been
found to be more likely to indicate a point which is ahead of the actual vanishing point
in terms of the direction of the moving dot (for a review, Hubbard, 2005). This effect is

93
influenced by many factors such as the velocity, the direction of the target and the
temporal interval between the responses of the subjects and when the target vanished.
For instance, Hubbard and Bharucha (1988) reported that faster speeds led to larger
forward displacements, while Halpern and Kelly (1993) observed that the effect was
larger for targets presented in the left visual field. These results are consistent with the
data we reported.
3.5 General discussion
In the current study five tasks were run to investigate the probable lateralized spatial
effects on accuracy in estimating the position of an invisible moving target. The first
four main tasks differed from each other with respect to the direction of the moving
target within the display (Experiment 1: Task 1, Task 2 and Task 3) and to the hand
used (Experiment 2). Moreover, in the additional task (Experiment 3), subjects were
required to remember the final spatial position of a moving target after a temporal
interval of 1 or 3 seconds.
In Experiment 1 an analysis of the accuracy of the subjects revealed a significant main
effect of the hemispace variable, indicating that participants were more accurate when
they predicted the position of an invisible moving target in the left hemispace rather
than the right. This suggested that a right hemisphere superiority could exist for
spatiotemporal integration.
Our findings seem to be in contrast with those of previous fMRI studies in which
collision and trajectory judgments caused an increase in the neural activity of the left
parietal cortex (Assmus et al., 2005; Coull et al. 2008). However, it shoul be noted that
in both the latter experiments, healthy volunteers were required to judge whether the
stimuli would have collided or not by selecting and pressing the corresponding response
button. Therefore, one can claim that the left parietal activation is not directly related to
on-line spatio-temporal integration, but to conscious action selection and action
preparation. Interestingly, previous brain imaging studies showed that when the
selection of the movement is crucial for the task (e.g. as in a choice reaction time task),
an activation of the left parietal cortex could be observed, independently of the hand

94
used (Kawashima et al., 1993; Schluter et al., 2001). Conversely, this left hemisphere
dominance was not observed in a simple reaction time task, where brain activation was
contralateral to the hand used. Notwithstanding, our findings do not preclude a role for
the left parietal cortex in tasks other than the one used, the simple prediction of the
spatial position an invisible target would take over in time. In other words, predicting if
a collision would occur could require additional cognitive processes, not spatiotemporal
integration alone.
Conversely, the results fit well with the ATOM theory (Walsh, 2003), according to
which the right parietal cortex could have a role in the integration of spatial and
temporal information. Also findings with neglect patients support this view. Indeed,
patients with neglect following a right hemisphere lesion frequently show impairments
in temporal representation as well as spatial (Basso et al., 1996; Danckert et al., 2007;
Calabria et al., 2011). If the interpretation of the laterality effects as related to a right
hemisphere superiority for spatio-temporal integration is correct, we should have
observed a different pattern in patients with brain damage involving the right parietal
cortex. We will investigate this issue in the next Chapter (Chapter 4).
Finally, in Experiment 2 and Experiment 3 we demonstrated that the left hemispace
advantage for spatio-temporal integration could not be explained by a hand effect or by
a spatial processing per se. Indeed, the effect was still present when patients used the
left (non-dominant) hand and it was not present anymore when subjects were required
to remember the last spatial position of the moving target.

95
Chapter 4
Hemispatial effects on spatio-temporal integration: evidence from brain tumour
patients

96

97
4.1 Introduction
In Chapter 3 evidence has been provided that the right hemisphere plays an important
role in integrating spatial and temporal information. In particular, we observed that
subjects are generally more accurate in estimating the position of an invisible moving
target when the predicted position is in the left hemispace rather than the right. In
accordance with the theory of Walsh (ATOM; 2003) (see paragraph 1.3.1.2, Chapter 1
and paragraph 3.6, Chapter 3), the results were explained in terms of a right hemisphere
superiority for the process responsible for spatio-temporal integration.
In the study presented in this chapter, we have investigated this issue more directly in a
population of unilateral brain tumour patients with lesion occurring in the anterior or in
the posterior (parietal or parietal-occipital) regions of the brain. The specific aim is to
examine whether the laterality effects observed in healthy subjects will no be longer to
be present in patients with damage to the right posterior cortex.
Methodologically, a slight change to the procedure used in Task 1 of Experiment 1
(paragraph 3.1.2, Chapter 3) was made, due to the smaller size of the monitor that was
available for patient testing. In the left-to-right condition, patients track the visible
moving target in the left hemispace but need to predict the position of the no longer
visible target when it would be in the right hemispace. We refer to this as a right
hemispace (RHsp) effect. In a complementary fashion, in the right-to-left condition,
patients track the visible moving object in the right hemispace and respond when it
would be in the left hemispace (LHsp, left hemispace effect).
A pilot study with 16 healthy controls confirmed the validity of the new adapted task in
generating similar hemispatial effects to those observed in studies reported in Chapter 3
(see Figure 1). As before, subjects were more accurate in making the judgement about
the position of the invisible moving target in the left hemispace rather than the right
(Wilcoxon Signed Rank Test, z = -2.64, p<.01), with no significant differences in terms
of speed (Wilcoxon Signed Rank Test, z = -.36, p>.5).

98
Figure 1: Mean absolute accuracy (cm) and standard errors for the left hemispace (LHsp) and the right
hemispace (RHsp) in Experiment 4.
4.2 Methods
Participants
45 patients less than 70 years old who were being operated to remove a cerebral tumour
in the left or right frontal and parietal-occipital cortex were tested in the Neurosurgery
Department (Santa Maria della Misericordia Hospital, Udine). Patients were assigned to
the posterior group (Post) if the lesion primarily involved the parietal and/or the
occipital cortex, but not the motor, premotor or prefrontal cortices. Those with lesions
of the motor, premotor and/or prefrontal cortices have been included in the anterior
group (Ant). Of these 45 patients tested, 5 were excluded for the following reasons: (i)
multiple or bilateral lesions (n=1), (ii) recurrence of the tumour (n=1), (iii) hemiplegia
(n=3). All the remaining 40 patients underwent the experimental assessment within one
week of their operation. In this patient group, 25 patients had a predominantly anterior
lesion (12 left and 13 right) and 15 a predominantly posterior lesion (5 left and 10
right). A display of the overlapping regions is shown in Figure 2. Patients were between
17 and 67 years of age (mean age=47.75 years; SD=14.03 years).
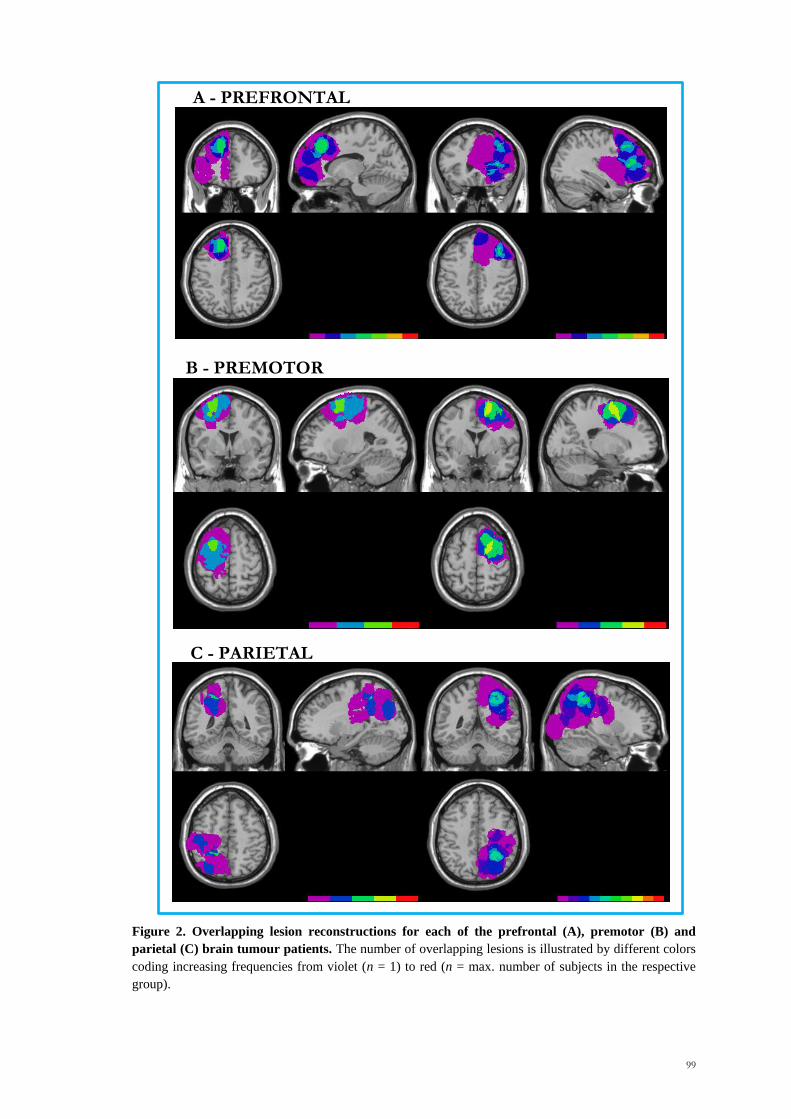
99
Figure 2. Overlapping lesion reconstructions for each of the prefrontal (A), premotor (B) and
parietal (C) brain tumour patients. The number of overlapping lesions is illustrated by different colors
coding increasing frequencies from violet (n = 1) to red (n = max. number of subjects in the respective
group).
A - PREFRONTAL
B - PREMOTOR
C - PARIETAL

100
The mean educational level was 12.88 years, SD 5.36years. The mean lesion size was
37.65 ml (SD=28.63). No significant differences were observed between groups for
lesion size (Kruskal-Wallis x2= .69, p =.88), age (Kruskal-Wallis x
2= 6.78, p =.08) or
educational level (Kruskal-Wallis x2= .90, p =.82) (Table 1, p.77). Any possible
disorder in the attention domain patients was assessed by the use of four standard tests:
Trail Making test (Giovagnoli et al., 1996), Attentional Matrices (Spinnler & Tognoni,
1987), Star cancellation test (Wilson et al., 1987) and the Balloons test (Edgeworth et
al., 1998). Moreover, for each parietal patient, the standard clinical procedure for testing
gaze apraxia was used (See Chapter 2, p.51).
Table 1: Age, educational level, lesion size (mean, SD) and gender distribution of
the four patient groups
Group Gender (M/F) Age Years of
education Lesion size (ml)
L Ant 8/4 50.25 (17.05) 12.25 (6.05) 33.92 (22.49)
R Ant 4/9 41.38 (11.41) 12.85 (4.28) 40.00 (36.47)
L Post 2/5 43.20 (11.19) 12.00 (5.61) 43.00 (16.23)
R Post 6/4 55.30 (1.29) 14.10 (6.24) 36.40 (31.61)
L Ant= left anterior, R Ant= right anterior, L Post=left posterior, R Post=right posterior
Apparatus, Stimuli and Design
A 15-inch resistive high resolution touch screen (3M) and a personal computer
(Pentium 4, 3 GHz) running E-Prime were used for the presentation of stimuli and to
record the response of participants. All subjects sat in a dark room at a viewing distance
of 50 cm from the display. The starting hand position was aligned to the display‘s
centre and located 40 cm away from it on a response pad. The target was initially
presented on one side of the display. It moved along the x axis with a fast (5.8 cm/s) or
a slow (2.3 cm/s) speed and it disappeared after an unpredictable spatial interval (range:
6.5-17.9 cm) in order to prevent any a priori knowledge of where the target would be
likely to stop its movement. After an 8.8 cm occlusion distance, a 1000 Hz tone warned
the subjects to point as quickly and accurately as possible to where they thought the
circle would have arrived at the moment of the sound. The final position of the invisible
target varied across trials in a range of about 11 cm from the centre of the screen. The
101
pointing response on the touchscreen allows us to record the display coordinates.
Participants were not allowed to trace the target with the finger on the screen, but they
were free to follow the target with the eyes. Once they touched the screen, they were
required to place the hand back on the starting position. No response was collected if
the subjects leave the response pad before the tone. Patients were required to perform
four blocks of trials counterbalanced for the moving direction of the dot (ABBA
design). In one block the dot moved from left-to-right in the left hemispace, in the other
one it moved from right-to-left in the right hemispace. As mentioned before
(Introduction, paragraph 4.1, Chapter 4), for the first type of stimuli patients predict the
position of the invisible target when it is in the right hemispace, whereas in the second
type they responded to where it should be in the left hemispace. Moreover, in contrast
with the previous experiments (Experiment 1 and 2, Chapter 3), only a long occlusion
distance was used. Within each block, the slow and fast speeds were presented in a
pseudo-randomized order. Each session began with a short practice (4 trials for the dot
moving left-to-right and 4 trials for the dot moving right-to-left). No eye-movements
instructions were given to the patients.
Data analysis
Behavioural data
For each participant we calculated the mean Reaction Times (RTs), Movement Times
(MTs) and the accuracy. RTs were measured from the onset of the target to the release
of the response pad. MTs were measured from the release of the contact switch to the
moment at which patients touched the touch-screen. Accuracy was calculated as the
absolute distance in millimetres between the real position of the invisible target and the
point of contact on the touch screen. Trials were discarded if the RTs and Accuracy
were four SDs below or above the grand mean of each participant or if the touch screen
failed to record the response of the patient. For all patients this accounted for less than
5% of trials.
For all the measures, we used the same statistical procedure based on that adapted by
Stuss et al. (2005), which involved two levels of analysis:
(i) We first selected and divided patients into four groups according to the side and the
predominant location of the brain tumour (left anterior, L Ant, right anterior, R Ant,
left posterior, L Post and right posterior, R Post) and we first compared the
102
performance among these groups. Three different measures were examined: (i) the
overall effects on RTs, MTs and absolute accuracy; (ii) the difference in terms of
accuracy, reaction times and movement times between the left minus the right
hemispace (LHsp-RHsp, hemispatial effect) and (iii) between fast minus slow speed
(Fast-Slow, speed effect). The results were corrected for multiple comparisons (p <
.017).
(ii) If a significant overall effect was observed at this level, we contrasted the
performance of each group of patients with those of the other groups combined (e.g.
R Post vs. L Ant, R Ant and L Post combined). In this way we were able to be more
specific about the location of any impairment with respect to our patient population.
The raw data were first checked for normality using the Kolmogorov-Smirnov test and
for homogeneity of variance by applying the Levene test. As the data were not normally
distributed, non-parametric tests were used. The results were considered significant if
the p value was <.05; all the significance tests were two-tailed.
Anatomical data
The location and the extension of the tumour were carried out using a digital format
contrast-enhanced t1-weighted MRI scans obtained 1-7 days before operation using a
1.5T machine. The preoperative MRI scans were selected, as they are the scans
generally used by the neurosurgeon during the operation with the Neuronavigator as the
best indicator of macroscopic tumour extent. This allowed us to avoid any possible
confusion in draw lesions due to the replacement of neural brain tissue that occurs after
surgical removal. MRicro reconstructional software was used to extrapolate a 3D
representation of the lesion from digital MR scans (Rorden and Brett, 2000). The scans
and ROIs were normalized to the Montreal Neurological Institute template by using
SPM05b with 12 affine transformations and 7 x 9 x 7 basis functions.
4.3 Results
4.3.1 RTs and MTs
The Kruskal-Wallis test showed no significant effect of the overall RTs and MTs
among the four groups of patients (RTs: x2=2.18, p =.54; MTs: x
2=2.57, p =.46;
Kruskal-Wallis test), as well as hemispatial (LHsp-RHsp, RTs: x2=1.80, p =.61; MTs:

103
x2=4.46, p =.22; Kruskal-Wallis test) and speed effects (Fast-Slow, RTs: x
2=2.26, p
=.52; MTs: x2=5.83, p =.12; Kruskal-Wallis test).
Absolute Accuracy
Absolute accuracy refers to the distance in cm between the position pointed by the
patient and the real position of the invisible target at the moment of the sound, given the
axis and the constant speed. A non-parametric analysis between the four groups of
patients revealed that they did not differ significantly in terms of overall accuracy (left
and right hemispace combined) (Kruskal-Wallis, x2=1.67, p =.64).
However, when considering the hemispatial effects, a significant difference between the
patient groups was observed (LHsp-RHsp Kruskal-Wallis, x2=10.32, p =.016). Then, in
order to identify a possible candidate impaired group, we contrasted the performance of
each group of patients with the other three combined. At this stage of analysis both the
left anterior and right posterior groups differed significantly from the other groups
combined (L Ant vs. Others: U=88, p =.017; R Ant vs. Others: U =169, p =.86; L Post
vs. Others: U =81, p =.81; R Post vs. Others: U =57, p =.003; Mann-Whitney test)
(Figure 3).
Since each of the left anterior and right posterior groups were part of the control group
for the others, and the effects were in opposite directions, it is possible that only one of
the two apparent effects is real, with the other arising from the composition of the
respective control group. We therefore repeated the analogous procedure removing the
Figure 3: A schematic
representation of the
procedure used in the
three experiments.
Subjects are presented
with a filled dot, which
moves along the screen
and then suddenly
disappears.
Immediately upon
hearing the warning
sound, they are asked to
predict the actual
position of the invisible

104
left anterior and the right posterior groups from the respective control group. On this
second round, only the right posterior group differed statistically from the other two
groups combined (R Post vs. R Ant+L Post, U=46, p =.008; Mann-Whitney test). The
difference observed between the left anterior and the other two groups was not
significant (L Post vs. R Ant+L Post, U=58, p =.17; Mann-Whitney test). This means
that only the right posterior effect is clearly genuine. Moreover, the right posterior
group was significantly worse than the other groups combined in the left hemispace, but
it was not in the right one (LHsp: U= 85, p =.043; RHsp: U=150, p =1).
No significant effects were observed between the four groups over possible speed
effects (Fast-Slow, Kruskal-Wallis: x2=.92, p =.82) (Figure 4).
Figure 4: Speed effects as a function of patients groups. Mean absolute accuracy (cm) and standard
errors for fast and slow speeds. L Ant= left anterior; R Ant= right anterior; L Post= left posterior; R Post=
right posterior.
Moreover, in order to assess the possible concomitant effects of attention disorders,
patients were also tested with four standard attention tests. The results of the right
posterior patient are given in Table 2. The performance of each patient was compared
with the normal norms. All the patients were within the normal range, with the
exception of RPa9, who showed impairments in the Attentional Matrices test.

105
Table 2: Results of the right parietal on the most directly relevant clinical tests.
Patient Sex.age
Lesion
volume
(ml)
LHsp
accuracy
(cm)
RHsp
accuracy
(cm)
Star
cancellation Balloons Trail
A
Trail
B
Attentional
Matrices L (27) R (27) L (10) R (10)
Rpa 1 F.62 71 3.03 2.63 25 22
Rpa 2 F.67 37 3.49 3.60
Rpa 3 F.53 21 1.48 1.80 50‘‘ 111‘‘ 53.75
Rpa 4 M.52 4 2.88 1.51 A: 9
B: 8
A: 10
B: 10 26‘‘ 77‘‘ 44.25
Rpa 5 M.65 65 4.36 2.85 A: 9
B: 10
A: 9
B: 9 58‘‘ 158‘‘ 49.25
Rpa 6 M.57 15 4.75 4.36
Rpa 7 M.67 7 1.25 1.88 27 27 45‘‘ 114‘‘ 52.25
Rpa 8 F.54 10 1.82 1.11 27 27 44‘‘ 194‘‘ 50.75
Rpa 9 M.31 97 2.10 1.77 25 24 52‘‘ 129‘‘ 30.25*
Rpa 10 M.61 12 2.23 1.78
*Significant impairment
Additional analyses were performed to assess possible correlations between the
performance of patients in the left and right hemispaces. Significant associations were
observed between the two measures in the non-parietal groups (Spearman correlation
coefficient =.76, p <.001) and in the right posterior group (Spearman correlation
coefficient =.65, p =.04), whereas no significant correlations between the accuracy in
the left and the right hemispace were observed for the left posterior group (Spearman
correlation coefficient =.40, p =.51). A significant correlation between the two
measures was also observed in normal controls in the Pilot Study (Spearman correlation
coefficient = .86, p <.001) (see Paragraph 4.1).
Underestimation/Overestimations
The responses of the patients were also considered in terms of overshooting (positive
sign, when pointing too far) or undershooting (negative sign). A repeated measures
analyses of the variance (ANOVA) with side and tumour location as between factors
showed a significant main effect of hemispace, with patients showing in general larger
overestimations in the right hemispace than in the left (F1,36 =11.16, p =.002).
Moreover, significant Hemispace by Group (F3,36 =4.79, p =.019) and Hemispace by
Speed (F3,36 =3.20, p =.035) interactions were observed. However, no significant

106
interaction were observed between hemispace effects and location of the brain tumour
(Hemispace*Group, F2,36 =1.93, p =.16).
4.4 Discussion
This study aimed to assess whether damage to the right posterior cortex can disrupt the
hemispatial effects we reported in normal subjects (Chapter 3). From a behavioural
point of view, there was a significant difference between groups with respect to the
hemispatial effect. The present work confirmed the results of Chapter 3 by
demonstrating that patients with a lesion involving the left anterior, right anterior and
left posterior cortex behave in a similar fashion to normal subjects with respect to the
hemispatial effects. However, the right posterior group showed a different pattern. They
were worse then the other patients in the left hemispace, but not in the right.
One way in which one might try to interpret the different pattern of results for the right
posterior group compared with the others is in terms of a right hemisphere superiority
for spatio-temporal processing (Walsh, 2003; Olivieri et al., 2009). According to this
hypothesis, damage to the right posterior cortex would impair the ability to integrate
spatial and temporal information, independently of whether the prediction has to be
made for the left or for the right hemispace. However, on a closer inspection, there are
suggestions that the effect observed in the right posterior group might not be simply
interpreted in this way. Thus, clear evidence for impairments in both hemispaces was
obtained, which is what one expects if the right posterior cortex is the only structure
involved in integrating spatial and temporal information.
Why might this specific pattern of results occur? It is possible that two factors operate
in spatio-temporal integration. One, in accordance with the theory of Walsh (2003), is
that the right posterior cortex has greater resources than the left one for integrating
spatial and temporal information. The second is that systems in each hemisphere
operate more effectively for stimuli in the contralateral than in its ipsilateral
hemispace. The overall model would be as shown in Figure 5. On this model, patients
with a right posterior lesion would be particularly impaired in the integration of spatial
and temporal information in the left hemispace. On the other hand, damage to the left

107
posterior cortex would have less effect on the performance of patients, since the right
posterior cortex would combine spatial and temporal information with respect to targets
in both the left and right hemispace.
This hypothesis is supported by the correlation analysis we performed. The strong
positive correlation between the accuracy in the left hemispace and the right hemispace
in both healthy (pilot study) and non-parietal patients supports the idea that spatial and
temporal information are combined in a single module (placed in the right posterior
cortex, in unimpaired subjects). Damage to the critical right posterior module would
lessen the correlation as the left posterior system would be partially responsable for
right hemispace effects, as there were suggestions of this effect in the right posterior
group (Spearman correlation coefficient = .65, p =.04). The correlation of the right
posterior group is in fact weaker than the non-parietals (Spearman correlation
coefficient =.76) and the normal controls (Spearman correlation coefficient =.86).
However, in the model proposed, significant correlations between the accuracy in left
and right hemispace should also be observed in the left posterior group. We failed to
find this positive association. Since the number of patients with left posterior lesion that
could be tested in the present study was very small (N=5), the model we propose clearly
needs to be tested by future studies.

108
One alternative hypothesis to explain the lower performance of the right posterior group
in the left hemispace is in terms of neglect. In the present study, clear signs of left
neglect were not observed in any of the six right posterior patients who were tested (see
Table 2, p.82). Moreover, no significant differences in RTs and MTs were observed
between the four groups of patients and more critically, no hemispatial effects in these
measures were found. Therefore, a possible role of neglect in the spatio-temporal
integration impairments remains only a remote possibility.
Of course, in this study we only investigated a single task, the most basic spatio-
temporal one. Other investigations would be needed to assess whether the spatio-
temporal system like the trajectory setting and reaching ones involved in optic ataxia
are influenced by the hand used. Conceivably, one could obtain effects analogous to
those we obtained with respect to hemispace. In addition, the possibility needs to be
considered that slowing up of RTs occurring in the spatial condition could lead to the
involvement of the ventral route.
109
Chapter 5
Two qualitatively different impairments in making rotation operations
Buiatti T, Mussoni A, Toraldo A, Skrap M, & Shallice T (2011). Two qualitatively different impairments
in making rotation operations. Cortex, 47(2): 166-179.

110
111
5.1 Introduction
In the previous chapters, processes underlying reaching and spatio-temporal integration
were investigated in detail. In this chapter we will focus on a more cognitive process,
such as mental rotation. The aims of the study reported in the current chapter are
twofold. A first purpose is to investigate whether a unilateral brain tumour occurring in
different part of the brain, such as the prefrontal, premotor and parietal cortex lead to
impairments in performing mental rotation operations. A second aim is to further
investigate the categorical-metric account (Kosslyn et al., 1989) by means of
neuropsychological tools (see paragraph 1.3.2.1, Chapter 1). For this purpose, we used
the experimental paradigm based on the previous work by Bricolo et al. (2000), which
required patients to remember the position of a dot inside an upright or a tilted frame of
reference and to reproduce it inside a subsequent identical upright reference frame after
the frame was re-oriented vertically.
In this work, we used different methods of analysis. The first traditional methodology
used was an anatomically based group study approach. In the initial comparisons,
following the procedure of Stuss et al. (2005), the relative performance of patients with
tumours in six different regions of cortex was contrasted. This analysis allowed us to
investigate the contaminating effects of variables such as lesion size and age. This
procedure was then followed by an examination of the lesion sites of poorly as opposed
to satisfactorily behaving patients. Here the procedure adopted was the Voxel Lesion
Symptom Mapping (VLSM) analysis (Bates et al., 2003; Rorden and Karnath, 2004,
Rorden et al., 2007). Finally, in order to validate the main findings of the group analysis
and to exclude any possibility that the pattern of responding observed was achieved by
chance, we also contrasted our empirical findings with a Monte-Carlo simulation study.
5.2 Methods
Patients
A total of 95 patients with a single circumscribed brain tumour confined in the left or
right prefrontal, premotor and parietal cortex were selected and tested in the
Neurosurgery Department (Santa Maria della Misericordia Hospital, Udine) within a
time period of about three years. Of these 95 patients, 40 were excluded by means of

112
the following criteria: (i) multiple or bilateral lesions; (ii) recurrence of the tumour; (iii)
hemianopia, severe neglect or right hand motor impairment, (iv) diagnosed stroke, head
injury or other neurological and psychiatric diseases. We performed the experimental
test on the remaining 55 patients (Tab. 1). All the 55 patients underwent the
experimental assessment within one week from their operation. Within this patient
group, 26 patients had a predominant prefrontal lesion (12 right prefrontal, 14 left
prefrontal), 13 a predominant premotor lesion (5 right premotor, 8 left premotor) and 16
a predominant parietal lesion (9 right parietal, 7 left parietal). A display of the
overlapping regions is shown in Figure 1.
Patients were between 20 and 70 years of age (mean age, 45.35 years; SD, 12.79 years).
The mean educational level was 11.27 years, SD 4.02 years. With respect to the
aetiology, 43 patients with glioma (17 high grade; 26 low grade), eight with
meningioma, three with metastases and one with an arteriovenous malformation (AVM)
were tested. Lesion volume mean was 46.76 ml, SD 35.83 ml. A significant difference
1 1 1
1 1 1
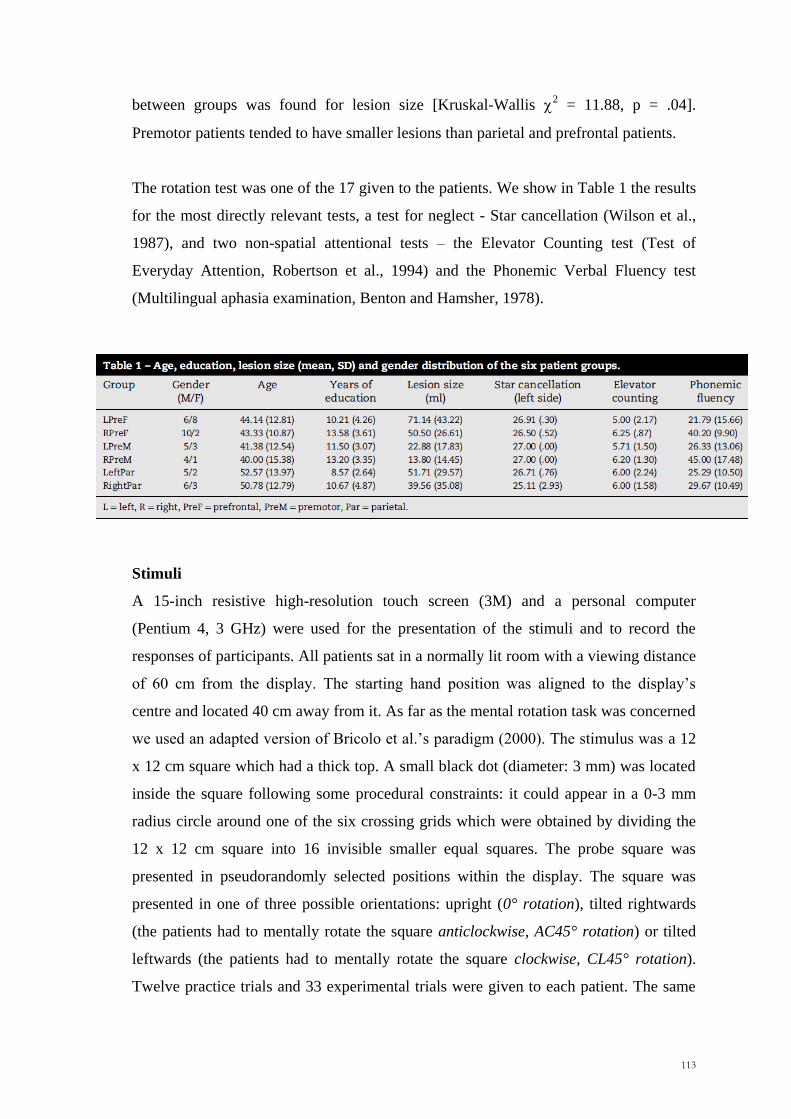
113
between groups was found for lesion size [Kruskal-Wallis 2 = 11.88, p = .04].
Premotor patients tended to have smaller lesions than parietal and prefrontal patients.
The rotation test was one of the 17 given to the patients. We show in Table 1 the results
for the most directly relevant tests, a test for neglect - Star cancellation (Wilson et al.,
1987), and two non-spatial attentional tests – the Elevator Counting test (Test of
Everyday Attention, Robertson et al., 1994) and the Phonemic Verbal Fluency test
(Multilingual aphasia examination, Benton and Hamsher, 1978).
Stimuli
A 15-inch resistive high-resolution touch screen (3M) and a personal computer
(Pentium 4, 3 GHz) were used for the presentation of the stimuli and to record the
responses of participants. All patients sat in a normally lit room with a viewing distance
of 60 cm from the display. The starting hand position was aligned to the display‘s
centre and located 40 cm away from it. As far as the mental rotation task was concerned
we used an adapted version of Bricolo et al.‘s paradigm (2000). The stimulus was a 12
x 12 cm square which had a thick top. A small black dot (diameter: 3 mm) was located
inside the square following some procedural constraints: it could appear in a 0-3 mm
radius circle around one of the six crossing grids which were obtained by dividing the
12 x 12 cm square into 16 invisible smaller equal squares. The probe square was
presented in pseudorandomly selected positions within the display. The square was
presented in one of three possible orientations: upright (0° rotation), tilted rightwards
(the patients had to mentally rotate the square anticlockwise, AC45° rotation) or tilted
leftwards (the patients had to mentally rotate the square clockwise, CL45° rotation).
Twelve practice trials and 33 experimental trials were given to each patient. The same
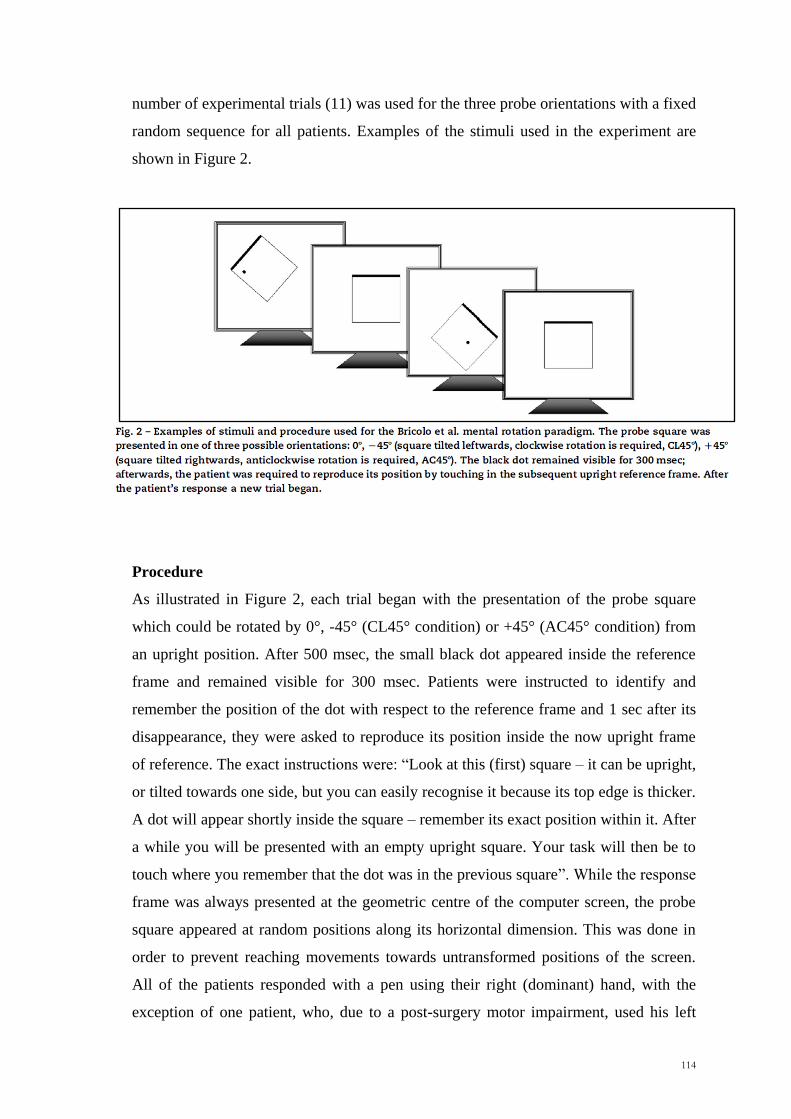
114
number of experimental trials (11) was used for the three probe orientations with a fixed
random sequence for all patients. Examples of the stimuli used in the experiment are
shown in Figure 2.
Procedure
As illustrated in Figure 2, each trial began with the presentation of the probe square
which could be rotated by 0°, -45° (CL45° condition) or +45° (AC45° condition) from
an upright position. After 500 msec, the small black dot appeared inside the reference
frame and remained visible for 300 msec. Patients were instructed to identify and
remember the position of the dot with respect to the reference frame and 1 sec after its
disappearance, they were asked to reproduce its position inside the now upright frame
of reference. The exact instructions were: ―Look at this (first) square – it can be upright,
or tilted towards one side, but you can easily recognise it because its top edge is thicker.
A dot will appear shortly inside the square – remember its exact position within it. After
a while you will be presented with an empty upright square. Your task will then be to
touch where you remember that the dot was in the previous square‖. While the response
frame was always presented at the geometric centre of the computer screen, the probe
square appeared at random positions along its horizontal dimension. This was done in
order to prevent reaching movements towards untransformed positions of the screen.
All of the patients responded with a pen using their right (dominant) hand, with the
exception of one patient, who, due to a post-surgery motor impairment, used his left

115
(non-dominant). The upright response frame remained visible until the participants
responded. When they pointed to the touch screen, the stimulus disappeared and the
experimenter started the next trial by pressing the spacebar. Patients were given four
practice trials for each orientation condition. Each session lasts about ten minutes.
Data analyses
Behavioural data: For the data analyses we employed an anatomically based group
study approach that was based on the Stuss et al.‘s 2005 procedure. The methodology
used to infer brain-behaviour relations involved three levels of analysis:
(i) We selected and divided patients into six groups according to the side and the
predominant location of the brain tumour (right prefrontal, RPreF; left prefrontal,
LPreF; right premotor, RPreM; left premotor, LPreM; right parietal, RPar; left
parietal, LPar) and we first compared the performance among these groups.
(ii) If a significant overall effect was obtained, we compared the performance of each
group of patients with those of the other groups combined (e.g. RPar vs. RPreF,
LPreF, RPreM, LPreM, and LPar combined). In this way we were able to be more
specific about the location of any impairment with respect to our patient
population.
(iii) If we found a significant effect at this level, we performed more detailed analyses.
We applied the following procedure of error classification to the data set of each
individual patient (Toraldo and Shallice, in preparation):
1. Errors. An error was assigned when the patient reached out to a point more than
1.5 cm away from the correct position. The 1.5 cm criterion corresponds to the
25% of the width of one of the four quadrants into which the 12 x 12 square was
divided for the qualitative analyses (see below).
2. Classification of errors in spatial categories. The reference frame was
considered as a square divided into four quadrants (top-left, top-right, bottom-
left, bottom-right) and we determined whether the target‘s position and the
wrong response of the patients were in the same or in a different quadrant. In
this way, each response was broadly classified as ―Correct Quadrant‖ (CQ,
response in the correct quadrant but more than 1.5 cm away from target
position) or as ―Quadrant error‖ (Q, response in an incorrect quadrant). A
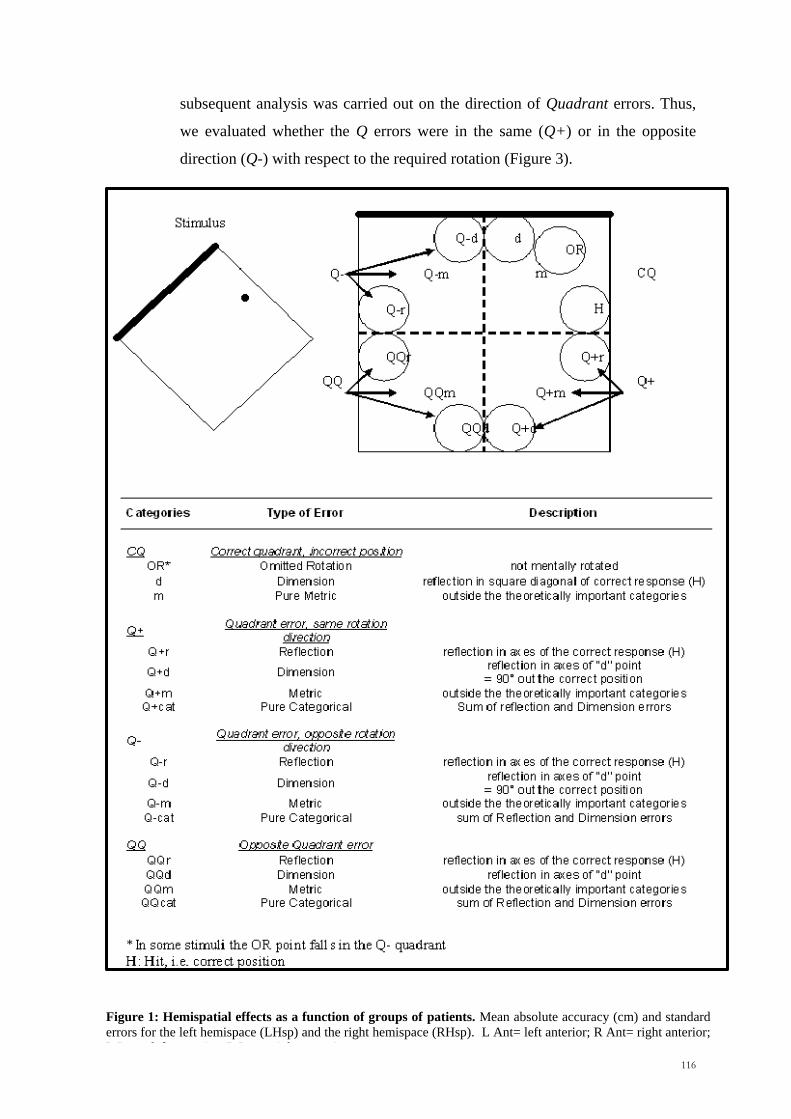
116
subsequent analysis was carried out on the direction of Quadrant errors. Thus,
we evaluated whether the Q errors were in the same (Q+) or in the opposite
direction (Q-) with respect to the required rotation (Figure 3).
Figure 1: Hemispatial effects as a function of groups of patients. Mean absolute accuracy (cm) and standard
errors for the left hemispace (LHsp) and the right hemispace (RHsp). L Ant= left anterior; R Ant= right anterior;
L Post= left posterior; R Post= right posterior.

117
In order to address the model put forward by Kosslyn et al. (1989), all responses were
further classified into a number of spatial subcategories, according to whether or not
the patient‘s response was close to (i.e., less than 1.5 cm from) theoretically important
positions within the frame of reference (see Fig. 3 for details)1. These positions were:
i. OR (Omitted Rotation). The OR position is where a patient would point
to, when no mental rotation at all has been applied to the square. In other
words, the position of the stimulus dot with respect to the square centre
has been reproduced, with no regard for the orientation of the frame.
ii. Cat (Pure Categorical): Qr (Reflection error), Qd and d (Dimension
errors). We defined the response of the patient as Qr error, when the
placed mark was in a reflection of the correct position with respect to the
horizontal, the vertical, or both axes of the square. A d error was
diagnosed when the mark was within the correct quadrant, but in the
position obtained by swapping the two vectors from the two closest
edges of the square; e.g. if correct position was 2 cm from the left edge
and 3 cm from the top edge, the d point was 3 cm from the left, and 2 cm
from the top edge. Qd positions were axes-reflections of the d position in
other quadrants. Interestingly, the Q+d and the Q-d points are exactly
90° away from the correct position in either direction with respect to the
reference frame. All these categories were collectively called ―Pure
Categorical‖ errors because they both preserve the metrics – the touched
position is at correct distances from the closest sides of the square – but
do not respect the categorical aspects of the representation. We first
analysed the general category – ―Pure Categorical‖ errors – and on a
following step we analysed Reflection and Dimension errors separately.
iii. m (Pure Metric). We called ―Pure Metric errors‖ those responses that
were located in the correct quadrant – thus indicating preserved
categorical processing – but well away (more than 1.5 cm) from all
theoretically relevant positions, i.e., the correct position (C), the d and
1 Disambiguation procedure. When more than one error category could be applied to a given response, we chose the closest theo- retical point to
classify it. For instance, if a patient responded 1.1 cm from the OR point and 1.3 cm from the Q-r point, we clas- sified the error as OR because the OR
point was the closer.

118
the OR points. This indicates selective damage to the metric component
of the processing.
iv. Qm (Quadrant and Metric error). We called ―Qm‖ errors those
responses located in an incorrect quadrant and outside all of the
theoretically important areas (d and r).
Kosslyn et al.‘s (1989) distinction between categorical and metric processing is best
characterized, in this error classification procedure, by classes (ii) and (iii) above, i.e.
―Pure Categorical‖ and ―Pure Metric‖ errors.
The raw data were first checked for normality using the Kolmogorov-Smirnov test and
for homogeneity of variance by the Levene test. As the data were not normally
distributed, non-parametric tests were used. The results were considered significant if
the p value was < .05. All the significant tests were two- tailed unless otherwise
specified.
Anatomical data: The pre-operative location of the tumour was carried out using a
digital format contrast-enhanced t1-weighted MRI scan obtained 1-2 days before
operation, using a 1.5T machine and a GRE-3D T1-weighted scan (TI 600 msec, TR
1400 msec, TE 31 msec, TH 1 mm, DF 1 mm); this image was selected as it is the scan
generally used by the neurosurgeon during the operation with the Neuronavigator as the
best indicator of macroscopic tumour extent. MRicro reconstructional software was
used to extrapolate a 3D representation of the lesion from digital MR scans (Rorden and
Brett, 2000). The boundary of a lesion was drawn as a region of interest (ROI) on each
sagittal slide in collaboration with the neurosurgeon and a neuroradiologist, who did not
know the behavioural results, so as to limit the lesion‘s boundary to the brain tissue
removed during the surgical approach. The scans and ROIs were normalized using
SPM05b with 12 affine transformations and 7 x 9 x 7 basis functions. Each patient‘s
lesion was referred to an anatomical template image AAL (Automated Anatomical
Labelling) (Tzourio-Mazoyer et al., 2002), a macroscopic anatomical parcellation of
MNI volume (Collins et al., 1998). Afterwards, the Voxel-based Lesion-Symptom
Mapping analyses were run. The procedure allows one to use the statistical relation
between behavioral data and the specific voxels affected by the lesion without grouping

119
patients for lesion location or relying on behavioral cut-offs (Bates et al., 2003; Rorden
and Karnath, 2004). The Non-Parametric Mapping software (NPM) (Holmes et al.,
1996) was used to run the Brunnel-Munzel test (Brunner and Munzel 2000) and
compute a statistical map for continuous variable results (Rorden et al. 2007). The
results are shown using Bonferonni corrected significance values, requiring a minimum
of three patients affected for a voxel for it to be included.
5.3 Results
The Background variables were analysed first. No significant differences were found
among the six groups for educational level [F(5,48) = 1.6, p = .18] and age [F(5,48) =
0.77, p = .57]. We also studied the effects of the variables on performance in our
experimental task. Age did not significantly influence error rate in the two rotation
conditions combined [F(1,46) = 1.13, p = .29, with error rate being normalized by a log-
transformation]. A significant effect of educational level on error rate was, however,
found [F(1,46) = 4.77, p = .03].
Overall error analysis
An exploratory analysis was performed by comparing the overall number of errors in
the rotation conditions (CL45° and AC45° combined) and in the non-rotation condition
(0°). The average number of errors was greater for the CL45°/AC45° conditions
combined than for the 0° condition. This result was significant for almost all patient
groups [LPreF: z = -2.94, p = .002, RPreF: z = -2.49, p = .007, LPreM: z = -1.81, p =
.036, RPreM: z = -1.00, p = .159, LPar: z = -1.63, p = .051, RPar: z = -2.67, p = .004;
one-tailed Wilcoxon Signed Rank tests]. No significant differences were observed by
comparing the number of error responses in the CL45° and the AC45° rotation
conditions within each patient group (for all groups: p >.05, Wilcoxon Signed Rank
test) (Figure 4).
A one-way non-parametric ANOVA across all six groups on the number of errors
occurring in the rotation conditions (CL45°/AC45°) showed that the groups differed
significantly [Kruskal-Wallis; 2(5) = 13.18, p = .02].

120
One of the aims of this study was to examine whether or not the more impaired groups
behave qualitatively differently in the nature of their errors from other impaired groups
and from less impaired patients. However this aim is faced by the methodological
problem that controls are at virtually ceiling, so we cannot use the nature of their errors
to contrast with the pattern of errors made by impaired groups. So a modification of the
approach developed by Stuss and colleagues was adopted to putatively identify more
impaired groups and potential control groups. First, we compared the performance

121
among all the six groups to determine whether there was a significant difference
between them. Given at what was found, we then contrasted the performance of each
group of patients with the other five groups combined. At this stage the left prefrontal
group differed significantly from the other five (CL45°/AC45° errors combined, Mann-
Whitney U=178, p = .035), but the right parietal did not. In order to investigate whether
there were differences among the five groups, we removed the left prefrontal group and
repeated the analogous procedure. On this second round only the right parietal group
performed statistically worse than the other groups combined (RP: U=77, p = .03;
Mann-Whitney). Repeating the procedure a third time did not lead to any new
significant effects (p > .35). We will therefore putatively take the right parietal and left
prefrontal groups as impaired groups and treat the other groups combined as a control
group.
In order to determine whether the effects observed were related to differences in lesion
size, we correlated the patients performance in the CL45°/AC45° conditions combined
with lesion size. Overall the correlation of the total number of errors with lesion size
was completely insignificant [F(1,46) = 0.83, p = .37]. Spearman correlation
coefficients for the six subgroups ranged from -.87 to .42 for the six groups, in all cases
being far from significance (p >.3).
Direction of errors
The statistical analyses revealed that both the right parietal and the left prefrontal
groups made a significantly greater number of Quadrant errors (Q) compared to the
other four groups combined [RPar vs. Others: Mann-Whitney U=75, p = .03; LPreF vs.
Others: Mann-Whitney U=130, p = .02]. For the negative Quadrant errors (Q-) –
moving in the direction opposite to that of the rotation required – the right parietal
patients made a significantly greater number than the other groups combined [RPar vs.
Others: Mann-Whitney U=62, p = .01]. However, for the positive Quadrant errors (Q+)
– moving too far in the same direction as that of the required rotation, the left prefrontal
patients made a larger number than the other groups combined [LPreF vs. Others:
Mann-Whitney U=153.5, p = .04] (Table 2).
When a direct comparison of the number of Q- and Q+ errors within each group was
carried out, a significant effect was found for the right parietal patients with the Q-

122
errors being the more frequent (Wilcoxon Signed Rank test z = -2.54, p = .01). The four
patient control groups combined also showed significantly more than Q+ errors (z = -
2.52, p = .01). However, in the left prefrontal group, the difference was far from
significant (p = .51). If we consider the direction in which the square has to be rotated,
clockwise (CL45°) versus anticlockwise (AC45°), the right parietal patients showed a
similar rate of Q- errors in both conditions – no significant difference could be detected.
In other words, the right parietal patients tended to rotate in an incorrect direction more
than the other lesion control groups irrespective of the direction required, clockwise or
anticlockwise.
Qualitative differences in error types: Metric and Categorical errors
The analysis of Quadrant errors showed us that gross group differences emerged with
respect to the direction of the error. We then investigated whether the errors could arise
from the malfunction of a purely metric or categorical process. For this reason we
considered the number of errors that fell into three qualitative error categories. One type
is the error that would arise if the patient did not perform a rotation operation and
responded on the basis of the initial position of the target point (Omitted Rotation)2 A
second is if the patient produced a response in the reflection of the correct response
point with respect to the horizontal, the vertical, or both axes of the square (Reflection
error). The third is if the patient made the correct metric operation on the target point
but used an incorrect neighbouring side or corner as the starting point for the metric
operation (Dimension error); these were the type of categorical errors described by
Bricolo et al. (2000) and Toraldo and Shallice (in preparation) in individual right
hemisphere patients. These last two types were collectively considered as ―Pure
Categorical‖ errors. Symmetrically, we identified another category as ―Pure Metric‖
errors, i.e., locations of the response mark that unambiguously suggest a specific
impairment of metric information processing, with spared categorical information: this
area is the part of the correct quadrant which is outside of all the theoretically relevant
areas (OR, d, correct target position). A final error type, which is not purely categorical,
is the Quadrant and Metric error, which occurs when the patients place the mark in an
incorrect quadrant and outside all the theoretically important areas listed above.
2 The omitted rotation point (OR) falls in the correct quadrant in some trials, and in the Q- quadrant in some others, according to where the target is
located within its quadrant.

123
There were theoretically important effects involving the two relevant groups, namely
the right parietal and the left prefrontal (Table 2).
First, for both groups no significant difference was found in the number of Omitted
Rotation (OR) [RPar vs. Others: Mann-Whitney U=111, p = .25; LPreF vs. Others:
Mann-Whitney U=174, p = .20]. Second, a Mann-Whitney analysis revealed that only
the left prefrontal patients were impaired in the processing of metrics, showing a larger
number of Pure Metric (m) errors [LPreF vs. Others: Mann-Whitney U=127, p = .02].
Conversely, with respect to the Pure Categorical errors (d, Q+d, QQd, Q+r, QQr), we
found that only the right parietal patients made a significantly larger number of such
errors [RPar vs. Others: Mann-Whitney U=82.5, p = .04]. In more detail, by looking
separately at the two spatial subcategories, we observed that the right parietal group
made a significantly greater number of both Dimension (d, Q+d, Q-d, QQd) [RPar vs.
Others: Mann-Whitney U=87, p = .05] and Reflection errors (Q+r, Q-r, QQr) [RPar vs.
Others: Mann-Whitney U=78, p = .02]. No significant effects were observed with these
measures for the left prefrontal group. Third, with respect to the Quadrant and Metric
(Q+m, Q-m, QQm) errors a significant result was again observed only for the left
prefrontal group [LPreF vs. Others: Mann-Whitney U=102, p = .002].
Voxel Lesion Symptom Mapping
With VLSM analyses we were able to anatomically localize the brain areas responsible
for the mental rotation deficits without any a priori grouping method. For the Pure
124
Categorical Errors patients with lesions in the right inferior parietal cortex showed a
significant involvement. On the other hand, the common area for the Pure Metric and
Quadrant and Metric errors was the left insula verging on the putamen. All these
anatomical loci survived Bonferroni corrections.
Monte-Carlo simulation
In order to test whether the qualitative impairments observed in the right parietal and in
the left prefrontal groups truly reflected a mental transformation deficit and were not
just the effect of random selection of locations within the square, we additionally
performed a Monte Carlo simulation study to obtain chance levels. We generated
random positions within the square as responses to each of the 33 stimuli that have been
really administered, and repeated this procedure 10,000 times. On each of the 10,000
samples, we applied the same error classification procedure that was applied to real data
from patients. For each spatial subcategory we compared the probability of an error
occurring by chance (expected probability) with the observed probability. The binomial
tests revealed that the error proportions in the Pure Metric and Quadrant and Metric
subcategories were significantly lower than chance in the left prefrontal group.
Conversely, the observed proportions of Pure Categorical errors were more frequent
than expected by chance in the right parietal group. These findings clearly indicate that
the incorrect responses of patients in theoretically important regions did not occur by
random selection of points in the square (Figure 5).

125
Figure 3: Model of the spatio-temporal integration. The filled-boxes correspond to the systems
involved in the integration of spatial and temporal information. The empty boxes indicate the hemispace
in which the target is presented. The arrows indicate the direction of the putative spatio-temporal vectors.
According to this model the right posterior cortex has greater resources for spatio-temporal computations,
as suggested by the size of the red arrows. Moreover, the vectors directed toward the contralateral
hemispace are much stronger than the ipsilateral ones.
5.4 Discussion
The initial aim of this study was to provide further evidence on what cortical regions
are responsible for mental rotation transformations. We employed the mental rotation
126
task developed by Bricolo et al. (2000), but we used an anatomically based group study
approach rather than a single-case method. Each patient was assigned to one of six
groups, namely left prefrontal, right prefrontal, left premotor, right premotor, left
parietal, right parietal. A broad analysis on the number of error responses in the rotation
conditions revealed that the six groups performed in a significantly different way. We
used a modification of the procedure adopted by Stuss et al. (2005) to determine
candidate impaired groups. This procedure selected the left prefrontal and right parietal
groups, which did not differ significantly from each other for the overall number of
errors, as candidate impaired groups; the other four groups were treated collectively as a
patient control group. The appropriateness of this candidate categorisation was
supported by the analyses carried out on the qualitative nature of the errors, which
revealed that the impairments in the left prefrontal and right parietal groups were
significantly different in a number of ways from the other patient groups combined.
These include findings on the direction of errors, namely the positive Quadrant errors
for the left prefrontal group and the negative Quadrant errors for the right parietal
group. In addition if one considers the qualitative error classification, there were again
significant effects for the left prefrontal group with respect to Pure Metric and
Quadrant and Metric and for the right parietal group with respect to Dimension and
Reflection errors.
Right parietal group
The analysis of the overall error rate indicated that patients with a lesion centered on the
right parietal cortex made a significantly larger number of errors with respect to the
other four patient groups combined. Particularly, in the two rotation conditions about
44% of all trials were errors, which is definitely a sizeable effect. This result supports
the widely accepted claim that the right parietal cortex is specifically involved in mental
rotation transformations, which is consistent with previous neuropsychological, EEG,
TMS and neuroimaging researches (Ratcliff, 1979; Inoue et al., 1998; Harris et al.,
2000; Harris and Miniussi, 2003). In detail, by looking at the qualitative nature of these
errors we observed that the right parietal patients were specifically impaired in the
processing of categorical spatial information. Indeed, they produced a significant
number of Pure Categorical errors, which occur when one ignores the qualitative
spatial cues without any metric impairment. If a patient operates correctly metrically
with respect to a landmark, say a corner, but chooses an incorrect neighbouring corner

127
for the operation, this produces a Dimension error. The patient‘s performance is
metrically correct, but categorically incorrect. One subset of such errors (Q-d)
corresponds to rotating the square in the incorrect direction. The right parietal group
made significantly more Dimension errors than the other four control patient groups
combined. If a patient takes a reflection of the position of the target with respect to the
horizontal, the vertical, or both axes of the square, this is a Reflection error. S/he places
the mark in a complementary horizontal or vertical position in an incorrect quadrant,
failing to take into account the categorical representation of the target. Right parietal
patients also produced significantly more such errors than the other four patient groups
combined. These results were confirmed by a subsequent simulation study, which
showed that the proportion of categorical error responses were significantly greater than
would be expected by random selection of locations in the square.
Moreover, we observed that unlike the patient control groups the right parietal patients
showed a greater tendency to rotate the square in the wrong direction (Q- errors). We
believe that this behavior reflects a deficit, which is specifically qualitative in nature.
One could argue that this significant frequency of Q- errors might instead reflect lack of
precision in applying the appropriate spatial transformations (angles). However, if this
hypothesis holds true, then it would remain unexplained why in the right parietal group
both the Pure Metric and the Quadrant & Metric error rates were not statistically
different from those in patient control groups, or even from chance (Monte Carlo
simulation). In fact errors clustered in categorically important positions of the square.
An alternative hypothesis is that the findings observed in the right parietal group might
be explained in terms of neglect. In a study performed by Kerkhoff and Zoelch in 1998,
it has been observed that when asked to orient an oblique line (―target‖) to match a
horizontal, vertical or 45° reference line, neglect patients with a right hemisphere lesion
showed a significant anticlockwise tilt of the target. In the present study, signs of
neglect on the Star Cancellation task (Wilson et al., 1987) were observed in three out of
nine right parietal patients. All three were in the subset of five patients making the
larger number of categorical errors. Of the other two patients in this subset, one
obtained a perfect score on Star Cancellation and the other had a poor but not
lateralized performance. However, with respect to our rotation task, it is not likely that
the pattern of results shown by right parietal patients can be explained just in terms of
an indirect effect of neglect. If neglect had had a major role, one would have predicted a

128
sizable difference in performance according to the direction – clockwise (CL45°) vs.
anticlockwise (AC45°), of the required rotation. Following Kerkhoff and Zoelch
(1998), neglect should induce a bias towards performing anticlockwise rotations,
resulting in more frequent errors in those trials where the opposite rotation is required,
i.e. the CL45° condition. The same prediction is derived by another possible scenario
related to neglect: in the CL45° condition the thick side is in the left half of the tilted
stimulus; failure to detect the thick side would induce random selection of rotation
direction, with consequent Q- errors being more frequent in this CL45° than in the
AC45° condition. However, no such effect was found, with right parietal patients who
make roughly comparable numbers of errors in the two conditions. Indeed, they made
more errors than patient controls in rotating leftwards when presented with a CL45°
stimulus, and rightwards when an AC45° stimulus was displayed. In other words, they
had an increased tendency to rotate in the wrong direction, whichever direction was
required on a trial. A possible partial role of neglect in the categorical errors remains a
possibility.
Martin et al. (2008) have argued that both hemispheres are involved in coding both
metric and categorical positions for a Continuous Spatial Coding hypothesis in which
both hemispheres are implicated in both types of spatial relation coding. They found
some degree of hemispheric specialization, not related to the categorical/metric nature
of the task, but to the processing load involved. Thus for instance, they found a right
hemisphere advantage in the inferior parietal lobule and the angular gyrus. In many
respects our evidence fits well with their findings: we also obtained greater involvement
of the right parietal than the left parietal cortex in the task. However unlike in the work
of Martin et al., we did not find any deficits in right parietal patients in carrying out
metric operations per se. This dissociation – a categorical deficit without a metric
deficit – is difficult to reconcile with the Continuous Spatial Code hypothesis, which
had explained Martin et al.‘s findings well. This model assumes that categorical and
metric relations differ on a complexity continuum, with metric encoding being
generally more complex than categorical encoding. In this case, however, one would
expect that a lesion would produce the complementary dissociation, with categorical
relations being relatively spared.
129
It is plausible that the difference between the present study and Martin et al.‘s is due to
the different type of task used. Martin et al. used a working memory task, in which
rotation was not involved. In such a task, metric accuracy is likely to be more stressed
than categorical accuracy, as no transformation is required. By contrast, our rotation
task is more heavily loaded on categorical operations than on metric accuracy, both
because of the need to rotate, and because the absolute metric error allowed was quite
large (1.5 cm).
In summary, we agree with Martin et al. on the likely involvement of both hemispheres
in both metric and categorical operations. However, the existence of an above chance
rate of error types such as Reflection and Dimension strongly suggests that the two
types of operation can be separately impaired. Indeed in Reflection and Dimension
errors, responses are very close to simple geometrical transformations of the correct
position. Thus a gross categorical mistake and a fine metric analysis are simultaneously
observed. Such a dissociation is even more convincing if other error types involving
metric-based inaccuracies do not occur at above chance levels. This profile was
previously reported in an individual case study of Bricolo et al. (2000) and is also the
case for the right parietal group in the current study.
How might such errors be explained? A typical analogue rotation process (à la Shepard
& Meltzer) would predict very different error patterns from the ones we observed. It
should be noted that our task, while corresponding to operations often made in the daily
life, is very different from the tasks standardly used in ―mental rotation‖ experiments.
Indeed, it allows another strategy in addition to the analogue rotation procedure.
Suppose that the spatial analysis of the figure is carried out in two main steps, (i)
categorical operations are carried out to relate parts of the figure to an object-centred
reference frame – known to be important, for instance, in neglect (Behrmann and
Moscovitch, 1994; Driver, 1998; Humphreys et al., 1996, Humphreys and Riddoch,
1995), and subsequently (ii) metric operations are carried out with respect to crucial
parts of the figure. It would then follow that our task allows subjects the much easier
possibility of not actually carrying out an analogue rotation operation. Instead, the
subject might store the categorical and metric encodings from the first square, and
reproduce them on the second square. This would only be possible if subjects could
categorically organise the figure in terms of an object-centred reference frame. The
130
gross spatial agnosia shown clinically by many right parietal patients (e.g. Warrington,
1969) suggests that this may not be possible in some patients of this group. In this case
Reflection and Dimension errors would correspond to a failure of one of the categorical
operations stages of the process.
More specifically, we suggest that poor performance in our mental rotation task could
be explained by an impairment of one or more steps of the following procedure:
1. Implement a correct object-centred reference frame on the first (tilted)
square.
2. Carry out a categorical encoding of the position of the dot.
3. Carry out a metric encoding of the position of the dot.
4. (Following presentation of the upright empty square), retrieve the
object-centred reference frame.
5. Retrieve the appropriate categorical representation.
6. Retrieve the metric representation.
Our proposal is that a lesion of the right parietal cortex may disrupt the object-centred
system of reference, the categorical spatial representation of the target, or both. The
account is motivated by the need to explain the qualitative impairments we observed in
our clinical population. New investigations would be needed to test whether other
predictions of the model are correct.
Left prefrontal group
A second group of patients was impaired in the performance of our mental rotation task,
namely the left prefrontal group. More detailed determination of the anatomical locus
involved was limited by characteristics of our patient series, namely a lack of patients
with tumours involving the more superior parts of prefrontal cortex.
The left prefrontal group had a different type of mental transformation deficit with
respect to right parietal patients. They produced a significant increase in the number of
metrically incorrect responses both in the correct and in the incorrect quadrants. This
finding is in agreement with the study of Martin et al. (2008), who found a strong
recruitment of the attentional and executive processes, especially when metric coding
was required. In addition, with respect to the other four groups combined the left
131
prefrontal group was the only one to produce a relatively large number of errors where
rotation was too far in the correct direction (Q+). They also made a similar number of
errors of rotation in the wrong direction (Q-). The specific mental rotation impairment
of the left prefrontal patients might be explained in different ways.
One possible explanation is that the deficits found in the left prefrontal patients are due
to impairments in the short-term retention of spatial information. Indeed activity in the
DLPFC has been often observed in both humans and primates in tasks which require the
retention of spatial information for a limited period of time (Wilson et al., 1993,
Courtney et al., 1996, 1998; Owen et al., 1996; Levy and Goldman-Rakic, 2000; Wager
and Smith, 2003). However, lesions to the right prefrontal cortex impair spatial working
memory more than ones to the left (Bor et al. 2006), so this makes this account less
plausible for a specifically left prefrontal deficit.
A second account would be in terms of a difficulty in producing the appropriate
amplitude for the motion response. Desmurget et al. (2004) presented results that are
clearly supportive of a role of the basal ganglia in advance planning of movement
extent. Patients with Parkinson disease were found to be selectively impaired in using
advance information about movement amplitude. Moreover, in a subsequent PET
experiment increased neural activation in the rostral and caudal portions of the bilateral
putamen was specifically observed in a task requiring amplitude planning. The results
found for some of the patients placed in our left prefrontal group would fit well with
damage or a disconnection of the putamen (three patients), but this would be a less
satisfactory account for patients with a more specifically prefrontal damage. Moreover,
a hypothetical amplitude planning deficit could well affect the baseline condition too
(0°, no rotation); however our left prefrontal group was not specifically impaired in
such a condition.
One related question is why no sign of any such impairment was found in the right
prefrontal group. As reported in the overall error analysis, the performance of the right
prefrontal patients was not statistically different from that observed for the other groups
combined. The absence of effects cannot be a problem of lack of statistical power.
Indeed the sample size was similar for right prefrontal (N = 12) and left prefrontal (N =
132
14) groups and the difference in the overall number of errors was sizeable and
significant (averaging at, respectively, 5.7 and 11 out of 33; Mann-Whitney p =.041).
Since the subjects almost gave their responses with their right hand, it might be
suggested that the greater impairment of the left and in the right prefrontal patients
simply reflect their using of the right hand. This possibility cannot be ruled out.
However, if a lateralized hand effect would contribute to the results, then one might
expect a greater impairment in the left premotor group, which was not found.
As a third possible explanation we suggest that the pattern of performance found in the
left prefrontal group arises from a set of processes related to acquiring action
operations. This are the so-called task setting operations (Stuss et al., 1995; Alexander
et al., 2005; Shallice et al., 2008a, 2008b) specifically impaired in left prefrontal
lesions. Task-setting is the collective name for the processes involved in learning in
going from a novel set of operations when the subject is initially faced by a new task to
their smooth well-learned execution after repeated practice. A left prefrontal lesion
would be expected to increased error rates early in task performance because of
impairments in task-setting. In our study the task was very short requiring only 5
minutes to be completed. Thus the errors occurred before the task was over-learned. We
propose that the failure on the task of the left prefrontal patients arises because they do
not acquire the specific categorical and metric operations listed in the section above
[―Right Parietal group‖ (the six-step procedure)]; instead they would fall back on a
rough rotation operation, with little control over its correct angular size, failing to carry
out a proper metric or a categorical encoding. This hypothesis would explain the
specific pattern of performance of the left prefrontal patients and in particular the
relatively large number of quadrant errors in the same direction as that of the rotation
required (Q+ errors), and the high incidence of metric errors.

133
Chapter 6
Phonological dyslexia following left and right parietal lesions

134

135
6.1 Introduction
The development of models of the reading process has been intimately linked to the
investigation of the acquired dyslexias. Thus the argument of Marshall & Newcombe
(1973) that there are two different routes through which letter strings can be read was
based on the contrast between the properties of deep and surface dyslexia. The
assumption that there are three routes for reading aloud not two, while originally
suggested by Coltheart (1978) on the basis of studies in normal subjects, received a
major boost from the identification of reading without semantics by Schwartz et al.
(1979). In this syndrome the patient has no understanding of words irregular in their
spelling-to-sound correspondences but they can be read aloud well.
More recently, with the development of models of reading aloud, such as those of Plaut
et al. (1996), Coltheart et al. (1993, 2001), Zorzi, Houghton & Butterworth (1998) and
Perry, Ziegler & Zorzi (2007) a major bone of contention between the protagonists of
the different theories has concerned their ability to account for the existence of
individual neuropsychological syndromes, and in particular for reading without
semantics and phonological alexia (see e.g. Coltheart, 2006; Woollams et al., 2007).
Phonological alexia, originally described by Beauvois & Derouesne (1979), is the
disorder in which the patient can read words well but is impaired at reading
orthographically and phonologically legal non-words. That the syndrome was
theoretically important for understanding the mechanisms of normal reading was argued
very early by Funnell (1983) on the basis of the existence of a patient of this type who
had little comprehension of words. The disorder was held to provide evidence for the
existence of separate routes for lexical and non-lexical reading aloud, both being
distinct from a semantic route. Clearly the existence of this pattern of performance is
easily explained if three routes exist, as in the models of Coltheart et al. (2001) and
Zorzi et al. (1998); the pattern can then arise from the selective impairment of a non-
lexical reading route. However, proponents of connectionist two-route models had an
excellent retort (e.g. Harm & Seidenberg, 1999). Patterson & Marcel (1992) showed in
six phonological alexic patients that they were unable to blend in production a three
phoneme nonsense syllable even if the individual phonemes to be combined were
presented non-visually, such as by being presented separately auditorily. It was
therefore suggested that phonological alexia arose from impairments in those parts of
136
the speech output system concerned with phonological-level processing and so the
syndrome not relevant to how the information was transmitted from the orthographic to
the phonological system in reading aloud.
The pattern of performance shown in the patients of Patterson & Marcel was not
however, found in all phonological alexic patients. Caccapolo-van Vliet et al. (2004a,
2004b) described three phonological patients with Alzheimer‘s disease whose word
reading was at 96% or better. By contrast the best of the three achieved only 56%
correct in the reading of non-words, far worse. However the patients behaved almost
perfectly on certain tests loading on processing within the phonological system itself,
such as blending or segmentation. No tests of the ability to read non-words homophonic
with words, e.g. kwite, such as that carried out by Derouesné & Beauvois (1979),
appear to have been used with these patients and so a completely conclusive theoretical
conclusion cannot be drawn. However, the natural theoretical interpretation is that the
impairment of these patients cannot be attributed to a problem in the phonological
output system, such as in the phonological output buffer. Thus the work of Caccapolo-
van Vliet et al. removes the indirect support that the earlier study of Patterson & Marcel
had provided for the two-reading route (e.g. a single phonological route and a semantic
route) theory of say, Plaut et al. (1996).
More recently, however, the drawing of conclusions concerning the organisation of the
normal reading system from single-case studies alone has been apparently undermined
by Woollams et al. (2007) in their analyses of reading-without-semantics carried out in
a large group of semantic dementia patients. They found that patients presenting as
having the syndrome of reading-without-semantics could be plausibly reinterpreted as
being qualitatively no different from the more common condition of surface dyslexia;
instead they could be held to lie at one end of the distribution of individual performance
of how much their reading system weighted the respective contributions of a semantic
route and a single phonological route. In support of this interpretation, the pattern of
decline of the reading abilities of patients who initially presented as showing reading-
without-semantics paralleled that of surface dyslexic patients as the disease progressed.
The syndrome appeared to be the end of the distribution of surface dyslexia and not a
qualitatively different disorder. Thus individual case studies seem to need to be
combined with investigation of an unselected series of a range of patients.

137
In a recent neuropsychological study, Rapcsak et al. (2009) investigated the presence or
absence of phonological dyslexia in a large series of patients, confirming the
importance of the left hemisphere for the development of the disorder. However,
previous works have also reported that damage to the right and not only to the left
hemisphere can lead to phonological dyslexia (Derouesne & Beauvois, 1985; Job &
Sartori, 1984) (see paragraph 1.3.2.2, Chapter 1).
The purpose of the present investigation is to follow up the study of Rapcsak et al. with
patients having a different aetiology, namely cerebral tumours (Shallice & Skrap,
2010), and to investigate not only left hemisphere patients but also right hemisphere
ones. In addition, the nature of the errors made by patients will be investigated,
contrasting errors where the order of the letter units is not respected, that is
transpositions, omissions or insertions, with ones where letter substitutions occur, but
qualitatively appropriate spatial processing of the letter units has taken place. As the
aim of the work is to enable functional comparisons to be made between anatomically
defined groups, a fixed anatomical grouping procedure is used to allow functional
inferences to take place across the multiple measures (see Shallice & Cooper, 2011).
This is difficult or impossible to do with measures such as VLSM or VBM, where the
anatomical specification of the critical lesions is conducted separately for each measure.
Finally, the present study also aims at describing the existence of perseverative
phenomena in patients with phonological alexia. Perseveration, an inappropriate
repetition of an earlier response, has been often reported in brain-damaged patients in
both spontaneous speech and naming tasks (Sandson & Albert, 1984; Cohen &
Dehaene, 1998; Papagno & Basso, 1996). For example, in an object-naming task, after
naming correctly the picture of a cat, the patient can perseverate (saying ‗cat‘) in the
following items, when a different response is expected (for instance when a mouse is
presented). Perseverative errors, which can be observed in a wide range of verbal and
non-verbal tasks, have also been found in reading tasks (Halpern, 1965; Shallice &
Warrington, 1977; Hirsh, 1998; Caccappolo-van Vliet et al., 2003). Perseverative errors
will tend to increase when similar stimuli are used. By manipulating the order of
presentation of words and nonwords in the reading list in this fashion, we aimed at
inducing perseverative errors in our patient groups.
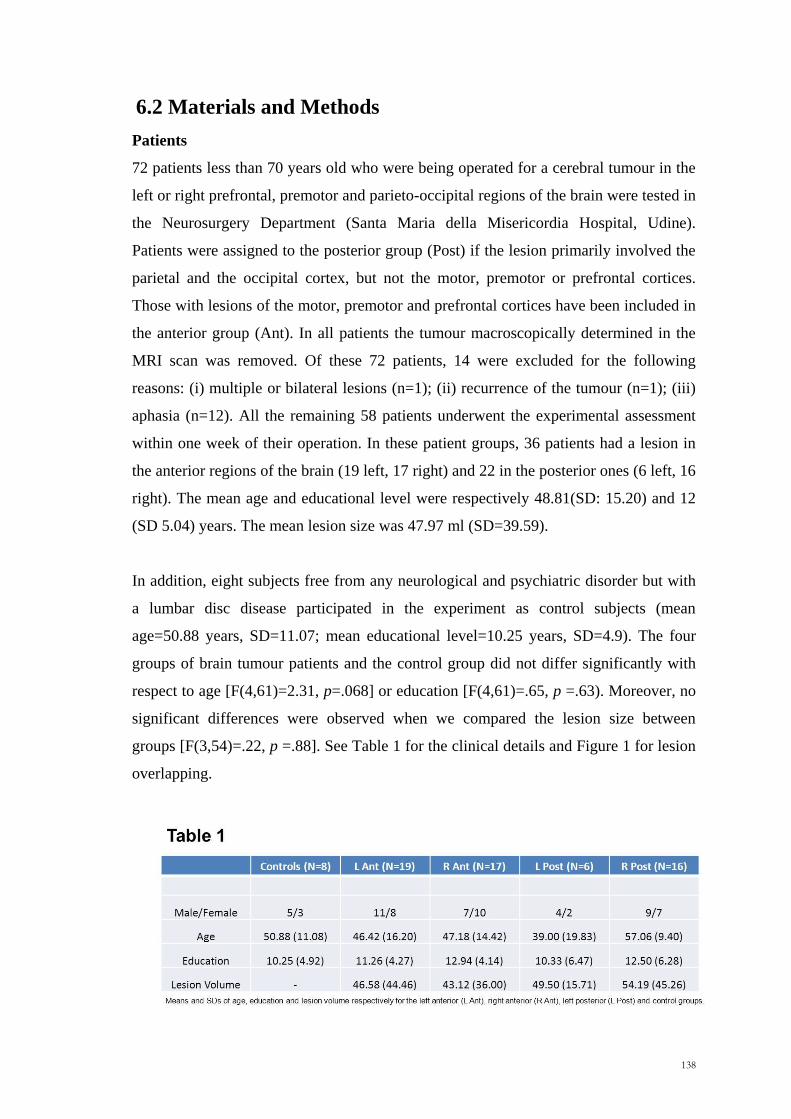
138
6.2 Materials and Methods
Patients
72 patients less than 70 years old who were being operated for a cerebral tumour in the
left or right prefrontal, premotor and parieto-occipital regions of the brain were tested in
the Neurosurgery Department (Santa Maria della Misericordia Hospital, Udine).
Patients were assigned to the posterior group (Post) if the lesion primarily involved the
parietal and the occipital cortex, but not the motor, premotor or prefrontal cortices.
Those with lesions of the motor, premotor and prefrontal cortices have been included in
the anterior group (Ant). In all patients the tumour macroscopically determined in the
MRI scan was removed. Of these 72 patients, 14 were excluded for the following
reasons: (i) multiple or bilateral lesions (n=1); (ii) recurrence of the tumour (n=1); (iii)
aphasia (n=12). All the remaining 58 patients underwent the experimental assessment
within one week of their operation. In these patient groups, 36 patients had a lesion in
the anterior regions of the brain (19 left, 17 right) and 22 in the posterior ones (6 left, 16
right). The mean age and educational level were respectively 48.81(SD: 15.20) and 12
(SD 5.04) years. The mean lesion size was 47.97 ml (SD=39.59).
In addition, eight subjects free from any neurological and psychiatric disorder but with
a lumbar disc disease participated in the experiment as control subjects (mean
age=50.88 years, SD=11.07; mean educational level=10.25 years, SD=4.9). The four
groups of brain tumour patients and the control group did not differ significantly with
respect to age [F(4,61)=2.31, p=.068] or education [F(4,61)=.65, p =.63). Moreover, no
significant differences were observed when we compared the lesion size between
groups [F(3,54)=.22, p =.88]. See Table 1 for the clinical details and Figure 1 for lesion
overlapping.

139
Figure 1. Overlapping lesion reconstructions for each of the four groups of brain tumour patients.
The lighter the colour the higher the number of patients within that group who have that brain area
damaged. L ant= left anterior, R ant= right anterior, L post= left posterior, R post= right posterior.
Stimulus presentation
A 15-inch resistive high-resolution touch screen (3M) and a personal computer
(Pentium 4, 3 GHz) were used for the presentation of the stimuli and to record the
response of participants. All patients sat in a normally lit room at a viewing distance of
60 cm from the display. The eyes of the patients were positioned at the level of the
centre of the display.
The task started with a fixation cross and 200 msec after an upper case word (W) or a
nonword (NW) was displayed on the monitor. The stimuli were located at the center of
the display and presented horizontally. The stimuli remained visible for 2s after the
onset of the response of the patients, who were required to read the target aloud. The
1 1
1 1
140
linguistic material consisted of a list containing 32 words and 32 nonwords. The same
set of linguistic material and the same order of stimuli presentation were used for all the
participants. The length of the stimuli was 4, 6, 8 and 10 letters long. The stimuli were
presented according to an ABBA design (W-NW-NW-W), in which each nonword was
directly related to the previous or subsequent word. Thus, the nonwords were derived
from words by modifying the order of the letters while maintaining orthographic and
phonological plausibility [e.g. Word: PATATA (English potato), Nonword:
TAPATA]. The pairing was constructed in such way in order to induce perseverations.
Data analysis
Initially, the average number of (i) words (W), (ii) nonwords (NW), and (iii) the
difference between nonwords and words (NW-W) was calculated and contrasted among
the four patient groups (left anterior, L Ant; right anterior, R Ant, left posterior, L Post,
right posterior, R Post) and control (Ctrl) groups. The performance of each group of
patient was also directly compared with the controls, by using a Bonferroni correction
of p =.0125.
If significant effects were observed at this level, we further investigated whether the
nature of the nonword reading errors was qualitatively different in the impaired groups
and if there were significant effects of hemisphere. With respect to the types of error
patients made, four different error subcategories were defined. Omitting, inserting or
changing the position of one or more letters in the real words or nonwords were
considered to be positional errors (e.g., OTRA ‗‗ota‘‘, ‗‗otara‘‘ or ‗‗orta‘‘), whereas
substitution errors (e.g., TAPATA ‗‗tepata‘‘) were those in which the number of the
letters was the same, but the patient erroneously substituted one or more letters. When
no response was obtained, the error was classified as a no response. If the reading error
made by the participant did not fulfil the previous three criteria, the response of the
patient was labelled as complex (e.g., GADONA ‗‗ganonana‘‘). Then, a subsequent
analysis examined the number of perseveration and lexicalisation errors.
The raw data were first checked for normality using the Kolmogorov-Smirnov test and
for homogeneity of variance by applying the Levene test. As the data were not normally
distributed, non-parametric tests were used. The results were considered significant if
the p value was <.05. All the significance tests were two-tailed.

141
6.3 Results
Word and nonword errors
When contrasting the number of errors among the four groups of patients and the
controls, a significant difference was found in the total number of NONWORD errors
(Kruskal Wallis tests, x2=14.51, p=.006) and the difference NONWORD minus WORD
errors (Kruskal Wallis tests, x2=14.54, p=.006). No significant difference between the
groups was observed for the number of WORD errors (Kruskal Wallis tests, x2=4.24,
p=.374) (Figure 2).
Figure 2: Number of reading errors (means and standard errors) as a function of condition (word
and nonwords) and patient group. In order to be comparable with the number of errors in the nonword
list, the number of reading errors in words has been divided by 4. L ant= left anterior, R ant= right
anterior, L post= left posterior, R post= right posterior.
The left anterior, left posterior and the right posterior groups all made highly
significantly more NONWORD errors than controls (Mann-Whitney test, L Ant vs.
Ctrl: U=26.50; L Post vs. Ctrl: U=3, p=.005; R Post vs. Ctrl: U=20, p=.006). The right
anterior group was not significantly different from the controls on the NONWORD
measure (Mann-Whitney test: U=40.50, p =.110). Moreover, the three ‗positive‘ groups
showed equivalent effects on the NONWORD-WORD error measure (Mann-Whitney
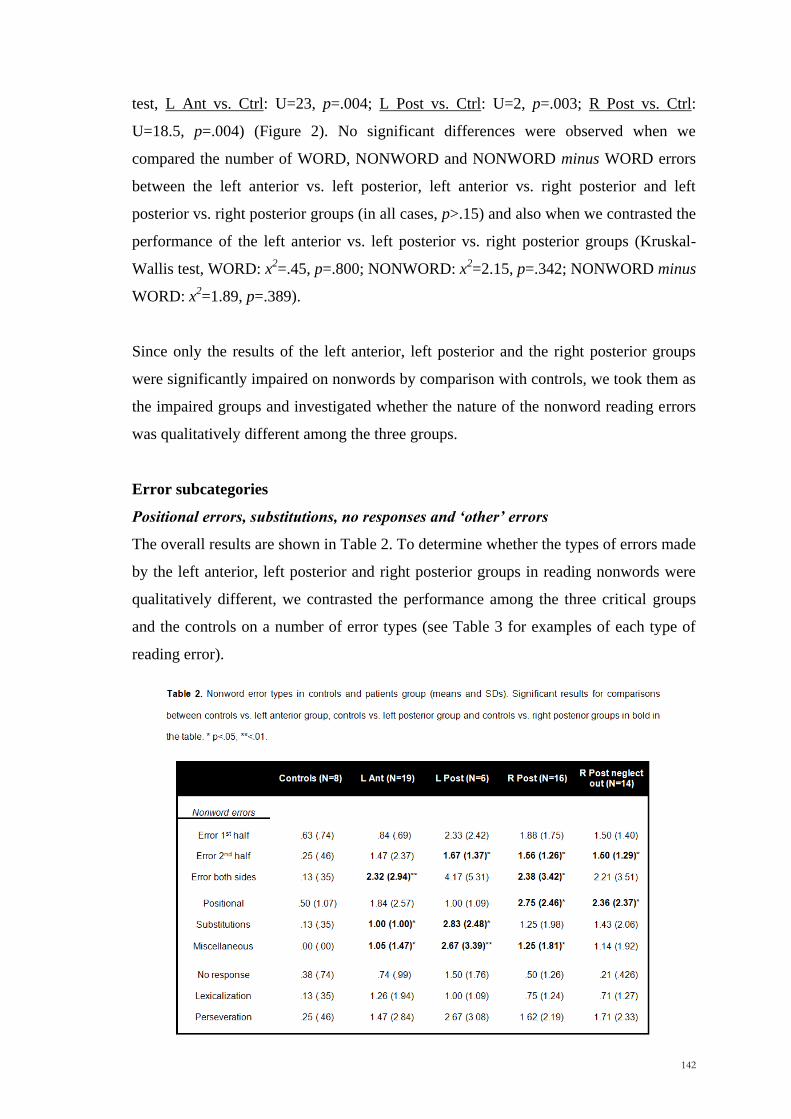
142
test, L Ant vs. Ctrl: U=23, p=.004; L Post vs. Ctrl: U=2, p=.003; R Post vs. Ctrl:
U=18.5, p=.004) (Figure 2). No significant differences were observed when we
compared the number of WORD, NONWORD and NONWORD minus WORD errors
between the left anterior vs. left posterior, left anterior vs. right posterior and left
posterior vs. right posterior groups (in all cases, p>.15) and also when we contrasted the
performance of the left anterior vs. left posterior vs. right posterior groups (Kruskal-
Wallis test, WORD: x2=.45, p=.800; NONWORD: x
2=2.15, p=.342; NONWORD minus
WORD: x2=1.89, p=.389).
Since only the results of the left anterior, left posterior and the right posterior groups
were significantly impaired on nonwords by comparison with controls, we took them as
the impaired groups and investigated whether the nature of the nonword reading errors
was qualitatively different among the three groups.
Error subcategories
Positional errors, substitutions, no responses and ‘other’ errors
The overall results are shown in Table 2. To determine whether the types of errors made
by the left anterior, left posterior and right posterior groups in reading nonwords were
qualitatively different, we contrasted the performance among the three critical groups
and the controls on a number of error types (see Table 3 for examples of each type of
reading error).

143
As shown in Figure 3, an interesting pattern was observed with respect to the
substitution and the positional errors. A significant difference between the four groups
was found in the number of positional errors (Kruskal Wallis tests, x2=8.71, p=.033),
substitutions (Kruskal Wallis tests, x2=9.44, p=.024), positional errors minus
substitutions (Kruskal Wallis tests, x2=7.89, p=.048) and the complex errors (Kruskal
Wallis tests, x2=9.81, p=.020).
Figure 3: Number
of positional and
substitution errors
(means and standard
errors) committed
by the left anterior
(L ant), left posterior
(L post), right
posterior (R post),
right posterior with
the two neglect
patients out (R post-
N) and control (Ctrl)
groups.

144
Post-hoc contrasts between the impaired group and the controls indicated that the right
posterior group made a significantly higher number of positional errors (Mann-Whitney
test, R Post vs. Ctrl: U=23, p=.011) but not substitutions than controls (Mann-Whitney
test, U=41.5, p =.172). The right posterior group also made a significantly higher
number of nonword reading errors in the complex category (Mann-Whitney test: U=28,
p =.027). Similar analyses conducted on the left posterior group revealed that for them
the number of substitutions and complex errors (Mann-Whitney test, substitutions:
U=5.5, p =.013; complex: U=4; p =.008) but not positional errors (Mann-Whitney test:
U=15, p =.282) were significantly higher than for the controls. When we compared the
performance of the left anterior group to the controls, no significant effects were
observed for the positional errors (Mann-Whitney test: U=43.5, p =.084), while a
significant effect was found for both substitutions (Mann-Whitney test: U=32, p =.019)
and the complex errors (Mann-Whitney test: U=36, p =.034).
When the three impaired groups were compared, we observed that the number of
positional errors minus substitutions differed significantly (Kruskal Wallis tests, L Ant
vs. L Post vs. R post: x2=7.01, p =.030). Looking in more detail, we found that the left
posterior group differed from the right posterior group on this measure (Mann-Whitney
test, U=16.5, p =.017) and that the patients with a left anterior lesion did not differ from
either left or right posterior groups (Mann-Whitney test, L Ant vs. L Post: U=28, p
=.069; L Ant vs. R Post: U=114, p =.217). Taken together the analyses show that the
left anterior, left posterior and right posterior groups were all impaired in reading
nonwords, but with the error profiles being qualitatively different among the three
groups and more specifically between the left posterior and the right posterior groups.
Hemi-Space errors
Additional analyses were performed to establish whether the misreading occurred more
often on the left, right side of the nonword or on both sides. No significant differences
were observed when comparing the number of errors in the first and second halves of
the nonwords within each of the groups of patient (Wilcoxon Signed Ranks Test, L Ant:
z=-.99, p =.318; L Post: z=-.730, p=.465; R Post: z=-.742, p =.458). Also by contrasting
the number of nonwords in which errors occurred in the first half, in the second half or
on both sides of the stimulus, no significant differences were observed among the three

145
impaired groups (Kruskal Wallis tests, first half: x2=3.46, p =.177; second half: x
2=2.12,
p =.346; both sides: x2=7.46, p =.689). The overall results are shown in Figure 4.
Figure 4. Number of nonword errors (means and standard errors) occurred in the first half, second
half or on both sides as a function of patient group. L ant= left anterior, R ant= right anterior, L post=
left posterior, R post= right posterior, R post-N= right posterior with the two neglect patients out, Ctrl=
controls.
These results are not what one would expect on the hypothesis that the right posterior
pattern derives from neglect dyslexia, where a first-half effect would be expected.
However, when considering the number of omissions in reading nonwords among the
three impaired groups we found a significant effect in the first half of nonwords
(Kruskal Wallis tests, first half: x2=7.38, p =.025). Patients with a right posterior lesion
made a significantly higher number of omissions in the first half of the word with
respect to the left anterior group (Whitney test, R post vs. L ant, first half: U=86, p
=.029), but not with respect to the left posterior group (Whitney test, R post vs. L post,
first half: U=31, p =.231). The results on the standard neglect tests are shown in Table
4.

146

147
Now, the omissions are the standard way in which neglect dyslexia manifests itself with
Italian readers (Ladavas, Shallice & Zanella, 1997a). At an individual level, two right
posterior patients (Rpost1 and Rpost2) did indeed omit the first half of words or
nonwords on 10 and 3 trials respectively (e.g. RARBUCANTI ‗‗ucanti‘‘, TITOLO
‗‗tolo‘‘). The two patients made only omissions and complex errors. They differed
from the other right posterior patients in showing clear signs of neglect dyslexia. When
these two patients were removed from the analyses, there was still a significant effect
for the right posterior group compared with the controls in showing a higher number of
positional errors (Mann-Whitney test, R Post vs. Ctrl: U=23, p =.024) and a significant
difference in positional errors minus substitution when comparing the left and the right
posterior groups (Mann-Whitney test, R Post vs. L Post: U=16.5, p =.033).
One right parietal case shows the non-neglect form of right parietal phonological alexia
particularly clearly. This patient – RPa12 - had a lesion involving mainly Brodmann
Areas 7 and 40. He read the words 100% correctly but pronounceable nonwords only
47% correctly. Of the errors, 4 affected the first half of the word only, 4 only the
second half, and 9 both halves. 4 of the errors were omissions, 2 in the first half of the
word and 2 in the second. 4 were order errors. There was 1 insertion and 4 substitutions.
The complete corpus of his errors is given in Table 5.
148
Perseverations
We investigated whether a higher incidence of perseverations occurred for each of the
left anterior, left posterior and right posterior groups. Taking into account the number of
nonword perseverations and using a criterion of three standard deviation above the
mean of the healthy controls, we observed that 3 out of 6 left parietal patients made a
higher number of perseverative errors. The number of patients with perseverations was
insignificantly lower for the left anterior (4 out of 19) and right posterior groups (3 out
16) (Chi-Square test, x2= 2.53, p= .28).
Lexicalisations
Lexicalisations occurred only in a small proportion of the stimuli for the left anterior,
left posterior and the right posterior groups, for example SAPOTE ‗‗sapone’’
(English – soap). By using the same criterion of three standard deviations above the
controls mean, we observed that 4 out of 19 left anterior, 1 out of 6 left posterior and 3
out of 16 right posterior patients made a higher number of lexicalisations. This result
was not statistically significant (Chi-Square test, x2= 0.07, p= .97).
6.4 Discussion
The results need to be considered in three different contexts. The first is whether they
support the findings of Rapcsak et al. (2009) who were the first to examine the
incidence of phonological alexia systematically in a group of left hemisphere patients.
The second concerns they way in which we could explain the possible occurrence of
phonological alexia following right parietal lesions. The third concerns the implication
of these findings for models of the normal reading system.
As far as the first issue is concerned, the results obtained from patients with a lesion of
the left hemisphere replicate those reported by Rapcsak et al. Similarly, we observed
that at a group level, lesions involving the left anterior and left posterior cortical regions
significantly affect the phonological ability of patients who, as a group, produce a
higher number of errors on orthographically and phonologically legal nonwords
compared with normal controls, but there is no such effect with words. However, what

149
it is new with respect to the group study of Rapcsak et al. is that not only a left
hemisphere lesion, but also a right posterior one can lead to phonological dyslexia.
Right parietal patients made significantly more errors than normal subjects on reading
nonwords. Indeed, as far as nonword reading is concerned, they made more than six
times as many errors, on average, as do normal subjects; and have the second highest
error rate of the four groups of patients. However, it should be noted that while their
word reading errors were not significantly higher than those of the controls, they also
made on average six times as many word reading errors as controls, and were again the
second-highest of the patient groups in this respect. Thus for the overall reading errors
alone, one cannot rule out the possibility that the high rates of nonword reading errors
in the group, just reflect a general reading impairment combined with the generally
greater difficulty of nonwords over words.
If we look in more detail at the nature of the reading errors, however, any single factor
account becomes implausible. In particular, the number of substitution errors is
significantly greater in the left posterior and the left anterior groups than the controls
but not for the right posterior group. By contrast, what we have called positional errors
are significantly greater in the right posterior group only. Moreover, the rate of
positional minus substitution errors differs significantly across the three groups.
However, the pattern found in the right parietal group is in fact quite similar to that of
the left anterior group and the controls; it is the left parietal group that has the unusual
pattern.
Rapcsak et al. account for their findings in terms of a "general phonological deficit in
patients with perisylvian lesions (which) produces enlarged lexicality effects across all
language tasks" (p. 586). As far as the left hemisphere results are concerned, the lack of
a significant difference between the error patterns of the left posterior and left anterior
groups means that this hypothesis is not refuted by our findings. However, the overall
results suggest that it is the left posterior group that stands out as far as its error pattern
is concerned. What is clear is that phonological alexia is a common symptom pattern
following right parietal lesions as well as left hemisphere ones and it is very implausible
that the "general phonological deficit‖ could be extended to that group too. Thus any
attempt to explain phonological alexia in terms of a single locus of impairment in the

150
model of the reading system, such as in the phonological processing parts of the speech
output system, or as a general phonological deficit can only capture one of a number of
qualitatively different impairments.
Why, though, should the right parietal group produce as many errors with nonwords as
it does? It is well known that right parietal lesions give rise to a wide range of spatial
processing disturbances. Indeed, one of these is unilateral spatial neglect, in which
patients fail to respond and orient to stimuli presented in the contralesional (left)
hemispace. Neglect can be observed in different tasks, including reading. One of the
most investigated reading disorders frequently co-occurring with unilateral spatial
neglect is neglect dyslexia. Many experimental studies concerning with reading list of
words and nonwords have reported findings that right hemisphere injured patients omit
or misread letters on the left part of the stimulus (Kinsbourne & Warrington, 1962;
Ladavas et al., 1997a, Ladavas et al., 1997b; Arduino et al., 2002; Vallar, Burani &
Arduino, 2010 for a review). Moreover in neglect dyslexia words can often be read
better than nonwords (e.g. Riddoch et al., 1990; Hillis & Caramazza 1995b; Ladavas et
al., 1997a). Thus, one possibility is that the effects can be explained in terms of neglect
dyslexia. However, when the possible hemispatial reading effects were taken into
account, no significant difference were observed among the groups for errors occurring
in the first half of the nonword (pp. 144-147). Clear signs of neglect dyslexia – on
omissions - were indeed only observed in 2 out of 16 right posterior patients in the
present study. When these two neglect dyslexia patients were removed from the
analysis, no overall change in other aspects of the pattern of results was found.
Errors other than clear neglect dyslexic ones are much higher in the right parietal group
than in the control group, so one appears to also have genuine phonological alexia not
attributable to neglect in the right parietal group. Given that the right parietal area does
not make a major contribution to phonological processing, some other source of
processing difficulty is presumably involved.
One possibility that must be considered is that the effects can result in some way from
disorders of eye movements or of remapping after a saccade. Some tasks have been
held to lead to a right hemisphere effect on eye movement control, particularly with
respect to the double step saccade task. Thus, in an initial report, Heide et al. (1996)
151
held that patients with parietal lesions were impaired in remapping contralesional
saccades, but gave no lateralisation effects; in a later paper they argued ―our data
confirm the key role of the posterior parietal cortex in the analysis of space with a
dominance of the right hemisphere‖ (Heide and Kompf, 1997, p 166). However, these
effects were observed when saccades were made after the target had been turned off.
Other possibilities could include some forms of word crowding effect on reading
(Crutch and Warrington, 2009), although as far as we know no lateralisation effects
have been described with the syndrome.
Procedure for translating letter strings into speech must segment the letter strings and
produce an ordering of the segments. If, as has been argued in the Introduction, the
right parietal lobe is concerned with representing qualitative spatial relations between
objects in the visual array, then the process of ordering segments in the letter string
could well be parasitic on this spatial process, with individual graphemes corresponding
to objects. In this case, transpositions, insertions, particularly of letters occurring
elsewhere in the string and omissions, which collectively we have called positional
errors, are to be expected. As we have seen, lesions to the right posterior region produce
not only high rates of errors in reading nonwords but also, by comparison with control
subjects, an excess of positional errors. As word reading does not lead to a high rate of
errors in these patients, it can be presumed that the reading of words is less parasitic on
the same process of representing the qualitative spatial relation between objects.
If this line of argument is accepted, this suggests that, at least for multisyllabic strings,
nonwords are read by a different procedure from words. This would appear to support
the position of two separate procedures being involved in the non-semantic mapping of
orthographic onto phonological representations, one being for whole word units and the
other for the segmented components of the letter string. This is of course the position of
three-route theorists such as Coltheart (1978), Morton and Patterson (1980), Coltheart
et al. (1993, 2001), Zorzi et al. (1998) (see also Shallice & McCarthy, 1985; Norris,
1994). However, it would be premature to argue that these findings are necessarily in
conflict with two-route theories such as that of Plaut et al. (1996). Such models were
initially developed to deal with monosyllabic words only. When they are elaborated to
deal with multisyllabic words, the model almost necessarily becomes more complex.
Thus Sibley et al. (2008) and Sibley, Kello & Seidenberg (2010) have developed a

152
model where the basic inputs to a single undifferentiated 3-layer phonological route,
which takes the place of the orthographic-to-phonological net of Plaut et al. model, are
representations of letter sequences. The letter sequence representations themselves are
learned from a preceding 3-level Elman-type network, which takes as input individual
letter-forms. Intuitively, it is not at all clear, how damage to the main network could
give rise to positional errors. However, until the effect of damage to such networks is
examined computationally, one cannot definitively say that this would not occur (see
also Pagliuca & Monaghan, 2010).

153
Chapter 7
General Discussion

154

155
7.1 Summary of the project
Many of the daily activity such as passing an object to a friend, picking up a cup of tea
involve spatial representations. Although we interact with objects in space apparently
without effort, the cognitive system is faced with several types of problem, which have
to be promptly solved. The main purpose of this thesis was to investigate the cognitive
processes and the neural substrates of representing and processing spatial information,
as required by different spatial tasks. To this end a neuropsychological approach has
been adopted. In particular, we made use of patients who have been operated for a
unilateral cerebral tumour involving the left or the right prefrontal, premotor and
parietal cortices. In detail, we tried to extend our knowledge on the mechanisms
underlying (i) direct and corrected reaching (Chapter 2), (ii) the integration of spatial
and temporal information (Chapters 3 and 4), (iii) the ability to mentally rotate an
object (Chapter 5) and to (iv) qualitatively structure the spatial relations between letters
in words and non-words (Chapter 6).
The research reported resulted in the following contributions:
1. Neuropsychological data suggest that setting the trajectory and signalling the
need to update the hand trajectory in flight might require two anatomically and
functionally distinct systems;
2. Behavioural data on both normal adults and brain tumour patients suggest that
the right posterior cortex is crucial for integrating spatial and temporal
information, even if a subsidiary role of the left posterior cortex is accepted;
3. Neuropsychological data showed that the right posterior cortex is critically
involved in the processing of categorical information as required in a mental
rotation task;
4. Results from patients with lesions involving the right posterior cortex suggest
that this brain region is probably necessary for segmenting and spatially
organizing letters in non-words.
In the next sections we will provide a detailed summary of each of these findings.
156
7.1.1 Reaching in near space
The specific goal of Chapter 2 was to investigate the cognitive and neural mechanisms
underlying the ability to reach to an object in near space. In particular, we aimed at
investigating whether processes such as reaching to a target located in central vision, to
the periphery or performing fast changes of the hand trajectory are behaviorally and
anatomically dissociable.
In the first experiment we required patients operated for a brain tumour in the left or
right prefrontal, premotor and parietal cortices to point as accurately as possible to
peripheral stimuli, while continuing to fixate the cross at the center of the display. The
analysis of their overall accuracy corroborated many earlier studies in showing that the
parietal patients were less accurate than the non-parietals in pointing to targets to the
periphery. Moreover, a hemifield effect was observed, with right parietals being less
accurate in the left (contralateral) hemifield, and the left parietal patients being less
accurate in the right (contralateral) one. These results are clearly in line with the
literature about optic ataxia, which is thought to mainly manifest as a reaching disorder
toward extrafoveal targets following a posterior parietal cortex lesion (Perenin &
Vighetto, 1988; Carey et al., 2002; Buxbaum & Coslett, 1998; Rossetti et al., 2003;
Shallice et al., 2010). A second experiment investigated the neural correlates of in-flight
hand movement corrections in the same brain tumour population. In this work, we
presented patients with a static target and asked them to point to it, as quickly and
accurate as possible. On about the 30% of the trials the initial position of the target was
suddenly shifted about 5 degrees left, right, up or down at the movemnt onset, thus
requiring a correction of the hand path. First, we observed that compared to the non-
parietals, patients with a lesion involving the parietal cortex were less accurate in the
non-shift (foveal) condition and had larger shift costs. The incidence of patients having
abnormal shift costs in the left hemispace was higher for right parietal patients than the
other group combined. Second, reduced shift costs for accuracy and higher shift costs
for movement times were observed in the premotor group compared to non-premotor
patients. Given the results of the parietal patients in Experiment 1 (extrafoveal pointing)
and 2 (automatic pilot task), we next investigated whether the performance of the
parietal group dissociate or not at a behavioural level.

157
Foveal vs. Extrafoveal reaching
Previous studies suggested that optic ataxic patients are impaired in extrafoveal
reaching, but often they are without evident movement disorders in central vision. Only
few works suggest that both disorders can coexist in the same patient (Perenin &
Vighetto, 1988; Buxbaum & Coslett, 1998). However, what the previous researchers on
optic ataxia have neglected is that in general the control subjects are more accurate at
reaching to foveally presented than non-foveal targets. Therefore, if one also takes into
account the performance of control subjects by the use of z-scores (as we did in the
present work), it can be observed that there are almost as many patients showing
misreaching in central as in peripheral vision. In our reserach, the result was also
strengthened by the strong positive correlation we found in the parietal group between
the accuracy in the non-shift (foveal) condition and the accuracy in the extrafoveal task.
Extrafoveal vs. Shift costs
In contrast, in the current literature on optic ataxia what has been claimed to be
associated is the misreaching to the periphery and the concomitant deficit in adjusting
the hand trajectory in flight (Pisella et al., 2000; Blangero et al., 2008). For instance, in
a recent study Blangero and colleagues (2008) required the optic ataxia patient CF to
reach as accurate as possible to a target presented to the left or the right peripheral
visual field. In contrast to his spared performance in central vision, CF was found to be
significantly impaired when the hand movement was directed toward the left
(controlateral) peripheral targets, especially when the left hand was used. The same
pattern of results was also observed in an automatic pilot task (Pisella et al., 2000),
where the target suddenty jumped to the ataxic or the healthy peripheral visual field at
the movement onset. CF showed only slightly corrections when the target jumped to the
periphery in the ataxic visual field. Moreover, the rare movements that he could correct
were anticipated by a saccade, which brought the target in central vision. In summary,
in contrast to his normal performance in foveal reaching, CF was significantly less
accurate when the target was presented to the left (extrafoveal condition) or jumped
(automatic pilot task) to his left ataxic visual field. In other words, foveal and
extrafoveal reaching appear to dissociate at a behavioral level, whereas reaching to
peripheral targets and adjusting the hand trajectory in flight can reflect the activity of
the same module. Blangero and colleagues claimed that what is damaged in CF is the
module responsible for reaching targets acquired in peripheral vision (for extrafoveal
158
and automatic pilot tasks, located in the POJ), whereas the one subserving central vision
(located in the mIPS) is intact.
Our study does not support the claim of Blangero and collegues. Indeed, a strong
positive correlation between reaching to the periphery and reaching to foveal targets
was found in parietal patients, suggesting the existence of similar mechanims. By
contrast, what dissociated were extrafoveal reaching and the ability to modify the hand
trajectory on-line. Indeed, there was absolutely no correlation across parietal patients
between the two measures, which gave rise to classical double dissociations at an
individual level. The results are clearly in contrast with the position of Blangero et al.
(2008) and suggest that the processes involved in reaching to the periphery and in
adpting motor trajectory on-line require two at least partially segregated neural systems.
Inaccuracy to central and peripheral targets vs inability to adjust the hand
trajectory on-line: possible interpretation
Recently, a cell recording study has adressed the question of the role of the motor,
premotor and parietal cortex in fast corrections of hand trajectory (Archambault et al.,
2011). By examining the hand trajectories of monkeys during direct and corrected
reaches, the authors showed that the PPC seems to be prefentially involved in the
estimation of the kinematics and in the implementation of the online adjustment,
whereas the PMd provided the signal to update the motor command toward a suddently
change of the position of the target. The results we found in brain tumour patients fit
with the existence of two such distinct systems in reaching. One system, located in the
posterior parietal lobe, would be engaged in the determination of the movement
trajectory. Damage to this system would result in less accurate reaching movements in
both (foveal) non-shift and extrafoveal tasks, as frequently occured in our parietal
patients. However, since the spatial resolution provided by visual stimuli in the
periphery is much lower than in central vision, impairments in extrafoveal condition
might be observed more frequently than those observed in central vision, and also for
shift costs. Indeed, since the movement of the target to the new shifted position
(Experiment 2) was relatively small (only 5 degress), the resources required by the
trajectory setting system would be much closer to those needed in the non-shift
condition. The second system would be located in the premotor cortex and would be
recruited to suppress the initiated motor trajectory or to signal the need to update the

159
hand trajectory. Damage to the premotor cortex should then cause a slowing in shift
costs for movement times, as we found in the premotor group. Moreover, disconnection
between the first (estimation of the kinematics of the motor periphery) and the second
(higher order command for the correction) system should result in higher shift costs for
accuracy.
7.1.1.1 Suggestions for future research
There are certain lines of research, which could better elucidate the interactions
between systems for trajectory setting and trajectory updating. First, given the results
we observed in the automatic pilot task (Experiment 2), it would be valiable to assess
the effects of a lesion of the parietal and the premotor cortices on the shift costs when a
signal calling for a change of movement direction is given earlier during the formation
of a motor plan. In other words, the temporal dynamics of the trajectory updating could
be better investigated in a future work, in which different shifting times are used.
Moreover, the quality of the work could be improved by monitoring the path of the
hand and the eye movements respectively with motion and eye tracking systems. For
clinical reasons this would be better investigated in somewhat longer studies after
operation than the studies conducted in this thesis. In this way we would be able to
assess the important relation between the movement of the hand and the movement of
the eyes.
Second, one could use a behavioural paradigm in which reaching is made more difficult
by the presence of obstacles. Patients could be asked to fixate and perform hand
movements toward stationary targets (foveal simple condition). In the 30% of the trials,
an obstacle could be presented between the hand of the subject and the target. A motion
tracking systems could be used in order to record the hand trajectory, as well as some
kinematic parameters such as the direction and the speed of the movement. Care should
be taken about the choice of the position of the target in space (left vs. right hemispace)
and the time at which the obstacle appears. In light of the model proposed by Blangero
et al. (2008), patients who have no sign of foveal optic ataxia should not be impaired in
such as task, since the target is not presented in the periphery. Conversely, on the
Archambault et al. (2011) account, one would predict that a disconnection between the
premotor and the parietal cortex would impair performance on the ‗obstacle‘ condition,

160
with no impairments in the classical foveal one (in this case the subcortical structures
could be involved in setting up the kinematic parameters).
A third aspect, which needs further investigation, is the possibility of hemispatial
effects. Given the presence of the obstacle, in setting up the trajectory the brain needs
also to take into account the spatial relations between the obstacle and the target,
namely an allocentric-based representation. Therefore, a question might arise ‗can we
observe different accuracy effects with respect to the position of the target and the
obstacle in space‘?
A fourth possible point concerns the cerebella activity. The potential role of the
cerebellum in reaching has not been investigated in the present thesis. However, since
the cerebellum is functionally connected to the frontal and parietal regions (Sasaki,
1979) and it is involved in movement control as well in other cognitive functions (Ito,
1984; Leiner et al., 1986; Sanes, Dimitrov & Hallet, 1990; Ivry et al., 2002), it would be
interesting to assess whether the reaching impairments following cerebellum lesions are
behaviourally distinct from those observed after damage to the parietal cortex.
7.1.2 Brain correlates of spatio-temporal integration
In three behavioural studies we required healthy subjects to predict the position of an
invisible moving target, in order to investigate whether the performance of the subjects
could take advantage from the hemipace in which the response occurs. Significantly
more accurate responses were expected to occur in the left hemispace, given the
suggested superiority of the right hemisphere in making spatio-temporal integrations
(Walsh 2003). The results showed that subjects were significantly better in predicting
the position of the target in the left hemispace than the right, independently of the
direction of the movement of the target (Experiment 1, Chapter 3) and the hand used
(Experiment 2, Chapter 3), nor of a spatial processing per se (Experiment 3, Chapter 3).
We interpreted the results in terms of a superiority of the right hemisphere in integrating
spatial and temporal information, as suggested by previous studies (Boulinguez et al.,
2003; Olivieri et al., 2009).
More critically, the study on normal volunteers was conducted in parallel with a
neuropsychological one to examine the lesion site critical for this process (Chapter 4).
Thus, the specific propose of the lesion study was to assess whether the hemispatial

161
effects observed in healthy subjects would no longer be present in patients with damage
to the right posterior cortex. As expected, the right posterior group was worse than the
other groups combined in the left hemispace. On the other hand in general they were
accurate as the other groups in the right hemispace. The latter result gives rise to an
important question related to the specificity of the right posterior cortex in integrating
spatial and temporal information. Indeed, if the right posterior cortex is the only
structure involved in this computation, one cannot easily explain why the right posterior
patients were not also impaired in the right hemispace. One possibility is given by a
model in which both the left and the right hemisphere are involved in the combination
of spatial and temporal information, but with different strengths. According to this
model, two factors might operate on spatio-temporal integration. One is that the right
hemisphere has greater resources than the left hemisphere and the second is that the
systems in each hemisphere operate more efficiently for stimuli in the contralateral than
the ipsilateral hemispace. On this model the right posterior patients will be significantly
impaired in the left hemispace, but not in the right. On the other hand, a left posterior
lesion would not result in an impaired performance, since the right posterior hemisphere
has greater reasources compared to the left.
7.1.2.1 Suggestions for future research
In Chapter 4, we found that the right parietal patients were less accurate in the left
hemispace, but as accurate as the other groups in the right. On the other hand, in the
same way as the healthy controls and the frontal groups, the left parietal group was
found to be more accurate in the left rather then the right hemispace. Given these
results, we proposed a model in which both the left and the right hemisphere are
involved in the computation of a combination of spatial and temporal information, but
with the right one having greater resources for performing the task. However, the
number of patients with a left posterior lesion was very small in our brain tumour
population (N=5). Thus, it would be important to assess the reliability of these results
with a larger number of left posterior patients. Moreover, questions can also be
formulated on the specific task we used to investigate the combination of spatial
temporal information. Do the hemispatial effects relate to the superiority of the right
posterior cortex in representing the objects spatial locations in allocentric frames of
references? In order to answer to this question we think it would be beneficial to use a
different type of prediction task, in which the response relies only on allocentric cues.

162
For instance, patients could be required to judge the time at which two moving visible
objects would collide in the left or in the right hemispace, namely a task in which the
spatial relations between the two objects has to be taken into account. If the right
hemisphere is specifically engaged in allocentric representation, we might observe a
poor performance for the right parietal patients only.
7.1.3 Mental transformations in space
Kosslyn et al. (1989) proposed that the representation of the spatial context in which
objects lie involved two distinct processes: a categorical analysis, in which the spatial
position of the object is represented in qualitative terms (e.g. left, right, up, down), and
a metric analysis, in which the spatial relations among objects are represented in
quantitative terms (e.g. distance and angles). On the basis of the response time of
healthy subjects to a tachistoscopic presentation of visual stimuli, Kosslyn claimed that
the metric processing involves the right hemisphre, whereas the categorical engages the
left one. The latter would follow if categorical processing relates to language. However,
the anatomical basis for the theoretical framework of Kosslyn and colleagues was
questioned in two single case studies, which demonstrated that a specific disorder of
categorical spatial representations followed a right and not a left hemiphere lesion in
two cases (Bricolo et al., 2000; Toraldo & Shallice, 2004). By using a modified version
of the Bricolo et al.‘s task (2000), we attempted to establish the cortical regions relevant
for the categorical aspects of mental rotation transformations.
In accordance with previous single-case neuropsychological investigations (Bricolo et
al., 2000; Toraldo and Shallice, 2004), we found that patients with right and not left
parietal cortex lesions had problems, which we interpreted as involving categorical
spatial processing. In our task we required patients to remember the position of a dot
with respect to an upright or a tilted frame of reference and physically to reproduce it
inside a subsequent identical upright reference frame. It is likely that the patients did
not use a matching strategy (mentally rotate the image until it is aligned, as used in the
classical mental rotation task of Shepard and Metzler, 1971). Moreover, the use of an
analogue process to mentally rotate the frame would not completely explain our results.
If an analogue process had been used to solve the task, one could not explain why in the
right parietal group the errors were mainly clustered in some categories (Reflections and
Dimension errors) and not broadly distributed. Conversely, we propose that participants
163
could simply use object-centred and categorical spatial representations of the dot in
relation to the spatial reference frame and could perform the rotation in a step-like
manner. A failure of the object-centred or of the encoding of the categorical features
encoding could therefore have been responsible for the deficits we observed in the right
parietal group.
On the other hand, with respect to the left prefrontal group, we found a broader mental
transformation deficit, which resulted in a significant number of metrically incorrect
responses in both the correct and the incorrect quadrants. This finding is in agreement
with the study of Martin et al. (2008), who observed a strong recruitment of the
attentional and executive process, especially when a metric coding was required. We
currently favour the task setting hypothesis according to which left prefrontal patients
would have a difficulty in acquiring the specific program necessary to organize the
sequence of operations required to carry out the task. However, we consider such an
interpretation as provisional and further investigation being needed, especially with
respect to the representation of metric information.
7.1.3.1 Suggestions for future research
Chapter 5 showed that damage to the right posterior cortex affects the ability to encode
and retrieve categorical information and provided no evidence in favour of a role in
metric processing. In fact, the right parietal patients failed to process the qualitative
spatial cues, without showing signs of impairment in processing metric representation.
However, it is possible that some posterior patients, who made metric errors, have been
missed in our study due to the group study approach or because of the restricted set of
target position employed. Using a similar mental rotation task it would be interesting to
find out whether a different set of stimuli would give rise to the same effects. For
instance, one could use not only a set of 2D objects, but also 3D shapes, in order to ass
possible neural differences. Another suggestion would be to investigate more
systematically whether there are positions and/or sets of stimuli, which give rise to
metric errors, other than for left anterior patients. A finding like that would increase the
evidence for an influence of the right posterior cortex in allocentric/object centered
spatial representation. Moreover, it would be interesting to find out the temporal
dynamics of the metric and the categorical information. We speculated that one first
carries out the categorical encoding of the position of the dot with respect to the object-

164
centred axes and then accesses the metric information. This hypothesis may be tested in
an electroencehalography (EEG) experiment. For instance, patients could be required to
judge whether two subsequent stimuli are identical or not. In one condition, two images
can be presented which differ in their metric aspects, but not in the categorical ones
(e.g. the dot is always presented near to the left-top corner, but some distance below the
original position). In the other one, we could present two images, which differ for a
categorical aspect (e.g. same distance from the corner, in another part of the frame). We
would expect an earlier activation of the right parietal cortex for the categorical cues.
Conversely, a delayed electrophysiological response could be recorded for the metric
information in both the right parietal cortex and the left anterior one.
7.1.4 Phonological dyslexia: the role of the right posterior cortex
Phonological dyslexia, originally described by Beauvois & Derouesne (1979) is
characterized by a selective impairment in reading non-words, while at the same time
words are read without any particular problem. Phonological dyslexia has been
frequently observed in association to damage to a number of sites in the left dominant
hemisphere (e.g. Rapcsak et al., 2009), but also in few individual cases following a
right hemisphere lesion (Derouesne & Beauvois, 1985; Job & Sartori, 1984; Patterson,
2000). By using an antomically based group study approach, we aimed at investigate
further the role of the right hemisphere in reading. In particular, we assed whether the
right posterior cortex could play a critical role in segmenting and spatially organizing
letters within words and non-words. Thus, we reasoned that if the right posterior cortex
is engaged in the representation of spatial relationships between objects (as considered
in Chapter 5), reading impairments might also occur in reading non-words, where
representation of the letter sequence is critical. Indeed, althought in processing a word,
any putative ordering can be supported by units that categorise the word-form as a
whole (Morton, 1969; McClelland & Rumelhart, 1981), in pronounceable nonwords the
ordering of letters lacks this top-down support and so damage to the sequence
information could give rise to phonological dyslexia.
In the study presented in Chapter 6 we required patients with a lesion involving the left
or the right anterior or posterior cortex to read a list of words and pronounceable non-
words. The results are closely related to those recently documented by Rapcsak et al.
(2009). Patients with a brain tumour involving the left anterior and the left posterior
165
cortices were significantly impaired in reading non-words compared to normal controls,
but there was no such effect in reading words. However, more surprisingly, we
observed that phonological dyslexia could arise not only from a left but also from a
right posterior lesion. At a gross level, the performance of the left anterior, left posterior
and the right posterior groups had similar characteristics. They produced a higher
number of errors on orthographically and phonologically legal non-words compared
with normal controls, but there was no such effect with words. However, on a more
detailed investingation on the nature of the non-word reading errors, differences
between their impairments emerged. Thus, we observed that with respect to the
controls, the number of substitution errors was significantly higher in the left anterior
and left posterior groups, whereas the positional errors (deletions, insertions and order
errors) were larger in the right posterior patients. Critically, we claimed that neglect
might not account for the reading deficits of the right posterior group. Indeed, at a
group level no significant differences were observed between groups for errors
occurring in the first half of the non-word. On the other hand, we suggest that what was
significantly impaired in the right posterior group was the ability to structure the spatial
relationships between letters. This suggests that, at least for multisyllabic strings, non-
words might be read by a different procedure from words, supporting the hypothesis of
a 3 reading routes, a semantically mediated lexical route (for words), and two non-
semantic routes, one for processing whole word units and the other for the segmented
components of the string.
7.1.4.1 Suggestions for future research
The overall account of the findings of Chapter 6 leaves some issues that need to be
resolved in future work. For instance, the left anterior group shows a very similar error
pattern to the right parietal group. It is not clear why this should be. Possibly the left
anterior group do not show sufficient care in implementing a nonword decomposition
procedure, a somewhat similar interpretation to that we provide for the rotation errors
they make (Chapter 5). However, the most basic and surprising findings, namely that
phonological alexia arises frequently after right parietal lesions, and that in most such
patients the pattern of errors seems to reflect an impairment of the process of
segmenting and spatially organising the segmented units, strongly suggests that the
reading aloud of nonwords, at least in Italian, involves processes that are not critically
involved in the reading aloud of words. It would be interesting to investigate whether
166
the same pattern of results could be observed also in a similar ‗word-nonword‘ writing
task. A finding like that would increase the evidence for the importance of the right
parietal cortex in spatially organizing letters in a string.
7.2 Discussion of the overall project
In the thesis a large amount of data supporting the importance of the posterior parietal
cortex in a number of different daily spatial tasks was provided. As we mentioned in the
General Introduction, spatial representation involves at least two frames of reference, (i)
an egocentric frame, where objects are represented with respect to the momentary
location and orientation of the user and (ii) an object frame, in which the spatial
relations between object parts are represented with respect to axes inherent to the object
itself or the environment. The neuropsychological data presented in the thesis
demonstrated that damage the posterior parietal cortex can disrupt the ability to
combined spatial information in both egocentric and allocentric frames of references,
with possible functional dissociations with respect to the hemisphere compromised.
Previous studies suggested that damage to the posterior parietal cortex would severely
affect the ability to combine the ocular and arm spatial information in a common
egocentric frame (Lacquaniti et al., 1995; Lacquaniti, 1997), resulting in a specific
reaching impairment (Battaglia-Mayer & Caminiti, 2002). Studies on patients with
optic ataxia are especially pertinent in this context. Optic ataxic patients are impaired in
localizing (via reaching) an object with respect to their body, that is a primary
egocentric information. This naturally occurs when one has to reach to an object
presented in central vision, to the periphery, as well as when the target suddenly moves
to a new position at the movement onset. However, even though egocentric encoding
alone is useful if one requires stationary ―snapshots‖ of an environment, when the
object moves in space or when the spatial relationship between objects has to be taken
into account, a real-time representation of the surroundings is also needed. In other
word, the brain faces the necessity to process allocentric/object-centered spatial
coordinates. One might argue that localising objects ‗via reaching‘ requires always an
absolute or egocentric representation, whereas more cognitive tasks such as the one we
used in Chapter 5 (mental rotation) can be executed accurately without egocentric
localisation, on the basis of the spatial relationship between the dot and the square.

167
Previous studies suggested that there is parallel processing of egocentric and allocentric
information in the parietal lobe and the hippocampal formation (Feigenbaum and
Morris, 2004, Kesner, 2000; Waller & Hodgson, 2006; for a review on the topic see
Burgess, 2008). However, behavioural differences could emerge with respect to the
hemisphere compromised. Anatomically, Benton (1979) argued that an intact right
hemisphere might be crucial for processing relative position information, but not
absolute egocentric localization. In accordance with this claim, studies investigating the
ability to encode spatial relationship have revealed a specific right hemisphere deficit in
individual cases (Bricolo et al., 2000; Toraldo & Shallice, 2004), whereas studies
investigating visuomotor deficits typically involved patients with left hemisphere
involvement, but also right parietal patients were found to be impaired (Ratcliff and
Davies-Jones, 1972; Perenin and Vighetto, 1988). Moreover, that there are differences
in the hemispherical specialisation for egocentric and allocentric spatial information has
also been supported by two fMRI studies, which revealed a bilateral fronto-parietal
activation for egocentric representations and a right-sided parietal asymmetry for
allocentric ones (Galati et al., 2000; Zaehle et al., 2007).
In Chapter 2 we found that both the left and the right parietal patients were equally
impaired in reaching to foveal and extrafoeval targets, thus suggesting that the systems
involved in reaching are in general bilaterally distributed. This hypothesis is supported
by the current literature on optic ataxia showing that both left and right parietal lesions
can give rise to misreaching deficits (e.g. Perenin and Vighetto, 1988). However,
regarding the shift costs for accuracy, we observed that the incidence of parietal patients
having abnormal shift costs was higher for right parietal patients than the other groups
combined. None of the left parietal patients showed abnormal shift costs, even than
three of them showed abnormalities in foveal reaching. One possibility is that updating
the hand trajectory in-flight requires both egocentric and allocentric spatial
representations, with the former be implemented in both the left and the right
hemisphere and the latter being a prerequisite of the right parietal cortex. However,
since the movements of the target and of the hand are fast and the path very short, it
seems more plausible that an allocentric representation is unlikely to be used. An
alternative hypothesis is that the right parietal patients showed higher shift costs,
because signalling the need of change the trajectory in flight involved specifically the
right premotor cortex. It is conceivable that the left premotor cortex could be less

168
engaged in this process, because it might be more involved in language and particularly
in action-selection processes of the contention scheduling type. Further investigations
are needed to test these alternative hypotheses for why it is specifically right parietal
patients that are selectively impaired in making adjustments of hand movements.
There are other complex situations in which a simple viewer-centered reference frame
account would be probabily insufficient to explain the poor performance of parietal
patient, as when one is required to predict the position of an invisible moving target
(Chapter 4). In this latter case the egocentric information (e.g. the retinal and extra-
retinal signals) needs to be supplemented by allocentric information (e.g. the
surrounding space). A question naturally arises on what is the relation between the
reaching impairments observed in parietal patients in the three basic reaching tasks and
the inability to predict the next position of an object over time. Are the spatial disorders
just two instances of a single more general visuomotor deficit in an egocentric frame of
reference or does the latter task require different spatial representation? Intuitively, one
could argue that the hemispatial effect observed in the right parietal patients in the
prediction task (namely, a poor performance in the left hemispace) is just a reflection of
a basic problem in using and combining egocentric coordinates for reaching in the left
hemisphere. However, the errors were much larger in the prediction task than in the
reaching task. The difference between the left and the right parietal patients was 0.87
cm cm in the prediction task and about 0.3 cm in the three reaching conditions (foveal=
0.27 cm, extrafoveal= 0.17, shift costs= 0.40 cm). Therefore, just adding a basic
reaching impairment onto the other cognitive processes involved in spatio-temporal
integration would not explain the space-time difficulty. One needs to consider what
determines where one reaches when the target object is not visible. We suggest that
predicting the position of an invisible moving target requires more than a spatial
representation within a combination of egocentric coordinates (namely the position of
the eyes, body and the hand). In this task an allocentric object-based representation can
also be used for action planning. In accordance to what was claimed just above, we also
propose that - object-centred and other allocentric representations of objects in the very
local environment might also preferentially engage the right posterior hemisphere.
In summary, the experimental data reported in the thesis seems to suggest that the right
parietal lobe seems to be involved in disturbance of allocentric/object-centered spatial
representation. In general, right parietal patients were found to be less accurate in
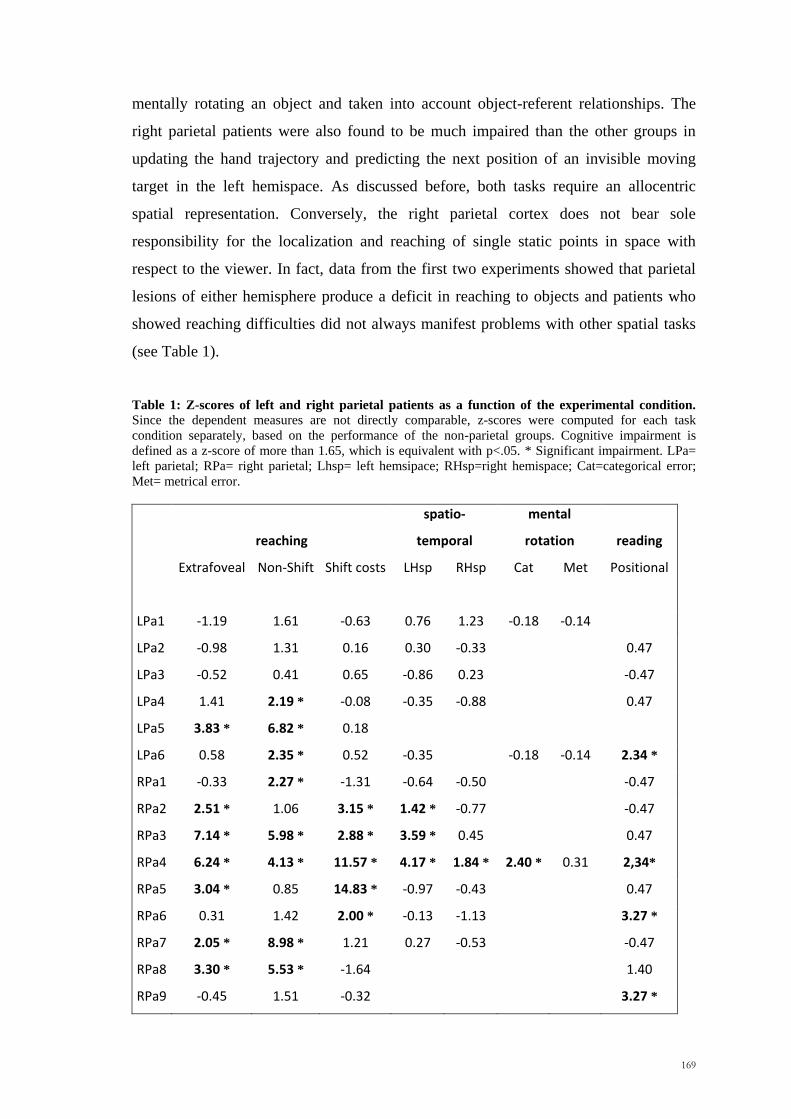
169
mentally rotating an object and taken into account object-referent relationships. The
right parietal patients were also found to be much impaired than the other groups in
updating the hand trajectory and predicting the next position of an invisible moving
target in the left hemispace. As discussed before, both tasks require an allocentric
spatial representation. Conversely, the right parietal cortex does not bear sole
responsibility for the localization and reaching of single static points in space with
respect to the viewer. In fact, data from the first two experiments showed that parietal
lesions of either hemisphere produce a deficit in reaching to objects and patients who
showed reaching difficulties did not always manifest problems with other spatial tasks
(see Table 1).
Table 1: Z-scores of left and right parietal patients as a function of the experimental condition.
Since the dependent measures are not directly comparable, z-scores were computed for each task
condition separately, based on the performance of the non-parietal groups. Cognitive impairment is
defined as a z-score of more than 1.65, which is equivalent with p<.05. * Significant impairment. LPa=
left parietal; RPa= right parietal; Lhsp= left hemsipace; RHsp=right hemispace; Cat=categorical error;
Met= metrical error.
reaching
spatio-
temporal
mental
rotation reading
Extrafoveal Non-Shift Shift costs LHsp RHsp Cat Met Positional
LPa1 -1.19 1.61 -0.63 0.76 1.23 -0.18 -0.14
LPa2 -0.98 1.31 0.16 0.30 -0.33 0.47
LPa3 -0.52 0.41 0.65 -0.86 0.23 -0.47
LPa4 1.41 2.19 * -0.08 -0.35 -0.88 0.47
LPa5 3.83 * 6.82 * 0.18
LPa6 0.58 2.35 * 0.52 -0.35 -0.18 -0.14 2.34 *
RPa1 -0.33 2.27 * -1.31 -0.64 -0.50 -0.47
RPa2 2.51 * 1.06 3.15 * 1.42 * -0.77 -0.47
RPa3 7.14 * 5.98 * 2.88 * 3.59 * 0.45 0.47
RPa4 6.24 * 4.13 * 11.57 * 4.17 * 1.84 * 2.40 * 0.31 2,34*
RPa5 3.04 * 0.85 14.83 * -0.97 -0.43 0.47
RPa6 0.31 1.42 2.00 * -0.13 -1.13 3.27 *
RPa7 2.05 * 8.98 * 1.21 0.27 -0.53 -0.47
RPa8 3.30 * 5.53 * -1.64 1.40
RPa9 -0.45 1.51 -0.32 3.27 *

170
Unfortunately, for practical reasons, not all the patients were tested with all the spatial
tasks we developed. In particular, for the mental rotation task a different population of
brain tumour patients have been used (with the exception of 2 patients, one left and one
right parietal). Therefore, we have only limited data showing the behavioural
association and dissociation of impairments in the brain tumour population. However,
regarding the hemispherical specialisation issue, at a group level there are signs
suggesting that the reaching impairments may be unrelated to the impairments in more
complex tasks requiring allocentric spatial processing. This is in accordance with
previous studies, which showed that low-level sensory analysis are carried out equally
well by either hemisphere, whereas when a more complex analysis of spatial
components are required, the right hemisphere has a critical role (Moscovitch, 1979;
Young & Ratcliff, 1983).
7.3 Conclusions
In conclusion, evidence from separate studies suggested that damage to the posterior
parietal cortex can lead to distinct spatial disorders, ranging from more basic spatial
impairments such as reaching and integrating spatial and temporal information, to more
cognitive disorders such as the inability to mentally rotate an object in space and to
structure the position of letters in non-words. With an anatomically based group study
approach, we were able to confirm the results observed in the past by the use of
different methods, and were also able to provide new insights on the mechanisms and
the neural substrates underlying spatial processing. Understanding how all of these
processes work together is possibly the next major task for researchers interested in
spatial cognition.
171
References
AITB (1944). Army Individual Test Battery. Manual of directions and scoring.
Washington, DC: War Department, Adjutant General‘s Office.
Alexander MP, Stuss DT, Shallice T, Picton W & Gillingham S (2005). Impaired
concentration due to frontal lobe damage from two distinct lesion sites.
Neurology, 65: 572-579.
Alexander LD, Black SE, Gao F, Szilagyi G, Danells CJ & McIlroy WE (2010).
Correlating lesion size and location to deficits after ischemic stroke: The
influence of accounting for altered peri-necrotic tissue and incidental silent
infarcts. Behavioral and Brain Functions 6, p. 6.
Andersen RA, Essick GK, & Siegel RM (1987). Neurons of area 7a activated by both
visual stimuli and oculomotor behavior. Experimental Brain Research, 67: 316–
322.
Andersen RA, Bracewell RM, Barash S, Gnadt JW, & Fogassi L (1990). Eye position
effects on visual, memory, and saccade-related activity in areas LIP and 7a of
macaque. Journal of Neuroscience, 10: 1176–1196.
Alexander MP, Stuss DT, Shallice T, Picton W & Gillingham S (2005). Impaired
concentration due to frontal lobe damage from two distinct lesion sites.
Neurology, 65: 572 – 579.
Archambault P, Caminiti R, Battaglia-Mayer A (2009). Cortical mechanisms for on-line
control of hand movement trajectory. The role of the posterior parietal cortex,
Cereb. Cortex, 19(12): 2848-2864
Archambault P, Ferrari-Toniolo S, Battaglia-Mayer (2011). On-line control of hand
trajectory and evolution of motor intention in the parieto-frontal system. J
Neurosci; 31(2): 742–752.
Arduino LS, Burani C & Vallar G (2002). Lexical effects in left neglect dyslexia: a
study in Italian patients. Cognitive Neuropsychology, 19(5), 421-444.
Assmus A, Marshall JC, Ritzl A, Noth J, Zilles K, Fink GR (2003). Left inferior
parietal cortex integrates time and space during collision judgments. Neuroimage,
20:S82–S88.
Assmus A, Marshall JC, Noth J, Zilles K, Fink GR (2005). Difficulty of perceptual
spatiotemporal integration modulates the neural activity of left inferior parietal
cortex. Neuroscience, 132:923–927.
Averbeck B, Battaglia-Mayer A, Guglielmo C & Caminiti R (2009). Statistical analysis
of the parieto-frontal cognitive-motor network. J. Neurophysiol, 102: 1911–1920.
Bächtold D, Brugger P, Regard M. Processing of spatial locations: hemispace effects
during encoding but not recall (2000). Neuropsychologia, 38:864-872.
Bálint R. Seelenlähmung des ‗schauens‘, optische ataxie, räumliche störung der
aufmerksamkeit (1909). Mschr Psychiat Neurol; 25: 51–81.

172
Bartolomeo P, Thiebaut de Schotten M, and Doricchi F. Left unilateral neglect as a
disconnection syndrome (2007). Cerebral Cortex, 45(14): 3127-3148.
Bartolomeo P. The quest for the ‗critical lesion site‘ in cognitive deficits: Problems and
perspectives (2011). Cortex, 47(8): 10010-12.
Basso G, Nichelli P, Frassinetti F, Pellegrino G (1996). Time perception in a neglected
space. NeuroReport, 7: 2111–2114.
Bates E, Wilson SM, Saygin AP, Dick F, Sereno MI, Knight RT and Dronkers NF
(2003). Voxel-based lesion-symptom mapping. Nature Neuroscience, 6: 448-450.
Battaglia-Mayer A, Ferraina S, Mitsuda T, Marconi B, Genovesio A, Onorati P,
Lacquaniti F & Caminiti R. Early coding of reaching in the parieto-occipital
cortex (2000). J. Neurophysiol, 83: 2374–2391.
Battaglia-Mayer A, Ferraina S, Genovesio A, Marconi B, Squatrito S, Lacquaniti F et
al. Eye-hand coordination during reaching. II. An analysis of the relationhisps
between visuomanual signals in parietal cortex and parieto-frontal association
projections (2001). Cereb Cortex; 11: 528-544.
Battaglia-Mayer A, Caminiti R (2002). Optic ataxia as a result of the breakdown of the
global tuning fields of parietal neurons. Brain; 125:225-237.
Battaglia-Mayer A, Caminiti R, Lacquaniti F, Zago M (2003). Multiple levels of
representation of reaching in the parieto-frontal network. Cereb Cortex; 13: 1009-
1022.
Battaglia-Mayer A, Mascaro M, Brunamonti E & Caminiti R (2005). The over-
representation of contralateral space in parietal cortex: a positive image of
directional motor components of neglect? Cereb. Cortex, 15: 514–525.
Battaglia-Mayer A, Archambault PS, Caminiti R (2006). The cortical network for eye-
hand coordination and its relevance to understanding motor disorders of parietal
patients. Neuropsychologia, 44: 2607-20.
Battaglia-Mayer A, Mascaro M & Caminiti R (2007). Temporal evolution and strength
of neural activity in parietal cortex during eye and hand movements. Cereb
Cortex, 17: 1350–1363.
Battaglini PP, Muzur A, Galletti C, Fattori P, Skrap M (1998). Very fast recovery
following lesion of the superior parietal cortex in the monkey. Pflugers Arch - Eur
J Physiol, 437, R28.
Battaglini PP, Muzur A, Galletti C, Skrap M, Brovelli A & Fattori P (2002). Effects of
lesions to area V6A in monkeys. Exp. Brain Res., 144: 419–422.
Beauvois, MF & Dérouesné J. Phonological alexia: three dissociations (1979). Journal
of Neurology, Neurosurgery, and Psychiatry; 42(12), 1115-1124.
Becker W, Fuchs AF (1985). Prediction in the oculomotor system: smooth pursuit
during transient disappearance of a visual target. Exp Brain Res, 57:562-575.

173
Behrmann M, Moscovitch M, Black SE, & Mozer M (1990). Perceptual and conceptual
mechanisms in neglect dyslexia. Brain, 113:1163-1183.
Behrmann M & Moscovitch M (1994). Object-centered neglect in patients with
unilateral neglect: Effects of left-right coordinates of objects. Journal of Cognitive
Neuroscience, 6:1-16.
Benton A (1969). Disorders of spatial orientation. In: VInken PJ, Ponrijn GW, Critchley
M, Frederiks JAM (Eds). Handbook of clinical neurology, Vol 3. Disorders of
higher nervous activity. North Holland, Amsterdam, pp: 212-228.
Benton A & Hamsher K (1978). Multilingual aphasia examination. Iowa City: The
University of Iowa.
Berti A & Frassinetti F (2000). When far becomes near: Remapping of space by tool
use, Journal of Cognitive Neuroscience, 12: 415–420.
Binkofski F, Dohle C, Posse S, Stephan KM, Hefter H, Seitz RJ, et al (1998). Human
anterior intraparietal area subserves prehension: A combined lesion and functional
MRI activation study. Neurology, 50(5): 1253–1259.
Bisiach E & Luzzatti C (1978). Unilateral neglect of representational space. Cortex, 14:
129–133.
Bisley JW, Goldberg ME (2010). Attention, intention, and priority in the parietal lobe.
Annu Rev Neurosci, 33:1-21.
Bizzi A (2011). Clinico-anatomical correlation in gliomas: A new frontier in clinical
neuroscience. Cortex, 47(8): 10013-15.
Blangero A, Gaveau V, Luauté J, Rode G, Salemme R, Guinard M et al. (2008). A hand
and a field effect in on-line motor control in unilateral optic ataxia. Cortex, 44(5):
560-568.
Bor D, Duncan J, Lee AC, Parr A and Owen AM (2006). Frontal lobe involvement in
spatial span: Converging studies of normal and impaired function,
Neuropsychologia, 44: 229–237.
Boulinguez P, Ferrois M, Graumer G (2003). Hemispheric asymmetry for trajectory
perception. Brain Res Cogn Brain Res., 16(2): 219-25.
Bowers D & Heilman KM (1980). Pseudoneglect: effects of hemispace on a tactile line
bisection task. Neuropsychologia, 18: 491-498.
Brain WR (1941). Visual disorientation with special reference to lesions of the right
hemisphere. Brain, 64: 244-272.
Brambati SM, Myers D, Wilson A, Rankin KP, Allison SC & Rosen HJ (2006). The
anatomy of category-specific object naming in neurodegenerative diseases,
Journal of Cognitive Neuroscience, 18 (10): 1644–1653.
Bremmer F, Schlack A, Shah NJ, Zafiris O, Kubischik M, Hoffman KP, et al (2001).
Polymodal motion processing in posterior parietal and premotor cortex: A human
fMRI study strongly implies equivalencies between humans and monkeys.
Neuron, 29(1): 287–296.

174
Bricolo E, Shallice T, Priftis K and Meneghello F (2000). Selective space
transformation deficit in a patient with spatial agnosia. Neurocase, 6: 307–319.
Brunner E & Munzel U (2000). The nonparametric Behrens-Fisher problem: asymptotic
theory and small-sample approximation. Biometrical Journal, 42: 17–25.
Buch ER, Mars RB, Boorman ED, Rushworth MFS (2010). A network centered on
ventral premotor cortex exerts both facilitatory and inhibitory control over
primary motor cortex during action reprogramming. J Neurosci; 30: 1395–1401.
Buiatti, T, Mussoni, A. Toraldo, A., Skrap, M., & Shallice, T (2011). Two qualitatively
different impairments in making rotation operations. Cortex, 47(2): 166-179.
Buneo CA, Jarvis MR, Batista AP, Andersen RA (2002). Direct visuomotor
transformations for reaching. Nature 2, 416:632– 636.
Buneo CA, Andersen RA (2006). The posterior parietal cortex: sensorimotor interface
for the planning and online control of visually guided movements.
Neuropsychologia, 44: 2594–2606.
Burgess N. Spatial cognition and the brain (2008). Ann N Y Acad Sci; 1124:77–97.
Buxbaum LJ, Coslett HB (1998). Spatio-motor representations in reading: evidence for
subtypes of optic ataxia. Cgn Neuropsychol; 15: 279–312.
Caccappolo-van Vliet E, Miozzo M, Marder K, & Stern Y (2003). Where do
perseverations come from? Neurocase, 9(4), 297-307.
Caccappolo-van Vliet E, Miozzo M, & Stern Y (2004a). Phonological dyslexia without
phonological impairment? Cognitive Neuropsychology, 21, 820–839.
Caccappolo-van Vliet E, Miozzo M, & Stern Y (2004b). Phonological dyslexia: A test
case for reading models. Psychological Science, 15, 583–590.
Calabria M, Jacquin-Courtois S, Miozzo A, Rossetti Y, Padovani A, Cotelli M,
Miniussi C (2011). Time perception in spatial neglect: a distorted representation?
Neuropsychology, 25(2): 193-200.
Caminiti R, Ferraina S, Johnson PB (1996). The sources of visual input to the primate
frontal lobe: A novel role for the superior parietal lobule. Cereb Cortex, 6:102-
119.
Caminiti R, Chafee MV, Battaglia-Mayer A, Averbeck BB, Crowe DA, Georgopoulous
AP (2010). Understanding the parietal lobe syndrome from a neurophysiological
and evolutionary perspective. European Journal of Neuroscience, 31:2320-2340.
Campanella F, D‘Agostini S, Skrap M, and Shallice T (2010). Naming manipulable
objects: Anatomy of a category specific effect in left temporal tumours.
Neuropsychologia, 48: 1583-1597.
Carey DP, Coleman RJ, Della Sala S (1997). Magnetic misreaching, Cortex; 33: 639–
652.

175
Carey DP, Della Sala S, Ietswaart M (2002). Neuropsychological perspectives on eye-
hand coordination in visually-guided reaching. Prog. Brain Res.; 140: 311–327.
Carpenter PA, Just MA, Keller TA, Eddy W and Thulborn K (1999). Graded functional
activation in the visuospatial system with the amount of task demand. Journal of
Cognitive Neuroscience, 11: 9-24.
Casarotti M, Michielin M, Zorzi M, Umiltà C (2007). Temporal order judgements
reveal how number magnitude affects visuospatial attention. Cognition, 102: 101-
117.
Cohen MS & Bookheimer SY (1994). Localization of brain function using magnetic
resonance imaging. Trends in Neurosciences, 17: 268-77.
Cohen L & Dehaene S. Competition between past and present (1998). Assessment and
interpretation of verbal perseverations. Brain: A Journal of Neurology, 121 (9),
1641-1659.
Colby CL & Duhamel JR (1991). Heterogeneity of extrastriate visual areas and multiple
parietal areas in the macaque monkey. Neuropsychologia, 29: 517–537.
Colby CL, Duhamel JR & Goldberg ME (1993).Ventral intraparietal area of the
macaque: Anatomic location and visual response properties. Journal of
Neurophysiology, 6(3): 902–914.
Collins DL, Zijdenbos AP, Kollokian V, Sled JG, Kabani NJ, Holmes CJ and Evans AC
(1998). Design and construction of a realistic digital brain phantom, IEEE
Transactions on Medical Imaging, 17: 463–468.
Coltheart M (1978). Lexical access in simple reading tasks. Strategies of Information
Processing (pp. 151-216). Academic Press.
Coltheart M (1980). Deep dyslexia: A right-hemisphere hypothesis. In M. Coltheart, K.
Patterson, and J.C. Marshall (Eds.), Deep Dyslexia. London: Routledge & Kegan
Paul.
Coltheart M, Masterson J, Byng S, Prior M, & Riddoch J (1983). Surface dyslexia.
Quarterly Journal of Experimental Psychology, 35A: 469-495.
Coltheart M (1985). Cognitive neuropsychology and the study of reading. In M. I.
Posner, & O. S. M. Marin (Eds.), Attention and performance XI (pp. 3–37).
Hillsdale, NJ: Lawrence Erlbaum Associates.
Coltheart M, Curtis B, Atkins P, & Haller M (1993). Models of reading aloud: Dual-
route and parallel-distributed-processing approaches. Psychological Review,
100:589-608.
Coltheart M, Rastle K, Perry C, Langdon R, & Ziegler J (2001). DRC: a dual route
cascaded model of visual word recognition and reading aloud. Psychological
Review, 108(1): 204-256.
Coltheart M (2006). Acquired dyslexias and the computational modelling of reading.
Cognitive Neuropsychology, 23(1), 96-109.
Connolly JD, Andersen RA, & Goodale MA (2003). FMRI evidence for a ‗parietal
reach region‘ in the human brain. Experimental Brain Research, 153(2): 140–145.

176
Cooper AN & Shepard RN (1973). The time required to prepare for a rotated stimulus.
Memory & Cognition, 1: 246-250.
Corballis MC & Sergent J (1989). Mental rotation in a commissurotomized subject,
Neuropsychologia, 27: 585–597.
Corballis MC (1997). Mental rotation and the right hemisphere. Brain and Language,
57 (1): 100-21.
Coull JT, Nobre AC (1998). Where and when to pay attention: the neural systems for
directing attention to spatial locations and to time intervals as revealed by both
PET and fMRI. J Neurosci, 18: 7426-7435.
Coull JT, Vidal F, Goulon C, Nazarian B, Craig C (2008). Using time-to-contact
information to assess potential collision modulates both visual and temporal
prediction networks. Front Hum Neurosci, 2:10.
Coulthard E, Parton A, Husain M (2006). Action control in visual neglect.
Neuropsychologia; 44(13): 2717-2733.
Courtney SM, Ungerleider LG, Keil K and Haxby JV (1996). Object and spatial visual
working memory activate separate neural systems in human cortex. Cerebral.
Cortex, 6: 39–49.
Courtney SM, Petit L, Maisog JM, Ungerleider LG and Haxby JV (1998). An area
specialized for spatial working memory in human frontal cortex. Science, 279:
1347–1351.
Crawford JR, Howell DC (1998). Comparing an individual‘s test score against norms
derived from small samples. Clinical Neuropsychol; 12: 482-486.
Crawford JR, Garthwaite PH (2005). Testing for suspected impairments and
dissociations in single-case studies in neuropsychology: evaluation of alternatives
using Monte Carlo simulations and revised tests for dissociations.
Neuropsychology; 19(3): 318-331.
Critchley M (1953). The parietal lobes. London: Edward Arnold.
Crutch SJ & Warrington EK (2009). The relationship between visual crowding and
letter confusability: towards an understanding of dyslexia in posterior cortical
atrophy. Cognitive Neuropsychology, 26(5): 471-498.
Culham JC, & Kanwisher NG (2001). Neuroimaging of cognitive functions in human
parietal cortex. Current Opinion in Neurobiology, 11(2): 157–163.
Culham JC, Cavina Pratesi C, & Goodale MA (2004). Object size matters for grasping
but NOT for perception in the human anterior intraparietal area. Paper presented
at the Society for Neuroscience, San Diego, CA.
Culham JC, Cavina-Pratesi C & Singhal A (2006). The role of parietal cortex in
visuomotor control: What have we learned from neuroimaging?
Neuropsychologia, 44: 2668-2684.
177
Danckert J, Ferber S, Pun C, Broderick C, Striemer C, Rock S, Stewart D (2007).
Neglected time: impaired temporal perception of multisecond intervals in
unilateral neglect. J Cogn Neurosci, 19(10):1706–1720.
De Lange FP, Hagoort P and Toni I (2005). Neural topography and content of
movement representations. Journal of Cognitive Neuroscience, 17: 97-112.
Dérouesné J, & Beauvois MF (1979). Phonological processing in reading: data from
alexia. Journal of Neurology, Neurosurgery, and Psychiatry, 42(12), 1125-1132.
Dérouesné J, & Beauvois MF (1985). The ‗‗phonemic‘‘ state in the nonlexical reading
process: Evidence from a case of phonological alexia. In K.E. Patterson, J.C.
Marshall, & M. Coltheart (Eds.), Surface dyslexia: Neuropsychological and
cognitive studies of phonological reading (pp. 399–457). London: Erlbaum.
Desmurget M, Epstein CM, Turner RS, Prablanc C, Alexander GE, Grafton ST (1999).
Role of the posterior parietal cortex in updating reaching movements to a visual
target. Nat Neurosci; 2(6): 563-567.
Desmurget M, Grafton ST, Vindras P, Grea H and Turner RS (2004). The basal ganglia
network mediates the planning of movement amplitude. European Journal of
Neuroscence, 19: 2871–2880.
Deutsch G, Bourbon WT, Papanicolaou AC and Eisenberg HM (1988). Visuospatial
tasks compared via activation of regional cerebral blood flow. Neuropsychologia,
26: 445-52.
Ditunno PL and Mann VA (1990). Right hemisphere specialization for mental rotation
in normals and brain damaged subjects. Cortex, 26: 177-88.
Driver J. Object-based and egocentric visual neglect (1998). In Burgess N and O'Keefe
J (Eds), The Hippocampal and parietal foundations of spatial cognition. Oxford:
Oxford University Press.
Driver J, & Mattingley JB (1998). Parietal neglect and visual awareness. Nature
Neuroscience, 1:17–22.
Duffau H (2011). Do brain tumours allow valid conclusions on the localisation of
human brain functions? Cortex, 47(8): 10016-17.
Dunn TD (1895). Double hemiplegia with double hemianopsia and loss of geographical
centre. Transactions of the College of Physicians of Philadelphia, 17:45-56.
Edgeworth JA, Robertson IH, McMillan TM (1998). The Balloons test. Bury St
Edmunds (UK): Thames Valley Test Company Limited.
Ellis AW, Flude BM, & Young AW (1987). ―Neglect dyslexia‖ and the early visual
processing of letters in words and nonwords. Cognitive Neuropsychology, 4(4),
439.
Ellis AW & Young AW (1988). Human Cognitive Neuropsychology. Hove, East
Sussex: Lawrence Erlbaum.
Ettlinger G, Warrington E & Zangwill OL (1957). A further study of visual-spatial
agnosia. Brain, 80:335-361.
178
Faillenot I, Sakata H, Costes N, Decety J, & Jeannerod M (1997). Visual working
memory for shape and 3D-orientation: A PET study. Neuroreport, 8(4), 859–862.
Feigenbaum JD, & Morris RG (2004). Allocentric versus egocentric spatial memory
after unilateral temporal lobectomy in humans. Neuropsychology, 18: 462–472.
Ferraina S, Battaglia-Mayer A, Genovesio A, Marconi B, Onorati P, Caminiti R (2001).
Early coding of visuomanual coordination during reaching in parietal area PEc. J
Neurophysiol; 85: 462-465.
Ferraina S, Brunamonti E, Giusti MA, Costa S, Genovesio A, Caminiti R (2009).
Reaching in depth: Hand position dominates over binocular eye position in the
rostral Superior Parietal Lobule. J Neurosci; 29(37): 11461-11470.
Fink GR, Marshall JC, Halligan PW, and Dolan RJ (1999). Hemispheric asymmetries in
global/local processing are modulated by perceptual salience. Neuropsychologia,
37: 31-40.
Fischer MH, Castel AD, Dodd MD, Pratt J (2003). Perceiving numbers causes spatial
shifts of attention. Nature Neuroscience, 6: 555–556.
Fogassi L, Ferrari PF, Gesierich B, Rozzi S, Chersi F, & Rizzolatti G (2005). Parietal
lobe: From action organization to intention understanding. Science, 308(5722):
662–667.
Franconeri SL, Lin JY, Pylyshyn ZW, Fisher B, Enns JT (2008). Evidence against a
speed limit in multiple-object tracking. Psychon Bull Rev, 15:802-808.
Franklin N and Tversky B. Searching imagined environments (1990). Journal of
Experimental Psychology, 119: 63-76.
Freyd JJ, Finke RA (1984). Representational momentum. J Exp Phychol Learn, 10:126-
132.
Friedmann N, & Gvion A (2001). Letter position dyslexia. Cognitive Neuropsychology,
18(8): 673-696.
Friedmann N, & Rahamim, E (2007). Developmental letter position dyslexia. Journal of
Neuropsychology, 1(2): 201-236.
Funnell E (1983). Phonological processes in reading: new evidence from acquired
dyslexia. British Journal of Psychology, 74 (2): 159-180.
Galati G, Lobel E, Vallar G, Berthoz A, Pizzamiglio L & Le Bihan D (2000). The
neural basis of egocentric and allocentric coding of space in humans: a functional
magnetic resonance study, Exp. Brain Res., 133:156–164.
Garcin R, Rondot P, de Recondo J (1967). Optic ataxia localized in 2 left homonymous
visual hemifields. Rev. Neurol.; 116(6): 707-714.
Georgopoulos AP, Caminiti R & Kalaska JF (1984). Static spatial effects in motor
cortex and area 5: quantitative relations in a two-dimensional space. Exp. Brain
Res, 54: 446–454.

179
Giovagnoli AR, Del Pesce M, Mascheroni S, Simoncelli M, Laiacanona M, & Capitani
E (2006). Trail making test: normative values from 287 normal adult controls.
Italian Journal of Neurological Sciences, 17:305-309.
Glover S (2003). Optic ataxia as a deficit specific to the on-line control of actions.
Neurosci Biobehav Rev; 27(5): 447-56.
Goodale MA & Milner AD (1992). Separate visual pathways for perception and action.
Trends in Neurosciences, 15(1): 20–25.
Gréa H, Pisella L, Rossetti Y, Desmurget M, Tilikete C, Grafton S et al (2002). A lesion
of the posterior parietal cortex disrupts on-line adjustments during aiming
movements. Neuropsychologia; 40(13): 2471-80.
Grefkes C, & Fink GR (2005). The functional organization of the intraparietal sulcus in
humans and monkeys. Journal of Anatomy, 207(1): 3–17.
Halari R, Sharma T, Hines M, Andrew C, Simmons A and Kumari V (2006).
Comparable fMRI activity with differential behavioural performance on mental
rotation and overt verbal fluency tasks in healthy men and women. Experimental
Brain Research, 169: 1-14.
Halpern H. Effect of stimulus variables on verbal perseveration of dysphasic subjects
(1965). Perceptual and Motor skills, 20: 421-429.
Halpern AR, Kelly MH. Memory biases in left versus right implied motion (1993). J
Exp Phychol Learn, 19:471-484.
Harm M, & Seidenberg MS (1999). Reading acquisition, phonology, and dyslexia:
insights from a connectionist model. Psychological Review, 106: 491-528.
Harrington DL, Haaland KY, Knight RT. Cortical networks underlying mechanisms of
time perception. J Neurosci 1998b; 18: 1085–95.
Harris IM, Egan GF, Sonkkila C, Tochon-Danguy HJ, Paxinos G and Watson JD
(2000). Selective right parietal lobe activation during mental rotation: a
parametric PET study. Brain, 123: 65-73.
Harris IM and Miniussi C (2003). Parietal lobe contribution to mental rotation
demonstrated with rTMS. Journal of Cognitive Neuroscience, 15: 315-23.
Hegarty M (1992). Mental animation: inferring motion from static displays of
mechanical systems. Journal of Experimental Psychology. Learning, Memory,
and Cognition, 18: 1084-102.
Heide W, Kurzidim K, Kömpf D (1996). Deficits of smooth pursuit eye movements
after frontal and parietal lesions. Brain, 119 ( Pt 6):1951-69.
Heide W, Kömpf D (1997). Specific parietal lobe contribution to spatial constancy
across saccades. In "Parietal Lobe Contributions to Orientation in 3D Space", eds
Their P., Karnath H.-O. (Springer-Verlag, Heidelberg, Germany), pp 149–172.
Helson H (1948). Adaptation-level as a basis for a quantitative theory of frames of
reference. Psychol Rev., 55(6): 297-313.
180
Hillis AE & Caramazza A (1995). A framework for interpreting distinct patterns of
hemispatial neglect. Neurocase, 1(3): 189.
Hirsh KW (1998). Perseveration and activation in aphasic speech production. Cognitive
Neuropsychology, 15: 377–88.
Holmes G (1918). Disturbances of visual orientation. Brit J Ophtal, 2:449-468.
Holmes, EJ, & Gross, CG (1984). Effects of inferior temporal lesions on discrimination
of stimuli differing in orientation. Journal of Neuroscience, 4(12), 3063- 3068.
Holmes AP, Blair RC,Watson JDG and Ford I (1996). Non-Parametric Analysis of
Statistic Images From Functional Mapping Experiments. Journal of Cerebral
Blood Flow and Metabolism, 16: 7-22.
Huang RS, & Sereno M (2005). Mapping the human homologue of the ventral
intraparietal area (VIP). Neuroimage, 26(Suppl.), S23.
Hubbard TL, Bharucha JJ (1988). Judged displacement in apparent vertical and
horizontal motion. Percept Psychophys, 44:211-221.
Hubbard TL (2005). Representational momentum and related displacements in spatial
memory: a review of the findings. Psychon. Bull. Rev., 12:822–851.
Humphreys GW and Riddoch MJ (1995). Separate coding of space within and between
perceptual objects: Evidence from unilateral visual neglect. Cognitive
Neuropsychology, 12, 283-311.
Humphreys GW, Olson A, Romani C and Riddoch MJ (1996). Competitive
mechanisms of selection by space and object: a neuropsychological approach. In
Kramer AF, Coles MGH and Logan GD (Eds.), Converging operations in the
study of visual selective attention, pp 365-393, Washington, DC: American
Psychological Association.
Husain M & Rorden C (2003). Non-spatially lateralized mechanisms in hemispatial
neglect. Nature Reviews Neuroscience, 4:26-36.
Inoue M, Yoshino A, Suzuki A, Ogasawara T and Nomura S (1998). Topographic study
of human event-related potentials using a task requiring mental rotation.
Neuroscience Letters, 253: 107-10.
Ishihara M, Keller PE, Rossetti Y, & Prinz W (2008). Horizontal spatial representations
of time: evidence for the STEARC effect. Cortex, 44: 454-461.
Ito M (1984). The cerebellum and neural control. New York: Raven.
Ivry RB. (1996). The representation of temporal information in perception and motor
control. Current opinion in Neurobiology, 6, 851-857.
Ivry RB, Spencer RM, Zelaznik HN, & Diedrichsen J (2002). The cerebellum and event
timing. Annals of the New York Academy of Sciences, 978: 302-317.

181
Jackson JH (1876). Case of large cerebral tumour without optic neuritis and left
hemiplegia and imperception. Royal London Ophthalmic Hospital Reports, 8:434.
Jackson SR, Newport R, Mort D, Husain M (2005). Where the eye looks, the hand
follows; limb-dependent magnetic misreaching in optic ataxia. Curr. Biol; 15(1):
42-46.
Job R, & Sartori G (1984). Morphological decomposition: evidence from crossed
phonological dyslexia. The Quarterly Journal of Experimental Psychology, 36(3),
435-458.
Johnson PB, Ferraina S, Bianchi L & Caminiti R (1996). Cortical networks for visual
reaching: physiological and anatomical organization of frontal and parietal lobe
arm regions. Cereb Cortex, 6: 102–119.
Johnston S, Leek EC, Atherton C, Thacker N and Jackson A (2004). Functional
contribution of medial premotor cortex to visuo-spatial transformation in humans.
Neuroscience Letters, 355: 209-12.
Jolicoeur P. (1985). The time to name disoriented natural objects. Memory Cogn,
13:289-303.
Jordan K, Heinze HJ, Lutz K, Kanowski M and Jäncke L (2001). Cortical activations
during the mental rotation of different visual objects. NeuroImage, 13: 143-52.
Karlin L (1959). Reaction time as a function of foreperiod duration and variability. J
Exp Psychol, 58:185–191.
Karnath HO, Ferber S, Himmelbach M (2001). Spatial awareness is a function of the
temporal not the posterior parietal lobe. Nature, 411(6840):950-3.
Karnath HO, Steinbach JP (2011). Do brain tumours allow valid conclusions on the
localisation of human brain functions? - Objections. Cortex, 47(8): 1004-6.
Keehner M, Guerin SA, Miller MB, Turk DJ and Hegarty M (2006). Modulation of
neural activity by angle of rotation during imagined spatial transformations.
NeuroImage, 33: 391-8.
Kerkhoff G and Zoelch C (1998). Disorders of visuospatial orientation in the frontal
plane in patients with visual neglect following right or left parietal lesions.
Experimental brain research, 122: 108-20.
Kerzel D, Jordan JS, Müsseler J (2001). The role of perception in the mislocalization of
the final position of a moving target. J Exp Psychol Hum Percept Perform,
27:829–840.
Kesner RP (2000). Behavioral analysis of the contribution of the hippocampus and
parietal cortex to the processing of information: Interactions and dissociations.
Hippocampus, 10: 483–490.
Kimura D (1969). Spatial localization in left and right visual fields. Can J Psychol, 23:
445-458.

182
Kinsbourne M, & Warrington EK (1962). A variety of reading disability associated
with right hemisphere lesions. Journal of Neurology, Neurosurgery, and
Psychiatry, 25: 339-344.
Kosslyn SM (1980). Image and mind. Cambridge, MA: Harvard UniversityPress.
Kosslyn SM, Koenig O, Barrett A, Cave CB, Tang J and Gabrieli JD (1989). Evidence
for two types of spatial representations: hemispheric specialization for categorical
and coordinate relations. Journal of Experimental Psychology. Human Perception
and Performance, 15: 723-35.
Kosslyn SM, DiGirolamo GJ, Thompson WL and Alpert NM (1998). Mental rotation of
objects versus hands: neural mechanisms revealed by positron emission
tomography. Psychophysiology, 35: 151-61.
Kosslyn SM, Thompson WL, Wraga M and Alpert NM (2001). Imagining rotation by
endogenous versus exogenous forces: distinct neural mechanisms. Neuroreport,
12: 2519-25.
Lacquaniti F, Guigon E, Bianchi L, Ferraina S, & Caminiti R (1995). Representing
spatial information for limb movement: the role of area 5 in the monkey. Cereb
Cortex, 5: 391-409.
Lacquaniti F, Perani D, Bettinardi V, Carrozzo M, Grassi F, Rossetti Y, & Fazio F
(1997). Visuomotor transformations for reaching to memorized targets: a PET
study. Neuroimage; 5: 129–146.
Làdavas E (1987). Is the hemispatial deficit produced by right parietal lobe damage
associated with retinal or gravitational coordinates? Brain, 110:167–180.
Làdavas E, Shallice T, & Zanella MT (1997a). Preserved semantic access in neglect
dyslexia. Neuropsychologia, 35(3), 257-270.
Làdavas E, Umiltà C, & Mapelli D (1997b). Lexical and semantic processing in the
absence of word reading: evidence from neglect dyslexia. Neuropsychologia,
35(8), 1075-1085.
Lambon Ralph MA, & Ellis AW (1997). ―Patterns of paralexia‖ revisited: Report of a
case of visual dyslexia. Cognitive Neuropsychology, 14: 953–974.
Lamm C, Windischberger C, Moser E and Bauer H (2007). The functional role of
dorso-lateral premotor cortex during mental rotation: an event-related fMRI study
separating cognitive processing steps using a novel task paradigm. NeuroImage,
36: 1374-86.
Leiner HC, Leiner AL, & Dow RS (1986). Does the cerebellum contribute to mental
skills? Behavioral Neuroscience, 100: 443–454.
Levy R and Goldman-Rakic PS (2000). Segregation of working memory functions
within the dorsolateral prefrontal cortex. Experimental Brain Research, 133: 23-
32.
Lewis PA, Miall RC (2003). Brain activation patterns during measurement of sub- and
supra-second intervals. Neuropsychologia 41:1583–1592.

183
Logan GD (1994). On the ability to inhibit thought and action: a users‘ guide to the stop
signal paradigm. In: Dagenbach D, Carr TH (Eds) Inhibitory processes in
attention, memory and language. Academic Press, San Diego; pp 189–239.
Marr D (1980). Visual information: The structure and creation of visual representations.
Philosophical Transactions of the Royal Society of London—Series B: Biological
Sciences, 290: 199–218.
Marshall JC, & Newcombe F (1973). Patterns of paralexia: a psycholinguistic approach.
Journal of Psycholinguistic Research, 2(3), 175-199.
Martin R, Houssemand C, Schiltz C, Burnod Y and Alexandre F (2008). Is there
continuity between categorical and coordinate spatial relations coding? Evidence
from a grid/no-grid working memory paradigm. Neuropsychologia, 46: 576-94.
Mattingley JB, Bradshaw JL, & Phillips JG (1992). Impairments of movement initiation
and execution in unilateral neglect. Directional hypokinesia and bradykinesia.
Brain, 115 ( Pt 6): 1849-1874.
Mattingley JB, Husain M, Rorden C, Kennard C, & Driver J (1998). Motor role of
human inferior parietal lobe revealed in unilateral neglect patients. Nature, 392:
179-182.
McClelland JL, & Rumelhart DE (1981). An interactive activation model of context
effects in letter perception: I. An account of basic findings. Psychological
Review, 88(5): 375-407.
Mesulam MM (1999). Spatial attention and neglect: parietal, frontal and cingulate
contributions to the mental representation and attentional targeting of salient
extrapersonal events. Philos Trans R Soc Lond B Biol Sci, 354: 1325-1346.
Milner AD, Paulignan Y, Dijkerman HC, Michel F, Jeannerod M (1999). A paradoxical
improvement of misreading in optic ataxia: new evidence for two separate neural
systems for visual localization. Proc R Soc Lond B Biol Sci; 266: 2225–9.
Milner AD & Goodale MA (2006). The visual brain in action (2nd ed.), Oxford
University Press, Oxford.
Mort DJ, Malhotra P, Mannan SK, Rorden C, Pambakian A, Kennard C, and Husain M
(2003). The anatomy of visual neglect. Brain, 126: 1986-1997.
Morton J (1969). Interaction of information in word recognition. Psychological Review,
76(2): 165-178.
Morton J. & Patterson KE (1980). A new attempt at interpretation or, an attempt at a
new interpretation. In M. Coltheart, K. E. Patterson, & J.C. Marshall (Eds), Deep
dyslexia (pp. 91-118). London: Routledge and Kegan Paul.
Moscovitch M (1979). Information processing and the cerebral hemispheres. In M. S.
Gazzaniga (Ed.), Handbook of Behavioural Neurobiology: Vol. 2
Neuropsychology. 379-446. New York: Plenum Press.
Mostofsky SH, Simmonds DJ (2008). Response inhibition and response selection: two
sides of the same coin. J Cogn Neurosci. May; 20(5): 751-61.
184
Mountcastle VB, Lynch JC, Georgopoulos A, Sakata H, Acuna C (1975). Posterior
parietal association cortex of the monkey: command function for operations
within extrapersonal space. J Neurophysiol, 38:871–908.
Murata A, Gallese V, Luppino G, Kaseda M, & Sakata H (2000). Selectivity for the
shape, size, and orientation of objects for grasping in neurons of monkey parietal
area AIP. Journal of Neurophysiology, 83(5): 2580–2601.
Muri RM, Iba-Zizen MT, Derosier C, Cabanis EA, & Pierrot-Deseiligny C (1996).
Location of the human posterior eye fields with functional magnetic resonance
imaging. Journal of Neurology, Neurosurgery and Psychiatry, 60: 445–448.
Norris D (1994). A quantitative multiple-levels model of reading aloud. Journal of
Experimental Psychology: Human Perception and Peflormance, 20:1212-1232.
Oliveri M, Koch G, Salerno S, Torriero S, Gerfo EL., Caltagirone C (2009).
Representation of time intervals in the right posterior parietal cortex: implications
for a mental time line. Neuroimage, 46: 1173-9.
Owen AM, Doyon J, Petrides M and Evans AC (1996). Planning and spatial working
memory: a positron emission tomography study in humans. The European Journal
of Neuroscience, 8: 353-64.
Pagliuca G, & Monaghan P (2010). Discovering large grain-sizes in a transparent
orthography: Insights from a connectionist model of Italian word naming.
European Journal of Cognitive Psychology, 22(5): 813-835.
Papagno C, & Basso A (1996). Perseveration in two aphasic patients. Cortex, 32(1), 67-
82.
Parducci A., Wedell D.H (1986). The category effect with rating scales: number of
categories, number of stimuli, and method of presentation. J Exp Psychol, 12:496-
516.
Paterson A & Zangwill OL (1944). Disorders of visual space perception associated with
lesions of the right cerebral hemisphere. Brain, 67:331-358.
Patterson K (1982). The relation between reading and phonological coding: Further
neuropsychological observations. In A. W. Ellis (Ed.), Normality and pathology
in cognitive functions. London: Academic.
Patterson K, & Marcel A (1992). Phonological ALEXIA or PHONOLOGICAL alexia.
In J. Alegria, D. Holender, J. Morais, and M. Radeau (Eds.), Analytic approaches
to human cognition. Amsterdam: Elsevier.
Patterson K (2000). Phonological alexia: The case of the singing detective. In E.
Funnell (Ed.), Neuropsychology of reading (pp. 57–84). Hove, UK: Psychology
Press.
Perenin MT, Vighetto A (1988). Optic ataxia: a specific disruption in visuomotor
mechanisms. Brain; 111: 643–74.

185
Perry C, Ziegler JC, & Zorzi M (2007). Nested incremental modeling in the
development of computational theories: The CDP+ model of reading aloud.
Psychological Review, 114(2): 273-315.
Pisella L, Gréa H, Tilikete C, Vighetto A, Desmurget M, Rode G et al (2000). An
‗automatic pilot‘ for the hand in human posterior parietal cortex: toward
reinterpreting optic ataxia. Nature Neurosci; 3: 729–36.
Pisella, L, Ota H, Vighetto A, Rossetti, Y (2008). Optic ataxia and Bálint's syndrome:
neuropsychological and neurophysioogical prospects. In: Goldenberg G, Milner
B, editors. Handbook of Clinical Neurology, Neuropsychology and Behavioral
Neurology, Elsevier, UK; p. 393–416.
Pisella L, Sergio L, Blangero A, Torchin H, Vighetto A, Rossetti Y (2009). Optic ataxia
and the function of the dorsal stream: contributions to perception and action.
Neuropsychologia; 47(14): 3033-3044.
Plaut DC, McClelland JL, Seidenberg MS, & Patterson K (1996). Understanding
normal and impaired word reading: computational principles in quasi-regular
domains. Psychological Review, 103(1), 56-115.
Prado J, Clavagnier S, Otzenberger H, Scheiber C, Kennedy H, Perenin M (2005). Two
cortical systems for reaching in central and peripheral vision. Neuron; 48(5): 849-
858.
Pylyshyn ZW (2002). Mental imagery: in search of a theory. The Behavioral and Brain
Sciences, 25: 157-82.
Rao SM, Mayer AR, Harrington DL (2001): The evolution of brain activation during
temporal processing. Nat Neurosci 4:317–323.
Rapcsak SZ, Beeson PM, Henry ML, Leyden A, Kim E, Rising K, Andersen S, et al.
(2009) Phonological Dyslexia and Dysgraphia: Cognitive Mechanisms and
Neural Substrates. Cortex, 45(5): 575-591.
Ratcliff G, Davies-Jones GA (1972). Defective visual localization in focal brain
wounds. Brain; 95: 49–60.
Ratcliff G (1979). Spatial thought, mental rotation and the right cerebral hemisphere.
Neuropsychologia, 17: 49-54.
Richter W, Somorjai R, Summers R, Jarmasz M, Menon RS, Gati JS (2000). Motor area
activity during mental rotation studied by time-resolved single-trial fMRI. Journal
of Cognitive Neuroscience, 12: 310-20.
Riddoch MJ, Humphreys GW (1987). Perceptual and action systems in unilateral visual
neglect. In: Jeannerod M (ed) Neurophysiological and Neuropsychological
Aspects of Spatial Neglect, New York: Elsevier, pp 151-181.
Riddoch J, Humphreys G, Cleton P, & Fery P (1990). Interaction of attentional and
lexical processes in neglect dyslexia. Cognitive Neuropsychology, 7(5), 479.
Rizzolatti G & Matelli M (2003). Two different streams form the dorsal visual system:
anatomy and functions. Exp. Brain Res, 153: 146–157.

186
Robertson IH, Ward A, Ridgeway V and Nimmo-Smith I (1994). Test of Everyday
Attention. Bury St Edmunds, U.K.: Thames Valley Test Company.
Rondot P, Recondo J de, Dumas JL (1977). Visuomotor ataxia. Brain; 100: 355–76.
Rorden C and Brett M (2000). Stereotaxic display of brain lesions. Behavioural
Neurology, 12: 191-200.
Rorden C and Karnath H-O (2004). Using human brain lesions to infer function: a relic
from a past era in the fMRI age? Nature Reviews Neurosicence, 5: 813-819.
Rorden C, Karnath H-O, Bonilha L (2007). Improving lesion-symptom mapping.
Journal of Cognitive Neuroscience, 19: 1081-1088.
Rossetti Y, & Pisella L (2002). Several 'vision for action' systems: a guide to
dissociating and integrating dorsal and ventral functions (tutorial). In 'Attention
and performance XIX; Common mechanisms in perception and action". Prinz W.
and Hommel B. (eds), Oxford Univ Press 2002, pp: 62-119.
Rossetti Y, Pisella L, Vighetto A (2003). Optic ataxia revisited: visually guided action
versus immediate visuomotor control. Exp Brain Res; 153(2): 171-9.
Sandson J, & Albert ML (1984). Varieties of perseveration. Neuropsychologia, 22(6):
715-732.
Sanes JN, Dimitrov B, & Hallett M (1990). Motor learning in patients with cerebellar
dysfunction. Brain, 113: 103–120.
Sasaki K, Jinnai K, Gemba H, Hashimoto S & Mizuno N (1979). Projection of the
cerebellar dentate nucleus onto the frontal association cortex in monkey, Exp.
Brain Res. 37: 193-198.
Schwartz MF, Marin OS, & Saffran EM (1979). Dissociations of language function in
dementia: a case study. Brain and Language, 7(3), 277-306.
Shallice T & Warrington EK (1977). The possible role of selective attention in acquired
dyslexia. Neuropsychologia, 15: 31-41.
Shallice T, & McCarthy R (1985). Phonological reading: From patterns of impairment
to possible procedures. In K. Patterson, J. C. Marshall, & M. Coltheart (Eds.),
Surface dyslexia: Neuropsychological and cognitive studies of phonological
nading (pp. 361-398). Hillsdale, NJ: Erlbaum.
Shallice T (1988). From neuropsychology to mental structure, Cambridge, Cambridge
University Press.
Shallice T, Stuss DT, Picton TW, Alexander MF & Gillingham S (2008a). Multiple
effects of prefrontal lesions on task-switching. Frontiers in Human Neuroscience
1, 2:1-12.
Shallice T, Stuss DT, Picton TW, Alexander MP, & Gillingham S (2008b). Mapping
task switching in frontal cortex through neuropsychological group studies.
Frontiers in Human Neuroscience, 2, 1:79-85.

187
Shallice T, Mussoni A, D'Agostino S, Skrap M (2010). Right posterior cortical
functions in a tumour patient series. Cortex; 46(9): 1178-1188.
Shallice T & Cooper RP (2011). The organisation of mind, Oxford University Press,
Oxford, UK.
Shallice T, Skrap M (2011). Localisation through operation for brain tumour: A reply to
Karnath and Steinbach. Cortex, 47(8): 1007-9.
Shepard RN and Metzler J (1971). Mental rotation of three-dimensional objects.
Science, 171: 701-3.
Shepard R & Cooper L (1982). Mental images and their transformations. Cambridge,
MA: MIT Press.
Sibley DE, Kello CT, Plaut DC, & Elman JL (2008). Large‐Scale Modeling of
Wordform Learning and Representation. Cognitive Science, 32(4): 741-754.
Sibley DE, Kello CT, & Seidenberg MS (2010). Learning orthographic and
phonological representations in models of monosyllabic and bisyllabic naming.
Journal of Cognitive Psychology, 22(5), 650.
Snyder LH, Batista AP & Andersen RA (2000). Intention-related activity in the
posterior parietal cortex: a review. Vision Res, 40: 1433–1441.
Spinnler H and Tognoni G (1987). Standardizzazione e Taratura Italiana di test
neuropsicologici. Ital J Neurol Sci; (Suppl 8, 6).
Sterken Y, Postma A, De Haan EHF, & Dingemans A (1999). Egocentric and
exocentric spatial judgements of visual displacement, Quarterly Journal of
experimental Psychology, 52(4): 1047–1055.
Striemer C, Locklin J, Blangero A, Rossetti Y, Pisella L, Danckert J (2009). Attention
for action? Examining the link between attention and visuomotor control deficits
in a patient with optic ataxia. Neuropsychologia; 47(6): 1491-1499.
Stuss DT., Shallice T, Alexander MP, Picton TW (1995). A multidisciplinary approach
to anterior attentional functions. Annals of the New York Academy of Sciences,
769: 191–211.
Stuss DT, Alexander MP, Shallice T, Picton TW, Binns MA, Macdonald R, Borowiec
A and Katz DI (2005). Multiple frontal systems controlling response speed.
Neuropsychologia, 43: 396-417.
Taira M, Mine S, Georgopoulos AP, Murata A & Sakata H (1990). Parietal cortex
neurons of the monkey related to the visual guidance of hand movement. Exp.
Brain Res, 83: 29–36.
Tomasino B, Toraldo A. and Rumiati RI (2003). Dissociation between the mental
rotation of visual images and motor images in unilateral brain-damaged patients.
Brain and Cognition, 51: 368-71.
Toraldo A and Shallice T (2004). Error analysis at the level of single moves in Block
Design. Cognitive Neuropsychology, 21: 645 - 659.

188
Torralbo A, Santiago J, Lupiaqez J (2006). Flexible conceptual projection of time onto
spatial frames of reference. Cognitive Science, 30: 745–757.
Tzourio-Mazoyer N, Landeau B, Papathanassiou D, Crivello F, Etard O, Delcroix N,
Mazoyer B and Joliot M (2002). Automated anatomical labeling of activations in
SPM using a macroscopic anatomical parcellation of the MNI MRI single-subject
brain, NeuroImage, 15: 273–289.
Vallar G & Perani D (1986). The anatomy of unilateral neglect after right-hemisphere
stroke lesions. A clinical/CT-scan correlation study in man. Neuropsychologia,
24: 609-622.
Vallar G, Burani C, & Arduino LS (2010). Neglect dyslexia: a review of the
neuropsychological literature. Experimental Brain Research, 206(2): 219-235.
Vallesi A, Shallice T (2007). Developmental dissociations of preparation over time:
deconstructing the variable foreperiod phenomena. J Exp Psychol Hum Percept
Perform, 33:1377-1388.
Vallesi A, Binns MA, Shallice T (2008). An effect of spatial-temporal association of
response codes: Understanding the cognitive representations of time. Cognition,
107: 501-527.
Vingerhoets G, Santens P, Van Laere K, Lahorte P, Dierckx RA and De Reuck J
(2001). Regional brain activity during different paradigms of mental rotation in
healthy volunteers: a positron emission tomography study. NeuroImage, 13: 381-
91.
Wager TD and Smith EE (2003). Neuroimaging studies of working memory: a meta-
analysis. Cognitive, Affective & Behavioral Neuroscience, 3: 255-74.
Waller D, & Hodgson E (2006). Transient and enduring spatial representations under
disorientation and self-rotation. Journal of Experimental Psychology: Learning,
Memory, & Cognition, 32: 867-882.
Walsh V (2003). A theory of magnitude: common cortical metrics of time, space and
quantity. Trends Cogn Sci. 7:483-488.
Warrington EK. Constructional apraxia (1969). In Handbook of Clinical Neurology,
vol. 4, pp. 67-83. Edited by P. J. Vinken and G. W. Bruyn. North Holland:
Amsterdam.
Warrington EK and James M (1991). The Visual Object and Space Perception Battery.
Bury St Edmunds: Thames Valley Test Company.
Wilson B, Cockburn J and Halligan PW (1987). Behavioural inattention test. Titchfield,
Hants: Thames Valley Test Company.
Wilson FA, Scalaidhe SP and Goldman-Rakic PS (1993). Dissociation of object and
spatial processing domains in primate prefrontal cortex. Science, 260: 1955–1958.
Woodrow H (1914). The measurement of attention. Psychological Monographs, 5:1–
158.

189
Woollams AM, Lambon-Ralph MA, Plaut DC, & Patterson K (2007). SD-squared: on
the association between semantic dementia and surface dyslexia. Psychological
Review, 114(2): 316-339.
Yoshino A, Inoue M and Suzuki A (2000). A topographic electrophysiologic study of
mental rotation. Brain Research. Cognitive Brain Research, 9: 121-4.
Young AW & Ratcliff G (1983). Visuospatial abilities of the right hemisphere. In A. W.
Young (Ed.), Functions of the right cerebral hemisphere. 1-32. London:
Academic Press.
Zacks J, Rypma B, Gabrieli JD, Tversky B and Glover GH (1999). Imagined
transformations of bodies: an fMRI investigation. Neuropsychologia, 37: 1029-
40.
Zacks JM (2008). Neuroimaging studies of mental rotation: a meta-analysis and review.
Journal of Cognitive Neuroscience, 20: 1-19.
Zaehle T, Jordan K, Wustenberg T, Baudewig J, Dechet P & Mast FW (2007). The
Neural Basis of the Egocentric and Allocentric Spatial Frame of Reference. Brain
Research, 1137(2): 92-103.
Zorzi M, Houghton G, & Butterworth B (1998). The Development of Spelling-Sound
Relationships in a Model of Phonological Reading. Language and Cognitive
Processes, 13(2), 337.

190

191
Appendix
TA
BL
E 1
.
Tab
le 1

192
TA
BL
E 2
.
Tab
le 2

193
Related Documents