PAPE•R P14%. LOW.LIGHT.LIEVII. PARFORMANC( OF VISUAL SYSTEMS SAlvin 1), Schnitkler March 1971 d op--.-I by NATIONAL TECHNICAL INFORMATION SERVICE ~ t~d ye Z1 INSTITUITE FOR DEFENSE ANALYSES SCIEN(:CE AND IECH.NOLOGY DIVISION IDA Log No. HO 71-12373 Copy ,4"q of 350 copies

Welcome message from author
This document is posted to help you gain knowledge. Please leave a comment to let me know what you think about it! Share it to your friends and learn new things together.
Transcript

PAPE•R P14%.
LOW.LIGHT.LIEVII. PARFORMANC( OF VISUAL SYSTEMS
SAlvin 1), Schnitkler
March 1971
d op--.-I by
NATIONAL TECHNICALINFORMATION SERVICE
~ t~d ye Z1
INSTITUITE FOR DEFENSE ANALYSESSCIEN(:CE AND IECH.NOLOGY DIVISION
IDA Log No. HO 71-12373
Copy ,4"q of 350 copies

A DISCLAIMEI Id
THIS -DOCUMENT IS BEST
QUALIFY AVAILABLE. TIi COPY
FURNISHED TO DTIC CONTAINED
A SIGNIFICANT NUMBER OF
PAGES WHICH DO NOT
LEFROD UCIE LEGIBLY
REPRODUCED FROMBEST AVAILABLE COPY

I I The work tmpartlo II Ihik Clckoeunen well collduted undo, c6"11,141'I AHC 15 67 C 0011 I Pit the Do postmOwnItit Doe enso T ho loohlI cIII ttC'i
of lhit IDA Popoi doot not tIdicalse ondopsrnlen bI,, ON# Dopm"ne'tof Defenise ow kthuild thel eviltent be constsueilds~'i. tit 4 lhoficial. paltin't of thNOt 01genct
hti*VOdt -PUbli L!eie.nse iio buin nimt-

cUNR W ES
DOCUMENT CONTROL DATA.- A & b6001l and fe f neefet moo iot .moo &, moilpd when thee vwoite I# #Se it tllsas 01pd
Jý81`TUTE FOR BEFE14SE ANALYSES UNCLASSIFIEDry-Navy z'lve 1 %lo
Arlington, Virginia 22202 -
Low-Light-Level Performdnce of Visual Systems
4 SIt atPYIT Iv oYTCIS (TV" so ftwo sad #04 as Iue e de10.1
Paper P-743 L March 197114W vose"1 I (P*.ei anos, mIMQ 1041141, feel "aee)
Alvin D. Schznitzler
4 1111141y GAVI vdv&.yea e* esswee
March 1971882be Colo ee TRA T EN so emI& booie~n "11,.., NM1uussrns
DAHC15 67 C 0011 P-743
41Task T-36 W1m OKO Gl Ap*k#"01e 6 arb glne
d , g u * V Y U N N o n e
Approved for public release; Distribution unlimitedii ~ ~ 409 SUPLWN?8 O~E u PONSOMINe UILIYANV AC lIVIlY
NA I Advanced Research Projects AgencyJArlington, Virginia 22209
Visual systems for employment at low light levels are exam-ined from two points of view:
14 As extensions of the human visual system and2. As optical information acquisition and convertiion sys-
tems.
The first point of view is adopted to examine the general suit-ability and the limitations of relianca on the dark-adapted humaneye alone, the dark-adapted human eye aided by binoculars, a~id thelight-adapted human eye aided by photoelectronic imaging systemssuch as image intensifiers and low-light-level television. Thesecond point of view is adopted to analyze the dependence ofphotoelectronic imaging system performance on system parameters.(Finally. both points of view are combined to examine the transfer'of image information from the display of a photoelectronic imagingsystem to the output of the eye.
~wO~e5 473 1ICLASSIFIEDDD .Plv..14 3 -1emufl'y CIossificetion

I.LINK a LINO 0 LIN1KRP U OI v. vi 01 Do
low-light-leve3. televis ionF imowagre, intensif iers
visual systems
U NCLASSFIED~security C18611IS6caion

0
PAPER P.743
LOW-LIGHT-LEVEL PERFORMANCE OF VISUAL SYSTEMS
Alvin D. Schnitzler
March 1971
IDAINSTITUTE FOR DEFENSE ANALYSES
SCIENCE AND TECHNOLOGY DIVISION
400 Army-Navy Drive, Arlington, Virginia 22202
Contract DAHC13 67 C 0011Task T-36

PREFACE
Exploitation of electrooptical technology has culminated in thesuccussful deployment of night vision systems in the field. The choice
of the most direct and efficient means of further improving the per-
formance of night vision systems depends on a thorough understanding
of the effect on performance of independent variations of system pa-rameters and of the interactions between them. It is the purpose of
this paper to provide the necessary understanding for those who are
interested in a full mathematical treatment. A companion IDA report
contains a nonmathematical condensation of this paper as well as areview ot specific night vision devices. That report is Low-Light-
Levwl Devices: A Components Manual for Systems Designers, IDA ReportR-169, by Lucien M. Biberman, Alvin D. Schnitzler, Frederick A. Rosells
Harry L. Snyder, and Otto H. Schade, Sr.
This paper is one in a series under ODDR&E Task T-36, Infrared
and Night Vision. The program is responsive to E. N. Myers, Elec-tronics Information Systems, ODDR&E.
iii
4
I

SYMBOLS
A area of apertureA area of entrance pupilA s area of image formed by visual system on retina
s
Au area of image formed by unaided eye on retinaB luminance
e magnitude of electric charge, coulombsF luminous fluxF s luminous flux collected by visual system
Fu luminous flux collected by unaided eye
fo 0 focal length of objective
fp focal length of eyepieceG number of photons emitted by display per photoelectron
emitted by primary photocathode
G I electric current gain
H irradiance
Hk X spectral irradianceH irradiance at photocathode
hD height of displayhT height of target
i electric currenti primary photoelectric current
5
JD electric current density incident on display3S electric current density at photocathodeK luminous efficacy of display radianceKS luminous efficacy of input irradiancekXD spectral radiant conversion factor of phosphor
kHB luminous conversion efficiency
L apparent radiance
v

LD effective length of sine-wave patternMD modulation amplitude on display
MS modulation amplitude on pho'cocathoderr' subjective magnification
m magnification
m I magnification of image intensifier
m0 magnification of eyepiece
mPE magnification of eyepiece-eye subsystem
N number of television lines per raster height
n index of refraction of object space
ný index of refraction of eye
n s photoelectron flux density1X spectral radiant power
R(X) relative spectral response
S separation between display and observerT(v) sine-wave response, frequency response, modulation transfer
function
t effective integration time of eyeWD width of sine-wave half period
Z(X) .elative spectral radiant conversion factor
0 half angle of field of view
e effective length-to-width ratio of half period of testfrequency
SI mean quantum efficiency
ic collection efficiency
TI E quantum efficiency of eye8 E angle subtended by eye radius at object9 0 angle subtended by entrance pupil radius at object0' angle subtended by exit pupil radius at image0
8PE angle subtended by eyepiece-eye entrance pupil radiusat display
X wavelength of radiation
V sine-wave spatial frequency
V D spatial frequency on display
V R spatial frequency on retina
vi

VS spatial frequency on photocathode
PC radius of photocathode
PE radius of entrance pupil of eye
p(I radius of exit pupil of objective
PS radius of entrance pupil of viýt'al system
a(k) responsivity of photocathode, amperes per watt
Q solid angle
vii

,rho mosit: s It ' I MtIcit it t I Iiti Itipi ot't )hin -in AI yn It ot tho pot, rorm4nqv~
of Photool&tc'truil" 1114 '~ Ifinq tysto~mA .ijv thu gorpri notay woAi% t rPvt
at A unviu t 1 ~itht I ovolk, of v.virt~ion in v'i thur phot kt 401000 rompoinionv-itcy or ovc 'cai 1 yntu'm intoirrAt i cnt t ,n ~mo tith i at riatioj or tr'v ort vAr i t
tion in the modulAtion transfer wnoiwVIii, r~ho roori nooti At t-
tic.'tntly low liqhilt t1ovt'1, but theon pu'rlormanu!o is movoroy (104rodod
by lark of sufficieent signal-t *noiso rat~io, Vico~~ rmults Ar tim-portant to the detign ~tnd the eOicio of moans for furthor imp~rovomokit
of image-intensifier and low-light-lovel televialoti systoms,
x

CON'rKNTOI
IV. Photoe~eotronto Imag4itnj SystemsaA. Optical Pai'amotors And prin4iw1pe of Ot 1ra~nU %B. Spectral Roapon~e of Photoc~athode* 2C. Lu.minous Convev ton PoktMor nt Phosphars'1D. Temiporal. ResporiueE, Spatiali Froquoncy Responso, Modulation Tt'.nater 4
Funct ion
V, Analysis of Phovoelectr'oniic Imaging Systems 51A. Noise-Equivalent Modulation 5
B., Improv:emet of PEI %rformancee6
References 7S
Appendix A--Imagn Tnformation Transfer, 7Display to E~ye
Appendix B--Required Modulation, Signal-to-Noise Ratio, aand Resolution
I Xi

1. INTODUCTION
Visual systems designed for operation at low light levels goner-ally fall into two categories, passive optical systems and active pto-
toelectronic systems, The former •tr rapreaented by night visionbinoculars and the latter by image-intensifier and low-light-level
television systems,
The utilization of photoelectronic imaging systems at low light
levels involves a number of engineering factorst
* The reflection and/or emission of radiant flux by targets and
background&.
* The absorption and scattering of radiant flux by the interven-
ing atmosphere.
* The efficiency of collection of radiant flux.
• The efficiency of conversion of radiant flux into luminous flux
by the photoelectronic. imaging system.
All of these factors could apply to a radiometer as well as to animaging system. But the purpose of a photoelectronic imaging systemis not merely to collect and convert radiant flux into luminous flux.
The purpose of a photoelectronic imaging system is to increase
the acquisition and flow of optical information from a scene to animage interpreter over what would be possible if the interpreter were
forced to rely on his eyes alone. Hence, a photoelectronic imaging
system is part of a communication system. The information source isthe scene, the optical information being in the form of a spatial modu-
lation of the radiance of the scene. The transmitter or power sourceis either the irradiance of the scene by moonlight, starlight, and
1
airglow or the thermal selt-radiazice of the scene The tranemiseivemedium is the atmosphere. The communication receiver is the night vi-
sion system itself. The user is the image interpreter.
A widespread notion has persisted among many optical engineers
that the performance of a photoelectronic imaging system cannot bespecified independently of the physical oonditions of the scene ano
the atmosphere as well as the physiological and psychological state
of the image interpreter. In communication engineering this wouldcorrespond to the notion that a communication receiver cannot be sen-sibly spevified because the output depends on the power and distance
of the transmitter, the conditions of the atmosphere, and the state
of the operator. But we can and do specify the performance of a com-munication receiver, essentially by the temporal frequency mesponseor the transfer characteristic and the sensitivity or noise equivalentpower. Likewise, the performance of a night vision system may be es-sentially specified by the spatial frequency response, or the modula-
tion transfer function as it is called in optics, and the noise equivalentnodulation.
The performance of a photoelectronic imaging system depends onthe fidelity of the conversion of radiant input signals into luminousoutput signals which appear on the display. This conversion processis degraded by:
* The responsivity of the photocathode,
* The roll-off of the modulation transfer function at the higherspatial frequencies, and by
* The generation of noise in the system.
All three combine to reduce the ratio of signal to noise in the output
luminous image and, therefore, the probability of target detection bythe image interpreter, where the signal in luminous images is due tothe spatial variation of the mean luminance and the noise is due totemporal fluctuations of the luminance. In principle, to the approxi-mation that a photoelectronic imaging system is linear, temporally in-variant, and spatially invariant, the luminous output signal and the
2

radiant input signal can be related by employing the modulation transfer
function of the myatem in the appropriate Fourier transformations.Similarly, the luminous output noise can be related to both the radiant
input noise and the electrical system noise by the Wiener transforma-
tion. Tnen the signal-to-noise ratio can be calculated, and the proba-
bility of target detection can be estimated,
In practice, except for simple targets such as points, squares,
and rectangles, the detailed signal-to-noise, ratio analysis of a com-
plex target is too difficult to perform rigorously. However, the out-put signal-to-noise ratio as a function of the spatial frequency of aone-dimensional sine-wave input signal can be calculated and the reso-lution frequency--that is, the maximum spatial frequency for which theoutput signal-to-noise ratio is greater than approximately unity--canbe determined. Moreover, it has been shown experimentally that thedetection, recognition, and identification probabilities of complextargets are proportional to the number of periods of the resolutionfrequency subtended by the minimum target dimension presented to theviewer on the display. More periods are required for high probabilitythan for low, for identification than for recognitions and for recog-nition than for detection. Therefore) if the probabilities are knownas a function of resolution frequency and if a signal-to-noise ratiocalculation of the resolution frequency of a photoelectronic imaging
system is made, then the probabilities for complex targets as a func-tion of minimum dimension and range can be predicted by analysis.
The dependence of the probabilities on the number of periods of
the resolution frequency is plausible analytically because the reso-lution frequency defines the useful spatial bandwidth of the system,i.e., the range of spatial frequencies for which the signal-to-noiseratio is greater than unity. At the same time, the spectral densitycorresponding to the minimum dimension W of a target is just the sincfunction of rrvW, where v is the spatial frequency. The sinc functionis unity at v = 0, decreases to zero at Y = l/W, and then undergoes
damped oscillations about the frequency axis with increasing fre-quency. Thus, the spectral density is essentially contained in the
3

frequency range from 0 to l/W. If W subtends one period of the reso-
lution frequency, then 1/W is also the resolution frequency. Hence,
the useful bandwidth of the system essentially contains the spectral
density corremponding to the minimum dimension of the target. Recog-
nition depends on perception of target detail, and hence for a given
range and target size more periods of the resolution frequency or
greater spatial bandwidths are required.
4

II. LOW-LIGHT-LEVEL PERFORMANCE OF THE EYE
A full appreciation of the principles of operation of photoelec-tronic imaging (PEI) systems depends on knowledge of certain features
of the visual process. For this purpose it is useful to examine andcompare the operation of visual systems such as the unaided eye andbinoculars on the one hand with PEI systems on the other. However, inany comparison of visual systems, in which the retina of the eye isthe primary radiation sensor, with physical devices, in which someother radiation-sensitive layer is the primary sensor, one is con-fronted with the relation between the subjective and objective effects
of radiation in the visible and adjacent regions of the spectrum.This relation is pafticularly important in examining the operation ofvisual systems incorporating PEI systems, since their overall perform-
ance depends on both the physical properties of the Input radiationand the subjective properties of the output radiation.
The problem arises because the eye, as shown in Fig. 1, is so se-
lective in its spectral response that radiant power expressed in wattsis an inadequate measure of the subjective effect of a flux of radiant
energy. Two alternative procedures are available:
1. a. Specify the spectral response of the eye,b. Specify the spectral content of the flux, and
c. Perform a numerical integration of their product over allwavelengths within the passband of the eye.
2. Define an arbitrary unit of luminous flux, spectrally normal-
ized to the peak of hunan visual response, as an overall meas-
ure of the subjective effect of the flux of radiant energywithout explicit concern for its spectral content and the
spectral response of the eye.
5

1.0
0.9
0. 8 _- 1_
0.7
LUL 0.6Z
LA 0.5 _ _
tll
LU
A, 0.5
U
-IILU
Lu 0.
0.3
01).
0.40 0.45 0.50 0.55 0.60 0.65 0.70 0.75WAVELUNGTH, micron
S 3-15-71-10
FIGURE 1. Standard Visibility Curve of the Photopic Eye
6

The second procedure requires the establishment of a standard of lu-
minous flux as a reference to determine the value of unknown luminous
flux by comparison. Tn practice, it is easier to maintain a standard
of luminous intensity rather than a standard of luminous flux. The
standard of luminous intensity, the candela, is defined as one-sixtieth
of the luminous intensity per square centimeter of a blackbody radi-
ator at the temperature of solidification of platinum (approximately
2042°K). The unit of luminous flux, the lumen, is the amount of lu-
minous flux emitted within a unit solid angle by an isotropic point
source of luminous intensity equal to one candela. For an extended
source of luminous flux, the luminance of an element of surface is de-
fined as the luminous flux that leaves the surface per unit solid
angle and unit projected area of the element of surface. If the sur-
face is a perfectly diffuse radiating (or reflecting) surface, the
total luminous flux leaving the surface per unit area is equal to T1
times the luminance. The amount of luminous flux incident per unit
area of a surface is the illumination of the surface. The unit of il-
lumination, lumen per unit area, depends on the unit of area chosen.
Since the procedure of establishing a unit of luminous flux as
an overall measure of the subjective effect of a flux of radiant energy
is implicitly dependent on the spectral response of the Commission
Internationale de l'Eclairage (CIE) "standard observer," this procedure
does not apply to radiation sensors with other spectral responsivities.
For general application to all radiation sensors, the first procedure,
explicitly taking into account the spectral response of the radiation
sensor (e.g., the eye), is superior, for then the radiant power can be
expressed in watts without loss of rigor. In the case of the eye, for
any spectral distribution of radiant power, one has
F = 680 J y(X)Pkdk (1)
0
7
L

where F (in lumens) may be viewed either as a luminous flux (i.e., thevisual content of the flux of radiant energy) or as a measure of the
amount of visual sensation evoked by the radiant power, y (X) is theT.elative spectral response (better known as the "standard observer"function) of the eye, and PX is the spectral radiant power in watt/nm.The numerical factor 680 is the luminous equivalent of one watt ofradiant power at the peak of the visibility curve [y(W) = 1), whichfor photopic vision occurs at S55 nm.
If a photoelectronic sensor is employed, rather than visual sensa•-tion, the output is a directly measurable electric current. In this
case, one has
i = 011f R(N)PxdW (2>
0
where i is the electric current in amperes, a(\) is the absolute
radiant responsivity of the sensor 3t the peak wavelength in amperes/
watt, R(X) is the relative spectral response of the sensors and PX isagain the spectral radiant power. The evaluation of photocathodes isdiscussed in detail in Section IV-B.
The physical quantities corresponding to luminance and illuminanceare radiance and irradiance. They are based on radiant power in watts.The unit of radiance, depending on the choice of unit of area, is wattper unit area per unit solid angle. Likewise, the unit of irradianceis watt per unit area. A table of some of the corresponding subjec-
tive (photometric) and physical (radiometric) quantities is given be-low:
8

Photometric RadiometricQuantity Unit Quantity Unit
Luminous flux lumen Radiant flux watt
Luminous candela* Radiant watt/steradianintensity intensity
Luminance candeia/ Radiance watt/meter 2 _meter steradian
Illuminance lumen! Irradiance watt/meter 2
meter 2
For a more extensive treatment of p7otometric and radiometric quanti-
ties, see, for example, Refs. 1 and 2, among other sources.
In the text below, wherever it is appropriate to take explicitnote of the spectral response of the eye or wherever photoelectronic
sensors are under consideration, the quantities used will be radio-
metric.
At low light levels, to compensate for the loss of visual stimuli,the eye automatically undergoes various adjustments. These adjust-
ments include:
• Increasing photon collection by dilation of the pupil.
* Integrating the signal over larger areas on the retina by ex-tracting the signal from larger clusters of elemental sensors.
0 Increasing the sensitivity of the retina by means of dark
adaptation, which includes switching from less sensitive tomore sensitive sensors as well as lowering the sensitivity
thresholds of both.
* Integrating the signal over a longer time.
WThe candela is defined to yield one lumen per steradian. Thus
the unit solid angle is implicit in the definition.
9

The area of the pupil of the eye is contoilled by the tria, aring-shaped involuntary muscle adjacent to the anterior Otirfaee of the
lens. It has been shown (Ref. 3) that the pupil area Inogeases by
approximately a factor of 10 at the liglit level, decreases form bright
sunlight at 103 cd/m 2 to tht darkness of an overcast nighlt at 10's
cd/m2 .
The amount of light collected by a circular aperture much as the
entrance pupil of the eye is given by
F a A1 C (3)
where A is the area of the aperture, B is the luminance of a paraxial
object, and n is the solid angle subtended by the object at the aper-ture. Since an Increase in the area of the entrance pupil has no ef-fect on the magnification of the eye, the area of the image on the
retina remains unchanged. Hence, by dilation of the pupil retinalillumination increases, image brightness increases, and visual percep-
tion at low light levels is Improved.
The ability of the eye to integrate the signal over increasing
areas of the retina with eicreasing light level is shown (Ref. 4) in
Fig. 2. The threshold luminance B required for perception of an ob-ject subtending an angle a at the entrance pupil of the eye decreasoe
with increasing a 2, which is proportional to the area of the image on
the retina. Data such as are shown in Fig. 2 differ little, whether
a disk or a Landolt C-ring is projected on a screen, and for a givenY the luminance is increased until the viewer perceives the locationof either the disk or the gap in the C-ring. The two portilons of the
curve in Fig. 2 are due to the presence of two types of sensors:(1) the rods, which respond at low light levels, and (2) the cones,
for daylight and color vision.
According to Eq. 3, the luminous flux collected from an object by2 2the eye is proportional to the product of B. and Ct (since 0 = 2)
However, Fig. 2 shows that at low light levels, wheru vision depends onthe rod sensors, the eye becomes quite ineffective at integrating the
10

xiqnal from e*iiotst separated tfrm the oenter of the obhocit by dip-
tatueo whtlth subton~d ngnlee lar•ger than 4 or S (log, Th'um as a appi'o4(oleU
4 or t dog, •i•e threshoAd flux increasem rapidly, Vit limitatin isoho•w in Soetion III to be of speital uignitttanoo for the applioavion
oa las e-Apertkre bMnooul,•rs or n•ghv Vlomsos to tnureave vitsual por-
ception ae low light levela,
-I ',
-4
0 is a 3 4 3 6 7 13- 14,11 .1 LOO a , minute&
FIGURE 2. Threshold Luminance as a Function of Angle Subtended at Eye PupIlIby Disk or Gap In Landolt C-Ring (Ref, 4)
The increase in sensitivity (reduction in visual threshold) thatocours with increasing dark adaptation is illustrated in Fig. 3 (Ret. 5),
where the logarithm of threshold luminance versus time of dark adapta-
tion is plotted. The experiments were conducted by preadaptation with
approximately 5000 cd/mr of white light and then determination of the
threshold luminance required by the observer to resolve the lines of
11

SUattng., In these ex4perimnt*, vision is dominated by the conesensors duti~l the first I or I min of dark adaptation before thevisual threshold ot the rod sensors, deoreasing more, rapidly, beoomes
dominAnt., The efteot of area on visual threshold, as disoussed above,
iv also ovident in FiV. 3. It ti interesting to note that the rod
sensors oannot r,,eolve lines subtending an angle of 4 min, while the
cone sensors man resolve objects of less than 1 mt:n,
4'O OlA IN*
0 1 I0 Is 0 3
1IM4. wiMOO,
FIGURE 3. Threshold Luminance as, P d...ion of Time During DarkAdaptation Following Preadoptatlon to 5000 cd/m 2 (Ref. 5)
The relatively slow progress of dark adaptation shown in Fig. 3
poses a severe problem for sensitive vision at night if an observer
is required to pass from a brightly illuminated artificial environ-
mwet into a dimly illuminated natural environment or if dark adapta-
tion is destroyed by flashes or occasional sources of light in an
otherwise dark scene. For example, under the conditions applying to
2Fig. 3 if the object luminance were c02d/rn , the observer would
12

have to wait nealiy U min to become sufficiently dark-adapted to
perceive a gross unlined object, and approximately 22 min to resolve
a line grating in which a line subtends an angle of 8 min at thP Pye.
Image-intensifier and television systems can be of great value % ter
such conditions, since it is unnecessary to wait for dark adaptation
if the output image is presented at sufficient brightness.
The ability of the eye to integrate the ignal over a longer time
at low light levels appears to be the least important of the response
par•meter adjustments made to compensate for the decreased photon flux,Rose (Ref. 6), for example, claims that the effective storage or inte-
gration time of the eye is close to 0.2 sec and that it varies little
from extremely low to high light levels. Schade (Ref. 7), on the other
hand, claims that the effective storage time decreases from approxi-
mately 0.2 sac at the threshold of vision towards a plateau of approxi-
mately 0.05 sec at high illumination.
13

In. L.W-LIGHT-LEVEL PSRFORKANCE OF BINOCULARS
Limited aid to visual performance at low light levels can be
provided by means of purely geometric optic devices such as binoculars.Special care is taken in the design and construction of such devices
to ensure maximum transfer of radiation collected by the objective to
the retina of the eye. It is essential that the exit pupil of the de-vice is large enough to match the large entrance pupil of the dark-
adapted eye. In this case, binoculars will produce the subjective im-pression of increased image brightness and permit the detection of
targets not visible to the unaided eye. This increase in visual per-formance, the well-known night-glass effect, is shown below to resultfrom the increased size of the image on the retina provided by thesubjective magnification of the binoculars. It does not result frommore irradiance in the image. Indeed, an increase in image radiance
by purely geometric optics would violate the second law of thermo-dynamics.
The other parameters upon which the detection of a target imagedepends, such as wavelength, exposure time, contrast, and requirement
for dark adaptation, are little affected by night-vision binoculars.The aid to visual performance provided by night-vision binoculars de-pends solely on the spatial integration capability of the dark-adaptedeye, which was described in Section II as relatively ineffective forimages viewed in the eyepiece subtending more than 4 to 5 deg at the
entrance pupil of the eye.
In any well-designed visual instrument, such as night-vision
binoculars, the eye is placed so that the entrance pupil of the eyenearly coincides in position with the exit pupil of the instrument,
since placing the eye elsewhere merely introduces an additional stop
15

that may unnecessarily roduce the field of view. A diagran, of the
complete visual system is shown in Fig. 4. A detailed discussion of
the limitation of rays by apertures will be found in Chapter V of
Ref. 3.
By making use uf Abbe's sine condition (Ref. 3) and the defini-
tion ot the subjective magnification 1h as the ratio of the magnifica-
tion with binoculars to the magnification of the unaided eyes it can
be shown that 1h Is given by
=h (/P (3in ed/sin e~ (4)
where P. and P are the radii of the entrance pupils of the visual
syster, and eye, respectively; es and 6" are the angles subtended at
the image by the radii of exit pupils.
W W, E1El E mES I
! II I
I 70!
II
I ~RE TINA
II
ENTRANCE ENTRANCE EXIT EXITWINDOW PUPIL WINDOW PUPIL
S3-17-71-9
FIGURE 4. Schematic Diagram of Binocular Visual System
16

According to Eq. 3, the total flux collected from a small object
near the optical axis is proportional to the area of the entrance pu-
pil of an optical system. Hence, the relative increase of flux with
binoculars compared to the unaided eye is given by
Ps/P = P2/P2 (5)s u sE
where Fs and Fu are the total fluxes collected from an object by thecomplete visual system and the unaided eye, respectively. Since the
illumination in an image is equal to the light flux per unit area, the
ratio of the retinal illumination in the images of an object producedby the complete visual system and the unaided eye, respectively, is
given by
Es/Eu = (PFs/As)/(AFu/A U) (6)
where As and Au are the image areas for the complete visual system and
the unaided eye, respectively. By combining Eqs. 4 to 6, one obtains
Es/E = sin= 2 8"/sin2 el (7)
By referring to Pig. 4, it is clear that, if 86' i 8', thenE 0
the eye pupil is the aperture stop of the complete system, 0s 8
and
E s/Eu = 1. (8)
On the other hand, ,if 8e > 8v, the aperture stop of the binoculars isthe aperture stop of the system, 8O 8 and
E /E =sin2 8"/sin2 9, (9)Su 0 E (
17

i.e., E s/Eu is less than unity. Thus, one sees that binoculars cannotprovide an increase in retinal image illumination, and increasing
visual perception with such instruments will depend on the effect de-
scribed below.
Clearly, good design requires that the eye pupil be the aperture
stop of the system so that, except for whatever reduction results from
transmission losses in the lenses, retinal image illumination will be
as great with binoculars as with the unaided eye. Then '= 8, and
by Eq. 4 the subjective magnification is simply
rD = Ps/PE (10)
and by Eq. 5
FsIFu = M2. (11)
Equations 10 and 11 show that use of binoculars results in the forma-
tion of a larger image on the retina (in proportion to M2 ), which,
neglecting transmission losses, exactly balances an increase in photon
collection efficiency. Thus, the increase in visual perception pro-
v-' d by binoculars depends on the spatial integration capability of
tne ele, illustr.ited in Fig. 2, to lower the luminance threshold.
For nearby objects too small to be resolved at a given light level,
subjective magnification may increase the image area on the retina
sufficiently for visual perception. Such an effect is limited, how-
ever, by the limited ability of the eye to summate the signals from a
large number of elemental sensors.
To produce a sharply defined field of view in a visual instru-
ment, the field stop is usually placed so that its image (the entrance
wineow) in object space lies in the object plane and its image (the
exit window) in image space is in the image plane. Then, by the def-
inition of O, the angle 0', subtended at the exit pupil by the radius
of the exit window, is related to the angle B, subtended at the en-
trance pupil by the radius of the entrance window, by the equation
18

8= fl~(12)
The angle 0' of a well-corrected eyepiece is limited to approximately
0.5 radian (i.e., the full angular field of view of an eyepiece is
limited to approximately 1.0 radian)v and consequently, for even small
values of the subjective magnification, 0 is severely restricted.
The increase in visual perception at low light levels realized
with binoculars may be attributed to the increase in image area on theretina produced by the subjective magnification and depends on the
limited ability of the eye to integrate the signal over the increased
image area. High subjective magnification is required for target de-tection, but the field of view, which is of major importance in visual
search operations, is reduced in proportion to the increase in reti-
nal image area. Thus, binoculars increase the probability of detec-
tion if the object is within the field of view but decrease the
probability that the visual field includes the object to be detected.
It 19

IV. PHOTOELECTRONIC IMAGING SYSTEMS
A. OPTICAL PARAMETERS AND PRINCIPLE OF OPERATION
The incorporation of PEI devices in visual systems permits the
manipulation of design parameters with far greater flexibility than
allowed with binoculars. Image-intensifier night-vision systei,'," in-
corporate an objective for collecting and focusing the radiant fluxemanating from the scene onto the fiber-optic faceplate of an image-
intensifier tube, an image-intensifier tube usually containing three
stages of intensification, and an eyepiece presenting an enlarged vir-
tual image of the intensifier display. Low-light-level televisionsystems incorporate the following: an objective, one or more intensi-
fier modules, a camera tube, fiber-optic couplers, a video signal am-
plifier, and a monitor containing a kinescope for displaying a real
image for viewing. The incorporation of PEI devices in visual systems
has the effect of decoupling the input and output radiant fluxes, re-
moving some of the optical constraints encountered in binocular sys-tems, such as those on!
o The utilization of radiant flux outside the visible spectrum andgenerally the use of more efficient image sensors than che eye.
a Independent adjustments of subjective magnification and fluxcollection power.
* The use of integration times longer than that of the eye.
* The time required for dark adaptation (dark adaptation is notrequired).
o The independent choice of optimum image brightness for high
visual acuity anu freedom from eyestrain.
Preceding pago blank 21

In addi t.ion, PCI .y :. r y im.'i may' "'I'l' lt'' o l' r, Ihi I 'V ', i MtltOWili
through the itso ,of vu',io.tc-v t.,ww Itfo, \izXlo 1,)( I u tp, II I Ilrtittio,
limitat iolls oil t0h,0 p11t'. tt'ittttt t1 4I1 , ¶.ein 1, ,1r•t h o ,-''' v' O ot ii•fmlpt
fect techriolo iqy mid ,)rol odl rc a tls tt ',t OItlt o1 t , W, jh llt t,"ONVOl,
i. Irnaqo-I1telonls t I, r SIstuI,
In visual systomus fI\CtoL'poIn"'i, n+ q Oc itjo intottIi I r I, , l im Ut &'e
parameters, (1) subject ivo nagn' t'c't on, ,) coAloet'on ipowor, and(3) field of view, can be adjustedl independontly, iL ovnt~rat to bin-
ocular visual systems. In addition, thm threshold aonivt:ivty, quanl-turn efficiency, and integration time of the systom are subjoet tooptimization to incrnase visual perception at low voalues of anoen ra-
diance. Each of the parameters will be considered in turn, begiming
with subjective magnification.
A diagram of a complete image-intensifier visual system, compies-ing an optical objective, an image intensifier, an eyepiQca, and the
eye, is shown in Fig. 5. The magnification m. between the retinalimage and a distant object viewed through an image-intensifier system
is given by
where m0 is the magnification of the objective, m, is the magnification
of the image intensifier, and rpE is the magnification of the subsys-tem, consisting of the eyepiece and the eye together. By Abbe's sinecondition, m0 is given by
mu = sin 8o/sin e (14)
where 00 is the angle subtended by the radius of the entrance pupil
at the object and 0' is the angle subtended by the radius of the exitpupil at the image that falls on the sensor surface of the image In-
tensifier. The magnification of the eyepiece and eye subsystem is
given by
22

wherp n and n' are the indi0.em of refraootion of the object apace andtho. eye, rspe~ottvly, Nor t the angle subtondel by the radius or theentranoe pluptl of the vuboyatom at th, display surrafae of the 1"9eintensif er, and A' is tho angle oubviuted by the radtiis of the exttPCpupil ot the subsystem at the retina,
w o 1 0 l o t 1 1 " - 1 11
ITW0 t P1
IM•MO INTINSIPIlI RITINA
INTRANCI INTRANC! IENTRANCEI 1MITWINDOW PUPIL ClJECTIVE PUPIL PUPIL
svgll~c,
FIGURE 5, Schematic Diagram of Image-Intensifler Visual System
The magnification mu of the unaided eye viewing the samedistant object ls given by
!i ~~mu =,(nn')(in Oe/sin el#)E(B
23

Vwere(o and are the Angles subternded by the radius (the radii oferntrani'e arid exit, pup~ils of the w.ye are nearly equal) of the eye pupilAt the distant oheisot arid its imago on the Weine, respeotively.
The aubjeotiv, magndtication N of the complete image intei-sifier system tI by definition equal to the rdtio at mp to mu '.there-
fao,• by tmbnhbnig r, se,13 thr•tkqh 16 with ehii definrtion ard rearranging,Iai ,,van hý
For a distant aobjet, sin 40/sin as f p0/y, and for a woll-deosgnedeyepiece, 61 1 S, sinct the eye pupil is th© aperture stop. It isevident from rig, S that
where oI is the radius ot the exit pupil and to I the tocal length ofthe objective. In terms ot the f-number, Eq. 19 becomes
sin S'[a + 4 (f/no.)o]. (19)
Finally, the subjective magntfication reduces to
h m1 (Po/PI) + 4 (f/no.)g] sin ePE. (20)
Examzination of Eq. 20 reveals that, in contrast to binocular systems,imago-intensifier systems can be designed to have as large an aper-
ture as desired without a concomitant inrrease in M by reducing either
m. or sin eOp to compensate for the increase in PO. Consequently,
the collection power of the system can be increased while the area
24

of the retinal image of an object is kept at a sizs sufficiently small
for the eye to integrate the signal efficiently.
Equation 20 may be further reduced by expressing sin 0PE in teras
of the suhJective magnification 1h of the eyepiece. By definition,pa" MpE/mu and, according to Eqs. 15 and 16, one has sin 9 P- a/pm~ 1 PEu
sin 0E. where again one has assumed the eye pupil is the aperture
stop, so that 0'e 0' In the standard definition of the subjective
magnification of an eyepiece, it is assumed that the distance from the
unaided eye to the object plane is 254 mm. Hence, sin 9e E s /254,and sin 0PE is given by
sin 0PE E M p / 2 54. (21)
If one substitutes Eq. 21 into Eq. 20 and neglects unity in comparison2with 4 (f/no.) 0 , one obtains
MI U mI(f 0 /254)Ml . (22)
The term f 0 /254 may be considered to be the subjective magnification
of the objective just as for the case of a visual telescope (Ref. 3).
Likewise, by referring to Fig. 4 and the definition of fl P, it can be
shown (Ref. 3) thet %I a 254/fp, where fp ic the focal length of the
eyepiece. If one substitutes this expression for fl0 in Eq. 22, one
obtains
M = M.fo/f (23)
This expression for th differs from that for binoculars by the factor
mi, which, as shown above, allows adjustment of M independent of the
collection power.
The field of view of an image-intensifier system is determinedby the photocathode, which acts as the field stop. Referring toFig. 5, one notes that the total angular field of view is 20, where
0 is determined by
25

Sm tan 1l (P cfo) (24a)
and P is the radius of the photocathode. IU teomb of the f-number
(f/no.)0 of the objective, • is given by
S= tan - [Pc/2 P0 (f/no° )O ]. (24b)
The f-number of objectives is limited by technology to values greater
than approximately unity. Hence, an increase in P0 for greater collec-
tion efficiency must be accompanied by a commensurate increase in Pc
to maintain the same field of view independent of the subjective mag-
nification.
In image-intensifier systems, if sufficient gain is provided,the appearance of a scintillation on the display will educe a visual
oensation in the retina. Hence, the quantum efficiency of a visual
system incorporating an image intensifier is characteristic of thequantum efficiency of the image-sensing surface of the intensifier.The photocathodes employed as image sensors in image intensifiers are
discussed in Section IV-B.
If the duration of a scintillation produced on the display of animage intensifier is considerably longer than the integration time of
the eye, the effective integration time of the complete visubl systemis characteristic of the integration time of the intensifier. Gener-ally, however, image intensifiers are designed with integration timescomparable to that of the eye to avoid loss of visual perception formoving targets.
2. Television Systems
Television systems for low-light-level applications offer someadditional degrees of design flexibility not available to direct-view
image-intensifier systems. Besides the possibility of separating theposition of the image sensor from the image display, it is possible toperform contrast enhancement and other forms of image processing bymeans of associated optical and computer systems with the long-range
26

poss~billty of a completely automatic photcolict:ronic imaging and
docis ion-making system.
These additional degrees of design flexibility in romote-viewtelevision systems result: from the incorporation of an additionalconverion process not touvkd in direct-view iniago intonsifiers--theconversion of the two-dimensional alectron image generated at the pri-mary photocathode into a video signal current by means of sequentialreadout of the image elements of the electron image on the camera-tubecharge storage target. The conversion of the electron image into avideo signal and subsequent amplification may introduce a limit onsensitivity not associated with the parameters of the eye. The mini-
mum detectable signal current will be detezmined by the video pre-amplifier noise unless sufficient electron m'ultiplication of theprimary photoelectron is provided. In practice, it has been foundthat an electron multiplication of about l04 is required. Electronmultiplication may be achieved with image-intensifier modules and/orinternal electron multiplication by means of electron bombardment of
the storage target.
If sufficient electron multiplication ahead of the storage andreadout system is provided, the video current will consist of a coarse-grainec signal current of large pulses reflecting the Poisson distribu-tion and its noise in the signal current--large pulses compared to theusual fine-grained noise current of the preamplifier. The luminousimage formed on the display by conversion of the video current will
consist of bright scintillations forming the image and a dim back-ground randomly generated by the video noise current. Under theseconditions, the quantum efficiency of the total visual system com-prising the remote-view television system and the operator will becharacteristic of the primary photocathode. Threshold sensitivityand integration time, as In direct-view image-intensifier systems,will be at the disposal of the designer subject to whatever restric-tions are imposed by operational requirements, size, weight, and cost.
The same flexibility in design of subjective magnification and
radiant flux collection power exists in remote-view television systems
27
L

as in direct-view image-intensifier systems. However, the subjective
magnification is not so rigidly specified. The difference lies in the
fact that the magnification between the display and the retina depends
on the distance, which may not be rigidly controlled. If one followsthe convention that normal magnification corresponds to a separation
of 254 mm, then for a separation SD one has
M = 254/8D (25)
where h is the subjective magnification between display and eye.Then, by Eq. 22, one has for the subjective magnification of a remote-
view television system
S= m I(hD/hT )(fO/SD ) (26)
where mI is the magnification between the primary photocathode of the
intensifier st.tges and the camera-tube target, hD/hT is the ratio of
the heights of the display and target, respectively, and f0 is the
focal length of the objective.
The field of view of a television system, as determined by the
size of the primary photocathode and the focal length of the objec-
tive, is given by Eq. 24, derived for image-intensifier systems.
B. SPECTRAL RESPONSE OF PHOTOCATHODES
The effectiveness of a photocathode employed in a low-light-levelphotoelectronic imaging (PEI) system largely depends on the match be-
tween the spectral content of the input image irradiance and the spec-
tral responsivity of the photocathode. The principal sources of passivenighttime radiant power in the order of decreasing magnitudes are the
full moon, the hydroxyl emissions of the upper reaches of the atmos-phere known as airglow, and the stars. The spectral content of moon-light, of course, is somewhat similar to that of suriight. The airglow,
whose integrated spectral radiant power (in the T'ange from 0.6 to 1.8microns) is only a factor of 10 less than full moonlight, exhibits
28

roughly an exponentially increasing spectral radiant power dependence
on wavelength. In addition, since both the contrast of military tar-gets against vegetation increases and the loss of contrast in trans-
missior via atmospheric scattering decreases with increasing wavelength
from the visible into the near infrared, it is valuable in low-light-level PEI systems to employ photocathodes with high near-infrared re-
sponse.
The spectral responses of several typical photocathodes used as
image sensors in PEI systems are shown in Fig. 6. The S-1 surfaces
are sensitive well into the near infrared and have been used in con-
junction with auxiliary near-infrared scene irradiators designed to
achieve operational covertness. One application during World War II
was the sniperscope. Although the S-10 surface has been used exten-
sively in commercial broadcast applications, where the similarity be-
t-ween its spectral response and that of the eye (shown in Fig. 1) is
prized, it is of no interest in the design of low-light-level PEI
systems. The S-20 and its derivatives, the S-25 and S-20VR*, with
their high responsivity in both the visible and near-infrared portions
of the spectrum, are the standard photocathodes employed in low-light-
level PEI systems.
The responsivity o(x) of a photocathode at a wavelength X in
amperes per watt is given by
oa() = lirn AX-O [Us/Hx•X) (27)
where js is the value of the photoelectric current density produced
by irradiance within the wavelength interval Ax, and H is the spectral
irradiance at a wavelength in the interval AX.
S-20VR is not a Joint Electron Device Engineering Council (JEDEC)term but is applied to the recent better S-20 cathodes by Varo,Inc., and others.
29

10
0"'0
L4U
7-J
*S-2OVR IS NOT A JOINT ELECTRONDEVICE ENGINEERING COUNCIL --- - -
(JEDEC) TERM BUT IS APPLIED TOTHE RECENT BETTER S-20 CATHODESBY VARO, INC., AND OTHERS.
0.35 0.45 0.55 0.65 0.75 0.85 0.95 1.05
WAVELENGTH, microns
FIGURE 6. Spectral Responsivity Versus Wavelength for Several PhotoemnissivePhotocathodes
30

The performance of a photocathode irradiated by a source of spec-tral composition described by Hx is measured by the total photoelec-tric current density produced by the total irradiance. Analytically,
it is given by
js = f a(X)HxdX (28a)
or
is = o() f R()HXd% (28b)
where c( p) is the peak value of the responsivity at the wavelength
Sof the peak , and the dimensionless function R(N) is the relativevalue of the responsivity function of %.
Often the mean responsivity a is specified as a measure of thequality of a photocathode. The mean responsivity is defined by
0- (29)
Tf HxdX
which is equivalent to
a = Js/H
where H = HxdX is the total irradiance. Thus, the performance offo x0
a photocathode with a source of irradiance of a given spectral compo-sition may be specified equally well by the value of is at a given
value of H or by a.
31

It is important to note from Eq. 29 that a depends on the spectral
composition of the irradiance as well as the spectral dependence of
the responsiviity itself. Thus, it is necessary to make sure, in
comparing the responsivities of different photocathodes to be used
with a given source, that the responsivities were determined with the
same given source or one of similar spectral composition.
Unfortunately, a variety of standard sources, matching natural
sources such as moonlight and airglow, is not available for measuring
the mean responsivity of photocathodes. Only the tungsten lamp at
28540K has been accepted as a standard source. The mean responsivity
aT of a photocathode measured with this source is given by
a( X) HX.9 28540 Ko=0 (30)
-T
H X9 28540K dX
where H % 285400 is the spectral irradiance due to the tungsten lamp
operated at 2854°K in watts per micron-meter squared.
The value of the mean responsivity oT of an S-10 surface measured
with a 2854 0 Y lamp is typically 0.8 ma/watt.
One of the first steps forward in low-light-level imaging was the
development of the S-20 surface with a oT of typically 3 ma/watt.
This surface was gradually improved by extending its red response so
that by the mid-1960's values of qT equal to 4 ma/watt became quite
commonplace, with occasional values as high as 5 to 6 ma/watt. As the
S-20 was improved, it became known as the 6-20XR (XR for extended red)and was finally type-classified as the S-25. More recently even
further improvements have resulted in a surface which is tentatively
described as the S-20VR (VR for very red), whose mean responsivity isreported to vary from 5 to 9 ma/watt. The responsivity of the S-20VRin the near infrared is especially notable. Both the S-25 and the
32

S-20VR will be used in calculations, although the S-20VR is not now
as commonly available.
If the thernionic emission or dark current of a photocathode iscomparable to or higher than the photoelectric current, contrast in
the output image of a scene is reduced. The thermionic emission or
dark current of the S-I is quite high, being 10-11 to 10-12 amp/cm2 atroom temperature. In many cases it is necessary to cool this surface
to avoid e-.cebsive contrast loss. The dark cuirent of the S-10 is
considerably better at i0-13 to l0"14 amp/cm2 but is still higherthan desired for low-light-level applications. For the S-20 and S-25
surface, dark current is extremely low (10-15 to lO-16 amp/cm2) and isnot ordinarily a problem. The dark current of the S-20VR is similarly
low.
C. LUMINOUS CONVERSION FACTOR OF PHOSPHORS
In the operation of a low-light-level PEI system, the photoelec-tric current density generated at the primary photocathode is first
amplified and then focused onto an output phosphor where a radiant
image is generated with spectral radiance Lx() given by
L ),) = jDkXD(X) (31a)
or
L7(%) = jDk D(X ) Z(X) (31b)
where is the current density incident on the phosphor, k D(W) is
the spectral radiant conversion factor of the phosphor in watts pernanometer-steradian-ampere, kXD(X ) is the peak value of kXD at thewavelength ½ of the peak, and the dimensionless function Z(X) is the
relative value of the spectral radiant conversion factor. For a given
set of electrode potentials the spectral radiant conversion factor of
an imaqe intensifier or kinescope is constant over a range of incident
33

c.u~rront dont it:. io it J) t 'I~ rttmI a1v :r to nwo&v il 1AVv1IrV 1011 VAI k~o This
5,itlivat ion ('11.~utt. Iolil ofi t. u1 .i nc ýiulph1do phsphorsu im'uh As tho NM2,
LS a ppvo x inlito' ~y (1.1 111ýd/01 omtd~i~d~itf' tho Irwid"Ift 0'lisitroti on1-
ortjy.
The val.titvo spoc~tvlrasi La .%t oonvot~rion faotor as a Nnoioi tn of
X i' shown in ritj. 7 for the typi,ý,al ,nodififd P-20 pý,oaphor' tisud in
most modern image-intensifier i, , Comparison of the spectral na-
dianr conversion factor of the modified P-20 with thi relatlvo spoo-
tral response ourve of chp eye shown in Fig. I and the photwcathodo
spectral responsivity cur-.es shown in Fig. 6 reveals that efficient
optical coupling exists bet:ween chis phosphor arid both the human eye
and the photocathodes S-20 and S-25,
The luminous conversion factor kLB of a PEI system is defined
by kL, BD/L', the ratio of the lLminance % of tho output phosphor
to the "apparent" radiance L' of the s..ono. (If the atmospheric trans-
mission were unity or the distance to the scene were small, L' would
be the radiance of the scene.) The units of kLB reduce from (candela/
meter 2,/(watt/meter 2-steradian) to simply lumen/watt.
The dependence of the phosphor luminance on the apparent radiancv
of the scene is given by
BD= KD [ k kDMi dX] (C r/IM2) a [TLI/4( f /11.)2] (32)
where the last bracketed factor is the input irradionce HS to the
photocathode, oHS is the photoelectric current density Js generated at
the photocathode, (G1 /m2 ) is is the photoelectric current density JD
incider.. on the output phosphor (GI ib the electric current gain, m is
the magnification), the product of the first bracketed term and JD isthe radiance of the phosphor, and
34

0.01 _
0.0011 1b -
06 0 060 0.70 08
WAVE~LENGTH, microns
FIGURE 7. Relative Spectral Radiance of a Modified P-20 Phosphor
r3

ti tho luminoua fft•,avy ot the output radinheS.
tt is conven~ient vo express Eq. "• in the fo•QowLngi roln
A •Ha ink(34)
where k1, nD/HS is the luminous conversion efficiency of the PEI de-
vice and TL ,n l/4(f/ro.) 2 is the col1.ection efficiency of the objec-
tive (for a perfectly transmitting atmosphere and diffusively reflect-
ing object T, is the ratio of the photocathode i.radiance to the object
irradiance)., The units of NB are (candela/meter 2 )/(watt/meter 2 ),
which reduce to lumen/watt-steradian. Tables including values of kHB
for several image-intensifier tubes are presented in Part IV of Ref. 8.
In terms of kHB and IC the luminouA conversion factor of a PEI
system according to Eq. 34 is given by
kL#B E *HBll (35)
and by Eq. 32 the luminous conversion factor of a PEI device is
given by
kHB 2)D [4 D( d (/m o. (36)
If the phosphor is a Lambertian radiator or, if not, within the
approximation that it is, the power gain defined by the ratio of radi-
ant power emitted by the phosphor to radiant power incident on the
photocathodq is given by
GP = G (LD/HS) m2 (37a)
36

0l'
Op 0 rvýa kS X(X dW (37b)
where the only new symbol in the above equations ia LD equal to thho
radiance of the phosphor. Gain factor Gp is dimensionless, as is aiy
gain factor. In terms of p,. the luminous conversion factor o: a PEI
system is given by kHB w k DGP1/m v and the luminous conversion factor2of a PEI device is given by kHB n KDGp/wM2. It should be noted that
the luminous conversion factors and power gain defined above depend
on a, which was defined in Section IV-B and shown to depend on both
the spectral distribution of the source and the spectral dependence of
the responsivity.
The ratio of the luminance of the output phosphor in footlambertsto the illuminance of the photocathode in footcandles has been widely
employed as the definition of the "brightness" gain GB of an image
intensifier tube. The above units of GB reduce to (v steradians)However, if the phosphor can be approximated by a Lambertian radiator,then GB can be considered to be dimensionless--equal to the ratio of
the luminous exitance of the phosphor in lumen/ft 2 to the illuminance
of the photocathode in footcandles. The expression for the "bright-ness" gain is given by
GB = HB/•IS (38)
where kHB is given by Eq. 36 and KS, the luminous efficacy of the in-
put irradiance, is given by
CO -
KS = 680 j y(X) HWS (O.) df HXS() dX (39)
37

whor• Hl (k) is che npectra.L irradiance function of wavelength X at the
photocat:hodo. Tho t;Actor n in Eq. 38 arises froem the fact that the
tunL solid angle :;n rho definition of GB is Y steradians.
Thti use of "briqjhtness" gain as a characteristic parameter of animage-intensifier tube is to be strongly discouraged for the following
reasons:
* The proper units (Ref. 1) for luminance and illuminance are
candela/meter2 and lumen/meter2, respectively (not footlambert
and footcandle).
9 The use of luminous units for the input to a photocathode is
often misunderstood, for although a lumen of luminous power
from any source produces the same visuql response, the response
of a photocathode depends on the spectral content of the lumi-
nous power.
* Photocathodes used in image-intensifier tubes exhibit infrared
responsivity, so that an output luminanue may result even if
the luminous efficacy of the input irradiance is zero.
In the latter event the "tbrightness"l gain given by Eq. 38 would be un-
defined. Instead of "brightness" gain the luminous conversion factor
kHB is preferred.
It has been standard practice to measure the "brightness"t gain
with a 28540K tungsten lamp. 7 . luminous ,efficacy of radiant power
from this standard source is dproximately 20 lumen/watt. Hence, ac-
cording to Eq. 38 measurements of GB with a 28540K tungsten lamp may
be converted to the luminous conversion factor by the formula kHB =
20GB/rr.
The luminous conversion factor of two image-intensifier tubes incascade is given by Eq. 36, where the output phosphor is that of the
second tube, the photocathode is that of the first tube, and the cur-
rent gain GI results from coupling the radiant power generated at the
first phosphor to the photocathode of the second tube. Thus, in a
two-stage image intensifier (without an electron multiplication dynode),
38

the current gain defined by G l 2 = is2/JDl is given approximatelv byI"lG1 1 2 = N f a2 (x) kXDl(() dX (40a)
0
or equivalently by
GI1 2 = "rC 2 (I) kXDl(X) f R2 (X) Zl(X) dx (40b)
where the subscripts 1 and 2 refer to the first and second stages,respectively, and N is the transfer efficiency of the radiant powerfrom the first phosphor to the second photocathode. The value of GI1 2
is usually iW the range 30-50 with 40 being a typical value for image-intensifier tubes with a P-20/S-20 phosphor-photocathode combination.
D. TEMPORAL RESPONSE
If an image system has a temporal response longer than that ofthe eye, the effect is to smear together image detail when an inputimage moves across the photocathode. In an intensifier some lag dueto phosphor decay can be expected. One such measurement of temporalresponse performed with a modulated light source is shown in Fig. 8.The temporal. response at the normal TV frame rate (30 frames/sec) isseen to be quite high for a single-stage intensifier but is appreciablylower for three-stage intensifiers. Methods of measuring and specify-ing temporal responses are not well known, but such measurements and
specifications can be quite important, and are discussed in connectionwith TV camera tubes in Ref. 8.
Although intensifiers do exhibit lag effects of their own, theiraddition to a system can reduce overall system lag. Most camera tubes,in particular, have lag characteristics that depend on light level.That is, lag increases as light level decreases. By increasing light
39

level on the camer'a tube, the increase in lag due to an added intensi-fier is usually more than offset by the decrease in camera lag.
"25-mm SINGLE-STAGE INTENSIFIER
0.8 __ _ _ __ _ _
z0.6
25-mm TWO-STAGE-- • \INTENSIFIER30.4 - - - . _ _ _ _ _ _ _ _ _ _ _ _ _ _ _
'U
25-mm THREE-STAGE
0.2- INTENSIFIER
0.1 1.0 10 100 1000
S3-15-71-13 FREQUENCY, Hz
FIGURE 8. Temporal Response of Image Intensifiers
E. SPATIAL FREQUENCY RESPONSE, MODULATION TRANSFER FUNCTION
In the process of detecting the input image, converting it intoelectrons, focusing it onto the phosphor, and recreating a visibleimage, contrast is lost at each step for the reason that aberrationscause an overlapping of the radiance pattern on the display producedby the input image irradiance. In the limit of small.-image elementsizes, as contrast falls below a few percent, detection probability
approaches zero.
Rather than reproduction of contrast on the display as a functionof image element size, it is customary to consider the reproduction of
40

the modulation amplitude of a sinusoidal, spatially modulated, radianttest pattern as a function of spatial frequency. The relation betweencontrast and modulation amplitude is described below. The modulationtransfer function (MTF) or sine-wave response of a PEI system is de-fined as the ratio of the modulation amplitude of the display image tothe modulation amplitude of the input image on the photocathode as afunction of spatial frequency--normalized to unity as the frequencyapproaches zero. The 3ine-wave response can be measured by projectinga sine-wave pattern with 100 percent modulation on-c the photocathode.First, a sine-wave pattern of low spatial frequercy is employed andthe peak-to-peak output amplitude is noted. With this amplitude as areference, the pattern spatial frequency is increased in discretesteps. At each step, the new peak-to-peak amplitude is measured andthe ratio of this amplitude to that measured at the low spatial fre-quency is formed. The plot of these amplitude ratios as functions ofpattern spatial frequency constitutes the sine-wave response.
The sine-wave spatial frequency is described quantitatively interms of v, the number of cycles (or line pairs) per millimeter or,alternatively, the number of half cycles (or lines) in some dimensionsuch as the photocathode diameter or height of the display. The sine-wave responses of a typical single-intensifier module and of two- andthree-intensifier modules, respectively, in cascade with unity magnifi-cation are shown in Fig. 8. In general, the overall sine-wave re-sponse of several components in cascade is given by
T( vlsv D) = TI(vis/ml)T2( vls/'lm2)...Tn(vls/mlm2...ran (41.)
where T(vls, VnD) is the overall sine-wave response on the outputphosphor at frequency vnD to an input sine-wave pattern at frequency
Sls; T1(vis/ml) is the sine-wave response of the first component,etc.; mI is the image magnification in the first component, and so on.Equation 41 results from observing that:
* The spatial frequency on the display is related to the spatialfrequency on the sensor byv VD = Vs/m.
41

"* The modulation amplitude M at the input to the second component
is equal to the modulation amplitude at the output of the first
component.
"* The modulation amplitude at the output of each component is
related to the modulation input by MD = T(v/m)Ms.
It is apparent, on referring to Fig. 9, that care must be exercised
in cascading components that the expected increase in performance due
to increased intensifier gain at the designed spatial frequency is not
cancelled by the reduced sine-wave response of cascaded stages at that
spatial frequency.
1.01
0.6 --
0.2 ..Z
0 5 iQ 15 20 25 30 35 40 45 50
LINE PAIRS/MILLIMETER AT PHOSPHOR
FIGURE 9. Modulation Transfer Function of Image Intensifiers
The case of a zoom intensifier mer" -s special attention. If the
zoom-intensifier sine-wave response wcre lnity at all spatial frequen-
cies, resolution would be unlimited in both wide-angle and narrow-
angle modes. Since the wide-angle mode also covers more viewfield,
there would be little point to zoom with consequent reduction of view-
field. As a practical matter, the sine-wave response of the intensifier
42

is limited by aberrations in the electron optics and the phosphor par-
ticle sizes. The sine-wave response of a zoom intensifier in both
wide- and narrow-angle modes is shown in Fig. 10. As the viewfield
is decreased, going from the wide- to the narrow-angle modes, image
magnification increases from mw to mN in the same ratio, Consequently,
the spatial frequency scale of the sine-wave response curve is com-
pressed by thb factor mN/mW or, alternatively, on the same frequen¢-v
scale the abscissa of points on the curve may be multiplied by mN/mW,
shifting the entire curve as indicated in Fig. 10. Specifically, for
an 80/25-mm zoom tube, the magnification increases from approximately
1/3 to unity as the viewfield is decreased, and the abscissa of points
on the wide-angle curve at a given response is shifted in the narrow
field mode by approximately three times the frequency. Thus, some of
the higher sine-wave response at a given target spatial frequency in
the narrow-angle mode is sacrificed in the wide-angle mode fur the
sake of wider viewfield. On the other hand, greater brightness gain
is realized and, if sufficient brightness gain is not otherwise pro-
vidcd, may provide some improvement in performance.
For evaluation of the overall performance of a complete visual
system comprising both the human operator and the PEI system, it is
also necessary to consider the spatial frequency response of the eye
and the relation between frequency on the display and on the retina.
Since it is not feasible to monitor the spatial dependence of the
electrical signals generated in the eye as a function of spatial var-
iations in the irradiance of the retina, it is not possible to make a
direct measurement of the spatial frequency response. Rather, spatial
frequency response can only be indirectly inferred from measurements
of the modulation amplitude of a sine-wave test pattern required bythe eye for some specified detection probability and the signal-to-noise ratio theory of detection probability. The dependence of de-
tection probability on the signal-to-noise ratio at the decision cen-
ters of the brain, because it involves such parameters as the quantum
efficiency and the temporal and spatial bandwidths of the eye, is in-
complete. However, the required modulation function alone is sufficient
43

to make predictions of the overall performance of a PEI system and its
operator.
1.0
08NARROW-ANGLE VIW0.8 -- 25/25-mm INTENSIFIER
U 0.7z S0.
0. 0.4 .UJ
v80/25-mm INTENSIFIER
0.2-
0.1
0L0 5 10 15 20 25 30 35 40 45
LINE PAIRS/MILLIMETER AT PHOTOCATHODE
FIGURE 10. Response of a Zoom Intensifier Referred to the Input Photocathode
The frequency scale of the required modulation function depends
on the distance from the eye to the display of a television monitor
or the subjective magnification (th) of an eyepiece. If 254 mm (10
in.) is assumed as the standard viewing distance (M=i), then the re-
lation between frequency v on the retina and frequency vD on the dis-
play is given by
VD = O.0 6 7flvR (42)
wnere the separation of the retina and second nodal point of the eye
44

is assumed equivalent to 17 mm in air. For example, if the viewing
distance were 30 inches, M would be 1/3.
The required modulation as a function of frequency in cycles per
inch calculated from retinal modulation sensitivity curves published
by A. van Meeteren (Ref. 9) is shown in Fig. 11 for a subjective mag-
nification of unity and three luminance levels. These curves were de-
"termined under conditions such that for a given display luminance the
signal-to-noise ratio is maximum and hence, as will be explained in
Section V, the curves represent the minimum required modulation func-2tions. The curve at 0.52 cd/mi or 0.15 ft-L corresponds approximately
to the usual luminance working level of an image-intensifier display.
Figure 11 reveals that reduction of display luminance below 0.52 cd/m2
has a dramatic effect -n the required modulation function, while in-
creases in display luminance have a much smaller relative effect.
The relation between the minimum required modulation functionsand the output modulation of a typical low-light-leval television sys-
tem is shown in Fig. 12a and b at two display luminances, as indicated.
The relation between frequency N in television lines per raster height
and frequency vD for M=l is given by
N = 20D/(S/H), for t in cycles per inch,* (43a)
or
"N 500j/(S/H), for vD in cycles per millimeter, (43b)
where S is the separation between display and observer, and H is the
raster height. In Fig. 12a and b, for 30 percent input modulation,
the output modulation of a single-stage noise-free but otherwise typi-
cal low-light-level television tube as a function of spatial frequency
is showA in conjunction with the required modulation at viewing
*
Display tubes are normally measured in inches.
45

i I-alwir~ oqlml ~ i X~ and 011,410 v Imon I i p 1"r~u 431 tu%0 (%jil Til , 'I p
qute'ro 's at thclo lilt 'taI.tm IonaiiC It v)1o r'I(pi' It'l 11odmIi(ttoti 4110 owilkil
moduildt-tuin curvois .io hOl vasiolmt oll valklor of 010~ w0yo-d ilkpAy I'motiil t-
t~ion undor thio 85 uino'd cond Ittono , In r Iq. 1.'h, Worp.%tilti 1-ho virow-
ing dstdtnete fromn tiroa L,. six timoe 0io~ rmUinr )wljiotj i votwion 00
resolution froin ?'ougjhly $00 to 3ý)O tolovisa(on i nomi pot1 1v4sital iolvit,
1.0-
zQ (MAGNIFYING POWER *1)
90.6-
S0.4 0'
0.2
0
0123456 7 acycla/mm
ST4-28-70-1* DISPLAY SPATIAL FREQUENCY
FIUE1 Minimum Required Modulation for Detection of Sine-Wave Patternby Eye (Rof. 9)
46

~,DIWe'AY LUMINANILI; 1i &o/n1
all ~INPUT MOj)ULAjjtUM X
DISP'LAY LUMINAN~tId -7)g~,
IISPAYUALLA FREQIeNCY, -V 0,ea2radtM
Equa to Si PAnd ThrA e TimEQU N Y aTer Heighrtfo 0-, T e N is e o
the Data Is Determined Only by the Electric Noise Generated In theEye Dut. to the Photon Nature of the Display Luminance.)
47

In image-intensifier systems the subjective magnification of the
eyepiece is typically seven tities, which is equivalent to a viewing
distance of only 1.4 in. Therefore, both the required modulation of
the eye and the resolution are deternined by the output liuninance
fluctuations considered in Section V. However, an exception may arisein slngle-stage demagnifying image intensifiers, where both, M and the
display luminance may become low compared to their corresponding val-
ues in a conventional multistage image intensifier.
It is important in the design of both remote-view television and
direct-view image-intensifier systems to present the output image to
the eyo at sufficient luminance and angular size that the required
modulation is little affected by the optical properties of the eye and
thu neurological organization of the retina but rather by the funda-
mental effects of output luminous fluctuations on the decision process
discussed in Section V.
It has been determined empirically (Part II of Ref. 8) that ex-
cellent correlation exists between the subjective quality of aerial
photographs and the modulation transfer function area (MTFA) bounded
by the ordinate axis, the image modulation function of the photograph,
and the requirod modulation function of the eye. The rationale for
the choice (Ref. 10) of the MTFA as an overall measure of picture qual-
ity and observer performance is based on the observation that easy
detection of a particular spatial frequency requires that the modula-
tion should be as high as possible (conspicuous) above that required
by the eye, for, say, 50 percent detection probability with unlimited
viewing time. In aerial photographs, all spatial frequencies are gen-erally of interest. Hence, the MTFA was proposed as an overall meas-
ure of observer performance and picture quality. In the visual
observation of photographs, the modulation required by the eye at low
spatial frequencies depends on the properties of the visual system.
At higher spatial frequencies, fluctuations in grain size set the re-
quirement and cause the required modulation to rise.
In the case of low-input image irradiance to PEI systems, a rise
in required modulation with increasing frequency is observed that is
48

due to fluctuations in the output luminance produced by scintillationson the display. While the required modulation function depends on theoptics and neuroloqical organization of the eye at high input irradi-ance, at low-input irzadiance the required modulation function islargely determined by the effects of luminance fluctuations at thedisplay on the decision process. A different required modulationcurve occurs at low-input irradiance for each photocathore at eachinput irradiance. The effect of fluctuations on the required modula-tion function of the eye is discussed in detail below.
49

V. ANALYSIS OF PHOTOELECTRONIC IMAGING SYSTEMS
The probability of correctly identifying a known signa-l in the
presence of noise is a function of the signal-to-noise ratio. It has
been demonstrated by Rose (Ref. 6), Schade (Ref. 11), Coltman (Ref.
12), and Coltman and Anderson (Ref. 13) that the probability of de-
tecting simple targets, such as disks on a uniform background, bar
patterns, and sine-wave patterns, depends on the signal-to-noise ratio
of the image formed on the display. They concluded that in an image
formed by scintillations (under low brightness conditions when fluctua-
tions in intensifier gain and internal sources of noise can be neg-lected), the signal is proportional to the average difference in the
number of scintillations generated at adjacent image elements per sam-
pling time (the effective integration time of the eye), and the noise
is proportional to the root-mean-square value of the fluctuations in
the difference.
The primary source of noise at the input of a PEI system arisesfrom shot noise inherent in the photoelectric current generated at the
photocathode by random absorption of the incident photon flux. It is
observed that the numbers arriving on a small area of the sensor in
equal intervals of time obey the Poisson distribution function. The
root-mean-square value of the fluctuations about the average number
is equal to the average number. Such temporal fluctuations constitutenoise that inhibits image perception and reduces detection probability
per glimpse.
For a given input-image element size and sampling time, the signal-
to-noise ratio of the output image is determined by four properties of
the PEI system:
Preceding page blank 51
L

1. The size of the entrance pupil of the objective.
2. The quantum efficiency of the photocathode.
3. The internal generation of noise, such as shot noise in therm-
ionic current (fluctuations in electron multiplication proc-
esses and Johnson noise in the input resistor of the video
amplifier).
4. The degree to which the input image can be reproduced on the
display without overlap of the luminance of adjacent image
elements, i.e., the modulation transfer function.
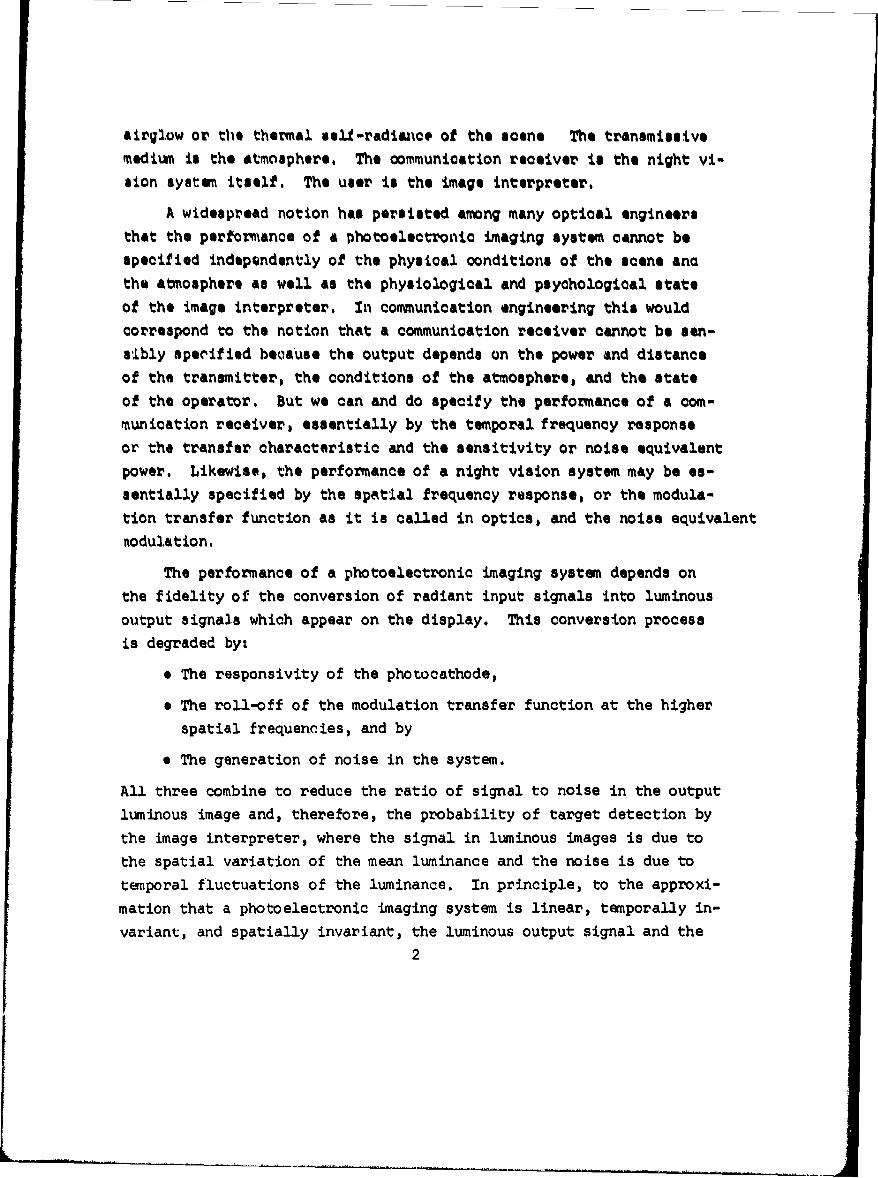
In image-intensifier tubesi thermionic current and fluctuations
in electron multiplication are generally negligible compared to the
shot noise of the photocathode current. In low-light-level television
systems, if high intensifier gain is provided, the video amplifier
output current consists of a coarse-grained current of large pulses
and a fine-grained noise current. The large pulses result from charge
pulses evoked by emission of an electron from the photocathode and by
electron multiplication increased to several thousand electrons before
the video amplifier. The fine-grained noise current in tubes without
electron multipliers largely results from random thermal generation
in the first stage of the video preamplifier. Intensification of a
primary photoelectron by a factor of approximately 104 at standard
scan rates is sufficient to overcome the effect of video noise in the
output image.
As an example, if the storage target comprises 5 x 10⁵ storage
elements and the frame time is 1/30 see, the readout time of one
storage element is 6.7 x 10⁻⁸ sec. For a readout time of 6.7 x 10⁻⁸
sec and primary electron intensification of 10 the average pulse
current due to a single photoelectron will be roughly 24 na, providing
an average pulse-current signal-to-video-amplifier-noise ratio of 10
at the input to a good video preamplifier. Primary electron intensifi-
cation of 104 can be easily obtained with a combination of a one-stageimage intensifier and SEBIR tube, can be just barely obtained with a
one-stage image intensifier and SEC vidicon combination, and cannot be
52

realized with a double imre intensifier and plu:nbicon or vidicon
combination. The required factor of 104 requires three cascaded
intensifiers for an intensifier vidicon camera. However, ýýor, inte-,:J-
facation, at a sacyifice in frequency response, is obtaire( i9 KaS"ý-
ing more intensifier stages.
A. NOISE-EQUIVALENT MODULATION
The following noise calculations apply to image-intensifier sys-tems and to television systems possessing sufficient intensifier gain
to make the effect of video amplifier noise in the output image negli-gible. The steps to be followed are to calculate the signal and thenoise, form the S/N ratio, set it equal to unity, and solve for themodulation, i.e., the noise-equivalent modulation (NEM). The modula-tion required by the eye is then determined by multiplying the NEM bythe appropriate required S/N factor k.
The input image to be considered is a sine-wave pattern on zeroDackground. Results of measurements made on square-wave test patternsand analysis based on sine-wave functions are easily related (Ref. '4)
by the simple Fourier series expansion of the periodic square-wavefunction. It has been demonstrated (Refs. 6 and 12) that the signaland shot noises of an image formed by scintillations are equal to thedifference in the number of scintillations in adjacent image elerneenrsand the root-mean-square value of the fluctuations in the differen-'e,respectively. To a good approximation, they are independen-: c :,distribution of scintillations within the image elements. 7'1, iFone considers a sine-wave mcdulation pattern on the disv}vnecessary to calculate thc number of scintillation ..elements considered somewhat- arbitrarily to be tif. sc; i .,tive half cycle, of the sine-wave modulation.
photoelectron flux density ns(xs) generated j: 7 i:.,
is given by
- A
ns(xs) = ns + nssin 2rvosxs (44)
53

or
ns(X) = s(l + M sin 2TTvosXs) (45)
where n is the average value of the flux density over a period of the
test pattern in particles/mm2-sec, ns is the amplitude of the sine-
wave modulation, vos is the modulation frequency in cycles/mm, and Msis the modulation amplitude at the photocathode defined by Ms =
+ + =A -+ -S(ns - ns)/(n• + ns) = n s where ns and n• are the peak and valleyvalues, of the photoelectron flux density.
If the dynamic response of the PEI system to the modulation is
linear and the spatial frequency response of the optical system is
uniform over a sufficiently large portion of the field of view, then
the luminance of the pattern image on the display is given by
nD(XD) = 7D(I + MDsin 2"oDXD) (46)
where, if m is the magnification, xD = mxs and vol = vos/m. The modu-
lation MD on the display and the modulation Ms at the photocathode are
related by MD = T(VoD)Ms, where T(voD) is the frequency response or
modulation transfer function discussed in Section IV-E.
If one integrates Eq. 46 over a positive and a negative half cy-
cle of the modulation, takes the difference, assumes that the eye sam-
ples one period of the test pattern (Ref. 12), and lets t equal the
sampling time, the output signal is given by
(N+ - ND)t = (4/r)LDWDtFDMD (47)D ND DaDDe
where ND and are the respective numbers of photons emitted per
second from a positive and negative half cycle of the modulation, LD
is the effective length of the pattern, and WD is the width of a half
period equal to 1/2 oD.
54

The mean square value of the fluctuatiori, in ',-Ie differenrce ob-
tained by adding the mean square values of the fluctuations in each of
the half cycles is determined by the scintillation generation rate.
Thus, the mean square value of the fluctuations in a sampling period
2WD and a sampling time t is given by
G 2< [(N' - ND)t/G] 2> = 2GL W . t (48)D DDD
where G is the mean value of the particle gain, i.e., the number of
photons emitted per scintillation. If the noise is measured by the
root-mean-square value of the fluctuations, the signal-to-noise ratio
at the display is given by
(S/N)D = (2/7T)MD(2LDWDtR D/G)" (49)
This expression is simplified by noting that 1D/G, the scintillation
rate on the display, is equal to F /m2 and LDW = D2 em2/4vo2 wheres DD D os
e is the effective length-to-width ratio. Thus, the signal-to-noise
ratio on the display is given by
(S/N) D = (2eF St)½MD/Mros (50)
Only if the value of e is sufficiently large can one treat the test
pattern in one dimension. It has been stated by Schade (Ref. 7) that
the sampling aperture of the eye for lines or bands is the image of
the band with the effective length equal to 14 equivalent widths.
Therefore, e should be somewhat greater than 14 so that the luminance
of the output image of the pattern will be uniform, over a length equalto the saTplingq aperture of the eye.
Instead of-modulation amplitude, it has become customary (Ref.12) :'n the ana"l,,sis of low-light-level television -;,stems to describe
the input test pattern by its contrast, as defined by
i = (n+ - n;)/n+ (51), s .
55

at the primary photocathode. In Eq. 51, n+ and n- are the maximum ands s
minimLuIT values of the primary photoelectron flux density, respectively.
The relation between modalation amplitude, defined following Eq. 45,
and contrasr, defined by Eq. 51, is given by
Ms = Cs/(2 - C S) (52)
In terms of the parameters contained in the detailed discussions
of low-light-level television systems in Part V of Ref. 8 (e.g., Eq.
V-C-18), Ed. 50 for (S/N)D is given by
(S/N)D /c = (2/n)T(vos)Cs[0.75t(is max/e)/(2 - Cs)]ý/N (53)
where is max' defined by is max = en A", and n are related by
ns = (2 - Cs )is max/2eAT (54)
and N, the number of television lines per raster height H, is given by
N = 2Hv Os. In Eq. 54, AT is the area of the camera tube target, which
is given by AT = (4/3)H , if a width-to-height ratio of 4/3 is assumed.
Often, the factor el appearing in Eq. 53 is included implicitly in the
(S/N)D. In addition, a factor of 2/k occurs in Eq. 53 due to the ra-
tio of average signal (used in Eq. 53) to peak signal (used in Part V
of Ref. 8).
The average photoelectron flux density is given by
7 = f 7TK0ýjýd X (55)
where KX ) is the quantum efficiency of the photocathode at wavelength
X and •j is the average input spectral photon flux density over asampling period. It is convenient to define
56

and ,It 'R H O fo Ft1%"X Then Rq. 1h beconcs
F S TH -(57)
In general, it is necessary to perform a numerical integrationover the spectral bandwidth of the input image irradiance to determine
values oý C* However, if the source of irradiance is a standard
2854 0K tungsten lamp, then we have n5 = 4.•/e, where CT and TOT dis-cussed in Section IV-B, are the responsitivity and average photocathode
irradiance in ma/watt and watt/m2 , respectively. In terms of the op-tical parameters of the objective, the average photoelectron flux den-
sity is given by
where A 0 s the area of the entrance pupil, f0 is the focal length ofthe objective, and r is the average radiance of the sine-wave test
pattern in photons/cm -sec-sterad.
The explicit dependence of the output-image signal-to-noise ratio
on the basic parameters of a PEI system can now be given as
(S/N)D " (2etAo'TC)9 T( vo0 )M5 /rVo', (59)
where
i is the length-to-width ratio of a half period of the testpattern,
t is the effective integration time of the eye,
57

A0 is th, t'11,a of tho o•1ti."In, pupil (it thil' o•,j,'wl: Ivo,
i' is tho 1o rl qu i.tnlin t'.[f ic olloy koftlld by 1k. I )6,
ris the average radiance of the test pattern,
T(Vo ) is the frequency response of the PET system,
`o* v `0/3f is the angular frequency of the test pattern atthe entrance pupil in units of cycle/radian, and
Ms is the modulation amplitude of the test pattern.
For a given sampling time and sine-wave tesot pattern, the output signal-
to-noise ratio is proportional to the square root of both the area of
the objective and the quantum efficiency of the photocathode and is
also proportional to the frequency response.
If we refer to Eq. 50, we see that at a given input irradianco(7s constant), as the frequency of the test pattern increases, the out-
put modulation required for a specified output signal-to-noise ratio,increases. It has been determined that if the (S/N)D is approximately
3.8 (Ref. 15), then the modulation prescribed by Eq. 50 (i.e., 3.8times the noise-equivalent modulation) approximates the modulation Mt
required by the eye for 50 percent detection probability of the imageof a test pattern formed by scintillations with unlimited samplingtime. Thus, the modulation required by the eye in the presence ofshot noise (Ref. 16) is given approximately by
Mt 3.8rvos/(2i t)h (60a)
Higher values of Mt would be required if higher detection probability,
shorter detection time, or detection under more difficult conditionsthan that presented by a simple sine-wave pattern were required.
*Often the length-to-width ratio c of one-dimensional test pat-
terns is included implicitly in the (S/N)D, which then equalsapproximately 1.1 instead of 3.8.
58

'111\)1 'h l i -'i'Al u , (Ildlotatrd by iq, oi.I. Thin dlffiuilty witlh )Aq, 604
,lT'i•,osl 11\11t1 ,I lin it-tioll t0111XI't, d hy .r ll, to wf Iw1i'Id, w it 'll 111'V0,1t1 0
li, ti•tn1iltio a Mlif , l tolri t wol~J tlo (: t C Ix) tip et' ths fro,•lt 1 lt toi ll ir l oill
1 imnon. lollal, Tho d if t i]i, I c ty ,4I) CIrA M at r'o.iJ~iI y .17 oyl orr/min Onl n d I -
plAy vIOdWLI throuqlh i , / 1-powolr .l IIIo o or ' Ico'lo/rlil, oill . t.lov i llol
dilplay vtiowad frOm ,I ili,
Pobr low-lighL-lo~vol t~'3 "vfI iIon tnytzt~imi It, Jr oolivou Ilt nVO tO x-
press the modulation raquired by thet oyo in tlih tovii
Mt -; LtTN/[rcCis/0)tr (Gob)
where N is the numIlber of television lines par raster height, c is the
length-to-width ratio of a half period of the teat pattern, t Is u.2
sec, the integration time of the eye, e is the magnitude of the elec-
tron charge in coulombs, i e s(4/3)H2 is the total primary photo-
cathode current? and it is the height of i raster oel the photocathode.
Equation 60b applies to low-light-level television systems with suf-
ficient intensifier gain that the output signal-to-noise ratio is
negligibly affected by the video preamplifier noise.
The overall performance of a low-light-level PEI-human eye sys-
tem at a given scene radiance is essentially specified by the frequencyresponse (modulation transfer) function and the required modulation
function of the eye. For example, output modulation functions for
several values of input modulation, calculated curves of required modu-lation for several values of primary photocathode current, and minimum
required modulation functions (introduced in Section IV-E) at display
luminances of 0.52 cd/m2 and 7.7? cd/mr2 are shown in Fig. 13 for a
typical triple image intensifier and in Fig. 14 for a typical low-
light-level television system. A detailed discussion of the minimum
required modulation ind the transfer of information from the display
to the output of the eye is contained in Appendix A.
Figures 13 and 14 depict the following information:
59
L.
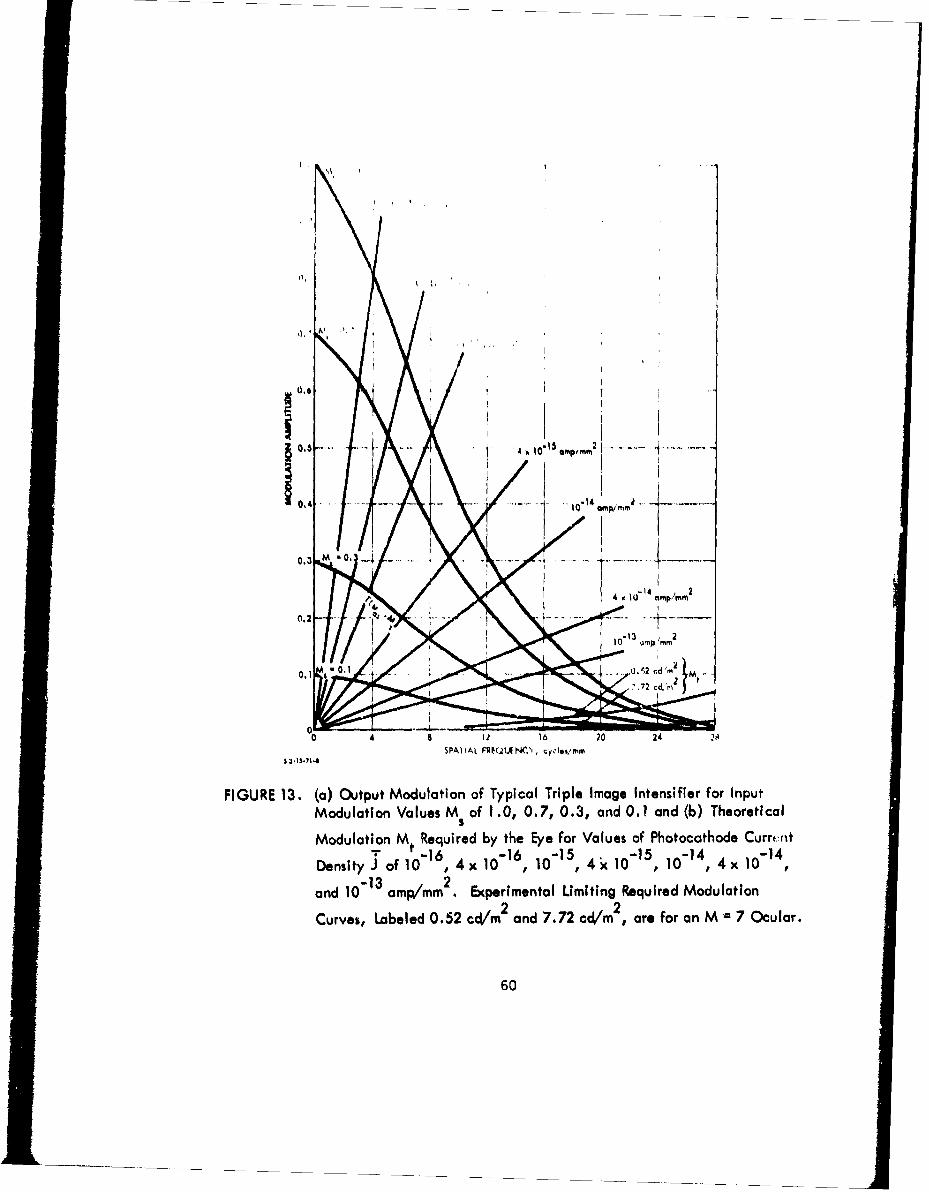
0,3• 13 20 M
0.54 .... .. "4 mp mm • . .. .
O.3 k 0 . . . -
1 1 4-1 np
012
0 12 16 20 24 28
SPA) IAL FRP(• fC.A N cyclmtlmmS .lI S.flt4
FIGURE 13. (a) Output Modulation of Typical Triple Image Intensifier for InputModulation Values M of 1.0, 0.7, 0.3, and 0.1 and (b) Theoretical5
Modulation Mt Required by the Eye for Values of Photocathode Curr.int0 t- 16 -16 -15 -15 -14 -14
Density J of 10 , 4x 10 6, 10", 4k 10", 10", 4x10-14
and 0"13 amp/mm 2. Experimental Limiting Required Modulation
Curves, Labeled 0.52 cd/m2 and 7.72 cd/m 2, are for an M = 7 Ocular.
60

l, U .. . . . .. . .. ... j . ....* .. . . . . ...
M 1,0
0.6 I 10 -li
I
01?
M '0,
0.3
0. O'5 'O t• p . .. ....
'I 0,,- --.. .......... 1......
0.1 . . . . .... ..
05- 100 200 300 400 M0 600 700SPATIAL FREQUENCY, TV lines/raster
FIGURE 14. (a) Output Modulation of Typical Low-Light-Level Television for InputModulation Values M of 1 .0, 0.7, 0.3, and 0.1 and (b) TheoreticalS
Modulation Required by the Eye for Primary Photocathode Current i
of 10-13, 10"12, 10'11, and 10"10 amp. Experimental ULmiting
Required Modulation Curves, Labeled 0.52 cd/m2 and 7.72 cc/mr2
are for a Viewing Distance Equal to Three Times the Raster Height.
61

* The ratio of tho output modulation to the required modulation
at a ,tven spatial frequency is by Eq. B-lb equal to 1/3.8
times the output signal-to-noise ratio.
* At the intersection of a given output modulation and required
modulation curve, the value of the output signal-to-noise ra-
tio is just 3.8, the minimum required for 50 percent detectionprobability. Hence, for test patterns of a given modulation
and radiance, the corresponding value of spatial frequency at
the point of intersection is the resolution frequency of the
PEI-human eye system, and the range of frequencies from essen-
tially zero to the resolution frequency is the useful bandwidth
of the system.
The definition of resolution has been much abused by authors of
papers describing the performance of visual systems. Hence, it is im-
portant to umphasize that here resolution frequency is defined by the
point of intersection of an output modulation and a required modula-
tion curve and thus defines the upper limit of the useful spatial band-width of the system. It is also important to note that the resolution
frequency and useful bandwidth of low-light-level PEI systems depend
not only on the MTF but also on all the system parameters that affect
the (S/N)D, as well as the modulation amplitude and the mean radiance
of the scene. Furthermore, it is interesting to note that the value of
required modulation at the resolution frequency is not 3 percent, as
commonly supposed, but depends on the primary photocathode current den-
sity determined by the "apparent" radiance of the test pattern, the f-
number of the objective, and the mean responsivity of the photocathode.
Moreover, the resolution frequency at low input irradiance is not pro-
portional to the square root of the primary photocathode current den-
sity but rather is relatively insensitive to it.
The common assumption that resolution frequency is proportional
to the square root of the mean responsivity owes its origin to the
earliest papers (Refs. 6, 12) on the signal-to-noise theory of resolu-
tion, in which the authors did not include consideration of the frequency-
response function. This, in effect, amounts to assuming an ideal flat
62
Li Ai

frequency-response function. For example, in Fig. 13 this assumption
would result in the output modulation curves becoming horizontal lines.
The intersections of the required modulation curves with these hori-
zontal lines of output modulation would then yield the proportionality
of resolution frequency on the square root of mean responsivity. How-
ever, due to the rppid roll-off of frequency response with increasing
frequency, the resolution frequency is quite insensitive to responsiv-
ity. The relationship between graphical representations of the per-
formance of PEI systems by the MTF and required modulation functions
on the one hand and the (S/N)D and resolution functions on the other
is discussed in Appendix B.
B. IMPROVEMENT OF PEI PERFORMANCE
The performance of image-intensifier and low-light-level tele-
vision tubes is chiefly determined by three parameters:
1. The modulation transfer function (MTF).
2. The effective responsivity of the primary photocathode.
3. The noise introduced by the intensification process.
It is clearly evident that both the MTF and the cathode responsiv-
ity of PEI systems should be and can be improved. However, as shown
in Figs. 13 and 14, the improvement of cathodes by relatively largefactors, which in principle would result in relatively large improve-
ments in resolution at low light levels if the MTF were unity overthe frequency range of interest, results in practice in relatively
small improvements at the light levels where PEI systems are useful.
On the other hand, improvements in MTF will show a direct improvement
in PEI resolution and, as shown below, even provide an enhancement of
the effect of improvements in cathode responsivity on resolution.
The exploitation of electrooptical technology, principally by
the Night Vision Laboratories of the U. S. Army Electronics Command,
culminated in the development of the ??first generation" of image-
intensifier systems. In the design of the first generation, it was
63

necessary to couple thuoo,: intensifier stages in cascade to achieve
sufficient intensif i ation of low-light-level scenes to view the dis-
play without dark Idapt:ation of the eye. But, as shown in Fig. 9,
the MTF of image-intcnoifier and low-light-level television tubes is
degraded in proportion to the number of stages which are cascaded to
achieve sufficient intensification. Thus, the MTF could be greatly
improved if sufficient intensification could be achieved in a single
stage without having the intensifier structure degrade the MTF.
To diminish the degradation of MTF occurrincr in the three-stage,cascade, image-intensifier tubes, a "second genera-con" of image-
intensifier systems was envisioned which would employ a single-stage
intensifier tube incorporating a high-gain microchannel plate (MCP).
Besides achieving a greatly improved MTF and a reduction in size, itwas further believed that the method of fabrication of the MCPs would
lead to high production volumes and lower cost.
The MCP image-intensifier tube consists of a fiber-optic faceplate,on the back side of which is formed a photocathode, an electrostatic
image-inverting electron lens, an MCP secondary-electron multiplier,and a second fiber-optic plate, on the front side of which is formed
a phosphor screen with the usual aluminum film required to prevent
light feedback to the photocathode. Image transfer from the MCP to
the phosphor depends on the close proximity of these two elements.
The electron image generated at the photocathode is focused on the
MCP by means of an electrostatic lens. These MCP image-intensifier
tubes are customarily called inverter tubes. It is necessary to em-
ploy a decelerating electric field to correct the flat image planepresented by the front surface of the MCP. Besides the inverter tubes
employing electrostatic focusing between the photocathode and the MCP,
considerable effort has been expended in the development of proximity
focusing in what is customarily called.a wafer tube. Development of
the wafer tube has been even less successful than development of the
inverter tube.
Unfortunately, of the three objectives of the MCP image-intensifier
tube development, only a reduction in size has been achieved. The64

expected improvement in MTF has not been achieved. Further, reliachi>-
ity and cost remain problems.
Recent research results (Ref. 17) on silicon transmission
secondary-electron multiplication indicate for the first time tha•sufficient gain can be achieved in a single staqe with little degi -
tion of the MTF.
The silicon transmission secondary-electron multiplication (TSEM)dynode consists of a thin (approximately 5 microns--sufficient thick-
ness to be self-supporting) wafer of low-resistivity, P-type silicon,
having one surface carefully cleaned and treated with cesium and oxy-gen to reduce the potential difference between the bulk and vacuum
(the effective bulk electron affinity) to zero or less. The dynode ismounted in a vacuum-tube image intensifier with the untreated surfacefacing the photocathode and the cesium oxide-treated surface facing
the phosphor. Photoelectrons generated by the radiant image of the
scene focused on the photocathode are accelerated and focused to strike
the silicon TSEM dynode with the energy of several thousand electron
volts. As the primary electrons penetrate the silicon to a depth of
a few thousand angstroms, energy is primarily lost via electron-hole
pair production at the rate of approximately 3.6 ev per pair. Some ofthe resulting excess holes recombine with electrons supplied to an
ohmic contact at the periphery of the silicon wafer, while an equalnumber of excess electrons rapidly thermalize to the temperature of
the wafer, diffuse toward the silicon-cesium oxide interface, and es-cape into the vacuum to maintain current continuity. In a first ef-
fort (Ref. 17), 750 secondary electrons per primary electron have beenmeasured at 20 kv, and 230 at 10 kv. Slightly heavier acceptor con-centration at the front surface to reduce surface recombination will
increase the yield. Photoemission measurements reported earlier (Ref.18) indicate that the escape probability of excited electrons fromcesium- and oxygen-treated, P-type silicon surfaces can be 20 percent
or higher. Recent unpublished measurements indicate that an escapeprobability as high as 50 percent is attainable.
65

A transmission secondary-emission ratio of at least 500 at 10 kv
can be expected. This TSEM gain of 500, multiplied by a diode gain of
50 due to the photocathode-phosphor combination, yields an overall
gain of 25,000. An overall gain of 25,000 is ample to view scenes of
low radiance down to the limit determined by the phot:oelectron shot
noise without dark adaptation.
The silicon TSEM dynode offers the following advantages over the
glass MCP dynode:
"* Silicon, unlike glass (a notoriously "dirty" material), is a
single element, completely stable chemically, susceptible to
ultrahigh purification via zone refining, and susceptible to
high-temperature bakeout during tube fabrication to remove any
and essentially all adsorbed gases that could damage the photo-
cathode during tube operation. The compatibility of silicon
with photocathodes of the S-20 type has been amply demonstrated
in the camera tube employing the silicon-diode-array, charge-
storage target.
"* The solid structure of the TSEM dynode, in contrast to the
porous MCP structure, greatly facilitates surface cleansing
and removal of adsorbed gases during bakeout, and it reduces
the surface-to-volume ratio of the dynode.
"* Gain in a silicon TSEM dynode is essentially noiseless. Ingeneral, the mean square fluctuation in the number of secondary
electrons per incident photoelectron observed for a large num-
ber of incident photoelectrons is given by the product of the
Fano factor and the mean number of secondary electrons per in-
cident photoelectron. If the distribution of yields is Gaussian
or Poissonian, the Fano factor is unity. For the MCP dynode,
the Fano factor is generally acknowledged to be greater than
unity--approximately 2. For secondary-electron multiplication
in semiconductors, the Fano factor is known to be in the range
of 0.1 to 0.2.
66

* The silicon TSEM dynode does not require deposition of an elec-'
trode over a portion of the front surface of the dynode. Hence,
the collection efficiency for incident photoelectrons is essen-
tially 100 percent, compared to 70 to 80 percent for the MCP
dynode. For a'70 percent collection efficiency, the effective
responsivity of a 4-ma/watt photocathode is reduced to 2.8 ma/
watt.
* Degradation of image-tube MTF by the silicon TSEM dynode oughtto be nil compared to the degradation produced by an MCP dynode.
The causes of MTF degradation in MCP intensifiers are the broad
spread in sacondary-electron exit trajectories from adjacent
microchannels and the finite size of the microchannels making
up the MCP structure. The effect of the broad spread in secondary-electron trajectories is to produce poor proximity focusing in
the space between the MCP and the phosphor screen. The originof the broad spread in secondary-electron trajectories is the
high secondary-electron energies coupled wich the required ac-
celerating voltage for good phosphor conversion efficiency and
limited breakdown field observed in any electron vacuum tube.
Typical values of the energy of electrons emerging from an MCPare in the range 10 to 100 ev. On the other hand, in a silicon
TSEM dynode, the transmission secondary electrons emerge viathermal diffusion to and across the cesium oxide-vacuum inter-face with thermal energy equal to only 1/40 ev at room tempera-
ture. While some improvement in the MTF of MCP tubes has been
achieved via "end spoiling" the channels to restrict the angles
of the exiting electrons, the MTF remains comparable to that of
a three-stage, first-generation intensifier, despite earlierpredictions of a better MTF than even that of a single-stage
inverter tube.
It is clear that the microchannel approach is only one of two com-
peting technologies for second-generation image-intensifier tubes, and
that the silicon TSEM offers a much greater potential tcr improvement
of MTF and resolution.
67

To obtain good operation of PEI systems at less than "quarter"moonlight, a continuing effort to improve photocathode responsivity
has been pursued. Better methods of manufacturing first-generation
image-intensifier tubes have resulted in the improvement of the re-
sponsivity of S-20 type photocathodes from 3.5 ma/watt to 5-6 ma/watt,
and even 8-9 ma/watt is available, although at lower manufacturing
yield and consequently higher cost. Further improvement in photo-
cathode responsivity will depend on the outcome of the long-range
effort to develop the cesium oxide-activated, gallium arsenide-type
photocathodes and the "third-generation" image tube configurations
required to employ them. But, as shown in Figs. 13 and 14, large
factors of improvement in responsivity are required to have a signi-
ficant effect on resolution.
A comparison of the relative improvenment in resolution that could
be realized with the successful development of the silicon TSEM tube
and the improvement realized with a factor-of-two improvement in photo-
cathode responsivity is shown in 7ig. 15.
The lower curve in Fig. 15 is the modulation on the screen pro-
duced by a three-stage, first-generation image-intensifier tube for
a sine-wave test pattern of 30 percent modulation as a function of
test pattern frequency. To estiMate the relative importance of MTFand responsivity on resol'tion, consider the line representing the
modulation required to provide an S/N ratio of 1.1 as required by the
eye for percrotion of the image of the pattern on the screen of an
image intensifier wilt an S-25 ,4 ma/watt) photocathod• and irradianceof the test pattern by 0.3 moon.iht. All of the modulation-requir-ed-
by-the-eye versus number-cf-lines-per-millimeter curves were calcu-
lated on the assumptions that the average reflectivity of the pattern
is 20 percent, the objective is effectively f/2, and the S/N ratio re-
quired by the eye for this one-dimensional variation in luminance is
approximately 1.1. The intersection of the required modulation line
for an S-25 cathode and 0.3 moonlight with the three-stage modulationon the screen curve at Point A indicates that the resolution is approxi-
mately 12 cycles/mm (line pairs/mm). With this point of intersection
as a reference, consider two alternatives for increasing resolution:
68

I VI
II 4'
I
S I Ia - - - ---- - 6
U - - - - - - - - Iii
4it I
II' '2
0
dNOIIViriQOW �AVM-�NIS
69

1, Choose an 8-20Vk photocathode with double the responsivity
(,eanurod with a standard 2 854UK tunqsten lamp).
.', Devylop a gain structure, the silicon TSEM, which will allow
reduction of the number of intensifier stages from three to
one with the consequence that the MTF is increased as shownby thu two curves of modulation on the screen in Fig. 15.
In the case of higher photocathode responsivity, the resolutionwould increaso fi-m 12 to 13.4 cycles/mm, as indicated by the arrow
from A to B, In the casm of bettev, MTF, the resolution would increase
from 12 to 18.2 cycles/mm, as indicated by the arrow from A to C. Itis clear in this example that of the two alternatives for increasing
resolution, increasing the MTF is the most effective. Furtherloro,
by comparison of the arrows from C to D and from A to B, respectively,
it is evident that increases in MTF enhance the effect of subsequent
increases in cathode responsivity on resolution.
Figure 15 also shows the effects on resolution of changes in re-
sponsivity and MTF at the low value of scene irradiance provided by
airglow alone (clear night sky, no moonlight). As the irradiance de-
creases from 0.3 moonlight to airglow, the resolution of a three-stage
image intensifier with an S-25 photocathode decreases to such a low
value (3 cyclec/mm or 75 cycles per diameter with the 25-mm tube used
in the starlight telescope) that little improvement can be realized by
improving the MTF alone. It is generally acknowledged that with the
presently availablv S-25 photocathodes "quarter" moonlight is required
for satisfactory operational performance. Theoretically, the present
quarter moonlight performance could be achieved at airglow by increasing
the photocathode responsivity to airglow by a factor of approximately
50. Such a large increase in responsivity is not in the offing. How-
ever, the dashed line in Fig. 15, respresenting the required modulation
with a hypothetical photocathode 12 times more responsive to airglow
than the S-25, indicates that by improving the MTF the required improve-
ment in responsivity could be relaxed. An improvement in the MTF to
that of a single-stage tube would reduce the required increase in photo-
70

cathode responaivity from 50 to approximatoly 12. Thus, it seems clear
that the required resolution and operational performance currently
realized at quarter moonlight could be achieved with airglow alone in
the foreseeable future only if both the responsivity and the MTF were
greatly improved.
71

V1., XNCh:Ikt'N1;
i~tiU tntii,! i t unetion thAlu b 11ý lik"V it'llV-Wt iyt ll~ wth
rt.,sponsl v i ty. Therefore, a rna1ior o•tlort shoul.i lit ) .,' 'd tJitn itnpv.\'-
ing the MTF of image-intensifier tubes by devemOpillg i:he silicon traans-mission secondary-electron multiplication tube, incorporating existing
manufacturable photocathodes, as an alternative to the microchannel
plate image-intensifier tube.
A sustained effort of lesser priority to improve photocathode re-sponuivity by developing the cesium oxide-activated, gallium arsenide-
type photocathodes shoulJ continue. But if a new tube configuration
is required, it is essential that the MTF is not sacrificed to achieve
better responsivity. Good image-intensifier performance will be real-ized without depending on either moonlight or artificial irradiance
only if both MTF and cathode responsivity are substantially increased.
Preceding page blank 73

REFERENCES
1. Jurgen R. Meyer-Arendt, Appl. _ pt., Vol. 7, p. 2081, 1968.
2. Institute for Defense Analyses, Luminance, Radlunce, and Tempera-ture, IDA Research Paper P-339, Luclen M. BiberMan, August 1967.
3. A.C. Hardy and F.H. Perrin, The PrincipLes of Optics, McGraw-Hill, New York, 1932.
4. C.H. Graham, Vision ar'd Visual Perception, John Wiley and Sons,Inc., Noew Yor, 1965.
5. Brown, Graham, Leibowitz, and Ranker, J. 22t. Soc. Am., Vol. 43,p. 197, 1953.
6. A. Rose, J. Opt. Soc. Am.I Vol. 38, p. 196, 1948; Advances inElectronicsi Vol. 1i p. 131, 1947.
7. Otto H. Schade, J. Opt. Soc. Am., Vol. 46, p. 721, 1956.
8. Institute for Defense Analyses, Lqw-Light-Level Devices: A Sen-sor Components Manual for Systems Designers, IDA Report R-169,Lucien M. Biberman, Alvin D. Schnitzler, Frederick A. Rosell,and Harry L. Sny4er, in publication.
9. A. van Meeteren, paper presented at Optical Society of Americameeting, Chicago, 111., October 21-24, 1969.
10. W.N. Charman and A. Olin, Photo. Sci. Eng., Vol. 9, p. 385, 1965.
11. Otto H. Schade, RCA Review, Vol. 26, p. 460, 1967.
12. J.W. Coltman, J. Opt. Soc. Am., Vol. 44, p. 1168, 1954.
13. J.W. Coltman and A.E. Anderson, Proc. IRE, Vol. 4b, p. 858, 1960.
14. J.W. Coltman, J. Opt. Soc. Am., Vol. 44, p. 468, 1954.
15. Richard Legault in Photoelectronic Imaging Devices, Lucien M.Biberman and Sol Nudelman, eds., Plenum Press, New York, 1971.
Preceding page blank

I i1,, " ~ t~ Do w.AayeI Ovctra3. Pa.orfcr'ndRie of Photo-ITO It 1 11, 1,-, h~ q I.,M, S p IDA Not, N-/27(R, , Alvin D. Schnitzier,
-rvmr T;T Pvuo.18th IIS, to bo published.
. '. U, U. MAt, ' u[1i. , _j)IiL. Phys. Letters,, Vol. 17, p. 313, .1970.
i. R�. U. Marttnelli, Apl.- Phys. Leetters, Vol. 16, p. 261, 1970.
76

APPENDIX A
IMAGE INFORMATION TRANSFER, DISPLAY TO EYE
To understand the significance of the minimur, required modulation
curves introduced in Section IV-E and shown in Fiqf. 13 and 14,
it is necessary to consider the signal-to-noise ratio (S/N)E at the
output of the eye as a function of the particle gain G. (The particle
gain is given by G = m2 FD/Fs, the number of photons emitted by the
output display per photoelectron emitted by the primary photocathode.)
The calculation of (S/N)E requires a distinction to be made between
two cases dtfined by G >1/1c and G </TVic, respectively, where
is the quantum efficiency of the eye and % is the collection effi-
ciency of the eye or ocular. The collection efficiency of the eye is
given by 2 = p /S 2 and of an ocular by l = p m2 /254 2 , where p. is
the radius of the entrance pupil of the eye in millimeters, S is the
separation between a display and the eye, and ril is the subjective mag-
nification of an ocular.
The quantity WG equals the number of photons detected by the
eye per primary photoelectron. In the first case, NJ cCG is greater
than unity, so that each primary photoelectron initiates a visual re-
sponse by the eye--the quantum transfer efficiency from the primary
photocathode to the output of the eye is unity. Consequently, the
signal and shot noise, respectively, at the output of the eye are
S= E c(2/r)(2LDWDNDt)TE(voD)MD(voD) (A-i)
and
77

= E = jCG(2L DWDt/G)(
and (S/N)E is given by
(SIN)E = (2/r)(2LDWJRDt/G)½ TE(voD)MD(VoD) (A-3)
where
G >l/fIcVlE.
In the second case, j)jG is the fraction of primary photoelec-trons which, on the average, initiate a visual response by the eye.
'Ihus, in this case, the quantum transfer efficiency is equal to JG.The signal and shot noise, respectively, are given by
SE = Jjc(2/T)(2LDWD Dt)TE( voD)MD(voD) (A-4)
and
aE = ('1c) (2LDWDTDt)½ (A-5)
The signal-to-noise ratio at the output of the eye is given by
(S/N)E = ( i1c• (2/r)(2LDWD Dt)ý TE( voD)MD(voD) (A-6)
where
0 < G < 1/j%.
Careful examination of Eq. A-6 reveals that, for a given dis-play luminance nD' the signal-to-noise ratio at the output of the eyeis independent of G and ns. If G increases, the corresponding decrease
in n s is compensated by an increase in the quantum transfer efficiency.
78

However, if G >1/T1•c consideration of Eq. A-3 reveals that for agiven value of s the (SIN decreases in proportion to 1/G or ps as
G increases.
In the vicinity of G = 1/10~c, neither Eq. A-3 nor Eq. A-6 is ac-
curate due to the statistical distribution of the particle gain aboutits average value. As G increases and approaches 1i/Ec, the particlegain of an increasing number of photoelectrons exceeds 1/10~c, causingthe (SIN )E to fall below the value predicted by Eq. A-6. ý7en G in-
creases above i/1E0c, the particle gain of a decreasing number of pho-toelectrons fails to exceed l1/VEc' and the (S/N)E approaches the valuedetermined by Eq. A-3. The relative dependence of the (S/N))E over the
complete range of G is illustrated in Fig. A-1.
0.8 -
Z 0.6uJ
u 0.2 054•T/ ---
O0 1 2
PARTICLE GAIN IN UNITS OF I/ijE7 cS 3-15-71-7
FIGURE A-I. Signal-to-Noise Ratio Squared at the Output of the Eye Versus ParticleGain at a Fixed Display Luminance. Insert Centered at Average ParticleGain Equal to 1/77E7 is Probability of Gain P(G) Versus Gain G.
79

Under normal operating conditions, the particle gain of a low-light-level PEI system exceeds i/1E0c, so that the quantum transfer
efficiency is unity, as assumed in the derivation of Eq. 49 for the
(S/N)D. In image intensifiers, for example,
IIEc 2542/ 2 2(A7
=54 2 /EPE? . (A-7)
For typical values of the parameters, such as -nE = 0.01 (Ref. 2) for
green light, PE = 1 mm and M = 7, the value of 1/0Ec is approximately51.3 x 10g. Typical manufacturers' data sheets report that with a
standard 2854°K tungsten source and a photocathode responsivity of4 ma/watt, an input irradiance of 10-6 watt/ft2 results in an output
2luminous exitance of 1 lumen/ft . The resulting particle gain, givenby G = m2 nD/s. is equal to 1.6 x l10, somewhat greater than required
for unity quantum transfer efficiency. (The magnification m in the
above example is unity.) For a low-light-level television system
,/1 2 (A-8) I1/Vc = S1 /qEPE
and if S = 30 in., .= 0.01, and PE = 1 mm, 1/1% is approximately7equal to 5.8 x 10 In practice, typically m = 10, and the luminous
exitance of the display equals 10 lumen/ft 2 . Thus, the resulting
particle gain is approximately .1.6 x 10 8, nearly a factor of three
greater than required for unity transfer efficiency.
If the procedure for determining the modulation on the display
required by the eye is followed by setting (S/N)E, given by Eq. A-3
or Eq. A-6, equal to 3.8, the minimum required by the brain for 50percent detection probability, then for a given value of RD and for
G <I/1E0c' the required modulation Mt(voD) is minimal and independent
of G, and for G >l/TEVc the required modulation increases in propor-
tion to G. The experimental determination of Mt(VoD) reported by van
Meeteren (Ref. 1) was made by illuminating variable transmission trans-parencies with a tungsten lamp for viewing by the unaided eye. Theconditions of the experiments correspond to setting G equal to unity,
8o

which is much less than I/jEj.. Hence, the (S/N)E is givei1 by Eq.
A-6, and the required modulation functions at each value of luminance
are minimal, as indicated in Figs. 13 and 14.
Further consideration of Eq. A-6 reveals that it could be em-ployed along with van Meeteren's data for M (v oD) to deduce the fre-
quency response function of the eye TE(VoD). It should be noted thatTE(VoD) does not equal l/Mt(VoD), as is often assumed. It depends on
several other factors as well, which appear in Eq. A-6.
It should also be observed that Eq. 49 was derived for low-light-
level PEI systems on the assumption, based on experimental evidence,
that the signal-to-noise ratio at che display is identical with the
signal-to-noise ratio at the output of the eye. However, the results
of our derivations, Eqs. 49 and A-3, indicate that they differ by the
factor TE(voD). In actual fact, neither equation is strictly correct,
for if the noise is represented by its power spectra, it is apparentthat higher frequency components are attenuated by the roll-off in the
frequency response of both the PEI device and the eye. In practice,
the fact that good, experimental agreement is observed with Eq. 49
indicates that the additional attenuation of signal'at high frequenciesby the roll-off of the frequency response of the eye is compensated
by neglect of the high-frequency attenuation of noise by the frequency
response of both the PEI device and the eye.
APPENDIX A REFERENCES
1. A. van Meeteren, paper presented at Optical Society of Americameeting, Chicago, Ill., October 21-24, 1969.
2. R. Clark Jones, J. Opt. Soc. Am., Vol. 49, p. 645, 1959.
81
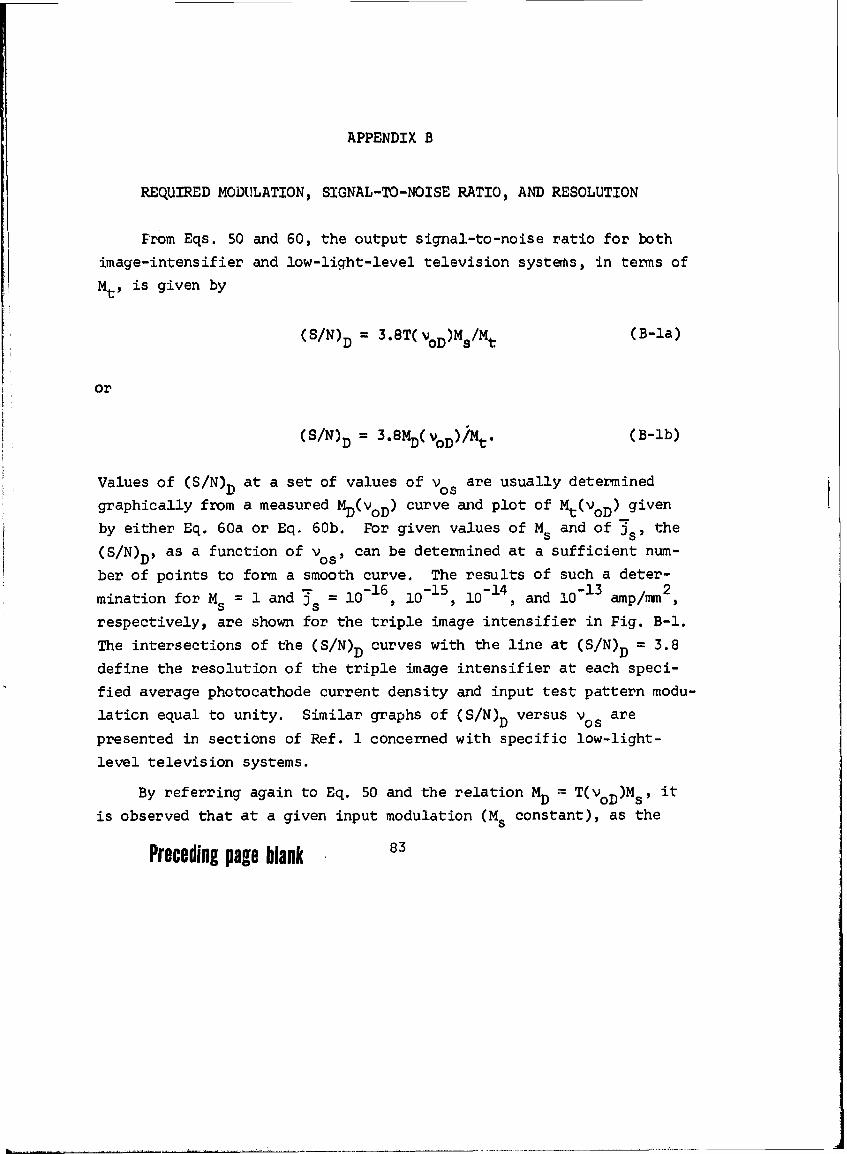
APPENDIX B
REQUIRED MODULATION, SIGNAL-TO-NOISE RATIO, AND RESOLUTION
From Eqs. 50 and 60, the output signal-to-noise ratio for both
image-intensifier and low-light-level television systes, in terms of
Mt, is given by
(S/N)D = 3 . 8 T( VoD)Ms/Mt (B-la)
or
(SIN)D = 3 .8MD(VoD)/Mt. (B-lb)
Values of (S/N)D at a set of values of vos are usually determined
graphically from a measured MD (voD ) curve and plot of Mt(voD) given
by either Eq. 60a or Eq. 60b. For given values of Ms and of j , the
(S/N)D, as a function of vos, can be determined at a sufficient num-
ber of points to form a smooth curve. The results of such a deter-
mination for Ms = 1 and s - 10-16 10-15, 10-14, and 10-13 2
respectively, are shown for the triple image intensifier in Fig. B-1.
The intersections of the (S/N)D curves with the line at (S/N)D = 3.8
define the resolution of the triple image intensifier at each speci-
fied average photocathode current density and input test pattern modu-
lation equal to unity. Similar graphs of (S/N)D versus vos are
presented in sections of Ref. 1 concerned with specific low-light-
level television systems.By referring again to Eq. 50 and the relation M = T(voD)Ms, it
is observed that at a given input modulation (M. constant), as the
Preceding page blank 83

S3
10 2 ...
1 2 0 2 5
Val, cyclts/rmm
FIGURE B-1. Display Signal-to-Noise Ratio Versus Test Pattern Frequency
on Photocathode for Photocathode Current-Density Values J of
¼s
-16 -15 14 -31
10 , 10 , 10 14, 4 x 10 , 10 and 4 x l0o - a//mmmm
(Note Signal-to-Noise Ratio of 3.8 Required for 50% DetectionProbability by Observer.)
84

input irradiance or n5a increases, tho spatial frequency must be in-
creased to maintain a specified value of (S/N)D, If (S/N)D is Not:
equal to 3,8, the minimum roquired by the eye, then Eq. 50 approximates
the relation between the subjective resolution of the ey- .Arid T for
a given value of Ms. The explicit relation between v., id n is
not generally available because, as noted above, T(v0 D) is usually
known only empirically. However, Vos as a function of F. for a given
value of M. can be determined graphic .Lly from the simultaneous plots
of output modulation MD(VoD) and required modulation Mt(VoD) shown in
Fig. 13,
The resolution as a function of average photocathode current den-
sity determined from Fig. 13 is shown in Fig. B-2 from M5 = 1.0, 0.7,0.3, and 0.1. As the photocathode current density increases, eventu-
ally the resolution saturates. This result occurs because, as the
photocathode current density increases, the required modulation ap-
proaches the limiting required modulation curves. The intersectionsof the two limiting required modulation curves shown in Fig. 13 with
the MD(Vos) curves yield the saturation values of the resolution atthe specified display luminance. For a given intensifier gain, the
display luminance increases with photocathodo current density. Thus,
the saturation resolution will lie somewhere between the values deter-2 2mined by the Mt(vos) curves for 0.52 cd/mi and 7.72 cd/m.
The resolution as a function of photocathode current density or
input-image irradiance is often determined subjectively and plotted
in the manner of Fig. B-2. From such experimental data and the meas-
"ured MD(vos) curves for corresponding values of input modulation,
subjective curves of required modulation versus spatial frequency at
a given value of photocathode current density can be deduced and plot-
ted in the manner of Fig. 13.
Of the graphical forms described above for representing the de-
pendence of overall performance of a PEI system and human observer on
signal and noise, that of Fig. 13 seems preferable. An important dd-vantage of Fig. 13 is that, to a good approximation, at least, the
dependence of the (S/N)D on the frequency-response function and the
85

ICIle 1¶#Y40101''TI~
'47
I _L_ II -_' t
10" 11014 10"13 10 2 1011
1 a
FIGURE S-2. Resolution Versus Photocathode Current Density for InputModulation Values of 1 .0, 0.7, 0.3, and 0.1 I
photocathode current density is shown explicitly. In particular, theeffects of photocathode current density and frequency response on reso-lution (the highest spatial frequency at which the (S/N)D is equal toor greater than 3.8, the minimum required by tne eye) are readily de-duced from Fig. 13 by noting the intersections of the required and out-put modulation curves. For example, if M = 0.3 and if 38 is increasedfrom 10-14 to 10"13 amp/mm2 by increasing either the photocathode ir-radiance or quantum efficiency by a factor of 10, the resolution wouldincrease from approximately 8 to 13 cycles/mm.
86

If it is anticipated that a PEI system will be used for detection
of images of all sines on the display$ then the overall performance of
a PEI system and an observer will depend on the (S/N)D ratio at all
frequencies weighted equally, If the scene comprised a random distri-
"bution of image element sizes such that the frequency distribution
were white, then the (S/IN)D ratio of the scene would be roughly pro-
portional to the ratio of the area under the output modulation curve
to the area under the required modulation curve, This differs some-
what from the overall image quality measure of aerial photography dis-
cussed in Pari 11 of Ref. 1. The latter, defined as the area bounded
by the output and required modulation curves, is proportional to out-
put signal minus noise. Since detection probability is a monotonicallv
increasing function of (S/N)D and (S-N)D increases with (S/N)DI cor-
relation of the detection probability with either the ratio or thedifference will yield equally good results. The SIN ratio is prefer-
able from the standpoint of analysis, however, because it is a funda-
mental parameter of decision and information theory.
In addition to the PEI system and observer, it is useful to specifya measure of the performance of a PEI system without reference to the
eye. Such a measure should maximize the S/IN ratio of the image on the
display. The definition of detection efficiency (Ref. 2) for infrared
point detectors can be logically extended (Ref. 3) to imaging systems
by utilizing the image S/N ratio. The input image S/N ratio of a sine-
wave-modulated incident photon flux is given by
(SIN) 2. 2Lw (B-2)
If the image detection efficiency D is defined by
D = (SIN) 2/(S/N) 2 (B-3)
then for a shot-noise-limited PEI system one obtains
87

D• o T T2 (os) (B-4)
at troquoncy vo0 on tho sensor. The effects of internal noise could
ba included in the expression for D but do not appear hee because one
has dassumed neglitlible dark current and sufficient intensifier gainfor shot noise to be dominant.
Por a scene that comprised a random distribution of image element
sizes such that the frequency distribution were white, performance
would be proportiorial to the integral of Ea. B-4 over all frequen-
ciea and the image detection efficiency would be given by
D a . { T2(vos)d\oa. (B-S)
This integral will be recognized as the noise-equivalent bandwidth as
defined by Schade (Ref. 4). Therefore, the performance of a PEI sys-
tem by itself, with sifficient intensifier gain to produce a shot-
noise-limited image and negligible dark current, is proportional to
the product of the quantum efficiency of the sensor and the noise-
equivalent bandwidth of the system.
APPENDIX B REFERENCES
1. Institute for Defense Analyses, __w-Light-Level Devices: A SensorComponents Manual for Systems Designers, IDA Report R-169. LuC{nM. Biberman, ATvin D. Schnitzler, Frederick A. Rosell, and Harry L.Snyder, in publication.
2. R. Clark Jones, Proc. IRE, Vol. 47, p. 1495, 1959.
3. Institute for Defense Analyses, Overall Performance of Photoelec-tronic Imaging Systems, IDA Note N-727(R), Alvin D. Schnitz~er,iMay 1970; Proc. 18th IRIS, to be published.
4. Otto H. Schade, Jour. SMPTE, Vol. 58, p. 181, 1952.
88
Related Documents


