PARETURN Société d'Investissement à Capital Variable RCS Luxembourg N° B 47 104 Unaudited Semi-Annual Report as at March 31, 2018

Welcome message from author
This document is posted to help you gain knowledge. Please leave a comment to let me know what you think about it! Share it to your friends and learn new things together.
Transcript
PARETURNSociété d'Investissement à Capital Variable
RCS Luxembourg N° B 47 104Unaudited Semi-Annual Report as at March 31, 2018

PARETURN
Pareturn Best Selection
Pareturn Best Selection Side - Pocket
Pareturn Croissance 2000
Pareturn Cartesio Equity
Pareturn Cartesio Income
Pareturn Stamina Systematic
Pareturn Stamina Systematic Plus*
Pareturn Mutuafondo Global Fixed Income
Pareturn Barwon Listed Private Equity
Pareturn Global Balanced Unconstrained
Pareturn Cervino World Investments
Pareturn Entheca Patrimoine
Pareturn Ataun
Pareturn Invalux Fund
Pareturn Gladwyne Absolute Credit
Pareturn Mutuafondo España Lux
Pareturn EtendAR
Pareturn GVC Gaesco Patrimonial Fund
Pareturn GVC Gaesco Euro Small Caps Equity Fund
Pareturn GVC Gaesco Absolute Return Fund
Pareturn Mapfre Euro Bonds Fund*
Pareturn Diversified Fund
Pareturn Security Latam Corporate Debt
Pareturn Rivendale
Pareturn Fidelius Global
Pareturn Santalucia Espabolsa (Luxembourg)*
Pareturn Santalucia Fonvalor*
Pareturn Imantia USD Global High Yield Bond
No subscription can be received on the basis of these financial statements. Subscriptions are only valid if made on the basis of the current prospectus and relevant KeyInvestor Information Document ("KIID") which will be accompanied by a copy of the latest annual report including audited financial statements and a copy of the latestavailable semi-annual report, if published after such annual report.
* Please see note 1 for details.
PARETURN
1
Table of Contents
Organisation of the Company 7
General Information 10
Statistics 11
Combined Statement of Net Assets as at March 31, 2018 17
Combined Statement of Operations and Changes in Net Assets for the period ended March 31, 2018 17
Pareturn Best Selection
Statement of Net Assets as at March 31, 2018 18
Statement of Operations and Changes in Net Assets for the period ended March 31, 2018 18
Statement of Changes in Number of Shares 18
Securities Portfolio as at March 31, 2018 19
Portfolio Breakdowns 20
Top Ten Holdings 20
Pareturn Best Selection Side - Pocket
Statement of Net Assets as at March 31, 2018 21
Statement of Operations and Changes in Net Assets for the period ended March 31, 2018 21
Statement of Changes in Number of Shares 21
Securities Portfolio as at March 31, 2018 22
Pareturn Croissance 2000
Statement of Net Assets as at March 31, 2018 23
Statement of Operations and Changes in Net Assets for the period ended March 31, 2018 23
Statement of Changes in Number of Shares 23
Securities Portfolio as at March 31, 2018 24
Financial derivative instruments as at March 31, 2018 24
Portfolio Breakdowns 25
Top Ten Holdings 25
Pareturn Cartesio Equity
Statement of Net Assets as at March 31, 2018 26
Statement of Operations and Changes in Net Assets for the period ended March 31, 2018 26
Statement of Changes in Number of Shares 26
Securities Portfolio as at March 31, 2018 27
Financial derivative instruments as at March 31, 2018 27
Portfolio Breakdowns 29
Top Ten Holdings 29
* Please see note 1 for details.

PARETURN
2
Table of Contents
Pareturn Cartesio Income
Statement of Net Assets as at March 31, 2018 30
Statement of Operations and Changes in Net Assets for the period ended March 31, 2018 30
Statement of Changes in Number of Shares 30
Securities Portfolio as at March 31, 2018 31
Financial derivative instruments as at March 31, 2018 32
Portfolio Breakdowns 33
Top Ten Holdings 33
Pareturn Stamina Systematic
Statement of Net Assets as at March 31, 2018 34
Statement of Operations and Changes in Net Assets for the period ended March 31, 2018 34
Statement of Changes in Number of Shares 34
Securities Portfolio as at March 31, 2018 35
Financial derivative instruments as at March 31, 2018 35
Portfolio Breakdowns 36
Top Ten Holdings 36
Pareturn Stamina Systematic Plus*
Statement of Net Assets as at March 31, 2018 37
Statement of Operations and Changes in Net Assets for the period ended March 31, 2018 37
Statement of Changes in Number of Shares 37
Pareturn Mutuafondo Global Fixed Income
Statement of Net Assets as at March 31, 2018 38
Statement of Operations and Changes in Net Assets for the period ended March 31, 2018 38
Statement of Changes in Number of Shares 38
Securities Portfolio as at March 31, 2018 39
Financial derivative instruments as at March 31, 2018 40
Portfolio Breakdowns 41
Top Ten Holdings 41
Pareturn Barwon Listed Private Equity
Statement of Net Assets as at March 31, 2018 42
Statement of Operations and Changes in Net Assets for the period ended March 31, 2018 42
Statement of Changes in Number of Shares 42
Securities Portfolio as at March 31, 2018 43
Portfolio Breakdowns 44
Top Ten Holdings 44
* Please see note 1 for details.
PARETURN
3
Table of Contents
Pareturn Global Balanced Unconstrained
Statement of Net Assets as at March 31, 2018 45
Statement of Operations and Changes in Net Assets for the period ended March 31, 2018 45
Statement of Changes in Number of Shares 45
Securities Portfolio as at March 31, 2018 46
Portfolio Breakdowns 47
Top Ten Holdings 47
Pareturn Cervino World Investments
Statement of Net Assets as at March 31, 2018 48
Statement of Operations and Changes in Net Assets for the period ended March 31, 2018 48
Statement of Changes in Number of Shares 48
Securities Portfolio as at March 31, 2018 49
Financial derivative instruments as at March 31, 2018 50
Portfolio Breakdowns 51
Top Ten Holdings 51
Pareturn Entheca Patrimoine
Statement of Net Assets as at March 31, 2018 52
Statement of Operations and Changes in Net Assets for the period ended March 31, 2018 52
Statement of Changes in Number of Shares 52
Securities Portfolio as at March 31, 2018 53
Financial derivative instruments as at March 31, 2018 54
Portfolio Breakdowns 55
Top Ten Holdings 55
Pareturn Ataun
Statement of Net Assets as at March 31, 2018 56
Statement of Operations and Changes in Net Assets for the period ended March 31, 2018 56
Statement of Changes in Number of Shares 56
Securities Portfolio as at March 31, 2018 57
Financial derivative instruments as at March 31, 2018 57
Portfolio Breakdowns 58
Top Ten Holdings 58
Pareturn Invalux Fund
Statement of Net Assets as at March 31, 2018 59
Statement of Operations and Changes in Net Assets for the period ended March 31, 2018 59
Statement of Changes in Number of Shares 59
Securities Portfolio as at March 31, 2018 60
Financial derivative instruments as at March 31, 2018 61
Portfolio Breakdowns 62
Top Ten Holdings 62

PARETURN
4
Table of Contents
Pareturn Gladwyne Absolute Credit
Statement of Net Assets as at March 31, 2018 63
Statement of Operations and Changes in Net Assets for the period ended March 31, 2018 63
Statement of Changes in Number of Shares 63
Securities Portfolio as at March 31, 2018 65
Financial derivative instruments as at March 31, 2018 66
Portfolio Breakdowns 67
Top Ten Holdings 67
Pareturn Mutuafondo España Lux
Statement of Net Assets as at March 31, 2018 68
Statement of Operations and Changes in Net Assets for the period ended March 31, 2018 68
Statement of Changes in Number of Shares 68
Securities Portfolio as at March 31, 2018 69
Portfolio Breakdowns 70
Top Ten Holdings 70
Pareturn EtendAR
Statement of Net Assets as at March 31, 2018 71
Statement of Operations and Changes in Net Assets for the period ended March 31, 2018 71
Statement of Changes in Number of Shares 71
Securities Portfolio as at March 31, 2018 72
Financial derivative instruments as at March 31, 2018 72
Portfolio Breakdowns 73
Top Ten Holdings 73
Pareturn GVC Gaesco Patrimonial Fund
Statement of Net Assets as at March 31, 2018 74
Statement of Operations and Changes in Net Assets for the period ended March 31, 2018 74
Statement of Changes in Number of Shares 74
Securities Portfolio as at March 31, 2018 75
Financial derivative instruments as at March 31, 2018 75
Portfolio Breakdowns 76
Top Ten Holdings 76
Pareturn GVC Gaesco Euro Small Caps Equity Fund
Statement of Net Assets as at March 31, 2018 77
Statement of Operations and Changes in Net Assets for the period ended March 31, 2018 77
Statement of Changes in Number of Shares 77
Securities Portfolio as at March 31, 2018 78
Portfolio Breakdowns 79
Top Ten Holdings 79

PARETURN
5
Table of Contents
Pareturn GVC Gaesco Absolute Return Fund
Statement of Net Assets as at March 31, 2018 80
Statement of Operations and Changes in Net Assets for the period ended March 31, 2018 80
Statement of Changes in Number of Shares 80
Securities Portfolio as at March 31, 2018 81
Financial derivative instruments as at March 31, 2018 83
Portfolio Breakdowns 84
Top Ten Holdings 84
Pareturn Mapfre Euro Bonds Fund*
Statement of Net Assets as at March 31, 2018 85
Statement of Operations and Changes in Net Assets for the period ended March 31, 2018 85
Statement of Changes in Number of Shares 85
Pareturn Diversified Fund
Statement of Net Assets as at March 31, 2018 86
Statement of Operations and Changes in Net Assets for the period ended March 31, 2018 86
Statement of Changes in Number of Shares 86
Securities Portfolio as at March 31, 2018 87
Portfolio Breakdowns 88
Top Ten Holdings 88
Pareturn Security Latam Corporate Debt
Statement of Net Assets as at March 31, 2018 89
Statement of Operations and Changes in Net Assets for the period ended March 31, 2018 89
Statement of Changes in Number of Shares 89
Securities Portfolio as at March 31, 2018 90
Portfolio Breakdowns 92
Top Ten Holdings 92
Pareturn Rivendale
Statement of Net Assets as at March 31, 2018 93
Statement of Operations and Changes in Net Assets for the period ended March 31, 2018 93
Statement of Changes in Number of Shares 93
Securities Portfolio as at March 31, 2018 94
Portfolio Breakdowns 95
Top Ten Holdings 95
Pareturn Fidelius Global
Statement of Net Assets as at March 31, 2018 96
Statement of Operations and Changes in Net Assets for the period ended March 31, 2018 96
Statement of Changes in Number of Shares 96
Securities Portfolio as at March 31, 2018 97
Financial derivative instruments as at March 31, 2018 97
Portfolio Breakdowns 98
Top Ten Holdings 98
* Please see note 1 for details.

PARETURN
6
Table of Contents
Pareturn Santalucia Espabolsa (Luxembourg)*
Statement of Net Assets as at March 31, 2018 99
Statement of Operations and Changes in Net Assets for the period ended March 31, 2018 99
Statement of Changes in Number of Shares 99
Securities Portfolio as at March 31, 2018 100
Portfolio Breakdowns 101
Top Ten Holdings 101
Pareturn Santalucia Fonvalor*
Statement of Net Assets as at March 31, 2018 102
Statement of Operations and Changes in Net Assets for the period ended March 31, 2018 102
Statement of Changes in Number of Shares 102
Securities Portfolio as at March 31, 2018 103
Portfolio Breakdowns 104
Top Ten Holdings 104
Pareturn Imantia USD Global High Yield Bond
Statement of Net Assets as at March 31, 2018 105
Statement of Operations and Changes in Net Assets for the period ended March 31, 2018 105
Statement of Changes in Number of Shares 105
Securities Portfolio as at March 31, 2018 106
Financial derivative instruments as at March 31, 2018 107
Portfolio Breakdowns 108
Top Ten Holdings 108
Notes to the Financial Statements 109
Additional Information 127
* Please see note 1 for details.
PARETURN
7
Board of Directors of the Company
Chairman
M. Michel Vareika 8, rue de Killebierg, L-5762 Hassel Grand Duchy of Luxembourg
Directors
M. Carlo Alberto Montagna The Director's Office 19, rue de Bitbourg L-1273 Luxembourg Grand Duchy of Luxembourg
M. Yves Wagner The Director's Office 19, rue de Bitbourg L-1273 Luxembourg Grand Duchy of Luxembourg
Management Company
MDO Management Company S.A. 19, rue de Bitbourg L-1273 Luxembourg Grand Duchy of Luxembourg
Delegate Investment Managers
For sub-funds Pareturn Best Selection and Pareturn Best Selection Side - Pocket Massena Partners 78, avenue Raymond Poincaré F-75116 Paris France
For sub-funds Pareturn Croissance 2000 and Pareturn - Ataun J.P. Morgan International Bank Limited1 KnightsbridgeLondon SW1X7LXUnited Kingdom
For sub-fund Pareturn Diversified Fund BGL BNP Paribas 50, avenue John Fitzgerald Kennedy L-2951 Luxembourg Grand-Duchy of Luxembourg
For sub-funds Pareturn Cartesio Equity and Pareturn Cartesio Income Cartesio Inversiones, S.G.I.I.C., S.A. Rubén Darío, 3 S-28010 Madrid Spain
For sub-funds Pareturn Stamina Systematic and Pareturn Stamina Systematic Plus (until November 30, 2017) Stamina Asset Management 15/19, Avenue de Suffren 75007 Paris France
For sub-funds Pareturn Mutuafondo Global Fixed Income and Pareturn Mutuafondo España Lux Mutuactivos S.A.U., S.G.I.I.C. P° de la Castellana, 33 S-28046 Madrid Spain
For sub-fund Pareturn Barwon Listed Private Equity Barwon Investment Partners PTY LTD Level 3, 17 Castlereagh Street Sydney NSW 2000 Australia
Organisation of the Company
PARETURN
8
For sub-fund Pareturn Global Balanced Unconstrained Sinergia Advisors 2006 Agencia de Valores S.A C/. Velázquez, 47-5º Izquierda S-28001 Madrid Spain
For sub-funds Pareturn Cervino World Investments and Pareturn Invalux Fund Varianza Gestión S.G.I.I.C., S.A. C/ Zurbano , 23 S-28010 Madrid Spain
For sub-fund Pareturn Entheca Patrimoine Entheca Finance S.A.S. 22, rue de Marignan F-75008 Paris France
For sub-fund Pareturn Security Latam Corporate Debt Administradora General de Fondos Security S.A., Avenida Apoquindo 3150, Piso 7, Las Condes Santiago, Chile
For sub-fund Pareturn Gladwyne Absolute Credit Gladwyne Investments LLP 29, St Jame's Place, SW1A 1 NR London United Kingdom
For sub-fund Pareturn EtendAR SKYLAR France - Société Privée de Gestion de Patrimoine S.A.S. 71-73 Avenue des Champs Elysées F-75008 Paris France
For sub-funds Pareturn GVC Gaesco Patrimonial Fund, Pareturn GVC Gaesco Euro Small Caps Equity Fund and Pareturn GVC Gaesco Absolute Return Fund GVC GAESCO GESTION, SGIIC, S.A. Doctor Ferrán, 3-5 S-08034 Barcelona Spain
For sub-fund Pareturn Mapfre Euro Bonds Fund (until November 24, 2017) MAPFRE ASSET MANAGEMENT, SGIIC, SA Carretera de Pozuelo, 50-1, S-28222 Majadahonda, Madrid, Spain
For sub-fund Pareturn Rivendale Banque Pictet & Cie, SA 60 route des Acacias 1211 Geneva 73 Switzerland
For sub-fund Pareturn Fidelius Global CREDIT SUISSE GESTIÓN SGIIC SA Calle Ayala 42 S-28001 Madrid Spain
For sub-fund Pareturn Imantia USD Global High Yield Bond IMANTIA CAPITAL SGIIC SA Serrano 45, 3 Planta S-28001 Madrid Spain
Organisation of the Company (continued)
PARETURN
9
For sub-funds Pareturn Santalucia Espabolsa (Luxembourg) and Pareturn Santalucia Fonvalor (since November 14, 2017) Santa Lucia Gestion SGIIC S.A. Camina Fuente de la Mora, 9 S-28005 Madrid Spain
Depositary, Delegate Registrar Agent, Domiciliation and Listing Agent
BNP Paribas Securities Services - Luxembourg Branch 60, Avenue John Fitzgerald Kennedy, L-1855 Luxembourg Grand Duchy of Luxembourg
Delegate Administrative Agent
BNP Paribas Securities Services - Luxembourg Branch 60, Avenue John Fitzgerald Kennedy, L-1855 Luxembourg Grand Duchy of Luxembourg
Cabinet de révision agréé / Auditor of the Company
Deloitte Audit Société à responsabilité limitée 560, rue de Neudorf L-2220 Luxembourg Grand Duchy of Luxembourg
Registered office
60, Avenue John Fitzgerald Kennedy, L-1855 Luxembourg Grand Duchy of Luxembourg
Representative and Local Paying Agent in Switzerland
BNP Paribas Securities Services, Zurich Branch 16, Selnautrasse CH-8002 Zurich Switzerland
Organisation of the Company (continued)

PARETURN
10
Incorporation
PARETURN (the "Company") was incorporated in Luxembourg on March 25, 1994 for an indefinite period. The minimum capital in the Company is€1,250,000 (one million two hundred and fifty thousand euros). The Company's capital is expressed in EUR and is, at all times, equal to the value ofthe net assets of all sub-funds of the Company, and is represented by shares with no par value.
The amount of capital changes automatically and without any publication in the Trade Register, as would otherwise be necessary for capitalincreases and decreases in sociétés anonymes (limited companies).The Company's articles of association were published in the Mémorial C onApril 29, 1994 after being filed, on April 1, 1994, with the Clerk of the District Court of Luxembourg where they may be examined and copies may beobtained against payment of a fee. Following the Extraordinary General Meeting of August 17, 2005, the Company was brought into compliancewith the amended law of December 20, 2002 on Undertakings for Collective Investment. These changes were published in the Mémorial C onSeptember 2, 2005. Further amendments in the articles of association were published in the Mémorial C on August 13, 2010 and on December 18,2015. Since July 1, 2011 the Company is subject to the provisions of Part I of the amended law of December 17, 2010 (the "Law") relating toUndertakings for Collective Investment in transferable securities (UCITS). The Company is registered on the Luxembourg Trade Register undernumber B - 47 104.
Listing
No shares of any sub-fund of the Company are listed on the Luxembourg stock exchange. However, the Company's Board of Directors reserves theright to do so at a later date.
Communications and reports to shareholders
1. Periodic reports
Annual reports including Audited Financial Statements for the year ended September 30, unaudited semi-annual reports for the six months endedMarch 31 and the list of changes made to the composition of the securities portfolio are available to shareholders free of charge from branches ofthe Depositary, other designated banks and the Company's registered office. These reports cover each of the sub-funds and the assets of theCompany as a whole.
The financial statements of each sub-fund are drawn up in the currency of the sub-fund but the consolidated accounts are denominated in euro.
Annual reports are available within four months of the financial year-end.
Semi-annual reports are published within two months of the end of the six-month period they cover.
2. Information to shareholders
a) Net asset value ("NAV")
The net asset values per share of each sub-fund, category or class of shares of the Company are available on each business day at the registeredoffice of the Company. The Board of Directors of the Company may subsequently decide to publish these net asset values in the newspapers ofcountries where the Company's shares are marketed or sold. They shall moreover be posted each business day on Reuters screen. Furthermore,they can be obtained at the registered office of the Depositary as well as from the banks in charge of financial services.
b) Subscription and redemption prices
The subscription and redemption prices of shares in each sub-fund, category or class of shares of the Company are published daily at theDepositary and from the banks ensuring of financial services.
c) Notifications to shareholders
Other information intended for shareholders are published in the Recueil Electronique des Sociétés et Associations (RESA) in Luxembourg, if suchpublication is prescribed by the Law. They may also be published in a Luxembourg newspaper.
General Information
PARETURN
11
The accompanying notes are an integral part of these financial statements.
Statistics
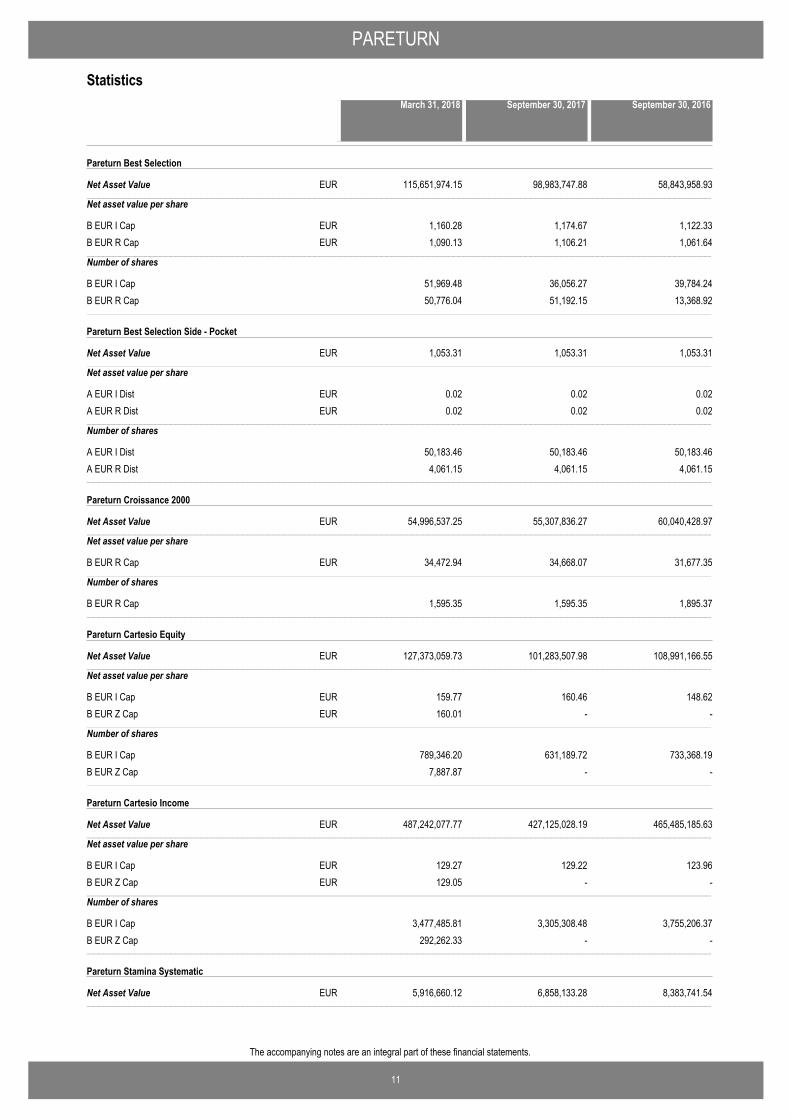
Pareturn Best Selection
Net Asset Value−−−−−−−−−−−−−−−−−−−−−−−−−−−−−−−−−−−−−−−−−−−−−−−−−−−−−−−−−−−−−−−−−−−−−−−−−−−−−−−−−−−−−−−−−−−−−−−−−−−−−−−−−−−−−−−−−−−−−−−−−−−−−−−−−−−−−−−−−−−−−−−−−−−−−−−−−−−−−−−−−−−−−−−−−−−−−−−−−−−−−−−−−−−−−−−−−−−−−−−−−−−−−−−−−−−−−−−−−−−−−−−−−−−−−−−−−−−−−−−−−−−−−−−−−−−−−−−−−−−−−−−−−−−−−−−−−−−−−−−−−−−−−−−−−−−−−−−−−−−−−−−−−−−−−−−−−−−−−−−−−−−−−−−−−−−−−−−−−−−−−−−−−−−−−−−−−−−−−−−−−−−−−−−−−−−−−−−−−−−−−−−−−−−−−−−−−−−−−−−−−−−−−−−−−−−−−−−−−−−−−−−−−−−−−−−−−−−−−−−−−−−−−−−−−−−−−−−−−−−−−−−−−−−−−−−−−−−−−−−−−−−−−−−−−−−−−−−−−−−−−−−
115,651,974.15 98,983,747.88 58,843,958.93EUR
Net asset value per share
B EUR I Cap 1,160.28 1,174.67 1,122.33EURB EUR R Cap 1,090.13 1,106.21 1,061.64EUR−−−−−−−−−−−−−−−−−−−−−−−−−−−−−−−−−−−−−−−−−−−−−−−−−−−−−−−−−−−−−−−−−−−−−−−−−−−−−−−−−−−−−−−−−−−−−−−−−−−−−−−−−−−−−−−−−−−−−−−−−−−−−−−−−−−−−−−−−−−−−−−−−−−−−−−−−−−−−−−−−−−−−−−−−−−−−−−−−−−−−−−−−−−−−−−−−−−−−−−−−−−−−−−−−−−−−−−−−−−−−−−−−−−−−−−−−−−−−−−−−−−−−−−−−−−−−−−−−−−−−−−−−−−−−−−−−−−−−−−−−−−−−−−−−−−−−−−−−−−−−−−−−−−−−−−−−−−−−−−−−−−−−−−−−−−−−−−−−−−−−−−−−−−−−−−−−−−−−−−−−−−−−−−−−−−−−−−−−−−−−−−−−−−−−−−−−−−−−−−−−−−−−−−−−−−−−−−−−−−−−−−−−−−−−−−−−−−−−−−−−−−−−−−−−−−−−−−−−−−−−−−−−−−−−−−−−−−−−−−−−−−−−−−−−−−−−−−−−−−−−−−
Number of shares
B EUR I Cap 51,969.48 36,056.27 39,784.24B EUR R Cap 50,776.04 51,192.15 13,368.92−−−−−−−−−−−−−−−−−−−−−−−−−−−−−−−−−−−−−−−−−−−−−−−−−−−−−−−−−−−−−−−−−−−−−−−−−−−−−−−−−−−−−−−−−−−−−−−−−−−−−−−−−−−−−−−−−−−−−−−−−−−−−−−−−−−−−−−−−−−−−−−−−−−−−−−−−−−−−−−−−−−−−−−−−−−−−−−−−−−−−−−−−−−−−−−−−−−−−−−−−−−−−−−−−−−−−−−−−−−−−−−−−−−−−−−−−−−−−−−−−−−−−−−−−−−−−−−−−−−−−−−−−−−−−−−−−−−−−−−−−−−−−−−−−−−−−−−−−−−−−−−−−−−−−−−−−−−−−−−−−−−−−−−−−−−−−−−−−−−−−−−−−−−−−−−−−−−−−−−−−−−−−−−−−−−−−−−−−−−−−−−−−−−−−−−−−−−−−−−−−−−−−−−−−−−−−−−−−−−−−−−−−−−−−−−−−−−−−−−−−−−−−−−−−−−−−−−−−−−−−−−−−−−−−−−−−−−−−−−−−−−−−−−−−−−−−−−−−−−−−−−
Pareturn Best Selection Side - Pocket
Net Asset Value−−−−−−−−−−−−−−−−−−−−−−−−−−−−−−−−−−−−−−−−−−−−−−−−−−−−−−−−−−−−−−−−−−−−−−−−−−−−−−−−−−−−−−−−−−−−−−−−−−−−−−−−−−−−−−−−−−−−−−−−−−−−−−−−−−−−−−−−−−−−−−−−−−−−−−−−−−−−−−−−−−−−−−−−−−−−−−−−−−−−−−−−−−−−−−−−−−−−−−−−−−−−−−−−−−−−−−−−−−−−−−−−−−−−−−−−−−−−−−−−−−−−−−−−−−−−−−−−−−−−−−−−−−−−−−−−−−−−−−−−−−−−−−−−−−−−−−−−−−−−−−−−−−−−−−−−−−−−−−−−−−−−−−−−−−−−−−−−−−−−−−−−−−−−−−−−−−−−−−−−−−−−−−−−−−−−−−−−−−−−−−−−−−−−−−−−−−−−−−−−−−−−−−−−−−−−−−−−−−−−−−−−−−−−−−−−−−−−−−−−−−−−−−−−−−−−−−−−−−−−−−−−−−−−−−−−−−−−−−−−−−−−−−−−−−−−−−−−−−−−−−−
1,053.31 1,053.31 1,053.31EUR
Net asset value per share
A EUR I Dist 0.02 0.02 0.02EURA EUR R Dist 0.02 0.02 0.02EUR−−−−−−−−−−−−−−−−−−−−−−−−−−−−−−−−−−−−−−−−−−−−−−−−−−−−−−−−−−−−−−−−−−−−−−−−−−−−−−−−−−−−−−−−−−−−−−−−−−−−−−−−−−−−−−−−−−−−−−−−−−−−−−−−−−−−−−−−−−−−−−−−−−−−−−−−−−−−−−−−−−−−−−−−−−−−−−−−−−−−−−−−−−−−−−−−−−−−−−−−−−−−−−−−−−−−−−−−−−−−−−−−−−−−−−−−−−−−−−−−−−−−−−−−−−−−−−−−−−−−−−−−−−−−−−−−−−−−−−−−−−−−−−−−−−−−−−−−−−−−−−−−−−−−−−−−−−−−−−−−−−−−−−−−−−−−−−−−−−−−−−−−−−−−−−−−−−−−−−−−−−−−−−−−−−−−−−−−−−−−−−−−−−−−−−−−−−−−−−−−−−−−−−−−−−−−−−−−−−−−−−−−−−−−−−−−−−−−−−−−−−−−−−−−−−−−−−−−−−−−−−−−−−−−−−−−−−−−−−−−−−−−−−−−−−−−−−−−−−−−−−−
Number of shares
A EUR I Dist 50,183.46 50,183.46 50,183.46A EUR R Dist 4,061.15 4,061.15 4,061.15−−−−−−−−−−−−−−−−−−−−−−−−−−−−−−−−−−−−−−−−−−−−−−−−−−−−−−−−−−−−−−−−−−−−−−−−−−−−−−−−−−−−−−−−−−−−−−−−−−−−−−−−−−−−−−−−−−−−−−−−−−−−−−−−−−−−−−−−−−−−−−−−−−−−−−−−−−−−−−−−−−−−−−−−−−−−−−−−−−−−−−−−−−−−−−−−−−−−−−−−−−−−−−−−−−−−−−−−−−−−−−−−−−−−−−−−−−−−−−−−−−−−−−−−−−−−−−−−−−−−−−−−−−−−−−−−−−−−−−−−−−−−−−−−−−−−−−−−−−−−−−−−−−−−−−−−−−−−−−−−−−−−−−−−−−−−−−−−−−−−−−−−−−−−−−−−−−−−−−−−−−−−−−−−−−−−−−−−−−−−−−−−−−−−−−−−−−−−−−−−−−−−−−−−−−−−−−−−−−−−−−−−−−−−−−−−−−−−−−−−−−−−−−−−−−−−−−−−−−−−−−−−−−−−−−−−−−−−−−−−−−−−−−−−−−−−−−−−−−−−−−−
Pareturn Croissance 2000
Net Asset Value−−−−−−−−−−−−−−−−−−−−−−−−−−−−−−−−−−−−−−−−−−−−−−−−−−−−−−−−−−−−−−−−−−−−−−−−−−−−−−−−−−−−−−−−−−−−−−−−−−−−−−−−−−−−−−−−−−−−−−−−−−−−−−−−−−−−−−−−−−−−−−−−−−−−−−−−−−−−−−−−−−−−−−−−−−−−−−−−−−−−−−−−−−−−−−−−−−−−−−−−−−−−−−−−−−−−−−−−−−−−−−−−−−−−−−−−−−−−−−−−−−−−−−−−−−−−−−−−−−−−−−−−−−−−−−−−−−−−−−−−−−−−−−−−−−−−−−−−−−−−−−−−−−−−−−−−−−−−−−−−−−−−−−−−−−−−−−−−−−−−−−−−−−−−−−−−−−−−−−−−−−−−−−−−−−−−−−−−−−−−−−−−−−−−−−−−−−−−−−−−−−−−−−−−−−−−−−−−−−−−−−−−−−−−−−−−−−−−−−−−−−−−−−−−−−−−−−−−−−−−−−−−−−−−−−−−−−−−−−−−−−−−−−−−−−−−−−−−−−−−−−−
54,996,537.25 55,307,836.27 60,040,428.97EUR
Net asset value per share
B EUR R Cap 34,472.94 34,668.07 31,677.35EUR−−−−−−−−−−−−−−−−−−−−−−−−−−−−−−−−−−−−−−−−−−−−−−−−−−−−−−−−−−−−−−−−−−−−−−−−−−−−−−−−−−−−−−−−−−−−−−−−−−−−−−−−−−−−−−−−−−−−−−−−−−−−−−−−−−−−−−−−−−−−−−−−−−−−−−−−−−−−−−−−−−−−−−−−−−−−−−−−−−−−−−−−−−−−−−−−−−−−−−−−−−−−−−−−−−−−−−−−−−−−−−−−−−−−−−−−−−−−−−−−−−−−−−−−−−−−−−−−−−−−−−−−−−−−−−−−−−−−−−−−−−−−−−−−−−−−−−−−−−−−−−−−−−−−−−−−−−−−−−−−−−−−−−−−−−−−−−−−−−−−−−−−−−−−−−−−−−−−−−−−−−−−−−−−−−−−−−−−−−−−−−−−−−−−−−−−−−−−−−−−−−−−−−−−−−−−−−−−−−−−−−−−−−−−−−−−−−−−−−−−−−−−−−−−−−−−−−−−−−−−−−−−−−−−−−−−−−−−−−−−−−−−−−−−−−−−−−−−−−−−−−−
Number of shares
B EUR R Cap 1,595.35 1,595.35 1,895.37−−−−−−−−−−−−−−−−−−−−−−−−−−−−−−−−−−−−−−−−−−−−−−−−−−−−−−−−−−−−−−−−−−−−−−−−−−−−−−−−−−−−−−−−−−−−−−−−−−−−−−−−−−−−−−−−−−−−−−−−−−−−−−−−−−−−−−−−−−−−−−−−−−−−−−−−−−−−−−−−−−−−−−−−−−−−−−−−−−−−−−−−−−−−−−−−−−−−−−−−−−−−−−−−−−−−−−−−−−−−−−−−−−−−−−−−−−−−−−−−−−−−−−−−−−−−−−−−−−−−−−−−−−−−−−−−−−−−−−−−−−−−−−−−−−−−−−−−−−−−−−−−−−−−−−−−−−−−−−−−−−−−−−−−−−−−−−−−−−−−−−−−−−−−−−−−−−−−−−−−−−−−−−−−−−−−−−−−−−−−−−−−−−−−−−−−−−−−−−−−−−−−−−−−−−−−−−−−−−−−−−−−−−−−−−−−−−−−−−−−−−−−−−−−−−−−−−−−−−−−−−−−−−−−−−−−−−−−−−−−−−−−−−−−−−−−−−−−−−−−−−−
Pareturn Cartesio Equity
Net Asset Value−−−−−−−−−−−−−−−−−−−−−−−−−−−−−−−−−−−−−−−−−−−−−−−−−−−−−−−−−−−−−−−−−−−−−−−−−−−−−−−−−−−−−−−−−−−−−−−−−−−−−−−−−−−−−−−−−−−−−−−−−−−−−−−−−−−−−−−−−−−−−−−−−−−−−−−−−−−−−−−−−−−−−−−−−−−−−−−−−−−−−−−−−−−−−−−−−−−−−−−−−−−−−−−−−−−−−−−−−−−−−−−−−−−−−−−−−−−−−−−−−−−−−−−−−−−−−−−−−−−−−−−−−−−−−−−−−−−−−−−−−−−−−−−−−−−−−−−−−−−−−−−−−−−−−−−−−−−−−−−−−−−−−−−−−−−−−−−−−−−−−−−−−−−−−−−−−−−−−−−−−−−−−−−−−−−−−−−−−−−−−−−−−−−−−−−−−−−−−−−−−−−−−−−−−−−−−−−−−−−−−−−−−−−−−−−−−−−−−−−−−−−−−−−−−−−−−−−−−−−−−−−−−−−−−−−−−−−−−−−−−−−−−−−−−−−−−−−−−−−−−−−
127,373,059.73 101,283,507.98 108,991,166.55EUR
Net asset value per share
B EUR I Cap 159.77 160.46 148.62EURB EUR Z Cap 160.01 - -EUR−−−−−−−−−−−−−−−−−−−−−−−−−−−−−−−−−−−−−−−−−−−−−−−−−−−−−−−−−−−−−−−−−−−−−−−−−−−−−−−−−−−−−−−−−−−−−−−−−−−−−−−−−−−−−−−−−−−−−−−−−−−−−−−−−−−−−−−−−−−−−−−−−−−−−−−−−−−−−−−−−−−−−−−−−−−−−−−−−−−−−−−−−−−−−−−−−−−−−−−−−−−−−−−−−−−−−−−−−−−−−−−−−−−−−−−−−−−−−−−−−−−−−−−−−−−−−−−−−−−−−−−−−−−−−−−−−−−−−−−−−−−−−−−−−−−−−−−−−−−−−−−−−−−−−−−−−−−−−−−−−−−−−−−−−−−−−−−−−−−−−−−−−−−−−−−−−−−−−−−−−−−−−−−−−−−−−−−−−−−−−−−−−−−−−−−−−−−−−−−−−−−−−−−−−−−−−−−−−−−−−−−−−−−−−−−−−−−−−−−−−−−−−−−−−−−−−−−−−−−−−−−−−−−−−−−−−−−−−−−−−−−−−−−−−−−−−−−−−−−−−−−
Number of shares
B EUR I Cap 789,346.20 631,189.72 733,368.19B EUR Z Cap 7,887.87 - -−−−−−−−−−−−−−−−−−−−−−−−−−−−−−−−−−−−−−−−−−−−−−−−−−−−−−−−−−−−−−−−−−−−−−−−−−−−−−−−−−−−−−−−−−−−−−−−−−−−−−−−−−−−−−−−−−−−−−−−−−−−−−−−−−−−−−−−−−−−−−−−−−−−−−−−−−−−−−−−−−−−−−−−−−−−−−−−−−−−−−−−−−−−−−−−−−−−−−−−−−−−−−−−−−−−−−−−−−−−−−−−−−−−−−−−−−−−−−−−−−−−−−−−−−−−−−−−−−−−−−−−−−−−−−−−−−−−−−−−−−−−−−−−−−−−−−−−−−−−−−−−−−−−−−−−−−−−−−−−−−−−−−−−−−−−−−−−−−−−−−−−−−−−−−−−−−−−−−−−−−−−−−−−−−−−−−−−−−−−−−−−−−−−−−−−−−−−−−−−−−−−−−−−−−−−−−−−−−−−−−−−−−−−−−−−−−−−−−−−−−−−−−−−−−−−−−−−−−−−−−−−−−−−−−−−−−−−−−−−−−−−−−−−−−−−−−−−−−−−−−−−
Pareturn Cartesio Income
Net Asset Value−−−−−−−−−−−−−−−−−−−−−−−−−−−−−−−−−−−−−−−−−−−−−−−−−−−−−−−−−−−−−−−−−−−−−−−−−−−−−−−−−−−−−−−−−−−−−−−−−−−−−−−−−−−−−−−−−−−−−−−−−−−−−−−−−−−−−−−−−−−−−−−−−−−−−−−−−−−−−−−−−−−−−−−−−−−−−−−−−−−−−−−−−−−−−−−−−−−−−−−−−−−−−−−−−−−−−−−−−−−−−−−−−−−−−−−−−−−−−−−−−−−−−−−−−−−−−−−−−−−−−−−−−−−−−−−−−−−−−−−−−−−−−−−−−−−−−−−−−−−−−−−−−−−−−−−−−−−−−−−−−−−−−−−−−−−−−−−−−−−−−−−−−−−−−−−−−−−−−−−−−−−−−−−−−−−−−−−−−−−−−−−−−−−−−−−−−−−−−−−−−−−−−−−−−−−−−−−−−−−−−−−−−−−−−−−−−−−−−−−−−−−−−−−−−−−−−−−−−−−−−−−−−−−−−−−−−−−−−−−−−−−−−−−−−−−−−−−−−−−−−−−
487,242,077.77 427,125,028.19 465,485,185.63EUR
Net asset value per share
B EUR I Cap 129.27 129.22 123.96EURB EUR Z Cap 129.05 - -EUR−−−−−−−−−−−−−−−−−−−−−−−−−−−−−−−−−−−−−−−−−−−−−−−−−−−−−−−−−−−−−−−−−−−−−−−−−−−−−−−−−−−−−−−−−−−−−−−−−−−−−−−−−−−−−−−−−−−−−−−−−−−−−−−−−−−−−−−−−−−−−−−−−−−−−−−−−−−−−−−−−−−−−−−−−−−−−−−−−−−−−−−−−−−−−−−−−−−−−−−−−−−−−−−−−−−−−−−−−−−−−−−−−−−−−−−−−−−−−−−−−−−−−−−−−−−−−−−−−−−−−−−−−−−−−−−−−−−−−−−−−−−−−−−−−−−−−−−−−−−−−−−−−−−−−−−−−−−−−−−−−−−−−−−−−−−−−−−−−−−−−−−−−−−−−−−−−−−−−−−−−−−−−−−−−−−−−−−−−−−−−−−−−−−−−−−−−−−−−−−−−−−−−−−−−−−−−−−−−−−−−−−−−−−−−−−−−−−−−−−−−−−−−−−−−−−−−−−−−−−−−−−−−−−−−−−−−−−−−−−−−−−−−−−−−−−−−−−−−−−−−−−
Number of shares
B EUR I Cap 3,477,485.81 3,305,308.48 3,755,206.37B EUR Z Cap 292,262.33 - -−−−−−−−−−−−−−−−−−−−−−−−−−−−−−−−−−−−−−−−−−−−−−−−−−−−−−−−−−−−−−−−−−−−−−−−−−−−−−−−−−−−−−−−−−−−−−−−−−−−−−−−−−−−−−−−−−−−−−−−−−−−−−−−−−−−−−−−−−−−−−−−−−−−−−−−−−−−−−−−−−−−−−−−−−−−−−−−−−−−−−−−−−−−−−−−−−−−−−−−−−−−−−−−−−−−−−−−−−−−−−−−−−−−−−−−−−−−−−−−−−−−−−−−−−−−−−−−−−−−−−−−−−−−−−−−−−−−−−−−−−−−−−−−−−−−−−−−−−−−−−−−−−−−−−−−−−−−−−−−−−−−−−−−−−−−−−−−−−−−−−−−−−−−−−−−−−−−−−−−−−−−−−−−−−−−−−−−−−−−−−−−−−−−−−−−−−−−−−−−−−−−−−−−−−−−−−−−−−−−−−−−−−−−−−−−−−−−−−−−−−−−−−−−−−−−−−−−−−−−−−−−−−−−−−−−−−−−−−−−−−−−−−−−−−−−−−−−−−−−−−−−
Pareturn Stamina Systematic
Net Asset Value−−−−−−−−−−−−−−−−−−−−−−−−−−−−−−−−−−−−−−−−−−−−−−−−−−−−−−−−−−−−−−−−−−−−−−−−−−−−−−−−−−−−−−−−−−−−−−−−−−−−−−−−−−−−−−−−−−−−−−−−−−−−−−−−−−−−−−−−−−−−−−−−−−−−−−−−−−−−−−−−−−−−−−−−−−−−−−−−−−−−−−−−−−−−−−−−−−−−−−−−−−−−−−−−−−−−−−−−−−−−−−−−−−−−−−−−−−−−−−−−−−−−−−−−−−−−−−−−−−−−−−−−−−−−−−−−−−−−−−−−−−−−−−−−−−−−−−−−−−−−−−−−−−−−−−−−−−−−−−−−−−−−−−−−−−−−−−−−−−−−−−−−−−−−−−−−−−−−−−−−−−−−−−−−−−−−−−−−−−−−−−−−−−−−−−−−−−−−−−−−−−−−−−−−−−−−−−−−−−−−−−−−−−−−−−−−−−−−−−−−−−−−−−−−−−−−−−−−−−−−−−−−−−−−−−−−−−−−−−−−−−−−−−−−−−−−−−−−−−−−−−−
5,916,660.12 6,858,133.28 8,383,741.54EUR
September 30, 2016March 31, 2018 September 30, 2017

PARETURN
12
The accompanying notes are an integral part of these financial statements.
Statistics
Net asset value per share
B EUR F Cap 113.65 115.89 111.63EUR−−−−−−−−−−−−−−−−−−−−−−−−−−−−−−−−−−−−−−−−−−−−−−−−−−−−−−−−−−−−−−−−−−−−−−−−−−−−−−−−−−−−−−−−−−−−−−−−−−−−−−−−−−−−−−−−−−−−−−−−−−−−−−−−−−−−−−−−−−−−−−−−−−−−−−−−−−−−−−−−−−−−−−−−−−−−−−−−−−−−−−−−−−−−−−−−−−−−−−−−−−−−−−−−−−−−−−−−−−−−−−−−−−−−−−−−−−−−−−−−−−−−−−−−−−−−−−−−−−−−−−−−−−−−−−−−−−−−−−−−−−−−−−−−−−−−−−−−−−−−−−−−−−−−−−−−−−−−−−−−−−−−−−−−−−−−−−−−−−−−−−−−−−−−−−−−−−−−−−−−−−−−−−−−−−−−−−−−−−−−−−−−−−−−−−−−−−−−−−−−−−−−−−−−−−−−−−−−−−−−−−−−−−−−−−−−−−−−−−−−−−−−−−−−−−−−−−−−−−−−−−−−−−−−−−−−−−−−−−−−−−−−−−−−−−−−−−−−−−−−−−−
Number of shares
B EUR F Cap 52,059.73 59,177.40 75,103.38−−−−−−−−−−−−−−−−−−−−−−−−−−−−−−−−−−−−−−−−−−−−−−−−−−−−−−−−−−−−−−−−−−−−−−−−−−−−−−−−−−−−−−−−−−−−−−−−−−−−−−−−−−−−−−−−−−−−−−−−−−−−−−−−−−−−−−−−−−−−−−−−−−−−−−−−−−−−−−−−−−−−−−−−−−−−−−−−−−−−−−−−−−−−−−−−−−−−−−−−−−−−−−−−−−−−−−−−−−−−−−−−−−−−−−−−−−−−−−−−−−−−−−−−−−−−−−−−−−−−−−−−−−−−−−−−−−−−−−−−−−−−−−−−−−−−−−−−−−−−−−−−−−−−−−−−−−−−−−−−−−−−−−−−−−−−−−−−−−−−−−−−−−−−−−−−−−−−−−−−−−−−−−−−−−−−−−−−−−−−−−−−−−−−−−−−−−−−−−−−−−−−−−−−−−−−−−−−−−−−−−−−−−−−−−−−−−−−−−−−−−−−−−−−−−−−−−−−−−−−−−−−−−−−−−−−−−−−−−−−−−−−−−−−−−−−−−−−−−−−−−−
Pareturn Stamina Systematic Plus*
Net Asset Value−−−−−−−−−−−−−−−−−−−−−−−−−−−−−−−−−−−−−−−−−−−−−−−−−−−−−−−−−−−−−−−−−−−−−−−−−−−−−−−−−−−−−−−−−−−−−−−−−−−−−−−−−−−−−−−−−−−−−−−−−−−−−−−−−−−−−−−−−−−−−−−−−−−−−−−−−−−−−−−−−−−−−−−−−−−−−−−−−−−−−−−−−−−−−−−−−−−−−−−−−−−−−−−−−−−−−−−−−−−−−−−−−−−−−−−−−−−−−−−−−−−−−−−−−−−−−−−−−−−−−−−−−−−−−−−−−−−−−−−−−−−−−−−−−−−−−−−−−−−−−−−−−−−−−−−−−−−−−−−−−−−−−−−−−−−−−−−−−−−−−−−−−−−−−−−−−−−−−−−−−−−−−−−−−−−−−−−−−−−−−−−−−−−−−−−−−−−−−−−−−−−−−−−−−−−−−−−−−−−−−−−−−−−−−−−−−−−−−−−−−−−−−−−−−−−−−−−−−−−−−−−−−−−−−−−−−−−−−−−−−−−−−−−−−−−−−−−−−−−−−−−
- 11,476,528.79 26,681,088.26EUR
Net asset value per share
B EUR F Cap - 118.20 114.48EUR−−−−−−−−−−−−−−−−−−−−−−−−−−−−−−−−−−−−−−−−−−−−−−−−−−−−−−−−−−−−−−−−−−−−−−−−−−−−−−−−−−−−−−−−−−−−−−−−−−−−−−−−−−−−−−−−−−−−−−−−−−−−−−−−−−−−−−−−−−−−−−−−−−−−−−−−−−−−−−−−−−−−−−−−−−−−−−−−−−−−−−−−−−−−−−−−−−−−−−−−−−−−−−−−−−−−−−−−−−−−−−−−−−−−−−−−−−−−−−−−−−−−−−−−−−−−−−−−−−−−−−−−−−−−−−−−−−−−−−−−−−−−−−−−−−−−−−−−−−−−−−−−−−−−−−−−−−−−−−−−−−−−−−−−−−−−−−−−−−−−−−−−−−−−−−−−−−−−−−−−−−−−−−−−−−−−−−−−−−−−−−−−−−−−−−−−−−−−−−−−−−−−−−−−−−−−−−−−−−−−−−−−−−−−−−−−−−−−−−−−−−−−−−−−−−−−−−−−−−−−−−−−−−−−−−−−−−−−−−−−−−−−−−−−−−−−−−−−−−−−−−−
Number of shares
B EUR F Cap - 97,097.25 233,067.64−−−−−−−−−−−−−−−−−−−−−−−−−−−−−−−−−−−−−−−−−−−−−−−−−−−−−−−−−−−−−−−−−−−−−−−−−−−−−−−−−−−−−−−−−−−−−−−−−−−−−−−−−−−−−−−−−−−−−−−−−−−−−−−−−−−−−−−−−−−−−−−−−−−−−−−−−−−−−−−−−−−−−−−−−−−−−−−−−−−−−−−−−−−−−−−−−−−−−−−−−−−−−−−−−−−−−−−−−−−−−−−−−−−−−−−−−−−−−−−−−−−−−−−−−−−−−−−−−−−−−−−−−−−−−−−−−−−−−−−−−−−−−−−−−−−−−−−−−−−−−−−−−−−−−−−−−−−−−−−−−−−−−−−−−−−−−−−−−−−−−−−−−−−−−−−−−−−−−−−−−−−−−−−−−−−−−−−−−−−−−−−−−−−−−−−−−−−−−−−−−−−−−−−−−−−−−−−−−−−−−−−−−−−−−−−−−−−−−−−−−−−−−−−−−−−−−−−−−−−−−−−−−−−−−−−−−−−−−−−−−−−−−−−−−−−−−−−−−−−−−−−
Pareturn Mutuafondo Global Fixed Income
Net Asset Value−−−−−−−−−−−−−−−−−−−−−−−−−−−−−−−−−−−−−−−−−−−−−−−−−−−−−−−−−−−−−−−−−−−−−−−−−−−−−−−−−−−−−−−−−−−−−−−−−−−−−−−−−−−−−−−−−−−−−−−−−−−−−−−−−−−−−−−−−−−−−−−−−−−−−−−−−−−−−−−−−−−−−−−−−−−−−−−−−−−−−−−−−−−−−−−−−−−−−−−−−−−−−−−−−−−−−−−−−−−−−−−−−−−−−−−−−−−−−−−−−−−−−−−−−−−−−−−−−−−−−−−−−−−−−−−−−−−−−−−−−−−−−−−−−−−−−−−−−−−−−−−−−−−−−−−−−−−−−−−−−−−−−−−−−−−−−−−−−−−−−−−−−−−−−−−−−−−−−−−−−−−−−−−−−−−−−−−−−−−−−−−−−−−−−−−−−−−−−−−−−−−−−−−−−−−−−−−−−−−−−−−−−−−−−−−−−−−−−−−−−−−−−−−−−−−−−−−−−−−−−−−−−−−−−−−−−−−−−−−−−−−−−−−−−−−−−−−−−−−−−−−
58,555,862.79 57,971,622.77 57,263,183.04EUR
Net asset value per share
B EUR P Cap 171.46 171.22 169.12EUR−−−−−−−−−−−−−−−−−−−−−−−−−−−−−−−−−−−−−−−−−−−−−−−−−−−−−−−−−−−−−−−−−−−−−−−−−−−−−−−−−−−−−−−−−−−−−−−−−−−−−−−−−−−−−−−−−−−−−−−−−−−−−−−−−−−−−−−−−−−−−−−−−−−−−−−−−−−−−−−−−−−−−−−−−−−−−−−−−−−−−−−−−−−−−−−−−−−−−−−−−−−−−−−−−−−−−−−−−−−−−−−−−−−−−−−−−−−−−−−−−−−−−−−−−−−−−−−−−−−−−−−−−−−−−−−−−−−−−−−−−−−−−−−−−−−−−−−−−−−−−−−−−−−−−−−−−−−−−−−−−−−−−−−−−−−−−−−−−−−−−−−−−−−−−−−−−−−−−−−−−−−−−−−−−−−−−−−−−−−−−−−−−−−−−−−−−−−−−−−−−−−−−−−−−−−−−−−−−−−−−−−−−−−−−−−−−−−−−−−−−−−−−−−−−−−−−−−−−−−−−−−−−−−−−−−−−−−−−−−−−−−−−−−−−−−−−−−−−−−−−−−
Number of shares
B EUR P Cap 341,506.92 338,587.03 338,587.03−−−−−−−−−−−−−−−−−−−−−−−−−−−−−−−−−−−−−−−−−−−−−−−−−−−−−−−−−−−−−−−−−−−−−−−−−−−−−−−−−−−−−−−−−−−−−−−−−−−−−−−−−−−−−−−−−−−−−−−−−−−−−−−−−−−−−−−−−−−−−−−−−−−−−−−−−−−−−−−−−−−−−−−−−−−−−−−−−−−−−−−−−−−−−−−−−−−−−−−−−−−−−−−−−−−−−−−−−−−−−−−−−−−−−−−−−−−−−−−−−−−−−−−−−−−−−−−−−−−−−−−−−−−−−−−−−−−−−−−−−−−−−−−−−−−−−−−−−−−−−−−−−−−−−−−−−−−−−−−−−−−−−−−−−−−−−−−−−−−−−−−−−−−−−−−−−−−−−−−−−−−−−−−−−−−−−−−−−−−−−−−−−−−−−−−−−−−−−−−−−−−−−−−−−−−−−−−−−−−−−−−−−−−−−−−−−−−−−−−−−−−−−−−−−−−−−−−−−−−−−−−−−−−−−−−−−−−−−−−−−−−−−−−−−−−−−−−−−−−−−−−
Pareturn Barwon Listed Private Equity
Net Asset Value−−−−−−−−−−−−−−−−−−−−−−−−−−−−−−−−−−−−−−−−−−−−−−−−−−−−−−−−−−−−−−−−−−−−−−−−−−−−−−−−−−−−−−−−−−−−−−−−−−−−−−−−−−−−−−−−−−−−−−−−−−−−−−−−−−−−−−−−−−−−−−−−−−−−−−−−−−−−−−−−−−−−−−−−−−−−−−−−−−−−−−−−−−−−−−−−−−−−−−−−−−−−−−−−−−−−−−−−−−−−−−−−−−−−−−−−−−−−−−−−−−−−−−−−−−−−−−−−−−−−−−−−−−−−−−−−−−−−−−−−−−−−−−−−−−−−−−−−−−−−−−−−−−−−−−−−−−−−−−−−−−−−−−−−−−−−−−−−−−−−−−−−−−−−−−−−−−−−−−−−−−−−−−−−−−−−−−−−−−−−−−−−−−−−−−−−−−−−−−−−−−−−−−−−−−−−−−−−−−−−−−−−−−−−−−−−−−−−−−−−−−−−−−−−−−−−−−−−−−−−−−−−−−−−−−−−−−−−−−−−−−−−−−−−−−−−−−−−−−−−−−−
21,811,394.08 25,934,719.80 26,246,075.70EUR
Net asset value per share
A EUR I Dist 287.25 296.81 251.70EURA GBP G Dist 247.57 257.12 213.79GBPB USD U Cap 297.99 295.94 238.59USD−−−−−−−−−−−−−−−−−−−−−−−−−−−−−−−−−−−−−−−−−−−−−−−−−−−−−−−−−−−−−−−−−−−−−−−−−−−−−−−−−−−−−−−−−−−−−−−−−−−−−−−−−−−−−−−−−−−−−−−−−−−−−−−−−−−−−−−−−−−−−−−−−−−−−−−−−−−−−−−−−−−−−−−−−−−−−−−−−−−−−−−−−−−−−−−−−−−−−−−−−−−−−−−−−−−−−−−−−−−−−−−−−−−−−−−−−−−−−−−−−−−−−−−−−−−−−−−−−−−−−−−−−−−−−−−−−−−−−−−−−−−−−−−−−−−−−−−−−−−−−−−−−−−−−−−−−−−−−−−−−−−−−−−−−−−−−−−−−−−−−−−−−−−−−−−−−−−−−−−−−−−−−−−−−−−−−−−−−−−−−−−−−−−−−−−−−−−−−−−−−−−−−−−−−−−−−−−−−−−−−−−−−−−−−−−−−−−−−−−−−−−−−−−−−−−−−−−−−−−−−−−−−−−−−−−−−−−−−−−−−−−−−−−−−−−−−−−−−−−−−−−
Number of shares
A EUR I Dist 28,158.14 43,379.31 60,633.67A GBP G Dist 25,387.84 23,217.22 22,398.64B USD U Cap 27,048.94 25,104.74 25,666.14−−−−−−−−−−−−−−−−−−−−−−−−−−−−−−−−−−−−−−−−−−−−−−−−−−−−−−−−−−−−−−−−−−−−−−−−−−−−−−−−−−−−−−−−−−−−−−−−−−−−−−−−−−−−−−−−−−−−−−−−−−−−−−−−−−−−−−−−−−−−−−−−−−−−−−−−−−−−−−−−−−−−−−−−−−−−−−−−−−−−−−−−−−−−−−−−−−−−−−−−−−−−−−−−−−−−−−−−−−−−−−−−−−−−−−−−−−−−−−−−−−−−−−−−−−−−−−−−−−−−−−−−−−−−−−−−−−−−−−−−−−−−−−−−−−−−−−−−−−−−−−−−−−−−−−−−−−−−−−−−−−−−−−−−−−−−−−−−−−−−−−−−−−−−−−−−−−−−−−−−−−−−−−−−−−−−−−−−−−−−−−−−−−−−−−−−−−−−−−−−−−−−−−−−−−−−−−−−−−−−−−−−−−−−−−−−−−−−−−−−−−−−−−−−−−−−−−−−−−−−−−−−−−−−−−−−−−−−−−−−−−−−−−−−−−−−−−−−−−−−−−−
Pareturn Global Balanced Unconstrained
Net Asset Value−−−−−−−−−−−−−−−−−−−−−−−−−−−−−−−−−−−−−−−−−−−−−−−−−−−−−−−−−−−−−−−−−−−−−−−−−−−−−−−−−−−−−−−−−−−−−−−−−−−−−−−−−−−−−−−−−−−−−−−−−−−−−−−−−−−−−−−−−−−−−−−−−−−−−−−−−−−−−−−−−−−−−−−−−−−−−−−−−−−−−−−−−−−−−−−−−−−−−−−−−−−−−−−−−−−−−−−−−−−−−−−−−−−−−−−−−−−−−−−−−−−−−−−−−−−−−−−−−−−−−−−−−−−−−−−−−−−−−−−−−−−−−−−−−−−−−−−−−−−−−−−−−−−−−−−−−−−−−−−−−−−−−−−−−−−−−−−−−−−−−−−−−−−−−−−−−−−−−−−−−−−−−−−−−−−−−−−−−−−−−−−−−−−−−−−−−−−−−−−−−−−−−−−−−−−−−−−−−−−−−−−−−−−−−−−−−−−−−−−−−−−−−−−−−−−−−−−−−−−−−−−−−−−−−−−−−−−−−−−−−−−−−−−−−−−−−−−−−−−−−−−
81,520,889.75 65,923,270.40 57,357,517.33EUR
Net asset value per share
B EUR P Cap 114.67 113.91 108.37EUR−−−−−−−−−−−−−−−−−−−−−−−−−−−−−−−−−−−−−−−−−−−−−−−−−−−−−−−−−−−−−−−−−−−−−−−−−−−−−−−−−−−−−−−−−−−−−−−−−−−−−−−−−−−−−−−−−−−−−−−−−−−−−−−−−−−−−−−−−−−−−−−−−−−−−−−−−−−−−−−−−−−−−−−−−−−−−−−−−−−−−−−−−−−−−−−−−−−−−−−−−−−−−−−−−−−−−−−−−−−−−−−−−−−−−−−−−−−−−−−−−−−−−−−−−−−−−−−−−−−−−−−−−−−−−−−−−−−−−−−−−−−−−−−−−−−−−−−−−−−−−−−−−−−−−−−−−−−−−−−−−−−−−−−−−−−−−−−−−−−−−−−−−−−−−−−−−−−−−−−−−−−−−−−−−−−−−−−−−−−−−−−−−−−−−−−−−−−−−−−−−−−−−−−−−−−−−−−−−−−−−−−−−−−−−−−−−−−−−−−−−−−−−−−−−−−−−−−−−−−−−−−−−−−−−−−−−−−−−−−−−−−−−−−−−−−−−−−−−−−−−−−
Number of shares
B EUR P Cap 710,911.70 578,730.37 529,262.40−−−−−−−−−−−−−−−−−−−−−−−−−−−−−−−−−−−−−−−−−−−−−−−−−−−−−−−−−−−−−−−−−−−−−−−−−−−−−−−−−−−−−−−−−−−−−−−−−−−−−−−−−−−−−−−−−−−−−−−−−−−−−−−−−−−−−−−−−−−−−−−−−−−−−−−−−−−−−−−−−−−−−−−−−−−−−−−−−−−−−−−−−−−−−−−−−−−−−−−−−−−−−−−−−−−−−−−−−−−−−−−−−−−−−−−−−−−−−−−−−−−−−−−−−−−−−−−−−−−−−−−−−−−−−−−−−−−−−−−−−−−−−−−−−−−−−−−−−−−−−−−−−−−−−−−−−−−−−−−−−−−−−−−−−−−−−−−−−−−−−−−−−−−−−−−−−−−−−−−−−−−−−−−−−−−−−−−−−−−−−−−−−−−−−−−−−−−−−−−−−−−−−−−−−−−−−−−−−−−−−−−−−−−−−−−−−−−−−−−−−−−−−−−−−−−−−−−−−−−−−−−−−−−−−−−−−−−−−−−−−−−−−−−−−−−−−−−−−−−−−−−
Pareturn Cervino World Investments
Net Asset Value−−−−−−−−−−−−−−−−−−−−−−−−−−−−−−−−−−−−−−−−−−−−−−−−−−−−−−−−−−−−−−−−−−−−−−−−−−−−−−−−−−−−−−−−−−−−−−−−−−−−−−−−−−−−−−−−−−−−−−−−−−−−−−−−−−−−−−−−−−−−−−−−−−−−−−−−−−−−−−−−−−−−−−−−−−−−−−−−−−−−−−−−−−−−−−−−−−−−−−−−−−−−−−−−−−−−−−−−−−−−−−−−−−−−−−−−−−−−−−−−−−−−−−−−−−−−−−−−−−−−−−−−−−−−−−−−−−−−−−−−−−−−−−−−−−−−−−−−−−−−−−−−−−−−−−−−−−−−−−−−−−−−−−−−−−−−−−−−−−−−−−−−−−−−−−−−−−−−−−−−−−−−−−−−−−−−−−−−−−−−−−−−−−−−−−−−−−−−−−−−−−−−−−−−−−−−−−−−−−−−−−−−−−−−−−−−−−−−−−−−−−−−−−−−−−−−−−−−−−−−−−−−−−−−−−−−−−−−−−−−−−−−−−−−−−−−−−−−−−−−−−−
102,561,702.39 108,345,516.36 97,709,856.03EUR
Net asset value per share
B EUR P Cap 186.23 188.62 172.25EUR−−−−−−−−−−−−−−−−−−−−−−−−−−−−−−−−−−−−−−−−−−−−−−−−−−−−−−−−−−−−−−−−−−−−−−−−−−−−−−−−−−−−−−−−−−−−−−−−−−−−−−−−−−−−−−−−−−−−−−−−−−−−−−−−−−−−−−−−−−−−−−−−−−−−−−−−−−−−−−−−−−−−−−−−−−−−−−−−−−−−−−−−−−−−−−−−−−−−−−−−−−−−−−−−−−−−−−−−−−−−−−−−−−−−−−−−−−−−−−−−−−−−−−−−−−−−−−−−−−−−−−−−−−−−−−−−−−−−−−−−−−−−−−−−−−−−−−−−−−−−−−−−−−−−−−−−−−−−−−−−−−−−−−−−−−−−−−−−−−−−−−−−−−−−−−−−−−−−−−−−−−−−−−−−−−−−−−−−−−−−−−−−−−−−−−−−−−−−−−−−−−−−−−−−−−−−−−−−−−−−−−−−−−−−−−−−−−−−−−−−−−−−−−−−−−−−−−−−−−−−−−−−−−−−−−−−−−−−−−−−−−−−−−−−−−−−−−−−−−−−−−−
Number of shares
B EUR P Cap 550,725.32 574,401.94 567,263.32−−−−−−−−−−−−−−−−−−−−−−−−−−−−−−−−−−−−−−−−−−−−−−−−−−−−−−−−−−−−−−−−−−−−−−−−−−−−−−−−−−−−−−−−−−−−−−−−−−−−−−−−−−−−−−−−−−−−−−−−−−−−−−−−−−−−−−−−−−−−−−−−−−−−−−−−−−−−−−−−−−−−−−−−−−−−−−−−−−−−−−−−−−−−−−−−−−−−−−−−−−−−−−−−−−−−−−−−−−−−−−−−−−−−−−−−−−−−−−−−−−−−−−−−−−−−−−−−−−−−−−−−−−−−−−−−−−−−−−−−−−−−−−−−−−−−−−−−−−−−−−−−−−−−−−−−−−−−−−−−−−−−−−−−−−−−−−−−−−−−−−−−−−−−−−−−−−−−−−−−−−−−−−−−−−−−−−−−−−−−−−−−−−−−−−−−−−−−−−−−−−−−−−−−−−−−−−−−−−−−−−−−−−−−−−−−−−−−−−−−−−−−−−−−−−−−−−−−−−−−−−−−−−−−−−−−−−−−−−−−−−−−−−−−−−−−−−−−−−−−−−−
Pareturn Entheca Patrimoine
Net Asset Value−−−−−−−−−−−−−−−−−−−−−−−−−−−−−−−−−−−−−−−−−−−−−−−−−−−−−−−−−−−−−−−−−−−−−−−−−−−−−−−−−−−−−−−−−−−−−−−−−−−−−−−−−−−−−−−−−−−−−−−−−−−−−−−−−−−−−−−−−−−−−−−−−−−−−−−−−−−−−−−−−−−−−−−−−−−−−−−−−−−−−−−−−−−−−−−−−−−−−−−−−−−−−−−−−−−−−−−−−−−−−−−−−−−−−−−−−−−−−−−−−−−−−−−−−−−−−−−−−−−−−−−−−−−−−−−−−−−−−−−−−−−−−−−−−−−−−−−−−−−−−−−−−−−−−−−−−−−−−−−−−−−−−−−−−−−−−−−−−−−−−−−−−−−−−−−−−−−−−−−−−−−−−−−−−−−−−−−−−−−−−−−−−−−−−−−−−−−−−−−−−−−−−−−−−−−−−−−−−−−−−−−−−−−−−−−−−−−−−−−−−−−−−−−−−−−−−−−−−−−−−−−−−−−−−−−−−−−−−−−−−−−−−−−−−−−−−−−−−−−−−−−
67,639,054.94 66,746,257.21 64,869,315.52EUR
September 30, 2016March 31, 2018 September 30, 2017

PARETURN
13
The accompanying notes are an integral part of these financial statements.
Statistics
Net asset value per share
B EUR I Cap 153.47 154.66 149.97EURB EUR R Cap 149.36 151.03 147.43EUR−−−−−−−−−−−−−−−−−−−−−−−−−−−−−−−−−−−−−−−−−−−−−−−−−−−−−−−−−−−−−−−−−−−−−−−−−−−−−−−−−−−−−−−−−−−−−−−−−−−−−−−−−−−−−−−−−−−−−−−−−−−−−−−−−−−−−−−−−−−−−−−−−−−−−−−−−−−−−−−−−−−−−−−−−−−−−−−−−−−−−−−−−−−−−−−−−−−−−−−−−−−−−−−−−−−−−−−−−−−−−−−−−−−−−−−−−−−−−−−−−−−−−−−−−−−−−−−−−−−−−−−−−−−−−−−−−−−−−−−−−−−−−−−−−−−−−−−−−−−−−−−−−−−−−−−−−−−−−−−−−−−−−−−−−−−−−−−−−−−−−−−−−−−−−−−−−−−−−−−−−−−−−−−−−−−−−−−−−−−−−−−−−−−−−−−−−−−−−−−−−−−−−−−−−−−−−−−−−−−−−−−−−−−−−−−−−−−−−−−−−−−−−−−−−−−−−−−−−−−−−−−−−−−−−−−−−−−−−−−−−−−−−−−−−−−−−−−−−−−−−−−
Number of shares
B EUR I Cap 408,793.43 404,477.40 406,476.28B EUR R Cap 32,804.35 27,735.06 26,529.32−−−−−−−−−−−−−−−−−−−−−−−−−−−−−−−−−−−−−−−−−−−−−−−−−−−−−−−−−−−−−−−−−−−−−−−−−−−−−−−−−−−−−−−−−−−−−−−−−−−−−−−−−−−−−−−−−−−−−−−−−−−−−−−−−−−−−−−−−−−−−−−−−−−−−−−−−−−−−−−−−−−−−−−−−−−−−−−−−−−−−−−−−−−−−−−−−−−−−−−−−−−−−−−−−−−−−−−−−−−−−−−−−−−−−−−−−−−−−−−−−−−−−−−−−−−−−−−−−−−−−−−−−−−−−−−−−−−−−−−−−−−−−−−−−−−−−−−−−−−−−−−−−−−−−−−−−−−−−−−−−−−−−−−−−−−−−−−−−−−−−−−−−−−−−−−−−−−−−−−−−−−−−−−−−−−−−−−−−−−−−−−−−−−−−−−−−−−−−−−−−−−−−−−−−−−−−−−−−−−−−−−−−−−−−−−−−−−−−−−−−−−−−−−−−−−−−−−−−−−−−−−−−−−−−−−−−−−−−−−−−−−−−−−−−−−−−−−−−−−−−−−
Pareturn Ataun
Net Asset Value−−−−−−−−−−−−−−−−−−−−−−−−−−−−−−−−−−−−−−−−−−−−−−−−−−−−−−−−−−−−−−−−−−−−−−−−−−−−−−−−−−−−−−−−−−−−−−−−−−−−−−−−−−−−−−−−−−−−−−−−−−−−−−−−−−−−−−−−−−−−−−−−−−−−−−−−−−−−−−−−−−−−−−−−−−−−−−−−−−−−−−−−−−−−−−−−−−−−−−−−−−−−−−−−−−−−−−−−−−−−−−−−−−−−−−−−−−−−−−−−−−−−−−−−−−−−−−−−−−−−−−−−−−−−−−−−−−−−−−−−−−−−−−−−−−−−−−−−−−−−−−−−−−−−−−−−−−−−−−−−−−−−−−−−−−−−−−−−−−−−−−−−−−−−−−−−−−−−−−−−−−−−−−−−−−−−−−−−−−−−−−−−−−−−−−−−−−−−−−−−−−−−−−−−−−−−−−−−−−−−−−−−−−−−−−−−−−−−−−−−−−−−−−−−−−−−−−−−−−−−−−−−−−−−−−−−−−−−−−−−−−−−−−−−−−−−−−−−−−−−−−−
147,145,982.45 148,461,933.94 102,293,240.44EUR
Net asset value per share
B EUR I Cap 146.50 147.81 144.49EUR−−−−−−−−−−−−−−−−−−−−−−−−−−−−−−−−−−−−−−−−−−−−−−−−−−−−−−−−−−−−−−−−−−−−−−−−−−−−−−−−−−−−−−−−−−−−−−−−−−−−−−−−−−−−−−−−−−−−−−−−−−−−−−−−−−−−−−−−−−−−−−−−−−−−−−−−−−−−−−−−−−−−−−−−−−−−−−−−−−−−−−−−−−−−−−−−−−−−−−−−−−−−−−−−−−−−−−−−−−−−−−−−−−−−−−−−−−−−−−−−−−−−−−−−−−−−−−−−−−−−−−−−−−−−−−−−−−−−−−−−−−−−−−−−−−−−−−−−−−−−−−−−−−−−−−−−−−−−−−−−−−−−−−−−−−−−−−−−−−−−−−−−−−−−−−−−−−−−−−−−−−−−−−−−−−−−−−−−−−−−−−−−−−−−−−−−−−−−−−−−−−−−−−−−−−−−−−−−−−−−−−−−−−−−−−−−−−−−−−−−−−−−−−−−−−−−−−−−−−−−−−−−−−−−−−−−−−−−−−−−−−−−−−−−−−−−−−−−−−−−−−−
Number of shares
B EUR I Cap 1,004,420.22 1,004,420.22 707,955.00−−−−−−−−−−−−−−−−−−−−−−−−−−−−−−−−−−−−−−−−−−−−−−−−−−−−−−−−−−−−−−−−−−−−−−−−−−−−−−−−−−−−−−−−−−−−−−−−−−−−−−−−−−−−−−−−−−−−−−−−−−−−−−−−−−−−−−−−−−−−−−−−−−−−−−−−−−−−−−−−−−−−−−−−−−−−−−−−−−−−−−−−−−−−−−−−−−−−−−−−−−−−−−−−−−−−−−−−−−−−−−−−−−−−−−−−−−−−−−−−−−−−−−−−−−−−−−−−−−−−−−−−−−−−−−−−−−−−−−−−−−−−−−−−−−−−−−−−−−−−−−−−−−−−−−−−−−−−−−−−−−−−−−−−−−−−−−−−−−−−−−−−−−−−−−−−−−−−−−−−−−−−−−−−−−−−−−−−−−−−−−−−−−−−−−−−−−−−−−−−−−−−−−−−−−−−−−−−−−−−−−−−−−−−−−−−−−−−−−−−−−−−−−−−−−−−−−−−−−−−−−−−−−−−−−−−−−−−−−−−−−−−−−−−−−−−−−−−−−−−−−−
Pareturn Invalux Fund
Net Asset Value−−−−−−−−−−−−−−−−−−−−−−−−−−−−−−−−−−−−−−−−−−−−−−−−−−−−−−−−−−−−−−−−−−−−−−−−−−−−−−−−−−−−−−−−−−−−−−−−−−−−−−−−−−−−−−−−−−−−−−−−−−−−−−−−−−−−−−−−−−−−−−−−−−−−−−−−−−−−−−−−−−−−−−−−−−−−−−−−−−−−−−−−−−−−−−−−−−−−−−−−−−−−−−−−−−−−−−−−−−−−−−−−−−−−−−−−−−−−−−−−−−−−−−−−−−−−−−−−−−−−−−−−−−−−−−−−−−−−−−−−−−−−−−−−−−−−−−−−−−−−−−−−−−−−−−−−−−−−−−−−−−−−−−−−−−−−−−−−−−−−−−−−−−−−−−−−−−−−−−−−−−−−−−−−−−−−−−−−−−−−−−−−−−−−−−−−−−−−−−−−−−−−−−−−−−−−−−−−−−−−−−−−−−−−−−−−−−−−−−−−−−−−−−−−−−−−−−−−−−−−−−−−−−−−−−−−−−−−−−−−−−−−−−−−−−−−−−−−−−−−−−−
45,157,620.85 45,541,554.59 46,436,058.98EUR
Net asset value per share
B EUR I Cap 153.31 154.61 142.85EUR−−−−−−−−−−−−−−−−−−−−−−−−−−−−−−−−−−−−−−−−−−−−−−−−−−−−−−−−−−−−−−−−−−−−−−−−−−−−−−−−−−−−−−−−−−−−−−−−−−−−−−−−−−−−−−−−−−−−−−−−−−−−−−−−−−−−−−−−−−−−−−−−−−−−−−−−−−−−−−−−−−−−−−−−−−−−−−−−−−−−−−−−−−−−−−−−−−−−−−−−−−−−−−−−−−−−−−−−−−−−−−−−−−−−−−−−−−−−−−−−−−−−−−−−−−−−−−−−−−−−−−−−−−−−−−−−−−−−−−−−−−−−−−−−−−−−−−−−−−−−−−−−−−−−−−−−−−−−−−−−−−−−−−−−−−−−−−−−−−−−−−−−−−−−−−−−−−−−−−−−−−−−−−−−−−−−−−−−−−−−−−−−−−−−−−−−−−−−−−−−−−−−−−−−−−−−−−−−−−−−−−−−−−−−−−−−−−−−−−−−−−−−−−−−−−−−−−−−−−−−−−−−−−−−−−−−−−−−−−−−−−−−−−−−−−−−−−−−−−−−−−−
Number of shares
B EUR I Cap 294,550.12 294,550.12 325,078.69−−−−−−−−−−−−−−−−−−−−−−−−−−−−−−−−−−−−−−−−−−−−−−−−−−−−−−−−−−−−−−−−−−−−−−−−−−−−−−−−−−−−−−−−−−−−−−−−−−−−−−−−−−−−−−−−−−−−−−−−−−−−−−−−−−−−−−−−−−−−−−−−−−−−−−−−−−−−−−−−−−−−−−−−−−−−−−−−−−−−−−−−−−−−−−−−−−−−−−−−−−−−−−−−−−−−−−−−−−−−−−−−−−−−−−−−−−−−−−−−−−−−−−−−−−−−−−−−−−−−−−−−−−−−−−−−−−−−−−−−−−−−−−−−−−−−−−−−−−−−−−−−−−−−−−−−−−−−−−−−−−−−−−−−−−−−−−−−−−−−−−−−−−−−−−−−−−−−−−−−−−−−−−−−−−−−−−−−−−−−−−−−−−−−−−−−−−−−−−−−−−−−−−−−−−−−−−−−−−−−−−−−−−−−−−−−−−−−−−−−−−−−−−−−−−−−−−−−−−−−−−−−−−−−−−−−−−−−−−−−−−−−−−−−−−−−−−−−−−−−−−−
Pareturn Gladwyne Absolute Credit
Net Asset Value−−−−−−−−−−−−−−−−−−−−−−−−−−−−−−−−−−−−−−−−−−−−−−−−−−−−−−−−−−−−−−−−−−−−−−−−−−−−−−−−−−−−−−−−−−−−−−−−−−−−−−−−−−−−−−−−−−−−−−−−−−−−−−−−−−−−−−−−−−−−−−−−−−−−−−−−−−−−−−−−−−−−−−−−−−−−−−−−−−−−−−−−−−−−−−−−−−−−−−−−−−−−−−−−−−−−−−−−−−−−−−−−−−−−−−−−−−−−−−−−−−−−−−−−−−−−−−−−−−−−−−−−−−−−−−−−−−−−−−−−−−−−−−−−−−−−−−−−−−−−−−−−−−−−−−−−−−−−−−−−−−−−−−−−−−−−−−−−−−−−−−−−−−−−−−−−−−−−−−−−−−−−−−−−−−−−−−−−−−−−−−−−−−−−−−−−−−−−−−−−−−−−−−−−−−−−−−−−−−−−−−−−−−−−−−−−−−−−−−−−−−−−−−−−−−−−−−−−−−−−−−−−−−−−−−−−−−−−−−−−−−−−−−−−−−−−−−−−−−−−−−−
172,622,822.04 150,081,906.64 89,959,773.13EUR
Net asset value per share
B EUR I Cap 175.69 173.37 160.45EURB EUR P Cap 170.67 168.45 155.95EURB GBP G Hedged Cap 152.85 150.38 -GBPB USD R1 Hedged Cap 153.04 - -USDB USD U Hedged Cap 154.05 150.73 -USD−−−−−−−−−−−−−−−−−−−−−−−−−−−−−−−−−−−−−−−−−−−−−−−−−−−−−−−−−−−−−−−−−−−−−−−−−−−−−−−−−−−−−−−−−−−−−−−−−−−−−−−−−−−−−−−−−−−−−−−−−−−−−−−−−−−−−−−−−−−−−−−−−−−−−−−−−−−−−−−−−−−−−−−−−−−−−−−−−−−−−−−−−−−−−−−−−−−−−−−−−−−−−−−−−−−−−−−−−−−−−−−−−−−−−−−−−−−−−−−−−−−−−−−−−−−−−−−−−−−−−−−−−−−−−−−−−−−−−−−−−−−−−−−−−−−−−−−−−−−−−−−−−−−−−−−−−−−−−−−−−−−−−−−−−−−−−−−−−−−−−−−−−−−−−−−−−−−−−−−−−−−−−−−−−−−−−−−−−−−−−−−−−−−−−−−−−−−−−−−−−−−−−−−−−−−−−−−−−−−−−−−−−−−−−−−−−−−−−−−−−−−−−−−−−−−−−−−−−−−−−−−−−−−−−−−−−−−−−−−−−−−−−−−−−−−−−−−−−−−−−−−
Number of shares
B EUR I Cap 729,046.91 742,881.16 547,532.55B EUR P Cap 22,764.49 16,885.00 13,523.87B GBP G Hedged Cap 106,828.54 75,588.45 -B USD R1 Hedged Cap 6,224.87 - -B USD U Hedged Cap 170,296.54 43,482.57 -−−−−−−−−−−−−−−−−−−−−−−−−−−−−−−−−−−−−−−−−−−−−−−−−−−−−−−−−−−−−−−−−−−−−−−−−−−−−−−−−−−−−−−−−−−−−−−−−−−−−−−−−−−−−−−−−−−−−−−−−−−−−−−−−−−−−−−−−−−−−−−−−−−−−−−−−−−−−−−−−−−−−−−−−−−−−−−−−−−−−−−−−−−−−−−−−−−−−−−−−−−−−−−−−−−−−−−−−−−−−−−−−−−−−−−−−−−−−−−−−−−−−−−−−−−−−−−−−−−−−−−−−−−−−−−−−−−−−−−−−−−−−−−−−−−−−−−−−−−−−−−−−−−−−−−−−−−−−−−−−−−−−−−−−−−−−−−−−−−−−−−−−−−−−−−−−−−−−−−−−−−−−−−−−−−−−−−−−−−−−−−−−−−−−−−−−−−−−−−−−−−−−−−−−−−−−−−−−−−−−−−−−−−−−−−−−−−−−−−−−−−−−−−−−−−−−−−−−−−−−−−−−−−−−−−−−−−−−−−−−−−−−−−−−−−−−−−−−−−−−−−−
Pareturn Mutuafondo España Lux
Net Asset Value−−−−−−−−−−−−−−−−−−−−−−−−−−−−−−−−−−−−−−−−−−−−−−−−−−−−−−−−−−−−−−−−−−−−−−−−−−−−−−−−−−−−−−−−−−−−−−−−−−−−−−−−−−−−−−−−−−−−−−−−−−−−−−−−−−−−−−−−−−−−−−−−−−−−−−−−−−−−−−−−−−−−−−−−−−−−−−−−−−−−−−−−−−−−−−−−−−−−−−−−−−−−−−−−−−−−−−−−−−−−−−−−−−−−−−−−−−−−−−−−−−−−−−−−−−−−−−−−−−−−−−−−−−−−−−−−−−−−−−−−−−−−−−−−−−−−−−−−−−−−−−−−−−−−−−−−−−−−−−−−−−−−−−−−−−−−−−−−−−−−−−−−−−−−−−−−−−−−−−−−−−−−−−−−−−−−−−−−−−−−−−−−−−−−−−−−−−−−−−−−−−−−−−−−−−−−−−−−−−−−−−−−−−−−−−−−−−−−−−−−−−−−−−−−−−−−−−−−−−−−−−−−−−−−−−−−−−−−−−−−−−−−−−−−−−−−−−−−−−−−−−−
32,115,544.86 31,255,339.57 27,811,877.20EUR
Net asset value per share
B EUR P Cap 158.91 154.65 137.61EUR−−−−−−−−−−−−−−−−−−−−−−−−−−−−−−−−−−−−−−−−−−−−−−−−−−−−−−−−−−−−−−−−−−−−−−−−−−−−−−−−−−−−−−−−−−−−−−−−−−−−−−−−−−−−−−−−−−−−−−−−−−−−−−−−−−−−−−−−−−−−−−−−−−−−−−−−−−−−−−−−−−−−−−−−−−−−−−−−−−−−−−−−−−−−−−−−−−−−−−−−−−−−−−−−−−−−−−−−−−−−−−−−−−−−−−−−−−−−−−−−−−−−−−−−−−−−−−−−−−−−−−−−−−−−−−−−−−−−−−−−−−−−−−−−−−−−−−−−−−−−−−−−−−−−−−−−−−−−−−−−−−−−−−−−−−−−−−−−−−−−−−−−−−−−−−−−−−−−−−−−−−−−−−−−−−−−−−−−−−−−−−−−−−−−−−−−−−−−−−−−−−−−−−−−−−−−−−−−−−−−−−−−−−−−−−−−−−−−−−−−−−−−−−−−−−−−−−−−−−−−−−−−−−−−−−−−−−−−−−−−−−−−−−−−−−−−−−−−−−−−−−−
Number of shares
B EUR P Cap 202,099.64 202,099.64 202,099.64−−−−−−−−−−−−−−−−−−−−−−−−−−−−−−−−−−−−−−−−−−−−−−−−−−−−−−−−−−−−−−−−−−−−−−−−−−−−−−−−−−−−−−−−−−−−−−−−−−−−−−−−−−−−−−−−−−−−−−−−−−−−−−−−−−−−−−−−−−−−−−−−−−−−−−−−−−−−−−−−−−−−−−−−−−−−−−−−−−−−−−−−−−−−−−−−−−−−−−−−−−−−−−−−−−−−−−−−−−−−−−−−−−−−−−−−−−−−−−−−−−−−−−−−−−−−−−−−−−−−−−−−−−−−−−−−−−−−−−−−−−−−−−−−−−−−−−−−−−−−−−−−−−−−−−−−−−−−−−−−−−−−−−−−−−−−−−−−−−−−−−−−−−−−−−−−−−−−−−−−−−−−−−−−−−−−−−−−−−−−−−−−−−−−−−−−−−−−−−−−−−−−−−−−−−−−−−−−−−−−−−−−−−−−−−−−−−−−−−−−−−−−−−−−−−−−−−−−−−−−−−−−−−−−−−−−−−−−−−−−−−−−−−−−−−−−−−−−−−−−−−−
Pareturn EtendAR
Net Asset Value−−−−−−−−−−−−−−−−−−−−−−−−−−−−−−−−−−−−−−−−−−−−−−−−−−−−−−−−−−−−−−−−−−−−−−−−−−−−−−−−−−−−−−−−−−−−−−−−−−−−−−−−−−−−−−−−−−−−−−−−−−−−−−−−−−−−−−−−−−−−−−−−−−−−−−−−−−−−−−−−−−−−−−−−−−−−−−−−−−−−−−−−−−−−−−−−−−−−−−−−−−−−−−−−−−−−−−−−−−−−−−−−−−−−−−−−−−−−−−−−−−−−−−−−−−−−−−−−−−−−−−−−−−−−−−−−−−−−−−−−−−−−−−−−−−−−−−−−−−−−−−−−−−−−−−−−−−−−−−−−−−−−−−−−−−−−−−−−−−−−−−−−−−−−−−−−−−−−−−−−−−−−−−−−−−−−−−−−−−−−−−−−−−−−−−−−−−−−−−−−−−−−−−−−−−−−−−−−−−−−−−−−−−−−−−−−−−−−−−−−−−−−−−−−−−−−−−−−−−−−−−−−−−−−−−−−−−−−−−−−−−−−−−−−−−−−−−−−−−−−−−−
4,079,952.02 4,820,512.09 10,579,878.19EUR
September 30, 2016March 31, 2018 September 30, 2017
PARETURN
14
The accompanying notes are an integral part of these financial statements.
Statistics
Net asset value per share
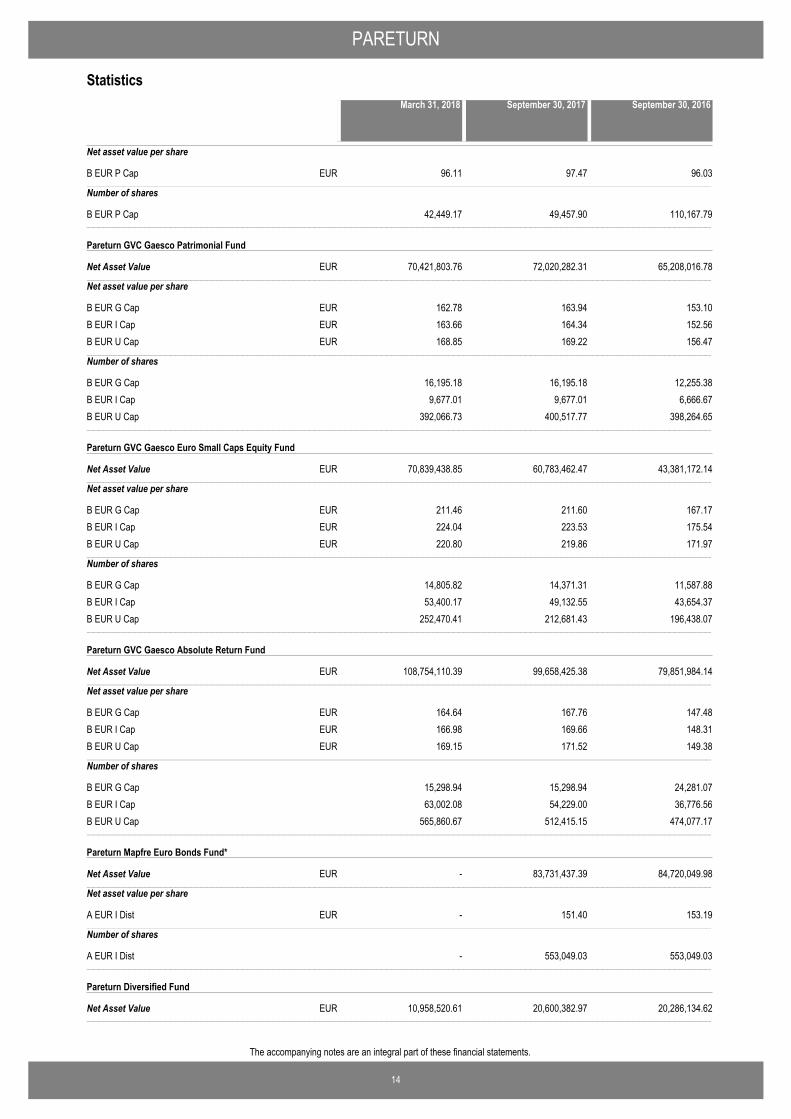
B EUR P Cap 96.11 97.47 96.03EUR−−−−−−−−−−−−−−−−−−−−−−−−−−−−−−−−−−−−−−−−−−−−−−−−−−−−−−−−−−−−−−−−−−−−−−−−−−−−−−−−−−−−−−−−−−−−−−−−−−−−−−−−−−−−−−−−−−−−−−−−−−−−−−−−−−−−−−−−−−−−−−−−−−−−−−−−−−−−−−−−−−−−−−−−−−−−−−−−−−−−−−−−−−−−−−−−−−−−−−−−−−−−−−−−−−−−−−−−−−−−−−−−−−−−−−−−−−−−−−−−−−−−−−−−−−−−−−−−−−−−−−−−−−−−−−−−−−−−−−−−−−−−−−−−−−−−−−−−−−−−−−−−−−−−−−−−−−−−−−−−−−−−−−−−−−−−−−−−−−−−−−−−−−−−−−−−−−−−−−−−−−−−−−−−−−−−−−−−−−−−−−−−−−−−−−−−−−−−−−−−−−−−−−−−−−−−−−−−−−−−−−−−−−−−−−−−−−−−−−−−−−−−−−−−−−−−−−−−−−−−−−−−−−−−−−−−−−−−−−−−−−−−−−−−−−−−−−−−−−−−−−−
Number of shares
B EUR P Cap 42,449.17 49,457.90 110,167.79−−−−−−−−−−−−−−−−−−−−−−−−−−−−−−−−−−−−−−−−−−−−−−−−−−−−−−−−−−−−−−−−−−−−−−−−−−−−−−−−−−−−−−−−−−−−−−−−−−−−−−−−−−−−−−−−−−−−−−−−−−−−−−−−−−−−−−−−−−−−−−−−−−−−−−−−−−−−−−−−−−−−−−−−−−−−−−−−−−−−−−−−−−−−−−−−−−−−−−−−−−−−−−−−−−−−−−−−−−−−−−−−−−−−−−−−−−−−−−−−−−−−−−−−−−−−−−−−−−−−−−−−−−−−−−−−−−−−−−−−−−−−−−−−−−−−−−−−−−−−−−−−−−−−−−−−−−−−−−−−−−−−−−−−−−−−−−−−−−−−−−−−−−−−−−−−−−−−−−−−−−−−−−−−−−−−−−−−−−−−−−−−−−−−−−−−−−−−−−−−−−−−−−−−−−−−−−−−−−−−−−−−−−−−−−−−−−−−−−−−−−−−−−−−−−−−−−−−−−−−−−−−−−−−−−−−−−−−−−−−−−−−−−−−−−−−−−−−−−−−−−−
Pareturn GVC Gaesco Patrimonial Fund
Net Asset Value−−−−−−−−−−−−−−−−−−−−−−−−−−−−−−−−−−−−−−−−−−−−−−−−−−−−−−−−−−−−−−−−−−−−−−−−−−−−−−−−−−−−−−−−−−−−−−−−−−−−−−−−−−−−−−−−−−−−−−−−−−−−−−−−−−−−−−−−−−−−−−−−−−−−−−−−−−−−−−−−−−−−−−−−−−−−−−−−−−−−−−−−−−−−−−−−−−−−−−−−−−−−−−−−−−−−−−−−−−−−−−−−−−−−−−−−−−−−−−−−−−−−−−−−−−−−−−−−−−−−−−−−−−−−−−−−−−−−−−−−−−−−−−−−−−−−−−−−−−−−−−−−−−−−−−−−−−−−−−−−−−−−−−−−−−−−−−−−−−−−−−−−−−−−−−−−−−−−−−−−−−−−−−−−−−−−−−−−−−−−−−−−−−−−−−−−−−−−−−−−−−−−−−−−−−−−−−−−−−−−−−−−−−−−−−−−−−−−−−−−−−−−−−−−−−−−−−−−−−−−−−−−−−−−−−−−−−−−−−−−−−−−−−−−−−−−−−−−−−−−−−−
70,421,803.76 72,020,282.31 65,208,016.78EUR
Net asset value per share
B EUR G Cap 162.78 163.94 153.10EURB EUR I Cap 163.66 164.34 152.56EURB EUR U Cap 168.85 169.22 156.47EUR−−−−−−−−−−−−−−−−−−−−−−−−−−−−−−−−−−−−−−−−−−−−−−−−−−−−−−−−−−−−−−−−−−−−−−−−−−−−−−−−−−−−−−−−−−−−−−−−−−−−−−−−−−−−−−−−−−−−−−−−−−−−−−−−−−−−−−−−−−−−−−−−−−−−−−−−−−−−−−−−−−−−−−−−−−−−−−−−−−−−−−−−−−−−−−−−−−−−−−−−−−−−−−−−−−−−−−−−−−−−−−−−−−−−−−−−−−−−−−−−−−−−−−−−−−−−−−−−−−−−−−−−−−−−−−−−−−−−−−−−−−−−−−−−−−−−−−−−−−−−−−−−−−−−−−−−−−−−−−−−−−−−−−−−−−−−−−−−−−−−−−−−−−−−−−−−−−−−−−−−−−−−−−−−−−−−−−−−−−−−−−−−−−−−−−−−−−−−−−−−−−−−−−−−−−−−−−−−−−−−−−−−−−−−−−−−−−−−−−−−−−−−−−−−−−−−−−−−−−−−−−−−−−−−−−−−−−−−−−−−−−−−−−−−−−−−−−−−−−−−−−−
Number of shares
B EUR G Cap 16,195.18 16,195.18 12,255.38B EUR I Cap 9,677.01 9,677.01 6,666.67B EUR U Cap 392,066.73 400,517.77 398,264.65−−−−−−−−−−−−−−−−−−−−−−−−−−−−−−−−−−−−−−−−−−−−−−−−−−−−−−−−−−−−−−−−−−−−−−−−−−−−−−−−−−−−−−−−−−−−−−−−−−−−−−−−−−−−−−−−−−−−−−−−−−−−−−−−−−−−−−−−−−−−−−−−−−−−−−−−−−−−−−−−−−−−−−−−−−−−−−−−−−−−−−−−−−−−−−−−−−−−−−−−−−−−−−−−−−−−−−−−−−−−−−−−−−−−−−−−−−−−−−−−−−−−−−−−−−−−−−−−−−−−−−−−−−−−−−−−−−−−−−−−−−−−−−−−−−−−−−−−−−−−−−−−−−−−−−−−−−−−−−−−−−−−−−−−−−−−−−−−−−−−−−−−−−−−−−−−−−−−−−−−−−−−−−−−−−−−−−−−−−−−−−−−−−−−−−−−−−−−−−−−−−−−−−−−−−−−−−−−−−−−−−−−−−−−−−−−−−−−−−−−−−−−−−−−−−−−−−−−−−−−−−−−−−−−−−−−−−−−−−−−−−−−−−−−−−−−−−−−−−−−−−−
Pareturn GVC Gaesco Euro Small Caps Equity Fund
Net Asset Value−−−−−−−−−−−−−−−−−−−−−−−−−−−−−−−−−−−−−−−−−−−−−−−−−−−−−−−−−−−−−−−−−−−−−−−−−−−−−−−−−−−−−−−−−−−−−−−−−−−−−−−−−−−−−−−−−−−−−−−−−−−−−−−−−−−−−−−−−−−−−−−−−−−−−−−−−−−−−−−−−−−−−−−−−−−−−−−−−−−−−−−−−−−−−−−−−−−−−−−−−−−−−−−−−−−−−−−−−−−−−−−−−−−−−−−−−−−−−−−−−−−−−−−−−−−−−−−−−−−−−−−−−−−−−−−−−−−−−−−−−−−−−−−−−−−−−−−−−−−−−−−−−−−−−−−−−−−−−−−−−−−−−−−−−−−−−−−−−−−−−−−−−−−−−−−−−−−−−−−−−−−−−−−−−−−−−−−−−−−−−−−−−−−−−−−−−−−−−−−−−−−−−−−−−−−−−−−−−−−−−−−−−−−−−−−−−−−−−−−−−−−−−−−−−−−−−−−−−−−−−−−−−−−−−−−−−−−−−−−−−−−−−−−−−−−−−−−−−−−−−−−
70,839,438.85 60,783,462.47 43,381,172.14EUR
Net asset value per share
B EUR G Cap 211.46 211.60 167.17EURB EUR I Cap 224.04 223.53 175.54EURB EUR U Cap 220.80 219.86 171.97EUR−−−−−−−−−−−−−−−−−−−−−−−−−−−−−−−−−−−−−−−−−−−−−−−−−−−−−−−−−−−−−−−−−−−−−−−−−−−−−−−−−−−−−−−−−−−−−−−−−−−−−−−−−−−−−−−−−−−−−−−−−−−−−−−−−−−−−−−−−−−−−−−−−−−−−−−−−−−−−−−−−−−−−−−−−−−−−−−−−−−−−−−−−−−−−−−−−−−−−−−−−−−−−−−−−−−−−−−−−−−−−−−−−−−−−−−−−−−−−−−−−−−−−−−−−−−−−−−−−−−−−−−−−−−−−−−−−−−−−−−−−−−−−−−−−−−−−−−−−−−−−−−−−−−−−−−−−−−−−−−−−−−−−−−−−−−−−−−−−−−−−−−−−−−−−−−−−−−−−−−−−−−−−−−−−−−−−−−−−−−−−−−−−−−−−−−−−−−−−−−−−−−−−−−−−−−−−−−−−−−−−−−−−−−−−−−−−−−−−−−−−−−−−−−−−−−−−−−−−−−−−−−−−−−−−−−−−−−−−−−−−−−−−−−−−−−−−−−−−−−−−−−
Number of shares
B EUR G Cap 14,805.82 14,371.31 11,587.88B EUR I Cap 53,400.17 49,132.55 43,654.37B EUR U Cap 252,470.41 212,681.43 196,438.07−−−−−−−−−−−−−−−−−−−−−−−−−−−−−−−−−−−−−−−−−−−−−−−−−−−−−−−−−−−−−−−−−−−−−−−−−−−−−−−−−−−−−−−−−−−−−−−−−−−−−−−−−−−−−−−−−−−−−−−−−−−−−−−−−−−−−−−−−−−−−−−−−−−−−−−−−−−−−−−−−−−−−−−−−−−−−−−−−−−−−−−−−−−−−−−−−−−−−−−−−−−−−−−−−−−−−−−−−−−−−−−−−−−−−−−−−−−−−−−−−−−−−−−−−−−−−−−−−−−−−−−−−−−−−−−−−−−−−−−−−−−−−−−−−−−−−−−−−−−−−−−−−−−−−−−−−−−−−−−−−−−−−−−−−−−−−−−−−−−−−−−−−−−−−−−−−−−−−−−−−−−−−−−−−−−−−−−−−−−−−−−−−−−−−−−−−−−−−−−−−−−−−−−−−−−−−−−−−−−−−−−−−−−−−−−−−−−−−−−−−−−−−−−−−−−−−−−−−−−−−−−−−−−−−−−−−−−−−−−−−−−−−−−−−−−−−−−−−−−−−−−
Pareturn GVC Gaesco Absolute Return Fund
Net Asset Value−−−−−−−−−−−−−−−−−−−−−−−−−−−−−−−−−−−−−−−−−−−−−−−−−−−−−−−−−−−−−−−−−−−−−−−−−−−−−−−−−−−−−−−−−−−−−−−−−−−−−−−−−−−−−−−−−−−−−−−−−−−−−−−−−−−−−−−−−−−−−−−−−−−−−−−−−−−−−−−−−−−−−−−−−−−−−−−−−−−−−−−−−−−−−−−−−−−−−−−−−−−−−−−−−−−−−−−−−−−−−−−−−−−−−−−−−−−−−−−−−−−−−−−−−−−−−−−−−−−−−−−−−−−−−−−−−−−−−−−−−−−−−−−−−−−−−−−−−−−−−−−−−−−−−−−−−−−−−−−−−−−−−−−−−−−−−−−−−−−−−−−−−−−−−−−−−−−−−−−−−−−−−−−−−−−−−−−−−−−−−−−−−−−−−−−−−−−−−−−−−−−−−−−−−−−−−−−−−−−−−−−−−−−−−−−−−−−−−−−−−−−−−−−−−−−−−−−−−−−−−−−−−−−−−−−−−−−−−−−−−−−−−−−−−−−−−−−−−−−−−−−
108,754,110.39 99,658,425.38 79,851,984.14EUR
Net asset value per share
B EUR G Cap 164.64 167.76 147.48EURB EUR I Cap 166.98 169.66 148.31EURB EUR U Cap 169.15 171.52 149.38EUR−−−−−−−−−−−−−−−−−−−−−−−−−−−−−−−−−−−−−−−−−−−−−−−−−−−−−−−−−−−−−−−−−−−−−−−−−−−−−−−−−−−−−−−−−−−−−−−−−−−−−−−−−−−−−−−−−−−−−−−−−−−−−−−−−−−−−−−−−−−−−−−−−−−−−−−−−−−−−−−−−−−−−−−−−−−−−−−−−−−−−−−−−−−−−−−−−−−−−−−−−−−−−−−−−−−−−−−−−−−−−−−−−−−−−−−−−−−−−−−−−−−−−−−−−−−−−−−−−−−−−−−−−−−−−−−−−−−−−−−−−−−−−−−−−−−−−−−−−−−−−−−−−−−−−−−−−−−−−−−−−−−−−−−−−−−−−−−−−−−−−−−−−−−−−−−−−−−−−−−−−−−−−−−−−−−−−−−−−−−−−−−−−−−−−−−−−−−−−−−−−−−−−−−−−−−−−−−−−−−−−−−−−−−−−−−−−−−−−−−−−−−−−−−−−−−−−−−−−−−−−−−−−−−−−−−−−−−−−−−−−−−−−−−−−−−−−−−−−−−−−−−
Number of shares
B EUR G Cap 15,298.94 15,298.94 24,281.07B EUR I Cap 63,002.08 54,229.00 36,776.56B EUR U Cap 565,860.67 512,415.15 474,077.17−−−−−−−−−−−−−−−−−−−−−−−−−−−−−−−−−−−−−−−−−−−−−−−−−−−−−−−−−−−−−−−−−−−−−−−−−−−−−−−−−−−−−−−−−−−−−−−−−−−−−−−−−−−−−−−−−−−−−−−−−−−−−−−−−−−−−−−−−−−−−−−−−−−−−−−−−−−−−−−−−−−−−−−−−−−−−−−−−−−−−−−−−−−−−−−−−−−−−−−−−−−−−−−−−−−−−−−−−−−−−−−−−−−−−−−−−−−−−−−−−−−−−−−−−−−−−−−−−−−−−−−−−−−−−−−−−−−−−−−−−−−−−−−−−−−−−−−−−−−−−−−−−−−−−−−−−−−−−−−−−−−−−−−−−−−−−−−−−−−−−−−−−−−−−−−−−−−−−−−−−−−−−−−−−−−−−−−−−−−−−−−−−−−−−−−−−−−−−−−−−−−−−−−−−−−−−−−−−−−−−−−−−−−−−−−−−−−−−−−−−−−−−−−−−−−−−−−−−−−−−−−−−−−−−−−−−−−−−−−−−−−−−−−−−−−−−−−−−−−−−−−
Pareturn Mapfre Euro Bonds Fund*
Net Asset Value−−−−−−−−−−−−−−−−−−−−−−−−−−−−−−−−−−−−−−−−−−−−−−−−−−−−−−−−−−−−−−−−−−−−−−−−−−−−−−−−−−−−−−−−−−−−−−−−−−−−−−−−−−−−−−−−−−−−−−−−−−−−−−−−−−−−−−−−−−−−−−−−−−−−−−−−−−−−−−−−−−−−−−−−−−−−−−−−−−−−−−−−−−−−−−−−−−−−−−−−−−−−−−−−−−−−−−−−−−−−−−−−−−−−−−−−−−−−−−−−−−−−−−−−−−−−−−−−−−−−−−−−−−−−−−−−−−−−−−−−−−−−−−−−−−−−−−−−−−−−−−−−−−−−−−−−−−−−−−−−−−−−−−−−−−−−−−−−−−−−−−−−−−−−−−−−−−−−−−−−−−−−−−−−−−−−−−−−−−−−−−−−−−−−−−−−−−−−−−−−−−−−−−−−−−−−−−−−−−−−−−−−−−−−−−−−−−−−−−−−−−−−−−−−−−−−−−−−−−−−−−−−−−−−−−−−−−−−−−−−−−−−−−−−−−−−−−−−−−−−−−−
- 83,731,437.39 84,720,049.98EUR
Net asset value per share
A EUR I Dist - 151.40 153.19EUR−−−−−−−−−−−−−−−−−−−−−−−−−−−−−−−−−−−−−−−−−−−−−−−−−−−−−−−−−−−−−−−−−−−−−−−−−−−−−−−−−−−−−−−−−−−−−−−−−−−−−−−−−−−−−−−−−−−−−−−−−−−−−−−−−−−−−−−−−−−−−−−−−−−−−−−−−−−−−−−−−−−−−−−−−−−−−−−−−−−−−−−−−−−−−−−−−−−−−−−−−−−−−−−−−−−−−−−−−−−−−−−−−−−−−−−−−−−−−−−−−−−−−−−−−−−−−−−−−−−−−−−−−−−−−−−−−−−−−−−−−−−−−−−−−−−−−−−−−−−−−−−−−−−−−−−−−−−−−−−−−−−−−−−−−−−−−−−−−−−−−−−−−−−−−−−−−−−−−−−−−−−−−−−−−−−−−−−−−−−−−−−−−−−−−−−−−−−−−−−−−−−−−−−−−−−−−−−−−−−−−−−−−−−−−−−−−−−−−−−−−−−−−−−−−−−−−−−−−−−−−−−−−−−−−−−−−−−−−−−−−−−−−−−−−−−−−−−−−−−−−−−
Number of shares
A EUR I Dist - 553,049.03 553,049.03−−−−−−−−−−−−−−−−−−−−−−−−−−−−−−−−−−−−−−−−−−−−−−−−−−−−−−−−−−−−−−−−−−−−−−−−−−−−−−−−−−−−−−−−−−−−−−−−−−−−−−−−−−−−−−−−−−−−−−−−−−−−−−−−−−−−−−−−−−−−−−−−−−−−−−−−−−−−−−−−−−−−−−−−−−−−−−−−−−−−−−−−−−−−−−−−−−−−−−−−−−−−−−−−−−−−−−−−−−−−−−−−−−−−−−−−−−−−−−−−−−−−−−−−−−−−−−−−−−−−−−−−−−−−−−−−−−−−−−−−−−−−−−−−−−−−−−−−−−−−−−−−−−−−−−−−−−−−−−−−−−−−−−−−−−−−−−−−−−−−−−−−−−−−−−−−−−−−−−−−−−−−−−−−−−−−−−−−−−−−−−−−−−−−−−−−−−−−−−−−−−−−−−−−−−−−−−−−−−−−−−−−−−−−−−−−−−−−−−−−−−−−−−−−−−−−−−−−−−−−−−−−−−−−−−−−−−−−−−−−−−−−−−−−−−−−−−−−−−−−−−−
Pareturn Diversified Fund
Net Asset Value−−−−−−−−−−−−−−−−−−−−−−−−−−−−−−−−−−−−−−−−−−−−−−−−−−−−−−−−−−−−−−−−−−−−−−−−−−−−−−−−−−−−−−−−−−−−−−−−−−−−−−−−−−−−−−−−−−−−−−−−−−−−−−−−−−−−−−−−−−−−−−−−−−−−−−−−−−−−−−−−−−−−−−−−−−−−−−−−−−−−−−−−−−−−−−−−−−−−−−−−−−−−−−−−−−−−−−−−−−−−−−−−−−−−−−−−−−−−−−−−−−−−−−−−−−−−−−−−−−−−−−−−−−−−−−−−−−−−−−−−−−−−−−−−−−−−−−−−−−−−−−−−−−−−−−−−−−−−−−−−−−−−−−−−−−−−−−−−−−−−−−−−−−−−−−−−−−−−−−−−−−−−−−−−−−−−−−−−−−−−−−−−−−−−−−−−−−−−−−−−−−−−−−−−−−−−−−−−−−−−−−−−−−−−−−−−−−−−−−−−−−−−−−−−−−−−−−−−−−−−−−−−−−−−−−−−−−−−−−−−−−−−−−−−−−−−−−−−−−−−−−−
10,958,520.61 20,600,382.97 20,286,134.62EUR
September 30, 2016March 31, 2018 September 30, 2017

PARETURN
15
The accompanying notes are an integral part of these financial statements.
Statistics
Net asset value per share
B EUR I Cap 152.50 154.32 151.97EUR−−−−−−−−−−−−−−−−−−−−−−−−−−−−−−−−−−−−−−−−−−−−−−−−−−−−−−−−−−−−−−−−−−−−−−−−−−−−−−−−−−−−−−−−−−−−−−−−−−−−−−−−−−−−−−−−−−−−−−−−−−−−−−−−−−−−−−−−−−−−−−−−−−−−−−−−−−−−−−−−−−−−−−−−−−−−−−−−−−−−−−−−−−−−−−−−−−−−−−−−−−−−−−−−−−−−−−−−−−−−−−−−−−−−−−−−−−−−−−−−−−−−−−−−−−−−−−−−−−−−−−−−−−−−−−−−−−−−−−−−−−−−−−−−−−−−−−−−−−−−−−−−−−−−−−−−−−−−−−−−−−−−−−−−−−−−−−−−−−−−−−−−−−−−−−−−−−−−−−−−−−−−−−−−−−−−−−−−−−−−−−−−−−−−−−−−−−−−−−−−−−−−−−−−−−−−−−−−−−−−−−−−−−−−−−−−−−−−−−−−−−−−−−−−−−−−−−−−−−−−−−−−−−−−−−−−−−−−−−−−−−−−−−−−−−−−−−−−−−−−−−−
Number of shares
B EUR I Cap 71,857.06 133,491.06 133,491.06−−−−−−−−−−−−−−−−−−−−−−−−−−−−−−−−−−−−−−−−−−−−−−−−−−−−−−−−−−−−−−−−−−−−−−−−−−−−−−−−−−−−−−−−−−−−−−−−−−−−−−−−−−−−−−−−−−−−−−−−−−−−−−−−−−−−−−−−−−−−−−−−−−−−−−−−−−−−−−−−−−−−−−−−−−−−−−−−−−−−−−−−−−−−−−−−−−−−−−−−−−−−−−−−−−−−−−−−−−−−−−−−−−−−−−−−−−−−−−−−−−−−−−−−−−−−−−−−−−−−−−−−−−−−−−−−−−−−−−−−−−−−−−−−−−−−−−−−−−−−−−−−−−−−−−−−−−−−−−−−−−−−−−−−−−−−−−−−−−−−−−−−−−−−−−−−−−−−−−−−−−−−−−−−−−−−−−−−−−−−−−−−−−−−−−−−−−−−−−−−−−−−−−−−−−−−−−−−−−−−−−−−−−−−−−−−−−−−−−−−−−−−−−−−−−−−−−−−−−−−−−−−−−−−−−−−−−−−−−−−−−−−−−−−−−−−−−−−−−−−−−−
Pareturn Security Latam Corporate Debt
Net Asset Value−−−−−−−−−−−−−−−−−−−−−−−−−−−−−−−−−−−−−−−−−−−−−−−−−−−−−−−−−−−−−−−−−−−−−−−−−−−−−−−−−−−−−−−−−−−−−−−−−−−−−−−−−−−−−−−−−−−−−−−−−−−−−−−−−−−−−−−−−−−−−−−−−−−−−−−−−−−−−−−−−−−−−−−−−−−−−−−−−−−−−−−−−−−−−−−−−−−−−−−−−−−−−−−−−−−−−−−−−−−−−−−−−−−−−−−−−−−−−−−−−−−−−−−−−−−−−−−−−−−−−−−−−−−−−−−−−−−−−−−−−−−−−−−−−−−−−−−−−−−−−−−−−−−−−−−−−−−−−−−−−−−−−−−−−−−−−−−−−−−−−−−−−−−−−−−−−−−−−−−−−−−−−−−−−−−−−−−−−−−−−−−−−−−−−−−−−−−−−−−−−−−−−−−−−−−−−−−−−−−−−−−−−−−−−−−−−−−−−−−−−−−−−−−−−−−−−−−−−−−−−−−−−−−−−−−−−−−−−−−−−−−−−−−−−−−−−−−−−−−−−−−
281,287,610.75 9,555,874.71 8,777,422.47USD
Net asset value per share
B USD I Cap 109,476.55 110,268.58 101,285.74USD−−−−−−−−−−−−−−−−−−−−−−−−−−−−−−−−−−−−−−−−−−−−−−−−−−−−−−−−−−−−−−−−−−−−−−−−−−−−−−−−−−−−−−−−−−−−−−−−−−−−−−−−−−−−−−−−−−−−−−−−−−−−−−−−−−−−−−−−−−−−−−−−−−−−−−−−−−−−−−−−−−−−−−−−−−−−−−−−−−−−−−−−−−−−−−−−−−−−−−−−−−−−−−−−−−−−−−−−−−−−−−−−−−−−−−−−−−−−−−−−−−−−−−−−−−−−−−−−−−−−−−−−−−−−−−−−−−−−−−−−−−−−−−−−−−−−−−−−−−−−−−−−−−−−−−−−−−−−−−−−−−−−−−−−−−−−−−−−−−−−−−−−−−−−−−−−−−−−−−−−−−−−−−−−−−−−−−−−−−−−−−−−−−−−−−−−−−−−−−−−−−−−−−−−−−−−−−−−−−−−−−−−−−−−−−−−−−−−−−−−−−−−−−−−−−−−−−−−−−−−−−−−−−−−−−−−−−−−−−−−−−−−−−−−−−−−−−−−−−−−−−−
Number of shares
B USD I Cap 2,569.39 86.66 86.66−−−−−−−−−−−−−−−−−−−−−−−−−−−−−−−−−−−−−−−−−−−−−−−−−−−−−−−−−−−−−−−−−−−−−−−−−−−−−−−−−−−−−−−−−−−−−−−−−−−−−−−−−−−−−−−−−−−−−−−−−−−−−−−−−−−−−−−−−−−−−−−−−−−−−−−−−−−−−−−−−−−−−−−−−−−−−−−−−−−−−−−−−−−−−−−−−−−−−−−−−−−−−−−−−−−−−−−−−−−−−−−−−−−−−−−−−−−−−−−−−−−−−−−−−−−−−−−−−−−−−−−−−−−−−−−−−−−−−−−−−−−−−−−−−−−−−−−−−−−−−−−−−−−−−−−−−−−−−−−−−−−−−−−−−−−−−−−−−−−−−−−−−−−−−−−−−−−−−−−−−−−−−−−−−−−−−−−−−−−−−−−−−−−−−−−−−−−−−−−−−−−−−−−−−−−−−−−−−−−−−−−−−−−−−−−−−−−−−−−−−−−−−−−−−−−−−−−−−−−−−−−−−−−−−−−−−−−−−−−−−−−−−−−−−−−−−−−−−−−−−−−
Pareturn Rivendale
Net Asset Value−−−−−−−−−−−−−−−−−−−−−−−−−−−−−−−−−−−−−−−−−−−−−−−−−−−−−−−−−−−−−−−−−−−−−−−−−−−−−−−−−−−−−−−−−−−−−−−−−−−−−−−−−−−−−−−−−−−−−−−−−−−−−−−−−−−−−−−−−−−−−−−−−−−−−−−−−−−−−−−−−−−−−−−−−−−−−−−−−−−−−−−−−−−−−−−−−−−−−−−−−−−−−−−−−−−−−−−−−−−−−−−−−−−−−−−−−−−−−−−−−−−−−−−−−−−−−−−−−−−−−−−−−−−−−−−−−−−−−−−−−−−−−−−−−−−−−−−−−−−−−−−−−−−−−−−−−−−−−−−−−−−−−−−−−−−−−−−−−−−−−−−−−−−−−−−−−−−−−−−−−−−−−−−−−−−−−−−−−−−−−−−−−−−−−−−−−−−−−−−−−−−−−−−−−−−−−−−−−−−−−−−−−−−−−−−−−−−−−−−−−−−−−−−−−−−−−−−−−−−−−−−−−−−−−−−−−−−−−−−−−−−−−−−−−−−−−−−−−−−−−−−
28,227,716.18 21,579,319.73 20,633,346.52EUR
Net asset value per share
B EUR R Cap 152.23 154.37 149.60EUR−−−−−−−−−−−−−−−−−−−−−−−−−−−−−−−−−−−−−−−−−−−−−−−−−−−−−−−−−−−−−−−−−−−−−−−−−−−−−−−−−−−−−−−−−−−−−−−−−−−−−−−−−−−−−−−−−−−−−−−−−−−−−−−−−−−−−−−−−−−−−−−−−−−−−−−−−−−−−−−−−−−−−−−−−−−−−−−−−−−−−−−−−−−−−−−−−−−−−−−−−−−−−−−−−−−−−−−−−−−−−−−−−−−−−−−−−−−−−−−−−−−−−−−−−−−−−−−−−−−−−−−−−−−−−−−−−−−−−−−−−−−−−−−−−−−−−−−−−−−−−−−−−−−−−−−−−−−−−−−−−−−−−−−−−−−−−−−−−−−−−−−−−−−−−−−−−−−−−−−−−−−−−−−−−−−−−−−−−−−−−−−−−−−−−−−−−−−−−−−−−−−−−−−−−−−−−−−−−−−−−−−−−−−−−−−−−−−−−−−−−−−−−−−−−−−−−−−−−−−−−−−−−−−−−−−−−−−−−−−−−−−−−−−−−−−−−−−−−−−−−−−
Number of shares
B EUR R Cap 185,433.76 139,788.76 137,925.62−−−−−−−−−−−−−−−−−−−−−−−−−−−−−−−−−−−−−−−−−−−−−−−−−−−−−−−−−−−−−−−−−−−−−−−−−−−−−−−−−−−−−−−−−−−−−−−−−−−−−−−−−−−−−−−−−−−−−−−−−−−−−−−−−−−−−−−−−−−−−−−−−−−−−−−−−−−−−−−−−−−−−−−−−−−−−−−−−−−−−−−−−−−−−−−−−−−−−−−−−−−−−−−−−−−−−−−−−−−−−−−−−−−−−−−−−−−−−−−−−−−−−−−−−−−−−−−−−−−−−−−−−−−−−−−−−−−−−−−−−−−−−−−−−−−−−−−−−−−−−−−−−−−−−−−−−−−−−−−−−−−−−−−−−−−−−−−−−−−−−−−−−−−−−−−−−−−−−−−−−−−−−−−−−−−−−−−−−−−−−−−−−−−−−−−−−−−−−−−−−−−−−−−−−−−−−−−−−−−−−−−−−−−−−−−−−−−−−−−−−−−−−−−−−−−−−−−−−−−−−−−−−−−−−−−−−−−−−−−−−−−−−−−−−−−−−−−−−−−−−−−
Pareturn Fidelius Global
Net Asset Value−−−−−−−−−−−−−−−−−−−−−−−−−−−−−−−−−−−−−−−−−−−−−−−−−−−−−−−−−−−−−−−−−−−−−−−−−−−−−−−−−−−−−−−−−−−−−−−−−−−−−−−−−−−−−−−−−−−−−−−−−−−−−−−−−−−−−−−−−−−−−−−−−−−−−−−−−−−−−−−−−−−−−−−−−−−−−−−−−−−−−−−−−−−−−−−−−−−−−−−−−−−−−−−−−−−−−−−−−−−−−−−−−−−−−−−−−−−−−−−−−−−−−−−−−−−−−−−−−−−−−−−−−−−−−−−−−−−−−−−−−−−−−−−−−−−−−−−−−−−−−−−−−−−−−−−−−−−−−−−−−−−−−−−−−−−−−−−−−−−−−−−−−−−−−−−−−−−−−−−−−−−−−−−−−−−−−−−−−−−−−−−−−−−−−−−−−−−−−−−−−−−−−−−−−−−−−−−−−−−−−−−−−−−−−−−−−−−−−−−−−−−−−−−−−−−−−−−−−−−−−−−−−−−−−−−−−−−−−−−−−−−−−−−−−−−−−−−−−−−−−−−
19,791,163.23 20,771,840.87 -EUR
Net asset value per share
B EUR P Cap 100.58 105.56 -EUR−−−−−−−−−−−−−−−−−−−−−−−−−−−−−−−−−−−−−−−−−−−−−−−−−−−−−−−−−−−−−−−−−−−−−−−−−−−−−−−−−−−−−−−−−−−−−−−−−−−−−−−−−−−−−−−−−−−−−−−−−−−−−−−−−−−−−−−−−−−−−−−−−−−−−−−−−−−−−−−−−−−−−−−−−−−−−−−−−−−−−−−−−−−−−−−−−−−−−−−−−−−−−−−−−−−−−−−−−−−−−−−−−−−−−−−−−−−−−−−−−−−−−−−−−−−−−−−−−−−−−−−−−−−−−−−−−−−−−−−−−−−−−−−−−−−−−−−−−−−−−−−−−−−−−−−−−−−−−−−−−−−−−−−−−−−−−−−−−−−−−−−−−−−−−−−−−−−−−−−−−−−−−−−−−−−−−−−−−−−−−−−−−−−−−−−−−−−−−−−−−−−−−−−−−−−−−−−−−−−−−−−−−−−−−−−−−−−−−−−−−−−−−−−−−−−−−−−−−−−−−−−−−−−−−−−−−−−−−−−−−−−−−−−−−−−−−−−−−−−−−−−
Number of shares
B EUR P Cap 196,776.97 196,776.97 -−−−−−−−−−−−−−−−−−−−−−−−−−−−−−−−−−−−−−−−−−−−−−−−−−−−−−−−−−−−−−−−−−−−−−−−−−−−−−−−−−−−−−−−−−−−−−−−−−−−−−−−−−−−−−−−−−−−−−−−−−−−−−−−−−−−−−−−−−−−−−−−−−−−−−−−−−−−−−−−−−−−−−−−−−−−−−−−−−−−−−−−−−−−−−−−−−−−−−−−−−−−−−−−−−−−−−−−−−−−−−−−−−−−−−−−−−−−−−−−−−−−−−−−−−−−−−−−−−−−−−−−−−−−−−−−−−−−−−−−−−−−−−−−−−−−−−−−−−−−−−−−−−−−−−−−−−−−−−−−−−−−−−−−−−−−−−−−−−−−−−−−−−−−−−−−−−−−−−−−−−−−−−−−−−−−−−−−−−−−−−−−−−−−−−−−−−−−−−−−−−−−−−−−−−−−−−−−−−−−−−−−−−−−−−−−−−−−−−−−−−−−−−−−−−−−−−−−−−−−−−−−−−−−−−−−−−−−−−−−−−−−−−−−−−−−−−−−−−−−−−−−
Pareturn Santalucia Espabolsa (Luxembourg)*
Net Asset Value−−−−−−−−−−−−−−−−−−−−−−−−−−−−−−−−−−−−−−−−−−−−−−−−−−−−−−−−−−−−−−−−−−−−−−−−−−−−−−−−−−−−−−−−−−−−−−−−−−−−−−−−−−−−−−−−−−−−−−−−−−−−−−−−−−−−−−−−−−−−−−−−−−−−−−−−−−−−−−−−−−−−−−−−−−−−−−−−−−−−−−−−−−−−−−−−−−−−−−−−−−−−−−−−−−−−−−−−−−−−−−−−−−−−−−−−−−−−−−−−−−−−−−−−−−−−−−−−−−−−−−−−−−−−−−−−−−−−−−−−−−−−−−−−−−−−−−−−−−−−−−−−−−−−−−−−−−−−−−−−−−−−−−−−−−−−−−−−−−−−−−−−−−−−−−−−−−−−−−−−−−−−−−−−−−−−−−−−−−−−−−−−−−−−−−−−−−−−−−−−−−−−−−−−−−−−−−−−−−−−−−−−−−−−−−−−−−−−−−−−−−−−−−−−−−−−−−−−−−−−−−−−−−−−−−−−−−−−−−−−−−−−−−−−−−−−−−−−−−−−−−−
10,275,973.52 - -EUR
Net asset value per share
B EUR A Cap 154.15 - -EURB EUR I Cap 153.98 - -EURB EUR P Cap 153.67 - -EUR−−−−−−−−−−−−−−−−−−−−−−−−−−−−−−−−−−−−−−−−−−−−−−−−−−−−−−−−−−−−−−−−−−−−−−−−−−−−−−−−−−−−−−−−−−−−−−−−−−−−−−−−−−−−−−−−−−−−−−−−−−−−−−−−−−−−−−−−−−−−−−−−−−−−−−−−−−−−−−−−−−−−−−−−−−−−−−−−−−−−−−−−−−−−−−−−−−−−−−−−−−−−−−−−−−−−−−−−−−−−−−−−−−−−−−−−−−−−−−−−−−−−−−−−−−−−−−−−−−−−−−−−−−−−−−−−−−−−−−−−−−−−−−−−−−−−−−−−−−−−−−−−−−−−−−−−−−−−−−−−−−−−−−−−−−−−−−−−−−−−−−−−−−−−−−−−−−−−−−−−−−−−−−−−−−−−−−−−−−−−−−−−−−−−−−−−−−−−−−−−−−−−−−−−−−−−−−−−−−−−−−−−−−−−−−−−−−−−−−−−−−−−−−−−−−−−−−−−−−−−−−−−−−−−−−−−−−−−−−−−−−−−−−−−−−−−−−−−−−−−−−−
Number of shares
B EUR A Cap 62,666.67 - -B EUR I Cap 3,333.33 - -B EUR P Cap 666.67 - -−−−−−−−−−−−−−−−−−−−−−−−−−−−−−−−−−−−−−−−−−−−−−−−−−−−−−−−−−−−−−−−−−−−−−−−−−−−−−−−−−−−−−−−−−−−−−−−−−−−−−−−−−−−−−−−−−−−−−−−−−−−−−−−−−−−−−−−−−−−−−−−−−−−−−−−−−−−−−−−−−−−−−−−−−−−−−−−−−−−−−−−−−−−−−−−−−−−−−−−−−−−−−−−−−−−−−−−−−−−−−−−−−−−−−−−−−−−−−−−−−−−−−−−−−−−−−−−−−−−−−−−−−−−−−−−−−−−−−−−−−−−−−−−−−−−−−−−−−−−−−−−−−−−−−−−−−−−−−−−−−−−−−−−−−−−−−−−−−−−−−−−−−−−−−−−−−−−−−−−−−−−−−−−−−−−−−−−−−−−−−−−−−−−−−−−−−−−−−−−−−−−−−−−−−−−−−−−−−−−−−−−−−−−−−−−−−−−−−−−−−−−−−−−−−−−−−−−−−−−−−−−−−−−−−−−−−−−−−−−−−−−−−−−−−−−−−−−−−−−−−−−
Pareturn Santalucia Fonvalor*
Net Asset Value−−−−−−−−−−−−−−−−−−−−−−−−−−−−−−−−−−−−−−−−−−−−−−−−−−−−−−−−−−−−−−−−−−−−−−−−−−−−−−−−−−−−−−−−−−−−−−−−−−−−−−−−−−−−−−−−−−−−−−−−−−−−−−−−−−−−−−−−−−−−−−−−−−−−−−−−−−−−−−−−−−−−−−−−−−−−−−−−−−−−−−−−−−−−−−−−−−−−−−−−−−−−−−−−−−−−−−−−−−−−−−−−−−−−−−−−−−−−−−−−−−−−−−−−−−−−−−−−−−−−−−−−−−−−−−−−−−−−−−−−−−−−−−−−−−−−−−−−−−−−−−−−−−−−−−−−−−−−−−−−−−−−−−−−−−−−−−−−−−−−−−−−−−−−−−−−−−−−−−−−−−−−−−−−−−−−−−−−−−−−−−−−−−−−−−−−−−−−−−−−−−−−−−−−−−−−−−−−−−−−−−−−−−−−−−−−−−−−−−−−−−−−−−−−−−−−−−−−−−−−−−−−−−−−−−−−−−−−−−−−−−−−−−−−−−−−−−−−−−−−−−−
7,055,722.35 - -EUR
Net asset value per share
B EUR A Cap 149.13 - -EURB EUR I Cap 149.02 - -EURB EUR P Cap 148.85 - -EUR−−−−−−−−−−−−−−−−−−−−−−−−−−−−−−−−−−−−−−−−−−−−−−−−−−−−−−−−−−−−−−−−−−−−−−−−−−−−−−−−−−−−−−−−−−−−−−−−−−−−−−−−−−−−−−−−−−−−−−−−−−−−−−−−−−−−−−−−−−−−−−−−−−−−−−−−−−−−−−−−−−−−−−−−−−−−−−−−−−−−−−−−−−−−−−−−−−−−−−−−−−−−−−−−−−−−−−−−−−−−−−−−−−−−−−−−−−−−−−−−−−−−−−−−−−−−−−−−−−−−−−−−−−−−−−−−−−−−−−−−−−−−−−−−−−−−−−−−−−−−−−−−−−−−−−−−−−−−−−−−−−−−−−−−−−−−−−−−−−−−−−−−−−−−−−−−−−−−−−−−−−−−−−−−−−−−−−−−−−−−−−−−−−−−−−−−−−−−−−−−−−−−−−−−−−−−−−−−−−−−−−−−−−−−−−−−−−−−−−−−−−−−−−−−−−−−−−−−−−−−−−−−−−−−−−−−−−−−−−−−−−−−−−−−−−−−−−−−−−−−−−−
September 30, 2016March 31, 2018 September 30, 2017

PARETURN
16
The accompanying notes are an integral part of these financial statements.
Statistics
* Please see note 1 for details.
Number of shares
B EUR A Cap 38,323.37 - -B EUR I Cap 7,664.82 - -B EUR P Cap 1,333.12 - -−−−−−−−−−−−−−−−−−−−−−−−−−−−−−−−−−−−−−−−−−−−−−−−−−−−−−−−−−−−−−−−−−−−−−−−−−−−−−−−−−−−−−−−−−−−−−−−−−−−−−−−−−−−−−−−−−−−−−−−−−−−−−−−−−−−−−−−−−−−−−−−−−−−−−−−−−−−−−−−−−−−−−−−−−−−−−−−−−−−−−−−−−−−−−−−−−−−−−−−−−−−−−−−−−−−−−−−−−−−−−−−−−−−−−−−−−−−−−−−−−−−−−−−−−−−−−−−−−−−−−−−−−−−−−−−−−−−−−−−−−−−−−−−−−−−−−−−−−−−−−−−−−−−−−−−−−−−−−−−−−−−−−−−−−−−−−−−−−−−−−−−−−−−−−−−−−−−−−−−−−−−−−−−−−−−−−−−−−−−−−−−−−−−−−−−−−−−−−−−−−−−−−−−−−−−−−−−−−−−−−−−−−−−−−−−−−−−−−−−−−−−−−−−−−−−−−−−−−−−−−−−−−−−−−−−−−−−−−−−−−−−−−−−−−−−−−−−−−−−−−−−
Pareturn Imantia USD Global High Yield Bond
Net Asset Value−−−−−−−−−−−−−−−−−−−−−−−−−−−−−−−−−−−−−−−−−−−−−−−−−−−−−−−−−−−−−−−−−−−−−−−−−−−−−−−−−−−−−−−−−−−−−−−−−−−−−−−−−−−−−−−−−−−−−−−−−−−−−−−−−−−−−−−−−−−−−−−−−−−−−−−−−−−−−−−−−−−−−−−−−−−−−−−−−−−−−−−−−−−−−−−−−−−−−−−−−−−−−−−−−−−−−−−−−−−−−−−−−−−−−−−−−−−−−−−−−−−−−−−−−−−−−−−−−−−−−−−−−−−−−−−−−−−−−−−−−−−−−−−−−−−−−−−−−−−−−−−−−−−−−−−−−−−−−−−−−−−−−−−−−−−−−−−−−−−−−−−−−−−−−−−−−−−−−−−−−−−−−−−−−−−−−−−−−−−−−−−−−−−−−−−−−−−−−−−−−−−−−−−−−−−−−−−−−−−−−−−−−−−−−−−−−−−−−−−−−−−−−−−−−−−−−−−−−−−−−−−−−−−−−−−−−−−−−−−−−−−−−−−−−−−−−−−−−−−−−−−
39,007,035.96 27,791,207.10 -USD
Net asset value per share
B USD R Cap 10.06 10.11 -USD−−−−−−−−−−−−−−−−−−−−−−−−−−−−−−−−−−−−−−−−−−−−−−−−−−−−−−−−−−−−−−−−−−−−−−−−−−−−−−−−−−−−−−−−−−−−−−−−−−−−−−−−−−−−−−−−−−−−−−−−−−−−−−−−−−−−−−−−−−−−−−−−−−−−−−−−−−−−−−−−−−−−−−−−−−−−−−−−−−−−−−−−−−−−−−−−−−−−−−−−−−−−−−−−−−−−−−−−−−−−−−−−−−−−−−−−−−−−−−−−−−−−−−−−−−−−−−−−−−−−−−−−−−−−−−−−−−−−−−−−−−−−−−−−−−−−−−−−−−−−−−−−−−−−−−−−−−−−−−−−−−−−−−−−−−−−−−−−−−−−−−−−−−−−−−−−−−−−−−−−−−−−−−−−−−−−−−−−−−−−−−−−−−−−−−−−−−−−−−−−−−−−−−−−−−−−−−−−−−−−−−−−−−−−−−−−−−−−−−−−−−−−−−−−−−−−−−−−−−−−−−−−−−−−−−−−−−−−−−−−−−−−−−−−−−−−−−−−−−−−−−−
Number of shares
B USD R Cap 3,875,746.85 2,749,131.89 -−−−−−−−−−−−−−−−−−−−−−−−−−−−−−−−−−−−−−−−−−−−−−−−−−−−−−−−−−−−−−−−−−−−−−−−−−−−−−−−−−−−−−−−−−−−−−−−−−−−−−−−−−−−−−−−−−−−−−−−−−−−−−−−−−−−−−−−−−−−−−−−−−−−−−−−−−−−−−−−−−−−−−−−−−−−−−−−−−−−−−−−−−−−−−−−−−−−−−−−−−−−−−−−−−−−−−−−−−−−−−−−−−−−−−−−−−−−−−−−−−−−−−−−−−−−−−−−−−−−−−−−−−−−−−−−−−−−−−−−−−−−−−−−−−−−−−−−−−−−−−−−−−−−−−−−−−−−−−−−−−−−−−−−−−−−−−−−−−−−−−−−−−−−−−−−−−−−−−−−−−−−−−−−−−−−−−−−−−−−−−−−−−−−−−−−−−−−−−−−−−−−−−−−−−−−−−−−−−−−−−−−−−−−−−−−−−−−−−−−−−−−−−−−−−−−−−−−−−−−−−−−−−−−−−−−−−−−−−−−−−−−−−−−−−−−−−−−−−−−−−−−
September 30, 2016March 31, 2018 September 30, 2017

17
The accompanying notes are an integral part of these financial statements.
PARETURN
Combined Statement
EUR
AssetsInvestment in securities at cost 1,923,171,288.83Unrealised appreciation / (depreciation) on securities 6,961,589.41
Investment in securities at market value 3.3 1,930,132,878.24Investment in options contracts at market value 3.5 900.00Cash at bank 183,769,855.32Receivable for investment sold 4,745,056.92Receivable on subscription 249,613.86Receivable on withholding tax reclaim 202,908.98Net unrealised appreciation on forward foreign exchangecontracts
3.4, 15 231,122.63
Net unrealised appreciation on futures contracts 3.5 114,599.27Net unrealised appreciation on Contracts for Difference 3.10, 16 971,217.41Dividends and interest receivable 9,489,901.38Formation expenses 3.7 44,771.08Other assets 217,625.87
Total assets 2,130,170,450.96
LiabilitiesBank overdraft 1,606,140.76Accrued expenses 5,159,775.87Payable for investment purchased 8,557,449.80Payable on redemption 289,026.49Payable on Contracts for Difference 125,513.87Net unrealised depreciation on forward foreign exchangecontracts
3.4, 15 173,591.78
Net unrealised depreciation on futures contracts 3.5 2,349,462.42Other liabilities 758,937.19
Total liabilities 19,019,898.18
Net assets at the end of the period 2,111,150,552.78
Notes
Statement of Net Assets as at March 31, 2018
IncomeDividends (net of withholding taxes) 3.8 2,745,997.20Interest on bonds (net of withholding taxes) 3.8 13,599,918.56Bank interest 3.8 43,361.37Dividend on Contracts for Difference (net of withholdingtaxes)
3.8 174,505.35
Other income 12 276,577.53
Total income 16,840,360.01
ExpensesInvestment advisory fees and management fees 4 7,780,519.35Depositary fees 363,976.92Performance fees 4 746,677.77Administration fees 592,317.69Professional fees 270,798.35Distribution fees 14 30,953.09Transaction costs 9 808,196.43Taxe d'abonnement 5 178,098.11Bank interest and charges 492,030.06Expenses on Contracts for Difference 1,445,939.71Agent association fees 2,273.05Amortisation of formation expenses 3.7 14,628.18Other expenses 13 408,867.61
Total expenses 13,135,276.32
Net investment income / (loss) 3,705,083.69
Net realised gain / (loss) on:Sales of Investments 3.9 19,463,143.46Foreign exchange transactions 3.2 332,054.41Futures contracts 3.5 3,829,044.85Forward foreign exchange contracts 3.4 2,013,975.28Options contracts 3.5 523,448.48Contracts for Difference 3.10 729,478.27
Net realised gain / (loss) for the period 30,596,228.44
Net change in unrealised appreciation / (depreciation) on:Investments 3.9 (39,516,418.54)Futures contracts 3.5 (1,699,381.36)Forward foreign exchange contracts 3.4 378,423.12Options contracts 3.5 913,618.88Contracts for Difference 3.10, 16 968,942.90
Increase / (Decrease) in net assets as a result ofoperations
(8,358,586.56)
Proceeds received on subscription of shares (334,785,496.96)Net amount paid on redemption of shares 638,663,831.26Net assets at the beginning of the period 1,816,854,792.16Translation difference 3.11 (1,223,987.12)
Net assets at the end of the period 2,111,150,552.78
EURNotes
Statement of Operations and Changes in Net Assets forthe period ended March 31, 2018

18
The accompanying notes are an integral part of these financial statements.
PARETURN
Pareturn Best Selection (in EUR)Statement of Operations and Changes in Net Assets for theperiod ended March 31, 2018
EUR
AssetsInvestment in securities at cost 106,919,057.62Unrealised appreciation / (depreciation) on securities 5,452,039.92
Investment in securities at market value 3.3 112,371,097.54Cash at bank 3,465,150.85Dividends and interest receivable 794.09Formation expenses 3.7 29,314.68Other assets 200,754.90
Total assets 116,067,112.06
LiabilitiesAccrued expenses 390,799.73Other liabilities 24,338.18
Total liabilities 415,137.91
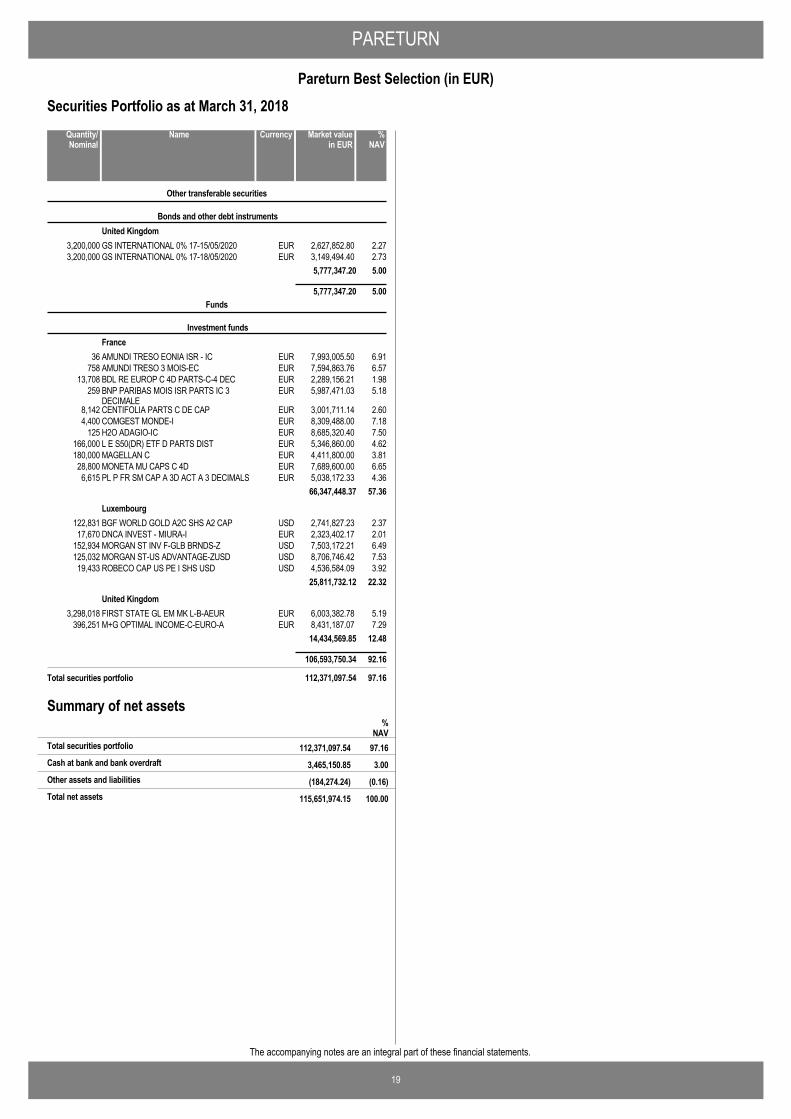
Net assets at the end of the period 115,651,974.15
Notes
Statement of Net Assets as at March 31, 2018
IncomeDividends (net of withholding taxes) 3.8 13,440.00Interest on bonds (net of withholding taxes) 3.8 12,580.00Bank interest 3.8 2,972.04Other income 12 104,447.43
Total income 133,439.47
ExpensesInvestment advisory fees and management fees 4 688,736.37Depositary fees 16,911.71Performance fees 4 21,158.03Administration fees 13,671.22Professional fees 21,978.57Transaction costs 9 3,831.32Taxe d'abonnement 5 13,092.02Bank interest and charges 14,010.02Amortisation of formation expenses 3.7 9,534.21Other expenses 13 10,015.59
Total expenses 812,939.06
Net investment income / (loss) (679,499.59)
Net realised gain / (loss) on: Sales of Investments 3.9 1,723,122.13Foreign exchange transactions 3.2 (38,375.65)
Net realised gain / (loss) for the period 1,005,246.89
Net change in unrealised appreciation / (depreciation) on: Investments 3.9 (2,855,249.20)
Increase / (Decrease) in net assets as a result ofoperations
(1,850,002.31)
Proceeds received on subscription of shares 34,807,599.67Net amount paid on redemption of shares (16,289,371.09)Net assets at the beginning of the period 98,983,747.88
Net assets at the end of the period 115,651,974.15
EURNotes
Statement of Operations and Changes in Net Assets forthe period ended March 31, 2018
Number of shares in issue atthe end of the period
Number of shares in issue atthe beginning of the period
Number of sharessubscribed
Number of sharesredeemed
Statement of Changes in Number of Shares
B EUR I Cap 36,056 16,888 (975) 51,969
B EUR R Cap 51,192 13,017 (13,433) 50,776
PARETURN
19
Pareturn Best Selection (in EUR)
The accompanying notes are an integral part of these financial statements.
Securities Portfolio as at March 31, 2018
GS INTERNATIONAL 0% 17-15/05/2020 EUR 2,627,852.80 2.273,200,000
Other transferable securities
Bonds and other debt instrumentsUnited Kingdom
GS INTERNATIONAL 0% 17-18/05/2020 EUR 3,149,494.40 2.733,200,0005,777,347.20 5.00
5,777,347.20 5.00
AMUNDI TRESO EONIA ISR - IC EUR 7,993,005.50 6.9136
Funds
Investment fundsFrance
AMUNDI TRESO 3 MOIS-EC EUR 7,594,863.76 6.57758BDL RE EUROP C 4D PARTS-C-4 DEC EUR 2,289,156.21 1.9813,708BNP PARIBAS MOIS ISR PARTS IC 3DECIMALE
EUR 5,987,471.03 5.18259
CENTIFOLIA PARTS C DE CAP EUR 3,001,711.14 2.608,142COMGEST MONDE-I EUR 8,309,488.00 7.184,400H2O ADAGIO-IC EUR 8,685,320.40 7.50125L E S50(DR) ETF D PARTS DIST EUR 5,346,860.00 4.62166,000MAGELLAN C EUR 4,411,800.00 3.81180,000MONETA MU CAPS C 4D EUR 7,689,600.00 6.6528,800PL P FR SM CAP A 3D ACT A 3 DECIMALS EUR 5,038,172.33 4.366,615
66,347,448.37 57.36
BGF WORLD GOLD A2C SHS A2 CAP USD 2,741,827.23 2.37122,831Luxembourg
DNCA INVEST - MIURA-I EUR 2,323,402.17 2.0117,670MORGAN ST INV F-GLB BRNDS-Z USD 7,503,172.21 6.49152,934MORGAN ST-US ADVANTAGE-ZUSD USD 8,706,746.42 7.53125,032ROBECO CAP US PE I SHS USD USD 4,536,584.09 3.9219,433
25,811,732.12 22.32
FIRST STATE GL EM MK L-B-AEUR EUR 6,003,382.78 5.193,298,018United Kingdom
M+G OPTIMAL INCOME-C-EURO-A EUR 8,431,187.07 7.29396,25114,434,569.85 12.48
106,593,750.34 92.16
Total securities portfolio 112,371,097.54 97.16
NameQuantity/Nominal
Market valuein EUR
Currency %NAV
Summary of net assets%
NAV112,371,097.54 97.16Total securities portfolio
3,465,150.85 3.00Cash at bank and bank overdraft
(184,274.24) (0.16)Other assets and liabilities
115,651,974.15 100.00Total net assets

PARETURN
20
Pareturn Best Selection (in EUR)
The accompanying notes are an integral part of these financial statements.
Nature allocation % of portfolio % of netassets
Investment funds 94.86 92.16
Bonds and other debt instruments 5.14 5.00
100.00 97.16
Country allocation % of portfolio % of netassets
France 59.04 57.36
Luxembourg 22.97 22.32
United Kingdom 17.99 17.48
100.00 97.16
Portfolio Breakdowns
Top Ten Holdings Market value % ofnet
assets
MORGAN ST-US ADVANTAGE-ZUSD 8,706,746.42 7.53Open-ended Funds
H2O ADAGIO-IC 8,685,320.40 7.50Open-ended Funds
M+G OPTIMAL INCOME-C-EURO-A 8,431,187.07 7.29Open-ended Funds
COMGEST MONDE-I 8,309,488.00 7.18Open-ended Funds
AMUNDI TRESO EONIA ISR - IC 7,993,005.50 6.91Open-ended Funds
MONETA MU CAPS C 4D 7,689,600.00 6.65Open-ended Funds
AMUNDI TRESO 3 MOIS-EC 7,594,863.76 6.57Open-ended Funds
MORGAN ST INV F-GLB BRNDS-Z 7,503,172.21 6.49Open-ended Funds
FIRST STATE GL EM MK L-B-AEUR 6,003,382.78 5.19Open-ended Funds
BNP PARIBAS MOIS ISR PARTS IC 3 DECIMALE 5,987,471.03 5.18Open-ended Funds
EUR
Sector
Top Ten Holdings

21
The accompanying notes are an integral part of these financial statements.
PARETURN
Pareturn Best Selection Side - Pocket (in EUR)Statement of Operations and Changes in Net Assets for theperiod ended March 31, 2018
EUR
Assets
Cash at bank 55,883.43
Total assets 55,883.43
LiabilitiesAccrued expenses 60.63Other liabilities 54,769.49
Total liabilities 54,830.12
Net assets at the end of the period 1,053.31
Notes
Statement of Net Assets as at March 31, 2018
Income
Expenses
Proceeds received on subscription of shares -Net amount paid on redemption of shares -Net assets at the beginning of the period 1,053.31
Net assets at the end of the period 1,053.31
EURNotes
Statement of Operations and Changes in Net Assets forthe period ended March 31, 2018
Number of shares in issue atthe end of the period
Number of shares in issue atthe beginning of the period
Number of sharessubscribed
Number of sharesredeemed
Statement of Changes in Number of Shares
A EUR I Dist 50,183 - - 50,183
A EUR R Dist 4,061 - - 4,061
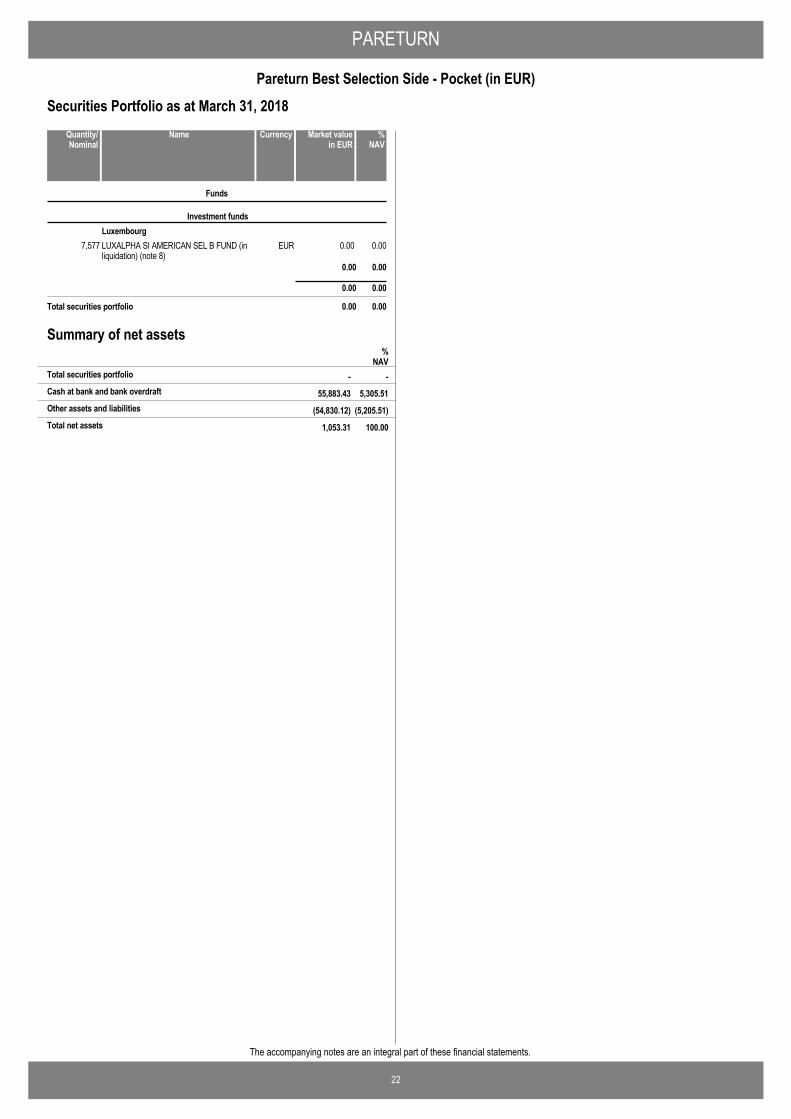
PARETURN
22
Pareturn Best Selection Side - Pocket (in EUR)
The accompanying notes are an integral part of these financial statements.
Securities Portfolio as at March 31, 2018
LUXALPHA SI AMERICAN SEL B FUND (inliquidation) (note 8)
EUR 0.00 0.007,577
Funds
Investment fundsLuxembourg
0.00 0.00
0.00 0.00
Total securities portfolio 0.00 0.00
NameQuantity/Nominal
Market valuein EUR
Currency %NAV
Summary of net assets%
NAV- -Total securities portfolio
55,883.43 5,305.51Cash at bank and bank overdraft
(54,830.12) (5,205.51)Other assets and liabilities
1,053.31 100.00Total net assets

23
The accompanying notes are an integral part of these financial statements.
PARETURN
Pareturn Croissance 2000 (in EUR)Statement of Operations and Changes in Net Assets for theperiod ended March 31, 2018
EUR
AssetsInvestment in securities at cost 52,586,375.83Unrealised appreciation / (depreciation) on securities 1,098,509.09
Investment in securities at market value 3.3 53,684,884.92Cash at bank 1,409,629.06Dividends and interest receivable 40,416.93
Total assets 55,134,930.91
LiabilitiesAccrued expenses 126,552.49Net unrealised depreciation on forward foreign exchangecontracts
3.4, 15 9,358.90
Other liabilities 2,482.27
Total liabilities 138,393.66
Net assets at the end of the period 54,996,537.25
Notes
Statement of Net Assets as at March 31, 2018
IncomeDividends (net of withholding taxes) 3.8 86,026.07Bank interest 3.8 0.41
Total income 86,026.48
ExpensesInvestment advisory fees and management fees 4 161,864.25Depositary fees 15,311.35Administration fees 14,689.73Professional fees 12,876.81Transaction costs 9 8,737.79Taxe d'abonnement 5 8,508.96Bank interest and charges 8,742.60Other expenses 13 3,004.20
Total expenses 233,735.69
Net investment income / (loss) (147,709.21)
Net realised gain / (loss) on: Sales of Investments 3.9 2,284,689.97Foreign exchange transactions 3.2 10,039.21
Net realised gain / (loss) for the period 2,147,019.97
Net change in unrealised appreciation / (depreciation) on: Investments 3.9 (2,448,960.09)Forward foreign exchange contracts 3.4 (9,358.90)
Increase / (Decrease) in net assets as a result ofoperations
(311,299.02)
Proceeds received on subscription of shares -Net amount paid on redemption of shares -Net assets at the beginning of the period 55,307,836.27
Net assets at the end of the period 54,996,537.25
EURNotes
Statement of Operations and Changes in Net Assets forthe period ended March 31, 2018
Number of shares in issue atthe end of the period
Number of shares in issue atthe beginning of the period
Number of sharessubscribed
Number of sharesredeemed
Statement of Changes in Number of Shares
B EUR R Cap 1,595 - - 1,595

PARETURN
24
Pareturn Croissance 2000 (in EUR)
The accompanying notes are an integral part of these financial statements.
Securities Portfolio as at March 31, 2018
BLACKROCK JAPAN EQTY 1-J YEN JPY 2,896,206.09 5.2728,072
Funds
Investment fundsIreland
FINDLAY PARK US SMALLER COS FD USD 1,253,555.47 2.2814,283GLG JAPAN COREALPHA-IXX JPY JPY 1,135,964.31 2.0716,964ISHARES CORE MSCI PAC EX JAP EUR 1,350,468.00 2.4611,592ISHARES CORE S&P 500 UCITS ETF USD 2,232,541.02 4.0610,866ISHARES EDGE MSCI ERP VALUE EUR 1,138,275.88 2.07203,046ISHARES EDGE MSCI USA VALUE USD 1,230,627.56 2.24234,324ISHARES MSCI ERP MID CAP-ACC EUR 1,181,286.25 2.15238,451ISHARES MSCI EUROPE EUR SHS ETF EUR 550,117.99 1.0024,091ISHARES S&P FINANCIALS SCTR USD 576,756.73 1.05100,235ISHARES S&P HEALTH CARE USD 1,149,724.01 2.09243,332ISHARES S&P 500 IT SECTOR USD 2,418,483.59 4.40373,131ISHARES USD TIPS EUR 1,015,772.24 1.856,196PIMCO GBL INV GRADE I HD ACC EUR 2,519,542.38 4.58135,096PIMCO GIS-INCOME FUND-INSEURHA EUR 554,112.38 1.0140,954PIMCO-TOTAL RETURN BD INST EUR EUR 1,008,766.38 1.8347,271VANGUARD S+P 500 USD 9,737,095.47 17.69240,701
31,949,295.75 58.10
ALKEN FUND-EUROP OPPORT-EU1A EUR 1,804,124.28 3.289,740Luxembourg
BGF-CONTINENT EUR FL-I2 EUR 2,739,959.40 4.98157,198JP MORGAN FUNDS SICAV US SELECT EQPL FU
USD 1,210,994.81 2.2015,084
JPM AGGREGATE BOND-I2 EUR EUR 3,565,004.66 6.4936,281JPM GLBL HI YLD BD-I2 EUR EUR 495,114.22 0.905,032JPM GLOBAL CORPORAT BD-I2EUR EUR 2,466,474.83 4.4825,394MLIS-GLOBAL DBT-CR UC-EURBAH EUR 1,991,171.61 3.6220,447MLIS-GLOBAL DBT-GOV U-EURBAH EUR 3,502,538.56 6.3735,311MLIS-GLOBAL DBT-SEC U-EURBAH EUR 1,013,519.18 1.8410,361PICTET-GLOBL EMRG DBT-HJ EUR EUR 485,237.21 0.882,096ROBECO US LARGE CAP EQ-I-USD USD 1,185,704.49 2.166,057SISF EUROPEAN SPEC SIT FD-C EUR 680,661.76 1.243,583UBS ETF-MSCI CANADA UCITS A EUR 595,084.16 1.0824,112
21,735,589.17 39.52
53,684,884.92 97.62
Total securities portfolio 53,684,884.92 97.62
NameQuantity/Nominal
Market valuein EUR
Currency %NAV
1,279,000 26/04/181,023,319 (9,358.90)USDEUR 1,023,318.70Forward foreign exchange contracts
(9,358.90)
Total Forward foreign exchange contracts (9,358.90)
SalePurchase Unrealisedappreciation /(depreciation)
in EUR
MaturityDate
Commitmentin EUR
Financial derivative instruments as at March 31, 2018
Total financial derivative instruments (9,358.90)
Summary of net assets
(9,358.90) (0.02)Total financial derivative instruments
%NAV
53,684,884.92 97.62Total securities portfolio
1,409,629.06 2.56Cash at bank and bank overdraft
(88,617.83) (0.16)Other assets and liabilities
54,996,537.25 100.00Total net assets

PARETURN
25
Pareturn Croissance 2000 (in EUR)
The accompanying notes are an integral part of these financial statements.
Nature allocation % of portfolio % of netassets
Investment funds 100.00 97.62
100.00 97.62
Country allocation % of portfolio % of netassets
Ireland 59.51 58.10
Luxembourg 40.49 39.52
100.00 97.62
Portfolio Breakdowns
Top Ten Holdings Market value % ofnet
assets
VANGUARD S+P 500 9,737,095.47 17.69Open-ended Funds
JPM AGGREGATE BOND-I2 EUR 3,565,004.66 6.49Open-ended Funds
MLIS-GLOBAL DBT-GOV U-EURBAH 3,502,538.56 6.37Open-ended Funds
BLACKROCK JAPAN EQTY 1-J YEN 2,896,206.09 5.27Open-ended Funds
BGF-CONTINENT EUR FL-I2 2,739,959.40 4.98Open-ended Funds
PIMCO GBL INV GRADE I HD ACC 2,519,542.38 4.58Open-ended Funds
JPM GLOBAL CORPORAT BD-I2EUR 2,466,474.83 4.48Open-ended Funds
ISHARES S&P 500 IT SECTOR 2,418,483.59 4.40Open-ended Funds
ISHARES CORE S&P 500 UCITS ETF 2,232,541.02 4.06Open-ended Funds
MLIS-GLOBAL DBT-CR UC-EURBAH 1,991,171.61 3.62Open-ended Funds
EUR
Sector
Top Ten Holdings

26
The accompanying notes are an integral part of these financial statements.
PARETURN
Pareturn Cartesio Equity (in EUR)Statement of Operations and Changes in Net Assets for theperiod ended March 31, 2018
EUR
AssetsInvestment in securities at cost 115,641,370.15Unrealised appreciation / (depreciation) on securities (753,377.53)
Investment in securities at market value 3.3 114,887,992.62Cash at bank 12,982,772.54Receivable on withholding tax reclaim 78,890.31Dividends and interest receivable 32,114.83
Total assets 127,981,770.30
LiabilitiesAccrued expenses 501,286.11Net unrealised depreciation on futures contracts 3.5 92,432.86Other liabilities 14,991.60
Total liabilities 608,710.57
Net assets at the end of the period 127,373,059.73
Notes
Statement of Net Assets as at March 31, 2018
IncomeDividends (net of withholding taxes) 3.8 335,948.43Bank interest 3.8 559.98Other income 12 34,776.74
Total income 371,285.15
ExpensesInvestment advisory fees and management fees 4 857,209.26Depositary fees 22,610.71Administration fees 26,536.87Professional fees 8,434.10Transaction costs 9 85,095.36Taxe d'abonnement 5 6,195.92Bank interest and charges 35,362.64Other expenses 13 37,792.08
Total expenses 1,079,236.94
Net investment income / (loss) (707,951.79)
Net realised gain / (loss) on: Sales of Investments 3.9 2,171,922.40Foreign exchange transactions 3.2 (18,840.68)Futures contracts 3.5 (36,082.87)Options contracts 3.5 229,674.11
Net realised gain / (loss) for the period 1,638,721.17
Net change in unrealised appreciation / (depreciation) on: Investments 3.9 (2,499,465.35)Futures contracts 3.5 84,310.53
Increase / (Decrease) in net assets as a result ofoperations
(776,433.65)
Proceeds received on subscription of shares 40,074,888.50Net amount paid on redemption of shares (13,208,903.10)Net assets at the beginning of the period 101,283,507.98
Net assets at the end of the period 127,373,059.73
EURNotes
Statement of Operations and Changes in Net Assets forthe period ended March 31, 2018
Number of shares in issue atthe end of the period
Number of shares in issue atthe beginning of the period
Number of sharessubscribed
Number of sharesredeemed
Statement of Changes in Number of Shares
B EUR I Cap 631,190 239,686 (81,530) 789,346
B EUR Z Cap - 7,888 - 7,888

PARETURN
27
Pareturn Cartesio Equity (in EUR)
The accompanying notes are an integral part of these financial statements.
Securities Portfolio as at March 31, 2018
LETRAS 0% 17-07/12/2018 EUR 25,080,500.00 19.6925,000,000
Transferable securities admitted to an official exchange listing
Money market instrumentsSpain
LETRAS 0% 17-11/05/2018 EUR 5,002,800.00 3.935,000,000LETRAS 0% 17-13/07/2018 EUR 8,012,240.00 6.298,000,000LETRAS 0% 17-14/09/2018 EUR 11,023,540.00 8.6511,000,000LETRAS 0% 17-15/06/2018 EUR 6,006,120.00 4.726,000,000LETRAS 0% 17-17/08/2018 EUR 7,013,020.00 5.517,000,000
62,138,220.00 48.79
62,138,220.00 48.79
ALMIRALL SA EUR 671,300.00 0.5370,000
SharesSpain
ENDESA SA EUR 780,626.60 0.6143,647IBERDROLA SA EUR 1,339,519.60 1.05224,300INTL CONSOLIDATED AIRLINE-DI GBP 1,720,013.69 1.35245,400LIBERBANK SA EUR 1,024,810.30 0.802,303,980MERLIN PROPERTIES SOCIMI SA EUR 2,369,658.28 1.85190,487NH HOTEL GROUP SA EUR 778,005.87 0.61121,849OBRASCON HUARTE LAIN S.A. EUR 1,624,101.98 1.28468,987TALGO SA EUR 1,196,590.50 0.94227,922
11,504,626.82 9.02
EDF EUR 1,208,928.00 0.95102,800France
PUBLICIS GROUPE EUR 2,034,051.00 1.5935,950VALEO SA EUR 1,389,276.00 1.0925,900VINCI SA EUR 1,319,788.20 1.0416,518
5,952,043.20 4.67
BAE SYSTEMS PLC GBP 1,691,110.38 1.34255,054United Kingdom
CENTRICA PLC GBP 839,629.81 0.66517,754HOWDEN JOINERY GROUP PLC GBP 819,788.57 0.64156,000ITV PLC GBP 1,493,661.43 1.17908,600STAGECOACH GROUP PLC GBP 909,419.14 0.71604,123
5,753,609.33 4.52
KONINKLIJKE KPN NV EUR 1,771,172.61 1.39726,784Netherlands
PHILIPS LIGHTING NV EUR 1,510,055.00 1.1949,510ROYAL DUTCH SHELL PLC-A SHS EUR 2,183,989.50 1.7184,700
5,465,217.11 4.29
ALLIANZ AG REG EUR 1,302,140.00 1.027,100Germany
CONTINENTAL AG EUR 1,348,043.00 1.066,010SIEMENS AG-REG EUR 1,024,848.00 0.809,900VOLKSWAGEN AG-PREF EUR 1,353,009.92 1.078,384
5,028,040.92 3.95
PETROFAC LTD GBP 1,224,129.46 0.96211,800Jersey
SHIRE PLC GBP 2,595,735.22 2.0463,7483,819,864.68 3.00
GOODYEAR TIRE & RUBBER CO USD 1,467,302.44 1.1567,900United States
MICROSOFT CORP USD 1,599,673.71 1.2621,5583,066,976.15 2.41
PRYSMIAN SPA EUR 739,500.00 0.5829,000Italy
TELECOM ITALIA SPA EUR 1,999,974.00 1.572,594,0002,739,474.00 2.15
BANK OF IRELAND GROUP PLC EUR 1,496,370.60 1.18210,460Ireland
RYANAIR HOLDINGS PLC EUR 1,084,464.00 0.8567,7792,580,834.60 2.03
NameQuantity/Nominal
Market valuein EUR
Currency %NAV
ERICSSON LM-B SHS SEK 1,213,874.91 0.96235,600Sweden
SCANDIC HOTELS GROUP AB SEK 921,598.27 0.72118,3982,135,473.18 1.68
AP MOLLER-MAERSK A/S-B DKK 1,270,934.41 1.001,014Denmark
1,270,934.41 1.00
SES EUR 1,123,820.43 0.88102,305Luxembourg
1,123,820.43 0.88
NOS SGPS EUR 1,038,472.00 0.82216,800Portugal
1,038,472.00 0.82
NOVARTIS AG-REG CHF 780,849.19 0.6111,889Switzerland
780,849.19 0.61
STRABAG SE-BR EUR 489,536.60 0.3815,203Austria
489,536.60 0.38
52,749,772.62 41.41
Total securities portfolio 114,887,992.62 90.20
NameQuantity/Nominal
Market valuein EUR
Currency %NAV
EURO / GBP FUTURE 18/06/2018 GBP 5,889,940.9347 (79,729.61)
Futures contracts
EURO FX CURR FUT (CME)18/06/2018
USD 2,511,890.2420 (12,703.25)
(92,432.86)
Total Futures (92,432.86)
NameQuantity Commitmentin EUR
Currency Unrealisedappreciation /(depreciation)
in EUR
Financial derivative instruments as at March 31, 2018
Total financial derivative instruments (92,432.86)
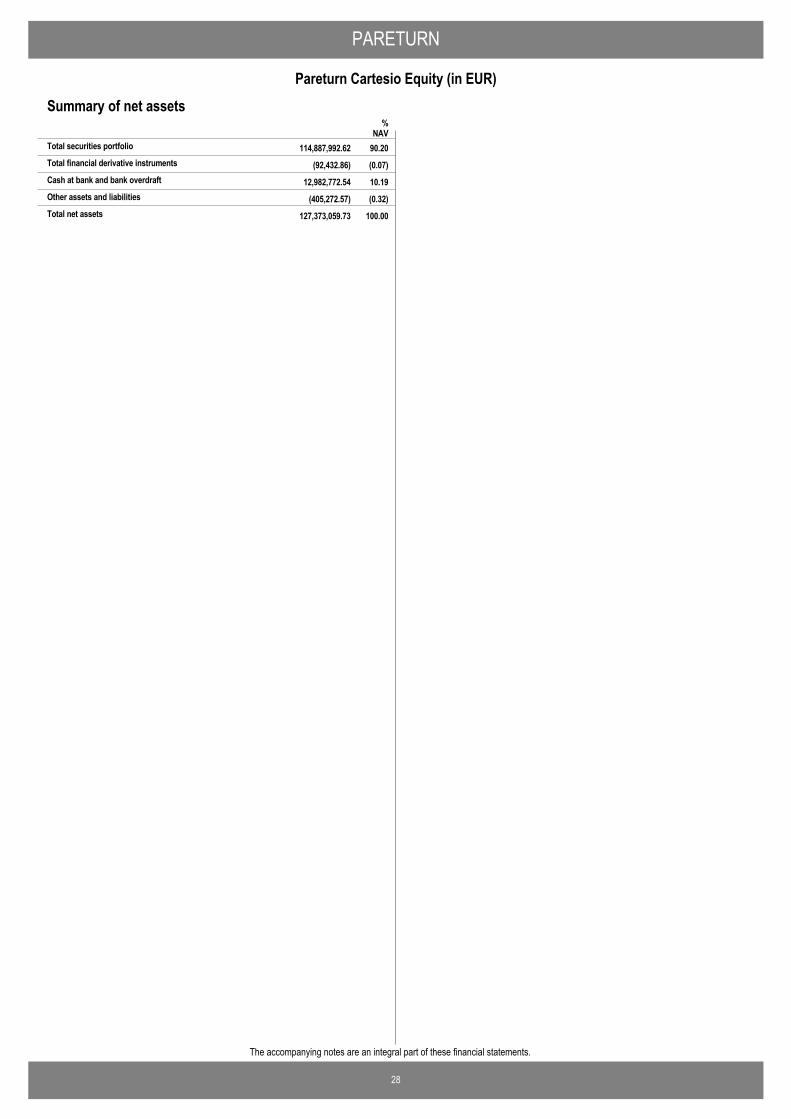
PARETURN
28
Pareturn Cartesio Equity (in EUR)
The accompanying notes are an integral part of these financial statements.
Summary of net assets
(92,432.86) (0.07)Total financial derivative instruments
%NAV
114,887,992.62 90.20Total securities portfolio
12,982,772.54 10.19Cash at bank and bank overdraft
(405,272.57) (0.32)Other assets and liabilities
127,373,059.73 100.00Total net assets
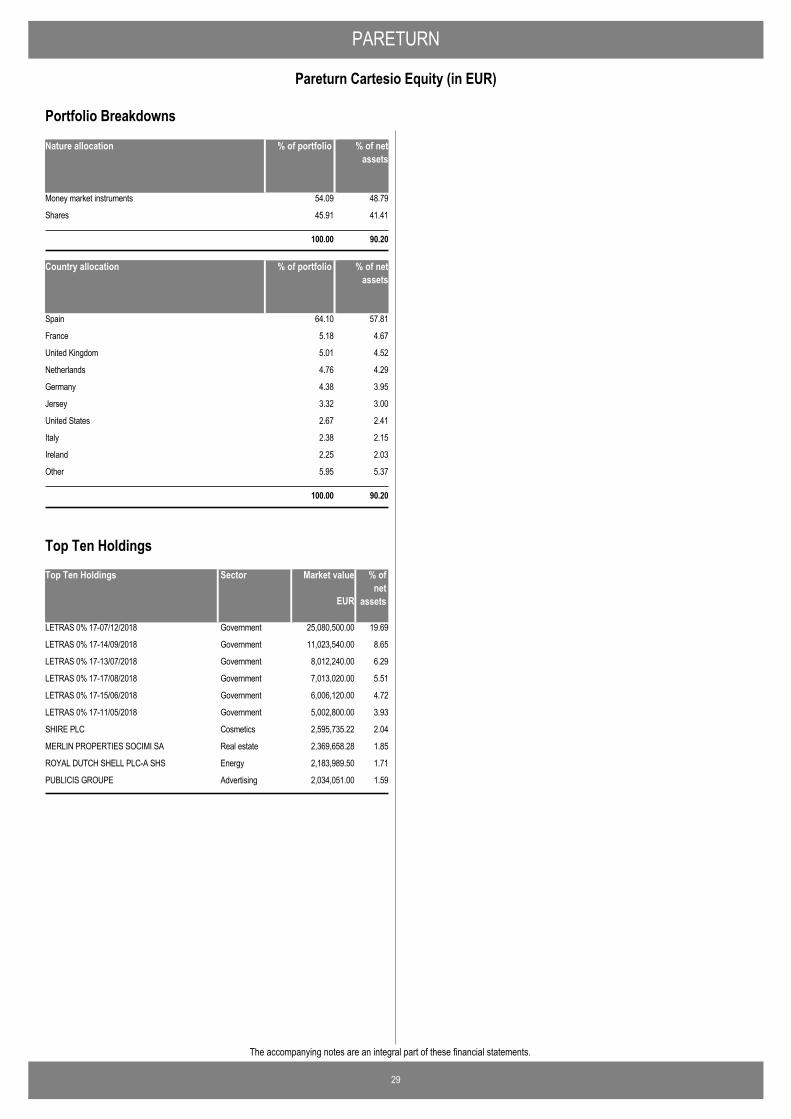
PARETURN
29
Pareturn Cartesio Equity (in EUR)
The accompanying notes are an integral part of these financial statements.
Nature allocation % of portfolio % of netassets
Money market instruments 54.09 48.79
Shares 45.91 41.41
100.00 90.20
Country allocation % of portfolio % of netassets
Spain 64.10 57.81
France 5.18 4.67
United Kingdom 5.01 4.52
Netherlands 4.76 4.29
Germany 4.38 3.95
Jersey 3.32 3.00
United States 2.67 2.41
Italy 2.38 2.15
Ireland 2.25 2.03
Other 5.95 5.37
100.00 90.20
Portfolio Breakdowns
Top Ten Holdings Market value % ofnet
assets
LETRAS 0% 17-07/12/2018 25,080,500.00 19.69Government
LETRAS 0% 17-14/09/2018 11,023,540.00 8.65Government
LETRAS 0% 17-13/07/2018 8,012,240.00 6.29Government
LETRAS 0% 17-17/08/2018 7,013,020.00 5.51Government
LETRAS 0% 17-15/06/2018 6,006,120.00 4.72Government
LETRAS 0% 17-11/05/2018 5,002,800.00 3.93Government
SHIRE PLC 2,595,735.22 2.04Cosmetics
MERLIN PROPERTIES SOCIMI SA 2,369,658.28 1.85Real estate
ROYAL DUTCH SHELL PLC-A SHS 2,183,989.50 1.71Energy
PUBLICIS GROUPE 2,034,051.00 1.59Advertising
EUR
Sector
Top Ten Holdings
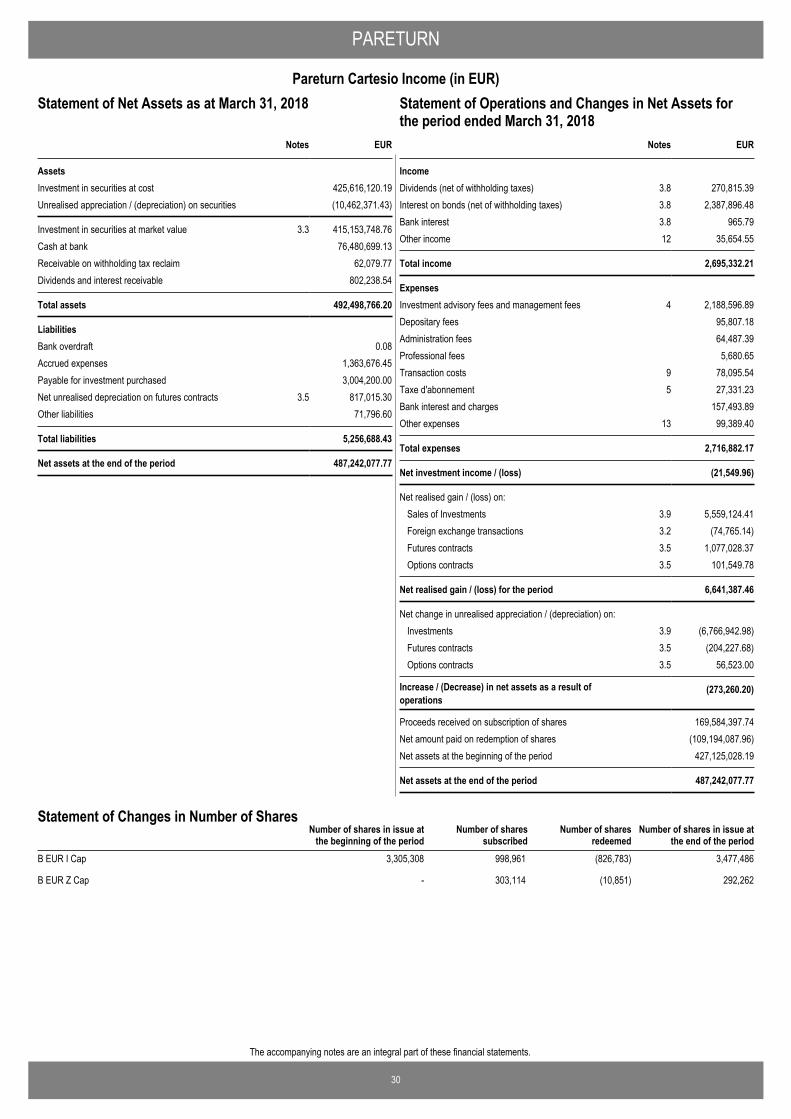
30
The accompanying notes are an integral part of these financial statements.
PARETURN
Pareturn Cartesio Income (in EUR)Statement of Operations and Changes in Net Assets for theperiod ended March 31, 2018
EUR
AssetsInvestment in securities at cost 425,616,120.19Unrealised appreciation / (depreciation) on securities (10,462,371.43)
Investment in securities at market value 3.3 415,153,748.76Cash at bank 76,480,699.13Receivable on withholding tax reclaim 62,079.77Dividends and interest receivable 802,238.54
Total assets 492,498,766.20
LiabilitiesBank overdraft 0.08Accrued expenses 1,363,676.45Payable for investment purchased 3,004,200.00Net unrealised depreciation on futures contracts 3.5 817,015.30Other liabilities 71,796.60
Total liabilities 5,256,688.43
Net assets at the end of the period 487,242,077.77
Notes
Statement of Net Assets as at March 31, 2018
IncomeDividends (net of withholding taxes) 3.8 270,815.39Interest on bonds (net of withholding taxes) 3.8 2,387,896.48Bank interest 3.8 965.79Other income 12 35,654.55
Total income 2,695,332.21
ExpensesInvestment advisory fees and management fees 4 2,188,596.89Depositary fees 95,807.18Administration fees 64,487.39Professional fees 5,680.65Transaction costs 9 78,095.54Taxe d'abonnement 5 27,331.23Bank interest and charges 157,493.89Other expenses 13 99,389.40
Total expenses 2,716,882.17
Net investment income / (loss) (21,549.96)
Net realised gain / (loss) on: Sales of Investments 3.9 5,559,124.41Foreign exchange transactions 3.2 (74,765.14)Futures contracts 3.5 1,077,028.37Options contracts 3.5 101,549.78
Net realised gain / (loss) for the period 6,641,387.46
Net change in unrealised appreciation / (depreciation) on: Investments 3.9 (6,766,942.98)Futures contracts 3.5 (204,227.68)Options contracts 3.5 56,523.00
Increase / (Decrease) in net assets as a result ofoperations
(273,260.20)
Proceeds received on subscription of shares 169,584,397.74Net amount paid on redemption of shares (109,194,087.96)Net assets at the beginning of the period 427,125,028.19
Net assets at the end of the period 487,242,077.77
EURNotes
Statement of Operations and Changes in Net Assets forthe period ended March 31, 2018
Number of shares in issue atthe end of the period
Number of shares in issue atthe beginning of the period
Number of sharessubscribed
Number of sharesredeemed
Statement of Changes in Number of Shares
B EUR I Cap 3,305,308 998,961 (826,783) 3,477,486
B EUR Z Cap - 303,114 (10,851) 292,262

PARETURN
31
Pareturn Cartesio Income (in EUR)
The accompanying notes are an integral part of these financial statements.
Securities Portfolio as at March 31, 2018
LETRAS 0% 17-06/04/2018 EUR 14,000,700.00 2.8714,000,000
Transferable securities admitted to an official exchange listing
Money market instrumentsSpain
LETRAS 0% 17-07/12/2018 EUR 25,080,500.00 5.1525,000,000LETRAS 0% 17-11/05/2018 EUR 58,032,480.00 11.9158,000,000LETRAS 0% 17-13/07/2018 EUR 40,061,200.00 8.2240,000,000LETRAS 0% 17-14/09/2018 EUR 41,087,740.00 8.4341,000,000LETRAS 0% 17-15/06/2018 EUR 59,060,180.00 12.1359,000,000LETRAS 0% 17-17/08/2018 EUR 40,074,400.00 8.2240,000,000LETRAS 0% 18-18/01/2019 EUR 10,036,400.00 2.0610,000,000
287,433,600.00 58.99
287,433,600.00 58.99
BANCO SANTANDER 5.179% 15-19/11/2025 USD 679,089.43 0.14800,000
Bonds and other debt instrumentsSpain
BANKIA 17-31/12/2049 EUR 4,636,654.00 0.954,400,000CAIXABANK 18-31/12/2049 FRN EUR 5,596,108.00 1.155,600,000GRIFOLS SA 3.2% 17-01/05/2025 EUR 2,526,662.50 0.522,500,000IBERCAJA 18-31/12/2049 FRN EUR 3,008,160.00 0.623,000,000LIBERBANK 17-14/03/2027 EUR 4,392,480.00 0.904,000,000OBRASCON HUARTE 4.75% 14-15/03/2022 EUR 3,373,198.75 0.693,350,000
24,212,352.68 4.97
BARCLAYS PLC 14-29/06/2049 FRN USD 1,249,890.24 0.261,500,000United Kingdom
HSBC HOLDINGS 14-29/12/2049 FRN USD 1,668,682.93 0.342,000,000LLOYDS BANKING 14-29/12/2049 FRN GBP 3,828,731.74 0.793,000,000SANTANDER UK GRP 17-31/12/2049 GBP 3,969,299.90 0.813,200,000STANDARD CHART 17-29/12/2049 USD 3,700,195.12 0.764,250,000
14,416,799.93 2.96
AXA SA 5.5% 13-29/07/2049 USD 4,320,965.04 0.905,300,000France
BNP PARIBAS 16-29/12/2049 USD 2,505,015.80 0.512,934,000CRED AGRICOLE SA 14-29/09/2049 FRN USD 3,762,585.37 0.774,500,000ELEC DE FRANCE 13-29/01/2049 FRN USD 1,626,934.96 0.332,000,000
12,215,501.17 2.51
ENEL SPA 13-24/09/2073 FRN USD 969,426.83 0.201,000,000Italy
GENERALI FINANCE 14-30/11/2049 FRN EUR 1,069,700.00 0.221,000,000INTESA SANPAOLO 15-29/12/2049 FRN USD 1,708,959.35 0.352,000,000INTESA SANPAOLO 5.017% 14-26/06/2024 USD 1,608,186.99 0.332,000,000UNICREDIT SPA 14-29/12/2049 FRN EUR 2,158,880.00 0.442,000,000UNICREDIT SPA 17-31/12/2049 FRN EUR 2,001,620.00 0.412,000,000
9,516,773.17 1.95
DEMETER INVEST 17-31/12/2049 USD 1,204,134.15 0.251,500,000Netherlands
ING GROEP NV 15-29/12/2049 FRN USD 4,153,780.49 0.855,000,000KPN NV 13-28/03/2073 FRN USD 2,662,768.37 0.553,020,000TELEFONICA EUROP 18-31/12/2049 FRN EUR 1,484,182.50 0.301,500,000
9,504,865.51 1.95
ARYZTA AG 13-31/12/2049 FRN FLAT CHF 1,234,762.06 0.251,750,000Switzerland
CREDIT SUISSE 14-29/12/2049 FRN USD 3,515,451.22 0.734,200,000UBS GROUP 16-29/12/2049 FRN USD 1,024,843.90 0.211,200,000
5,775,057.18 1.19
HUTCHISON 13-29/05/2049 FRN EUR 3,662,866.25 0.753,650,000Cayman Islands
3,662,866.25 0.75
SOFTBANK GRP COR 17-31/12/2049 FRN USD 2,301,378.05 0.473,000,000Japan
2,301,378.05 0.47
NameQuantity/Nominal
Market valuein EUR
Currency %NAV
ATENTO LUXCO 1 S 6.125% 17-10/08/2022 USD 933,594.51 0.191,125,000Luxembourg
933,594.51 0.19
82,539,188.45 16.94
ALMIRALL SA EUR 671,300.00 0.1470,000
SharesSpain
ENDESA SA EUR 624,490.55 0.1334,917IBERDROLA SA EUR 1,059,432.80 0.22177,400INTL CONSOLIDATED AIRLINE-DI GBP 1,366,058.14 0.28194,900LIBERBANK SA EUR 817,821.29 0.171,838,627MERLIN PROPERTIES SOCIMI SA EUR 1,820,021.76 0.37146,304NH HOTEL GROUP SA EUR 593,389.98 0.1292,935OBRASCON HUARTE LAIN S.A. EUR 1,373,117.59 0.28396,511TALGO SA EUR 924,535.50 0.19176,102
9,250,167.61 1.90
EDF EUR 1,167,768.00 0.2499,300France
PUBLICIS GROUPE EUR 1,622,714.40 0.3328,680VALEO SA EUR 1,115,712.00 0.2320,800VINCI SA EUR 1,085,681.20 0.2213,588
4,991,875.60 1.02
BAE SYSTEMS PLC GBP 1,336,523.14 0.27201,575United Kingdom
CENTRICA PLC GBP 688,500.85 0.14424,561HOWDEN JOINERY GROUP PLC GBP 788,258.24 0.16150,000ITV PLC GBP 1,179,016.05 0.24717,200STAGECOACH GROUP PLC GBP 854,672.41 0.18567,755
4,846,970.69 0.99
KONINKLIJKE KPN NV EUR 1,442,947.70 0.30592,100Netherlands
PHILIPS LIGHTING NV EUR 1,254,190.50 0.2641,121ROYAL DUTCH SHELL PLC-A SHS EUR 1,727,595.00 0.3567,000
4,424,733.20 0.91
ALLIANZ AG REG EUR 1,054,550.00 0.225,750Germany
CONTINENTAL AG EUR 1,069,911.00 0.224,770SIEMENS AG-REG EUR 848,864.00 0.178,200VOLKSWAGEN AG-PREF EUR 1,068,012.84 0.226,618
4,041,337.84 0.83
PETROFAC LTD GBP 1,003,924.87 0.21173,700Jersey
SHIRE PLC GBP 2,052,344.27 0.4250,4033,056,269.14 0.63
GOODYEAR TIRE & RUBBER CO USD 1,220,951.22 0.2556,500United States
MICROSOFT CORP USD 1,083,367.48 0.2214,6002,304,318.70 0.47
PRYSMIAN SPA EUR 637,500.00 0.1325,000Italy
TELECOM ITALIA SPA EUR 1,550,658.33 0.322,011,2302,188,158.33 0.45
BANK OF IRELAND GROUP PLC EUR 1,140,500.88 0.23160,408Ireland
RYANAIR HOLDINGS PLC EUR 763,824.00 0.1647,7391,904,324.88 0.39
ERICSSON LM-B SHS SEK 995,418.65 0.21193,200Sweden
SCANDIC HOTELS GROUP AB SEK 787,185.87 0.16101,1301,782,604.52 0.37
NameQuantity/Nominal
Market valuein EUR
Currency %NAV
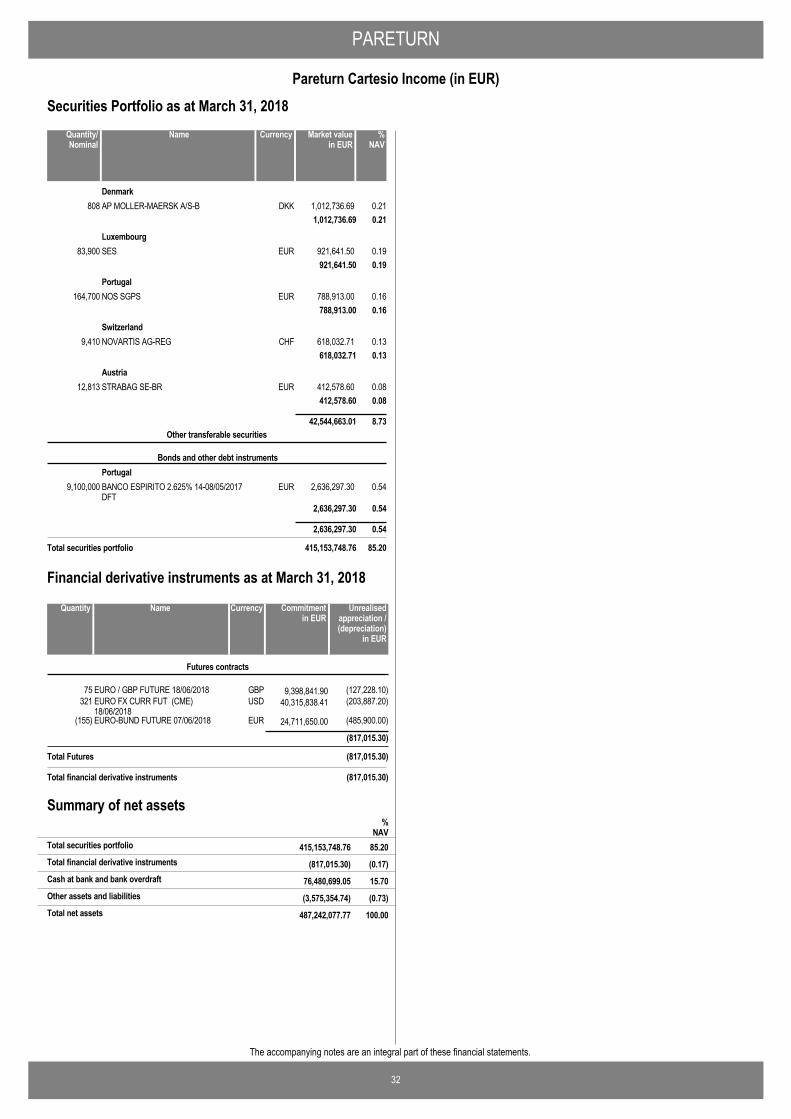
PARETURN
32
Pareturn Cartesio Income (in EUR)
The accompanying notes are an integral part of these financial statements.
Securities Portfolio as at March 31, 2018
AP MOLLER-MAERSK A/S-B DKK 1,012,736.69 0.21808Denmark
1,012,736.69 0.21
SES EUR 921,641.50 0.1983,900Luxembourg
921,641.50 0.19
NOS SGPS EUR 788,913.00 0.16164,700Portugal
788,913.00 0.16
NOVARTIS AG-REG CHF 618,032.71 0.139,410Switzerland
618,032.71 0.13
STRABAG SE-BR EUR 412,578.60 0.0812,813Austria
412,578.60 0.08
42,544,663.01 8.73
BANCO ESPIRITO 2.625% 14-08/05/2017DFT
EUR 2,636,297.30 0.549,100,000
Other transferable securities
Bonds and other debt instrumentsPortugal
2,636,297.30 0.54
2,636,297.30 0.54
Total securities portfolio 415,153,748.76 85.20
NameQuantity/Nominal
Market valuein EUR
Currency %NAV
EURO / GBP FUTURE 18/06/2018 GBP 9,398,841.9075 (127,228.10)
Futures contracts
EURO FX CURR FUT (CME)18/06/2018
USD 40,315,838.41321 (203,887.20)
EURO-BUND FUTURE 07/06/2018 EUR 24,711,650.00(155) (485,900.00)
(817,015.30)
Total Futures (817,015.30)
NameQuantity Commitmentin EUR
Currency Unrealisedappreciation /(depreciation)
in EUR
Financial derivative instruments as at March 31, 2018
Total financial derivative instruments (817,015.30)
Summary of net assets
(817,015.30) (0.17)Total financial derivative instruments
%NAV
415,153,748.76 85.20Total securities portfolio
76,480,699.05 15.70Cash at bank and bank overdraft
(3,575,354.74) (0.73)Other assets and liabilities
487,242,077.77 100.00Total net assets
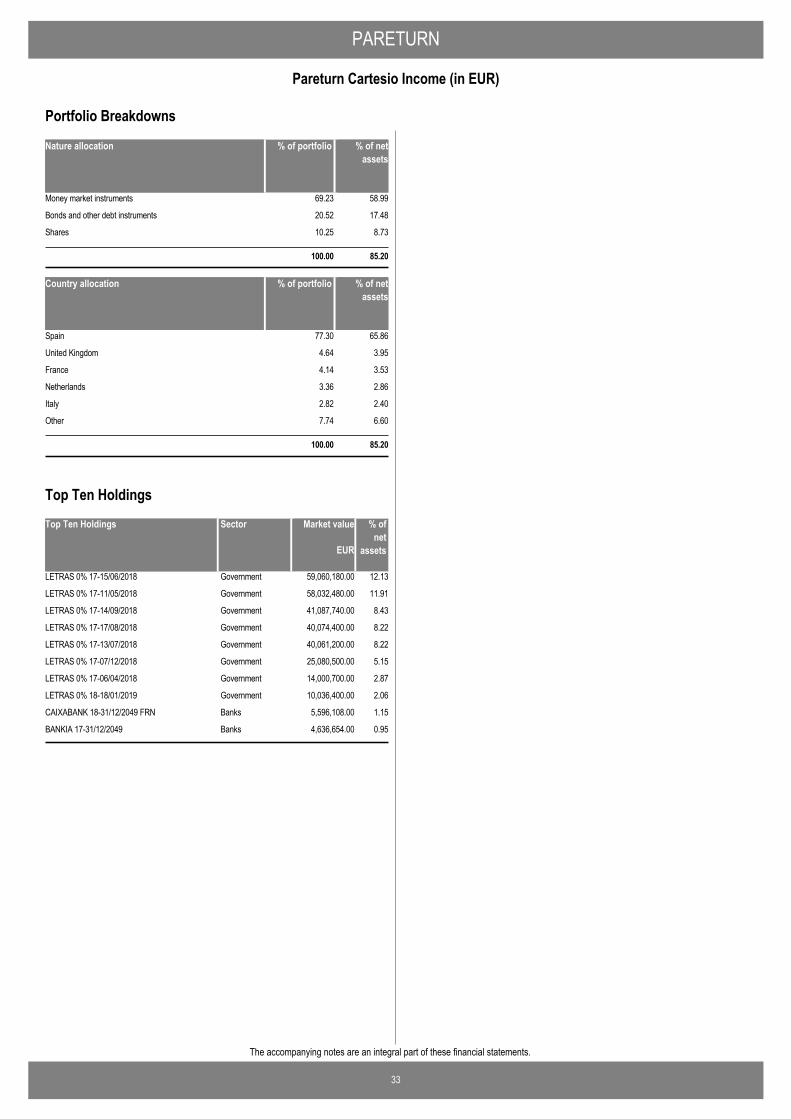
PARETURN
33
Pareturn Cartesio Income (in EUR)
The accompanying notes are an integral part of these financial statements.
Nature allocation % of portfolio % of netassets
Money market instruments 69.23 58.99
Bonds and other debt instruments 20.52 17.48
Shares 10.25 8.73
100.00 85.20
Country allocation % of portfolio % of netassets
Spain 77.30 65.86
United Kingdom 4.64 3.95
France 4.14 3.53
Netherlands 3.36 2.86
Italy 2.82 2.40
Other 7.74 6.60
100.00 85.20
Portfolio Breakdowns
Top Ten Holdings Market value % ofnet
assets
LETRAS 0% 17-15/06/2018 59,060,180.00 12.13Government
LETRAS 0% 17-11/05/2018 58,032,480.00 11.91Government
LETRAS 0% 17-14/09/2018 41,087,740.00 8.43Government
LETRAS 0% 17-17/08/2018 40,074,400.00 8.22Government
LETRAS 0% 17-13/07/2018 40,061,200.00 8.22Government
LETRAS 0% 17-07/12/2018 25,080,500.00 5.15Government
LETRAS 0% 17-06/04/2018 14,000,700.00 2.87Government
LETRAS 0% 18-18/01/2019 10,036,400.00 2.06Government
CAIXABANK 18-31/12/2049 FRN 5,596,108.00 1.15Banks
BANKIA 17-31/12/2049 4,636,654.00 0.95Banks
EUR
Sector
Top Ten Holdings

34
The accompanying notes are an integral part of these financial statements.
PARETURN
Pareturn Stamina Systematic (in EUR)Statement of Operations and Changes in Net Assets for theperiod ended March 31, 2018
EUR
AssetsInvestment in securities at cost 5,859,148.72Unrealised appreciation / (depreciation) on securities (150,460.28)
Investment in securities at market value 3.3 5,708,688.44Cash at bank 277,585.81Receivable on subscription 2,429.23Net unrealised appreciation on forward foreign exchangecontracts
3.4, 15 5,064.76
Dividends and interest receivable 1.50
Total assets 5,993,769.74
LiabilitiesAccrued expenses 47,917.01Payable on redemption 28,730.71Other liabilities 461.90
Total liabilities 77,109.62
Net assets at the end of the period 5,916,660.12
Notes
Statement of Net Assets as at March 31, 2018
IncomeBank interest 3.8 13.26Other income 12 42.59
Total income 55.85
ExpensesInvestment advisory fees and management fees 4 59,003.63Depositary fees 6,120.17Performance fees 4 1,093.58Administration fees 16,083.65Professional fees 6,475.07Distribution fees 14 14,074.36Transaction costs 9 11,524.39Taxe d'abonnement 5 53.49Bank interest and charges 9,137.02Other expenses 13 8,460.21
Total expenses 132,025.57
Net investment income / (loss) (131,969.72)
Net realised gain / (loss) on: Sales of Investments 3.9 166,115.47Foreign exchange transactions 3.2 (17,898.16)Forward foreign exchange contracts 3.4 46,731.84
Net realised gain / (loss) for the period 62,979.43
Net change in unrealised appreciation / (depreciation) on: Investments 3.9 (191,886.62)Forward foreign exchange contracts 3.4 16,982.30
Increase / (Decrease) in net assets as a result ofoperations
(111,924.89)
Proceeds received on subscription of shares 41,638.88Net amount paid on redemption of shares (871,187.15)Net assets at the beginning of the period 6,858,133.28
Net assets at the end of the period 5,916,660.12
EURNotes
Statement of Operations and Changes in Net Assets forthe period ended March 31, 2018
Number of shares in issue atthe end of the period
Number of shares in issue atthe beginning of the period
Number of sharessubscribed
Number of sharesredeemed
Statement of Changes in Number of Shares
B EUR F Cap 59,177 358 (7,475) 52,060

PARETURN
35
Pareturn Stamina Systematic (in EUR)
The accompanying notes are an integral part of these financial statements.
Securities Portfolio as at March 31, 2018
AMUNDI F2 - EURO SH/TRM-IEUR EUR 42,177.35 0.716
Funds
Investment fundsLuxembourg
BGF EM EQ INC D2C SHS-D2-CAP USD 357,520.40 6.0426,457BGF-EMERGING EUROPE FUND-EURD2 EUR 361,589.39 6.113,191BGF-JAPAN S/M CAP OPPOR-YEND2 JPY 371,959.34 6.295,714BGF-WORLD FINANCIAL D2C SHS-D2-CAP USD 352,269.89 5.9513,827BGF-WORLD GOLD FUND-USDD2 USD 78,529.00 1.333,280BLACKROCK GL-ASEAN LDR-DUSD USD 239,510.32 4.0520,479BNP INSTICASH-EUR-I* EUR 14.72 0.000ING (L) Invest - Consumer Goods I CAP USD 100,197.90 1.6958ING (L) INVEST EMERGING EUROPE I CAP EUR 343,198.21 5.804,921ING (L) LIQUID EUR F CAP EUR 1,120,903.90 18.95219PARVEST CONV BD EU SMCP-I EUR 55,627.99 0.94297PARVEST ENHANCED CASH-6M-I EUR 407,958.08 6.903,575PARVEST EQ EUR VALUE-INSTIT EUR 373,034.89 6.301,911PARVEST EQUITY EUROPE EMERGING EUR 400,781.24 6.772,923PARVEST EQUITY JAP SMC-INSTN JPY 400,490.50 6.773,464PARVEST EQUITY RUSSIAOPPORTUNITIES ICA
USD 207,529.45 3.512,334
PARVEST EQU-LATIN AMER-INST* USD 372,703.97 6.3011,449PARVEST EQY BEST SEL EURO-I EUR 122,689.56 2.07505PICTET SIC-CHF BD-I-CAP* CHF 1.29 0.000PICTET-USD GOVERNMNT BONDS-I* USD 1.05 0.000
5,708,688.44 96.48
5,708,688.44 96.48
Total securities portfolio 5,708,688.44 96.48
NameQuantity/Nominal
Market valuein EUR
Currency %NAV
100,000,000 24/04/18770,755 8,475.23JPYEUR 770,755.09Forward foreign exchange contracts
2,120,000 24/04/181,714,420 (3,410.47)USDEUR 1,714,419.73
5,064.76
Total Forward foreign exchange contracts 5,064.76
SalePurchase Unrealisedappreciation /(depreciation)
in EUR
MaturityDate
Commitmentin EUR
Financial derivative instruments as at March 31, 2018
Total financial derivative instruments 5,064.76
Summary of net assets
5,064.76 0.09Total financial derivative instruments
%NAV
5,708,688.44 96.48Total securities portfolio
277,585.81 4.69Cash at bank and bank overdraft
(74,678.89) (1.26)Other assets and liabilities
5,916,660.12 100.00Total net assets

PARETURN
36
Pareturn Stamina Systematic (in EUR)
The accompanying notes are an integral part of these financial statements.
Nature allocation % of portfolio % of netassets
Investment funds 100.00 96.48
100.00 96.48
Country allocation % of portfolio % of netassets
Luxembourg 100.00 96.48
100.00 96.48
Portfolio Breakdowns
Top Ten Holdings Market value % ofnet
assets
ING (L) LIQUID EUR F CAP 1,120,903.90 18.95Open-ended Funds
PARVEST ENHANCED CASH-6M-I 407,958.08 6.90Open-ended Funds
PARVEST EQUITY EUROPE EMERGING 400,781.24 6.77Open-ended Funds
PARVEST EQUITY JAP SMC-INSTN 400,490.50 6.77Open-ended Funds
PARVEST EQ EUR VALUE-INSTIT 373,034.89 6.30Open-ended Funds
PARVEST EQU-LATIN AMER-INST* 372,703.97 6.30Open-ended Funds
BGF-JAPAN S/M CAP OPPOR-YEND2 371,959.34 6.29Open-ended Funds
BGF-EMERGING EUROPE FUND-EURD2 361,589.39 6.11Open-ended Funds
BGF EM EQ INC D2C SHS-D2-CAP 357,520.40 6.04Open-ended Funds
BGF-WORLD FINANCIAL D2C SHS-D2-CAP 352,269.89 5.95Open-ended Funds
EUR
Sector
Top Ten Holdings
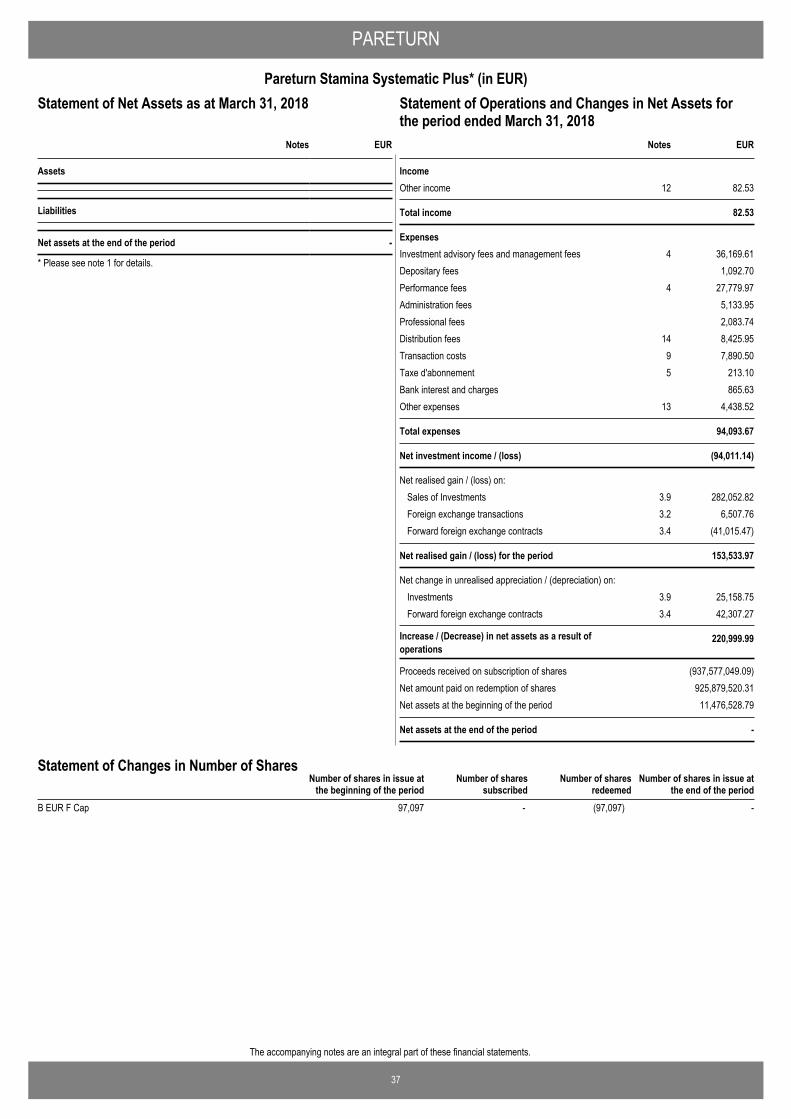
37
The accompanying notes are an integral part of these financial statements.
PARETURN
Pareturn Stamina Systematic Plus* (in EUR)Statement of Operations and Changes in Net Assets for theperiod ended March 31, 2018
EUR
Assets
Liabilities
Net assets at the end of the period -
Notes
Statement of Net Assets as at March 31, 2018
* Please see note 1 for details.
IncomeOther income 12 82.53
Total income 82.53
ExpensesInvestment advisory fees and management fees 4 36,169.61Depositary fees 1,092.70Performance fees 4 27,779.97Administration fees 5,133.95Professional fees 2,083.74Distribution fees 14 8,425.95Transaction costs 9 7,890.50Taxe d'abonnement 5 213.10Bank interest and charges 865.63Other expenses 13 4,438.52
Total expenses 94,093.67
Net investment income / (loss) (94,011.14)
Net realised gain / (loss) on:Sales of Investments 3.9 282,052.82Foreign exchange transactions 3.2 6,507.76Forward foreign exchange contracts 3.4 (41,015.47)
Net realised gain / (loss) for the period 153,533.97
Net change in unrealised appreciation / (depreciation) on:Investments 3.9 25,158.75Forward foreign exchange contracts 3.4 42,307.27
Increase / (Decrease) in net assets as a result ofoperations
220,999.99
Proceeds received on subscription of shares (937,577,049.09)Net amount paid on redemption of shares 925,879,520.31Net assets at the beginning of the period 11,476,528.79
Net assets at the end of the period -
EURNotes
Statement of Operations and Changes in Net Assets forthe period ended March 31, 2018
Number of shares in issue atthe end of the period
Number of shares in issue atthe beginning of the period
Number of sharessubscribed
Number of sharesredeemed
Statement of Changes in Number of Shares
B EUR F Cap 97,097 - (97,097) -

38
The accompanying notes are an integral part of these financial statements.
PARETURN
Pareturn Mutuafondo Global Fixed Income (in EUR)Statement of Operations and Changes in Net Assets for theperiod ended March 31, 2018
EUR
AssetsInvestment in securities at cost 53,889,742.35Unrealised appreciation / (depreciation) on securities (894,852.89)
Investment in securities at market value 3.3 52,994,889.46Cash at bank 5,089,803.38Dividends and interest receivable 577,321.09
Total assets 58,662,013.93
LiabilitiesBank overdraft 576.88Accrued expenses 80,843.92Net unrealised depreciation on futures contracts 3.5 21,843.68Other liabilities 2,886.66
Total liabilities 106,151.14
Net assets at the end of the period 58,555,862.79
Notes
Statement of Net Assets as at March 31, 2018
IncomeInterest on bonds (net of withholding taxes) 3.8 707,257.65Bank interest 3.8 350.53Other income 12 307.40
Total income 707,915.58
ExpensesInvestment advisory fees and management fees 4 83,721.88Depositary fees 8,314.05Administration fees 14,440.94Professional fees 11,741.17Transaction costs 9 3,001.74Taxe d'abonnement 5 14,567.27Bank interest and charges 13,415.43Other expenses 13 3,992.79
Total expenses 153,195.27
Net investment income / (loss) 554,720.31
Net realised gain / (loss) on:Sales of Investments 3.9 (83,358.18)Foreign exchange transactions 3.2 (14,605.55)Futures contracts 3.5 62,177.52
Net realised gain / (loss) for the period 518,934.10
Net change in unrealised appreciation / (depreciation) on:Investments 3.9 (419,094.51)Futures contracts 3.5 (15,599.52)
Increase / (Decrease) in net assets as a result ofoperations
84,240.07
Proceeds received on subscription of shares 499,999.95Net amount paid on redemption of shares -Net assets at the beginning of the period 57,971,622.77
Net assets at the end of the period 58,555,862.79
EURNotes
Statement of Operations and Changes in Net Assets forthe period ended March 31, 2018
Number of shares in issue atthe end of the period
Number of shares in issue atthe beginning of the period
Number of sharessubscribed
Number of sharesredeemed
Statement of Changes in Number of Shares
B EUR P Cap 338,587 2,920 - 341,507
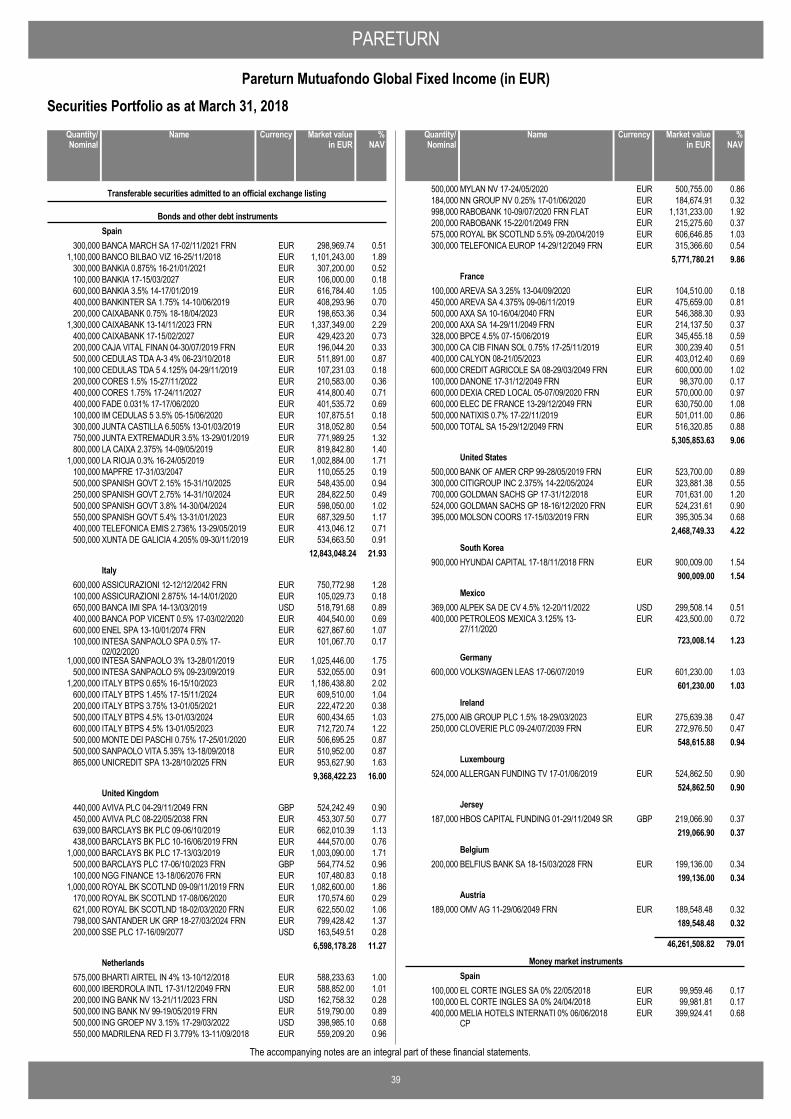
PARETURN
39
Pareturn Mutuafondo Global Fixed Income (in EUR)
The accompanying notes are an integral part of these financial statements.
Securities Portfolio as at March 31, 2018
BANCA MARCH SA 17-02/11/2021 FRN EUR 298,969.74 0.51300,000
Transferable securities admitted to an official exchange listing
Bonds and other debt instrumentsSpain
BANCO BILBAO VIZ 16-25/11/2018 EUR 1,101,243.00 1.891,100,000BANKIA 0.875% 16-21/01/2021 EUR 307,200.00 0.52300,000BANKIA 17-15/03/2027 EUR 106,000.00 0.18100,000BANKIA 3.5% 14-17/01/2019 EUR 616,784.40 1.05600,000BANKINTER SA 1.75% 14-10/06/2019 EUR 408,293.96 0.70400,000CAIXABANK 0.75% 18-18/04/2023 EUR 198,653.36 0.34200,000CAIXABANK 13-14/11/2023 FRN EUR 1,337,349.00 2.291,300,000CAIXABANK 17-15/02/2027 EUR 429,423.20 0.73400,000CAJA VITAL FINAN 04-30/07/2019 FRN EUR 196,044.20 0.33200,000CEDULAS TDA A-3 4% 06-23/10/2018 EUR 511,891.00 0.87500,000CEDULAS TDA 5 4.125% 04-29/11/2019 EUR 107,231.03 0.18100,000CORES 1.5% 15-27/11/2022 EUR 210,583.00 0.36200,000CORES 1.75% 17-24/11/2027 EUR 414,800.40 0.71400,000FADE 0.031% 17-17/06/2020 EUR 401,535.72 0.69400,000IM CEDULAS 5 3.5% 05-15/06/2020 EUR 107,875.51 0.18100,000JUNTA CASTILLA 6.505% 13-01/03/2019 EUR 318,052.80 0.54300,000JUNTA EXTREMADUR 3.5% 13-29/01/2019 EUR 771,989.25 1.32750,000LA CAIXA 2.375% 14-09/05/2019 EUR 819,842.80 1.40800,000LA RIOJA 0.3% 16-24/05/2019 EUR 1,002,884.00 1.711,000,000MAPFRE 17-31/03/2047 EUR 110,055.25 0.19100,000SPANISH GOVT 2.15% 15-31/10/2025 EUR 548,435.00 0.94500,000SPANISH GOVT 2.75% 14-31/10/2024 EUR 284,822.50 0.49250,000SPANISH GOVT 3.8% 14-30/04/2024 EUR 598,050.00 1.02500,000SPANISH GOVT 5.4% 13-31/01/2023 EUR 687,329.50 1.17550,000TELEFONICA EMIS 2.736% 13-29/05/2019 EUR 413,046.12 0.71400,000XUNTA DE GALICIA 4.205% 09-30/11/2019 EUR 534,663.50 0.91500,000
12,843,048.24 21.93
ASSICURAZIONI 12-12/12/2042 FRN EUR 750,772.98 1.28600,000Italy
ASSICURAZIONI 2.875% 14-14/01/2020 EUR 105,029.73 0.18100,000BANCA IMI SPA 14-13/03/2019 USD 518,791.68 0.89650,000BANCA POP VICENT 0.5% 17-03/02/2020 EUR 404,540.00 0.69400,000ENEL SPA 13-10/01/2074 FRN EUR 627,867.60 1.07600,000INTESA SANPAOLO SPA 0.5% 17-02/02/2020
EUR 101,067.70 0.17100,000
INTESA SANPAOLO 3% 13-28/01/2019 EUR 1,025,446.00 1.751,000,000INTESA SANPAOLO 5% 09-23/09/2019 EUR 532,055.00 0.91500,000ITALY BTPS 0.65% 16-15/10/2023 EUR 1,186,438.80 2.021,200,000ITALY BTPS 1.45% 17-15/11/2024 EUR 609,510.00 1.04600,000ITALY BTPS 3.75% 13-01/05/2021 EUR 222,472.20 0.38200,000ITALY BTPS 4.5% 13-01/03/2024 EUR 600,434.65 1.03500,000ITALY BTPS 4.5% 13-01/05/2023 EUR 712,720.74 1.22600,000MONTE DEI PASCHI 0.75% 17-25/01/2020 EUR 506,695.25 0.87500,000SANPAOLO VITA 5.35% 13-18/09/2018 EUR 510,952.00 0.87500,000UNICREDIT SPA 13-28/10/2025 FRN EUR 953,627.90 1.63865,000
9,368,422.23 16.00
AVIVA PLC 04-29/11/2049 FRN GBP 524,242.49 0.90440,000United Kingdom
AVIVA PLC 08-22/05/2038 FRN EUR 453,307.50 0.77450,000BARCLAYS BK PLC 09-06/10/2019 EUR 662,010.39 1.13639,000BARCLAYS BK PLC 10-16/06/2019 FRN EUR 444,570.00 0.76438,000BARCLAYS BK PLC 17-13/03/2019 EUR 1,003,090.00 1.711,000,000BARCLAYS PLC 17-06/10/2023 FRN GBP 564,774.52 0.96500,000NGG FINANCE 13-18/06/2076 FRN EUR 107,480.83 0.18100,000ROYAL BK SCOTLND 09-09/11/2019 FRN EUR 1,082,600.00 1.861,000,000ROYAL BK SCOTLND 17-08/06/2020 EUR 170,574.60 0.29170,000ROYAL BK SCOTLND 18-02/03/2020 FRN EUR 622,550.02 1.06621,000SANTANDER UK GRP 18-27/03/2024 FRN EUR 799,428.42 1.37798,000SSE PLC 17-16/09/2077 USD 163,549.51 0.28200,000
6,598,178.28 11.27
BHARTI AIRTEL IN 4% 13-10/12/2018 EUR 588,233.63 1.00575,000Netherlands
IBERDROLA INTL 17-31/12/2049 FRN EUR 588,852.00 1.01600,000ING BANK NV 13-21/11/2023 FRN USD 162,758.32 0.28200,000ING BANK NV 99-19/05/2019 FRN EUR 519,790.00 0.89500,000ING GROEP NV 3.15% 17-29/03/2022 USD 398,985.10 0.68500,000MADRILENA RED FI 3.779% 13-11/09/2018 EUR 559,209.20 0.96550,000
NameQuantity/Nominal
Market valuein EUR
Currency %NAV
MYLAN NV 17-24/05/2020 EUR 500,755.00 0.86500,000NN GROUP NV 0.25% 17-01/06/2020 EUR 184,674.91 0.32184,000RABOBANK 10-09/07/2020 FRN FLAT EUR 1,131,233.00 1.92998,000RABOBANK 15-22/01/2049 FRN EUR 215,275.60 0.37200,000ROYAL BK SCOTLND 5.5% 09-20/04/2019 EUR 606,646.85 1.03575,000TELEFONICA EUROP 14-29/12/2049 FRN EUR 315,366.60 0.54300,000
5,771,780.21 9.86
AREVA SA 3.25% 13-04/09/2020 EUR 104,510.00 0.18100,000France
AREVA SA 4.375% 09-06/11/2019 EUR 475,659.00 0.81450,000AXA SA 10-16/04/2040 FRN EUR 546,388.30 0.93500,000AXA SA 14-29/11/2049 FRN EUR 214,137.50 0.37200,000BPCE 4.5% 07-15/06/2019 EUR 345,455.18 0.59328,000CA CIB FINAN SOL 0.75% 17-25/11/2019 EUR 300,239.40 0.51300,000CALYON 08-21/05/2023 EUR 403,012.40 0.69400,000CREDIT AGRICOLE SA 08-29/03/2049 FRN EUR 600,000.00 1.02600,000DANONE 17-31/12/2049 FRN EUR 98,370.00 0.17100,000DEXIA CRED LOCAL 05-07/09/2020 FRN EUR 570,000.00 0.97600,000ELEC DE FRANCE 13-29/12/2049 FRN EUR 630,750.00 1.08600,000NATIXIS 0.7% 17-22/11/2019 EUR 501,011.00 0.86500,000TOTAL SA 15-29/12/2049 FRN EUR 516,320.85 0.88500,000
5,305,853.63 9.06
BANK OF AMER CRP 99-28/05/2019 FRN EUR 523,700.00 0.89500,000United States
CITIGROUP INC 2.375% 14-22/05/2024 EUR 323,881.38 0.55300,000GOLDMAN SACHS GP 17-31/12/2018 EUR 701,631.00 1.20700,000GOLDMAN SACHS GP 18-16/12/2020 FRN EUR 524,231.61 0.90524,000MOLSON COORS 17-15/03/2019 FRN EUR 395,305.34 0.68395,000
2,468,749.33 4.22
HYUNDAI CAPITAL 17-18/11/2018 FRN EUR 900,009.00 1.54900,000South Korea
900,009.00 1.54
ALPEK SA DE CV 4.5% 12-20/11/2022 USD 299,508.14 0.51369,000Mexico
PETROLEOS MEXICA 3.125% 13-27/11/2020
EUR 423,500.00 0.72400,000
723,008.14 1.23
VOLKSWAGEN LEAS 17-06/07/2019 EUR 601,230.00 1.03600,000Germany
601,230.00 1.03
AIB GROUP PLC 1.5% 18-29/03/2023 EUR 275,639.38 0.47275,000Ireland
CLOVERIE PLC 09-24/07/2039 FRN EUR 272,976.50 0.47250,000548,615.88 0.94
ALLERGAN FUNDING TV 17-01/06/2019 EUR 524,862.50 0.90524,000Luxembourg
524,862.50 0.90
HBOS CAPITAL FUNDING 01-29/11/2049 SR GBP 219,066.90 0.37187,000Jersey
219,066.90 0.37
BELFIUS BANK SA 18-15/03/2028 FRN EUR 199,136.00 0.34200,000Belgium
199,136.00 0.34
OMV AG 11-29/06/2049 FRN EUR 189,548.48 0.32189,000Austria
189,548.48 0.32
46,261,508.82 79.01
EL CORTE INGLES SA 0% 22/05/2018 EUR 99,959.46 0.17100,000
Money market instrumentsSpain
EL CORTE INGLES SA 0% 24/04/2018 EUR 99,981.81 0.17100,000MELIA HOTELS INTERNATI 0% 06/06/2018CP
EUR 399,924.41 0.68400,000
NameQuantity/Nominal
Market valuein EUR
Currency %NAV

PARETURN
40
Pareturn Mutuafondo Global Fixed Income (in EUR)
The accompanying notes are an integral part of these financial statements.
Securities Portfolio as at March 31, 2018
VIESGO HOLDCO SA 0% 20/04/2018 EUR 999,988.35 1.711,000,0001,599,854.03 2.73
1,599,854.03 2.73
VERSE 3 SNR 1.99% 15-12/02/2019 EUR 247,838.96 0.42246,110
Mortgage backed securitiesPortugal
VERSE 5 SEN 0.85% 17-12/02/2022 EUR 484,953.65 0.83484,820732,792.61 1.25
DRVES 3 A 16-21/12/2026 FRN EUR 123,140.36 0.21122,287Spain
DRVES 4 A 17-21/04/2028 EUR 369,397.77 0.63368,487492,538.13 0.84
1,225,330.74 2.09
ITALY BTPS 0.9% 17-01/08/2022 EUR 609,722.16 1.04600,000
Other transferable securities
Bonds and other debt instrumentsItaly
ITALY BTPS 0.95% 16-15/03/2023 EUR 809,608.24 1.38800,0001,419,330.40 2.42
GS INTERNATIONAL 0.2% 17-26/06/2018 EUR 1,200,376.80 2.051,200,000United Kingdom
1,200,376.80 2.05
COMUNIDAD MADRID 17-30/04/2020 EUR 799,520.17 1.36800,000Spain
COMUNIDAD MADRID 2.875% 14-06/04/2019
EUR 308,968.50 0.53300,000
1,108,488.67 1.89
BANCO ESPIRITO 2.625% 14-08/05/2017DFT
EUR 180,000.00 0.31600,000Portugal
180,000.00 0.31
3,908,195.87 6.67
Total securities portfolio 52,994,889.46 90.50
NameQuantity/Nominal
Market valuein EUR
Currency %NAV
EURO / GBP FUTURE 18/06/2018 GBP 1,375,784.9111 (14,035.56)
Futures contracts
EURO FX CURR FUT (CME)18/06/2018
USD 250,607.242 576.88
EURO-BOBL FUTURE 07/06/2018 EUR 1,967,850.00(15) (5,760.00)EURO-BUND FUTURE 07/06/2018 EUR 477,930.003 630.00EURO-SCHATZ FUTURE 07/06/2018 EUR 3,470,915.00(31) (3,255.00)
(21,843.68)
Total Futures (21,843.68)
NameQuantity Commitmentin EUR
Currency Unrealisedappreciation /(depreciation)
in EUR
Financial derivative instruments as at March 31, 2018
Total financial derivative instruments (21,843.68)
Summary of net assets
(21,843.68) (0.04)Total financial derivative instruments
%NAV
52,994,889.46 90.50Total securities portfolio
5,089,226.50 8.69Cash at bank and bank overdraft
493,590.51 0.85Other assets and liabilities
58,555,862.79 100.00Total net assets

PARETURN
41
Pareturn Mutuafondo Global Fixed Income (in EUR)
The accompanying notes are an integral part of these financial statements.
Nature allocation % of portfolio % of netassets
Bonds and other debt instruments 94.67 85.68
Money market instruments 3.02 2.73
Mortgage backed securities 2.31 2.09
100.00 90.50
Country allocation % of portfolio % of netassets
Spain 30.27 27.39
Italy 20.36 18.42
United Kingdom 14.72 13.32
Netherlands 10.89 9.86
France 10.01 9.06
United States 4.66 4.22
Other 9.09 8.23
100.00 90.50
Portfolio Breakdowns
Top Ten Holdings Market value % ofnet
assets
CAIXABANK 13-14/11/2023 FRN 1,337,349.00 2.29Banks
GS INTERNATIONAL 0.2% 17-26/06/2018 1,200,376.80 2.05Diversified services
ITALY BTPS 0.65% 16-15/10/2023 1,186,438.80 2.02Government
RABOBANK 10-09/07/2020 FRN FLAT 1,131,233.00 1.92Banks
BANCO BILBAO VIZ 16-25/11/2018 1,101,243.00 1.89Banks
ROYAL BK SCOTLND 09-09/11/2019 FRN 1,082,600.00 1.86Banks
INTESA SANPAOLO 3% 13-28/01/2019 1,025,446.00 1.75Banks
BARCLAYS BK PLC 17-13/03/2019 1,003,090.00 1.71Banks
LA RIOJA 0.3% 16-24/05/2019 1,002,884.00 1.71Government
VIESGO HOLDCO SA 0% 20/04/2018 999,988.35 1.71Banks
EUR
Sector
Top Ten Holdings
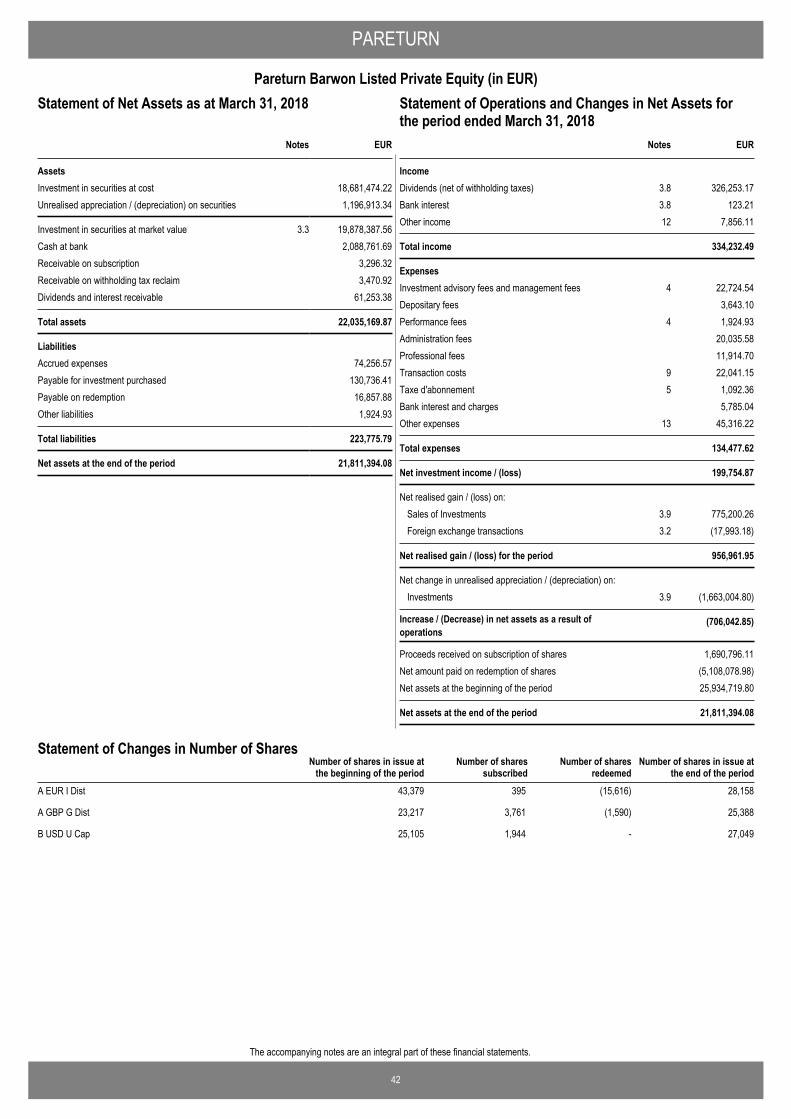
42
The accompanying notes are an integral part of these financial statements.
PARETURN
Pareturn Barwon Listed Private Equity (in EUR)Statement of Operations and Changes in Net Assets for theperiod ended March 31, 2018
EUR
AssetsInvestment in securities at cost 18,681,474.22Unrealised appreciation / (depreciation) on securities 1,196,913.34
Investment in securities at market value 3.3 19,878,387.56Cash at bank 2,088,761.69Receivable on subscription 3,296.32Receivable on withholding tax reclaim 3,470.92Dividends and interest receivable 61,253.38
Total assets 22,035,169.87
LiabilitiesAccrued expenses 74,256.57Payable for investment purchased 130,736.41Payable on redemption 16,857.88Other liabilities 1,924.93
Total liabilities 223,775.79
Net assets at the end of the period 21,811,394.08
Notes
Statement of Net Assets as at March 31, 2018
IncomeDividends (net of withholding taxes) 3.8 326,253.17Bank interest 3.8 123.21Other income 12 7,856.11
Total income 334,232.49
ExpensesInvestment advisory fees and management fees 4 22,724.54Depositary fees 3,643.10Performance fees 4 1,924.93Administration fees 20,035.58Professional fees 11,914.70Transaction costs 9 22,041.15Taxe d'abonnement 5 1,092.36Bank interest and charges 5,785.04Other expenses 13 45,316.22
Total expenses 134,477.62
Net investment income / (loss) 199,754.87
Net realised gain / (loss) on:Sales of Investments 3.9 775,200.26Foreign exchange transactions 3.2 (17,993.18)
Net realised gain / (loss) for the period 956,961.95
Net change in unrealised appreciation / (depreciation) on:Investments 3.9 (1,663,004.80)
Increase / (Decrease) in net assets as a result ofoperations
(706,042.85)
Proceeds received on subscription of shares 1,690,796.11Net amount paid on redemption of shares (5,108,078.98)Net assets at the beginning of the period 25,934,719.80
Net assets at the end of the period 21,811,394.08
EURNotes
Statement of Operations and Changes in Net Assets forthe period ended March 31, 2018
Number of shares in issue atthe end of the period
Number of shares in issue atthe beginning of the period
Number of sharessubscribed
Number of sharesredeemed
Statement of Changes in Number of Shares
A EUR I Dist 43,379 395 (15,616) 28,158
A GBP G Dist 23,217 3,761 (1,590) 25,388
B USD U Cap 25,105 1,944 - 27,049
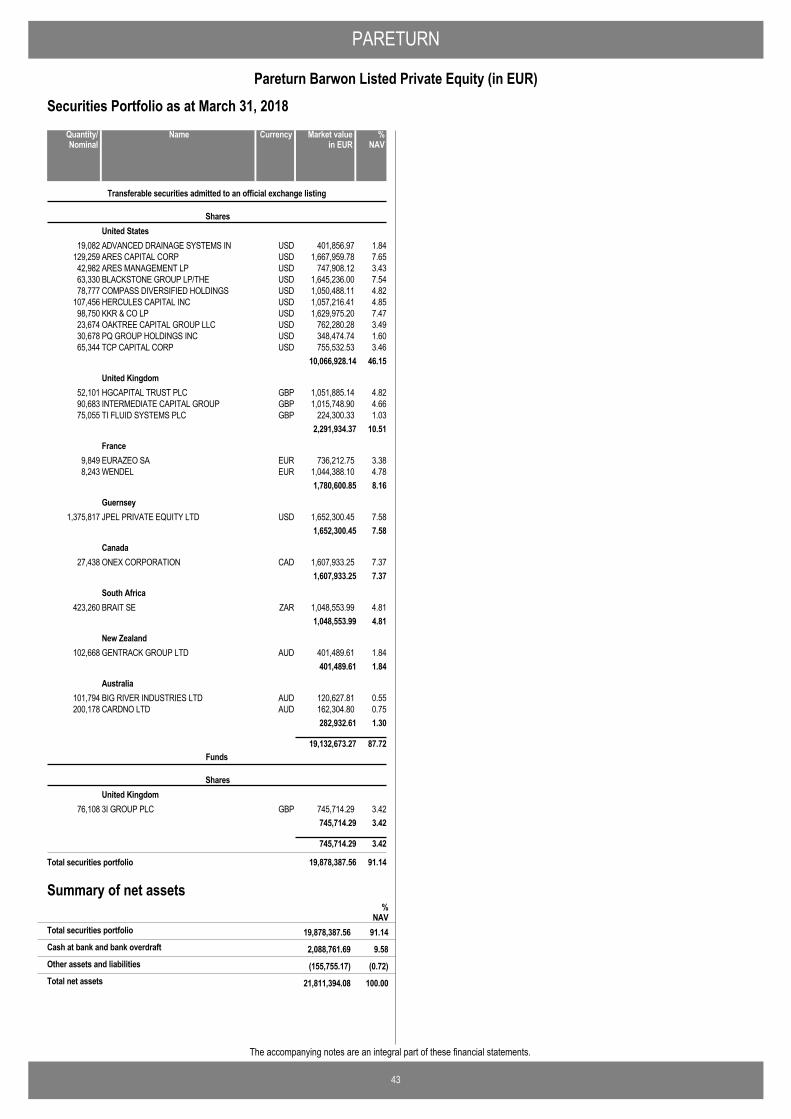
PARETURN
43
Pareturn Barwon Listed Private Equity (in EUR)
The accompanying notes are an integral part of these financial statements.
Securities Portfolio as at March 31, 2018
ADVANCED DRAINAGE SYSTEMS IN USD 401,856.97 1.8419,082
Transferable securities admitted to an official exchange listing
SharesUnited States
ARES CAPITAL CORP USD 1,667,959.78 7.65129,259ARES MANAGEMENT LP USD 747,908.12 3.4342,982BLACKSTONE GROUP LP/THE USD 1,645,236.00 7.5463,330COMPASS DIVERSIFIED HOLDINGS USD 1,050,488.11 4.8278,777HERCULES CAPITAL INC USD 1,057,216.41 4.85107,456KKR & CO LP USD 1,629,975.20 7.4798,750OAKTREE CAPITAL GROUP LLC USD 762,280.28 3.4923,674PQ GROUP HOLDINGS INC USD 348,474.74 1.6030,678TCP CAPITAL CORP USD 755,532.53 3.4665,344
10,066,928.14 46.15
HGCAPITAL TRUST PLC GBP 1,051,885.14 4.8252,101United Kingdom
INTERMEDIATE CAPITAL GROUP GBP 1,015,748.90 4.6690,683TI FLUID SYSTEMS PLC GBP 224,300.33 1.0375,055
2,291,934.37 10.51
EURAZEO SA EUR 736,212.75 3.389,849France
WENDEL EUR 1,044,388.10 4.788,2431,780,600.85 8.16
JPEL PRIVATE EQUITY LTD USD 1,652,300.45 7.581,375,817Guernsey
1,652,300.45 7.58
ONEX CORPORATION CAD 1,607,933.25 7.3727,438Canada
1,607,933.25 7.37
BRAIT SE ZAR 1,048,553.99 4.81423,260South Africa
1,048,553.99 4.81
GENTRACK GROUP LTD AUD 401,489.61 1.84102,668New Zealand
401,489.61 1.84
BIG RIVER INDUSTRIES LTD AUD 120,627.81 0.55101,794Australia
CARDNO LTD AUD 162,304.80 0.75200,178282,932.61 1.30
19,132,673.27 87.72
3I GROUP PLC GBP 745,714.29 3.4276,108
Funds
SharesUnited Kingdom
745,714.29 3.42
745,714.29 3.42
Total securities portfolio 19,878,387.56 91.14
NameQuantity/Nominal
Market valuein EUR
Currency %NAV
Summary of net assets%
NAV19,878,387.56 91.14Total securities portfolio
2,088,761.69 9.58Cash at bank and bank overdraft
(155,755.17) (0.72)Other assets and liabilities
21,811,394.08 100.00Total net assets
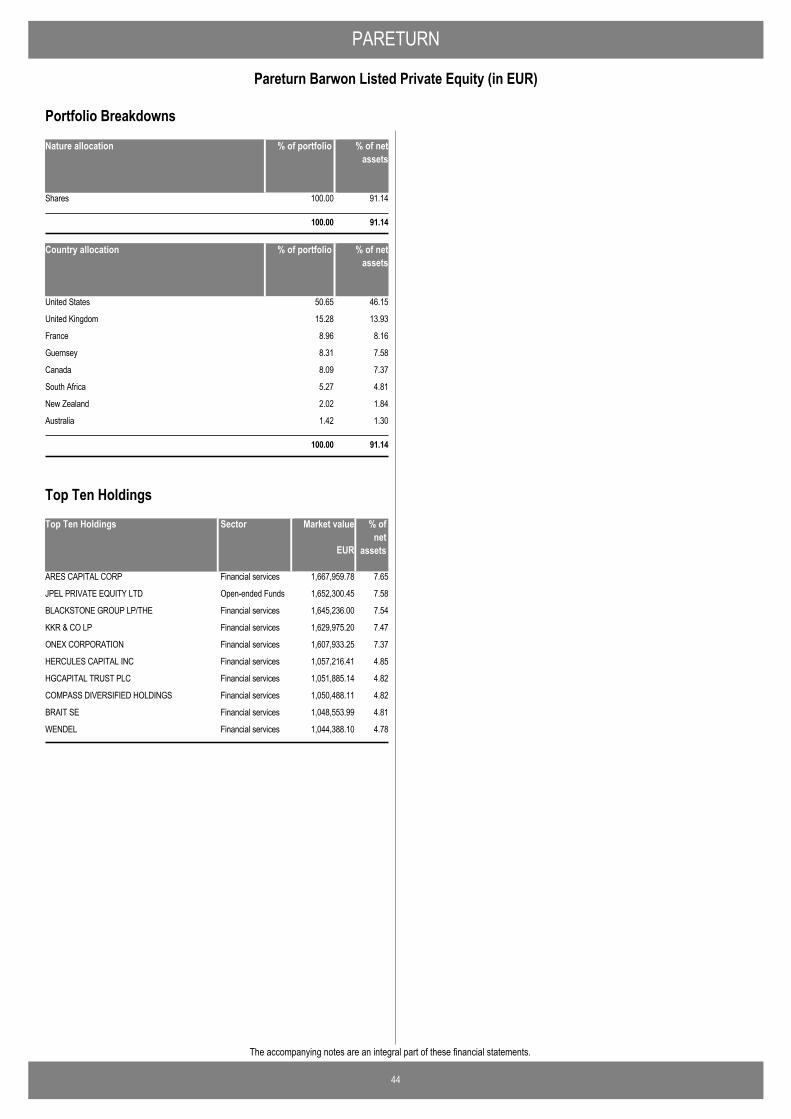
PARETURN
44
Pareturn Barwon Listed Private Equity (in EUR)
The accompanying notes are an integral part of these financial statements.
Nature allocation % of portfolio % of netassets
Shares 100.00 91.14
100.00 91.14
Country allocation % of portfolio % of netassets
United States 50.65 46.15
United Kingdom 15.28 13.93
France 8.96 8.16
Guernsey 8.31 7.58
Canada 8.09 7.37
South Africa 5.27 4.81
New Zealand 2.02 1.84
Australia 1.42 1.30
100.00 91.14
Portfolio Breakdowns
Top Ten Holdings Market value % ofnet
assets
ARES CAPITAL CORP 1,667,959.78 7.65Financial services
JPEL PRIVATE EQUITY LTD 1,652,300.45 7.58Open-ended Funds
BLACKSTONE GROUP LP/THE 1,645,236.00 7.54Financial services
KKR & CO LP 1,629,975.20 7.47Financial services
ONEX CORPORATION 1,607,933.25 7.37Financial services
HERCULES CAPITAL INC 1,057,216.41 4.85Financial services
HGCAPITAL TRUST PLC 1,051,885.14 4.82Financial services
COMPASS DIVERSIFIED HOLDINGS 1,050,488.11 4.82Financial services
BRAIT SE 1,048,553.99 4.81Financial services
WENDEL 1,044,388.10 4.78Financial services
EUR
Sector
Top Ten Holdings

45
The accompanying notes are an integral part of these financial statements.
PARETURN
Pareturn Global Balanced Unconstrained (in EUR)Statement of Operations and Changes in Net Assets for theperiod ended March 31, 2018
EUR
AssetsInvestment in securities at cost 78,507,335.71Unrealised appreciation / (depreciation) on securities 1,450,905.03
Investment in securities at market value 3.3 79,958,240.74Cash at bank 1,456,745.64Dividends and interest receivable 199,365.12
Total assets 81,614,351.50
LiabilitiesAccrued expenses 92,165.25Other liabilities 1,296.50
Total liabilities 93,461.75
Net assets at the end of the period 81,520,889.75
Notes
Statement of Net Assets as at March 31, 2018
IncomeDividends (net of withholding taxes) 3.8 25,647.20Interest on bonds (net of withholding taxes) 3.8 303,749.65Bank interest 3.8 104.08Other income 12 27,624.40
Total income 357,125.33
ExpensesInvestment advisory fees and management fees 4 98,726.43Depositary fees 1,784.54Administration fees 15,851.73Professional fees 7,362.64Transaction costs 9 1,802.25Taxe d'abonnement 5 11,409.61Bank interest and charges 7,518.11Agent association fees 429.03Other expenses 13 14,152.11
Total expenses 159,036.45
Net investment income / (loss) 198,088.88
Net realised gain / (loss) on:Sales of Investments 3.9 446,211.61Foreign exchange transactions 3.2 (11,845.19)
Net realised gain / (loss) for the period 632,455.30
Net change in unrealised appreciation / (depreciation) on:Investments 3.9 (313,005.67)
Increase / (Decrease) in net assets as a result ofoperations
319,449.63
Proceeds received on subscription of shares 15,278,169.72Net amount paid on redemption of shares -Net assets at the beginning of the period 65,923,270.40
Net assets at the end of the period 81,520,889.75
EURNotes
Statement of Operations and Changes in Net Assets forthe period ended March 31, 2018
Number of shares in issue atthe end of the period
Number of shares in issue atthe beginning of the period
Number of sharessubscribed
Number of sharesredeemed
Statement of Changes in Number of Shares
B EUR P Cap 578,730 132,182 - 710,912

PARETURN
46
Pareturn Global Balanced Unconstrained (in EUR)
The accompanying notes are an integral part of these financial statements.
Securities Portfolio as at March 31, 2018
BANCA MARCH SA 17-02/11/2021 FRN EUR 697,583.47 0.86700,000
Transferable securities admitted to an official exchange listing
Bonds and other debt instrumentsSpain
BANCO BILBAO VIZ 15-29/12/2049 FRN EUR 428,500.00 0.53400,000BANCO BILBAO VIZ 17-12/04/2022 EUR 303,484.20 0.37300,000BANCO SANTANDER 17-21/11/2024 FRN EUR 899,541.00 1.10900,000BANCO SANTANDER 17-31/12/2049 FRN EUR 838,000.00 1.03800,000BANKIA 17-31/12/2049 EUR 1,257,000.00 1.541,200,000CAIXA TERRASSA 06-09/08/2021 FRN EUR 491,500.00 0.60500,000CAIXABANK 17-31/12/2049 EUR 900,070.40 1.10800,000IBERCAJA 15-28/07/2025 FRN EUR 1,146,591.60 1.411,100,000
6,962,270.67 8.54
AIR FRANCE-KLM 15-29/10/2049 FRN EUR 768,110.00 0.94700,000France
BNP PARIBAS 17-22/09/2022 EUR 666,585.64 0.82655,000ELEC DE FRANCE 14-29/01/2049 FRN EUR 1,061,000.00 1.301,000,000RCI BANQUE 18-12/03/2025 FRN EUR 398,016.00 0.49400,000SOCIETE GENERALE 17-22/05/2024 EUR 806,465.60 0.99800,000
3,700,177.24 4.54
FERROVIAL NL 17-31/12/2049 FRN EUR 1,185,600.00 1.451,235,000Netherlands
ING GROEP NV 15-29/12/2049 FRN USD 410,477.35 0.50500,000TELEFONICA EUROP 14-29/12/2049 FRN EUR 526,900.00 0.65500,000TELEFONICA EUROP 18-31/12/2049 FRN EUR 396,180.00 0.49400,000
2,519,157.35 3.09
INTESA SANPAOLO 16-29/12/2049 FRN EUR 541,495.00 0.66500,000Italy
INTESA SANPAOLO 17-19/04/2022 EUR 305,293.80 0.37300,000UNICREDIT SPA 17-31/12/2049 FRN EUR 794,000.00 0.98800,000
1,640,788.80 2.01
CENTRICA PLC 15-10/04/2076 FRN EUR 720,274.10 0.89700,000United Kingdom
JAGUAR LAND ROVR 3.875% 15-01/03/2023
GBP 580,075.56 0.71500,000
1,300,349.66 1.60
FORD MOTOR CRED 18-07/12/2022 FRN EUR 398,488.00 0.49400,000United States
GOLDMAN SACHS GP 16-27/07/2021 EUR 559,629.40 0.69550,000958,117.40 1.18
BANK OF IRELAND 17-19/09/2027 FRN GBP 754,888.78 0.93675,000Ireland
754,888.78 0.93
RAIFFEISEN BK IN 18-31/12/2049 FRN EUR 556,543.20 0.68600,000Austria
556,543.20 0.68
UBS GROUP 16-29/12/2049 FRN USD 421,729.77 0.52500,000Switzerland
421,729.77 0.52
BANCO ESPIRITO 4% 14-21/01/2019 EUR 140,000.00 0.17500,000Portugal
140,000.00 0.17
18,954,022.87 23.26
ALMIRALL SA EUR 4,015,999.50 4.92424,300
SharesSpain
4,015,999.50 4.92
ABENGOA YIELD PLC USD 1,604,577.67 1.97102,600United Kingdom
1,604,577.67 1.97
5,620,577.17 6.89
NameQuantity/Nominal
Market valuein EUR
Currency %NAV
BESTINVER SICAV BESTVEINTERNATIONAL RCA
EUR 591,846.00 0.73818
Other transferable securities
Investment fundsLuxembourg
591,846.00 0.73
591,846.00 0.73
BELLEVUE-BB ENT EUR SM-IE EUR 589,668.68 0.721,705
Funds
Investment fundsLuxembourg
BGF-EUR M D2C SH D2 CAP EUR 917,136.70 1.1328,877BGF-EUR SHORT DUR BOND-EURD2 EUR 1,859,356.51 2.28112,416DNCA INVEST EUROPE GROWTH-IEUR EUR 591,219.22 0.733,028FRANK TEMP INV MUT EURPN EUR 739,677.71 0.9132,700FRANK-US LOW DUR-I ACC E-H1 EUR 353,711.40 0.4334,109INVESCO EU ST BOND-CAEUR EUR 2,660,891.55 3.26232,017INVESCO PAN EUROPEAN EQTY-C EUR 1,003,021.23 1.2345,571MORGAN ST INV F-GLB BRNDS-ZH EUR 892,220.48 1.0912,695MORGAN ST-EU CHAMP-Z EUR 856,798.37 1.0530,361MORGAN ST-EURO CORP BD-ZD EUR 6,816,176.75 8.35228,884MS LIQUID-EUR LIQ-INST ACC EUR 3,448,418.43 4.2331,800MSIF GLOBAL MORTGAGE SEC-Z USD 453,885.87 0.5617,686MSIM GLOBAL FIXED INC O-ZH EUR 4,028,602.18 4.94139,833OAKTREE LUX FD-GLHY B-HEURIB EUR 1,606,643.50 1.9714,971PARVEST MONEY MARKET EURO - PRIVL EUR 3,739,099.07 4.593,798
30,556,527.65 37.47
ABACO GLB VALUE OPPORTUNIT-I EUR 749,714.76 0.92130,114Spain
MUTUAFONDO BONOS FLOTANTES EUR 3,991,652.71 4.8939,900MUTUAFONDO BONOS SUBORDINADO EUR 3,911,188.43 4.8033,182MUTUAFONDO DINERO-A EUR 3,836,556.81 4.7136,118MUTUAFONDO-A EUR 2,942,739.74 3.6186,201
15,431,852.45 18.93
GAM STAR-MBS TOT RT-I EUR HD EUR 1,803,974.79 2.21166,328Ireland
GAM STAR-MBS TOT RT-IUSDA USD 667,390.04 0.8272,282GOLDMAN SACHS-LIQ RES-ACCUM CL EUR 3,398,684.65 4.17276
5,870,049.48 7.20
M&G 7 GL FLO RATE HY-EUR CHA EUR 2,933,365.12 3.60270,381United Kingdom
2,933,365.12 3.60
54,791,794.70 67.20
Total securities portfolio 79,958,240.74 98.08
NameQuantity/Nominal
Market valuein EUR
Currency %NAV
Summary of net assets%
NAV79,958,240.74 98.08Total securities portfolio
1,456,745.64 1.79Cash at bank and bank overdraft
105,903.37 0.13Other assets and liabilities
81,520,889.75 100.00Total net assets

PARETURN
47
Pareturn Global Balanced Unconstrained (in EUR)
The accompanying notes are an integral part of these financial statements.
Nature allocation % of portfolio % of netassets
Investment funds 69.27 67.93
Bonds and other debt instruments 23.70 23.26
Shares 7.03 6.89
100.00 98.08
Country allocation % of portfolio % of netassets
Luxembourg 38.95 38.20
Spain 33.03 32.39
Ireland 8.29 8.13
United Kingdom 7.30 7.17
France 4.63 4.54
Netherlands 3.15 3.09
Italy 2.05 2.01
Other 2.60 2.55
100.00 98.08
Portfolio Breakdowns
Top Ten Holdings Market value % ofnet
assets
MORGAN ST-EURO CORP BD-ZD 6,816,176.75 8.35Open-ended Funds
MSIM GLOBAL FIXED INC O-ZH 4,028,602.18 4.94Open-ended Funds
ALMIRALL SA 4,015,999.50 4.92Cosmetics
MUTUAFONDO BONOS FLOTANTES 3,991,652.71 4.89Open-ended Funds
MUTUAFONDO BONOS SUBORDINADO 3,911,188.43 4.80Open-ended Funds
MUTUAFONDO DINERO-A 3,836,556.81 4.71Open-ended Funds
PARVEST MONEY MARKET EURO - PRIVL 3,739,099.07 4.59Open-ended Funds
MS LIQUID-EUR LIQ-INST ACC 3,448,418.43 4.23Open-ended Funds
GOLDMAN SACHS-LIQ RES-ACCUM CL 3,398,684.65 4.17Open-ended Funds
MUTUAFONDO-A 2,942,739.74 3.61Open-ended Funds
EUR
Sector
Top Ten Holdings

48
The accompanying notes are an integral part of these financial statements.
PARETURN
Pareturn Cervino World Investments (in EUR)Statement of Operations and Changes in Net Assets for theperiod ended March 31, 2018
EUR
AssetsInvestment in securities at cost 91,452,796.53Unrealised appreciation / (depreciation) on securities 2,590,748.34
Investment in securities at market value 3.3 94,043,544.87Investment in options contracts at market value 3.5 900.00Cash at bank 8,761,176.94Receivable on withholding tax reclaim 6,028.98Dividends and interest receivable 152,319.07
Total assets 102,963,969.86
LiabilitiesAccrued expenses 227,818.80Payable for investment purchased 154,637.18Other liabilities 19,811.49
Total liabilities 402,267.47
Net assets at the end of the period 102,561,702.39
Notes
Statement of Net Assets as at March 31, 2018
IncomeDividends (net of withholding taxes) 3.8 841,558.97Interest on bonds (net of withholding taxes) 3.8 145,563.53Bank interest 3.8 7,191.43Other income 12 36,931.19
Total income 1,031,245.12
ExpensesInvestment advisory fees and management fees 4 312,926.93Depositary fees 13,050.39Performance fees 4 19,811.49Administration fees 25,701.32Professional fees 12,324.00Transaction costs 9 21,428.95Taxe d'abonnement 5 25,751.80Bank interest and charges 13,415.33Other expenses 13 22,217.20
Total expenses 466,627.41
Net investment income / (loss) 564,617.71
Net realised gain / (loss) on:Sales of Investments 3.9 1,378,453.37Foreign exchange transactions 3.2 (204,549.27)Futures contracts 3.5 425,950.23Options contracts 3.5 185,335.82
Net realised gain / (loss) for the period 2,349,807.86
Net change in unrealised appreciation / (depreciation) on:Investments 3.9 (4,369,741.22)Options contracts 3.5 835,192.41
Increase / (Decrease) in net assets as a result ofoperations
(1,184,740.95)
Proceeds received on subscription of shares 3,460,555.37Net amount paid on redemption of shares (8,059,628.39)Net assets at the beginning of the period 108,345,516.36
Net assets at the end of the period 102,561,702.39
EURNotes
Statement of Operations and Changes in Net Assets forthe period ended March 31, 2018
Number of shares in issue atthe end of the period
Number of shares in issue atthe beginning of the period
Number of sharessubscribed
Number of sharesredeemed
Statement of Changes in Number of Shares
B EUR P Cap 574,402 18,104 (41,781) 550,725

PARETURN
49
Pareturn Cervino World Investments (in EUR)
The accompanying notes are an integral part of these financial statements.
Securities Portfolio as at March 31, 2018
APPLE INC USD 1,445,403.18 1.4110,595
Transferable securities admitted to an official exchange listing
SharesUnited States
BANK OF NEW YORK MELLON CORP USD 2,250,375.88 2.1953,709BERKSHIRE HATHAWAY INC-CL B USD 6,063,309.64 5.9037,382CIRRUS LOGIC INC USD 726,804.08 0.7122,000CVS HEALTH CORP USD 2,023,336.18 1.9740,000EXXON MOBIL CORP USD 1,408,238.35 1.3723,213FOOT LOCKER INC USD 1,851,445.30 1.8150,000GILEAD SCIENCES INC USD 2,406,521.62 2.3539,258INTEL CORP USD 2,852,680.57 2.7867,365QUALCOMM INC USD 1,897,370.68 1.8542,113TWENTY-FIRST CENTURY FOX - B USD 2,365,816.97 2.3180,000
25,291,302.45 24.65
AXA SA EUR 2,471,666.40 2.41114,429France
GAZTRANSPORT ET TECHNIGA SA EUR 2,574,878.30 2.5150,587MICHELIN (CGDE) EUR 3,599,757.70 3.5130,023PUBLICIS GROUPE EUR 835,233.96 0.8114,762SAVENCIA SA EUR 1,744,000.00 1.7020,000
11,225,536.36 10.94
BRITISH AMERICAN TOBACCO PLC GBP 1,177,997.03 1.1525,000United Kingdom
EASYJET PLC GBP 2,836,562.74 2.76154,990MEGGITT PLC GBP 1,802,660.34 1.76366,001MITIE GROUP PLC GBP 1,014,145.06 0.99559,183PERSIMMON PLC GBP 2,112,767.88 2.0573,212
8,944,133.05 8.71
PARGESA HOLDING SA-BR CHF 4,721,753.50 4.6165,653Switzerland
ROCHE HOLDING AG-GENUSSCHEIN CHF 2,024,865.76 1.9710,8846,746,619.26 6.58
BANKIA SA EUR 1,073,621.45 1.05295,032Spain
BOLSAS Y MERCADOS ESPANOLES EUR 1,046,925.00 1.0238,070NATURHOUSE HEALTH SAU EUR 540,707.35 0.53148,139TECNICAS REUNIDAS SA EUR 1,919,200.00 1.8780,000
4,580,453.80 4.47
TAIWAN SEMICONDUCTOR-SP ADR USD 3,202,341.75 3.1290,000Taiwan
3,202,341.75 3.12
DUERR AG EUR 1,961,080.00 1.9022,000Germany
HORNBACH BAUMARKT AG EUR 1,051,316.00 1.0337,547KUKA AG EUR 159,517.20 0.161,732
3,171,913.20 3.09
ASSA ABLOY AB-B SEK 1,360,642.45 1.3477,706Sweden
DOMETIC GROUP AB SEK 999,417.46 0.97135,000HENNES & MAURITZ AB-B SHS SEK 537,740.15 0.5244,245
2,897,800.06 2.83
MICHAEL KORS HOLDINGS LTD USD 2,690,865.26 2.6253,308Virgin Islands
2,690,865.26 2.62
MARINE HARVEST NOK 2,621,221.07 2.56161,000Norway
2,621,221.07 2.56
SCANDINAVIAN TOBACCO GROUP A DKK 2,028,843.57 1.98142,000Denmark
2,028,843.57 1.98
NameQuantity/Nominal
Market valuein EUR
Currency %NAV
C&C GROUP PLC EUR 1,740,837.00 1.70654,450Ireland
1,740,837.00 1.70
BPOST SA EUR 1,605,141.36 1.5787,426Belgium
1,605,141.36 1.57
SHIRE PLC GBP 1,209,783.31 1.1829,705Jersey
1,209,783.31 1.18
CTT-CORREIOS DE PORTUGAL EUR 1,123,574.47 1.10359,199Portugal
1,123,574.47 1.10
SAMPO OYJ-A SHS EUR 1,112,445.54 1.0824,579Finland
1,112,445.54 1.08
80,192,811.51 78.18
BANCA MARCH SA 17-02/11/2021 FRN EUR 3,687,194.30 3.593,700,000
Bonds and other debt instrumentsSpain
SACYR SA 4.5% 17-16/11/2024 EUR 1,114,377.00 1.091,100,0004,801,571.30 4.68
KFW 5.5% 16-22/11/2019 MXN 1,503,052.47 1.4735,000,000Germany
KFW 9% 16-15/12/2021 BRL 433,074.89 0.421,685,0001,936,127.36 1.89
UNIPOL 03-28/07/2023 SR EUR 997,499.00 0.971,000,000Italy
997,499.00 0.97
STANDARD CHART 15-29/12/2049 FRN USD 830,385.82 0.811,000,000United Kingdom
830,385.82 0.81
BANK OF AMER CRP 6.625% 14-31/12/49FLAT
USD 319,673.13 0.3115,000United States
MERRILL LYNCH 06-14/09/2018 FRN EUR 400,065.60 0.39400,000719,738.73 0.70
OI BRASIL HLDG 5.625% 15-22/06/2021 EUR 610,769.25 0.601,570,000Netherlands
610,769.25 0.60
9,896,091.46 9.65
ISHARES MSCI JP EUR-AC ACC SHS EURETF
EUR 2,290,856.00 2.2446,600
Funds
Investment fundsIreland
2,290,856.00 2.24
SPROTT FOCUS TRUST INC USD 1,663,785.90 1.62262,671United States
1,663,785.90 1.62
3,954,641.90 3.86
Total securities portfolio 94,043,544.87 91.69
NameQuantity/Nominal
Market valuein EUR
Currency %NAV
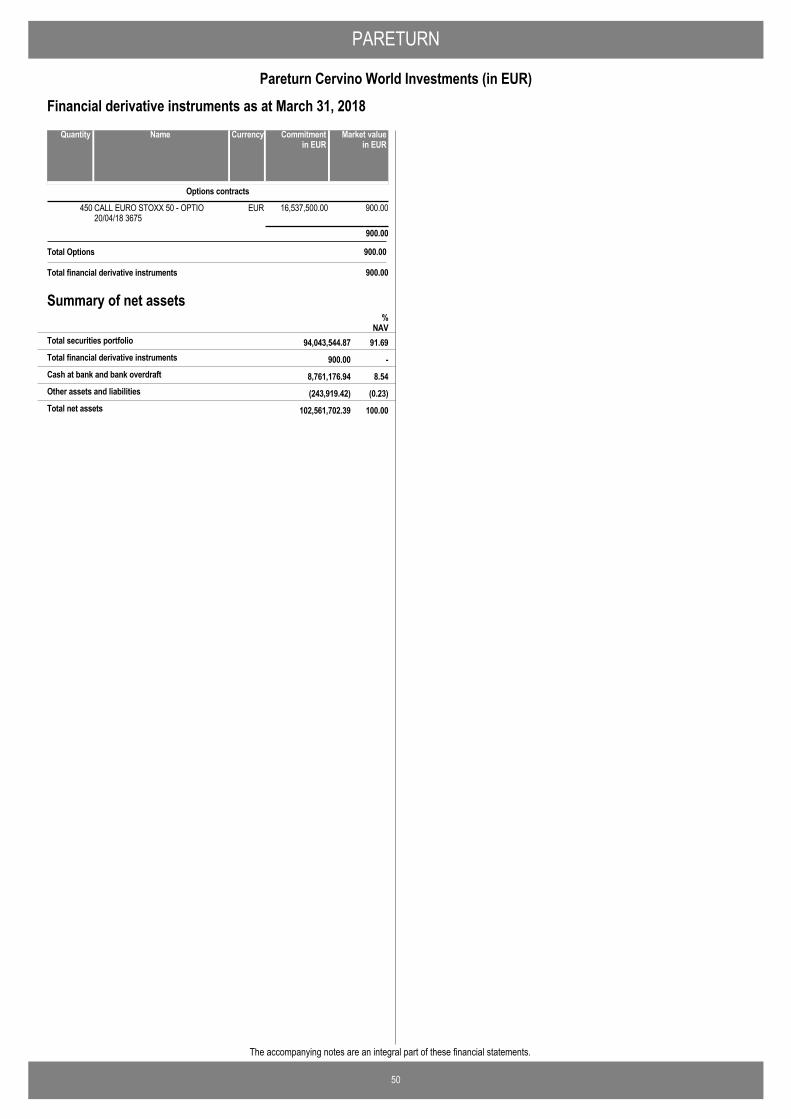
PARETURN
50
Pareturn Cervino World Investments (in EUR)
The accompanying notes are an integral part of these financial statements.
CALL EURO STOXX 50 - OPTIO20/04/18 3675
EUR450 16,537,500.00 900.00
Options contracts
900.00
Total Options 900.00
NameQuantity Market valuein EUR
Currency Commitmentin EUR
Financial derivative instruments as at March 31, 2018
Total financial derivative instruments 900.00
Summary of net assets
900.00 -Total financial derivative instruments
%NAV
94,043,544.87 91.69Total securities portfolio
8,761,176.94 8.54Cash at bank and bank overdraft
(243,919.42) (0.23)Other assets and liabilities
102,561,702.39 100.00Total net assets

PARETURN
51
Pareturn Cervino World Investments (in EUR)
The accompanying notes are an integral part of these financial statements.
Nature allocation % of portfolio % of netassets
Shares 85.27 78.18
Bonds and other debt instruments 10.52 9.65
Investment funds 4.21 3.86
100.00 91.69
Country allocation % of portfolio % of netassets
United States 29.42 26.97
France 11.94 10.94
United Kingdom 10.39 9.52
Spain 9.98 9.15
Switzerland 7.17 6.58
Germany 5.43 4.98
Ireland 4.29 3.94
Taiwan 3.41 3.12
Sweden 3.08 2.83
Virgin Islands 2.86 2.62
Norway 2.79 2.56
Denmark 2.16 1.98
Other 7.08 6.50
100.00 91.69
Portfolio Breakdowns
Top Ten Holdings Market value % ofnet
assets
BERKSHIRE HATHAWAY INC-CL B 6,063,309.64 5.90Insurance
PARGESA HOLDING SA-BR 4,721,753.50 4.61Financial services
BANCA MARCH SA 17-02/11/2021 FRN 3,687,194.30 3.59Banks
MICHELIN (CGDE) 3,599,757.70 3.51Auto Parts &Equipment
TAIWAN SEMICONDUCTOR-SP ADR 3,202,341.75 3.12Electric & Electronic
INTEL CORP 2,852,680.57 2.78Electric & Electronic
EASYJET PLC 2,836,562.74 2.76Transportation
MICHAEL KORS HOLDINGS LTD 2,690,865.26 2.62Textile
MARINE HARVEST 2,621,221.07 2.56Food services
GAZTRANSPORT ET TECHNIGA SA 2,574,878.30 2.51Building materials
EUR
Sector
Top Ten Holdings

52
The accompanying notes are an integral part of these financial statements.
PARETURN
Pareturn Entheca Patrimoine (in EUR)Statement of Operations and Changes in Net Assets for theperiod ended March 31, 2018
EUR
AssetsInvestment in securities at cost 64,856,577.27Unrealised appreciation / (depreciation) on securities 590,275.87
Investment in securities at market value 3.3 65,446,853.14Cash at bank 3,066,625.32Receivable on withholding tax reclaim 1,003.96Net unrealised appreciation on futures contracts 3.5 31,845.31Dividends and interest receivable 51,906.61Other assets 6,510.07
Total assets 68,604,744.41
LiabilitiesAccrued expenses 87,477.44Payable for investment purchased 875,263.67Other liabilities 2,948.36
Total liabilities 965,689.47
Net assets at the end of the period 67,639,054.94
Notes
Statement of Net Assets as at March 31, 2018
IncomeDividends (net of withholding taxes) 3.8 43,159.02Interest on bonds (net of withholding taxes) 3.8 48,526.93Bank interest 3.8 174.45Other income 12 11,461.14
Total income 103,321.54
ExpensesInvestment advisory fees and management fees 4 163,464.16Depositary fees 8,180.96Performance fees 4 7.75Administration fees 19,871.32Professional fees 8,908.05Transaction costs 9 28,308.48Taxe d'abonnement 5 3,257.01Bank interest and charges 17,305.66Other expenses 13 5,380.84
Total expenses 254,684.23
Net investment income / (loss) (151,362.69)
Net realised gain / (loss) on:Sales of Investments 3.9 1,640,330.99Foreign exchange transactions 3.2 15,445.10Futures contracts 3.5 139,073.47
Net realised gain / (loss) for the period 1,643,486.87
Net change in unrealised appreciation / (depreciation) on:Investments 3.9 (2,279,602.96)Futures contracts 3.5 85,135.63
Increase / (Decrease) in net assets as a result ofoperations
(550,980.46)
Proceeds received on subscription of shares 2,274,656.07Net amount paid on redemption of shares (830,877.88)Net assets at the beginning of the period 66,746,257.21
Net assets at the end of the period 67,639,054.94
EURNotes
Statement of Operations and Changes in Net Assets forthe period ended March 31, 2018
Number of shares in issue atthe end of the period
Number of shares in issue atthe beginning of the period
Number of sharessubscribed
Number of sharesredeemed
Statement of Changes in Number of Shares
B EUR I Cap 404,477 8,150 (3,834) 408,793
B EUR R Cap 27,735 6,615 (1,546) 32,804

PARETURN
53
Pareturn Entheca Patrimoine (in EUR)
The accompanying notes are an integral part of these financial statements.
Securities Portfolio as at March 31, 2018
US TREASURY N/B 2.125% 15-15/05/2025 USD 1,551,881.07 2.292,000,000
Transferable securities admitted to an official exchange listing
Bonds and other debt instrumentsUnited States
US TREASURY N/B 2.375% 14-15/08/2024 USD 1,625,404.53 2.412,050,000US TSY INFL IX N/B 0.375% 17-15/07/2027 USD 953,600.71 1.411,214,028
4,130,886.31 6.11
AIR FRANCE-KLM 3.875% 14-18/06/2021 EUR 755,391.00 1.11700,000France
ARGAN 5.5% 13-21/11/2018 EUR 256,750.00 0.38250,000BPCE 5.75% 09-13/02/2019 EUR 207,533.35 0.31197,600CARREFOUR BANQUE 15-20/03/2020 FRN EUR 100,639.00 0.15100,000ORPEA 2.625% 18-10/03/2025 EUR 601,326.00 0.89600,000
1,921,639.35 2.84
ALFA LAVAL AB 14-12/09/2019 FRN EUR 301,407.00 0.45300,000Sweden
301,407.00 0.45
BEKAERT SA 4.5% 10-23/12/2018 EUR 206,214.00 0.30200,000Belgium
206,214.00 0.30
6,560,146.66 9.70
ACCOR SA EUR 186,054.50 0.284,181
SharesFrance
AIR LIQUIDE SA EUR 200,464.80 0.302,020ALSTOM EUR 143,560.00 0.214,000BOUYGUES SA EUR 187,866.00 0.284,725COMPAGNIE DE SAINT GOBAIN EUR 152,852.16 0.233,578DANONE GROUPE EUR 240,407.52 0.353,747ELIOR GROUP EUR 94,401.00 0.145,553KLEPIERRE EUR 162,196.65 0.245,115LOREAL EUR 210,436.20 0.311,196ORANGE EUR 229,892.80 0.3316,960ORPEA EUR 112,656.64 0.171,132SANOFI EUR 187,307.40 0.282,940SOCIETE GENERALE EUR 194,015.25 0.294,455SODEXO SA EUR 127,648.08 0.191,302SOPRA STERIA GROUP EUR 143,705.60 0.21872SUEZ EUR 203,862.71 0.3018,097TOTAL SA EUR 164,898.00 0.243,600VICAT EUR 166,238.25 0.252,645VINCI SA EUR 254,746.08 0.373,246VIRBAC SA EUR 79,049.00 0.12685
3,442,258.64 5.09
DORMAKABA HOLDING AG CHF 95,653.66 0.14155Switzerland
NESTLE SA-REG CHF 224,574.13 0.333,565ROCHE HOLDING AG-GENUSSCHEIN CHF 203,085.60 0.301,100
523,313.39 0.77
KONINKLIJKE AHOLD DELHAIZE N EUR 103,740.60 0.155,550Netherlands
RANDSTAD HOLDING NV EUR 167,567.00 0.253,050ROYAL DUTCH SHELL PLC-A SHS EUR 190,798.65 0.287,497
462,106.25 0.68
ACS ACTIVIDADES CONS Y SERV EUR 78,925.00 0.122,500Spain
78,925.00 0.12
4,506,603.28 6.66
ALTAREIT 0% 20/11/2018 NEUCP EUR 698,831.40 1.03700,000
Other transferable securities
Money market instrumentsFrance
NameQuantity/Nominal
Market valuein EUR
Currency %NAV
ALTAREIT 0% 22/10/2018 NEUCP EUR 1,997,530.62 2.962,000,000ARCELOR FINANCE 0% 05/06/2018 NEUCP EUR 1,200,000.00 1.771,200,000CASINO GUICHARD PERR 0% 29/10/2018NEUCP
EUR 1,199,658.55 1.771,200,000
ELIS 0% 10/04/2018 BT EUR 599,892.65 0.89600,000ELIS 0% 22/01/2019 NEUCP EUR 647,704.46 0.96650,000ELIS 0% 26/10/2018 NEUCP EUR 997,312.21 1.471,000,000RALLYE SA 0% 02/05/2018 NEUCP EUR 1,499,577.88 2.221,500,000VALLOUREC SA 0% 06/09/2018 NEUCP EUR 598,070.25 0.88600,000VALLOUREC SA 0% 20/06/2018 NEUCP EUR 598,758.64 0.89600,000VALLOUREC SA 0% 29/03/2018 NEUCP EUR 999,912.64 1.481,000,000VALLOUREC SA 0% 29/03/2019 NEUCP EUR 494,485.12 0.73500,000
11,531,734.42 17.05
11,531,734.42 17.05
AMUNDI ETF MSCI EMERGING M UCITSETF
EUR 528,324.82 0.78128,995
Funds
Investment fundsFrance
BDL REMPART EUROPE-I EUR 1,171,147.23 1.7310,149BNP PARIBAS CAH INVEST - PARTS I CAP* EUR 2,788,494.88 4.1249CONSTANCE BE AMERICA-I USD 778,531.93 1.1532ENTHECA RARETE PARTS DE CAP 4DECIMALES
EUR 2,343,378.66 3.4619,623
ENTHECA REGULARITE-I EUR 8,400,592.80 12.437,620HUGAU MONETERME FCP EUR 702,156.12 1.046LYX ETF MSCI EUROPE DIST EUR 250,365.57 0.372,051M CONVERTIBLES-IC EUR 2,322,311.04 3.434,088MONETA MU CAPS C 4D EUR 1,066,131.00 1.583,993MONTPENSIER QUADRATOR EUR 230,231.43 0.34603RAYMOND JAMES MICROCAPS-I EUR 172,338.87 0.251SYCOMORE L/S OPPORTUNITIES-I EUR 666,264.06 0.991,749TIKEHAU COURT TERME-PART A EUR 803,591.60 1.197,630TIKEHAU TAUX VARIABLE-A ACC EUR 2,711,896.20 4.0121,330UNION MONEPLUS* EUR 595.31 0.000VARENNE VALEUR-P EUR EUR 752,550.70 1.117,370
25,688,902.22 37.98
AMUNDI-BD GL EM HARD CU-IEC EUR 1,083,251.26 1.6025Luxembourg
AXA WF-US HI YLD BD-F USD USD 687,629.77 1.023,760AXA WORLD FUND-US HY BOND-FEUR EUR 662,360.95 0.983,095GEFIP INVEST RENDEMENT ICA EUR 2,801,625.10 4.142,710HELIUM-HELIUM FUND-I CAP EUR 1,296,728.84 1.921,233HELIUM-HELIUM PERFORMANCE-A EUR 1,384,389.77 2.051,146LYX ETF S&P 500 D-HEDGED EUR 3,631,214.70 5.3623,805SCHRODER INT EME ASIA-CE-ACC EUR 589,650.21 0.8716,130SCHRODER ISF EURO HIGH YD-C EUR 1,473,942.40 2.1810,150SSGA-US INDEX EQUITY-I CAP USD 826,674.26 1.2274,110
14,437,467.26 21.34
M&G EMERG MKTS BOND-EUR C HA EUR 1,405,829.84 2.08121,928United Kingdom
1,405,829.84 2.08
COMGEST GROWTH EME MKT-E RZA EUR 304,531.50 0.458,970Ireland
COMGEST GROWTH JPN-EUR I ACC EUR 750,496.82 1.1178,504ISHARES CORE S&P 500 UCITS ETF USD 261,141.14 0.391,271
1,316,169.46 1.95
42,848,368.78 63.35
Total securities portfolio 65,446,853.14 96.76
NameQuantity/Nominal
Market valuein EUR
Currency %NAV

PARETURN
54
Pareturn Entheca Patrimoine (in EUR)
The accompanying notes are an integral part of these financial statements.
CAC40 EURO FUT 20/04/2018 EUR 406,400.00(8) 14,320.00
Futures contracts
EUR/CHF CURRENCY FUTURE18/06/2018
CHF 374,919.873 528.87
EURO / GBP FUTURE 18/06/2018 GBP 501,860.334 (7,255.29)EURO FX CURR FUT (CME)18/06/2018
USD 2,265,746.3618 197.21
EURO STOXX 50 - FUTURE15/06/2018
EUR 1,414,160.00(44) 3,650.00
NASDAQ E-MINI FUTURE 15/06/2018 USD 424,223.30(4) 3,737.86S&P 500 E-MINI FUTURE 15/06/2018 USD 1,050,869.74(10) 16,666.66
31,845.31
Total Futures 31,845.31
NameQuantity Commitmentin EUR
Currency Unrealisedappreciation /(depreciation)
in EUR
Financial derivative instruments as at March 31, 2018
Total financial derivative instruments 31,845.31
Summary of net assets
31,845.31 0.05Total financial derivative instruments
%NAV
65,446,853.14 96.76Total securities portfolio
3,066,625.32 4.53Cash at bank and bank overdraft
(906,268.83) (1.34)Other assets and liabilities
67,639,054.94 100.00Total net assets

PARETURN
55
Pareturn Entheca Patrimoine (in EUR)
The accompanying notes are an integral part of these financial statements.
Nature allocation % of portfolio % of netassets
Investment funds 65.47 63.35
Money market instruments 17.62 17.05
Bonds and other debt instruments 10.02 9.70
Shares 6.89 6.66
100.00 96.76
Country allocation % of portfolio % of netassets
France 65.07 62.96
Luxembourg 22.06 21.34
United States 6.31 6.11
United Kingdom 2.15 2.08
Ireland 2.01 1.95
Other 2.40 2.32
100.00 96.76
Portfolio Breakdowns
Top Ten Holdings Market value % ofnet
assets
ENTHECA REGULARITE-I 8,400,592.80 12.43Open-ended Funds
LYX ETF S&P 500 D-HEDGED 3,631,214.70 5.36Open-ended Funds
GEFIP INVEST RENDEMENT ICA 2,801,625.10 4.14Open-ended Funds
BNP PARIBAS CAH INVEST - PARTS I CAP* 2,788,494.88 4.12Open-ended Funds
TIKEHAU TAUX VARIABLE-A ACC 2,711,896.20 4.01Open-ended Funds
ENTHECA RARETE PARTS DE CAP 4DECIMALES
2,343,378.66 3.46Open-ended Funds
M CONVERTIBLES-IC 2,322,311.04 3.43Open-ended Funds
ALTAREIT 0% 22/10/2018 NEUCP 1,997,530.62 2.96Banks
US TREASURY N/B 2.375% 14-15/08/2024 1,625,404.53 2.41Government
US TREASURY N/B 2.125% 15-15/05/2025 1,551,881.07 2.29Government
EUR
Sector
Top Ten Holdings

56
The accompanying notes are an integral part of these financial statements.
PARETURN
Pareturn Ataun (in EUR)Statement of Operations and Changes in Net Assets for theperiod ended March 31, 2018
EUR
AssetsInvestment in securities at cost 133,757,186.73Unrealised appreciation / (depreciation) on securities (66,113.57)
Investment in securities at market value 3.3 133,691,073.16Cash at bank 13,731,986.65Dividends and interest receivable 0.33
Total assets 147,423,060.14
LiabilitiesAccrued expenses 99,341.62Net unrealised depreciation on forward foreign exchangecontracts
3.4, 15 164,232.88
Other liabilities 13,503.19
Total liabilities 277,077.69
Net assets at the end of the period 147,145,982.45
Notes
Statement of Net Assets as at March 31, 2018
IncomeBank interest 3.8 330.25
Total income 330.25
ExpensesInvestment advisory fees and management fees 4 238,473.25Depositary fees 20,207.99Administration fees 25,733.49Professional fees 13,274.16Distribution fees 14 7,226.63Transaction costs 9 23,582.00Taxe d'abonnement 5 5,193.26Bank interest and charges 29,614.70Other expenses 13 7,636.80
Total expenses 370,942.28
Net investment income / (loss) (370,612.03)
Net realised gain / (loss) on:Sales of Investments 3.9 584,399.13Foreign exchange transactions 3.2 348,206.78Forward foreign exchange contracts 3.4 566,892.86
Net realised gain / (loss) for the period 1,128,886.74
Net change in unrealised appreciation / (depreciation) on:Investments 3.9 (2,280,605.35)Forward foreign exchange contracts 3.4 (164,232.88)
Increase / (Decrease) in net assets as a result ofoperations
(1,315,951.49)
Proceeds received on subscription of shares -Net amount paid on redemption of shares -Net assets at the beginning of the period 148,461,933.94
Net assets at the end of the period 147,145,982.45
EURNotes
Statement of Operations and Changes in Net Assets forthe period ended March 31, 2018
Number of shares in issue atthe end of the period
Number of shares in issue atthe beginning of the period
Number of sharessubscribed
Number of sharesredeemed
Statement of Changes in Number of Shares
B EUR I Cap 1,004,420 - - 1,004,420

PARETURN
57
Pareturn Ataun (in EUR)
The accompanying notes are an integral part of these financial statements.
Securities Portfolio as at March 31, 2018
BLK ICS EUR USBF PREMIER EUR 14,308,923.90 9.72143,679
Funds
Investment fundsIreland
FIRST QUADRT MACRO FX-J2 EUR EUR 4,385,873.88 2.9846,046GAM STAR-GLOBAL RATES-E ACC EUR 2,996,890.57 2.04272,794GLG INVESTMENTS VI PLC - MAN GLG EUR 6,583,025.79 4.4765,568GLG JAPAN COREALPHA-IXX JPY JPY 5,878,710.62 4.0085,029HEPTAGON KOPERNIK GL EQ-CE EUR 2,945,448.37 2.0022,490ISHARES S&P FINANCIALS SCTR USD 2,772,638.52 1.88481,859MAGNA NEW FRONTIERS FD-G EUR EUR 3,193,149.24 2.17211,117MAJEDIE-TORTOISE FND-Z EUR H EUR 2,998,787.79 2.043,158,614MAN-MAN NUM MKT NEU-INUHEUR EUR 3,590,682.64 2.4437,829MUZIN-ENHANCEDYIELD-ST EUR-ACC EUR 13,484,080.60 9.1683,550PIMCO GIS-CAPITAL SEC-EH EUR 5,834,405.09 3.97435,079PIMCO MORTGAGE OPPORT-IEURHA EUR 4,470,583.77 3.04438,723POLAR CAP-INSURANCE-IEA EUR 5,931,718.81 4.03892,229SOURCE ENERGY S&P US SECTOR USD 2,675,598.92 1.829,316
82,050,518.51 55.76
ASHMORE EMKTS SH DUR-Z2IAEUR EUR 4,397,863.95 2.9933,139Luxembourg
BGF-ASIAN DRAGON-I2 EUR UNH EUR 2,770,352.19 1.88261,354BNP PARIBAS FLEXI I US MORTGAGE IHE EUR 2,948,191.47 2.0029,882BOUSSARD&GAV ABS RET-Z EUR C EUR 4,488,820.27 3.053,994EDGEWOOD L SL-US SL GR-ARHEU EUR 3,009,937.90 2.0518,844HENDERSON GART-CON EU-GEURA EUR 2,843,335.09 1.93239,127HENDERSON GART-UK ABR-GEURAH EUR 4,475,162.83 3.04784,676NORDEA 1-US TOT RET B-HBDEUR EUR 1,374,542.02 0.9315,054NORDEA 1-US TOTAL RET-HBIE EUR 7,486,049.63 5.1088,739TCW METWEST UNCONS BD-XXEHE EUR 7,457,171.03 5.077,400VONTOBEL TWF STRT INC-HGHEUR EUR 5,877,403.58 3.9958,768
47,128,829.96 32.03
ETFS PHYSICAL GOLD EUR 4,511,724.69 3.0743,129Jersey
4,511,724.69 3.07
133,691,073.16 90.86
Total securities portfolio 133,691,073.16 90.86
NameQuantity/Nominal
Market valuein EUR
Currency %NAV
14,042,227 26/04/1817,377,000 (12,088.19)EURUSD 14,042,226.70Forward foreign exchange contracts
27,843,000 26/04/1822,328,524 (152,144.69)USDEUR 22,328,524.34
(164,232.88)
Total Forward foreign exchange contracts (164,232.88)
SalePurchase Unrealisedappreciation /(depreciation)
in EUR
MaturityDate
Commitmentin EUR
Financial derivative instruments as at March 31, 2018
Summary of net assets%
NAV133,691,073.16 90.86Total securities portfolio
13,731,986.65 9.33Cash at bank and bank overdraft
(277,077.36) (0.19)Other assets and liabilities
147,145,982.45 100.00Total net assets

PARETURN
58
Pareturn Ataun (in EUR)
The accompanying notes are an integral part of these financial statements.
Nature allocation % of portfolio % of netassets
Investment funds 100.00 90.86
100.00 90.86
Country allocation % of portfolio % of netassets
Ireland 61.38 55.76
Luxembourg 35.25 32.03
Jersey 3.37 3.07
100.00 90.86
Portfolio Breakdowns
Top Ten Holdings Market value % ofnet
assets
BLK ICS EUR USBF PREMIER 14,308,923.90 9.72Open-ended Funds
MUZIN-ENHANCEDYIELD-ST EUR-ACC 13,484,080.60 9.16Open-ended Funds
NORDEA 1-US TOTAL RET-HBIE 7,486,049.63 5.10Open-ended Funds
TCW METWEST UNCONS BD-XXEHE 7,457,171.03 5.07Open-ended Funds
GLG INVESTMENTS VI PLC - MAN GLG 6,583,025.79 4.47Open-ended Funds
POLAR CAP-INSURANCE-IEA 5,931,718.81 4.03Open-ended Funds
GLG JAPAN COREALPHA-IXX JPY 5,878,710.62 4.00Open-ended Funds
VONTOBEL TWF STRT INC-HGHEUR 5,877,403.58 3.99Open-ended Funds
PIMCO GIS-CAPITAL SEC-EH 5,834,405.09 3.97Open-ended Funds
ETFS PHYSICAL GOLD 4,511,724.69 3.07Open-ended Funds
EUR
Sector
Top Ten Holdings
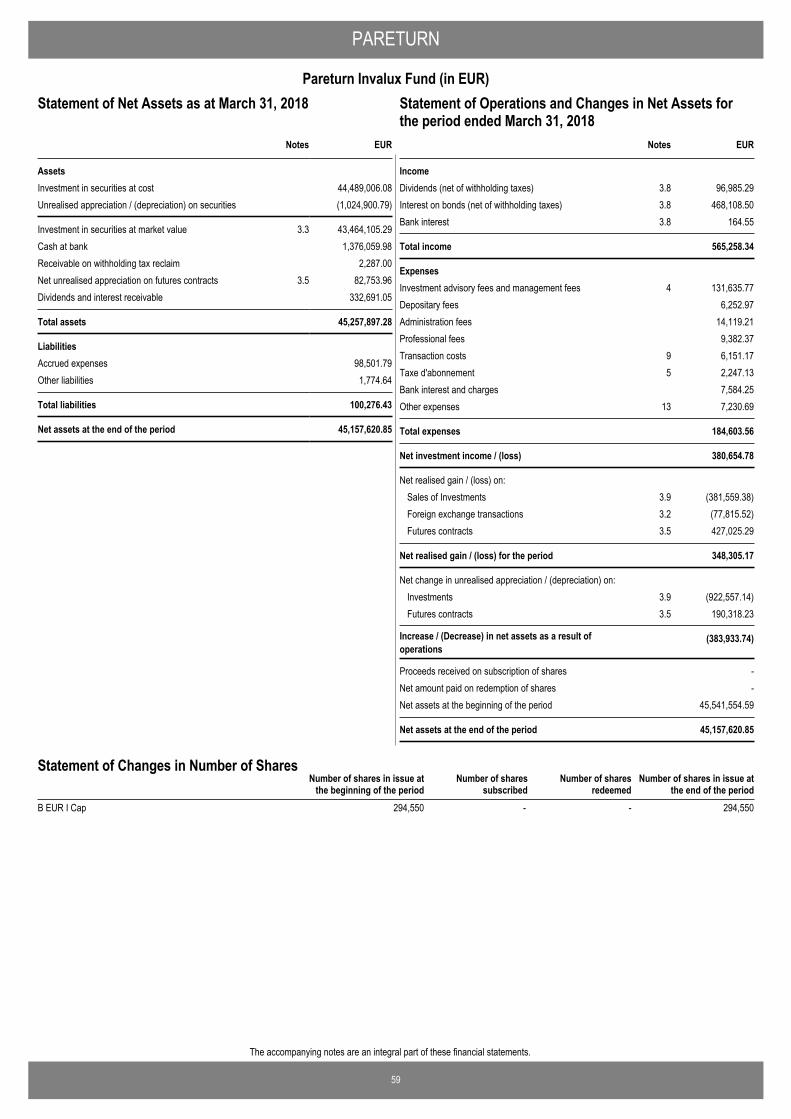
59
The accompanying notes are an integral part of these financial statements.
PARETURN
Pareturn Invalux Fund (in EUR)Statement of Operations and Changes in Net Assets for theperiod ended March 31, 2018
EUR
AssetsInvestment in securities at cost 44,489,006.08Unrealised appreciation / (depreciation) on securities (1,024,900.79)
Investment in securities at market value 3.3 43,464,105.29Cash at bank 1,376,059.98Receivable on withholding tax reclaim 2,287.00Net unrealised appreciation on futures contracts 3.5 82,753.96Dividends and interest receivable 332,691.05
Total assets 45,257,897.28
LiabilitiesAccrued expenses 98,501.79Other liabilities 1,774.64
Total liabilities 100,276.43
Net assets at the end of the period 45,157,620.85
Notes
Statement of Net Assets as at March 31, 2018
IncomeDividends (net of withholding taxes) 3.8 96,985.29Interest on bonds (net of withholding taxes) 3.8 468,108.50Bank interest 3.8 164.55
Total income 565,258.34
ExpensesInvestment advisory fees and management fees 4 131,635.77Depositary fees 6,252.97Administration fees 14,119.21Professional fees 9,382.37Transaction costs 9 6,151.17Taxe d'abonnement 5 2,247.13Bank interest and charges 7,584.25Other expenses 13 7,230.69
Total expenses 184,603.56
Net investment income / (loss) 380,654.78
Net realised gain / (loss) on:Sales of Investments 3.9 (381,559.38)Foreign exchange transactions 3.2 (77,815.52)Futures contracts 3.5 427,025.29
Net realised gain / (loss) for the period 348,305.17
Net change in unrealised appreciation / (depreciation) on:Investments 3.9 (922,557.14)Futures contracts 3.5 190,318.23
Increase / (Decrease) in net assets as a result ofoperations
(383,933.74)
Proceeds received on subscription of shares -Net amount paid on redemption of shares -Net assets at the beginning of the period 45,541,554.59
Net assets at the end of the period 45,157,620.85
EURNotes
Statement of Operations and Changes in Net Assets forthe period ended March 31, 2018
Number of shares in issue atthe end of the period
Number of shares in issue atthe beginning of the period
Number of sharessubscribed
Number of sharesredeemed
Statement of Changes in Number of Shares
B EUR I Cap 294,550 - - 294,550
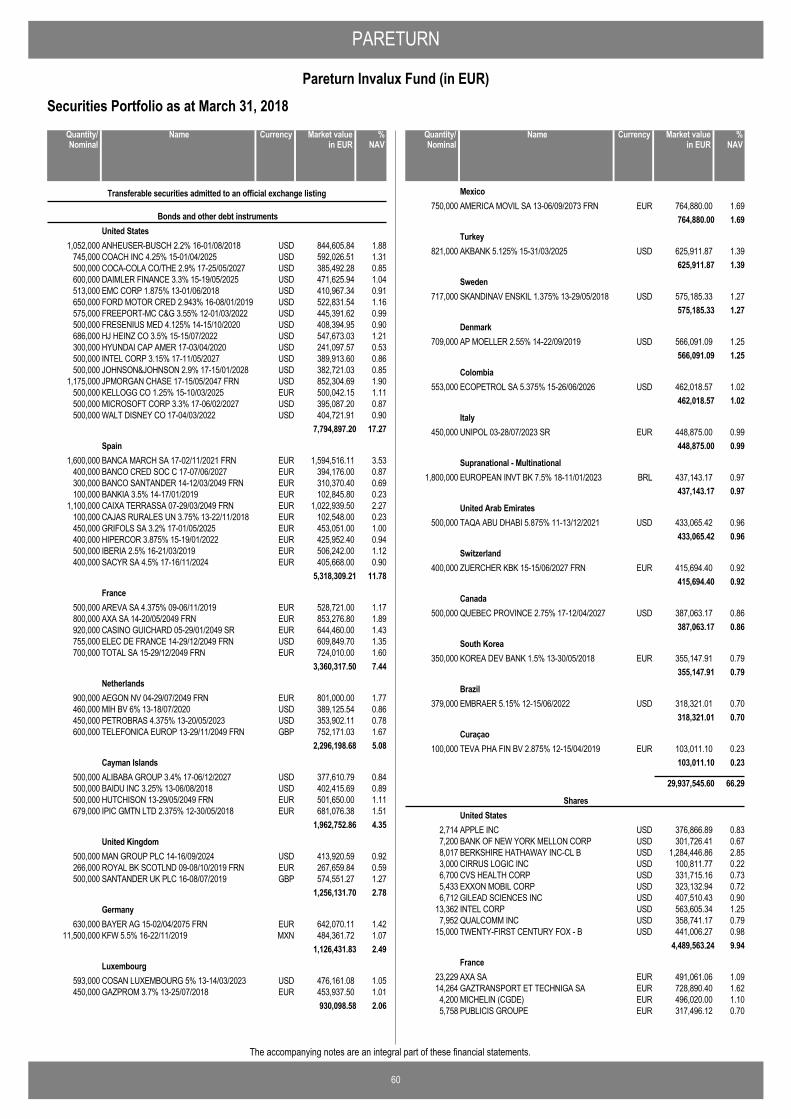
PARETURN
60
Pareturn Invalux Fund (in EUR)
The accompanying notes are an integral part of these financial statements.
Securities Portfolio as at March 31, 2018
ANHEUSER-BUSCH 2.2% 16-01/08/2018 USD 844,605.84 1.881,052,000
Transferable securities admitted to an official exchange listing
Bonds and other debt instrumentsUnited States
COACH INC 4.25% 15-01/04/2025 USD 592,026.51 1.31745,000COCA-COLA CO/THE 2.9% 17-25/05/2027 USD 385,492.28 0.85500,000DAIMLER FINANCE 3.3% 15-19/05/2025 USD 471,625.94 1.04600,000EMC CORP 1.875% 13-01/06/2018 USD 410,967.34 0.91513,000FORD MOTOR CRED 2.943% 16-08/01/2019 USD 522,831.54 1.16650,000FREEPORT-MC C&G 3.55% 12-01/03/2022 USD 445,391.62 0.99575,000FRESENIUS MED 4.125% 14-15/10/2020 USD 408,394.95 0.90500,000HJ HEINZ CO 3.5% 15-15/07/2022 USD 547,673.03 1.21686,000HYUNDAI CAP AMER 17-03/04/2020 USD 241,097.57 0.53300,000INTEL CORP 3.15% 17-11/05/2027 USD 389,913.60 0.86500,000JOHNSON&JOHNSON 2.9% 17-15/01/2028 USD 382,721.03 0.85500,000JPMORGAN CHASE 17-15/05/2047 FRN USD 852,304.69 1.901,175,000KELLOGG CO 1.25% 15-10/03/2025 EUR 500,042.15 1.11500,000MICROSOFT CORP 3.3% 17-06/02/2027 USD 395,087.20 0.87500,000WALT DISNEY CO 17-04/03/2022 USD 404,721.91 0.90500,000
7,794,897.20 17.27
BANCA MARCH SA 17-02/11/2021 FRN EUR 1,594,516.11 3.531,600,000Spain
BANCO CRED SOC C 17-07/06/2027 EUR 394,176.00 0.87400,000BANCO SANTANDER 14-12/03/2049 FRN EUR 310,370.40 0.69300,000BANKIA 3.5% 14-17/01/2019 EUR 102,845.80 0.23100,000CAIXA TERRASSA 07-29/03/2049 FRN EUR 1,022,939.50 2.271,100,000CAJAS RURALES UN 3.75% 13-22/11/2018 EUR 102,548.00 0.23100,000GRIFOLS SA 3.2% 17-01/05/2025 EUR 453,051.00 1.00450,000HIPERCOR 3.875% 15-19/01/2022 EUR 425,952.40 0.94400,000IBERIA 2.5% 16-21/03/2019 EUR 506,242.00 1.12500,000SACYR SA 4.5% 17-16/11/2024 EUR 405,668.00 0.90400,000
5,318,309.21 11.78
AREVA SA 4.375% 09-06/11/2019 EUR 528,721.00 1.17500,000France
AXA SA 14-20/05/2049 FRN EUR 853,276.80 1.89800,000CASINO GUICHARD 05-29/01/2049 SR EUR 644,460.00 1.43920,000ELEC DE FRANCE 14-29/12/2049 FRN USD 609,849.70 1.35755,000TOTAL SA 15-29/12/2049 FRN EUR 724,010.00 1.60700,000
3,360,317.50 7.44
AEGON NV 04-29/07/2049 FRN EUR 801,000.00 1.77900,000Netherlands
MIH BV 6% 13-18/07/2020 USD 389,125.54 0.86460,000PETROBRAS 4.375% 13-20/05/2023 USD 353,902.11 0.78450,000TELEFONICA EUROP 13-29/11/2049 FRN GBP 752,171.03 1.67600,000
2,296,198.68 5.08
ALIBABA GROUP 3.4% 17-06/12/2027 USD 377,610.79 0.84500,000Cayman Islands
BAIDU INC 3.25% 13-06/08/2018 USD 402,415.69 0.89500,000HUTCHISON 13-29/05/2049 FRN EUR 501,650.00 1.11500,000IPIC GMTN LTD 2.375% 12-30/05/2018 EUR 681,076.38 1.51679,000
1,962,752.86 4.35
MAN GROUP PLC 14-16/09/2024 USD 413,920.59 0.92500,000United Kingdom
ROYAL BK SCOTLND 09-08/10/2019 FRN EUR 267,659.84 0.59266,000SANTANDER UK PLC 16-08/07/2019 GBP 574,551.27 1.27500,000
1,256,131.70 2.78
BAYER AG 15-02/04/2075 FRN EUR 642,070.11 1.42630,000Germany
KFW 5.5% 16-22/11/2019 MXN 484,361.72 1.0711,500,0001,126,431.83 2.49
COSAN LUXEMBOURG 5% 13-14/03/2023 USD 476,161.08 1.05593,000Luxembourg
GAZPROM 3.7% 13-25/07/2018 EUR 453,937.50 1.01450,000930,098.58 2.06
NameQuantity/Nominal
Market valuein EUR
Currency %NAV
AMERICA MOVIL SA 13-06/09/2073 FRN EUR 764,880.00 1.69750,000Mexico
764,880.00 1.69
AKBANK 5.125% 15-31/03/2025 USD 625,911.87 1.39821,000Turkey
625,911.87 1.39
SKANDINAV ENSKIL 1.375% 13-29/05/2018 USD 575,185.33 1.27717,000Sweden
575,185.33 1.27
AP MOELLER 2.55% 14-22/09/2019 USD 566,091.09 1.25709,000Denmark
566,091.09 1.25
ECOPETROL SA 5.375% 15-26/06/2026 USD 462,018.57 1.02553,000Colombia
462,018.57 1.02
UNIPOL 03-28/07/2023 SR EUR 448,875.00 0.99450,000Italy
448,875.00 0.99
EUROPEAN INVT BK 7.5% 18-11/01/2023 BRL 437,143.17 0.971,800,000Supranational - Multinational
437,143.17 0.97
TAQA ABU DHABI 5.875% 11-13/12/2021 USD 433,065.42 0.96500,000United Arab Emirates
433,065.42 0.96
ZUERCHER KBK 15-15/06/2027 FRN EUR 415,694.40 0.92400,000Switzerland
415,694.40 0.92
QUEBEC PROVINCE 2.75% 17-12/04/2027 USD 387,063.17 0.86500,000Canada
387,063.17 0.86
KOREA DEV BANK 1.5% 13-30/05/2018 EUR 355,147.91 0.79350,000South Korea
355,147.91 0.79
EMBRAER 5.15% 12-15/06/2022 USD 318,321.01 0.70379,000Brazil
318,321.01 0.70
TEVA PHA FIN BV 2.875% 12-15/04/2019 EUR 103,011.10 0.23100,000Curaçao
103,011.10 0.23
29,937,545.60 66.29
APPLE INC USD 376,866.89 0.832,714
SharesUnited States
BANK OF NEW YORK MELLON CORP USD 301,726.41 0.677,200BERKSHIRE HATHAWAY INC-CL B USD 1,284,446.86 2.858,017CIRRUS LOGIC INC USD 100,811.77 0.223,000CVS HEALTH CORP USD 331,715.16 0.736,700EXXON MOBIL CORP USD 323,132.94 0.725,433GILEAD SCIENCES INC USD 407,510.43 0.906,712INTEL CORP USD 563,605.34 1.2513,362QUALCOMM INC USD 358,741.17 0.797,952TWENTY-FIRST CENTURY FOX - B USD 441,006.27 0.9815,000
4,489,563.24 9.94
AXA SA EUR 491,061.06 1.0923,229France
GAZTRANSPORT ET TECHNIGA SA EUR 728,890.40 1.6214,264MICHELIN (CGDE) EUR 496,020.00 1.104,200PUBLICIS GROUPE EUR 317,496.12 0.705,758
NameQuantity/Nominal
Market valuein EUR
Currency %NAV
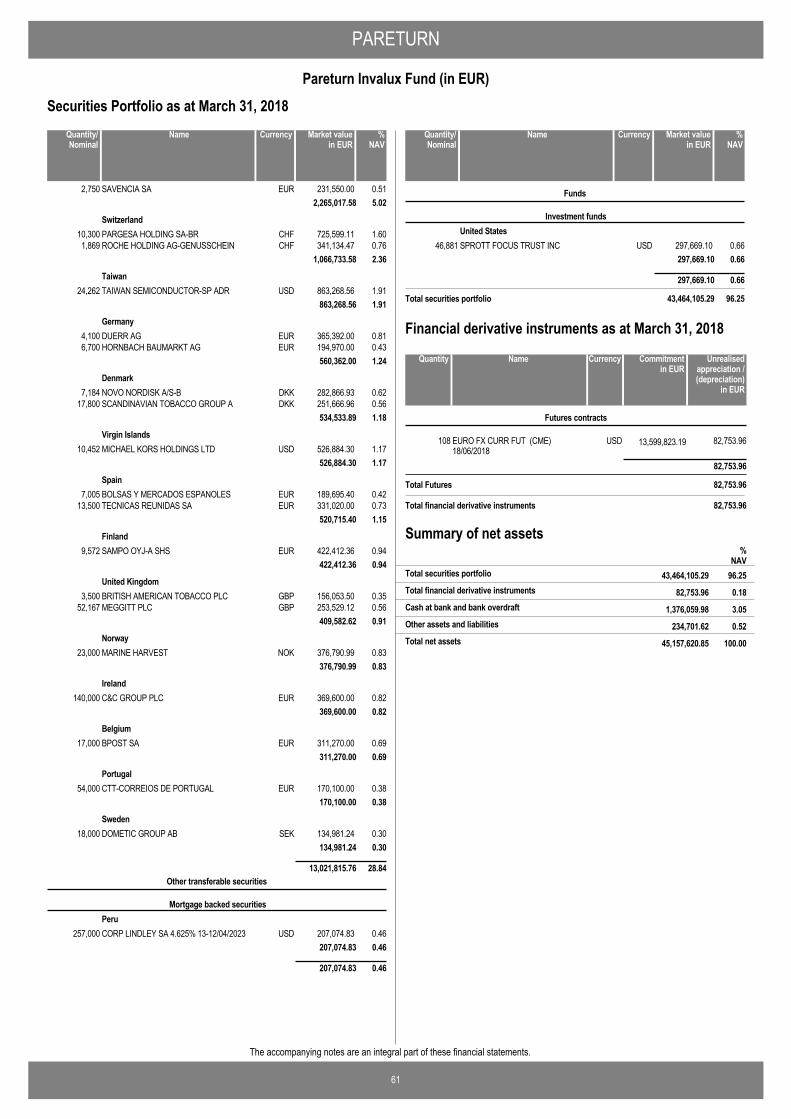
PARETURN
61
Pareturn Invalux Fund (in EUR)
The accompanying notes are an integral part of these financial statements.
Securities Portfolio as at March 31, 2018
SAVENCIA SA EUR 231,550.00 0.512,7502,265,017.58 5.02
PARGESA HOLDING SA-BR CHF 725,599.11 1.6010,300Switzerland
ROCHE HOLDING AG-GENUSSCHEIN CHF 341,134.47 0.761,8691,066,733.58 2.36
TAIWAN SEMICONDUCTOR-SP ADR USD 863,268.56 1.9124,262Taiwan
863,268.56 1.91
DUERR AG EUR 365,392.00 0.814,100Germany
HORNBACH BAUMARKT AG EUR 194,970.00 0.436,700560,362.00 1.24
NOVO NORDISK A/S-B DKK 282,866.93 0.627,184Denmark
SCANDINAVIAN TOBACCO GROUP A DKK 251,666.96 0.5617,800534,533.89 1.18
MICHAEL KORS HOLDINGS LTD USD 526,884.30 1.1710,452Virgin Islands
526,884.30 1.17
BOLSAS Y MERCADOS ESPANOLES EUR 189,695.40 0.427,005Spain
TECNICAS REUNIDAS SA EUR 331,020.00 0.7313,500520,715.40 1.15
SAMPO OYJ-A SHS EUR 422,412.36 0.949,572Finland
422,412.36 0.94
BRITISH AMERICAN TOBACCO PLC GBP 156,053.50 0.353,500United Kingdom
MEGGITT PLC GBP 253,529.12 0.5652,167409,582.62 0.91
MARINE HARVEST NOK 376,790.99 0.8323,000Norway
376,790.99 0.83
C&C GROUP PLC EUR 369,600.00 0.82140,000Ireland
369,600.00 0.82
BPOST SA EUR 311,270.00 0.6917,000Belgium
311,270.00 0.69
CTT-CORREIOS DE PORTUGAL EUR 170,100.00 0.3854,000Portugal
170,100.00 0.38
DOMETIC GROUP AB SEK 134,981.24 0.3018,000Sweden
134,981.24 0.30
13,021,815.76 28.84
CORP LINDLEY SA 4.625% 13-12/04/2023 USD 207,074.83 0.46257,000
Other transferable securities
Mortgage backed securitiesPeru
207,074.83 0.46
207,074.83 0.46
NameQuantity/Nominal
Market valuein EUR
Currency %NAV
SPROTT FOCUS TRUST INC USD 297,669.10 0.6646,881
Funds
Investment fundsUnited States
297,669.10 0.66
297,669.10 0.66
Total securities portfolio 43,464,105.29 96.25
NameQuantity/Nominal
Market valuein EUR
Currency %NAV
EURO FX CURR FUT (CME)18/06/2018
USD 13,599,823.19108 82,753.96
Futures contracts
82,753.96
Total Futures 82,753.96
NameQuantity Commitmentin EUR
Currency Unrealisedappreciation /(depreciation)
in EUR
Financial derivative instruments as at March 31, 2018
Total financial derivative instruments 82,753.96
Summary of net assets
82,753.96 0.18Total financial derivative instruments
%NAV
43,464,105.29 96.25Total securities portfolio
1,376,059.98 3.05Cash at bank and bank overdraft
234,701.62 0.52Other assets and liabilities
45,157,620.85 100.00Total net assets

PARETURN
62
Pareturn Invalux Fund (in EUR)
The accompanying notes are an integral part of these financial statements.
Nature allocation % of portfolio % of netassets
Bonds and other debt instruments 68.88 66.29
Shares 29.96 28.84
Other 1.16 1.12
100.00 96.25
Country allocation % of portfolio % of netassets
United States 28.96 27.87
Spain 13.43 12.93
France 12.94 12.46
Netherlands 5.28 5.08
Cayman Islands 4.52 4.35
Germany 3.88 3.73
United Kingdom 3.83 3.69
Switzerland 3.41 3.28
Denmark 2.53 2.43
Luxembourg 2.14 2.06
Other 19.08 18.37
100.00 96.25
Portfolio Breakdowns
Top Ten Holdings Market value % ofnet
assets
BANCA MARCH SA 17-02/11/2021 FRN 1,594,516.11 3.53Banks
BERKSHIRE HATHAWAY INC-CL B 1,284,446.86 2.85Insurance
CAIXA TERRASSA 07-29/03/2049 FRN 1,022,939.50 2.27Banks
TAIWAN SEMICONDUCTOR-SP ADR 863,268.56 1.91Electric & Electronic
AXA SA 14-20/05/2049 FRN 853,276.80 1.89Insurance
JPMORGAN CHASE 17-15/05/2047 FRN 852,304.69 1.90Banks
ANHEUSER-BUSCH 2.2% 16-01/08/2018 844,605.84 1.88Food services
AEGON NV 04-29/07/2049 FRN 801,000.00 1.77Insurance
AMERICA MOVIL SA 13-06/09/2073 FRN 764,880.00 1.69Telecommunication
TELEFONICA EUROP 13-29/11/2049 FRN 752,171.03 1.67Telecommunication
EUR
Sector
Top Ten Holdings

63
The accompanying notes are an integral part of these financial statements.
PARETURN
Pareturn Gladwyne Absolute Credit (in EUR)Statement of Operations and Changes in Net Assets for theperiod ended March 31, 2018
EUR
AssetsInvestment in securities at cost 158,076,968.57Unrealised appreciation / (depreciation) on securities 874,603.22
Investment in securities at market value 3.3 158,951,571.79Cash at bank 15,009,306.99Receivable for investment sold 1,966.67Receivable on withholding tax reclaim 22,241.86Net unrealised appreciation on forward foreign exchangecontracts
3.4, 15 226,057.87
Net unrealised appreciation on Contracts for Difference 3.10, 16 971,217.41Dividends and interest receivable 2,702,558.20Formation expenses 3.7 7,456.40
Total assets 177,892,377.19
LiabilitiesBank overdraft 1,583,528.70Accrued expenses 928,519.45Payable for investment purchased 2,112,845.60Payable on Contracts for Difference 125,513.87Other liabilities 519,147.53
Total liabilities 5,269,555.15
Net assets at the end of the period 172,622,822.04
Notes
Statement of Net Assets as at March 31, 2018
IncomeDividends (net of withholding taxes) 3.8 275,055.16Interest on bonds (net of withholding taxes) 3.8 2,950,320.88Bank interest 3.8 1,620.76Dividend on Contracts for Difference (net of withholdingtaxes)
3.8 174,505.35
Other income 12 12.71
Total income 3,401,514.86
ExpensesInvestment advisory fees and management fees 4 1,179,097.55Depositary fees 15,824.34Performance fees 4 673,923.25Administration fees 49,976.21Professional fees 40,241.63Distribution fees 14 1,226.15Transaction costs 9 39,899.17Taxe d'abonnement 5 8,682.72Bank interest and charges 74,176.89Expenses on Contracts for Difference 1,445,939.71Amortisation of formation expenses 3.7 1,324.09Other expenses 13 26,469.77
Total expenses 3,556,781.48
Net investment income / (loss) (155,266.62)
Net realised gain / (loss) on:Sales of Investments 3.9 3,044,285.76Foreign exchange transactions 3.2 517,519.99Forward foreign exchange contracts 3.4 1,431,474.69Contracts for Difference 3.10 729,478.27
Net realised gain / (loss) for the period 5,567,492.09
Net change in unrealised appreciation / (depreciation) on:Investments 3.9 (4,966,844.04)Forward foreign exchange contracts 3.4 486,548.73Contracts for Difference 3.10, 16 968,942.90
Increase / (Decrease) in net assets as a result ofoperations
2,056,139.68
Proceeds received on subscription of shares 43,870,965.05Net amount paid on redemption of shares (23,386,189.33)Net assets at the beginning of the period 150,081,906.64
Net assets at the end of the period 172,622,822.04
EURNotes
Statement of Operations and Changes in Net Assets forthe period ended March 31, 2018
Number of shares in issue atthe end of the period
Number of shares in issue atthe beginning of the period
Number of sharessubscribed
Number of sharesredeemed
Statement of Changes in Number of Shares
B EUR I Cap 742,881 116,967 (130,801) 729,047
B EUR P Cap 16,885 7,269 (1,390) 22,764
B GBP G Hedged Cap 75,588 32,238 (997) 106,829
B USD R1 Hedged Cap - 6,225 - 6,225

64
The accompanying notes are an integral part of these financial statements.
PARETURN
Pareturn Gladwyne Absolute Credit (in EUR)
Number of shares in issue atthe end of the period
Number of shares in issue atthe beginning of the period
Number of sharessubscribed
Number of sharesredeemed
Statement of Changes in Number of Shares
B USD U Hedged Cap 43,483 126,814 - 170,297
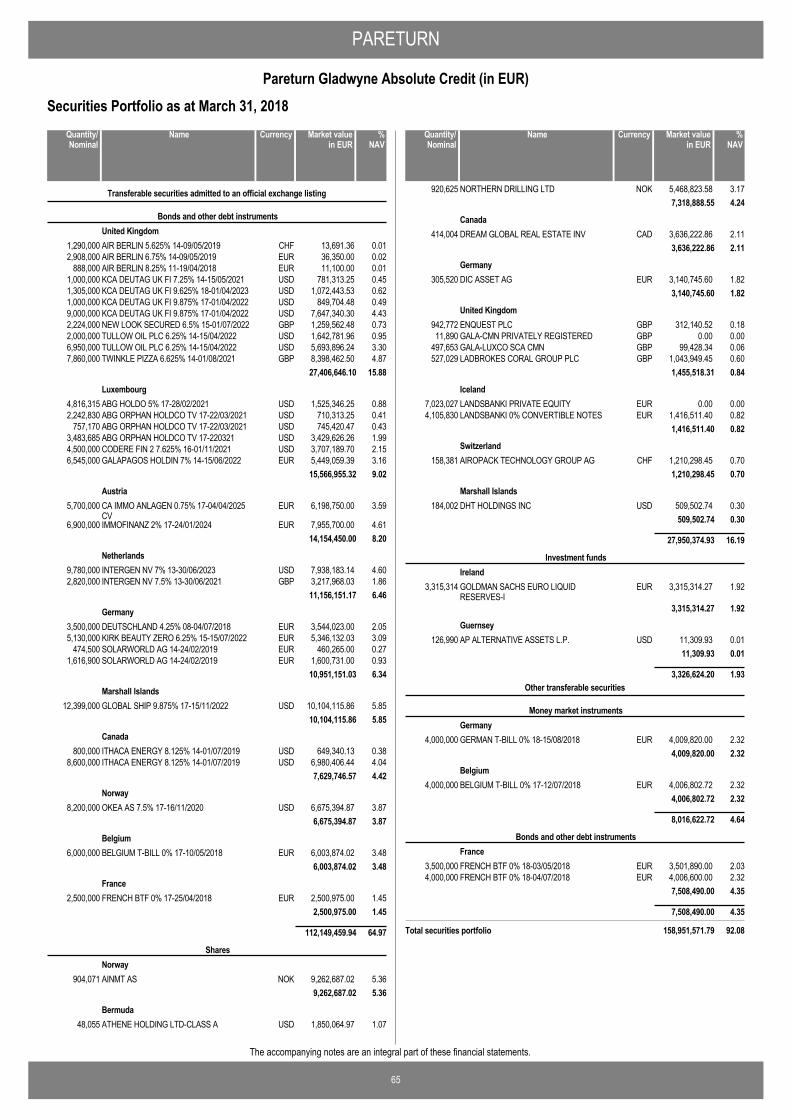
PARETURN
65
Pareturn Gladwyne Absolute Credit (in EUR)
The accompanying notes are an integral part of these financial statements.
Securities Portfolio as at March 31, 2018
AIR BERLIN 5.625% 14-09/05/2019 CHF 13,691.36 0.011,290,000
Transferable securities admitted to an official exchange listing
Bonds and other debt instrumentsUnited Kingdom
AIR BERLIN 6.75% 14-09/05/2019 EUR 36,350.00 0.022,908,000AIR BERLIN 8.25% 11-19/04/2018 EUR 11,100.00 0.01888,000KCA DEUTAG UK FI 7.25% 14-15/05/2021 USD 781,313.25 0.451,000,000KCA DEUTAG UK FI 9.625% 18-01/04/2023 USD 1,072,443.53 0.621,305,000KCA DEUTAG UK FI 9.875% 17-01/04/2022 USD 849,704.48 0.491,000,000KCA DEUTAG UK FI 9.875% 17-01/04/2022 USD 7,647,340.30 4.439,000,000NEW LOOK SECURED 6.5% 15-01/07/2022 GBP 1,259,562.48 0.732,224,000TULLOW OIL PLC 6.25% 14-15/04/2022 USD 1,642,781.96 0.952,000,000TULLOW OIL PLC 6.25% 14-15/04/2022 USD 5,693,896.24 3.306,950,000TWINKLE PIZZA 6.625% 14-01/08/2021 GBP 8,398,462.50 4.877,860,000
27,406,646.10 15.88
ABG HOLDO 5% 17-28/02/2021 USD 1,525,346.25 0.884,816,315Luxembourg
ABG ORPHAN HOLDCO TV 17-22/03/2021 USD 710,313.25 0.412,242,830ABG ORPHAN HOLDCO TV 17-22/03/2021 USD 745,420.47 0.43757,170ABG ORPHAN HOLDCO TV 17-220321 USD 3,429,626.26 1.993,483,685CODERE FIN 2 7.625% 16-01/11/2021 USD 3,707,189.70 2.154,500,000GALAPAGOS HOLDIN 7% 14-15/06/2022 EUR 5,449,059.39 3.166,545,000
15,566,955.32 9.02
CA IMMO ANLAGEN 0.75% 17-04/04/2025CV
EUR 6,198,750.00 3.595,700,000Austria
IMMOFINANZ 2% 17-24/01/2024 EUR 7,955,700.00 4.616,900,00014,154,450.00 8.20
INTERGEN NV 7% 13-30/06/2023 USD 7,938,183.14 4.609,780,000Netherlands
INTERGEN NV 7.5% 13-30/06/2021 GBP 3,217,968.03 1.862,820,00011,156,151.17 6.46
DEUTSCHLAND 4.25% 08-04/07/2018 EUR 3,544,023.00 2.053,500,000Germany
KIRK BEAUTY ZERO 6.25% 15-15/07/2022 EUR 5,346,132.03 3.095,130,000SOLARWORLD AG 14-24/02/2019 EUR 460,265.00 0.27474,500SOLARWORLD AG 14-24/02/2019 EUR 1,600,731.00 0.931,616,900
10,951,151.03 6.34
GLOBAL SHIP 9.875% 17-15/11/2022 USD 10,104,115.86 5.8512,399,000Marshall Islands
10,104,115.86 5.85
ITHACA ENERGY 8.125% 14-01/07/2019 USD 649,340.13 0.38800,000Canada
ITHACA ENERGY 8.125% 14-01/07/2019 USD 6,980,406.44 4.048,600,0007,629,746.57 4.42
OKEA AS 7.5% 17-16/11/2020 USD 6,675,394.87 3.878,200,000Norway
6,675,394.87 3.87
BELGIUM T-BILL 0% 17-10/05/2018 EUR 6,003,874.02 3.486,000,000Belgium
6,003,874.02 3.48
FRENCH BTF 0% 17-25/04/2018 EUR 2,500,975.00 1.452,500,000France
2,500,975.00 1.45
112,149,459.94 64.97
AINMT AS NOK 9,262,687.02 5.36904,071
SharesNorway
9,262,687.02 5.36
ATHENE HOLDING LTD-CLASS A USD 1,850,064.97 1.0748,055Bermuda
NameQuantity/Nominal
Market valuein EUR
Currency %NAV
NORTHERN DRILLING LTD NOK 5,468,823.58 3.17920,6257,318,888.55 4.24
DREAM GLOBAL REAL ESTATE INV CAD 3,636,222.86 2.11414,004Canada
3,636,222.86 2.11
DIC ASSET AG EUR 3,140,745.60 1.82305,520Germany
3,140,745.60 1.82
ENQUEST PLC GBP 312,140.52 0.18942,772United Kingdom
GALA-CMN PRIVATELY REGISTERED GBP 0.00 0.0011,890GALA-LUXCO SCA CMN GBP 99,428.34 0.06497,653LADBROKES CORAL GROUP PLC GBP 1,043,949.45 0.60527,029
1,455,518.31 0.84
LANDSBANKI PRIVATE EQUITY EUR 0.00 0.007,023,027Iceland
LANDSBANKI 0% CONVERTIBLE NOTES EUR 1,416,511.40 0.824,105,8301,416,511.40 0.82
AIROPACK TECHNOLOGY GROUP AG CHF 1,210,298.45 0.70158,381Switzerland
1,210,298.45 0.70
DHT HOLDINGS INC USD 509,502.74 0.30184,002Marshall Islands
509,502.74 0.30
27,950,374.93 16.19
GOLDMAN SACHS EURO LIQUIDRESERVES-I
EUR 3,315,314.27 1.923,315,314
Investment fundsIreland
3,315,314.27 1.92
AP ALTERNATIVE ASSETS L.P. USD 11,309.93 0.01126,990Guernsey
11,309.93 0.01
3,326,624.20 1.93
GERMAN T-BILL 0% 18-15/08/2018 EUR 4,009,820.00 2.324,000,000
Other transferable securities
Money market instrumentsGermany
4,009,820.00 2.32
BELGIUM T-BILL 0% 17-12/07/2018 EUR 4,006,802.72 2.324,000,000Belgium
4,006,802.72 2.32
8,016,622.72 4.64
FRENCH BTF 0% 18-03/05/2018 EUR 3,501,890.00 2.033,500,000
Bonds and other debt instrumentsFrance
FRENCH BTF 0% 18-04/07/2018 EUR 4,006,600.00 2.324,000,0007,508,490.00 4.35
7,508,490.00 4.35
Total securities portfolio 158,951,571.79 92.08
NameQuantity/Nominal
Market valuein EUR
Currency %NAV
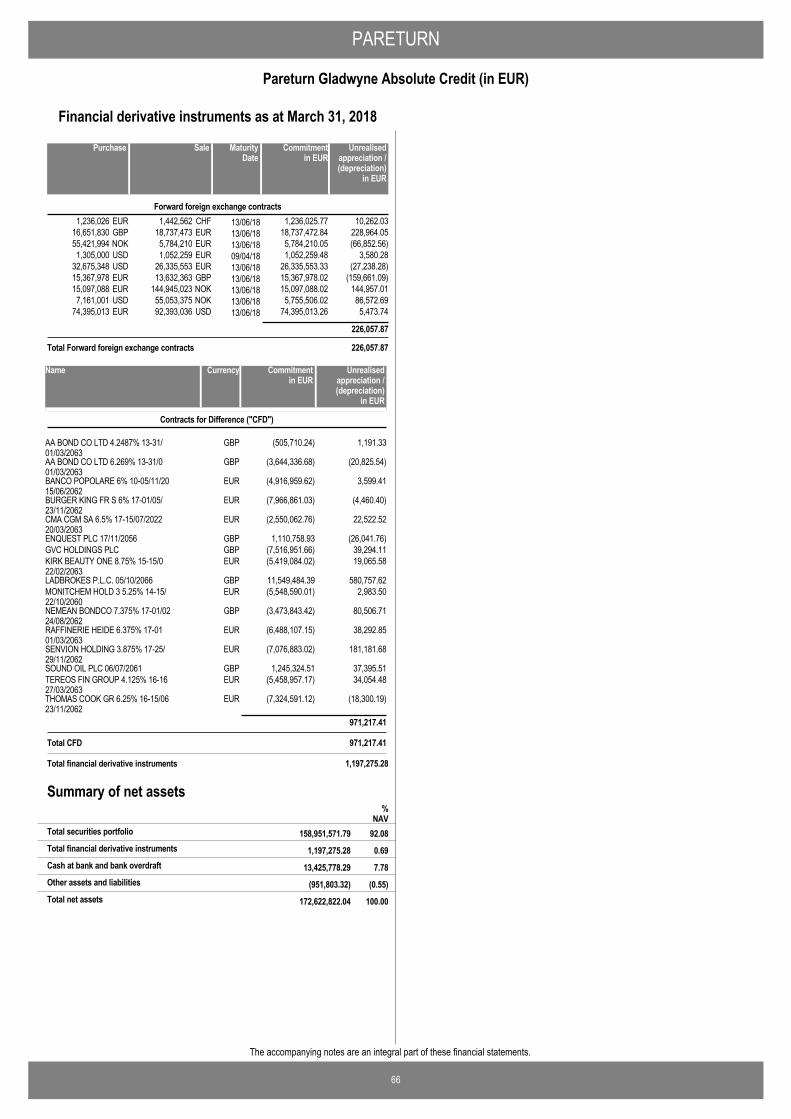
PARETURN
66
Pareturn Gladwyne Absolute Credit (in EUR)
The accompanying notes are an integral part of these financial statements.
1,442,562 13/06/181,236,026 10,262.03CHFEUR 1,236,025.77Forward foreign exchange contracts
18,737,473 13/06/1816,651,830 228,964.05EURGBP 18,737,472.845,784,210 13/06/1855,421,994 (66,852.56)EURNOK 5,784,210.051,052,259 09/04/181,305,000 3,580.28EURUSD 1,052,259.48
26,335,553 13/06/1832,675,348 (27,238.28)EURUSD 26,335,553.3313,632,363 13/06/1815,367,978 (159,661.09)GBPEUR 15,367,978.02
144,945,023 13/06/1815,097,088 144,957.01NOKEUR 15,097,088.0255,053,375 13/06/187,161,001 86,572.69NOKUSD 5,755,506.0292,393,036 13/06/1874,395,013 5,473.74USDEUR 74,395,013.26
226,057.87
Total Forward foreign exchange contracts 226,057.87
SalePurchase Unrealisedappreciation /(depreciation)
in EUR
MaturityDate
Commitmentin EUR
Financial derivative instruments as at March 31, 2018
AA BOND CO LTD 4.2487% 13-31/01/03/2063
GBP 1,191.33(505,710.24)
Contracts for Difference ("CFD")
Name Currency Unrealisedappreciation /(depreciation)
in EUR
Commitmentin EUR
AA BOND CO LTD 6.269% 13-31/001/03/2063
GBP (20,825.54)(3,644,336.68)
BANCO POPOLARE 6% 10-05/11/2015/06/2062
EUR 3,599.41(4,916,959.62)
BURGER KING FR S 6% 17-01/05/23/11/2062
EUR (4,460.40)(7,966,861.03)
CMA CGM SA 6.5% 17-15/07/202220/03/2063
EUR 22,522.52(2,550,062.76)
ENQUEST PLC 17/11/2056 GBP (26,041.76)1,110,758.93GVC HOLDINGS PLC GBP 39,294.11(7,516,951.66)KIRK BEAUTY ONE 8.75% 15-15/022/02/2063
EUR 19,065.58(5,419,084.02)
LADBROKES P.L.C. 05/10/2066 GBP 580,757.6211,549,484.39MONITCHEM HOLD 3 5.25% 14-15/22/10/2060
EUR 2,983.50(5,548,590.01)
NEMEAN BONDCO 7.375% 17-01/0224/08/2062
GBP 80,506.71(3,473,843.42)
RAFFINERIE HEIDE 6.375% 17-0101/03/2063
EUR 38,292.85(6,488,107.15)
SENVION HOLDING 3.875% 17-25/29/11/2062
EUR 181,181.68(7,076,883.02)
SOUND OIL PLC 06/07/2061 GBP 37,395.511,245,324.51TEREOS FIN GROUP 4.125% 16-1627/03/2063
EUR 34,054.48(5,458,957.17)
THOMAS COOK GR 6.25% 16-15/0623/11/2062
EUR (18,300.19)(7,324,591.12)
971,217.41
Total CFD 971,217.41
Total financial derivative instruments 1,197,275.28
Summary of net assets
1,197,275.28 0.69Total financial derivative instruments
%NAV
158,951,571.79 92.08Total securities portfolio
13,425,778.29 7.78Cash at bank and bank overdraft
(951,803.32) (0.55)Other assets and liabilities
172,622,822.04 100.00Total net assets

PARETURN
67
Pareturn Gladwyne Absolute Credit (in EUR)
The accompanying notes are an integral part of these financial statements.
Nature allocation % of portfolio % of netassets
Bonds and other debt instruments 75.29 69.32
Shares 17.58 16.19
Money market instruments 5.04 4.64
Investment funds 2.09 1.93
100.00 92.08
Country allocation % of portfolio % of netassets
United Kingdom 18.15 16.72
Germany 11.39 10.48
Norway 10.03 9.23
Luxembourg 9.79 9.02
Austria 8.90 8.20
Canada 7.09 6.53
Netherlands 7.02 6.46
Marshall Islands 6.68 6.15
Belgium 6.30 5.80
France 6.30 5.80
Bermuda 4.60 4.24
Ireland 2.09 1.92
Other 1.66 1.53
100.00 92.08
Portfolio Breakdowns
Top Ten Holdings Market value % ofnet
assets
GLOBAL SHIP 9.875% 17-15/11/2022 10,104,115.86 5.85Transportation
AINMT AS 9,262,687.02 5.36Telecommunication
TWINKLE PIZZA 6.625% 14-01/08/2021 8,398,462.50 4.87Distribution &Wholesale
IMMOFINANZ 2% 17-24/01/2024 7,955,700.00 4.61Real estate
INTERGEN NV 7% 13-30/06/2023 7,938,183.14 4.60Energy
KCA DEUTAG UK FI 9.875% 17-01/04/2022 7,647,340.30 4.43Chemical
ITHACA ENERGY 8.125% 14-01/07/2019 6,980,406.44 4.04Energy
OKEA AS 7.5% 17-16/11/2020 6,675,394.87 3.87Energy
CA IMMO ANLAGEN 0.75% 17-04/04/2025 CV 6,198,750.00 3.59Real estate
BELGIUM T-BILL 0% 17-10/05/2018 6,003,874.02 3.48Government
EUR
Sector
Top Ten Holdings

68
The accompanying notes are an integral part of these financial statements.
PARETURN
Pareturn Mutuafondo España Lux (in EUR)Statement of Operations and Changes in Net Assets for theperiod ended March 31, 2018
EUR
AssetsInvestment in securities at cost 28,612,599.24Unrealised appreciation / (depreciation) on securities 3,536,217.91
Investment in securities at market value 3.3 32,148,817.15Cash at bank 121,912.39
Total assets 32,270,729.54
LiabilitiesAccrued expenses 155,184.68
Total liabilities 155,184.68
Net assets at the end of the period 32,115,544.86
Notes
Statement of Net Assets as at March 31, 2018
Income
ExpensesInvestment advisory fees and management fees 4 243,327.35Depositary fees 4,744.00Administration fees 11,375.66Professional fees 6,236.46Taxe d'abonnement 5 7,869.27Bank interest and charges 2,874.98Other expenses 13 6,065.01
Total expenses 282,492.73
Net investment income / (loss) (282,492.73)
Net realised gain / (loss) on:Sales of Investments 3.9 13,312.63Foreign exchange transactions 3.2 (32.57)
Net realised gain / (loss) for the period (269,212.67)
Net change in unrealised appreciation / (depreciation) on:Investments 3.9 1,129,417.96
Increase / (Decrease) in net assets as a result ofoperations
860,205.29
Proceeds received on subscription of shares -Net amount paid on redemption of shares -Net assets at the beginning of the period 31,255,339.57
Net assets at the end of the period 32,115,544.86
EURNotes
Statement of Operations and Changes in Net Assets forthe period ended March 31, 2018
Number of shares in issue atthe end of the period
Number of shares in issue atthe beginning of the period
Number of sharessubscribed
Number of sharesredeemed
Statement of Changes in Number of Shares
B EUR P Cap 202,100 - - 202,100
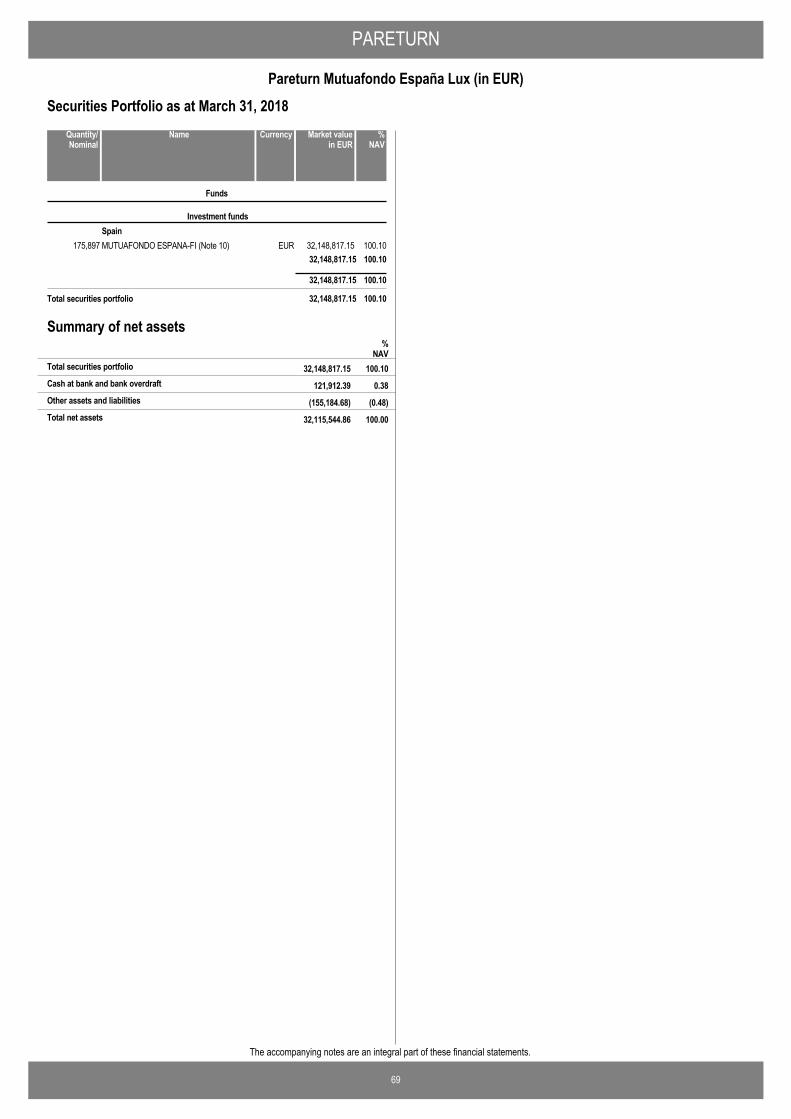
PARETURN
69
Pareturn Mutuafondo España Lux (in EUR)
The accompanying notes are an integral part of these financial statements.
Securities Portfolio as at March 31, 2018
MUTUAFONDO ESPANA-FI (Note 10) EUR 32,148,817.15 100.10175,897
Funds
Investment fundsSpain
32,148,817.15 100.10
32,148,817.15 100.10
Total securities portfolio 32,148,817.15 100.10
NameQuantity/Nominal
Market valuein EUR
Currency %NAV
Summary of net assets%
NAV32,148,817.15 100.10Total securities portfolio
121,912.39 0.38Cash at bank and bank overdraft
(155,184.68) (0.48)Other assets and liabilities
32,115,544.86 100.00Total net assets
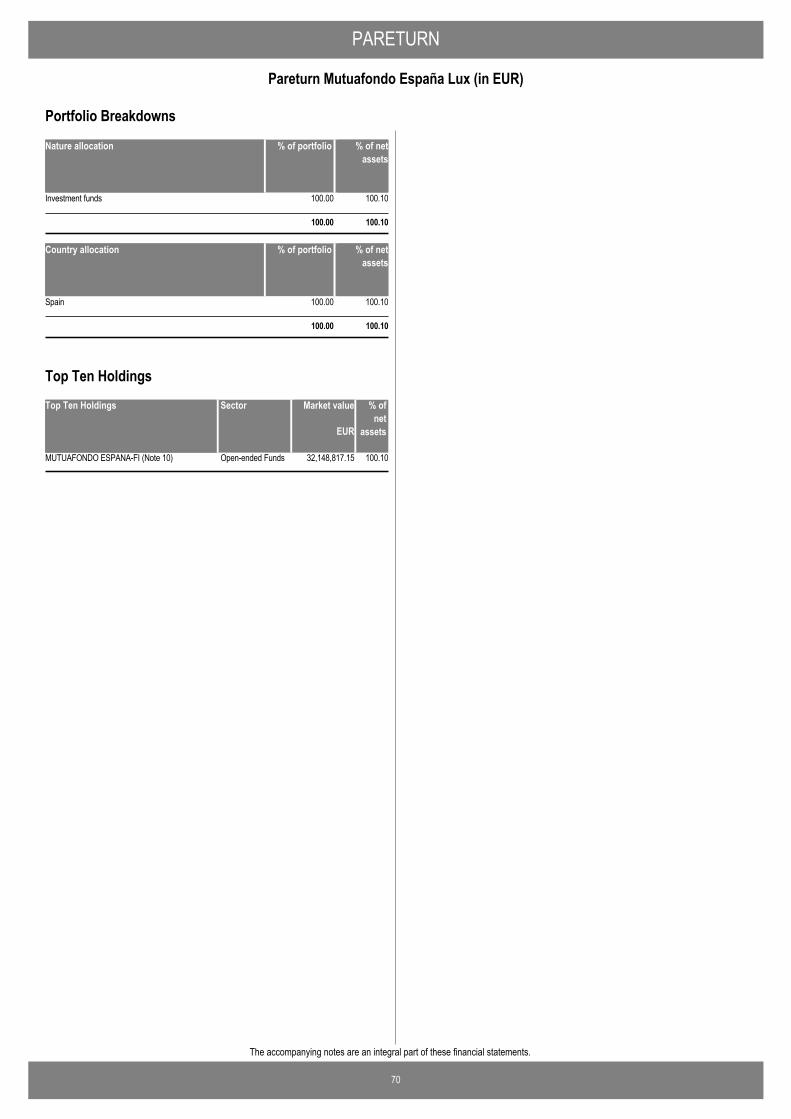
PARETURN
70
Pareturn Mutuafondo España Lux (in EUR)
The accompanying notes are an integral part of these financial statements.
Nature allocation % of portfolio % of netassets
Investment funds 100.00 100.10
100.00 100.10
Country allocation % of portfolio % of netassets
Spain 100.00 100.10
100.00 100.10
Portfolio Breakdowns
Top Ten Holdings Market value % ofnet
assets
MUTUAFONDO ESPANA-FI (Note 10) 32,148,817.15 100.10Open-ended Funds
EUR
Sector
Top Ten Holdings

71
The accompanying notes are an integral part of these financial statements.
PARETURN
Pareturn EtendAR (in EUR)Statement of Operations and Changes in Net Assets for theperiod ended March 31, 2018
EUR
AssetsInvestment in securities at cost 4,095,095.54Unrealised appreciation / (depreciation) on securities 2,693.07
Investment in securities at market value 3.3 4,097,788.61Cash at bank 57,883.27Dividends and interest receivable 83.63Other assets 79.09
Total assets 4,155,834.60
LiabilitiesBank overdraft 21,243.33Accrued expenses 51,602.04Net unrealised depreciation on futures contracts 3.5 2,683.25Other liabilities 353.96
Total liabilities 75,882.58
Net assets at the end of the period 4,079,952.02
Notes
Statement of Net Assets as at March 31, 2018
IncomeDividends (net of withholding taxes) 3.8 8,199.52Bank interest 3.8 122.86Other income 12 79.09
Total income 8,401.47
ExpensesInvestment advisory fees and management fees 4 39,975.78Depositary fees 12,155.57Performance fees 4 978.77Administration fees 14,502.54Professional fees 10,528.69Transaction costs 9 4,523.85Taxe d'abonnement 5 901.93Bank interest and charges 4,725.19Agent association fees 419.39Other expenses 13 20,947.42
Total expenses 109,659.13
Net investment income / (loss) (101,257.66)
Net realised gain / (loss) on:Sales of Investments 3.9 151,184.68Foreign exchange transactions 3.2 1,249.13Futures contracts 3.5 5,589.66
Net realised gain / (loss) for the period 56,765.81
Net change in unrealised appreciation / (depreciation) on:Investments 3.9 (104,485.61)Futures contracts 3.5 911.74
Increase / (Decrease) in net assets as a result ofoperations
(46,808.06)
Proceeds received on subscription of shares 6,241.11Net amount paid on redemption of shares (699,993.12)Net assets at the beginning of the period 4,820,512.09
Net assets at the end of the period 4,079,952.02
EURNotes
Statement of Operations and Changes in Net Assets forthe period ended March 31, 2018
Number of shares in issue atthe end of the period
Number of shares in issue atthe beginning of the period
Number of sharessubscribed
Number of sharesredeemed
Statement of Changes in Number of Shares
B EUR P Cap 49,458 63 (7,072) 42,449

PARETURN
72
Pareturn EtendAR (in EUR)
The accompanying notes are an integral part of these financial statements.
Securities Portfolio as at March 31, 2018
AMUNDI ETF JAPAN TOPIX EUR H EUR 208,746.30 5.12929
Funds
Investment fundsFrance
ENDYMION MARKET NEUTRAL EUR PAR I EUR 273,751.20 6.71360HYPERION EUR 360,264.32 8.831,634L E EU UC ETF ACC PARTS -ACC- EUR 154,422.40 3.787,216LESPRIT DU LUX-ACTION I EUR 348,835.82 8.55298LYXOR ETF MSCI EM LAT AMER EUR 252,367.43 6.199,179ORIGIN-I EUR 381,160.08 9.34252RP SELECTION CONVERTIBLES EUR 354,987.26 8.701,102SILVER ECONOMY EUR 200,161.74 4.91183THE DIGITAL EXPLORER-I EUR 383,507.67 9.39273TIME FOR AFRICA ACT EUR 189,124.63 4.641,909TIME FOR AFRICA-I USD USD 116,504.94 2.8612
3,223,833.79 79.02
ISHARES S&P 500 EUR-H EUR 554,938.60 13.609,355Ireland
554,938.60 13.60
DBX MSCI EU SMALL CAP (DR) EUR 161,678.16 3.963,774Luxembourg
MUL LY PAUE SHS-ACC-CAPITALISATION EUR 157,338.06 3.8616,676319,016.22 7.82
4,097,788.61 100.44
Total securities portfolio 4,097,788.61 100.44
NameQuantity/Nominal
Market valuein EUR
Currency %NAV
EURO FX CURR FUT (CME)18/06/2018
USD 251,219.662 (2,683.25)
Futures contracts
(2,683.25)
Total Futures (2,683.25)
NameQuantity Commitmentin EUR
Currency Unrealisedappreciation /(depreciation)
in EUR
Financial derivative instruments as at March 31, 2018
Total financial derivative instruments (2,683.25)
Summary of net assets
(2,683.25) (0.07)Total financial derivative instruments
%NAV
4,097,788.61 100.44Total securities portfolio
36,639.94 0.90Cash at bank and bank overdraft
(51,793.28) (1.27)Other assets and liabilities
4,079,952.02 100.00Total net assets
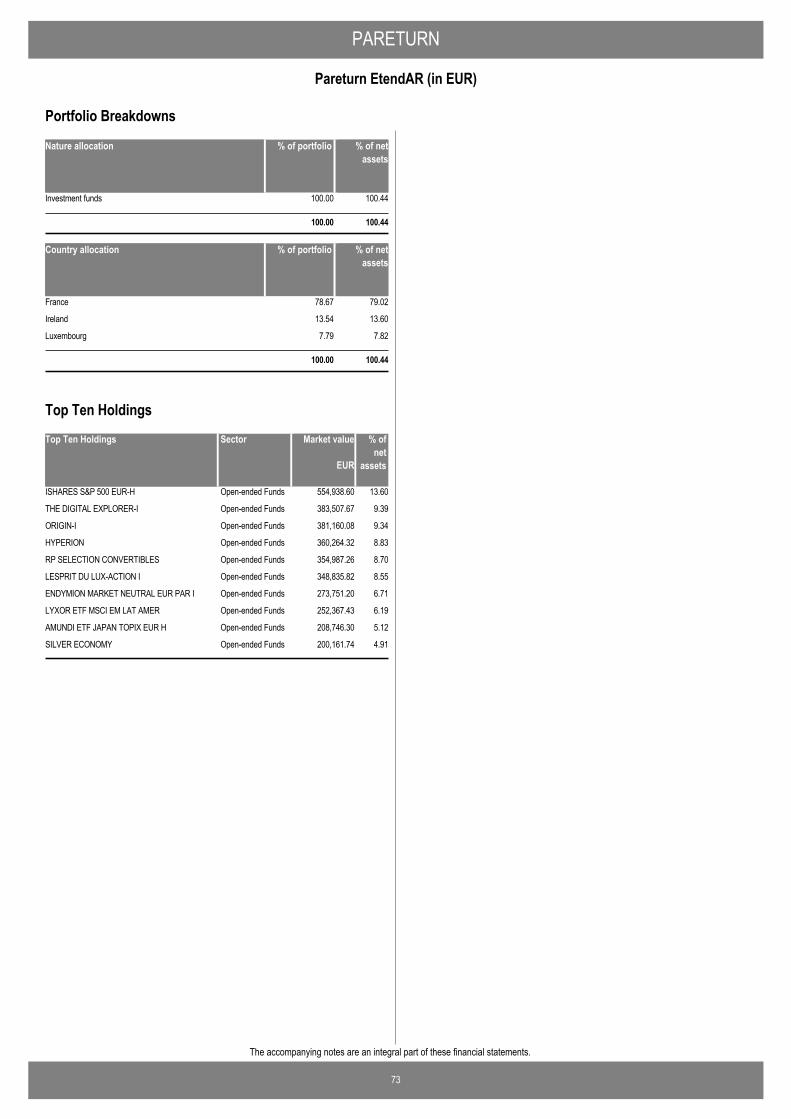
PARETURN
73
Pareturn EtendAR (in EUR)
The accompanying notes are an integral part of these financial statements.
Nature allocation % of portfolio % of netassets
Investment funds 100.00 100.44
100.00 100.44
Country allocation % of portfolio % of netassets
France 78.67 79.02
Ireland 13.54 13.60
Luxembourg 7.79 7.82
100.00 100.44
Portfolio Breakdowns
Top Ten Holdings Market value % ofnet
assets
ISHARES S&P 500 EUR-H 554,938.60 13.60Open-ended Funds
THE DIGITAL EXPLORER-I 383,507.67 9.39Open-ended Funds
ORIGIN-I 381,160.08 9.34Open-ended Funds
HYPERION 360,264.32 8.83Open-ended Funds
RP SELECTION CONVERTIBLES 354,987.26 8.70Open-ended Funds
LESPRIT DU LUX-ACTION I 348,835.82 8.55Open-ended Funds
ENDYMION MARKET NEUTRAL EUR PAR I 273,751.20 6.71Open-ended Funds
LYXOR ETF MSCI EM LAT AMER 252,367.43 6.19Open-ended Funds
AMUNDI ETF JAPAN TOPIX EUR H 208,746.30 5.12Open-ended Funds
SILVER ECONOMY 200,161.74 4.91Open-ended Funds
EUR
Sector
Top Ten Holdings
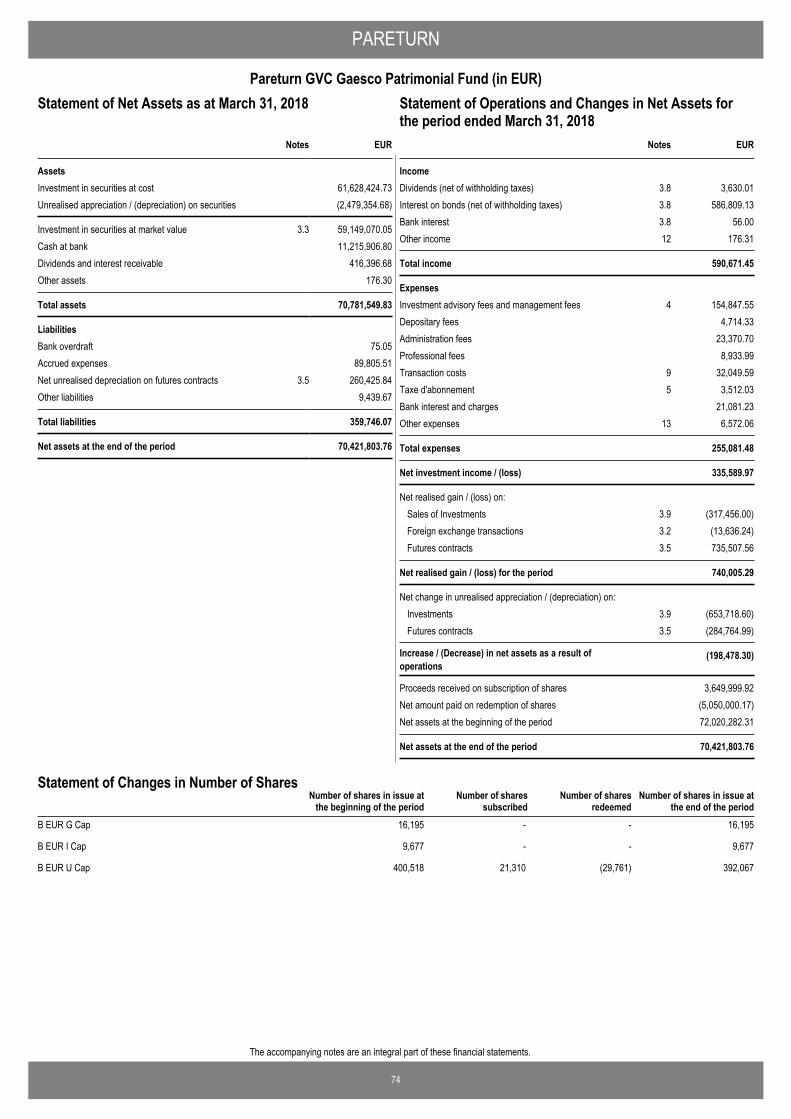
74
The accompanying notes are an integral part of these financial statements.
PARETURN
Pareturn GVC Gaesco Patrimonial Fund (in EUR)Statement of Operations and Changes in Net Assets for theperiod ended March 31, 2018
EUR
AssetsInvestment in securities at cost 61,628,424.73Unrealised appreciation / (depreciation) on securities (2,479,354.68)
Investment in securities at market value 3.3 59,149,070.05Cash at bank 11,215,906.80Dividends and interest receivable 416,396.68Other assets 176.30
Total assets 70,781,549.83
LiabilitiesBank overdraft 75.05Accrued expenses 89,805.51Net unrealised depreciation on futures contracts 3.5 260,425.84Other liabilities 9,439.67
Total liabilities 359,746.07
Net assets at the end of the period 70,421,803.76
Notes
Statement of Net Assets as at March 31, 2018
IncomeDividends (net of withholding taxes) 3.8 3,630.01Interest on bonds (net of withholding taxes) 3.8 586,809.13Bank interest 3.8 56.00Other income 12 176.31
Total income 590,671.45
ExpensesInvestment advisory fees and management fees 4 154,847.55Depositary fees 4,714.33Administration fees 23,370.70Professional fees 8,933.99Transaction costs 9 32,049.59Taxe d'abonnement 5 3,512.03Bank interest and charges 21,081.23Other expenses 13 6,572.06
Total expenses 255,081.48
Net investment income / (loss) 335,589.97
Net realised gain / (loss) on:Sales of Investments 3.9 (317,456.00)Foreign exchange transactions 3.2 (13,636.24)Futures contracts 3.5 735,507.56
Net realised gain / (loss) for the period 740,005.29
Net change in unrealised appreciation / (depreciation) on:Investments 3.9 (653,718.60)Futures contracts 3.5 (284,764.99)
Increase / (Decrease) in net assets as a result ofoperations
(198,478.30)
Proceeds received on subscription of shares 3,649,999.92Net amount paid on redemption of shares (5,050,000.17)Net assets at the beginning of the period 72,020,282.31
Net assets at the end of the period 70,421,803.76
EURNotes
Statement of Operations and Changes in Net Assets forthe period ended March 31, 2018
Number of shares in issue atthe end of the period
Number of shares in issue atthe beginning of the period
Number of sharessubscribed
Number of sharesredeemed
Statement of Changes in Number of Shares
B EUR G Cap 16,195 - - 16,195
B EUR I Cap 9,677 - - 9,677
B EUR U Cap 400,518 21,310 (29,761) 392,067

PARETURN
75
Pareturn GVC Gaesco Patrimonial Fund (in EUR)
The accompanying notes are an integral part of these financial statements.
Securities Portfolio as at March 31, 2018
ITALY BTPS 0.25% 15-15/05/2018 EUR 2,001,380.00 2.842,000,000
Transferable securities admitted to an official exchange listing
Bonds and other debt instrumentsItaly
ITALY BTPS 0.3% 15-15/10/2018 EUR 3,512,901.00 4.993,500,000ITALY BTPS 0.35% 17-15/06/2020 EUR 2,124,923.43 3.022,100,000ITALY BTPS 0.7% 15-01/05/2020 EUR 3,159,257.12 4.493,100,000ITALY BTPS 1.05% 14-01/12/2019 EUR 1,022,508.40 1.451,000,000ITALY BTPS 3.5% 13-01/06/2018 EUR 2,515,507.50 3.572,500,000ITALY BTPS 3.5% 13-01/12/2018 EUR 3,590,055.00 5.103,500,000ITALY BTPS 4.25% 03-01/02/2019 EUR 3,635,289.00 5.163,500,000ITALY BTPS 4.5% 08-01/08/2018 EUR 2,540,455.00 3.612,500,000
24,102,276.45 34.23
SPANISH GOVT 0.25% 15-30/04/2018 EUR 1,000,350.00 1.421,000,000Spain
SPANISH GOVT 0.25% 16-31/01/2019 EUR 4,524,003.00 6.424,500,000SPANISH GOVT 0.75% 16-30/07/2021 EUR 1,030,960.00 1.461,000,000SPANISH GOVT 1.15% 15-30/07/2020 EUR 1,033,860.00 1.471,000,000SPANISH GOVT 1.4% 14-31/01/2020 EUR 1,032,130.00 1.471,000,000SPANISH GOVT 2.75% 14-30/04/2019 EUR 3,101,760.00 4.403,000,000SPANISH GOVT 3.75% 13-31/10/2018 EUR 2,048,380.00 2.912,000,000SPANISH GOVT 4% 10-30/04/2020 EUR 1,089,930.00 1.551,000,000SPANISH GOVT 4.3% 09-31/10/2019 EUR 1,073,700.00 1.521,000,000SPANISH GOVT 5.5% 11-30/04/2021 EUR 1,176,020.00 1.671,000,000SPGB-GEN STRIP 0% 01-30/07/2020 EUR 2,110,155.60 3.002,100,000
19,221,248.60 27.29
US TREASURY N/B 0.625% 13-30/04/2018 USD 812,498.27 1.151,000,000United States
US TREASURY N/B 0.75% 13-31/03/2018 USD 813,107.29 1.151,000,000US TREASURY N/B 0.75% 16-30/09/2018 USD 565,862.50 0.80700,000US TREASURY N/B 0.875% 16-15/09/2019 USD 876,984.02 1.251,100,000US TREASURY N/B 1.375% 15-30/09/2020 USD 1,111,181.20 1.581,400,000US TREASURY N/B 1.75% 11-31/10/2018 USD 2,030,068.71 2.882,500,000US TREASURY N/B 2.25% 11-31/07/2018 USD 2,035,547.02 2.892,500,000US TREASURY N/B 2.375% 11-30/06/2018 USD 814,209.86 1.161,000,000
9,059,458.87 12.86
UK TREASURY 1.25% 13-22/07/2018 GBP 2,572,088.51 3.652,250,000United Kingdom
UK TREASURY 1.5% 15-22/01/2021 GBP 928,390.56 1.32800,000UK TREASURY 1.75% 13-22/07/2019 GBP 577,790.58 0.82500,000UK TREASURY 2% 14-22/07/2020 GBP 1,698,233.32 2.411,450,000
5,776,502.97 8.20
58,159,486.89 82.58
LIF MSCI E V DR DD SHS-DIST-DISTRIBUTION
EUR 206,983.80 0.291,770
Investment fundsFrance
LIF MSCI EMU SC DD SHS-DIST-DISTRIBUTION
EUR 557,828.05 0.801,885
764,811.85 1.09
ISHARES S&P SMALLCAP 600 USD 224,771.31 0.324,500Ireland
224,771.31 0.32
989,583.16 1.41
Total securities portfolio 59,149,070.05 83.99
NameQuantity/Nominal
Market valuein EUR
Currency %NAV
E-MINI MSCI EMERGING MARKETS15/06/2018
USD 2,269,650.7747 (57,324.06)
Futures contracts
MINI DOW JONES INDUS AVG 5$15/06/2018
USD 1,079,875.5911 (35,284.79)
NASDAQ E-MINI FUTURE 15/06/2018 USD 1,822,954.0217 (135,256.33)RUSSELL 2000 E MINI INDEX FUT15/06/2018
USD 373,508.966 (15,709.23)
S&P 500 E-MINI FUTURE 15/06/2018 USD 429,808.514 (20,124.41)STOXX 600(SXXP) 15/06/2018 EUR 127,540.007 (1,085.00)TOPIX INDX FUTR 07/06/2018 JPY 782,830.786 4,357.98
(260,425.84)
Total Futures (260,425.84)
NameQuantity Commitmentin EUR
Currency Unrealisedappreciation /(depreciation)
in EUR
Financial derivative instruments as at March 31, 2018
Total financial derivative instruments (260,425.84)
Summary of net assets
(260,425.84) (0.37)Total financial derivative instruments
%NAV
59,149,070.05 83.99Total securities portfolio
11,215,831.75 15.93Cash at bank and bank overdraft
317,327.80 0.45Other assets and liabilities
70,421,803.76 100.00Total net assets

PARETURN
76
Pareturn GVC Gaesco Patrimonial Fund (in EUR)
The accompanying notes are an integral part of these financial statements.
Nature allocation % of portfolio % of netassets
Bonds and other debt instruments 98.33 82.58
Investment funds 1.67 1.41
100.00 83.99
Country allocation % of portfolio % of netassets
Italy 40.74 34.23
Spain 32.50 27.29
United States 15.32 12.86
United Kingdom 9.77 8.20
Other 1.67 1.41
100.00 83.99
Portfolio Breakdowns
Top Ten Holdings Market value % ofnet
assets
SPANISH GOVT 0.25% 16-31/01/2019 4,524,003.00 6.42Government
ITALY BTPS 4.25% 03-01/02/2019 3,635,289.00 5.16Government
ITALY BTPS 3.5% 13-01/12/2018 3,590,055.00 5.10Government
ITALY BTPS 0.3% 15-15/10/2018 3,512,901.00 4.99Government
ITALY BTPS 0.7% 15-01/05/2020 3,159,257.12 4.49Government
SPANISH GOVT 2.75% 14-30/04/2019 3,101,760.00 4.40Government
UK TREASURY 1.25% 13-22/07/2018 2,572,088.51 3.65Government
ITALY BTPS 4.5% 08-01/08/2018 2,540,455.00 3.61Government
ITALY BTPS 3.5% 13-01/06/2018 2,515,507.50 3.57Government
ITALY BTPS 0.35% 17-15/06/2020 2,124,923.43 3.02Government
EUR
Sector
Top Ten Holdings

77
The accompanying notes are an integral part of these financial statements.
PARETURN
Pareturn GVC Gaesco Euro Small Caps Equity Fund (in EUR)Statement of Operations and Changes in Net Assets for theperiod ended March 31, 2018
EUR
AssetsInvestment in securities at cost 54,245,372.07Unrealised appreciation / (depreciation) on securities 14,888,476.93
Investment in securities at market value 3.3 69,133,849.00Cash at bank 1,754,924.21Receivable on withholding tax reclaim 8,948.38Dividends and interest receivable 35,700.00
Total assets 70,933,421.59
LiabilitiesAccrued expenses 91,987.55Other liabilities 1,995.19
Total liabilities 93,982.74
Net assets at the end of the period 70,839,438.85
Notes
Statement of Net Assets as at March 31, 2018
IncomeDividends (net of withholding taxes) 3.8 214,222.66
Total income 214,222.66
ExpensesInvestment advisory fees and management fees 4 167,996.05Depositary fees 6,263.39Administration fees 22,171.16Professional fees 8,288.07Transaction costs 9 17,709.59Taxe d'abonnement 5 3,457.42Bank interest and charges 6,096.79Other expenses 13 6,455.78
Total expenses 238,438.25
Net investment income / (loss) (24,215.59)
Net realised gain / (loss) on:Sales of Investments 3.9 3,915.00Foreign exchange transactions 3.2 (1,962.81)
Net realised gain / (loss) for the period (22,263.40)
Net change in unrealised appreciation / (depreciation) on:Investments 3.9 (73,693.21)
Increase / (Decrease) in net assets as a result ofoperations
(95,956.61)
Proceeds received on subscription of shares 10,449,989.91Net amount paid on redemption of shares (298,056.92)Net assets at the beginning of the period 60,783,462.47
Net assets at the end of the period 70,839,438.85
EURNotes
Statement of Operations and Changes in Net Assets forthe period ended March 31, 2018
Number of shares in issue atthe end of the period
Number of shares in issue atthe beginning of the period
Number of sharessubscribed
Number of sharesredeemed
Statement of Changes in Number of Shares
B EUR G Cap 14,371 1,803 (1,368) 14,806
B EUR I Cap 49,133 4,267 - 53,400
B EUR U Cap 212,681 39,789 - 252,470

PARETURN
78
Pareturn GVC Gaesco Euro Small Caps Equity Fund (in EUR)
The accompanying notes are an integral part of these financial statements.
Securities Portfolio as at March 31, 2018
ARCADIS NV EUR 684,558.05 0.9742,919
Transferable securities admitted to an official exchange listing
SharesNetherlands
BASIC-FIT NV EUR 235,000.00 0.3310,000BETER BED HOLDING NV EUR 1,303,400.00 1.84140,000FUGRO NV-CVA EUR 2,789,800.00 3.94260,000HEIJMANS N.V.-CVA EUR 2,814,000.00 3.97300,000KENDRION NV EUR 4,084,131.20 5.77123,016LUCAS BOLS NV -W/I EUR 1,620,000.00 2.2990,000RHI MAGNESITA NV EUR 2,982,000.00 4.2160,000VAN LANSCHOT KEMPEN NV EUR 258,000.00 0.3610,000
16,770,889.25 23.68
AUDEN AG EUR 6,052.00 0.0134,000Germany
BAUER AG EUR 382,800.00 0.5420,000CENTROTEC SUSTAINABLE AG EUR 844,800.00 1.1960,000CEWE STIFTUNG + CO KGAA EUR 639,200.00 0.908,000DEUTSCHE PFANDBRIEFBANK AG EUR 640,000.00 0.9050,000DEUTZ AG EUR 1,490,000.00 2.10200,000DRAEGERWERK AG - PREF EUR 656,200.00 0.938,500HAMBORNER REIT AG EUR 471,500.00 0.6750,000KLOECKNER & CO SE EUR 1,530,000.00 2.16150,000RIB SOFTWARE SE EUR 772,863.00 1.0944,700SIXT SE - PRFD EUR 1,554,984.00 2.2125,040VA-Q-TEC AG EUR 663,750.00 0.9437,500VISCOM AG EUR 801,500.00 1.1335,000
10,453,649.00 14.77
AGRANA BETEILIGUNGS AG EUR 1,142,400.00 1.6112,000Austria
FACC AG EUR 2,564,500.00 3.62115,000KAPSCH TRAFFICCOM AG EUR 671,664.80 0.9516,876PALFINGER AG EUR 1,637,500.00 2.3150,000PORR AG EUR 921,287.90 1.3032,962
6,937,352.70 9.79
CONSTRUCC Y AUX DE FERROCARR EUR 1,890,000.00 2.6745,000Spain
EUSKALTEL SA EUR 1,219,500.00 1.72180,000MIQUEL Y COSTAS EUR 741,300.00 1.0521,000TALGO SA EUR 2,659,996.50 3.75506,666
6,510,796.50 9.19
APRIL EUR 981,500.00 1.3965,000France
BENETEAU EUR 1,059,600.00 1.5060,000CHARGEURS SA EUR 593,000.00 0.8425,000LECTRA EUR 1,055,700.00 1.4946,000PIERRE & VACANCES EUR 516,642.55 0.7314,213TRIGANO SA EUR 2,053,800.00 2.8914,000
6,260,242.55 8.84
EURONAV NV EUR 1,683,750.00 2.38250,000Belgium
EXMAR NV EUR 1,575,000.00 2.22300,000MELEXIS NV EUR 810,000.00 1.1410,000SIOEN INDUSTRIES NV EUR 1,098,900.00 1.5537,000
5,167,650.00 7.29
SAF-HOLLAND SA EUR 3,116,000.00 4.39190,000Luxembourg
SOLUTIONS 30 SE EUR 982,400.00 1.3932,000STABILUS SA EUR 387,750.00 0.555,000
4,486,150.00 6.33
AEGEAN AIRLINES EUR 1,786,000.00 2.53200,000Greece
GEK TERNA HOLDING REAL ESTAT EUR 880,200.00 1.24180,000MOTOR OIL (HELLAS) SA EUR 1,553,800.00 2.1985,000
4,220,000.00 5.96
NameQuantity/Nominal
Market valuein EUR
Currency %NAV
EXPERT SYSTEM SPA EUR 416,000.00 0.59320,000Italy
FINLOGIC SPA EUR 251,520.00 0.3648,000GEL SPA EUR 362,850.00 0.51153,750MARR SPA EUR 482,800.00 0.6820,000MODELLERIA BRAMBILLA SPA EUR 150,192.00 0.2150,400SABAF SPA EUR 526,200.00 0.7430,000TECHNICAL PUBLICATIONS SERVI EUR 589,860.00 0.83130,500
2,779,422.00 3.92
CORTICEIRA AMORIM SA EUR 1,664,000.00 2.35160,000Portugal
MOTA ENGIL SGPS SA EUR 654,000.00 0.92200,0002,318,000.00 3.27
C&C GROUP PLC EUR 1,105,003.90 1.56415,415Ireland
ORIGIN ENTERPRISES PLC EUR 428,000.00 0.6080,0001,533,003.90 2.16
TIETO OYJ EUR 812,400.00 1.1530,000Finland
812,400.00 1.15
EDAG ENGINEERING GROUP AG EUR 789,000.00 1.1150,000Switzerland
789,000.00 1.11
69,038,555.90 97.46
EXPERT SYSTEM WTS 16-31/10/2018 EUR 2,419.00 0.0059,000
WarrantsItaly
FINLOGIC W 16/07/2020 EUR 34,750.00 0.0569,500WARRANT TPS 2017 CW 16/06/2020 WTPS2017
EUR 58,124.10 0.08156,500
95,293.10 0.13
95,293.10 0.13
Total securities portfolio 69,133,849.00 97.59
NameQuantity/Nominal
Market valuein EUR
Currency %NAV
Summary of net assets%
NAV69,133,849.00 97.59Total securities portfolio
1,754,924.21 2.48Cash at bank and bank overdraft
(49,334.36) (0.07)Other assets and liabilities
70,839,438.85 100.00Total net assets

PARETURN
79
Pareturn GVC Gaesco Euro Small Caps Equity Fund (in EUR)
The accompanying notes are an integral part of these financial statements.
Nature allocation % of portfolio % of netassets
Shares 99.86 97.46
Warrants 0.14 0.13
100.00 97.59
Country allocation % of portfolio % of netassets
Netherlands 24.26 23.68
Germany 15.12 14.77
Austria 10.03 9.79
Spain 9.42 9.19
France 9.06 8.84
Belgium 7.47 7.29
Luxembourg 6.49 6.33
Greece 6.10 5.96
Italy 4.16 4.05
Portugal 3.35 3.27
Ireland 2.22 2.16
Other 2.32 2.26
100.00 97.59
Portfolio Breakdowns
Top Ten Holdings Market value % ofnet
assets
KENDRION NV 4,084,131.20 5.77Auto Parts &Equipment
SAF-HOLLAND SA 3,116,000.00 4.39Auto Parts &Equipment
RHI MAGNESITA NV 2,982,000.00 4.21Building materials
HEIJMANS N.V.-CVA 2,814,000.00 3.97Building materials
FUGRO NV-CVA 2,789,800.00 3.94Chemical
TALGO SA 2,659,996.50 3.75Auto Parts &Equipment
FACC AG 2,564,500.00 3.62Engineering &Construction
TRIGANO SA 2,053,800.00 2.89Diversified services
CONSTRUCC Y AUX DE FERROCARR 1,890,000.00 2.67Transportation
AEGEAN AIRLINES 1,786,000.00 2.53Transportation
EUR
Sector
Top Ten Holdings
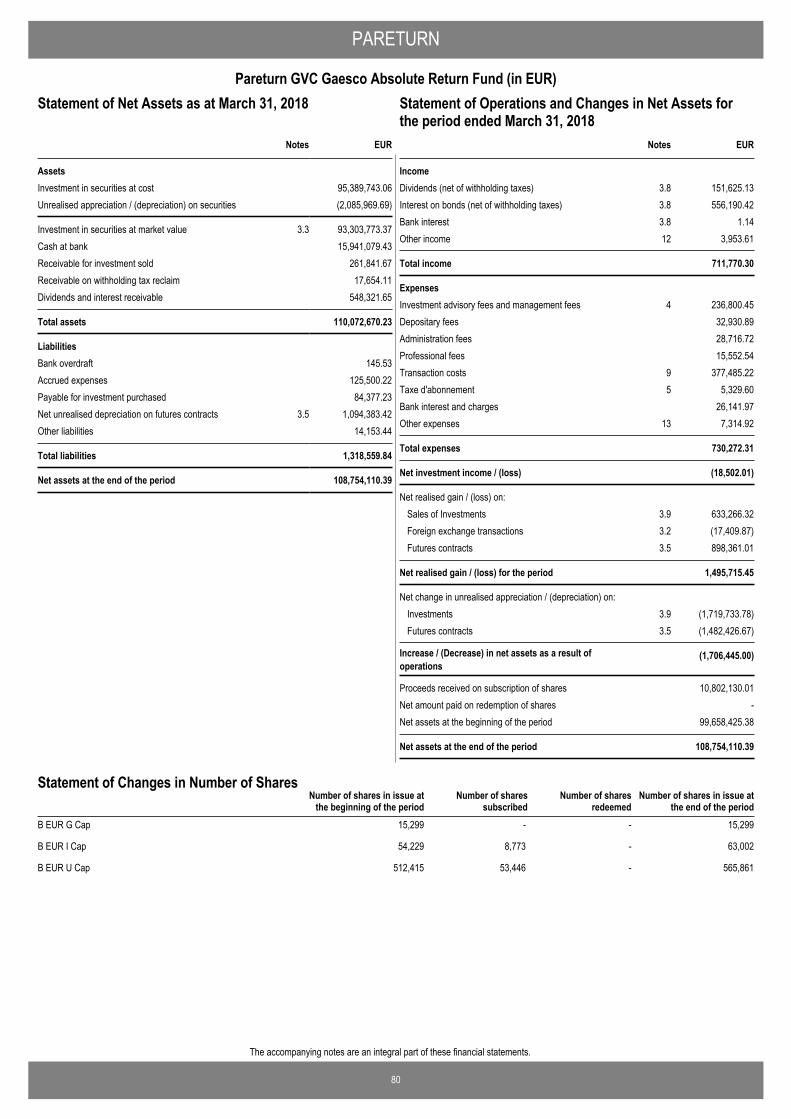
80
The accompanying notes are an integral part of these financial statements.
PARETURN
Pareturn GVC Gaesco Absolute Return Fund (in EUR)Statement of Operations and Changes in Net Assets for theperiod ended March 31, 2018
EUR
AssetsInvestment in securities at cost 95,389,743.06Unrealised appreciation / (depreciation) on securities (2,085,969.69)
Investment in securities at market value 3.3 93,303,773.37Cash at bank 15,941,079.43Receivable for investment sold 261,841.67Receivable on withholding tax reclaim 17,654.11Dividends and interest receivable 548,321.65
Total assets 110,072,670.23
LiabilitiesBank overdraft 145.53Accrued expenses 125,500.22Payable for investment purchased 84,377.23Net unrealised depreciation on futures contracts 3.5 1,094,383.42Other liabilities 14,153.44
Total liabilities 1,318,559.84
Net assets at the end of the period 108,754,110.39
Notes
Statement of Net Assets as at March 31, 2018
IncomeDividends (net of withholding taxes) 3.8 151,625.13Interest on bonds (net of withholding taxes) 3.8 556,190.42Bank interest 3.8 1.14Other income 12 3,953.61
Total income 711,770.30
ExpensesInvestment advisory fees and management fees 4 236,800.45Depositary fees 32,930.89Administration fees 28,716.72Professional fees 15,552.54Transaction costs 9 377,485.22Taxe d'abonnement 5 5,329.60Bank interest and charges 26,141.97Other expenses 13 7,314.92
Total expenses 730,272.31
Net investment income / (loss) (18,502.01)
Net realised gain / (loss) on:Sales of Investments 3.9 633,266.32Foreign exchange transactions 3.2 (17,409.87)Futures contracts 3.5 898,361.01
Net realised gain / (loss) for the period 1,495,715.45
Net change in unrealised appreciation / (depreciation) on:Investments 3.9 (1,719,733.78)Futures contracts 3.5 (1,482,426.67)
Increase / (Decrease) in net assets as a result ofoperations
(1,706,445.00)
Proceeds received on subscription of shares 10,802,130.01Net amount paid on redemption of shares -Net assets at the beginning of the period 99,658,425.38
Net assets at the end of the period 108,754,110.39
EURNotes
Statement of Operations and Changes in Net Assets forthe period ended March 31, 2018
Number of shares in issue atthe end of the period
Number of shares in issue atthe beginning of the period
Number of sharessubscribed
Number of sharesredeemed
Statement of Changes in Number of Shares
B EUR G Cap 15,299 - - 15,299
B EUR I Cap 54,229 8,773 - 63,002
B EUR U Cap 512,415 53,446 - 565,861
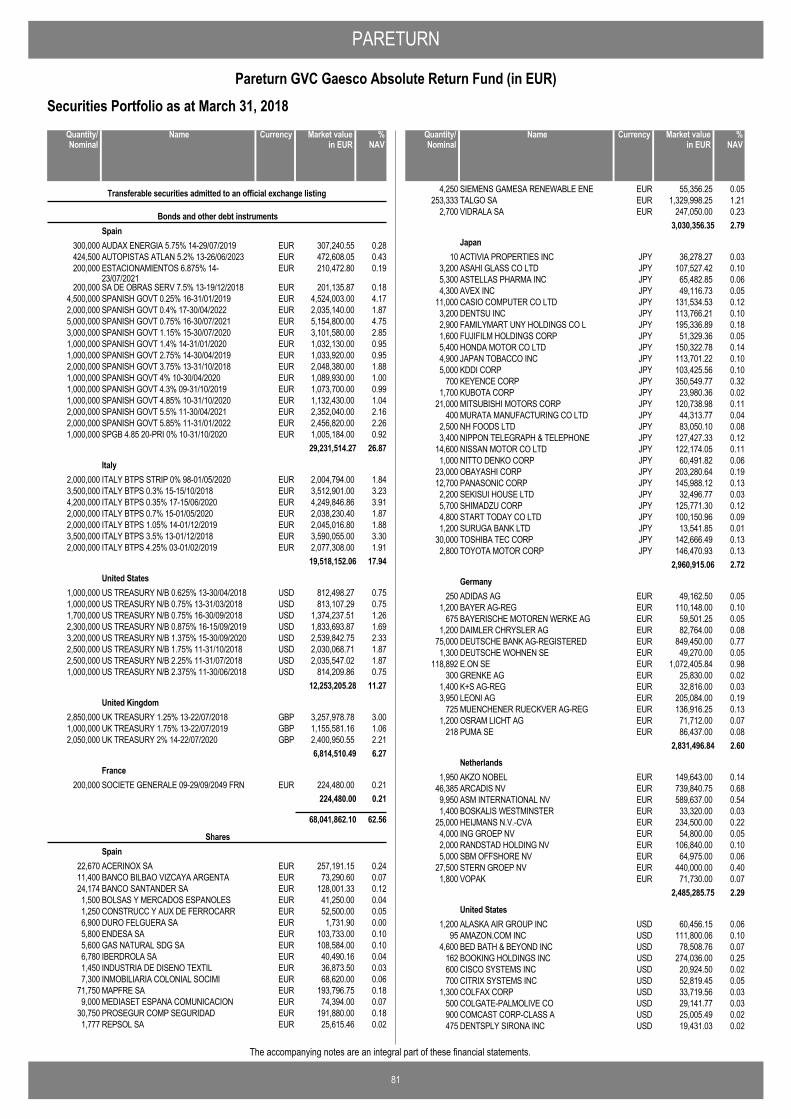
PARETURN
81
Pareturn GVC Gaesco Absolute Return Fund (in EUR)
The accompanying notes are an integral part of these financial statements.
Securities Portfolio as at March 31, 2018
AUDAX ENERGIA 5.75% 14-29/07/2019 EUR 307,240.55 0.28300,000
Transferable securities admitted to an official exchange listing
Bonds and other debt instrumentsSpain
AUTOPISTAS ATLAN 5.2% 13-26/06/2023 EUR 472,608.05 0.43424,500ESTACIONAMIENTOS 6.875% 14-23/07/2021
EUR 210,472.80 0.19200,000
SA DE OBRAS SERV 7.5% 13-19/12/2018 EUR 201,135.87 0.18200,000SPANISH GOVT 0.25% 16-31/01/2019 EUR 4,524,003.00 4.174,500,000SPANISH GOVT 0.4% 17-30/04/2022 EUR 2,035,140.00 1.872,000,000SPANISH GOVT 0.75% 16-30/07/2021 EUR 5,154,800.00 4.755,000,000SPANISH GOVT 1.15% 15-30/07/2020 EUR 3,101,580.00 2.853,000,000SPANISH GOVT 1.4% 14-31/01/2020 EUR 1,032,130.00 0.951,000,000SPANISH GOVT 2.75% 14-30/04/2019 EUR 1,033,920.00 0.951,000,000SPANISH GOVT 3.75% 13-31/10/2018 EUR 2,048,380.00 1.882,000,000SPANISH GOVT 4% 10-30/04/2020 EUR 1,089,930.00 1.001,000,000SPANISH GOVT 4.3% 09-31/10/2019 EUR 1,073,700.00 0.991,000,000SPANISH GOVT 4.85% 10-31/10/2020 EUR 1,132,430.00 1.041,000,000SPANISH GOVT 5.5% 11-30/04/2021 EUR 2,352,040.00 2.162,000,000SPANISH GOVT 5.85% 11-31/01/2022 EUR 2,456,820.00 2.262,000,000SPGB 4.85 20-PRI 0% 10-31/10/2020 EUR 1,005,184.00 0.921,000,000
29,231,514.27 26.87
ITALY BTPS STRIP 0% 98-01/05/2020 EUR 2,004,794.00 1.842,000,000Italy
ITALY BTPS 0.3% 15-15/10/2018 EUR 3,512,901.00 3.233,500,000ITALY BTPS 0.35% 17-15/06/2020 EUR 4,249,846.86 3.914,200,000ITALY BTPS 0.7% 15-01/05/2020 EUR 2,038,230.40 1.872,000,000ITALY BTPS 1.05% 14-01/12/2019 EUR 2,045,016.80 1.882,000,000ITALY BTPS 3.5% 13-01/12/2018 EUR 3,590,055.00 3.303,500,000ITALY BTPS 4.25% 03-01/02/2019 EUR 2,077,308.00 1.912,000,000
19,518,152.06 17.94
US TREASURY N/B 0.625% 13-30/04/2018 USD 812,498.27 0.751,000,000United States
US TREASURY N/B 0.75% 13-31/03/2018 USD 813,107.29 0.751,000,000US TREASURY N/B 0.75% 16-30/09/2018 USD 1,374,237.51 1.261,700,000US TREASURY N/B 0.875% 16-15/09/2019 USD 1,833,693.87 1.692,300,000US TREASURY N/B 1.375% 15-30/09/2020 USD 2,539,842.75 2.333,200,000US TREASURY N/B 1.75% 11-31/10/2018 USD 2,030,068.71 1.872,500,000US TREASURY N/B 2.25% 11-31/07/2018 USD 2,035,547.02 1.872,500,000US TREASURY N/B 2.375% 11-30/06/2018 USD 814,209.86 0.751,000,000
12,253,205.28 11.27
UK TREASURY 1.25% 13-22/07/2018 GBP 3,257,978.78 3.002,850,000United Kingdom
UK TREASURY 1.75% 13-22/07/2019 GBP 1,155,581.16 1.061,000,000UK TREASURY 2% 14-22/07/2020 GBP 2,400,950.55 2.212,050,000
6,814,510.49 6.27
SOCIETE GENERALE 09-29/09/2049 FRN EUR 224,480.00 0.21200,000France
224,480.00 0.21
68,041,862.10 62.56
ACERINOX SA EUR 257,191.15 0.2422,670
SharesSpain
BANCO BILBAO VIZCAYA ARGENTA EUR 73,290.60 0.0711,400BANCO SANTANDER SA EUR 128,001.33 0.1224,174BOLSAS Y MERCADOS ESPANOLES EUR 41,250.00 0.041,500CONSTRUCC Y AUX DE FERROCARR EUR 52,500.00 0.051,250DURO FELGUERA SA EUR 1,731.90 0.006,900ENDESA SA EUR 103,733.00 0.105,800GAS NATURAL SDG SA EUR 108,584.00 0.105,600IBERDROLA SA EUR 40,490.16 0.046,780INDUSTRIA DE DISENO TEXTIL EUR 36,873.50 0.031,450INMOBILIARIA COLONIAL SOCIMI EUR 68,620.00 0.067,300MAPFRE SA EUR 193,796.75 0.1871,750MEDIASET ESPANA COMUNICACION EUR 74,394.00 0.079,000PROSEGUR COMP SEGURIDAD EUR 191,880.00 0.1830,750REPSOL SA EUR 25,615.46 0.021,777
NameQuantity/Nominal
Market valuein EUR
Currency %NAV
SIEMENS GAMESA RENEWABLE ENE EUR 55,356.25 0.054,250TALGO SA EUR 1,329,998.25 1.21253,333VIDRALA SA EUR 247,050.00 0.232,700
3,030,356.35 2.79
ACTIVIA PROPERTIES INC JPY 36,278.27 0.0310Japan
ASAHI GLASS CO LTD JPY 107,527.42 0.103,200ASTELLAS PHARMA INC JPY 65,482.85 0.065,300AVEX INC JPY 49,116.73 0.054,300CASIO COMPUTER CO LTD JPY 131,534.53 0.1211,000DENTSU INC JPY 113,766.21 0.103,200FAMILYMART UNY HOLDINGS CO L JPY 195,336.89 0.182,900FUJIFILM HOLDINGS CORP JPY 51,329.36 0.051,600HONDA MOTOR CO LTD JPY 150,322.78 0.145,400JAPAN TOBACCO INC JPY 113,701.22 0.104,900KDDI CORP JPY 103,425.56 0.105,000KEYENCE CORP JPY 350,549.77 0.32700KUBOTA CORP JPY 23,980.36 0.021,700MITSUBISHI MOTORS CORP JPY 120,738.98 0.1121,000MURATA MANUFACTURING CO LTD JPY 44,313.77 0.04400NH FOODS LTD JPY 83,050.10 0.082,500NIPPON TELEGRAPH & TELEPHONE JPY 127,427.33 0.123,400NISSAN MOTOR CO LTD JPY 122,174.05 0.1114,600NITTO DENKO CORP JPY 60,491.82 0.061,000OBAYASHI CORP JPY 203,280.64 0.1923,000PANASONIC CORP JPY 145,988.12 0.1312,700SEKISUI HOUSE LTD JPY 32,496.77 0.032,200SHIMADZU CORP JPY 125,771.30 0.125,700START TODAY CO LTD JPY 100,150.96 0.094,800SURUGA BANK LTD JPY 13,541.85 0.011,200TOSHIBA TEC CORP JPY 142,666.49 0.1330,000TOYOTA MOTOR CORP JPY 146,470.93 0.132,800
2,960,915.06 2.72
ADIDAS AG EUR 49,162.50 0.05250Germany
BAYER AG-REG EUR 110,148.00 0.101,200BAYERISCHE MOTOREN WERKE AG EUR 59,501.25 0.05675DAIMLER CHRYSLER AG EUR 82,764.00 0.081,200DEUTSCHE BANK AG-REGISTERED EUR 849,450.00 0.7775,000DEUTSCHE WOHNEN SE EUR 49,270.00 0.051,300E.ON SE EUR 1,072,405.84 0.98118,892GRENKE AG EUR 25,830.00 0.02300K+S AG-REG EUR 32,816.00 0.031,400LEONI AG EUR 205,084.00 0.193,950MUENCHENER RUECKVER AG-REG EUR 136,916.25 0.13725OSRAM LICHT AG EUR 71,712.00 0.071,200PUMA SE EUR 86,437.00 0.08218
2,831,496.84 2.60
AKZO NOBEL EUR 149,643.00 0.141,950Netherlands
ARCADIS NV EUR 739,840.75 0.6846,385ASM INTERNATIONAL NV EUR 589,637.00 0.549,950BOSKALIS WESTMINSTER EUR 33,320.00 0.031,400HEIJMANS N.V.-CVA EUR 234,500.00 0.2225,000ING GROEP NV EUR 54,800.00 0.054,000RANDSTAD HOLDING NV EUR 106,840.00 0.102,000SBM OFFSHORE NV EUR 64,975.00 0.065,000STERN GROEP NV EUR 440,000.00 0.4027,500VOPAK EUR 71,730.00 0.071,800
2,485,285.75 2.29
ALASKA AIR GROUP INC USD 60,456.15 0.061,200United States
AMAZON.COM INC USD 111,800.06 0.1095BED BATH & BEYOND INC USD 78,508.76 0.074,600BOOKING HOLDINGS INC USD 274,036.00 0.25162CISCO SYSTEMS INC USD 20,924.50 0.02600CITRIX SYSTEMS INC USD 52,819.45 0.05700COLFAX CORP USD 33,719.56 0.031,300COLGATE-PALMOLIVE CO USD 29,141.77 0.03500COMCAST CORP-CLASS A USD 25,005.49 0.02900DENTSPLY SIRONA INC USD 19,431.03 0.02475
NameQuantity/Nominal
Market valuein EUR
Currency %NAV
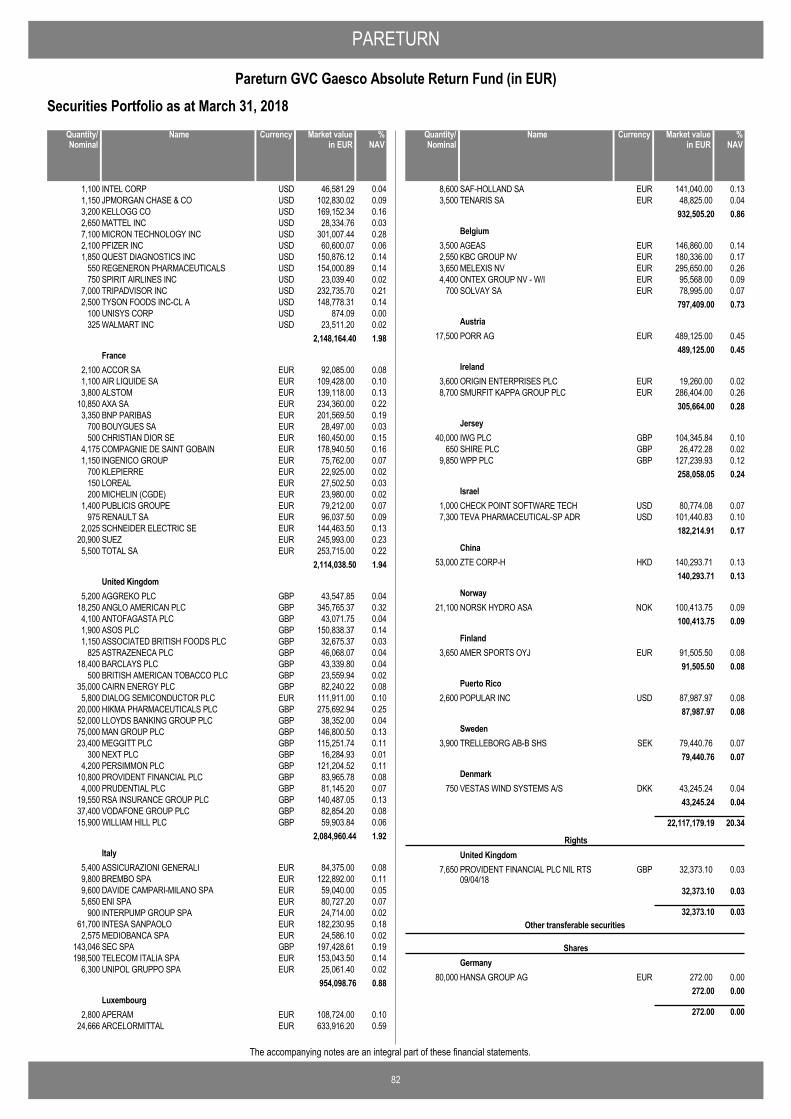
PARETURN
82
Pareturn GVC Gaesco Absolute Return Fund (in EUR)
The accompanying notes are an integral part of these financial statements.
Securities Portfolio as at March 31, 2018
INTEL CORP USD 46,581.29 0.041,100JPMORGAN CHASE & CO USD 102,830.02 0.091,150KELLOGG CO USD 169,152.34 0.163,200MATTEL INC USD 28,334.76 0.032,650MICRON TECHNOLOGY INC USD 301,007.44 0.287,100PFIZER INC USD 60,600.07 0.062,100QUEST DIAGNOSTICS INC USD 150,876.12 0.141,850REGENERON PHARMACEUTICALS USD 154,000.89 0.14550SPIRIT AIRLINES INC USD 23,039.40 0.02750TRIPADVISOR INC USD 232,735.70 0.217,000TYSON FOODS INC-CL A USD 148,778.31 0.142,500UNISYS CORP USD 874.09 0.00100WALMART INC USD 23,511.20 0.02325
2,148,164.40 1.98
ACCOR SA EUR 92,085.00 0.082,100France
AIR LIQUIDE SA EUR 109,428.00 0.101,100ALSTOM EUR 139,118.00 0.133,800AXA SA EUR 234,360.00 0.2210,850BNP PARIBAS EUR 201,569.50 0.193,350BOUYGUES SA EUR 28,497.00 0.03700CHRISTIAN DIOR SE EUR 160,450.00 0.15500COMPAGNIE DE SAINT GOBAIN EUR 178,940.50 0.164,175INGENICO GROUP EUR 75,762.00 0.071,150KLEPIERRE EUR 22,925.00 0.02700LOREAL EUR 27,502.50 0.03150MICHELIN (CGDE) EUR 23,980.00 0.02200PUBLICIS GROUPE EUR 79,212.00 0.071,400RENAULT SA EUR 96,037.50 0.09975SCHNEIDER ELECTRIC SE EUR 144,463.50 0.132,025SUEZ EUR 245,993.00 0.2320,900TOTAL SA EUR 253,715.00 0.225,500
2,114,038.50 1.94
AGGREKO PLC GBP 43,547.85 0.045,200United Kingdom
ANGLO AMERICAN PLC GBP 345,765.37 0.3218,250ANTOFAGASTA PLC GBP 43,071.75 0.044,100ASOS PLC GBP 150,838.37 0.141,900ASSOCIATED BRITISH FOODS PLC GBP 32,675.37 0.031,150ASTRAZENECA PLC GBP 46,068.07 0.04825BARCLAYS PLC GBP 43,339.80 0.0418,400BRITISH AMERICAN TOBACCO PLC GBP 23,559.94 0.02500CAIRN ENERGY PLC GBP 82,240.22 0.0835,000DIALOG SEMICONDUCTOR PLC EUR 111,911.00 0.105,800HIKMA PHARMACEUTICALS PLC GBP 275,692.94 0.2520,000LLOYDS BANKING GROUP PLC GBP 38,352.00 0.0452,000MAN GROUP PLC GBP 146,800.50 0.1375,000MEGGITT PLC GBP 115,251.74 0.1123,400NEXT PLC GBP 16,284.93 0.01300PERSIMMON PLC GBP 121,204.52 0.114,200PROVIDENT FINANCIAL PLC GBP 83,965.78 0.0810,800PRUDENTIAL PLC GBP 81,145.20 0.074,000RSA INSURANCE GROUP PLC GBP 140,487.05 0.1319,550VODAFONE GROUP PLC GBP 82,854.20 0.0837,400WILLIAM HILL PLC GBP 59,903.84 0.0615,900
2,084,960.44 1.92
ASSICURAZIONI GENERALI EUR 84,375.00 0.085,400Italy
BREMBO SPA EUR 122,892.00 0.119,800DAVIDE CAMPARI-MILANO SPA EUR 59,040.00 0.059,600ENI SPA EUR 80,727.20 0.075,650INTERPUMP GROUP SPA EUR 24,714.00 0.02900INTESA SANPAOLO EUR 182,230.95 0.1861,700MEDIOBANCA SPA EUR 24,586.10 0.022,575SEC SPA GBP 197,428.61 0.19143,046TELECOM ITALIA SPA EUR 153,043.50 0.14198,500UNIPOL GRUPPO SPA EUR 25,061.40 0.026,300
954,098.76 0.88
APERAM EUR 108,724.00 0.102,800Luxembourg
ARCELORMITTAL EUR 633,916.20 0.5924,666
NameQuantity/Nominal
Market valuein EUR
Currency %NAV
SAF-HOLLAND SA EUR 141,040.00 0.138,600TENARIS SA EUR 48,825.00 0.043,500
932,505.20 0.86
AGEAS EUR 146,860.00 0.143,500Belgium
KBC GROUP NV EUR 180,336.00 0.172,550MELEXIS NV EUR 295,650.00 0.263,650ONTEX GROUP NV - W/I EUR 95,568.00 0.094,400SOLVAY SA EUR 78,995.00 0.07700
797,409.00 0.73
PORR AG EUR 489,125.00 0.4517,500Austria
489,125.00 0.45
ORIGIN ENTERPRISES PLC EUR 19,260.00 0.023,600Ireland
SMURFIT KAPPA GROUP PLC EUR 286,404.00 0.268,700305,664.00 0.28
IWG PLC GBP 104,345.84 0.1040,000Jersey
SHIRE PLC GBP 26,472.28 0.02650WPP PLC GBP 127,239.93 0.129,850
258,058.05 0.24
CHECK POINT SOFTWARE TECH USD 80,774.08 0.071,000Israel
TEVA PHARMACEUTICAL-SP ADR USD 101,440.83 0.107,300182,214.91 0.17
ZTE CORP-H HKD 140,293.71 0.1353,000China
140,293.71 0.13
NORSK HYDRO ASA NOK 100,413.75 0.0921,100Norway
100,413.75 0.09
AMER SPORTS OYJ EUR 91,505.50 0.083,650Finland
91,505.50 0.08
POPULAR INC USD 87,987.97 0.082,600Puerto Rico
87,987.97 0.08
TRELLEBORG AB-B SHS SEK 79,440.76 0.073,900Sweden
79,440.76 0.07
VESTAS WIND SYSTEMS A/S DKK 43,245.24 0.04750Denmark
43,245.24 0.04
22,117,179.19 20.34
PROVIDENT FINANCIAL PLC NIL RTS09/04/18
GBP 32,373.10 0.037,650
RightsUnited Kingdom
32,373.10 0.03
32,373.10 0.03
HANSA GROUP AG EUR 272.00 0.0080,000
Other transferable securities
SharesGermany
272.00 0.00
272.00 0.00
NameQuantity/Nominal
Market valuein EUR
Currency %NAV

PARETURN
83
Pareturn GVC Gaesco Absolute Return Fund (in EUR)
The accompanying notes are an integral part of these financial statements.
Securities Portfolio as at March 31, 2018
ISHARES USD DURATION BD SHS USD 2,021,181.44 1.8625,000
Funds
Investment fundsIreland
SALAR FUND PLC-E1EUR EUR 1,069,349.71 0.987,1863,090,531.15 2.84
3,090,531.15 2.84
3I GROUP PLC GBP 21,555.83 0.022,200
SharesUnited Kingdom
21,555.83 0.02
21,555.83 0.02
Total securities portfolio 93,303,773.37 85.79
NameQuantity/Nominal
Market valuein EUR
Currency %NAV
CHI AUD / USD 18/06/2018 USD 1,123,454.0818 (28,540.07)
Futures contracts
DAX INDEX - FUTURE 15/06/2018 EUR 2,423,900.008 32,650.00EURO STOXX 50 - FUTURE15/06/2018
EUR 18,078,310.00551 (177,530.00)
EURO-BUND FUTURE 07/06/2018 EUR 7,971,500.00(50) (139,500.00)IBEX35 EURO 20/04/2018 EUR 3,349,955.0035 35,805.00NASDAQ E-MINI FUTURE 15/06/2018 USD 2,359,116.9722 (32,101.47)S&P 500 E-MINI FUTURE 15/06/2018 USD 17,407,244.78162 (785,166.88)
(1,094,383.42)
Total Futures (1,094,383.42)
NameQuantity Commitmentin EUR
Currency Unrealisedappreciation /(depreciation)
in EUR
Financial derivative instruments as at March 31, 2018
Total financial derivative instruments (1,094,383.42)
Summary of net assets
(1,094,383.42) (1.01)Total financial derivative instruments
%NAV
93,303,773.37 85.79Total securities portfolio
15,940,933.90 14.66Cash at bank and bank overdraft
603,786.54 0.56Other assets and liabilities
108,754,110.39 100.00Total net assets

PARETURN
84
Pareturn GVC Gaesco Absolute Return Fund (in EUR)
The accompanying notes are an integral part of these financial statements.
Nature allocation % of portfolio % of netassets
Bonds and other debt instruments 72.93 62.56
Shares 23.73 20.36
Investment funds 3.31 2.84
Rights 0.03 0.03
100.00 85.79
Country allocation % of portfolio % of netassets
Spain 34.59 29.66
Italy 21.94 18.82
United States 15.43 13.25
United Kingdom 9.60 8.24
Ireland 3.64 3.12
Japan 3.17 2.72
Germany 3.03 2.60
Netherlands 2.66 2.29
France 2.51 2.15
Other 3.43 2.94
100.00 85.79
Portfolio Breakdowns
Top Ten Holdings Market value % ofnet
assets
SPANISH GOVT 0.75% 16-30/07/2021 5,154,800.00 4.75Government
SPANISH GOVT 0.25% 16-31/01/2019 4,524,003.00 4.17Government
ITALY BTPS 0.35% 17-15/06/2020 4,249,846.86 3.91Government
ITALY BTPS 3.5% 13-01/12/2018 3,590,055.00 3.30Government
ITALY BTPS 0.3% 15-15/10/2018 3,512,901.00 3.23Government
UK TREASURY 1.25% 13-22/07/2018 3,257,978.78 3.00Government
SPANISH GOVT 1.15% 15-30/07/2020 3,101,580.00 2.85Government
US TREASURY N/B 1.375% 15-30/09/2020 2,539,842.75 2.33Government
SPANISH GOVT 5.85% 11-31/01/2022 2,456,820.00 2.26Government
UK TREASURY 2% 14-22/07/2020 2,400,950.55 2.21Government
EUR
Sector
Top Ten Holdings

85
The accompanying notes are an integral part of these financial statements.
PARETURN
Pareturn Mapfre Euro Bonds Fund* (in EUR)Statement of Operations and Changes in Net Assets for theperiod ended March 31, 2018
EUR
Assets
Liabilities
Net assets at the end of the period -
Notes
Statement of Net Assets as at March 31, 2018
* Please see note 1 for details.
IncomeInterest on bonds (net of withholding taxes) 3.8 294,633.28
Total income 294,633.28
ExpensesInvestment advisory fees and management fees 4 67,815.22Depositary fees 2,083.82Administration fees 6,997.50Professional fees 3,018.48Taxe d'abonnement 5 1,276.03Bank interest and charges 2,619.10Other expenses 13 2,141.62
Total expenses 85,951.77
Net investment income / (loss) 208,681.51
Net realised gain / (loss) on:Sales of Investments 3.9 (189,232.00)Foreign exchange transactions 3.2 (87.25)
Net realised gain / (loss) for the period 19,362.26
Net change in unrealised appreciation / (depreciation) on:Investments 3.9 2,175,175.08
Increase / (Decrease) in net assets as a result ofoperations
2,194,537.34
Proceeds received on subscription of shares (83,542,050.63)Net amount paid on redemption of shares (2,383,924.10)Net assets at the beginning of the period 83,731,437.39
Net assets at the end of the period -
EURNotes
Statement of Operations and Changes in Net Assets forthe period ended March 31, 2018
Number of shares in issue atthe end of the period
Number of shares in issue atthe beginning of the period
Number of sharessubscribed
Number of sharesredeemed
Statement of Changes in Number of Shares
A EUR I Dist 553,049 18,798 571,847 -
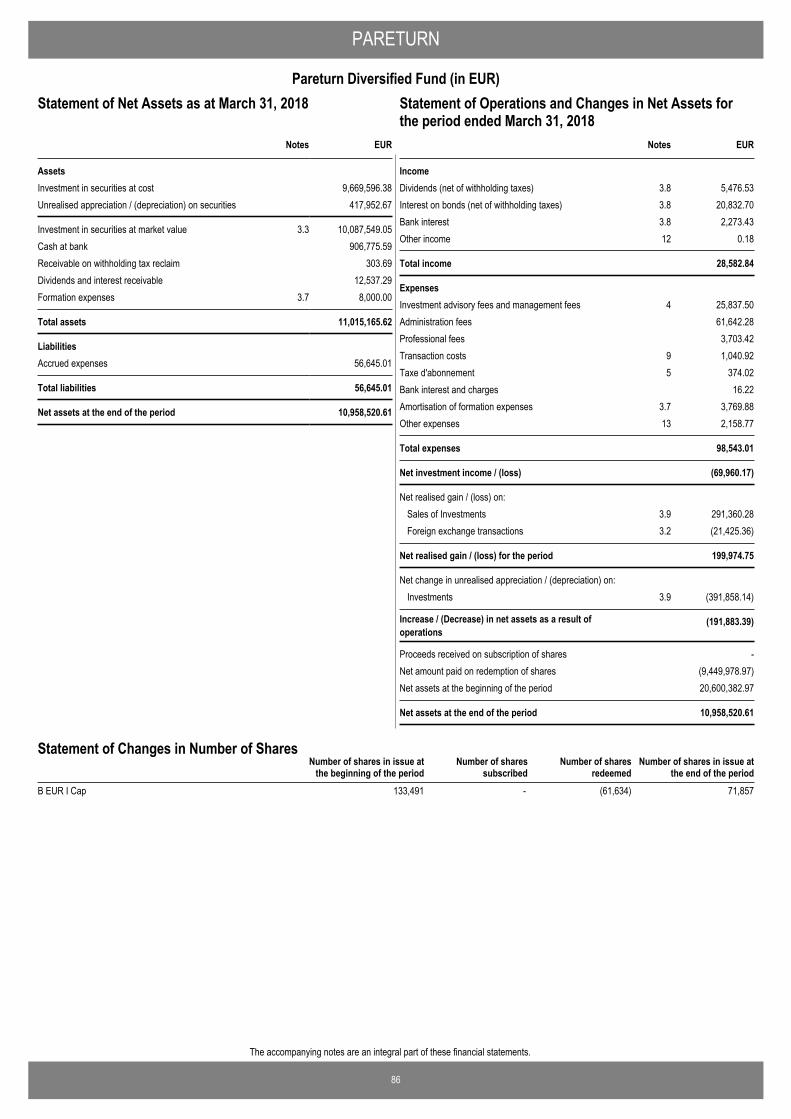
86
The accompanying notes are an integral part of these financial statements.
PARETURN
Pareturn Diversified Fund (in EUR)Statement of Operations and Changes in Net Assets for theperiod ended March 31, 2018
EUR
AssetsInvestment in securities at cost 9,669,596.38Unrealised appreciation / (depreciation) on securities 417,952.67
Investment in securities at market value 3.3 10,087,549.05Cash at bank 906,775.59Receivable on withholding tax reclaim 303.69Dividends and interest receivable 12,537.29Formation expenses 3.7 8,000.00
Total assets 11,015,165.62
LiabilitiesAccrued expenses 56,645.01
Total liabilities 56,645.01
Net assets at the end of the period 10,958,520.61
Notes
Statement of Net Assets as at March 31, 2018
IncomeDividends (net of withholding taxes) 3.8 5,476.53Interest on bonds (net of withholding taxes) 3.8 20,832.70Bank interest 3.8 2,273.43Other income 12 0.18
Total income 28,582.84
ExpensesInvestment advisory fees and management fees 4 25,837.50Administration fees 61,642.28Professional fees 3,703.42Transaction costs 9 1,040.92Taxe d'abonnement 5 374.02Bank interest and charges 16.22Amortisation of formation expenses 3.7 3,769.88Other expenses 13 2,158.77
Total expenses 98,543.01
Net investment income / (loss) (69,960.17)
Net realised gain / (loss) on:Sales of Investments 3.9 291,360.28Foreign exchange transactions 3.2 (21,425.36)
Net realised gain / (loss) for the period 199,974.75
Net change in unrealised appreciation / (depreciation) on:Investments 3.9 (391,858.14)
Increase / (Decrease) in net assets as a result ofoperations
(191,883.39)
Proceeds received on subscription of shares -Net amount paid on redemption of shares (9,449,978.97)Net assets at the beginning of the period 20,600,382.97
Net assets at the end of the period 10,958,520.61
EURNotes
Statement of Operations and Changes in Net Assets forthe period ended March 31, 2018
Number of shares in issue atthe end of the period
Number of shares in issue atthe beginning of the period
Number of sharessubscribed
Number of sharesredeemed
Statement of Changes in Number of Shares
B EUR I Cap 133,491 - (61,634) 71,857
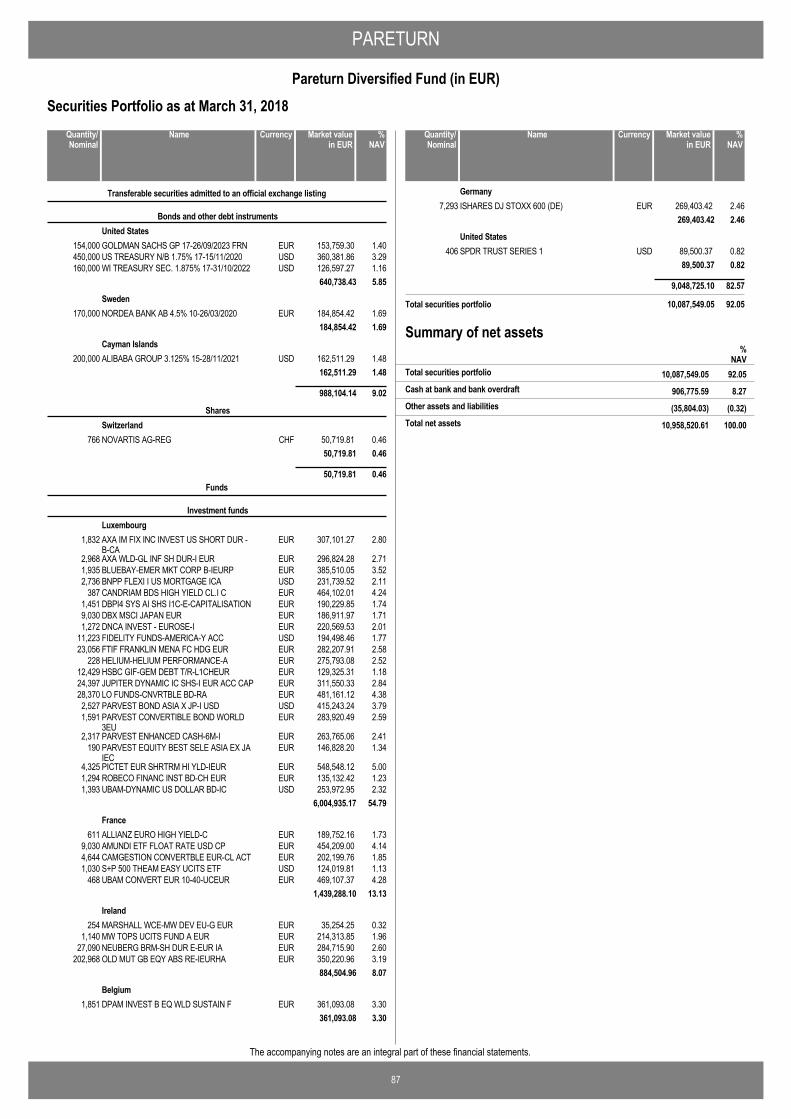
PARETURN
87
Pareturn Diversified Fund (in EUR)
The accompanying notes are an integral part of these financial statements.
Securities Portfolio as at March 31, 2018
GOLDMAN SACHS GP 17-26/09/2023 FRN EUR 153,759.30 1.40154,000
Transferable securities admitted to an official exchange listing
Bonds and other debt instrumentsUnited States
US TREASURY N/B 1.75% 17-15/11/2020 USD 360,381.86 3.29450,000WI TREASURY SEC. 1.875% 17-31/10/2022 USD 126,597.27 1.16160,000
640,738.43 5.85
NORDEA BANK AB 4.5% 10-26/03/2020 EUR 184,854.42 1.69170,000Sweden
184,854.42 1.69
ALIBABA GROUP 3.125% 15-28/11/2021 USD 162,511.29 1.48200,000Cayman Islands
162,511.29 1.48
988,104.14 9.02
NOVARTIS AG-REG CHF 50,719.81 0.46766
SharesSwitzerland
50,719.81 0.46
50,719.81 0.46
AXA IM FIX INC INVEST US SHORT DUR -B-CA
EUR 307,101.27 2.801,832
Funds
Investment fundsLuxembourg
AXA WLD-GL INF SH DUR-I EUR EUR 296,824.28 2.712,968BLUEBAY-EMER MKT CORP B-IEURP EUR 385,510.05 3.521,935BNPP FLEXI I US MORTGAGE ICA USD 231,739.52 2.112,736CANDRIAM BDS HIGH YIELD CL.I C EUR 464,102.01 4.24387DBPI4 SYS AI SHS I1C-E-CAPITALISATION EUR 190,229.85 1.741,451DBX MSCI JAPAN EUR EUR 186,911.97 1.719,030DNCA INVEST - EUROSE-I EUR 220,569.53 2.011,272FIDELITY FUNDS-AMERICA-Y ACC USD 194,498.46 1.7711,223FTIF FRANKLIN MENA FC HDG EUR EUR 282,207.91 2.5823,056HELIUM-HELIUM PERFORMANCE-A EUR 275,793.08 2.52228HSBC GIF-GEM DEBT T/R-L1CHEUR EUR 129,325.31 1.1812,429JUPITER DYNAMIC IC SHS-I EUR ACC CAP EUR 311,550.33 2.8424,397LO FUNDS-CNVRTBLE BD-RA EUR 481,161.12 4.3828,370PARVEST BOND ASIA X JP-I USD USD 415,243.24 3.792,527PARVEST CONVERTIBLE BOND WORLD3EU
EUR 283,920.49 2.591,591
PARVEST ENHANCED CASH-6M-I EUR 263,765.06 2.412,317PARVEST EQUITY BEST SELE ASIA EX JAIEC
EUR 146,828.20 1.34190
PICTET EUR SHRTRM HI YLD-IEUR EUR 548,548.12 5.004,325ROBECO FINANC INST BD-CH EUR EUR 135,132.42 1.231,294UBAM-DYNAMIC US DOLLAR BD-IC USD 253,972.95 2.321,393
6,004,935.17 54.79
ALLIANZ EURO HIGH YIELD-C EUR 189,752.16 1.73611France
AMUNDI ETF FLOAT RATE USD CP EUR 454,209.00 4.149,030CAMGESTION CONVERTBLE EUR-CL ACT EUR 202,199.76 1.854,644S+P 500 THEAM EASY UCITS ETF USD 124,019.81 1.131,030UBAM CONVERT EUR 10-40-UCEUR EUR 469,107.37 4.28468
1,439,288.10 13.13
MARSHALL WCE-MW DEV EU-G EUR EUR 35,254.25 0.32254Ireland
MW TOPS UCITS FUND A EUR EUR 214,313.85 1.961,140NEUBERG BRM-SH DUR E-EUR IA EUR 284,715.90 2.6027,090OLD MUT GB EQY ABS RE-IEURHA EUR 350,220.96 3.19202,968
884,504.96 8.07
DPAM INVEST B EQ WLD SUSTAIN F EUR 361,093.08 3.301,851Belgium
361,093.08 3.30
NameQuantity/Nominal
Market valuein EUR
Currency %NAV
ISHARES DJ STOXX 600 (DE) EUR 269,403.42 2.467,293Germany
269,403.42 2.46
SPDR TRUST SERIES 1 USD 89,500.37 0.82406United States
89,500.37 0.82
9,048,725.10 82.57
Total securities portfolio 10,087,549.05 92.05
NameQuantity/Nominal
Market valuein EUR
Currency %NAV
Summary of net assets%
NAV10,087,549.05 92.05Total securities portfolio
906,775.59 8.27Cash at bank and bank overdraft
(35,804.03) (0.32)Other assets and liabilities
10,958,520.61 100.00Total net assets

PARETURN
88
Pareturn Diversified Fund (in EUR)
The accompanying notes are an integral part of these financial statements.
Nature allocation % of portfolio % of netassets
Investment funds 89.70 82.57
Bonds and other debt instruments 9.80 9.02
Shares 0.50 0.46
100.00 92.05
Country allocation % of portfolio % of netassets
Luxembourg 59.52 54.79
France 14.27 13.13
Ireland 8.77 8.07
United States 7.24 6.67
Belgium 3.58 3.30
Germany 2.67 2.46
Other 3.95 3.63
100.00 92.05
Portfolio Breakdowns
Top Ten Holdings Market value % ofnet
assets
PICTET EUR SHRTRM HI YLD-IEUR 548,548.12 5.00Open-ended Funds
LO FUNDS-CNVRTBLE BD-RA 481,161.12 4.38Open-ended Funds
UBAM CONVERT EUR 10-40-UCEUR 469,107.37 4.28Open-ended Funds
CANDRIAM BDS HIGH YIELD CL.I C 464,102.01 4.24Open-ended Funds
AMUNDI ETF FLOAT RATE USD CP 454,209.00 4.14Open-ended Funds
PARVEST BOND ASIA X JP-I USD 415,243.24 3.79Open-ended Funds
BLUEBAY-EMER MKT CORP B-IEURP 385,510.05 3.52Open-ended Funds
DPAM INVEST B EQ WLD SUSTAIN F 361,093.08 3.30Open-ended Funds
US TREASURY N/B 1.75% 17-15/11/2020 360,381.86 3.29Government
OLD MUT GB EQY ABS RE-IEURHA 350,220.96 3.19Open-ended Funds
EUR
Sector
Top Ten Holdings

89
The accompanying notes are an integral part of these financial statements.
PARETURN
Pareturn Security Latam Corporate Debt (in USD)Statement of Operations and Changes in Net Assets for theperiod ended March 31, 2018
USD
AssetsInvestment in securities at cost 280,453,919.92Unrealised appreciation / (depreciation) on securities (8,066,448.04)
Investment in securities at market value 3.3 272,387,471.88Cash at bank 3,321,153.30Receivable for investment sold 4,657,830.74Receivable on subscription 299,946.03Dividends and interest receivable 3,767,948.26
Total assets 284,434,350.21
LiabilitiesBank overdraft 702.48Accrued expenses 246,067.11Payable for investment purchased 2,700,000.00Payable on redemption 199,966.07Other liabilities 3.80
Total liabilities 3,146,739.46
Net assets at the end of the period 281,287,610.75
Notes
Statement of Net Assets as at March 31, 2018
IncomeInterest on bonds (net of withholding taxes) 3.8 5,267,842.77Bank interest 3.8 11,466.79
Total income 5,279,309.56
ExpensesInvestment advisory fees and management fees 4 419,075.19Depositary fees 39,019.05Administration fees 44,235.61Professional fees 15,760.41Taxe d'abonnement 5 14,195.27Bank interest and charges 17,359.77Other expenses 13 15,570.72
Total expenses 565,216.02
Net investment income / (loss) 4,714,093.54
Net realised gain / (loss) on:Sales of Investments 3.9 (166,686.93)Foreign exchange transactions 3.2 (39.00)
Net realised gain / (loss) for the period 4,547,367.61
Net change in unrealised appreciation / (depreciation) on:Investments 3.9 (8,380,751.04)
Increase / (Decrease) in net assets as a result ofoperations
(3,833,383.43)
Proceeds received on subscription of shares 386,797,415.78Net amount paid on redemption of shares (111,232,296.31)Net assets at the beginning of the period 9,555,874.71
Net assets at the end of the period 281,287,610.75
USDNotes
Statement of Operations and Changes in Net Assets forthe period ended March 31, 2018
Number of shares in issue atthe end of the period
Number of shares in issue atthe beginning of the period
Number of sharessubscribed
Number of sharesredeemed
Statement of Changes in Number of Shares
B USD I Cap 87 3,496 (1,014) 2,569

PARETURN
90
Pareturn Security Latam Corporate Debt (in USD)
The accompanying notes are an integral part of these financial statements.
Securities Portfolio as at March 31, 2018
ALFA S.A. 5.25% 14-25/03/2024 USD 519,687.50 0.18500,000
Transferable securities admitted to an official exchange listing
Bonds and other debt instrumentsMexico
ALFA S.A. 6.875% 14-25/03/2044 USD 832,000.00 0.30800,000ALPEK SA DE CV 5.375% 13-08/08/2023 USD 723,625.00 0.26700,000BANCO INBURSA SA 4.375% 17-11/04/2027 USD 3,377,500.00 1.203,500,000BANCO MERC NORTE 17-31/12/2049 USD 1,067,500.00 0.381,000,000BANCO MERCANTIL 16-04/10/2031 USD 2,153,250.00 0.772,200,000BANCO SANTANDER 4.125% 12-09/11/2022 USD 998,750.00 0.361,000,000BBVA BANCOMER SA 18-18/01/2033 FRN USD 2,880,000.00 1.023,000,000BBVA BANCOMER SA 6.75% 12-30/09/2022 USD 4,486,630.00 1.604,100,000BBVA BANCOMER SA 7.25% 10-22/04/2020 USD 529,745.00 0.19500,000CEMEX SAB 7.75% 16-16/04/2026 USD 3,853,675.00 1.373,500,000CONTROLADORA MAB 7.875% 09-28/10/2019
USD 1,473,500.00 0.521,400,000
CREDITO REAL SA 7.25% 16-20/07/2023 USD 2,532,000.00 0.902,400,000ELEMENTIA 5.5% 14-15/01/2025 USD 5,719,612.50 2.045,670,000GRUMA SAB DE CV 4.875% 14-01/12/2024 USD 518,750.00 0.18500,000GRUPO KUO SAB 5.75% 17-07/07/2027 USD 3,473,750.00 1.233,500,000MEXICHEM SAB 4% 17-04/10/2027 USD 236,875.00 0.08250,000MEXICHEM SAB 4.875% 12-19/09/2022 USD 2,051,960.00 0.732,000,000MEXICHEM SAB 5.875% 14-17/09/2044 USD 1,473,750.00 0.521,500,000MEXICHEM SAB 6.75% 12-19/09/2042 USD 1,899,750.00 0.681,700,000PLA ADMINISTRADO 5.25% 15-10/11/2022 USD 512,500.00 0.18500,000TRUST F/1401 5.25% 15-30/01/2026 USD 202,250.00 0.07200,000TRUST F/1401 6.95% 14-30/01/2044 USD 2,508,000.00 0.892,400,000
44,025,060.00 15.65
BRASKEM NL 4.5% 17-10/01/2028 USD 4,848,250.00 1.725,000,000Netherlands
EMBRAER NL FINAN 5.05% 15-15/06/2025 USD 1,442,000.00 0.511,400,000EMBRAER NL FINAN 5.4% 17-01/02/2027 USD 2,113,200.00 0.752,000,000PETROBRAS GLOB 7.375% 17-17/01/2027 USD 1,083,500.00 0.391,000,000PETROBRAS INTL 6.75% 11-27/01/2041 USD 3,695,500.00 1.313,800,000PETROBRAS INTL 6.875% 09-20/01/2040 USD 2,341,200.00 0.832,400,000PETROBRAS 5.625% 13-20/05/2043 USD 2,187,500.00 0.782,500,000PETROBRAS 7.25% 14-17/03/2044 USD 8,870,955.00 3.158,700,000PETROBRAS 8.75% 16-23/05/2026 USD 9,022,860.00 3.227,700,000
35,604,965.00 12.66
BRASKEM FIN LTD 5.375% 12-02/05/2022 USD 3,618,125.00 1.293,500,000Cayman Islands
BRASKEM FIN LTD 6.45% 14-03/02/2024 USD 325,875.00 0.12300,000EMBRAER OVERSEAS 5.696% 13-16/09/2023
USD 1,063,750.00 0.381,000,000
EMBRAER OVERSEAS 6.375% 09-15/01/2020
USD 105,213.50 0.04100,000
FIBRIA OVERSEAS 4% 17-14/01/2025 USD 965,000.00 0.341,000,000FIBRIA OVERSEAS 5.5% 17-17/01/2027 USD 4,650,750.00 1.654,500,000GRUPO AVAL LTD 4.75% 12-26/09/2022 USD 3,308,250.00 1.183,300,000LATAM FINANCE LT 6.875% 17-11/04/2024 USD 8,404,200.00 2.988,004,000VALE OVERSEAS 4.375% 12-11/01/2022 USD 306,195.00 0.11300,000VALE OVERSEAS 6.25% 16-10/08/2026 USD 3,907,925.00 1.393,500,000VALE OVERSEAS 6.875% 06-21/11/2036 USD 5,646,000.00 2.004,800,000VALE OVERSEAS 6.875% 09-10/11/2039 USD 591,250.00 0.21500,000VALE OVERSEAS 8.25% 04-17/01/2034 USD 1,675,375.00 0.601,300,000
34,567,908.50 12.29
BANCO BRADES CI 5.75% 12-01/03/2022 USD 1,139,875.00 0.411,100,000Brazil
BANCO BRADES CI 5.9% 10-16/01/2021 USD 830,000.00 0.30800,000BANCO BRASL (CI) 13-29/10/2049 FRN USD 5,249,000.00 1.865,800,000BANCO BRASL (CI) 3.875% 12-10/10/2022 USD 385,060.00 0.14400,000BANCO BRASL (CI) 4.625% 17-15/01/2025 USD 243,875.00 0.09250,000BANCO BRASL (CI) 5.875% 12-19/01/2023 USD 409,980.00 0.15400,000BANCO BRASL (CI) 9% 14-29/06/2049 USD 856,288.00 0.30800,000BANCO BRASL 5.375% 10-15/01/2021 USD 306,375.00 0.11300,000BANCO BRASL 5.875% 11-26/01/2022 USD 3,382,500.00 1.203,300,000GLOBO COMMUN PAR 15-08/06/2025 SR USD 244,687.50 0.09250,000ITAU UNIBANCO 2.85% 15-26/05/2018 USD 249,750.00 0.09250,000ITAU UNIBANCO/KY 17-31/12/2049 FRN USD 2,446,875.00 0.872,500,000ITAU UNIBANCO/KY 5.125% 12-13/05/2023 USD 4,717,625.00 1.684,700,000ITAU UNIBANCO/KY 5.5% 12-06/08/2022 USD 2,035,000.00 0.722,000,000
NameQuantity/Nominal
Market valuein USD
Currency %NAV
ITAU UNIBANCO/KY 5.65% 12-19/03/2022 USD 5,117,500.00 1.815,000,000NATURA SA 5.375% 18-01/02/2023 USD 4,988,375.00 1.775,000,000
32,602,765.50 11.59
BANCO DAVIVIENDA 5.875% 12-09/07/2022 USD 1,571,250.00 0.561,500,000Colombia
BANCO DE BOGOTA 5.375% 13-19/02/2023 USD 1,035,000.00 0.371,000,000BANCO DE BOGOTA 6.25% 16-12/05/2026 USD 5,250,000.00 1.875,000,000BANCO GNB SUDAM 6.5% 17-03/04/2027 USD 1,539,375.00 0.551,500,000BBVA COLOMBIA SA 4.875% 15-21/04/2025 USD 3,148,145.00 1.123,094,000ECOPETROL SA 5.375% 15-26/06/2026 USD 3,332,000.00 1.183,200,000ECOPETROL SA 5.875% 13-18/09/2023 USD 3,852,000.00 1.373,600,000GNB SUDAMERIS BK 3.875% 13-02/05/2018 USD 597,750.00 0.21600,000TRNSPRTA DE GAS 5.7% 12-20/03/2022 USD 203,250.00 0.07200,000
20,528,770.00 7.30
KLABIN FINANCE S 4.875% 17-19/09/2027 USD 3,084,000.00 1.103,200,000Luxembourg
KLABIN FINANCE S 5.25% 14-16/07/2024 USD 2,328,750.00 0.832,300,000MAGNESITA FINANC 8.625% 12-29/04/2049 USD 216,540.00 0.08300,000MINERVA LUX SA 6.5% 16-20/09/2026 USD 6,589,500.00 2.346,900,000REDE DOR FIN 4.95% 18-17/01/2028 USD 1,897,500.00 0.672,000,000TUPY S/A 6.625% 14-17/07/2024 USD 3,631,250.00 1.293,500,000
17,747,540.00 6.31
CAP 7.375% 06-15/09/2036 USD 480,000.00 0.17480,000Chile
CENCOSUD SA 4.375% 17-17/07/2027 USD 2,602,125.00 0.932,700,000CORPGROUP BANK 6.75% 13-15/03/2023 USD 3,271,125.00 1.163,300,000INVERSIONES CMPC 4.5% 12-25/04/2022 USD 205,000.00 0.07200,000LATAM AIRLINES 7.25% 15-09/06/2020 USD 3,939,262.50 1.403,750,000SMU SA 7.75% 13-08/02/2020 USD 2,538,718.11 0.902,499,000
13,036,230.61 4.63
BANCO DE CREDITO 12-24/04/2027 FRN USD 852,000.00 0.30800,000Peru
BANCO INTER PERU 14-19/03/2029 FRN USD 872,000.00 0.31800,000INRETAIL SHOP 5.75% 18-03/04/2028 USD 2,693,250.00 0.962,700,000MINSUR SA 6.25% 14-07/02/2024 USD 1,073,750.00 0.381,000,000VOLCAN CIA MIN-B 5.375% 12-02/02/2022 USD 4,686,500.00 1.674,550,000
10,177,500.00 3.62
BRASKEM AMERICA 7.125% 11-22/07/2041 USD 116,155.00 0.04100,000United States
JBS USA LLC/JBS 5.875% 14-15/07/2024 USD 3,911,780.00 1.404,000,000SOUTHERN COPPER 5.25% 12-08/11/2042 USD 209,250.00 0.07200,000SOUTHERN COPPER 5.875% 15-23/04/2045 USD 169,612.50 0.06150,000SOUTHERN COPPER 6.75% 10-16/04/2040 USD 2,958,000.00 1.052,400,000SOUTHERN PERU 7.5% 06-27/07/2035 USD 2,451,000.00 0.871,900,000
9,815,797.50 3.49
GERDAU SA 5.75% 10-30/01/2021 USD 1,876,500.00 0.671,800,000Virgin Islands
GERDAU TRADE INC 4.875% 17-24/10/2027 USD 2,462,500.00 0.882,500,000GTL TRADE FIN 5.893% 14-29/04/2024 USD 2,975,000.00 1.052,800,000GTL TRADE FIN 7.25% 14-16/04/2044 USD 557,500.00 0.20500,000
7,871,500.00 2.80
BAHIA SUL HLDGS 5.75% 16-14/07/2026 USD 3,894,250.00 1.383,700,000Austria
BRF GMBH 4.35% 16-29/09/2026 USD 605,500.00 0.22700,000JBS INVESTMENTS 7.25% 14-03/04/2024 USD 493,000.00 0.18500,000JBS INVESTMENTS 7.75% 13-28/10/2020 USD 1,943,700.00 0.691,900,000SUZANO AUSTRIA 7% 17-16/03/2047 USD 566,150.00 0.20500,000
7,502,600.00 2.67
COSAN LTD 5.95% 17-20/09/2024 USD 2,027,500.00 0.722,000,000Bermuda
GEOPARK 6.5% 17-21/09/2024 USD 3,690,750.00 1.313,700,0005,718,250.00 2.03
IRSA PROPIEDADES 8.75% 16-23/03/2023 USD 1,101,250.00 0.391,000,000Argentina
YPF SOCIEDAD ANO 6.95% 17-21/07/2027 USD 2,209,020.00 0.792,200,000
NameQuantity/Nominal
Market valuein USD
Currency %NAV

PARETURN
91
Pareturn Security Latam Corporate Debt (in USD)
The accompanying notes are an integral part of these financial statements.
Securities Portfolio as at March 31, 2018
YPF SOCIEDAD ANO 8.5% 15-28/07/2025 USD 2,200,000.00 0.782,000,0005,510,270.00 1.96
INTERCORP FIN 4.125% 17-19/10/2027 USD 2,098,125.00 0.752,250,000Panama
2,098,125.00 0.75
FRESNILLO PLC 5.5% 13-13/11/2023 USD 949,500.00 0.34900,000United Kingdom
949,500.00 0.34
INTERCORP PERU 5.875% 15-12/02/2025 USD 518,750.00 0.18500,000Bahamas
518,750.00 0.18
248,275,532.11 88.27
LIMA METRO LINE 5.875% 15-05/07/2034 USD 4,749,500.00 1.694,600,000
Mortgage backed securitiesCayman Islands
4,749,500.00 1.69
EMPRESA ANGAMOS 4.875% 14-25/05/2029
USD 1,129,107.95 0.401,150,000Chile
ENTEL CHILE SA 4.875% 13-30/10/2024 USD 1,618,000.00 0.581,600,000GNL QUINTERO SA 4.634% 14-31/07/2029 USD 1,721,250.00 0.611,700,000
4,468,357.95 1.59
YPF SOCIEDAD ANO 8.75% 14-04/04/2024 USD 3,548,000.00 1.263,200,000Argentina
3,548,000.00 1.26
FERMACA ENTERPR 6.375% 14-30/03/2038 USD 1,345,193.69 0.481,252,800Mexico
MEXICO GENERADOR 5.5% 12-06/12/2032 USD 1,532,928.73 0.541,481,0912,878,122.42 1.02
FENIX POWER PERU 4.317% 17-20/09/2027 USD 973,750.00 0.351,000,000Peru
973,750.00 0.35
16,617,730.37 5.91
US TREASURY BILL 0% 17-19/04/2018 USD 7,494,209.40 2.667,500,000
Other transferable securities
Money market instrumentsUnited States
7,494,209.40 2.66
7,494,209.40 2.66
Total securities portfolio 272,387,471.88 96.84
NameQuantity/Nominal
Market valuein USD
Currency %NAV
Summary of net assets%
NAV272,387,471.88 96.84Total securities portfolio
3,320,450.82 1.18Cash at bank and bank overdraft
5,579,688.05 1.98Other assets and liabilities
281,287,610.75 100.00Total net assets
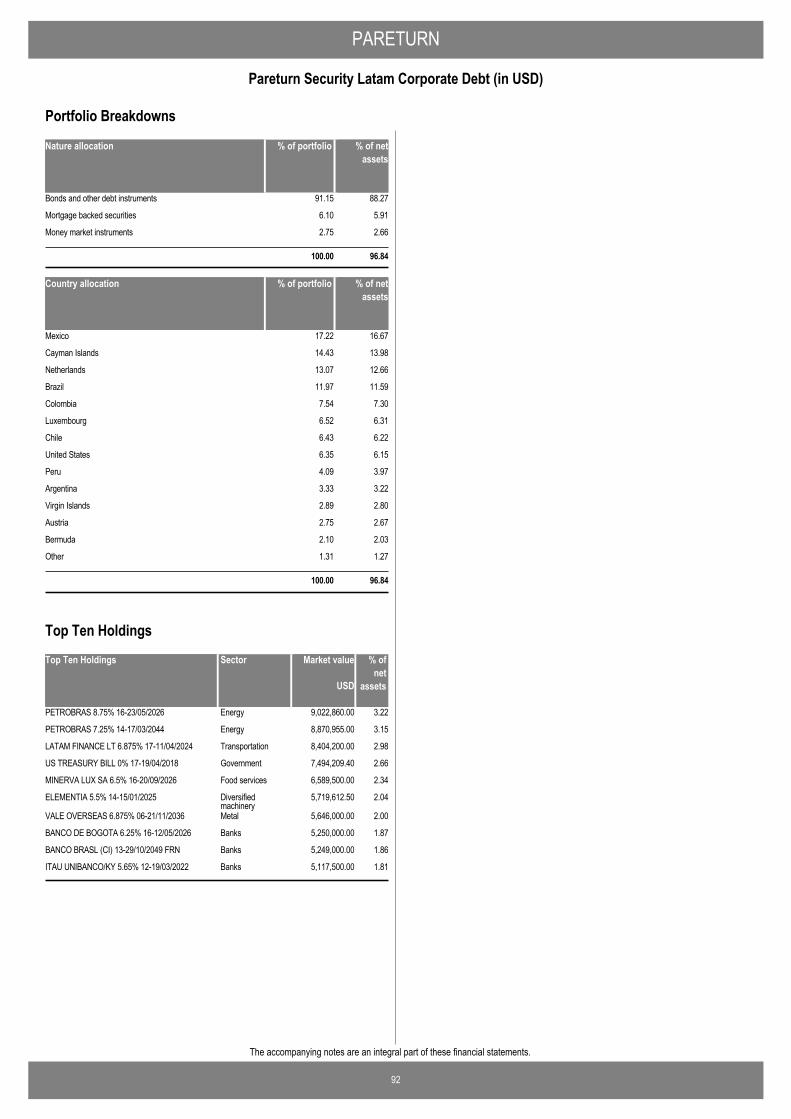
PARETURN
92
Pareturn Security Latam Corporate Debt (in USD)
The accompanying notes are an integral part of these financial statements.
Nature allocation % of portfolio % of netassets
Bonds and other debt instruments 91.15 88.27
Mortgage backed securities 6.10 5.91
Money market instruments 2.75 2.66
100.00 96.84
Country allocation % of portfolio % of netassets
Mexico 17.22 16.67
Cayman Islands 14.43 13.98
Netherlands 13.07 12.66
Brazil 11.97 11.59
Colombia 7.54 7.30
Luxembourg 6.52 6.31
Chile 6.43 6.22
United States 6.35 6.15
Peru 4.09 3.97
Argentina 3.33 3.22
Virgin Islands 2.89 2.80
Austria 2.75 2.67
Bermuda 2.10 2.03
Other 1.31 1.27
100.00 96.84
Portfolio Breakdowns
Top Ten Holdings Market value % ofnet
assets
PETROBRAS 8.75% 16-23/05/2026 9,022,860.00 3.22Energy
PETROBRAS 7.25% 14-17/03/2044 8,870,955.00 3.15Energy
LATAM FINANCE LT 6.875% 17-11/04/2024 8,404,200.00 2.98Transportation
US TREASURY BILL 0% 17-19/04/2018 7,494,209.40 2.66Government
MINERVA LUX SA 6.5% 16-20/09/2026 6,589,500.00 2.34Food services
ELEMENTIA 5.5% 14-15/01/2025 5,719,612.50 2.04Diversifiedmachinery
VALE OVERSEAS 6.875% 06-21/11/2036 5,646,000.00 2.00Metal
BANCO DE BOGOTA 6.25% 16-12/05/2026 5,250,000.00 1.87Banks
BANCO BRASL (CI) 13-29/10/2049 FRN 5,249,000.00 1.86Banks
ITAU UNIBANCO/KY 5.65% 12-19/03/2022 5,117,500.00 1.81Banks
USD
Sector
Top Ten Holdings

93
The accompanying notes are an integral part of these financial statements.
PARETURN
Pareturn Rivendale (in EUR)Statement of Operations and Changes in Net Assets for theperiod ended March 31, 2018
EUR
AssetsInvestment in securities at cost 26,160,734.51Unrealised appreciation / (depreciation) on securities 365,884.48
Investment in securities at market value 3.3 26,526,618.99Cash at bank 1,038,197.99Receivable for investment sold 693,932.40Dividends and interest receivable 42,137.42
Total assets 28,300,886.80
LiabilitiesAccrued expenses 73,170.62
Total liabilities 73,170.62
Net assets at the end of the period 28,227,716.18
Notes
Statement of Net Assets as at March 31, 2018
IncomeDividends (net of withholding taxes) 3.8 22,535.56Interest on bonds (net of withholding taxes) 3.8 44,835.60Bank interest 3.8 175.13
Total income 67,546.29
ExpensesInvestment advisory fees and management fees 4 35,039.28Depositary fees 3,949.56Administration fees 14,508.03Professional fees 7,303.77Transaction costs 9 12,692.70Taxe d'abonnement 5 4,133.95Bank interest and charges 9,055.51Other expenses 13 3,624.66
Total expenses 90,307.46
Net investment income / (loss) (22,761.17)
Net realised gain / (loss) on:Sales of Investments 3.9 70,180.15Foreign exchange transactions 3.2 (30,826.32)
Net realised gain / (loss) for the period 16,592.66
Net change in unrealised appreciation / (depreciation) on:Investments 3.9 (334,083.06)
Increase / (Decrease) in net assets as a result ofoperations
(317,490.40)
Proceeds received on subscription of shares 6,965,886.85Net amount paid on redemption of shares -Net assets at the beginning of the period 21,579,319.73
Net assets at the end of the period 28,227,716.18
EURNotes
Statement of Operations and Changes in Net Assets forthe period ended March 31, 2018
Number of shares in issue atthe end of the period
Number of shares in issue atthe beginning of the period
Number of sharessubscribed
Number of sharesredeemed
Statement of Changes in Number of Shares
B EUR R Cap 139,789 45,645 - 185,434

PARETURN
94
Pareturn Rivendale (in EUR)
The accompanying notes are an integral part of these financial statements.
Securities Portfolio as at March 31, 2018
BERKSHIRE HATHWY 0.625% 17-17/01/2023
EUR 401,719.58 1.42400,000
Transferable securities admitted to an official exchange listing
Bonds and other debt instrumentsUnited States
GEN MOTORS FIN 18-26/03/2022 FRN EUR 400,254.80 1.42400,000GOLDMAN SACHS GP 1.375% 17-15/05/2024
EUR 405,192.74 1.44400,000
GOLDMAN SACHS GP 16-27/07/2021 EUR 407,124.40 1.44400,000MCDONALDS CORP 0.625% 17-29/01/2024 EUR 396,285.98 1.40400,000MORGAN STANLEY 2.375% 14-31/03/2021 EUR 392,956.91 1.39370,000PRICELINE GROUP 2.375% 14-23/09/2024 EUR 429,402.74 1.52400,000UNITED PARCEL 0.375% 17-15/11/2023 EUR 394,741.30 1.40400,000
3,227,678.45 11.43
BNP PARIBAS 17-22/09/2022 EUR 407,389.20 1.44400,000France
CNP ASSURANCES 1.875% 16-20/10/2022 EUR 416,338.26 1.48400,000CREDIT AGRICOLE 17-20/04/2022 EUR 405,614.00 1.44400,000RCI BANQUE 0.625% 16-10/11/2021 EUR 403,687.64 1.43400,000RCI BANQUE 1.25% 15-08/06/2022 EUR 308,805.75 1.09300,000RENAULT 1% 17-08/03/2023 EUR 406,231.16 1.44400,000SOCIETE GENERALE 1% 16-01/04/2022 EUR 304,033.23 1.08300,000
2,652,099.24 9.40
AMADEUS CAP MKT 1.625% 15-17/11/2021 EUR 209,736.74 0.74200,000Spain
BANCO BILBAO VIZ 0.75% 17-11/09/2022 EUR 400,297.24 1.42400,000BANCO SANTANDER 1.375% 17-09/02/2022 EUR 411,045.54 1.46400,000CAIXABANK 0.75% 18-18/04/2023 EUR 398,048.14 1.41400,000
1,419,127.66 5.03
BP CAPITAL PLC 1.077% 17-26/06/2025 EUR 400,819.20 1.42400,000United Kingdom
COCA-COLA EURO 0.75% 16-24/02/2022 EUR 507,725.15 1.80500,000FCE BANK PLC 1.134% 15-10/02/2022 EUR 405,940.76 1.44400,000
1,314,485.11 4.66
EDP FINANCE BV 2.375% 16-23/03/2023 EUR 215,960.12 0.77200,000Netherlands
MYLAN NV 1.25% 16-23/11/2020 EUR 306,999.03 1.08300,000522,959.15 1.85
ATF NETHERLANDS 2.125% 16-13/03/2023 EUR 419,244.84 1.49400,000Luxembourg
419,244.84 1.49
FRESENIUS FIN IR 1.5% 17-30/01/2024 EUR 413,088.68 1.46400,000Ireland
413,088.68 1.46
9,968,683.13 35.32
TELEFONICA SA EUR 407,284.52 1.4450,733
SharesSpain
407,284.52 1.44
ROCHE HOLDING AG-GENUSSCHEIN CHF 314,408.59 1.111,690Switzerland
314,408.59 1.11
UNILEVER NV-CVA EUR 176,599.50 0.633,850Netherlands
176,599.50 0.63
898,292.61 3.18
BGF-FIXED INC GBL OP HED-EURD2 EUR 631,200.00 2.2460,000
Funds
Investment fundsLuxembourg
CS FUND ASIA CRP BOND-BHEUR EUR 549,359.70 1.954,570
NameQuantity/Nominal
Market valuein EUR
Currency %NAV
FRANK TEMP GLB BD-I-AC-H1-EUR EUR 597,380.00 2.1234,000MAGALLANES VALUE IBERN EQ-R EUR 405,553.80 1.443,000MAINFIRST TOP EUROPN IDEAS-C EUR 771,496.00 2.7212,100MELCH SEL-EURO OPPOR-I1-EUR EUR 926,635.11 3.273,590NORDEA I SIC-STAB RET-BP-EUR EUR 392,640.00 1.3924,000NORDEA 1-FLEXIBLE FI-BI EUR EUR 599,995.00 2.135,500NORDEA 1-US TOTAL RET-HBIE EUR 594,809.60 2.117,040PICTET EMERGING CORP BD-HIEUR EUR 730,880.00 2.598,000PICTET TR - DIVERSIFIED ALPHA IEU EUR 506,160.00 1.794,500PICTET-ABSO RET FX IN-HI EUR EUR 665,344.35 2.366,255PICTET-SHTRM EM CRP BD-HPEUR EUR 672,408.00 2.388,800PTR AGORA IC SHS-I EUR-CAPITALISATION
EUR 445,631.50 1.583,550
SISF EUROPEAN SPEC SIT FD-C EUR 372,609.13 1.321,9608,862,102.19 31.39
ALGEBRIS FINANCIAL CRD-IE EUR 390,100.00 1.382,500Ireland
ISHARES JPM EM LCAL GOVT USD SHSUSD ETF
USD 325,978.78 1.155,900
LM WA MACRO OPPORT BD-PAHEUR EUR 612,900.00 2.175,000MUZINICH SHORT DUR HG YD-HEURA EUR 522,450.00 1.854,300NEUBERG BRM-SH DUR EM-EUR A EUR 669,500.00 2.3765,000PIMCO GIS-INCOME FUND-INSEURHA EUR 1,003,272.00 3.5673,770
3,524,200.78 12.48
BARING EUROPE SEL-I EUR INC EUR 988,020.00 3.5022,000United Kingdom
M+G OPTIMAL INCOME-C-EURO-A EUR 789,154.50 2.8037,0001,777,174.50 6.30
H2O ADAGIO-IC EUR 624,215.43 2.219France
PL P FR SM CAP A 3D ACT A 3 DECIMALS EUR 372,076.60 1.32490996,292.03 3.53
PICTET-CH SWISS M/S CAP-P CHF 499,873.75 1.7776Switzerland
499,873.75 1.77
15,659,643.25 55.47
Total securities portfolio 26,526,618.99 93.97
NameQuantity/Nominal
Market valuein EUR
Currency %NAV
Summary of net assets%
NAV26,526,618.99 93.97Total securities portfolio
1,038,197.99 3.68Cash at bank and bank overdraft
662,899.20 2.35Other assets and liabilities
28,227,716.18 100.00Total net assets
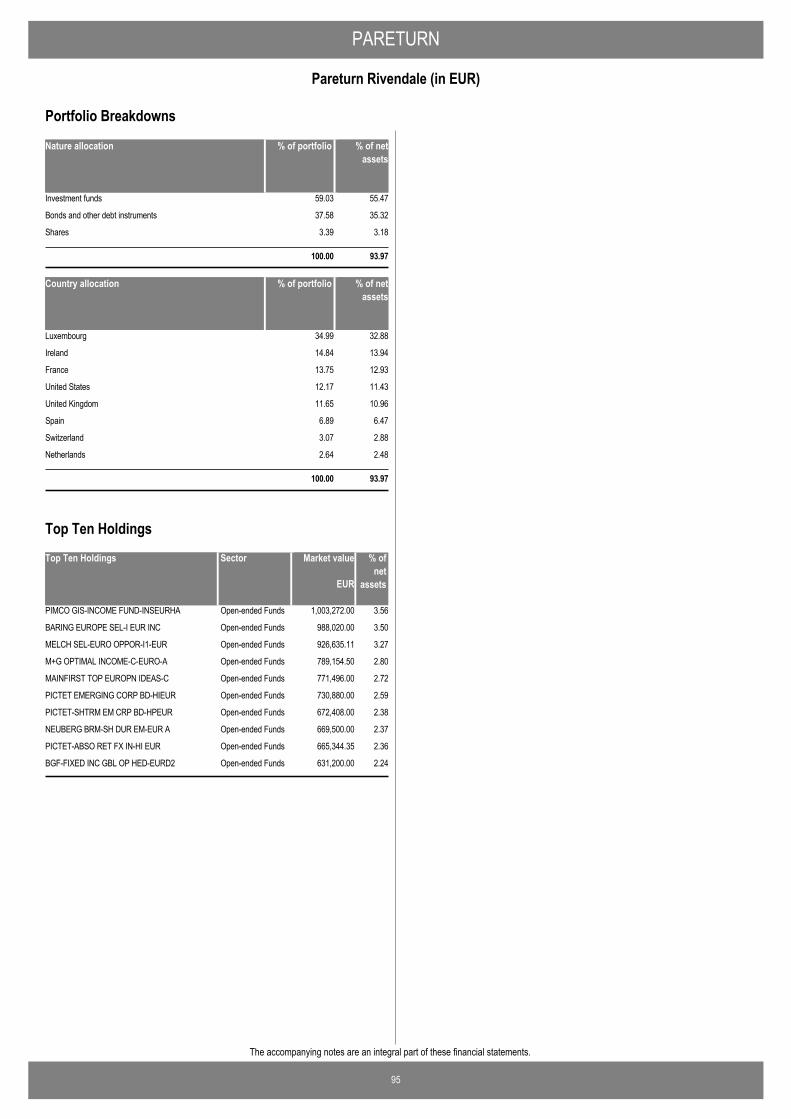
PARETURN
95
Pareturn Rivendale (in EUR)
The accompanying notes are an integral part of these financial statements.
Nature allocation % of portfolio % of netassets
Investment funds 59.03 55.47
Bonds and other debt instruments 37.58 35.32
Shares 3.39 3.18
100.00 93.97
Country allocation % of portfolio % of netassets
Luxembourg 34.99 32.88
Ireland 14.84 13.94
France 13.75 12.93
United States 12.17 11.43
United Kingdom 11.65 10.96
Spain 6.89 6.47
Switzerland 3.07 2.88
Netherlands 2.64 2.48
100.00 93.97
Portfolio Breakdowns
Top Ten Holdings Market value % ofnet
assets
PIMCO GIS-INCOME FUND-INSEURHA 1,003,272.00 3.56Open-ended Funds
BARING EUROPE SEL-I EUR INC 988,020.00 3.50Open-ended Funds
MELCH SEL-EURO OPPOR-I1-EUR 926,635.11 3.27Open-ended Funds
M+G OPTIMAL INCOME-C-EURO-A 789,154.50 2.80Open-ended Funds
MAINFIRST TOP EUROPN IDEAS-C 771,496.00 2.72Open-ended Funds
PICTET EMERGING CORP BD-HIEUR 730,880.00 2.59Open-ended Funds
PICTET-SHTRM EM CRP BD-HPEUR 672,408.00 2.38Open-ended Funds
NEUBERG BRM-SH DUR EM-EUR A 669,500.00 2.37Open-ended Funds
PICTET-ABSO RET FX IN-HI EUR 665,344.35 2.36Open-ended Funds
BGF-FIXED INC GBL OP HED-EURD2 631,200.00 2.24Open-ended Funds
EUR
Sector
Top Ten Holdings

96
The accompanying notes are an integral part of these financial statements.
PARETURN
Pareturn Fidelius Global (in EUR)Statement of Operations and Changes in Net Assets for theperiod ended March 31, 2018
EUR
AssetsInvestment in securities at cost 19,144,089.18Unrealised appreciation / (depreciation) on securities (567,361.62)
Investment in securities at market value 3.3 18,576,727.56Cash at bank 1,233,057.69Dividends and interest receivable 28,079.64Other assets 10,105.51
Total assets 19,847,970.40
LiabilitiesAccrued expenses 41,867.17Net unrealised depreciation on futures contracts 3.5 14,940.00
Total liabilities 56,807.17
Net assets at the end of the period 19,791,163.23
Notes
Statement of Net Assets as at March 31, 2018
IncomeDividends (net of withholding taxes) 3.8 25,419.09Interest on bonds (net of withholding taxes) 3.8 80,462.75Bank interest 3.8 33.04Other income 12 10,105.51
Total income 116,020.39
ExpensesInvestment advisory fees and management fees 4 37,093.33Depositary fees 9,961.10Administration fees 14,782.19Professional fees 7,531.58Transaction costs 9 20,065.62Taxe d'abonnement 5 3,213.57Bank interest and charges 3,419.22Other expenses 13 4,673.19
Total expenses 100,739.80
Net investment income / (loss) 15,280.59
Net realised gain / (loss) on:Sales of Investments 3.9 (709,658.31)Foreign exchange transactions 3.2 (9,735.53)Futures contracts 3.5 (92,233.54)Forward foreign exchange contracts 3.4 9,891.36Options contracts 3.5 6,888.77
Net realised gain / (loss) for the period (779,566.66)
Net change in unrealised appreciation / (depreciation) on:Investments 3.9 (211,851.05)Futures contracts 3.5 (17,340.00)Forward foreign exchange contracts 3.4 6,176.60Options contracts 3.5 21,903.47
Increase / (Decrease) in net assets as a result ofoperations
(980,677.64)
Proceeds received on subscription of shares -Net amount paid on redemption of shares -Net assets at the beginning of the period 20,771,840.87
Net assets at the end of the period 19,791,163.23
EURNotes
Statement of Operations and Changes in Net Assets forthe period ended March 31, 2018
Number of shares in issue atthe end of the period
Number of shares in issue atthe beginning of the period
Number of sharessubscribed
Number of sharesredeemed
Statement of Changes in Number of Shares
B EUR P Cap 196,777 - - 196,777

PARETURN
97
Pareturn Fidelius Global (in EUR)
The accompanying notes are an integral part of these financial statements.
Securities Portfolio as at March 31, 2018
BANCO BILBAO VIZ 14-29/12/2049 FRN EUR 208,738.40 1.05200,000
Transferable securities admitted to an official exchange listing
Bonds and other debt instrumentsSpain
BANKIA 14-22/05/2024 FRN EUR 311,196.60 1.57300,000IBERCAJA 15-28/07/2025 FRN EUR 418,363.20 2.12400,000LIBERBANK 17-14/03/2027 EUR 219,296.00 1.11200,000
1,157,594.20 5.85
TEVA PHARM FNC 0.375% 16-25/07/2020 EUR 487,231.00 2.46500,000Netherlands
487,231.00 2.46
ORIGIN ENER FIN 14-16/09/2074 FRN EUR 469,216.35 2.37450,000Australia
469,216.35 2.37
UBS GROUP 15-29/12/2049 FRN USD 166,633.66 0.84200,000Switzerland
166,633.66 0.84
2,280,675.21 11.52
GOLDMAN SACH GL EMMKT EQ-IA USD 758,831.68 3.8344,077
Funds
Investment fundsLuxembourg
HEND HORIZ-CONT EUROP-I2EUR EUR 1,101,120.29 5.5677,763INVESCO PAN EUR STR EQ-CAEPH EUR 967,532.17 4.8972,747JUPITER GL FD-EURO GRO-D EUR EUR 996,509.91 5.0465,907PICTET-EMERG MKTS IDX-I EUR EUR 1,006,452.58 5.093,920RAM SYS EM EQ IPC SHS-IP(EUR)CAP EUR 407,973.65 2.061,960ROBECO CAP US PE I SHS USD USD 1,422,184.46 7.186,133UBAM GLOB HIGH YLD SOL-IHCEUR EUR 502,736.36 2.543,171
7,163,341.10 36.19
BLACKSTONE DIVERS MS-IEURACC EUR 715,042.29 3.6170,171Ireland
GAM STAR CREDIT OPP-INST EUR EUR 514,906.44 2.6032,770ISHARES CORE S&P 500 UCITS ETF USD 808,622.89 4.093,994ISHARES MSCI JP EUR-AC ACC SHS EURETF
EUR 555,426.00 2.8111,800
JOHAM SELECT VALUE EUR-A SHSCLASS-A EUR
EUR 980,957.29 4.95274,701
3,574,954.91 18.06
ARTEMIS US EXT ALPHA-IUSD USD 1,295,733.93 6.551,010,817United Kingdom
M+G OPTIMAL INCOME-C-EURO-A EUR 673,828.85 3.4031,8071,969,562.78 9.95
CARMIGNAC SECUR A EUR 3D PARTS EUR 1,014,458.90 5.13575France
L I35 DR ETF D PARTS DIST EUR 952,195.00 4.8110,2941,966,653.90 9.94
DPAM INV REAL EST EUR DV-F EUR 1,032,309.66 5.225,076Belgium
1,032,309.66 5.22
ISHARES EURO STOXX50 UCITS D EUR 589,230.00 2.9818,000Germany
589,230.00 2.98
16,296,052.35 82.34
Total securities portfolio 18,576,727.56 93.86
NameQuantity/Nominal
Market valuein EUR
Currency %NAV
EURO-BUND FUTURE 07/06/2018 EUR 953,580.00(6) (14,940.00)
Futures contracts
(14,940.00)
Total Futures (14,940.00)
NameQuantity Commitmentin EUR
Currency Unrealisedappreciation /(depreciation)
in EUR
Financial derivative instruments as at March 31, 2018
Total financial derivative instruments (14,940.00)
Summary of net assets
(14,940.00) (0.08)Total financial derivative instruments
%NAV
18,576,727.56 93.86Total securities portfolio
1,233,057.69 6.23Cash at bank and bank overdraft
(3,682.02) (0.01)Other assets and liabilities
19,791,163.23 100.00Total net assets
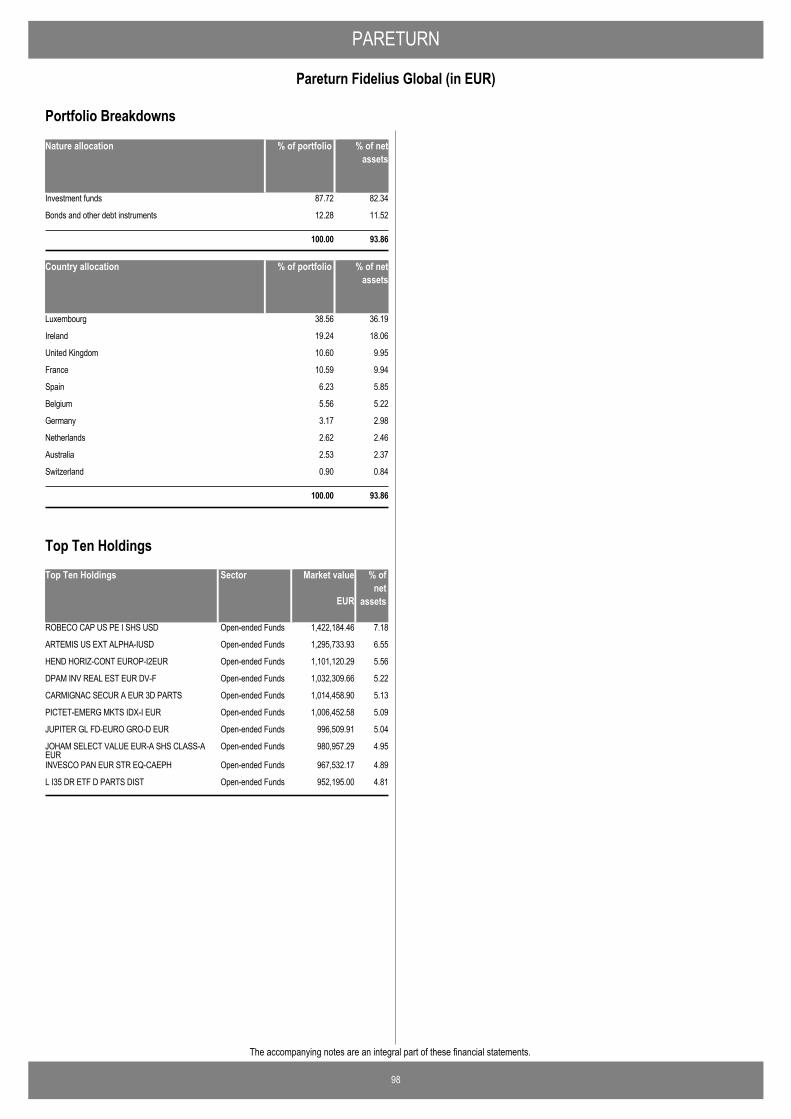
PARETURN
98
Pareturn Fidelius Global (in EUR)
The accompanying notes are an integral part of these financial statements.
Nature allocation % of portfolio % of netassets
Investment funds 87.72 82.34
Bonds and other debt instruments 12.28 11.52
100.00 93.86
Country allocation % of portfolio % of netassets
Luxembourg 38.56 36.19
Ireland 19.24 18.06
United Kingdom 10.60 9.95
France 10.59 9.94
Spain 6.23 5.85
Belgium 5.56 5.22
Germany 3.17 2.98
Netherlands 2.62 2.46
Australia 2.53 2.37
Switzerland 0.90 0.84
100.00 93.86
Portfolio Breakdowns
Top Ten Holdings Market value % ofnet
assets
ROBECO CAP US PE I SHS USD 1,422,184.46 7.18Open-ended Funds
ARTEMIS US EXT ALPHA-IUSD 1,295,733.93 6.55Open-ended Funds
HEND HORIZ-CONT EUROP-I2EUR 1,101,120.29 5.56Open-ended Funds
DPAM INV REAL EST EUR DV-F 1,032,309.66 5.22Open-ended Funds
CARMIGNAC SECUR A EUR 3D PARTS 1,014,458.90 5.13Open-ended Funds
PICTET-EMERG MKTS IDX-I EUR 1,006,452.58 5.09Open-ended Funds
JUPITER GL FD-EURO GRO-D EUR 996,509.91 5.04Open-ended Funds
JOHAM SELECT VALUE EUR-A SHS CLASS-AEUR
980,957.29 4.95Open-ended Funds
INVESCO PAN EUR STR EQ-CAEPH 967,532.17 4.89Open-ended Funds
L I35 DR ETF D PARTS DIST 952,195.00 4.81Open-ended Funds
EUR
Sector
Top Ten Holdings

99
The accompanying notes are an integral part of these financial statements.
PARETURN
Pareturn Santalucia Espabolsa (Luxembourg)* (in EUR)Statement of Operations and Changes in Net Assets for theperiod ended March 31, 2018
EUR
AssetsInvestment in securities at cost 9,500,000.00Unrealised appreciation / (depreciation) on securities 315,322.96
Investment in securities at market value 3.3 9,815,322.96Cash at bank 483,776.11
Total assets 10,299,099.07
LiabilitiesAccrued expenses 22,583.94Other liabilities 541.61
Total liabilities 23,125.55
Net assets at the end of the period 10,275,973.52
Notes
Statement of Net Assets as at March 31, 2018
* Please see note 1 for details.
Income
ExpensesInvestment advisory fees and management fees 4 8,323.49Depositary fees 2,219.38Administration fees 8,298.59Professional fees 2,782.90Taxe d'abonnement 5 531.28Bank interest and charges 1,936.23Other expenses 13 15,257.57
Total expenses 39,349.44
Net investment income / (loss) (39,349.44)
Net realised gain / (loss) for the period (39,349.44)
Net change in unrealised appreciation / (depreciation) on:Investments 3.9 315,322.96
Increase / (Decrease) in net assets as a result ofoperations
275,973.52
Proceeds received on subscription of shares 10,000,000.00Net amount paid on redemption of shares -Net assets at the beginning of the period -
Net assets at the end of the period 10,275,973.52
EURNotes
Statement of Operations and Changes in Net Assets forthe period ended March 31, 2018
Number of shares in issue atthe end of the period
Number of shares in issue atthe beginning of the period
Number of sharessubscribed
Number of sharesredeemed
Statement of Changes in Number of Shares
B EUR A Cap - 62,667 - 62,667
B EUR I Cap - 3,333 - 3,333
B EUR P Cap - 667 - 667
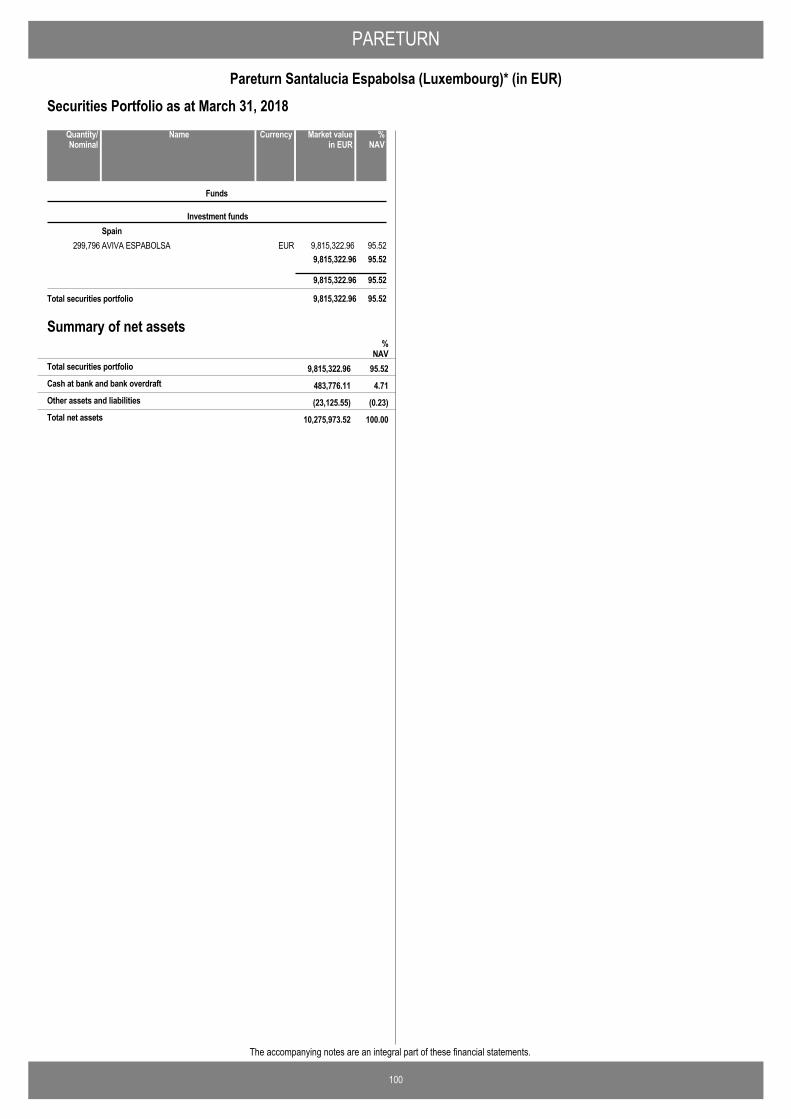
PARETURN
100
Pareturn Santalucia Espabolsa (Luxembourg)* (in EUR)
The accompanying notes are an integral part of these financial statements.
Securities Portfolio as at March 31, 2018
AVIVA ESPABOLSA EUR 9,815,322.96 95.52299,796
Funds
Investment fundsSpain
9,815,322.96 95.52
9,815,322.96 95.52
Total securities portfolio 9,815,322.96 95.52
NameQuantity/Nominal
Market valuein EUR
Currency %NAV
Summary of net assets%
NAV9,815,322.96 95.52Total securities portfolio
483,776.11 4.71Cash at bank and bank overdraft
(23,125.55) (0.23)Other assets and liabilities
10,275,973.52 100.00Total net assets

PARETURN
101
Pareturn Santalucia Espabolsa (Luxembourg)* (in EUR)
The accompanying notes are an integral part of these financial statements.
Nature allocation % of portfolio % of netassets
Investment funds 100.00 95.52
100.00 95.52
Country allocation % of portfolio % of netassets
Spain 100.00 95.52
100.00 95.52
Portfolio Breakdowns
Top Ten Holdings Market value % ofnet
assets
AVIVA ESPABOLSA 9,815,322.96 95.52Open-ended Funds
EUR
Sector
Top Ten Holdings

102
The accompanying notes are an integral part of these financial statements.
PARETURN
Pareturn Santalucia Fonvalor* (in EUR)Statement of Operations and Changes in Net Assets for theperiod ended March 31, 2018
EUR
AssetsInvestment in securities at cost 6,850,000.00Unrealised appreciation / (depreciation) on securities (16,090.65)
Investment in securities at market value 3.3 6,833,909.35Cash at bank 244,402.87
Total assets 7,078,312.22
LiabilitiesAccrued expenses 22,320.34Other liabilities 269.53
Total liabilities 22,589.87
Net assets at the end of the period 7,055,722.35
Notes
Statement of Net Assets as at March 31, 2018
* Please see note 1 for details.
Income
ExpensesInvestment advisory fees and management fees 4 8,021.08Depositary fees 2,219.38Administration fees 8,178.35Professional fees 2,780.20Taxe d'abonnement 5 392.82Bank interest and charges 1,546.45Other expenses 13 5,048.76
Total expenses 28,187.04
Net investment income / (loss) (28,187.04)
Net realised gain / (loss) for the period (28,187.04)
Net change in unrealised appreciation / (depreciation) on:Investments 3.9 (16,090.65)
Increase / (Decrease) in net assets as a result ofoperations
(44,277.69)
Proceeds received on subscription of shares 7,100,000.04Net amount paid on redemption of shares -Net assets at the beginning of the period -
Net assets at the end of the period 7,055,722.35
EURNotes
Statement of Operations and Changes in Net Assets forthe period ended March 31, 2018
Number of shares in issue atthe end of the period
Number of shares in issue atthe beginning of the period
Number of sharessubscribed
Number of sharesredeemed
Statement of Changes in Number of Shares
B EUR A Cap - 38,323 - 38,323
B EUR I Cap - 7,665 - 7,665
B EUR P Cap - 1,333 - 1,333

PARETURN
103
Pareturn Santalucia Fonvalor* (in EUR)
The accompanying notes are an integral part of these financial statements.
Securities Portfolio as at March 31, 2018
AVIVA FONVALOR EURO-A EUR 6,833,909.35 96.86397,640
Funds
Investment fundsSpain
6,833,909.35 96.86
6,833,909.35 96.86
Total securities portfolio 6,833,909.35 96.86
NameQuantity/Nominal
Market valuein EUR
Currency %NAV
Summary of net assets%
NAV6,833,909.35 96.86Total securities portfolio
244,402.87 3.46Cash at bank and bank overdraft
(22,589.87) (0.32)Other assets and liabilities
7,055,722.35 100.00Total net assets
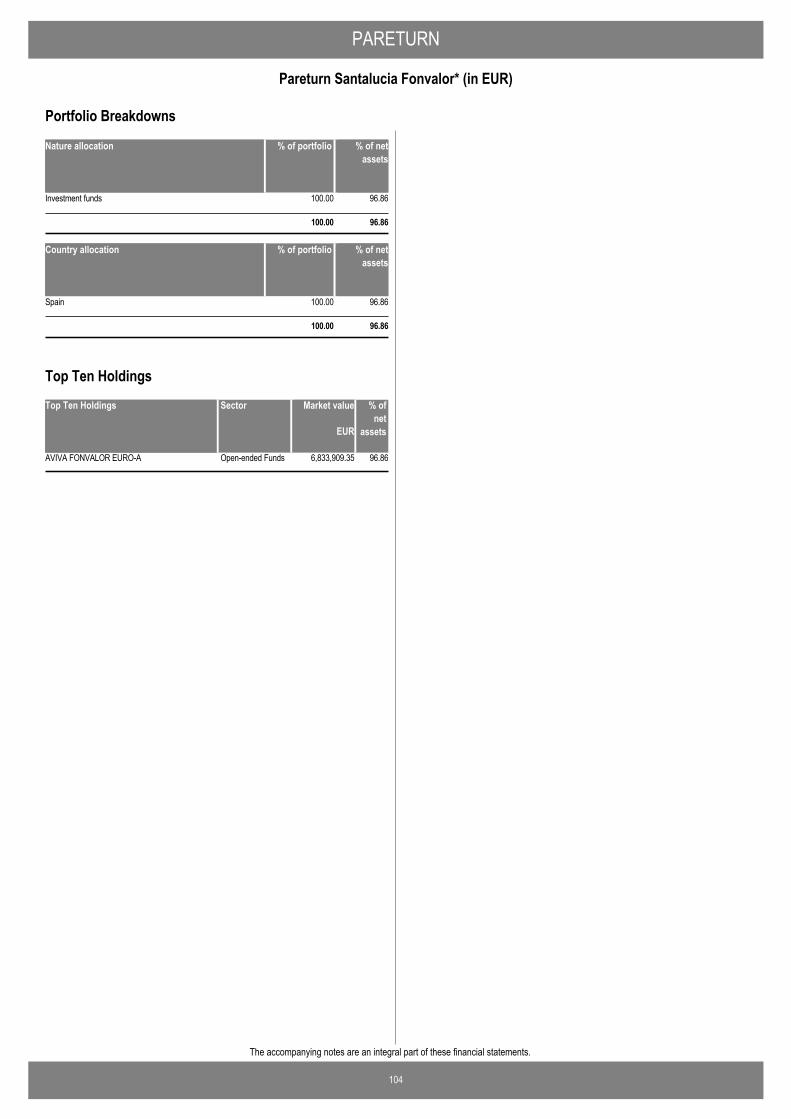
PARETURN
104
Pareturn Santalucia Fonvalor* (in EUR)
The accompanying notes are an integral part of these financial statements.
Nature allocation % of portfolio % of netassets
Investment funds 100.00 96.86
100.00 96.86
Country allocation % of portfolio % of netassets
Spain 100.00 96.86
100.00 96.86
Portfolio Breakdowns
Top Ten Holdings Market value % ofnet
assets
AVIVA FONVALOR EURO-A 6,833,909.35 96.86Open-ended Funds
EUR
Sector
Top Ten Holdings

105
The accompanying notes are an integral part of these financial statements.
PARETURN
Pareturn Imantia USD Global High Yield Bond (in USD)Statement of Operations and Changes in Net Assets for theperiod ended March 31, 2018
USD
AssetsInvestment in securities at cost 36,284,687.83Unrealised appreciation / (depreciation) on securities (933,717.48)
Investment in securities at market value 3.3 35,350,970.35Cash at bank 3,467,313.07Dividends and interest receivable 479,540.76
Total assets 39,297,824.18
LiabilitiesAccrued expenses 135,052.98Payable on redemption 99,426.03Net unrealised depreciation on futures contracts 3.5 56,250.96Other liabilities 58.25
Total liabilities 290,788.22
Net assets at the end of the period 39,007,035.96
Notes
Statement of Net Assets as at March 31, 2018
IncomeInterest on bonds (net of withholding taxes) 3.8 871,754.12Bank interest 3.8 20,668.00Other income 12 3,770.77
Total income 896,192.89
ExpensesInvestment advisory fees and management fees 4 236,547.68Depositary fees 19,550.52Administration fees 19,029.54Professional fees 10,632.90Transaction costs 9 1,523.95Taxe d'abonnement 5 9,799.48Bank interest and charges 4,888.17Agent association fees 1,752.08Other expenses 13 25,151.37
Total expenses 328,875.69
Net investment income / (loss) 567,317.20
Net realised gain / (loss) on: Sales of Investments 3.9 74,792.49Foreign exchange transactions 3.2 6,053.86Futures contracts 3.5 229,549.23
Net realised gain / (loss) for the period 877,712.78
Net change in unrealised appreciation / (depreciation) on: Investments 3.9 (1,063,290.68)Futures contracts 3.5 (68,500.96)
Increase / (Decrease) in net assets as a result ofoperations
(254,078.86)
Proceeds received on subscription of shares 13,857,808.76Net amount paid on redemption of shares (2,387,901.04)Net assets at the beginning of the period 27,791,207.10
Net assets at the end of the period 39,007,035.96
USDNotes
Statement of Operations and Changes in Net Assets forthe period ended March 31, 2018
Number of shares in issue atthe end of the period
Number of shares in issue atthe beginning of the period
Number of sharessubscribed
Number of sharesredeemed
Statement of Changes in Number of Shares
B USD R Cap 2,749,132 1,362,609 (235,994) 3,875,747
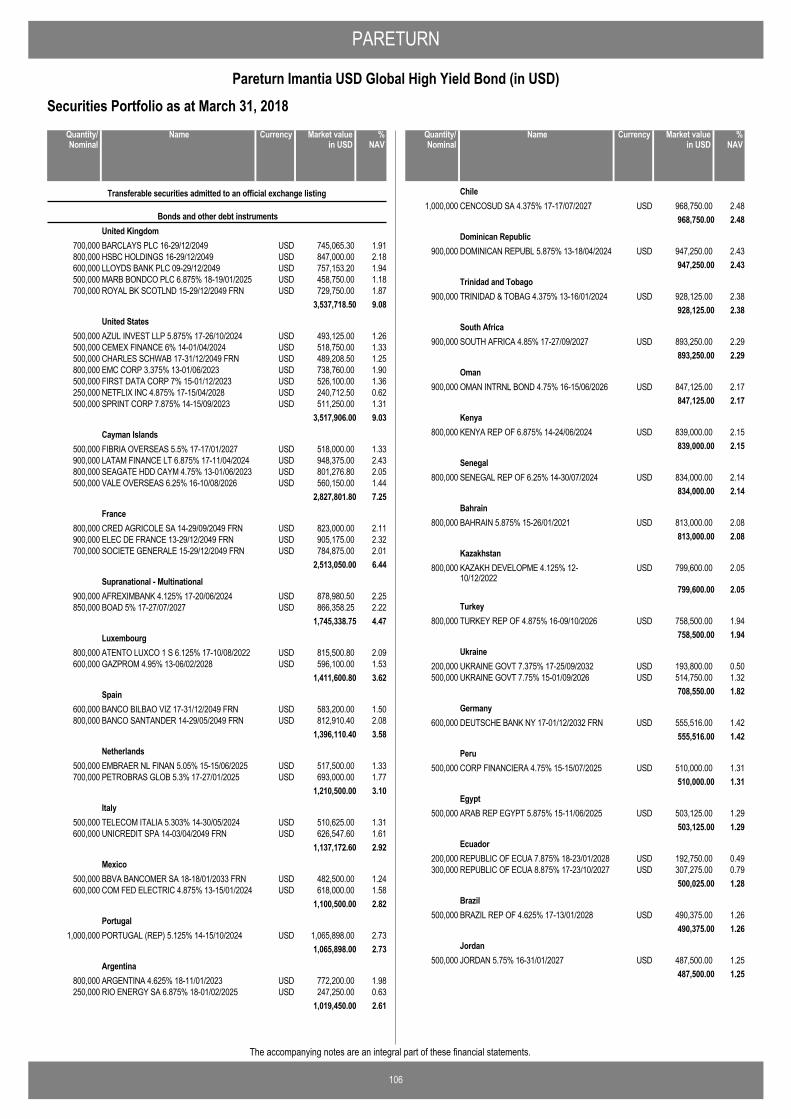
PARETURN
106
Pareturn Imantia USD Global High Yield Bond (in USD)
The accompanying notes are an integral part of these financial statements.
Securities Portfolio as at March 31, 2018
BARCLAYS PLC 16-29/12/2049 USD 745,065.30 1.91700,000
Transferable securities admitted to an official exchange listing
Bonds and other debt instrumentsUnited Kingdom
HSBC HOLDINGS 16-29/12/2049 USD 847,000.00 2.18800,000LLOYDS BANK PLC 09-29/12/2049 USD 757,153.20 1.94600,000MARB BONDCO PLC 6.875% 18-19/01/2025 USD 458,750.00 1.18500,000ROYAL BK SCOTLND 15-29/12/2049 FRN USD 729,750.00 1.87700,000
3,537,718.50 9.08
AZUL INVEST LLP 5.875% 17-26/10/2024 USD 493,125.00 1.26500,000United States
CEMEX FINANCE 6% 14-01/04/2024 USD 518,750.00 1.33500,000CHARLES SCHWAB 17-31/12/2049 FRN USD 489,208.50 1.25500,000EMC CORP 3.375% 13-01/06/2023 USD 738,760.00 1.90800,000FIRST DATA CORP 7% 15-01/12/2023 USD 526,100.00 1.36500,000NETFLIX INC 4.875% 17-15/04/2028 USD 240,712.50 0.62250,000SPRINT CORP 7.875% 14-15/09/2023 USD 511,250.00 1.31500,000
3,517,906.00 9.03
FIBRIA OVERSEAS 5.5% 17-17/01/2027 USD 518,000.00 1.33500,000Cayman Islands
LATAM FINANCE LT 6.875% 17-11/04/2024 USD 948,375.00 2.43900,000SEAGATE HDD CAYM 4.75% 13-01/06/2023 USD 801,276.80 2.05800,000VALE OVERSEAS 6.25% 16-10/08/2026 USD 560,150.00 1.44500,000
2,827,801.80 7.25
CRED AGRICOLE SA 14-29/09/2049 FRN USD 823,000.00 2.11800,000France
ELEC DE FRANCE 13-29/12/2049 FRN USD 905,175.00 2.32900,000SOCIETE GENERALE 15-29/12/2049 FRN USD 784,875.00 2.01700,000
2,513,050.00 6.44
AFREXIMBANK 4.125% 17-20/06/2024 USD 878,980.50 2.25900,000Supranational - Multinational
BOAD 5% 17-27/07/2027 USD 866,358.25 2.22850,0001,745,338.75 4.47
ATENTO LUXCO 1 S 6.125% 17-10/08/2022 USD 815,500.80 2.09800,000Luxembourg
GAZPROM 4.95% 13-06/02/2028 USD 596,100.00 1.53600,0001,411,600.80 3.62
BANCO BILBAO VIZ 17-31/12/2049 FRN USD 583,200.00 1.50600,000Spain
BANCO SANTANDER 14-29/05/2049 FRN USD 812,910.40 2.08800,0001,396,110.40 3.58
EMBRAER NL FINAN 5.05% 15-15/06/2025 USD 517,500.00 1.33500,000Netherlands
PETROBRAS GLOB 5.3% 17-27/01/2025 USD 693,000.00 1.77700,0001,210,500.00 3.10
TELECOM ITALIA 5.303% 14-30/05/2024 USD 510,625.00 1.31500,000Italy
UNICREDIT SPA 14-03/04/2049 FRN USD 626,547.60 1.61600,0001,137,172.60 2.92
BBVA BANCOMER SA 18-18/01/2033 FRN USD 482,500.00 1.24500,000Mexico
COM FED ELECTRIC 4.875% 13-15/01/2024 USD 618,000.00 1.58600,0001,100,500.00 2.82
PORTUGAL (REP) 5.125% 14-15/10/2024 USD 1,065,898.00 2.731,000,000Portugal
1,065,898.00 2.73
ARGENTINA 4.625% 18-11/01/2023 USD 772,200.00 1.98800,000Argentina
RIO ENERGY SA 6.875% 18-01/02/2025 USD 247,250.00 0.63250,0001,019,450.00 2.61
NameQuantity/Nominal
Market valuein USD
Currency %NAV
CENCOSUD SA 4.375% 17-17/07/2027 USD 968,750.00 2.481,000,000Chile
968,750.00 2.48
DOMINICAN REPUBL 5.875% 13-18/04/2024 USD 947,250.00 2.43900,000Dominican Republic
947,250.00 2.43
TRINIDAD & TOBAG 4.375% 13-16/01/2024 USD 928,125.00 2.38900,000Trinidad and Tobago
928,125.00 2.38
SOUTH AFRICA 4.85% 17-27/09/2027 USD 893,250.00 2.29900,000South Africa
893,250.00 2.29
OMAN INTRNL BOND 4.75% 16-15/06/2026 USD 847,125.00 2.17900,000Oman
847,125.00 2.17
KENYA REP OF 6.875% 14-24/06/2024 USD 839,000.00 2.15800,000Kenya
839,000.00 2.15
SENEGAL REP OF 6.25% 14-30/07/2024 USD 834,000.00 2.14800,000Senegal
834,000.00 2.14
BAHRAIN 5.875% 15-26/01/2021 USD 813,000.00 2.08800,000Bahrain
813,000.00 2.08
KAZAKH DEVELOPME 4.125% 12-10/12/2022
USD 799,600.00 2.05800,000Kazakhstan
799,600.00 2.05
TURKEY REP OF 4.875% 16-09/10/2026 USD 758,500.00 1.94800,000Turkey
758,500.00 1.94
UKRAINE GOVT 7.375% 17-25/09/2032 USD 193,800.00 0.50200,000Ukraine
UKRAINE GOVT 7.75% 15-01/09/2026 USD 514,750.00 1.32500,000708,550.00 1.82
DEUTSCHE BANK NY 17-01/12/2032 FRN USD 555,516.00 1.42600,000Germany
555,516.00 1.42
CORP FINANCIERA 4.75% 15-15/07/2025 USD 510,000.00 1.31500,000Peru
510,000.00 1.31
ARAB REP EGYPT 5.875% 15-11/06/2025 USD 503,125.00 1.29500,000Egypt
503,125.00 1.29
REPUBLIC OF ECUA 7.875% 18-23/01/2028 USD 192,750.00 0.49200,000Ecuador
REPUBLIC OF ECUA 8.875% 17-23/10/2027 USD 307,275.00 0.79300,000500,025.00 1.28
BRAZIL REP OF 4.625% 17-13/01/2028 USD 490,375.00 1.26500,000Brazil
490,375.00 1.26
JORDAN 5.75% 16-31/01/2027 USD 487,500.00 1.25500,000Jordan
487,500.00 1.25
NameQuantity/Nominal
Market valuein USD
Currency %NAV

PARETURN
107
Pareturn Imantia USD Global High Yield Bond (in USD)
The accompanying notes are an integral part of these financial statements.
Securities Portfolio as at March 31, 2018
SOFTBANK GRP COR 4.75% 17-19/09/2024 USD 484,232.50 1.24500,000Japan
484,232.50 1.24
35,350,970.35 90.63
Total securities portfolio 35,350,970.35 90.63
NameQuantity/Nominal
Market valuein USD
Currency %NAV
US 5YR NOTE FUTURE (CBT)29/06/2018
USD 13,735,312.56(120) (56,250.96)
Futures contracts
(56,250.96)
Total Futures (56,250.96)
NameQuantity Commitmentin USD
Currency Unrealisedappreciation /(depreciation)
in USD
Financial derivative instruments as at March 31, 2018
Total financial derivative instruments (56,250.96)
Summary of net assets
(56,250.96) (0.14)Total financial derivative instruments
%NAV
35,350,970.35 90.63Total securities portfolio
3,467,313.07 8.89Cash at bank and bank overdraft
245,003.50 0.62Other assets and liabilities
39,007,035.96 100.00Total net assets
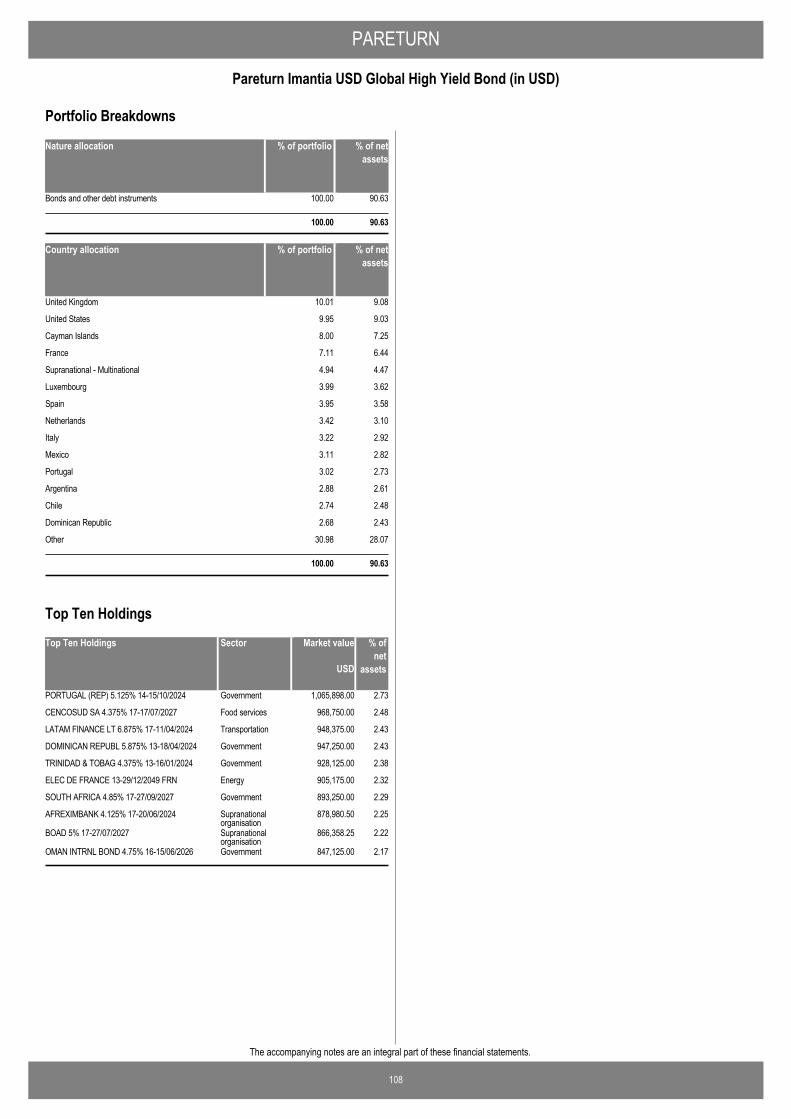
PARETURN
108
Pareturn Imantia USD Global High Yield Bond (in USD)
The accompanying notes are an integral part of these financial statements.
Nature allocation % of portfolio % of netassets
Bonds and other debt instruments 100.00 90.63
100.00 90.63
Country allocation % of portfolio % of netassets
United Kingdom 10.01 9.08
United States 9.95 9.03
Cayman Islands 8.00 7.25
France 7.11 6.44
Supranational - Multinational 4.94 4.47
Luxembourg 3.99 3.62
Spain 3.95 3.58
Netherlands 3.42 3.10
Italy 3.22 2.92
Mexico 3.11 2.82
Portugal 3.02 2.73
Argentina 2.88 2.61
Chile 2.74 2.48
Dominican Republic 2.68 2.43
Other 30.98 28.07
100.00 90.63
Portfolio Breakdowns
Top Ten Holdings Market value % ofnet
assets
PORTUGAL (REP) 5.125% 14-15/10/2024 1,065,898.00 2.73Government
CENCOSUD SA 4.375% 17-17/07/2027 968,750.00 2.48Food services
LATAM FINANCE LT 6.875% 17-11/04/2024 948,375.00 2.43Transportation
DOMINICAN REPUBL 5.875% 13-18/04/2024 947,250.00 2.43Government
TRINIDAD & TOBAG 4.375% 13-16/01/2024 928,125.00 2.38Government
ELEC DE FRANCE 13-29/12/2049 FRN 905,175.00 2.32Energy
SOUTH AFRICA 4.85% 17-27/09/2027 893,250.00 2.29Government
AFREXIMBANK 4.125% 17-20/06/2024 878,980.50 2.25Supranationalorganisation
BOAD 5% 17-27/07/2027 866,358.25 2.22Supranationalorganisation
OMAN INTRNL BOND 4.75% 16-15/06/2026 847,125.00 2.17Government
USD
Sector
Top Ten Holdings

PARETURN Notes to the Financial Statements as at March 31, 2018 Note 1. General information The Company's articles of association were published in the Mémorial C, Recueil des Sociétés et Associations (hereafter “Mémorial”) on April 29, 1994 after being filed, on April 1, 1994, with the Clerk of the District Court of Luxembourg where they may be examined and copies may be obtained against payment of a fee. Following the Extraordinary General Meeting of August 17, 2005, the Company was brought into compliance with the amended law of December 20, 2002 on Undertakings for Collective Investment. These changes were published in the Mémorial C on September 2, 2005. Further amendments in the articles of association were published in the Mémorial C on August 13, 2010 and on December 18, 2015. Since July 1, 2011 the Company is subject to the provisions of Part I of the amended law of December 17, 2010 (the “Law”) relating to Undertakings for Collective Investment in Transferable Securities. The Company is registered on the Luxembourg Trade Register under number B - 47 104. MDO Management Company S.A. (the "MDO Management Company" or the “Management Company”) is a company incorporated in Luxembourg as a société anonyme on 2 August 2013 for an undetermined period of time and the latest revision of the articles of association were published in the official gazette of the Grand Duchy of Luxembourg Mémorial C, Recueil des Sociétés et Associations (hereinafter referred to as “Mémorial”) in Luxembourg on 2 August 2014. Its fully paid-up share capital amounts to EUR 1,700,000. The Management Company is registered with the Luxembourg Trade and Companies Register under number B 96744 and is approved as a management company under Chapter 15 of the Law. As at March 31, 2018, the Company has the following active sub-funds: - Pareturn Best Selection - Pareturn Best Selection Side - Pocket - Pareturn Croissance 2000 - Pareturn Cartesio Equity - Pareturn Cartesio Income - Pareturn Stamina Systematic - Pareturn Mutuafondo Global Fixed Income - Pareturn Barwon Listed Private Equity - Pareturn Global Balanced Unconstrained - Pareturn Cervino World Investments - Pareturn Entheca Patrimoine - Pareturn Ataun - Pareturn Invalux Fund - Pareturn Gladwyne Absolute Credit - Pareturn Mutuafondo España Lux - Pareturn EtendAR - Pareturn GVC Gaesco Patrimonial Fund - Pareturn GVC Gaesco Euro Small Caps Equity Fund - Pareturn GVC Gaesco Absolute Return Fund - Pareturn Diversified Fund - Pareturn Security Latam Corporate Debt - Pareturn Rivendale - Pareturn Fidelius Global - Pareturn Imantia USD Global High Yield - Pareturn Santalucia Espabolsa (launched on November 14, 2017) - Paretunr Santalucia Fonvalor (launched on November 14, 2017) The following sub-funds have been merged during the period ended: - Pareturn Stamina Systematic Plus (merged into Echiquier Patrimoine – Quantostars (French FCP) on November 30, 2017) - Pareturn Mapfre Euro Bonds Fund (merged into Mapfre AM - Euro Bonds Fund on November 24, 2017) Additionnally, Pareturn EtendAR has been put into liquidation effective March 26, 2018.
109
PARETURN Notes to the Financial Statements as at March 31, 2018 (continued) Note 2. Shares of the Company The Company may issue shares of the following share classes:
(i) distribution shares (shares of Class “A” or “A shares”) which receive an annual dividend and the Net Asset Value of which is reduced by an amount equal to that distributed amount,
(ii) capitalisation shares (shares of Class “B” or “B shares”), which do not receive a dividend and of which the Net Asset Value remains unchanged (resulting in the percentage of the global Net Assets Value attributable to the shares of Class B).
The Company may issue shares of the following categories: (i) the “Retail” categories, “R”, “R1” and “P” which are open to all type of investors, (ii) the “Institutional” categories “A”, “I”, “G” and “U” which are exclusively reserved for institutional investors, (iii) the "S", "T", and "Others" categories which are subject to any other rate of Delegate Manager's Fees.
(iv) the "M" category which is reserved for institutional investors like Discretionary Portfolio Managers and Financial Managers of UCITS/UCI.
(v) the “F” category which is available for both retail investors and institutional investors,
(vi) the “l1” and “l2” categories are both reserved to institutional investors. These two categories are distinct by different structure fee as specified in the relevant particulars of the sub-fund.
(vii) the “Z” category is only available to investors who have entered into a separate agreement with investment services providers which, according to regulatory requirements, are not allowed to accept and keep trail commissions (in the European Economic Area, this shall include investment services providers providing discretionary portfolio management or investment advice on an independent basis on a fee-based relationship); and institutional investors exclusively investing on their own account which meet any of the categories of Eligible Counterparty/Professional Investor defined by letters a) to f) (inclusive) for paragraph I.1 of Annex II of Directive 2014/65/EU of the European Parliament and of the Council of 15 May 2014 (MIFID II).
Note 3. Significant accounting principles The financial statements of the Company are presented in accordance with Luxembourg regulations relating to Undertakings for Collective Investment in transferable securities (UCITS). They are prepared in accordance with accounting policies generally accepted in Luxembourg. 1) Combination of the different sub-funds The combined financial statements of the Company are expressed in euro and are equal to the sum of the corresponding accounts in the financial statements of each sub-fund converted into euro at the exchange rate prevailing at the end of the financial year. 2) Currency conversion The accounts of each sub-fund are kept in the currency of its net asset value and the financial statements are expressed in the same currency. The acquisition cost of securities purchased in a currency other than that of the sub-fund is converted into the currency of the sub-fund on the basis of the exchange rates prevailing on the date on which the securities are acquired. Income and expenses denominated in a currency other than that of the sub-fund are converted into the currency of the sub-fund on the basis of the exchange rates prevailing on the transaction date. At the closing date of the financial year, the security valuations (determined as described below), receivables, bank deposits and debts denominated in a currency other than that of the sub-fund are converted into the currency of the sub-fund on the basis of the exchange rates prevailing at that date; the foreign exchange differences resulting from the conversion of receivables, bank deposits and debts are included in the net realised gain/loss on foreign exchange transactions in the Statement of Operations and Changes in Net Assets for the financial period. 3) Valuation of investments The valuation of transferable securities and money market instruments listed or traded on an official stock market or other regulated market which operates regularly and is recognised and open to the public, is based on the last known price and if that transferable security / money market instrument is traded on several markets, on the basis of the last known price on the principal market for that security or instrument. If the last known price is not representative, the valuation is based on the probable realisation value estimated with prudence and in good faith by the Board of Directors of the Company. Securities and money market instruments not listed or traded on an official stock exchange or on another regulated market which operates regularly and are recognised and open to the public is valued on the basis of their probable sale price as estimated in accordance with the principle of prudence and good faith by the Board of Directors of the Company. The shares/units of UCITS and/or other UCI are valued at their last known Net Asset Value per share/unit. All other securities and assets are valued at their market value determined in good faith, in accordance with the procedures established by the Board of Directors of the Company. All other asset balances are valued on the basis of their probable realisation price, as estimated prudently and in accordance with the principle of prudence and good faith by the Board of Directors of the Company.
110
PARETURN Notes to the Financial Statements as at March 31, 2018 (continued) Note 3. Significant accounting principles (continued) 4) Valuation of forward foreign exchange contracts Forward foreign exchange contracts are valued on the basis of the forward exchange rate corresponding to the residual maturity of the contract. All realised gains or losses and net changes in unrealised appreciations or depreciations are included in the Statement of Operations and Changes in Net Assets. Regarding the calculation of net positions per currency, the positions are converted at the exchange rates prevailing on the closing date of the financial period. 5) Valuation of Futures and Options contracts The liquidation value of futures and options contracts not traded on regulated markets is equal to their net liquidation value as determined in accordance with the policies adopted by the Board of Directors of the Company on the basis of a method applied consistently to each type of contract. The liquidation value of futures or options contracts traded on regulated markets is based on the last available settlement price of these contracts on the regulated markets on which they are traded by the Company; insofar as a futures or options contract cannot be liquidated on the day on which the net assets are valued, the Board of Directors of the Company will determine the basis to be used to calculate the liquidation value of said contract in a fair and reasonable manner. Realised gains or losses and the net change in unrealised appreciation or depreciation are included in the Statement of Operations and Changes in Net Assets. 6) Valuation of swaps Swaps on indices or financial instruments shall be valued at their market value established by reference to the index of the financial instrument concerned. The valuation of swap contracts relating to those indices or financial instruments shall be based on the market value of those swap transactions in accordance with the procedures established by the Board of Directors of the Company. Credit default swaps are valued in a reliable and verifiable manner on a daily basis and verified by a competent professional appointed by the Board of Directors of the Company. Realised gains or losses and the net change in unrealised appreciation or depreciation are included in the Statement of Operations and Changes in Net Assets. The fund did not invest into swap positions during the period ended at March 31, 2018. 7) Formation expenses Formation expenses are amortised on a linear basis over a five-year period. 8) Investment income Dividends are recorded on ex-date. Interest is recorded pro rata temporis at the time of each net asset value calculation. Dividends and interest are recorded net of any non-recoverable withholding tax. 9) Net realised gains/losses on sales of investments Gains and losses realised on the sale of securities are determined on the basis of the average acquisition cost. 10) Contracts for Difference ("CFD") Contracts for Difference ("CFD") are over-the-counter financial instruments which allow an investor to take advantage of the share price movements without having to hold such shares or to manage the holding constraints (custody, financing, loan for shorts). Indeed, a "CFD" is a contract entered into between two parties to exchange, at the end of this contract, the difference between the opening and the closing prices of the contract, multiplied by the number of units of the underlying asset as specified in the contract. The settlement of these differences is completed through a cash payment, not through a physical delivery of the underlying assets. Contracts for Difference are valued at their market value according to the closing price of the underlying securities on the valuation day. The market value of the corresponding line indicates the difference between the market value and the strike price of the underlying securities. Realised gains or losses and the net change in unrealised appreciations or depreciations are presented in the Statement of Operations and Changes in Net Assets. 11) Translation difference The combined financial statements of PARETURN are expressed in euro (EUR) by converting the financial statements of sub-funds denominated in currencies other than euro at the exchange rate prevailing at the financial year end and adding the sub-funds. The difference mentioned above results from the conversion of the net assets at the beginning of the year (for the sub-funds denominated in currencies other than Euro) at exchange rates applicable on September 30, 2017 and exchange rates applicable on March 31, 2018. Note 4. Investment advisory, management and performance fees Pareturn Best Selection As remuneration for its services, the Delegate Investment Manager receives a fixed fee, calculated on the average of the net asset values of the sub-fund, of the category or class of shares, at the end of each quarter and payable quarterly as follows: - Category “S”: maximum 2% p.a. - Category “Retail”: maximum 1.5% p.a. - Category “Institutional”: maximum 1.% p.a. In addition, the Delegate Investment Manager receives a performance fee equal to 10% of the net annual performance of the sub-fund exceeding that of the EONIA capitalised index + 2%. This performance fee is calculated on each NAV calculation. In the event of a loss, any provisions are taken back up to the maximum of the account of previous provisions made to that effect. In the event of share redemptions, if a performance fee is calculated, the part proportional to the redeemed shares is taken in favour of the Delegate Investment Manager.
111

PARETURN Notes to the Financial Statements as at March 31, 2018 (continued) Note 4. Investment advisory, management and performance fees (continued) Any payment of the performance fee is made on the basis of the NAV calculated on September 30 of each financial year. The Sub-Fund may invest up to 10% if its assets in structured products (such as reverse convertibles, discount certificates etc.) in which the Delegate Investment Manager will have mandate related to the provision of investment management, structuring or other professional advice remunerated through an upfront fee charged to the issuer or the arranger of the structured product. Pareturn Best Selection Side - Pocket No fee is applied. Pareturn Croissance 2000 As remuneration for services provided, the Delegate Investment Manager receives a fixed fee, calculated on the average of the net asset values of the sub-fund, of the category or class of shares, at the end of each quarter and payable quarterly as follows: maximum 1% p.a. The fixed fee of the Delegate Investment Manager is included in the last applicable appendix to the aforementioned Delegate Investment Manager Agreement date March 4, 2011 signed between J.P. Morgan International Bank Limited and the Company’s management Company. Pareturn Cartesio Equity As compensation for its services the Delegate Investment Manager is entitled to the following commissions deducted from the net assets of the sub-fund a Delegate Investment Manager’s Fee payable in advance on a quarterly basis and calculated on the basis of the average net assets of the sub-fund for the previous quarter of: - Category “I” : maximum 1.5% p.a. - Category “Z” : maximum 0.75% p.a. Pareturn Cartesio Income As compensation for its services the Delegate Investment Manager is entitled to the following commissions deducted from the net assets of the sub-fund a Delegate Investment Manager’s Fee payable in advance on a quarterly basis and calculated on the basis of the average net assets of the sub-fund for the previous quarter of: - Category “I”: maximum 0.95% p.a. - Category “Z”: maximum 0.50% p.a. Pareturn Stamina Systematic As remuneration for services provided, the Delegate Investment Manager receives a fixed fee, calculated on the average of the net asset values of the sub-fund, of the category or class of shares, over the past month and payable on a monthly basis as follows: - Category “F”: maximum 1.65% p.a. A performance fee corresponding to 15% of the positive difference between the performance of each of the sub-fund’s categories and the performance of the 1M Euribor index since the previous closing date, applied to the category’s daily net assets. As for investments in a UCITS or other UCIs, total Delegate Investment Manager’s Fees charged to the Sub-Fund as well as to each UCITS or other UCIs concerned may not exceed 5% of the NAV of the Sub-Fund. Pareturn Stamina Systematic Plus (merged on November 30, 2017) As remuneration for services provided, the Delegate Investment Manager receives a fixed fee, calculated on the average of the net asset values of the sub-fund, of the category or class of shares, over the past month and payable on a monthly basis as follows: - Category “F”: maximum 1.80% p.a. A performance fee corresponding to 15% of the positive difference between the performance of each of the sub-fund’s categories and the performance of the 1M Euribor index since the previous closing date, applied to the category’s daily net assets. As for investments in a UCITS or other UCIs linked to the Sub-Fund, total Delegate Investment Manager’s Fees charged to the Sub-Fund as well as to each UCITS or other UCIs concerned may not exceed 5% of the NAV of the Sub-Fund. Pareturn Mutuafondo Global Fixed Income As remuneration for services provided, the Delegate Investment Manager receives a fixed fee, calculated on the average of the net asset values of the sub-fund, of the category or class of shares, over the past month and payable on a monthly basis as follows: - Category “P”: maximum 0.25% p.a. Pareturn Barwon Listed Private Equity As remuneration for its services, the Delegate Investment Manager receives an annual fee of maximum 0.65% calculated on the daily net asset values of the sub-fund, of the category or class of shares, and payable monthly in arrears. In addition, the Delegate Investment Manager receives a performance fee equal to 15% of any out-performance above the performance hurdle of 12% per annum payable on a semi-annual basis. The performance of the sub-fund is measured by the sub-fund’s daily unit price movement after fees and expenses. The fee is calculated and accrued daily and paid out of the Fund semi-annually. Any cumulative underperformance from the 24 months previous to the current performance fee calculation period (or lesser period if the period since the sub-fund’s first offering is less than 30 months) must be earned back before any performance fee is payable.
112

PARETURN Notes to the Financial Statements as at March 31, 2018 (continued) Note 4. Investment advisory, management and performance fees (continued) Pareturn Global Balanced Unconstrained As remuneration for services provided, the Delegate Investment Manager will receive a fixed fee, calculated on the average of the net asset values of the Sub-Fund, of the category or class of shares, at the end of each quarter and payable quarterly as follows: - Category “P”: maximum 0.25% p.a. Pareturn Cervino World Investments As compensation for its services the Delegate Investment Manager is entitled to the following commissions deducted from the net asset of the sub-fund: A Delegate Investment Manager’s Fee payable in advance on a quarterly basis and calculated on the basis of the average net assets of the sub-fund for the previous quarter of: - Category “P”: 0.55% p.a. - Category “I” : 0.55% p.a. In addition, the Delegate Investment Manager receives a performance fee equal to 10% of the net annual performance of the sub-fund calculated against the NAV as of end of the previous year (adjusted by all subscriptions and redemptions) if the Sub-Fund performance exceeds the performance of the EURIBOR index + 6%. The NAV after performance fees would be capped to prevent the NAV after performance fee to decrease below the hurdle. This performance fee is calculated on each NAV calculation. In the event of a loss, any provisions is taken back up to the maximum of the account for previous provisions made to that effect. In the event of share redemptions, if a performance fee is calculated, the part proportional to the redeemed shares is taken in favour of the Delegate Investment Manager. Any payment of the performance fee is made at the close and on the basis of the NAV calculated on 30 September of each financial year. No high watermark is used. EURIBOR 1 Week: EUR001W Index. As for investments in a UCITS or other UCIs, total Delegate Investment Manager’s Fees charged to the Sub-Fund as well as to each UCITS or other UCIs concerned may not exceed 2% of the NAV of the Sub-Fund. Pareturn Entheca Patrimoine As remuneration for its services, the Delegate Investment Manager receives an annual fee calculated on the net asset values of the sub-fund, of the category or class of shares, payable monthly in arrears of: - Category “R” : maximum 1.30% p.a. - Category “I” : maximum 0.70% p.a. As for investments in a UCITS or other UCIs, total Delegate Investment Manager's fees charged to the sub-fund as well as to each UCITS or other UCIs concerned may not exceed 3% of the NAV of the sub-fund. Moreover, for both classes of shares, the delegated Investment Manager is entitled to receive a performance fee, as described as follows: For Class “R”: The positive difference between the annual performance of the share class (i.e. over the accounting year) and the hurdle rate (this is a fixed rate equal to 5%). This fee amounted to 15% above the hurdle rate is payable to the Delegated Manager. The performance fee will be calculated and provision will be adjusted on each Valuation Day during the financial year with the application of the hurdle rate method. Performance fees becomes payable to the Delegated Manager, after deducting any performance fee. Performance fee will be accrued if the performance of the share class of the sub-fund exceeds the hurdle rate. In case of redemption, the performance fee accrued (if any) attributable to shares redeemed within the financial year, will be crystallized and paid to the Delegated Manager. The performance fees will be paid in an annual basis. For Class “I”: The positive difference between the annual performance of the share class (i.e. over the accounting year) and the hurdle rate (this is a fixed rate equal to 6%). This fee, amounted to 10% above the hurdle rate and capped to 35% of the Delegate Investment Manager’s Fees applicable to the relevant share class, is payable to the Delegated Manager. The performance fee will be calculated and provision will be adjusted on each Valuation Day during the financial year with the application of the “high water mark with hurdle rate” method. Hurdle rate means the performance of a reference index (or other references) as specified at the level of the share class whereas high water mark means the highest NAV of the share class as at the end of any previous financial year on which performance fees becomes payable to Delegated Manager, after deducting any performance fee. Performance fee will be accrued if the performance of the share class exceeds the hurdle rate and the high water mark. In case of redemption, the performance fee accrued (if any) attributable to shares redeemed within the financial year, will be crystallized and paid to the Delegated Manager. The performance fees will be paid in an annual basis.
113

PARETURN Notes to the Financial Statements as at March 31, 2018 (continued) Note 4. Investment advisory, management and performance fees (continued) Pareturn Ataun As remuneration for services provided, the Delegate Investment Manager receives a fixed fee, calculated on the average of the net asset values of the sub-fund, of the category or class of shares, at the end of each quarter and payable quarterly as follows: maximum 0.30% p.a.. Fees for distribution and marketing is a component of the Delegate Investment Manager’s Fees. Such fees may be paid out of the Delegate Investment Manager’s Fees or, alternatively, directly out of the assets of the sub-fund. As for investments in a UCITS or other UCIs, total management fees charged to the sub-fund as well as to each UCITS or other UCIs concerned may not exceed 3% of the NAV of the sub-fund.
Pareturn Invalux Fund As remuneration for its services, the Delegate Investment Manager receives an annual fee of 0.55%, calculated on the daily net asset values of the sub-fund, of the category or class of shares payable monthly in arrears. Pareturn Gladwyne Absolute Credit As remuneration for its services, the Delegate Investment Manager receives an annual fee of maximum 1.50% fee, calculated on the daily net asset values of the sub-fund, of the category or class of shares, payable monthly in arrears. The Delegated Manager will also be entitled to receive a Performance Fee from the Sub-Fund calculated on a Share-by-Share basis so that each Share is charged a Performance Fee which equates precisely with that Share’s performance. This method of calculation ensures that any Performance Fee paid to the Delegated Manager is charged only to those Shares which have appreciated in value, all holders of Shares of the same Class have the same amount of capital per Share at risk in the Sub-Fund, and all Shares of the same Class have the same Net Asset Value per Share. The Performance Fee in respect of each Share will be calculated in respect of each financial year (a “Calculation Period”). However, the first Calculation Period in respect of Euro Shares, US$ Shares and Sterling Shares will be the period which commences on the Business Day immediately following the close of the relevant Initial Offer Period and which ends on 30 September of the relevant year. The Performance Fee will be deemed to accrue on a monthly basis as at each Valuation Day. For each Calculation Period, the Performance Fee in respect of each Share will be equal to 20% of the appreciation in the Net Asset Value per Share of the relevant Class during that Calculation Period above the Base Net Asset Value per Share of that Class. The Base Net Asset Value per Share is the greater of the Net Asset Value per Share of the relevant Class at the time of issue of that Share and the highest Net Asset Value per Share of that Class achieved as at the end of any previous Calculation Period (if any) during which such Share was in issue. Pareturn Mutafondo España Lux As remuneration for its services, the Delegate Investment Manager receives an annual fee of 1.50% fee, calculated on the daily net asset values of the sub-fund, of the category or class of shares payable monthly in arrears. Pareturn EtendAR As remuneration for its services, the Delegate Investment Manager receives the following annual fees calculated on the daily net asset values of the sub-fund, of the category or class of shares, payable monthly in arrears. Category “P”: maximum 1.50% p.a. Category “I”: maximum 0.75% p.a. As for investments in a UCITS or other UCIs, total management fees charged to sub-fund as well as to each UCITS or other UCIs concerned may not exceed 5% for shares “P” and 4.25% for shares “I” of the NAV of the sub-fund. For each shares “P“ and “I“, the Delegate Investment Manager receives a performance fee equal to 10% of the net annual performance of the Sub-Fund exceeding 7%. This performance fee will be provisioned on each NAV calculation. In the event of a loss, any provisions will be taken back up to the maximum of the account for previous provisions made to that effect. In the event of share redemptions, if a performance fee is provisioned, the part proportional to the redeemed shares will be taken in favour of the Delegate Investment Manager. Pareturn GVC Gaesco Patrimonial Fund As remuneration for its services, the Delegate Investment Manager receives an annual management fee. The management fee for each class (as described below) is calculated on the daily net asset values of the Sub-Fund, of the category or class of shares, payable monthly in arrears. Category “U”: maximum 0.35% p.a. Category “G”: maximum 1.35% p.a. Category “I”: maximum 0.75% p.a. Pareturn GVC Gaesco Euro Small Caps Equity Fund As remuneration for its services, the Delegate Investment Manager receives an annual management fee. The management fee for each class (as described below) is calculated on the daily net asset values of the Sub-Fund, of the category or class of shares, payable monthly in arrears. Category “U”: maximum 0.35% p.a. Category “G”: maximum 1.35% p.a. Category “I”: maximum 0.75% p.a.
114

PARETURN Notes to the Financial Statements as at March 31, 2018 (continued)
Note 4. Investment advisory, management and performance fees (continued) Pareturn GVC Gaesco Absolute Return Fund As remuneration for its services, the Delegate Investment Manager receives an annual management fee. The management fee for each class (as described below) is calculated on the daily net asset values of the Sub-Fund, of the category or class of shares, payable monthly in arrears. Category “U”: maximum 1.35% p.a. Category “G”: maximum 1.35% p.a. Category “I”: maximum 0.75% p.a. In addition a performance fee will be paid to the Delegate Investment Manager for each shares “U”, “G” and “I”: 7% Yearly returns highwatermark. Pareturn Mapfre Euro Bonds Fund (merged on November 24, 2017) As remuneration for its services, the Delegate Investment Manager receives an annual fee of maximum 0.5% fee, calculated on the daily net asset values of the sub-fund, of the category or class of shares, payable monthly in arrears. Pareturn Diversified Fund As remuneration for its services, the Delegate Investment Manager receives an annual management fee. The management fee for each class is calculated on the daily net asset values of the Sub-Fund, of the category or class of shares, payable monthly in arrears. Category “I”: maximum 0.30% p.a. As for investments in a UCITS or other UCIs, total Delegate Investment Manager’s Fees charged to the Sub-Fund as well as to each UCITS or other UCIs concerned may not exceed 2% of the NAV of the Sub-Fund. Pareturn Security Latam Corporate Debt As remuneration for its services, the Delegate Investment Manager receives an annual management fee. The management fee for each class is calculated on the daily net asset values of the Sub-Fund, of the category or class of shares, payable monthly in arrears. Category “I”: maximum 0.70% p.a. Category “R”: maximum 1.50% p.a. Pareturn Rivendale As remuneration for its services, the Delegate Investment Manager receives an annual management fee. The management fee for each class is calculated on the daily net asset values of the Sub-Fund, of the category or class of shares, payable monthly in arrears. Category “R”: maximum 0.30% p.a. As for investments in a UCITS or other UCIs, total Delegate Investment Manager’s Fees charged to the Sub-Fund as well as to each UCITS or other UCIs concerned may not exceed 2% of the NAV of the Sub-Fund. Pareturn Fidelius Global As remuneration for its services, the Delegate Investment Manager receives an annual fee of maximum 0.30% fee, calculated on the daily net asset values of the Sub-Fund, of the category or class of shares, payable monthly in arrears. As for investments in a UCTIS or other UCIs, total Delegate Investment Manager’s Fees charged to the Sub-Fund as well as to each UCITS or other UCIs concerned may not exceed 3% of the NAV of the Sub-Fund. Pareturn Santalucia Espabolsa (Luxembourg) (launched on November 14, 2017) As remuneration for its services, the Delegate Manager will receive an annual fee calculated on the daily net asset values of the respective category or class of sahres, payable monthly in arrears. Category “P”: maximum 1.00% p.a. Category “I” : maximum 1.00% p.a. Category “A”: maximum 1.00% p.a. Pareturn Imantia USD Global High Yield Bond As remuneration for its services, the Delegate Manager will receive an annual fee up to 1.30% calculated on the daily net asset values of the Sub-Fund, of the category or class of shares, payable monthly in arrears. Pareturn Santalucia Fonvalor (launched on November 14, 2017) As remuneration for its services, the Delegate Manager will receive an annual fee calculated on the daily net asset values of the respective category or class of sahres, payable monthly in arrears. Category “P”: maximum 1.00% p.a. Category “I” : maximum 1.00% p.a. Category “A”: maximum 1.00% p.a.
115

PARETURN Notes to the Financial Statements as at March 31, 2018 (continued) Note 5. Taxe d'abonnement Pursuant to the legislation and regulations in force, the Company is subject to an annual taxe d’abonnement (subscription tax) of 0.01% for the “Institutional” category, “A”, “F”, “l1”, “l2”, “I”, “G” and “U” categories and 0.05% for the “Retail”, “F”, “S” , “P”, “R” and “Z” categories, calculated and payable quarterly on the basis of the total net assets of the Company at the end of the quarter in question. The value of assets represented by units held in other undertakings for collective investments is exempt from the taxe d’abonnement provided that such units have already been subject to the taxe d’abonnement. Note 6. Exchange rates at March 31, 2018 The exchange rates used in the conversion of the Company’s assets or liabilities denominated in currencies other than the Euro are:
1 Australian Dollar (AUD) = 0.623694 1 Mexican Peso (MXN) = 0.044545 1 Brazilian Real (BRL) = 0.244648 1 South African Commercial Rand (ZAR) = 0.068624 1 Canadian Dollar (CAD) = 0.630676 1 Pound Sterling (GBP) = 1.140641 1 Danish Krone (DKK) = 0.134156 1 Swedish Krona (SEK) = 0.097089 1 Hong Kong Dollar (HKD) = 0.103603 1 Swiss Franc (CHF) = 0.849112 1 Japanese Yen (JPY) = 0.007646 1 US Dollar (USD) = 0.813107 1 Norwegian Krone (NOK) = 0.103568
Note 7. Changes in the composition of the portfolios The report on changes in the composition of the portfolios for each sub-fund is available upon request and free of charge at the registered office of the Company. Note 8. Information relating to the Pareturn Best Selection and Pareturn Best Selection Side-Pocket sub-funds The Pareturn Best Selection sub-fund (the “Sub-fund”) is invested in the UCITS III Luxalpha SI American Sel B Fund (in liquidation). This SICAV, for which UBS (Luxembourg) S.A. is the custodian, paying agent and distributor, UBS Fund Services (Luxembourg) S.A., the administrative agent, and UBS Third Party Management Company S.A., the management company, as mentioned in the prospectus dated November 2008 (approved by the Commission de Surveillance du Secteur Financier on December 10, 2008), is impacted by the information issued by the US Securities and Exchange Commission (SEC) with regard to Bernard L. Madoff Investment Securities LLC and consequently is unable to provide a net asset value. Therefore, as of December 15, 2008, the net asset value (“NAV”) of the Sub-fund, (as well as subscriptions, redemptions and conversions), have been suspended. In order to offer liquidity to shareholders of the Sub-fund and in compliance with the provisions of the Company’s prospectus, the Board of Directors of the Company decided to create a “Side - Pocket” so as to isolate the illiquid assets (the UCITS III Luxalpha American Selection SICAV in liquidation) and resume the daily calculation of the NAV of the Sub-fund with effect from February 13, 2009. The side-pocket took the form of a new sub-fund of the Company named Pareturn Best Selection “Side - Pocket” (the “Side - Pocket” Sub-Fund). As the Pareturn Best Selection “Side - Pocket” sub-fund holds illiquid assets, it is closed to subscriptions, redemptions and conversions. Should these assets become liquid again, they will be redistributed to shareholders on a pro rata basis. The NAV of the Pareturn Best Selection “Side - Pocket” sub-fund is calculated at the end of each calendar quarter on the basis of the best estimates possible. The Board of Directors of the Company decided to value the illiquid assets at zero until such time as further information is available. In the event of the sale of the Side-Pocket’s investments, or the payment of interim dividends by the underlying fund in relation to a transaction or the result of any appeal or litigation, the Board of Directors of the Company may decide to carry out an additional NAV calculation in order to allow for the payment of interim dividends by the Pareturn Best Selection “Side - Pocket” sub-fund. A General Meeting was held on January 20, 2017 for Luxalpha American Selection SICAV (in liquidation), but no significant decision was taken for the concerned sub-fund until March 31, 2018.
116

PARETURN Notes to the Financial Statements as at March 31, 2018 (continued) Note 9. Transaction costs For the period ended March 31, 2018, the Company incurred transaction costs which have been defined as brokerage fees, certain taxes and certain depositary fees relating to the purchase and sale of transferable securities, money market instruments or other eligible assets. All these costs are included in the caption “Transaction costs” in the statement of operations and changes in net assets of each sub-fund. Transaction costs on bonds are included in the spread. Note 10. Master Feeder The Sub-Fund PARETURN MUTUAFONDO ESPAÑA LUX is a feeder fund of the master fund MUTUAFONDO ESPAÑA FI (the “Master Fund”). The Sub-Fund will invest more than 85% of its total net exposure in the Master Fund. The rest of the assets can be invested in cash (for ancillary purposes), deposits, repurchase agreement, current accounts, derivatives for hedging. The objective, the investment policy and the risk profile of the Feeder Sub-Fund and the Master Fund are similar. The performance of the Feeder Sub-Fund and the Master Fund are similar with the exception of the assets of the Feeder Sub-Fund which will not be invested in the Master Fund. The Feeder Sub-Fund may not invest more than 15% of its assets in the following elements: • ancillary liquid assets in accordance with Article 41, paragraph (2), second subparagraph of the 2010 Law; • financial derivative instruments which may be used only for hedging purposes, in accordance with Article 41 first paragraph, point g) and Article 42
second and third paragraphs of the 2010 Law. Investment Policy of the Master Fund: Management benchmark is the performance of the Ibex 35 index. The Master Fund invests over 60% of its total exposure in equity assets. The issuers of these equity assets are Spanish and Portuguese companies publicly quoted in these markets, with no restrictions regarding their market capitalisation. Investment in equity assets from Portuguese entities will not exceed 25% of total exposure. The Master Fund has no currency risk exposure. The Master Fund’s remaining non-equity exposure may be invested in repos on Spanish public debt, in deposits, and in non-traded liquid money market instruments issued by entities from OECD countries. These investments have a high rating (A-1 from S&P or equivalent rating from other rating agencies) or the rating of the Kingdom of Spain, if lower. The maximum average term for the fixed asset portfolio is 1 month. The Master Fund may invest up to 10% of its assets in financial collective investment schemes representing a suitable asset, whether harmonised or not and whether belonging to the Management Company’s Group or not. The Master Fund’s maximum exposure to market risk arising from the use of derivatives amounts to the Master Fund’s equity, with a cap of 60% for equity derivatives. As at March 31, 2018, the aggregate rate for the management fees of the Sub-Fund PARETURN MUTUAFONDO ESPANA LUX and the master fund MUTUAFONDO ESPANA FI is 2.00%. The Sub-Fund PARETURN MUTUAFONDO ESPAÑA LUX (the “Feeder”) invested EUR 32,148,817.15 in MUTUAFONDO ESPAÑA FI (the “Master Fund”) as at period end March 31, 2018. The Sub-Fund Santalucia Espabolsa (Luxembourg) is a feeder fund of the master fund Santalucia Espabolsa, FI (The “Master Fund”). The Sub-Fund will invest more than 90% of its total net exposure in the Master Fund. The rest of the assets will be invested in cash (for ancillary purposes), deposits repurchase agreement and current accounts in accordance with the 2010 Law. The objective, the investment policy and the risk profile of the Feeder Sub-Fund and the Master Fund are similar. The performance of the Feeder Sub-Fund and the Master Fund are similar with the exception of the assets of the Feeder Sub-Fund which will not be invested in the Master Fund. The Feeder Sub-Fund may not invest more than 10% of its assets in ancillary liquid assets in accordance with Article 41, paragraph (2), first sub-paragraph of the 2010 Law. Investment Policy of the Master Fund: Management benchmark is the performance of the IBEX 35 index. The Master Fund’s minimum exposure to equity will be 75% of total exposure. No less than 75% of the Master Fund’s exposure to equity will be invested in Spannish issuers. The remaining percentage of exposure to equity may occasionally be invested in European issuers and markets, both from within and without the Euro Zone. The Master Fund will invest in high, medium and small capitalization securities.
117
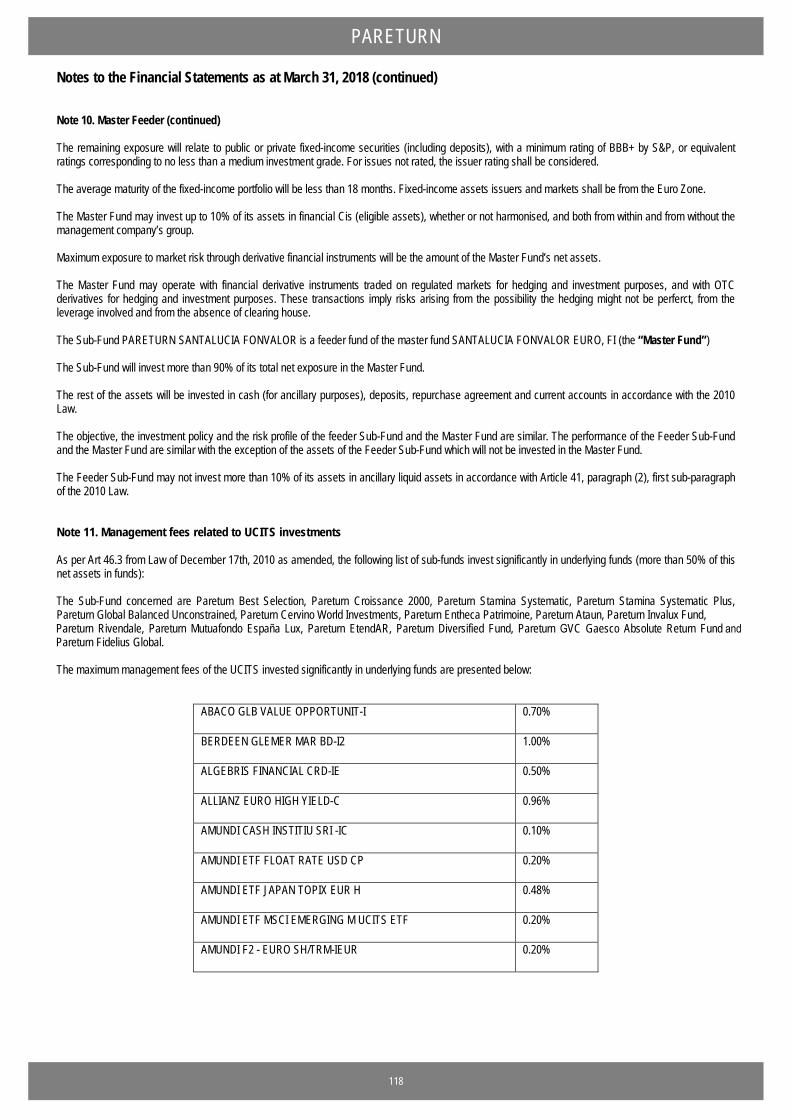
PARETURN Notes to the Financial Statements as at March 31, 2018 (continued) Note 10. Master Feeder (continued) The remaining exposure will relate to public or private fixed-income securities (including deposits), with a minimum rating of BBB+ by S&P, or equivalent ratings corresponding to no less than a medium investment grade. For issues not rated, the issuer rating shall be considered. The average maturity of the fixed-income portfolio will be less than 18 months. Fixed-income assets issuers and markets shall be from the Euro Zone. The Master Fund may invest up to 10% of its assets in financial Cis (eligible assets), whether or not harmonised, and both from within and from without the management company’s group. Maximum exposure to market risk through derivative financial instruments will be the amount of the Master Fund’s net assets. The Master Fund may operate with financial derivative instruments traded on regulated markets for hedging and investment purposes, and with OTC derivatives for hedging and investment purposes. These transactions imply risks arising from the possibility the hedging might not be perferct, from the leverage involved and from the absence of clearing house. The Sub-Fund PARETURN SANTALUCIA FONVALOR is a feeder fund of the master fund SANTALUCIA FONVALOR EURO, FI (the “Master Fund”) The Sub-Fund will invest more than 90% of its total net exposure in the Master Fund. The rest of the assets will be invested in cash (for ancillary purposes), deposits, repurchase agreement and current accounts in accordance with the 2010 Law. The objective, the investment policy and the risk profile of the feeder Sub-Fund and the Master Fund are similar. The performance of the Feeder Sub-Fund and the Master Fund are similar with the exception of the assets of the Feeder Sub-Fund which will not be invested in the Master Fund. The Feeder Sub-Fund may not invest more than 10% of its assets in ancillary liquid assets in accordance with Article 41, paragraph (2), first sub-paragraph of the 2010 Law. Note 11. Management fees related to UCITS investments As per Art 46.3 from Law of December 17th, 2010 as amended, the following list of sub-funds invest significantly in underlying funds (more than 50% of this net assets in funds): The Sub-Fund concerned are Pareturn Best Selection, Pareturn Croissance 2000, Pareturn Stamina Systematic, Pareturn Stamina Systematic Plus, Pareturn Global Balanced Unconstrained, Pareturn Cervino World Investments, Pareturn Entheca Patrimoine, Pareturn Ataun, Pareturn Invalux Fund, Pareturn Rivendale, Pareturn Mutuafondo España Lux, Pareturn EtendAR, Pareturn Diversified Fund, Pareturn GVC Gaesco Absolute Return Fund and Pareturn Fidelius Global. The maximum management fees of the UCITS invested significantly in underlying funds are presented below:
ABACO GLB VALUE OPPORTUNIT-I 0.70%
BERDEEN GLEMER MAR BD-I2 1.00%
ALGEBRIS FINANCIAL CRD-IE 0.50%
ALLIANZ EURO HIGH YIELD-C 0.96%
AMUNDI CASH INSTITIU SRI -IC 0.10%
AMUNDI ETF FLOAT RATE USD CP 0.20%
AMUNDI ETF JAPAN TOPIX EUR H 0.48%
AMUNDI ETF MSCI EMERGING M UCITS ETF 0.20%
AMUNDI F2 - EURO SH/TRM-IEUR 0.20%
118
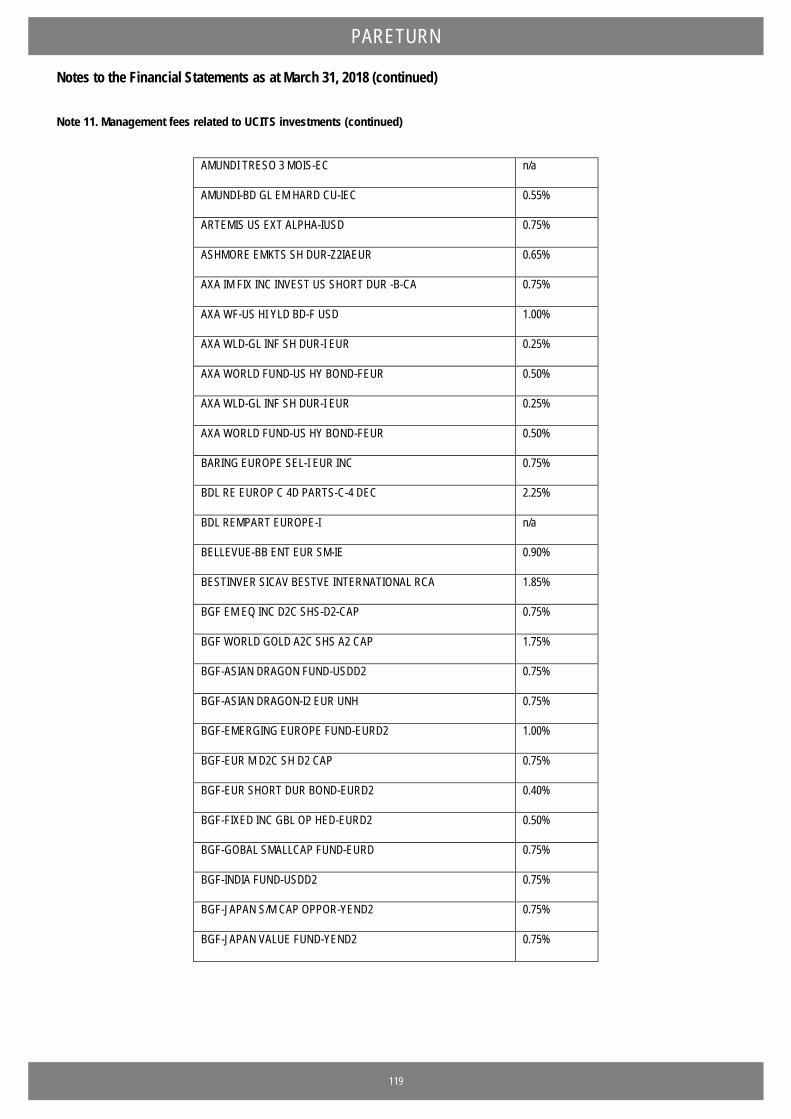
PARETURN Notes to the Financial Statements as at March 31, 2018 (continued)
Note 11. Management fees related to UCITS investments (continued)
AMUNDI TRESO 3 MOIS-EC n/a
AMUNDI-BD GL EM HARD CU-IEC 0.55%
ARTEMIS US EXT ALPHA-IUSD 0.75%
ASHMORE EMKTS SH DUR-Z2IAEUR 0.65%
AXA IM FIX INC INVEST US SHORT DUR -B-CA 0.75%
AXA WF-US HI YLD BD-F USD 1.00%
AXA WLD-GL INF SH DUR-I EUR 0.25%
AXA WORLD FUND-US HY BOND-FEUR 0.50%
AXA WLD-GL INF SH DUR-I EUR 0.25%
AXA WORLD FUND-US HY BOND-FEUR 0.50%
BARING EUROPE SEL-I EUR INC 0.75%
BDL RE EUROP C 4D PARTS-C-4 DEC 2.25%
BDL REMPART EUROPE-I n/a
BELLEVUE-BB ENT EUR SM-IE 0.90%
BESTINVER SICAV BESTVE INTERNATIONAL RCA 1.85%
BGF EM EQ INC D2C SHS-D2-CAP 0.75%
BGF WORLD GOLD A2C SHS A2 CAP 1.75%
BGF-ASIAN DRAGON FUND-USDD2 0.75%
BGF-ASIAN DRAGON-I2 EUR UNH 0.75%
BGF-EMERGING EUROPE FUND-EURD2 1.00%
BGF-EUR M D2C SH D2 CAP 0.75%
BGF-EUR SHORT DUR BOND-EURD2 0.40%
BGF-FIXED INC GBL OP HED-EURD2 0.50%
BGF-GOBAL SMALLCAP FUND-EURD 0.75%
BGF-INDIA FUND-USDD2 0.75%
BGF-JAPAN S/M CAP OPPOR-YEND2 0.75%
BGF-JAPAN VALUE FUND-YEND2 0.75%
119

PARETURN Notes to the Financial Statements as at March 31, 2018 (continued)
Note 11. Management fees related to UCITS investments (continued)
BGF-US DOLLAR CORE BOND-USDD2 0.45%
BGF-WORLD AGRICULTURE-D2 USD 1.00%
BGF-WORLD FINANCIAL D2C SHS-D2-CAP 0.75%
BGF-WORLD GOLD FUND-USDD2 1.00%
BLACKROCK GL-ASEAN LDR-DUSD 0.75%
BLACKSTONE DIVERS MS-IEURACC n/a
BLK ICS EUR USBF PREMIER 0.10%
BLUEBAY-EMER MKT CORP B-IEURP 0.80%
BNP INSTICASH-EUR-I 0.15%
BNP PARIBAS CAH INVEST - PARTS I CAP 0.20%
BNP PARIBAS MOIS ISR PARTS IC 3 DECIMALE 0.12%
BNPP FLEXI I US MORTGAGE ICA 0.30%
BOUSSARD&GAV ABS RET-Z EUR C 1.00%
CAMGESTION CONVERTBLE EUR-CL ACT 1.15%
CANDRIAM BDS HIGH YIELD CL.I C 0.60%
CARMIGNAC SECUR A EUR 3D PARTS 0.80%
CENTIFOLIA PARTS C DE CAP 2.39%
COMGEST GROWTH EME MKT-E RZA 1.05%
COMGEST GROWTH JPN-EUR I ACC 0.85%
COMGEST MONDE-I 1.00%
CONSTANCE BE AMERICA-I 1.20%
CS FUND ASIA CRP BOND-BHEUR 1.10%
DBPI4 SYS AI SHS I1C-E-CAPITALISATION 0.85%
DBX MSCI EU SMALL CAP (DR) 0.45%
DBX MSCI JAPAN EUR 0.50%
DNCA INVEST - EUROSE-I 0.70%
DNCA INVEST - MIURA-I 1.00%
120
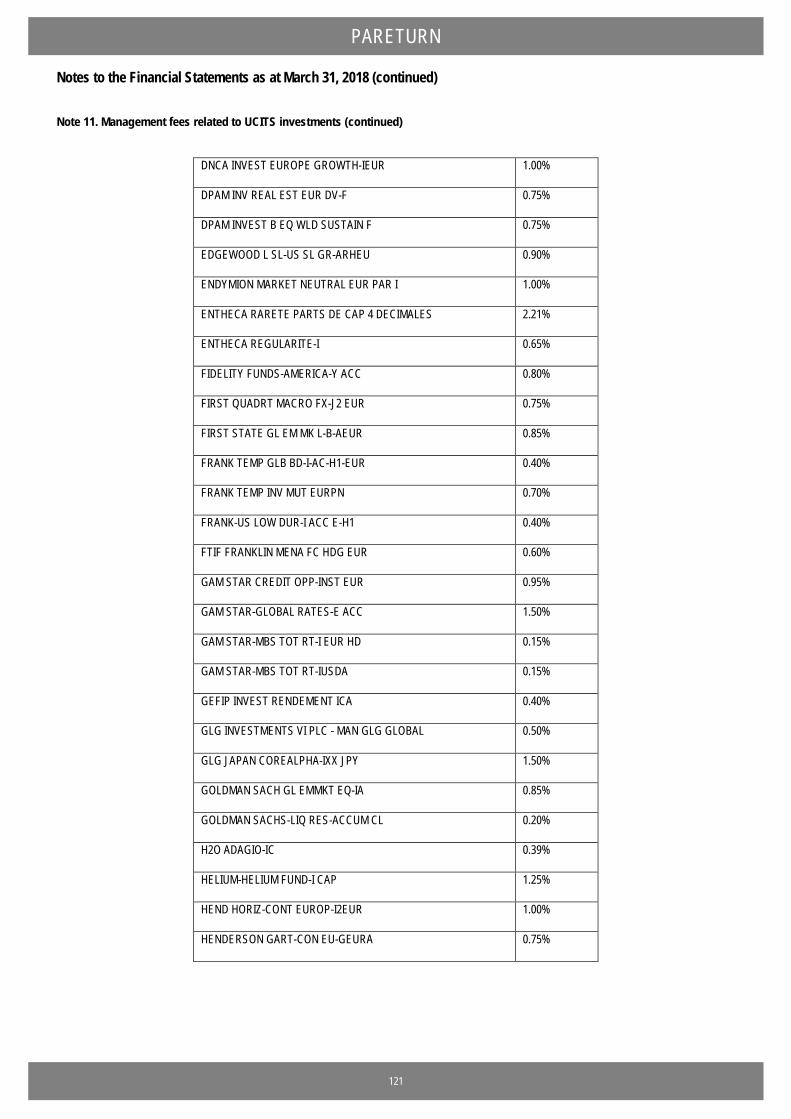
PARETURN Notes to the Financial Statements as at March 31, 2018 (continued)
Note 11. Management fees related to UCITS investments (continued)
DNCA INVEST EUROPE GROWTH-IEUR 1.00%
DPAM INV REAL EST EUR DV-F 0.75%
DPAM INVEST B EQ WLD SUSTAIN F 0.75%
EDGEWOOD L SL-US SL GR-ARHEU 0.90%
ENDYMION MARKET NEUTRAL EUR PAR I 1.00%
ENTHECA RARETE PARTS DE CAP 4 DECIMALES 2.21%
ENTHECA REGULARITE-I 0.65%
FIDELITY FUNDS-AMERICA-Y ACC 0.80%
FIRST QUADRT MACRO FX-J2 EUR 0.75%
FIRST STATE GL EM MK L-B-AEUR 0.85%
FRANK TEMP GLB BD-I-AC-H1-EUR 0.40%
FRANK TEMP INV MUT EURPN 0.70%
FRANK-US LOW DUR-I ACC E-H1 0.40%
FTIF FRANKLIN MENA FC HDG EUR 0.60%
GAM STAR CREDIT OPP-INST EUR 0.95%
GAM STAR-GLOBAL RATES-E ACC 1.50%
GAM STAR-MBS TOT RT-I EUR HD 0.15%
GAM STAR-MBS TOT RT-IUSDA 0.15%
GEFIP INVEST RENDEMENT ICA 0.40%
GLG INVESTMENTS VI PLC - MAN GLG GLOBAL 0.50%
GLG JAPAN COREALPHA-IXX JPY 1.50%
GOLDMAN SACH GL EMMKT EQ-IA 0.85%
GOLDMAN SACHS-LIQ RES-ACCUM CL 0.20%
H2O ADAGIO-IC 0.39%
HELIUM-HELIUM FUND-I CAP 1.25%
HEND HORIZ-CONT EUROP-I2EUR 1.00%
HENDERSON GART-CON EU-GEURA 0.75%
121

PARETURN Notes to the Financial Statements as at March 31, 2018 (continued)
Note 11. Management fees related to UCITS investments (continued)
HENDERSON GART-UK ABR-GEURAH 0.75%
HEPTAGON KOPERNIK GL EQ-CE 0.90%
HSBC GIF-GEM DEBT T/R-L1CHEUR 0.50%
HUGAU MONETERME FCP 0.35%
HYPERION 2.39%
ING (L) INV COMMODITY ENHANCED I CAP USD 0.50%
ING (L) INV Consumer Good I CAP 0.60%
ING (L) INV Emerging Europe I CAP 0.65%
ING (L) INV Energy I CAP 0.60%
ING (L) INV Euro High Dividend I CAP 1.00%
ING (L) INV Industrials I CAP n/a
ING (L) INV Japan I CAP 0.60%
ING (L) LIQUID EUR F CAP 0.06%
INVESCO EU ST BOND-CAEUR 0.40%
INVESCO PAN EUR STR EQ-CAEPH 1.00%
INVESCO PAN EUROPEAN EQTY-C 1.00%
ISHARES CORE S&P 500 UCITS ETF 0.07%
ISHARES DJ STOXX 600 (DE) 0.19%
ISHARES EURO STOXX50 UCITS D 0.16%
ISHARES JPM EM LCAL GOVT USD SHS USD ETF 0.50%
ISHARES MSCI JP EUR-AC ACC SHS EUR ETF 0.35%
ISHARES S&P 500 EUR-H 0.20%
ISHARES S&P FINANCIALS SCTR 0.15%
ISHARES USD DURATION BD SHS 0.20%
JOHAM SELECT VALUE EUR-A SHS CLASS-A EUR 0.90%
JUPITER DYNAMIC IC SHS-I EUR ACC CAP 0.50%
JUPITER GL FD-EURO GRO-D EUR 0.75%
122

PARETURN Notes to the Financial Statements as at March 31, 2018 (continued)
Note 11. Management fees related to UCITS investments (continued)
L E EU UC ETF ACC PARTS -ACC- 0.50%
L E S50(DR) ETF D PARTS DIST 0.20%
L I35 DR ETF D PARTS DIST 0.30%
LESPRIT DU LUX-ACTION I 1.40%
LM WA MACRO OPPORT BD-PAHEUR 1.00%
LO FUNDS-CNVRTBLE BD-RA 0.65%
LYX ETF S&P 500 D-HEDGED 0.15%
LYXOR ETF MSCI EM LAT AMER 0.65%
LYXOR ETF MSCI EUROPE FCP 0.25%
M CONVERTIBLES-IC 0.80%
M&G 7 GL FLO RATE HY-EUR CHA 0.65%
M&G EMERG MKTS BOND-EUR C HA 0.60%
M+G OPTIMAL INCOME-C-EURO-A 0.75%
MAGALLANES VALUE IBERN EQ-R 2.00%
MAGELLAN SICAV DISTRIBUTION 1.75%
MAGNA NEW FRONTIERS FD-G EUR 1.00%
MAINFIRST TOP EUROPN IDEAS-C 1.00%
MAJEDIE-TORTOISE FND-Z EUR H 1.50%
MAN-MAN NUM MKT NEU-INUHEUR 1.25%
MARSHALL WCE-MW DEV EU-G EUR 2.00%
MELCH SEL-EURO OPPOR-I1-EUR 0.85%
MONETA MU CAPS C 4D 1.80%
MONTPENSIER QUADRATOR 1.50%
MORGAN ST INV F-GLB BRNDS-Z 0.75%
MORGAN ST INV F-GLB BRNDS-ZH 0.75%
MORGAN ST-EU CHAMP-Z 0.75%
MORGAN ST-EURO CORP BD-ZD 0.45%
123

PARETURN Notes to the Financial Statements as at March 31, 2018 (continued)
Note 11. Management fees related to UCITS investments (continued)
MORGAN ST-US ADVANTAGE-ZUSD 0.70%
MS LIQUID-EUR LIQ-INST ACC 0.09%
MSIF GLOBAL MORTGAGE SEC-Z 0.50%
MSIM GLOBAL FIXED INC O-ZH 0.45%
MUL LY PAUE SHS-ACC-CAPITALISATION 0.85%
MUTUAFONDO BONOS FLOTANTES 0.25%
MUTUAFONDO BONOS SUBORDINADO 0.60%
MUTUAFONDO DINERO-A 0.15%
MUTUAFONDO-A 0.25%
MUZIN-ENHANCEDYIELD-ST EUR-ACC 0.45%
MUZINICH SHORT DUR HG YD-HEURA 0.80%
NEUBERG BRM-SH DUR E-EUR IA 0.60%
NEUBERG BRM-SH DUR EM-EUR A 0.60%
NORDEA 1-FLEXIBLE FI-BI EUR 0.40%
NORDEA 1-US TOT RET B-HBDEUR 0.55%
NORDEA 1-US TOTAL RET-HBIE 0.55%
NORDEA I SIC-STAB RET-BP-EUR 1.50%
OLD MUT GB EQY ABS RE-IEURHA 0.75%
ORIGIN-I 1.40%
PARVEST BOND ASIA X JP-I USD 0.60%
PARVEST CONV BD EU SMCP-I 0.60%
PARVEST CONVERTIBLE BOND WORLD 3EU 0.60%
PARVEST DISRUPTIVE TECHNOLOGY ICA 0.75%
PARVEST ENHANCED CASH-6M-I 0.20%
PARVEST EQ EUR VALUE-INSTIT 0.75%
PARVEST EQUI-JAPAN-INSTITNL 0.85%
PARVEST EQUITY BEST SELE ASIA EX JA IEC 0.75%
124
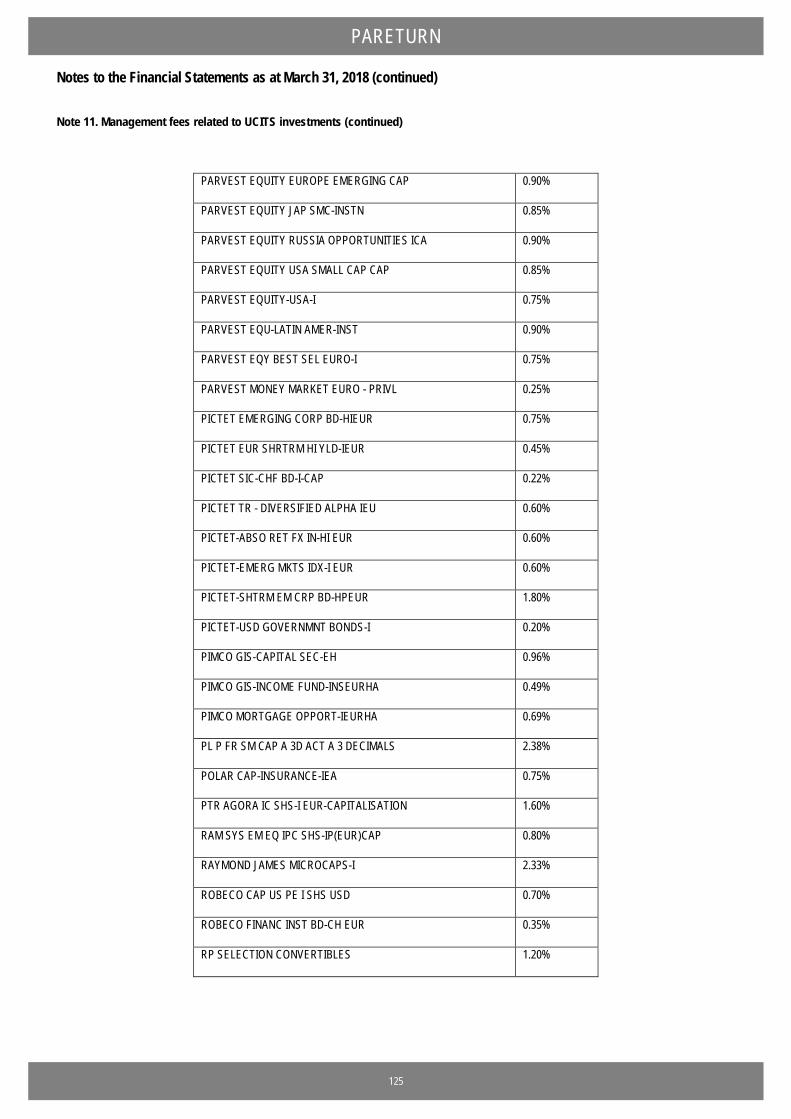
PARETURN Notes to the Financial Statements as at March 31, 2018 (continued)
Note 11. Management fees related to UCITS investments (continued)
PARVEST EQUITY EUROPE EMERGING CAP 0.90%
PARVEST EQUITY JAP SMC-INSTN 0.85%
PARVEST EQUITY RUSSIA OPPORTUNITIES ICA 0.90%
PARVEST EQUITY USA SMALL CAP CAP 0.85%
PARVEST EQUITY-USA-I 0.75%
PARVEST EQU-LATIN AMER-INST 0.90%
PARVEST EQY BEST SEL EURO-I 0.75%
PARVEST MONEY MARKET EURO - PRIVL 0.25%
PICTET EMERGING CORP BD-HIEUR 0.75%
PICTET EUR SHRTRM HI YLD-IEUR 0.45%
PICTET SIC-CHF BD-I-CAP 0.22%
PICTET TR - DIVERSIFIED ALPHA IEU 0.60%
PICTET-ABSO RET FX IN-HI EUR 0.60%
PICTET-EMERG MKTS IDX-I EUR 0.60%
PICTET-SHTRM EM CRP BD-HPEUR 1.80%
PICTET-USD GOVERNMNT BONDS-I 0.20%
PIMCO GIS-CAPITAL SEC-EH 0.96%
PIMCO GIS-INCOME FUND-INSEURHA 0.49%
PIMCO MORTGAGE OPPORT-IEURHA 0.69%
PL P FR SM CAP A 3D ACT A 3 DECIMALS 2.38%
POLAR CAP-INSURANCE-IEA 0.75%
PTR AGORA IC SHS-I EUR-CAPITALISATION 1.60%
RAM SYS EM EQ IPC SHS-IP(EUR)CAP 0.80%
RAYMOND JAMES MICROCAPS-I 2.33%
ROBECO CAP US PE I SHS USD 0.70%
ROBECO FINANC INST BD-CH EUR 0.35%
RP SELECTION CONVERTIBLES 1.20%
125
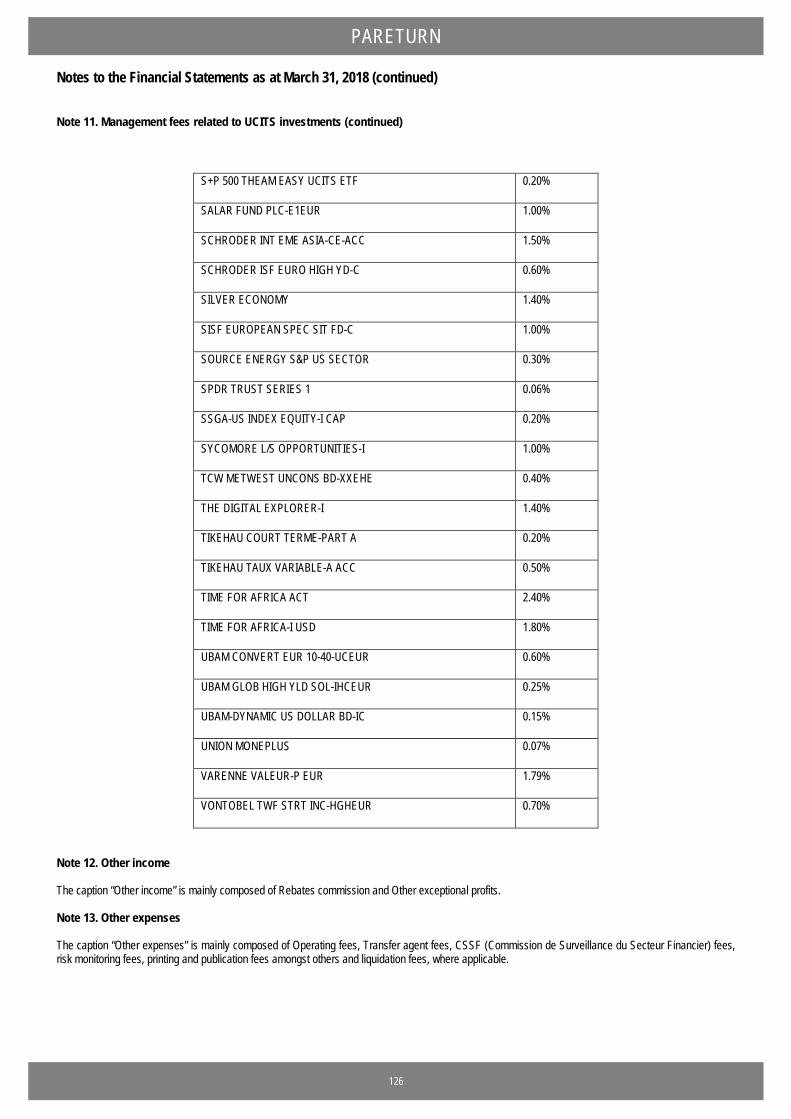
PARETURN Notes to the Financial Statements as at March 31, 2018 (continued)
Note 11. Management fees related to UCITS investments (continued)
S+P 500 THEAM EASY UCITS ETF 0.20%
SALAR FUND PLC-E1EUR 1.00%
SCHRODER INT EME ASIA-CE-ACC 1.50%
SCHRODER ISF EURO HIGH YD-C 0.60%
SILVER ECONOMY 1.40%
SISF EUROPEAN SPEC SIT FD-C 1.00%
SOURCE ENERGY S&P US SECTOR 0.30%
SPDR TRUST SERIES 1 0.06%
SSGA-US INDEX EQUITY-I CAP 0.20%
SYCOMORE L/S OPPORTUNITIES-I 1.00%
TCW METWEST UNCONS BD-XXEHE 0.40%
THE DIGITAL EXPLORER-I 1.40%
TIKEHAU COURT TERME-PART A 0.20%
TIKEHAU TAUX VARIABLE-A ACC 0.50%
TIME FOR AFRICA ACT 2.40%
TIME FOR AFRICA-I USD 1.80%
UBAM CONVERT EUR 10-40-UCEUR 0.60%
UBAM GLOB HIGH YLD SOL-IHCEUR 0.25%
UBAM-DYNAMIC US DOLLAR BD-IC 0.15%
UNION MONEPLUS 0.07%
VARENNE VALEUR-P EUR 1.79%
VONTOBEL TWF STRT INC-HGHEUR 0.70%
Note 12. Other income The caption “Other income” is mainly composed of Rebates commission and Other exceptional profits. Note 13. Other expenses The caption “Other expenses” is mainly composed of Operating fees, Transfer agent fees, CSSF (Commission de Surveillance du Secteur Financier) fees, risk monitoring fees, printing and publication fees amongst others and liquidation fees, where applicable.
126
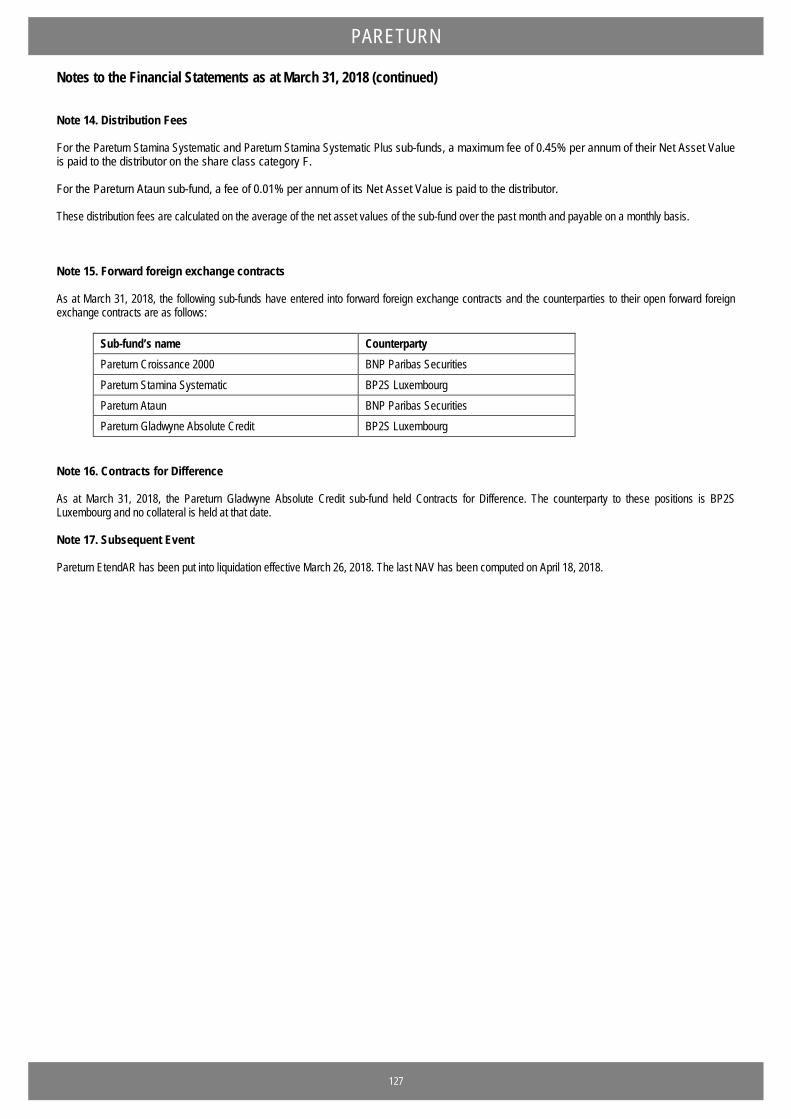
PARETURN Notes to the Financial Statements as at March 31, 2018 (continued) Note 14. Distribution Fees For the Pareturn Stamina Systematic and Pareturn Stamina Systematic Plus sub-funds, a maximum fee of 0.45% per annum of their Net Asset Value is paid to the distributor on the share class category F. For the Pareturn Ataun sub-fund, a fee of 0.01% per annum of its Net Asset Value is paid to the distributor. These distribution fees are calculated on the average of the net asset values of the sub-fund over the past month and payable on a monthly basis. Note 15. Forward foreign exchange contracts As at March 31, 2018, the following sub-funds have entered into forward foreign exchange contracts and the counterparties to their open forward foreign exchange contracts are as follows:
Sub-fund’s name Counterparty Pareturn Croissance 2000 BNP Paribas Securities Pareturn Stamina Systematic BP2S Luxembourg Pareturn Ataun BNP Paribas Securities Pareturn Gladwyne Absolute Credit BP2S Luxembourg
Note 16. Contracts for Difference As at March 31, 2018, the Pareturn Gladwyne Absolute Credit sub-fund held Contracts for Difference. The counterparty to these positions is BP2S Luxembourg and no collateral is held at that date. Note 17. Subsequent Event Pareturn EtendAR has been put into liquidation effective March 26, 2018. The last NAV has been computed on April 18, 2018.
127

PARETURN Additional information Investments remuneration policy and UCITS V requirement “The management company has adopted a remuneration policy pursuant to applicable laws and regulations with the objective to ensure that its remuneration structure is in line with its interests and those of the collective investment schemes it manages and to prevent risktaking which is inconsistentwith the risk profiles, rules or articles of incorporation or management regulations of the collective investment schemes it manages. Details of the remuneration policy of the management company, including the persons in charge of determining the fixed and variable remunerations of staffs, a description of the key remuneration elements and an overview of how remuneration is determined, is available at http://www.mdo-manco.com/about-us/legal-documents. With respect to the financial year ended 31 December 2017 (as of that date, the management company had a headcount of 57 employees), the total fixed and variable remuneration paid by the management company to its employees amounted to EUR 3’966’032 and to EUR 775’776 respectively. The total remuneration paid by the management company to senior management and members of its staff whose actions have a material impact on the risk profile of the collective investment schemes managed amounted to EUR 2’683’915. The remuneration committee of the management company has reviewed the implementation of the remuneration policy and has not identified any deficiency in that respect. Moreover, the remuneration policy updates performed in the course of the financial year ended 31 December 2017 were not material in nature and mainly related to organisational changes.” SFTR At the date of the financial statements, Pareturn is currently not concerned by the requirements of the Securities Financing Transaction Regulation (SFTR) 2015/2365 on transparency of securities financing transactions and of reuse. Furthermore, no corresponding transactions were carried out during the period referring to the financial statements.
128

Related Documents