Pareto Oil & Offshore Conference 2011 Vice President – Business Development Rune Juliussen 31 August 2011

Welcome message from author
This document is posted to help you gain knowledge. Please leave a comment to let me know what you think about it! Share it to your friends and learn new things together.
Transcript

Pareto Oil & Offshore Conference
2011
Vice President – Business Development
Rune Juliussen
31 August 2011
Siem Offshore Overview
2
• Established as a stand alone company in July 2005.
• Market capitalization $ 650 million.
• Siem Industries holds 34%.
• $ 2 billion Investments in new fleet.
• Total fleet of 45 vessels with average age around 3 years for PSV/ AHTS/ MRSV.
• Majority of newbuilds delivered and operating.
• Fully financed with bank facilities.
• Sound backlog of $ 830 million per 2Q11.
• Achieved leading position in High-End segment for AHTS and PSV vessels, and
niche position in other segments.
• Main markets in North Sea and Brazil.
• Moving into a new phase operationally and financially.
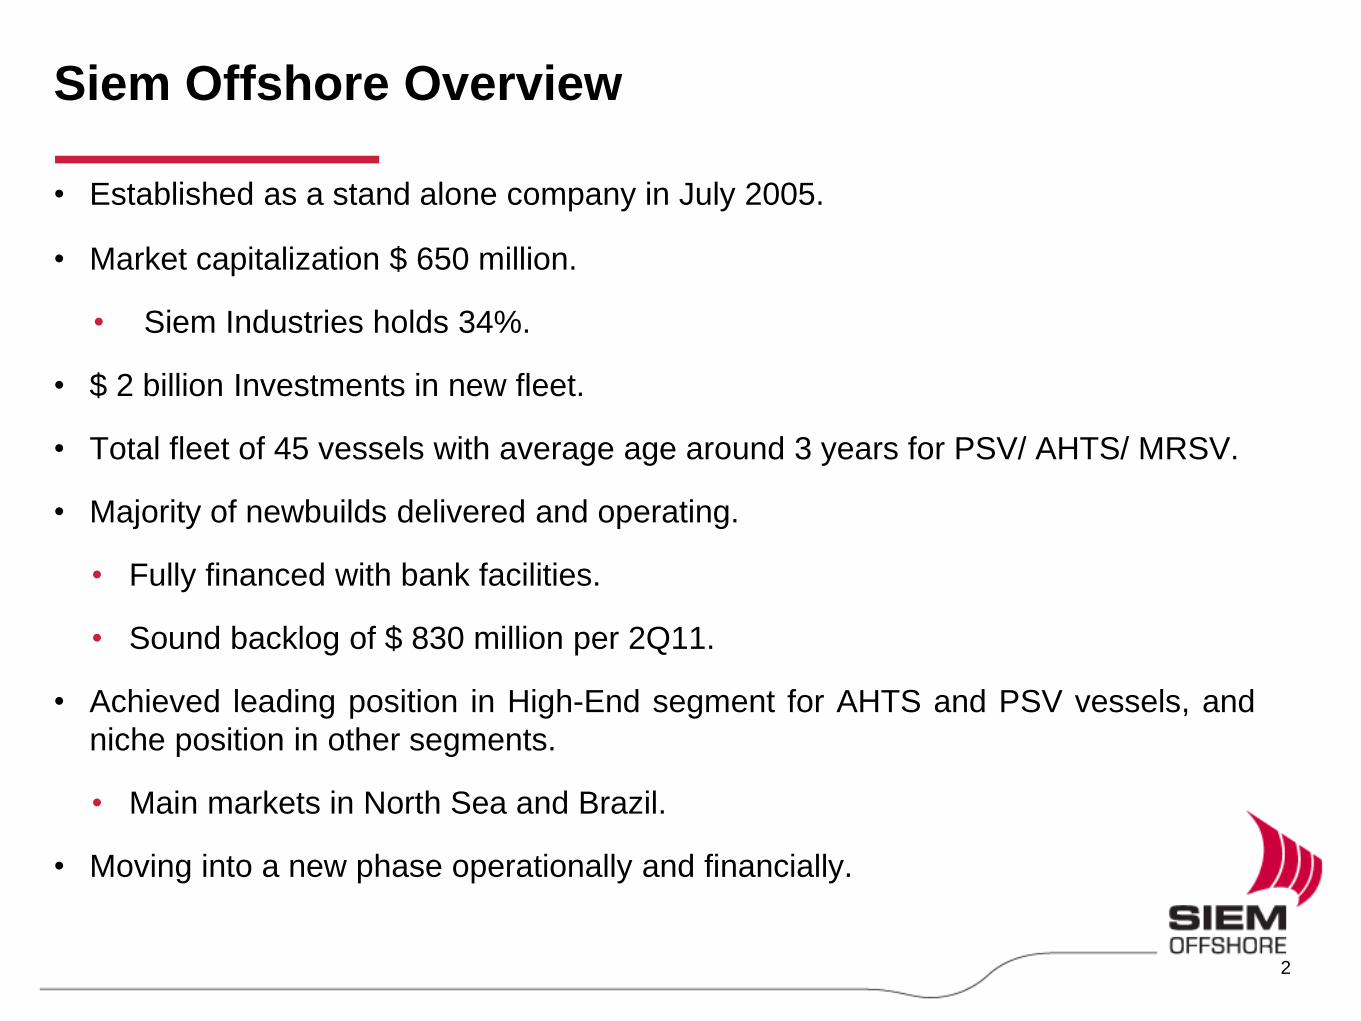
Siem Offshore – Part of the Siem Industries Group
3
Total Group fleet of more than 100 vessels
Web-sites: www.siemindustries.com, www.siemoffshore.com, www.subsea7.com, www.star-reefers.com
Siem Industries Inc
Subsea 7 20%
Siem Offshore
34%
Star Reefers 72%
Siem Car Carriers 100%
Deep Sea Insurance Inc
51%
Other

Accomplishments and positioning
• Revenues from $ 50 millions to > $ 300
millions p.a. from 2005-1H 2011.
• Taken delivery of ten large AHTS vessels
2009-2011. • 4x 4+4 years AHTS to Petrobras (2010).
• Statoil Barents Sea (2010/2011).
• 2x AHTS and 3x PSV Cairn Greenland (2011).
• Leading North Sea AHTS spot rates.
• Established a sizeable fleet of 14 PSVs
and 4 MSRVs.
• HSEQ and organization. • Established quality services from vessels/
personnel.
• Good Safety Record as result of attitude, training,
and QA-system.
• Total of 1300 employees.
• Siem Consub in Brazil with 400 employees.
• Built niche position in special segments.
4
*
* = including Siem Carrier
© Siem Offshore, ODS Petrodata

Siem Offshore Organization
Offices:
• Norway* (Kristiansand)
• Brazil (Rio de Janeiro)
• India (Mombai)
• Germany (Leer)
• USA (Houston)
*) Headquarters
Employees:
• Onshore personnel: > 200
• Offshore personnel: < 1100
= SIOFF Offices
5

MRSV
4
PSV (3,300 – 4,700 dwt)
14
AHTS
10 *)
• Pre-laying of anchor systems
• Anchor handling
• Towing and mobilisation
Chain work and inspection
Ploughing and trenching
• Inspection repair and
maintenance
• Subsea installation
• General supply service
• ERRV services, Oil
Recovery, FiFi
• Subsea construction support
• ROV operations
• Diving support
• Supply duties
• Inspection, repair and
maintenance of subsea
installations
• Transport supplies to and
from offshore installations
• Deck cargo, containers and
pipes
• Dry and liquid products in
underdeck tanks
• ROV-support vessels,
seismic vessels, well
stimulation vessels
SIOFF Fleet of High-End Offshore service vessels
*) Incl. two vessels owned by a partner 6
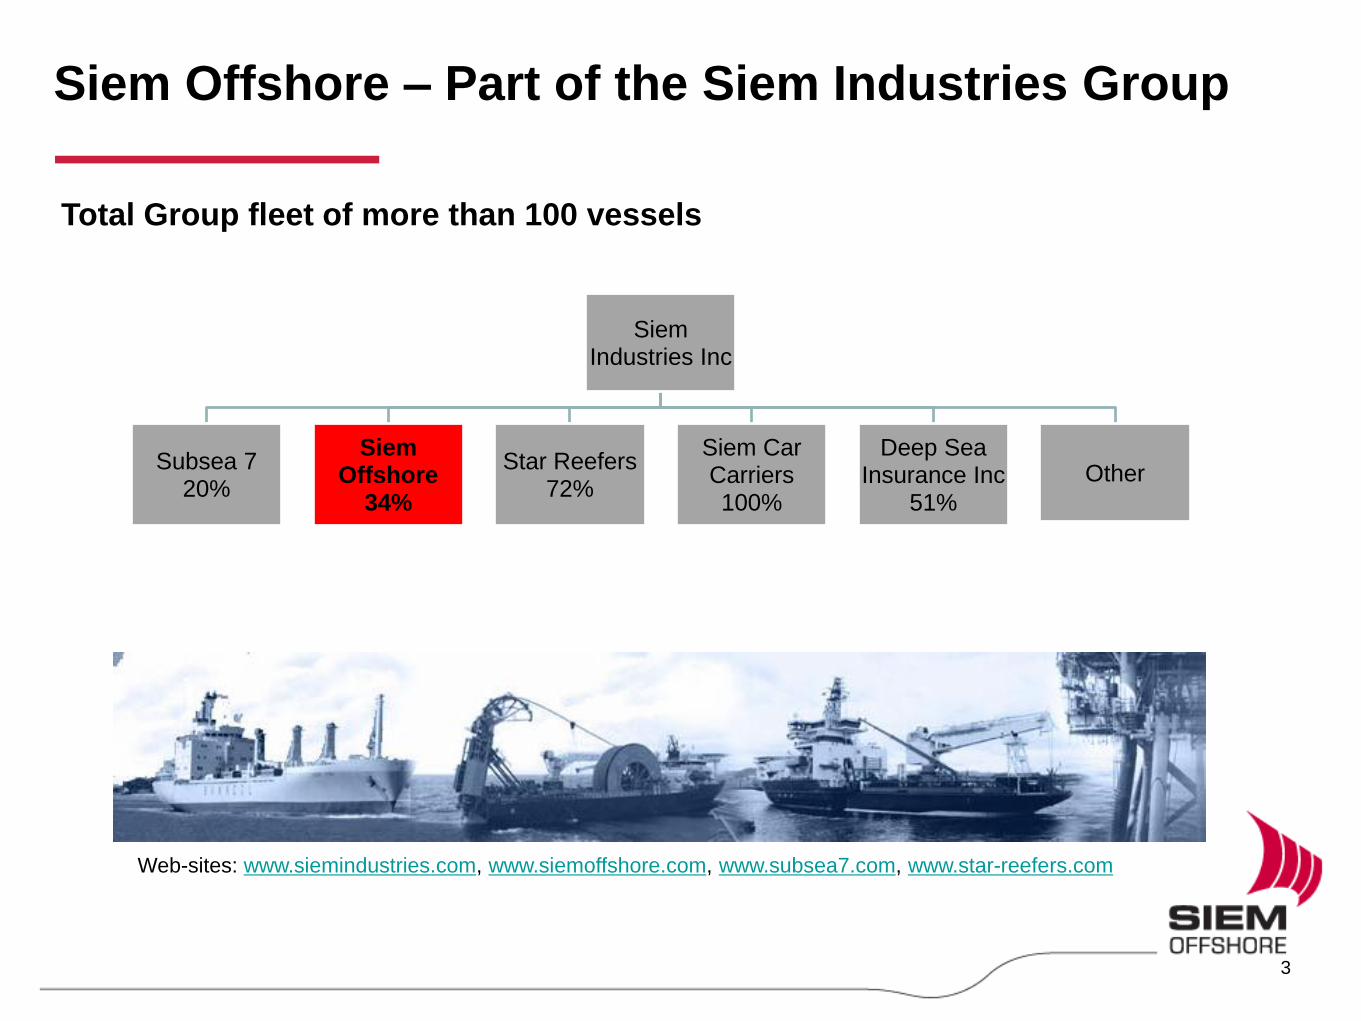
2 FSV (new) 2 OSRVs (new) 2 FCV (new)
1 Well Stimulation Vessel 9 Old Brazilian fleet 1 Core Drilling Vessel
SIOFF Fleet of Niche operating vessels
7
Non-vessel operating segments
8
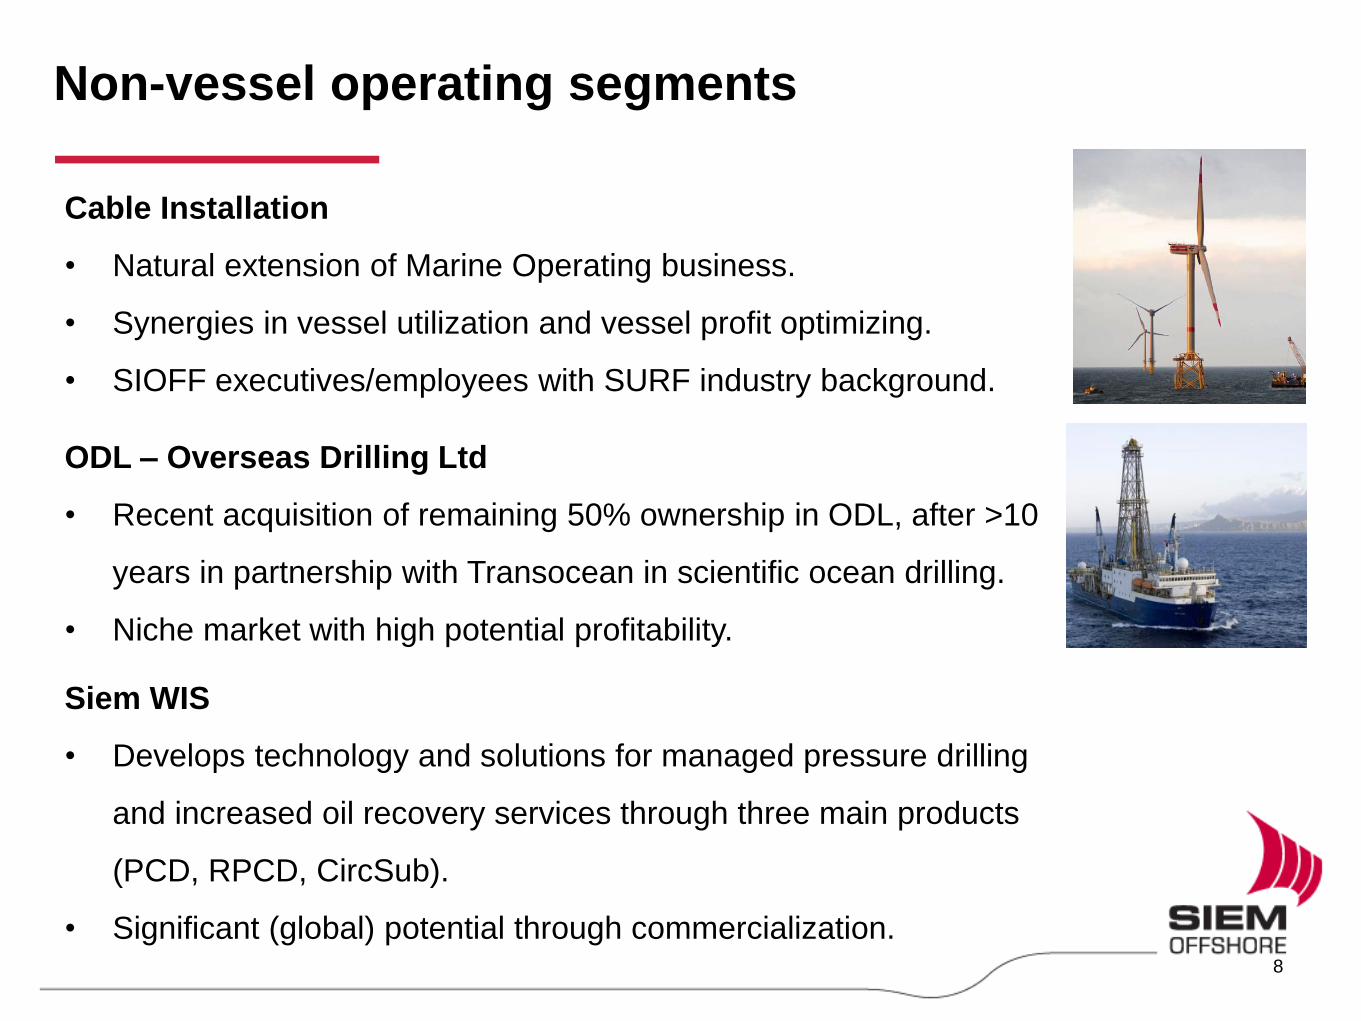
Cable Installation
• Natural extension of Marine Operating business.
• Synergies in vessel utilization and vessel profit optimizing.
• SIOFF executives/employees with SURF industry background.
ODL – Overseas Drilling Ltd
• Recent acquisition of remaining 50% ownership in ODL, after >10
years in partnership with Transocean in scientific ocean drilling.
• Niche market with high potential profitability.
Siem WIS
• Develops technology and solutions for managed pressure drilling
and increased oil recovery services through three main products
(PCD, RPCD, CircSub).
• Significant (global) potential through commercialization.

Income Statement Q2
Q2 January - June Year Ended
31 December
Amounts in USD million
2011
Unaudited
2010
Unaudited
2011
Unaudited
2010
Unudited
2010
Audited
Operating Revenue 78,6 59,6 147,5 109,4 228,3
Operating expenses ( 45,1) ( 28,9) ( 84,6) ( 60,7) ( 127,6)
Administration expenses ( 8,6) ( 5,6) ( 16,3) ( 11,6) ( 26,0)
Operating margin [1] 24,9 25,1 46,7 37,2 74,6
Depreciation and amortisation ( 20,2) ( 12,7) ( 38,9) ( 23,6) ( 59,3)
Gain/(Loss) on sale of assets ( 0,0) 0,0 0,1 0,0 6,3
Gain/(Loss) FX forward contracts [2] 0,8 ( 12,1) 2,1 ( 19,1) ( 4,8)
Net financial items [3] ( 3,7) ( 11,0) ( 5,9) ( 14,8) ( 6,5)
Profit before tax 1,7 ( 10,7) 4,1 ( 20,3) 10,3
Income Tax Provision ( 0,2) 0,0 ( 1,6) ( 0,5) ( 0,6)
Net Profit 1,5 ( 10,7) 2,4 ( 20,8) 9,7
Attributable to minorities ( 0,1) 0,1 ( 0,5) 0,1 ( 0,5)
Attributable to equity holders 1,6 ( 10,8) 3,0 ( 20,9) 10,2
Net Profit 1,5 ( 10,7) 2,4 ( 20,8) 9,7
Earnings per share [4] 0,000 ( 0,03) 0,007 ( 0,06) 0,03
Average number of shares outstanding [5] 395 952 359 774 359 853 359 774 377 414
[1] Operating revenue less operating expenses
[2] Revaluation of off-balance sheet currency exchange contracts entered into in order to hedge future yard
installments
[3] Including revaluation of non-USD currency balance sheet items
[4] Net profit / Average number of shares outstanding (diluted)
[5] Weighted average number of shares outstanding (diluted) ('000)
9

Operating Margin Q2
Q2 2011 Q2 2010
Amounts in
USD million
Operating
revenue
Operating
expenses
Operating
margin
Operating
revenue
Operating
expenses
Operating
margin
PSVs 23,8 ( 11,5) 12,2 25,3 ( 10,7) 14,6
MRSVs 14,3 ( 5,9) 8,4 16,8 ( 6,5) 10,3
AHTS Vessels 31,0 ( 15,5) 15,5 7,9 ( 5,7) 2,2
Brazilian built vessels 5,8 ( 6,6) ( 0,8) 6,2 ( 4,3) 1,9
Cable Installation 0,2 ( 2,5) ( 2,3) 0,0 0,0 0,0
CMS 3,0 ( 3,1) ( 0,0) 2,1 ( 1,7) 0,3
Siem WIS 0,0 0,0 0,0 1,3 ( 0,0) 1,3
Other 0,5 0,5 0,0 0,0 0,0
G&A ( 8,6) ( 8,6) 0,0 ( 5,6) ( 5,6)
Total 78,6 ( 53,7) 24,9 59,6 ( 34,5) 25,1
10
• 100% utilization in the MRSV segment.
• 87% utilization in the PSV segment.
• 88% utilization in the AHTS segment.
• 70% utilization of the Brazilian Fleet (ex AHTS).
• Cable Installation segment business with no installation work during 2Q.
• WIS commercialization phase has taken longer time to achieve.

Statement of Financial Position First Half 2011
11
30 June
2011
Unaudited
30 June
2010
Unaudited
31 December
2010
Audited
Intangible assets 35,5 14,0 15,2
Vessels under construction 93,2 195,8 106,0
Vessels, equipment and other 1 467,3 841,4 1 287,9
CIRR loan deposits 66,7 63,5 65,0
Investment in associates and other long-term receivables 21,7 38,0 37,8
Debtors, prepayments and other current assets 83,0 92,5 84,5
Cash and cash equivalents 92,4 28,0 115,2
Total Assets 1 859,8 1 273,3 1 711,5
Total Equity 790,0 582,2 769,1
Borrowings falling due after 1 year 847,3 461,6 739,1
CIRR loan 66,7 63,5 65,0
Other non-currant liabilities 25,6 9,2 12,6
Borrowings falling due within 1 year 83,4 99,3 71,1
Trade creditors and other current liabilities 46,8 57,3 54,6
Total Liabilities 1 069,8 691,0 942,4
Total Equity and Liabilities 1 859,8 1 273,3 1 711,5
Amounts in USD million

Market outlook summary
• The North Sea spot market improved sequentially in 2Q11 and 3Q11 shows further
strengthening. AHTS vessels with average dayrates of around NOK300.000 and
PSVs around NOK150.000. High Fixtures made above NOK1,000,000 for AHTS
vessels and above NOK200.000 for PSVs.
• Coming winter season will be stronger than in the previous two years: • Further reduction in the North Sea AHTS Fleet during August.
• Increased activity to be somewhat offset by AHTS vessels entering the spot market late third quarter
and in the fourth quarter, as a result of ending term-work in the North Sea and other regions.
• Long-term outlook is positive with higher E&P spending, and increase in Drilling,
FPSO, and Subsea activities. • More uncertainty surrounding the global economic situation.
• Global Demand continue to increase: Brazil continues to be strong, improvement in
the North Sea, US GoM turning up. West Africa still flat, but long-term prospects.
Incremental demand also seen in other regions and countries.
12
• Still some uncertainty with regards to the relatively large number of OSV
newbuilds to be delivered in certain segments, especially PSVs, and how it will
impact the market in 2012-13.

Global Rig and FPSO Market
13
© Siem Offshore, ODS Petrodata
• Total # UDW Drilling rigs currently working at 75, up from 43 twelve months ago (-12M).
• Total # North Sea Floater Rigs currently working at 36, up from 33 twelve months ago (-12M).
• Total # Floater Rigs currently working in Brazil at 61, up from 55twelve months ago (-12M).
• Total # FPSOs currently working and under construction at 177, up from 161twelve months ago (-12M).
• Continue to see increased activity going forward for both Drilling, FPSO and Subsea.
Global Drilling Market Global FPSO market
* = Ultra Deep Water (UDW)

North Sea Market
14
© Siem Offshore, ODS Petrodata
• Number of AHTS > 15k bhp working in the North
Sea reduced by 15 vessels since 3Q10 to 45.
• Spot Fleet* currently around 25 vessels,
significantly down from high of 45 in 3Q10.
• Expect stronger winter season Y/Y despite
vessels ending term-work in the North Sea/other
regions (seasonal) late 3Q11 and in 4Q11.
• No Newbuild deliveries until 2013.
* Spot Fleet = Total Fleet – Term Demand
• Number of PSV> 3.000 dwt working in the North
Sea has stabilized around 180 vessels.
• Spot Fleet* currently around 20 vessels due to
strong term-demand.
• Spot Fleet will increase in 4Q as vessels end
term-work in the North Sea (seasonal).
• Around 45 PSVs currently on order from
Norwegian yards.
Global AHTS and PSV Market
15
© Siem Offshore, ODS Petrodata
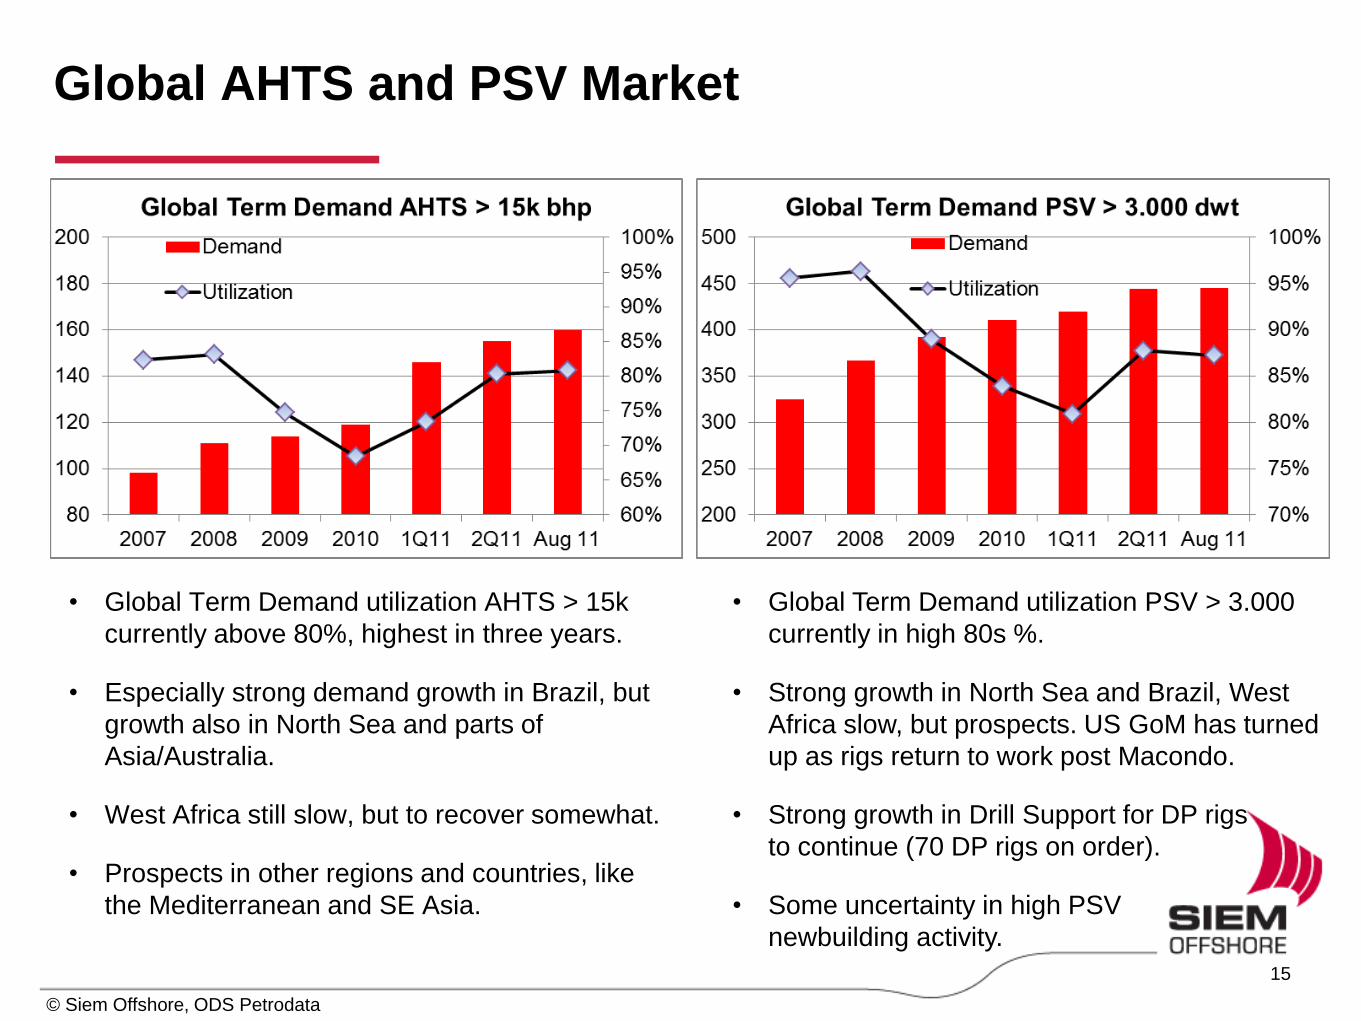
• Global Term Demand utilization AHTS > 15k
currently above 80%, highest in three years.
• Especially strong demand growth in Brazil, but
growth also in North Sea and parts of
Asia/Australia.
• West Africa still slow, but to recover somewhat.
• Prospects in other regions and countries, like
the Mediterranean and SE Asia.
• Global Term Demand utilization PSV > 3.000
currently in high 80s %.
• Strong growth in North Sea and Brazil, West
Africa slow, but prospects. US GoM has turned
up as rigs return to work post Macondo.
• Strong growth in Drill Support for DP rigs
to continue (70 DP rigs on order).
• Some uncertainty in high PSV
newbuilding activity.

Appendix
16
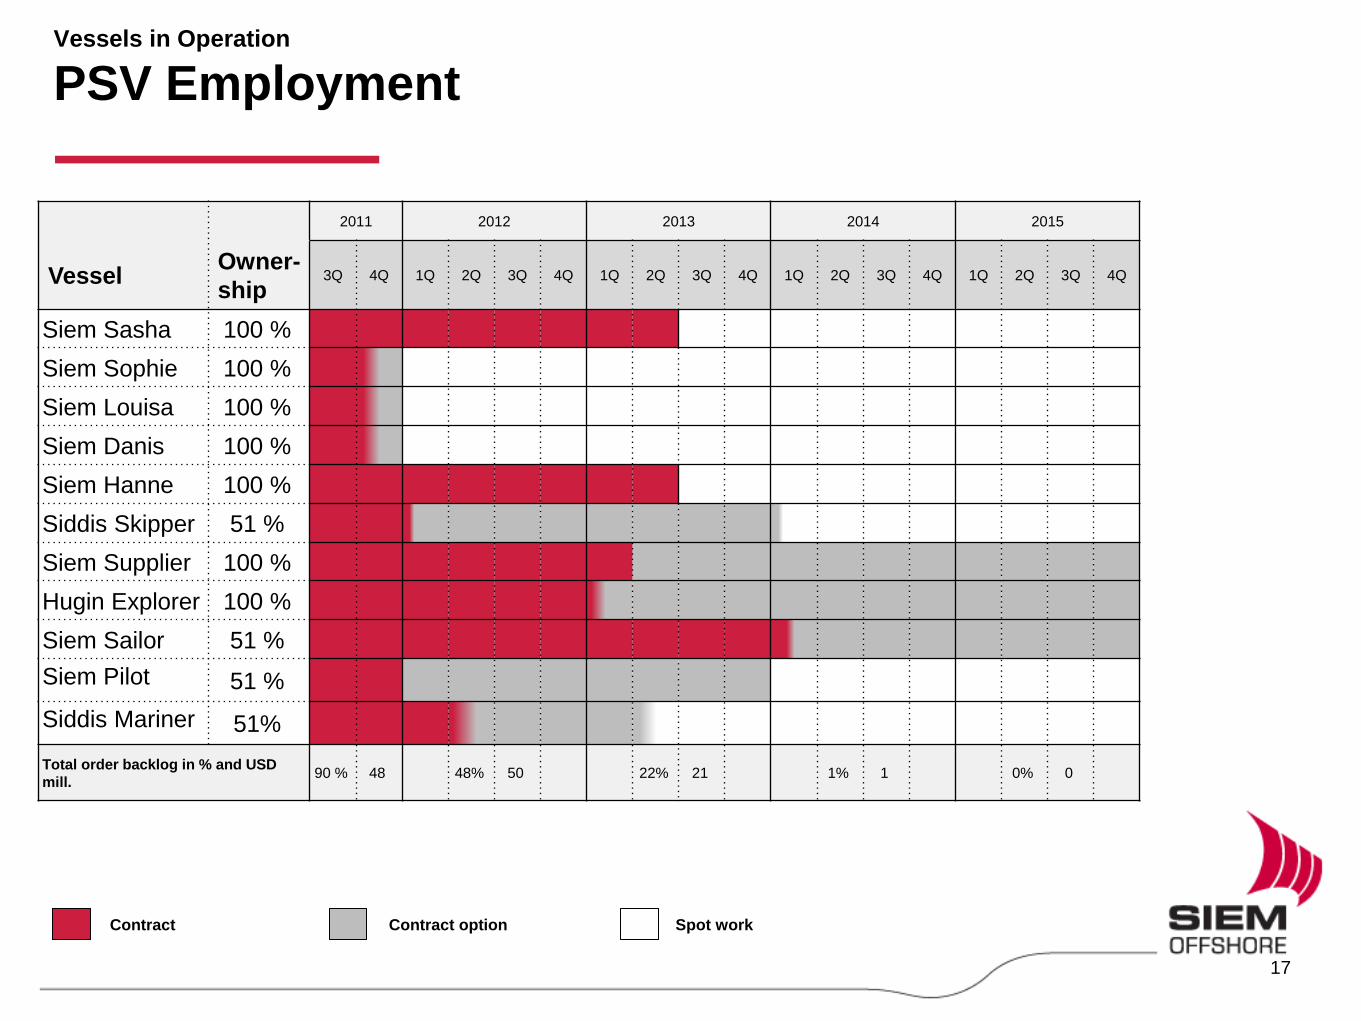
Vessels in Operation
PSV Employment
2011 2012 2013 2014 2015
Vessel Owner-
ship 3Q 4Q 1Q 2Q 3Q 4Q 1Q 2Q 3Q 4Q 1Q 2Q 3Q 4Q 1Q 2Q 3Q 4Q
Siem Sasha 100 %
Siem Sophie 100 %
Siem Louisa 100 %
Siem Danis 100 %
Siem Hanne 100 %
Siddis Skipper 51 %
Siem Supplier 100 %
Hugin Explorer 100 %
Siem Sailor 51 %
Siem Pilot 51 %
Siddis Mariner 51%
Total order backlog in % and USD
mill. 90 % 48 48% 50 22% 21 1% 1 0% 0
Contract Contract option Spot work
17
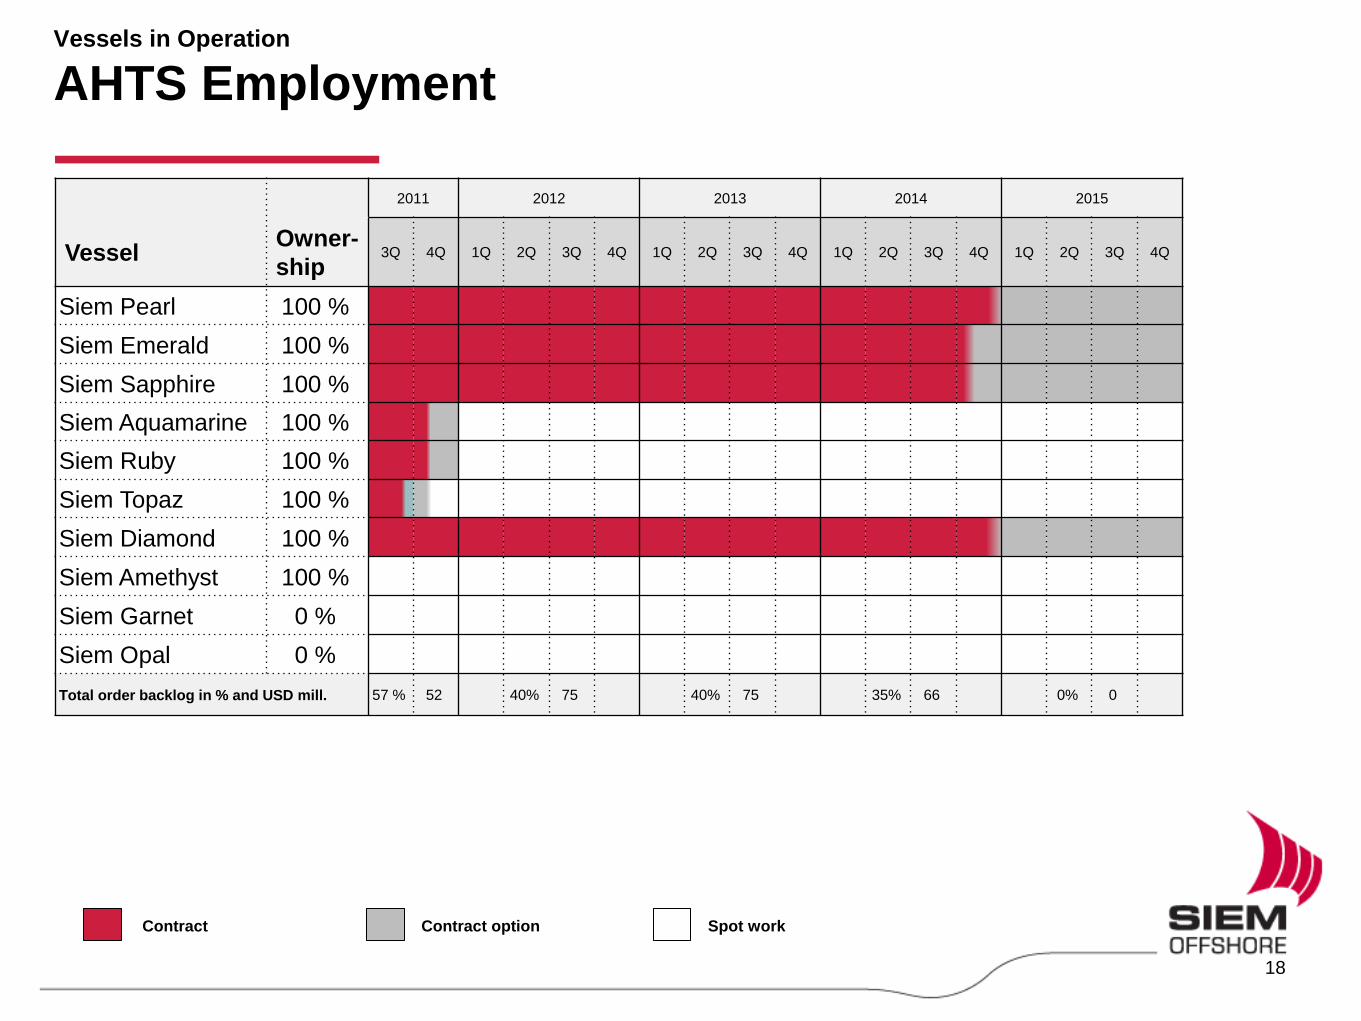
Vessels in Operation
AHTS Employment
18
2011 2012 2013 2014 2015
Vessel Owner-
ship 3Q 4Q 1Q 2Q 3Q 4Q 1Q 2Q 3Q 4Q 1Q 2Q 3Q 4Q 1Q 2Q 3Q 4Q
Siem Pearl 100 %
Siem Emerald 100 %
Siem Sapphire 100 %
Siem Aquamarine 100 %
Siem Ruby 100 %
Siem Topaz 100 %
Siem Diamond 100 %
Siem Amethyst 100 %
Siem Garnet 0 %
Siem Opal 0 %
Total order backlog in % and USD mill. 57 % 52 40% 75 40% 75 35% 66 0% 0
Contract Contract option Spot work
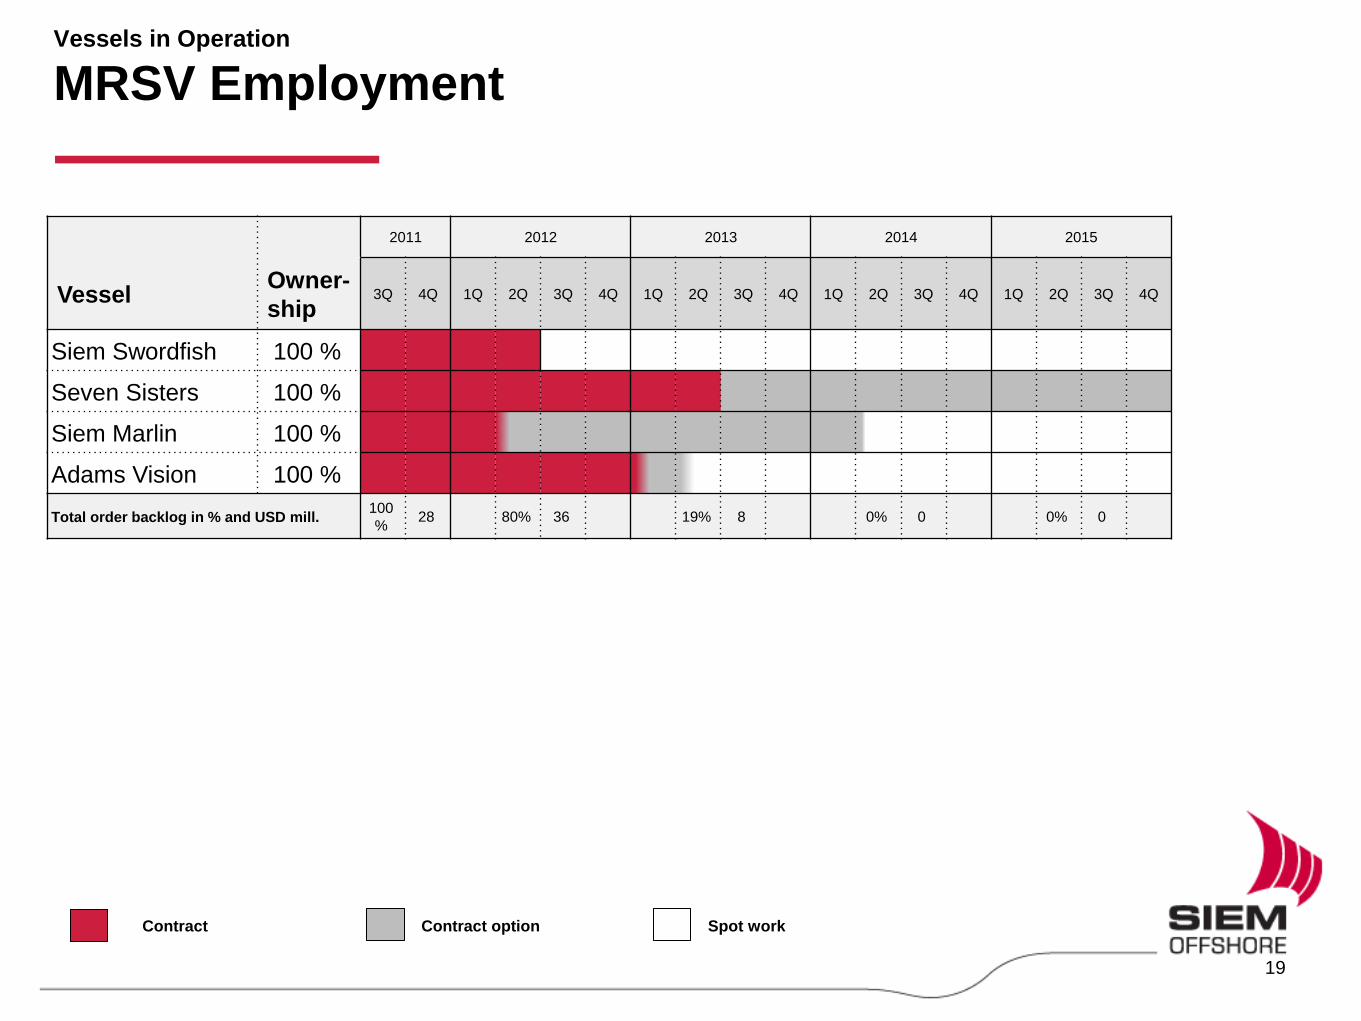
Vessels in Operation
MRSV Employment
19
2011 2012 2013 2014 2015
Vessel Owner-
ship 3Q 4Q 1Q 2Q 3Q 4Q 1Q 2Q 3Q 4Q 1Q 2Q 3Q 4Q 1Q 2Q 3Q 4Q
Siem Swordfish 100 %
Seven Sisters 100 %
Siem Marlin 100 %
Adams Vision 100 %
Total order backlog in % and USD mill. 100
% 28 80% 36 19% 8 0% 0 0% 0
Contract Contract option Spot work

Vessels in Operation
Other Employment
20
2011 2012 2013 2014 2015
Vessel Type Owner-
ship 3Q 4Q 1Q 2Q 3Q 4Q 1Q 2Q 3Q 4Q 1Q 2Q 3Q 4Q 1Q 2Q 3Q 4Q
Big Orange
XVIII WSV 41 %
Joides
Resolution SPV 100 %
Total order backlog in % and USD mill. 50% 12 50% 25 37% 18 0% 0 0% 0
Marati OSRV 100 %
Marabá OSRV 100 %
Parnaiba FSV 100 %
Paropriá FSV 100 %
Paracaru FSV 100 %
Capela FSV 100 %
Piracicaba FSV 100 %
Parati FSV 100 %
Siem Piatã FCV 100 %
Atalaia FSV 100 %
Total order backlog in % and USD mill. 77% 12 60% 18 53% 15 30% 8 10% 2
Contract Contract option Spot work
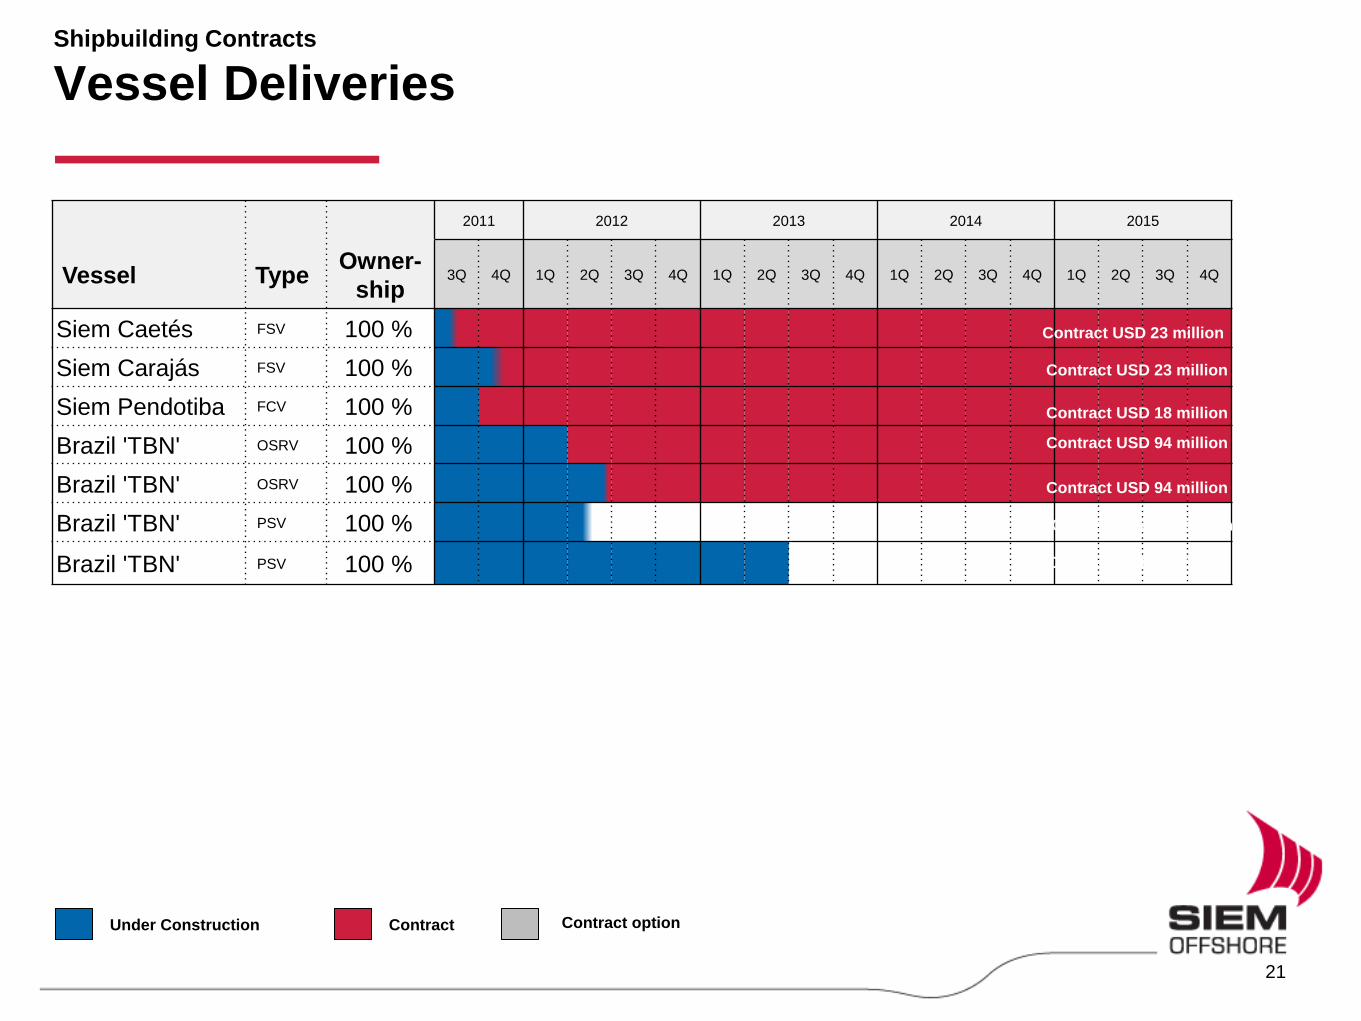
Shipbuilding Contracts
Vessel Deliveries
2011 2012 2013 2014 2015
Vessel Type Owner-
ship 3Q 4Q 1Q 2Q 3Q 4Q 1Q 2Q 3Q 4Q 1Q 2Q 3Q 4Q 1Q 2Q 3Q 4Q
Siem Caetés FSV 100 %
Siem Carajás FSV 100 %
Siem Pendotiba FCV 100 %
Brazil 'TBN' OSRV 100 %
Brazil 'TBN' OSRV 100 %
Brazil 'TBN' PSV 100 %
Brazil 'TBN' PSV 100 %
Under Construction Contract
Contract USD 23 million
Contract USD 18 million
Contract USD 94 million
Contract USD 94 million
Contract USD 94 million
Contract USD 94 million
Contract USD 94 million
Contract USD 94 million
Contract option
21
Contract USD 23 million
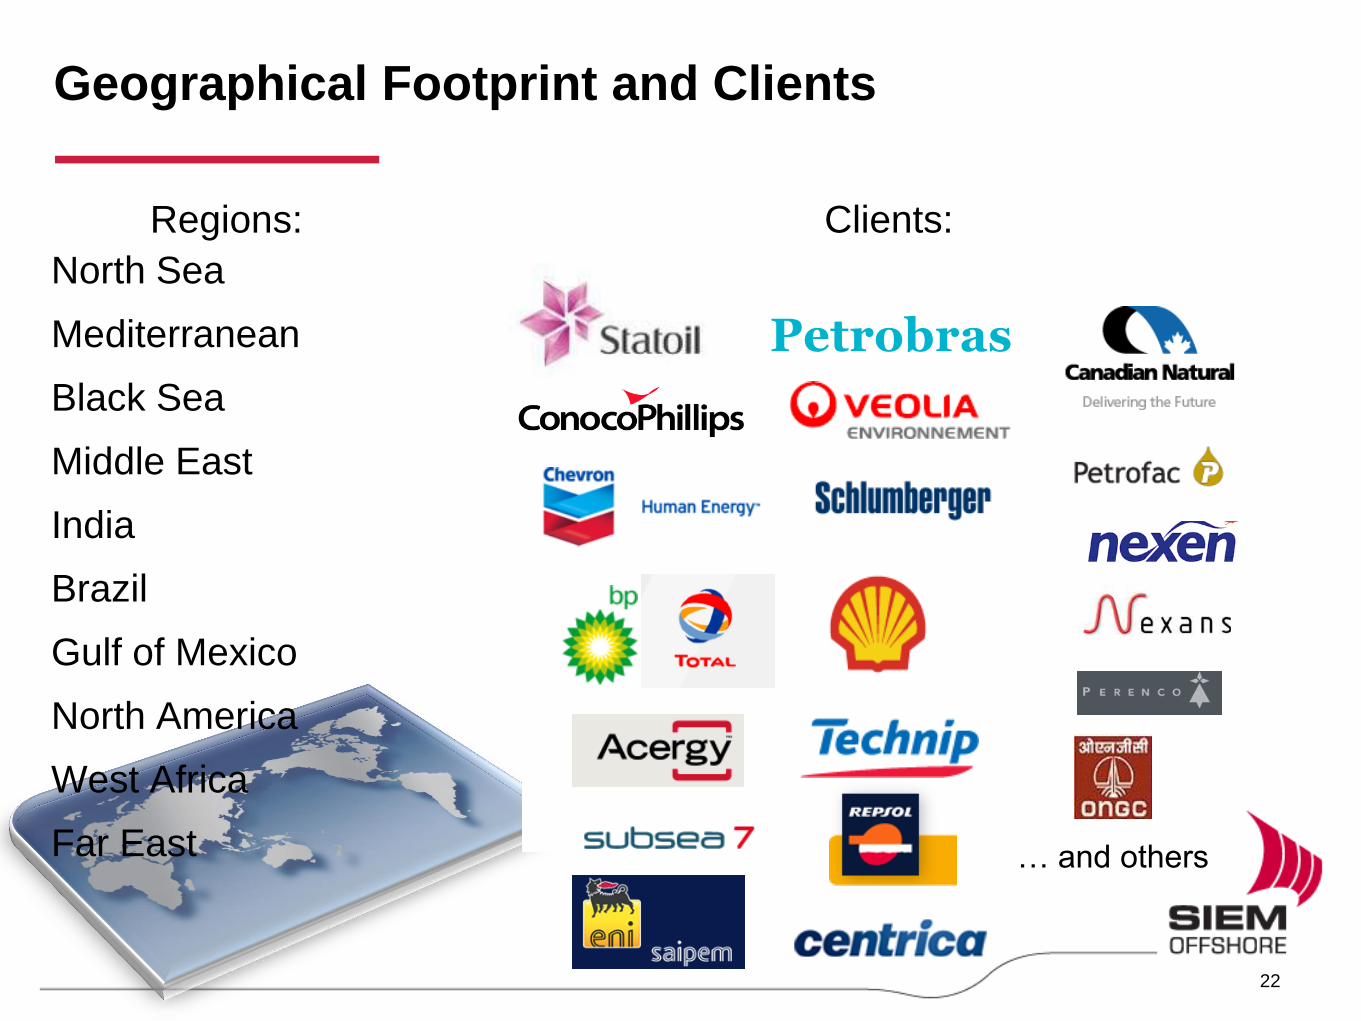
Geographical Footprint and Clients
North Sea
Mediterranean
Black Sea
Middle East
India
Brazil
Gulf of Mexico
North America
West Africa
Far East
22
Petrobras
Clients: Regions:
… and others
Related Documents