This article was downloaded by: [King's College London] On: 28 October 2011, At: 06:14 Publisher: Routledge Informa Ltd Registered in England and Wales Registered Number: 1072954 Registered office: Mortimer House, 37-41 Mortimer Street, London W1T 3JH, UK Education Economics Publication details, including instructions for authors and subscription information: http://www.tandfonline.com/loi/cede20 Parents' skills and children's cognitive and non-cognitive outcomes Augustin de Coulon a , Elena Meschi b & Anna Vignoles b a Department of Management, King's College, London, UK b Department of Quantitative Social Science, Institute of Education, Centre for the Economics of Education (CEE), University of London, UK Available online: 24 May 2011 To cite this article: Augustin de Coulon, Elena Meschi & Anna Vignoles (2011): Parents' skills and children's cognitive and non-cognitive outcomes, Education Economics, 19:5, 451-474 To link to this article: http://dx.doi.org/10.1080/09645292.2010.511829 PLEASE SCROLL DOWN FOR ARTICLE Full terms and conditions of use: http://www.tandfonline.com/page/terms-and- conditions This article may be used for research, teaching, and private study purposes. Any substantial or systematic reproduction, redistribution, reselling, loan, sub-licensing, systematic supply, or distribution in any form to anyone is expressly forbidden. The publisher does not give any warranty express or implied or make any representation that the contents will be complete or accurate or up to date. The accuracy of any instructions, formulae, and drug doses should be independently verified with primary sources. The publisher shall not be liable for any loss, actions, claims, proceedings, demand, or costs or damages whatsoever or howsoever caused arising directly or indirectly in connection with or arising out of the use of this material.

Welcome message from author
This document is posted to help you gain knowledge. Please leave a comment to let me know what you think about it! Share it to your friends and learn new things together.
Transcript
This article was downloaded by: [King's College London]On: 28 October 2011, At: 06:14Publisher: RoutledgeInforma Ltd Registered in England and Wales Registered Number: 1072954 Registeredoffice: Mortimer House, 37-41 Mortimer Street, London W1T 3JH, UK
Education EconomicsPublication details, including instructions for authors andsubscription information:http://www.tandfonline.com/loi/cede20
Parents' skills and children's cognitiveand non-cognitive outcomesAugustin de Coulon a , Elena Meschi b & Anna Vignoles ba Department of Management, King's College, London, UKb Department of Quantitative Social Science, Institute ofEducation, Centre for the Economics of Education (CEE),University of London, UK
Available online: 24 May 2011
To cite this article: Augustin de Coulon, Elena Meschi & Anna Vignoles (2011): Parents' skills andchildren's cognitive and non-cognitive outcomes, Education Economics, 19:5, 451-474
To link to this article: http://dx.doi.org/10.1080/09645292.2010.511829
PLEASE SCROLL DOWN FOR ARTICLE
Full terms and conditions of use: http://www.tandfonline.com/page/terms-and-conditions
This article may be used for research, teaching, and private study purposes. Anysubstantial or systematic reproduction, redistribution, reselling, loan, sub-licensing,systematic supply, or distribution in any form to anyone is expressly forbidden.
The publisher does not give any warranty express or implied or make any representationthat the contents will be complete or accurate or up to date. The accuracy of anyinstructions, formulae, and drug doses should be independently verified with primarysources. The publisher shall not be liable for any loss, actions, claims, proceedings,demand, or costs or damages whatsoever or howsoever caused arising directly orindirectly in connection with or arising out of the use of this material.
Education Economics
ISSN 0964-5292 print/ISSN 1469-5782 online© 2011 Taylor & Francis
http://www.tandfonline.com
Parents’ skills and children’s cognitive and non-cognitive outcomes
Augustin de Coulona, Elena Meschib* and Anna Vignolesb
aDepartment of Management, King’s College, London, UK; bDepartment of Quantitative Social Science, Institute of Education, Centre for the Economics of Education (CEE),
University of London, UKTaylor and FrancisCEDE_A_511829.sgm (Received November 2009; final version received 26 July 2010)10.1080/09645292.2010.511829Journal of Education Economics0964-5292 (print)/1469-5782 (online)Original Article2010Taylor & [email protected]
Previous research has suggested a positive intergenerational relationship betweena parent’s childhood cognitive skill level and their own children’s skill levels. Yetwe also know that individuals’ skill levels change during childhood and intoadulthood, not least as a result of their education, training and work experience.Thus parents’ adult skill levels are potentially as important in predicting thecognitive and non-cognitive skills of their children. The aims of this paper are twofold. Firstly, to assess the strength of the intergenerational correlation betweenparental skill in adulthood, specifically literacy and numeracy skills, and theirchildren’s early skills. The second aim is to assess whether, from a policyperspective, identifying adults with poor basic skills in literacy and numeracy ishelpful in devising policies to target children at risk of having poor cognitive andnon-cognitive skills. The data used are from the British Cohort Study (BCS),which in 2004 assessed cohort members’ adult literacy and numeracy skills and,for a subset of the cohort, the cognitive and non-cognitive skills of their children.We find strong evidence that parents with better numeracy and literacy inadulthood have children who perform better in early cognitive and non-cognitivetests. This finding is not simply due to the positive correlation between parents’early cognitive skills and their adult cognitive skills. Rather, parents’ adult skilllevels provide additional useful information to help explain their children’s earlyskills in regressions that also control for parents’ own early cognitive skills asmeasured at age five. This paper provides clear support for the notion thatidentifying parents with poor literacy and numeracy skills can help us predictwhich children are most at risk of having poor skills themselves.
JEL classifications: I21; J13; J24
Keywords: basic skills; intergenerational transfer; education
1. Introduction
A large proportion of the UK adult population has very poor literacy and/or numeracyskills, collectively referred to as ‘basic skills’ (see the 1999 Moser Report (DfEE1999), the 2003 Skills for Life Survey and the 2006 Leitch report). In 1999, the Moserreport found that approximately 20% of adults in England had severe literacy difficul-ties, whilst around 40% had some numeracy problems. Having a population with alarge proportion of people with poor literacy and numeracy is harmful both to the low-skilled individuals themselves (who face a higher probability of being unemployed,having an unstable job and lower wages) and to firms (that increasingly need a better
*Corresponding author. Email: [email protected]
http://dx.doi.org/10.1080/09645292.2010.511829
Vol. 19, No. 5, December 2011, 451–474
Dow
nloa
ded
by [
Kin
g's
Col
lege
Lon
don]
at 0
6:14
28
Oct
ober
201
1
A. de Coulon et al.
skilled workforce). This paper explores whether having a population with a highproportion of adults with poor basic skills is also harmful to the cognitive and non-cognitive development of their children.
Certainly the evidence suggesting that basic literacy and numeracy has higheconomic value is now extensive. The US literature has found strong wage effectsfrom various cognitive skills, particularly mathematics (Boissiere, Knight, and Sabot1985; Ishikawa and Ryan 2002; Murnane, Willett, and Levy 1995; Tyler 2004; Zaxand Rees 2002) and some evidence that returns to cognitive skills are rising (Murnaneet al. 2000). There is also a UK literature which has found a strong link betweenliteracy and numeracy specifically and labour market outcomes, particularly earnings(Bynner et al. 2001; Dearden et al. 2002; De Coulon, Marcenaro-Gutierrez, andVignoles 2007; McIntosh and Vignoles 2001). Whilst policy-makers in the UK havetargeted adults with poor basic skills, hoping to improve their economic prospects byraising their skill levels, there is another potential reason to target adults with poorskills – namely that their children may themselves be at increased risk of having poorcognitive, and perhaps non-cognitive, development.
This paper addresses the important question of how parents’ skills in numeracy andliteracy relate to the early cognitive and non-cognitive development of their children(at ages three to six). This question is important firstly because early cognitive devel-opment is crucially important for children: it is a key determinant of their subsequentschooling, wages and other socio-economic outcomes (Heckman 1995; Feinstein andDuckworth 2006; Murnane, Willett, and Levy 1995). Secondly, the relationshipbetween parental skills and their children’s skills1 is central to the issue of socialmobility. We know there are significant cognitive achievement gaps between childrenfrom different socio-economic backgrounds and indeed from more and less educatedparents. These socio-economic gaps emerge early in the pre-school period (Cunha andHeckman 2007) and increase as children age (Carneiro and Heckman 2004; Feinstein2003). Understanding the intergenerational transmission of skills is therefore impor-tant from both a distributional and an efficiency perspective, and we aim to add to theextensive literature on the contribution of parents to the early formation of theirchildren’s cognitive skills (Cunha and Heckman 2007; Todd and Wolpin 2007).
Previous UK research has suggested a positive intergenerational relationshipbetween a parent’s childhood cognitive skill level and their own children’s skill levels(Blanden, Gregg, and Macmillan 2007; Brown, McIntosh, and Taylor 2009). This UKliterature has used data from a cohort born in 1958 and largely focused on the relation-ship between parents’ early cognitive skills (measured by tests taken at age seven) andtheir own children’s early cognitive and non-cognitive development at a similar age.Yet we also know that parents’ skill levels change during their lifetime, not least as aresult of their education, training and work experience. Thus parents’ adult skill levelsare potentially as important in predicting the skills of their children. The aims of thispaper are therefore two fold. Firstly, to assess the strength of the intergenerationalcorrelation between parental skills in adulthood, specifically adult literacy and numer-acy skills, and their children’s early cognitive and non-cognitive skills. The secondaim is to assess whether, from a policy perspective, identifying adults with poor basicskills in literacy and numeracy is likely to be helpful in devising policies to helpchildren at risk of having poor skills.
The data used are from the 1970 British Cohort Study (BCS), which in 2004assessed cohort members’ adult literacy and numeracy skills and, for a subset of thecohort, the cognitive and non-cognitive skills of their children. Specifically, we use
452
Dow
nloa
ded
by [
Kin
g's
Col
lege
Lon
don]
at 0
6:14
28
Oct
ober
201
1
Education Economics
numeracy and literacy tests taken by the parents at age 34 and relate them to cognitiveand non-cognitive test scores for their children taken pre-school at ages three to six.To preview our results, we find strong evidence that parents with better numeracy andliteracy in adulthood have children who perform better in early cognitive and non-cognitive tests. This result is robust to the inclusion of exogenous factors, includingdemographic characteristics (age, gender) and family structure (number of siblings,lone parenthood). This finding is not, however, simply due to the positive correlationbetween parents’ early cognitive skills and their adult cognitive skills. Rather, parents’adult skill levels provide additional useful information to help explain their children’searly skills in regressions that also control for parents’ own early cognitive skills asmeasured at age five. This paper provides clear support for the notion that identifyingparents with poor literacy and numeracy skills can help us predict which children aremost at risk of having poor skills themselves.
The layout of the paper is the following: in Section 2, the recent literature issurveyed. We provide a discussion of the empirical strategy in Section 3. In Section4, we describe our data and the main results are presented in Section 5. Section 6presents some conclusions and discusses policy implications.
2. Existing evidence on intergenerational relationships in skill production
There are several strands of literature which focus on intergenerational relationshipsin relation to skills. Firstly, there is economic research on children’s attainment whichhas focused on the processes by which family inputs can affect children’s educationaloutcomes (the production function approach – see Todd and Wolpin 2007 andHaveman and Wolfe 1995 for a detailed review). The amount of family resources allo-cated to children, the nature of these resources and parents’ choices regarding familystructure, type of neighbourhood and type of school all influence the attainments ofchildren in the family. Cunha and Heckman (2008) operationalise a model of skillformation using data from the Children of the National Longitudinal Survey of Youth(CNLSY). They focus on the production of both cognitive and non-cognitive skillsand investigate how family inputs affect these skills over different phases of the life-cycle. Their results reveal a degree of persistence in cognitive and non-cognitive skillsover time, and suggest that non-cognitive skills affect the accumulation of next periodcognitive skills, but not vice versa. Parental investments seem to affect both children’scognitive and non-cognitive skills, but mother’s ability is found to affect cognitiveability only. They also show that the early years are a particularly sensitive periods forthe development of cognitive and non-cognitive skills with respect to parental invest-ments (such as family income).
Our analysis also relates to the literature on intergenerational transmission of paren-tal education. Parents with higher educational levels have children with higher educa-tional levels in most countries, including the UK (Chevalier 2004; Ermisch andFrancesconi 2001), although it is not clear whether this link is causal (Antonovics andGoldberger 2005; Belzil and Hansen 2003; Carneiro, Meghir, and Parey 2007). It maybe the case that parents with more education also have higher inherent ability (e.g. IQ)or other cognitive and non-cognitive skills. They may then have children who also havehigher ability and better skills, and hence who would get more schooling, regardlessof the education level of their parents. Establishing the causal impact of parental educa-tion is therefore quite problematic. Behrman and Rosenzweig (2002), using twin data,found no causal impact from maternal education on children’s schooling, although the
453
Dow
nloa
ded
by [
Kin
g's
Col
lege
Lon
don]
at 0
6:14
28
Oct
ober
201
1
A. de Coulon et al.
effect of father’s education in their study was large in magnitude. Comparing adoptedchildren with those reared by biological parents, Plug (2003) and Sacerdote (2002,2007) found positive effects from parental schooling on children’s schooling, albeit forfathers only in the case of Plug. Chevalier (2004), Black, Devereux, and Salvanes(2005) and Oreopoulos, Page, and Stevens (2003) use an IV approach based on thenatural experiment caused by changes in compulsory schooling laws in the UK,Norway and USA respectively. Chevalier (2004) and Oreopoulos, Page, and Stevens(2003) find positive effects from parental education, whilst Black, Devereux, andSalvanes (2005) find only weak effects. Carneiro, Meghir, and Parey (2007) use adifferent instrument, namely the costs of schooling. Their results suggest that amother’s education increases the child’s attainment in both math and reading at agesseven to eight, but not at ages 12–14. They also find that maternal education reducesthe incidence of behavioural problems and reduces grade repetition. Overall, theseworks point to a positive causal effect from parental education on children’s outcomes.
The literature on the intergenerational transmission of skill, as distinct fromeducation, is more limited, although some studies have examined intergenerationalcorrelations in IQ (Björklund, Eriksson, and Jäntti 2010; Black, Devereux, andSalvanes 2009). Both Black, Devereux, and Salvanes and Björklund, Eriksson, andJäntti found substantial correlations between parent and child IQ (circa 0.3). Björk-lund then compared sibling and fatherson IQ correlations and concluded that there isa substantial role for family background in determining child IQ (around half a child’sIQ was determined by family background in their data for Sweden). For the UK,Blanden, Gregg, and Macmillan (2007) found cognitive skills to be an importantexplanation for the sizeable intergenerational correlation of income (0.2) that theyfound using data on a cohort born in 1958. For the same cohort, Brown, McIntosh, andTaylor (2009) analysed more directly the intergenerational correlation in the UKbetween parental early cognitive test scores (age seven) and their children’s earlycognitive test scores measured at a similar age in 1991. They used Poisson regressionmodels and found a strong positive correlation between early age seven cognitive testscores of the parents and the test scores of their children at a similar age. They attemptto separate the effect of a genetic component versus an environmental effect using aninstrumental variable strategy and conclude that environment largely explains theintergenerational transmission of reading skills, whilst the genetic component is moreimportant for mathematical skills. There is only limited evidence on the impact ofadult skills on child development, although Bynner et al. (2001) found that parentswith better basic skills were less likely to have children with self-reported literacy ornumeracy difficulties at school.
Our work contributes to the literature by focusing on the intergenerational impactof adult basic skills on cognitive and non-cognitive outcomes of their children.
3. The empirical approach
In this paper, we focus on the relationship between parental cognitive skills in adult-hood and children’s cognitive and non-cognitive skills in early childhood, bothmeasured in 2004 in the BCS. For most of the analysis, the dependent variables ofinterest are: (1) an index of the child’s cognitive skills, or (2) a measure of the child’snon-cognitive skills, both constructed from tests administered at ages three to six (seeSection 4 for more details of these tests). We hypothesise that the child’s skills at thisage are determined partially by parental cognitive skills levels2 as follows:
454
Dow
nloa
ded
by [
Kin
g's
Col
lege
Lon
don]
at 0
6:14
28
Oct
ober
201
1
Education Economics
where the subscript c = child; subscript p = parents or family. The variable Sp
measures the cognitive skills of the child’s parents and X is a set of exogenous or pre-determined child characteristics (sex, age, whether first born). We assume that F,which describes family structure (lone parents; number of siblings), is also exogenous.The above equation can be viewed as a reduced form. We do not include otherparental inputs to the cognitive skill production function, such as parental education,household income and other measures of family environment, since these are them-selves determined by parental skill levels and are hence endogenous to the variable ofinterest.
We assume that the skills of the parent in adulthood depend on their initial geneticendowment (GE), the environment they were exposed to during the early years(family background, schooling, etc.), their adult environment (experiences in adult-hood, work history, etc.) and potential interactions between these sets of variables. Wedo not have data on the genetic endowment of parents, nor all the factors that mightinfluence parental skill levels over their lifetime. Furthermore, some of these influenc-ing factors, such as schooling, are also outcomes from parents’ initial genetic endow-ment and skill levels. So instead we proxy parental skills (Sp) with two measures ofactual parental skills that span their lifetime, namely an early cognitive skill measurederived from tests taken at age five and an adult skill measure from tests of literacyand numeracy taken at age 34. Based on Cunha and Heckman (2007), we wouldexpect early cognitive skill measures (age five tests) to be a better proxy of geneticendowment. We also acknowledge that the early parental cognitive tests potentiallymeasure slightly different aspects of parents’ cognitive skills from the adult literacyand numeracy tests. We also expect there to be high but not perfect correlationbetween the age five and age 34 test scores due to differences in environmental factorsin the person’s early and adult life.
Our estimating equation below therefore includes both early age five test scores andadult age 34 test scores. We measure the extent to which parents’ literacy andnumeracy skills in adulthood provide an additional explanation of their child’s earlycognitive and non-cognitive skill levels, over and above the role of parents’ own earlychildhood cognition. We adjust the standard errors to allow for clustering withinhouseholds and estimate the model using Ordinary Least Squares (OLS). We estimateseparate regressions by gender of both parent and child, to explore whether maternalor paternal skills have differing effects on boys’ and girls’ early skill levels.
Both sets of parental skill test scores will be correlated with parental genetic endowmentwhich is unobserved. It remains a possibility therefore that any positive relationshipbetween parental literacy and numeracy in adulthood and their child’s early cognitiveand non-cognitive skills may be due to unobservable factors correlated with both parentand child skills and not measured by early parental cognitive test scores. One approachto uncover causality would be to find an instrumental variable. Other papers, such as
S S X Fcp p cp p cp (1)= + + + +β β β β ε0 1 2 3
S f GE EE AEp = ( )p p p, , (2)
S S S X Fcp 5 34 cp p cp (3)= + + + + +β β β β β ε0 1 2 3 4
455
Dow
nloa
ded
by [
Kin
g's
Col
lege
Lon
don]
at 0
6:14
28
Oct
ober
201
1
A. de Coulon et al.
Brown, McIntosh, and Taylor (2009), make use of the characteristics of the parent andthe parent’s family background to instrument for parental cognitive skills in theirchildhood. The BCS data that we use also provide a wealth of similar information thatmight be candidate instruments. For example, we have data on grandparents’ educationlevels, which we found did predict parental basic skill level. However, in our data theparental characteristics we have are also arguably correlated with other unobservedfamily characteristics that influence both parental skill levels and the development oftheir offspring. We were unable to find a credibly exogenous instrument from withinour data-set. Other credible instruments used in the literature include exogenous differ-ences in the cost of schooling, changes in legislation on the school leaving age and theuse of twin data (see previous section for a summary of this literature). Unfortunatelyin these data none of these strategies is possible. In the absence of an experimenttherefore, we cannot claim definitively to have uncovered a causal intergenerationalrelationship. However, we would argue that our empirical strategy is strong enough tobe highly suggestive of a causal link and provides the necessary empirical support forprogrammes that target low-skilled adults who have children at risk of having poorcognitive and non-cognitive skills.
4. Data description
We use data from the BCS, a longitudinal data-set that follows the same group ofpeople from birth into adulthood. BCS began in 1970, when data were collected on allthe babies born in England, Wales and Scotland in one week in April of that year.Cohort members have since been followed up six times at ages 5, 10, 16, 26, 30 and34 to collect data about their health, educational, social and economic circumstances.Over time, the number of people participating in the survey decreased due to attrition.In the most recent follow-up, carried out in 2004 when cohort members were aged 34,the sample size was 9665: this is 54% of the original birth cohort and about 74% ofthe first (age five) follow-up sample. However, despite the losses from the originalsample over time, the overall profile of the cohort across the survey is remarkablystable3 (see Bynner and Parsons 2006 for details on attrition).
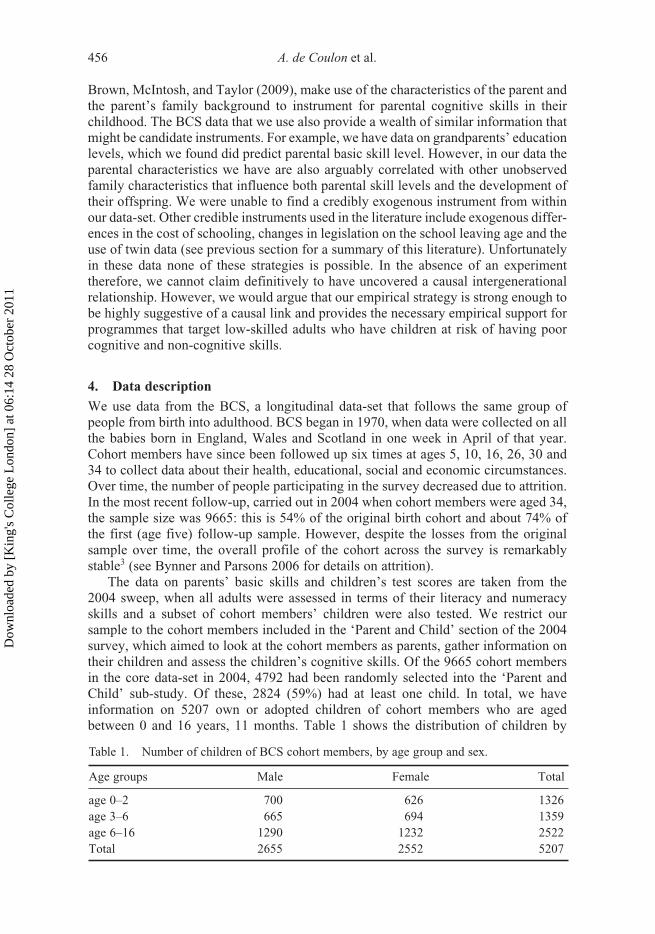
The data on parents’ basic skills and children’s test scores are taken from the2004 sweep, when all adults were assessed in terms of their literacy and numeracyskills and a subset of cohort members’ children were also tested. We restrict oursample to the cohort members included in the ‘Parent and Child’ section of the 2004survey, which aimed to look at the cohort members as parents, gather information ontheir children and assess the children’s cognitive skills. Of the 9665 cohort membersin the core data-set in 2004, 4792 had been randomly selected into the ‘Parent andChild’ sub-study. Of these, 2824 (59%) had at least one child. In total, we haveinformation on 5207 own or adopted children of cohort members who are agedbetween 0 and 16 years, 11 months. Table 1 shows the distribution of children by
Table 1. Number of children of BCS cohort members, by age group and sex.
Age groups Male Female Total
age 0–2 700 626 1326age 3–6 665 694 1359age 6–16 1290 1232 2522Total 2655 2552 5207
456
Dow
nloa
ded
by [
Kin
g's
Col
lege
Lon
don]
at 0
6:14
28
Oct
ober
201
1
Education Economics
age group and sex. Full descriptive statistics on other variables used in the analysisare at Appendix 1.
Of the 5207 children, only those aged between 3 and 16 undertook cognitive assess-ment. Of these, 1359 (about 65%) are aged between three and five years, 11 months.We focus on the pre-school years, guided by the literature which suggests investmentsmade early have greater impact (Cunha et al. 2005). Also, although the role of schoolingin determining cognitive achievement may not be as important as the inputs of parents(Cunha et al. 2005), we do not have good data on the nature of the children’s schoolingand for older children we have no measures of their early cognitive skills. We thereforedo not present the results for the school age child sample. However, results for schoolage children are qualitatively similar to those presented here for pre-school children.4
4.1. Parents’ skills assessments
In 2004 all cohort members were assessed in terms of their basic skills in literacy andnumeracy. The basic skills section consisted of a series of multiple-choice questions,followed by a set of open-ended questions (for a detailed explanation of the tests’design see Parsons and Bynner 2005). The multiple-choice questions were adaptedfrom the Skills for Life National Adult Basic Skills Baseline Survey.5 The assessmentconsisted of 20 questions assessing literacy skills.6 Depending on the cohort members’answers to the first 10 literacy items (screening items), the difficulty of the next 10literacy items changed. The numeracy assessment is made of 17 questions, asked toall individuals.7 The open-ended questions (seven assessing literacy skills and sixassessing numeracy skills) were administered in a standard interview format: the inter-viewer showed the cohort member a visual stimulus on a specified show card, forexample a map or a page from the Yellow Pages directory, and then asked a question.Any correct answer was given 1 point, and any incorrect answer was 0 points. Theoverall scores for literacy and numeracy questions are calculated by summing thecorrect answers to both multiple choice and open-ended question.8
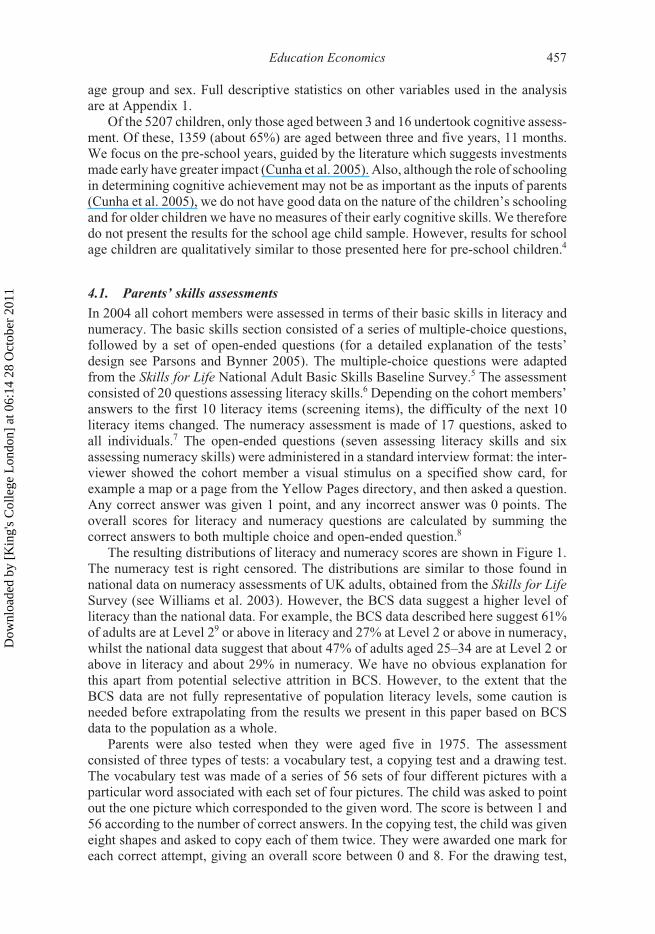
The resulting distributions of literacy and numeracy scores are shown in Figure 1.The numeracy test is right censored. The distributions are similar to those found innational data on numeracy assessments of UK adults, obtained from the Skills for LifeSurvey (see Williams et al. 2003). However, the BCS data suggest a higher level ofliteracy than the national data. For example, the BCS data described here suggest 61%of adults are at Level 29 or above in literacy and 27% at Level 2 or above in numeracy,whilst the national data suggest that about 47% of adults aged 25–34 are at Level 2 orabove in literacy and about 29% in numeracy. We have no obvious explanation forthis apart from potential selective attrition in BCS. However, to the extent that theBCS data are not fully representative of population literacy levels, some caution isneeded before extrapolating from the results we present in this paper based on BCSdata to the population as a whole.Figure 1. BCS 70 adult literacy and numeracy scores from 2004 survey.Parents were also tested when they were aged five in 1975. The assessmentconsisted of three types of tests: a vocabulary test, a copying test and a drawing test.The vocabulary test was made of a series of 56 sets of four different pictures with aparticular word associated with each set of four pictures. The child was asked to pointout the one picture which corresponded to the given word. The score is between 1 and56 according to the number of correct answers. In the copying test, the child was giveneight shapes and asked to copy each of them twice. They were awarded one mark foreach correct attempt, giving an overall score between 0 and 8. For the drawing test,
457
Dow
nloa
ded
by [
Kin
g's
Col
lege
Lon
don]
at 0
6:14
28
Oct
ober
201
1

A. de Coulon et al.
the child was asked to draw a picture of a man, which was then awarded a mark outof 30 according to the features that were included.
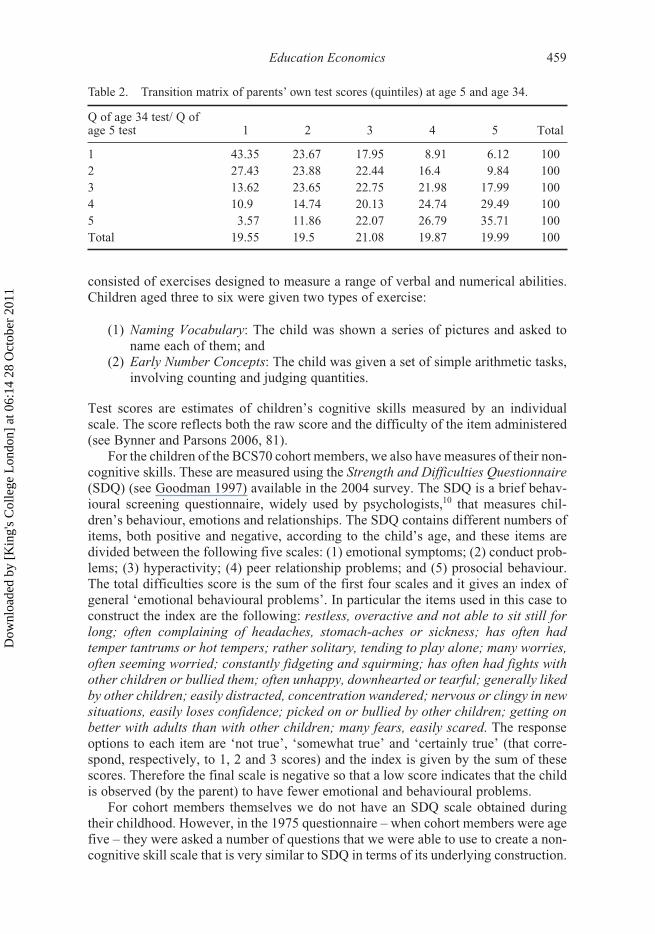
The adult literacy and numeracy scores and the parents’ childhood scores from agefive are measuring similar but not identical cognitive skills. Therefore one has to becautious when measuring changes in individuals’ cognitive skills over their lifetimeusing these measures. Nevertheless, as we argued earlier, individuals’ skills maychange during childhood and into adulthood as a result of their education and jobhistory, and so it is of interest to explore how individuals move up and down thecognitive skill distribution. Table 2 shows the extent to which individuals’ test scoresin childhood and in adulthood are similar. The transition matrix shows the quintiles ofthe skill distribution from standardised versions of the age five and age 34 tests. Theoff diagonal elements are heavily populated suggesting that many individuals changetheir location in the skill distribution over time. For instance, only just under onequarter of individuals who start in the second, third or fourth quintiles of the age fivetest end up in a similar quintile of the age 34 test score distribution. This providesfurther justification as to why we might want to evaluate the correlation betweenparents’ childhood and adult skill levels and their children’s skills.
4.2. Children’s skills assessments
The 2004 cognitive assessments of the children of a subset of the BCS cohort wereadapted from the British Ability Scales Second Edition (BAS II) (Elliot, Smith, andMcCulloch 1996), a widely used educational assessment tool, normally used byeducational psychologists to examine cognitive development. The assessment
Figure 1. BCS 70 adult literacy and numeracy scores from 2004 survey.
458
Dow
nloa
ded
by [
Kin
g's
Col
lege
Lon
don]
at 0
6:14
28
Oct
ober
201
1
Education Economics
consisted of exercises designed to measure a range of verbal and numerical abilities.Children aged three to six were given two types of exercise:
(1) Naming Vocabulary: The child was shown a series of pictures and asked toname each of them; and
(2) Early Number Concepts: The child was given a set of simple arithmetic tasks,involving counting and judging quantities.
Test scores are estimates of children’s cognitive skills measured by an individualscale. The score reflects both the raw score and the difficulty of the item administered(see Bynner and Parsons 2006, 81).
For the children of the BCS70 cohort members, we also have measures of their non-cognitive skills. These are measured using the Strength and Difficulties Questionnaire(SDQ) (see Goodman 1997) available in the 2004 survey. The SDQ is a brief behav-ioural screening questionnaire, widely used by psychologists,10 that measures chil-dren’s behaviour, emotions and relationships. The SDQ contains different numbers ofitems, both positive and negative, according to the child’s age, and these items aredivided between the following five scales: (1) emotional symptoms; (2) conduct prob-lems; (3) hyperactivity; (4) peer relationship problems; and (5) prosocial behaviour.The total difficulties score is the sum of the first four scales and it gives an index ofgeneral ‘emotional behavioural problems’. In particular the items used in this case toconstruct the index are the following: restless, overactive and not able to sit still forlong; often complaining of headaches, stomach-aches or sickness; has often hadtemper tantrums or hot tempers; rather solitary, tending to play alone; many worries,often seeming worried; constantly fidgeting and squirming; has often had fights withother children or bullied them; often unhappy, downhearted or tearful; generally likedby other children; easily distracted, concentration wandered; nervous or clingy in newsituations, easily loses confidence; picked on or bullied by other children; getting onbetter with adults than with other children; many fears, easily scared. The responseoptions to each item are ‘not true’, ‘somewhat true’ and ‘certainly true’ (that corre-spond, respectively, to 1, 2 and 3 scores) and the index is given by the sum of thesescores. Therefore the final scale is negative so that a low score indicates that the childis observed (by the parent) to have fewer emotional and behavioural problems.
For cohort members themselves we do not have an SDQ scale obtained duringtheir childhood. However, in the 1975 questionnaire – when cohort members were agefive – they were asked a number of questions that we were able to use to create a non-cognitive skill scale that is very similar to SDQ in terms of its underlying construction.
Table 2. Transition matrix of parents’ own test scores (quintiles) at age 5 and age 34.
Q of age 34 test/ Q of age 5 test 1 2 3 4 5 Total
1 43.35 23.67 17.95 8.91 6.12 1002 27.43 23.88 22.44 16.4 9.84 1003 13.62 23.65 22.75 21.98 17.99 1004 10.9 14.74 20.13 24.74 29.49 1005 3.57 11.86 22.07 26.79 35.71 100Total 19.55 19.5 21.08 19.87 19.99 100
459
Dow
nloa
ded
by [
Kin
g's
Col
lege
Lon
don]
at 0
6:14
28
Oct
ober
201
1
A. de Coulon et al.
In particular, we used the following items: child has headaches; child has stomachache or vomits; child has temper tantrums; child has sleeping difficulty; tears onarrival at school; restless; squirmy, fidgety; fights with other children; not much likedby other children; worried; solitary, does things on own; miserable, tearful,distressed; twitches mannerisms; cannot settle; fearful, afraid of new situations;bullies others. To be consistent with the SDQ scale, we created the index by summingthe scores from each question. Each response has a score of 1, 2 and 3 that correspondrespectively to these options: ‘does not apply’, ‘applies somewhat’ and ‘certainlyapplies’. The final scale is therefore negative (the higher the score the higher theemotional and behavioural problems). We then standardised the final scale (with mean0 and standard deviation 1) in order to make this variable comparable with the SDQscale available for cohort members’ children.
4.3. Modelling parent and child skills
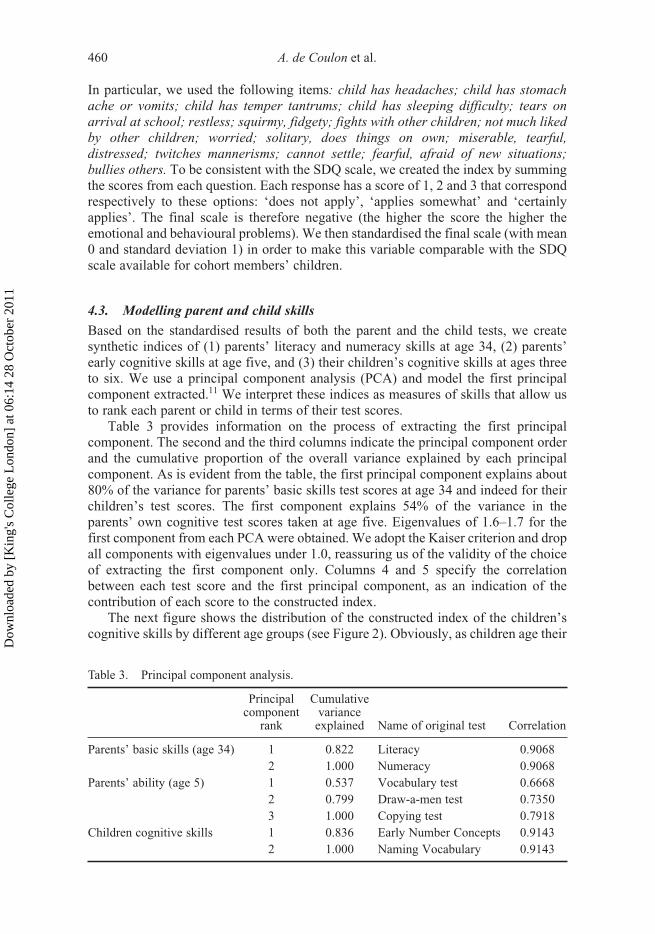
Based on the standardised results of both the parent and the child tests, we createsynthetic indices of (1) parents’ literacy and numeracy skills at age 34, (2) parents’early cognitive skills at age five, and (3) their children’s cognitive skills at ages threeto six. We use a principal component analysis (PCA) and model the first principalcomponent extracted.11 We interpret these indices as measures of skills that allow usto rank each parent or child in terms of their test scores.
Table 3 provides information on the process of extracting the first principalcomponent. The second and the third columns indicate the principal component orderand the cumulative proportion of the overall variance explained by each principalcomponent. As is evident from the table, the first principal component explains about80% of the variance for parents’ basic skills test scores at age 34 and indeed for theirchildren’s test scores. The first component explains 54% of the variance in theparents’ own cognitive test scores taken at age five. Eigenvalues of 1.6–1.7 for thefirst component from each PCA were obtained. We adopt the Kaiser criterion and dropall components with eigenvalues under 1.0, reassuring us of the validity of the choiceof extracting the first component only. Columns 4 and 5 specify the correlationbetween each test score and the first principal component, as an indication of thecontribution of each score to the constructed index.
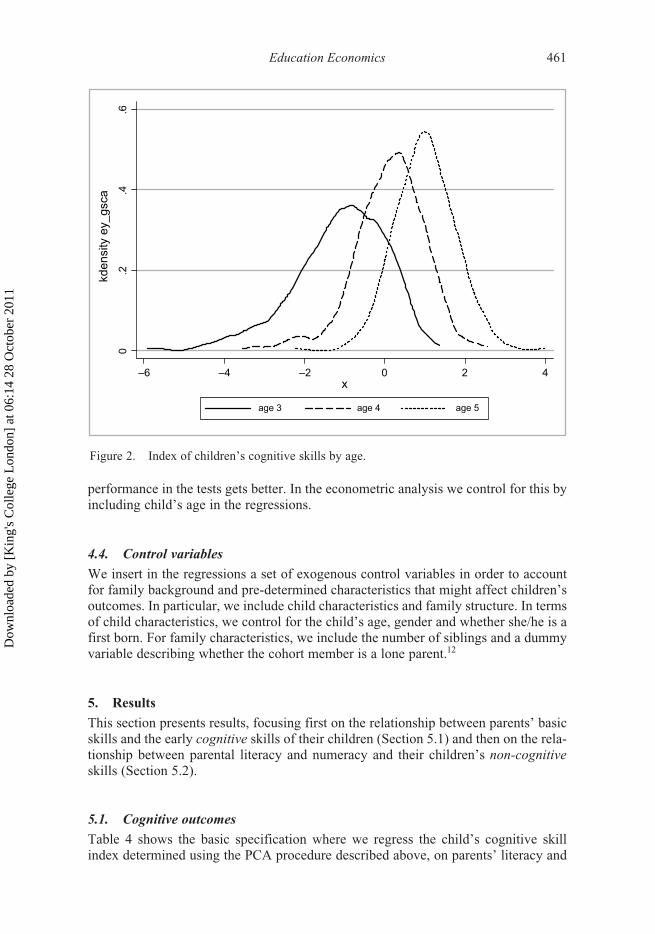
The next figure shows the distribution of the constructed index of the children’scognitive skills by different age groups (see Figure 2). Obviously, as children age their
Table 3. Principal component analysis.
Principal component
rank
Cumulative variance
explained Name of original test Correlation
Parents’ basic skills (age 34) 1 0.822 Literacy 0.90682 1.000 Numeracy 0.9068
Parents’ ability (age 5) 1 0.537 Vocabulary test 0.66682 0.799 Draw-a-men test 0.73503 1.000 Copying test 0.7918
Children cognitive skills 1 0.836 Early Number Concepts 0.91432 1.000 Naming Vocabulary 0.9143
460
Dow
nloa
ded
by [
Kin
g's
Col
lege
Lon
don]
at 0
6:14
28
Oct
ober
201
1
Education Economics
performance in the tests gets better. In the econometric analysis we control for this byincluding child’s age in the regressions.Figure 2. Index of children’s cognitive skills by age.
4.4. Control variables
We insert in the regressions a set of exogenous control variables in order to accountfor family background and pre-determined characteristics that might affect children’soutcomes. In particular, we include child characteristics and family structure. In termsof child characteristics, we control for the child’s age, gender and whether she/he is afirst born. For family characteristics, we include the number of siblings and a dummyvariable describing whether the cohort member is a lone parent.12
5. Results
This section presents results, focusing first on the relationship between parents’ basicskills and the early cognitive skills of their children (Section 5.1) and then on the rela-tionship between parental literacy and numeracy and their children’s non-cognitiveskills (Section 5.2).
5.1. Cognitive outcomes
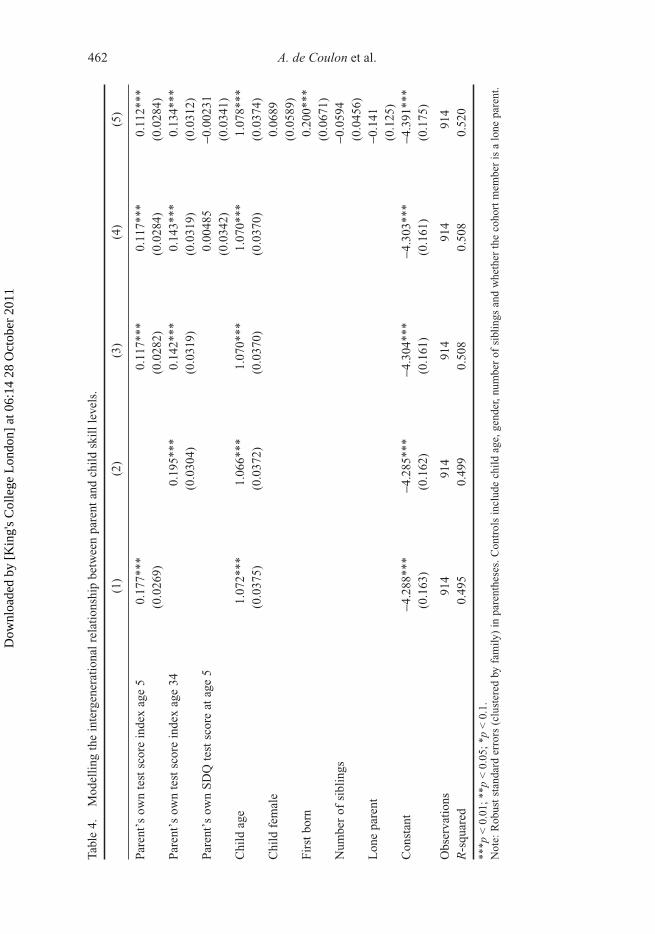
Table 4 shows the basic specification where we regress the child’s cognitive skillindex determined using the PCA procedure described above, on parents’ literacy and
Figure 2. Index of children’s cognitive skills by age.
461
Dow
nloa
ded
by [
Kin
g's
Col
lege
Lon
don]
at 0
6:14
28
Oct
ober
201
1
A. de Coulon et al.
Tabl
e 4.
Mod
elli
ng t
he i
nter
gene
rati
onal
rel
atio
nshi
p be
twee
n pa
rent
and
chi
ld s
kill
lev
els.
(1)
(2)
(3)
(4)
(5)
Par
ent’
s ow
n te
st s
core
ind
ex a
ge 5
0.17
7***
0.11
7***
0.11
7***
0.11
2***
(0.0
269)
(0.0
282)
(0.0
284)
(0.0
284)
Par
ent’
s ow
n te
st s
core
ind
ex a
ge 3
40.
195*
**0.
142*
**0.
143*
**0.
134*
**(0
.030
4)(0
.031
9)(0
.031
9)(0
.031
2)P
aren
t’s
own
SD
Q t
est
scor
e at
age
50.
0048
5−0
.002
31(0
.034
2)(0
.034
1)C
hild
age
1.07
2***
1.06
6***
1.07
0***
1.07
0***
1.07
8***
(0.0
375)
(0.0
372)
(0.0
370)
(0.0
370)
(0.0
374)
Chi
ld f
emal
e0.
0689
(0.0
589)
Fir
st b
orn
0.20
0***
(0.0
671)
Num
ber
of s
ibli
ngs
−0.0
594
(0.0
456)
Lon
e pa
rent
−0.1
41(0
.125
)C
onst
ant
−4.2
88**
*−4
.285
***
−4.3
04**
*−4
.303
***
−4.3
91**
*(0
.163
)(0
.162
)(0
.161
)(0
.161
)(0
.175
)
Obs
erva
tion
s91
491
491
491
491
4R
-squ
ared
0.49
50.
499
0.50
80.
508
0.52
0
***p
< 0
.01;
**p
< 0
.05;
*p
< 0
.1.
Not
e: R
obus
t st
anda
rd e
rror
s (c
lust
ered
by
fam
ily)
in p
aren
thes
es. C
ontr
ols
incl
ude
chil
d ag
e, g
ende
r, nu
mbe
r of
sib
ling
s an
d w
heth
er t
he c
ohor
t m
embe
r is
a l
one
pare
nt.
462
Dow
nloa
ded
by [
Kin
g's
Col
lege
Lon
don]
at 0
6:14
28
Oct
ober
201
1
Education Economics
numeracy skills at 34, as well as the parents’ age five cognitive skill index score anda set of control variables. We control for child age in every specification. In Column1 we only include the child’s age and their parents’ cognitive skills when the parentwas aged five. In this way we obtain the correlation coefficient between parentalearly cognitive skills and their child’s cognitive skills at roughly the same age (0.17).The coefficient is large and highly significant suggesting a strong intergenerationalcorrelation in cognitive skills. The coefficient is somewhat smaller in magnitude tothat found by Brown, McIntosh, and Taylor (2009) when they analysed the intergen-erational correlation in early reading scores using an older, 1958 cohort (0.25) andsomewhat larger in magnitude to their results for mathematics (0.09). This isconsistent, since our parent and child cognitive skill measures combine informationabout both reading and mathematics.13 In Column 2 we include only the index ofparents’ basic skills at age 34 and find a similarly large intergenerational correlationcoefficient (0.2). In Column 3 we include both the early and adult measures ofparental cognitive skills, to introduce proxy measures for parental cognitive skillsover the course of their life time. Having both measures in the model reduces themagnitude of the coefficient on both the early parental skill measure (0.11) and theadult literacy and numeracy skill measure (0.14). Yet both coefficients remain size-able and statistically significant. Parents’ own skill level early in childhood (agefive) and later when they are raising their children both predict the cognitive skilllevel of their children. This result holds when we control for other child and familycharacteristics in the final column. In Column 4 we also include parents’ non-cogni-tive skills at age five, but this variable turns out to be insignificant. This seems tosuggest that parents’ early non-cognitive skills do not exert a direct influence ontheir children’s cognitive outcomes.14 The results (from Column 4) suggest that a 1standard deviation increase in parental adult skill is associated with an intergenera-tional gain in the child’s cognitive skill of 0.14 of a standard deviation. To illustrateits magnitude, this effect is somewhat smaller than the effect of being a first bornchild, for example.
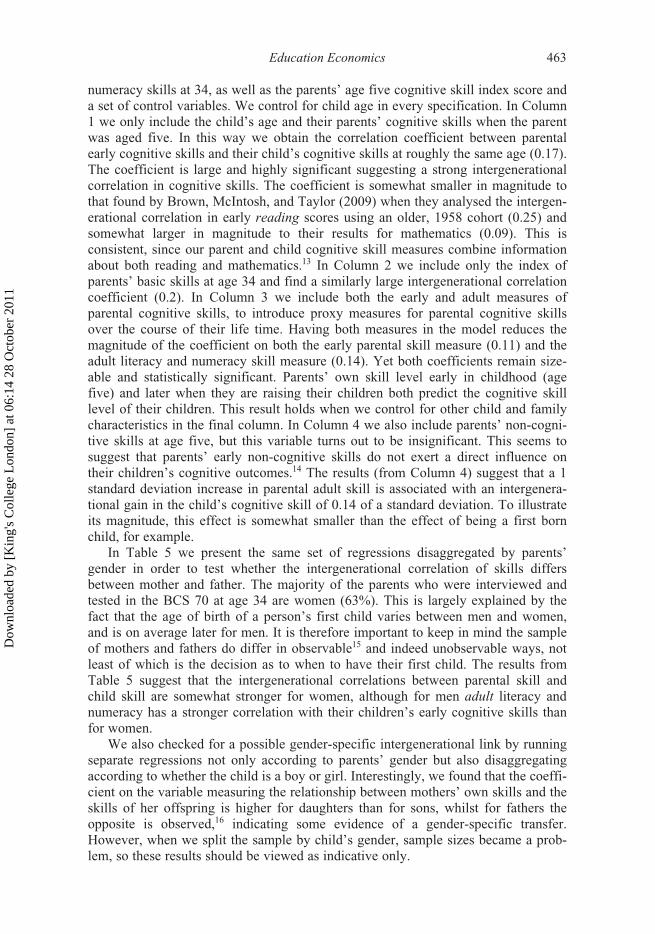
In Table 5 we present the same set of regressions disaggregated by parents’gender in order to test whether the intergenerational correlation of skills differsbetween mother and father. The majority of the parents who were interviewed andtested in the BCS 70 at age 34 are women (63%). This is largely explained by thefact that the age of birth of a person’s first child varies between men and women,and is on average later for men. It is therefore important to keep in mind the sampleof mothers and fathers do differ in observable15 and indeed unobservable ways, notleast of which is the decision as to when to have their first child. The results fromTable 5 suggest that the intergenerational correlations between parental skill andchild skill are somewhat stronger for women, although for men adult literacy andnumeracy has a stronger correlation with their children’s early cognitive skills thanfor women.
We also checked for a possible gender-specific intergenerational link by runningseparate regressions not only according to parents’ gender but also disaggregatingaccording to whether the child is a boy or girl. Interestingly, we found that the coeffi-cient on the variable measuring the relationship between mothers’ own skills and theskills of her offspring is higher for daughters than for sons, whilst for fathers theopposite is observed,16 indicating some evidence of a gender-specific transfer.However, when we split the sample by child’s gender, sample sizes became a prob-lem, so these results should be viewed as indicative only.
463
Dow
nloa
ded
by [
Kin
g's
Col
lege
Lon
don]
at 0
6:14
28
Oct
ober
201
1
A. de Coulon et al.
Tabl
e 5.
Mod
elli
ng t
he i
nter
gene
rati
onal
rel
atio
nshi
p be
twee
n pa
rent
and
chi
ld s
kill
lev
els
– m
othe
r an
d fa
ther
sep
arat
ely.
(1)
(2)
(3)
(4)
(5)
(6)
(7)
(8)
Mot
hers
Fat
hers
Par
ent’
s ow
n te
st s
core
ind
ex a
ge 5
0.19
5***
0.12
9***
0.11
9***
0.15
0***
0.08
70**
0.08
21*
(0.0
370)
(0.0
366)
(0.0
363)
(0.0
369)
(0.0
436)
(0.0
440)
Par
ent’
s ow
n te
st s
core
ind
ex a
ge 3
40.
196*
**0.
138*
**0.
134*
**0.
223*
**0.
181*
**0.
181*
**(0
.037
8)(0
.037
4)(0
.036
8)(0
.049
7)(0
.057
5)(0
.056
9)O
ther
con
trol
sv
vv
vv
vv
vO
bser
vati
ons
584
584
584
584
347
347
347
347
R-s
quar
ed0.
496
0.49
80.
509
0.53
00.
495
0.51
00.
516
0.52
4
***p
< 0
.01;
**p
< 0
.05;
*p
< 0
.1.
Not
e: R
obus
t st
anda
rd e
rror
s (c
lust
ered
by
fam
ily)
in p
aren
thes
es. C
ontr
ols
incl
ude
chil
d ag
e, g
ende
r, nu
mbe
r of
sib
ling
s an
d w
heth
er t
he c
ohor
t m
embe
r is
a l
one
pare
nt.
464
Dow
nloa
ded
by [
Kin
g's
Col
lege
Lon
don]
at 0
6:14
28
Oct
ober
201
1
Education Economics
In the previous tables we have considered the common components of parents’skills at age 34 derived from two different tests (i.e. the literacy and numeracy tests).This approach is based on the assumption that a lot of the skills measured in the twotests are highly positively correlated. The tests are indeed designed to differentiatevery low levels of basic skills, so that for example someone who cannot read properlywill also tend to score low in the numeracy test. However, we also relax this assump-tion and investigate whether it is possible to observe separate effects from parents’literacy and numeracy on their children’s tests scores. In Table 6 (Columns 1–4), weshow the correlations between adult literacy and numeracy and their children’scognitive skills separately. The estimates reveal a very similar correlation for bothliteracy and numeracy.
It may also be the case that parents’ literacy and numeracy skills have a dissimilarimpact on different aspects of children’s cognitive skills. We might expect parents’literacy to have a stronger impact on children’s Naming Vocabulary test and parents’numeracy to be more highly correlated with their children’s early number concepts.We test this hypothesis by running separate regressions of parents’ literacy and numer-acy on the two different children’s tests. Interestingly both parents’ literacy and numer-acy skills have a stronger correlation with children’s early number concepts, with thehighest correlation being between parents’ literacy and children’s number test score.This appears to vindicate our decision to treat these tests as measuring similar cognitiveskills and, given the high correlation between the various test scores, to combine theminto one single measure of cognitive skills. Our results have revealed that parents withbetter early cognitive skills and also higher adult literacy and numeracy scores havechildren who themselves score more highly on early cognitive skills tests. This resultwas obtained via reduced form models that simply controlled for parental skill at twopoints in time, as well as clearly exogenous child characteristics. Ideally however, wewould like to know the mechanisms by which parental cognitive skills impact on thechild’s own skill level. As we have already indicated, the existing literature suggeststhat these mechanisms will include a genetic component as well as interactionsbetween genetic predisposition and the child’s environment.
We could of course try to determine the importance of different transmissionmechanisms by including them in our model. This is, however, problematic as thesevariables are endogenous and may also be capturing other unobserved transmissionmechanisms. For illustration, if we include parental education and whether or not theparent reads to their child in our model of child cognitive skills, the correlation coef-ficients on both the parental childhood and adult skill scores are in fact reduced.17
This would seem to imply that parents’ cognitive skills impact on their children’scognitive skills because more skilled parents get more education and are more likelyto read to their children. However, since we cannot control properly for parental IQand aspirations, and given that parental education in particular will be highly corre-lated with both these unobserved factors, we cannot use this approach to determinehow parental cognitive skills impact on the child’s own skill. Instead, we simplyreport the intergenerational correlations that we observe and comment on their impli-cations for policy. We also note that the coefficients on both of our measures ofparental cognitive skills remain significant even when we control for parental educa-tion, socio-professional status of the parents, income levels of parent and frequencywith which the parent read to the child. This suggests some other remaining unob-served mechanisms by which parental cognitive skills impact on their children’scognitive skills.
465
Dow
nloa
ded
by [
Kin
g's
Col
lege
Lon
don]
at 0
6:14
28
Oct
ober
201
1

A. de Coulon et al.
Tabl
e 6.
Impa
ct o
f pa
rent
s’ l
iter
acy
and
num
erac
y on
dif
fere
nt t
est
scor
e ou
tcom
es f
or t
heir
chi
ldre
n.
(1)
(2)
(3)
(4)
(5)
(6)
(7)
(8)
(9)
(10)
(11)
(12)
Dep
ende
nt
vari
able
:C
ogni
tive
ski
lls’
ind
exN
amin
g V
ocab
ular
y te
stE
arly
Num
ber
Con
cept
tes
t
Par
ent’
s ow
n te
st s
core
in
dex
age
5
0.13
2***
(0.0
281)
0.12
6***
(0.0
281)
0.12
6***
(0.0
270)
0.12
1***
(0.0
270)
0.11
1***
(0.0
236)
0.10
5***
(0.0
238)
0.10
5***
(0.0
230)
0.10
0***
(0.0
231)
0.07
65**
*(0
.022
1)0.
0743
***
(0.0
222)
0.07
18**
*(0
.021
3)0
.069
6***
(0.0
213)
Par
ent’
s ow
n li
tera
cy t
est
scor
e ag
e 34
0.16
5***
(0.0
455)
0.15
6***
(0.0
448)
0.16
9***
0.10
2***
(0.0
342)
0.09
05**
*(0
.033
5)0.
124*
**(0
.037
1)0.
121*
**(0
.036
9)
Par
ent’
s ow
n nu
mer
acy
test
sc
ore
age
34
(0.0
366)
0.15
9***
(0.0
357)
0.11
0***
(0.0
304)
0.09
82**
*(0
.029
1)0.
127*
**(0
.028
4)0.
125*
**(0
.028
2)
Oth
er c
ontr
ols
vv
vv
vv
vv
vv
vv
Obs
erva
tion
s93
193
193
193
193
893
893
893
893
193
193
193
1
R-s
quar
ed0.
504
0.51
60.
507
0.51
90.
362
0.38
70.
365
0.38
90.
484
0.48
60.
488
0.49
0
***p
< 0
.01;
**p
< 0
.05;
*p
< 0
.1.
Not
e: R
obus
t st
anda
rd e
rror
s (c
lust
ered
by
fam
ily)
in p
aren
thes
es. C
ontr
ols
incl
ude
chil
d ag
e, g
ende
r, nu
mbe
r of
sib
ling
s an
d w
heth
er t
he c
ohor
t m
embe
r is
a l
one
pare
nt.
The
cog
nitiv
e sk
ill
inde
x is
der
ived
fro
m a
pri
ncip
al c
ompo
nent
s an
alys
is i
nvol
ving
the
Nam
ing
Voc
abul
ary
test
and
the
Ear
ly N
umbe
r C
once
pt t
est.
466
Dow
nloa
ded
by [
Kin
g's
Col
lege
Lon
don]
at 0
6:14
28
Oct
ober
201
1
Education Economics
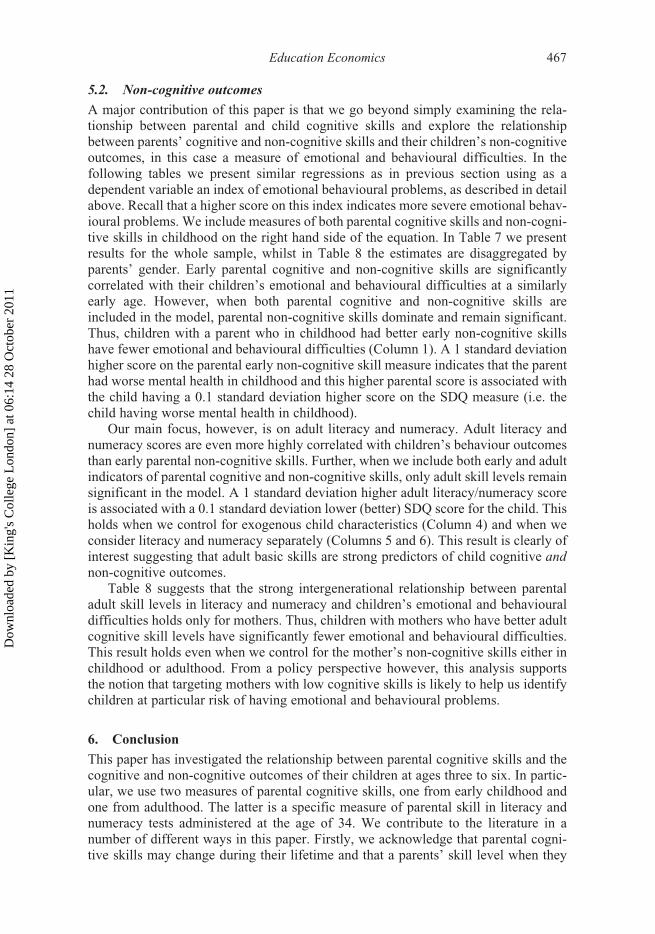
5.2. Non-cognitive outcomes
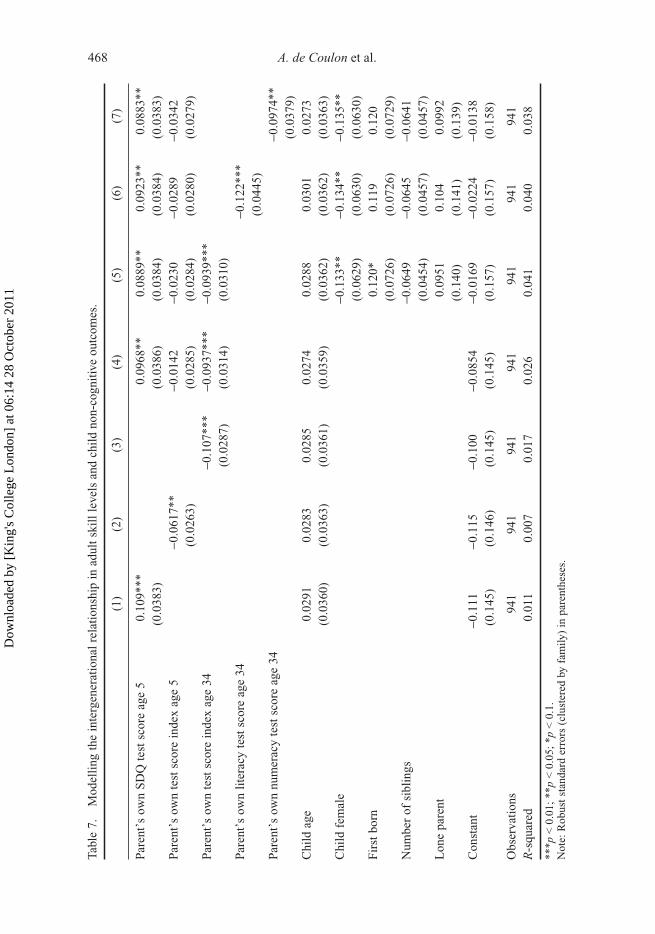
A major contribution of this paper is that we go beyond simply examining the rela-tionship between parental and child cognitive skills and explore the relationshipbetween parents’ cognitive and non-cognitive skills and their children’s non-cognitiveoutcomes, in this case a measure of emotional and behavioural difficulties. In thefollowing tables we present similar regressions as in previous section using as adependent variable an index of emotional behavioural problems, as described in detailabove. Recall that a higher score on this index indicates more severe emotional behav-ioural problems. We include measures of both parental cognitive skills and non-cogni-tive skills in childhood on the right hand side of the equation. In Table 7 we presentresults for the whole sample, whilst in Table 8 the estimates are disaggregated byparents’ gender. Early parental cognitive and non-cognitive skills are significantlycorrelated with their children’s emotional and behavioural difficulties at a similarlyearly age. However, when both parental cognitive and non-cognitive skills areincluded in the model, parental non-cognitive skills dominate and remain significant.Thus, children with a parent who in childhood had better early non-cognitive skillshave fewer emotional and behavioural difficulties (Column 1). A 1 standard deviationhigher score on the parental early non-cognitive skill measure indicates that the parenthad worse mental health in childhood and this higher parental score is associated withthe child having a 0.1 standard deviation higher score on the SDQ measure (i.e. thechild having worse mental health in childhood).
Our main focus, however, is on adult literacy and numeracy. Adult literacy andnumeracy scores are even more highly correlated with children’s behaviour outcomesthan early parental non-cognitive skills. Further, when we include both early and adultindicators of parental cognitive and non-cognitive skills, only adult skill levels remainsignificant in the model. A 1 standard deviation higher adult literacy/numeracy scoreis associated with a 0.1 standard deviation lower (better) SDQ score for the child. Thisholds when we control for exogenous child characteristics (Column 4) and when weconsider literacy and numeracy separately (Columns 5 and 6). This result is clearly ofinterest suggesting that adult basic skills are strong predictors of child cognitive andnon-cognitive outcomes.
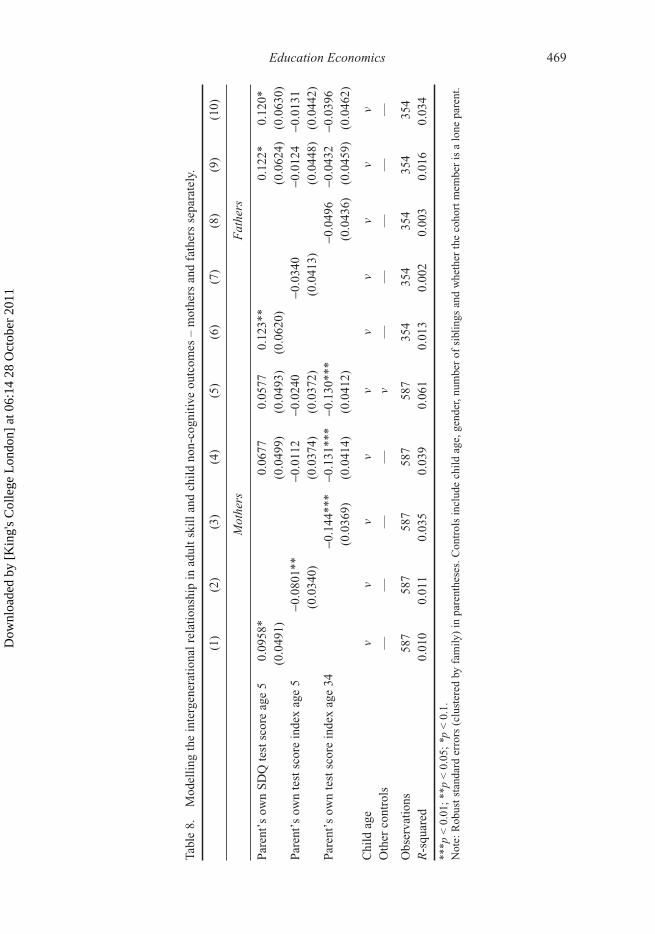
Table 8 suggests that the strong intergenerational relationship between parentaladult skill levels in literacy and numeracy and children’s emotional and behaviouraldifficulties holds only for mothers. Thus, children with mothers who have better adultcognitive skill levels have significantly fewer emotional and behavioural difficulties.This result holds even when we control for the mother’s non-cognitive skills either inchildhood or adulthood. From a policy perspective however, this analysis supportsthe notion that targeting mothers with low cognitive skills is likely to help us identifychildren at particular risk of having emotional and behavioural problems.
6. Conclusion
This paper has investigated the relationship between parental cognitive skills and thecognitive and non-cognitive outcomes of their children at ages three to six. In partic-ular, we use two measures of parental cognitive skills, one from early childhood andone from adulthood. The latter is a specific measure of parental skill in literacy andnumeracy tests administered at the age of 34. We contribute to the literature in anumber of different ways in this paper. Firstly, we acknowledge that parental cogni-tive skills may change during their lifetime and that a parents’ skill level when they
467
Dow
nloa
ded
by [
Kin
g's
Col
lege
Lon
don]
at 0
6:14
28
Oct
ober
201
1
A. de Coulon et al.
Tabl
e 7.
Mod
elli
ng t
he i
nter
gene
rati
onal
rel
atio
nshi
p in
adu
lt s
kill
lev
els
and
chil
d no
n-co
gnit
ive
outc
omes
.
(1)
(2)
(3)
(4)
(5)
(6)
(7)
Par
ent’
s ow
n S
DQ
tes
t sc
ore
age
50.
109*
**0.
0968
**0.
0889
**0.
0923
**0.
0883
**(0
.038
3)(0
.038
6)(0
.038
4)(0
.038
4)(0
.038
3)P
aren
t’s
own
test
sco
re i
ndex
age
5−0
.061
7**
−0.0
142
−0.0
230
−0.0
289
−0.0
342
(0.0
263)
(0.0
285)
(0.0
284)
(0.0
280)
(0.0
279)
Par
ent’
s ow
n te
st s
core
ind
ex a
ge 3
4−0
.107
***
−0.0
937*
**−0
.093
9***
(0.0
287)
(0.0
314)
(0.0
310)
Par
ent’
s ow
n li
tera
cy t
est
scor
e ag
e 34
−0.1
22**
*(0
.044
5)P
aren
t’s
own
num
erac
y te
st s
core
age
34
−0.0
974*
*(0
.037
9)C
hild
age
0.02
910.
0283
0.02
850.
0274
0.02
880.
0301
0.02
73(0
.036
0)(0
.036
3)(0
.036
1)(0
.035
9)(0
.036
2)(0
.036
2)(0
.036
3)C
hild
fem
ale
−0.1
33**
−0.1
34**
−0.1
35**
(0.0
629)
(0.0
630)
(0.0
630)
Fir
st b
orn
0.12
0*0.
119
0.12
0(0
.072
6)(0
.072
6)(0
.072
9)N
umbe
r of
sib
ling
s−0
.064
9−0
.064
5−0
.064
1(0
.045
4)(0
.045
7)(0
.045
7)L
one
pare
nt0.
0951
0.10
40.
0992
(0.1
40)
(0.1
41)
(0.1
39)
Con
stan
t−0
.111
−0.1
15−0
.100
−0.0
854
−0.0
169
−0.0
224
−0.0
138
(0.1
45)
(0.1
46)
(0.1
45)
(0.1
45)
(0.1
57)
(0.1
57)
(0.1
58)
Obs
erva
tion
s94
194
194
194
194
194
194
1R
-squ
ared
0.01
10.
007
0.01
70.
026
0.04
10.
040
0.03
8
***p
< 0
.01;
**p
< 0
.05;
*p
< 0
.1.
Not
e: R
obus
t st
anda
rd e
rror
s (c
lust
ered
by
fam
ily)
in p
aren
thes
es.
468
Dow
nloa
ded
by [
Kin
g's
Col
lege
Lon
don]
at 0
6:14
28
Oct
ober
201
1
Education Economics
Tabl
e 8.
Mod
elli
ng t
he i
nter
gene
rati
onal
rel
atio
nshi
p in
adu
lt s
kill
and
chi
ld n
on-c
ogni
tive
outc
omes
– m
othe
rs a
nd f
athe
rs s
epar
atel
y.
(1)
(2)
(3)
(4)
(5)
(6)
(7)
(8)
(9)
(10)
Mot
hers
Fat
hers
Par
ent’
s ow
n S
DQ
tes
t sc
ore
age
50.
0958
*0.
0677
0.05
770.
123*
*0.
122*
0.12
0*(0
.049
1)(0
.049
9)(0
.049
3)(0
.062
0)(0
.062
4)(0
.063
0)P
aren
t’s
own
test
sco
re i
ndex
age
5−0
.080
1**
−0.0
112
−0.0
240
−0.0
340
−0.0
124
−0.0
131
(0.0
340)
(0.0
374)
(0.0
372)
(0.0
413)
(0.0
448)
(0.0
442)
Par
ent’
s ow
n te
st s
core
ind
ex a
ge 3
4−0
.144
***
−0.1
31**
*−0
.130
***
−0.0
496
−0.0
432
−0.0
396
(0.0
369)
(0.0
414)
(0.0
412)
(0.0
436)
(0.0
459)
(0.0
462)
Chi
ld a
gev
vv
vv
vv
vv
vO
ther
con
trol
s—
——
—v
——
——
—
Obs
erva
tion
s58
758
758
758
758
735
435
435
435
435
4R
-squ
ared
0.01
00.
011
0.03
50.
039
0.06
10.
013
0.00
20.
003
0.01
60.
034
***p
< 0
.01;
**p
< 0
.05;
*p
< 0
.1.
Not
e: R
obus
t st
anda
rd e
rror
s (c
lust
ered
by
fam
ily)
in p
aren
thes
es. C
ontr
ols
incl
ude
chil
d ag
e, g
ende
r, nu
mbe
r of
sib
ling
s an
d w
heth
er t
he c
ohor
t m
embe
r is
a l
one
pare
nt.
469
Dow
nloa
ded
by [
Kin
g's
Col
lege
Lon
don]
at 0
6:14
28
Oct
ober
201
1
A. de Coulon et al.
have their children may be a stronger predictor of the child’s cognitive skill level thanearlier measures of parental cognitive skills. We also extend the existing work that hasbeen carried by Brown, McIntosh, and Taylor (2009) on an older (1958) cohort, andpresent results on the intergenerational correlation between early measures of parentalcognitive skills (at age five) and their children’s cognitive skills for a cohort born in1970. Lastly, we make a contribution by also considering the relationship betweenparental cognitive and non-cognitive skills and their children’s non-cognitiveoutcomes, namely the extent of any behavioural or emotional difficulties the childmay have. For this analysis we have both early measures of the parent’s non-cognitiveskills and measures of the child’s non-cognitive skills as measured by the Strength andDifficulties Questionnaire instrument.
We found strong evidence that parents with better cognitive skills have childrenwho also perform better in cognitive tests. The intergenerational correlation betweenearly parental cognitive skills and early measures of the cognitive skills of their childrenis consistent with Brown, McIntosh, and Taylor (2009), namely around 0.17. Interest-ingly, both our early measure of parental cognitive skills and our adult measure remainhighly significant and of sizable magnitude when included in the model together, evenafter controlling for exogenous characteristics of the children. We do not have a plau-sible instrument to determine causality in this analysis; however, it is noteworthy thatthe adult skills variable remains positive and statistically significant, even after control-ling for the significant relationship between early parental skills (both cognitive andnon-cognitive) and their children’s cognitive skills. This implies at the very least thattargeting adults with poor literacy and numeracy would be useful from a policy perspec-tive, in that we would be able to identify individuals whose children are at risk of havingpoor cognitive skills themselves. Our results also suggest that knowing a person’scognitive skills at the age of five is not sufficient to be able to determine whether theirchildren are at risk of having poor cognitive skills. A person’s skills change overtheir lifetime and the skills with which they enter parenthood will also predict how welltheir children do in terms of early childhood cognitive skill development.
Our results also indicate that parental cognitive skills in adulthood, i.e. theirliteracy and numeracy skill, are significantly correlated with their children’s propen-sity to have emotional and behavioural difficulties. Children whose parents are morecognitively skilled have fewer emotional and behavioural difficulties. This resultholds even when we control for the parent’s early non-cognitive skills. Again, thisfinding has implications as to how we might target programmes designed to help chil-dren at risk of these emotional and behavioural problems.
In policy terms, our results if interpreted as causal would suggest that policiesaimed at increasing parents’ cognitive skills may not only impact on parents’ earningsand economic well-being but also on their children’s cognitive and non-cognitiveoutcomes. We fully recognise however, that we are not necessarily uncovering causalrelationships, and therefore, programmes targeted at low-skilled adults need to beproperly evaluated in order to determine both whether the programmes impact directlyon the skills of the adults and then whether there are any beneficial effects on thecognitive and non-cognitive skills of their children.
AcknowledgementsPrevious versions of this paper have been presented at the University of Essex (ISER seminar),European Society of Population Economics (ESPE, London, 11–13 June), Work and Pension
470
Dow
nloa
ded
by [
Kin
g's
Col
lege
Lon
don]
at 0
6:14
28
Oct
ober
201
1

Education Economics
Economic Group (WPEG, Sheffield, 14–16 July), European Association of Labour Economists(EALE, Amsterdam, 18–20 September 2008) conferences. We wish to thank all the partici-pants for their useful comments and suggestions. In particular, precious insights by Emilia delBono, Arnaud Chevalier, Steve Machin, John Micklewright and Erik Plug are gratefullyacknowledged.
Notes1. We refer to skills of both parents and children throughout the paper, as distinct from their
ability. Ability, skills and indeed educational attainment are all positively correlated but notsynonymous. Ability is often used to describe IQ or ‘inherent ability’ as opposed to learnedskills. In our data we have no measure of IQ or similar. In any case, the extent to which IQmeasures can measure genuine ability as opposed to skill is contested.
2. The child’s cognitive and non-cognitive skills are likely to be related to the skills of boththeir parents. Unfortunately, in our data we only have the skills of one parent (the cohortmember). Given assortative mating, we hypothesise that maternal and paternal skills arelikely to be positively correlated and therefore the skills of one parent may act as a proxyfor the skills of the other parent. In the absence of better data this is all we can do. Weexplore the issue of whether maternal or paternal skills have greater impact on child’s skillslater in the paper.
3. Bynner and Parsons’ (2006) analysis of representativeness of the sample reveals a slightbias in 2004 towards women and towards the better educated.
4. These results are available on request.5. Devised by the Centre for the Development and Evaluation of Lifelong Learning (CDELL)
at the University of Nottingham. Carried out by BMRB on behalf of the Department forEducation and Skills in 2002.
6. In particular, the literacy items cover aspects of reading and writing, such as readingcomprehension, vocabulary, word recognition, writing composition, spelling and grammar,but the item selection was heavily concentrated on reading comprehension.
7. Numeracy questions include items on basic money, whole numbers and time, measures andproportion, weights and scales, length and scaling, chart and data, money calculation.
8. For the multiple choice (MC) literacy questions, in order to calculate an overall score thatincluded the 4% of cohort members who – because they failed to answer six or more ofthe screening questions correctly – moved down to the lower tier of the MC assessment,we have to assume they would not have been able to answer any of the more difficultquestions on the upper tier. Accordingly, a score of ‘0’ was automatically awarded to thisgroup for the 10 questions on the upper tier. Likewise, a score of ‘1’ for each of the 10questions on the lower tier was automatically awarded to the 96% of cohort memberswho progressed along the upper tier. The maximum literacy score available from themultiple choice questions is therefore within the range 16–30 for cohort members on theupper tier and 0–15 for cohort members who progressed on the lower tier (see Bynner andParsons 2006).
9. These levels are national levels and Level 2 is approximately equivalent to GCSE standard.10. Different psychological studies have confirmed that the SDQ has adequate discriminant
and predictive validity (Goodman 1997; Goodman and Scott 1999) and that diagnosticpredictions based on the SDQ agree well with clinical diagnoses (Goodman, Renfrew, andMullick 2000), supporting its clinical validity.
11. This procedure is very common in the psychometric literature in order to build an index ofgeneral ability (Cawley et al. 1996). The index is constructed from the product of the testscore vector and the eigenvector associated with the largest eigenvalue of the matrix ofcorrelations among standardised test scores.
12. We do not control for ethnicity because the ethnic composition of our sample is not mixedenough: more than 97% of individuals in our sample are classified as white British.
13. The intergenerational correlations between different types of reading and number skills arediscussed later in this section.
14. Since the variable on parents’ SDQ scale at age five is never significant in the differentspecifications of the child cognitive equation, we do not include it in the following tables.
15. Women constitute 60.58% of our sample, whilst the men are only 39.42%. Men tend to beslightly more educated and more skilled in literacy and numeracy (their average score is
471
Dow
nloa
ded
by [
Kin
g's
Col
lege
Lon
don]
at 0
6:14
28
Oct
ober
201
1
A. de Coulon et al.
0.89 [SD = 1.88], whilst that of women is 0.98 [SD = 1.29]). Moreover, men’s partners areusually younger than woman’s partners (age 32.9 against 36.7).
16. In particular, in the fully specified regression, the coefficient on mother’s skills is 0.162for daughters and 0.125 for sons and on father’s skills is 0.106 for daughters and 0.219 forsons.
17. For example, when we include dummies for parents’ education among other controls in thebasic specification (Table 4, Column 4), the coefficients of parents’ skills at age 34 and ofparents’ skills at age five both decrease by about 10% (the former changes from about0.136 to 0.122, whilst the latter from 0.111 to 0.099).
ReferencesAntonovics, K., and A. Goldberger. 2005. Does increasing women’s schooling raise the
schooling of the next generation? Comment. American Economic Review 95: 1738–44.Behrman J.R., and M. Rosenzweig. 2002. Does increasing women’s schooling raise the
schooling of the next generation? American Economic Review 92, no. 1: 323–34.Belzil, C., and J. Hansen. 2003. Structural estimates of the intergenerational education
correlation. Journal of Applied Econometrics 18: 679–96.Björklund, A., K.H. Eriksson, and M. Jäntti. 2010. IQ and family background: Are associations
strong or weak? B.E. Journal of Economic Analysis & Policy 10, no. 1, Article 2.Black, S., P.J. Devereux, and K. Salvanes. 2005. Why the apple doesn’t fall far: Understand-
ing intergenerational transmission of human capital. American Economic Review 95,no. 1: 437–49.
Black, S., P.J. Devereux, and K.G. Salvanes. 2009. Like father, like son? A note on the inter-generational transmission of IQ scores. Economics Letters 105, no. 1: 138–40.
Blanden, J., P. Gregg, and L. Macmillan. 2007. Accounting for intergenerational incomepersistence: Noncognitive skills, ability and education. Economic Journal 117, no. 519:C43–C60.
Boissiere, M., J.B. Knight, and R.H. Sabot. 1985. Earnings, schooling, ability, and cognitiveskills. American Economic Review 75, no. 5: 1016–30.
Brown, S., S. McIntosh, and K. Taylor. 2009. Following in your parents’ footsteps? Empiricalanalysis of matched parent–offspring test scores. IZA Discussion Papers 3986, Institutefor the Study of Labor (IZA), Bonn.
Bynner, J., H. Dearden, S. McIntosh, J. Reed, J. Van Reenen, and A. Vignoles. 2001. Improv-ing adult basic skills: Benefits to the individual and to society. DfEE Research Brief No.251. London: dFFE.
Bynner, J., and S. Parsons. 2006. New light on literacy and numeracy: Results of the literacyand numeracy assessment in the age 34 follow-up of the 1970 cohort study (BCS70).London: NRDC.
Carneiro, P., and J. Heckman. 2004. Human capital policy. In Inequality in America: Whatrole for human capital policies? ed. J.J. Heckman and A.B. Krueger, 77–239. Cambridge,MA: MIT Press.
Carneiro, P., C. Meghir, and M. Parey. 2007. Maternal education, home environments andthe development of children and adolescents. IZA Discussion Papers no. 3072, IZA,Bonn.
Cawley, J., K. Conneely, J. Heckman, and E. Vytlacil. 1996. Measuring the effects of cogni-tive ability. NBER Working Paper no. 5645, National Bureau of Economic Research atCambridge, MA.
Chevalier, A. 2004. Parental education and child’s education: A natural experiment. IZADiscussion Paper no. 1153, IZA, Bonn.
Cunha, F., and J. Heckman. 2007. The technology of skill formation. American EconomicReview 97, no. 2: 31–47.
Cunha, F., and J. Heckman. 2008. Formulating, identifying, and estimating the technologyof cognitive and non-cognitive skill formation. Journal of Human Resources 43, no. 4:738–82.
Cunha, F., J. Heckman, L. Lochner, and D. Masterov. 2005. Interpreting the evidence on lifecycle skill formation. NBER Working Paper no. 11331, National Bureau of EconomicResearch at Cambridge, MA.
472
Dow
nloa
ded
by [
Kin
g's
Col
lege
Lon
don]
at 0
6:14
28
Oct
ober
201
1

Education Economics
Dearden, L., S. McIntosh, M. Myck, and A. Vignoles. 2002. The returns to academic,vocational and basic skills in Britain. Bulletin of Economic Research 54, no. 3: 249–74.
De Coulon, A., O. Marcenaro-Gutierrez, and A. Vignoles. 2007. The value of basic skills inthe British labour market. London: Centre for Economic Performance, London School ofEconomics.
DfEE. 1999. Improving literacy and numeracy: A fresh start. Great Britain Working Group onPost-School Basic Skills chaired by Sir Claus Moser. London: Department for Educationand Employment.
Elliot, C.D., P. Smith, and K. McCulloch. 1996. British Ability Scales II: Administration andscoring manual. London: NFER-Nelson
Ermisch, J., and M. Francesconi. 2001. Family matters: The impact of family background oneducational attainment. Economica 68: 137–56.
Feinstein, L. 2003. Inequality in the early cognitive development of British children in the1970 cohort. Economica 70, no. 277: 73–97.
Feinstein, L., and K. Duckworth. 2006. Development in the early years: Its importance forschool performance and adult outcomes. Wider Benefits of Learning Research ReportNo. 20. London: Institute of Education.
Goodman, R. 1997. The strengths and difficulties questionnaire: A research note. Journal ofChild Psychology and Psychiatry 38: 581–6.
Goodman, R., D. Renfrew, and M. Mullick. 2000. Predicting type of psychiatric disorder fromthe Strengths and Difficulties Questionnaire (SDQ) scores in child mental health clinics inLondon and Dhaka. European Child and Adolescent Psychiatry 9: 129–34.
Goodman, R., and S. Scott. 1999. Comparing the Strengths and Difficulties Questionnaire andthe Child Behaviour Checklist: Is small beautiful? Journal of Abnormal Child Psychology27: 17–24.
Haveman, R., and B. Wolfe. 1995. The determinants of children’s attainments: A review ofmethods and findings. Journal of Economic Literature 33, no. 4: 1829–78.
Heckman, J. 1995. Lessons from the Bell Curve. Journal of Political Economy 103, no. 5:1091–20.
Ishikawa, M., and D. Ryan. 2002. Schooling, basic skills, and economic outcomes. Economicsof Education Review 21, no. 3: 231–43.
Leitch Review of Skills. 2006. Prosperity for all in the global economy – World class skills.Final Report. London: HMSO.
McIntosh, S., and A. Vignoles. 2001. Measuring and assessing the impact of basic skills onlabour market outcomes. Oxford Economic Papers 53, no. 3: 453–81.
Murnane, R., J. Willett, Y. Duhaldeborde, and T. Tyler. 2000. How important are the cogni-tive skills of teenagers in predicting subsequent earnings? Journal of Policy Analysis andManagement 19, no. 4: 547–68.
Murnane, R.J., J.B. Willett, and F. Levy. 1995. The growing importance of cognitive skills inwage determination. Review of Economics and Statistics 77, no. 2: 251–66.
Oreopoulos, P., M.E. Page, and A.H., Stevens. 2003. Does human capital transfer from parentto child? The intergenerational effects of compulsory schooling. NBER Working Papersno. 10164, National Bureau of Economic Research at Cambridge, MA.
Parsons, S., and J. Bynner. 2005. Measuring basic skills for longitudinal study: The designand development of instruments for use with cohort members in the age 34 follow-up ofthe 1970 British Cohort Study (BCS70). http://www.nrdc.org.uk/content.asp?CategoryID=424
Plug, E. 2003. Schooling, family background, and adoption: Is it nature or is it nurture?Journal of Political Economy 111: 611–41.
Sacerdote, B. 2002. The nature and nurture of economic outcomes. American EconomicReview 92: 344–8.
Sacerdote, B. 2007. How large are the effects from changes in family environment? A studyof Korean American adoptees. Quarterly Journal of Economics 122: 1–119.
Todd, P., and K. Wolpin. 2007. The production of cognitive achievement in children: Home,school, and racial test score gaps. Journal of Human Capital 1, no. 1: 91–136.
Tyler, J. 2004. Basic skills and the earnings of dropouts. Economics of Education Review 23,no. 3: 221–35.
473
Dow
nloa
ded
by [
Kin
g's
Col
lege
Lon
don]
at 0
6:14
28
Oct
ober
201
1
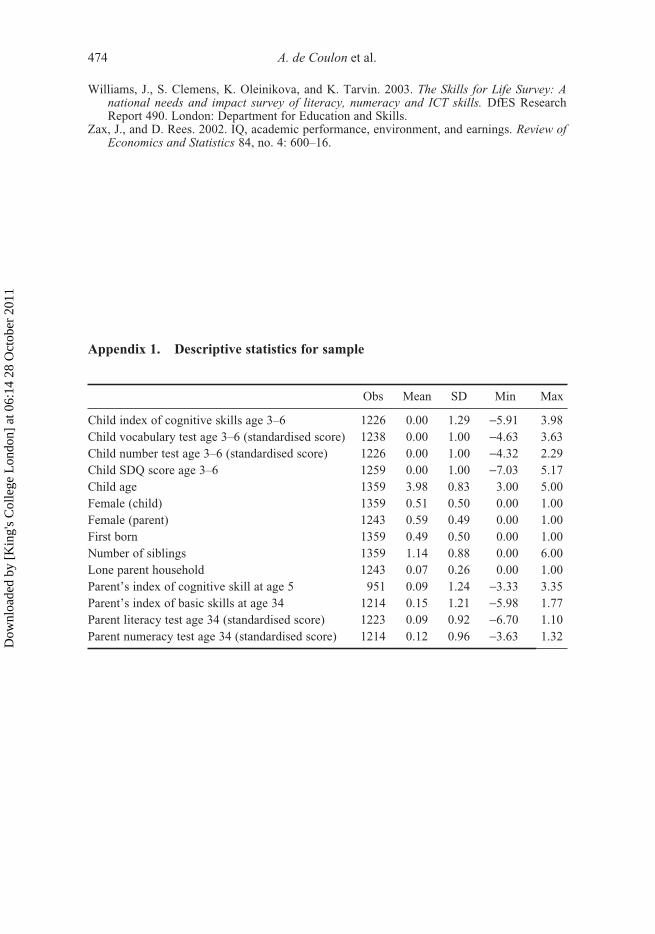
A. de Coulon et al.
Williams, J., S. Clemens, K. Oleinikova, and K. Tarvin. 2003. The Skills for Life Survey: Anational needs and impact survey of literacy, numeracy and ICT skills. DfES ResearchReport 490. London: Department for Education and Skills.
Zax, J., and D. Rees. 2002. IQ, academic performance, environment, and earnings. Review ofEconomics and Statistics 84, no. 4: 600–16.
Appendix 1. Descriptive statistics for sample
Obs Mean SD Min Max
Child index of cognitive skills age 3–6 1226 0.00 1.29 −5.91 3.98Child vocabulary test age 3–6 (standardised score) 1238 0.00 1.00 −4.63 3.63Child number test age 3–6 (standardised score) 1226 0.00 1.00 −4.32 2.29Child SDQ score age 3–6 1259 0.00 1.00 −7.03 5.17Child age 1359 3.98 0.83 3.00 5.00Female (child) 1359 0.51 0.50 0.00 1.00Female (parent) 1243 0.59 0.49 0.00 1.00First born 1359 0.49 0.50 0.00 1.00Number of siblings 1359 1.14 0.88 0.00 6.00Lone parent household 1243 0.07 0.26 0.00 1.00Parent’s index of cognitive skill at age 5 951 0.09 1.24 −3.33 3.35Parent’s index of basic skills at age 34 1214 0.15 1.21 −5.98 1.77Parent literacy test age 34 (standardised score) 1223 0.09 0.92 −6.70 1.10Parent numeracy test age 34 (standardised score) 1214 0.12 0.96 −3.63 1.32
474
Dow
nloa
ded
by [
Kin
g's
Col
lege
Lon
don]
at 0
6:14
28
Oct
ober
201
1
Related Documents