RESEARCH ARTICLE Open Access Parental socioeconomic position and development of overweight in adolescence: longitudinal study of Danish adolescents Camilla Schmidt Morgen 1* , Laust Hvas Mortensen 2 , Mette Rasmussen 3 , Anne-Marie Nybo Andersen 2 , Thorkild IA Sørensen 4 , Pernille Due 3 Abstract Background: An inverse social gradient in overweight among adolescents has been shown in developed countries, but few studies have examined whether weight gain and the development of overweight differs among adolescents from different socioeconomic groups in a longitudinal study. The objective was to identify the possible association between parental socioeconomic position, weight change and the risk of developing overweight among adolescents between the ages 15 to 21. Methods: Prospective cohort study conducted in Denmark with baseline examination in 1996 and follow-up questionnaire in 2003 with a mean follow-up time of 6.4 years. A sample of 1,656 adolescents participated in both baseline (mean age 14.8) and follow-up (mean age 21.3). Of these, 1,402 had a body mass index (BMI = weight/ height 2 kg/m 2 ) corresponding to a value below 25 at baseline when adjusted for age and gender according to guidelines from International Obesity Taskforce, and were at risk of developing overweight during the study period. The exposure was parental occupational status. The main outcome measures were change in BMI and development of overweight (from BMI < 25 to BMI > = 25). Results: Average BMI increased from 21.3 to 22.7 for girls and from 20.6 to 23.6 in boys during follow-up. An inverse social gradient in overweight was seen for girls at baseline and follow-up and for boys at follow-up. In the full population there was a tendency to an inverse social gradient in the overall increase in BMI for girls, but not for boys. A total of 13.4% developed overweight during the follow-up period. Girls of lower parental socioeconomic position had a higher risk of developing overweight (OR’s between 4.72; CI 1.31 to 17.04 and 2.03; CI 1.10-3.74) when compared to girls of high parental socioeconomic position. A tendency for an inverse social gradient in the development of overweight for boys was seen, but it did not meet the significance criteria Conclusions: The levels of overweight and obesity among adolescents are high and continue to rise. Results from this study suggest that the inverse social gradient in overweight becomes steeper for girls and emerges for boys in late adolescence (age span 15 to 21 years). Late adolescence seems to be an important window of opportunity in reducing the social inequality in overweight among Danish adolescents. Background The prevalence of overweight and obesity has increased markedly among children and adolescents in recent years in Denmark as it has internationally [1-7]. Although recent studies suggest that the rapid increase in childhood obesity prevalence may be leveling off [8-10], this does not seems to be the case among adoles- cents [9]. The teenage years may be important in the life course development of obesity, as obese adolescents often become obese adults [4,11-13] with elevated risk of hypertension, impaired vascular function, type 2 dia- betes, systemic inflammation, oxidative stress and cor- onary heart disease [14,15]. Furthermore overweight and obesity in adolescence may themselves be a more powerful predictors of these risks regardless of * Correspondence: [email protected] 1 Institute of Public Health, University of Copenhagen, Denmark Full list of author information is available at the end of the article Morgen et al. BMC Public Health 2010, 10:520 http://www.biomedcentral.com/1471-2458/10/520 © 2010 Schmidt et al; licensee BioMed Central Ltd. This is an Open Access article distributed under the terms of the Creative Commons Attribution License (http://creativecommons.org/licenses/by/2.0), which permits unrestricted use, distribution, and reproduction in any medium, provided the original work is properly cited.

Welcome message from author
This document is posted to help you gain knowledge. Please leave a comment to let me know what you think about it! Share it to your friends and learn new things together.
Transcript
RESEARCH ARTICLE Open Access
Parental socioeconomic position anddevelopment of overweight in adolescence:longitudinal study of Danish adolescentsCamilla Schmidt Morgen1*, Laust Hvas Mortensen2, Mette Rasmussen3, Anne-Marie Nybo Andersen2,Thorkild IA Sørensen4, Pernille Due3
Abstract
Background: An inverse social gradient in overweight among adolescents has been shown in developedcountries, but few studies have examined whether weight gain and the development of overweight differs amongadolescents from different socioeconomic groups in a longitudinal study. The objective was to identify the possibleassociation between parental socioeconomic position, weight change and the risk of developing overweightamong adolescents between the ages 15 to 21.
Methods: Prospective cohort study conducted in Denmark with baseline examination in 1996 and follow-upquestionnaire in 2003 with a mean follow-up time of 6.4 years. A sample of 1,656 adolescents participated in bothbaseline (mean age 14.8) and follow-up (mean age 21.3). Of these, 1,402 had a body mass index (BMI = weight/height2kg/m2) corresponding to a value below 25 at baseline when adjusted for age and gender according toguidelines from International Obesity Taskforce, and were at risk of developing overweight during the study period.The exposure was parental occupational status. The main outcome measures were change in BMI anddevelopment of overweight (from BMI < 25 to BMI > = 25).
Results: Average BMI increased from 21.3 to 22.7 for girls and from 20.6 to 23.6 in boys during follow-up. Aninverse social gradient in overweight was seen for girls at baseline and follow-up and for boys at follow-up. In thefull population there was a tendency to an inverse social gradient in the overall increase in BMI for girls, but notfor boys. A total of 13.4% developed overweight during the follow-up period. Girls of lower parentalsocioeconomic position had a higher risk of developing overweight (OR’s between 4.72; CI 1.31 to 17.04 and 2.03;CI 1.10-3.74) when compared to girls of high parental socioeconomic position. A tendency for an inverse socialgradient in the development of overweight for boys was seen, but it did not meet the significance criteria
Conclusions: The levels of overweight and obesity among adolescents are high and continue to rise. Results fromthis study suggest that the inverse social gradient in overweight becomes steeper for girls and emerges for boys inlate adolescence (age span 15 to 21 years). Late adolescence seems to be an important window of opportunity inreducing the social inequality in overweight among Danish adolescents.
BackgroundThe prevalence of overweight and obesity has increasedmarkedly among children and adolescents in recentyears in Denmark as it has internationally [1-7].Although recent studies suggest that the rapid increasein childhood obesity prevalence may be leveling off
[8-10], this does not seems to be the case among adoles-cents [9]. The teenage years may be important in the lifecourse development of obesity, as obese adolescentsoften become obese adults [4,11-13] with elevated riskof hypertension, impaired vascular function, type 2 dia-betes, systemic inflammation, oxidative stress and cor-onary heart disease [14,15]. Furthermore overweight andobesity in adolescence may themselves be a morepowerful predictors of these risks regardless of
* Correspondence: [email protected] of Public Health, University of Copenhagen, DenmarkFull list of author information is available at the end of the article
Morgen et al. BMC Public Health 2010, 10:520http://www.biomedcentral.com/1471-2458/10/520
© 2010 Schmidt et al; licensee BioMed Central Ltd. This is an Open Access article distributed under the terms of the Creative CommonsAttribution License (http://creativecommons.org/licenses/by/2.0), which permits unrestricted use, distribution, and reproduction inany medium, provided the original work is properly cited.
overweight and obesity in adulthood [5,16,17]. Over-weight adolescents may experience a reduction in thequality of life [18] because of lower self-esteem [19], dis-crimination [20], poorer body image [19] and poorsocial and economic outcomes in young adulthood[12,21,22] associated with the early onset of obesity[23,24].In cross sectional studies, obesity has been shown to
be related to socioeconomic position among childrenand adolescents as suggested by Sobal and Stunkard in1989 [25] and by Shrewsbury and Wardle in 2008 [26].The studies show that in developed countries childrenfrom low socioeconomic families appear to be at higherthan average risk for overweight and obesity. The oppo-site gradient is seen in some middle-income countries.In these countries there are also examples of oppositegradients between boys and girls, with an inverse gradi-ent for girls [27]. Ball et al. reviewed the literature onsocioeconomic status and weight change among adultsin 2005 showing a relatively consistent inverse relation-ship over time when socioeconomic status was mea-sured as occupation [28]. However, few studies haveexplored if this is the case for children and adolescents[29-31], and it remains unknown at what age the rela-tionship between socioeconomic position and obesityemerges [25] and whether it leads to a self-promotingvicious cycle in which the psychosocial adverse effects ofobesity worsen the obesity [32].A good understanding of when the inverse social gra-
dient in overweight emerges, if this gradient is change-able and either strengthens or weakens as adolescentsmove into adulthood may provide useful insights for thedevelopment of an effective prevention strategy targetingsocioeconomic inequality in overweight. Therefore, weaimed to investigate whether there is an inverse socialgradient in overweight and weight change, and whetherthe inverse social gradient in overweight emerges orchanges during late adolescence in a Danish setting.
MethodsSampleThe study comprised a sample of 23 municipalitiesselected to be representative of all municipalities inDenmark, supplemented by a representative sample ofschools from the two largest cities in Denmark, Copen-hagen and Aarhus. In the municipalities included(except for Aarhus and Copenhagen), the samples com-prised all students who underwent the standard healthexamination by a school physician before leaving schoolin the school year 1996/97. The health examinations areoffered to all schools and take place in both private andpublic schools.The storage and linking of the data was approved by
the Danish Data Protection Agency and The Danish
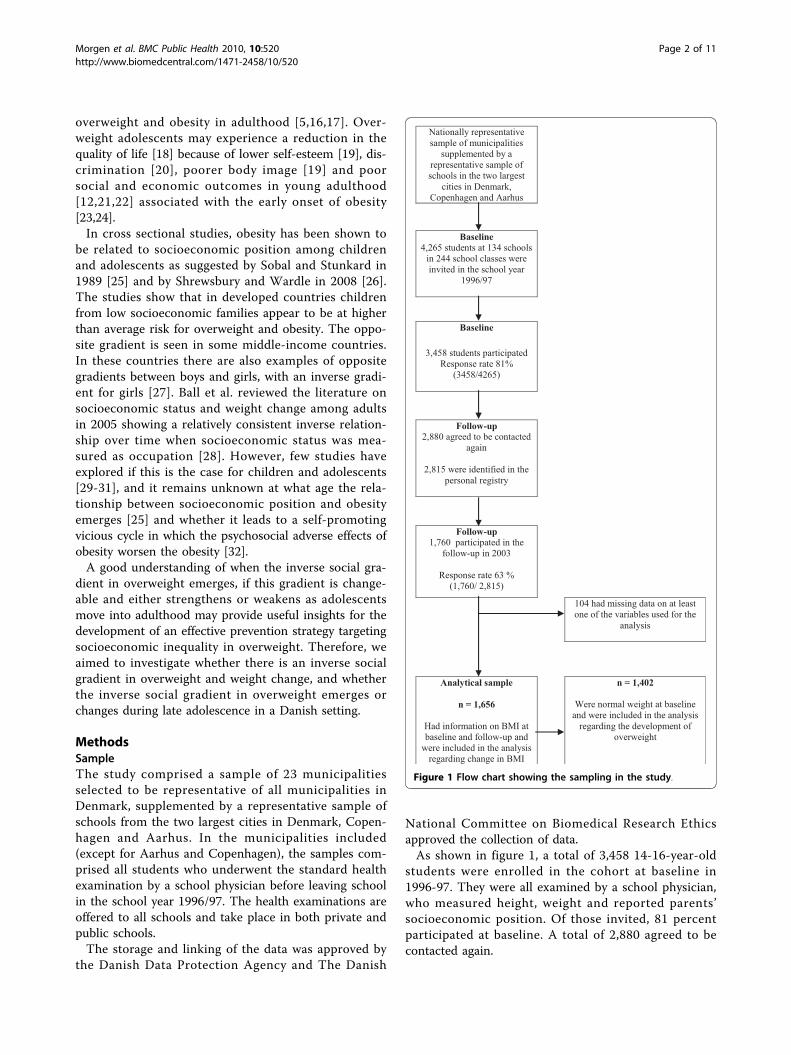
National Committee on Biomedical Research Ethicsapproved the collection of data.As shown in figure 1, a total of 3,458 14-16-year-old
students were enrolled in the cohort at baseline in1996-97. They were all examined by a school physician,who measured height, weight and reported parents’socioeconomic position. Of those invited, 81 percentparticipated at baseline. A total of 2,880 agreed to becontacted again.
Nationally representative sample of municipalities
supplemented by a representative sample of schools in the two largest
cities in Denmark, Copenhagen and Aarhus
Baseline4,265 students at 134 schools
in 244 school classes were invited in the school year
1996/97
Baseline
3,458 students participatedResponse rate 81%
(3458/4265)
Follow-up2,880 agreed to be contacted
again
2,815 were identified in the personal registry
Follow-up1,760 participated in the
follow-up in 2003
Response rate 63 % (1,760/ 2,815)
104 had missing data on at least one of the variables used for the
analysis
Analytical sample
n = 1,656
Had information on BMI at baseline and follow-up and
were included in the analysis regarding change in BMI
n = 1,402
Were normal weight at baseline and were included in the analysis
regarding the development of overweight
Figure 1 Flow chart showing the sampling in the study.
Morgen et al. BMC Public Health 2010, 10:520http://www.biomedcentral.com/1471-2458/10/520
Page 2 of 11

At follow-up, we identified 2,815 of the 20-22-year-olds in the civil registry by their personal identificationnumber (after permission from the National Board ofHealth and the Danish Data Protection Agency) andthey were invited to participate. The follow-up consistedof a self-administered questionnaire, including self-reported height and weight. A total of 1,760 returnedthe questionnaire (response rate at 1,760/2,815 = 63%).In the analyses we excluded 104 with missing informa-tion on height and weight. Body Mass Index (BMI =weight (kg)/height2 (m)) was calculated for each indivi-dual on the basis of measured weight and height atbaseline and on the basis of self-reported weight andheight at follow-up. Thus, 1,656 participants were eligi-ble for analyses on change in BMI during follow-up, and1,402 with a normal weight at baseline were eligible forthe analysis regarding the development of overweight.At baseline, girls and individuals with parents from
the highest socioeconomic groups were overrepresentedwhen compared to the Danish population in general.
ExposureWe used socioeconomic position measured by occupa-tion of the parents as exposure. Information about par-ental socioeconomic position came from the schoolphysician questionnaire and was reported at baseline.The school physician determined parental occupationalstatus from own knowledge about the child, from infor-mation from the child and from the teacher. The rank-ing was based on DISCO-88 classification, which is aDanish version of ISCO-88 used by Statistics Denmarkhttp://www.dst.dk. In order to combine information onpaternal and maternal occupational level into one vari-able we used the highest level of occupational statusfrom either the father or mother, whichever was higher.We worked with eight occupational groups and theywere ranked with unemployed as the lowest level andself-employed as the highest level. We used white-collargroup 1 as reference, since this group was more homo-geneous and bigger than the group of self-employed.The levels were defined as unemployed, non-skilled
manual worker, under education, skilled-manual worker,white-collar group 3, white-collar group 2, white-collargroup 1 and self-employed. The categorisation wasmade from a combination of four questions regardingoccupation of the mother and father and a questionregarding the reason for not being on the labour marketfor the mother and the father.From the questionnaire we have aggregated self-employed
with self-employed farmers into one. The group of self-employed included self-employed with and without employ-ees. The unemployed group contains disability retired,housewife (unemployed), unemployed, long time illness(unemployed) and people receiving social security benefit.
OutcomeThere were two primary outcomes: increase in BMI anddevelopment of overweight (BMI > = 25, includingobese) during the study period.Change in BMI in the full population was categorised
as a continuous measure of upward change in crudeBMI “points” (not adjusted for age) from baseline to fol-low-up.Since adult BMI criteria for overweight and obesity
underestimate the proportion of overweight and obesityamong adolescents we categorized the students’ weightstatus using the International Obesity Task Force(IOTF) criteria, which identify BMI for each age in halfyears differentiated on sex with a predicted BMI of 25or more at age 18 [33]. Students with an age and sexadjusted BMI [33] corresponding to a value below 25 atbaseline were categorised as normal weight, and stu-dents with a BMI at or above 25 (n = 254) wereexcluded from the analysis regarding the risk of devel-oping overweight.Adolescents with an age and sex adjusted BMI corre-
sponding to a value below 25 at baseline and above orat 25 at follow-up were categorized as individualsbecoming overweight during the study period.
Statistical analysisIn this study, students were nested within naturallyoccurring hierarchies of school physicians (studentswere examined by 34 different school physicians) andschools (pupils nested in 134 different schools). Toaccount for the cluster sampling of the study, we usedmultilevel linear regression to examine the change inBMI from baseline to follow-up, adjusting for schoolphysician and school cluster effects and multilevel logis-tic regression to examine the risk of developing over-weight while adjusting for school physician and schoolcluster effects [34-36]. We did not adjust for schoolclass cluster effects, as there were less than 10 studentsin all classes in the final analytical sample. We usedSTATA software version 10.0 and used the proceduresXTMELOGIT and XTMIXED.
ResultsAdolescents lost to follow-upAt baseline a total of 3,458 students were included inthe study, as shown in table 1. Of these, 1,802 wereexcluded from the final analytical sample because theywere lost to follow-up or had missing information onkey variables. The excluded group was not differentfrom the included group (n = 1,656) regarding BMI andage at baseline, but they had a higher prevalence of par-ents from lower socioeconomic groups, and a lower pro-portion of males and of individuals living with bothbiological parents.
Morgen et al. BMC Public Health 2010, 10:520http://www.biomedcentral.com/1471-2458/10/520
Page 3 of 11
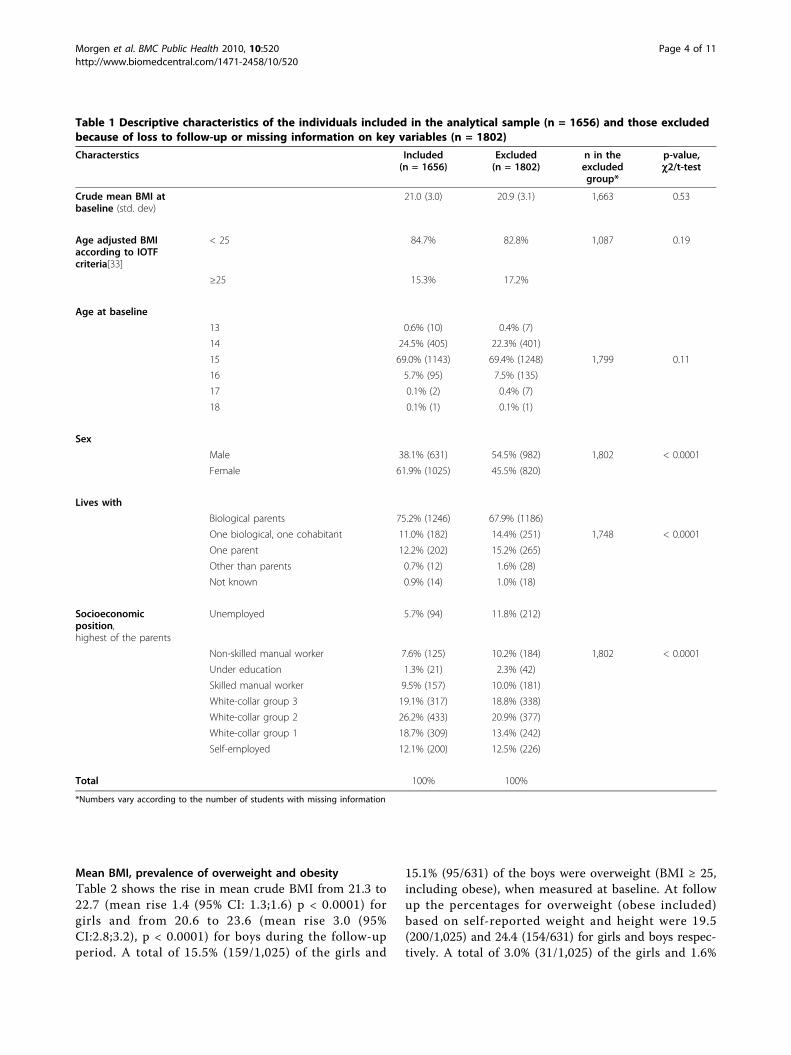
Mean BMI, prevalence of overweight and obesityTable 2 shows the rise in mean crude BMI from 21.3 to22.7 (mean rise 1.4 (95% CI: 1.3;1.6) p < 0.0001) forgirls and from 20.6 to 23.6 (mean rise 3.0 (95%CI:2.8;3.2), p < 0.0001) for boys during the follow-upperiod. A total of 15.5% (159/1,025) of the girls and
15.1% (95/631) of the boys were overweight (BMI ≥ 25,including obese), when measured at baseline. At followup the percentages for overweight (obese included)based on self-reported weight and height were 19.5(200/1,025) and 24.4 (154/631) for girls and boys respec-tively. A total of 3.0% (31/1,025) of the girls and 1.6%
Table 1 Descriptive characteristics of the individuals included in the analytical sample (n = 1656) and those excludedbecause of loss to follow-up or missing information on key variables (n = 1802)
Characterstics Included(n = 1656)
Excluded(n = 1802)
n in theexcludedgroup*
p-value,c2/t-test
Crude mean BMI atbaseline (std. dev)
21.0 (3.0) 20.9 (3.1) 1,663 0.53
Age adjusted BMIaccording to IOTFcriteria[33]
< 25 84.7% 82.8% 1,087 0.19
≥25 15.3% 17.2%
Age at baseline
13 0.6% (10) 0.4% (7)
14 24.5% (405) 22.3% (401)
15 69.0% (1143) 69.4% (1248) 1,799 0.11
16 5.7% (95) 7.5% (135)
17 0.1% (2) 0.4% (7)
18 0.1% (1) 0.1% (1)
Sex
Male 38.1% (631) 54.5% (982) 1,802 < 0.0001
Female 61.9% (1025) 45.5% (820)
Lives with
Biological parents 75.2% (1246) 67.9% (1186)
One biological, one cohabitant 11.0% (182) 14.4% (251) 1,748 < 0.0001
One parent 12.2% (202) 15.2% (265)
Other than parents 0.7% (12) 1.6% (28)
Not known 0.9% (14) 1.0% (18)
Socioeconomicposition,highest of the parents
Unemployed 5.7% (94) 11.8% (212)
Non-skilled manual worker 7.6% (125) 10.2% (184) 1,802 < 0.0001
Under education 1.3% (21) 2.3% (42)
Skilled manual worker 9.5% (157) 10.0% (181)
White-collar group 3 19.1% (317) 18.8% (338)
White-collar group 2 26.2% (433) 20.9% (377)
White-collar group 1 18.7% (309) 13.4% (242)
Self-employed 12.1% (200) 12.5% (226)
Total 100% 100%
*Numbers vary according to the number of students with missing information
Morgen et al. BMC Public Health 2010, 10:520http://www.biomedcentral.com/1471-2458/10/520
Page 4 of 11

Table 2 Socioeconomic and anthropometric characteristics of the study population by sex (n = 1,656)
Baseline characteristics, 1996-97 Girls, n = 1,025 Boys, n = 631 p-value, c2/t-test
Mean age (SD*) 14.8 (0.5) 14.8 (0.6)
Average weight (SD) 58.4 kg (9.7 kg) 62.7 kg (10.8 kg) < 0.0001
Mean height (SD) 165.7 cm (6.1 cm) 174.2 cm (7.6 cm)
Crude mean BMI (SD) (weight in kg/(height in meters2)) 21.3 (3.2) 20.6 (2.7) < 0.0001
Age adjusted BMI according to IOTF criteria**
< 25 84.5% (866) 84.9% (536) 0.16
25 ≤ BMI< 30 12.4% (127) 13.5% (85)
≥30 3.0% (31) 1.6% (10)
Socioeconomic position, highest of the household
Unemployed 5.9% (60) 5.4% (34) 0.73
Non-skilled manual worker 7.7% (79) 7.3% (46)
Under education 1.5% (15) 1.0% (6)
Skilled manual worker 9.9% (101) 8.9% (56)
White-collar group 3 19.9% (204) 17.9% (113)
White-collar group 2 26.1% (267) 26.3% (166)
White-collar group 1 17.7% (181) 20.3% (128)
Self-employed 11.5% (118) 13.0% (82)
Total 100% 1025 100% 631
Follow-up characteristics, 2003 Girls, n = 1,025 Boys, n = 631
Mean age (SD) 21.2 (0.7) 21.3 (0.7)
Average weight (SD) 64.8 kg (11.0 kg) 78.7 kg (11.5 kg) < 0.0001
Mean height (SD) 169.0 cm (6.2 cm) 182.6 cm (6.7 cm) < 0.0001
Crude mean BMI (SD) (weight in kg/(height in meters2)) 22.7 (3.6)*** 23.6 (3.0)*** < 0.0001
BMI cut points
< 25 80.5% (825) 75.6% (477) 0.02
25 ≤ BMI< 30 15.1% (155) 20.4% (129)
≥30 4.4% (45) 4.0% (25)
Individuals becoming overweight at follow-up**
Yes, moved from BMI < 25 to BMI ≥25 11.2% (97) 17.0% (91) 0.002
No 88.8% (769) 83.0% (445)
Individuals becoming normal weight at follow-up
Yes, moved from BMI ≥25* to BMI < 25 35.2% (56) 33.7% (32) 0.80
No 64.8% (103) 66.3% (63)
*Standard deviation
**BMI cut points at baseline according to IOTF criteria[33]
***Difference from baseline crude mean BMI p < 0.0001.
Morgen et al. BMC Public Health 2010, 10:520http://www.biomedcentral.com/1471-2458/10/520
Page 5 of 11

(10/631) of the boys were obese (BMI≥30) at baseline.At follow-up the percentages for obesity were 4.4 (45/1,025) and 4.0 (25/631) for girls and boys respectively.
Weight development during the six-year study periodAs shown in the lower part of table 2, a total of 11.2%(97/866) of the non-overweight girls (BMI correspond-ing to an age and sex adjusted value below 25) at base-line developed overweight over the six-year studyperiod. 17.0% (91/536) of the non-overweight boysdeveloped overweight during the study period.A total of 35.2% (56/159) of girls who were overweight
at baseline moved to a normal weight over the six years,and 33.7% (32/95) of the overweight boys moved fromoverweight to normal weight in the study period. Thepercentages moving to a normal weight range were lar-ger for individuals from families of higher socioeco-nomic position (data not shown).
The inverse social gradient in overweight at baseline andfollow-upResults from multilevel logistic regression analysis,shown in table 3, revealed an inverse social gradient inoverweight at baseline and at follow-up among girls.Girls from families with an occupational level corre-sponding to white-collar group 1 had the lowest risk ofoverweight at baseline and at follow-up. Girls fromfamilies with an occupational level corresponding tounemployed, non-skilled manual worker, under educa-tion, skilled manual worker, white-collar group 3 to 1and self-employed had increased risks of overweight,both at baseline and at follow-up when compared togirls from white-collar group 1 families. Though theconfidence intervals were wide, the inverse social gradi-ent in overweight seemed steeper at follow-up, indicat-ing that the relative social inequality in overweight wasmore pronounced among the population of 21-year-oldgirls than in the population of 15-year-old girls. Thetwo gradients are, however, not calculated in the samenumber of subjects (1544 versus 1025 included) as wewanted to keep as many individuals as possible in thebaseline sample in order to show a social gradient asclose as possible to the one in the source population.For boys the overall p-value indicated that parental
occupational status was associated with overweight atbaseline. Based on the OR estimates, however, thereseemed to be no clear inverse social gradient in over-weight among boys at baseline. At follow-up, based onthe OR estimates, an inverse social gradient in over-weight was present. Boys from families with a parentaloccupational level corresponding to non-skilled manualworker, skilled manual worker and white-collar group 3had a higher risk of overweight when compared to boysfrom families with a parental occupational level
corresponding to white-collar group 1. An inverse socialgradient in overweight seemed to emerge in late adoles-cence for boys. Again, due to attrition, the gradients aremeasured in two different populations (1199 versus 631boys included).Adjusting for school physician and school effects did
not alter the results.
Association between socioeconomic position and changein BMI from baseline to follow-up in the entire studypopulationTable 4 shows that parental socioeconomic position hadan influence on the overall weight change from baselineto follow-up for females, but not for males. The b coef-ficient indicates the change in BMI from baseline to fol-low-up relative to the reference group, white-collargroup 1. Adjusting for school and school physician clus-ter effects did not alter the results.
Association between socioeconomic position and thedevelopment of overweightAn inverse social gradient was seen in the developmentof overweight in girls, as shown in table 5. Compared togirls with a parental occupational level corresponding towhite-collar group 1, girls in families with an occupa-tional level of white-collar group 2, white-collar group 3,under education and non-skilled manual workers had asignificantly higher risk of developing overweight overthe six-year study period, between the ages 15 to 21years. Girls with parents in the unemployed and self-employed groups did not have a higher risk of develop-ing overweight than girls with parents in white-collargroup 1.For boys there was no significant social gradient in the
risk of developing overweight in the six-year study per-iod between the mean ages of 15 to 21 years.Due to the sample size it was not possible to adjust
for school physician cluster effects. Adjusting for schoolcluster effects did not alter the results.
DiscussionBased on a sample of 1,656 adolescents, we found highrates of overweight and obesity combined at around15.5% at the age of 15 years and the proportionincreased markedly to 19.5% and 24.4% for girls andboys, respectively, from the age of 15 to 21 years. Paren-tal socioeconomic position was associated with the over-all rise in BMI from the age of 15 to 21 among girlsonly. An inverse social gradient was seen in the develop-ment of overweight among girls. A tendency for aninverse social gradient in the development of overweightfor boys was seen, but it did not meet the significancecriteria, possibly due to lack of statistical power becausemore boys than girls were lost to follow-up. Overweight
Morgen et al. BMC Public Health 2010, 10:520http://www.biomedcentral.com/1471-2458/10/520
Page 6 of 11
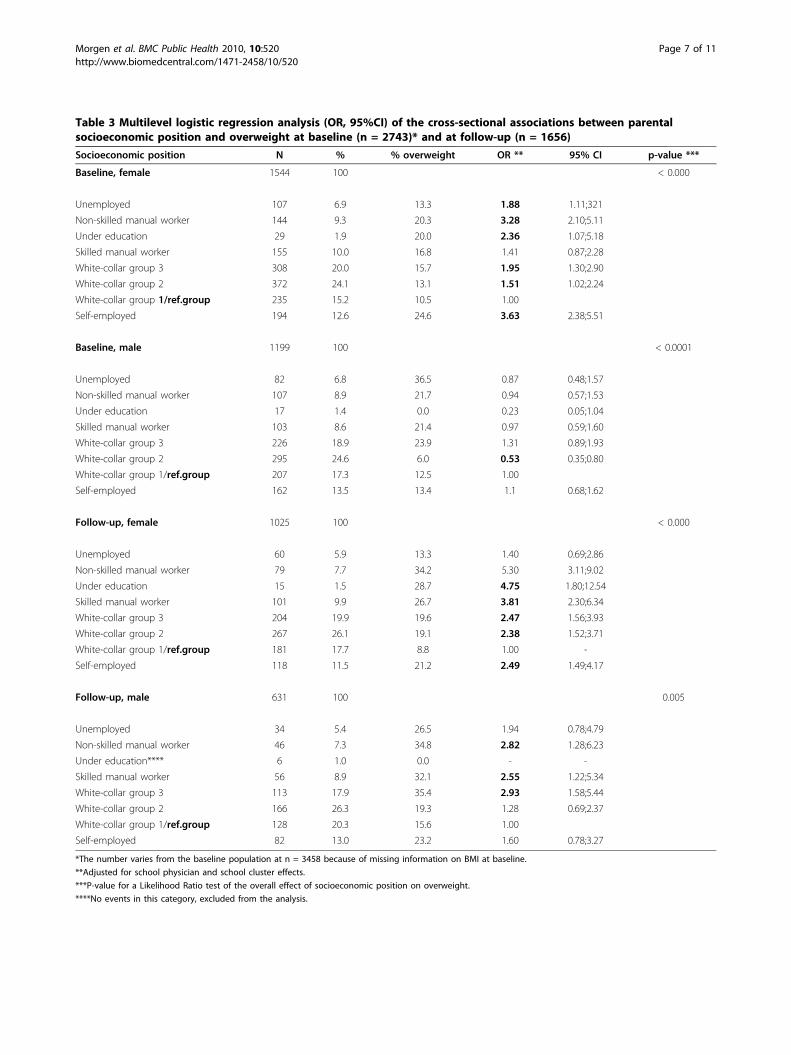
Table 3 Multilevel logistic regression analysis (OR, 95%CI) of the cross-sectional associations between parentalsocioeconomic position and overweight at baseline (n = 2743)* and at follow-up (n = 1656)
Socioeconomic position N % % overweight OR ** 95% CI p-value ***
Baseline, female 1544 100 < 0.000
Unemployed 107 6.9 13.3 1.88 1.11;321
Non-skilled manual worker 144 9.3 20.3 3.28 2.10;5.11
Under education 29 1.9 20.0 2.36 1.07;5.18
Skilled manual worker 155 10.0 16.8 1.41 0.87;2.28
White-collar group 3 308 20.0 15.7 1.95 1.30;2.90
White-collar group 2 372 24.1 13.1 1.51 1.02;2.24
White-collar group 1/ref.group 235 15.2 10.5 1.00
Self-employed 194 12.6 24.6 3.63 2.38;5.51
Baseline, male 1199 100 < 0.0001
Unemployed 82 6.8 36.5 0.87 0.48;1.57
Non-skilled manual worker 107 8.9 21.7 0.94 0.57;1.53
Under education 17 1.4 0.0 0.23 0.05;1.04
Skilled manual worker 103 8.6 21.4 0.97 0.59;1.60
White-collar group 3 226 18.9 23.9 1.31 0.89;1.93
White-collar group 2 295 24.6 6.0 0.53 0.35;0.80
White-collar group 1/ref.group 207 17.3 12.5 1.00
Self-employed 162 13.5 13.4 1.1 0.68;1.62
Follow-up, female 1025 100 < 0.000
Unemployed 60 5.9 13.3 1.40 0.69;2.86
Non-skilled manual worker 79 7.7 34.2 5.30 3.11;9.02
Under education 15 1.5 28.7 4.75 1.80;12.54
Skilled manual worker 101 9.9 26.7 3.81 2.30;6.34
White-collar group 3 204 19.9 19.6 2.47 1.56;3.93
White-collar group 2 267 26.1 19.1 2.38 1.52;3.71
White-collar group 1/ref.group 181 17.7 8.8 1.00 -
Self-employed 118 11.5 21.2 2.49 1.49;4.17
Follow-up, male 631 100 0.005
Unemployed 34 5.4 26.5 1.94 0.78;4.79
Non-skilled manual worker 46 7.3 34.8 2.82 1.28;6.23
Under education**** 6 1.0 0.0 - -
Skilled manual worker 56 8.9 32.1 2.55 1.22;5.34
White-collar group 3 113 17.9 35.4 2.93 1.58;5.44
White-collar group 2 166 26.3 19.3 1.28 0.69;2.37
White-collar group 1/ref.group 128 20.3 15.6 1.00
Self-employed 82 13.0 23.2 1.60 0.78;3.27
*The number varies from the baseline population at n = 3458 because of missing information on BMI at baseline.
**Adjusted for school physician and school cluster effects.
***P-value for a Likelihood Ratio test of the overall effect of socioeconomic position on overweight.
****No events in this category, excluded from the analysis.
Morgen et al. BMC Public Health 2010, 10:520http://www.biomedcentral.com/1471-2458/10/520
Page 7 of 11
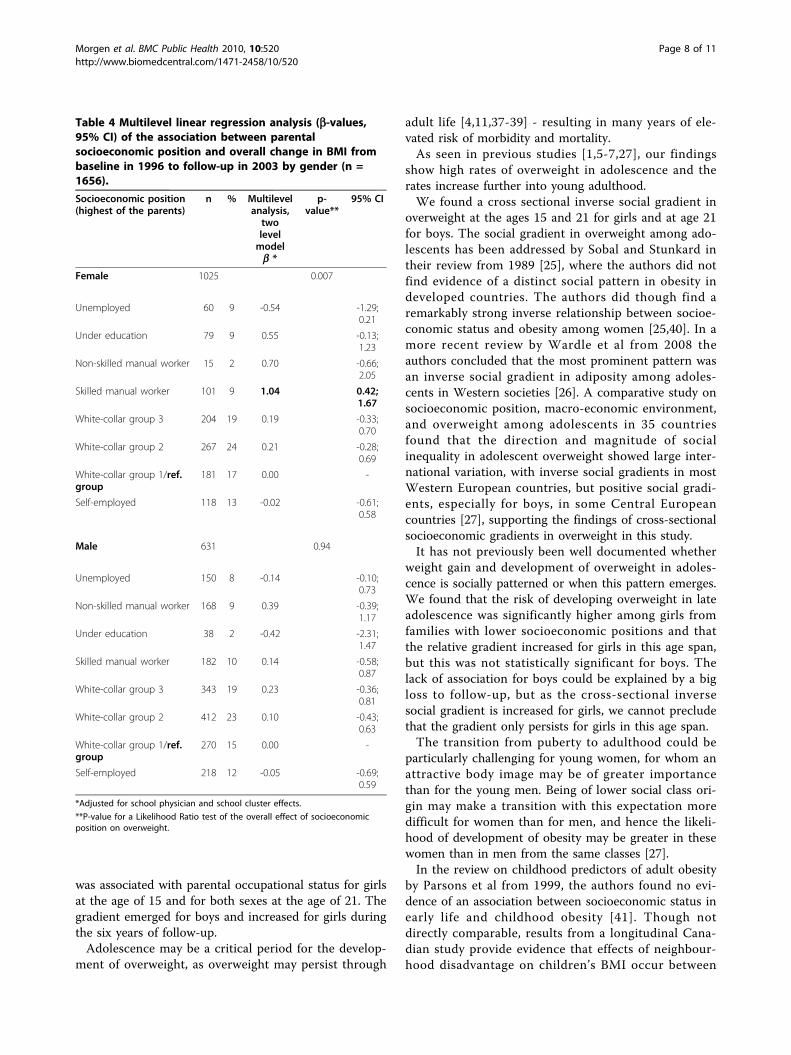
was associated with parental occupational status for girlsat the age of 15 and for both sexes at the age of 21. Thegradient emerged for boys and increased for girls duringthe six years of follow-up.Adolescence may be a critical period for the develop-
ment of overweight, as overweight may persist through
adult life [4,11,37-39] - resulting in many years of ele-vated risk of morbidity and mortality.As seen in previous studies [1,5-7,27], our findings
show high rates of overweight in adolescence and therates increase further into young adulthood.We found a cross sectional inverse social gradient in
overweight at the ages 15 and 21 for girls and at age 21for boys. The social gradient in overweight among ado-lescents has been addressed by Sobal and Stunkard intheir review from 1989 [25], where the authors did notfind evidence of a distinct social pattern in obesity indeveloped countries. The authors did though find aremarkably strong inverse relationship between socioe-conomic status and obesity among women [25,40]. In amore recent review by Wardle et al from 2008 theauthors concluded that the most prominent pattern wasan inverse social gradient in adiposity among adoles-cents in Western societies [26]. A comparative study onsocioeconomic position, macro-economic environment,and overweight among adolescents in 35 countriesfound that the direction and magnitude of socialinequality in adolescent overweight showed large inter-national variation, with inverse social gradients in mostWestern European countries, but positive social gradi-ents, especially for boys, in some Central Europeancountries [27], supporting the findings of cross-sectionalsocioeconomic gradients in overweight in this study.It has not previously been well documented whether
weight gain and development of overweight in adoles-cence is socially patterned or when this pattern emerges.We found that the risk of developing overweight in lateadolescence was significantly higher among girls fromfamilies with lower socioeconomic positions and thatthe relative gradient increased for girls in this age span,but this was not statistically significant for boys. Thelack of association for boys could be explained by a bigloss to follow-up, but as the cross-sectional inversesocial gradient is increased for girls, we cannot precludethat the gradient only persists for girls in this age span.The transition from puberty to adulthood could be
particularly challenging for young women, for whom anattractive body image may be of greater importancethan for the young men. Being of lower social class ori-gin may make a transition with this expectation moredifficult for women than for men, and hence the likeli-hood of development of obesity may be greater in thesewomen than in men from the same classes [27].In the review on childhood predictors of adult obesity
by Parsons et al from 1999, the authors found no evi-dence of an association between socioeconomic status inearly life and childhood obesity [41]. Though notdirectly comparable, results from a longitudinal Cana-dian study provide evidence that effects of neighbour-hood disadvantage on children’s BMI occur between
Table 4 Multilevel linear regression analysis (b-values,95% CI) of the association between parentalsocioeconomic position and overall change in BMI frombaseline in 1996 to follow-up in 2003 by gender (n =1656).
Socioeconomic position(highest of the parents)
n % Multilevelanalysis,twolevelmodelb *
p-value**
95% CI
Female 1025 0.007
Unemployed 60 9 -0.54 -1.29;0.21
Under education 79 9 0.55 -0.13;1.23
Non-skilled manual worker 15 2 0.70 -0.66;2.05
Skilled manual worker 101 9 1.04 0.42;1.67
White-collar group 3 204 19 0.19 -0.33;0.70
White-collar group 2 267 24 0.21 -0.28;0.69
White-collar group 1/ref.group
181 17 0.00 -
Self-employed 118 13 -0.02 -0.61;0.58
Male 631 0.94
Unemployed 150 8 -0.14 -0.10;0.73
Non-skilled manual worker 168 9 0.39 -0.39;1.17
Under education 38 2 -0.42 -2.31;1.47
Skilled manual worker 182 10 0.14 -0.58;0.87
White-collar group 3 343 19 0.23 -0.36;0.81
White-collar group 2 412 23 0.10 -0.43;0.63
White-collar group 1/ref.group
270 15 0.00 -
Self-employed 218 12 -0.05 -0.69;0.59
*Adjusted for school physician and school cluster effects.
**P-value for a Likelihood Ratio test of the overall effect of socioeconomicposition on overweight.
Morgen et al. BMC Public Health 2010, 10:520http://www.biomedcentral.com/1471-2458/10/520
Page 8 of 11

childhood and early adolescence and in a five-year long-itudinal study based on an English population of adoles-cents Wardle et al. found that the inverse socialgradient in overweight was already established at the ageof 11 and that no further divergence occurred from theage of 11 [29]. These results are not in line with thefindings of this study, where the inverse social gradientin overweight changed and got steeper from 15 to 21years, which may indicate differences between developedcountries. Alternatively, it could be explained by the useof different measures of socioeconomic position. Oliveret al. used neighbourhood income and Wardle et al.used residential area as a proxy for the socioeconomicposition of the adolescents. Our findings are supportedby a recent study by Sherwood et al. based on an Amer-ican population of adolescents in which girls fromfamilies of lower socioeconomic position were atincreased risk of developing overweight. No associationwas seen among boys. Socioeconomic position was pri-marily measured by parental education and, in addition,occupation and eligibility for public assistance [30].
Strengths and limitationsThis study is based on a nationally representative sam-ple of adolescents, which increases the external validity.
Information regarding height and weight at baseline wasmeasured objectively, while at follow-up they were selfreported. The main weakness of the study is the largeattrition, which may bias the results. Participants whodid not attend follow-up, were more often from familieswith lower socioeconomic position, and were less oftenliving with both biological parents, all factors contribut-ing to the risk of selection bias. Since more boys thangirls were lost to follow-up, we might have underesti-mated the social inequality in the development of over-weight among boys. These results should therefore beinterpreted with caution. However, as the group lost tofollow-up did not differ with regards to BMI at baseline,and since the participation rate in the school physicianexaminations (at baseline) is generally high, we believethat the associations found are not severely biased dueto loss to follow-up.Another limitation of the study is the self-reported
measurements of height and weight at follow-up, sinceself-reporting tends to lead to an underreporting of BMIat follow-up [42,43]. This potential misclassificationmight lead to an underestimation of the number of par-ticipants who develop overweight and an overestimationof the number of participants who achieve a healthyweight range during the six-year study period. Two
Table 5 Multilevel logistic regression analysis (OR, 95% CI) of the association between parental socioeconomicposition and the risk of developing overweight between age 15 and 21 years among non-overweight individuals (n =1402)
Socioeconomic position (highest of the parents) n % OR p-value 95% CI
Female 866 0.020
Unemployed 52 6.0 1.00 0.36;2.81
Non-skilled man. worker 63 7.3 4.08 2.03;8.22
Under education 12 1.4 4.72 1.31;17.04
Skilled manual worker 84 9.7 3.48 1.80;6.75
White-collar group 3 172 19.9 2.03 1.10;3.74
White-collar group 2 232 26.8 2.70 1.52;4.79
White-collar group 1/ref.group 162 18.7 1.00 -
Self-employed 89 10.3 1.12 0.51;2.47
Male 536 0.067
Unemployed 25 4.7 0.60 0.16;2.22
Non-skilled man. worker 36 6.7 1.23 0.54;2.80
Under education 6 1.1 - -
Skilled manual worker 44 8.2 1.79 0.85;3.78
White-collar group 3 86 16.0 1.87 1.00;3.52
White-collar group 2 156 29.1 1.13 0.63;2.03
White-collar group 1/ref.group 112 20.9 1.00 -
Self-employed 71 13.3 1.05 0.53;2.10
*Adjusted for school cluster effects.
**No events in this group, excluded from the analysis.
Morgen et al. BMC Public Health 2010, 10:520http://www.biomedcentral.com/1471-2458/10/520
Page 9 of 11
previous studies have found misclassification to be lar-ger among adolescents from lower socioeconomicgroups [44,45], which would mean that associations inour study are underestimated. A false associationbetween parental occupational status and the longitudi-nal development of overweight would appear if partici-pants from families with a lower socioeconomic positionat baseline were more likely to under- or over reportweight at follow-up. We have not been able to findresearch covering this subject.The use of BMI as a measure of weight status has
been criticised because it is not sex-specific for adultsand may be confounded by skeletal structure [46]. Moreprecise measures such as waist circumference andDEXA scans were not available and BMI was suitable atfollow-up to secure the least degree of non-response.BMI is though a widely used and accepted measure inepidemiological studies.The use of parental occupational status as the expo-
sure had limitations as the information from the ques-tionnaire was difficult to aggregate into fewersocioeconomic groups. A further aggregation of thecategories would have made the interpretation unclearand would have thrown away too much of the informa-tion given in the questionnaires.A further limitation of the exposure used is the fact
that the source of information was the school physician,who determined parental occupational status from itsown knowledge about the child, from information fromthe child and from the school teacher. How thoroughschool physicians were in obtaining this informationmay have differed. We have, though, considered thispossible bias to be non-differential as we find it mostlikely that the proportion of misclassified individualsdoes not depend on the later risk of obesity.Parental occupational status is one of many ways to
quantify the socioeconomic position of adolescents andit seems to have an influence on weight gain and risk ofobesity that is independent of the parents’ own degreeof obesity [47]. Information on parental educational andincome levels might improve the understanding of thefactors and processes that create the socioeconomic dis-parities in overweight and the development of over-weight among adolescents.
ConclusionsThe levels of overweight and obesity among adolescentsare high and continue to rise. In our study, the resultssuggest that the inverse social gradient in overweightgets steeper for girls and arises for boys in late adoles-cence. Late adolescence seems to be an important win-dow of opportunity in reducing the social inequality inoverweight among Danish adolescents.
AcknowledgementsThis study was supported by grants from The Danish Ministry of Health
Author details1Institute of Public Health, University of Copenhagen, Denmark. 2Departmentof Social Medicine, University of Copenhagen, Copenhagen K, Denmark.3National Institute of Public Health, University of Southern Denmark.4Institute of Preventive Medicine, Copenhagen University Hospital,Copenhagen, Denmark.
Authors’ contributionsThe CSM, ANA and PDU author designed and initiated the study. CSM andLHM author performed the statistical analyses. All authors helped gather orinterpret data and write the article. All authors approved the final version ofthe article. The study complies with the Helsinki declaration on ethics inscience. There are no conflicting interests regarding the funding of thestudy. The storage and linking of the data were approved by the DanishData Protection Agency, and The Danish National Committee on BiomedicalResearch Ethics approved the collection of data.
Competing interestsThe authors declare that they have no competing interests.
Received: 3 February 2010 Accepted: 29 August 2010Published: 29 August 2010
References1. Due P, Heitmann BL, Sorensen TIA: Prevalence of obesity in Denmark.
Obesity Reviews 2007, 8:187-189.2. Lissau I, Overpeck MD, Ruan WJ, Due P, Holstein BE, Hediger ML: Body
mass index and overweight in adolescents in 13 European countries,Israel, and the United States. Arch Pediatr Adolesc Med 2004, 158:27-33.
3. Reilly JJ, Armstrong J, Dorosty AR, Emmett PM, Ness A, Rogers I, et al: Earlylife risk factors for obesity in childhood: cohort study. BMJ 2005,330:1357.
4. Whitaker RC, Wright JA, Pepe MS, Seidel KD, Dietz WH: Predicting obesityin young adulthood from childhood and parental obesity. N Engl J Med1997, 337:869-873.
5. Lobstein T, Baur L, Uauy R: Obesity in children and young people: a crisisin public health. Obes Rev 2004, 5(Suppl 1):4-104.
6. Ogden CL, Flegal KM, Carroll MD, Johnson CL: Prevalence and trends inoverweight among US children and adolescents, 1999-2000. Jama-Journal of the American Medical Association 2002, 288:1728-1732.
7. Matthiessen J, Groth MV, Fagt S, Biltoft-Jensen A, Stockmarr A, Andersen JS,et al: Prevalence and trends in overweight and obesity among childrenand adolescents in Denmark. Scandinavian Journal of Public Health 2008,36:153-160.
8. Han JC, Lawlor DA, Kimm SYS: Childhood obesity. Lancet 2010,375:1737-1748.
9. Pearson S, Hansen B, Sorensen TI, Baker JL: Overweight and obesity trendsin Copenhagen schoolchildren from 2002 to 2007. Acta Paediatr 2010.
10. Lissner L, Sohlstrom A, Sundblom E, Sjoberg A: Trends in overweight andobesity in Swedish schoolchildren 1999-2005: has the epidemic reacheda plateau? Obes Rev 2009.
11. Dietz WH: Critical periods in childhood for the development of obesity.Am J Clin Nutr 1994, 59:955-959.
12. Freedman DS, Dietz WH, Srinivasan SR, Berenson GS: The relation ofoverweight to cardiovascular risk factors among children andadolescents: the Bogalusa Heart Study. Pediatrics 1999, 103:1175-1182.
13. Sorensen TI, Sonne-Holm S: Risk in childhood of development of severeadult obesity: retrospective, population-based case-cohort study. Am JEpidemiol 1988, 127:104-113.
14. Burke V: Obesity in childhood and cardiovascular risk. Clin Exp PharmacolPhysiol 2006, 33:831-837.
15. Baker JL, Olsen LW, Sorensen TI: Childhood body-mass index and the riskof coronary heart disease in adulthood. N Engl J Med 2007,357:2329-2337.
16. Must A, Jacques PF, Dallal GE, Bajema CJ, Dietz WH: Long-term morbidityand mortality of overweight adolescents. A follow-up of the HarvardGrowth Study of 1922 to 1935. N Engl J Med 1992, 327:1350-1355.
Morgen et al. BMC Public Health 2010, 10:520http://www.biomedcentral.com/1471-2458/10/520
Page 10 of 11

17. Power C, Lake JK, Cole TJ: Measurement and long-term health risks ofchild and adolescent fatness. International Journal of Obesity 1997,21:507-526.
18. Swallen KC, Reither EN, Haas SA, Meier AM: Overweight, obesity, andhealth-related quality of life among adolescents: The nationallongitudinal study of adolescent health. Pediatrics 2005, 115:340-347.
19. Wardle J, Waller J, Fox E: Age of onset and body dissatisfaction inobesity. Addictive Behaviors 2002, 27:561-573.
20. Puhl RM, Andreyeva T, Brownell KD: Perceptions of weight discrimination:prevalence and comparison to race and gender discrimination inAmerica. International Journal of Obesity 2008, 32:992-1000.
21. Gortmaker SL, Must A, Perrin JM, Sobol AM, Dietz WH: Social andeconomic consequences of overweight in adolescence and youngadulthood. N Engl J Med 1993, 329:1008-1012.
22. Sobal J: Social and Economic Consequences of Overweight inAdolescence. New England Journal of Medicine 1994, 330:647.
23. Sorensen TI, Sonne-Holm S: Intelligence test performance in obesity inrelation to educational attainment and parental social class. J Biosoc Sci1985, 17:379-387.
24. Sonne-Holm S, Sorensen TI: Prospective study of attainment of socialclass of severely obese subjects in relation to parental social class,intelligence, and education. Br Med J (Clin Res Ed) 1986, 292:586-589.
25. Sobal J, Stunkard AJ: Socioeconomic-Status and Obesity - A Review ofthe Literature. Psychological Bulletin 1989, 105:260-275.
26. Shrewsbury V, Wardle J: Socioeconomic status and adiposity inchildhood: A systematic review of cross-sectional studies 1990-2005.Obesity 2008, 16:275-284.
27. Due P, Damsgaard MT, Rasmussen M, Holstein BE, Wardle J, Merlo J, et al:Socioeconomic position, macroeconomic environment and overweightamong adolescents in 35 countries. International Journal of Obesity 2009,33:1084-1093.
28. Ball K, Crawford D: Socioeconomic status and weight change in adults: areview. Social Science & Medicine 2005, 60:1987-2010.
29. Wardle J, Brodersen NH, Cole TJ, Jarvis MJ, Boniface R: Development ofadiposity in adolescence: five year longitudinal study of an ethnicallyand socioeconomically diverse sample of young people in Britain. BritishMedical Journal 2006, 332:1130-1132A.
30. Sherwood NE, Wall M, Neumark-Sztainer D, Story M: Effect ofsocioeconomic status on weight change patterns in adolescents. PrevChronic Dis 2009, 6:A19.
31. Oliver LN, Hayes MV: Effects of neighbourhood income on reported bodymass index: an eight year longitudinal study of Canadian children. BmcPublic Health 2008, 8.
32. Stunkard AJ, Sorensen TI: Obesity and socioeconomic status–a complexrelation. N Engl J Med 1993, 329:1036-1037.
33. Cole TJ, Bellizzi MC, Flegal KM, Dietz WH: Establishing a standarddefinition for child overweight and obesity worldwide: internationalsurvey. BMJ 2000, 320:1240-1243.
34. Larsen K, Merlo J: Appropriate assessment of neighborhood effects onindividual health: Integrating random and fixed effects in multilevellogistic regression. American Journal of Epidemiology 2005, 161:81-88.
35. Ohlsson H, Merlo J: Understanding the effects of a decentralized budgeton physicians’ compliance with guidelines for statin prescription - amultilevel methodological approach. Bmc Health Services Research 2007, 7.
36. Rabe-Hesketh S, Skrondal A: Multilevel and Longitudinal Modeling Using StataTexas: Stata Press, Second 2008.
37. Dietz WH: Overweight in childhood and adolesence. New England Journalof Medicine 2004, 350:855-857.
38. Freedman DS, Khan LK, Serdula MK, Dietz WH, Srinivasan SR, Berenson GS:The relation of childhood BMI to adult adiposity: The Bogalusa HeartStudy. Pediatrics 2005, 115:22-27.
39. Sonneholm S, Sorensen TIA, Jensen G, Schnohr P: Long-Term Changes ofBody-Weight in Adult Obese and Nonobese Men. International Journal ofObesity 1990, 14:319-326.
40. Sorensen TI: Socio-economic aspects of obesity: causes or effects? Int JObes Relat Metab Disord 1995, 19(Suppl 6):S6-S8.
41. Parsons TJ, Power C, Logan S, Summerbell CD: Childhood predictors ofadult obesity: a systematic review. Int J Obes Relat Metab Disord 1999,23(Suppl 8):S1-107.
42. Elgar FJ, Roberts C, Tudor-Smith C, Moore L: Validity of self-reportedheight and weight and predictors of bias in adolescents. Journal ofAdolescent Health 2005, 37:371-375.
43. Goodman E, Hinden BR, Khandelwal S: Accuracy of teen and parentalreports of obesity and body mass index. Pediatrics 2000, 106:52-58.
44. Himes JH, Hannan P, Wall M, Neumark-Sztainer D: Factors associated witherrors in self-reports of stature, weight, and body mass index inMinnesota adolescents. Annals of Epidemiology 2005, 15:272-278.
45. Jansen W, Looij-Jansen PMV, Ferreira I, de Wilde EJ, Brug J: Differences inmeasured and self-reported height and weight in Dutch adolescents.Annals of Nutrition and Metabolism 2006, 50:339-346.
46. Taylor RW, Jones IE, Williams SM, Goulding A: Evaluation of waistcircumference, waist-to-hip ratio, and the conicity index as screeningtools for high trunk fat mass, as measured by dual-energy X-rayabsorptiometry, in children aged 3-19 y. American Journal of ClinicalNutrition 2000, 72:490-495.
47. Teasdale TW, Sorensen TIA, Stunkard AJ: Genetic and Early EnvironmentalComponents in Sociodemographic Influences on Adult Body Fatness.British Medical Journal 1990, 300:1615-1618.
Pre-publication historyThe pre-publication history for this paper can be accessed here:http://www.biomedcentral.com/1471-2458/10/520/prepub
doi:10.1186/1471-2458-10-520Cite this article as: Morgen et al.: Parental socioeconomic position anddevelopment of overweight in adolescence: longitudinal study ofDanish adolescents. BMC Public Health 2010 10:520.
Submit your next manuscript to BioMed Centraland take full advantage of:
• Convenient online submission
• Thorough peer review
• No space constraints or color figure charges
• Immediate publication on acceptance
• Inclusion in PubMed, CAS, Scopus and Google Scholar
• Research which is freely available for redistribution
Submit your manuscript at www.biomedcentral.com/submit
Morgen et al. BMC Public Health 2010, 10:520http://www.biomedcentral.com/1471-2458/10/520
Page 11 of 11
Related Documents