IZA DP No. 3244 Parental Leave Policies and Parents’ Employment and Leave-Taking Wen-Jui Han Christopher Ruhm Jane Waldfogel DISCUSSION PAPER SERIES Forschungsinstitut zur Zukunft der Arbeit Institute for the Study of Labor December 2007

Welcome message from author
This document is posted to help you gain knowledge. Please leave a comment to let me know what you think about it! Share it to your friends and learn new things together.
Transcript

IZA DP No. 3244
Parental Leave Policies and Parents’ Employmentand Leave-Taking
Wen-Jui HanChristopher RuhmJane Waldfogel
DI
SC
US
SI
ON
PA
PE
R S
ER
IE
S
Forschungsinstitutzur Zukunft der ArbeitInstitute for the Studyof Labor
December 2007
Parental Leave Policies and
Parents’ Employment and Leave-Taking
Wen-Jui Han Columbia University
Christopher Ruhm
University of North Carolina, Greensboro and IZA
Jane Waldfogel
Columbia University
Discussion Paper No. 3244 December 2007
IZA
P.O. Box 7240 53072 Bonn
Germany
Phone: +49-228-3894-0 Fax: +49-228-3894-180
E-mail: [email protected]
Any opinions expressed here are those of the author(s) and not those of the institute. Research disseminated by IZA may include views on policy, but the institute itself takes no institutional policy positions. The Institute for the Study of Labor (IZA) in Bonn is a local and virtual international research center and a place of communication between science, politics and business. IZA is an independent nonprofit company supported by Deutsche Post World Net. The center is associated with the University of Bonn and offers a stimulating research environment through its research networks, research support, and visitors and doctoral programs. IZA engages in (i) original and internationally competitive research in all fields of labor economics, (ii) development of policy concepts, and (iii) dissemination of research results and concepts to the interested public. IZA Discussion Papers often represent preliminary work and are circulated to encourage discussion. Citation of such a paper should account for its provisional character. A revised version may be available directly from the author.

IZA Discussion Paper No. 3244 December 2007
ABSTRACT
Parental Leave Policies and Parents’ Employment and Leave-Taking*
Utilizing data from the June Current Population Survey (CPS) Fertility Supplement merged with data from other months of the CPS, we describe trends in parents’ employment and leave-taking after birth of a newborn and analyze the extent to which these behaviors are associated with parental leave policies. The period we examine – 1987 to 2004 – is one in which such policies were expanded at both the state and federal level. We also provide the first comprehensive evidence as to how these expansions are correlated with employment and leave-taking for both mothers and fathers over this period. Our main finding is that leave expansions have increased the amount of time that new mothers and fathers spend on leave, with effects that are small in absolute terms but large relative to the baseline for men and much greater for college-educated women than for their counterparts with less schooling. JEL Classification: J13, J18, J22 Keywords: parental leave policies, parental employment, leave-taking Corresponding author: Wen-Jui Han Columbia University School of Social Work 1255 Amsterdam Avenue New York, NY 10027 USA E-mail: [email protected]
* The authors gratefully acknowledge funding support from NICHD and helpful comments from Heather Hill and Elizabeth Washbrook.

The labor force participation of women with children has risen sharply in recent years
and women have become much more likely to work continuously over their lifecycle. For no
group has the change been more dramatic than for women with newborns. In 1968, only 21
percent of women with a child under the age of one were in the labor force (U.S. Bureau of the
Census, 2001). By contrast, over half of such women have been in the labor force in every year
since 1986 (Dye, 2005; U.S. Department of Labor, 2007).
The fact that mothers are employed does not mean that they are at work. In most
countries, mothers with infants are entitled to take a period of paid and job-protected leave to
recover from the birth and care for the newborn, and many nations have extended parental leave
rights to fathers (Kamerman, 2000; Waldfogel, 2001a). The U.S. was long an exception in this
regard, but in recent years, parental leave laws have been enacted at both the state and federal
level. At the federal level, the U.S. had no parental leave law until the passage of the Family and
Medical Leave Act (FMLA) in 1993. The FMLA requires employers with 50 or more workers to
offer a job-protected leave of up to 12 weeks to qualifying employees who need to be absent
from work for family or medical reasons. The leave is unpaid, but employers who offer health
insurance must continue to do so during the leave. Because of the firm size and qualifying
conditions, less than 50 percent of private sector workers are eligible for leave under the FMLA
(Ruhm, 1997). Men are slightly more likely to be eligible than women; there are also differences
by family income and education, with low-income and less-educated workers less likely to be
covered than their peers (Commission on Family and Medical Leave, 1996; Cantor et al., 2001).
One intent of the federal and state laws is to provide mothers and fathers with the
opportunity to take some time off work after the birth of a child, without the risk of losing their
2

job.1 Even the most generous of U.S. laws provide leave for relatively short periods (typically,
less than 3 months) and the limited previous research does not conclusively indicate how such
legislation has influenced the leave-taking of mothers or fathers.
This study investigates whether recent changes in federal and state parental leave
legislation have led to more mothers and fathers taking leave in the birth month and succeeding
months. If so, this could have important implications for children as it would presumably
increase the time that parents are able to spend with their infants. We also explore whether leave
extensions have resulted in more mothers being employed post-childbirth, as opposed to leaving
work altogether, as this would tend to have the opposite effect, reducing maternal time with
young children.
Our primary finding is that the leave expansions have had little effect on overall
employment rates but have increased the amount of time that new mothers and fathers spend on
leave. The effects vary by education group as well as gender. We find positive effects of leave
legislation on mothers’ leave-taking in the birth month and the succeeding two months.
However, these effects are confined to more educated mothers, probably because this group is
more likely to be covered by the laws. Fathers, in contrast, typically take extremely short leaves
(or none at all), so where we find effects of leave laws, these occur only in the birth month. As
for mothers, the results for men differ by education group, with significant effects only for the
more educated.
Background
Understanding how parental leave legislation has affected employment and leave-taking
is of more than academic interest. Rights to parental (particularly maternity) leave have been
viewed as important to improve the job continuity of mothers – who without the entitlement to 1 Some laws also permit work absences for other reasons, such as to care for sick relatives.
3

leave would often be forced to terminate jobs in order to spend time with their children – and so
to reduce the “family gap” in women’s wages (see, e.g., Fuchs, 1988; Waldfogel, 1998a, 1998b;
Korenman & Neumark, 1992; Lundberg & Rose, 2000; Budig & England, 2001; Baum, 2003).
Maternity leave might also improve the health of mothers and the limited research on this topic
(e.g. Chatterji & Markowitz, 2005) provides suggestive but inconclusive evidence of benefits.
There is also evidence that extending maternity leave might improve children’s health.
Cross-national studies have found that when parental leave entitlements are extended, infant
mortality rates are lower (Ruhm, 2000; Tanaka, 2005). U.S. research indicates that when mothers
return to work in the first 3 months, infants are less likely to be breast-fed, taken to the doctor for
well-baby visits, or up-to-date on their immunizations (Berger, Hill, & Waldfogel, 2005).
Another mechanism by which earlier returns to work might affect infant health would be through
earlier enrollment in child care. However, while group child care in the first years of life does
pose some health risks to children, these tend to be relatively minor and short-lived (Meyers,
Rosenbaum, Ruhm, & Waldfogel, 2004).
Earlier maternal employment may also have implications for child development. There is
a large body of research on the effects of first-year maternal employment and non-maternal child
care on children's later cognitive and emotional well-being (see e.g. Haskins, 1985; Baydar &
Brooks-Gunn, 1991; Belsky & Eggebeen, 1991; Bates et al, 1994; Belsky, 2001; Bornstein et al.,
in press). Specifically, maternal employment in the first year of life is associated with lower
cognitive test scores for children at age three, four, or five (see, e.g., Desai, Chase-Lansdale, &
Michael, 1989; Baydar & Brooks-Gunn, 1991; Blau & Grossberg, 1992; Han, Waldfogel, &
Brooks-Gunn, 2001; Ruhm, 2004). And, children whose mothers work long hours in the first
year of life, or who spend long hours in child care in the first several years, have been found to
4

have more behavior problems (see e.g. NICHD ECCRN, 1998, 2003). These effects may relate to
the mother’s absence (although time at work does not necessarily translate into less time with the
child; see Bianchi, 2000; Huston & Aronson, 2005) or to enrollment in child care.
Only a few studies have examined the effects of parental leave laws on mothers’
employment and leave-taking. Klerman and Leibowitz (1997), using data from the 1980 and
1990 Census for the pre-FMLA period, find that mothers covered by state parental leave laws
took about two weeks more maternity leave than mothers who were not covered (see also
Klerman & Leibowitz, 1998, 1999). Waldfogel’s (1999b) analysis of the March 1992-1995 CPS
indicated that the likelihood of women with infants being on leave rose 23 percent post-FMLA.
Ross (1998), using the Survey of Income and Program Participation (SIPP), found that women
took about six weeks more unpaid leave due to the FMLA. Han and Waldfogel (2003), also
using SIPP data, found that longer leave entitlements corresponded to more leave-taking by
mothers, but that the effects were often not significant when state fixed effects were included.
However, the latter two studies did not examine paid-leave taking (since the SIPP tracks unpaid
leave only) and none of the preceding analyses investigate leave-taking for more than a few
years after implementation of the FMLA.
The second gap in the prior literature is the lack of research on how parental leave laws
affect fathers. To the extent that paternity leave facilitates fathers establishing relationships with
newborns and being more involved with their children subsequently, such policies have
potentially important implications for child well-being. Yet, paternity leave is fairly new in the
United States, and there has been little study of it. Limited research suggests that men are
reluctant to take leave even when covered, with many reporting the fear that doing so would hurt
their careers (Conference Board, 1994; Malin, 1994, 1998). Moreover, even when men take
5

leave, they are usually off work for only a week or two (Commission on Family and Medical
Leave, 1996; Hyde, Essex, & Horton, 1993; Pleck, 1993). In analyses of families with children
born in 2001, Neponmyaschy & Waldfogel (2007) find that about 90 percent of resident fathers
have taken some leave after the birth, but most take only a week or two. However, men who take
longer leaves are more involved with their children nine months later (Neponmyaschy &
Waldfogel, 2007). Research shows that more men had access to paternity leave post-FMLA than
before it (Waldfogel, 1999a, 2001b; Cantor et al., 2001) but we know little about the effect of the
FMLA or other leave laws on men’s leave usage. Han and Waldfogel (2003) represents the only
prior analysis that included fathers and they examined unpaid leave-taking only. This paper fills
that gap by examining paid and unpaid leave-taking among mothers and providing an in-depth
investigation of how leave entitlements have affected the leave-taking of fathers.
A third shortcoming of prior research is that, to our knowledge, no studies have
specifically assessed the effects of leave policies on families headed by less-educated parents,
even though these families may need the support of leave policies the most. Prior research has
found that workers with less education relatively infrequently have coverage or take parental
leave, saying that they cannot afford to take unpaid leave (Cantor et al., 2001; Waldfogel,
2001b). We examine whether families headed by less-educated parents are differentially affected
by leave policies by carrying out supplementary analyses focusing on this group.
A fourth limitation of related previous work is the lack of attention paid to other public
policies. The potential role of means-tested benefits is readily apparent, particularly when
considering less-educated families. We address this by estimating models that include controls
for the welfare reforms of the 1990s, which made a host of changes to work requirements and
other rules affecting the eligibility for cash welfare and other benefits. We also control for
6

changes in the Earned Income Tax Credit (EITC), which is known to be linked with female
employment (e.g. Meyer & Rosenbaum, 2001), and may be spuriously correlated with changes
in leave entitlements.
Utilizing data from the June Current Population Survey Fertility Supplement merged with
data from other months of the CPS, we describe trends in parents’ employment and leave-taking
in the months immediately following childbirth and analyze the extent to which these are
affected by parental leave policies. We provide the first comprehensive evidence as to how
expansions of such policies during the period examined – 1987 to 2004 – affected employment
and leave-taking for both mothers and fathers.
Parental leave policies
Several authors (e.g. Klerman & Leibowitz, 1997; Ruhm, 1998; Waldfogel, 1999b)
provide detailed discussions of the anticipated effects of parental leave policies. Most obviously,
expanded entitlements are expected to increase the amount of leave-taking, by permitting time
off work without having to quit jobs. The overall effects on employment are ambiguous,
however, for two reasons. First, some parents may choose a short period of job-protected leave,
when legislation guarantees their right to do so, instead of a longer absence that would require
subsequently finding a new job. Some might also work more prior to childbirth so as to
subsequently qualify for leave (particularly when leaves are paid). On the other hand, the policies
sometimes permit a longer period off work after the birth, which might induce some parents to
develop a taste for being at home with their child and so to leave their jobs. There are also
indirect effects whose direction is ambiguous. For instance, some husbands may increase labor
supply to offset leave-taking by wives and the mandates could affect wages or fertility.
7

We consider three types of leave policies: the federal FMLA; state parental leave laws;
and state temporary disability insurance (TDI) programs. Data on these policies were from Han
and Waldfogel (2003), with updated information from the National Partnership for Women &
Families (2002) and Stutts (2006). Appendix Table A.1 summarizes the parental leave policies in
effect in different years.
The FMLA, which was signed into law in February 1993 and took effect nationwide in
August 1993, provides up to 12 weeks of unpaid leave for specified reasons, including the birth
or assumption of care of a new child. The law applies only to workers who meet its qualifying
conditions, which include having worked for at least 12 months for an employer with 50 or more
employees. As discussed, slightly fewer than half of all private sectors workers are estimated to
be eligible for leave under the FMLA, with men and more educated workers slightly more likely
than their counterparts to be covered and eligible. Since we cannot distinguish in our data which
new parents meet the qualifying conditions (and arguably whether they do so is potentially
endogenous), we code any mother or father who had a child born on or after August 1993 as
potentially eligible for 12 weeks of unpaid parental leave under the FMLA.
Several states enacted parental leave laws before the federal legislation took effect. The
earliest state statute dates from October 1972 (in Massachusetts), and states have continued to
pass laws even after the FMLA. Like the federal legislation, state laws apply only to qualifying
workers, with small employers often exempt and some laws applying only to government (but
not private sector) employees. Our data do not allow us to identify which workers meet
qualifying requirements under state laws and we again code any parents with children born on or
8

after enactment of the state law as being potentially eligible for leave under that law. 2 Many
state laws cover mothers only and so we code only mothers as being eligible under these laws.
Five states offer paid leave to disabled workers through Temporary Disability Insurance
(TDI) programs. These states and the dates on which their laws came into effect are Rhode
Island (1942), California (1946), New Jersey (1948), New York (1949), and Hawaii (1969). TDI
laws, while not designed for this purpose, have the effect of providing paid parental leave to
mothers for a period of time after giving birth because the 1978 federal Pregnancy
Discrimination Act required TDIs to cover pregnancy and maternity-related disability in the
same way as other types of disability. Typically new mothers are entitled to 6 weeks of paid
leave through TDI programs (8 weeks after a Caesarean section), so we classify mothers giving
birth in a month and year when such laws were in effect as being potentially eligible for 6 weeks
of paid leave. We do not code fathers as being eligible under TDI programs since these laws
apply only to mothers.
Parental leave entitlements became more widespread over the period examined. In our
sample, the share of new mothers living in a state with a state parental leave or TDI law, or who
could potentially be covered under the FMLA, rose from 26 percent in 1987 to 100 percent in
1994 (Appendix Table A1). The increase for men was even sharper – rising from 3 percent in
1987 to 100 percent in 1994. Both figures are 100 percent in 1994 and thereafter since all new
parents are potentially eligible for parental leave under the FMLA beginning in 1993 (although
whether they are actually covered and eligible depends on job tenure and firm size). However,
there is still some variation by state post-FMLA since some states guarantee more than 12 weeks
of leave. We account for this in supplemental models by controlling for the number of weeks of
leave, rather than just leave coverage. As mentioned, some states provide paid leave through TDI 2 However, we exclude laws that apply to state employees only, as these cover only a small minority of parents.
9

programs, which we account for in supplemental models focusing on state laws and
distinguishing between paid and unpaid leave entitlements.3
Other policies
It is important to take into account other policies that might affect the employment and
leave-taking of new parents, particularly those whose provisions have changed over the period
analyzed. Especially important are policies related to welfare reform and the Earned Income Tax
Credit. Most welfare reforms occurring in the 1990s were designed to increase parental
employment, but the specific provisions enacted were diverse and may not have had uniform
effects (e.g. see review by Blank, 2002). Nor is it clear whether or how these reforms should
affect leave-taking. Our main focus is not to determine the impact of welfare reforms but rather
to insure that our estimates of the effects of parental leave policies are not biased by omitting
these potentially important covariates.
We control for three specific welfare system provisions that changed over the study
period. The first is a dichotomous variable indicating whether the state had an approved welfare
waiver program prior to the 1996 enactment of TANF, which indicates if welfare reform was
underway in the state prior to 1996. Our second dummy variable is “turned on” in the month and
year a state implemented TANF (and we “turn off” the waiver variable, if applicable, at the same
time).4 Our third welfare variable measures the length, in months, of any welfare work
exemptions for mothers of infants. Prior to welfare reform, women were exempt from welfare’s
work requirements until their youngest child was 36 months old. After welfare reform, mothers
3 Some states cover more workers than the FMLA because they have lower job tenure or firm size requirements; we do not account for this as we lack data on individuals’ tenure and firm size. 4 TANF was passed at the federal level in 1996 but became effective in states at varying dates ranging from late 1996 to late 1998. We obtain our data on waivers and TANF effective dates from the Council of Economic Advisors (CEA) report on “The Effects of Welfare Policy and the Economic Expansion on Welfare Caseloads” and the TANF annual Reports to Congress from the U.S Department of Health & Human Services (http://www.acf.dhhs.gov/programs/opre/director.htm)
10

could be required to work when their child was as young as 3 months old (or even younger at
state option). By 2000, 22 states had no exemption or required mothers to work as early as 3
months; another 3 states required work by 6 months, and 20 others (and the District of
Columbia) required work by 12 months (Brady-Smith, Brooks-Gunn, Waldfogel, & Fauth, 2001;
Hill, 2007). Mothers with young children are more likely to be employed in states that do not
exempt them from work requirements (Hill, 2007) and these mothers also breast-feed their
infants for shorter durations (Haider, Jacknowitz, & Schoeni, 2003).5
Finally, we control for the generosity of EITC benefits, as proxied by the natural log of
the cash value of the maximum refundable benefit for a family with 2 or more children in the
state and year. This measure combines amounts available under federal and state programs,
where applicable.6 We do not include, in this calculation, EITC programs in the few states
providing non-refundable benefits, since these do not reach all low-income families.7
Data
Data on the exact month and year that mothers gave birth was obtained from the June
supplements to the monthly Current Population Surveys (CPS) available in even numbered years
between 1988 and 2004. Information on labor force status, number of children, and demographic
variables (age, education, marital status and race/ethnicity) of mothers and fathers residing with
them was obtained from the regular monthly CPS. We also use the CPS sampling structure –
where households are in the sample for four months, out for the next eight, and then surveyed
again for four additional months – to identify labor force status for periods up to 12 months prior 5 Data on welfare work exemptions for mothers with infants are from various years of the Welfare Rules Databook compiled by the Urban Institute. 6 We take our data on the EITC from Blau, Han, Kahn, & Waldfogel (2006). 7 We considered but did not include controls for child care policies because we think child care subsidies are likely to have less effect on the labor supply of parents in the first few months of life than the other policies considered here. Hill’s (2007) study, for instance, found no significant effects of child care subsidies on the labor supply of mothers with children age 0 to 60 months. Also, as a practical matter, we lack consistent data on child care subsidies over our time period.
11

to and following the birth, although this information is available for only some of the time period
for each individual respondent.
Consider, for example, a woman surveyed for the second time in June of 1998 who has a
child born in April of that year. For this mother, we will have data on labor force status only for
one through four months after the birth month (measured in May through August of 1998).
Conversely, for a woman whose child is born in June, we would have data for the month prior to
the birth, the birth month, and the next two months, as well as for 11 and 12 months after the
birth month. Finally, for a mother who is in the eighth survey month in June of 1998 and gave
birth in May of that year, we would be able to identify labor force status in the birth month and
previous two months (from the April through June 1998 interviews) but also for the 11th and 12th
months prior to the birth month (from the surveys taking place in May and June of 1997). The
latter are important because we will use women giving birth 11 or 12 months later as a control
group in the difference-in-difference (DD) estimates emphasized below.
It is important to note that we are not able to identify the exact timing of births, since the
June supplements give month and year but not the day of birth. Labor force status is measured in
the week prior to the CPS survey (the reference week) which, during the birth month, may occur
before or after the child was actually born.8 This matters for two reasons. First, it implies that
our estimates refer to the birth month rather than the child’s first month of life and similarly for
later months. We will sometimes refer to our results in terms of months of child age, for ease of
exposition, when indicating the number of months before or after the birth month would be more
accurate. (For example, we may discuss leave-taking during the child’s second month, when we
8 Most CPS surveys occur during the third week of the month (according to the “Overview of CPS Monthly Operations” (US Department of Labor, 2002)). Consider the plausible case where the child is born on June 23 but the survey occurred on June 19 (with labor force measured for the previous week). This implies that the birth month will actually cover the period before the child was born and the data for the next month, obtained on or near July 19, will indicate employment behavior during the reference week during the child’s first month of life.
12

really mean the second month following the birth month). Second, it means we will miss some
very short leaves, which do not occur during the survey reference week. This is particularly
relevant for men who generally take minimal amounts of leave. Specifically, our estimates will
indicate the percentage of time that mothers or fathers are off work during the specified month,
rather than the probability of their being on leave during that month.9
Two additional issues deserve mention. First, we only have data on fathers who reside
with the child’s mother. Although we cannot be certain, it seems probable that such fathers will
take more leave around the time of the child’s birth than fathers who not living with the mother.
If so, our estimates will overstate the amount of paternity leave used. Second, with the
procedures discussed above, we need to match individuals and families across survey months.
This is done using the household identifier, household number, and personal line number, as
recommended by the CPS user’s guide, with information on the month in the sample used to
match families across survey months. Average match rates were 85 percent or higher within
three-month periods (e.g., birth month merged with two months prior to the birth or with two
months after the birth) and about 50 percent for the months more than six months apart (e.g.,
birth month merged with 10 months prior to the birth).10
We then attach information on whether federal or state parental leave laws were in effect
during the specified month, the number of weeks of leave entitlement, and also supplementary
9 Consider the case where all men take exactly one week of leave following the birth of a child. This will occur during the reference week approximately one-quarter of the time. It would not be correct to interpret this to indicate that only one-quarter of men take leave. Rather, the correct interpretation is that about 25 percent of male employment involves leave-taking during that month. 10 These match rates refer to observations that are potentially matchable. One issue was that the structure of the household identifiers changed in 1995 in ways that precluded matching observations from this year with those from either 1994 or 1996. For this reason, information from 1995 was excluded.
13

policy variables related to state welfare system characteristics, EITC benefits, and state monthly
unemployment rates.11
Empirical strategy
We begin with descriptive analyses of trends in employment and leave-taking among
parents of infants (aged 0 to 12 months). Using survey questions about each parent’s activity the
prior week, we consider three outcomes: 1) employment (those working or with a job but not
working during the prior week); 2) leave (those who had a job but were not at work in the
previous week); and 3) leave for “other reasons” (those employed but not at work for reasons
other than vacation, own illness, bad weather, labor dispute or layoff, or because they are waiting
for a new job to begin). We lack a consistent explicit measure of maternity/paternity leave and so
believe this is best accounted for through the measure of leave for “other reasons”, which we
therefore focus upon below.12 It is important to note that the 1994 redesign of the CPS resulted
in a slight increase in reported employment rates for females (Polivka & Miller, 1995). The
effects of this change will hopefully be captured by the inclusion of year effects in our regression
models, but may make it difficult to estimate the effect of the FMLA which came into effect at
roughly the same time as the redesign. In supplemental analyses, we estimate separate models for
the pre-FMLA and post-FMLA periods. These help us to discern the effects of state policies
before and after the FMLA came into effect, but can not shed light on the FMLA itself.
We next estimate a series of econometric models, the basic form of which is:
Yit = αit + β1Xit + β2Mit + β3Lit + γMit x Lit + δ1Si + δ2Tt + µit. (1)
11 The unemployment data come from the U.S. Department of Labor, Bureau of Labor Statistics, Local Area Unemployment Statistics database, which can be accessed at: http://www.bls.gov/lau. 12 The CPS does have questions about maternity or paternity leave starting in 1994. The percentages of mothers and fathers using “other” as the reason to be not at work in years prior to 1994 are similar to those of mothers and fathers using “maternity or paternity leave” as the reason to be not at work in years after 1994.
14
In equation (1), the subscripts i and t indicate the survey respondent and time period and Yit is
one of three labor force status dichotomous variables indicating employment, leave, or leave for
“other reasons”. The latter two outcomes are estimated for the subsample of employed
individuals, and so indicate rates of leave-taking conditional on employment. Xit is a vector of
supplementary regressors that includes: parent’s age, education, marital status, race/ethnicity,
whether the child is a first-born, and the number of children in the household (all taken from the
June CPS), as well as the welfare policies, EITC benefits, and monthly unemployment rate in the
state during the survey month. Mit is a vector of four dummy variables, respectively, taking the
value of one in the birth month and the three following months, 13 with the reference group
consisting of mothers (or fathers) who will have a birth 11 or 12 months after the survey date. Lit
controls for whether any parental leave law (whether federal, state, or TDI) was in effect during
the survey month. Si and Tt are vectors of state and year dummy variables and µit is an error
term.
Several features of equation (1) deserve mention. First, we provide separate estimates for
mothers and fathers, since their employment and leave-taking behavior are likely to differ
dramatically. Second, state “fixed-effects” and general year effects control for all time-invariant
but state-specific determinants of employment (such as local attitudes), as well as factors that
affect all locations but differ across time periods (like national macroeconomic conditions).
Third, because several of our variables are defined at the state rather than person level, the
13 We do not consider later months because parental leave benefits provided under state or federal law in the United States almost never extend beyond three months. In future work, however, it might be of interest to explore whether leave laws have effects on employment in later months.
15

standard errors in all of our models are adjusted for non-independence within states (using the
cluster function in STATA).14
Even with the extensive controls just discussed, there could be omitted variables biases, if
unobserved determinants of employment or leave-taking are correlated with changes in parental
leave rights. For instance, it is possible that more generous parental leave entitlements are
enacted in response to increased maternal employment, since these policies are viewed as an
important way to help parents balance family and work responsibilities. Equation (1) addresses
this by including a control group – men or women who will have a birth 11 or 12 months after
the survey date – whose labor force behavior is likely to be affected by the confounding factors
in similar ways as the new parents but who are not subject to the leave legislation itself.
Specifically, equation (1) is a difference-in-difference (DD) model. Notice that the
coefficients on Mit show the estimated differences in employment or leave-taking in the birth
month and next three months, relative to the treatment group of parents who will have infants
approximately one year after the survey date. Similarly, the main effects on parental leave refer
to this reference group, and so indicate the effects of any uncontrolled confounding factors, while
the interaction coefficients show how parental leave entitlements differentially affect parents in
the month immediately after childbirth. The key assumption of the DD model is that the leave
laws do not causally affect the labor market status of the reference group. This generally seems
reasonable, although there could be small effects. For instance, it is possible that some women
work more in the year prior to childbirth, in order to be eligible for maternity leave benefits. If
so, expanded leave might increase employment among the control group and result in an
14 We experimented with instead clustering at the person level, since individuals appear in our sample more than once. The standard errors were similar using this procedure.
16
understatement (overstatement) of the extent to which leave rights increase (decrease)
employment among the treatment group.15
We report results of linear probability (LP) models, even though the labor force
dependent variables are dichotomous and probit or logit models might be more appropriate. The
reason is that coefficients from the LP specifications are easier to interpret, especially when
including interactions between leave laws and the timing variables (the birth month and
following three months), where marginal effects depend on the values of the covariates and the
associated probit or logit coefficients are often misleading.16 However, prior to doing so, we
estimated both LP and probit models for specifications that include all covariates except the
interactions. The magnitudes and statistical significance of the marginal effects were quite
similar, indicating that predictions from the linear probability estimates will be informative.
We also estimate several variants of the basic model. First, some specifications control
for the duration (number of weeks) of leave provided through the state or federal leave law,
rather than the dichotomous entitlement variable. Second, we estimate our basic model
separately for less- and more-educated parents (defining these as those with less than college, or
some college or more education, respectively). Third, we estimate separate models for the pre-
FMLA and post-FMLA periods; we estimate these using our main entitlement variable, as well
as with variables distinguishing between the availability of paid leave (through TDI programs)
versus unpaid leave (through state parental leave laws).
Results
Descriptive Results
15 The employment effects are likely to be quite small, since most leaves are unpaid. It also seems unlikely that the leave rights will have much effect on leave-taking among the control group. 16 Ai and Norton (2003) show that the coefficients may have the opposite sign as the predicted effect of the interaction on the dependent variable.
17
Table 1 displays average rates of employment and leave-taking for the control group of
mothers and fathers whose child will be born 11 or 12 months later, as well as corresponding
means for the birth month and the next three months. Women are much more likely to hold jobs
before birth than after it – 66 percent of the control group is employed versus 46 to 49 percent of
the treatment groups. Not only do rates of maternal employment fall after childbirth but many
women also take brief periods of leave. For instance, over half of employed mothers are not
working during the birth month and first month thereafter, compared to just 7 percent of the
control group. The data also provide suggestive evidence that the leave for “other reasons”
variable is a good proxy for maternity leave. Specifically, this accounts for less than 2 percent of
employment among the control group, who will rarely be on parental leave, but 42 percent of
employment of mothers in the month of birth and 55 percent in the following month.17
Moreover, 82 (85) percent of work absences in the birth month (first month after birth) occur for
“other reasons”, consistent with an important role of maternity leave during these periods.
Notice, however, that consistent with prior evidence (see e.g. Berger & Waldfogel, 2004) most
maternity leaves appear to be brief. Just 28 percent of mothers are absent for “other reasons” two
months after birth and less than 12 percent three months subsequent to it. For both leave, and
leave for “other reasons”, we find higher shares of women on leave one month after the birth
than in the birth month. This reflects the issue discussed earlier, that the week for which labor
force information is documented in the birth month is not always post-birth, whereas the week
documented in the next month is.
Conversely, relatively few men stop working following the birth of a child. Ninety-two
percent of fathers are employed during the birth month and each of the subsequent three months,
compared to a 93 percent employment rate 11 or 12 months before the child was born. Paternity 17 There may be some maternity leave taken by the control group following the birth of an earlier child.
18
leave is also rare. Just 3 percent of employed fathers are absent for “other reasons” in the birth
month and fewer than 1 percent in any of the following three months. Even using a more
expansive definition of leave, including all fathers with a job but not working, just 7 percent of
employed fathers report being off the job in the birth month and around 4 percent in the
subsequent months. This is consistent with the commonly held belief that the presence of young
children has a weaker impact on the labor supply behavior of men than of women. Recall also
that our measure of leave will miss short work absences not occurring during the reference week.
With many men taking leaves of just a week or two, this is more of a problem for fathers than
mothers.
Sample averages for the explanatory variables are provided in Appendix Table A.2. Most
of these are self-explanatory and so need not be discussed. However, it is important to note that
the demographic characteristic means are similar for the control and treatment groups. This is
desirable, since large disparities might reflect differential rates of matching across types of
individuals and raise concern that the treatment and control groups are not comparable.
It is also worth pointing out that 62 to 75 percent of mothers and 45 to 63 percent for
fathers are potentially eligible for parental leave, with average entitlements of 6 to 8 weeks for
mothers and 5 to 8 weeks for fathers (Appendix Table A.2). As mentioned, the share of parents
with parental leave entitlements rose from 26 percent for mothers and 3 percent for fathers in
1987 to 100 percent for both groups in 1994 and thereafter. Leave entitlements are higher in the
treatment groups than in the control group, reflecting the evolution of policies over time. For the
same reason, the control group has more months of infant welfare work exemptions and
somewhat lower EITC benefits.
19

Figures 1 through 3 supply additional detail on time trends in maternal employment and
leave-taking from three months before through 12 months after the birth month. Dates refer to
the year of the June CPS survey from which birth information was obtained. Therefore, the births
could have actually occurred in this or the previous year. Across all years, there is a decline in
employment as a birth approaches, because some women leave employment altogether, followed
by an additional reduction in the birth month and (for most years) a gradual increase beginning
three or so months after birth (Figure 1). Even more pronounced is a sharp uptick in leave-taking
at the time of the birth. Leave-taking also increases slightly at the end of pregnancy, much more
dramatically immediately after birth, and then rapidly declines after the peak at one month post-
birth to approximately reach pre-birth levels within only a few months (Figures 2 and 3).
These patterns can be illustrated using data from 2004, the latest period we analyze. In
that year, rates of maternal employment fell from 55 percent in the third month prior to birth to
48 percent in the month prior to delivery and 44 percent in the birth month. They remained in the
range of 45-46 percent during the next three months and then rose to between 49 and 51 percent
for the 4th through 12th months after delivery. Using the broad definition of leave-taking
(including all women who are employed but not working), 4 percent of employed mothers were
on leave in the third month prior to birth, rising to 15, 45 and 69 percent in the month before
birth, the birth month and the month after birth. Leave-taking declined to 40 and 19 percent over
the next two months and ranged between 4 and 9 percent in the 4th through 12th months after
delivery. Using our preferred and narrower definition of leave-taking (employed and absent from
work for “other reasons”), 1, 3 and 11 percent of women were on maternity leave in the three
months preceding delivery, 40 percent in the birth month, 34, 16, and 4 percent during the next
three months, and between 1 and 3 percent during the 4th through 12th months after birth. What
20

these results indicate is that childbirth is associated with substantial reductions in maternal
employment and increases in leave-taking. However, whereas a portion of the decline in
employment lasts for at least one year, maternity leaves, while common, are of short duration.
These results are largely consistent with analysis of CPS data for an earlier (1979-1988) period
conducted by Klerman & Leibowitz (1994), except that they find a faster recovery of post-birth
employment for the earliest portion (1979-1982) of their data.18
Whether leave-taking has increased among mothers over time is difficult to determine
from Figures 2 and 3. The level of leave-taking was lowest in 1988 and higher in 2004 than in
most years, but rates of leave-taking were also high in 1992 and 1994. This can be seen more
clearly in Figure 4 which shows the share of mothers on leave for “other reasons” in the birth
month and the succeeding three months. The figure shows that leave for “other reasons” in the
birth month and first month after it rose from 1988 to 1994, dipped in 1998, and then grew
slightly thereafter.19 The dips occurring between 1994 and 1998 are not fully explained but are
likely to reflect changes in the sampling strategy and household identification approach carried
out between 1994 and 1996, as well as the CPS redesign implemented at the beginning of 1994.
The patterns for fathers, displayed in Figures 5-8, are quite different. First, there is no
consistent employment trend when moving from three months pre-birth to 12 months post-birth
(Figure 5).20 Second, there is a sharp increase in leave-taking during the birth month. For
instance, between 2 and 5 percent of fathers are employed but not working three months before
birth (depending on the survey year) compared to 4 to 10 percent in the birth month. However, 18 For instance, in 1983-1985, maternal employment rates for mothers with 1, 3, 6 and 12 month old children were 38, 38, 37 and 40 percent, with 71, 20, 13 and 7 percent of these mothers being on maternity leave. Klerman & Leibowitz (1994) do not report results for the period before birth. 19 Note that data on many of the persons surveyed in June of 1994 actually came from 1993, before the CPS redesign: for example, the birth month occurred in 1993 in 55 percent of such cases. 20 The percentage of men employed is lower in the birth month than three months earlier in seven of eight survey years but the difference is small – generally less than two percentage points. The employment rate 12 months after birth is higher than in the birth month in three of eight survey years but the differences are again relatively small.
21

leave-taking returns to or near pre-birth levels within a month (Figure 6). This suggests that a
small but growing fraction of fathers take paternity leaves, usually of very short duration.
Interestingly, Figure 7 shows that leaves for “other reasons” in the birth month have increased
over time, suggesting that parental leave entitlements may be having a noticeable impact on
fathers: 1.1, 2.3, 3.0 and 2.7 percent of fathers were on leave for “other reasons” in the birth
month in 1988, 1990, 1992 and 1994, compared with 4.5, 4.2, 5.0 and 6.1 percent in 1998, 2000,
2002 and 2004. This pattern is shown more clearly in Figure 8. We should also note that
although the measure of work absences for “other reasons” is likely to be useful when
considering maternity leaves, very low prevalence rates in most months for fathers imply that it
will be difficult to obtain precise estimates for them, using this narrow definition of leave-
taking.21
Leave Rights Increase Leave-Taking But Not Employment
Table 2 presents our first econometric estimates of the effects of leave policies. As
described, the samples include parents observed 11 or 12 months prior to a birth (the control
group), in the birth month, or one to three months after it. The “main” effects show relationships
for the control group and the interaction coefficients show DD estimates of the differential
impact for the treatment groups of mothers or fathers, relative to those of the control group. The
table shows marginal effects from linear probability models. These can be interpreted as
indicating the percentage point increase in the dependent variable associated with a one unit
change in each regressor.
Looking first at women, we find as expected, that mothers are less likely to be employed
in the birth month as well as the three months post-birth, with employment rates falling by 16 to
21 For example, 5 or fewer males in our sample were absent from work for “other reasons” in any individual survey year. Given the short duration of leave-taking by fathers, it seems likely that many such absences would be covered by accrued vacation, sick leave or personal time and so would not fall into the “other reasons” category.
22

19 percentage points (from the base rate of 66 percent employed 11 or 12 months before the
birth). However, there are no significant effects of leave policies on employment.
Conversely, we uncover some evidence that leave entitlements are associated with higher
rates of leave-taking. This is less apparent in the model for any leave-taking (column 2), where
the interaction terms are positive but not significant, than when we consider our preferred
definition of leave-taking for “other reasons” (column 3). Here we find that mothers are
significantly more likely to be on leave for “other reasons” in the birth month and the following
two months if they have a leave entitlement, although the effect for two months after the birth is
only marginally significant. In the birth month, having a leave law is predicted to raise leave-
taking for “other reasons” by 5.4 percentage points, a growth of 13 percent relative to the base
rate of 41.5 percent that month. The increase in the first month after the birth is 8.7 points, or 16
percent higher than the base rate; the increase in the second month after the birth is 5.6
percentage points, or 20 percent above the base rate.
Columns 4-6 of Table 2 summarize the econometric results for fathers. In contrast to
mothers, we find little sensitivity of fathers’ employment or leave-taking to leave laws. The
effects we do find are concentrated in the birth month, where fathers are 3.9 percentage points
more likely to be on leave if covered by a leave law, an increase of 54 percent relative to the base
rate of 7.2 percent. Narrowing our focus to leave for “other reasons”, fathers are 2.5 percentage
points more likely to be on leave if they are covered by a leave law, an 83 percent increase
relative to the base rate of 3 percent.22
22 Results for the full set of covariates, including the supplementary policy variables (available for women in Appendix Table A.3), indicate that the welfare reform policies and more generous EITC benefits are not significantly associated with women’s employment or leave-taking, except for a small positive effect on leave-taking of more generous welfare-related work exemptions for mothers. As we might expect, the welfare reform variables have no effects on men’s employment or leave-taking (results not shown but available on request).
23
Table 3 summarizes results of models that correspond to those in Table 2, except that we
control for weeks of parental leave entitlement, rather than the dichotomous measure of whether
or not a law was in effect. The results are quite consistent with those previously obtained. In
particular, we again find no effect of leave entitlements on employment but some increases in
leave-taking in specific months. For women, each additional 10 weeks of leave rights is
predicted to raise the likelihood of being on leave for “other reasons” in the birth month and two
subsequent months by 4, 6, and 5 percentage points respectively, although two of these effects
are only marginally significant (column 3). For men, 10 extra weeks of leave entitlement is
predicted to raise the likelihood of being on leave in the birth month by 3 percentage points
(column 5) and leave for “other reasons” in the birth month by 2 percentage points (column 6).
Leave Laws Most Strongly Affect Highly Educated Parents
The results presented thus far point to small and imprecisely estimated effects of leave
laws on leave-taking by women and men. One reason that our estimates may be attenuated is that
not all women and men are covered by the leave laws. Although the data do not identify which
women or men are covered, highly educated parents are more likely to be eligible for leave and
are also more likely to take advantage of the mainly unpaid leave such laws offer.
We therefore re-estimated our models separating our samples of women and men into
those with no college (less than high school or just high school) versus those with college
educations (some college, a college degree, or more). Because college-educated workers are
more likely to be covered by leave laws, we expect to find stronger effects for this group.
The results summarized in Table 4 are consistent with this expectation. Looking first at
women, we do not uncover significant positive effects of leave rights among those with no
college (most estimates are negative and insignificant). In contrast, among the college educated,
24

the leave laws have uniformly positive predicted effects and these are significant when
examining leave for “other reasons” in the birth month and two succeeding months (column 3).
For men, the full sample coefficients are quite small and for the most part are estimated
imprecisely. However, where we do find effects – in the birth month – these are larger and more
precisely estimated in the more-educated group than in the less-educated group. This provides
evidence that, as for women, leave policies increase leave-taking among the more-educated, but
not the less-educated.
Estimates for the Pre-FMLA and Post-FMLA Periods
As a further robustness check, we estimated separate models for women during the pre-
FMLA and post-FMLA periods.23 This allows us to examine samples pre- and post-CPS re-
design. These analyses are also useful in that they focus in on the effects of state laws, holding
the FMLA constant. We would expect the state laws to have quite strong effects pre-FMLA, as
they would be the only source of mandated coverage (short of voluntary employer provision or
provision negotiated via union agreements). After enactment of the FMLA, we expect state laws
to have weaker effects, although there may be some impact if they cover more workers (because
of less restrictive firm size or work hours requirements), provide longer leave periods, or supply
paid leave (as the TDI programs do).
The results in Table 5 provide evidence that state leave laws influence leave-taking of
women both pre- and post-FMLA. Prior to the FMLA period, the state laws have significant and
sizable effects on leave-taking and leave for “other reasons” in each of the three months
subsequent to the birth (although not in the birth month). Results are similar for the post-FMLA
period, except that here we find significant effects of leave laws in the birth month as well. These
23 We do not conduct similar estimates for men because relatively few are eligible under state parental leave laws and none are covered for parental leave by TDI laws.
25
results suggest that state leave laws continue to play an important role, even in the post-FMLA
period.24
Conclusions
The expansion of leave laws, and in particular the implementation of the federal FMLA
in 1993, increased the share of new parents potentially eligible for a job-protected parental leave
from 26 percent of women and 3 percent of men in 1987 to 100 percent of both groups in 1994
and thereafter. Even though the state and federal leave laws typically provide only unpaid
absences (with the exception of the TDI laws already in place prior to 1987 and California’s new
paid leave law which did not come into effect until after 2004), we find that these leave
expansions did increase parents’ leave-taking, although by varying amounts across gender and
education groups.
The most robust effects of leave laws for women are for leave-taking for “other reasons”
in the birth month and the succeeding two months, where the share of mothers on maternity
leave rises by 5 to 9 percentage points, or 13 to 20 percent of the baseline level, when a leave law
is in effect. For men, by contrast, we find effects of leave laws only in the birth month, with the
share on leave predicted to rise by 4 percentage points and the fraction on leave for “other
reasons” by 2.5 points, representing increases of 54 and 83 percent respectively relative to
baseline rates.
U.S. leave laws do not cover the whole workforce. For instance, due to firm size and job
tenure requirements, somewhat less than half the private sector workforce is covered and eligible
under the FMLA. State leave laws also typically include restrictions as to which employees are
covered. If around half of parents are eligible under these laws, our estimated effects should be
24 We also estimated models where we controlled separately for TDI laws (which provide paid leave) and other state parental leave laws (which provide unpaid leave) and find that both types of laws influence leave-taking in the pre- and post-FMLA periods.
26

approximately doubled to indicate the changes resulting from a given worker newly receiving
leave rights. Doing so implies that leave laws raise leave-taking by 10 to 18 percentage points
among mothers in the birth month and two succeeding months, and by 5 percentage points
among fathers in the birth month.
Moreover, we know that highly educated workers are more likely to be covered by
current federal and state laws than their less educated counterparts. Therefore, we expect the
leave laws to have larger effects on more educated parents. Our results confirm this. In
particular, leave laws have consistently stronger predicted effects on leave-taking among women
with at least some college, but no significant effects for less educated mothers. Although the
effects for men are small in absolute terms and confined to the birth month, we find the same
pattern across education groups.
Many factors other than parental leave laws changed over the period we examine, and
there may be other differences between states that do and do not enact parental leave legislation.
To control for such factors, all of our models account for state and year fixed effects, parents’
demographic characteristics, and the state’s monthly unemployment rate. We also controlled for
key policies (welfare waivers, the implementation of TANF, welfare work exemptions for
mothers of infants, and the value of the state and federal EITC) that might affect parents’
employment and leave-taking and vary by state and over time. Such policies had few effects on
employment and leave-taking in our data and their inclusion did not alter the main results.
Another potential concern is that the largest change in leave laws, the implementation of
the federal FMLA (in August 1993), occurred close to the time of the CPS re-design. However,
when we split our sample and estimate our models separately for the pre-FMLA and post-FMLA
27
period, our main findings are unchanged. Specifically, we continue to find evidence that leave
laws increase parental leave-taking by mothers in the birth month and two succeeding months.
Our results suggest that extensions of parental leave rights do result in more mothers
being on leave in the months following a birth. Whether these effects are large enough to
substantially influence maternal or child health is at this point unknown and firm conclusions
must await studies directly examining maternal and child health outcomes. What is noteworthy is
that current laws appear to primarily benefit relatively highly educated mothers and that other
measures (such as paid leave) may be needed to provide similar benefits to those with less
schooling.
The results for fathers, who have been the subject of little previous research, are also
intriguing. We cannot precisely identify the duration of many of the typically very short leaves
that men take (if they take any at all), because our data cover only the week prior to the monthly
survey and so will miss many short work absences, but we can calculate the percentage of weeks
that men are on leave in the birth month. Doing so, we find that although men take little leave
during the period surrounding childbirth, the leave laws do increase male leave-taking. These
effects are small in absolute terms, but quite large relative to the baseline percentage of men on
leave without such laws – the percentage of the birth month employed fathers spend on leave is
predicted to increase by 7 to 11 percent, or approximately two extra days off work. Since only
around half of men are covered and eligible under the FMLA, the effects of actually gaining
leave rights are roughly twice as large. As with women, we cannot project what impact this
increased leave-taking might have for fathers’ or children’s well-being. This certainly merits
further research.
28

References Ai, C. & E.C. Norton. 2003. “Interaction Terms in Logit and Probit Models” Economic Letters 80(1), 123-129. Bates, J.E., D. Marvinney, T. Kelly, K.A. Dodge, D.S. Bennett, & G.S. Pettit (1994). "Child-Care History and Kindergarten Adjustment." Developmental Psychology 30(5) 690-700. Baum, C. (2003) “The Effects of Maternity Leave Legislation on Mothers’ Labor Supply After Childbirth.” Southern Economic Journal 69(4), 772-799. Baydar, N. & J. Brooks-Gunn (1991). "Effects of Maternal Employment and Child Care Arrangements in Infancy on Preschoolers' Cognitive and Behavioral Outcomes: Evidence from the Children of the NLSY." Developmental Psychology 27, 918-931. Belsky, J. (2001). “Developmental Risk (Still) Associated with Early Child Care.” Journal of Child Psychology and Psychiatry 42, 845-860. Belsky, J. & D. Eggebeen (1991). "Early and Extensive Maternal Employment/Child Care and 4-6 Year Olds Socioemotional Development: Children of the National Longitudinal Survey of Youth." Journal of Marriage and the Family 53, 1083-1099. Berger, L., J. Hill, & J. Waldfogel (2005). “Maternity Leave, Early Maternal Employment, and Child Health and Development in the U.S.” Economic Journal 115 (February): F29-F47. Berger, L. & J. Waldfogel (2004). “Maternity Leave and the Employment of New Mothers in the United States.” Journal of Population Economics 17(2): 331-349. Bianchi, S. (2000). “Maternal Employment and Time with Children: Dramatic Change or Surprising Continuity?” Demography 37(4), 401-414. Blank, R. (2002). “Evaluating Welfare Reform in the United States.” Journal of Economic Literature 40(4), 1105-1167. Blau, F.D. & A.J. Grossberg. (1992). “Maternal Labor Supply and Children’s Cognitive Development.” Review of Economics and Statistics 74(3), 474-481. Blau, F.D., W. Han, L.M. Kahn, & J. Waldfogel (2006). “Does Welfare Influence Young Women’s Marriage, Single Parenthood, and Female Headship Decisions? Evidence from the CPS.” Columbia University mimeo. Bornstein, M., C.S. Hahn, N.F. Gist, & O.M. Haynes (in press). “Long-Term Cumulative Effects of Child Care on Children’s Mental and Socioemotional Development in a Non-Risk Sample: The Moderating Effects of Gender.” Forthcoming in Early Child Development and Care.
29

Brady-Smith, C., J. Brooks-Gunn, J. Waldfogel, & R. Fauth. (2001). “Work or Welfare? Assessing the Impacts of Recent Employment and Policy Changes on Very Young Children.” Evaluation and Program Planning 24, 409-425. Budig, M. & P. England (2001). "The Effects of Motherhood on Wages in Recent Cohorts." American Sociological Review 66(2), 204-225. Cantor, D, J. Waldfogel, J. Kerwin, M.M.Wright, K.Levin, J.Rauch, T. Hagerty, & M.S. Kudela (2001). Balancing the Needs of Families and Employers: Family and Medical Leave Surveys, 2000 Update. Rockville, MD: Westat. Chatterji, P. & S. Markowitz. (2005). “Does the Length of Maternity Leave Affect Maternal Health?” Southern Economic Journal 72(1), 16-41. Commission on Family and Medical Leave (1996). A Workable Balance: Report to Congress on Family and Medical Leave Policies. Washington, D.C.: U.S. Department of Labor, Women's Bureau. Conference Board (1994). "Family and Medical Leave." Work-Family Roundtable, 4(6), 1-14. Desai, S., L. Chase-Lansdale, & R. Michael (1989). "Mother or Market?: Effects of Maternal Employment on Cognitive Development of Four Year Old Children." Demography, 26, 545-561. Dye, J.L. (2005). Fertility of American Women: June 2004. Current Population Reports, P20-555. Washington D.C.: U.S. Census Bureau. Fuchs, V. (1988). Women’s Quest for Economic Equality. Cambridge: Harvard University Press. Haider, S.J., A. Jacknowitz, & R. F. Schoeni (2003). “Welfare Work Requirements and Child Well-Being: Evidence from the Effects on Breast-Feeding.” Demography 40(3): 479-497. Han, W. & J. Waldfogel (2003). “Parental Leave: The Impact of Recent Legislation on Parents’ Leave-Taking.” Demography 40(1), 191-200. Han, W., J. Waldfogel, & J. Brooks-Gunn (2001). “The Effects of Early Maternal Employment on Later Cognitive and Behavioral Outcomes.” The Journal of Marriage and the Family 63, 336-354. Haskins, R. (1985). “Public School Aggression Among Children with Varying Day Care Experience.” Child Development 56, 689-703. Hill, H. (2007). “Maternity Leave for the Poor: Welfare to Work Exemptions and Employment Rates among Single Mothers with Young Children.” Working Paper, Northwestern University.
30

Huston, A.C. & S.R. Aronson (2005). “Mothers’ Time with Infant and Time in Employment as Predictors of Mother-Child Relationships and Children’s Early Development.” Child Development 76(2): 467-482. Hyde, J.S., M.J. Essex, & F. Horton (1993). "Fathers and Parental Leave: Attitudes and Experiences." Journal of Family Issues 14(4), 616-638. Kamerman, S. (2000). “Parental Leave Policies: An Essential Ingredient in Early Childhood Education and Care Policies.” Social Policy Report 14(2), 3-15. Klerman, J. & A. Leibowitz (1994). "The Work-Employment Decision Among New Mothers." Journal of Human Resources 29(2), 277-303. Klerman, J. & A. Leibowitz (1997). "Labor Supply Effects of State Maternity Leave Legislation." In F. Blau and R. Ehrenberg (eds). Gender and Family Issues in the Workplace. New York: Russell Sage. Klerman, J. & A. Leibowitz (1998). “FMLA and the Labor Supply of New Mothers: Evidence from the June CPS.” Santa Monica, CA: Rand. Klerman, J. & A. Leibowitz (1999). “Job Continuity Among New Mothers.” Demography 36(2), 143-155. Korenman, S. & D. Neumark (1992). “Marriage, Motherhood, and Wages.” Journal of Human Resources 27(2), 233-255. Lundberg, S. & E. Rose (2000). “Parenthood and the Earnings of Married Men and Women.” Labour Economics 7(6), 689-710. Malin, M. (1994). “Fathers and Parental Leave.” Texas Law Review 72(5), 1047-1095. Malin, M. (1998). “Fathers and Parental Leave Revisited.” Northern University Law Review 19(1), 25-56. Meyer, B. & D. Rosenbaum (2001(. “Welfare, the Earned Income Tax Credit, and the Labor Supply of Single Mothers.” Quarterly Journal of Economics 116(3), 1063-1113. Meyers, M., D. Rosenbaum, C. Ruhm, & J. Waldfogel (2004). “Inequality in Early Childhood Education and Care: What Do We Know?” In K. Neckerman (ed) Social Inequality. New York: Russell Sage Foundation. National Partnership for Women & Families. (2002). State Family and Medical Leave Laws Prior to the Enactment of the FMLA. Washington, DC: National Partnership for Women & Families.
31

NICHD Early Child Care Research Network (NICHD ECCRN) (1998). “Early Child Care, Self-Control, Compliance, and Behavior Problems at 24 and 36 Months.” Child Development 69(4), 1145-1170. NICHD Early Child Care Research Network. (NICHD ECCRN) (2003). “Does Amount of Time Spent in Child Care Predict Socioemotional Adjustment during the Transition to Kindergarten?” Child Development 74(4), 976-1005. Nepomnyaschy, L. & J. Waldfogel (2007). “Paternity Leave and Fathers’ Involvement with Their Young Children: Evidence from the ECLS-B.” Community, Work, and Family 10(4): 425-451. Pleck, J. (1993). “Are ‘Family-Supportive’ Employment Policies Relevant to Men?” In J.C. Hood (ed) Men, Work, and Family (Pp. 217-237). Newbury Park, CA: Sage. Polivka, A.E. & S.M. Miller (1995). “The CPS After the Redesign: Refocusing the Economic Lens.” Retrieved on September 12, 2007 from http://www.bls.gov/ore/pdf/ec950090.pdf. Ross, K. (1998). “Labor Pains: The Effects of the Family and Medical Leave Act on Recent Mothers’ Returns to Work After Childbirth.” Paper presented at the Population Association of America Annual Meeting, Chicago, Illinois, April 1998. Ruhm, C. (1997). “Policy Watch: The Family and Medical Leave Act” Journal of Economic Perspectives 11(3), 175-186. Ruhm, C. (1998). “The Economic Consequences of Parental Leave Mandates: Lessons from Europe.” Quarterly Journal of Economics 113(1), 285-318. Ruhm, C. (2000). “Parental Leave and Child Health.” Journal of Health Economics 19(6), 931-960. Ruhm, C. (2004). “Parental Employment and Child Cognitive Development.” Journal of Human Resources 39(1), 155-192. Stutts, J. R. (2006). The 1993 Federal Family & Medial Leave Act as Compared to Similar State Legislation. Undergraduate Honors Thesis, Florida State University. Tanaka, S. (2005). “Parental Leave and Child Health Across OECD Countries.” Economic Journal 115 (February): F7-F28. U.S. Bureau of the Census (2001). “Fertility Tables 2000.” Retrieved on September 12, 2007 from www.census.gov. U.S. Department of Labor, Bureau of Labor Statistics (2002). “Design and methodology.” CPS Technical Paper 63RV. Retrieved on September 12, 2007 from http://www.bls.census.gov/cps/bmethdoc.htm.
32

U.S. Department of Labor, Bureau of Labor Statistics. (2007). “Charting the U.S. labor market in 2006.” Retrieved on November 15, 2007 from http://www.bls.gov/cps/labor2006/home.htm Waldfogel, J. (1998a). “The Family Gap for Young Women in the U.S. and Britain: Can Maternity Leave Make a Difference” Journal of Labor Economics 16(3), 505-545. Waldfogel, J. (1998b). “”Understanding the ‘Family Gap’ for Women with Children.” Journal of Economic Perspectives 12, 137-156. Waldfogel, J. (1999a). “Family Leave Coverage in the 1990s.” Monthly Labor Review October, 13-21. Waldfogel, J. (1999b). “The Impact of the Family and Medical Leave Act.” Journal of Policy Analysis and Management 18(2), 281-302. Waldfogel, J. (2001a). “What Other Nations Do: International Policies Toward Parental Leave and Child Care.” The Future of Children: Caring for Infants and Toddlers 11(1), 99-111. Waldfogel, J. (2001b). “Family and Medical Leave: Evidence from the 2000 Surveys.” Monthly Labor Review September, 17-23.
33
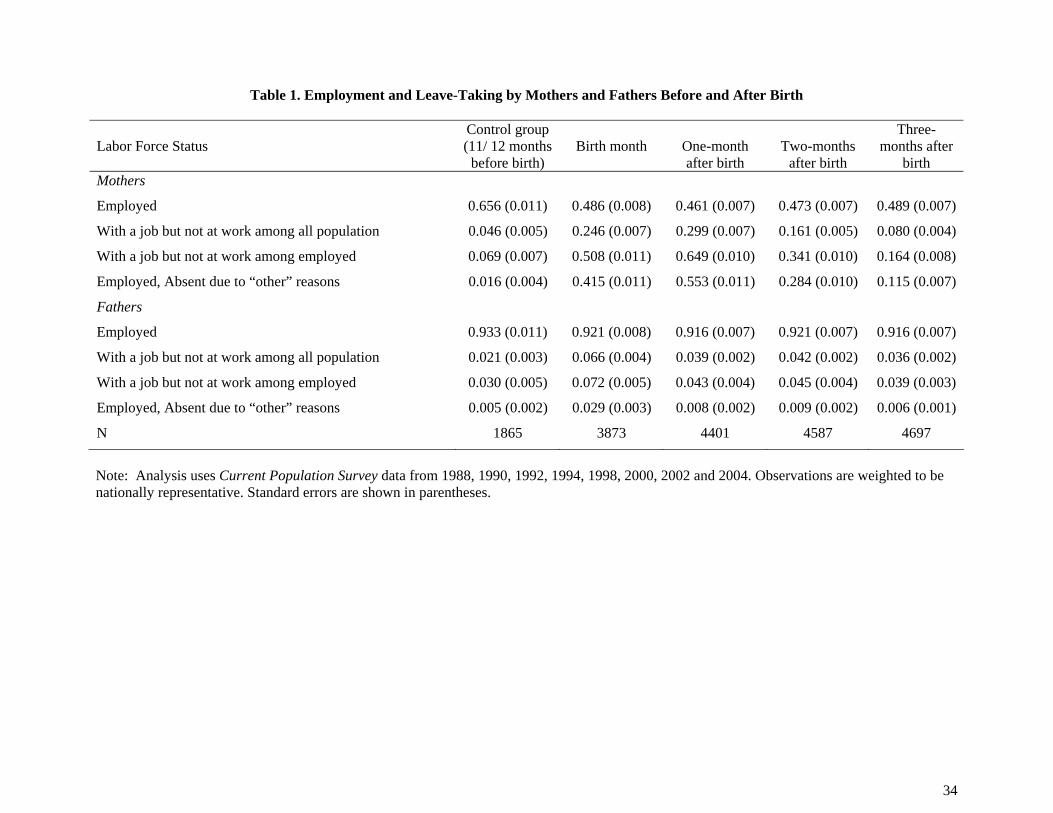
Table 1. Employment and Leave-Taking by Mothers and Fathers Before and After Birth
Labor Force Status
Control group (11/ 12 months
before birth)
Birth month
One-month after birth
Two-months
after birth
Three-months after
birth Mothers
Employed 0.656 (0.011) 0.486 (0.008) 0.461 (0.007) 0.473 (0.007) 0.489 (0.007)
With a job but not at work among all population 0.046 (0.005) 0.246 (0.007) 0.299 (0.007) 0.161 (0.005) 0.080 (0.004)
With a job but not at work among employed 0.069 (0.007) 0.508 (0.011) 0.649 (0.010) 0.341 (0.010) 0.164 (0.008)
Employed, Absent due to “other” reasons 0.016 (0.004) 0.415 (0.011) 0.553 (0.011) 0.284 (0.010) 0.115 (0.007)
Fathers
Employed 0.933 (0.011) 0.921 (0.008) 0.916 (0.007) 0.921 (0.007) 0.916 (0.007)
With a job but not at work among all population 0.021 (0.003) 0.066 (0.004) 0.039 (0.002) 0.042 (0.002) 0.036 (0.002)
With a job but not at work among employed 0.030 (0.005) 0.072 (0.005) 0.043 (0.004) 0.045 (0.004) 0.039 (0.003)
Employed, Absent due to “other” reasons 0.005 (0.002) 0.029 (0.003) 0.008 (0.002) 0.009 (0.002) 0.006 (0.001)
N 1865 3873 4401 4587 4697
Note: Analysis uses Current Population Survey data from 1988, 1990, 1992, 1994, 1998, 2000, 2002 and 2004. Observations are weighted to be nationally representative. Standard errors are shown in parentheses.
34

Table 2. OLS Regression Estimates for Parental Employment Surrounding the Birth June CPS 1988-2004
MOTHERS FATHERS
EMPLOYED
WITH JOB BUT NOT AT WORK (AMONG EMPLOYED)
ABSENT FROM WORK DUE TO “OTHER” REASONS (AMONG EMPLOYED) EMPLOYED
WITH JOB BUT NOT AT WORK (AMONG EMPLOYED)
ABSENT FROM WORK DUE TO “OTHER” REASONS (AMONG EMPLOYED)
Birth month -0.176 (0.027)*** 0.416 (0.030)*** 0.352 (0.026)*** -0.014 (0.018) 0.026 (0.011)** 0.011 (0.007) One-month after -0.191 (0.025)*** 0.559 (0.033)*** 0.469 (0.031)*** -0.013 (0.019) 0.002 (0.013) -0.002 (0.007) Two-month after -0.181 (0.029)*** 0.223 (0.035)*** 0.220 (0.031)*** -0.013 (0.020) -0.000 (0.017) 0.000 (0.008) Three-month after -0.158 (0.030)*** 0.088 (0.028)** 0.088 (0.025)*** -0.009 (0.023) -0.003 (0.014) -0.004 (0.008) Any leave provided by state and federal -0.020 (0.032) -0.051 (0.030) -0.073 (0.026)** 0.000 (0.020) -0.012 (0.020) -0.003 (0.010) Birth month & Any leave 0.024 (0.032) 0.033 (0.033) 0.054 (0.027)* 0.009 (0.021) 0.039 (0.018)* 0.025 (0.010)** One-month after & Any leave 0.015 (0.027) 0.031 (0.032) 0.087 (0.028)** 0.005 (0.024) 0.011 (0.017) 0.005 (0.009) Two-month after & Any leave 0.027 (0.032) 0.070 (0.043) 0.056 (0.032)+ 0.008 (0.023) 0.014 (0.019) -0.003 (0.008) Three-month after & Any leave 0.020 (0.034) 0.018 (0.033) 0.006 (0.023) -0.002 (0.025) 0.012 (0.017)
-0.000 (0.009)
R-square 0.1437 0.2307 0.2183 0.0636 0.0200 0.0180Number of Observations 19423 9600 9600 13742 12680 12680
Note. Table shows unstandardized coefficients with robust standard errors, clustered by state, in parentheses. Control group is composed of people (women for mothers’ sample and men for fathers’ sample) at 12- and 11-months prior to the birth. Model also controls for mother’s (father’s) age, education, marital status, race/ethnicity, whether the child is firth-born, the number of children, state monthly unemployment rate, state dummies, year dummies, and the month corresponding to the monthly unemployment rate. Other state/federal policies include: state policy on infant exemption (months after the birth women were exempted from work), the month/year passed waiver program, the month/year passed TANF program, and the maximum of (the natural log of) federal and state EITC refundable benefits, in dollars. + p < .10. * p < .05. ** p < .01. *** p < .001.
35

Table 3. OLS Regression Estimates for Effects of Weeks of Leave Entitlement on Parental Employment and Leave-Taking June CPS 1988-2004
MOTHERS FATHERS
EMPLOYED
WITH JOB BUT NOT AT WORK (AMONG EMPLOYED)
ABSENT FROM WORK DUE TO “OTHER REASONS” (AMONG EMPLOYED) EMPLOYED
WITH JOB BUT NOT AT WORK (AMONG EMPLOYED)
ABSENT FROM WORK DUE TO “OTHER REASONS” (AMONG EMPLOYED)
Birth month -0.168 (0.024)*** 0.430 (0.027)*** 0.358 (0.024)*** -0.012 (0.018) 0.025 (0.011)* 0.011 (0.007) One-month after -0.186 (0.022)*** 0.580 (0.030)*** 0.485 (0.030)*** -0.012 (0.019) -0.001 (0.013) -0.002 (0.007) Two-month after -0.185 (0.026)*** 0.232 (0.030)*** 0.224 (0.030)*** -0.011 (0.020) -0.001 (0.017) 0.000 (0.008) Three-month after -0.159 (0.027)*** 0.091 (0.025)*** 0.088 (0.024)*** -0.007 (0.023) -0.005 (0.014) -0.004 (0.008) Weeks of leave provided by state and federal -0.004 (0.003) -0.005 (0.002)+ -0.007 (0.002)** -0.000 (0.002) -0.000 (0.002) -0.000 (0.001) Birth month & Weeks of leave 0.001 (0.003) 0.001 (0.003) 0.004 (0.002)+ 0.000 (0.002) 0.003 (0.001)* 0.002 (0.001)* One-month after & Weeks of leave 0.001 (0.002) 0.000 (0.002) 0.006 (0.002)* 0.000 (0.002) 0.001 (0.001) 0.000 (0.001) Two-month after & Weeks of leave 0.003 (0.003) 0.005 (0.003) 0.005 (0.003)+ 0.000 (0.002) 0.001 (0.002) -0.000 (0.001) Three-month after & Weeks of leave
0.002 (0.003) 0.001 (0.002) 0.001 (0.002)
-0.000 (0.002)
0.001 (0.001) -0.000 (0.001)
R-square
0.1438 0.2309 0.2181 0.0636 0.0201 0.0181 Number of Observations 19423 9600 9600 13742 12680 12680
Note. Table shows unstandardized coefficients with robust standard errors, clustered by state, in parentheses. Control group is composed of people (women for mothers’ sample and men for fathers’ sample) at 12- and 11-months prior to the birth. Model also controls for mother’s (father’s) age, education, marital status, race/ethnicity, whether the child is firth-born, the number of children, state monthly unemployment rate, state dummies, year dummies, and the month corresponding to the monthly unemployment rate. Other state/federal policies include: state policy on infant exemption (months after the birth women were exempted from work), the month/year passed waiver program, the month/year passed TANF program, and the maximum of (the natural log of) federal and state EITC refundable benefits, in dollars. + p < .10. * p < .05. ** p < .01. *** p < .001.
36
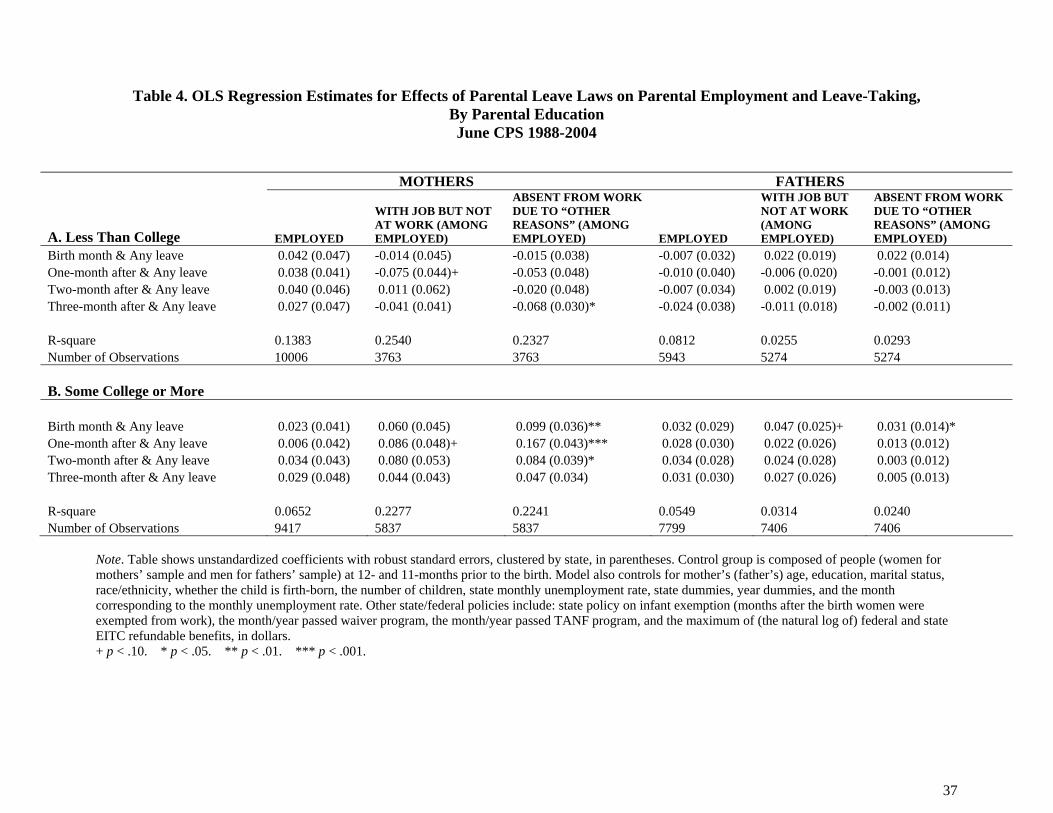
Table 4. OLS Regression Estimates for Effects of Parental Leave Laws on Parental Employment and Leave-Taking, By Parental Education June CPS 1988-2004
MOTHERS FATHERS
A. Less Than College EMPLOYED
WITH JOB BUT NOT AT WORK (AMONG EMPLOYED)
ABSENT FROM WORK DUE TO “OTHER REASONS” (AMONG EMPLOYED) EMPLOYED
WITH JOB BUT NOT AT WORK (AMONG EMPLOYED)
ABSENT FROM WORK DUE TO “OTHER REASONS” (AMONG EMPLOYED)
Birth month & Any leave 0.042 (0.047) -0.014 (0.045) -0.015 (0.038) -0.007 (0.032) 0.022 (0.019) 0.022 (0.014) One-month after & Any leave 0.038 (0.041) -0.075 (0.044)+ -0.053 (0.048) -0.010 (0.040) -0.006 (0.020) -0.001 (0.012) Two-month after & Any leave 0.040 (0.046) 0.011 (0.062) -0.020 (0.048) -0.007 (0.034) 0.002 (0.019) -0.003 (0.013) Three-month after & Any leave 0.027 (0.047) -0.041 (0.041) -0.068 (0.030)*
-0.024 (0.038)
-0.011 (0.018) -0.002 (0.011)
R-square
0.1383 0.2540 0.2327 0.0812 0.0255 0.0293Number of Observations 10006 3763 3763 5943 5274 5274
B. Some College or More
Birth month & Any leave 0.023 (0.041) 0.060 (0.045) 0.099 (0.036)** 0.032 (0.029) 0.047 (0.025)+ 0.031 (0.014)* One-month after & Any leave 0.006 (0.042) 0.086 (0.048)+ 0.167 (0.043)*** 0.028 (0.030) 0.022 (0.026) 0.013 (0.012) Two-month after & Any leave 0.034 (0.043) 0.080 (0.053) 0.084 (0.039)* 0.034 (0.028) 0.024 (0.028) 0.003 (0.012) Three-month after & Any leave 0.029 (0.048) 0.044 (0.043) 0.047 (0.034)
0.031 (0.030)
0.027 (0.026) 0.005 (0.013)
R-square 0.0652 0.2277 0.2241 0.0549 0.0314 0.0240Number of Observations 9417 5837 5837 7799 7406 7406
Note. Table shows unstandardized coefficients with robust standard errors, clustered by state, in parentheses. Control group is composed of people (women for mothers’ sample and men for fathers’ sample) at 12- and 11-months prior to the birth. Model also controls for mother’s (father’s) age, education, marital status, race/ethnicity, whether the child is firth-born, the number of children, state monthly unemployment rate, state dummies, year dummies, and the month corresponding to the monthly unemployment rate. Other state/federal policies include: state policy on infant exemption (months after the birth women were exempted from work), the month/year passed waiver program, the month/year passed TANF program, and the maximum of (the natural log of) federal and state EITC refundable benefits, in dollars. + p < .10. * p < .05. ** p < .01. *** p < .001.
37

Table 5. OLS Regression Estimates for Effects of Parental Leave Laws on Maternal Employment and Leave-Taking, by Pre-/Post-FMLA June CPS 1988-2004
A. Pre-FMLA EMPLOYED
WITH JOB BUT NOT AT WORK (AMONG EMPLOYED)
ABSENT FROM WORK DUE TO “OTHER REASONS” (AMONG EMPLOYED)
Birth month & Having State law 0.009 (0.029) 0.053 (0.032) 0.046 (0.028) One-month after & Having State law 0.020 (0.020) 0.074 (0.039)+ 0.090 (0.039)* Two-month after & Having State law 0.034 (0.028) 0.202 (0.044)*** 0.149 (0.038)*** Three-month after & Having State law 0.045 (0.026)+
0.118 (0.040)**
0.076 (0.025)**
R-square 0.1495 0.2500 0.2145 Number of Observations 8753 4304 4304 B. Post-FMLA Birth month & Having State law -0.023 (0.046) 0.101 (0.042)* 0.118 (0.043)** One-month after & Having State law -0.031 (0.043) 0.077 (0.040)+ 0.102 (0.036)** Two-month after & Having State law -0.066 (0.044) 0.174 (0.038)*** 0.155 (0.043)*** Three-month after & Having State law -0.056 (0.046)
0.113 (0.044)**
0.106 (0.048)*
R-square 0.1562 0.2396 0.2344 Number of Observations 10670 5296 5296
Note. Table shows unstandardized coefficients with robust standard errors, clustered by state, in parentheses. Control group is composed of people (women for mothers’ sample and men for fathers’ sample) at 12- and 11-months prior to the birth. Model also controls for mother’s (father’s) age, education, marital status, race/ethnicity, whether the child is firth-born, the number of children, state monthly unemployment rate, state dummies, year dummies, and the month corresponding to the monthly unemployment rate. Other state/federal policies include: state policy on infant exemption (months after the birth women were exempted from work), the month/year passed waiver program, the month/year passed TANF program, and the maximum of (the natural log of) federal and state EITC refundable benefits, in dollars. + p < .10. * p < .05. ** p < .01. *** p < .001.
38
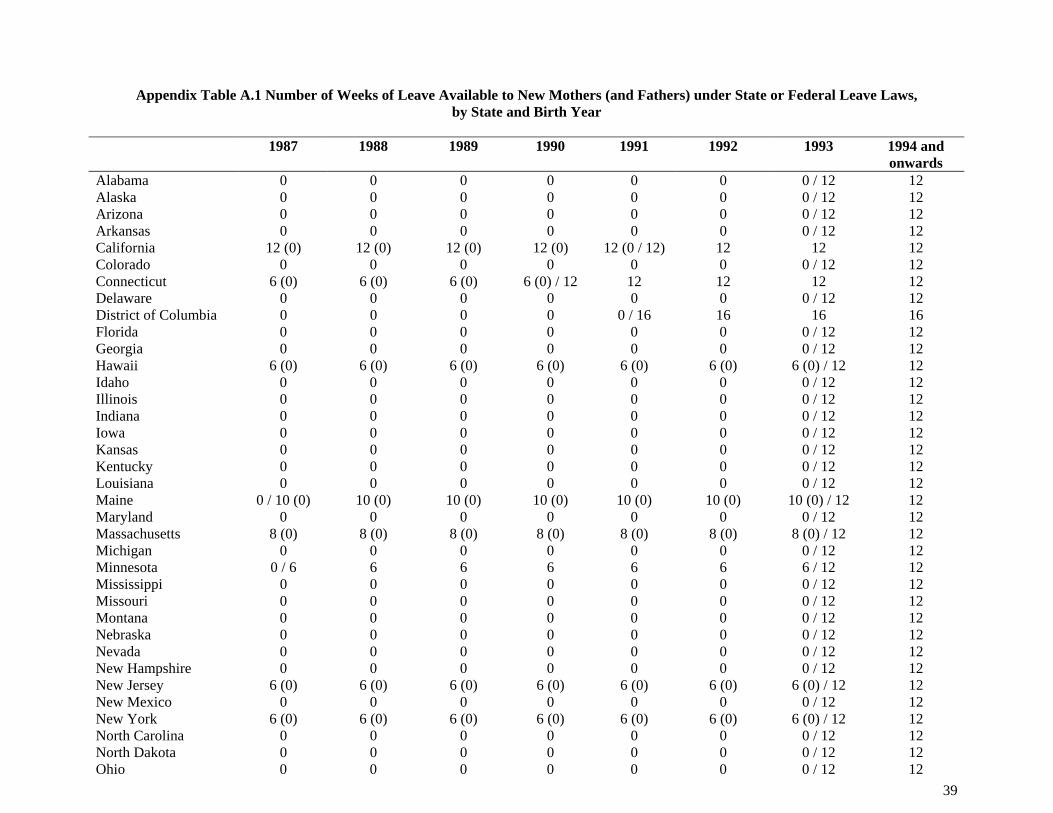
Appendix Table A.1 Number of Weeks of Leave Available to New Mothers (and Fathers) under State or Federal Leave Laws, by State and Birth Year
1987 1988 1989 1990 1991 1992 1993 1994 and
onwards Alabama 0 0 0 0 0 0 0 / 12 12 Alaska 0 0 0 0 0 0 0 / 12 12 Arizona 0 0 0 0 0 0 0 / 12 12 Arkansas 0 0 0 0 0 0 0 / 12 12 California 12 (0) 12 (0) 12 (0) 12 (0) 12 (0 / 12) 12 12 12 Colorado 0 0 0 0 0 0 0 / 12 12 Connecticut 6 (0) 6 (0) 6 (0) 6 (0) / 12 12 12 12 12 Delaware 0 0 0 0 0 0 0 / 12 12 District of Columbia 0 0 0 0 0 / 16 16 16 16 Florida 0 0 0 0 0 0 0 / 12 12 Georgia 0 0 0 0 0 0 0 / 12 12 Hawaii 6 (0) 6 (0) 6 (0) 6 (0) 6 (0) 6 (0) 6 (0) / 12 12 Idaho 0 0 0 0 0 0 0 / 12 12 Illinois 0 0 0 0 0 0 0 / 12 12 Indiana 0 0 0 0 0 0 0 / 12 12 Iowa 0 0 0 0 0 0 0 / 12 12 Kansas 0 0 0 0 0 0 0 / 12 12 Kentucky 0 0 0 0 0 0 0 / 12 12 Louisiana 0 0 0 0 0 0 0 / 12 12 Maine 0 / 10 (0) 10 (0) 10 (0) 10 (0) 10 (0) 10 (0) 10 (0) / 12 12 Maryland 0 0 0 0 0 0 0 / 12 12 Massachusetts 8 (0) 8 (0) 8 (0) 8 (0) 8 (0) 8 (0) 8 (0) / 12 12 Michigan 0 0 0 0 0 0 0 / 12 12 Minnesota 0 / 6 6 6 6 6 6 6 / 12 12 Mississippi 0 0 0 0 0 0 0 / 12 12 Missouri 0 0 0 0 0 0 0 / 12 12 Montana 0 0 0 0 0 0 0 / 12 12 Nebraska 0 0 0 0 0 0 0 / 12 12 Nevada 0 0 0 0 0 0 0 / 12 12 New Hampshire 0 0 0 0 0 0 0 / 12 12 New Jersey 6 (0) 6 (0) 6 (0) 6 (0) 6 (0) 6 (0) 6 (0) / 12 12 New Mexico 0 0 0 0 0 0 0 / 12 12 New York 6 (0) 6 (0) 6 (0) 6 (0) 6 (0) 6 (0) 6 (0) / 12 12 North Carolina 0 0 0 0 0 0 0 / 12 12 North Dakota 0 0 0 0 0 0 0 / 12 12 Ohio 0 0 0 0 0 0 0 / 12 12 39

Oklahoma 0 0 0 0 0 0 0 / 12 12 Oregon 0 0 / 12 12 12 12 12 12 12 Pennsylvania 0 0 0 0 0 0 0 / 12 12 Rhode Island 6 (0) 6 (0) 6 (0) 6 (0) 6 (0) 6 (0) 6 (0) / 12 12 South Carolina 0 0 0 0 0 0 0 / 12 12 South Dakota 0 0 0 0 0 0 0 / 12 12 Tennessee 0 / 16 (0) 16 (0) 16 (0) 16 (0) 16 (0) 16 (0) 16 (0 / 12) 16 (12) Texas 0 0 0 0 0 0 0 / 12 12 Utah 0 0 0 0 0 0 0 / 12 12 Vermont 0 0 0 0 0 0 0 / 12 12 Virginia 0 0 0 0 0 0 0 / 12 12 Washington 6 (0) 6 (0) 6 (0) / 12 12 12 12 12 12 West Virginia 0 0 0 0 0 0 0 / 12 12 Wisconsin 0 / 6 6 6 6 6 6 6 / 12 12 Wyoming 0 0 0 0 0 0 0 / 12 12 United States 2.13 (0.22) 2.32 (0.35) 2.81 (0.54) 2.97 (0.98)
3.67 (1.61)
2.94 (2.26)
5.40 (4.95)
12 (12)
% of mothers at birth month with state or federal leave laws
25.85 27.66 36.11 33.85 43.00 31.91 55.48 100.00
% of fathers at birth month with state or federal leave laws
2.97 3.17 7.78 9.90 18.50 18.42 45.16 100.00
Note. Whenever the number of weeks leave is different between mothers and fathers, the numbers in parentheses are for the fathers.
40

Appendix Table A.2 Demographic Characteristics of Mothers and Fathers Demographic Variable
Control group (11/ 12 months before
birth)
Birth month
One-month after
birth
Two-months after
birth
Three-months
after birth Characteristics of Mother/Child Age (years) 27.74 (5.64) 27.72 (5.98) 27.57 (6.04) 27.51 (6.14) 27.47 (6.08) <High School Graduate High School Graduate Some College College Graduate
0.130 (0.337)*** 0.264 (0.441)*** 0.177 (0.382)*** 0.302 90.459)***
0.161 (0.368) 0.315 (0.464) 0.214 (0.410) 0.268 (0.443)
0.166 (0.372) 0.321 (0.467) 0.221 (0.415) 0.269 (0.444)
0.175 (0.380) 0.329 (0.470) 0.218 (0.413) 0.264 (0.441)
0.179 (0.384) 0.330 (0.470) 0.229 (0.420) 0.258 (0.438)
Married 0.759 (0.428) 0.746 (0.436) 0.730 (0.444)* 0.715 (0.452)*** 0.705 (0.456)*** Non-Hispanic White Non-Hispanic Black Hispanic Other Race
0.737 (0.440) 0.094 (0.292) 0.119 (0.323) 0.050 (0.218)
0.711 (0.453) 0.108 (0.310) 0.123 (0.329) 0.058 (0.234)
0.707 (0.455) 0.112 (0.316) 0.127 (0.334) 0.054 (0.225)
0.705 (0.456) 0.114 (0.318) 0.130 (0.336) 0.050 (0.219)
0.695 (0.460) 0.120 (0.325) 0.133 (0.339) 0.052 (0.222)
Child is First-Born 0.340 (0.474)*** 0.369 (0.483) 0.379 (0.485) 0.385 (0.487) 0.385 (0.487) Number of children 2.18 (1.21)** 2.10 (1.22) 2.08 (1.20) 2.06 (1.18) 2.07 (1.20) Characteristics of Father
Age (years) 32.01 (7.10) 31.87 (6.34) 31.64 (6.35) 31.88 (6.45) 31.80 (6.54) <High School Graduate High School Graduate Some College College Graduate
0.096 (0.295) 0.248 (0.432) 0.183 (0.387) 0.345 (0.475)
0.100 (0.300) 0.302 (0.459) 0.221 (0.415) 0.354 (0.478)
0.098 (0.297) 0.292 (0.455) 0.206 (0.405) 0.357 (0.479)
0.096 (0.295) 0.298 (0.457) 0.224 (0.417) 0.354 (0.478)
0.109 (0.312) 0.312 (0.463) 0.225 (0.418) 0.350 (0.477)
Non-Hispanic White Non-Hispanic Black Hispanic Other Race
0.801 (0.400) 0.050 (0.218) 0.107 (0.309) 0.042 (0.201)
0.786 (0.410) 0.050 (0.217) 0.107 (0.309) 0.057 (0.233)
0.787 (0.410) 0.054 (0.225) 0.110 (0.313) 0.049 (0.216)
0.794 (0.405) 0.052 (0.222) 0.108 (0.310) 0.046 (0.210)
0.783 (0.412) 0.050 (0.218) 0.118 (0.323) 0.048 (0.214)
State/Federal Characteristics & Policies State Unemployment Rate 5.64 (1.65)** 5.54 (1.63) 5.51 (1.59) 5.53 (1.60) 5.54 (1.59) Any State/Federal Maternity Leave Entitlement (%) 62.14*** 70.82 72.63 74.00 74.50 Weeks of State/Federal Maternity Leave Entitlement 6.28 (6.00)*** 7.28 (5.85) 7.56 (5.80) 7.83 (5.74) 7.95 (5.71) Any State/Federal Paternity Leave Entitlement (%) 45.80*** 57.49 60.10 62.09 63.73 Weeks of State/Federal Paternity Leave Entitlement 5.39 (5.96)*** 6.74 (5.92) 7.12 (5.87) 7.36 (5.83) 7.56 (5.78) State infant exemption (child’s age in months) 31.88 (22.52)*** 26.50 (17.01) 25.36 (16.00) 24.30 (15.41) 23.72 (14.87) State providing waiver program (%) 3.85 3.53 3.24 3.20 3.50 TANF (%) 12.06 12.21 12.74 13.21 * 13.41 ** Federal and state max. refundable EITC (log) 7.69 (0.50)*** 7.74 (0.51) 7.76 (0.51) 7.78 (0.50) 7.80 (0.50) Note: Analysis uses Current Population Survey data from 1988, 1990, 1992, 1994, 1998, 2000, 2002 and 2004. Observations are weighted to be nationally representative. Standard errors are shown in parentheses. Asterisks in the control-group column indicate significant differences between the control group and all of the treatment groups. Asterisks in the individual treatment-group column indicate significant differences between the control and that individual treatment group. * p < .05, ** p < .01, *** p < .001.
41

Appendix Table A.3. OLS Regression Estimates for Effects of Leave Laws on Maternal Employment and Leave-Taking Surrounding the Birth
June CPS 1988-2004
EMPLOYED
WITH JOB BUT NOT AT WORK (AMONG EMPLOYED)
ABSENT FROM WORK DUE TO “OTHER” REASONS (AMONG EMPLOYED)
Birth month -0.176 (0.027)*** 0.416 (0.030)*** 0.352 (0.026)*** One-month after -0.191 (0.025)*** 0.559 (0.033)*** 0.469 (0.031)*** Two-month after -0.181 (0.029)*** 0.223 (0.035)*** 0.220 (0.031)*** Three-month after -0.158 (0.030)*** 0.088 (0.028)** 0.088 (0.025)*** Any leave provided by state and federal -0.020 (0.032) -0.051 (0.030)+ -0.073 (0.026)** Birth month & Any leave 0.024 (0.032) 0.033 (0.033) 0.054 (0.027)* One-month after & Any leave 0.015 (0.027) 0.031 (0.032) 0.087 (0.028)** Two-month after & Any leave 0.027 (0.032) 0.070 (0.043) 0.056 (0.032)+ Three-month after & Any leave 0.020 (0.034) 0.018 (0.033) 0.006 (0.023) Year of 1988 0.026 (0.034) 0.054 (0.043) 0.060 (0.041) Year of 1989 0.021 (0.042) 0.164 (0.048)*** 0.182 (0.044)*** Year of 1990 0.047 (0.041) 0.103 (0.053)* 0.118 (0.045)** Year of 1991 -0.345 (0.187)+ -0.001 (0.238) 0.020 (0.202) Year of 1992 -0.405 (0.256) 0.023 (0.329) 0.022 (0.286) Year of 1993 -0.530 (0.302)+ -0.036 (0.397) -0.046 (0.346) Year of 1994 -1.254 (0.745)+ -0.181 (0.962) -0.154 (0.831) Year of 1997 -1.692 (1.013) -0.320 (1.307) -0.340 (1.120) Year of 1998 -1.702 (1.018) -0.283 (1.322) -0.311 (1.133) Year of 1999 -1.669 (1.007) -0.255 (1.316) -0.295 (1.105) Year of 2000 -1.704 (0.997)+ -0.253 (1.297) -0.265 (1.105) Year of 2001 -1.700 (1.007)+ -0.232 (1.303) -0.271 (1.105) Year of 2002 -1.730 (1.019)+ -0.233 (1.322) -0.257 (1.132) Year of 2003 -1.677 (1.012) -0.281 (1.306) -0.290 (1.116) Year of 2004 -1.727 (1.009)+ -0.221 (1.310) -0.234 (1.126) State infant exemption (in child’s age in month) 0.000 (0.001) 0.003 (0.001)** 0.002 (0.001)** State providing waiver program 0.002 (0.023) 0.022 (0.027) 0.026 (0.028) TANF 0.030 (0.024) -0.005 (0.020) -0.022 (0.021) Federal and state maximum refundable EITC in log value 1.540 (0.914)+ 0.419 (1.165) 0.482 (1.000)
Mother’s age 0.011 (0.001)*** 0.005 (0.001)*** 0.005 (0.001)*** Mother’s education < 12 -0.310 (0.021)*** -0.096 (0.024)*** -0.048 (0.019)** Mother’s education = 12 -0.127 (0.014)*** -0.056 (0.012)*** -0.004 (0.013) Mother’s education > 12 & <16 -0.028 (0.020) -0.057 (0.016)*** -0.016 (0.013) Mother divorced/separated 0.004 (0.014) -0.090 (0.017)*** -0.081 (0.017)*** Mother never married -0.061 (0.028)* -0.089 (0.026)*** -0.062 (0.025)* Non-Hispanic Black -0.017 (0.018) 0.027 (0.023) 0.032 (0.022) Hispanic -0.084 (0.016)*** -0.035 (0.016)* -0.036 (0.018)* Other race/ethnicity -0.083 (0.026)** -0.027 (0.030) -0.012 (0.021) Baby is firth born 0.053 (0.014)*** 0.017 (0.014) 0.026 (0.017) Number of children -0.038 (0.006)*** -0.034 (0.007)*** -0.032 (0.007)*** State monthly unemployment rate -0.006 (0.007) -0.002 (0.007) -0.001 (0.007) R-square 0.1437 0.2307 0.2183 Number of Observations 19423 9600 9600
42

Note. Table shows unstandardized coefficients with robust standard errors, clustered by state, in parentheses. Control group is composed of people (women for mothers’ sample and men for fathers’ sample) at 12- and 11-months prior to the birth. Model also controls for state dummies and the month corresponding to the monthly unemployment rate dummies. The reference group is non-college educated married non-Hispanic white mothers surveyed in 1987. + p < .10. * p < .05. ** p < .01. *** p < .001.
43

Figure 1: Maternal Employment Before and After Birth
1992
19921992
1998
19881988
1990
1992
1994
20042002
20001998
1994
1988
199040.00%
45.00%
50.00%
55.00%
60.00%
65.00%
70.00%
-3 -2 -1 0 1 2 3 4 5 6 7 8 9 10 11 12Months After Birth
Perc
enta
ge
1988 1990 1992 1994 1998 2000 2002 2004
1998
2002 1990
2000
2004
Note. Employment includes both “At work” and “With a job but not at work.”
Figure 2: Mothers Employed but Not at Work Before and After Birth
1994
1994
1988
1994
1992
1988
1988
2004
0.00%
10.00%
20.00%
30.00%
40.00%
50.00%
60.00%
70.00%
80.00%
-3 -2 -1 0 1 2 3 4 5 6 7 8 9 10 11 12Months After Birth
Perc
enta
ge
1988 1990 1992 1994 1998 2000 2002 2004
44

Figure 3: Maternal Leave-Taking Before and After Birth
1994
1994
1994
1994
1988
2002
2004
1988
1992
0.00%
10.00%
20.00%
30.00%
40.00%
50.00%
60.00%
70.00%
80.00%
-3 -2 -1 0 1 2 3 4 5 6 7 8 9 10 11 12Months After Birth
Perc
enta
ge
1988 1990 1992 1994 1998 2000 2002 2004
Note: Leave-taking measured as being with a job but not at work for “other reasons”. Figure 4: Mothers Absent from Work Surrounding the Birth Month for “Other Reasons”
Birth month
1 month prior
3 months after
2 months after
1 month after
0.00%
10.00%
20.00%
30.00%
40.00%
50.00%
60.00%
70.00%
80.00%
1988 1990 1992 1994 1998 2000 2002 2004
Year
Perc
enta
ge
45

Figure 5: Paternal Employment Before and After Birth
2004
2004
20022004
1994
1994
1994
1992
1992
1990
2002
1990
1988
1988
2004
84.00%
86.00%
88.00%
90.00%
92.00%
94.00%
96.00%
98.00%
100.00%
-3 -2 -1 0 1 2 3 4 5 6 7 8 9 10 11 12Months After Birth
Perc
enta
ge
1988 1990 1992 1994 1998 2000 2002 2004
2002
1998
19982000
2000
Note. Employment includes both “At work” and “With a job but not at work.”
Figure 6: Fathers Employed but Not at Work Before and After Birth
1990
19901990
1990
1990
1992
1994
1992
1994
1992
2002
1994
2002
2004
1998
2004
0.00%
2.00%
4.00%
6.00%
8.00%
10.00%
12.00%
-3 -2 -1 0 1 2 3 4 5 6 7 8 9 10 11 12Months After Birth
Perc
enta
ge
1988 1990 1992 1994 1998 2000 2002 2004
46

Figure 7: Paternal Leave-Taking Before and After Birth
2004
2004
2004
1998
20001998
1992
1988
19882004
2002
1992
1992
1994
1994
1990
0.00%
1.00%
2.00%
3.00%
4.00%
5.00%
6.00%
7.00%
-3 -2 -1 0 1 2 3 4 5 6 7 8 9 10 11 12Months After Birth
Perc
enta
ge
1988 1990 1992 1994 1998 2000 2002 2004
Note: Leave-taking measured as being with a job but not at work for “other reasons”.
Figure 8: Fathers Absent From Work Surrounding the Birth for “Other Reasons”
1 month prior
Birth month1 month after
2 months after
3 months after0%
1%
2%
3%
4%
5%
6%
7%
1988 1990 1992 1994 1998 2000 2002 2004
Year
Perc
enta
ge
47
Related Documents