Int. Journal of Applied Sciences and Engineering Research, Vol. 3, Issue 3, 2014 www.ijaser.com © 2014 by the authors – Licensee IJASER- Under Creative Commons License 3.0 [email protected] Research article ISSN 2277 – 9442 ————————————— *Corresponding author (e-mail: [email protected]) Received on April 2014; Accepted on May, 2014; Published on June 2014 641 Parametric Optimization of MIG Welding for MS 5986 Fe 410 using Taguchi Method 1 Rakesh Sharma, 2 Jagdeep Singh 1 PG Student, Guru Nanak Dev Engineering College, Ludhiana, Punjab, India 2 Asst. Professor, Guru Nanak Dev Engineering College, Ludhiana, Punjab, India DOI: 10.6088/ijaser.030300008 Abstract: The aim of this study is to investigate the optimization process parameters for Metal inert gas welding (MIG). In the present work, bead-on -plate welds were carried out on MS 5986 Fe 410 carbon steel sheets using Gas Metal Arc Welding (GMAW) process. In this present investigation ER70S-6 solid wire having 1.2 mm diameter was used as an electrode with direct current electrode positive polarity. A mixture of argon-carbon dioxide was employed for shielding purposes. The fusion zone is generally characterized by a few geometrical features namely bead width, bead height and depth of penetration. The shape of the fusion zone depends upon a number of parameters such as gas flow rate, voltage, travel speed and welding current. Taguchi Technique is applied to plan the experiments. The weld bead geometry plays an important role in determining the mechanical properties of a weld joint. Therefore, it is important to set up proper welding parameters to produce a good weld bead. Keywords: MIG welding, Taguchi orthogonal array, bead geometry, mini tab 15. 1. Introduction MIG (Metal Inert Gas) welding, also known as MAG (Metal Active Gas) and in the USA as GMAW (Gas Metal Arc Welding), is a welding process that is now widely used for welding a variety of materials, ferrous and non ferrous. It is recognized that IS 5986 Fe410 MS can be successfully welded using a variety of techniques, including Gas Metal Arc Welding (GMAW), Shielded Metal Arc Welding (SMAW), Gas Tungsten Arc Welding (GTAW), Submerged Arc Welding (SAW), Flux Cored Arc Welding (FCAW) and Plasma Arc Welding (PAW). Welding is used as a fabrication process in every industry large or small. It is a principal means of fabricating and repairing metal products. The process is efficient, economical and dependable as a means of joining metals. This is the only process which has been tried in the space. The process finds its applications in air, underwater and in space. Why welding is used, because it is suitable for thicknesses ranging from fractions of a millimeter to a third of a meter and Versatile, being applicable to a wide range of component shapes and sizes. In gas shielded arc welding both the arc and the molten weld pool are shielded from the atmosphere by a stream of gas. The arc may be produced between a continuously fed wire and the work. The shielding gas can be both inert gas like argon and active gases like argon-oxygen mixture and carbon-di-oxide which are chemically reactive. Arc travel speed is typically 30-38 cm/minute and weld metal deposition rate varies from 1.25 kg/hr when welding out of position to 5.5 kg/hr in flat position. With the increase of automation

Welcome message from author
This document is posted to help you gain knowledge. Please leave a comment to let me know what you think about it! Share it to your friends and learn new things together.
Transcript
Int. Journal of Applied Sciences and Engineering Research, Vol. 3, Issue 3, 2014 www.ijaser.com
© 2014 by the authors – Licensee IJASER- Under Creative Commons License 3.0 [email protected]
Research article ISSN 2277 – 9442
—————————————
*Corresponding author (e-mail: [email protected])
Received on April 2014; Accepted on May, 2014; Published on June 2014
641
Parametric Optimization of MIG Welding for MS 5986 Fe 410
using Taguchi Method
1Rakesh Sharma, 2Jagdeep Singh
1 PG Student, Guru Nanak Dev Engineering College, Ludhiana, Punjab, India
2 Asst. Professor, Guru Nanak Dev Engineering College, Ludhiana, Punjab, India
DOI: 10.6088/ijaser.030300008
Abstract: The aim of this study is to investigate the optimization process parameters for Metal inert gas
welding (MIG). In the present work, bead-on -plate welds were carried out on MS 5986 Fe 410 carbon
steel sheets using Gas Metal Arc Welding (GMAW) process. In this present investigation ER70S-6 solid
wire having 1.2 mm diameter was used as an electrode with direct current electrode positive polarity. A
mixture of argon-carbon dioxide was employed for shielding purposes. The fusion zone is generally
characterized by a few geometrical features namely bead width, bead height and depth of penetration. The
shape of the fusion zone depends upon a number of parameters such as gas flow rate, voltage, travel speed
and welding current. Taguchi Technique is applied to plan the experiments. The weld bead geometry plays
an important role in determining the mechanical properties of a weld joint. Therefore, it is important to set
up proper welding parameters to produce a good weld bead.
Keywords: MIG welding, Taguchi orthogonal array, bead geometry, mini tab 15.
1. Introduction
MIG (Metal Inert Gas) welding, also known as MAG (Metal Active Gas) and in the USA as GMAW (Gas
Metal Arc Welding), is a welding process that is now widely used for welding a variety of materials,
ferrous and non ferrous. It is recognized that IS 5986 Fe410 MS can be successfully welded using a variety
of techniques, including Gas Metal Arc Welding (GMAW), Shielded Metal Arc Welding (SMAW), Gas
Tungsten Arc Welding (GTAW), Submerged Arc Welding (SAW), Flux Cored Arc Welding (FCAW) and
Plasma Arc Welding (PAW).
Welding is used as a fabrication process in every industry large or small. It is a principal means of
fabricating and repairing metal products. The process is efficient, economical and dependable as a means
of joining metals. This is the only process which has been tried in the space. The process finds its
applications in air, underwater and in space. Why welding is used, because it is suitable for thicknesses
ranging from fractions of a millimeter to a third of a meter and Versatile, being applicable to a wide range
of component shapes and sizes.
In gas shielded arc welding both the arc and the molten weld pool are shielded from the atmosphere by a
stream of gas. The arc may be produced between a continuously fed wire and the work. The shielding gas
can be both inert gas like argon and active gases like argon-oxygen mixture and carbon-di-oxide which are
chemically reactive. Arc travel speed is typically 30-38 cm/minute and weld metal deposition rate varies
from 1.25 kg/hr when welding out of position to 5.5 kg/hr in flat position. With the increase of automation
Predictability analysis of meteorological data of Jammu and Kashmir using wavelet based methods
Rakesh Sharma, Jagdeep Singh
Int. Journal of Applied Sciences and Engineering Research, Vol. 3, No. 3, 2014
642
in arc welding, the selection of welding procedure must be more specific to ensure that adequate bead
quality is obtained. Several researchers have attempted to investigate the effects of various process
variables on the weld bead geometry. Also the mechanical strength of welds is influenced by the
compositions of the metal and to greater extent by the weld bead geometry and shape relationships and in
turn the weld bead geometry is influenced by the direct and indirect welding parameters. The study of weld
bead geometry and shape relationships is important as these dimensions and ratios decide to a great extent,
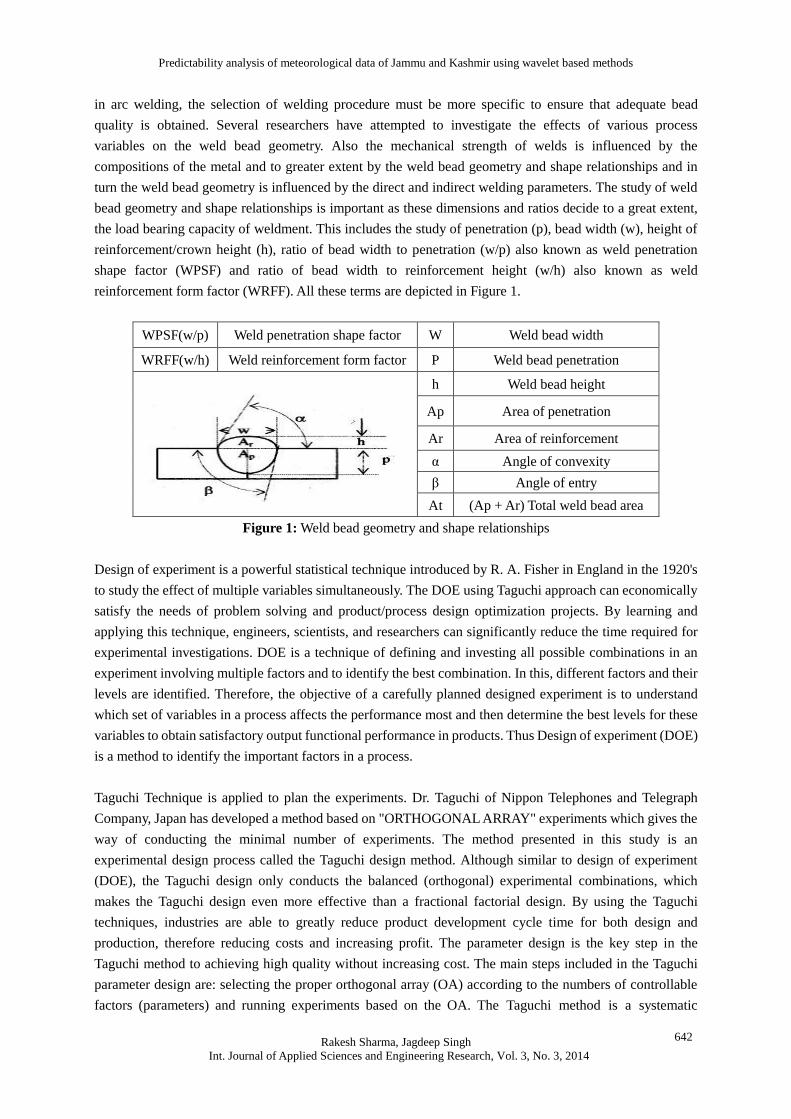
the load bearing capacity of weldment. This includes the study of penetration (p), bead width (w), height of
reinforcement/crown height (h), ratio of bead width to penetration (w/p) also known as weld penetration
shape factor (WPSF) and ratio of bead width to reinforcement height (w/h) also known as weld
reinforcement form factor (WRFF). All these terms are depicted in Figure 1.
WPSF(w/p) Weld penetration shape factor W Weld bead width
WRFF(w/h) Weld reinforcement form factor P Weld bead penetration
h Weld bead height
Ap Area of penetration
Ar Area of reinforcement
α Angle of convexity
β Angle of entry
At (Ap + Ar) Total weld bead area
Figure 1: Weld bead geometry and shape relationships
Design of experiment is a powerful statistical technique introduced by R. A. Fisher in England in the 1920's
to study the effect of multiple variables simultaneously. The DOE using Taguchi approach can economically
satisfy the needs of problem solving and product/process design optimization projects. By learning and
applying this technique, engineers, scientists, and researchers can significantly reduce the time required for
experimental investigations. DOE is a technique of defining and investing all possible combinations in an
experiment involving multiple factors and to identify the best combination. In this, different factors and their
levels are identified. Therefore, the objective of a carefully planned designed experiment is to understand
which set of variables in a process affects the performance most and then determine the best levels for these
variables to obtain satisfactory output functional performance in products. Thus Design of experiment (DOE)
is a method to identify the important factors in a process.
Taguchi Technique is applied to plan the experiments. Dr. Taguchi of Nippon Telephones and Telegraph
Company, Japan has developed a method based on "ORTHOGONAL ARRAY" experiments which gives the
way of conducting the minimal number of experiments. The method presented in this study is an
experimental design process called the Taguchi design method. Although similar to design of experiment
(DOE), the Taguchi design only conducts the balanced (orthogonal) experimental combinations, which
makes the Taguchi design even more effective than a fractional factorial design. By using the Taguchi
techniques, industries are able to greatly reduce product development cycle time for both design and
production, therefore reducing costs and increasing profit. The parameter design is the key step in the
Taguchi method to achieving high quality without increasing cost. The main steps included in the Taguchi
parameter design are: selecting the proper orthogonal array (OA) according to the numbers of controllable
factors (parameters) and running experiments based on the OA. The Taguchi method is a systematic
Predictability analysis of meteorological data of Jammu and Kashmir using wavelet based methods
Rakesh Sharma, Jagdeep Singh
Int. Journal of Applied Sciences and Engineering Research, Vol. 3, No. 3, 2014
643
application of design and analysis of experiments for the purpose of designing and improving product
quality. In recent years, the Taguchi method has become a powerful tool for improving productivity during
research and development so that high quality products can be produced quickly and at low cost. However,
the original Taguchi method is designed to optimize a single quality characteristic. Furthermore,
optimization of multiple quality characteristics is much more complicated than optimization of a single
quality characteristic. Antony has demonstrated an alternative approach for tackling such optimization
problem using Taguchi quality loss function analysis by taking an example of electronic assembly problem.
He has found considerable improvement in multiple quality characteristics, in comparison to single quality
characteristics.
Abdul Ghalib has investigated, As a result, it obvious that increasing the parameters value of welding
current increased the value of depth of penetration. Other than that, arc voltage and welding speed is
another factor that influenced the value of depth of penetration. The microstructure has shown the different
grain boundaries of each parameter that affected of the welding parameters. Erdal Karadeniz has
investigated, As a result of this study; it was obvious that increasing welding current increased the depth of
penetration. In addition, arc voltage is another parameter in incrimination of penetration. However, its
effect is not as much as current. Chandresh N. Patel studied the parametric optimization of weld strength of
metal inert gas welding and tungsten inert gas welding by using analysis of variance and grey relational
analysis. He concluded that the welding current was most significant parameter for MIG and TIG welding.
Welding current was found to have effect on hardness. Increase in welding current, the value of hardness is
increase in both welding. Dinesh Mohan Arya stated that Bead width, Bead height and Heat affected zone
(HAZ) lower is better of the alloy steel element to acquire by using Metal inert gas welding. After identify
the predict optimal parameter setting with the help of (ANOVA) the most significant factor also found in
this case welding current have maximum percentage contribution. So it was most significant factor in this
result.
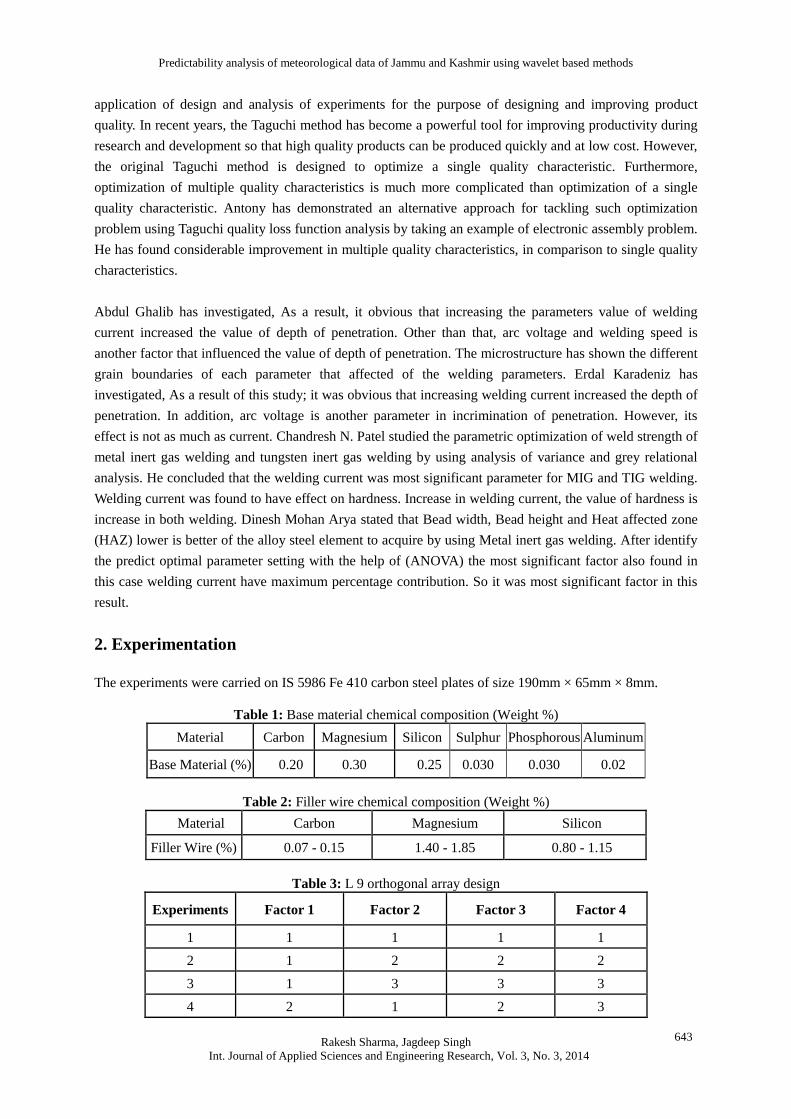
2. Experimentation
The experiments were carried on IS 5986 Fe 410 carbon steel plates of size 190mm × 65mm × 8mm.
Table 1: Base material chemical composition (Weight %)
Material Carbon Magnesium Silicon Sulphur Phosphorous Aluminum
Base Material (%) 0.20 0.30 0.25 0.030 0.030 0.02
Table 2: Filler wire chemical composition (Weight %)
Material Carbon Magnesium Silicon
Filler Wire (%) 0.07 - 0.15 1.40 - 1.85 0.80 - 1.15
Table 3: L 9 orthogonal array design
Experiments Factor 1 Factor 2 Factor 3 Factor 4
1 1 1 1 1
2 1 2 2 2
3 1 3 3 3
4 2 1 2 3
Predictability analysis of meteorological data of Jammu and Kashmir using wavelet based methods
Rakesh Sharma, Jagdeep Singh
Int. Journal of Applied Sciences and Engineering Research, Vol. 3, No. 3, 2014
644
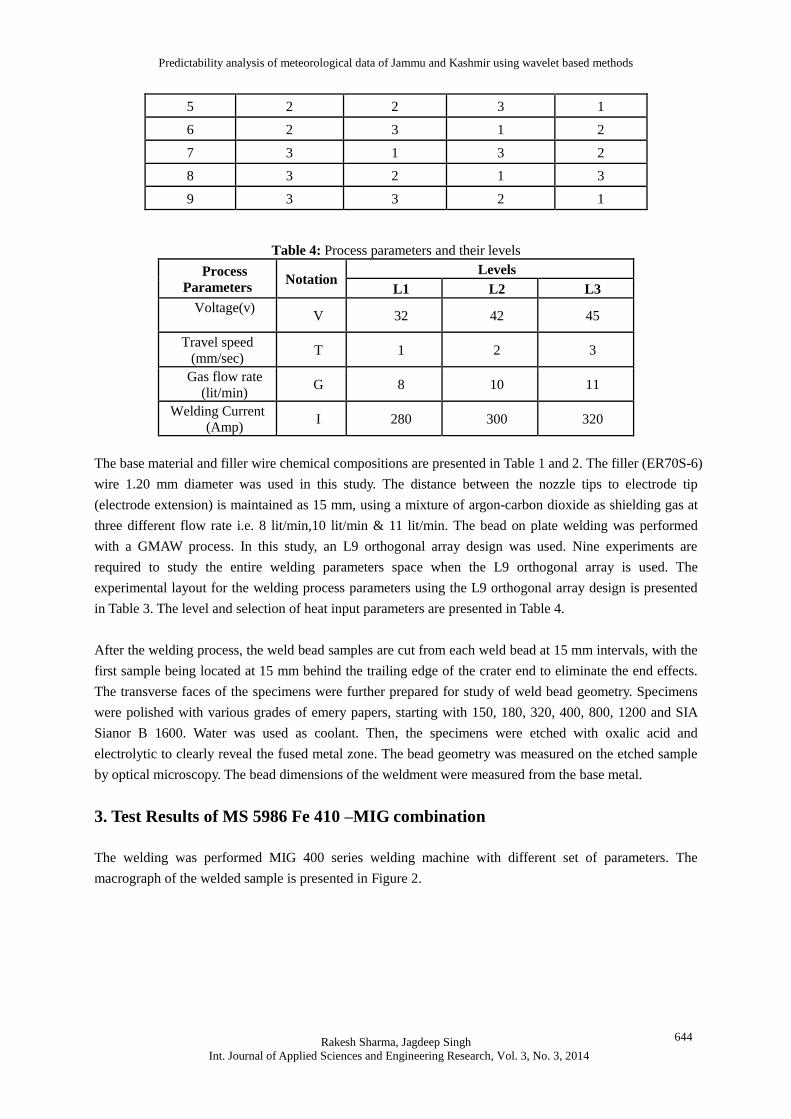
5 2 2 3 1
6 2 3 1 2
7 3 1 3 2
8 3 2 1 3
9 3 3 2 1
Table 4: Process parameters and their levels
Process
Parameters Notation
Levels
L1 L2 L3
Voltage(v)
V 32 42 45
Travel speed
(mm/sec) T 1 2 3
Gas flow rate
(lit/min) G 8 10 11
Welding Current
(Amp) I 280 300 320
The base material and filler wire chemical compositions are presented in Table 1 and 2. The filler (ER70S-6)
wire 1.20 mm diameter was used in this study. The distance between the nozzle tips to electrode tip
(electrode extension) is maintained as 15 mm, using a mixture of argon-carbon dioxide as shielding gas at
three different flow rate i.e. 8 lit/min,10 lit/min & 11 lit/min. The bead on plate welding was performed
with a GMAW process. In this study, an L9 orthogonal array design was used. Nine experiments are
required to study the entire welding parameters space when the L9 orthogonal array is used. The
experimental layout for the welding process parameters using the L9 orthogonal array design is presented
in Table 3. The level and selection of heat input parameters are presented in Table 4.
After the welding process, the weld bead samples are cut from each weld bead at 15 mm intervals, with the
first sample being located at 15 mm behind the trailing edge of the crater end to eliminate the end effects.
The transverse faces of the specimens were further prepared for study of weld bead geometry. Specimens
were polished with various grades of emery papers, starting with 150, 180, 320, 400, 800, 1200 and SIA
Sianor B 1600. Water was used as coolant. Then, the specimens were etched with oxalic acid and
electrolytic to clearly reveal the fused metal zone. The bead geometry was measured on the etched sample
by optical microscopy. The bead dimensions of the weldment were measured from the base metal.
3. Test Results of MS 5986 Fe 410 –MIG combination
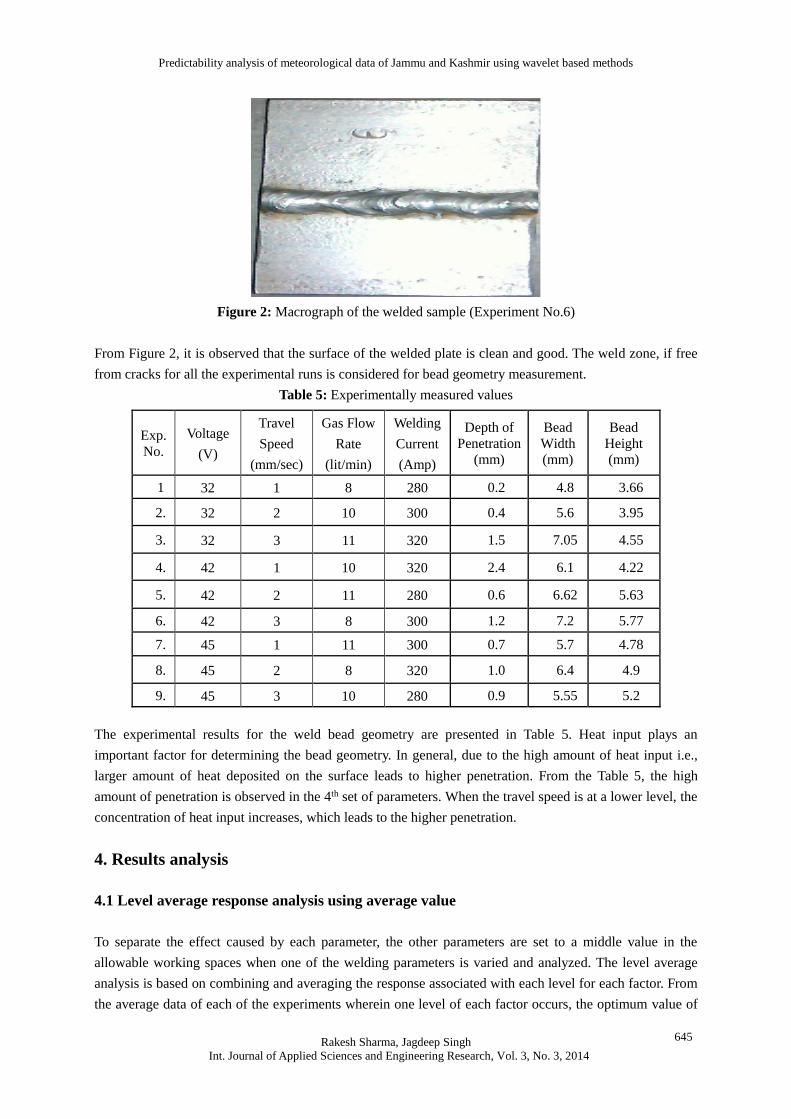
The welding was performed MIG 400 series welding machine with different set of parameters. The
macrograph of the welded sample is presented in Figure 2.
Predictability analysis of meteorological data of Jammu and Kashmir using wavelet based methods
Rakesh Sharma, Jagdeep Singh
Int. Journal of Applied Sciences and Engineering Research, Vol. 3, No. 3, 2014
645
Figure 2: Macrograph of the welded sample (Experiment No.6)
From Figure 2, it is observed that the surface of the welded plate is clean and good. The weld zone, if free
from cracks for all the experimental runs is considered for bead geometry measurement.
Table 5: Experimentally measured values
The experimental results for the weld bead geometry are presented in Table 5. Heat input plays an
important factor for determining the bead geometry. In general, due to the high amount of heat input i.e.,
larger amount of heat deposited on the surface leads to higher penetration. From the Table 5, the high
amount of penetration is observed in the 4th set of parameters. When the travel speed is at a lower level, the
concentration of heat input increases, which leads to the higher penetration.
4. Results analysis
4.1 Level average response analysis using average value
To separate the effect caused by each parameter, the other parameters are set to a middle value in the
allowable working spaces when one of the welding parameters is varied and analyzed. The level average
analysis is based on combining and averaging the response associated with each level for each factor. From
the average data of each of the experiments wherein one level of each factor occurs, the optimum value of
Exp.
No.
Voltage
(V)
Travel
Speed
(mm/sec)
Gas Flow
Rate
(lit/min)
Welding
Current
(Amp)
Depth of
Penetration
(mm)
Bead
Width
(mm)
Bead
Height
(mm)
1 32 1 8 280 0.2 4.8 3.66
2. 32 2 10 300 0.4 5.6 3.95
3. 32 3 11 320 1.5 7.05 4.55
4. 42 1 10 320 2.4 6.1 4.22
5. 42 2 11 280 0.6 6.62 5.63
6. 42 3 8 300 1.2 7.2 5.77
7. 45 1 11 300 0.7 5.7 4.78
8. 45 2 8 320 1.0 6.4 4.9
9. 45 3 10 280 0.9 5.55 5.2
Predictability analysis of meteorological data of Jammu and Kashmir using wavelet based methods
Rakesh Sharma, Jagdeep Singh
Int. Journal of Applied Sciences and Engineering Research, Vol. 3, No. 3, 2014
646
factors is determined.
Table 6: Average effect of voltage on bead dimensions
Table 7: Average effect of welding current on bead dimensions
Table 8: Average effect of gas flow rate on bead dimensions
Table 9: Average effect of travel speed on bead dimensions
For the analysis of weld quality generated by MIG welding process, penetration, bead width and bead
height of the weld were considered. From the level average response analysis using the average values of
each trial run, the optimum conditions for each of the factors Voltage (V), Welding Current (I), Travel
Speed (T) and Gas Flow Rate (G) can be determined. Table 6, 7, 8 and 9 shows the average effect of each
parameter level on the weld bead dimensions. The optimum conditions are those that give the best welds
quality. It can be seen from Figure 3, 4, 5 and 6, that V2 (Voltage at 42 V), I3 (Welding Current at 320
Amp) and T3 (Travel Speed at 3 mm/sec) and G2, (Gas Flow Rate at 10 lit/min) are the optimum
conditions. So V2 I3 T3 G2 can produce best results in terms of weld penetration levels. Therefore the
optimum conditions are Voltage of 42V, Welding Current of 320 Amp, Travel Speed of 3mm/sec and Gas
Flow Rate of 10 lit/min.
4.2 Direct effect of welding parameters on bead dimensions
Direct effects of welding parameters are studied by keeping all the parameters at the middle level except
Voltage (V) Depth of
Penetration (mm)
Bead Width
(mm)
Bead Height
(mm)
32 0.70 5.81 4.05
42 1.40 6.64 5.20
45 0.80 5.88 4.96
Welding
Current (Amp)
Depth of
Penetration (mm)
Bead Width
(mm)
Bead Height
(mm)
280 0.56 5.65 4.83
300 0.76 6.16 4.83
320 1.63 6.51 4.55
Gas Flow Rate
(lit/min)
Depth of
Penetration
(mm)
Bead Width
(mm)
Bead Height
(mm)
8 0.80 6.13 4.77
10 1.23 5.75 4.45
11 0.93 6.45 4.98
Travel Speed
(mm/sec)
Depth of
Penetration (mm)
Bead Width
(mm)
Bead Height
(mm)
1 1.10 5.53 4.22
2 0.66 6.20 4.82
3 1.20 6.60 5.17
Predictability analysis of meteorological data of Jammu and Kashmir using wavelet based methods
Rakesh Sharma, Jagdeep Singh
Int. Journal of Applied Sciences and Engineering Research, Vol. 3, No. 3, 2014
647
the parameter whose direct effect was studied.
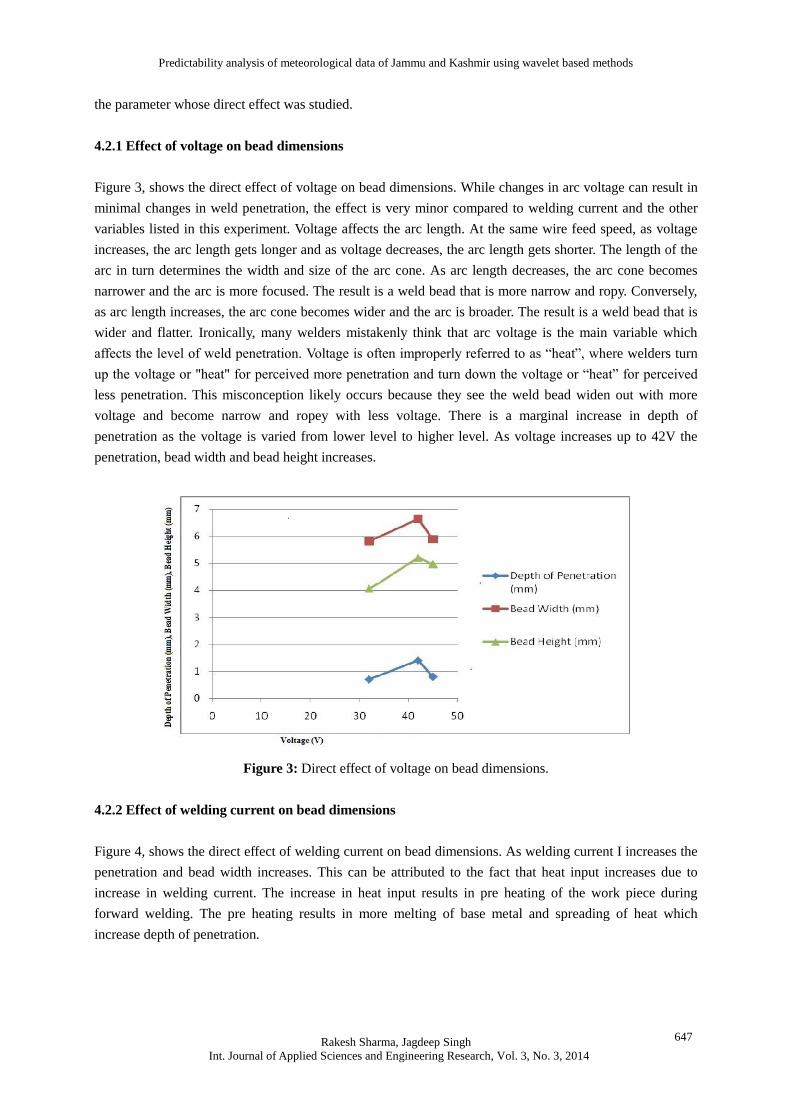
4.2.1 Effect of voltage on bead dimensions
Figure 3, shows the direct effect of voltage on bead dimensions. While changes in arc voltage can result in
minimal changes in weld penetration, the effect is very minor compared to welding current and the other
variables listed in this experiment. Voltage affects the arc length. At the same wire feed speed, as voltage
increases, the arc length gets longer and as voltage decreases, the arc length gets shorter. The length of the
arc in turn determines the width and size of the arc cone. As arc length decreases, the arc cone becomes
narrower and the arc is more focused. The result is a weld bead that is more narrow and ropy. Conversely,
as arc length increases, the arc cone becomes wider and the arc is broader. The result is a weld bead that is
wider and flatter. Ironically, many welders mistakenly think that arc voltage is the main variable which
affects the level of weld penetration. Voltage is often improperly referred to as “heat”, where welders turn
up the voltage or "heat" for perceived more penetration and turn down the voltage or “heat” for perceived
less penetration. This misconception likely occurs because they see the weld bead widen out with more
voltage and become narrow and ropey with less voltage. There is a marginal increase in depth of
penetration as the voltage is varied from lower level to higher level. As voltage increases up to 42V the
penetration, bead width and bead height increases.
Figure 3: Direct effect of voltage on bead dimensions.
4.2.2 Effect of welding current on bead dimensions
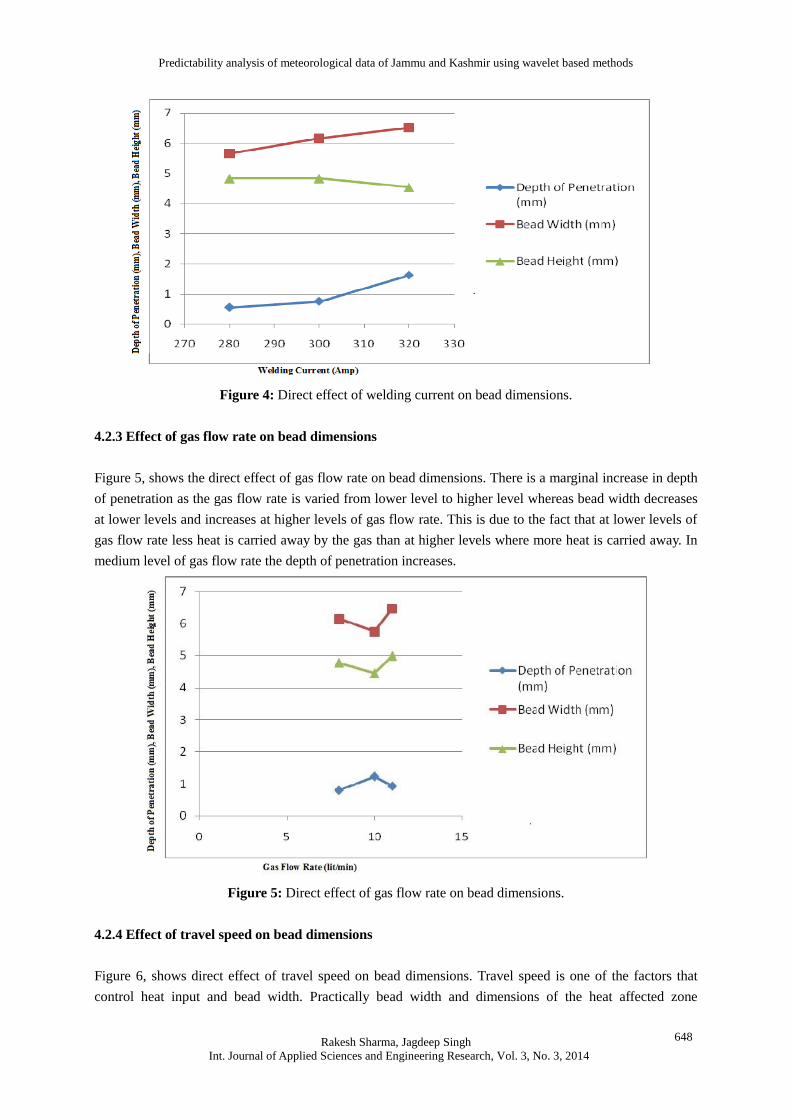
Figure 4, shows the direct effect of welding current on bead dimensions. As welding current I increases the
penetration and bead width increases. This can be attributed to the fact that heat input increases due to
increase in welding current. The increase in heat input results in pre heating of the work piece during
forward welding. The pre heating results in more melting of base metal and spreading of heat which
increase depth of penetration.
Predictability analysis of meteorological data of Jammu and Kashmir using wavelet based methods
Rakesh Sharma, Jagdeep Singh
Int. Journal of Applied Sciences and Engineering Research, Vol. 3, No. 3, 2014
648
Figure 4: Direct effect of welding current on bead dimensions.
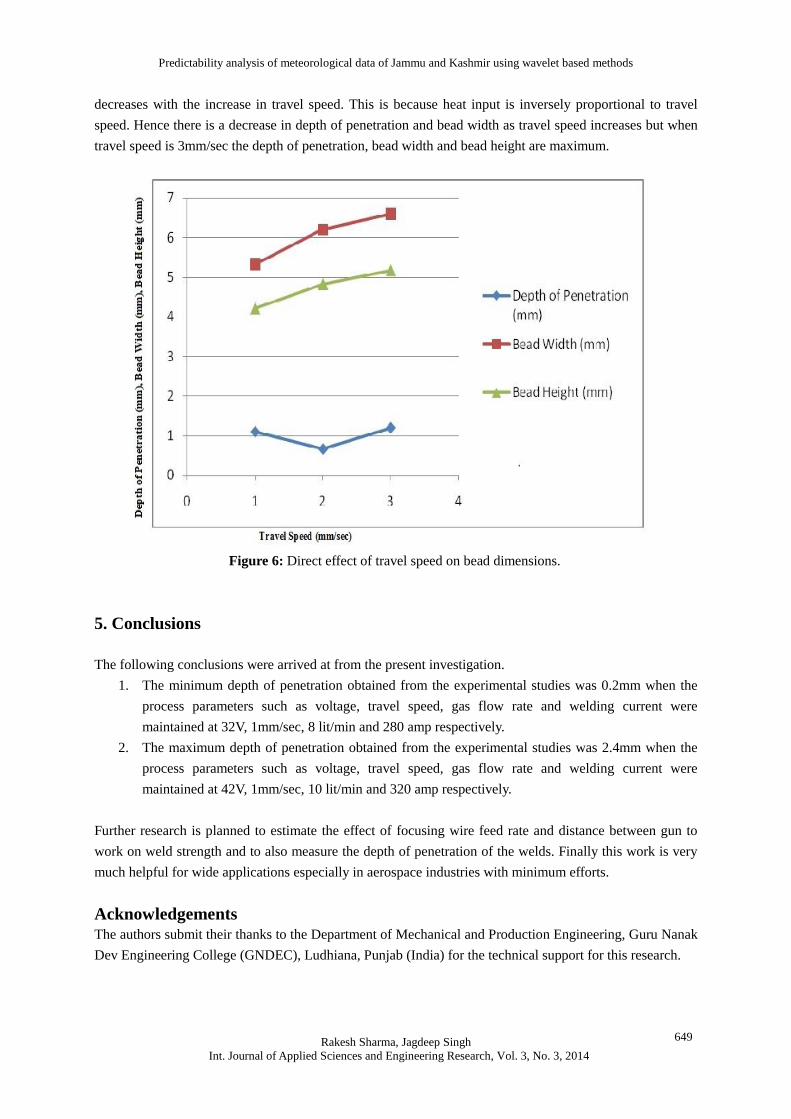
4.2.3 Effect of gas flow rate on bead dimensions
Figure 5, shows the direct effect of gas flow rate on bead dimensions. There is a marginal increase in depth
of penetration as the gas flow rate is varied from lower level to higher level whereas bead width decreases
at lower levels and increases at higher levels of gas flow rate. This is due to the fact that at lower levels of
gas flow rate less heat is carried away by the gas than at higher levels where more heat is carried away. In
medium level of gas flow rate the depth of penetration increases.
Figure 5: Direct effect of gas flow rate on bead dimensions.
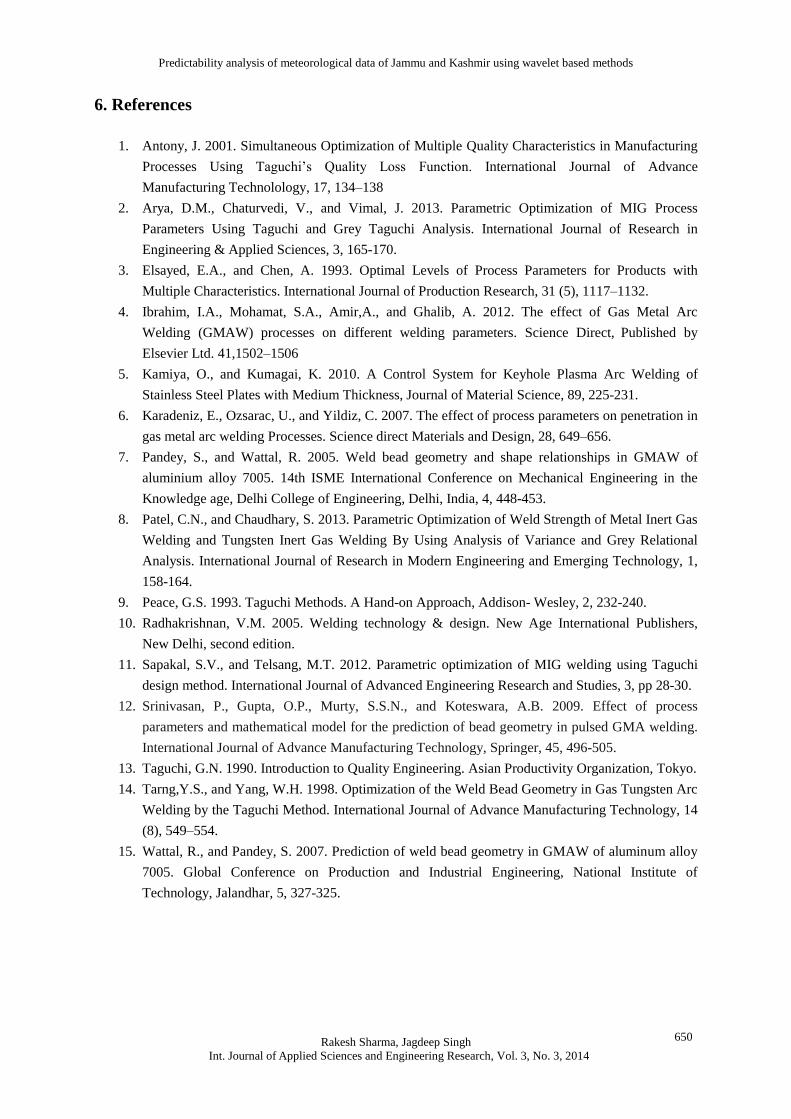
4.2.4 Effect of travel speed on bead dimensions
Figure 6, shows direct effect of travel speed on bead dimensions. Travel speed is one of the factors that
control heat input and bead width. Practically bead width and dimensions of the heat affected zone
Predictability analysis of meteorological data of Jammu and Kashmir using wavelet based methods
Rakesh Sharma, Jagdeep Singh
Int. Journal of Applied Sciences and Engineering Research, Vol. 3, No. 3, 2014
649
decreases with the increase in travel speed. This is because heat input is inversely proportional to travel
speed. Hence there is a decrease in depth of penetration and bead width as travel speed increases but when
travel speed is 3mm/sec the depth of penetration, bead width and bead height are maximum.
Figure 6: Direct effect of travel speed on bead dimensions.
5. Conclusions
The following conclusions were arrived at from the present investigation.
1. The minimum depth of penetration obtained from the experimental studies was 0.2mm when the
process parameters such as voltage, travel speed, gas flow rate and welding current were
maintained at 32V, 1mm/sec, 8 lit/min and 280 amp respectively.
2. The maximum depth of penetration obtained from the experimental studies was 2.4mm when the
process parameters such as voltage, travel speed, gas flow rate and welding current were
maintained at 42V, 1mm/sec, 10 lit/min and 320 amp respectively.
Further research is planned to estimate the effect of focusing wire feed rate and distance between gun to
work on weld strength and to also measure the depth of penetration of the welds. Finally this work is very
much helpful for wide applications especially in aerospace industries with minimum efforts.
Acknowledgements
The authors submit their thanks to the Department of Mechanical and Production Engineering, Guru Nanak
Dev Engineering College (GNDEC), Ludhiana, Punjab (India) for the technical support for this research.
Predictability analysis of meteorological data of Jammu and Kashmir using wavelet based methods
Rakesh Sharma, Jagdeep Singh
Int. Journal of Applied Sciences and Engineering Research, Vol. 3, No. 3, 2014
650
6. References
1. Antony, J. 2001. Simultaneous Optimization of Multiple Quality Characteristics in Manufacturing
Processes Using Taguchi’s Quality Loss Function. International Journal of Advance
Manufacturing Technolology, 17, 134–138
2. Arya, D.M., Chaturvedi, V., and Vimal, J. 2013. Parametric Optimization of MIG Process
Parameters Using Taguchi and Grey Taguchi Analysis. International Journal of Research in
Engineering & Applied Sciences, 3, 165-170.
3. Elsayed, E.A., and Chen, A. 1993. Optimal Levels of Process Parameters for Products with
Multiple Characteristics. International Journal of Production Research, 31 (5), 1117–1132.
4. Ibrahim, I.A., Mohamat, S.A., Amir,A., and Ghalib, A. 2012. The effect of Gas Metal Arc
Welding (GMAW) processes on different welding parameters. Science Direct, Published by
Elsevier Ltd. 41,1502–1506
5. Kamiya, O., and Kumagai, K. 2010. A Control System for Keyhole Plasma Arc Welding of
Stainless Steel Plates with Medium Thickness, Journal of Material Science, 89, 225-231.
6. Karadeniz, E., Ozsarac, U., and Yildiz, C. 2007. The effect of process parameters on penetration in
gas metal arc welding Processes. Science direct Materials and Design, 28, 649–656.
7. Pandey, S., and Wattal, R. 2005. Weld bead geometry and shape relationships in GMAW of
aluminium alloy 7005. 14th ISME International Conference on Mechanical Engineering in the
Knowledge age, Delhi College of Engineering, Delhi, India, 4, 448-453.
8. Patel, C.N., and Chaudhary, S. 2013. Parametric Optimization of Weld Strength of Metal Inert Gas
Welding and Tungsten Inert Gas Welding By Using Analysis of Variance and Grey Relational
Analysis. International Journal of Research in Modern Engineering and Emerging Technology, 1,
158-164.
9. Peace, G.S. 1993. Taguchi Methods. A Hand-on Approach, Addison- Wesley, 2, 232-240.
10. Radhakrishnan, V.M. 2005. Welding technology & design. New Age International Publishers,
New Delhi, second edition.
11. Sapakal, S.V., and Telsang, M.T. 2012. Parametric optimization of MIG welding using Taguchi
design method. International Journal of Advanced Engineering Research and Studies, 3, pp 28-30.
12. Srinivasan, P., Gupta, O.P., Murty, S.S.N., and Koteswara, A.B. 2009. Effect of process
parameters and mathematical model for the prediction of bead geometry in pulsed GMA welding.
International Journal of Advance Manufacturing Technology, Springer, 45, 496-505.
13. Taguchi, G.N. 1990. Introduction to Quality Engineering. Asian Productivity Organization, Tokyo.
14. Tarng,Y.S., and Yang, W.H. 1998. Optimization of the Weld Bead Geometry in Gas Tungsten Arc
Welding by the Taguchi Method. International Journal of Advance Manufacturing Technology, 14
(8), 549–554.
15. Wattal, R., and Pandey, S. 2007. Prediction of weld bead geometry in GMAW of aluminum alloy
7005. Global Conference on Production and Industrial Engineering, National Institute of
Technology, Jalandhar, 5, 327-325.
Related Documents