Resource Parallel genetics of regulatory sequences using scalable genome editing in vivo Graphical abstract Highlights d Inducible Cas9 in C. elegans populations produces targeted indels in parallel d ‘‘crispr-DART’’ software to analyze indel mutations in targeted DNA sequencing d Two let-7 miRNA binding sites in the lin-41 3 0 UTR can function independently d Gene-regulatory mutations are mapped to morphological phenotypes Authors Jonathan J. Froehlich, Bora Uyar, Margareta Herzog, Kathrin Theil, Petar Gla zar, Altuna Akalin, Nikolaus Rajewsky Correspondence [email protected] In brief Animal phenotypes rely on gene- regulatory mechanisms. Froehlich et al. develop parallel genome editing in C. elegans to produce diverse indel mutations at regulatory DNA. They describe indel characteristics, study the function of two adjacent microRNA binding sites, and directly map gene- regulatory genotypes to animal phenotypes. Froehlich et al., 2021, Cell Reports 35, 108988 April 13, 2021 ª 2021 The Authors. https://doi.org/10.1016/j.celrep.2021.108988 ll

Welcome message from author
This document is posted to help you gain knowledge. Please leave a comment to let me know what you think about it! Share it to your friends and learn new things together.
Transcript

Resource
Parallel genetics of regula
tory sequences usingscalable genome editing in vivoGraphical abstract
Highlights
d Inducible Cas9 in C. elegans populations produces targeted
indels in parallel
d ‘‘crispr-DART’’ software to analyze indel mutations in
targeted DNA sequencing
d Two let-7 miRNA binding sites in the lin-41 30 UTR can
function independently
d Gene-regulatory mutations are mapped to morphological
phenotypes
Froehlich et al., 2021, Cell Reports 35, 108988April 13, 2021 ª 2021 The Authors.https://doi.org/10.1016/j.celrep.2021.108988
Authors
Jonathan J. Froehlich, Bora Uyar,
Margareta Herzog, Kathrin Theil,
Petar Gla�zar, Altuna Akalin,
Nikolaus Rajewsky
In brief
Animal phenotypes rely on gene-
regulatory mechanisms. Froehlich et al.
develop parallel genome editing in
C. elegans to produce diverse indel
mutations at regulatory DNA. They
describe indel characteristics, study the
function of two adjacent microRNA
binding sites, and directly map gene-
regulatory genotypes to animal
phenotypes.
ll

OPEN ACCESS
llResource
Parallel genetics of regulatory sequencesusing scalable genome editing in vivoJonathan J. Froehlich,1,3 Bora Uyar,2,3 Margareta Herzog,1 Kathrin Theil,1 Petar Gla�zar,1 Altuna Akalin,2
and Nikolaus Rajewsky1,4,*1Systems Biology of Gene Regulatory Elements, Berlin Institute for Medical Systems Biology, Max Delbr€uck Center for Molecular Medicine in
the Helmholtz Association, Hannoversche Str. 28, 10115 Berlin, Germany2Bioinformatics and Omics Data Science Platform, Berlin Institute for Medical Systems Biology, Max Delbr€uck Center for Molecular Medicinein the Helmholtz Association, Hannoversche Str. 28, 10115 Berlin, Germany3These authors contributed equally4Lead contact
*Correspondence: [email protected]://doi.org/10.1016/j.celrep.2021.108988
SUMMARY
How regulatory sequences control gene expression is fundamental for explaining phenotypes in health anddisease. Regulatory elements must ultimately be understood within their genomic environment and devel-opment- or tissue-specific contexts. Because this is technically challenging, few regulatory elements havebeen characterized in vivo. Here, we use inducible Cas9 and multiplexed guide RNAs to create hundredsof mutations in enhancers/promoters and 30 UTRs of 16 genes in C. elegans. Our software crispr-DART an-alyzes indel mutations in targeted DNA sequencing. We quantify the impact of mutations on expressionand fitness by targeted RNA sequencing and DNA sampling. When applying our approach to the lin-4130 UTR, generating hundreds of mutants, we find that the two adjacent binding sites for the miRNA let-7can regulate lin-41 expression independently of each other. Finally, we map regulatory genotypes tophenotypic traits for several genes. Our approach enables parallel analysis of regulatory sequencesdirectly in animals.
INTRODUCTION
Understanding gene regulation is fundamental for understanding
development and tissue function in health and disease. Animal
genomes contain diverse regulatory sequences that are orga-
nized in contiguous stretches of genomic DNA, ranging from a
few to hundreds or thousands of bases. Promoters, enhancers,
and silencers act mainly on transcription, whereas mRNA 50
and 30 untranslated regions (UTRs) mainly regulate mRNA
export, localization, degradation, and translation. Many gene-
regulatory sequences encode multiple functions that can coop-
erate, compensate, and compete (Davidson, 2010; Levo and Se-
gal, 2014; Long et al., 2016). Understanding this logic requires
combinatorial perturbations. Moreover, a single binding site,
because of fuzzy recognition motifs, may tolerate certain muta-
tions (Chen and Rajewsky, 2007; Farley et al., 2015; Jankowsky
and Harris, 2015). The interaction between effectors and regula-
tory elements can be modulated by sequence structure, co-fac-
tors, chemical modifications, and the temporal order of binding,
and sequence activity is dependent on native sequence context,
cell type, development, and the environment (Davidson, 2010;
Dominguez et al., 2018; Jankowsky and Harris, 2015; Levo and
Segal, 2014; Long et al., 2016). Mechanisms that confer robust-
ness or stochasticity of phenotype add another layer of
complexity to this (Burga and Lehner, 2012; Kontarakis and
This is an open access article under the CC BY-N
Stainier, 2020; Macneil and Walhout, 2011; Smits et al., 2019).
Accordingly, phenotypic consequences of gene-regulatory mu-
tations are difficult to predict. To understand biological functions
and mechanisms in animals, scalable approaches to target reg-
ulatory sequences with many different mutations are required.
Although massively parallel functional assays of regulatory se-
quences have been developed in cell lines and yeast (Canver
et al., 2015; Findlay et al., 2014; Gasperini et al., 2016; Shendure
and Fields, 2016; Vierstra et al., 2015), few in vivo approaches
have been achieved in animal models. These use integration of
reporters (Fuqua et al., 2020; Kvon et al., 2020) or injection of
RNA libraries (Rabani et al., 2017; Yartseva et al., 2017) and,
therefore, do not evaluate endogenous phenotypes or are
restricted to one stage of the animal life cycle. Classical genome
editing by injection, now widely accessible because of CRISPR-
Cas-based techniques, has enabled functional tests, but this is
still labor intensive and limited in scalability (Anzalone et al.,
2020; Barrangou and Doudna, 2016; Hornblad et al., 2021;
Labi et al., 2019).
Here, we use inducible expression of Cas9 and multiplexed
single guide RNAs in Caenorhabditis elegans populations to
generate hundreds of targetedmutations in parallel. We targeted
different regulatory regions across 16 genes and analyzed more
than 12,000 Cas9-induced mutations to first describe character-
istics of double-stranded DNA (dsDNA) break repair in the
Cell Reports 35, 108988, April 13, 2021 ª 2021 The Authors. 1C-ND license (http://creativecommons.org/licenses/by-nc-nd/4.0/).

Resourcell
OPEN ACCESS
C. elegans germline and the introduced genotype diversity at the
targeted loci. We then applied our mutagenesis approach to
generate hundreds of deletions along the well-studied lin-41 30
UTR, which is targeted by the microRNA (miRNA) let-7 (Ecsedi
et al., 2015; Reinhart et al., 2000; Vella et al., 2004a). We devel-
oped an RNA sequencing-based strategy to quantify the effect
of each mutation on lin-41 RNA level. Using DNA sequencing,
we followed the relative abundance of these different mutations
over several generations to infer their phenotype. Finally, we
couple the targeted mutagenesis of regulatory sequences to se-
lection by phenotypic traits. We isolate 57 alleles in 3 genes that
show strong morphological defects in phenotype, mediated by
mutations in an enhancer, TATA box, and 30 UTRs.
RESULTS
Cas9 induction for targeted and parallel mutagenesis inC. elegans populationsTo introducemany different targetedmutations in vivo, we devel-
oped a scalable approach in C. elegans using inducible expres-
sion of Cas9 and several multiplexed single guide RNAs
(sgRNAs). This required only a few initial injections to create
transgenic animals, allowed maintenance without mutagenesis,
and enabled time-controlled creation of mutated populations in
parallel, with sizes only limited by culturing approaches (up to
�106 in our case). Mutant populations could then be used for
various purposes. For example, they could be selected by
phenotype or reporter activity or analyzed directly by targeted
sequencing to measure the effect of mutations on RNA levels
or fitness (Figure 1A).
As an initial test, we generated transgenic lines with plasmids
for heat shock-driven Cas9 expression and one or multiple
sgRNAs targeting a ubiquitously expressed single-copy GFP
reporter. After a transient heat shock, we could observe GFP-
negative animals in culture, indicating activity of Cas9. We per-
formed a 2-h heat shock induction of Cas9 in the parents (P0)
and collected progeny (F1) in a time course experiment. The
highest fractions of mutants were obtained 14–16 h after heat
shock, with approximately 50% (sg1) and 20% (sg2) of eggs pro-
ducing GFP-negative animals (Figure S1A). We obtained similar
results whenwe targeted the dpy-10 gene and counted the char-
acteristic Dumpy (Dpy) phenotype, comparing two plasmids for
heat shock-induced expression of Cas9. Eggs collected 12–15 h
after heat shock produced around 20%–35% of Dpy animals
with both plasmids (Figure S1B). We also found that a U6 pro-
moter with a reported higher gonad expression (Diag et al.,
2018) resulted in a larger number of Dpy progeny on average
(Figure S1C).
Characteristic CRISPR-Cas9-induced mutations from 91
GFP-negative animals consisted of insertions or deletions (in-
dels) or a combination of both and originated from sgRNA cut
sites (Figures S1D and S1E). When we used three sgRNAs within
the same transgenic line, targeting adjacent positions, deletions
appeared around one cut site or spanned two cut sites (Fig-
ure S1E). This indicated that pools of sgRNAs could lead to
more diverse genotypes and cover more nucleotides. Most de-
letions induced by a single sgRNA were between 3–10 bp
2 Cell Reports 35, 108988, April 13, 2021
long, and we observed insertion lengths between 1–30 bp
(Figure S1F).
Homozygous animals would be produced in the F2 by hetero-
zygous self-fertilizing F1. Additionally, if Cas9 induced in P0
would still be active after fertilization, F1 animals could be
mosaic with a wild-type germline and mutant somatic cells (Fig-
ure S1G). We therefore wanted to assess how many germline
mutations were generated in the F1. For this, we analyzed the in-
heritance of the GFP-negative phenotype from F1 to F2 genera-
tions using an automated flow system and found that �80% of
mutations were indeed germline mutations (Figures S1H–S1J).
For the rest of our work, we used such non-mosaic F2, generated
by F1 germline mutations.
To analyze large populations of mutatedC. elegans in bulk, we
established a targeted sequencing protocol based on long 0.5-
to 3-kb PCR amplicons. This allowed us to sequence the com-
plete targeted locus, place most primers more than 300 bp
away from the nearest sgRNA cut site to avoid deletion of primer
binding sites, and capture large deletions. Barcoding samples
enabled combined sequencing on the same flow cell (Figures
S2A–S2C). To handle targeted sequencing data of such
amplicons and analyze the contained mutations, we created
the software pipeline crispr-DART (CRISPR-Cas downstream
analysis and reporting tool; https://github.com/BIMSBbioinfo/
crispr_DART). The pipeline extracts and quantifies indels from
various targeted sequencing technologies, single or multiple re-
gions of interest, and single- or multiplexed sgRNAs. The output
contains reports of coverage, indel mutation profiles, sgRNA ef-
ficiencies, and optional comparisons between samples to iden-
tify differential regions and mutations. Processed genomics files
from the output can be used for more in-depth custom analyses
with additional supplied R scripts (Figures S2D and S2E; Data
and code availability).
To test our approach at a larger scale, we induced Cas9 in
50,000 P0 animals by heat shock and amplicon sequenced the
mutated locus from bulk samples of 400,000 F2 progeny. Dele-
tions per genomic base pair peaked sharply around sgRNA cut
sites (Figure 1B). Pools of multiplexed sgRNA plasmids resulted
in deletions spanning two or several sgRNAs (multi-cut) in addi-
tion to smaller deletions surrounding single sgRNAs (single-cut)
(Figure 1B, bottom). Insertions occurred within a few nucleotides
to cut sites and were less frequent than deletions (�1/2–1/10th;
Figure 1C). We observed background mutations of short 1-bp
deletions and insertions that were also present with similar abun-
dance in isogenic wild-type controls and occurred independent
of sgRNA cut sites. These could have been caused by biological
(e.g., DNA modifications, natural mutations) and technical fac-
tors (e.g., during or after extraction of genomic DNA, PCR,
sequencing errors). Such mutations were absent in genotyping
by Sanger sequencing, and we later established computational
filters to separate these from CRISPR-Cas9-induced mutations.
Features of CRISPR-Cas9-induced indelsTo understand gene-regulatory logic, ideally, many different var-
iants are produced with high efficiency that can then be tested
for their effects in vivo. We set out to analyze the efficiency and
characteristics of mutations produced with our approach. We
targeted 16 genes at different regions with 1–9 sgRNAs per

Figure 1. Cas9 induction for targeted and parallel mutagenesis in C. elegans populations
(A) Outline of our approach. Heat shock Cas9 induction creates large ‘‘diversified’’ populations containing indel mutations at the targeted region. Mutated
populations can be used for various downstream assays: selection by morphological traits or reporter activity, bulk RNA sequencing to measure effects of in-
dividual 30 UTR mutations, or DNA sampling over several generations to infer fitness of different genotypes.
(B) Example of the complete spectrum of observedmutations after targeting a locus. The percentage of DNA sequencing reads containing deletions with respect to
the total read coverage is plotted at the corresponding genomic position. Bulk worm sampleswere sequenced; thus, 2%deletions per genomic nucleotide refers to
approximately 2% of worms with a deletion at the respective nucleotide. Orange triangles, sgRNA cut sites. Individual deletion events are shown below in red.
(C) Same analysis as in (B) but for insertion events.
See also Figures S1 and S2.
Resourcell
OPEN ACCESS
transgenic line. These genes were selected for different down-
stream experiments and contained one gene with a known
miRNA interaction, 8 genes with known reduction-of-function
phenotypes, and 7 essential genes. After Cas9 heat shock in-
duction, we sequenced bulk genomic DNA from 400,000 F2 an-
imals with long amplicon sequencing. Together with wild-type
controls, this produced data for 60 samples and 91 sgRNAs
(Tables S1 and S3).
To measure sgRNA efficiencies, we counted all reads with de-
letions overlapping ±5 bp of a given sgRNA cut site and normal-
ized this value by the number of total reads at that position. The
median efficiency was 1.4%, with most sgRNAs showing effi-
ciencies of 0%–6.3% (95% confidence interval [CI]) (Figure 2A).
1.4% corresponded to approximately 5,600 mutant animals per
sgRNA in our samples. We then compared observed sgRNA effi-
ciencies with published efficiency prediction scores but found no
significant predictive power (Figure S2F). Possible reasons for
this could be that these scores were obtained in other experi-
mentalmodels or that sequence-independent factorsweredomi-
nating in our system. Also, the injected plasmid concentrations
during generation of transgenic lines were not correlated with ef-
ficiency (Figure S2G).We found, however, that sgRNAs for target
siteswith twoguaninespreceding theprotospacer adjacentmotif
(PAM) were significantly more efficient, as described previously
for C. elegans ("GGNGG sites"; Farboud and Meyer, 2015; Fig-
ure S2H). Also, lethal phenotypes were likely not confounding
these analyses (e.g., by depleting for animals with efficient
sgRNAs) (Figure S2I). We then used the detected mutations to
characterize CRISPR-Cas9-induced dsDNA break repair out-
comes in the C. elegans germline. We analyzed the proportion
ofmutation typespresent in sequencing reads fromeach sample.
On average, samples contained 57.9% deletions, 22.9% inser-
tions, and 19.3% complex events (combinations of insertions,
deletions, and substitutions) (Figure 2B). These proportions are
similar for naturally occurring germline indels in C. elegans
(75% deletions, 25% insertions) (Konrad et al., 2019) and human
(50% deletions, 35% insertions) (Collins et al., 2020).
The targeted sequencing approach resulted in a uniform read
coverage per amplicon between 200,000- to 800,000-fold. We
empirically determined general read support thresholds to
robustly detect mutations in treated samples while observing
few mutations in the isogenic wild-type controls. An indel had
to be supported by at least 0.001% reads mapped to a position,
at least 5 reads, and overlap with a sgRNA cut site ±5 bp. We
excluded complex events (combinations of insertions, deletions,
and substitutions) from the rest of our analyses to be more
certain about the resulting sequences. 100 ng of genomic DNA
was used as input for our sequencing protocol, representing
Cell Reports 35, 108988, April 13, 2021 3

Figure 2. Features of CRISPR-Cas9-induced indels
Pooled data from 60 experiments, each sample expressing 1–8 sgRNAs targeting one region among 16 genes (n = 24 wild-type controls, n = 36 samples with
induced Cas9).
(A) Efficiency measured for each sgRNA per experiment (n = 127 sgRNAs).
(B) Proportions of reads with different types of mutations detected in each experiment (n = 60 experiments). ‘‘Complex’’ indels, reads with more than one indel or
additional adjacent substitutions.
(C) Length distribution of deletions found in all treated samples (n = 2,915 multi-cut and 3,169 single-cut deletions).
(D) Length distribution of insertions found in all experiments (n = 6,616 insertions).
(E) Matches of 5-mers from insertions (blue) to surrounding sequence (±50 bp). Randomly shuffled insertion sequences were used as controls (gray). Data are
from 34 samples.
See also Figure S3.
Resourcell
OPEN ACCESS
more than 90million genomes, enough to cover all animals in our
samples. With the assumption that animals contributed equally
to the extracted genomic DNA, we estimated that 4–10 mutants
among 400,000 animals were sufficient to detect a mutation, de-
pending on the amplicon coverage (Figure S3A).
Using these thresholds, we detected 12,700 indels in our sam-
ples. We computationally separated deletions into single- or
multi-cut based on overlapwith cut sites (Figure S3B). The length
of single-cut deletions ranged from 1 to over 100 bp, with thema-
jority around 5–25 bp. Because larger deletions have a higher
chance of overlapping with a second sgRNA cut site, this is likely
an underestimation. Multi-cut deletions were larger, mostly
several hundred base pairs, as expected from the spacing be-
tween multiplexed sgRNAs (Figure 2C). Most (>90%) insertions
were 1–20 bp long, although we could find insertions up to
45 bp (Figure 2D). These length distributions were similar to
our observations made by Sanger sequencing (Figure S1E).
Inspection of individual genotypes revealed that most inser-
tions contained short sequences also found in close proximity
to the insertion position (Figure S3C and S3D). Using our
deep sequencing data, we systematically analyzed such micro-
homologous matches between insertions and the surrounding
regions. 5-mers from insertions matched to sequences in a win-
dow ±13 bp around the insertion position and only in the same
orientation (Figure 2E; Figures S3E and S3F). Thus, our data
indicate that many insertions are duplications of surrounding
microhomologous sequences occurring mainly in the
same orientation. This could be the result of a dissociation
and re-annealing during microhomology-mediated end joining
of dsDNA breaks (Figure S3G).
Genotype diversity produced by indelsFinally, we assessed the genotype diversity generated by indels.
We considered each unique indel sequence a genotype, given
4 Cell Reports 35, 108988, April 13, 2021
that they reached the filtering thresholds defined before
(0.001% reads, 5 reads, cut site overlap). We started by counting
the number of unique deletions per base pair.We first studied de-
letions created by single-cut events for each sgRNA and found
that highly active sgRNAs could generate up to 150 unique dele-
tion genotypes and the highest diversity close to cut sites (rows in
Figure 3A). Most of these genotypes defined by deletions
covered a 10- to 12-bp region surrounding the cut sites. On
average, every sgRNA could generate around 15 different geno-
types per base pair at the center of the cut site and up to 5
different genotypes per base pair 5 bp away from the cut site
(black line profile in Figure 3A). We then studiedmulti-cut events.
Here,we foundup to200uniquedeletion genotypesperbasepair
and, on average, around 20 per sgRNA covering a region more
than 500bp surrounding each cut site (Figure 3B).When counting
the number of genotypes generated by one sgRNA, one sgRNA
created 50deletion and 10 insertion genotypes onaverage.How-
ever, some sgRNAs created up to 400 genotypes (Figure 3C).
Because we used several sgRNAs per transgenic line, we
observed a median of 162 insertion and 190 deletion genotypes
per sample and, in the most efficient lines, 1,833 deletion and
1,213 insertion genotypes (Figure 3D). More efficient sgRNAs re-
sulted in a higher number of new genotypes (Figure 3E). Trans-
genic lines expressing more sgRNAs showed more unique dele-
tion genotypes, possibly because of an increased chance of
containing efficient sgRNAs and the combined activity ofmultiple
sgRNAs creating combinatorial deletions (Figure 3F). These data
show that inducible expression of Cas9withmultiplexed sgRNAs
can induce hundreds of indel-based genotypes in parallel at the
targeted regulatory regions. This includes small deletions to
target individual regulatory elements at nucleotide resolution,
large deletions to interrogate combinatory interactions, and in-
sertions to change the spacing between elements and create
semi-random or duplicated sequences.
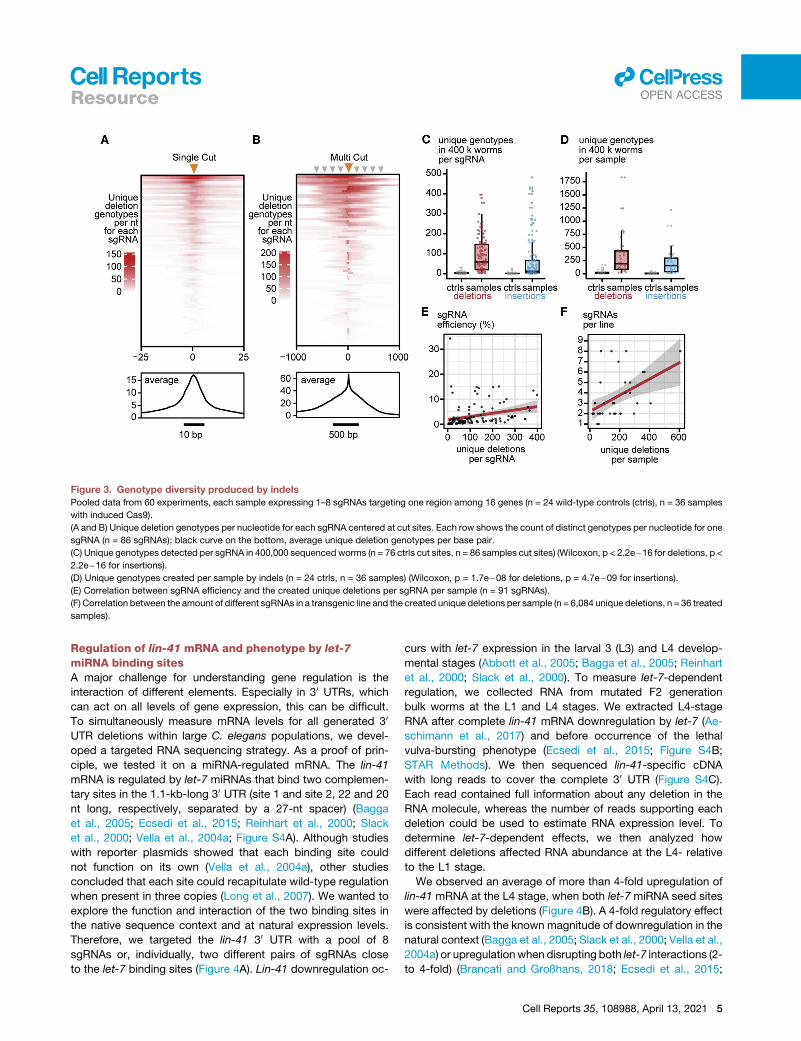
Figure 3. Genotype diversity produced by indels
Pooled data from 60 experiments, each sample expressing 1–8 sgRNAs targeting one region among 16 genes (n = 24 wild-type controls (ctrls), n = 36 samples
with induced Cas9).
(A and B) Unique deletion genotypes per nucleotide for each sgRNA centered at cut sites. Each row shows the count of distinct genotypes per nucleotide for one
sgRNA (n = 86 sgRNAs); black curve on the bottom, average unique deletion genotypes per base pair.
(C) Unique genotypes detected per sgRNA in 400,000 sequenced worms (n = 76 ctrls cut sites, n = 86 samples cut sites) (Wilcoxon, p < 2.2e�16 for deletions, p <
2.2e�16 for insertions).
(D) Unique genotypes created per sample by indels (n = 24 ctrls, n = 36 samples) (Wilcoxon, p = 1.7e�08 for deletions, p = 4.7e�09 for insertions).
(E) Correlation between sgRNA efficiency and the created unique deletions per sgRNA per sample (n = 91 sgRNAs).
(F) Correlation between the amount of different sgRNAs in a transgenic line and the created unique deletions per sample (n = 6,084 unique deletions, n = 36 treated
samples).
Resourcell
OPEN ACCESS
Regulation of lin-41 mRNA and phenotype by let-7
miRNA binding sitesA major challenge for understanding gene regulation is the
interaction of different elements. Especially in 30 UTRs, which
can act on all levels of gene expression, this can be difficult.
To simultaneously measure mRNA levels for all generated 30
UTR deletions within large C. elegans populations, we devel-
oped a targeted RNA sequencing strategy. As a proof of prin-
ciple, we tested it on a miRNA-regulated mRNA. The lin-41
mRNA is regulated by let-7 miRNAs that bind two complemen-
tary sites in the 1.1-kb-long 30 UTR (site 1 and site 2, 22 and 20
nt long, respectively, separated by a 27-nt spacer) (Bagga
et al., 2005; Ecsedi et al., 2015; Reinhart et al., 2000; Slack
et al., 2000; Vella et al., 2004a; Figure S4A). Although studies
with reporter plasmids showed that each binding site could
not function on its own (Vella et al., 2004a), other studies
concluded that each site could recapitulate wild-type regulation
when present in three copies (Long et al., 2007). We wanted to
explore the function and interaction of the two binding sites in
the native sequence context and at natural expression levels.
Therefore, we targeted the lin-41 30 UTR with a pool of 8
sgRNAs or, individually, two different pairs of sgRNAs close
to the let-7 binding sites (Figure 4A). Lin-41 downregulation oc-
curs with let-7 expression in the larval 3 (L3) and L4 develop-
mental stages (Abbott et al., 2005; Bagga et al., 2005; Reinhart
et al., 2000; Slack et al., 2000). To measure let-7-dependent
regulation, we collected RNA from mutated F2 generation
bulk worms at the L1 and L4 stages. We extracted L4-stage
RNA after complete lin-41 mRNA downregulation by let-7 (Ae-
schimann et al., 2017) and before occurrence of the lethal
vulva-bursting phenotype (Ecsedi et al., 2015; Figure S4B;
STAR Methods). We then sequenced lin-41-specific cDNA
with long reads to cover the complete 30 UTR (Figure S4C).
Each read contained full information about any deletion in the
RNA molecule, whereas the number of reads supporting each
deletion could be used to estimate RNA expression level. To
determine let-7-dependent effects, we then analyzed how
different deletions affected RNA abundance at the L4- relative
to the L1 stage.
We observed an average of more than 4-fold upregulation of
lin-41 mRNA at the L4 stage, when both let-7 miRNA seed sites
were affected by deletions (Figure 4B). A 4-fold regulatory effect
is consistent with the known magnitude of downregulation in the
natural context (Bagga et al., 2005; Slack et al., 2000; Vella et al.,
2004a) or upregulationwhen disrupting both let-7 interactions (2-
to 4-fold) (Brancati and Großhans, 2018; Ecsedi et al., 2015;
Cell Reports 35, 108988, April 13, 2021 5

Figure 4. Regulation of lin-41 mRNA and phenotype by let-7 miRNA binding sites
(A) The lin-41 30 UTR locus after targeted mutagenesis with three different lines (sg pool, sg15+sg16, and sg26+sg27; sgRNA cut sites are indicated by orange
triangles). Deletions of three lines were pooled and analyzed together (n > 900 deletion events).
(B) Relative fold change of deletions detected in targeted full-length sequencing of cDNA between the L1 and L4 developmental stages. Deletions are classified
by their unique overlap with regions of interest. Non-seed, all nucleotides of the let-7 complementary sites, excluding themiRNA seed region (see Figure S4A for a
detailed diagram) (Wilcoxon rank-sum test; not significant [ns], p > 0.05; **p < 0.01; ***p < 0.001; ****p < 0.0001).
(C) Fraction of reads supporting deletions in bulk genomic DNA of consecutive generations relative to the first (F1) generation. Deletions from six samples were
pooled for this analysis (sg pool, sg15+sg16, and sg26+sg27, grown at 16�C and 24�C).(D) lin-41 mRNA levels in the let-7mutant allele let-7(n2853) and in lin-41 strains with deletions affecting site 1 or site 2 relative to wild-type levels, quantified by
qPCR. One experiment with 7,000 animals, 30 h into synchronized development at 24�C. Bars represent mean and error bars ± standard deviation.
(E) Phenotype of lin-41 site 1 and site 2 mutant strains compared with wild-type and let-7(n2853), 50 h into synchronized development at 24�C. Scale, 1 mm.
(F) Dead or burst animals 50 h into synchronized development at 24�C from three plates (n = 3), scoring 200 animals on each plate.
See also Figure S4.
Resourcell
OPEN ACCESS
Hunter et al., 2013). Weak but significant upregulation was
observed for deletions overlapping with the site 1 seed. We ob-
tained fewer deletions for the site 2 seed and, therefore, did not
have the statistical power to rule out a similar weak effect. As an
independent approach and to measure the effect of genotypes
with multiple deletions per animal, we used unsupervised clus-
tering of long cDNA reads using the k-mer content of reads to
obtain clusters representing similar genotypes. These data also
6 Cell Reports 35, 108988, April 13, 2021
suggest that RNA molecules transcribed from genotypes with
deletions overlapping both sites were detected with more reads
in L4-stage compared with L1-stage animals (see clusters 1–4,
7–8, and 11–13 in Figures S4D–S4F). Additionally, this analysis
revealed two other areas that affected mRNA in the opposite
way by increasing levels at the L1 stage or decreasing levels at
the L4 stage, which could be investigated further in the future
(see clusters 5 and 10 in Figure S4F).

Resourcell
OPEN ACCESS
To assign fitness to individual mutations in a controlled envi-
ronment, we established measurements on genotype abun-
dance over several generations. For this, we sampled genomic
DNA of consecutive generations. Disrupting let-7 regulation of
lin-41 mRNA is known to result in lethal developmental defects
(Brancati and Großhans, 2018; Ecsedi et al., 2015; Reinhart
et al., 2000; Slack et al., 2000; Zhang et al., 2015). We performed
this analysis starting at the F1 generation because mosaic ani-
mals would be expected to show a phenotype with a fitness
disadvantage. Deletions in the lin-41 30 UTR, which overlapped
both seeds, disappeared quickly from the population after one
generation (Figures 4C and S4G). Consistent with the effect on
RNA expression, deletions of both seeds were depleted
strongly, whereas deletions affecting either one of the two sites
alone were depleted only slightly compared with control dele-
tions not overlapping any features (‘‘none’’). This also indicated
that deletions with stronger effects were possibly already
missing in themRNA analysis we performed in the F2 generation.
Although deletion of both let-7 binding sites has been reported
to be lethal (Ecsedi et al., 2015), our results showed that dele-
tions of one site could be tolerated. We therefore created two
lines for each site with seed-disrupting deletions (Figure S4H).
We then compared lin-41 mRNA expression and phenotypes
of homozygous mutants with wild-type animals. To disrupt
both let-7 interactions simultaneously, we used the tempera-
ture-sensitive let-7(n2853) allele. At the L4 developmental stage,
lin-41 mRNA was upregulated around 8-fold in let-7(n2853),
around 3-fold in site 1 mutants, and around 1.5-fold in site 2 mu-
tants (Figure 4D). This could indicate that our high-throughput
bulk mRNA measurements were biased toward deletions with
smaller effects, possibly because of depletion of animals in the
F1 generation. At 50 h into synchronized, we quantified the lethal
phenotype that occurs by bursting when lin-41 regulation by let-
7 is disrupted. Adult animals with mutations in site 2 displayed a
normal wild-type phenotype, whereas site 1mutants were visibly
sick but laying eggs. Let-7 mutants were dead (Figure 4E). We
found that, although 98% of let-7 mutants were dead or had
burst, only 3% of site 1 and none of the site 2 mutants showed
this phenotype (Figure 4F).
Our results indicate that each of the two let-7 miRNA binding
sites can function on its own and that disruption of site 1 has a
stronger effect than disruption of site 2. Furthermore, sites might
be able to compensate for each other’s loss to some degree
because the effect of disrupting each site alone was weaker
than that of combined loss of both sites. We conclude that
parallel mutagenesis coupled with targeted RNA or DNA
sequencing can be used to directly analyze the function and in-
teractions of regulatory elements in vivo from large populations
in bulk.
Screening for functional regulatory sequences thatchange the morphological phenotypeNext, we wanted to directly map regulatory sequence variants to
phenotypic traits. This could be useful to discover functional
elements, provide starting points to study regulatory mecha-
nisms, and to explore phenotypic plasticity in animals. Such an
approach would also capture any functional sequences regard-
less of the type, time, or place of regulation. We targeted a pre-
dicted enhancer (Janes et al., 2018), three promoters, and all 30
UTRs of 8 genes andmanually screened 35,000 animals for each
of these regions (Table S1). Loss of function and reduction of
function of the screened genes are known to result in strong
organismal defects in animal movement and body shape (Unc,
Slu, Rol, and Dpy). We selected worms based on these pheno-
types and identified the causative mutations. Although we
screened for general defects in movement and body shape,
our approach was biased toward finding reduction- and loss-
of-function mutations. To determine which mutations were
initially present in the screened population, we performed tar-
geted sequencing on siblings (Figures 5A and S5A). Initially, we
isolated several mutants with large deletions (>500 bp) that
disrupted the coding sequence or the polyadenylation signal
(AATAAA) (Figures S5B and S5C). Similar large-scale, on-target
deletions have also been described in cell lines and mice (Adiku-
suma et al., 2018; Gasperini et al., 2017; Kosicki et al., 2018). We
also found large insertions (up to 250 bp) that originated from
within ±1 kb of the targeted region or from loci on other chromo-
somes (Figures S5B and S5C). We found such large indels in 5 of
8 screened genes, demonstrating that, for these genes, our
screen was sensitive enough to detect animals with affected
phenotypes (Table S2).
From the screen, we isolated 57 alleles for 3 genes (egl-30,
sqt-2, and sqt-3) and none for the other 5 genes (dpy-2, dpy-
10, rol-6, unc-26, and unc-54) (Table S2). All alleles showed
phenotypic defects described previously for a reduction of func-
tion of the affected genes. Deletions, insertions, and complex
mutations (combination of insertions and deletions) were repre-
sented equally among isolates (Figure S5D). The observed
phenotypic traits showed complete penetrance, and we scored
their expression, which differed between mutations. We found
that several mutations in the 30 UTR of egl-30 resulted in the
Sluggish (Slu) phenotype, which is characterized by slow move-
ment. In 7 of 11 mutants, a region around 100 bp downstream of
the stop codon was affected, and the smallest deletion was 6 bp
(Figures 5B and S5F).We foundmutations overlapping a putative
sqt-2 enhancer predicted from chromatin accessibility profiling
(Janes et al., 2018) with a Roller (Rol) phenotype, where animals
rotate around their body axis and move in circles (Figure S5E).
This was the only region for which penetrance varied between
different mutations. We also targeted sqt-3, a gene associated
with three distinct morphological traits (Dpy, Rol, and Lon)
(Cox et al., 1980; Kusch and Edgar, 1986). 13 mutations up-
stream of sqt-3 likely affected transcriptional initiation, with 11
of 13 overlapping the predicted TATA box (Figure 5C). In line
with the Rol phenotype, which indicates a reduction of function,
pre-mRNA and mRNA levels were reduced to around half (Fig-
ure S5I). This suggests that sqt-3 transcription partially tolerates
removal of this core promoter element.
The 26 other isolated sqt-3 alleles were 30 UTR mutations.
Almost all (25 of 26) were insertions or insertions combined
with deletions, originating at sg2 (Figure 5D). The only deletion
overlapped with a canonical polyadenylation signal (AATAAA).
We knew from sequencing siblings that sg2 was very efficient
(�25%) and that various deletions covering the 30 UTRwere pre-
sent in our samples. We therefore isolated 13 distinct non-Rol
mutants using direct PCR screening (Figures S5G). Despite
Cell Reports 35, 108988, April 13, 2021 7

Figure 5. Screening for functional regulatory sequences using morphological phenotypes
Shown are genotypes of strains that were isolated according to phenotypic traits after targeting regulatory regions. Phenotypes showed complete penetrance (n
> 300 animals), and expression was scored as indicated by +, ++, or +++ (n > 300 animals).
(A) Outline of the screen. 8 genes were targeted by pools of 2–6 sgRNAs in different regulatory regions (some enhancer, promoter, all 30 UTRs), resulting in 21
samples. 35,000 F2 animals were screened manually for morphological traits.
(B) Eleven mutations along the egl-30 30 UTR that show slight or strong Sluggish (Slu) phenotypes. No canonical polyadenylation signal could be found.
(C) Thirteen mutations upstream of sqt-3 that show a Roller (Rol) phenotype.
(D) Mutations in the sqt-3 30 UTR that show a Rol phenotype or are tolerated (non-Rol). ‘‘poly(A)’’ indicates the canonical polyadenylation signal AATAAA.
(E) Fifteen mutations, mostly deletions, that suppressed the Rol phenotype of one insertion allele sqt-3(ins). Black bars at the bottom, uncovered compensatory
interaction.
See also Figure S5.
Resourcell
OPEN ACCESS
containing indels originating at the efficient sg2, these animals
showed the wild-type non-Rol trait (Figure 5E). We did follow-
up experiments with one of the 25 insertion alleles, sqt-3(ins),
and determined that mRNA levels were reduced post-transcrip-
tionally to around 50% (Figure S5H and S5I). Because deletions
and some insertions in this region were well tolerated (non-Rol),
we concluded that the isolated Rol mutations likely resulted from
a gain of repressive sequence that led to the observed reduction
of mRNA. The poly(A) mutant sqt-3(polyA), for which mRNA
levels were reduced equally to 50%, showed a weaker Rol
phenotype than sqt-3(ins) with only slight bending of the head
(Figures 5D, S5I, and S5J). This suggests that in addition to
mRNA downregulation, other mechanisms might further reduce
protein output in sqt-3(ins).
To define the repressive sequence elements in sqt-3(ins), we
targeted the inserted sequence with several sgRNAs and
screened for revertants, in which the wild-type non-Rol trait
was restored by intragenic suppressor mutations. 12 of 13 rever-
tants contained deletions overlapping the insertion, with the
smallest being 5 bp (Figure 5F). A restored wild-type trait likely
resulted from restored expression levels. Indeed, mRNA levels
in two independent revertants were restored to normal (Fig-
8 Cell Reports 35, 108988, April 13, 2021
ure S5L). Overall, the predicted RNA secondary structures did
not change, suggesting that other factors caused the Rol pheno-
type of sqt-3(ins) (Figure S5M). Finally, wewanted to test whether
the repressive sequence could function in other genes. We per-
formed sequence transplantations into the 30 UTR of dpy-10 and
unc-22, of which only unc-22 showed the characteristic reduc-
tion-of-function Twitcher phenotype (Figure S5N). These results
indicated that the repressive sequence might also function in
other contexts, but more experiments would be needed to test
this thoroughly.
To discover other interacting regulatory sequences, we
included sgRNAs for the remaining 30 UTR and isolated non-
Rol revertants that contained intragenic suppressor mutations.
This revealed a compensatory deletion upstream of the insertion
that was able to revert the Rol phenotype. We isolated two addi-
tional alleles after using sgRNAs specific for this region (Figures
5F and S5K). Surprisingly, mRNA levels were not restored (Fig-
ure S5L). This points to an alternative mechanism of restored
protein function; for example, affecting translation or mRNA
localization.
Overall, these results demonstrate that parallel genetics and
selectionbyphenotypecanbeused tofind functional sequences,

Resourcell
OPEN ACCESS
isolate a variety of mutant genotypes for follow-up studies, and
discover unexpected intragenic regulatory interactions in vivo.
DISCUSSION
In this study, we developed a general approach for parallel ge-
netics of regulatory sequences in vivo, using inducible expres-
sion of a CRISPR nuclease and multiplexed sgRNAs. Large
‘‘diversified’’ populations can then be used for comprehensive
analysis using deep sequencing and for selection by phenotypic
traits or reporter expression. This allows directly linking regulato-
ry genotypeswith phenotypes.We demonstrate this in themodel
organism C. elegans but believe that it could be similarly appli-
cable in other animals that allow transgenesis and inducible
expression of genome editors.
As we show, sgRNA efficiencies around 1.5% are sufficient to
analyze effects of mutations on gene regulation and phenotype
when coupled with deep sequencing and manual or automated
selection of animals from large populations. However, higher ef-
ficiency would be desired for improved comprehensive testing.
This could already be achieved with available improved expres-
sion systems (Aljohani et al., 2020; Nance and Frøkjær-Jensen,
2019). Alternative induction systems could enable continuous
and germline-specific Cas9 expression to further increase effi-
ciency and allow directed evolution experiments (Nance and
Frøkjær-Jensen, 2019; Zhang et al., 2015). Our method only
works at nucleotide resolution close to the sgRNA cut sites. To
allow denser tiling of regions with mutations, CRISPR nucleases
with alternative or dispensable PAM requirements could be used
(Anzalone et al., 2020; Chatterjee et al., 2020; Walton et al.,
2020). Although indels are applicable to regulatory regions and
even coding sequences (He et al., 2019; Sher et al., 2019; Shi
et al., 2015), point mutagenesis would enable fine mapping of
regulatory nucleotides and coding sequences. This exciting pos-
sibility could be realized by implementing hyperactive base edi-
tors (Chen et al., 2019a; Hess et al., 2016; Li et al., 2020;Ma et al.,
2016) or programmable in situ production of single-stranded
DNA templates from sgRNAs (Anzalone et al., 2019; Sharon
et al., 2018). Alternatives to CRISPR-Cas could be developed
based on inducible recombinase-mediated cassette exchange
(Hubbard, 2014; Macıas-Leon and Askjaer, 2018; Nonet, 2020)
or transposon-mediated single-copy insertion (Frøkjær-Jensen
et al., 2012, 2014) to integrate variant libraries in parallel. Target-
ing several independent loci in one step might be applied to
screen candidate regulatory elements (for example, miRNA tar-
gets or enhancers), to screen genes from networks or pathways,
or for synthetic co-evolution of several loci (Simon et al., 2019).
Our targeted sequencing protocol can capture long deletions,
uses the same amplicon for the whole locus, and allows sample
multiplexing. Unique molecule-counting methods for long reads
should be incorporated to reduce PCR bias (Karst et al., 2021;
McCoy et al., 2014). Established protocols are available for
shorter (100- to 300-bp) target regions (Chen et al., 2019b). We
assumed that each animal in bulk samples contributed equally
to the extracted genomic DNA. In the future, animal barcoding
to determine genotypes of individuals could be added, with
plate-based or split-pool methods (Cao et al., 2017; Rosenberg
et al., 2018).
Indel data from high-throughput genome editing in human
cells has led to insights into dsDNA break repair outcomes (Al-
len et al., 2018; Chakrabarti et al., 2019; Chen et al., 2019b; Lee-
nay et al., 2019; Shen et al., 2018; Shou et al., 2018). We found
longer indels and fewer 1-nt templated insertions in our data.
This can likely be explained by a higher activity of microhomol-
ogy-mediated end joining (MMEJ), which uses 5- to 25-bp
microhomologies and has been reported as the main dsDNA
break repair pathway in C. elegans (van Schendel et al.,
2015). Mutations typical for MMEJ have been implicated in dis-
eases (Schimmel et al., 2019), and our approach to produce
deep mutation profiles could be used to study mechanisms of
MMEJ in the germline.
Gain or loss of regulatory sequences is important for determi-
nation and evolution of phenotypes (Davidson, 2010; Wittkopp
and Kalay, 2011; Wray et al., 2003). Mutational effect can be
modeled as a gradual process by single-nucleotide changes
(Chen and Rajewsky, 2007; Hardison and Taylor, 2012; Romero
et al., 2012; Wittkopp and Kalay, 2011; Wray, 2007; Wray et al.,
2003). However, although indels occur less often, their effects
can be more severe. We found that insertions contained se-
quences surrounding the dsDNA break, mainly in the same
orientation. Such local duplications could have particular strong
consequences when functional sequences are multiplied.
Using targeted RNA and DNA sequencing in bulk populations,
we quantified the effect of lin-41 30 UTR deletions on mRNA
expression and fitness effect. High-throughput methods to
determine single-animal genotypes could improve statistical po-
wer, and single-cell RNA sequencing could be used to detect
cell-type- or tissue-specific effects. We found that each let-7
site could function on its own. In contrast, previous studies
had concluded that one binding site could not function alone
to repress an extra-chromosomal LacZ protein reporter (Vella
et al., 2004a) or tested only multiple copies of each site (Long
et al., 2007; Vella et al., 2004b). We found a stronger effect on
mRNA regulation and phenotype when disrupting let-7 binding
site 1 compared with site 2. Supporting this, site 1 has a longer
seed pairing (8 nt) than site 2 (6 nt and a G-U pair) and was
covered with more reads in an in vivo miRNA proximity ligation
approach (Broughton et al., 2016). Surprisingly, site 2 mutants
did not show any obviousmorphological defects or a bursting/le-
thal phenotype. Future studies could investigate the detailed
function of each site and possible compensatory mechanisms.
Our screen for sequences that affect phenotypic traits doubles
the regulatory alleles registered at Wormbase in the last 40 years
(Harris et al., 2020). Our approach can be applied to isolate ani-
mals with altered expression and phenotypic traits, which is use-
ful to identify functional sequences and study the regulation of
animal phenotype. Our results also highlight the possibility of un-
covering unexpected intragenic regulatory interactions using
readout of phenotype. Because of the mutagenesis efficiency
and because we screened for strong phenotypes, we did not
saturate and likely missed many mutations. To determine
comprehensively which mutations are tolerated by a locus,
even higher efficiencies would be needed.
We believe that the approaches presented here will help with
understanding how gene-regulatory logic and mechanisms
affect phenotypes in vivo.
Cell Reports 35, 108988, April 13, 2021 9

Resourcell
OPEN ACCESS
STAR+METHODS
Detailed methods are provided in the online version of this paper
and include the following:
d KEY RESOURCES TABLE
d RESOURCE AVAILABILITY
B Lead contact
B Materials availability
B Data and code availability
d EXPERIMENTAL MODEL AND SUBJECT DETAILS
B Caenorhabditis elegans
d METHOD DETAILS
B Plasmid construction
B sgRNA design
B Generation of transgenic C. elegans
B C-terminal GFP knock-in of his-72
B Biosorter
B Small-scale Cas9 induction and time course
B Developmental synchronization
B Large-scale Cas9 heat shock induction
B Genomic DNA extraction
B DNA long amplicon sequencing
B The crispr-DART software
B Steps of the crispr-DART software
B Browser shots
B sgRNA efficiency comparisons
B Indel characteristics
B Genotype diversity
B Targeted mRNA sequencing, lin-41
B RNA analysis of lin-41 30 UTR deletions
B RNA analysis by unsupervised clustering of long reads
B DNA sampling over generations, lin-41
B Fitness analysis of lin-41 30 UTR deletions
B Lin-41 strains with site1 or site2 deletions
B Screen for regulatory sequences by phenotype
B PCR Genotyping
B Sqt-3 mRNA quantifications by Nanostring or qPCR
B Transplantations into dpy-10, unc-22 30 UTRsd QUANTIFICATION AND STATISTICAL ANALYSIS
SUPPLEMENTAL INFORMATION
Supplemental information can be found online at https://doi.org/10.1016/j.
celrep.2021.108988.
ACKNOWLEDGMENTS
Weare very grateful to Baris Tursun and Luisa Cochella for in-depth comments
and discussion. We thank David Koppstein and the Rajewsky and Akalin labs
for helpful feedback and discussions and Claudia Quedenau, Daniele Franze,
the sequencing facility for Pacbio sequencing, Sergej Herzog, and Salah
Ayoub for technical assistance. For sharing plasmids and strains, we thank
Jo~ao Ramalho, Mike Boxem, Jason Chin, Christian Frøkjaer-Jensen, Erik Jor-
gensen, Daniel Dickinson, Bob Goldstein, and the Caenorhabditis Genetics
Center (CGC), funded by the NIH Office of Research Infrastructure Programs
P40 OD010440. B.U. acknowledges funding from the German Federal Ministry
of Education andResearch (BMBF) as part of the RNABioinformatics Center of
the German Network for Bioinformatics Infrastructure (de.NBI; 031 A538C
RBC). J.J.F. was supported by funding from the German Research Foundation
(DFG; RA 838/5-1 and RA 838/11-1). Part of this work was supported by the
10 Cell Reports 35, 108988, April 13, 2021
Leibniz Prize of the German Research Foundation awarded to N.R. (DFG;
RA 838/5-1)
AUTHOR CONTRIBUTIONS
J.J.F. andN.R. developed concepts andmethodology and discussed the data.
J.J.F. and B.U. performed validation, formal analysis, curation, and visualiza-
tion of data. B.U. wrote the software with input from J.J.F. and A.A., and P.G.
contributed to the software. J.J.F., M.H., and K.T. performed investigations
and experimental work. J.J.F. and N.R. assembled figures, wrote the original
draft, and revised the manuscript. J.J.F., B.U., A.A., and N.R. reviewed and
edited the manuscript. A.A. and N.R. contributed resources, supervision, proj-
ect administration, and funding acquisition.
DECLARATION OF INTERESTS
The authors declare no competing interests.
Received: August 24, 2020
Revised: January 13, 2021
Accepted: March 23, 2021
Published: April 13, 2021
REFERENCES
Abbott, A.L., Alvarez-Saavedra, E., Miska, E.A., Lau, N.C., Bartel, D.P., Hor-
vitz, H.R., and Ambros, V. (2005). The let-7 MicroRNA family members mir-
48, mir-84, and mir-241 function together to regulate developmental timing
in Caenorhabditis elegans. Dev. Cell 9, 403–414.
Adikusuma, F., Piltz, S., Corbett, M.A., Turvey, M., McColl, S.R., Helbig, K.J.,
Beard, M.R., Hughes, J., Pomerantz, R.T., and Thomas, P.Q. (2018). Large de-
letions induced by Cas9 cleavage. Nature 560, E8–E9.
Aeschimann, F., Kumari, P., Bartake, H., Gaidatzis, D., Xu, L., Ciosk, R., and
Großhans, H. (2017). LIN41 Post-transcriptionally Silences mRNAs by Two
Distinct and Position-Dependent Mechanisms. Mol. Cell 65, 476–489.e4.
Aljohani, M.D., El Mouridi, S., Priyadarshini, M., Vargas-Velazquez, A.M., and
Frøkjær-Jensen, C. (2020). Engineering rules that minimize germline silencing
of transgenes in simple extrachromosomal arrays in C. elegans. Nat. Commun.
11, 6300.
Allen, F., Crepaldi, L., Alsinet, C., Strong, A.J., Kleshchevnikov, V., De Angeli,
P., Palenıkova, P., Khodak, A., Kiselev, V., Kosicki, M., et al. (2018). Predicting
the mutations generated by repair of Cas9-induced double-strand breaks.
Nat. Biotechnol. 37, 64–72.
Anzalone, A.V., Randolph, P.B., Davis, J.R., Sousa, A.A., Koblan, L.W., Levy,
J.M., Chen, P.J., Wilson, C., Newby, G.A., Raguram, A., and Liu, D.R.
(2019). Search-and-replace genome editing without double-strand breaks or
donor DNA. Nature 576, 149–157.
Anzalone, A.V., Koblan, L.W., and Liu, D.R. (2020). Genome editing with
CRISPR-Cas nucleases, base editors, transposases and prime. Nat. Bio-
technol. 38, 824–844.
Bagga, S., Bracht, J., Hunter, S., Massirer, K., Holtz, J., Eachus, R., and Pas-
quinelli, A.E. (2005). Regulation by let-7 and lin-4 miRNAs results in target
mRNA degradation. Cell 122, 553–563.
Barrangou, R., and Doudna, J.A. (2016). Applications of CRISPR technologies
in research and beyond. Nat. Biotechnol. 34, 933–941.
Brancati, G., and Großhans, H. (2018). An interplay of miRNA abundance and
target site architecture determines miRNA activity and specificity. Nucleic
Acids Res. 46, 3259–3269.
Brenner, S. (1974). The genetics of Caenorhabditis elegans. Genetics 77,
71–94.
Broughton, J.P., Lovci, M.T., Huang, J.L., Yeo, G.W., and Pasquinelli, A.E.
(2016). Pairing beyond the Seed Supports MicroRNA Targeting Specificity.
Mol. Cell 64, 320–333.

Resourcell
OPEN ACCESS
Burga, A., and Lehner, B. (2012). Beyond genotype to phenotype: why the
phenotype of an individual cannot always be predicted from their genome
sequence and the environment that they experience. FEBS J. 279, 3765–3775.
Bushnell, B. (2014). BBMap: A Fast, Accurate, Splice-Aware Aligner (Lawrence
Berkeley National Laboratory. LBNL Report LBNL-7065E). https://jgi.doe.gov/
wp-content/uploads/2013/11/BB_User-Meeting-2014-poster-FINAL.pdf.
Canver, M.C., Smith, E.C., Sher, F., Pinello, L., Sanjana, N.E., Shalem, O.,
Chen, D.D., Schupp, P.G., Vinjamur, D.S., Garcia, S.P., et al. (2015).
BCL11A enhancer dissection by Cas9-mediated in situ saturating mutagen-
esis. Nature 527, 192–197.
Cao, J., Packer, J.S., Ramani, V., Cusanovich, D.A., Huynh, C., Daza, R., Qiu,
X., Lee, C., Furlan, S.N., Steemers, F.J., et al. (2017). Comprehensive single-
cell transcriptional profiling of a multicellular organism. Science 357, 661–667.
Chakrabarti, A.M., Henser-Brownhill, T., Monserrat, J., Poetsch, A.R., Lus-
combe, N.M., and Scaffidi, P. (2019). Target-Specific Precision of CRISPR-
Mediated Genome Editing. Mol. Cell 73, 699–713.e6.
Chatterjee, P., Jakimo, N., Lee, J., Amrani, N., Rodrıguez, T., Koseki, S.R.T.,
Tysinger, E., Qing, R., Hao, S., Sontheimer, E.J., et al. (2020). An engineered
ScCas9 with broad PAM range and high specificity and activity. Nat. Bio-
technol. 38, 1154–1158.
Chen, K., and Rajewsky, N. (2007). The evolution of gene regulation by tran-
scription factors and microRNAs. Nat. Rev. Genet. 8, 93–103.
Chen, H., Liu, S., Padula, S., Lesman, D., Griswold, K., Lin, A., Zhao, T.,
Marshall, J.L., and Chen, F. (2019a). Efficient, continuous mutagenesis in hu-
man cells using a pseudo-random DNA. Nat. Biotechnol. 38, 165–168.
Chen, W., McKenna, A., Schreiber, J., Haeussler, M., Yin, Y., Agarwal, V., No-
ble, W.S., and Shendure, J. (2019b). Massively parallel profiling and predictive
modeling of the outcomes of CRISPR/Cas9-mediated double-strand break
repair. Nucleic Acids Res. 47, 7989–8003.
Collins, R.L., Brand, H., Karczewski, K.J., Zhao, X., Alfoldi, J., Francioli, L.C.,
Khera, A.V., Lowther, C., Gauthier, L.D., Wang, H., et al.; Genome Aggregation
Database Production Team; Genome Aggregation Database Consortium
(2020). A structural variation reference for medical and population genetics.
Nature 581, 444–451.
Cox, G.N., Laufer, J.S., Kusch,M., and Edgar, R.S. (1980). Genetic and Pheno-
typic Characterization of Roller Mutants of CAENORHABDITIS ELEGANS. Ge-
netics 95, 317–339.
Davidson, E.H. (2010). The Regulatory Genome: Gene Regulatory Networks in
Development And Evolution (Elsevier).
DePristo, M.A., Banks, E., Poplin, R., Garimella, K.V., Maguire, J.R., Hartl, C.,
Philippakis, A.A., del Angel, G., Rivas, M.A., Hanna, M., et al. (2011). A frame-
work for variation discovery and genotyping using next-generation DNA
sequencing data. Nat. Genet. 43, 491–498.
Diag, A., Schilling, M., Klironomos, F., Ayoub, S., and Rajewsky, N. (2018).
Spatiotemporal m(i)RNA Architecture and 30 UTR Regulation in the C. elegans
Germline. Dev. Cell 47, 785–800.e8.
Dickinson, D.J., Pani, A.M., Heppert, J.K., Higgins, C.D., and Goldstein, B.
(2015). Streamlined Genome Engineering with a Self-Excising Drug Selection
Cassette. Genetics 200, 1035–1049.
Dominguez, D., Freese, P., Alexis, M.S., Su, A., Hochman, M., Palden, T., Ba-
zile, C., Lambert, N.J., Van Nostrand, E.L., Pratt, G.A., et al. (2018). Sequence,
Structure, and Context Preferences of Human RNA Binding Proteins. Mol. Cell
70, 854–867.e9.
Ecsedi, M., Rausch, M., and Großhans, H. (2015). The let-7 microRNA directs
vulval development through a single target. Dev. Cell 32, 335–344.
Ewels, P., Magnusson, M., Lundin, S., and Kaller, M. (2016). MultiQC: summa-
rize analysis results for multiple tools and samples in a single report. Bioinfor-
matics 32, 3047–3048.
Farboud, B., and Meyer, B.J. (2015). Dramatic Enhancement of Genome Edit-
ing by CRISPR/Cas9 Through Improved Guide RNA Design. Genetics 199,
959–971.
Farley, E.K., Olson, K.M., Zhang, W., Brandt, A.J., Rokhsar, D.S., and Levine,
M.S. (2015). Suboptimization of developmental enhancers. Science 350,
325–328.
Fatt, H.V., and Dougherty, E.C. (1963). Genetic Control of Differential Heat
Tolerance in Two Strains of the Nematode Caenorhabditis elegans. Science
141, 266–267.
Findlay, G.M., Boyle, E.A., Hause, R.J., Klein, J.C., and Shendure, J. (2014).
Saturation editing of genomic regions by multiplex homology-directed repair.
Nature 513, 120–123.
Friedland, A.E., Tzur, Y.B., Esvelt, K.M., Colaiacovo, M.P., Church, G.M., and
Calarco, J.A. (2013). Heritable genome editing in C. elegans via a CRISPR-
Cas9 system. Nat. Methods 10, 741–743.
Frøkjaer-Jensen, C., Davis, M.W., Hopkins, C.E., Newman, B.J., Thummel,
J.M., Olesen, S.-P., Grunnet, M., and Jorgensen, E.M. (2008). Single-copy
insertion of transgenes in Caenorhabditis elegans. Nat. Genet. 40, 1375–1383.
Frøkjær-Jensen, C., Davis, M.W., Ailion, M., and Jorgensen, E.M. (2012).
Improved Mos1-mediated transgenesis in C. elegans. Nat. Methods 9,
117–118.
Frøkjær-Jensen, C., Davis, M.W., Sarov, M., Taylor, J., Flibotte, S., LaBella, M.,
Pozniakovsky, A., Moerman, D.G., and Jorgensen, E.M. (2014). Random and
targeted transgene insertion in Caenorhabditis elegans using a modified
Mos1 transposon. Nat. Methods 11, 529–534.
Fuqua, T., Jordan, J., van Breugel, M.E., Halavatyi, A., Tischer, C., Polidoro, P.,
Abe, N., Tsai, A., Mann, R.S., Stern, D.L., and Crocker, J. (2020). Dense and
pleiotropic regulatory information in a developmental enhancer. Nature 587,
235–239.
Gasperini, M., Starita, L., and Shendure, J. (2016). The power of multiplexed
functional analysis of genetic variants. Nat. Protoc. 11, 1782–1787.
Gasperini, M., Findlay, G.M., McKenna, A., Milbank, J.H., Lee, C., Zhang,
M.D., Cusanovich, D.A., and Shendure, J. (2017). CRISPR/Cas9-Mediated
Scanning for Regulatory Elements Required for HPRT1 Expression via Thou-
sands of Large, Programmed Genomic Deletions. Am. J. Hum. Genet. 101,
192–205.
Gibson, D.G., Young, L., Chuang, R.-Y., Venter, J.C., Hutchison, C.A., 3rd, and
Smith, H.O. (2009). Enzymatic assembly of DNA molecules up to several hun-
dred kilobases. Nat. Methods 6, 343–345.
Haeussler, M., Schonig, K., Eckert, H., Eschstruth, A., Mianne, J., Renaud,
J.-B., Schneider-Maunoury, S., Shkumatava, A., Teboul, L., Kent, J., et al.
(2016). Evaluation of off-target and on-target scoring algorithms and integra-
tion into the guide RNA selection tool CRISPOR. Genome Biol. 17, 148.
Hardison, R.C., and Taylor, J. (2012). Genomic approaches towards finding
cis-regulatory modules in animals. Nat. Rev. Genet. 13, 469–483.
Harris, T.W., Arnaboldi, V., Cain, S., Chan, J., Chen, W.J., Cho, J., Davis, P.,
Gao, S., Grove, C.A., Kishore, R., et al. (2020).WormBase: amodernModel Or-
ganism Information Resource. Nucleic Acids Res. 48 (D1), D762–D767.
He,W., Zhang, L., Villarreal, O.D., Fu, R., Bedford, E., Dou, J., Patel, A.Y., Bed-
ford, M.T., Shi, X., Chen, T., et al. (2019). De novo identification of essential
protein domains from CRISPR-Cas9 tiling-sgRNA knockout screens. Nat.
Commun. 10, 4541.
Heigwer, F., Kerr, G., and Boutros, M. (2014). E-CRISP: fast CRISPR target site
identification. Nat. Methods 11, 122–123.
Hess, G.T., Fresard, L., Han, K., Lee, C.H., Li, A., Cimprich, K.A., Montgomery,
S.B., and Bassik, M.C. (2016). Directed evolution using dCas9-targeted so-
matic hypermutation in mammalian cells. Nat. Methods 13, 1036–1042.
Hornblad, A., Bastide, S., Langenfeld, K., Langa, F., and Spitz, F. (2021).
Dissection of the Fgf8 regulatory landscape by in vivo CRISPR-editing reveals
extensive inter- and intra-enhancer redundancy. Nat. Commun. 12, 439.
Hubbard, E.J.A. (2014). FLP/FRT and Cre/lox recombination technology in C.
elegans. Methods 68, 417–424.
Hunter, S.E., Finnegan, E.F., Zisoulis, D.G., Lovci, M.T., Melnik-Martinez, K.V.,
Yeo, G.W., and Pasquinelli, A.E. (2013). Functional genomic analysis of the let-
7 regulatory network in Caenorhabditis elegans. PLoS Genet. 9, e1003353.
Cell Reports 35, 108988, April 13, 2021 11

Resourcell
OPEN ACCESS
Janes, J., Dong, Y., Schoof, M., Serizay, J., Appert, A., Cerrato, C., Woodbury,
C., Chen, R., Gemma, C., Huang, N., et al. (2018). Chromatin accessibility dy-
namics across C. elegans development and ageing. eLife 7, e37344.
Jankowsky, E., and Harris, M.E. (2015). Specificity and nonspecificity in RNA-
protein interactions. Nat. Rev. Mol. Cell Biol. 16, 533–544.
Karst, S.M., Ziels, R.M., Kirkegaard, R.H., Sørensen, E.A., McDonald, D., Zhu,
Q., Knight, R., and Albertsen, M. (2021). High-accuracy long-read amplicon
sequences using unique molecular identifiers with Nanopore or PacBio
sequencing. Nat. Methods 18, 165–169.
Kent,W.J., Sugnet, C.W., Furey, T.S., Roskin, K.M., Pringle, T.H., Zahler, A.M.,
and Haussler, D. (2002). The human genome browser at UCSC. Genome Res.
12, 996–1006.
Konrad, A., Brady, M.J., Bergthorsson, U., and Katju, V. (2019). Mutational
Landscape of Spontaneous Base Substitutions and Small Indels in Experi-
mental Caenorhabditis elegans Populations of Differing Size. Genetics 212,
837–854.
Kontarakis, Z., and Stainier, D.Y.R. (2020). Genetics in Light of Transcriptional
Adaptation. Trends Genet. 36, 926–935.
Kosicki, M., Tomberg, K., and Bradley, A. (2018). Repair of double-strand
breaks induced by CRISPR-Cas9 leads to large deletions and complex rear-
rangements. Nat. Biotechnol. 36, 765–771.
Koster, J., and Rahmann, S. (2012). Snakemake–a scalable bioinformatics
workflow engine. Bioinformatics 28, 2520–2522.
Kusch, M., and Edgar, R.S. (1986). Genetic studies of unusual loci that affect
body shape of the nematode Caenorhabditis elegans andmay code for cuticle
structural proteins. Genetics 113, 621–639.
Kvon, E.Z., Zhu, Y., Kelman, G., Novak, C.S., Plajzer-Frick, I., Kato, M., Garvin,
T.H., Pham, Q., Harrington, A.N., Hunter, R.D., et al. (2020). Comprehensive
In Vivo Interrogation Reveals Phenotypic Impact of Human Enhancer Variants.
Cell 180, 1262–1271.e15.
Labi, V., Peng, S., Klironomos, F., Munschauer, M., Kastelic, N., Chakraborty,
T., Schoeler, K., Derudder, E., Martella, M., Mastrobuoni, G., et al. (2019).
Context-specific regulation of cell survival by a miRNA-controlled BIM rheo-
stat. Genes Dev. 33, 1673–1687.
Lawrence, M., Huber, W., Pages, H., Aboyoun, P., Carlson, M., Gentleman, R.,
Morgan, M.T., and Carey, V.J. (2013). Software for computing and annotating
genomic ranges. PLoS Comput. Biol. 9, e1003118.
Leenay, R.T., Aghazadeh, A., Hiatt, J., Tse, D., Roth, T.L., Apathy, R., Shifrut,
E., Hultquist, J.F., Krogan, N., Wu, Z., et al. (2019). Large dataset enables pre-
diction of repair after CRISPR-Cas9 editing in primary T cells. Nat. Biotechnol.
37, 1034–1037.
Levo, M., and Segal, E. (2014). In pursuit of design principles of regulatory se-
quences. Nat. Rev. Genet. 15, 453–468.
Li, C., Zhang, R., Meng, X., Chen, S., Zong, Y., Lu, C., Qiu, J.-L., Chen, Y.-H.,
Li, J., and Gao, C. (2020). Targeted, random mutagenesis of plant genes with
dual cytosine and adenine base. Nat. Biotechnol. 38, 875–882.
Long, D., Lee, R., Williams, P., Chan, C.Y., Ambros, V., and Ding, Y. (2007).
Potent effect of target structure on microRNA function. Nat. Struct. Mol.
Biol. 14, 287–294.
Long, H.K., Prescott, S.L., and Wysocka, J. (2016). Ever-Changing Land-
scapes: Transcriptional Enhancers in Development and Evolution. Cell 167,
1170–1187.
Ma, Y., Zhang, J., Yin, W., Zhang, Z., Song, Y., and Chang, X. (2016). Targeted
AID-mediated mutagenesis (TAM) enables efficient genomic diversification in
mammalian cells. Nat. Methods 13, 1029–1035.
Macıas-Leon, J., and Askjaer, P. (2018). Efficient FLP-mediated germ-line
recombination in C. elegans (MicroPublication Biology).
Macneil, L.T., and Walhout, A.J.M. (2011). Gene regulatory networks and the
role of robustness and stochasticity in the control of gene expression. Genome
Res. 21, 645–657.
McCoy, R.C., Taylor, R.W., Blauwkamp, T.A., Kelley, J.L., Kertesz, M., Push-
karev, D., Petrov, D.A., and Fiston-Lavier, A.-S. (2014). Illumina TruSeq syn-
12 Cell Reports 35, 108988, April 13, 2021
thetic long-reads empower de novo assembly and resolve complex, highly-re-
petitive transposable elements. PLoS ONE 9, e106689.
Mello, C., and Fire, A. (1995). DNA transformation. Methods Cell Biol. 48,
451–482.
Morgan, M., Pages, H., Obenchain, V., and Hayden, N. (2020). Rsamtools:
Binary alignment (BAM), FASTA, variant call (BCF), and tabix file import
(Bioconductor version Release 3.12). R package version 2.6.0. https://
bioconductor.org/packages/Rsamtools.
Nance, J., and Frøkjær-Jensen, C. (2019). The Caenorhabditis elegans Trans-
genic Toolbox. Genetics 212, 959–990.
Nonet, M.L. (2020). Efficient Transgenesis inCaenorhabditis elegansUsing Flp
Recombinase-Mediated Cassette Exchange. Genetics 215, 903–921.
Pages, H., Aboyoun, P., Gentleman, R., and DebRoy, S. (2020). Biostrings:
Efficient manipulation of biological strings. R package version 2.58.0.
https://bioconductor.org/packages/Biostrings.
Rabani, M., Pieper, L., Chew, G.-L., and Schier, A.F. (2017). A Massively Par-
allel Reporter Assay of 30 UTR Sequences Identifies In Vivo Rules for mRNA
Degradation. Mol. Cell 68, 1083–1094.e5.
Radman, I., Greiss, S., and Chin, J.W. (2013). Efficient and rapid C. elegans
transgenesis by bombardment and hygromycin B selection. PLoS ONE 8,
e76019.
Reinhart, B.J., Slack, F.J., Basson, M., Pasquinelli, A.E., Bettinger, J.C., Roug-
vie, A.E., Horvitz, H.R., and Ruvkun, G. (2000). The 21-nucleotide let-7 RNA
regulates developmental timing in Caenorhabditis elegans. Nature 403,
901–906.
Robinson, J.T., Thorvaldsdottir, H., Winckler, W., Guttman, M., Lander, E.S.,
Getz, G., and Mesirov, J.P. (2011). Integrative genomics viewer. Nat. Bio-
technol. 29, 24–26.
Romero, I.G., Ruvinsky, I., and Gilad, Y. (2012). Comparative studies of gene
expression and the evolution of gene regulation. Nat. Rev. Genet. 13, 505–516.
Rosenberg, A.B., Roco, C.M., Muscat, R.A., Kuchina, A., Sample, P., Yao, Z.,
Graybuck, L.T., Peeler, D.J., Mukherjee, S., Chen, W., et al. (2018). Single-cell
profiling of the developing mouse brain and spinal cord with split-pool barcod-
ing. Science 360, 176–182.
Schimmel, J., van Schendel, R., den Dunnen, J.T., and Tijsterman, M. (2019).
Templated Insertions: A Smoking Gun for Polymerase Theta-Mediated End
Joining. Trends Genet. 35, 632–644.
Sharon, E., Chen, S.-A.A., Khosla, N.M., Smith, J.D., Pritchard, J.K., and
Fraser, H.B. (2018). Functional Genetic Variants Revealed by Massively Paral-
lel Precise Genome Editing. Cell 175, 544–557.e16.
Shen, M.W., Arbab, M., Hsu, J.Y., Worstell, D., Culbertson, S.J., Krabbe, O.,
Cassa, C.A., Liu, D.R., Gifford, D.K., and Sherwood, R.I. (2018). Predictable
and precise template-free CRISPR editing of pathogenic variants. Nature
563, 646–651.
Shendure, J., and Fields, S. (2016). Massively Parallel Genetics. Genetics 203,
617–619.
Sher, F., Hossain, M., Seruggia, D., Schoonenberg, V.A.C., Yao, Q., Cifani, P.,
Dassama, L.M.K., Cole, M.A., Ren, C., Vinjamur, D.S., et al. (2019). Rational
targeting of a NuRD subcomplex guided by comprehensive in situ mutagen-
esis. Nat. Genet. 51, 1149–1159.
Shi, J., Wang, E., Milazzo, J.P., Wang, Z., Kinney, J.B., and Vakoc, C.R. (2015).
Discovery of cancer drug targets by CRISPR-Cas9 screening of protein do-
mains. Nat. Biotechnol. 33, 661–667.
Shou, J., Li, J., Liu, Y., and Wu, Q. (2018). Precise and Predictable CRISPR
Chromosomal Rearrangements Reveal Principles of Cas9-Mediated Nucleo-
tide Insertion. Mol. Cell 71, 498–509.e4.
Simon, A.J., d’Oelsnitz, S., and Ellington, A.D. (2019). Synthetic evolution. Nat.
Biotechnol. 37, 730–743.
Slack, F.J., Basson, M., Liu, Z., Ambros, V., Horvitz, H.R., and Ruvkun, G.
(2000). The lin-41 RBCC gene acts in the C. elegans heterochronic pathway
between the let-7 regulatory RNA and the LIN-29 transcription factor. Mol.
Cell 5, 659–669.

Resourcell
OPEN ACCESS
Smits, A.H., Ziebell, F., Joberty, G., Zinn, N., Mueller, W.F., Clauder-M€unster,
S., Eberhard, D., Falth Savitski, M., Grandi, P., Jakob, P., et al. (2019). Biolog-
ical plasticity rescues target activity in CRISPR knock outs. Nat. Methods 16,
1087–1093.
Stuart, T., Butler, A., Hoffman, P., Hafemeister, C., Papalexi, E., Mauck, W.M.,
3rd, Hao, Y., Stoeckius, M., Smibert, P., and Satija, R. (2019). Comprehensive
Integration of Single-Cell Data. Cell 177, 1888–1902.e21.
Sulston, J.E., and Hodgkin, J. (1988). The Nematode Caenorhabditis elegans
(Cold Spring Harbor Laboratory Press), pp. 587–606.
van Schendel, R., Roerink, S.F., Portegijs, V., van den Heuvel, S., and Tijster-
man, M. (2015). Polymerase Q is a key driver of genome evolution and of
CRISPR/Cas9-mediated mutagenesis. Nat. Commun. 6, 7394.
Vella, M.C., Choi, E.-Y., Lin, S.-Y., Reinert, K., and Slack, F.J. (2004a). The C.
elegans microRNA let-7 binds to imperfect let-7 complementary sites from the
lin-41 3’UTR. Genes Dev. 18, 132–137.
Vella, M.C., Reinert, K., and Slack, F.J. (2004b). Architecture of a validated mi-
croRNA:target interaction. Chem. Biol. 11, 1619–1623.
Vierstra, J., Reik, A., Chang, K.-H., Stehling-Sun, S., Zhou, Y., Hinkley, S.J.,
Paschon, D.E., Zhang, L., Psatha, N., Bendana, Y.R., et al. (2015). Functional
footprinting of regulatory DNA. Nat. Methods 12, 927–930, advance online
publication.
Waaijers, S., Portegijs, V., Kerver, J., Lemmens, B.B.L.G., Tijsterman, M., van
den Heuvel, S., and Boxem,M. (2013). CRISPR/Cas9-targeted mutagenesis in
Caenorhabditis elegans. Genetics 195, 1187–1191.
Waaijers, S., Munoz, J., Berends, C., Ramalho, J.J., Goerdayal, S.S., Low,
T.Y., Zoumaro-Djayoon, A.D., Hoffmann, M., Koorman, T., Tas, R.P., et al.
(2016). A tissue-specific protein purification approach in Caenorhabditis ele-
gans identifies novel interaction partners of DLG-1/Discs large. BMC Biol.
14, 66.
Walton, R.T., Christie, K.A., Whittaker, M.N., and Kleinstiver, B.P. (2020). Un-
constrained genome targeting with near-PAMless engineered CRISPR-Cas9
variants. Science 368, 290–296.
Wittkopp, P.J., and Kalay, G. (2011). Cis-regulatory elements: molecular
mechanisms and evolutionary processes underlying divergence. Nat. Rev.
Genet. 13, 59–69.
Wray, G.A. (2007). The evolutionary significance of cis-regulatory mutations.
Nat. Rev. Genet. 8, 206–216.
Wray, G.A., Hahn, M.W., Abouheif, E., Balhoff, J.P., Pizer, M., Rockman, M.V.,
and Romano, L.A. (2003). The evolution of transcriptional regulation in eukary-
otes. Mol. Biol. Evol. 20, 1377–1419.
Wurmus, R., Uyar, B., Osberg, B., Franke, V., Gosdschan, A., Wreczycka, K.,
Ronen, J., and Akalin, A. (2018). PiGx: reproducible genomics analysis pipe-
lines with GNU Guix. Gigascience 7, giy123.
Xie, Y., Allaire, J.J., and Grolemund, G. (2018). R Markdown: The Definitive
Guide (Chapman and Hall/CRC).
Yartseva, V., Takacs, C.M., Vejnar, C.E., Lee, M.T., and Giraldez, A.J. (2017).
RESA identifies mRNA-regulatory sequences at high resolution. Nat. Methods
14, 201–207.
Zhang, H., Artiles, K.L., and Fire, A.Z. (2015). Functional relevance of ‘‘seed’’
and ‘‘non-seed’’ sequences in microRNA-mediated promotion of C. elegans
developmental progression. RNA 21, 1980–1992.
Zhang, Liangyu, Ward, Jordan, D., Cheng, Ze, and Dernburg, Abby, F.. (2015).
The auxin-inducible degradation (AID) system enables versatile conditional
protein depletion in C. elegans. Development. https://doi.org/10.1242/dev.
129635.
Cell Reports 35, 108988, April 13, 2021 13

Resourcell
OPEN ACCESS
STAR+METHODS
KEY RESOURCES TABLE
REAGENT or RESOURCE SOURCE IDENTIFIER
Bacterial and virus strains
E. coli OP50 Caenorhabditis Genetics Center (CGC) https://cgc.umn.edu/strain/OP50
E. coli DH5alpha Mix & Go Competent Cells Zymo Cat#T3007
E. coli One Shot ccdB Survival Thermo Fisher Cat#A10460
Chemicals, peptides, and recombinant proteins
Hygromycin B Thermo Fisher Cat#10687010
HiFi DNA Assembly Master Mix NEB Cat#E2621L
Fastdigest Eco31I Thermo Fisher Cat#FD0293
Fastdigest BpiI Thermo Fisher Cat#FD1014
T4 DNA ligase and buffer Thermo Fisher Cat#EL0011
T4 PNK Thermo Fisher Cat#EK0031
ZymoPURE Plasmid Miniprep kit Zymo Cat#D4208T
phenol/chlorophorm/isoamylacohol pH 8.0 Carl Roth Cat#A156
RNase I Thermo Fisher Cat#EN0601
Phusion HF polymerase NEB Cat#M0530L
TRIzol reagent Thermo Fisher Cat#15596-018
Maxima H Minus Reverse Transcriptase Thermo Fisher Cat#EP0752
Alt-R Cas9 V3 IDT Cat#1081058
tracrRNA IDT Cat#1072532
Blue S’Green qPCR Kit Biozym Cat#331416XL
Critical commercial assays
Qubit dsDNA HS kit Thermo Fisher Cat#Q32854
Zymoclean Gel DNA Recovery Kit Zymo Cat#D4002
AMPure XP Reagent Beckman Coulter Cat#A63881
Nextera XT DNA kit Illumina Cat#FC-131-1096
Miniseq Mid Output kit, 2x150 cycles Illumina Cat#FC-420-1004
Nextseq 500 V2 Mid Output kit, 150 cycles Illumina Cat#FC-404-1001
Deposited data
All raw sequencing data This study NCBI Bioproject: PRJNA701945
All raw sequencing data - alternative
repository
This study https://bimsbstatic.mdc-berlin.de/akalin/
buyar/froehlich_uyar_et_al_2020/reads.tgz
Sample sheet for running crispr-DART This study https://bimsbstatic.mdc-berlin.de/akalin/
buyar/froehlich_uyar_et_al_2020/sample_
sheet.csv
Output of crispr-DART This study https://bimsbstatic.mdc-berlin.de/akalin/
buyar/froehlich_uyar_et_al_2020/crispr_
dart_pipeline_output.tgz
HTML report of crispr-DART This study https://bimsbstatic.mdc-berlin.de/akalin/
buyar/froehlich_uyar_et_al_2020/reports/
index.html
C. elegans genome ce11 Kent et al., 2002 http://genome.ucsc.eduvia http://
bioconductor.org/packages/release/data/
annotation/html/BSgenome.Celegans.
UCSC.ce11.html
(Continued on next page)
e1 Cell Reports 35, 108988, April 13, 2021

Continued
REAGENT or RESOURCE SOURCE IDENTIFIER
Experimental models: organisms/strains
See Table S3 for all C. elegans strains Table S3 N/A
Oligonucleotides
See Table S3 for all DNA oligonucleotides Table S3 N/A
Recombinant DNA
See Table S3 for all plasmids Table S3 N/A
pJJF152_Phsp_Cas9 This study Addgene #163862
pJJF439_PU6_empty_sgRNAscaffold This study Addgene #164266
pJJF143_SECGFP_sg1 This study Addgene #163864
pJJF144_SECGFP_sg2 This study Addgene #163865
pJJF449_dpy-10_CDS_sg1 This study Addgene #163866
pJJF328_sqt-3_30UTR_sg2 This study Addgene #163867
pJJF496_dpy-10_CDS_sg6 (in pJJR50) This study Addgene #164267
pJJF495_dpy-10_CDS_sg6 (in pJJF439) This study Addgene #164268
Software and algorithms
crispr-DART This study https://github.com/BIMSBbioinfo/
crispr_DART
code to reproduce analyses and figures This study https://github.com/BIMSBbioinfo/
froehlich_uyar_et_al_2020
CRISPOR Haeussler et al., 2016 https://crispor.tefor.net/
E-CRISP Heigwer et al., 2014 http://www.e-crisp.org/E-CRISP
Ape (A plasmid Editor) M.W. Davis https://jorgensen.biology.utah.edu/
wayned/ape/
Snapgene GSL Biotech https://www.snapgene.com/
Snakemake Koster and Rahmann, 2012 https://github.com/snakemake/snakemake
fastqc Bioinformatics Group at the Babraham
Institute
https://www.bioinformatics.babraham.ac.
uk/projects/fastqc/
multiqc Ewels et al., 2016 https://github.com/ewels/MultiQC
Trim-Galore! Bioinformatics Group at the Babraham
Institute
https://www.bioinformatics.babraham.ac.
uk/projects/trim_galore/
BBMAP Bushnell, 2014 https://sourceforge.net/projects/bbmap/
GATK DePristo et al., 2011 https://github.com/broadinstitute/gatk
GenomicAlignments Lawrence et al., 2013 https://bioconductor.org/packages/
GenomicAlignments
RSamtools Morgan et al., 2020 https://bioconductor.org/packages/
Rsamtools
Rmarkdown Xie et al., 2018 https://github.com/rstudio/rmarkdown
UCSC genome browser Kent et al., 2002 http://genome.ucsc.edu
IGV browser Robinson et al., 2011 https://igv.org/
Biostrings package Pages et al., 2020 https://bioconductor.org/packages/
Biostrings
Seurat package Stuart et al., 2019 https://github.com/satijalab/seurat
Other
Biosorter Copas N/A
Innova 42 programmable incubator New Brunswick Scientific/Eppendorf N/A
Precellys 24 tissue homogenizer Bertin Instruments N/A
nCounter Nanostring N/A
StepOnePlus real-time PCR system Thermo Fisher N/A
Cell Reports 35, 108988, April 13, 2021 e2
Resourcell
OPEN ACCESS

Resourcell
OPEN ACCESS
RESOURCE AVAILABILITY
Lead contactFurther information and requests for resources and reagents should be directed to and will be fulfilled by the Lead Contact, Nikolaus
Rajewsky ([email protected]).
Materials availabilityPlasmids generated for this work for heat-shock expression of Cas9 (pJJF152), sgRNA cloning (pJJF439) and proof-of-concept
sgRNAs (SECGFP_sg1, SECGFP_sg2, dpy-10_CDS_sg1, sqt-3_UTR_sg2, dpy-10_CDS_sg6 in pJJR50 backbone, dpy-
10_CDS_sg6 in pJJF439 backbone) have been deposited to Addgene (under IDs 163862, 164266, 163864, 163865, 163866,
163867, 164267, 164268). Plasmids for other sgRNAs (see Table S3) are available upon request.
C. elegans strains generated in this study (see Table S3) are available upon request.
Data and code availabilityThe software ‘‘crispr-DART’’ created as part of this study is available at Github along with installation instructions and sample input
files https://github.com/BIMSBbioinfo/crispr_DART.
The R scripts to reproduce the analyses and figures of this study are available at Github https://github.com/BIMSBbioinfo/
froehlich_uyar_et_al_2020.
The accession number for the raw sequencing data reported in this paper is NCBI Bioproject: PRJNA701945.
The same raw sequencing data can additionally be found at the following link:
https://bimsbstatic.mdc-berlin.de/akalin/buyar/froehlich_uyar_et_al_2020/reads.tgz.
The sample sheet which describes the experimental setup for running crispr-DART can be found here:
https://bimsbstatic.mdc-berlin.de/akalin/buyar/froehlich_uyar_et_al_2020/sample_sheet.csv.
The output of crispr-DART for this data can be found here:
https://bimsbstatic.mdc-berlin.de/akalin/buyar/froehlich_uyar_et_al_2020/crispr_dart_pipeline_output.tgz.
The HTML report produced by crispr-DART for this study can be browsed here: https://bimsbstatic.mdc-berlin.de/akalin/buyar/
froehlich_uyar_et_al_2020/reports/index.html.
EXPERIMENTAL MODEL AND SUBJECT DETAILS
Caenorhabditis elegans
The wild-type strain N2 Bristol (Fatt and Dougherty, 1963) was used to create transgenic lines for experiments. In a screen for phe-
notypes, we isolated several mutants and revertants for different regulatory regions. For initial tests we generated a his-72 c-terminal
GFP knock-in strain (NIK123) which we crossed into a strain expressing Peft-3:tdTomato:H2B from a single copy insertion (EG7927)
(Frøkjær-Jensen et al., 2014) resulting in a GFP/tdTomato expressing strain (NIK124) for automated quantifications and sorting using
the Copas Biosorter. A complete list of strains can be found in Table S3.
Animals were maintained on NGM plates with Escherichia coli OP50 as originally described (Brenner, 1974) at 16, 20 or 24�C.Plates for hygromycin resistant transgenic animals were modified by adding working stock solution of 5 mg/mL Hygromycin B
(Thermo Fisher) in water onto plates before use, to a final concentration of 75 mg/mL NGM. For standard 6 cm plates with 10 mL
NGM that would be 150 mL of 5 mg/mL Hygromycin working stock solution.
METHOD DETAILS
Plasmid constructionA list of all plasmids created or used in this study can be found in Table S3. The plasmid for heat-shock inducible Streptococcus
pyogenes Cas9 expression (pJJF152) was created by Gibson assembly (Gibson et al., 2009) of a previously published C. elegans
optimized SpCas9 (Friedland et al., 2013) (‘‘Friedland Cas9’’), with the hsp-16.48 heat-shock promoter and the unc-54 30 UTR using
HiFi DNA Assembly Master Mix (NEB). The plasmid backbone for sgRNA expression (pJJF439) was created by PCR amplification of
the U6 promoter of W05B2.8 and replacing the promoter of pJJR50, using restriction digest and Gibson assembly.
Plasmids for sgRNA expression were cloned as previously described using one of two published backbones, pMB70 (Waaijers
et al., 2013), pJJR50 (Waaijers et al., 2016) or pJJF439 (this study). For this, 5-10 mg of backbone was digested using 1 mL Fastdigest
Eco31I (aka BsaI, Thermo Fisher) or Fastdigest BpiI (aka BbsI, Thermo Fisher) at 37�C for 2-6 hr, separated from undigested plasmid
on a 1.5% Agarose/TAE gel, and extracted using the Zymoclean Gel DNA Recovery Kit (Zymo), according to the instruction manual.
Two complementary DNA oligonucleotides containing the spacer sequence, plus an optional 50 G for optimal U6 promoter expres-
sion, and 4 nucleotide overhangs for ligation into the backbone were phosphorylated and annealed in a thermocycler. This reaction
contained 1 mL of each oligo (at 100 mM), 1 mL of 10x T4 DNA ligase buffer (Thermo Fisher), 1 mL T4 PNK (Thermo Fisher) and 6 mL
water and was incubated 37�C 30 min, 95�C 5 minutes and cooled down at �0.1�C/second to 25�C. Sample was diluted 1:200 in
water and 1 mL was used for ligation with 70-130 ng of linearized backbone, 1 mL of 10x T4 DNA ligase buffer and 1 mL of T4 DNA
e3 Cell Reports 35, 108988, April 13, 2021

Resourcell
OPEN ACCESS
ligase (Thermo Fisher) and water to a volume of 10 mL. Ligation was performed at room temperature for 1 hr or overnight. 5 mL were
then transformed.
The HDR repair template plasmid used for the his-72::GFP knock-in was prepared as described previously (Dickinson et al., 2015).
For transformation and amplification, we used DH5alpha Mix & Go Competent Cells (Zymo) in all the above clonings except for the
his-72::GFP repair template which required ccdB resistant bacteria for which we used One Shot ccdB Survival (Thermo Fisher). DNA
extractions by miniprep were done with the ZymoPURE Plasmid Miniprep kit (Zymo) and elution with water.
sgRNA designMost sgRNAs were designed using the CRISPOR web application (http://crispor.tefor.net/) (Haeussler et al., 2016). Some sgRNAs
were designed manually using the plasmid editor Ape (A plasmid Editor; M.W. Davis ; https://jorgensen.biology.utah.edu/wayned/
ape/). All sgRNAs were designed for C. elegans genome version ce11 and we evaluated all sgRNAs using the E-CRISP web appli-
cation (http://www.e-crisp.org/E-CRISP; Heigwer et al., 2014). For regulatory regions of interest, we aimed at a regular spacing be-
tween target sites, dense coverage and as little as possible predicted off-targets with less than three mismatches. A detailed list of
sgRNA sequences, together with their characteristics, efficiency prediction scores and predicted off-targets can be found in Table
S3.
Generation of transgenic C. elegans
Simple extra-chromosomal array transgenes were generated by standard procedure using micro-injection into the gonad (Mello and
Fire, 1995). A detailed list of injection mixes and their composition can be found in Table S3. The injectionmix usually contained plas-
mids for heat-shock inducible Cas9, pMB67 (Waaijers et al., 2013) or pJJF152 (this study) at 50 ng/mL, 1-10 sgRNAs using the back-
bones pMB70 (Waaijers et al., 2013), pJJR50 (Waaijers et al., 2016) or pJJF439 (this study) at 10-50 ng/mL, a visual co-injection
marker expressing mCherry in the pharynx, pCFJ90 (Frøkjaer-Jensen et al., 2008) at 5 ng/mL, and hygromycin resistance IR98 (Rad-
man et al., 2013) at 3 ng/mL. For large scale experiments followed by targeted DNA sequencing we used pMB67 for Cas9 expression
and sgRNAs cloned into the pJJR50 backbone. Independent lines were created from F1 animals selected for pharynx expression of
the mCherry co-injection marker. Lines were maintained on Hygromycin selection plates as described above.
C-terminal GFP knock-in of his-72C-terminal GFP knock-in of his-72 was performed as described previously using a self-excising selection cassette (Dickinson et al.,
2015).
BiosorterAutomatedmeasurement of GFP negative animals in F1 and their F2 progeny.His-72::GFPwas targeted with sg1, sg2, pool1 (sg2, 3,
4, 6, 8) or pool2 (sg3, 5, 8). F1 generation was collected by bleaching 12 hr after heat-shock. These were either measured on the
Biosorter flow system at larvae stage L3 or grown to adulthood to collect F2 generation which was then alsomeasured at larvae stage
L3. The number of analyzed worms per sample was between 1,662 and 21,983 worms.
Small-scale Cas9 induction and time course20-40 egg-laying adults were transferred to small 6cm NGM plates with OP50 Escherichia coli and without Hygromycin. Plates were
placed in a programmable incubator ‘‘Innova 42’’ (New Brunswick Scientific/Eppendorf) at 20�C. Heat shock was applied for 2 hours
at 34�C, followed by 20�C. For time course experiments adults were transferred to new plates using a picking tool at regular time
intervals (14, 16, 18, 20, 22, 43 or 12, 15, 18, 21, 48 hr) after heat shock to analyze eggs laid within each interval.
Developmental synchronizationSynchronized L1s were obtained by bleaching, as previously described (Sulston and Hodgkin, 1988). Egg-laying animals were
washed off plates in 50 mL M9 buffer (42 mM Na2HPO4, 22 mM KH2PO4, 86 mM NaCl, 1 mM MgSO4) and settled for 10 minutes.
M9 was aspirated until a remaining volume of 7.5 mL. Then 1 mL 12% NaClO and 1 mL 5 M NaOH were added. Worms were incu-
bated under gentle rotation, vortexed briefly after 4minutes and incubated under constant observation for another 3minutes. Bleach-
ing was stopped by addition of 40 mL M9 when circa 50% of animals were dissolved. Eggs were then pelleted by centrifugation at
1,200 g for 1.5 minutes and washed two more times using M9, centrifugation and decanting. Finally, eggs were resuspended in circa
4 mLM9 and left shaking at 16�C overnight for at least 12 hours to allow hatching and developmental arrest of L1 larvae. Larvae con-
centration was then counted in triplicates and the desired amount was dispensed on plates with food to begin synchronized
development.
Large-scale Cas9 heat shock inductionBefore the experiments, animals were maintained 5-25 generations in culture under Hygromycin selection to ensure expression of
transgenes. Expression was indicated by Hygromycin resistance and the visual mCherry co-injection marker expressed in the phar-
ynx. For all experiments three independent lines from the same injection mix were used. For transient heat shock induction of Cas9,
synchronized populations were seeded on large 15 cmNGM plates with food and without Hygromycin. Plates with egg-laying adults
Cell Reports 35, 108988, April 13, 2021 e4

Resourcell
OPEN ACCESS
(P0) were placed in a programmable incubator ‘‘Innova 42’’ (New Brunswick Scientific/Eppendorf) at 20�C and 34�C heat shock was
applied for 2 hours. Plates were kept at 20�C for 12 hr and eggs were collected by bleaching as described above for developmental
synchronization. Hatched larvae, arrested at the L1-stage, the first generation after Cas9 induction (F1), were then again seeded on
large NGM plates with food for synchronized development until egg-laying, to collect the next generation (F2) by bleaching. We used
this F2 generation for all experiments to ensure non-mosaic animals generated by F1 germline mutations. We seeded 50,000 P0 for
Cas9 induction at 24�C on Hygromycin (25,000 / big plate), and 100,000 F1 at 16�C (25,000 / big plate). 400,000 F2 were frozen for
genomic DNA extraction to determine introduced indel mutations. The remaining F2 were used for experiments described below.
Genomic DNA extractionGenomic DNA was obtained using worm lysis, phenol-chloroform extraction and ethanol precipitation. Worms were washed once in
50 mL M9 buffer and frozen in 1 mL M9. After thawing, M9 was removed and 100 mL of TENSK buffer (50mM Tris pH 7.5, 10 mM
EDTA, 100 mM NaCl, 0.5% SDS. 0.1 mg/mL proteinase K, 0.5% b-Mercaptoethanol) was added. Sample was incubated for
1.5 hr at 60�C while shaking at 1,000 rpm on a benchtop heating block. 300 mL of water was added, followed by 400 mL phenol/chlo-
roform/isoamylacohol pH 8.0 (Carl Roth). Sample was mixed by shaking the tube and centrifuged for 10 min. at 15’000 g at room
temperature. The upper aqueous phase, circa 350 mL, was transferred to a new tube and an equal volume of chloroform was added.
After additional centrifugation 10min. at 15,000 g at 4�C, the upper aqueous phasewas transferred to a new tube, and 2 mL glyco blue
added. This was followed by addition of 30 mL 3MNaAc (pH 5.2-6) and 1mL pure ethanol. Samples were centrifuged for 10min. at full
speed and 4�C in benchtop centrifuge. Pellet was washed oncewith 70%ethanol and resuspended in 25 mLwater at 50�C for 30min.
Then 0.25 mL RNase I (10 U/mL, Thermo Fisher) was added and incubated for 30 min. at 37�C. DNA concentration was determined on
a Nanodrop ND-1000 (Thermo Fisher) and diluted to 50-200 ng/mL in water.
DNA long amplicon sequencingAmpliconswere designed so that they contained all the regions of a gene targeted in our experiments. 0.5 – 3 kb ampliconswere large
enough that deletions between the outermost sgRNAs would not change the amplicon size bymore than 10% to avoid more efficient
amplification of templates with large deletions. Furthermore, large amplicons should capture the reported large deletions missed by
100-300 bp amplicons of other workflows. Primers used for amplification together with annealing temperature and resulting amplicon
sizes can be found in Table S3. Genomic DNA concentration was fluorimetrically quantified using Qubit dsDNA HS kit (Thermo
Fisher). For PCR reactions we used 100 ng template DNA. We calculated that 100 ng of genomic DNA equals more than 90 million
C. elegans genomes and therefore represented all animals in our samples that contained for most samples 400,000 and maximal (for
DNA sampling over generations) 2,000,000 animals.
50 mL PCR the reactions were set up as follows. Phusion HF polymerase (NEB) 0.2 mL, 5X HF buffer 10 mL, dNTP mix 1 mL, forward
and reverse oligos at 10 mM 5 mL, water 32 mL, and template DNA. Samples were incubated at 98�C 3 min, followed by 35 cycles of
98�C 15 s, 58-72�C 30 s, 72�C for 7 min with a final elongation at 72�C for 7 min. PCR reactions were analyzed on agarose gels to
ensure successful amplification.
Cleanup was then done by either agarose gel or SPRI beads. For gel-based cleanup 1.5% Agarose/TAE gels were run and bands
were excised with circa ± 500 bp, to also include products with deletions or insertions. DNA was recovered from agarose gel using
the Zymoclean Gel DNARecovery Kit (Zymo). For SPRI beads cleanup and no size selection we used AMPure XP Reagent (Beckman
Coulter). 0.8 x volume of beads were added to PCR reactions, incubated 2 min at room temperature, washed twice with freshly pre-
pared 80 % EtOH using a magnetic rack, and eluted with water.
DNA was quantified by Nanodrop, diluted to 5 ng/mL, quantified by Qubit, diluted to 0.4 ng/mL, quantified by Qubit and diluted to
0.2 ng/mL for library preparation. Library preparation was done with the Nextera XT DNA kit (Illumina) which fragments input DNA and
adds sample-specific barcodes by tagmentation. Although we used one barcode per sample, it is also possible to pool amplicons
before library preparation and use the same barcode for multiple samples provided that samples don’t need to be identified individ-
ually or that reads for each sample can be distinguished after mapping (e.g., non-overlapping amplicons from different genes). Li-
braries were analyzed with a Tapestation D1000 ScreenTape system (Agilent) or Bioanalyzer HS DNA kit (Agilent), and showed an
average fragment size of around 500 bp (range 400 – 600 bp). Average fragment size, together with the DNA concentration measured
with Qubit, was used to determine molarity and an equimolar pool of libraries was prepared. This pool was again analyzed using
Tapestation or Bioanalyzer, measured by Qubit and diluted to 2 nM as input for the Illumina sequencing workflow. The library
pool was then sequenced using 150 bp reads with a MiniseqMid Output kit, 2x150 cycles (Illumina), or a Nextseq 500 V2Mid Output
kit, 150 cycles (Illumina).
The crispr-DART softwareIn order to evaluate the outcomes of the CRISPR-Cas9 induced mutations by the protocol described in this study, we developed a
computational pipeline to process the high-throughput sequencing reads coming from samples treated/untreated with CRISPR-
Cas9. We made crispr-DART as generic as possible to accommodate different experimental setups, hoping that the pipeline can
be useful to the scientific community carrying out genome editing experiments using CRISPR-based technologies, in particular those
that aim to introducemany combinations of mutations in a genome via inducing double-stranded DNA breaks repaired by end joining
e5 Cell Reports 35, 108988, April 13, 2021

Resourcell
OPEN ACCESS
pathways. The pipeline can handle both short (e.g., single- or paired-end Illumina) but also long reads (e.g., PacBio). Each sample can
contain multiple sgRNAs targeting multiple regions of the genome.
The first purpose of the pipeline is to serve as a quality control/reporting tool to evaluate the genome-editing experiment and
address the following questions: Has the CRISPR-Cas9 treatment induced any mutations? If so, how are they distributed in the
genome? Do the mutations that are commonly found in many reads originate at the intended cut site based on the designed guide
RNA matching sites in the genome? How efficient were different guide designs in inducing DNA damage? Can we capture long de-
letions if there are multiple sgRNAs used in the same sample targeting nearby sites? How diverse are the deletions or insertions de-
tected at the cut sites? We developed the pipeline to produce HTML reports collated into a website with interactive figures that help
the user to quickly visualize and evaluate the outcomes of their experiment.
The second purpose of the pipeline is to producemany processed files containing information that can be useful for further analysis
by external tools. Therefore, the pipeline’s output consists of BAM files, bigwig files, BED files, and many different tables containing
information about insertions and deletions along with the reads in which they were detected. In this study, many of the figures made
for the manuscript were generated based on these intermediate files to address the many custom questions.
Steps of the crispr-DART softwarecrispr-DART is implemented using Snakemake (Koster and Rahmann, 2012) following the practices as implemented for the PiGx
pipelines (Wurmus et al., 2018). The pipeline consists of the following sequence of processing steps (see also Figure S2E):
InputThe input consists of a settings file in yaml format, which contains configurations for the tools used in the pipeline. Moreover, it con-
tains file paths for where the sequencing reads are located, the target genome sequence to be used for mapping the reads, the sam-
ple sheet file which contains the experimental design (in comma-separated file format), the file containing the genomic coordinates of
the expected sgRNA cut sites (in BED file format), and a table (in tab-separated format) that is needed for when a pair of samples are
to be compared (for instance to observe the differences in per-base distribution of deletions detected in a treated sample and an
untreated control sample, or to find specific deletions or insertions that are overrepresented in a sample compared to a control
sample).
Pre-processing readsQuality control using fastqc (https://www.bioinformatics.babraham.ac.uk/projects/fastqc/) andmultiqc (Ewels et al., 2016) and qual-
ity improvement of reads using Trim-Galore! (https://www.bioinformatics.babraham.ac.uk/projects/trim_galore/).
Mapping and re-alignmentMapping/alignment of the reads to the genome using BBMAP (Bushnell, 2014). We use BBMAP for read alignment because it can
handle both long and short reads, both single-end and paired-end reads, both DNA and RNA reads, and it can help detect both short
and long insertion and deletion events.
Re-alignment of reads with indels using GATK (DePristo et al., 2011). This step helps reconcile different indel alignments to mini-
mize the noise in alignments.
Extraction of indelsExtraction of indels from the BAM files using R packages GenomicAlignments (Lawrence et al., 2013) and RSamtools (Morgan et al.,
2020), producing the following output.
Output filesBED files: genomic coordinates of insertions and deletions.
Bigwig files: alignment coverage (how many reads aligned per each base of the genome).
Bigwig files: insertion/deletion/indel scores which represent the ratio of reads with an insertion, deletion or either (indel) to the num-
ber of reads aligned at a given base position of the genome. These files are very useful in visualizing profiles of the degree ofmutations
per-base resolution.
Tab-separated format files for the following:
Inserted sequences - this table contains the list of all reads with an insertion, along with the exact genomic coordinate of where the
insertion occurs, and the actual sequence of the inserted segment.
Indels - This table contains the genomic coordinates of the deletions and insertions supported by at least one read along with how
many reads support the insertions/deletions and the maximum depth of coverage (considering all reads) along the deleted segment
or at the insertion site.
Reads with indels - This table is the complete list of reads with insertions/deletions along with the coordinates of the insertions/
deletions.
sgRNA efficiency - This table contains statistics about the efficiency of each guide RNA in inducingmutations at the targeted site of
the genome. The efficiency of a sgRNA is defined as the ratio of the number of reads with an insertion/deletion that start or end at ±
5bp of the intended cut-site to the total number of reads aligned at this region.
HTML reportsAll the pre-processed files from the previous steps are combined to generate interactive (where applicable) HTML reports from all the
analyzed samples that exist in the input sample sheet. For each targeted region (assuming a region of a few thousand base pairs that
is sequenced), currently four different reporting Rmarkdown scripts are run. The resulting HTML files are organized into a website
Cell Reports 35, 108988, April 13, 2021 e6
Resourcell
OPEN ACCESS
using the ‘render_site‘ function of the Rmarkdown package (Xie et al., 2018). Thus, all the processed data and outcomes can be
quickly browsed through a website.
Browser shotsBrowser shots were compiled using indel profiles and top indels provided by the computational pipeline crispr-DART as BigWig and
BED files and loading them into the UCSC genome browser (Kent et al., 2002) or the IGV browser (Robinson et al., 2011) followed by
export as vector graphics compatible format. We used C. elegans genome version ce11/WBcel235 including 26 species base-wise
conservation (PhyloP).
sgRNA efficiency comparisonsCrispr-DART calculates the efficiency of a sgRNA as the ratio of the number of reads with an insertion/deletion that start or end at ±
5bp of the intended cut-site to the total number of reads aligned at this region. For untreated wild-type control samples, we used all
cut sites present in any of the treated samples of the same amplicon. For comparing observed efficiencies to published prediction
scores and other sgRNA characteristics, these scores were manually extracted from the CRISPOR web application (http://crispor.
tefor.net/; Haeussler et al., 2016) for each sgRNA and compared to the sgRNA efficiencies determined by crispr-DART.
Indel characteristicsFor indel proportions, the fraction of reads containing insertion, deletion or complex events was determined per sample. Complex
events were defined as reads containing more than one event. These could be either insertions, deletions or additional substitutions
which suggested a combination of multiple events.
For the distribution of indel lengths we considered all deletions or insertions supported by at least 0.001% of reads at that position,
at least 5 reads and overlapping with any cut site ± 5 bp. Deletions were further classified as ‘‘multi cut’’ deletions when a deletion
overlapped with more than one sgRNA cut site ± 5 bp or otherwise were classified as ‘‘single cut’’ deletions when they only overlap-
ped with one cut site (see also Figure S3B for a scheme describing this).
For the analysis of insertion origin, all 5-mers from insertions were extracted. Thenmatches to the surrounding sequence ± 50 bp of
the insertion position were counted on the forward and reverse complement strand. As control sequences nucleotides of insertions
were shuffled randomly.
R scripts to reproduce these analyses and figures are available at the Github repository (see Data and Code Availability section).
Genotype diversityFor genotype diversity we considered indels supported by at least 0.001% of reads at that position, at least 5 reads and overlapping
with any cut site ± 5 bp. Each deletion, defined by start and end coordinates, irrespective of its abundance (except reaching the
threshold defined above) was considered as one unique deletion genotype. Each insertion genotype was defined by position and
by taking into account the inserted sequence. For untreated wild-type control samples, we used all cut sites present in any of the
treated samples of the same amplicon.
For the plots of ‘‘unique deletions per nucleotide by sgRNA,’’ each deletion was assigned to a sgRNAwhen it was overlapping with
its cut site ± 5 bp.
R scripts to reproduce these analyses and figures are available at the Github repository (see Data and Code Availability section).
Targeted mRNA sequencing, lin-41Mutated F2, arrested at the L1 developmental stage, were obtained fromCas9-induced P0 as described above. 40,000 were directly
frozen for genomic DNA extraction. 80,000 were directly frozen for RNA extraction by adding 1 mL TRIzol reagent (Thermo Fisher),
homogenization with a Precellys 24 tissue homogenizer (Bertin Instruments) and storage at �80�C. 5,000 L1s were seeded on large
15 cm NGM plates at 24�C and collected 32 hours later, at late-L4 stage, and prepared for RNA extraction like the L1 sample. At 32
hours, lin-41mRNA is fully downregulated (Aeschimann et al., 2017), while the lethal vulva bursting occurs later, after molting, in the
adult stage (Ecsedi et al., 2015).
RNA was chloroform-extracted as follows. Samples were thawed, 0.2 mL of chloroform added, incubated for 3 minutes, and
centrifuged for 15 minutes at 12,000 x g at 4�C. The upper aqueous phase was transferred to a new tube, 2 mL GlycoBlue (30 mg)
were added, 500 mL of isopropanol were added and sample was incubated for 10 minutes. Sample was centrifuged 10 minutes
at 12,000 x g at 4�C, supernatant discarded, and 1 mL of 75% EtOH was added. Sample was centrifuged for 5 minutes at 7,500
x g at 4�C, supernatant removed, pellet air-dried and resuspended in 20 mL RNase-free water. RNA concentrations ranged between
1,000 - 2,000 ng/mL, as determined on a Nanodrop ND-1000. Sample was diluted to 300 ng/mL and used for reverse transcription.
RNA was reverse transcribed using Maxima H Minus Reverse Transcriptase (Thermo Fisher). A reaction containing 11.5 mL RNA
(3.45 mg), 2 mL gene-specific RT primer at 10 mM (oJJF890 ‘‘30end,’’ containing a UMI and PCR handle), 1 mL dNTPMix (10mM each),
was incubated 5minutes at 65�C. Then 4 mL 5X RT buffer, 0.5 mL RiboLock RNase inhibitor, and 1 mL (200 U)Maxima HMinus reverse
transcriptase were added and the reaction was incubated for 30 minutes at 60�C, and 5 minutes at 85�C.PCR was performed with a lin-41-specific primer containing a sample-specific barcode (oJJF1140-1147 for samples N2, 1516,
2627, pool3 at L1 and L4 stages) binding in the second last exon and a primer (oJJF960) binding the PCR handle introduced by
e7 Cell Reports 35, 108988, April 13, 2021

Resourcell
OPEN ACCESS
the reverse transcription primer. 2 mL of each RT reaction was used as template in 4 PCR reactions, each containing 10 mL 5X HF
buffer, 1 mL dNTP mix (10 mM each), 5 mL F+R primer mix (10 mM), 0.2 mL Phusion polymerase, 32 mL water and 2.5 mL DMSO
(5%final). Samples were incubated at 98�C 3min, followed by 35 cycles of 98�C 10 s, 69�C 20 s, 72�C for 1min with a final elongation
at 72�C for 7 min. PCR was then analyzed on an agarose gel and DNA was cleaned up using Ampure XP beads (Beckman Coulter).
For this the four PCR reactions were pooled resulting in 100 mL. 80 mL beads were added, incubated for 5 min at room temperature,
washed once with 70% ethanol, and DNA was eluted in 10 mL water. This resulted in concentrations between 40-110 ng/mL. All sam-
ples were diluted to 40ng/mL and then pooled. 32 mL of this pool (1280 ng) was then used as the input for SMRTBell (Pacbio) library
preparation according to the instruction manual and sequenced using a Pacbio Sequel I sequencer.
RNA analysis of lin-41 30 UTR deletionsDeletions supported by at least 5 Pacbio reads from L1 and L4 stage samples were filtered to keep only those deletions detected in
both samples. No read percentage threshold was applied in this analysis. Each deletion was categorized based on their overlap with
important sites in the 30 UTR of lin-41.
d Seed region of the first let-7 microRNA complementary site (site1) (‘‘LCS1_seed’’): chrI:9335255-9335263
d Seed region of the second let-7 microRNA complementary site (site2) (‘‘LCS2_seed’’): chrI:9335208-9335214
d Non-seed nucleotides of the first let-7 microRNA complementary site (site1) (‘‘LCS1_3compl’’): chrI:9335264-9335276
d Non-seed nucleotides of the second let-7 microRNA complementary site (site2) (‘‘LCS2_3compl’’): chrI:9335215-9335227
Deletions were further categorized based onwhether they overlap both let-7microRNA seed regions (‘‘both’’), and those that don’t
overlap any of these defined regions (‘‘none’’).
Deletion frequency values were computed and the ratio of deletion frequencies between L4 stage and L1 stage samples were
computed in log2 scale. For each category of deletions, a one-sided Wilcoxon rank-sum test was computed to test the null hypoth-
esis that the stage specific abundance of deletions that overlap a let-7 binding site is not greater from those deletions that don’t over-
lap any of these sites.
RNA analysis by unsupervised clustering of long readsOnly Pacbio reads from both L1 and L4 stage lin-41 RNA samples that covered the complete region between chrI:9334840-9336100
(the region from the beginning of the amplified segment up to the first intron) were selected, to make sure that all reads that go into
analysis are covering the whole segment. For each read, the alignment of the read (including the inserted sequences) was obtained
and all combinations of k-mers (k = 5) were counted within these alignments allowing for up to 1 mismatch using Biostrings package
(Pages et al., 2020). Seurat package (Stuart et al., 2019) was used to process the k-mer count matrix to do scaling, dimension reduc-
tion (PCA and UMAP) and network-based spectral clustering. The clustering of long PacBio reads covering the region enabled us to
cluster reads into genotypes, thus taking advantage of the length of the reads while also allowing for the high rate of indels in the
PacBio reads (compared to Illumina reads).
DNA sampling over generations, lin-41Mutated F1 samples were obtained as described above using large-scale mutagenesis by Cas9 heat shock induction. For this we
used N2 as control and 3 lines with sgRNAs against the lin-41 30 UTR (sg15 and sg16, sg26 and sg27, sg pool). We conducted
the experiment at 16�C and 24�C. 3,000 L1 stage animals (F1 generation) were seeded onmedium plates with OP50. After egg laying
and hatching of the next generation (F2) after 3 or 5 days (24�C or 16�C) F1 and F2 were separated. For this, animals were washed
from plates in a final volume of 2 mL M9 buffer into 2 mL Eppendorf tubes. Adult animals sink faster and after circa 2-5 minutes are
collected at the bottom of the tube, while L1 animals still swim. This was carefully monitored visually. When most adults (95%) had
sunken to the bottom, supernatant M9, containing L1 stage animals, was removed to a separate tube. This was repeated three times
by adding 2 mL M9 and separation by sinking. Adult animals were frozen for genomic DNA extraction in circa 20 uL M9. For gener-
ations F2-F4, 2,000 L1 were seeded on new medium plates, and frozen as adults after separation from the next generation. Gener-
ation F5 was frozen at L1 stage. Genomic DNA extraction and targeted large amplicon sequencing was performed as described
above.
Fitness analysis of lin-41 30 UTR deletionsFor this analysis, we used lin-41 DNA samples sequenced with Illumina single-end sequencing from multiple generations from F1 to
F5 of the same pool of animals treated with sgRNA guides ‘‘sg15 and sg16,’’ ‘‘sg26 and sg27’’ or ‘‘sg pool.’’ Deletions were consid-
ered for this analysis when they were supported in the F1 samples by at least 0.001% of reads at that position and at least 5 reads.
The important sites considered for this analysis were the following.
d Seed region of the first let-7 microRNA complementary site (site1) (‘‘LCS1_seed’’): chrI:9335255-9335263
d Seed region of the second let-7 microRNA complementary site (site2) (‘‘LCS2_seed’’): chrI:9335208-9335214
d Non-seed nucleotides of the first let-7 microRNA complementary site (site1) (‘‘LCS1_3compl’’): chrI:9335264-9335276
Cell Reports 35, 108988, April 13, 2021 e8

Resourcell
OPEN ACCESS
d Non-seed nucleotides of the second let-7 microRNA complementary site (site2) (‘‘LCS2_3compl’’): chrI:9335215-9335227
d Poly-adenylation signal: chrI:9334816-9334821
d Stop-codon: chrI:9335965-9335967
We wanted to address the question whether the deletions that exist at F1 were exposed to purifying selection over generations if
they overlapped the important sites in the 30 UTR region of lin-41. We did this analysis in two ways. First, we counted the deletions
categorized by their overlap (or non-overlap) with the important sites that existed in F1 generation and analyzed how many of them
still existed in later generations. Second, we did the same analysis at the level of reads: we counted the reads with deletions that
overlapped or did not overlap the important sites from generations F1 to F5. When comparing the number of reads, the read counts
were normalized by the library sizes (total number of reads in the sample).
Lin-41 strains with site1 or site2 deletionsWe generated mutant strains by targeting either site1 or site2 using Cas9/tracRNA/crRNA RNP injections. Injection mix contained
0.3 mg/ml Cas9 protein (Alt-R Cas9 V3 from IDT), 0.12 M KCl, 8 nM HEPES pH 7.4, 8 mM tracrRNA (Alt-R from IDT), 8 mM crRNA
(custom crRNA, Alt-R from IDT), 5 ng/ml pCFJ90 (RFP co-injection marker), in duplex buffer (IDT). To prepare injection mixes,
Cas9 protein was mixed with KCl and HEPES. crRNA and tracrRNA were annealed in duplex buffer for 5 min at 95�C and ramp
down to 25�C and added. Cas9/tracRNA/crRNA mix was incubated at 37�C for 10 min. F1 progeny positive for the pharynx ex-
pressed RFP co-injection marker were singled, allowed to lay eggs at 16�C, then genotyped using single worm lysis followed by
Sanger sequencing of PCR amplicons. We observed mutations in 12/24 (50%) (site1) and 15/32 (47%) (site2) genotyped animals.
For each site we kept the two strains with the biggest disruption of the seed regions. We maintained these strains at 16�C. Strainswere bleached for developmental synchronization as described above. Three 10cm plates with egg-laying adults were bleached for
each strain. For the strain MT7626 let-7(n2853), which shows developmental defects, six plates were bleached. L1 larvae hatched
overnight at 16�C.For RNA quantifications, 7000 L1 larvae were seeded onto medium 10cm plates and cultured at 24�C. 30 hours into synchronized
development animals were collected using M9. After settling 200 uL were added to 1 mL of TRIzol reagent, homogenized in a Pre-
cellys 24 tissue homogenizer (Bertin Instruments) and stored at�80�C. Samples were thawed and RNAwas chloroform-extracted as
follows. 0.2 mL of chloroform were added, incubated for 3 minutes, and centrifuged for 15 minutes at 12,000 x g at 4�C. The upper
aqueous phase was transferred to a new tube, 2 mL GlycoBlue (30 mg) were added, 500 mL of isopropanol were added and sample
was incubated for 10 minutes. Sample was centrifuged 10 minutes at 12,000 x g at 4�C, supernatant discarded, and 1 mL of 75%
EtOH was added. Sample was centrifuged for 5 minutes at 7,500 x g at 4�C, supernatant removed, pellet air-dried and resuspended
in 20 mL RNase-free water. RNA concentrations ranged between 1,000 - 4,000 ng/mL, as determined on a Nanodrop ND-1000. Sam-
ple was diluted to 150 ng/mL and used for reverse transcription. RNA was reverse transcribed using Maxima H Minus Reverse Tran-
scriptase (Thermo Fisher). A reaction containing 10 mL RNA (1. 5 mg), 2.5 mL water, 1 mL of random hexamer primer at 5 ng/mL, 1 mL
dNTPMix (10mM each), was incubated 5minutes at 65�C. Then 4 mL 5X RT buffer, 0.5 mL RiboLock RNase inhibitor, and 1 mL (200 U)
Maxima H Minus reverse transcriptase were added and the reaction was incubated for 30 minutes at 60�C, and 5 minutes at 85�C.Quantitative real-time PCR (qPCR) was then performed using 10 mL SYBR green 2x (with 35 mL ROX/ 1mL), 2 mL forward and reverse
primer mix (5 mM each), and 8 mL cDNA (10 ng/mL) (80ng total). Primers were tested using a stepwise four-fold dilution series for ef-
ficiency and melting curves for specificity. Reactions were performed in technical triplicates, water and RT- reactions served as con-
trols for contamination and genomic DNA amplifications respectively. Differences in RNA/cDNA input were normalized using the
tubulin gene tbb-2 and fold changes were calculated relative to wild-type (N2) samples.
For quantification of phenotype, 200 L1 larvae were seeded onto small 6cm plates and cultured at 24�C. Photos and videos were
taken at 50 hours into synchronized development. We then scored dead animals or animals that had burst (with the intestine exciting
the body cavity through the vulva) by examining 200 animals per plate and 3 plates for each strain.
Screen for regulatory sequences by phenotypeWe targeted 8 genes with known RNAi-phenotypes (dpy-2, dpy-10, egl-30, rol-6, sqt-2, sqt-3, unc-26, unc-54) using different sets of
sgRNAs against regulatory regions. We used lines in which we targeted the 30 UTR and for some genes we used additional lines tar-
geting predicted enhancer, TATA-box, initiator (INR) and upstream/promoter regions. A list with all samples can be found in Table S1.
For each transgenic line (injection mixes imJJF181-215) we screened 35,000 F2 animals produced from P0 with large-scale
induced Cas9 expression as described above. Animals were seeded onto NGM plates with food at a concentration of 15,000 per
15 cm plates or at 2,500 - 5,000 per 10 cm plates. Plates were kept at 16�C or 24�C. We then directly screened these plates by
eye. Additionally, we collected worms in M9 and dispensed worms in drops on an empty plate. We then observed worms moving
in M9 and moving away after M9 was dried (< 1 min.). Dpy, Unc, and Rol worms were identified by morphology, their movement
in M9 or slow and otherwise impaired movement away from the spot of dispension. Potential mutants were then picked and kept
on plates for 2 to 4 generations at 24�C to achieve homozygosity. Animals were then singled again by phenotype and genotyped.
This resulted in isolation of several mutant strains with the same genotype. We could not distinguish between cousins/siblings com-
ing from the same F1/F2 or independent mutants coming from independently mutated F1s. In these cases, we kept one represen-
tative strain. We determined that penetrance was complete for all alleles except for the sqt-2 enhancer locus (n > 300 animals). For
e9 Cell Reports 35, 108988, April 13, 2021

Resourcell
OPEN ACCESS
sqt-2 the penetrance varied between 10%–100%. We scored the expressivity of the phenotypes into three categories (+, ++, +++)
(n > 300 animals). All the reported phenotypes have been determined and validated for several generations at 24�C.We also validated
the absence of the extra-chromosomal transgenes judged by the red fluorescent co-injection marker. For sqt-3 all isolated Dpy an-
imals, characteristic for complete loss-of-function, contained large mutations affecting the coding frame. We therefore screened
mainly for reduction-of-function alleles by screening for Rol animals. Non-Rol revertants of the sqt-3(ins) Rol animals were isolated
using the small-scale approach on 6 cm plates (see above) with injection mixes imJJF215 or imJJF230.
PCR GenotypingSingle worms were picked using a platin wire picking tool and immersed in 10 mL of worm lysis buffer (WLB) (10mM Tris pH 8.3,
2.5 mM MgCl2, 50mM KCl, 0.45% NP-40, 0.45% Tween-20, 0.01% gelatine, and freshly added 100 mg/mL proteinase K). Samples
were frozen at�80�C for at least 10minutes, incubated at 60�C for 30-60minutes, and 95�C for 15-30minutes in a thermocycler. 1 mL
of lysate was used as template in the following PCR. 25 mL PCR reactions were set up as follows. Phusion HF polymerase (NEB)
0.1 mL, 5X HF buffer 5 mL, dNTP mix 0.5 mL, forward and reverse oligos at 10 mM 2.5 mL, water 16 mL, and template DNA. 98�C3 min, followed by 35 cycles of 98�C 15 s, 58-72�C 30 s, 72�C for 7 min with a final 7 min at 72�C. 2 mL of the reaction was then
analyzed on an agarose gel. DNAwas then cleaned up using AMPure XPReagent (BeckmanCoulter) by adding 0.8 x volume of beads
to 23 mL PCR reaction, 2 min at room temperature, washed twice with freshly prepared 80%EtOH using amagnetic rack, and eluted
with 18 mL water. DNA was then either analyzed by T7 nuclease assay or directly sent to Sanger sequencing. T7 nuclease assay was
performed on cleaned upDNA using T7 endonuclease. Sanger sequencing traces were aligned to genomic loci using Snapgene (GSL
Biotech) and linear maps were exported as svg vector files to create figures.
Sqt-3 mRNA quantifications by Nanostring or qPCR10 k L1-arrested synchronized animals were dispensed on 10 cm NGM plates with Escherichia coliOP50 at 24�C. Worms were then
collected at different time points (22, 24, 26, 28, 30, 32 hr), washed once withM9 and homogenized in 1mL of TRIzol reagent (Thermo
Fisher) using a Precellys 24 tissue homogenizer (Bertin Instruments). RNA was isolated by standard phenol-chloroform extraction.
RNA expression was quantified using an nCounter (Nanostring) which measures absolute RNA amounts using a set of gene-specific
probes. Raw counts were normalized using reference genes (‘‘house-keeping’’). For quantitative real-time PCR (qPCR) of pre-mRNA
andmRNAwe usedRNA from the 26 hr time point where sqt-3 expression peaked. Pre-mRNAwas specifically detected using intron-
overlapping primers, while mRNA primers overlapped with exon-exon junctions. Controls without reverse transcriptase (‘‘RT-‘‘) were
done to ensure specific amplification of cDNA and no amplification from potential contaminating genomic DNA. Final values were
obtained by normalizing to pre-mRNA or mRNA of tbb-2 and presented relative to N2wild-type controls. QPCRwas performed using
Blue S’Green qPCR Kit following the instruction manual and quantification on a StepOnePlus real-time PCR system. Probes and
primers can be found in Table S3.
Transplantations into dpy-10, unc-22 30 UTRsKnock-in animals were produced usingCas9/tracRNA/crRNARNP injections with ssDNA oligo repair templates. Injectionmixes con-
tained: 0.3 mg/ml Cas9 protein (Alt-R Cas9 V3 from IDT), 0.12MKCl, 8 nMHEPES pH 7.4, 8 mM tracrRNA (Alt-R from IDT), 8 mMcrRNA
(custom crRNA, Alt-R from IDT), 3.15 ng/ml pJJF062 (GFP co-injection marker), 3.15 ng/ml pIR98 (HygroR), 0.75 mM of a ssDNA oligo
repair template, in duplex buffer (IDT). To prepare injectionmixes, Cas9 protein wasmixedwith KCl andHEPES. crRNA and tracrRNA
were annealed in duplex buffer for 5 min at 95�C and ramp down to 25�C and added. Cas9/tracRNA/crRNA mix was incubated at
37�C for 10 min. Then plasmids and ssDNA repair template were added and 10 P0 animals were injected. For each injection mix
8 F1s positive for the co-injection marker were picked and genotyped using two PCR reactions (one primer pair flanking the insertion,
the other with one primer binding in the insertion).
QUANTIFICATION AND STATISTICAL ANALYSIS
The statistical parameters (i.e., exact values of n, what n represents, SEM, SD, confidence intervals, p values, mean,median etc.) and
the performed statistical tests are reported in the Figure legends. No statistical methodswere used to pre-determine sample size. The
investigators were not blinded to allocation during experiments and outcome assessment.
Cell Reports 35, 108988, April 13, 2021 e10

Cell Reports, Volume 35
Supplemental information
Parallel genetics of regulatory sequences
using scalable genome editing in vivo
Jonathan J. Froehlich, Bora Uyar, Margareta Herzog, Kathrin Theil, Petar Gla�zar, AltunaAkalin, and Nikolaus Rajewsky

B100
0
908070605040302010
Dp
y w
orm
s (
%)
0-1
21
2-1
51
5-1
81
8-2
12
1-4
8time after
heat-shock (h)
ctrlnohs
pMB67 pJJF152
0-1
21
2-1
51
5-1
81
8-2
12
1-4
8
time afterheat-shock (h)
ctrlnohs
100
0
908070605040302010G
FP
ne
g w
orm
s (
%)
0-1
41
4-1
61
6-1
81
8-2
02
0-2
22
2-4
3
0-1
41
4-1
61
6-1
81
8-2
02
0-2
22
2-4
3
GFPsg1 GFPsg2
time afterheat-shock (h)
A
his-72::GFP
sgRNAs
Cas9
heat shock
collecteggs intimecourse
P0 F1
Phsp-16.48
tbb-23xFlag SV40 NLS
egl-13 NLS
Cas9
Phsp-16.48
SV40 NLS
Cas9
3’UTR
unc-543’UTR
pMB67 (Waaijers et al.)
pJJF152
dpy-10
sgRNA
collecteggs intimecourse
P0 F1
insertions
length (bp)
0
20
40
1
10
100
1’000
10’000
deletions(single sgRNA)
length (bp)F H J
100
80
60
40
20
0
remaining GFPneg F2 (%)
samples
F2F1
measure fluorescenceon Biosorter
germline mutated?
GF
P
extinction (size)
Biosortern>1500 worms
GFPneg
100
80
60
40
20
0
GFPneg worms (%)
F1
samplesN2 -Cas9-sgRNA
F2F1F2F1F2
controls
D
E
singlewormPCR
GFPneg Sanger
C
C
GT
TT
AA
A
C
GG
F2
sg1cut site
10bp
frameshiftor STOP
sg3 sg5 sg8
sg2
sg5insertion length
deletioninsertion
sgRNA cut site
G
oocyte
zygote
F1germline
P0
sperm
F2
Cas9I
0
50
40
30
20
10
Dp
y w
orm
s (
%)
12
-14
h a
fte
r h
ea
t-sh
ock
pJJF439 pJJR50
5 25 50 ng/µl
C
pJJR50 (Waaijers et al.)
PU6
sgRNA pJJF439
R07E5.16
W05B2.8
gonad small RNA expression(RPM)
7400
60Diag & Schilling et al.
Figure S1. Transiently induced Cas9 expression creates germline indel mutations. Related to Figures 1
and 2. (A) Defining the temporal dynamics of Cas9 induction. An endogenously tagged his-72::GFP was
targeted with two different sgRNAs. After a two-hour heat shock, eggs were collected in a time course and GFP-
negative animals were counted. Experiment was conducted with 3 independent lines (n=3). The eggs collected
14 – 16 hours after heat shock produced the most GFP-negative animals. (B) Comparison of two different
plasmids for heat shock inducible Cas9, pMB67 (Waaijers et al., 2013) and pJJF152 (this study). Dpy-10 coding
sequence was targeted with a sgRNA (“dpy-10_CDS_sg1”, pJJF449), time course was performed as in A) and
Dpy progeny were counted. Experiment was conducted with 3 independent lines (n=3). Eggs collected 12 – 14
hours after heat shock produced the most Dpy animals. (C) Comparison of two different U6 promoters for sgRNA
expression, in backbone plasmids pJJR50 (Waaijers et al., 2016) and pJJF439 (this study), used at 5, 25 or 50
ng/ul in the injection mix. Dpy-10 coding sequence was targeted with sgRNA “dpy-10_CDS_sg6”. Eggs were
collected 12 – 14 hours after heat shock and Dpy progeny were counted. Data from two experiments using 5
independent lines (n=10). Expression of U6 snRNAs in reads per million (RPM) was obtained from Diag & Schill-
ing et al., 2018. (D) Indel mutations detected by Sanger sequencing of individual GFP-negative animals after
targeting his-72::GFP with sgRNAs. (E) Sanger sequencing of indel mutations created by a pool of three
sgRNAs. (F) Length distribution of the indels from individual GFP-negative worms. Deletion length is shown only
for the two lines with a single sgRNA. Insertion length is shown for all three lines including the line with a pool of
sgRNAs. (G) A scheme showing the germline lineage in C. elegans. F2 animals are created by a germline cell
which is determined in the F1 4-cell embryo. (H) Scheme showing automated fluidics measurement of F1 and F2
GFP negative animals to determine the amount of germline mutations. (I) Amount of GFP-negative F1 and F2
animals in control strains and after targeting his-72::GFP with sg1, sg2, pool1 or pool2. N = 1,662 - 21,983
analyzed worms per sample. (J) Difference in the amount of GFP-negative animals between F1 and F2 genera-
tion. Almost the same amount (80%) of GFP-negative animals in the F2 generations indicates high germline
transmission of mutations.

A
E
DCB
processed data
html report
.......
.....
.......logs
OUTPUT
QC/improve
mapping
realignment
sequencing reads
sample sheet,cut sites,comparisons
settings
INPUT PROCESSING
extract indels
CUSTOM ANALYSES in RGENOME BROWSERHTML REPORT
sg1
sg2 sg3 sg4
amplicon 1
amplicon 2
sg5 sg6
amplicon 3
indelprofiles
indelevents
sgRNAefficiencies
sample comparisons
...
sg1 2 3 4 5 6 ...
experiment 1 vs 2amplicon 2
mutationproportions
sgRNAefficiencies
sgRNAcomparisons
to scores
unique genotypes
per bp
insertionk-mer
matches per bp
indel length
indelsover time
uniquegenotypes
fold changeof dels
shortor
long reads
single or
multiplexedgRNA(s) short
or
long amplicons
DNAor
cDNACRISPR-Cas
nuclease
deletionsinsertions
DNA
mu
tatio
ng
en
oty
pe
s
EXPERIMENT SEQUENCING
oneor
manyregions
indels
wt
reads150 bpanimals
PCR
tagment
sequencing
0.5-3 kb
+barcode
cleanup gel/beads
gDNA
distance of primer to closest cut site (bp)
amplicon size (bp)
allamplicons
allamplicons
1000
2000
3000
500
1500
2500
100
300
500
700
900
1100
1300
CDS of essential gene(let-2, let-7, par-2, snb-1, tbb-2, zyg-1)
IH
F
sgRNA efficiency sgRNA efficiency sgRNA efficiency sgRNA efficiency sgRNA efficiency
sgRNA efficiency
sg
RN
A e
ffic
ien
cy
pre
dic
tio
n s
co
res
R=0.09, p=0.37 R=0.15, p=0.14 R=0.01, p=0.94 R=0.03, p=0.79 R=0.02, p=0.81
R=0.08, p=0.45
R=0.12, p=0.23 R=0.06, p=0.55 R=0.13, p=0.18 R=0.13, p=0.21 R=0.05, p=0.61
plasmid in injection mix (%)
Doench14 Wang Moreno−Mateos Azimuth in−vitro CCTop
Doench16 OldDoench16 Chari Xu Wu−Crispr
0 5 10 15 0 5 10 15 0 5 10 15 0 5 10 15 0 5 10 15
0 5 10 15
0
25
50
75
50
60
70
80
−0.5
0.0
0.5
1.0
20
30
40
50
60
70
0
25
50
75
100
20
40
60
20
40
60
80
25
50
75
20
40
60
0
20
40
60
80
10
20
30
40
G
p = 0.005 p = 0.72 p = 0.39p = 0.16 p = 0.84
FALSE TRUE FALSE TRUE FALSE TRUEFALSE TRUEFALSE TRUE FALSE TRUE
p = 0.052
0
5
10
15
0
5
10
15
“GGNGG”Farboud et al.
5’G for U6 promoter
TTTTstretch
GC contentunder 25%
“inefficient design”Graf et al.
sg
RN
A e
ffic
ien
cy
sg
RN
A e
ffic
ien
cy
Figure S2. Software pipeline “crispr-DART” and sgRNA efficiency characteristics. Related to Figures 1 -
3. (A) Scheme showing our long PCR amplicon sequencing approach. (B) Size of the amplicons used for
targeted DNA sequencing. (C) Distance between the amplicon PCR primers and the closest sgRNA cut site. (D)
Examples to show the versatility of experimental data that can be analyzed with crispr-DART. (E) The software
pipeline “crispr-DART”. The user provides input files, and the pipeline produces processed genomic files and
html reports. Custom analyses for this study were then performed with R scripts using the processed genomic
files as input. For crispr-DART and R scripts see “Code Availability” in the STAR Methods. (F) Correlation of
various prediction scores for sgRNA efficiency and our observed sgRNA efficiency (n=91 sgRNAs). (G) Correla-
tion of the percentage of plasmid in the original injection mix and the observed sgRNA efficiency. (H) Comparison
of sgRNA efficiency for different sgRNA features. Categories were compared using the Wilcoxon signed-rank
test. (I) Comparison of sgRNA efficiency for sgRNAs targeting the coding sequence of essential genes and all
other sgRNAs. Categories were compared using the Wilcoxon signed-rank test.

single-cut
multi-cut
multi-cut
5 bp
sgRNA cut sitesB
D sg2
AAAGGAGAAGAAUUGUUCAC
-
+ 3 bp del+ 3 bp del
+ 3 bp del
+ 1 bp del
+ 9 bp del
+ 1 bp del
sg1
GGAUGCCUUUCGAGUGGGAGPAM
alignmentuncertainty
+ 2 bp del+ 5 bp del
+ 1 bp del
+ 3 bp del+ 4 bp del
+ 1 bp del+ 1 bp del
+ 4 bp del+ 5 bp del
+ 5 bp del+ 3 bp del
+ 4 bp del
alignmentuncertainty
AGAGGGAGACGCCACCTAGCCAGGTGCCACGTTGTTTGCCCGGAAAGCTCACCCTCAA
AGAGGGAGACGCCACCTAGGCAACGTGGCACCCGGAAAGCTCACCCTCAA
AGAGGGAGACGCCACCTACGGCCACCGAAAGCTCACCCTCAA
AGAGGGAGACGCCACAAAGGAAAGCTCACCCTCAAAGAGGGAGACGCCACCTTTCGAAAGCTCACCCTCAAAGAGGGAGACGCCGTCGGAAAGCTCACCCTCAAAGAGGGAGACGCCACCGCGGAAAGCTCACCCTCAA
AGAGGGAGACGCCACCGCCACCACGGAAAGCTCACCCTCAA
AGAGGGAGACGCCACCACGCCAACGGAAAGCTCACCCTCAA
AGAGGGAGACGCCACGTTGAGGGAAAGCTCACCCTCAAAGAGGGAGACGCGGAGACGGAAAGCTCACCCTCAA
AGAGGGAGACGCGCGGAGACGGAAAGCTCACCCTCAA
AGAGGGAGACGCCACCCTCACGAGGGAAAGCTCACCCTCAA
AGAGGGAGACGCCACCCTCACCCTCACCCTCAAAAAGAAAGCTCACCCTCAA
AGAGGGAGACGCCACCTACGGAAAGCTCACCCTCAA
AGAGGGAGACGCCACCACGCCAACGGAAAGCTCACCCTCAA
PAM
AAAGGAGAAGAATTGTTCAATTCTTCTGATGCACTGGAGTTGTCCCAATCCTCG
AAAGGAGAAGAATTGTTGTCTGGATTGTTGCACTGGAGTTGTCCCAATCCTCG
AAAGGAGAAGAATTGTTGATAATTGACACTGGAGTTGTCCCAATCCTCG
AAAGGAGAAGAATTGTTGGAACACTGGAGTTGGAGAACACTGGAGTTGTCCCAATCCTCG
AAAGGAGAAGAATTGTTGAGAAGAATTGTACACTGGAGTTGTCCCAATCCTCG
AAAGGAGAAGAATTGGACTGGAGTTGTCCCAATCCTCG
AAAGGAGAAGAATTGTTGTTGGAGTTGTCCCAATCCTCG
AAAGGAGAAGAATTGCAGAAGAAACTGGAGTTGTCCCAATCCTCG
AAAGGAGAAGAATTGTGAAGAATTGTGACACTGGAGTTGTCCCAATCCTCG
AAAGGAGAAGAATTGTCCCAATCCTCTTGATTCTTGTCCCAATCCTCG
AAAGGAGAAGAATTGTCCCTGTACACTGGAGCACTGGAACACTGGAGTTGTCCCAATCCTCG
AAAGGAGAAGAATTGTTGTCCCTGGACTGGACTGGACTGGACTCTGGACTTCGACTGGAGTTGTCCCAATCCTCG
AAAGGAGAAGAATTGTTCACTGGAGTTGTCCCAATCCTCG
AAAGGAGAAGAATTGTTCAATTCTTCTGATGCACTGGAGTTGTCCCAATCCTCG
5-mers
perfect matches?
insertionsDNA
E
C
F
G
ACTGCGCTGATGCTCTGACTGCTGGCGCTAGAATGCTA
GAGACTGACGACCGCGATCTTACGAT
match
sqt-3 UTR sg1-3 tbb-2 CDS sg1-2 snb-1 ups sg1-7
−600
−300
0
300
600
−50 −25 0 25 50
distance form insertion site (bp)
5−
me
r m
atc
he
s (
co
un
t)
inserted sequence
shuffled ctrl
−2000
−1000
0
1000
2000
−50 −25 0 25 50
−5000
0
5000
−50 −25 0 25 50
+
-
wt
mut
dissociation & re-annealing
flap removal & fill in
annealingat 5-25 nt
microhomologies
5’ resection
templated insertion
deletion + templated
insertion
deletion
fill in & ligation
Aanimals in sample 400,000 400,000 400,000 400,000 200,000
amplicon read coverage 200,000 400,000 800,000 1,200,000 1,200,000coverage per animal 0.5 1 2 3 6
0.001% reads threshold 2 reads 4 reads 8 reads 12 reads 12 reads
5 reads threshold 0.0025% 0.0013% 0.0006% 0.0004% 0.0004%
minimum animalsto support one indel 10 5 4 4 2
acting threshold 5 reads 5 reads 8 reads 12 reads 12 reads
Figure S3. Indel detection and templated insertions. Related to Figures 2 and 3. (A) A table estimating the
sensitivity of calling one indel present in the sequenced animal populations. In samples of lower coverage (e.g.
200,000-fold), the threshold of 5 reads acts, while for samples with higher coverage (e.g.800,000-fold) the
threshold of 0.001 % reads acts. This results in usually 4-10 animals required to call an indel in our samples with
400,000 animals. (B) Scheme which illustrates how single-cut or multi-cut deletions were categorized computa-
tionally. (C and D) Examples of microhomology observed between insertions and surrounding regions in geno-
types of GFP-negative his-72::GFP animals. (E) Scheme showing the analysis approach which matches all
possible 5-mers from an insertion to the surrounding sequence. (F) Matches of 5-mers from insertions to
surrounding sequence (+/- 50bp), shown for three samples. (G) Diagram showing mechanistic steps of dsDNA
repair by microhomology-mediated end joining. Highlighted is the dissociation & re-annealing step which could
lead to the templated insertions observed in our data.
microhomology-mediated end joining (MMEJ)

C
handleRT
RFBC
mRNAlin-41
cDNA
long reads (Pacbio)
reverse transcription
PCR & cleanup
cDNA
SMRTBelladapter ligation
adapter
cDNA long read workflowB
FALSETRUE
UM
AP
2
both let-7 sites deleted let-7 site1 deleted let-7 site2 deleted
UMAP 1
D E
F
H
clusters of cDNA long reads
L1 stage L4 stage
UM
AP
2
UMAP 1
clusters01234567891011121314
01
23
4
5
6
7
89
1011
12
13
14
01
23
4
5
6
7
89
1011
12
13
14
UUAUACAACCGUU
CUACACUCA
UUGAUAUGUUGG
AUGAUG GAGU3′
UUAUACAACCAUU
CUGCCUC
UUGAUAUGUUGG
AUGAUGGAG
U 5′
site2
let-7miRNA
site1
lin-41mRNA
3′5′
seedseed
......
non-seed non-seed
... ...
A
lin-41
1 kb
spacer20 nt22 nt 27 nt
cDNA
del
lin-41
let-7
L1 L4
developmental time
exp
ressio
n
DNA
developmentalstages
ACCTTTTATACAACCGTTCTACACTCAACGCGATGTAAATATCGCAATCCCTTTTTATACAACCATTCTGCCTCTGAACCATTGAAACCTTCTCCCGTA
ACCTTTTATACAACCGTTC-------AACGCGATGTAAATATCGCAATCCCTTTTTATACAACCATTCTGCCTCTGAACCATTGAAACCTTCTCCCGTA
wild type lin-41 3′UTR
ACCTTTTATACAACCGTTC---ACTCAACGCGATGTAAATATCGCAATCCCTTTTTATACAACCATTCTGCCTCTGAACCATTGAAACCTTCTCCCGTA
crRNA/tracrRNA/Cas9 RNP
ACCTTTTATACAACCGTTCTACACTCAACGCGATGTAAATATCGCAATCCCTTTTTATACAACC-------------------------TTCTCCCGTA
lin-41(site1_del2)
ACCTTTTATACAACCGTTCTACACTCAACGCGATGTAAATATCGCAATCCCTTTTTATACAACCATTCTG---------------AACCTTCTCCCGTATACAACC
lin-41(site2_indel2)
lin-41(site1_del1)
lin-41(site2_del1)
raj190
raj192
raj189
raj191
seedseed non-seed non-seed
−1.5
−1
−0.5
0
0.5
1
1.5
G deletion frequency over generationsfor pooled samples
(row-normalized z scores)
F2
features affectedby deletion
F3F1 F4 F5
site
1 s
ee
dsite
2 s
ee
dsite
1 n
on
-se
ed
site
2 n
on
-se
ed
po
lyA
sto
p c
od
on
generations
Figure S4. Impact of lin-41 3′ UTR deletions on RNA levels. Related to Figure 4. (A) Diagram showing let-7
complementary sites site1, site2 in the lin-41 3′ UTR. (B) Diagram of lin-41 and let-7 developmental expression
and time points of RNA extraction. (C) Diagram of the targeted RNA sequencing strategy. cDNA was amplified
using a large amplicon and sequenced using the Pacbio long read workflow. (D) UMAP clusters of long reads
covering the complete lin-41 3′ UTR, detected in cDNA from L1 or L4 developmental stages. Each dot represents
one read. (E) Status of overlap with let-7 sites for each read. (F) Number of detected reads with a deletion
(y-axis) per genomic nucleotide (x-axis). Reads are separated by cluster (sub-panels) and developmental stage
(L1=red, L4=green). The two vertical black lines indicate the location of the two let-7 complementary sites (site1
and site2). (G) Heatmap displaying the frequency of deletions (on rows) scaled by row over multiple generations
(columns). The annotation columns display which deletions overlap different features (e.g. let-7 binding sites,
polyA signal, stop codon). (H) Genotypes of strains with deletions in let-7 complementary site1 and site2 in the
lin-41 3′ UTR.

25
20
15
10
5
0
larvae (F2) per bleached adult (F1)
A
C
B
insertion length
deletioninsertion position
sgRNA cut sites
F
CTCTCACTGGGTCGAGTGAGACACCACCACCTAAA---------------------------- ------------------------------------------------------------------------------------------TTTATGT
TTCGTTTTTTTT---------TCAAATTTTTATTTTTTTTACCTTTCTAACAATT
TTCGTTTTTTTTTGTCTTGATTCAAATTTTTATTTTTTTTACCTTTCTAACAATT
GGCTGGA
TAGAATTGTTTCGTTTTTTTTTGTCTTGATTCAAATTTTTATTTTTTTTACCTTTCT------- -------AAACTTCACCCTTAC
CCTCCCCAAACTTCACCCTTAC
ACCATCATCCTTCTCATCACCATCCTTCCCCATTC
CACCATCCCCCCTTCTTCTTCCCCATTATTGTATCGACTTTTTGCGATAGTTTTTAATTTCATATTTATTTCTATTAACATTGATCTAATTTTATGT
--------------------------------ATCGACTTTTTGCGATAGTTTTTAATTTCATATTTATTTCTATTAACATTGATCTAATTTTATGTCTCTCACTGGGTCGAGTGAGACACCACCACCTAAACCTAGGAAACATTTTCTTGTACTCCTTC
CCACCACCTAAA
CTCTCACTGG-------------------------------------TTTCTTGTACTCCTTC
CTCTCACTGGGTCGAGTGAG------------------------------------------- ----------------------------------------------------TTTAATTTCATATTTATTTCTATTAACATTGATCTAATTTTATGT
ATTAAAAATATAAAAAAATTAATAAATTATTAGTCATAAATTATAAAAAAATTGTTTCACCA
CTCTCACTGGGTCGAGTGAGACACCACCAC---C---TAGGAAACATTTTCTTGTACTCCTTC
AATGTTCCTATGTTTCCTAGTTTCCATAGTTTTCAATGTTT
CACCATCCCCCCTTCTTCTTCCCCATTATTGTATCGACTTTTTGCGATAGTTTTTAATTTCATATTTATTTCTATTAACATTGATCTAATTTTATGT
CACCATCCCCCCTTCTTCTTCCCCATTATTGTATCGACTTTTTGCGATAGTTTTTAATTTCATATTTATTTCTATTAACATTGATCTAATTTTATGT
CACCATCCCCCCTTCTTCTTCCCCATTATTGTATCGACTTTTTGCGATAGTTTTTAATTTCATATTTATTTCTATTAACATTGATCTAATTTTATGT
CACCATCCCCCCTTCTTCTTCCCCATTATTGTATCGACTTTTTGCGATAGTTTTTAATTTCATATTTATTTCTATTAACATTGATCTAATTTTATGT
CACCATCCCCCCTTCTTCTTCCCCATTATTGTATCGACTTTTTGCGATAGTTTTTAATTTCATATTTATTTCTATTAACATTGATCTAATTTTATGT
CACCATCCCCCCTTCTTCTTCCCCATTATTGTATCGACTTTTTGCGATAGTTTTTAATTTCATATTTATTTCTATTAACATTGATCTAATTTTATGT
CCTCCCCAAACTTCACCCTTAC
CCTCCCCAAACTTCACCCTTAC
CCTCCCCAAACTTCACCCTTAC
CCTCCCCAAACTTCACCCTTAC
CCTCCCCAAACTTCACCCTTAC
----------------------
----------------------
----------------------
TTCGTTTTTTTTTGTCTTGATTCAAATTTTTATTTTTTTTACCTTTCTAACAATT
TTCGTTTTTTTTTGTCTTGATTCAAATTTTTATTTTTTTTACCTTTCTAACAATT
TTCGTTTTTTTTTGTCTTGATTCAAATTTTTATTTTTTTTACCTTTCTAACAATT
-------------------------------------------------------
-------------------------------------------------------
TTCGTTTTTTTTTGTCTTGATTCAAATTTTTATTTTTTTTACCTTTCTAACAATT
-------------------------------------------------------
TTCGTTTTTTTTTGTCTTGATTCAAATTTTTATTTTTTTTACCTTTCTAACAATT CCTCCCCAAACTTCACCCTTAC
CTCTCACTGGGTCGAGTGAGACACCACCACCTAAACCTAGGAAACATTTTCTTGTACTCCTTC
CTCTCACTGGGTCGAGTGAGACACCACCACCTAAACCTAGGAAACATTTTCTTGTACTCCTTC
CTCTCACTGGGTCGAGTGAGACACCACCACCTAAACCTAGGAAACATTTTCTTGTACTCCTTC
CTCTCACTGGGTCGAGTGAGACACCACCACCTAAACCTAGGAAACATTTTCTTGTACTCCTTC
egl-30
100 bp
M01D7.11
conservation(PhyloP)
Slu
++++++++++
+++++++++
++++++
++++
E
sqt-3
500 bp
Dpy sqt-3
chrXsqt-3
origin:
sqt-3
origin:
chrVsqt-3Rol
AATAAA
500 bp
++++++
+
TATA INR
50 bp
sqt-2
enhancer?
C01B12.10
conservation(PhyloP)
Rol++++++++++++
G
pick 96randomnon-Rol
F2
findmutations:T7 assay
24/96 (25%)with mutations
H
molt moltL4
at 24°C
adultL3
col-73
dpy-4
tbb-2tba-1
sqt-3
dpy-13
wild type (N2)
RNAexpression
(normalizedcounts)
80k
60k
20k
0
40k
22 3230282624 22 3230282624time (h) time (h)
N2 polyA ins
J
AAUAAA
sqt-3
no
n-R
ol
25 bponly heterozygotesSanger sequenced
same genotypes
sq
t-3
exp
ressio
nre
lative
to
wt
0
1
2
mRNApre-mRNA
polyA
ins
TATAN
2
polyA
ins
TATAN
2
Isqt-3(ins) measuredat 26 hrs
K
inswild type
CUC
AUCA
UCCCUCA
AACCUCACC
A A A CCUC
C
A
ACC
AUCCCU
CAAACCUCACC
AA A C
CUC
A
revertant2
3’U
TR
fo
lde
dw
ho
le m
RN
A fo
lde
d
C
C
U
C
A
U
CAUCC C U C A
AAC
C
U
C
A
C
C
AA
ACCUCA
A A
C
C
A
U
C
CCUC
A A CCUC
A
C
C
A
AA
CCUCA
A
AC
CU C
AUC
A
A
C CUCAUCA
Rolnon-Rol non-Rol
L
M
TTTCTTCTCACAGTCCAAACCTCATCATCCCTCAAACCTCACCAAACCTCATCATCTCGTTGTTGTG
GCACCGTTATGATTCAATCATTCCTCA----TATCCTCTCTCTTTTTTGTTTCAACTTTACTTCTTTCTTCTCACAGT---------------------------CCAAACCTCATCATCTCGTTGTTGTGGCACCGTTATGATTCAATCATTCCTCAATCATATCCTCTCTCTTTTTTGTTTCAACTTTACTTCTTTCTTCTCACAG-----------------TCCAAACCTCACCAAACCTCATCATCTCGTTGTTGTGGCACCGTTATGATTCAATCATTCCTCAATCATATCCTCTCTCTTTTTTGTTTCAACTTTACTTCTTTCTTCTCACAGTCCAAACC-----ATCCCTCAAACCTCACCAAACCTCATCATCTCGTTGTTGTGGCACCGTTATGATTCAATCATTCCTCAA------------------------------------------------GTCCAAACCTCATCATCCCTCAAACCTCACCAAACCTCATCATCTCGTTGTTGTGGCACCGTTATGATTCAATCATTCCTC--------------------------------------------------GTCCAAACCTCATCATCCCTCAAACCTCACCAAACCTCATCATCTCGTTGTTGTGGCACC--------------------------------------------------------------------------------TCATCATCCCTCAAACCTCACCAAACCTCATCATCTCGTTGTTGTG
TTTCTTCTCACAGTCCAAACCTCATCATCATCTCGTTGTTGTGTATAGTCGCGT
TTTCTTCTCACAGTCCAAACCTCAAATCCAAATCTCCAAATCTCCAAATCTCCAAATCAAAGTCCAA-----ATCTCGTTGTTGTGTATAGTCGCGTTTTCTTCTCACAGTCCAAACCTCATCTCGTTCATCTCGTTGTTCATCTCGTTCATCTCGTTCATCTCGTGT-TCATCTCGTTGTTGTGTATAGTCGCGTTTTCTTCTCACAGTCCAAACCTCATCTCGTTCATCTCTCATCTCATC-TCATCTCGTTGTTGTGTATAGTCGCGTTTTCTTCTCACAGTCCAAACCTCAAACAAACAGTCCAAACAGTCCAAA-CATCATCTCGTTGTTGTGTATAGTCGCGT
TTTCTTCTCACAGTCCAAACCTCATCATCCCTCAAACCTCACCAAACCTCATCATCTCGTTGTTGTGTATAGTCGCGTTTTCTTCTCACAGTCCAAACCTCAACCTCAAACCATCATCTCATTTGTTTCATCATCTCGTTGTTGTGTATAGTCGCGTTTTCTTCTCACAGTCCAAACCTCATCTCATCATCTCAAACCTCATCATCTCGTTGTTGTGTATAGTCGCGTTTTCTTCTCACAGTCCAAACCTCATCTCCTCCATCTCATCTCCAAACATCATCTCGTTGTTGTGTATAGTCGCGTTTTCTTCTCACAGTCCAAACCTCATCTCGTTCACCTCATCATCTCATCATCTCGTTGTTGTGTATAGTCGCGTTTTCTTCTCACAGTCCAAACCTCATCTCAAACCTCAAACCTCATCAAACATCATCTCGTTGTTGTGTATAGTCGCGTTTTCTTCTCACAGTCCAAACCTCATCTCGTTCATCTCTCAATCATCTCTCATCATCTCGTTGTTGTGTATAGTCGCGTTTTCTTCTCACAGTCCAAACCTCATCTCGTTCATCTCGTTCATCTCGTTCATCATCTCGTTGTTGTGTATAGTCGCGTTTTCTTCTCACAGTCCAAACCTCATCTCATCTCGATCTCGTTGTGACAACGAGATCATCTCGTTGTTGTGTATAGTCGCGT
TTTCTTCTCACAGTCCAAACCTCATCTCGTTATCATCTCGTTCATCTCGTTGTTCATCATCTCGTATCATCTCGTTGTATCATCTCGTTGTTGTGTATAGTCGCGTTTTCTTCTCACAGTCCAAACCTCATCTCGTTCTCATCATCTCATCATCTCGTTGTTGTGTATCATCATCTCGTTGTTGTGTATAGTCGCGT
TTTCTTCTCACAGTCCAAACCTCATCTCGTTCATCATCTCTCATCATCTCATCTCATCATCTCGTTGTTGTGTATAGTCGCGTTTTCTTCTCACAGTCCAAACCTCATCTCATCTCATCTCACTTACGTCCTCAAAAATCATCTCGTTGTTGTGTATAGTCGCGTTTTCTTCTCACAGTCCAAACCTCATCACAGTCCAAACCTCATCATACCTCATCACAGTCCAAACCTCATCATCTCGTTGTTGTGTATAGTCGCGTTTTCTTCTCACAGTCCAAACCTCATCATCTCATCATCTCATCATCAAACATCATCTCGTTGTTGTGTATAGTCGCGTTTTCTTCTCACAGTCCAAACCTCATCATCTCTTTCATCTCATCATCTCATCATCATCTCGTTGTTGTGTATAGTCGCGTTTTCTTCTCACAGTCCAAACCTCATCATCTCAATCTCAATCTCATCATCAAACATCATCTCGTTGTTGTGTATAGTCGCGTTTTCTTCTCACAGTCCAAACCTCATCATCTCATCTCATCTCATCATCTCATCATCATCATCTCGTTGTTGTGTATAGTCGCGTTTTCTTCTCACAGTCCAAACCTCATCATCTCAAATCATCATCATCATCTCATCCAAACATCATCTCGTTGTTGTGTATAGTCGCGTTTTCTTCTCACAGTCCAAACCTCATCATCTCATCTCATCATCATCTCCTCATCATCATCTCATCATCTCGTTGTTGTGTATAGTCGCGTTTTCTTCTCACAGTCCAAACCTCATCATCTCTCATCATCTCATCATCTCATCATCATCTCGTTGTTGTGTATAGTCGCGT
TTTCTTCTCACAGTCCAAACCTCATCATCTCAATCAAACATCATCTCGTTGTTGTGTATAGTCGCGTTGACAGACTCAGATTTTATCACCATCGAGCCCTTTCTTCTCACAGTCCAAACCTCAT-GATCATCACGAGATGATCATCTCGTTGTTGTGTATAGTCGCGTTGACAGACTCAGATTTTATCACCATCGAGCCC
TTTCTTCTCACAGTCCAAACCTCATCATCATCCAAACATCATCTCGTTGTTGTGTATAGTCGCGTTGACAGACTCAGATTTTATCACCATCGAGCCC
TTTCTTCTCACAGTCCAAACCTCATCATC---TCGTTGTTGTGTATAGTCGCGTTGACAGACTCAGATTTTATCACCATCGAGCCCGTCAGTACATCGACCAAATAAA
TT-----------------------------------GTTGTGTATAGTCGCGTTGACAGACTCAGATTTTATCACCATCGAGCCCGTCAGTACATCGACCAAATAAA
TTTCTTCTCACAGTCCAAAC------ATCATCTCGTTGTTGTGTATAGTCGCGTTGACAGACTCAGATTTTATCACCATCGAGCCCGTCAGTACATCGACCAAATAAA
TTTCTTCTCACAGT--------------------GTTGTTGTGTATAGTCGCGTTGACAGACTCAGATTTTATCACCATCGAGCCCGTCAGTACATCGACCAAATAAA
TTTCTTCTCACAGTCCAAACCTCATC------TCGTTGTTGTGTATAGTCGCGTTGACAGACTCAGATTTTATCACCATCGAGCCCGTCAGTACATCGACCAAATAAA
TTTCTTCTCACAGT----------------------TGTTGTGTATAGTCGCGTTGACAGACTCAGATTTTATCACCATCGAGCCCGTCAGTACATCGACCAAATAAA
TTTCTTCTCACAGTCCAAAC---------ATCTCGTTGTTGTGTATAGTCGCGTTGACAGACTCAGATTTTATCACCATCGAGCCCGTCAGTACATCGACCAAATAAA
TTTCTTCTCACAGTCCAAACC-----ATCATCTCGTTGTTGTGTATAGTCGCGTTGACAGACTCAGATTTTATCACCATCGAGCCCGTCAGTACATCGACCAAATAAA
TTTCTTCTCACAGTCCAAACCTCATC-----------------------------------------------------------------------GACCAAATAAA
wildtype
non-Rol
Rol
non-Rol
intragenic suppressors
TTTCTTCTCACAGTCCAAACCTCATCATCATCTCGTTGTTGTGTATAGTCGCGTTGACAGACTCAGATTTTATCACCATCGAGCCCGTCA-----TCGACCAAATAAA
GCACCGTTATGATTCAATCATTCCTCATCATCTCGTCATCT---------------------------------------------------------------------CCTCATCATCTCGTTGTTGTG
sq
t-3
exp
ressio
nre
lative
to
wt
N2
reve
rtant
1
reve
rtant
2
reve
rtant
3N2
ins
reve
rtant
1
reve
rtant
2
reve
rtant
30
1
2
ins
mRNApre-mRNA
sqt-3(revertant2)sqt-3(revertant3)
sqt-3(revertant1)
raj132raj133raj134raj135raj136raj137raj138raj139
raj142raj143
raj141raj140
raj145raj146raj147
raj151
raj148raj149raj150
raj144
raj152raj153raj154raj155raj156
raj131sqt-3(ins)
raj131sqt-3(ins)
raj158raj159raj160
raj164
raj161raj162raj163
raj157
raj165raj166raj167raj168raj169
raj173raj179raj180raj181raj182raj183raj184
CCAAACCTCATCATCCCTCAAACCTCACCAAACCTCATCATCTCG
CCAAACCTCA TCATCATCTCG
CCAAACC-----ATCCCTCAAACCTCACCAAACCTCATCATCTCG
sqt-3(ins)
sqt-3 wild type
sqt-3(revertant2)
200 bp
200 bp
unc-22
dpy-10 Dpy:
Twi:
N
reduction of functionphenotype
transplant ins
reve
rtant
2
mutation proportions among isolated alleles (%)
25
50
75
100
deletion insertion complex
egl-30sqt-2sqt-3sqt-3
(3'UTR)(enh)(TATA)(3'UTR)
D
polyA
sqt-3
25 bp
Figure S5. Screening for functional regulatory sequences using morphological phenotypes. Related to Figure 5. (A) Amount of F2
progeny obtained per bleached adult of the F1 generation which allowed us to perform targeted sequencing on the siblings of the screened
animals. (B) Location and extent of mutations affecting the coding sequence in Dpy sqt-3 mutants. For long insertions the origin was
determined by BLAT. (C) Rol mutations isolated after targeting the sqt-3 3′ UTR without sg2. (D) Proportion of mutation types in the isolated
reduction-of-function alleles from four targeted regions (egl-30 3′ UTR, sqt-2 enhancer, sqt-3 TATA-box, and sqt-3 3′ UTR). “Complex”: alleles
with a combination of insertion and deletion. (E) Indels affecting a putative enhancer region (Jänes et al. 2018) of sqt-2. +, ++, +++ indicate
the expressivity of the trait. This was the only region for which penetrance was not complete (10-100%). (F) Sequences of the mutations in
Uncoordinated egl-30 mutants. (G) Isolation strategy of non-Rol mutants. Indels in non-Rol animals determined by Sanger sequencing. (H)
Quantification of sqt-3 RNA expression along development during L4 stage in wild type (N2) and sqt-3(ins) mutant. Worms were synchro-
nized by bleaching and RNA was quantified on the Nanostring system. (I) sqt-3 mRNA and pre-mRNA levels in different sqt-3 alleles at 26
hrs into synchronized development. Levels were quantified by qPCR with primers specific for the spliced or the un-spliced transcript. Barplots
show mean +/- standard deviation of technical triplicates. (J) Microscope images of the weak Rol phenotype with only slight bending of the
head in the sqt-3(polyA) mutant and strong characteristic Rol phenotype in the sqt-3(ins) mutant. (K) Nucleotide sequences of relevant 3′
UTR regions in Rol, non-Rol and revertant mutants showing the inserted and deleted nucleotides. (L) mRNA and pre-mRNA levels of sqt-3
in mutant and revertants at 26 hours into synchronized development. Levels were quantified by qPCR with primers specific for spliced or
un-spliced transcript. Barplots show mean +/- standard deviation of technical triplicates. (M) Predicted RNA secondary structures of wild type,
insertion mutant and revertant allele. Predictions were made for the whole mRNA or only the 3′ UTR. (N) Transplantation of mutant
sequences into independent 3′ UTRs. Sequence 1 (from insertion mutant) or sequence 2 (from revertant2 of the insertion mutant) were
knocked-in at the dpy-10 or unc-22 3′ UTR. Seq1 led to the characteristic reduction-of-function phenotype Twitching (Twi) in unc-22.

gene regionnumber of sgRNAs
amplicon size selected
lin-41 CDS 2 +/-
lin-41 3'UTR 5
lin-41 3'UTR 2
lin-41 3'UTR 5
lin-41 3'UTR 2
lin-41 3'UTR 8
lin-41 3'UTR 8
lin-41 3'UTR 8
lin-41 downs 2
dpy-2 3'UTR 2 +
dpy-10 3'UTR 2 +/-
dpy-10 3'UTR 2
dpy-10 3'UTR 4
egl-30 3'UTR 2 +
egl-30 3'UTR 2
egl-30 3'UTR 2
rol-6 enh 2 -
rol-6 TATA 2
rol-6 INR 1
rol-6 3'UTR 2
snb-1 ups 7 +
snb-1 CDS 2
snb-1 CDS 2
snb-1 3'UTR 8
snb-1 3'UTR 7
sqt-2 ups 3 -
sqt-2 TATA_INR 2
sqt-2 3'UTR 3
sqt-3 TATA 4
+/-sqt-3 INR 2
sqt-3 3'UTR 3
sqt-3 3'UTR 3
sqt-3 3'UTR 6
sqt-3 3'UTR 9
unc-26 3'UTR 2 +
unc-54 3'UTR 3 +
let-2 CDS 2 -
let-2 3'UTR 6
let-7 miRNA 2 -
par-2 CDS 2 -
tbb-2 CDS 2 -
tbb-2 3'UTR 3
unc-119 CDS 1 +/-
zyg-1 CDS 2 -
zyg-1 3'UTR 3
+/-
+/-
+/-
+/-
+/-
+/-
+/-
+/-
-
-
+
+
-
-
-
+
+
+
+
-
-
-
-
-
-
-
-
-
-
Table S1. Overview of sequenced samples, Related to Figure 2 and 3.

genedels into coding
isolated mutants phenotype region deletion
complex/insertion
proportion of deletions (%)
egl-30 - 11 Slu 3'UTR 4 7 36sqt-2 + 7 Rol enhancer 3 4 43sqt-3 + 13 Rol TATA box 5 8 38sqt-3 + 26 Rol 3'UTR 1 25 4dpy-2 + 0 - 3'UTR - - -dpy-10 + 0 - 3'UTR - - -rol-6 - 0 - prom, TATA - - -rol-6 - 0 - 3'UTR - - -sqt-2 + 0 - TATA - - -sqt-2 + 0 - 3'UTR - - -unc-26 - 0 - 3'UTR - - -unc-54 + 0 - 3'UTR - - -sqt-3(ins) + 15 Rol->non-Rol 3'UTR 11 4 73
Table S2. Results of the screen for functional regulatory sequences using morphological phenotypes,
Related to Figure 5.
Related Documents