Parallel ecological diversification in Antarctic notothenioid fishes as evidence for adaptive radiation SEREINA RUTSCHMANN,* MICHAEL MATSCHINER,* MALTE DAMERAU,† MORITZ MUSCHICK,* MORITZ F. LEHMANN,‡ REINHOLD HANEL† and WALTER SALZBURGER* *Zoological Institute, University of Basel, Vesalgasse 1, CH-4051 Basel, Switzerland, †Institute of Fisheries Ecology, Johann Heinrich von Thu ¨ nen-Institute, Federal Research Institute for Rural Areas, Forestry and Fisheries, Palmaille 9, D-22767 Hamburg, Germany, ‡Institute of Environmental Geosciences, University of Basel, Bernoullistrasse 30, CH-4056 Basel, Switzerland Abstract Antarctic notothenioid fishes represent a rare example of a marine species flock. They evolved special adaptations to the extreme environment of the Southern Ocean including antifreeze glycoproteins. Although lacking a swim bladder, notothenioids have diver- sified from their benthic ancestor into a wide array of water column niches, such as epibenthic, semipelagic, cryopelagic and pelagic habitats. Applying stable carbon (C) and nitrogen (N) isotope analyses to gain information on feeding ecology and foraging habitats, we tested whether ecological diversification along the benthic–pelagic axis followed a single directional trend in notothenioids, or whether it evolved indepen- dently in several lineages. Population samples of 25 different notothenioid species were collected around the Antarctic Peninsula, the South Orkneys and the South Sandwich Islands. The C and N stable isotope signatures span a broad range (mean d 13 C and d 15 N values between )25.4& and )21.9& and between 8.5& and 13.8&, respectively), and pairwise niche overlap between four notothenioid families was highly significant. Analysis of isotopic disparity-through-time on the basis of Bayesian inference and maximum-likelihood phylogenies, performed on a concatenated mitochondrial (cyt b) and nuclear gene (myh6, Ptr and tbr1) data set (3148 bp), showed that ecological diversification into overlapping feeding niches has occurred multiple times in parallel in different notothenioid families. This convergent diversification in habitat and trophic ecology is a sign of interspecific competition and characteristic for adaptive radiations. Keywords: disparity-through-time, marine speciation, niche overlap, pelagization, phylogeny, stable nitrogen and carbon isotopes Received 1 February 2011; revision received 7 July 2011; accepted 15 July 2011 Introduction Adaptive radiation, the evolution of ecological and phe- notypic diversity within a rapidly multiplying lineage, is thought to be responsible for a great portion of the diversity of life (Simpson 1953; Schluter 2000). The most famous examples of adaptive radiations are the Dar- win’s finches on Gala ´pagos, the Caribbean Anolis liz- ards and the East African cichlid fishes. One of the key features of an adaptive radiation is the correlation between the morphologically diverse phenotypes of the ‘participating’ species and the various habitats that these occupy (Schluter 2000). While it is conceivable how such an ‘adaptive disparity’ is fulfilled by the par- adigmatic Darwin’s finches, anoles and cichlids with their characteristic adaptations in beaks, limbs and tro- phic structures, respectively, the inference of pheno- type-environment correlation remains a challenge in other cases of adaptive radiation (Schluter 2000; Gavri- lets & Losos 2009). In fishes, most studies on adaptive radiation focus on freshwater systems, with the cichlid species flocks of Correspondence: Walter Salzburger, Fax: +41 61 267 03 01; E-mail: [email protected] and Reinhold Hanel, Fax: +49 40 38 90 52 61; E-mail: [email protected] Ó 2011 Blackwell Publishing Ltd Molecular Ecology (2011) 20, 4707–4721 doi: 10.1111/j.1365-294X.2011.05279.x

Welcome message from author
This document is posted to help you gain knowledge. Please leave a comment to let me know what you think about it! Share it to your friends and learn new things together.
Transcript
Parallel ecological diversification in Antarcticnotothenioid fishes as evidence for adaptive radiation
SEREINA RUTSCHMANN,* MICHAEL MATSCHINER,* MALTE DAMERAU,† MORITZMUSCHICK,* MORITZ F. LEHMANN,‡ REINHOLD HANEL† and WALTER SALZBURGER**Zoological Institute, University of Basel, Vesalgasse 1, CH-4051 Basel, Switzerland, †Institute of Fisheries Ecology, JohannHeinrich von Thunen-Institute, Federal Research Institute for Rural Areas, Forestry and Fisheries, Palmaille 9, D-22767Hamburg, Germany, ‡Institute of Environmental Geosciences, University of Basel, Bernoullistrasse 30, CH-4056 Basel,Switzerland
Abstract
Antarctic notothenioid fishes represent a rare example of a marine species flock. Theyevolved special adaptations to the extreme environment of the Southern Ocean includingantifreeze glycoproteins. Although lacking a swim bladder, notothenioids have diver-sified from their benthic ancestor into a wide array of water column niches, such asepibenthic, semipelagic, cryopelagic and pelagic habitats. Applying stable carbon (C)and nitrogen (N) isotope analyses to gain information on feeding ecology and foraginghabitats, we tested whether ecological diversification along the benthic–pelagic axisfollowed a single directional trend in notothenioids, or whether it evolved indepen-dently in several lineages. Population samples of 25 different notothenioid species werecollected around the Antarctic Peninsula, the South Orkneys and the South SandwichIslands. The C and N stable isotope signatures span a broad range (mean d13C and d15Nvalues between )25.4& and )21.9& and between 8.5& and 13.8&, respectively), andpairwise niche overlap between four notothenioid families was highly significant.Analysis of isotopic disparity-through-time on the basis of Bayesian inference andmaximum-likelihood phylogenies, performed on a concatenated mitochondrial (cyt b)and nuclear gene (myh6, Ptr and tbr1) data set (3148 bp), showed that ecologicaldiversification into overlapping feeding niches has occurred multiple times in parallel indifferent notothenioid families. This convergent diversification in habitat and trophicecology is a sign of interspecific competition and characteristic for adaptive radiations.
Keywords: disparity-through-time, marine speciation, niche overlap, pelagization, phylogeny,stable nitrogen and carbon isotopes
Received 1 February 2011; revision received 7 July 2011; accepted 15 July 2011
Introduction
Adaptive radiation, the evolution of ecological and phe-notypic diversity within a rapidly multiplying lineage,is thought to be responsible for a great portion of thediversity of life (Simpson 1953; Schluter 2000). The mostfamous examples of adaptive radiations are the Dar-win’s finches on Galapagos, the Caribbean Anolis liz-ards and the East African cichlid fishes. One of the key
features of an adaptive radiation is the correlationbetween the morphologically diverse phenotypes of the‘participating’ species and the various habitats thatthese occupy (Schluter 2000). While it is conceivablehow such an ‘adaptive disparity’ is fulfilled by the par-adigmatic Darwin’s finches, anoles and cichlids withtheir characteristic adaptations in beaks, limbs and tro-phic structures, respectively, the inference of pheno-type-environment correlation remains a challenge inother cases of adaptive radiation (Schluter 2000; Gavri-lets & Losos 2009).In fishes, most studies on adaptive radiation focus on
freshwater systems, with the cichlid species flocks of
Correspondence: Walter Salzburger, Fax: +41 61 267 03 01;E-mail: [email protected] and Reinhold Hanel,Fax: +49 40 38 90 52 61; E-mail: [email protected]
! 2011 Blackwell Publishing Ltd
Molecular Ecology (2011) 20, 4707–4721 doi: 10.1111/j.1365-294X.2011.05279.x

the East African Great Lakes being the prime examples(Salzburger 2008, 2009). The Antarctic notothenioidsrepresent a marine species flock that evolved underextreme environmental conditions (Eastman & Clarke1998; Eastman 2000). The perciform suborder Notothe-nioidei diversified into at least 130 species in eight fami-lies, encompassing over 100 Antarctic species (Eastman2005; Eakin et al. 2009). Three ancestral families,Bovichtidae, Pseudaphritidae and Eleginopidae, com-prise eleven primarily non-Antarctic species, distributedaround southern South America, the Falkland Islands,southern New Zealand and southeastern Australia(Eastman 1993). The remaining families Artedidraconi-dae, Bathydraconidae, Channichthyidae, Harpagiferidaeand Nototheniidae are, with few exceptions, endemic toAntarctic waters and are usually referred to as the ‘Ant-arctic clade’ (e.g. Eastman 1993). Notothenioids domi-nate the Antarctic continental shelf and upper slope,accounting for approximately 46% of the species diver-sity and over 90% of the fish biomass (Eastman &Clarke 1998; Eastman 2005).Antarctic waters are constrained by the Antarctic Cir-
cumpolar Current (ACC). The Antarctic Polar Front, thenorthern boundary of the ACC between 50"S and 60"S,acts as major oceanographic barrier, effectively isolatingthe Southern Ocean faunal assemblages from those ofthe Indian, Pacific and Atlantic oceans. Through theestablishment of a thermally and oceanographically iso-lated area and the inhibition of faunal admixture, theAntarctic Polar Front is, hence, a likely driver of noto-thenioid evolution (Coppes Petricorena & Somero 2007).As a means to adapt to Southern Ocean environmentalconditions, the Antarctic notothenioids evolved specialanatomical and physiological features and, at the sametime, lost traits no longer ‘needed’ in permanently coldwaters: (i) The evolution of antifreeze glycoproteins isregarded as an evolutionary key innovation of notothe-nioids (Eastman 1993; Matschiner et al. 2011), facilitat-ing permanent life in subzero temperate waters. (ii) Allnotothenioids lack a functional swim bladder. Severalpelagic species, however, have evolved neutral buoy-ancy by a combination of skeletal mineralization andthe accumulation of lipid deposits (Eastman 1993; Klin-genberg & Ekau 1996). (iii) Some notothenioids havelost the classical heat-shock protein response (Place &Hofmann 2005; Clark et al. 2008). (iv) The Channich-thyidae represent the only known vertebrate group thatlacks erythrocytes in the adult state and that is unableto synthesize a functional version of the respiratoryoxygen transporter haemoglobin (Ruud 1954; Near et al.2006).Here, we investigate niche evolution in notothenioids,
using a set of 25 representative species (and 365 indi-viduals) that belong to four of the five notothenioid
families in the exceptionally species-rich Antarcticclade. Apparently, Antarctic notothenioids diversifiedalong the benthic-pelagic axis in the absence of competi-tion from other fish taxa (Eastman 1993, 2005). From amorphological perspective, this process termed ‘pelagi-zation’ appears to have occurred independently in sev-eral clades (Klingenberg & Ekau 1996; Bargelloni et al.2000).We used isotopic signatures as indicators for ecologi-
cal specialization to assess the diversity of lifestyles andfeeding strategies ⁄habits of the Antarctic clade, as hasbeen done for adaptively radiating rockfishes (Ingram2011), and to further test whether these strategies ⁄habitsevolved clade-specifically and unidirectionally or inde-pendently in several lineages. Stable isotope analysis(SIA) makes use of the fact that the C and N stable iso-tope signatures (d13C and d15N) of organisms aredirectly related to their diet. In general, the ratio of theheavier over the lighter stable isotope is greater in con-sumers than in food material and thus continuouslyincreases with trophic level (TL; e.g. Hobson & Welch1992; Hobson et al. 1994). This is particularly true fornitrogen, where N isotope fractionation leads to trophicshifts of 3–5& (DeNiro & Epstein 1978; Minagawa &Wada 1984; Post 2002). The C isotope fractionation isless pronounced during food chain processing, with atypical 1& increase per TL (Hobson & Welch 1992).Yet, carbon isotopic values can often be used to assessconstraints on the primary carbon source, which canvary strongly between different feeding grounds (e.g.inshore vs. offshore and pelagic vs. benthic). Thus,while N isotope ratios can be used to predict the rela-tive TL of an organism, its C isotopic compositionyields valuable information with regard to its habitat(e.g. Hobson et al. 1994).To reconstruct the evolution of ecological specializa-
tion in notothenioids, which has not been studied indetail, we established a new phylogeny of the studiedspecies based on mitochondrial and nuclear markers[3148 base pairs (bp) in total]. This phylogeny extendsprevious work (e.g. Near & Cheng 2008) by the use ofmultiple nuclear markers and by the longest totalsequence length used in notothenioid phylogenetics todate. Phylogeny and time estimation were fully inte-grated with SIA by the application of a disparity-through-time (DTT) analysis.According to the results of earlier studies (Klingen-
berg & Ekau 1996; Eastman & McCune 2000), weexpected to find evidence for independent colonizationof ecological niches in different lineages. Furthermore,should previous descriptions of the notothenioid diver-sification as an adaptive radiation be appropriate, thepattern of average subclade disparity throughout theradiation could be expected to resemble those found in
4708 S . RUTSCHMANN ET AL.
! 2011 Blackwell Publishing Ltd

other adaptive radiations like Liolaemus lizards (Harmonet al. 2003) or Tanganyikan cichlid fishes (Gonzalez-Vo-yer et al. 2009) and to be different from patternsobserved in putative non-adaptive radiations, such asrats (Rowe et al. 2011).
Materials and methods
Sample collection
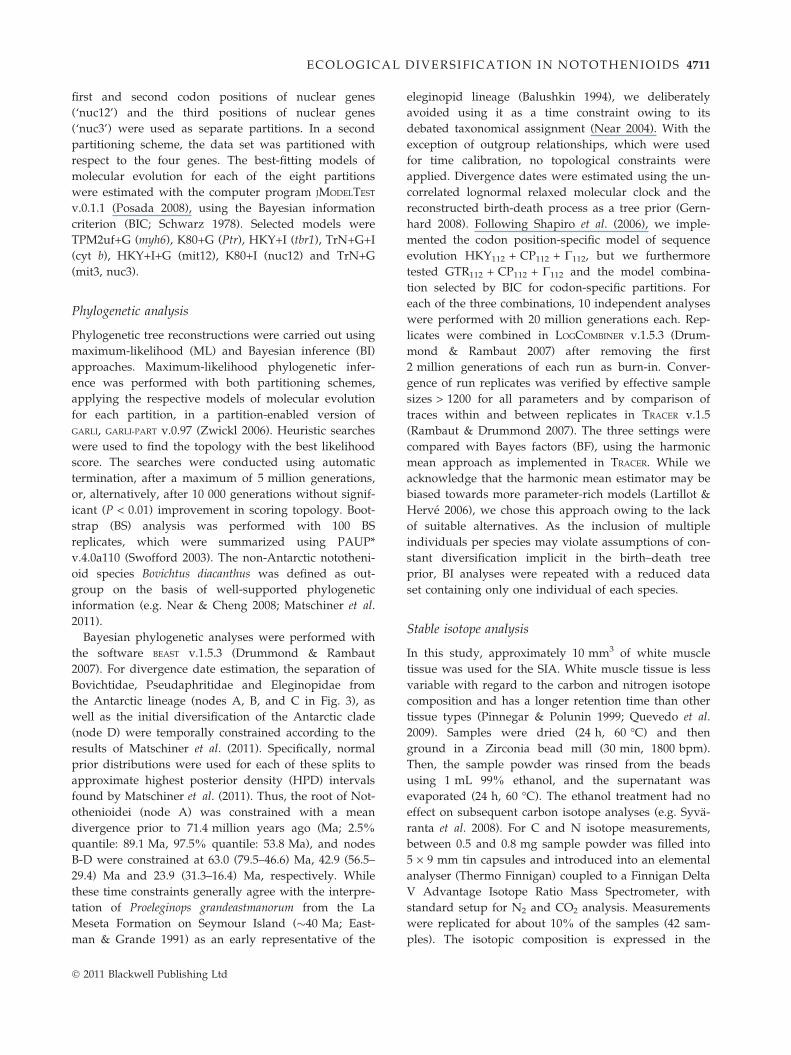
Sampling took place during three expeditions in theaustral summer to the Scotia Sea: The ICEFISH 2004cruise with RV Nathaniel B. Palmer (Jones et al. 2008),cruise ANT-XXIII ⁄ 8 with RV Polarstern, and the2008 ⁄ 09 US AMLR Survey with RV Yuzhmorgeologiya(Jones et al. 2009) (Fig. 1 and Table 1, Tables S1 andS2, Supporting information). White muscle tissue sam-ples were preserved in 95% ethanol and stored at)20 "C for subsequent investigations. A total of 365adult individuals of 25 Antarctic notothenioid specieswere processed for SIA. Molecular analyses were per-formed with 39 individuals of the same 25 species andthree representatives of non-Antarctic notothenioid fam-ilies serving as outgroups (Table 1).
DNA extraction, amplification, sequencing andalignment
Genomic DNA from approx. 10 mm3 white muscletissues was extracted by proteinase K digestion,followed by sodium chloride extraction and ethanolprecipitation. Marker selection was based on thegenome-wide marker comparison of Li et al. (2007). Weincluded a fast-evolving gene (myh6), a gene evolving atintermediate rates (Ptr) and a slowly evolving gene(tbr1). As a representative mitochondrial marker
(mtDNA), we used cytochrome b (cyt b), which hadpreviously been proven suitable for phylogenetic analy-ses in notothenioids (Chen et al. 1998; Matschiner et al.2011). Nuclear markers were amplified with the follow-ing primer pairs: myh6_F507 ⁄myh6_R1325, Ptr_F458 ⁄Ptr_R1248 and tbr1_F86 ⁄ tbr1_R820 (Li et al. 2007); theamplification of cyt b was performed using the primersNotCytBf and H15915n (Matschiner et al. 2011).Sequences of the three outgroup species and Pogonoph-ryne scotti, as well as Ptr sequences of Notothenia corii-ceps and Trematomus newnesi were obtained fromGenBank (see Data accessibility and Table S4, Support-ing information).The gene fragments were amplified using different
polymerase chain reaction (PCR) protocols. Cyt b, myh6and Ptr PCR products were achieved using the Finn-zymes’ Phusion# High-Fidelity DNA Polymerase (Finn-zymes). Individual reaction volumes contained 8.6 lLddH20, 10.0 lL 2 · Phusion# Master Mix with HF Buf-fer [containing 0.04 U ⁄lL Phusion# DNA Polymerase,2 · Phusion# HF Buffer, 400 lM of each deoxynucleo-tides (dNTP)], 0.2 lL forward primer, 0.2 lL reverseprimer and 1.0 lL DNA template. The PCR profilesincluded initial denaturation (30 s, 98 "C), followed by30 (cyt b) or 40 cycles (myh6, Ptr) of denaturation (10 s,98 "C), annealing (30 s, 56 "C) (53 "C for Ptr), extension(30 s, 72 "C) and a final extension phase (10 min,72 "C). Tbr1 amplification was achieved using REDTaq#
DNA Polymerase (Sigma-Aldrich). The PCR mixescontained 5.5 lL ddH2O, 1.25 lL 10· Taq buffer(Sigma-Aldrich), 1.0 lL MgCl2, 1.25 lL dNTP mix,1.0 lL forward primer, 1.0 lL reverse primer, 0.5 lLREDTaq# DNA Polymerase (Sigma-Aldrich) and 1.0 lLDNA template. Amplifications of tbr1 were carried outusing the following temperature profile: initial denatur-ation (2 min, 94 "C) followed by 32 thermocycles ofdenaturation (30 s, 94 "C), annealing (30 s, 57 "C),extension (1 min, 72 "C) and a final extension phase(7 min, 72 "C). All amplification products were purifiedusing the ExoSAP-IT (USB) standard protocol, adding0.5 lL ExoSAP-IT and 3.5 lL ddH2O to 2.5 lL PCRtemplates, incubating (15 min, 37 "C; 15 min, 80 "C)and, in some cases, using the GenElute$ Gel ExtractionKit (Sigma-Aldrich). The purified PCR products wereused as templates for cycle sequencing reactions withthe BigDye# Terminator v3.1 Cycle Sequencing Kit(Applied Biosystems), following the manufacturer’sinstructions. The reaction volumes included 0.5 lL pri-mer, 1.0 lL BigDye# Terminator Reaction Mix (AppliedBiosystems) and 3.0–6.5 lL purified DNA in a total vol-ume of 8 lL. The nuclear markers were sequenced withone forward and reverse primer each. Sequencing of cytb was additionally performed with two different for-ward primers: NotCytBf (Matschiner et al. 2011) and
0 500 kmAntarctic Peninsula
South Orkney Islands
SouthSandwichIslands
South America
Scotia Sea
50
60
7040 30 20 10
°S
°W70 60 50
ICEFISH ANT-XXIII/8 AMLR Survey
Fig. 1 Sampling sites off the northern Antarctic Peninsula, theSouth Orkney Islands and the South Sandwich Islands. Thesolid line indicates the 1000 m depth contour.
ECOLOGICAL DIVERSIFICATION IN NOTOTHENIOIDS 4709
! 2011 Blackwell Publishing Ltd
cytbcentralF (5¢- CYA CCC TNA CYC GYT TCT TTG C-3¢), which was newly designed to bind at a centralposition of cyt b (bases 518–539 in cyt b of Chionodracorastrospinosus). The reaction conditions were as follows:initial denaturation (1 min, 94 "C) followed by 25 cyclesof denaturation (10 s, 94 "C), annealing (20 s, 52 "C)and elongation phase (4 min, 60 "C). UnincorporatedBigDye# terminators were removed with the BigDye#
XTerminator$ Purification Kit (Applied Biosystems). Tothis end, 14.5 lL ddH2O, 22.5 lL SAM$ solution and5.0 lL XTerminator$ beads were added to the sequenc-ing products, then shaken (30 min, 2000 rpm), andfinally centrifuged (2 min, 211 g). All sequences wereread with an ABI3130xl Capillary Sequencer (Applied
Biosystems). Sequence reads were verified by eye, andforward and reverse fragments were assembled usingCODONCODE ALIGNER v.3.5.6 (CodonCode Corporation).All sequences were aligned per locus with the multi-
ple sequence alignment program MAFFT v.6.717b (Katoh& Toh 2008). The alignments were trimmed in MESQUITE
v.2.72 (Maddison & Maddison 2009) so that each align-ment started and ended with codon triplets, and wealso checked for stop codons. Alignments were concate-nated and partitioned by molecule type and codon posi-tion to account for heterogeneity in evolutionary ratesand substitution patterns. Thus, the first and secondcodon positions of mitochondrial cyt b (‘mit12’), thethird codon positions of mitochondrial cyt b (‘mit3’), the
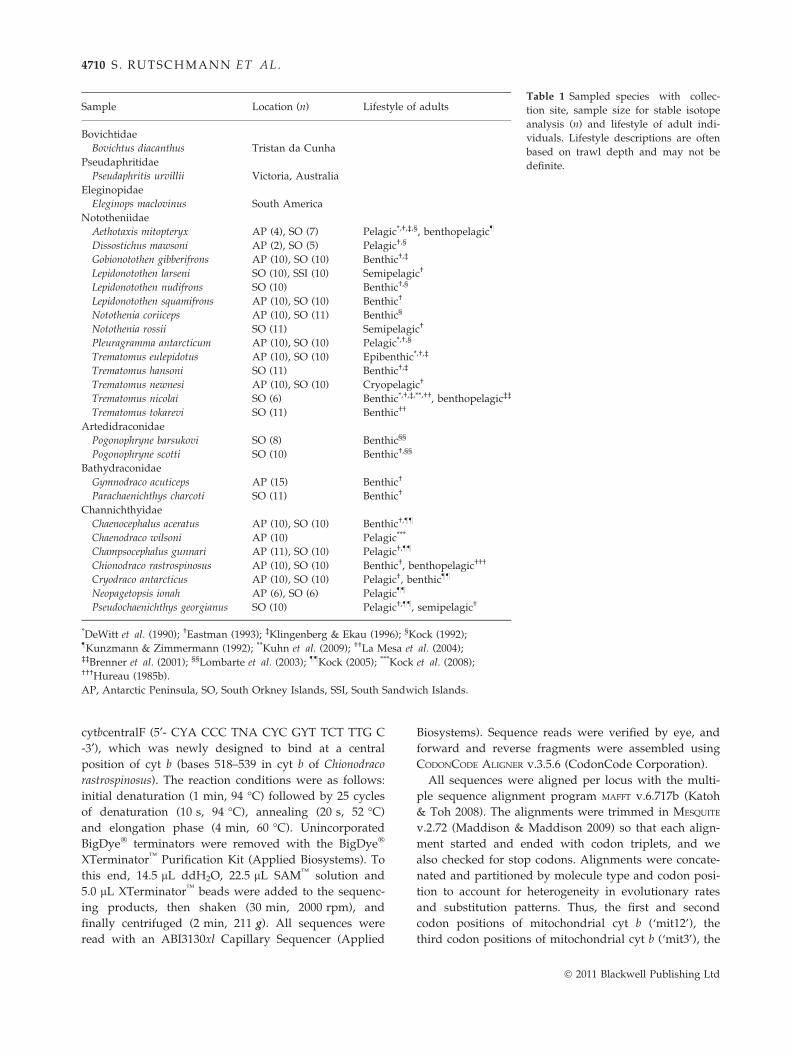
Table 1 Sampled species with collec-tion site, sample size for stable isotopeanalysis (n) and lifestyle of adult indi-viduals. Lifestyle descriptions are oftenbased on trawl depth and may not bedefinite.
Sample Location (n) Lifestyle of adults
BovichtidaeBovichtus diacanthus Tristan da Cunha
PseudaphritidaePseudaphritis urvillii Victoria, Australia
EleginopidaeEleginops maclovinus South America
NototheniidaeAethotaxis mitopteryx AP (4), SO (7) Pelagic*,†,‡,§, benthopelagic–
Dissostichus mawsoni AP (2), SO (5) Pelagic†,§
Gobionotothen gibberifrons AP (10), SO (10) Benthic†,‡
Lepidonotothen larseni SO (10), SSI (10) Semipelagic†
Lepidonotothen nudifrons SO (10) Benthic†,§
Lepidonotothen squamifrons AP (10), SO (10) Benthic†
Notothenia coriiceps AP (10), SO (11) Benthic§
Notothenia rossii SO (11) Semipelagic†
Pleuragramma antarcticum AP (10), SO (10) Pelagic*,†,§
Trematomus eulepidotus AP (10), SO (10) Epibenthic*,†,‡
Trematomus hansoni SO (11) Benthic†,‡
Trematomus newnesi AP (10), SO (10) Cryopelagic†
Trematomus nicolai SO (6) Benthic*,†,‡,**,††, benthopelagic‡‡
Trematomus tokarevi SO (11) Benthic††
ArtedidraconidaePogonophryne barsukovi SO (8) Benthic§§
Pogonophryne scotti SO (10) Benthic†,§§
BathydraconidaeGymnodraco acuticeps AP (15) Benthic†
Parachaenichthys charcoti SO (11) Benthic†
ChannichthyidaeChaenocephalus aceratus AP (10), SO (10) Benthic†,––
Chaenodraco wilsoni AP (10) Pelagic***
Champsocephalus gunnari AP (11), SO (10) Pelagic†,––
Chionodraco rastrospinosus AP (10), SO (10) Benthic†, benthopelagic†††
Cryodraco antarcticus AP (10), SO (10) Pelagic†, benthic––
Neopagetopsis ionah AP (6), SO (6) Pelagic––
Pseudochaenichthys georgianus SO (10) Pelagic†,––, semipelagic†
*DeWitt et al. (1990); †Eastman (1993); ‡Klingenberg & Ekau (1996); §Kock (1992);–Kunzmann & Zimmermann (1992); **Kuhn et al. (2009); ††La Mesa et al. (2004);‡‡Brenner et al. (2001); §§Lombarte et al. (2003); ––Kock (2005); ***Kock et al. (2008);†††Hureau (1985b).AP, Antarctic Peninsula, SO, South Orkney Islands, SSI, South Sandwich Islands.
4710 S . RUTSCHMANN ET AL.
! 2011 Blackwell Publishing Ltd
first and second codon positions of nuclear genes(‘nuc12’) and the third positions of nuclear genes(‘nuc3’) were used as separate partitions. In a secondpartitioning scheme, the data set was partitioned withrespect to the four genes. The best-fitting models ofmolecular evolution for each of the eight partitionswere estimated with the computer program JMODELTEST
v.0.1.1 (Posada 2008), using the Bayesian informationcriterion (BIC; Schwarz 1978). Selected models wereTPM2uf+G (myh6), K80+G (Ptr), HKY+I (tbr1), TrN+G+I(cyt b), HKY+I+G (mit12), K80+I (nuc12) and TrN+G(mit3, nuc3).
Phylogenetic analysis
Phylogenetic tree reconstructions were carried out usingmaximum-likelihood (ML) and Bayesian inference (BI)approaches. Maximum-likelihood phylogenetic infer-ence was performed with both partitioning schemes,applying the respective models of molecular evolutionfor each partition, in a partition-enabled version ofGARLI, GARLI-PART v.0.97 (Zwickl 2006). Heuristic searcheswere used to find the topology with the best likelihoodscore. The searches were conducted using automatictermination, after a maximum of 5 million generations,or, alternatively, after 10 000 generations without signif-icant (P < 0.01) improvement in scoring topology. Boot-strap (BS) analysis was performed with 100 BSreplicates, which were summarized using PAUP*v.4.0a110 (Swofford 2003). The non-Antarctic nototheni-oid species Bovichtus diacanthus was defined as out-group on the basis of well-supported phylogeneticinformation (e.g. Near & Cheng 2008; Matschiner et al.2011).Bayesian phylogenetic analyses were performed with
the software BEAST v.1.5.3 (Drummond & Rambaut2007). For divergence date estimation, the separation ofBovichtidae, Pseudaphritidae and Eleginopidae fromthe Antarctic lineage (nodes A, B, and C in Fig. 3), aswell as the initial diversification of the Antarctic clade(node D) were temporally constrained according to theresults of Matschiner et al. (2011). Specifically, normalprior distributions were used for each of these splits toapproximate highest posterior density (HPD) intervalsfound by Matschiner et al. (2011). Thus, the root of Not-othenioidei (node A) was constrained with a meandivergence prior to 71.4 million years ago (Ma; 2.5%quantile: 89.1 Ma, 97.5% quantile: 53.8 Ma), and nodesB-D were constrained at 63.0 (79.5–46.6) Ma, 42.9 (56.5–29.4) Ma and 23.9 (31.3–16.4) Ma, respectively. Whilethese time constraints generally agree with the interpre-tation of Proeleginops grandeastmanorum from the LaMeseta Formation on Seymour Island (!40 Ma; East-man & Grande 1991) as an early representative of the
eleginopid lineage (Balushkin 1994), we deliberatelyavoided using it as a time constraint owing to itsdebated taxonomical assignment (Near 2004). With theexception of outgroup relationships, which were usedfor time calibration, no topological constraints wereapplied. Divergence dates were estimated using the un-correlated lognormal relaxed molecular clock and thereconstructed birth-death process as a tree prior (Gern-hard 2008). Following Shapiro et al. (2006), we imple-mented the codon position-specific model of sequenceevolution HKY112 + CP112 + C112, but we furthermoretested GTR112 + CP112 + C112 and the model combina-tion selected by BIC for codon-specific partitions. Foreach of the three combinations, 10 independent analyseswere performed with 20 million generations each. Rep-licates were combined in LOGCOMBINER v.1.5.3 (Drum-mond & Rambaut 2007) after removing the first2 million generations of each run as burn-in. Conver-gence of run replicates was verified by effective samplesizes > 1200 for all parameters and by comparison oftraces within and between replicates in TRACER v.1.5(Rambaut & Drummond 2007). The three settings werecompared with Bayes factors (BF), using the harmonicmean approach as implemented in TRACER. While weacknowledge that the harmonic mean estimator may bebiased towards more parameter-rich models (Lartillot &Herve 2006), we chose this approach owing to the lackof suitable alternatives. As the inclusion of multipleindividuals per species may violate assumptions of con-stant diversification implicit in the birth–death treeprior, BI analyses were repeated with a reduced dataset containing only one individual of each species.
Stable isotope analysis
In this study, approximately 10 mm3 of white muscletissue was used for the SIA. White muscle tissue is lessvariable with regard to the carbon and nitrogen isotopecomposition and has a longer retention time than othertissue types (Pinnegar & Polunin 1999; Quevedo et al.2009). Samples were dried (24 h, 60 "C) and thenground in a Zirconia bead mill (30 min, 1800 bpm).Then, the sample powder was rinsed from the beadsusing 1 mL 99% ethanol, and the supernatant wasevaporated (24 h, 60 "C). The ethanol treatment had noeffect on subsequent carbon isotope analyses (e.g. Syva-ranta et al. 2008). For C and N isotope measurements,between 0.5 and 0.8 mg sample powder was filled into5 · 9 mm tin capsules and introduced into an elementalanalyser (Thermo Finnigan) coupled to a Finnigan DeltaV Advantage Isotope Ratio Mass Spectrometer, withstandard setup for N2 and CO2 analysis. Measurementswere replicated for about 10% of the samples (42 sam-ples). The isotopic composition is expressed in the
ECOLOGICAL DIVERSIFICATION IN NOTOTHENIOIDS 4711
! 2011 Blackwell Publishing Ltd
conventional delta notation as permil (&) deviation vs.atmospheric N2 (AIR) and carbonate standards (V-PDB): d = [(Rsample ⁄Rstandard) – 1] · 1000, with R repre-senting the ratio of the heavy to the light isotope (i.e.13C ⁄ 12C and 15N ⁄ 14N) in the sample and in the standardmaterial, respectively. EDTA (d13C = )30.25&, d15N =)1.1&) and ammonium oxalate (d13C = )17.02&,d15N = 32.7&) were used as internal standards, calibratedagainst international nitrogen (IAEA-N1, IAEA-N2) andcarbon (NBS22) standards. The analytical reproducibil-ity based on replicate sample and standard measure-ments was better than 0.2& for both d13C and d15N.Isotope values are presented as mean ± standard devia-tion (SD). Variable lipid content can have a biasingeffect on the interpretation of bulk C and N stableisotope data. In marine fish samples, this effect seemsto be minor (Kiljunen et al. 2006; Logan et al. 2008),and hence, we did not perform a lipid removal step.Nevertheless, we performed a posteriori ‘mathematicallipid correction’ after the study of Logan et al. (2008).The correction, however, did not affect the species dis-tribution pattern, and thus, only the uncorrected valuesare presented in this study. (The corrected data set isavailable upon request.)
Statistical analysis
The correlation of d13C and d15N was tested with aPearson correlation, whereby we accounted for phyloge-netic non-independence using phylogenetic indepen-dent contrast (‘pic’ function in the R package ‘ape’;Paradis et al. 2004; R Development Core Team 2009).We tested for the effect of geographic sites on isotopicsignatures by comparison of pooled d13C and d15N val-ues between AP and SO (t-test). Here, only values fromspecies with similar sample sizes at both locations wereconsidered. Pairwise niche overlap between all familiesand additional comparisons of the nototheniid Lepido-notothen–Trematomus clade with the other families weretested with a multivariate analysis of variance (MANOVA).To assess the group overlap in isotopic signatures, wecalculated Wilk’s lambda (Wilk’s k) for each compari-son.We analysed the subdivision of ecological niche space
throughout the radiation using the BI phylogeny(Fig. 3) and the averaged stable isotope data for eachspecies. Average subclade disparity was calculated ateach splitting event and plotted against time. A Brown-ian motion (BM) model of trait evolution was employedfor comparison. Disparity-through-time analyses wereconducted in R using the package ‘geiger’ (Harmonet al. 2008). Using 475 trees drawn from the posteriordistribution of the BI analysis and 500 permutations ofthe stable isotope data, we assessed the robustness of
the observed pattern against phylogenetic uncertaintyand intraspecific variation.
Results
Phylogenetic analysis
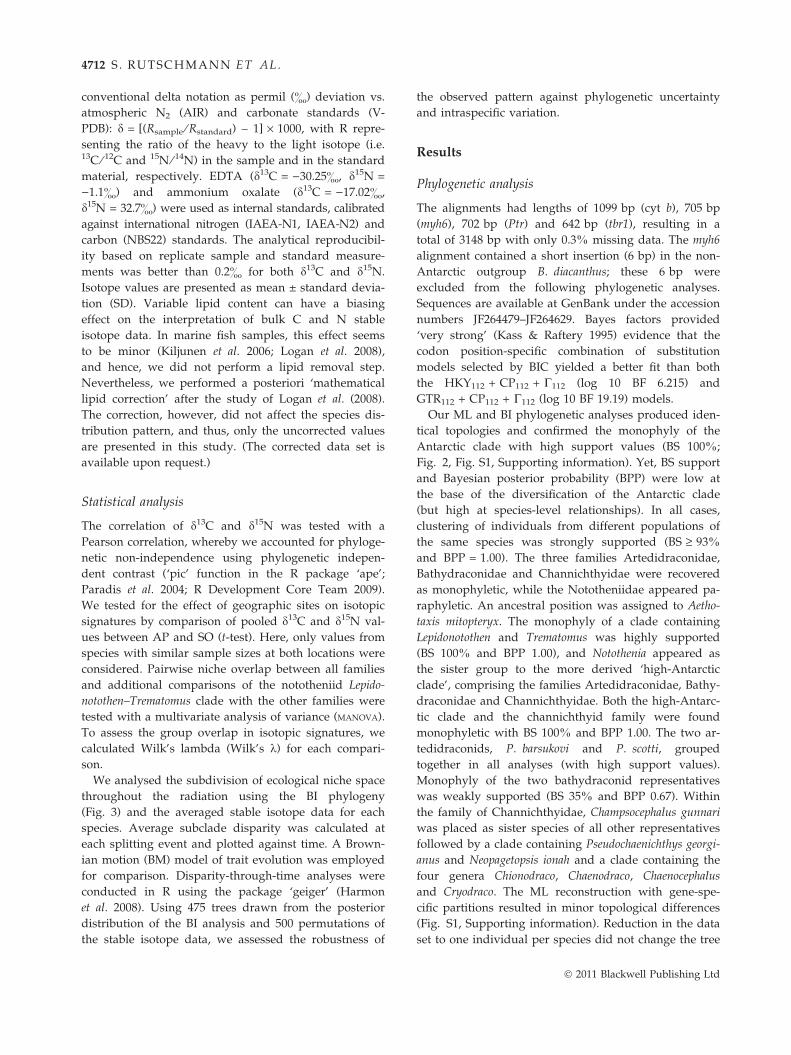
The alignments had lengths of 1099 bp (cyt b), 705 bp(myh6), 702 bp (Ptr) and 642 bp (tbr1), resulting in atotal of 3148 bp with only 0.3% missing data. The myh6alignment contained a short insertion (6 bp) in the non-Antarctic outgroup B. diacanthus; these 6 bp wereexcluded from the following phylogenetic analyses.Sequences are available at GenBank under the accessionnumbers JF264479–JF264629. Bayes factors provided‘very strong’ (Kass & Raftery 1995) evidence that thecodon position-specific combination of substitutionmodels selected by BIC yielded a better fit than boththe HKY112 + CP112 + C112 (log 10 BF 6.215) andGTR112 + CP112 + C112 (log 10 BF 19.19) models.Our ML and BI phylogenetic analyses produced iden-
tical topologies and confirmed the monophyly of theAntarctic clade with high support values (BS 100%;Fig. 2, Fig. S1, Supporting information). Yet, BS supportand Bayesian posterior probability (BPP) were low atthe base of the diversification of the Antarctic clade(but high at species-level relationships). In all cases,clustering of individuals from different populations ofthe same species was strongly supported (BS ‡ 93%and BPP = 1.00). The three families Artedidraconidae,Bathydraconidae and Channichthyidae were recoveredas monophyletic, while the Nototheniidae appeared pa-raphyletic. An ancestral position was assigned to Aetho-taxis mitopteryx. The monophyly of a clade containingLepidonotothen and Trematomus was highly supported(BS 100% and BPP 1.00), and Notothenia appeared asthe sister group to the more derived ‘high-Antarcticclade’, comprising the families Artedidraconidae, Bathy-draconidae and Channichthyidae. Both the high-Antarc-tic clade and the channichthyid family were foundmonophyletic with BS 100% and BPP 1.00. The two ar-tedidraconids, P. barsukovi and P. scotti, groupedtogether in all analyses (with high support values).Monophyly of the two bathydraconid representativeswas weakly supported (BS 35% and BPP 0.67). Withinthe family of Channichthyidae, Champsocephalus gunnariwas placed as sister species of all other representativesfollowed by a clade containing Pseudochaenichthys georgi-anus and Neopagetopsis ionah and a clade containing thefour genera Chionodraco, Chaenodraco, Chaenocephalusand Cryodraco. The ML reconstruction with gene-spe-cific partitions resulted in minor topological differences(Fig. S1, Supporting information). Reduction in the dataset to one individual per species did not change the tree
4712 S . RUTSCHMANN ET AL.
! 2011 Blackwell Publishing Ltd
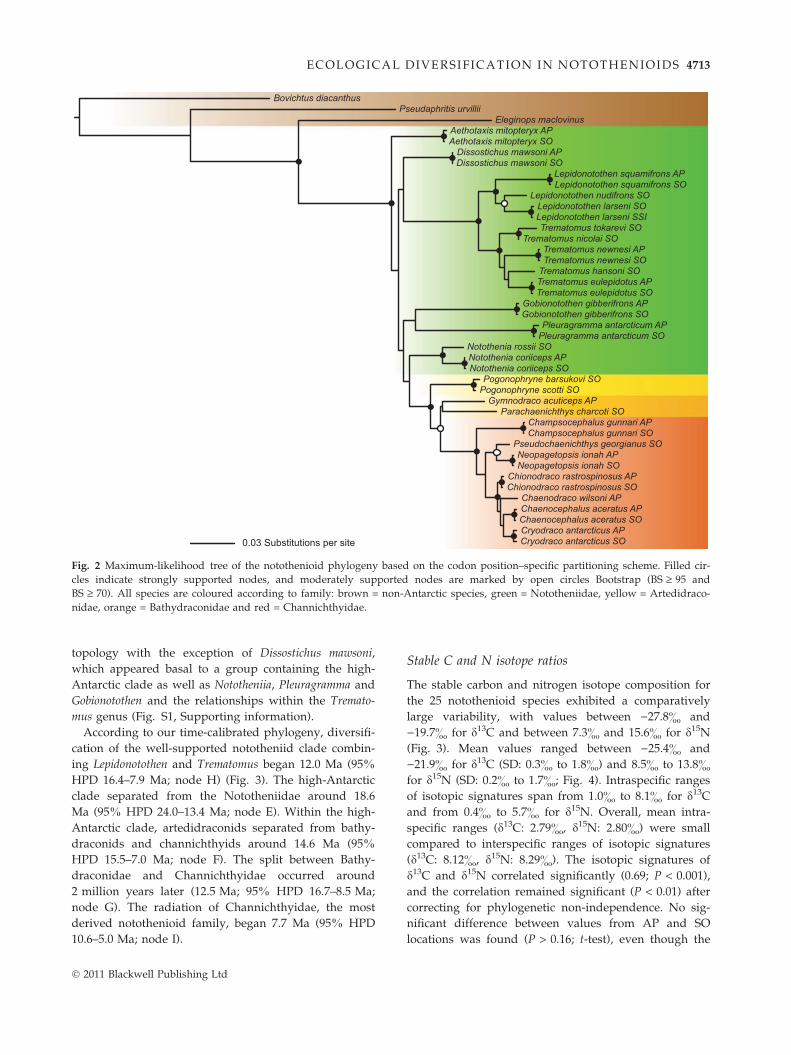
topology with the exception of Dissostichus mawsoni,which appeared basal to a group containing the high-Antarctic clade as well as Nototheniia, Pleuragramma andGobionotothen and the relationships within the Tremato-mus genus (Fig. S1, Supporting information).According to our time-calibrated phylogeny, diversifi-
cation of the well-supported nototheniid clade combin-ing Lepidonotothen and Trematomus began 12.0 Ma (95%HPD 16.4–7.9 Ma; node H) (Fig. 3). The high-Antarcticclade separated from the Nototheniidae around 18.6Ma (95% HPD 24.0–13.4 Ma; node E). Within the high-Antarctic clade, artedidraconids separated from bathy-draconids and channichthyids around 14.6 Ma (95%HPD 15.5–7.0 Ma; node F). The split between Bathy-draconidae and Channichthyidae occurred around2 million years later (12.5 Ma; 95% HPD 16.7–8.5 Ma;node G). The radiation of Channichthyidae, the mostderived notothenioid family, began 7.7 Ma (95% HPD10.6–5.0 Ma; node I).
Stable C and N isotope ratios
The stable carbon and nitrogen isotope composition forthe 25 notothenioid species exhibited a comparativelylarge variability, with values between )27.8& and)19.7& for d13C and between 7.3& and 15.6& for d15N(Fig. 3). Mean values ranged between )25.4& and)21.9& for d13C (SD: 0.3& to 1.8&) and 8.5& to 13.8&for d15N (SD: 0.2& to 1.7&; Fig. 4). Intraspecific rangesof isotopic signatures span from 1.0& to 8.1& for d13Cand from 0.4& to 5.7& for d15N. Overall, mean intra-specific ranges (d13C: 2.79&, d15N: 2.80&) were smallcompared to interspecific ranges of isotopic signatures(d13C: 8.12&, d15N: 8.29&). The isotopic signatures ofd13C and d15N correlated significantly (0.69; P < 0.001),and the correlation remained significant (P < 0.01) aftercorrecting for phylogenetic non-independence. No sig-nificant difference between values from AP and SOlocations was found (P > 0.16; t-test), even though the
Bovichtus diacanthusPseudaphritis urvillii
Eleginops maclovinusAethotaxis mitopteryx APAethotaxis mitopteryx SO
Dissostichus mawsoni APDissostichus mawsoni SO
Lepidonotothen squamifrons APLepidonotothen squamifrons SO
Lepidonotothen nudifrons SOLepidonotothen larseni SOLepidonotothen larseni SSITrematomus tokarevi SO
Trematomus nicolai SOTrematomus newnesi APTrematomus newnesi SO
Trematomus hansoni SOTrematomus eulepidotus APTrematomus eulepidotus SO
Gobionotothen gibberifrons APGobionotothen gibberifrons SO
Pleuragramma antarcticum APPleuragramma antarcticum SO
Notothenia rossii SONotothenia coriiceps APNotothenia coriiceps SO
Pogonophryne scotti SOPogonophryne barsukovi SO
Gymnodraco acuticeps APParachaenichthys charcoti SO
Champsocephalus gunnari APChampsocephalus gunnari SO
Pseudochaenichthys georgianus SONeopagetopsis ionah APNeopagetopsis ionah SO
Chionodraco rastrospinosus APChionodraco rastrospinosus SO
Chaenodraco wilsoni AP
Cryodraco antarcticus APCryodraco antarcticus SO
Chaenocephalus aceratus APChaenocephalus aceratus SO
0.03 Substitutions per site
Fig. 2 Maximum-likelihood tree of the notothenioid phylogeny based on the codon position–specific partitioning scheme. Filled cir-cles indicate strongly supported nodes, and moderately supported nodes are marked by open circles Bootstrap (BS ‡ 95 andBS ‡ 70). All species are coloured according to family: brown = non-Antarctic species, green = Nototheniidae, yellow = Artedidraco-nidae, orange = Bathydraconidae and red = Channichthyidae.
ECOLOGICAL DIVERSIFICATION IN NOTOTHENIOIDS 4713
! 2011 Blackwell Publishing Ltd
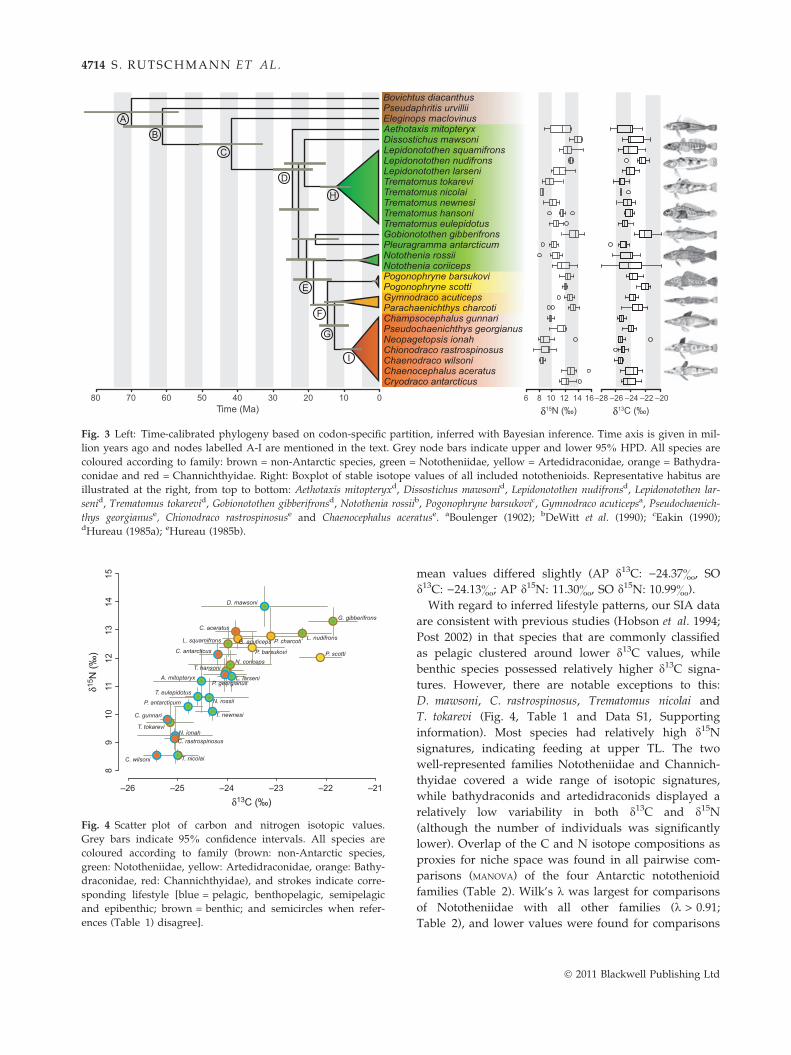
mean values differed slightly (AP d13C: )24.37&, SOd13C: )24.13&; AP d15N: 11.30&, SO d15N: 10.99&).With regard to inferred lifestyle patterns, our SIA data
are consistent with previous studies (Hobson et al. 1994;Post 2002) in that species that are commonly classifiedas pelagic clustered around lower d13C values, whilebenthic species possessed relatively higher d13C signa-tures. However, there are notable exceptions to this:D. mawsoni, C. rastrospinosus, Trematomus nicolai andT. tokarevi (Fig. 4, Table 1 and Data S1, Supportinginformation). Most species had relatively high d15Nsignatures, indicating feeding at upper TL. The twowell-represented families Nototheniidae and Channich-thyidae covered a wide range of isotopic signatures,while bathydraconids and artedidraconids displayed arelatively low variability in both d13C and d15N(although the number of individuals was significantlylower). Overlap of the C and N isotope compositions asproxies for niche space was found in all pairwise com-parisons (MANOVA) of the four Antarctic notothenioidfamilies (Table 2). Wilk’s k was largest for comparisonsof Nototheniidae with all other families (k > 0.91;Table 2), and lower values were found for comparisons
13C (‰)15N (‰)Time (Ma) !!6 8 10 12 14 16–28 –26 –24 –22 –2060 50 40 30 20 10 07080
Bovichtus diacanthusPseudaphritis urvilliiEleginops maclovinusAethotaxis mitopteryx Dissostichus mawsoniLepidonotothen squamifrons
Gymnodraco acuticeps
Lepidonotothen nudifrons Lepidonotothen larseni Trematomus tokarevi Trematomus nicolai Trematomus newnesi Trematomus hansoni Trematomus eulepidotus Gobionotothen gibberifrons Pleuragramma antarcticumNotothenia rossii Notothenia coriiceps
Pogonophryne scottiPogonophryne barsukovi
Parachaenichthys charcotiChampsocephalus gunnari Pseudochaenichthys georgianus Neopagetopsis ionah Chionodraco rastrospinosus Chaenodraco wilsoni
Cryodraco antarcticusChaenocephalus aceratus
I
H
G
F
E
D
C
BA
Fig. 3 Left: Time-calibrated phylogeny based on codon-specific partition, inferred with Bayesian inference. Time axis is given in mil-lion years ago and nodes labelled A-I are mentioned in the text. Grey node bars indicate upper and lower 95% HPD. All species arecoloured according to family: brown = non-Antarctic species, green = Nototheniidae, yellow = Artedidraconidae, orange = Bathydra-conidae and red = Channichthyidae. Right: Boxplot of stable isotope values of all included notothenioids. Representative habitus areillustrated at the right, from top to bottom: Aethotaxis mitopteryxd, Dissostichus mawsonid, Lepidonotothen nudifronsd, Lepidonotothen lar-senid, Trematomus tokarevid, Gobionotothen gibberifronsd, Notothenia rossiib, Pogonophryne barsukovic, Gymnodraco acuticepsa, Pseudochaenich-thys georgianuse, Chionodraco rastrospinosuse and Chaenocephalus aceratuse. aBoulenger (1902); bDeWitt et al. (1990); cEakin (1990);dHureau (1985a); eHureau (1985b).
T. tokarevi
T. nicolai
T. newnesi
T. hansoni
T. eulepidotus
P. scotti
P. georgianus
P. charcoti
P. barsukovi
P. antarcticum N. rossii
N. ionah
N. coriceps
L. squamifrons L. nudifrons
L. larseni
G. gibberifrons
G. acuticeps
D. mawsoni
C. wilsoni
C. rastrospinosus
C. gunnari
C. antarcticus
C. aceratus
A. mitopteryx
–26 –25 –23–24 –22
1413
1110
129
815
–21
!15N
(‰)
!13C (‰)
Fig. 4 Scatter plot of carbon and nitrogen isotopic values.Grey bars indicate 95% confidence intervals. All species arecoloured according to family (brown: non-Antarctic species,green: Nototheniidae, yellow: Artedidraconidae, orange: Bathy-draconidae, red: Channichthyidae), and strokes indicate corre-sponding lifestyle [blue = pelagic, benthopelagic, semipelagicand epibenthic; brown = benthic; and semicircles when refer-ences (Table 1) disagree].
4714 S . RUTSCHMANN ET AL.
! 2011 Blackwell Publishing Ltd
including the lesser-represented families Artedidraconi-dae and Bathydraconidae (k > 0.68). Notably, within-family variation resulted mostly from interspecific varia-tion, instead of intraspecific variation, and closelyrelated species with small intraspecific variation couldbe found at both ends of the ranges (e.g. T. nicolai andLepidonotothen nudifrons; Fig. 3).Using the DTT method, we assessed how the stable
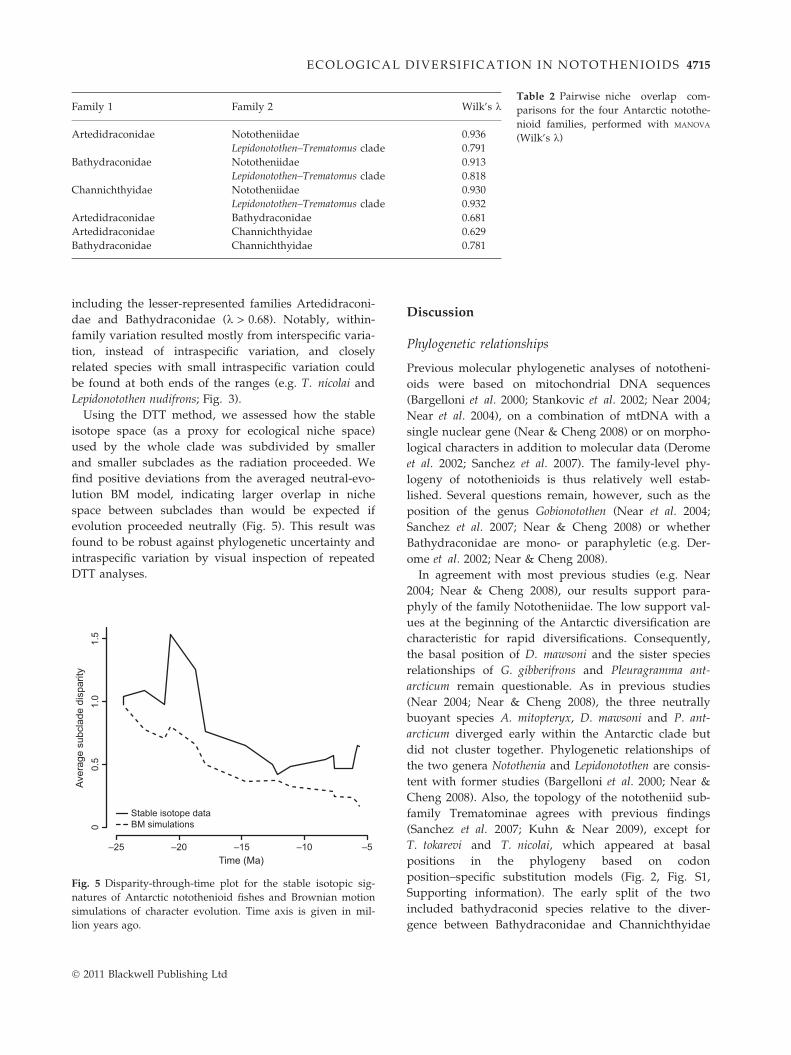
isotope space (as a proxy for ecological niche space)used by the whole clade was subdivided by smallerand smaller subclades as the radiation proceeded. Wefind positive deviations from the averaged neutral-evo-lution BM model, indicating larger overlap in nichespace between subclades than would be expected ifevolution proceeded neutrally (Fig. 5). This result wasfound to be robust against phylogenetic uncertainty andintraspecific variation by visual inspection of repeatedDTT analyses.
Discussion
Phylogenetic relationships
Previous molecular phylogenetic analyses of nototheni-oids were based on mitochondrial DNA sequences(Bargelloni et al. 2000; Stankovic et al. 2002; Near 2004;Near et al. 2004), on a combination of mtDNA with asingle nuclear gene (Near & Cheng 2008) or on morpho-logical characters in addition to molecular data (Deromeet al. 2002; Sanchez et al. 2007). The family-level phy-logeny of notothenioids is thus relatively well estab-lished. Several questions remain, however, such as theposition of the genus Gobionotothen (Near et al. 2004;Sanchez et al. 2007; Near & Cheng 2008) or whetherBathydraconidae are mono- or paraphyletic (e.g. Der-ome et al. 2002; Near & Cheng 2008).In agreement with most previous studies (e.g. Near
2004; Near & Cheng 2008), our results support para-phyly of the family Nototheniidae. The low support val-ues at the beginning of the Antarctic diversification arecharacteristic for rapid diversifications. Consequently,the basal position of D. mawsoni and the sister speciesrelationships of G. gibberifrons and Pleuragramma ant-arcticum remain questionable. As in previous studies(Near 2004; Near & Cheng 2008), the three neutrallybuoyant species A. mitopteryx, D. mawsoni and P. ant-arcticum diverged early within the Antarctic clade butdid not cluster together. Phylogenetic relationships ofthe two genera Notothenia and Lepidonotothen are consis-tent with former studies (Bargelloni et al. 2000; Near &Cheng 2008). Also, the topology of the nototheniid sub-family Trematominae agrees with previous findings(Sanchez et al. 2007; Kuhn & Near 2009), except forT. tokarevi and T. nicolai, which appeared at basalpositions in the phylogeny based on codonposition–specific substitution models (Fig. 2, Fig. S1,Supporting information). The early split of the twoincluded bathydraconid species relative to the diver-gence between Bathydraconidae and Channichthyidae
Table 2 Pairwise niche overlap com-parisons for the four Antarctic notothe-nioid families, performed with MANOVA
(Wilk’s k)
Family 1 Family 2 Wilk’s k
Artedidraconidae Nototheniidae 0.936Lepidonotothen–Trematomus clade 0.791
Bathydraconidae Nototheniidae 0.913Lepidonotothen–Trematomus clade 0.818
Channichthyidae Nototheniidae 0.930Lepidonotothen–Trematomus clade 0.932
Artedidraconidae Bathydraconidae 0.681Artedidraconidae Channichthyidae 0.629Bathydraconidae Channichthyidae 0.781
Time (Ma)
BM simulationsStable isotope data
Aver
age
subc
lade
dis
parit
y
–25 –20 –15 –10
1.0
0.5
01.
5
–5
Fig. 5 Disparity-through-time plot for the stable isotopic sig-natures of Antarctic notothenioid fishes and Brownian motionsimulations of character evolution. Time axis is given in mil-lion years ago.
ECOLOGICAL DIVERSIFICATION IN NOTOTHENIOIDS 4715
! 2011 Blackwell Publishing Ltd
could indicate paraphyly of the former, as was con-cluded in previous studies (e.g. Derome et al. 2002;Near et al. 2004; Near & Cheng 2008). Resulting supportvalues within the channichthyids were high, and therecovered topology was in complete agreement withthe study of Derome et al. (2002). The three generaChampsocephalus, Neopagetopsis and Pseudochaenichthysseem to be well established as the most basal channich-thyids (Chen et al. 1998; Near et al. 2003). In disagree-ment with former findings, C. rastrospinosus andChaenodraco wilsoni did not cluster monophyletically(Chen et al. 1998). Near et al. (2003) also recoveredthese two species as paraphyletic but placed Chaenoceph-alus aceratus as the sister taxon to the genera Cryodraco,Chaenodraco and Chionodraco, which disagrees with ourfindings. Near & Cheng (2008) determined C. aceratusas the closest related species of C. rastrospinosus.Inferred split dates (Fig. 3) roughly agree with those
found by Near (2004) and Matschiner et al. (2011):Divergence estimates for the Lepidonotothen–Trematomusclade and the high-Antarctic clade were 12.0 (95% HPD16.4–7.9) Ma and 18.6 (95% HPD 24.0–13.4) Ma, respec-tively, while Near (2004) reported them to be14 ± 0.4 Ma and Matschiner et al. (2011) found thesesplits at 10.3 (95% HPD 15.2–6.1) Ma and 14.7 (95%HPD 20.0–9.9) Ma. According to our estimates, the radi-ation of the Channichthyidae began 7.7 (95% HPD10.6–5.0) Ma ago, in good agreement with the estimatesof Near (2004) (8.5 ± 0.3 Ma) and Matschiner et al.(2011) (6.2 Ma; 95% HPD 9.4–3.4 Ma).
Foraging ecology of notothenioids
So far, it has been shown that some particular feedingstrategies are poorly represented or even absent in noto-thenioids, such as active skeleton-breaking predation(Clarke et al. 2004) or planktivory (Eastman & Grande1989; Eastman 1993). The latter is probably due torestricted phytoplankton production during the australwinter (Clarke et al. 2004). The drawback of traditionaldietary proxies (stomach content analyses and foragingobservations) is that they only captures a snapshot offood uptake. Contrarily, SIA provides time-integratedinformation on the feeding ‘ecology’ for a period ofweeks to years (McIntyre & Flecker 2006). Isotopic sig-natures could theoretically be influenced by geographicdifferences, sampling season and the age of sampledindividuals, especially when ontogenic shifts occur inthe investigated species. However, our sampling designaccounted for these potential problems, as only adultspecimens were collected, and all expeditions tookplace during austral summers. Also, most species werecollected at the same two sampling locations, AP andSO, and populations from these two sites did not differ
in isotopic signatures. Thus, the observed interspecificdifferences suggest ecological specialization rather thaneffects of geographical distribution or life history traits.Our SIA data confirm that notothenioids occupy a
wide variety of ecological niches (Figs 3 and 4). Com-paratively high d15N values suggest that most investi-gated species reside at a high TL and may beconsidered tertiary consumers (see also Dunton 2001;Pakhomov et al. 2006). The wide range of the carbonstable isotope signatures reflects the notothenioids’ vari-ety in habitats along the benthic-pelagic axis (Fig. 4).However, our results are only partly congruent withthe lifestyles and feeding reports based on stomach con-tent analyses (Fig. 4, Table 1, Table S3 and Data S1,Supporting information).At the family level, Nototheniidae are – in terms of
habitat and feeding strategies – the most diverse cladeamong Antarctic notothenioids (La Mesa et al. 2004; thisstudy) and include plankton, nekton and benthos feed-ers, as well as species that combine several feedingmodes (Grohsler 1994). The five included Trematomusspecies were differentiated in both isotopic signatures,thus indicating trophic niche separation (see also Bren-ner et al. 2001). Artedidraconids and bathydraconidsrepresent the most benthic families among nototheni-oids (Fig. 4; Olaso et al. 2000; La Mesa et al. 2004).Their d15N values suggest feeding habits at higher TL(Olaso et al. 2000; Jones et al. 2009). The well-studiedchannichthyids clustered into three groups according totheir diet (Fig. 4: C. wilsoni, N. ionah, C. rastrospinosusand C. gunnari at low TL; P. georgianus and Cryodracoantarcticus at intermediate TL; and C. aceratus at highTL; see also Kock 2005). Carbon signatures indicated arather pelagic lifestyle for most channichthyid species,with the exception for C. aceratus, which we can classifyas benthic top predator, in agreement with previousfindings (Kock 2005; Reid et al. 2007).The DTT plot (Fig. 5) indicates larger overlap of
subclades in niche use than expected from a model ofneutral evolution. This is characteristic for adaptiveradiations (Harmon et al. 2003; Gonzalez-Voyer et al.2009) and differs from patterns of putative nonadaptiveradiations, which show a negative deviation from theaveraged neutral-evolution BM model (e.g. Rowe et al.2011). Taking into account the considerable variation instable isotope signatures found in notothenioids as awhole (Fig. 4) – basically ruling out stasis in the evolu-tion of niche use – as well as the robustness of this pat-tern against intraspecific variation, these results suggestconvergent evolution in niche use between species ofnotothenioid subclades, especially between those cladesseparating around 20 Ma (Figs 3 and 5). This empha-sizes the importance of ecological niche differentiationin the adaptive radiation of notothenioids.
4716 S . RUTSCHMANN ET AL.
! 2011 Blackwell Publishing Ltd
Adaptive radiation and ecological diversificationin notothenioids
Our integrative analyses, combining both the phyloge-netic relationships and the isotopic signatures of 25 not-othenioid species, reveal that ecological diversificationinto overlapping feeding niches has occurred multipletimes in parallel in different notothenioid families(Figs 3 and 5). Using carbon and nitrogen stable isotoperatios as indicators of TL, feeding strategy and macro-habitat, we find great variation within, and substantialoverlap between the more basal nototheniids and thederived channichthyids. The representatives of the ben-thic artedidraconids and bathydraconids also overlapand cluster at high TLs and d13C values. Our resultsfurther confirm partitioning of habitat and trophicresources within notothenioid fishes, indicating thatdiversification along the benthic–pelagic axis and to dif-ferent TLs took place independently in at least two offive notothenioid families of the Antarctic clade (Noto-theniidae and Channichthyidae; Fig. 3 and Table 2).Convergent diversification in habitat and trophic ecol-
ogy suggests interspecific competition and is a charac-teristic of adaptive radiations (e.g. Losos 1995; Schluter2000). For example, Anolis lizards of the Caribbean haveindependently evolved four to six so-called ecomorphson each of the four large islands of the Greater Antilles,including species specialized to live on grass, twigs,trunks and tree crowns. Variation in limb lengths of an-ole ecomorphs supports these different lifestyles, so thate.g. the trunk-ground ecomorph possesses relativelylong legs adapted to running and jumping on broadsurfaces, while the twig ecomorph has short legs andmoves slowly on narrow surfaces (Losos 2009). In thiscontext, diversification of notothenioids along the ben-thic-pelagic axis, as evidenced by their isotopic compo-sition, and the respective adaptations in buoyancy(Eastman 1993) can be considered analogous to the Ano-lis diversification along the ground-tree axis. The noto-thenioid adaptive radiation shows further analogies tothat of Caribbean anoles in terms of species richness(both around 120 species) and age (about 24 and 15–66 Ma, respectively) (Fig. 3; Eastman 2005; Nicholsonet al. 2005; Losos 2009; Matschiner et al. 2011). Not alldescendents of the Anolis radiation remained within theconfined area of the radiation (Nicholson et al. 2005),and neither did the notothenioids: Notothenia angustata,N. microlepidota and the genus Patagonotothen secondar-ily escaped Antarctic waters and occur in New Zealandand South America (Eastman 2005). Moreover, bothradiations were probably triggered by key innovations:subdigital toepads support the particular arboreality ofAnolis lizards, whereas antifreeze glycoproteins in bloodand tissues allow notothenioid survival in ice-laden
Antarctic waters (Chen et al. 1997; Losos 2009; Matsch-iner et al. 2011).Compared to another well-studied adaptive radiation,
that of cichlid fishes in East African lakes, the rate atwhich lineage formation seems to have occurred ismuch smaller in Antarctic notothenioids. In the GreatLakes of East Africa, cichlid fishes have diversified intoat least 1500 species that differ greatly in naturally andsexually selected traits, including body shape, mouthmorphology and colouration (Salzburger 2009). Com-parison of cichlid species flocks between East Africanlakes, as well as mathematical models, have shown thatlarger habitats effectuate higher diversification rates, asthey provide greater habitat heterogeneity and facilitateisolation by distance (‘area effect’; Salzburger & Meyer2004; Gavrilets & Vose 2005; Seehausen 2006). Differentadaptive radiations may not be directly comparable asthey depend on many ecological, genetic and develop-mental factors, with an important contribution of histor-ical contingencies (Gavrilets & Losos 2009). Cichlids areknown for their philopatry and low dispersal abilities(Danley & Kocher 2001; Salzburger & Meyer 2004),whereas most notothenioids have prolonged pelagic lar-val stages, enhancing long-range migration (Eastman1993). Notothenioid populations are characterized byfragmented habitat, historical demographic fluctuations(Patarnello et al. 2011) and the absence of genetic struc-turing over large distances (Matschiner et al. 2009; andreferences therein), whereas many cichlid species possessignificant population structuring even on extremelysmall scales (e.g. Arnegard et al. 1999; Rico & Turner2002). Genetic differentiation over small scales hasrarely been found in notothenioids (but see Clementet al. 1998). Eastman & McCune (2000) suggested thatthe smaller species number of notothenioids, comparedwith cichlid species flocks, could be explained by theabsence of certain prime inshore habitats in the South-ern Ocean. Alternatively, the notothenioid adaptiveradiation may not yet have entered its final stage,namely the diversification with respect to communica-tion. Streelman & Danley (2003) suggested a three-stagemodel of adaptive radiation (see also Danley & Kocher2001), in which diversification first occurs with respectto macrohabitats, then with respect to microhabitatsand finally with respect to communication (e.g. matingtraits such as colouration; see also Gavrilets & Losos2009). Full species richness would only be achievedthrough this final step. Streelman & Danley (2003) fur-ther suggested that divergence of habitat and trophicmorphology is driven by natural selection, whereasdiversification along the axis of communication isforced by sexual selection. It is as of yet unclearwhether the radiation of notothenioids followed discretestages. Here, we provide conclusive evidence that the
ECOLOGICAL DIVERSIFICATION IN NOTOTHENIOIDS 4717
! 2011 Blackwell Publishing Ltd

species are separated along the benthic-pelagic axis (i.e.according to macrohabitats; Figs 3 and 4) and probablyalso as a function of bottom topography and sedimenttypes (Kock & Stransky 2000). Much less is knownabout microhabitat diversification, although our datasuggest that closely related species do differ withrespect to foraging strategies (e.g. genera Lepidonotothenand Trematomus; Figs 3 and 4). Recent evidence furtherindicates the possibility of divergence along Streelmanand Danley’s axis of communication, as egg guardingand parental care were observed in all major nototheni-oid lineages except within the Artedidraconidae (Kocket al. 2006; Barrera-Oro & Lagger 2010 and referencestherein).On the other hand, because of the paucity of the
Antarctic fossil record, it cannot be excluded that thenotothenioid radiation has already surpassed its maxi-mum species richness. It is an important characteristicthat young adaptive radiations often ‘overshoot’ interms of species number and that, generally, niche fill-ing causes declining speciation rates (e.g. Seehausen2006; Gavrilets & Losos 2009; Meyer et al. 2011). Thatnotothenioids already underwent periods of ‘over-shooting’ and niche filling could possibly explain thesmaller diversity of Notothenioidei compared to theyounger cichlid radiation in the East African Lakes.However, in this case, an early burst of diversificationshould have left its footprint in a ‘bottom-heavy’ phy-logeny (Gavrilets & Vose 2005). A more extensivestudy, including many more representatives of the not-otheniods, would be necessary to reconstruct the suc-cession of their adaptive radiation.
Acknowledgements
We acknowledge the help of the Museum Victoria (Melbourne)for providing a Pseudaphritis urvillii specimen, Mark Rollog forstable isotope assistance and measurement, Brigitte Aeschbachand Nicolas Boileau for assistance with laboratory work andFabienne Hamburger for providing technical support for thestable isotope measurement. We are grateful to Christopher D.Jones as well as all scientists and crew members of the UnitedStates Antarctic Marine Living Resources Program (US AMLR)cruise in February–March 2009 aboard RV Yuzhmorgeologiyafor their invaluable help in sampling and species identification.Further, we thank the Subject Editor Louis Bernatchez and theanonymous reviewers for constructive comments on the manu-script. This study was supported by a PhD scholarship of theVolkswagenStiftung priority program ‘Evolutionary Biology’for M.Ma., funding from the European Research Council (ERC;Starting Grant ‘INTERGENADAPT’) to W.S. and grant HA4328 ⁄ 4 from the Deutsche Forschungsgemeinschaft (DFG-Prior-ity Programme 1158) to R.H. and W.S. We further thank ourresearch groups for constructive comments and familiar work-ing atmosphere.
References
Arnegard ME, Jeffrey AM, Danley PD et al. (1999) Populationstructure and colour variation of the cichlid fishLabeotropheus fuelleborni Ahl along a recently formedarchipelago of rocky habitat patches in southern LakeMalawi. Proceedings of the Royal Society B, 266, 119–130.
Balushkin AV (1994) Fossil notothenioid, and not gadiform,fish Proeleginops grandeastmanorum gen. nov. sp. nov.(Perciformes, Notothenioidei, Eleginopidae) from the lateEocene found in Seymour Island (Antarctica). Journal ofIchthyology, 34, 298–307.
Bargelloni L, Marcato S, Zane L, Patarnello T (2000)Mitochondrial phylogeny of notothenioids: a molecularapproach to Antarctic fish evolution and biogeography.Systematic Biology, 49, 114–129.
Barrera-Oro ER, Lagger C (2010) Egg-guarding behaviour inthe Antarctic bathydraconid dragonfish Parachaenichthyscharcoti. Polar Biology, 33, 1585–1587.
Boulenger GA (1902) Pisces. In: Report on the Collections ofNatural History Made in the Antarctic Regions During theVoyage of the ‘Southern Cross’. pp. 174–189, British Museum(Natural History), London, UK.
Brenner M, Buck BH, Cordes S et al. (2001) The role of icebergscours in niche separation within the Antarctic fish genusTrematomus. Polar Biology, 24, 502–507.
Chen L, DeVries AL, Cheng CHC (1997) Convergent evolutionof antifreeze glycoproteins in Antarctic notothenioid fish andArctic cod. Proceedings of the National Academy of Sciences,USA, 94, 3817–3822.
Chen WJ, Bonillo C, Lecointre G (1998) Phylogeny of theChannichthyidae (Notothenioidei, Teleostei) based on twomitochondrial genes. In: Fishes of Antarctica. A BiologicalOvervie (eds di Prisco G, Pisano E, Clarke A), pp. 287–298.Springer-Verlag, Milan, Italy.
Clark MS, Fraser KPP, Burns G, Peck LS (2008) The HSP70heat shock response in the Antarctic fish Harpagiferantarcticus. Polar Biology, 31, 171–180.
Clarke A, Aronson RB, Crame JA, Gili JM, Blake DB (2004)Evolution and diversity of the benthic fauna of the SouthernOcean continental shelf. Antarctic Science, 16, 559–568.
Clement O, Ozouf-Costaz C, Lecointre G, Berrebi P (1998)Allozymic polymorphism and phylogeny of the familyChannichthyidae. In: Fishes of Antarctica. A Biological Overvie(eds di Prisco G, Pisano E, Clarke A), pp. 299–309. SpringerVerlag Publishers, Milan, Italy.
Coppes Petricorena ZL, Somero GN (2007) Biochemicaladaptations of notothenioid fishes: comparisons betweencold temperate South American and New Zealand speciesand Antarctic species. Comparative Biochemistry andPhysiology, 147A, 799–807.
Danley PD, Kocher TD (2001) Speciation in rapidly divergingsystems: lessons from Lake Malawi. Molecular Ecology, 10,1075–1086.
DeNiro MJ, Epstein S (1978) Influence of diet on thedistribution of carbon isotopes in animals. Geochimica etCosmochimica Acta, 42, 495–506.
Derome N, Chen WJ, Detta!ı A, Bonillo C, Lecointre G (2002)Phylogeny of Antarctic dragonfishes (Bathydraconidae,Notothenioidei, Teleostei) and related families based on their
4718 S . RUTSCHMANN ET AL.
! 2011 Blackwell Publishing Ltd

anatomy and two mitochondrial genes. MolecularPhylogenetics and Evolution, 24, 139–152.
DeWitt HH, Heemstra PC, Gon O (1990) Nototheniidae. In:Fishes of the Southern Ocea (eds Gon O, Heemstra PC), pp.279–331. J.L.B. Smith Institute of Ichthyology, Grahamstown,South Africa.
Drummond AJ, Rambaut A (2007) BEAST: Bayesianevolutionary analysis by sampling trees. BMC EvolutionaryBiology, 7, 214.
Dunton KH (2001) d15N and d13C measurements of AntarcticPeninsula fauna: trophic relationships and assimilation ofbenthic seaweeds. American Zoologist, 41, 99–112.
Eakin RR (1990) Artedidraconidae. In: Fishes of the SouthernOcea (eds Gon O, Heemstra PC), pp. 332–356. J.L.B. SmithInstitute of Ichthyology, Grahamstown, South Africa.
Eakin RR, Eastman JT, Near TJ (2009) A new species and amolecular phylogenetic analysis of the Antarctic fish genusPogonophryne (Notothenioidei: Artedidraconidae). Copeia, 4,705–713.
Eastman JT (1993) Antarctic fish biology: evolution in a uniqueenvironment. Academic Press, San Diego, California.
Eastman JT (2000) Antarctic notothenioid fishes as subjects forresearch in evolutionary biology. Antarctic Science, 12, 276–287.
Eastman JT (2005) The nature of the diversity of Antarcticfishes. Polar Biology, 28, 93–107.
Eastman JT, Clarke A (1998) A comparison of adaptiveradiations of Antarctic fish with those of non Antarcticfish. In: Fishes of Antarctica. A Biological Overvie (eds diPrisco G, Pisano E, Clarke A), pp. 3–26. Springer-Verlag,Milan, Italy.
Eastman JT, Grande L (1989) Evolution of the Antarctic fishfauna with emphasis on the recent notothenioids. In: Originsand Evolution of the Antarctic Biot (ed Crame JA), pp. 241–252.Geological Society. London, UK.
Eastman JT, Grande L (1991) Late Eocene gadiform (Teleostei)skull from Seymour-Island, Antarctic Peninsula. AntarcticScience, 3, 87–95.
Eastman JT, McCune AR (2000) Fishes on the Antarcticcontinental shelf: evolution of a marine species flock? Journalof Fish Biology, 57, 84–102.
Gavrilets S, Losos JB (2009) Adaptive radiation: contrastingtheory with data. Science, 323, 732–737.
Gavrilets S, Vose A (2005) Dynamic patterns of adaptiveradiation. Proceedings of the National Academy of Sciences, USA,102, 18040–18045.
Gernhard T (2008) The conditioned reconstructed process.Journal of Theoretical Biology, 253, 769–778.
Gonzalez-Voyer A, Winberg S, Kolm N (2009) Distinctevolutionary patterns of brain and body size duringadaptive radiation. Evolution, 63, 2266–2274.
Grohsler T (1994) Feeding habits as indicators of ecologicalniches: investigations of Antarctic fish conduced nearElephant Island in late autumn ⁄winter 1986. Archive ofFishery and Marine Research, 42, 17–34.
Harmon LJ, Schulte JA, Larson A, Losos JB (2003) Tempo andmode of evolutionary radiation in iguanian lizards. Science,301, 961–964.
Harmon LJ, Weir JT, Brock CD, Glor RE, Challenger W (2008)GEIGER: investigation evolutionary radiations. Bioinformatics,24, 129–131.
Hobson KA, Welch HE (1992) Determination of trophicrelationships within a high Arctic marine food web usingd13C and d15N analysis. Marine Ecology Progress Series, 84, 9–18.
Hobson KA, Piatt JF, Pitocchelli J (1994) Using stable isotopesto determine seabird trophic relationships. Journal of AnimalEcology, 63, 786–798.
Hureau JC (1985a) Family Channichthyidae – Icefishes. In:FAO Species Identification Sheets for Fishery Purposes. SouthernOcean. CCAMLR Convention Area. Fishing Areas 48, 58 and 8(eds Fischer W, Hureau JC), pp. 261–277. Food andAgriculture Organization of the United Nations, Rome, Italy.
Hureau JC (1985b) Family Nototheniidae – Antarctic rock cods.In: FAO Species Identification Sheets for Fishery Purposes.Southern Ocean. CCAMLR Convention Area. Fishing Areas 48,58 and 8 (eds Fischer W, Hureau JC), pp. 323–385. Food andAgriculture Organization of the United Nations, Rome, Italy.
Ingram T (2011) Speciation along a depth gradient in a marineadaptive radiation. Proceedings of the Royal Society B, 278,613–618.
Jones CD, Anderson ME, Balushkin AV et al. (2008) Diversity,relative abundance, new locality records and populationstructure of Antarctic demersal fishes from the northern ScotiaArc islands and Bouvetøya. Polar Biology, 31, 1481–1497.
Jones CD, Damerau M, Deitrich K et al. (2009) Demersal finfishsurvey of the South Orkney Islands. In: AMLR 2008 ⁄ 2009Field Season Report: Objectives, Accomplishments and TentativeConclusion (ed Van Cise AM), pp. 49–66. U.S. Department ofCommerce, La Jolla, CA. NOAA Technical MemorandumNMFS, NOAA-TM-NMFS-SWFSC-445.
Kass RE, Raftery AE (1995) Bayes factors. Journal of theAmerican Statistical Association, 90, 773–795.
Katoh K, Toh H (2008) Recent developments in the MAFFTmultiple alignment program. Briefings in Bioinformatics, 9,286–298.
Kiljunen M, Grey J, Sinisalo T et al. (2006) A revised model forlipid-normalizing d13C values from aquatic organisms, withimplications for isotope mixing models. Journal of AppliedEcology, 43, 1213–1222.
Klingenberg CP, Ekau W (1996) A combined morphometricand phylogenetic analysis of an ecomorphological trend:pelagization in Antarctic fishes (Perciformes: Nototheniidae).Biological Journal of the Linnean Society, 59, 143–177.
Kock KH (1992) Antarctic fish and fisheries. CambridgeUniversity Press, Cambridge, UK.
Kock KH (2005) Antarctic icefishes (Channichthyidae): aunique family of fishes. A review, part I. Polar Biology, 28,862–895.
Kock KH, Stransky C (2000) The composition of the coastalfish fauna around Elephant Island (South Shetland Islands,Antarctica). Polar Biology, 23, 825–832.
Kock KH, Pshenichnov LK, DeVries AL (2006) Evidence foregg brooding and parental care in icefish and othernototehnioids in the Southern Ocean. Antarctic Science, 18,223–227.
Kock KH, Pshenichnov L, Jones CD, Groger J, Riehl R (2008)The biology of the spiny icefish Chaenodraco wilsoni Regan,1914. Polar Biology, 31, 381–393.
Kuhn KL, Near TJ (2009) Phylogeny of Trematomus(Notothenioidei: Nototheniidae) inferred from mitochondrialand nuclear gene sequences. Antarctic Science, 21, 565–570.
ECOLOGICAL DIVERSIFICATION IN NOTOTHENIOIDS 4719
! 2011 Blackwell Publishing Ltd
Kuhn KL, Near TJ, Jones CD, Eastman JT (2009) Aspects of thebiology and population genetics of the Antarctic nototheniidfish Trematomus nicolai. Copeia, 2, 320–327.
Kunzmann A, Zimmermann C (1992) Aethotaxis mitopteryx, ahigh Antarctic fish with benthopelagic mode of life. MarineEcology Progress Series, 88, 33–40.
La Mesa M, Eastman JT, Vacchi M (2004) The role ofnotothenioid fish in the food web of the Ross Sea shelfwaters: a review. Polar Biology, 27, 321–338.
Lartillot N, Herve P (2006) Computing Bayes Factors usingthermodynamic integration. Systematic Biology, 55, 195–207.
Li C, Ortı G, Zhang G, Lu G (2007) A practical approach to phylo-genomics: the phylogeny of ray-finned fish (Actinopterygii) asa case study. BMCEvolutionary Biology, 7, 44.
Logan JM, Jardine TD, Miller TJ et al. (2008) Lipid correctionin carbon and nitrogen stable isotope analyses: comparisonof chemical extraction and modeling methods. Journal ofAnimal Ecology, 77, 838–846.
Lombarte A, Olaso I, Bozzano A (2003) Ecomorphological trendsin the Artedidraconidae (Pisces: Perciformes: Notothenioidei)of the Weddell Sea. Antarctic Science, 15, 211–218.
Losos JB (1995) Community evolution in Greater AntilleanAnolis lizards: phylogenetic patterns and experimental tests.Philosophical Transactions of the Royal Society of London B, 349,69–75.
Losos JB (2009) Lizards in an Evolutionary Tree: Ecology andAdaptive Radiation of Anoles. University of California Press,Berkeley.
Maddison WP, Maddison DW (2009) MESQUITE: a modularsystem for evolutionary analysis. Version 2.72, Availablefrom http://mesquiteproject.org (last accessed 7 September2011).
Matschiner M, Hanel R, Salzburger W (2009) Gene flow bylarval dispersal in the Antarctic notothenioid fishGobionotothen gibberifrons. Molecular Ecology, 18, 2574–2587.
Matschiner M, Hanel R, Salzburger W (2011) On the origin andtrigger of the notothenioid adaptive radiation. PLoS ONE, 6,e18911.
McIntyre PB, Flecker AS (2006) Rapid turnover of tissuenitrogen of primary consumers in tropical freshwaters.Oecologia, 148, 12–21.
Meyer JR, Schoustra SE, Lachapelle J, Kassen R (2011)Overshooting dynamics in a model adaptive radiation.Proceedings of the Royal Society B, 278, 392–398.
Minagawa M, Wada E (1984) Stepwise enrichment of 15Nalong food chains: further evidence and the relation betweend15N and animal age. Geochimica et Cosmochimica Acta, 48,1135–1140.
Near TJ (2004) Estimating divergence times of notothenioidfishes using a fossil-calibrated molecular clock. AntarcticScience, 16, 37–44.
Near TJ, Cheng CHC (2008) Phylogenetics of notothenioidfishes (Teleostei: Acanthomorpha): inferences frommitochondrial and nuclear gene sequences. MolecularPhylogenetics and Evolution, 47, 832–840.
Near TJ, Pesavento JJ, Cheng CHC (2003) Mitochondrial DNA,morphology and the phylogenetic relationships of Antarcticicefishes (Notothenioidei: Channichthyidae). MolecularPhylogenetics and Evolution, 28, 87–98.
Near TJ, Pesavento JJ, Cheng CHC (2004) Phylogeneticinvestigations of Antarctic notothenioid fishes (Perciformes:
Notothenioidei) using complete gene sequences of themitochondrial encoded 16S rRNA. Molecular Phylogeneticsand Evolution, 32, 881–891.
Near TJ, Parker SK, Detrich HW (2006) A genomic fossilreveals key steps in hemoglobin loss by the Antarcticicefishes. Molecular Phylogenetics and Evolution, 23, 2008–2016.
Nicholson KE, Glor RE, Kolbe JJ et al. (2005) Mainlandcolonization by island lizards. Journal of Biogeography, 32,929–938.
Olaso I, Rauschert M, De Broyer C (2000) Trophic ecology ofthe family Artedidraconidae (Pisces: Osteichthyes) and itsimpact on the eastern Weddell Sea benthic system. MarineEcology Progress Series, 194, 143–158.
Pakhomov EA, Bushula T, Kaehler S, Watkins BP, Leslie RW(2006) Structure and distribution of the slope fish communityin the vicinity of the sub-Antarctic Prince EdwardArchipelago. Journal of Fish Biology, 68, 1834–1866.
Paradis E, Claude J, Strimmer K (2004) APE: analyses ofphylogenetics and evolution in R language. Bioinformatics, 20,289–290.
Patarnello T, Verde C, di Prisco G, Bergelloni L, Zane L (2011)How will fish that evolved at constant sub-zerotemperatures cope with global warming? Notothenioids as acase study. Bioessays, 33, 260–268.
Pinnegar JK, Polunin NVC (1999) Differential fractionation ofd13C and d15N among fish tissues: implications for the studyof trophic interactions. Functional Ecology, 13, 225–231.
Place SP, Hofmann GE (2005) Constitutive expression of astress-inducible heat shock protein gene, hsp70, inphylogenetically distant Antarctic fish. Polar Biology, 28, 261–267.
Posada D (2008) JMODELTEST: phylogenetic model averaging.Molecular Biology and Evolution, 25, 1253–1256.
Post DM (2002) Using stable isotopes to estimate trophicposition: models, methods and assumptions. Ecology, 83,703–718.
Quevedo M, Svanback R, Eklov P (2009) Intrapopulation nichepartitioning in a generalist predator limits food webconnectivity. Ecology, 90, 2263–2274.
R Development Core Team (2009) R: A Language andEnvironment for Statistical Computing. R Foundation forStatistical Computing, Vienna, Austria. ISBN 3-900051-07-0,Available from http://www.R-project.org (last accessed 7September 2011).
Rambaut A, Drummond AJ (2007) TRACER V.1.5. Available fromhttp://beast.bio.ed.ac.uk/Tracer (last accessed 7 September2011).
Reid WDK, Clarke S, Collins MA, Belchier M (2007)Distribution and ecology of Chaenocephalus aceratus(Channichthyidae) around South Georgia and Shag Rocks(Southern Ocean). Polar Biology, 30, 1523–1533.
Rico C, Turner GF (2002) Extreme microallopatric divergencein cichlid species from Lake Malawi. Molecular Ecology, 11,1585–1590.
Rowe KC, Aplin KP, Baverstock PR, Moritz C (2011) Recentand rapid speciation within limited morphological disparityin the genus Rattus. Systematic Biology, 60, 188–203.
Ruud JT (1954) Vertebrates without erythrocytes and bloodpigment. Nature, 173, 848–850.
Salzburger W (2008) To be or not to be a hamlet pair insympatry. Molecular Ecology, 17, 1397–1400.
4720 S . RUTSCHMANN ET AL.
! 2011 Blackwell Publishing Ltd
Salzburger W (2009) The interaction of sexually and naturallyselected traits in the adaptive radiations of cichlid fishes.Molecular Ecology, 18, 169–185.
Salzburger W, Meyer A (2004) The species flocks of EastAfrican cichlid fishes: recent advances in molecularphylogenetics and population genetics. Naturwissenschaften,91, 277–290.
Sanchez S, Detta!ı A, Bonillo C et al. (2007) Molecular andmorphological phylogenies of the Antarctic teleostean familyNototheniidae, with emphasis on the Trematominae. PolarBiology, 30, 155–166.
Schluter D (2000) The Ecology of Adaptive Radiation. OxfordUniversity Press, New York.
Schwarz G (1978) Estimating the dimension of a model. TheAnnals of Statistics, 6, 461–464.
Seehausen O (2006) African cichlid fish: a model system inadaptive radiation research. Proceedings of the Royal Society B:Biological Sciences, 273, 1987–1998.
Shapiro B, Rambaut A, Drummond AJ (2006) Choosingappropriate substitution models for the phylogeneticanalysis of protein-coding sequences. Molecular Biology andEvolution, 23, 7–9.
Simpson GG (1953) The Major Features of Evolution. ColombiaUniversity Press, New York.
Stankovic A, Spalik K, Kamler E, Borsuk P, Weglenski P (2002)Recent origin of sub-Antarctic notothenioids. Polar Biology,25, 203–205.
Streelman JT, Danley PD (2003) The stages of vertebrateevolutionary radiation. Trends in Ecology and Evolution, 18,126–131.
Swofford DL (2003) PAUP*. Phylogenetic Analysis UsingParsimony (*and Other Methods), ed. 4.0a. Sinauer Associates,Sunderland, Massachusetts.
Syvaranta J, Vesala S, Rask M, Ruuhijarvi J, Jones RI (2008)Evaluating the utility of stable isotope analyses of archivedfreshwater sample materials. Hydrobiologia, 600, 121–130.
Zwickl DJ (2006) Genetic algorithm approaches for the phylogeneticanalysis of large biological sequence datasets under the maximum-likelihood criterion. PhD. thesis, The University of Texas atAustin.
S.R. is interested in the diversity of animals, including theirevolution and adaptations to the environment. M.Ma. workson the molecular processes underlying adaptive radiation.M.D. is interested in population ecology and evolutionary biol-ogy. M.F.L. is specialized on stable isotope biogeochemistry inaquatic environments. R.H. is interested in causes and path-ways of adaptation and speciation in the sea. W.S. and
M.Mu.’s research focuses on the understanding of the geneticbasis of adaptation, evolutionary innovation and animal diver-sification, using the East Africa’ cichlid radiations as mainmodel system. The laboratory’s homepage at http://www.evolution.unibas.ch/salzburger provides further details on thegroup’s (research) activities.
Data accessibility
All DNA sequences from this study are available under Gen-Bank accessions: JF264479–JF264516 (cyt b); JF264517–JF264554(myh6); JF264555–JF264590 (Ptr); and JF264591–JF264629 (tbr1).GenBank accession numbers for sequences of other studies arethe following: B. diacanthus (HM049936; HM050034;HM050153; HM050214); Eleginops maclovinus (DQ526429;HM050045; HM050163; HM050225); N. coriiceps (HM050183);P. urvillii (HM049963; HM050074; HM050195; HM050258);P. scotti (HM049962; HM050072; HM050193); and T. newnesi(HM050204) (see Table S4, Supporting information). All stableisotope values are given in Table S5, (Supporting information).
Supporting information
Additional supporting information may be found in the onlineversion of this article:
Fig. S1 Maximum-likelihood tree based on the codon position-specific partitioning with numbered nodes (1–19).
Table S1 Antarctic notothenioid samples with correspondingcollection id (Table S2) and sample size (n) for stable isotopeanalysis.
Table S2 Collection id for all Antarctic notothenioid samples.
Table S3 Lifestyle and feeding for all included Antarctic noto-thenioid species.
Table S4 GenBank accession numbers for all used samples.
Table S5 Stable isotope values of all investigated species.
Data S1 Discussion of stable isotope analysis results of individ-ual species.
Please note: Wiley-Blackwell are not responsible for the contentor functionality of any supporting information supplied by theauthors. Any queries (other than missing material) should bedirected to the corresponding author for the article.
ECOLOGICAL DIVERSIFICATION IN NOTOTHENIOIDS 4721
! 2011 Blackwell Publishing Ltd
Related Documents