PARAÍBA STATE, BRAZIL AGRICULTURAL SECTOR RISK ASSESSMENT Diego Arias and Jorge Caballero WORLD BANK GROUP REPORT 100993-BR November 2015 AGRICULTURE GLOBAL PRACTICE TECHNICAL ASSISTANCE PAPER Public Disclosure Authorized Public Disclosure Authorized Public Disclosure Authorized Public Disclosure Authorized

Welcome message from author
This document is posted to help you gain knowledge. Please leave a comment to let me know what you think about it! Share it to your friends and learn new things together.
Transcript
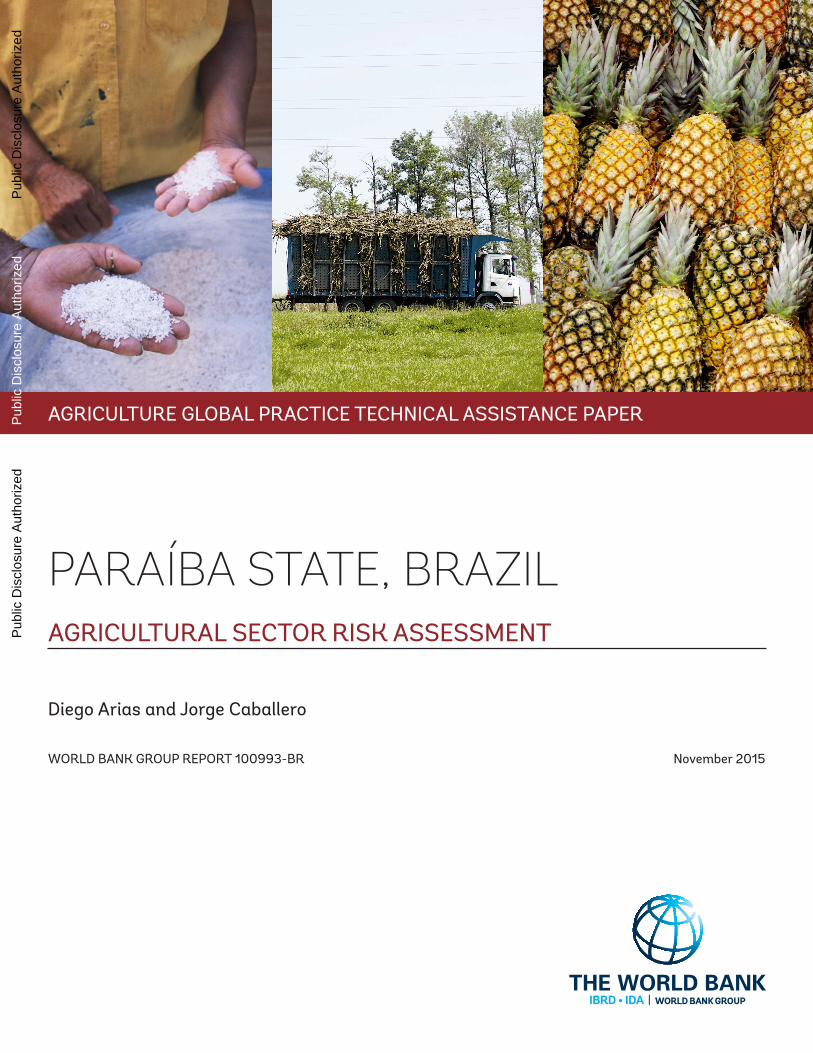
PARAÍBA STATE, BRAZILAGRICULTURAL SECTOR RISK ASSESSMENT
Diego Arias and Jorge Caballero
WORLD BANK GROUP REPORT 100993-BR November 2015
AGRICULTURE GLOBAL PRACTICE TEChNICAL ASSISTANCE PAPER
Pub
lic D
iscl
osur
e A
utho
rized
Pub
lic D
iscl
osur
e A
utho
rized
Pub
lic D
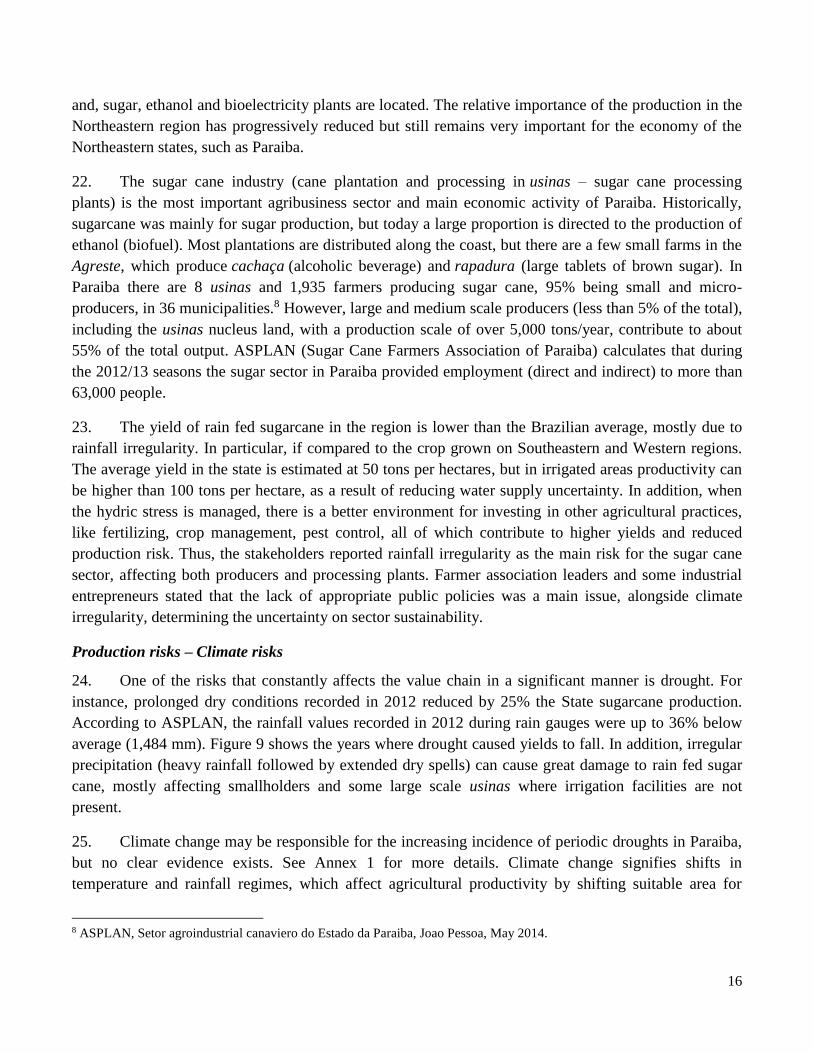
iscl
osur
e A
utho
rized
Pub
lic D
iscl
osur
e A
utho
rized
THE WORLD BANK GROUP
PARAÍBA STATE AGRICULTURE SECTOR RISK ANALYSIS Volume 1: Risk Assessment Volume 2: Risk Management Strategy
© 2015 World Bank Group
1818 H Street NW
Washington, DC 20433
Telephone: 202-473-1000
Internet: www.worldbank.org
Email: [email protected]
All rights reserved
This volume is a product of the staff of the World Bank Group. The findings, interpretations, and conclusions expressed in this paper do not
necessarily reflect the views of the Executive Directors of the World Bank Group or the governments they represent.
The World Bank Group does not guarantee the accuracy of the data included in this work. The boundaries, colors, denominations, and
other information shown on any map in this work do not imply any judgment on the part of the World Bank Group concerning the legal
status of any territory or the endorsement or acceptance of such boundaries.
Rights and Permissions
The material in this publication is copyrighted. Copying and/or transmitting portions or all of this work without permission may be a
violation of applicable law. World Bank Group encourages dissemination of its work and will normally grant permission to reproduce
portions of the work promptly.
For permission to photocopy or reprint any part of this work, please send a request with complete information to the Copyright Clearance
Center, Inc., 222 Rosewood Drive, Danvers, MA 01923, USA, telephone: 978-750-8400, fax: 978-750-4470, http://www.copyright.com/.
All other queries on rights and licenses, including subsidiary rights, should be addressed to the Office of the Publisher, World Bank Group,
1818 H Street NW, Washington, DC 20433, USA, fax: 202-522-2422, e-mail: [email protected].
Cover images from left to right: Julio Pantoja, World Bank; Shell; Benjamin Thompson.

ii
ACKNOWLEDGEMENTS
This report was prepared by the Team on Agriculture Sector Risk Management within the Agriculture Global
Practice of the World Bank. The team was led by Diego Arias (GAGDR) and relied on technical support from
Barbara Farinelli (GAGDR), Pablo Valdivia (GAGDR), and Sophie Storm (GAGDR). The international
consultants that participated in the making of this report: Jorge Caballero (Main Consultant – GAGDR), Decio
Gazzoni (Consultant - GAGDR), Jaime Estupiñan (Consultant - GAGDR) and Vitor Ozaki (Consultant -
GAGDR).
The Team would like to thank all those involved in the making of this report of the diverse sectors of the State
Secretariat for Agriculture, Livestock and Aquiculture Development (SEDAP) for their invaluable contributions
and enrichment of the document in their respective fields.
The Team would also like to thank Mônica Alexandra Tavares de Melo and Ricardo Arlington from Project
Cooperar, SEDAP, for their valuable on the ground field work that constantly contributed to creating a practical
dimension of the technical discussions.
Also, the team would like to express gratitude towards the different representatives of the value chains of the
agriculture sector (producers, banks, processing firms, traders, exporters, amidst others), which contributed with
their experience and knowledge regarding the sector, which allowed for a fuller and more comprehensive
understanding of the reality of the diverse sectors.
Asa Giertz (GAGDR) and David Tuschneider (GAGDR) met with the mission in various moments throughout the
making and review of final version of this report. The Team extends their gratitude to them for their valuable
contributions.
This volume is product of the staff and consultants of the International Bank for Reconstruction and
Development / The World Bank. The findings, interpretations, and conclusions expressed in this volume
do not necessarily reflect the views of the Executive Directors of The World Bank or the governments
they represent. The World Bank does not guarantee the accuracy of the data included in this work. The
boundaries, colors, denominations, and other information shown on any map in this work do not imply
any judgment on the part of The World Bank concerning the legal status of any territory or the
endorsement or acceptance of such boundaries.

iii
CONTENTS
ACKNOWLEDGEMENTS ...................................................................................................................................... ii
CONTENTS ............................................................................................................................................................. iii
ACRONYMS AND ABBREVIATIONS ................................................................................................................. vi
LIST OF TABLES ................................................................................................................................................... xi
LIST OF FIGURES ................................................................................................................................................ xiii
LIST OF TEXT BOXES ..........................................................................................................................................xv
EXECUTIVE SUMMARY ........................................................................................................................................ I
INTRODUCTION AND CONTEXT .........................................................................................................................1
VOLUME 1: RISK ASSESSMENT ........................................................................................................................4
Chapter 1: PARAIBA’S AGRICULTURAL SYSTEM ............................................................................................5
Agriculture Sector Overview and Performance ......................................................................................................5
Agro-Climatic Conditions ......................................................................................................................................8
Agricultural Production and Market Trends .........................................................................................................10
Chapter 2: AGRICULTURE SECTOR RISKS ........................................................................................................12
Sugar Cane Supply Chain .....................................................................................................................................15
Overview of supply chain .................................................................................................................................15
Production risks – Climate risks .......................................................................................................................16
Production risks - Pests and diseases ................................................................................................................18
Price volatility risks. .........................................................................................................................................18
Enabling environment risks. .............................................................................................................................20
Fruticulture Sector ................................................................................................................................................20
Overview of Subsector .....................................................................................................................................20
Production Risks - Climate ...............................................................................................................................21
Production risks – Pests and diseases ...............................................................................................................22
Price volatility risk. ..........................................................................................................................................23
Family Agriculture in Semi-arid Zone .................................................................................................................25
Overview of Subsector .....................................................................................................................................25
Production risks - Climate ................................................................................................................................26
Production risks - Pests and diseases ................................................................................................................28
Price volatility risk. ..........................................................................................................................................29
iv
Livestock Production Chains ................................................................................................................................31
Overview of Subsector and Supply Chain Profile ............................................................................................31
Production risks - Climate ................................................................................................................................33
Chapter 3: ADVERSE IMPACTS OF AGRICULTURAL RISKS .........................................................................37
Indicative Value of Losses ...................................................................................................................................37
Production Volatility by Regions: The Case of Cassava ......................................................................................39
Chapter 4: STAKEHOLDERS ASSESSMENT .......................................................................................................41
Impact of Risks at Individual Stakeholder Level .................................................................................................41
Vulnerable Hotspots .............................................................................................................................................42
Chapter 5: AGRICULTURE RISK PRIORITIZATION AND MANAGEMENT ..................................................45
Risk Prioritization .................................................................................................................................................45
Proposed Long List of Solutions ..........................................................................................................................50
Key Risk Management Measures .........................................................................................................................55
Next steps .............................................................................................................................................................57
VOLUME 2: RISK MANAGEMENT STRATEGY ...........................................................................................61
Chapter 1: SUMMARY OF THE AGRICULTURE RISK MANAGEMENT STRATEGY ..................................62
Chapter 2: PARAIBA'S AGRICULTURE RISK MANAGEMENT FRAMEWORK ............................................65
Brief Information on the Agricultural Sector .......................................................................................................65
Agricultural Risk Profile and Risk Management Options ....................................................................................66
Current Institutional ARM Programs and Policies ...............................................................................................69
Chapter 3: PROPOSED ARM STRATEGY……………………………………………………………………….73
Agroclimatic Risk Information System ................................................................................................................73
Sanitary and Phytosanitary Systems .....................................................................................................................76
Family Agriculture in the Semiarid ......................................................................................................................80
Livestock Production Chains ................................................................................................................................81
Supply Chain Coordination ..................................................................................................................................83
Agricultural Innovation System ...........................................................................................................................86
Chapter 4: ARM ACTION PLAN………...……………………………………………………………………….94
REFERENCES…………………………… ……………………………………………………………………...106
Annex 1: PROJECTED CLIMATE CHANGE IMPACTS ON AGRICULTURE IN NORTHEAST BRAZIL ..112
Annex 2: VULNERABILITY IN PARAIBA ........................................................................................................117
A. Vulnerability and Welfare Indicators ............................................................................................................118
B. Vulnerability is Heterogeneous .....................................................................................................................122
v
C. Sensitivity: .....................................................................................................................................................125
E. Exposure: .......................................................................................................................................................139
F. Scales of Vulnerability Analysis ....................................................................................................................139
Annex 3: STOCKTAKING OF PROJECTS AND PROGRAMS RELEVANT FOR ARM ................................141
Annex 4: OUTLINE OF WEATHER RISK MANAGEMENT PROJECTS AND PROGRAMS ........................117
Annex 5: STOCKTAKING OF RESEARCH, EXTENSION, AND COOPERATION PROGRAMS AND
PROJECTS .............................................................................................................................................................117
Annex 6: BACKGROUND INFORMATION ON PESTS AND DISEASES IN PARAIBA ...............................117

vi
ACRONYMS AND ABBREVIATIONS
ADAB Agency for Agricultural/Livestock
Defense
Agência de Defesa Agropecuária da
Bahia
ACIS Agroclimatic Risk Information System -
ADC Complete Water Supply Systems Sistemas de Abastecimento de Água
Completo
ADR Rural Development Agent Agente de Desenvolvimento Rural
ADS Single Water Supply Systems Sistemas de Abastecimento de Água
Singelos
AESA Executive Agency of Water Management
of Paraiba
Agência Executiva de Gestão das Águas
do Estado da Paraíba
AGEVISA State Agency for Sanitary Surveillance Agência Estadual de Vigilância Sanitaria
AGF Federal Government Acquisitions Aquisições do Governo Federal
AGRITEMPO Agrometeorological Monitoring System Sistema de Monitoramento
Agrometeorológico
AIS Agricultural Innovation System -
ANA National Water Agency Agência Nacional de Águas
ANATER National Agency for Technical Assistance
and Rural Extension
Agência Nacional de Assistência Técnica
e Extensão Rural
APL Local Productive Systems Arranjos Produtivos Locais
ARM Agriculture Risk Management -
ASA/PB Articulation of Paraiba Semiarid Articulação do Semi-árido Paraibano
ASPLAN Sugar Cane Farmers Association of
Paraiba
Associação de Plantadores Cana da
Paraíba
ATER Technical Assistance and Rural Extension Assistência Técnica e Extensão Rural
ATR Recoverable Total Sugars Açucares Totais Recuperáveis
BA State of Bahia -
BACEN Central Bank of Brazil Banco Central do Brasil
BE Drought Grant Bolsa Estiagem
BNDES National Bank for Economic and Social
Development
Banco Nacional de Desenvolvimento
Econômico e Social
BR-3 Average Risk of Foot and Mouth Disease Risco Medio de Febre Aftosa
BSE Bovine Spongiform Encephalopathy -
CCA Center of Agricultural Sciences Centro de Ciências Agrárias
CDAF Direct Purchase from Family Agriculture Compra Direta da Agricultura Familiar
CE State of Ceara -
CEDA State Board for Agriculture Defense Conselho Estadual de Defesa
Agropecuária
CEDRS State Board of Sustainable Rural
Development
Conselho Estadual de Desenvolvimento
Rural Sustentável
vii
CEF Federal Economic Bank Caixa Econômica Federal
CEPEA Centre for Advanced Studies in Applied
Economics
Centro de Estudos Avançados
em Economia Aplicada
CONAB National Supply Company Companaia Nacional de Abastecimento
COOPERAR World Bank Financed Project -
COSALFA South-american Commision Against Foot
and Mouth Disease
Comisión Sudamericana de Lucha contra
la Fiebre Aftosa
CSF Classical Swine Fever -
DAP Capability Statement for PRONAF Declaração de Aptidão ao PRONAF
DATAGRO Consultancy of Ethanol and Sugar in
Brazil Consultoria de Etanol e Açúcar
DBMS Database Management System -
EMATER-PB Paraiba State Company for Technical
Assistance and Rural Extension
Empresa de Asistência Técnica e
Extensão Rural da Paraíba
EMBRAPA Brazilian Company for Agriculture and
Livestock Research
Empresa Brasileira de Pesquisa
Agropecuária
EMBRATER Brazilian Company for Technical
Assistance and Rural Extension
Empresa Brasileira de Assistência
Técnica e Extensão Rural
EMEPA-PB Paraiba State Company for Agriculture
and Livestock Research
Empresa Estadual de Pesquisa
Agropecuária da Pariaba
EMPASA Paraiba State Company for Supply and
Agriculture Services
Empresa Paraibana de Abastecimento e
Serviços Agrícolas
ENSO El Niño Southern Oscillation -
FAEPA Agriculture and Livestock Federation of
Paraiba
Federação da Agricultura e Pecuária da
Paraíba
FAO Food and Agriculture Organization -
FETAG Agricultural Workers Federation Federação dos Trabalhadores na
Agricultura
FGS Garantia Safra Fund Fundo da Garantia Safra
FMD Foot and Mouth Disease -
FNDE National Fund for the Development of
Education
Fundo Nacional de Desenvolvimento da
Educação
FNE Constitutional Fund for Financing of the
Northeast
Fundo Constitucional de Financiamento
do Nordeste
FUNCEP State Fund for Poverty Combat and
Eradication
Fundo de Combate e Erradicação da
Pobreza
GAP Good Agricultural Practices -
GDP Gross Domestic Product -
GPV Gross Production Value -
GS Garantia Safra Program Programa Garantia Safra
ha hectare -
HDI Human Development Index -
HLB Huang long bing -
HPAI Highly Pathogenic Avian Influenza -
viii
IADB Inter-american Development Bank -
IBGE Brazilian Institute of Geography and
Statistics
Instituto Brasileiro de Geografia e
Estatística
IICA Inter-american Institute for Agriculture
Cooperation
Instituto Interamericano de Cooperação
para a Agricultura
INCRA National Institute for Colonization and
Agrarian Reform
Instituto Nacional de Colonização e
Reforma Agrária
INMET National Institute of Meteorology Instituto Nacional de Meteorologia
INPE/CPTEC National Institute for Space Research Instituto Nacional de Pesquisas Espaciais
INSA National Institute for the Semi-Arid Instituto Nacional do Semi-Árido
IPCC Intergovernmental Panel on Climate
Change -
ITZC Inter-tropical Convergence Zone -
Km Kilometres -
MAPA Ministry of Agriculture, Livestock and
Supply
Ministerio da Agricultura, Pecuaria e
Abstecimento
MDA Ministry of Agrarian Development Ministério do Desenvolvimento Agrário
MDS Ministry of Social Development and Fight
Against Hunger
Ministério do Desenvolvimento Social e
Combate à Fome
MF Ministry of Finance Ministério da Fazenda
MI Ministry of National Integration Ministério da Integração Nacional
mm Millimetre -
MPOG Ministério do Planejamento, Orçamento e
Gestão
MST Landless Rural Workers Movement Movimento dos Trabalhadores Rurais
Sem Terra
NCDV Newcastle Disease Virus -
NGOs Non-governmental Organizations -
OIE World Organization for Animal Health Organização Internacional de Saúde
Animal
OIE/PVS World Organization for Animal Health /
Performance of Veterinary Services -
PAA National Program for Acquisition of Food
from Family Farmers Programa de Aquisição de Alimentos
PB State of Paraiba Estado da Paraíba
PEP Premium for Product Outflow Prêmio para Escoamento de Produto
PEPRO Premium for Product Equalization Prêmio Equalizador do Produto
PETROBRAS Brazilian Mixed Capital Energy Company Empresa Brasileira de Energia de
Capital Misto
PGPAF Minimum Price Guarantee Policy Programa de Garantia Preços para a
Agricultura Familiar
PGPM Policy for Mininum Price Guarantee Política de Garantia de Preços Mínimos
PNAE National School Feeding Program Programa Nacional de Alimentação
Escolar

ix
PNCEBT
National Program for Control, Eradication
and Prevention of Brucellosis and
Tuberculosis
Progrma Nacional de Controle e
Erradicaco de Brucelose e Tuberculose
PNCRH National Program for Control, Eradication
and Prevention of Rabies
Programa Nacional de Controle da
Raiva dos Herbívoros e outras
Encefalopatias
PNEFA
National Program for Control,
Eradication, and Prevention of Foot and
Mouth Disease
Programa Nacional de Controle,
Erradicacao e Prevencao da Febre
Aftosa
PNESA National Program for Sanitary Education Programa Nacional de Educação
Sanitária
PNSA National Avian Health Program Programa Nacional de Saúde Aviária
PNSAA National Program of Health of Aquatic
Animals
Programa Nacional de Saúde dos
Animais Aquáticos
PNSAp National Program for Bee Health Programa Nacional de Sanidade Apícola
PNSCO National Program of Goats and Sheep
Health
Programa Nacional de Saúde de
Caprinos e Ovinos
PNSE National Program for Horse Health Programa Nacional de Sanidade dos
Equídeos
PNSS National Program of Swine Health Programa Nacional de Saúde Suína
PROAGRO
MAIS
Agriculture and Livestock Activity
Guarantee Program for Family Agriclture
Programa de Garantia da Atividade
Agropecuária da Agricultura Familiar
PROAGRO/
PROAGRO
TRADICIONAL
Agriculture and Livestock Activity
Guarantee Program
Programa de Garantia da Atividade
Agropecuária
PROCASE Cariri and Serido Sustainable
Development Project (financed by IFAD) -
PRONAF National Program for the Strengthening of
Family Agriculture
Programa Nacional de Fortalecimento
da Agricultura Familiar
PROP Risk Premium for Product Acquisition
through Options Market
Prêmio de Risco para Aquisição de
Produto Agrícola oriundo de Contrato
Privado de Opção de Venda
PSR Rural Insurance Premium Subsidy
Program
Programa de Subvenção ao Prêmio do
Seguro Rural
SDA National Secretary for Agriculture and
Livestock Health
Secretaria Nacional de Defesa
Agropecuária
SEAF Insurance for Family Farming Seguro da Agricultura Familiar
SEBRAE Brazilian Micro and Small Business
Support Service
Serviço Brasileiro de Apoio às Micro e
Pequenas Empresas
SEDAP State Secretariat for Agriculture,
Livestock and Aquiculture Development
Secretaria de Estado de Desenvolvimento
da Agropecuaria e Pesca
SENAR Rural Learning National Service Servico Nacional de Aprendizagem Rural
SEPLAG State Secretariat for Planning and
Management
Secretaria de Estado de Planejamento e
Gestão
SISBI Brazilian System for Inspection of Animal
Origin Products
Sistema Brasileiro de Inspeção de
Produtos de Origem Animal
x
SLP Sea Level Pressure -
SPEI Standardized Precipitation
Evapotranspiration Index -
SPI Standardized Precipitation Index -
SPS Sanitary and Phytosanitary System -
SST Sea Surface Temperature -
SUASA Unified System of Agricultural Health and
Food Safety
Sistema Unificado de Atenção à Sanidade
Agropecuária
SUDENE Superintendency for the Development of
the Northeast
Superintendência do Desenvolvimento do
Nordeste
SUSEP Superintendency of Private Insurance Superintendência de Seguros Privados
TA Technical Assistance -
TAH tons of total reducible sugars per hectare Toneladas de açúcares redutíveis por
hectare
UEPB State University of Paraiba Universidade Estadual da Paraíba
UFCG Federal University of Campina Grande Universidade Federal de Campina
Grande
UFLA Federal University of Lavras Universidade Federal de Lavras
UFPB Federal University of Paraiba Universidade Federal da Paraíba
UFV Viçosa Federal University Universidade Federal de Viçosa
USAID United States Agency for International
Development -
USP/ESALQ São Paulo University Universidade de São Paulo
VEP Product Outflow Value Valor de Escoamento de Produto
WHO World Health Organization -
ZARC Climatic Risk Agriculture Zoning Zoneamento Agrícola de Risco Climático

xi
LIST OF TABLES
Volume 1: Risk Assessment
Table 1: Gross Production Value (GPV) of Main Crops and Indicative Annual Losses, % of Total State
Agriculture ................................................................................................................................................ 13
Table 2: Summary of Productive Systems' Features and Main Risks ...................................................... 13
Table 3: Price of Sugar Cane - Reference Price Pernambuco State* (Gross Price, R$/kg of ATR) ........ 20
Table 4: Number of Farmers Enrolled in Garantia Safra Program and Number of Farmers who Receive
Payments, Paraiba (2002-2012) ................................................................................................................ 27
Table 5: Goat and sheep’s Population Evolution in Paraiba (1975-2012)................................................ 32
Table 6: Indicative Agricultural Losses in Paraiba, per Crop ................................................................... 39
Table 7: Production Volatility by Meso-region ........................................................................................ 40
Table 8: Stakeholder Risk Profile ............................................................................................................. 41
Table 9: Sugar Cane Supply Chain ........................................................................................................... 45
Table 10: Fruticulture Supply Chain......................................................................................................... 46
Table 11: Family Agriculture Supply Chains - Maize, Beans and Cassava ............................................. 47
Table 12: Livestock Supply Chains .......................................................................................................... 48
Table 13: Proposed Instruments as Solutions to Main Risks .................................................................... 51
Table 14: Programs and Projects Currently Addressing Some of the Identified Risks ............................ 55
Volume 2: Risk Management Strategy
Table 15: Summary Break Down of Costs by Category of Intervention ................................................................93
Annex 1: PROJECTED CLIMATE CHANGE IMPACTS ON AGRICULTURE IN
NORTHEAST BRAZIL
Table A1- 1: Impact of Climate Change on Current Low Risk Areas Suitable for Cultivation .............. 114
Table A1- 2: Economic Losses for Key Crops by 2050, projected in pessimistic scenario ................... 114
xii
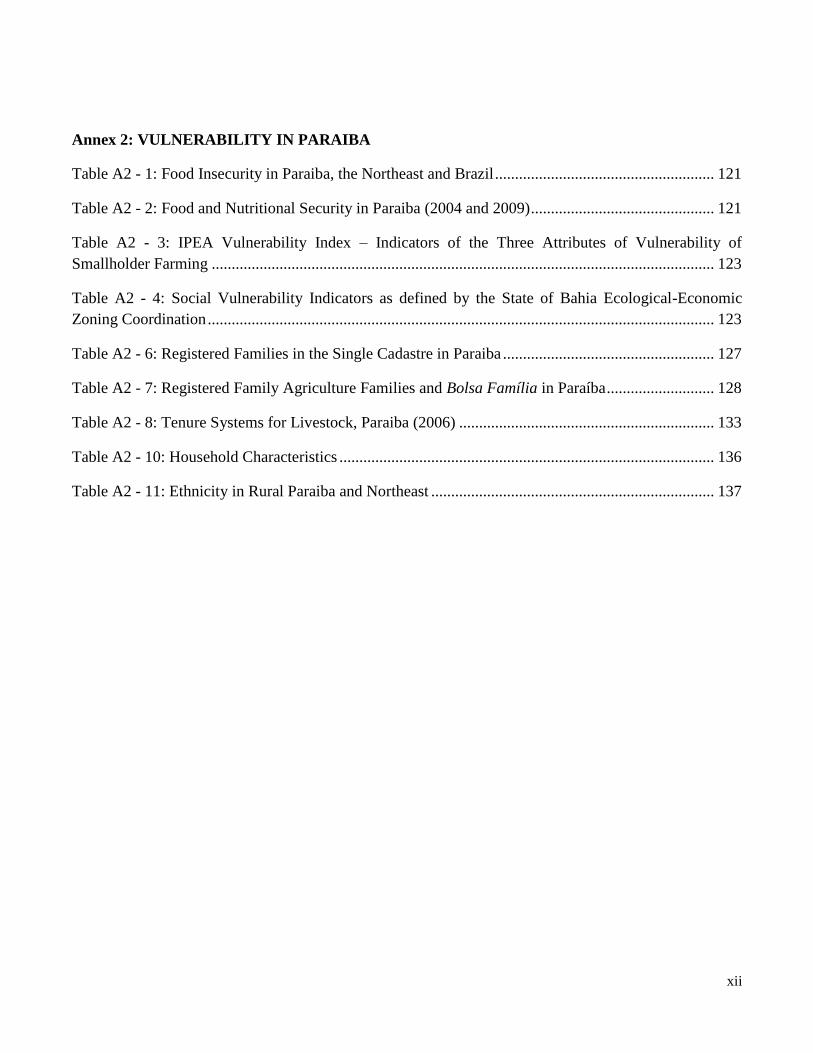
Annex 2: VULNERABILITY IN PARAIBA
Table A2 - 1: Food Insecurity in Paraiba, the Northeast and Brazil ....................................................... 121
Table A2 - 2: Food and Nutritional Security in Paraiba (2004 and 2009) .............................................. 121
Table A2 - 3: IPEA Vulnerability Index – Indicators of the Three Attributes of Vulnerability of
Smallholder Farming .............................................................................................................................. 123
Table A2 - 4: Social Vulnerability Indicators as defined by the State of Bahia Ecological-Economic
Zoning Coordination ............................................................................................................................... 123
Table A2 - 6: Registered Families in the Single Cadastre in Paraiba ..................................................... 127
Table A2 - 7: Registered Family Agriculture Families and Bolsa Família in Paraíba ........................... 128
Table A2 - 8: Tenure Systems for Livestock, Paraiba (2006) ................................................................ 133
Table A2 - 10: Household Characteristics .............................................................................................. 136
Table A2 - 11: Ethnicity in Rural Paraiba and Northeast ....................................................................... 137
xiii
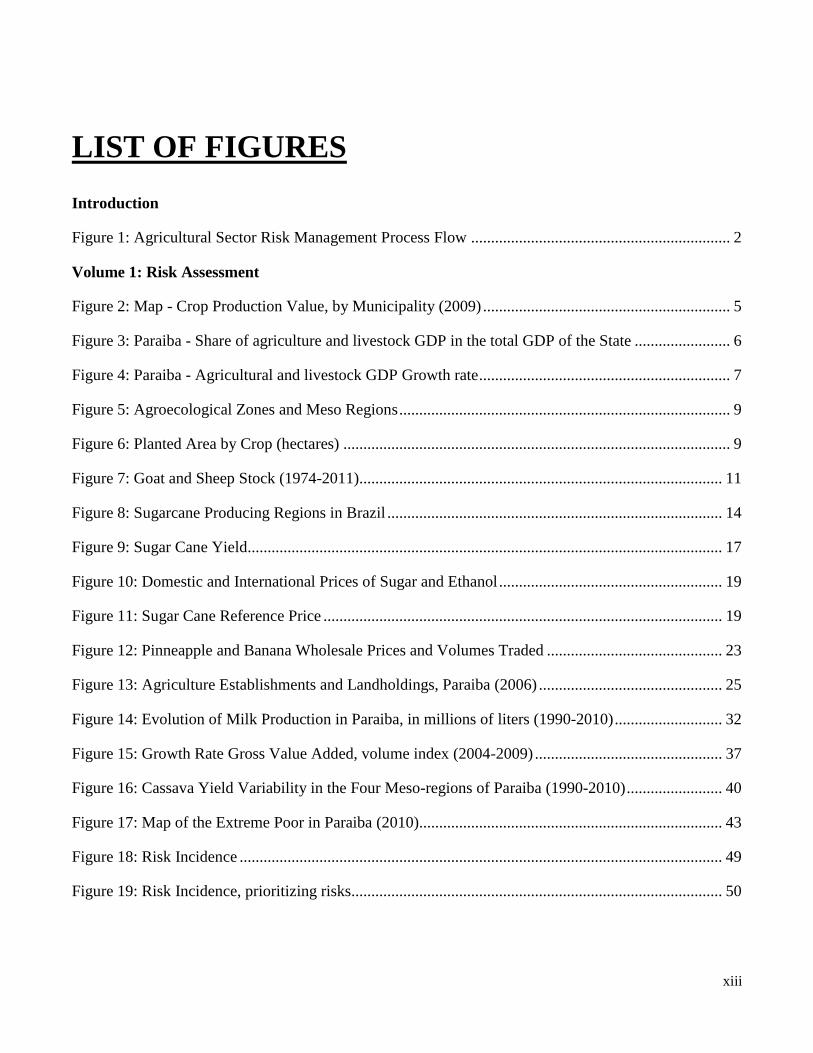
LIST OF FIGURES
Introduction
Figure 1: Agricultural Sector Risk Management Process Flow ................................................................. 2
Volume 1: Risk Assessment
Figure 2: Map - Crop Production Value, by Municipality (2009) .............................................................. 5
Figure 3: Paraiba - Share of agriculture and livestock GDP in the total GDP of the State ........................ 6
Figure 4: Paraiba - Agricultural and livestock GDP Growth rate ............................................................... 7
Figure 5: Agroecological Zones and Meso Regions ................................................................................... 9
Figure 6: Planted Area by Crop (hectares) ................................................................................................. 9
Figure 7: Goat and Sheep Stock (1974-2011)........................................................................................... 11
Figure 8: Sugarcane Producing Regions in Brazil .................................................................................... 14
Figure 9: Sugar Cane Yield....................................................................................................................... 17
Figure 10: Domestic and International Prices of Sugar and Ethanol ........................................................ 19
Figure 11: Sugar Cane Reference Price .................................................................................................... 19
Figure 12: Pinneapple and Banana Wholesale Prices and Volumes Traded ............................................ 23
Figure 13: Agriculture Establishments and Landholdings, Paraiba (2006) .............................................. 25
Figure 14: Evolution of Milk Production in Paraiba, in millions of liters (1990-2010) ........................... 32
Figure 15: Growth Rate Gross Value Added, volume index (2004-2009) ............................................... 37
Figure 16: Cassava Yield Variability in the Four Meso-regions of Paraiba (1990-2010) ........................ 40
Figure 17: Map of the Extreme Poor in Paraiba (2010)............................................................................ 43
Figure 18: Risk Incidence ......................................................................................................................... 49
Figure 19: Risk Incidence, prioritizing risks............................................................................................. 50

xiv
Annex 1: PROJECTED CLIMATE CHANGE IMPACTS ON AGRICULTURE IN
NORTHEAST BRAZIL
Figure A1 - 1: Northeast Brazil Climate Predictions, 1971-2000 and 2041-2070 ................................. 112
Figure A1 - 2: Climate Vulnerability Indicators ..................................................................................... 113
Figure A1 - 3: Projected Losses in Pasture Productivity, % relative to 2010 baseline under optimistic and
pessimistic scenarios (2020 and 2030) ................................................................................................... 115
Figure A1 - 4: Impact of Climate Change on Area Suitable for Maize (2010 baseline, 2030 optimistic
and pessimistic) ....................................................................................................................................... 115
Figure A1 - 5: Impact of Climate Change on Area Suitable for Beans (2010 baseline, 2030 optimistic
and pessimistic) ....................................................................................................................................... 116
Annex 2: VULNERABILITY IN PARAIBA
Figure A2 - 1: Distribution of Rural Population in Paraiba (2010) ........................................................ 118
Figure A2 - 2: Percent of Population with Monthly per capita Income less than R$ 140 in Paraiba ..... 119
Figure A2 - 3: Percent of Extreme Poor (left) and Poor (right) in Paraiba (2010) ................................. 119
Figure A2 - 4: Evoluation of Income per capita, 2000 (left) and 2010 (right) ....................................... 120
Figure A2 - 5: Evoluation of Human Development Index, 2000 (left) and 2010 (right) ....................... 120
Figure A2 - 6: Percent of people over age 18 occupied in agriculture/livestock .................................... 126
Figure A2 - 7: Percent of people over age 18 Occupied in Service Industry ......................................... 126
Figure A2 - 8: Value of Agricultural Production from temporary and permanent crops (2009)........... 128
Figure A2 - 9: Value of Agricultural Production from Temporary Crops (2009) .................................. 129
Figure A2 - 10: Value of Agricultural Production from Permanent Crops (2009) ................................. 129
Figure A2 - 10: Percent of People in Households with Inadequate Access to Water and Sanitation ..... 131
Figure A2 - 12: Dependency Ratio ......................................................................................................... 131
Figure A2 - 13: Number of People over 65 ............................................................................................ 132
Figure A2 - 14: Schematic Cycle of Land Tenure and Vulnerability for Semi-Arid Ranchers ............. 134
Figure A2 - 15: Percent of Household Heads that are Women who have Not Completed Fundamental
Education and have Children less than 15 years of age .......................................................................... 136
xv
LIST OF TEXT BOXES
Volume 1: Risk Assessment
Text Box 1. 1: Irrigation in Paraiba ..........................................................................................................................7
Text Box 1. 2: The boll weevil and the cotton crisis in northeastern Brazil – A story to remember .......................22
Text Box 1. 3: Brazil Garantia Safra ........................................................................................................................27
Text Box 1. 4: Brazil - Procurement and price support policies ..............................................................................29
Volume 2: Risk Management Strategy
Text Box 2. 1: Key ARM areas ................................................................................................................................61
Text Box 2. 2: Santa Rita Pinneapple Production Cooperative ................................................................................82
Text Box 2. 3: EMATER in Paraíba ........................................................................................................................89

I
EXECUTIVE SUMMARY
1. The present study is part of an effort by the World Bank and the State of Paraiba to assess
Agriculture Sector Risks as a contribution to the strategic economic development and poverty reduction
agenda of the State Government. It is composed of two phases: an Agricultural Sector Risk Identification and
Prioritization (Volume I) and a Risk Management Strategy and Action Plan (Volume II). The study was
conducted in close collaboration with the Cooperar agency (which is currently preparing a World Bank financed
project) and the Secretary of Agriculture of Paraiba (SEDAP).
2. Paraiba’s agricultural sector when compared to the total national agriculture GDP, detains only
0.7% of total production. In relation to the Northeast, the State contributes with 11% of total agriculture GDP.
Nonetheless, agriculture remains an important source of employment for the largest part of the rural population
and the rural population remains vulnerable, in that the impact of a shock will have greater proportional impacts on
welfare of a poor household that on a wealthier one.
3. The risks in Paraiba’s agriculture are highly concentrated in a few crops that account for more
than 80% of the total agricultural gross output value of the State and 84% of total estimated annual losses
due to realized production risks: sugar cane, pineapple, banana, coconut, cassava, maize and beans. Thus,
the priority value chains and subsectors chosen for the risk management analysis, based on the productive structure
(reflecting relative importance of both crops and production patterns) are: sugar cane; commercial fruit production;
family agriculture; and livestock.
4. The risk assessment confirmed that there are no risks with critical impact that at the same time are
highly probable (1 in 3 years) or probable (1 in 5 years) in Paraiba but there are several probable and
highly probable risks that cause moderate or high impact when realized. It was observed that the important
issues identified around these main risks–- require comprehensive measures to complement the already existing
federal policies and programs that in some way contribute to manage agricultural risks (Garantia Safra, price
guarantees, livestock sanitary services, food safety, etc.) and to improve their implementation in Paraiba.
5. For the sugar cane value chain, the most important risks are: drought; irregular precipitation;
possibility of contamination with the ferrugem laranja disease; and uncertainty about gasoline price. The
sugar cane industry is the most important agribusiness sector and main economic activity of Paraiba. As a result,
any adverse impact on this supply chain has also important financial consequences to the State. For the fruticulture
value chain, the four main risks are: irregular rainfall; pests and diseases; pesticide use without needed technical
knowledge; and inter-annual price variations. The State of Paraiba always stood out among the largest producing
states of pineapple in Brazil, presently ranked as the second largest producer in the country. For the livestock
sector (cattle, sheep and goat mainly), the three main risks are: drought; exotic diseases that affect the world beef
trade; and zoonotic diseases.
6. Severe drought, irregular rainfall, and pests and diseases are the main risks affecting family
farmers in Paraiba. When the risks are prioritized taking into account the relative importance of family
agriculture in the total number of farmers (there are 148,047 family agriculture farmers in Paraiba out of a total of
167,272 farmers ), it results that those risks are the main risks in Paraiba. Accordingly, the solutions scenario
II
presents strong actions directed towards improving risk mitigation among family farmers, such as adoption of
innovative technology, improved agricultural practices and effective marketing mechanisms, as well as better
agroclimatic information management, together with recommendations regarding other sectors of the agriculture in
Paraiba.
7. The impacts of the aforementioned risks have greater consequences for human welfare among the
individuals, communities and regions of Paraiba that are more vulnerable. The poorest areas of the state, as
measured by earned income per capita, are not necessarily the areas that will be hardest hit by drought. State
transfers for old age pensions and Bolsa Família serve to diversify the poor’s portfolio and buffer the direct effects
of drought.
8. Approximately R$ 28 million (equivalent to US$ 16 million), or 2.3% of the agricultural GDP, was
estimated as the value of the average production loss annually in the agricultural sector as a result of
unmanaged production risks. Drought was the main cause of these shocks, sometimes in combination with other
events. The calculation involves all crops but the losses are concentrated in the crops whose gross output value
accounts for over 80% of the total agricultural gross output value: sugar cane, beans, banana, pineapple, maize,
papaya fruit and cassava. ). Sugar cane and fruits, especially pineapple, because of their large share in the total
agricultural production value of Paraiba, are the greatest determinants of the agricultural losses.
9. Average figures tend to conceal the actual catastrophic impact that some shocks have at the time
they occur. For instance, during the 2010 drought, losses amounted to R$ 65 million (against the R$ 28 million
annual average), or 5.4% of the state’s agricultural GDP, and there were much higher losses in previous years: R$
108 million in 1998, R$ 104 million in 1993 and R$ 82 million in 1996. Not surprisingly, the first two years match
with two very severe droughts throughout the state (1998 and 1992-1993).
10. Losses in terms of the normal production value in 2010 were extreme for important smallholder
crops like beans and maize, accounting for R$ 16 million and R$ 7 million losses respectively. In the same
year, the losses of sugar cane and banana reached R$ 18 million and R$ 13 million respectively. In total these four
crops accounted for 83% of the total losses in 2010.
11. The first phase of the assessment identified the following risk management intervention areas to
address priority risks: (i) strengthening State rural extension and technical assistance system including both
production and marketing aspects; (ii) review and reinforce State animal and plant health sanitary system; and (iii)
improve coordination within fruit supply chains, and (iv) develop an integrated agroclimatic information system.
After analyzing a number of programs and projects that are already addressing some of the identified risks along
the above solution areas, came up some gaps and complementary actions.
12. As a result, the following are the strategic lines identified during the agriculture risk management
assessment – ARM (second phase):
Agroclimatic Risk Information System (ACIS):
a. Development of a Agroclimatic Database Integrated System in the state of Paraiba including federal
institutions and AESA
b. Strengthening of the Drought Management Committee, making actions more proactive and less reactive
c. Training to the extension workers associated to inspection procedures in the Garantia Safra project, in
order to reduce moral hazard and technical issues
III
Sanitary and Phytosanitary System (SPS):
Sugarcane
a. Expand the area of sugarcane under biological control
b. Assess the impact of the possible introduction of the ferrugem laranja in Paraiba
c. Set up a surveillance network for ferrugem laranja in Paraíba
Fruticulture
a. Assess the likelihood and impact of the possible introduction of the diseases sigatoka negra and moko
(bananas), cancro da videira and HLB (Citrus)
Family Agriculture in the Semi-arid zone
a. Substitute the varieties of palma forrageira susceptible to the cochonilha do carmim for resistant ones
Livestock Production
a. Reinforce the program for controlling and eradication of brucellosis and tuberculosis
b. Coordination of the animal health and food safety programsfor what?
c. Establish the actual status of CSF and NCDV in Paraibameaning?
d. Create the State Agency for Agricultural Healthfor what?
Supply Chain Coordination:
a. Identify successful farm to market experiences in Paraiba and assess the viability of being replicated
under a massive technical assistance program
b. Develop market oriented business development methodologies for training and providing technical
assistance to associated small scale farmers
c. Assess different options to support market development for family agriculture products, including
revision of the legal framework to channel public resources
Agricultural Innovation System (AIS):
a. Improve the coordination of the Agriculture Innovation System for family agriculture risk management
b. Improve efficiency of the Agricultural Innovation System for family agriculture risk management -
Strengthen the research sub-system
c. Improve efficiency of the Agricultural Innovation System for family agriculture risk management -
Strengthen the ATER sub-system
d. Improve efficiency of the Agricultural Innovation System for family agriculture risk management -
Enlargement of successful programs and projects
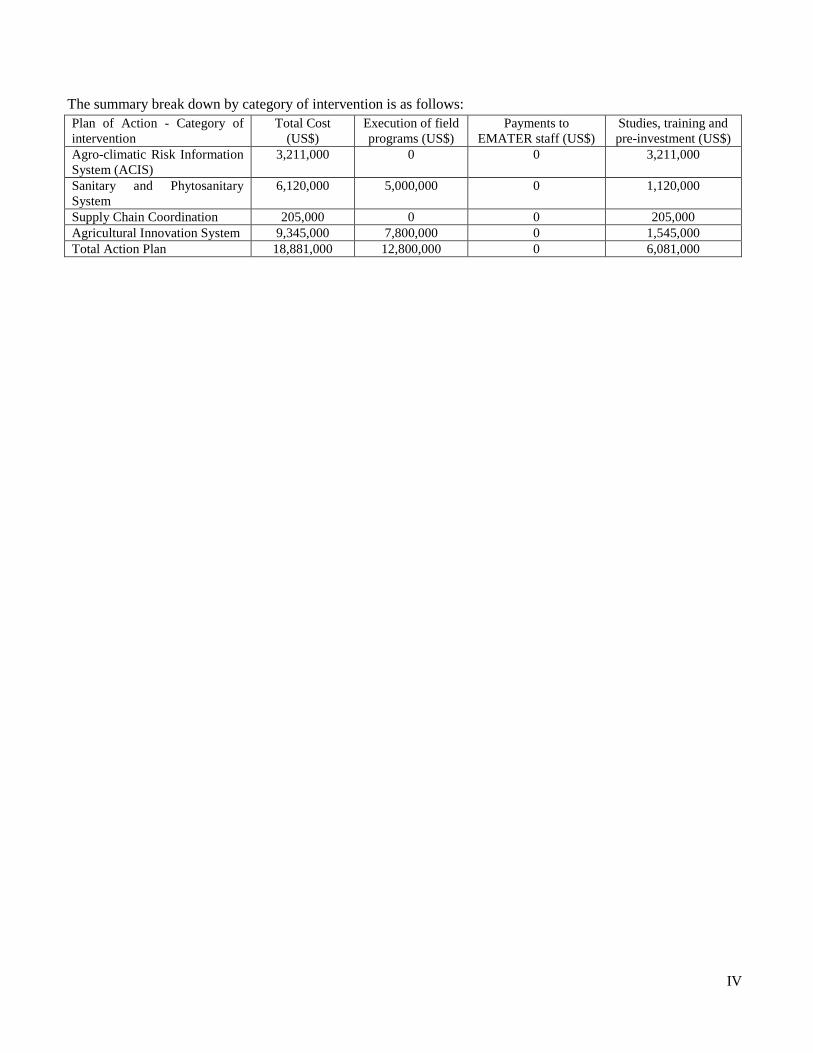
13. The proposed action plan (detailed in the text) reflects the strategic lines and includes some basic
details on who, when and how much is required for the implementation of the actions proposed. The
estimated cost of the ARM Action Plan is a total of US$ 18,881,000 over 5 years, with a strong concentration
of activities within the first two years. Out of this total, US$ 6,081,000 would correspond to studies, training and
pre-investment and US$12,800,000 to program investments. The EMATER’s staff cost is not part of the ARM
Action Plan but it is included as a complementary public policy, as has been mentioned by State policy makers.
IV
The summary break down by category of intervention is as follows:
Plan of Action - Category of
intervention
Total Cost
(US$)
Execution of field
programs (US$)
Payments to
EMATER staff (US$)
Studies, training and
pre-investment (US$)
Agro-climatic Risk Information
System (ACIS)
3,211,000 0 0 3,211,000
Sanitary and Phytosanitary
System
6,120,000 5,000,000 0 1,120,000
Supply Chain Coordination 205,000 0 0 205,000
Agricultural Innovation System 9,345,000 7,800,000 0 1,545,000
Total Action Plan 18,881,000 12,800,000 0 6,081,000
1
INTRODUCTION AND CONTEXT
Background
1. The World Bank and the State of Paraiba conducted an Agriculture Sector Risk Assessment for
agriculture in Paraiba in Brazil. The assessment was composed of two phases. The first phase was an
Agricultural Sector Risk Identification and Prioritization undertaken in June 2014.
2. Expert interviews, in combination with primary and secondary data and literature, provided the
basis for this Risk Assessment. The work included consultations with state and federal government,
private sector, civil society, and academic stakeholders to inform this analysis and draw a diversity of
perspectives on risk management.
3. The rapid risk assessment methodology developed by the World Bank involves several phases.
The first phase – the Risk Assessment – provides a diagnosis of the primary risks in the entire
agricultural sector. Risks are classified on the basis of the probability of occurrence and degree of
impact, from which emerge the prioritized risks for the sector and a list of potential management
strategies. Then, those solutions are confronted with the existing programs and projects that somehow
address the agricultural risks, and a set of solutions that fill gaps in current risk management is proposed.
4. The first phase serves as the basis for planning the second phase of the risk methodology, which
focuses on the development of a Risk Management Strategy and Action Plan. The Action Plan can be
executed in the medium-term to mitigate, transfer, and cope with the risks in the sector. The specific
solutions are developed in depth with stakeholders in response to the first phase’s characterization of
risks.
5. The second phase of the Agriculture Sector Risk Assessment aimed to develop an Agriculture
Risk Management Strategy by deepening the analysis into the risk management solutions and risk
capacity assessment along the lines of the above priority risk solutions areas.
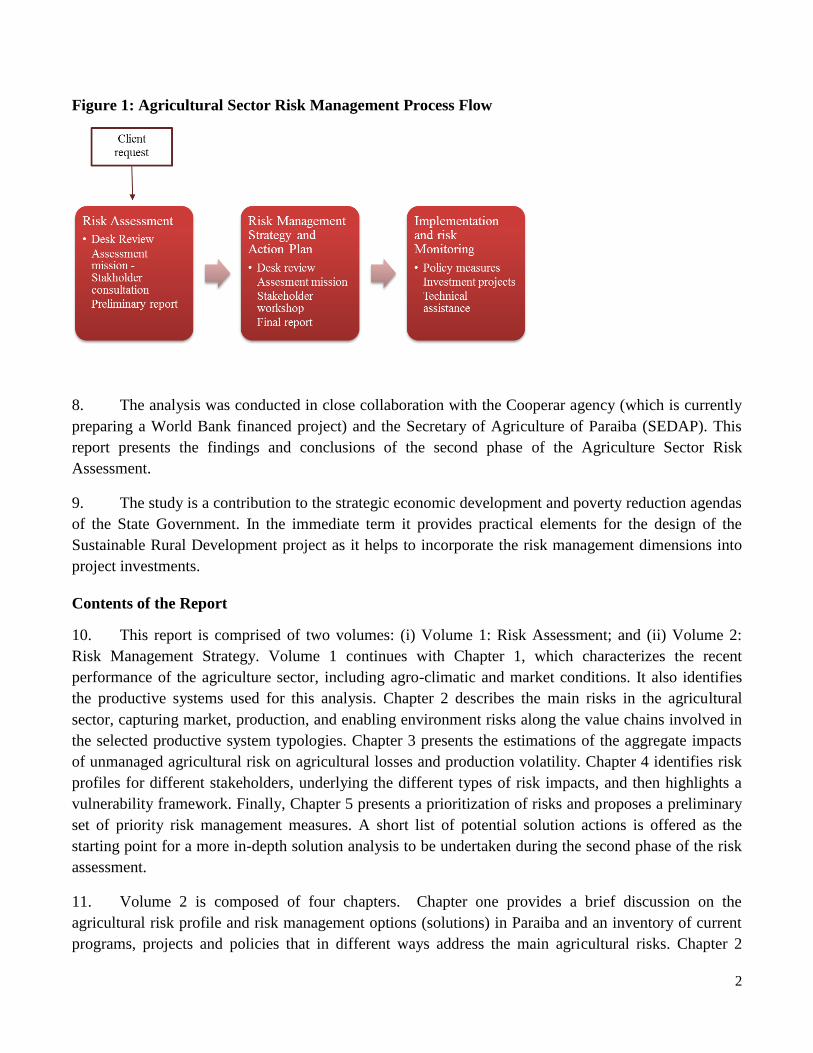
6. Figure 1 on the following page provides an overview of the full process of the World Bank’s risk
assessment methodology.
7. Brazil has developed a portfolio of agricultural risk management solutions (activities and
instruments like Garantia Safra, several EMBRAPA research programs, Price Guarantee programs, etc.)
that involve management of risks such as drought, pest and diseases and prices. These solutions have a
regional or nationwide coverage and their implementation require the participation of many state and
federal institutions. However, there is still room for strengthening the risk management capacity of the
public and private sector, especially through improving policy and program coordination, taking
advantage of synergies and strengthening the support services to the most vulnerable farmers.
2
Figure 1: Agricultural Sector Risk Management Process Flow
8. The analysis was conducted in close collaboration with the Cooperar agency (which is currently
preparing a World Bank financed project) and the Secretary of Agriculture of Paraiba (SEDAP). This
report presents the findings and conclusions of the second phase of the Agriculture Sector Risk
Assessment.
9. The study is a contribution to the strategic economic development and poverty reduction agendas
of the State Government. In the immediate term it provides practical elements for the design of the
Sustainable Rural Development project as it helps to incorporate the risk management dimensions into
project investments.
Contents of the Report
10. This report is comprised of two volumes: (i) Volume 1: Risk Assessment; and (ii) Volume 2:
Risk Management Strategy. Volume 1 continues with Chapter 1, which characterizes the recent
performance of the agriculture sector, including agro-climatic and market conditions. It also identifies
the productive systems used for this analysis. Chapter 2 describes the main risks in the agricultural
sector, capturing market, production, and enabling environment risks along the value chains involved in
the selected productive system typologies. Chapter 3 presents the estimations of the aggregate impacts
of unmanaged agricultural risk on agricultural losses and production volatility. Chapter 4 identifies risk
profiles for different stakeholders, underlying the different types of risk impacts, and then highlights a
vulnerability framework. Finally, Chapter 5 presents a prioritization of risks and proposes a preliminary
set of priority risk management measures. A short list of potential solution actions is offered as the
starting point for a more in-depth solution analysis to be undertaken during the second phase of the risk
assessment.
11. Volume 2 is composed of four chapters. Chapter one provides a brief discussion on the
agricultural risk profile and risk management options (solutions) in Paraiba and an inventory of current
programs, projects and policies that in different ways address the main agricultural risks. Chapter 2
3
presents an overview of the key agricultural sector features as are relevant for understanding the ARM
strategy.1 Chapter three presents the ARM strategy with respect to the intervention areas identified
during the first phase, i.e. weather information system, Sanitary and Phytosanitary System (SPS), supply
chain coordination, and Agroclimatic Information Systems, including concrete risk management actions.
Chapter four incorporates detailed information on the proposed actions aggregated in strategic lines. It
includes information about the estimated cost of the actions, the responsible institution and the
timeframe. Moreover, a second table provides a short term calendar by institution.
1 Volume I of the Risk Assessment already contains a more detailed analysis of the agriculture sector and the recent
production and market trends.

4
VOLUME 1: RISK ASSESSMENT
5
CHAPTER 1: PARAIBA’S AGRICULTURAL SYSTEM
Agriculture Sector Overview and Performance
1. Located in the Northeastern region, the State of Paraiba occupies an area of 56,469.47 km² and
has 223 municipalities. Its neighboring states are Rio Grande do Norte, to the North, Ceara to the west,
Pernambuco to the south, and the Atlantic Ocean to the east, with approximately 135 km of coast. The
climate of Paraiba is tropical humid on the coast, with abundant rainfall. Inland the climate becomes
semi-arid and subject to prolonged droughts and low rainfall.
2. The services sector generates the majority of revenues in Paraiba, accounting for 74% of the
State’s GDP (2011)2, mainly driven by public services and trade. The agriculture and livestock sector,
represents 5.7% of the State’s economy (2009)3 (3.7% corresponds to agriculture and forestry and 2% is
livestock production). It is comprised mainly of plantation of sugarcane, fruits (such as pineapple,
banana, coconut, among others), cassava (manioc), maize and beans, and livestock production
(composed mostly of goats and bovines).
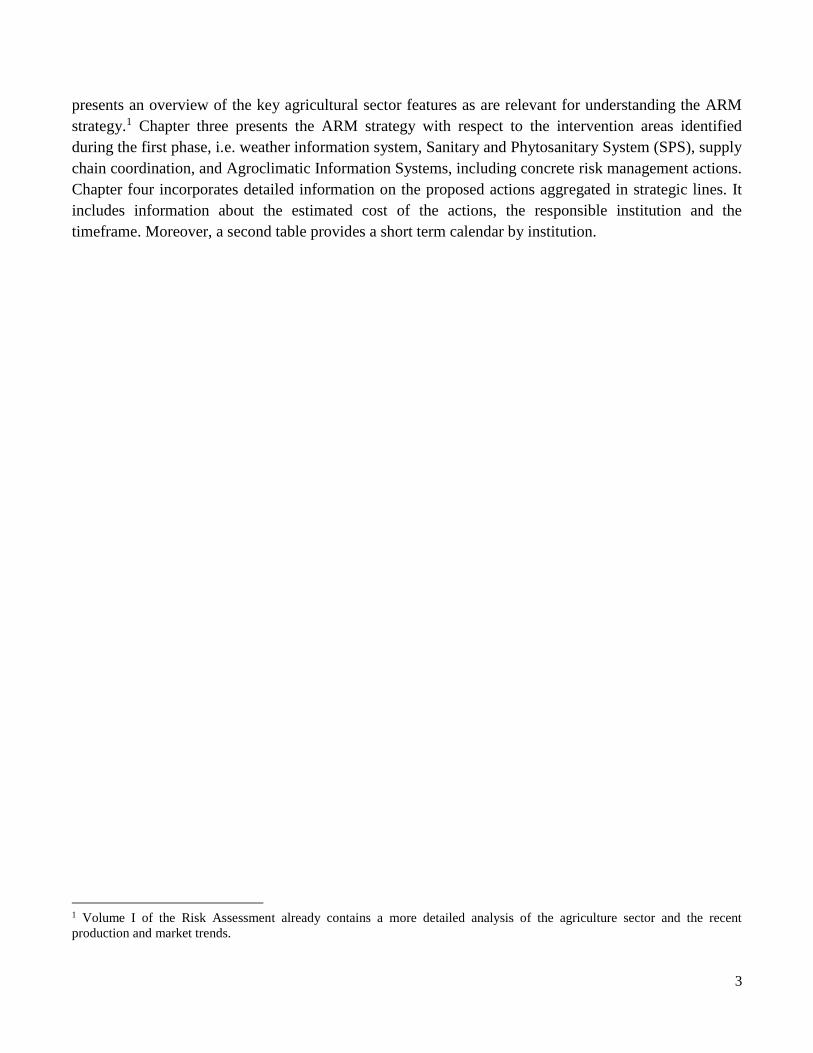
3. Due to harsher climate conditions found in the semi-arid inland, most agricultural lands are
located in the coastal regions. Figure 2 below shows the distribution of the crop production value among
the different municipalities, with concentration of production value in the regions with better
agroecological conditions, near the coast (municipalities of Mata Paraibana and Agreste Paraibano, in
particular in the micro-regions of Brejo Paraibano, Esperança and Campina Grande, and in some
municipalities of Serra de Teixeira and Sousa regions). The lowest production densities are fond in the
Borborema and Sertão Paraibano regions, where livestock raising predominates (see location of regions
in Figure 5 in next Section).
Figure 2: Map - Crop Production Value, by Municipality (2009)
Source: IBGE.
2 Data from IBGE. 3 Data from IBGE.
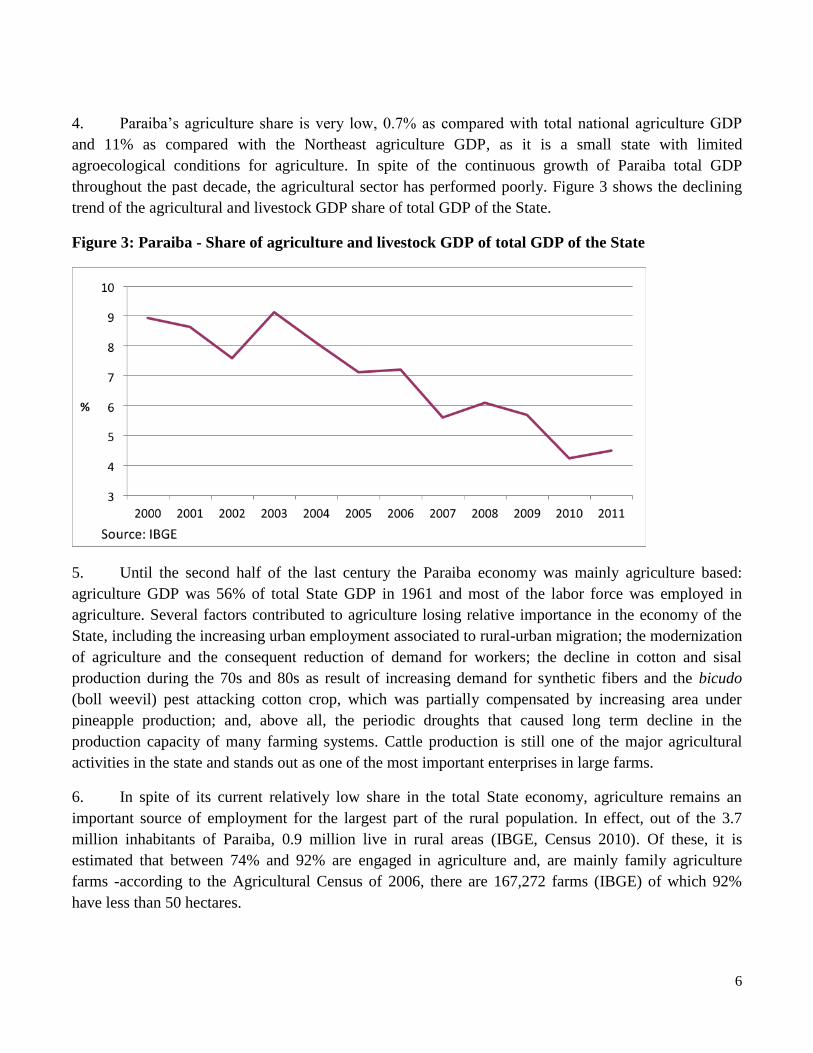
6
4. Paraiba’s agriculture share is very low, 0.7% as compared with total national agriculture GDP
and 11% as compared with the Northeast agriculture GDP, as it is a small state with limited
agroecological conditions for agriculture. In spite of the continuous growth of Paraiba total GDP
throughout the past decade, the agricultural sector has performed poorly. Figure 3 shows the declining
trend of the agricultural and livestock GDP share of total GDP of the State.
Figure 3: Paraiba - Share of agriculture and livestock GDP of total GDP of the State
5. Until the second half of the last century the Paraiba economy was mainly agriculture based:
agriculture GDP was 56% of total State GDP in 1961 and most of the labor force was employed in
agriculture. Several factors contributed to agriculture losing relative importance in the economy of the
State, including the increasing urban employment associated to rural-urban migration; the modernization
of agriculture and the consequent reduction of demand for workers; the decline in cotton and sisal
production during the 70s and 80s as result of increasing demand for synthetic fibers and the bicudo
(boll weevil) pest attacking cotton crop, which was partially compensated by increasing area under
pineapple production; and, above all, the periodic droughts that caused long term decline in the
production capacity of many farming systems. Cattle production is still one of the major agricultural
activities in the state and stands out as one of the most important enterprises in large farms.
6. In spite of its current relatively low share in the total State economy, agriculture remains an
important source of employment for the largest part of the rural population. In effect, out of the 3.7
million inhabitants of Paraiba, 0.9 million live in rural areas (IBGE, Census 2010). Of these, it is
estimated that between 74% and 92% are engaged in agriculture and, are mainly family agriculture
farms -according to the Agricultural Census of 2006, there are 167,272 farms (IBGE) of which 92%
have less than 50 hectares.
7
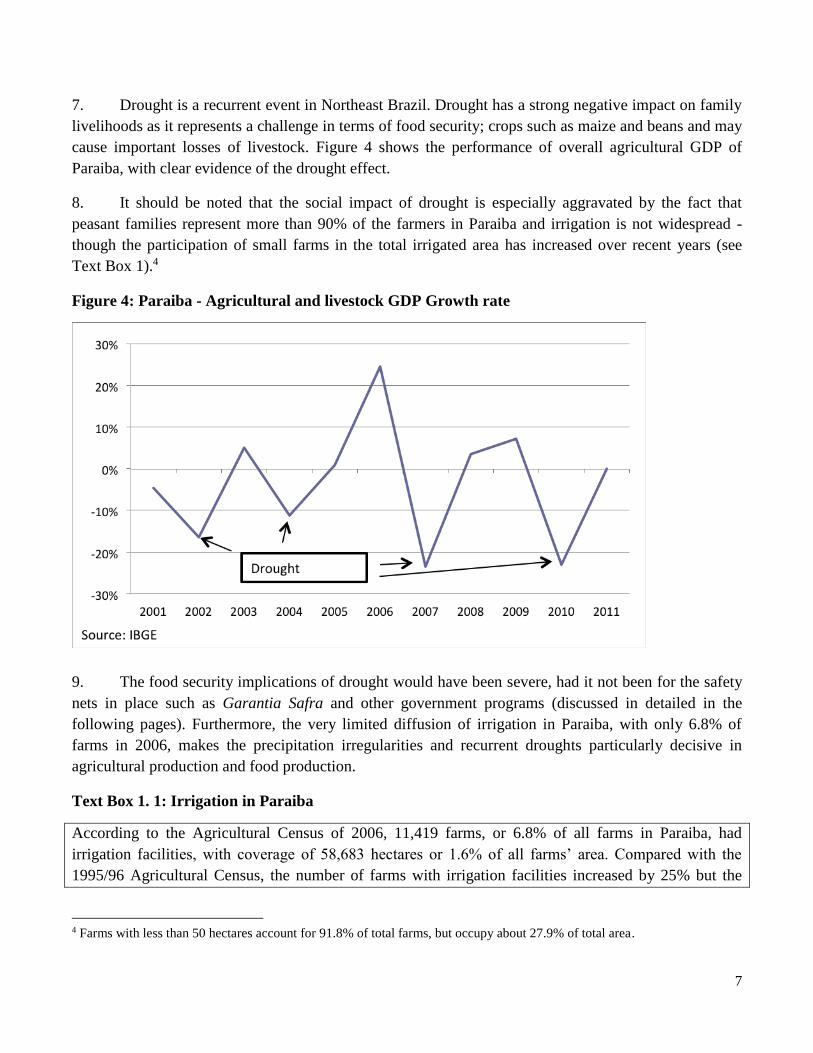
7. Drought is a recurrent event in Northeast Brazil. Drought has a strong negative impact on family
livelihoods as it represents a challenge in terms of food security; crops such as maize and beans and may
cause important losses of livestock. Figure 4 shows the performance of overall agricultural GDP of
Paraiba, with clear evidence of the drought effect.
8. It should be noted that the social impact of drought is especially aggravated by the fact that
peasant families represent more than 90% of the farmers in Paraiba and irrigation is not widespread -
though the participation of small farms in the total irrigated area has increased over recent years (see
Text Box 1).4
Figure 4: Paraiba - Agricultural and livestock GDP Growth rate
9. The food security implications of drought would have been severe, had it not been for the safety
nets in place such as Garantia Safra and other government programs (discussed in detailed in the
following pages). Furthermore, the very limited diffusion of irrigation in Paraiba, with only 6.8% of
farms in 2006, makes the precipitation irregularities and recurrent droughts particularly decisive in
agricultural production and food production.
Text Box 1. 1: Irrigation in Paraiba
According to the Agricultural Census of 2006, 11,419 farms, or 6.8% of all farms in Paraiba, had
irrigation facilities, with coverage of 58,683 hectares or 1.6% of all farms’ area. Compared with the
1995/96 Agricultural Census, the number of farms with irrigation facilities increased by 25% but the
4 Farms with less than 50 hectares account for 91.8% of total farms, but occupy about 27.9% of total area.
8
irrigated area decreased by 7.7%. The explanation for this may be found in the vulnerability of the
watersheds, as discussed below.
Eighty one per cent of the farms with irrigation infrastructure have less than 10 hectares (9,300 farms or
8% of all farms with less than 10 hectares). However, larger farms (those with more than 500 hectares)
with irrigation represent only 0.2% of the total farms with irrigation (24 farms or 2% of all farms with
more than 500 hectares) but have more than 20,000 hectares under irrigation or 35% or the total irrigated
area. Therefore, irrigation is not a widespread practice in Paraiba, particularly among large scale
farmers.
There are twelve irrigation schemes in Paraiba developed by the government, with 12,516 hectares of
irrigated area that are intended to benefit 2,000 families. The Federal Government through the National
Department Infrastructure Against Drought developed three of them and the other schemes belong to the
State Government.
However, there are several restrictions on the use of available water resources due to watershed
vulnerability to drought events (quantitative aspects) and restrictions related to water quality (hard water
and water salinity levels). In terms of water quality, a study conducted by the Government of Paraiba5
found that there are moderate restrictions to human consumption and strong restrictions for industrial
purpose use. Restrictions are also present in the use of water for crop irrigation, especially in the
watersheds of Jacu, Curimataú, Seridó, Espinharas and the sub-watershed of Taperoá, where the
misuse of irrigation water may cause soil salinization, reduce soil water infiltration capacity, plant
toxicity, and corrosion on irrigation equipment. Furthermore, lessons learned from irrigated programs
that have been implemented in Paraiba suggest that caution should be taken when promoting these types
of investments due to collateral damages, including: soil salinization, impossibility of selling all the
agricultural production due to an increase of the supply, low profit margins due to high energy costs, etc.
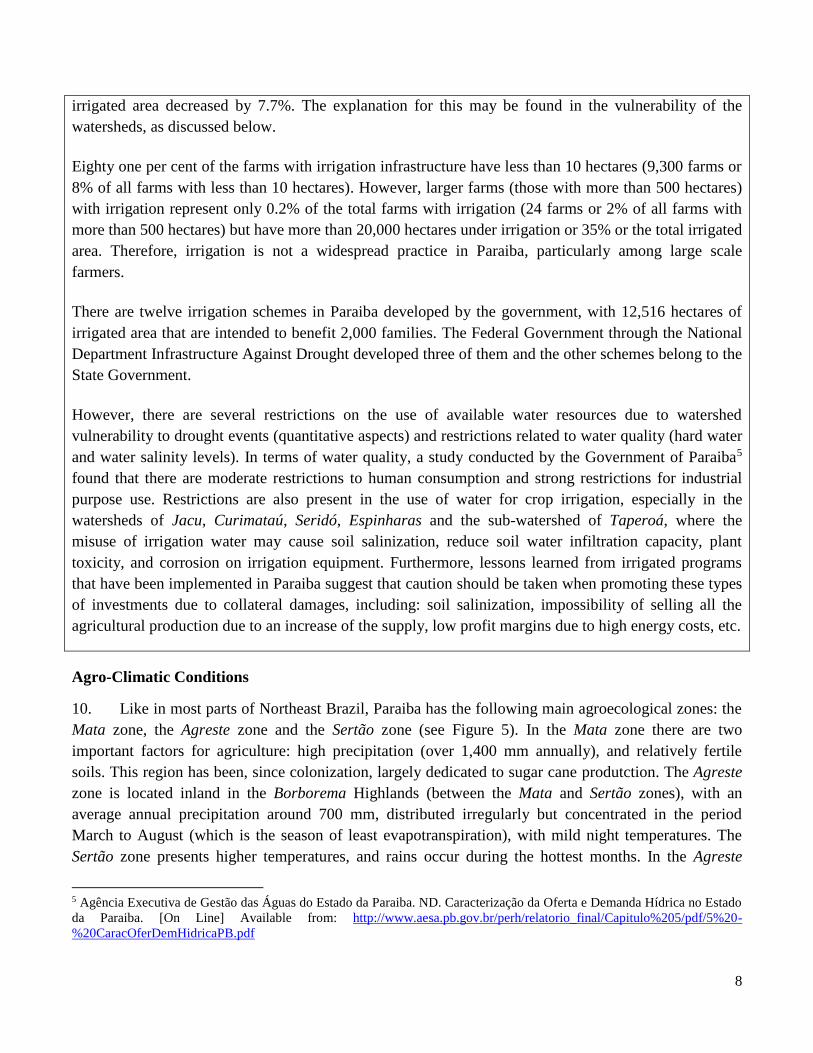
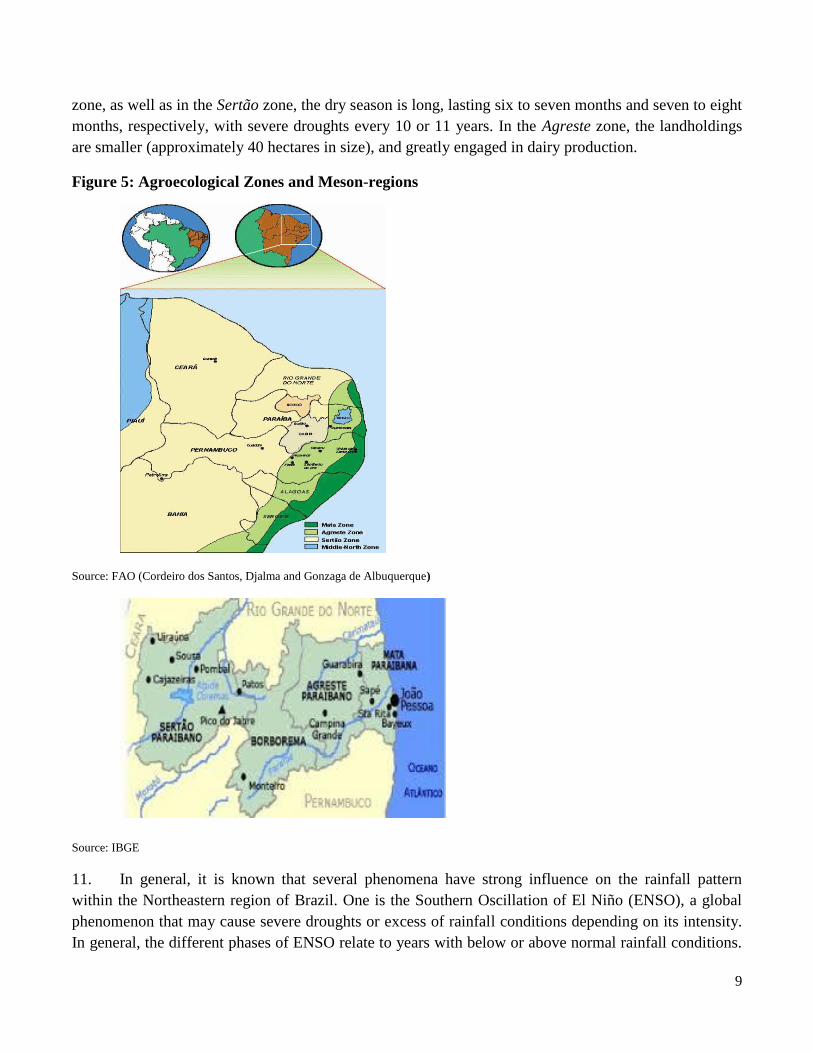
Agro-Climatic Conditions
10. Like in most parts of Northeast Brazil, Paraiba has the following main agroecological zones: the
Mata zone, the Agreste zone and the Sertão zone (see Figure 5). In the Mata zone there are two
important factors for agriculture: high precipitation (over 1,400 mm annually), and relatively fertile
soils. This region has been, since colonization, largely dedicated to sugar cane produtction. The Agreste
zone is located inland in the Borborema Highlands (between the Mata and Sertão zones), with an
average annual precipitation around 700 mm, distributed irregularly but concentrated in the period
March to August (which is the season of least evapotranspiration), with mild night temperatures. The
Sertão zone presents higher temperatures, and rains occur during the hottest months. In the Agreste
5 Agência Executiva de Gestão das Águas do Estado da Paraiba. ND. Caracterização da Oferta e Demanda Hídrica no Estado
da Paraiba. [On Line] Available from: http://www.aesa.pb.gov.br/perh/relatorio_final/Capitulo%205/pdf/5%20-
%20CaracOferDemHidricaPB.pdf
9
zone, as well as in the Sertão zone, the dry season is long, lasting six to seven months and seven to eight
months, respectively, with severe droughts every 10 or 11 years. In the Agreste zone, the landholdings
are smaller (approximately 40 hectares in size), and greatly engaged in dairy production.
Figure 5: Agroecological Zones and Meson-regions
Source: FAO (Cordeiro dos Santos, Djalma and Gonzaga de Albuquerque)
Source: IBGE
11. In general, it is known that several phenomena have strong influence on the rainfall pattern
within the Northeastern region of Brazil. One is the Southern Oscillation of El Niño (ENSO), a global
phenomenon that may cause severe droughts or excess of rainfall conditions depending on its intensity.
In general, the different phases of ENSO relate to years with below or above normal rainfall conditions.
10
However, Northeast Brazil has experienced severe drought events that are not necessarily related to the
ENSO, but to the influence of different atmospheric systems that cause rainfall in this region.6 Other
phenomena are: the Sea Surface Temperature (SST) in the Atlantic Ocean, Easterly Winds, the Sea
Level Pressure (SLP); the Inter-tropical Convergence Zone (ITZC) – one of the most important factors
that determine how generous or deficient rainfall conditions are going to be reported in the northern
areas of Northeast Brazil;7 Cold Fronts, recorded between November and January (cold fronts are
organized bands of cloud created in the areas where there is a confluence of cold and hot air masses);
and the Upper Tropospheric Cyclonic Vortices that are originated in the Atlantic Ocean between
November and March and they move from east to west more often between January and February. In
addition, the effects of sea breeze also influence rainfall conditions: continental areas record rainfall
values as low as 300 mm compared to the coast (around 1,400 mm annually). The sea breeze, which
may affect up to 100 Km inland, is due to the difference in temperature values recorded between sea
surface (low temperature) and mainland (high temperature).
12. The rainfall spatial variability experienced in Paraiba in combination with strong temporal
rainfall erraticism generates not only dry spells but also severe drought conditions and even flooding.
Agricultural Production and Market Trends
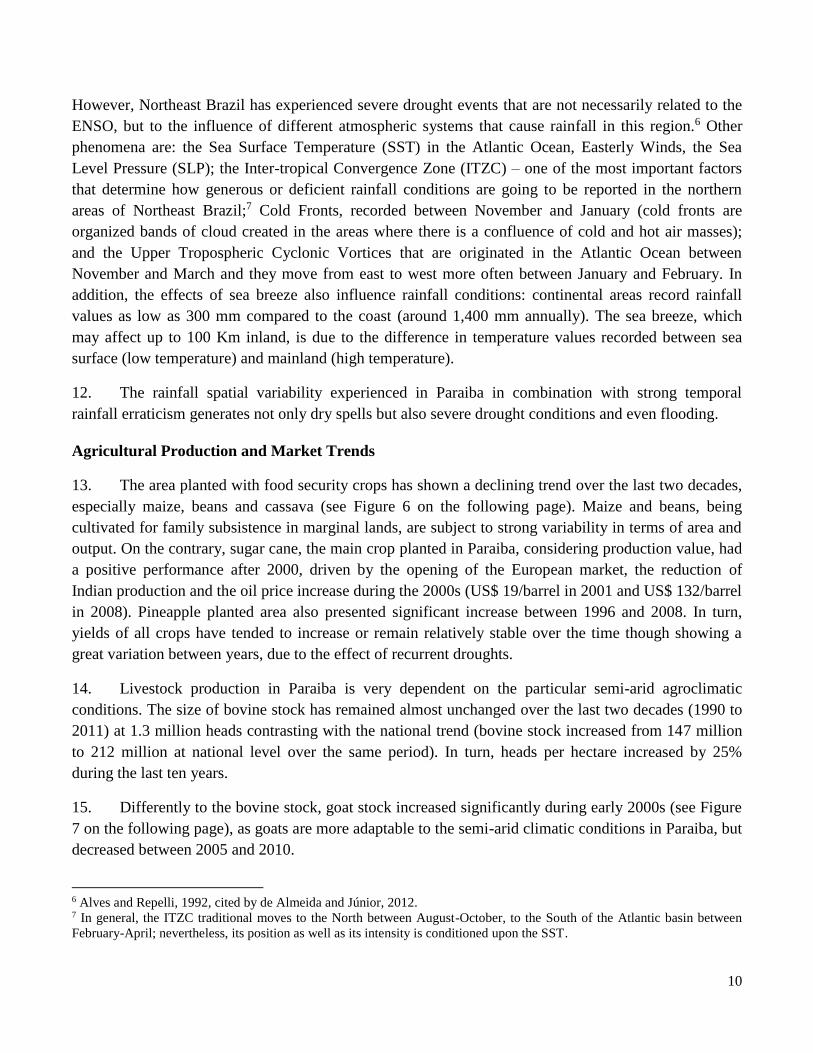
13. The area planted with food security crops has shown a declining trend over the last two decades,
especially maize, beans and cassava (see Figure 6 on the following page). Maize and beans, being
cultivated for family subsistence in marginal lands, are subject to strong variability in terms of area and
output. On the contrary, sugar cane, the main crop planted in Paraiba, considering production value, had
a positive performance after 2000, driven by the opening of the European market, the reduction of
Indian production and the oil price increase during the 2000s (US$ 19/barrel in 2001 and US$ 132/barrel
in 2008). Pineapple planted area also presented significant increase between 1996 and 2008. In turn,
yields of all crops have tended to increase or remain relatively stable over the time though showing a
great variation between years, due to the effect of recurrent droughts.
14. Livestock production in Paraiba is very dependent on the particular semi-arid agroclimatic
conditions. The size of bovine stock has remained almost unchanged over the last two decades (1990 to
2011) at 1.3 million heads contrasting with the national trend (bovine stock increased from 147 million
to 212 million at national level over the same period). In turn, heads per hectare increased by 25%
during the last ten years.
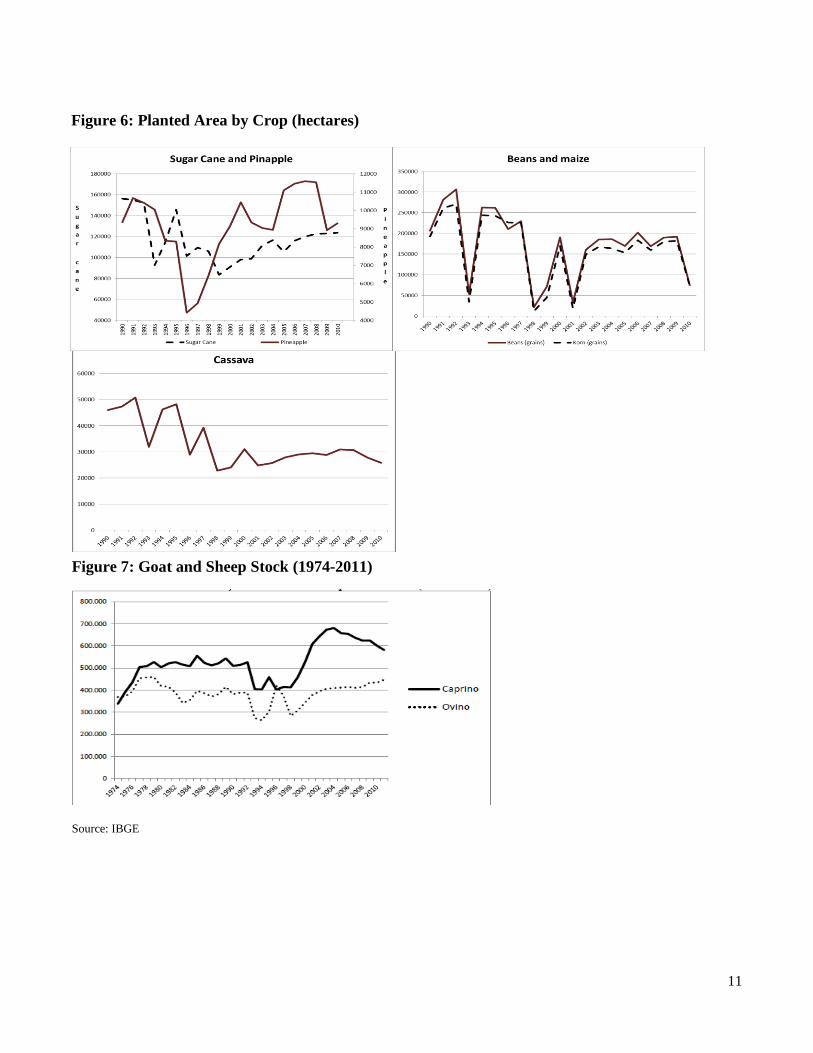
15. Differently to the bovine stock, goat stock increased significantly during early 2000s (see Figure
7 on the following page), as goats are more adaptable to the semi-arid climatic conditions in Paraiba, but
decreased between 2005 and 2010.
6 Alves and Repelli, 1992, cited by de Almeida and Júnior, 2012. 7 In general, the ITZC traditional moves to the North between August-October, to the South of the Atlantic basin between
February-April; nevertheless, its position as well as its intensity is conditioned upon the SST.
11
Figure 7: Goat and Sheep Stock (1974-2011)
Source: IBGE
Figure 6: Planted Area by Crop (hectares)

12
CHAPTER 2: AGRICULTURE SECTOR RISKS
16. Agriculture is inherently variable as producers may incur in moderate losses every year due to
sub-optimal climatic conditions at different times thorughout the production cycle or to other production
related factors. For the purpose of this report, production risks refer to the more severe and unpredictable
adverse events that occur besides these smaller events. They are measured by per yield reductions with
respect to the linear trend line greater than 33% of the standard deviation (see details in Chapter 4). Also
modest departures from expected prices may cause moderate losses that are not considered risks but
unexpected significant price drops is an important risk affecting all actors along the supply chain. The
price variations are measured and compared using the coefficient of variation (standard deviation/mean).
17. The state of Paraiba has suffered from severe droughts, which are reported by stakeholders as the
most damaging production risk for all crops. Severe droughts should be differentiated from the recurrent
(annual) droughts in the Semi-arid, which are not a risk, but can be regarded as a constraint given their
predictability. In addition, erratic rainfall is frequent but of moderate or low impact. The damaging
impact of pests and diseases is significant when they are not properly mitigated. Historically, they have
been particularly devastating when new pests/diseases arrived and the State technology support services
were not prepared to respond adequately (e.g.. cotton boll weevil). Livestock sanitary risks are very
relevant. Northeastern export crops, in particular sugar cane, have their prices largely determined by
prices in the international and national markets. Northeast producers are price takers.
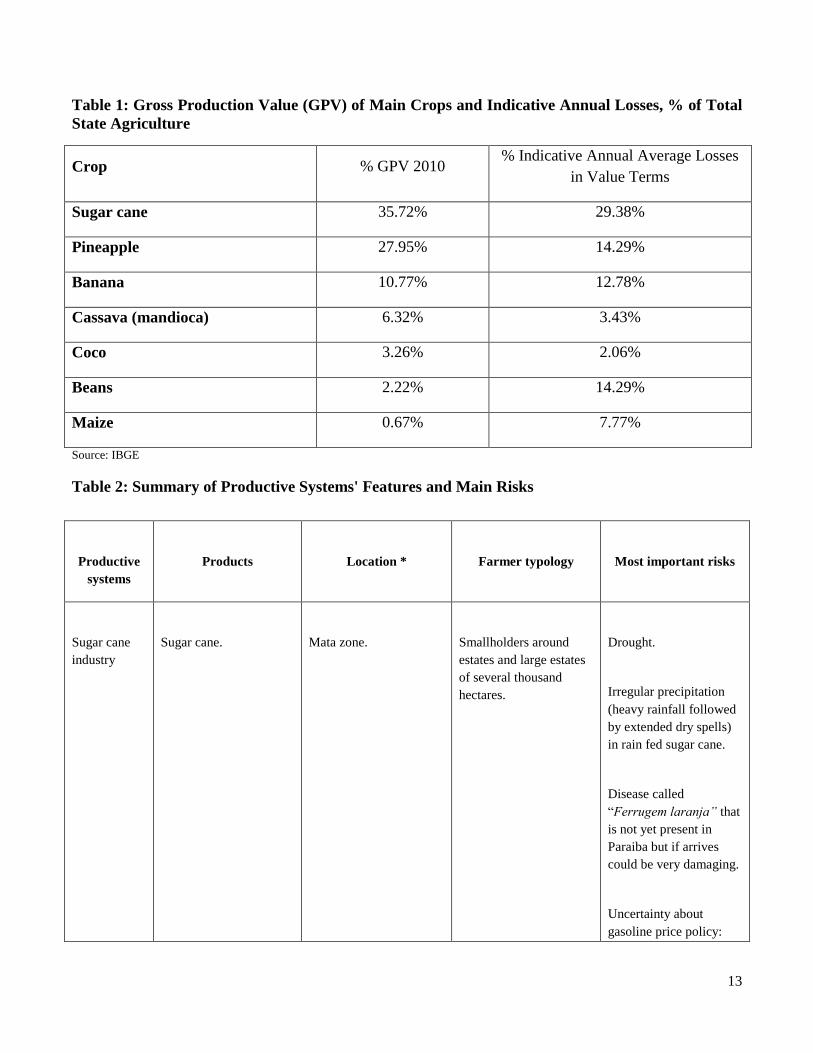
18. Risks are highly concentrated in a few crops that account for far more than 80% of the total
production value of the state and 84% of the total estimated annual losses due to realized production
risks in the last 20 years (see detailed calculation in Chapter 4): sugar cane, pineapple, banana, coconut,
cassava, maize and beans. They are particularly important both for family food security and for the
sustainability of commercial farming. Table 1 shows the relative importance of the main crops in
Paraiba in terms of contribution to the State agricultural production value.
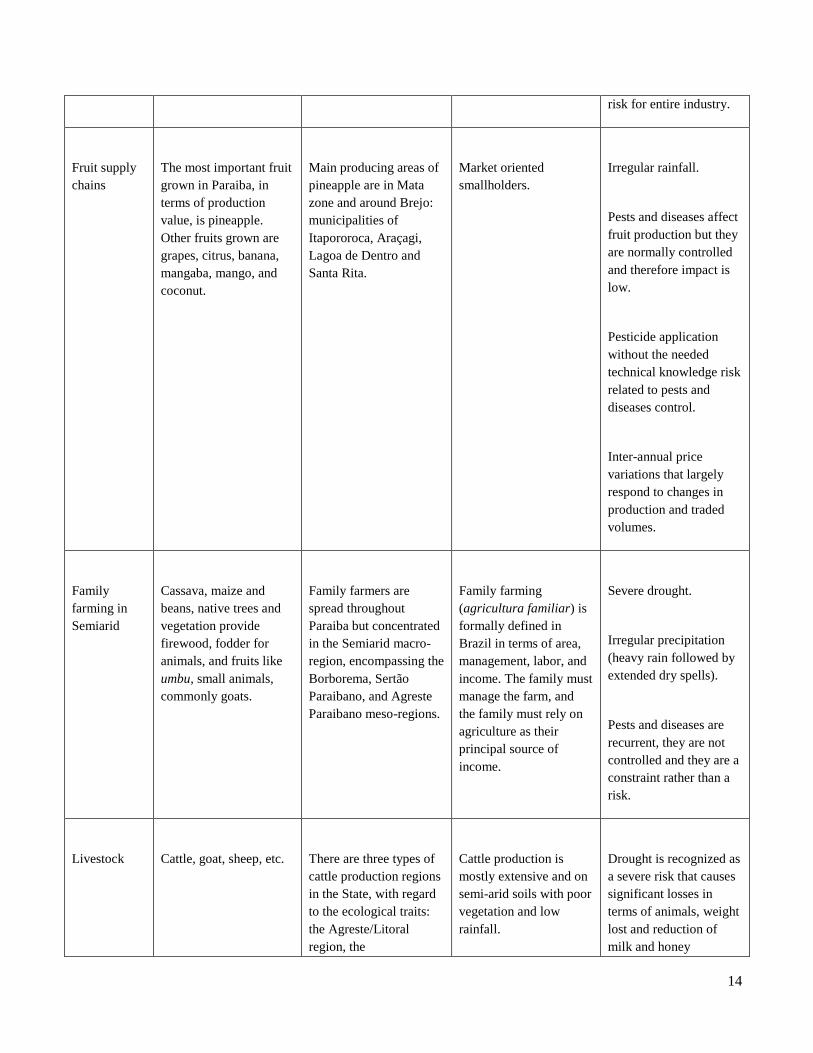
19. Based on this productive structure, that reflects the relative importance of both crops and
production patterns, the following are the productive systems were chosen for the risk management
analysis: sugar cane, commercial fruit production, family agriculture, and livestock -this analytical
structure was discussed and agreed with the project Cooperar. Table 2 presents a summary of the
information on these productive systems and their most important risks (further discussed along this
Chapter).
13
Table 1: Gross Production Value (GPV) of Main Crops and Indicative Annual Losses, % of Total
State Agriculture
Crop % GPV 2010 % Indicative Annual Average Losses
in Value Terms
Sugar cane 35.72% 29.38%
Pineapple 27.95% 14.29%
Banana 10.77% 12.78%
Cassava (mandioca) 6.32% 3.43%
Coco 3.26% 2.06%
Beans 2.22% 14.29%
Maize 0.67% 7.77%
Source: IBGE
Table 2: Summary of Productive Systems' Features and Main Risks
Productive
systems
Products Location * Farmer typology Most important risks
Sugar cane
industry
Sugar cane. Mata zone. Smallholders around
estates and large estates
of several thousand
hectares.
Drought.
Irregular precipitation
(heavy rainfall followed
by extended dry spells)
in rain fed sugar cane.
Disease called
“Ferrugem laranja” that
is not yet present in
Paraiba but if arrives
could be very damaging.
Uncertainty about
gasoline price policy:
14
risk for entire industry.
Fruit supply
chains
The most important fruit
grown in Paraiba, in
terms of production
value, is pineapple.
Other fruits grown are
grapes, citrus, banana,
mangaba, mango, and
coconut.
Main producing areas of
pineapple are in Mata
zone and around Brejo:
municipalities of
Itapororoca, Araçagi,
Lagoa de Dentro and
Santa Rita.
Market oriented
smallholders.
Irregular rainfall.
Pests and diseases affect
fruit production but they
are normally controlled
and therefore impact is
low.
Pesticide application
without the needed
technical knowledge risk
related to pests and
diseases control.
Inter-annual price
variations that largely
respond to changes in
production and traded
volumes.
Family
farming in
Semiarid
Cassava, maize and
beans, native trees and
vegetation provide
firewood, fodder for
animals, and fruits like
umbu, small animals,
commonly goats.
Family farmers are
spread throughout
Paraiba but concentrated
in the Semiarid macro-
region, encompassing the
Borborema, Sertão
Paraibano, and Agreste
Paraibano meso-regions.
Family farming
(agricultura familiar) is
formally defined in
Brazil in terms of area,
management, labor, and
income. The family must
manage the farm, and
the family must rely on
agriculture as their
principal source of
income.
Severe drought.
Irregular precipitation
(heavy rain followed by
extended dry spells).
Pests and diseases are
recurrent, they are not
controlled and they are a
constraint rather than a
risk.
Livestock Cattle, goat, sheep, etc. There are three types of
cattle production regions
in the State, with regard
to the ecological traits:
the Agreste/Litoral
region, the
Cattle production is
mostly extensive and on
semi-arid soils with poor
vegetation and low
rainfall.
Drought is recognized as
a severe risk that causes
significant losses in
terms of animals, weight
lost and reduction of
milk and honey
15
* See map in Chapter 2.
20. This section presents findings regarding the production, market and enabling environment risks
for the selected supply chains covering the referred major production systems in the state of Paraiba.
The impact of the adverse events on different stakeholders is discussed in Chapter 5.
Sugar Cane Supply Chain
Overview of supply chain
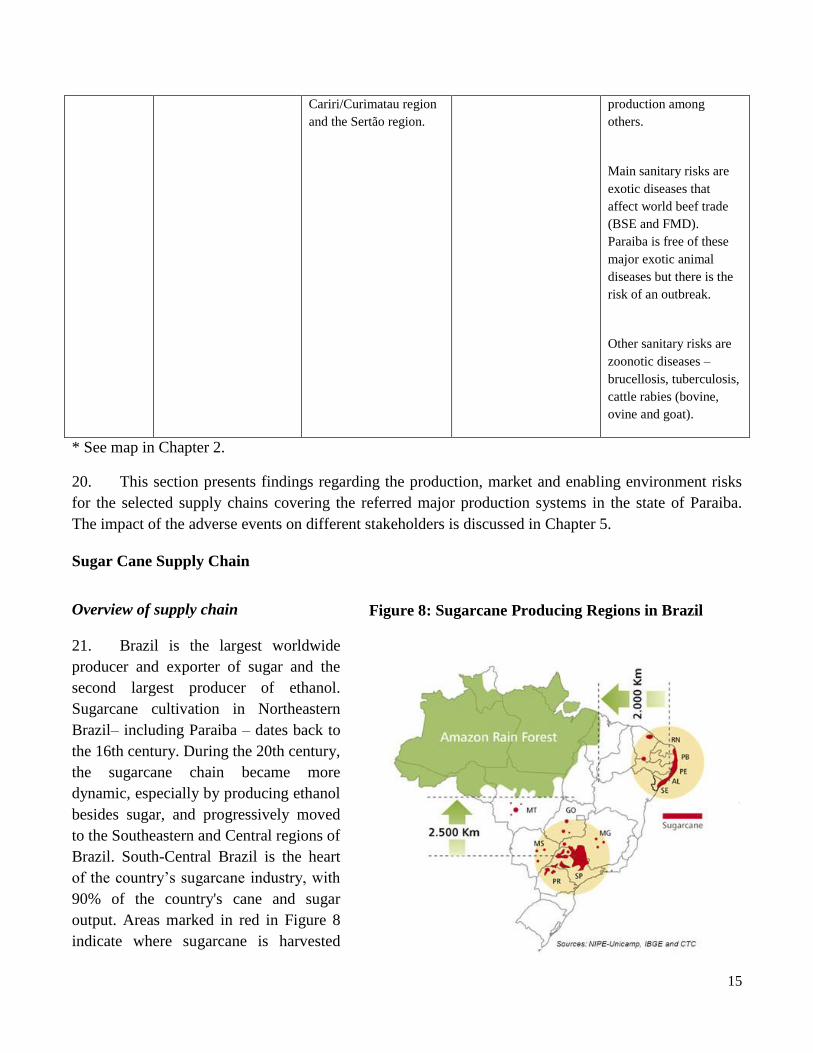
21. Brazil is the largest worldwide
producer and exporter of sugar and the
second largest producer of ethanol.
Sugarcane cultivation in Northeastern
Brazil– including Paraiba – dates back to
the 16th century. During the 20th century,
the sugarcane chain became more
dynamic, especially by producing ethanol
besides sugar, and progressively moved
to the Southeastern and Central regions of
Brazil. South-Central Brazil is the heart
of the country’s sugarcane industry, with
90% of the country's cane and sugar
output. Areas marked in red in Figure 8
indicate where sugarcane is harvested
Cariri/Curimatau region
and the Sertão region.
production among
others.
Main sanitary risks are
exotic diseases that
affect world beef trade
(BSE and FMD).
Paraiba is free of these
major exotic animal
diseases but there is the
risk of an outbreak.
Other sanitary risks are
zoonotic diseases –
brucellosis, tuberculosis,
cattle rabies (bovine,
ovine and goat).
Figure 8: Sugarcane Producing Regions in Brazil
16
and, sugar, ethanol and bioelectricity plants are located. The relative importance of the production in the
Northeastern region has progressively reduced but still remains very important for the economy of the
Northeastern states, such as Paraiba.
22. The sugar cane industry (cane plantation and processing in usinas – sugar cane processing
plants) is the most important agribusiness sector and main economic activity of Paraiba. Historically,
sugarcane was mainly for sugar production, but today a large proportion is directed to the production of
ethanol (biofuel). Most plantations are distributed along the coast, but there are a few small farms in the
Agreste, which produce cachaça (alcoholic beverage) and rapadura (large tablets of brown sugar). In
Paraiba there are 8 usinas and 1,935 farmers producing sugar cane, 95% being small and micro-
producers, in 36 municipalities.8 However, large and medium scale producers (less than 5% of the total),
including the usinas nucleus land, with a production scale of over 5,000 tons/year, contribute to about
55% of the total output. ASPLAN (Sugar Cane Farmers Association of Paraiba) calculates that during
the 2012/13 seasons the sugar sector in Paraiba provided employment (direct and indirect) to more than
63,000 people.
23. The yield of rain fed sugarcane in the region is lower than the Brazilian average, mostly due to
rainfall irregularity. In particular, if compared to the crop grown on Southeastern and Western regions.
The average yield in the state is estimated at 50 tons per hectares, but in irrigated areas productivity can
be higher than 100 tons per hectare, as a result of reducing water supply uncertainty. In addition, when
the hydric stress is managed, there is a better environment for investing in other agricultural practices,
like fertilizing, crop management, pest control, all of which contribute to higher yields and reduced
production risk. Thus, the stakeholders reported rainfall irregularity as the main risk for the sugar cane
sector, affecting both producers and processing plants. Farmer association leaders and some industrial
entrepreneurs stated that the lack of appropriate public policies was a main issue, alongside climate
irregularity, determining the uncertainty on sector sustainability.
Production risks – Climate risks
24. One of the risks that constantly affects the value chain in a significant manner is drought. For
instance, prolonged dry conditions recorded in 2012 reduced by 25% the State sugarcane production.
According to ASPLAN, the rainfall values recorded in 2012 during rain gauges were up to 36% below
average (1,484 mm). Figure 9 shows the years where drought caused yields to fall. In addition, irregular
precipitation (heavy rainfall followed by extended dry spells) can cause great damage to rain fed sugar
cane, mostly affecting smallholders and some large scale usinas where irrigation facilities are not
present.
25. Climate change may be responsible for the increasing incidence of periodic droughts in Paraiba,
but no clear evidence exists. See Annex 1 for more details. Climate change signifies shifts in
temperature and rainfall regimes, which affect agricultural productivity by shifting suitable area for
8 ASPLAN, Setor agroindustrial canaviero do Estado da Paraiba, Joao Pessoa, May 2014.
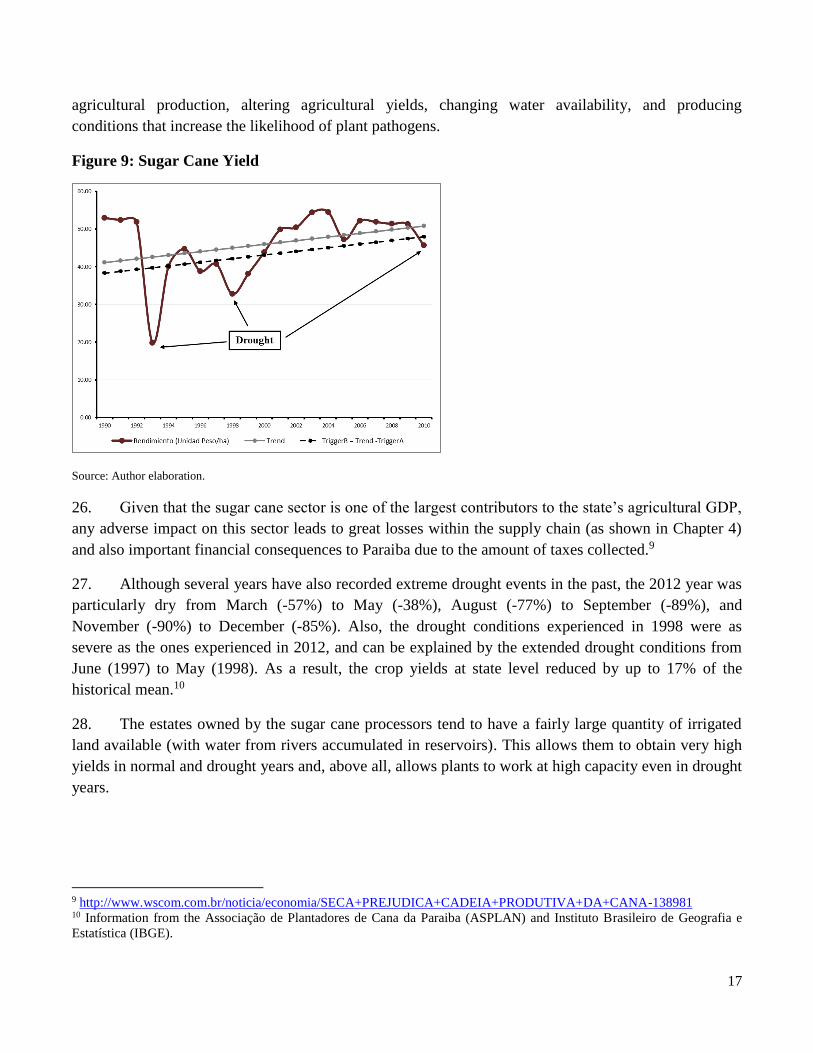
17
agricultural production, altering agricultural yields, changing water availability, and producing
conditions that increase the likelihood of plant pathogens.
Figure 9: Sugar Cane Yield
Source: Author elaboration.
26. Given that the sugar cane sector is one of the largest contributors to the state’s agricultural GDP,
any adverse impact on this sector leads to great losses within the supply chain (as shown in Chapter 4)
and also important financial consequences to Paraiba due to the amount of taxes collected.9
27. Although several years have also recorded extreme drought events in the past, the 2012 year was
particularly dry from March (-57%) to May (-38%), August (-77%) to September (-89%), and
November (-90%) to December (-85%). Also, the drought conditions experienced in 1998 were as
severe as the ones experienced in 2012, and can be explained by the extended drought conditions from
June (1997) to May (1998). As a result, the crop yields at state level reduced by up to 17% of the
historical mean.10
28. The estates owned by the sugar cane processors tend to have a fairly large quantity of irrigated
land available (with water from rivers accumulated in reservoirs). This allows them to obtain very high
yields in normal and drought years and, above all, allows plants to work at high capacity even in drought
years.
9 http://www.wscom.com.br/noticia/economia/SECA+PREJUDICA+CADEIA+PRODUTIVA+DA+CANA-138981 10 Information from the Associação de Plantadores de Cana da Paraiba (ASPLAN) and Instituto Brasileiro de Geografia e
Estatística (IBGE).

18
Production risks - Pests and diseases
29. There are three major insect pests attacking sugarcane in Paraiba: the broca do colmo, broca
gigante and cigarrinha. Their presence is very frequent, but impact is relatively low, as farmers suitably
manage the pests. On the farms owned by the sugar cane processors there is an intensive use of
biological control, which includes parasitic wasps and fungi that parasitizes the insect pest. The
biological agents, both wasps and fungi, are produced by the processors on their own laboratories, and
sprayed or released on their own farms. There is only occasional need to supplement the biological
control with pesticide applications.
30. On the other hand, among the small-scale farmers supplying the usinas, there is a more intensive
use of pesticides, as they do not have scale to implement and maintain a biological laboratory to produce
the wasps and fungi used for pest control. A way to improve their pest control practices would be to
implement laboratories operated by the Sugarcane Farmer Association (Associação dos Plantadores de
Cana da Paraiba), sharing costs and the inputs in order to produce the biological control agents. This
approach would not only be advantageous from the economic standpoint, but would also be more
environmentally friendly.
31. In regards to diseases, there is a serious potential phytosanitary threat to the sugarcane
production in Paraiba, due to Ferrugem Laranja. This disease was recently detected in sugarcane
plantations in São Paulo and, to date, there is no assessment of its impact. In other countries where it is
present - like in Australia - the impact is rated as high. It is very difficult to anticipate when and if the
disease will be introduced in Paraiba, and once introduced if the fungus will adapt to the environmental
conditions and effectively become a serious threat. Nevertheless, considering its potential damaging
impact for Paraiba, this disease risk should be considered of high impact.
Price volatility risks.
32. Sugar cane price volatility is not high in general, both in Paraiba and in Brazil, in spite of the
higher volatility of sugar price in the international market. In effect, sugar cane prices are negotiated
between producers and buyers and changes in the relative prices between sugar and ethanol result in
shifts of industrial output between the two sugar cane products, ethanol and sugar. That type of
industrial decision is possible in Paraiba because most processing plants are mixed plants capable of
producing both ethanol and sugar. They also tend to cogenerate electricity. All in all the sugar cane
industry is efficient at both processing and farm level.
33. The different actors along the supply chain (farmers’ association – ASPLAN – and the
processing plants), agree on a reference procurement ATR (Açúcares Totais Recuperáveis) price. The
determination of the reference price takes into account the international price of sugar (in the New York
and London markets) and ethanol price (mostly domestically determined as follows the domestic price
of gasoline) as well as production costs, and is based on information provided by technical organizations
such as CEPEA and DATAGRO. Figure 10 below shows the domestic and international prices of sugar
and ethanol.
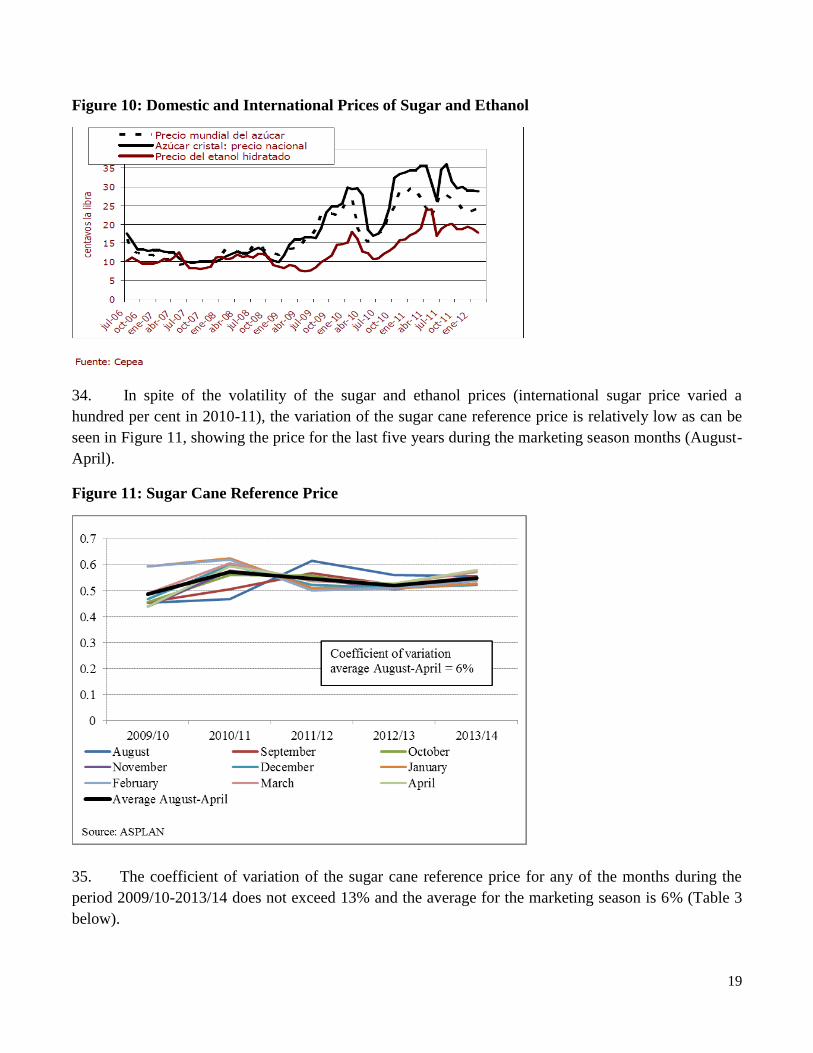
19
Figure 10: Domestic and International Prices of Sugar and Ethanol
34. In spite of the volatility of the sugar and ethanol prices (international sugar price varied a
hundred per cent in 2010-11), the variation of the sugar cane reference price is relatively low as can be
seen in Figure 11, showing the price for the last five years during the marketing season months (August-
April).
Figure 11: Sugar Cane Reference Price
35. The coefficient of variation of the sugar cane reference price for any of the months during the
period 2009/10-2013/14 does not exceed 13% and the average for the marketing season is 6% (Table 3
below).
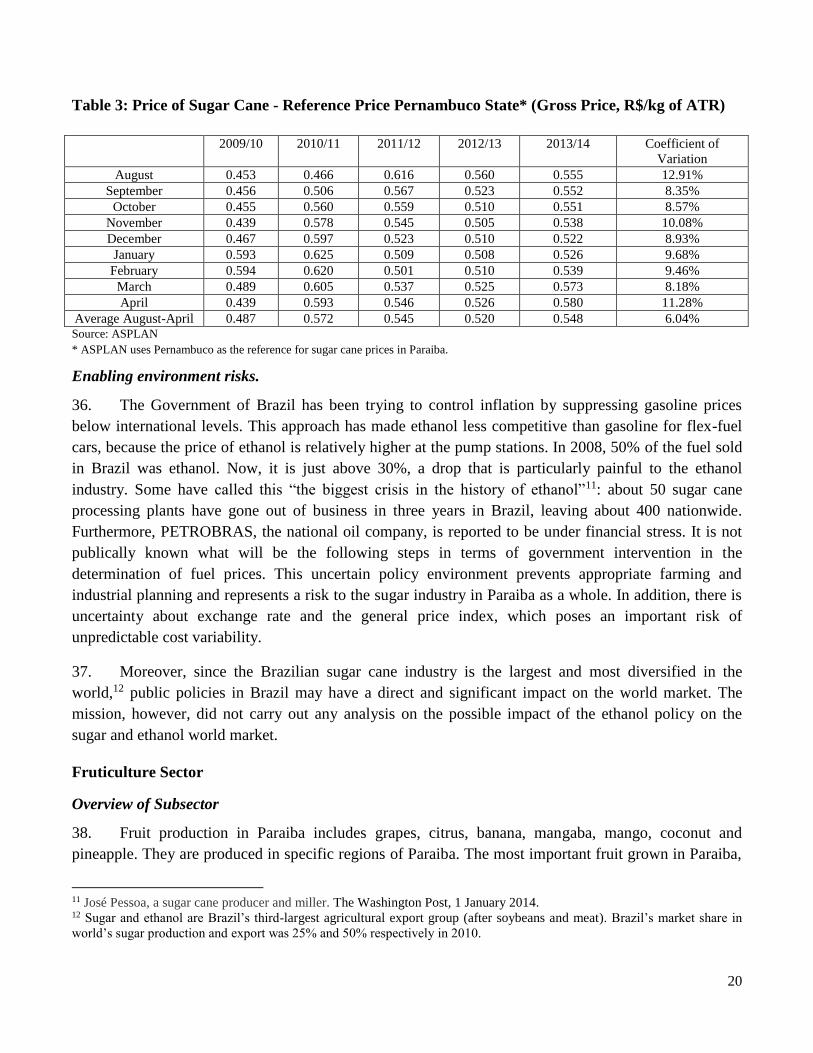
20
Table 3: Price of Sugar Cane - Reference Price Pernambuco State* (Gross Price, R$/kg of ATR)
Source: ASPLAN
* ASPLAN uses Pernambuco as the reference for sugar cane prices in Paraiba.
Enabling environment risks.
36. The Government of Brazil has been trying to control inflation by suppressing gasoline prices
below international levels. This approach has made ethanol less competitive than gasoline for flex-fuel
cars, because the price of ethanol is relatively higher at the pump stations. In 2008, 50% of the fuel sold
in Brazil was ethanol. Now, it is just above 30%, a drop that is particularly painful to the ethanol
industry. Some have called this “the biggest crisis in the history of ethanol”11: about 50 sugar cane
processing plants have gone out of business in three years in Brazil, leaving about 400 nationwide.
Furthermore, PETROBRAS, the national oil company, is reported to be under financial stress. It is not
publically known what will be the following steps in terms of government intervention in the
determination of fuel prices. This uncertain policy environment prevents appropriate farming and
industrial planning and represents a risk to the sugar industry in Paraiba as a whole. In addition, there is
uncertainty about exchange rate and the general price index, which poses an important risk of
unpredictable cost variability.
37. Moreover, since the Brazilian sugar cane industry is the largest and most diversified in the
world,12 public policies in Brazil may have a direct and significant impact on the world market. The
mission, however, did not carry out any analysis on the possible impact of the ethanol policy on the
sugar and ethanol world market.
Fruticulture Sector
Overview of Subsector
38. Fruit production in Paraiba includes grapes, citrus, banana, mangaba, mango, coconut and
pineapple. They are produced in specific regions of Paraiba. The most important fruit grown in Paraiba,
11 José Pessoa, a sugar cane producer and miller. The Washington Post, 1 January 2014. 12 Sugar and ethanol are Brazil’s third-largest agricultural export group (after soybeans and meat). Brazil’s market share in
world’s sugar production and export was 25% and 50% respectively in 2010.
2009/10 2010/11 2011/12 2012/13 2013/14 Coefficient of
Variation
August 0.453 0.466 0.616 0.560 0.555 12.91%
September 0.456 0.506 0.567 0.523 0.552 8.35%
October 0.455 0.560 0.559 0.510 0.551 8.57%
November 0.439 0.578 0.545 0.505 0.538 10.08%
December 0.467 0.597 0.523 0.510 0.522 8.93%
January 0.593 0.625 0.509 0.508 0.526 9.68%
February 0.594 0.620 0.501 0.510 0.539 9.46%
March 0.489 0.605 0.537 0.525 0.573 8.18%
April 0.439 0.593 0.546 0.526 0.580 11.28%
Average August-April 0.487 0.572 0.545 0.520 0.548 6.04%
21
in terms of production value, is pineapple. Pineapple is massively exported out of Paraiba and traded in
the Recife Market (main) and the wholesale market of João Pessoa.
39. Brazil stands out as the largest global producer of pineapple, annually growing 86,630 hectares,
with a current production of 1.5 billion fruits. The state of Paraiba always stood out among the largest
producing states, presently ranked as the second producer. Until the second half of the twentieth century,
the cultivation of pineapple in Paraiba was concentrated in the municipality of Sapé and its surrounding
region, located in the transition of the Coastal Plains to the Seridó meso-region. In recent decades, the
planted area shifted closer to the Coastal areas. One of the causes of the movement is the incidence of
fusariose disease, which has caused great damage and disincentive for its growing in the traditional
producing region.
40. In the assessment by municipality, the first producer of pineapple is Itapororoca with
approximately 3,000 ha, followed by Araçagi with 2,200 ha and Lagoa de Dentro with 550 ha. Santa
Rita, a small municipality in the outskirts of João Pessoa is the fourth most important pineapple
producer region of the State. Leveraged by a more organized production chain, it is quickly growing and
the trend for the short term is that Santa Rita will surpass Ipapororoca as the first producer.
41. There are factors that limit technological improvement of the pineapple production chain, such as
the lack of information that contributes to management inefficiency and the poor supply chain
coordination, with the exemption of few cooperatives. In present days, the high and rampant use of
pesticides along with the flow of residential waste and pesticide containers, are among the biggest
environmental concerns. The cultivation of pineapple depends on chemical pesticides.
42. The production of pineapple in the municipality of Itapororoca is predominantly marketed to
middlemen (atravessadores). Part of the production is sold in the Northeast and the rest is exported to
the Southeast. Taking advantage of the situation of indebtedness and lack of specific public policies to
support farmers, atravessadores buy pineapple production from the grower before harvesting, after the
first application of fertilizer. They do not care about the preservation of the environment, the working
conditions and health of the workforce, or the sustainable local development and even less with the
sanity of the product for the final consumer. A report from CONAB foresees in the medium term a
reduction of the planted area in the region, consequence of the lack of incentives for small farmers to
improve production. That could explain why production is shifting from Itapororoca to Santa Rita,
where better supply chain coordination exists partially with help from APL programs.
Production Risks - Climate
43. Irregular rainfall is a recurrent risk for fruit production. Recently, the drought conditions
experienced between August 2012 and March 2013 caused severe problems in the pineapple sector.
Production losses were between 20%-25%; in addition, the quality of the products was also affected as
the size of most pineapples did not meet the standards required by the market. The drought conditions
reported between 2012 and 2013 also impacted on other crops, such as coconut. In the municipalities of
Sousa and Aparecida, around 60% of the total coconut plantations was lost and the level of production
22
registered in 2013 only met 10% of its historical values. In contrast, coco plantations located near the
coast did not registered plant losses but the decline in production was around 20% to 25% (FAEPA,
2013).13
Production risks – Pests and diseases
44. Insect pests like the broca do olho do coqueiro (coconut) and the disease sigatoka amarela
(banana) are highly frequent but result in low impact. Both the broca and the sigatoka are satisfactorily
managed by cultural practices, including pesticide application. Citrus, mango and mangaba are
frequently attacked by the fruit fly mosca negra dos citrus. Trapping or insecticide applications are used
to control the pest. The impact of this pest is considered as moderate, along with the pineapple disease
fusariose that attacks the crop almost every year. Control of the pest can be made by means of cultural
practices (clean seedlings, eradication of contaminated plants), use of resistant varieties or spraying of
recommended fungicides. As long as these pests are adequately and massively monitored they could be
considered as constraints rather than risks. However, no clear evidence on this exists.
45. Quarantine pests like the disease sigatoka negra (bananas) and cancro bacteriano (grapes), not
yet present in Paraiba, may be extremely damaging if introduced in the fruit regions of Paraiba. Consider
the devastating effect that boll weevil had on cotton production explained in the Text Box 2 below.
Strong actions of the SEDAP (Phytosanitary department of the Paraiba Government), aligned with the
Federal authorities, are considered paramount to avoid the introduction of these and other quarantine
pests in the state.
46. Finally, a phytosanitary risk considered as probable and with high impact arises from the use of
pesticides without the necessary technical knowledge and skill. The result is that farmers may face
increased production costs, ineffective pest control and human and environmental hazards as well as
fruit contamination with pesticides residues, a risk for consumers.
Text Box 1. 2: The boll weevil and the cotton crisis in northeastern Brazil – A story to remember
Cotton cultivation in Brazil dates back to the colonial era, in the sixteenth century. The Northeast of
Brazil, especially the State of Paraiba had always been a leading producer and processor of cotton
fiber. Both in the Northeast, as well as in the Southern states of São Paulo, Paraná and Mato Grosso
do Sul, where cotton was widely grown until 1990, it was characterized as a smallholder crop, with
intensive use of labor force. This reality dramatically changed in the late 1980s, with the entry of
the boll weevil (Anthonomus grandis), known in Brazil as bicudo do algodoeiro, a global major
pest for this crop.
The first record of the boll weevil presence in Brazil is from nearby Jaguariúna and Campinas (State
of São Paulo), in February 1983, and subsequently its presence was detected in Paraiba (July 1983).
The most solid evidence suggests it was introduced from Southeastern United States, as a
13 http://www.faern.com.br/novosite/noticia/perdas-da-agricultura-na-paraiba-podem-se-agravar

23
contamination carried by aircraft, and not by natural expansion of the insect, since the initial
infestation was found in cotton fields near Viracopos International Airport, in São Paulo. The initial
boll weevil infestations in the Northeast area of Brazil were found in the State of Paraiba,
municipality of Inga (July 4th, 1983), most likely due to a secondary introduction from the infested
area of São Paulo. By December of the year, over 90% of the cotton cultivated area was infested
with boll weevil in the State of Paraiba.
Given the rapid expansion of the pest in the state of Paraiba, as well as on the entire cotton
producing surrounding states, there was no way to eradicate the insect and allow the continuity of
cotton cultivation. The entry of the pest required a large number of pesticide applications, which
increased the cost of production beyond the financial capacity of family producers. As such, cotton
profitability in the region fell, resulting in the abandonment of cotton cultivation in Paraiba and
other northeastern states. As a result of the boll weevil infestation, there was not only economic loss
but also unemployment on a historically poor region. The cotton industry, already weakened by the
boll weevil infestation, was further affected in the early 1990s, by the intense and abrupt reduction
of import tariffs, which created an unfavorable situation for the Brazilian fiber.
The result was: reduction in the domestic production from one million tons in 1981 to 420,000 tons
in 1993; increase in imports, which reached nearly 500,000 tons in 1993 (through the mid-1980s,
Brazil was not only self-sufficient in cotton but a major exporter; the cotton area was reduced from
4.1 million hectares in 1981, to 1.3 million hectares in 1995; in the Northeastern region, the area
planted dropped from 3.2 million hectares in 1976/77, to 1.2 million hectares in 1986/87; in the first
ten years following the boll weevil introduction, the cotton acreage reduction eliminated 800,000
jobs (over one million workers in 1985 to 385,000 in 1994), leading to a massive rural exodus;
disappearance of cotton cultivation in Northeast Brazil, with the exception of the Cerrado of
Western Bahia, where it is currently grown in large farms, using top technology, intense
mechanization, with low demand for labor force. Currently, no smallholders produce cotton in
Brazil, due to the high costs of boll weevil control. According to an evaluation made by Santos et al
(2001),14 the private losses due to the boll weevil between 1984 and 1990 were estimated to be over
R$ 11 billion.
Price volatility risk.
47. Pineapple and banana are among the fruits that are most largely produced and traded in Paraiba.
They are both traded at the wholesale market in Joao Pessoa, EMPASA: the mission visited EMPASA
and held discussions with several traders. Due to of this interaction, and the analysis of price data
provided by the management of EMPASA, it was possible to obtain some conclusions on the price
14 Robério Ferreira dos Santos, Maria Auxiliadora Lemos Barros, José Wellingthon dos Santos, Kleodósio Leôncio da Silva e
Phillipe Farias Ferreira. Impactos da propagação do bicudo e da globalização da economia brasileira na produção interna de
algodão. Revista Oleaginosas & Fibrosas, 5(3):423-31. 2001.

24
behavior of pineapple and banana. The inter-annual price variations of both pineapple and banana
largely respond to the changes in production and traded volumes. In effect, the price fluctuates are
inversely proportional to the volumes traded in most years. For instance, the 2005 drought in the
pineapple producing areas caused a significant reduction in the availability of product and an important
increase in price (Figure 12 below).
48. The correlation coefficient between the annual average prices and the volumes traded is -64%,
which is considerable high and, in spite of the few observations available (2004-2012), it is a reasonably
good indication of the causality of the two variables.
49. Lower price volatility would be possible under more coordinated supply chain arrangements and
stronger cooperative organization that allow for better production and marketing planning, as is the
experience in Santa Rita with pineapple production. Efforts should be made to strengthen farm to market
coordination with a view to achieve better production planning and less output volatility, possibly
making an extensive use of the APL (Arranjos Produtivos Locais) approach, which has been very
positively assessed in Brazil.15 However, this will have to be assessed during the solutions assessment
mission.
15 BNDES, Nota Técnica, Produto 9 do projeto “Análise do Mapeamento e das Políticas para Arranjos Produtivos Locais no
Norte e Nordeste do Brasil e dos Impactos dos Grandes Projetos Federais em Estados Nordestinos.
www.politicaapls.redesist.ie.ufrj.br
Figure 12: Pineapple and Banana Wholesale Prices and Volumes Traded

25
Family Agriculture in Semi-arid Zone
Overview of Subsector
50. Family farming (agricultura familiar) is formally defined in Brazil16 in terms of area,
management, labor, and income. The family must manage the farm, and the family must rely on
agriculture as their principal source of income. According to the 2006 Agricultural Census there are
148,077 family farmers in Paraiba (or 91% of the total farmers) covering 1,596,273 hectares,
corresponding to 42% of the total area17; two-thirds of family farmers have land title. Figure 13 below
shows the land tenure structure in Paraiba.
Figure 13: Agriculture Establishments and Landholdings, Paraiba (2006)
Source: IBGE, Censo Agropecuario 2006
51. Family farmers in Paraiba grow temporary crops like: cassava, maize, and beans, on small, rain
fed, plots. Especially in dry regions, small farmers raise small animals, commonly goats. Native trees
and vegetation provide firewood, fodder for animals, and fruits like umbu and nuts like cashew, part of
the nutritional security. Family farmers are spread throughout Paraiba but concentrated in the semiarid
macro-region, encompassing the Borborema, Sertão Paraibano, and Agreste Paraibano meso-regions.
Family farmers often use fundos de pasto, or communal pasture regimes, to feed goat and sheep
livestock herds. However, these areas often have insecure tenure regimes and are vulnerable to
usurpation from competing ranchers. In addition, since the herds rely on natural vegetation, food for
animals is vulnerable to drought.
16 Family Agriculture, agricultura familiar, is defined as a form o production where the interaction of management and work
is predominant; family agricultures drive the productive process, emphasizing diversification and using an main work force,
family labor at times receiving wages (http://www.mds.gov.br/falemds/perguntas-frequentes/bolsa-familia/programas-
complementares/beneficiario/agricultura-familiar). 17 IBGE.
26
52. In general, family farmers are characterized by little land size, poor soils, low precipitation, low
market access due to physical isolation, low access to credit and technical assistance, and low levels of
farmer organization. Some attribute low association participation to a lack of incentives to associate and
a history of patronage arrangements that small farmers depend on to receive emergency relief supplies in
times of drought. Rural credit is concentrated in the wealthier meso-region of Mata Paraibana at 40% of
the value of contracts but 6.65% of the number of contracts. The Semiarid meso-regions evidence
smaller-value contracts.
53. Family farmers consume their own production and sell it through cash transfers from social
assistance programs provide a significant proportion of family income and allow food to be purchased
outside the household. Livestock provides a particularly important sources of animal protein in meat and
milk, and artisan crafts from animal hides provide supplementary income.
54. High rates of female-headed households stand out in Paraiba at about 30% in rural areas. A long
history of principally male out-migration to cities leaves family farmering in the hands of women, with
many elder folk and children. The percent of dependents (population under age 15 and over age 65) in
total population exceeds 50% in many regions of Paraiba. Though dependents represent more mouths to
feed that are not economically active, they also help bring in significant income transfers from federal
government programs, mainly the Rural Retirement Pension from INSS, comprising up 17% of the
average rural family income, and Bolsa Família.
Production risks - Climate
55. Family agriculture is largely based on livestock, though maize, beans and cassava are grown for
self-consumption. By far the most important risk to the production of these crops is severe drought. In
addition to severe droughts, irregular precipitation (heavy rain followed by extended dry spells) is
another climate risk for smallholders, as irrigation facilities are not usual. In the 2011-2012 crop season,
Paraiba represented the fifth largest Federal State in terms of number of small farmers (86,367 farmers
out of a total number of 771,343) enrolled in the Garantia Safra program (See Text Box 3 for further
details about this compensation mechanism). Given that this compensation mechanism only covers
municipalities within the Semi-arid region and that it triggers payout only when the enrolled
Municipality registers severe crop losses due to extreme rainfall events (mainly drought), historical
payouts disbursed by this program could be used as a proxy of drought events that negatively impacted
the small farming sector. Table 4 shows that on average 6 out of 10 years the Garantia Safra program
disburses compensation payouts above 90% of all enrolled municipalities. The analysis of the historical
records of this program shows that the 2011-2012, 2006-2007 and 2009-2010 crop seasons were the
worst ever recorded.

27
Table 4: Number of Farmers Enrolled in Garantia Safra Program and Number of Farmers who
Receive Payments, Paraiba (2002-2012)
ItemEnrolled
Farmers
No. Farmers
Received
Payments
% Possitive
Payments
Total Payout
(R$)
Payout/F
armer
(R$)
2002 - 2003 29,972 27,147 90.6% R$ 12,894,825 R$ 475
2003 - 2004 37,562 23,264 61.9% R$ 12,795,200 R$ 550
2004 - 2005 49,755 47,318 95.1% R$ 26,024,900 R$ 550
2005 - 2006 54,791 23,947 43.7% R$ 13,170,850 R$ 550
2006 - 2007 59,310 57,985 97.8% R$ 31,891,750 R$ 550
2007 - 2008 74,345 24,447 32.9% R$ 13,445,850 R$ 550
2008 - 2009 83,329 75,112 90.1% R$ 41,311,600 R$ 550
2009 - 2010 82,205 80,183 97.5% R$ 48,109,800 R$ 600
2010 - 2011 81,083 30,808 38.0% R$ 19,717,120 R$ 640
2011 - 2012 86,367 86,367 100.0% R$ 107,095,080 R$ 1,240 Source: Ministério do Desenvolvimento Agrário (MDA).
56. The severe losses recorded by Garantia Safra in 2012 are consistent with the very low
precipitation values reported by AESA. In March 2012, only three cities in Paraiba reported rainfall
indexes above their historical average values for the same period. The rainfall forecasts made at the time
indicated a decrease of up to 40% of the average. As a result, the Government of Paraiba supported
different federal programs in order to alleviate farmer losses. Some of these programs include:
Programa Emergencial de Manutenção do Rebanho Paraibano, Garantia Safra; and Programa Palma
Resistente.18
Text Box 1. 3: Brazil Garantia Safra
The Garantia Safra program was created in 2002 (Law No. 10420, and then it was modified in 2012 by
the Law 12766) with the objective to provide compensations payouts to vulnerable farmers and rural
families who are systematically affected by severe drought events and excess water events, within the
semi-arid region of Brazil. Given that this federal program reduces the effects of extreme rainfall
conditions (mainly drought) it has reduced the need from State Governments and enrolled farmers to
request Federal emergency actions. The total annual cost is distributed among the stakeholders (federal,
state and municipal governments and the farmers), with the Federal Government as main contributor.
The potential beneficiaries of this program are rural families located in the semi-arid region and with:
monthly gross family income of up to 1.5 times minimum wage; plant between 0.6 and 5 hectares of
beans, maize, rice, cassava, cotton or any other agricultural activity that effectively coexist with the
semi-arid conditions; request their adherence to the program and pay a small contribution to the
Garantia Safra Fund (FGS) for its enrollment.
Operation: The program triggers a compensation payout when crop losses exceed by 50% the average
18 Cunha, 2012.
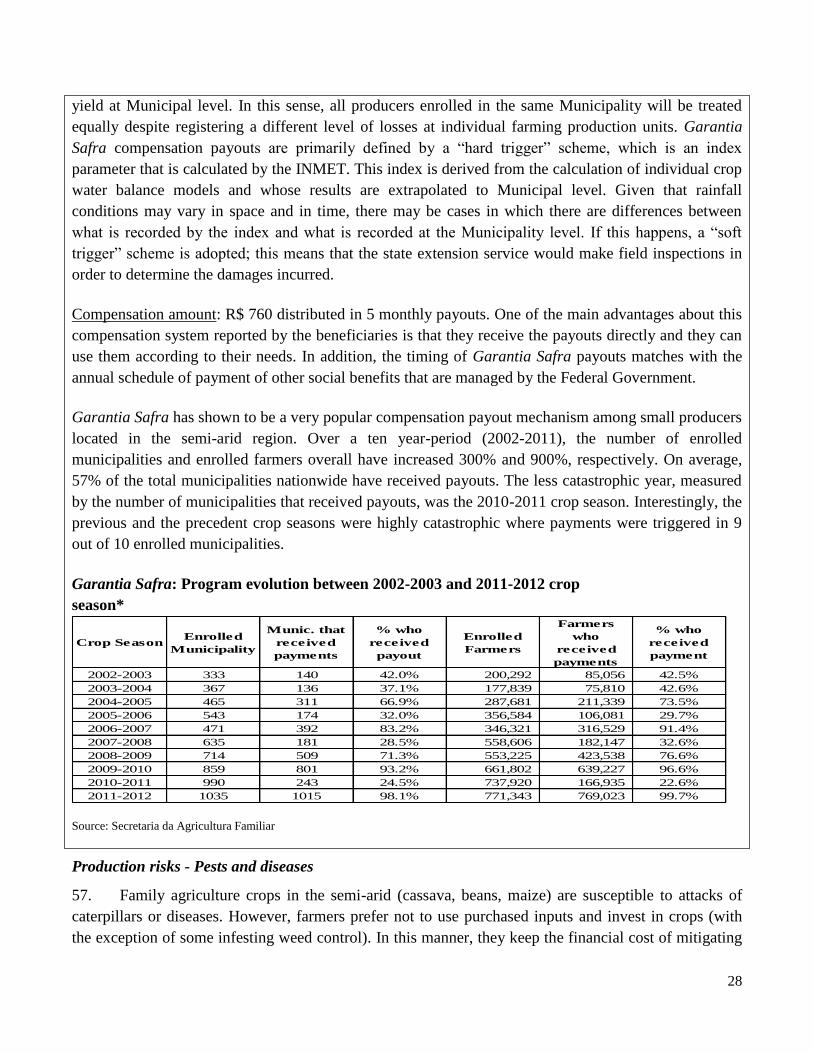
28
yield at Municipal level. In this sense, all producers enrolled in the same Municipality will be treated
equally despite registering a different level of losses at individual farming production units. Garantia
Safra compensation payouts are primarily defined by a “hard trigger” scheme, which is an index
parameter that is calculated by the INMET. This index is derived from the calculation of individual crop
water balance models and whose results are extrapolated to Municipal level. Given that rainfall
conditions may vary in space and in time, there may be cases in which there are differences between
what is recorded by the index and what is recorded at the Municipality level. If this happens, a “soft
trigger” scheme is adopted; this means that the state extension service would make field inspections in
order to determine the damages incurred.
Compensation amount: R$ 760 distributed in 5 monthly payouts. One of the main advantages about this
compensation system reported by the beneficiaries is that they receive the payouts directly and they can
use them according to their needs. In addition, the timing of Garantia Safra payouts matches with the
annual schedule of payment of other social benefits that are managed by the Federal Government.
Garantia Safra has shown to be a very popular compensation payout mechanism among small producers
located in the semi-arid region. Over a ten year-period (2002-2011), the number of enrolled
municipalities and enrolled farmers overall have increased 300% and 900%, respectively. On average,
57% of the total municipalities nationwide have received payouts. The less catastrophic year, measured
by the number of municipalities that received payouts, was the 2010-2011 crop season. Interestingly, the
previous and the precedent crop seasons were highly catastrophic where payments were triggered in 9
out of 10 enrolled municipalities.
Garantia Safra: Program evolution between 2002-2003 and 2011-2012 crop
season*
Crop SeasonEnrolled
Municipality
Munic. that
received
payments
% who
received
payout
Enrolled
Farmers
Farmers
who
received
payments
% who
received
payment
2002-2003 333 140 42.0% 200,292 85,056 42.5%
2003-2004 367 136 37.1% 177,839 75,810 42.6%
2004-2005 465 311 66.9% 287,681 211,339 73.5%
2005-2006 543 174 32.0% 356,584 106,081 29.7%
2006-2007 471 392 83.2% 346,321 316,529 91.4%
2007-2008 635 181 28.5% 558,606 182,147 32.6%
2008-2009 714 509 71.3% 553,225 423,538 76.6%
2009-2010 859 801 93.2% 661,802 639,227 96.6%
2010-2011 990 243 24.5% 737,920 166,935 22.6%
2011-2012 1035 1015 98.1% 771,343 769,023 99.7%
Source: Secretaria da Agricultura Familiar
Production risks - Pests and diseases
57. Family agriculture crops in the semi-arid (cassava, beans, maize) are susceptible to attacks of
caterpillars or diseases. However, farmers prefer not to use purchased inputs and invest in crops (with
the exception of some infesting weed control). In this manner, they keep the financial cost of mitigating
29
phytosanitary risks low. In the eventuality of a pest (insect, disease or nematode) attack, smallholders do
nothing and just wait to harvest the remaining production, if any. Their rationale is “why invest on
fertilizers, improved seeds or pest control if the risk of loosing the harvest due to a lack of rainfall is so
high”. The impact is on family food security. Adequate technical assistance would be required to
improve risk management all together and change farmer attitude towards drought risk management and
phytosanitary risk management.
58. Currently, smallholders usually cultivate a type of cactus called palma forrageira as feed for
goats and sheep and even bovines. A pest called cochonilha do carmim is a serious threat for achieving
higher biomass production, which is fundamental to feed the animals during hydric stress. The State
Government Research Institution (EMEPA) developed a variety that is resistant to the cochonilha and
the public technical assistance (EMATER-PB) is freely distributing this genetic material to family
farmers, to substitute their traditional susceptible varieties, leading to an almost complete control of the
pest.
Price volatility risk
59. Price guarantees are used to incentivize production and to provide support to poorer farmers.
They are mostly targeted by region, seeking to support poor small farmers (agricultura familiar) and
commercial farmers. See Text Box 4 with details on the current price support and procurement
programs. The result has been more stable prices of basic foodstuffs (like beans, maize, cassava flour,
etc.) that are in turn the main crops grown by the family agriculture farmers. Paraiba, however, is a food
deficit state and frequently maize (basic foodstuff and key feed) is imported using the PEP mechanism
(see Text Box 4 below). These interventions through CONAB, the national food supply agency, have led
to the maintenance of stable prices for consumers even during periods of domestic production scarcity in
the state. The CONAB State Manager mentioned that most often CONAB is unable to meet their
procurement targets because of supply unavailability.
Text Box 1. 4: Brazil - Procurement and price support policies
The Brazilian government operates a series of food procurement and minimum crop price policies
and programs. They are the PGPM (Politica de Garantia de Preços Minimos), which is concerned
with commercial agriculture, and the PAA (Programa de Aquisição de Alimentos) that is
specifically target family farming. The Ministry of Agriculture (MAPA) is responsible for the
former policy, and the latter program is the responsibility of the Ministry of Agrarian Development
(MDA).19 The Federal Government, States and Municipalities implement PAA. The National
Supply Company also executes it – CONAB (Companhia Nacional de Abastecimento), also
participates in the implementation of PGPM. CONAB is a public enterprise that reports to MAPA;
it is responsible for managing several agriculture policies and programs related to the supply and
demand of food products.
19 MDA is also responsible for the National Program to Strengthen Family Farming (PRONAF).

30
The PGPM is an instrument that works as a basis for several types of purchasing or financing
operations, always with the objective of supporting producer income. It is used to smooth producer
price variations over time and facilitate trade of agricultural products from the surplus regions to
deficit ones at competitive prices for the producers, particularly in periods of price drop when the
transport cost may represent a serious obstacle for commodity flow across the country. The PGPM
uses different instruments. One is the PEP (Prêmio para o Escoamento de Produto) program,
which involves an “equalization” payment to buyers (wholesalers, processing companies, etc.)
who agree to pay the producer a specified minimum price. The equalization premium (subsidy) is
determined in an auction, with a maximum fixed selling value set by government. This is the most
common instrument. A similar program is PEPRO (Prêmio Equalizador do Produto), which
provides an equalization payment directly to the farmer and works like a deficiency payment by
paying the seller (whether a farmer or a cooperative) the difference between the reference price
and the price received at auction. A third program is PROP (Prêmio de Risco para Aquisição de
Produto Agrícola Oriundo de Contrato Privado de Opção de Venda), which provides a premium
to commercial buyers under a sell option contract, i.e. where delivery takes place in the future (for
instance, coffee). This instrument works as a hedging mechanism for the farmer. The Government
may also operate the Product Outflow Value instrument (Valor de Escoamento de Produto - VEP),
through which the Government grants a subsidy to buyers that intend to buy government stocks to
supply a specific food deficit region that has been prioritized. This instrument would operate when
the market price is higher than the minimum price. Under the PGPM, the government also
purchases from family farmers and their cooperatives (AGF - Aquisições do Governo Federal) at
prices that are above market levels when they are below the minimum prices. The impact of this
program throughout the economy is not supposed to be relevant. Since 2010 family farming has
been entitled to 20% of the resources of the guaranteed minimum price program (PGPM).
The government defines the quality, quantity, value and delivery of the products and establishes
the regions to be supplied on a case by case basis. The Bolsa Brasileira de Mercadorias (Sao
Paulo) and other commodity exchanges operate the government stocks auctions and the CONAB’S
commercial stock auctions. Among the main products included in the PGPM are: cotton, beans,
rice, maize, cassava flour, milk, sorghum, coffee, etc.
PAA was created by Law in 2003. It serves two basic purposes: promote access to food to those in
need and support family farming. The PAA purchases a wide variety of food produced by family
farmers including fruits, vegetables, animal products, etc. The Program is implemented through
different modalities that do not involve a bidding process: Purchase with Simultaneous Donation,
Direct Purchase (CDAF), and Stock Formation by family farming. The Purchase with
Simultaneous Donation involves direct purchase of food from family farmers and simultaneous
free distribution to people in food and nutrition insecurity as well as to those served by social
assistance networks, public facilities for food and nutrition security, and public and philanthropic
education institutions. The CDAF (Compra Direta da Agricultura Familiar) whereby the
31
government purchases produce from family farmers (enrolled in PRONAF) at subsidized or
market prices (reference prices) to supply populations facing food insecurity. The PAA also
contributes to the formation of stocks of foodstuffs produced by family farmers and of stocks
managed by family farmers´ organizations; farmers’ groups stock part of their production in
exchange for a promissory note that provides farmers access to financial resources.
The budget of PAA consists of funds from the Ministry of Social Development and Fight Against
Hunger (MDS) and the Ministry of Agrarian Development (MDA). Since its conception, the
annual volume of funds invested increased from US$64 million in 2003 to US$434 million in 2012
– an increase of 580%.
Livestock Production Chains
Overview of Subsector and Supply Chain Profile
60. Cattle production is one of the major agricultural activities in the state and stands out as one of
the most important income generating activities in large farms. Cattle production is mostly extensive and
on semi-arid soils with poor vegetation and low rainfall. According to the Committee for Agricultural
Planning of the State of Paraiba, there are three types of cattle production regions in the State, in regards
to the ecological traits: the Agreste/Litoral region, the Cariri/Curimatau region and the Sertão region.
61. Dairy production in Paraiba is located in the Agreste /Litoral region, and is considered jointly
with Sergipe, one of the fastest growing milk producing states in the Northeaster Region (Figure 14
below). Milk production is based on extensive grazing with limited animal feed supplementation. In this
system, the ration consists almost entirely of grazed pasture grass. Herds are typically in the 30–70 cow
size range and consist mostly of crossbred animals. Cows in these herds are usually hand-milked in
parlors.
62. The sheep and goat production chain has experienced a very significant increase, especially since
the second half of the 1990s (Table 5). This growth occurred due to two main aspects: the first was the
policy of the state government to strengthen these herds by providing resources and technical assistance,
as well as the introduction of new races; secondly, the adoption of the Food Acquisition Program (PAA)
as to ensure market and price for products from livestock strategy (milk, cheese, etc.).
63. Goat milk production has a very important economic role in the semiarid part of Paraiba State.
Although the productivity of the goat milk industry in this region is low compared with developed
regions worldwide or even with intensive systems in southern Brazil, it is currently the main goat
production region in Brazil and is responsible for approximately 20% of the total Brazilian goat milk
production. Producers are organized in associations and currently 8 small-scale dairy plants exist for the
pasteurization of goat milk.

32
Figure 14: Evolution of Milk Production in Paraiba, in millions of liters (1990-2010)
Source: IBGE / Pesquisa da Pecuária Municipal
Elaboração: R. ZOCCAL - Embrapa Gado de Leite
2011* Estimated
Table 5: Goat and sheep’s Population Evolution in Paraiba (1975-2012)
Species/
year
1975 1980 1985 1990 1995 2000 2005 2010 2012
Goats 390,735 505,342 555,054 509,450 458,477 526,179 657,824 600,607 520,867
Sheep’s 370,593 418,382 396,266 380,692 302,611 343,844 411,069 433,032 447,406
Total 761,308 923,724 951,320 890,142 761,088 870,023 1,078,89
3
1,033,63
9
968,273
Source: Targino, I et Al . Aspectos da Agropecuaria Paraibana.
64. The swine production chain of Paraiba is relatively small (with small population) and shows a
decreasing tendency over the last three decades. The estimated population in 2011 is 151,702 heads.
However there is a potential to growth in order to supply the state demands, favored by the availability
and the price sustainability of grains.
65. The poultry production chain had an estimated population in 2010 of 7,7 million broilers and 2,2
laying hens and has had an important increase of 56% since 2000. This increase had been favored by the
price sustainability policy for corn, which facilitates the preparation of low cost feeds. Poultry
production has been a very productive activity for small producers in the rural areas. They are organized
in cooperatives. The small producers are being supported to construct small slaughterhouses to
guarantee that poultry products have official inspection services (meet official commercial criteria) and
can be sold in supermarkets and in interstate markets.
66. The apiculture production chain is important for the rural population in Paraiba. The areas of
production of honey are the Sertao and Brejo regions. The production is of around 500 tons of honey.
Production is mainly absorbed within the State, through the federal food programs. The remaining
production absorbed by the country and some is occasionally exported to other states. There are around
33
40 extraction plants to process the honey. Some of these plants are inspected by the Federal and State
inspection services, which make the honey suitable for the food programs and interstate exportation
market. The main risk faced by apiculture is the drought that kills bees and forces the beehives to
migrate to other areas.
Production risks - Climate
67. Most stakeholders interviewed by the mission have identified unreliable rainfall in terms of
intensity and distribution as one of the most likely and damaging production risk. Drought also is
acknowledged as a severe risk and one with great potential to cause severe impact to livestock. The most
recent severe droughts affecting livestock production occurred in 1992-1993, 1998, 2001-2002, 2010,
2012-2013. During the drought periods, cattle, goat and sheep, and apiculture have had significant losses
in terms of animals, weight lost and reduction of milk and honey production, among others. It is reported
that during the last drought 80% of the honey harvest was lost and 70% of the beehives migrated. The
State annual production of honey is estimated in 500 tons. The bee producers have good technical
cooperation from EMATER, SEBRAE and COOPERAR among others.
Production risks - Sanitary risks
68. Animal diseases are significant production risks. Their damaging potential varies among animal
species and is very much correlated to the actual risk management actions in place. On a global level,
there has been a noticeable increase over recent decades in the incidence of exotic animal diseases.
Among the exotic diseases that affect world beef trade, two are most relevant: BSE (Bovine Spongiform
Encephalopathy or "Mad Cow Disease") and FMD (Foot and Mouth Disease). Paraiba is free of these
major exotic animal diseases, which gives a significant advantage to the Brazilian producers and
exporters. The situation about the principal exotic diseases risks can be summarized as follows.
69. FMD: In May 2014, Paraiba (and the other Northeastern States: Alagoas, Ceara, Maranhao,
North Region of Pará, Bahia, Pernambuco, Piauí and Río Grande do Norte) was certified by the World
Animal Health Organization (OIE) as an area is free of FMD, with vaccination. In the past, the
presentation of the disease in Paraiba was sporadic and classified as of medium risk. There has not been
a case in more than ten years. Currently this risk has diminished because the bordering states are also
free with vaccination and there is a strict national program to control movement of animals and animal
products in the country, which provides additional protection to prevent the entrance of this disease.20 In
any event, the impact of a disease outbreak could be catastrophic in terms of animal losses, eradication
costs and export earning losses, and thus controls must continue.
20 There exists a Federal Program for the Eradication of FMD coordinated by the Ministry of Agriculture (MAPA), which
was started in 1998 and is covering 78% of the area and 99% of the cattle and buffaloes stock. There is also an area free of
FMD without vaccination, which covers the State of Santa Catharina. The only states, which are considered infected, are
Amazonas (BR-3), Amapá and Roraima (BR-4), in the North Region of the country. The last outbreak of FMD in Brazil
occurred in Mato Grosso do Sul and Parana in 2006. (Informe de Situación de los Programas de Erradicación de la Fiebre
Aftosa - año 2013 – Documento de trabajo para la COSALFA 41, abril 2014).

34
70. BSE: According to OIE, Brazil´s risk status for BSE is "Negligible", the safest of all. To reach
this status the country presented a risk analysis situation which probes that there are not cases or
possible animals imported from countries where the disease is present or imported feed for cattle
containing cattle meat flour and that has a surveillance and prevention program in place. The major risk
is from the importation of cattle from infected countries and the appearance of atypical cases as it
occurred in Mato Grosso in 2014.
71. Highly Pathogenic Avian Influenza (HPAI): Paraiba is currently free of HPAI, Asiatic Types, as
the whole country is. However the risk still persists due to the possibility of contamination by wildlife,
as has occurred in other parts of the world.21 In order to prevent entrance of the disease, Brazil has a plan
of action that calls for training of professionals and producers to detect the disease.
72. Prevalent animal diseases of economic and public health importance: Bovine, Goat and Sheep
Brucellosis is considered by FAO, WHO and the OIE as one of the most important and widespread
zoonosis in the world, causing great economic losses. It can be transmitted to humans causing undulant
fever and joint arthritis syndromes and is a labor related disease because of the contamination of workers
in slaughterhouses. Bovine brucellosis due to Brucella Abortus is endemic and the most prevalent
Brucella infection in Brazil. the National Program for Control and Eradication of Brucellosis and
Tuberculosis Animal (PNCEBT) coordinated by MAPA has been in place since 2001. Each state has to
follow the orientations of the MAPA Federal Program.22 A number of studies and surveys were carried
out in the State of Paraiba to assess the prevalence of bovine brucellosis. The conclusions varied widely:
SEDAP carried out a study in 2013 that indicated the prevalence of bovine brucellosis may range
between 2% to 4% in Paraiba; while an evaluation of the Federal Program carried out in 2010 indicated
there was a decrease in the number of cases of brucellosis in the Northeastern Region from 4.138 to
2.082 (50.3%) between 2001 and 2010. The general conclusion is that bovine brucellosis is still present
in the State of Paraiba and it is both a risk to the animal population and humans (public health).
Regarding the presence of Brucella Mellitensis in goats and sheep, there is no evidence of its presence in
Brazil. Brucella Mellitensis represents an important public health risk because it is transmitted to
humans by goat milk consumption and can cause severe symptoms.
73. Bovine Tuberculosis is an infectious disease of worldwide distribution caused by pathogenic
Mycobacteria that affect humans and several mammal species. It is also considered by WHO and OIE also
consider it as an important cause of losses to livestock producers and a serious public health risk.
Several studies were carried out confirming that tuberculosis in cattle and goat exists and is a risk to
animal production and public health. Salomon, M. and collaborators carried out a study on bovine
tuberculosis in 2010, which found that: of the herds investigated, 62 (0.57%) had at least one positive
21 The current international HPAI or “bird-flu” outbreak began in poultry in Southeast Asia and has since spread to Asia,
Europe, the Pacific, the Middle East and Africa. Although many countries have eradicated the virus from their domesticated
poultry, worldwide eradication is not expected in the short term. 22 Normativa No6 de 8 de janeiro de 2004. Aprova o Regulamento Técnico do Programa Nacional de Controle e Erradicação
da Brucelose e Tuberculose Animal. Diário Oficial da União, Brasília, 12 jan. 2004, Seção 1, p. 6–10: 2001.
35
animal, and of the animals examined, 136 (0.25%) were positive. Prevalence of tuberculosis in goats it
was found to be 10.7% of positive in 10.7% of herds.
74. Classical swine fever (CSF):). According to the surveillance system the last outbreak of CSF in
Paraiba occurred in 2006. However, there are risks of introduction because the disease is present in other
Northeastern States. A federal program for the eradication of CSF, coordinated by the MAPA, which has
led to the eradication of the disease in 49% of the territory, 54% of the properties and 81% of the swine
population of the country. As a result, a CSF disease free area has been established which included the
states of the South, Southeastern and South Regions, and the states of Tocantins, Bahia, Sergipe and
Rondonia. The Northeastern States are considered infected and are the next goal of the CSF eradication
program. A survey will be necessary to obtain precise information on the absence of this disease. In
addition, the state animal Health Authorities need to update the prevention and contention programs.
75. Newcastle Disease Virus (NCDV):). This is a very important poultry disease, which may lead to
serious losses to the producers from killed birds and delays in flock restocking. The State is free of this
disease according to non-official information. However, there are no epidemiological studies to verify
this situation.
76. Food Safety: There has been an increase in the frequency of outbreaks of foodborne diseases,
making food safety a major concern worldwide. Foodborne diseases pose an important risk because they
endanger public health and can interfere with the domestic and external markets. There is no published
evidence of serious foodborne outbreaks in the state of Paraiba. However, it was found that small
producers do not have enough official assistance to control and inspect their production. This situation
can lead to risks of contaminated products and presentation of foodborne outbreaks. On the other hand,
the lack of official control and inspection system for small producers limit their marketing possibilities.
It also prevents the selling of the production for the federal food acquisition programs (PNAE and PAA)
that requires the products to be officially controlled and inspected. In regards to slaughterhouses, there is
a good federal and state control and inspection service for the large slaughter houses. There is also a
municipal network of slaughter houses, but their status regarding official control and inspections
services is not very clear. From the information gathered there is not a mechanism of coordination
between the Federal, State and Municipal control and inspection services.23
77. In summary, food safety is a sanitary risk, because there is an incomplete food safety system to
efficiently cover all the steps of the food chain. There is a limited control and inspection service for
small producers and there is no coordination mechanism among the agencies responsible for the control
and inspection of animal food products.
78. Finally, it is noteworthy that animal health and food safety risks have a significant impact on all
livestock food chains stockholders, including producers, processors, distributors, consumers, exporters 23 The State Government has taking initial steps to create an Intersectoral Chamber of Food Security and Nutrition
(CAISAN/PB) with the aim to establish the State System of Food Security (SISAN), which will also take care of food safety
aspects.
36
and the government. There have not been recent animal health risk events in Paraiba, however there is a
potential risk of occurrence as has occurred in other states of Brazil and countries. In these cases, the
impact on government was very high: costs of the actions of eradication, compensation to the producers,
etc. On the other hand, exporters suffered high losses from the closing of external markets for long
periods of time until the free status was regained.
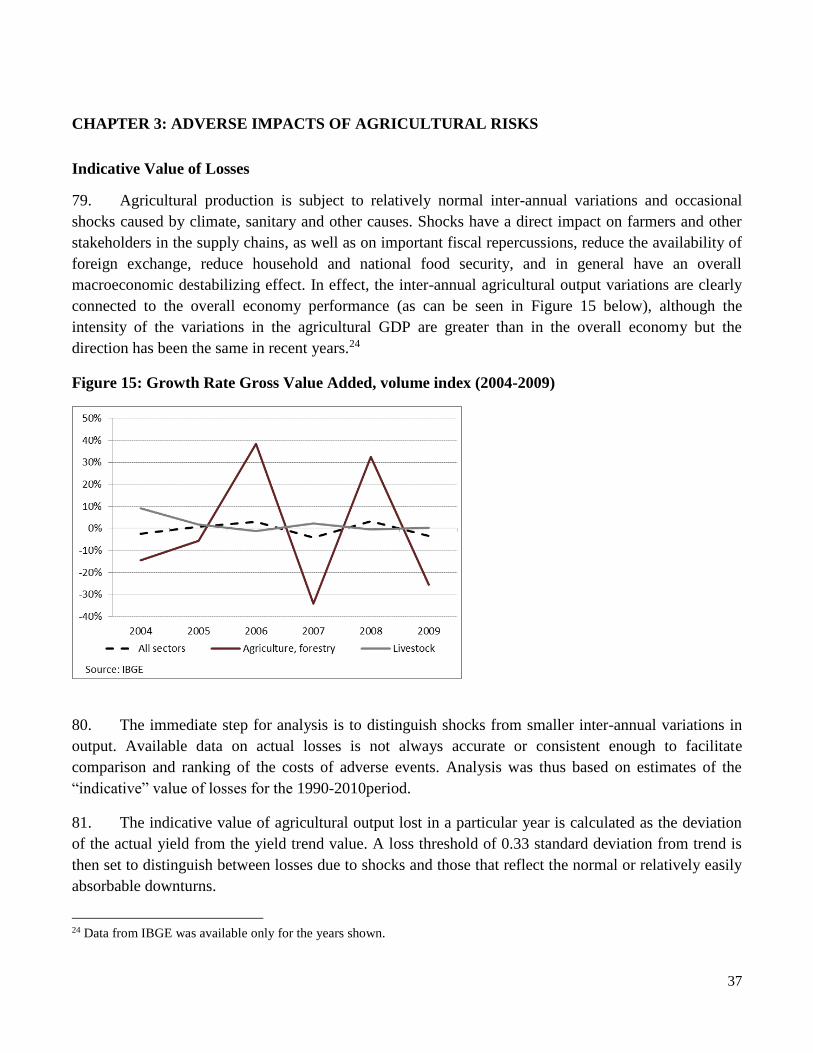
37
CHAPTER 3: ADVERSE IMPACTS OF AGRICULTURAL RISKS
Indicative Value of Losses
79. Agricultural production is subject to relatively normal inter-annual variations and occasional
shocks caused by climate, sanitary and other causes. Shocks have a direct impact on farmers and other
stakeholders in the supply chains, as well as on important fiscal repercussions, reduce the availability of
foreign exchange, reduce household and national food security, and in general have an overall
macroeconomic destabilizing effect. In effect, the inter-annual agricultural output variations are clearly
connected to the overall economy performance (as can be seen in Figure 15 below), although the
intensity of the variations in the agricultural GDP are greater than in the overall economy but the
direction has been the same in recent years.24
Figure 15: Growth Rate Gross Value Added, volume index (2004-2009)
80. The immediate step for analysis is to distinguish shocks from smaller inter-annual variations in
output. Available data on actual losses is not always accurate or consistent enough to facilitate
comparison and ranking of the costs of adverse events. Analysis was thus based on estimates of the
“indicative” value of losses for the 1990-2010period.
81. The indicative value of agricultural output lost in a particular year is calculated as the deviation
of the actual yield from the yield trend value. A loss threshold of 0.33 standard deviation from trend is
then set to distinguish between losses due to shocks and those that reflect the normal or relatively easily
absorbable downturns.
24 Data from IBGE was available only for the years shown.
38
82. The yield difference in the years where actual yields were below the loss threshold is then
multiplied by the actual area that year, valued at 2010 producer prices and converted into US$ at the
2010 exchange rate. Indicative loss values are also compared to agricultural GDP in the relevant year in
order to provide a relative measure of the loss.25
83. The quantification of losses presented in this chapter capture production risks, such as drought
and pest and disease outbreaks. Approximately R$ 28 million (equivalent to US$ 16 million), or 2.3% of
the agricultural GDP, was estimated as the value of the average production loss annually in the
agricultural sector as a result of unmanaged production risks. This percentage is higher than the one
calculated for Bahia (1.9%). Drought was the main cause of these shocks, sometimes in combination
with other events. The calculation involves all crops but the losses are concentrated in the following
crops: sugar cane, beans, banana, pineapple, maize, papaya fruit (mamão) and cassava, affecting all
supply chain actors. As indicated in chapter 3, these crops are responsible for over 80% of state
agricultural GDP and are representative of Paraiba’s agricultural sector risk profile (see Table 6 for
detail information by crop).
84. Average figures are useful to understand the aggregate costs of production risk. However, they
tend to conceal the actual catastrophic impact that some shocks have at the time that they occur. For
instance, during the 2010 drought, losses amounted to R$ 65 million (against the R$ 28 million annual
average), or 5.4% of the state’s agricultural GDP, and there were much higher losses in previous years:
R$ 108 million in 1998, R$ 104 million in 1993 and R$ 82 million in 1996. Not surprisingly, the first
two years match with two very severe droughts throughout the state (1998 and 1992-1993, respectively).
85. Furthermore, the losses in terms of the normal production value in 2010 were extreme for
important smallholder crops like beans and maize, accounting for R$ 16 million and R$ 7 million losses
respectively. In the same year, the losses of sugar cane and banana reached R$ 18 million and R$ 13
million respectively. In total these four crops accounted for 83% of total losses in 2010.
86. The following are some examples of realized risk impact in the livestock sector:
20% of the cattle and 50% of the goat population were lost during the 2012-2013 drought;
During the last drought (2012-2013) there was a 90% decrease of honey production and 50%
of bees died and 70% of the beehives migrated;
The outbreak of an exotic disease (e.g. FMD or BSE) would have a catastrophic impact
(elimination of animals, quarantine and disinfection, loss of external markets, etc.) as occurred
during the 2005 FMD outbreak in Mato Grosso do Sul and Parana.26
25 Analysis of this nature requires a consistent set of data on both production and prices, for an extended time period. The
source of data chosen was IBGE, where complete statistical information was found for the period 1990-2010. 26 Study by Costa, et al. on the impact of the 2005 foot and mouth disease outbreaks in Mato Grosso do Sul y Parana. The
outbreak had great impact on exports and prices of beef, poultry and pork, which only recovered after the lifting of the import
bans by Russia, the main importing country, 28 months later. It was necessary to eliminate 33,741 FMD-susceptible animals
(32,549 cattle, 566 pigs, 626 sheep and goats). One to two months after the import ban by Russia and other countries,
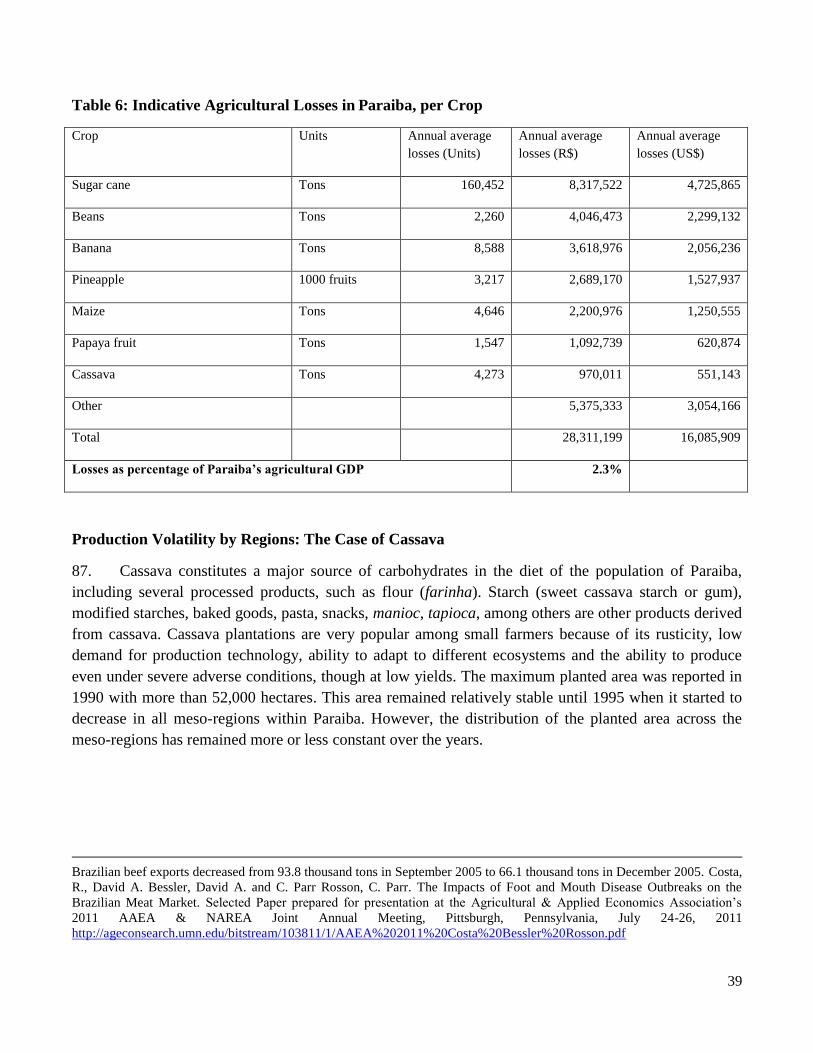
39
Table 6: Indicative Agricultural Losses in Paraiba, per Crop
Crop Units Annual average
losses (Units)
Annual average
losses (R$)
Annual average
losses (US$)
Sugar cane Tons 160,452 8,317,522 4,725,865
Beans Tons 2,260 4,046,473 2,299,132
Banana Tons 8,588 3,618,976 2,056,236
Pineapple 1000 fruits 3,217 2,689,170 1,527,937
Maize Tons 4,646 2,200,976 1,250,555
Papaya fruit Tons 1,547 1,092,739 620,874
Cassava Tons 4,273 970,011 551,143
Other 5,375,333 3,054,166
Total 28,311,199 16,085,909
Losses as percentage of Paraiba’s agricultural GDP 2.3%
Production Volatility by Regions: The Case of Cassava
87. Cassava constitutes a major source of carbohydrates in the diet of the population of Paraiba,
including several processed products, such as flour (farinha). Starch (sweet cassava starch or gum),
modified starches, baked goods, pasta, snacks, manioc, tapioca, among others are other products derived
from cassava. Cassava plantations are very popular among small farmers because of its rusticity, low
demand for production technology, ability to adapt to different ecosystems and the ability to produce
even under severe adverse conditions, though at low yields. The maximum planted area was reported in
1990 with more than 52,000 hectares. This area remained relatively stable until 1995 when it started to
decrease in all meso-regions within Paraiba. However, the distribution of the planted area across the
meso-regions has remained more or less constant over the years.
Brazilian beef exports decreased from 93.8 thousand tons in September 2005 to 66.1 thousand tons in December 2005. Costa,
R., David A. Bessler, David A. and C. Parr Rosson, C. Parr. The Impacts of Foot and Mouth Disease Outbreaks on the
Brazilian Meat Market. Selected Paper prepared for presentation at the Agricultural & Applied Economics Association’s
2011 AAEA & NAREA Joint Annual Meeting, Pittsburgh, Pennsylvania, July 24-26, 2011
http://ageconsearch.umn.edu/bitstream/103811/1/AAEA%202011%20Costa%20Bessler%20Rosson.pdf

40
88. The relative production volatility among different meso-regions is measured using the coefficient
of variation27 of yields. All meso-regions show high inter-annual variations: the coefficient of variation
of yields (tons/ha) range between 14% in the Agreste Paraibano and 45% in the Sertão Paraibano,
which is the drier region in Paraiba. Due to the different level of area planted, these variations have
different impacts on total production (Table 7).
Table 7: Production Volatility by Meso-region
Meso-region Planted Area, 2010 (ha) Coefficient of variation of cassava yields
Sertão Paraibano 1,022 45%
Agreste Paraibano 16,998 14%
Borborema 485 30%
Mata Paraibana 7,278 16%
Paraiba 25,783 11%
89. The year of 1998, when a severe drought occurred, shows the most drastic reduction of cassava’s
productivity in all regions. According to the Confederação da Agricultura e Pecuária do Brasil, during
this year the severe drought affected all Northeastern states of Brazil. Similar negative yield
performance is evident in all meso-regions during the 1992-1993 and 2010 droughts. Figure 17 (on
following page) shows cassava yield variability in all the four meso-regions of Paraiba.
Figure 16: Cassava Yield Variability in the Four Meso-regions of Paraiba (1990-2010)
Source: IBGE
27 Calculated as the standard deviation divided by the series arithmetic media. It shows the extent of variability in relation to
mean of the population: the higher the worse.
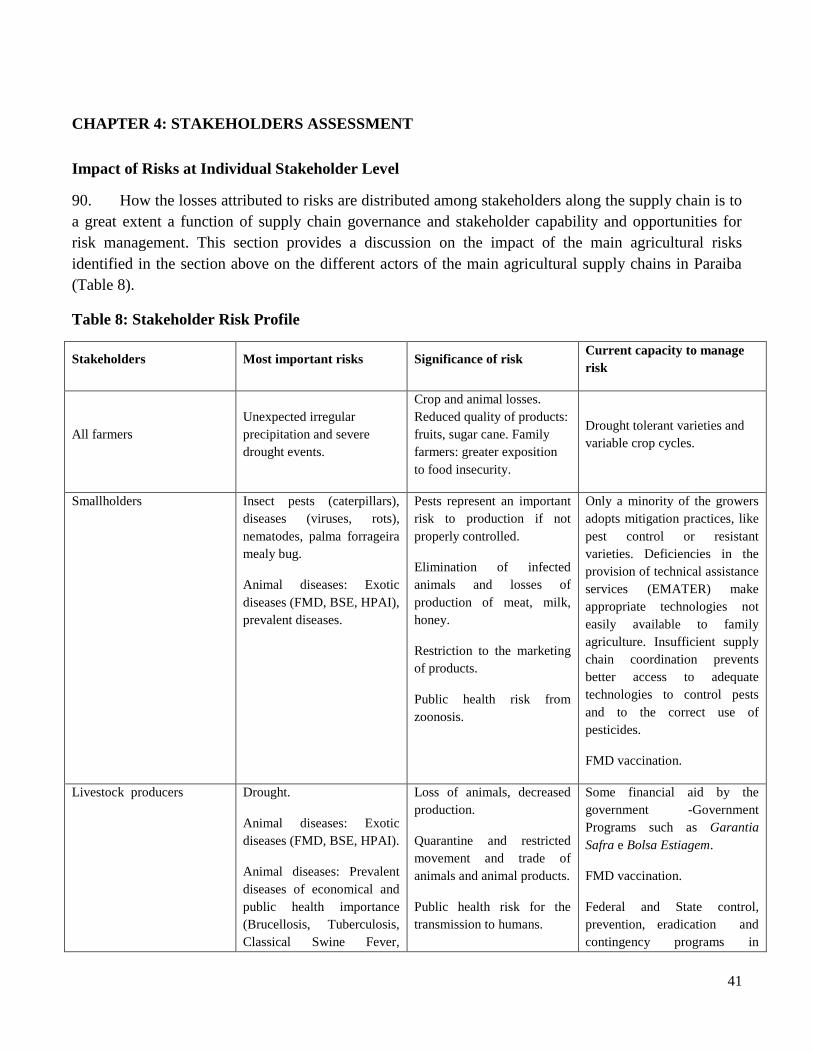
41
CHAPTER 4: STAKEHOLDERS ASSESSMENT
Impact of Risks at Individual Stakeholder Level
90. How the losses attributed to risks are distributed among stakeholders along the supply chain is to
a great extent a function of supply chain governance and stakeholder capability and opportunities for
risk management. This section provides a discussion on the impact of the main agricultural risks
identified in the section above on the different actors of the main agricultural supply chains in Paraiba
(Table 8).
Table 8: Stakeholder Risk Profile
Stakeholders Most important risks Significance of risk Current capacity to manage
risk
All farmers
Unexpected irregular
precipitation and severe
drought events.
Crop and animal losses.
Reduced quality of products:
fruits, sugar cane. Family
farmers: greater exposition
to food insecurity.
Drought tolerant varieties and
variable crop cycles.
Smallholders Insect pests (caterpillars),
diseases (viruses, rots),
nematodes, palma forrageira
mealy bug.
Animal diseases: Exotic
diseases (FMD, BSE, HPAI),
prevalent diseases.
Pests represent an important
risk to production if not
properly controlled.
Elimination of infected
animals and losses of
production of meat, milk,
honey.
Restriction to the marketing
of products.
Public health risk from
zoonosis.
Only a minority of the growers
adopts mitigation practices, like
pest control or resistant
varieties. Deficiencies in the
provision of technical assistance
services (EMATER) make
appropriate technologies not
easily available to family
agriculture. Insufficient supply
chain coordination prevents
better access to adequate
technologies to control pests
and to the correct use of
pesticides.
FMD vaccination.
Livestock producers Drought.
Animal diseases: Exotic
diseases (FMD, BSE, HPAI).
Animal diseases: Prevalent
diseases of economical and
public health importance
(Brucellosis, Tuberculosis,
Classical Swine Fever,
Loss of animals, decreased
production.
Quarantine and restricted
movement and trade of
animals and animal products.
Public health risk for the
transmission to humans.
Some financial aid by the
government -Government
Programs such as Garantia
Safra e Bolsa Estiagem.
FMD vaccination.
Federal and State control,
prevention, eradication and
contingency programs in
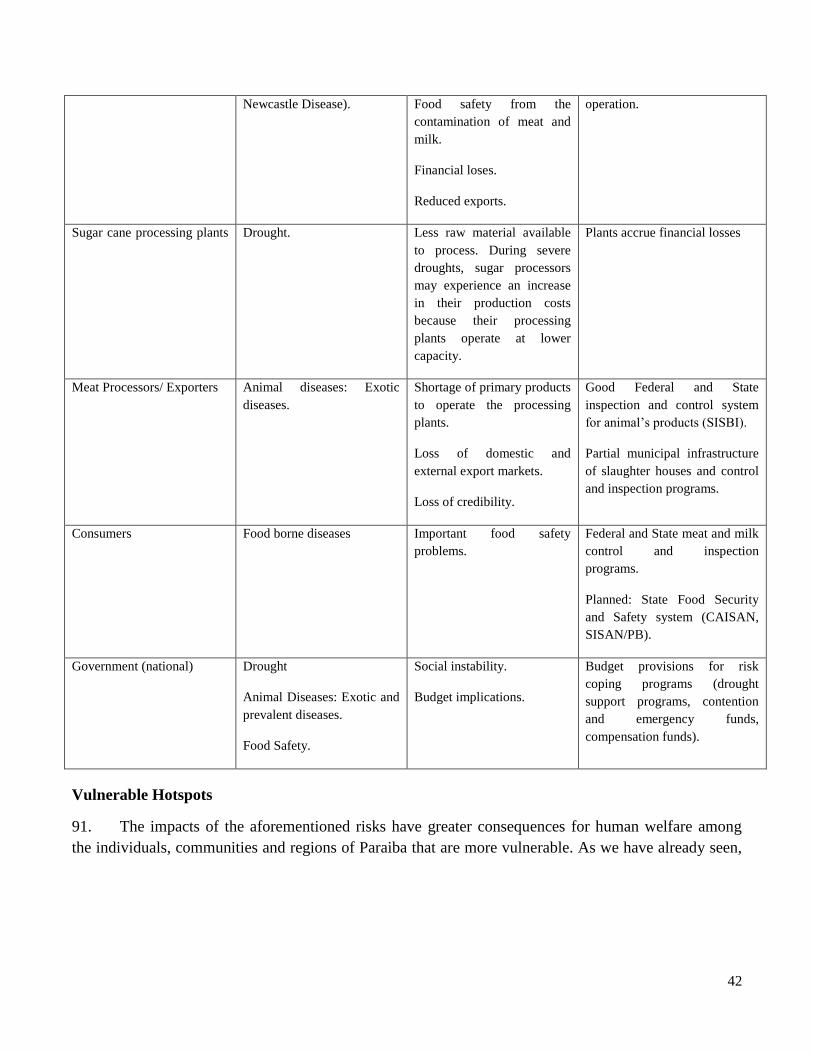
42
Newcastle Disease). Food safety from the
contamination of meat and
milk.
Financial loses.
Reduced exports.
operation.
Sugar cane processing plants
Drought. Less raw material available
to process. During severe
droughts, sugar processors
may experience an increase
in their production costs
because their processing
plants operate at lower
capacity.
Plants accrue financial losses
Meat Processors/ Exporters Animal diseases: Exotic
diseases.
Shortage of primary products
to operate the processing
plants.
Loss of domestic and
external export markets.
Loss of credibility.
Good Federal and State
inspection and control system
for animal’s products (SISBI).
Partial municipal infrastructure
of slaughter houses and control
and inspection programs.
Consumers Food borne diseases Important food safety
problems.
Federal and State meat and milk
control and inspection
programs.
Planned: State Food Security
and Safety system (CAISAN,
SISAN/PB).
Government (national) Drought
Animal Diseases: Exotic and
prevalent diseases.
Food Safety.
Social instability.
Budget implications.
Budget provisions for risk
coping programs (drought
support programs, contention
and emergency funds,
compensation funds).
Vulnerable Hotspots
91. The impacts of the aforementioned risks have greater consequences for human welfare among
the individuals, communities and regions of Paraiba that are more vulnerable. As we have already seen,

43
a single risk, such as drought, has different effects on different systems of productions and producers.
Vulnerability is the concept that explains the heterogeneity in impact.28
92. Though poverty has been declining in the Northeast, as in the rest of Brazil, over the last decade,
poverty in rural areas where livelihoods concentrate on agriculture, remains high. In Paraiba, you are
twice as likely to be poor if you live in rural areas, than in urban areas. In 2012, 25% of the rural
population was poor, compared to 12% in urban Paraiba, and 8.1% of the population was extremely
poor. However, in the 170 municipalities of the Paraiba Semi-Arid region, which covers most of the area
of the state and most of family agriculture families, the average rate of extreme poverty is 20% (Figure
18).
93. Poverty exacerbates vulnerability because a shock will have greater proportional effects on the
welfare of a poor household than on that of a wealthier one. In effect, repeated shocks confine poor rural
households into a poverty trap, exhausting savings and dissolving investments that would otherwise help
propel the household ahead. Vulnerable households in Paraiba respond to shocks by reducing household
consumption, selling household and productive assets, and seeking income sources off the farm with
diverse strategies, including migration to urban areas. Expenditures on drought mitigation and
emergency measures also divert resources from longer-term investments in human capital and
productivity.
Figure 17: Map of the Extreme Poor in Paraiba (2010)
Source: IPEA
94. To capture why vulnerability varies between individuals and between households, vulnerability
can be seen as the function of three factors: (i) sensitivity, (ii) adaptive capacity, and (iii) exposure.29
28 Vulnerability is “the likelihood that at a given time in the future, an individual will have a level of welfare below some
norm or benchmark.” Common welfare indicators include poverty measurements, household expenditures, savings levels,
and food security and nutrition measures (such as food consumption score and household dietary diversity). Though
vulnerability depends on the severity of external shocks like climate, the likelihood of a drop in welfare depends on both
people’s context and capacity to act and react. Socio-economic assets and institutions play an important role in people’s
vulnerability.
44
i. Sensitivity is the degree of impact of the initial shock. Sensitivity can be thought of as
the elasticity of household welfare (e.g. consumption levels) in response to a shock.
ii. Adaptive capacity is the ability of the household to access ex-post coping strategies that
helps the household return to pre-shock welfare levels.30
iii. Exposure is the probability of the given shock materializing and affecting the
household’s assets.
95. Annex 2 expands on these relevant indicators and suggests measurements for analyzing
vulnerability to drought, the most significant agricultural risk for small farmers in Paraiba. A notional
application of this framework to Paraiba indicates that the poorest areas of the state (measured by earned
income per capita), are not necessarily the areas that will suffer the most from drought. State transfers
for old age pensions and Bolsa Família serve to diversify the poor’s portfolio and buffer the direct
effects of drought.
96. Policy can reduce all three aspects of vulnerability: sensitivity through encouraging
diversification away from drought-exposed livelihoods to better adapted sources of income/production;
adaptive capacity through education, land regularization, market access and social protection; natural
resource management. This methodology should be applied at the municipality level using available
IBGE data, and state or policymakers should identify which welfare indicators they wish to prioritize in
the analysis. For example, a state that is more concerned with vulnerability that causes hunger or
malnutrition will involve a very different policy response than a concern for rural exodus/out-migration.
Participatory territorial planning methods should be involved to validate and gain ownership over a
technical vulnerability analysis.
29 Lindoso et al. 2012. “Indicators for Assessing the Vulnerability of Smallholder Farming to Climate Change: The Case of
Brazil’s Semi-Arid Northeastern Region.” Instituto de Pesquisa Economica Aplicada. International Policy Centre for
Inclusive Growth. 30 Adaptive capacity is a subset of resilience. United States Agency for International Development (USAID) defines
resilience as the ability of people, households, communities, countries, and systems to adapt to and recover from shocks and stresses
in a manner that reduces chronic vulnerability and facilitates inclusive growth.
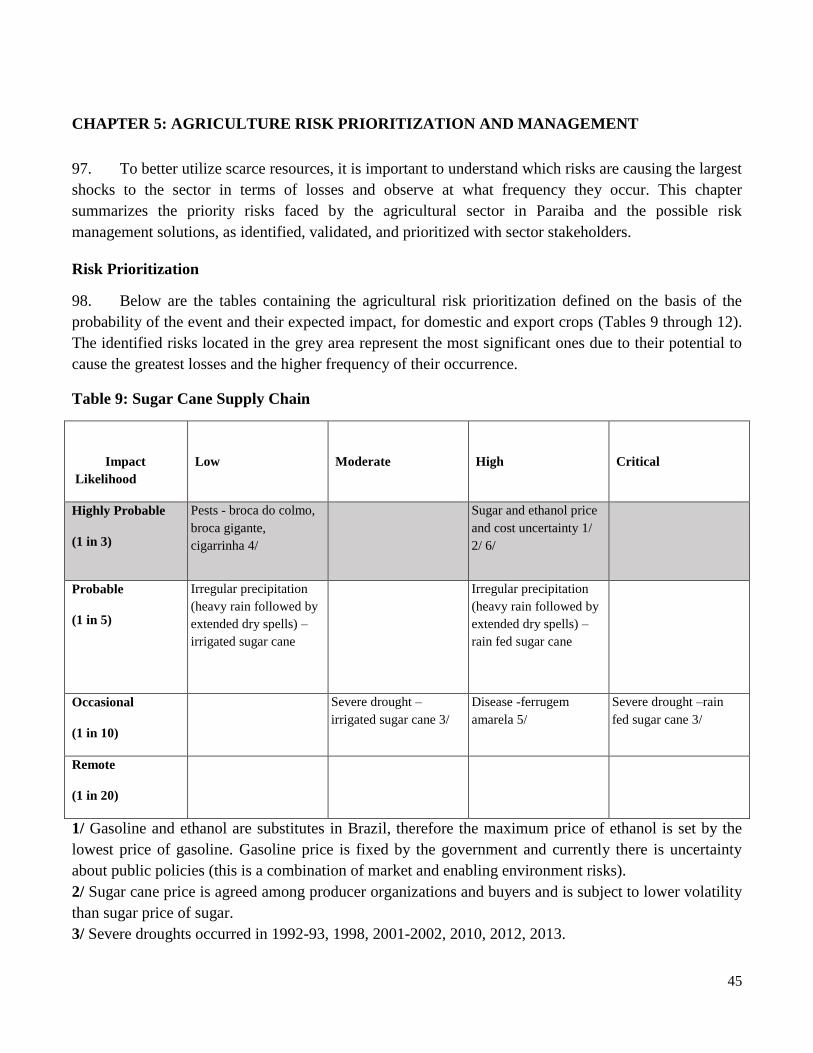
45
CHAPTER 5: AGRICULTURE RISK PRIORITIZATION AND MANAGEMENT
97. To better utilize scarce resources, it is important to understand which risks are causing the largest
shocks to the sector in terms of losses and observe at what frequency they occur. This chapter
summarizes the priority risks faced by the agricultural sector in Paraiba and the possible risk
management solutions, as identified, validated, and prioritized with sector stakeholders.
Risk Prioritization
98. Below are the tables containing the agricultural risk prioritization defined on the basis of the
probability of the event and their expected impact, for domestic and export crops (Tables 9 through 12).
The identified risks located in the grey area represent the most significant ones due to their potential to
cause the greatest losses and the higher frequency of their occurrence.
Table 9: Sugar Cane Supply Chain
Impact
Likelihood
Low Moderate High Critical
Highly Probable
(1 in 3)
Pests - broca do colmo,
broca gigante,
cigarrinha 4/
Sugar and ethanol price
and cost uncertainty 1/
2/ 6/
Probable
(1 in 5)
Irregular precipitation
(heavy rain followed by
extended dry spells) –
irrigated sugar cane
Irregular precipitation
(heavy rain followed by
extended dry spells) –
rain fed sugar cane
Occasional
(1 in 10)
Severe drought –
irrigated sugar cane 3/
Disease -ferrugem
amarela 5/
Severe drought –rain
fed sugar cane 3/
Remote
(1 in 20)
1/ Gasoline and ethanol are substitutes in Brazil, therefore the maximum price of ethanol is set by the
lowest price of gasoline. Gasoline price is fixed by the government and currently there is uncertainty
about public policies (this is a combination of market and enabling environment risks).
2/ Sugar cane price is agreed among producer organizations and buyers and is subject to lower volatility
than sugar price of sugar.
3/ Severe droughts occurred in 1992-93, 1998, 2001-2002, 2010, 2012, 2013.
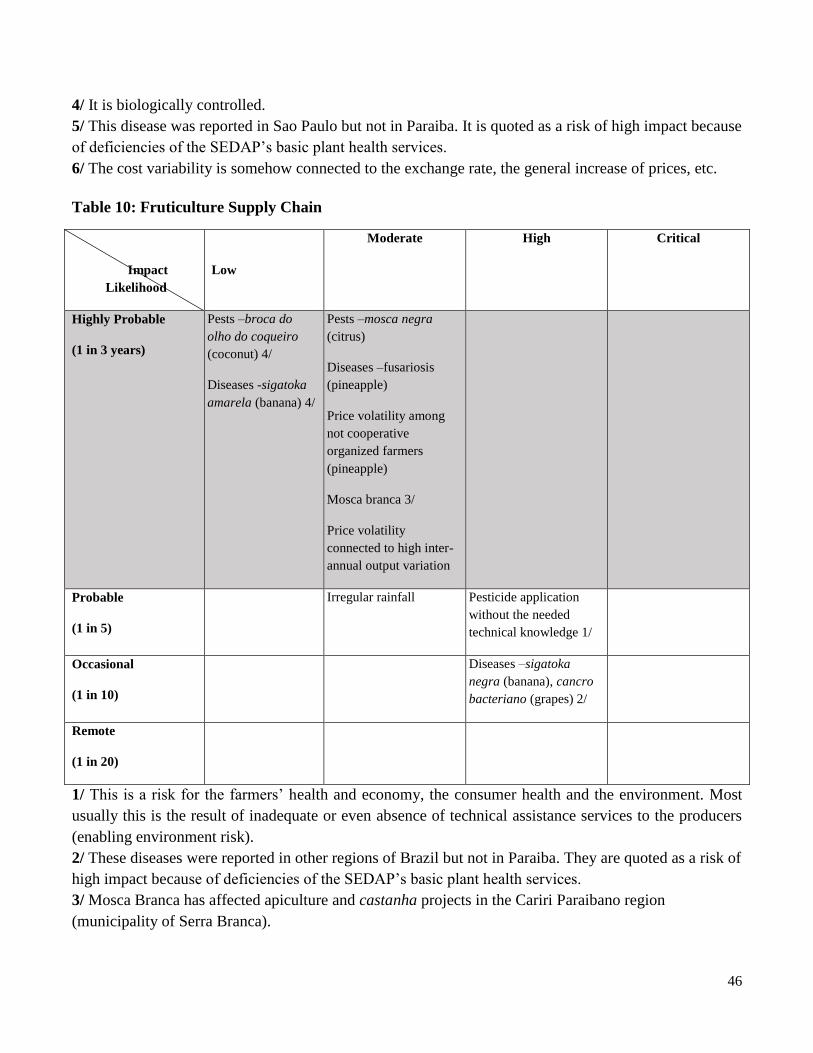
46
4/ It is biologically controlled.
5/ This disease was reported in Sao Paulo but not in Paraiba. It is quoted as a risk of high impact because
of deficiencies of the SEDAP’s basic plant health services.
6/ The cost variability is somehow connected to the exchange rate, the general increase of prices, etc.
Table 10: Fruticulture Supply Chain
Impact
Likelihood
Low
Moderate High Critical
Highly Probable
(1 in 3 years)
Pests –broca do
olho do coqueiro
(coconut) 4/
Diseases -sigatoka
amarela (banana) 4/
Pests –mosca negra
(citrus)
Diseases –fusariosis
(pineapple)
Price volatility among
not cooperative
organized farmers
(pineapple)
Mosca branca 3/
Price volatility
connected to high inter-
annual output variation
Probable
(1 in 5)
Irregular rainfall Pesticide application
without the needed
technical knowledge 1/
Occasional
(1 in 10)
Diseases –sigatoka
negra (banana), cancro
bacteriano (grapes) 2/
Remote
(1 in 20)
1/ This is a risk for the farmers’ health and economy, the consumer health and the environment. Most
usually this is the result of inadequate or even absence of technical assistance services to the producers
(enabling environment risk).
2/ These diseases were reported in other regions of Brazil but not in Paraiba. They are quoted as a risk of
high impact because of deficiencies of the SEDAP’s basic plant health services.
3/ Mosca Branca has affected apiculture and castanha projects in the Cariri Paraibano region
(municipality of Serra Branca).
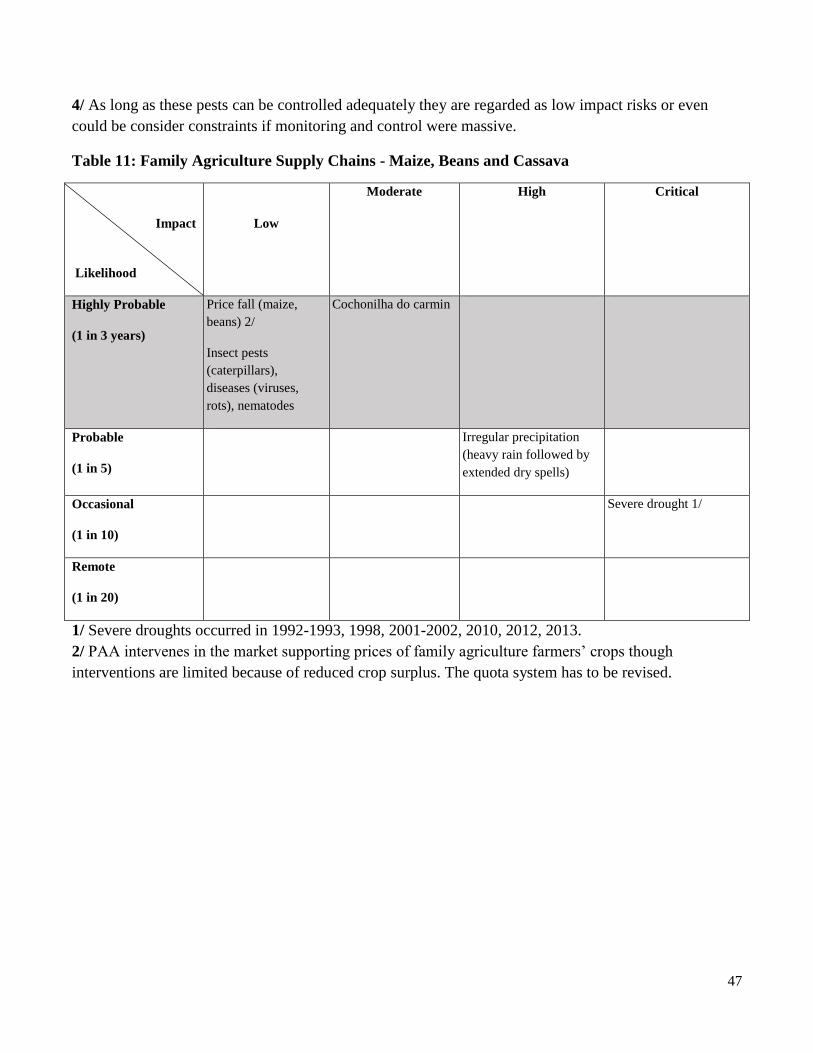
47
4/ As long as these pests can be controlled adequately they are regarded as low impact risks or even
could be consider constraints if monitoring and control were massive.
Table 11: Family Agriculture Supply Chains - Maize, Beans and Cassava
Impact
Likelihood
Low
Moderate High Critical
Highly Probable
(1 in 3 years)
Price fall (maize,
beans) 2/
Insect pests
(caterpillars),
diseases (viruses,
rots), nematodes
Cochonilha do carmin
Probable
(1 in 5)
Irregular precipitation
(heavy rain followed by
extended dry spells)
Occasional
(1 in 10)
Severe drought 1/
Remote
(1 in 20)
1/ Severe droughts occurred in 1992-1993, 1998, 2001-2002, 2010, 2012, 2013.
2/ PAA intervenes in the market supporting prices of family agriculture farmers’ crops though
interventions are limited because of reduced crop surplus. The quota system has to be revised.
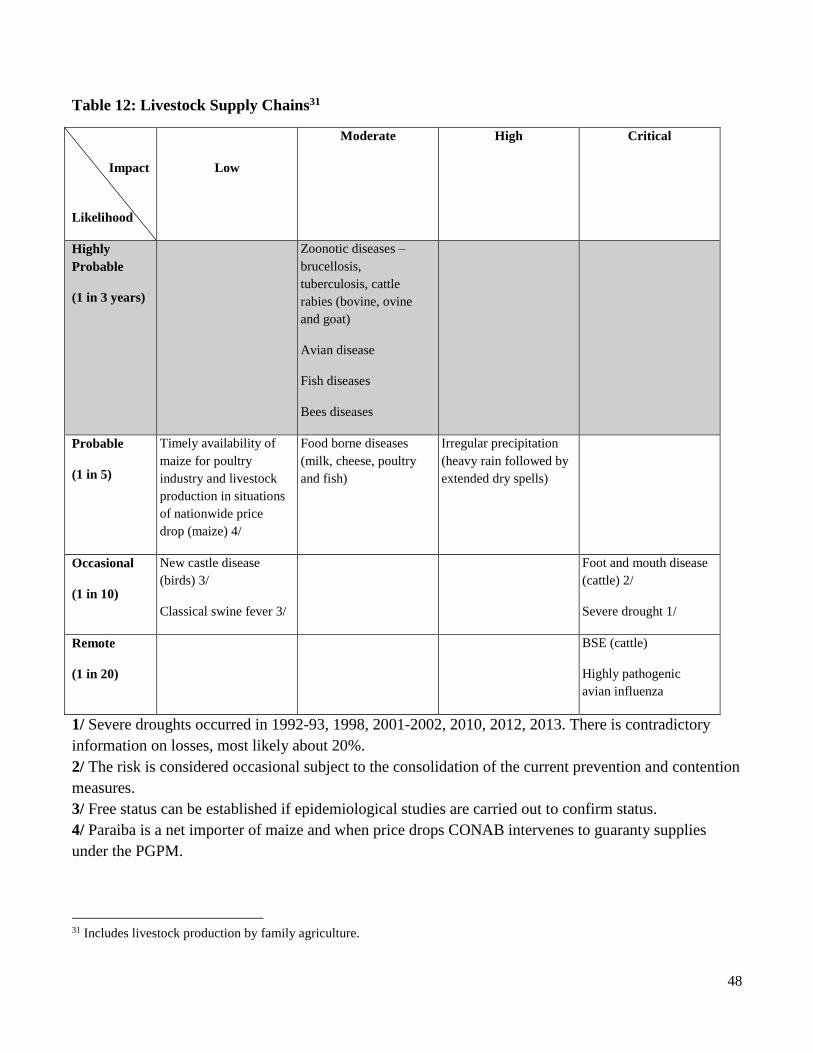
48
Table 12: Livestock Supply Chains31
Impact
Likelihood
Low
Moderate
High Critical
Highly
Probable
(1 in 3 years)
Zoonotic diseases –
brucellosis,
tuberculosis, cattle
rabies (bovine, ovine
and goat)
Avian disease
Fish diseases
Bees diseases
Probable
(1 in 5)
Timely availability of
maize for poultry
industry and livestock
production in situations
of nationwide price
drop (maize) 4/
Food borne diseases
(milk, cheese, poultry
and fish)
Irregular precipitation
(heavy rain followed by
extended dry spells)
Occasional
(1 in 10)
New castle disease
(birds) 3/
Classical swine fever 3/
Foot and mouth disease
(cattle) 2/
Severe drought 1/
Remote
(1 in 20)
BSE (cattle)
Highly pathogenic
avian influenza
1/ Severe droughts occurred in 1992-93, 1998, 2001-2002, 2010, 2012, 2013. There is contradictory
information on losses, most likely about 20%.
2/ The risk is considered occasional subject to the consolidation of the current prevention and contention
measures.
3/ Free status can be established if epidemiological studies are carried out to confirm status.
4/ Paraiba is a net importer of maize and when price drops CONAB intervenes to guaranty supplies
under the PGPM.
31 Includes livestock production by family agriculture.
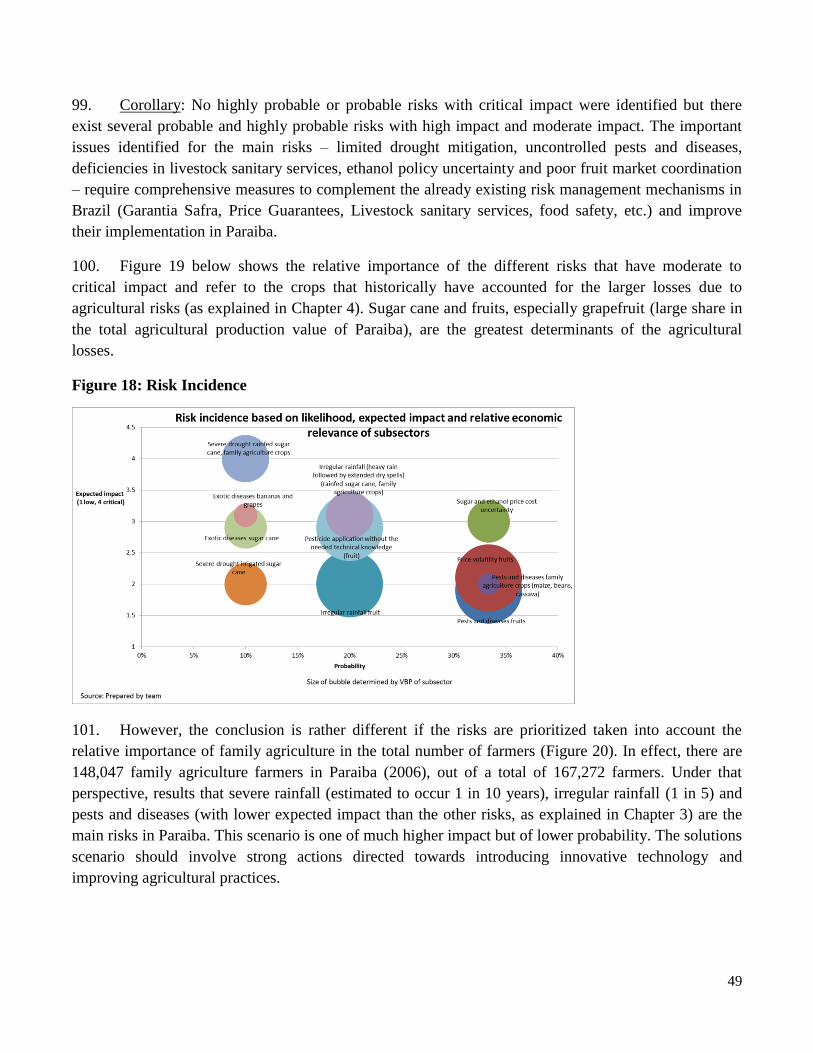
49
99. Corollary: No highly probable or probable risks with critical impact were identified but there
exist several probable and highly probable risks with high impact and moderate impact. The important
issues identified for the main risks – limited drought mitigation, uncontrolled pests and diseases,
deficiencies in livestock sanitary services, ethanol policy uncertainty and poor fruit market coordination
– require comprehensive measures to complement the already existing risk management mechanisms in
Brazil (Garantia Safra, Price Guarantees, Livestock sanitary services, food safety, etc.) and improve
their implementation in Paraiba.
100. Figure 19 below shows the relative importance of the different risks that have moderate to
critical impact and refer to the crops that historically have accounted for the larger losses due to
agricultural risks (as explained in Chapter 4). Sugar cane and fruits, especially grapefruit (large share in
the total agricultural production value of Paraiba), are the greatest determinants of the agricultural
losses.
Figure 18: Risk Incidence
101. However, the conclusion is rather different if the risks are prioritized taken into account the
relative importance of family agriculture in the total number of farmers (Figure 20). In effect, there are
148,047 family agriculture farmers in Paraiba (2006), out of a total of 167,272 farmers. Under that
perspective, results that severe rainfall (estimated to occur 1 in 10 years), irregular rainfall (1 in 5) and
pests and diseases (with lower expected impact than the other risks, as explained in Chapter 3) are the
main risks in Paraiba. This scenario is one of much higher impact but of lower probability. The solutions
scenario should involve strong actions directed towards introducing innovative technology and
improving agricultural practices.

50
Figure 19: Risk Incidence, prioritizing risks
Proposed Long List of Solutions
102. The potential solutions presented below (Table 13) were identified during field interviews as
well as already suggested in various government and non-governmental documents. Usually, risk
management strategies are a combination of risk mitigation, risk transfer, and risk coping instruments.
Risk mitigation refers to actions taken to eliminate or reduce events from occurring, or reduce the
severity of losses; risk transfer are mechanisms to transfer the risk to a willing third party, at a cost (e.g.,
insurance); and, risk coping (e.g. government assistance to farmers, debt re-structuring, etc.). How
instruments are applied for a given risk will likely depend on the current risk management and the
probability of the risk and the severity of its impacts.
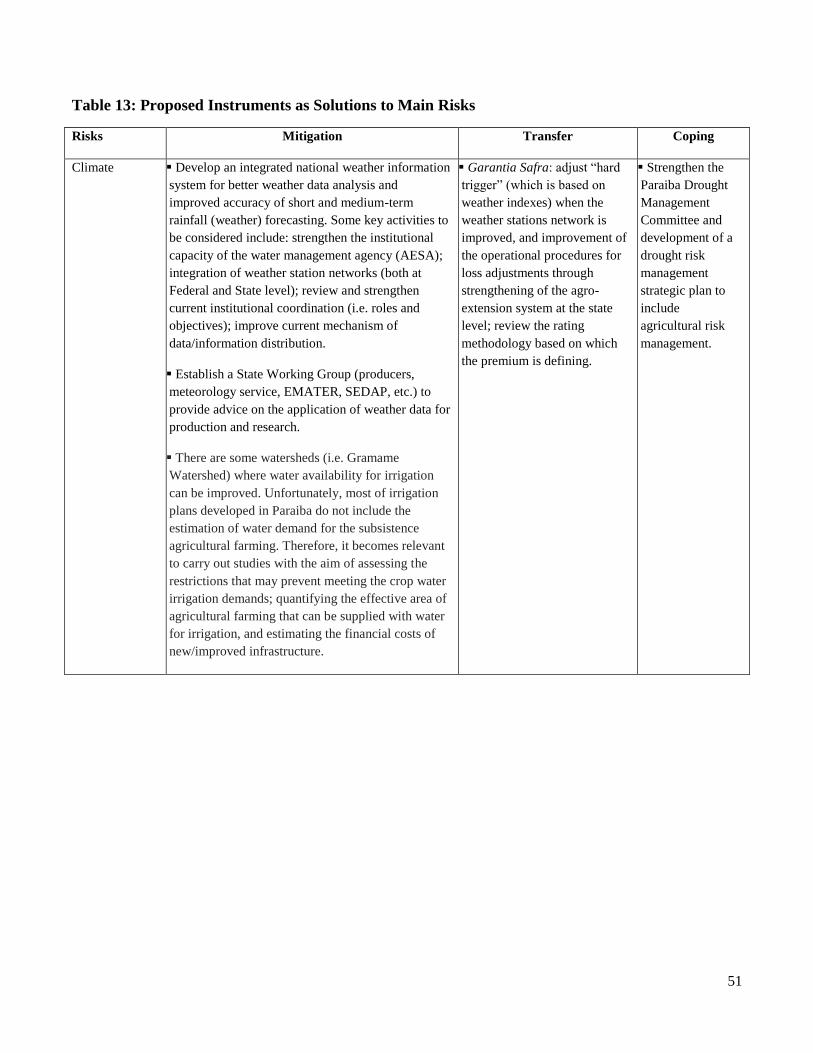
51
Table 13: Proposed Instruments as Solutions to Main Risks
Risks Mitigation Transfer Coping
Climate Develop an integrated national weather information
system for better weather data analysis and
improved accuracy of short and medium-term
rainfall (weather) forecasting. Some key activities to
be considered include: strengthen the institutional
capacity of the water management agency (AESA);
integration of weather station networks (both at
Federal and State level); review and strengthen
current institutional coordination (i.e. roles and
objectives); improve current mechanism of
data/information distribution.
Establish a State Working Group (producers,
meteorology service, EMATER, SEDAP, etc.) to
provide advice on the application of weather data for
production and research.
There are some watersheds (i.e. Gramame
Watershed) where water availability for irrigation
can be improved. Unfortunately, most of irrigation
plans developed in Paraiba do not include the
estimation of water demand for the subsistence
agricultural farming. Therefore, it becomes relevant
to carry out studies with the aim of assessing the
restrictions that may prevent meeting the crop water
irrigation demands; quantifying the effective area of
agricultural farming that can be supplied with water
for irrigation, and estimating the financial costs of
new/improved infrastructure.
Garantia Safra: adjust “hard
trigger” (which is based on
weather indexes) when the
weather stations network is
improved, and improvement of
the operational procedures for
loss adjustments through
strengthening of the agro-
extension system at the state
level; review the rating
methodology based on which
the premium is defining.
Strengthen the
Paraiba Drought
Management
Committee and
development of a
drought risk
management
strategic plan to
include
agricultural risk
management.
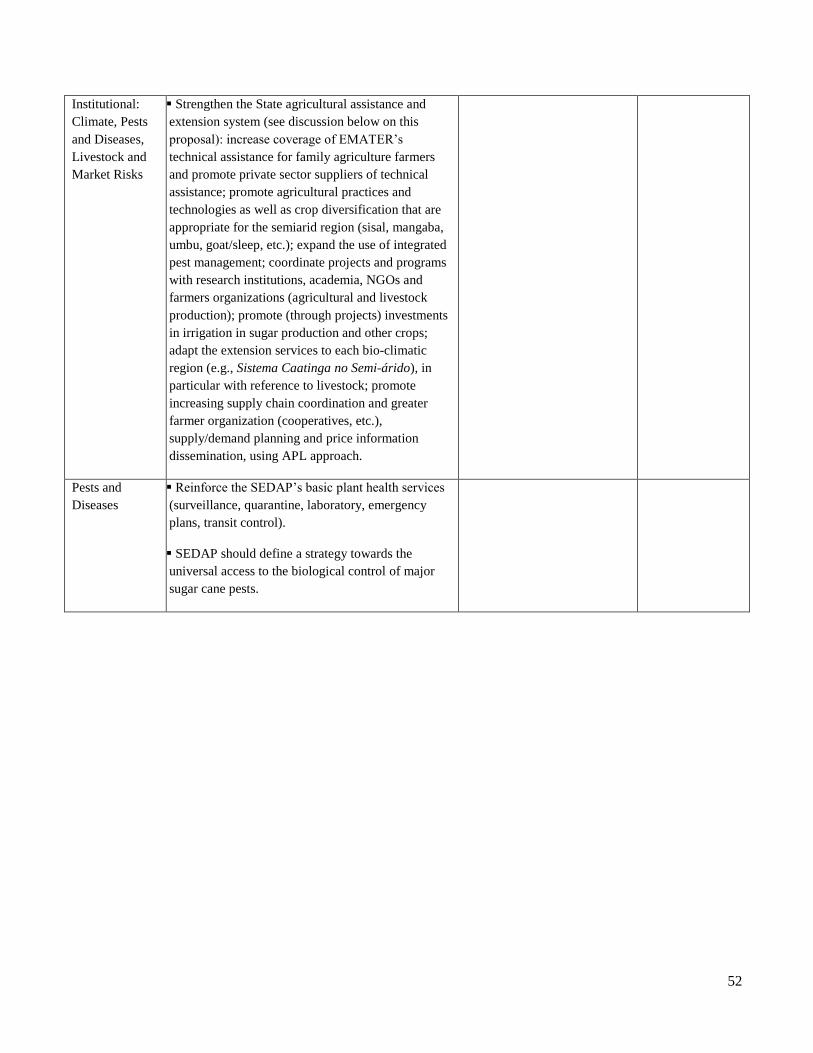
52
Institutional:
Climate, Pests
and Diseases,
Livestock and
Market Risks
Strengthen the State agricultural assistance and
extension system (see discussion below on this
proposal): increase coverage of EMATER’s
technical assistance for family agriculture farmers
and promote private sector suppliers of technical
assistance; promote agricultural practices and
technologies as well as crop diversification that are
appropriate for the semiarid region (sisal, mangaba,
umbu, goat/sleep, etc.); expand the use of integrated
pest management; coordinate projects and programs
with research institutions, academia, NGOs and
farmers organizations (agricultural and livestock
production); promote (through projects) investments
in irrigation in sugar production and other crops;
adapt the extension services to each bio-climatic
region (e.g., Sistema Caatinga no Semi-árido), in
particular with reference to livestock; promote
increasing supply chain coordination and greater
farmer organization (cooperatives, etc.),
supply/demand planning and price information
dissemination, using APL approach.
Pests and
Diseases
Reinforce the SEDAP’s basic plant health services
(surveillance, quarantine, laboratory, emergency
plans, transit control).
SEDAP should define a strategy towards the
universal access to the biological control of major
sugar cane pests.

53
Livestock
Production
Risks
Promote the utilization of: cochonilha resistant
varieties of palma forrageira in a coordinated way
among the several existing programs; grass resistant
varieties for the semiarid areas and the use of silage.
Promote the utilization of animal species, which
are more resistant to the semiarid areas such as
goats, sheep, poultry and apiculture.
Promote the utilization of adequate systems of
drinking water storage for the drought periods.
Update and consolidate (SEDAP) prevention
programs for exotic animal diseases according to the
new FMD free status of Paraiba State.
Update veterinary services and control and
eradication action plans (SEDAP) for prevalent
diseases (brucelosis, etc.), according to the
epidemiological situation of each disease.
Adopt the SISBI as the inspection system for
improving the food safety system (SEDAP in
coordination with MAPA).
Coordination of all sanitary and food safety
services (AGEVISA, SEDAP sanitary agencies and
the municipalities sanitary services) under MAPA
leadership.
Request technical OIE cooperation for the
performance evaluation of the animal health and
food safety services (OIE/PVS and GAP
evaluation).
Under the frame of the Intersectoral Chamber of
Food Security and Nutrition (CAISAN/PB) and the
proposed State System of Food Security (SISA)
promote the establishment of a food safety policy
and the coordination mechanisms of all the federal,
state and municipal entities related to the food
safety.
Establish a
contingency fund
to respond to
exotic animal
diseases
outbreaks.
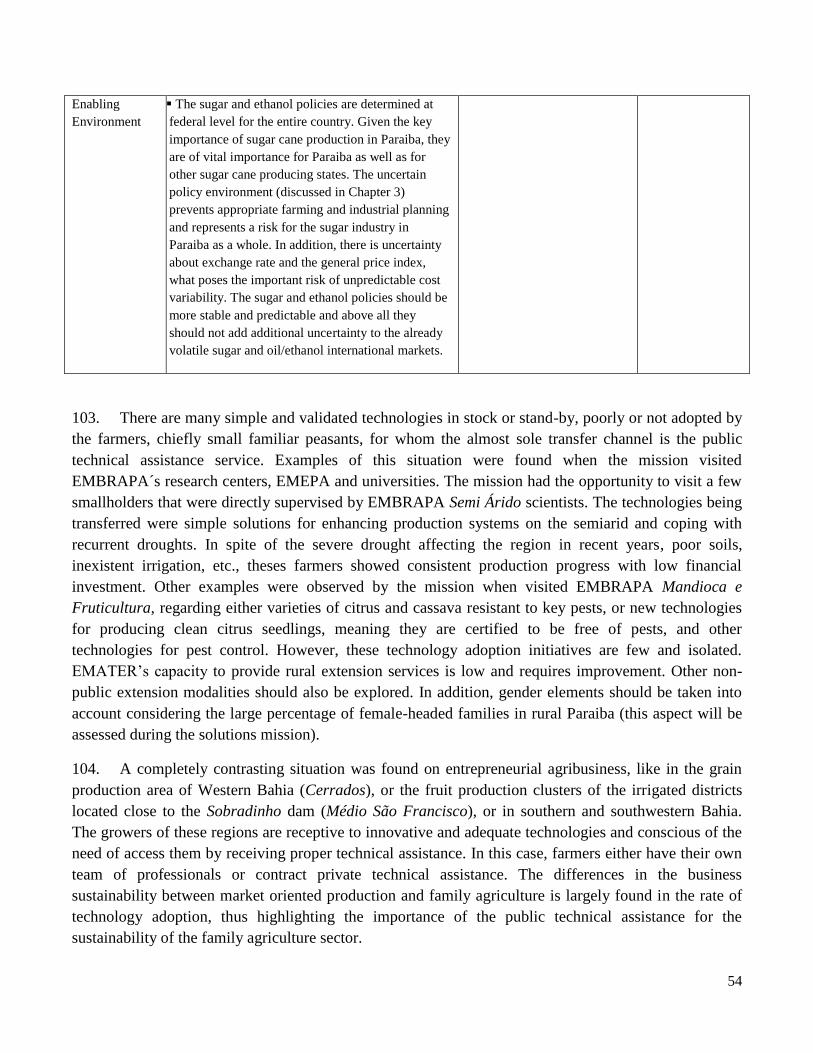
54
103. There are many simple and validated technologies in stock or stand-by, poorly or not adopted by
the farmers, chiefly small familiar peasants, for whom the almost sole transfer channel is the public
technical assistance service. Examples of this situation were found when the mission visited
EMBRAPA´s research centers, EMEPA and universities. The mission had the opportunity to visit a few
smallholders that were directly supervised by EMBRAPA Semi Árido scientists. The technologies being
transferred were simple solutions for enhancing production systems on the semiarid and coping with
recurrent droughts. In spite of the severe drought affecting the region in recent years, poor soils,
inexistent irrigation, etc., theses farmers showed consistent production progress with low financial
investment. Other examples were observed by the mission when visited EMBRAPA Mandioca e
Fruticultura, regarding either varieties of citrus and cassava resistant to key pests, or new technologies
for producing clean citrus seedlings, meaning they are certified to be free of pests, and other
technologies for pest control. However, these technology adoption initiatives are few and isolated.
EMATER’s capacity to provide rural extension services is low and requires improvement. Other non-
public extension modalities should also be explored. In addition, gender elements should be taken into
account considering the large percentage of female-headed families in rural Paraiba (this aspect will be
assessed during the solutions mission).
104. A completely contrasting situation was found on entrepreneurial agribusiness, like in the grain
production area of Western Bahia (Cerrados), or the fruit production clusters of the irrigated districts
located close to the Sobradinho dam (Médio São Francisco), or in southern and southwestern Bahia.
The growers of these regions are receptive to innovative and adequate technologies and conscious of the
need of access them by receiving proper technical assistance. In this case, farmers either have their own
team of professionals or contract private technical assistance. The differences in the business
sustainability between market oriented production and family agriculture is largely found in the rate of
technology adoption, thus highlighting the importance of the public technical assistance for the
sustainability of the family agriculture sector.
Enabling
Environment
The sugar and ethanol policies are determined at
federal level for the entire country. Given the key
importance of sugar cane production in Paraiba, they
are of vital importance for Paraiba as well as for
other sugar cane producing states. The uncertain
policy environment (discussed in Chapter 3)
prevents appropriate farming and industrial planning
and represents a risk for the sugar industry in
Paraiba as a whole. In addition, there is uncertainty
about exchange rate and the general price index,
what poses the important risk of unpredictable cost
variability. The sugar and ethanol policies should be
more stable and predictable and above all they
should not add additional uncertainty to the already
volatile sugar and oil/ethanol international markets.

55
Key Risk Management Measures
105. Many programs and projects are already addressing some of the identified risks along the lines of
the solution proposed in the Table 13. Table 14 below, contains a number of these projects and programs
as were identified by the mission (see Annex 3), indicating their connection with the risk assessment
results and the potential gaps to be covered with additional specific risk management actions.
Table 14: Programs and Projects Currently Addressing Some of the Identified Risks
Long list solutions Current projects or programs Gap?
Develop an integrated national
weather information system.
Various weather stations throughout the state and in other
parts of the Northeast run by different entities, with limited
coordination between each other or communication with
agricultural producers
Improve coordination
Establish a State Working Group
to provide advice on the
application of weather data for
production and research.
Group to be establish
Irrigation development.
The State of Paraiba has developed Water Management
Plans for different watersheds with the aim of providing
support to the implementation of both national and state
irrigation projects and policies to develop the agricultural
sector.
Government programs in
place, though studies
required to meet
deficiencies.
Garantia Safra improvements. Partial adjustments
required
Strengthen the State agricultural
technical assistance and extension
system.
Various projects to provide technical assistance
(EMATER, SEDAP, INSA, PROCASE) but unsystematic
and limited in geographic coverage and beneficiaries.
Limited coordination between providers and between
agricultural research and extension agents.
The entire system to be
improved and
coordination
strengthened
Reinforce the SEDAP’s basic
plant health services. State Program for Sanitary Defense Partial adjustment
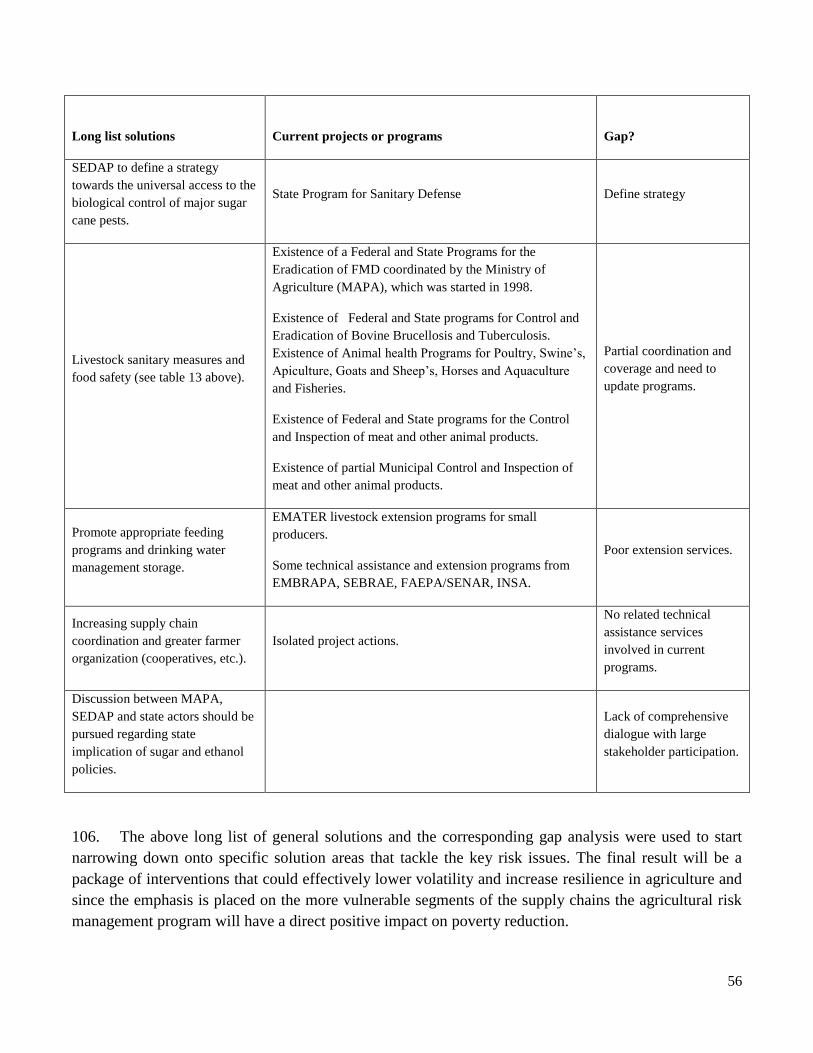
56
Long list solutions Current projects or programs Gap?
SEDAP to define a strategy
towards the universal access to the
biological control of major sugar
cane pests.
State Program for Sanitary Defense Define strategy
Livestock sanitary measures and
food safety (see table 13 above).
Existence of a Federal and State Programs for the
Eradication of FMD coordinated by the Ministry of
Agriculture (MAPA), which was started in 1998.
Existence of Federal and State programs for Control and
Eradication of Bovine Brucellosis and Tuberculosis.
Existence of Animal health Programs for Poultry, Swine’s,
Apiculture, Goats and Sheep’s, Horses and Aquaculture
and Fisheries.
Existence of Federal and State programs for the Control
and Inspection of meat and other animal products.
Existence of partial Municipal Control and Inspection of
meat and other animal products.
Partial coordination and
coverage and need to
update programs.
Promote appropriate feeding
programs and drinking water
management storage.
EMATER livestock extension programs for small
producers.
Some technical assistance and extension programs from
EMBRAPA, SEBRAE, FAEPA/SENAR, INSA.
Poor extension services.
Increasing supply chain
coordination and greater farmer
organization (cooperatives, etc.).
Isolated project actions.
No related technical
assistance services
involved in current
programs.
Discussion between MAPA,
SEDAP and state actors should be
pursued regarding state
implication of sugar and ethanol
policies.
Lack of comprehensive
dialogue with large
stakeholder participation.
106. The above long list of general solutions and the corresponding gap analysis were used to start
narrowing down onto specific solution areas that tackle the key risk issues. The final result will be a
package of interventions that could effectively lower volatility and increase resilience in agriculture and
since the emphasis is placed on the more vulnerable segments of the supply chains the agricultural risk
management program will have a direct positive impact on poverty reduction.
57
107. In brief, the following are the key risk management areas, deepened in Volume 2: Risk
Management Strategy:
1. Strengthen State’s rural extension and technical assistance system for agriculture, livestock
and marketing, is key for family agriculture farmers and other small and medium scale
farmers in order to access risk management technology and adopt relative practices.
Currently, the State extension services are weak:
a. Smallholders have difficulties accessing private suppliers of technical assistance;
b. There are not enough Paraiba State Company for Technical Assistance and Rural
Extension (Empresa de Asistência Técnica e Extensão Rural da Paraíba – EMATER)
extension offices to cover all the municipalities;
c. Most of these offices do not have enough technical and support personnel to carry out
medium or large scale programs;
d. Extentionists do not have access to updated knowledge and continuous capacitation;
e. The supporting resources (vehicles, per diem, fuel) are below the requirements for
minimum operation levels;
f. The technological transfer programs have to be revised in order to assure transfer of
proved technologies;
g. EMATER programs and operations should be coordinated at fine tune level with other
research and extension institutions working in Paraiba.
EMATER should allocate more resources to increase the coverage of the extension services,
improve program coordination, upgrade training programs, develop risk management tailor made
programs, etc. Simultaneously, efforts should be made to put in place private sector based
technical assistance services driven by farmers.
2. Carry out studies with the aim of assessing the restrictions that may prevent meeting the
crop water irrigation demands; quantifying the effective area of agricultural farming that
can be supplied with water for irrigation, and estimating the financial costs of
new/improved infrastructure.
3. Strengthen SEDAP’s phytosanitary services in order to guarantee proper control and
prevention of plant diseases. This would include:
a. Programs to avoid the entry of major pests which are not presently attacking crops grown
in Paraiba, strengthening sanitary controls, active surveillance and be prepared to
eradicate exotic pests detections at first detections;
58
b. More sound actions to control pesticide trade and use;
c. In addition, institutions in the three levels of sanitary intervention (Federal, State and
Municipal) should act in strict coordination.
4. Enhance animal sanitary risk management to assure adequate protection from exotic and
other diseases. This would require the following actions:
a. FMD prevention program has to be revised and updated
b. Control and eradication programs for prevalent diseases of economic and public health
importance need to be revised, updated and speed its execution.
c. Municipal control and inspection programs need to be coordinated and harmonized with
Federal and State Programs following SISBI orientations.
d. Need to establish State food safety policy and mechanism of coordination along the food
chain.
5. Improve coordination within the supply chains and assure fine tuning planning. Price
volatility in important cash crops such as fruits is very much driven by significant inter-annual
changes in the domestic supply, resulting in an output-price looping behavior. This behavior is
invigorated by poor farm to market coordination and scarce marketing-production planning. In
Brazil the APL (Arranjos Produtivos Locais) approach, a sort of cluster approach, has become
popular since 2004. It is regarded as articulations among supply chain actors for mobilizing
resources (credit, technology), facilitate marketing and in general promote greater economic
dynamism and less volatility. Value chain or productive partnership approaches could be
incorporated into the agricultural risk management strategy in subsectors such as pineapple and
could be part of the regular technical assistance services in Paraiba.
6. Develop an integrated weather information system in Paraiba to improve the analysis of
weather data and to improve the accuracy of short and medium-term weather forecasting.
Some key activities to explore during the solutions assessment, would include:
a. Integration of weather station networks both at Federal and State level;
b. Review current institutional arrangement coordination, and strengthen the institutional
structure and regulatory framework to achieve better coordination between national and
state weather authorities;
c. Improvement of current mechanism of data and information dissemination;
d. Establishment of a state working group to coordinate and manage the application of
weather data in commercial activities, research, and to warm the civil society about the
occurrence and magnitude of weather events.
59
7. Train Paraiba rural extension officers and professionals associated with Garantia Safra on
the collection of crop loss data in order to minimize sampling errors and to reduce the risk
of moral hazard. Garantia Safra operation is currently based on the estimation of crop losses
due to drought events. The losses are derived from a hard trigger or weather index. Given that
not all regions have a dense weather station network, hard triggers are extrapolated. Therefore,
the possibility that the resulted output does not accurately reflect the actual yields exists. In these
cases, Garantia Safra compensation payouts are triggered after the conduct of field loss
assessments (soft trigger). Loss assessments are made by the state rural extension service or
alternatively by professionals with background in agronomy that work in public institutions.
There is, therefore, a need to train rural extension officers because there are several crops that are
covered under this risk transfer mechanism, and that these crops show different phenological
structure and level of resilience to drought.
8. Strengthen the Paraiba Drought Management Committee, in order to shift its main focus
from reactive activities to emergency preparedness. The solutions assessment could concentrate
on the following aspects:
a. Develop the Committee’s drought risk management plan;
b. Develop a communication plan and a communication system;
c. Improve institutional capacity (knowledge, training) and legal framework;

60
VOLUME 2: RISK MANAGEMENT
STRATEGY
61
CHAPTER 1: SUMMARY OF THE AGRICULTURE RISK MANAGEMENT STRATEGY
1. The first phase of the assessment based on the productive structure (reflecting relative
importance of both crops and production patterns) identified: sugar cane; commercial fruit production;
family agriculture crops; and livestock as the value chains and sectors targeted under the Agriculture
Risk Management Strategy. Sugar cane and fruits, especially grapefruit, because of their large share in
the total gross output value of Paraiba (73%), are the greatest determinants of the average annual
production risk related losses (58%).32
2. Limited drought mitigation, uncontrolled pests and diseases, deficiencies in livestock sanitary
services and poor market coordination for fruit products are the key issues addressed for reducing losses
in Paraiba’s agriculture sector. The risk assessment confirmed that there are no risks with critical impact
that at the same time are highly probable (1 in 3 years) or probable (1 in 5 years) in Paraiba but there are
several probable and highly probable risks that cause moderate or high impact when realized. It was
observed that the important issues identified around these main risks–- require comprehensive measures
to complement the already existing federal policies and programs that in some way contribute to manage
agricultural risks (Garantia Safra, price guarantees, livestock sanitary services, food safety, etc.) and to
improve their implementation in Paraiba.
3. Severe drought, irregular rainfall, and pests and diseases are the main risks affecting family
farmers in Paraiba. When risks are prioritized taking into account the relative importance of family
agriculture in the total number of farmers (there are 148,047 family agriculture farmers in Paraiba out of
a total of 167,272 farmers33), the main risks in Paraiba are severe drought (estimated to occur 1 in 10
years), irregular rainfall (1 in 5) and pests and diseases (with lower expected impact than the other
risks). Accordingly, the solutions scenario presents strong actions directed towards improving risk
mitigation among family farmers, such as adoption of innovative technology, improved agricultural
practices and effective marketing mechanisms, as well as better agroclimatic information management,
together with recommendations regarding other sectors of the agriculture in Paraiba.
4. The Text Box 1 presents a summary of all the general agricultural risk management (ARM) areas
recommended at the Risk Assessment.
Text Box 2. 1: Key ARM areas
The following are the Key ARM Areas proposed during the first phase for deepening the
analysis during the second phase of the assessment:
Agriculture Extension and Technical Assistance: Strengthen State’s rural extension and
technical assistance system for agriculture, livestock and marketing. This is key for
family agriculture farmers and other small and medium scale farmers in order to access
32 See Agriculture Sector Risk Assessment, Volume I. 33 According to the 2006 Agricultural Census.
62
risk management technology.
Supply Chain Coordination: Improve coordination within fruit supply chains. Value
chain or productive partnership approaches could be incorporated into the agricultural
risk management strategy in subsectors such as pineapple and could be part of the regular
technical assistance services in Paraiba.
Plant Health: Strengthen the State Secretariat for Agriculture, Livestock and Aquiculture
Development (Secretaria de Estado de Desenvolvimento da Agropecuaria e Pesca –
SEDAP) phytosanitary services in order to guarantee proper control and prevention of
plant diseases. This would include: programs to avoid the entry of major pests; more
sound actions to control pesticide trade and use; and improved coordination among
institutions in the three levels of sanitary intervention (Federal, State and Municipal).
Animal Health: Enhance animal sanitary risk management to assure adequate protection
from exotic and other diseases.
Agroclimatic Information Systems (ACIS): Develop an integrated agroclimatic risk
information system in Paraiba to improve the analysis of weather data and to improve the
accuracy of short and medium-term weather forecasting.
Irrigation can also be an important solution to the management of agriculture risks, but
careful feasibility assessments need to be done. The first phase of the Risk Assessment
also included a proposal to carry out studies with the aim of assessing the restrictions that
may prevent meeting the crop water irrigation demands, quantifying the effective area of
agricultural farming that can be supplied with water for irrigation, and estimating the
financial costs of new/improved infrastructure. However, it was found appropriate to
postpone the study of these complex issues and propose that the Sustainable Rural
Development Project (follow up to COOPERARII) incorporates them into its activities.
5. The following are the strategic lines identified during the ARM assessment. The detailed actions
under each strategic line are contained in Chapter 4: ARM Action Plan.
Agroclimatic Risk Information System (ACIS):
a. Development of a Agroclimatic Database Integrated System in the state of Paraiba including
federal institutions and Executive Agency of Water Management of Paraiba (Agência Executiva
de Gestão das Águas do Estado da Paraíba - AESA);
b. Strengthening of the Drought Management Committee, making actions more proactive and less
reactive;
c. Training to the extension workers associated to inspection procedures in the Garantia Safra
project, in order to reduce moral hazard and technical issues.
Sanitary and Phytosanitary System (SPS):
a. Sugarcane
Expand the area of sugarcane under biological control;
Assess the impact of the possible introduction of the ferrugem laranja in Paraiba;
Set up a surveillance network for ferrugem laranja in Paraíba.
63
b. Fruticulture
Assess the likelihood and impact of the possible introduction of the diseases sigatoka negra
and moko (bananas), cancro da videira and Huang long bing (HLB - Citrus);
Family Agriculture in the Semi-arid zone;
Substitute the varieties of palma forrageira susceptible to the cochonilha do carmim for
resistant ones.
c. Livestock Production
Reinforce the program for controlling and eradication of brucellosis and tuberculosis;
Coordination of the animal health and food safety programs;
Establish the actual status of Classical Swine Fever (CSF) and Newcastle Disease Virus
(NCDV) in Paraiba;
Create the State Agency for Agricultural Health.
Supply Chain Coordination
a. Identify successful farm to market experiences in Paraiba and assess the viability of being
replicated under a massive technical assistance programwe already did, doubt there are
possibilities to replicate through a “massive technical assistance program”
b. Develop market oriented business development methodologies for training and providing
technical assistance to associated small scale farmers
c. Assess different options to support market development for family agriculture products,
including revision of the legal framework to channel public resources
Agricultural Innovation System (AIS):
a. Improve the coordination of the Agriculture Innovation System for family agriculture risk
management;
b. Improve efficiency of the Agricultural Innovation System for family agriculture risk
management - Strengthen the research sub-system;
c. Improve efficiency of the Agricultural Innovation System for family agriculture risk
management - Strengthen the Technical Assistance and Rural Extension (Assistência Técnica e
Extensão Rural – ATER) sub-system;
d. Improve efficiency of the Agricultural Innovation System for family agriculture risk
management -Enlargement of successful programs and projects.

64
CHAPTER 2: PARAIBA’S AGRICULTURE RISK MANAGEMENT FRAMEWORK
Brief Information on the Agricultural Sector
Agroecology
6. Like in most parts of Northeast Brazil, the State of Paraiba has the following main
agroecological zones: the Mata zone, the Agreste zone and the Sertão zone. In the Mata zone there are
two factors important to agriculture, namely high precipitation (over 1,400 mm annually), and relatively
fertile soils. This region has been, since colonization, largely dedicated to sugar cane. The Agreste zone
is located towards the interior, in the Borborema Highlands, with an average annual precipitation around
700 mm, distributed irregularly but concentrated in the period March to August (which is the season of
least evapotranspiration), with mild night temperatures. The Sertão zone has higher temperatures, and
the rains occur during the hottest months. In the Agreste zone, as well as in the Sertão zone, the dry
season is long, lasting six to seven months and seven to eight months, respectively, with severe droughts
every 10 or 11 years. In the Agreste zone, the landholdings are smaller, approximately 40 hectares in
size, and greatly involved in dairy production. In the Sertão…
7. Most agricultural lands in Paraiba are located in the coastal regions, due to harsher climate
conditions found in the semi-arid inland. The lowest production densities are found in the Borborema
and Sertão Paraibano regions, where livestock raising predominates.
Main features of agriculture in Paraiba34
8. Paraiba is a small state with limited agroecological conditions for agriculture. Its agriculture
share is very low: 0.7% as compared with total national agriculture gross domestic product (GDP) and
11% as compared with the Northeast agriculture GDP. As compared with the total GDP of the State, the
agricultural GDP is 4.5% in 2011.35 The main economic activity of Paraiba is the plantation of sugar
cane, which is processed in usinas located in the largest farms; for centuries, sugar cane was used for
production of white sugar, but today a large proportion is directed to the production of alcohol fuel.
Most plantations are located along the coast. There are 8 usinas and 1,935 farmers producing sugar cane,
95% being small and micro-producers in Paraiba.36 However, large and medium scale producers
(accounting for less than 5% of the total number of producers in the State), including the usinas nucleus
land, contribute to about 55% of the total output.
9. Fruit production is also important in Paraiba. It includes grapes, citrus, banana, mangaba, mango,
coconut and pineapple. The most important fruit grown in Paraiba, in terms of production value, is
34 Sugar cane, pineapple, banana and cassava account for 35%, 27%, 10% and 6% of the State agricultural Gross Output
Value in 2010, respectively. That is, the four crops aggregated account for 78% of the total State’s agricultural Gross Outpu t
Value. 35 IBGE. 36 ASPLAN, Setor agroindustrial canaviero do Estado da Paraiba, Joao Pessoa, May 2014.
65
pineapple, which is massively exported out of Paraiba to the rest of Brazil. Main producing areas of
pineapple are the Mata and Brejo zones. Production is mostly in the hands of small scale farmers with
heterogeneous levels of technology development and market coordination.
10. In the Agreste and humid areas of Borborema, there is beans and cassava cultivation, usually just
for subsistence (beans and cassava flour, along with maize, can be stocked up for long periods, and
constitute the basic food items of most families) or trading in local fairs. Maize is most common in the
Sertão, along with plants adapted to dry climates. Regarding livestock, the raising of caprines is more
common than of bovines in the Sertao. Family farmers are spread throughout Paraiba but concentrated
in the semi-arid macro-region, encompassing the Borborema, Sertão Paraibano, and Agreste Paraibano
meso-regions.
Family agriculture
11. There are 148,047 family farmers37 in Paraiba, representing 91% of the total number of farmers
in the State, covering a total of 1,596,273 hectares, representing 42% of total areas. Of these, two-thirds
have land title. High rates of female-headed households stand out in Paraíba at around 30% in rural
areas. Family agriculture is largely based on livestock, though maize, beans and cassava are grown for
self-consumption on small, rain fed plots. Especially in dry regions, small farmers raise small animals,
commonly goats. Native trees and vegetation provide firewood, fodder for animals, and fruits (like umbu
and nuts like cashew) are part of nutritional security. Since the herds rely on natural vegetation, food for
animals is vulnerable to drought.
12. In general, small land size, poor soils, low precipitation, low market access, low access to credit
and technical assistance, and low levels of farmer organization characterize family farmers. Some
attribute low participation in associations to a lack of incentives to associate and a history of patronage
arrangements that small farmers depend on to receive emergency relief supplies in times of drought.
Cash transfers from social assistance programs provide a significant proportion of family income and
allow food to be purchased outside the household.
Agricultural Risk Profile and Risk Management Options (solutions)
Agricultural risks and constraints
13. Drought is a recurrent event in the Northeast of Brazil and has strong negative impact on
household livelihoods as it represents a challenge to food security crops such as maize and beans and
may cause important losses of livestock. It should be noted that the social impact of drought is especially
aggravated by the fact that family farmers represent more than 90% of the farmers in Paraiba and water
availability (including irrigation) is poor.
37 Family farming (agricultura familiar) is formally defined in Brazil in terms of area, management, labor, and income. The
farm must be managed by the family, and the family must rely on agriculture as their principal source of income. Definition of
agricultura familiar from Law No. 11326.

66
14. One of the first records of drought in Northeast Brazil happened in the XVIII century, between
the years of 1777 and 1779. It is estimated that more than 500,000 people died and mortality rate of
animals reached 80% (Campos e Studart, 1997). In the subsequent century, the Great Drought took
place from 1877 to 1879, followed by other droughts in 1897, 1898, 1915, 1931 through 1932, 1951
through 1953, 1992 through 1995 and 2012 through 2013. The 2012/13 drought is considered the worst
drought in the last fifty years (Miranda, 2013). One hundred and seventy municipalities decreed
calamity situation during the 2012 drought (almost 80% of the total number of municipalities), and 2.6
million people were affected.
15. Severe droughts should be differentiated from the dry season in the Semi-arid, which is not a
risk, but rather a constraint38 to agriculture development given its predictability. In addition, erratic
rainfall (high precipitation followed by a long period of drought) is frequent but of moderate or low
impact.
16. The damaging impact of pests and diseases is significant when they are not properly mitigated.
They have been particularly devastating when new pests/diseases arrived and the State’s support
services were not prepared to respond adequately (e.g. cotton boll weevil). Family farming crops in the
Semi-arid (cassava, beans, maize) are susceptible to attacks by caterpillars or diseases. However,
farmers prefer not to use purchased inputs nor make investments on their crops with the exception of
some infesting weed control. Their rationale is “why invest on fertilizers, improved seeds or pest control
if the risk to lose the harvest because of lack of rainfall is so high”.
17. Currently, family farmers usually cultivate a type of cactus called palma forrageira as feed for
goats and sheep and even bovines, fundamental to feed the animals during hydric stresses. A pest called
cochonilha-do-carmim (Dactylopius opuntiae) is a serious threat for achieving higher biomass
production and a risk to family agriculture subsistence.
18. A phytosanitary risk with high social, environmental, agronomic and economic impact arises
from the use of pesticides without the necessary technical knowledge and skill, which are applied at high
rates not in accordance with technical recommendations. The result is that farmers may face increased
production costs, ineffective pest control and human and environmental hazards as well as fruit
contamination with pesticides residues, representing a risk for the consumer health.
19. Finally, the inter-annual price variations of fruits, mostly pineapple and banana, are also a
serious risk for family farmers. The volatility largely responds to changes in production and traded
volumes, which is in turn connected to the lack of supply chain coordination, farmer organization and
38 Constraints are certain conditions that result in sub-optimal performance. For instance, low production yields are a
constraint to development and the cause is lack of access to inputs, poor technology, etc. A constraint ignores the volatility in
an outcome. There are also trends. Trends are longer term patterns, e.g. declining production yields are the result of structural
changes in agriculture, changes in climatic patterns, etc. Risk, in turn, is defined as the possibility that an event will occur that
will potentially have a negative impact on the farm and/or the supply chain. Understanding the linkages between these 3
concepts is key for planning and action. The presence of risk often constitutes a constraint, or aggravates an existing one.
Therefore, risks and constraints are intrinsically interrelated.
67
poor production and marketing planning. For family farmers with an important portion of self-
subsistence agriculture and limited but essential commercial farming, the low value and unpredictability
of their markets is not only a risk but also a restriction for development.
ARM options (solutions)
20. As explained above, Paraiba has a small commercial agricultural sector and a widespread small
scale semi-arid rural population that includes extensive subsistence family farmer groups. The risk
profile is different with respect to the different types of producers, though drought and unmanaged pests
and diseases are a common risk across the State.
21. Drought is the main risk for family farmers in the semi-arid. Small scale commercial farmers are
exposed to great market vulnerability, like the fruit producers, sugar cane outgrowers, usinas and sugar
cane estates suffer from changing policy environment. Larger farmers and usinas usually have
resources, available tools, and know how to manage other risks.
22. Commercial farmers tend to utilize drought tolerant varieties and variable crop cycles, control
pests and diseases and are connected to relatively high value markets. However, only a minority of
family farmers adopts mitigation practices like pest control or resistant varieties. Appropriate agriculture
risk mitigation technologies are not easily available to family farmers due to: (i) deficiencies in the
provision of technical assistance services and (ii) poor supply chain coordination. These factors also
prevent family farmers from accessing higher market prices and financial resources for on-farm
investments.
23. Such a productive and economic dichotomy makes the ARM strategy necessarily complex and
involving a variety of actions of different nature. Given the impacts of realized risks in the past (see
Volume 1: Risk Assessment), it can be inferred that there is room for cost-effective risk reduction by
investing in programs to mitigate, transfer and cope with agriculture risks. The State of Paraiba could
reduce sector losses substantially.
24. As it was identified in the first phase (Volume 1: Risk Assessment), improved ARM should
involve a comprehensive approach that tackles problems affecting all supply chains, including, at State
level, the availability of better agroclimatic information systems, solid and trusted sanitary and
phytosanitary systems and upgraded technological and market support services. At the Federal level it
would be expected to have more stable and neutral sugar and alcohol policies, but this discussion goes
beyond the scope of this assessment.
25. Family farming is the most vulnerable segment in the sector and currently there are not many
ARM options (solutions) available for them outside the regular Federal Government support programs.
Thus, many of the proposals below regard institutional capacity building at State level and are to a great
extent directed to improving the agronomical and marketing risk management capabilities of family
farmers. These measures will also have a positive impact on family farmer food security, and
consequently poverty reduction.

68
Current Institutional ARM Programs and Policies
26. There are a number of State and Federal programs and policies that in one way or another impact
the management of agricultural risks. In the past, as back as the XIX century, several measures were
taken. For instance: construction of weirs; dams and aqueducts; river transposing; and construction of
wells (Miranda, 2013). But they have not been sufficient to mitigate the impact of severe drought. More
recently, the Cooperar Project has financed investments in water reservoirs/tanks, Complete Water
Supply Systems (Sistemas de Abastecimento de Água Completo - ADC), and Single Water Supply
Systems (Sistemas de Abastecimento de Água Singelos - ADS), which basically consist in drilling wells
to store water in public reservoirs that will supply residences (for the ADC) or public distribution
systems (ADS systems). In total, 8,180 families benefited from the program (Projeto Cooperar, 2014).
27. More specifically, in regards to weather related agriculture risks, Annex 4 provides a detailed
description of the current programs and policies. The following are the most relevant initiatives:
The Agricultural Climate Risk Zoning (ZARC) of Ministry of Agriculture, Livestock and Supply
(Ministerio da Agricultura, Pecuaria e Abstecimento - MAPA), which aims to minimize the risk
related to weather phenomena, and allows identification of the best planting dates in selected
municipalities considering different types of soil and crop cycles.
The Agriculture and Livestock Activity Guarantee Program (Programa de Garantia da
Atividade Agropecuária - PROAGRO), which is a public insurance operated by financial
institutions. It aims to compensate the rural producer for the occurrence of adverse weather
phenomena, plagues and diseases afflicting crops and livestock.
The Agriculture and Livestock Activity Guarantee Program for Family Farmers (Programa de
Garantia da Atividade Agropecuária da Agricultura Familiar - PROAGRO MAIS) aiming to
compensate the Family Farmers for the occurrence of adverse natural phenomena, plagues and
diseases. The difference between PROAGRO and the PROAGRO MAIS is the target public: the
PROAGRO MAIS focuses solely on family farmers and the traditional PROAGRO aims
remaining farmers.
The Rural Insurance Premium Subsidy Program (Programa de Subvenção ao Prêmio do Seguro
Rural - PSR), through which insurance companies accredited by MAPA are allowed to operate a
subsidy. In general, the program consists of establishing percentages of subventions for each
modality of insurance and crops.
The Garantia Safra Program (GS), operated by the Ministry of Agrarian Development
(Ministério do Desenvolvimento Agrário – MDA) since 2002. It aims to guarantee minimum
conditions of survival of the rural family farmers that are affected systematically by drought or
excess rainfall. The family farmers may receive a benefit on the occurrence of drought or excess
rainfall, which causes at least 50% of loss on productions of beans, corn, rice, cassava or cotton
crops.
The program Drought Grant (Bolsa Estiagem - BE), managed by the Ministry of National
Integration (Ministério da Integração Nacional – MI), MDA and the Ministry of Social
69
Development and Fight Against Hunger (Ministério do Desenvolvimento Social e Combate à
Fome – MDS). This program aims to support families of agricultural workers which have
monthly income equivalent to at most two minimum wages and are located in municipalities that
are considered to have suffered a disaster or emergency situation recognized by Federal
Government.
The Brazilian Company for Agriculture and Livestock Research (Empresa Brasileira de
Pesquisa Agropecuária – EMBRAPA) developed an Agrometeorological Monitoring System
(Sistema de Monitoramento Agrometeorológico - AGRITEMPO), which allows access to
meteorological and agrometeorological information for all the Brazilian territory on an
aggregated level. Since 2002, the available products are drought maps, water available in soil,
rainfall, agricultural drought areas, necessity of reposition by rainfall and accumulated rainfall.
The National Institute for Space Research (Instituto Nacional de Pesquisas Espaciais -
INPE/CPTEC) supplies weather monitoring information regarding drought, frost, soil moisture
and weather forecast for all Brazilian territory with applicability to agriculture and livestock.
The World Bank, MI, ANA and state institutions are conducting a technical assistance program
named Preparation for Drought and Resilience to Weather Changes in response to the long
lasting droughts in 2012 and 2013. The goal is to define specific instruments for drought
management in a proactive manner, and is based on the concept of risk for the entire
Northeastern region.
28. There are several permanent and transitory programs undertaken by the Sanitary and
Phytosanitary Program of SEDAP, which are quite the same for all Brazilian states. Among the
permanent programs are: the traffic control and the surveillance of animals, plants and its products;
pesticide market and use control; and slaughterhouses inspection.
29. As for the transitory programs, follows a list for animal and plant health programs. Animal
health programs:
PNEFA - National Program for Control, Prevention and Eradication of Foot and Mouth Disease;
PNCEBT - National Program for Control and Eradication of Brucellosis and Tuberculosis;
PNSA - National Program for Avian Health;
PNCRH -National Program for Rabies Control and other Encephalopathies;
PNSE - National Health Equidae Program;
PNESA - National Sanitary Education Program;
PNSSO -National Program of Goats and Sheep Health;
PNSS - National Program of Swine Health;
PNSAA - National Program of Health of Aquatic Animals;
PNSAp -National Program of Health Bee.
30. The plant protection programs include:
70
Surveillance and maintenance of free area for A2 quarantine pests of citrus (HLB, pinta preta
and cancro cítrico), bananas (sigatoka negra and moko), grape (cancro da videira) and
sugarcane (ferrugem laranja). The main tasks conducted in this program is the control of the
transit of plants and parts of plants, which can host the causal agents of the mentioned diseases.
A wider approach could be adopted by involving all the stakeholders, training personnel and
establish a protocol for active surveillance, aiming at early detection of any eventual introduction
of the pests.
Monitoring and sanitary control of A2 quarantine pests of palma forrageira (cochonilha do
carmim) and citrus (mosca negra). As for the first pest there is an active program in place for
substituting the presently used palma varieties by resistant ones. The program is technically
solid, and should be scaled up in order to completely substitute the genetic material grown in
Paraiba. Regarding the mosca negra, the major action is the transit control of host plants, in
order to avoid its dissemination. Appropriate control of the pest by growers is the recommended
technique in this situation.
31. Concerning food procurement and price volatility, there are a series of Federal food procurement and
minimum crop price policies and programs. They are the Policy for Mininum Price Guarantee
(Politica de Garantia de Preços Minimos - PGPM), which is concerned with commercial
agriculture, and the National Program for Acquisition of Food from Family Farmers (Programa de
Aquisição de Alimentos - PAA) that specifically targets family farming. The Ministry of Agriculture
(MAPA) is responsible for the former policy, and the latter program is the responsibility of the
Ministry of Agrarian Development (MDA). The Federal Government, States and Municipalities
implement PAA. The National Supply Company (Companhia Nacional de Abastecimento -
CONAB) also participates in the implementation of PGPM.
32. Finally, there are a number of State programs and projects of research and technical assistance (with
the exemption of the National Institute for the Semi-Arid - Instituto Nacional do Semi-Árido, INSA)
that provide support to small scale farmers and to family agriculture farmers in particular. However,
they are insufficient, both in quantity and quality, to assure optimum risk mitigation practices and
technology. They are (see Annex 5 with information on the objectives, activities and other key :
INSA projects. INSA is a Federal institution belonging to the Ministry of Science, Technology,
and Innovation.
Paraiba Sustainable Rural Development Project (Cooperar). World Bank financed project under
preparation. It aims at reducing household vulnerability and improving smallholder access to
markets in Paraiba’s rural areas.
Cariri and Seridó Sustainable Development Project (PROCASE). SEDAP-IFAD. It is a local
capacity building project that aims at improving smallholder production and market
competitiveness and promoting farming practices resilience/adaptive to drought.

71
The Paraiba State Company for Agriculture and Livestock Research (Empresa Estadual de
Pesquisa Agropecuária da Pariaba - EMEPA-PB) projects. EMEPA has nine experimental
agricultural research stations throughout the State.
EMEPA small demonstrative projects:
o Beekeeping as a tool for improving the quality of life for small rural farmers in the semi-
arid of Paraiba;
o Multiplication and distribution of animal and plant germplasm, seeking to increase family
agriculture dairy production of the Piancó Valley;
o Production and distribution of free-range hens for diversifying farmer families´ sources
of income and labor;
o Program for strengthening family farmers´ goat and sheep breeding;
o Multinutrient blocks: alternative nutritional strategy for herds during drought periods;
o Use of solar energy in the sustainable production of irrigated fruits and vegetables;
o Production and distribution of sorghum seeds to family farmers in the semi-arid;
o Production and distribution of seedlings for domestic fruit tree plantations in family
farmer settlements;
o Production and distribution of citrus seedlings to family farmers;
o Programa Palma Resistente.
EMATER projects. EMATER provides extension services, registration of family farmers,
support for access to family farming public policies and services, support for commercialization,
food and nutritional security, assessment of losses to calibrate Garantia Safra.
Sertão Emprendedor (Rural Learning National Service / Servico Nacional de Aprendizagem
Rural - SENAR, Brazilian Micro and Small Business Support Service / Serviço Brasileiro de
Apoio às Micro e Pequenas Empresas - SEBRAE). Support for projects of water conservation
and, production and conservation of animal forage.
72
CHAPTER 3: PROPOSED ARM STRATEGY
33. This Chapter presents the ARM strategy proposal based on the existing risk management
framework and the identified gaps. It takes into account the main risks identified during the first phase
(Voume 1: Risk Assessment) and comprises actions regarding the agroclimatic information system, the
sanitary and phytosanitary system, the fruit supply chain coordination and the agricultural innovation
system. The detailed justification for the inclusion of these four ARM areas is contained in Volume 1:
Risk Assessment.
Agroclimatic Risk Information System (ACIS)
Need for Improved ACIS
34. In order to develop good and integrated drought management policies it is necessary to have a
proper database of agrometeorological information, that is, information related to agricultural related
topics (i.e. phenology, vulnerability, technical production packages, etc) and data gathered on time and
efficiently stored from automatic and/or conventional weather stations that are properly spread out
throughout the State.
35. The current weather information system has a relatively low density of agrometeorological
stations39 and deficiencies regarding data collection and debugging. Most of the stations in operation are
conventional pluviometric stations where data collection is non-automatic, which can result in
measurement failures. Another important point is the low maintenance of existing stations, which may
result in malfunction and even the interruption in data collection because of some kind equipment
damage.
36. In addition to the technical deficiencies, there is the issue of articulation between state and
federal institutions, and between them and the public sector and universities. Furthermore, at operational
level there is no communication between the federal stations and AESA’s stations. For instance, AESA
shares data with the National Water Agency (Agência Nacional de Águas – ANA) but this data is not
validated before the sharing, which incurs in poor quality information in ANA’s database. Moreover,
AESA has reduced personnel and office space over the years. There is an urgent need to strengthen
AESA’s institutional capacity as the responsible institution for meteorological monitoring in the state.
37. The first step is to create an integrated systematic weather database for use by policymakers in
the construction of risk management tools. This system should optimize all resources available at both
39 Compared to other states in Brazil, the density of the stations in Paraiba is relatively low. Taking into account only the
automatic stations, AESA owns only 10 stations, that is, approximately 1 station in 5,600 km2. When all the types of stations
are considered (hydrometeorological, automatic, meteorological automatic, conventional meteorological, automatic
pluviometer, conventional pluviometer and others) there are 292 stations, with up to 21 years of data available, which
increases the density to 1 station in 194 km2, on average (Banco Mundial, 2014). Out of this total, the majority of the stations
are conventional pluviometers, working on manual basis (manual information collection).
73
federal and state government levels. There are several institutions who could jointly implement this
system. These institutions include, among others:
Water and Sewer Company of Paraiba (CAGEPA);
National Monitoring Center and Natural Disaster Alerts (CEMADEN);
Executive Agency of Water Management of Paraiba (AESA);
National Institute of Meteorology (INMET);
National Water Agency (ANA);
National Institute for Space Research (INPE/CPTEC);
Brazilian Company for Agriculture and Livestock Research (EMBRAPA);
Brazilian Institute of Geography and Statistics (IBGE);
Semiarid National Institute (INSA);
The Secretariat for Agriculture, Livestock and Aquiculture Development of Paraiba (SEDAP);
Municipalities and the extension workers of the State Company for Technical Assistance and
Rural Extension (EMATER-PB);
Company of Agricultural Research of Paraiba.
38. The density of the stations should be increased. In order to overcome this problem, AESA is
submitting a project proposal to the World Bank which includes the purchase of around 20 automatic
agro-meteorological stations. The acquisition of these instruments will ensure speed and quality of data
collection. In addition, AESA needs to be strengthened with trained personnel in order to guarantee the
operation of a database management system that processes and storaes high quality data and
information.
39. Furthermore, a committee for the coordination of drought mitigation should be consolidated. The
main objective of the committee would be to improve synergy and integration of efforts, inter and intra-
institutional, in order to increase the efficiency of drought mitigation public policies and shift its main
focus from reactive activities to emergency preparedness. The committee should consolidate and
disseminate information concerning the implementation of the risk management policies and encourage
the elaboration of technical reports to support the public decision makers. The drought committee could
be part of the State Secretariat for Planning and Management (Secretaria de Estado de Planejamento e
Gestão - SEPLAG).
40. The development of the agro-climatic risk information system is fundamental for proper
operations of programs such as Garantia Safra and PROAGRO MAIS. Both programs rely on weather
information to operate. Further to the database improvements, Garantia Safra in Paraiba requires
strengthening of extensionist drought assessment skills. The methodologies adopted to evaluate the
drought losses are not standardized. Moral hazard issues may arise because of the aforementioned
limitations.
74
Main elements of the ACIS
41. The strategy would comprise the following elements:
42. Development of Agroclimatic Risk Information System in the State of Paraiba. The Executive
Agency of Water Management of Paraiba (AESA) manages the actual set of weather stations but there
are some difficulties to overcome, including expanding the monitoring coverage. Technical and
institutional issues should be taken into account in order to improve the existing infrastructure and
operation. The short term suggestion would be to develop an agro-climatic information system that
should integrate other databases such as the INMET, CPTEC and ANA databases, with the purpose of
improving data quality by standardizing the computational, agrometeorological and statistical
procedures.
43. Another important issue is to strengthen the operational capacity of AESA by increasing the
number of specialists in its staff. The hiring of personnel by AESA would be important to guarantee the
correct execution of the aforementioned procedures and reduce errors in data collection and generation
of useful information to a minimum level.
44. The system would comprise the following products and information: agro-climatic bulletins,
maps and tables of precipitation, accumulated precipitation, drought, water availability in the soil,
weather forecast. The direct benefits to farmers and agents in the state agribusiness would concentrate in
the updated information regarding the weather and its impact on agriculture. The decision making
process would be more efficient and based on a reliable agro-climatic system.
45. The plan of action in the next chapter contains the specific actions for implementing this
strategy.
46. Strengthening the Drought Management Committee. One of the main beneficiaries of the
development of an ACIS would be the state drought committee. ACIS would support the members of
the committee to create risk management tools and elaborate efficient public policies into more
proactive and less reactive actions. The drought committee could be composed by the State Secretaries
and the top leaders of government institutions in areas linked to the drought risk management policies.
47. Training of EMATER-PB extensionists on drought impact assessment. EMATER-PB’s
extensionists are responsible for the enrollment of family farmers in the Garantia Safra program and,
also act as a claim adjuster to verify the losses in the affected municipalities when drought occurs. About
87% of the inspection reports are carried out by the EMATER´s extension workers.
48. The Paraiba State Company for Technical Assistance and Rural Extension, EMATER-PB, has
faced financial and operational difficulties (see AIS discussion below) and its field personnel is not
completely able to properly assess the drought impact for Garantia Safra when required.
49. This step demands improved training (claim adjustment). Taking this fact into account the
recommendation is to develop a short term technical courses for the extension workers. The courses
75
would be focused on operational, agronomic, climatic and geotechnological aspects of the Garantia
Safra program. Extensionist training can be supported by State universities and experts from research
and education institutions40.
Sanitary and Phytosanitary Systems
50. Poorly managed pests and diseases are important risks for all agriculture supply chains
considered during the assessment. However, the nature and extent of their impact varies significantly
from one supply chain to another. Annex 6 provides detailed background information. Animal sanitary
quarantine risks are relatively minor in Paraiba but there are still a few issues that require improvement.
Phytosanitary Issues
51. There are two agricultural sanitary bodies in Paraiba, SEDAP and MAPA. Operational actions
directly conducted by MAPA are limited, as its attributions are normally focused on interstate and
international markets. The program run by SEDAP faces several structural limitations to comply with
the diversity of challenges on both plant and animal health. Among these, the following are noteworthy:
budgetary, personnel, transport, laboratory and infrastructure constraints. As regards personnel, the
problem is not only the reduced number but also the poor training of the professionals. In turn,
coordination with the federal body (MAPA) is present and fluid. As regards state official partners like
EMEPA and EMATER there is a need for more integration and coordination as is the case with the
private sector, in order to reach more efficient results out of the single actors’ programs.
52. Studies and negotiations have been set up to create an autonomous State Agency with the
mission of protecting the agriculture and livestock of Paraiba from sanitary risks, as well as safeguarding
the environment and public health. This Agency should have normative and operational functions and
would run not only structural activities (quarantine, surveillance, sanitary education, traffic control,
pesticide inspection), but also the transitory programs like targeted pest eradication. It is strongly
recommended that the studies and negotiations be speeded up in order to solve present institutional and
organizational problems, like autonomy, budget and personnel.
53. The State Board for Agriculture Defense (Conselho Estadual de Defesa Agropecuária - CEDA)
is an advisory body to SEDAP on agricultural health issues, and it is composed by representatives of
government institutions and of the private sector. According to reports from the State Secretary and
officials of the Agricultural Health Program of SEDAP, the CEDA is not acting according to the
conceptualization that supported its creation, and should be reoriented to effectively discuss and give
advice on priorities, programs and operational actions. The creation of the State Agency would be an
40 The following universities have capacity to participate in the training program: the Federal University of Paraiba (UFPB),
the State University of Paraiba (UEPB) and the Federal University of Campina Grande (UFCG), counting on the support of
the State Secretariat for Agriculture, Livestock and Aquiculture Development (SEDAP), municipalities and EMATER-PB,
besides the universities from other states such as the University of São Paulo (USP/ESALQ), and Federal University of
Viçosa (UFV), the Federal University of Lavras (UFLA), and EMBRAP A.

76
excellent opportunity for an overall discussion on the role of each stakeholder, including the
composition, attributions and operationalization of the CEDA.
54. It is also strongly recommended to develop deeper integration of SEDAP (and the future
Agency) with the private sector, both to implement cooperative programs and to support producer
initiatives. In the case of substitution of chemical control, there are several opportunities, like supporting
present capacity expansion of the of Sugar Cane Growers Association of Paraiba (Associação de
Plantadores Cana da Paraíba – ASPLAN) to produce biological control agents for the sugarcane
plantations. Another opportunity is the expansion of the substitution of palma forrageira varieties
presently grown for resistant ones, where cooperatives, associations and other producer or civil
organizations can contribute in order to reach more ambitious targets in reduced time.
55. Active phytosanitary surveillance can also be designed to include the private sector, in particular
farmers, especially regarding exotic pests. This action should be concatenated with sanitary education
programs, to enhance consciousness of the risk of new pests, and with training to better monitor and
early identify new pests. This would increase the probability of success in focused sanitation and pest
eradication.
Animal Sanitary Issues
56. Animal health in the state of Paraiba can be ranked as relatively good. Meanwhile, some
shortcomings and improvements can be mentioned, regarding animal feeding, quarantine and other
diseases as well as institutional issues. The details are contained in the Volume 1: Risk Assessment and
the proposals are made in the following section.
Sanitary and Phytosanitary Risk Management Strategy
57. The focus of the phytosanitary and sanitary risk management strategy is to avoid or delay the
occurrence of the risk event and manage the impact in the event of occurance. In particular avoiding or
at least delaying the appearance of exotic pests and animal diseases. The major actions are sanitary
education, surveillance, transit control and eradication. Detailed actions recommended for each one of
the supply chain categories follow:
Sugarcane
a) Expand the production of biological control agents to supply the autonomous cane growers’ potential
demand.
58. Scope: To control the broca do caule and cigarrinhas da cana with biological control agents,
reducing the damage to the crop, production costs and negative environmental impacts.
59. Beneficiaries: Autonomous sugarcane growers.
60. Institutional framework: ASPLAN presently operates a commercial scale laboratory for
producing biological control agents, but its capacity is restricted and roughly meets 30-40% of the
77
potential demand from the growers. The expertise is available in the laboratory but physical expansion is
needed.
61. Connection with national policies: There is strong incentive and support from MAPA to
implement Integrated Pest Management Programs, which includes the use of biological control agents.
62. Potential benefit: For each 1% infestation of the broca da cana, there is a reduction of 0.77% of
the weight of raw cane, 0.25% in sugar yield (35 kg / ha) and 0.20% in alcohol yield (30 L / ha),
according to Gallo et al., 2002. For biological control, wasps (Cotesia Flavipes) are released in the cane
fields at an average of 6,000 adults / ha / year (Biocontrol, no date). In addition to positive
environmental impact, biological pest control has economic advantages. The price per hectare of
applying insecticides averages R$ 42.00, while the biological control with Cotesia Flavipes, this cost is
approximately R$16.00 (Usina Jalles Machado, no date).
63. The losses attributed to the leafhoppers are due to the extraction of sap in the leaves and roots of
sugarcane by adults and nymphs, respectively, and the injection of toxins by adults during the suction
process. The attack of this pest can result in losses in crop yield ranging from 15% to 80%, reduction of
the quality of the raw material with reductions of up to 30% sugar content. In addition, there may be
contamination problems in the manufacturing process due to sugarcane deterioration in the field
(Claudimir Penatti, Socicana, 2006). Biological control of leafhoppers with the fungus Metarhizium
Anisopliae is made using ca. 500 grams of pure conidia or the equivalent of 2-10kg of commercial
product per hectare. The cost of biological control can reach up to R$ 40.00 per hectare (Terezinha
Monteiro dos Santos Cividanes, personal information41), which is normally equivalent to 10% of
chemical control cost (Batista Filho, 2002).
64. Actions planned for the short and medium term are as follows. In order to determine the
feasibility of expanding the present ASPLAN facilities for the production of biological control agents, it
is proposed to: determine the present demand of biological control agents and forecast the demand for
the next 10 years; identify the investments and recurrent resources needed for the expansion of present
laboratory facilities, in order to supply potential demand; establish the unitary costs (per hectare) of
biological control according to the projections of the expanded facilities, compared to present
technology (chemical control); organize a workshop and complementary actions, with interested
stakeholders, to discuss the expansion of the biological control agents; decide the next steps, including
providing the necessary funds, final expansion projects and chronogram.
b) Establish the risk and the impacts of the possible introduction of ferrugem laranja in the state of
Paraíba.
65. Scope: Inform the Government, sanitary institutions, associations, private sector, growers and
other stakeholders of the negative impacts of the possible introduction of ferrugem laranja.
41 Terezinha Monteiro dos Santos Cividanes, Pesquisadora – Entomologia. APTA - Agência Paulista de Tecnologia dos
Agronegócios, Ribeirão Preto – SP. E-mail: [email protected], URL www.apta.sp.gov.br
78
66. Beneficiaries: Government, growers, sugarcane processors, sugar exporters, alcohol distributors.
67. Institutional framework: SEDAP has the institutional and organizational conditions to perform
this action.
68. Connection with national policies: There is a permanent quarantine service at federal level to
avoid or minimize the risks of the introduction of exotic pests, along with surveillance and quarantine
pest control services.
69. Potential benefit: Based on the study of Zuza & Borsato (2011), losses in TAH (tons of total
reducible sugars per hectare) on sugarcane fields attacked by the ferrugem laranja were estimated at
18.82% (-2.19 TAH) for the second cut, 41.02% (-4.85 TAH) for third cut and 33.06% (-3.62 TAH) to
the fourth section, an overall average of 30.97%. Economic losses at field level were calculated to be
R$94.69 per hectare. There are no fungicides which might avoid its damages and losses registered in
Brazil (control of this disease).
70. Actions planned for the short and medium term: Carry out a study to establish impacts
(agronomic, sanitary, economic, social, environmental and trade-related) in the case of ferrugem laranja
introduction in the state of Paraíba.
c) Set up a task force and a voluntary monitoring network to minimize the risk of introduction of the
ferrugem laranja.
71. Scope: To protect the State against the introduction of the ferrugem laranja and be prepared for
its eventual introduction.
72. Beneficiaries: Government, growers, sugarcane processors, sugar exporters, alcohol distributors
73. Institutional framework: SEDAP has the institutional and organizational conditions to perform
this action.
74. Connection with national policies: There is a permanent quarantine service at federal level to
avoid or minimize the risks of the introduction of exotic pests, along with surveillance and quarantine
pest control services.
75. Potential benefits: There are two major benefits. First of all, if the stakeholders are fully
organized, focusing on minimizing the risk of introduction, all risky anthropic actions will be avoided or
adequately performed. Secondly, just in case of an eventual introduction, there is a large probability of
early detection, a key factor for the success of eradication measures.
76. Actions planned for the short and medium term: identify all stakeholders, especially technical
assistance professionals, growers and its associations, cane processors, transporters among others;
prepare a surveillance plan and a long list of risky actions that might facilitate pest introduction, and the
correct procedures for each one of these actions; organize a workshop with the major stakeholders and
79
smaller meetings in sugarcane production regions, to implement the plans; set up an information
services.
Fruticulture
a) Establish the risks and be aware of the impact of the possible introduction of the diseases sigatoka
negra and moko (bananas), cancro da videira and HLB (Citrus).
77. Scope: Inform the Government, sanitary institutions, associations, private sector, growers and
other stakeholders of the negative impacts of the introduction of these diseases in Paraíba.
78. Beneficiaries: Government, growers, processors and consumers.
79. Institutional framework: SEDAP has the institutional and organizational conditions to perform
this action.
80. Connection with national policies: There is a permanent quarantine service at federal level to
avoid or minimize the risk of exotic pests introduction, along with surveillance and quarantine pest
control services.
81. Potential benefits and losses: Minimizing the risk of pest entry will avoid the losses caused by
the diseases, as follow: Sigatoka negra is a disease with a potential to completely destroy banana
plantations. Fungicide control of the pest is quite expensive and places negative hazards or impacts upon
the environment and public health; Moko is a disease caused by a bacteria attacking the whole plants.
Losses can reach up to 100% of the fruits; Cancro da videira is a bacterial disease which reduces both
the production and commercial quality of grapes; HLB is recongnized as the most destructive disease
affecting citrus. There is no curative control for the affected plants (which must be eradicated).
82. Actions planned for the short and medium term: carry out a study to determine the risk of an
eventual introduction of the diseases sigatoka negra and moko (bananas), cancro da videira and HLB
(Citrus) and the impacts (agronomic, sanitary, economic, social, environmental and trade-related) of this
occurrence.
Family Agriculture in the Semiarid
a) Strengthen and improve the program aiming to substitute the older palma forrageira varieties for the
varieties resistant to the cochonilha do carmim, in order to increase the availability of food and water
for the goats or bovine herds during the drought season.
83. Scope: Avoid the yield reduction of palma forrageira due to the attack of the cochonilha do
carmim throughout the semiarid zone.
84. Beneficiaries: Government, rural households in the Semiarid.
85. Institutional framework: Presently, there is a program to substitute the varieties of palma
forrageira, susceptible to the cochonilha do carmim, by resistant ones, developed by EMEPA. The

80
institutions involved in this program (SEDAP, EMEPA and EMATER) have the conditions to elaborate
a study to enhance the program and implement it on a more ambitious basis.
86. Connection with national policies: There are several federal policies targeting the improvement
of the production systems on the semi-arid zone (see under Current Institutional ARM Programs and
Policies above).
87. Potential benefits and losses: During the drought season, herds are adversely affected by the
shortage of fodder and water, reducing their weight, meat quality, sometimes leading to death or
imposing unplanned selling of the animals to avoid even larger losses. Availability of staple fodder like
palma forrageira, which also is an important source of water for the animals, will substantially reduce
the animal losses, enhancing the households’ income.
88. Actions planned for the short and medium term: determine the need of raquetes (palma
forrageira basic propagation material) needed to completely substitute the presently grown varieties,
susceptible to the cochonilha do carmim, by resistant ones; establish a chronogram and the resources to
be allocated for the production and distribution of raquetes.
Livestock Production Chains
a) Reinforce the program for control and eradication of brucellosis and tuberculosis.
89. Scope: Reduce economic losses, and, health and social impacts of these diseases throughout the
State.
90. Beneficiaries: Growers, consumers and the entire society.
91. Institutional framework: There is a program for eradication of livestock diseases in Paraiba run
by the State Government, in close coordination with the Federal Government and the private sector.
92. Connection with national policies: There is a national program aiming to the eradication of both
brucellosis and tuberculosis, and state programs that are conducted under this framework.
93. Potential benefits and losses: According to Lilia Paulin42, brucellosis43 can cause a decrease in
meat production by 10%-15% and expand the interval between pregnancies between 12 to 20 months. It
also causes 30% increase in animal replacement rate, 15% drop in the birth of calves and decrease of
10%-24% in milk production. In addition, brucellosis can expose the product to sanitary barriers, which
reduces the competitiveness in international trade. Similar consequences occur with tuberculosis, being
the losses related to animal weight loss, delay in first lactation, reduced number of lactation, shorter
42 Lília Paulin, scientific researcher at the Instituto Biológico, Centro de P&D de Sanidade Animal.
[email protected]. 43 The International Organization for Animal Health (OIE) classifies brucellosis as List B disease, meaning diseases that have
socio-economic and / or public health importance and significant consequences in international trade in animals and animal
products.
81
duration of lactation, economic losses by the sacrifice of positive reacting animals, barriers to national
and international trade and the possibility of contamination and transmission to humans.
94. Actions planned for the short and medium term: evaluate the present implementation of the
eradication programs, specially identifying its gaps and deficiencies; implement appropriate actions for
enhancing the current programs, including operational actions, advertisement, sanitary education,
training and capacitation of stakeholders, and continuous follow up and evaluation.
b) Strengthen the coordination of the animal health services and programs, including food safety
programs, in order to rationalize the veterinary and public health protection services.
95. Scope: Reduce the cases of non-conformity of processed animal products for human
consumption in the State of Paraiba.
96. Beneficiaries: Growers, processors, Government, consumers.
97. Institutional framework: There are several federal and state institutions involved in the inspection
of animal slaughter and animal product processing, with some degree of overlapping and lack of
coordination. There is need to involve the different actors (SEDAP, State Agency for Sanitary
Surveillance - AGEVISA, CAISAN, veterinary services of the municipalities) under the leadership of
the National Secretary for Agriculture and Livestock Health (Secretaria Nacional de Defesa
Agropecuária - SDA/MAPA) represented by the local MAPA office.
98. Connection with national policies: There are national programs for inspection of slaughter
houses and food processors, as indicated in the paragraph above.
99. Potential benefit: Reduced cases of non-conformity of animal products, reduced risk to the public
health, reduced economic losses and market barriers. There are no available estimations of financial
benefits that would derive from better animal health services coordination.
100. Actions planned for the short and medium term: Organize round tables involving animal
slaughter and food processing inspection; develop, agree and approve a common program; develop
coordination mechanisms; organize annual workshops for following up the implementation of the
common program and coordination mechanisms.
c) Establish the actual status of Classical Swine Fever (CSF) and Newcastle Disease Virus (NCDV) in
Paraiba and the measures to reach or maintain the pest free area status. as the last outbreak in the state
was recorded in 2006.
101. Scope: Reduce the potential economic and trade related losses, and, the negative impact on
public health.
102. Beneficiaries: Farmers, processors, consumers, Government.
82
103. Institutional framework: SEDAP is responsible for the official veterinary services in Paraiba,
including surveillance, eradication of animal diseases and to reach and maintain the disease free area of
the State.
104. Connection with national policies: There are national programs to eradicate, reach and maintain
CSF and NCDV free areas in Brazil, to which the state programs are subordinated.
105. Potential benefits and losses: Reduced cases of non-conformity of animal products, reduced risk
to public health, reduced economic losses and market barriers.
106. Actions planned for the short and medium term: conduct epidemiological surveys regarding CSF
and NCDV on the swine and poultry herds, respectively; take the appropriate actions according to the
results of the surveys, in case of virus presence; submit official bid for certification of area free of CSF,
NCDV or both.
d) Besides the exposed above, it is necessary to integrate EMEPA, universities and EMATER-PB to
develop alternatives and promote the use of fodder species suitable for the semiarid areas, for extensive
consumption and for silage. In addition, it is recommended to toughen the traffic control barriers and
the surveillance systems to support the free area condition of Paraiba for Foot and Mouth Disease
(FMD) and Highly Pathogenic Avian Influenza (HPAI).
Supply Chain Coordination
Market Risks and Opportunities
107. Pineapple and banana are among the fruits that are most largely produced and traded in Paraiba.
Both are produced mostly for export outside the State. The inter-annual price variation is high and
largely responds to the changes in production and traded volumes (see Volume 1: Risk Assessment).
This price volatility, which is higher than the average volatility, results in production inefficiencies and
limits the commercial development opportunities for individual farmers, mostly family farmers.
108. There is a close relation between production and trade volatility, the poor supply chain
coordination and the limited access to adequate market information of most small scale fruit producing
farmers. Moreover, the incipient farmer organization in Paraiba is a contributing factor to the poor
supply chain coordination among the fruit producers in Paraiba.
109. Closer farm to market coordination and stronger farmer organization are the most evident ways
to cope with this situation. There are positive market coordination experiences that can be replicated
with the appropriate support. Among them it is worth to mention the pineapple producing and marketing
cooperative at Santa Rita, illustrated in the Text Box 2.
Text Box 2. 2: Santa Rita Pinneapple Production Cooperative
This cooperative was born in 1999 due to the need of a group of small scale pineapple producers
(43 now) to access a market that guarantees stable demand for their produce, proper price

83
discovery and contract enforcement. Up to the Cooperative creation, most of the prospective
farmers sold their produce to local middlemen or to buyers in the consumer markets outside
Paraiba. They used to face high price volatility and serious problems to enforce the contracts. By
doing business with the Bolsa de Hortifrutigranjeiros, Cereais e Produtos Agropecuários do
Estado de Pernambuco (BHCP) the now associated farmers had the opportunity to access an
organized and transparent market. The prices are negotiated in a transparent manner and reflect
the national and international markets. The BHCP also provides insurance on the products
shipped, normally to Sao Paulo and other states in the central part of Brazil, and provides a legal
framework to guarantee payment. The prices obtained are not always the highest in the region
but there is a high degree of certainty about the business environment and, therefore, farmers
have managed to make investments and plan for the medium and long term. The cooperative also
receives permanent technical assistance from EMATER-PB, and that is possible because they are
organized as a group. The members of the cooperative feel they are better off now and in a
position to plan and undertake on farm investments.
110. The Local Productive Systems (Arranjo Produtivo Local - APL) approach has been encouraged
in Brazil and, in particular, in Paraiba. It is another background type of business development experience
to look at. APLs are a sort of cluster approach. APLs are regarded as articulations among supply chain
actors for mobilizing resources (credit, technology), facilitate marketing and in general promote greater
economic dynamism and less volatility.
111. For instance, the case of the citrus APL in Paraiba, the organizational structure is comprised of
governmental and non-governmental organizations, private companies, farmers associations and a
cooperative (Coopertange) which is the center of the APL. In the inner circle are the several farmers
associations in the different municipalities that are part of Coopertange, in the second circle are the
support infrastructure (EMATER, EMAPA, Universities, CONAB, banks, etc.), in the third circle are
the companies providing inputs, transportation services, packing, machinery maintenance, etc. However,
in spite of this well-structured organization there are no specific provisions for the market and marketing
issues. In that regard, there is an opportunity for assessing the APLs in Paraiba and identifying possible
areas of cooperation for improving the marketing components. In effect. APLs tend not to include a
marketing component.
112. In addition, there are business opportunities arising from procurement and policy stabilization
policies and programs managed by CONAB in Paraiba, specially PAA and National School Feeding
Program (Programa Nacional de Alimentação Escolar – PNAE), that could be incentivized through
appropriate technical assistance services and credit facilities.
113. Small farmers are particularly vulnerable to weak food markets and price volatility. The PAA
aims to support family farmer production and their access to market through simplified public
procurement procedures, and to distribute food in quantity, quality and regularity necessary to food-
insecure groups. Fundamentally, the PAA directly addresses one of the central challenges in family
farmer production: commercialization. Through State intervention it increases demand for smallholder
84
food production. The PAA is a potentially important factor in expanding production for families
participating in the program as well as for strengthening the collective organizations.
114. PNAE, Brazil’s school feeding program, is the other major source of structured demand for
family farmers. Purchase from family farmers also aims at promoting local development and
complements the income of family farmers. PNAE’s procurement objectives, however, include both
price and the quality of food and the seasonality of production at local level. Therefore, it offers a stable
demand if the quantity, quality and continuity requirements are met.
115. Family agriculture farmers have the opportunity to organize themselves in associations to
participate in the CONAB’s procurement projects (PAA and PNAE). They provide primary products
and add value to their primary products by introducing some processing and incorporating adjustments
in the production process that improve the quality of the products. By doing so organized family
agriculture farmers can access to CONAB procurement and financial facilities. As was expressed by
CONAB’ managers in Paraiba, there is unmet demand and enough budget resources to increase the
buying programs. The opportunities include fruit processing, chicken abattoirs, milk and dairy, etc., in
addition to obtaining quality certifications mostly for animal products.
116. After a while beneficiary farmers can also access commercial market segments that are currently
outside their reach. In fact, CONAB’s projects offer a fixed price and a procurement long timeframe that
usually exceeds one year, in addition to financial resources, allowing for the groups to consolidate their
organization and technical skills before attempting to access the open market. This production and
marketing upgrade, however, requires strong technical assistance services. The discussion on the
Agricultural Innovation System below is relevant.
117. Cooperar made instruments available for market development through its cooperation program.
Cooperar participation in market development will be extensively expanded under the next phase (under
preparation) and the following actions can complement the initiatives already being planned.
Market Strategy
118. The ARM strategy proposed comprises actions aimed at reducing excessive fruit price and sales
volatility faced by family farmers, and, supporting them to take advantage of market opportunities
provided by the federal and state policies and programs. Both actions require technical assistant services,
availability of credit resources and market development support, involving EMATER-PB, Project
Cooperar II and other development projects, the APL initiative, etc.
119. COOPERAR will support a competitive mechanism for supporting small-scale producers,
including: identification of market opportunities, development of business plans in conjunction with
public and private purchasers, co-financing of investments and technical assistance to producer
organizations and capacity building of producer organizations.
120. The following are other recommended actions:
85
a) Make an inventory of farm to market experiences in Paraiba like the one involving pineapple
producer in Santa Rita described above (Text Box 2.2).
b) Identify value adding activities for family farmer groups that can be developed as projects for
CONAB’s managed PAA or PNAE, carried out in cooperation between CONAB and SEDAP.
c) Investigate successful APL experiences in the State of Paraiba seeking to identify initiatives that
require additional support to strengthen market coordination.
d) In cooperation with EMATER-PB, and within the framework of the Agriculture Innovation
System explained in next section, develop a methodology to support family farmer organizations
to develop business plans regarding activities such as fruit processing, packaging, chicken
abattoirs, etc.
e) Assess different market development support options for family farming products, including
establishing market space facilities in places like Campina Grande or Patos, as is being planned
by the Paraiba State Company for Supply and Agriculture Services (Empresa Paraibana de
Abastecimento e Serviços Agrícolas – EMPASA), channel public resources through Project
Cooperar to transfer resources to farmer organizations for establishing and managing marketing
infrastructure, etc.
f) Analyze the legal implications of the above proposal, in particular with respect to the possibility
of transferring public funds to farmer organizations, and proposal elaboration regarding
Cooperar.
Agricultural Innovation System (AIS)
Current Research and Extension Institutional Framework
121. There are several institutions (see list below) that generate technological innovations for the
semi-arid region, both at state and regional level. From the analysis of the major programs and projects
of these institutions and interviews with different stakeholders, the issue of a lack of inter-agency
coordination arises. Many times, there is a repetition of research topics without the certainty that the
tests carried out on the same topic in other research centers are taken into account.
122. The current coordination between the research and the extension agencies also seems to be
insufficient; to enable producers to have better risk management, it is necessary to strengthen the
coordination among the institutions in charge of technology generation, and between these and the ones
in charge of technologic transfer to family farmers.
123. In regard to technical assistance, the several projects and programs that provide technical
assistance to family farmers are unsystematic and limited in terms of geographic coverage and
recipients. Currently family farmers who receive technical assistance are a minority, and their number is
not expected to increase significantly in coming years. It was also verified that the coordination among
technical assistance providers is limited, the same as occurs between the research and the extension
agents.

86
124. The technical assistance services should be improved, both qualitatively and quantitatively. The
quality of technical assistance refers both to the content of technological packages issued and to the
methods and methodologies used to provide technical assistance. It also alludes to the coordination that
must exist, not only among the group of institutions that provide technical assistance, but also with the
other institutions that are a part of the agriculture innovation system in Paraiba (basically the previously
mentioned research institutions).
125. The capacity of EMATER-PB to provide agricultural extension services is low and requires
improvements. Bascially, the only transfer channel family farmers have is the public technical assistance
service. EMATER-Paraiba currently assists 30% of Paraiba’s family farmers (approximately 40-45,000
producers, out of a total of more than 148,000 family farmers), and is not ready to expand its coverage
with its current technical staff.
126. On the other hand, there are other technical assistance providers in the State, mainly non-
governmental organizations (NGOs). By way of example, the National Institute for Colonization and
Agrarian Reform (Instituto Nacional de Colonização e Reforma Agrária – INCRA) hires private entities
for the provision of technical assistance and extension services to the families living in their settlements
(there are more than 300 settlements in Paraiba, with 14,500 families in total). SEDAP has also hired
NGOs to develop some programs. COOPERAR is conducting a survey on potential technical assistance
providers in the State, as well as to explore other non-public extension modalities.
127. According to several stakeholders, technical assistance provided by these NGOs is not good
(some say the same of EMATER) and disagreements exist between EMATER-PB and NGOs. In any
case, it is clear that the vast majority of family farmers will still depend on the efficiency of the technical
assistance and agricultural extension public system.
128. Faced with the current limitations that hinder technical assistance universalization for the vast
number of family farmers in Paraiba’s Semi-arid, it is necessary to carry out a detailed analysis for
understanding the technological requirements by the different types of farmers. It is necessary to define
the most appropriate technological solutions for each group of farmers, to identify the percentage of
them who can get involved in profitable agricultural activities, etc. It would be very inefficient to
propose uniform solutions for such a heterogeneous rural population.
On the Need for a Working Agriculture Innovation System
129. According to the World Bank (2012), "an innovation system is defined as a network of
organizations, enterprises and individuals focused on bringing new products, new processes and new
forms of organization into social and economic use, together with the institutions and policies that affect
their behavior and performance. It embraces science suppliers as well as the totality of actors and
interactions involved in innovation. It extends beyond the creation of knowledge to encompass the
factors affecting demand for and use of knowledge in new and useful ways."

87
130. An Agriculture Innovation System (AIS) does not exist as such in Paraiba, since the
organizations that provide services are not structured as a network and they are not minimally
coordinated. The system has to be created, but it is useful to refer to it as a consolidation of categories of
analysis. The components of the System would be the institutions responsible for knowledge generation,
i.e. research centers; the institutions responsible for transferring that knowledge to end-users, i.e.
technical assistance and extension agencies; and those in charge of training producers.
131. In Paraiba, and with focus on family farming, the institutions involved in the agriculture
innovation system would need to be: (i) on the research side, the EMEPA-PB, INSA, EMBRAPA-
Semiárido, and to a lesser extent EMBRAPA-Algodão, EMBRAPA-Mandioca e Fruticultura and the
Federal University of Paraíba in the Center of Agricultural Sciences (Centro de Ciências Agrárias -
CCA/UFPB); and (ii) on the side of technical assistance, extension, and training of family farmers, the
EMATER Paraíba, some NGOs, universities, private providers and externally funded projects, as
Cooperar (World Bank) and Procase (IFAD). And regarding institutions not related to semiarid,
ASPLAN (Associação de Plantadores de Cana da Paraíba) deserves to be mentioned; it carries out
technical assistance activities for micro and small sugarcane planters who pertain to family farming.
Main Elements of the Agriculture Innovation System Related ARM Strategy
Improve coordination of the Agriculture Innovation System for family farming ARM
132. As mentioned above, there is need for a strategy focused on the improvement of the agriculture
innovation system efficiency and coordination. It is absolutely necessary to establish and/or strengthen
inter-agency coordination mechanisms, based on a state policy, clear priorities and the allocation of
resources. This requires short and medium-term measures.
133. Currently, there is the State Board of Sustainable Rural Development (Conselho Estadual de
Desenvolvimento Rural Sustentável - CEDRS), chaired by the Secretary of the SEDAP (Secretaria
Estadual de Desenvolvimento Agropecuário e da Pesca), and composed of representatives of the main
public entities who support rural development and family agriculture, like the MDA, EMATER,
INTERPA, SEDAP, Federal Economic Bank (Caixa Econômica Federal – CEF), Banco do Brazil,
Banco do Nordeste, Projeto Cooperar, CONAB, INCRA and other Secretaries of State, as well as the
institutions that represent farmers the most, such as the Agricultural Workers Federation (Federação dos
Trabalhadores na Agricultura - FETAG), Agriculture and Livestock Federation of Paraiba (Federação
da Agricultura e Pecuária da Paraíba – FAEPA), Paraíba Rural Producers Union, Landless Rural
Workers Movement (Movimento dos Trabalhadores Rurais Sem Terra – MST), Articulation of Paraiba
Semiarid (Articulação do Semi-árido Paraibano - ASA/PB, and NGOs from other segments of civil
society. Given its current integration it is a deliberative and consultative body, with poor executive
functions, but with the appropriate adjustments it could constitute the right agriculture innovation system
coordination framework.
134. In order to better focus the actions of CEDRS in the agriculture innovation system, it would be
necessary to create a sub-council or a similar organ that can bring together the institutions that are part
88
of the agriculture innovation system in a coordinated way. At present, an internal committee was created
to propose amendments to the CEDRS regulations in order to become more executive. This could be a
good opportunity to make detailed proposals on the agriculture innovation system sub-council
integration, definition of roles and interrelations, establishment of procedural rules and to appoint an
Executive Secretary. With this general framework in place, it would be possible to formally create the
Paraiba Agricultural Innovation System.
135. In addition, it will be necessary to implement measures for the internal coordination of the two
sub-systems: one in charge of research, and the other one in charge of technical assistance and
agricultural extension. The research sub-system will consist of state and regional institutions. Among the
state institutions, the most relevant is EMEPA-PB, which has been strengthened in recent years after
undergoing a weakening period. It currently works on adaptive research and technology related solutions
for family agriculture and agribusiness (several of those solutions aim at the coexistence with semi-arid)
by way of nine Experimental Stations. EMEPA-PB seems to have constant relation and coordination of
activities with the research centers of EMBRAPA, but that is not the case with INSA, which is a federal
research institution focused on the Brazilian semi-arid.
136. INSA44 could have an important role in the coordination and organization of the technology
generation activities in the Semi-arid. However, the approach taken by INSA seems to have been mostly
oriented towards research, putting aside the role of organizer or coordinator. In the technician
interviews, both from EMEPA-PB and EMBRAPA-Semiarid, it was agreed that INSA mostly works
alone, not interacting with those institutions.
137. Taking into account that no technology generation institution participates in the CEDRS, the
proposed short-term action is that INSA must fulfil its mission as the body in charge of organizing semi-
arid related research and that it should allocate most of its human and material resources to that
assignment. Once the CEDRS is restructured or once the agriculture innovation system coordinating
sub-council is created, with all institutions involved in agricultural research under its orbit, then INSA
could remain as the organizer of the research sub-system.
138. Regarding the technical assistance and agricultural extension sub-system, all its institutions are
part of the CEDRS, so it should be easier to promote coordination. However, as was mentioned before,
according to government officers, the relationship between EMATER-PB and NGOs that provide
technical assistance is not a good one, there are mistrusts and disagreements between both parties. So
until the proposed agriculture innovation system coordinating sub-council is created it might not be
possible to make any progress in the organization and coordination of these institutions.
44 INSA mission is to: "Make inter-agency solutions viable for the fulfillment of actions related to the research, training,
dissemination, and policy formulation to reach sustainable coexistence with the Brazilian semi-arid from the socio economic
and environmental potentialities of the region."
89
Increase Efficiency of the Agriculture Innovation System for Family Farming ARM
139. Apparently, the activities of both EMEPA-PB and EMBRAPA have many simple and validated
technologies in stock or standby, using a set of technologies that reduce vulnerability to drought
(tecnologias de convivência com o semiárido), but that have not been adopted by the farmers. This
means that available technology would not be a constraint for family farmers to improve the production
risk management, mainly in the case of semi-arid. In any case, it would be important to carry out a
survey to gather precise information regarding available technologies for coexistence with the semi-arid,
currently being done in the context of the preparation of Cooperar. The proposal in the short-term is to
make an exhaustive inventory of the available techniques and practices that allow an increase of the
resilience of agricultural systems and to determine the extent of their implementation at field level.
140. To improve efficiency of the research sub-system, it is essential that the different research
institutions do not duplicate research activities and in turn cooperate to potentiate the achievements. This
seems to be the case with the palma forrageira: both EMEPA-PB and INSA conducted researches to
develop varieties resistant to the Cochinilla-do-Carmim (Dactylopius opuntiae) – an hemiptera insect
that damages plants – and to develop micropropagation techniques of the species to produce large scale
seedlings. It seems that EMEPA-PB was the pioneer in these works in the State (using varieties that
were previously tested in Pernambuco), and it is not clear why INSA also dabbled in the same area.
These inefficacies could be solved once a good coordination environment is in place.
141. In regards to technical assistance and extension sub-system a reference is needed to EMATER-
PB (see Text Box 3 with information on EMATER-PB), as the State institution responsible for extension
services. But there has been a significant institutional deterioration in Paraiba, something that is widely
acknowledged. The strengthening of EMATER-PB is key for family farmers and other small and
medium scale farmers to be able to access risk management technology and adopt related practices,
since smallholders are almost unable to access commercial technical assistance suppliers. The new
technical assistance model should not consider EMATER as the sole technical assistance provider.
Family farmers could also receive subsidies to purchase these services in the market.
Text Box 2. 3: EMATER in Paraíba
EMATER was founded in 1975, under the Secretaria da Agricultura e Abastecimento, with the
objective of collaborating with the competent bodies in the formulation and implementation of
technical assistance and agricultural extension policies in the State, and to plan, coordinate and
execute technical assistance and agricultural extension programs. In the 90s it suffered from the
crisis endured by the entire system in Brazil, when the Brazilian Company for Technical
Assistance and Rural Extension (Empresa Brasileira de Assistência Técnica e Extensão Rural -
EMBRATER), the company that led the system, was closed down at federal level. The recent
creation of the National Agency for Technical Assistance and Rural Extension (Agência
Nacional de Assistência Técnica e Extensão Rural - ANATER ) in May 2014, indicates that the
Federal Government wants to promote technical assistance and agricultural extension throughout
the country. Article 19 of Law 12.897 (18.12.2013) authorizes ANATER to sign "specific
partnerships with state bodies in charge of technical assistance and agricultural extension for the
90
execution of services", thus enabling the transfer of resources to state institutions.
142. One of the issues is technical assistance coverage. Currently EMATER-PB assists 30% of the
State’s family farmers with approximately 500 field technicians. But EMATER-PB also performs other
functions that absorb part of its staff time, for example, registration of farmers for the issuance of the
DAP (Capability Statement for PRONAF45), which is required by farmers to have access to subsidized
agricultural credit. Furthermore, field agents do not work under a results-orientation system, their
performance is not measured, and they are not accountable to farmers.
143. Another issue is the limited availability of field technical staff. The company has 15 regional
coordination offices and 213 operating units to deal with the 223 State municipalities (177 belong to the
semi-arid region), but 40 of those units do not have agricultural extensionists in charge at the moment.
The solution proposed by EMATER’s technicians and authorities is to increase the number of technical
staff. In addition, there is the issue of poor specific technical trainings for extensionists, as apparently
was available in the past. Training, update of technical skills and human development are considered
key elements. Extension agents do not have access to updated knowledge and ongoing training.
144. Moreover, 38% of the technicians in the company are retired but still working, and R$ 40 million
are required in order to terminate their contracts. 70% of the staff is over the age of 50. The Secretary of
SEDAP mentioned that in 2015 they will make a call for applications to hire 500 technicians. The last
time they made a call was in 2006.
145. Related to the weaknesses of EMATER-PB is the issue of overlapping functions with EMEPA-
PB. For instance, EMEPA-PB executes small demonstrative projects (mentioned above and in Annex)
financed by the State Fund for Poverty Combat and Eradication (Fundo de Combate e Erradicação da
Pobreza – FUNCEP) (11,200 beneficiary farmers and total financing of R$ 2.6 million). This most
likely happens because EMATER-PB is not capable of providing the technical assistance services.
146. In conclusion, in order to expand the coverage of the extension services, improve program
coordination and effectiveness, upgrade training programs, develop tailor-made ARM programs,
EMATER-PB needs to increase its budget and improve its effectiveness and results orientation, as
current resources and modalities limit the coverage and quality of service.
Improve and Better Target Technical Assistance and Training Programs
147. It is proposed that new technical assistance and training models for technicians and farmers be
tested, promoting trainers training, cascade training, farmer to farmer technology transfer methodology,
farmer contracting, etc. Another proposal is to widen the use of information and communication
technologies (ICT) as a way to reduce costs and reach farmers massively. In this sense the use of cell
45 PRONAF: National Program for the Strengthening of Family Agriculture - Programa Nacional de Fortalecimento da
Agricultura Familiar.
91
phone messaging to transmit technical information should become widespread; and start training
producers through distance education methodologies.
148. An interesting example of appropriate program methodology is the Programa Agente de
Desenvolvimento Rural (ADR), developed by SEBRAE-PB in support of goat farming. The ADRs are
people belonging to the communities that have been technically trained. Each one of the agentes works
with around 20 producers. The program is considered successful46, since it has improved goat
production significantly in the Cariri region, where it originated and currently assists about 1500 family
farmers.
149. At the same time, efforts should be made to put in place private sector based technical assistance
services driven by farmers. There are many NGOs that perform technical assistance and agricultural
extension activities at private level, mainly in INCRA settlements. There are 305 settlements in Paraiba,
with 14.5 thousand families living there. In addition, externally funded rural development projects,
which have been implemented in the State, Procase (IFAD) and Cooperar (World Bank), have hired
technical assistance providers to develop some activities.
150. It is essential that in the future, EMATER programs and operations are well coordinated with
other research and extension institutions working in Paraiba. There is a need to complete a registry of all
technical assistance providers in the State, currently underway in Cooperar, including either private
entities or individuals who may provide technical assistance to family agriculture. This will help identify
available resources and plan a proper coordination between public and private technical assistance
supply for family farmers.
151. Finally, there is the issue of targeted assistance. The 1991 Agricultural Law determined that the
Union must maintain technical assistance and rural extension services publicly provided and free for
small farmers (Primo Junior, J. et al., 2013). But, are all the 148,000 family farmers, especially those in
the semi-arid, may not be economically viable agricultural units that would obtain appropriate benefits
from technology services.
152. One might think that the recurring droughts would motivate migration to urban areas and, thus,
the number of family farmers to decrease over the years. However, the data from the agricultural census
does not confirm such hypothesis. Between 1980 and 2006 the number of all farms remained the same,
while the area registered in the census did not increase. Considering farms of up to 50 hectares in size47
as proxy for family farmers, these increased 11.1% between the last two censuses (1995-2006), while its
total area increased by 11.9%.
46 The team was not able to assess the program directly but there are positive evaluations like “O fortalecimento da cadeia da
caprinocultura como instrumento de desenvolvimento e geração de renda: um estudo de caso no município de Monteiro/PB,
by Gilney Christierny Barros dos Anjos, Universidade Federal de Campina Grande.
47 146,291 in the 2006 census, meanwhile family farms were 148,047. Only in the 2006 census the number of family farmers
(according to the definition of agricultura familiar from Law No. 11326) was estimated.
92
153. The size of almost 60% of the farms with less than 50 hectares is of less than 5 hectares, with an
average area of less than two hectares. It is highly unlikely for a family in the semi-arid to reach the
subsistence threshold if it relies only on the production of a farm of less than 5 hectares, or even worse
of 2 hectares. In the case of livestock production, the average stocking rate for the Caatinga48 area is
around 12.5 ha/Animal Unit (AU)/year, although the verified average stocking rate is around 4.4
ha/AU/year (A. Maia Neto, 2013). It can be argued that smallholder sheep and goat breeding is carried
out with the support of the so-called Fundo de Pastos, areas for collective use where flocks of several
farmers are extensively raised.
154. Even so, it is most likely that these families currently rely more on other sources of income (such
as social assistance and drought and flood compensation programs).49 Therefore, such rural households
may not be very interested in adopting technological innovations requiring additional on-farm
investments, higher recurrent costs, and increased use of labor in the farm, which probably is being used
to generate income from off-farm sources.
155. The most reasonable approach to such a diversity of rural households is to adapt agricultural
extension means and methods to user specific asset situations and market perspective. Therefore, the
proposal is to perform a baseline study to determine the extent of household heterogeneity in the semi-
arid of Paraiba and to have a first approximation to a farmer typology. It will then be possible to have a
better estimate of the number of farmers that have to be targeted with appropriate ARM technological
solutions and approaches. EMATER-PB restructuring should follow these results.
156. Some programs, however, are crucial in the semi-arid, such as the upgrading of Programa Palma
Resistente, and should in any case continue to be a priority. According to EMEPA-PB’s technicians, the
Programa Palma Resistente has a demand of 60 million rackets and is expected to produce 13 million in
its second phase next year.
48 Caatinga is the prevailing biome in the semi-arid. 49 Retirements, Bolsa Familia, etc. State transfers from pensions and social assistance programs provide a substantial part of
families' incomes and allow food to be purchased outside the household. State transfers for old age pensions and Bolsa
Família serves to diversify the poor's portfolio and buffer the direct effects of drought.
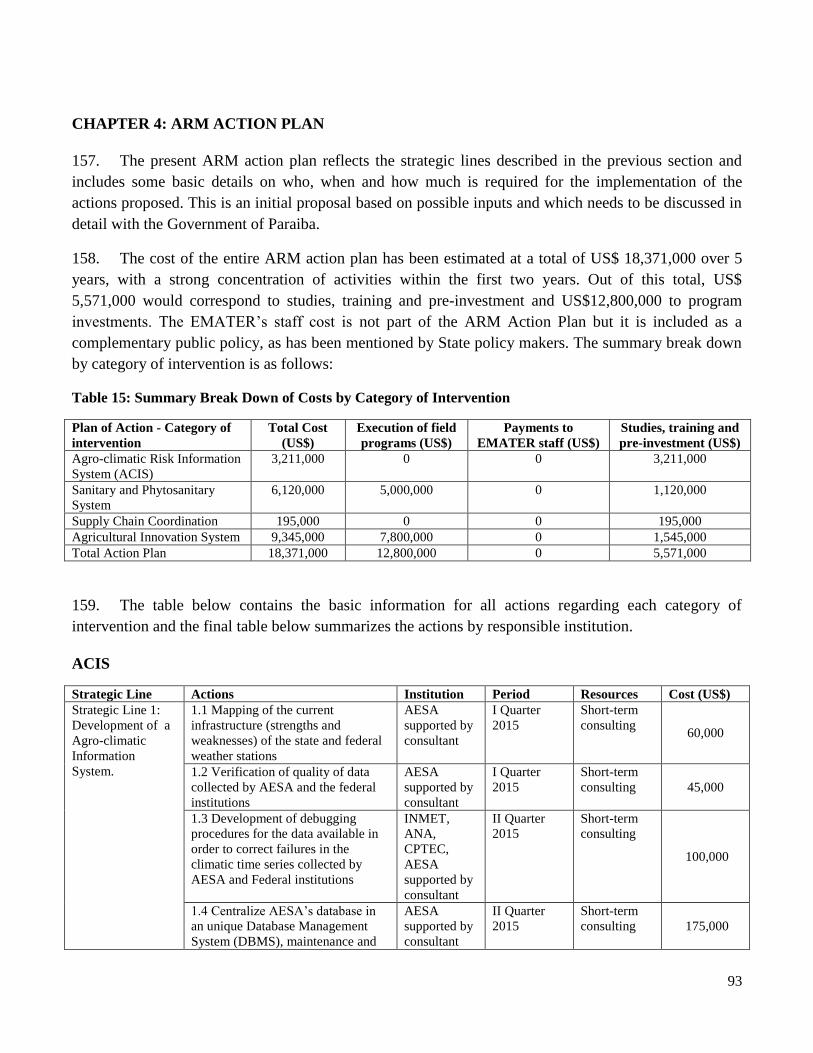
93
CHAPTER 4: ARM ACTION PLAN
157. The present ARM action plan reflects the strategic lines described in the previous section and
includes some basic details on who, when and how much is required for the implementation of the
actions proposed. This is an initial proposal based on possible inputs and which needs to be discussed in
detail with the Government of Paraiba.
158. The cost of the entire ARM action plan has been estimated at a total of US$ 18,371,000 over 5
years, with a strong concentration of activities within the first two years. Out of this total, US$
5,571,000 would correspond to studies, training and pre-investment and US$12,800,000 to program
investments. The EMATER’s staff cost is not part of the ARM Action Plan but it is included as a
complementary public policy, as has been mentioned by State policy makers. The summary break down
by category of intervention is as follows:
Table 15: Summary Break Down of Costs by Category of Intervention
Plan of Action - Category of
intervention
Total Cost
(US$)
Execution of field
programs (US$)
Payments to
EMATER staff (US$)
Studies, training and
pre-investment (US$)
Agro-climatic Risk Information
System (ACIS)
3,211,000 0 0 3,211,000
Sanitary and Phytosanitary
System
6,120,000 5,000,000 0 1,120,000
Supply Chain Coordination 195,000 0 0 195,000
Agricultural Innovation System 9,345,000 7,800,000 0 1,545,000
Total Action Plan 18,371,000 12,800,000 0 5,571,000
159. The table below contains the basic information for all actions regarding each category of
intervention and the final table below summarizes the actions by responsible institution.
ACIS
Strategic Line Actions Institution Period Resources Cost (US$)
Strategic Line 1:
Development of a
Agro-climatic
Information
System.
1.1 Mapping of the current
infrastructure (strengths and
weaknesses) of the state and federal
weather stations
AESA
supported by
consultant
I Quarter
2015
Short-term
consulting 60,000
1.2 Verification of quality of data
collected by AESA and the federal
institutions
AESA
supported by
consultant
I Quarter
2015
Short-term
consulting 45,000
1.3 Development of debugging
procedures for the data available in
order to correct failures in the
climatic time series collected by
AESA and Federal institutions
INMET,
ANA,
CPTEC,
AESA
supported by
consultant
II Quarter
2015
Short-term
consulting
100,000
1.4 Centralize AESA’s database in
an unique Database Management
System (DBMS), maintenance and
AESA
supported by
consultant
II Quarter
2015
Short-term
consulting 175,000
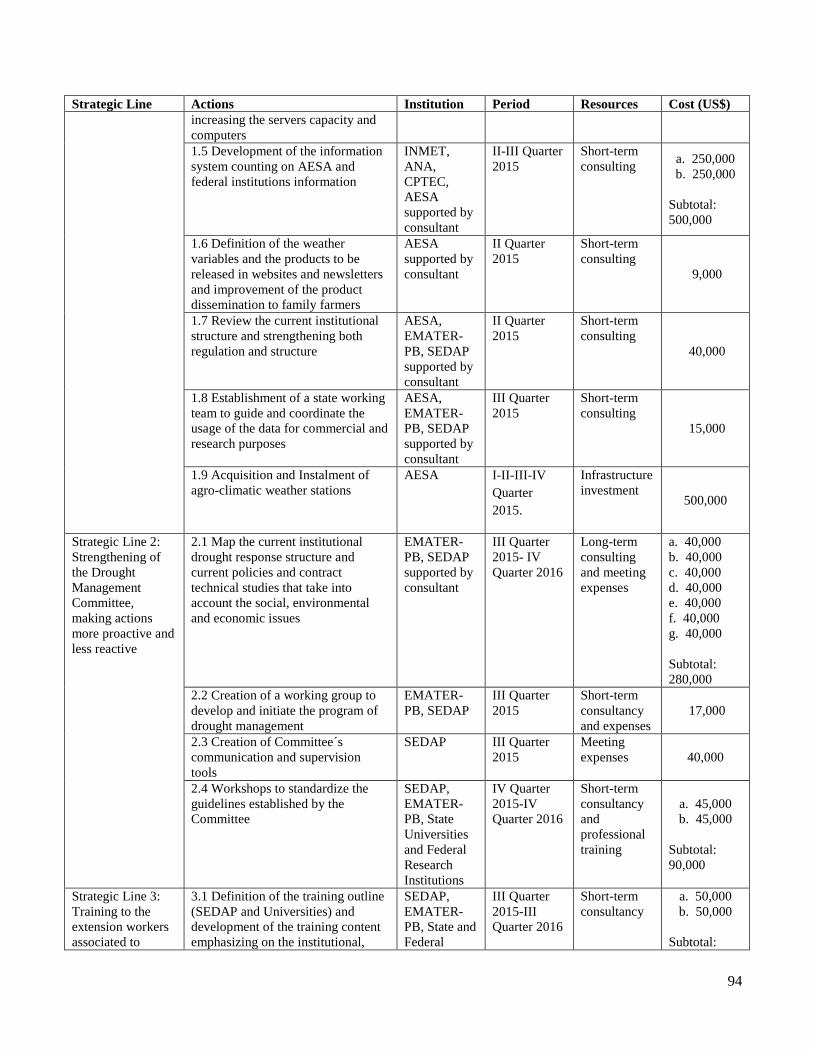
94
Strategic Line Actions Institution Period Resources Cost (US$)
increasing the servers capacity and
computers
1.5 Development of the information
system counting on AESA and
federal institutions information
INMET,
ANA,
CPTEC,
AESA
supported by
consultant
II-III Quarter
2015
Short-term
consulting a. 250,000
b. 250,000
Subtotal:
500,000
1.6 Definition of the weather
variables and the products to be
released in websites and newsletters
and improvement of the product
dissemination to family farmers
AESA
supported by
consultant
II Quarter
2015
Short-term
consulting
9,000
1.7 Review the current institutional
structure and strengthening both
regulation and structure
AESA,
EMATER-
PB, SEDAP
supported by
consultant
II Quarter
2015
Short-term
consulting
40,000
1.8 Establishment of a state working
team to guide and coordinate the
usage of the data for commercial and
research purposes
AESA,
EMATER-
PB, SEDAP
supported by
consultant
III Quarter
2015
Short-term
consulting
15,000
1.9 Acquisition and Instalment of
agro-climatic weather stations
AESA I-II-III-IV
Quarter
2015.
Infrastructure
investment 500,000
Strategic Line 2:
Strengthening of
the Drought
Management
Committee,
making actions
more proactive and
less reactive
2.1 Map the current institutional
drought response structure and
current policies and contract
technical studies that take into
account the social, environmental
and economic issues
EMATER-
PB, SEDAP
supported by
consultant
III Quarter
2015- IV
Quarter 2016
Long-term
consulting
and meeting
expenses
a. 40,000
b. 40,000
c. 40,000
d. 40,000
e. 40,000
f. 40,000
g. 40,000
Subtotal:
280,000
2.2 Creation of a working group to
develop and initiate the program of
drought management
EMATER-
PB, SEDAP
III Quarter
2015
Short-term
consultancy
and expenses
17,000
2.3 Creation of Committee´s
communication and supervision
tools
SEDAP III Quarter
2015
Meeting
expenses 40,000
2.4 Workshops to standardize the
guidelines established by the
Committee
SEDAP,
EMATER-
PB, State
Universities
and Federal
Research
Institutions
IV Quarter
2015-IV
Quarter 2016
Short-term
consultancy
and
professional
training
a. 45,000
b. 45,000
Subtotal:
90,000
Strategic Line 3:
Training to the
extension workers
associated to
3.1 Definition of the training outline
(SEDAP and Universities) and
development of the training content
emphasizing on the institutional,
SEDAP,
EMATER-
PB, State and
Federal
III Quarter
2015-III
Quarter 2016
Short-term
consultancy
a. 50,000
b. 50,000
Subtotal:

95
Strategic Line Actions Institution Period Resources Cost (US$)
inspection
procedures in the
Garantia Safra
project, in order to
reduce moral
hazard and
technical issues
technical, operational, agronomical
and geotechnological issues
Universities
and Federal
Research
Institutions
100,000
3.2 Establishment of partnerships
with Federal and State Universities,
and Research Centers in the
northeastern region
SEDAP,
EMATER-
PB
III Quarter
2015-III
Quarter 2016
Short-term
consulting
a. 120,000
b. 120,000
Subtotal:
240,000
3.3 Execution of the professional
training
State and
Federal
Universities
and Federal
Research
Institutions
IV Quarter
2015-IV
Quarter 2016
Trainers and
Short-term
consultancy
a. 500,000
b. 500,000
Subtotal:
1,000,000
Total Weather
Information
System
US$
3,211,000
Sanitary and Phytosanitary System
Strategic line Actions Responsible
institution
Period Resources Cost (US$)
A.Sugarcane
A1.Expand the area of
sugarcane under
biological control
A.1.1 Prepare background
information and conduct a
workshop to determine the
feasibility to expand the
present ASPLAN facilities
for production of biological
control agents
ASPLAN II-III Quarter,
2015
ASPLAN own
resources
(personnel and
structure)
5,000
A.2 Assess the impact
of the possible
introduction of the
ferrugem laranja in
Paraiba
A.2.1 Contract a study on
the impacts
SEDAP II Quarter,
2015
Expertise on
the subject
(University,
consultant)
20,000
A.3 Set up a
surveillance network
for ferrugem laranja in
Paraíba
A.3.1 Produce the
surveillance plans;
A.3.2 Organize the
stakeholders;
A.3.3 Implement the
surveillance net
SEDAP Starting on II
Quarter 2015,
permanent
actions
SEDAP own
resources
(personnel)
5,000
B. Fruticulture
B.1 Assess the impact
of the possible
introduction of the
diseases sigatoka
negra and moko
B.1.1 Contract the impact
studies
SEDAP II and III
Quarter, 2015
Expertise on
the subject
(University,
consultants)
60,000

96
Strategic line Actions Responsible
institution
Period Resources Cost (US$)
(bananas), cancro da
videira and HLB
(Citrus)
C. Family Agriculture
in the Semi-arid zone
C.1 Substitute the
varieties of palma
forrageira susceptible
to the cochonilha do
carmim for resistant
ones
C.1.1 – Develop a study to
completely substitute the
varieties on a feasible time
frame;
C.1.2 – Implement the
necessary actions in the field
SEDAP,
EMEPA,
EMATER
II Quarter
2015 and time
frame
proposed by
the study
SEDAP,
EMEPA and
EMATER own
personnel and
resources
5,000,000
D. Livestock
Production
D.1 Reinforce the
program for control
and eradication of
brucellosis and
tuberculosis
D.1.1 Evaluation study;
D.1.2 Implementation of
recommended actions;
D.1.3 Follow up
SEDAP,
MAPA
II Quarter
2015 and time
frame
proposed by
the evaluation
MAPA experts
and SEDAP
operational
resources
20,000
D.2 Coordination of
the animal health and
food safety programs
D.2.1 Round tables for
establishing a common
program, coordination
mechanisms and follow up
SEDAP,
MAPA,
AGEVISA
I Quarter
2015 and time
frame
proposed by
the evaluation
Own resources
of the involved
institutions
10,000
D.3 Establish the
actual status of CSF
and NCDV in Paraiba
D.3.1 Conduct a field
epidemiological survey;
D.3.2 Take the appropriate
measures in case of positive
virus circulation;
D.3.3 Free area certification
SEDAP I Quarter of
2016 and time
frame
proposed by
the evaluation
MAPA
expertise and
own resources
of SEDAP
1,000,000
E.1 Create the State
Agency for
Agricultural Health
E.1.1 Speed up the
negotiations and associated
legislation
SEDAP I and II
Quarter 2015
Legal support
of SEDAP.
No financial
costs involved
in the
negotiations
Total SPS System US$
6,120,000
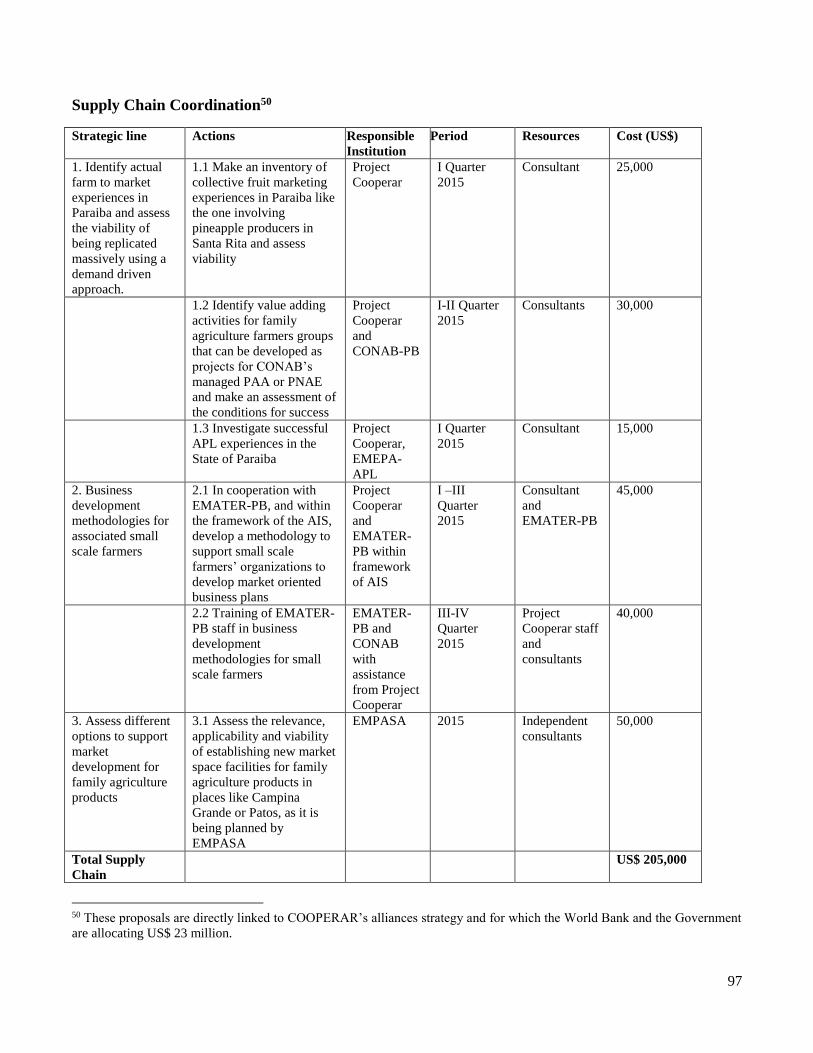
97
Supply Chain Coordination50
Strategic line Actions Responsible
Institution
Period Resources Cost (US$)
1. Identify actual
farm to market
experiences in
Paraiba and assess
the viability of
being replicated
massively using a
demand driven
approach.
1.1 Make an inventory of
collective fruit marketing
experiences in Paraiba like
the one involving
pineapple producers in
Santa Rita and assess
viability
Project
Cooperar
I Quarter
2015
Consultant 25,000
1.2 Identify value adding
activities for family
agriculture farmers groups
that can be developed as
projects for CONAB’s
managed PAA or PNAE
and make an assessment of
the conditions for success
Project
Cooperar
and
CONAB-PB
I-II Quarter
2015
Consultants 30,000
1.3 Investigate successful
APL experiences in the
State of Paraiba
Project
Cooperar,
EMEPA-
APL
I Quarter
2015
Consultant 15,000
2. Business
development
methodologies for
associated small
scale farmers
2.1 In cooperation with
EMATER-PB, and within
the framework of the AIS,
develop a methodology to
support small scale
farmers’ organizations to
develop market oriented
business plans
Project
Cooperar
and
EMATER-
PB within
framework
of AIS
I –III
Quarter
2015
Consultant
and
EMATER-PB
45,000
2.2 Training of EMATER-
PB staff in business
development
methodologies for small
scale farmers
EMATER-
PB and
CONAB
with
assistance
from Project
Cooperar
III-IV
Quarter
2015
Project
Cooperar staff
and
consultants
40,000
3. Assess different
options to support
market
development for
family agriculture
products
3.1 Assess the relevance,
applicability and viability
of establishing new market
space facilities for family
agriculture products in
places like Campina
Grande or Patos, as it is
being planned by
EMPASA
EMPASA 2015 Independent
consultants
50,000
Total Supply
Chain
US$ 205,000
50 These proposals are directly linked to COOPERAR’s alliances strategy and for which the World Bank and the Government
are allocating US$ 23 million.

98
Strategic line Actions Responsible
Institution
Period Resources Cost (US$)
Coordination
Agricultural Innovation System
Strategic line Actions Responsible
Institution
Period Resources Cost (US$)
1. Improve the
coordination of the
Agriculture
Innovation System
for family
agriculture risk
management
1.1 Creation of a sub-council
within the CEDRS, for the
coordination of the
institutions that would be
part of the Agriculture
Innovation System
SEDAP 2015 Consulting
services to carry
out the study,
decide the sub-
council
integration and
how members
will be
interrelated,
internal
rules of
procedure,
appointment of
an Executive
Secretary, etc.
20,000
1.2 Carry out negotiations
among the research
institutions for INSA to work
as the body in charge of
coordinating semiarid related
researches until the creation
of the above sub-council
SEDAP 2015 One consultant
to conduct
negotiations
15,000
1.3 Formalize and start up
the sub-council in charge of
coordination of the
Agriculture Innovation
System within the CEDRS
SEDAP 2015 One consultant
to explain the
proposal to State
authorities and
conduct the
institutional-
political
articulation to
formalize the
sub-council
15,000
2. Improve
efficiency of the
Agricultural
Innovation System
for family
agriculture risk
management
- Strengthen the
research sub-system
2.1. Carry out a survey to
gather information regarding
available technologies for
the coexistence with semi-
arid.
Project
Cooperar
2015 Consulting
services to make
an inventory of
techniques and
practices known,
have they been
or not
implemented at
field level,
which will allow
an increase of
the resilience of
agricultural
systems used.
45,000
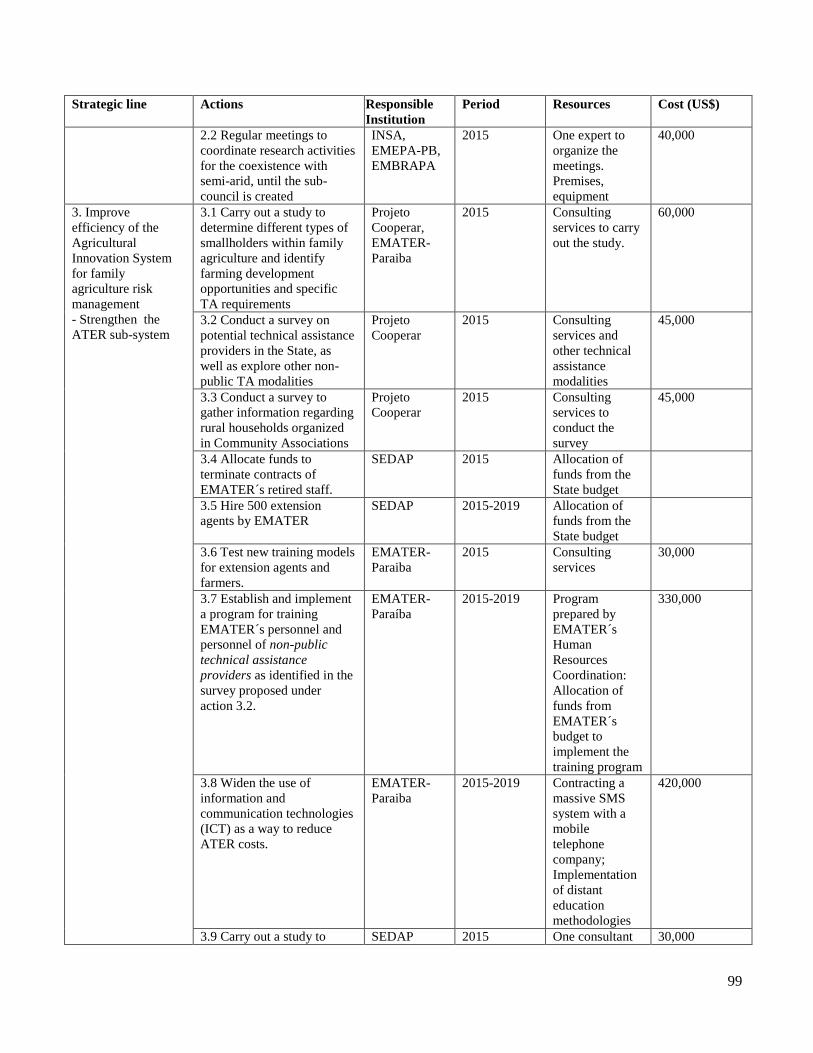
99
Strategic line Actions Responsible
Institution
Period Resources Cost (US$)
2.2 Regular meetings to
coordinate research activities
for the coexistence with
semi-arid, until the sub-
council is created
INSA,
EMEPA-PB,
EMBRAPA
2015 One expert to
organize the
meetings.
Premises,
equipment
40,000
3. Improve
efficiency of the
Agricultural
Innovation System
for family
agriculture risk
management
- Strengthen the
ATER sub-system
3.1 Carry out a study to
determine different types of
smallholders within family
agriculture and identify
farming development
opportunities and specific
TA requirements
Projeto
Cooperar,
EMATER-
Paraiba
2015 Consulting
services to carry
out the study.
60,000
3.2 Conduct a survey on
potential technical assistance
providers in the State, as
well as explore other non-
public TA modalities
Projeto
Cooperar
2015 Consulting
services and
other technical
assistance
modalities
45,000
3.3 Conduct a survey to
gather information regarding
rural households organized
in Community Associations
Projeto
Cooperar
2015 Consulting
services to
conduct the
survey
45,000
3.4 Allocate funds to
terminate contracts of
EMATER´s retired staff.
SEDAP 2015 Allocation of
funds from the
State budget
3.5 Hire 500 extension
agents by EMATER
SEDAP 2015-2019 Allocation of
funds from the
State budget
3.6 Test new training models
for extension agents and
farmers.
EMATER-
Paraiba
2015 Consulting
services
30,000
3.7 Establish and implement
a program for training
EMATER´s personnel and
personnel of non-public
technical assistance
providers as identified in the
survey proposed under
action 3.2.
EMATER-
Paraíba
2015-2019 Program
prepared by
EMATER´s
Human
Resources
Coordination:
Allocation of
funds from
EMATER´s
budget to
implement the
training program
330,000
3.8 Widen the use of
information and
communication technologies
(ICT) as a way to reduce
ATER costs.
EMATER-
Paraiba
2015-2019 Contracting a
massive SMS
system with a
mobile
telephone
company;
Implementation
of distant
education
methodologies
420,000
3.9 Carry out a study to SEDAP 2015 One consultant 30,000
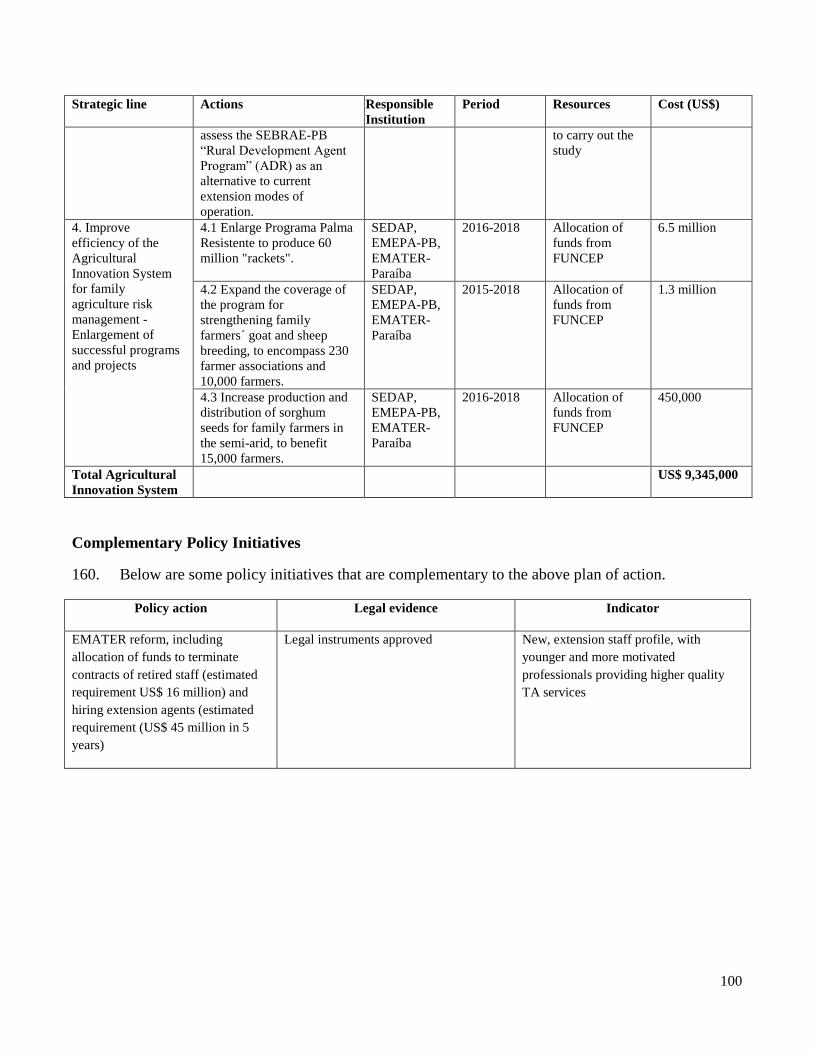
100
Strategic line Actions Responsible
Institution
Period Resources Cost (US$)
assess the SEBRAE-PB
“Rural Development Agent
Program” (ADR) as an
alternative to current
extension modes of
operation.
to carry out the
study
4. Improve
efficiency of the
Agricultural
Innovation System
for family
agriculture risk
management -
Enlargement of
successful programs
and projects
4.1 Enlarge Programa Palma
Resistente to produce 60
million "rackets".
SEDAP,
EMEPA-PB,
EMATER-
Paraíba
2016-2018 Allocation of
funds from
FUNCEP
6.5 million
4.2 Expand the coverage of
the program for
strengthening family
farmers´ goat and sheep
breeding, to encompass 230
farmer associations and
10,000 farmers.
SEDAP,
EMEPA-PB,
EMATER-
Paraíba
2015-2018 Allocation of
funds from
FUNCEP
1.3 million
4.3 Increase production and
distribution of sorghum
seeds for family farmers in
the semi-arid, to benefit
15,000 farmers.
SEDAP,
EMEPA-PB,
EMATER-
Paraíba
2016-2018 Allocation of
funds from
FUNCEP
450,000
Total Agricultural
Innovation System
US$ 9,345,000
Complementary Policy Initiatives
160. Below are some policy initiatives that are complementary to the above plan of action.
Policy action Legal evidence Indicator
EMATER reform, including
allocation of funds to terminate
contracts of retired staff (estimated
requirement US$ 16 million) and
hiring extension agents (estimated
requirement (US$ 45 million in 5
years)
Legal instruments approved New, extension staff profile, with
younger and more motivated
professionals providing higher quality
TA services

101
The agro-climatic information
system described above provides a
weather, climate and agro-climatic
decision making tools framework.
The operation of this system must be
performed by an inter-institutional
team comprising experts from public
institutions and private
organizations, therefore requiring
policy actions at the involved
institutions.
Legal instruments approved Development of strategic partnership and
cooperation.
Conformation of the Technical Working
Group.
Agro-climatic information system in
operation.
Design, implementation and
dissemination of agro-climatic decision
making tools.
Harmonized procedures for cooperation,
data/information/products sharing, and
communication
Short-term plan by responsible institution
Agroclimatic Information System
1. AESA 2015 (cost-US$) 2016 (cost-US$)
Actions I II III IV I II III IV
1.1 X
50,000
1.2 X
30,000
1.4 X
150,000
1.6 X
9,000
1.9 X
500,000
2. INMET, ANA, CPTEC, AESA 2015 (cost-US$) 2016 (cost-US$)
Actions I II III IV I II III IV
1.3 X
85,000
1.5 X
400,000
3. AESA, EMATER-PB, SEDAP 2015 (cost-US$) 2016 (cost-US$)
Actions I II III IV I II III IV
1.7 X
25,000
1.8 X
10,000

102
4. EMATER-PB, SEDAP 2015 (cost-US$) 2016 (cost-US$)
Actions I II III IV I II III IV
2.1 X
25,000
X
25,000
X
25,000
X
25,000
X
25,000
X
25,000
2.2 X
10,000
2.4 X
30,000
X
30,000
3.1 X
50,000
X
50,000
3,2 X
100,000
X
100,000
3.3 X
500,000
X
500,000
5. SEDAP 2015 (cost-US$) 2016 (cost-US$)
Actions I II III IV I II III IV
2.3 X
30,000
Sanitary and Phytosanitary System
1. ASPLAN 2015 (cost-US$)
Actions I II III IV
A1 X
5,000
2. SEDAP 2015 (cost-US$)
Actions I II III IV
A2 X
20,000
A3 X
5,000
B1 X
20,000
X
40,000
C1 X
300,000
X
400,000
X
400,000
D1 X
5,000
X
5,000
D2 X
3,000
3. EMEPA 2015 (cost-US$)
Actions I II III IV
C1 X
100,000
X
100,000
X
100,000
4. EMATER

103
2015 (cost-US$)
Actions I II III IV
C1 X
100,000
X
200,000
X
300,000
5. AGEVISA 2015 (cost-US$)
Actions I II III IV
D2 X
2,000
6. MAPA 2015 (cost-US$)
Actions I II III IV
D1 X
5,000
X
3,000
X
2,000
D2 X
5,000
Supply Chain Coordination
1. Project Cooperar en cooperación con EMEPA and CONAB51
2015 (cost-US$)
Actions I II III IV
1.1 X
25,000
1.2 X
15,000
X
15,000
1.3 X
15,000
2.1 X
15,000
X
15,000
X
15,000
2.2 X
20,000
X
20,000
Agricultural Innovation System
1. SEDAP 2015 (cost-US$)
Actions I II III IV
A1 X
20,000
A2 X
15,000
A3 X
15,000
C9 X
15,000
X
15,000
2. Project Cooperar 2015 (cost-US$)
51 These activities have to be adjusted to reflect the preparation of Cooperar II which is underway.
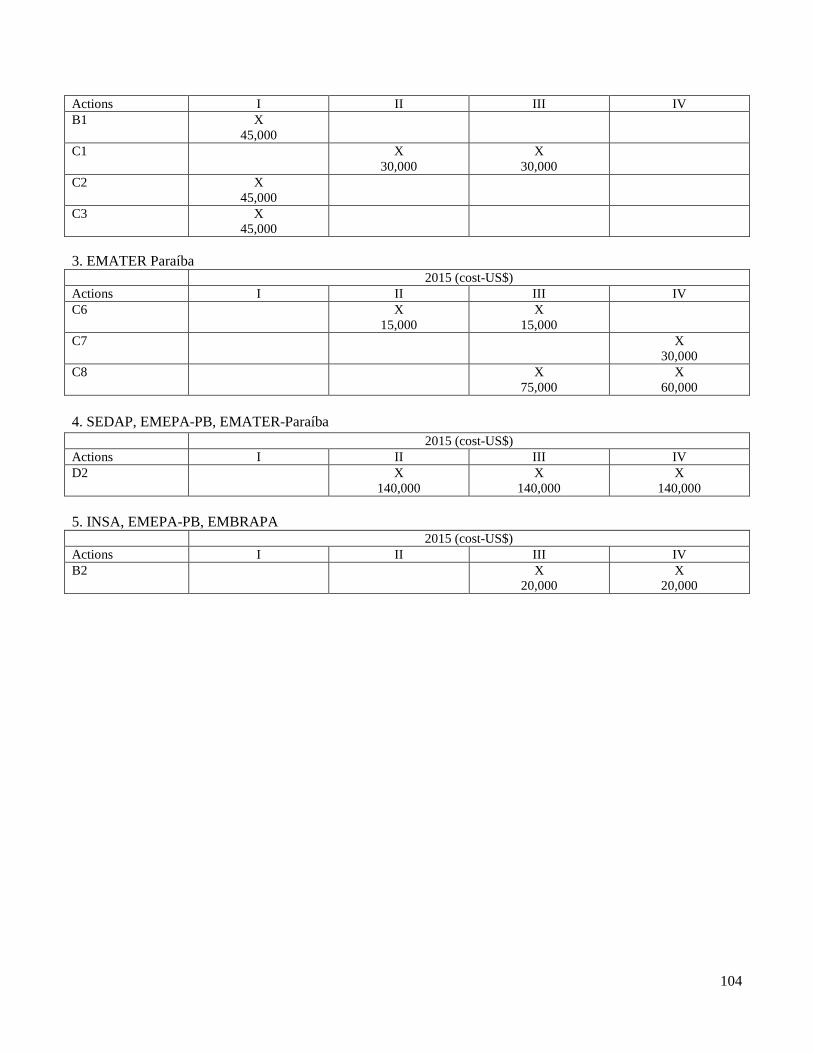
104
Actions I II III IV
B1 X
45,000
C1 X
30,000
X
30,000
C2 X
45,000
C3 X
45,000
3. EMATER Paraíba 2015 (cost-US$)
Actions I II III IV
C6 X
15,000
X
15,000
C7 X
30,000
C8 X
75,000
X
60,000
4. SEDAP, EMEPA-PB, EMATER-Paraíba
2015 (cost-US$)
Actions I II III IV
D2 X
140,000
X
140,000
X
140,000
5. INSA, EMEPA-PB, EMBRAPA 2015 (cost-US$)
Actions I II III IV
B2 X
20,000
X
20,000
105
REFERENCES
Volume 1: Risk Assessment
Agência Executiva de Gestão das Águas do Estado da Paraiba. ND. Caracterização da Oferta e
Demanda Hídrica no Estado da Paraiba. [On Line] Available from:
http://www.aesa.pb.gov.br/perh/relatorio_final/Capitulo%205/pdf/5%20-
%20CaracOferDemHidricaPB.pdf
Alves, C, J et Al. Detection of Brucella ovis in ovine from Paraiba State, in the Northeast region of
Brazil. Braz. J. Microbiol. vol.41 no.2 São Paulo Apr./June 2010
Alves and Júnior (2012) “The influence of El Niño phenomen over the rainfall regime in Sousa Micro-
region, PB”, Revista Geonorte, Vol. 2 (4), pp. 904-915 [Online] Available from:
http://www.revistageonorte.ufam.edu.br/attachments/009_(INFLU%C3%8ANCIA%20DO%20FEN%C
3%94MENO%20EL-
NI%C3%91O%20SOBRE%20O%20REGIME%20PLUVIAL%20NA%20MICRORREGI%C3%83O%
20DE%20SOUSA,%20PB.).pdf
Amaral, E. and Targino, I (2009) “Política de Irrigação e Viabilidade da Pequena Produção no
Semiárido: O Caso do Projeto Piancó – PB”, OKARA:Geografia em debate, Vol.3 (1), pp.1-22 [On
Line] Available from: http://www.okara.ufpb.br
Antonio Sérgio Tavares de Melo, Janete Lins Rodriguez (2003) “Paraíba: Desenvolvimento econômico
e a questão ambiental”, João Pessoa, Grafset [Online] Available from:
http://historiadaparaiba.blogspot.com/2010/01/climas-da-paraiba.html
ASPLAN, Setor agroindustrial canaviero do Estado da Paraiba, Joao Pessoa, May 2014
Assad, Eduardo; Pinto, Hilton S.; Nassar, Andre; Harfuch, Leila; Freitas, Saulo; Farinelli, Barbara;
Lundell, Mark; Fernandes, Erick C.M.. 2013. Impacts of Climate Change on Brazilian Agriculture.
World Bank, Washington, DC
Assad, E and H. Pinto. 2008. Global warming and future scenarios for Brazilian Agriculture.
EMBRAPA and CEPAGRI/UNICAMP. - www.climaeagricultura.org.br EMBRAPA and CEPAGRI/
UNICAMP.
Barbieri et al, 2010. Climate change and population migration in Brazil’s Northeast: scenarios for 2025-
2050. Population and Environment (2010) 31:344-370.
BNDES, Nota Técnica, Produto 9 do projeto “Análise do Mapeamento e das Políticas para Arranjos
Produtivos Locais no Norte e Nordeste do Brasil e dos Impactos dos Grandes Projetos Federais em
Estados Nordestinos. www.politicaapls.redesist.ie.ufrj.br
106
CONAB, Indicadores da Agricultura, 2014
Cordeiro dos Santos, Djalma and Gonzaga de Albuquerque, Severino, Opuntia as fodderer in the Semi-
arid Northeast of Brazil, FAO Plant Production and Protection Paper, 2001.
Costa, R., David A. Bessler, David A. and C. Parr Rosson, C. Parr. The Impacts of Foot and Mouth
Disease Outbreaks on the Brazilian Meat Market. Selected Paper prepared for presentation at the
Agricultural & Applied Economics Association’s 2011 AAEA & NAREA Joint Annual Meeting,
Pittsburgh, Pennsylvania, July 24-26, 201.
http://ageconsearch.umn.edu/bitstream/103811/1/AAEA%202011%20Costa%20Bessler%20Rosson.pdf
Cunha, M. (2012) Cenário de seca persiste na Paraíba, Jefte News, [Online] Available from:
http://jeftenews.blogspot.com/2013/04/cenario-de-seca-persiste-na-paraiba.html
EMBRAPA. Centro de Inteligencia do Leite:
http://guernsey.cnpgl.embrapa.br/ http://www.cnpgl.embrapa.br/nova/principal.php
http://www.cnpgl.embrapa.br/nova/informacoes/estatisticas/producao/grafico02.73.php
EMBRAPA, Panorama de politica agricola Brasileira: A política de garantía de precos minimos, 2009
Fernandes, ECM, Soliman, A., Confalonieri, R., Donatelli, M, and Tubiello, F. (2011) Climate change
and agriculture in Latin America (2020-2050). The World Bank, Washington, DC.
Ferreira, A. and Mello, N. (2005) “Main Atmospheric Systems Acting Over the Northeastern Region of
Brazil and the Influence of Pacific and Atlantic Oceans on the Climate of the Region”, Revista
Brasileira de Climatologia, Vol. 1 (1): 15-28
FEWSNET Technical Note on Measuring Resilience, USAID June 2013.
Figueiredo S. et al.. BOVINE BRUCELOSIS IN THE STATE OF PARAÍBA: A RETROSPECTIVE
SURVEY Arq. Inst. Biol., São Paulo, v.78, n.1, p.9-16, jan./mar., 2011
F. Poester1, V.C.F. Figueiredo2, J.R. Lôbo2, V.S.P. Gonçalves1,3, A.P. Lage1,4, E. Roxo1,5.
F.R. Lima F.S. & Mota P.M.P. 2009. [Prevalence for caprine tuberculosis in semi-arid of Paraíba.]
Prevalência para tuberculose caprina no semi-árido paraibano. Pesquisa Veterinária Brasileira
29(7):526-532. Centro de Saúde e Tecnologia Rural, Campus de Patos, Universidade Federal de
Campina Grande, Patos, PB 58700-000, Brazil. E-mail: [email protected]
Gazzoni, Decio Luiz, Bioetanol: a reversão das expectativas
Henrique Leite et Al. A random sample survey of bovine Brucellosis in the State of Paraíba, Brazil.
Prevalência de Brucelose bovina no Estado da Paraíba. Braz. J. Vet. Res. Anim. Sci. vol.40 suppl.3 São
Paulo 2003)

107
IPEA, A Agricultura Brasileira: desempenhos, desafíos e perspectivas, 2010
IPEA-Universidad de Brasilia-CONAB, A Formação de Estoques Públicos Via Mecanismo de Preço
Mínimo Responde aos Desafios do Agronegócio Brasileiro?
Kilmer Coelho Campos, Análise da volatilidade de preços de produtos agropecuários no Brasil, 2007
Lindoso et al. 2012. “Indicators for Assessing the Vulnerability of Smallholder Farming to Climate
Change: The Case of Brazil’s Semi-Arid Northeastern Region.” Instituto de Pesquisa Economica
Aplicada. International Policy Centre for Inclusive Growth.
Lindoso et al. 2012. Supplementary Material for “Integrated Assessment of Smallholder Farming’s
Vulnerability to drought in the Brazilian Semi-Arid: a case study in Ceará”
MAPA. Instrução Normativa, Programa Nacional de Controle e Erradicação da Brucelose e Tuberculose
Animal. Departamento de Defesa Animal, Secretaria de Defesa Agropecuária, Ministério da
Agricultura, Pecuária e Abastecimento (MAPA). Diário Oficial da República Federativa do Brasil,
Poder Executivo, Brasília, DF, 16 de janeiro de 2001, Seção 1, (2):11-17.
MAPA. Secretaria de defesa Agropecuária - Programa Nacional de Controle e Erradicação da Brucelose
e Tuberculose (PNCEBT). Brasília: Departamento de Saúde Animal, 2006. 188p. (Manual Técnico) .
MAPA. Programa Nacional de Controle e Erradicação de Brucelose e Tuberculose Animal (PNCEBT):
evolução no controle da brucelose bovina de 2001 a 2010.
Margulis, S. and Dubeux, S.B.C. (2010) The Economy of Climate Change in Brazil: Costs and
Opportunites.
Meinzin-Dick, Ruth. 2014. Social Capital for Resilience. IFPRI Resilience Conference Brief.
Nogueira, M.S. et Al. INQUÉRITO EPIDEMIOLÓGICO DE BRUCELOSE CAPRINA PELO TESTE
DO ANEL DO LEITE (TAL) EM MUNICÍPIO DO CARIRI PARAIBANO. Agropecuária Técnica – v.
32, n. 1, 2011, 1 Centro de Ciências Agrárias, Universidade Federal da Paraíba. PANAFTOSA. Informe
de Situación de los Programas de Erradicación de la Fiebre Aftosa - año 2013 – Documento de trabajo
para la COSALFA 41, abril 2014.
OECD, Agricultural Policies Monitoring and Evaluation, 2011
Pesquisa de Orçamento Familiares, 2008. Sidra/IBGE, Brazil.
Pignata W.A., Alves C.J., Azevedo S.S., Dantas A.F.M., Gomes A.A.B., Remígio
P.M.P.C. Mota1,6, E.E. Müller1,7, J.S. Ferreira Neto1,8* Estudos de prevalência da brucelose bovina
no âmbito do Programa Nacional de Controle e Erradicação de Brucelose e Tuberculose: Introdução
[Prevalence studies on bovine brucellosis according to Brazilian National Program for the Control and
108
Eradication of Bovine Brucellosis and Tuberculosis: Introduction] Arq. Bras. Med. Vet. Zootec., v.61,
supl. 1, p.1-5, 2009
Salomão M. Figueiredo; Vivianne C.M. Rocha; Severino S.S. Higino; Carolina S.A. Batista; Clebert J.
Alves; Inácio J. Clementino; Sérgio S. Azevedo .Tuberculose bovina no Estado da Paraíba: estudo
retrospectivo. Bovine tuberculosis in the state of Paraíba: retrospective survey,* Pesq. Vet.
Bras. vol.30 no.9 Rio de Janeiro Sept. 2010 http://www.scielo.br/scielo.php?pid=S0100-
736X2010000900002&script=sci_arttext
Salomão M. et al. Tuberculose bovina no Estado da Paraíba: estudo retrospectivo (Bovine tuberculosis
in the state of Paraíba: retrospective survey) Pesq. Vet. Bras. vol.30 no.9 Rio de Janeiro Sept. 2010.
http://www.biologico.sp.gov.br/docs/arq/v78_1/figueiredo.pdf
Santos. 2008. Vulnerabilidades socioambientais diante das mudanças projectadas para o semi-arido da
Bahia. Doctoral Thesis, Universidade de Brasília
Secretaria de Estado do Desenvolvimento da Agropecuária e Pesca (SEDAP). Programa Estadual de
Defesa Sanitária Animal.
SEPLAN/SEMA, Bahia. 2010. Diagnóstico da Vulnerabilidade Social.
SM Figueiredo, VCM Rocha, SSS Higino, CSA Batista, Tuberculose bovina no Estado da Paraíba:
estudo retrospectivo. - Pesq Vet, 2010 - l. Brasil 2006.
S.M. Figueiredo1, V.C.M. Rocha2, S.S.S. Higino1, C.S.A. Batista2, C.J. Alves1, I.J. Clementino3, S.S.
Azevedo1. BOVINE BRUCELOSIS IN THE STATE OF PARAÍBA: A RETROSPECTIVE SURVEY.
Arq. Inst. Biol., São Paulo, v.78, n.1, p.9-16, jan./mar., 2011
Toni, Fabiano and Evandro Holanda. 2008. The effects of land tenure on vulnerability to droughts in
Northeastern Brazil. Global Environmental Change 18, 575-582.World Bank, 2013. Climate Change
Impacts on Water Resources Management: Adaptation Challenges and Opportunities in Northeast
Brazil.
WA Pignata, CJ Alves, SS Azevedo, AFM Dantas. Prevalência para tuberculose caprina no semi-árido
paraibano. Pesq. Vet, 2009 - SciELO Brasil Brasil 2006.
Wisconsin International Trade Team BRAZIL MARKET REPORT. Brazil Dairy Industry Overview.
Dairy & Genetics, March 2012.
World Bank, 2009. Brazil: Country Note on Climate Change Aspects in Agriculture
http://datcp.wi.gov/uploads/Business/pdf/Brazil.pdf

109
Volume 2: Risk Management Strategy
Almeida, S.W. Massificação das operações do seguro rural: o grande desafio brasileiro. Revista de
Política Agrícola, n. 4, p. 21-26, 2007.
Antonio Batista Filho, Diretor Geral do Instituto Biológico. Available at
http://revistapesquisa.fapesp.br/2002/11/01/ataques-da-cigarrinha/. Retrieved on Nov 28, 2014.
ASPLAN. 2014. História e Desafíos. A importância da entidade no desenvolvimento do setor. João
Pessoa-PB, Brasil.
ASPLAN. 2014. Setor agroindustrial canaviero do Estado da Paraíba. João Pessoa-PB, Brasil.
Banco Central. http://www4.bcb.gov.br/NXT/gateway.dll?f=templates&fn=default.htm&
vid=nmsGeropMCR:idvGeropMCR (20 Nov. 2014). Manual do crédito rural.
Banco Mundial. 2012. Agricultural Innovation Systems, An Investment Sourcebook. Washington, DC:
World Bank
Banco Mundial. 2014. Paraíba state agriculture sector risk analysis. Volume 1: risk assessment.
Banco Mundial. 2014. Preparação para as secas e resiliência às mudanças climáticas.
Batista Lopes, E. (Organizador). 2012. PALMA FORRAGEIRA. Cultivo, Uso atual e Perspectivas de
Utilização no Semiárido Nordestino. EMEPA-PB, João Pessoa-PB, Brasil.
Biocontrol. Available at http://www.biocontrol.com.br/produtos-cotesia.php. Retrieved on Nov 28,
2014.
Bracale, G. 2012. III Reunião técnica do CEMADEN. Ceará: Fortaleza, abril de 2012.
Campos, J. N. B.; Studart, T. M. C. 1997. Droughts and water policy in Northeast of Brazil: Background
and rationale: water policy, USP, São Paulo, v.11, n.29, p.127-54, 1997.
Claudimir Penatti - Socicana - Cigarrinha das raízes da cana-de-açúcar. Available at
www.coplana.com/gxpfiles/ws001/design/RevistaCoplana/2006/Novembro/pag24.pdf+&cd=1&hl=pt-
BR&ct=clnk&gl=br. Retrieved on Nov 28, 2014.
CONAB. Acompanhamento da safra brasileira de cana-de-açúcar 2014/15. Available at
http://www.conab.gov.br/OlalaCMS/uploads/arquivos/14_08_28_08_52_35_boletim_cana_portugues_-
_2o_lev_-_2014-15.pdf. Retrieved Nov 29, 2014.
Cunha, M. 2012. Cenário de seca persiste na Paraíba. Jefte News, [Online] Available from:
http://jeftenews.blogspot.com/2013/04/cenario-de-seca-persiste-na-paraiba.html
Dos Santos, E.C., Costa de Souza, L., Silva Souto, J., e de Araújo Filho, J.B. 2006. ENERGÍA SOLAR.
Uma Alternativa para a Pequena Irrigação. EMEPA-PB, João Pessoa-PB, Brasil.

110
EMATER Paraíba. 2013. Relatório Anual de Atividades.2012. EMATER-PB, SEDAP, Governo da
Paraíba, João Pessoa-PB, Brasil.
Embrapa Algodão. 2014. https://www.embrapa.br/algodao/apresentacao
Embrapa Caprinos e Ovinos. 2014. https://www.embrapa.br/caprinos-e-ovinos/apresentacao
Embrapa Mandioca e Fruticultura. 2014. https://www.embrapa.br/mandioca-e-fruticultura/apresentacao
Embrapa Semiárido. 2014. https://www.embrapa.br/semiarido/apresentacao
EMEPA-PB. 2011. Integrando Soluções para o Agronegócio e a Agricultura Familiar da Paraíba. João
Pessoa-PB, Brasil.
EMEPA-PB. 2013. EMEPA Socilaizando Tecnologias Sustentáveis para Aumentar a Competitividade
da Agricultura Familiar. EMEPA-PB, Governo da Paraíba, João Pessoa-PB, Brasil.
Gallo, D., O. Nakano, S.S. Neto, R.P.L. Carvalho, G.C. Batista, E.B. Filho, J.R.P. Parra, R.A. Zucchi,
S.B. Alves & J.D. Vendramim. 1988. Manual de entomologia agrícola. São Paulo, CERES, 649p.
IBGE, Censo Agropecuário 1995-96. http://downloads.ibge.gov.br/downloads_estatisticas.htm
IBGE, Censo Agropecuário 2006. http://downloads.ibge.gov.br/downloads_estatisticas.htm
INSA, Instituto Nacional do Semiárido. 2014. http://www.insa.gov.br/
Maia Neto, A.L. 2013. Gestão ambiental para a sustentabilidade dos Fundos de Pastos no Semiárido
baiano. Bahia Agrícola, v.9, n.2, Mar. 2013. Salvador-BA, Brasil.
MAPA. 2014. http://www.agricultura.gov.br/politica-agricola/seguro-rural
Miranda, L. 2013. A seca na Bahia. SEAGRI: Governo do Estado da Bahia.
Ozaki, V.A. 2013. Impact analysis of the PROAGRO in Brazil. Working paper, USP/ESALQ.
Primo Junior, J.F., Vasconcelos Dias, W.J., Andrade Santos, R. 2013. Assistência Técnica e Extensão
Rural: novos caminhos para o desenvolvimento rural sustentável. Bahia Agrícola, v.9, n.2, Mar. 2013.
Salvador-BA, Brasil.
PROCASE, Projeto de Desenvolvimento Sustentável do Cariri, Seridó e Curimataú. 2013. Manual de
Implementação. Governo da Paraíba, FIDA, João Pessoa-PB, Brasil.
PROJETO COOPERAR. 2014. Revista Paraíba Rural Sustentável, ed. 1.
RAMOS, R.C. O seguro rural no Brasil: origem, evolução e proposições para aperfeiçoamento.
Informações Econômicas, v. 39, n. 3, 2009.
Universidade Federal da Paraíba (UFPB), Centro de Ciências Agrárias. 2014. http://www.cca.ufpb.br/
Usina Jalles Machado. Laboratório Biológico. Machado at
111
http://www.jallesmachado.com.br/portugues/meioambiente.php?laboratorio_biologico. Retrieved on
Nov 28, 2014.
Zuza, J. L. M. F.; Borsato, J. M. S. L. Análise de perdas agrícolas e econômicas ocasionada pela doença
ferrugem alaranjada em canaviais comerciais de uma empresa de bioenergia no interior de São Paulo.
XX Congresso Brasileiro de Custos – Uberlândia, MG, Brasil, 18 a 20 de novembro de 2013.

112
ANNEX 1: PROJECTED CLIMATE CHANGE IMPACTS ON AGRICULTURE IN
NORTHEAST BRAZIL
1. It is considered probable that climate change will cause global increases in temperature by 2 to
5.4 degrees Celsius in a pessimistic scenario (Intergovernmental Panel on Climate Change - IPCC A2)
and by 1.4 to 3.8 degrees Celsius in the more optimistic scenario (IPCC B2).52 In Northeast Brazil, this
means that rainfall will likely be reduced by 15-20% under the pessimistic scenario. In the Semi-Arid
region that covers most of Northeast Brazil, rainfall is already less than 800 millimeters per year and
rainfall variability is among the highest in the world.53 See Figure A1-1 below.
Figure A1 - 1: Northeast Brazil Climate Predictions, 1971-2000 and 2041-207054
Source: World Bank, 2013
52 The IPCC A2 scenario represents high carbon emissions; the B2 scenario implies low carbon emissions under the hypothesis that all
countries sign the Kyoto Protocol. 53 World Bank, 2013. Climate Change Impacts on Water Resources Management: Adaptation Challenges and Opportunities in Northeast
Brazil. 54 Figure shows mean annual precipitation, mean annual evapotranspiration, and drought index (precipitation divided by
evapotranspiration) for the periods of 1971-2000 and 2041-2070 (projected) using the MIMR climatic model under the B1 emission
scenario. The more red coloration corresponds to increased drought, due to reduced rainfall and/or increased evapotranspiration.

113
2. Possible impacts of climate change in Northeast Brazil include (i) increased frequency of dry
spells and evaporation rates leading to lower soil moisture levels and reductions in water reservoirs, (ii)
losses in natural ecosystems such as the caatinga, (iii) tendency towards aridization and desertification
in the Semi-Arid Region, (iv) water scarcity, (v) climate induced migration to large cities, and (vi)
impacts on human health.55
3. Figure A1-2 highlights seven indicators that convey vulnerability to climate change in Brazil as a
whole. In the Northeast, the vulnerability scenario is more drastic: employment in agriculture, soil
degradation, and the risk of extreme weather events indicators are all higher than the country average.
Figure A1 - 2: Climate Vulnerability Indicators56
Source: World Bank, 2013
4. In the Northeast, climate change will have significant impacts on the livelihoods of the poorest,
those that rely on rain-fed agriculture. Climate change is seen as a migration “push” factor, and
migration is projected to increase from the rural Northeast as the value of agricultural production
declines due to climate risks.57
5. Climate change signifies shifts in temperature and rainfall regimes, which affect agricultural
productivity by shifting suitable area for agricultural production, altering agricultural yields, changing
water availability, and producing conditions that increase the likelihood of plant pathogens.
55 World Bank, 2009. Brazil: Country Note on Climate Change Aspects in Agriculture 56 Employment in agriculture (percent of total employment), rain fed cropland (percent of total cropland), Gini, water usage in agriculture
(percent of total annual fresh water withdrawals) from World Development Indicators 2007, 2000-2007 average. Uninsured cropland
(percent of total cultivated land area) from the Inter-american Development Bank (IADB), Inter-american Institute for Agriculture
Cooperation (IICA) 2002/2003 figures. Soil degradation (percent of total land) from FAO AGL 2005. Risk of extreme weather events
(index, annual average 1997-2006) from German watch. 57 Barbieri et al, 2010. Climate change and population migration in Brazil’s Northeast: scenarios for 2025-2050. Population and
Environment (2010) 31:344-370.
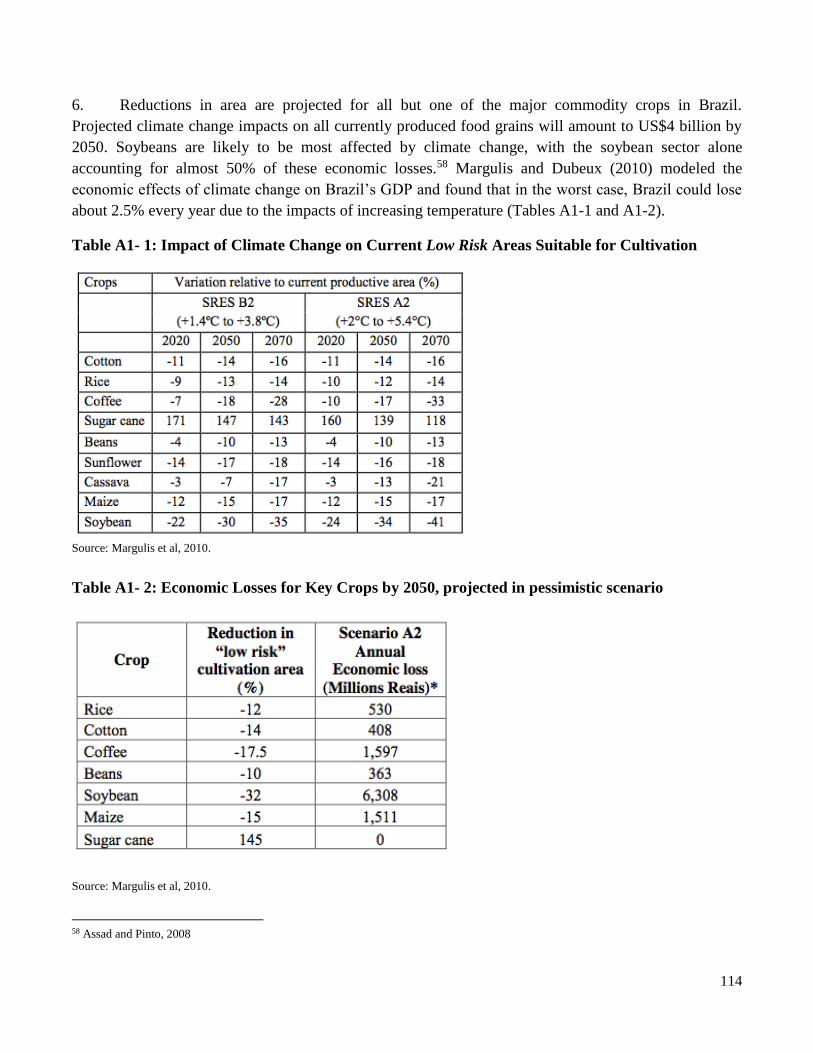
114
6. Reductions in area are projected for all but one of the major commodity crops in Brazil.
Projected climate change impacts on all currently produced food grains will amount to US$4 billion by
2050. Soybeans are likely to be most affected by climate change, with the soybean sector alone
accounting for almost 50% of these economic losses.58 Margulis and Dubeux (2010) modeled the
economic effects of climate change on Brazil’s GDP and found that in the worst case, Brazil could lose
about 2.5% every year due to the impacts of increasing temperature (Tables A1-1 and A1-2).
Table A1- 1: Impact of Climate Change on Current Low Risk Areas Suitable for Cultivation
Source: Margulis et al, 2010.
Table A1- 2: Economic Losses for Key Crops by 2050, projected in pessimistic scenario
Source: Margulis et al, 2010.
58 Assad and Pinto, 2008

115
7. Projections from Assad et al (2012) highlight the severe risks of climate change’s negative
impacts on three principal agricultural activities in Northeast Brazil (livestock pasture, maize, and
beans). However, even under a pessimistic scenario (IPCC Scenario A2), the area suitable for sugarcane
in Brazil could double by 2020. For Paraiba, this would offset some of the production lost from other
crops. See Figures A1-3, A1-4, and A1-5, below.
Figure A1 - 3: Projected Losses in Pasture Productivity, % relative to 2010 baseline under
optimistic and pessimistic scenarios (2020 and 2030)
Figure A1 - 4: Impact of Climate Change on Area Suitable for Maize (2010 baseline, 2030
optimistic and pessimistic)
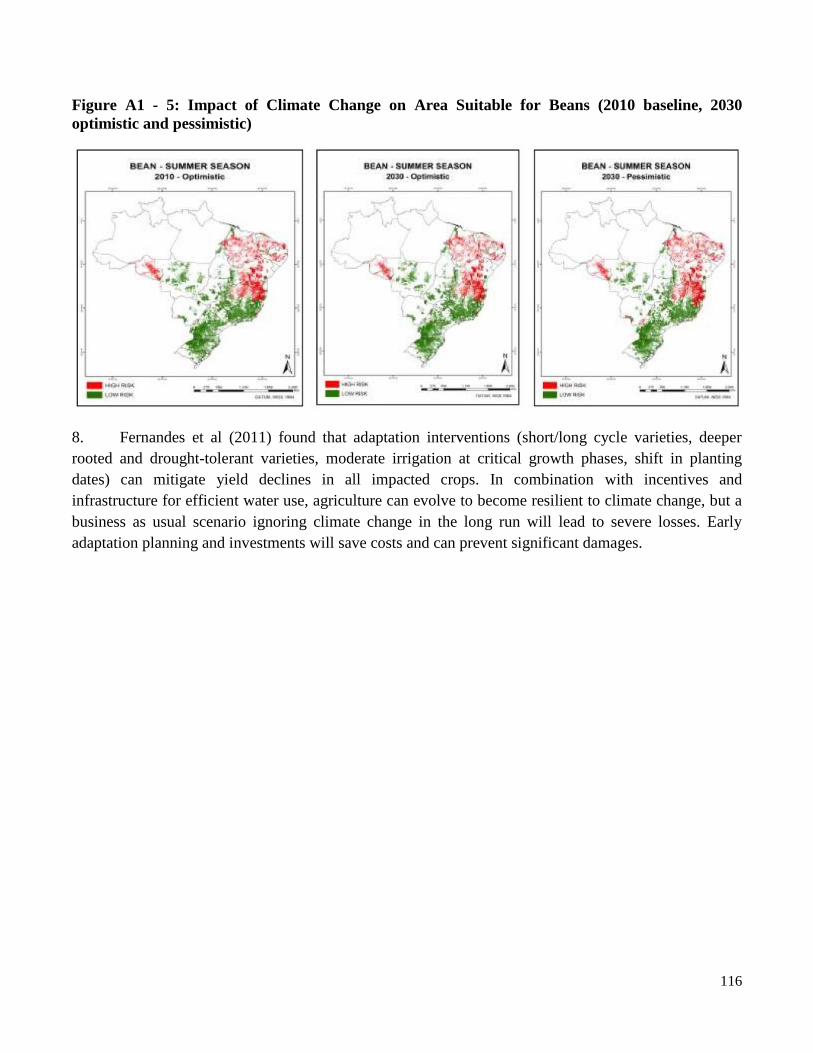
116
Figure A1 - 5: Impact of Climate Change on Area Suitable for Beans (2010 baseline, 2030
optimistic and pessimistic)
8. Fernandes et al (2011) found that adaptation interventions (short/long cycle varieties, deeper
rooted and drought-tolerant varieties, moderate irrigation at critical growth phases, shift in planting
dates) can mitigate yield declines in all impacted crops. In combination with incentives and
infrastructure for efficient water use, agriculture can evolve to become resilient to climate change, but a
business as usual scenario ignoring climate change in the long run will lead to severe losses. Early
adaptation planning and investments will save costs and can prevent significant damages.
117
ANNEX 2: VULNERABILITY IN PARAIBA
1. Climate variability has long been considered a constraint to economic development and poverty
alleviation in Northeast Brazil. Long-term impacts of repeated exposure to shocks bring household food
insecurity, which is much higher in the rural Northeast than urban, and whose rural levels are amongst
the highest in Brazil. Repeated shocks confine rural households into a poverty trap, exhausting savings
and dissolving investments that would otherwise help propel the household ahead. Expenditures on
drought mitigation and emergency measures also divert municipal resources from longer-term
investments in human capital and productivity.
2. The impacts of the aforementioned risks have greater consequences for human welfare among
the individuals, communities, and regions of Paraiba that are more vulnerable. As we have already seen,
a single risk such as drought has different effects on different systems of productions and producers.
Vulnerability is the concept that explains this heterogeneity in impact. This annex explores drivers of
heterogeneity in vulnerability in Paraiba.
3. Vulnerability is “the likelihood that at a given time in the future, an individual will have a level
of welfare below some norm or benchmark.”59 Common welfare indicators include poverty
measurements, household expenditures, savings levels, and food security and nutrition measures (such
as food consumption score and household dietary diversity). Though vulnerability depends on the
severity of external shocks like climate, the likelihood of a drop in welfare depends on both people’s
context and capacity to act and react. Socio-economic assets and institutions play an important role in
people’s vulnerability.
4. Vulnerability is not the same thing as exposure to a shock, since many households can
experience, say, a drought with different welfare outcomes. Vulnerability research emphasizes that both
the settings and the asset levels of a household influence the livelihood strategies households choose.60
Since vulnerability results from the combination of factors exogenous and endogenous to the individual,
the same exogenous shock, like drought, affects individuals differently. In addition, if an individual or
household is vulnerable to one exogenous shock, it does not follow that the household is vulnerable to
all shocks. For example, a subsistence-oriented rural farming household may be vulnerable to drought
and other possible climatic shocks like irregular and delayed rainfall, but may not be vulnerable to price
shocks if the household is not commercializing its production.
5. Vulnerable households in Paraiba respond to shocks by reducing household consumption, selling
household and productive assets, and seeking income sources off the farm with diverse strategies
including migration and even prostitution. Households depend on their own production for income as
59 J. Hoddinott and A. Quisumbing. 2010. “Methods for Microeconometric Risk and Vulnerability Assessment.” In Risk, Shocks and Human Development:
On the Brink, edited by R. Fuentes-Nieva and P. A. Seck, 72. London: Palgrave Macmillan for United Nations Development Programme. 60 Hoddinott, John. 2014. “Resilience: A Primer.” 2020 Conference Brief 8, IFPRI.
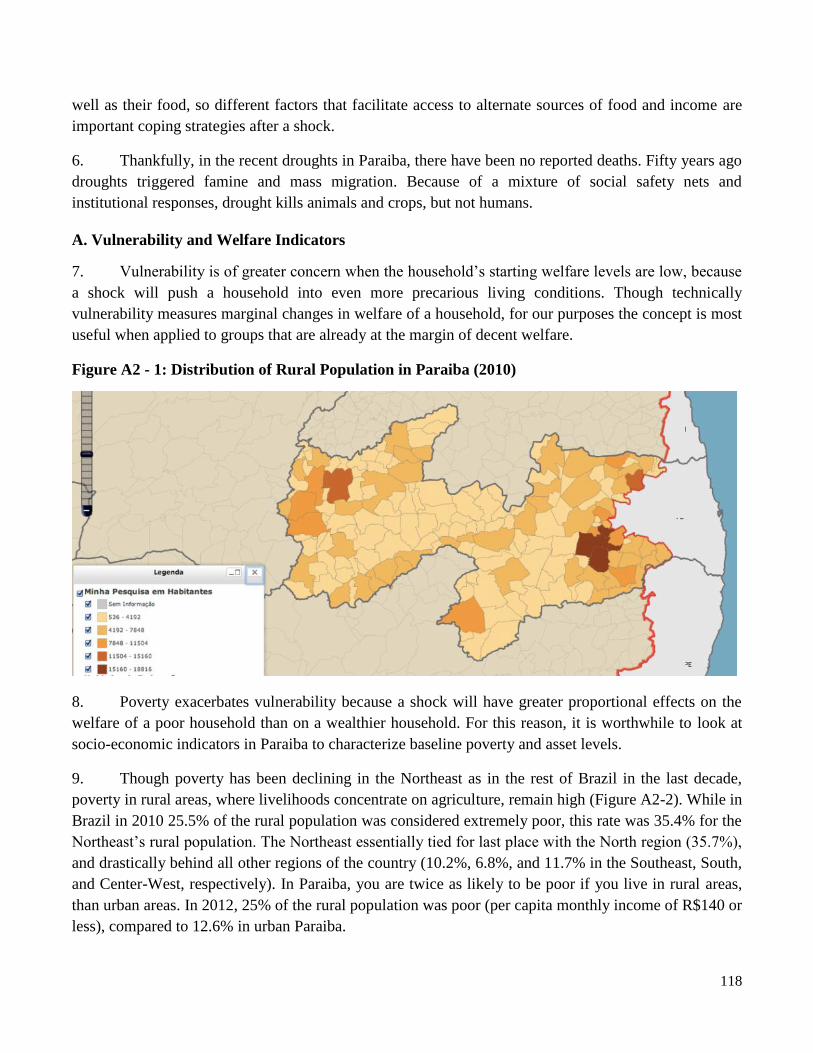
118
well as their food, so different factors that facilitate access to alternate sources of food and income are
important coping strategies after a shock.
6. Thankfully, in the recent droughts in Paraiba, there have been no reported deaths. Fifty years ago
droughts triggered famine and mass migration. Because of a mixture of social safety nets and
institutional responses, drought kills animals and crops, but not humans.
A. Vulnerability and Welfare Indicators
7. Vulnerability is of greater concern when the household’s starting welfare levels are low, because
a shock will push a household into even more precarious living conditions. Though technically
vulnerability measures marginal changes in welfare of a household, for our purposes the concept is most
useful when applied to groups that are already at the margin of decent welfare.
Figure A2 - 1: Distribution of Rural Population in Paraiba (2010)
8. Poverty exacerbates vulnerability because a shock will have greater proportional effects on the
welfare of a poor household than on a wealthier household. For this reason, it is worthwhile to look at
socio-economic indicators in Paraiba to characterize baseline poverty and asset levels.
9. Though poverty has been declining in the Northeast as in the rest of Brazil in the last decade,
poverty in rural areas, where livelihoods concentrate on agriculture, remain high (Figure A2-2). While in
Brazil in 2010 25.5% of the rural population was considered extremely poor, this rate was 35.4% for the
Northeast’s rural population. The Northeast essentially tied for last place with the North region (35.7%),
and drastically behind all other regions of the country (10.2%, 6.8%, and 11.7% in the Southeast, South,
and Center-West, respectively). In Paraiba, you are twice as likely to be poor if you live in rural areas,
than urban areas. In 2012, 25% of the rural population was poor (per capita monthly income of R$140 or
less), compared to 12.6% in urban Paraiba.
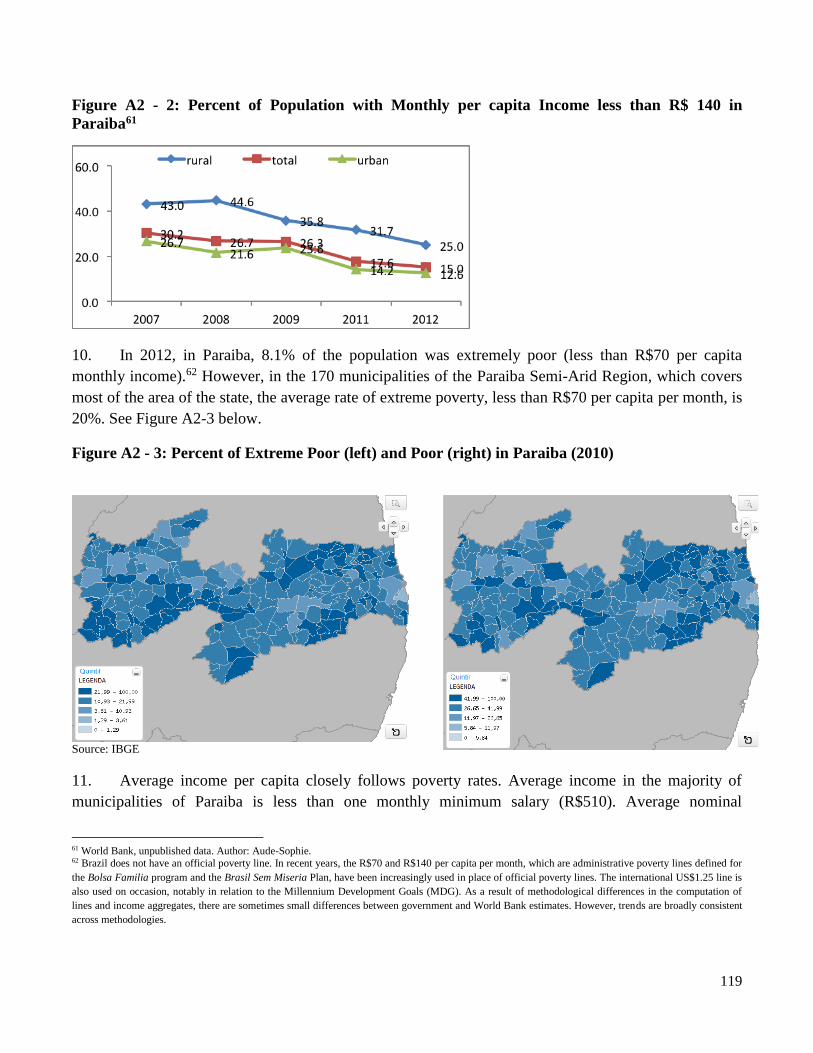
119
Figure A2 - 2: Percent of Population with Monthly per capita Income less than R$ 140 in
Paraiba61
10. In 2012, in Paraiba, 8.1% of the population was extremely poor (less than R$70 per capita
monthly income).62 However, in the 170 municipalities of the Paraiba Semi-Arid Region, which covers
most of the area of the state, the average rate of extreme poverty, less than R$70 per capita per month, is
20%. See Figure A2-3 below.
Figure A2 - 3: Percent of Extreme Poor (left) and Poor (right) in Paraiba (2010)
Source: IBGE
11. Average income per capita closely follows poverty rates. Average income in the majority of
municipalities of Paraiba is less than one monthly minimum salary (R$510). Average nominal
61 World Bank, unpublished data. Author: Aude-Sophie. 62 Brazil does not have an official poverty line. In recent years, the R$70 and R$140 per capita per month, which are administrative poverty lines defined for
the Bolsa Familia program and the Brasil Sem Miseria Plan, have been increasingly used in place of official poverty lines. The international US$1.25 line is
also used on occasion, notably in relation to the Millennium Development Goals (MDG). As a result of methodological differences in the computation of
lines and income aggregates, there are sometimes small differences between government and World Bank estimates. However, trends are broadly consistent
across methodologies.

120
household income (monthly) R$660.68; in rural it is just R$252.81. The median is R$330 urban and
R$170 rural (Figure A2-4).
Figure A2 - 4: Evolution of Income per capita, 2000 (left) and 2010 (right)
Source: IBGE
12. The human development index, which accounts for education (literacy and school enrollment
rates), longevity (life expectancy at birth) in addition to income (GDP per capita), has improved like
other indicators since 2000, but Paraiba remains in the low human development category (Human
Development Index – HDI, below 0.499). The municipalities of João Pessoa and Campina Grande
consistently stand out on development indicators (Figure A2-5).
Figure A2 - 5: Evolution of Human Development Index, 2000 (left) and 2010 (right)
Source: IBGE
13. Paraiba in 2004, the time of last food security research, had 2.1 million people living with food
insecurity. Household income is positively associated with food security. See Table A2-1 and A2-2
below.
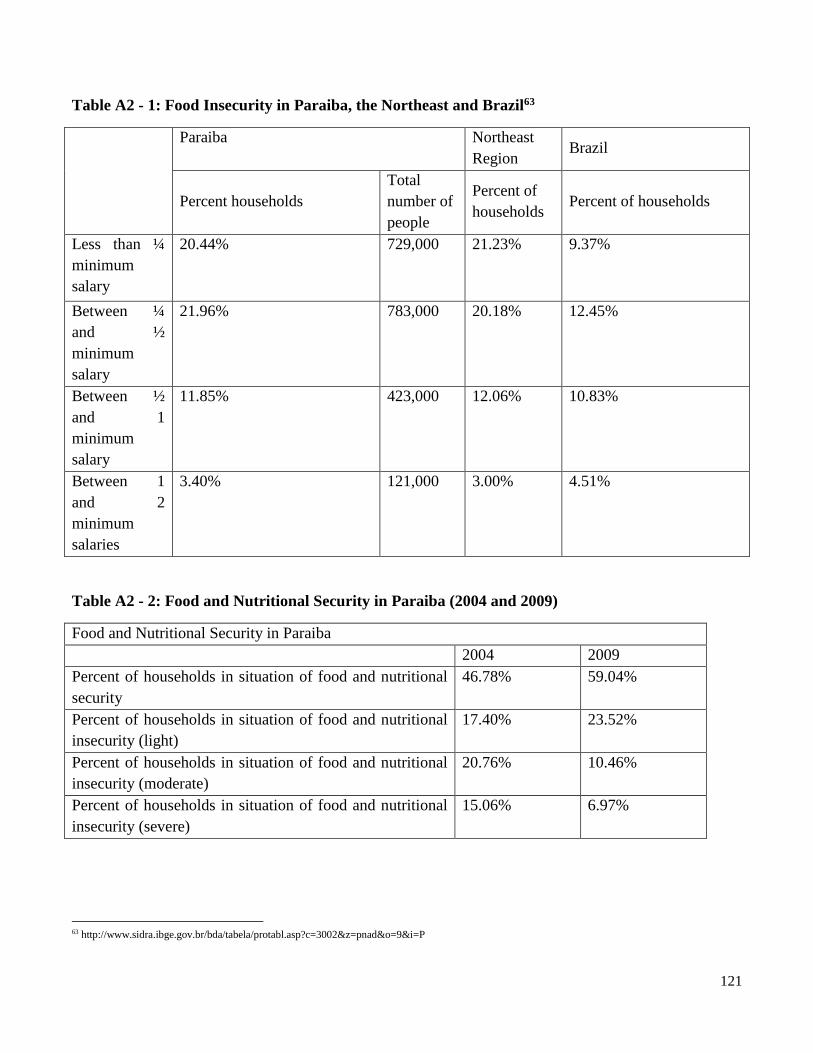
121
Table A2 - 1: Food Insecurity in Paraiba, the Northeast and Brazil63
Paraiba
Northeast
Region Brazil
Percent households
Total
number of
people
Percent of
households Percent of households
Less than ¼
minimum
salary
20.44%
729,000 21.23% 9.37%
Between ¼
and ½
minimum
salary
21.96% 783,000 20.18% 12.45%
Between ½
and 1
minimum
salary
11.85%
423,000 12.06% 10.83%
Between 1
and 2
minimum
salaries
3.40% 121,000 3.00% 4.51%
Table A2 - 2: Food and Nutritional Security in Paraiba (2004 and 2009)
Food and Nutritional Security in Paraiba
2004 2009
Percent of households in situation of food and nutritional
security
46.78% 59.04%
Percent of households in situation of food and nutritional
insecurity (light)
17.40% 23.52%
Percent of households in situation of food and nutritional
insecurity (moderate)
20.76% 10.46%
Percent of households in situation of food and nutritional
insecurity (severe)
15.06% 6.97%
63 http://www.sidra.ibge.gov.br/bda/tabela/protabl.asp?c=3002&z=pnad&o=9&i=P

122
14. Though 24% of the population in Paraiba is officially classified as rural (2004), the number of
food insecure households in rural areas contributes 28% of the total number of food insecure in
Paraiba,64 making food insecurity disproportionately rural.
15. Families on average spend 20% of income on food and acquire 7.5% of their food from their
own production or non-monetary acquisition (2008).
16. Food insecurity also disproportionately affects people of color that identify as negro or pardo.
The majority (68.47%) of all the moderate/grave food insecure households in Paraiba are non-white.65
17. When measuring vulnerability, it is important to focus on populations that are most at risk of
falling beneath the poverty line, into food insecurity, or other measurement of human development and
social welfare. To be systematic the set of measurements of interest should be determined in advance
and prioritized in order to work to avoid the worst outcomes. For example, in the Sahel donors agreed
upon a limited set of indicators of resilience-related livelihood outcomes and impacts: Reduction in
Humanitarian Assistance Needs, Depth of Poverty, Moderate to Severe Hunger, and Global Acute
Malnutrition.66
B. Vulnerability is Heterogeneous
18. To capture why vulnerability varies between individual to individual, household to household,
vulnerability can be seen as the function of three factors: (i) sensitivity, (ii) adaptive capacity, and (iii)
exposure.67
i. Sensitivity is the degree of impact of the initial shock. Sensitivity can be thought of as the
elasticity of household welfare (e.g. consumption levels) in response to a shock.
ii. Adaptive capacity is the ability of the household to access ex-post coping strategies that helps
the household return to pre-shock welfare levels.68
iii. Exposure is the probability of the given shock materializing and affecting the household’s
assets.
19. Several indices have been constructed in Northeast Brazil to measure the socio-economic aspects
of vulnerability of smallholder farmers. 69 Two examples are included here, with the first (Table A2-3)
focused on the risk of drought and the second (Table A2-4) on conditions of social vulnerability to
64 http://www.sidra.ibge.gov.br/bda/tabela/protabl.asp?c=3000&z=pnad&o=9&i=P 65 http://www.sidra.ibge.gov.br/bda/tabela/protabl.asp?c=3026&z=pnad&o=9&i=P 66 FEWSNET Technical Note on Measuring Resilience, USAID June 2013. 67 Lindoso et al. 2012. “Indicators for Assessing the Vulnerability of Smallholder Farming to Climate Change: The Case of Brazil’s Semi-Arid Northeastern
Region.” Instituto de Pesquisa Economica Aplicada. International Policy Centre for Inclusive Growth. 68 Adaptive capacity is a subset of resilience. USAID defines resilience as the ability of people, households, communities, countries, and systems to adapt to
and recover from shocks and stresses in a manner that reduces chronic vulnerability and facilitates inclusive growth. 69 Sensitivity, adaptive capacity, and exposure can each be measured through a number of indicators, and several vulnerability indices have been formulated
to capture the heterogeneity of impacts of agricultural risk for farmers in developing countries. See Lindoso et al. 2012. Supplementary Material for
“Integrated Assessment of Smallholder Farming’s Vulnerability to drought in the Brazilian Semi-Arid: a case study in Ceará” for a more comprehensive
review of the vulnerability index literature and comparison of various indices. Though there is growing consensus that vulnerability is defined by sensitivity,
adaptive capacity, and exposure, consensus does not yet exist for what composite of variables should be measured to determine each of these factors.
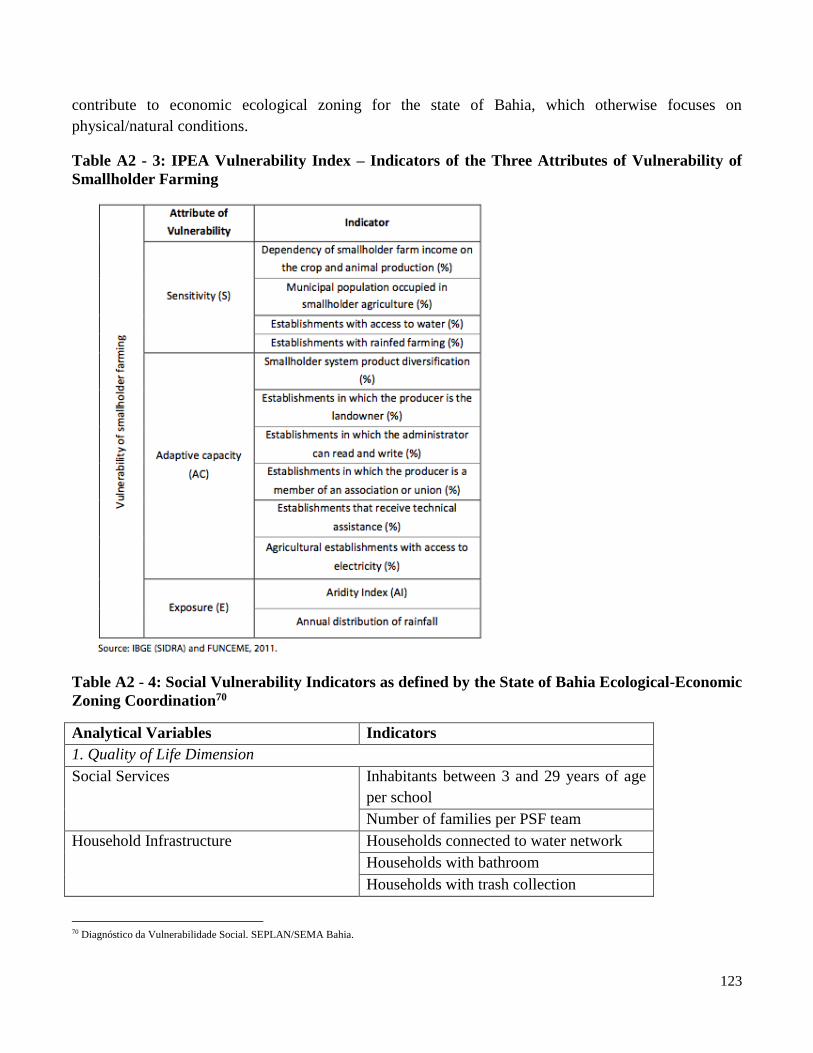
123
contribute to economic ecological zoning for the state of Bahia, which otherwise focuses on
physical/natural conditions.
Table A2 - 3: IPEA Vulnerability Index – Indicators of the Three Attributes of Vulnerability of
Smallholder Farming
Table A2 - 4: Social Vulnerability Indicators as defined by the State of Bahia Ecological-Economic
Zoning Coordination70
Analytical Variables Indicators
1. Quality of Life Dimension
Social Services Inhabitants between 3 and 29 years of age
per school
Number of families per PSF team
Household Infrastructure Households connected to water network
Households with bathroom
Households with trash collection
70 Diagnóstico da Vulnerabilidade Social. SEPLAN/SEMA Bahia.
124
Households with sewage system
Percent of energy supply
Housing Deficit
2. Living Conditions Dimension
Social Exclusion Death from external causes
Infant mortality
Number of children between 0 and 4 years
of age
Life expectancy at birth
Number of illiterate people older than 15
years of age
Number of people below the poverty line
Adolescent pregnancy rate
Household density
3. Economic Conditions Dimension
Management Capacity Municipal budget per capita
Percent of municipal resources generated
by the municipality
Work Percent of PEA relative to population
Production Diversification of the economy – Sectorial
GDP
GDP per capita
Income Income per capita
Concentration of income (Gini)
Land Concentration of landholdings (Gini)
Population Population growth
Box A2-1: Formula for Calculating Socio-Environmental Vulnerability71
Index of Socio-Environmental Vulnerability = (Aridity Index * Agricultural GDP) / (Municipal HDI *
Basic Education Development Index)
20. This annex expands upon these relevant indicators (socio-economic vulnerability index as
presented in Box A2-1) and suggests measurements for analyzing vulnerability to drought, the most
significant agricultural risk for small farmers in Paraiba. A number of indicators for sensitivity, adaptive
capacity, and exposure can be considered to characterize the vulnerability of farmers.
71 Santos. 2008. Vulnerabilidades socioambientais diante das mudanças projectadas para o semi-arido da Bahia. Doctoral Thesis, Universidade de Brasília.
125
C. Sensitivity:
21. Sensitivity is the extent of change in a household’s welfare (elasticity) induced by a shock.
22. A number of factors influence the sensitivity of a household to an agricultural shock like
drought. Prolonged drought affects household incomes most directly by constraining agricultural and
livestock yields. However, income diversification and productive diversification, along with ex-ante
mitigation measures, can minimize household sensitivity. Measurements of sensitivity of a household
should take into account:
Household revenue diversification, including access to income transfers (Retirement and
disability stipends, Bolsa Família);
Agricultural/productive diversification;
Access to water resources for productive activities and human consumption;
Number of dependents.
23. A household with diversified income sources, including non-farm income, and diversified
agricultural production will be less sensitive to drought because their principal income sources will not
all be affected in the same way. Access to water resources is important to minimize sensitivity because
household consumption and production is less dependent on rainfall. Finally, a household with a larger
number of dependents is likely to have a more elastic initial response to drought because finite
household resources must be divided between more people that cannot contribute substantially to
household revenues. However, this is somewhat offset by the fact that these dependents qualify the
household to receive social transfers (Bolsa Família for children and retirement for adults), so the
baseline of these households’ revenues may even be higher than without dependents.
24. Fortifying these kinds of characteristics/assets help to mitigate the impact of a shock, reduce
sensitivity, and reduce vulnerability.
a) Income Diversification
25. A farming household that has little or no income diversification is more sensitive to an
agricultural risk than a household that has a stream of income from non-farm economic activities. In
Paraiba, like much of rural Northeast Brazil, agricultural activities are generally the dominant form of
occupation (Figure A2-6). In many municipalities of Paraiba, employment in agricultural activities is
over 50%. The service industry is the second most important sector of work and often includes public
employment (Figure A2-7). 87% of agricultural units in Paraiba classify as family farming (less than
four fiscal modules with predominantly family labor).
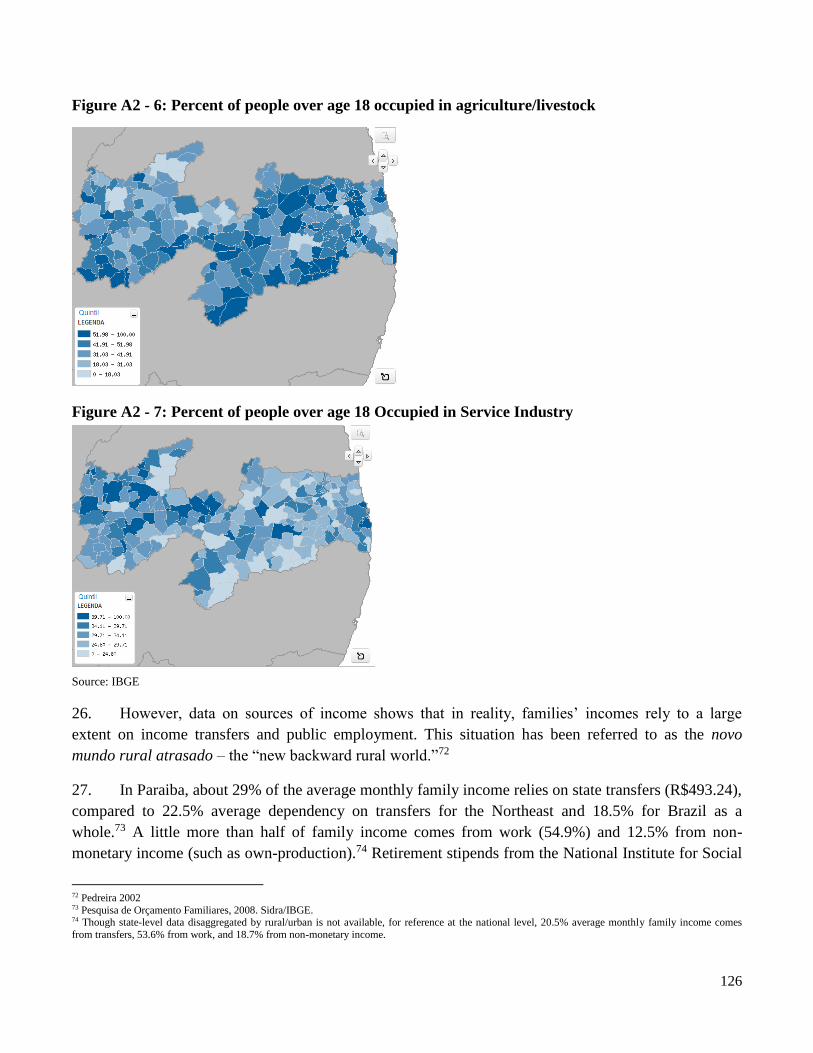
126
Figure A2 - 6: Percent of people over age 18 occupied in agriculture/livestock
Figure A2 - 7: Percent of people over age 18 Occupied in Service Industry
Source: IBGE
26. However, data on sources of income shows that in reality, families’ incomes rely to a large
extent on income transfers and public employment. This situation has been referred to as the novo
mundo rural atrasado – the “new backward rural world.”72
27. In Paraiba, about 29% of the average monthly family income relies on state transfers (R$493.24),
compared to 22.5% average dependency on transfers for the Northeast and 18.5% for Brazil as a
whole.73 A little more than half of family income comes from work (54.9%) and 12.5% from non-
monetary income (such as own-production).74 Retirement stipends from the National Institute for Social
72 Pedreira 2002 73 Pesquisa de Orçamento Familiares, 2008. Sidra/IBGE. 74 Though state-level data disaggregated by rural/urban is not available, for reference at the national level, 20.5% average monthly family income comes
from transfers, 53.6% from work, and 18.7% from non-monetary income.
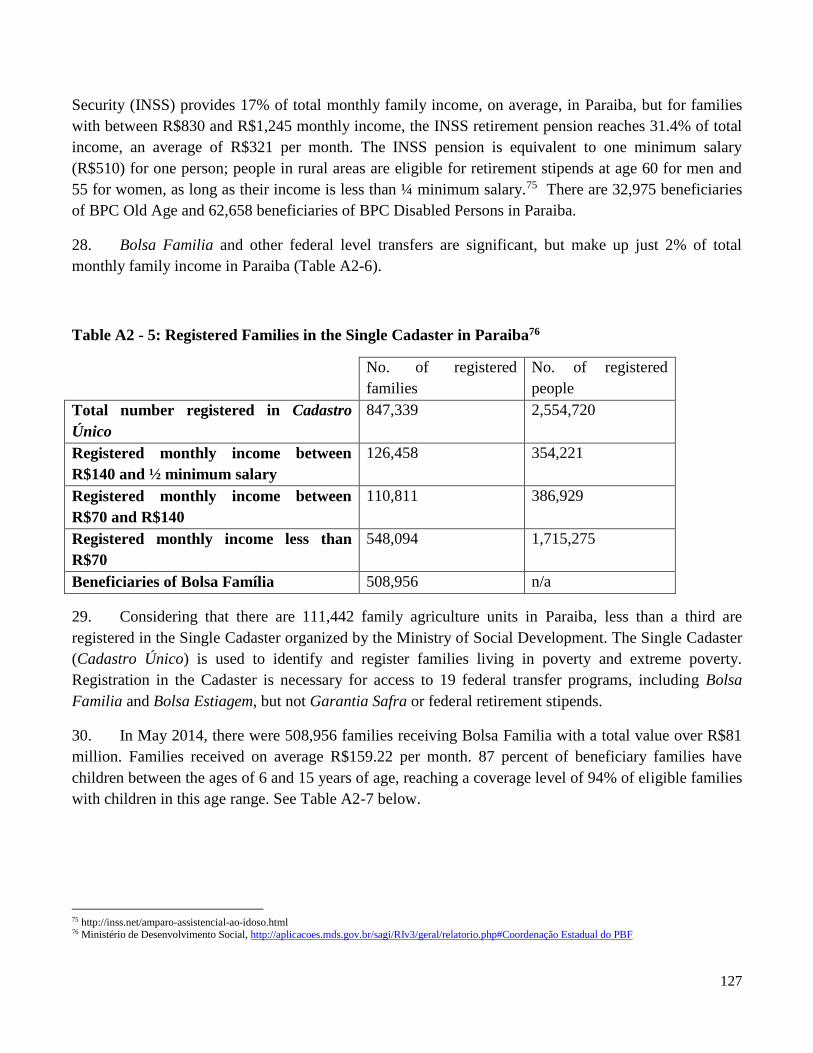
127
Security (INSS) provides 17% of total monthly family income, on average, in Paraiba, but for families
with between R$830 and R$1,245 monthly income, the INSS retirement pension reaches 31.4% of total
income, an average of R$321 per month. The INSS pension is equivalent to one minimum salary
(R$510) for one person; people in rural areas are eligible for retirement stipends at age 60 for men and
55 for women, as long as their income is less than ¼ minimum salary.75 There are 32,975 beneficiaries
of BPC Old Age and 62,658 beneficiaries of BPC Disabled Persons in Paraiba.
28. Bolsa Familia and other federal level transfers are significant, but make up just 2% of total
monthly family income in Paraiba (Table A2-6).
Table A2 - 5: Registered Families in the Single Cadaster in Paraiba76
No. of registered
families
No. of registered
people
Total number registered in Cadastro
Único
847,339 2,554,720
Registered monthly income between
R$140 and ½ minimum salary
126,458
354,221
Registered monthly income between
R$70 and R$140
110,811 386,929
Registered monthly income less than
R$70
548,094 1,715,275
Beneficiaries of Bolsa Família 508,956 n/a
29. Considering that there are 111,442 family agriculture units in Paraiba, less than a third are
registered in the Single Cadaster organized by the Ministry of Social Development. The Single Cadaster
(Cadastro Único) is used to identify and register families living in poverty and extreme poverty.
Registration in the Cadaster is necessary for access to 19 federal transfer programs, including Bolsa
Familia and Bolsa Estiagem, but not Garantia Safra or federal retirement stipends.
30. In May 2014, there were 508,956 families receiving Bolsa Familia with a total value over R$81
million. Families received on average R$159.22 per month. 87 percent of beneficiary families have
children between the ages of 6 and 15 years of age, reaching a coverage level of 94% of eligible families
with children in this age range. See Table A2-7 below.
75 http://inss.net/amparo-assistencial-ao-idoso.html 76 Ministério de Desenvolvimento Social, http://aplicacoes.mds.gov.br/sagi/RIv3/geral/relatorio.php#Coordenação Estadual do PBF
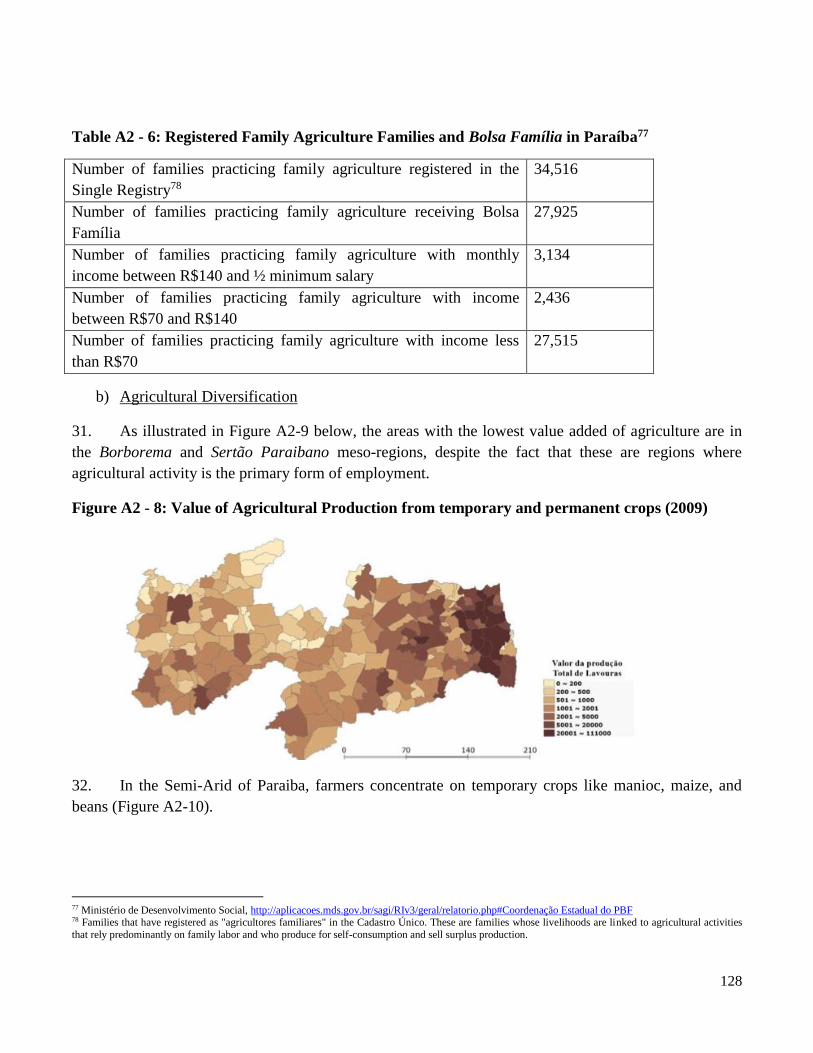
128
Table A2 - 6: Registered Family Agriculture Families and Bolsa Família in Paraíba77
Number of families practicing family agriculture registered in the
Single Registry78
34,516
Number of families practicing family agriculture receiving Bolsa
Família
27,925
Number of families practicing family agriculture with monthly
income between R$140 and ½ minimum salary
3,134
Number of families practicing family agriculture with income
between R$70 and R$140
2,436
Number of families practicing family agriculture with income less
than R$70
27,515
b) Agricultural Diversification
31. As illustrated in Figure A2-9 below, the areas with the lowest value added of agriculture are in
the Borborema and Sertão Paraibano meso-regions, despite the fact that these are regions where
agricultural activity is the primary form of employment.
Figure A2 - 8: Value of Agricultural Production from temporary and permanent crops (2009)
32. In the Semi-Arid of Paraiba, farmers concentrate on temporary crops like manioc, maize, and
beans (Figure A2-10).
77 Ministério de Desenvolvimento Social, http://aplicacoes.mds.gov.br/sagi/RIv3/geral/relatorio.php#Coordenação Estadual do PBF 78 Families that have registered as "agricultores familiares" in the Cadastro Único. These are families whose livelihoods are linked to agricultural activities
that rely predominantly on family labor and who produce for self-consumption and sell surplus production.
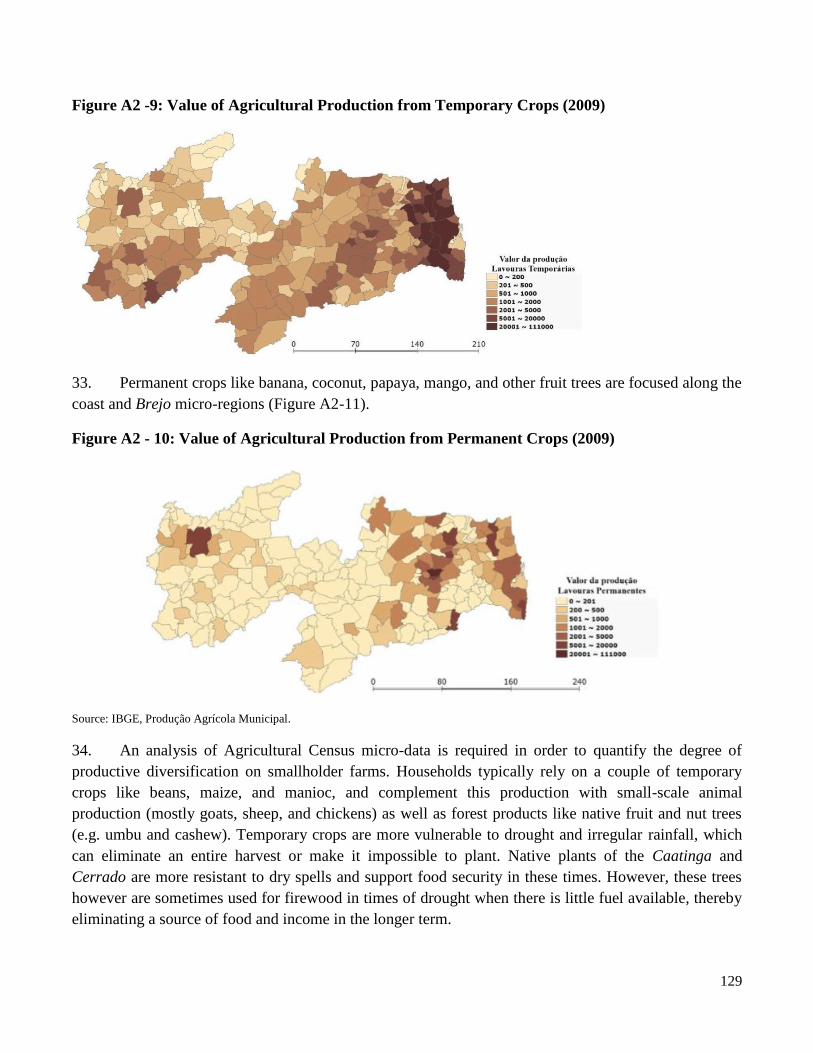
129
Figure A2 -9: Value of Agricultural Production from Temporary Crops (2009)
33. Permanent crops like banana, coconut, papaya, mango, and other fruit trees are focused along the
coast and Brejo micro-regions (Figure A2-11).
Figure A2 - 10: Value of Agricultural Production from Permanent Crops (2009)
Source: IBGE, Produção Agrícola Municipal.
34. An analysis of Agricultural Census micro-data is required in order to quantify the degree of
productive diversification on smallholder farms. Households typically rely on a couple of temporary
crops like beans, maize, and manioc, and complement this production with small-scale animal
production (mostly goats, sheep, and chickens) as well as forest products like native fruit and nut trees
(e.g. umbu and cashew). Temporary crops are more vulnerable to drought and irregular rainfall, which
can eliminate an entire harvest or make it impossible to plant. Native plants of the Caatinga and
Cerrado are more resistant to dry spells and support food security in these times. However, these trees
however are sometimes used for firewood in times of drought when there is little fuel available, thereby
eliminating a source of food and income in the longer term.
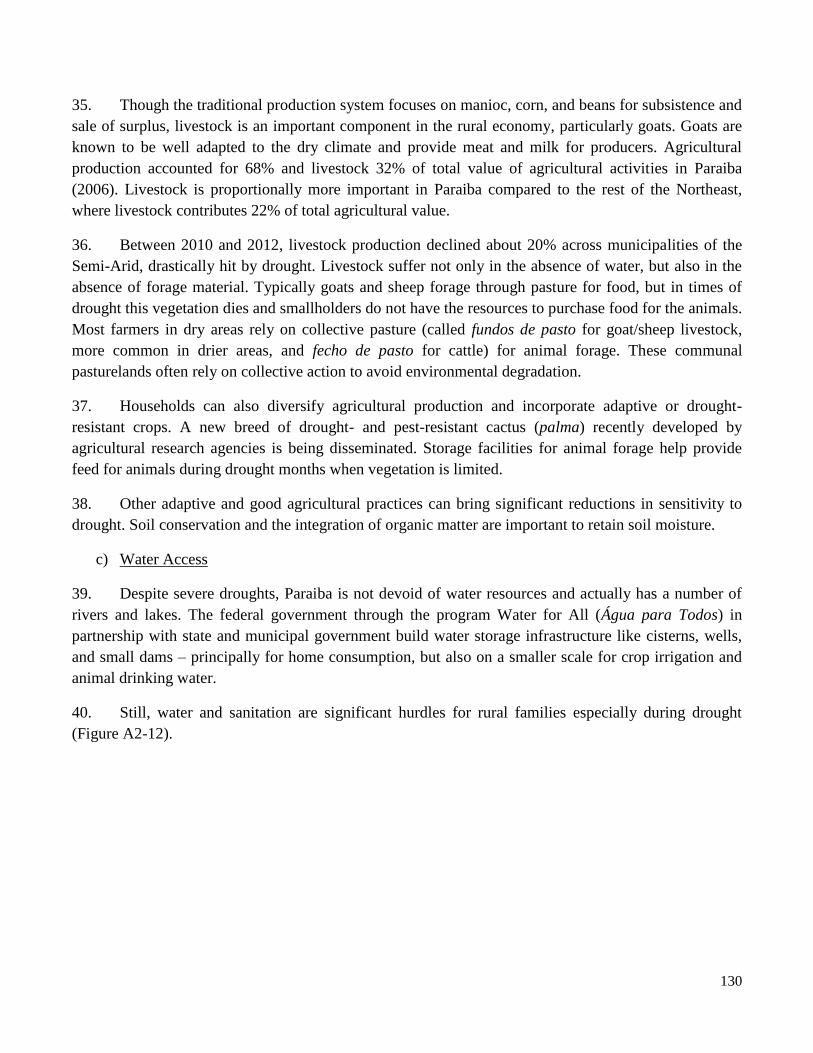
130
35. Though the traditional production system focuses on manioc, corn, and beans for subsistence and
sale of surplus, livestock is an important component in the rural economy, particularly goats. Goats are
known to be well adapted to the dry climate and provide meat and milk for producers. Agricultural
production accounted for 68% and livestock 32% of total value of agricultural activities in Paraiba
(2006). Livestock is proportionally more important in Paraiba compared to the rest of the Northeast,
where livestock contributes 22% of total agricultural value.
36. Between 2010 and 2012, livestock production declined about 20% across municipalities of the
Semi-Arid, drastically hit by drought. Livestock suffer not only in the absence of water, but also in the
absence of forage material. Typically goats and sheep forage through pasture for food, but in times of
drought this vegetation dies and smallholders do not have the resources to purchase food for the animals.
Most farmers in dry areas rely on collective pasture (called fundos de pasto for goat/sheep livestock,
more common in drier areas, and fecho de pasto for cattle) for animal forage. These communal
pasturelands often rely on collective action to avoid environmental degradation.
37. Households can also diversify agricultural production and incorporate adaptive or drought-
resistant crops. A new breed of drought- and pest-resistant cactus (palma) recently developed by
agricultural research agencies is being disseminated. Storage facilities for animal forage help provide
feed for animals during drought months when vegetation is limited.
38. Other adaptive and good agricultural practices can bring significant reductions in sensitivity to
drought. Soil conservation and the integration of organic matter are important to retain soil moisture.
c) Water Access
39. Despite severe droughts, Paraiba is not devoid of water resources and actually has a number of
rivers and lakes. The federal government through the program Water for All (Água para Todos) in
partnership with state and municipal government build water storage infrastructure like cisterns, wells,
and small dams – principally for home consumption, but also on a smaller scale for crop irrigation and
animal drinking water.
40. Still, water and sanitation are significant hurdles for rural families especially during drought
(Figure A2-12).

131
Figure A2 - 11: Percent of People in Households with Inadequate Access to Water and Sanitation79
d) Dependency
41. Finally, the last important aspect of sensitivity is the number of dependents per household.
Paraiba, like much of the rural Northeast, has experienced rural out-migration over the last decades
whereby the economically active population leaves rural areas. The dependency ratio (ratio of
population less than 15 and more than 65 to the population between 15-65 years of age) is very high
throughout Paraiba, especially in some of the poorer meso-regions like the Borborema and Northern
Agreste. This means that it is common that over 58% of the population in these regions is either under
age 15 or over age 65 (Figures A2-13 and A2-14, respectively).
Figure A2 - 12: Dependency Ratio
79 http://www.atlasbrasil.org.br/2013/pt/consulta

132
Figure A2 - 13: Number of People over 65
D. Adaptive Capacity:
42. Households’ access to ex-post coping strategies is closely linked to poverty, social
marginalization, and access to public policies. Ex-post coping strategies are diverse. Migration and off-
farm work has long been a coping strategy in the Northeast to compensate for loss of
production/livestock due to drought; communities and social networks often emerge to help one another
in times of need; and state and federal governments have a variety of emergency measures to help
families maintain welfare levels during drought like cash, animal feed, and seed transfers.80
43. Measurements of adaptive capacity in Paraiba should include the following components:
Literacy/education level;
Social inclusion;
Land title for security of tenure, including pasture land, and to access PRONAF credit;
Social capital (“horizontal” and “vertical” ties, including membership in producer organizations
and patronage arrangements);
Access to technical assistance and research/technology transfer;
Access to markets;
Access to emergency coping services (distribution of food, seed, and fertilizer).
44. The exposed above are forms of capital that facilitate recovery after a shock. Interventions to
increase adaptive capacity can consider investing in these categories. The concept of intersectionality
80 Small farmers in the Northeast do not have access to true risk transfer mechanisms, which could also be considered as a strategy for adaptive capacity. Garantia Safra is not a “true” insurance but rather a fund. Premiums are not calculated by an actuary to reflect risk; every participating farmer pays the same
premium and receives the same payout if the index is triggered.

133
applies in this context, meaning that overlapping disadvantages (e.g. someone with more than one
historically marginalized identity like gender and ethnicity) typically present greater social exclusion;
i.e., someone with various disadvantages tend to be more socially excluded, than someone with just one
disadvantage.
45. Conversely, many of these categories reinforce one another. Social capital can support access to
markets and technical assistance; extension agents are more likely to work with organized groups of
producers, and group organization can facilitate access to markets.
a) Land Tenure
46. Secure land tenure is an important asset that enables access to coping strategies. Title is required
to access PRONAF credit, among other forms of credit, in addition to conveying security of ownership.
Property ownership is also important to retain possession of land in times of hardship; people renting
land may lose access to land when they cannot produce the resources to pay for rental, either cash or
through sharing a portion of agricultural production with the owner (sharecropping). In the Semi-Arid,
69.6% of family farming plots have legal title. For the roughly 76,000 households engaged in livestock
and ranching in Paraiba, about 75% own the land on which the animals are raised.
47. Secure tenure is particularly important for pasture for animals (Table A2-8). The three meso-
regions with the most livestock producers are the Agreste Paraibano (38% of all producers), Sertão
Paraibano (35%), and Borborema (21%). In each of these, ownership is most common, but occupants
are the second most frequent category of producers, respectively 14%, 8%, and 12% in Agreste, Sertão,
and Borborema.
Table A2 - 7: Tenure Systems for Livestock, Paraiba (2006)81
Type of Tenure Number of establishments Percent of total
Owner 57,542 75.7%
Occupant 8,919 11.7%
Producer without land 3,837 5.0%
Settled without definitive title 2,772 3.6%
Partnership 1,511 2.0%
Rental 1,469 1.9%
81 http://www.sidra.ibge.gov.br/bda/tabela/protabl.asp?c=1244&z=t&o=11&i=P

134
Total 76,050 100%
48. In times of drought, a critical coping strategy is moving the herd to pasturelands that have
retained vegetation (Figure A2-15). Whether or not a rancher has access to pasture reserves is an
important factor of adaptive capacity. Collective action to preserve communal pasture land is important,
but rarely are these lands titled and ranchers must be able to defend outsiders from using their land,
which is not always possible especially in times of drought when competition for resources is high.
Other ranchers, miners, and land-grabbers also threaten ownership of common lands.
Figure A2 - 14: Schematic Cycle of Land Tenure and Vulnerability for Semi-Arid Ranchers82
49. It is more common to raise goats on common pasturelands because they require less investment
in fodder than bovines and are lower-value than cows. Fabiano and Holanda (2008) conclude that
ranchers who use common pasturelands are less vulnerable to droughts because goats are better adapted
to very dry conditions and require fewer resources to maintain.
50. Land occupation, without title, is even higher for temporary crops in Paraiba (Table A2-9).
Table A2 - 8: Tenure Systems for Temporary Crops, Paraiba (2006) 83
Type of Tenure Number of
establishments
Percent of total
Owner 41,711 59.8%
Occupant 14,095 20.2%
Producer without land 2,922 4.2%
Settled without definitive title 3,103 4.4%
82 Toni, Fabiano and Evandro Holanda. 2008. The effects of land tenure on vulnerability to droughts in Northeastern Brazil. Global Environmental Change
18, 575-582. 83 http://www.sidra.ibge.gov.br/bda/tabela/protabl.asp?c=1244&z=t&o=11&i=P
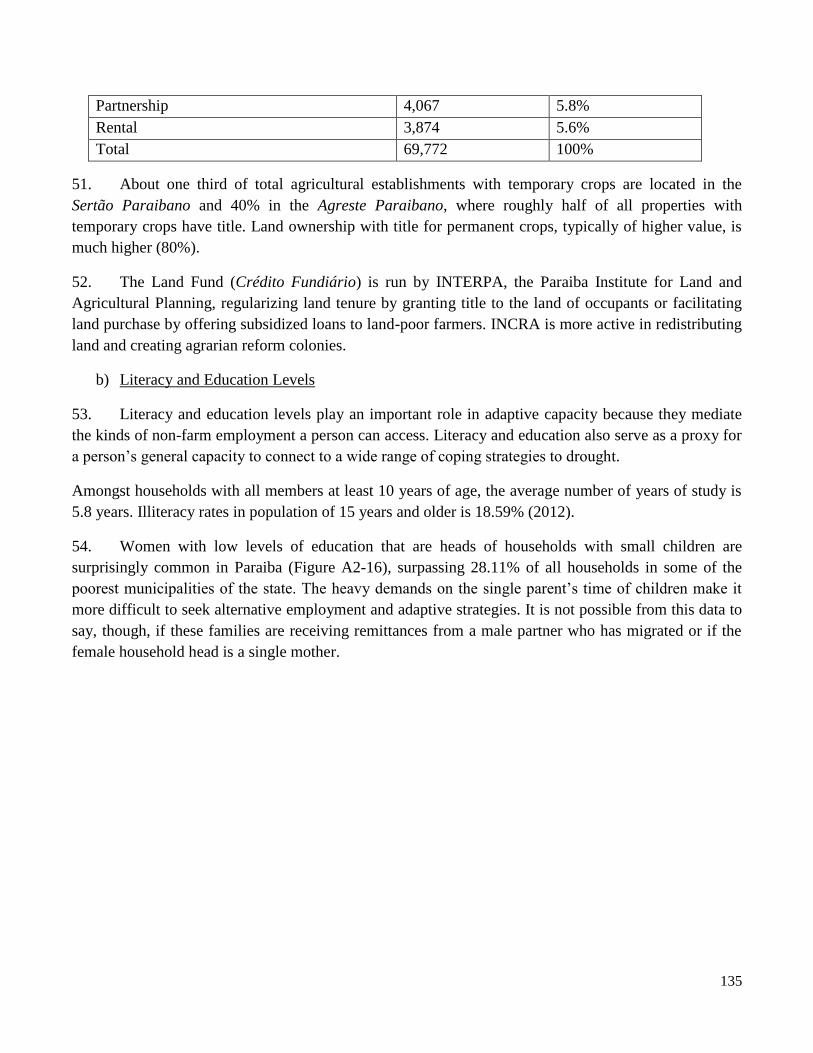
135
Partnership 4,067 5.8%
Rental 3,874 5.6%
Total 69,772 100%
51. About one third of total agricultural establishments with temporary crops are located in the
Sertão Paraibano and 40% in the Agreste Paraibano, where roughly half of all properties with
temporary crops have title. Land ownership with title for permanent crops, typically of higher value, is
much higher (80%).
52. The Land Fund (Crédito Fundiário) is run by INTERPA, the Paraiba Institute for Land and
Agricultural Planning, regularizing land tenure by granting title to the land of occupants or facilitating
land purchase by offering subsidized loans to land-poor farmers. INCRA is more active in redistributing
land and creating agrarian reform colonies.
b) Literacy and Education Levels
53. Literacy and education levels play an important role in adaptive capacity because they mediate
the kinds of non-farm employment a person can access. Literacy and education also serve as a proxy for
a person’s general capacity to connect to a wide range of coping strategies to drought.
Amongst households with all members at least 10 years of age, the average number of years of study is
5.8 years. Illiteracy rates in population of 15 years and older is 18.59% (2012).
54. Women with low levels of education that are heads of households with small children are
surprisingly common in Paraiba (Figure A2-16), surpassing 28.11% of all households in some of the
poorest municipalities of the state. The heavy demands on the single parent’s time of children make it
more difficult to seek alternative employment and adaptive strategies. It is not possible from this data to
say, though, if these families are receiving remittances from a male partner who has migrated or if the
female household head is a single mother.
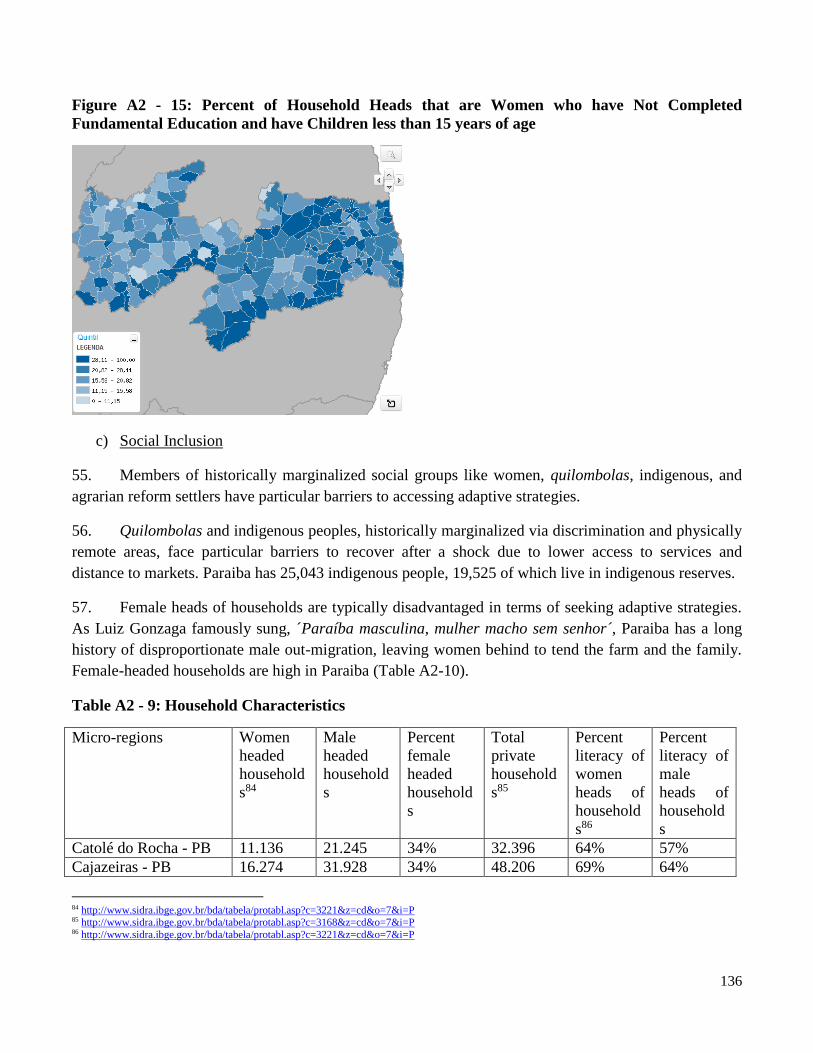
136
Figure A2 - 15: Percent of Household Heads that are Women who have Not Completed
Fundamental Education and have Children less than 15 years of age
c) Social Inclusion
55. Members of historically marginalized social groups like women, quilombolas, indigenous, and
agrarian reform settlers have particular barriers to accessing adaptive strategies.
56. Quilombolas and indigenous peoples, historically marginalized via discrimination and physically
remote areas, face particular barriers to recover after a shock due to lower access to services and
distance to markets. Paraiba has 25,043 indigenous people, 19,525 of which live in indigenous reserves.
57. Female heads of households are typically disadvantaged in terms of seeking adaptive strategies.
As Luiz Gonzaga famously sung, ´Paraíba masculina, mulher macho sem senhor´, Paraiba has a long
history of disproportionate male out-migration, leaving women behind to tend the farm and the family.
Female-headed households are high in Paraiba (Table A2-10).
Table A2 - 9: Household Characteristics
Micro-regions Women
headed
household
s84
Male
headed
household
s
Percent
female
headed
household
s
Total
private
household
s85
Percent
literacy of
women
heads of
household
s86
Percent
literacy of
male
heads of
household
s
Catolé do Rocha - PB 11.136 21.245 34% 32.396 64% 57%
Cajazeiras - PB 16.274 31.928 34% 48.206 69% 64%
84 http://www.sidra.ibge.gov.br/bda/tabela/protabl.asp?c=3221&z=cd&o=7&i=P 85 http://www.sidra.ibge.gov.br/bda/tabela/protabl.asp?c=3168&z=cd&o=7&i=P 86 http://www.sidra.ibge.gov.br/bda/tabela/protabl.asp?c=3221&z=cd&o=7&i=P

137
Sousa - PB 17.88 34.05 34% 51.940 67% 60%
Patos - PB 14.662 21.435 41% 36.110 75% 71%
Piancó - PB 6.288 13.721 31% 20.019 58% 53%
Itaporanga - PB 7.219 15.623 32% 22.847 62% 57%
Serra do Teixeira - PB 12.673 19.129 40% 31.816 62% 59%
Seridó Ocidental
Paraibano - PB
4.089 7.39 36% 11.481 75% 65%
Seridó Oriental
Paraibano - PB
7.82 13.313 37% 21.138 71% 61%
Cariri Ocidental - PB 15.52 22.437 41% 37.972 72% 62%
Cariri Oriental - PB 6.883 11.858 37% 18.742 73% 63%
Curimataú Ocidental -
PB
13.575 21.299 39% 34.881 63% 57%
Curimataú Oriental -
PB
10.291 15.615 40% 25.915 57% 49%
Esperança - PB 6.512 9.105 42% 15.618 66% 65%
Brejo Paraibano - PB 11.513 20.155 36% 31.672 57% 53%
Guarabira - PB 17.688 30.032 37% 47.729 61% 59%
Campina Grande - PB 59.361 86.245 41% 145.648 80% 81%
Itabaiana - PB 12.348 19.366 39% 31.718 57% 53%
Umbuzeiro - PB 5.972 8.941 40% 14.918 58% 49%
Litoral Norte - PB 13.644 25.852 35% 39.501 58% 59%
Sapé - PB 14.911 22.216 40% 37.132 58% 55%
João Pessoa - PB 126.052 174.598 42% 300.729 85% 87%
Litoral Sul - PB 7.549 14.994 33% 22.544 61% 64%
58. The majority ethnicity in rural Paraíba is parda, about two-thirds of the rural population. Whites
make up the next largest group, 26.5% of the rural population (Table A2-11).
Table A2 - 10: Ethnicity in Rural Paraiba and Northeast
Percent of Total PB Population
Ethnicity Paraiba Northeast
White 5.15% 6.03%
Black (negro) 0.95% 1.90%
Parda 13% 18.47%
Amarela 0.14% 0.02%
Indigenous 0.17% 0.16%
Total Rural Population 19.41% 26.58%
d) Social Capital
138
59. Social capital is an important factor for resilience to risks. Social capital can be both horizontal
(between people with the same relative power within a community) and vertical (patronage or clientele
relationships between differential powers).
60. Social relationships between community members are important to analyze, as communities with
strong social ties may pool resources together in times of hardship.87 However, formal membership in
associations was described as weak in qualitative interviews in Paraiba. There is not a strong tradition of
association formation in the Northeast compared to other places regions in the country, such as the
South. Just 6.74% are of the interviewees were associated to a union.88 However, it was highlighted that
incentives to organize the society must exist, since it is unlikely to happen spontaneously; with limited
public technical assistance available and resources distributed without the need of social formally
arrangements (associations, cooperatives, etc.), incentives for formal organization are limited. Councils
for Sustainable Rural Development are comprised of producer associations and municipal government
representatives to discuss municipal development planning, but experts noted that participation can be
erratic since representatives do not receive financial compensation for transportation costs or time.
61. The Northeast Region presents a long history of patronage arrangements and, many times,
facilitate access to public services including investments and emergency responses: “Patronage
continues to be the dominant tool for survival,” and extreme competition exists over access to scarce
state services.89 The indústria da seca (drought industry) is a popular phrase that characterizes the
business of drought mitigation and emergency efforts in exchange or political support. Several
interviewees mentioned the fact that Paraiba has a large number of municipalities, given its small size
(223 –Pernambuco, a larger State, has 185), as an indicator of political capture and fierce feudalism-type
arrangements.
e) Access to Markets, Technical Assistance, and Public Services
62. Drought is a covariate shock, rather than idiosyncratic, meaning that it affects entire
communities, municipalities, and territories. While with idiosyncratic shocks, such as the death of a
family member, affected households can often turn to their social networks and community
organizations for support coping, covariate shocks like drought in areas where there is limited economic
diversification affects the resource upon which everyone depends. Typical agricultura familiar in the
Semi-Arid involves a system of staple crops like manioc, corn, and beans, along with herds of goats and
sheep. While rural families consume some of their production, increasingly these crops are sold more
often than they are consumed in the household, as cash transfers and remittances from off-farm income
supplement household revenues.
63. The lack of diversification between farmers reduces coping capacity of whole regions and
increases competition for limited resources, like water and pasture or forage material for animals.
87 Meinzin-Dick, Ruth. 2014. Social Capital for Resilience. IFPRI Resilience Conference Brief. 88 http://www.sidra.ibge.gov.br/bda/tabela/protabl.asp?c=1891&z=pnad&o=3&i=P 89 http://www.tandfonline.com/doi/pdf/10.1080/1366879022000020194
139
Coping strategies are often very similar and the homogeneity makes for a less resilient system: when
farmers seek to sell their animals, as a last resort, many others are attempting to do the same. While
there may be cases of collective action to commercialize animals, more commonly, the bump in supply
of animal meat exceeds demand and presses down prices.
64. Distance from markets and infrastructure for supply chains are also very limited. Agricultural
producers – especially for milk and meat – face challenges marketing their product in the absence of
cold storage facilities and distance to markets.
65. A number of productive inclusion projects, including COOPERAR, exist at the municipal level90
that provide investments in small farmers or guaranteed markets, as in through Food Acquisition
Program from smallholders (PAA) for different crops and milk.
66. A number of municipal, state, and federal level relief services exist to support rural populations
during drought (See Stocktaking of Projects and Programs related to Agricultural Risk Management in
Paraiba), including Cesta Básica (food distribution) to traditional populations,91 Water for All program
(investments in emergency water infrastructure), Garantia Safra (for municipalities that lose over 50%
of agricultural production due to drought). Access to these programs often requires farmers to register as
a family farmer, submitting a DAP (Declaration of Aptitude for PRONAF) at a local EMATER office.
In 2006, 11,340 establishments received occasional technical assistance, 29% of which could not read or
write; 3,985 received regular technical assistance, 24.8% of which could not read or write; and the
remaining 151,961 establishments did not receive technical assistance. The majority received assistance
from the government, followed by private technical assistance (4,394), and trailed by cooperatives (412)
and other organizations.
67. Technology transfer is sporadic and limited in Paraiba, and agricultural research faces a
bottleneck at the stage of application to the producer since EMATER is essentially the only institution
offering technical assistance and has about 500 agents for the entire state.
E. Exposure:
68. Exposure is discussed in the climate section of this report in greater detail, but the main message
is that the Semi-Arid is not homogenous in climate. Aridity indices are often used to measure this aspect
of vulnerability.
F. Scales of Vulnerability Analysis
69. In this section, the focus was on vulnerability of the household. However, vulnerability can be
measured at different scales of analysis: the individual, household, community, municipality, region, and
so on.
90 http://aplicacoes.mds.gov.br/sagi/RIv3/geral/index.php# 91 http://aplicacoes.mds.gov.br/sagi/RIv3/geral/relatorio.34%php#Políticas relacionadas ao Acesso à Alimentação Adequada
140
70. Commonly, it is assumed that households share resources equally and ownership is collective
within the household. In reality, ownership of many household assets is not shared and it is rare to find
decision-making jointly distributed between heads of households.92 In a region with a history of male
out-migration, women-headed households are fairly common and respondents noted that gender roles
allow women to participate actively in agricultural production and important risk-management activities
like water use.
92 IFPRI Gender Assets and Agriculture Project (GAAP)

141
ANNEX 3: STOCKTAKING OF PROJECTS AND PROGRAMS RELEVANT FOR
AGRICULTURAL RISK MANAGEMENT
Name of
Project/Progr
am
Year
Initiated
Objective and
target group
Components
and key
activities
Executing
Units
Cost
FEDERAL
PROJECTS
AND
PROGRAMS
Garantia
Safra93
2002 Crop
insurance for
families with
family income
less than or
equal to 1.5
minimum
salary, living
in the area
under
responsibility
of
Superintenden
t of
Development
of the
Northeast
(Sudene)
Farmers
enrolled in
Garantia
Safra that pay
a monthly
premium
receive
indemnity if
they live in
municipalities
that lose 50%
or more of
their harvest.
In PB, 141
municipalities,
80,970
beneficiaries
were served in
2012/2013
harvest.
MDA
Water for
All94
2011 Expand access
to water for
Installation of
water facilities
Ministry of
Integration
93 http://www.brasil.gov.br/observatoriodaseca/garantia-safra.html 94 http://www.integracao.gov.br/web/guest/entenda-o-programa
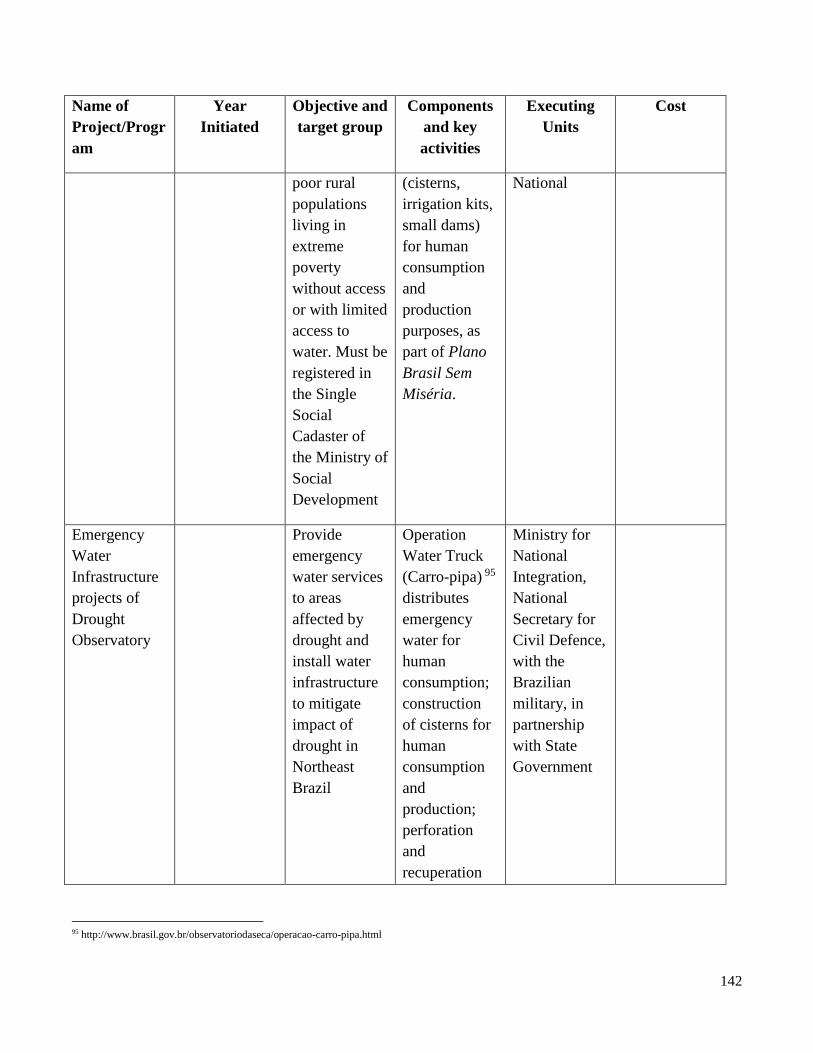
142
Name of
Project/Progr
am
Year
Initiated
Objective and
target group
Components
and key
activities
Executing
Units
Cost
poor rural
populations
living in
extreme
poverty
without access
or with limited
access to
water. Must be
registered in
the Single
Social
Cadaster of
the Ministry of
Social
Development
(cisterns,
irrigation kits,
small dams)
for human
consumption
and
production
purposes, as
part of Plano
Brasil Sem
Miséria.
National
Emergency
Water
Infrastructure
projects of
Drought
Observatory
Provide
emergency
water services
to areas
affected by
drought and
install water
infrastructure
to mitigate
impact of
drought in
Northeast
Brazil
Operation
Water Truck
(Carro-pipa) 95
distributes
emergency
water for
human
consumption;
construction
of cisterns for
human
consumption
and
production;
perforation
and
recuperation
Ministry for
National
Integration,
National
Secretary for
Civil Defence,
with the
Brazilian
military, in
partnership
with State
Government
95 http://www.brasil.gov.br/observatoriodaseca/operacao-carro-pipa.html

143
Name of
Project/Progr
am
Year
Initiated
Objective and
target group
Components
and key
activities
Executing
Units
Cost
of wells
Emergency
Credit96
2011 Provide
R$3.45 billion
in credit for
rural
producers
affected by
drought in
municipalities
declared to be
in emergency
situations as
recognized by
the National
Secretary of
Civil Defense.
Must live in
the area under
responsibility
of
Superintenden
t of
Development
of the
Northeast
(Sudene)
Credit
between
R$2,500 to
R$100,000,
with interest
rates from 1%
to 3.5% per
year. In
Paraiba, 203
municipalities
were reached
in 51,178
operations
with a total of
R$284 million
contracted.
Constitutional
Fund for
Financing of
the Northeast
(FNE) through
Banco do
Nordeste
Ministry of
Finance
R$3.45 billion
in credit
Bolsa
Estiagem97
2004 Cash transfer
to family
farmers living
in
municipalities
declared to be
in emergency
Families
receive R$80
monthly. 203
municipalities,
87,879
beneficiaries
Ministry of
National
Integration,
Ministry of
Agrarian
Development,
Ministry of
Monthly cost
of R$95.1
million
96 http://www.brasil.gov.br/observatoriodaseca/linha-de-credito.html 97 http://www.brasil.gov.br/observatoriodaseca/bolsa-estiagem.html

144
Name of
Project/Progr
am
Year
Initiated
Objective and
target group
Components
and key
activities
Executing
Units
Cost
situations as
recognized by
the National
Secretary of
Civil Defense.
in PB Social
Development
Insurance for
Family
Farming
(SEAF)98
1991 Family farmer
crop insurance
for producers
that receive
PRONAF
Farmer pays
2% of total
insured value
and Federal
Government
pays rest of
premium.
Farmers with
30% of
production
lost
Ministry of
Agrarian
Development
Subsidized
Sale of
Maize99
Provide
purchase of
maize from
family farmers
and subsidized
sale of maize
for animal
feed of family
farmers in
regions
affected by
drought
Subsidized
sale of maize
for animal
feed at price
between
R$18.10 and
R$24.60. As
of March
2014, 115,925
tones were
distributed to
20,100
beneficiaries
in PB.
CONAB
98 http://portal.mda.gov.br/portal/saf/programas/seaf/2259694 99 http://www.brasil.gov.br/observatoriodaseca/venda-de-milho.html
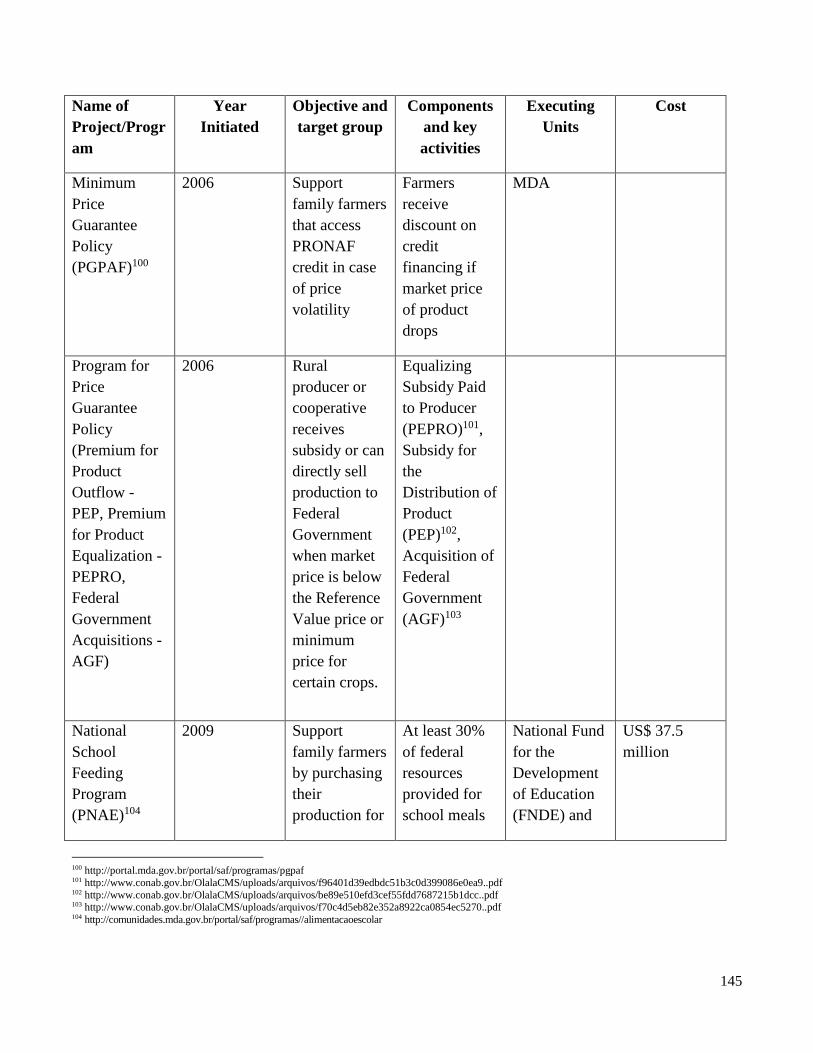
145
Name of
Project/Progr
am
Year
Initiated
Objective and
target group
Components
and key
activities
Executing
Units
Cost
Minimum
Price
Guarantee
Policy
(PGPAF)100
2006 Support
family farmers
that access
PRONAF
credit in case
of price
volatility
Farmers
receive
discount on
credit
financing if
market price
of product
drops
MDA
Program for
Price
Guarantee
Policy
(Premium for
Product
Outflow -
PEP, Premium
for Product
Equalization -
PEPRO,
Federal
Government
Acquisitions -
AGF)
2006 Rural
producer or
cooperative
receives
subsidy or can
directly sell
production to
Federal
Government
when market
price is below
the Reference
Value price or
minimum
price for
certain crops.
Equalizing
Subsidy Paid
to Producer
(PEPRO)101,
Subsidy for
the
Distribution of
Product
(PEP)102,
Acquisition of
Federal
Government
(AGF)103
National
School
Feeding
Program
(PNAE)104
2009 Support
family farmers
by purchasing
their
production for
At least 30%
of federal
resources
provided for
school meals
National Fund
for the
Development
of Education
(FNDE) and
US$ 37.5
million
100 http://portal.mda.gov.br/portal/saf/programas/pgpaf 101 http://www.conab.gov.br/OlalaCMS/uploads/arquivos/f96401d39edbdc51b3c0d399086e0ea9..pdf 102 http://www.conab.gov.br/OlalaCMS/uploads/arquivos/be89e510efd3cef55fdd7687215b1dcc..pdf 103 http://www.conab.gov.br/OlalaCMS/uploads/arquivos/f70c4d5eb82e352a8922ca0854ec5270..pdf 104 http://comunidades.mda.gov.br/portal/saf/programas//alimentacaoescolar
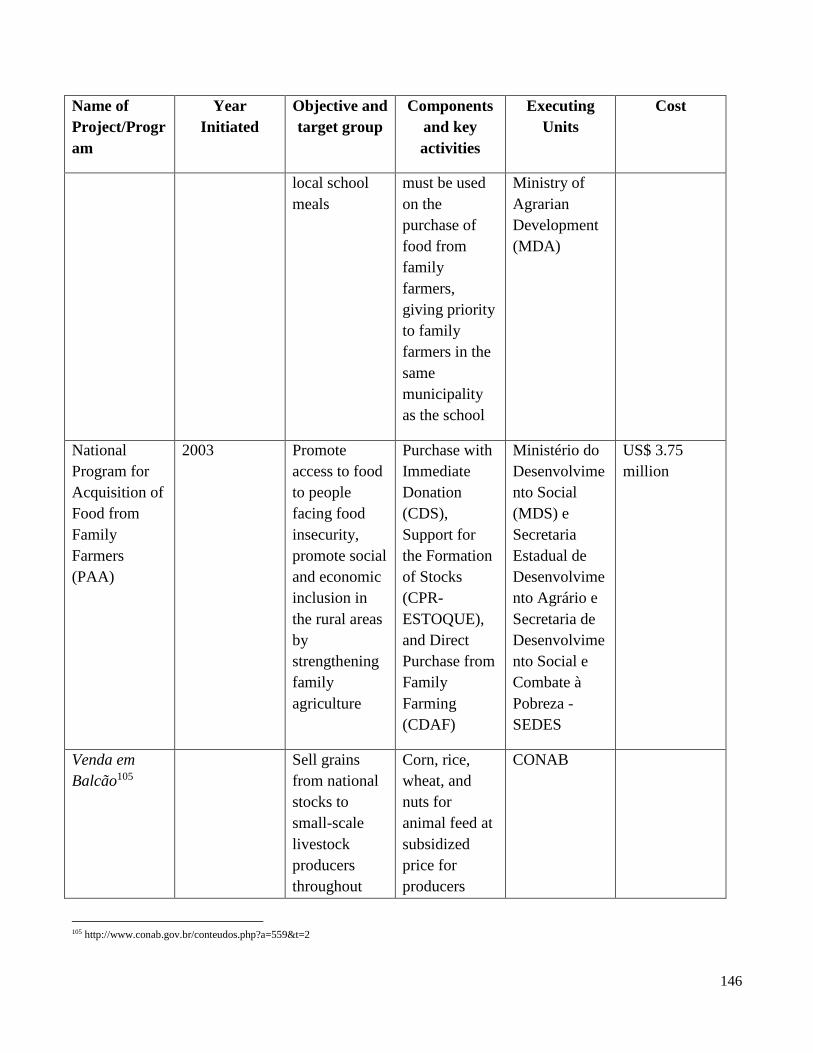
146
Name of
Project/Progr
am
Year
Initiated
Objective and
target group
Components
and key
activities
Executing
Units
Cost
local school
meals
must be used
on the
purchase of
food from
family
farmers,
giving priority
to family
farmers in the
same
municipality
as the school
Ministry of
Agrarian
Development
(MDA)
National
Program for
Acquisition of
Food from
Family
Farmers
(PAA)
2003 Promote
access to food
to people
facing food
insecurity,
promote social
and economic
inclusion in
the rural areas
by
strengthening
family
agriculture
Purchase with
Immediate
Donation
(CDS),
Support for
the Formation
of Stocks
(CPR-
ESTOQUE),
and Direct
Purchase from
Family
Farming
(CDAF)
Ministério do
Desenvolvime
nto Social
(MDS) e
Secretaria
Estadual de
Desenvolvime
nto Agrário e
Secretaria de
Desenvolvime
nto Social e
Combate à
Pobreza -
SEDES
US$ 3.75
million
Venda em
Balcão105
Sell grains
from national
stocks to
small-scale
livestock
producers
throughout
Corn, rice,
wheat, and
nuts for
animal feed at
subsidized
price for
producers
CONAB
105 http://www.conab.gov.br/conteudos.php?a=559&t=2
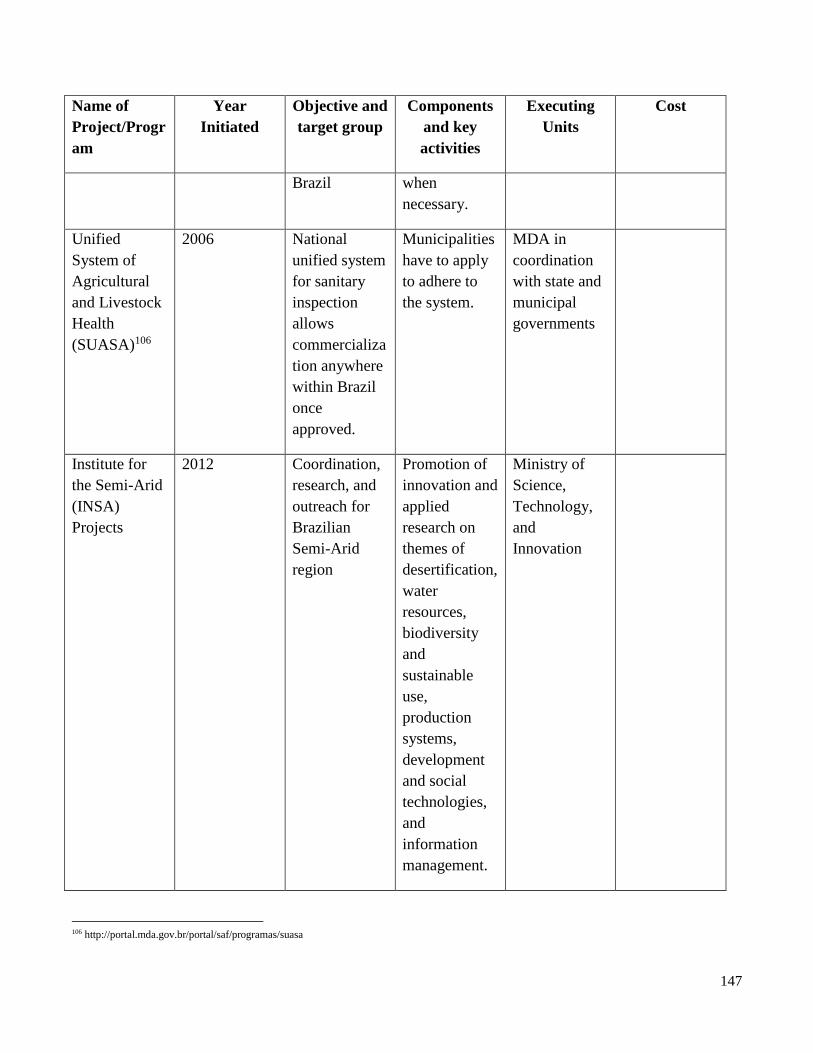
147
Name of
Project/Progr
am
Year
Initiated
Objective and
target group
Components
and key
activities
Executing
Units
Cost
Brazil when
necessary.
Unified
System of
Agricultural
and Livestock
Health
(SUASA)106
2006 National
unified system
for sanitary
inspection
allows
commercializa
tion anywhere
within Brazil
once
approved.
Municipalities
have to apply
to adhere to
the system.
MDA in
coordination
with state and
municipal
governments
Institute for
the Semi-Arid
(INSA)
Projects
2012 Coordination,
research, and
outreach for
Brazilian
Semi-Arid
region
Promotion of
innovation and
applied
research on
themes of
desertification,
water
resources,
biodiversity
and
sustainable
use,
production
systems,
development
and social
technologies,
and
information
management.
Ministry of
Science,
Technology,
and
Innovation
106 http://portal.mda.gov.br/portal/saf/programas/suasa
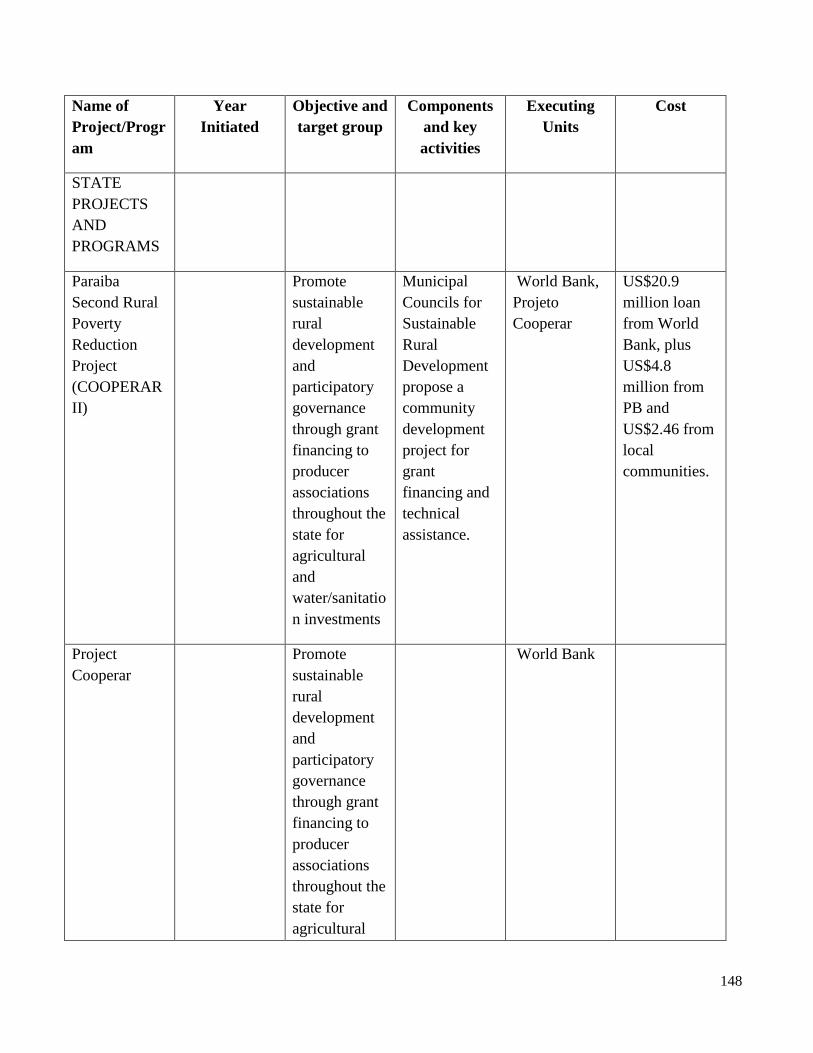
148
Name of
Project/Progr
am
Year
Initiated
Objective and
target group
Components
and key
activities
Executing
Units
Cost
STATE
PROJECTS
AND
PROGRAMS
Paraiba
Second Rural
Poverty
Reduction
Project
(COOPERAR
II)
Promote
sustainable
rural
development
and
participatory
governance
through grant
financing to
producer
associations
throughout the
state for
agricultural
and
water/sanitatio
n investments
Municipal
Councils for
Sustainable
Rural
Development
propose a
community
development
project for
grant
financing and
technical
assistance.
World Bank,
Projeto
Cooperar
US$20.9
million loan
from World
Bank, plus
US$4.8
million from
PB and
US$2.46 from
local
communities.
Project
Cooperar
Promote
sustainable
rural
development
and
participatory
governance
through grant
financing to
producer
associations
throughout the
state for
agricultural
World Bank
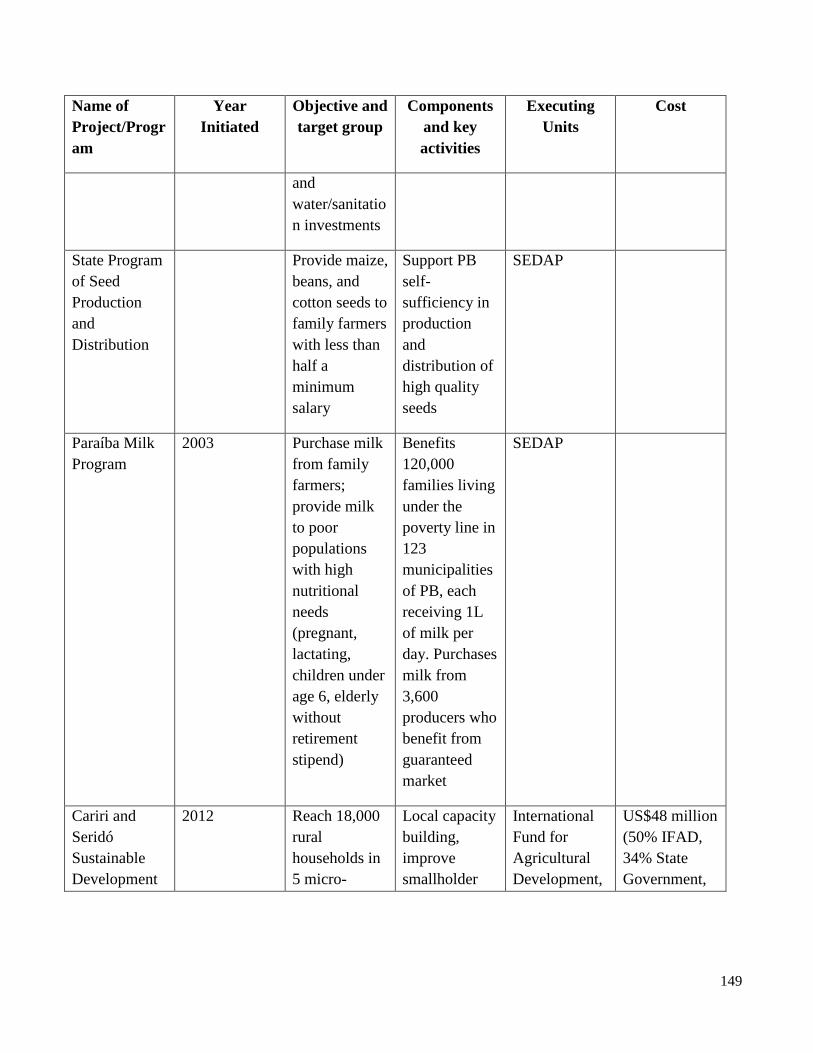
149
Name of
Project/Progr
am
Year
Initiated
Objective and
target group
Components
and key
activities
Executing
Units
Cost
and
water/sanitatio
n investments
State Program
of Seed
Production
and
Distribution
Provide maize,
beans, and
cotton seeds to
family farmers
with less than
half a
minimum
salary
Support PB
self-
sufficiency in
production
and
distribution of
high quality
seeds
SEDAP
Paraíba Milk
Program
2003 Purchase milk
from family
farmers;
provide milk
to poor
populations
with high
nutritional
needs
(pregnant,
lactating,
children under
age 6, elderly
without
retirement
stipend)
Benefits
120,000
families living
under the
poverty line in
123
municipalities
of PB, each
receiving 1L
of milk per
day. Purchases
milk from
3,600
producers who
benefit from
guaranteed
market
SEDAP
Cariri and
Seridó
Sustainable
Development
2012 Reach 18,000
rural
households in
5 micro-
Local capacity
building,
improve
smallholder
International
Fund for
Agricultural
Development,
US$48 million
(50% IFAD,
34% State
Government,

150
Name of
Project/Progr
am
Year
Initiated
Objective and
target group
Components
and key
activities
Executing
Units
Cost
Project
(Procase)107
regions of PB:
Cariri
Ocidental e
Oriental,
Seridó
Ocidental e
Oriental, and
Curimataú
Ocidental.
production
and market
competitivene
ss, promote
farming
practices
resilience/adap
tive to drought
SEDAP 16% farmer
associations)
State
Irrigation
Project of
Várzea de
Souza (Pivas)
Irrigation
project for
Alto Sertão
Region to
reach 178
small
producers and
141 agrarian
reform
settlement
families.
Install
irrigation for
4,390 hectares
for fruit and
sheep
production,
experimental
agricultural
stations, and
an agrarian
reform
settlement.
SEDAP
State Program
for
Agriculture/Li
vestock
Defense
Program to
register,
inspect, and
enforce
sanitary
conditions for
the production
and circulation
of agriculture
and livestock
National
Programs for
Control,
Eradication,
and
Prevention of
Foot and
Mouth
Disease
(PNEFA);
Control of
Rabies
SEDAP
107 http://www.ifad.org/media/press/2012/63.htm
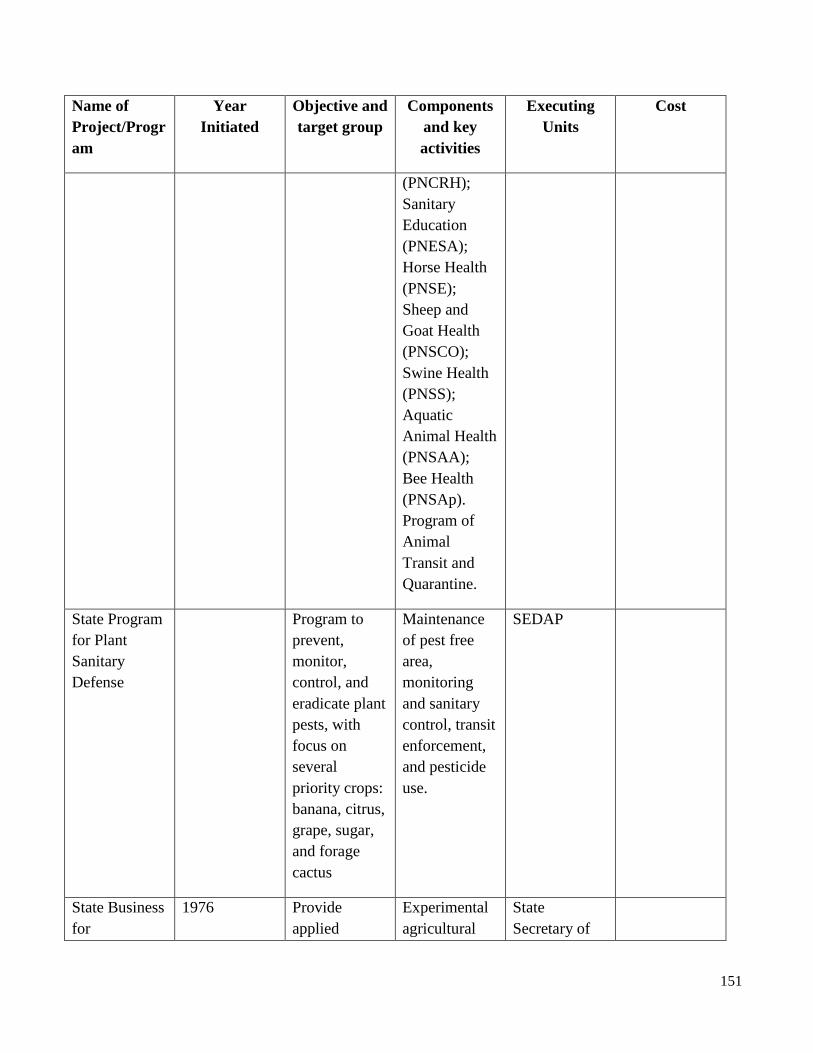
151
Name of
Project/Progr
am
Year
Initiated
Objective and
target group
Components
and key
activities
Executing
Units
Cost
(PNCRH);
Sanitary
Education
(PNESA);
Horse Health
(PNSE);
Sheep and
Goat Health
(PNSCO);
Swine Health
(PNSS);
Aquatic
Animal Health
(PNSAA);
Bee Health
(PNSAp).
Program of
Animal
Transit and
Quarantine.
State Program
for Plant
Sanitary
Defense
Program to
prevent,
monitor,
control, and
eradicate plant
pests, with
focus on
several
priority crops:
banana, citrus,
grape, sugar,
and forage
cactus
Maintenance
of pest free
area,
monitoring
and sanitary
control, transit
enforcement,
and pesticide
use.
SEDAP
State Business
for
1976 Provide
applied
Experimental
agricultural
State
Secretary of

152
Name of
Project/Progr
am
Year
Initiated
Objective and
target group
Components
and key
activities
Executing
Units
Cost
Agricultural/L
ivestock
Research of
Paraíba
(EMEPA)
Projects
research for
family farmers
and
agribusiness in
Paraiba and
help form state
public policy
in agricultural
sector.
research
stations
Science and
Technology,
SEDAP, and
can capture
resources from
external
sources (e.g.
COOPERAR)
EMATER
Projects
Advisory and
extension
services for
family farmers
in Paraiba.
184,000
family farmers
served in
Paraiba.
Registration of
family
farmers,
support for
access to
family
farming public
policies and
services,
support for
commercializa
tion,
agroecological
transition,
food and
nutritional
security,
assessment of
losses to
calibrate
Garantia
Safra.
SEDAP R$244 million
(2012)
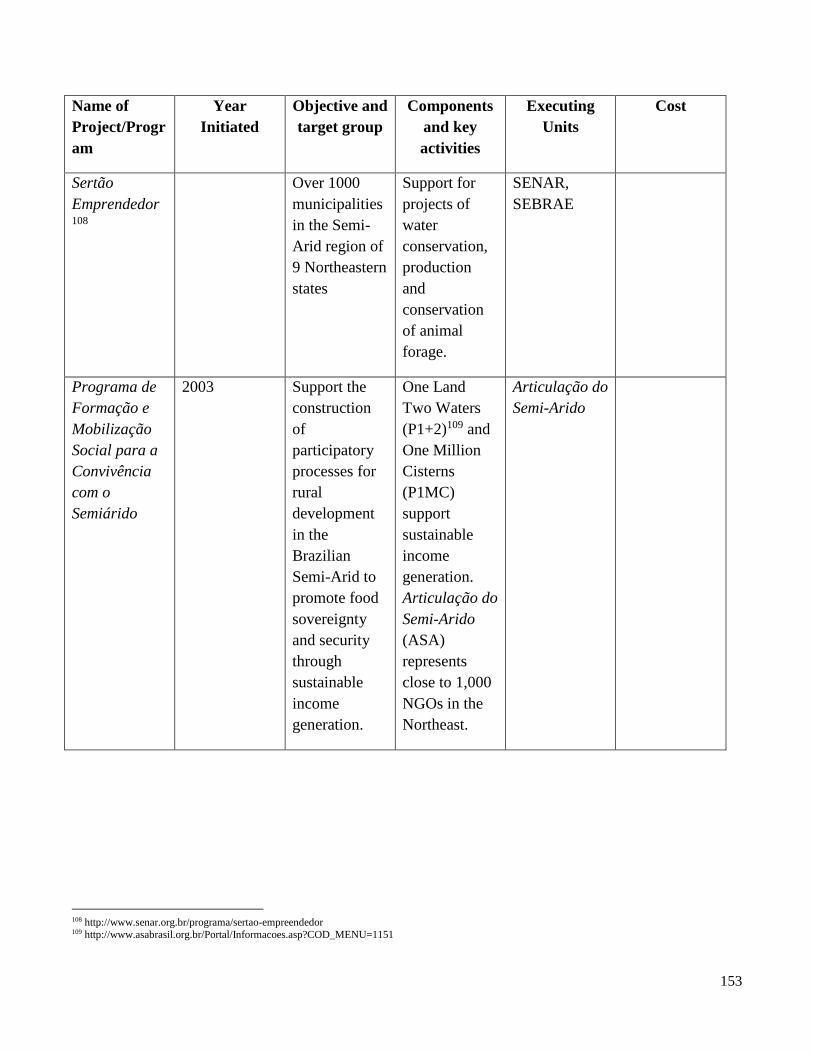
153
Name of
Project/Progr
am
Year
Initiated
Objective and
target group
Components
and key
activities
Executing
Units
Cost
Sertão
Emprendedor108
Over 1000
municipalities
in the Semi-
Arid region of
9 Northeastern
states
Support for
projects of
water
conservation,
production
and
conservation
of animal
forage.
SENAR,
SEBRAE
Programa de
Formação e
Mobilização
Social para a
Convivência
com o
Semiárido
2003 Support the
construction
of
participatory
processes for
rural
development
in the
Brazilian
Semi-Arid to
promote food
sovereignty
and security
through
sustainable
income
generation.
One Land
Two Waters
(P1+2)109 and
One Million
Cisterns
(P1MC)
support
sustainable
income
generation.
Articulação do
Semi-Arido
(ASA)
represents
close to 1,000
NGOs in the
Northeast.
Articulação do
Semi-Arido
108 http://www.senar.org.br/programa/sertao-empreendedor 109 http://www.asabrasil.org.br/Portal/Informacoes.asp?COD_MENU=1151

154
ANNEX 4: OUTLINE OF WEATHER RISK MANAGEMENT RELATED PROGRAMS AND
PROJECTS
As a result of recurrent droughts, many initiatives of risk management were created, mainly by the
Federal Government and institutions but also by State institutions. The most important ones are listed
below.
The MINISTRY OF AGRICULTURE, LIVESTOCK AND SUPPLY (MAPA) is responsible for the
Agricultural Climate Risk Zoning (ZARC), which aims to minimize the risk related to weather
phenomena, and allows identify the best moments for planting in selected municipalities considering
different types of soil and crop cycles. Based on these parameters it is estimated that 2 out of 10 years
face considerable losses when the planting is done on the recommended period. The ZARC started in
1996 for the wheat crop and nowadays it includes 40 crops, 16 of annual cycle and 24 permanent crops,
covering 24 states (BRACALE, 2012).
The FEDERAL GOVERNMENT created by law nº 5,969, from December 11th 1973, the Agriculture
and livestock Activity Guarantee Program (PROAGRO) (Table 1). Basically the covered risks are
adverse weather phenomena, plagues and diseases afflicting crops and livestock. The PROAGRO is a
public insurance operated by the financial institutions. Its management is under the responsibility of the
Central Bank of Brazil (BACEN), which articulates permanently the Ministries of Finance (MF),
Planning, Budget and Management (MPOG), Agriculture, Livestock and Supply (MAPA) and
Agricultural Development (MDA). The revenue of the PROAGRO is constituted in its majority by the
Federal Government funding. On the other hand, payment of coverage (indemnity) constitutes the
biggest portion of the expenses. The claim adjustment to confirm the losses are done by technical
assistance institutions. The farms eligible for PROAGRO are the ones which are associated with
agricultural costing, funded or not, and the they should necessarily follow the ZARC recommendations,
except the properties which are associated to the National Program for Family Farming Strengthening
(PRONAF) and the ones located in states not covered by the ZARC. The maximum liability per agent of
the PROAGRO is US$ 130,434 (Resolution nº 4,111/12). The insurable risks are: a) Excessive rainfall,
frost, hail, drought, excessive temperature oscillations, strong winds, cold winds, and disease and
plagues without methods of control; b) on livestock costing credit operations: losses incurred by diseases
without methods of prophylaxis. The compensation of the program may range from 70% to 100% of the
coverage limit. In case where there is irrigation in the farm the compensation will be 100% of the
coverage. The PROAGRO premium rates are: i) 1% for irrigated farms; ii) 2% for the farms associated
to PRONAF, except irrigated farms; iii) 3% for the others; and, iv) 5% for the non-funded farms
(OZAKI, 2013);
The FEDERAL GOVERNMENT, through the resolution nº 3,234/04, created the Agriculture and
livestock Activity Guarantee Program for the Family Farmers (PROAGRO MAIS). The difference
between PROAGRO, also known as TRADITIONAL PROAGRO, and the PROAGRO MAIS, is the
target public. The PROAGRO MAIS focuses only on the Family Farmers and the TRADITIONAL
PROAGRO aim the remaining farmers. The PROAGRO MAIS is regulated according to the Traditional
PROAGRO, including the ZARC rules. The most important rules regarding the program are: i) The
coverage is equal to 100%; ii) Obligation of associating to the program when obtaining agricultural
costing credit from PRONAF; iii) It is possible to insure up to 65% of the expected net revenue; iv) The

155
trigger for receiving the compensation is the gross revenue, that is, if the gross revenue obtained is less
than 70% of the expected gross revenue then the farmer is compensated; v) Covered risks: excessive
rainfall, frost, hail, drought, excessive temperature oscillations, strong winds, cold winds, and disease
and plagues without methods of control; vi) The premium rate is 2%. In case where the farm is irrigated
and located in the semiarid region, the rate is 1%.
Table 1. Operational results of PROAGRO TRADICIONAL (PT) and PROAGRO MAIS
(PM).
From the crop year 1998/99 to the crop year 2009/10, the total number of contracts of PT
and PM presented relative growth until the crop year 2006/07, when it started to decrease
because of the relative increase of the private crop insurance (Figure 1).
Figure 1. Amount of operations hired from TRADITIONAL PROAGRO, PROAGRO
MAIS and total, from crop year 1998/99 to 2011/12, in thousands.
Source: Central Bank of Brazil (2014)
Another important variable in the program is the liability that shows how much is being
insured each year. In both programs, the liability increased until the crop year 2008/09,
when it started to decrease.
Considering only the PT, until the crop year 2004/05 the liability was, on average, equal to
US$ 339 million. From 2005/06 to 2011/12, the average number increased to US$ 1 billion.
After the creation of PM, the liability of both programs increased to US$ 1.8 billion, on
average. (figure 2).
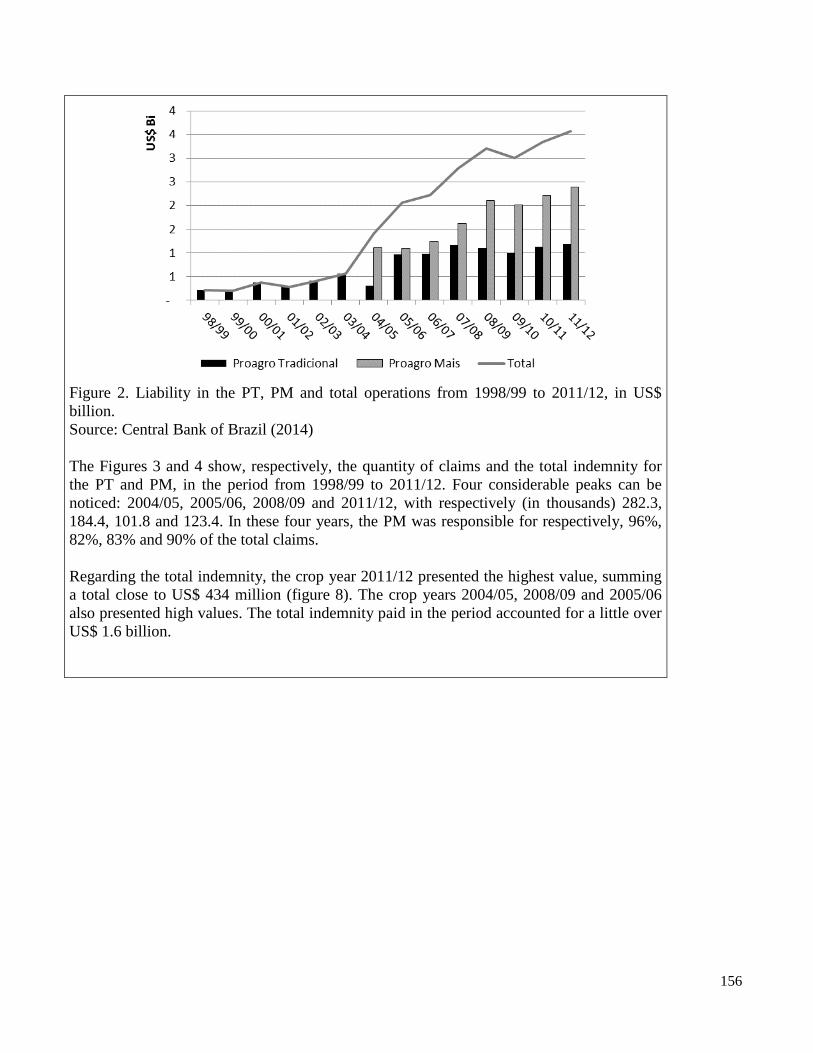
156
Figure 2. Liability in the PT, PM and total operations from 1998/99 to 2011/12, in US$
billion.
Source: Central Bank of Brazil (2014)
The Figures 3 and 4 show, respectively, the quantity of claims and the total indemnity for
the PT and PM, in the period from 1998/99 to 2011/12. Four considerable peaks can be
noticed: 2004/05, 2005/06, 2008/09 and 2011/12, with respectively (in thousands) 282.3,
184.4, 101.8 and 123.4. In these four years, the PM was responsible for respectively, 96%,
82%, 83% and 90% of the total claims.
Regarding the total indemnity, the crop year 2011/12 presented the highest value, summing
a total close to US$ 434 million (figure 8). The crop years 2004/05, 2008/09 and 2005/06
also presented high values. The total indemnity paid in the period accounted for a little over
US$ 1.6 billion.

157
Figure 3. Amount of claims in the PT, PM and total, from 1998/99 to 2011/12, in thousands.
Source: Central Bank of Brazil (2014)
Figure 4. Total indemnity in the PT, PM and total, and total, from 1998/99 to 2011/12, in
US$ million.
Source: Central Bank of Brazil (2014)
From the crop year 2004/05 to 2011/12, considering the average number of contracts, the
most important crops were corn (43.6%), soybean (18%) and coffee (8.7%). Regarding the
territorial concentration, the south region of Brazil presented considerable importance. In
average values, the region was responsible for 67.5% of the contracts, followed by the
northeast region (13.6%) and southeast (14.9%). In the south region, the state of Rio Grande
do Sul (36%) is the most important, followed by Paraná (19%) and Santa Catarina (12%).

158
Accounting for the average indemnity in the analyzed period, the corn crops represented
almost 48.2%, and average value equal to US$ 100 million, followed by the soybean
(29.1%) and wheat (15.7%). Besides the short average participation on the total number of
contracts, the wheat crops have relatively high importance on the average indemnity. The
south region accounted for almost 91.9 % of the total indemnity. The state of Rio Grande do
Sul was responsible for about 48.2%, Paraná, 33.6% and Santa Catarina, 10.1%. The
northeast region accounted for 5% of the total indemnity. In the region, Bahia (2%), Sergipe
(1%) and Ceará (1%) were the most important states. Among the risk covered, in the period
analyzed, drought accounted for over 86% of the total indemnity
The MINISTRY OF AGRICULTURE, LIVESTOCK AND SUPPLY (MAPA) is responsible to
operate the Rural Insurance Premium Subsidy Program (PSR) created by the law 10,823/03 (Almeida,
2007; Ramos, 2009). In general, the program consists of establishing percentages of subventions for
each modality of insurance and crops. This percentage corresponds to the liability taken by the
government. For instance, if the total premium is equal to US$ 10 thousand and the percentage of
subsidy is 50%, the farmer is responsible for US$ 5 thousand and the Federal government the remaining
premium. The limit for the subvention in the agricultural modality, per farmer and year, is US$ 41.740.
The farmer will be able to receive subsidy for more than one crop, since the total does exceed the
maximum value. For the modalities of livestock, forests and aquaculture insurance, the limit is US$
13.900 per modality (Resolution nº 26/12).
Table 2. Operational results of PSR.
Since the beginning of the PSR, in 2005, until the year of 2009, there was a relative growth.
In 2005, the total area insured by PSR was close to 68 thousand hectares and reached the
maximum area in 2009, covering almost 6.7 million hectares. From 2009, the total area
decreased and stabilized in 2012, covering approximately 5.2 million hectares (figure 5).
Figure 5. Evolution of the total insured area in PSR, from 2005 to 2012, in million hectares.

159
Source: MAPA (2014).
The causes for the reduction of the growth rate in PSR are related to the budget constraints
and operational difficulties. Up to 2008, the resources available for the PSR were sufficient
to the insurance companies to operate the subsidy program. In that year, out of US$ 70
million available, US$ 69 million were effectively spent. However, this scenario changed in
2009, when the demand exceeded the total budget available in US$ 39 million. That is, the
government owed money to the insurers.
In December 2009, the government approved a bill for extra resources to cover the dept.
However, according to the PSR regulation, the subvention resources must be used in the
same year of its availability. Since there was no use for the same year, the insurance
companies did not receive the resources.
At that time, the government signaled that part of the budget for 2010, in total US$ 104
million, would be used as payment for the US$ 39 million debt from 2009. This situation
stressed the market. Besides not having increased the amount of resources to the PSR, the
budget decreased in US$ 39 million. However, in May 2010, the government approved the
law 12,241 giving additional credit of US$ 39 million for that year’s budget. Despite of this
fact, the problem reoccurred in the second semester of 2010, and all the following years.
Nowadays, the insurance companies authorized to operate in the PSR are: Allianz Seguros
S.A., Essor Seguros S.A., Fairfax Brasil Seguros Corporativos S/A, Grupo BBMapfre
(Companhia de Seguros Aliança do Brasil e Mapfre Seguros), Nobre Seguradora do Brasil
S.A., Porto Seguro Companhia de Seguros Gerais, Sancor Seguros do Brasil S.A. and Swiss
Re Corporate Solutions Brasil Seguros S.A (MAPA, 2013).
The reinsurance companies operating rural insurance are: Austral Re, Catlin Brasil Serviços
Técnicos Ltda, Everest RE Group Ltda, Hannover Re Escritório de Representação no Brasil
Ltda, Instituto de Resseguros do Brasil – IRB, Lloyd`s Escritório de Representação no
Brasil Ltda, Mapfre Re Assessoria, Münchener do Brasil Serviços Técnicos Ltda, PartnerRe
Escritório de Representação no Brasil Ltda, Scor Brazil Ltda, Swiss Re Brasil Serviços e
Participações S/C Ltda and XL Re Holding.
According to data from the Superintendency of Private Insurance (Superintendência de
Seguros Privados – SUSEP), in the crop year 2012/13, the Insurance company Aliança do
Brasil accounted for 58.4% of the total premium of the sector, followed by Mapfre Seguros
Gerais, accounting for 10.2%, Nobre Seguradora do Brasil, 7.5%, and Allianz Seguros,
6.4%. The five companies together accounted for 83% of the market. The participation of
the first two mentioned accounted for approximately 70%.
In 2012, the grains insured, such as soybean, wheat, corn, rice and others, represented
almost 91% of the total insured area, almost 75% of the subvention paid, 73% of the total
premium collected and 73% of the global liability. The soybean was responsible for 40% of
the total liability and of the total premium collected, 57% of the total insured area and 37%
of the subvention paid.
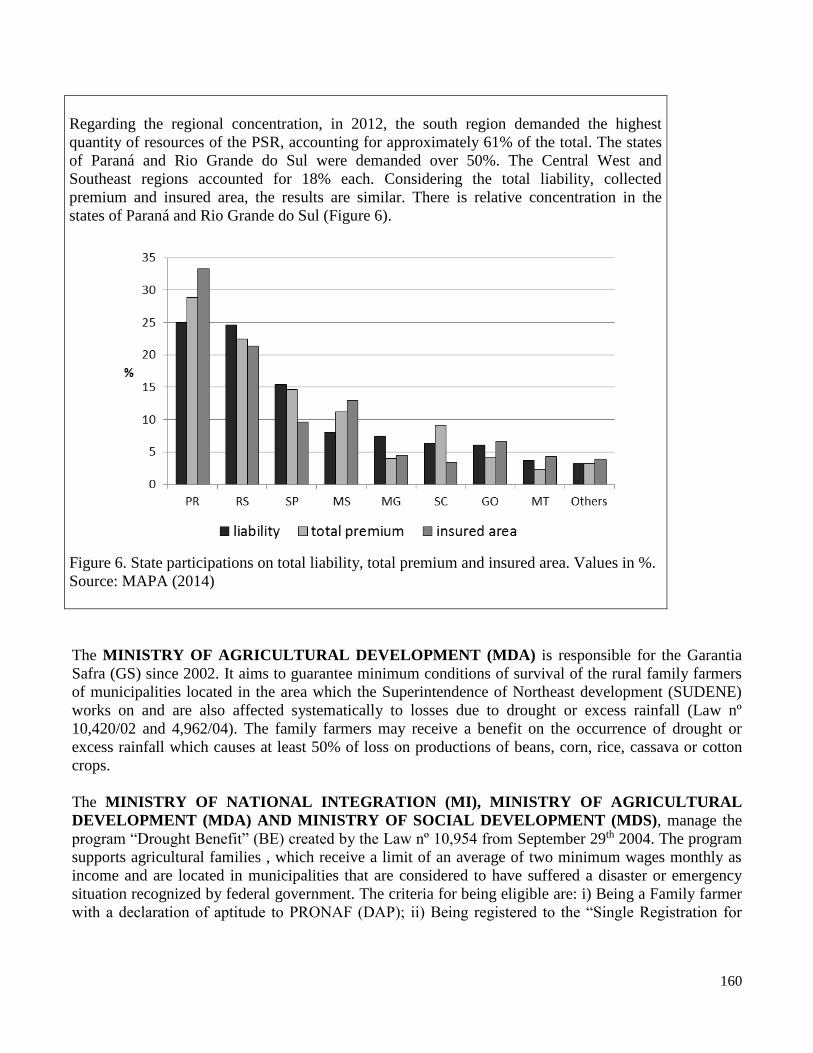
160
Regarding the regional concentration, in 2012, the south region demanded the highest
quantity of resources of the PSR, accounting for approximately 61% of the total. The states
of Paraná and Rio Grande do Sul were demanded over 50%. The Central West and
Southeast regions accounted for 18% each. Considering the total liability, collected
premium and insured area, the results are similar. There is relative concentration in the
states of Paraná and Rio Grande do Sul (Figure 6).
Figure 6. State participations on total liability, total premium and insured area. Values in %.
Source: MAPA (2014)
The MINISTRY OF AGRICULTURAL DEVELOPMENT (MDA) is responsible for the Garantia
Safra (GS) since 2002. It aims to guarantee minimum conditions of survival of the rural family farmers
of municipalities located in the area which the Superintendence of Northeast development (SUDENE)
works on and are also affected systematically to losses due to drought or excess rainfall (Law nº
10,420/02 and 4,962/04). The family farmers may receive a benefit on the occurrence of drought or
excess rainfall which causes at least 50% of loss on productions of beans, corn, rice, cassava or cotton
crops.
The MINISTRY OF NATIONAL INTEGRATION (MI), MINISTRY OF AGRICULTURAL
DEVELOPMENT (MDA) AND MINISTRY OF SOCIAL DEVELOPMENT (MDS), manage the
program “Drought Benefit” (BE) created by the Law nº 10,954 from September 29th 2004. The program
supports agricultural families , which receive a limit of an average of two minimum wages monthly as
income and are located in municipalities that are considered to have suffered a disaster or emergency
situation recognized by federal government. The criteria for being eligible are: i) Being a Family farmer
with a declaration of aptitude to PRONAF (DAP); ii) Being registered to the “Single Registration for
161
Social Programs of the federal government”; iii) Not being associated to the GS program. The associated
worker receives US$ 76,00 per family.
The BRAZILIAN COMPANY FOR AGRICULTURE AND LIVESTOCK RESEARCH
(EMBRAPA) developed an agrometeorological monitoring system (AGRITEMPO), which allows
access of meteorological and agrometeorological information for all the Brazilian territory, on an
aggregated level. Since 2002, the products available are drought maps, water available in soil, rainfall,
agricultural drought areas, necessity of reposition by rainfall and accumulated rainfall. The
AGRITEMPO also allows the consultation of information from the weather stations, although there are
limitations for data access.
THE NATIONAL INSTITUTE FOR SPACE RESEARCH (INPE/CPTEC) supplies products on
weather monitoring information, such as, drought, frost, soil moisture and weather forecasts for all the
Brazilian territory with applicability to agriculture and livestock. Among the available products are the
maps of: i) soil water availability; ii) irrigation necessity; iii) soil management conditions; iv)
phytosanitary treatment conditions. The CPTEC also allows the consultation of information of weather
stations, although there are limitations for data access.
The WORLD BANK, MINISTRY OF NATIONAL INTEGRATION (MI), THE NATIONAL
WATER AGENCY (ANA) AND STATE INSTITUTIONS are conducting the technical assistance
named “Preparation for drought and resilience to weather changes”, because of the long lasting droughts
in 2012 and 2013. The main objective is to define specific instruments for drought management, in a
proactive manner, and it is based on the concept of risk for all the northeastern region. The drought
monitor is based on two indexes named SPI (standardized precipitation index) and SPEI (standardized
precipitation evapotranspiration index).
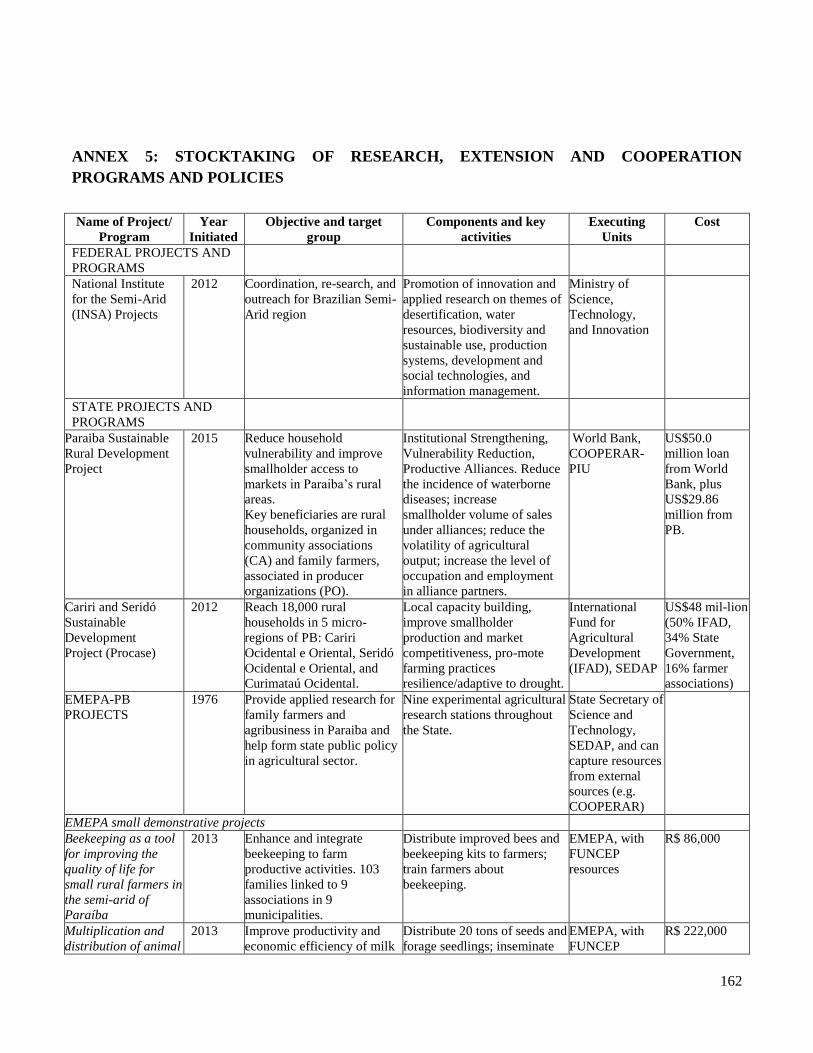
162
ANNEX 5: STOCKTAKING OF RESEARCH, EXTENSION AND COOPERATION
PROGRAMS AND POLICIES
Name of Project/
Program
Year
Initiated
Objective and target
group
Components and key
activities
Executing
Units
Cost
FEDERAL PROJECTS AND
PROGRAMS
National Institute
for the Semi-Arid
(INSA) Projects
2012 Coordination, re-search, and
outreach for Brazilian Semi-
Arid region
Promotion of innovation and
applied research on themes of
desertification, water
resources, biodiversity and
sustainable use, production
systems, development and
social technologies, and
information management.
Ministry of
Science,
Technology,
and Innovation
STATE PROJECTS AND
PROGRAMS
Paraiba Sustainable
Rural Development
Project
2015 Reduce household
vulnerability and improve
smallholder access to
markets in Paraiba’s rural
areas.
Key beneficiaries are rural
households, organized in
community associations
(CA) and family farmers,
associated in producer
organizations (PO).
Institutional Strengthening,
Vulnerability Reduction,
Productive Alliances. Reduce
the incidence of waterborne
diseases; increase
smallholder volume of sales
under alliances; reduce the
volatility of agricultural
output; increase the level of
occupation and employment
in alliance partners.
World Bank,
COOPERAR-
PIU
US$50.0
million loan
from World
Bank, plus
US$29.86
million from
PB.
Cariri and Seridó
Sustainable
Development
Project (Procase)
2012 Reach 18,000 rural
households in 5 micro-
regions of PB: Cariri
Ocidental e Oriental, Seridó
Ocidental e Oriental, and
Curimataú Ocidental.
Local capacity building,
improve smallholder
production and market
competitiveness, pro-mote
farming practices
resilience/adaptive to drought.
International
Fund for
Agricultural
Development
(IFAD), SEDAP
US$48 mil-lion
(50% IFAD,
34% State
Government,
16% farmer
associations)
EMEPA-PB
PROJECTS
1976 Provide applied research for
family farmers and
agribusiness in Paraiba and
help form state public policy
in agricultural sector.
Nine experimental agricultural
research stations throughout
the State.
State Secretary of
Science and
Technology,
SEDAP, and can
capture resources
from external
sources (e.g.
COOPERAR)
EMEPA small demonstrative projects
Beekeeping as a tool
for improving the
quality of life for
small rural farmers in
the semi-arid of
Paraíba
2013 Enhance and integrate
beekeeping to farm
productive activities. 103
families linked to 9
associations in 9
municipalities.
Distribute improved bees and
beekeeping kits to farmers;
train farmers about
beekeeping.
EMEPA, with
FUNCEP
resources
R$ 86,000
Multiplication and
distribution of animal
2013 Improve productivity and
economic efficiency of milk
Distribute 20 tons of seeds and
forage seedlings; inseminate
EMEPA, with
FUNCEP
R$ 222,000
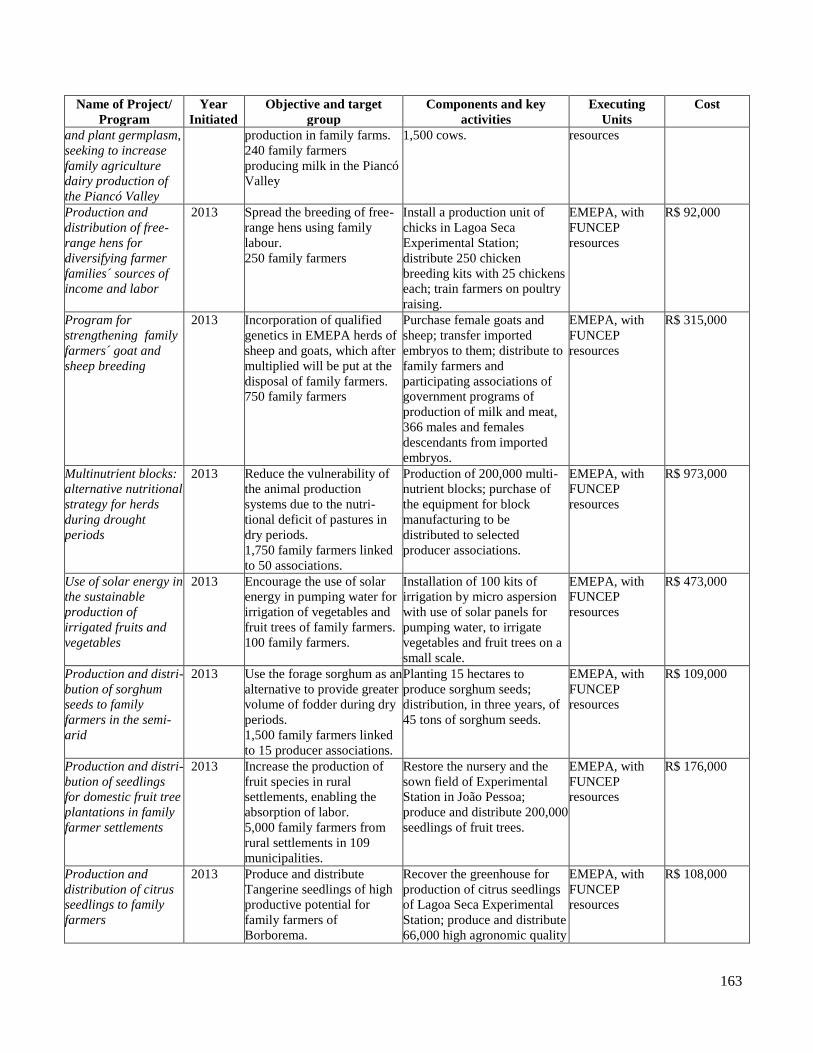
163
Name of Project/
Program
Year
Initiated
Objective and target
group
Components and key
activities
Executing
Units
Cost
and plant germplasm,
seeking to increase
family agriculture
dairy production of
the Piancó Valley
production in family farms.
240 family farmers
producing milk in the Piancó
Valley
1,500 cows.
resources
Production and
distribution of free-
range hens for
diversifying farmer
families´ sources of
income and labor
2013 Spread the breeding of free-
range hens using family
labour.
250 family farmers
Install a production unit of
chicks in Lagoa Seca
Experimental Station;
distribute 250 chicken
breeding kits with 25 chickens
each; train farmers on poultry
raising.
EMEPA, with
FUNCEP
resources
R$ 92,000
Program for
strengthening family
farmers´ goat and
sheep breeding
2013 Incorporation of qualified
genetics in EMEPA herds of
sheep and goats, which after
multiplied will be put at the
disposal of family farmers.
750 family farmers
Purchase female goats and
sheep; transfer imported
embryos to them; distribute to
family farmers and
participating associations of
government programs of
production of milk and meat,
366 males and females
descendants from imported
embryos.
EMEPA, with
FUNCEP
resources
R$ 315,000
Multinutrient blocks:
alternative nutritional
strategy for herds
during drought
periods
2013 Reduce the vulnerability of
the animal production
systems due to the nutri-
tional deficit of pastures in
dry periods.
1,750 family farmers linked
to 50 associations.
Production of 200,000 multi-
nutrient blocks; purchase of
the equipment for block
manufacturing to be
distributed to selected
producer associations.
EMEPA, with
FUNCEP
resources
R$ 973,000
Use of solar energy in
the sustainable
production of
irrigated fruits and
vegetables
2013 Encourage the use of solar
energy in pumping water for
irrigation of vegetables and
fruit trees of family farmers.
100 family farmers.
Installation of 100 kits of
irrigation by micro aspersion
with use of solar panels for
pumping water, to irrigate
vegetables and fruit trees on a
small scale.
EMEPA, with
FUNCEP
resources
R$ 473,000
Production and distri-
bution of sorghum
seeds to family
farmers in the semi-
arid
2013 Use the forage sorghum as an
alternative to provide greater
volume of fodder during dry
periods.
1,500 family farmers linked
to 15 producer associations.
Planting 15 hectares to
produce sorghum seeds;
distribution, in three years, of
45 tons of sorghum seeds.
EMEPA, with
FUNCEP
resources
R$ 109,000
Production and distri-
bution of seedlings
for domestic fruit tree
plantations in family
farmer settlements
2013 Increase the production of
fruit species in rural
settlements, enabling the
absorption of labor.
5,000 family farmers from
rural settlements in 109
municipalities.
Restore the nursery and the
sown field of Experimental
Station in João Pessoa;
produce and distribute 200,000
seedlings of fruit trees.
EMEPA, with
FUNCEP
resources
R$ 176,000
Production and
distribution of citrus
seedlings to family
farmers
2013 Produce and distribute
Tangerine seedlings of high
productive potential for
family farmers of
Borborema.
Recover the greenhouse for
production of citrus seedlings
of Lagoa Seca Experimental
Station; produce and distribute
66,000 high agronomic quality
EMEPA, with
FUNCEP
resources
R$ 108,000
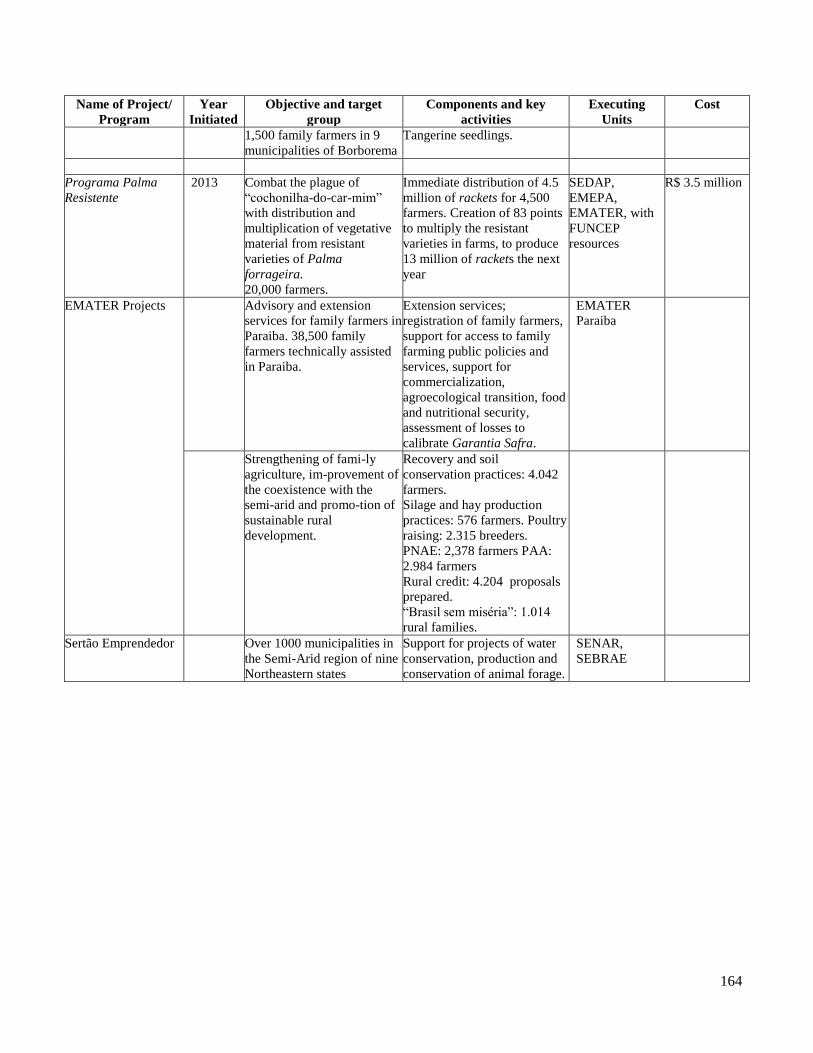
164
Name of Project/
Program
Year
Initiated
Objective and target
group
Components and key
activities
Executing
Units
Cost
1,500 family farmers in 9
municipalities of Borborema
Tangerine seedlings.
Programa Palma
Resistente
2013 Combat the plague of
“cochonilha-do-car-mim”
with distribution and
multiplication of vegetative
material from resistant
varieties of Palma
forrageira.
20,000 farmers.
Immediate distribution of 4.5
million of rackets for 4,500
farmers. Creation of 83 points
to multiply the resistant
varieties in farms, to produce
13 million of rackets the next
year
SEDAP,
EMEPA,
EMATER, with
FUNCEP
resources
R$ 3.5 million
EMATER Projects Advisory and extension
services for family farmers in
Paraiba. 38,500 family
farmers technically assisted
in Paraiba.
Extension services;
registration of family farmers,
support for access to family
farming public policies and
services, support for
commercialization,
agroecological transition, food
and nutritional security,
assessment of losses to
calibrate Garantia Safra.
EMATER
Paraiba
Strengthening of fami-ly
agriculture, im-provement of
the coexistence with the
semi-arid and promo-tion of
sustainable rural
development.
Recovery and soil
conservation practices: 4.042
farmers.
Silage and hay production
practices: 576 farmers. Poultry
raising: 2.315 breeders.
PNAE: 2,378 farmers PAA:
2.984 farmers
Rural credit: 4.204 proposals
prepared.
“Brasil sem miséria”: 1.014
rural families.
Sertão Emprendedor Over 1000 municipalities in
the Semi-Arid region of nine
Northeastern states
Support for projects of water
conservation, production and
conservation of animal forage.
SENAR,
SEBRAE
165
ANNEX 6: BACKGROUND INFORMATION ON PESTS AND DISEASES IN PARAIBA
Sugar cane. Despite several pests are associated with the sugarcane cultivation, according to the historic
records the broca do colmo (Diatraea saccharalis), broca gigante (Telchin licus) and cigarrinha
(Mahanarva fimbriolata) are considered the key pests, due to the frequency and intensity of its attack
and the potential or actual damage to the crop. Possible damages caused by the broca do colmo are
reduced yield, death of gems, cane lodging by wind (if the galleries are transverse), dying of tips -
known as dead heart - aerial roots and lateral shoots. The damages of the broca gigante produce vertical
galleries inside the stem, causing the complete destruction of the stem, reduction in germination, and
also open the doors for fungi that cause rots. Damages caused by the attack of the cigarrinha are
extraction of large quantities of water and nutrients from the roots by nymphs, reducing sugar content in
the stalks, increasing fiber content, increasing the number of dead stems (which reduces the milling
yield), and increasing content of contaminants, making it more difficult to recovery sugars and inhibiting
the fermentation.
Although the attack of these pests is frequent, the impact is relatively low, because the farmers suitably
manage them. Control can be made via cultural practices, suppression of alternative hosts, and
biological or chemical control.
On the farms owned by the sugar cane processors there is an intensive use of biological control, which
includes parasitic wasps and fungi that parasitizes the insect pests. The biological agents, both wasps
and fungi, are produced by the processors on their own laboratories, and sprayed or released on their
farms. Only occasionally there is a need to supplement the biological control with pesticide applications.
The ASPLAN (Autonomous Sugarcane Producers Association of Paraiba) also maintains a commercial
production of biological control agents. Prior to the present and lasting drought season, the laboratories
located at the Camaratuba Experimental Station produced an annual amount of 30 tons of Metarhizium
anisopliae (fungi), which is enough for the biological control of cigarrinha in approximately 8,000
hectares. Regarding Cotesia flavipes (wasps), 138.000 insects used to be produced each year, which
corresponds to a coverage of 27,531 hectares (Personal Information, Engo. Agr o. Vamberto
Freitas110). The estimated sugarcane area in Paraíba for the 2013-2014 season is in excess of 122,000
ha (CONAB, 2014), from which roughly 35% will be conducted by autonomous growers (Personal
information, ASPLAN). In this case, biological control coverage on the autonomous cane growers
would be around 20-60%, depending on the pest to be controlled.
A potential threat to sugarcane production is the quarantine disease Ferrugem Laranja, caused by the
fungus Puccinia kuehinii, which is present in sugarcane plantations in São Paulo, but absent from
110 Vamberto Freitas, Coordenador do Departamento Técnico da ASPLAN, [email protected]
166
Paraiba up to the moment. It is very difficult to anticipate when and if the disease will be introduced in
Paraiba, and once introduced if the fungus will adapt to the environmental conditions and effectively
become a serious threat. There is no assessment of its impact to local plantations and the probabilities of
entering the state and successfully establish on the cane plantations. In other countries where it is present
- like in Australia - the impact is rated as high. Nevertheless, considering its potential damaging impact
for Paraiba, this disease risk should be assessed as of high impact.
Fruticulture. Pineapple, coconut and bananas are the most largely produced and traded fruits in Paraíba.
Several species of citrus, besides manga, mangaba and grapes are also cultivated.
Banana plantations are subject to the attack of sigatoka amarela (caused by the fungus Mycosphaerella
musicola). The pest is conveniently managed by adequate cultural practices, resistant varieties and the
application of fungicides. The key pest present on coconut in Paraiba is the broca do olho do coqueiro
(Rhynchophorus palmarum). The pest is conveniently controlled by trapping or using biological control.
Citrus, mango and mangaba are frequently attacked by the fruit fly mosca negra dos citrus
(Rhynchophorus palmarum). Insect trapping or insecticide applications are used to control this pest.
The pineapple disease fusariose is caused by the fungus Fusarium subglutinans f.sp. ananas and is very
frequent on pineapple plantations. Control of the pest can be made by means of cultural practices (clean
seedlings, eradication of contaminated plants), use of resistant varieties or spraying of recommended
fungicides.
Potential serious threats to the fruticulture in Paraíba are the diseases sigatoka negra (Mycosphaerella
fijiensis) and moko (Ralstonia (Pseudomonas) solanacearum (Race 2), which attacks bananas, and the
cancro bacteriano (Xanthomonas campestris pv. viticola), a pest of grapes. Both are quarantine pests for
Paraiba and present on other Brazilian states. They may be extremely damaging if introduced in the fruit
regions of Paraiba, but there is no definitive assessment of its potential impact up to the moment.
Family Agriculture in Semiarid Zone. The natural vocation of this region is the livestock production,
mainly sheep and goats, being agriculture a side activity, normally for self-consumption. The crops
grown in the semiarid zone are cassava, beans and maize, normally cultivated under low technology
production systems, with minimum or none use of inputs like fertilizers or pesticides, being the seeds or
manivas (cassava) supplied by the goverment. As the climatic risk is very high, growers do not take into
account the phytosanitary risks, this way pests are usually not controlled, exception made for a small
group of family growers more closely supported by technical assistance.
In order to feed the herd (and also as a water supplier), smallholders cultivate a cactus called palma
forrageira. A pest called cochonilha do carmim (Dactylopius coccus) is a serious threat for the yield and
even the production of palma. The State Government Research Institution (EMEPA) developed four
varieties resistant to the cochonilha and the public technical assistance (EMATER-PB) is freely
distributing this genetic material to the family farmers, to substitute their traditional susceptible
varieties, leading to an almost complete control of the pest. Although important, the program must be
enhanced to benefit the majority of the smallholders of the semiarid.
167
Livestock Production Chains. The state of Paraiba is free of the Foot and Mouth Disease (FMD) with
vaccination, certified by the World Animal Health Organization (OIE) in May 2014. During the last ten
years, there was no record of FMD cases in the state. Currently this risk has even diminished because the
bordering states are also free of FMD with vaccination and because there is a strict national program to
control movement of animals and animal products in the country. Paraiba is also a territory considered
free of the Highly Pathogenic Avian Influenza (HPAI) and the risk is low as the state is not on the major
routes of migratory birds, which are the main vectors that spread the disease. There is no specific risk
classification for the Bovine Spongiform Encefalopatitis (BSE) for Paraiba, but Brazil has been included
on the “Negligible” status, the safest of all, therefore the state can be classified in the same risk status.
Paraiba is also apparently free of Classical Swine Fever (CSF) as the last outbreak in the state was
recorded in 2006. Similar situation is verified regarding Newcastle Disease Virus (NCDV) as no recent
outbreaks were detected, but no epidemiological studies were conducted to confirm this status.
The Bovine, Goat and Sheep Brucellosis and Bovine Tuberculosis are endemic zoonosis. A SEDAP
study of 2013 demonstrated that the prevalence of bovine brucellosis ranged between 2% to 4% in
Paraiba, and in an evaluation of the Federal Program carried out in 2010 it was observed that there was a
decrease in the number of cases of brucellosis in the Northeastern Region from 4,138 to 2,082 (50.3%)
between 2001 and 2010. Salomon and collaborators carried out a study on bovine tuberculosis in 2010,
which found that: of the herds investigated, 62 (0.57%) had at least one positive animal, and of the
animals examined, 136 (0.25%) were positive. Prevalence of tuberculosis in goats it was found to be
10.7% of positive in 10.7% of herds. Regarding the presence of Brucella mellitensis in goats and sheeps,
there is no evidence of its presence in Brazil.
There are no official records of serious recent foodborne outbreaks in the state of Paraiba; however, it
was found that small producers do not have enough official assistance to control and inspect their
facilities for processing food derived from animals. This situation can lead to risks of contaminated
products and presentation of foodborne outbreaks. On the other hand, the lack of official control and
inspection system for small producers limit their marketing possibilities, including the selling of the
production for the federal food acquisition programs (PNAE and PAA) that requires the products to be
officially controlled and inspected.
W o r l d B a n k r e p o r t n u m B e r 100993-Br
agriculture gloBal practice technical assistance paper
1818 h street, nWWashington, d.c. 20433 usatelephone: 202-473-1000internet: www.worldbank.org/agriculturetwitter: wb_agriculture
Related Documents