I The University of Edinburgh College of Medicine & Veterinary Medicine The School of Molecular & Clinical Medicine Department of Medical Science Clinical Pharmacology Unit Clinical Research Centre Royal Infirmary of Edinburgh Scottish Poison Information Bureau & Toxicology Ward Paracetamol Poisoning and its Treatment in Man Nasrin Pakravan, M.D Doctorate of Philosophy University of Edinburgh 2008

Welcome message from author
This document is posted to help you gain knowledge. Please leave a comment to let me know what you think about it! Share it to your friends and learn new things together.
Transcript

I
The University of Edinburgh
College of Medicine & Veterinary Medicine
The School of Molecular & Clinical Medicine
Department of Medical Science
Clinical Pharmacology Unit
Clinical Research Centre
Royal Infirmary of Edinburgh
Scottish Poison Information Bureau & Toxicology Ward
Paracetamol Poisoning and its Treatment in Man
Nasrin Pakravan, M.D
Doctorate of Philosophy
University of Edinburgh
2008
II
Declaration I hereby declare that the work presented in this thesis is my own, except where
stated in the text. The work has not been submitted in any previous application
for a degree.
Nasrin Pakravan
M.D (Pesticide Poisoning, 2000, Iran)
Clinical Research Fellow (Paracetamol Toxicity, University of Edinburgh, UK,
2004-2008)
© Nasrin Pakravan, 2008
No part of this publication may be reproduced, copied, transmitted or saved
without written permission of the author and in accordance with the provision of
Copyright, or under the terms of the licence granted to the University of
Edinburgh library.
All trademarks are acknowledged as the property of their respective owners.
III
Abstract Title: Paracetamol poisoning and its treatment in man Paracetamol is the most common drug taken in overdose in the UK. Although it has been used in overdose for about 50 years, there are many aspects of its toxicity and treatment that are not fully understood. In this thesis a series of related studies on paracetamol overdose are reported. The nephrotoxic effects of paracetamol in overdose have long been recognised. To better understand the mechanisms of this effect the effect of acute paracetamol overdose on plasma electrolytes were investigated, both retrospectively and, more intensively, prospectively. The results of these studies showed paracetamol overdose is associated with dose-related hypokalemia, and kaliuresis of short duration (<24h), suggesting a specific renal effect of paracetamol in overdose, perhaps via cyclo-oxygenase inhibition. This effect seems distinct from any nephrotoxic effect of paracetamol. In the third study the possible impact of features at admission, including renal impairment, on outcomes in a large cohort of patients who developed severe liver injury following paracetamol overdose was evaluated retrospectively. The key finding was that plasma creatinine, and gamma glutamyl transpeptidase, at first admission appeared to be useful predictors of poor outcome. The last three studies focus on antidote treatment of paracetamol overdose. Intravenous acetylcysteine (NAC) has been used as treatment of choice for over 30 years in patients who are at risk of hepatotoxicity. There are reports of liver failure and death in patients who have “non-toxic” plasma paracetamol concentrations on the UKL nomogram, and who are therefore not treated. To better understand this, the frequency of liver failure in patients who had low paracetamol was assessed by examining retrospective data from the Scottish Liver Unit over a 12-year period. Similar data was collected in the University of Newcastle upon Tyne by colleagues there. Only a small percentage of patients developed hepatotoxicity when initial paracetamol was low. It was concluded that on a cost-benefit basis the current thresholds for antidote treatment should not be lowered. The final 2 studies examine adverse reactions (ADRs) to NAC, a common clinical problem. The pattern and mechanisms of ADRs in man are not well described or understood. Factors influencing the frequency of adverse effects were studied in a prospective manner. Paracetamol concentration and male gender were protective and family history of allergy was a risk factor for adverse effects in this cohort. In a smaller focussed study the roles of histamine and other biomarkers as underlying pathophysiological mechanisms in ADR occurrence were studied. The severity of ADRs correlated with the extent of histamine release, which was independent of tryptase increase, suggesting a non-mast cell source. The mechanisms by which paracetamol might lessen histamine release require further investigation.
IV
Acknowledgement “You who have attained to faith! Be patient in adversity, and vie in patience with one another, and be ever ready and remain conscious of God, so that you might attain to happy state” Imran verse 200. I am praising him for granting me his mercy and the strength through the adversities of life. This work was performed over more than 4 years, during which I was a postgraduate student at the University of Edinburgh and a Clinical Research Fellow in the toxicology unit and NPIS Edinburgh (Scottish Poisons Information Bureau) in the Royal Infirmary of Edinburgh. The topic of paracetamol toxicity and its treatment in man was originally proposed by Professor DN Bateman. The nephrotoxic aspect of the study was proposed by Dr J Goddard. They guided me initially through the controversies in the field and were both responsible for the supervision of my project. I am most grateful for their advice and the opportunities they gave me to perform this research. Thanks especially to my primary supervisor, Professor DN Bateman for his time spent reviewing this project. My PhD was sponsored by a course and research postgraduate scholarship by Mazandaran University of Medical Science, Sari, Iran. I am most grateful to all members in the Mazandaran University of Medical Science, in the Ministry of Health and Education, Tehran, and the academic section of the Iranian Embassy in London who supported me financially. I would also thank my supervisors, Professor M Jalali and Professor AK Pajoumand, Loghman Hakim Hospital, Toxicology Unit, Tehran, Iran. I would like to thank a number of other members in the Clinical Pharmacology Unit and Laboratory, Scottish Poisons Information Bureau, colleagues and nurses in the toxicology unit, Clinical Research Facility (CRF), biochemistry, haematology and immunology laboratory staff in the Royal Infirmary of Edinburgh, colleagues in the Free Radical Research Facility, UHI Millennium Institute, Inverness, colleagues in the University of Newcastle, Liver Unit, Freeman Hospital, and Scottish Liver Transplant Unit in the Royal Infirmary of Edinburgh, colleagues and staff in the department of Public Health, postgraduate office in the school of Medicine & Veterinary Medicine, staff in the library and in the international office of the University of Edinburgh, and all members in the Welcome Trust Research Facility who have offered assistance during the course

V
of this work. Many other people have also contributed to my scientific career. I would also like to thank all of the following individuals: Professor J Bard, Professor N Turner, Professor DJ Webb, Professor C Ludlam, Professor IL Megson, Dr P Cawood, Dr LP Yap, Dr SHL Thomas, Dr K Simpson, Dr R Afshari, Mr MR Baneshi, Dr WS Waring, Mrs AM Good, Ms LD Gordon, Mrs M Dow, Mrs J Pettie, Mr CD Chalmers, Mrs J Davidson, Ms S Cameron, Ms F Paterson, and Ms E Adams. My five years of student life in the UK also offered me an opportunity to extend my horizon by meeting and socialising with people from other countries and cultures which indeed was an unforgettable experience for me. I thank all of my friends, British, Persian or friends from other countries, who have helped me in different aspects of my student life in the UK, especially my dear friends Ms E Adams, Ms M Festa, Mrs S Abadikhah, Mrs F Zolala, Mrs R Yousef Komaki, staff in Aspen Hamilton Caring Management office, Mr I Parker and Mrs E Parker. This project would not have been possible without the co-operation of the patients presenting to the Royal Infirmary of Edinburgh with paracetamol overdose who participated in the study. Finally, I would like to acknowledge the patience and support of my father, brothers and sister during the conduct of this project. With all my love To my father, whose best wishes have always inspired me. In memory of my mother, especially for the impact of her strong character on me. To my other family members, for their kind support and encouragement.
I dedicate this thesis to my father
VI
List of Publications 1. Full paper: Beer C, Pakravan N, Hudson M et al. Liver unit admission following paracetamol overdose with concentrations below current UK treatment thresholds. Published in QJM. 2007; 100:93-96 (see appendices). 2. Full paper: Pakravan N, Bateman DN, Goddard J. Effect of acute paracetamol Overdose on changes in serum and urine electrolytes. Published in Br.J.Clin.Pharmacol.2007; 64:824-832 (see appendix). 3. Letter: Pakravan N, Goddard J, Bateman DN. Hypokalaemia following Paracetamol overdose. Published in Ann.Clin.Biochem. 2008; 45:111-112 (see appendices).
4. Full paper: Pakravan N, Waring WS, Sharma S, Ludlam C, Megson IL, Bateman DN. Risk factors and mechanisms of anaphylactoid reactions to acetylcysteine in acetaminophen overdose. Published in American Journal Of Clinical Toxicology. September 2008: 46 (8): 697-702 (see appendices). 5. Full paper: Pakravan N, Simpson KJ, Waring WS, Bates CM, Bateman DN. Renal injury at first presentation as a predictor for poor outcome in severe paracetamol poisoning preferred to a liver transplant unit. Published in European Journal of Clinical Pharmacology, October 2008 (see appendices).

VII
List of Presentation 1. Talk presentation in Scottish Renal Association, Dundee, UK, November 2004 2. Poster presentation in British Association of Clinical Pharmacology (BPS), Newcastle, UK, December 2004. 3. Poster presentation in British Association of Clinical Pharmacology (BPS), Oxford, UK, December 2006 (nominated for Young Scientist Award) 4. Poster presentation in European Association of Poisons Centres and Clinical Toxicologist (EAPCCT), Athens, Greece, May 2007 5. Poster Presentation in the North American Association of Clinical Toxicologist (AACT), New Orleans, USA, October 2007. 6. Talk presentation in European Association of Poisons Centres and Clinical Toxicologist (EAPCCT), Seville, Spain, May 2008 (Winner of Young Scientist Award) 7.Poster Presentation on “ Mechanisms of adverse reaction to IV acetylcysteine in acetaminophen overdose” presented by Prof DN Bateman in the North American Association of Clinical Toxicologist (AACT), held on Sept 2008 in Toronto. 9. 3 talk presentations in Clinical Pharmacology Unit meetings, in Western General Hospital and Queen Margaret Institute (QMRI), Edinburgh, UK 10. 4 Talk presentations in TRIM meetings, Royal Infirmary of Edinburgh, Edinburgh, UK.

VIII
List of Abbreviations A II: angiotensin II ADH: anti-diuretic hormone ADRs: adverse reactions ALT: alanine transaminase AM404: N-arachidonyol-phenolamine ANOVA: analysis of variance ARF: acute renal failure AUC: area under the curve CNS: central nervous system COX: cylco-oxygenase Cr: creatinine [Cr]: plasma creatinine concentration CRP: C-reactive protein CYP1A2: cytochrome 1A2 CYP2E1: cytochrome 2E1 DBP: Diastolic blood pressure DIC: disseminated intra vascular coagulation ECF: extracellular fluid ECG: electrocardiogram EDTA: Ethylene Diamine Tetra Acetic acid HETEs: hydroxyeicosatetraenoic acids EETs: epoxyeicosatrienoic acids ELIZA: Enzyme-Linked Immuno Sorbent Assay F: Female Fe: fraction of excretion FeK: fraction of excretion of potassium FeMg: fraction of excretion of magnesium Fe Na: fraction of excretion of sodium FePO4: fraction of excretion of phosphate GI: gastrointestinal GGT: gamma glutamyl transpeptidase GFR: glomerular filtration rate GSH: glutathione h:hour HCL: hydro chloric acid HCO3: bicarbonate [HCO3]: plasma bicarbonate concentartion HIV: human immunodeficiency virus ICF: intracellular fluid Ig E: Immunoglobulin E IL-6: interleukin 6 ITU: intensive care unit IQR: inter quartile range

IX
IV: Intravenouse K: potassium [K]: plasma potassium concentartion KCH: King’s College Criteria K U :urinary potassium K S: serum potassium M: male Mg: magnesium Min: minute Mm: milli metre Mm: milli mol mmHg: millimetre mercury Na: sodium [Na]: plasma sodium concentartion NADPH: nicotinamide adenine dinucleotide phosphate NAKA: sodium-potassium ATPase NAPQI: N-acetyl-p-benzoquinoneimine NAC: N-acetylcysteine, N-acetylcysteine or parvolex NHCL4: ammonium chloride NMDA: N-methyl-D-aspartate NSAID: non-steroidal anti-inflammatory drug O2 sat: oxygen saturation PG: prostaglandin PGE2: prostaglandin E2 PEFR: peak expiratory flow metre rate PAH: p-aminohippuric acid PGI2: prostaglandin I2 PO4: phosphate PR: pulse rate PT: prothrombin time PRA: plasma renin activity PT: prothrombin time RBF: renal blood flow RBP: retinol binding protein ROC: Receiver operator characteristics SBP: systolic blood pressure Sem: standard error of the mean SIADH: syndrome of inappropriate anti diuretic hormone SLTU: The Scottish Liver Transplant Unit S Osm: serum osmolality SSRI: selective serotonine reuptake inhibitor T: temperature TmP/GFR: Renal threshold of phosphate tPA: tissue plasminogen activator TRP: total reabsorbed phosphate

X
TTKG:Trans tubular potassium gradient TX: thromboxane TXA2: thromboxane A2 TXB2: thromboxane B2 U Cr: urinary creatinine UK: United Kingdom U Na:Urinary sodium U Osm: urine osmolality US: United State vWf: von Willebrand factor

XI
List Figures……………………………………………………………………...Page Figure 1.1: Metabolism paracetamol………………………………………………..8 Figure 1.2: Nomogram used for treatment of paracetamol OD in the UK………12 Figure 1.3: Regulation of extracellular and intracellular potassium……………..18 Figure 1.4: Renal handling of potassium…………………………………………...21 Figure 1.5a: Mechanism of potassium reabsorption in the loop of Henle……....22 Figure 1.5b: Mechanism of potassium secretion in collecting tubules…………..22 Figure 1.5c: Mechanism of potassium reabsorption in collecting tubules……....23 Figure 1.6: Nomogram for the estimation of TmPO4/GFR……………................26 Figure 1.7: Metabolic pathway of arachidonic acid cascade……………………..28 Figure 1.8: Major nephrotoxic processes and the sites of………………………..34 Figure 1.9: Mediators responsible for the signs and symptoms of ADRs……….57 Figure 1.10: Effect of mast-cell degranulation on organs………………………...58 Figure 2.1: Relationship between potassium change between admission…….71 and follow-up K and paracetamol at 4 h in the retrospective study. Figure 2.2: Change in plasma potassium in the groups according to the………72 paracetamol concentration at 4h in the retrospective study. Figure 2.3: Time course of FeK changes according to paracetamol at 4h………80 Figure 2.4: Time course of TTKG changes according to paracetamol…………..81 Figure 2.5: Relationship between potassium at 24 h and paracetamol …………82 Figure 2.6: Relationship between TmPO4/GFR and paracetamol……………….85 Figure 3.1: Distribution of patients with OD according to sex and age bands…101 Figure 3.2: Severity of liver and renal impairment at presentation to…………..105 referring hospital and SLTU.
XII
Figure 3.3: Survival according to time between ingestion and…………………..108 first admission to the hospital. Figure 3.4: Dialysis requirement according to time between ingestion…………109 and first admission to the hospital. Figure 3.5: Relationship between PT at first admission to hospital………….....111 and creatinine at admission to SLTU. Figure 3.6: Relationship between GGT at first admission to referring to………114 referring hospital and creatinine at admission to SLTU. Figure 3.7: ROC curve for creatinine at first admission to referring…………….115 hospital and the end point of poor prognosis according to KCH criteria. Figure 3.8: Relationship between referring plasma potassium and …….……...118 and paracetamol in the group presenting within 12 h post-ingestion. Figure 3.9: Relationship between plasma potassium and creatinine…………...118 the group presenting after 12 h post-ingestion. Figure 4.1: Patient inclusion and exclusion diagram……………………………..130 Figure 5.1: Diagrammatic representation of ADRS in patients treated………...149 with NAC for paracetamol poisoning, according to the severity of ADRs. Figure 5.2: Median change in plasma histamine at 1time points after NAC. …159 infusion according to the severity of ADRs. Figure 5.3: Clotting factors concentration at baseline and………………….......162 time point after NAC infusion.

XIII
List of Tables………………………………………………………......................Page Table 1.1: Distribution of potassium distribution in organs………………...........17 Table 1.2: Effects of renal autacoids in the kidney……………………………......29 Table 1.3: Risk factors for renal failure…………………………………………......38 Table 2.1: Number of subjects with and without NAC treatment in each group..73 Table 2.2: Demographic characteristics of subjects in the groups …………......79 Table 2.3: Fraction excretion of electrolytes in the SSRI group……………….....83 Table 2.4: Plasma concentration and fraction of excretion of electrolytes in……85 Paracetamol group Table 3.1: Demographic characteristic of subjects with paracetamol…….…....102 OD with suspected liver damage referred to SLTU. Table 3.2: Severity of liver and renal injury at admission …………..……….......104 Table 3.3: Laboratory and clinical variables with respect to the interval ……....107 between acute paracetamol ingestion and first admission to hospital. Table 3.4: Clinical characteristics and outcomes in patients with ………..........112 paracetamol OD grouped by renal function at the time of admission to SLTU. Table 3.5: Demographic characteristic of subjects with acute………………......117 Paracetamol OD with suspected liver damage at admission according to time interval between ingestion and first admission. Table 4.1 : Demographic and characteristic of patients with..........……..….......131 with paracetamol below current UK guideline and liver toxicity. Table 5.1: Occurrence of ADRs to NAC in patients with paracetamol OD….....148 Table 5.2: History of asthma, drug allergy, family history of allergy …..............148 and previous ADRs to NAC in the groups according to severity of ADRs to NAC. Table 5.3: Logistic regression for possible variables associated ……...............151 with moderate to severe adverse effects of NAC. Table 5.4: Clinical features of ADRs to NAC in patients with severe ADRs…...154
XIV
Table 5.5: Peak flow rate at baseline and time point after NAC infusion………155 Table 5.6: Systolic blood pressure at baseline and time points after NAC …....156 infusion commencement in the groups according to the severity of ADRs. Table 5.7: Median plasma NAC according to the severity……………………….158 Table 5.8: Plasma histamine in 8 healthy volunteers………………………........160 Table 5.9: Median change in plasma tryptase at time points after ……...……..160 commencing IV NAC infusion from baseline according to the severity of ADRs. Table 5.10: Change from baseline in plasma tPA activity at time points……….161 after start of NAC infusion in the groups according to the severity of ADRs. Table 5.11: Clotting factors at baseline and time points after NAC …………….163 Infusion in patients with paracetamol overdose.

XV
List Of Contents..........................................................................................Page Chapter I: Introduction and Literature Review of Paracetamol Toxicity..............1 1-1: Introduction..............................................................................................2 1-2: Pharmacology & Toxicology Of Paracetamol..........................................3
1-2-1: Pharmacodynamics..........................................................................3 1-2-2: Pharmacokinetics..............................................................................5 1-2-3: Toxicokinetics....................................................................................7
1-2-3-1: Epidemiology of Toxicity.............................................................9 1-2-3-2: Hepatotoxicity.............................................................................9
1-2-3-2-1: Epidemiology of hepatic toxicity..........................................9 1-2-3-2-2: Pathophysiology of Hepatotoxicity......................................10 1-2-3-2-3: Effect of paracetamol on clotting factors.............................11 1-3: Paracetamol and Kidney..........................................................................13
1-3-1: Epidemiology of Nephrotoxicity.........................................................13 1-3-1: Physiology of renal function.............................................................. 14
1-3-2-1: Renal potssium handling............................................................16 1-3-2-2: Renal handling of phosphate..................................................... 24 1-3-2-3: Nephron structure and functional significance of renal PG....... 27
1-3-3: Pathophysiology of Nephrotoxicity................................................... 32 1-3-4: Acute renal failure (ARF)...................................................................35
1-3-4-1: Pre-renal ARF.............................................................................36 1-3-5: Risk factors and Mortality of ARF......................................................37
1-3-6: Laboratory Examinations and disturbances in ARF...........................38 1-3-6-1: Plasma creatinine…………………………………………………...38 1-3-6-2: Hypokalaemia.............................................................................39
1-3-6-3: Fraction of excretion of filtered electrolytes................................42 1-3-6-4: Trans-tubular potassium gradient...............................................42
1-3-6-5: Proteinuria and enzymuria..........................................................43 1-3-7: Paracetamol-induced nephrotoxicity..................................................44
1-3-7-1: Pathophysiology......................................................................... 44 1-3-7-2: Paracetamol and plasma electrolytes.........................................47
1-4: Acetylcysteine (NAC).............................................................................. .51 1-4-1: NAC, the treatment of choice for paracetamol poisoning................ ..51
1-4-2: Death from low dose paracetamol concentartion.............................. 54 1-4-3: Effect of NAC on clotting factors.........................................................55 1-4-4: Anaphylaxis and anaphylactoid adverse reactions.............................56
1-4-4-1: Adverse Reactions to NAC...........................................................59 1-5: Summary...................................................................................................62 1-6: The focus of the thesis..............................................................................64
Chapter II: Effects of Single Paracetamol Overdose on Renal Function and Plasma and Urine Electrolytes...........................................................................65 2-1: Introduction..............................................................................................66 2-1: Retrospective study.................................................................................68
XVI
2-2-1: Methods.............................................................................................68 2-2-2: Statistical analysis.............................................................................70 2-2-3: Results...............................................................................................70 2-3: Prospective study.....................................................................................74
2-3-1: Method...............................................................................................74 2-3-2: Laboratory techniques.......................................................................77
2-3-3: Statistical analysis.............................................................................77 2-3-4: Results...............................................................................................78 2-4: Discussion.................................................................................................86 2-5: Summary...................................................................................................92 2-6: Limitation of the study................................................................................93 Chapter III: Frequency of renal Injury in Significant Paracetamol Poisoning and the Impact of Severity of Renal Dysfunction on Outcome.................................. 94
3-1: Introduction.............................................................................................. 95 3-2: Methods...................................................................................................96
3-2-1: Data collection...................................................................................96 3-2-2: Data analyses................................................................................... 97
3-3: Statistical analyses...................................................................................99 3-4: Results....................................................................................................100
3-4-1: Demographic characteristic..............................................................100 3-4-2: Frequency of renal insufficiency.......................................................103 3-4-3: Timing of onset of renal and liver dysfunction..................................105 3-4-4: Effect of delay at first admission on outcome..................................106
3-4-5: Associated risk factors for developing renal dysfunction..................110 3-4-6: Creatinine at first admission as a prognostic factor..........................114 3-4-7: Effect of acute paracetamol overdose an plasma electrolytes.........115
3-5: Discussion...............................................................................................119 3-6: Conclusion...............................................................................................123
Chapter IV: Liver admission following paracetamol overdose with concentartion below current UK treatment threshold...............................................................125
4-1: Introduction.............................................................................................126 4-2: Method....................................................................................................127 4-3: Results....................................................................................................128 4-4: Discussion...............................................................................................132
4-5: Conclusion..............................................................................................135 Chapter V: The mechanisms and the associated factors involved in anaphylactoid reactions to acetylcysteine in patients with paracetamol OD.....136 5-1: Introduction............................................................................................137
5-2: Method...................................................................................................138 5-2-1: Blood collection, sample processing and laboratory analysis.........141
5-2-1-1: Plasma histamine.....................................................................141 5-2-1-2: Plasma NAC.............................................................................142
XVII
5-2-1-3: Plasma trypatse........................................................................142 5-2-1-4: Plasma tPA activity and antigen...............................................143 5-2-1-5: Clotting factors, vWf, and IL6....................................................143 5-2-1-6: Plasma paracetamol and salicylate..........................................144 5-2-1-7: CRP..........................................................................................144
5-2-2: Measurement of PEFR....................................................................144 5-2-2-1: Method of measurement of PEFR............................................145 5-2-2-2: Severity of bronchospasm according to PEFR.........................146
5-3: Statistical analysis..................................................................................146 5-4: Results...................................................................................................147
5-4-1: Result of total cohort.......................................................................147 5-4-1-1: Demographic data....................................................................147 5-4-1-1: Clinical features of ADRs..........................................................147
5-4-1-3: Paracetamol..............................................................................150 5-4-1-4: Assocaited factors of ADRs………………………………………150
5-4-2: Result of the intensive study............................................................151 5-4-2-1: Demographic data.....................................................................151 5-4-2-2: Severity of ADRs.......................................................................152 5-4-2-3: Plasma Paracetamol.................................................................152
5-4-2-4: Plasma NAC..............................................................................153 5-4-2-5: Plasma Histamine......................................................................156 5-4-2-6: Plasma tryptase.........................................................................157 5-4-2-7: Plasma CRP and IL6.................................................................161
5-4-2-7: tPA antigen and activity.............................................................161 5-4-2-9: Clotting factors and vWf factor...................................................162
6-6: Conclusion...............................................................................................169 Chapter VI: Discussion.......................................................................................170
6-1: Summary of the thesis.............................................................................171 6-2: Conclusion...............................................................................................176 6-3: Weakness of the thesis...........................................................................178
6-4: Further studies............................................................................................179 Index..................................................................................................................181 References........................................................................................................182 Appendices ...........................................................................................................1

Chapter I: Introduction and Literature Review of
Paracetamol Toxicity
Paracetamol: N-(4-hydroxyphenyl) acetamide
2
1-1: Introduction The name “paracetamol” known as acetaminophen in the US, derives from its
chemical name para-acetylaminophenol. Paracetamol was first synthesised by
Morse in Germany in 1878 and it was used clinically as an antipyretic by Von
Mering in 1887 [1] only for a short period, but was discarded in favour of
phenacetin because it was assumed that it was less toxic than paracetamol.
In 1893, paracetamol was discovered in the urine of individuals who had
taken phenacetin. In 1899, paracetamol was found to be a metabolite of
acetanilide; however nobody realised the importance of this discovery at the
time.
In 1948, Brodie and Axelrod’s work led to rediscovery of paracetamol. They
elegantly demonstrated that the therapeutic effect of phenacetin was due to
its active hepatic metabolite, paracetamol, and since it did not have the toxic
effects of phenacetin, they advised use of paracetamol as an analgesic in
medical treatment [2]. In 1955, for the first time McNeil laboratories in the US
sold the product under the brand name of Tylenol Children’s Elixir as an
analgesic and antipyretic in children [3].
Paracetamol was introduced to the UK market in 1956. Frederick Stearns &
Co sold 500 mg tablets of paracetamol under the brand name of Panadol as
a prescribed pain killer and antipyretic. In 1958, Panadol Elixir, a children’s
3
formulation, was introduced. In 1963, paracetamol was added to the British
National Formulary. Concern about safety postponed its widespread
acceptance, but, when phenacetin was finally withdrawn from the market
because of nephrotoxicity in the 1970’s, paracetamol became widely used as an
analgesic replacement [4]. Due to its few side effects and less interaction with
other drugs it gained significant worldwide popularity among analgesics and
it became the most commonly prescribed drug in children [5].
The main topics of study in this thesis are the renal effects of paracetamol, and
the adverse reactions caused by intravenous infusion of acetylcysteine (NAC), a
treatment of choice in paracetamol overdose. This introductory chapter includes
three separate parts. In the first part pharmacology and toxicology of
paracetamol will be discussed. In the second part renal physiology and the
pathophysiology of renal dysfunction, in particular toxic effects of paracetamol
on the kidney are reviewed. Finally in the last part NAC treatment and the
mechanisms of its adverse reactions in paracetamol overdose are discussed.
1-2: Pharmacology & Toxicology of Paracetamol
1-2-1: Pharmacodynamics The main therapeutic effects of paracetamol are analgesia and antipyresis; it
also has a weak anti-inflammatory effect [6]. Although paracetamol has been in
clinical use for over half a century, the precise mechanisms of the analgesic and

4
antipyretic effects of paracetamol are still unclear. Like classical non-steroidal
anti inflammatory drugs (NSAIDs), paracetamol reduces production of
prostaglandins (PG), a family of pro-inflammatory chemicals, through inhibition
of cyclo-oxygenase (COX) enzymes. Unlike classical NSAIDs however,
paracetamol does not have important anti-inflammatory effects [1;7-9].
However, some studies have suggested that paracetamol may have mild anti-
inflammatory effects. Paracetamol, like selective COX-II inhibitors, decreases
PG concentrations in vivo, but unlike COX- II inhibitors does not suppress
severe inflammation [8]. A recent study on healthy volunteers given 1000 mg
paracetamol orally showed that paracetamol inhibited COX-II by more than 80%,
i.e. a degree comparable to NSAIDs and selective COX-II inhibitors [10]. This
study also showed that inhibition of COX-I as measured by thromboxane B2
(TXB2) synthesis was minor (56%) and not sufficient for suppression of platelet
function. These data support an anti-inflammatory action of paracetamol, and
indicate why it has a superior overall gastrointestinal safety profile compared
with non-steroidal anti-inflammatory drugs (NSAIDs).
In animal studies the antipyretic and analgesic effects of paracetamol have been
shown to be mediated through COX-III inhibition, a new variant of COX-I,
[11;12]. However, low level of expression of COX-III in man suggests little
clinical relevance at therapeutic doses [13]. Some studies suggest that the
central nervous system (CNS) is the site of the anti-nociceptive effect of
paracetamol [14;15]. Other suggested mechanisms for the analgesic effects of

5
paracetamol are inhibition of nitric oxide generation, and effects on either N-
methyl-D-aspartate (NMDA) or substance P [16]. Recently, an active conjugate
of paracetamol has been suggested as a mediator of the analgesic effects of
paracetamol [17]. In this novel metabolic pathway, following deacetylation of
paracetamol to its primary amine, which occurs mainly in liver, this amine is
conjugated with arachidonic acid in the CNS to form N-arachidonyol-
phenolamine (AM404). AM404 is postulated to be involved in the analgesic
effect of paracetamol through its effect on endogenous cannabinoid systems
[17].
1-2-2: Pharmacokinetics The therapeutic dose of paracetamol is 10-15 mg/kg with a therapeutic index of
approximately 10 [18]. The adult oral dose of paracetamol for
analgesic and antipyretic effects is 650-1000 mg every 4h, with a maximum daily
dose of 4g. Following oral ingestion of regular release tablets, paracetamol is
rapidly absorbed and reaches peak concentration within approximately 45
minutes. Time to peak for liquid paracetamol is 30 minutes, but food prolongs
time to peak concentration [19;20]. Peak concentration after recommended
dose ranges from 8-32 mg/l. Bioavailability of paracetamol is 60-98% with
protein binding of 10-30% at therapeutic doses [19]. Paracetamol passes
through the blood brain barrier [21] and placenta [22].
6
The liver is the main organ for metabolism of paracetamol, eliminating 25% of
the therapeutic dose by first pass metabolism. In adults the majority of
paracetamol (approximately 90%) is conjugated with glucuronide (40-67%),
sulphate (20-46%) and cysteine (3%), forming inactive and harmless
metabolites (Figure 1.1) [1]. In premature infants, newborns, and young infants
the majority of paracetamol is metabolised by sulphation [23]. Less than 5% is
excreted unchanged in the urine.
A small, yet significant fraction, ranging from 5-15% is metabolised via the
hepatic cytochrome P450 enzyme system (cytochrome 2E1: CYP2E1 and
cytochrome 1A2: CYP1A2 isoenzymes) resulting in the formation of a highly
toxic metabolite N-acetyl-p-benzoquinoneimine (NAPQI). Glutathione is
immediately conjugated with this intermediate metabolite resulting in
formation of non-toxic cysteine and mercaptate conjugates, which are
excreted in urine [24-29] (Figure 1.1).
Some drugs such as carbamazepine, phenobarbital, phenytoin, primidone,
and rifampicin induce cytochrome P450 enzymes and thus increase
subsequent production of this toxic metabolite (NAPQI) [30;31]. The
interaction between paracetamol metabolism and ethanol ingestion is
complex and its implication in acute overdose remains controversial. In
chronic alcoholism the combination of hepatic enzyme induction and

7
glutathione depletion seems to increase paracetamol toxicity. In contrast,
acute alcohol ingestion reduces toxic metabolic activation due to competitive
inhibition, and depletion of cytosolic NADPH (nicotinamide adenine
dinucleotide phosphate) and therefore, plays a protective role in hepatotoxicity
[32-37].
1-2-3: Toxicokinetics In general paracetamol, when taken in therapeutic dose, is a safe drug. The
lowest dose which is generally thought to be capable of causing toxicity is
considered 7.5 g in adults and 150 mg/kg in children [19]. It is believed that
toxicity generally occurs above 150 mg/kg [18]. Even after taking a toxic dose,
the majority of paracetamol absorption occurs within 2h and is thought to reach
peak plasma levels by 4h [19]. There are case reports of later peaks in
overdose, particularly in co-ingestion with other drugs that delay gastric
emptying [38] or following ingestion of an extended release of paracetamol
preparation [39].

8
Figure 1.1: Metabolism of paracetamol ( From [1] )

9
1-2-3-1: Epidemiology of toxicity Paracetamol has been available as an over-the-counter drug (without
prescription) since 1956, and has a remarkable safety record. 30 million packs
containing paracetamol are sold in the UK every year [40]. The first report of
paracetamol toxicity in man was in 1966 [41;42]. It is now the most commonly
drug used in deliberate self harm in the UK [43-46] and is involved in 48% of
poisoning admissions to hospital [47]. This trend is not confined to the UK and
has also been reported in other European countries [48;49], and the US [50].
Every year, around 70,000-100,000 cases of paracetamol poisoning occur in
Britain [43;45]. The liver and kidney are the main targets involved in paracetamol
toxicity.
1-2-3-2: Hepatotoxicity
1-2-3-2-1: Epidemiology of hepatic toxicity Paracetamol is the commonest cause of fulminant hepatic failure and liver
transplantation in the UK and in the US [51-56]. The estimated number of deaths
in the UK following paracetamol poisoning is currently at least 150 per year [57-
59]. The death rate in England and Wales between 1993 and 1997 was higher
at 500 per year [60]. Mortality in Scotland has been shown to be twice as high
as England and Wales [61]. Following restricting paracetamol pack sizes in
September 1998 [62] there have been conflicting reports in regards to effect on

10
hospital admission, admission to liver units and liver transplantation and
mortality rate following paracetamol overdose. While the new legislation was
initially shown to reduce mortality and morbidity following paracetamol overdose
in England and Wales [63], in Scotland restricting paracetamol pack sizes has
not had a significant effect on mortality [64]. Later data for England supports
the Scottish evidence [65] .
1-2-3-2-2: Pathophysiology of hepatotoxicity The liver is the main target of acute paracetamol toxicity. The safety of
therapeutic dose of paracetamol results from the availability of electron donors
such as glutathione (GSH) and other thiol-containing compounds. When
paracetamol is taken in appropriate dose glutathione supply far exceeds that
which is required to detoxify the toxic metabolite, NAPQI, and therefore no
toxicity occurs. In overdose the rate and quantity of formation of toxic metabolite,
NAPQI, exceeds glutathione supply. The highly reactive NAPQI rapidly binds to
cellular macromolecules containing cysteine. This covalent binding causes
hepatocellular necrosis, predominantly in the centrilobular zone (Zone III), due to
local formation of NAPQI [19;26;66-68]. In severe toxicity, necrosis may destroy
the entire liver parenchyma. Severe cases develop fulminant hepatic failure [54].
Children with acute febrile illness [66;69] and patients taking P450 enzyme
inducing drugs and ethanol [70] are at greater risk of hepatotoxicity. Malnutrition,
when the glutathione supply is inadequate (less than 30% of normal) is also a

11
risk factor. Taking paracetamol even just above daily recommended doses (4g)
following a period of fasting may cause hepatotoxicity [71].
The risk of clinically significant hepatotoxicity following paracetamol poisoning
can be predicted by measurement of plasma concentration of paracetamol at a
timed interval after poisoning, providing that this time interval is not less than 4
hours. The concentration is plotted on a paracetamol treatment graph with a
reference line (‘normal treatment line’) joining plots of 200 mg/l (1.32 mmol/l) at
4 hours and 6.25 mg/litre (0.04 mmol/litre) at 24 hour [31] (Figure 1.2). Patients
whose plasma paracetamol concentrations are above the “normal treatment
line” or “high risk line” in the high risk group are treated with IV NAC.
1-2-3-2-3: Effect of paracetamol on clotting factors Previous studies have shown that at therapeutic doses paracetamol decreases
prothrombin index and increases international normalised ratio (INR). The early
case reports began to appear in the literature in 1968 indicating an interaction
between coumarin anticoagulants and paracetamol [72], however, supporting
scientific evidence was only published in 1998 [73]. The study initially
investigating risk factors of excessive warfarin anticoagulation in a clinical
setting reported that paracetamol ingestion was independently in a dose-
dependent manner associated with high INR greater than 6.

12
Figure 1.2: Nomogram used for treatment of paracetamol poisoning in the UK (from
[31])

13
Further studies showed that paracetamol increases INR in patients on warfarin
[74;75] and suppress vitamin K-dependent clotting factors (II, VII, IX, X) ,
supporting the existence of clinically significant interaction between Warfarin and
daily dose of paracetamol (2-4g) [74-78].The exact mechanism of the interaction
is not known, but the most plausible hypothesis is that paracetamol or its
metabolites interfere with enzymes involved in vitamin K-dependent coagulation
factor synthesis. Although some other studies have not shown significance
interaction between paracetamol and anticoagulant therapy [79;80], the
possibility of such an interaction must be considered by clinicians in clinical
practice. Whether it has any relevance to the measurement of INR as a risk
assessment in paracetamol overdose is less clear, but in general changes in
clotting function in this situation are thought predominantly due to hepatic injury.
1-3: Paracetamol and Kidney
1-3-1: Epidemiology of Nephrotoxicity The kidney is the second target organ in paracetamol poisoning. Renal
insufficiency during the course of paracetamol overdose, with or without
concomitant hepatic failure, has been reported since the1970s [42;81-90]. The
incidence of paracetamol-induced renal failure varies in different studies and
various conditions. It has been reported that the incidence of acute renal failure
in paracetamol poisoning is less than 2% overall and 10% in severe poisoning

14
[18]. Before usage of NAC as a treatment of choice for paracetamol poisoning,
renal failure requiring dialysis occurred in approximately 1% of unselected
patients arriving to hospital following paracetamol overdose [18;91]. In another
unselected patient series with later presentation (more than 10h), which included
more severe toxicity, renal failure developed in 21% [90]. This figure increases
to 50%-70% in patients who have concomitant liver failure [53;92].
In the following section the physiology of kidney function and pathophysiology of
paracetamol-induced nephrotoxicty are reviewed.
1-3-2: Physiology of Renal function
The kidney maintains the constancy of the extracellular fluid by producing an
ultrafiltrate of the plasma, free of blood cells and macromolecules, which is
processed, reclaiming what the body needs, and excreting the rest as urine.
Every 24 hours, an adult’s kidneys filter 25000 mEq of sodium (total body
sodium is ~ 1200-2800 mEq), and 180 L of water (total body water is around
25-60 L). Only 0.5% of the filtered sodium and 1% of filtered water are excreted
[93].
Renal function begins with filtration at the glomerulus, which is a highly
permeable capillary network between afferent and efferent arterioles. The
relative constriction and dilatation of these arterioles control glomerular
15
filtration rate (GFR). In normal conditions, ~ 20% of the plasma water entering
in the glomeruli goes through the filter, carrying with it electrolytes and small
metabolites and leaving behind blood cells and larger proteins. Then, the
filtrate enters a series of tubules that reabsorb most of it and secrete certain
molecules such as amino acids and acids/bases into the urinary space. 60-
70% of reabsorption occurs in the proximal tubules. Distal to that is loop of
Henle, which controls concentration and dilution of the urine. The final part of
the nephron is distal tubule, which fine-tunes the balance between excretion
and reabsorption [93].
Sodium reabsorption is controlled in the proximal and distal part of the
tubule. Sodium handling is regulated by hydrostatic and oncotic pressure in
the peri-tubular capillaries in the proximal tubules; and by hormones such as
aldosterone in the distal tubules. Water balance is principally regulated by
the loop of Henle, which makes the medullary interstitium hypertonic; and by
the level of anti-diuretic hormone (ADH) in the final segment of nephron
(collecting duct) [93]. Sodium-potassium ATPase (NAKA), also known as
sodium-potassium pump, in the loop of Henle and collecting duct excretes
two potassium ions into the lumen in exchange for reabsorption of three
sodium ions into the blood. The kidneys also regulate potassium and
hydrogen ions, both of which are affected by aldosterone in the distal tubule
[94]. The kidney also plays an important role in phosphate homeostasis [95].

16
1-3-2-1: Renal potassium handling
Potassium is the major intracellular cation in the human body and is
involved in the regulation of intracellular enzyme function, and
neuromuscular tissue excitability. The typical Western diet contains
approximately 70-150 mmol potassium per day. The gastrointestinal (GI)
tract absorbs potassium efficiently. After absorption from the GI tract,
potassium is distributed into the intracellular (ICF) and extracellular fluid
(ECF) compartments. Total ICF potassium body content is 3000-3500 mmol
in healthy individuals and is primarily located in muscle (70%), with smaller
amounts present in bone, red blood cells, liver, and skin (Table 1.1). Only 1-
2% of the total body potassium is distributed in ECF [94]. Normally plasma
potassium has narrow range of 3.5-5.5 mmol/l. The ratio of potassium
concentration in ICF to ECF is a major determinant of cell membrane
potential, and intracellular electro-negativity, because of action of
potassium-selective ion channels. This means that a small change in extra
cellular potassium concentration can cause a significant effect on
neuromuscular tissue excitability. Thus, the body has developed complex
regulatory mechanisms to maintain potassium homeostasis [96].
17
Table 1.1: Distribution of total body potassium distribution in organs and body compartments (Adapted from [94]) Distribution of total body potassium in organs and body compartments
Organs and compartment Body compartment concentration
Muscle 2650 mmol
Liver 250 mmol
Intracellular
concentration
150 mmol/L
Interstitial Fluid 35 mmol
Red Blood Cells 35 mmol
Plasma 15 mmol
Extracellular
concentration
4 mmol/L
With potassium addition to ECF, there is a concomitant shift of potassium from
the ECF to ICF compartment. Conversely, in the state of potassium depletion
there is a cellular potassium shift into the ECF, particularly from muscle. This
process minimises changes in transcellular potassium ratio and membrane
potential. Accordingly, a small change in ECF potassium concentration is often
associated with significant change in total body potassium [94;96]. Short-term
potassium homeostasis occurs via transcellular potassium shifts. There are
several important factors that affect potassium shift between the ICF and ECF
(Figure 1.3).

18
Figure 1.3: Regulation of extracellular and intracellular potassium (From [94])
Acidosis associated with inorganic anions such as ammonium chloride
(NH4Cl) and hydrochoric acid (HCL) result in hyperkalemia due to
movement of potassium out of cells; however, acidosis associated with
organic acids such as lactic acid have no significant effect on cellular shifts
of potassium [97].
Insulin and ß2-adrenergic receptor activation cause cellular potassium
uptake by Na+-K+-ATPase stimulation, resulting in lower plasma
potassium. In contrast, α-adrenergic receptors activation opposes the ß2-
adrenergic receptor effect. Exercise induces α-adrenergic receptors

19
activation and movement of potassium out of skeletal muscle, resulting in
hyperkalemia [98].
The kidney is responsible for long-term potassium homeostasis, primarily
via urinary potassium excretion, which is regulated extensively by active
transport in the collecting duct. Potassium is completely ionized and does
not bind to plasma protein. It is therefore, filtered by the glomerulus (Figure
1.4). Proximal tubules reabsorb 60-70% of filtered potassium passively, but
this segment exhibits little regulation in response to changes in dietary
potassium intake.
Potassium is then secreted into tubular fluid in the descending limb of loop
of Henle. The main site of active potassium reabsorption is the thick
ascending limb of the loop of Henle by the action of “Na+-K+-2Cl- co-
transporter” (Figure 1.5a). Therefore modest net reabsorption of filtered
potassium usually occurs in the loop of Henle. This reabsorption can be
altered to secretion by administration of a loop diuretic, or large doses of
potassium loading. However, the majority of potassium excretion is
normally modulated by alteration in the rates of active secretion and
absorption occurring in distal convoluted tubules and collecting duct
[94;96]. By the end of the distal convoluted tubule, only 10% -15% of
filtered potassium remains in the tubule lumen. Net potassium transport in
the collecting duct and outer medullary collecting duct occurs through
20
distinct cell types, named “principal cells” that allow fine regulation of renal
potassium excretion (Figure 1.5b).
Several factors affect potassium secretion by principal cells. In relative
order of importance, these factors are: luminal flow rate and distal sodium
delivery; aldosterone, extracellular potassium and extracellular pH. An
increase in luminal flow rate induces potassium secretion. In contrast, low
luminal flow rate status, such as pre-renal uraemia and urinary tract
obstruction, may result in reduced potassium excretion and hyperkalemia.
Decreasing apical sodium reabsorption, either from reduced luminal
sodium delivery or due to sodium channel inhibitors, decreases potassium
secretion. Aldosterone increases Na+-K+-ATPase expression and thereby
stimulates potassium secretion [94]. An increase in ECF potassium
directly stimulates Na+ -K+ATPase, leading to potassium secretion.
21
Figure 1.4: Renal handling of potassium (from [94]
60-70%of filtered potassium is passively reclaimed by the end of the proximal convoluted tubules. Potassium is then added to tubular fluid in the descending limb of loop of Henle. The main site of active potassium reabsorption is the thick ascending limb of the loop of Henle, so that, by the end of the distal convoluted tubule only 10% -15% of filtered potassium remains in the tubule lumen. Potassium is secreted mainly by the principal cells of the cortical collecting duct and outer medullary collecting duct. Potassium reabsorption occurs via the intercalated cells of the medullary collecting duct. Urinary potassium excretion is the result of difference between potassium secreted, and potassium reabsorbed [94;99;100].

22
Figure 1.5a: Mechanism of potassium reabsorption in the thick ascending loop of Henle (from [94]).
Figure 1.5b: Mechanism of potassium secretion in collecting tubules (from [94])
23
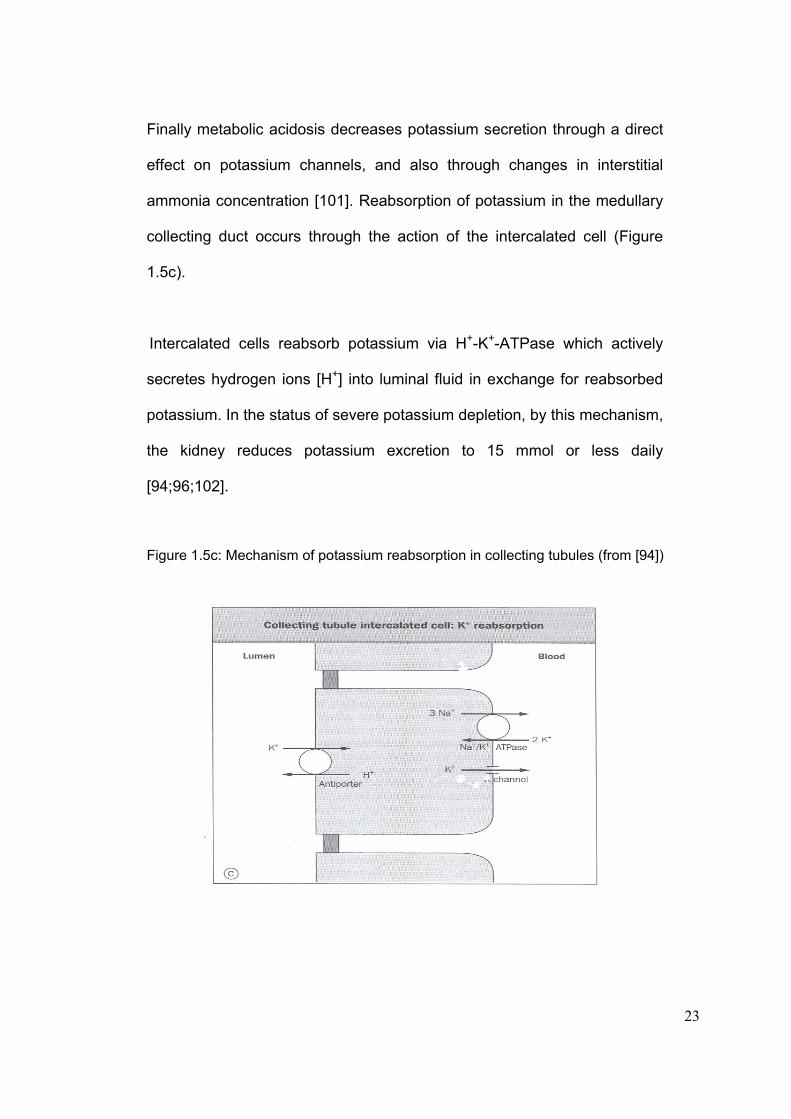
Finally metabolic acidosis decreases potassium secretion through a direct
effect on potassium channels, and also through changes in interstitial
ammonia concentration [101]. Reabsorption of potassium in the medullary
collecting duct occurs through the action of the intercalated cell (Figure
1.5c).
Intercalated cells reabsorb potassium via H+-K+-ATPase which actively
secretes hydrogen ions [H+] into luminal fluid in exchange for reabsorbed
potassium. In the status of severe potassium depletion, by this mechanism,
the kidney reduces potassium excretion to 15 mmol or less daily
[94;96;102].
Figure 1.5c: Mechanism of potassium reabsorption in collecting tubules (from [94])

24
1-3-2-2: Renal handling of phosphate
The physiological concentration of plasma phosphate in normal adults ranges
from 0.80–1.44 mmol/l (2.5-4.5 mg/dl), and 80 to 85% of the total body
phosphate is found in the skeleton. The rest is widely distributed throughout
the body in the form of organic phosphate compounds. In the extracellular fluid
phosphate is present mostly in the inorganic form, with over 85% of plasma
phosphate present as the free ion, the rest being protein-bound. Phosphate
plays an important role in several aspects of cellular metabolism [95]. Dietary
intake and GI absorption of phosphate, urinary excretion of phosphate, and
shifts between the ICF and ECF are major determinants of plasma
concentration. Abnormalities in any of these steps can cause either hypo- or
hyperphosphatemia [95;103].
The kidneys play a major role in regulating ECF phosphate homeostasis [104].
Under normal conditions, the daily amount of phosphate which is excreted in the
urine equals that absorbed in the intestine. This comprises 5-20% of filtered
phosphate. The amount of phosphate which is reabsorbed can be expressed in
relation to the amount filtered as TRP (total reabsorbed phosphate). TRP is
calculated from:
[1- (Cl p / GFR)] * 100 or 1- [(U p * P Cr) / (P p * U Cr)]
25
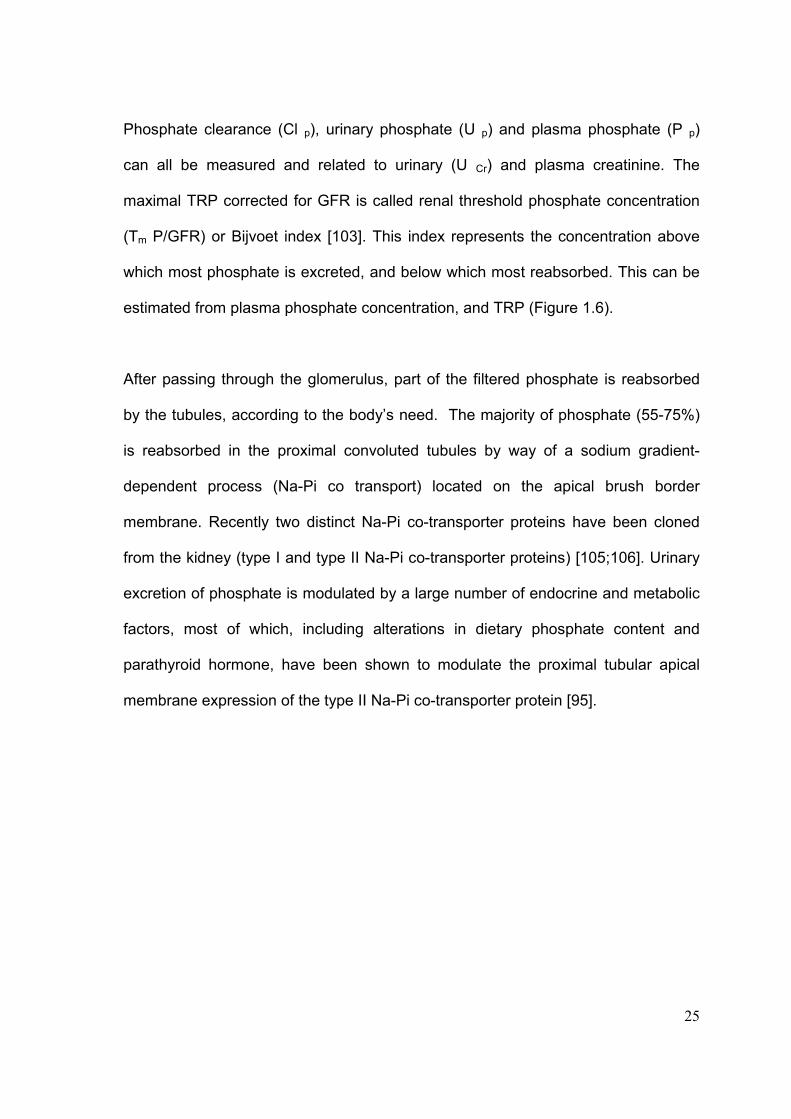
Phosphate clearance (Cl p), urinary phosphate (U p) and plasma phosphate (P p)
can all be measured and related to urinary (U Cr) and plasma creatinine. The
maximal TRP corrected for GFR is called renal threshold phosphate concentration
(Tm P/GFR) or Bijvoet index [103]. This index represents the concentration above
which most phosphate is excreted, and below which most reabsorbed. This can be
estimated from plasma phosphate concentration, and TRP (Figure 1.6).
After passing through the glomerulus, part of the filtered phosphate is reabsorbed
by the tubules, according to the body’s need. The majority of phosphate (55-75%)
is reabsorbed in the proximal convoluted tubules by way of a sodium gradient-
dependent process (Na-Pi co transport) located on the apical brush border
membrane. Recently two distinct Na-Pi co-transporter proteins have been cloned
from the kidney (type I and type II Na-Pi co-transporter proteins) [105;106]. Urinary
excretion of phosphate is modulated by a large number of endocrine and metabolic
factors, most of which, including alterations in dietary phosphate content and
parathyroid hormone, have been shown to modulate the proximal tubular apical
membrane expression of the type II Na-Pi co-transporter protein [95].

26
Figure 1.6: Nomogram for the estimation of renal threshold phosphate concentration (Tm P/GFR).
A straight line through the appropriate values of plasma phosphate concentration and TRP or Cl p / Cl Cr where Cl is clearance for phosphate (p) and creatinine (Cr) passes through the corresponding value of renal threshold phosphate concentration (Tm P/GFR) (from [103]).

27
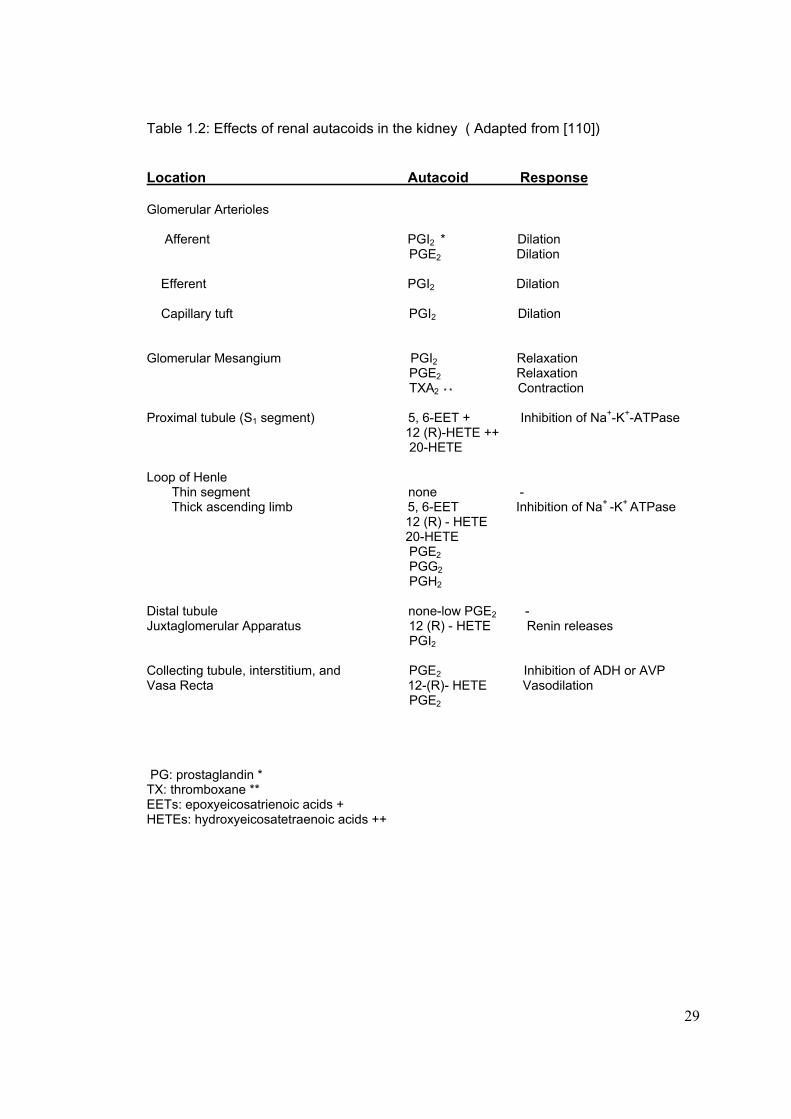
1-3-2-3: Nephron structure and functional significance of renal prostaglandins Prostaglandins (PGs), prostacyclin and thromboxanes (TX), family of 20-
carbon fatty acids, are synthesised from arachidonic acid in the renal
tissues (Figure 1.7). PGs have vasodilatory effects and are essential for
the maintenance of renal perfusion. If there is reduction in actual, or
effective, circulating volume, they influence water and electrolyte
homeostasis (Table 1.2). The anatomical sites of production of PGs and
their metabolites affect their main activity [107;108]. Thus PGI2 is mainly
found in the glomerulus and is the primary PG that influences glomerular
hemodynamics [107;109].
Although certain endothelial-derived autacoids such as nitric oxide and
endothelin-1 balance renal perfusion in both disease and health, PGs have
minor effects on renal hemodynamics in healthy individuals. However, in
low renal perfusion states, renal vasodilation is dependent to the presence
of PGs. Administration of NSAIDs which have inhibitory effects on PG
synthesis in such circumstances can decrease renal plasma flow and
glomerular filtration rate (GFR), resulting in an hypoxic insult to the kidney
[110].

28
Figure 1.7: Metabolic pathway of arachidonic acid cascade (Adapted from [110;111])
Cell Membranes Phospholipids Phospholipase A2 Arachidonic Acid Cytochrome P-450 Cyclo-oxgygenase (NSAIDs) Lipo-oxygenase Mono-oxygenase (COX-I, II) COX-I and COX-II are irreversibly bound by salicylates, reversibly bound by other NSAIDs Leukotrienes EETs HETEs Prostacyclin (PG I2) Prostaglandins (PGE2, PGD2, PGF2) Thromboxanes (TXA2, TXB2) antiplatelet aggregation erythema, oedema platelet aggregation vasodilation pain, fever, uterine contraction vasoconstriction
EETs: epoxyeicosatrienoic acids; HETEs: hydroxyeicosatetraenoic acids; PG: prostaglandin; TX: thromboxane
29
Table 1.2: Effects of renal autacoids in the kidney ( Adapted from [110]) Location Autacoid Response Glomerular Arterioles Afferent PGI2 * Dilation PGE2 Dilation Efferent PGI2 Dilation Capillary tuft PGI2 Dilation Glomerular Mesangium PGI2 Relaxation PGE2 Relaxation TXA2 * * Contraction Proximal tubule (S1 segment) 5, 6-EET + Inhibition of Na+-K+-ATPase 12 (R)-HETE ++ 20-HETE Loop of Henle Thin segment none - Thick ascending limb 5, 6-EET Inhibition of Na+ -K+ ATPase 12 (R) - HETE 20-HETE PGE2 PGG2 PGH2 Distal tubule none-low PGE2 - Juxtaglomerular Apparatus 12 (R) - HETE Renin releases PGI2 Collecting tubule, interstitium, and PGE2 Inhibition of ADH or AVP Vasa Recta 12-(R)- HETE Vasodilation PGE2 PG: prostaglandin * TX: thromboxane ** EETs: epoxyeicosatrienoic acids + HETEs: hydroxyeicosatetraenoic acids ++
30
The net effect of PGs on renal hemodynamics is the result of interactions
with a number of other vasoactive compounds in the kidney vasculature.
While angiotensin II (AII) has minor effects on the afferent arterioles, or
within the capillaries of the glomerulus, efferent arterioles are extremely
sensitive to the effect of AII. The vasoconstrictive effects of AII are
counterbalanced mainly by PGI2 and to a lesser extent by PGE2 [108;109].
Renin release is also controlled partially by PGI2 [107;108]. Inhibition of PG
production by administration of NSAIDs can, therefore, affect the renin-
angiotensin-aldosterone system, resulting in hyporeninemic
hypoaldosteronism, hyperkalaemia and hyponatremia [110;112;113], in
particular in patients with pre-existing renal impairment. PGE2 is the main
PG produced in the collecting tubules and interstitium. It is the primary PG
that influences medullary hemodynamics, and sodium and water handling
[107;108] (Table 1.2).
PGs have natriuretic effects via two mechanisms: first PGs cause
vasodilation and increase renal blood flow and subsequently a reduction in
proximal reabsorption of sodium; secondly, PGs directly inhibit sodium
reabsorption at the thick ascending limb of the loop of Henle. Thus,
administration of NSAIDs can cause sodium retention and reduce
response to diuretics [110;114].
31
Cytochrome P-450 metabolites of arachidonic acid (HETEs:
hydroxyeicosatetraenoic acids and EETs: epoxyeicosatrienoic acids)
(Figure 1.7) are also natriuretic. They are mainly found in the proximal
tubules and the medullary thick ascending limb of the loop of Henle (Table
1.2). The primary effect of HETEs is inhibition of “Na+ - K+ - ATPase” at the
S1 segment of proximal tubules and medullary thick ascending limb, and
possibly vasodilation of the medullary capillary plexus [110;114].
The enzyme responsible for PG synthesis is cyclo-oxygenase which has
two isoenzymes known as COX-I and COX-II (Figure 1.7). Both
isoenzymes are expressed in the kidney. COX-I, which is a constitutive
enzyme, is expressed in most cells, including platelets. It is involved in
tissue homeostasis and cell-cell signalling and its inhibition is associated
with GI bleeding and ulceration. COX-II produces prostanoid mediators in
inflammatory reactions. The pharmacological effects of some drugs such
as NSAIDs are due to inhibition of COX-I and COX-II. Most NSAIDs
currently being used are inhibitors of both isoenzymes and their unwanted
effects are primarily associated with the inhibition of COX-I. New NSAIDs
which selectively inhibit COX-II have come on the market, based on the
hypothesis that by inhibiting only COX-II these agents can be as
efficacious as nonselective NSAIDs, but with less GI effects. However,
further studies showed that COX-II inhibitors exhibit the same renal effects
as non selective NSAIDs. Findings of studies conducted on rofecoxib
32
showed that COX-II is constitutively expressed in the human kidney and
contributes to production of renal PGs. Thus renal function may be
adversely affected due to vasoconstriction following NSAID-induced COX-
II inhibition and therefore PG synthesis inhibition, particularly in people with
underlying renal disease. Rofecoxib and valdecoxib are potent and
selective COX-II inhibitors [111;115;116] and cases of acute renal failure
(ARF) associated with the use of both these agents have been reported
[115-117].
1-3-3: Pathophysiology of Nephrotoxicity The kidneys are susceptible to toxic or ischemic injury for five important
reasons:
1: while the kidneys make up less than 1% of total body, they receive 20-
25% of cardiac output;
2: because of high metabolic activity (enzyme systems and transcellular
transport), they are susceptible to agents that disrupt metabolism;
3: their ability to remove water from filtrate results in a high concentration
of toxic substances in the medulla which is harmful to the kidney;
4: they have the largest endothelial surface by weight;
5: they alter tubular fluid acidification and this in turn influences plasma
protein binding.
All these factors may be affected by toxins [118;119].

33
Injury to any part of the nephron, either glomeruli or tubules, can cause renal
dysfunction and therefore decrease in GFR and increase in plasma levels of the
marker substances urea and creatinine. However, the relationship between GFR
and urea and creatinine is hyperbolic not linear, meaning that a small increase in
plasma level of these markers denotes a significant renal dysfunction. By the time
plasma creatinine exceeds the normal range, GFR is already reduced by greater
than 50% [93]. While nephrotoxins may influence any segment of the nephron
they usually affect the tubules, the most metabolically active segment of the
nephron. Glomerular damage may also result from drugs or chemicals. These
processes are not mutually exclusive, and toxic nephropathy may involve more
than one part of the nephron (e.g. NSAID-induced ARF and nephrotic syndrome)
[93;118;120] (Figure 1.8).

34
Figure 1.8: Major nephrotoxic processes and the sites of injury induced by nephrotoxic agents (from [93] )
35
1-3-4: Acute renal failure (ARF)
ARF is characterized by a sudden decline (hours to days) in renal function
sufficient to decrease the elimination of urea and creatinine and other
uraemic toxins [121]. The true incidence of ARF is difficult to determine from
the literature because of the wide variation in the populations studied, and
different diagnostic criteria for the definition of ARF. It is generally believed
that the incidence of ARF in the hospital setting is approximately 5% in all
patients, and 15-25% in the critically ill patients [122]. ARF can result from
low renal perfusion without cellular injury; an ischemic, toxic or obstructive
insult to the tubules; a tubulointerstitial process with inflammation and
oedema; or a primary reduction in the filtering capacity of the glomerulus.
Traditionally, ARF is classified into three pathophysiological processes: pre-
renal, intrinsic and post-renal failure. If tubular and glomerular function is
intact, but, renal function is affected by factors compromising renal
perfusion, the failure is called “pre-renal”. If the renal dysfunction is caused
by an obstruction of the urinary outflow tract, it is defined as “post-renal”
failure; and if the primary source of failure is intra-renal it is termed “intrinsic”
renal failure. Pre-renal and intrinsic renal failure due to ischemic and
nephrotoxic insults are the most common causes of ARF [123].

36
1-3-4-1: Pre-renal ARF Pre-renal ARF is responsible for approximately 70% of community-
acquired [124] and 40% of hospital-acquired ARF cases [125]. Sustained
hypo-perfusion is the most important predisposing factor for ischemia-
induced tubular necrosis. Pre-renal ARF in the poisoned patient can occur
from mechanisms leading to hypotension and subsequently renal hypo-
perfusion. These mechanisms include: cardiotoxicity leading to a lower
cardiac output, vasodilation, vasoconstriction and loss of effective
circulatory volume due to diuresis, GI fluid loss, bleeding, or third space
volume such as in a chemical burn.
Nephrotoxins may produce pre-renal failure by affecting the intra-renal
vasculature, leading to decreased renal blood flow and GFR. Renal blood flow is
a result of a balance between vasoconstrictors (catecholamines, A II) and
vasodilator (PG) factors. Some toxins such as NSAIDs inhibit the formation of
the vasodilatory PGs, causing vasoconstriction. This effect, at therapeutic doses
of NSAIDs, generally does not compromise renal function, however, in hypo-
perfusion states, such as volume loss, shock or congestive heart failure, it may
precipitate ARF. Elderly patients are particularly susceptible to pre-renal ARF
[118;123].
37
1-3-5: Risk factors and Mortality of ARF Risk factors of ARF can be patient related or drug/toxin related (Table 1.3).
In pre-renal uraemia renal injury is more likely to occur after drugs that
alter intra-renal haemodynamics, such as NSAIDs [126;127], or reach high
concentration in the renal tissue, such as aminoglycosides [128].
Aminoglycosides are renally excreted and therefore accumulate more
easily in ARF, and then are concentrated in the kidney and cause injury.
Patients with a history of renal disease are more susceptible to the
nephrotoxic drugs [129;130]. Age is also an important risk factor. Elderly
patients are more likely to develop ARF and have a poor prognosis
because of the structural change (reduction in renal size and volume,
reduction in the number of glomeruls, change in the renal tubules,
interestitium and renal vessels) and functional changes (reduction in renal
plasma flow and to lesser extent in GFR) observed in the aging kidney
[131-133]. Liver disease has been shown to increase the risk of ARF and
mortality [134]. Patients with non-oliguric renal failure (urinary output ≥ 400
ml per day) have a better prognosis [135].
Dialysis requirement in patients with ARF ranges from 20-60%. Less than
25% of those who survive initial dialysis require long-term dialysis. This
indicates the potential reversibility of the syndrome [123]. Mortality rate in
ARF ranges from 7-100% in different population studied. The mortality rate
38
of patients admitted to hospital with pre-renal uraemia has been reported
as 7% [124]. This increases to 50-100% in patients with post-operative
ARF [136;137]. In this group of patients ARF will occur largely in the setting
of multi-organ failure.
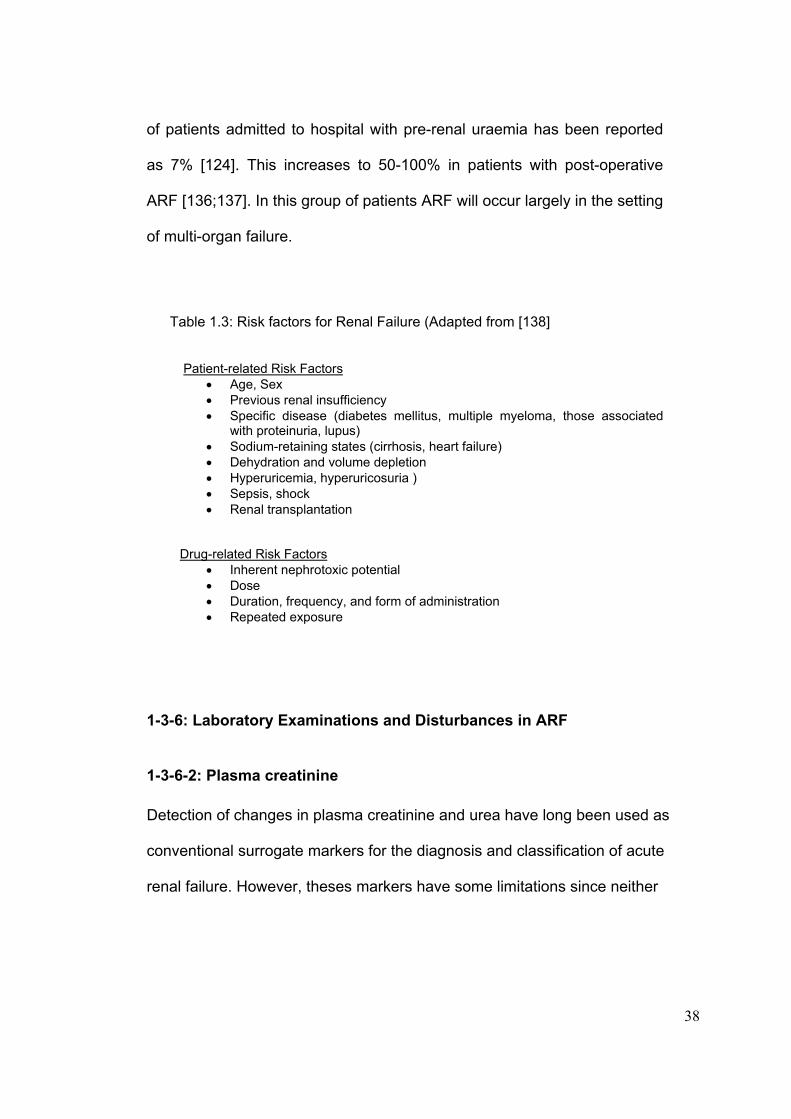
Table 1.3: Risk factors for Renal Failure (Adapted from [138]
Patient-related Risk Factors
• Age, Sex • Previous renal insufficiency • Specific disease (diabetes mellitus, multiple myeloma, those associated
with proteinuria, lupus) • Sodium-retaining states (cirrhosis, heart failure) • Dehydration and volume depletion • Hyperuricemia, hyperuricosuria ) • Sepsis, shock • Renal transplantation
Drug-related Risk Factors • Inherent nephrotoxic potential • Dose • Duration, frequency, and form of administration • Repeated exposure
1-3-6: Laboratory Examinations and Disturbances in ARF
1-3-6-2: Plasma creatinine Detection of changes in plasma creatinine and urea have long been used as
conventional surrogate markers for the diagnosis and classification of acute
renal failure. However, theses markers have some limitations since neither

39
reflect time-course of changes in GFR. These markers require some time to
accumulate before being detected in plasma as abnormal, and this potentially
results in a delay in the diagnosis of the renal dysfunction. Production and
release of creatinine into plasma can be highly variable. Some factors including
age, sex, muscle mass (i.e., neuromuscular disease, malnutrition, amputation),
dietary intake and drugs (e.g., trimethoprim, cimetidine) may affect creatinine
production and excretion. Moreover, 10-40% of creatinine is excreted by tubular
secretion and this has the potential to hide a significant initial decline in GFR
[139]. Nevertheless serum creatinine is still widely used as a surrogate marker
of renal function by clinicians worldwide, primarily due to simplicity, familiarity
and low cost.
1-3-6-2: Hypokalaemia Hypokalaemia is a common electrolyte abnormality in hospitalised patients. It is
usually defined as plasma potassium of less than 3.5 mmol/l. Patients with mild
hypokalaemia (plasma potassium concentration 3.0- 3.5 mmol/l) usually have no
symptoms. However, patients with more severe hypokalaemia (plasma
potassium concentration of less than 2.5 mmol/l) may develop generalised
weakness, muscle necrosis (rhabdomyolysis) and paralysis [140-142]. Both mild
and severe hypokalaemia increase risk of cardiac arrhythmias [143;144].
Hypokalemia also has some other effects including, hormonal, muscular and

40
renal effect [94]. Hypokalemia can be classified in five groups:
pseudohypokalemia; redistribution or transcellular shift; hormonal imbalance,
renal potassium loss and other causes.
Pseudohypokalemia: large number of white blood cells in certain disease states,
such as acute myelogenous leukaemia, when stored for a long period at room
temperature can take up extracellular potassium resulting in low potassium
concentration in the laboratory [94].
Redistribution: more than 98% of total body potassium is located in ICF.
Therefore, movement of small amount of potassium from ECF to ICF can alter
plasma potassium concentration markedly. As discussed earlier many hormones
(insulin, glucagon and aldosterone), ß2-adrenergic agonist, and plasma acid-
base changes stimulate cellular potassium uptake, resulting in hypokalemia
[94;97;141;145].
Hormonal imbalance: aldosterone is the most important hormone regulating total
body potassium homeostasis, resulting in hypokalaemia both by inducing
potassium uptake into cells, and by increasing potassium excretion [94;141].
Any disorder that affects aldosterone synthesis can also alter potassium
haemostasis [146-148].

41
Renal potassium loss: renal potassium loss is the most common cause of
hypokalaemia either due to medications, endogenous hormone production, or
rarely due to intrinsic kidney disease (eg. Bartters’s, Gitelman’s syndrome,
Liddle’s syndrome). Both thiazide and loop diuretics induce urinary potassium
excretion in a dose-dependent and treatment duration-related manner
[94;149;150]. Certain antibiotics such as penicillins [151], aminoglycosides [152],
and antifungal agents [153] increase renal potassium loss. There have been
reports of hypokalaemia associated with anticancer drugs such as cisplatin
[154;155]. Toluene exposure from sniffing certain glues can also cause renal
tubular acidosis and renal potassium loss [156].
Other causes: magnesium deficiency can cause renal potassium wasting. This
condition should be considered in any adult patient with hypokalaemia of
unknown aetiology [157;158]. Any case of increase in distal tubular bicarbonate
delivery, such as metabolic alkalosis, renal tubular acidosis or treatment of renal
tubular acidosis can also increase potassium secretion [94]. Hypokalaemia,
although less frequent, may develop in excessive sweating, chronic diarrhoea,
vomiting, or prolonged nasogastric suction; however, the main mechanism of
potassium loss in such circumstances is renal loss due to metabolic alkalosis
and hyperaldosteronism secondary to volume loss [159].

42
1-3-6-3: Fraction of excretion of filtered electrolytes The fractional excretion of filtered sodium (Fe Na) can help us to
differentiate between pre-renal and intrinsic renal failure. Fe Na is
calculated from:
Fe Na = (U Na / P Na) ÷ (U Cr / P Cr) × 100
Fe Na less than 1% is characteristic of pre-renal failure whereas value more
than 1% indicates with acute intrinsic renal failure [93].
1-3-6-4: Trans-tubular potassium gradient Trans-tubular potassium gradient (TTKG) is another useful marker of renal
function. TTKG is a measurement of net K secretion in the distal nephron
and corrects the urinary potassium for changes in osmolarity that may
occur with water reabsorption in the collecting duct. TTKG provides an
indirect measurement of the net potassium secretion of the distal tubules. It
is calculated from:
TTKG= (U K/ P K) ÷ (U osm / P osm)
where U K and P K are the concentration of potassium in urine and plasma,
respectively, and U osm and P osm are the osmolalities of urine and plasma,
respectively.
TTKG is often used to determine if hyperkalaemia is caused by
aldosterone deficiency / resistance or secondary to non-renal causes. A

43
value of less than 5-7 in the setting of hyperkalaemia implies impaired
distal tubular secretion of potassium due to either aldosterone deficiency or
resistance. A value of more than 10 indicates increased K intake and
normal distal nephron handling of potassium [94].
1-3-6-5: Proteinuria and enzymuria The kidney includes several enzyme systems, found only in specific
segments of the nephron. Several different tests are being developed
(enzymuria, renal tubular antigens, to screen for preclinical renal damage.
The sensitivity and specificity as well as the potential clinical uses of these
tests remain to be clarified. Additional application of enzymuria tests may
include a role in localization of site of injury in the nephron. The anatomical
site of nephrotoxicity may generally be localized by classifying proteinuria
as either low molecular weight or high molecular weight. Low molecular
weight proteins such as β2 microglobulin or retinol binding protein, are
freely filtered at the glomerulus and are taken up by the proximal tubular
cells, where they are catabolised. Thus, low molecular weight proteinuria
is a highly sensitive index of proximal tubular dysfunction. In contrast, high
molecular weight proteins such as albumin are repelled from glomerular
filtration because of size and charge restraints. Nephrotoxins that produce
a loss of glomerular size selectivity or a loss of the glomerular poly-anion
can cause albuminuria. The Tamm-Horsfall is a specific renal protein

44
located in the thick ascending limb of the loop of Henle. It is a high
molecular weight protein, and its excretion in the urine increases when this
segment of the loop of Henle is damaged by toxic agent [93;160].
1-3-7: Paracetamol-induced nephrotoxicity
1-3-7-1: Pathophysiology The mechanism of paracetamol-induced nephrotoxicity is not fully understood.
Several mechanisms have been suggested. The primary pathological lesion is
acute tubular necrosis which most often occurs in the context of liver injury
[83;92]. However, it also occurs rarely in the absence of clinical and biochemical
evidence of major liver injury [85;90;161]. Evidences of coagulative necrosis of
the proximal tubular cells, tubular dilation, collection of cellular debris within
damaged tubules, rupture of tubular membranes, interstitial oedema and
infiltration with lymphocytes and plasma cells have been shown in the renal
biopsies and autopsy specimens of patients who developed renal failure
following paracetamol overdose [162-165]. Interstitial nephritis [166] and distal
tubular damage [84] have also been reported.
Like liver damage, the pathophysiology of renal necrosis after acute
paracetamol overdose is believed mainly due to formation of NAPQI by P450
enzymes in the renal parenchyma [18;167;168]. It is likely that the nephrotoxic
45
agent is the quinoneimine metabolite [169]. Further studies indicate that the
quinoneimine intermediate conjugates with sulphydryl-containing
macromolecules to cause renal injury [170;171]. While GSH-conjugation is
primarily considered as a detoxification pathway, experimental studies have
shown that GSH conjugates of paracetamol metabolism may contribute to
nephrotoxicity [172]. How the binding of NAPQI-cysteine protein then causes
renal damage is still not clear. In 1991 Moller-Hartmann and Sieger suggested
that the mechanism of nephrotoxicity is quite different than that of hepatotoxicity
in paracetamol overdose, and that paracetamol-S-conjugates might be
responsible for the nephrotoxic effect of paracetamol [173]. In animal models
pretreatment with either inhibitors of GGT (gamma glutamyl trans peptidase) or
the probenecid-sensitive organic anion transporter prevented paracetamol-
induced nephrotoxicity [174;175]. GGT catalyses the initial step in the
catabolism of GSH conjugates and plays an important roles in the exposure of
intracellular cells to potentially toxic S-conjugates [176]. One recent
experimental study suggested a contributory role for paracetamol-GSH-derived
metabolites in paracetamol-induced renal, as opposed to hepatic injury, that
involved renal-selective GSH depletion [172]. Acute necrosis in the proximal
convoluted tubules of the inner renal cortex of the rat was described by Mitchell
et al. [168] after single non-lethal doses of paracetamol in 1977. They showed a
positive correlation between renal injury and degree of covalently bound
paracetamol in the renal cortex, and also described a negative correlation to
renal glutathione supply. They suggested that paracetamol is converted to a

46
toxic metabolite by P450 enzyme within the kidney, and that glutathione protects
against renal damage, in a manner parallel to the liver.
Why the occurrence of renal injury after acute paracetamol overdose is
uncommon and why some patients are more susceptible to nephrotoxicity is not
fully understood. This might be due to individual differences in the amount of
P450 oxidases present in the kidney [164]. An additional factor might be the
inducibility of oxidative enzyme system. This has been well described in the
literature [30;177;178]. There are reports of sex differences in susceptibility to
paracetamol-induced nephrotoxicity in animals [179-181]. Some experimental
studies have shown that paracetamol-induced nephrotoxicty is more common in
males [179;180]. The studies suggested that testosterone increases CYP2E1
activity in the kidney. CYP2E1 is thought to play an important role in the
metabolic bioactivation of paracetamol resulting in nephrotoxicty. Other
contributing factors to nephrotoxicity of paracetamol include volume depletion,
hepatorenal syndrome, pre-existing renal disease, chronic excessive dosing of
paracetamol, and co-ingestion with other nephrotoxic drugs [182;183].
Two clinical forms of nephrotoxicity following paracetamol overdose have been
described. Within 24-48 hours oliguric renal failure develops, accompanied by
proteinuria and microscopic haematuria. The oliguria usually occurs in the
context of liver injury and it may last for only few hours or progress to anuria
requiring haemodialysis [163;184]. The other form of renal failure with a delayed

47
onset is associated with hepatic failure. This form is generally accompanied by a
multiple organ failure. Endotoxaemia and disseminated intravascular
coagulation (DIC) have been suggested as aetiological factors in the
pathogenesis of renal insufficiency [163]. Previous studies have shown that
plasma renin activity (PRA), atrial natriuretic factor and aldosterone
concentrations are increased in proportion to the severity of renal failure [185].
The increase in PRA is in association with renal vasoconstriction and low renal
prostaglandin excretion [186].
1-3-7-2: Paracetamol and plasma electrolytes The adverse effects of aspirin and NSAIDs on the kidney have been previously
described. NSAIDs interfere with water excretion and natriuresis by PG
synthesis inhibition, and, under certain conditions, may reduce renal blood flow
[187]. The clinical and laboratory features of the renal effects of NSAIDs include
weight gain, oedema, hyponatraemia, hyperkalaemia and interference with the
effect of diuretics and antihypertensive drugs [188]. They may also cause acute
renal dysfunction in patients with underlying kidney disease [189]. Furthermore,
NSAIDs may cause tubulo-interstitial damage, nephrotic syndrome and renal
papillary necrosis (analgesic nephropathy) [190].
Paracetamol does not seem to have renal effects similar to NSAIDs, which are
associated with a more general inhibition of PG synthesis. It does not cause

48
clinically significant fluid and sodium retention, or renal impairment when taken
in therapeutic doses [187]. Although rare, there have been reports of analgesic
nephropathy with paracetamol [191].
Haylor and colleagues investigated the renal effects of acute oral administration
of 1.5 g paracetamol on six healthy female subjects and showed a reduced
excretion of sodium, water and PGE2 [192]. Berg and colleagues studied the
acute effect of paracetamol (40 mg/kg/day for 3 days) on renal function and PG
synthesis. They reported that oral treatment with paracetamol in therapeutic
doses reversibly reduced thromboxane B2 (TXB2), a potent vasoconstictor, for at
least 4h after ingestion both in healthy controls and in patients with impaired
renal function. The study also showed a reduction in PGE2 excretion, a potent
vasodilator, especially in patients with renal dysfunction, but with no significant
effect on GFR or plasma electrolytes [193]. Prescott and colleagues, in a study
on 10 female healthy volunteers given therapeutic dose of paracetamol, (4g
daily), indometacin (150 mg daily) and placebo for 3 days, showed paracetamol
and indometacin had no significant effect of GFR and effective renal plasma flow
as measured by the renal clearance of inulin, creatinine and PAH (p-
aminohippuric acid) [187]. However, paracetamol, and in particular indometacin,
did reduce urinary excretion of PGE2. The low urinary excretion of PGE2 induced
by paracetamol and indometacin was associated with a reduction in urinary
excretion of sodium and volume retention.

49
Paracetamol acts differently when it is taken in overdose. An animal study [194]
in which different single toxic doses of paracetamol were given to Wistar rats
showed a dose dependent reduction in GFR and renal blood flow (RBF).
Thereafter distal tubular damage was observed, as detected by alteration in
renal concentration ability. The time course of this change after a single toxic
dose of paracetamol (1000 mg/kg) was for an increase in fraction of excretion of
potassium (FeK) and sodium (FeNa) to reach maximum at 16 hours after
exposure. FeK and FeNa returned to normal by 24 hours. The authors
concluded that the early stage of paracetamol nephrotoxicity might be due to
renal hemodynamic change which may cause tubular dysfunction mainly in the
distal parts of the medullary tissue. These changes occurred at different doses
of paracetamol from those usually associated with a reduction in hepatic
glutathione levels. Renal glutathione reduced only at high doses of paracetamol
(1000 mg/kg). In this study renal damage occurred in the presence or absence
of liver damage.
Hypophosphataemia is also a recognised feature of liver failure [195;196] and if
severe may contribute to the morbidity and mortality by causing mental
confusion, irritability, coma, blood abnormalities and rhabdomyolysis [197]. It
has also been described as a general feature of paracetamol poisoning.
Although the degree of hypophosphataemia is correlated with the severity of
liver injury, it may also occurs in the absence of clinical or biomedical features of
liver injury [198]. Several mechanisms, including systemic alkalosis, glucose
50
infusion during NAC therapy, the breakdown of intracellular organic phosphate
in the presence of intracellular acidosis, and phosphaturia have been suggested
to contribute in hypophosphataemia. However, the kidney has been suggested
to play the major role in determining plasma phosphate concentration via the
degree of tubular phosphate reabsorption and excretion [198-200].
A previous study on patients with paracetamol overdose showed that serum
phosphate was negatively correlated with markers of liver injury, but, positively
correlated with plasma potassium concentration [198]. In the same study, the
renal phosphate threshold concentration (Tm PO4/GFR) was highly significantly
correlated with degree of hypophosphataemia, and therefore renal loss of
phosphate rather than intracellular redistribution was considered as the main
cause of hypophosphataemia [198]. The authors suggested that, although renal
tubular necrosis in paracetamol overdose is rare, if phosphaturia accounts for
hypophosphataemia, renal tubular abnormalities appear to be far more common
than previously recognised and special consideration should be given for
replacement of phosphate if needed.
A further study [199] in patients with paracetamol overdose confirmed the results
of the previous study [198] showing a correlation between hypophosphataemia,
TmPO4/GFR, retinol binding protein (RBP), a biomarker of renal tubular
damage, and severity of overdose. The authors suggested that both
phosphaturia and RBP can be used as a marker of nephrotoxicity in

51
paracetamol overdose, however, RBP is a less sensitive marker and increases
occur only in more severe cases.
1-4: Acetylcysteine (NAC)
1-4-1: NAC, the treatment of choice for paracetamol poisoning NAC has long been used as an effective antidote in paracetamol poisoning in
animals [201] and man [202;203]. NAC reduces the extent of glutathione
depletion following toxic doses of paracetamol [204-206], supports the
glutathione conjugation of paracetamol, and increases the urinary excretion of
cysteine and mercapturic acid conjugates of paracetamol following paracetamol
overdose [18;207]. High doses of paracetamol deplete inorganic sulphate and
saturate sulphate conjugation. In vitro studies showed that NAC is partly
metabolised to inorganic sulphates, such as sodium sulphate, and thus supports
the sulphate conjugation pathway. It also increases the rate of paracetamol
elimination [208;209].
The optimal route and duration of NAC administration has remained
controversial. In the US a 72-hour oral regimen has long been used [210] while
the current protocol for antidote therapy in paracetamol poisoning in the UK,
Canada and Australia is the Prescott protocol [203], which is a step-down, 20-
hour intravenous (IV) NAC infusion (150 mg / Kg over 15 min in 200 ml 5%

52
dextrose, followed by 50 mg/kg in 500 ml 5% dextrose over 4 hours and 100
mg/Kg in 1000 ml 5% dextrose over 16 hours). A meta-analysis has shown no
difference in the outcome between oral and IV NAC regimens, however, a
shorter hospital stay and the potential reduction in the bioavailability of oral NAC
due to vomiting and activated charcoal administration make IV NAC regimen
preferable [210]. For optimal effect it is generally accepted that NAC must be
given within 10 hours of ingestion. The earlier treatment is given the more likely
it is to be protective. The protective effect of NAC begins to decline after 8 to 10
hours and after 12 hours the efficacy rapidly decreases [203;211].
Patients whose plasma paracetamol concentrations are above the “normal
treatment line” or “high risk treatment line” in the high risk group are treated with
IV NAC (Figure 1.2). In remote areas where NAC is not available, methionine,
which may be prescribed orally, can be given. Providing that the overdose has
been taken within 10-12 hours and the patient is not vomiting [31].
When the time of ingestion is not known or when tablets are taken over period
of several hours (staggered overdose) the plasma paracetamol concentration is
difficult to interpret. In such circumstances treatment with antidote is
recommended [31].
Patients who are taking P450 enzyme-inducing drugs including carbamazepine,
phenobarbital, phenytoin, primidone, rifampicin, alcohol, and St Johns Wort, or

53
who are malnourished (e.g. anorexia, alcoholics, or patients with malabsorption
or HIV [human immunodeficiency virus] positive) may develop toxicity at a lower
paracetamol concentration. In this group of patients treatment should be started
when the paracetamol concentration is above the “high risk treatment line”
(which is a line plotted at 50% of the normal treatment line [31] (Figure 1.2).
If patients are treated within 10 hours of overdose serious hepatotoxicity is
uncommon [212]. Without treatment about 60% of patients with a plasma
paracetamol concentration above the “treatment line” may develop liver injury.
Of these about 5% will die [213]. The prognostic accuracy of plasma
paracetamol concentration taken after 15 hours is uncertain, but a concentration
above the relevant treatment line is considered as carrying a serious risk of liver
injury [31]. Whether NAC treatment is beneficial in late presentation (>15 h post
ingestion) and in patients with established liver failure following paracetamol
overdose is less certain [214]. Studies have suggested that NAC give after 16
hours, even at the stage of encephalopathy, can improve survival [215;216].
Late NAC treatment reduced progression to grade III or IV encephalopathy and
had a beneficial effect on survival even in patients with poor prognosis [215].
The main protective effects of NAC after paracetamol overdose are
replenishment of reduced intracellular glutathione and detoxification on toxic
metabolite; however, there are other suggested mechanisms by which NAC
given in patients with later presentation could be beneficial. Experimental study
has shown NAC can restore the capacity of intracellular protelolytic systems to

54
degrade arylated proteins [217]. Thus in vivo, poisoned cells may remain viable.
Moreover, neutrophil accumulation within the liver worsens liver damage, and
the antioxidant properties of NAC may prevent this [215].
1-4-2: Death from low dose paracetamol concentration There have been reports of death and liver injury in patients with paracetamol
overdose who had plasma paracetamol concentration under the treatment
line and therefore, according to protocol, not treated by IV NAC [218]. While
factors such as inaccurate time of ingestion, unknown number of tablets taken,
staggered overdose, enhanced susceptibility to liver damage, and co-ingestion
with other drugs have been suggested to be possible associated factors,
recently there has been an argument regarding the accuracy of the current
guideline for the treatment of paracetamol poisoning, in particular when
identifying high risk patients. It has been suggested that treatment strategy must
allow a margin of safety that permits some degree of inaccuracy in the patient’s
history or individual susceptibility to paracetamol [219]. Bridger at al suggested
changing the current treatment line for use of NAC. They recommended use of a
lower line passing through 150 mg/l at 4h and 30 mg/l at 12h as the standard
treatment line and 100 mg/l at 4h for those patients with known risk. This
standard is widely used in the US [218]. This suggestion has been discussed by
others [219-226]. While some agreed with this recommendation [219;222],
others questioned whether there is sufficient evidence for such a change

55
[220;223;225], arguing that only a small fraction of the large group of patients
who have paracetamol concentration under current treatment line are at risk of
paracetamol toxicity. Thus, whether using a lower treatment line can justify the
increase use of in-patient resources that would be needed to treat this
potentially large population is uncertain, and more information on the occurrence
of death and liver failure in this group is required [225].
1-4-3: Effect of NAC on clotting factors Antidote treatment with NAC reduces the severity of liver injury induced by
paracetamol overdose [203]. Clotting factors are used as indicators of prognosis
in fulminant hepatic failure [227], and management decisions in paracetamol
overdose are partly based on serial measurement of prothrombin time.
However, NAC itself has been shown to reduce prothrombin index in patients
with paracetamol overdose [228-230] and also in healthy volunteers [229-231].
Prothrombin index measures the relative activity of clotting factor II, VII and X in
comparison to normal controls. The mechanism behind anticoagulant property of
NAC is unknown. It is thought that this might be due to destabilization of
proteins, including clotting factors that contain disulphide bonds [232]. The
results of previous studies suggest that although the prothrombin index provides
useful prognostic information, management decisions should not solely rely on
this value [230].

56
1-4-4: Anaphylaxis and anaphylactoid adverse reactions The terms anaphylaxis and anaphylactoid reactions were first introduced by
Charles Robert Richet in 1902 [233].The term anaphylaxis refers to amplified,
harmful immunologic reactions that occur when the human body is exposed to a
specific antigen that cross-links antigen-specific IgE molecules. These IgE
molecules are bound to the surface of mast cells and peripheral basophils. This
reaction leads to degranulation of mast cell and basophils resulting in immediate
release of potent mediators such as histamine and tryptase. Furthermore,
metabolism of arachidonic acid in cell membranes produces other mediators,
including prostaglandins and leukotrienes (Figure 1.7).
The pre-formed and newly generated mediators of mast cell and basophil
degranulation are responsible for the sudden and potentially life-threatening
progression of events involving cardiovascular and respiratory systems, GI
(gastrointestinal) tract and skin (Figure 1.9 and 1.10).
Initial anaphylactic symptoms include nasal congestion, rhinorrhea,
conjunctivitis, flushing, pruritus, nausea, vomiting, diarrhoea, urinary urgency
and uterine cramp. In more severe cases patients may develop hypotensive
shock and cardiovascular collapse, laryngeal bronchospasm, asphyxia and
death. Symptoms usually occur within 20 minutes following exposure to the

57
agent; however, the time course can be variable. In general, larger oral doses
and IV administration are more likely to cause severe adverse reactions [234].
Figure 1.9: Mediators responsible for the signs and symptoms of anaphylactic Reactions (from [235])
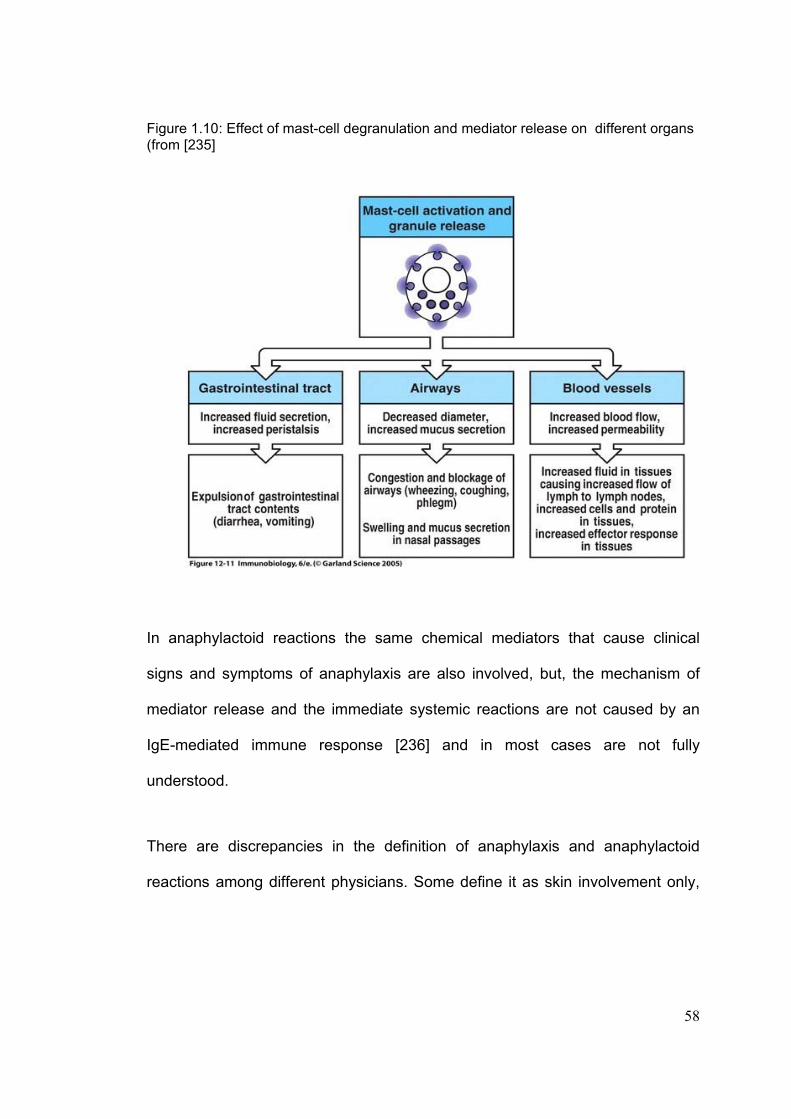
58
Figure 1.10: Effect of mast-cell degranulation and mediator release on different organs (from [235]
In anaphylactoid reactions the same chemical mediators that cause clinical
signs and symptoms of anaphylaxis are also involved, but, the mechanism of
mediator release and the immediate systemic reactions are not caused by an
IgE-mediated immune response [236] and in most cases are not fully
understood.
There are discrepancies in the definition of anaphylaxis and anaphylactoid
reactions among different physicians. Some define it as skin involvement only,
59
and others define a more severe adverse reaction involving cardiovascular,
respiratory and gastrointestinal features. It may be difficult in an individual
patient to be completely certain of the mechanisms involved, and whether
immunological or non-immunological processes are causative.
1-4-4-1: Adverse Reactions to NAC Since the introduction of the NAC treatment regimen for paracetamol overdose
in 1979, there have been reports of anaphylactoid adverse reactions. The first
adverse reaction to NAC was reported by Walton et al in 1979 [237]. The
reported frequency of such reactions, has varied from 3-9% [238-240] to 48.4%
[241] in different population of patients with paracetamol overdose who were
treated with NAC.
The full profile of adverse reactions reported includes rash, pruritus, flushing,
nausea and vomiting, coughing, dyspnoea, chest pain, bronchospasm,
wheezing, angioedema, hypotension, hypertension, tachycardia, ECG changes,
and fever [240;242;243]. Some patients seem to be more susceptible to adverse
reactions from IV NAC. It has been suggested that asthma is a risk factor for
NAC ADRs [244;245] and there has been a report of death in an asthmatic
patient [246]. Some studies report that plasma paracetamol concentration is
lower in patients with ADRs [239;241;245]. The high incidence of ADRs to IV
NAC (50%) in healthy volunteers not receiving paracetamol is further evidence

60
that paracetamol itself may have some protective effect against ADRs to NAC
[231].
The pathophysiological mechanisms involved in ADRs to NAC are not fully
understood. In a human study an intra dermal injection of NAC caused a wheal
and flare reaction. Some authors suggest that a non-allergic release of
histamine which was a direct, dose-dependent effect of NAC to which individuals
had variable susceptibility, was the potential mechanism of ADRs [247]. An in
vitro study has shown histamine release is induced by NAC [248]. Previous
studies on acute allergic reactions and anaphylactic shock in other situations
have shown an increase in plasma concentrations of mast cell products
(histamine and tryptase) [249-252], endothelial injury parameters (von
Willebrand factor [vWf]) and fibrinolytic parameters (tissue plasminogen activator
[tPA] [251]. Healthy volunteers given antidotal doses of NAC intravenously who
developed adverse reactions had elevated factor VIII and vWf within an hour of
starting IV infusion of the therapeutic dose of NAC (400 mg/kg, over 36h,
distributed as a 150 mg/kg bolus over 15 min, 50 mg/kg over 4h, and 200 mg/kg
over 32h). The authors suggested that NAC induces release of vWf from
endothelial cells in subjects who develop adverse effects [231].
Interleukin 6 (IL-6) is known to be secreted by mast cells and basophils and has
also been reported to contribute in allergic reactions [253]. As it has a longer
half-life (48h) than serum histamine and tryptase, it has been suggested that

61
IL-6 could have a place as a biomarker in the diagnosis of anaphylactoid
reactions [254]. IL-6 also stimulates C-reactive protein (CRP) production and the
two correlate with one another in various conditions [255;256] and in acute
allergic reactions [257]. Whether these response mechanisms apply in patients
with paracetamol overdose is unknown.
There is a need to better understand the risk factors for these reactions since
they result in temporary cessation of antidote therapy, cause patient distress,
and delay treatment and discharge. If the mechanisms were better understood,
effective treatment could potentially be used to prevent the reaction occurring.

62
1-5: Summary Paracetamol is the most common analgesic and antipyretic over the counter
drug and is well tolerated at therapeutic dose by adults and children. It also has
weak anti-inflammatory effect. The mechanism of action of paracetamol includes
inhibition of cyclo-oxygenase and prostaglandin synthesis; however, the precise
mechanism of action is still unclear. In overdose it causes toxicity and this is a
major public health problem in the UK. Forty percent of all overdose
presentation to the hospital involve paracetamol, and it is the main cause of
acute liver failure, resulting in several hundred liver unit admissions and
substantial deaths each year in the UK. The liver is the main target organ
affected in paracetamol overdose.
The kidney controls electrolyte and acid-base homeostasis, and maintains
the content of extracellular fluid. Nephrotoxicity may be caused by a wide
variety of drugs and substances which are readily available in routine life,
and the workplace. Nephrotoxic agents can cause different types of renal
failure according to the site of action. Acute tubular necrosis is the most
common type of acure renal failure caused by drugs.
Cyclo-oxygenase I and II are both expressed in the kidney and synthesise
prostaglandin in the kidney. Prostaglandins are essential for the
maintenance of renal perfusion. If there is reduction in actual, or effective,
circulating volume, they influence water and electrolyte homeostasis.

63
Some drugs including NSAIDs have inhibitory effects of cyclo-oxygenase
resulting in renal failure, in particular in patients with risk factors. Such an
acute renal impairment is mediated through inhibition of renal
prostaglandin synthesis, resulting in vasoconstriction and renal
hypoperfusion. The kidney is also involved in paracetamol toxicity, even in
the absence of liver injury. The mechanisms of nephrotoxicity are not fully
understood; however, a specific renal effect of paracetamol possibly due to
inhibitory effect on cylo-oxygenase and prostaglandin synthesis has been
suggested. Electrolytes abnormalities, in particular potassium
abnormalities may occur following renal dysfunction, including drug-
induced acute renal failure. Early diagnosis, recognition of associated risk
factors, prevention and follow up of different kidney diseases, in particular
drug-induced nephropathy, is an important issue in the practice of
medicine. Whether the toxic effects of paracetamol on the kidney are due
to similar mechanisms to NSAIDs remains unclear. The relationship
between renal and hepatic damage in paracetamol overdose is also
uncertain.
NAC is a treatment of choice in paracetamol poisoning. Some patients develop
adverse reactions following intravenous infusion of NAC. The mechanisms of
the reactions are not clear. A possibility of histamine related mechanism for the
adverse reactions has been suggested.

64
1-6: The focus of the thesis This thesis composes of studies in which different aspects of paracetamol
poisoning have been explored. The main focus of the first three studies is on
the nephrotoxic aspects of paracetamol overdose. Initially the effect of
paracetamol overdose on plasma electrolytes was examined, and then the
mechanisms involved in plasma electrolyte change were identified in a
prospective intensive study, based on data collected from timed blood and urine
collections at intervals after overdose. In the third study the frequency of renal
injury on patients with severe paracetamol overdose admitted to a liver unit was
assessed retrospectively, and risk factors for renal injury and poor outcome
assessed.
The last three studies focus on the treatment of paracetamol poisoning. In the
fourth study the frequency of liver failure in patients who had paracetamol
concentrations under the current “treatment line” and who, therefore were not
treated with NAC, was explored. In the fifth study the risk factors for adverse
reactions to IV NAC in a cohort of patients requiring therapy were examined.
Finally, a small intensive study investigating the mechanisms of adverse
reactions to NAC was conducted in patients with paracetamol overdose who
required antidote treatment.

65
Chapter II: Effect of Single Paracetamol Overdose on Renal
Function and Plasma and Urine Electrolytes

66
2-1: Introduction A number of mechanisms have been proposed to explain the analgesic and
antipyretic effects of paracetamol. Paracetamol can inhibit cyclo-oxygenase
(COX) but, in contrast to non-sterodial anti-inflammatory drugs (NSAIDs), does
not have anti-inflammatory effect due to lack of peripheral inhibition of
prostaglandin (PG) synthesis [258]. Selective inhibition of COX-III by
paracetamol, a variant of COX-I resulting in central inhibition of PG synthesis
was proposed by Chandrasekharan [11]. However, there is also some in vivo
evidence showing that, in addition to its CNS inhibitory effects on COX-III,
paracetamol can, in fact, inhibit COX-II systemically in a manner similar to the
selective COX-II inhibitors [8;10].
Renal PG production is mediated primarily by COX, and plays a major role in
compensatory renal hemodynamics. NSAIDs have a variety of effects on the
kidney. Severe adverse renal effects may be in part due to vasoconstriction,
consequent upon inhibition of renal PG-mediated vasodilatation. This
decreases renal blood flow, and results in a reduction in glomerular filtration
rate [259]. NSAID-induced acute renal failure depends on the drug, dose,
duration of pharmacologic effect, and the health of patient. Generally,
individuals who are well hydrated and have normal renal function are unlikely to
develop acute renal failure [260].

67
Paracetamol in overdose can cause renal failure. The actual mechanism of
paracetamol-induced nephrotoxicity in man is not fully understood. There is a
possibility that at high doses paracetamol-induced nephrotoxicity may be due to
local haemodynamic changes, perhaps through COX inhibitory effects in the
kidney similar to classical NSAIDs. It has previously been shown, in a study on
Wistar rats, that single doses of paracetamol caused a significant reduction in
glomerular filtration rate (GFR) and renal blood flow in a dose dependent
manner [194]. This altered tubular function, mainly in the distal tubules,
observed as a change in renal concentrating ability. The maximum changes
were observed at 16 h post-ingestion, and after 24 h renal function was
restored. The authors suggest that the early stage of paracetamol-induced
nephrotoxicity might be due to vasoconstriction. Other work has shown
phosphaturia after paracetamol overdose, possibly due to tubular effects of
paracetamol [198;199]. However, studies on therapeutic doses of paracetamol
have found no effect on plasma electrolytes in man [193;261].
It has previously been shown that in overdose NSAIDs, such as ibuprofen,
increase fractional excretion of potassium and cause sodium retention [262] an
effect that might to be due to renal vasoconstriction and consequent activation
of the renin-angiotensin-aldosterone system.
It was hypothesized that paracetamol in overdose might cause similar tubular
effects to NSAIDs via inhibition of PG synthesis, secondary vasoconstriction and

68
activation of renin-angiotensin-aldosterone system which would be identified by
change in electrolyte handling and urine electrolytes.
In this chapter two separate studies, retrospective and prospective, conducted
on patients with paracetamol overdose will be discussed. In the retrospective
study the effect of paracetamol overdose on plasma electrolytes and in the
prospective study its effect on plasma and urine electrolytes were investigated.
2-2: Retrospective study
2-2-1: Methods A retrospective cross-sectional study was conducted on patients, male and
female, age 16-60 year-old, presenting with single acute paracetamol overdose
within 6 hours (h) post-ingestion and admitted to the toxicology ward of Royal
Infirmary of Edinburgh from January 2002 to May 2006. Information regarding
name of tablets taken, time of ingestion, time of presentation to the hospital,
acetylcysteine (NAC) treatment, other treatment, change in blood pressure and
past medical history was collected from patient notes. Laboratory test results
(plasma paracetamol, plasma sodium [Na] and potassium [K] and plasma
creatinine [Cr]), time and date of sample collection were obtained from the
hospital laboratory computer system.
69
Case notes of patients presenting within 6 h of a stated ingestion of single
paracetamol were reviewed. Records of patients who had at least two blood
tests at 4-6 and 12-24 h post ingestion were extracted and examined to exclude
later presentations to the hospital (after 4-6 h post-ingestion), mixed overdose,
staggered overdose (taking tablet over period of longer than 2 h), pregnancy,
and chronic underlying diseases, including history of kidney disease, liver
disease, heart disease, hypertension and diabetes. Patients who had
co-ingested benzodiazepines and/or ethanol with paracetamol were included, as
these compounds are not thought to be nephrotoxic. Patients who were on
regular prescribed potentially nephrotoxic drugs according to the British National
Formulary [31] and cases with missing information, were excluded from the
study.
The biochemistry results of blood samples on admission (within 4-6 h post-
ingestion) and 12-24 h post-ingestion (plasma paracetamol, Cr, Na, K, and
bicarbonate [HCO3]) were extracted from the hospital computerised laboratory
results system. The relationships between plasma paracetamol concentration at
admission, “4 h”, and subsequent changes in plasma electrolytes seen during
the period of admission were examined.
Patients were divided into three subgroups according to the plasma
paracetamol at 4 h post-ingestion for illustrative purposes: group 1: patients with
plasma paracetamol <100 mg/l (low risk treatment threshold), group 2: patients

70
with plasma paracetamol 100-199 mg/l (high risk treatment threshold), and
group 3 with plasma paracetamol ≥200 mg/l (normal treatment threshold). In the
UK NAC is differentially given to patients with specified “risk factors” [31] in
addition to a high plasma paracetamol.
2-2-2: Statistical analysis SPSS version 11.5 was used for statistical analysis. The data was normally
distributed; and therefore parametric tests were used for statistical analysis.
Demographic data and two group comparisons were compared using unpaired
independent student t-test and Mann-Whitney U test as appropriate. Multiple
comparisons were made by one-way analysis of variance (ANOVA) with post-
hoc Bonferroni test and Kruskal-Wallis H test as appropriate. Correlation
between variables was made by Pearson correlation test. Data are reported as
mean ± standard error of the mean (sem).
2-2-3: Results 155 patients with paracetamol overdose met the inclusion criteria. 38% were
male (n=59) and 62% (n=96) female. The patients had mean age of 32.3 ± 2.6
years. There was a significant correlation (R2=0.10, p<0.0001, n=155, Figure
2.1) between admission plasma paracetamol (mg/l) and fall in plasma
potassium (mmol/l) between the admission and second blood sample. The
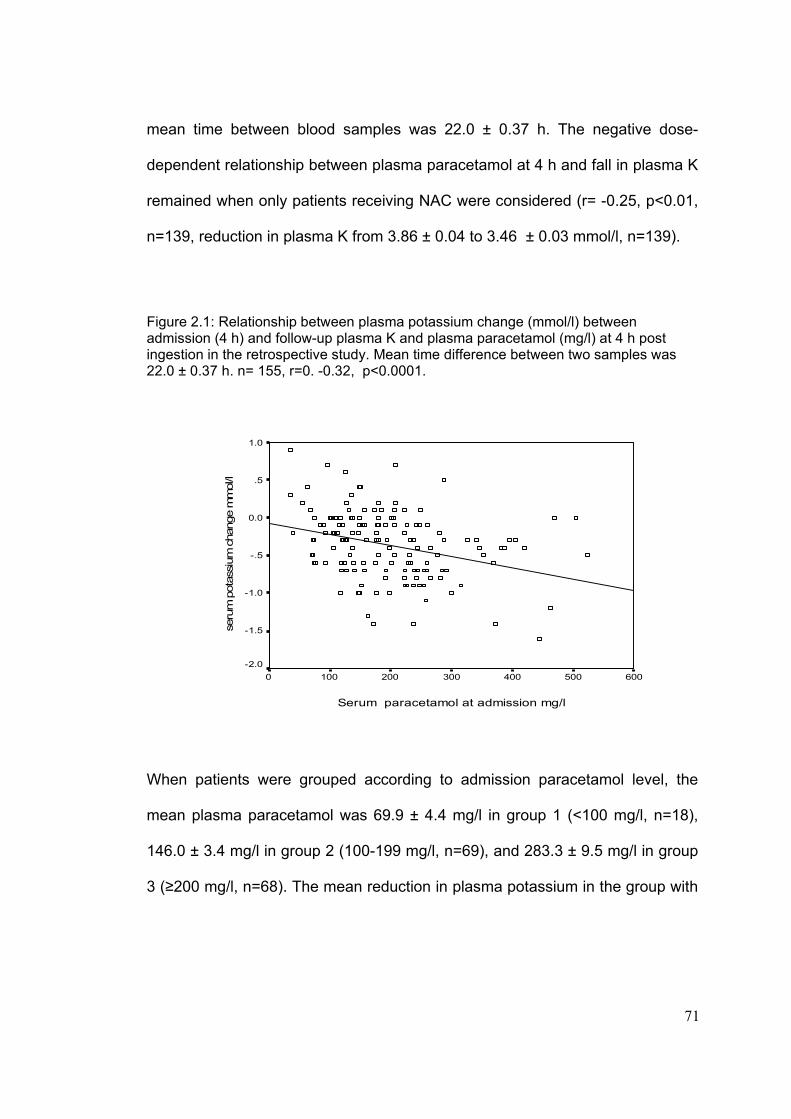
71
mean time between blood samples was 22.0 ± 0.37 h. The negative dose-
dependent relationship between plasma paracetamol at 4 h and fall in plasma K
remained when only patients receiving NAC were considered (r= -0.25, p<0.01,
n=139, reduction in plasma K from 3.86 ± 0.04 to 3.46 ± 0.03 mmol/l, n=139).
Figure 2.1: Relationship between plasma potassium change (mmol/l) between admission (4 h) and follow-up plasma K and plasma paracetamol (mg/l) at 4 h post ingestion in the retrospective study. Mean time difference between two samples was 22.0 ± 0.37 h. n= 155, r=0. -0.32, p<0.0001.
Serum paracetamol at admission mg/l
6005004003002001000
seru
m p
otas
sium
cha
nge
mm
ol/l
1.0
.5
0.0
-.5
-1.0
-1.5
-2.0
When patients were grouped according to admission paracetamol level, the
mean plasma paracetamol was 69.9 ± 4.4 mg/l in group 1 (<100 mg/l, n=18),
146.0 ± 3.4 mg/l in group 2 (100-199 mg/l, n=69), and 283.3 ± 9.5 mg/l in group
3 (≥200 mg/l, n=68). The mean reduction in plasma potassium in the group with

72
highest paracetamol concentration was -0.5 ± 0.05 mmol/l. There was a
significant difference in change in plasma potassium between groups with low
(-0.08 ± 0.10 mmol/l) and high (-0.50 ± 0.05 mmol/l), (p<0.01), and medium
(-0.31 ± 0.05 mmol/l) and high paracetamol concentration at admission,
(p<0.05) (Figure 2.2).
Figure 2.2: Change in plasma potassium (mmol/l) in the groups according to the plasma paracetamol concentration at 4h in the retrospective study. Data shown by risk category (plasma paracetamol <100 mg/l (low, 69.9 ± 4.4, n=18), 100-199 mg/l (medium, 146.0 ± 3.4, n=69), and ≥ 200 mg/l (high, 283.3 ± 9.5, n=68), in box and whisker format (Median, interquartile box). There was a significant difference in the change in plasma potassium between groups with low (-0.08 ± 0.10 mmol/l) and high (-0.50 ± 0.05 mmol/l), (p<0.01), and medium (-0.31 ± 0.05 mmol/l) and high paracetamol concentration at admission, (p<0.05) Circle shows outliers which are cases with values between 1.5 and 3 box lengths from the upper and lower edge of the box. The box length is the interquartile range.
>=200 mg/l 100-199 mg/l<100 mg/lgroups according to plasma paracetamol concentartion at 4h
1.00
0.50
0.00
-0.50
-1.00
-1.50
-2.00
Plas
ma
pota
ssiu
m c
hang
e m
mol
/l

73
If only patients receiving NAC were considered, the negative dose-dependent
relationship between plasma paracetamol at 4 h and plasma potassium change
remained (R2: 0.06, p<0.01, n=139, and plasma potassium fell from 3.86 ± 0.04
to 3.46 ± 0.03 mmo/l) (see table 2.1 for the number of patients treated with NAC
and plasma paracetamol concentrations in each group).
Table 2.1: Numbers of subjects in each group according to the plasma paracetamol level at 4 h and NAC treatment in the retrospective study. n=155.
n Plasma paracetamol (mg/l) Groups according to plasma paracetamol level
With NAC
Without NAC
With NAC Without NAC
Group 1 10 8 56.29 ± 8.29 78.00 ± 3.29 Group 2 61 8 145.59 ± 3.54 149.00 ± 11.60 Group 3 68 0 283.31 ± 9.46 -
Blood pressure did not change significantly in either paracetamol or control
group. Vomiting did not affect change in plasma K significantly (plasma K in the
group with vomiting: -0.38 ± 0.05 mmol/l, n=94, vs. group without vomiting: -0.34
± 0.06 mmol/l, n=61). There was neither correlation between plasma
paracetamol and changes in plasma HCO3 nor between change in plasma K
and plasma HCO3. There was also no correlation between changes in plasma
Na or plasma Cr with plasma paracetamol.

74
2-3: Prospective study
2-3-1: Method A prospective cohort study was conducted on patients, presenting with a single
paracetamol overdose and admitted to the toxicology ward of the Royal
Infirmary of Edinburgh from July 2004 to April 2006. Subjects who were
recruited to the prospective study were not included in the retrospective study.
Inclusion criteria were patients, male and female, aged 16y and over, with single
paracetamol overdose with or without alcohol co-ingestion, presenting to
hospital within 6 h post-ingestion. Exclusion criteria included later presentations
to hospital (>6 h post-ingestion); mixed overdose; staggered overdose;
pregnancy (relied on patient history and physical exam, not specifically verified
by pregnancy test); underlying chronic disease, including history of kidney
disease, liver disease, heart disease, hypertension and diabetes, patients who
were on regular prescribed potentially nephrotoxic drugs; patients who were not
conscious at admission, and those who had learning difficulty. Patients who
withdrew from the study or were not able to give blood and urine samples within
6 h and/or at least one blood and urine samples at either 12 h or 24 h post-
ingestion were also excluded. As a control group patients with single overdose
of fluoxetine or paroxetine according to the patient’s history were recruited as an
example of SSRI ingestion (selective serotonin reuptake inhibitors). Inclusion
and exclusion criteria for the control group were the same as paracetamol
group.

75
The study was approved by the local Ethics Committee, and informed consent
was obtained on admission (see appendix 2.1, 2.2, 2.3 and 2.4). Subjects were
interviewed at admission to hospital, and information regarding name of tablets
taken, alcohol ingestion, time of ingestion, time of presentation to the hospital,
vomiting, medical history and drug history was obtained (see appendix 2.5, 2.6
and 2.7).
At 4 to 6 h after ingestion, a paired blood sample (5ml) for measurement of
plasma paracetamol and salicylates, plasma Na, K, HCO3, Mg, PO4, Cr,
osmolality) and a urine sample (10ml, in universal container, for measurement
of urine Na, K, Mg, PO4, Cr, osmolality) were collected. When subjects were not
able to give a urine sample at the time of blood collection a urine sample was
taken within two h of blood collection. Further paired blood and urine samples
were taken at 12 h and at 24 h post ingestion. Blood and urine samples were
sent to the Biochemistry laboratory, Royal Infirmary of Edinburgh, within 30
minutes of collection for analysis. Not all patients complied fully with urine
collection protocols, and data reported relates to subjects completing a
particular study component, however, all subjects included in the analysis had
paired blood and urine samples taken within 6 h and at least another paired
blood and urine samples at either 12 h or 24 h post-ingestion.

76
Fractional excretion (Fe) in percent was calculated for Na, K, PO4 and Mg from
[urinary/plasma concentration of electrolyte] x [plasma/urinary concentration of
Cr]*100. Trans tubular potassium gradient (TTKG) was calculated from
[urinary/plasma K] x [plasma/urine osmolality]. Renal threshold of phosphate
concentration (TmP/GFR: the ratio of the maximum rate of renal tubular
phosphate reabsorption to the glomerular filtration rate [GFR]) was calculated
based on an established nomogram [103].
The relationships between plasma paracetamol at admission “4 h level” with
changes in plasma and urine electrolytes at 12 h and 24h post-ingestion were
examined. The predictive value of urinary electrolytes in early detection of
creatinine rise was also studied. We grouped patients into 3 subgroups
according to the plasma paracetamol at 4 h post-ingestion for illustrative
purposes: group 1: patients with plasma paracetamol less <100mg/l, group 2:
patients with plasma paracetamol 100-199 mg/l, and group 3 with plasma
paracetamol 200 mg/l and above.
Blood pressure and pulse rate was recorded at admission and at the time of
blood and urine collection. The observational chart documented routinely by
nursing staff was also reviewed to exclude haemodynamic compromise as a
cause of renal dysfunction. Systolic blood pressure less than 90 mmHg or
diastolic blood pressure less than 50 mmHg was considered as hypotension.

77
2-3-2: Laboratory techniques Plasma paracetamol was measured by an enzymic method using aryl acyl
amidase to produce p-aminophenol which reacts with tetrahyroquinoline and
was measured at 670 nm on a Vitros 250 analyser. Plasma and urine Na and K
were measured by indirect reading in selective electrolytes on Olympus AU
2700 analyser. Plasma and urine Mg were measured by complexing to Xylidyl
blue in a basic solution and measured at 520 nm on an Olympus AU 2700
analyser. Plasma and urine inorganic PO4 were measured by complexing to
molybdate and measured at 340 nm on an Olympus AU 2700 analyser. Plasma
HCO3 was measured by enzymic method: phosphoenolpyruvate carboxylase
linked to malate dehydrogenase was measured at 340 nm on an Olympus AU
2700 analyser. Plasma and urine osmolality were measured using freezing point
depression. Plasma and urine Cr were measured using kinetic colour test (Jaffe
method) on Olympus AU 2700 analyser (all laboratory tests were performed by
laboratory technicians in the Royal Infirmary of Edinburgh clinical laboratories).
2-3-3: Statistical analysis SPSS version 11.5 was used for statistical analysis. Data was tested for
normality. As data in each group was not normally distributed, non-parametric
tests were used for comparison analysis. Mann-Whitney U test was used for
two-group comparison. Multiple comparisons between groups were made using
Kruskal-Wallis H test. Correlation between variables was made using Pearson
78
and Spearman correlation test as appropriate. Data are reported as mean ±
standard error of the mean (sem).
2-3-4: Results 41 cases of paracetamol overdose, 16 male and 25 female, and 18 cases of
SSRI overdose (16 fluoxetine and 2 paroxetine), 7 male and 11 female,
completed the study. In both groups 39% were male and 61% female. There
was no significance difference in either group in respect of age and gender. In
the paracetamol group mean age was 30.0 ± 1.9 years and in the control SSRI
group 28.6 ± 2.6 years (Table 2.2). In the paracetamol group, a kaliuresis
occurred at 12 h. FeK and TTKG at 12 h post-ingestion were significantly
correlated with plasma paracetamol at admission (r=0.55, n=34, p<0.01 and
r=0.46, n=34, p<0.01, respectively).
FeK and TTKG at 12 h were significantly different between groups with low and
medium (p<0.01 and p<0.05, respectively), and between low and high plasma
paracetamol at admission (p<0.01 in both cases, Figures 2.3 and 2.4). This
change was no longer evident at 24 h.

79
Table 2.2: Demographic characteristics of subjects and study variables in paracetamol and SSRI groups. NS: not significant.
Variable
Groups number mean± sem Significance level
Paracetamol 25/16 Gender (F/M) SSRI
11/7 NS
Paracetamol 41 30.04 ± 1.89 Age (Y) SSRI
18 28.59 ± 2.63 NS
Paracetamol 37 -0.28 ± 0.05 Change in plasma K at 4-12 h (mmol/l)
SSRI
18 -0.07± 0.08 p<0.01
Paracetamol 31 -0.23± 0.09 Change in plasma K at 4-24 h (mmol/l)
SSRI
10 -0.05 ± 0.18 NS
Paracetamol 41 16.06 ± 1.46 FeK at 4 h (%) SSRI
18 8.74 ± 1.43
p<0.01
Paracetamol 34 16.47 ± 1.70 FeK at 12 h (%) SSRI
16 11.38 ± 1.80
p=0.05
Paracetamol 31 7.35 ± 1.2 FeK at 24 h (%) SSRI
9 7.20 ± 1.48
NS
Paracetamol 40 300.08 ± 3.55 Plasma osmolality at 4 h (mosmol/kg) SSRI
17 302.71± 3.91
NS
Paracetamol 37 290.24 ± 2.06 Plasma osmolality at 12 h (mosmol/kg) SSRI
18 294.83 ± 2.76
NS
Paracetamol 32 287.69 ± 1.29 Plasma osmolality at 24 h (mosmol/kg) SSRI
10 288.90 ± 1.62
NS
Paracetamol 41 600.12 ± 49.09 Urine osmolality at 4 h (mmol/kg) SSRI
18 581.11 ± 65.81
NS
Paracetamol 34 659.94 ± 48.55 Urine osmolality at 12 h (mmol/kg) SSRI 17 777.53 ± 68.99
NS
Paracetamol 31 462.26 ± 42.89 Urine osmolality at 24 h (mmol/kg) SSRI 9 905.22 ± 42.80
P<0.01
Paracetamol 32 -0.94 ± 1.35 Change in plasma creatinine at 12 h (µmol/l) SSRI
9 2.22 ±1.64
NS
Paracetamol 37 -1.68 ± 0.83 Change in plasma creatinine at 24 h (µmol/l) SSRI
18 1.39 ± 1.42
NS

80
Figure 2.3: Time course of FeK changes according to plasma paracetamol at 4 h in the prospective study. Data shown by risk category (plasma paracetamol <100 mg/l (low, 61.3 ± 6.5), 100-199 mg/l (medium, 141 ±. 5.4), and >=200 mg/l (high, 286.6 ± 30.0), in box and whisker format (Median, interquartile box). FeK at 12 h was significantly different between groups with low and medium (p<0.01) and low and high plasma paracetamol (p<0.01). Para: plasma paracetamol (mg/l). (Circle shows outliers which are cases with values between 1.5 and 3 box lengths from the upper and lower edge of the box. The box length is the interquartile range. Asterisk shows extremes which are cases with values more than 3 box length from the upper and lower edge of the box.)
467 171418 101416N =
Groups according to hour post-ingestion
24 hours12 hours4 hours
FeK
( %
)
60
50
40
30
20
10
0
-10
N=number of subjects
para <100mg/l
para 100-199 mg/l
para >=200mg/l
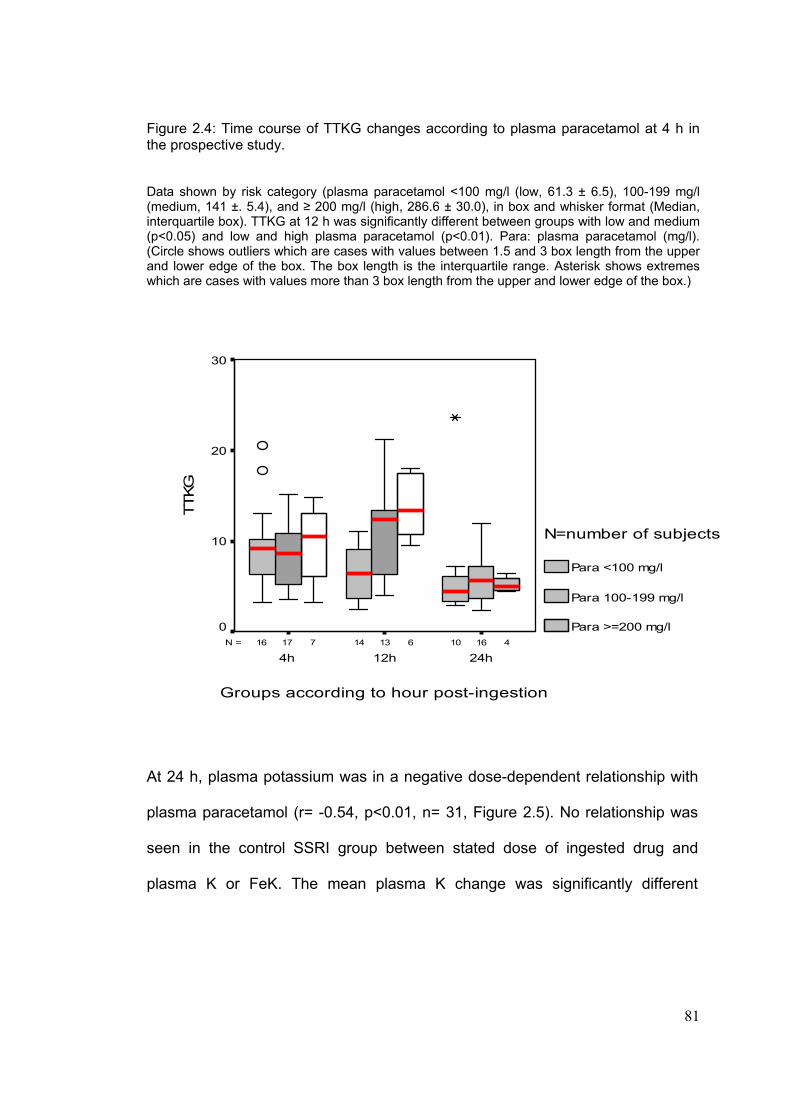
81
Figure 2.4: Time course of TTKG changes according to plasma paracetamol at 4 h in the prospective study. Data shown by risk category (plasma paracetamol <100 mg/l (low, 61.3 ± 6.5), 100-199 mg/l (medium, 141 ±. 5.4), and ≥ 200 mg/l (high, 286.6 ± 30.0), in box and whisker format (Median, interquartile box). TTKG at 12 h was significantly different between groups with low and medium (p<0.05) and low and high plasma paracetamol (p<0.01). Para: plasma paracetamol (mg/l). (Circle shows outliers which are cases with values between 1.5 and 3 box length from the upper and lower edge of the box. The box length is the interquartile range. Asterisk shows extremes which are cases with values more than 3 box length from the upper and lower edge of the box.)
467 161317 101416N =
Groups according to hour post-ingestion
24h12h4h
TTKG
30
20
10
0
N=number of subjects
Para <100 mg/l
Para 100-199 mg/l
Para >=200 mg/l
At 24 h, plasma potassium was in a negative dose-dependent relationship with
plasma paracetamol (r= -0.54, p<0.01, n= 31, Figure 2.5). No relationship was
seen in the control SSRI group between stated dose of ingested drug and
plasma K or FeK. The mean plasma K change was significantly different
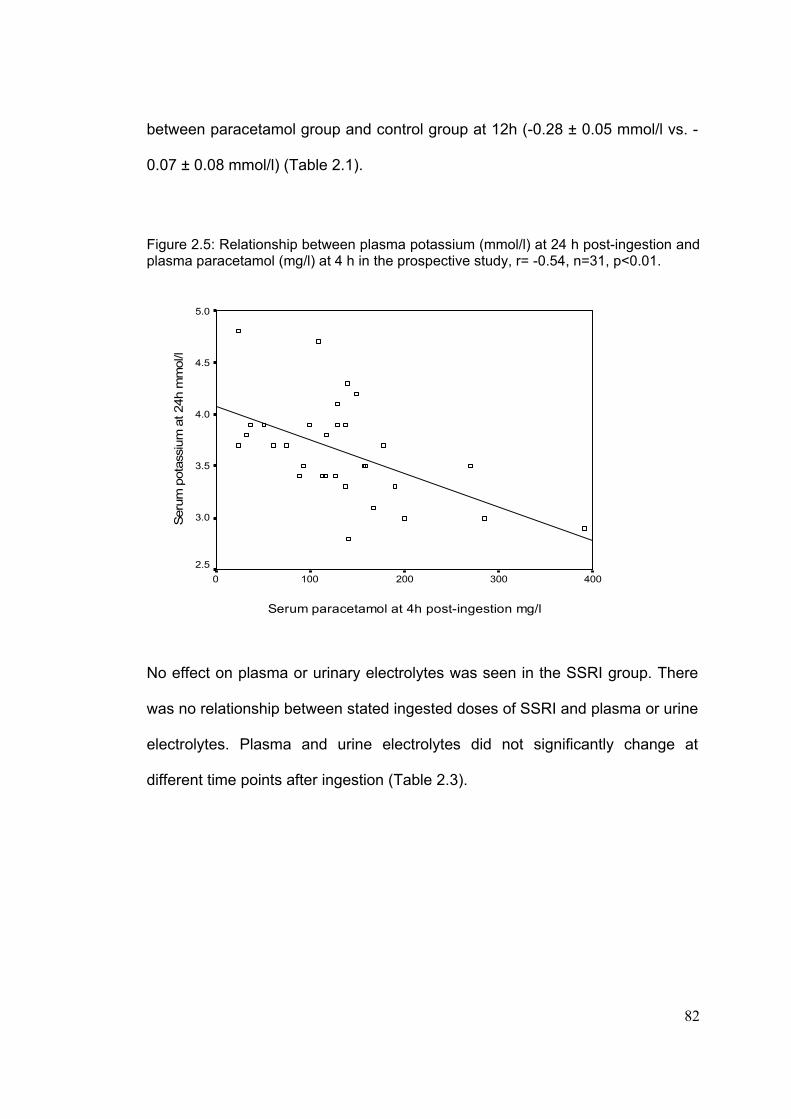
82
between paracetamol group and control group at 12h (-0.28 ± 0.05 mmol/l vs. -
0.07 ± 0.08 mmol/l) (Table 2.1).
Figure 2.5: Relationship between plasma potassium (mmol/l) at 24 h post-ingestion and plasma paracetamol (mg/l) at 4 h in the prospective study, r= -0.54, n=31, p<0.01.
Serum paracetamol at 4h post-ingestion mg/l
4003002001000
Seru
m p
otas
sium
at 2
4h m
mol
/l
5.0
4.5
4.0
3.5
3.0
2.5
No effect on plasma or urinary electrolytes was seen in the SSRI group. There
was no relationship between stated ingested doses of SSRI and plasma or urine
electrolytes. Plasma and urine electrolytes did not significantly change at
different time points after ingestion (Table 2.3).

83
Table 2.3: Fraction excretion of electrolytes (Na, Mg, PO4) at different time points after ingestion in the control group (SSRI). Nonparametric test (Kruskal- Wallis), (NS: not significant). N=number
4 h
12 h
24 h
Sig.
Variables
Mean±sem n Mean±sem n Mean±sem n
FeK (%) 8.78±1.43 18 11.38±1.8 16 7.18±1.48 9 NS
Plasma K (mmol/l) 4.00±0.07 18 3.93±0.06 18 3.94±0.11 10 NS
FeNa (%) 0.57±0.08 18 0.46±0.06 17 0.41±0.07 9 NS
Plasma Na (mmol/l) 140.28±0.44 18 140.72±0.39 18 139.5±0.82 10 NS
FeMg (%) 3.09±0.37 18 1.89±0.24 17 2.7±0.47 9 p<0.05
Plasma Mg (mmol/l) 0.84±0.02 18 0.83±0.02 18 0.87±0.02 10 NS
FePO4 (%) 9.38±2.20 18 18.78±2.10 15 14.22±3.23 9 NS
Plasma PO4 (mmol/l) 1.09±0.05 18 1.17±0.04 16 0.91±0.12 10 NS
There was consequently a significant difference between paracetamol and SSRI
group in FeK at 4 h and plasma K change at 12h (p<0.01). The difference in
FeK at 12 h between 2 groups was in borderline significance difference
(p=0.05). The difference in FeK and plasma K change had disappeared by 24 h
(Table 2.1).
In both groups (paracetamol and SSRI) the ratio of urinary osmolality to plasma
osmolality (U/P) was high at 4 h (U/P osmolality at 4 h: 2 in paracetamol group
and 1.9 in SSRI group) and 12 h (U/P osmolality at 12 h: 2.2 in paracetamol

84
group and 2.6 at SSRI group), but, there was no significant difference between
groups. In the paracetamol group U/P osmolality was restored after 24 h (U/P
osmolality at 24 h: 2); however, this continued increasing in the SSRI group
(U/P osmolality at 24 h: 3.1) and that was significantly higher than that of
paracetamol group (p<0.0001) (Table 2.2). There was no significant difference
in plasma and urinary excretion of K and PO4 at 4 h, 12 h and 24 h in the
paracetamol group with (n=31) and without (n=10) co-ingestion of alcohol.
Plasma paracetamol was in a negative dose dependent correlation with plasma
PO4 (mmol/l) (r=-0.44, n=39, p<0.01) and renal threshold phosphate
concentration (TmP/GFR, mmol/ll) (r=0-0.33, n=38, p<0.05) at 4 h (Figure 2.6).
Plasma PO4 decreased at 12 h and 24 h but FePO4 increased at 12 h and
consequently decreased at 24 h (Table 2.4). In SSRI group plasma PO4 and
FePO4 did not change significantly at 12 h and 24 h (Table 2.3).
Plasma and urinary Mg did not change in the paracetamol group (Table 2.4),
however, in the SSRI group there was a reduction in FeMg at 12 h. FeNa
reduced in paracetamol group without any significant change in plasma Na. No
effect on plasma Na or FeNa was seen in the SSRI group (Table 2.3).

85
Table 2.4: Plasma concentrations and fractional excretion of electrolytes (K, Na, Mg, PO4) at different time points after ingestion of paracetamol. NS: not significant, n=number.
4 h 12 h 24 h Variables Mean ±sem n Mean ±sem n Mean ±sem n
Sig. level
FeK (%) 16.07±1.47 41 16.47±1.70 34 7.36±1.20 31 P<0.01 Plasma K (mmol/l) 3.90±0.05 41 3.62±0.06 37 3.65±0.09 31 P<0.01 FeNa (%) 0.64±0.07 41 0.56±0.05 34 0.40±0.05 31 P<0.05 Plasma Na (mmol/l) 139.02±0.4 41 138.89±0.48 37 138.81±0.54 31 NS FeMg (%) 2.36±0.26 40 2.15±0.24 32 2.52±0.26 9 NS Plasma Mg (mmol/l) 0.81±0.02 40 0.74±0.05 35 0.84±0.02 30 NS FePO4 (%) 15.28±1.8 38 19.12±1.17 30 12.51±1.51 29 P<0.05 Plasma PO4 (mmol/l) 1.18±0.04 39 1.15±1.0.46 36 0.90±0.40 32 P<0.01
Figure 2.6: Relationship between renal threshold phosphate concentration (TmP/GFR) (mmol/l) and plasma paracetamol at 4 h in the prospective study, n= 38, r= -0.33, p<0.05
paracetamol at 4h post-ingestion mg/l
5004003002001000
TmP/
GFR
at 4
h m
mol
/l
1.8
1.6
1.4
1.2
1.0
.8
.6
.4
86
Vomiting did not affect plasma potassium significantly. Additionally, there was
no correlation between changes in plasma HCO3 and in plasma K, or between
plasma HCO3 and plasma paracetamol. There was no change in plasma Cr.
Only 3 cases in the paracetamol group developed features of liver injury (rise in
ALT) at 24 h. Plasma Cr in these three cases was in the normal range. Blood
pressure did not change significantly in either paracetamol or control groups.
2-4: Discussion Understanding the processes by which paracetamol affects the kidney in
overdose is key to any prediction of renal toxicity, and evaluation of potential
antidotal therapy. Identification of patients at risk of renal failure would enable
them to be targeted for special monitoring and intervention. Most cases of
paracetamol intoxication seen in the UK are discharged within a 24 h time
frame, during which hepatic toxicity can be predicted, and appropriate treatment
continued, or commenced. This is not the case in renal toxicity, which develops
later. The true extent of renal toxicity is unknown, since only the most severe
forms re-present as acute renal failure. According to the clinical experience of
patients presenting to the Toxicology unit of Royal Infirmary of Edinburgh one or
two out of 1000 cases with paracetamol overdose may develop renal failure
without significant liver involvement (rise in ALT).
87
The main finding of the retrospective study was the dose-dependent relationship
between 4 h plasma paracetamol and fall in plasma K. The prospective study
also demonstrated a relationship between 4 h plasma paracetamol and 24 h
plasma K and additionally showed an increase in FeK and TTKG at 12 h post-
ingestion, again in dose-dependent relationship with plasma paracetamol that
had normalised by 24 h. These changes in K were not seen in the SSRI control
group. Because no patients studied developed a significant rise in Cr, it is not
possible to state these findings are relevant to the development of
nephrotoxicity. However, the results of the retrospective and prospective studies
were consistent with the results of a previous pilot study on ibuprofen overdose,
a classical NSAID. This also showed a dose-dependent relationship between
dose of ibuprofen ingested and FeK [262].
The most common causes of hypokalemia from renal K loss are due to either
medication, endogenous hormone production or in rare cases, intrinsic renal
defects [94]. The dose-dependent relationship between plasma paracetamol
and FeK at 12 h post-ingestion implicates renal loss of K to explain the
hypokalaemia observed in paracetamol overdose. However, there were some
confounding factors which might affect change in plasma K.
Firstly hydration may have had an effect as the group of patients with high
paracetamol received NAC in 5% plasma dextrose (total volume of 1700 ml).
However, there was no significant change in plasma Na relating to NAC

88
treatment in either study, or change in plasma osmolality in the prospective
study, indicating that it is very unlikely that hypokalemia was a result of dilution.
Secondly, since only cases with a particular risk or high plasma paracetamol
received NAC infused in 5% dextrose, this may have altered plasma K levels
through endogenous insulin production induced by the 5% dextrose, resulting in
movement of K into the intra-cellular compartment. NAC might also have
affected tubular K handling directly. To determine the effect of NAC and 5%
dextrose on plasma K and FeK, the ideal would be to compare these
measurements in two groups with the same plasma paracetamol who did and
did not receive NAC treatment. However, due to unequal distribution of subjects
in each group, it was not possible to define such groups for comparison (Table
2.4). To address this, in the retrospective study the relationship between plasma
paracetamol at 4 h and plasma K change over 20 h in the NAC treated group
alone was examined. The significant relationship seen in all subjects persisted
in this subset. While this does not rule out an effect of NAC, it does suggest that
plasma paracetamol itself is a factor in plasma K change. Further studies
investigating the actual effect of NAC in 5% dextrose on renal function and
electrolyte handling and plasma K in healthy volunteers are required to define
this further.
Thirdly, vomiting is known to cause hypokalemia as a consequence of metabolic
alkalosis. However, in neither retrospective nor prospective studies could an

89
effect of vomiting be found. In addition, change in plasma K and FeK did not
show association with change in plasma HCO3, which would be expected if
vomiting changed K by causing alkalosis.
As a small number of patients had ingested alcohol before or with drug (n=10) in
the prospective study, there might be a potential effect of alcohol. An
experimental study on rats investigating the acute effect of ethanol on renal
electrolyte transport showed diuresis, an increase in FeNa and no change in
FeK within an hour after acute ingestion of ethanol [263]. Another animal
experiment studying the acute effect of ethanol on renal hemodynamics and
monovalent ion excretion over a longer period showed an increase in excretion
of sodium at 2 h, 10 h, 18 h and 26 h post-ingestion and a biphasic change in
potassium excretion [264] while potassium excretion decreased at 2 h and
started increasing at 10 h, 18 h and 26 h. The maximal change was seen at 18
h. In the current study, plasma alcohol was not measured, however, changes in
plasma and urine electrolytes in the groups with and without alcohol ingestion
was compared. The results of the current study did not show a significant
difference in plasma Na, K, Mg, PO4, FeNa, FeK, FeMg and FePO4 between
these groups, suggesting that alcohol is unlikely to be a major contributor to the
changes in plasma and urine electrolytes observed. A further study in a larger
group of subjects with measurement of plasma alcohol could give a better
understanding of dose and time dependent effect of alcohol on electrolyte
handling in paracetamol overdose.

90
Finally, paracetamol in aqueous solution has a pH of 6.24 [261]. While the
buffering capacity of plasma is large, it is possible that a high plasma
paracetamol is associated with a mild acidosis that resolves as the paracetamol
falls. This would result in K shifts between the plasma and the intracellular
compartment. However, there was no correlation between plasma HCO3 and
paracetamol. Additionally, acidosis would be associated with plasma K egress
from the intracellular compartment, increasing plasma K, the converse of the
result observed in this study.
In a study on Wistar rats [194], the effect of different single doses of
paracetamol on renal function and electrolytes handling was examined. GFR
and renal plasma flow significantly decreased in a dose-dependent manner.
Time course of changes in electrolyte excretion in the group given toxic dose of
paracetamol (1000 mg/kg) showed an increase in FeK and no change in FeNa
at 1 h, 6 h, and 16 h. The maximal change in FeK and renal perfusion was at
16 h post-ingestion and was restored at 24 h. The authors suggested that early
stages of paracetamol nephrotoxicity are due to renal haemodynamic changes.
In the current study, renal blood flow was not measured, nor did plasma Cr
change significantly, though this is a relatively insensitive marker of small
changes in GFR. The major changes seen in this study were in K with the
maximum derangement in FeK occurring after 12 h and restored after 24 h
which was consistent with the results of animal study.
91
Aldosterone is the most important hormone regulating total body K homeostasis,
causing hypokalemia by stimulating K uptake into cells and increasing renal K
excretion [94]. Aldosterone secretion is increased by renal hypoperfusion via
activation of the renin-angiotensin-aldosterone axis. The results of the current
study could therefore be consistent with the early effects of paracetamol toxicity
being due to renal haemodynamic change consequent upon activation of the
renin-angiotensin-aldosterone axis, seen here as increasing K excretion and Na
retention.
In the SSRI group an increase in urine osmolality at 4 h, 12 h and 24 h supports
the results of previous studies [265-267], in which hyponatremia secondary to
SSRI-induced syndrome of inappropriate anti diuretic hormone secretion
(SIADH) occurred. In this study plasma Na and FeNa did not change
significantly in SSRI overdose.
The other result of the study was a reduction in plasma PO4 at 12 and 24 h and
also a negative dose-dependent relationship between plasma paracetamol and
plasma PO4, and renal threshold phosphate concentration (TmP/GFR) at 4 h
post-ingestion. This finding was consistent with the results of other studies
investigating renal loss as a source of hypophosphataemia after paracetamol
poisoning [198;199]. Hypophosphataemia due to a decrease in renal threshold
phosphate concentration in the early stage of toxicity has been suggested as an
early marker in determining the severity of paracetamol toxicity.
92
Because no patients developed significant renal dysfunction the utility of urinary
excretion of electrolytes in predicting specific renal toxicity could not be
assessed and studies in patients with this outcome are required.
2-5: Summary In conclusion paracetamol overdose is associated with a kaliuresis, and a
reduction in plasma K which is related to the dose ingested and is of relatively
short duration, not longer than 24 h post-ingestion in this study. This suggests a
specific renal effect of paracetamol in overdose. These findings might be
consistent with increasing aldosterone action on the distal tubules as a fall in
renal perfusion due to paracetamol-induced renal vasoconstriction consequent
upon cyclo-oxygenase inhibition, (and hence reduced production of vasodilator
prostaglandins) activates the renin-angiotensin-aldosterone system.
Measurement of aldosterone and plasma rennin activity (PRA) in the future
studies may give us a better understanding of renal effects of paracetamol
overdose. None of cases developed significant renal impairment. It is therefore
uncertain whether these effects are directly related to the renal failure seen
occasionally in paracetamol overdose.

93
2-6: Limitation of the study Due to the nature of the retrospective study, it was not possible to obtain precise
information from patients, and the information recorded in the patient notes was
used. As the study required having two sets of biochemistry tests in order to
investigate the changes in plasma electrolytes, only those cases that had at
least two sets of data were included. This means that the subjects were not
necessarily representative of the whole population, particularly at lower doses of
paracetamol.
In the prospective study due to nature of the subjects not all cases were able to
comply with all blood and urine collections. As routine drug screening for drugs
of abuse would not have detected non-steroidal presence and since the
complete screen of this nature would be extremely expensive, a full drug screen
to rule out co-ingestion of other drugs in the paracetamol group was not
performed. Cases of mixed overdose were excluded by patient interview,
however, it would have been more likely that co-ingestion to confound and
reduce the power of the data and statistical analysis rather than increase it
giving us the positive result observed. The precise effect of 5% dextrose and
NAC itself was not clear, but the intention was not primarily to examine this. The
effects of paracetamol seen appear independent of NAC administration.
94
Chapter III: Frequency of Renal Injury in Significant
Paracetamol Poisoning and the Impact of Severity of
Renal Dysfunction on Outcome

95
3-1:Introduction
Paracetamol poisoning is responsible for around 200 deaths annually in the
United Kingdom alone [43;51;268;269]. High doses of paracetamol are capable
of causing hepatic necrosis and renal tubular necrosis [18;81;85;164]. Renal
failure is less common than liver failure after paracetamol overdose, and has
been reported in about 1% of all patients and reaches 8.9-10% in severe
poisoning [18;91;270]. The occurrence of renal failure is greater in severely
poisoned patients, and is often observed in those that develop significant liver
injury [81;271]. Nonetheless, the occurrence of renal failure cannot be attributed
solely to co-existent hepatic damage, and has been reported as an isolated
manifestation of paracetamol toxicity [87;89;183].
Renal injury, as evaluated by plasma creatinine (Cr) concentrations, may be
used to indicate the severity of paracetamol poisoning, and concentrations
greater than 300 µmol/l are part of the King’s College (KCH) Criteria (arterial pH
< 7.3 or all three of an international normalised ratio [INR] of greater than 6.5,
plasma Cr > 300 µmol/l and the presence of encephalopathy of grade III or IV
for liver transplantation) [54;227]. Despite this, comparatively little is known
about the prognostic value of plasma Cr concentrations in patients referred to
liver units after severe poisoning.
96
The present study was designed to examine the frequency of renal injury in
patients with severe paracetamol poisoning. The aim was to identify the possible
impact of renal impairment on clinical outcomes in this high-risk patient group,
and risk factors associated with the development of renal failure in this selected
group. Additionally, the effects of significant paracetamol overdose on plasma
electrolytes in patients who developed hepatic damage was also investigated.
The specific questions asked were:
1. What is the frequency of renal insufficiency in severe paracetamol overdose?
2. Is the timing of onset of renal dysfunction different from liver dysfunction?
3. What is the effect of delay at first presentation on outcome?
4. What are the associated risk factors in developing kidney dysfunction in
paracetamol overdose?
5. What is the impact of Cr at first admission on outcome?
6. What is the effect of paracetamol overdose on serum electrolytes in this
selected population?
3-2: Methods
3-2-1: Data Collection The Scottish Liver Transplant Unit (SLTU) is a tertiary referral centre for
Scotland and part of Northern Ireland, and provides clinical management of

97
patients with severe liver disease and patients that require liver transplantation.
Patients were identified from a database held within the SLTU that contains
clinical and laboratory variables and outcome data for patients referred to the
Unit. Patients referred to the SLTU between 1992 and 2004 inclusive due to
severe paracetamol-induced liver damage were included. Available data at the
time of initial referral to SLTU included age, gender, other medication ingested,
stated dose ingested, associated alcohol, unit of ingested alcohol, interval
between ingestion and presentation to hospital, plasma paracetamol
concentration, the presence of hypotension (systolic blood pressure <100
mmHg), plasma Cr, alanine transaminase (ALT) activity, gamma glutamyl
transpeptidase (GGT) activity, prothrombin time (PT), plasma sodium (Na),
potassium (K), bicarbonate (HCO3) and pH at time of admission to referring
hospital and to SLTU. Additional data were worst recorded PT, and outcome
data: liver transplant, haemodialysis, intensive care unit (ITU) admission and
death. Admission to ITU was determined by necessity for ventilation. Patients
with poor prognosis were identified according to the KCH Criteria.
3-2-2: Data Analyses Ingestion of paracetamol at a single time-point or within a two-hour period was
considered as an acute ingestion, whereas ingestion at multiple time-points
during an interval of more than two hours was considered a staggered overdose.

98
Two time points were recorded in patients with acute ingestion of paracetamol.
Time from ingestion to first blood taken in referring hospital was considered as
interval between ingestion and first admission (or delay at first admission) and
time point from ingestion to first blood taken in SLTU was considered as interval
between ingestion and admission to SLTU (or delay at admission to SLTU).
Patients were categorised into four groups according to interval between
overdose and first presentation to referring hospital: ≤12h, >12h to 24 h, >24h to
48 h, and >48 h. For some analyses this interval was classified into three
groups: ≤24h, >24-48h and ≥48h.
Renal function was classified into four groups according to plasma Cr
concentration: normal: if Cr<120 µmol/l; mild impairment: if Cr>120≤180 µmol/l;
moderate impairment: if Cr>180 and <300 µmol/l; and severe impairment: if
Cr≥300 µmol/l. The effect of different risk factors was examined in these groups.
Liver dysfunction was defined as PT≥25 (s). Worst PT was defined as worst
recorded PT over hospital stay either in referring hospital or in the SLTU.
In the previous studies reported in this thesis (chapter II) the effect of acute
paracetamol overdose on electrolytes was investigated. In the current data, the
effects of acute severe paracetamol overdose on plasma electrolytes, sodium
(Na) and potassium (K), in the subset of patients with acute paracetamol
overdose (n=361) presenting at different times after ingestion was examined. In

99
this analysis patients were categorised in three groups according to the time
between ingestion and first presentation to the hospital (or the time of first blood
taken in referring hospital): group 1: ≤12h; group 2: >12h to 24h; and group 3:
≥24h. In this subset, the relationships between plasma K, paracetamol, Cr and
PT at first admission to hospital were also examined.
3-3: Statistical analyses Data was tested for normality. The data are presented as mean ± standard error
of the mean (sem), median and inter quartile range (IQR), and proportions
where appropriate. Between-group comparisons were made using Student’s t
test for independent samples for continuous data, and Pearson’s Chi square
tests for categorical data. Multiple comparisons analysis for continuous data was
made by one-way analysis of variance (ANOVA) with Post-Hoc Bonferroni for
parametric data and Kruskal-Wallis test for non-parametric data. Receiver
operator characteristics (ROC) were used to examine the relationship between
Cr concentration at the time of admission to referring hospital and end-point of
prognosis defined by KCH criteria (when mortality was also used as the end-
point, the same result was obtained).
To determine risk factors of renal dysfunction initially univariate analysis was
performed. In the second step multiple regression analysis was applied,
however, the model automatically excluded patient with “staggered overdose”

100
because time between ingestion and admission was unknown in this group. As
this group was found to be an important risk factor in the univariate analysis, use
of multiple regression was thought likely to be unreliable. The results from the
univariate analysis are therefore presented.
3-4: Results
3-4-1: Demographic characteristic Data was available for 522 patients (49.2% men and 50.8% women) with mean
age of 36 ± 1 y. In younger patients (<20 y) overdose was more common
among women, but in older patients (>40 y) overdose was more frequent in men
(Figure and Table 3.1) (see appendix 3.1 for raw data).

101
Figure 3.1: Distribution of patients with overdose according to sex and age bands.
AGES BANDS sex Total
male female 11-20 YEARS 11 28 39 21-30 YEARS 81 95 176
31-40 YEARS 68 69 137
41-50 YEARS 59 53 112
51-60 YEARS 26 10 36
61 AND OLDER 12 10 22 Total 257 265 522
61 AND OLDER
51-60 YEARS
41-50 YEARS
31-40 YEARS
21-30 YEARS
11-20 YEARS
Age bands
100
80
60
40
20
0
Numb
er of
men a
nd w
omen
with
overd
ose
femalemalesex

102
Table 3.1: Demographic characteristic of subjects with paracetamol overdose (n=522) with suspected liver damage referred to SLTU at admission to the referring hospital.
• Total n (%) 522 (100%) • Gender
Male 257 (49.2%) Female 265 (50.8%)
• Age y (mean ±sem) 35.6 ± 0.6 Male 37.2 ± 0.8 Female 34.1 ± 0.8
• NAC treatment Yes n (valid %) 431 (84.5%) NO n (valid %) 79 (15.5%) Missing data n 5
• Staggered overdose Yes n (valid %) 128 (26.6%) NO n (valid %) 354 (73.4%) Missing data 40
• KCH poor prognosis Yes n (%) 145 (27.8%) NO n (%) 377 (72.2%)
• Dialysis requirement Yes n (valid %) 177 (34.2%) NO n (valid%) 341 65.8%) Missisng data n 4
• Mortality Died without transplant n (%) 134 (25.7%) Died with transplant n (%) 13 (2.5%) Survived without transplant n (%) 347 (66.5%) Survived with transplant 28 (5.4%)
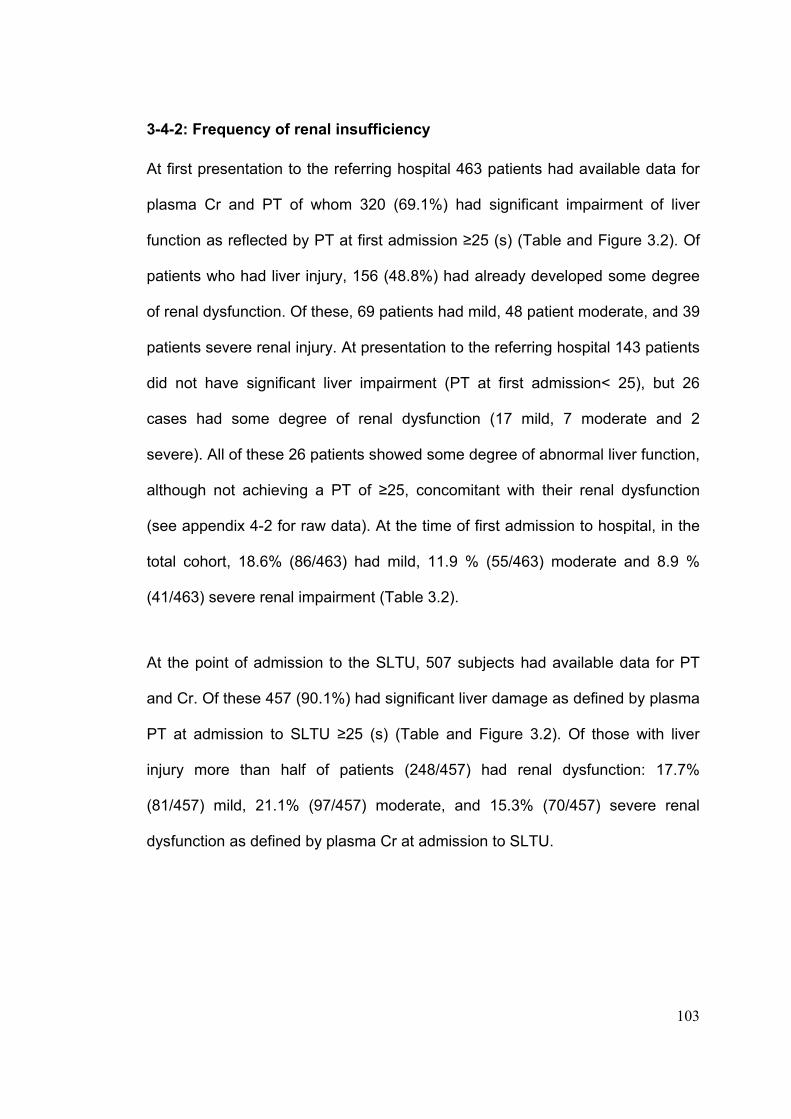
103
3-4-2: Frequency of renal insufficiency At first presentation to the referring hospital 463 patients had available data for
plasma Cr and PT of whom 320 (69.1%) had significant impairment of liver
function as reflected by PT at first admission ≥25 (s) (Table and Figure 3.2). Of
patients who had liver injury, 156 (48.8%) had already developed some degree
of renal dysfunction. Of these, 69 patients had mild, 48 patient moderate, and 39
patients severe renal injury. At presentation to the referring hospital 143 patients
did not have significant liver impairment (PT at first admission< 25), but 26
cases had some degree of renal dysfunction (17 mild, 7 moderate and 2
severe). All of these 26 patients showed some degree of abnormal liver function,
although not achieving a PT of ≥25, concomitant with their renal dysfunction
(see appendix 4-2 for raw data). At the time of first admission to hospital, in the
total cohort, 18.6% (86/463) had mild, 11.9 % (55/463) moderate and 8.9 %
(41/463) severe renal impairment (Table 3.2).
At the point of admission to the SLTU, 507 subjects had available data for PT
and Cr. Of these 457 (90.1%) had significant liver damage as defined by plasma
PT at admission to SLTU ≥25 (s) (Table and Figure 3.2). Of those with liver
injury more than half of patients (248/457) had renal dysfunction: 17.7%
(81/457) mild, 21.1% (97/457) moderate, and 15.3% (70/457) severe renal
dysfunction as defined by plasma Cr at admission to SLTU.
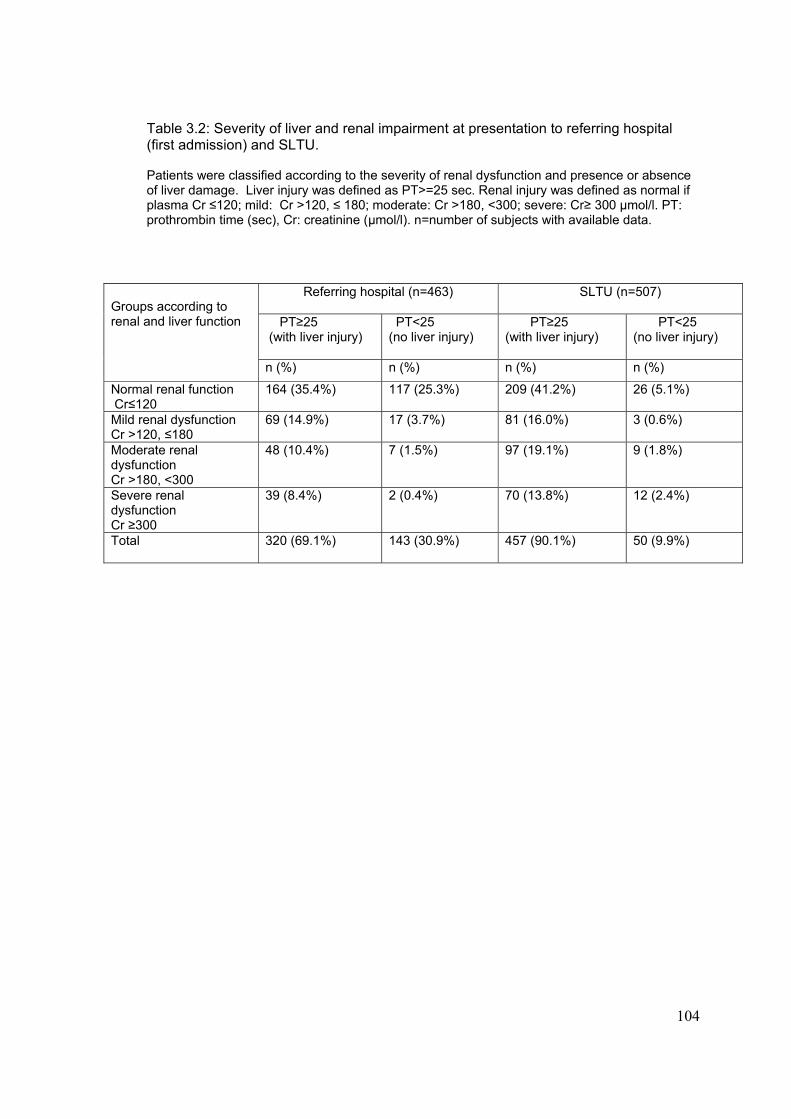
104
Table 3.2: Severity of liver and renal impairment at presentation to referring hospital (first admission) and SLTU. Patients were classified according to the severity of renal dysfunction and presence or absence of liver damage. Liver injury was defined as PT>=25 sec. Renal injury was defined as normal if plasma Cr ≤120; mild: Cr >120, ≤ 180; moderate: Cr >180, <300; severe: Cr≥ 300 µmol/l. PT: prothrombin time (sec), Cr: creatinine (µmol/l). n=number of subjects with available data.
Referring hospital (n=463)
SLTU (n=507)
PT≥25 (with liver injury)
PT<25 (no liver injury)
PT≥25 (with liver injury)
PT<25 (no liver injury)
Groups according to renal and liver function
n (%) n (%) n (%) n (%)
Normal renal function Cr≤120
164 (35.4%)
117 (25.3%) 209 (41.2%) 26 (5.1%)
Mild renal dysfunction Cr >120, ≤180
69 (14.9%) 17 (3.7%) 81 (16.0%) 3 (0.6%)
Moderate renal dysfunction Cr >180, <300
48 (10.4%) 7 (1.5%) 97 (19.1%) 9 (1.8%)
Severe renal dysfunction Cr ≥300
39 (8.4%) 2 (0.4%) 70 (13.8%) 12 (2.4%)
Total 320 (69.1%)
143 (30.9%) 457 (90.1%) 50 (9.9%)

105
Figure 3.2: Severity of liver and renal impairment at presentation to referring hospital (first admission) and SLTU.
PT<25 (sec),
Cr>=300 (umol/l)
PT<25, Cr>180,
<300
PT<25, Cr>120,
<180
PT<25, Cr<=120
PT>=25, Cr>=300
PT>=25, Cr>180,
<300
PT>=25, Cr>120, <=180
PT>=25, Cr<=120
Groups according to the liver and renal function in the referring hospital and SLTU
250
200
150
100
50
0
Numb
er of
patie
nts i
n eac
ah gr
oup a
ccor
ding t
o live
r-re
nal fu
nctio
n
SLTUReferring hospital
3-4-3: Timing of onset of renal and liver dysfunction Changes in liver function occurred more rapidly than those in renal function.
Thus PT (s) and ALT (IU/l) were generally abnormal at initial presentation in all
patients, although higher in those who presented at more than 24 h after
overdose (PT: 50.8 ± 2.4 (s), ALT: 6227 ± 454 (IU/l)) compared to those
presented within 24 h (PT: 29.9 ± 1.7 (s), ALT: 1960 ± 264 (IU/l)), p<0.0001
(Table 3.3).
106
Changes in renal function occurred later after overdose (>48h). Cr
concentrations (µmol/l) at first admission were significantly higher in patients
presenting more than 24 h after ingestion (155.8 ± 7.9 µmol/l) whereas patients
who presenting within 24 h often had a normal Cr (98.3 ± 3.7 µmol/l), p<0.0001
(Table 3.3). Cr in the group that presented after 48 h (192.6 ± 18.2 µmol/l) was
significantly higher than that in the group presenting between >24 and 48 h
(140.6 ± 7.9 µmol/l), p<0.0001. Cr at first admission (µmol/l) in staggered
overdose was 177.9 ± 12.0 µmol/l). There was no age difference between
groups presenting within (32.5 ± 0.9 y) or after 24 h (34.6 ± 1.0 y).
3-4-4: Effect of delay at first admission on outcome Mortality rates were highest in patients first presenting to hospital more than 24
h after ingestion (p<0.01) and after staggered overdose (Table 3.3, Figure 3.3).
A prolonged interval between paracetamol ingestion and first presentation to
hospital (>24h) was also associated with an increase in proportion having poor
prognosis based on KCH and dialysis requirement (Table 3.3, Figure 3.4). Thus
in the group who presented after 24 h, 33.6% (49 of 146) had poor prognosis
criteria as compared to 17.6% (31/176) in patients presenting within 24 h,
p<0.01 (Table 3.3). Mortality in the group with staggered overdose was
significantly worse [34.4% (44/128)] than in those with acute overdose [21.5%
(76/354)], p<0.01.

107
Table 3.3: Laboratory and clinical variables with respect to the interval between acute paracetamol ingestion and first blood taken at first admission to hospital in paracetamol overdose, presented as mean± sem. Group comparison was made using ANOVA with post-Hoc Bonferroni for continuous data and Pearson Chi-square test for categorical data. n=number of subjects with available data. KCH: King’s College Criteria.
a Plasma Cr and PT was significantly different between groups (p<0.0001). Those presenting less than 24h were different to those presenting later (p<0.0001). Cr and PT was also significantly higher in the group who presented more than 48h compared to group presenting >24-48h (p<0.0001). b ALT was higher in patients presenting >24h (p<0.0001) compared to groups presenting within 24h. ALT was also higher in >48h group compared to >24 to 48h group (p<0.05). c Dialysis requirement was significantly higher in patients presenting >24h compared to group presenting <24h (p<0.0001). d KCHC poor prognosis and mortality were significantly higher in patients presenting more than 24h compared to those presenting within 24h (p<0.01 for KCHC poor prognosis, p<0. 05 for mortality).
Time between ingestion and first blood taken at first admission to referring hospital
≤24h >24 ≤48h >48h Sig level
Interval (h) 15.2 ± 0.5 (n=176) 37.4 ± 0.8 (n=104) 66.6 ± 2.8 (n=42)
Cr at first admission (µmol/l) 98.3±3.7(n=161) 140.6±7.9 (n=94) 192.6±18.2 (n=39) p<0.0001 a
PT at first admission (s) 29.9±1.7 (n=166) 45.4±2.1 (n=101) 65.0±6.0 (n=39) p<0.0001 a
ALT at first admission (IU/l) 1960±264 (n=147) 5524±520 (n=75) 7887±875 (n=30) p<0.0001 b
Worst PT (s) 62.8±2.9 (n=173) 67.3±3.4 (n=104) 77.1± 6.4 (n=42) NS
Dialysis (%) 19.5 (n=34/174) 44.2 (n=46/104) 34.1 (n=14/41) p<0.0001 c
KCH poor prognosis (%) 17.6 (n=31/176) 36.5 (n=38/104) 26.2 (n=11/42) p<0.01 d
Mortality ( %) 15.3 (n=27/176) 28.3 (n=30/104) 23.8 (n=10/42) P<0.05 d
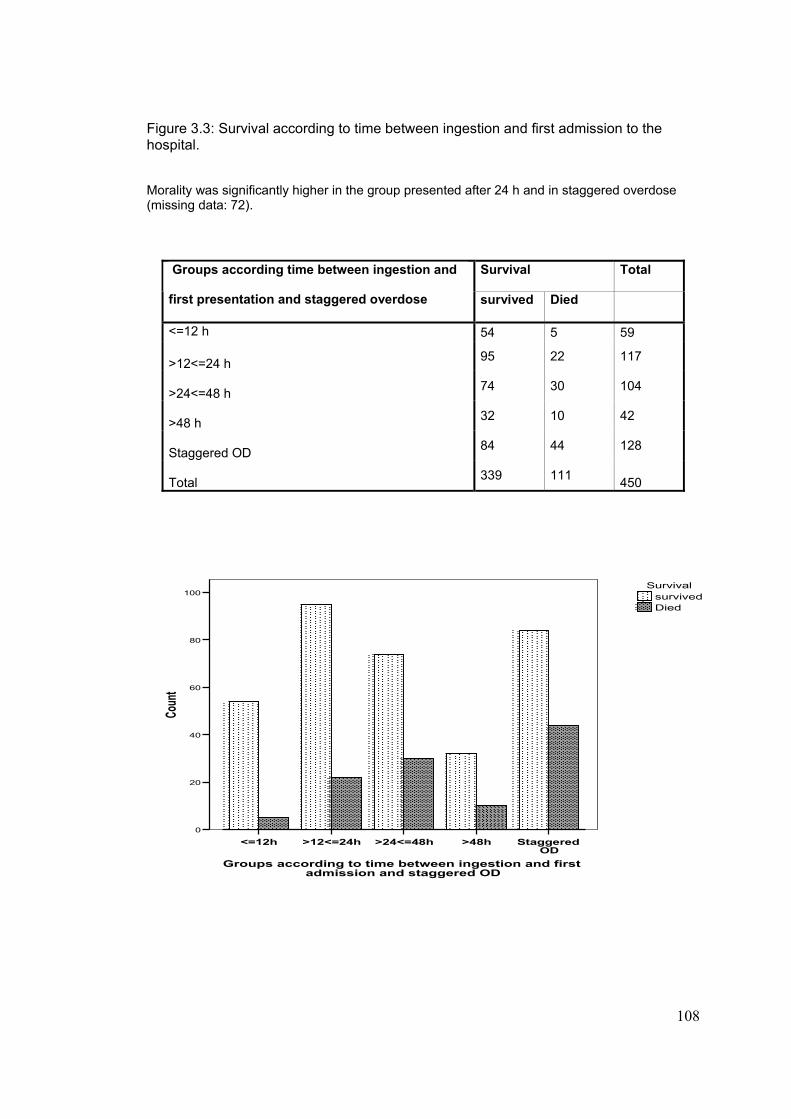
108
Figure 3.3: Survival according to time between ingestion and first admission to the hospital. Morality was significantly higher in the group presented after 24 h and in staggered overdose (missing data: 72).
Survival Total Groups according time between ingestion and
first presentation and staggered overdose survived Died
<=12 h 54 5 59 >12<=24 h 95 22 117
>24<=48 h 74 30 104
>48 h 32 10 42
Staggered OD 84 44 128
Total 339 111
450
Staggered OD
>48h>24<=48h>12<=24h<=12h
Groups according to time between ingestion and first admission and staggered OD
100
80
60
40
20
0
Coun
t
Diedsurvived
Survival

109
Figure 3.4: Dialysis requirement according to time between ingestion and first admission to the hospital (missing data: 75).
dialysis Total Groups according to time between ingestion an first admission and staggered overdose
not required
dialysis required
<=12 h 50 9 59 >12<=24 h 90 25 115
>24<=48 h 58 46 104
>48 h 27 14 41
Staggered overdose 76 52 128
Total 301 146 447
Staggered>48h>24<=48h>12<=24h<=12hDialysis required in the group according to time between ingestion and first admission and also in the group with
staggered overdose
100
80
60
40
20
0
Coun
t
dialysis requirednot required
dialysis

110
Overall, 96.6% of patients developed significant liver injury (worst PT ≥25 s).
Data on the highest Cr during in-patient stay was not available; however, 34.2%
of patients (177) required dialysis, and 27.8% (145) had poor KCH criteria.
Overall mortality was 28.2% (147) (Table 3.1).
Stated paracetamol dose in acute ingestions did not correlate with risk of renal
impairment as judged by Cr at time of admission to SLTU (Cr ≤120 µmol/l:
paracetamol 34 ± 2 g; Cr>120 and ≤180 µmol/l: paracetamol 28 ± 2g; Cr >180
and <300 µmol/l: paracetamol 39 ± 3 g; ≥300 µmol/l: paracetamol 27 ± 3 g).
There was no significant difference in the stated dose of ingested paracetamol in
the group with acute and staggered overdose (staggered overdose: 30 ± 2.3 g
vs. acute overdose: 33.5 ± 5 g).
3-4-5: Associated risk factors for developing renal dysfunction Factors associated with more severe renal impairment at the time of transfer to
SLTU were age, hypotension at admission to either hospital, and interval
between ingestion and first presentation to hospital (all p<0.0001). Patients with
more severe renal injury (defined by Cr at presentation to SLTU) also had a
higher GGT and PT at first presentation (Table 3.4 and Figure 3.5 and 3.6,
p<0.0001). There was no statistically significant association between severity of
renal impairment with weekly alcohol intake or associated alcohol ingestion with
overdose. Patients with more severe renal dysfunction were more acidotic and

111
hyperkalaemic (Table 3.4). A higher proportion of patients with severe renal
impairment had taken a staggered overdose, compared to acute overdose
(Table 3.4). The data showed that males were more likely to develop renal
dysfunction (p<0.05), however this was confounded by age as men were
significantly older than women (male: 37.2 ± 0.8 y vs. female: 34.1 ± 0.8 y,
p<0.01).
Figure 3.5: Relationship between PT (Sec) at first admission to referring hospital and creatinine (µmol/l) at admission to SLTU. There was significant positive association between PT at first admission and creatinine at admission to SLTU (r=0.22, n=465, p<0.0001).
200.00150.00100.0050.000.00
PT at admission to referring hospital (Sec)
1250.00
1000.00
750.00
500.00
250.00
0.00
Crea
tinin
e at a
dmiss
ion
to S
LTU
(um
ol/l)
R Sq Linear = 0.05

112
Table 3.4: Clinical characteristics and outcomes in patients with paracetamol overdose grouped by renal function (see text) at the time of admission to SLTU. Group comparison was made using ANOVA with post-Hoc Bonferroni for continuous variables and Chi-square test for categorical variables. n=number of subjects with available data.
Cr (µmol/l) at admission to SLTU
Normal ≤120
Mild >120 and ≤ 180
Moderate >180 and <300
Severe ≥300
Sig. level
n (%) 239 (46.8%) 84 (16.4%) 106 (20.7%) 82 (16.0%)
M / F 102/137 45/39 62/44 42/40
Age (y) 32 ± 1 38 ± 2 39 ± 1 39 ± 1 p<0.0001 a
Staggered overdose (%) (n=Yes/total)
18.5% (n=43/233)
28.5% (n=22/78)
26.9% (n=25/93)
50.7% (n=36/71)
P<0.0001 b
Alcohol intake (Unit per week)
56.2 ± 7.02 n=149
86.5 ± 15.8 n=58
90.8 ± 13.3 n=76
78.3 ± 16.0 n=70
P=0.08
Associated alcohol (n=Yes/total)
87/212 38/77 47/90 4/67 P=0.22
Hypotension at first admission (%)
3.9% (n=9/239)
18.1% (n=15/83)
32.0% (n=33/103)
32.1% (n=25/78)
p<0.0001 c
Delay to first admission (h)
25 ± 1 (n=179)
28 ± 2 (n=56)
36 ± 3 (n=65)
43 ± 5 (n=37)
p<0.0001 d
Delay to admission to SLTU (h)
55 ± 2 (n=158)
55 ± 3 (n=51)
59 ± 2 (n=56)
68 ± 5 (n=33)
p<0.05 e
PT at first admission (s)
37 ± 9 (n=211)
42 ± 2.8 (n=77)
51 ± 3.2 (n=92)
59 ± 4 (n=75)
P<0.0001 f
GGT at first admission (u/l)
82 ± 8 (n=144)
155 ±19 (n=57)
164 ± 18 (n=57)
238 ±24 (n=51)
p<0.0001 g
[H+] at first admission (mmol/l
42 ± 1 (n=149)
53 ± 3 (n=58)
61 ± 4 (n=64)
54 ± 3 (n=54)
p<0.0001 h
K at first admission (mmol/l)
3.9 ± 0.05 (n=222)
4.2 ± 1.0 (n=75)
4.5± 1.0 (n=100)
4.8± 0.1 (n=73)
p<0.0001 i
Worst PT (sec) 59±2 (n=235)
73 ± 5 (n=84)
82 ± 5 (n=106)
75 ± 5 (n=81)
p<0.0001 k
ITU stay (days) 1.4 ± 0.2 (n=237)
2.5 ± 0.4 (n=83)
4.7± 1.0 (n=104)
4.1 ± 0.6 (n=80)
p<0.0001 m
Mortality (%) 8.8 (n=21/239)
32.1 (n=27/84)
47.2 (n=50/106)
51.2 (n=42/82)
p<0.0001 n

113
Foot notes for Table 3.4 a Patients with mild, moderate and severe renal dysfunction were older (p<0.0001). Those with moderate and severe renal dysfunction were older than those with mild renal dysfunction (p<0.0001). b Patients with severe renal dysfunction were more likely to take staggered overdose compared to normal renal function (p<0.0001), and mild or moderate renal dysfunction (p<0.01). c Patients with normal renal dysfunction were less likely to have hypotension at first admission compared to other groups (p<0.0001). d Patients with moderate and severe renal dysfunction presented later than those with normal renal function (p<0.0001). Patients with severe renal dysfunction presented later than patients with mild renal dysfunction (p<0.01). eTime from overdose to admission to SLTU was significantly longer in the group with severe renal dysfunction compared to group with normal renal function (p<0.05). f There was significant difference in first admission PT between groups (p<0.0001). PT at first admission in those with normal renal function was lower than moderate and severe renal dysfunction (p<0.01). Referral PT in mild and severe renal dysfunction was also significantly different (p<0.01). g GGT at first admission was lower in patients with normal renal function (p<0.0001). GGT at first admission was higher in severe than mild (p<0.01) or moderate (p<0.05) renal dysfunction. h [H+] at first admission in the group with normal renal function was significantly different to mild (p<0.01), moderate (p<0.0001) and severe (p<0.01) renal dysfunction. i K+ at first admission in the group with normal renal function was significantly lower than moderate and severe renal dysfunction (p<0.0001). K+ at first admission in mild renal dysfunction was significantly lower than severe renal dysfunction (p<0.0001). K Worst PT in normal group was significantly different between group with mild (p<0.05), moderate (p<0.0001) and severe renal dysfunction (p<0.05). m Patients with moderate and severe renal dysfunction stayed longer in the intensive care unit (ITU) compared to group with normal renal function (p<0.0001, and p<0.01, respectively). n Mortality in the group with normal renal function was significantly lower compared to the group with mild, moderate and severe renal dysfunction (p<0.0001). Group with mild renal dysfunction had lower mortality compared to the group with moderate and severe renal dysfunction (p<0.05).

114
Figure 3.6: Relationship between GGT (U/l) at first admission to referring hospital and creatinine (µmol/l) at admission to SLTU. There was significant positive association between GGT at first admission and creatinine at admission to SLTU (r=0.33, n=309, p<0.0001).
1000.00800.00600.00400.00200.000.00
GGT at referring hospital (U/l)
1250.00
1000.00
750.00
500.00
250.00
0.00
Crea
tinine
in S
LTU
(umo
l/l)
R Sq Linear = 0.109
3-4-6: Creatinine at first admission as a prognostic factor The ROC curve for Cr concentration at first admission as predictor of poor prognosis
based on KCH criteria gave an area under the curve of 74.3.0% (95% confidence
interval 70.1 to 78.1%, p <0.0001). This plot indicated that a Cr >123 µmol/l at first
presentation to the hospital had a sensitivity of 71.3% (95% CI: 62.7-78.9%) and
specificity of 73.3% (95% CI: 68.3-77.9%) for poor prognosis defined by KCH criteria
during hospital stay (Figure 3.7).

115
Figure 3.7. Receiver operating characteristic (ROC) for creatinine concentration (µmol/l) at first admission to referring hospital and the end point of poor prognosis according to “King’s College Criteria” (KCH). Area under the ROC curve (AUC) = 74.3% (95% Confidence interval 70.1 to 78.1%) Significance level p< 0.0001 (versus 0.5 line by z-test). Most ‘accurate’ predictor is referral creatinine >123 µmol/L 71.3% sensitivity (95% CI: 62.7-78.9) and 73.3% specificity (95% CI: 68.3-77.9) (□ point in the graph). Dashed curve lines represent 95% confidence interval lines.
0 2 0 4 0 6 0 8 0 1 0 0
1 0 0
8 0
6 0
4 0
2 0
0
1 0 0 -S p ec if ic ity (% )
Sen
sitiv
ity (%
)
3-4-7: Effect of acute paracetamol overdose on plasma electrolytes The number of patients with acute paracetamol overdose and known time of
ingestion who were entered into this analysis was 316, 49.4% (n=156) male
and 50.6% (n=160) female, with mean age of 32.2 ± 0.7 y (Table 3.5).
Median and IQR of time interval between ingestion and first admission in the
groups presenting within 12 h (group 1, n=59) was 8.0 (6.0-11.0) h; in the
group with >12 and ≤24 h (group 2, n=115) 18.0 (16.0-22.0) h; and in the
group with >24 h (group 3, n=142): 44.0 (33.0-52.0) h. As expected plasma
116
paracetamol (mg/l) at first admission was significantly higher in the groups
presenting earlier (group 1: 166.3 [83.1-266.5], n=53; group 2: 90.7 [42.0-
151.2], n=103; group 3: 37.8 [14.4-93.1 n=117], p<0.0001). There was no
significant different in plasma K in the groups presenting within 12 or 24 h
(≤12 h: 3.7 [3.3-4.2] mmol/l, n=53 and >12 and ≤24 h: 3.9 [3.4-4.4] mmol/l,
n=108), but plasma potassium was significantly higher (4.5 [3.8-5.0] mmol/l,
n=133) in patients presenting after 24h than those admitted earlier
(p<0.0001).
Plasma K at first admission in the group presenting within 12 h was in a
borderline significant negative correlation with plasma paracetamol
(r = - 0.28, p=0.05, n=49, Figure 3.8) and did not correlate to Cr or PT at first
admission. In patients presenting after 12 h plasma K was significantly
positively correlated with plasma Cr (r=0.37, n=225, P<0.0001, Figure 3.9),
PT (r = 0.38, n=237, p<0.0001) and plasma [H+] (r = 0.28, n=163, p<0.0001),
but not with plasma paracetamol concentration.
There was no significant correlation between plasma sodium and Cr or PT at
first admission. Plasma [H+] (mmol/l) at first admission was significantly lower
in the group with normal renal function than groups with renal dysfunction
(p<0.01) (Table 3.5).

117
Table 3.5: Demographic characteristic of subjects with acute paracetamol overdose (n=316) with suspected liver damage at admission to the referring hospital in the groups according to time interval between ingestion and first admission to the hospital. Group 1: ≤12 h; group 2: >12 h and ≤24 h; group 3: >24 h. There was significant difference between groups in respect of plasma paracetamol concentration, ALT, PT, Cr and K in the groups presented to the hospital in different time after ingestion. Plasma paracetamol concentration was significantly higher in the group presented earlier (p<0.0001). Plasma ALT, PT, Cr and K was significantly higher in the group presented after 24 h compared to those presented before 24 h (p<0.0001). There was no significant difference in plasma PT, Cr and K in the group presenting within 12 or 24 h after ingestion. Plasma ALT was slightly higher in the group admitted after 12 h compared to the that of group 2, p<0.05. Data was presented as median and IQR. Group comparison was made by Kruskal Wallis test. *: p<0.0001, **: not significant. n=number.
Variables/groups ≤12h >12 h and ≤24 h > 24 h
Number
59 115 142
Interval (h)
8.0 (6.0-11.0) 18.0 (16.0-22.0) 44.0 (33.0-52.0)
Sex (M/F)** 26/33 54/61 76/66
Age (y) **
30.0 (24.0-41.0) 30.0 (23.0-37.0) 34.0 (24.0-43.0)
Para (mg/l)*
166.3 (83.1-266.5), n=53 90.7 (42.0-151.2), n=103 37.8 (14.4-93.1), n=117
ALT (IU/L)* 443 (1770-2100), n=51 878 (409-1785), n=94 5748 (2126-9233), n=104
PT (sec)*
22.5 (16.1-35.8), n=52 22.9 (19.0-31.8), n=112 42.8 (31.5-63.5, n=137
Cr (µml/l)* 85.0 (75.0-101.0), n=55 90.0 (74.3-110.3), n=104 124.0 (92.0-189.0), n=130
K (mmol/l)*
3.7 (3.3-4.2), n=53 3.9 (3.4-4.4), n=108 4.5 (3.8-5.0), n=133
H+(mmol/l)**
39 (37-43), n=31 39.8 (35.5-47.5), n=77 41.4 (36.0-53.6), n=94

118
Figure 3.8: Relationship between referring plasma potassium (mmol/l) and paracetamol concentration (mg/l) in the group presenting within 12 h post-ingestion. There was borderline reverse association between plasma potassium and paracetamol concentration in the group presenting within 12 h post-ingestion (r= -0.28, n=49, p=0.05).
800.00600.00400.00200.000.00
Paracetamol level in the group presenting within 12 h (mg/l)
5.00
4.50
4.00
3.50
3.00
2.50refe
ral p
otas
siu
in th
e gr
oup
pres
ente
d wi
thin
12h
(mm
ol/l)
R Sq Linear = 0.078
Figure 3.9: Relationship between plasma potassium (K) and creatinine in the group presenting after 12 h post-ingestion. There was significant positive association between potassium and creatinine in the group presenting after 12 h post-ingestion (r=0.37, n=225, p<0.0001).
600.00500.00400.00300.00200.00100.000.00
Referring creatinine in the group presenting after 12h post-ingestion(umol/l)
8.00
7.00
6.00
5.00
4.00
3.00
2.00
Refe
rring
K in
the
grou
p pr
eset
ing
afte
r 12h
ost
-inge
stio
n (m
mol
/l)
R Sq Linear = 0.137

119
3-5: Discussion Paracetamol poisoning is a common presentation and early identification of
patients with more severe poisoning is key to improving outcomes. Present
approaches are based on risk stratification using paracetamol concentrations
timed after ingestion, but this is dependent on accurate history and assumes
an acute ingestion time point. This is also less accurate beyond 15 h after
ingestion. Thus, work that is aimed to improve outcome prediction based on
paracetamol concentrations [272] may not be applicable to many in this
cohort. Previous work has identified acidosis and hypophosphataemia as
potential early markers of more severe toxicity [198]. Patients in this cohort
often did not have phosphate measured and this has not been a focus of this
study.
Although renal failure is a recognised complication of paracetamol toxicity,
the underlying mechanisms are poorly understood. Toxic metabolites of
paracetamol are generated by local metabolism in the kidney and may cause
acute tubular necrosis, particularly in conditions associated with glutathione
depletion [168]. Even in the absence of acute renal failure, paracetamol
ingestion is associated with dose-dependent changes in electrolyte transport,
suggesting a direct pharmacological action of paracetamol on renal tubular
function [194;273]. Risk factors such as glutathione depletion in the kidney,
concomitant ingestion of nephrotoxic substances, dehydration at
presentation, chronic excessive overdose of paracetamol, and pre-existing

120
liver and renal insufficiency have been suggested to promote the risk of renal
injury after paracetamol overdose [183].
As expected, most patients in the current series of tertiary referrals after
paracetamol overdose had evidence of acute liver dysfunction defined by PT
≥ 25 sec (96.6%). Within this patient population there was a high prevalence
of serious renal impairment (34.2% of patients required dialysis). In
comparison the incidence of paracetamol-induced nephrotoxicity (blood urea
nitrogen>6.4 mmol/l, or Cr>97.2 µmol/l) in adolescents (12-18y) who were
admitted to a tertiary hospital was reported to be 8.9% [270]. In the current
study 15.4% (6/39) of patients aged 11-20y had Cr≥120 µmol/l and 13%
(n=5) required dialysis. The overall incidence of paracetamol-induced
nephrotoxicity in unselected patients has previously been reported to be
around 1-2 % rising to 10% in more severely poisoned patients [18;91;274].
The high incidence of renal impairment in the current study is likely to be due
to the highly selected patient population, who were characterised by liver
dysfunction secondary to paracetamol overdose sufficient to warrant referral
to a tertiary centre. Severe liver failure itself was found to be an important
associated factor in developing renal failure.
As shown in Table 3.3 the onset of renal dysfunction seems to be later than
liver dysfunction. Other studies also report liver dysfunction starts within 24 h
after overdosage while renal dysfunction occurs one to three days later, and
often is in association with severe liver damage [18;42;83;91]. In some

121
cases, although rare, renal failure due to paracetamol overdose occurs in the
absence of liver injury [84;87;90;161;183]. In the current data set all patients
with renal impairment also had some degree of concomitant liver dysfunction.
Importantly the data indicate that Cr at the time of first admission was an
important predictor of developing poor prognosis (as defined by KCH criteria)
and thus the need for liver transplantation (Figure 3.7). Groups with more
severe renal injury at presentation had worse outcome, as indicated by
higher PT, longer stay in ITU, greater need for dialysis, and higher mortality
(Table 3.4).
Renal dysfunction was more severe with later presentations, in patients with
hypotension at admission, those who were older and those who had a high
GGT. However, in this data set there was no significant association between
weekly intake of alcohol or history of alcohol abuse and renal dysfunction.
Renal dysfunction was also worse in those who had taken the overdose in a
staggered manner. The findings of the current study are similar to those in
children, in whom prolonged interval between ingestion and presentation to
hospital, and renal impairment were both associated with poorer prognosis
[275].
Mortality in the current study (28.2%) is lower than that reported in a previous
study from another UK tertiary care date set (62% in 1987 and 40% in 1993).

122
This may suggest an improvement in the quality of care given for this patient
group in the UK in the recent years, or be due to changes in referral practice.
The current data comes from a large acute UK centre but may not be
representative of other liver units. Other factors not tested in this study
include social deprivation, which has also been found to be associated with
poor outcome from paracetamol overdose in Scotland [276]. The use of
plasma creatinine needs to be tested independently by others. The present
data underpin the importance of prompt administration of acetylcysteine,
which has been shown to be most effective when given within the first 8-12 h
after paracetamol ingestion [277]. Another study on similar patients admitted
to an acute liver unit in the UK showed that patients who were not treated
with NAC, or in whom NAC was started after 24h, had significantly higher
mortality rate [53]. It is increasingly recognised that patients presenting to
hospital after staggered overdose are at substantially increased risk
compared to those after acute ingestion. This is reflected in the present data,
where staggered overdoses comprise a high proportion of patients referred to
the SLTU. Thus close attention to Cr concentration, presence of hypotension
and GGT activity should allow earlier identification of patients that are at
greater risk of poor outcome.
In the subset of patients with acute (non-staggered) overdose, in the
group who presented early (within 12h) plasma K was in a borderline
dose-dependent negative relationship with plasma paracetamol. This

123
finding is similar to the results of previous human and experimental
studies [194;198;273] (chapter II of the thesis) in which the effect of
paracetamol overdose on plasma electrolytes were investigated. There
was no association between plasma paracetamol and plasma K in the
group presenting later than 12h. In these patients plasma K was in
significant positive relationship with plasma Cr and PT. This suggests
relationships between plasma K and plasma paracetamol vary with time
after exposure. In the early stages of toxicity fall in plasma K might be
associated with higher plasma paracetamol concentrations, and hence
ingested dose. Later changes reflect renal injury, either secondary to
plasma paracetamol itself or consequent upon liver injury.
3-6: Conclusion While renal impairment is relatively uncommon after mild to moderate
paracetamol overdose [271], it is a common complication in patients referred
to a tertiary centre with severe paracetamol toxicity. The timing of onset of
renal dysfunction is later than liver injury. Important clinical factors predicting
poor outcome were: presentation to hospital after 24 h after ingestion, high
Cr concentration at the time of first presentation, hypotension, staggered
overdose, raised GGT and concomitant liver dysfunction. Renal dysfunction
at first presentation appears an important predictor of subsequent liver
toxicity and death. Further work is required to explore whether more subtle
markers of renal impairment might allow better risk stratification in patients
that present to hospital after paracetamol overdose. The effect of

124
paracetamol on plasma potassium varies with time after ingestion,
suggesting different mechanisms for plasma K change in early and later
stage of toxicity. Fall in plasma potassium in the early stage may be due to
cyclo-oxygenase inhibitory effects of paracetamol, which alter renal
haemodynamics and tubular handling of electrolytes in the kidney. Later
changes in plasma K are likely to be due to direct nephrotoxic effects of
paracetamol. Measurement of renal effects of paracetamol overdose may
allow greater understanding of mechanisms of paracetamol toxicity.

125
Chapter IV: Liver Admission Following Paracetamol
Overdose with Concentration Below Current UK
Treatment Threshold
126
4-1: Introduction Paracetamol overdose is a major public health problem in the UK and the
cause of 40% of all overdose presentations to hospital. Paracetamol
overdose is the commonest cause of acute liver failure in the UK [51],
resulting in several hundred liver unit admissions and about 200 deaths each
year [278;279]. Patients at sufficient risk of hepatotoxicity are treated with the
intravenous antidote acetylcysteine (NAC), which has been used as the
treatment of choice for paracetamol overdose since 1979 [203]. For patients
presenting within 15 hours (h) after ingestion, the need to antidote therapy is
determined on the basis of a nomogram which relates plasma paracetamol
concentration to the time since ingestion. Patients are stratified depending on
their “risk factors” including: chronic alcohol misuse [280], chronic enzyme
induction [281], and malnutrition [282]. Those with no risk factors are treated
if they have a paracetamol concentration above a line starting at 200 mg/l at
4 h and subject to first-order decline with 4 h half-life (the “200 line”). Those
with risk factors of enhanced hepatotoxicity are treated at half these
concentrations (“100 line”). If patients are not treated with antidote, more than
60% of patients with plasma paracetamol concentration above the treatment
line may develop serious liver damage, and of those about 5% may die [213].
In 1998, 4 cases of fatal hepatotoxicity were reported following paracetamol
overdose with plasma concentration below the “200 line”. All 4 patients
presented within 4-6 h pots-ingestion. None of the cases received antidote
therapy initially and in three of four this action was consistent with current UK
127
guidelines [218]. The authors suggested lowering treatment threshold by
25% to a “150 line” (in the absence of risk factors) to bring them in the line
with nomograms used in some other countries, including the US. The report
generated much controversy with both support [219] and criticism
[220;221;223;224;283]. However, the absolute risk of hepatotoxicity in
patients with paracetamol concentration between the 150 and 200 lines has
not determined accurately, and it remains unclear whether the benefits of
treatment outweigh the risks, or if additional treatment is cost-effective in this
group. Consequently, UK treatment guidelines have not been changed.
The current study is a systemic retrospective survey performed in defined
geographic areas over specific time periods, to establish the numbers of
patients admitted to two liver units with paracetamol-induced hepatic
dysfunction who had initial paracetamol concentration below the current
nomogram levels at their original presentation.
4-2: Method The records of all patients admitted to the Scottish Liver Transplant Unit
(SLTU) in Royal Infirmary of Edinburgh and regional liver service in
Newcastle with paracetamol overdose and liver dysfunction were reviewed.
The period of study was from January 1992 to June 2004 for SLTU data and
from September 1996 to March 2003 for Newcastle data set. These two
services cover a population of 9.0 million people, and therefore the period of

128
study encompassed about 95 million person-years. Data in Edinburgh and
Newcastle were separately extracted, and amalgamated.
Details of all patients were recorded at the time of admission and were
available in Edinburgh from the SLTU database. The clinical details, including
patient’s history and biochemistry results were sought from the clinical notes
in the referring hospital and SLTU. Data collected included plasma
paracetamol concentration at initial presentation and the timing of this
following overdose, the presence of risk factors for enhanced hepatotoxicity,
use and timing of NAC treatment and liver function tests. Patients with a
plasma paracetamol concentration below threshold were identified and
reviewed. Information on the overall pattern of paracetamol poisoning was
obtained from a survey of hospitals in North East England performed in 1994
[278] , and from review of patients with paracetamol poisoning presenting to
the Newcastle Hospital NHS Trust during 2004. Data from the SLTU in
Edinburgh was collected by myself. The data collection for Newcastle, risk
analysis and cost-benefit calculations were performed by colleagues in
Newcastle. The results presented in this chapter are a summary of the
combined data sets.
4-3: Results During the period of study, 696 patients (522 SLTU and 174 Newcastle) with
possible paracetamol hepatotoxicity were admitted to the two liver units. Of
these, 553 (79%) presented more than 15 h post-ingestion and in 19 (2.7%)

129
there was no adequate information available. Of the remaining 124
presenting within 15 h, 105 (81%) had a plasma paracetamol above the
appropriate treatment line, and 19 below it. Of these 19, 5 cases were
excluded; in two cases because plasma paracetamol had been taken less
than 4 h after ingestion and results were therefore uninterpretable, and in
three cases liver function tests or clotting factor was already deranged at
presentation, indicating the paracetamol overdose may have been taken
earlier than stated (Figure 4.1).
Thus 14 patients (6 from SLTU), 10 female and 4 male, with mean age (SD)
of 30.4 ± 10.8 y were admitted to a liver unit after presenting within 15 h of
overdose, with no evidence of abnormal liver function, and with a plasma
paracetamol concentration below the appropriate treatment line (Figure 4.1)
at presentation (for raw data for cases from SLTU see appendix 4.1).
Eight of these patients had normal venous bicarbonate concentrations at
initial presentation; results were not available in the other six. Ten had no
recorded features to indicate high risk; of these, four were below the “100
line”, four between “100 and150 lines” and two between the “150 and 200
lines”. Four patients were at high risk, all as a result of excess alcohol
consumption, and all had paracetamol concentration below the “100 line”.
Two patients were treated with NAC soon after presentation, but the
remaining 12 were not treated until abnormal liver function or clotting

130
developed. Two patients died; one after undergoing liver transplantation, and
other from sepsis. The remainder recovered.
Figure 4.1: Patient inclusion and exclusion diagram
> 15 h (n=553), Excluded
Not sufficient information (n=19), Excluded
Paracetamol above treatment line (n=105), Excluded
Paracetamol was taken < 2 h post-ingestion (n=2), Excluded
Deranged liver function test at admission (n=3), Excluded
Inclusion criteria
Presenting within 15 h
Plasma paracetamol below treatment line
No deranged liver function test at admission
Total: 696
< 15 h (n=143)
Paracetamol below treatment line (n=19)
Total included patients (n=14)

131
Table 4.1 : Demographic and characteristic of patients with paracetamol overdose presenting within 15 h post-ingestion with normal liver function and plasma paracetamol concentration below current UK guideline (n=14) to two liver centres (SLTU and Newcastle liver centre). SLTU: Scottish Liver Transplant Unit, P’mol: paracetamol; OD: overdose; M: male; F: female; Max: maximum; TP: transplantation; HAV: hepatitis A virus; HBV: hepatitis B virus; HCV: hepatitis C virus; HIV: human immunodeficiency virus; AC: acetylcysteine; INR: international normalized ratio; PT: prothrombin time; NK: not known; Outcome: R: recovered and D: Died
Patient number (case number and code in SLTU)
Age and Sex
P’mol dose (g)
P’mol level (mg/l)
Interval between OD and sample (h)
Relationship To treatment line Co-ingestion
Relevant conditions
Risk Status
Interval from OD to NAC infusion (h)
Max INR/PT
Time from OD to max INR (h)
Max ALT (IU/l)
Time from OD to max INR (h)
Liver TP Outcome
1 (SLTU) (314, MM080409) 40/F 25 45.6 6.0 Below 100 Alcohol
Hysterectomy for cancer 10 years earlier Normal 30 INR 3.1 63 3345 72 No R
2 (SLTU) (260, SL050351) 21/F 10 16.6 14.0 Below 100
Ecstasy, alcohol (previous day)
Cardiac failure, chronic alcohol excess High 30
INR 11.3 56 9740 48 No R
3 (SLTU) (432, CR070556) 40/F 29 62.5 6.0 Below 100
Codeine, fluoxetine, diazepam - Normal 16 INR 9.1 20 10183 84 No R
4 (SLTU) (11, DA030015) 26/F 10 95.2 6.0 100-150
Alcohol, salicylates - Normal Not treated INR 3.2 80 11000 57 No R
5 (SLTU) (75, SC060100) 29/F 48 18.1 15.0 100-150
Codeine, paroxetine
HAV, HCV, HIV ,antibodies, cardiac failure NK 18 INR 4.8 55 9945 63 No R
6 (SLTU) (169, NG040228) 29/F 10 93 5.0 Below 100 -
Cardiac failure Normal 48
INR 11.8 51 7430 65 No R
7 (Newcastle) NK/F NK 24.5 4.2 Below 100 Alcohol
Chronic alcohol excess High 8
INR 10.9 53 13173 40 No R
8 (Newcastle) 26/M 17.5 84 4.0 Below 100
Benzodiazepine, codeine, ecstasy
Possible p’mol OD one day earlier Normal 26 PT 87 s 61 - - No R
9 (Newcastle) 30/F 13 71 8.3 150-200 - - Normal 32 PT 82 s 81 9380 48 No R
10 (Newcastle) 55/M 15 61 5.7 Below 100
Alcohol, benzodiazepine
Chronic alcohol excess High 47 Pt 64 s NK 4780 50 No R
11 (Newcastle) 17/F 25 136 4.0 100-150 - - Normal 24 PT 76 s 58 4610 96 No R
12 (Newcastle) 38/M 10 56 4.0 Below 100 Salicylate, ibuprofen
Chronic alcohol High NK PT 35 s 90 - - No D
13 (Newcastle) 15/F 7.5 170 4.0 150-200 Alcohol - Normal 33 PT 160 52 11396 46 Yes D 14 (Newcastle) 29/M 24 107 4.0 100-150 Alcohol - Normal 24 PT 79 s 42 114900 52 No R

132
In data collected from patients presenting with paracetamol overdose
(n=352) to the Newcastle Clinical Toxicology Service in 2004, 71% (250) had
plasma paracetamol under the “100 line”, 15% (53) between “100 and 150
lines” and 3.8% (13) between “150 and 200 lines”. This figure was similar to
data collected from six A&E departments in the north-east of England in 1994
(n=287). The proportions of all patients presenting with plasma paracetamol
concentrations at presentation below “100 line", between “100 and 150 lines
“and between “150 and 200 lines” was 64% (184), 13% (37) and 6.4% (18),
respectively [278].
4-4: Discussion These data confirm the previous observation [218] that some patients with
relatively low plasma paracetamol concentrations and normal liver function
tests and clotting factors at admission when apparently presenting within 15
h of overdose develop severe, and occasionally fatal, hepatic necrosis. In the
current systematic retrospective analysis, about 2% (14/696) of patients
admitted to liver units following paracetamol overdose fell into this category.
From the catchment populations of the liver units concerned and the time
periods studied, (95 million person-years population) this equates to a
presentation rate of 0.15 episodes per million populations per annum
[(14/95,000,000) *1000,000] or about nine UK case annually
[(60,000,000*0.15/1000,000)].

133
In the context of the frequency of paracetamol overdose, these cases
therefore occur very infrequently. The possibility that, in some of these cases,
unexpected hepatotoxicity developed because the interval between overdose
and presentation was not given or recorded accurately cannot be excluded.
In addition some patients with liver failure may not have been referred for
assessment.
The previous study [278;279] reported an annual presentation rate for
paracetamol overdose of 750 cases/million population/year. Assuming the
same presentation rate, the total number of patient presenting with
paracetamol overdose during the study population is 71250 (750*95). If the
number of patients presenting in each concentration range was assumed as
midway between the figures obtained in 1994 [278] and 2004 (67.5% below
“100 line”, 14% between “100-150 lines” and 5.1% between “150-200 lines),
the numbers of patients presenting in each paracetamol concentration range
each year can be derived (48093 below “100 line”, 9975 between “100-150
lines” and 3634 between “150-200 lines”). Using data provided by this study
on the numbers of patients requiring liver unit admission in each of these
concentration ranges (8 below “100 line”, 4 between “100-150 lines” and 2
between “150-200 lines”), it is possible to estimate the risk for each group.
For patients with concentrations between the 150 and 200 lines, the 100 and
150 lines and below the 100 line, respectively, these risks would be
approximately 1:1250, 1:1850 and 1:4400. However, these estimates should
be interpreted with caution: proportions are based on limited patient

134
numbers, and the data collection periods and geographic areas are not
identical with the liver unit data presented here. Furthermore, factors for
enhanced hepatotoxicity are ignored, as there was inadequate information
about presentation patterns in relation to them. The frequency of severe
poisoning may have been reduced by legislation affecting pack sizes [284].
Not all patients with severe hepatotoxicity will be referred to a liver unit.
Finally, an unknown number of patients in each category will have been
treated with NAC in spite of their low initial paracetamol concentration,
especially following the Bridger [218] publication. This may reduce the
numbers of these patients needing liver unit admission, and thus result in an
underestimation of risk. The proportion of patients treated with NAC
increased from 25% to 76% for patients between the 150 and 200 lines, and
from 2% to 15% for those between the 100 and 150 lines comparing the
1994 [278] and 2004 North-East England data sets. On the basis of these
data, use of the 150 line for determining need for treatment would prevent
only a few liver unit admissions; use of lower thresholds still would require
treatment of very large patient numbers and would avoid only a few further
episodes. These marginal benefits need to be offset against the
inconvenience and costs of therapy and the risk of adverse reactions.
Although usually not severe, anaphylactoid reactions to acetylcysteine
appear more common in patients with lower plasma paracetamol
concentrations [245]. In a randomized controlled trial, drug-related adverse
effects occurred in 45% and anaphylactoid reactions in 18% of recipients of
the standard acetylcysteine infusion schedule [285]. It is possible that lower

135
doses of acetylcysteine may be effective and safer for patients with
paracetamol concentrations below current UK thresholds. Clinical trials of
these would be helpful, but are difficult to perform because of the very large
numbers of participants that would be required to achieve adequate study
power to demonstrate efficacy in this group. Larger observational studies,
which include the simultaneous collection of data on presentation patterns
and risk factors, would be helpful in order to obtain more accurate estimates
of risks without antidotal treatment in these patient groups. Abnormal liver
function tests were present at presentation in some of the patients who went
on to develop severe hepatic dysfunction, suggesting a longer interval
between overdose and presentation than that suggested by the history. It
may therefore be appropriate that liver function tests should be performed on
all patients at their original presentation; those with abnormal values should
receive acetylcysteine irrespective of the plasma paracetamol concentration
unless an alternative cause can be demonstrated.
4-5: Conclusion Only a very small percentage of patients with plasma concentrations below
UK treatment threshold may develop features of liver toxicity. In the view of
the rarity of this event, the costs of therapy and risk of adverse reactions the
results of this study does not suggest a need to lower current UK thresholds
for antidote therapy in paracetamol overdose.

136
Chapter V: The Mechanisms and the Associated
Factors Involved in Anaphylactoid Reactions to
Acetylcysteine in Patients with Paracetamol Overdose

137
5-1: Introduction The current protocol for antidote therapy in paracetamol poisoning in the UK is
the Prescott protocol [203], which is a step-down, 20-hour intravenous NAC
infusion (150 mg /kg over 15 min in 200 ml 5% dextrose, followed by 50 mg/kg
in 500 ml 5% dextrose over 4 hours and 100 mg/Kg in 1000 ml 5% dextrose
over 16 hours). IV infusion of NAC causes adverse reactions in some patients
[237]. The frequency of such reactions, varies from 3-9% [238-240] to 48.4%
[241] in different studies. Some factors including asthma [244;245] and low
paracetamol concentration [239;241;245;286] have been reported to associated
with ADRs. Death has been report in an asthmatic patient due to adverse effects
of a therapeutic dose of IV NAC [246]. In 1984, two deaths were reported due to
ADRs to overdose of IV NAC [238]. In both these cases the dose of NAC given
was 10 times higher than therapeutic. The high incidence of ADRs to IV NAC
(50%) in healthy individuals not receiving paracetamol is further evidence that
paracetamol itself may have some protective effect against ADRs to NAC [231].
The mechanisms of ADRs to NAC remain unclear. A non-allergic release of
histamine has been suggested as a potential mechanism of ADRs [247]. An in
vitro study has shown histamine release induced by NAC [248]. Previous
studies on acute allergic reactions, and anaphylactic shock, in other situations
have shown an increase in plasma concentrations of mast cell products
(histamine and tryptase) [249-252], endothelial injury parameters (von
138
Willebrand factor [vWf]) and fibrinolytic parameters (tissue plasminogen activator
[tPA]) [251]. Healthy volunteers given therapeutic doses of NAC intravenously
who developed ADRs had elevated factor VIII and vWf within an hour of starting
NAC. The authors suggested that NAC induces release of vWf from endothelial
cells in subjects who develop adverse effects [231].
Interleukin 6 (IL6), released from mast cells and basophils, has also been
reported to contribute in allergic reactions [253]. IL6 also stimulates C-reactive
protein (CRP) production and the two correlate with one another in acute allergic
reactions [257].
The aim of this study was to examine the profile of ADRs to NAC and potential
risk factors in a patient cohort with paracetamol overdose. In addition the
potential mechanisms of ADR to NAC were also explored.
5-2: Method This was a prospective study on patients admitted to the Royal Infirmary of
Edinburgh from July 2006 to May 2007 with paracetamol overdose who required
NAC treatment. The study was approved by the Local Ethics Committee and
informed consent form (see appendix 5.1, 5.2 and 5.3) was obtained from all
patients who took part. All patients who received antidotal therapy were carefully
monitored for adverse effects. Patients were seen during their hospital stay, with

139
case note review and telephone follow up of patients discharged from hospital
over night, at weekends or public holidays. Data collected included age and
gender; type and number of paracetamol tablets taken; time(s) and date of
ingestion; plasma paracetamol concentration at admission; UK risk
categorisation for treatment [31]; alcohol history; history of allergy, including
atopy, asthma or drug; family history of allergy; previous NAC treatment; history
of ADRs to NAC; nature of any reaction to NAC in the current admission,
together with treatments given, including necessity to interrupt the NAC infusion
(see appendix 5.4, 5.5 and 5.6).
In a subset “convenience” sample, a more intense study was conducted in
patients who gave additional consent. This more detailed study involved blood
sample collection immediately before and during antidote treatment.
Measurements included (see also appendix 5.7):
-Paracetamol: baseline and 4h after NAC
-Histamine: baseline, 15min, 30min, 1h, 2h
- NAC: baseline, 30min, 2h, 4h, 20h
- Tryptase: baseline, 30min, 1h, 2h
-IL6: baseline, 30 min, 1h, 2h, 4h, 20h
-C-reactive protein (CRP): baseline, 1h, 2h, 4h
-Clotting factors (II, V, VII, VIII, IX, X, XI, XII): baseline, 30min, 1h, 2h, 4h, 20h
-vWf: baseline, 30min, 1h, 2h, 4h, 20h
140
The blood was collected from the contra-lateral arm to that in which the NAC
infusion was given. In addition, systolic blood pressure (SBP), diastolic blood
pressure (DBP), temperature (T), O2 saturation (O2 Sat) and peak expiratory
flow rate (PEFR) were measured at baseline, 30 min, 1h, 2h, 4h and 20h after
NAC infusion initiation. The precise details of any reactions, including time of
initiation, any treatment and termination, were recorded. Hypotension was
defined as a SBP <90 mmHg. Tachycardia was defined as pulse rate>100 and
fever as temperature ≥ 38 ºC.
In view of the sampling protocol, this study was carried out in daylight hours.
In both parts of the study, overall severity of reaction was graded clinically as
minimal if patients had no reaction or only gastrointestinal (GI) signs and
symptoms with or without anti-emetic treatment; moderate if patients had GI
signs and symptoms requiring temporary NAC infusion cessation and/or mild
flushing, pruritus and/or breathlessness (in the intensive study reduction in
PEFR ≥ 25 and <50 % from baseline), and/or mild chest pain; and
severe If NAC was stopped for adverse effects such as severe flushing and/or
respiratory distress (in the intensive study: ≥ 50% reduction in PEFR from
baseline) and/or severe chest pain.
To examine the stability of histamine in plasma if processed at different time
points after blood collection an experiment was conducted on 8 healthy
volunteers. 4 male and 4 female subjects, older than 16 year-old and non-
141
pregnant, took part in the study. In this group plasma histamine of samples
collected at once but spun at different time points after collection were
compared.
5-2-1: Blood collection, sample processing and laboratory analysis Two cannulas were inserted, one in each arm: one for NAC infusion and one, in
the contra lateral arm for blood collection. After inserting the sampling cannula 5
ml normal saline was flushed into the vein. Before blood sampling at each time
point 5 ml blood was collected and discarded. After blood sampling at each time
point 5 ml normal saline was flushed. More details of blood collection, sampling
process and laboratory analysis for each marker is as shown below. Plasma
histamine analysis was measured by myself and a laboratory technician in
Clinical Pharmacology Unit in the University of Edinburgh. Measurement of
plasma NAC was performed by the Free radical Research Facility, UHI
Millennium Institute, Inverness (Prof Megson). The rest of tests were performed
by biochemistry and haematology technicians in the Royal Infirmary of
Edinburgh clinical laboratories.
5-2-1-1: Plasma histamine 3 ml of blood was collected by venepuncture with 5 ml syringe and immediately
transferred to two aliquots (1.5 ml each, containing EDTA) and after shaking on
a roller (5 min), it was cooled in crushed ice and spun by a micro centrifuge

142
(15000 rpm, 3 minutes, 4ºC) within 30 minutes. The supernatant was transferred
into two plane aliquots and stored in -80ºC for later analysis.
In the histamine experiment study, 15 ml blood was collected (using 10 ml and a
5 ml syringe) at once. The blood was immediately distributed in 4 paired
aliquots, 1.5 ml each. Samples were shaken on the roller for 5 minutes and
cooled in crushed ice immediately. Each paired sample was spun at 5min, at
20min, 35min and 65min after collection. The supernatant was transferred into
two plain tubes and stored at -80 ºC and analysed within 2 months. Plasma
histamine was measured using an EIA (Enzyme Immunoassay) kit
manufactured by Bio Source Europe S.A. The sensitivity of the technique was
0.1ng/ml for plasma histamine.
5-2-1-2: Plasma NAC The blood collection and sampling process was the same as histamine. NAC
was measured by high performance liquid chromatography (HPLC; Agilent 1200
series with fluorescence detector, Agilent Technologies, South Queensferry, UK)
using a published method for thiol analysis [287-289] with minor modifications.
5-2-1-3: Plasma tryptase 10 ml blood was collected by venepunture by a plain white top tube, allowed for
10-15 min to clot in room temperature. The sample was spun (3000 rpm, 4 ºC,

143
15 min) within 30min and the supernatant was stored in two aliquots in -80ºC for
later analysis. Plasma tryptase was measured by a fluoroenzyme immunoassay
(ImmunoCAP Tryptase; Phadia AB, Uppsala, Sweden), which detects both α-
and β-tryptase (mean: 3.8 µg/l, 95% upper limit: 11.4 µg/l, detection limit <0.1
µg/l).
5-2-1-4: Plasma tPA activity and antigen 5 ml blood was taken by 5ml syringe and transferred immediately to Stabilyte
tube. The sample was shaken on roller for 5min and cooled in crushed ice and
spun (3000 rpm, 15 minutes, 4ºC) within 30 min. The supernatant was stored in
-80ºC in two plain aliquots. The plasma tPA activity and antigen were assayed
by ELISA (tPA Combi Actibind, Technoclone, Vienna, Austria).
5-2-1-5: Clotting factors, vWf and IL6 9 ml blood was collected by venepunture (using three 3ml green top tubes). The
samples were shaken for 5 min on a roller, cooled in crushed ice and spun
(15000 rpm, 15 minutes, 4ºC) within 30 min and stored in two plain aliquots in -
80ºC. The plasma clotting factor activity assays were all performed by ELIZA
using the CA 600 instrument manufactured by Sysmex. Plasma vWf antigen
was performed by an ELISA (Enzyme-Linked Immuno Sorbent Assay) technique
using antibodies supplied by Dacko, Denmark. Plasma IL6 was measured by
ELISA (Quantikin Human IL-6, R&D Systems, USA).

144
5-2-1-6: Plasma paracetamol and salicylate 5 ml venous blood was collected by venepunture using (5 ml orange top tube)
and shaken on a roller for 5 min. The sample was cooled in crushed ice and
spun (15000 rpm, 15 min, 4ºC) within 30 min. The supernatant was stored in two
aliquots in -80ºC for later analysis. Plasma paracetamol was measured by an
aryl acyl amidase enzymic method (Ortho Clinical Diagnostics, UK) on a Vitros
auto-analyser.
5-2-1-7: CRP 5 ml blood was taken by venepunture using (orange top tube). After shaking on
a roller for 5 minutes it was cooled in crushed ice and spun within 30 minutes
(3000 rpm, 4 ºC, 15 min). Supernatant was extracted and stored into two plain
aliquots in -80ºC for later analysis. Plasma CRP was measured by an
immunoturbidometric technique.
5-2-2: Measurement of PEFR PEFR (peak expiratory flow rate) is the patient’s maximum ability to expel air
from the respiratory system. It is measured by a small hand-held device called a
peak flow meter. Peak flow is a measure of the degree of restriction in the
airways by measuring airflow rate. Peak flow reading is high when patients are
145
well and is lower when there is bronchoconstriction. The peak flow meter is
normally used to monitor severity and treatment options in asthmatic patients
[290]. The main weakness of peak flow meter is that it is patient dependent, and
if patients do not co-operate may not be an accurate reflection of airway
function. Its advantages are its simplicity in use, and general reproducibility in
co-operative patients.
5-2-2-1: Method of measurement of PEFR Step 1: make sure that marker or arrow on the Peak Flow Meter was at the
bottom of the numbered scale (zero or the lowest number on the scale).
Step 2: patients were asked to remove gum or any food from their mouth, to
take a deep breath (as deep as they could) and to put the mouthpiece of the
peak flow meter into their mouth. They were told to close their lips tightly around
the mouthpiece, made sure to keep their tongue away from the mouthpiece and
in one breath blow out as hard and as quickly as possible until they emptied out
nearly all of the air from their lungs.
Step 3: the force of the air coming out of the respiratory system caused the
marker to move along the numbered scale. The number was recorded as peak
flow.

146
Step 4: the same steps were repeated twice and the highest number was
recorded [290].
5-2-2-2: Severity of bronchospasm according to PEFR
Less than 25% reduction in PEFR from baseline was considered as no or mild,
≥25% and <50% reduction in baseline PEFR: moderate, and ≥50% reduction
was considered as severe bronchospasm [290].
5-3: Statistical analysis Analysis in the total cohort focused on the pattern of adverse effects and
potential risk factors. In the more intensive study the relationship between
severity of ADRs and the changes in the various biological markers were
examined. Data are presented as mean and 95% confidence intervals or median
and interquartile range. For two-group comparisons, the Mann-Whitney U test
was used and for multiple group comparisons of continuous data, a Kruskal-
Wallis H test was performed. AUC (area under the curve) analyses of the
change from baseline histamine concentration was undertaken between 0 and
120 min, and a simple linear imputation method was used to minimize the
potential effects of missing data on AUC analyses. A Chi-square tests was
performed to compare categorical data. Univariate analyses were performed
using Spearman’s rank correlation, and possible risk factors were examined
using binary logistic regression (stepwise backward) with exclusion of factors if
p >0.1.

147
5-4: Results
5-4-1: Result of total cohort
5-4-1-1: Demographic data Over the period of the study, 193 patients were admitted to the Toxicology unit
of Royal Infirmary of Edinburgh who required IV NAC infusion following
paracetamol overdose. Data were not available in 24 cases because the
patients had absconded from the ward or took their own discharge against
medical advice and could not be interviewed. Therefore, the study population
consisted of 169 patients (71 men, 42.0%) with mean (95% confidence interval)
age 37 y (35 to 39 y).
5-4-1-2: Clinical features of ADRs Reported adverse effects were nausea (70.4%), vomiting (60.4%), flushing
(24.9%), pruritus (20.1%), dyspnoea (13.6%), chest pain (7.1%), dizziness
(7.7%), fever (4.7%), wheezing and bronchospasm (7.1%), and rash and
urticaria (3.6%) (Table5.1).
None of the patients developed hypotension. Severity was graded minimal in
101 (39: no ADRs, 62 mild ADRs), moderate in 51, and severe in 17 patients
(Figure 5.1 and Table 5.2). NAC infusion was stopped temporarily due to
adverse effects in 18 patients.

148
Table 5.1: Occurrence of ADRs to intravenous NAC in patients with paracetamol overdose (n=169).
Signs & Symptoms n (%)
Nausea 119 (70.4%)
Vomiting 102 (60.4%)
Gastrointestinal
Abdominal discomfort 8 (4.7%)
Flushing 42 (24.9%)
Pruritus 34 (20.1%)
Skin
Rash and urticaria 6 (3.6%)
Dyspnoea 23 (13.6%)
Wheeze & bronchospasm 12 (7.1 %)
Respiratory
Coughing 4 (2.4%)
Dizziness 13 (7.7%)
Chest Pain 12 (7.1%)
Fever (temperature ≥38 ºC) 8 (4.7%)
Other
Hypotension 0 (0.0%)
Table 5.2: History of asthma, drug allergy, family history of allergy and previous ADRs to NAC in the group with minimal and moderate or severe ADRs to NAC. M: male, F: female.
Severity of ADRs
Minimal (no:39, mild: 62)
Moderate and severe (moderate: 51, severe: 17)
Total number (n=169) 101 68
Gender (M/F) 39/62 32/36
Age (mean 95% CI) (y) 38.1 (35.0-41.2) 34.8 (31.6-38.0)
Paracetamol level at admission (mg/l)
(mean 95% CI )
130.0 (114.6-145.3) 104.4 (81.2-127.7)
Asthma, n (Yes/No) 13/88 10/58
Drug allergy, n (Yes/No) 17/84 17/51
Family allergy, (Yes/No)
Total=151, unknown=18
32/59 32/28
Previous allergy to NAC, (Yes/No)
Total: 52, Unknown: 19, No previous
treatment with NAC: 98
23/10 15/4

149
Figure 5.1: Diagrammatic representation of adverse effect profiles in patients treated
with acetylcysteine for paracetamol poisoning, categorised by adverse effect severity:
minimal-moderate-severe (n= 169, including 39 patients with no adverse effects).
0-0-1
0-3-3
0-24-6 0-4-0
Skin
Gastrointestinal
Respiratory
62-2-0
Chest Pain
0-2-1
0-8-4
0-1-1
0-1-0
0-6-1

150
5-4-1-3: Paracetamol Plasma paracetamol concentration was lower in patients with severe adverse
effects [median (IQR) in severe: 46 mg/l (0 to 101 mg/l), moderate: 108 mg/l (54
to 178 mg/l) and minimal: 119 mg/l (77 to 174 mg/l)], p=0.002 by 3-way
comparison. Concentrations were undetectable in 4 patients; two had taken a
staggered overdose, and two had presented late (at 21h and at 48h after
ingestion).
5-4-1-4: Associated factors of ADRs Logistic regression (stepwise backward) analyses of possible risk factors of
ADRs showed that moderate to severe adverse effects were correlated inversely
with plasma paracetamol concentration [odds ratio (95% CI): 0.99 (0.99 -1.00)]
and male gender [odds ratio (95% CI): 0.45 (0.22 - 0.92)], and correlated
positively with a family history of allergy [odds ratio (95% CI): 2.89 (1.39-5.99)].
No significant correlations were found with age, history of asthma, or previous
drug allergy (Table 5.2 and 5.3).

151
Table 5.3: Stepwise backward binary logistic regression for possible variables
associated with moderate to severe adverse effects of NAC. * Change in risk related to each year of life and each mg/l increase in paracetamol
concentration, other variables treated as categorical data. Analyses were made between two
groups: minima ADRs group (n=101) and moderate or severe ADRs (n=68).
Odds ratio (95% CI) p-value
Univariate analyses
Male gender 0.40 (0.19 to 0.84) 0.016
Age (y) * 0.98 (0.95 to 1.00) 0.102
[paracetamol] (mg/l) * 1.00 (0.99 to 1.00) 0.062
Asthma 1.09 (0.42 to 2.83) 0.867
Drug allergy 1.82 (0.73 to 4.52) 0.200
Family history of allergy 2.36 (1.09 to 5.08) 0.029
Constant 6.02 0.032
Logistic Stepwise backward regression analyses
Male gender 0.45 (0.22 to 0.92) 0.028
[paracetamol] (mg/l) * 0.99 (0.99 to 1.00) 0.043
Family history of allergy 2.89 (1.39 to 5.99) 0.004
Constant 2.452 0.147
5-4-2: Result of the intensive study
5-4-2-1: Demographic data 22 patients (11 male and 11 female) with mean age (95% CI) of 34.6 (21-45) y
were recruited into the more intensive study. These patients were almost all
studied in daylight hours and therefore are not representative of the total cohort
with respect to nature of paracetamol overdose, often being later presentations.

152
Some patients did not complete the whole course of the study because they did
not require a full course of NAC treatment, self-discharged or withdrew from the
study. All patients completed the first 2 hours of the study, 18 the first 4h and 16
completed the full study (20h).
5-4-2-2: Severity of ADRs 10 subjects (45%) had minimal, 5 (23%) moderate and 7 (32%) severe ADRs
(Table 5.4 and 5.5).There was no significant difference between groups with
respect to systolic blood pressure at baseline or during antidote infusion (Table
5.6). The onset of ADRs in most subjects occurred within the first hour and 15
min after commencement of treatment (see appendix 5.8). There was no
significant difference between these groups in terms of age and gender.
5-4-2-3: Plasma Paracetamol As in the total study paracetamol at baseline (median and IQR) was significantly
lower in patients with severe ADRs (severe: 0.0 mg/l [0.0-41.0] vs. minimal:
137.8 mg/l [59.5-230.0]; p=0.02.

153
5-4-2-4: Plasma NAC As expected, plasma NAC concentration was maximal at the 30min time point
after infusion. There was no difference in plasma NAC in the groups with
different ADRs severity at any time point (Table 5.7) (see appendix 5.9 for raw
data).

154
Table 5.4: Clinical features of ADRs to NAC in patients with severe ADRs, n=7 (intensive study)
* Vomiting: mild: no treatment required; moderate: treatment required; severe: required temporary IV NAC infusion stop
** Bronchospasm: moderate: if reduction in baseline PEFR ≥25% and ≤50%; severe: if reduction in baseline PEFR≥50%
*** Chest Pain: moderate: feeling tight chest with no sharp pain; severe: with a sharp pain in the chest requiring temporary stop in NAC
infusion
Features of ADRs Case 1 Case 2 Case 3 Case 4 Case 5 Case 6 Case 7 Rash (Yes, No) No No No No No No Pruritus (Yes, No) No No Yes No No Yes No Urticaria (Yes, No) No No No No No No No Angioedema (Yes, No) No No No No No No No Nausea(Yes, No) Yes No Yes Yes Yes Yes No Vomiting (Yes *, No) Yes (Moderate) No Yes (Moderate) Yes (Moderate) Yes (Severe) Yes (Moderate) No Chest Pain (Yes, No) No No No No No No No Abdominal cramp (Yes, No) No No No No No No No Diarrhoea (Yes, No) No No No No No No No Flushing (Yes, No) Yes Yes Yes Yes Yes Yes Yes Fever (Yes, No) No Yes No No No No No Coughing (Yes, No) No Yes Yes No Yes No Yes Wheezing (Yes, No) No Yes No No No No No Dyspnoea (Yes, No) Yes Yes Yes No Yes No Yes Bronchospasm (Yes **, No) Yes (Moderate) Yes (Severe) No No Yes (Severe) No Yes (Moderate) Chest Pain (Yes***, No) No No Yes (Moderate) No Yes (Severe) No Yes (Moderate) Tachycardia (Yes, No) No Yes No No Yes No No Hypertension (Yes, No) No Yes No No Yes No No Hypotension (Yes, No) No No No No No No No Faint/dizziness (Yes, No) No Yes No No No No No

155
Table 5.5: Peak flow rate (L/per min) at base line and time points (30min, 1h, 2h, 4h and 20h) after IV NAC commencement.
ND: No data available.
Pt No Severity PEFR BASE L/pm T1 h PEFR 1 T2 PEFR 2 T3 PEFR 3 T4 PEFR 4 T5 PEFR 5
5 1 ND ND ND ND ND ND 6 1 400.00 ND 0.90 470.00 2.10 470.00 4.00 420.00 20.00 520.00 7 1 340.00 0.50 250.00 1.30 380.00 2.30 220.00 4.50 250.00 20.50 340.00 9 1 ND ND ND ND ND ND 13 1 ND ND ND ND ND ND 17 1 600.00 0.50 550.00 1.00 575.00 2.10 430.00 4.10 440.00 22.00 520.00 18 1 360.00 0.50 300.00 1.00 300.00 2.00 340.00 5.00 340.00 21.00 370.00 19 1 575.00 0.60 420.00 1.10 390.00 2.10 430.00 4.10 420.00 20.50 440.00 20 1 180.00 0.50 150.00 ND 2.00 150.00 4.00 150.00 20.00 200.00 22 1 280.00 0.50 230.00 1.00 210.00 2.30 230.00 4.00 200.00 ND 1 2 500.00 0.50 480.00 1.00 450.00 2.00 490.00 4.50 500.00 ND 2 2 490.00 0.50 450.00 1.10 450.00 2.20 440.00 4.50 ND 20.00 450.00 12 2 210.00 ND 1.10 200.00 2.10 220.00 4.60 180.00 20.20 240.00 15 2 ND ND ND ND ND ND 21 2 350.00 0.50 410.00 1.00 400.00 2.10 400.00 4.20 400.00 20.00 350.00 3 3 480.00 0.50 300.00 ND 3.00 440.00 4.00 370.00 20.30 410.00 4 3 340.00 0.50 120.00 1.00 290.00 2.00 340.00 ND ND 8 3 260.00 0.40 390.00 1.50 250.00 2.50 300.00 4.10 320.00 20.50 340.00 10 3 520.00 ND ND ND ND 11 3 600.00 0.60 250.00 1.30 440.00 2.10 500.00 4.00 600.00 20.30 570.00 14 3 380.00 0.50 330.00 1.00 300.00 2.40 350.00 ND ND 16 3 300.00 1.00 200.00 2.00 270.00 4.20 300.00 ND

156
Table 5.6: Systolic blood pressure (SBP) at baseline and time points after IV NAC
infusion commencement in the groups according to the severity of ADRs. There was no significant difference in SBP between groups at baseline and any time points after
IV NAC infusion commencement. n: number of subjects (intensive study).
SBP in the groups
according to ADRs
Minimal
Median and IQR, n
Moderate
Median and IQR, n
Severe
Median and IQR, n
baseline 127.0 (107.3-146.3), 10 112.0 (109.0-115.5), 5 123.0 (112.0-147.0), 7
30min 128.5 (105.5-154.5), 8 122.0 (117.0-127.0), 4 131.0 (125.0-171.5), 5
1h 128.0 (112.3-133.5), 10 116.0 (109.0-131.0), 5 146.0 (121.0-172.0), 6
2h 124.5 (106.8-155.5),10 117.0 (115.5-124.5), 5 125.0 (109.5-157.5), 6
4h 151.0 (113.0-168.8),10 128.0 (112.5-146.5), 5 133.0 (114.8-173.8), 4
20h 126.0 (114.0-140.5), 9 112.0 (109.50-127.3), 4 137.0 (97.0,- ), 3
5-4-2-5: Plasma Histamine There was no significant difference in plasma histamine concentrations between
groups at baseline. After commencement of NAC, plasma histamine increased
in the groups with moderate and severe ADRs and it reached maximum (2.5 fold
increase) between 30 to 70 min. There was significant difference in change in
plasma histamine between groups at 1h (p=0.02) (Figure 5.2) (see appendix
5.10, 5.11 and 5.12 for raw data).
The AUC of histamine-time expressed as change from baseline (median and
IQR) was significantly different between groups (p=0.01):minimal: -6.4 ng/ml.min
[-60.3-10.8]; moderate 25.6 ng/ml.min [2.9-128.7]; severe 49.0 ng/ml.min [21.0-

157
68.0].The significance level was between minimal and severe ADRS groups
(p=0.005). The difference between AUC change of minimal and moderate group
just failed to pass conventional significance level (p=0.06), perhaps due to small
number of subjects in each group.
In the experimental study on 8 healthy volunteers there was no significant
difference in plasma histamine concentration when centrifuged and separated
either at 5min, 15min, 30min or 1h after blood collection (Table 5.8) (see
appendix 5.13 for raw data).
5-4-2-6: Plasma tryptase There was no significant difference in change in plasma tryptase concentration
between groups at 30 min and 1h following IV NAC infusion. Plasma tryptase
change at 2h was significantly different between groups, but not related to the
severity of adverse reactions (Table 5.9) (see appendix 5.14 for raw data).
Change in AUC tryptase (0-2h) was not significantly different between groups
(p=0.22).
Median and IQR of AUC change of tryptase (0-2h) was -85.0 [-182.50- (-32.5)]
µg/l.min in the minimal ADRs group; 59.50 [-254.35-207.50] in the moderate
group and -67.0 [-106.0-81.0)] in the severe group.

158
Table 5.7: Median plasma NAC concentration (IQR) (mg/l) after intravenous infusion
according to the severity of adverse effects: minimal, moderate, and severe.
NAC reached maximum concentration at 30min time point. After 30min NAC decreased steadily.
There was no significant difference in plasma NAC concentration between groups with different
ADR severities at any time point. n=number of subjects.
plasma NAC (mg/l) and
time Median (IQR)
Minimal ADRs
Moderate ADRs
Severe ADRs
Baseline: 0.0 0.7 (-0.5-1.9)
n=10
1.1 (-1.9-4.0)
n=5
1.2 (-0.8-3.2)
n=7
30min: 0.55 (0.52-0.58) 90.3 (72.6-108.1)
n=10
89.5 (26.1-152.8)
n=5
95.9 (64.4-127.4)
n=6
2h: 2.06 (2.00-2.18) 47.6 (37.3-58.9)
n=10
45.5 (31.0-59.9)
n=5
34.5 (23.2-45.8)
n=7
4h: 4.10 (4.0-4.30) 27.8 (17.7-38.0)
n=10
36.3 (19.0-53.6)
n=5
30.1 (20.7-39.5)
n=4
20h: 20.08 (20.0-20.33) 15.6 (8.79-22.5)
n=9
13.8 (-5.7-33.2)
n=5
14.0 (-2.1-30.0)
n=4
159
Figure 5.2: Median change in plasma histamine concentrations (ng/ml) at 15 min, 30
min, 1h and 2h after commencing intravenous NAC infusion from baseline according to
the severity of ADRs: minimal ( ), moderate ( ), and severe (▲). Data in the table shows median and IQR and data in the graph represent median. 3 -group
comparison showed a significant difference between groups at 1h time point (p=0.02). The
difference was between groups with minimal and severe ADRs (p=0.01). n: number of subjects.
Change in plasma
histamine (ng/ml) at time
points
Median (IQR)
Minimal ADRs
Moderate ADRs )
Severe ADRs
15min: 15.0 [15.0-18.0] -0.25 [-0.64-(-0.03)] -0.11[ -0.16-1.13 ] -0.05 [-0.21- 0.11]
30min: 33.0 [30.0-35.0] -0.09 [-0.59-0.08] 0.33 [-0.11-1.23] 0.67 [-0.11-1.16]
60min: 65.0 [60.0-70.0] -0.04 [-0.61-0.18] 0.50 [0.16-1.43] 0.63 [0.23-1.40]
120min: 124.0 [120.0-
130.0]
-0.04 [-0.45-0.25] 0.02 [-0.2-0.82] 0.10 [0.16-0.31]
-0.5
-0.2
0.1
0.4
0.7
1
0 15 30 45 60 75 90 105 120 135 150
Time from NAC infusion start (min)
Cha
nge
in h
ista
min
e (n
g/m
l)

160
Table 5.8: Effect of delay in sample processing on plasma histamine assay (ng/ml) in 8
healthy volunteers (4 male and 4 female). Samples were collected and cooled at once, but processed at different time points after blood
collection (5min, 15min, 30min and 60min). Data are reported as median and IQR. There was no
significant difference in plasma histamine when processed either at 5min, 15min, 30min or 1h
after collection (p=0.939). n: number of subjects.
Table 5.9: median change in plasma tryptase concentrations (µg/l) at 30 min, 1h and 2h after commencing IV NAC infusion from baseline according to the severity of ADRs (minimal, moderate and severe). Change in plasma tryptase at 2h was significantly different between groups according to the severity (p=0.02) and the difference was between minimal and moderate ADRs (p=0.03) and minimal and severe ADRs (p=0.016). n=number of subjects
Change in plasma tryptase
(µg/l) at time points after IV
NAC infusion
Median (IQR)
Minimal ADRs
Moderate ADRs
Severe ADRs
30min: 33.0 [30.0-35.0] -1.16 [-1.37-(-0.18)]
n=8
-0.18 [-1.82-(-0.02)]
n=4
-0.89 [-1.54-0.82]
n=6
60min: 65.0 [60.0-70.0] -0.65 [-2.31-0.00]
n=8
0.68 [-4.34-1.77]
n=4
-0.67 [-1.27-0.42]
n=7
120min: 124.0 [120.0-130.0] -0.97 [-1.32-(1.14)]
n=9
1.16 [-0.30-4.34]
n=4
0.67 [-0.31-1.74]
n=7
Time from collection to sample processing
Median and IQR (ng/ml)
n
5min 0.53 (0.48-0.82) 8
15min 0.62 (0.51-0.73) 8
30min 0.64 (0.35-0.78) 8
60min 0.55 (0.43-0.81) 8

161
5-4-2-7: Plasma CRP and IL6 There was no significant difference in plasma CRP or plasma IL-6 between
groups with different severity at baseline, or subsequently (see appendix 6.15
and 6.16 for raw data).
5-4-2-8: tPA antigen and activity There was no significant change in plasma tPA antigen between groups with
different severity at baseline or time points after NAC infusion. Change in
plasma tPA activity at 1h and 2h were significantly higher in the severe group
compared to minimal group (p=0.007 and p=0.02, respectively) (Table 5.10),
however, AUC change of tPA (0-4h) was not significantly different between
groups. Median and IQR of AUC change of tPA (0-4h) was -2.3 [-36.1-5.1]
(u/ml.min) in the minimal group; 0.0 [-26.4-34.5] in the moderate and -10.9
[-49.8-76.6] in the severe group (see appendix 6.17 and 6.18 for raw data).
Table 5.10: Change from baseline in plasma tPA activity concentration (u/ml) at time points after start of IV NAC infusion commencement in the groups according to the severity of ADRs. Data are reported as median and inter-quartile range (IQR).
Change in plasma tPA
activity (u/ml) at time point
Median (IQR)
Minimal ADRs
(n=10)
Moderate ADRs
(n=5)
Severe ADRs
(n=6)
1h: 1.08 [1.00-1.16] 0.00 (-0.13-0.13) 0.00 (-0.20-0.80) 1.00 (0.23-1.15)
2h: 2.06 [2.00-2.18] 0.00 (-0.26-0.00) 0.00 (-0.05-0.15) 0.10 (0.00-0.30)
4h: 4.1 [4.0-4.3] 0.00 (-0.18-0.13) 0.00 (0.00-1.35) -0.25 (-0.58-0.23)

162
5-4-2-9: Clotting factors and vWf factor There was no association between plasma vWf and plasma clotting factor
activity and severity of ADRs (see appendix 5.19 to 5.26 for raw data). Activity
for the clotting factors II, VII, IX and X were, however, significantly decreased
within 4h of NAC infusion commencement. Maximum derangement in factor II,
IX and X occurred within an hour and for factor VII at 4h (Figure 5.3 and Table
5.11). There was significant correlation between plasma factor VIII and its carrier
(plasma vWf) at baseline (r=0.4, p=0.05, n=22), at 1h (r=0.6, p=0.01, n=18) and
at 2h (r=0.6, p=0.006, n=21).
Figure 5.3: Clotting factor activity (mean, iu/l) at baseline and time points (30min, 1h, 2h, 4h and 20h) after IV NAC infusion in patients with paracetamol overdose. Activity of factor II (◊), factor VII ( ), factor IX (●), and factor X (▲). Factors: II, VII, IX and X were significantly decreased compared to baseline within 4h of NAC infusion initiation (see also table 5.10 for details)
0.4
0.5
0.6
0.7
0.8
0.9
Baseline 30min 1h 2h 4h 20h
Time from IV NAC start
Clo
tting
fact
or a
ctiv
ity
(iu/
l)
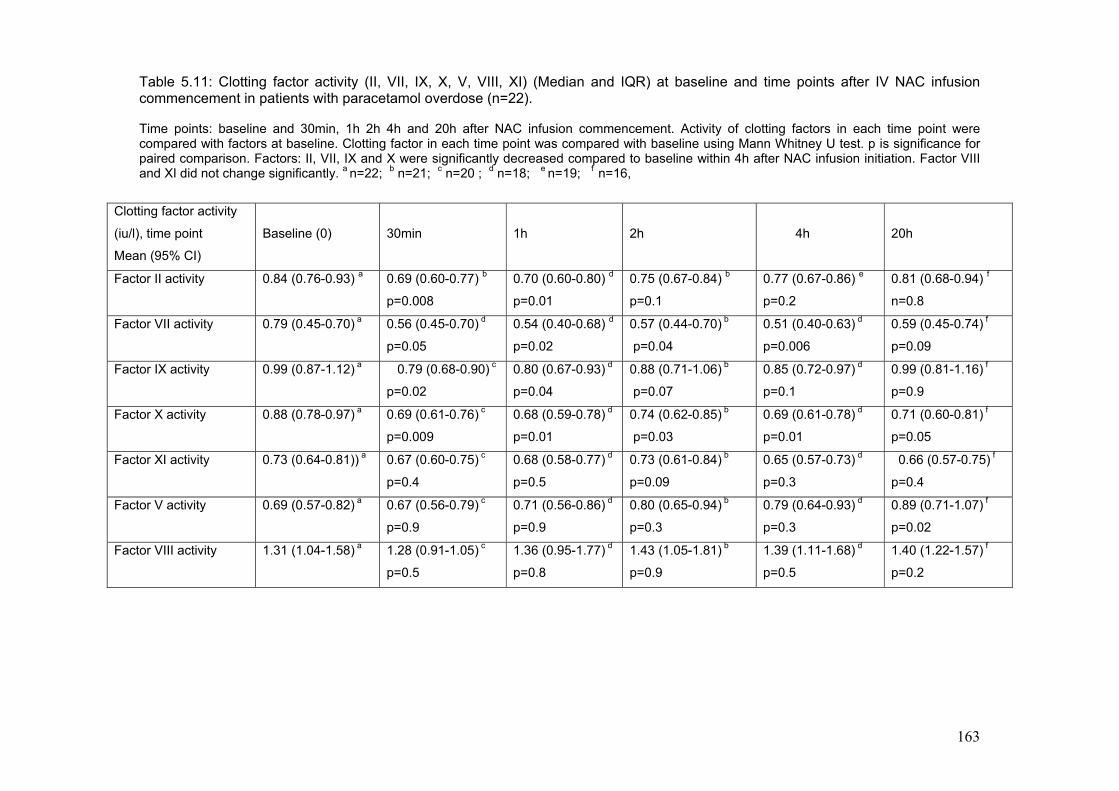
163
Table 5.11: Clotting factor activity (II, VII, IX, X, V, VIII, XI) (Median and IQR) at baseline and time points after IV NAC infusion commencement in patients with paracetamol overdose (n=22). Time points: baseline and 30min, 1h 2h 4h and 20h after NAC infusion commencement. Activity of clotting factors in each time point were compared with factors at baseline. Clotting factor in each time point was compared with baseline using Mann Whitney U test. p is significance for paired comparison. Factors: II, VII, IX and X were significantly decreased compared to baseline within 4h after NAC infusion initiation. Factor VIII and XI did not change significantly. a n=22; b n=21; c n=20 ; d n=18; e n=19; f n=16,
Clotting factor activity
(iu/l), time point
Mean (95% CI)
Baseline (0)
30min
1h
2h
4h
20h
Factor II activity 0.84 (0.76-0.93) a
0.69 (0.60-0.77) b
p=0.008
0.70 (0.60-0.80) d
p=0.01
0.75 (0.67-0.84) b
p=0.1
0.77 (0.67-0.86) e
p=0.2
0.81 (0.68-0.94) f
n=0.8
Factor VII activity 0.79 (0.45-0.70) a
0.56 (0.45-0.70) d
p=0.05
0.54 (0.40-0.68) d
p=0.02
0.57 (0.44-0.70) b
p=0.04
0.51 (0.40-0.63) d
p=0.006
0.59 (0.45-0.74) f
p=0.09
Factor IX activity 0.99 (0.87-1.12) a
0.79 (0.68-0.90) c
p=0.02
0.80 (0.67-0.93) d
p=0.04
0.88 (0.71-1.06) b
p=0.07
0.85 (0.72-0.97) d
p=0.1
0.99 (0.81-1.16) f
p=0.9
Factor X activity 0.88 (0.78-0.97) a
0.69 (0.61-0.76) c
p=0.009
0.68 (0.59-0.78) d
p=0.01
0.74 (0.62-0.85) b
p=0.03
0.69 (0.61-0.78) d
p=0.01
0.71 (0.60-0.81) f
p=0.05
Factor XI activity 0.73 (0.64-0.81)) a 0.67 (0.60-0.75) c
p=0.4
0.68 (0.58-0.77) d
p=0.5
0.73 (0.61-0.84) b
p=0.09
0.65 (0.57-0.73) d
p=0.3
0.66 (0.57-0.75) f
p=0.4
Factor V activity 0.69 (0.57-0.82) a
0.67 (0.56-0.79) c
p=0.9
0.71 (0.56-0.86) d
p=0.9
0.80 (0.65-0.94) b
p=0.3
0.79 (0.64-0.93) d
p=0.3
0.89 (0.71-1.07) f
p=0.02
Factor VIII activity 1.31 (1.04-1.58) a
1.28 (0.91-1.05) c
p=0.5
1.36 (0.95-1.77) d
p=0.8
1.43 (1.05-1.81) b
p=0.9
1.39 (1.11-1.68) d
p=0.5
1.40 (1.22-1.57) f
p=0.2

5-5:Discussion
NAC has been a treatment of choice in paracetamol overdose since its
introduction in the 1970s [202;203]. Anaphylactoid reactions following IV NAC
infusion were reported soon after its introduction [237;291], however the
mechanism of the ADRs is not fully understood. The reported incidence of ADRs
varies from 3% to 50% [231;239-241;243;292]. In the current study the
incidence of anaphylactoid reactions was found to be 40.2% (10.1%: severe and
30.1% moderate). The discrepancy in ADRs incidence among different studies
is likely due to variability in definition of ADRs, in mode of administration of NAC
infusion (drip or pump), and possibly different study populations. The present
study suggests that paracetamol concentration at the time of antidote use might
be an important confounder.
Factors reported to increase the risk of anaphylactoid reactions to NAC, include
history of asthma [237;244;245;293;294], atopy [295], drug allergy [245] and low
plasma paracetamol concentration [239;241;245]. Female gender, family history
of allergy and low paracetamol concentration were the only independent risk
factors that were identified in the current study. It is unclear why asthma should
be identified as a risk factor by Schmidt & Dalhoff, but not in this study. Whether
there are differences in the genetic factors or other factors requires further
studies.

165
During an anaphylactic reaction, mediators are released and can be detected in
the blood soon afterwards. Histamine is detectable in plasma 10 minutes to 1h
after reaction initiation [296;297]. Following bee sting histamine and tryptase
have been shown to be in a significant association with clinical severity of
anaphylactic reactions [250].
In man, a dose-dependent wheal and flare response to intradermal injection of
Parvolex (the pharmaceutical branded preparation containing 200 mg/ml NAC
together with EDTA [ethylene diamine tetra acetic acid] as a stabilizer and
sodium hydroxide to correct pH) has been reported [247]. Pre-treatment with a
specific H1 antagonist (terfenadine) suppressed the weal and flare response.
NAC also caused dose-dependent histamine release from cultured mouse mast
cell (PT18 cell line) and human basophils [248]. The authors suggested that
ADRs to NAC might be attributed to a direct effect on mast cell and basophils.
An in vitro study [298] showed that NAC induced spontaneous histamine release
from human peripheral leukocytes. The main finding of the current study was a
higher histamine concentration in the group with severe ADRs. Adding this
finding to the previous studies findings, it seems clear that histamine is involved
in mediating ADRs following IV NAC infusion; however this is not primarily due
to variability in NAC concentration as there was no difference in NAC
concentration between groups (Table 5.7).

166
The measurement of plasma tryptase along with plasma histamine has been
suggested for the diagnosis of anaphylaxis and change can be detected 1 to 2
hours after initiation of anaphylactic responses [297]. In this study no
relationship was found between ADRs severity and change in plasma tryptase
(Table 5.9). These findings suggest either very low levels of release from mast
cells, or more likely, that the source of histamine was basophils which have far
lower tryptase levels [299].
Endothelial injury and activation of the coagulation system occurs in anaphylaxis
[300-302]. An elevation in vWf factor, a marker of endothelial injury, has been
reported in anaphylactic shock [251]. A study on healthy volunteers receiving
therapeutic doses of NAC showed a rapid increase in factor VIII and its carrier,
vWf factor, in the group with anaphylactoid reactions but not in the group without
ADRs [231]. In the present study there was no association between changes in
the activity of clotting factors and vWf and severity of reaction. Furthermore, vWf
did not correlate with histamine. It is possible that the presence of paracetamol
or recent paracetamol overdose may accounts for this difference, but further
studies are required to understand the reason for the difference in adverse
effects profile.
As reported by others there was a significant fall in vitamin K dependent clotting
factor activity (II, VII, IX and X) in all subjects within 1 to 4h of NAC infusion
commencement (Figure 5.3 and Table 5.11) [302]. While this may be relevant

167
to the diagnosis of hepatotoxicity following paracetamol overdose there was no
relationship to ADR occurrence. There was a significant correlation between
factor VIII activity and its carrier, vWf factor, confirming previous findings [231].
Anaphylaxis also activates the fibrinolytic system, an effect thought to be due to
release of mast cell products, resulting in endothelial cell stimulation [302-306] .
In a study on subjects with anaphylactic shock after insect sting challenge both
tPA, a marker and fibrinolytic injury, and vWf, a marker on endothelial injury,
increased within a few minutes of onset of clinical symptoms [251]. In this study
the effects on tPA were not significant when AUC of response was examined,
suggesting this mediator is not a primary factor in this adverse reaction. In vitro
studies have shown that toxic, but not therapeutic, doses of paracetamol inhibit
the function of lymphocytes, [307] neutrophils, [308] and platelets [309]. The
suggested mechanism is thought to be paracetamol-induced reversible cyclo-
oxygenase inhibition, resulting in reduction in PG and thromboxane synthesis,
indicating that paracetamol may perhaps have some specific mast cell effects.
Since PG is a key mediator in anaphylactic reactions [309], its inhibition by
paracetamol might play a role in preventing ADRs to NAC . The present data
showed an inverse relationship between plasma paracetamol and severity of
ADRs, which also confirms the results of other studies, suggesting that higher
concentrations of paracetamol are protective against anaphylactoid reactions to
NAC. More studies are required to elucidate the effect of paracetamol on PG
synthesis, mediator release and inhibiting anaphylactoid reactions.
168
It thus appears that NAC-induced histamine release in paracetamol overdose
occurs in the absence of release of other traditional markers of mast cell
degranulation or endothelial dysfunction. The source of histamine therefore
seems most likely to be from basophils, which have lower tryptase content. The
protective role of paracetamol implies a pharmacological effect on the
mechanisms involved in the ADR process. The most likely target would seem to
be cyclo-oxygenase. In a previous study discussed in this thesis it was
hypothesized that paracetamol effects on renal potassium loss in overdose are
due to inhibitory effects of paracetamol on cyclo-oxygenase [273]. In vitro data
suggests that NAC may modulate PG synthetic pathways, promoting
bronchoconstriction by increasing synthesis of PGF2 alpha and reducing
synthesis of bronchodilator PGE [298]. Although asthma was not a predominant
feature a significant minority of patients had bronchoconstriction, which is in
keeping with this hypothesis.
In the intensive study one patient (subject number one, see appendix 5.11) who
had severe vomiting with no obvious features of anaphylactoid reaction in whom
NAC infusion was stopped also had an increase in plasma histamine
concentration within 30min after infusion, which was 5 times higher (2.44 ng/ml)
than baseline (0.48 ng/ml) level. Other subjects with ADRs showed
combinations of vomiting and feature of anaphylactoid reactions and it is
therefore unclear whether the release of histamine contributes to the nausea
169
caused by this antidote. The rates of nausea and vomiting observed in this study
were high and this raises the issue of whether routine anti-emetic prophylaxis
with an antihistamine would be effective and if histamine release is involved in
their causation. The ADR profiles illustrate the inter- individual susceptibility to
different ADR features. The reasons for this variability also require to be
understood if the incidence of ADRs to NAC is to be reduced. There appear to
be other individual factors that underlying the risk of having an ADR to NAC, and
family history of allergy and gender effect suggest that genetic factors may be
relevant here. Whether reducing the initial bolus dose of NAC or prolongation of
loading dose infusion would reduce the incidence of adverse effects without
impairing efficacy are other key questions to be clarified.
6-6: Conclusion Anaphylactoid reactions to acetylcysteine are relatively common in patients with
paracetamol overdose. Low paracetamol concentration is a risk factor in
developing ADRs. Histamine release is associated with the reaction severity.
Future study is required to elucidate the specific effects of paracetamol that
protects against ADRs to its antidote and these seem likely to involve inhibition
of PG synthesis. The involvement of histamine in the reaction raises the
possibility that pre treatment with antihistamine could be protective.
170
Chapter VI: Discussion
171
6-1: Summary of the thesis Paracetamol has been available as an over-the-counter drug (without
prescription) since 1956, with a remarkable safety record at normal therapeutic
doses. Although it has been used for more than 50 years, there are still many
unknown aspects in regards to its toxicity and treatment in overdose. The first
toxicity of paracetamol in overdose in man was reported in 1966 [41;42]. It is the
most commonly used drug in deliberate self harm [43-46] being involved as a
component in 48% of poisoning admissions to hospital in the UK [47].
Paracetamol is the commonest cause of fulminant hepatic failure and liver
transplantation in the UK and the US [40;51-57]. Renal insufficiency during the
course of paracetamol overdose, with or without concomitant hepatic failure, has
also long been recognised [42;81-90]. However, the mechanism of the
nephrotoxicity in man is not fully understood.
The main pharmacological effect of paracetamol is inhibition of cyclo-oxygenase
(COX) and thus prostaglandin (PG) synthesis [6]. In overdose non-steroidal anti-
inflammatory drugs such as ibuprofen, cause dose-dependent increase in
urinary potassium excretion (FeK) and sodium retention [262], probably due to
vasoconstriction. It was therefore hypothesised that paracetamol in overdose
may affect renal function due to similar mechanisms.

172
To examine this hypothesis the effect of acute paracetamol overdose on plasma
and urinary electrolytes was investigated retrospectively, and more intensively
prospectively (Chapter II). The results of these studies showed paracetamol
overdose is associated with dose-related hypokalaemia, and kaliuresis of short
duration (less than 24 h post-ingestion). A previous study also showed
hypophosphatemia and dose-dependent phosphaturia following paracetamol
overdose [198], but this effect of paracetamol overdose on potassium handling
has not been previously reported. The findings of the current and previous
studies suggest a specific renal effect of paracetamol in overdose. This is likely
to be due to inhibitory effect on COX and PG synthesis.
Liver failure is a well-known toxic effect of serious paracetamol overdose. Renal
failure is less common than liver failure and occurs in only 1% of all patients with
paracetamol overdose. This has been reported to reach 10% in severe
paracetamol poisoning [18;91;270]. In most cases kidney failure occurs
concomitantly with liver failure, although isolated kidney damage following
paracetamol overdose has been reported [87;89;90].
In the third chapter of this thesis the frequency of renal failure, the associated
risk factors of renal injury and impact of kidney damage on outcomes in a large
cohort of patients who developed liver failure following paracetamol overdose
were examined. The results of the study showed that whereas renal impairment
is known to be relatively uncommon after mild to moderate paracetamol
173
overdose, it was a common complication in patients referred to a tertiary centre
following severe paracetamol poisoning. Important associated factors in
predicting poor outcome were hypotension, higher plasma creatinine
concentration, raised GGT and concomitant liver dysfunction at first presentation
to hospital. Presentations to hospital more than 24 h post-ingestion and
staggered overdose are also poor prognostic factors. However, the population
studied was from a single large UK centre and may therefore not be an accurate
reflection of patients in other liver units around the world.
In these patients with severe paracetamol overdose the relationship between
time of presentation and plasma electrolytes at presentation was examined. This
analysis showed that paracetamol overdose had time-dependent effects on
potassium. In the earlier stages (within 24 h), plasma potassium fall is in a dose-
related association with plasma paracetamol concentration, probably due to
pharmacological effect of paracetamol in the kidney described in chapter three.
In the later stage of toxicity, rise in plasma potassium is associated with rise in
plasma creatinine concentration secondary to the nephrotoxic effect of
paracetamol. Thus different mechanisms for changes in plasma potassium exist
at different time after poisoning. The finding of the prospective study in the
chapter 3 of the thesis showed kaliuresis. This suggests that fall in plasma
potassium in the earlier stage is due to renal loss, possibly due to inhibitory
effect of paracetamol on cyclo-oxygenase which alters renal hemodynamics and

174
tubular handling of electrolytes. Later changes in plasma potassium are likely
due to direct nephrotoxic effects of paracetamol.
In the fourth and fifth chapters the focus of the thesis was on antidote treatment
of paracetamol poisoning. Acetylcysteine (NAC) has long been used as a
treatment of choice for the treatment of paracetamol overdose in patients who
are at risk of hepatotoxicity. There have been reports of liver failure and death in
patients who had plasma paracetamol concentration below the current UK
treatment threshold nomogram, and who are therefore not treated [218].These
authors suggested lowering the current UK treatment threshold line. The report
generated controversy with both support [219] and criticism of the suggested
policy change [220;221;223;283]. To establish the numbers of patients
presenting with severe liver dysfunction when initial paracetamol concentrations
are below the current nomogram level, a systemic retrospective study survey on
patients presenting to two tertiary liver centres due to suspected liver failure
following paracetamol poisoning was performed in defined geographic area over
a specific time. The findings of the study showed that this event occurs only in a
very small proportion of patients. In the view of the rarity of the event, the costs
of therapy and risk of adverse reactions (ADRs) the study concluded that it is
unnecessary to lower the current UK threshold for antidote therapy in
paracetamol overdose.

175
One other important problem in the management of paracetamol overdose is
ADRs to intra venous infusions of NAC. The current protocol for antidote therapy
in paracetamol poisoning in the UK is the Prescott protocol [203]. Intravenous
infusion of NAC causes adverse reactions in some patients [237].The frequency
of such reactions, varies from 3-9% [238-240] to 48.4% [241] in different studies.
Some factors including asthma [244;245] and low paracetamol concentration
[239;241;245] have been reported to associated with ADRs. The patterns and
mechanisms of ADRs in man are not well described or understood. A non-
allergic release of histamine has been suggested as a potential mechanism of
ADRs [247]. In the last two studies described in the thesis (chapter VI) the
frequency, risk factors and mechanisms of ADRs to NAC were examined. In a
prospective study the factors that influence frequency of ADRs were studied. In
a smaller intensive study the role of histamine and other biomarkers as
underlying pathophysiological mechanisms in the ADRs were explored. The
results of these studies showed that nausea and vomiting (mild ADRs) occurred
in 60% of the patients, and anaphylactoid reactions (moderate and severe
ADRs) in 40%. Plasma paracetamol concentration at the time of admission and
male gender were protective, and having family history of allergy was a risk
factor in developing ADRs to NAC. The results of the intensive study showed the
severity of ADRs was associated with higher plasma histamine, and lower
plasma paracetamol concentrations. In this study plasma tryptase and other
markers of anaphylaxis and anaphylactoid reactions did not change significantly.
This may suggest a non-mast cell source for the release of histamine, possibly
176
from circulating basophils, which have low levels of tryptase. A relationship
between paracetamol concentration and severity of ADRs has already been
reported in the literature [231;239], but this is the first time histamine rise in
plasma has been shown to be an underlying mechanism of ADRs to NAC in
man, and related to degree of severity. It is possible that inhibitory effect of
paracetamol on cyclo-oxygenase and PG synthesis, which are important
mediators in anaphylactoid reactions, may contribute to the protective effect of
paracetamol against ADRs to NAC.
6-2: Conclusion From the work presented in this thesis it is possible to draw the following
conclusions:
1. Paracetamol overdose is associated with dose-related hypokalaemia, and
kaliuresis of short duration (<24 h), suggesting a specific renal effect of
paracetamol in overdose perhaps via cyclo-oxygenase and prostaglandin
synthesis inhibition. This effect seems distinct from any nephrotoxic effect of
paracetamol.
2. Creatinine at first admission appears to be a predictor of poor outcome in
paracetamol overdose. A better understanding of mechanisms involved in
causing renal dysfunction may offer potential therapeutic targets for improving

177
outcomes in this common poisoning. Additionally, staggered overdose, liver
dysfunction, raised GGT and hypotension at first admission are also risk factors
of both renal injury and poor prognosis.
3. Liver dysfunction following overdose causing plasma paracetamol
concentrations below the current UK treatment threshold occurs in very small
percentage of patients with paracetamol overdose. Thus in view of the rarity of
this event, the work reported here does not suggest that lowering the current
thresholds for antidotal treatment is likely to be cost-efficient.
4. ADRs to IV NAC predominantly involve the gastrointestinal (GI) and
respiratory system and skin. Chest pain was also a feature observed. GI
involvement is more common and the reaction is often mild. More severe ADRs
are associated with rash, bronchospasm and chest pain. The severity of ADRs
correlates with the extent of histamine release as measured in plasma.
Histamine release in the patients studied appeared independent of tryptase
release, suggesting a non-mast cell source. Paracetamol is protective against
adverse effects of NAC, suggesting a mechanism involving inhibition of PG
synthesis.

178
6-3: Weaknesses of the thesis The studies presented in this thesis had the following weakness:
1. The thesis presents studies on the theme of paracetamol overdose.
Studies in this area are challenging due to the nature of the population involved.
The recruitment rate was often slow and the study groups often thus smaller
than originally conceived.
2. Some of the studies were retrospective and therefore there was a limited
control on collection of required information. Clinical assays vary from time to
time and place to place which could affect the conclusions in the retrospective
cohorts studied. However, the large numbers involved will tend to reduce the
impact of this.
3. In the prospective studies the number of subjects who eventually completed
the whole study or in part was small. This was due to difficult population
involved, and complexity and time dependent nature of the design of the studies.
4. The studies have been conducted on a Scottish population, and therefore the
results might not be generally reproducible to other population due to difference
in cultural factors, genetic factors and social habits, including in particular
alcohol consumption.

179
5. In the NAC intensive study, due to the nature of study most patient were
recruited during the daylight when patients who present later after ingestion tend
to be admitted and therefore have lower plasma concentrations. As this was
found to be a risk factor in developing adverse reactions to NAC this may be a
confounder. Thus the frequency of ADRs to NAC in this group was not an
accurate reflection of all paracetamol admissions to hospital who received NAC
following overdose, as is shown from the larger cohort studied. Sample
collection and handling in a clinical environment also present challenges that
might have affected sample stability, although careful steps were taken to
minimise this risk.
6-4: Further studies The findings of this thesis suggest following futures studies:
1. Further studies are required to measure the effect of paracetamol overdose
on renal function and hemodynamics using more sensitive surrogate markers of
renal injury. Measurement of renal PG, aldosterone and plasma renin activity
would also give us a better understanding of renal effects of paracetamol in
overdose.
2. Further studies on healthy volunteers are required to examine the effect of
NAC on kidney function.

180
3. Further studies are required to examine whether more subtle biomarkers of
renal dysfunction such as urinary enzymes biomarkers can be used as
predicting factors of renal injury at early stage of renal impairment following
paracetamol overdose, and whether these biomarkers are useful in predicting
liver injury.
4. Further studies are required for greater understanding of mechanisms of
paracetamol nephrotoxicity in severe paracetamol poisoning and whether the
renal injury is an independent phenomenon or as consequence of liver damage.
5. Further studies at the molecular level are required to elucidate the specific
effects of paracetamol on PG synthesis and its relationship with histamine
release in anaphylactoid reactions to IV NAC.
6. Further study is required to investigate the frequency of ADRs on patients
with paracetamol overdose who are pre-treated with antihistamine and
antiemetics before receiving antidote treatment.
7. Further studies are required to investigate the underlying mechanisms of
anticoagulant properties of paracetamol and NAC.

181
Index
182
Reference List
1. Bertolini A, Ferrari A, Ottani A, Guerzoni S, Tacchi R, Leone S. Paracetamol: new vistas of an old drug. CNS.Drug Rev. 2006; 12:250-275.
2. Brodie BB, Axelrod J. The fate of acetanilide in man. J Pharmacol Exp Ther 1948; 94:29-38.
3. The chemical heritage foundation. Pharmaceuticals Achievers. The festivals of Analgesics. The Chemical Heritage Foundation, 2001. internet: http://www.chemheritage.org/EducationalServices/pharm/asp/asp08.htm . 2001. Ref Type: Internet Communication
4. Abbott FV, Fraser MI. Use and abuse of over-the-counter analgesic agents. J Psychiatry Neurosci. 1998; 23:13-34.
5. Bentley E, Mackie IC. Trends in prescriptions of paracetamol for children. BMJ 1995; 311:362.
6. Rang HP, Dale MM, Riter JM. Pharmacology, 5th Edition, Churchill Livingstone, 2003.
7. Aronoff DM, Oates JA, Boutaud O. New insights into the mechanism of action of acetaminophen: Its clinical pharmacologic characteristics reflect its inhibition of the two prostaglandin H2 synthases. Clin.Pharmacol Ther 2006; 79:9-19.
8. Graham GG, Scott KF. Mechanism of action of paracetamol. Am.J Ther. 2005; 12:46-55.
9. Vane JR. Inhibition of prostaglandin synthesis as a mechanism of action for aspirin-like drugs. Nat.New Biol. 1971; 231:232-235.
10. Hinz B, Cheremina O, Brune K. Acetaminophen (paracetamol) is a selective cyclooxygenase-2 inhibitor in man. FASEB J. 2008; 22:383-390.

183
11. Chandrasekharan NV, Dai H, Roos KL et al. COX-3, a cyclooxygenase-1 variant inhibited by acetaminophen and other analgesic/antipyretic drugs: cloning, structure, and expression. Proc.Natl.Acad.Sci.U.S.A 2002; 99:13926-13931.
12. Botting R, Ayoub SS. COX-3 and the mechanism of action of paracetamol/acetaminophen. Prostaglandins Leukot.Essent.Fatty Acids 2005; 72:85-87.
13. Kis B, Snipes JA, Busija DW. Acetaminophen and the cyclooxygenase-3 puzzle: sorting out facts, fictions, and uncertainties. J Pharmacol Exp Ther 2005; 315:1-7.
14. Pini LA, Sandrini M, Vitale G. The antinociceptive action of paracetamol is associated with changes in the serotonergic system in the rat brain. Eur.J Pharmacol 1996; 308:31-40.
15. Sandrini M, Romualdi P, Capobianco A et al. The effect of paracetamol on nociception and dynorphin A levels in the rat brain. Neuropeptides 2001; 35:110-116.
16. Bjorkman R, Hallman KM, Hedner J, Hedner T, Henning M. Acetaminophen blocks spinal hyperalgesia induced by NMDA and substance P. Pain 1994; 57:259-264.
17. Hogestatt ED, Jonsson BA, Ermund A et al. Conversion of acetaminophen to the bioactive N-acylphenolamine AM404 via fatty acid amide hydrolase-dependent arachidonic acid conjugation in the nervous system. J Biol.Chem. 2005; 280:31405-31412.
18. Prescott LF. Paracetamol overdosage. Pharmacological considerations and clinical management. Drugs 1983; 25:290-314.
19. Bizovi K, Smilkstein M. Acetaminophen.In: Goldfrank's Toxicologic Emergencies, 7 Edition, eds Goldfra, Flomenbaum NE, Lewin NA, How, Hoffman RS, Nelson RS, New York: McGraw-Hill, 2002: 480-501.
20. Divoll M, Greenblatt DJ, Ameer B, Abernethy DR. Effect of food on acetaminophen absorption in young and elderly subjects. J Clin.Pharmacol 1982; 22:571-576.
21. Kumpulainen E, Kokki H, Halonen T, Heikkinen M, Savolainen J, Laisalmi M. Paracetamol (acetaminophen) penetrates readily into the cerebrospinal fluid of children after intravenous administration. Pediatrics 2007; 119:766-771.

184
22. Levy G, Garrettson LK, Soda DM. Letter: Evidence of placental transfer of acetaminophen. Pediatrics 1975; 55:895.
23. Rollins DE, von BC, Glaumann H, Moldeus P, Rane A. Acetaminophen: potentially toxic metabolite formed by human fetal and adult liver microsomes and isolated fetal liver cells. Science 1979; 205:1414-1416.
24. Corcoran GB, Mitchell JR, Vaishnav YN, Horning EC. Evidence that acetaminophen and N-hydroxyacetaminophen form a common arylating intermediate, N-acetyl-p-benzoquinoneimine. Mol.Pharmacol 1980; 18:536-542.
25. Miner DJ, Kissinger PT. Evidence for the involvement of N-acetyl-p- quinoneimine in acetaminophen metabolism. Biochem.Pharmacol 1979; 28:3285-3290.
26. Mitchell JR, Jollow DJ, Potter WZ, Davis DC, Gillette JR, Brodie BB. Acetaminophen-induced hepatic necrosis. I. Role of drug metabolism. J.Pharmacol.Exp.Ther. 1973; 187:185-194.
27. Mitchell JR, Jollow DJ, Potter WZ, Gillette JR, Brodie BB. Acetaminophen-induced hepatic necrosis. IV. Protective role of glutathione. J Pharmacol Exp Ther 1973; 187:211-217.
28. Prescott L. The Metabolism of paracetamol.In: Paracetamol: A Critical Bibliographic Review London: Taylor & Francis, 1996: 67-102.
29. Miller RP, Roberts RJ, Fischer LJ. Acetaminophen elimination kinetics in neonates, children, and adults. Clin.Pharmacol Ther 1976; 19:284-294.
30. Miners JO, Attwood J, Birkett DJ. Determinants of acetaminophen metabolism: effect of inducers and inhibitors of drug metabolism on acetaminophen's metabolic pathways. Clin.Pharmacol Ther 1984; 35:480-486.
31. British National Formulary. British Medical Association; Royal Pharmaceutical Society of Great Britain, 47 Edition, Pharmaceutical Press, 2008.
32. Draganov P, Durrence H, Cox C, Reuben A. Alcohol-acetaminophen syndrome. Even moderate social drinkers are at risk. Postgrad.Med. 2000; 107:189-195.
33. Teschke R, Stutz G, Strohmeyer G. Increased paracetamol-induced hepatotoxicity after chronic alcohol consumption. Biochem.Biophys.Res.Commun. 1979; 91:368-374.

185
34. Zimmerman HJ, Maddrey WC. Acetaminophen (paracetamol) hepatotoxicity with regular intake of alcohol: analysis of instances of therapeutic misadventure. Hepatology 1995; 22:767-773.
35. Prescott LF. Paracetamol, alcohol and the liver. Br.J Clin.Pharmacol 2000; 49:291-301.
36. Thummel KE, Slattery JT, Nelson SD. Mechanism by which ethanol diminishes the hepatotoxicity of acetaminophen. J Pharmacol Exp Ther 1988; 245:129-136.
37. Tredger JM, Smith HM, Read RB, Williams R. Effects of ethanol ingestion on the metabolism of a hepatotoxic dose of paracetamol in mice. Xenobiotica 1986; 16:661-670.
38. Tighe TV, Walter FG. Delayed toxic acetaminophen level after initial four hour nontoxic level. J Toxicol.Clin.Toxicol. 1994; 32:431-434.
39. Cetaruk EW, Dart RC, Hurlbut KM, Horowitz RS, Shih R. Tylenol Extended Relief overdose. Ann.Emerg.Med 1997; 30:104-108.
40. Fagan E, Wannan G. Reducing paracetamol overdoses. BMJ 1996; 313:1417-1418.
41. Thomson JS, Prescott LF. Liver damage and impaired glucose tolerance after paracetamol overdosage. Br.Med.J 1966; 2:506-507.
42. Davidson DG, Eastham WN. Acute liver necrosis following overdose of paracetamol. Br.Med.J 1966; 2:497-499.
43. Hawton K, Fagg J. Trends in deliberate self poisoning and self injury in Oxford, 1976-90. BMJ 1992; 304:1409-1411.
44. Hawton K, Ware C, Mistry H et al. Why patients choose paracetamol for self poisoning and their knowledge of its dangers. BMJ 1995; 310:164.
45. Hawton K, Ware C, Mistry H et al. Paracetamol self-poisoning. Characteristics, prevention and harm reduction. Br.J.Psychiatry 1996; 168:43-48.
46. McLoone P, Crombie IK. Hospitalisation for deliberate self-poisoning in Scotland from 1981 to 1993: trends in rates and types of drugs used. Br.J.Psychiatry 1996; 169:81-85.

186
47. Hawkins LC, Edwards JN, Dargan PI. Impact of restricting paracetamol pack sizes on paracetamol poisoning in the United Kingdom: a review of the literature. Drug Saf 2007; 30:465-479.
48. Augustin C, Schmoldt A. [Increase in paracetamol poisoning]. Beitr.Gerichtl.Med. 1991; 49:127-131.
49. Ott P, Dalhoff K, Hansen PB, Loft S, Poulsen HE. Consumption, overdose and death from analgesics during a period of over-the-counter availability of paracetamol in Denmark. J.Intern.Med. 1990; 227:423-428.
50. Ameer B, Greenblatt DJ. Acetaminophen. Ann.Intern.Med. 1977; 87:202-209.
51. Bray GP. Liver failure induced by paracetamol. BMJ 1993; 306:157-158.
52. Khashab M, Tector AJ, Kwo PY. Epidemiology of acute liver failure. Curr.Gastroenterol.Rep. 2007; 9:66-73.
53. Makin AJ, Wendon J, Williams R. A 7-year experience of severe acetaminophen-induced hepatotoxicity (1987-1993). Gastroenterology 1995; 109:1907-1916.
54. O'Grady JG, Wendon J, Tan KC et al. Liver transplantation after paracetamol overdose. BMJ 1991; 303:221-223.
55. Schiodt F, Atillasoy E, Shskil A, Sciff E, Calwell C, Cowdley Keal. Etiology and prognosis for 295 patients with acute liver failure (ALF) in the US. Gastroenterology 1997; 112.
56. Schiodt FV, Atillasoy E, Shakil AO et al. Etiology and outcome for 295 patients with acute liver failure in the United States. Liver Transpl.Surg. 1999; 5:29-34.
57. Flanagan RJ, Rooney C. Recording acute poisoning deaths. Forensic Sci.Int. 2002; 128:3-19.
58. O'Grady JG. Paracetamol-induced acute liver failure: prevention and management. J.Hepatol. 1997; 26 Suppl 1:41-46.
59. Spooner J, Harvey J. Paracetamol overdoseage-facts not misconceptions. Pharm J 1993; 250:706-707.
60. Atcha Z. Death related death in England and Wales 1993-1997. Health Statistics Quarterly 2000; 7:5-9.
187
61. Sheen CL, Dillon JF, Bateman DN, Simpson KJ, MacDonald TM. Paracetamol-related deaths in Scotland, 1994-2000. Br.J.Clin.Pharmacol. 2002; 54:430-432.
62. Paracetamol and asprin. Committee on Safety of Medicines,MCA. Current Problems Pharmacovigilance 1997; 23:9.
63. Hawton K, Townsend E, Deeks J et al. Effects of legislation restricting pack sizes of paracetamol and salicylate on self poisoning in the United Kingdom: before and after study. BMJ 2001; 322:1203-1207.
64. Bateman DN, Gorman DR, Bain M, Inglis JH, House FR, Murphy D. Legislation restricting paracetamol sales and patterns of self-harm and death from paracetamol-containing preparations in Scotland. Br.J.Clin.Pharmacol. 2006; 62:573-581.
65. Morgan OW, Griffiths C, Majeed A. Interrupted time-series analysis of regulations to reduce paracetamol (acetaminophen) poisoning. PLoS.Med 2007; 4:e105.
66. Anker A. Acetaminophen.In: Clinical Toxicology, 1 Edition, eds Ford M, Delaney K, Ling L, Erikson T, W. B. Saunders Company, 2001: 265-274.
67. Dai Y, Cederbaum AI. Cytotoxicity of acetaminophen in human cytochrome P4502E1-transfected HepG2 cells. J Pharmacol Exp Ther 1995; 273:1497-1505.
68. Potter WZ, Davis DC, Mitchell JR, Jollow DJ, Gillette JR, Brodie BB. Acetaminophen-induced hepatic necrosis. 3. Cytochrome P-450-mediated covalent binding in vitro. J Pharmacol Exp Ther 1973; 187:203-210.
69. Henretig FM, Selbst SM, Forrest C et al. Repeated acetaminophen overdosing. Causing hepatotoxicity in children. Clinical reports and literature review. Clin.Pediatr.(Phila) 1989; 28:525-528.
70. Lauterburg BH, Velez ME. Glutathione deficiency in alcoholics: risk factor for paracetamol hepatotoxicity. Gut 1988; 29:1153-1157.
71. Whitcomb DC, Block GD. Association of acetaminophen hepatotoxicity with fasting and ethanol use. JAMA 1994; 272:1845-1850.
72. Antlitz AM, Mead JA, Jr., Tolentino MA. Potentiation of oral anticoagulant therapy by acetaminophen. Curr.Ther.Res.Clin.Exp. 1968; 10:501-507.

188
73. Hylek EM, Heiman H, Skates SJ, Sheehan MA, Singer DE. Acetaminophen and other risk factors for excessive warfarin anticoagulation. JAMA 1998; 279:657-662.
74. Whyte IM, Buckley NA, Reith DM, Goodhew I, Seldon M, Dawson AH. Acetaminophen causes an increased International Normalized Ratio by reducing functional factor VII. Ther.Drug Monit. 2000; 22:742-748.
75. Whyte IM, Seldon M, Buckley NA, Dawson AH. Effect of paracetamol poisoning on international normalised ratio. Lancet 2003; 361:429-430.
76. Hylek EM. Paracetamol (acetaminophen) and warfarin interaction: unraveling the pivotal role of the vitamin K cycle. Thromb.Haemost. 2004; 92:672-673.
77. Mahe I, Bertrand N, Drouet L et al. Interaction between paracetamol and warfarin in patients: a double-blind, placebo-controlled, randomized study. Haematologica 2006; 91:1621-1627.
78. Parra D, Beckey NP, Stevens GR. The effect of acetaminophen on the international normalized ratio in patients stabilized on warfarin therapy. Pharmacotherapy 2007; 27:675-683.
79. Gadisseur AP, Van Der Meer FJ, Rosendaal FR. Sustained intake of paracetamol (acetaminophen) during oral anticoagulant therapy with coumarins does not cause clinically important INR changes: a randomized double-blind clinical trial. J.Thromb.Haemost. 2003; 1:714-717.
80. Fattinger K, Frisullo R, Masche U, Braunschweig S, Meier PJ, Roos M. No clinically relevant drug interaction between paracetamol and phenprocoumon based on a pharmacoepidemiological cohort study in medical inpatients. Eur.J.Clin.Pharmacol. 2002; 57:863-867.
81. Boyer TD, Rouff SL. Acetaminophen-induced hepatic necrosis and renal failure. JAMA 1971; 218:440-441.
82. Brown RA. Hepatic and renal damage with paractamol overdosage. J.Clin.Pathol. 1968; 21:793.
83. Clark R, Borirakchanyavat V, Davidson AR et al. Hepatic damage and death from overdose of paracetamol. Lancet 1973; 1:66-70.
84. Cobden I, Record CO, Ward MK, Kerr DN. Paracetamol-induced acute renal failure in the absence of fulminant liver damage. Br Med J (Clin Res.Ed) 1982; 284:21-22.
189
85. Curry RW, Jr., Robinson JD, Sughrue MJ. Acute renal failure after acetaminophen ingestion. JAMA 1982; 247:1012-1014.
86. Davenport A, Finn R. Paracetamol (acetaminophen) poisoning resulting in acute renal failure without hepatic coma. Nephron 1988; 50:55-56.
87. Eguia L, Materson BJ. Acetaminophen-related acute renal failure without fulminant liver failure. Pharmacotherapy 1997; 17:363-370.
88. Jeffery WH, Lafferty WE. Acute renal failure after acetaminophen overdose: report of two cases. Am.J.Hosp.Pharm. 1981; 38:1355-1358.
89. Kher K, Makker S. Acute renal failure due to acetaminophen ingestion without concurrent hepatotoxicity. Am.J Med 1987; 82:1280-1281.
90. Prescott LF, Proudfoot AT, Cregeen RJ. Paracetamol-induced acute renal failure in the absence of fulminant liver damage. Br Med J (Clin Res.Ed) 1982; 284:421-422.
91. Hamlyn AN, Douglas AP, James O. The spectrum of paracetamol (acetaminophen) overdose: clinical and epidemiological studies. Postgrad.Med J 1978; 54:400-404.
92. Wilkinson SP, Moodie H, Arroyo VA, Williams R. Frequency of renal impairment in paracetamol overdose compared with other causes of acute liver damage. J.Clin.Pathol. 1977; 30:141-143.
93. Feinfeld D. Renal Principles.In: Gold Frank's Toxicological Emergencies, 2 Edition, eds Gold Frank, Flomenbaum, Lewin, Howland, Hoffman, Nelson, Mc Graw-Hill, 2002: 346-363.
94. Weiner ID, Linas SL, Wingo C. Disorders of potssium metabolism.In: Comprehensive Clinical Nephrology eds Johnson RJ, Freehally J, Harcourt, 2003: 109-121.
95. Levi M, Popovtzer M. Disorders of Phosphate Balance.In: Atlas of Diseases of The Kidney ed Schrier P, Current Medicine, Inc.http://www.kidneyatlas.org/book1/adk1_03.pdf, 1999: 1-14.
96. Osorio F, Linas L. Disorders of Potssium Metabolism.In: Atlas of Diseases of The Kidney ed Schrier P, Current Medicine, Inc.http://www.kidneyatlas.org/book1/adk1_03.pdf, 1999: 1-18.
97. Adrogue HJ, Madias NE. Changes in plasma potassium concentration during acute acid-base disturbances. Am.J Med 1981; 71:456-467.

190
98. Williams ME, Gervino EV, Rosa RM et al. Catecholamine modulation of rapid potassium shifts during exercise. N.Engl.J Med 1985; 312:823-827.
99. Giebisch G, Wang W. Potassium transport: from clearance to channels and pumps. Kidney Int. 1996; 49:1624-1631.
100. Giebisch G. Renal potassium transport: mechanisms and regulation. Am.J Physiol 1998; 274:F817-F833.
101. Hamm LL, Gillespie C, Klahr S. NH4Cl inhibition of transport in the rabbit cortical collecting tubule. Am.J Physiol 1985; 248:F631-F637.
102. Bia MJ, DeFronzo RA. Extrarenal potassium homeostasis. Am.J Physiol 1981; 240:F257-F268.
103. Drueke TB, Lacour B. Disorders of Calcium, Phosphate, and magnesium Metabolism.In: Comprehensive Clinical Nephrology, 2th Edition, eds Johnson RJ, Feehally J, Mosby, 2003: 123-141.
104. Murer H, Hernando N, Forster L, Biber J. Molecular mechanisms in proximal tubular and small intestinal phosphate reabsorption (plenary lecture). Mol.Membr.Biol. 2001; 18:3-11.
105. Murer H, Lotscher M, Kaissling B, Levi M, Kempson SA, Biber J. Renal brush border membrane Na/Pi-cotransport: molecular aspects in PTH-dependent and dietary regulation. Kidney Int. 1996; 49:1769-1773.
106. Murer H, Biber J. Molecular mechanisms of renal apical Na/phosphate cotransport. Annu.Rev.Physiol 1996; 58:607-618.
107. Schlondorff D. Renal prostaglandin synthesis. Sites of production and specific actions of prostaglandins. Am.J Med 1986; 81:1-11.
108. Dunn MJ. Nonsteroidal antiinflammatory drugs and renal function. Annu.Rev.Med 1984; 35:411-428.
109. Patrono C, Ciabattoni G, Remuzzi G et al. Functional significance of renal prostacyclin and thromboxane A2 production in patients with systemic lupus erythematosus. J Clin.Invest 1985; 76:1011-1018.
110. Murray MD, Brater DC. Renal toxicity of the nonsteroidal anti-inflammatory drugs. Annu.Rev.Pharmacol.Toxicol. 1993; 33:435-465.
111. Watson W. Nonsteroidal Antiinflammatory Agents.In: Goldfrank's Toxicologic Emergencies, 7 Edition, eds Goldfrank L, Flomenbaum N, Lewin N, Howland M, Hoffman R, Nelson L, McGraw-Hill, 2002: 528-534.

191
112. DeFronzo RA. Hyperkalemia and hyporeninemic hypoaldosteronism. Kidney Int. 1980; 17:118-134.
113. Tan SY, Burton M. Hyporeninemic hypoaldosteronism. An overlooked cause of hyperkalemia. Arch.Intern.Med 1981; 141:30-33.
114. McGiff JC. Cytochrome P-450 metabolism of arachidonic acid. Annu.Rev.Pharmacol.Toxicol. 1991; 31:339-369.
115. Crofford LJ. COX-1 and COX-2 tissue expression: implications and predictions. J Rheumatol.Suppl 1997; 49:15-19.
116. Brater DC. Renal effects of cyclooxygyenase-2-selective inhibitors. J Pain Symptom.Manage. 2002; 23:S15-S20.
117. Morales E, Mucksavage JJ. Cyclooxygenase-2 inhibitor-associated acute renal failure: case report with rofecoxib and review of the literature. Pharmacotherapy 2002; 22:1317-1321.
118. Morgan B. Renal Failure.In: Clinical Toxicology, 1 Edition, eds Ford M, Delaney K, Ling L, Erickson T, WB Saunders Company, 2001: 193-200.
119. Porter GA, Palmer BF, Henrich WL. Clinical relevance.In: Clinical Nephrotoxin, 2 Edition, eds De Bore ME, Porter GA, Bennet WM, Verpooten GA, Kluwer Academia, 2003: 2-20.
120. Shirley D, Capasso G, Unwin R. Renal physiology.In: Comprehensive Clinical Nephrology, 2 Edition, eds Johnson R, Freehally J, Mosby, 2003: 13-27.
121. Jefferson A, AZager R. Causes of Acute Renal Failure.In: Comprehensive Clinical Nephrology, 2 Edition, eds Johnson R, Feehally J, Mosby, 2003: 207-224.
122. Brivet FG, Kleinknecht DJ, Loirat P, Landais PJ. Acute renal failure in intensive care units--causes, outcome, and prognostic factors of hospital mortality; a prospective, multicenter study. French Study Group on Acute Renal Failure. Crit Care Med 1996; 24:192-198.
123. Thadhani R, Pascual M, Bonventre JV. Acute renal failure. N.Engl.J Med 1996; 334:1448-1460.
124. Kaufman J, Dhakal M, Patel B, Hamburger R. Community-acquired acute renal failure. Am.J Kidney Dis. 1991; 17:191-198.
192
125. Hou SH, Bushinsky DA, Wish JB, Cohen JJ, Harrington JT. Hospital-acquired renal insufficiency: a prospective study. Am.J Med 1983; 74:243-248.
126. Shankel SW, Johnson DC, Clark PS, Shankel TL, O'Neil WM, Jr. Acute renal failure and glomerulopathy caused by nonsteroidal anti-inflammatory drugs. Arch.Intern.Med 1992; 152:986-990.
127. Huerta C, Castellsague J, Varas-Lorenzo C, Garcia Rodriguez LA. Nonsteroidal anti-inflammatory drugs and risk of ARF in the general population. Am.J Kidney Dis. 2005; 45:531-539.
128. Moore RD, Smith CR, Lipsky JJ, Mellits ED, Lietman PS. Risk factors for nephrotoxicity in patients treated with aminoglycosides. Ann.Intern.Med 1984; 100:352-357.
129. Rudnick MR, Goldfarb S, Wexler L et al. Nephrotoxicity of ionic and nonionic contrast media in 1196 patients: a randomized trial. The Iohexol Cooperative Study. Kidney Int. 1995; 47:254-261.
130. Cooper K, Bennett WM. Nephrotoxicity of common drugs used in clinical practice. Arch.Intern.Med 1987; 147:1213-1218.
131. Pascual J, Liano F, Ortuno J. The elderly patient with acute renal failure. J Am.Soc.Nephrol. 1995; 6:144-153.
132. Romao Junior JE, Haiashi AR, Vidonho Junior AF et al. [Causes and prognosis of acute renal failure in elderly patients]. Rev.Assoc.Med Bras. 2000; 46:212-217.
133. Pascual J, Orofino L, Liano F et al. Incidence and prognosis of acute renal failure in older patients. J Am.Geriatr.Soc. 1990; 38:25-30.
134. Sural S, Sharma RK, Gupta A, Sharma AP, Gulati S. Acute renal failure associated with liver disease in India: etiology and outcome. Ren Fail. 2000; 22:623-634.
135. Corwin HL, Teplick RS, Schreiber MJ, Fang LS, Bonventre JV, Coggins CH. Prediction of outcome in acute renal failure. Am.J Nephrol. 1987; 7:8-12.
136. Zanardo G, Michielon P, Paccagnella A et al. Acute renal failure in the patient undergoing cardiac operation. Prevalence, mortality rate, and main risk factors. J Thorac.Cardiovasc.Surg. 1994; 107:1489-1495.

193
137. Novis BK, Roizen MF, Aronson S, Thisted RA. Association of preoperative risk factors with postoperative acute renal failure. Anesth.Analg. 1994; 78:143-149.
138. Thatte L, Vaamonde CA. Drug-induced nephrotoxicity: the crucial role of risk factors. Postgrad.Med 1996; 100:83-8, 91.
139. Bagshaw SM, Gibney RT. Conventional markers of kidney function. Crit Care Med. 2008; 36:S152-S158.
140. Singhal PC, Abramovici M, Venkatesan J, Mattana J. Hypokalemia and rhabdomyolysis. Miner.Electrolyte Metab 1991; 17:335-339.
141. Rastegar A, Soleimani M. Hypokalaemia and hyperkalaemia. Postgrad.Med J 2001; 77:759-764.
142. Knochel JP, Schlein EM. On the mechanism of rhabdomyolysis in potassium depletion. J Clin.Invest 1972; 51:1750-1758.
143. Siscovick DS, Raghunathan TE, Psaty BM et al. Diuretic therapy for hypertension and the risk of primary cardiac arrest. N.Engl.J.Med. 1994; 330:1852-1857.
144. Garcia E, Nakhleh N, Simmons D, Ramsay C. Profound hypokalemia: unusual presentation and management in a 12-year-old boy. Pediatr.Emerg.Care 2008; 24:157-160.
145. Brown MJ, Brown DC, Murphy MB. Hypokalemia from beta2-receptor stimulation by circulating epinephrine. N.Engl.J Med 1983; 309:1414-1419.
146. Lifton RP, Dluhy RG, Powers M et al. A chimaeric 11 beta-hydroxylase/aldosterone synthase gene causes glucocorticoid-remediable aldosteronism and human hypertension. Nature 1992; 355:262-265.
147. White PC, New MI, Dupont B. Congenital adrenal hyperplasia (2). N.Engl.J Med 1987; 316:1580-1586.
148. Funder JW, Pearce PT, Smith R, Smith AI. Mineralocorticoid action: target tissue specificity is enzyme, not receptor, mediated. Science 1988; 242:583-585.
149. Aravena C, Salas I, Tagle R et al. [Hypokalemia, hypovolemia and electrocardiographic changes due to furosemide abuse. Report of one case]. Rev.Med Chil. 2007; 135:1456-1462.

194
150. Schwartz AB. Diuretic-induced hypokalemia. Am.Fam.Physician 1975; 11:101-104.
151. Gill MA, DuBe JE, Young WW. Hypokalemic, metabolic alkalosis induced by high-dose ampicillin sodium. Am.J Hosp.Pharm 1977; 34:528-531.
152. Shetty AK, Rogers NL, Mannick EE, Aviles DH. Syndrome of hypokalemic metabolic alkalosis and hypomagnesemia associated with gentamicin therapy: case reports. Clin.Pediatr.(Phila) 2000; 39:529-533.
153. Falagas ME, Ntziora F, Betsi GI, Samonis G. Caspofungin for the treatment of fungal infections: a systematic review of randomized controlled trials. Int.J Antimicrob.Agents 2007; 29:136-143.
154. Kintzel PE. Anticancer drug-induced kidney disorders. Drug Saf 2001; 24:19-38.
155. Miyazaki J, Kawai K. [Prevention and management of nephrotoxicity from anti-cancer agents]. Nippon Rinsho 2003; 61:973-977.
156. Taher SM, Anderson RJ, McCartney R, Popovtzer MM, Schrier RW. Renal tubular acidosis associated with toluene "sniffing". N.Engl.J Med 1974; 290:765-768.
157. Whang R. Magnesium deficiency: pathogenesis, prevalence, and clinical implications. Am.J Med 1987; 82:24-29.
158. Dyckner T, Wester PO. Potassium/magnesium depletion in patients with cardiovascular disease. Am.J Med 1987; 82:11-17.
159. Knochel JP, Dotin LN, Hamburger RJ. Pathophysiology of intense physical conditioning in a hot climate. I. Mechanisms of potassium depletion. J Clin.Invest 1972; 51:242-255.
160. Finn W, Porter G. Urinary biomarkers and nephrotoxicity.In: Clinical Nephrotoxins, Renal Injury from Drugs and Chemicals, 2 Edition, eds De Broe M, Porter G, Bennett W, Verpooten G, Lodon: Kluwer Academic Publisher, 2003: 622-655.
161. Campbell NR, Baylis B. Renal impairment associated with an acute paracetamol overdose in the absence of hepatotoxicity. Postgrad.Med.J 1992; 68:116-118.
162. Bjorck S, Svalander CT, Aurell M. Acute renal failure after analgesic drugs including paracetamol (acetaminophen). Nephron 1988; 49:45-53.

195
163. Jones AL, Prescott LF. Unusual complications of paracetamol poisoning. QJM. 1997; 90:161-168.
164. Kleinman JG, Breitenfield RV, Roth DA. Acute renal failure associated with acetaminophen ingestion: report of a case and review of the literature. Clin.Nephrol. 1980; 14:201-205.
165. Price LM, Poklis A, Johnson DE. Fatal acetaminophen poisoning with evidence of subendocardial necrosis of the heart. J Forensic Sci. 1991; 36:930-935.
166. Pusey CD, Saltissi D, Bloodworth L, Rainford DJ, Christie JL. Drug associated acute interstitial nephritis: clinical and pathological features and the response to high dose steroid therapy. Q.J Med. 1983; 52:194-211.
167. Hart SG, Beierschmitt WP, Wyand DS, Khairallah EA, Cohen SD. Acetaminophen nephrotoxicity in CD-1 mice. I. Evidence of a role for in situ activation in selective covalent binding and toxicity. Toxicol.Appl.Pharmacol 1994; 126:267-275.
168. Mitchell JR, McMurtry RJ, Statham CN, Nelson SD. Molecular basis for several drug-induced nephropathies. Am.J Med 1977; 62:518-526.
169. Newton JF, Kuo CH, Gemborys MW, Mudge GH, Hook JB. Nephrotoxicity of p-aminophenol, a metabolite of acetaminophen, in the fischer 344 rat. Toxicol.Appl.Pharmacol. 1982; 65:336-344.
170. Fowler LM, Moore RB, Foster JR, Lock EA. Nephrotoxicity of 4-aminophenol glutathione conjugate. Hum.Exp Toxicol. 1991; 10:451-459.
171. Eyanagi R, Hisanari Y, Shigematsu H. Studies of paracetamol/phenacetin toxicity: isolation and characterization of p-aminophenol-glutathione conjugate. Xenobiotica 1991; 21:793-803.
172. Stern ST, Bruno MK, Horton RA, Hill DW, Roberts JC, Cohen SD. Contribution of acetaminophen-cysteine to acetaminophen nephrotoxicity II. Possible involvement of the gamma-glutamyl cycle. Toxicol.Appl.Pharmacol. 2005; 202:160-171.
173. Moller-Hartmann W, Siegers CP. Nephrotoxicity of paracetamol in the rat--mechanistic and therapeutic aspects. J.Appl.Toxicol. 1991; 11:141-146.
174. Emeigh Hart SG, Wyand DS, Khairallah EA, Cohen SD. Acetaminophen nephrotoxicity in the CD-1 mouse. II. Protection by probenecid and AT-

196
125 without diminution of renal covalent binding. Toxicol.Appl.Pharmacol. 1996; 136:161-169.
175. Trumper L, Monasterolo LA, Elias MM. Nephrotoxicity of acetaminophen in male Wistar rats: role of hepatically derived metabolites. J.Pharmacol.Exp.Ther. 1996; 279:548-554.
176. Commandeur JN, Stijntjes GJ, Vermeulen NP. Enzymes and transport systems involved in the formation and disposition of glutathione S-conjugates. Role in bioactivation and detoxication mechanisms of xenobiotics. Pharmacol.Rev. 1995; 47:271-330.
177. Wilson JT, Kasantikul V, Harbison R, Martin D. Death in an adolescent following an overdose of acetaminophen and phenobarbital. Am.J Dis.Child 1978; 132:466-473.
178. Remmer H. The role of the liver in drug metabolism. Am.J Med. 1970; 49:617-629.
179. Hoivik DJ, Manautou JE, Tveit A, Hart SG, Khairallah EA, Cohen SD. Gender-related differences in susceptibility to acetaminophen-induced protein arylation and nephrotoxicity in the CD-1 mouse. Toxicol.Appl.Pharmacol. 1995; 130:257-271.
180. Hu JJ, Lee MJ, Vapiwala M, Reuhl K, Thomas PE, Yang CS. Sex-related differences in mouse renal metabolism and toxicity of acetaminophen. Toxicol.Appl.Pharmacol. 1993; 122:16-26.
181. Tarloff JB, Khairallah EA, Cohen SD, Goldstein RS. Sex- and age-dependent acetaminophen hepato- and nephrotoxicity in Sprague-Dawley rats: role of tissue accumulation, nonprotein sulfhydryl depletion, and covalent binding. Fundam.Appl.Toxicol. 1996; 30:13-22.
182. Perneger TV, Whelton PK, Klag MJ. Risk of kidney failure associated with the use of acetaminophen, aspirin, and nonsteroidal antiinflammatory drugs. N.Engl.J Med. 1994; 331:1675-1679.
183. von Mach MA, Hermanns-Clausen M, Koch I et al. Experiences of a poison center network with renal insufficiency in acetaminophen overdose: an analysis of 17 cases. Clin Toxicol.(Phila) 2005; 43:31-37.
184. Prescott L. Paracetamol, A Critical Bibliographic Review London: Taylor & Francis, 1996: 440-442.
197
185. Panos MZ, Anderson JV, Forbes A et al. Human atrial natriuretic factor and renin-aldosterone in paracetamol induced fulminant hepatic failure. Gut 1991; 32:85-89.
186. Guarner F, Hughes RD, Gimson AE, Williams R. Renal function in fulminant hepatic failure: haemodynamics and renal prostaglandins. Gut 1987; 28:1643-1647.
187. Prescott LF, Mattison P, Menzies DG, Manson LM. The comparative effects of paracetamol and indomethacin on renal function in healthy female volunteers. Br.J Clin.Pharmacol 1990; 29:403-412.
188. Garella S, Matarese RA. Renal effects of prostaglandins and clinical adverse effects of nonsteroidal anti-inflammatory agents. Medicine (Baltimore) 1984; 63:165-181.
189. Kimberly RP, Sherman RL, Mouradian J, Lockshin MD. Apparent acute renal failure associated with therapeutic aspirin and ibuprofen administration. Arthritis Rheum. 1979; 22:281-285.
190. Blackshear JL, Napier JS, Davidman M, Stillman MT. Renal complications of nonsteroidal antiinflammatory drugs: identification and monitoring of those at risk. Semin.Arthritis Rheum. 1985; 14:163-175.
191. Prescott LF. Analgesic nephropathy: a reassessment of the role of phenacetin and other analgesics. Drugs 1982; 23:75-149.
192. Haylor J. Prostaglandin synthesis and renal function in man. J Physiol 1980; 298:383-396.
193. Berg KJ, Djoseland O, Gjellan A et al. Acute effects of paracetamol on prostaglandin synthesis and renal function in normal man and in patients with renal failure. Clin Nephrol. 1990; 34:255-262.
194. Trumper L, Girardi G, Elias MM. Acetaminophen nephrotoxicity in male Wistar rats. Arch.Toxicol. 1992; 66:107-111.
195. Dawson DJ, Babbs C, Warnes TW, Neary RH. Hypophosphataemia in acute liver failure. Br.Med.J (Clin.Res.Ed) 1987; 295:1312-1313.
196. Moor PK, Wilkinson P. Hypophosphataemia in acute liver failure. Br.Med.J 1988; 296:131.
197. Knochel JP. The pathophysiology and clinical characteristics of severe hypophosphatemia. Arch.Intern.Med. 1977; 137:203-220.
198
198. Jones AF, Harvey JM, Vale JA. Hypophosphataemia and phosphaturia in paracetamol poisoning. Lancet 1989; 2:608-609.
199. Florkowski CM, Jones AF, Guy JM, Husband DJ, Stevens J. Retinol binding proteinuria and phosphaturia: markers of paracetamol-induced nephrotoxicity. Ann.Clin Biochem. 1994; 31 ( Pt 4):331-334.
200. Jones AF, Vale JA. Paracetamol poisoning and the kidney. J.Clin.Pharm.Ther. 1993; 18:5-8.
201. Piperno E, Mosher AH, Berssenbruegge DA, Winkler JD, Smith RB. Pathophysiology of acetaminophen overdosage toxicity: implications for management. Pediatrics 1978; 62:880-889.
202. Prescott LF, Park J, Ballantyne A, Adriaenssens P, Proudfoot AT. Treatment of paracetamol (acetaminophen) poisoning with N-acetylcysteine. Lancet 1977; 2:432-434.
203. Prescott LF, Illingworth RN, Critchley JA, Stewart MJ, Adam RD, Proudfoot AT. Intravenous N-acetylcystine: the treatment of choice for paracetamol poisoning. Br.Med.J. 1979; 2:1097-1100.
204. Vina J, Romero FJ, Estrela JM, Vina JR. Effect of acetaminophen (paracetamol) and its antagonists on glutathione (GSH) content in rat liver. Biochem.Pharmacol. 1980; 29:1968-1970.
205. Siegers CP. Antidotal effects of dimethyl sulphoxide against paracetamol-, bromobenzene-, and thioacetamide-induced hepatotoxicity. J.Pharm.Pharmacol. 1978; 30:375-377.
206. Strubelt O, Siegers CP, Schutt A. The curative effects of cysteamine, cysteine, and dithiocarb in experimental paracetamol poisoning. Arch.Toxicol. 1974; 33:55-64.
207. Prescott LF. Kinetics and metabolism of paracetamol and phenacetin. Br.J Clin.Pharmacol 1980; 10 Suppl 2:291S-298S.
208. Galinsky RE, Levy G. Effect of N-acetylcysteine on the pharmacokinetics of acetaminophen in rats. Life Sci. 1979; 25:693-699.
209. Galinsky RE, Slattery JT, Levy G. Effect of sodium sulfate on acetaminophen elimination by rats. J.Pharm.Sci. 1979; 68:803-805.
210. Buckley NA, Whyte IM, O'Connell DL, Dawson AH. Oral or intravenous N-acetylcysteine: which is the treatment of choice for acetaminophen (paracetamol) poisoning? J.Toxicol.Clin.Toxicol. 1999; 37:759-767.

199
211. Rumack BH, Peterson RC, Koch GG, Amara IA. Acetaminophen overdose. 662 cases with evaluation of oral acetylcysteine treatment. Arch.Intern.Med. 1981; 141:380-385.
212. Vale JA, Proudfoot AT. Paracetamol (acetaminophen) poisoning. Lancet 1995; 346:547-552.
213. Meredith TJ, Prescott LF, Vale JA. Why do patients still die from paracetamol poisoning? Br.Med J (Clin.Res.Ed) 1986; 293:345-346.
214. Jones AL. Mechanism of action and value of N-acetylcysteine in the treatment of early and late acetaminophen poisoning: a critical review. J.Toxicol.Clin.Toxicol. 1998; 36:277-285.
215. Harrison PM, Keays R, Bray GP, Alexander GJ, Williams R. Improved outcome of paracetamol-induced fulminant hepatic failure by late administration of acetylcysteine. Lancet 1990; 335:1572-1573.
216. Keays R, Harrison PM, Wendon JA et al. Intravenous acetylcysteine in paracetamol induced fulminant hepatic failure: a prospective controlled trial. BMJ 1991; 303:1026-1029.
217. Bruno MK, Cohen SD, Khairallah EA. Antidotal effectiveness of N-acetylcysteine in reversing acetaminophen-induced hepatotoxicity. Enhancement of the proteolysis of arylated proteins. Biochem.Pharmacol. 1988; 37:4319-4325.
218. Bridger S, Henderson K, Glucksman E, Ellis AJ, Henry JA, Williams R. Deaths from low dose paracetamol poisoning. BMJ 1998; 316:1724-1725.
219. Barnes J, Abban M, Howarth P. Deaths from low dose paracetamol poisoning. Executive action is needed to change national guidelines. BMJ 1998; 317:1654.
220. Aujla KS, Maclean VM, Richardson JR, Docherty EM. Deaths from low dose paracetamol poisoning. Nomogram does not show absolute concentration for treatment. BMJ 1998; 317:1655.
221. Brandon G. Deaths from low dose paracetamol poisoning. Guidelines are under review. BMJ 1998; 317:1654-1655.
222. Cameron MG. Death from low dose paracetamol poisoning. Lower threshold has probably not overburdened hospital services in Gloucester. BMJ . 1998. Ref Type: Journal (Full)

200
223. D'Costa DF. Deaths from low dose paracetamol poisoning. More evidence needed to change recommendations. BMJ 1998; 317:1656.
224. McAliskey DP. Deaths from low dose paracetamol poisoning. Several issues were not considered in the article. BMJ 1998; 317:1655.
225. Thomas SHL. Death from low paracetamol overdose. If in doubt use the antidote. B.M.J 1998; 317:1656.
226. Wright B, Crowe M. Deaths from low dose paracetamol poisoning. Use of oral methionine for overdose below threshold for acetylcysteine. BMJ 1998; 317:1656-1657.
227. O'Grady JG, Alexander GJ, Hayllar KM, Williams R. Early indicators of prognosis in fulminant hepatic failure. Gastroenterology 1989; 97:439-445.
228. Jepsen S, Herlevsen P, Knudsen P, Bud MI, Klausen NO. Antioxidant treatment with N-acetylcysteine during adult respiratory distress syndrome: a prospective, randomized, placebo-controlled study. Crit Care Med. 1992; 20:918-923.
229. Jepsen S, Hansen AB. The influence of N-acetylcysteine on the measurement of prothrombin time and activated partial thromboplastin time in healthy subjects. Scand.J.Clin.Lab Invest 1994; 54:543-547.
230. Schmidt LE, Knudsen TT, Dalhoff K, Bendtsen F. Effect of acetylcysteine on prothrombin index in paracetamol poisoning without hepatocellular injury. Lancet 2002; 360:1151-1152.
231. Knudsen TT, Thorsen S, Jensen SA et al. Effect of intravenous N-acetylcysteine infusion on haemostatic parameters in healthy subjects. Gut 2005; 54:515-521.
232. Koterba AP, Smolen S, Joseph A, Basista MH, Brecher AS. Coagulation protein function. II. Influence of thiols upon acetaldehyde effects. Alcohol 1995; 12:49-57.
233. Cohen SG, Zelaya-Quesada M. Portier, Richet, and the discovery of anaphylaxis: a centennial. J Allergy Clin.Immunol. 2002; 110:331-336.
234. Rusznak C, Peebles RSJr. Anaphylaxis and anaphylactoid reactions. A guide to prevention, recognition, and emergent treatment. Postgrad.Med. 2002; 111:101-8, 111.

201
235. Witcher R. Anaphylaxis. 2006. 6-6-2008. Ref Type: Internet Communication
236. American Academy of Allergy AaI. The diagnosis and management of anaphylaxis. J.Allergy Clin.Immunol. 1998; 101:S465-S528.
237. Walton NG, Mann TA, Shaw KM. Anaphylactoid reaction to N-acetylcysteine. Lancet 1979; 2:1298.
238. Mant TG, Tempowski JH, Volans GN, Talbot JC. Adverse reactions to acetylcysteine and effects of overdose. Br.Med.J.(Clin.Res.Ed) 1984; 289:217-219.
239. Dawson AH, Henry DA, McEwen J. Adverse reactions to N-acetylcysteine during treatment for paracetamol poisoning. Med J Aust. 1989; 150:329-331.
240. Lifshitz M, Kornmehl P, Reuveni H. The incidence and nature of adverse reactions during intravenous acetylcysteine therapy for acetaminophen overdose. J Pharm Technol 2000; 16:47-49.
241. Lynch RM, Robertson R. Anaphylactoid reactions to intravenous N-acetylcysteine: a prospective case controlled study. Accid.Emerg.Nurs. 2004; 12:10-15.
242. Bonfiglio MF, Traeger SM, Hulisz DT, Martin BR. Anaphylactoid reaction to intravenous acetylcysteine associated with electrocardiographic abnormalities. Ann.Pharmacother. 1992; 26:22-25.
243. Sanaie-Zadeh H, Taghaddosinejad F, Jalali N. Adverse effects of intravenous N-acetylcysteine. Prospective study on 206 patients with paracetamol poisoning. Clin Drug Invest 2003; 23 :139-143.
244. Prescott LF, Critchley JA. Asthma associated with N-acetylcysteine infusion and paracetamol poisoning. Br.Med.J.(Clin.Res.Ed) 1984; 288:151.
245. Schmidt LE, Dalhoff K. Risk factors in the development of adverse reactions to N-acetylcysteine in patients with paracetamol poisoning. Br.J.Clin.Pharmacol. 2001; 51:87-91.
246. Appelboam AV, Dargan PI, Knighton J. Fatal anaphylactoid reaction to N-acetylcysteine: caution in patients with asthma. Emerg.Med.J. 2002; 19:594-595.

202
247. Bateman DN, Woodhouse KW, Rawlins MD. Adverse reactions to N-acetylcysteine. Hum.Toxicol. 1984; 3:393-398.
248. Barrett KE, Minor JR, Metcalfe DD. Histamine secretion induced by N-acetyl cysteine. Agents Actions 1985; 16:144-146.
249. Lin RY, Schwartz LB, Curry A et al. Histamine and tryptase levels in patients with acute allergic reactions: An emergency department-based study. J.Allergy Clin.Immunol. 2000; 106:65-71.
250. van der Linden PW, Hack CE, Poortman J, Vivie-Kipp YC, Struyvenberg A, van der Zwan JK. Insect-sting challenge in 138 patients: relation between clinical severity of anaphylaxis and mast cell activation. J.Allergy Clin.Immunol. 1992; 90:110-118.
251. van der Linden PW, Hack CE, Struyvenberg A et al. Controlled insect-sting challenge in 55 patients: correlation between activation of plasminogen and the development of anaphylactic shock. Blood 1993; 82:1740-1748.
252. van der Linden PW, Hack CE, Struyvenberg A, van der Zwan JK. Insect-sting challenge in 324 subjects with a previous anaphylactic reaction: current criteria for insect-venom hypersensitivity do not predict the occurrence and the severity of anaphylaxis. J.Allergy Clin.Immunol. 1994; 94:151-159.
253. Kruger-Krasagakes S, Moller A, Kolde G, Lippert U, Weber M, Henz BM. Production of interleukin-6 by human mast cells and basophilic cells. J.Invest Dermatol. 1996; 106:75-79.
254. Sainte-Laudy J, Cado S. [Comparison of the levels of histamine, tryptase, and interleukin-6 for the investigation of anaphylactoid drug reactions]. Allerg.Immunol.(Paris) 1998; 30:209-211.
255. Kalabalikis P, Papazoglou K, Gouriotis D et al. Correlation between serum IL-6 and CRP levels and severity of head injury in children. Intensive Care Med. 1999; 25:288-292.
256. Sato Y, Takatsu Y, Kataoka K et al. Serial circulating concentrations of C-reactive protein, interleukin (IL)-4, and IL-6 in patients with acute left heart decompensation. Clin.Cardiol. 1999; 22:811-813.
257. Lin RY, Trivino MR, Curry A et al. Interleukin 6 and C-reactive protein levels in patients with acute allergic reactions: an emergency department-based study. Ann.Allergy Asthma Immunol. 2001; 87:412-416.
203
258. Prescott LF. Paracetamol, A Critical Bibliographic Review Taylor & Francis, 1996: 167-263.
259. Whelton A, Sturmer T, Porter G. Non-steroidal anti-inflammatory drugs.In: Clinical Nephrotoxin, 2th Edition, eds Marc E.De Broe, George AP, William MB, Gert AV, Kluwer Academia, 2003: 279-306.
260. Whelton A, Hamilton CW. Nonsteroidal anti-inflammatory drugs: effects on kidney function. J Clin Pharmacol. 1991; 31:588-598.
261. Prescott LF. Paracetamol, A Critical Bibliographic Review Taylor & Francis, 1996: 5-6.
262. Goddard J, Stachan FE, Bateman DN. Urinary sodium and potassium excretion as measures of ibuprofen nephrotoxicity. J Clin Toxicol 2003; 41:747.
263. Carney SL, Gillies AH, Ray CD. Acute effect of ethanol on renal electrolyte transport in the rat. Clin.Exp.Pharmacol.Physiol 1995; 22:629-634.
264. Sargent WQ, Simpson JR, Beard JD. The effect of acute and chronic alcohol administration on renal hemodynamics and monovalent ion excretion. J.Pharmacol.Exp.Ther. 1974; 188:461-471.
265. Blacksten JV, Birt JA. Syndrome of inappropriate secretion of antidiuretic hormone secondary to fluoxetine. Ann.Pharmacother. 1993; 27:723-724.
266. Kazal LA, Jr., Hall DL, Miller LG, Noel ML. Fluoxetine-induced SIADH: a geriatric occurrence? J.Fam.Pract. 1993; 36:341-343.
267. Rosner MH. Severe hyponatremia associated with the combined use of thiazide diuretics and selective serotonin reuptake inhibitors. Am.J.Med.Sci. 2004; 327:109-111.
268. Bialas MC, Reid PG, Beck P et al. Changing patterns of self-poisoning in a UK health district. QJM. 1996; 89:893-901.
269. Spooner J. Liver failure induced by paracetamol. BMJ 1993; 306:457-458.
270. Boutis K, Shannon M. Nephrotoxicity after acute severe acetaminophen poisoning in adolescents. J Toxicol.Clin Toxicol. 2001; 39:441-445.
204
271. Blakely P, McDonald BR. Acute renal failure due to acetaminophen ingestion: a case report and review of the literature. J Am.Soc.Nephrol. 1995; 6:48-53.
272. Sivilotti ML, Yarema MC, Juurlink DN, Good AM, Johnson DW. A risk quantification instrument for acute acetaminophen overdose patients treated with N-acetylcysteine. Ann.Emerg.Med 2005; 46:263-271.
273. Pakravan N, Bateman DN, Goddard J. Effect of acute paracetamol overdose on changes in serum and urine electrolytes. Br.J.Clin.Pharmacol. 2007; 64:824-832.
274. Chan TY, Critchley JA, Chan AY. Renal failure is uncommon in Chinese patients with paracetamol (acetaminophen) poisoning. Vet.Hum.Toxicol. 1995; 37:154-156.
275. Mahadevan SB, McKiernan PJ, Davies P, Kelly DA. Paracetamol induced hepatotoxicity. Arch.Dis.Child 2006; 91:598-603.
276. Gorman DR, Bain M, Inglis JH, Murphy D, Bateman DN. How has legislation restricting paracetamol pack size affected patterns of deprivation related inequalities in self-harm in Scotland? Public Health 2007; 121:45-50.
277. Smilkstein MJ, Knapp GL, Kulig KW, Rumack BH. Efficacy of oral N-acetylcysteine in the treatment of acetaminophen overdose. Analysis of the national multicenter study (1976 to 1985). N.Engl.J.Med. 1988; 319:1557-1562.
278. Thomas SH, Horner JE, Chew K et al. Paracetamol poisoning in the north east of England: presentation, early management and outcome. Hum.Exp.Toxicol. 1997; 16:495-500.
279. Morgan O, Griffiths C, Majeed A. Impact of paracetamol pack size restrictions on poisoning from paracetamol in England and Wales: an observational study. J Public Health (Oxf) 2005; 27:19-24.
280. Bray GP, Mowat C, Muir DF, Tredger JM, Williams R. The effect of chronic alcohol intake on prognosis and outcome in paracetamol overdose. Hum.Exp.Toxicol. 1991; 10:435-438.
281. Bray GP, Harrison PM, O'Grady JG, Tredger JM, Williams R. Long-term anticonvulsant therapy worsens outcome in paracetamol-induced fulminant hepatic failure. Hum.Exp Toxicol. 1992; 11:265-270.

205
282. Eriksson LS, Broome U, Kalin M, Lindholm M. Hepatotoxicity due to repeated intake of low doses of paracetamol. J Intern.Med 1992; 231:567-570.
283. Routledge P, Vale JA, Bateman DN et al. Paracetamol (acetaminophen) poisoning. No need to change current guidelines to accident departments. BMJ 1998; 317:1609-1610.
284. Morgan O, Majeed A. Restricting paracetamol in the United Kingdom to reduce poisoning: a systematic review. J Public Health (Oxf) 2005; 27:12-18.
285. Kerr F, Dawson A, Whyte IM et al. The Australasian Clinical Toxicology Investigators Collaboration randomized trial of different loading infusion rates of N-acetylcysteine. Ann.Emerg.Med. 2005; 45:402-408.
286. Waring WS, Stephen AF, Robinson OD, Dow MA, Pettie JM. Lower incidence of anaphylactoid reactions to N-acetylcysteine in patients with high acetaminophen concentrations after overdose. Clin.Toxicol.(Phila) 2008; 46:496-500.
287. Imai K, Toyo'oka T, Watanabe Y. A novel fluorogenic reagent for thiols: ammonium 7-fluorobenzo-2-oxa-1,3-diazole-4-sulfonate. Anal.Biochem. 1983; 128:471-473.
288. Rizzo V, Montalbetti L, Valli M, Bosoni T, Scoglio E, Moratti R. Study of factors affecting the determination of total plasma 7-fluorobenzo-2-oxa-1,3-diazole-4-sulfonate (SBD)-thiol derivatives by liquid chromatography. J Chromatogr.B Biomed.Sci.Appl. 1998; 706:209-215.
289. Wilkinson IB, Megson IL, MacCallum T et al. Acute methionine loading does not alter arterial stiffness in humans. J Cardiovasc.Pharmacol 2001; 37:1-5.
290. National Heart, lung and Blood Institues. Guidelines for the Diagnosis and Management of Asthma. 3, 122-123. 28-8-2007. US Department of Health and Human Service. Ref Type: Report
291. Vale JA, Wheeler DC. Anaphylactoid reaction to acetylcysteine. Lancet 1982; 2:988.
292. Sunman W, Hughes AD, Sever PS. Anaphylactoid response to intravenous acetylcysteine. Lancet 1992; 339:1231-1232.

206
293. Ho SW, Beilin LJ. Asthma associated with N-acetylcysteine infusion and paracetamol poisoning: report of two cases. Br.Med.J.(Clin.Res.Ed) 1983; 287:876-877.
294. Vale JA, Buckley BM. Asthma associated with N-acetylcysteine infusion and paracetamol poisoning. Br.Med.J.(Clin.Res.Ed) 1983; 287:1223.
295. Gheshlaghi R, Scharer JM, Moo-Young M, Douglas PL. Medium optimization for hen egg white lysozyme production by recombinant Aspergillus niger using statistical methods. Biotechnol.Bioeng. 2005; 90:754-760.
296. Cottineau C, Drouet M, Costerousse F, Dussaussoy C, Sabbah A. [Importance of plasma (histamine and tryptase) and urinary (methylhistamine) in peri-anesthetic anaphylactic and/or anaphylactoid reactions]. Allerg.Immunol.(Paris) 1996; 28:270, 273-270, 276.
297. Laroche D, Vergnaud MC, Sillard B, Soufarapis H, Bricard H. Biochemical markers of anaphylactoid reactions to drugs. Comparison of plasma histamine and tryptase. Anesthesiology 1991; 75:945-949.
298. Dorsch W, Auch E, Powerlowicz P. Adverse effects of acetylcysteine on human and guinea pig bronchial asthma in vivo and on human fibroblasts and leukocytes in vitro. Int.Arch.Allergy Appl.Immunol. 1987; 82:33-39.
299. Caughey GH. Tryptase genetics and anaphylaxis. J Allergy Clin.Immunol. 2006; 117:1411-1414.
300. Roizen MF, Rodgers GM, Valone FH et al. Anaphylactoid reactions to vascular graft material presenting with vasodilation and subsequent disseminated intravascular coagulation. Anesthesiology 1989; 71:331-338.
301. Smith PL, Kagey-Sobotka A, Bleecker ER et al. Physiologic manifestations of human anaphylaxis. J.Clin.Invest 1980; 66:1072-1080.
302. Zimmermann RE, Czarnetzki BM. Changes in the coagulation system during pseudoallergic anaphylactoid reactions to drugs and food additives. Int.Arch.Allergy Appl.Immunol. 1986; 81:375-377.
303. Fesus L, Muszbek L, Csaba B. Evidence of fibrinogen degradation in rat anaphylaxis. Int.Arch.Allergy Appl.Immunol. 1975; 49:540-547.
304. Fesus L, Csaba B, Muszbek L. Activation and consumption of Hageman factor in the anaphylactic shock of the rat. Int.Arch.Allergy Appl.Immunol. 1976; 51:496-507.

207
305. Newball HH, Talamo RC, Lichtenstein LM. Anaphylactic relase of a basophil kallikrein-like activity. II. A mediator of immediate hypersensitivity reactions. J.Clin.Invest 1979; 64:466-475.
306. Schwartz LB, Bradford TR, Littman BH, Wintroub BU. The fibrinogenolytic activity of purified tryptase from human lung mast cells. J.Immunol. 1985; 135:2762-2767.
307. Panush RS. Effects of certain antirheumatic drugs on normal human peripheral blood lymphocytes. Inhibition of mitogen- and antigen-stimulated incorporation of tritiated thymidine. Arthritis Rheum. 1976; 19:907-917.
308. Shalabi EA. Acetaminophen inhibits the human polymorphonuclear leukocyte function in vitro. Immunopharmacology 1992; 24:37-45.
309. Lages B, Weiss HJ. Inhibition of human platelet function in vitro and ex vivo by acetaminophen. Thromb.Res. 1989; 53:603-613.

1
Appendices

2
List of Contents of Appendices Appendix 2.1: Patient invitation letter............................................................. 5 Appendix 2.2: Patient Information Sheet........................................................ 6 Appendix 2.3: GP Information Letter.............................................................. 7 Appendix 2.4: Patient’s Consent Form........................................................... 8 Appendix 2.5: Data Collection Sheet ............................................................. 9 Appendix 2.6: Study Guideline..................................................................... 10 Appendix 2.7: Study Flow chart ................................................................... 11 Appendix 2.8: Original data of patients with single paracetamol overdose (Retrospective study), n=155. ...................................................................... 12 Appendix 2.9: Original data of patients with single paracetamol overdose (Prospective study), n=41. ........................................................................... 19 Appendix 2.10: Original data of patients with single SSTI (Fluoxetine) overdose (Prospective study), n=18. ........................................................... 26 Appendix 3.1: Collected data from 522 patients admitted to Scottish Liver Transplant Unit from referring hospital in Scotland. ..................................... 29 Appendix 5.1: Patient invitation letter......................................................... 103 Appendix 5.2: Patient information sheet .................................................... 104 Appendix 5.3: Patient Consent Form ......................................................... 106 Appendix 5.4: Data Collection Sheet ......................................................... 107 Appendix 5.5: Observation Sheet .............................................................. 108 Observation Sheet ..................................................................................... 108 Appendix 5.6: Adverse Reactions Sheet.................................................... 109 Appendix 5.7: Blood Sampling Sheet......................................................... 110 Appendix 5.8: Plasma histamine (ng/ml) at baseline and time points after IV NAV infusion commencement and time of initiation and/or peak adverse reactions in the groups according to the severity of ADRs (intensive study), NS: no sample (intensive study). .............................................................. 111 Appendix 5.9: Plasma NAC concentration (µg/100µl) at baseline and time points (baseline, 1h, 2h and 4h) after IV NAC infusion commencement in each subject . NS: no sample. (1: minimal ADRs, 2: moderate ADRs, 3: severe ADRs) (intensive study).................................................................. 112 Appendix 5.10: Plasma histamine concentration at baseline and different time points after IV NAC infusion in each subject in the group with minimal ADRs, N=10, His: Plasma histamine (ng/ml), T: time (min) ((Intensive study). NS: no sample (intensive study). ........................................................................... 113 Appendix 5.11: Plasma histamine concentration at baseline and different time points after IV NAC infusion in each subject in the group with moderate ADRs. N=5, His: plasma histamine (ng/ml), T: time (min) (intensive study).................................................................................................................... 113 Appendix 5.12: plasma histamine concentration at baseline and different time points after IV NAC infusion in subjects with severe ADRs, N=7, His=plasma histamine (ng/ml), T=time (min), (intensive study). .................................... 113 Appendix 5.13: histamine validation experiment: plasma histamine (ng/ml) in 8 healthy volunteers (4 male and 4 female). Samples were collected and cooled at once, but spun at different time points (5 min, 15 min, 30 min and

3
60 min) after collection. His: histamine; T: spinning time (minute after blood collection) (intensive study)........................................................................ 114 Appendix 5.14: plasma tryptase concentration (µg/l) at baseline and time points (baseline, 1h, 2h and 4h) after IV NAC infusion commencement in each subject. NS: no sample. (1: minimal ADRs, 2: moderate ADRs, 3: severe ADRs) (intensive study).................................................................. 114 Appendix 5.15: plasma CRP concentration (mg/l) at baseline and time points (baseline, 1h, 2h and 4h) after IV NAC infusion commencement in each subject. NS: no sample. (1: minimal ADRs, 2: moderate ADRs, 3: severe ADRs) (Intensive study). ............................................................................ 115 Appendix 5.16: plasma IL6 (pg/ml) concentration at baseline and time points (baseline, 30 min, 1h, 2h, 4h and 20h) after IV NAC infusion commencement in each subject . NS: no sample. (1: minimal ADRs, 2: moderate ADRs, 3: severe ADRs) (Intensive study). ................................................................ 116 Appendix 5.17: plasma tPA activity (u/ml) concentration at baseline and time points (baseline, 1h, 2h and 4h) after IV NAC infusion commencement in each subject . NS: no sample. (1: minimal ADRs, 2: moderate ADRs, 3: severe ADRs) (Intensive study). ................................................................ 117 Appendix 5.18: plasma tPA antigen (ng/ml) concentration at baseline and time points (baseline, 1h, 2h and 4h) after IV NAC infusion commencement in each subject.NS: no sample. (1: minimal ADRs, 2: moderate ADRs, 3: severe ADRs) (Intensive study). ............................................................................ 118 Appendix 5.19: plasma vWf (ng/ml) concentration at baseline and time points (baseline, 30min,1h, 2h, 4h and 20h) after IV NAC infusion commencement in each subject. NS: no sample. (1: minimal ADRs, 2: moderate ADRs, 3: severe ADRs) (Intensive study). ................................................................ 119 Appendix 5.20: plasma clotting factor II concentration (iu/l) at baseline and time points (baseline, 30 min, 1h, 2h, 4h and 20h) after IV NAC infusion commencement in each subject. NS: no sample. (1: minimal ADRs, 2: moderate ADRs, 3: severe ADRs) (intensive study). ................................. 120 Appendix 5.21: plasma clotting factor V concentration (iu/l) at baseline and time points (baseline, 30 min, 1h, 2h, 4h and 20h) after IV NAC infusion commencement in each subject. NS: no sample. (1: minimal ADRs, 2: moderate ADRs, 3: severe ADRs) (intensive study). ................................. 121 Appendix 5.22: plasma clotting factor VII concentration (iu/l) at baseline and time points (baseline, 30 min, 1h, 2h, 4h and 20h) after IV NAC infusion commencement in each subject. NS: no sample. (1: minimal ADRs, 2: moderate ADRs, 3: severe ADRs) (intensive study). ................................. 122 Appendix 5.23: plasma clotting factor VIII concentration (iu/l) at baseline and time points (baseline, 30 min, 1h, 2h, 4h and 20h) after IV NAC infusion commencement in each subject. NS: no sample. (1: minimal ADRs, 2: moderate ADRs, 3: severe ADRs) (intensive study). ................................. 123 Appendix 5.24: plasma clotting factor IX concentration (iu/l) at baseline and time points (baseline, 30 min, 1h, 2h, 4h and 20h) after IV NAC infusion commencement in each subject. NS: no sample. (1: minimal ADRs, 2: moderate ADRs, 3: severe ADRs) iIntensive study). ................................. 124 Appendix 5.25: plasma clotting factor X (iu/l) concentration at baseline and different time (baseline, 30 min, 1h, 2h, 4h and 20h) points after IV NAC

4
infusion in each subject with different severity. NS: no sample. (1: minimal ADRs, 2: moderate ADRs, 3: severe ADRs) (intensive study). .................. 125 Appendix 5.26: plasma clotting factor XI concentration (iu/l) at baseline and time points (baseline, 30 min, 1h, 2h, 4h and 20h) after IV NAC infusion commencement in each subject. NS: no sample. (1: minimal ADRs, 2: moderate ADRs, 3: severe ADRs) (Intensive study). ................................. 126 Publications………………………………………………………………………127

5
Appendix 2.1: Patient invitation letter
Version3, 19/07/04 Ref No: 04/s1101/20
Renal Function Study-Patient invitation letter Researcher: Dr. Nasrin Pakravan
Dear Sir/Madam
You are being asked to take part in a study in which we are examining how
certain drugs affect kidney function. Before you decide it is important for you
to understand why the research is being done and what it will involve. Please
take time to read the information will be given you carefully and ask if there is
anything that is not clear or you would like more inform. If you wish not to
take part in this study, it will not affect your treatment. Thank you for your
time.
Yours Faithfully,
Dr Nasrin Pakravan MD
Clinical Research Fellow

6
Appendix 2.2: Patient Information Sheet
Version1, 25/05/04 Ref No: 04/s1101/20
Renal Function Study-Patient Information Sheet Researcher: Dr. Nasrin Pakravan
You are being asked to take part in a study in which we are examining how certain drugs affect kidney function, and would be grateful of your help. It is thought that overdose of some drugs such as paracetamol (Panadol), ibuprofen (Brufen) and some antidepressants can adversely affect the way kidneys work, and by measuring marker substances in blood and urine we may be able to predict this, and therefore protect the kidney. A greater understanding of this process may be a useful step in improving care of overdosed patients in general. You are being asked to take part in study as you have taken an overdose of one of these drugs. The actual risk of you suffering kidney damage is small, but your results will assist us in determining the best markers to use for predicting kidney problems. If you agree to take part in this study, you will be asked to allow us to use the routine urine and blood samples taken when you were admitted for this research, and to provide an extra blood and urine sample at 12 hours and 24 hours after ingestion for more investigations to guide your care. We are also asking your permission to use these clinical samples for research. To evaluate your kidney’s function accurately we need to check your blood pressure and pulse rate regularly. Blood samples will be taken either by one of the nursing staff or myself. All the results will be kept anonymous, and your personal details will not be disclosed to a third party. We also inform your general practitioner (GP) of this study, unless you object to this. Thank you for reading this information sheet. Please ask if you have any questions. Dr Nasrin Pakravan Clinical Research Fellow
7
Appendix 2.3: GP Information Letter
Version1, 25/05/04 Ref No: 04/s1101/20
Renal function: study-GP Information Letter Researcher: Dr. Nasrin Pakravan
Dear Dr. …………………………
I am a Ph-D medical student doing a research study on patients with certain kinds of
drug overdose, including paracetamol, ibuprofen and SSRIs to evaluate their effect
on kidney function.
I am writing to inform you that Mr/ Mrs……………
who was admitted to the toxicology ward of Royal Infirmary of Edinburgh with an
overdose of one of these drugs, with his/her permission provided samples of urine
and blood for this study. The study has not involved any additional medication on
his/her treatment.
Yours Faithfully,
Dr Nasrin Pakravan MD
Clinical Research Fellow

8
Appendix 2.4: Patient’s Consent Form
Version 1 15/04/04
Renal function: Patient’s Consent Form
Researcher: Dr. Nasrin Pakravan
Patient’s Name: …………………………………………………………………. I have read and understood the patient information regarding the above study, and
agree to take part. I understand that this will involve me providing up to three blood
and urine samples in addition to routine samples being taken during my time in
hospital. In addition my blood pressure and pulse rate will be recorded regularly at
hourly intervals, which is more frequently than would otherwise be the case. I
realized that I can withdraw my consent at any time, without giving any reason, and
it will not affect my Clinical care. I also agree that my GP may be informed.
Signed: …………………………………… Date Witnessed: ……………………………… Date
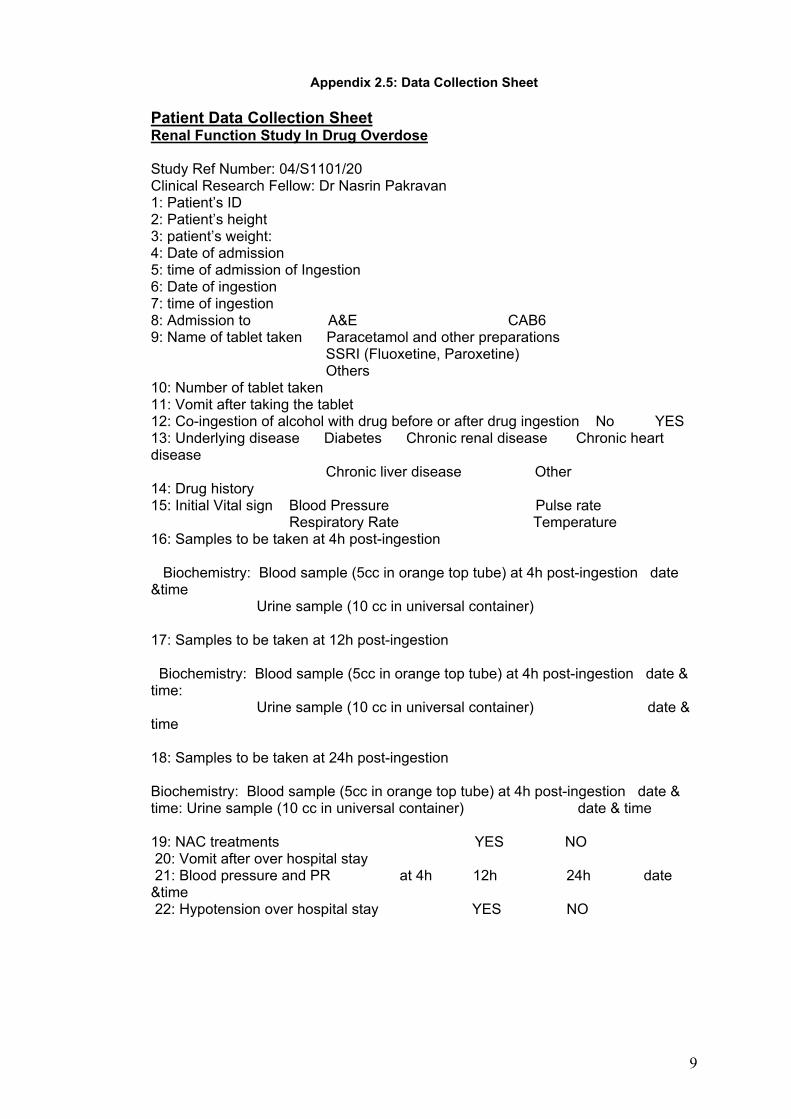
9
Appendix 2.5: Data Collection Sheet Patient Data Collection Sheet Renal Function Study In Drug Overdose Study Ref Number: 04/S1101/20 Clinical Research Fellow: Dr Nasrin Pakravan 1: Patient’s ID 2: Patient’s height 3: patient’s weight: 4: Date of admission 5: time of admission of Ingestion 6: Date of ingestion 7: time of ingestion 8: Admission to A&E CAB6 9: Name of tablet taken Paracetamol and other preparations SSRI (Fluoxetine, Paroxetine) Others 10: Number of tablet taken 11: Vomit after taking the tablet 12: Co-ingestion of alcohol with drug before or after drug ingestion No YES 13: Underlying disease Diabetes Chronic renal disease Chronic heart disease Chronic liver disease Other 14: Drug history 15: Initial Vital sign Blood Pressure Pulse rate Respiratory Rate Temperature 16: Samples to be taken at 4h post-ingestion Biochemistry: Blood sample (5cc in orange top tube) at 4h post-ingestion date &time Urine sample (10 cc in universal container) 17: Samples to be taken at 12h post-ingestion Biochemistry: Blood sample (5cc in orange top tube) at 4h post-ingestion date & time: Urine sample (10 cc in universal container) date & time 18: Samples to be taken at 24h post-ingestion Biochemistry: Blood sample (5cc in orange top tube) at 4h post-ingestion date & time: Urine sample (10 cc in universal container) date & time 19: NAC treatments YES NO 20: Vomit after over hospital stay 21: Blood pressure and PR at 4h 12h 24h date &time 22: Hypotension over hospital stay YES NO

10
Appendix 2.6: Study Guideline
Study Guideline
Study Ref No: 04/s1101/20
Project Title
Effect of single paracetamol overdose on renal function and plasma and urine
electrolytes
Clinical Research Fellow
Dr Nasrin Pakravan
Subjects
Inclusion Criteria
-Single overdose with paracetamol, ibuprofen, fluoxetine, and benzodiazepines.
-Mixed overdose of each of this drug with benzodiazepines or alcohol
-Patients admitted 4 or less than 4 hours after ingestion
-Age 16 years and older
-Non-pregnant patients
Exclusion Criteria
-Patients under 16 and over 60 years old
-Pregnant women
-Patients with inability to read and understand the information sheet and consent
forms
-Patients with underlying disease: Diabetes mellitus, chronic renal failure,
Chronic heart failure, hypertension, hypovolaemic shock
-Mixed overdose with other drugs except with benzodiazepines or alcohol
-Unknown time of overdose or admission more than 4 hours after ingestion

11
Appendix 2.7: Study Flow chart
Study Flow chart
Patient Admitted in A&E/ Toxicology Ward
Invitation Information sheet
Obtaining consent Patient data collection sheet
4-hr post-ingestion samples For Biochemistry - 5 cc blood sample in orange top tube (use labels provided for biochemistry) -10 cc urine sample in universal container
12 hr- post-ingestion samples
For Biochemistry -5 cc blood sample in orange top tube (use labels provided for biochemistry) -10 cc urine sample in universal container
take 24 hr- post-ingestion samples For Biochemistry -5 cc blood sample in orange top tube (use labels provided for biochemistry) -10 cc urine sample in universal container

12
Appendix 2.8: Original data of patients with single paracetamol overdose (Retrospective study), n=155.
Code DOB DOA Sex Age y Type of OD
4h para Sali Cr1 Na1
1 24.03.1970 24.09.2005 M 35.53 single od 259 0 97 140 2 28.12.1950 07.09.2002 F 51.73 single od 524 . 92 133 3 24.02.1962 29.08.2003 F 41.54 single od 382 . 64 138 4 24.07.1984 26.10.2005 F 21.27 single od 288 0 60 137 5 06.11.1956 09.04.2006 M 49.45 single od 238 0 76 134 6 19.07.1983 18.12.2004 F 21.43 single od 105 0 60 141 7 24.05.1985 03.04.2006 F 20.87 single od 207 0 77 140 8 20.05.1982 16.03.2002 F 19.84 single od 106 . 88 135 9 23.08.1977 11.01.2002 F 24.4 single od 405 0 99 136 10 13.09.1980 27.04.2004 F 23.64 single od 260 0 66 138 11 13.09.1980 16.01.2005 F 24.36 single od 179 0 75 141 12 28.03.1960 05.01.2002 M 41.8 single od 178 . 75 136 13 19.01.1962 19.02.2004 M 42.11 single od 180 . 88 137 14 19.01.1962 16.05.2004 M 42.35 single od 138 0 106 141 15 24.02.1985 02.02.2004 F 18.95 single od 125 . 76 138 16 07.12.1973 11.09.2005 F 31.78 single od 179 0 75 142 17 10.03.1955 09.02.2003 F 47.95 single od 226 . 72 137 18 11.06.1974 10.10.2004 F 30.35 single od 504 0 75 134 19 23.03.1968 31.10.2005 M 37.63 single od 148 0 76 137 20 23.03.1968 02.11.2005 M 37.64 single od 155 0 79 139 21 23.03.1968 06.11.2005 M 37.65 single od 123 0 72 140 22 23.03.1968 09.11.2005 M 37.66 single od 136 0 70 142 23 23.03.1968 04.12.2005 M 37.73 single od 117 0 82 142 24 25.05.1984 04.07.2002 F 18.12 single od 222 . 70 139 25 14.12.1962 06.03.2006 F 43.25 single od 446 0 77 140 26 30.11.1957 07.12.2003 M 46.05 single od 346 0 114 137 27 07.02.1979 15.08.2002 M 23.53 single od 151 0 102 141 28 27.09.1977 12.07.2004 M 26.81 single od 207 0 101 143 29 30.07.1973 06.07.2003 M 29.95 single od 76 0 99 138 30 01.11.1974 27.05.2003 M 28.59 single od 194 0 90 138 31 22.10.1995 19.09.2003 M 7.92 single od 95 0 91 139 32 22.07.1988 25.01.2005 F 16.52 single od 368 0 86 142 33 22.07.1988 15.03.2005 F 16.66 single od 463 . 84 144 34 19.11.1962 28.10.2005 F 42.97 single od 72 . 78 145 35 26.11.1942 11.04.2002 F 59.41 single od 208 . 84 133 36 26.02.1958 15.01.2005 F 46.92 single od 133 0 59 141 37 10.08.1968 10.04.2004 M 35.69 single od 92 0 76 138 38 01.08.1958 14.12.2002 M 44.4 single od 288 0 96 138 39 13.05.1961 20.12.2003 F 42.63 single od 138 0 73 140 40 11.07.1949 02.03.2002 M 52.68 single od 89 . 84 137 41 21.05.1946 25.10.2002 F 56.47 single od 135 0 75 135 42 29.04.1987 07.11.2005 F 18.54 single od 255 0 69 141 43 06.02.1960 15.11.2003 M 43.8 single od 176 0 87 138 44 05.05.1963 16.04.2003 F 39.98 single od 92 0 93 136 45 08.08.1941 20.10.2004 F 63.24 single od 261 0 80 129 46 22.01.1946 14.08.2002 F 56.6 single od 156 . 85 134 47 16.02.1981 04.10.2003 M 22.64 single od 100 0 99 141 48 24.07.1972 08.04.2006 M 33.73 single od 233 0 93 140

13
Code DOB DOA Sex Age y Type of OD
4h para Sali Cr1 Na1
49 05.09.1972 13.08.2003 F 30.96 single od 206 75 140 50 22.11.1984 02.10.2003 F 18.87 single od 237 77 139 51 10.11.1982 14.01.2006 F 23.19 single od 372 0 79 137 52 22.03.1955 15.11.2004 M 49.69 single od 74 0 102 142 53 15.05.1984 09.04.2006 F 21.92 single od 63 0 85 143 54 18.07.1976 31.08.2004 F 28.14 single od 239 78 140 55 02.12.1963 20.03.2002 F 38.32 single od 132 78 139 56 02.12.1963 21.02.2004 F 40.25 single od 137 0 67 143 57 28.08.1980 14.02.2003 M 22.48 single od 115 91 141 58 24.06.1968 24.04.2002 F 33.85 single od 468 97 140 59 27.08.1980 07.09.2004 M 24.05 single od 108 0 96 142 60 23.08.1965 09.02.2005 F 39.49 single od 388 0 81 145 61 10.06.1981 01.03.2002 M 20.74 single od 247 95 142 62 17.09.1961 28.12.2004 M 43.31 single od 163 0 126 143 63 09.06.1971 15.03.2003 M 31.79 single od 149 0 95 133 64 07.12.1987 31.01.2005 M 17.16 single od 173 0 102 142 65 07.03.1973 10.09.2002 M 29.53 single od 201 0 79 139 66 16.01.1969 06.10.2002 M 33.74 single od 125 88 137 67 07.09.1972 25.12.2003 F 31.32 single od 122 0 108 139 68 08.10.1986 18.04.2004 F 17.54 single od 260 73 141 69 08.10.1986 21.04.2004 F 17.55 single od 242 71 138 70 08.10.1986 15.05.2004 F 17.61 single od 265 0 79 142 71 08.10.1986 20.05.2004 F 17.63 single od 258 83 140 72 08.10.1986 27.07.2004 F 17.81 single od 148 78 140 73 04.10.1965 13.05.2002 F 36.63 single od 222 0 82 139 74 26.06.1983 29.07.2003 M 20.1 single od 110 86 136 75 20.05.1967 19.09.2002 F 35.36 single od 340 81 139 76 29.08.1966 18.05.2003 M 36.74 single od 395 91 135 77 21.03.1987 01.06.2004 F 17.21 single od 34 79 139 78 01.08.1963 21.11.2003 M 40.33 single od 55 0 90 140 79 13.06.1973 29.06.2003 F 30.06 single od 141 77 137 80 22.03.1984 11.03.2006 F 21.98 single od 224 0 5.5 140 81 11.08.1983 19.04.2005 M 21.7 single od 242 0 88 143 82 09.12.1985 01.12.2003 F 17.99 single od 74 78 136 83 27.01.1986 03.11.2003 F 17.78 single od 176 86 141 84 07.10.1958 12.01.2006 F 47.3 single od 157 0 80 139 85 27.10.1961 24.04.2002 F 40.52 single od 300 78 139 86 27.10.1961 02.08.2002 F 40.79 single od 353 72 138 87 27.10.1961 29.04.2003 F 41.53 single od 202 0 56 139 88 27.10.1961 17.09.2003 F 41.92 single od 125 0 77 143 89 02.06.1968 03.04.2006 F 37.86 single od 208 0 67 142 90 11.01.1980 20.10.2003 M 23.79 single od 277 75 141 91 07.07.1976 03.09.2003 M 27.18 single od 147 0 91 145 92 02.03.1976 14.12.2005 F 29.81 single od 84 0 89 141 93 05.11.1950 05.12.2002 M 52.12 single od 72 0 84 138 94 28.04.1959 05.09.2004 F 45.39 single od 190 0 78 134 95 28.04.1986 19.11.2002 F 16.57 single od 70 69 137 96 25.03.1980 01.07.2004 F 24.28 single od 233 93 140 97 03.03.1985 16.07.2005 F 20.38 single od 175 0 89 143 98 28.09.1966 30.08.2002 M 35.95 single od 113 0 83 140

14
Code DOB DOA Sex Age y Type of OD
4h para Sali Cr1 Na1
99 05.06.1987 01.05.2005 F 17.92 single od 111 0 72 140 100 11.11.1980 27.03.2003 M 22.39 single od 316 0 92 145 101 02.08.1963 16.03.2003 F 39.65 single od 121 0 84 142 102 02.08.1963 08.12.2005 F 42.38 single od 147 85 145 103 02.08.1963 09.08.2005 F 42.05 single od 107 80 143 104 23.05.1967 30.05.2003 F 36.04 single od 249 64 137 105 04.08.1988 01.05.2003 F 14.75 single od 101 0 86 139 106 28.03.1957 19.01.2003 F 45.84 single od 254 79 141 107 12.03.1956 10.02.2003 M 46.95 single od 127 90 135 108 19.09.1976 29.08.2004 M 27.96 single od 230 0 81 131 109 19.09.1969 21.09.2004 F 35.03 single od 266 0 82 139 110 19.09.1969 12.10.2004 F 35.09 single od 198 0 80 137 111 12.07.1988 15.10.2004 F 16.27 single od 117 0 76 142 112 12.07.1968 18.10.2004 F 36.29 single od 120 0 73 140 113 03.02.1965 23.03.2005 M 40.16 single od 180 . 85 135 114 25.02.1982 06.08.2003 F 21.46 single od 205 . 81 138 115 13.06.1975 08.09.2002 M 27.26 single od 119 0 88 140 116 13.06.1975 09.10.2003 M 28.34 single od 222 0 84 144 117 04.06.1983 20.11.2005 M 22.48 single od 192 0 91 145 118 03.09.1979 05.04.2003 F 23.6 single od 279 0 76 137 119 05.12.1970 02.03.2006 F 35.26 single od 420 72 138 120 24.07.1984 12.04.2005 F 20.73 single od 285 0 68 141 121 01.09.1958 01.11.2002 F 44.2 single od 233 83 138 122 27.12.1982 26.01.2005 M 22.1 single od 67 0 97 141 123 25.02.1972 18.09.2002 M 30.58 single od 148 77 140 124 13.10.1984 17.11.2002 F 18.11 single od 190 82 141 125 06.07.1967 27.03.2003 M 35.75 single od 35 0 111 139 126 23.08.1966 23.04.2006 F 39.69 single od 224 0 69 136 127 02.11.1971 10.12.2003 F 32.13 single od 199 0 85 138 128 24.03.1970 21.01.2005 M 34.85 single od 153 0 101 139 129 24.03.1970 22.11.2005 M 35.69 single od 119 0 88 138 130 25.09.1967 09.04.2006 F 38.56 single od 180 0 76 138 131 26.06.1984 18.11.2005 F 21.41 single od 172 0 81 141 132 24.04.1958 18.05.2003 F 45.1 single od 160 84 146 133 23.11.1968 14.07.2005 M 36.66 single od 75 0 103 139 134 16.04.1950 20.03.2005 F 54.96 single od 39 0 63 141 135 05.07.1976 26.07.2002 M 26.07 single od 176 101 138 136 06.08.1985 14.11.2004 F 19.29 single od 282 0 75 144 137 20.05.1977 21.10.2002 F 25.44 single od 150 95 141 138 06.06.1973 26.06.2005 F 32.08 single od 139 0 73 133 139 16.10.1971 16.05.2005 M 33.61 single od 127 0 90 140 140 05.10.1956 02.08.2003 F 46.85 single od 176 80 134 141 05.10.1956 03.04.2005 F 48.53 single od 238 0 74 139 142 05.10.1956 21.05.2005 F 48.66 single od 156 0 81 135 143 05.10.1956 26.08.2005 F 48.92 single od 118 0 66 142 144 09.10.1966 08.05.2002 M 35.6 single od 185 0 106 135 145 12.05.1976 16.08.2002 F 26.28 single od 247 86 141 146 12.05.1976 06.09.2002 F 26.34 single od 226 82 143 147 30.09.1971 16.01.2004 M 32.32 single od 326 0 77 142

15
Code DOB DOA Sex Age y Type of OD
4h para Sali Cr1 Na1
148 16.09.1963 22.08.2004 M 40.96 single od 231 0 79 134 149 17.10.1981 26.04.2004 F 22.54 single od 127 0 77 139 150 08.10.1986 19.05.2004 F 17.62 single od 258 83 140 151 08.10.1986 18.04.2005 F 18.54 single od 260 73 141 152 08.10.1986 15.05.2006 F 19.61 single od 265 0 79 142 153 18.04.1973 26.04.2005 F 32.04 single od 244 0 87 141 154 16.09.1967 20.03.2004 M 36.53 single od 292 0 86 139 155 22.06.1985 31.03.2002 M 16.78 single od 244 101 138
Code K1 TCO21 Cr2 Na2 K2 TCO22 DT NAC Vomit 1 3.8 22 91 . 3.2 24 19 YES YES 2 4.1 25 105 126 3.6 20 19 YES YES 3 3.2 20 60 138 2.8 26 33 YES YES 4 3 19 71 135 3.5 20 26 YES YES 5 3.5 22 88 135 3.2 20 19 YES YES 6 3.8 24 58 140 3.6 25 22 YES NO 7 3.5 18 77 140 3.4 25 22 YES YES 8 3.7 19 82 142 3.3 30 23 YES YES 9 3.4 17 96 138 3.1 21 21 YES YES
10 3.6 22 66 139 2.9 26 20.5 YES YES 11 3.4 24 60 141 3.1 26 23 YES YES 12 3.7 23 75 139 3.6 28 12.5 NO YES 13 3.6 25 81 140 3.8 28 23 YES NO 14 3.4 21 103 141 3.4 27 13.5 YES YES 15 4.1 19 73 136 3.8 25 22 YES YES 16 4 26 75 139 3.5 25 13 NO NO 17 4.1 24 73 137 3.2 26 24 YES YES 18 4.4 20 68 136 4.4 17 24 YES NO 19 3.9 24 80 140 3.9 23 22 YES YES 20 3.9 24 72 138 3.3 25 23 YES YES 21 4.4 21 74 139 3.8 23 22 YES YES 22 3.5 22 75 138 3.8 28 18 NO YES 23 4.7 26 71 139 3.7 27 24 YES YES 24 3.6 24 88 142 3.4 26 23 YES YES 25 4.6 24 78 138 3 21 31 YES YES 26 4 24 76 137 3.6 26 26 YES YES 27 4.4 22 83 136 3.5 27 23.5 YES NO 28 4.1 21 94 139 4.2 30 24 YES YES 29 4.1 25 94 138 3.5 31 21 YES YES 30 4.1 25 90 137 3.8 26 19 YES NO 31 3.4 21 98 138 4.1 23 11 YES YES 32 3.5 21 81 137 2.9 26 20 YES YES 33 4.2 26 73 140 3 25 24 YES NO 34 4.2 23 65 140 3.9 24 25 YES NO 35 2.8 21 73 136 3.5 27 24 YES YES 36 3.4 28 60 138 2.9 31 24 YES NO 37 4 19 77 138 3.4 24 19 YES YES 38 3.9 21 87 138 3.6 25 21 YES YES

16
Code K1 TCO21 Cr2 Na2 K2 TCO22 DT NAC Vomit 39 3.4 18 71 136 3 22 19 YES YES 40 4.7 23 71 134 4.6 27 22 YES YES 41 3.3 24 71 138 3.3 23 22.5 YES NO 42 3.5 25 62 137 2.6 27 21 YES YES 43 3.9 22 81 140 3.7 23 22 YES NO 44 3.6 22 80 138 3.4 24 26 NO NO 45 2.5 20 78 130 2.4 26 21.5 YES YES 46 3.6 27 73 141 3.5 30 12 YES YES 47 3.8 24 88 137 3.8 29 29 YES NO 48 4.1 26 88 139 3.5 27 19.5 YES YES 49 4 22 69 139 3.5 27 21 YES YES 50 4.2 18 64 138 3.3 21 23.5 YES YES 51 4.4 25 80 137 3 28 20 YES YES 52 3.8 24 88 137 3.5 23 14 YES NO 53 3.2 23 69 141 3.6 23 21.5 YES YES 54 4.1 24 79 139 3.4 26 22.5 YES YES 55 3.5 26 78 137 3.6 26 23 YES YES 56 3.4 24 71 137 3.2 25 21 YES NO 57 3.4 25 106 141 3.3 23 14 NO YES 58 3.8 23 105 136 3.8 21 21 YES YES 59 3.8 24 85 140 3.6 26 8 YES NO 60 3.7 19 72 141 3.3 20 21 YES YES 61 4.1 22 95 141 4 30 21 YES YES 62 5.2 28 112 143 3.9 28 22 YES NO 63 3.7 20 100 138 4.1 23 24 YES NO 64 3.7 25 96 141 3.8 24 24 YES YES 65 4 29 75 140 4 29 28 YES NO 66 3.7 22 85 137 3.4 28 22.5 YES NO 67 3.8 21 64 141 3.5 23 23.5 YES YES 68 3.9 23 70 139 3.3 23 27 YES YES 69 4.3 20 68 139 3.5 21 22 YES NO 70 3.7 23 73 141 3.3 25 21 YES YES 71 4.5 20 78 136 3.4 21 22 YES NO 72 3.9 22 77 138 3.8 23 24 YES NO 73 3.3 23 72 137 3.4 27 28 YES NO 74 3.3 23 79 138 3.3 27 22 YES YES 75 3.3 18 68 137 3 27 23.5 YES YES 76 3.6 24 80 135 3.3 24 30 YES YES 77 3.6 23 78 141 3.9 26 5.5 NO NO 78 3.7 23 102 141 3.9 26 20 NO YES 79 3.9 19 77 140 3.2 26 19 YES YES 80 4.4 27 76 140 3.7 26 24 YES YES 81 4 21 106 138 3.9 25 22 YES NO 82 3.8 27 84 134 3.2 26 23 YES YES 83 4.2 23 82 140 3.2 26 22 YES YES 84 3.8 28 80 135 3.1 29 20 YES NO 85 4.8 27 76 138 3.8 26 23 YES NO 86 3.9 28 69 138 3.4 27 23 YES YES 87 4.1 22 64 136 3.5 23 22 YES YES 88 3.8 23 72 138 4.4 22 21.5 YES YES 89 3.5 22 69 139 3.7 24 21.5 YES YES

17
Code K1 TCO21 Cr2 Na2 K2 TCO22 DT NAC Vomit 89 3.5 22 69 139 3.7 24 21.5 YES YES 90 4 21 85 138 3.5 25 28.5 YES NO 91 3.8 19 85 137 3.6 25 21 YES NO 92 3.9 25 93 141 3.8 26 . NO NO 93 4.1 27 89 141 3.6 22 14 NO NO 94 3.9 18 76 138 3.1 23 23.5 YES NO 95 4.1 24 63 137 3.6 22 22 YES NO 96 4 23 82 138 3.4 22 21.5 YES YES 97 3.6 20 77 140 3 21 24 YES YES 98 3.4 27 82 138 3.2 27 29 YES YES 99 3.9 23 72 138 3.9 24 22.5 YES NO 100 4 19 84 138 3.1 24 21.5 YES YES 101 3.5 22 76 139 3.2 24 22.5 YES YES 102 4.2 25 72 138 3.2 25 24 YES YES 103 3.7 24 81 140 3.5 26 27 YES YES 104 2.9 22 66 135 3 27 25 YES YES 105 4.1 26 81 139 4.1 25 7.5 NO NO 106 3.9 24 72 141 3.2 29 22 YES YES 107 4 21 94 139 4.2 28 21 YES NO 108 4 27 63 141 3.4 25 22 YES NO 109 4.1 25 71 138 3.3 23 22.5 YES NO 110 4.1 24 75 138 3.7 24 24 YES NO 111 3.8 23 69 139 3.8 23 24 YES NO 112 3.8 25 72 139 3.7 25 20 YES NO 113 3.8 22 97 136 3.8 24 18 NO NO 114 3.7 20 82 137 3.7 25 24 YES YES 115 3.9 22 93 140 3.3 25 21 YES NO 116 3.9 25 77 140 3.1 25 23 YES YES 117 4.3 25 93 140 3.6 28 21 YES NO 118 3.3 13 79 135 3.1 17 19 YES YES 119 3.6 22 68 136 3.2 23 24.5 YES YES 120 4 20 76 142 3.3 24 26 YES YES 121 3.3 22 77 134 3 26 12 YES YES 122 3.9 22 95 139 4 22 28 NO NO 123 4 19 73 139 3 28 21 YES YES 124 3.3 24 81 137 3.2 26 23.5 YES YES 125 3.4 24 104 139 4.3 26 19 NO NO 126 4.3 21 68 138 3.4 23 25 YES NO 127 4.4 21 65 138 3.4 23 24 YES YES 128 4.1 24 101 142 4 24 22 YES YES 129 4 26 84 138 3.4 26 22 YES NO 130 3.6 23 76 137 3.5 21 21 YES YES 131 4.6 24 80 141 3.2 25 30 YES YES 132 3.6 30 61 136 3.3 26 22 YES YES 133 3.6 24 93 141 3.6 . 32 YES NO 134 4.1 22 62 138 3.9 25 24 NO NO 135 3.4 23 103 136 3.1 28 33 YES YES 136 3.8 22 76 140 3 24 20 YES YES 137 3.8 21 96 138 4.2 24 21.5 YES YES 138 3.9 24 62 135 3.3 26 23.5 YES YES 139 4.2 20 84 140 3.5 26 21 YES NO

18
Code K1 TCO21 Cr2 Na2 K2 TCO22 DT NAC Vomit 140 3.7 21 69 133 3.5 23 24 NO NO 141 4.7 19 65 136 3.3 23 26 YES NO 142 4.3 25 80 135 4.4 24 7 YES NO 143 4.4 21 62 138 3.7 23 24 YES NO 144 3.1 25 103 139 3.2 27 20 YES YES 145 4 29 78 140 3.1 29 23 YES YES 146 4 29 78 141 3.9 29 38 YES NO 147 3.7 28 84 140 3.4 29 28 YES NO 148 3.7 16 75 137 3.2 24 22.5 YES NO 149 3.8 23 62 140 3.5 27 14 NO NO 150 4.5 20 78 136 3.4 21 22 YES NO 151 3.9 23 70 139 3.3 23 22 YES YES 152 3.7 23 73 141 3.3 25 23 YES YES 153 4.4 25 79 142 3.7 26 29 YES YES 154 4.1 21 88 138 3.4 22 21.5 YES YES 155 4 29 86 140 3.6 31 20 YES YES
Code: patient code DOB: date of birth F: female; M: Male DOA: date of admission 1: frist sample taken at admission; 2: second sample taken Cr: plasma Creatinine (µmol/l); Na: plasma sodium (mmol/l); K: plasma potassium (mmol/l); TCO2: plasma bicarbonate (mmol/l), DT: time between two first and second sample (h), 4h para: plasma paracetamol at 4h post-ingestion (mg/l) Sali: plasma salicylate
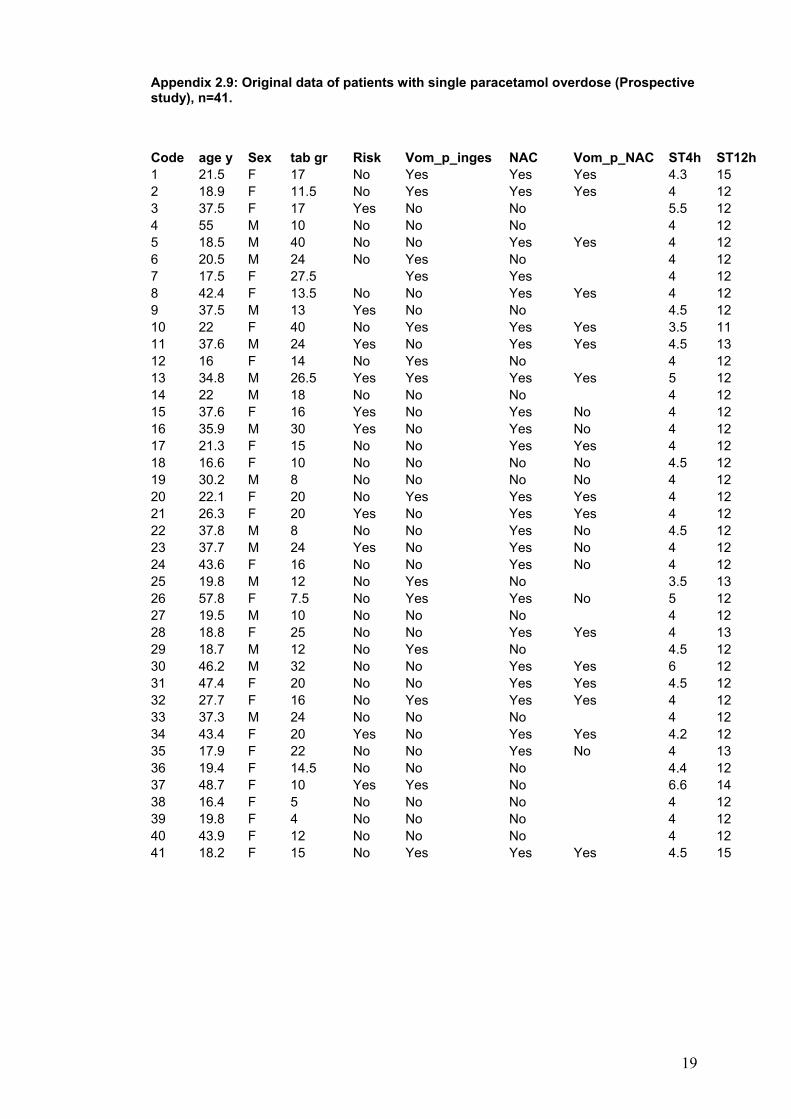
19
Appendix 2.9: Original data of patients with single paracetamol overdose (Prospective study), n=41.
Code age y Sex tab gr Risk Vom_p_inges NAC Vom_p_NAC ST4h ST12h
1 21.5 F 17 No Yes Yes Yes 4.3 15 2 18.9 F 11.5 No Yes Yes Yes 4 12 3 37.5 F 17 Yes No No 5.5 12 4 55 M 10 No No No 4 12 5 18.5 M 40 No No Yes Yes 4 12 6 20.5 M 24 No Yes No 4 12 7 17.5 F 27.5 Yes Yes 4 12 8 42.4 F 13.5 No No Yes Yes 4 12 9 37.5 M 13 Yes No No 4.5 12 10 22 F 40 No Yes Yes Yes 3.5 11 11 37.6 M 24 Yes No Yes Yes 4.5 13 12 16 F 14 No Yes No 4 12 13 34.8 M 26.5 Yes Yes Yes Yes 5 12 14 22 M 18 No No No 4 12 15 37.6 F 16 Yes No Yes No 4 12 16 35.9 M 30 Yes No Yes No 4 12 17 21.3 F 15 No No Yes Yes 4 12 18 16.6 F 10 No No No No 4.5 12 19 30.2 M 8 No No No No 4 12 20 22.1 F 20 No Yes Yes Yes 4 12 21 26.3 F 20 Yes No Yes Yes 4 12 22 37.8 M 8 No No Yes No 4.5 12 23 37.7 M 24 Yes No Yes No 4 12 24 43.6 F 16 No No Yes No 4 12 25 19.8 M 12 No Yes No 3.5 13 26 57.8 F 7.5 No Yes Yes No 5 12 27 19.5 M 10 No No No 4 12 28 18.8 F 25 No No Yes Yes 4 13 29 18.7 M 12 No Yes No 4.5 12 30 46.2 M 32 No No Yes Yes 6 12 31 47.4 F 20 No No Yes Yes 4.5 12 32 27.7 F 16 No Yes Yes Yes 4 12 33 37.3 M 24 No No No 4 12 34 43.4 F 20 Yes No Yes Yes 4.2 12 35 17.9 F 22 No No Yes No 4 13 36 19.4 F 14.5 No No No 4.4 12 37 48.7 F 10 Yes Yes No 6.6 14 38 16.4 F 5 No No No 4 12 39 19.8 F 4 No No No 4 12 40 43.9 F 12 No No No 4 12 41 18.2 F 15 No Yes Yes Yes 4.5 15

20
Code ST24h 4hpara K4h K12h K24h FeK4h FeK12h FeK24h 1 24 93 3 2.9 3.5 9.1 7.4 6.6 2 26 157 3.9 3.3 3.5 18.4 15.3 4 3 24 75 3.7 3.5 14.7 4.4 4 24 74 4.2 3.7 3.7 6.4 7.2 7 5 24 285 3.2 3.2 3 24 30.7 6 6 24 50 4 3.9 3.9 10.5 3.7 7 24 89 3.9 3.5 3.4 15.3 13.7 6.7 8 28 137 4.2 4 3.3 8.1 39.5 0.7 9 24 34 4 4.2 13 9.7 10 24 112 4.1 3.8 3.4 19 15.8 7.8 11 24 129 4.5 4 4.1 18.5 9.4 12 24 44 4.4 4.1 8 7.8 13 24 115 4.1 3.6 3.4 10.3 22.1 4.9 14 24 80 4.2 3.6 18.6 3.7 15 26 139 4.1 4.3 16.4 5.2 16 24 159 3.7 4 3.5 40.9 27.5 31 17 24 190 4.2 4.3 3.3 8.8 26 4.6 18 24 61 3.9 3.5 3.7 15 5.8 2.5 19 24 83 3.9 3.9 15.3 14 20 24 200 4 3.8 3 32 26.6 5 21 24 108 3.9 3.3 4.7 14.7 7.7 4.8 22 24 129 3.5 3 3.9 7.4 24 6.6 23 24 151 3.9 3.3 11.3 40.1 24 24 177 3.5 3.3 3.7 14.8 11.7 7.9 25 22 99 4.7 4.1 3.9 4.3 11.2 4.3 26 24 140 3.5 . 2.8 48.6 17.1 27 23 127 4.1 3.4 3.4 5.1 15.7 5.5 28 24 216 4 3.2 25.8 31.6 29 27 116 3.7 3.4 3.8 16.2 16.9 1.9 30 28 270 4 3.5 27.8 7.4 31 23 167 3.5 3.2 3.1 21 7.8 32 24 398 4.3 4.1 9.7 26.6 33 19 148 4.2 3.7 4.2 17.5 8.5 3.6 34 28 391 3.1 2.9 2.9 4.6 19.5 6.4 35 24 246 3.9 3.6 19.8 19.2 36 23 137 4 3.9 3.9 9.8 7.8 4.7 37 20 24 3.9 3.5 3.7 23.4 12.6 4.8 38 22 36 3.9 4.2 3.9 8.6 5.3 6.4 39 24 24 3.7 4.8 5.3 4.8 40 25 32 4 3.6 3.8 21.5 9.6 29 41 24 83 3.6 3.8 19.2 14.8
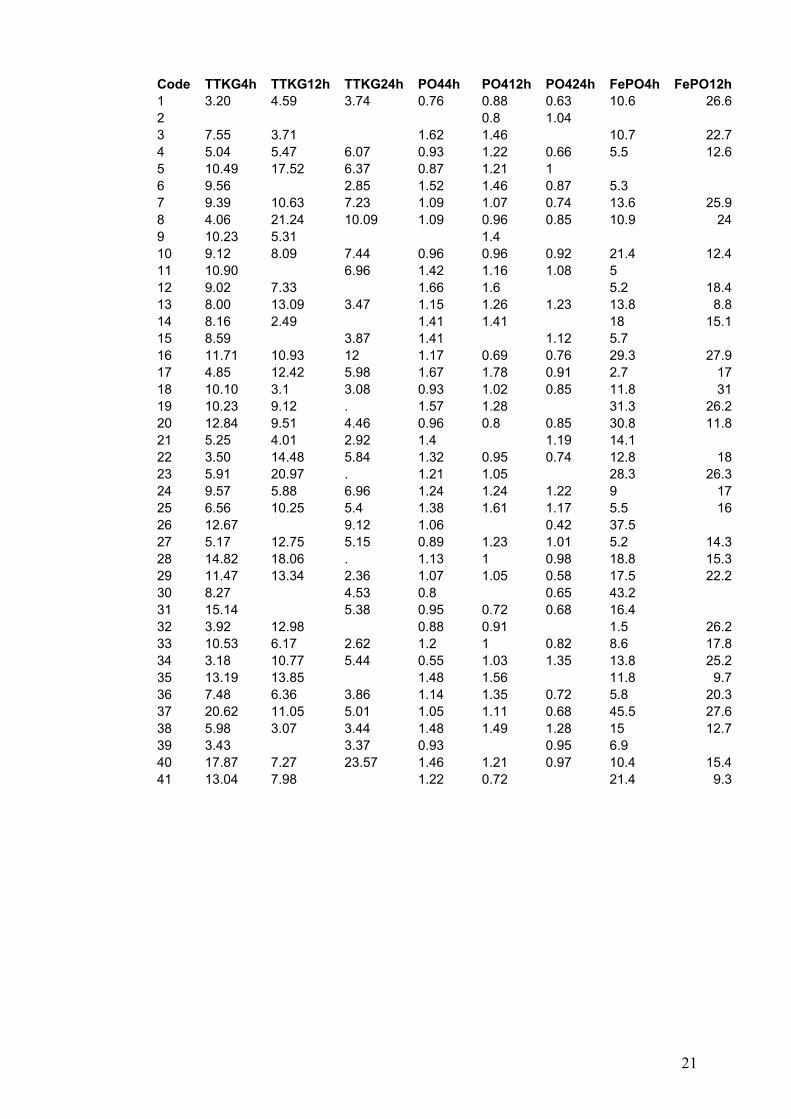
21
Code TTKG4h TTKG12h TTKG24h PO44h PO412h PO424h FePO4h FePO12h1 3.20 4.59 3.74 0.76 0.88 0.63 10.6 26.62 0.8 1.04 3 7.55 3.71 1.62 1.46 10.7 22.74 5.04 5.47 6.07 0.93 1.22 0.66 5.5 12.65 10.49 17.52 6.37 0.87 1.21 1 6 9.56 2.85 1.52 1.46 0.87 5.3 7 9.39 10.63 7.23 1.09 1.07 0.74 13.6 25.98 4.06 21.24 10.09 1.09 0.96 0.85 10.9 249 10.23 5.31 1.4 10 9.12 8.09 7.44 0.96 0.96 0.92 21.4 12.411 10.90 6.96 1.42 1.16 1.08 5 12 9.02 7.33 1.66 1.6 5.2 18.413 8.00 13.09 3.47 1.15 1.26 1.23 13.8 8.814 8.16 2.49 1.41 1.41 18 15.115 8.59 3.87 1.41 1.12 5.7 16 11.71 10.93 12 1.17 0.69 0.76 29.3 27.917 4.85 12.42 5.98 1.67 1.78 0.91 2.7 1718 10.10 3.1 3.08 0.93 1.02 0.85 11.8 3119 10.23 9.12 . 1.57 1.28 31.3 26.220 12.84 9.51 4.46 0.96 0.8 0.85 30.8 11.821 5.25 4.01 2.92 1.4 1.19 14.1 22 3.50 14.48 5.84 1.32 0.95 0.74 12.8 1823 5.91 20.97 . 1.21 1.05 28.3 26.324 9.57 5.88 6.96 1.24 1.24 1.22 9 1725 6.56 10.25 5.4 1.38 1.61 1.17 5.5 1626 12.67 9.12 1.06 0.42 37.5 27 5.17 12.75 5.15 0.89 1.23 1.01 5.2 14.328 14.82 18.06 . 1.13 1 0.98 18.8 15.329 11.47 13.34 2.36 1.07 1.05 0.58 17.5 22.230 8.27 4.53 0.8 0.65 43.2 31 15.14 5.38 0.95 0.72 0.68 16.4 32 3.92 12.98 0.88 0.91 1.5 26.233 10.53 6.17 2.62 1.2 1 0.82 8.6 17.834 3.18 10.77 5.44 0.55 1.03 1.35 13.8 25.235 13.19 13.85 1.48 1.56 11.8 9.736 7.48 6.36 3.86 1.14 1.35 0.72 5.8 20.337 20.62 11.05 5.01 1.05 1.11 0.68 45.5 27.638 5.98 3.07 3.44 1.48 1.49 1.28 15 12.739 3.43 3.37 0.93 0.95 6.9 40 17.87 7.27 23.57 1.46 1.21 0.97 10.4 15.441 13.04 7.98 1.22 0.72 21.4 9.3
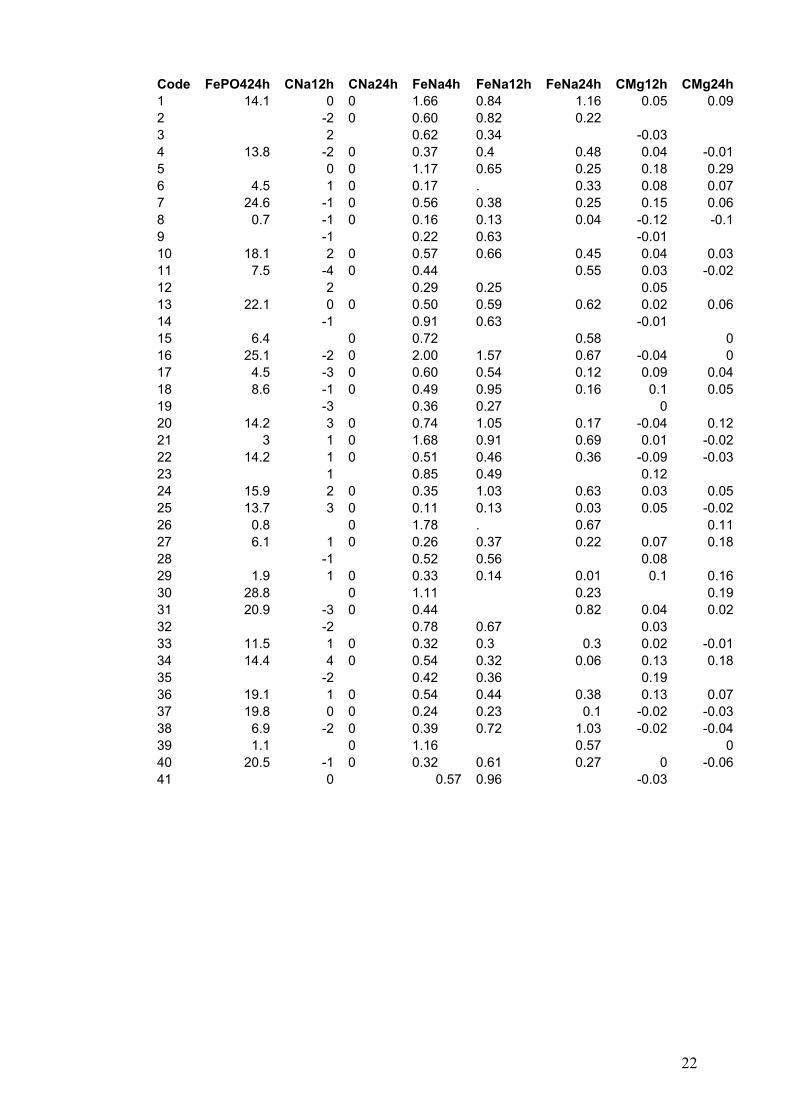
22
Code FePO424h CNa12h CNa24h FeNa4h FeNa12h FeNa24h CMg12h CMg24h1 14.1 0 0 1.66 0.84 1.16 0.05 0.092 -2 0 0.60 0.82 0.22 3 2 0.62 0.34 -0.03 4 13.8 -2 0 0.37 0.4 0.48 0.04 -0.015 0 0 1.17 0.65 0.25 0.18 0.296 4.5 1 0 0.17 . 0.33 0.08 0.077 24.6 -1 0 0.56 0.38 0.25 0.15 0.068 0.7 -1 0 0.16 0.13 0.04 -0.12 -0.19 -1 0.22 0.63 -0.01 10 18.1 2 0 0.57 0.66 0.45 0.04 0.0311 7.5 -4 0 0.44 0.55 0.03 -0.0212 2 0.29 0.25 0.05 13 22.1 0 0 0.50 0.59 0.62 0.02 0.0614 -1 0.91 0.63 -0.01 15 6.4 0 0.72 0.58 016 25.1 -2 0 2.00 1.57 0.67 -0.04 017 4.5 -3 0 0.60 0.54 0.12 0.09 0.0418 8.6 -1 0 0.49 0.95 0.16 0.1 0.0519 -3 0.36 0.27 0 20 14.2 3 0 0.74 1.05 0.17 -0.04 0.1221 3 1 0 1.68 0.91 0.69 0.01 -0.0222 14.2 1 0 0.51 0.46 0.36 -0.09 -0.0323 1 0.85 0.49 0.12 24 15.9 2 0 0.35 1.03 0.63 0.03 0.0525 13.7 3 0 0.11 0.13 0.03 0.05 -0.0226 0.8 0 1.78 . 0.67 0.1127 6.1 1 0 0.26 0.37 0.22 0.07 0.1828 -1 0.52 0.56 0.08 29 1.9 1 0 0.33 0.14 0.01 0.1 0.1630 28.8 0 1.11 0.23 0.1931 20.9 -3 0 0.44 0.82 0.04 0.0232 -2 0.78 0.67 0.03 33 11.5 1 0 0.32 0.3 0.3 0.02 -0.0134 14.4 4 0 0.54 0.32 0.06 0.13 0.1835 -2 0.42 0.36 0.19 36 19.1 1 0 0.54 0.44 0.38 0.13 0.0737 19.8 0 0 0.24 0.23 0.1 -0.02 -0.0338 6.9 -2 0 0.39 0.72 1.03 -0.02 -0.0439 1.1 0 1.16 0.57 040 20.5 -1 0 0.32 0.61 0.27 0 -0.0641 0 0.57 0.96 -0.03

23
Code FeMg4h FeMg12h FeMg24h Cr4h Cr12h Cr24h Ucr4h UCr12h 1 6.5 1.5 3.1 68 67 82 8 5.32 63 64 64 10.2 10.93 1.3 4.1 83 78 3.5 10.54 1.1 1.6 1.7 97 90 95 4.7 7.85 2.8 0.6 2.4 83 83 86 12 19.16 2.7 5 101 90 93 38.5 7 1 66 61 68 13.8 98 4.3 0.6 0 62 66 67 1.1 9.29 1.5 3.2 82 76 11.8 5.410 2.1 3.9 1.5 78 81 70 1.9 5.811 0.7 2.4 77 78 74 15.8 12 2.1 2.2 78 80 22.2 16.113 2.7 0.4 1 87 78 73 21.5 17.814 1.8 3 87 85 4.9 1715 0.8 1.8 78 85 4.4 16 1.7 1.2 1.1 102 92 91 5.8 11.417 3 2.1 1.5 83 85 73 7.6 11.618 2.2 3.2 2.9 84 77 90 20.2 1.919 1.8 1.2 72 72 9.9 9.920 0.8 2.8 2.5 74 75 71 1.1 7.521 2.9 4.1 3.4 83 79 84 2.6 6.222 4.2 1.3 1.2 78 75 77 1.8 4.923 1.5 1 78 84 10.3 1124 0.6 2.4 2.6 92 86 81 9.4 5.125 1.6 0.9 1.5 110 101 97 50.6 34.326 9.4 . 2.8 86 102 4.5 27 1.5 0.9 3.8 85 89 93 6.1 23.228 3.3 2.8 79 80 77 1.3 11.429 0.6 0.6 2.1 83 93 91 22 26.730 1.5 2.5 106 98 10 31 2.1 3.3 69 64 68 10.6 32 5 2 79 83 . 5.5 12.533 2.3 3.6 6.9 88 89 95 14.4 2434 2 0.5 2 80 80 81 11.2 4.135 1.5 1.1 75 70 . 13.5 13.936 1.7 2.6 3.3 82 82 74 6.7 13.737 1.6 0.8 2.9 64 63 61 11.7 9.738 3.5 5.5 4.4 69 70 69 8.2 6.239 2.4 3 74 78 11.8 40 2 2.6 0.5 83 72 74 10.7 11.841 2.4 4.6 . 66 70 8.3 4.6
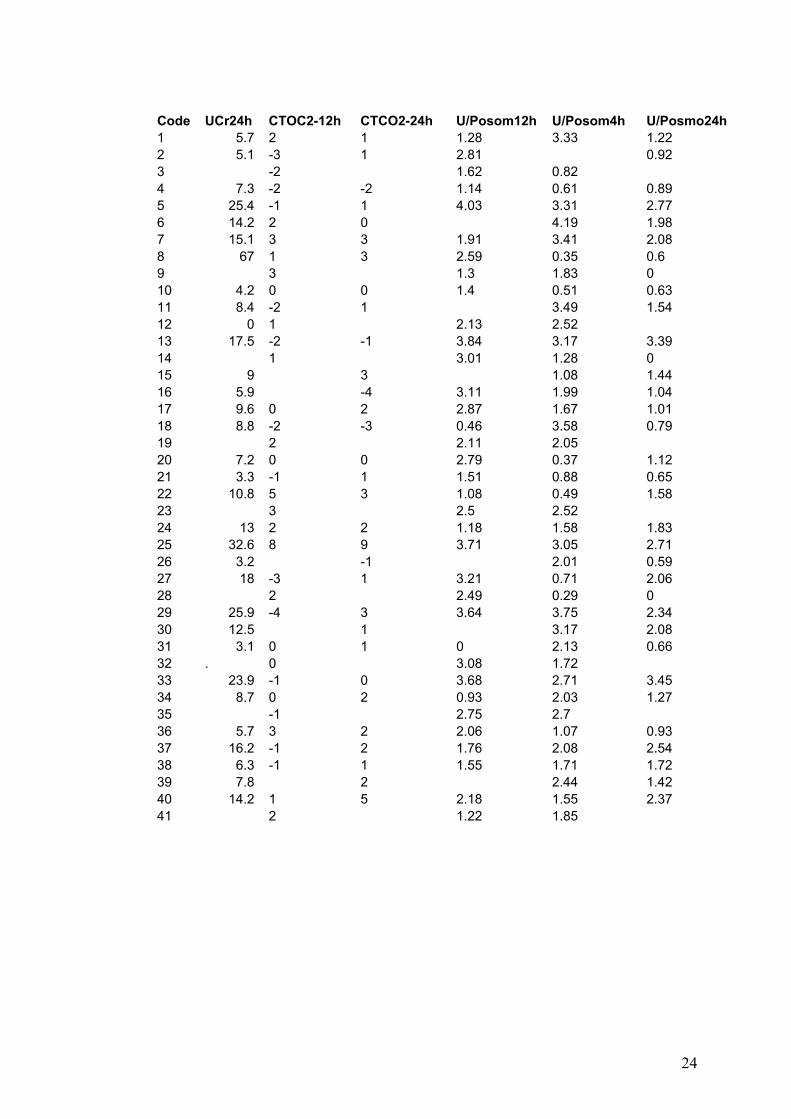
24
Code UCr24h CTOC2-12h CTCO2-24h U/Posom12h U/Posom4h U/Posmo24h 1 5.7 2 1 1.28 3.33 1.22 2 5.1 -3 1 2.81 0.92 3 -2 1.62 0.82 4 7.3 -2 -2 1.14 0.61 0.89 5 25.4 -1 1 4.03 3.31 2.77 6 14.2 2 0 4.19 1.98 7 15.1 3 3 1.91 3.41 2.08 8 67 1 3 2.59 0.35 0.6 9 3 1.3 1.83 0 10 4.2 0 0 1.4 0.51 0.63 11 8.4 -2 1 3.49 1.54 12 0 1 2.13 2.52 13 17.5 -2 -1 3.84 3.17 3.39 14 1 3.01 1.28 0 15 9 3 1.08 1.44 16 5.9 -4 3.11 1.99 1.04 17 9.6 0 2 2.87 1.67 1.01 18 8.8 -2 -3 0.46 3.58 0.79 19 2 2.11 2.05 20 7.2 0 0 2.79 0.37 1.12 21 3.3 -1 1 1.51 0.88 0.65 22 10.8 5 3 1.08 0.49 1.58 23 3 2.5 2.52 24 13 2 2 1.18 1.58 1.83 25 32.6 8 9 3.71 3.05 2.71 26 3.2 -1 2.01 0.59 27 18 -3 1 3.21 0.71 2.06 28 2 2.49 0.29 0 29 25.9 -4 3 3.64 3.75 2.34 30 12.5 1 3.17 2.08 31 3.1 0 1 0 2.13 0.66 32 . 0 3.08 1.72 33 23.9 -1 0 3.68 2.71 3.45 34 8.7 0 2 0.93 2.03 1.27 35 -1 2.75 2.7 36 5.7 3 2 2.06 1.07 0.93 37 16.2 -1 2 1.76 2.08 2.54 38 6.3 -1 1 1.55 1.71 1.72 39 7.8 2 2.44 1.42 40 14.2 1 5 2.18 1.55 2.37 41 2 1.22 1.85

25
Risk: high risk; Vom_P_inges: vomiting post ingestion; Vom_P_NAc: vomiting post NAC infusion; ST4h: time of 4h sample taken (h); ST12h: time of 12h sample taken (h); ST24h: time of 24h sample taken (h); 4hpara: paracetamol level at 4h (mg/l); K4h: plasma potassium at 4h (mmol/l); K12h: plasma potassium at 12h; K24h: plasma potassium at 24h; FeK4h: FeK at 4h (%); Fe12h: FeK at 12h; Fe24h: FeK at 24h; TTKG4h: TKG at 4h; TTKG12h: TTKG at 12h; TKG24h: TTKG at 24h; PO44h: plasma phosphate at 4h (mmol/l); PO412h: plasma phosphate at 12h; PO424h: plasma phosphate at 24h; FePO4h: FePO4 at 4h (%); FePO12h: FePO4 at 12h; FePO24h; FePO4 at 24h; CNa12h:cange in plasma sodium at 12h (mmol/l); CNa24h: change in plasma sodium at 24h; FeNa4h: FeNa at 4h (%); FeNa12h: FeNa at 12h; FeNa24h: FeNa at 24h; CMag12h: Change in plasma magnesium at 12h (mmol/l); CMg24h: Change in plasma magnesium at 24h; FeMg4h: FeMg at 4h (%); FeMg12h: FeMg at 12h; FeMg24h: FeMg at 24h; Cr4h: plasma Creatinne (Cr) at 4h (µmol/l); Cr12h: plasma Cr at 12h; Cr24h: plasma Cr at 24h; UCr4h: urine Cr at 4h (mmol/l), UCr12h: urine Cr at 12h; UCr24h: urine Cr at 24h; CTCO2-12h: change in plasma bicarbonate at 12h (mmol/l); CTCO2-24h: change in plasma bicarbonate at 24h; U/Posmo12h: urinary osmolality/plasma osmolality at 12h; U/Posmo24h: urinary osmolality/plasma osmolality at 24h;

26
Appendix 2.10: Original data of patients with single SSTI (Fluoxetine) overdose (Prospective study), n=18.
Code age y Sex tablet gr Vom_Pingestion T4h T12h T24h 4hpara1 28 M 0.48 No 4 12 . 0 2 27 M 0.46 No 3.5 12 24 0 3 21 F 0.6 No 4 12 20 0 4 43.8 F 0.4 No 5 12 . 0 5 25.7 M 0.4 No 5 12 24 0 6 54.5 F 2 Yes 6 12 0 0 7 19.6 F 0.4 Yes 4 12 . 0 8 37.1 M 0.44 Yes 6 12 . 0 9 22.9 F 0.84 Yes 4 12 24 0 10 24.3 F 0.42 No 4 12 21 0 11 17 F 1.2 Yes 6 12 24 0 12 45.8 F 0.9 Yes 4 12 20 0 13 16.2 M 0.6 No 7 10 . 0 14 19.2 M 0.52 No 4 13 20 0 15 20.4 F 0.18 Yes 7 12 22 0 16 27.2 F 3.6 No 2.5 12 . 0 17 41.6 M 6 No 7 16 . 17 18 23.3 F 0.88 Yes 4 12 17 0
Code cK12h cK24h FeK4h cFeK12h cFeK24h TTKG4h cTTKG12h cTTKG24h 1 -0.2 8.2 0.03 4.96 4.98 2 -0.1 0.6 31 -0.07 -0.14 0.00 13.14 3 -1 -1.2 7.1 0.00 -0.04 5.34 0.00 -1.39 4 -0.4 8.9 -0.04 5.27 -0.86 5 -0.1 -0.4 5.7 0.06 -0.01 4.34 2.72 -1.18 6 0 9.6 0.11 7.59 8.14 7 0.1 4 -0.01 2.40 0.48 8 0 14.2 0.12 11.26 5.29 9 -0.5 0 6.6 -0.01 8.20 -2.17 10 0 0 7.7 0.02 3.04 2.33 11 0.1 -0.1 3.7 0.02 -0.01 3.80 2.29 0.59 12 0.5 0.6 8.6 0.02 -0.01 13.26 -4.17 -6.06 13 0.5 7.7 0.06 4.64 3.83 14 0.3 0.5 6.8 -0.03 0.01 3.57 0.16 1.96 15 -0.1 -0.5 6.6 -0.01 -0.03 3.85 -0.01 -0.50 16 -0.1 7.8 0.03 7.34 1.86 17 -0.2 9.6 0.08 7.46 4.25 18 -0.1 0 3.6 0.03 0.06 2.01 5.79 9.30

27
Code PO44h cPO412h cPO424h FePO44h 4hPO4 cFePO12h cFePO424h 1 1.03 -0.12 3.3 1.03 0.09 2 1.11 0.23 0.14 14.2 1.11 0.10 0.223 0.83 -0.21 8.4 0.83 -0.054 0.88 0.31 14 0.88 0.06 5 1.65 -0.31 -0.3 13.4 1.65 0.06 0.096 1.02 -0.17 30.3 1.02 -0.03 7 1.14 -1.14 12.3 1.14 8 1.08 0.05 18.6 1.08 0.18 9 1.25 0.15 -1.25 5.8 1.25 0.03 10 1.11 0.01 -0.02 21 1.11 -0.0511 0.95 0.23 0.09 0.7 0.95 0.04 0.0012 0.88 0.51 0.33 10.1 0.88 0.10 0.0713 1.46 -0.15 12.9 1.46 -0.01 14 1.19 -0.05 -0.37 7.4 1.19 0.18 0.0515 0.92 0.12 -0.08 34.6 0.92 -0.10 -0.0916 1.08 -0.03 10.4 1.08 0.04 17 1.22 -0.11 27 1.22 -0.09 18 0.86 0.39 0.02 4 0.10 0.14
Code CNa12h CNa24h FeNa4h cFeNa12h cFeNa24h CMg12h CMg24h FeMg4h1 -1 0.60 -0.005 -0.03 . 1.82 -2 -6 0.80 0.000 -0.003 -0.07 -0.05 3.73 2 -1 0.40 0.004 -0.001 0.09 0.1 1.44 2 0.70 -0.004 0.01 . 3.75 1 -5 0.60 0.002 -0.002 -0.07 0.03 3.16 0 0.40 0.001 -0.01 . 2.77 -2 1.00 -0.005 -0.02 . 3.88 -2 0.60 0.000 -0.02 . 3.49 -2 -3 0.20 0.000 -0.07 0.01 110 0 -1 1.60 -0.007 -0.01 0.03 3.211 0 -1 0.30 0.002 0.000 -0.01 0.02 2.912 2 5 0.00 0.003 0.002 0.07 0.07 2.113 5 0.70 0.001 0.03 . 2.614 2 0 0.40 -0.003 0.001 -0.02 0.02 5.415 0 2 0.60 -0.003 -0.004 0.06 0 2.216 3 0.50 0.000 -0.03 . 1.917 -4 0.40 0.000 -0.06 . 318 4 3 0.50 -0.002 -0.001 -0.04 -0.05 7.8

28
Code cFeMg12h cFeMg24h cCr12h cCr24h CTOC2-12h CTCO2-24h 1 -0.005 1 -1 . 2 -0.019 -0.026 -6 -4 2 1 3 0.007 0.016 0 5 3 1 4 0.007 -1 0 . 5 -0.014 -0.012 15 2 0 . 6 -0.017 3 3 . 7 -0.004 2 -3 . 8 -0.029 -2 1 . 9 0.010 -6 1 2 10 -0.013 3 6 0 -1 11 -0.014 -0.004 -7 -1 -1 -1 12 -0.012 -0.010 -9 -6 2 -1 13 0.000 7 -4 . 14 -0.029 -0.037 7 3 2 2 15 -0.005 0.012 2 7 3 5 16 -0.007 3 6 . 17 -0.004 7 -1 . 18 -0.069 -0.074 6 8 1 4
Code U/Posom12h U/Posom4h U/Posmo24h 1 3.81 2.47 . 2 2.36 . 2.89 3 1.4 1.87 3.31 4 2.84 2.42 . 5 2.58 1.96 3.08 6 2.57 0.94 . 7 4.01 3.4 . 8 2.85 2.1 . 9 3.55 3.29 . 10 . 1.29 2.82 11 0.95 0.29 3.42 12 2.96 2.44 3.26 13 1.82 0.74 . 14 3.96 2.65 3.83 15 3.33 3.3 3.32 16 2.26 1.9 . 17 2.97 1.25 . 18 0.74 0.36 2.29
cK12: change in plasma potassium at 12h (mmol/l); cK24h: change in plasma potassium at 24h; cFeK12h: change in FeK at 12h (%); cFeK24h: change in FeK at 24h; cTTKG12h: change in TTKG at 12h; cTTKG24h: change in TTKG at 24h; cPO412h: change in plasma phosphate at 12h (mmol/l); cPO424h: change in plasma phosphate at 24h; cFePO412h: change in FePO4 at 12h (%); cFePO424h: change in FePO4 at 24h; cNa12h: change in plasma sodoium at 12h (mmol/l); cNa24h: change in plasma sodium at 24h; cFeNa12h: change in FeNa at 12h (%); cFena24h: change in FeNa at 24h; cMg12h: change in plasma magnesium at12h (mmol/l); cMg24h: change in plasma magnesium at 24h; cFeMag12h: change in FeMg at 12h (%); cFeMg24h: change in FeMag at 24h; cCr12h: change in plasma Cr at 12h (µmol/l); cCr24h: change in plasma Cr at 24h;

29
Appendix 3.1: Collected data from 522 patients admitted to Scottish Liver Transplant Unit from referring hospital in Scotland.
Number Code DOB Sex Age Age band No Tablet Stag OD 1 TA040001 24-Jun-79 female 16 11-20 YEARS 50 NO 2 DA090002 23-Jun-52 male 47 41-50 YEARS 12 YES 3 IA020004 15-Jan-56 female 36 31-40 YEARS NO 4 DA070006 24-Apr-62 male 36 51-60 YEARS 32 NO 5 PA030007 15-Oct-65 male 28 21-30 YEARS 40 NO 6 JA080009 30-Dec-75 female 23 21-30 YEARS 40 NO 7 SA080010 30-Mar-65 female 33 31-40 YEARS YES 8 CA050012 13-Jul-60 female 35 31-40 YEARS 50 NO 9 RA060014 25-Nov-45 male 51 51-60 YEARS 100 NO 10 DA120687 12-Dec-61 female 43 41-50 YEARS NO 11 DA030015 31-Dec-67 female 26 21-30 YEARS 20 NO 12 AA050016 01-Sep-68 male 28 21-30 YEARS 72 NO 13 CA070017 06-Jun-76 female 22 21-30 YEARS 15 NO 14 EA060019 30-Mar-35 female 61 61 AND OLDER 40 NO 15 AA030021 14-Mar-69 male 25 21-30 YEARS 220 NO 16 JA060023 12-Sep-30 male 66 61 AND OLDER NO 17 DB020024 05-Nov-55 female 39 31-40 YEARS 18 NO 18 JB060026 16-Jun-48 male 50 41-50 YEARS 100 YES 19 JB120685 21-May-76 female 27 21-30 YEARS 60 YES 20 SB100028 29-Feb-60 female 41 41-50 YEARS 80 NO 21 KB110029 14-Sep-53 female 48 41-50 YEARS YES 22 MB070030 14-Dec-58 male 39 31-40 YEARS 125 NO 23 MB050032 13-Dec-56 female 39 31-40 YEARS 50 NO 24 VB120681 12-Jul-62 female 42 41-50 YEARS 35 YES 25 DB060034 17-Dec-61 male 35 31-40 YEARS 44 26 SB040037 27-Nov-65 male 29 21-30 YEARS 60 NO 27 WB060038 02-Jul-60 male 36 31-40 YEARS 48 NO 28 LB110039 21-Sep-82 female 19 11-20 YEARS 64 NO 29 AB120682 23-Dec-50 male 53 51-60 YEARS 112 YES 30 MB050040 21-Jan-51 female 46 41-50 YEARS 100 NO 31 JB070041 14-Mar-55 male 43 41-50 YEARS 75 NO 32 EB060042 09-Feb-74 female 23 21-30 YEARS 50 NO 33 IB060043 10-Feb-57 male 40 31-40 YEARS 150 NO 34 RB040045 11-Feb-43 male 52 51-60 YEARS YES 35 SB090046 25-Apr-76 female 24 21-30 YEARS 14 YES 36 AB050047 19-Feb-71 female 25 21-30 YEARS 48 YES 37 NB100048 07-Jun-64 male 37 31-40 YEARS 46 NO 38 AB070050 05-Mar-77 male 20 11-20 YEARS 42 NO 39 AB010051 12-Apr-42 male 50 41-50 YEARS 80 NO 40 GB120662 16-Aug-48 female 43 41-50 YEARS 95 NO 41 CB040053 03-Mar-58 female 36 31-40 YEARS 37 42 AB060055 04-Feb-43 male 54 51-60 YEARS 43 LB060056 12-Sep-67 female 29 21-30 YEARS 60 NO 44 KB050057 08-Jan-50 male 46 41-50 YEARS 50 NO 45 HB070058 11-Nov-77 female 22 21-30 YEARS 40 NO 46 JB120680 24-Jun-86 female 17 11-20 YEARS 35 NO 47 FB020059 12-Feb-51 female 41 41-50 YEARS 30 NO
30
Number Code DOB Sex Age Age band No Tablet Stag OD 48 NB080060 24-Jun-48 female 50 41-50 YEARS YES 49 JB090062 13-Feb-77 male 23 21-30 YEARS 104 YES 50 JB050063 20-Jun-74 male 22 21-30 YEARS YES 51 LB060064 25-Feb-68 female 29 21-30 YEARS 72 NO 52 GB110066 01-Feb-40 male 52 51-60 YEARS 50 NO 53 MB060067 01-Oct-75 male 21 21-30 YEARS 50 NO 54 SB100068 17-Jul-66 female 34 31-40 YEARS 64 NO 55 VB080069 11-Jul-63 male 35 31-40 YEARS 56 MB100070 02-May-77 male 24 21-30 YEARS NO 57 AB020071 16-Jun-42 male 50 41-50 YEARS 50 YES 58 MB130705 27-Dec-78 male 25 21-30 YEARS 70 NO 59 SB090073 16-Sep-77 female 22 21-30 YEARS 60 NO 60 MB030075 03-Jan-71 female 23 21-30 YEARS 50 NO 61 MB030076 03-Jan-71 female 23 21-30 YEARS 80 NO 62 RB070079 11-Sep-65 female 33 31-40 YEARS 40 NO 63 JB050080 02-Jul-57 male 39 31-40 YEARS 128 64 RB090081 19-Apr-74 male 26 21-30 YEARS 116 NO 65 PB040082 02-Jul-61 male 34 31-40 YEARS 150 NO 66 MB050083 04-Nov-53 female 40 31-40 YEARS 60 NO 67 SB080085 19-Oct-71 male 27 21-30 YEARS 50 NO 68 GB110086 16-Sep-67 male 34 31-40 YEARS YES 69 IB050088 24-Oct-45 male 50 41-50 YEARS 40 NO 70 CC060089 24-Jun-62 male 34 31-40 YEARS 50 NO 71 JC040092 30-Oct-74 male 22 21-30 YEARS 50 YES 72 LC050094 22-May-68 female 28 21-30 YEARS 77 NO 73 PC090095 09-Feb-65 male 35 31-40 YEARS 32 NO 74 PC100096 09-Jul-63 female 38 31-40 YEARS 189 NO 75 SC070098 01-Jun-69 female 29 21-30 YEARS 48 NO 76 SC060100 26-Apr-67 male 30 21-30 YEARS 74 NO 77 EC110102 01-Sep-72 female 29 21-30 YEARS 30 NO 78 MC060103 25-Jun-60 male 37 31-40 YEARS 8 NO 79 JC100105 22-May-82 male 18 11-20 YEARS 40 NO 80 MC020108 30-Nov-59 female 34 31-40 YEARS 60 NO 81 HC070109 18-Sep-62 female 35 31-40 YEARS 85 NO 82 VC120683 03-Jun-80 female 23 21-30 YEARS 32 NO 83 JC100113 24-Oct-75 female 25 21-30 YEARS 100 NO 84 AC110114 09-May-76 female 52 21-30 YEARS 64 NO 85 AC080115 13-Jun-65 female 34 31-40 YEARS 55 NO 86 DC110116 03-Nov-75 female 26 21-30 YEARS 23 YES 87 JC120674 28-Oct-55 male 48 41-50 YEARS 50 NO 88 LC070117 29-Jul-68 female 30 21-30 YEARS 30 NO 89 MC040118 03-Jul-61 female 34 31-40 YEARS 50 NO 90 JC110119 08-Nov-65 male 36 31-40 YEARS 40 NO 91 DC070120 14-Sep-41 male 56 51-60 YEARS 45 NO 92 AC17711 07-Aug-71 male 33 31-40 YEARS 100 YES 93 JC040121 18-Sep-58 male 37 31-40 YEARS 25 NO 94 AC070122 17-Mar-66 male 32 31-40 YEARS 25 NO 95 DC070123 11-Oct-60 male 38 31-40 YEARS 60 NO 96 WC110124 19-Aug-39 female 63 61 AND OLDER UNKNOWN 97 JC110125 03-Dec-50 male 21 51-60 YEARS YES 98 GC100126 10-Sep-66 male 34 31-40 YEARS 35 NO

31
Number Code DOB Sex Age Age band No Tablet Stag OD 99 HC060127 15-Nov-63 male 33 31-40 YEARS 48 NO 100 GC070129 12-Aug-57 male 40 31-40 YEARS 34 YES 101 CC050131 15-Aug-47 female 49 41-50 YEARS 40 102 WC080132 29-Oct-72 male 26 21-30 YEARS 130 NO 103 AC120135 27-Aug-38 female 65 61 AND OLDER 90 NO 104 LC040136 06-Nov-71 female 23 21-30 YEARS NO 105 AC090137 24-Apr-78 female 21 21-30 YEARS YES 106 JC120138 05-Mar-49 male 54 51-60 YEARS 100 NO 107 RC100140 23-Sep-47 male 53 51-60 YEARS 50 NO 108 CC110141 13-Sep-46 male 55 51-60 YEARS YES 109 PC040142 30-Jul-74 male 20 11-20 YEARS YES 110 PC130708 18-Jan-72 male 32 31-40 YEARS YES 111 SC100144 29-Jan-60 female 40 31-40 YEARS 70 NO 112 FC100145 23-Apr-68 female 33 11-20 YEARS UNKNOWN 113 JC130689 31-Dec-58 male 42 41-50 YEARS 24 NO 114 MC020146 10-Aug-30 female 63 61 AND OLDER 115 MD120147 27-Feb-73 male 30 21-30 YEARS 22 NO 116 JD020150 29-Aug-51 male 35 31-40 YEARS 50 NO 117 PD030151 17-May-62 female 31 31-40 YEARS 30 NO 118 MD020153 17-Mar-39 female 54 51-60 YEARS 100 NO 119 FD110154 30-Nov-58 male 41 41-50 YEARS 128 NO 120 GD050157 30-Aug-72 male 25 21-30 YEARS 120 NO 121 HD070158 24-Mar-74 female 24 21-30 YEARS 38 NO 122 DD100159 11-Jun-68 male 33 31-40 YEARS 16 YES 123 LD080160 11-Dec-57 female 41 41-50 YEARS 50 NO 124 MD050161 07-Feb-50 female 45 41-50 YEARS YES 125 RD080162 03-Mar-73 male 26 21-30 YEARS YES 126 AD050163 08-Jun-52 female 44 41-50 YEARS 100 NO 127 JD080164 30-Jun-56 male 43 41-50 YEARS 50 YES 128 PD120168 11-Sep-59 male 43 41-50 YEARS 40 NO 129 SD040169 15-Jul-73 female 22 21-30 YEARS 50 NO 130 RD050170 30-May-41 female 54 51-60 YEARS NO 131 VD080171 17-Mar-38 female 61 61 AND OLDER 14 YES 132 SD040174 03-Jul-76 male 19 11-20 YEARS 50 NO 133 SD050175 18-Dec-56 female 39 31-40 YEARS 58 NO 134 MD040176 16-Jun-30 female 64 61 AND OLDER 140 NO 135 AD090177 09-Mar-58 male 42 41-50 YEARS 90 YES 136 PD060178 05-Dec-52 female 44 41-50 YEARS YES 137 AD060179 09-Aug-46 female 50 41-50 YEARS 138 DD120180 21-Nov-50 male 52 51-60 YEARS 160 NO 139 PD120181 27-Aug-79 male 22 21-30 YEARS YES 140 JE130709 17-Apr-68 male 36 31-40 YEARS NO 141 IE050185 20-Jul-53 male 44 41-50 YEARS 200 NO 142 BE120187 31-Mar-75 female 28 21-30 YEARS 20 YES 143 RE060188 25-Apr-37 male 59 51-60 YEARS 40 NO 144 FF060189 15-Dec-71 female 25 21-30 YEARS 50 NO 145 TF040190 29-Oct-70 female 24 21-30 YEARS 48 NO 146 HF120191 16-May-53 female 50 41-50 YEARS UNKNOWN 147 CF020192 11-Apr-37 male 56 51-60 YEARS YES 148 GF100193 14-Jan-47 female 54 51-60 YEARS 92 NO
149 GF050194 14-Jul-68 male 28 21-30 YEARS 36 YES
32
Number Code DOB Sex Age Age band No Tablet Stag OD
149 GF050194 14-Jul-68 male 28 21-30 YEARS 36 YES
150 NF060197 01-May-59 male 38 31-40 YEARS 120 NO 151 RF030198 16-Sep-66 male 28 21-30 YEARS YES 152 SF030202 24-Sep-73 female 20 11-20 YEARS 30 NO 153 AF090203 23-Mar-62 female 38 31-40 YEARS 50 NO 154 MF130704 27-Nov-38 female 65 61 AND OLDER UNKNOWN 155 EF080205 12-Nov-57 female 41 41-50 YEARS 42 NO 156 YF09207 29-Aug-63 female 37 31-40 YEARS UNKNOWN 157 JF09208 25-Mar-51 male 47 41-50 YEARS 170 NO 158 JF070210 12-Nov-47 male 50 41-50 YEARS 150 NO 159 AF060211 03-Feb-70 female 27 21-30 YEARS 50 NO 160 AF050213 13-Jul-29 female 66 61 AND OLDER 161 EF060218 21-May-56 male 41 41-50 YEARS 75 NO 162 KF050219 21-Jun-66 male 30 21-30 YEARS 90 NO 163 AF100220 26-Mar-56 male 45 41-50 YEARS 80 YES 164 DF090222 16-Feb-71 female 29 21-30 YEARS YES 165 RG050224 22-Dec-76 male 19 11-20 YEARS 300 NO 166 SG050225 16-Sep-66 male 30 21-30 YEARS 54 NO 167 CG100226 22-Feb-32 male 69 61 AND OLDER 89 NO 168 LG110227 11-Jul-80 female 21 21-30 YEARS 48 NO 169 NG040228 04-Aug-74 female 20 11-20 YEARS 20 NO 170 SG020230 14-Jul-71 male 22 21-30 YEARS 17 NO 171 CG130707 26-May-71 male 33 31-40 YEARS 130 YES 172 JG020231 05-Jun-55 male 38 31-40 YEARS 100 NO 173 LG100232 13-Mar-72 male 29 21-30 YEARS 60 YES 174 AG110234 30-Jun-55 male 46 41-50 YEARS YES 175 MG030236 15-Apr-58 female 36 31-40 YEARS 50 NO 176 SG100237 04-Feb-82 male 29 21-30 YEARS 50 NO 177 MG030239 17-Sep-76 female 17 11-20 YEARS 40 NO 178 AG100242 17-Oct-59 male 41 41-50 YEARS 40 YES 179 AG030243 25-Sep-71 female 22 21-30 YEARS 24 NO 180 DG090244 11-Dec-76 male 23 21-30 YEARS 100 NO 181 SG080245 29-Oct-68 female 30 21-30 YEARS NO 182 SG080248 03-Feb-75 female 23 21-30 YEARS 50 NO 183 SG060249 27-Sep-81 female 16 11-20 YEARS 38 NO 184 CG120251 20-Oct-65 female 37 31-40 YEARS UNKNOWN 185 DG120252 26-Aug-72 female 30 21-30 YEARS 20 NO 186 FG100253 24-May-74 female 27 21-30 YEARS 40 NO 187 SG040254 13-Dec-69 female 26 21-30 YEARS 50 NO 188 LG080255 15-Oct-68 female 31 31-40 YEARS 32 YES 189 PG040256 24-Jul-71 male 23 21-30 YEARS 70 NO 190 SG090260 21-Mar-69 female 31 31-40 YEARS 90 YES 191 JH050263 06-Feb-47 female 49 41-50 YEARS 72 NO 192 RH120264 15-Feb-44 male 59 51-60 YEARS YES 193 IH020265 11-Mar-74 female 19 11-20 YEARS NO 194 AH010268 16-Sep-70 male 22 21-30 YEARS YES 195 MH060269 12-Feb-80 female 17 11-20 YEARS 70 NO 196 WH020271 10-Sep-44 male 48 41-50 YEARS 50 NO 197 JF030273 21-Oct-64 female 29 21-30 YEARS 30 NO 198 JH080274 30-Sep-37 male 62 61 AND OLDER YES

33
Number Code DOB Sex Age Age band No Tablet Stag OD 199 KH030275 19-Mar-45 male 48 41-50 YEARS 250 NO 200 RH060276 09-Jan-55 male 42 41-50 YEARS 60 NO 201 PH110277 19-Sep-62 female 39 31-40 YEARS YES 202 BH090279 29-Jun-71 female 29 21-30 YEARS 100 NO 203 JH070280 10-Apr-72 male 26 21-30 YEARS 60 NO 204 PH060281 10-Dec-44 male 53 51-60 YEARS 40 NO 205 LH120282 20-Oct-60 female 42 41-50 YEARS 32 NO 206 KH060283 02-Apr-80 female 17 11-20 YEARS 40 NO 207 AH040284 22-Jun-74 female 21 21-30 YEARS 48 NO 208 VH060286 08-Sep-79 female 18 11-20 YEARS 14 NO 209 KH090287 08-Dec-67 male 32 31-40 YEARS 50 NO 210 AH050288 20-Jan-72 female 24 21-30 YEARS 60 NO 211 LH070289 22-Jan-77 female 21 21-30 YEARS 48 NO 212 BH080290 05-Jan-82 male 17 11-20 YEARS UNKNOWN 213 CH090291 07-Oct-55 female 45 41-50 YEARS 48 YES 214 SH130692 24-Aug-60 male 43 41-50 YEARS 100 NO 215 LH030293 18-Sep-62 female 31 31-40 YEARS 35 216 TH070294 10-Feb-40 male 58 41-50 YEARS 72 YES 217 TI060296 25-Dec-68 female 28 21-30 YEARS 70 NO 218 JI040297 09-Jun-79 female 16 11-20 YEARS 40 NO 219 LI120355 14-Mar-74 female 28 21-30 YEARS 100 NO 220 RI120298 24-Mar-54 female 47 41-50 YEARS 60 NO 221 FI050300 10-Mar-63 male 32 31-40 YEARS 100 NO 222 JJ080302 27-May-43 male 56 41-50 YEARS 40 YES 223 MJ100303 10-Apr-44 female 57 51-60 YEARS 56 NO 224 BJ090304 03-Apr-55 male 45 31-40 YEARS 80 YES 225 AJ090305 20-Dec-67 male 32 31-40 YEARS 10 YES 226 WJ030306 27-Jun-49 male 44 41-50 YEARS 100 YES 227 AJ050307 09-Aug-75 female 20 11-20 YEARS 60 NO 228 BJ040308 08-Nov-76 female 18 11-20 YEARS 16 NO 229 AJ100309 09-Nov-62 female 38 31-40 YEARS 196 NO 230 EJ080310 05-Apr-43 female 56 51-60 YEARS 70 UNKNOWN 231 SJ010311 28-Feb-63 female 29 21-30 YEARS UNKNOWN 232 PJ110312 06-Jun-69 male 33 31-40 YEARS YES 233 TK120313 17-Mar-76 male 23 21-30 YEARS 50 NO 234 BK050314 16-Jul-65 male 30 21-30 YEARS 100 NO 235 JK100316 16-Jul-61 male 40 31-40 YEARS 32 NO 236 KK060317 28-Jan-81 female 16 11-20 YEARS 32 NO 237 MK090318 24-Nov-76 female 24 21-30 YEARS 38 YES 238 RK090320 08-Mar-47 male 52 51-60 YEARS 50 NO 239 WK060321 24-Apr-52 male 44 41-50 YEARS 100 NO 240 LK040323 22-Mar-61 female 34 31-40 YEARS 10 NO 241 WK130700 29-Aug-29 male 74 61 AND OLDER 96 NO 242 GK120327 18-Dec-45 male 57 51-60 YEARS 60 NO 243 JK020330 27-Oct-59 female 34 31-40 YEARS 20 NO 244 TK050331 14-Dec-71 male 24 21-30 YEARS 200 NO 245 SK100333 16-Aug-76 male 25 21-30 YEARS 72 YES 246 JK120334 08-Dec-73 male 29 21-30 YEARS 100 NO 247 LL060335 26-Mar-60 female 36 31-40 YEARS UNKNOWN 248 FL120336 28-Nov-64 female 38 31-40 YEARS YES
34
Number Code DOB Sex Age Age band No Tablet Stag OD 249 FL090338 06-Oct-66 female 34 31-40 YEARS UNKNOWN 250 KL050339 08-Jul-74 female 22 21-30 YEARS 18 NO 251 SL050340 21-Apr-81 female 14 11-20 YEARS 35 NO 252 DL070341 27-Feb-74 male 24 21-30 YEARS 93 NO 253 JL120676 29-Aug-24 female 79 61 AND OLDER UNKNOWN 254 LS050343 15-Oct-44 male 50 41-50 YEARS 70 NO 255 JL090344 03-Oct-50 male 49 41-50 YEARS NO 256 AL030345 08-Mar-65 female 29 21-30 YEARS 35 NO 257 JL030347 18-Dec-67 female 26 21-30 YEARS 30 NO 258 WL040348 21-Sep-60 male 34 31-40 YEARS 100 NO 259 DL070349 20-Mar-22 female 76 61 AND OLDER 260 SL050351 27-Mar-75 female 21 21-30 YEARS 20 NO 261 KL120352 07-Jul-73 female 30 21-30 YEARS 60 NO 262 LL040353 17-May-79 female 16 11-20 YEARS 80 NO 263 EL030354 13-Jan-33 male 61 61 AND OLDER NO 264 CL030356 08-Jul-57 female 37 31-40 YEARS 50 NO 265 RL050367 17-Aug-74 male 22 21-30 YEARS UNKNOWN 266 SM120594 04-Nov-76 male 26 21-30 YEARS 70 NO 267 DM080358 27-May-99 male 55 41-50 YEARS 12 YES 268 CM080359 23-Jul-55 female 44 41-50 YEARS 269 KM030360 21-Jun-69 female 25 21-30 YEARS 50 NO 270 FM030361 19-Jul-60 female 33 31-40 YEARS 42 YES 271 RM070362 28-Apr-53 female 44 41-50 YEARS YES 272 SM120363 07-Aug-74 female 27 21-30 YEARS 32 NO 273 LM100364 25-Oct-79 female 22 21-30 YEARS 170 NO 274 JM030367 14-May-57 female 38 31-40 YEARS YES 275 VM080368 18-Sep-71 female 27 21-30 YEARS 96 NO 276 WM080369 28-Jul-38 male 60 51-60 YEARS 100 NO 277 WM040370 12-Jul-54 male 40 31-40 YEARS NO 278 KM100371 31-Oct-77 female 23 21-30 YEARS YES 279 CM090372 02-Apr-75 female 23 11-20 YEARS 96 YES 280 BM100374 01-Nov-73 male 28 21-30 YEARS 16 YES 281 SM030375 24-Aug-82 female 11 11-20 YEARS 20 NO 282 CM060377 02-Apr-76 male 21 21-30 YEARS 27 NO 283 SM060378 06-Oct-64 male 32 31-40 YEARS NO 284 SM040379 21-Jul-64 female 30 21-30 YEARS 130 NO 285 UM040380 17-May-53 female 41 41-50 YEARS YES 286 WM040382 09-Jul-50 male 45 41-50 YEARS 200 NO 287 AM100383 01-Feb-29 male 71 61 AND OLDER UNKNOWN 288 JM110384 15-Oct-62 male 39 21-30 YEARS UNKNOWN 289 AM070385 19-Aug-75 female 22 21-30 YEARS NO 290 CM110386 23-Dec-63 female 38 31-40 YEARS 60 NO 291 JM110387 23-Oct-35 male 66 61 AND OLDER 85 NO 292 SM130693 27-Dec-65 male 38 31-40 YEARS 130 YES 293 KM050389 15-Dec-56 female 39 31-40 YEARS YES 294 TM120678 11-Oct-28 male 75 61 AND OLDER YES 295 EM060390 29-Jun-50 female 47 41-50 YEARS 296 KM130694 14-Jan-83 male 21 21-30 YEARS 20 YES 297 SM070391 08-Mar-68 male 30 21-30 YEARS 55 NO

35
Number Code DOB Sex Age Age band No Tablet Stag OD 298 SM030392 19-Sep-69 female 24 21-30 YEARS 42 NO 299 GM060393 25-Jul-77 male 19 21-30 YEARS 40 NO 300 AM060394 09-Jun-73 female 24 21-30 YEARS 50 NO 301 SM080395 03-Aug-73 male 26 21-30 YEARS 50 NO 302 RM060396 28-Aug-75 female 21 21-30 YEARS 20 NO 303 JM070397 03-Mar-70 male 28 21-30 YEARS 150 NO 304 DM100399 23-Jul-60 male 40 31-40 YEARS 16 NO 305 EM030400 03-Nov-68 female 25 21-30 YEARS 306 CM100402 27-Sep-60 female 40 31-40 YEARS 150 NO 307 DM040403 13-Apr-69 female 26 21-30 YEARS 21 NO 308 DM060404 05-May-77 male 20 11-20 YEARS 100 NO 309 DM090405 21-Nov-57 male 43 41-50 YEARS NO 310 JM120673 16-Oct-58 male 45 41-50 YEARS YES 311 LM060406 04-Jul-70 female 26 21-30 YEARS 100 NO 312 FM020407 12-Nov-61 female 31 31-40 YEARS 50 NO 313 JM080408 23-Jun-74 female 24 21-30 YEARS 50 NO 314 MM080409 06-Jan-59 female 40 31-40 YEARS 50 NO 315 HM020411 29-Sep-68 female 24 21-30 YEARS 100 NO 316 JM090412 08-Mar-61 male 39 31-40 YEARS 100 NO 317 JM100413 15-Feb-70 male 31 31-40 YEARS 80 NO 318 CM080414 30-Jun-62 female 36 31-40 YEARS 40 NO 319 TM050416 16-Dec-74 female 21 21-30 YEARS 40 NO 320 GM070417 18-Apr-46 female 52 51-60 YEARS 321 PM050418 26-Sep-51 female 45 41-50 YEARS 50 NO 322 SM040419 11-Sep-46 female 48 41-50 YEARS YES 323 DM020420 26-Feb-64 male 29 21-30 YEARS YES 324 DM100421 19-Feb-34 male 66 61 AND OLDER 50 NO 325 LM060422 11-Mar-67 female 30 21-30 YEARS 100 NO 326 MM040423 30-Mar-45 female 50 41-50 YEARS YES 327 AM090424 18-Dec-48 male 52 51-60 YEARS 328 NM050427 05-Sep-72 male 24 21-30 YEARS 196 NO 329 HM090430 01-Nov-56 female 44 31-40 YEARS UNKNOWN 330 JM010431 09-Sep-52 female 40 31-40 YEARS UNKNOWN 331 TM050433 17-Mar-72 female 23 21-30 YEARS 40 NO 332 JM040435 13-Mar-57 male 37 31-40 YEARS 69 NO 333 JM110436 31-May-74 male 28 31-40 YEARS 40 NO 334 SM030437 27-May-63 female 31 31-40 YEARS 70 NO 335 AM100428 29-May-85 female 16 11-20 YEARS 50 NO 336 NM090439 06-Jan-79 female 21 21-30 YEARS 70 NO 337 VM030440 01-Oct-45 male 49 41-50 YEARS 50 NO 338 AM070441 17-Apr-34 male 64 61 AND OLDER 50 NO 339 JM020443 27-May-69 female 23 21-30 YEARS 30 NO 340 MM050444 14-Apr-38 female 58 51-60 YEARS 102 NO 341 FM070445 24-Aug-71 female 27 21-30 YEARS 15 NO 342 MM030446 11-Jun-63 female 30 21-30 YEARS 50 NO 343 EM110448 30-Sep-67 female 34 31-40 YEARS 32 NO 344 IM100449 05-Jul-57 female 43 41-50 YEARS YES 345 DM100450 22-Jul-58 female 41 41-50 YEARS 32 NO

36
Number Code DOB Sex Age Age band No Tablet Stag OD 346 DM130688 29-Jun-69 male 34 31-40 YEARS 100 NO 347 TM020451 25-Dec-68 female 24 21-30 YEARS 100 NO 348 HM050452 15-Oct-41 male 55 41-50 YEARS 100 NO 349 AM120679 17-Jan-67 female 36 31-40 YEARS NO 350 GM120453 15-Nov-29 male 73 61 AND OLDER YES 351 SM100454 19-Jan-73 male 28 21-30 YEARS 50 NO 352 AM040455 19-Sep-69 female 25 21-30 YEARS 100 NO 353 EM110456 26-Sep-65 male 37 31-40 YEARS 40 YES 354 MM030457 09-Sep-53 female 40 31-40 YEARS 100 NO 355 TM060461 28-Aug-61 male 35 31-40 YEARS 20 NO 356 PM090462 15-Oct-65 male 34 31-40 YEARS 100 NO 357 AM120465 22-Jun-47 male 55 51-60 YEARS 60 NO 358 GM020466 02-Jul-70 male 23 21-30 YEARS 30 YES 359 AM050467 24-Apr-74 female 22 21-30 YEARS 100 NO 360 MM130696 24-Jan-82 female 22 21-30 YEARS 20 NO 361 BM110468 31-May-58 male 43 41-50 YEARS 40 YES 362 FM060469 30-Jul-75 male 21 21-30 YEARS 50 NO 363 JM040470 24-Aug-53 male 41 41-50 YEARS 50 NO 364 JM080471 25-Feb-68 female 31 31-40 YEARS 95 NO 365 DM070473 21-Jan-60 male 38 31-40 YEARS YES 366 JM060474 16-Nov-54 male 43 41-50 YEARS 30 NO 367 BM090475 07-Sep-54 female 46 41-50 YEARS 30 NO 368 SM120476 12-Aug-61 female 42 41-50 YEARS 16 YES 369 AM120477 09-Feb-43 male 60 51-60 YEARS 64 NO 370 HM080478 09-Jun-61 female 37 31-40 YEARS YES 371 AM110479 22-Jan-52 female 50 41-50 YEARS YES 372 BM030480 05-May-40 male 54 51-60 YEARS 40 YES 373 JM070481 20-Dec-72 male 25 21-30 YEARS 30 YES 374 JM030482 18-Jun-76 female 28 21-30 YEARS 90 YES 375 TM060483 20-May-68 female 28 21-30 YEARS 55 NO 376 KM100485 17-Jul-87 male 13 11-20 YEARS 36 NO 377 EM080487 16-Jul-76 female 23 21-30 YEARS YES 378 CM050488 09-Apr-79 female 16 11-20 YEARS 35 NO 379 GM030489 20-Oct-62 male 31 31-40 YEARS 100 NO 380 AN100490 14-May-72 male 28 21-30 YEARS YES 381 DN060491 06-Dec-56 male 40 31-40 YEARS 50 NO 382 EN030493 14-Sep-51 female 42 41-50 YEARS YES 383 JN040494 09-Mar-65 male 30 21-30 YEARS 100 NO 384 WN130697 22-Jul-72 male 32 31-40 YEARS YES 385 RN090495 04-Dec-67 male 23 21-30 YEARS 100 NO 386 SN110496 27-Jan-71 female 31 31-40 YEARS 60 NO 387 LO090498 12-Nov-70 female 30 21-30 YEARS 80 NO 388 DP110503 21-Jan-75 male 27 21-30 YEARS 90 NO 389 JP070504 05-Jun-66 male 31 31-40 YEARS 50 NO 390 RP110505 21-Jun-81 male 20 11-20 YEARS 30 NO 391 EP090507 28-May-56 female 44 31-40 YEARS 70 392 CP040509 24-Feb-53 male 42 41-50 YEARS 100 NO

37
Number Code DOB Sex Age Age band No Tablet Stag OD 393 MP120510 27-Jun-61 male 42 41-50 YEARS 64 NO 394 SP020511 09-Aug-75 female 18 11-20 YEARS 55 NO 395 HP050512 10-Apr-66 female 29 21-30 YEARS 120 NO 396 JP100513 11-Feb-54 female 47 41-50 YEARS NO 397 CP100514 27-Dec-54 female 46 41-50 YEARS 6 NO 398 JP120516 21-Mar-66 male 37 31-40 YEARS 70 YES 399 MP070517 06-Jun-69 female 28 21-30 YEARS 55 YES 400 YP070518 09-Oct-71 female 27 21-30 YEARS 50 YES 401 DP040519 07-Nov-26 male 68 61 AND OLDER 36 NO 402 PP040520 13-Sep-57 male 37 31-40 YEARS UNKNOWN 403 JP120521 26-Oct-55 female 47 41-50 YEARS 70 NO 404 LP120670 18-Oct-66 female 37 31-40 YEARS YES 405 LP060522 16-Oct-51 female 45 41-50 YEARS 406 WP020523 04-Jul-69 female 23 21-30 YEARS 55 NO 407 AQ030524 24-Dec-75 female 18 11-20 YEARS 50 NO 408 MQ110525 29-Jun-65 female 37 31-40 YEARS 20 NO 409 PQ050526 09-Apr-42 male 54 51-60 YEARS 100 YES 410 HR050527 08-Nov-78 female 18 11-20 YEARS 14 NO 411 MR100528 05-Apr-51 female 49 41-50 YEARS 96 NO 412 GR040529 16-Jun-73 male 21 21-30 YEARS 60 NO 413 LR050531 06-Mar-62 female 34 31-40 YEARS 60 NO 414 AR080532 25-Oct-67 male 31 31-40 YEARS YES 415 MR040533 24-Aug-47 female 47 41-50 YEARS YES 416 NR090534 14-Jan-79 female 21 21-30 YEARS 70 NO 417 MR050535 01-Sep-69 male 26 21-30 YEARS 56 NO 418 MR030537 18-Jul-64 male 29 21-30 YEARS 30 YES 419 SR050536 30-May-69 male 27 21-30 YEARS 48 YES 420 WR120538 08-Aug-51 male 51 41-50 YEARS 50 NO 421 AR090539 20-Sep-73 male 26 21-30 YEARS 112 NO 422 PR110542 27-Oct-73 male 28 21-30 YEARS 100 YES 423 JR040543 20-Nov-78 male 16 11-20 YEARS 70 NO 424 CR120545 01-Mar-59 female 44 41-50 YEARS YES 425 CR040546 17-Oct-63 male 31 31-40 YEARS 40 NO 526 DR120547 16-Sep-60 male 42 41-50 YEARS 130 YES 427 DR090548 24-Nov-78 female 21 21-30 YEARS 40 NO 428 JR040550 25-Mar-63 female 31 31-40 YEARS 30 NO 429 JR070552 25-Jun-58 female 40 31-40 YEARS 60 NO 430 PR120554 04-Sep-52 female 50 41-50 YEARS YES 431 WR070555 18-Jan-69 male 29 21-30 YEARS 20 NO 432 CR070556 24-Nov-58 female 39 31-40 YEARS 48 NO 433 JR030557 07-Nov-68 male 25 21-30 YEARS 100 NO 434 JR120686 07-Jun-56 female 47 41-50 YEARS NO 435 NR050558 15-Nov-79 male 16 11-20 YEARS 22 YES 436 MR120684 20-May-61 female 42 41-50 YEARS 60 NO 437 GR040559 11-Jan-66 male 29 21-30 YEARS 150 YES 438 WR080560 27-Sep-53 male 45 41-50 YEARS 16 NO 439 IR100562 15-Dec-55 female 45 41-50 YEARS 30 NO

38
Number Code DOB Sex Age Age band No Tablet Stag OD 440 JR090563 17-Dec-65 male 34 31-40 YEARS 98 NO 441 ER090564 16-May-71 male 29 21-30 YEARS 100 NO 442 MR040565 30-Jan-64 male 31 31-40 YEARS 60 YES 443 KS080569 23-Nov-65 female 33 31-40 YEARS 24 YES 444 WS030570 29-Oct-55 male 38 31-40 YEARS 90 NO 445 SW030571 26-Jan-50 male 43 41-50 YEARS 80 NO 446 KS130695 19-May-69 female 34 31-40 YEARS 10 NO 447 JS090574 23-Feb-51 female 49 41-50 YEARS YES 448 BS020575 04-Mar-72 male 21 21-30 YEARS 140 NO 449 SS060576 17-Apr-45 female 46 41-50 YEARS 150 YES 450 KS110578 31-Oct-57 male 44 41-50 YEARS YES 451 NS110579 20-Jul-60 female 42 41-50 YEARS YES 452 PS080580 31-May-58 female 40 31-40 YEARS 9 YES 453 WS020582 11-Apr-68 male 25 21-30 YEARS 50 NO 454 AS090583 16-Jan-64 male 35 31-40 YEARS 50 NO 455 IS100584 13-Mar-75 male 26 21-30 YEARS 100 NO 456 JS030585 20-Dec-52 male 41 41-50 YEARS 100 NO 457 MS050587 12-Apr-59 male 36 31-40 YEARS 80 NO 458 LS130710 10-Sep-64 male 39 31-40 YEARS 60 NO 459 SS060589 05-May-71 female 25 21-30 YEARS 46 NO 460 TS080590 20-Feb-42 female 57 51-60 YEARS YES 461 JS020591 27-May-58 female 35 31-40 YEARS 60 NO 462 DS040592 07-Sep-70 male 24 21-30 YEARS 200 NO 463 ES100594 25-May-67 male 34 31-40 YEARS NO 464 PS030595 07-Nov-49 female 45 41-50 YEARS UNKNOWN 465 GS110597 08-Feb-02 male 22 21-30 YEARS 32 NO 466 JS040598 09-Mar-64 male 31 31-40 YEARS 80 NO 467 MS110600 02-May-48 male 53 41-50 YEARS 100 NO 468 PS030601 16-Jun-67 male 26 21-30 YEARS 60 NO 469 AS080602 30-Mar-68 female 31 31-40 YEARS 90 YES 470 JS030603 25-Feb-41 female 53 51-60 YEARS 60 NO 471 WS090605 04-May-58 male 41 41-50 YEARS 70 NO 472 AS060606 01-Nov-59 female 37 31-40 YEARS 45 YES 473 RT060608 17-Jan-54 male 43 41-50 YEARS 72 NO 474 BT060610 06-Mar-65 female 32 31-40 YEARS 48 NO 475 CT120677 30-Apr-60 female 43 41-50 YEARS YES 476 DT010612 25-Feb-70 male 23 21-30 YEARS 200 NO 477 ET050613 27-May-70 male 26 21-30 YEARS 50 NO 478 RT040614 19-Jun-66 male 28 21-30 YEARS 30 NO 479 AT060615 07-Jan-76 female 20 11-20 YEARS 25 NO 480 CT030616 09-Dec-51 male 42 41-50 YEARS 481 DT090617 22-Feb-57 male 43 41-50 YEARS 120 YES 482 ET040618 20-Apr-74 female 21 21-30 YEARS 24 NO 483 JT060620 17-Dec-24 male 54 51-60 YEARS 100 NO 484 VT110621 28-Nov-65 female 36 31-40 YEARS 96 NO 485 DT040622 06-Jan-64 male 30 21-30 YEARS 55 NO

39
Number Code DOB Sex Age Age band No Tablet Stag OD 486 CT080623 24-Jan-65 female 34 31-40 YEARS NO 487 JT050624 11-Dec-51 male 45 41-50 YEARS 30 NO 488 KT100625 24-Apr-46 female 55 41-50 YEARS YES 489 GT110626 06-Jun-80 male 21 21-30 YEARS 30 NO 490 GT010627 09-May-58 male 34 31-40 YEARS 100 NO 491 ST070628 10-Dec-62 male 35 31-40 YEARS 48 NO 492 ST110629 26-Sep-86 female 15 11-20 YEARS 100 NO 493 DW050632 26-Nov-70 male 25 21-30 YEARS 150 NO 494 EW050633 02-Dec-46 female 49 41-50 YEARS 60 NO 495 JW030634 20-Jun-47 male 46 41-50 YEARS 110 NO 496 PW070635 18-Apr-53 male 44 41-50 YEARS 30 NO 497 PW100636 25-Jan-44 male 45 41-50 YEARS 60 YES 498 MW060637 26-Jun-55 female 42 41-50 YEARS 120 YES 499 SW040638 23-Jul-54 female 40 31-40 YEARS 19 YES 500 DW120639 07-Sep-70 female 22 21-30 YEARS 32 NO 501 IW060640 10-Jul-80 female 16 11-20 YEARS 70 NO 502 PW070642 18-Apr-53 male 44 41-50 YEARS 30 NO 503 PW090643 27-Dec-71 male 28 21-30 YEARS 60 YES 504 WW080644 28-Oct-48 male 50 41-50 YEARS 18 YES 505 CW100645 17-Jul-62 female 38 31-40 YEARS UNKNOWN 506 DW120647 21-Nov-77 male 31 31-40 YEARS 12 YES 507 EW120648 05-Mar-57 female 46 41-50 YEARS YES 508 MW040649 19-Jun-61 female 34 31-40 YEARS UNKNOWN 509 JW070650 18-Feb-45 male 53 51-60 YEARS 82 NO 510 MW010651 17-Oct-66 female 26 21-30 YEARS 42 NO 511 BW080652 23-Mar-65 male 34 31-40 YEARS 100 YES 512 LW050653 02-Aug-73 male 23 21-30 YEARS 75 NO 513 SW130703 30-Mar-60 female 44 31-40 YEARS 140 YES 514 JW070655 25-Dec-46 male 52 41-50 YEARS 40 NO 515 JW040656 14-May-68 male 26 21-30 YEARS 40 NO 516 KW060657 12-Oct-68 female 28 21-30 YEARS 150 NO 517 RW090658 16-Oct-65 male 34 31-40 YEARS 60 NO 518 EW090659 16-Aug-78 female 21 21-30 YEARS 64 NO 519 KW060660 17-Apr-71 male 26 21-30 YEARS YES 520 HW110662 19-Aug-42 female 60 51-60 YEARS 20 NO 521 TW100666 08-Nov-77 female 23 21-30 YEARS 40 NO 522 MZ030667 15-Jan-64 female 30 21-30 YEARS 80 NO
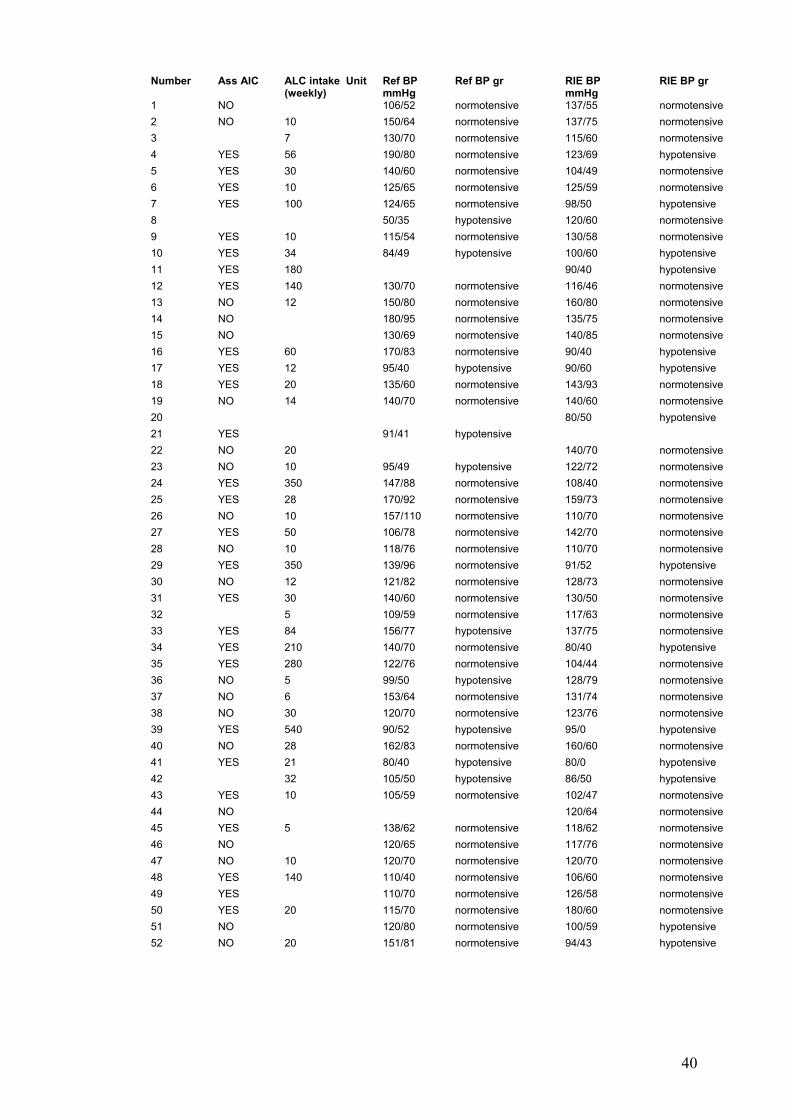
40
Number Ass AlC ALC intake Unit (weekly)
Ref BP mmHg
Ref BP gr RIE BP mmHg
RIE BP gr
1 NO 106/52 normotensive 137/55 normotensive 2 NO 10 150/64 normotensive 137/75 normotensive 3 7 130/70 normotensive 115/60 normotensive 4 YES 56 190/80 normotensive 123/69 hypotensive 5 YES 30 140/60 normotensive 104/49 normotensive 6 YES 10 125/65 normotensive 125/59 normotensive 7 YES 100 124/65 normotensive 98/50 hypotensive 8 50/35 hypotensive 120/60 normotensive 9 YES 10 115/54 normotensive 130/58 normotensive 10 YES 34 84/49 hypotensive 100/60 hypotensive 11 YES 180 90/40 hypotensive 12 YES 140 130/70 normotensive 116/46 normotensive 13 NO 12 150/80 normotensive 160/80 normotensive 14 NO 180/95 normotensive 135/75 normotensive 15 NO 130/69 normotensive 140/85 normotensive 16 YES 60 170/83 normotensive 90/40 hypotensive 17 YES 12 95/40 hypotensive 90/60 hypotensive 18 YES 20 135/60 normotensive 143/93 normotensive 19 NO 14 140/70 normotensive 140/60 normotensive 20 80/50 hypotensive 21 YES 91/41 hypotensive 22 NO 20 140/70 normotensive 23 NO 10 95/49 hypotensive 122/72 normotensive 24 YES 350 147/88 normotensive 108/40 normotensive 25 YES 28 170/92 normotensive 159/73 normotensive 26 NO 10 157/110 normotensive 110/70 normotensive 27 YES 50 106/78 normotensive 142/70 normotensive 28 NO 10 118/76 normotensive 110/70 normotensive 29 YES 350 139/96 normotensive 91/52 hypotensive 30 NO 12 121/82 normotensive 128/73 normotensive 31 YES 30 140/60 normotensive 130/50 normotensive 32 5 109/59 normotensive 117/63 normotensive 33 YES 84 156/77 hypotensive 137/75 normotensive 34 YES 210 140/70 normotensive 80/40 hypotensive 35 YES 280 122/76 normotensive 104/44 normotensive 36 NO 5 99/50 hypotensive 128/79 normotensive 37 NO 6 153/64 normotensive 131/74 normotensive 38 NO 30 120/70 normotensive 123/76 normotensive 39 YES 540 90/52 hypotensive 95/0 hypotensive 40 NO 28 162/83 normotensive 160/60 normotensive 41 YES 21 80/40 hypotensive 80/0 hypotensive 42 32 105/50 hypotensive 86/50 hypotensive 43 YES 10 105/59 normotensive 102/47 normotensive 44 NO 120/64 normotensive 45 YES 5 138/62 normotensive 118/62 normotensive 46 NO 120/65 normotensive 117/76 normotensive 47 NO 10 120/70 normotensive 120/70 normotensive 48 YES 140 110/40 normotensive 106/60 normotensive 49 YES 110/70 normotensive 126/58 normotensive 50 YES 20 115/70 normotensive 180/60 normotensive 51 NO 120/80 normotensive 100/59 hypotensive 52 NO 20 151/81 normotensive 94/43 hypotensive
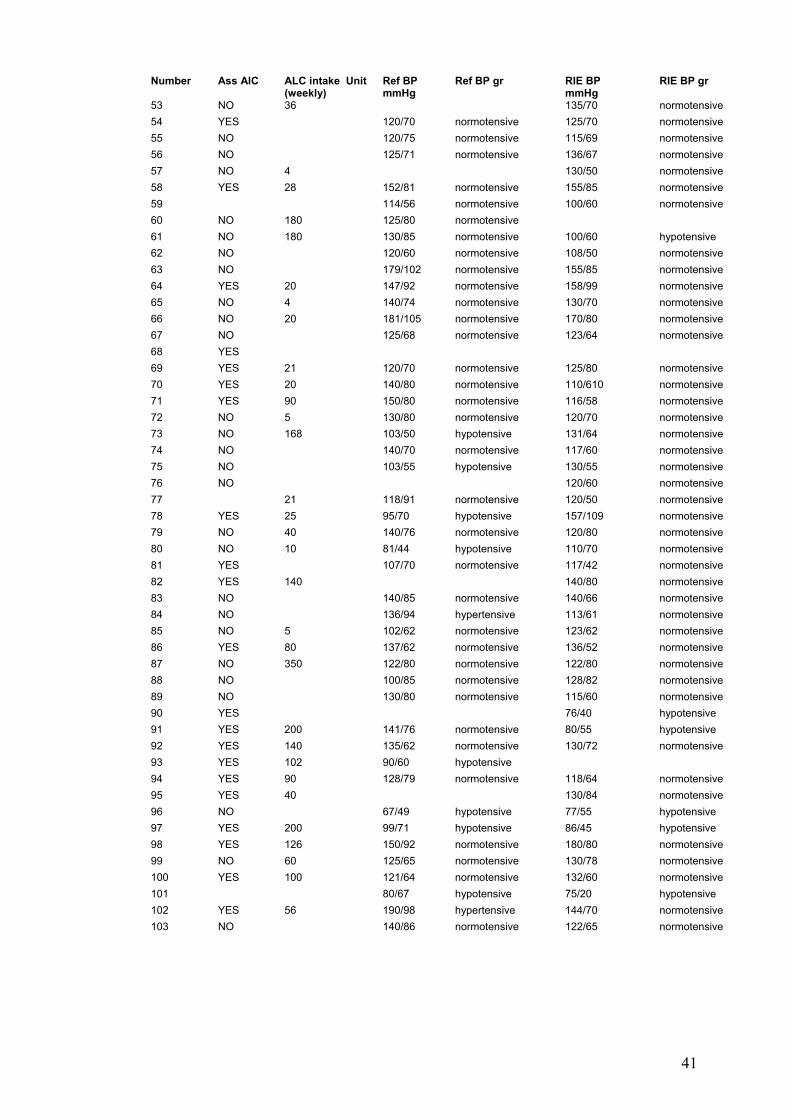
41
Number Ass AlC ALC intake Unit (weekly)
Ref BP mmHg
Ref BP gr RIE BP mmHg
RIE BP gr
53 NO 36 135/70 normotensive 54 YES 120/70 normotensive 125/70 normotensive 55 NO 120/75 normotensive 115/69 normotensive 56 NO 125/71 normotensive 136/67 normotensive 57 NO 4 130/50 normotensive 58 YES 28 152/81 normotensive 155/85 normotensive 59 114/56 normotensive 100/60 normotensive 60 NO 180 125/80 normotensive 61 NO 180 130/85 normotensive 100/60 hypotensive 62 NO 120/60 normotensive 108/50 normotensive 63 NO 179/102 normotensive 155/85 normotensive 64 YES 20 147/92 normotensive 158/99 normotensive 65 NO 4 140/74 normotensive 130/70 normotensive 66 NO 20 181/105 normotensive 170/80 normotensive 67 NO 125/68 normotensive 123/64 normotensive 68 YES 69 YES 21 120/70 normotensive 125/80 normotensive 70 YES 20 140/80 normotensive 110/610 normotensive 71 YES 90 150/80 normotensive 116/58 normotensive 72 NO 5 130/80 normotensive 120/70 normotensive 73 NO 168 103/50 hypotensive 131/64 normotensive 74 NO 140/70 normotensive 117/60 normotensive 75 NO 103/55 hypotensive 130/55 normotensive 76 NO 120/60 normotensive 77 21 118/91 normotensive 120/50 normotensive 78 YES 25 95/70 hypotensive 157/109 normotensive 79 NO 40 140/76 normotensive 120/80 normotensive 80 NO 10 81/44 hypotensive 110/70 normotensive 81 YES 107/70 normotensive 117/42 normotensive 82 YES 140 140/80 normotensive 83 NO 140/85 normotensive 140/66 normotensive 84 NO 136/94 hypertensive 113/61 normotensive 85 NO 5 102/62 normotensive 123/62 normotensive 86 YES 80 137/62 normotensive 136/52 normotensive 87 NO 350 122/80 normotensive 122/80 normotensive 88 NO 100/85 normotensive 128/82 normotensive 89 NO 130/80 normotensive 115/60 normotensive 90 YES 76/40 hypotensive 91 YES 200 141/76 normotensive 80/55 hypotensive 92 YES 140 135/62 normotensive 130/72 normotensive 93 YES 102 90/60 hypotensive 94 YES 90 128/79 normotensive 118/64 normotensive 95 YES 40 130/84 normotensive 96 NO 67/49 hypotensive 77/55 hypotensive 97 YES 200 99/71 hypotensive 86/45 hypotensive 98 YES 126 150/92 normotensive 180/80 normotensive 99 NO 60 125/65 normotensive 130/78 normotensive 100 YES 100 121/64 normotensive 132/60 normotensive 101 80/67 hypotensive 75/20 hypotensive 102 YES 56 190/98 hypertensive 144/70 normotensive 103 NO 140/86 normotensive 122/65 normotensive

42
Number Ass ALC ALC intake Unit (weekly)
Ref BP mmHg
Ref BP gr RIE BP mmHg
RIE BP gr
104 104/60 normotensive 94/60 hypotensive 105 YES 16 130/70 normotensive 144/96 normotensive 106 YES 200 90/42 hypotensive 108/45 hypotensive 107 YES 50 140/30 hypotensive 108 YES 280 113/65 normotensive 109 YES 20 118/64 normotensive 110 YES 50 112/67 normotensive 106/52 normotensive 111 NO 92/60 hypotensive 110/80 normotensive 112 210 140/75 normotensive 85/50 hypotensive 113 YES 240 141/88 hypotensive 139/76 normotensive 114 80 95/60 hypotensive 115 NO 64 107/58 normotensive 149/84 normotensive 116 YES 35 110/70 normotensive 117 NO 8 120/72 normotensive 118/50 normotensive 118 NO 10 110/60 normotensive 120/60 normotensive 119 NO 140 114/76 normotensive 158/88 normotensive 120 YES 155/75 normotensive 120/75 normotensive 121 NO 105/60 normotensive 124/74 normotensive 122 YES 315 94/42 hypotensive 101/44 normotensive 123 YES 95/50 hypotensive 112/60 normotensive 124 NO 60/20 hypotensive 87/21 hypotensive 125 YES 45 136/60 normotensive 126 NO 113/47 normotensive 120/40 normotensive 127 NO 69/45 hypotensive 90/40 hypotensive 128 NO 12 134/87 normotensive 134/88 normotensive 129 NO 71/61 hypotensive 101/43 normotensive 130 NO 120/70 normotensive 121/57 normotensive 131 NO 8 145/49 normotensive 127/31 hypotensive 132 YES 28 146/82 normotensive 140/80 normotensive 133 YES 152/97 normotensive 154/74 normotensive 134 YES 14 128/76 normotensive 120/50 normotensive 135 YES 169/111 hypertensive 88/58 hypotensive 136 60 138/78 normotensive 115/50 normotensive 137 NO 178/60 normotensive 162/56 normotensive 138 94/42 hypotensive 124/65 normotensive 139 NO 60 148/92 hypertensive 120/80 normotensive 140 NO 14 143/84 normotensive 144/90 HYPERTENSIVE 141 NO 109/43 normotensive 142 NO 132/64 normotensive 110/55 normotensive 143 NO 60 99/46 hypotensive 99/51 hypotensive 144 YES 130/80 normotensive 141/78 normotensive 145 NO 146 140 124/68 normotensive 120/60 normotensive 147 NO 25 110/80 normotensive 148 NO 160/120 hypertensive 110/65 normotensive 149 NO 210 140/65 normotensive 150 NO 84 114/70 normotensive 151 YES 90 130/70 normotensive 100/80 hypotensive 152 NO 129/79 normotensive 120/80 normotensive 153 YES 70 109/61 normotensive 110/70 normotensive 154 YES 280 78/38 hypotensive 98/68 normotensive 155 NO 132/63 normotensive 97/43 hypotensive

43
Number Ass AlC ALC intake Unit (weekly)
Ref BP mmHg
Ref BP gr RIE BP mmHg
RIE BP gr
156 14 120/60 normotensive 120/60 normotensive 157 YES 113/58 normotensive 158 YES 30 130/70 normotensive 143/75 normotensive 159 90/40 hypotensive 140/83 normotensive 160 NO 100/64 normotensive 113/67 normotensive 161 YES 100 133/72 normotensive 126/68 normotensive 162 YES 70 140/80 normotensive 170/83 normotensive 163 NO 125/72 normotensive 150/62 normotensive 164 YES 100 74/35 hypotensive 93/45 hypotensive 165 YES 130/74 normotensive 145/55 normotensive 166 NO 14 160/72 normotensive 120/82 normotensive 167 149/82 normotensive 138/72 normotensive 168 YES 14 118/65 normotensive 125/38 normotensive 169 NO 110/80 normotensive 170 NO 40 120/80 normotensive 136/90 normotensive 171 YES 8 149/69 normotensive 132/80 normotensive 172 NO 40 130/70 normotensive 173 NO 140 127/88 normotensive 152/89 normotensive 174 NO 140/90 normotensive 140/70 normotensive 175 YES 20 130/70 normotensive 105/50 normotensive 176 YES 6 109/54 normotensive 95/60 177 YES 132/80 normotensive 116/63 normotensive 178 YES 10 164/86 normotensive 136/63 normotensive 179 YES 50 135/82 normotensive 110/70 normotensive 180 NO 122/60 normotensive 133/61 normotensive 181 560 88/60 hypotensive 110/55 normotensive 182 NO 10 130/80 normotensive 105/44 normotensive 183 8 138/80 normotensive 127/65 normotensive 184 88/72 hypotensive 140/70 normotensive 185 24 111/59 normotensive 132/65 normotensive 186 NO 113/47 normotensive 115/65 normotensive 187 NO 100/60 normotensive 120/50 normotensive 188 YES 112/89 normotensive 114/36 hypotensive 189 NO 20 135/82 normotensive 140/80 normotensive 190 YES 50 110/60 normotensive 120/60 normotensive 191 NO 121/49 normotensive 100/50 normotensive 192 YES 100 92/51 hypotensive 138/70 normotensive 193 NO 150/90 normotensive 120/70 normotensive 194 10 97/50 hypotensive 90/30 hypotensive 195 21 112/63 normotensive 117/72 normotensive 196 YES 50 197 YES 10 114/70 normotensive 120/60 normotensive 198 NO 8 126/80 normotensive 199 YES 14 85/50 hypotensive 200 NO 80 170/80 normotensive 131/63 normotensive 201 YES 300 158/122 hypertensive 90/70 hypotensive 202 NO 14 105/64 normotensive 120/70 normotensive 203 NO 130/70 normotensive 114/36 normotensive 204 NO 14 142/56 normotensive 205 YES 128/62 normotensive 206 NO 117/65 normotensive 140/80 normotensive 207 YES 110/60 normotensive 89 normotensive

44
Number Ass AlC ALC intake Unit
(weekly) Ref BP mmHg
Ref BP gr RIE BP mmHg
RIE BP gr
208 YES 113/63 normotensive 209 YES 60 128/70 normotensive 110/60 normotensive 210 NO 115/65 hypotensive 133/64 normotensive 211 NO 110/60 normotensive 105/43 normotensive 212 YES 140/80 normotensive 160/75 normotensive 213 YES 107/51 normotensive 214 YES 40 97/43 hypotensive 114/96 normotensive 215 NO 10 120/60 normotensive 110/80 normotensive 216 YES 28 170/100 HYPERTENSIVE 217 YES 30 128/64 normotensive 124/62 normotensive 218 NO 100/80 normotensive 115/50 normotensive 219 YES 50 144/91 hypertensive 125/60 normotensive 220 YES 20 119/86 normotensive 97/47 hypotensive 221 NO 14 116/73 normotensive 130/65 normotensive 222 YES 100 138/90 normotensive 130/40 normotensive 223 NO 116/58 normotensive 140/68 normotensive 224 NO 100 123/78 normotensive 186/103 HYPERTENSIVE 225 YES 100 110/60 normotensive 110/70 normotensive 226 86/50 hypotensive 227 YES 7 115/96 normotensive 106/43 normotensive 228 NO 105/45 normotensive 90/45 hypotensive 229 NO 27 140/80 normotensive 119/52 normotensive 230 121/57 normotensive 231 0/0 hypotensive 0 normotensive 232 YES 60 94/34 hypotensive 121/45 normotensive 233 NO 40 124/74 normotensive 125/85 normotensive 234 NO 125 150/70 normotensive 235 YES 140 120/80 normotensive 140/61 normotensive 236 YES 5 110/60 normotensive 114/60 normotensive 237 NO 135/68 normotensive 119/42 hypotensive 238 YES 16 140/90 normotensive 155/78 normotensive 239 YES 28 120/70 normotensive 138/74 normotensive 240 NO 20 120/70 normotensive 169/90 normotensive 241 NO 98 130/50 normotensive 118/50 normotensive 242 YES 180/120 hypertensive 243 NO 8 108/74 normotensive 110/60 normotensive 244 YES 20 142/66 normotensive 127/72 normotensive 245 YES 54 148/94 normotensive 124/67 normotensive 246 247 NO 140/60 normotensive 132 normotensive 248 NO 102/62 normotensive 100/60 normotensive 249 14 130/70 normotensive 139/72 normotensive 250 NO 10 122/37 normotensive 108/46 normotensive 251 NO 149/67 normotensive 115/55 normotensive 252 NO 20 140/90 normotensive 122/42 normotensive 253 75/40 hypotensive 84/38 hypotensive 254 YES 14 138/87 normotensive 141/90 normotensive 255 NO 90/70 hypotensive 90/50 hypotensive 256 NO 18 130/75 normotensive 257 YES 10 115/70 normotensive 130/70 normotensive 258 105/60 normotensive 120/60 normotensive
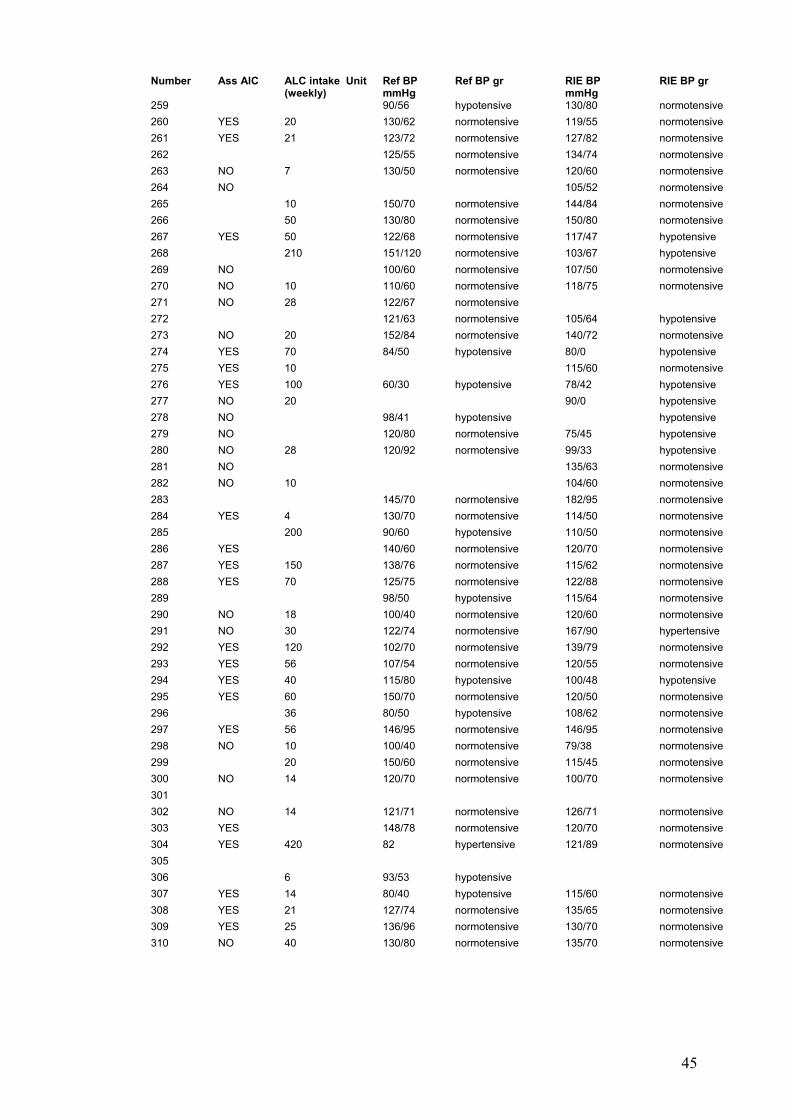
45
Number Ass AlC ALC intake Unit (weekly)
Ref BP mmHg
Ref BP gr RIE BP mmHg
RIE BP gr
259 90/56 hypotensive 130/80 normotensive 260 YES 20 130/62 normotensive 119/55 normotensive 261 YES 21 123/72 normotensive 127/82 normotensive 262 125/55 normotensive 134/74 normotensive 263 NO 7 130/50 normotensive 120/60 normotensive 264 NO 105/52 normotensive 265 10 150/70 normotensive 144/84 normotensive 266 50 130/80 normotensive 150/80 normotensive 267 YES 50 122/68 normotensive 117/47 hypotensive 268 210 151/120 normotensive 103/67 hypotensive 269 NO 100/60 normotensive 107/50 normotensive 270 NO 10 110/60 normotensive 118/75 normotensive 271 NO 28 122/67 normotensive 272 121/63 normotensive 105/64 hypotensive 273 NO 20 152/84 normotensive 140/72 normotensive 274 YES 70 84/50 hypotensive 80/0 hypotensive 275 YES 10 115/60 normotensive 276 YES 100 60/30 hypotensive 78/42 hypotensive 277 NO 20 90/0 hypotensive 278 NO 98/41 hypotensive hypotensive 279 NO 120/80 normotensive 75/45 hypotensive 280 NO 28 120/92 normotensive 99/33 hypotensive 281 NO 135/63 normotensive 282 NO 10 104/60 normotensive 283 145/70 normotensive 182/95 normotensive 284 YES 4 130/70 normotensive 114/50 normotensive 285 200 90/60 hypotensive 110/50 normotensive 286 YES 140/60 normotensive 120/70 normotensive 287 YES 150 138/76 normotensive 115/62 normotensive 288 YES 70 125/75 normotensive 122/88 normotensive 289 98/50 hypotensive 115/64 normotensive 290 NO 18 100/40 normotensive 120/60 normotensive 291 NO 30 122/74 normotensive 167/90 hypertensive 292 YES 120 102/70 normotensive 139/79 normotensive 293 YES 56 107/54 normotensive 120/55 normotensive 294 YES 40 115/80 hypotensive 100/48 hypotensive 295 YES 60 150/70 normotensive 120/50 normotensive 296 36 80/50 hypotensive 108/62 normotensive 297 YES 56 146/95 normotensive 146/95 normotensive 298 NO 10 100/40 normotensive 79/38 normotensive 299 20 150/60 normotensive 115/45 normotensive 300 NO 14 120/70 normotensive 100/70 normotensive 301 302 NO 14 121/71 normotensive 126/71 normotensive 303 YES 148/78 normotensive 120/70 normotensive 304 YES 420 82 hypertensive 121/89 normotensive 305 306 6 93/53 hypotensive 307 YES 14 80/40 hypotensive 115/60 normotensive 308 YES 21 127/74 normotensive 135/65 normotensive 309 YES 25 136/96 normotensive 130/70 normotensive 310 NO 40 130/80 normotensive 135/70 normotensive

46
Number Ass AlC ALC intake Unit (weekly)
Ref BP mmHg
Ref BP gr RIE BP mmHg
RIE BP gr
311 NO 28 99/53 normotensive 105/50 normotensive 312 NO 7 133/84 normotensive 313 NO 125/76 normotensive 132/62 normotensive 314 NO 114/59 normotensive 315 NO 10 128/78 normotensive 120/70 normotensive 316 YES 450 109/60 normotensive 148/91 normotensive 317 NO 20 88/40 hypotensive 160/70 normotensive 318 NO 110/59 normotensive 130/70 normotensive 319 NO 10 138/74 normotensive 134/50 normotensive 320 28 92/56 hypotensive 143/81 normotensive 321 NO 80/50 hypotensive 94/26 hypotensive 322 YES 35 88/0 hypotensive 323 YES 140 140/80 normotensive 150/85 normotensive 324 NO 210 170/90 hypertensive 151/61 normotensive 325 125/80 normotensive 9./35 hypotensive 326 YES 180 158/78 normotensive 327 328 NO 150/100 normotensive 150/85 normotensive 329 YES 330 hypotensive 331 YES 14 122/60 normotensive 127/54 normotensive 332 154/83 normotensive 333 YES 30 132/68 normotensive 140/70 normotensive 334 NO 8 105/70 normotensive 335 NO 133/61 normotensive 102/63 normotensive 336 YES 4 130/76 normotensive 110/60 normotensive 337 YES 210 134/70 normotensive 338 NO 138/78 normotensive 339 NO 10 116/58 normotensive 340 145/50 normotensive 85/45 hypotensive 341 YES 4 124/60 normotensive 118/55 normotensive 342 NO 141/80 normotensive 343 YES 200 118/66 normotensive 147/96 HYPERTENSIVE 344 YES 50 112/60 normotensive 80/20 normotensive 345 NO 97/79 hypotensive 121/64 normotensive 346 YES 112 144/96 hypertensive 105/45 hypotensive 347 NO 10 348 YES 60 140/90 normotensive 114/48 normotensive 349 YES 100/60 hypotensive 100/60 hypotensive 350 YES 40 132/86 normotensive 118/45 hypotensive 351 YES 21 143/85 normotensive 131/61 normotensive 352 NO 10 130/90 normotensive 353 YES 75 119/55 normotensive 118/54 normotensive 354 YES 70 73/38 hypotensive 355 YES 80 154/112 normotensive 139/95 normotensive 356 NO 10 113/74 normotensive 120/65 normotensive 357 YES 210 107/65 normotensive 130/70 normotensive 358 NO 10 120/80 normotensive 160/85 normotensive 359 120/60 normotensive 95/36 hypotensive 360 YES 118/61 normotensive 117/70 normotensive 361 YES 140 110/55 normotensive 362 NO 30 130/56 normotensive 137/65 normotensive

47
Number Ass AlC ALC intake Unit (weekly)
Ref BP mmHg
Ref BP gr RIE BP mmHg
RIE BP gr
363 NO 6 180/100 normotensive 100/0 hypotensive 364 NO 6 137/68 normotensive 116/70 normotensive 365 YES 40 116/60 normotensive 112/60 normotensive 366 YES 40 140/86 normotensive 130/70 normotensive 367 NO 63 184/92 hypertensive 128/60 normotensive 368 NO 26 105/70 hypotensive 105/70 normotensive 369 YES 98 105/65 normotensive 124/70 normotensive 370 YES 14 95/54 hypotensive 120/70 normotensive 371 NO 14 111/55 normotensive 139/90 normotensive 372 NO 720 100/60 normotensive 140/70 normotensive 373 YES 180 127/75 normotensive 151/84 normotensive 374 NO 126/64 normotensive 375 NO 118/48 normotensive 112/50 normotensive 376 NO 118/87 normotensive 118/70 normotensive 377 YES 10 68/40 hypotensive 110/30 hypotensive 378 NO 147/95 normotensive 138/79 normotensive 379 YES 40 130/70 normotensive 380 NO 170/100 hypertensive 95/44 hypotensive 381 NO 40 170/94 normotensive 135/80 normotensive 382 NO 720 120/70 normotensive 383 NO 20 135/80 normotensive 384 YES 280 176/108 hypertensive 100/30 hypotensive 385 NO 122/68 normotensive 82/50 hypotensive 386 NO 14 123/52 normotensive 120/70 normotensive 387 NO 116/66 normotensive 115/70 normotensive 388 144/69 normotensive 70/40 hypotensive 389 YES 120 130/70 normotensive 112/39 normotensive 390 YES 110/50 normotensive 138/74 normotensive 391 NO 101/40 hypotensive 392 NO 132/70 normotensive 105/80 normotensive 393 NO 14 150/70 normotensive 120/60 normotensive 394 NO 10 120/70 normotensive 395 NO 146/67 normotensive 110/54 normotensive 396 NO 116/79 normotensive 101/52 normotensive 397 NO 14 126/90 normotensive 82/40 hypotensive 398 NO 6 130/72 normotensive 399 14 131/67 normotensive 119/62 normotensive 400 NO 140/80 normotensive 96/60 hypotensive 401 YES 126 90/60 hypotensive 129/65 normotensive 402 150/70 normotensive 130/70 normotensive 403 NO 130/79 normotensive 138/68 HYPERTENSIVE 404 63 hypotensive 120/60 normotensive 405 14 60/40 hypotensive 99/47 hypotensive 406 NO 110/70 normotensive 407 NO 10 108/70 normotensive 120/60 normotensive 408 YES 78 127/60 normotensive 117/82 normotensive 409 NO 30 150/100 normotensive 105/55 normotensive 410 YES 10 110/50 normotensive 114/52 normotensive 411 YES 20 412 NO 20 100/55 normotensive 413 NO 123/73 normotensive 414 NO 10 102/68 normotensive 115/68 normotensive

48
Number Ass AlC ALC intake Unit (weekly)
Ref BP mmHg
Ref BP gr RIE BP mmHg
RIE BP gr
415 YES 78/40 hypotensive 416 YES 14 141/81 normotensive 110/45 normotensive 417 YES 80 113/43 normotensive 116/66 normotensive 418 NO 50 150/75 normotensive 110/70 normotensive 419 NO 50 123/72 normotensive 150/70 normotensive 420 YES 300 177/115 hypertensive 128/72 normotensive 421 NO 140/50 normotensive 120/60 normotensive 422 YES 26 192/103 hypertensive 197/96 HYPERTENSIVE 423 NO 160/80 normotensive 145/57 normotensive 424 NO 178/86 HYPERTENSIVE 425 YES 40 148/68 normotensive 526 YES 200 134/79 normotensive 145/75 normotensive 427 NO 14 139/88 normotensive 130/90 normotensive 428 NO 126/63 normotensive 429 NO 129/83 normotensive 152/101 HYPERTENSIVE 430 80/40 hypotensive 431 NO 20 91/52 hypotensive 127/85 normotensive 432 NO 30 125/72 normotensive 433 127/87 normotensive 434 126/86 normotensive 120/70 normotensive 435 NO 160/90 normotensive 120/60 normotensive 436 NO 136/76 normotensive 115/70 normotensive 437 NO 50 95/45 hypotensive 110/80 normotensive 438 YES 315 110/59 normotensive 80/40 hypotensive 439 YES 113/78 normotensive 120/60 normotensive 440 NO 8 144/78 normotensive 98/47 hypotensive 441 YES 110/70 normotensive 442 28 170/90 normotensive 170/90 normotensive 443 NO 108/50 hypotensive 110/60 normotensive 444 NO 360 170/80 normotensive 445 YES 4 142/89 normotensive 446 NO 53/41 hypotensive 86/44 hypotensive 447 NO 64/49 hypotensive 114/62 normotensive 448 NO 10 90/35 hypotensive 449 YES 14 90/68 normotensive 106/67 normotensive 450 YES 210 122/77 normotensive 127/77 normotensive 451 NO 400 114/65 normotensive 100/60 normotensive 452 NO 110/68 normotensive 115/42 normotensive 453 NO 10 122/68 normotensive 454 YES 118 133/87 normotensive 138/63 normotensive 455 NO 24 150/75 normotensive 110/70 normotensive 456 128/66 normotensive 457 NO 18 140/80 normotensive 138/63 normotensive 458 YES 125/94 hypertensive 125/94 HYPERTENSIVE 459 NO 113/69 normotensive 114/55 normotensive 460 NO 63 115/69 normotensive 140/75 normotensive 461 NO 10 105/50 normotensive 462 NO 70 100/20 hypotensive 463 14 141/88 normotensive 180/102 HYPERTENSIVE 464 YES 180 154/67 normotensive 465 NO 10 130/77 normotensive 140/70 normotensive 466 NO 154 133/52 normotensive
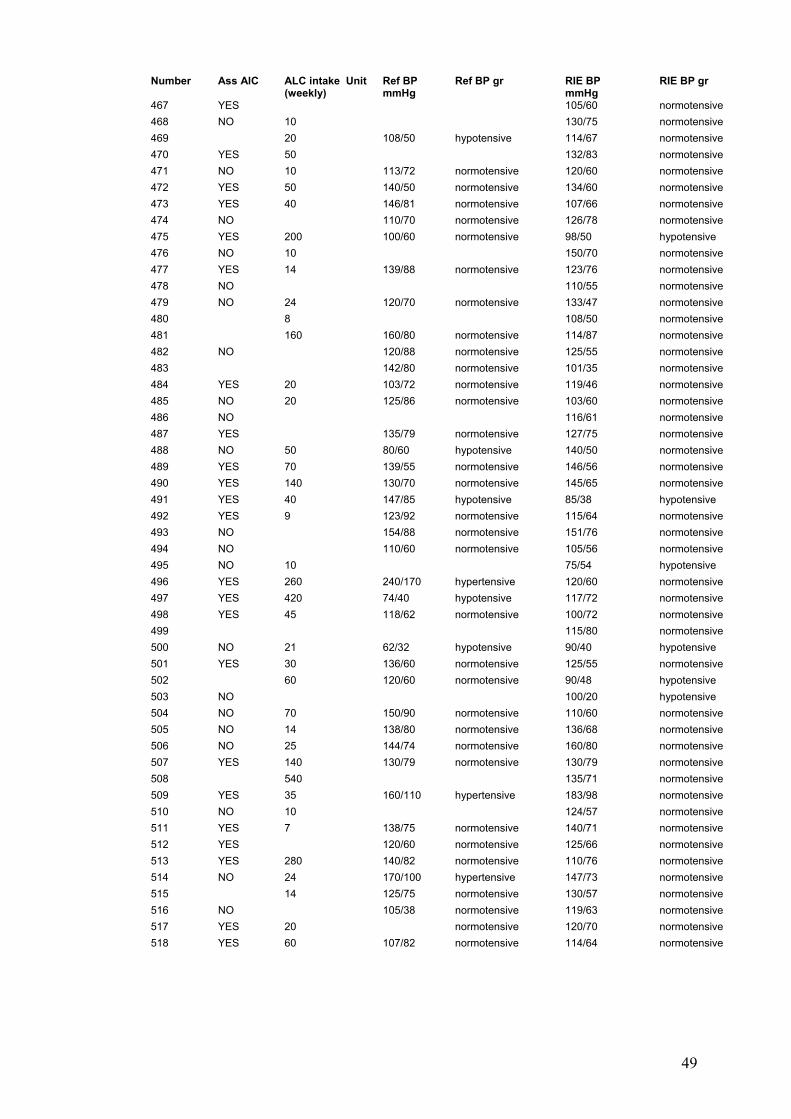
49
Number Ass AlC ALC intake Unit (weekly)
Ref BP mmHg
Ref BP gr RIE BP mmHg
RIE BP gr
467 YES 105/60 normotensive 468 NO 10 130/75 normotensive 469 20 108/50 hypotensive 114/67 normotensive 470 YES 50 132/83 normotensive 471 NO 10 113/72 normotensive 120/60 normotensive 472 YES 50 140/50 normotensive 134/60 normotensive 473 YES 40 146/81 normotensive 107/66 normotensive 474 NO 110/70 normotensive 126/78 normotensive 475 YES 200 100/60 normotensive 98/50 hypotensive 476 NO 10 150/70 normotensive 477 YES 14 139/88 normotensive 123/76 normotensive 478 NO 110/55 normotensive 479 NO 24 120/70 normotensive 133/47 normotensive 480 8 108/50 normotensive 481 160 160/80 normotensive 114/87 normotensive 482 NO 120/88 normotensive 125/55 normotensive 483 142/80 normotensive 101/35 normotensive 484 YES 20 103/72 normotensive 119/46 normotensive 485 NO 20 125/86 normotensive 103/60 normotensive 486 NO 116/61 normotensive 487 YES 135/79 normotensive 127/75 normotensive 488 NO 50 80/60 hypotensive 140/50 normotensive 489 YES 70 139/55 normotensive 146/56 normotensive 490 YES 140 130/70 normotensive 145/65 normotensive 491 YES 40 147/85 hypotensive 85/38 hypotensive 492 YES 9 123/92 normotensive 115/64 normotensive 493 NO 154/88 normotensive 151/76 normotensive 494 NO 110/60 normotensive 105/56 normotensive 495 NO 10 75/54 hypotensive 496 YES 260 240/170 hypertensive 120/60 normotensive 497 YES 420 74/40 hypotensive 117/72 normotensive 498 YES 45 118/62 normotensive 100/72 normotensive 499 115/80 normotensive 500 NO 21 62/32 hypotensive 90/40 hypotensive 501 YES 30 136/60 normotensive 125/55 normotensive 502 60 120/60 normotensive 90/48 hypotensive 503 NO 100/20 hypotensive 504 NO 70 150/90 normotensive 110/60 normotensive 505 NO 14 138/80 normotensive 136/68 normotensive 506 NO 25 144/74 normotensive 160/80 normotensive 507 YES 140 130/79 normotensive 130/79 normotensive 508 540 135/71 normotensive 509 YES 35 160/110 hypertensive 183/98 normotensive 510 NO 10 124/57 normotensive 511 YES 7 138/75 normotensive 140/71 normotensive 512 YES 120/60 normotensive 125/66 normotensive 513 YES 280 140/82 normotensive 110/76 normotensive 514 NO 24 170/100 hypertensive 147/73 normotensive 515 14 125/75 normotensive 130/57 normotensive 516 NO 105/38 normotensive 119/63 normotensive 517 YES 20 normotensive 120/70 normotensive 518 YES 60 107/82 normotensive 114/64 normotensive

50
Number Ass AlC ALC intake Unit (weekly)
Ref BP mmHg
Ref BP gr RIE BP mmHg
RIE BP gr
519 NO 30 137/63 normotensive 122/57 normotensive 520 YES 90 150/90 normotensive 521 YES 18 130/90 normotensive 110/70 normotensive 522 NO 10 120/60 normotensive
Number Ref Na Ref K Ref Bic Ref Bil Ref ALP Ref GGT Ref H+ Ref Cr Ref ALT Ref PT 1 138 3.4 19 44 98 50 71.3 2 144 4.3 77 71 61 99 81 40.6 3 135 6.1 7 22 449 68 37.8 130 90 142 4 135 3.3 17 186 87 129 99 40 5 137 4.9 11 60.4 167 71 6 144 3.6 23 89 53 7 135 3.9 4 77 394 129 72.5 138 124 8 136 5.1 8 99 70 58 305 387 81.8 9 135 3 58 45 22 52 62 13.8 10 136 4.5 13 80 378 59 275 264 51.3 11 141 3.8 26 12 140 70 186 16 12 142 3 23 34 209 161 74 266 50 13 138 3.9 9 182 19 32 101 70 14 141 3.3 20 976 83 336 36 15 145 4.6 76 102 26 174 93 54 16 128 3.2 21 3297 157 123 175 14 17 134 5.2 79 94 45 49 369 369 172 18 136 4.3 24 75 171 182 19 136 4.7 65 72 46 53.7 179 216 35 20 21 129 4.1 19 87 185 388 34 175 193 31 22 145 4.7 10 121 395 63 74 141 216 33 23 137 5 24 210 348 43 24 138 3.5 165 178 67 62 25 25 131 4.4 19 36 242 51 36 426 660 68 26 142 3.9 29 113 38 63 259 14 27 131 3.9 23.5 6880 114 194 32.8 92 83 35 28 141 3.2 18 47 193 11 37 110 91 35 29 136 3.7 23 116 92 116 286 14 30 135 4.9 103 253 33 37.8 340 304 50 31 144 4.9 123 237 161 120 58 32 136 4 17.3 76 219 36.5 80 52 25 33 142 4 22 54 92 44 31 50 56 15.3 34 129 4.5 20.9 188 219 40 394 544 35 135 3.8 26 211 221 81 79 270 15 36 140 4.7 21 34 90 42 37 99 81 42 37 136 3.8 165 286 59 225 87 38 136 3.7 24 69 64 24 38 78 68 21 39 137 5 178 312 157 42 462 460 38 40 136 5.2 15 74 154 63 111 419 52 41 123 5.7 36 297 253 143 42 119 7.3 7 240 1910 850 81 339 362 101 43 141 4.1 21 6 38 84 400 13.8 44 14 4.9 16 45 37 116 20

51
Number Ref Na Ref K Ref Bic Ref Bil Ref ALP Ref GGT Ref H+ Ref Cr Ref ALT Ref PT 45 139 4.6 24 39 284 44 41 57 93 27.2 46 140 4.1 21 75 599 64 79 73 47 134 4.3 20 62 72 30 39 86 61 22.5 48 132 5.8 13 40.5 457 529 77 49 139 3.4 24 84 21 107 108 12 50 128 4.1 97 286 192 450 488 51 51 140 3.5 17 39 220 43 65 176 16 52 130 4.5 10 81 168 132 83 221 317 37.4 53 134 4 25 52 298 95 66 42 30 54 137 4.9 62 92 70 112 85 27 55 140 4 26.2 118 69 46 33.5 80 72 18.3 56 136 5.8 31 127 98 35 150 80 53 57 134 4.4 124 122 174 141 277 65 58 134 3.8 34 129 256 53 32 107 75 32 59 128 4.9 19 55 326 129 107 63 60 132 3.2 23 35 179 79 35 92 54 16 61 141 4.4 13 56.7 130 115 19 62 138 4.2 23 33.2 90 80 21 63 139 3.4 16 33 80 215 38 70 250 43 64 144 4.3 6.9 85 156 67 126 112 21.5 65 138 3.7 20 101 126 14 46.6 111 75 22 66 140 4.3 60 193 38 93 184 63 67 142 3.3 26 29 96 36 94 134 68 69 134 4.2 26 83 129 102 95 137 42 70 138 3.6 28 96 74 167 39 74 14 71 134 3.5 18 23 251 120 42 99 70 18.1 72 141 3.3 13.4 63.8 98 56 27.8 73 130 3.4 145 353 276 195 305 76.6 74 137 4 22 42 286 20 24.9 79 65 29.5 75 137 4.4 17 81 149 31 35.2 59 38 14 76 208 18 77 142 2.9 17 44 212 43 84 65 18 78 133 7.2 26 176 269 421 122 219 28 79 134 3.9 29 130 271 44.1 80 99 30 80 139 5 17 82 260 55 46 108 118 39 81 142 3.7 9 117 60 133 132 67 82 119 146 31 96 95 30 83 141 4 25 66 624 36 90 97 40 84 138 4.2 54 193 19 80 83 32 85 145 3.8 13.8 70 45 25 86 137 5.3 9 100 428 317 42 104 78 85 87 144 4.5 69 129 267 33 119 124 23.8 88 136 3.5 30 48 140 23 34 67 64 39 89 138 3.1 22.7 15 126 12 32 73 145 21 90 135 3.6 166 293 347 79 224 51 91 141 4 20.5 45 182 69 96 119 23 92 132 4.4 132 293 260 36.1 75 75 69 93 129 5.6 63 532 376 87.2 301 180 94 140 3.6 57 113 53 83 85 19.3 95 142 47 109 103 99 140 14.8
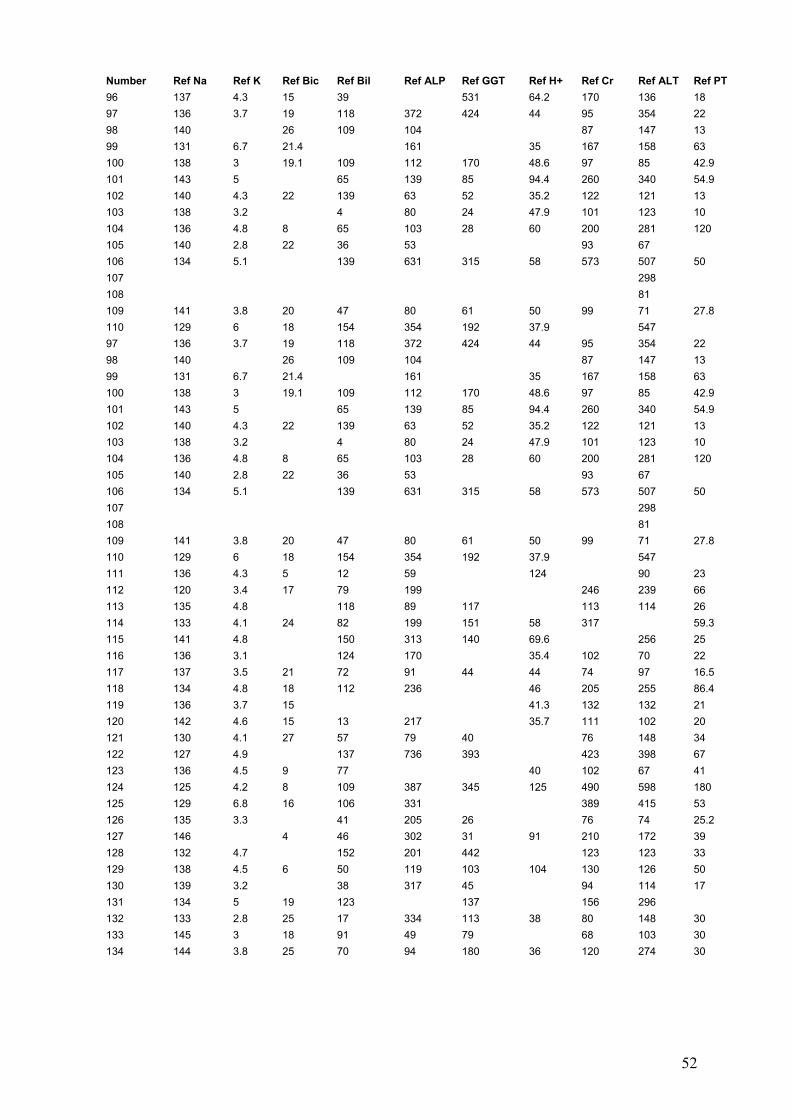
52
Number Ref Na Ref K Ref Bic Ref Bil Ref ALP Ref GGT Ref H+ Ref Cr Ref ALT Ref PT 96 137 4.3 15 39 531 64.2 170 136 18 97 136 3.7 19 118 372 424 44 95 354 22 98 140 26 109 104 87 147 13 99 131 6.7 21.4 161 35 167 158 63 100 138 3 19.1 109 112 170 48.6 97 85 42.9 101 143 5 65 139 85 94.4 260 340 54.9 102 140 4.3 22 139 63 52 35.2 122 121 13 103 138 3.2 4 80 24 47.9 101 123 10 104 136 4.8 8 65 103 28 60 200 281 120 105 140 2.8 22 36 53 93 67 106 134 5.1 139 631 315 58 573 507 50 107 298 108 81 109 141 3.8 20 47 80 61 50 99 71 27.8 110 129 6 18 154 354 192 37.9 547 97 136 3.7 19 118 372 424 44 95 354 22 98 140 26 109 104 87 147 13 99 131 6.7 21.4 161 35 167 158 63 100 138 3 19.1 109 112 170 48.6 97 85 42.9 101 143 5 65 139 85 94.4 260 340 54.9 102 140 4.3 22 139 63 52 35.2 122 121 13 103 138 3.2 4 80 24 47.9 101 123 10 104 136 4.8 8 65 103 28 60 200 281 120 105 140 2.8 22 36 53 93 67 106 134 5.1 139 631 315 58 573 507 50 107 298 108 81 109 141 3.8 20 47 80 61 50 99 71 27.8 110 129 6 18 154 354 192 37.9 547 111 136 4.3 5 12 59 124 90 23 112 120 3.4 17 79 199 246 239 66 113 135 4.8 118 89 117 113 114 26 114 133 4.1 24 82 199 151 58 317 59.3 115 141 4.8 150 313 140 69.6 256 25 116 136 3.1 124 170 35.4 102 70 22 117 137 3.5 21 72 91 44 44 74 97 16.5 118 134 4.8 18 112 236 46 205 255 86.4 119 136 3.7 15 41.3 132 132 21 120 142 4.6 15 13 217 35.7 111 102 20 121 130 4.1 27 57 79 40 76 148 34 122 127 4.9 137 736 393 423 398 67 123 136 4.5 9 77 40 102 67 41 124 125 4.2 8 109 387 345 125 490 598 180 125 129 6.8 16 106 331 389 415 53 126 135 3.3 41 205 26 76 74 25.2 127 146 4 46 302 31 91 210 172 39 128 132 4.7 152 201 442 123 123 33 129 138 4.5 6 50 119 103 104 130 126 50 130 139 3.2 38 317 45 94 114 17 131 134 5 19 123 137 156 296 132 133 2.8 25 17 334 113 38 80 148 30 133 145 3 18 91 49 79 68 103 30 134 144 3.8 25 70 94 180 36 120 274 30
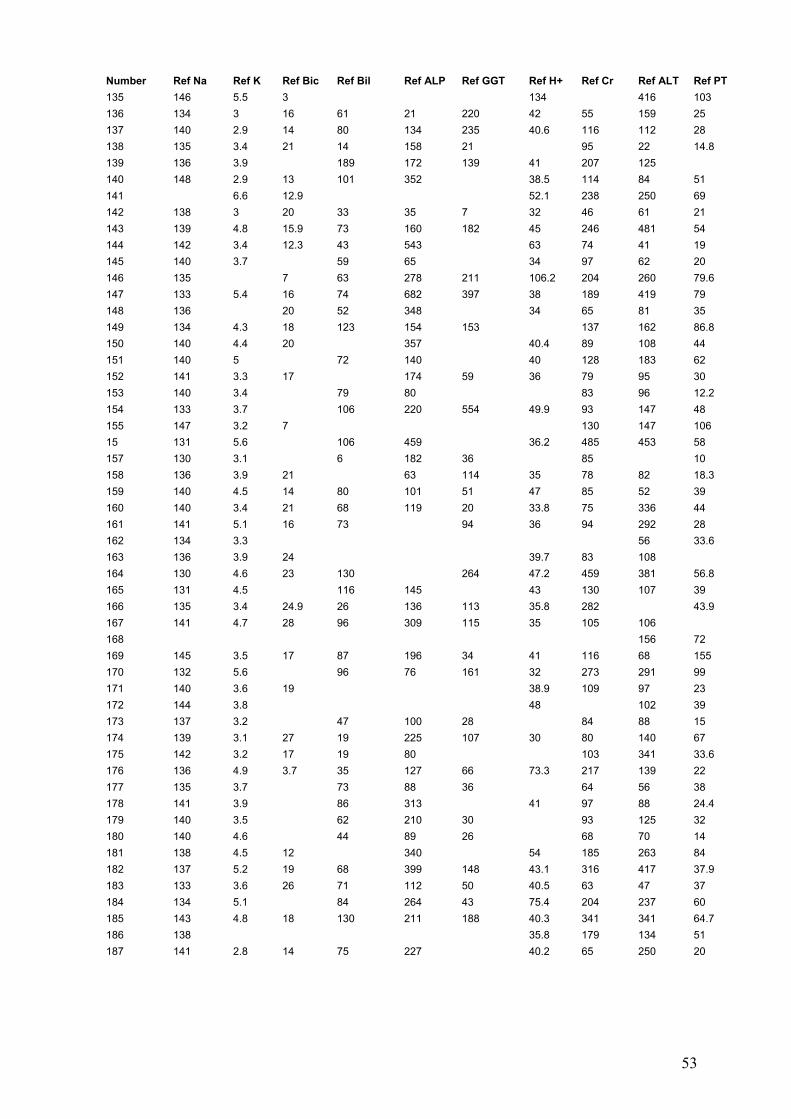
53
Number Ref Na Ref K Ref Bic Ref Bil Ref ALP Ref GGT Ref H+ Ref Cr Ref ALT Ref PT 135 146 5.5 3 134 416 103 136 134 3 16 61 21 220 42 55 159 25 137 140 2.9 14 80 134 235 40.6 116 112 28 138 135 3.4 21 14 158 21 95 22 14.8 139 136 3.9 189 172 139 41 207 125 140 148 2.9 13 101 352 38.5 114 84 51 141 6.6 12.9 52.1 238 250 69 142 138 3 20 33 35 7 32 46 61 21 143 139 4.8 15.9 73 160 182 45 246 481 54 144 142 3.4 12.3 43 543 63 74 41 19 145 140 3.7 59 65 34 97 62 20 146 135 7 63 278 211 106.2 204 260 79.6 147 133 5.4 16 74 682 397 38 189 419 79 148 136 20 52 348 34 65 81 35 149 134 4.3 18 123 154 153 137 162 86.8 150 140 4.4 20 357 40.4 89 108 44 151 140 5 72 140 40 128 183 62 152 141 3.3 17 174 59 36 79 95 30 153 140 3.4 79 80 83 96 12.2 154 133 3.7 106 220 554 49.9 93 147 48 155 147 3.2 7 130 147 106 15 131 5.6 106 459 36.2 485 453 58 157 130 3.1 6 182 36 85 10 158 136 3.9 21 63 114 35 78 82 18.3 159 140 4.5 14 80 101 51 47 85 52 39 160 140 3.4 21 68 119 20 33.8 75 336 44 161 141 5.1 16 73 94 36 94 292 28 162 134 3.3 56 33.6 163 136 3.9 24 39.7 83 108 164 130 4.6 23 130 264 47.2 459 381 56.8 165 131 4.5 116 145 43 130 107 39 166 135 3.4 24.9 26 136 113 35.8 282 43.9 167 141 4.7 28 96 309 115 35 105 106 168 156 72 169 145 3.5 17 87 196 34 41 116 68 155 170 132 5.6 96 76 161 32 273 291 99 171 140 3.6 19 38.9 109 97 23 172 144 3.8 48 102 39 173 137 3.2 47 100 28 84 88 15 174 139 3.1 27 19 225 107 30 80 140 67 175 142 3.2 17 19 80 103 341 33.6 176 136 4.9 3.7 35 127 66 73.3 217 139 22 177 135 3.7 73 88 36 64 56 38 178 141 3.9 86 313 41 97 88 24.4 179 140 3.5 62 210 30 93 125 32 180 140 4.6 44 89 26 68 70 14 181 138 4.5 12 340 54 185 263 84 182 137 5.2 19 68 399 148 43.1 316 417 37.9 183 133 3.6 26 71 112 50 40.5 63 47 37 184 134 5.1 84 264 43 75.4 204 237 60 185 143 4.8 18 130 211 188 40.3 341 341 64.7 186 138 35.8 179 134 51 187 141 2.8 14 75 227 40.2 65 250 20

54
Number Ref Na Ref K Ref Bic Ref Bil Ref ALP Ref GGT Ref H+ Ref Cr Ref ALT Ref PT 188 141 3.6 9 137 828 530 134 147 79 189 132 3.6 40 75 57 60 190 142 5 32 63 104 37 77 73 25 191 140 4.3 30 41 170 34.4 189 263 71 192 125 5.4 64 716 380 346 46.5 193 145 4.1 13 26 270 90 119 30 194 138 6 42 159 101 203 84 195 142 4.6 8 35 124 41 131 109 18 196 139 4 28 76 160 26 111 15 197 143 2.4 25 42 96 47 53 46 18.6 198 133 4.2 42 338 79 47 36 199 144 4.6 9 78 85 124 114 98 234 54.9 200 146 4.6 6 89 95 421 21 201 140 4.2 163 460 707 62.3 218 216 202 141 3.4 18 61 233 69 80 17 30 203 140 3.9 19 86 75 285 63 204 135 4.7 18 58 107 290 63 359 367 41.7 205 117 206 141 3.9 24 67 85 45 36 92 76 52 207 137 5.5 20 110 174 39 267 255 50 208 144 2.3 11 38 79 25 35 100 54 19.6 209 139 3.3 5.7 135 153 192 7.07 116 208 38.3 210 136 3.7 18.2 33 202 41.8 75 291 17 211 135 3.9 20 63 23 35 76 81 23.5 212 143 4.1 43 278 85 212 19 213 139 3.7 23 8 236 25 75 171 15 214 141 3.9 46 82 45 38 155 141 15 215 142 4 40 143 186 44 216 132 3.7 26 140 250 85 164 60 217 140 3.4 30 163 39.8 94 285 19 218 145 5.4 7 378 19 115 175 136 58 219 132 3.7 46 72 33 33.1 82 82 29 220 136 5.2 11 65 144 30 58.3 151 166 55 221 2086 137 137 44 169 95 90 222 137 5.4 8 159 181 216 50 223 144 4.6 53 146 45 43.9 124 208 48.4 224 134 4.5 180 136 180 105 225 139 3.9 14 53 157 211 123 226 130 8.5 6 254 212 120 227 134 3.2 26 12 233 36.4 100 92 12.8 228 146 4.6 5.2 85 298 90 140 177 66 229 147 4.4 23 42 127 20 120 47 106 14 230 136 4.2 9 93 166 315 323 67 231 138 5.4 86 376 100 232 109 40 32 327 50.5 233 136 4.4 13 187 173 125 99 88 234 139 4.3 23 870 57 38 38 120 95 18 235 144 4 14 162 120 133 140 40 236 143 4.8 25 43 110 52 96 84 54 237 138 4.5 197 149 107 136 238 134 5.2 333 420 142 271 25 239 137 3.9 18 262 97 36.2 102 73 24.9 240 136 3.3 14.7 241 284 50.9 504 1359 32.9
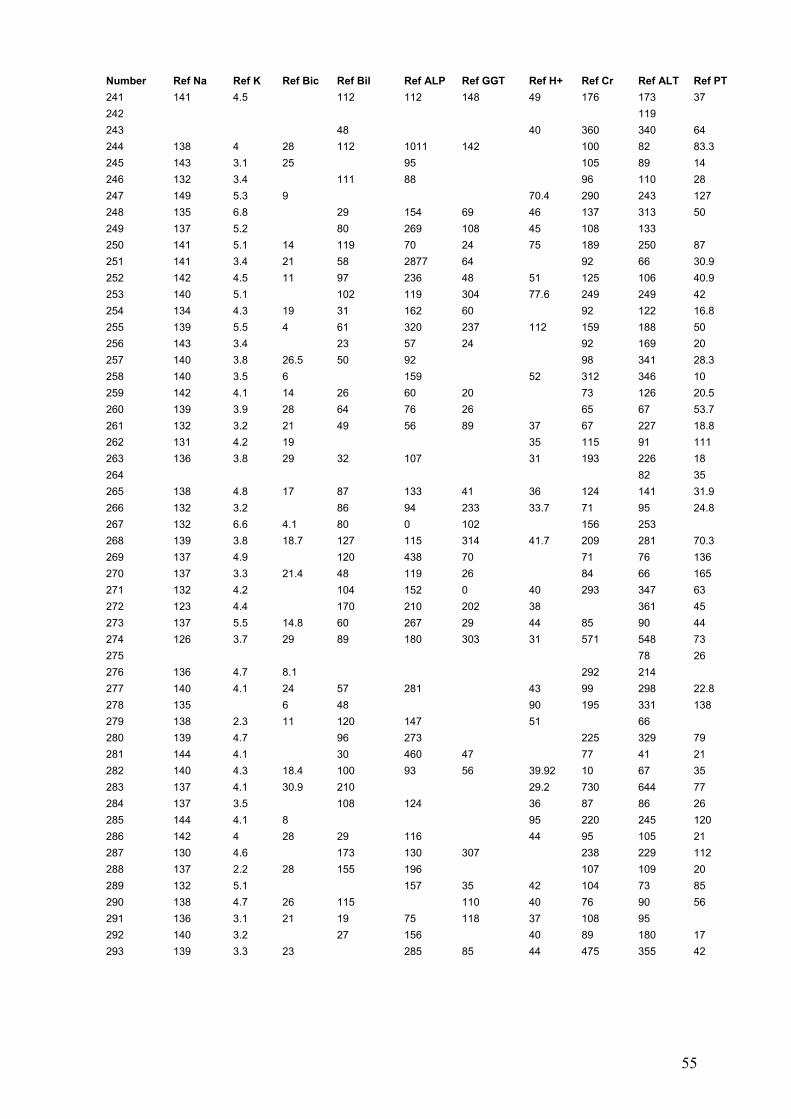
55
Number Ref Na Ref K Ref Bic Ref Bil Ref ALP Ref GGT Ref H+ Ref Cr Ref ALT Ref PT 241 141 4.5 112 112 148 49 176 173 37 242 119 243 48 40 360 340 64 244 138 4 28 112 1011 142 100 82 83.3 245 143 3.1 25 95 105 89 14 246 132 3.4 111 88 96 110 28 247 149 5.3 9 70.4 290 243 127 248 135 6.8 29 154 69 46 137 313 50 249 137 5.2 80 269 108 45 108 133 250 141 5.1 14 119 70 24 75 189 250 87 251 141 3.4 21 58 2877 64 92 66 30.9 252 142 4.5 11 97 236 48 51 125 106 40.9 253 140 5.1 102 119 304 77.6 249 249 42 254 134 4.3 19 31 162 60 92 122 16.8 255 139 5.5 4 61 320 237 112 159 188 50 256 143 3.4 23 57 24 92 169 20 257 140 3.8 26.5 50 92 98 341 28.3 258 140 3.5 6 159 52 312 346 10 259 142 4.1 14 26 60 20 73 126 20.5 260 139 3.9 28 64 76 26 65 67 53.7 261 132 3.2 21 49 56 89 37 67 227 18.8 262 131 4.2 19 35 115 91 111 263 136 3.8 29 32 107 31 193 226 18 264 82 35 265 138 4.8 17 87 133 41 36 124 141 31.9 266 132 3.2 86 94 233 33.7 71 95 24.8 267 132 6.6 4.1 80 0 102 156 253 268 139 3.8 18.7 127 115 314 41.7 209 281 70.3 269 137 4.9 120 438 70 71 76 136 270 137 3.3 21.4 48 119 26 84 66 165 271 132 4.2 104 152 0 40 293 347 63 272 123 4.4 170 210 202 38 361 45 273 137 5.5 14.8 60 267 29 44 85 90 44 274 126 3.7 29 89 180 303 31 571 548 73 275 78 26 276 136 4.7 8.1 292 214 277 140 4.1 24 57 281 43 99 298 22.8 278 135 6 48 90 195 331 138 279 138 2.3 11 120 147 51 66 280 139 4.7 96 273 225 329 79 281 144 4.1 30 460 47 77 41 21 282 140 4.3 18.4 100 93 56 39.92 10 67 35 283 137 4.1 30.9 210 29.2 730 644 77 284 137 3.5 108 124 36 87 86 26 285 144 4.1 8 95 220 245 120 286 142 4 28 29 116 44 95 105 21 287 130 4.6 173 130 307 238 229 112 288 137 2.2 28 155 196 107 109 20 289 132 5.1 157 35 42 104 73 85 290 138 4.7 26 115 110 40 76 90 56 291 136 3.1 21 19 75 118 37 108 95 292 140 3.2 27 156 40 89 180 17 293 139 3.3 23 285 85 44 475 355 42

56
Number Ref Na Ref K Ref Bic Ref Bil Ref ALP Ref GGT Ref H+ Ref Cr Ref ALT Ref PT 294 134 3.9 17 72 284 273 67 121 259 71 295 142 4.2 13 54 56 65 102 174 70 296 144 6.1 16 43 58 155 366 14 297 131 5.2 21 116 117 308 38 183 216 74.1 298 146 4.7 74 125 46 69 177 166 84 299 133 5 27 39 87 73 60 300 138 3.1 14 19 84 21 49 89 118 16.8 301 140 4.3 18 78 65 200 302 137 3.7 17 312 38 37 95 44 42 303 137 4.6 17.2 30 263 59 44.9 136 241 23.5 304 136 4.2 25 108 383 186 149 155 66 305 145 3.4 19 71 16.1 306 132 4.5 25 75 320 115 178 191 307 133 4.5 19.4 23 86 15 45 79 75 42 308 136 6 129 141 89 99 96 71 309 139 3.8 90 91 84 194 16.1 310 133 4.2 34 69 122 168 34.6 160 128 22 311 140 3.7 22 58 97 50 62 69 32 312 138 3.6 24 60 56 52 38 172 25 313 141 4.1 39.6 70 57 31 314 2.7 23 80 50 23 315 137 3.8 36 86 60 316 136 5.1 81 117 47 177 232 64.4 317 135 4.6 12 80.8 113 128 16 318 140 3.4 57 182 13 74 48 21.9 319 134 5.6 18 111 42 95 123 100 320 139 4.4 29 210 396 558 594 40.8 321 139 4.4 179 231 65 322 126 4.6 62 1080 491 38 446 498 42.9 323 136 3.7 21 250 204 100 78 30 324 142 3.6 67 34.4 127 201 325 134 5 19 127 158 45 36 121 84 88 326 136 327 328 137 4.7 11 59 121 92 108 329 182 330 331 138 3.8 20 75 54 68 39 84 74 22.9 332 135 3.9 44 193 61 78 90 17 333 138 4.5 23 66 317 113 40.9 137 390 34 334 56 335 135 5.1 16 104 461 44 43 107 103 86.9 336 137 3.9 18 6 192 12 44 71 71 15 337 284 420 23 338 135 2.8 185 32 82 89 42 339 140 4.2 33 293 49 83 87 21.6 340 134 4.6 14 61 178 69 160 173 35 341 139 3.7 22 61 98 39 78 59 20 342 96 343 135 5.3 84 136 151 278 50.8 344 128 3.8 21 98 690 153 45.9 75 73 78.8 345 139 3.9 17 54 334 76 66 99 109 346 147 3.6 16 70 260 201 69 129 223 28.2

57
Number Ref Na Ref K Ref Bic Ref Bil Ref ALP Ref GGT Ref H+ Ref Cr Ref ALT Ref PT 347 142 3.6 17 98 93 42 35 68 113 20.7 348 137 4.6 20 24000 58 203 281 79.2 349 145 3.6 76 136 56 120 207 246 36 350 128 6.6 129 406 424 38 448 359 60.7 351 140 3.8 39.3 97 236 61.6 352 142 3.7 17 45 43 70 20 353 132 5.4 103 119 137 34.7 111 86 30 354 142 4.2 13 46 207 455 138 28 355 137 4.5 19 89 275 341 49 154 176 36 356 141 3.2 16 97 351 42.7 75 91 20 357 132 6.2 93 102 245 192 215 37.3 358 140 4.1 18.6 239 239 210 110 137 359 135 3.5 18.5 94 151 56 50 80 98 46.8 360 133 3.3 75 76 22 36.5 70 104 20.3 361 106 362 139 4.6 19 78 178 71 36 108 74 77 363 137 6.7 20 425 182 34 401 439 34.3 364 141 3.8 13 31 255 9 37 36 20 365 137 4.6 192 135 494 535 104 366 136 6.9 120 482 36 249 248 34 367 135 4.1 53 76 63 81 18 368 127 6.1 65 259 146 70 138 138 112 369 137 5.5 12 127 311 632 45 258 315 34 370 133 3.7 17 26 545 59 140 165 52 371 129 6.3 41 605 171 477 419 52.2 372 131 5.1 14 134 309 231 39 190 157 46 373 133 4.3 31 79 128 175 118 555 19.8 374 9 120 149 30 375 139 4.4 28 21 92 12 29 66 92 13 376 147 3.7 15 48 87 18 377 138 4.4 92 278 155 43 403 454 38.4 378 140 3.5 20 48 81 58 15 379 141 3.4 171 82 207 17 380 130 4.1 140 163 332 47.6 444 452 40 381 140 3.4 25.5 47 52 35 77 65 21 382 133 4.1 104 195 314 226 303 14.5 383 141 4.4 21 129 192 290 41 104 197 35.5 384 139 5.7 7 64 543 239 144 126 219 34.6 385 140 4.6 12 23 314 26 43 129 284 21 386 139 5.1 19 142 224 38 128 196 28 387 138 3.1 93 283 51 41 47 79 35 388 140 5.9 4 262 54 98.1 111 260 78 389 143 4 21 54 240 67 35 83 129 28 390 143 4.6 5 98 50 33 101 107 48.4 391 394 392 139 4.6 20 108 82 39 40 180 356 92.4 393 140 2.9 30 94 128 39 85 60 394 136 3.8 17 12 45 79 61 23 395 141 3.8 75 186 86 396 127 4.9 8 29 246 155 78 74 130 24.8 397 144 5.3 82 118 82 100 255 270 398 108 91.2 399 139 3.3 13 31 124 24 49 88 59 36.9
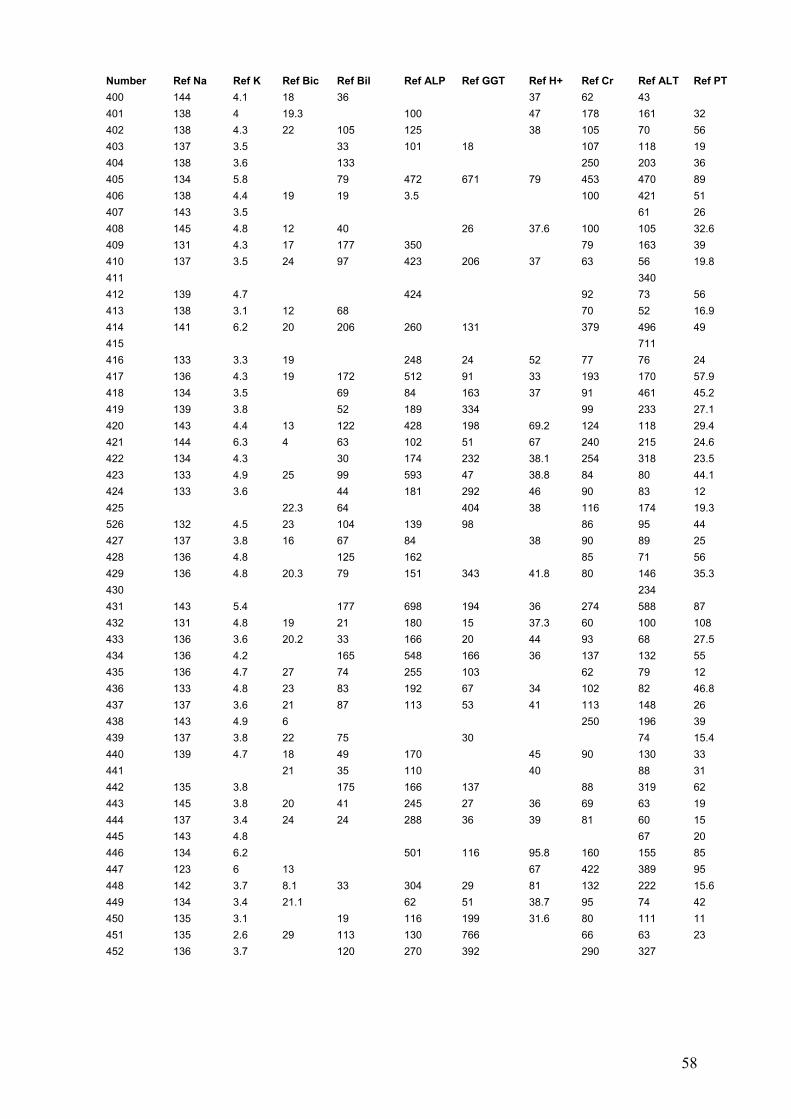
58
Number Ref Na Ref K Ref Bic Ref Bil Ref ALP Ref GGT Ref H+ Ref Cr Ref ALT Ref PT 400 144 4.1 18 36 37 62 43 401 138 4 19.3 100 47 178 161 32 402 138 4.3 22 105 125 38 105 70 56 403 137 3.5 33 101 18 107 118 19 404 138 3.6 133 250 203 36 405 134 5.8 79 472 671 79 453 470 89 406 138 4.4 19 19 3.5 100 421 51 407 143 3.5 61 26 408 145 4.8 12 40 26 37.6 100 105 32.6 409 131 4.3 17 177 350 79 163 39 410 137 3.5 24 97 423 206 37 63 56 19.8 411 340 412 139 4.7 424 92 73 56 413 138 3.1 12 68 70 52 16.9 414 141 6.2 20 206 260 131 379 496 49 415 711 416 133 3.3 19 248 24 52 77 76 24 417 136 4.3 19 172 512 91 33 193 170 57.9 418 134 3.5 69 84 163 37 91 461 45.2 419 139 3.8 52 189 334 99 233 27.1 420 143 4.4 13 122 428 198 69.2 124 118 29.4 421 144 6.3 4 63 102 51 67 240 215 24.6 422 134 4.3 30 174 232 38.1 254 318 23.5 423 133 4.9 25 99 593 47 38.8 84 80 44.1 424 133 3.6 44 181 292 46 90 83 12 425 22.3 64 404 38 116 174 19.3 526 132 4.5 23 104 139 98 86 95 44 427 137 3.8 16 67 84 38 90 89 25 428 136 4.8 125 162 85 71 56 429 136 4.8 20.3 79 151 343 41.8 80 146 35.3 430 234 431 143 5.4 177 698 194 36 274 588 87 432 131 4.8 19 21 180 15 37.3 60 100 108 433 136 3.6 20.2 33 166 20 44 93 68 27.5 434 136 4.2 165 548 166 36 137 132 55 435 136 4.7 27 74 255 103 62 79 12 436 133 4.8 23 83 192 67 34 102 82 46.8 437 137 3.6 21 87 113 53 41 113 148 26 438 143 4.9 6 250 196 39 439 137 3.8 22 75 30 74 15.4 440 139 4.7 18 49 170 45 90 130 33 441 21 35 110 40 88 31 442 135 3.8 175 166 137 88 319 62 443 145 3.8 20 41 245 27 36 69 63 19 444 137 3.4 24 24 288 36 39 81 60 15 445 143 4.8 67 20 446 134 6.2 501 116 95.8 160 155 85 447 123 6 13 67 422 389 95 448 142 3.7 8.1 33 304 29 81 132 222 15.6 449 134 3.4 21.1 62 51 38.7 95 74 42 450 135 3.1 19 116 199 31.6 80 111 11 451 135 2.6 29 113 130 766 66 63 23 452 136 3.7 120 270 392 290 327

59
Number Ref Na Ref K Ref Bic Ref Bil Ref ALP Ref GGT Ref H+ Ref Cr Ref ALT Ref PT 453 139 2.9 19 15 96 17 33 99 87 24.8 454 143 3.3 23 30 202 98 208 455 134 4.3 17.3 42 190 20 189 251 27.9 456 147 4 110 386 352 68 457 139 4.8 25.6 73 496 79 36 113 116 68 458 4 85 154 227 85 85 17 459 141 3.7 19 31 250 47 34 119 69 25 460 132 5.6 71 156 168 220 265 461 140 3.7 20.4 86 90 91 85 25 462 138 4.1 19 55 115 37 134 93 18 463 134 3.6 11 276 95 100 100 464 134 5.8 12 277 733 126 41 1196 1212 18 465 136 4.8 22 59 326 22 35 111 116 40 466 137 4.6 18 48 131 41 95 67 26.4 467 136 5 182 70 130 163 45 468 135 4.1 25.6 146 313 181 37 72 80 110 469 145 2.3 14 122 74 21.7 470 141 4.5 9 92 139 83 76 179 179 55.2 471 139 6.9 104 121 226 109 164 21.9 472 134 3.3 24 42 82 78 34 98 75 17.4 473 145 4.3 10 76 122 109 25 474 136 3.6 21 36 78 26 37 164 181 41 475 128 4.2 125 501 54.6 118 78 58 476 143 4.2 30 56 201 26 32 106 240 22.7 477 129 3.6 125 174 124 416 432 49 478 140 3.7 34 88 68 21.5 479 133 3.3 111 120 139 75 82 16.2 480 135 5.6 166 197 60 481 139 3.3 102 106 327 37 149 31 38 482 141 3.3 15 56 26 101 83 28.8 483 142 4.8 14 29 60 76 223 256 484 139 5.3 61 118 99 75 17 485 146 4.2 16 166 489 50 486 143 4.8 21 43 92 33 124 72 22 487 135 3.2 17 47 76 66 32 100 98 15 488 137 3.6 24 79 123 37 118 113 49 489 144 4 130 191 156 37.7 95 85 18 490 138 3.3 62 98 90 94 180 41 491 139 3.7 25 53 260 62 34 72 155 16 492 141 4 21 57 342 28 77 78 20 493 135 5.3 113 187 109 72 73 59 494 143 4.8 29 80 386 37 126 89 34 495 138 4.2 10.1 72 125 110 62 122 243 50 496 130 3.5 20 171 438 318 47.9 252 175 71 497 138 5.8 12 208 273 179 294 295 41 498 142 2.9 42 145 172 262 281 74 499 138 5 20 98 236 40 40 100 77 88 500 147 5.3 6 49 253 71 122 208 250 88 501 140 4.2 82 350 30 143 175 58 502 130 3.5 20 438 318 47.9 252 175 24 503 463 504 138 4.6 20 96 445 165 36.6 99 213 38.3 505 140 3.8 25 95 126 337 33 118 98 28

60
Number Ref Na Ref K Ref Bic Ref Bil Ref ALP Ref GGT Ref H+ Ref Cr Ref ALT Ref PT 506 140 3.3 92 84 218 23 496 130 3.5 20 171 438 318 47.9 252 175 71 497 138 5.8 12 208 273 179 294 295 41 498 142 2.9 42 145 172 262 281 74 499 138 5 20 98 236 40 40 100 77 88 500 147 5.3 6 49 253 71 122 208 250 88 501 140 4.2 82 350 30 143 175 58 502 130 3.5 20 438 318 47.9 252 175 24 503 463 504 138 4.6 20 96 445 165 36.6 99 213 38.3 505 140 3.8 25 95 126 337 33 118 98 28 506 140 3.3 92 84 218 23 507 134 3.9 129 208 487 34.7 339 164 45 508 136 4.2 210 161 344 160 100 48.8 509 133 4.1 26 69 269 214 214 269 38 510 137 6.1 58 76.1 103 94 30.4 511 142 4.5 26 92 233 51 95 92 512 17.8 105 127 132 43 132 177 42.8 513 165 135 391 55 52 60 514 141 3.7 17 48 267 58 110 83 23 515 173 99 46 83 33 516 140 3.3 24 57 97 101 37 68 221 39.5 517 142 2.2 28 177 66 123 84 18 518 143 48 44 90 76 24 519 139 2.9 17.7 32 46.7 84 145 77 520 134 4 57 343 130 120 72 45 521 142 2.9 19 42 60.8 113 22.2 522 144 3.6 16 26 96 30 49 56 18.8
Number RIE APTT RIE Na RIE K RIE Bil RIE GGT RIE ALP RIE H+ RIE Bic RIE Cr 1 46.9 137 2.6 134 76 188 50 2 144 3.6 79 62 98 30.1 25.5 81 3 68 149 2.9 78 38.5 23.8 90 4 48 134 3.2 205 214 87 39.3 20 99 5 85.5 133 5.8 107 42 46 57 13 167 6 51 137 4.2 114 39 178 53 7 63 127 3 62 100 62 124 8 164 136 4.4 94 78 130 97 6.3 387 9 48.6 129 3.6 97 56 83 62 10 57 126 4 101 59 192 264 11 127 4 112 156 115 30.3 25.8 186 12 70.9 133 4.2 146 139 185 41 22 266 13 50.7 126 6.9 64 107 50 7.07 5 70 14 47 134 3.9 50 148 111 336 15 143 5.2 46 17 57 39.6 26.7 93 16 34.3 130 3 78 336 182 175 17 80 134 5.2 79 45 94 49 15 369 18 54.1 128 3.6 69 101 82 182 19 77 138 3.9 64 50 69 37 16 216 20 21 73 136 3.5 49 152 75 193

61
Number RIE APTT RIE Na RIE K RIE Bil RIE GGT RIE ALP RIE H+ RIE Bic RIE Cr 22 84.3 140 4.1 39 44 72 41.3 19 216 23 78.4 138 2.9 68 90 188 40.2 348 24 93 135 3.6 212 208 156 31.7 27.5 62 25 50.7 131 4.7 111 92 134 38.7 21.6 660 26 76.8 133 3.9 100 261 157 37.4 27.8 259 27 33.8 133 3.3 83 131 104 83 28 35 138 3 29 11 79 91 29 53 136 4.4 181 565 137 36.5 20.2 286 30 36.3 136 4 82 24 90 27.1 27.6 304 31 47.5 138 4.3 122 172 81 38 19 120 32 41 136 3 39 35 89 33 24 52 33 59.8 138 3.8 143 143 126 31 25.5 56 34 56.7 127 3.5 216 288 155 40.9 23.2 544 35 75 113 4.2 202 76 91 30.8 24 270 36 139 3.8 19 22 97 81 37 50 137 5.6 197 97 222 225 38 45 135 3.5 75 46 84 36 26 68 39 62 134 4.5 133 109 87 460 40 1 132 4.2 135 149 142 52.9 17.9 419 41 93 127 3.7 112 124 143 36.4 28.3 253 42 70.3 124 6.8 268 152 1018 103 9 362 43 46.3 133 3.9 74 493 158 400 44 60.3 140 3.9 106 68 119 116 45 4404 140 3.4 22 56 124 36 23 93 46 46 139 3.6 55 60 183 73 47 41 138 3.9 207 67 89 37 19 61 48 120 125 5.4 182 52 106 7.42 20 529 49 60 138 3.5 82 38 123 36.8 19 108 50 48 131 3.9 125 149 192 24.6 38.5 488 51 96.9 146 3.7 71 26 106 76 10.5 176 52 100 132 4.9 43 80 39 79.5 12.2 317 53 59.7 136 3.1 78 73 148 42 54 73 132 3.7 104 77 103 37.9 20.4 85 55 43.1 139 3.4 68 26 70 72 56 58 135 4.2 36 93 103 32 25.2 80 57 125 3.3 127 187 110 277 58 38 137 3.4 81 78 83 75 59 49 134 4.2 86 28 144 35.4 22.3 107 60 56.3 140 3.5 63 106 99 33 25 54 61 138 2.9 92 79 140 29 25 115 62 443 140 3.8 96 39 110 32 22 80 63 34.3 138 3 68 230 119 37 19.5 250 64 130 3.2 192 84 157 36 19 112 65 34.9 140 3.3 101 25 61 38 21 75 66 66 127 3.8 57 28 63 41 16 184 67 48 133 4 37 28 118 7.47 27 134 68 69 56.2 137 3.2 112 106 189 137 70 42.4 134 4.1 58 145 94 74 71 136 4 141 98 188 36 23 70 72 134 4.2 57 27 91 56 73 59 129 3.7 136 104 78 32 27.5 305 74 137 3 39 25 108 33.3 26.3 65

62
Number RIE APTT RIE Na RIE K RIE Bil RIE GGT RIE ALP RIE H+ RIE Bic RIE Cr 75 74.5 139 3.2 90 50 94 38 76 47 130 3.8 108 39 144 21 208 77 60 132 3.9 103 141 65 78 50 131 4.1 94 174 47 36 24 219 79 46 131 3.2 149 79 146 35 27 99 80 41 137 3.7 56 54 103 118 81 43.5 141 3.8 117 24 26 41 . 132 82 57 137 3.1 129 224 195 32.3 24.7 95 83 37 134 3.4 58 35 240 97 84 42 141 3.4 39 32 92 83 85 46 135 3.9 76 47 67 45 86 44 133 3.5 99 290 132 78 87 72 128 3 90 296 132 30 27.8 124 88 45.3 143 4.1 83 38 145 31.2 64 89 140 2.9 67 27 81 32 145 90 60 138 3.3 145 190 77 41.2 23.7 224 91 72.4 137 3.8 58 104 99 39.2 17.9 119 92 53 127 4.2 107 222 101 75 93 170 125 5.4 79 169 87 51 13 301 94 41.5 136 3.5 68 59 146 34 29 85 95 43.1 132 3.1 117 199 124 140 96 120 132 3 31 47 92 57.1 136 97 79 124 2.9 137 400 139 43 354 98 60 146 3.5 93 93 65 27.5 30.3 147 99 46 129 5.9 87 90 120 158 100 57.6 131 4 118 110 100 34.3 22.4 85 101 114 134 4.4 42 56 107 49.2 15.7 340 102 55.1 136 3.7 182 58 90 121 103 132 4.7 144 85 137 33.4 23.8 123 104 129 5.3 66 14 79 53 15.8 281 105 43 138 4 94 20 96 67 106 76 139 4.9 85 159 129 135.1 5.8 507 107 135 4.8 94 293 150 141.7 6.9 298 108 55 135 3.5 7 297 190 81 109 139 3.8 114 59 130 71 110 62 130 4.1 134 123 88 51 547 111 63 145 3.7 19 25 34 38.6 18.1 90 112 70 124 4.1 49 308 162 70.3 239 113 64 135 5.2 147 168 103 41.3 7.97 114 114 115 41 133 4.2 176 119 94 38.9 18.9 256 116 50 138 4 177 237 107 37 23 70 117 48 138 4.1 98 39 127 97 118 58 127 3.2 109 165 194 38.3 23 255 119 34 139 3.7 88 63 128 38.1 20 132 120 45.1 137 3.2 32 39 137 38 24.5 102 121 125 2.8 30 38 71 37 23 148 122 59 132 4.8 168 391 302 398 123 622 131 3.9 77 48 52 20 67 124 84 130 5.1 94 115 162 129.7 6.9 598 125 58 132 5.5 106 72 107 19.8 415 126 142 3.9 28 33 137 36 26.7 74 127 62 139 5.2 88 19 48.3 16.3 172

63
Number RIE APTT RIE Na RIE K RIE Bil RIE GGT RIE ALP RIE H+ RIE Bic RIE Cr 128 43 132 4.7 152 443 201 38.9 22.4 123 129 54 132 5.4 83 98 140 37.9 21.3 126 130 48 134 4.9 80 73 314 36 20 114 131 66 139 5.9 76 58 49 95 8 296 132 136 4.2 94 228 167 148 133 31.3 134 3.6 91 96 70 103 134 56 137 2.7 84 166 121 36.9 25.2 274 135 74 138 5.7 81 232 229 85.6 416 136 40.3 134 4.8 81 213 110 41 17 159 137 46.8 135 3.3 122 186 112 39 11 112 138 59 12126 86 37 22 139 51 134 4 170 114 121 38.5 21.7 125 140 2.5 135 4.2 113 107 172 36.7 23.5 84 141 46.7 134 6.4 78 54 109 250 142 54 134 3.1 68 14 74 61 143 105 135 4.2 122 64 76 481 144 28.6 134 3.9 36 48 55 48 19.5 41 145 38.9 140 3.3 47 49 128 37 21 62 146 51 135 4.7 58 119 152 56.1 15.8 260 147 102 140 4.2 104 229 147 45.3 19.5 419 148 46 137 3 38 32 129 81 149 66.4 129 2.5 124 172 141 31 32 162 150 63.8 135 4.1 124 55 135 37.7 19.2 108 151 57.1 136 4.9 63 43 141 40 23.5 183 152 134 3.7 79 61 74 33 20 95 153 55 134 3.3 90 96 80 28.1 24.4 96 154 58 131 4 69 390 92 85.9 10.7 147 155 43 134 3.2 18 41 56 7.27 5 147 15 55 133 4.4 76 342 109 60.3 14.4 453 157 158 38.5 133 3 92 212 82 33 23 82 159 54.8 138 3.5 100 26 96 37 26 52 160 46 139 4.2 78 37 74 36 23.8 336 161 57.3 134 3.4 116 101 170 32 31.4 292 162 49 132 3.1 46 383 124 56 163 69 139 3.9 42 67 74 34.5 26.1 108 164 54 124 3.5 111 240 132 35.8 24.3 381 165 51 133 3.5 93 39 112 29 21 107 166 45.6 132 3.1 65 96 112 167 43 141 4.3 105 111 107 106 168 4.8 139 4.5 79 56 113 41.6 17.1 156 169 43.7 142 3.6 105 39 125 32 25.5 68 170 89 129 4.7 105 72 162 44 17 291 171 42 142 3.6 55 47 74 34.7 26.5 97 172 47 138 3.3 99 75 93 34 28.6 102 173 210 141 3 200 62 143 35 27.1 88 174 40 142 3.7 98 202 106 32 29 140 175 108 137 3.9 55 28 86 62 18 341 176 63 134 4.1 92 81 131 35.7 20.1 139 177 131 3.7 47 86 140 32 18 56 178 50 139 3.9 132 196 110 88 179 55.6 141 3.4 117 38 134 37 20.5 125 180 140 4.1 92 54 126 70

64
Number RIE APTT RIE Na RIE K RIE Bil RIE GGT RIE ALP RIE H+ RIE Bic RIE Cr 181 65.2 138 4.5 60 35 127 87.3 16.5 263 182 43 137 5.1 55 159 169 417 183 140 3.7 100 36 108 47 184 90 133 5 62 32 107 77.1 13.3 237 185 50 140 4.1 87 97 128 33.7 30.3 341 186 63 141 3 82 35 109 25 21 134 187 210 138 3.3 98 51 69 52.4 17.9 250 188 59 138 3.5 145 252 138 . 147 189 47.8 137 3.3 84 79 145 57 190 41 135 3.5 51 270 110 73 191 51.8 139 3.9 44 11 41 32.1 32.1 263 192 74 119 4.8 73 493 234 69.8 12.3 346 193 63 138 6.2 61 27 138 41 119 194 200 128 5.1 69 210 159 58.8 16 203 195 50.7 136 4 55 104 120 45 22 109 196 130 3.6 104 87 204 197 141 3.8 61 42 96 31 13 46 198 49 132 4.4 53 60 149 47 199 145 136 3.2 37 15.8 234 200 154 142 6.1 99 182 60 54.7 10 421 201 112 130 4 60 239 195 139.3 4.5 216 202 38 136 4.1 77 79 89 17 203 86.8 128 4 75 48 184 38.5 25 285 204 52.8 131 4.5 83 325 125 45 19 367 205 56 129 4.1 103 499 237 117 206 45.5 142 3.9 48 40 73 34 76 207 41.3 134 5.5 85 103 153 36 27 255 208 58 140 4.4 71 37 211 31.4 18.4 54 209 68 138 4.9 96 82 66 26.1 208 210 240 129 3.7 73 31 114 49.3 21.3 291 211 47.4 139 3.7 84 30 104 81 212 34 139 4.7 140 169 210 35.6 24.1 212 213 39 135 3.6 25 77 125 34 23 171 214 60 137 5.2 35 36 48 38 22.7 141 215 66.4 134 3 96 35 89 38 186 216 130 4 162 39 118 164 217 57 134 3.3 63 194 117 285 218 55.6 137 4.8 39 13 83 54.5 15.9 136 219 41 133 3.7 41 35 61 33.1 21.6 82 220 73 134 5.1 44 17 92 66.1 12.9 166 221 135 2.9 107 119 94 30 30.5 95 222 138.3 137 5.1 101 35 33 7.37 16.1 216 223 50 136 3.4 59 95 161 33 3.2 208 224 133 4.5 183 195 119 225 98 129 4.4 84 128 171 32.8 23.2 211 226 200 135 7.3 79 46 79 106 4.7 212 227 41.5 127 3.2 119 21 118 92 228 74 134 5.9 85 20 194 67.4 10 177 229 43 141 4.3 105 111 107 106 230 78 137 3.9 45 85 32 323 231 47 138 5.4 79 53 178 40.8 12.7 376 232 47 129 2.8 117 348 126 327 233 62 136 5.5 166 27 48 33.2 12.7 99

65
RIE APTT RIE Na RIE K RIE Bil RIE GGT RIE ALP RIE H+ RIE Bic RIE Cr 234 50.6 138 3.5 190 50 143 35 95 235 47 135 4.1 198 172 4.1 20 140 236 27.7 19 84 237 66 129 4.6 161 49 126 63.2 11.3 136 238 53 134 4.5 149 216 129 34 26 271 239 40.3 141 3.3 22 97 112 73 240 37.3 126 3.8 371 378 336 47 18 1359 241 61 136 4.1 110 139 98 42.8 16.1 173 242 41 137 4.2 115 102 146 47.4 15.2 119 243 92.6 128 3.3 42 42 77 40 21 340 244 70.3 138 4 106 107 271 33 28 82 245 56 136 3.7 160 74 94 36 25 89 246 69 129 4 129 231 112 42.8 110 247 72.8 146 3.8 36 8 63 66 12.3 243 248 71 133 5.2 36 76 165 313 249 60 136 4 75 74 81 36.8 21.7 133 250 74 133 4.3 106 27 94 44.6 16.4 250 251 40.9 138 3 35 73 159 66 252 51.7 141 4.2 69 45 65 44 15 106 253 49 140 5.1 102 304 119 249 254 45 133 3.9 121 135 98 35 25 122 255 63 125 5.8 63 194 115 94 188 256 42 136 3.8 47 83 123 34 20 169 257 44.8 129 3.8 84 108 165 341 258 81 131 3.2 81 69 96 38 20 346 259 63.8 132 3.7 26 24 65 38 17 126 260 36 137 4.5 121 57 103 24 26.3 67 261 132 3.8 66 109 98 227 262 59.8 136 3.8 87 29 127 32 27 91 263 132 3 44 143 122 33 27 226 264 81 132 4.2 68 32 113 82 265 53.1 139 3.3 118 33 187 26.2 30.8 141 266 66 135 3.6 136 183 91 30.7 28.4 95 267 109 123 6.2 77 37 80 7.38 16 253 268 67 135 3.4 85 96 54 . . 281 269 132 3.7 104 47 14 76 270 44.2 140 3.2 24 69 61 35 24.5 66 271 75.1 132 4.2 198 104 62 33.4 14.4 347 272 90 132 3.6 151 149 172 35.3 361 273 40 134 4.3 61 28 91 39.8 19.6 90 274 52.7 120 3 53 18.5 548 275 56.3 139 3.3 82 149 296 32.9 22.6 78 276 240 131 4.1 34 61 60 96.2 12.6 214 277 81.2 140 5.1 119 46 113 298 278 74 137 4.4 47 68 106 . . 331 279 50.6 138 3.3 171 84 167 66 280 110 136 4.9 53 33 68 43.7 19.5 329 281 46 136 4.1 32 38 364 41 282 33.3 137 3.7 60 29 91 67 283 200 134 3.1 139 107 96 24 34 644 284 49.8 132 3 61 27 69 86 285 55.4 134 4.1 52 247 75 81 11 245 286 200 138 3.8 89 92 106 34.4 15.4 105

66
Number RIE APTT RIE Na RIE K RIE Bil RIE GGT RIE ALP RIE H+ RIE Bic RIE Cr 287 69 128 4.1 169 300 118 35 19.7 229 288 56 136 3.2 229 723 79 109 289 86.8 137 3.7 78 35 121 45.3 14.2 73 290 54 137 4.4 116 132 118 35.5 24.3 90 291 31 136 3.4 116 192 90 95 292 75 137 3.5 139 109 99 40 15 180 293 46.1 140 3 58 57 93 36 355 294 94 138 4.6 38 140 85 119 7.5 259 295 50.7 130 6.3 57 84 50 44.1 20.1 174 296 73 143 5.3 13 33 55 50.4 17.9 366 297 75.1 126 3.9 94 232 11 216 298 83.9 138 4.1 51 46 21 166 299 55.6 134 3.9 121 48 202 35 28 73 300 41.8 134 3 19 36 114 118 301 30 137 4 16 20 56 . . 65 302 44 134 3.5 31 31 30 35 22.5 44 303 37 137 3.4 43 59 148 37 24 241 304 56 135 4.1 113 205 163 155 305 306 132 3.6 70 83 114 34.9 23.3 191 307 62 137 3.7 37 47 101 75 308 137 5.3 116 51 131 96 309 55 137 3.8 81 100 111 194 310 50 134 3.4 64 140 90 30.3 34.4 128 311 60 137 3.9 42 65 99 36 21 69 312 136 2.7 76 167 73 172 313 44.5 139 4 34 19 74 7.54 22 57 314 36 134 2.2 43 65 130 50 315 39 137 2.5 80 49 113 33 18.5 86 316 62 130 4.8 100 150 147 35 25 232 317 42 135 4.3 157 109 202 128 318 47 139 3.6 56 28 108 48 319 62 126 6.3 86 33 84 42 17 123 320 40.5 157 4.5 161 262 142 32 28 594 321 45 141 5.1 57 67 199 65.7 18 231 322 60.8 121 4.5 69 308 132 57 20 498 323 44 135 2.7 341 544 87 78 324 54 137 3.6 128 322 132 201 325 70.5 135 3.7 117 38 149 34 24 84 326 127 3 161 228 174 36 136 327 328 42.1 137 3.7 106 65 97 34 21 92 329 54 125 170 209 188 34 22 182 330 331 44.8 137 3.2 100 109 107 74 332 57.2 137 4.2 113 191 122 90 333 68 138 4.2 74 145 124 40.4 21.2 390 334 48.8 135 3.9 86 34 554 39 22.5 56 335 9 127 4.1 72 31 134 32 26.9 103 336 136 3.9 24 40 90 71 337 50 132 3.9 118 138 95 35 26 420 338 135 3.1 72 23 89 37 23 89

67
Number RIE APTT RIE Na RIE K RIE Bil RIE GGT RIE ALP RIE H+ RIE Bic RIE Cr 339 38 141 3.8 29 52 140 87 340 67 139 4.2 96 79 124 62.4 14.2 173 341 44.3 138 3.4 61 31 140 59 342 56 142 4.1 98 73 206 96 343 53 134 3.4 79 200 114 278 344 85 129 4 132 166 235 42.2 19.5 73 345 74 138 4 58 69 149 56 3.6 109 346 67 137 4.7 108 218 115 51.6 9.8 223 347 63 132 3 135 30 155 35 25 113 348 62.6 126 5.9 79 73 94 29.6 25 281 349 162 4.1 46 30 73 151 4.2 246 350 48 127 4.4 118 259 120 48 23.5 359 351 2.2 4 11746 171 43 236 352 63.8 141 3.3 65 46 93 38 18 70 353 57 86 3.1 101 130 97 34.3 27 86 354 92 138 4.4 120 6.4 355 44.8 129 3.5 95 265 96 38 21 176 356 49 133 4.1 179 89 159 91 357 61 126 4.3 100 207 82 215 358 49 144 3 392 104 162 137 359 72 139 4.1 92 47 181 31.6 19.5 98 360 45 135 3 70 26 81 104 361 57 139 3.8 86 99 99 106 362 47 136 3.3 56 65 110 36 19 74 363 120 138 4 167 96 97 439 364 40 130 3.1 53 26 114 36 365 91 124 4.7 208 232 73 58.2 5.8 535 366 43.2 133 4.5 100 317 131 248 367 133 3.4 69 87 114 81 368 155 127 6.1 65 146 259 70 8.4 138 369 39 137 4.8 131 501 125 48.8 17.7 315 370 71.4 132 3.7 42 125 307 7.4 22 165 371 46 128 5.4 43 176 221 419 372 51 132 3.6 107 203 107 39 18.7 157 373 37.8 127 3.2 58 139 108 555 374 46.3 134 3.6 35 16 107 149 375 52.2 130 3.3 88 27 164 24 25 92 376 30 138 3.5 31 25 204 39.6 21.3 87 377 45 137 4.4 78 96 83 454 378 33 133 4.3 63 23 119 39 18.5 58 379 55.6 136 3.1 131 718 106 40 24.5 207 380 50 125 4.5 137 306 149 57.3 16.8 452 381 30.6 137 3.2 44 207 91 65 382 64.6 125 5 125 212 97 41 20 303 383 49.3 138 3.7 137 303 102 197 384 115 136 6.4 59 126 159 105.2 8.2 219 385 115 139 5.2 55 21 123 45.7 13 284 386 44 130 4.4 130 95 186 196 387 43 138 4 93 106 171 79 388 103 127 87 46 67 67.5 13.9 260 389 45.9 136 4.3 74 97 102 129 390 57 133 3.7 91 95 162 107 391 42 136 4.8 111 60 111 39.5 24.3 394
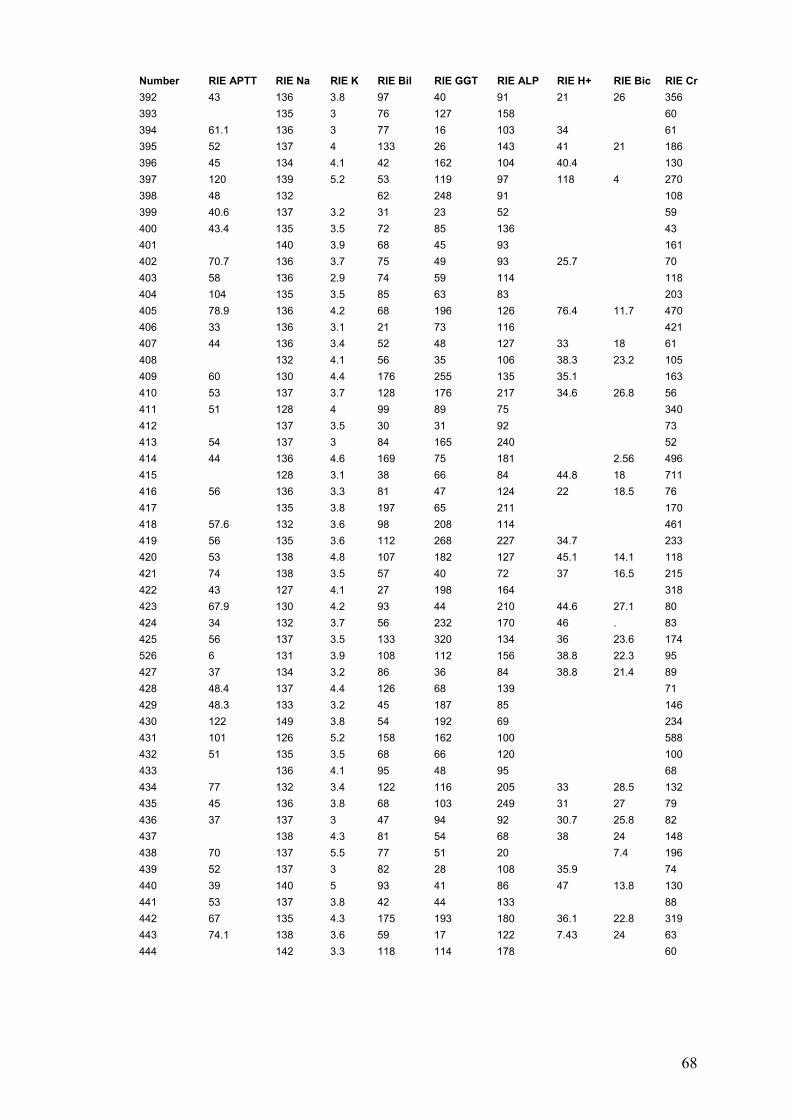
68
Number RIE APTT RIE Na RIE K RIE Bil RIE GGT RIE ALP RIE H+ RIE Bic RIE Cr 392 43 136 3.8 97 40 91 21 26 356 393 135 3 76 127 158 60 394 61.1 136 3 77 16 103 34 61 395 52 137 4 133 26 143 41 21 186 396 45 134 4.1 42 162 104 40.4 130 397 120 139 5.2 53 119 97 118 4 270 398 48 132 62 248 91 108 399 40.6 137 3.2 31 23 52 59 400 43.4 135 3.5 72 85 136 43 401 140 3.9 68 45 93 161 402 70.7 136 3.7 75 49 93 25.7 70 403 58 136 2.9 74 59 114 118 404 104 135 3.5 85 63 83 203 405 78.9 136 4.2 68 196 126 76.4 11.7 470 406 33 136 3.1 21 73 116 421 407 44 136 3.4 52 48 127 33 18 61 408 132 4.1 56 35 106 38.3 23.2 105 409 60 130 4.4 176 255 135 35.1 163 410 53 137 3.7 128 176 217 34.6 26.8 56 411 51 128 4 99 89 75 340 412 137 3.5 30 31 92 73 413 54 137 3 84 165 240 52 414 44 136 4.6 169 75 181 2.56 496 415 128 3.1 38 66 84 44.8 18 711 416 56 136 3.3 81 47 124 22 18.5 76 417 135 3.8 197 65 211 170 418 57.6 132 3.6 98 208 114 461 419 56 135 3.6 112 268 227 34.7 233 420 53 138 4.8 107 182 127 45.1 14.1 118 421 74 138 3.5 57 40 72 37 16.5 215 422 43 127 4.1 27 198 164 318 423 67.9 130 4.2 93 44 210 44.6 27.1 80 424 34 132 3.7 56 232 170 46 . 83 425 56 137 3.5 133 320 134 36 23.6 174 526 6 131 3.9 108 112 156 38.8 22.3 95 427 37 134 3.2 86 36 84 38.8 21.4 89 428 48.4 137 4.4 126 68 139 71 429 48.3 133 3.2 45 187 85 146 430 122 149 3.8 54 192 69 234 431 101 126 5.2 158 162 100 588 432 51 135 3.5 68 66 120 100 433 136 4.1 95 48 95 68 434 77 132 3.4 122 116 205 33 28.5 132 435 45 136 3.8 68 103 249 31 27 79 436 37 137 3 47 94 92 30.7 25.8 82 437 138 4.3 81 54 68 38 24 148 438 70 137 5.5 77 51 20 7.4 196 439 52 137 3 82 28 108 35.9 74 440 39 140 5 93 41 86 47 13.8 130 441 53 137 3.8 42 44 133 88 442 67 135 4.3 175 193 180 36.1 22.8 319 443 74.1 138 3.6 59 17 122 7.43 24 63 444 142 3.3 118 114 178 60

69
Number RIE APTT RIE Na RIE K RIE Bil RIE GGT RIE ALP RIE H+ RIE Bic RIE Cr 445 135 3.6 77 43 122 32 34 67 446 94 141 5.1 28 45 91 112.4 155 447 105 126 5.1 53 39 62 104.4 10.7 389 448 200 142 4.4 33 20 89 122 222 449 48.9 127 3.1 20 60 53 74 450 53 133 3.4 190 571 274 111 451 47 134 2.9 102 778 117 63 452 42.5 131 3.2 124 582 239 327 453 142 3.9 31 22 60 87 454 45 135 3.7 97 160 113 208 455 53 135 5 85 34 115 34.9 251 456 256 128 5.3 59 50 111 66.1 16.7 352 457 140 4.4 69 51 225 116 458 42 1 85 154 227 85 459 44.3 137 2.6 48 29 114 69 460 82 131 4.2 73 90 99 265 461 43 138 2.8 55 29 81 35 25 85 462 46.4 147 3.9 126 10 38 93 463 56 140 4.1 125 215 144 33 23 100 464 38.2 132 5.1 245 200 323 47.2 21.3 1212 465 34 137 3.2 45 37 167 116 466 138 3.3 70 163 138 67 467 76 134 5.5 98 92 69 70.3 13.7 163 468 81.3 134 3.4 161 163 130 80 469 138 4.1 53 32 96 74 470 49.1 141 4.5 92 83 139 76 5 179 471 240 128 4.7 66 88 26 51.6 14.9 164 472 57.6 134 3 109 125 132 35 18.5 75 473 50.3 136 5.4 110 56 48 49 6 109 474 30.4 140 2.9 28 41 93 181 475 62 124 4.1 108 404 176 49.8 15.4 78 476 56 128 2.8 112 34 102 25 240 477 76.6 129 2.8 101 86 109 25.1 26.4 432 478 141 3.5 39 32 115 34 29 68 479 61 132 4.2 105 82 118 33.3 23.3 82 480 110 135 5.6 68 41 100 139 197 481 40 139 3 261 346 102 30 27 31 482 139 4.2 117 25 92 31 25 83 483 108 143 3.8 24 24 72 77.6 16 256 484 53 135 3.4 94 72 156 75 485 110 129 4.6 81 29 90 41 22.1 489 486 44.5 139 3.6 29 61 131 72 487 51.4 134 3.9 96 145 114 98 488 137 3.4 71 146 91 31.7 25.6 113 489 46 134 3.7 113 167 94 85 490 62 135 3.3 93 185 121 32 26 180 491 61.2 136 3.9 105 99 162 155 492 42 140 3.6 52 29 129 78 493 61.9 135 4 145 125 189 32 27 73 494 43.2 131 3.4 83 49 167 89 495 73.7 131 6.3 72 22 89 243 496 46.5 132 2.9 230 297 162 28.8 25.6 175 497 64 131 3.9 195 194 98 295
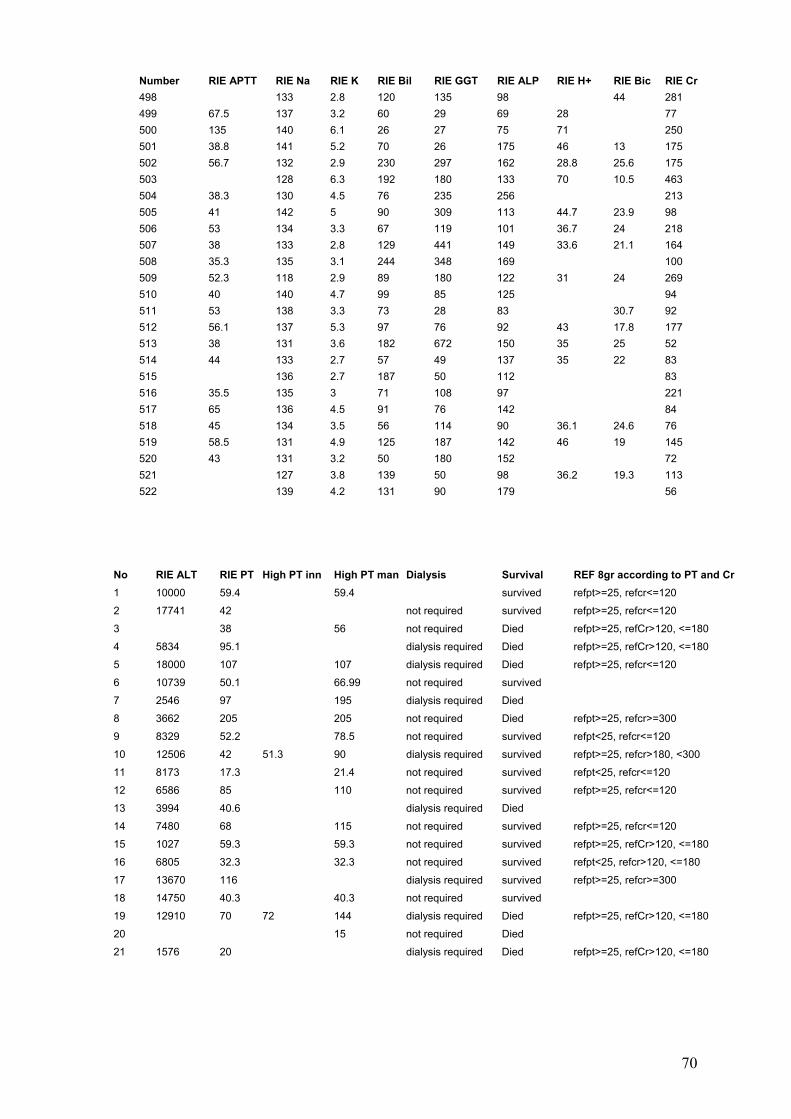
70
Number RIE APTT RIE Na RIE K RIE Bil RIE GGT RIE ALP RIE H+ RIE Bic RIE Cr 498 133 2.8 120 135 98 44 281 499 67.5 137 3.2 60 29 69 28 77 500 135 140 6.1 26 27 75 71 250 501 38.8 141 5.2 70 26 175 46 13 175 502 56.7 132 2.9 230 297 162 28.8 25.6 175 503 128 6.3 192 180 133 70 10.5 463 504 38.3 130 4.5 76 235 256 213 505 41 142 5 90 309 113 44.7 23.9 98 506 53 134 3.3 67 119 101 36.7 24 218 507 38 133 2.8 129 441 149 33.6 21.1 164 508 35.3 135 3.1 244 348 169 100 509 52.3 118 2.9 89 180 122 31 24 269 510 40 140 4.7 99 85 125 94 511 53 138 3.3 73 28 83 30.7 92 512 56.1 137 5.3 97 76 92 43 17.8 177 513 38 131 3.6 182 672 150 35 25 52 514 44 133 2.7 57 49 137 35 22 83 515 136 2.7 187 50 112 83 516 35.5 135 3 71 108 97 221 517 65 136 4.5 91 76 142 84 518 45 134 3.5 56 114 90 36.1 24.6 76 519 58.5 131 4.9 125 187 142 46 19 145 520 43 131 3.2 50 180 152 72 521 127 3.8 139 50 98 36.2 19.3 113 522 139 4.2 131 90 179 56
No RIE ALT RIE PT High PT inn High PT man Dialysis Survival REF 8gr according to PT and Cr1 10000 59.4 59.4 survived refpt>=25, refcr<=120
2 17741 42 not required survived refpt>=25, refcr<=120
3 38 56 not required Died refpt>=25, refCr>120, <=180
4 5834 95.1 dialysis required Died refpt>=25, refCr>120, <=180
5 18000 107 107 dialysis required Died refpt>=25, refcr<=120
6 10739 50.1 66.99 not required survived
7 2546 97 195 dialysis required Died
8 3662 205 205 not required Died refpt>=25, refcr>=300
9 8329 52.2 78.5 not required survived refpt<25, refcr<=120
10 12506 42 51.3 90 dialysis required survived refpt>=25, refcr>180, <300
11 8173 17.3 21.4 not required survived refpt<25, refcr<=120
12 6586 85 110 not required survived refpt>=25, refcr<=120
13 3994 40.6 dialysis required Died
14 7480 68 115 not required survived refpt>=25, refcr<=120
15 1027 59.3 59.3 not required survived refpt>=25, refCr>120, <=180
16 6805 32.3 32.3 not required survived refpt<25, refcr>120, <=180
17 13670 116 dialysis required survived refpt>=25, refcr>=300
18 14750 40.3 40.3 not required survived
19 12910 70 72 144 dialysis required Died refpt>=25, refCr>120, <=180
20 15 not required Died
21 1576 20 dialysis required Died refpt>=25, refCr>120, <=180

71
Number RIE ALT RIE PT High PT inn High PT man Dialysis Survival REF 8gr according to PT and Cr22 3644 162 dialysis required survived refpt>=25, refCr>120, <=180
23 10595 120 200 dialysis required Died refpt>=25, refcr>180, <300
24 9009 40 not required survived refpt>=25, refcr<=120
25 11210 29.4 dialysis required Died refpt>=25, refcr>=300
26 8434 72.1 93 not required survived refpt<25, refcr<=120
27 7810 25.5 25.5 not required survived refpt>=25, refcr<=120
28 748 26 37 not required survived refpt>=25, refcr<=120
29 9776 49 49 not required survived refpt<25, refcr<=120
30 10988 24.3 50 not required survived refpt>=25, refcr>=300
31 17000 63.3 63.3 not required survived refpt>=25, refCr>120, <=180
32 2381 29 31 not required survived refpt>=25, refcr<=120
33 5492 75.6 99.5 not required survived refpt<25, refcr<=120
34 3774 30.9 35 dialysis required Died .
35 16400 65 65 dialysis required Died refpt<25, refcr<=120
36 14276 57.3 57.3 not required survived refpt>=25, refcr<=120
37 17920 31 87 130 not required survived refpt>=25, refcr<=120
38 12906 44 80 not required survived refpt<25, refcr<=120
39 5077 44 dialysis required survived refpt>=25, refcr>=300
40 4320 32 52 63 dialysis required survived refpt>=25, refcr<=120
41 6063 185 not required survived refpt>=25, refcr>180, <300
42 2473 31.5 dialysis required Died refpt>=25, refcr>=300
43 9713 26.5 59 not required survived refpt<25, refcr<=120
44 13405 80.8 125 not required survived
45 10994 20.2 82 not required survived refpt>=25, refcr<=120
46 8300 27 27 49 not required survived
47 8790 23 not required survived refpt<25, refcr<=120
48 3270 50 dialysis required Died refpt>=25, refcr>=300
49 3114 59 130 dialysis required Died refpt<25, refcr<=120
50 2735 18 dialysis required Died refpt>=25, refcr>=300
51 8628 205 dialysis required Died refpt<25, refcr<=120
52 3916 61 61 130 dialysis required Died refpt>=25, refcr>180, <300
53 9090 89.4 89.4 not required survived refpt>=25, refcr<=120
54 2969 74 83 not required survived refpt>=25, refcr<=120
55 9797 27.8 67 not required survived refpt<25, refcr<=120
56 8964 31 50 not required survived refpt>=25, refCr>120, <=180
57 9590 89 89 not required survived refpt>=25, refCr>120, <=180
58 5902 16 32 22 not required survived refpt>=25, refcr<=120
59 9276 46 not required survived refpt>=25, refCr>120, <=180
60 6500 40.4 43.4 not required survived refpt<25, refcr<=120
61 9756 49.4 not required survived refpt<25, refcr>120, <=180
62 3740 36 56 not required survived refpt<25, refcr<=120
63 10000 31.9 not required survived refpt>=25, refcr<=120
64 11320 62 not required Died refpt<25, refcr>120, <=180
65 1133 91 not required survived refpt<25, refcr<=120
66 6192 120 120 dialysis required Died refpt>=25, refcr<=120
67 8649 33 35 not required survived
68 dialysis required Died
69 6467 55.5 58.9 not required survived refpt>=25, refcr<=120

72
Number RIE ALT RIE PT High PT inn High PT man Dialysis Survival REF 8gr according to PT and Cr70 9016 36.1 36.1 not required survived .
71 10000 85.8 89.3 not required survived refpt<25, refcr<=120
72 2147 39.3 53.5 not required survived refpt>=25, refcr<=120
73 6949 33 76.6 dialysis required Died refpt>=25, refcr>180, <300
74 9494 24 45 71 not required survived refpt>=25, refcr<=120
75 9945 50.2 50.2 not required survived refpt<25, refcr<=120
76 9586 67 67 not required survived .
77 10560 76 76 130 not required survived refpt<25, refcr<=120
78 1091 58 79 dialysis required survived refpt>=25, refCr>120, <=180
79 13560 15 30 not required survived refpt>=25, refcr<=120
80 17255 54 54 not required survived refpt>=25, refcr<=120
81 12240 98.5 142 dialysis required Died refpt>=25, refCr>120, <=180
82 11140 49 49 87 not required survived refpt>=25, refcr<=120
83 9596 45 45 70 not required survived refpt>=25, refcr<=120
84 8292 36 36 68 not required survived refpt>=25, refcr<=120
85 4080 45 90 not required survived refpt>=25, refcr<=120
86 1182 37 85 71 not required survived refpt>=25, refcr<=120
87 8499 36 39 61 not required survived refpt<25, refcr<=120
88 18289 65.8 65.8 not required survived refpt>=25, refcr<=120
89 9440 52 90 not required survived refpt<25, refcr<=120
90 1767 39 58 not required survived refpt>=25, refcr<=120
91 10490 66.3 86.3 not required survived refpt<25, refcr<=120
92 5739 51 69 90 not required survived refpt>=25, refcr<=120
93 1079 157 157 dialysis required Died refpt>=25, refcr<=120
94 6749 37.3 37.3 not required survived refpt<25, refcr<=120
95 9872 41.4 41.4 not required survived refpt<25, refcr<=120
96 844 72 130 not required Died refpt<25, refcr>120, <=180
97 3673 41 47 dialysis required Died refpt<25, refcr<=120
98 4453 18 not required survived refpt<25, refcr<=120
99 12010 33 43.9 not required survived refpt>=25, refCr>120, <=180
100 6981 59.4 116 dialysis required survived refpt>=25, refcr<=120
101 5303 84.9 dialysis required Died refpt>=25, refcr>180, <300
102 16852 66.6 66.6 not required survived refpt<25, refcr>120, <=180
103 5136 46 120 not required survived refpt<25, refcr<=120
104 10000 120 120 dialysis required Died refpt>=25, refcr>180, <300
105 10969 33 not required survived
106 5091 56 56 153 dialysis required Died refpt>=25, refcr>=300
107 7742 37 37 not required Died
108 2325 35 48 not required survived
109 10000 61.3 61.3 not required survived refpt>=25, refcr<=120
110 6481 40 40 64 dialysis required survived
111 311 25 55 120 not required survived
112 2190 31 66 not required Died refpt>=25, refcr>180, <300
113 11520 71 71 71 dialysis required Died refpt>=25, refcr<=120
114 not required Died refpt>=25, refcr>=300
115 2918 31 87 80 dialysis required Died refpt>=25, refcr<=120
116 8782 29 29.8 not required survived refpt<25, refcr<=120
117 25298 69 71.5 dialysis required survived refpt<25, refcr<=120

73
Number RIE ALT RIE PT High PT inn High PT man Dialysis Survival REF 8gr according to PT and Cr118 5520 54 67 dialysis required Died refpt>=25, refcr>180, <300
119 760 33 103 180 dialysis required Died refpt<25, refcr>120, <=180
120 16000 54.6 107 not required survived refpt<25, refcr<=120
121 8359 48 48 not required survived refpt>=25, refcr<=120
122 2236 44 not required survived refpt>=25, refcr>=300
123 4447 49 dialysis required Died refpt>=25, refcr<=120
124 4757 118 118 not required Died refpt>=25, refcr>=300
125 14806 34 53 dialysis required survived refpt>=25, refcr>=300
126 9400 60.6 60.6 not required survived refpt>=25, refcr<=120
127 9891 77 200 dialysis required Died refpt>=25, refcr>180, <300
128 11751 33 33 42.5 not required survived refpt>=25, refCr>120, <=180
129 4795 41 41 dialysis required survived refpt>=25, refCr>120, <=180
130 12800 73.8 100 not required survived refpt<25, refcr<=120
131 6825 26 45 dialysis required Died
132 12370 42.8 64 not required survived refpt>=25, refcr<=120
133 9180 49 72 not required survived refpt>=25, refcr<=120
134 10130 31 89.7 dialysis required Died refpt>=25, refcr<=120
135 7059 38 103 dialysis required Died refpt>=25, refcr<=120
136 3700 48.8 48.8 not required survived refpt>=25, refcr<=120
137 301 27.8 not required Died refpt>=25, refcr<=120
138 24 24 40 not required survived refpt<25, refcr<=120
139 4166 30 31 71 not required survived
140 13680 43 53 102 not required survived refpt>=25, refcr<=120
141 10000 53 69 not required survived refpt>=25, refcr>180, <300
142 1260 42 60 130 not required survived refpt<25, refcr<=120
143 4177 37.6 72.9 not required Died refpt>=25, refcr>180, <300
144 889 27 112 not required survived refpt<25, refcr<=120
145 7933 35.7 74 not required survived refpt<25, refcr<=120
146 6623 30 dialysis required Died refpt>=25, refcr>180, <300
147 2938 63 117 dialysis required Died refpt>=25, refcr>180, <300
148 8809 28 not required survived refpt>=25, refcr<=120
149 4373 60.8 86.8 not required survived refpt>=25, refCr>120, <=180
150 10000 97.3 120 not required survived refpt>=25, refcr<=120
151 10000 59 77 not required survived refpt>=25, refCr>120, <=180
152 8770 55.3 55.3 not required survived refpt>=25, refcr<=120
153 6754 42 52 not required survived refpt<25, refcr<=120
154 1318 29 48 53 not required Died refpt>=25, refcr<=120
155 5856 49 dialysis required Died refpt>=25, refCr>120, <=180
15 1362 42 77 not required Died refpt>=25, refcr>=300
157 74 not required survived refpt<25, refcr<=120
158 10130 32.3 32.3 not required survived refpt<25, refcr<=120
159 4563 24 not required survived refpt>=25, refcr<=120
160 8604 57.8 not required Died refpt>=25, refcr<=120
161 10000 71.8 72 dialysis required survived refpt>=25, refcr<=120
162 2966 39 39 not required survived refpt>=25, refcr<=120
163 1628 29 57 not required survived
164 2605 41 not required survived refpt>=25, refcr>=300
165 10000 99 not required survived refpt>=25, refCr>120, <=180

74
Number RIE ALT RIE PT High PT inn High PT man Dialysis Survival REF 8gr according to PT and Cr166 10000 38.4 43.9 not required survived refpt>=25, refcr>180, <300
167 7154 48 63 not required survived
168 8060 51 72 99 not required survived refpt>=25, refcr<=120
169 7430 32.8 176 not required survived refpt>=25, refcr<=120
170 5315 93 not required survived refpt>=25, refcr>180, <300
171 10140 35 35 66 not required survived refpt<25, refcr<=120
172 8780 51 75.1 not required survived refpt>=25, refcr<=120
173 4458 120 180 not required survived refpt<25, refcr<=120
174 5447 39 67 not required survived refpt>=25, refcr<=120
175 8330 240 240 dialysis required survived refpt>=25, refcr<=120
176 12280 54 dialysis required Died refpt<25, refcr>180, <300
177 10330 33.9 99 not required survived refpt>=25, refcr<=120
178 7397 43 not required survived refpt<25, refcr<=120
179 9056 85.4 89.6 not required survived refpt>=25, refcr<=120
180 13631 57 74 not required survived refpt<25, refcr<=120
181 3510 38.6 38.6 not required Died refpt>=25, refcr>180, <300
182 7906 22.2 22.2 not required survived refpt>=25, refcr>=300
183 3050 48 62.8 not required survived refpt>=25, refcr<=120
184 5551 228 300 300 dialysis required Died refpt>=25, refcr>180, <300
185 7051 23 64.7 74 dialysis required survived refpt>=25, refcr>=300
186 10294 51 91 not required survived refpt>=25, refCr>120, <=180
187 1668 180 180 dialysis required survived refpt<25, refcr<=120
188 2898 79 dialysis required Died refpt>=25, refCr>120, <=180
189 17190 42.3 42.3 not required survived refpt>=25, refcr<=120
190 6543 20 20 not required survived refpt>=25, refcr<=120
191 15400 64.4 71 not required survived refpt>=25, refcr>180, <300
192 1549 51 200 dialysis required Died refpt>=25, refcr>=300
193 10675 104 dialysis required survived refpt>=25, refcr<=120
194 4300 120 180 not required Died refpt>=25, refcr<=120
195 3583 68.7 141 not required survived refpt<25, refcr>120, <=180
196 42 not required survived refpt<25, refcr<=120
197 3820 53 80 not required survived refpt<25, refcr<=120
198 7282 16 36 not required survived refpt>=25, refcr<=120
199 150 150 not required Died refpt>=25, refcr<=120
200 8085 150 150 dialysis required Died refpt<25, refcr<=120
201 1497 106 106 dialysis required Died
202 7301 31 not required survived refpt>=25, refcr<=120
203 5630 50.6 dialysis required Died refpt>=25, refcr<=120
204 3452 48.1 48.1 not required survived refpt>=25, refcr>=300
205 3260 25 25 37 not required survived
206 4319 70.5 70.5 not required survived refpt>=25, refcr<=120
207 8022 34.3 50 not required survived refpt>=25, refcr>180, <300
208 7661 107 dialysis required survived refpt<25, refcr<=120
209 5491 31 1 dialysis required survived refpt>=25, refcr<=120
210 12136 240 240 dialysis required survived refpt<25, refcr<=120
211 5005 73.8 123 not required survived refpt<25, refcr<=120
212 6558 25 not required survived refpt<25, refcr<=120
213 25 dialysis required survived refpt<25, refcr<=120

75
Number RIE ALT RIE PT High PT inn High PT man Dialysis Survival REF 8gr according to PT and Cr214 1563 31 91 77 not required survived refpt<25, refcr>120, <=180
215 17500 99 dialysis required survived refpt>=25, refCr>120, <=180
216 10000 54 60 dialysis required survived refpt>=25, refcr<=120
217 10890 78 81 not required survived refpt<25, refcr<=120
218 2149 97.1 135 not required Died refpt>=25, refCr>120, <=180
219 17400 25 29 55 not required survived refpt>=25, refcr<=120
220 6998 91 130 210 dialysis required Died refpt>=25, refCr>120, <=180
221 6547 52.3 52.3 not required survived refpt>=25, refCr>120, <=180
222 4444 74.4 dialysis required Died refpt>=25, refcr>180, <300
223 6383 51 51 107 dialysis required Died refpt>=25, refCr>120, <=180
224 10455 33 33 54 not required survived
225 11820 105 200 dialysis required Died refpt>=25, refCr>120, <=180
226 8500 200 200 dialysis required Died refpt>=25, refcr>180, <300
227 4583 41.5 55.4 not required survived refpt<25, refcr<=120
228 4989 67 dialysis required survived refpt>=25, refCr>120, <=180
229 7154 48 63 not required survived refpt<25, refcr<=120
230 2219 41 dialysis required Died refpt>=25, refcr>=300
231 5795 100 100 dialysis required Died refpt>=25, refcr<=120
232 3456 40 50.5 57 not required survived refpt>=25, refcr<=120
233 10000 40 120 dialysis required survived refpt>=25, refCr>120, <=180
234 29790 68.4 68.4 not required survived refpt<25, refcr<=120
235 5867 56 dialysis required survived refpt>=25, refCr>120, <=180
236 52 52 not required survived refpt>=25, refcr<=120
237 15200 120 120 not required survived
238 10965 36 36 not required survived refpt>=25, refCr>120, <=180
239 15645 32.8 33 not required survived refpt<25, refcr<=120
240 1038 14.7 14.7 dialysis required survived refpt>=25, refcr>=300
241 2956 56 116 140 not required Died refpt>=25, refCr>120, <=180
242 4434 32 64 92 not required survived
243 4360 64.1 99 not required survived refpt>=25, refcr>=300
244 6159 64.6 64.6 not required survived refpt>=25, refcr<=120
245 3931 46 81 not required survived refpt<25, refcr<=120
246 10200 66 109 201 dialysis required survived refpt>=25, refcr<=120
247 4992 118 118 dialysis required Died refpt>=25, refcr>180, <300
248 7811 40 50 70 dialysis required survived refpt>=25, refCr>120, <=180
249 14840 50 dialysis required survived
250 12680 115 115 dialysis required survived refpt>=25, refcr>180, <300
251 12910 34.6 34.6 not required survived refpt>=25, refcr<=120
252 5823 45.1 48.4 not required survived refpt>=25, refCr>120, <=180
253 42 42 not required Died refpt>=25, refcr>180, <300
254 9788 49.3 76 not required survived refpt<25, refcr<=120
255 4237 42 dialysis required Died refpt>=25, refCr>120, <=180
256 15085 38 83 not required survived refpt<25, refcr<=120
257 6340 34.6 34.6 dialysis required survived refpt>=25, refcr<=120
258 6620 78 78 dialysis required survived refpt<25, refCr>=300
259 8508 59.3 59.3 not required survived refpt<25, refcr<=120
260 6680 65 66 not required survived refpt>=25, refcr<=120
261 12592 26 26 0 not required survived refpt<25, refcr<=120

76
Number RIE ALT RIE PT High PT inn High PT man Dialysis Survival REF 8gr according to PT and Cr262 8229 88.2 88.2 not required survived refpt>=25, refcr<=120
263 8800 24.9 43 not required survived refpt<25, refcr>180, <300
264 10000 65.3 92 not required survived refpt>=25, refcr<=120
265 10000 62.8 149 dialysis required Died refpt>=25, refCr>120, <=180
266 8846 28 33 74 not required survived refpt<25, refcr<=120
267 9784 62 dialysis required survived
268 1170 24 dialysis required Died refpt>=25, refcr>180, <300
269 5463 200 200 not required Died refpt>=25, refcr<=120
270 9510 23.8 23.8 not required survived refpt>=25, refcr<=120
271 838 57 63 dialysis required Died refpt>=25, refcr>180, <300
272 3079 51 65 0 dialysis required Died refpt>=25, refcr<=120
273 11600 38 dialysis required Died refpt>=25, refcr<=120
274 418 40.5 not required Died refpt>=25, refcr>=300
275 6807 62.5 124 not required survived refpt>=25, refcr<=120
276 5439 135 dialysis required Died
277 9788 125 dialysis required survived refpt<25, refcr<=120
278 7009 30 dialysis required Died refpt>=25, refcr>180, <300
279 2501 53.4 118 not required survived
280 10000 71 dialysis required survived refpt>=25, refcr>180, <300
281 910 34 34 not required survived refpt<25, refcr<=120
282 14990 35.8 75 not required survived refpt>=25, refcr<=120
283 5968 54.9 77 dialysis required survived refpt>=25, refcr>=300
284 13775 48.3 48.3 dialysis required survived refpt>=25, refcr<=120
285 3039 34 dialysis required Died refpt>=25, refcr>180, <300
286 16200 42 51.3 dialysis required survived refpt<25, refcr<=120
287 2105 59 84 not required Died refpt>=25, refcr>180, <300
288 2123 27 27 28 not required survived refpt<25, refcr<=120
289 6783 143 159 not required survived refpt>=25, refcr<=120
290 11153 50 67 110 not required survived refpt>=25, refcr<=120
291 1226 21 34 33 not required survived
292 12170 58 58 110 dialysis required survived refpt<25, refcr<=120
293 9472 30.8 45 not required survived refpt>=25, refcr>=300
294 4625 74 74 not required Died refpt>=25, refCr>120, <=180
295 10000 54.4 dialysis required Died refpt>=25, refcr<=120
296 7941 26 27 63 dialysis required survived refpt<25, refcr>120, <=180
297 10000 53.3 74.1 not required survived refpt>=25, refcr>180, <300
298 5944 97.5 100 dialysis required Died refpt>=25, refCr>120, <=180
299 13360 76.9 76.9 not required survived refpt>=25, refcr<=120
300 9174 44.3 44.3 not required survived refpt<25, refcr<=120
301 not required survived refpt>=25, refcr<=120
302 10540 69 149 not required Died refpt>=25, refcr<=120
303 11731 31 78 not required survived refpt<25, refcr>120, <=180
304 8770 41 66 not required survived refpt>=25, refCr>120, <=180
305 83 dialysis required Died refpt<25, refcr<=120
306 9736 52 95 dialysis required Died
307 7545 63 63 not required survived refpt>=25, refcr<=120
308 10000 62.1 62.1 not required survived refpt>=25, refcr<=120
309 11280 51 66 not required survived refpt<25, refcr<=120

77
Number RIE ALT RIE PT High PT inn High PT man Dialysis Survival REF 8gr according to PT and Cr310 7184 27 29 37 not required survived refpt<25, refcr>120, <=180
311 11390 47 72.4 not required survived refpt>=25, refcr<=120
312 56 56 dialysis required survived refpt>=25, refcr<=120
313 13564 22.2 22.2 not required survived refpt>=25, refcr<=120
314 25 25 not required survived refpt<25, refcr<=120
315 5012 30 30 not required survived refpt>=25, refcr<=120
316 15920 54 114 dialysis required survived refpt>=25, refCr>120, <=180
317 11700 49 54 not required survived refpt<25, refcr<=120
318 3306 36 48.6 not required survived refpt<25, refcr<=120
319 12395 110 111 dialysis required Died refpt>=25, refcr<=120
320 3034 41.5 dialysis required Died refpt>=25, refcr>=300
321 3230 63 81 not required Died refpt>=25, refCr>120, <=180
322 1446 40.1 dialysis required Died refpt>=25, refcr>=300
323 6094 40 48 not required survived refpt>=25, refcr<=120
324 6816 40 114 dialysis required survived
325 5279 63 not required Died refpt>=25, refCr>120, <=180
326 4503 32.7 32.7 not required survived
327 . Died
328 761 78 78 not required survived refpt>=25, refCr>120, <=180
329 4964 58 dialysis required Died
330 not required Died
331 11935 58.3 58.3 not required survived refpt<25, refcr<=120
332 7161 62.7 62.7 not required survived refpt<25, refcr<=120
333 11500 35 73 dialysis required survived refpt>=25, refCr>120, <=180
334 9407 67 100 not required survived
335 7968 63 86.9 111 not required survived refpt>=25, refcr<=120
336 8575 18 18 not required survived refpt<25, refcr<=120
337 10910 37 59 not required survived refpt<25, refcr>180, <300
338 6000 64.2 64.2 not required survived refpt>=25, refcr<=120
339 7582 23 23 not required survived refpt<25, refcr<=120
340 4725 102 102 dialysis required Died refpt>=25, refCr>120, <=180
341 8231 36.3 50 not required survived refpt<25, refcr<=120
342 15665 80 108 dialysis required Died
343 5837 23 dialysis required survived refpt>=25, refCr>120, <=180
344 1689 64 78.8 not required survived refpt>=25, refcr<=120
345 5092 57 115 dialysis required Died
346 8765 74 117 162 dialysis required Died refpt>=25, refCr>120, <=180
347 13000 120 dialysis required survived refpt<25, refcr<=120
348 10000 88.9 92 dialysis required Died refpt>=25, refcr>180, <300
349 4051 44 44 dialysis required Died refpt>=25, refcr>180, <300
350 1827 18 60.7 28 dialysis required Died refpt>=25, refcr>=300
351 61 130 not required survived refpt>=25, refcr<=120
352 6500 43 dialysis required survived refpt<25, refcr<=120
353 10640 35 35 63 not required survived refpt>=25, refcr<=120
354 59 59 dialysis required Died refpt>=25, refCr>120, <=180
355 13080 92.8 dialysis required survived refpt>=25, refCr>120, <=180
356 8611 51 not required survived refpt<25, refcr<=120
357 2948 40 66 121 dialysis required Died refpt>=25, refcr>180, <300

78
Number RIE ALT RIE PT High PT inn High PT man Dialysis Survival REF 8gr according to PT and Cr358 1635 37 37 not required survived
359 5449 81 81 not required Died refpt>=25, refcr<=120
360 5292 25 25 5.7 not required survived refpt<25, refcr<=120
361 7010 40 81 not required survived
362 1062 66 80.3 not required survived refpt>=25, refcr<=120
363 4770 48.7 80.1 dialysis required Died refpt>=25, refcr>=300
364 3619 27 49 not required survived refpt<25, refcr<=120
365 13380 111 111 dialysis required Died refpt>=25, refcr>=300
366 4420 38.1 38.1 not required survived refpt>=25, refcr>180, <300
367 8745 26 27 not required survived refpt<25, refcr<=120
368 3686 112 135 dialysis required Died refpt>=25, refCr>120, <=180
369 10450 28 34 48 not required survived refpt>=25, refcr>180, <300
370 992 29.8 dialysis required Died refpt>=25, refCr>120, <=180
371 2036 39 200 95 dialysis required Died refpt>=25, refcr>=300
372 5980 46.3 not required survived refpt>=25, refcr>180, <300
373 5573 15.9 19.8 not required survived refpt<25, refcr<=120
374 7208 34.6 34.6 not required survived refpt>=25, refcr<=120
375 12675 83.4 89.8 not required survived refpt<25, refcr<=120
376 625 18 29 36 not required survived
377 23 23 not required survived refpt>=25, refcr>=300
378 492 21 33 not required survived refpt<25, refcr<=120
379 5380 57 57.3 not required survived refpt<25, refcr<=120
380 9197 39 dialysis required Died refpt>=25, refcr>=300
381 13000 33 53 not required survived refpt<25, refcr<=120
382 1940 55.3 56.2 dialysis required survived refpt<25, refcr>180, <300
383 10000 43.8 43.8 not required survived refpt>=25, refcr<=120
384 8286 48 200 200 dialysis required Died refpt>=25, refCr>120, <=180
385 6163 120 120 dialysis required Died refpt<25, refcr>120, <=180
386 12488 40 40 73 not required survived refpt>=25, refCr>120, <=180
387 7562 67 not required survived refpt>=25, refcr<=120
388 7927 35 78 dialysis required Died refpt>=25, refcr<=120
389 10785 60 60 not required survived refpt>=25, refcr<=120
390 12684 48 48.4 83 not required survived refpt>=25, refcr<=120
391 9891 36 dialysis required survived
392 10580 69.6 69.6 dialysis required survived refpt>=25, refCr>120, <=180
393 13520 69 69 126 not required survived
394 9000 63.7 63.7 not required survived refpt<25, refcr<=120
395 11305 64 64 not required survived refpt>=25, refcr<=120
396 5925 29 62 not required survived refpt<25, refcr<=120
397 12465 101 dialysis required Died
398 8298 36 91.2 72 not required survived refpt>=25, refcr<=120
399 183 34.5 36.9 not required survived refpt>=25, refcr<=120
400 4768 50 50 not required survived
401 1146 33 41.7 not required survived refpt>=25, refCr>120, <=180
402 8770 35 66 not required survived refpt>=25, refcr<=120
403 7796 37 57 67 . survived refpt<25, refcr<=120
404 3135 52 57 155 dialysis required Died refpt>=25, refcr>180, <300
405 4538 110 dialysis required survived refpt>=25, refcr>=300

79
Number RIE ALT RIE PT High PT inn High PT man Dialysis Survival REF 8gr according to PT and Cr406 6730 15 15 not required survived refpt>=25, refcr<=120
407 10000 42 66 not required survived refpt>=25, refcr<=120
408 15600 55 130 104 dialysis required Died refpt>=25, refcr<=120
409 2870 106 108 not required Died refpt>=25, refcr<=120
410 13175 47 47 not required survived refpt<25, refcr<=120
411 11783 20 dialysis required Died
412 10000 27.9 56 not required survived refpt>=25, refcr<=120
413 10000 56.6 65 not required survived refpt<25, refcr<=120
414 10000 25 25 not required survived refpt>=25, refcr>=300
415 122 28.8 not required Died
416 11520 41 61 not required survived refpt<25, refcr<=120
417 14358 74.5 87 not required survived refpt>=25, refcr>180, <300
418 13715 46.8 46.8 dialysis required survived refpt>=25, refcr<=120
419 3080 90.4 90.4 dialysis required survived refpt>=25, refcr<=120
420 5444 28 dialysis required Died refpt>=25, refCr>120, <=180
421 8454 54 dialysis required survived refpt<25, refcr>180, <300
422 4372 13 23.5 not required survived refpt<25, refcr>180, <300
423 5383 53 93 dialysis required survived refpt>=25, refcr<=120
424 1526 9 12 16 not required survived refpt<25, refcr<=120
425 1600 42 79 dialysis required survived refpt<25, refcr<=120
526 11480 49 200 117 dialysis required survived refpt>=25, refcr<=120
427 2143 31 120 dialysis required survived refpt>=25, refcr<=120
428 8177 35.8 35.8 not required survived refpt>=25, refcr<=120
429 10000 51 56.4 dialysis required survived refpt>=25, refcr<=120
430 2949 55 dialysis required Died
431 8675 73.2 73.2 dialysis required survived refpt>=25, refcr>180, <300
432 14305 39 108 not required survived refpt>=25, refcr<=120
433 14380 57.4 57.4 not required survived refpt>=25, refcr<=120
434 13800 41 55 54 not required survived refpt>=25, refCr>120, <=180
435 9617 33 33 not required survived refpt<25, refcr<=120
436 11076 20 46.8 38 not required survived refpt>=25, refcr<=120
437 2418 19 30.9 not required survived refpt>=25, refcr<=120
438 6154 48 48 dialysis required Died refpt>=25, refcr>180, <300
439 9840 42 81 not required survived
440 2542 39 82 dialysis required Died refpt>=25, refcr<=120
441 7508 46 92 not required survived refpt>=25, refcr<=120
442 9625 57 61 dialysis required Died refpt>=25, refcr<=120
443 8299 74.2 78.8 not required survived refpt<25, refcr<=120
444 13350 67.2 not required survived refpt<25, refcr<=120
445 14365 42 42 not required survived
446 694 85 98 130 dialysis required survived refpt>=25, refCr>120, <=180
447 4287 34 dialysis required Died refpt>=25, refcr>=300
448 1463 200 200 not required Died refpt<25, refcr>120, <=180
449 4113 35.3 50 not required survived refpt>=25, refcr<=120
450 5422 45 45 65 not required survived refpt<25, refcr<=120
451 1000 19 23 27 not required survived refpt<25, refcr<=120
452 5357 47.5 54.5 not required survived
453 11490 34.3 46 not required survived refpt<25, refcr<=120

80
Number RIE ALT RIE PT High PT inn High PT man Dialysis Survival REF 8gr according to PT and Cr454 10000 19 19 not required survived
455 14440 56 dialysis required survived refpt>=25, refcr>180, <300
456 6641 200 dialysis required Died refpt>=25, refcr>=300
457 12700 53.3 53.3 not required survived refpt>=25, refcr<=120
458 7611 17 17 26 not required survived refpt<25, refcr<=120
459 10000 55 55 not required survived refpt>=25, refcr<=120
460 3156 73 dialysis required Died
461 10000 34 65 not required survived refpt>=25, refcr<=120
462 45 18.5 19.5 not required survived refpt<25, refcr>120, <=180
463 7565 33 113 not required Died refpt>=25, refcr<=120
464 831 14.3 dialysis required Died refpt<25, refCr>=300
465 5335 22 40 34 not required survived refpt>=25, refcr<=120
466 10000 43 43 not required survived refpt>=25, refcr<=120
467 5991 86 130 not required Died refpt>=25, refCr>120, <=180
468 7430 73.3 73.3 not required survived refpt>=25, refcr<=120
469 10000 65 not required survived refpt<25, refcr>120, <=180
470 3014 55.2 200 dialysis required Died refpt>=25, refCr>120, <=180
471 6236 240 240 dialysis required Died refpt<25, refcr<=120
472 2569 58.8 106 dialysis required survived refpt<25, refcr<=120
473 8112 42.6 200 dialysis required Died refpt>=25, refCr>120, <=180
474 10000 21 not required survived refpt>=25, refCr>120, <=180
475 1975 53 58 94 not required survived refpt>=25, refcr<=120
476 10930 73 130 dialysis required survived refpt<25, refcr<=120
477 4677 56.7 56 not required survived refpt>=25, refcr>=300
478 2370 45.8 62 not required survived refpt<25, refcr<=120
479 8224 67 95 not required survived refpt<25, refcr<=120
480 7050 167 dialysis required Died refpt>=25, refcr<=120
481 3443 22 not required survived refpt>=25, refCr>120, <=180
482 7172 70 71 not required survived refpt>=25, refcr<=120
483 3756 85.9 dialysis required Died
484 18700 32 54 85 not required survived refpt<25, refcr<=120
485 10000 69.6 dialysis required Died refpt>=25, refCr>120, <=180
486 9756 26.2 26.2 not required survived refpt<25, refcr>120, <=180
487 15200 53.5 53.5 not required survived refpt<25, refcr<=120
488 4619 43 63 not required Died refpt>=25, refcr<=120
489 8646 31 47 not required survived refpt<25, refcr<=120
490 6254 28 41 . survived refpt>=25, refcr<=120
491 15460 100 100 not required survived refpt<25, refcr<=120
492 1909 25 50 not required survived refpt<25, refcr<=120
493 18600 95.3 101 not required survived refpt>=25, refcr<=120
494 10000 57.8 64 not required survived refpt>=25, refCr>120, <=180
495 7138 155 190 dialysis required Died refpt>=25, refCr>120, <=180
496 1333 19.8 72 not required survived refpt>=25, refcr>180, <300
497 27 54 not required survived refpt>=25, refcr>180, <300
498 1675 64 74 not required survived refpt>=25, refcr>180, <300
499 4288 60.4 60.4 not required survived refpt>=25, refcr<=120
500 4327 99 99 130 dialysis required Died refpt>=25, refcr>180, <300
501 7674 73.8 159 dialysis required Died refpt>=25, refCr>120, <=180

81
Number RIE ALT RIE PT High PT inn High PT man Dialysis Survival REF 8gr according to PT and Cr502 1333 52.3 not required survived refpt<25, refcr>180, <300
503 18269 130 dialysis required Died
504 3777 16 38.3 not required survived refpt>=25, refcr<=120
505 2979 17 28 not required survived refpt>=25, refcr<=120
506 13493 23 32.8 44 not required survived refpt<25, refcr<=120
507 2737 38 45 not required survived refpt>=25, refcr>=300
508 5122 21.4 48.8 not required survived refpt>=25, refCr>120, <=180
509 9011 51 51 not required survived refpt>=25, refcr>180, <300
510 4190 38 114 not required Died refpt>=25, refcr<=120
511 10000 29 29 not required survived
512 10000 65.4 79 dialysis required survived refpt>=25, refCr>120, <=180
513 7222 35 68 35 not required survived refpt>=25, refcr<=120
514 10000 29 38.6 not required survived refpt<25, refcr<=120
515 5399 19.9 73 not required survived refpt>=25, refcr<=120
516 9960 34.8 59.1 dialysis required survived refpt>=25, refcr<=120
517 6529 65 134 not required survived refpt<25, refcr>120, <=180
518 4768 30 31 not required survived refpt<25, refcr<=120
519 4532 78.6 79 not required survived refpt>=25, refcr<=120
520 8718 35 45 50 not required survived refpt>=25, refcr<=120
521 4949 35 50 100 not required survived
522 10280 75 not required survived refpt<25, refcr<=120
Number gr according to RIE Cr Delay to Referring hospital Delay to ref hospital groups
Delay to RIE Delay to RIE group
1 Cr<=120 72 >48h 84 >48h 2 Cr<=120 Stag OD stag OD 3 Cr<=120 24 >12<=24 4 Cr<=120 24 >12<=24 31 >24, <=48h 5 Cr>120, <=180 36 >24<=48 6 Cr<=120 11 <=12 64 >48h 7 Cr>120, <=180 Stag OD stag OD 8 Cr>=300 96 >48h 101 >48h 9 Cr<=120 10 <=12 36 >24, <=48h 10 cr>180, <300 52 >48h 59 >48h 11 cr>180, <300 6 <=12 88 >48h 12 cr>180, <300 9 <=12 57 >48h 13 Cr<=120 7 <=12 241 >48h 14 Cr>=300 10 <=12 48 >24, <=48h 15 Cr<=120 20 >12<=24 16 Cr>120, <=180 24 >12<=24 70 >48h 17 Cr>=300 52 >48h 52 >48h 18 cr>180, <300 Stag OD stag OD 19 cr>180, <300 Stag OD stag OD 20 21 cr>180, <300 Stag OD stag OD 22 cr>180, <300 36 >24<=48 40 >24, <=48h 23 Cr>=300 33 >24<=48 48 >24, <=48h 24 Cr<=120 Stag OD stag OD
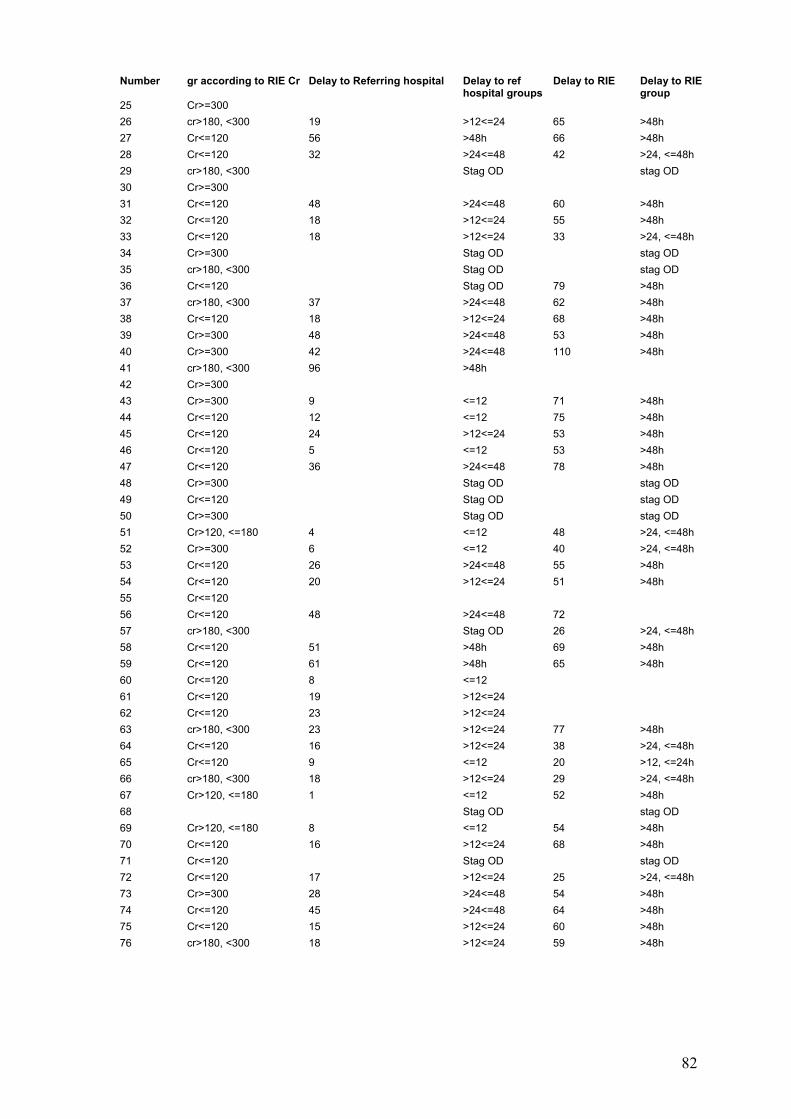
82
Number gr according to RIE Cr Delay to Referring hospital Delay to ref hospital groups
Delay to RIE Delay to RIE group
25 Cr>=300 26 cr>180, <300 19 >12<=24 65 >48h 27 Cr<=120 56 >48h 66 >48h 28 Cr<=120 32 >24<=48 42 >24, <=48h 29 cr>180, <300 Stag OD stag OD 30 Cr>=300 31 Cr<=120 48 >24<=48 60 >48h 32 Cr<=120 18 >12<=24 55 >48h 33 Cr<=120 18 >12<=24 33 >24, <=48h 34 Cr>=300 Stag OD stag OD 35 cr>180, <300 Stag OD stag OD 36 Cr<=120 Stag OD 79 >48h 37 cr>180, <300 37 >24<=48 62 >48h 38 Cr<=120 18 >12<=24 68 >48h 39 Cr>=300 48 >24<=48 53 >48h 40 Cr>=300 42 >24<=48 110 >48h 41 cr>180, <300 96 >48h 42 Cr>=300 43 Cr>=300 9 <=12 71 >48h 44 Cr<=120 12 <=12 75 >48h 45 Cr<=120 24 >12<=24 53 >48h 46 Cr<=120 5 <=12 53 >48h 47 Cr<=120 36 >24<=48 78 >48h 48 Cr>=300 Stag OD stag OD 49 Cr<=120 Stag OD stag OD 50 Cr>=300 Stag OD stag OD 51 Cr>120, <=180 4 <=12 48 >24, <=48h 52 Cr>=300 6 <=12 40 >24, <=48h 53 Cr<=120 26 >24<=48 55 >48h 54 Cr<=120 20 >12<=24 51 >48h 55 Cr<=120 56 Cr<=120 48 >24<=48 72 57 cr>180, <300 Stag OD 26 >24, <=48h 58 Cr<=120 51 >48h 69 >48h 59 Cr<=120 61 >48h 65 >48h 60 Cr<=120 8 <=12 61 Cr<=120 19 >12<=24 62 Cr<=120 23 >12<=24 63 cr>180, <300 23 >12<=24 77 >48h 64 Cr<=120 16 >12<=24 38 >24, <=48h 65 Cr<=120 9 <=12 20 >12, <=24h 66 cr>180, <300 18 >12<=24 29 >24, <=48h 67 Cr>120, <=180 1 <=12 52 >48h 68 Stag OD stag OD 69 Cr>120, <=180 8 <=12 54 >48h 70 Cr<=120 16 >12<=24 68 >48h 71 Cr<=120 Stag OD stag OD 72 Cr<=120 17 >12<=24 25 >24, <=48h 73 Cr>=300 28 >24<=48 54 >48h 74 Cr<=120 45 >24<=48 64 >48h 75 Cr<=120 15 >12<=24 60 >48h 76 cr>180, <300 18 >12<=24 59 >48h
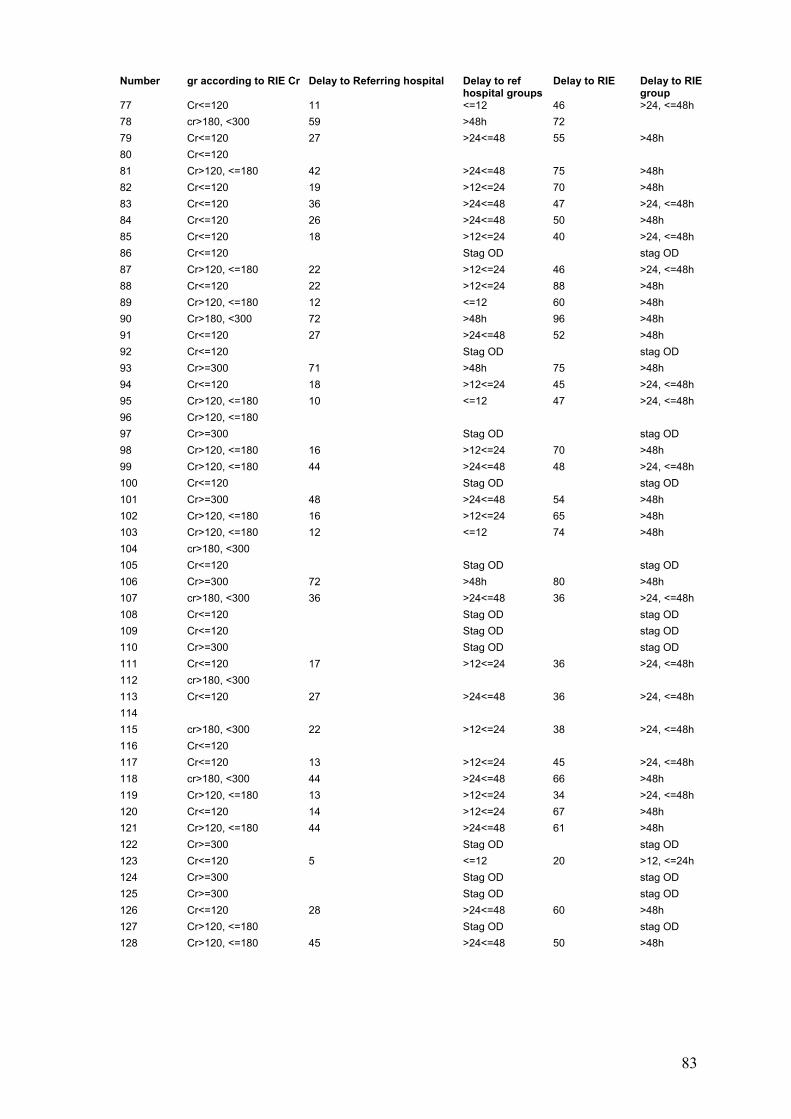
83
Number gr according to RIE Cr Delay to Referring hospital Delay to ref hospital groups
Delay to RIE Delay to RIE group
77 Cr<=120 11 <=12 46 >24, <=48h 78 cr>180, <300 59 >48h 72 79 Cr<=120 27 >24<=48 55 >48h 80 Cr<=120 81 Cr>120, <=180 42 >24<=48 75 >48h 82 Cr<=120 19 >12<=24 70 >48h 83 Cr<=120 36 >24<=48 47 >24, <=48h 84 Cr<=120 26 >24<=48 50 >48h 85 Cr<=120 18 >12<=24 40 >24, <=48h 86 Cr<=120 Stag OD stag OD 87 Cr>120, <=180 22 >12<=24 46 >24, <=48h 88 Cr<=120 22 >12<=24 88 >48h 89 Cr>120, <=180 12 <=12 60 >48h 90 Cr>180, <300 72 >48h 96 >48h 91 Cr<=120 27 >24<=48 52 >48h 92 Cr<=120 Stag OD stag OD 93 Cr>=300 71 >48h 75 >48h 94 Cr<=120 18 >12<=24 45 >24, <=48h 95 Cr>120, <=180 10 <=12 47 >24, <=48h 96 Cr>120, <=180 97 Cr>=300 Stag OD stag OD 98 Cr>120, <=180 16 >12<=24 70 >48h 99 Cr>120, <=180 44 >24<=48 48 >24, <=48h 100 Cr<=120 Stag OD stag OD 101 Cr>=300 48 >24<=48 54 >48h 102 Cr>120, <=180 16 >12<=24 65 >48h 103 Cr>120, <=180 12 <=12 74 >48h 104 cr>180, <300 105 Cr<=120 Stag OD stag OD 106 Cr>=300 72 >48h 80 >48h 107 cr>180, <300 36 >24<=48 36 >24, <=48h 108 Cr<=120 Stag OD stag OD 109 Cr<=120 Stag OD stag OD 110 Cr>=300 Stag OD stag OD 111 Cr<=120 17 >12<=24 36 >24, <=48h 112 cr>180, <300 113 Cr<=120 27 >24<=48 36 >24, <=48h 114 115 cr>180, <300 22 >12<=24 38 >24, <=48h 116 Cr<=120 117 Cr<=120 13 >12<=24 45 >24, <=48h 118 cr>180, <300 44 >24<=48 66 >48h 119 Cr>120, <=180 13 >12<=24 34 >24, <=48h 120 Cr<=120 14 >12<=24 67 >48h 121 Cr>120, <=180 44 >24<=48 61 >48h 122 Cr>=300 Stag OD stag OD 123 Cr<=120 5 <=12 20 >12, <=24h 124 Cr>=300 Stag OD stag OD 125 Cr>=300 Stag OD stag OD 126 Cr<=120 28 >24<=48 60 >48h 127 Cr>120, <=180 Stag OD stag OD 128 Cr>120, <=180 45 >24<=48 50 >48h

84
Number gr according to RIE Cr Delay to Referring hospital Delay to ref hospital groups
Delay to RIE Delay to RIE group
129 Cr>120, <=180 130 Cr<=120 131 cr>180, <300 Stag OD stag OD 132 Cr>120, <=180 20 >12<=24 75 >48h 133 Cr<=120 3 <=12 65 >48h 134 cr>180, <300 36 >24<=48 60 >48h 135 Cr>=300 Stag OD stag OD 136 Cr>120, <=180 Stag OD stag OD 137 Cr<=120 138 Cr<=120 3 <=12 64 >48h 139 Cr>120, <=180 Stag OD stag OD 140 Cr<=120 23 >12<=24 69 >48h 141 cr>180, <300 47 >24<=48 50 >48h 142 Cr<=120 Stag OD 36 >24, <=48h 143 Cr>=300 26 >24<=48 50 >48h 144 Cr<=120 24 >12<=24 30 >24, <=48h 145 Cr<=120 16 >12<=24 146 cr>180, <300 147 Cr>=300 Stag OD 72 stag OD 148 Cr<=120 41 >24<=48 64 >48h 149 Cr>120, <=180 Stag OD 48 >24, <=48h 150 Cr<=120 16 >12<=24 53 >48h 151 cr>180, <300 Stag OD stag OD 152 Cr<=120 12 <=12 21 >12, <=24h 153 Cr<=120 25 >24<=48 52 >48h 154 Cr>120, <=180 155 Cr>120, <=180 35 >24<=48 40 >24, <=48h 15 Cr>=300 157 1 <=12 158 Cr<=120 17 >12<=24 50 >48h 159 Cr<=120 7 <=12 40 >24, <=48h 160 Cr>=300 17 >12<=24 65 >48h 161 cr>180, <300 24 >12<=24 72 162 Cr<=120 47 >24<=48 56 >48h 163 Cr<=120 Stag OD stag OD 164 Cr>=300 Stag OD stag OD 165 Cr<=120 13 >12<=24 21 >12, <=24h 166 30 >24<=48 82 >48h 167 Cr<=120 168 Cr>120, <=180 16 >12<=24 48 >24, <=48h 169 Cr<=120 5 <=12 170 cr>180, <300 68 >48h 68 >48h 171 Cr<=120 Stag OD stag OD 172 Cr<=120 26 >24<=48 44 >24, <=48h 173 Cr<=120 Stag OD stag OD 174 Cr>120, <=180 Stag OD stag OD 175 Cr>=300 20 >12<=24 176 Cr>120, <=180 33 >24<=48 79 >48h 177 Cr<=120 17 >12<=24 178 Cr<=120 Stag OD stag OD 179 Cr>120, <=180 36 >24<=48 71 >48h 180 Cr<=120 19 >12<=24 45 >24, <=48h

85
Number gr according to RIE Cr Delay to Referring hospital Delay to ref hospital groups
Delay to RIE Delay to RIE group
181 cr>180, <300 182 Cr>=300 77 >48h 86 >48h 183 Cr<=120 28 >24<=48 41 >24, <=48h 184 cr>180, <300 185 Cr>=300 186 Cr>120, <=180 57 >48h 61 >48h 187 cr>180, <300 8 <=12 51 >48h 188 Cr>120, <=180 Stag OD stag OD 189 Cr<=120 60 >48h 70 >48h 190 Cr<=120 Stag OD stag OD 191 cr>180, <300 36 >24<=48 48 >24, <=48h 192 Cr>=300 Stag OD stag OD 193 Cr<=120 14 >12<=24 28 >24, <=48h 194 cr>180, <300 Stag OD stag OD 195 Cr<=120 45 >24<=48 50 >48h 196 20 >12<=24 64 >48h 197 Cr<=120 22 >12<=24 44 >24, <=48h 198 Cr<=120 Stag OD stag OD 199 cr>180, <300 18 >12<=24 39 >24, <=48h 200 Cr>=300 26 >24<=48 36 >24, <=48h 201 cr>180, <300 Stag OD stag OD 202 Cr<=120 31 >24<=48 37 >24, <=48h 203 cr>180, <300 36 >24<=48 46 >24, <=48h 204 Cr>=300 48 >24<=48 54 >48h 205 Cr<=120 70 >48h 206 Cr<=120 36 >24<=48 50 >48h 207 cr>180, <300 7 <=12 71 >48h 208 Cr<=120 14 >12<=24 48 >24, <=48h 209 cr>180, <300 33 >24<=48 51 >48h 210 cr>180, <300 8 <=12 48 >24, <=48h 211 Cr<=120 24 >12<=24 54 >48h 212 cr>180, <300 213 Cr>120, <=180 Stag OD stag OD 214 Cr>120, <=180 22 >12<=24 25 >24, <=48h 215 cr>180, <300 31 >24<=48 54 >48h 216 Cr>120, <=180 Stag OD stag OD 217 cr>180, <300 19 >12<=24 49 >48h 218 Cr>120, <=180 23 >12<=24 29 >24, <=48h 219 Cr<=120 57 >48h 63 >48h 220 Cr>120, <=180 45 >24<=48 52 >48h 221 Cr<=120 52 >48h 60 >48h 222 cr>180, <300 Stag OD stag OD 223 cr>180, <300 42 >24<=48 51 >48h 224 Stag OD stag OD 225 cr>180, <300 Stag OD stag OD 226 cr>180, <300 Stag OD stag OD 227 Cr<=120 228 Cr>120, <=180 41 >24<=48 58 >48h 229 Cr<=120 15 >12<=24 91 >48h 230 Cr>=300 231 Cr>=300 232 Cr>=300 Stag OD stag OD

86
Number gr according to RIE Cr Delay to Referring hospital Delay to ref hospital groups
Delay to RIE Delay to RIE group
233 Cr<=120 32 >24<=48 39 >24, <=48h 234 Cr<=120 8 <=12 80 >48h 235 Cr>120, <=180 28 >24<=48 12 <=12h 236 Cr<=120 47 >24<=48 55 >48h 237 Cr>120, <=180 Stag OD stag OD 238 cr>180, <300 239 Cr<=120 18 >12<=24 65 >48h 240 Cr>=300 48 >24<=48 120 >48h 241 Cr>120, <=180 25 >24<=48 31 >24, <=48h 242 Cr<=120 21 >12<=24 27 >24, <=48h 243 Cr>=300 50 >48h 66 >48h 244 Cr<=120 91 >48h 101 >48h 245 Cr<=120 Stag OD stag OD 246 Cr<=120 48 >24<=48 247 cr>180, <300 248 Cr>=300 Stag OD stag OD 249 Cr>120, <=180 250 cr>180, <300 36 >24<=48 51 >48h 251 Cr<=120 8 <=12 80 >48h 252 Cr<=120 41 >24<=48 46 >24, <=48h 253 cr>180, <300 254 Cr>120, <=180 12 <=12 96 >48h 255 cr>180, <300 256 Cr>120, <=180 20 >12<=24 257 Cr>=300 14 >12<=24 84 >48h 258 Cr>=300 50 >48h 98 >48h 259 Cr>120, <=180 260 Cr<=120 14 >12<=24 62 >48h 261 cr>180, <300 14 >12<=24 72 262 Cr<=120 263 cr>180, <300 264 Cr<=120 12 <=12 265 Cr>120, <=180 266 Cr<=120 26 >24<=48 42 >24, <=48h 267 cr>180, <300 Stag OD stag OD 268 cr>180, <300 269 Cr<=120 24 >12<=24 270 Cr<=120 Stag OD stag OD 271 Cr>=300 Stag OD stag OD 272 Cr>=300 120 >48h 126 >48h 273 Cr<=120 15 >12<=24 23 >12, <=24h 274 Cr>=300 Stag OD stag OD 275 Cr<=120 276 cr>180, <300 24 >12<=24 56 >48h 277 cr>180, <300 24 >12<=24 278 Cr>=300 Stag OD stag OD 279 Cr<=120 Stag OD stag OD 280 Cr>=300 Stag OD stag OD 281 Cr<=120 282 Cr<=120 6 <=12 72 283 Cr>=300 284 Cr<=120 5 <=12

87
Number gr according to RIE Cr Delay to Referring hospital Delay to ref hospital groups
Delay to RIE Delay to RIE group
285 cr>180, <300 Stag OD stag OD 286 Cr<=120 50 >48h 287 cr>180, <300 288 Cr<=120 289 Cr<=120 290 Cr<=120 46 >24<=48 58 >48h 291 Cr<=120 7 <=12 30 >24, <=48h 292 Cr>120, <=180 Stag OD stag OD 293 Cr>=300 Stag OD stag OD 294 cr>180, <300 Stag OD stag OD 295 Cr>120, <=180 296 Cr>=300 Stag OD 7 <=12h 297 cr>180, <300 60 >48h 67 >48h 298 Cr>120, <=180 18 >12<=24 24 >12, <=24h 299 Cr<=120 48 >24<=48 64 >48h 300 Cr<=120 14 >12<=24 42 >24, <=48h 301 Cr<=120 302 Cr<=120 24 >12<=24 35 >24, <=48h 303 cr>180, <300 304 Cr>120, <=180 45 >24, <=48h 305 306 cr>180, <300 88 >48h 92 >48h 307 Cr<=120 18 >12<=24 68 >48h 308 Cr<=120 56 >48h 72 309 cr>180, <300 48 >24<=48 86 >48h 310 Cr>120, <=180 Stag OD stag OD 311 Cr<=120 5 <=12 68 >48h 312 Cr>120, <=180 25 >24<=48 62 >48h 313 Cr<=120 40 >24<=48 47 >24, <=48h 314 Cr<=120 6 <=12 72 315 Cr<=120 40 >24<=48 93 >48h 316 cr>180, <300 26 >24<=48 36 >24, <=48h 317 Cr>120, <=180 3 <=12 83 >48h 318 Cr<=120 15 >12<=24 38 >24, <=48h 319 Cr>120, <=180 48 >24<=48 80 >48h 320 Cr>=300 321 cr>180, <300 48 >24<=48 58 >48h 322 Cr>=300 Stag OD 40 >24, <=48h 323 Cr<=120 Stag OD stag OD 324 cr>180, <300 325 Cr<=120 48 >24<=48 50 >48h 326 Cr>120, <=180 Stag OD stag OD 327 328 Cr<=120 48 >24<=48 60 >48h 329 cr>180, <300 330 331 Cr<=120 29 >24<=48 66 >48h 332 Cr<=120 12 <=12 333 Cr>=300 24 >12<=24 50 >48h 334 Cr<=120 40 >24<=48 48 >24, <=48h 335 Cr<=120 51 >48h 57 >48h 336 Cr<=120 10 <=12 63 >48h

88
Number gr according to RIE Cr Delay to Referring hospital Delay to ref hospital groups
Delay to RIE Delay to RIE group
337 Cr>=300 11 <=12 44 >24, <=48h 338 Cr<=120 19 >12<=24 54 >48h 339 Cr<=120 24 >12<=24 48 >24, <=48h 340 Cr>120, <=180 341 Cr<=120 20 >12<=24 52 >48h 342 Cr<=120 12 <=12 343 cr>180, <300 43 >24<=48 60 >48h 344 Cr<=120 Stag OD stag OD 345 Cr<=120 346 cr>180, <300 44 >24<=48 57 >48h 347 Cr<=120 16 >12<=24 72 348 cr>180, <300 52 >48h 59 >48h 349 cr>180, <300 350 Cr>=300 Stag OD stag OD 351 cr>180, <300 8 <=12 352 Cr<=120 16 >12<=24 48 >24, <=48h 353 Cr<=120 Stag OD stag OD 354 19 >12<=24 39 >24, <=48h 355 Cr>120, <=180 36 >24<=48 64 >48h 356 Cr<=120 18 >12<=24 50 >48h 357 cr>180, <300 56 >48h 67 >48h 358 Cr>120, <=180 Stag OD stag OD 359 Cr<=120 68 >48h 72 360 Cr<=120 22 >12<=24 42 >24, <=48h 361 Cr<=120 Stag OD stag OD 362 Cr<=120 55 >48h 62 >48h 363 Cr>=300 72 >48h 364 Cr<=120 19 >12<=24 37 >24, <=48h 365 Cr>=300 Stag OD stag OD 366 cr>180, <300 57 >48h 68 >48h 367 Cr<=120 11 <=12 38 >24, <=48h 368 Cr>120, <=180 Stag OD stag OD 369 Cr>=300 45 >24<=48 54 >48h 370 Cr>120, <=180 Stag OD stag OD 371 Cr>=300 Stag OD stag OD 372 Cr>120, <=180 Stag OD stag OD 373 Cr>=300 Stag OD stag OD 374 Cr>120, <=180 Stag OD stag OD 375 Cr<=120 7 <=12 60 >48h 376 Cr<=120 15 >12<=24 21 >12, <=24h 377 Cr>=300 Stag OD stag OD 378 Cr<=120 17 >12<=24 29 >24, <=48h 379 cr>180, <300 16 >12<=24 380 Cr>=300 Stag OD stag OD 381 Cr<=120 14 >12<=24 48 >24, <=48h 382 Cr>=300 Stag OD stag OD 383 cr>180, <300 48 >24<=48 384 cr>180, <300 Stag OD stag OD 385 cr>180, <300 16 >12<=24 69 >48h 386 cr>180, <300 66 >48h 74 >48h 387 Cr<=120 15 >12<=24 70 >48h 388 cr>180, <300 29 >24<=48 41 >24, <=48h

89
Number gr according to RIE Cr Delay to Referring hospital Delay to ref hospital groups
Delay to RIE Delay to RIE group
389 Cr>120, <=180 15 >12<=24 60 >48h 390 Cr<=120 391 Cr>=300 130 >48h 130 >48h 392 Cr>=300 55 >48h 72 393 Cr<=120 12 <=12 67 >48h 394 Cr<=120 1 <=12 78 >48h 395 cr>180, <300 11 <=12 24 >12, <=24h 396 Cr>120, <=180 22 >12<=24 52 >48h 397 cr>180, <300 54 >48h 60 >48h 398 Cr<=120 Stag OD stag OD 399 Cr<=120 Stag OD stag OD 400 Cr<=120 Stag OD stag OD 401 Cr>120, <=180 24 >12<=24 30 >24, <=48h 402 Cr<=120 403 Cr<=120 19 >12<=24 89 >48h 404 cr>180, <300 Stag OD stag OD 405 Cr>=300 406 Cr>=300 48 >24<=48 72 407 Cr<=120 18 >12<=24 408 Cr<=120 22 >12<=24 36 >24, <=48h 409 Cr>120, <=180 Stag OD stag OD 410 Cr<=120 23 >12<=24 69 >48h 411 Cr>=300 48 >24<=48 412 Cr<=120 27 >24<=48 74 >48h 413 Cr<=120 24 >12<=24 64 >48h 414 Cr>=300 Stag OD stag OD 415 Cr>=300 Stag OD stag OD 416 Cr<=120 22 >12<=24 72 417 Cr>120, <=180 72 >48h 86 >48h 418 Cr>=300 Stag OD stag OD 419 cr>180, <300 Stag OD 50 >48h 420 Cr<=120 27 >24<=48 42 >24, <=48h 421 cr>180, <300 28 >24<=48 39 >24, <=48h 422 Cr>=300 Stag OD stag OD 423 Cr<=120 30 >24<=48 46 >24, <=48h 424 Cr<=120 Stag OD stag OD 425 Cr>120, <=180 12 <=12 44 >24, <=48h 526 Cr<=120 Stag OD stag OD 427 Cr<=120 16 >12<=24 1 <=12h 428 Cr<=120 86 >48h 86 >48h 429 Cr>120, <=180 40 >24<=48 62 >48h 430 cr>180, <300 Stag OD stag OD 431 Cr>=300 432 Cr<=120 5 <=12 67 >48h 433 Cr<=120 24 >12<=24 434 Cr>120, <=180 435 Cr<=120 6 Stag OD 56 >48h 436 Cr<=120 46 >24<=48 48 >24, <=48h 437 Cr>120, <=180 Stag OD 55 >48h 438 cr>180, <300 30 >24<=48 36 >24, <=48h 439 Cr<=120 34 >24<=48 72 440 Cr>120, <=180 16 >12<=24 36 >24, <=48h

90
Number gr according to RIE Cr Delay to Referring hospital Delay to ref hospital groups
Delay to RIE Delay to RIE group
441 Cr<=120 20 >12<=24 51 >48h 442 Cr>=300 Stag OD stag OD 443 Cr<=120 Stag OD stag OD 444 Cr<=120 12 <=12 445 Cr<=120 18 >12<=24 66 >48h 446 Cr>120, <=180 447 Cr>=300 Stag OD stag OD 448 cr>180, <300 449 Cr<=120 Stag OD 22 >12, <=24h 450 Cr<=120 Stag OD stag OD 451 Cr<=120 Stag OD stag OD 452 Cr>=300 Stag OD stag OD 453 Cr<=120 15 >12<=24 454 cr>180, <300 18 >12<=24 74 >48h 455 cr>180, <300 26 >24<=48 456 Cr>=300 457 Cr<=120 48 >24<=48 72 458 Cr<=120 48 >24<=48 48 >24, <=48h 459 Cr<=120 28 >24<=48 57 >48h 460 cr>180, <300 Stag OD stag OD 461 Cr<=120 36 >24<=48 462 Cr<=120 6 <=12 463 Cr<=120 464 Cr>=300 465 Cr<=120 36 >24<=48 72 466 Cr<=120 10 <=12 45 >24, <=48h 467 Cr>120, <=180 43 >24<=48 468 Cr<=120 58 >48h 469 Cr<=120 Stag OD stag OD 470 Cr>120, <=180 32 >24<=48 35 >24, <=48h 471 Cr>120, <=180 26 >24<=48 37 >24, <=48h 472 Cr<=120 Stag OD 35 >24, <=48h 473 Cr<=120 17 >12<=24 24 >12, <=24h 474 cr>180, <300 56 >48h 100 >48h 475 Cr<=120 Stag OD stag OD 476 cr>180, <300 48 >24<=48 477 Cr>=300 11 <=12 59 >48h 478 Cr<=120 14 >12<=24 479 Cr<=120 11 <=12 57 >48h 480 cr>180, <300 481 Cr<=120 Stag OD stag OD 482 Cr<=120 5 <=12 48 >24, <=48h 483 cr>180, <300 484 Cr<=120 21 >12<=24 46 >24, <=48h 485 Cr>=300 24 >12<=24 55 >48h 486 Cr<=120 22 >12<=24 487 Cr<=120 16 >12<=24 42 >24, <=48h 488 Cr<=120 Stag OD stag OD 489 Cr<=120 17 >12<=24 54 >48h 490 Cr>120, <=180 16 >12<=24 46 >24, <=48h 491 Cr>120, <=180 20 >12<=24 52 >48h 492 Cr<=120 18 >12<=24 42 >24, <=48h

91
Number gr according to RIE Cr Delay to Referring hospital Delay to ref hospital groups
Delay to RIE Delay to RIE group
493 Cr<=120 62 >48h 68 >48h 494 Cr<=120 31 >24<=48 54 >48h 495 cr>180, <300 23 >12<=24 496 Cr>120, <=180 7 <=12 72 497 cr>180, <300 Stag OD stag OD 498 cr>180, <300 Stag OD 96 >48h 499 Cr<=120 Stag OD stag OD 500 cr>180, <300 36 >24<=48 42 >24, <=48h 501 Cr>120, <=180 33 >24<=48 41 >24, <=48h 502 Cr>120, <=180 52 >48h 108 >48h 503 Cr>=300 Stag OD stag OD 504 cr>180, <300 Stag OD stag OD 505 Cr<=120 506 cr>180, <300 Stag OD stag OD 507 Cr>120, <=180 Stag OD stag OD 508 Cr<=120 509 cr>180, <300 32 >24<=48 62 >48h 510 Cr<=120 18 >12<=24 22 >12, <=24h 511 Cr<=120 Stag OD stag OD 512 Cr>120, <=180 40 >24<=48 48 >24, <=48h 513 Cr<=120 Stag OD stag OD 514 Cr<=120 21 >12<=24 47 >24, <=48h 515 Cr<=120 12 <=12 48 >24, <=48h 516 cr>180, <300 37 >24<=48 72 517 Cr<=120 518 Cr<=120 24 >12<=24 50 >48h 519 Cr>120, <=180 Stag OD stag OD 520 Cr<=120 67 >48h 521 Cr<=120 17 >12<=24 44 >24, <=48h 522 Cr<=120 18 >12<=24 40 >24, <=48h
Number Outcome ITU Stay RIE Stay SLTU Stay 1 SURVIVED NO TP 0 3 3 2 SURVIVED NO TP 0 6 6 3 DIED NO TP 2 2 0 4 DIED NO TP 5 6 1 5 DIED NO TP 1 1 0 6 SURVIVED NO TP 0 4 4 7 DIED NO TP 3 5 2 8 DIED NO TP 1 1 0 9 SURVIVED NO TP 0 6 5 10 SURVIVED NO TP 0 8 8 11 SURVIVED NO TP 0 2 2 12 SURVIVED NO TP 0 3 9 13 DIED WITH TP 19 21 2 14 SURVIVED NO TP 0 9 9 15 SURVIVED NO TP 0 7 7
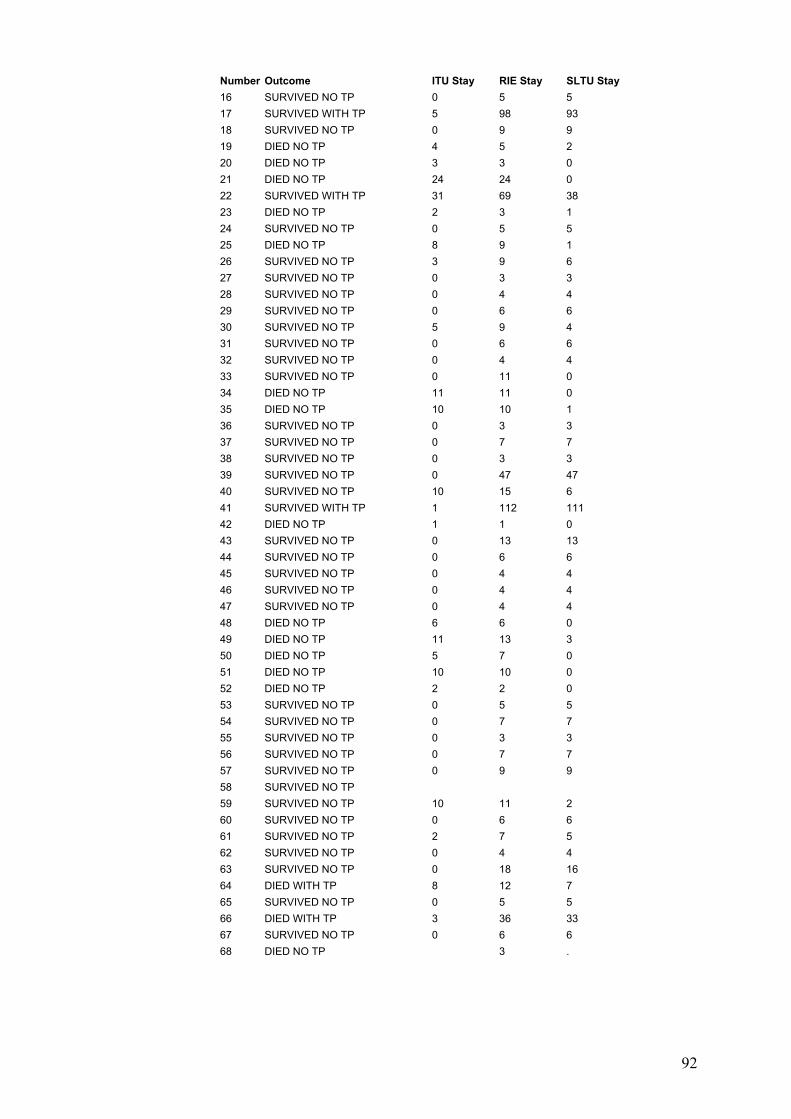
92
Number Outcome ITU Stay RIE Stay SLTU Stay 16 SURVIVED NO TP 0 5 5 17 SURVIVED WITH TP 5 98 93 18 SURVIVED NO TP 0 9 9 19 DIED NO TP 4 5 2 20 DIED NO TP 3 3 0 21 DIED NO TP 24 24 0 22 SURVIVED WITH TP 31 69 38 23 DIED NO TP 2 3 1 24 SURVIVED NO TP 0 5 5 25 DIED NO TP 8 9 1 26 SURVIVED NO TP 3 9 6 27 SURVIVED NO TP 0 3 3 28 SURVIVED NO TP 0 4 4 29 SURVIVED NO TP 0 6 6 30 SURVIVED NO TP 5 9 4 31 SURVIVED NO TP 0 6 6 32 SURVIVED NO TP 0 4 4 33 SURVIVED NO TP 0 11 0 34 DIED NO TP 11 11 0 35 DIED NO TP 10 10 1 36 SURVIVED NO TP 0 3 3 37 SURVIVED NO TP 0 7 7 38 SURVIVED NO TP 0 3 3 39 SURVIVED NO TP 0 47 47 40 SURVIVED NO TP 10 15 6 41 SURVIVED WITH TP 1 112 111 42 DIED NO TP 1 1 0 43 SURVIVED NO TP 0 13 13 44 SURVIVED NO TP 0 6 6 45 SURVIVED NO TP 0 4 4 46 SURVIVED NO TP 0 4 4 47 SURVIVED NO TP 0 4 4 48 DIED NO TP 6 6 0 49 DIED NO TP 11 13 3 50 DIED NO TP 5 7 0 51 DIED NO TP 10 10 0 52 DIED NO TP 2 2 0 53 SURVIVED NO TP 0 5 5 54 SURVIVED NO TP 0 7 7 55 SURVIVED NO TP 0 3 3 56 SURVIVED NO TP 0 7 7 57 SURVIVED NO TP 0 9 9 58 SURVIVED NO TP 59 SURVIVED NO TP 10 11 2 60 SURVIVED NO TP 0 6 6 61 SURVIVED NO TP 2 7 5 62 SURVIVED NO TP 0 4 4 63 SURVIVED NO TP 0 18 16 64 DIED WITH TP 8 12 7 65 SURVIVED NO TP 0 5 5 66 DIED WITH TP 3 36 33 67 SURVIVED NO TP 0 6 6 68 DIED NO TP 3 .

93
Number Outcome ITU Stay RIE Stay SLTU Stay 69 SURVIVED NO TP 0 4 4 70 SURVIVED NO TP 0 4 4 71 SURVIVED NO TP 0 3 3 72 SURVIVED NO TP 0 4 4 73 DIED NO TP 5 8 4 74 SURVIVED NO TP 0 5 5 75 SURVIVED NO TP 0 4 4 76 SURVIVED NO TP 0 6 6 77 SURVIVED NO TP 0 4 4 78 SURVIVED NO TP 4 13 9 79 SURVIVED NO TP 0 4 4 80 SURVIVED NO TP 0 4 4 81 DIED WITH TP 18 19 1 82 SURVIVED NO TP 0 7 7 83 SURVIVED NO TP 0 4 4 84 SURVIVED NO TP 0 3 3 85 SURVIVED NO TP 0 6 6 86 SURVIVED NO TP 0 3 3 87 SURVIVED NO TP 0 3 3 88 SURVIVED NO TP 0 5 5 89 SURVIVED NO TP 0 5 5 90 SURVIVED NO TP 5 5 0 91 SURVIVED NO TP 0 9 9 92 SURVIVED NO TP 0 6 6 93 DIED NO TP 3 4 1 94 SURVIVED NO TP 0 5 5 95 SURVIVED NO TP 0 14 14 96 DIED NO TP 2 2 1 97 DIED NO TP 9 10 2 98 SURVIVED NO TP 5 9 6 99 SURVIVED NO TP 0 10 10 100 SURVIVED NO TP 5 19 14 101 DIED NO TP 1 2 1 102 SURVIVED NO TP 0 3 3 103 SURVIVED NO TP 0 23 23 104 DIED NO TP 7 7 0 105 SURVIVED NO TP 0 4 4 106 DIED NO TP 2 2 0 107 DIED NO TP 0 2 2 108 SURVIVED NO TP 0 3 3 109 SURVIVED NO TP 0 5 5 110 SURVIVED NO TP 2 11 13 111 SURVIVED NO TP 2 10 11 112 DIED NO TP 1 1 1 113 DIED NO TP 5 6 2 114 DIED NO TP 2 4 2 115 DIED NO TP 5 7 3 116 SURVIVED NO TP 0 3 3 117 SURVIVED NO TP 0 7 7 118 DIED NO TP 11 11 0 119 DIED NO TP 15 18 4 120 SURVIVED NO TP 0 3 3 121 SURVIVED NO TP 0 9 9

94
Number Outcome ITU Stay RIE Stay SLTU Stay 122 SURVIVED NO TP 0 4 4 123 DIED NO TP 6 7 1 124 DIED NO TP 1 1 0 125 SURVIVED NO TP 0 8 8 126 SURVIVED NO TP 0 4 4 127 DIED NO TP 3 4 2 128 SURVIVED NO TP 0 4 4 129 SURVIVED WITH TP 7 27 20 130 SURVIVED NO TP 4 11 7 131 DIED NO TP 3 3 1 132 SURVIVED NO TP 0 5 5 133 SURVIVED NO TP 0 6 4 134 DIED NO TP 12 14 1 135 DIED NO TP 2 2 0 136 SURVIVED NO TP 0 13 13 137 DIED NO TP 0 3 2 138 SURVIVED NO TP 0 4 4 139 SURVIVED NO TP 0 10 10 140 SURVIVED NO TP 0 5 5 141 SURVIVED NO TP 0 13 13 142 SURVIVED NO TP 0 5 5 143 DIED NO TP 0 3 2 144 SURVIVED NO TP 0 8 8 145 SURVIVED NO TP 0 5 5 146 DIED NO TP 2 2 0 147 DIED NO TP 2 2 0 148 SURVIVED NO TP 0 6 6 149 SURVIVED NO TP 4 13 7 150 SURVIVED NO TP 0 14 14 151 SURVIVED NO TP 0 6 6 152 SURVIVED NO TP 0 3 3 153 SURVIVED NO TP 0 6 6 154 DIED NO TP 0 2 2 155 DIED NO TP 5 6 2 15 DIED NO TP 2 2 0 157 SURVIVED NO TP 8 15 7 158 SURVIVED NO TP 0 3 3 159 SURVIVED NO TP 10 24 14 160 DIED NO TP 4 5 1 161 SURVIVED NO TP 9 19 10 162 SURVIVED NO TP 0 6 6 163 SURVIVED NO TP 6 11 4 164 SURVIVED NO TP 3 5 3 165 SURVIVED NO TP 7 10 3 166 SURVIVED NO TP 1 8 7 167 SURVIVED NO TP 0 4 4 168 SURVIVED NO TP 8 . 169 SURVIVED NO TP 8 14 6 170 SURVIVED WITH TP 6 25 19 171 SURVIVED NO TP 0 4 4 172 SURVIVED NO TP 0 5 5 173 SURVIVED NO TP 0 10 10 174 SURVIVED NO TP 0 5 5
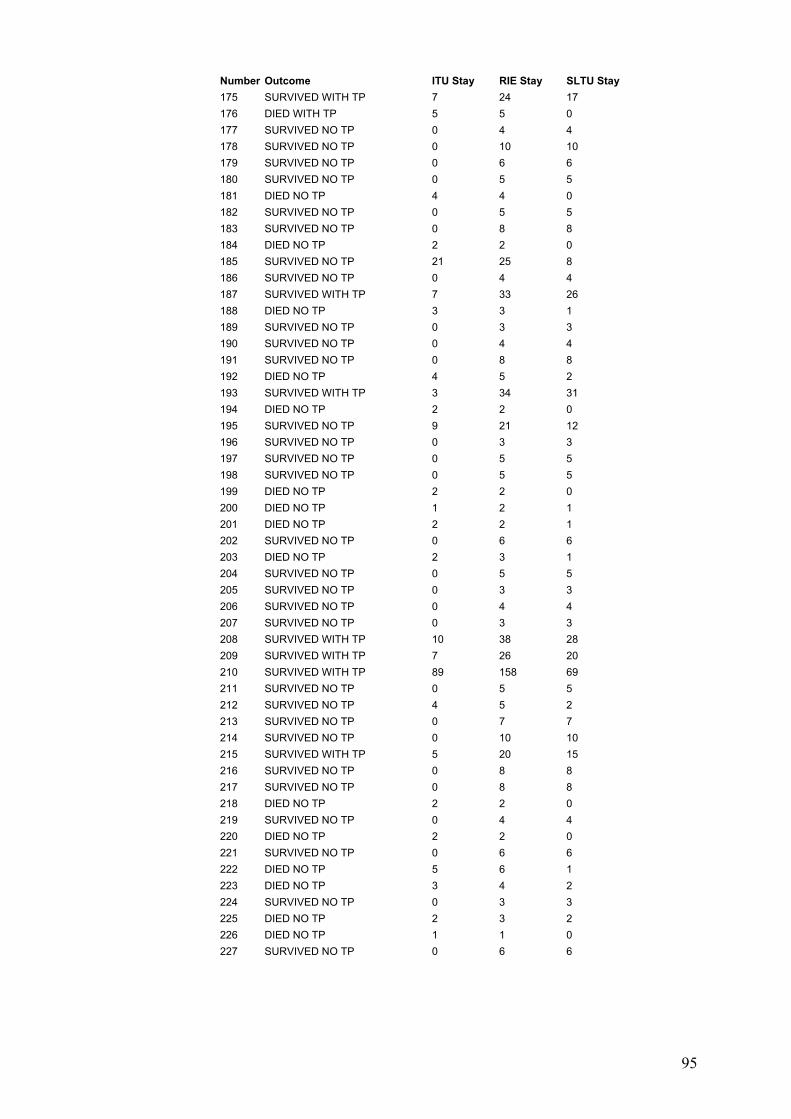
95
Number Outcome ITU Stay RIE Stay SLTU Stay 175 SURVIVED WITH TP 7 24 17 176 DIED WITH TP 5 5 0 177 SURVIVED NO TP 0 4 4 178 SURVIVED NO TP 0 10 10 179 SURVIVED NO TP 0 6 6 180 SURVIVED NO TP 0 5 5 181 DIED NO TP 4 4 0 182 SURVIVED NO TP 0 5 5 183 SURVIVED NO TP 0 8 8 184 DIED NO TP 2 2 0 185 SURVIVED NO TP 21 25 8 186 SURVIVED NO TP 0 4 4 187 SURVIVED WITH TP 7 33 26 188 DIED NO TP 3 3 1 189 SURVIVED NO TP 0 3 3 190 SURVIVED NO TP 0 4 4 191 SURVIVED NO TP 0 8 8 192 DIED NO TP 4 5 2 193 SURVIVED WITH TP 3 34 31 194 DIED NO TP 2 2 0 195 SURVIVED NO TP 9 21 12 196 SURVIVED NO TP 0 3 3 197 SURVIVED NO TP 0 5 5 198 SURVIVED NO TP 0 5 5 199 DIED NO TP 2 2 0 200 DIED NO TP 1 2 1 201 DIED NO TP 2 2 1 202 SURVIVED NO TP 0 6 6 203 DIED NO TP 2 3 1 204 SURVIVED NO TP 0 5 5 205 SURVIVED NO TP 0 3 3 206 SURVIVED NO TP 0 4 4 207 SURVIVED NO TP 0 3 3 208 SURVIVED WITH TP 10 38 28 209 SURVIVED WITH TP 7 26 20 210 SURVIVED WITH TP 89 158 69 211 SURVIVED NO TP 0 5 5 212 SURVIVED NO TP 4 5 2 213 SURVIVED NO TP 0 7 7 214 SURVIVED NO TP 0 10 10 215 SURVIVED WITH TP 5 20 15 216 SURVIVED NO TP 0 8 8 217 SURVIVED NO TP 0 8 8 218 DIED NO TP 2 2 0 219 SURVIVED NO TP 0 4 4 220 DIED NO TP 2 2 0 221 SURVIVED NO TP 0 6 6 222 DIED NO TP 5 6 1 223 DIED NO TP 3 4 2 224 SURVIVED NO TP 0 3 3 225 DIED NO TP 2 3 2 226 DIED NO TP 1 1 0 227 SURVIVED NO TP 0 6 6

96
Number Outcome ITU Stay RIE Stay SLTU Stay 228 SURVIVED WITH TP 6 37 31 229 SURVIVED NO TP 0 4 4 230 DIED NO TP 2 2 0 231 DIED NO TP 2 4 0 232 SURVIVED NO TP 13 23 12 233 SURVIVED WITH TP 7 31 26 234 SURVIVED NO TP 10 5 5 235 SURVIVED WITH TP 5 18 14 236 SURVIVED NO TP 0 4 4 237 SURVIVED WITH TP 3 33 31 238 SURVIVED NO TP 0 19 19 239 SURVIVED NO TP 0 5 5 240 SURVIVED NO TP 0 10 2 241 DIED NO TP 0 4 4 242 SURVIVED NO TP 0 4 4 243 SURVIVED NO TP 0 6 6 244 SURVIVED NO TP 0 3 3 245 SURVIVED NO TP 0 5 5 246 SURVIVED WITH TP 15 60 47 247 DIED NO TP 2 2 0 248 SURVIVED NO TP 2 13 12 249 SURVIVED WITH TP 12 28 18 250 SURVIVED WITH TP 33 67 34 251 SURVIVED NO TP 0 3 3 252 SURVIVED NO TP 0 7 7 253 DIED NO TP 0 2 2 254 SURVIVED NO TP 0 4 4 255 DIED WITH TP 3 3 1 256 SURVIVED NO TP 0 3 3 257 SURVIVED NO TP 0 4 4 258 SURVIVED NO TP 2 15 13 259 SURVIVED NO TP 4 15 11 260 SURVIVED NO TP 3 6 3 261 SURVIVED NO TP 0 3 3 262 SURVIVED NO TP 7 14 7 263 SURVIVED NO TP 0 4 4 264 SURVIVED NO TP 0 5 5 265 DIED NO TP 3 3 0 266 SURVIVED NO TP 0 7 7 267 SURVIVED WITH TP 13 25 14 268 DIED NO TP 5 5 1 269 DIED NO TP 0 3 3 270 SURVIVED NO TP 0 3 3 271 DIED NO TP 15 16 1 272 DIED NO TP 2 2 0 273 DIED NO TP 12 13 2 274 DIED NO TP 1 1 0 275 SURVIVED NO TP 0 5 5 276 DIED NO TP 1 1 1 277 SURVIVED WITH TP 10 49 39 278 DIED NO TP 2 2 0 279 SURVIVED NO TP 1 9 8 280 SURVIVED WITH TP 8 19 12

97
Number Outcome ITU Stay RIE Stay SLTU Stay 281 SURVIVED NO TP 0 6 6 282 SURVIVED NO TP 0 2 2 283 SURVIVED NO TP 7 16 9 284 SURVIVED NO TP 0 17 17 285 DIED NO TP 2 2 0 286 SURVIVED NO TP 6 10 4 287 DIED NO TP 6 8 2 288 SURVIVED NO TP 0 4 4 289 SURVIVED NO TP 4 11 7 290 SURVIVED NO TP 0 5 5 291 SURVIVED NO TP 0 9 9 292 SURVIVED NO TP 3 22 20 293 SURVIVED NO TP 0 6 6 294 DIED NO TP 1 1 0 295 DIED NO TP 7 8 1 296 SURVIVED NO TP 2 13 10 297 SURVIVED NO TP 0 11 11 298 DIED WITH TP 2 2 0 299 SURVIVED NO TP 0 3 3 300 SURVIVED NO TP 0 3 3 301 SURVIVED NO TP 0 2 2 302 DIED NO TP 2 3 1 303 SURVIVED NO TP 0 7 7 304 SURVIVED NO TP 0 6 6 305 DIED NO TP 2 2 0 306 DIED NO TP 16 19 7 307 SURVIVED NO TP 0 3 3 308 SURVIVED NO TP 0 3 3 309 SURVIVED NO TP 0 6 6 310 SURVIVED NO TP 0 5 5 311 SURVIVED NO TP 0 10 6 312 SURVIVED NO TP 0 15 2 313 SURVIVED NO TP 0 4 4 314 SURVIVED NO TP 0 3 3 315 SURVIVED NO TP 0 4 4 316 SURVIVED NO TP 3 13 11 317 SURVIVED NO TP 0 5 5 318 SURVIVED NO TP 0 6 6 319 DIED NO TP 3 4 1 320 DIED NO TP 20 22 2 321 DIED NO TP 1 1 1 322 DIED NO TP 0 3 3 323 SURVIVED NO TP 3 9 6 324 SURVIVED NO TP 325 DIED NO TP 2 2 0 326 SURVIVED NO TP 0 8 8 327 DIED NO TP 10 10 1 328 SURVIVED NO TP 6 11 5 329 DIED NO TP 10 11 2 330 DIED NO TP 2 2 0 331 SURVIVED NO TP 0 2 2 332 SURVIVED NO TP 0 6 6 333 SURVIVED NO TP 0 5 5

98
Number Outcome ITU Stay RIE Stay SLTU Stay 334 SURVIVED NO TP 4 8 4 335 SURVIVED NO TP 5 10 7 336 SURVIVED NO TP 0 2 2 337 SURVIVED NO TP 0 8 8 338 SURVIVED NO TP 0 13 13 339 SURVIVED NO TP 0 3 3 340 DIED NO TP 1 2 1 341 SURVIVED NO TP 0 4 4 342 DIED NO TP 0 14 14 343 SURVIVED NO TP 0 9 9 344 SURVIVED NO TP 0 8 8 345 DIED NO TP 2 3 1 346 DIED NO TP 8 8 1 347 SURVIVED WITH TP 5 28 22 348 DIED NO TP 15 18 3 349 DIED NO TP 2 2 0 350 DIED NO TP 6 6 0 351 SURVIVED NO TP 0 6 6 352 SURVIVED NO TP 3 14 11 353 SURVIVED NO TP 0 5 5 354 DIED NO TP 1 1 0 355 SURVIVED WITH TP 4 24 20 356 SURVIVED NO TP 0 5 5 357 DIED NO TP 358 SURVIVED NO TP 3 7 4 359 DIED NO TP 7 7 0 360 SURVIVED NO TP 0 12 12 361 SURVIVED NO TP 0 4 4 362 SURVIVED NO TP 0 3 3 363 DIED NO TP 3 3 0 364 SURVIVED NO TP 2 9 9 365 DIED NO TP 13 14 1 366 SURVIVED NO TP 0 5 5 367 SURVIVED NO TP 0 5 5 368 DIED NO TP 4 4 0 369 SURVIVED NO TP 0 6 5 370 DIED NO TP 13 13 0 371 DIED NO TP 3 5 3 372 SURVIVED NO TP 0 3 3 373 SURVIVED NO TP 0 7 7 374 SURVIVED NO TP 0 5 5 375 SURVIVED NO TP 5 18 13 376 SURVIVED NO TP 0 5 5 377 SURVIVED NO TP 0 6 6 378 SURVIVED NO TP 0 3 3 379 SURVIVED NO TP 0 8 8 380 DIED WITH TP 7 7 0 381 SURVIVED NO TP 0 3 3 382 SURVIVED NO TP 0 11 11 383 SURVIVED NO TP 0 4 4 384 DIED NO TP 2 2 0 385 DIED NO TP 4 4 0 386 SURVIVED NO TP 0 5 5

99
Number Outcome ITU Stay RIE Stay SLTU Stay 387 SURVIVED NO TP 0 3 3 388 DIED NO TP 2 2 0 389 SURVIVED NO TP 0 4 4 390 SURVIVED NO TP 0 4 4 391 SURVIVED NO TP 13 21 12 392 SURVIVED NO TP 13 18 5 393 SURVIVED NO TP 0 5 5 394 SURVIVED NO TP 0 4 4 395 SURVIVED NO TP 0 10 8 396 SURVIVED NO TP 0 6 6 397 DIED NO TP 2 2 1 398 SURVIVED NO TP 2 5 4 399 SURVIVED NO TP 0 4 4 400 SURVIVED NO TP 0 3 3 401 SURVIVED NO TP 0 7 7 402 SURVIVED NO TP 5 10 5 403 SURVIVED NO TP 13 . 404 DIED NO TP 2 2 0 405 SURVIVED WITH TP 13 37 24 406 SURVIVED NO TP 0 3 3 407 SURVIVED NO TP 0 4 4 408 DIED NO TP 9 9 1 409 DIED NO TP 0 8 8 410 SURVIVED NO TP 0 5 5 411 DIED WITH TP 25 25 412 SURVIVED NO TP 0 3 3 413 SURVIVED NO TP 0 5 5 414 SURVIVED NO TP 0 7 7 415 DIED NO TP 2 2 0 416 SURVIVED NO TP 0 3 3 417 SURVIVED NO TP 0 4 4 418 SURVIVED NO TP 0 7 7 419 SURVIVED NO TP 12 24 11 420 DIED NO TP 2 2 1 421 SURVIVED WITH TP 7 23 17 422 SURVIVED NO TP 0 6 6 423 SURVIVED NO TP 7 18 11 424 SURVIVED NO TP 0 8 8 425 SURVIVED NO TP 0 7 7 526 SURVIVED NO TP 14 25 12 427 SURVIVED NO TP 0 10 10 428 SURVIVED NO TP 0 3 3 429 SURVIVED NO TP 11 24 13 430 DIED NO TP 1 1 0 431 SURVIVED NO TP 13 21 8 432 SURVIVED NO TP 0 3 3 433 SURVIVED NO TP 0 4 4 434 SURVIVED NO TP 9 15 7 435 SURVIVED NO TP 0 5 3 436 SURVIVED NO TP 0 3 3 437 SURVIVED NO TP 0 2 2 438 DIED NO TP 9 10 2 439 SURVIVED NO TP 0 4 4

100
Number Outcome ITU Stay RIE Stay SLTU Stay 440 DIED NO TP 3 1 4 441 SURVIVED NO TP 0 6 6 442 DIED NO TP 8 9 1 443 SURVIVED NO TP 17 26 9 444 SURVIVED NO TP 0 3 3 445 SURVIVED NO TP 0 4 4 446 SURVIVED WITH TP 8 26 28 447 DIED WITH TP 448 DIED NO TP 2 2 0 449 SURVIVED NO TP 0 7 7 450 SURVIVED NO TP 0 11 11 451 SURVIVED NO TP 0 3 3 452 SURVIVED NO TP 0 9 9 453 SURVIVED NO TP 0 3 3 454 SURVIVED NO TP 0 5 5 455 SURVIVED WITH TP 7 34 28 456 DIED NO TP 10 10 0 457 SURVIVED NO TP 0 3 3 458 SURVIVED NO TP 0 3 3 459 SURVIVED NO TP 0 6 6 460 DIED NO TP 3 3 0 461 SURVIVED NO TP 0 3 3 462 SURVIVED NO TP 0 3 3 463 DIED NO TP 9 10 2 464 DIED NO TP 8 8 0 465 SURVIVED NO TP 0 2 2 466 SURVIVED NO TP 0 5 5 467 DIED NO TP 2 2 0 468 SURVIVED NO TP 0 6 6 469 SURVIVED NO TP 0 5 5 470 DIED NO TP 4 5 1 471 DIED NO TP 2 2 1 472 SURVIVED NO TP 0 12 12 473 DIED NO TP 2 3 1 474 SURVIVED NO TP 0 10 10 475 SURVIVED NO TP 3 5 3 476 SURVIVED NO TP 5 20 15 477 SURVIVED NO TP 7 12 5 478 SURVIVED NO TP 0 3 3 479 SURVIVED NO TP 0 5 5 480 DIED NO TP 3 3 0 481 SURVIVED NO TP 6 37 32 482 SURVIVED NO TP 0 6 6 483 DIED NO TP 1 2 1 484 SURVIVED NO TP 0 6 6 485 DIED WITH TP 6 6 0 486 SURVIVED NO TP 0 3 3 487 SURVIVED NO TP 0 5 0 488 DIED NO TP 7 7 0 489 SURVIVED NO TP 0 3 3 490 SURVIVED NO TP 0 12 10 491 SURVIVED NO TP 0 10 10 492 SURVIVED NO TP 0 3 0

101
Number Outcome ITU Stay RIE Stay SLTU Stay 493 SURVIVED NO TP 9 16 7 494 SURVIVED NO TP 0 4 4 495 DIED NO TP 3 3 0 496 SURVIVED NO TP 6 12 7 497 SURVIVED NO TP 0 6 6 498 SURVIVED NO TP 0 11 11 499 SURVIVED NO TP 1 6 5 500 DIED NO TP 2 2 1 501 DIED NO TP 2 3 1 502 SURVIVED NO TP 6 12 6 503 DIED WITH TP 2 2 0 504 SURVIVED NO TP 0 3 3 505 SURVIVED NO TP 0 6 6 506 SURVIVED NO TP 0 4 4 507 SURVIVED NO TP 0 3 3 508 SURVIVED NO TP 0 2 2 509 SURVIVED NO TP 7 14 7 510 DIED WITH TP 1 4 3 511 SURVIVED NO TP 0 6 6 512 SURVIVED NO TP 0 11 11 513 SURVIVED NO TP 0 10 10 514 SURVIVED NO TP 0 6 6 515 SURVIVED NO TP 0 6 4 516 SURVIVED NO TP 4 24 20 517 SURVIVED NO TP 1 6 6 518 SURVIVED NO TP 0 4 4 519 SURVIVED NO TP 0 11 11 520 SURVIVED NO TP 0 3 3 521 SURVIVED NO TP 2 11 10 522 SURVIVED NO TP 0 9 1
Number: number of each patient. Code: code for each patient; DOB: date of birth; Ref: referring; Cr: creatinine (µmol/l); Delay: time between ingestion and admission to referring hospital (h); Stag OD: staggered overdose; Asso ALC: associated alcohol; ALC intake: alcohol intake (unit/week); Na: plasma sodium (mmol/l); K: plasma potassium (mmol/l); Bic: plasma bicarbonate (mmol/l); Bil: bilirubin (µmol/l); ALP: alkaline phosphatase (U/l); GGT: gamma glutamyl transpeptidase (U/l); H+: [H+] (mmol/l); ALT: alanine transaminase (U/l); PT: prothrombin time (Sec); APTT: partial prothrombin time; ITU stay: intensive care unit stay (day); ref 8gr: 8 groups according to PT and Cr in the referring hospital; TP: transplant; Blank column: missing data.

102
Appendix 3.2: Subjects who had degrees of renal dysfunction (referring Cr.120 umol/l), but not significant liver impairment (PT<25 sec) at first admission to referring hospital (n=26). Interval: time between ingestion and admission to referring hospital.
Number Code DOB Sex Age (y) Ref Cr (µmol/l) Ref PT (Sec) Ref ALT (IU/l) Delay h 1 JA060023 12-Sep-30 male 66.0 123 14 6805 24 2 MB030076 03-Jan-71 female 23.0 130 19 9756 19 3 RB090081 19-Apr-74 male 26.0 126 21.5 11320 16 4 WC110124 19-Aug-39 female 63.0 170 18 844 Unknown 5 WC080132 29-Oct-72 male 26.0 122 13 16852 16 6 FD110154 30-Nov-58 male 41.0 132 21 760 13 7 MH060269 12-Feb-80 female 17.0 131 18 3583 45 8 SH130692 24-Aug-60 male 43.0 155 15 1563 22 9 KM130694 14-Jan-83 male 21.0 155 14 7941 Staggered 10 JM070397 03-Mar-70 male 28.0 136 23.5 11731 missing data 11 JM120673 16-Oct-58 male 45.0 160 22 7184 Staggered 12 RN090495 04-Dec-67 male 23.0 129 21 6163 16 13 BS020575 04-Mar-72 male 21.0 132 15.6 1463 missing data 14 DS040592 07-Sep-70 male 24.0 134 18 45 6 15 AS080602 30-Mar-68 female 31.0 122 21.7 10000 missing data 16 CT080623 24-Jan-65 female 34.0 124 22 9756 22 17 RW090658 16-Oct-65 male 34.0 123 18 6529 missing data 18 SG100237 04-Feb-82 male 29.0 217 22 12280 33 19 EL030354 13-Jan-33 male 61.0 193 18 8800 missing data 20 VM030440 01-Oct-45 male 49.0 284 23 10910 11 21 EN030493 14-Sep-51 female 42.0 226 14.5 1940 Staggered 22 AR090539 20-Sep-73 male 26.0 240 24.6 8454 28 23 PR110542 27-Oct-73 male 28.0 254 23.5 4372 Staggered 24 PW070642 18-Apr-53 male 44.0 252 24 1333 52 25 WL040348 21-Sep-60 male 34.0 312 10 6620 50 26 PS030595 07-Nov-49 female 45.0 1196 18 831 Unknown
103
Appendix 5.1: Patient invitation letter Ref NO: 06/S1101/10 Version 2 Date: 16/03/06
Patient invitation letter
Title of the study: Effects of Acetylcysteine in the management of paracetamol overdose
Researcher: Dr. Nasrin Pakravan
Dear Sir/ Madam
You are being asked to take part in a study in which we are examining how you respond to
the treatment you may receive. You have taken an overdose of paracetamol and may need
treatment with an antidote which is routinely used for this condition. We are studying the
effects of the antidote in a group of patient. Before you decide whether to take part it is
important for you to understand why the research is being done and what it will involve.
Please take time to read the following carefully and ask if there is anything that is not clear,
or if you would like more information. Please take time to decide whether or not you wish to
take part and. If you do not wish to take part in this study it will not affect your treatment in
any way.
Thank you for your time.
Yours faithfully,
Dr Nasrin Pakravan
Clinical Research Fellow
104
Appendix 5.2: Patient information sheet (page 1)
Ref NO: 06/S1101/10 Version 2 Date: 16/03/06
Patient information sheet
Title of the study: Effects of Acetylcysteine in the management of paracetamol overdose
Researcher: Dr. Nasrin Pakravan
Dear patient:
You are being asked to take part in a study in which we are examining how your body
responds to the treatment you may receive. You have taken an overdose of paracetamol and
may need treatment with an antidote to protect you from the poisonous effects of the
paracetamol.This antidote, NAC, N-acetylcysteine, protects your liver from very serious liver
injury which occurs when paracetamol is taken in overdose. Unfortunately a small group of
patients may suffer a range of side effects from treatment and we are trying to understand
more about this so we can prevent it happening, or identify which patients are more likely to
have a problem. These effects include in particular feeling sick, and flushed. As treatment is
essential, if needed, this is an important practical problem for us, even though all these side
effects can be treated successfully.
You are being asked to take part in this study as you have taken an overdose of paracetamol
and you may need NAC as treatment. We are hoping to study 50 patients.
It is up to you to decide whether or not to take part. If you decided to take part you will be
given this information sheet to keep and be asked to sign a consent form. If you decide to
take part you are still free to withdraw at any time and without giving a reason. A decision to
withdraw at any time, or a decision not to take part, will not affect the standard of care you
receive.
If the drug level in your blood shows that you require NAC treatment and you agree to take part in this study, you will be asked to allow us to use the routine blood samples taken when you were admitted for this research, and to provide some extra blood samples (15 ml) just before, 15 min, 30 min, 1 hour and 2 hours after starting treatment with NAC. Taking extra blood samples involves insertion of an additional cannula (small plastic tube) into your arm.

105
Appendix 5.2 (page 2)
We are also asking your permission to use these clinical samples for research to measure
some chemicals in your blood that may be involved in causing side effects.
To investigate better how your body responds to NAC, we need to accurately record your
blood pressure, pulse rate, respiratory rate and temperature every half an hour till 2 hours
and then every hour till 4 hours after start of NAC treatment and then as routinely to the end
of your treatment.
To detect any change in your breathing, you will be asked to take a standard test involving a
short sharp breath into a peak flow tube before and 1, 2, 4 hours after starting NAC and then
every 4 hours to the end of your treatment which takes 20 hours.
Blood samples will be taken either by one of the nursing staff or myself. All the results will be
kept anonymous, and your personal details will not be disclosed to a third party. If you agree
we will inform your GP of your participation in the study.
This study has been reviewed by the Lothian Local Research Ethics Committee. If you have
any further questions feel free to ask or contact the telephone number above.
Thank you for reading this information sheet.
Dr Nasrin Pakravan
Clinical Research Fellow

106
Appendix 5.3: Patient Consent Form Ref NO: 06/S1101/10 Version 2 Date: 20/03/2006 Patient Identification Number …………
Patient Consent Form
Effects of Acetylcysteine in the management of paracetamol overdose Researcher: Dr. Nasrin Pakravan
Please initial box
1- I confirm that I have read and understand the patient information sheet dated
16.03.2006 (Version 2) for the above study, and have had the opportunity to ask questions.
2- I understand that this study will normally involve me providing additional blood samples, to routine samples being taken during my time in the hospital. An additional cannula will be inserted in my arm for taking blood samples. My blood pressure, pulse rate, respiratory rate and temperature will be recorded more frequently than clinical routine. I also understand that a standard test of breathing involving me making a short breath into a peak flow tube will be measured for this study.
3- I understand that the results of the above samples will be used for research. 4- I understand that sections of any of my notes may be looked at by responsible
individuals from the Scottish Poison Information Bureau and the Toxicology unit at the Royal Infirmary of Edinburgh or from regulator authorities where is relevant to my taking part in research. I give permission for these individuals to have access to my records.
5- I realise that my participation is voluntary and that I can withdraw my consent at any
time without giving any reason, without my medical care or legal rights being affected.
6- I understand that my general practitioner (GP) will be informed from my participation
in this study.
7- I agree that to take part in the above study.
_______________________ ____________ ____________ Name of Patient Date Signature __________________________ _____________ _____________ Name of person taking consent Date Signature (If different from researcher) ___________________________ ______________ _____________
Researcher Date Signature

107
Appendix 5.4: Data Collection Sheet NAC Reaction Study Study Ref No: 06/S1101/10 Version 1 Patient ID NO
Subject Data Collection Sheet
Date:
Patient study no:
CRN NO:
Patient’s Initial
DOB:
Gender: Male Female Age:
Patient’s weight (Kg) Patient’s height (M)
Paracetamol overdose YES NO
Name of drugs taken
Alcohol consumption: before drug ingestion (h) with drug after (h)
Alleged amount of paracetamol (g):
Date of ingestion: Time of ingestion Staggered
Date of admission Time of admission
PMH such as liver disease, heart disease, Diabetes, allergic disease, HIV, ….
Drug Hx: Allergic Hx: Hay Fever Asthma Allergy to animal
Drug allergy Family history of allergy YES NO Unknown
History of NAC treatment YES NO Unknown
History of previous reaction to NAC YES NO Unknown
Alcohol consumption NO YES: Unit per week
High risk drug: NO YES
Phenobarbitone Phenytoin Carbamazepine Primidone
Rifampicin St John Wort Other
Paracetamol level hours after ingestion Location on R line:
Under high risk line Over high risk over normal
treatment line
NAC treatment Reaction to NAC YES NO
Name of interviewer

108
Appendix 5.5: Observation Sheet NAC Reaction Study Study Ref No: 06/S1101/10 Version 1 Patient ID NO: Observation Sheet First bag of NAC Date: Time started: Time finished Second bag of NAC Date: Time started: Time finished Third bag of NAC Date: Time started: Time finished
Time after start of
NAC
BP
PR
RR
Tem
PEFR
Time recorded
Comment
0
30 min
1h
2h
3h
4h
8h
12h
16h
20h

Appendix 5.6: Adverse Reactions Sheet NAC Reaction Study Study Ref No: 06/S1101/10 Version 1 Adverse Reactions Sheet
Type of reaction Time of initiation Time of Termination Treatment required Other
Rash
Pruritus
Flushing Coughing Wheezing Dyspnoea Nausea Vomiting Chest Pain Abdominal Cramp Diarrhoea Fever (T ≥38)
Hypotension (SBP<90 mmHg)
Hypertension (BP>140 /90 mmHg
Tachycardia (PR>120 )
Bronchospasm Abdominal Cramp Diarrhoea Angioedema
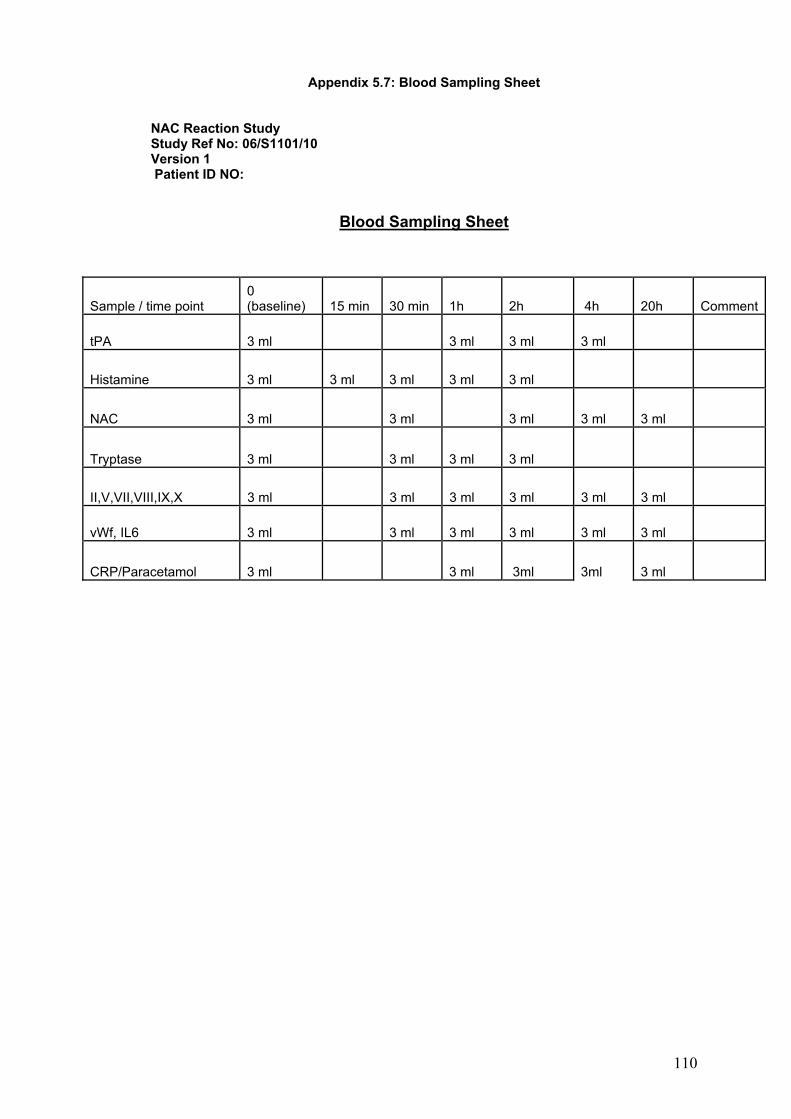
110
Appendix 5.7: Blood Sampling Sheet NAC Reaction Study Study Ref No: 06/S1101/10 Version 1 Patient ID NO:
Blood Sampling Sheet
Sample / time point 0 (baseline) 15 min 30 min 1h 2h 4h 20h Comment
tPA 3 ml 3 ml 3 ml 3 ml
Histamine 3 ml 3 ml 3 ml 3 ml 3 ml
NAC 3 ml 3 ml 3 ml 3 ml 3 ml
Tryptase 3 ml 3 ml 3 ml 3 ml
II,V,VII,VIII,IX,X 3 ml 3 ml 3 ml 3 ml 3 ml 3 ml
vWf, IL6 3 ml 3 ml 3 ml 3 ml 3 ml 3 ml
CRP/Paracetamol 3 ml 3 ml 3ml 3ml 3 ml

Appendix 5.8: Plasma histamine (ng/ml) at baseline and time points after IV NAV infusion commencement and time of initiation and/or peak adverse reactions in the groups according to the severity of ADRs (intensive study), NS: no sample (intensive study).
Severity of ADRs
Subject No
Time between INAC infusion initiation and start/peak of adverse reactions His 0 0min His 1 15min His 2 30min His 3 60min His 4 120min
5 start at 40min 0.98 0 0.73 15 0.22 30 0.57 60 0.5 120 6 start at 45min 0.44 0 NS NS NS NS 0.69 60 0.32 120 7 start at 80min 0.76 0 0.19 18 0.3 43 0.19 73 0.32 133 9 start at 30min 0.26 0 0.24 17 0.24 33 0.41 68 0.25 128 13 no reaction 0.82 0 0.53 20 0.73 40 0.72 70 0.84 120 17 start at 20-40min 1.2 0 0.5 15 0.76 30 0.47 60 0.36 120 18 start at 15 and 130min 1.41 0 0.71 15 0.7 30 0.7 70 1.83 190 19 start at 55 0.17 0 0.75 15 0.38 30 0.97 60 0.4 125 20 unclear time 0.52 0 0.39 20 0.68 35 0.55 70 0.82 120
Minimal 22 start at 15 0.35 0 0.31 15 0.35 35 0.37 65 0.28 140
1 peak at 60 min 0.48 0 2.28 13 2.44 30 0.92 60 0.75 120 2 start at 30-40 0.36 0 0.25 15 0.86 30 0.24 60 0.25 120 12 start at 30-40 0.48 0 0.93 16 0.81 37 2.82 58 1.85 123 15 start at 15-20 0.49 0 0.35 18 0.64 30 0.99 65 0.51 125
Moderate 21 start at 17 min 0.86 0 0.68 20 0.5 35 1.38 65 0.57 125
8 peak at 22 min 0.37 0 0.32 15 1.53 30 0.6 75 0.47 140 10 peak at 35 min 0.27 0 0.27 20 1.33 35 0.27 60 0.26 120 14 peak at 85min 0.5 0 0.29 15 1.76 35 1.13 70 0.81 135 3 peak at 55min 0.62 0 0.24 15 0.11 30 2.16 70 0.78 120 4 peak at 30min 0.79 0 0.58 15 0.68 30 1.34 60 0.39 120 11 peak at 40min 0.42 0 0.53 15 1.09 35 1.82 70 0.9 130
Severe 16 peak at 27min 0.49 0 0.93 17 0.53 35 1.48 65 0.33 125

Appendix 5.9: Plasma NAC concentration (µg/100µl) at baseline and time points (baseline, 1h, 2h and 4h) after IV NAC infusion commencement in each subject . NS: no sample. (1: minimal ADRs, 2: moderate ADRs, 3: severe ADRs) (intensive study).
Subject no Severity NAC baseline NAC 30min NAC 2h NAC 4h NAC 20h 1 2 0 9 4.75 4.25 NS 2 2 0.53 1.2 3.18 NS 2.3 3 3 0 12 4.5 2.75 1.7 4 3 0.3 NS 1 NS NS 5 1 0.53 9.5 3.75 3.75 1.65 6 1 0 7.5 6.75 1 3.22 7 1 0 10.25 6.75 3.5 1.75 8 3 0 7.25 3.27 2.3 1.5 9 1 0 4.55 3.62 3.12 0 10 3 0 5.03 3.22 NS NS 11 3 0 9.5 3.7 3.47 2.4 12 2 0 11.5 4.75 4.17 2.5 13 1 0 9.25 4.25 2.7 1.6 14 3 0 13 3.77 NS NS 15 2 0 15 6.25 4.1 0.7 16 3 0.53 10.75 4.7 3.52 0 17 1 0 11.77 6.43 3.72 1.57 18 1 0 6 3 0.75 0.78 19 1 0 8.5 4.75 5.02 1.28 20 1 0 12.5 5.02 3.27 2.23 21 2 0 8.03 3.8 2 0 22 1 0.15 10.5 3.28 1 NS

113
Appendix 5.10: Plasma histamine concentration at baseline and different time points after IV NAC infusion in each subject in the group with minimal ADRs, N=10, His: Plasma histamine (ng/ml), T: time (min) ((Intensive study). NS: no sample (intensive study).
Subject No His 0 T 0 His 1 T1 min His 2 T2 min His 3 T3 h His 4 T4 h 5 0.98 0 0.73 15 0.22 30 0.57 60 0.5 120 6 0.44 0 NS NS 0.69 60 0.32 120 7 0.76 0 0.19 18 0.3 43 0.19 73 0.32 133 9 0.26 0 0.24 17 0.24 33 0.41 68 0.25 128 13 0.82 0 0.53 20 0.73 40 0.72 70 0.84 120 17 1.2 0 0.5 15 0.76 30 0.47 60 0.36 120 18 1.41 0 0.71 15 0.7 30 0.7 70 1.83 190 19 0.17 0 0.75 15 0.38 30 0.97 60 0.4 125 20 0.52 0 0.39 20 0.68 35 0.55 70 0.82 120 22 0.35 0 0.31 15 0.35 35 0.37 65 0.28 140
Appendix 5.11: Plasma histamine concentration at baseline and different time points after IV NAC infusion in each subject in the group with moderate ADRs. N=5, His: plasma histamine (ng/ml), T: time (min) (intensive study).
Appendix 5.12: plasma histamine concentration at baseline and different time points after IV NAC infusion in subjects with severe ADRs, N=7, His=plasma histamine (ng/ml), T=time (min), (intensive study).
Subject No His 0 T 0 His 1 T15min His 2 T30min His 3 T1h His 4 T2h 1 0.48 0 2.28 13 2.44 30 0.92 60 0.75 120 2 0.36 0 0.25 15 0.86 30 0.24 60 0.25 120 12 0.48 0 0.93 16 0.81 37 2.82 58 1.85 123 15 0.49 0 0.35 18 0.64 30 0.99 65 0.51 125 21 0.86 0 0.68 20 0.5 35 1.38 65 0.57 125
Subject No His 0 T 0 His 1 T1 His 2 T2 His 3 T3 His 4 T4 8 0.37 0 0.32 15 1.53 30 0.6 75 0.47 140 10 0.27 0 0.27 20 1.33 35 0.27 60 0.26 120 14 0.50 0 0.29 15 1.76 35 1.13 70 0.81 135 3 0.62 0 0.24 15 0.11 30 2.16 70 0.78 120 4 0.79 0 0.58 15 0.68 30 1.34 60 0.39 120 11 0.42 0 0.53 15 1.09 35 1.82 70 0.9 130 16 0.49 0 0.93 17 0.53 35 1.48 65 0.33 125

114
Appendix 5.13: histamine validation experiment: plasma histamine (ng/ml) in 8 healthy volunteers (4 male and 4 female). Samples were collected and cooled at once, but spun at different time points (5 min, 15 min, 30 min and 60 min) after collection. His: histamine; T: spinning time (minute after blood collection) (intensive study).
Subject no T5min His5min T15min His15m T30min His30min T60m T60min 1 5 0.48 15 0.491 30 0.333 60 0.374 2 5 0.503 15 0.992 30 0.693 75 1.293 3 5 0.829 15 0.644 30 0.764 60 0.483 4 5 0.562 15 0.686 30 0.831 60 0.803 5 5 1.006 15 0.548 30 0.374 60 0.618 6 5 0.488 15 0.744 30 0.583 60 0.479 7 5 0.483 15 0.386 30 0.344 60 0.419 8 5 0.785 15 0.587 30 0.782 60 0.817
Appendix 5.14: plasma tryptase concentration (µg/l) at baseline and time points (baseline, 1h, 2h and 4h) after IV NAC infusion commencement in each subject. NS: no sample. (1: minimal ADRs, 2: moderate ADRs, 3: severe ADRs) (intensive study).
Subject no Severity Tryp 0 µg/l T0 min Tryp 30m T30min Tryp1h T 1h Tryp 2h T 2h 1 2 6.49 0 6.51 30 8.4 60 11.5 120 2 2 1 0 1 40 1 60 1 120 3 3 9.62 0 7.15 30 8.23 55 9.33 120 4 3 4.74 0 3.51 30 3.57 60 4.18 120 5 1 4.68 0 3.36 30 2.81 60 3.58 120 6 1 5.15 0 NS 1.53 85 3.76 145 7 1 2.65 0 1.62 40 1.99 72 2.06 132 8 3 1 0 1 40 1 75 1.67 135 9 1 1 0 1 33 1 68 1 128 10 3 3.69 0 NS 35 4.11 60 6.29 120 11 3 4.15 0 7.41 45 6.92 75 5.89 135 12 2 12.9 0 10.6 35 7.11 65 12.5 123 13 1 4.16 0 1.99 40 4.57 70 2.91 130 14 3 1.67 0 1 35 1 70 1.36 135 15 2 1.92 0 1.56 35 3.28 65 4.23 125 16 3 2.47 0 1.37 35 1.2 65 3.28 125 17 1 3.59 0 2.21 30 1.14 60 1.62 120 18 1 1 0 1 30 1 70 1 130 19 1 6.28 0 5.58 30 5.65 60 5.31 125 20 1 5.41 0 4.13 30 60 5.14 120 21 2 NS 0 NS 30 NS 60 NS 120 22 1 NS 0 NS 30 NS 60 NS 120

115
Appendix 5.15: plasma CRP concentration (mg/l) at baseline and time points (baseline, 1h, 2h and 4h) after IV NAC infusion commencement in each subject. NS: no sample. (1: minimal ADRs, 2: moderate ADRs, 3: severe ADRs) (Intensive study).
Subject no Severity CRP baseline CRP 1h CRP 2h CRP 4h 1 2 10 10 10 2 2 1 1 1 1 3 3 8 2 8 2 4 3 2 7 2 NS 5 1 1 1 1 1 6 1 1 1 1 1 7 1 1 1 1 1 8 3 1 1 1 1 9 1 1 1 1 2 10 3 50 NS NS NS 11 3 4 4 4 4 12 2 1 1 1 1 13 1 31 27 33 39 14 3 6 6 6 NS 15 2 4 4 4 4 16 3 1 1 1 1 17 1 1 2 2 2 18 1 NS 1 1 1 19 1 1 1 1 1 20 1 2 NS 2 1 21 2 1 1 1 7 22 1 8 8 7 7

116
Appendix 5.16: plasma IL6 (pg/ml) concentration at baseline and time points (baseline, 30 min, 1h, 2h, 4h and 20h) after IV NAC infusion commencement in each subject . NS: no sample. (1: minimal ADRs, 2: moderate ADRs, 3: severe ADRs) (Intensive study).
Subject no Severity IL6 baseline IL6 30min IL6 1h IL6 2h IL6 4h IL6 20hh 1 2 5.9 2 0.7 3.6 1.3 NS 2 2 5.2 4.9 3.1 3.5 1.6 NS 3 3 4 3.2 4.8 14.3 13.5 NS 4 3 1.1 NS 1.4 3.3 NS NS 5 1 1.1 NS 1.1 1.9 2.8 1.2 6 1 2.1 2 2.9 2 5.9 8.3 7 1 0.5 1.3 0.4 0.5 1.8 1.7 8 3 4 3.2 4.8 14.3 13.5 NS 9 1 3 2.2 2 2.2 2.5 1.9 10 3 2.8 NS NS 5.5 NS NS 11 3 0.4 0.7 1.2 2.8 1.8 NS 12 2 4.3 0.9 1.8 3.3 5 NS 13 1 31.2 29.6 33 31.4 34.6 28.4 14 3 2.4 2.2 1.8 2.3 NS NS 15 2 16.3 22.6 9.9 21.1 21.9 NS 16 3 4.6 4 4.4 5.2 4.9 NS 17 1 19.4 10.9 18.8 14.3 9.5 NS 18 1 4 4.3 8.5 19.2 20.5 9.3 19 1 0.3 0.5 0.7 1.3 6.8 1 20 1 1.2 0.7 1.1 1.2 1.06 4.4 21 2 4.9 3.4 3 4 10.6 6.1 22 1 2.2 2.3 2 2.8 2.9 NS

117
Appendix 5.17: plasma tPA activity (u/ml) concentration at baseline and time points (baseline, 1h, 2h and 4h) after IV NAC infusion commencement in each subject . NS: no sample. (1: minimal ADRs, 2: moderate ADRs, 3: severe ADRs) (Intensive study).
Subject no Severity tPA act baseline tPA act 1h tPA act 2h tPA act 4h 1 2 0.1 0.3 0.1 0.2 2 2 0.1 0.1 0.1 0.1 3 3 0.1 0.1 0.1 0.1 4 3 0.5 0.8 0.5 NS 5 1 0.2 0.1 0.1 0.3 6 1 0.1 0.1 0.3 0.3 7 1 0.4 0.6 0.4 0.3 8 3 0.7 2 0.8 0.2 9 1 0.1 0.1 0.1 0.1 10 3 NS NS NS NS 11 3 0.6 1.7 0.9 0.9 12 2 0.6 0.2 0.5 3.1 13 1 0.1 0.1 0.1 0.1 14 3 0.8 1.7 0.9 NS 15 2 0.9 2.2 1.1 0.9 16 3 0.3 1.4 0.6 0.5 17 1 0.9 0.1 0.1 0.1 18 1 0.1 0.1 0.1 0.1 19 1 0.43 1.09 0.1 0.1 20 1 0.3 0.4 0.1 0.3 21 2 0.1 0.1 0.1 0.1 22 1 0.1 0.1 0.1 0.2

118
Appendix 5.18: plasma tPA antigen (ng/ml) concentration at baseline and time points (baseline, 1h, 2h and 4h) after IV NAC infusion commencement in each subject.NS: no sample. (1: minimal ADRs, 2: moderate ADRs, 3: severe ADRs) (Intensive study).
Subject no Severity tPA Ag baseline tPA Ag 1h tPA Ag 2h tPA Ag 4h 1 2 14.5 13.1 12 10 2 2 3.2 8.8 14.8 14.2 3 3 99.6 88.9 94.9 97.5 4 3 8.4 6.8 6.8 NS 5 1 12.9 14.9 13.2 14.8 6 1 12.9 16.5 20.6 14.4 7 1 1.8 2.7 2.5 3.5 8 3 9.9 11.8 13.4 6 9 1 16.7 15.4 13.9 8.6 10 3 NS NS NS NS 11 3 6 6.2 9.7 7.9 12 2 6.3 3.6 9.2 15.9 13 1 29.9 20.6 46.1 35.7 14 3 3.2 4.8 3.8 NS 15 2 8.7 14.8 12.8 6.8 16 3 6.1 11.5 6.1 6 17 1 16.6 16.6 35.3 31.2 18 1 17.5 15.6 19.2 23.8 19 1 8.6 10.9 14.9 33.8 20 1 54.1 48.9 19.9 53.9 21 2 29.8 40.6 29.4 18.9 22 1 17.7 13.5 19.3 6.1

119
Appendix 5.19: plasma vWf (ng/ml) concentration at baseline and time points (baseline, 30min,1h, 2h, 4h and 20h) after IV NAC infusion commencement in each subject. NS: no sample. (1: minimal ADRs, 2: moderate ADRs, 3: severe ADRs) (Intensive study).
Subject no Severity vWf base line vWf 30min vWf 1h vWf 2h vWf 4h vWf 20h 1 2 1.09 2.83 0.68 0.97 0.94 NS 2 2 1.92 1.82 1.49 1.67 0.56 1.5 3 3 1 0.86 0.99 1.06 1.06 1.06 4 3 1.06 0.99 0.72 1.07 NS NS 5 1 0.88 0.69 0.75 0.83 0.76 1.23 6 1 0.89 NS 1.84 1.91 1.03 2.3 7 1 0.97 0.52 1.04 0.88 1.13 1.14 8 3 1 0.86 0.99 1.06 1.06 1.66 9 1 1.7 1.69 1.93 1.98 1.56 NS 10 3 1.51 NS NS 1.79 NS NS 11 3 0.78 0.75 1.01 1.06 1.21 0.95 12 2 2.21 2.12 2.06 2.17 2.19 2.04 13 1 2.16 2.98 3.25 0.94 2.72 0.9 14 3 1.2 1.2 1.12 1.04 NS 15 2 1.57 2.58 NS 1.32 1.13 1.46 16 3 0.86 0.88 0.69 0.78 0.82 NS 17 1 1.57 1.85 2.44 2.01 1.85 1.59 18 1 0.8 0.72 1.74 1.17 1.37 1.58 19 1 1.79 1.4 1.51 1.3 1.53 1.27 20 1 1.92 2.07 1.62 1.83 2.08 NS 21 2 3.23 3.13 3.02 2.19 2.38 2.02 22 1 0.89 1.08 1.13 1.13 1.14 NS

120
Appendix 5.20: plasma clotting factor II concentration (iu/l) at baseline and time points (baseline, 30 min, 1h, 2h, 4h and 20h) after IV NAC infusion commencement in each subject. NS: no sample. (1: minimal ADRs, 2: moderate ADRs, 3: severe ADRs) (intensive study).
Subject no Severity FacII baseline FacII 30min FacII1h FacII2h FacII4h FacII20h 1 2 0.95 0.717 0.878 1.01 0.936 NS 2 2 0.571 0.411 0.491 0.496 0.529 0.512 3 3 1.051 0.884 0.903 0.903 0.878 0.796 4 3 0.512 0.445 0.501 0.792 NS NS 5 1 0.765 0.665 0.665 0.717 0.626 0.736 6 1 1.21 NS 1.051 1.01 0.89 1.35 7 1 0.807 0.853 0.83 0.571 0.726 0.972 8 3 0.745 0.649 0.558 0.726 0.717 0.786 9 1 0.736 0.665 0.507 0.476 0.491 0.476 10 3 0.991 NS NS 0.878 NS NS 11 3 1.238 1.139 1.187 1.212 1.265 1.094 12 2 0.847 0.755 NS 0.676 0.83 0.903 13 1 0.612 0.449 0.425 0.471 0.441 0.584 14 3 0.755 0.673 0.641 0.755 NS NS 15 2 0.919 0.775 NS 0.818 0.83 0.89 16 3 0.736 0.517 0.491 0.584 NS NS 17 1 0.851 0.691 0.701 0.719 0.691 0.803 18 1 0.717 0.591 0.641 0.605 0.649 0.393 19 1 1.03 0.853 0.736 0.919 0.936 0.954 20 1 0.936 0.807 NS 0.83 0.796 0.936 21 2 0.781 0.617 0.701 0.647 0.803 0.781 22 1 0.803 0.561 0.729 NS 0.749 NS
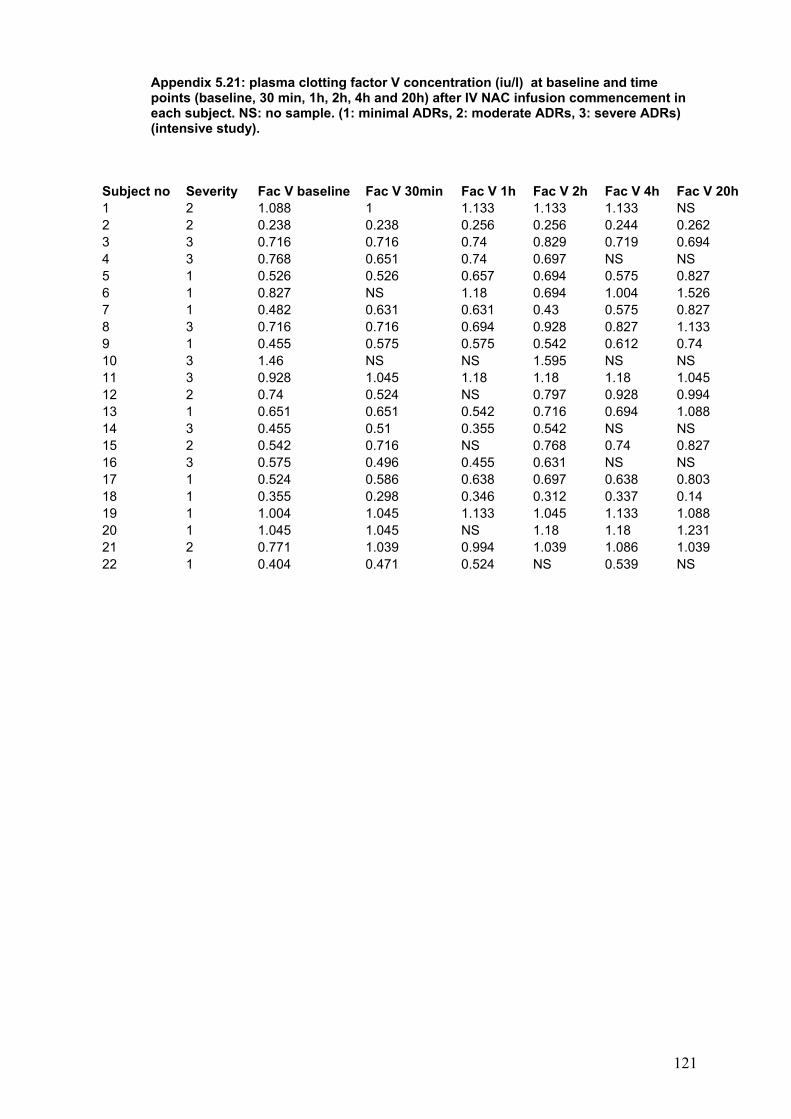
121
Appendix 5.21: plasma clotting factor V concentration (iu/l) at baseline and time points (baseline, 30 min, 1h, 2h, 4h and 20h) after IV NAC infusion commencement in each subject. NS: no sample. (1: minimal ADRs, 2: moderate ADRs, 3: severe ADRs) (intensive study).
Subject no Severity Fac V baseline Fac V 30min Fac V 1h Fac V 2h Fac V 4h Fac V 20h 1 2 1.088 1 1.133 1.133 1.133 NS 2 2 0.238 0.238 0.256 0.256 0.244 0.262 3 3 0.716 0.716 0.74 0.829 0.719 0.694 4 3 0.768 0.651 0.74 0.697 NS NS 5 1 0.526 0.526 0.657 0.694 0.575 0.827 6 1 0.827 NS 1.18 0.694 1.004 1.526 7 1 0.482 0.631 0.631 0.43 0.575 0.827 8 3 0.716 0.716 0.694 0.928 0.827 1.133 9 1 0.455 0.575 0.575 0.542 0.612 0.74 10 3 1.46 NS NS 1.595 NS NS 11 3 0.928 1.045 1.18 1.18 1.18 1.045 12 2 0.74 0.524 NS 0.797 0.928 0.994 13 1 0.651 0.651 0.542 0.716 0.694 1.088 14 3 0.455 0.51 0.355 0.542 NS NS 15 2 0.542 0.716 NS 0.768 0.74 0.827 16 3 0.575 0.496 0.455 0.631 NS NS 17 1 0.524 0.586 0.638 0.697 0.638 0.803 18 1 0.355 0.298 0.346 0.312 0.337 0.14 19 1 1.004 1.045 1.133 1.045 1.133 1.088 20 1 1.045 1.045 NS 1.18 1.18 1.231 21 2 0.771 1.039 0.994 1.039 1.086 1.039 22 1 0.404 0.471 0.524 NS 0.539 NS
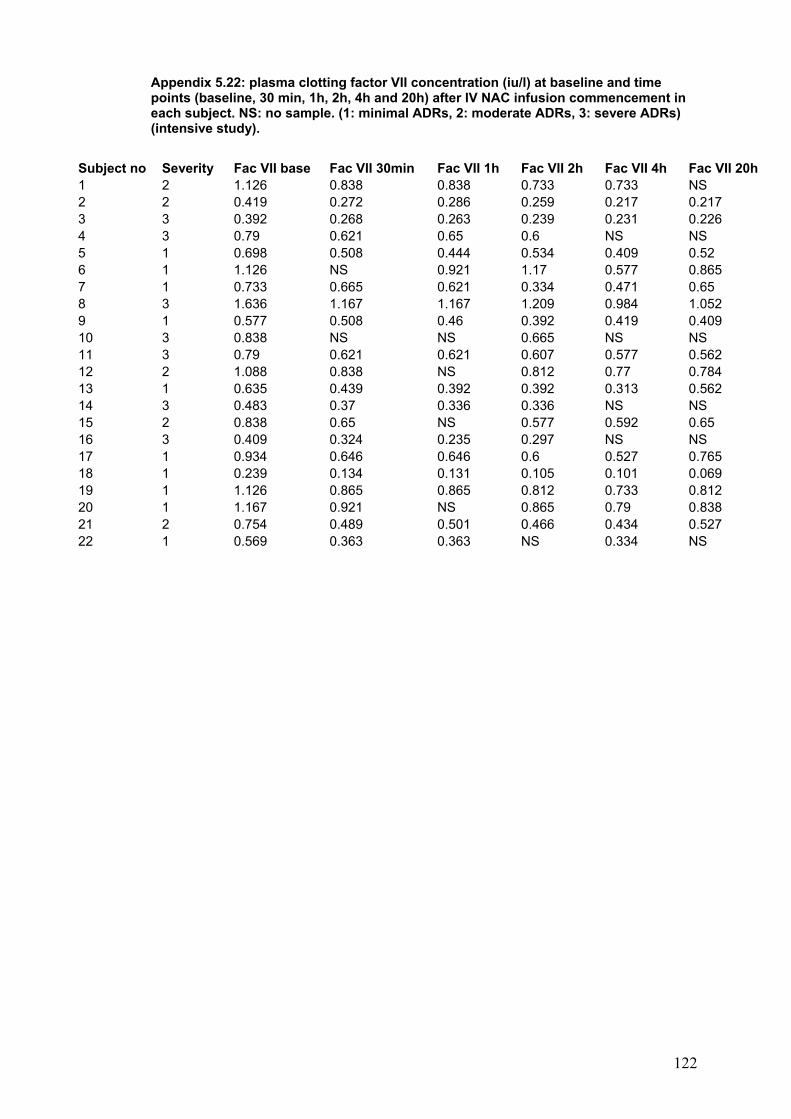
122
Appendix 5.22: plasma clotting factor VII concentration (iu/l) at baseline and time points (baseline, 30 min, 1h, 2h, 4h and 20h) after IV NAC infusion commencement in each subject. NS: no sample. (1: minimal ADRs, 2: moderate ADRs, 3: severe ADRs) (intensive study).
Subject no Severity Fac VII base Fac VII 30min Fac VII 1h Fac VII 2h Fac VII 4h Fac VII 20h 1 2 1.126 0.838 0.838 0.733 0.733 NS 2 2 0.419 0.272 0.286 0.259 0.217 0.217 3 3 0.392 0.268 0.263 0.239 0.231 0.226 4 3 0.79 0.621 0.65 0.6 NS NS 5 1 0.698 0.508 0.444 0.534 0.409 0.52 6 1 1.126 NS 0.921 1.17 0.577 0.865 7 1 0.733 0.665 0.621 0.334 0.471 0.65 8 3 1.636 1.167 1.167 1.209 0.984 1.052 9 1 0.577 0.508 0.46 0.392 0.419 0.409 10 3 0.838 NS NS 0.665 NS NS 11 3 0.79 0.621 0.621 0.607 0.577 0.562 12 2 1.088 0.838 NS 0.812 0.77 0.784 13 1 0.635 0.439 0.392 0.392 0.313 0.562 14 3 0.483 0.37 0.336 0.336 NS NS 15 2 0.838 0.65 NS 0.577 0.592 0.65 16 3 0.409 0.324 0.235 0.297 NS NS 17 1 0.934 0.646 0.646 0.6 0.527 0.765 18 1 0.239 0.134 0.131 0.105 0.101 0.069 19 1 1.126 0.865 0.865 0.812 0.733 0.812 20 1 1.167 0.921 NS 0.865 0.79 0.838 21 2 0.754 0.489 0.501 0.466 0.434 0.527 22 1 0.569 0.363 0.363 NS 0.334 NS

123
Appendix 5.23: plasma clotting factor VIII concentration (iu/l) at baseline and time points (baseline, 30 min, 1h, 2h, 4h and 20h) after IV NAC infusion commencement in each subject. NS: no sample. (1: minimal ADRs, 2: moderate ADRs, 3: severe ADRs) (intensive study).
Subject no Severity Fac VIII baseline Fac VIII30min Fac VIII1 h Fac VIII2h Fac VIII4h Fac VIII20h 1 2 0.791 0.752 0.64 0.657 0.733 NS 2 2 2.44 3.039 3.039 3.039 2.316 1.53 3 3 0.855 0.909 1.407 1.318 1.343 1.819 4 3 0.886 0.758 0.886 0.662 NS NS 5 1 0.567 0.577 0.504 0.741 0.607 0.82 6 1 2.852 NS 3.011 3.964 2.403 2.193 7 1 1.094 1.665 1.004 0.725 0.897 1.391 8 3 0.95 1.158 0.728 1.057 1.223 1.294 9 1 1.294 1.33 1.395 1.282 1.381 1.235 10 3 1.158 NS NS 1.934 NS NS 11 3 0.577 0.768 0.851 0.931 0.89 1.241 12 2 1.437 1.222 NS 1.156 1.536 1.165 13 1 1.486 1.202 1.498 1.63 1.767 1.754 14 3 0.952 0.857 0.917 0.989 NS NS 15 2 0.897 0.845 NS 0.938 0.945 1.202 16 3 1.559 0.521 0.464 0.68 NS NS 17 1 1.282 0.938 1.212 1.212 0.982 1.146 18 1 1.641 1.414 1.658 1.461 1.702 1.425 19 1 1.193 1.346 1.848 1.379 1.617 1.313 20 1 1.949 2.405 NS 2.137 1.934 1.335 21 2 2.171 3.326 2.759 2.24 2.025 1.549 22 1 0.838 0.582 0.651 NS 0.73 NS

124
Appendix 5.24: plasma clotting factor IX concentration (iu/l) at baseline and time points (baseline, 30 min, 1h, 2h, 4h and 20h) after IV NAC infusion commencement in each subject. NS: no sample. (1: minimal ADRs, 2: moderate ADRs, 3: severe ADRs) iIntensive study).
Subject no Severity
Fac IX baseline
Fac IX 30min Fac IX 1h
Fac IX 2h Fac IX 4h
Fac IX 20h
1 2 0.783 0.75 0.757 0.776 0.81 NS 2 2 0.812 0.453 0.447 0.426 0.426 0.389 3 3 1.113 0.914 0.99 0.922 0.922 0.906 4 3 1.044 0.845 0.964 0.763 NS NS 5 1 0.486 0.367 0.537 0.636 0.565 0.738 6 1 1.548 NS 1.328 2.115 1.063 1.594 7 1 0.619 0.666 0.591 0.418 0.535 0.894 8 3 0.955 0.824 0.81 0.89 0.875 1.063 9 1 0.738 0.684 0.698 0.641 0.69 0.906 10 3 1.063 NS NS 1.063 NS NS 11 3 1.194 1.047 1.218 1.31 1.296 1.194 12 2 1.17 1.016 NS 0.903 1.006 1.036 13 1 0.682 0.575 0.56 0.619 0.494 0.745 14 3 1.112 0.877 0.718 0.939 NS NS 15 2 0.948 0.796 NS 0.804 0.894 1.079 16 3 0.672 0.398 0.376 0.481 NS NS 17 1 1.194 0.86 0.844 0.903 0.844 1.158 18 1 0.961 0.781 0.812 0.672 0.731 0.379 19 1 0.93 0.835 0.903 0.835 0.885 1.006 20 1 1.6 1.38 NS 1.409 1.31 1.583 21 2 1.27 1.047 1.101 1.016 1.146 1.101 22 1 0.912 0.679 0.718 NS 0.759 NS

125
Appendix 5.25: plasma clotting factor X (iu/l) concentration at baseline and different time (baseline, 30 min, 1h, 2h, 4h and 20h) points after IV NAC infusion in each subject with different severity. NS: no sample. (1: minimal ADRs, 2: moderate ADRs, 3: severe ADRs) (intensive study).
Subject no Severity Fac X base
Fac X 30min
Fac X 1h
Fac X 2h
Fac X 4h
Fac X 20h
1 2 0.617 0.537 0.584 0.566 0.56 NS 2 2 0.759 0.69 0.735 0.677 0.686 0.506 3 3 0.998 0.854 0.984 0.872 0.784 0.731 4 3 0.636 0.58 0.621 0.699 NS NS 5 1 0.673 0.584 0.774 0.745 0.613 0.673 6 1 1.092 NS 0.938 1.632 0.656 0.805 7 1 0.577 0.717 0.58 0.417 0.515 0.64 8 3 1.07 0.793 0.763 0.858 0.793 0.911 9 1 0.671 0.604 0.555 0.555 0.614 0.625 10 3 1.07 NS NS 0.635 NS NS 11 3 1.21 0.974 0.997 1.021 1.021 0.841 12 2 1.045 0.875 NS 0.825 0.841 0.858 13 1 0.458 0.322 0.278 0.392 0.262 0.33 14 3 0.696 0.528 0.511 0.537 NS NS 15 2 1.045 0.749 NS 0.709 0.735 0.793 16 3 0.693 0.426 0.414 0.528 NS NS 17 1 0.952 0.709 0.696 0.709 0.683 0.778 18 1 0.841 0.636 0.647 0.583 0.564 0.271 19 1 1.021 0.809 0.841 0.841 0.809 0.778 20 1 1.273 0.974 NS 0.93 0.893 1.021 21 2 0.911 0.696 0.722 0.709 0.763 0.722 22 1 0.952 0.659 0.647 NS 0.671 NS

126
Appendix 5.26: plasma clotting factor XI concentration (iu/l) at baseline and time points (baseline, 30 min, 1h, 2h, 4h and 20h) after IV NAC infusion commencement in each subject. NS: no sample. (1: minimal ADRs, 2: moderate ADRs, 3: severe ADRs) (Intensive study).
Subject no Severity FacXI baseline FacXI 30min FacXI 1h FacXI 2h FacXI 4h FacXI 20h 1 2 0.617 0.537 0.584 0.566 0.56 NS 2 2 0.759 0.69 0.735 0.677 0.686 0.506 3 3 0.998 0.854 0.984 0.872 0.784 0.731 4 3 0.686 0.58 0.621 0.699 NS NS 5 1 0.673 0.584 0.774 0.745 0.613 0.673 6 1 1.092 NS 0.938 1.632 0.656 0.805 7 1 0.577 0.717 0.58 0.417 0.515 0.64 8 3 0.681 0.745 0.621 0.694 0.632 0.699 9 1 0.621 0.665 0.694 0.628 0.648 0.55 10 3 0.53 NS NS 0.635 NS NS 11 3 0.832 0.849 0.86 0.866 0.816 0.796 12 2 0.932 0.769 NS 0.849 0.838 0.895 13 1 0.243 0.24 0.238 0.272 0.243 0.235 14 3 0.726 0.669 0.673 0.694 NS NS 15 2 0.849 0.779 NS 0.774 0.805 0.821 16 3 0.621 0.5 0.448 0.546 NS NS 17 1 0.753 0.68 0.684 0.706 0.673 0.706 18 1 0.784 0.677 0.714 0.624 0.632 0.445 19 1 0.595 0.644 0.617 0.617 0.577 0.566 20 1 0.901 0.81 NS 0.816 0.779 0.779 21 2 0.953 1.04 0.998 0.974 0.9 0.725 22 1 0.537 0.462 0.453 NS 0.401 NS

127
Publications
Related Documents