PAPI 2016 The Viet Nam Provincial Governance and Public Administration Performance Index Measuring citizens’ experiences Centre for Community Support and Development Studies Centre for Research and Training of the Viet Nam Fatherland Front

Welcome message from author
This document is posted to help you gain knowledge. Please leave a comment to let me know what you think about it! Share it to your friends and learn new things together.
Transcript

PAPI 2016The Viet Nam Provincial Governance
and Public Administration Performance Index
Measuring citizens’ experiences
www.papi.org.vn
Centre for Community Support and Development Studies
Centre for Research and Training of the Viet Nam Fatherland Front
United Nations Development Programme304 Kim Ma, Ha Noi, Viet NamTel: (84 4) 38 500 100Fax: (84 4) 37 265 520Email: [email protected]
Centre for Community Support &Development StudiesRoom 1510, Building JSC 34 Alley 164, Khuat Duy Tien Street Thanh Xuan DistrictHa Noi, Viet NamTel: (04) 22 250 618
www.cecodes.orgFax: (04) 62 861935
Citation: CECODES, VFF-CRT & UNDP (2017). The Viet Nam Governance and Public Administration Performance Index (PAPI) 2016: Measuring Citizens’ Experiences. A Joint Policy Research Paper by Centre for Community Support and Development Studies (CECODES), Centre for Research and Training of the Viet Nam Fatherland Front (VFF-CRT), and United Nations Development Programme (UNDP). Ha Noi, Viet Nam
All rights reserved. No part of this publication may be reproduced, stored in a retrieval system or transmitted, in any form or by any means, electronic, mechanical, photocopying, recording or otherwise without prior permission.
For a list of any errors or omissions found subsequent to printing, please visit the PAPI website at www.papi.org.vn.
Disclaimer: The opinions, analyses and recommendations contained in this document do not necessarily reflect the official opinions of the partner organizations. The report is an independent publication.
Maps presented herein are intended for illustrative purposes only. For the United Nations Development Programme (UNDP), a co-implementing partner in this PAPI research, the designations employed and the presentation of material on the maps do not imply the expression of any opinion whatsoever on the part of UN or UNDP concerning the legal status of any country, territory, city or area or its authorities, or concerning the delimitation of its frontiers or boundaries.
Cover and Lay-out design: Golden Sky Co.,Ltd. – www.goldenskyvn.com
Publishing licence No: ĐKHXB 761-2017/CXBIPH/35-11/HĐ and QĐXB No: 425/QĐ-NXBHĐ issued on 24 March, 2017ISBN: 978 - 604 - 955 - 152 - 9
PAPI2016The Viet Nam Provincial Governance
and Public Administration Performance Index
Measuring citizens’ experiences
Centre for Community Support and Development Studies (CECODES)Centre for Research and Training of the Viet Nam Fatherland Front (VFF-CRT)
United Nations Development Programme (UNDP)
FOREWORD ..............................................................................................................................................................................VIII
ACKNOWLEDGEMENTS ............................................................................................................................................... X
PAPI NATIONAL ADVISORY BOARD ...........................................................................................................XII
SNAPSHOT OF PAPI FROM 2009-2016 ..................................................................................................XIII
EXECUTIVE SUMMARY............................................................................................................................................... XV
INTRODUCTION ..................................................................................................................................................................... 1
CHAPTER 1
NATIONAL TRENDS IN GOVERNANCE AND PUBLIC ADMINISTRATION
PERFORMANCE ...................................................................................................................................................................................... 7
Overview ................................................................................................................................................................................................. 7
National Trends Over Time from 2011 to 2016 .......................................................................................................................... 7
Measurable Improvements in Access to Public Health Insurance ...................................................................................... 8
Citizen Participation at Local Levels ............................................................................................................................................10
Trends in Land Seizures and Compensation ............................................................................................................................13
Access to Land Use Rights Certificates .......................................................................................................................................14
Satisfaction with Household Economic Conditions ..............................................................................................................16
Issues of Greatest Concern in 2016 ..............................................................................................................................................19
Implications ..........................................................................................................................................................................................22
TABLE OF CONTENTS

CHAPTER 2
IMPORTANT ISSUES IN VIET NAM IN 2016: ENVIRONMENT, POVERTY AND THE TRANS-PACIFIC PARTNERSHIP
Overview ...............................................................................................................................................................................................25
Environment as an Emerging Important Topic........................................................................................................................26
Trade-offs Between Economic and Environmental Concerns ............................................................................................28
Views on Specific Environmental Problems..............................................................................................................................31
Poverty as the Greatest Concern ..................................................................................................................................................32
Citizen Perspectives of the Trans-Pacific Partnership ............................................................................................................33
Implications ..........................................................................................................................................................................................35
CHAPTER 3
PROVINCIAL PERFORMANCE IN 2016 AND OVER TIME (2011-2016)
Overview ...............................................................................................................................................................................................37
Dimension 1: Participation at Local Levels ................................................................................................................................40
Dimension 2: Transparency ............................................................................................................................................................48
Dimension 3: Vertical Accountability ..........................................................................................................................................55
Dimension 4: Control of Corruption in the Public Sector ....................................................................................................61
Dimension 5: Public Administrative Procedures .....................................................................................................................69
Dimension 6: Public Service Delivery ..........................................................................................................................................78
Aggregated 2016 PAPI Performance and Implications ........................................................................................................85
BIBLIOGRAPHY .....................................................................................................................................................................90
APPENDICES ............................................................................................................................................................................94
Appendix A: Key Demographic Specifications of the PAPI 2016 Sample ......................................................................94
Appendix B: Provincial Responses to PAPI ................................................................................................................................96
Appendix C: PAPI and the Sustainable Development Goals...............................................................................................99
Appendix D: Citizen Views on Environmental Problems .................................................................................................. 101
TABLE OF CONTENTS

THE VIET NAM PROVINCIAL GOVERNANCE AND PUBLIC ADMINISTRATION PERFORMANCE INDEX PAPI 2016
VI
LIST OF FIGURESFigure 1.1: PAPI Mean Scores by Dimensions, 2011-2016 ............................................................................................. 8Figure 1.2: Public Service Delivery Scores, 2011-2016 .................................................................................................... 9Figure 1.3: Percentage of Population with Health Insurance, 2011-2016 ................................................................ 9Figure 1.4: Change in Citizen Participation at Local Levels Scores, 2011-2016 ...................................................10Figure 1.4a: Self-Reported Voter Turnout in 2011 and 2016 .........................................................................................11Figure 1.5: Percentage of Citizens Reporting Land Seizures, 2011-2016 ...............................................................13Figure 1.6: Types of Compensation Received for Land, 2014-2016 .........................................................................13Figure 1.7: Percentage of Citizens Reporting that Compensation for Land Seizure is Fair, 2014-2016 ..............14Figure 1.8: Percentage of Men and Women with Names on Land Use Rights Certificates, 2016 ..................15Figure 1.9: Current Economic Condition by Income Level, 2016 ..............................................................................18Figure 1.10: Change in Economic Condition from Past Five Years by Income Level ............................................18Figure 1.11: Economic Prospects for Five Years in Future by Income Level .............................................................18Figure 1.12: Most Important Issue Facing the Country from Citizens’ Perspective, 2016 ...................................19Figure 1.13: Change in Most Important Issue (Increase from 2015 to 2016) ..........................................................20Figure 1.14: Change in Most Important Issue (Decrease from 2015 to 2016) ........................................................20Figure 1.15: Perceptions of Corruption and Bribery in the Public Sector, 2011-2016 ..........................................21Figure 2.1: Environment as a Top Concern Facing the Country, 2015-2016 .........................................................26Figure 2.2: Environment as a Top Concern by Education Level, 2016 .....................................................................27Figure 2.3: Willingness to Sacrifice Economic Growth for Environmental Protection by Education Level, 2016 ......................................................................................................................................................29Figure 2.4: Predicted Vote Share for National Assembly Candidate by Policy Priority, 2016 ..........................30Figure 2.5: Areas with Most Citizens Reporting Declining Water, Air Quality in 2016 .......................................32Figure 2.6: Most Important Issue by Income Group from Citizens’ Perspective ..................................................33Figure 3.1: Changes in Indicators on Election of Village Heads, 2011-2016 .........................................................47Figure 3.2: Voluntary Participation in Community-based Infrastructure Projects, 2011-2016 ......................47Figure 3.2a: Transparency of Commune Land Plans and Land Compensation Frameworks, 2011-2016 ................50Figure 3.2b: Respondents Who Lost Land and Were Informed of Land Clearance Purposes, 2011-2016 ................50Figure 3.2c: Changes in Performance in Transparency (% - 2016 against 2011) ...................................................54Figure 3.3a: Whom Do Citizens Meet First When in Need? 2011-2016 .....................................................................60Figure 3.3b: Citizen Views of People’s Inspection Boards, 2011-2016 ........................................................................60Figure 3.4a: Relationship Needed for State Employment, 2011-2016.......................................................................63Figure 3.4b: Relationship Needed for State Employment by Province, 2016 ..........................................................67Figure 3.4c: Denunciation Price, 2011-2016 .......................................................................................................................67Figure 3.4d: Changes in Performance in Control of Corruption (% - 2016 against 2011) ...................................68Figure 3.5a: Total Quality of Public Certification Services, 2016 ..................................................................................76Figure 3.5b: Total Quality of Public Administrative Services for LURCs, 2016 .........................................................76Figure 3.5c: Total Quality of Commune-level Public Administrative Services, 2016 ............................................77Figure 3.5d: Access to One-stop Shops for Public Administrative Services, 2011-2016 .....................................77Figure 3.6a: Total District Hospital Quality (based on 10 criteria), 2011-2016 ........................................................83Figure 3.6b: Law and Order, 2011-2016 ................................................................................................................................83Figure 3.6c: Changes in Performance in Public Service Delivery (% - 2016 against 2011) ................................84Figure 3.7a. Correlation between 2016 PAPI and 2016 PAPI (weighted indexes)..................................................89Figure 3.7b: Correlation between 2016 PAPI with 2016 PCI ..........................................................................................89
THE VIET NAM PROVINCIAL GOVERNANCE AND PUBLIC ADMINISTRATION PERFORMANCE INDEX PAPI 2016
www.papi.org.vn
VII
LIST OF MAPS
LIST OF BOXES AND TABLES
Map 3.1: Provincial Performance in Citizen Participation at Local Levels by Quartiles in 2016 ...................43Map 3.2: Provincial Performance in Transparency by Quartiles in 2016 ...............................................................51Map 3.3: Provincial Performance in Vertical Accountability by Quartiles in 2016 .............................................57Map 3.4: Provincial Performance in Control of Corruption in the Public Sector by Quartiles in 2016 .....................................................................................................................................................64Map 3.5: Provincial Performance in Public Administrative Procedures by Quartiles in 2016 .......................72Map 3.6: Provincial Performance in Public Service Delivery by Quartiles in 2016 ............................................80Map 3.7: Provincial Performance in Governance and Public Administration by Quartiles in 2016 .....................................................................................................................................................87
Table 1.1: Citizens Participating in Pre-Election Meetings with Candidates, 2016 .............................................12Table 1.2: Citizens Participating in Meetings with People’s Council Delegates, 2016 .......................................12Table 1.3: Percentage of Respondents with Land Use Rights Certificates, 2016 .................................................14Table 1.4: Reason Why Respondent’s Name is not on the Land Use Rights Certificates, 2016 .......................15Table 1.5: Views on Household Economic Situation, 2011-2016 ...............................................................................16Table 1.6: Monthly Income Levels as Assessed by Respondents, 2016 ...................................................................16Table 1.7: Estimated Frequency of Paying Bribes to Obtain Land Use Right Certificates and Access Public Heath Care at District Level, 2012-2016 ..............................................................................21Table 2.1: Water Quality as Assessed by Citizens, 2016 .................................................................................................31Table 2.2: Air Quality as Assessed by Citizens, 2016 .......................................................................................................31Table 2.3: Support for Trans-Pacific Partnership, 2016 ..................................................................................................34Table 3.1: Citizen Participation at Local Levels (Dimension 1): Results by Indicators, 2011-2016 .................44Table 3.2: Transparency (Dimension 2): Results by Indicators, 2011-2016 ............................................................52Table 3.3: Vertical Accountability (Dimension 3): Results by Indicators in 2016 ..................................................58Table 3.4: Control of Corruption (Dimension 4): Results by Indicators, 2011-2016 ............................................65Table 3.5: Public Administrative Procedures (Dimension 5): Results by Indicators, 2011-2016 .....................73Table 3.6: Public Service Delivery (Dimension 6): Results by Indicators, 2011-2016 ..........................................81Table 3.7: Aggregate Performance by Province in 2016 ...............................................................................................88
Figure A: Comparison of Key Demographic Variables Over Time and with 2009 Census.............................94Figure A1: Kinh Ethnicity by Province in PAPI 2016 vs. National Census 2009 ....................................................94Figure A2: Age Distribution in PAPI 2015 Sample vs. National Census 2009 .......................................................95Figure A3: Occupation of PAPI 2016 Respondents ........................................................................................................95Figure A4: Education Levels of PAPI 2016 Respondents ..............................................................................................95
THE VIET NAM PROVINCIAL GOVERNANCE AND PUBLIC ADMINISTRATION PERFORMANCE INDEX PAPI 2016
VIII
FOREWORD
The Viet Nam Provincial Governance and Public Administration Performance Index (PAPI) is a policy monitoring tool that reflects citizens’ experiences with governance, public administration, and public service delivery in Viet Nam. The year 2016 saw the sixth nationwide PAPI survey (2011-2016) and the eighth year of PAPI implementation.
PAPI serves as a mirror to reflect the performance of 63 provincial governments in areas of citizen concerns and where citizens and local governments have the most direct interactions. PAPI has helped motivate public officials, civil servants, and public employees at different levels and in different sectors to perform better in citizen engagement in governance activities, public sector management, and public service delivery. The index ultimately contributes to Viet Nam’s endeavour to develop a civil service system that serves citizens, acts with integrity, and fosters national development. PAPI also provides evidence for officials, media, and civil society to advocate actionable measures that respond to citizens’ needs.
This 2016 PAPI Report presents the results of the 2016 nationwide survey, with quantitative data articulating the experiences of 14,063 citizens who were a randomly selected, representative sample of different demographic groups across the country. Since the first pilot survey in 2009, almost 89,000 citizens across Viet Nam have engaged in face-to-face interviews and shared their experiences and assessments of governance and public administration performance by the State apparatus from the central to commune levels.
The survey in 2016 was conducted from August to November, after the national elections of the 14th National Assembly and People’s Councils. The survey took place when the governments at all levels for the period 2016-2021 had started operation, with the Prime Minister’s commitment to building a “government that facilitates development, acts with integrity and pro-activeness, and works for its People”. In addition, Viet Nam started rolling out its national Agenda for Sustainable Development towards 2030, including Goal 16 which emphasizes citizen participation and inclusion in governance, as well as strong institutions that promote accountability, responsiveness, and anti-corruption.
To reflect the country’s context, and to make the 2016 PAPI the baseline for the 2016-2021 government term (to track improvement in governance and public administration performance), the research methodology was refined and updated to a significant extent in 2016. Changes were made to some sub-dimensions to incorporate actionable measures on local government performance in citizen engagement, vertical accountability, and public administrative procedures. Also, a few thematic questions were added to seek the opinions of citizens on environmental issues and the Trans-Pacific Partnership agreement, as well as their experiences when interacting with candidates and elected delegates before and after the 2016 elections. Some questions asking citizens to assess their income level also were added so that PAPI can look into inequality issues.
PAPI has consolidated its role as a source of baselines and evidence for policy makers, practitioners, civil society, the media, the research community, and international donors to monitor and assess sustainable development in Viet Nam. At the provincial level, at least 57 provinces have hosted or convened diagnostic workshops on PAPI findings, and 35 of these provinces have issued provincial resolutions, directives, and/or action plans in response to PAPI findings.
At the national level, PAPI has been received as a tool that reflects the voices and expectations of citizens, and transfers these to the State, the Government, and the National Assembly. It has been a reference for different
THE VIET NAM PROVINCIAL GOVERNANCE AND PUBLIC ADMINISTRATION PERFORMANCE INDEX PAPI 2016
www.papi.org.vn
IX
sectors (including health care, internal affairs, education, and government inspection) in developing their monitoring and evaluation systems to oversee user satisfaction with public services.
At the international level, PAPI has been highlighted as an innovative approach to collecting citizens’ voices related to their satisfaction with the performance of central and local governments. PAPI is used as a means of verification of Viet Nam’s progress in governance, citizen participation, gender equality, quality of public services, and control of corruption, as included in the One Plan of the United Nations and the Government of Viet Nam for the periods 2012-2016 and 2017-2021, and in country strategies of bilateral and multilateral donor agencies. PAPI also provides data and evidence for the United Nations to monitor Viet Nam’s progress in implementation of the 2030 Agenda on Sustainable Development that the country has committed to. PAPI data has been used by researchers for their international and domestic publications in governance and public administration disciplines. It is expected that with the 2016 PAPI data and evidence from PAPI surveys over the next five years, the Government of Viet Nam can better oversee how it moves towards “the government that facilitates development and serves its People” and Viet Nam’s progress in realising the 2030 Agenda. We hope that the 2016 PAPI Report will serve as a reference for provinces, sectors, the society and the citizenry to gauge Viet Nam’s progress in achieving sustainable development goals in the new development context.
Centre for Community Support
and Development Studies
Centre for Research and Training of
the Viet Nam Fatherland Front
United NationsDevelopment Programme
in Viet Nam

THE VIET NAM PROVINCIAL GOVERNANCE AND PUBLIC ADMINISTRATION PERFORMANCE INDEX PAPI 2016
X
ACKNOWLEDGEMENTS
This 2016 PAPI Report is the result of the continued productive partnership between the Centre for Community Support and Development Studies (CECODES), the Centre for Research and Training of the Viet Nam Fatherland Front (VFF-CRT), and the United Nations Development Programme (UNDP). The year 2016 marked the eighth round of collaboration between the implementing partners and the sixth nationwide PAPI survey.
The report is co-authored by Ms Đỗ Thanh Huyền from UNDP; Dr Đặng Ngọc Dinh and Dr Đặng Hoàng Giang from CECODES; Professor of Political Economy, Dr Edmund J. Malesky from Duke University (UNDP international consultant on governance measurement); and Dr Paul Schuler from the University of Arizona (UNDP international consultant on research quality control).
The team wishes to thank Mr Bakhodir Burkhanov, former Deputy Country Director of UNDP Viet Nam and Mr Dennis Curry, Head of Governance and Participation Unit of UNDP Viet Nam, for their substantive guidance and managerial advice throughout the 2016 PAPI implementation cycle. Special thanks also go to Dr Đào Minh Châu, former Senior Programme Officer at Swiss Development and Cooperation (SDC) for his great support and contributions since 2011.
PAPI surveys have been made possible thanks to diligent guidance from the Viet Nam Fatherland Front (VFF) and proactive VFF collaboration at the provincial to grassroots levels. Special thanks also go to the 14,063 Vietnamese citizens who were randomly selected for the face-to-face interviews. They actively participated in the 2016 PAPI survey by sharing their valuable experiences of interactions with local authorities and their perspectives on governance, public administration performance, and public service delivery in their localities. PAPI has been guided by the PAPI Advisory Board consisting of 24 national and international members (see the list of board members herein) who have great insights into Vietnamese public policies and practices and knowledge of international standards in the areas of governance and public administration. The advisors have played an instrumental role in making PAPI relevant and accountable to different beneficiaries.
Great appreciation goes to the Ho Chi Minh National Academy of Politics (HCMA), including former President Dr Tạ Ngọc Tấn, current President Dr Nguyễn Xuân Thắng, and other HCMA leaders and senior experts for their fruitful collaboration in PAPI action research in an increasing number of provinces, and for their use of PAPI findings in HCMA executive training programmes.
Thanks also go to VFF-CRT Vice Director Dr Phạm Thị Hồng and her colleagues, as well as Mr Nguyễn Ngọc Dinh, former Director of the Department for Democracy and Law (VFF Central Committee), for their diligent support during the process of PAPI data collection and in the successful organization of northern, central, and southern regional workshops in 2016 to disseminate PAPI findings to all 63 provinces.
Field controllers played a critical role in the 2016 PAPI survey. They include Nguyễn Thị Lan Anh, Phạm Hải Bình, Trần Công Chính, Tạ Kim Cúc, Lê Hữu Dũng, Bùi Thị Quế Dương, Đặng Phương Giang, Đoàn Thị Hà, Nguyễn Tuấn Hải, Nguyễn Thị Hiền, Nguyễn Công Hiển, Nguyễn Văn Hiệu, Nguyễn Văn Hùng, Nguyễn Nhật Linh, Lê Thế Lĩnh, Lê Văn Lư, Đinh Y Ly, Phạm Thị Minh Nguyệt, Trịnh Thị Trà My, Kim Thị Nhàn, Sùng A Phềnh, Hà Quang Phúc, Lê Minh Tâm, Nguyễn Thị Phương Thảo, Vũ Chiến Thắng, Phạm Văn Thịnh, Nguyễn Ngọc Tùng, Nguyễn Thị Quỳnh Trang, Trần Đình Trọng, Phan Lạc Trung, and Đặng Quốc Trung. These field controllers all deserve special mention as they ensured the data collection process was fully compliant with the strict PAPI procedures and standards.
THE VIET NAM PROVINCIAL GOVERNANCE AND PUBLIC ADMINISTRATION PERFORMANCE INDEX PAPI 2016
www.papi.org.vn
XI
In addition, thanks must go to the 324 enumerators who were selected from 2,180 applicants from final-year university students across Viet Nam. Without these young and enthusiastic interviewers, the data collection process could not have been completed. Special thanks go to CECODES collaborators Ms Trần Vân Anh and Ms Bùi Hải Ly for their support in recruiting the enumerators, following a rigorous process of enumerator selection, and meeting strict PAPI research requirements.
The tablet-based survey platform would not have been possible without the great technical support and services provided by Real-Time Analytics (RTA). Our appreciation in particular goes to RTA Director Dr Lê Đặng Trung and his associates, including Đào Hoàng Bình Thiên, Nguyễn Quang Tuyến, Lê Thị Tâm Phúc, Nguyễn Thị Hồng Linh, and Tăng Thị Hiên. They spent days and nights working to ensure that the 2016 PAPI tablet-based survey worked, the fieldwork monitoring website (www.papi.rta.vn) operated smoothly, real-time data collection functioned, and field support services were available every day. The work of Dr Lê Thị Nghệ and Ms Phạm Thị Minh Nguyệt from CECODES is recognized, particularly their pivotal role in administering and providing logistical support for the fieldwork. Likewise, we recognize the contributions of Mr Nguyễn Văn Phú and Mr Nguyễn Đức Trị from CECODES for their effective coordination with provincial VFF committees during the data collection process. Dr Phạm Minh Trí from CECODES followed up on the design of the 2016 tablet-based questionnaire and collaborated with the RTA team when required.
Thanks are also extended to W. G. Technology Solutions for its support in the development of the interactive www.papi.org.vn website. Ms Pernille Goodall and Mr Stanford Smith, UNDP editors and communication consultants, diligently provided editing of the English version of this report. Mr Nguyễn Việt Dũng, a young creative designer, helped with turning important findings into infographics.
As always, the generous funding from the Swiss Agency for Development and Cooperation (SDC) since 2011 is gratefully acknowledged. Funds from the One Plan Fund of the United Nations and UNDP in Viet Nam are greatly appreciated as well.

THE VIET NAM PROVINCIAL GOVERNANCE AND PUBLIC ADMINISTRATION PERFORMANCE INDEX PAPI 2016
XII
Mr Jairo Acuna-Alfaro, Policy Advisor, Responsive and Accountable Institutions Team, Governance and Peacebuilding, Bureau for Policy and Programme Support, United Nations Development Programme in New York
Mr Bùi Đặng Dũng, Vice Chairman, Committee on Finance and Budget, National Assembly, Member of the Kien Giang Provincial National Assembly Delegation
Mr Bùi Phương Đình, Director, Viet Nam Institute for Leadership and Public Policy, Ho Chi Minh National Academy of Politics
Mdm Cao Thị Hồng Vân, Former Director of the Centre for Women and Development, Central Committee of the Viet Nam Women’s Union
Mr Đinh Duy Hòa, Former General Director of Public Administration Reform Department, Ministry of Home Affairs
Mr Đinh Xuân Thảo, Former President, Institute of Legislative Studies, National Assembly Steering Committee
Mr Đỗ Duy Thường, Vice Chairman of Advisory Board on Democracy and Law, Viet Nam Fatherland Front Central Committee
Mdm Akiko Fujii, Deputy Country Director, United Nations Development Programme in Viet Nam
Mr Steven Geiger, Head of SDC Programme, Swiss Agency for Development and Cooperation
Mr. Hà Công Long, Former Vice Chairman, Commission on People’s Petitions, Standing Committee for the National Assembly
Mr Hồ Ngọc Hải, Member of the Advisory Board, Viet Nam Fatherland Front Central Committee
Ms Hoàng Vân Anh, Director of Legal Department, Land Administration Agency of Viet Nam, Ministry of Natural Resources and Environment
Mr Hoàng Xuân Hoà, Director of General Economic Affairs, Central Commission of Economic Affairs, Viet Nam Communist Party
Mdm Lê Thị Nga, Chairwoman, Judicial Committee, Viet Nam National Assembly
Mr Lê Văn Lân, Vice Chairman, North-western Region Steering Committee
Mr Nguyễn Doãn Khánh, Former Vice Chairman of the Law Committee, Viet Nam National Assembly
Mdm Nguyễn Thuý Anh, Division Head, Communist Party Magazine, Central Party Committee, Viet Nam Communist Party
Mr Nguyễn Văn Quyền, President of the Viet Nam Lawyers Association
Mr Phạm Anh Tuấn, Former Deputy Chairman, Central Commission on Internal Affairs, Viet Nam Communist Party
Mdm Phạm Chi Lan, Senior Economist and former Vice President, Viet Nam Chamber of Commerce and Industry
Mr Phạm Duy Nghĩa, Lecturer, Fulbright Economics Teaching Programme, University of Economics, Ho Chi Minh City
Mr Phạm Văn Tân, Vice President and General Secretary of Viet Nam Union of Science and Technology
Mr Thang Văn Phúc, (Advisory Board lead), former Vice Minister of Home Affairs, President of the Viet Nam Institute of Development Studies
Mr Trần Đức Lượng, Former Deputy Inspector General, Government Inspectorate
PAPI NATIONAL ADVISORY BOARD
Note: The list is in alphabetical order by family name.
THE VIET NAM PROVINCIAL GOVERNANCE AND PUBLIC ADMINISTRATION PERFORMANCE INDEX PAPI 2016
www.papi.org.vn
XIII
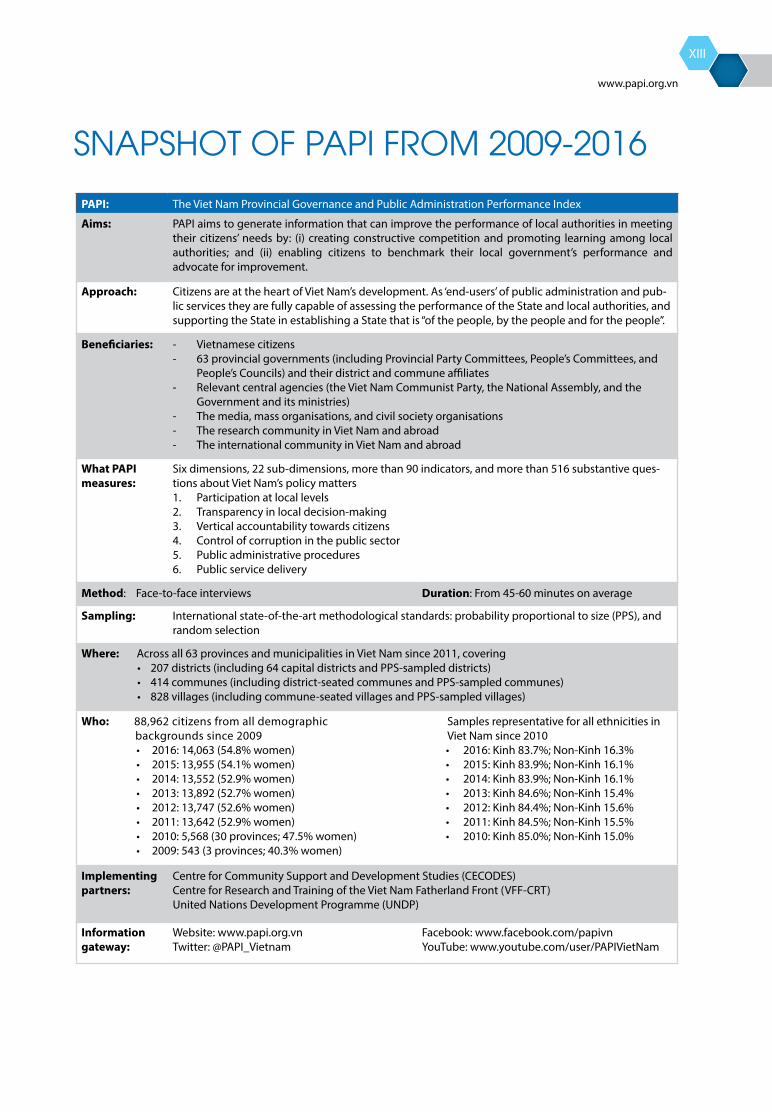
SNAPSHOT OF PAPI FROM 2009-2016PAPI: The Viet Nam Provincial Governance and Public Administration Performance Index
Aims: PAPI aims to generate information that can improve the performance of local authorities in meeting their citizens’ needs by: (i) creating constructive competition and promoting learning among local authorities; and (ii) enabling citizens to benchmark their local government’s performance and advocate for improvement.
Approach: Citizens are at the heart of Viet Nam’s development. As ‘end-users’ of public administration and pub-lic services they are fully capable of assessing the performance of the State and local authorities, and supporting the State in establishing a State that is “of the people, by the people and for the people”.
Beneficiaries: - Vietnamese citizens- 63 provincial governments (including Provincial Party Committees, People’s Committees, and
People’s Councils) and their district and commune affiliates- Relevant central agencies (the Viet Nam Communist Party, the National Assembly, and the
Government and its ministries) - The media, mass organisations, and civil society organisations - The research community in Viet Nam and abroad- The international community in Viet Nam and abroad
What PAPI measures:
Six dimensions, 22 sub-dimensions, more than 90 indicators, and more than 516 substantive ques-tions about Viet Nam’s policy matters1. Participation at local levels2. Transparency in local decision-making3. Vertical accountability towards citizens4. Control of corruption in the public sector5. Public administrative procedures6. Public service delivery
Method: Face-to-face interviews Duration: From 45-60 minutes on average
Sampling: International state-of-the-art methodological standards: probability proportional to size (PPS), and random selection
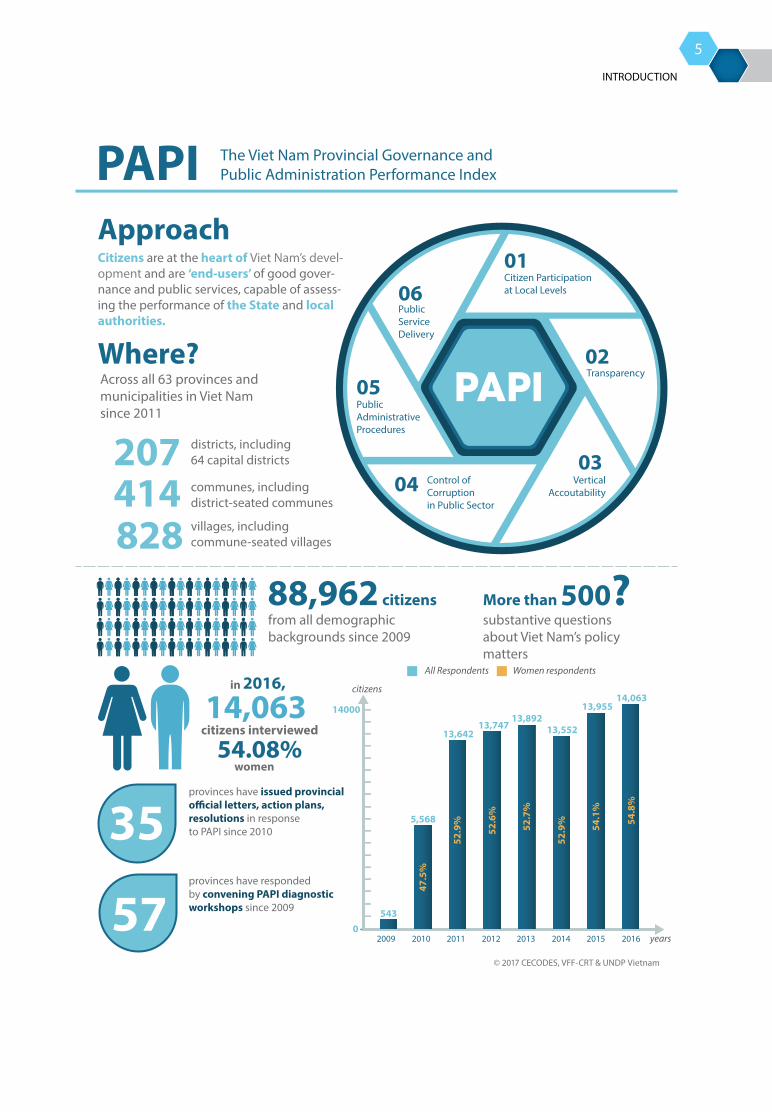
Where: Across all 63 provinces and municipalities in Viet Nam since 2011, covering • 207 districts (including 64 capital districts and PPS-sampled districts) • 414 communes (including district-seated communes and PPS-sampled communes) • 828 villages (including commune-seated villages and PPS-sampled villages)
Who: 8 8,962 citizens from all demographic backgrounds since 2009
• 2016: 14,063 (54.8% women) • 2015: 13,955 (54.1% women) • 2014: 13,552 (52.9% women) • 2013: 13,892 (52.7% women) • 2012: 13,747 (52.6% women) • 2011: 13,642 (52.9% women) • 2010: 5,568 (30 provinces; 47.5% women) • 2009: 543 (3 provinces; 40.3% women)
Samples representative for all ethnicities in Viet Nam since 2010 • 2016: Kinh 83.7%; Non-Kinh 16.3%• 2015: Kinh 83.9%; Non-Kinh 16.1%• 2014: Kinh 83.9%; Non-Kinh 16.1%• 2013: Kinh 84.6%; Non-Kinh 15.4%• 2012: Kinh 84.4%; Non-Kinh 15.6%• 2011: Kinh 84.5%; Non-Kinh 15.5%• 2010: Kinh 85.0%; Non-Kinh 15.0%
Implementing partners:
Centre for Community Support and Development Studies (CECODES)Centre for Research and Training of the Viet Nam Fatherland Front (VFF-CRT)United Nations Development Programme (UNDP)
Information gateway:
Website: www.papi.org.vnTwitter: @PAPI_Vietnam
Facebook: www.facebook.com/papivnYouTube: www.youtube.com/user/PAPIVietNam

This report presents the 2016 Viet Nam Provincial Governance and Public Administration Performance Index (PAPI). The index is based on the sixth consecutive annual nationwide survey, which in 2016 captured the views and experiences of 14,063 randomly selected citizens. Since the first pilot survey in 2009, 88,962 citizens across Viet Nam have engaged in face-to-face interviews and shared their experiences and assessments of governance and public administration performance by the State apparatus from the central to commune levels.
This report has three broad aims. First, it provides a set of baseline indicators for the Government of Viet Nam that can be used to track its performance during the 2016-2021 term. Second, the findings can help to gauge the effectiveness of ongoing institutional and policy reforms to achieve the new government’s goal “to build a government that facilitates development, acts with integrity and pro-activeness, and works for its People.” Third, it identifies areas for action as the government attempts to achieve the national agenda for sustainable development.
Reflecting changing social and governance circumstances, the 2016 survey underwent several
major changes. New questions were added to examine how citizens were engaging with their candidates and elected officials. Additionally, the survey asked questions pertaining to several “hot” topics such as environmental issues, concerns about inequality, views on the Trans-Pacific Partnership, and knowledge of the Law on Access to Information. Other dimensions (i.e. citizen participation at local levels, vertical accountability, and public administrative procedures) were also revised and streamlined.
Below are highlights of the national trends and main findings from the 2016 PAPI Report, as well as implications for national and provincial performance in the areas of governance and public administration.
National Trends in Governance and Public Administration in 2016
PAPI provides valuable insights at two levels. First, it provides an index of provincial government quality. Second, the indicators can highlight trends in national public opinion on governance and other issues over time.
Regarding views of national-level governance, three positive trends are worthy of note. First, public service
EXECUTIVE SUMMARY
THE VIET NAM PROVINCIAL GOVERNANCE AND PUBLIC ADMINISTRATION PERFORMANCE INDEX PAPI 2016
XVI
delivery improved once again in 2016, meaning that it has improved each year the PAPI survey has been conducted since 2011. Within the public service delivery dimension, 2016 was particularly notable for the large increase in the number of citizens receiving public health insurance; the proportion rose from 62% in 2015 to 74% in 2016. This reflects a broader improvement in health care indicators highlighted in this report.
Another notable improvement was in citizen participation in elections. The voter turnout for National Assembly elections was 69%, a 2% increase from the percentage reported in the 2011 survey results.
Finally, for the third successive year since the revised 2013 Land Law was passed, respondents reported substantially fewer land seizures than prior to the revision. Before 2013, an average of 9% of citizens reported having land seized compared to an average of 6.5% after 2013. This suggests that the amendment did in fact impose greater constraints for local officials in terms of acquiring land from citizens. The report also assesses differences in land title registration between men and women, showing that 13% fewer women have their names on land use rights certificates than men.
The survey also asked questions on economic satisfaction. In 2016, respondents continued to say that their household economic situations were good and had improved from past years. Furthermore, they continued to express optimism about the future. In particular, those with higher income levels were more likely to express satisfaction with their current household economic condition and had more optimism for the future.
Also, citizens were asked to describe their issues of greatest concern in 2016. The responses show a significant change from 2015. While poverty remained the most important issue, 2016 witnessed a 10% increase compared to 2015 in the percentage of respondents saying environmental problems represented the issue of greatest concern. The most obvious explanation for this sudden, major shift was the widespread reporting of the fish kill in the Central Coast in April 2016.
Nonetheless, concerns about the environment were not localized to the Central Coast region that was most directly impacted by the fish kill crisis, but have spread further. For example, the survey also reveals concerns about increasing air and water pollution in many areas of the country. More than 67% of surveyed citizens reported that water quality has deteriorated in the past three years, and 36% reported a decline in air quality. This suggests that the government should take a much closer look at environmental protection standards and policies and make transparent how these policies are implemented in practice so the public can scrutinize them.
This report also looks at citizen concerns with poverty, in particular how citizens view poverty reduction in comparison to other priorities such as the environment, trade, and economic growth. The results indicate that poverty was the highest priority for poorer respondents in 2016. Regarding poverty assistance, the findings show that poorer citizens are indeed more concerned about poverty reduction than wealthier citizens. However, even among the wealthiest respondents, poverty is the top priority.
Finally, reflecting the salience of the proposed Trans-Pacific Partnership, of which Viet Nam would be a member if ratified, the survey included a series of questions about citizen awareness and support for the pact. The results reveal strikingly low levels of citizen awareness of the pact, with only 27% expressing awareness. While support was high for the initiative, it was thin in the sense that respondents had little information about its provisions. Those who did have information were more likely to support the measure. The informed citizens also tended to be members of mass organizations, suggesting the importance of information dissemination.
Provincial Performance in 2016
Moving to the second level of analysis, despite changes made to three out of the six PAPI dimensions, provincial patterns in 2016 were consistent with the 2011-2015 trends. Better performing provinces were mostly clustered in the Northeast, Central Coast, and Mekong Delta regions, similar to previous surveys.
THE VIET NAM PROVINCIAL GOVERNANCE AND PUBLIC ADMINISTRATION PERFORMANCE INDEX PAPI 2016
EXECUTIVE SUMMARY
XVII
Among the 16 best performers are seven from the Northeast region (Hai Duong, Bac Ninh, Bac Giang, Nam Dinh, Thai Binh, Hung Yen, and Ninh Binh); five Central Coast provinces (Ha Tinh, Da Nang, Quang Binh, Quang Tri, and Binh Dinh); and three Mekong Delta provinces (Can Tho, Ben Tre, and Dong Thap). It is worthwhile noting that Nam Dinh, Ha Tinh, Quang Tri, and Da Nang have maintained their overall best performance status for six years in a row.
At the other end of the 2016 performance spectrum are northern-most and southern-most provinces. In particular, Yen Bai, Lang Son, Cao Bang, Ha Giang, and Lai Chau are in the same poorest performing group as Ca Mau, Bac Lieu, Tra Vinh, and Kien Giang. Lai Chau has been in the poorest performing group since 2011. While these provinces are rated as needing improvement, to a certain extent they may be penalized because of their socio-economic circumstances. However, not all poor-performing provinces are in disadvantaged areas. For example, Ha Noi joined this group in 2016 together with Khanh Hoa, Quang Ninh, and Binh Duong, where conditions for socio-economic development are more favourable. Binh Duong, in particular, saw a severe decline for the second year in a row.
Below are highlights of provincial performance in 2016 on each of the six dimensions:
1. Citizen participation at local levels. Consistent with previous years, there were strong regional patterns. Among the 16 best performing provinces in 2016, 13 were in the Red River Delta and North Central sub-regions. Meanwhile, 11 out of the poorest performing provinces were found in the Southeast and Mekong Delta sub-regions. The best five performing provinces were Ha Tinh, Bac Ninh, Bac Giang, Thai Binh, and Thai Nguyen, with their average scores ranging from 6.2 to 6.8 points on the dimension’s 1-10-point scale. The five poorest performing provinces were Tra Vinh, Binh Duong, An Giang, Kien Giang, and Ca Mau.
2. Transparency in local decision-making. Of the 16 best performers in this dimension, 14 were northern and central provinces. The
poorest performers were found more often in the South, with the four poorest performing provinces of Soc Trang, Tra Vinh, Ca Mau, and Bac Lieu having mean dimensional scores of around 4.8 points, below the average level. By the three sub-dimensions, Da Nang was the best performer in 2016 on land transparency, Bac Ninh on transparency of poverty lists, and Binh Phuoc on transparency of commune budget and expenditure lists. Compared to 2011, 13 provinces saw improvements of more than 5% in 2016. The largest hike was seen in Phu Tho (+29%) while the steepest drop was again seen in Ba Ria-Vung Tau (-19.5%).
3. Vertical accountability towards citizens. While this dimension saw some of the most dramatic changes, regional patterns were similar to those found in previous years despite a change in the composition of the dimension in 2016. There is a convergence of best performers in the northern and central regions in this dimension. Among the 16 best performers in 2016, six are northern provinces and four are central ones. Quang Ngai, a Central Coast province, was the top performer. On the other hand, the six poorest performers are from the Mekong Delta, with Kien Giang being the poorest performer among all 63 provinces .
4. Control of corruption in the public sector. The decline in overall provincial performance on this dimension continued in 2016. The largest declines were seen in two sub-dimensions: ‘limits on public sector corruption’ and ‘willingness to fight corruption’. Regional patterns follow previous years: central and and southern provinces tend to do better in anti-corruption efforts than northern provinces. Among the top 16 best performers, eight are Mekong Delta provinces and five are from the Central Coast region. In 2016, Can Tho, Tien Giang, and Ben Tre were the best performers in this dimension. Long An remained in the best performing group for the sixth year in a row, while Ha Noi has been in the poorest performing group over the same period. Two other centrally governed municipalities, Ho Chi Minh City and Hai Phong, joined this poor performing group, along with five northern and three Central Highlands provinces. A

THE VIET NAM PROVINCIAL GOVERNANCE AND PUBLIC ADMINISTRATION PERFORMANCE INDEX PAPI 2016
XVIII
total of 27 provinces significantly improved their performance in 2016 against their score in 2011. Cao Bang’s dimensional score increased 36% over six years, while Binh Duong saw the sharpest drop of 40% compared to 2011.
5. Public administrative procedures. All provinces seem to have maintained their level of performance from previous years in provision of certification services, construction permits, land use rights certificates (LURCs), and personal procedures for their citizens. Similar to previous years’ findings, there is no clear regional pattern. Best performers can be found across the country, but among the poorest performers are four Central Highlands provinces: Gia Lai, Lam Dong, Kon Tum, and Dak Nong. Of the four public administrative services, the public administrative procedures and services for LURCs were rated the poorest generally, similar to previous years.
6. Public service delivery. On this dimension, there was a wider gap between provinces in 2016 than in the previous five years. The difference between the best performing province (Da Nang, with a dimensional score of 8.03 points) and the lowest scoring one (Quang Ngai, with a score of 6.42) is larger than in previous years. Indeed, the survey results reveal a change in the landscape of provincial performance related to public service delivery. In the previous five years, the best performers were concentrated more in the South than in other regions of the country. Da Nang, Ho Chi Minh City, and Ba Ria-Vung Tau have consistently been in the best performing group since 2011. Ha Noi is the only centrally governed municipality that falls far below this group. For 2016, a more even regional distribution of provinces in the best performing group is seen. As observed in the PAPI 2015 Report, none of the provinces have fallen behind dramatically since 2011. A total of 35 provinces saw noticeable improvement in 2016 compared to 2011, while the rest saw insignificant changes. Dak Nong made the most impressive improvement in 2016 compared to its 2011 benchmark.
Implications of the 2016 PAPI Findings
Given the wealth of information in the PAPI report and the underlying survey results, central and local governments can use the findings to assess where they have done well and where they should target their efforts in the upcoming years in the areas of governance and public administration.
The aggregate national trends found in the first two chapters of this report show areas where citizens desire the most action. In particular, improvements are needed in the areas of citizen engagement in decision-making, transparency in local planning, government accountability towards citizens, and control of corruption in the public sector. The results also show that the environment is an important issue for citizens across the country, while poverty remains an ever-present concern. On the positive side, the report also shows areas where citizens see improvement, such as in the health care sector and public administrative procedures at the commune level.
The detailed findings presented by province in the third chapter reflect provincial strengths and weaknesses, offering leaders multi-faceted insights about how provinces perform and how they compare in different aspects of governance and public administration. For instance, most provinces have improved their performance in public service delivery, as evident in the fact that the vast majority of provinces scored higher on the dimension ‘Public Service Delivery’ in 2016 than in 2011. However, most provinces need to do more to improve the competence and attitude of civil servants and public employees, and enhance the transparency, responsiveness, and accountability of their institutions.
Indeed, the 2016 PAPI results show that shortcomings and weaknesses in provincial performance in governance and public administration are evident in the whole state apparatus and in the level of citizen engagement. On the one hand, they are embedded in the social context in which public officials and civil servants are not encouraged to be responsive, accountable, and understanding of citizen rights and concerns. On the other hand, citizens are not motivated to provide feedback and comments in a constructive manner to help local governments
THE VIET NAM PROVINCIAL GOVERNANCE AND PUBLIC ADMINISTRATION PERFORMANCE INDEX PAPI 2016
EXECUTIVE SUMMARY
XIX
perform better. The causes of these shortcomings are primarily structural: a lack of citizen consultation during the processes of developing and implementing policies and procedures, and the fact that policies and procedures are not adequately publicised, made transparent, complied with, or enforced.
To address these challenges, the central government and local governments may wish to adopt a holistic approach, with clear priorities, milestones, outputs, and outcomes assigned to each of the identified challenges. The following three-pronged approach can be used within the current institutional settings:
(i) Citizens should be more engaged in policy making, policy implementation, and policy monitoring because engaged citizens inform the government of their needs and expectations and also are enabled in this way to assume greater ownership of, and responsibility for, public policies and solutions.
(ii) The behaviour and skills of public officials and civil servants can be enhanced by using evidence-based approaches to training and apprenticing. This will help these individuals to gain new skills, allowing them to become enablers, negotiators, and collaborators with their citizen clients. This approach requires concrete job descriptions and performance appraisals for each
public sector staff so that they proactively engage with citizens in each stage of policy development and implementation.
(iii) It is important to create and promote a culture of openness and transparency from the government side. This requires a robust legislative regime that enables freedom of information, transparency in decision-making, responsiveness towards citizens, and accountable institutions.
Lastly, with its rights-based and citizen-centric approaches to policy implementation monitoring, PAPI also will be a useful tool to measure Viet Nam’s progress in implementation of the Sustainable Development Goals (SDGs) of the 2030 Agenda for Sustainable Development. The 2030 Agenda is about leaving no one behind, and PAPI reflects the experience of all segments of the population thanks to its representative sampling and nationwide coverage. In particular, Goal 16 is about building effective, accountable, and inclusive institutions at all levels, and PAPI aims to help call local governments into account and to inform policies and action plans to improve the performance of public institutions in reducing corruption and becoming accountable and transparent. The analysis of the linkages between PAPI and the SDGs in this report will show how valuable PAPI data is for gauging Viet Nam’s implementation of Goal 16.

The Viet Nam Provincial Governance and Public Administration Performance Index (PAPI) is the country’s largest annual time-series, citizen-centric, nationwide policy monitoring tool. As the section titled ‘Snapshot of PAPI from 2009-2016’ notes, over the years PAPI has collected the views of 88,962 citizens about the country’s performance in governance and public administration, as drawn from their direct experiences with interactions with local governments at different levels. PAPI generates information about the actual performance of local authorities in meeting citizen needs. By doing so, it has created constructive competition and promoted learning among local authorities, while enabling citizens to benchmark their local government’s performance and advocate for improvement.
PAPI is a matrix that provides evidence about how central and provincial governments have performed on an annual basis. It mirrors six dimensions of government performance: (i) participation in elections and policy making at the local level, (ii) transparency in decision-
1 See Resolution 100/NQ-CP dated 18 November 2016 on the issuance of the Action Plan for the 2016-2021
making, (iii) vertical accountability, (iv) control of corruption in the public sector, (v) public administrative procedures, and (vi) public service delivery. PAPI has helped different national stakeholders to understand how governance and public administration in Viet Nam has changed over time and suggested ways to address governance bottlenecks.
This report presents key survey findings, policy implications, and actionable measures from the 2016 PAPI research. The year 2016 marked the sixth nationwide PAPI survey and the first year in the 2016-2021 cycle of the PAPI exercise, which also covers the current government term in Viet Nam. Therefore, the aims of this report are three-fold. First, it provides a set of baseline indicators for the Government of Viet Nam in their 2016-2021 tenure to reflect on performance in governance and public administration from the first year of the term. Second, findings presented in this report help to gauge the outputs of on-going institutional and policy reforms “to build a government that facilitates development, acts with integrity and pro-activeness, and works for its People” as committed by the new government. 1 Third, it shows how PAPI helps Viet Nam to identify areas that need focus as the country rolls out its national agenda for sustainable development towards 2030.
INTRODUCTION

THE VIET NAM PROVINCIAL GOVERNANCE AND PUBLIC ADMINISTRATION PERFORMANCE INDEX PAPI 2016
2
PAPI puts citizens at the heart of Viet Nam’s development, in the same spirit as the 2030 Agenda for Sustainable Development that Viet Nam has committed to. As ‘end-users’ of public administration and public services, citizens are fully capable of assessing the performance of the central and local authorities and supporting the country in building a State “of the people, by the people and for the people”. PAPI promotes the realization of the rights-based motto “people know, people discuss, people do and people verify” as put forward in the 2007 Grassroots Democracy Ordinance as well as in important legislations and public policies that promote modern, participatory, responsive, and accountable institutions in Viet Nam. PAPI also fits the changing mind-set in government in Viet Nam, from ‘governing’ to ‘facilitating’, as put forward in Resolution 100/NQ-CP of the 2016-2021 government term.
The following sections summarize the contexts, implications, usage, and impacts of PAPI to date.
Grounded in Viet Nam’s laws and policies. PAPI aims to inform policy making by starting from policy implementation, with citizen engagement as a core element. Therefore, PAPI has been grounded in policy and regulations that have been implemented nationwide in Viet Nam.2 In 2016, a number of important legislative documents were promulgated that strengthen citizen roles and interests in governance and public administration. Among them, the Law on Access to Information was approved, and preparation of by-laws were underway to put the law into effect from 2018. By-laws to the Law on
2 The national policy context for PAPI since the date it was piloted in 2009 has been informed by: Viet Nam’s Constitution (2013); the Ordinance on Grassroots Democracy Implementation (2007); the State Administration Reforms for the period 2011-2020; the Socio-Economic Development Strategy for 2011-2020; the National Anti-Corruption Strategy towards 2020; the Anti-corruption Law (2005, 2013); the Investigation Law (2010); the Law on Complaints (2011); the Law on Denunciation (2011); the Land Law (2003 and 2013 amendments); the Law on Citizen Reception (2014); the Law on Universalisation of Primary Education (1991); the Law on Education (2005); the Law on Medical Examination and Treatment (2009); the Law on Health Insurance (2008, 2014); the Law on Elections of National Assembly Delegates and People’s Council Members (2015); the Law on Local Government Organisation (2015); the Law on State Budgets (2014); the Law on Housing (2014); and related by-laws and public policies.
Public Investment (2014) strengthen the importance of citizen engagement in supervision of public investment projects through community-based supervision mechanisms such as People’s Inspection Boards and/or Community Investment Supervision Boards. Also, the second phase of the Master Programme on Public Administration Reforms from 2016-2020 was rolled out in 2016 with the emphasis on streamlining and reshuffling the State apparatus to make it smaller and able to provide better quality public services for citizens.3 The policy to provide health insurance for all was adopted by the health sector in 2016.4
A reliable source of actionable data to increase government accountability and responsiveness. PAPI has become a frequently referenced monitoring tool for central and local governments. PAPI findings have generated extensive discussions on how Viet Nam could move forward with in various aspects of governance at the policy level. It has gained increasing interest from the National Assembly, with annual PAPI publications requested by delegates over the past five years. PAPI has been referenced at central government meetings, and has been used in reports and queries by National Assembly delegates. For instance, PAPI provided evidence for the Government Inspectorate and the National Assembly Justice Committee to back up their reviews of anti-corruption work at different National Assembly sessions in 2016.5 The National Assembly’s first self-initiated legislation project on developing a Law on Public Administration is the most recent visible effect of PAPI. The index informed the legislator who suggested the formulation of this law, which aims to govern the public administration system using modern governance approaches (i.e. citizen participation, transparency, and accountability) that PAPI incorporates. Also, possibly in response to PAPI 2015 findings, the Ministry of Natural
3 Decision No. 2218/QD-TTg of the Prime Minister on the Action Plan to implement Resolution No. 39-NQ/TW of 17 April 2015 of the Politburo on cutting state-funded staff and reorganizing state personnel (public officials, public employees and civil servants).
4 See VietNamNet (23/12/2016) for discussions on new policies in health insurance effective from 2016.
5 See VnExpress (28/10/2016) for the latest discussion of PAPI at the 2016 National Assembly Fall Session.
THE VIET NAM PROVINCIAL GOVERNANCE AND PUBLIC ADMINISTRATION PERFORMANCE INDEX PAPI 2016
INTRODUCTION
3
Resources and Environment has set up hotlines for citizens to report on bribery in public administrative services for LURCs since May 2016.
At the local level, PAPI has generated increasing interests from all 63 provincial governments. To date, at least 35 provinces have used PAPI to inform their action plans, directives, and resolutions to improve their performance in implementation of general governance measures, administrative procedures, and service delivery. Also, 57 provinces have hosted workshops to look more closely at citizen feedback on their performance. Appendix B provides detailed information about which provinces have responded to PAPI and in what ways. As provincial authorities have expressed at many provincial diagnostic workshops, local governments consider PAPI a useful tool to hear their citizens’ concerns and to learn from other provinces.
Furthermore, PAPI data has continued to inform action research and policy discussions that seek to better understand why citizens were satisfied or unsatisfied with the performance of various provinces. 6 In 2016, research on corruption risks and practices relating to land seizures was also conducted to explore reasons why citizens have been disappointed with land administration and to provide suggestions for curbing land corruption. 7
A citizen-centric tool to monitor progress in realising sustainable development goals. With its rights-based and citizen-centric approaches to monitoring of policy implementation, PAPI provides a wealth of evidence for tracking Viet Nam’s progress in implementation of the country’s 2030 Agenda for Sustainable Development. This is especially true for Goal 16 related to the promotion of peace, justice, and strong institutions; Goal 1 on equal rights to access basic services and ownership and control over land; Goal 6 on availability of water for all; and Goal 7 on the right to access electricity.
6 See Bui Phuong Dinh et al. (2016) regarding four action studies in An Giang, Phu Yen, Bac Lieu and Son La, with the active participation of provincial authorities in 2016.
7 See National Economics University and United Nations Development Programme (2017).
The usefulness of PAPI in providing a means of verification for gauging the Sustainable Development Goals (SDGs) is both at the conceptual and indicator levels. The 2030 Agenda is about improving people’s lives and development conditions, and PAPI is about how citizens experience the country’s governance and public administration institutions and processes that affect their lives. The 2030 Agenda is about leaving no one behind, and PAPI reflects the experience of all segments of the population thanks to its representative sampling and nationwide coverage. Goal 16 is about building effective, accountable and inclusive institutions at all levels, and PAPI is about calling local governments to account and helping to inform policies and action plans to improve the performance of public institutions. PAPI data also contributes to monitoring of Goal 16 by providing information on Viet Nam’s progress in reducing corruption and building accountable and transparent institutions from the perspective of citizens. The analysis of the linkages between PAPI and the SDGs in Appendix C will show how valuable PAPI data is for gauging Viet Nam’s implementation of Goal 16.
A complementary policy implementation monitoring tool. PAPI is one of several external time-series data sources and policy monitoring tools used by policymakers in Viet Nam. PAPI measures governance and the public administration performance of governments at different levels based on the experiences of citizens. PAPI complements the Provincial Competitiveness Index (PCI) conducted by the Viet Nam Chamber of Commerce and Industry, which measures businesses’ experiences with provincial economic governance; the Viet Nam Justice Index (VJI) conducted by the Viet Nam Lawyers Association and UNDP, which measures provincial performance in providing access to justice and protection of rights; and the Public Administration Reform Index (known as the PAR Index), which measures the performance of the public administration system at different levels in achieving public administration reforms by the Ministry of Home Affairs. Together, these tools help policymakers and practitioners triangulate government-business-citizen assessments of policy implementation so as to inform subsequent institutional and policy reforms.

THE VIET NAM PROVINCIAL GOVERNANCE AND PUBLIC ADMINISTRATION PERFORMANCE INDEX PAPI 2016
4
Improved methodology to respond to contextual changes. Given the evolving social and economic contexts in Viet Nam, higher demand for PAPI data, and the sophisticated expectations about PAPI from different levels, every year PAPI undergoes refinements to its methodology and questionnaires. In 2016, a number of major changes were made to the index and the questionnaire in response to evolving socio-economic conditions over the year. The PAPI 2016 questionnaire was informed by the 2016 national elections for the 2016-2021 National Assembly and People Councils at all levels in May, and subsequently by the new government in office. For example, new questions were added in 2016 to examine how citizens engaged with their candidates and elected officials. PAPI was also sensitive to emerging issues that were publicly discussed over the course of the year after the PAPI 2015 report was published. The survey in 2016 took into account, for instance, environmental concerns as a result of salt water intrusion in the Mekong Region and the massive fish deaths in the Central Coast region; arising public concerns about inequality; public discussions on Viet Nam’s interest in entering the Trans-Pacific Partnership; and passage of the Law on Access to Information.
More importantly, additional actionable indicators were introduced to the index so that citizen expectations could be directed to relevant state agencies for resolution, and to mitigate potential manipulation by provinces for better ranking. Key changes were made to Dimension 1 to include more concrete experiential questions about the 2016 national
elections, to Dimension 3 to add questions about how provinces respond to citizen actions and queries, and to Dimension 5 to streamline questions about quality of administrative procedures. Chapter 1 and Chapter 3 provide more details about these changes.
To enable easy tracking of changes in findings over time at the national and provincial levels, the PAPI 2016 Report is structured in a similar way to previous PAPI reports. The first chapter covers performance in the first year of the 2016-2021 Government administration following the May 2016 elections, and charts relevant changes in the overall national performance on governance and public administration from 2011-2016. The second chapter takes a close look at what citizens viewed as important issues in 2016 and policy implications. Chapter 3 presents aggregated and disaggregated findings for provinces in 2016 at dimensional, sub-dimensional, and indicator levels, as well as time series comparisons for 2011-2016 in areas where there were no changes to indicators used in the index. The report closes with an overview of aggregate performance for all provinces, the relationship between PAPI and the Provincial Competitiveness Index, as well as policy implications, options, and actions for relevant stakeholders to take into consideration.
The report is accompanied by the website www.papi.org.vn, which includes up-to-date and detailed provincial profiles, case studies, and policy responses.
THE VIET NAM PROVINCIAL GOVERNANCE AND PUBLIC ADMINISTRATION PERFORMANCE INDEX PAPI 2016
INTRODUCTION
5
PAPI The Viet Nam Provincial Governance and Public Administration Performance Index
PAPI
Citizen Participationat Local Levels
Transparency
VerticalAccoutability
Control of Corruptionin Public Sector
Public AdministrativeProcedures
Public ServiceDelivery
01
02
0304
05
06
Approach
Where?Across all 63 provinces and municipalities in Viet Nam since 2011
districts, including 64 capital districts
communes, including district-seated communes
villages, including commune-seated villages
207
88,962 citizens
414 828
More than 500? substantive questions about Viet Nam’s policy matters
provinces have responded by convening PAPI diagnostic workshops since 2009
provinces have issued provincial o�cial letters, action plans, resolutions in response to PAPI since 2010
from all demographic backgrounds since 2009
57
35
in 2016,
14,063citizens interviewed
54.08%
543
5,568
13,64213,747
13,89213,552
13,95514,063
14000
02009 2010 2011 2012 2013 2014 2015 2016 years
citizens
Women respondentsAll Respondents
47.5
%
52.9
%
52.6
%
52.7
%
52.9
% 54.1
%
54.8
%
Citizens are at the heart of Viet Nam’s devel-opment and are ‘end-users’ of good gover-nance and public services, capable of assess-ing the performance of the State and local authorities.
women
© 2017 CECODES, VFF-CRT & UNDP Vietnam


Overview
PAPI provides a range of information on indicators of interest to policy makers and citizens. While it is most known for its provincial governance scores, the index also provides information on national-level issues such as experiences with land acquisitions, economic satisfaction, and other issues of great concern. This chapter reviews these trends to provide a snapshot of the mood in Viet Nam in 2016 as it relates to these topics.
Reviewing the indicators comprising the PAPI index reveals three positive trends worthy of note. First, public service delivery improved once again in 2016, meaning that it has improved each year the PAPI survey has been conducted since 2011. Within the public service delivery dimension, 2016 was particularly notable for the dramatic increase in the number of citizens receiving public health insurance. This reflects a broader improvement in health care indicators that are highlighted in this chapter. Another improvement was in public participation in elections. Citizen participation in the 2016 election increased slightly compared to the 2011 election. Finally, for the third successive year since the revised 2013 Land Law was passed, respondents reported substantially fewer land seizures than prior to 2013. This suggests that the 2013 amendment did in fact impose greater costs on local officials in terms of acquiring land from citizens. Of continued concern, however, is that for those who
did have their land seized, most reported that they did not consider the compensation levels fair.
In terms of economic satisfaction, respondents continued to say that their household economic situations were good and had improved from the past. Furthermore, they continued to express optimism about the future. When the responses were broken down by income levels, the analysis shows that those with higher levels of income were more likely to express satisfaction with their current condition and had optimism for the future.
Finally, citizens were asked to describe their issues of greatest concern in 2016. The responses show a dramatic change from 2015. While poverty remained the most important issue, 2016 witnessed a significant increase in concern for environmental issues. The most obvious explanation for the sudden, dramatic shift was the widespread reporting of the fish kill in the Central Coast of Viet Nam in April 2016.
With this broad summary in mind, the remainder of the chapter provides specific numbers before concluding with some policy implications.
National Trends Over Time from 2011 to 2016
As noted in the introduction, in 2016 some of the PAPI indicators were reviewed and adjusted to reflect contextual and institutional changes as a result of the
NATIONAL TRENDS IN GOVERNANCE AND PUBLIC ADMINISTRATION
PERFORMANCE
01

THE VIET NAM PROVINCIAL GOVERNANCE AND PUBLIC ADMINISTRATION PERFORMANCE INDEX PAPI 2016
8
2016 national elections, the new government in office, and policy developments. Over the years, comments received at national and provincial events organized to share the findings of PAPI have suggested that new useful indicators should be added and obsolete indicators should be removed to reflect these changes. The suggestions made sense and coincided with the infusion of new blood into local and national-level government offices in 2016. While most PAPI indicators have remained the same, some adjustments have been made, particularly to Dimension 1 on Citizen Participation at Local Levels, Dimension 3 on Vertical Accountability, and Dimension 5 on Public Administrative Procedures. As a result, direct, year-to-year comparisons of results at the dimensional levels in these three dimensions are discouraged.
In terms of national trends, Figure 1.1 shows the aggregate scores for each of the dimensions that were not altered since 2011. The graph shows a steady increase in performance in public service delivery over the past six years. In 2016, there was some improvement in transparency and a stable trend in control of corruption compared to 2015, but these two dimensions still lagged behind the 2013 levels. One would expect some improvement in this dimension by the middle of the 2016-2021 government term if the public view is correct that government officials tend to be more proactive in the mid-term of their office rather than towards the end.
Dim
ensi
on S
core
s (S
cale
1-1
0)
Dimension 2:Transparency
Dimension 4:Control of Corruption
Dimension 6:Public Service
Delivery
2011 2012 2013 2014 2015 2016
0
2
4
6
8
5.64 5.79 5.92 5.885.43 5.61 5.69
5.93 6.15 6.06 5.82 5.80
6.74 6.91 6.91 6.99 7.01 7.06
Measurable Improvements in Access to Public Health Insurance
Regarding public service delivery, Figure 1.2 shows the changes in the components that make up this dimension, illustrating what has led to the steady improvement in the aggregate level. As the graph shows, perceptions of public health quality surged in 2016. Figure 1.3 indicates that the key reason for improvement in the access to health care score was the increase in the number of citizens with health insurance. The rate increased from 62% in 2015 to 73% in 2016. 8 See VietNamNet (23/12/2016).
Figure 1.1: PAPI Mean Scores by Dimensions, 2011-2016
This surge reflects the effect of the 2015 Law on Health Insurance (revised), which commits the government to providing universal health insurance, as well as the new initiative begun by the Ministry of Health in January 2016 to facilitate the use of total health insurance in primary health care and check-ups and treatments across the whole system of hospitals (whether they are public or private).8
* Dimensions 1, 3, and 5 are not included because they were reorganised in 2016.

THE VIET NAM PROVINCIAL GOVERNANCE AND PUBLIC ADMINISTRATION PERFORMANCE INDEX PAPI 2016
NATIONAL TRENDS IN GOVERNANCE AND PUBLIC ADMINISTRATION PERFORMANCE CHAPTER 1
9
Figure 1.2: Public Service Delivery Scores, 2011-2016
Figure 1.3: Percentage of Population with Health Insurance, 2011-2016
Sub-
Dim
ensi
on S
core
s (S
cale
0.2
5-2.
5)
0.5
0
1
1.5
2
2011
Public Health Public Education Public Infrastructure Law and Order
2012 2013 2014 2015 2016
1.77 1.79 1.79 1.80 1.801.88
1.65 1.67 1.66 1.65 1.67 1.701.73
1.84 1.851.91 1.90
1.83
1.61 1.61 1.62 1.63 1.64 1.65
80
60
40
20
0
57.28
2011 2012 2013 2014 2015 2016
56.96 57.23
60.8962.85
73.66
Perc
enta
ge o
f Res
pond
ents
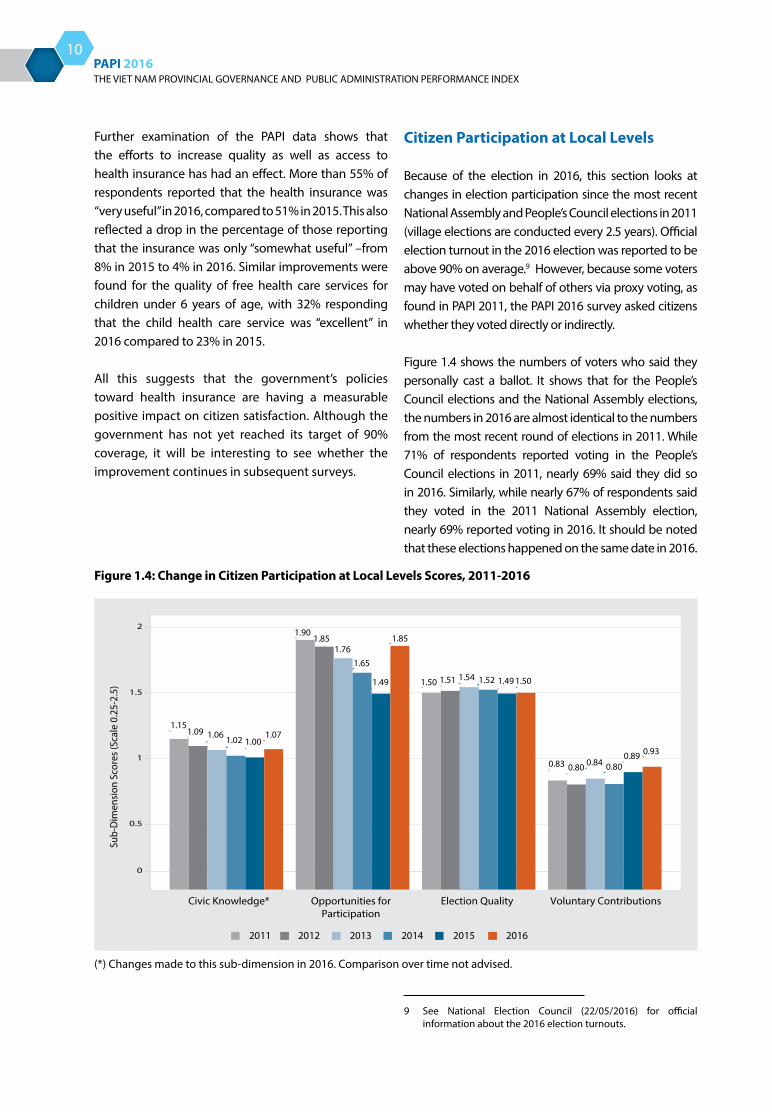
THE VIET NAM PROVINCIAL GOVERNANCE AND PUBLIC ADMINISTRATION PERFORMANCE INDEX PAPI 2016
10
Further examination of the PAPI data shows that the efforts to increase quality as well as access to health insurance has had an effect. More than 55% of respondents reported that the health insurance was “very useful” in 2016, compared to 51% in 2015. This also reflected a drop in the percentage of those reporting that the insurance was only “somewhat useful” –from 8% in 2015 to 4% in 2016. Similar improvements were found for the quality of free health care services for children under 6 years of age, with 32% responding that the child health care service was “excellent” in 2016 compared to 23% in 2015.
All this suggests that the government’s policies toward health insurance are having a measurable positive impact on citizen satisfaction. Although the government has not yet reached its target of 90% coverage, it will be interesting to see whether the improvement continues in subsequent surveys.
9 See National Election Council (22/05/2016) for official information about the 2016 election turnouts.
2011 2012 2013 2014 2015 2016
Civic Knowledge* Election Quality Voluntary Contributions
1.151.09 1.06 1.02 1.00
1.07
1.901.85
1.761.65
1.49 1.49
1.85
1.50 1.50
0.83 0.80 0.800.89 0.93
0.84
1.51 1.54 1.52
Opportunities forParticipation
Sub-
Dim
ensi
on S
core
s (Sc
ale
0.25
-2.5
)
0.5
0
1
1.5
2
Figure 1.4: Change in Citizen Participation at Local Levels Scores, 2011-2016
Citizen Participation at Local Levels
Because of the election in 2016, this section looks at changes in election participation since the most recent National Assembly and People’s Council elections in 2011 (village elections are conducted every 2.5 years). Official election turnout in the 2016 election was reported to be above 90% on average.9 However, because some voters may have voted on behalf of others via proxy voting, as found in PAPI 2011, the PAPI 2016 survey asked citizens whether they voted directly or indirectly.
Figure 1.4 shows the numbers of voters who said they personally cast a ballot. It shows that for the People’s Council elections and the National Assembly elections, the numbers in 2016 are almost identical to the numbers from the most recent round of elections in 2011. While 71% of respondents reported voting in the People’s Council elections in 2011, nearly 69% said they did so in 2016. Similarly, while nearly 67% of respondents said they voted in the 2011 National Assembly election, nearly 69% reported voting in 2016. It should be noted that these elections happened on the same date in 2016.
(*) Changes made to this sub-dimension in 2016 . Comparison over time not advised.
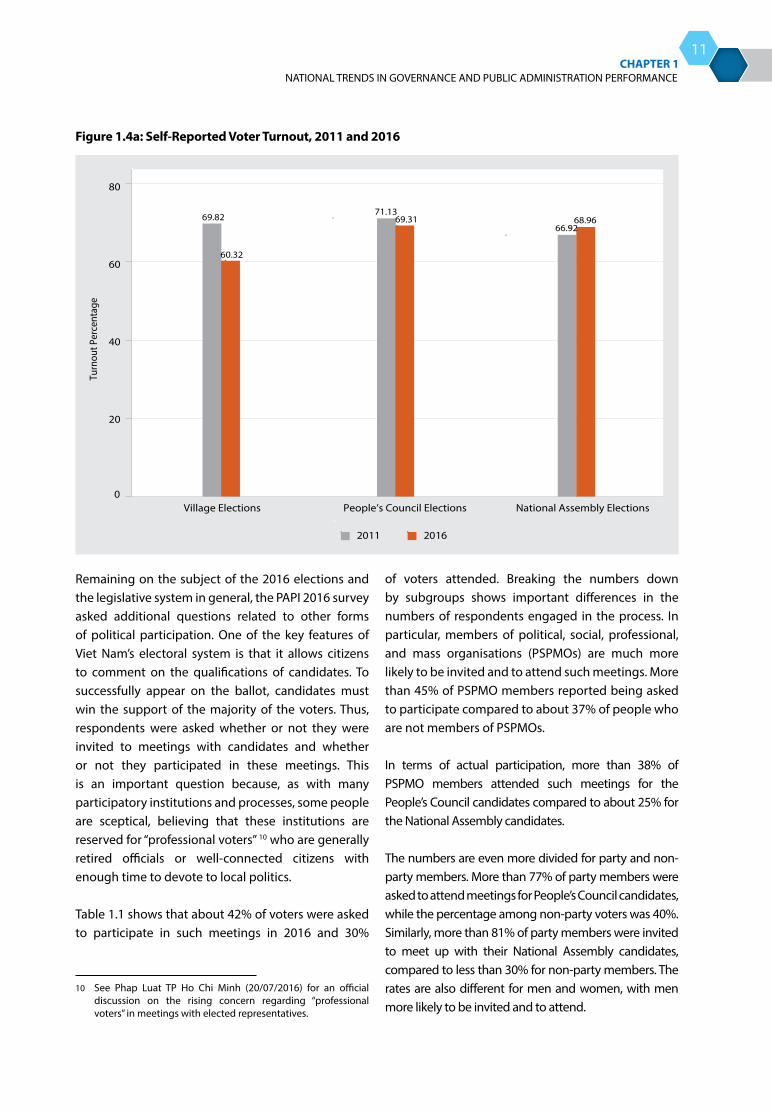
THE VIET NAM PROVINCIAL GOVERNANCE AND PUBLIC ADMINISTRATION PERFORMANCE INDEX PAPI 2016
NATIONAL TRENDS IN GOVERNANCE AND PUBLIC ADMINISTRATION PERFORMANCE CHAPTER 1
11
Turn
out P
erce
ntag
e
20
0
40
60
80
Village Elections People’s Council Elections National Assembly Elections
2011 2016
69.82
60.32
71.1369.31
66.9268.96
Figure 1.4a: Self-Reported Voter Turnout, 2011 and 2016
Remaining on the subject of the 2016 elections and the legislative system in general, the PAPI 2016 survey asked additional questions related to other forms of political participation. One of the key features of Viet Nam’s electoral system is that it allows citizens to comment on the qualifications of candidates. To successfully appear on the ballot, candidates must win the support of the majority of the voters. Thus, respondents were asked whether or not they were invited to meetings with candidates and whether or not they participated in these meetings. This is an important question because, as with many participatory institutions and processes, some people are sceptical, believing that these institutions are reserved for “professional voters” 10 who are generally retired officials or well-connected citizens with enough time to devote to local politics.
Table 1.1 shows that about 42% of voters were asked to participate in such meetings in 2016 and 30%
of voters attended. Breaking the numbers down by subgroups shows important differences in the numbers of respondents engaged in the process. In particular, members of political, social, professional, and mass organisations (PSPMOs) are much more likely to be invited and to attend such meetings. More than 45% of PSPMO members reported being asked to participate compared to about 37% of people who are not members of PSPMOs.
In terms of actual participation, more than 38% of PSPMO members attended such meetings for the People’s Council candidates compared to about 25% for the National Assembly candidates.
The numbers are even more divided for party and non-party members. More than 77% of party members were asked to attend meetings for People’s Council candidates, while the percentage among non-party voters was 40%. Similarly, more than 81% of party members were invited to meet up with their National Assembly candidates, compared to less than 30% for non-party members. The rates are also different for men and women, with men more likely to be invited and to attend.
10 See Phap Luat TP Ho Chi Minh (20/07/2016) for an official discussion on the rising concern regarding “professional voters” in meetings with elected representatives.
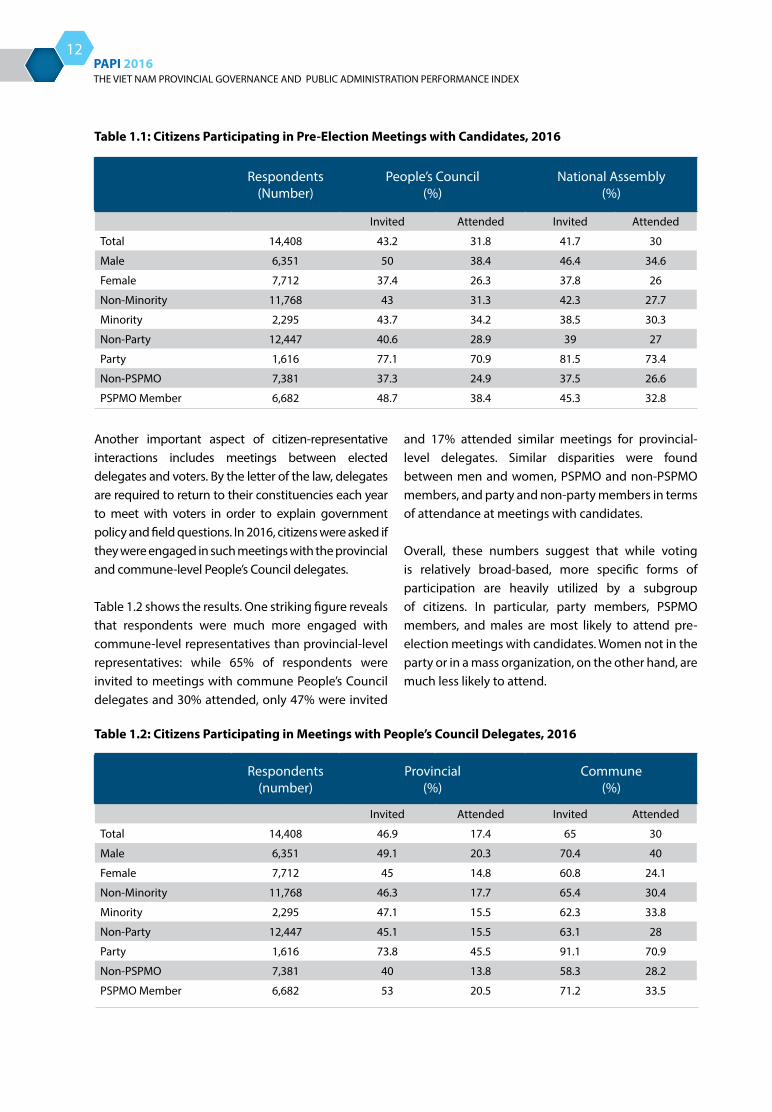
THE VIET NAM PROVINCIAL GOVERNANCE AND PUBLIC ADMINISTRATION PERFORMANCE INDEX PAPI 2016
12
Respondents(number)
Provincial(%)
Commune(%)
Invited Attended Invited Attended
Total 14,408 46.9 17.4 65 30
Male 6,351 49.1 20.3 70.4 40
Female 7,712 45 14.8 60.8 24.1
Non-Minority 11,768 46.3 17.7 65.4 30.4
Minority 2,295 47.1 15.5 62.3 33.8
Non-Party 12,447 45.1 15.5 63.1 28
Party 1,616 73.8 45.5 91.1 70.9
Non-PSPMO 7,381 40 13.8 58.3 28.2
PSPMO Member 6,682 53 20.5 71.2 33.5
Another important aspect of citizen-representative interactions includes meetings between elected delegates and voters. By the letter of the law, delegates are required to return to their constituencies each year to meet with voters in order to explain government policy and field questions. In 2016, citizens were asked if they were engaged in such meetings with the provincial and commune-level People’s Council delegates.
Table 1.2 shows the results. One striking figure reveals that respondents were much more engaged with commune-level representatives than provincial-level representatives: while 65% of respondents were invited to meetings with commune People’s Council delegates and 30% attended, only 47% were invited
and 17% attended similar meetings for provincial-level delegates. Similar disparities were found between men and women, PSPMO and non-PSPMO members, and party and non-party members in terms of attendance at meetings with candidates.
Overall, these numbers suggest that while voting is relatively broad-based, more specific forms of participation are heavily utilized by a subgroup of citizens. In particular, party members, PSPMO members, and males are most likely to attend pre-election meetings with candidates. Women not in the party or in a mass organization, on the other hand, are much less likely to attend.
Table 1.1: Citizens Participating in Pre-Election Meetings with Candidates, 2016
Table 1.2: Citizens Participating in Meetings with People’s Council Delegates, 2016
Respondents (Number)
People’s Council(%)
National Assembly(%)
Invited Attended Invited Attended
Total 14,408 43.2 31.8 41.7 30
Male 6,351 50 38.4 46.4 34.6
Female 7,712 37.4 26.3 37.8 26
Non-Minority 11,768 43 31.3 42.3 27.7
Minority 2,295 43.7 34.2 38.5 30.3
Non-Party 12,447 40.6 28.9 39 27
Party 1,616 77.1 70.9 81.5 73.4
Non-PSPMO 7,381 37.3 24.9 37.5 26.6
PSPMO Member 6,682 48.7 38.4 45.3 32.8
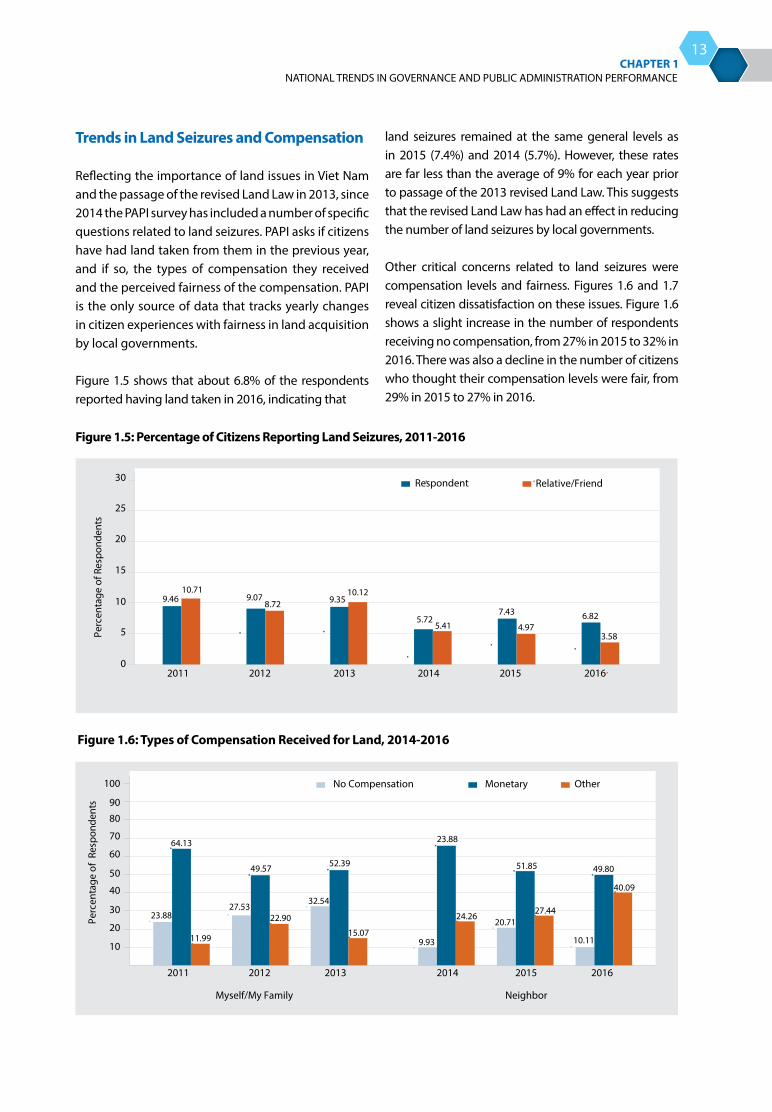
THE VIET NAM PROVINCIAL GOVERNANCE AND PUBLIC ADMINISTRATION PERFORMANCE INDEX PAPI 2016
NATIONAL TRENDS IN GOVERNANCE AND PUBLIC ADMINISTRATION PERFORMANCE CHAPTER 1
13
Trends in Land Seizures and Compensation
Reflecting the importance of land issues in Viet Nam and the passage of the revised Land Law in 2013, since 2014 the PAPI survey has included a number of specific questions related to land seizures. PAPI asks if citizens have had land taken from them in the previous year, and if so, the types of compensation they received and the perceived fairness of the compensation. PAPI is the only source of data that tracks yearly changes in citizen experiences with fairness in land acquisition by local governments.
Figure 1.5 shows that about 6.8% of the respondents reported having land taken in 2016, indicating that
land seizures remained at the same general levels as in 2015 (7.4%) and 2014 (5.7%). However, these rates are far less than the average of 9% for each year prior to passage of the 2013 revised Land Law. This suggests that the revised Land Law has had an effect in reducing the number of land seizures by local governments.
Other critical concerns related to land seizures were compensation levels and fairness. Figures 1.6 and 1.7 reveal citizen dissatisfaction on these issues. Figure 1.6 shows a slight increase in the number of respondents receiving no compensation, from 27% in 2015 to 32% in 2016. There was also a decline in the number of citizens who thought their compensation levels were fair, from 29% in 2015 to 27% in 2016.
Perc
enta
ge o
f Res
pond
ents
Respondent Relative/Friend30
25
20
15
10
5
0
9.4610.71
2011 2012 2013 2014 2015 2016
9.078.72 9.35
10.12
5.725.41
7.43
4.976.82
3.58
Perc
enta
ge o
f Re
spon
dent
s
No Compensation Monetary Other100
80
90
40
50
60
70
30
20
10
Myself/My Family Neighbor
2011 2012 2013 2014 2015 2016
64.13
49.57 52.39
23.88
15.079.93
24.26
51.85
27.44
10.11
49.80
40.09
20.71
32.54
22.9027.53
11.99
23.88
Figure 1.5: Percentage of Citizens Reporting Land Seizures, 2011-2016
Figure 1.6: Types of Compensation Received for Land, 2014-2016

THE VIET NAM PROVINCIAL GOVERNANCE AND PUBLIC ADMINISTRATION PERFORMANCE INDEX PAPI 2016
14
Perc
enta
ge o
f Re
spon
dent
s
2014 2015 2016
36.5428.83 27.09
49.4747.29
41.59
2014 2015 2016
Myself/My Family Neighbor
100
80
90
40
50
60
70
30
20
10
Figure 1.7: Percentage of Citizens Reporting that Compensation for Land Seizure is Fair, 2014-2016
Access to Land Use Rights Certificates
In the land use module in 2016, a series of questions regarding access to land use rights certificates (LURCs) were added. In recent years, policy makers and citizens have expressed concerns about unequal access to land use rights. In particular, women are less likely to have their names on LURCs when they are married, which can lead to difficulties for them in securing land tenure in the event of their husband’s death or a divorce.
The first question in the survey simply asks whether households have LURCs. As Table 1.3 shows, 79% of the respondents reported in 2016 that their households have LURCs. The figures are higher in urban areas, where 84.6% of households have LURCs, compared with 72.6% in rural areas. Within the households with LURCs, about 69% of respondents in urban and rural areas have their names on the certificates.
In terms of names on LURCs by sex, Figure 1.8 shows that the differences between men and women are large and vary by region. Nationwide, 13% more men have their names on LURCs than women. The figure is particularly large in rural areas, where the difference increases to nearly 19%.
One possible reason why a respondent living in a household with land may not have his/her name on the LURC is because they are not the head of the household (e.g., a guardian or parent of the respondent may hold the title). A more concerning possibility is that with married couples only the husband’s name is on the certificate.
Table 1.4 looks at these differences. It shows large disparities between men and women regarding the reasons why their names do not appear on LURCs. First, the raw total number is vastly higher for women, with 1,946 female respondents saying their name does not appear on their household’s LURC compared to 1,266 men in the same situation. The difference is almost entirely due to married women not signing the certificates. While only 124 men reported that their name does not appear on the certificate because their spouse was a signatory, 626 women reported that this was the case. This provides strong evidence that the wide gender gap in land use signatures is due to women not co-signing with their spouses.
Table 1.3: Percentage of Respondents with Land Use Rights Certificates, 2016
Total Rural UrbanPercentage of respondents whose households have LURCs 79.0% 72.6% 84.6%
Percentage of respondents with names on LURCs 69.0% 68.2% 69.1%
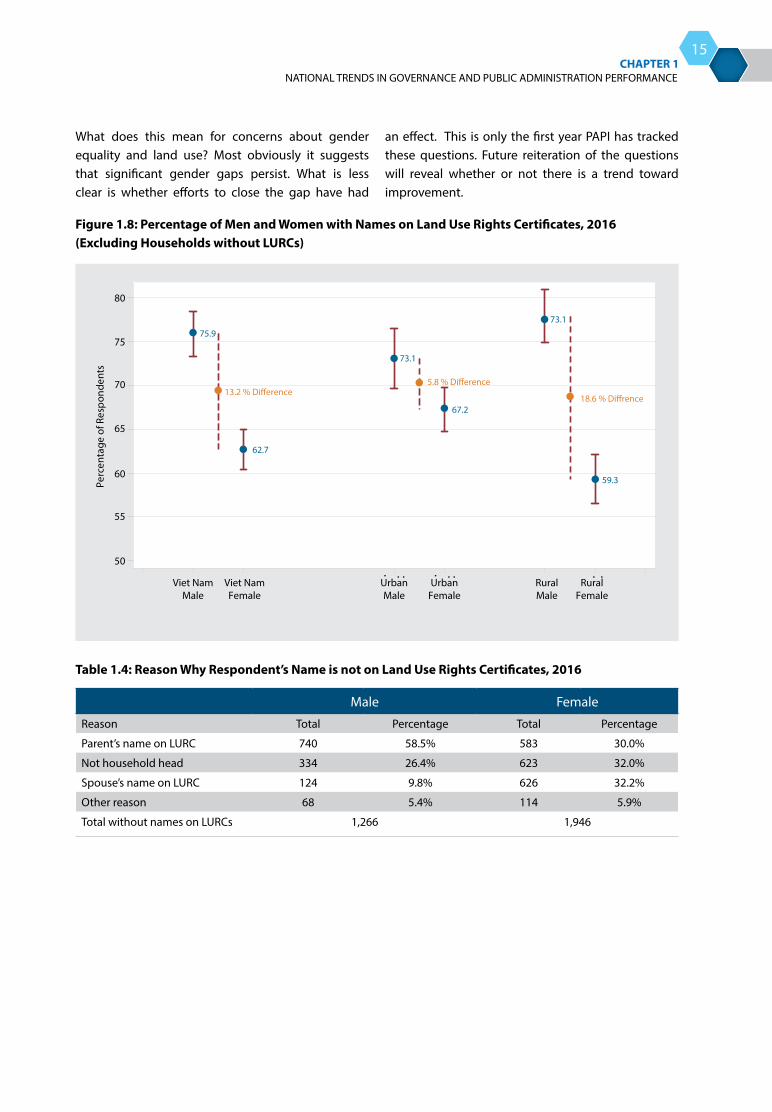
THE VIET NAM PROVINCIAL GOVERNANCE AND PUBLIC ADMINISTRATION PERFORMANCE INDEX PAPI 2016
NATIONAL TRENDS IN GOVERNANCE AND PUBLIC ADMINISTRATION PERFORMANCE CHAPTER 1
15
Figure 1.8: Percentage of Men and Women with Names on Land Use Rights Certificates, 2016 (Excluding Households without LURCs)
Viet NamMale
Viet NamFemale
UrbanMale
RuralMale
UrbanFemale
RuralFemale
55
50
60
65
70
75
80
75.9
62.7
73.1
67.2
59.3Perc
enta
ge o
f Res
pond
ents
13.2 % Di�erence5.8 % Di�erence
18.6 % Di�rence
73.1
What does this mean for concerns about gender equality and land use? Most obviously it suggests that significant gender gaps persist. What is less clear is whether efforts to close the gap have had
an effect. This is only the first year PAPI has tracked these questions. Future reiteration of the questions will reveal whether or not there is a trend toward improvement.
Table 1.4: Reason Why Respondent’s Name is not on Land Use Rights Certificates, 2016
Male Female
Reason Total Percentage Total Percentage
Parent’s name on LURC 740 58.5% 583 30.0%
Not household head 334 26.4% 623 32.0%
Spouse’s name on LURC 124 9.8% 626 32.2%
Other reason 68 5.4% 114 5.9%
Total without names on LURCs 1,266 1,946
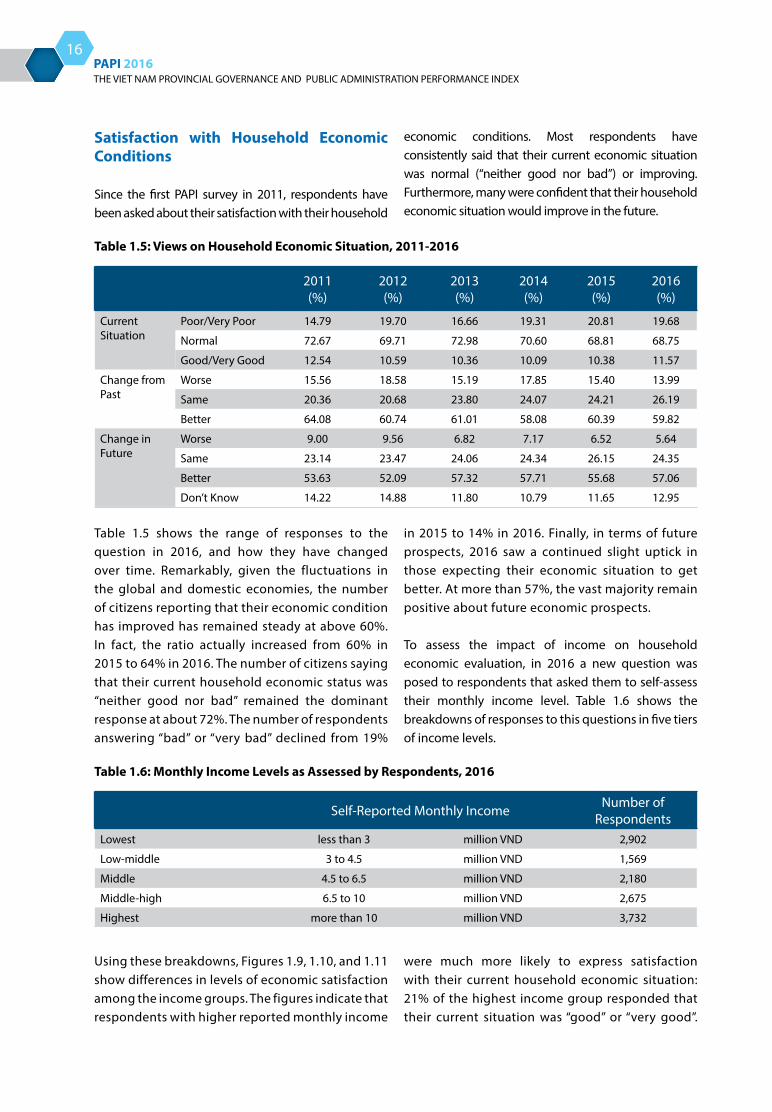
THE VIET NAM PROVINCIAL GOVERNANCE AND PUBLIC ADMINISTRATION PERFORMANCE INDEX PAPI 2016
16
Satisfaction with Household Economic Conditions
Since the first PAPI survey in 2011, respondents have been asked about their satisfaction with their household
economic conditions. Most respondents have consistently said that their current economic situation was normal (“neither good nor bad”) or improving. Furthermore, many were confident that their household economic situation would improve in the future.
Using these breakdowns, Figures 1.9, 1.10, and 1.11 show differences in levels of economic satisfaction among the income groups. The figures indicate that respondents with higher reported monthly income
were much more likely to express satisfaction with their current household economic situation: 21% of the highest income group responded that their current situation was “good” or “very good”.
Table 1.5 shows the range of responses to the question in 2016, and how they have changed over time. Remarkably, given the fluctuations in the global and domestic economies, the number of citizens reporting that their economic condition has improved has remained steady at above 60%. In fact, the ratio actually increased from 60% in 2015 to 64% in 2016. The number of citizens saying that their current household economic status was “neither good nor bad” remained the dominant response at about 72%. The number of respondents answering “bad” or “very bad” declined from 19%
in 2015 to 14% in 2016. Finally, in terms of future prospects, 2016 saw a continued slight uptick in those expecting their economic situation to get better. At more than 57%, the vast majority remain positive about future economic prospects.
To assess the impact of income on household economic evaluation, in 2016 a new question was posed to respondents that asked them to self-assess their monthly income level. Table 1.6 shows the breakdowns of responses to this questions in five tiers of income levels.
Self-Reported Monthly Income Number of Respondents
Lowest less than 3 million VND 2,902
Low-middle 3 to 4.5 million VND 1,569
Middle 4.5 to 6.5 million VND 2,180
Middle-high 6.5 to 10 million VND 2,675
Highest more than 10 million VND 3,732
Table 1.5: Views on Household Economic Situation, 2011-2016
2011(%)
2012(%)
2013(%)
2014(%)
2015(%)
2016(%)
Current Situation
Poor/Very Poor 14.79 19.70 16.66 19.31 20.81 19.68
Normal 72.67 69.71 72.98 70.60 68.81 68.75
Good/Very Good 12.54 10.59 10.36 10.09 10.38 11.57
Change from Past
Worse 15.56 18.58 15.19 17.85 15.40 13.99
Same 20.36 20.68 23.80 24.07 24.21 26.19
Better 64.08 60.74 61.01 58.08 60.39 59.82
Change in Future
Worse 9.00 9.56 6.82 7.17 6.52 5.64
Same 23.14 23.47 24.06 24.34 26.15 24.35
Better 53.63 52.09 57.32 57.71 55.68 57.06
Don’t Know 14.22 14.88 11.80 10.79 11.65 12.95
Table 1.6: Monthly Income Levels as Assessed by Respondents, 2016
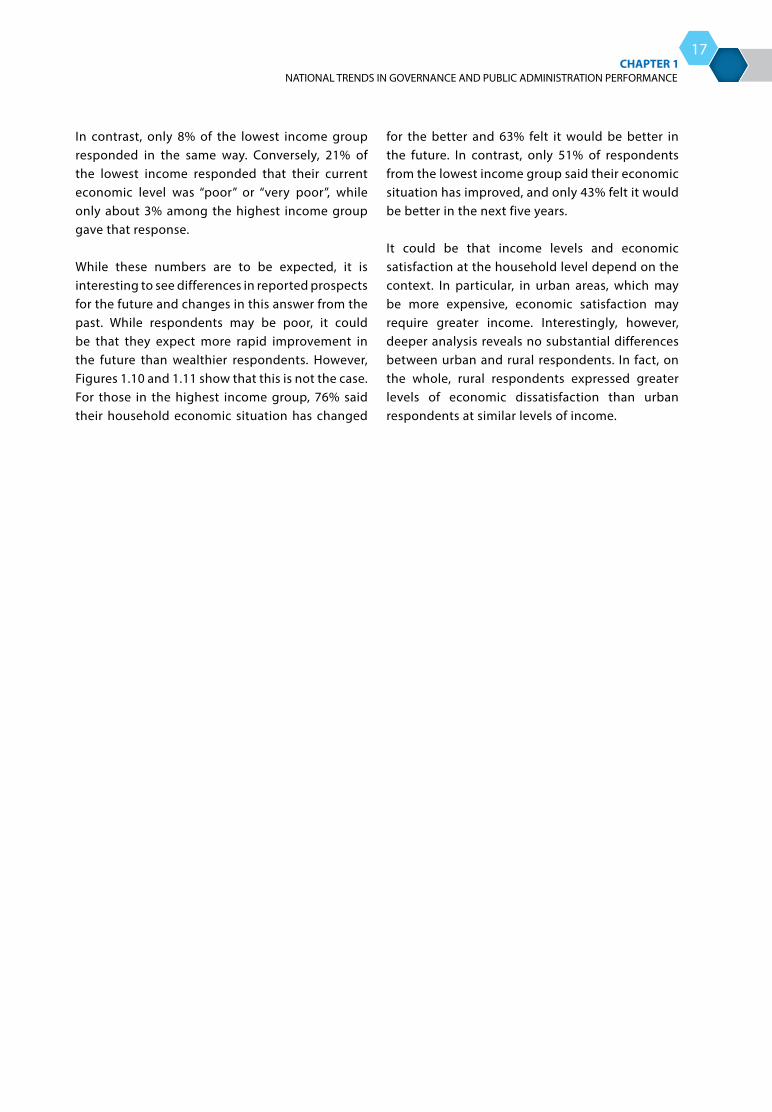
THE VIET NAM PROVINCIAL GOVERNANCE AND PUBLIC ADMINISTRATION PERFORMANCE INDEX PAPI 2016
NATIONAL TRENDS IN GOVERNANCE AND PUBLIC ADMINISTRATION PERFORMANCE CHAPTER 1
17
In contrast, only 8% of the lowest income group responded in the same way. Conversely, 21% of the lowest income responded that their current economic level was “poor” or “very poor”, while only about 3% among the highest income group gave that response.
While these numbers are to be expected, it is interesting to see differences in reported prospects for the future and changes in this answer from the past. While respondents may be poor, it could be that they expect more rapid improvement in the future than wealthier respondents. However, Figures 1.10 and 1.11 show that this is not the case. For those in the highest income group, 76% said their household economic situation has changed
for the better and 63% felt it would be better in the future. In contrast, only 51% of respondents from the lowest income group said their economic situation has improved, and only 43% felt it would be better in the next five years.
It could be that income levels and economic satisfaction at the household level depend on the context. In particular, in urban areas, which may be more expensive, economic satisfaction may require greater income. Interestingly, however, deeper analysis reveals no substantial differences between urban and rural respondents. In fact, on the whole, rural respondents expressed greater levels of economic dissatisfaction than urban respondents at similar levels of income.
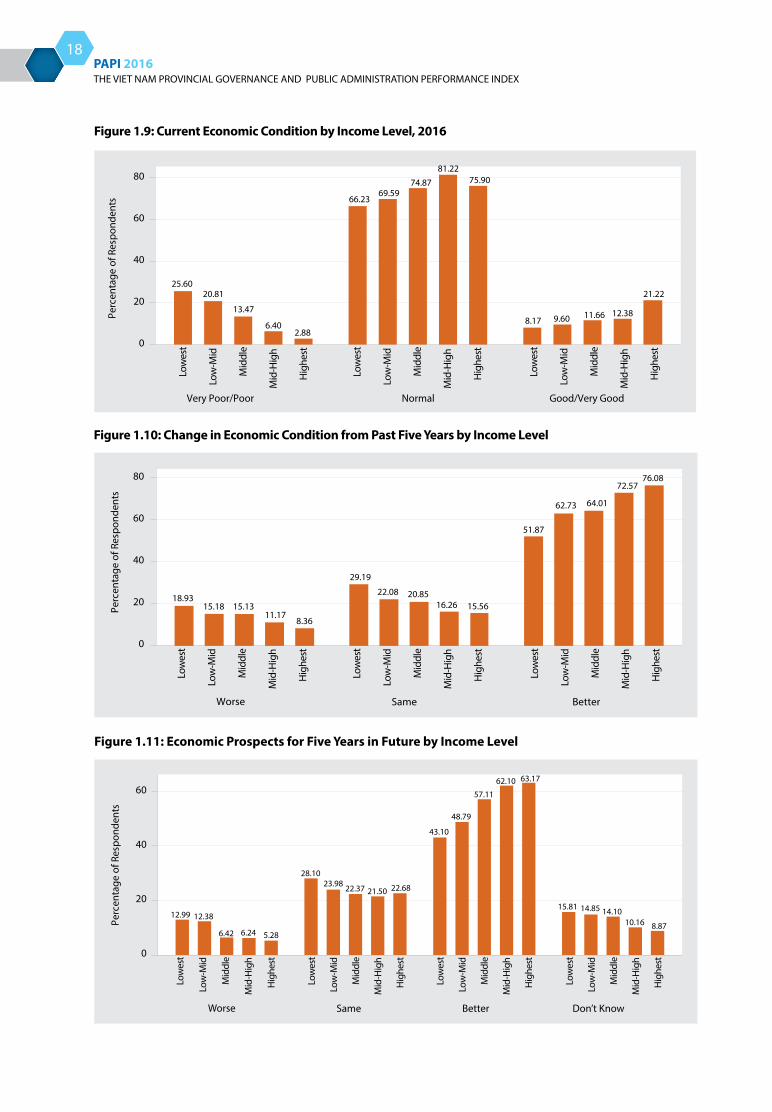
THE VIET NAM PROVINCIAL GOVERNANCE AND PUBLIC ADMINISTRATION PERFORMANCE INDEX PAPI 2016
18
Worse Same Better Don’t Know
Perc
enta
ge o
f Res
pond
ents
Low
est
Low
-Mid
Mid
dle
Mid
-Hig
h
Hig
hest
Low
est
Low
-Mid
Mid
dle
Mid
-Hig
h
Hig
hest
Low
est
Low
-Mid
Mid
dle
Mid
-Hig
h
Hig
hest
Low
est
Low
-Mid
Mid
dle
Mid
-Hig
h
Hig
hest
12.99 12.38
6.42 6.24 5.28
28.1023.98 22.37 21.50 22.68
43.10
48.79
57.11
62.10 63.17
15.81 14.85 14.1010.16 8.87
40
60
20
0
Good/Very GoodVery Poor/Poor Normal
Perc
enta
ge o
f Res
pond
ents
Low
est
Low
-Mid
Mid
dle
Mid
-Hig
h
Hig
hest
Low
est
Low
-Mid
Mid
dle
Mid
-Hig
h
Hig
hest
Low
est
Low
-Mid
Mid
dle
Mid
-Hig
h
Hig
hest
25.6020.81
13.47
6.402.88
66.2369.59
81.22
74.87 75.90
8.17 9.60 11.66 12.38
21.22
80
40
60
20
0
Worse Same Better
Perc
enta
ge o
f Res
pond
ents
Low
est
Low
-Mid
Mid
dle
Mid
-Hig
h
Hig
hest
Low
est
Low
-Mid
Mid
dle
Mid
-Hig
h
Hig
hest
Low
est
Low
-Mid
Mid
dle
Mid
-Hig
h
Hig
hest
18.9315.18 15.13
11.178.36
29.19
22.08 20.8516.26 15.56
51.87
62.73 64.01
72.5776.0880
40
60
20
0
Figure 1.9: Current Economic Condition by Income Level, 2016
Figure 1.10: Change in Economic Condition from Past Five Years by Income Level
Figure 1.11: Economic Prospects for Five Years in Future by Income Level
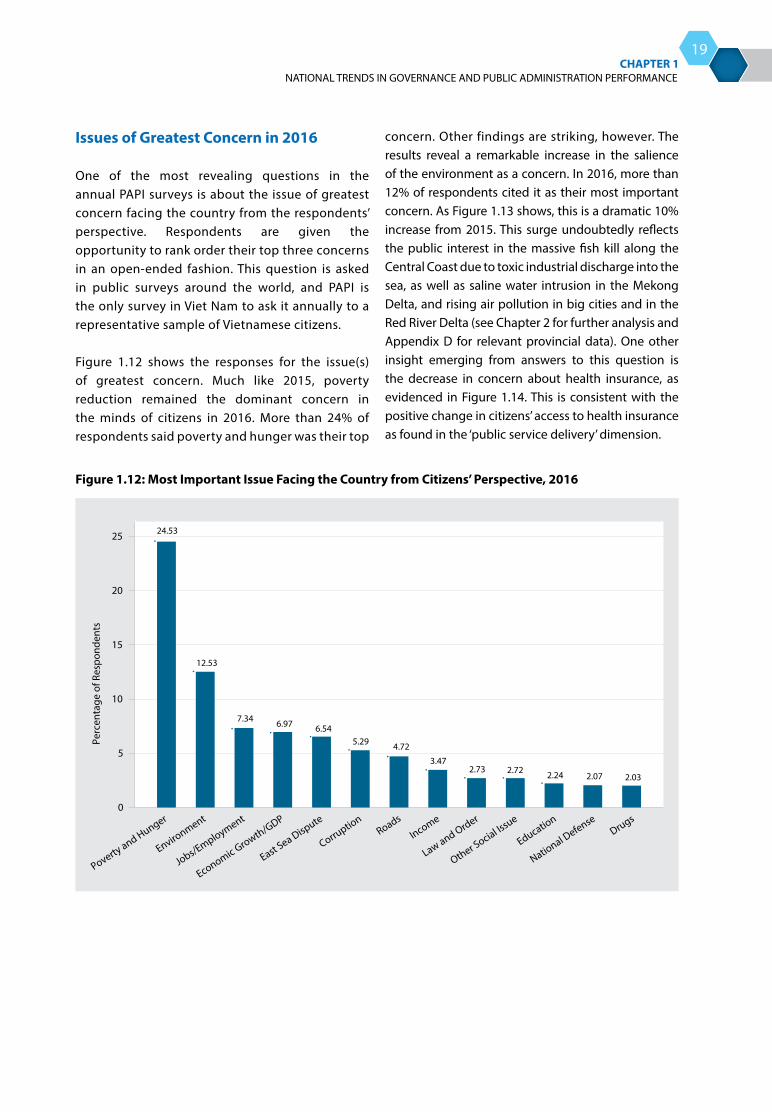
THE VIET NAM PROVINCIAL GOVERNANCE AND PUBLIC ADMINISTRATION PERFORMANCE INDEX PAPI 2016
NATIONAL TRENDS IN GOVERNANCE AND PUBLIC ADMINISTRATION PERFORMANCE CHAPTER 1
19
Figure 1.12: Most Important Issue Facing the Country from Citizens’ Perspective, 2016
Issues of Greatest Concern in 2016
One of the most revealing questions in the annual PAPI surveys is about the issue of greatest concern facing the country from the respondents’ perspective. Respondents are given the opportunity to rank order their top three concerns in an open-ended fashion. This question is asked in public surveys around the world, and PAPI is the only survey in Viet Nam to ask it annually to a representative sample of Vietnamese citizens.
Figure 1.12 shows the responses for the issue(s) of greatest concern. Much like 2015, poverty reduction remained the dominant concern in the minds of citizens in 2016. More than 24% of respondents said poverty and hunger was their top
concern. Other findings are striking, however. The results reveal a remarkable increase in the salience of the environment as a concern. In 2016, more than 12% of respondents cited it as their most important concern. As Figure 1.13 shows, this is a dramatic 10% increase from 2015. This surge undoubtedly reflects the public interest in the massive fish kill along the Central Coast due to toxic industrial discharge into the sea, as well as saline water intrusion in the Mekong Delta, and rising air pollution in big cities and in the Red River Delta (see Chapter 2 for further analysis and Appendix D for relevant provincial data). One other insight emerging from answers to this question is the decrease in concern about health insurance, as evidenced in Figure 1.14. This is consistent with the positive change in citizens’ access to health insurance as found in the ‘public service delivery’ dimension.
Poverty and Hunger
Environment
Jobs/Employment
Economic Growth/GDP
East Sea Dispute
Corruptio
nRoads
Income
Law and Order
Other Social Issue
Education
National D
efenseDrugs
0
5
10
15
20
25
Perc
enta
ge o
f Res
pond
ents
24.53
12.53
7.34 6.97 6.545.29 4.72
3.472.73 2.72 2.24 2.07 2.03
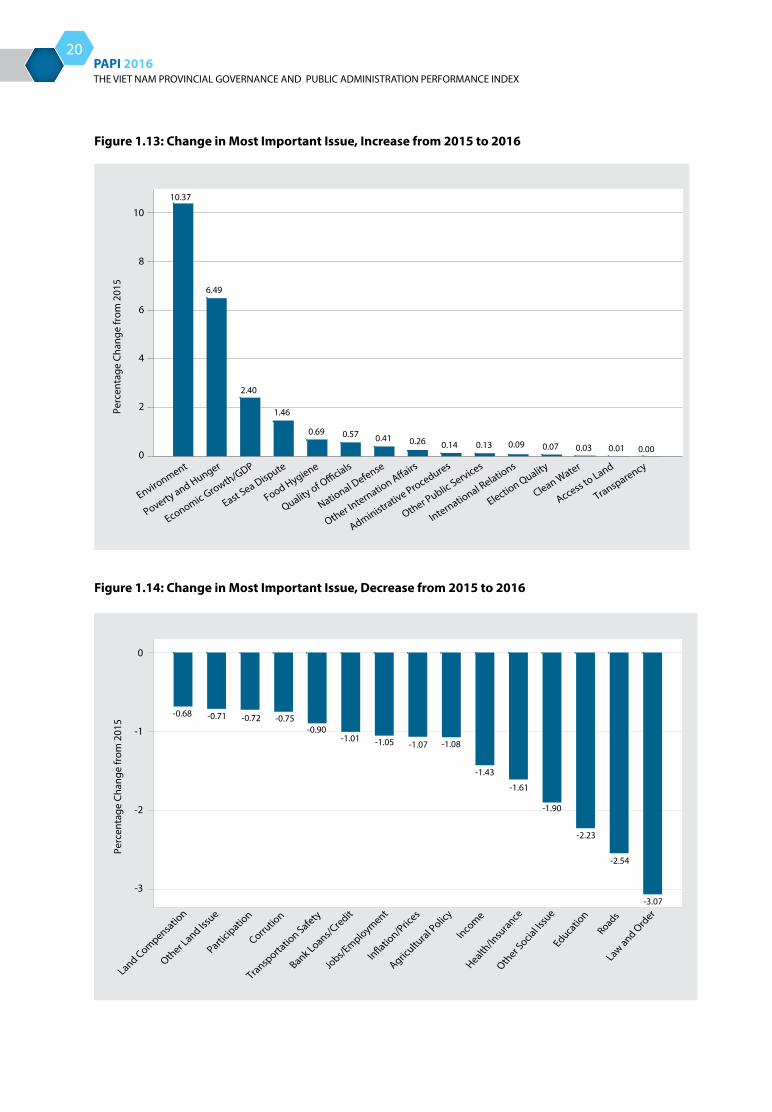
THE VIET NAM PROVINCIAL GOVERNANCE AND PUBLIC ADMINISTRATION PERFORMANCE INDEX PAPI 2016
20
Poverty and Hunger
Environment
Economic Growth/GDP
East Sea Dispute
Food Hygiene
Quality of O
�cials
National Defense
Other Internation A�airs
International Relations
Other Public Services
Administrative Procedures
Election Quality
Clean Water
Access to Land
Transparency0
2
4
6
8
10
Perc
enta
ge C
hang
e fr
om 2
015
10.37
6.49
2.40
1.46
0.69 0.57 0.41 0.26 0.14 0.13 0.09 0.07 0.03 0.01 0.00
Other L
and Issue
Land Compensatio
n
Participatio
n
Corrutio
n
Transporta
tion Safety
Bank Loans/Credit
Jobs/E
mployment
In�ation/Pric
es
Health/In
surance
Other S
ocial Is
sue
Educatio
n
RoadsLaw and O
rder
Income
Agricultu
ral Polic
y
-3
-2
-1
0
Perc
enta
ge C
hang
e fr
om 2
015
-0.68 -0.71 -0.72 -0.75-0.90
-1.01 -1.05 -1.07 -1.08
-1.43
-1.61
-1.90
-2.23
-2.54
-3.07
Figure 1.13: Change in Most Important Issue, Increase from 2015 to 2016
Figure 1.14: Change in Most Important Issue, Decrease from 2015 to 2016
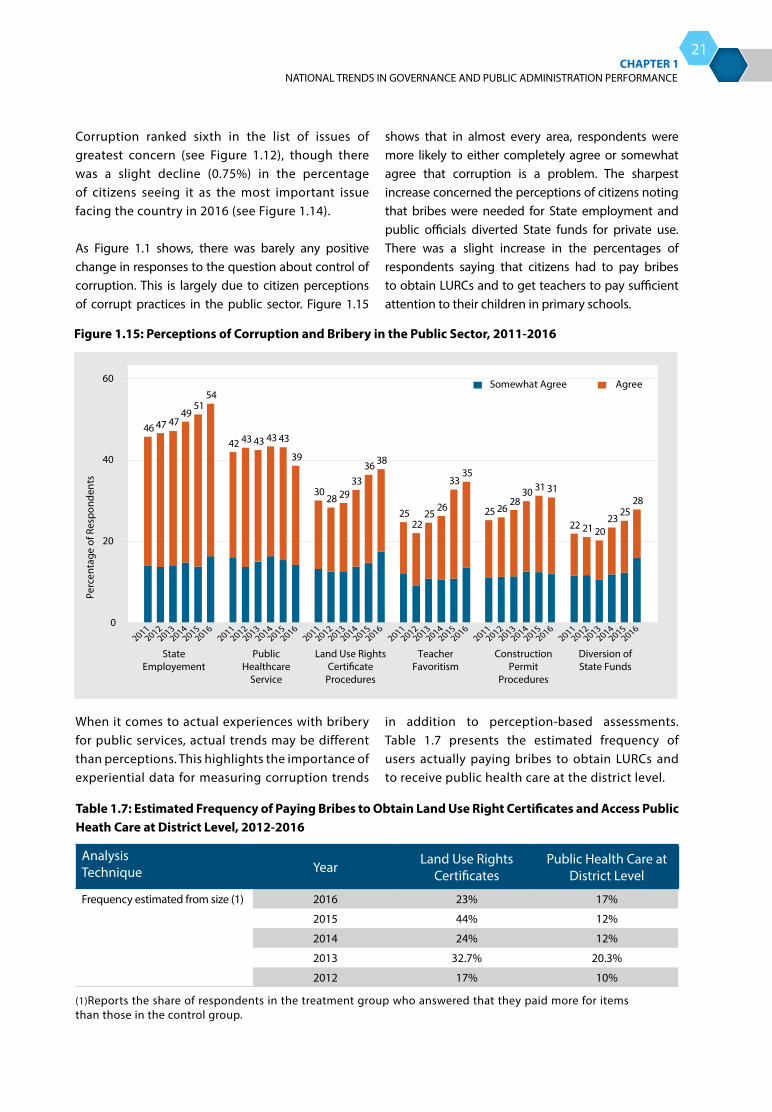
THE VIET NAM PROVINCIAL GOVERNANCE AND PUBLIC ADMINISTRATION PERFORMANCE INDEX PAPI 2016
NATIONAL TRENDS IN GOVERNANCE AND PUBLIC ADMINISTRATION PERFORMANCE CHAPTER 1
21
46 47 4749
5154
42 43 43 43 43
39
3028 29
3336 38
2522
2526
3335
25 2628
30 31 31
22 21 2023
2528
0
20
40
60
20112012
20132014
20152016
20112012
20132014
20152016
20112012
20132014
20152016
20112012
20132014
20152016
20112012
20132014
20152016
20112012
20132014
20152016
Perc
enta
ge o
f Res
pond
ents
StateEmployement
PublicHealthcare
Service
Land Use RightsCerti�cate
Procedures
TeacherFavoritism
ConstructionPermit
Procedures
Diversion ofState Funds
Somewhat Agree Agree
Corruption ranked sixth in the list of issues of greatest concern (see Figure 1.12), though there was a slight decline (0.75%) in the percentage of citizens seeing it as the most important issue facing the country in 2016 (see Figure 1.14). As Figure 1.1 shows, there was barely any positive change in responses to the question about control of corruption. This is largely due to citizen perceptions of corrupt practices in the public sector. Figure 1.15
shows that in almost every area, respondents were more likely to either completely agree or somewhat agree that corruption is a problem. The sharpest increase concerned the perceptions of citizens noting that bribes were needed for State employment and public officials diverted State funds for private use. There was a slight increase in the percentages of respondents saying that citizens had to pay bribes to obtain LURCs and to get teachers to pay sufficient attention to their children in primary schools.
When it comes to actual experiences with bribery for public services, actual trends may be different than perceptions. This highlights the importance of experiential data for measuring corruption trends
in addition to perception-based assessments. Table 1.7 presents the estimated frequency of users actually paying bribes to obtain LURCs and to receive public health care at the district level.
Figure 1.15: Perceptions of Corruption and Bribery in the Public Sector, 2011-2016
Analysis Technique Year Land Use Rights
CertificatesPublic Health Care at
District Level
Frequency estimated from size (1) 2016 23% 17%
2015 44% 12%
2014 24% 12%
2013 32.7% 20.3%
2012 17% 10%
Table 1.7: Estimated Frequency of Paying Bribes to Obtain Land Use Right Certificates and Access Public Heath Care at District Level, 2012-2016
(1)Reports the share of respondents in the treatment group who answered that they paid more for items than those in the control group.
THE VIET NAM PROVINCIAL GOVERNANCE AND PUBLIC ADMINISTRATION PERFORMANCE INDEX PAPI 2016
22
12 See National Economics University and United Nations Development Programme (2017), and Nguyen Van Thang, Do Thanh Huyen et al. (2017) for suggestions on how to promote citizen participation through deliberative policy making models.
Compared to the perception-based question in Figure 1.15 above, estimates of the frequency of actual payments for LURCs decreased from 44% in 2015 to 23% in 2016. This could be due to the prompt actions from the Ministry of National Resources and Environment in response to concerns that corruption in land was increasing. On 25 April 2016, the Ministry decided to set up hotlines for citizens to report on bribery during LURCs acquisition. There is some evidence that this action may have been in response to the PAPI 2015 findings, which reported increases in such bribes.11 In contrast, the number of respondents reporting that they paid bribes for public health care services at the district level rose slightly from 12% in the previous two years to 17% in 2016. The increase could be a sign of one area the health care sector could improve to increase user satisfaction.
Implications
In reviewing the trends from 2016, a number of policy implications present themselves. Public service delivery has continued to improve over the past six years. This is largely owing to greater citizen appreciation of access to better health care insurance and services. The health sector has made significant efforts to expand health insurance coverage and locations to access health care for health insurance holders. Additional inclusive policies like these should be developed in order to continue the momentum to achieve the health sector’s 2020 target to provide health care coverage to all citizens.
Regarding citizen participation, as reported in the 2015 PAPI report, grassroots participatory institutions
11 See Decision No. 931/QĐ-BTNMT of the Minister of Natural Resources and Environment on setting up hotlines to collect citizen and business feedback on bribery in the areas of natural resources and environment, including land administration, dated 4 May 2016. It was reported by the Ministry that after three months of operation, the hotline collected nearly 1,700 complaints about bribe asking by land administrators in handling LURCs (see Dan Tri, 4 October 2016).
remained focused on “professional voters” and gave only token attention to other voters in the 2016 elections. Proxy voting remains accepted by electoral committees in most of the country. Meetings with voters before and after elections were not participatory or inclusive. In particular, more work should be done to make voter meetings also available to non-associated members and to women. Subsequent PAPI reports may investigate population groups where participation in elections does appear broad-based, in order to suggest more specific recommendations in this area.
On land administration, land seizures have stayed low, but compensation levels remained a concern in 2016 for those who had their land taken. Enhanced transparency and deliberative public consultation of land compensation options should be priorities in implementation of land seizures at all levels.12 Furthermore, attention should be paid to the gender gap in land use rights registration. Women are far less likely to have their names on LURCs than men, particularly in rural areas. Efforts should be made to encourage women to co-sign their household land rights certificates.
Finally, as the next chapter will discuss in more detail, environmental issues surged as an important concern in 2016. Due to events in 2016, citizens were more concerned than ever about the environment. This suggests that the government should take a much closer look at environmental protection standards and policies, and make transparent how these policies are implemented in practice for the public to scrutinize.
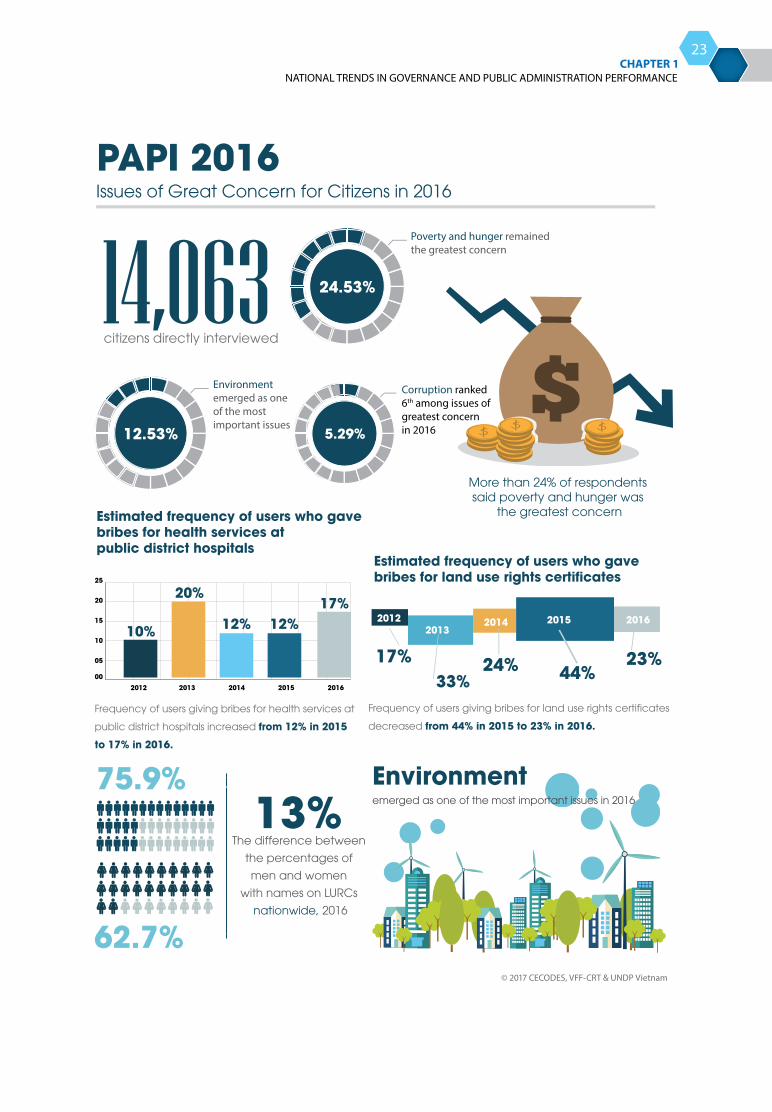
THE VIET NAM PROVINCIAL GOVERNANCE AND PUBLIC ADMINISTRATION PERFORMANCE INDEX PAPI 2016
NATIONAL TRENDS IN GOVERNANCE AND PUBLIC ADMINISTRATION PERFORMANCE CHAPTER 1
23
Frequency of users giving bribes for health services at
public district hospitals increased from 12% in 2015 to 17% in 2016.
Estimated frequency of users who gave bribes for health services at public district hospitals
05
00
10
15
20
25
2012 2013 2014 2015 2016
17%12%12%
20%
10%
Frequency of users giving bribes for land use rights certificates
decreased from 44% in 2015 to 23% in 2016.
Estimated frequency of users who gavebribes for land use rights certificates
20122013
2014 2015 2016
23%44%24%
33%17%
24.53%
Poverty and hunger remained the greatest concern
14,063citizens directly interviewed
More than 24% of respondents said poverty and hunger was
the greatest concern
Environment emerged as one of the most important issues12.53%
Environmentemerged as one of the most important issues in 2016
Corruption ranked 6th among issues of greatest concern in 20165.29%
13%The difference between
the percentages of men and women
with names on LURCs nationwide, 2016
75.9%
62.7%
PAPI 2016Issues of Great Concern for Citizens in 2016
© 2017 CECODES, VFF-CRT & UNDP Vietnam

02
Overview
The second chapter in every annual PAPI report highlights important issues facing Viet Nam. This report explores three prominent issues of great concern and interest in 2016 from the perspective of citizens: the environment, poverty, and the Trans-Pacific Partnership.
As discussed in Chapter 1, concerns about the environment became a salient topic, possibly as a result of several high-profile environmental events in 2016, including the massive fish death in the Central Coast region as the result of toxic industrial waste early in the year,13 saline water intrusion in the Mekong Delta region, and worsening air pollution in big cities and industrial zones.14
The analysis in this chapter looks at whether or not the recent events have increased the salience of the environment as a concern for Vietnamese citizens and how they would balance a trade-off between economic development and environmental protection.
Furthermore, this chapter assesses which strata of the population express the greatest concern for the environment. Results show that the environment is a primary concern for the educated – a demographic that is also more willing to trade economic growth for environmental protection. The survey also reveals concerns about increasing air and water pollution, particularly in the northern Red River Delta provinces.
This chapter also looks at citizen concerns regarding poverty. In particular, how do citizens view poverty reduction in comparison to other priorities such as the environment, trade, and economic growth? The results show that poverty was the highest priority for poorer respondents in 2016. Furthermore, wealthier respondents were more likely to weight the environment more heavily compared to poverty than poorer respondents. Nonetheless, poverty remains the most important priority across all income groups, reflecting the fact that this is still an important concern for Vietnamese citizens.
Finally, reflecting the salience of the proposed Trans-Pacific Partnership, of which Viet Nam would be a member if ratified, this chapter looks at responses to a series of questions about citizen awareness of,
13 Viet Nam News (30/06/2016) and VnExpress International (30/06/2016).
14 Tuoi Tre (05/02/2012).
IMPORTANT ISSUES IN VIET NAM IN 2016: ENVIRONMENT, POVERTY
AND THE TRANS-PACIFIC PARTNERSHIP
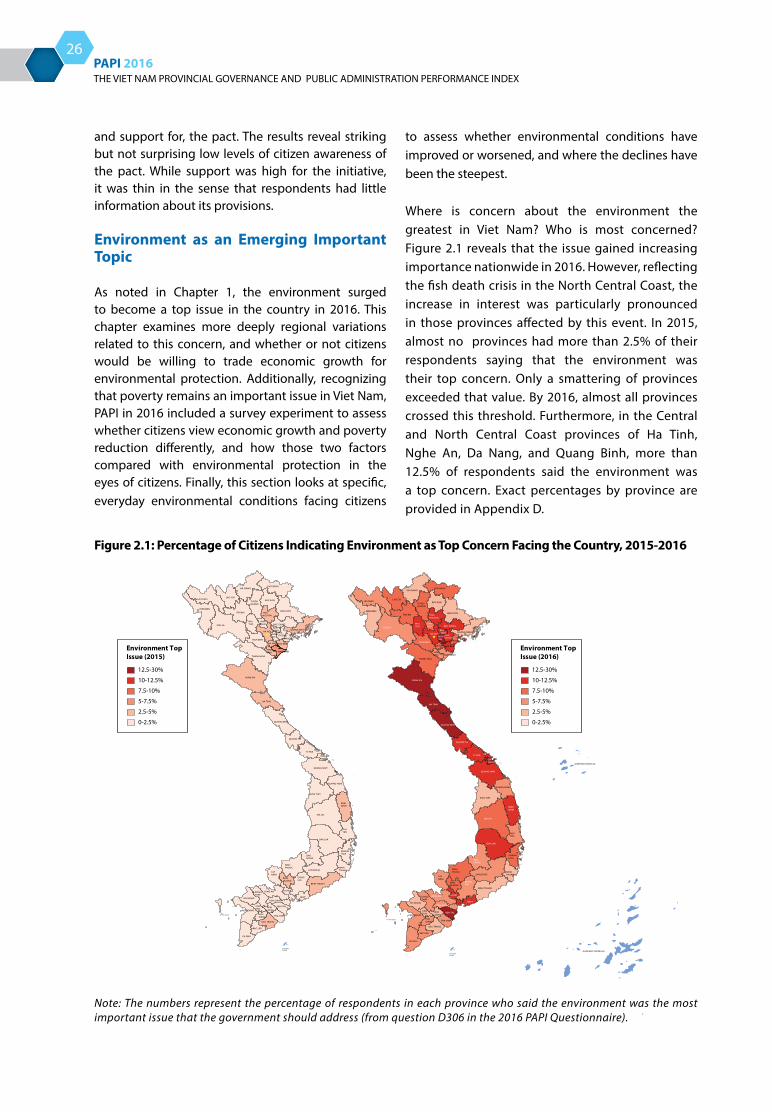
THE VIET NAM PROVINCIAL GOVERNANCE AND PUBLIC ADMINISTRATION PERFORMANCE INDEX PAPI 2016
26
and support for, the pact. The results reveal striking but not surprising low levels of citizen awareness of the pact. While support was high for the initiative, it was thin in the sense that respondents had little information about its provisions.
Environment as an Emerging Important Topic
As noted in Chapter 1, the environment surged to become a top issue in the country in 2016. This chapter examines more deeply regional variations related to this concern, and whether or not citizens would be willing to trade economic growth for environmental protection. Additionally, recognizing that poverty remains an important issue in Viet Nam, PAPI in 2016 included a survey experiment to assess whether citizens view economic growth and poverty reduction differently, and how those two factors compared with environmental protection in the eyes of citizens. Finally, this section looks at specific, everyday environmental conditions facing citizens
to assess whether environmental conditions have improved or worsened, and where the declines have been the steepest.
Where is concern about the environment the greatest in Viet Nam? Who is most concerned? Figure 2.1 reveals that the issue gained increasing importance nationwide in 2016. However, reflecting the fish death crisis in the North Central Coast, the increase in interest was particularly pronounced in those provinces affected by this event. In 2015, almost no provinces had more than 2.5% of their respondents saying that the environment was their top concern. Only a smattering of provinces exceeded that value. By 2016, almost all provinces crossed this threshold. Furthermore, in the Central and North Central Coast provinces of Ha Tinh, Nghe An, Da Nang, and Quang Binh, more than 12.5% of respondents said the environment was a top concern. Exact percentages by province are provided in Appendix D.
Figure 2.1: Percentage of Citizens Indicating Environment as Top Concern Facing the Country, 2015-2016
Environment Top Issue (2016)
12.5-30%
10-12.5%
7.5-10%
5-7.5%
2.5-5%
0-2.5%
Environment Top Issue (2015)
12.5-30%
10-12.5%
7.5-10%
5-7.5%
2.5-5%
0-2.5%
QUẦN ĐẢO HOÀNG SA
QUẦN ĐẢO TRƯỜNG SA
Note: The numbers represent the percentage of respondents in each province who said the environment was the most important issue that the government should address (from question D306 in the 2016 PAPI Questionnaire).

THE VIET NAM PROVINCIAL GOVERNANCE AND PUBLIC ADMINISTRATION PERFORMANCE INDEX PAPI 2016
IMPORTANT ISSUES IN VIET NAM IN 2016: ENVIRONMENT, POVERTY AND THE TRANS-PACIFIC PARTNERSHIPCHAPTER 2
27
This analysis suggests that, consistent with the figures from Chapter 1, the fish kill crisis did rapidly increase citizens’ interest in the environment. Furthermore, this increase was most pronounced in the provinces impacted by the crisis. At the same time, interest in the environment was not confined to those provinces. As Figure 2.1 shows, the environment has also grown into a national concern. In fact, the fish crisis in the Central Coast region is not the only environmental topic to grip the country in recent years. Other issues include, for example, river pollution, particularly due to discharge from industrial factories.
In addition to the geographical distribution of concerns about the environment, this chapter also assesses the demographic distribution. Analysis shows that there is little difference in level of concern based on gender, ethnicity, or whether or not the respondent is a party member. Outside of geographical location, the most important demographic feature is educational level. As Figure 2.2 shows, respondents with some post-secondary education are likely to express concern about the environment at a rate of 13%, while those with primary education or below have only a 4% likelihood of saying the environment is a top concern.
Figure 2.2: Environment as a Top Concern by Education Level, 2016
Notes:1. Dots are the estimated values; bars are the 95% confidence intervals.2. The estimates are from a probit regression including other control variables includingincome, gender, age, and province. 3. Educations quintiles are measured as follows: Low: complete primary and below Low-Mid: incomplete and complete secondary Middle: incomplete high school Mid-High: complete high school High: some college and above
Education Level
Low Low-Mid Middle Mid-High High
0
5
10
15
20
Perc
enta
ge o
f Res
pond
ents
4
7
910
13
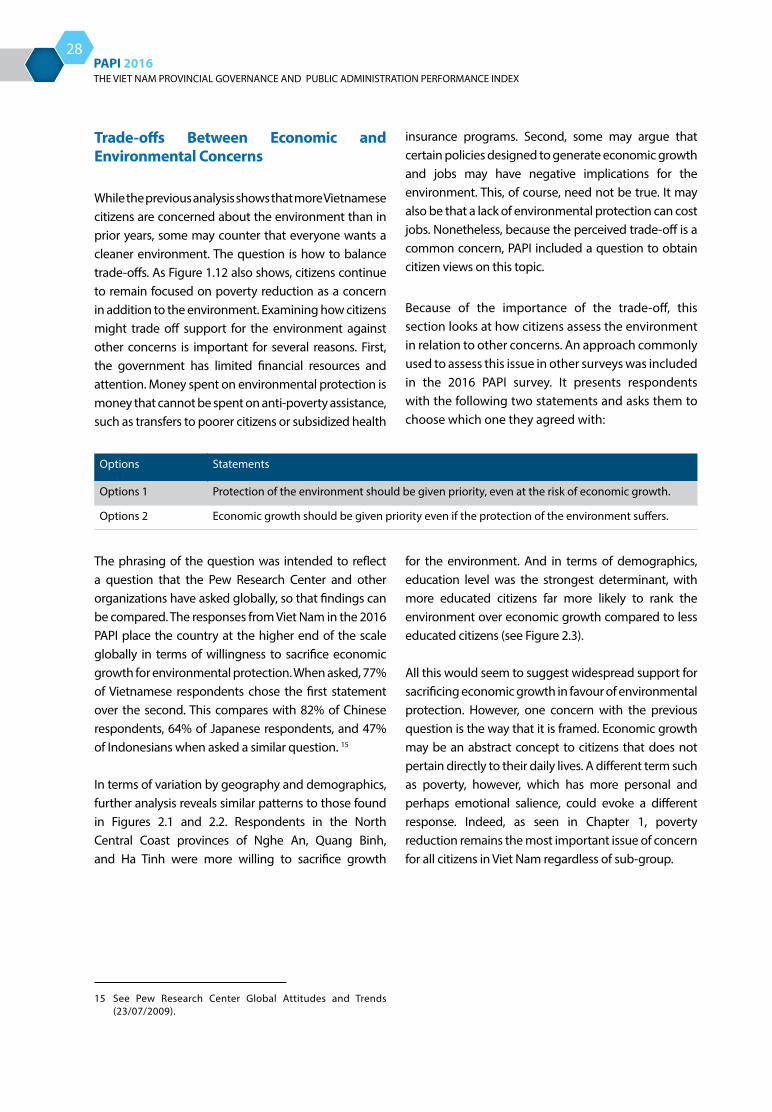
THE VIET NAM PROVINCIAL GOVERNANCE AND PUBLIC ADMINISTRATION PERFORMANCE INDEX PAPI 2016
28
Trade-offs Between Economic and Environmental Concerns
While the previous analysis shows that more Vietnamese citizens are concerned about the environment than in prior years, some may counter that everyone wants a cleaner environment. The question is how to balance trade-offs. As Figure 1.12 also shows, citizens continue to remain focused on poverty reduction as a concern in addition to the environment. Examining how citizens might trade off support for the environment against other concerns is important for several reasons. First, the government has limited financial resources and attention. Money spent on environmental protection is money that cannot be spent on anti-poverty assistance, such as transfers to poorer citizens or subsidized health
insurance programs. Second, some may argue that certain policies designed to generate economic growth and jobs may have negative implications for the environment. This, of course, need not be true. It may also be that a lack of environmental protection can cost jobs. Nonetheless, because the perceived trade-off is a common concern, PAPI included a question to obtain citizen views on this topic.
Because of the importance of the trade-off, this section looks at how citizens assess the environment in relation to other concerns. An approach commonly used to assess this issue in other surveys was included in the 2016 PAPI survey. It presents respondents with the following two statements and asks them to choose which one they agreed with:
The phrasing of the question was intended to reflect a question that the Pew Research Center and other organizations have asked globally, so that findings can be compared. The responses from Viet Nam in the 2016 PAPI place the country at the higher end of the scale globally in terms of willingness to sacrifice economic growth for environmental protection. When asked, 77% of Vietnamese respondents chose the first statement over the second. This compares with 82% of Chinese respondents, 64% of Japanese respondents, and 47% of Indonesians when asked a similar question. 15
In terms of variation by geography and demographics, further analysis reveals similar patterns to those found in Figures 2.1 and 2.2. Respondents in the North Central Coast provinces of Nghe An, Quang Binh, and Ha Tinh were more willing to sacrifice growth
for the environment. And in terms of demographics, education level was the strongest determinant, with more educated citizens far more likely to rank the environment over economic growth compared to less educated citizens (see Figure 2.3).
All this would seem to suggest widespread support for sacrificing economic growth in favour of environmental protection. However, one concern with the previous question is the way that it is framed. Economic growth may be an abstract concept to citizens that does not pertain directly to their daily lives. A different term such as poverty, however, which has more personal and perhaps emotional salience, could evoke a different response. Indeed, as seen in Chapter 1, poverty reduction remains the most important issue of concern for all citizens in Viet Nam regardless of sub-group.
Options Statements
Options 1 Protection of the environment should be given priority, even at the risk of economic growth.
Options 2 Economic growth should be given priority even if the protection of the environment suffers.
15 See Pew Research Center Global Attitudes and Trends (23/07/2009).
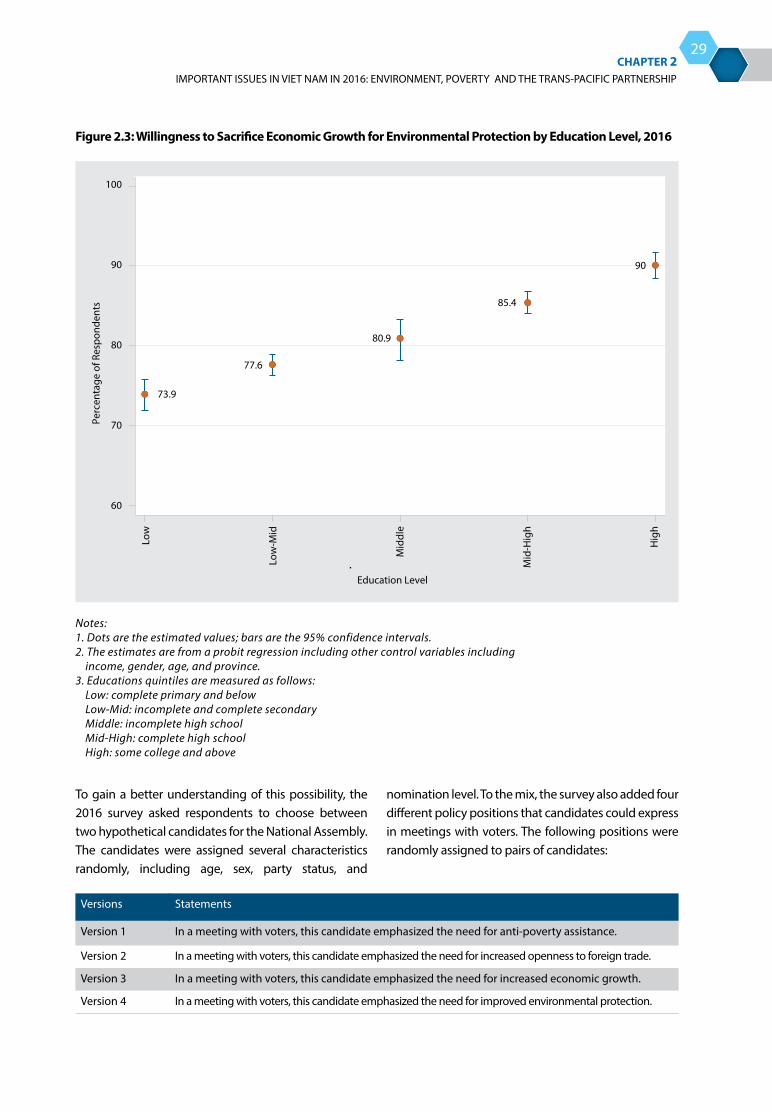
THE VIET NAM PROVINCIAL GOVERNANCE AND PUBLIC ADMINISTRATION PERFORMANCE INDEX PAPI 2016
IMPORTANT ISSUES IN VIET NAM IN 2016: ENVIRONMENT, POVERTY AND THE TRANS-PACIFIC PARTNERSHIPCHAPTER 2
29
To gain a better understanding of this possibility, the 2016 survey asked respondents to choose between two hypothetical candidates for the National Assembly. The candidates were assigned several characteristics randomly, including age, sex, party status, and
nomination level. To the mix, the survey also added four different policy positions that candidates could express in meetings with voters. The following positions were randomly assigned to pairs of candidates:
Versions Statements
Version 1 In a meeting with voters, this candidate emphasized the need for anti-poverty assistance.
Version 2 In a meeting with voters, this candidate emphasized the need for increased openness to foreign trade.
Version 3 In a meeting with voters, this candidate emphasized the need for increased economic growth.
Version 4 In a meeting with voters, this candidate emphasized the need for improved environmental protection.
Figure 2.3: Willingness to Sacrifice Economic Growth for Environmental Protection by Education Level, 2016
Education Level
Low
Low
-Mid
Mid
dle
Mid
-Hig
h
Hig
h
Perc
enta
ge o
f Res
pond
ents
60
70
80
90
100
73.9
77.6
80.9
85.4
90
Notes:1. Dots are the estimated values; bars are the 95% confidence intervals.2. The estimates are from a probit regression including other control variables including income, gender, age, and province. 3. Educations quintiles are measured as follows: Low: complete primary and below Low-Mid: incomplete and complete secondary Middle: incomplete high school Mid-High: complete high school High: some college and above

THE VIET NAM PROVINCIAL GOVERNANCE AND PUBLIC ADMINISTRATION PERFORMANCE INDEX PAPI 2016
30
Figure 2.4 shows the probability that respondents chose the different candidates based on their policy positions. The numbers should average to about 50% overall because the figures represent the percentage that a candidate would win against a hypothetical competitor in a direct electoral competition. 16
As the figure shows, foreign trade was the least popular position, with candidates expressing those
views only chosen by about 40% of voters (compared to a randomly selected hypothetical opponent). On the other hand, candidates emphasizing poverty reduction were chosen by almost 60% of voters. Candidates emphasizing the environment did win, but with just 50.9% of the votes. This was more than candidates emphasizing economic growth, who were selected with a predicted 47.8% of the votes.
Policy Issues of Priority
Trade Promotion Economic Growth
40.3
47.8
51
59.8
Environment Protection Poverty Reduction
Pred
icte
d Vo
te S
hare
40
35
45
50
55
65
60
Figure 2.4: Predicted Vote Share for National Assembly Candidate by Policy Priority, 2016
Notes:1. Dots are the estimated values; bars are the 95% confidence intervals.2. Estimates are the predicted vote share for hypothetical candidates for the National Assembly, controlling for other factors.
What are the implications of these results for citizens and environmental protection? It suggests that in Viet Nam, the environment in 2016 was an especially important concern. Furthermore, there is some
16 As there is no third alternative, total votes between the candidate and competitor should always sum to 100% of votes, so the average of two candidates will always be 50%.
evidence that citizens are willing to sacrifice economic growth in order to ensure that the environment is protected. However, poverty assistance remains an important priority. This means that if economic growth that causes environmental degradation is pitched as a way of alleviating poverty rather than simply a way of enriching the country as a whole, citizens may still be inclined to support those projects.

THE VIET NAM PROVINCIAL GOVERNANCE AND PUBLIC ADMINISTRATION PERFORMANCE INDEX PAPI 2016
IMPORTANT ISSUES IN VIET NAM IN 2016: ENVIRONMENT, POVERTY AND THE TRANS-PACIFIC PARTNERSHIPCHAPTER 2
31
Views on Specific Environmental Problems
What about specific environmental concerns? How do citizens feel about water and air quality? When asked about the most important environmental concern facing the country, 60% mentioned some form of water or air pollution. This section now turns to citizen perspectives regarding these concerns.
In terms of water pollution, the 2016 survey asked respondents living near a waterway about the quality of the water and how it has changed over time. Table 2.1 shows the results. Of the 48% that live near a waterway, 7% said it is clean enough to drink, 25% said it is clean enough to do laundry in, and 28% said it is clean enough to swim in.
Perhaps more revealing is how the perceived water quality has changed. Here, respondents were conclusive that water quality has declined. More than 67% said water quality was worse than three years ago. Figure 2.5 shows that most of the respondents who said that water has become less clean are in the Mekong Delta and South Coast regions. This may be due to serious saline water intrusion occurring as a result of large-scale drought in these regions. Perhaps surprisingly, the respondents near the area impacted by the fish kill in the Central Coast region were not as critical of the water quality conditions. However, this is likely because the question asks about water quality in waterways near the respondent’s home, not water quality in general.
Turning to air quality, citizens responded more favourably than for water quality. Table 2.2 shows that 64% of citizens surveyed said that overall air quality was good. Regarding the change over time, respondents were evenly split, with 36% indicating that air quality was worse compared to three years ago, and 38% responding that it had improved. The regional distribution looks similar to water quality, with respondents in the Red River Delta region reporting that air quality conditions
have deteriorated the most. However, in the South, respondents from the urban areas surrounding Ho Chi Minh City also reported worse air quality. Ha Noi and Ho Chi Minh City were particularly poor performing, with 42% of respondents in Ho Chi Minh City reporting declining air quality and 58% in Ha Noi reporting the same (see Appendix D for provincial breakdowns). This confirms previous reports that air pollution is an emerging environmental concern. 17
Table 2.1: Water Quality as Assessed by Citizens, 2016
Table 2.2: Air Quality as Assessed by Citizens, 2016
Live Near a Waterway Water clean enough to…
How does water compare to 3 years ago?
Yes 48%
Drink 7% Worse 67%
Do laundry in 25% Same 19%
Swim in 28% Better 14%
No 52%
Rating of air quality Do you wear a mask due to poor air quality?
How does air compare to three years ago?
Poor 11% Yes 60% Worse 36%
Poor most days 7% No 40% Same 25%
Good most days 18% Better 38%
Good 64%
17 See Tuoi Tre (05/02/2012).

THE VIET NAM PROVINCIAL GOVERNANCE AND PUBLIC ADMINISTRATION PERFORMANCE INDEX PAPI 2016
32
Figure 2.5: Areas with Most Citizens Reporting Declining Water, Air Quality in 2016
Air QualityWater Quality
25-40%
20-25%
15-20%
10-15%
0-10%
40-60%
35-40%
30-35%
25-30%
0-25%
QUẦN ĐẢO HOÀNG SA
QUẦN ĐẢO TRƯỜNG SA
Note: Percentages are the percentage of respondents reporting that the water quality (question D601bb) or air quality (question D610ab) has declined in the past three years.
Poverty as the Greatest Concern
Figure 2.4 above shows that poverty is one of the most important concerns in Viet Nam. An important question is why poverty remains such an important concern given Viet Nam’s dramatic reduction in poverty levels since 1986. With less than 15% of citizens in the country living below official poverty lines (including extreme poor and near-poor households, by multidimensional measures) in 2016, 18 why is the issue so important? One potential answer is that those close to the poverty line but not below it (about 5%) remain concerned about falling back into poverty.
To address this, responses were broken down by income group, as shown in Figure 2.6. Consistent with the
prediction, poverty does decline as a concern among higher income groups. Poverty is a top concern for 34% of those in the lowest income group compared to only 18% of those in the highest income group. Interestingly, wealthier respondents were more concerned about the environment than poorer ones. For all four of the lowest income groups, the environment was the top concern for between 10% and 12% of respondents. However, for the highest income group the rate was 17%.
While this is consistent with the prediction, the figures are nonetheless puzzling. Despite being less of a concern for wealthy individuals, poverty remains the top concern even for that group. Why is this the case? One possibility is that high-income earners are concerned about poverty reduction due to social concerns, while lower income earners have a more personal stake. Future surveys will probe this further in order to provide more concrete suggestions to policy makers on the implications of the findings.18 See Nhan Dan (23/08/2016).
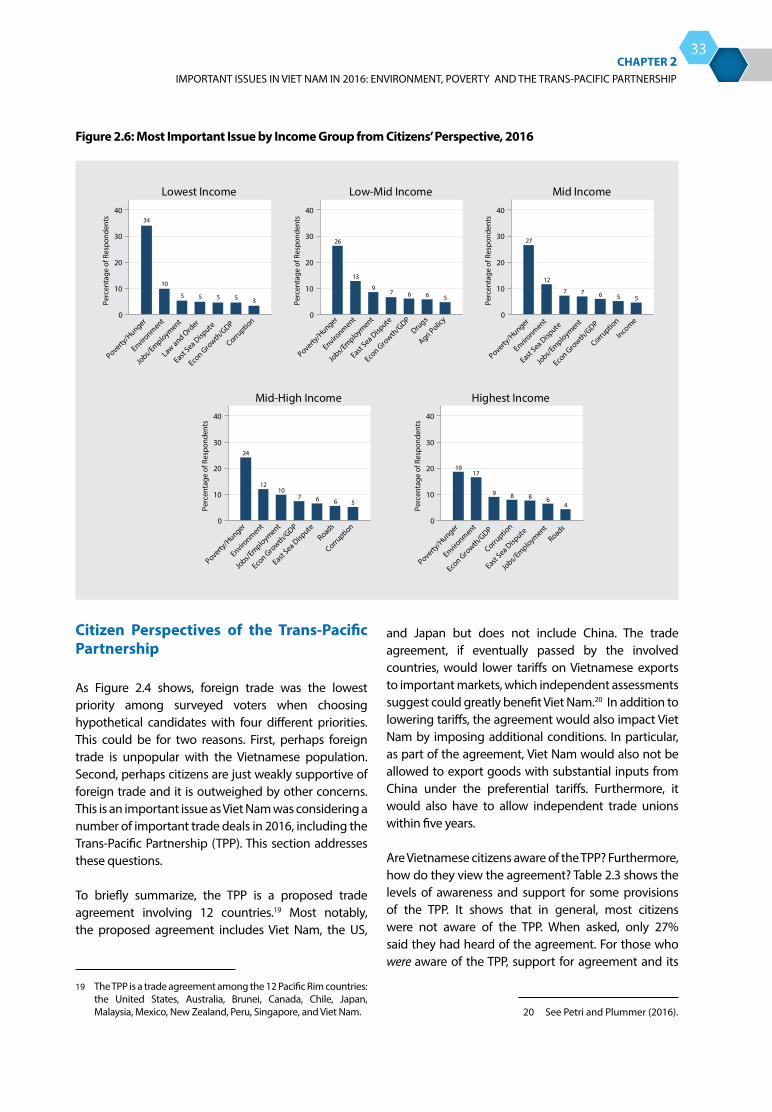
THE VIET NAM PROVINCIAL GOVERNANCE AND PUBLIC ADMINISTRATION PERFORMANCE INDEX PAPI 2016
IMPORTANT ISSUES IN VIET NAM IN 2016: ENVIRONMENT, POVERTY AND THE TRANS-PACIFIC PARTNERSHIPCHAPTER 2
33
Citizen Perspectives of the Trans-Pacific Partnership
As Figure 2.4 shows, foreign trade was the lowest priority among surveyed voters when choosing hypothetical candidates with four different priorities. This could be for two reasons. First, perhaps foreign trade is unpopular with the Vietnamese population. Second, perhaps citizens are just weakly supportive of foreign trade and it is outweighed by other concerns. This is an important issue as Viet Nam was considering a number of important trade deals in 2016, including the Trans-Pacific Partnership (TPP). This section addresses these questions.
To briefly summarize, the TPP is a proposed trade agreement involving 12 countries.19 Most notably, the proposed agreement includes Viet Nam, the US,
Figure 2.6: Most Important Issue by Income Group from Citizens’ Perspective, 2016
34
10
5 5 5 5 3
0
10
20
30
40
Perc
enta
ge o
f Res
pond
ents
Poverty/H
unger
Environm
ent
Jobs/E
mployment
Law and Ord
er
East Sea D
ispute
Econ Gro
wth/G
DP
Corruptio
n
Lowest Income
26
13
97 6 6 5
0
10
20
30
40
Perc
enta
ge o
f Res
pond
ents
Poverty/H
unger
Environm
ent
Jobs/E
mployment
East Sea D
ispute
Econ Gro
wth/G
DPDru
gs
Agri Polic
y
Low-Mid Income
27
12
7 7 6 5 5
0
10
20
30
40
Perc
enta
ge o
f Res
pond
ents
Poverty/H
unger
Environm
ent
East Sea D
ispute
Jobs/E
mployment
Econ Gro
wth/G
DP
Corruptio
n
Income
Mid Income
24
1210
7 6 6 5
0
10
20
30
40
Perc
enta
ge o
f Res
pond
ents
Poverty/H
unger
Environm
ent
Jobs/E
mployment
Econ Gro
wth/G
DP
East Sea D
ispute
Roads
Corruptio
n
Mid-High Income
1917
9 8 8 64
0
10
20
30
40Pe
rcen
tage
of R
espo
nden
ts
Poverty/H
unger
Environm
ent
Econ Gro
wth/G
DP
Corruptio
n
East Sea D
ispute
Jobs/E
mployment
Roads
Highest Income
19 The TPP is a trade agreement among the 12 Pacific Rim countries: the United States, Australia, Brunei, Canada, Chile, Japan, Malaysia, Mexico, New Zealand, Peru, Singapore, and Viet Nam. 20 See Petri and Plummer (2016).
and Japan but does not include China. The trade agreement, if eventually passed by the involved countries, would lower tariffs on Vietnamese exports to important markets, which independent assessments suggest could greatly benefit Viet Nam.20 In addition to lowering tariffs, the agreement would also impact Viet Nam by imposing additional conditions. In particular, as part of the agreement, Viet Nam would also not be allowed to export goods with substantial inputs from China under the preferential tariffs. Furthermore, it would also have to allow independent trade unions within five years.
Are Vietnamese citizens aware of the TPP? Furthermore, how do they view the agreement? Table 2.3 shows the levels of awareness and support for some provisions of the TPP. It shows that in general, most citizens were not aware of the TPP. When asked, only 27% said they had heard of the agreement. For those who were aware of the TPP, support for agreement and its

THE VIET NAM PROVINCIAL GOVERNANCE AND PUBLIC ADMINISTRATION PERFORMANCE INDEX PAPI 2016
34
specific provisions were overwhelming. For the 27% of the respondents who had heard of the TPP prior to the survey, 75% found the agreement a good thing, 88% supported greater foreign investment into Viet Nam in general, and 71% supported allowing more foreign imports. Furthermore, 78% supported a provision not allowing Vietnamese companies to export products using Chinese inputs to be eligible for preferential tariffs. Finally, 65% also supported the provision requiring independent trade unions.
For those who were not aware of the TPP, the PAPI interviewers explained the contents of the agreement. Some 60% offered an opinion while the other 40% did not know enough to evaluate the effects of those concrete provisions. It is worth noting that for both the informed and uninformed respondents, opposition was only at about 5%. This indicates that there was at least tacit support for the provisions.
In terms of the breakdown of responses by occupation and demographics, one might have thought workers in different sectors would have different views of the TPP. However, remarkably, after accounting for different factors determining awareness of the TPP, support for the accord was relatively even across all groups.21 After accounting for awareness of the TPP, the only factors that predicted support for the TPP were party membership and mass organization membership. Party members were about 20% more
Table 2.3: Support for Trans-Pacific Partnership, 2016
Heard of Trans-Pacific Partnership?
Would TPP be a good thing?
Support greater foreign
investment
Support more imports to Viet
Nam
Support not allowing
Chinese inputs
Support independent trade unions
Yes 27%
DK * 11% Yes 88% Yes 71% Yes 78% Yes 65%
No 5% No 6% No 23% No 17% No 18%
Neither 8% DK 5% DK 6% DK 3% DK 18%
Yes 75%
No 73%
DK 41% Yes 67% Yes 55% Yes 69% Yes 59%
No 5% No 13% No 21% No 18% No 11%
Neither 3% DK 19% DK 23% DK 10% DK 29%
Yes 50%
Total 100%
DK 34% Yes 72% Yes 58% Yes 72% Yes 60%
No 5% No 11% No 22% No 18% No 13%
Neither 5% DK 16% DK 17% DK 9% DK 25%
Yes 56%
likely to express support for the accord than non-party members, all else equal. Members of mass organizations were about 10% more likely to support the TPP than those who were not members of mass organizations. This suggests that those linked to the party or to mass organizations received more information about the initiative.
Overall, however, awareness of the pact remains minimal in Viet Nam. While citizens are generally supportive, only the most informed and engaged were genuinely aware and supportive of it.
21 The authors ran a Heckman selection model with awareness of the TPP in the first stage predicting support in the second. None of the occupational or demographic variables had any impact on support once awareness was accounted for.
* DK = Don’t Know
THE VIET NAM PROVINCIAL GOVERNANCE AND PUBLIC ADMINISTRATION PERFORMANCE INDEX PAPI 2016
IMPORTANT ISSUES IN VIET NAM IN 2016: ENVIRONMENT, POVERTY AND THE TRANS-PACIFIC PARTNERSHIPCHAPTER 2
35
Implications
The findings summarized in this chapter suggest that concerns about the environment have surged in salience, particularly in the Central Coast region that was most directly impacted by the fish kill crisis. However, interest in the environment was not localized to these areas. It has spread further. This is likely due to the fact that citizens have a wide range of environmental concerns that have been galvanized by the incident. Also, most citizens report declining quality in local waterways and a significant number report worsening air quality. Air quality concerns are highest in the Red River Delta, while water quality concerns are concentrated in the Mekong Delta. Clearly, citizens are willing to sacrifice economic growth for environmental protection. However, citizens also view anti-poverty assistance as a high priority, which also requires resources. The extent to which these interests can be balanced will be a key challenge for the new government.
Regarding poverty assistance, the findings show that poorer citizens are indeed more concerned about poverty reduction than wealthier citizens. However, even amongst the wealthiest respondents, poverty is the top priority. Further research is necessary to understand why poverty reduction has such broad salience across all groups in Viet Nam.
Finally, this chapter also looked at support for the TPP. It found that overall awareness of the proposed agreement was low. However, support for the agreement – particularly amongst those who were aware of it – was high. Furthermore, those with greater connections to local political groups, such as mass organization members and party members, were also more likely to support the agreement. This suggests that information dissemination played an important role in driving support for the agreement.

PROVINCIAL PERFORMANCEIN 2016 AND OVER TIME (2011-2016)
Overview
This chapter presents provincial performance by six PAPI dimensions and concludes with an overview of the aggregated PAPI scores by province. In each dimension, findings are presented in a map grouping the 63 provinces into four quartiles using a four-colour coding system.22 There are also tables summarizing concrete scores by dimension, sub-dimensions, and indicators, in addition to mean, median, and maximum scores for the corresponding provinces for 2016, the baseline year for gauging the performance of the State apparatus and local governments for the 2011-2016 government term.
As introduced in Chapter 1 and explained further below, comparisons over time are encouraged at the indicator level only for Dimension 1 on ‘Citizen Participation at Local Levels’, Dimension 3 on ‘Vertical Accountability’, and Dimension 5 on
‘Public Administrative Procedures’.23 This is due to changes made to the construction of these dimensions to accommodate new policy contexts and to provide indicators that more readily support follow-up actions by various stakeholders. However, for Dimension 2 on ‘Transparency’, Dimension 4 on ‘Control of Corruption’, and Dimension 6 on ‘Public Service Delivery’, comparisons are made in this report for provinces to track their progress over the course of the past six years (2011-2016).
The chapter concludes with aggregate un-weighted 2016 PAPI scores by quartiles, an overview of the correlations between the 2016 PAPI and the 2016 Provincial Competitiveness Index (PCI), and key policy implications for different stakeholders to take into consideration.
Below is an overview of provincial performance in 2016 and during the period 2011-2016.
22 The navy colour represents the top 16 performing provinces, green represents the runner-up 16 provinces, orange represents the 15 below-average performing provinces, and light yellow is used for the 16 poorest performing provinces.
23 Interested readers that wish to compare a selection of identical indicators can refer to the 2015 PAPI report for further research. See CECODES, VFF - CRT, and UNDP (2016), available at http://papi.org.vn/eng/documents-and-data-download, for details.
03
THE VIET NAM PROVINCIAL GOVERNANCE AND PUBLIC ADMINISTRATION PERFORMANCE INDEX PAPI 2016
38
Citizen participation at local levels in 2016. Consistent with previous years, there were strong regional patterns. Among the 16 best performing provinces in 2016, 13 were in the Red River Delta and North Central sub-regions. Meanwhile, 11 of the poorest performing provinces were found in the Southeast and Mekong Delta sub-regions. The five best performing provinces were Ha Tinh, Bac Ninh, Bac Giang, Thai Binh, and Thai Nguyen, with their average scores ranging from 6.2 to 6.8 points on the 1-10 point scale. The five poorest performing provinces were Tra Vinh, Binh Duong, An Giang, Kien Giang, and Ca Mau.
Transparency in local decision-making in 2016 and over time. At the provincial level, there was a slight improvement in this area in 2016 compared to 2015. The largest contribution to this progress was the increase in transparency of land use plans and local governments’ land compensation frameworks. Nonetheless, the stark regional variation in the level of performance in transparency observed in the 2011-2015 period was repeated in 2016. Of the 16 best performers in this dimension, 14 were northern and central provinces. Provincial mean scores for the best performers, however, remain at a high average level (ranging from 5.95 points to 6.49 points on the 10-point scale). This suggests that there is still much provinces can do to improve this important aspect of governance. The poorest performers were found more often in the South, with the four poorest performing provinces being Soc Trang, Tra Vinh, Ca Mau, and Bac Lieu, with mean dimensional scores at around 4.8 points, below the average level. By the three sub-dimensions, in 2016 Da Nang was the best performer on land transparency, Bac Ninh on transparency of poverty lists, and Binh Phuoc on transparency of commune budget and expenditure lists.
Vertical accountability. This dimension of the 2016 PAPI is constructed based on three revised and new sub-dimensions: (i) the frequency and effectiveness of citizen interactions with local authorities, (ii) the proactiveness of local governments in responding to citizen actions, and (iii) the coverage and effectiveness of People’s Inspection Boards (PIBs).
Findings from this dimension show that, despite the change in the composition of the dimension in 2016, regional patterns were similar to those found in previous years. There is a convergence of best
performers in the northern and central regions in this dimension. Among the 16 best performers in 2016, six are northern provinces and four are central ones. Quang Ngai, the Central Coast province, was the top performer. On the other hand, six of the poorest performers are from the Mekong Delta, with Kien Giang being the poorest performer of all 63 provinces.
Control of corruption in the public sector. The decline in overall provincial performance continued in 2016. The largest declines are seen in two sub-dimensions ‘limits on public sector corruption’ and ‘willingness to fight corruption’. The numbers of respondents saying that bribes are required for state employment, for LURCs, and for teachers’ favouritism, as well as cases of public officials diverting State funds, were higher than in previous years. On a more positive note, the sub-dimension ‘limit on corruption in public service delivery’ returned to its 2011 level after declining in 2015, with fewer respondents saying that bribes were needed for public health services at the district level.
Regional patterns have been strong in this dimension over the last six years. Central and southern provinces tend to do better in anti-corruption efforts than northern provinces. Among the top 16 best performers, eight are Mekong Delta provinces and five are from the Central Coast region. In 2016, Can Tho, Tien Giang, and Ben Tre were the best performers in this dimension. Long An has remained in the best performing status for six years in a row. On the contrary, Ha Noi has stayed in the poorest performing group for six years. Two other centrally governed municipalities, Ho Chi Minh City and Hai Phong, joined this poor performing group along with five other northern and three Central Highlands provinces.
Public administrative procedures. All provinces seem to have performed at a roughly similar level in 2016 in provision of certification services, construction permits, LURCs, and personal procedures for their citizens. Unlike the first four governance dimensions, the variation between the highest provincial score (7.64 points) and the lowest provincial score (6.64 points) is minor in this dimension. Similar to findings in previous years, the 2016 regional pattern is insignificant. Best performers can be found across the country, though among the poorest performing provinces are four Central Highlands provinces (Gia Lai, Lam Dong, Kon Tum, and Dak Nong). Of the four
THE VIET NAM PROVINCIAL GOVERNANCE AND PUBLIC ADMINISTRATION PERFORMANCE INDEX PAPI 2016
PROVINCIAL PERFORMANCE IN 2016 AND OVER TIME (2011-2016)CHAPTER 3
39
public administrative services, public administrative procedures and services for LURCs was rated the poorest, similar to what was found in previous years.
Public service delivery. There was a wider gap between provinces in 2016 than in the previous five years in this dimension. The difference between the best performing province (Da Nang with a dimensional score of 8.03 points) and the poorest one (Quang Ngai with a score of 6.42) is larger than before. It should also be noted that all provinces have improved their public services over time, as the lowest score in 2016 was higher than in prior years. This is owing to the improved accessibility and quality of public health care and public education, and a slightly better rating for residency safety in 2016. Also, there has been a change in the landscape of provincial performance. In the previous five years the best performers were concentrated more in the South than in other regions of the country.24 In 2016, a more even regional distribution in the best performing group is seen. Da Nang, Ho Chi Minh City, and Ba Ria-Vung Tau have consistently been in the best performing group since 2011. Ha Noi is the only centrally governed municipality that falls far below this group.
Aggregate level performance in 2016. Provincial performance over time in different aspects of governance and public administration has a lot to do with proactiveness by local governments in policy implementation and responsiveness to citizen feedback. Despite the changes made to three out of the six dimensions, the 2016 regional patterns are consistent with the 2011-2015 results. Better performing provinces in 2016 are found in the
Northeast, Central Coast, and Mekong Delta regions, as seen in previous nationwide PAPI iterations. Among the 16 best performers are the Northeast provinces of Hai Duong, Bac Ninh, Bac Giang, Nam Dinh, Thai Binh, Hung Yen, and Ninh Binh; five Central Coast provinces (Ha Tinh, Da Nang, Quang Binh, Quang Tri, and Binh Dinh); and three southern provinces (Can Tho, Ben Tre, and Dong Thap). It is worthwhile noting that Nam Dinh, Ha Tinh, Quang Tri, and Da Nang have maintained their overall best performance status for six years in a row.
At the other end of the 2016 performance spectrum are northern-most and southern-most provinces. Provinces like Yen Bai, Lang Son, Cao Bang, Ha Giang, and Lai Chau are in the same poorest performing group with Ca Mau, Bac Lieu, Tra Vinh, and Kien Giang. In particular, Lai Chau has been in the poorest performing group since 2011. But not all provinces with less favourable economic and geographical endowments were rated poorer by their respective citizens. Ha Noi joined this poorer performing group in 2016, together with Khanh Hoa, Quang Ninh, and Binh Duong, where conditions for socio-economic development are more favourable. Binh Duong, in particular, continues to see a severe decline as noted in 2015.
24 See CECODES, VFF-CRT and UNDP (2016, pp. 80-91).
THE VIET NAM PROVINCIAL GOVERNANCE AND PUBLIC ADMINISTRATION PERFORMANCE INDEX PAPI 2016
40
Dimension 1: Participation at Local Levels
Participation in political, social, and economic life is the constitutional right of all Vietnamese citizens from the age of 18. Such participation is important in order for citizens to exercise their democratic rights and to do their part to help improve local governance. The PAPI dimension ‘Participation at Local Levels’ measures how aware citizens are of their right to political participation and how the government facilitates the exercise of this right in elections and local decision-making. Table 3.1 presents the indicators that were used to construct this dimension.
It should be noted that in this dimension, comparison over time on every indicator is not encouraged due to changes made to the sub-dimension ‘civic knowledge of elections’, which was restructured with new score ranges based on the randomisation of knowledge questions in the survey questionnaire.
Overall provincial dimensional performance. Findings from this dimension show that citizen participation at the local level remained at an average performance level in 2016 by almost every measure. The national mean score was 5.15 points on the 1-10 scale, with Ha Tinh obtaining the highest score (at 6.81 points) and Tra Vinh the lowest (at 4.43 points). Nonetheless, it is worthwhile noting that citizen participation in making decisions on starting and implementing local infrastructure projects, a comparable sub-dimension, slightly increased compared to the previous five years.
In 2016, 13 out of the 16 best-performing provinces were in the Red River Delta and North Central sub-regions, while 11 of the poorest-performing ones were found in the Southeast and Mekong Delta sub-regions (see Map 3.1). These regional patterns have been found since 2011. Among the five centrally governed municipalities, Can Tho was in the top performing group, Ha Noi and Da Nang were in the low-average performing group, and Hai Phong and Ho Chi Minh City were in the poorest performing group.
Civic knowledge. The sub-dimension on civic knowledge looks at what citizens know about elections and term limits of elected representatives. Compared to 2011 when national elections took place, the civic knowledge sub-dimensional score was lower in 2016 (see Table 3.1). This was caused mainly by the fact that in 2016 the question on civic knowledge was put as a random question, as noted earlier in this chapter. Hai Duong was the province where more respondents were aware of which government posts were elected and which were nominated, although the indicator score was half of the maximum of 2 points. On correct term limits for village heads and National Assembly delegates, about 61% of Bac Giang respondents provided correct answers while in Tra Vinh only 6% could do so.
Opportunities for participation. This sub-dimension features citizens’ personal experiences with elections of representatives to the National Assembly and People’s Councils, and of village heads. It also shows how active local governments are in facilitating citizen political participation. Respondents were asked if they personally voted in the 2016 National Assembly and People’s Council elections, and in village head elections. As revealed in Chapter 1, voters’ direct experiences with the 2016 elections were about the same as in the 2011 elections. For example, 67% said they voted in the 2016 National Assembly elections, about 1% higher than in 2011. In Can Tho, 91% of the respondents said they voted, while in Vinh Phuc only 41.2% said they personally voted. Although elections for the National Assembly delegates and People’s Council members were convened on the same day, the percentage of respondents who said they went to elect their commune-level People’s Council members in 2016 was 65%, about 5% lower than the rate in 2011. In Dak Lak, 94% personally went to elect their commune People’s Council members, while in Binh Duong, about 37% did so. It is worth noting that the provinces of Thua Thien-Hue and Yen Bai were reported by the 2016 National Election Council to have the highest number of voters for the national

THE VIET NAM PROVINCIAL GOVERNANCE AND PUBLIC ADMINISTRATION PERFORMANCE INDEX PAPI 2016
PROVINCIAL PERFORMANCE IN 2016 AND OVER TIME (2011-2016)CHAPTER 3
41
elections (99.99%),25 but the results of the PAPI indicate that these provinces did not have the highest turnouts. Proxy voting could be an explanation for the difference between the PAPI survey results and what was officially announced by the 2016 National Election Council (which reported voter turnout of more than 90%, on average, for the country).
As shown in Table 3.1, only 60% of respondents nationwide said they participated in the most recent village head elections, lower than in the previous five years. At the provincial level, citizens in Kien Giang were more actively engaged in village head elections in 2016 than citizens in other provinces. The formalistic nature of village head elections may have discouraged citizens from active participation in selecting their grassroots representatives.
Quality of village elections. The quality of village elections is assessed by indicators measuring citizens’ free choice of candidates, the way the elections are conducted to ensure fair selection and transparency, and whether winners are properly announced to the public. Although the Grassroots Democracy Ordinance requires at least two candidates in village elections, fewer respondents confirmed this was the case in 2016 than in previous years. Figure 3.1 also indicates that fewer citizens were invited to village head elections, and paper ballots were less used than before. Competition was poorest in Ho Chi Minh City, where only 20% of respondents said there were two candidates to choose between. Ho Chi Minh City was also the province where the fewest voters were invited to village head elections in 2016, unlike Bac Ninh where 91% of voters said they were invited to village elections. Also, it seems that fewer paper ballots were used in village head elections in 2016 across the country. The range was significant, however: almost 100% of Tien Giang citizens said paper ballots were used in their province, while the percentage in Phu Tho was about 23%.
25 See National Election Council (22/05/2016) for official information about the 2016 election turnouts.
26 Viet Nam’s National Target Program on New Rural Development aims to improve the material and spiritual life of rural residents, develop socio-economic infrastructure and proper economic structure, and combine agricultural development and industrial-service development, among other goals. For more details, see: http://primeminister.chinhphu.vn/Home/PM-approves-national-target-program-on-new-rural-development/20168/3301.vgp
27 As action research by HCMA and UNDP shows, in a number of communes CISBs and PIBs have been merged into one since only PIBs are financially resourced at 2 million VND per year for their operation (CISBs are not). CISB and PIB staff also need to be equipped with technical skills to be able to supervise public investment projects as provided for in the 2014 Law on Public Investment.
Voluntary contributions. Voluntary, instead of forced, contributions to buildings and/or remodelling of community infrastructure – such as cultural houses, roads, or schools – is a form of active citizen participation. Once citizens contribute voluntarily, they tend to participate more actively in different project processes, from participatory to oversight roles. Positive change continued in this area, with more citizens in 2016 reporting that voluntary contributions were monitored by Community Investment Supervision Boards (CISBs) and/or People’s Inspection Boards (PIBs) compared to the previous five years. This may be owing to the promotion of community supervision in New Rural Development projects26 and/or the initial effect of the 2014 Law on Public Investment. In 2016, only 21% of respondents in localities with infrastructure projects reported that CISBs and/or PIBs carried out some form of supervision, about 5% higher than in 2015.27 Ha Tinh remained the top performer in this indicator, with 61% of respondents there reporting that CISBs and PIBs provided supervision. For citizen participation in decision-making in project design and implementation nationwide, more respondents said they took part in decision-making to start an infrastructure project (59%) and provided inputs during project design (36%) in 2016 than in prior years. However, provincial variations were large. Only 10% of respondents in Hai Phong provided their comments on project designs, while in Son La about 64% gave their comments.

THE VIET NAM PROVINCIAL GOVERNANCE AND PUBLIC ADMINISTRATION PERFORMANCE INDEX PAPI 2016
42
Implications. Citizen participation in local political life and decision-making remained the weakest governance aspect compared to the other five dimensions in 2016, similar to previous years’ findings. The ‘one person, one vote’ rule failed to be fully observed in the 2016 National Assembly and People’s Council elections, similar to PAPI findings from the 2011 election year. The 2016 PAPI survey looked at personal experiences of voters by province and this revealed proxy voting, and thus much lower actual voting levels than the high turnout rates officially reported by the 2016 National Election Council. Also,
similar to what was found in previous years, village elections continued to have weak engagement of citizens. The same low level of citizen participation was seen in infrastructure project design and implementation. Also, the role of CISBs and PIBs in oversight of public investment projects continues to be very limited. Therefore, innovative approaches for engaging voters in future national and grassroots elections, and in local decision-making, are needed to ensure their legitimate civic right to political participation.
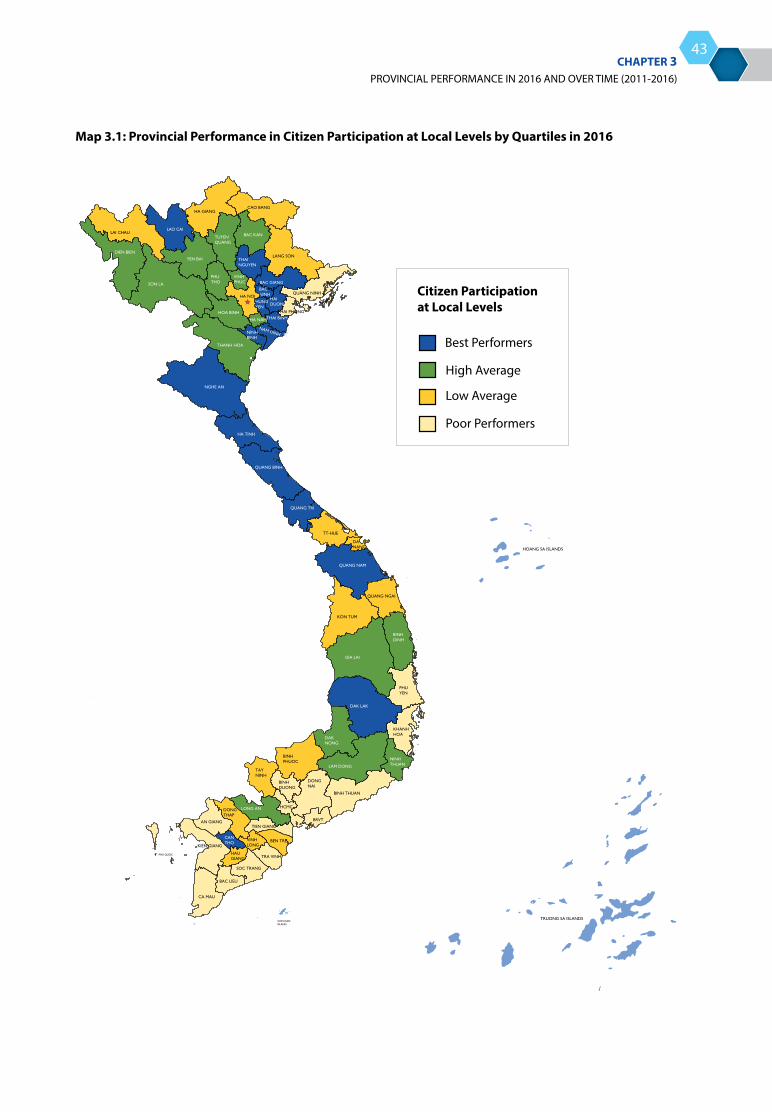
THE VIET NAM PROVINCIAL GOVERNANCE AND PUBLIC ADMINISTRATION PERFORMANCE INDEX PAPI 2016
PROVINCIAL PERFORMANCE IN 2016 AND OVER TIME (2011-2016)CHAPTER 3
43
Map 3.1: Provincial Performance in Citizen Participation at Local Levels by Quartiles in 2016
Citizen Participation at Local Levels
Best Performers
High Average
Low Average
Poor Performers
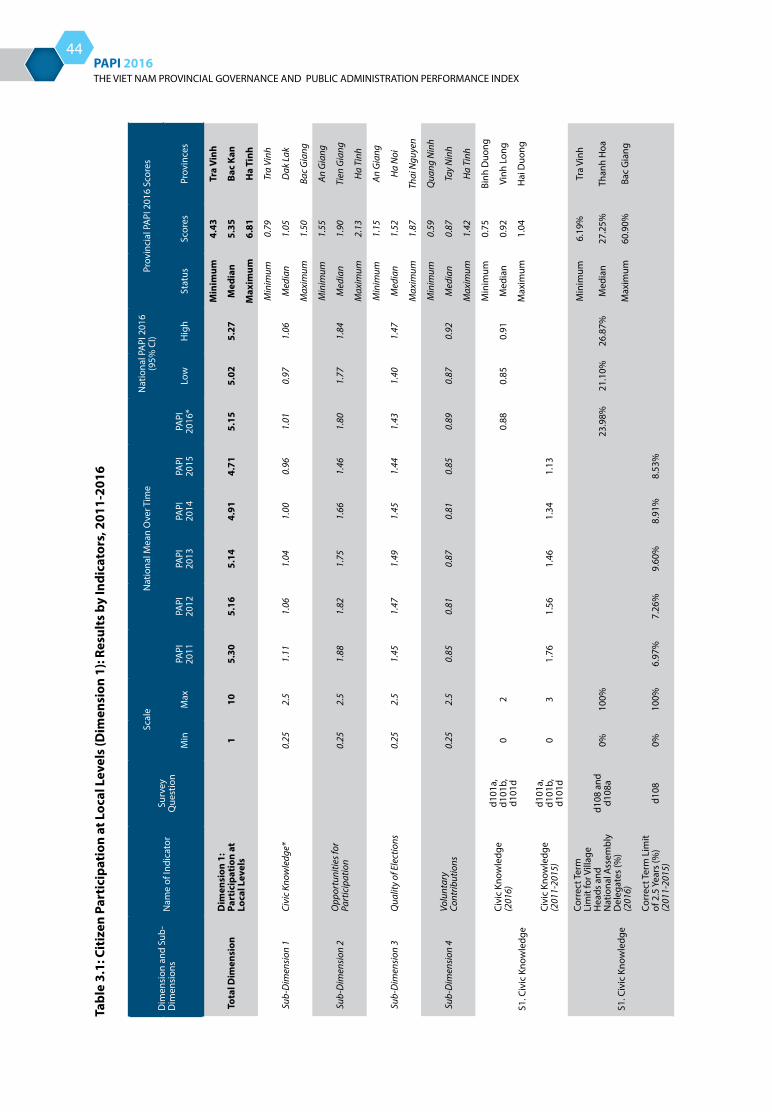
THE VIET NAM PROVINCIAL GOVERNANCE AND PUBLIC ADMINISTRATION PERFORMANCE INDEX PAPI 2016
44
Tabl
e 3.
1: C
itiz
en P
arti
cipa
tion
at L
ocal
Lev
els
(Dim
ensi
on 1
): Re
sult
s by
Indi
cato
rs, 2
011-
2016
Dim
ensi
on a
nd S
ub-
Dim
ensi
ons
Nam
e of
Indi
cato
rSu
rvey
Q
uest
ion
Scal
eN
atio
nal M
ean
Ove
r Tim
eN
atio
nal P
API
201
6 (9
5% C
I)Pr
ovin
cial
PA
PI 2
016
Scor
es
Min
Max
PAPI
20
11PA
PI
2012
PAPI
20
13PA
PI
2014
PAPI
20
15PA
PI
2016
*Lo
wH
igh
Stat
usSc
ores
Prov
ince
s
Tot
al D
imen
sion
Dim
ensi
on 1
: Pa
rtic
ipat
ion
at
Loca
l Lev
els
110
5.30
5.16
5.14
4.91
4.71
5.15
5.02
5.27
Min
imum
4.43
Tra
Vinh
Med
ian
5.35
Bac
Kan
Max
imum
6.81
Ha
Tinh
Sub
-Dim
ensi
on 1
Civi
c Kn
owle
dge*
0.
252.
51.
111.
061.
041.
000.
961.
010.
971.
06
Min
imum
0.79
Tra
Vinh
Med
ian
1.05
Dak
Lak
Max
imum
1.50
Bac
Gia
ng
Sub
-Dim
ensi
on 2
Opp
ortu
nitie
s for
Pa
rtic
ipat
ion
0.25
2.5
1.88
1.82
1.75
1.66
1.46
1.80
1.77
1.84
Min
imum
1.55
An G
iang
Med
ian
1.90
Tien
Gia
ng
Max
imum
2.13
Ha
Tinh
Sub
-Dim
ensi
on 3
Qua
lity
of E
lect
ions
0.
252.
51.
451.
471.
491.
451.
441.
431.
401.
47
Min
imum
1.15
An G
iang
Med
ian
1.52
Ha
Noi
Max
imum
1.87
Thai
Ngu
yen
Sub
-Dim
ensi
on 4
Volu
ntar
y Co
ntrib
utio
ns0.
252.
50.
850.
810.
870.
810.
850.
890.
870.
92
Min
imum
0.59
Qua
ng N
inh
Med
ian
0.87
Tay
Nin
h
Max
imum
1.42
Ha
Tinh
S1. C
ivic
Kno
wle
dge
Civi
c Kn
owle
dge
(201
6)d1
01a,
d1
01b,
d1
01d
02
0.88
0.85
0.91
Min
imum
0.75
Binh
Duo
ng
Med
ian
0.92
Vinh
Lon
g
Max
imum
1.04
Hai
Duo
ng
Civi
c Kn
owle
dge
(201
1-20
15)
d101
a,
d101
b,
d101
d0
31.
761.
561.
461.
341.
13
S1. C
ivic
Kno
wle
dge
Corr
ect T
erm
Li
mit
for V
illag
e H
eads
and
N
atio
nal A
ssem
bly
Del
egat
es (%
) (2
016)
d108
and
d1
08a
0%10
0%23
.98%
21.1
0%26
.87%
Min
imum
6.19
%Tr
a Vi
nh
Med
ian
27.2
5%Th
anh
Hoa
Max
imum
60.9
0%Ba
c G
iang
Corr
ect T
erm
Lim
it of
2.5
Yea
rs (%
) (2
011-
2015
)d1
080%
100%
6.97
%7.
26%
9.60
%8.
91%
8.53
%
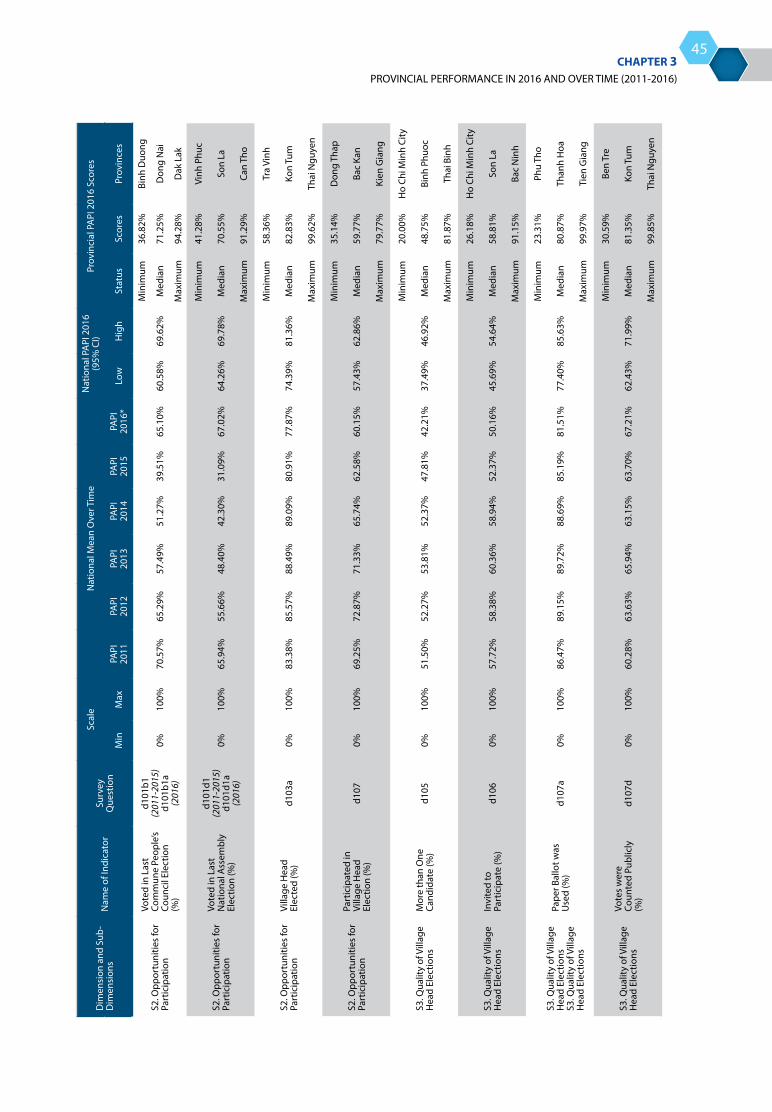
THE VIET NAM PROVINCIAL GOVERNANCE AND PUBLIC ADMINISTRATION PERFORMANCE INDEX PAPI 2016
PROVINCIAL PERFORMANCE IN 2016 AND OVER TIME (2011-2016)CHAPTER 3
45
Dim
ensi
on a
nd S
ub-
Dim
ensi
ons
Nam
e of
Indi
cato
rSu
rvey
Q
uest
ion
Scal
eN
atio
nal M
ean
Ove
r Tim
eN
atio
nal P
API
201
6 (9
5% C
I)Pr
ovin
cial
PA
PI 2
016
Scor
es
Min
Max
PAPI
20
11PA
PI
2012
PAPI
20
13PA
PI
2014
PAPI
20
15PA
PI
2016
*Lo
wH
igh
Stat
usSc
ores
Prov
ince
s
S2. O
ppor
tuni
ties
for
Part
icip
atio
n
Vote
d in
Las
t Co
mm
une
Peop
le’s
Coun
cil E
lect
ion
(%)
d101
b1(2
011-
2015
)d1
01b1
a (2
016)
0%10
0%70
.57%
65.2
9%57
.49%
51.2
7%39
.51%
65.1
0%60
.58%
69.6
2%
Min
imum
36.8
2%Bi
nh D
uong
Med
ian
71.2
5%D
ong
Nai
Max
imum
94.2
8%D
ak L
ak
S2. O
ppor
tuni
ties
for
Part
icip
atio
nVo
ted
in L
ast
Nat
iona
l Ass
embl
y El
ectio
n (%
)
d101
d1(2
011-
2015
)d1
01d1
a (2
016)
0%10
0%65
.94%
55.6
6%48
.40%
42.3
0%31
.09%
67.0
2%64
.26%
69.7
8%
Min
imum
41.2
8%Vi
nh P
huc
Med
ian
70.5
5%So
n La
Max
imum
91.2
9%Ca
n Th
o
S2. O
ppor
tuni
ties
for
Part
icip
atio
nVi
llage
Hea
d El
ecte
d (%
)d1
03a
0%10
0%83
.38%
85.5
7%88
.49%
89.0
9%80
.91%
77.8
7%
74.3
9%81
.36%
Min
imum
58.3
6%Tr
a Vi
nh
Med
ian
82.8
3%Ko
n Tu
m
Max
imum
99.6
2%Th
ai N
guye
n
S2. O
ppor
tuni
ties
for
Part
icip
atio
nPa
rtic
ipat
ed in
Vi
llage
Hea
d El
ectio
n (%
)d1
070%
100%
69.2
5%72
.87%
71.3
3%65
.74%
62.5
8%60
.15%
57.4
3%62
.86%
Min
imum
35.1
4%D
ong
Thap
Med
ian
59.7
7%Ba
c Ka
n
Max
imum
79.7
7%Ki
en G
iang
S3. Q
ualit
y of
Vill
age
Hea
d El
ectio
nsM
ore
than
One
Ca
ndid
ate
(%)
d105
0%10
0%51
.50%
52.2
7%53
.81%
52.3
7%47
.81%
42.2
1%37
.49%
46.9
2%
Min
imum
20.0
0%H
o Ch
i Min
h Ci
ty
Med
ian
48.7
5%Bi
nh P
huoc
Max
imum
81.8
7%Th
ai B
inh
S3. Q
ualit
y of
Vill
age
Hea
d El
ectio
nsIn
vite
d to
Pa
rtic
ipat
e (%
)d1
060%
100%
57.7
2%58
.38%
60.3
6%58
.94%
52.3
7%50
.16%
45.6
9%54
.64%
Min
imum
26.1
8%H
o Ch
i Min
h Ci
ty
Med
ian
58.8
1%So
n La
Max
imum
91.1
5%Ba
c N
inh
S3. Q
ualit
y of
Vill
age
Hea
d El
ectio
nsS3
. Qua
lity
of V
illag
e H
ead
Elec
tions
Pape
r Bal
lot w
as
Use
d (%
)d1
07a
0%10
0%86
.47%
89.1
5%89
.72%
88.6
9%85
.19%
81.5
1%77
.40%
85.6
3%
Min
imum
23.3
1%Ph
u Th
o
Med
ian
80.8
7%Th
anh
Hoa
Max
imum
99.9
7%Ti
en G
iang
S3. Q
ualit
y of
Vill
age
Hea
d El
ectio
nsVo
tes
wer
e Co
unte
d Pu
blic
ly
(%)
d107
d0%
100%
60.2
8%63
.63%
65.9
4%63
.15%
63.7
0%67
.21%
62.4
3%71
.99%
Min
imum
30.5
9%Be
n Tr
e
Med
ian
81.3
5%Ko
n Tu
m
Max
imum
99.8
5%Th
ai N
guye
n

THE VIET NAM PROVINCIAL GOVERNANCE AND PUBLIC ADMINISTRATION PERFORMANCE INDEX PAPI 2016
46
Dim
ensi
on a
nd S
ub-
Dim
ensi
ons
Nam
e of
Indi
cato
rSu
rvey
Q
uest
ion
Scal
eN
atio
nal M
ean
Ove
r Tim
eN
atio
nal P
API
201
6 (9
5% C
I)Pr
ovin
cial
PA
PI 2
016
Scor
es
Min
Max
PAPI
20
11PA
PI
2012
PAPI
20
13PA
PI
2014
PAPI
20
15PA
PI
2016
*Lo
wH
igh
Stat
usSc
ores
Prov
ince
s
S3. Q
ualit
y of
Vill
age
Hea
d El
ectio
nsCa
ndid
ate
was
not
Su
gges
ted
(%)
d107
b0%
100%
42.9
3%47
.92%
41.4
9%51
.17%
42.2
8%33
.49%
24.7
3%42
.26%
Min
imum
0.00
%H
o Ch
i Min
h Ci
ty
Med
ian
35.1
0%H
a Ti
nh
Max
imum
99.7
7%Ti
en G
iang
S3. Q
ualit
y of
Vill
age
Hea
d El
ectio
nsVo
ted
for t
he
Win
ner (
%)
d107
cM
inM
ax90
.74%
88.6
6%91
.71%
92.9
4%92
.73%
92.9
3%91
.30%
94.5
5%
Min
imum
77.0
8%Ki
en G
iang
Med
ian
93.0
1%H
oa B
inh
Max
imum
100.
00%
Nam
Din
h
S4. V
olun
tary
Co
ntrib
utio
nsVo
lunt
ary
Cont
ribut
ion
to
Proj
ect (
%)
d109
ba0%
100%
47.9
0%47
.28%
44.9
8%40
.09%
39.6
4%37
.53%
33.4
9%41
.58%
Min
imum
6.55
%Ye
n Ba
i
Med
ian
32.3
5%Bi
nh D
inh
Max
imum
69.5
5%Ba
c N
inh
S4. V
olun
tary
Co
ntrib
utio
ns
Com
mun
ity
Mon
itorin
g Bo
ard
Mon
itors
Co
ntrib
utio
n (%
)d1
09bb
0%10
0%10
.97%
8.56
%13
.89%
11.1
3%15
.69%
20.9
9%17
.42%
24.5
6%
Min
imum
0.02
%D
a N
ang
Med
ian
18.5
7%Ba
c Ka
n
Max
imum
62.0
1%H
a Ti
nh
S4. V
olun
tary
Co
ntrib
utio
nsVo
lunt
ary
Cont
ribut
ion
Reco
rded
(%)
d109
bc0%
100%
69.9
4%71
.12%
75.2
5%75
.95%
71.0
7%73
.36%
69.1
5%77
.58%
Min
imum
34.8
9%Tr
a Vi
nh
Med
ian
73.7
6%Bi
nh T
huan
Max
imum
96.5
9%Th
ai B
inh
S4. V
olun
tary
Co
ntrib
utio
nsPa
rtic
ipat
ed in
D
ecis
ion-
mak
ing
to S
tart
Pro
ject
(%)
d109
bd0%
100%
34.4
2%37
.29%
45.2
8%51
.73%
53.4
8%59
.41%
55.9
6%62
.86%
Min
imum
10.0
6%Ki
en G
iang
Med
ian
60.3
9%Vi
nh L
ong
Max
imum
89.8
9%H
ai D
uong
S4. V
olun
tary
Co
ntrib
utio
nsPr
ovid
ed In
put t
o Pr
ojec
t Des
ign
(%)
d109
be0%
100%
21.9
1%22
.78%
27.9
6%29
.43%
32.3
0%36
.29%
32.9
2%39
.67%
Min
imum
10.3
4%H
ai P
hong
Med
ian
34.3
6%Th
anh
Hoa
Max
imum
63.9
8%So
n La
Not
e: (*
) Som
e in
dica
tors
cha
nged
in 2
016.
Min
= S
ampl
e M
inim
um; M
ax =
Sam
ple
Max
imum

THE VIET NAM PROVINCIAL GOVERNANCE AND PUBLIC ADMINISTRATION PERFORMANCE INDEX PAPI 2016
PROVINCIAL PERFORMANCE IN 2016 AND OVER TIME (2011-2016)CHAPTER 3
47
Figure 3.1: Changes in Indicators on Election of Village Heads, 2011-2016
Figure 3.2: Changes in Voluntary Participation in Community-based Infrastructure Projects, 2011-2016
51.50 57.72
86.47
60.28
42.93
42.21
50.16
81.51
67.21
33.49
0
20
40
60
80
100
More Than One Candidate Invited to Participate Paper Ballot was Used Votes were Counted Publicly Candidate was Suggested
Perc
enta
ge o
f Res
pond
ents
2011 2012 2013 2014 2015 2016
10.97
34.42
21.91
20.99
59.41
36.29
0
20
40
60
80
100
Community Monitoring Board MonitorsContribution
Participated in Decision-making to Start Project Provided Input to Project Design
2011 2012 2013 2014 2015 2016
Perc
enta
ge o
f Res
pond
ents
THE VIET NAM PROVINCIAL GOVERNANCE AND PUBLIC ADMINISTRATION PERFORMANCE INDEX PAPI 2016
48
Dimension 2: Transparency
PAPI measures how local governments facilitate and respond to civic rights to better understand how public policies affect citizens’ lives and livelihoods. Transparency in the three sub-dimensional areas of ‘poverty lists’ (lists of poor households), ‘commune budget and expenditure lists’, and ‘local land use planning and pricing’ is the focus of the second dimension of PAPI. Information relating to the three sub-dimensions is required to be transparent and made publicly available so that citizens across the country can exercise their legitimate rights to know, to discuss, to do, and to verify, as stipulated by the 2007 Grassroots Democracy Ordinance and recent legislation like the 2013 Land Law. Table 3.2 presents the indicators that are used to construct this dimension.
Overall provincial performance on this dimension. At the provincial level, there was a slight improvement in 2016 compared to 2015 (see Table 3.2). The largest contribution to the progress was the increase in transparency of land use plans and local governments’ land compensation frameworks. Nonetheless, the stark regional variation in the level of performance in transparency observed in the 2011-2015 period was repeated in 2016. Of the 16 best performers in this dimension, 14 were northern and central provinces (see Map 3.2). Provincial mean scores for the best performers were at a high average level (from 5.95 points for Hoa Binh to 6.49 points for Bac Ninh). The poorest performing provinces were found more often in the South, with the four poorest performers being Soc Trang, Tra Vinh, Ca Mau, and Bac Lieu, with mean dimensional scores of around 4.8 points on the 1-10 point scale. Compared to 2011, 13 provinces saw improvements of more than 5% by 2016 (see Figure 3.2c). The largest hike was in Phu Tho (+29%) while the steepest drop was with Ba Ria-Vung Tau (-19.5%), as in 2015.
Transparency in lists of poor households. This sub-dimension measures the share of citizens who are aware of the publication of lists of poor households in their commune during the year, and reflects how citizens view the quality of these poor household listings. Findings from the 2016 survey
show that the percentage of citizens who were aware of the publication of lists of poor households in their communes remained stable at 53% in 2016 (see Table 3.2). Thai Binh was seen as a place where poverty lists were made publicly available in 2016 (with almost 97% of respondents in agreement with this statement), much better than the situation in Binh Duong (where only about 28% of respondents were in agreement). An average of about 39% of respondents in all provinces felt that there were no errors in the local poverty lists in 2016. About 65% of respondents in Soc Trang disagreed that truly poor households did not get on the “poor households list” for state subsidies in their province, while the percentage in Bac Ninh was low, at only 15%. The percentage of respondents who disagreed with the statement that non-poor households got on the poor household lists was high in Quang Ninh (75%) and low in An Giang (17%).
Transparency in commune budgets. Knowing how commune budgets are used is an important part of keeping local public officials in check and preventing the diversion of public funds for private use. This sub-dimension of PAPI reveals the level of transparency in commune budgets and expenditures, an important requirement of the Grassroots Democracy Ordinance which states that communes must ensure citizens’ rights to know. As Table 3.2 shows, there was a slight decrease in 2016 in the percentage of respondents agreeing that commune budget and expenditure lists were made publicly available across the country. In Thai Binh, about 87% of respondents agreed, while in Tra Vinh the percentage was about 8%. The positive change in 2016 was found in the indicator about citizens’ confidence in the accuracy of the publicised budget information. Of the 32% of respondents nationwide who read the commune budget, about 69% believed the information provided was accurate. In Lai Chau, more than 90% of respondents who read the budget and expenditure lists believed in the accuracy of the information.
Transparency of local land use planning and land compensation frameworks. Measuring transparency in land use planning and compensation helps to encourage local governments to publicize local land use plans and land compensation schemes,
THE VIET NAM PROVINCIAL GOVERNANCE AND PUBLIC ADMINISTRATION PERFORMANCE INDEX PAPI 2016
PROVINCIAL PERFORMANCE IN 2016 AND OVER TIME (2011-2016)CHAPTER 3
49
in compliance with the 2007 Grassroots Democracy Ordinance and the 2013 Land Law.
Findings from the 2016 survey show that there was insignificant improvement in the publicity of local land use plans and government compensation frameworks compared with 2015 (see Table 3.2 and Figure 3.2a). Transparency in land use plans and government land compensation frameworks returned to the 2014 level of 1.72 points after falling to 1.62 points in 2015 (on the scale from 0.33 to 3.33 points). This may be owing to the effect of the 2013 Land Law, which requires local governments to publicise land use plans and compensation frameworks. However, the national mean score fell far short of the expected maximum of 3.33 points for this sub-dimension. This can be seen in the results of action research undertaken by the Ho Chi Minh National Academy of Politics (HCMA) and UNDP in 28 provinces over the past five years, which revealed that land use plans and land compensation frameworks were either posted covertly inside provincial or district public offices, or went unpublicised. In 2016, Da Nang was the best performer with the mean score of 2.11 points, leaving the poorest performer, Binh Phuoc at 1.43 points, far behind.
As shown in Figure 3.2a, the percentage of respondents across all provinces who said they were aware of local land plans in 2016 was only 13.6%. There was a large variation between provinces: in Bac Ninh 42.8% said they were aware of their local land plans, while in Bac Giang only 3.4% of respondents said they were aware. Of those informed of local land plans, only a tiny share, about 4.2%, had an opportunity to comment on them, an even lower rate than in 2011 (see Figure 3.2a). In Binh Duong barely anyone had a chance to make comments on the land plans. Phu Tho was the best performer in this indicator, but still only 22% of respondents were able to comment. Almost every respondent in Yen Bai said local land plans did not acknowledge their comments.
In general, citizens felt that the impact of local land plans had been detrimental for their households and local residents over the past six years. Yen Bai citizens were happier with recent local land plans than citizens in other provinces. But among those who had land seized by local governments, fewer were aware of the
new purposes for the land than in past years. Of those who were informed of the new purposes, few in 2016 said that their seized land was used for the original purposes given by local officials (see Figure 3.2b). The lack of public consultation on land use plans and government land compensation frameworks has been the primary driver of land corruption and land conflicts in different provinces in recent years, and the main source of the rise in land complaints over the past decade of rapid urbanization.
Implications. Transparency in poverty lists, commune budget and expenditure lists, and land use plans at the provincial level remained the second weakest governance aspect among six dimensions in 2016, similar to previous years. To improve transparency in a sustainable way, it is important for local governments to find and adapt various means of disclosing trustworthy information to citizens of different demographic backgrounds. As they advance to digital “e-government”, local authorities should do more at the grassroots level.29 Having poverty lists and commune budget and expenditure reports posted on notice boards at commune People’s Committees, handed over to village heads, or announced on loudspeakers would help to disseminate this information to citizens.
To improve transparency of land use plans and government land compensation frameworks, districts and communes should share more with citizens by publicising land planning maps and land pricing lists in accessible venues rather than posting them inside office premises. Regular communication and consultation about changes to land use plans and land compensation frameworks through different means, including at meetings with village heads, will help.
29 Local governments have invested hugely in digital portals and information and communication technology in response to requirements in the 2011-2020 Master Plan on Public Administration Reform. However, the percentage of citizens with access to the Internet at home remains low, at 31% in 2016, with large variation between provinces.
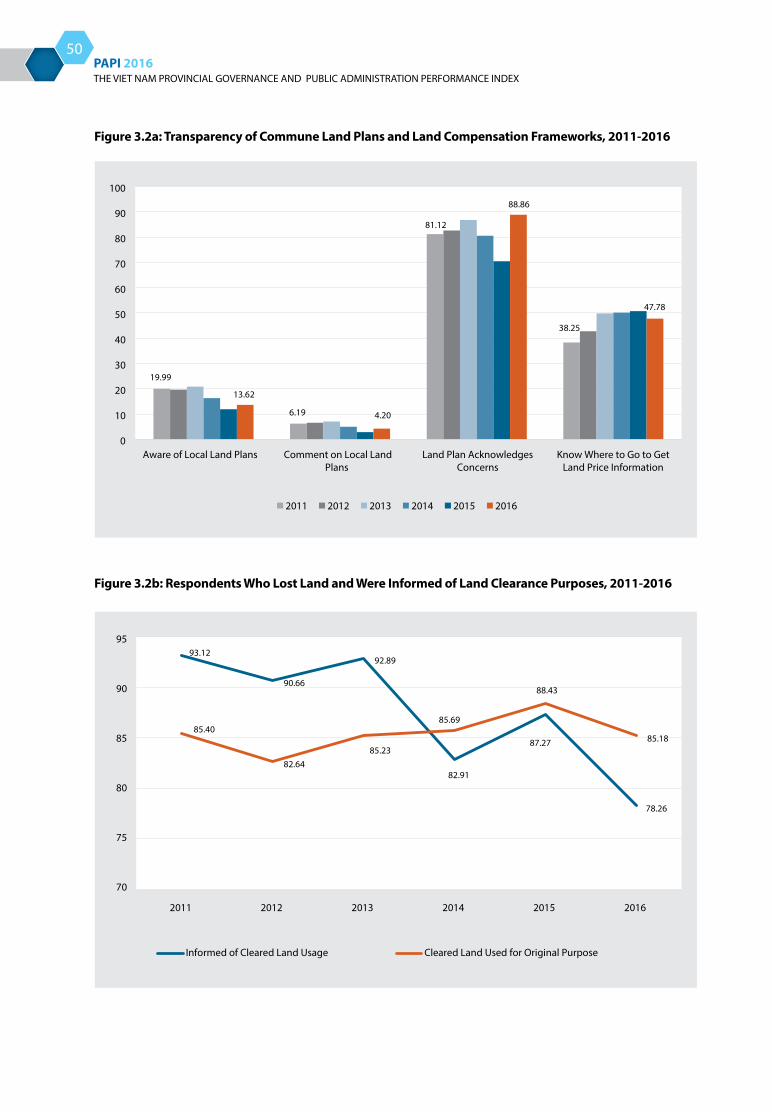
THE VIET NAM PROVINCIAL GOVERNANCE AND PUBLIC ADMINISTRATION PERFORMANCE INDEX PAPI 2016
50
Figure 3.2a: Transparency of Commune Land Plans and Land Compensation Frameworks, 2011-2016
Figure 3.2b: Respondents Who Lost Land and Were Informed of Land Clearance Purposes, 2011-2016
19.99
6.19
81.12
38.25
13.62
4.20
88.86
47.78
0
10
20
30
40
50
60
70
80
90
100
Aware of Local Land Plans Comment on Local LandPlans
Land Plan AcknowledgesConcerns
Know Where to Go to GetLand Price Information
2011 2012 2013 2014 2015 2016
93.12
90.66
92.89
82.91
87.27
78.26
85.40
82.6485.23
85.69
88.43
85.18
70
75
80
85
90
95
2011 2012 2013 2014 2015 2016
Informed of Cleared Land Usage Cleared Land Used for Original Purpose
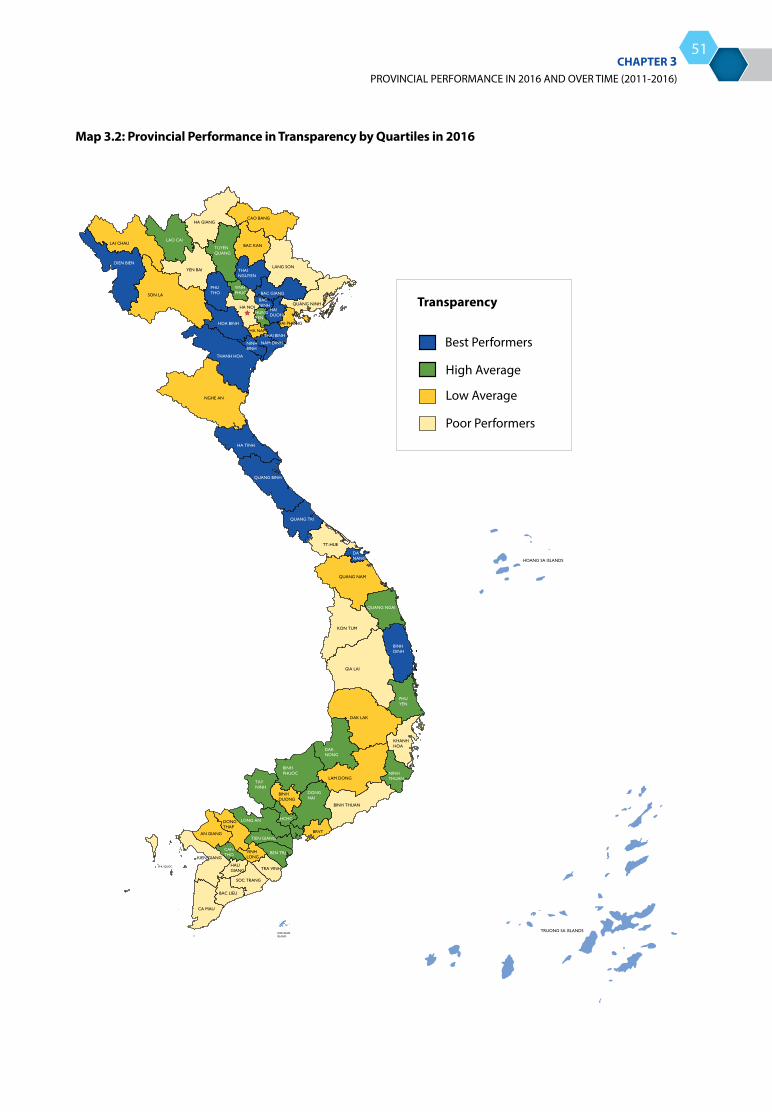
THE VIET NAM PROVINCIAL GOVERNANCE AND PUBLIC ADMINISTRATION PERFORMANCE INDEX PAPI 2016
PROVINCIAL PERFORMANCE IN 2016 AND OVER TIME (2011-2016)CHAPTER 3
51
Map 3.2: Provincial Performance in Transparency by Quartiles in 2016
Transparency
Best Performers
High Average
Low Average
Poor Performers
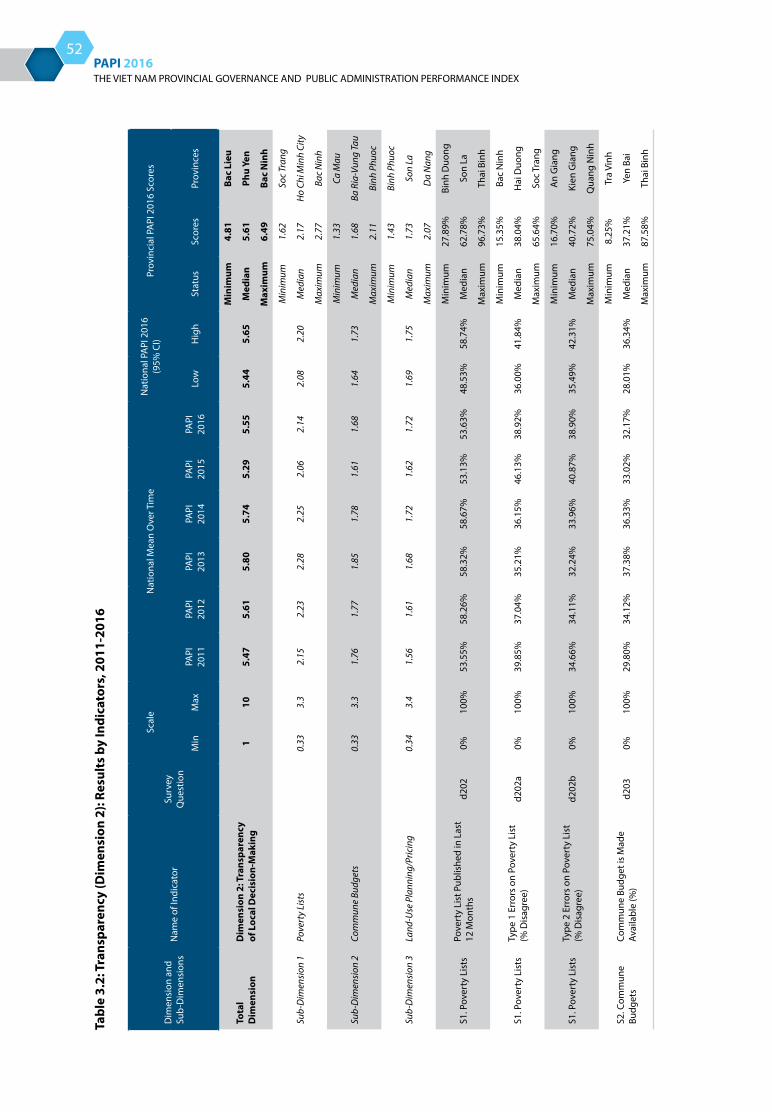
THE VIET NAM PROVINCIAL GOVERNANCE AND PUBLIC ADMINISTRATION PERFORMANCE INDEX PAPI 2016
52
Tabl
e 3.
2: T
rans
pare
ncy
(Dim
ensi
on 2
): Re
sult
s by
Indi
cato
rs, 2
011-
2016
Dim
ensi
on a
nd
Sub-
Dim
ensi
ons
Nam
e of
Indi
cato
rSu
rvey
Q
uest
ion
Scal
eN
atio
nal M
ean
Ove
r Tim
eN
atio
nal P
API
201
6 (9
5% C
I)Pr
ovin
cial
PA
PI 2
016
Scor
es
Min
Max
PAPI
20
11PA
PI
2012
PAPI
20
13PA
PI
2014
PAPI
20
15PA
PI
2016
Low
Hig
hSt
atus
Scor
esPr
ovin
ces
Tota
l D
imen
sion
Dim
ensi
on 2
: Tra
nspa
renc
y of
Loc
al D
ecis
ion-
Mak
ing
110
5.47
5.61
5.80
5.74
5.29
5.55
5.44
5.65
Min
imum
4.81
Bac
Lieu
Med
ian
5.61
Phu
Yen
Max
imum
6.49
Bac
Nin
h
Sub-
Dim
ensi
on 1
Pove
rty
List
s0.
333.
32.
152.
232.
282.
252.
062.
142.
082.
20
Min
imum
1.62
Soc
Tran
g
Med
ian
2.17
Ho
Chi M
inh
City
Max
imum
2.77
Bac
Nin
h
Sub-
Dim
ensi
on 2
Com
mun
e Bu
dget
s0.
333.
31.
761.
771.
851.
781.
611.
681.
641.
73
Min
imum
1.33
Ca M
au
Med
ian
1.68
Ba R
ia-V
ung
Tau
Max
imum
2.11
Binh
Phu
oc
Sub-
Dim
ensi
on 3
Land
-Use
Pla
nnin
g/Pr
icin
g0.
343.
41.
561.
611.
681.
721.
621.
721.
691.
75
Min
imum
1.43
Binh
Phu
oc
Med
ian
1.73
Son
La
Max
imum
2.07
Da
Nan
g
S1. P
over
ty L
ists
Pove
rty
List
Pub
lishe
d in
Las
t 12
Mon
ths
d202
0%10
0%53
.55%
58.2
6%58
.32%
58.6
7%53
.13%
53.6
3%48
.53%
58.7
4%
Min
imum
27.8
9%Bi
nh D
uong
Med
ian
62.7
8%So
n La
Max
imum
96.7
3%Th
ai B
inh
S1. P
over
ty L
ists
Type
1 E
rror
s on
Pov
erty
Lis
t (%
Dis
agre
e)d2
02a
0%
100%
39.8
5%37
.04%
35.2
1%36
.15%
46.1
3%38
.92%
36.0
0%41
.84%
Min
imum
15.3
5%Ba
c N
inh
Med
ian
38.0
4%H
ai D
uong
Max
imum
65.6
4%So
c Tr
ang
S1. P
over
ty L
ists
Type
2 E
rror
s on
Pov
erty
Lis
t (%
Dis
agre
e)d2
02b
0%
100%
34.6
6%34
.11%
32.2
4%33
.96%
40.8
7%38
.90%
35.4
9%42
.31%
Min
imum
16.7
0%A
n G
iang
Med
ian
40.7
2%Ki
en G
iang
Max
imum
75.0
4%Q
uang
Nin
h
S2. C
omm
une
Budg
ets
Com
mun
e Bu
dget
is M
ade
Avai
labl
e (%
)d2
030%
100%
29.8
0%34
.12%
37.3
8%36
.33%
33.0
2%32
.17%
28.0
1%36
.34%
Min
imum
8.25
%Tr
a Vi
nh
Med
ian
37.2
1%Ye
n Ba
i
Max
imum
87.5
8%Th
ai B
inh

THE VIET NAM PROVINCIAL GOVERNANCE AND PUBLIC ADMINISTRATION PERFORMANCE INDEX PAPI 2016
PROVINCIAL PERFORMANCE IN 2016 AND OVER TIME (2011-2016)CHAPTER 3
53
Dim
ensi
on a
nd
Sub-
Dim
ensi
ons
Nam
e of
Indi
cato
rSu
rvey
Q
uest
ion
Scal
eN
atio
nal M
ean
Ove
r Tim
eN
atio
nal P
API
201
6 (9
5% C
I)Pr
ovin
cial
PA
PI 2
016
Scor
es
Min
Max
PAPI
20
11PA
PI
2012
PAPI
20
13PA
PI
2014
PAPI
20
15PA
PI
2016
Low
Hig
hSt
atus
Scor
esPr
ovin
ces
S2. C
omm
une
Budg
ets
Resp
onde
nt R
ead
Com
mun
e Bu
dget
(%)
d203
a0%
100%
37.3
8%34
.07%
34.2
3%32
.51%
26.5
2%32
.18%
26.7
7%37
.60%
Min
imum
2.13
%Ye
n Ba
i
Med
ian
25.8
4%A
n G
iang
Max
imum
81.2
4%Bi
nh D
uong
S2. C
omm
une
Budg
ets
Belie
ve in
Acc
urac
y of
Bu
dget
(%)
d203
b0%
100%
69.6
6%73
.34%
74.0
4%73
.98%
63.7
4%69
.08%
65.2
7%72
.89%
Min
imum
28.6
4%Tr
a Vi
nh
Med
ian
70.9
8%Ki
en G
iang
Max
imum
92.5
9%La
i Cha
u
S3. L
and-
Use
Pl
anni
ng/P
ricin
gAw
are
of L
ocal
Lan
d Pl
ans
(%)
d204
0%10
0%19
.99%
19.6
1%20
.82%
16.2
4%11
.86%
13.6
2%11
.55%
15.6
8%
Min
imum
3.44
%Ba
c G
iang
Med
ian
14.0
6%D
ong
Thap
Max
imum
42.8
5%Ba
c N
inh
S3. L
and-
Use
Pl
anni
ng/P
ricin
gCo
mm
ent o
n Lo
cal L
and
Plan
s (%
)d2
050%
100%
6.19
%6.
49%
7.00
%4.
95%
2.79
%4.
20%
3.23
%5.
16%
Min
imum
0.01
%Bi
nh D
uong
Med
ian
4.83
%D
ong
Nai
Max
imum
22.2
8%Ph
u Th
o
S3. L
and-
Use
Pl
anni
ng/P
ricin
gLa
nd P
lan
Ackn
owle
dges
Yo
ur C
once
rns
(%)
d205
a0%
100%
81.1
2%82
.65%
86.7
7%80
.52%
70.4
4%88
.86%
84.8
1%92
.91%
Min
imum
4.08
%Ye
n Ba
i
Med
ian
97.2
0%Ba
c Li
eu
Max
imum
100%
Don
g Th
ap
S3. L
and-
Use
Pl
anni
ng/P
ricin
g
Impa
ct o
f Lan
d Pl
an o
n Yo
ur F
amily
(1=n
o im
pact
; 2=
hurt
my
fam
ily/v
illag
ers;
3=
Bene
ficia
l)
d206
13
2.05
2.09
2.04
2.12
2.05
2.09
2.01
2.17
Min
imum
1.07
Binh
Duo
ng
Med
ian
2.15
Qua
ng N
gai
Max
imum
2.54
Yen
Bai
S3. L
and-
Use
Pl
anni
ng/P
ricin
gD
id n
ot L
ose
Land
as
a Re
sult
of L
and
Plan
d207
0%10
0%71
.38%
74.9
1%76
.21%
81.1
8%83
.41%
83.4
4%81
.63%
85.2
5%
Min
imum
61.3
8%TT
-Hue
Med
ian
83.3
8%Kh
anh
Hoa
Max
imum
97.4
3%D
a N
ang
S3. L
and-
Use
Pl
anni
ng/P
ricin
gCo
mpe
nsat
ion
Clos
e to
M
arke
t Val
ue (%
)
d207
a(^)
, d2
07aa
&
d207
ba0%
100%
12.8
6%17
.96%
18.8
4%28
.10%
26.5
7%29
.29%
23.3
4%35
.24%
Min
imum
0%G
ia L
ai
Med
ian
22.2
6%Th
ai N
guye
n
Max
imum
94.0
4%Ba
c G
iang
S3. L
and-
Use
Pl
anni
ng/P
ricin
gIn
form
ed o
f Lan
d U
sage
(%)
d207
c0%
100%
93.1
2%90
.66%
92.8
9%82
.91%
87.2
7%78
.26%
72.4
2%84
.11%
Min
imum
0%G
ia L
ai
Med
ian
88.2
5%Ti
en G
iang
Max
imum
100%
Hai
Duo
ng
S3. L
and-
Use
Pl
anni
ng/P
ricin
gLa
nd U
sed
for O
rigin
al
Purp
ose
(%)
d207
d0%
100%
85.4
0%82
.64%
85.2
3%85
.69%
88.4
3%85
.18%
79.0
9%91
.26%
Min
imum
0%Ph
u Ye
n
Med
ian
94.2
1%Ca
n Th
o
Max
imum
100%
Ben
Tre
S3. L
and-
Use
Pl
anni
ng/P
ricin
gKn
ow W
here
to G
o to
Get
La
nd P
rice
Info
rmat
ion
(%)
d208
0%10
0%38
.25%
42.7
6%49
.85%
50.0
4%50
.70%
47.7
8%44
.01%
51.5
4%
Min
imum
11.3
5%La
i Cha
u
Med
ian
49.9
1%Bi
nh D
inh
Max
imum
84.5
2%D
a N
ang
Not
e: (*
) Min
= S
ampl
e M
inim
um; M
ax =
Sam
ple
Max
imum

THE VIET NAM PROVINCIAL GOVERNANCE AND PUBLIC ADMINISTRATION PERFORMANCE INDEX PAPI 2016
54
Figure 3.2c: Changes in Performance in Transparency (% - 2016 against 2011)
-30 -20 -10 0 10 20 30 40
Ba Ria-Vung TauLang Son
Son LaHa NoiGia Lai
Yen BaiCa Mau
Quang NinhKhanh Hoa
Nghe AnHa TinhBac KanDak Lak
Long AnQuang Nam
Nam DinhDak Nong
TP. Ho Chi MinhThua Thien-Hue
Binh DuongBen Tre
Soc TrangTien Giang
Ha NamBinh PhuocQuang Binh
Hoa BinhCao BangKon Tum
Quang TriThanh Hoa
Lao CaiTuyen Quang
Hai PhongDong Thap
Bac LieuHau GiangHai Duong
Binh ThuanThai Nguyen
Vinh PhucDong NaiDien Bien
Lai ChauKien GiangBinh DinhThai Binh
Can ThoTra Vinh
Vinh LongHa GiangDa Nang
Quang NgaiPhu Yen
An GiangBac GiangLam DongHung YenNinh Binh
Tay NinhBac Ninh
Ninh ThuanPhu Tho
Y<-5
5<=Y=>5
Y>5
Note: Y = percentage of change in 2016 data from 2011 data, with a change of ±5% defined as statistically significant.
THE VIET NAM PROVINCIAL GOVERNANCE AND PUBLIC ADMINISTRATION PERFORMANCE INDEX PAPI 2016
PROVINCIAL PERFORMANCE IN 2016 AND OVER TIME (2011-2016)CHAPTER 3
55
Dimension 3: Vertical Accountability
This dimension of the 2016 PAPI was constructed based on three revised and new sub-dimensions: (i) the frequency and effectiveness of citizen interactions with local authorities, (ii) the proactiveness of local governments in response to citizen proposals or complaints, and (iii) the coverage and effectiveness of People’s Inspection Boards (PIBs). Findings from this dimension in 2016 cannot be compared with previous years because indicators measuring local governments’ responses to citizen actions were introduced in 2016, and other sub-dimensions were revised or expanded. The new indicators about how local governments respond to citizen proposals, denunciations, complaints, and/or petitions help to measure how the 2011 Law on Denunciations, the 2011 Law on Complaints, and the 2014 Law on Citizen Reception are implemented in practice. The sub-dimension on effectiveness of Community Investment Supervision Boards (CISBs) was dropped because CISBs are convened on a project basis, not in every commune like the PIBs. Findings about the role of CISBs in supervision of grassroots public investment projects can be found in the section ‘Dimension 1: Citizen Participation at Local Levels’.
Overall provincial dimensional performance. Vertical accountability remains limited at the provincial level, similar to what was observed at the national level (see Chapter 1). There is a convergence of best performers in the northern and central regions in this dimension in 2016 (see Map 3.3). Interestingly, this trend is similar to what was seen in the 2011-2015 period, despite the change in the composition of this dimension in 2016. Among the 16 best performers, six are northern provinces and four are central ones. As Table 3.3 shows, Quang Ngai, the top performer from the central region with a mean score of 5.97 points, outperformed Kien Giang, the poorest performer with a mean score of 4.13 points.
On the effectiveness of interactions between local authorities and citizens, Can Tho did the best in 2016, achieving a score of 2.59 points and leaving Ha Giang, the poorest performer with 1.69 points, far behind. In terms of local governments’ response to citizen
actions, Quang Ngai scored the best and Khanh Hoa the worse. On the effectiveness of the People’s Inspection Boards, Hai Duong was the top performer while Ho Chi Minh City was the poorest.
Interactions with local authorities. This sub-dimension focuses on the frequency and effectiveness of interactions between citizens and local authorities, as provided for in the 2014 Law on Citizen Reception. These interactions are through ad-hoc inquiries to village heads, periodical meetings with public officials from commune People’s Committees or mass organisations, and/or voter meetings with commune People’s Council members. Table 3.3 shows that of the four types of local officials (village heads, commune People’s Committee officials, commune mass organisation representatives, and commune People’s Council members), respondents most frequently approached village heads, with 22% of respondents across the country saying they met village heads to discuss a problem with their family members, neighbours, or local authorities (see Figure 3.3a) in 2016. The percentages range from 4% in Thai Binh to 51% in Quang Nam. For those who met with village heads, about 85% rated the meeting as successful. In Binh Duong, almost everyone who met with village heads were satisfied with the outcome of the meetings.
Interestingly, as Table 3.3 shows, the least frequently encountered officials were commune People’s Council members, with only 4.7% of all respondents in 2016 indicating that they approached these elected members to discuss a problem. In Tay Ninh, nearly 14% of respondents went to meet with commune People’s Council members, while in Thai Binh barely anyone did. The performance of commune People’s Council members in Thai Binh was least appreciated among all provinces. See Table 3.3 for results by other indicators on the frequency and effectiveness of meetings with mass organisation representatives and commune People’s Committee officials.
Response to citizen actions. This sub-dimension focuses on the frequency of citizen proposals, denunciations, complaints, or petitions and how local governments respond to these citizen actions. It
THE VIET NAM PROVINCIAL GOVERNANCE AND PUBLIC ADMINISTRATION PERFORMANCE INDEX PAPI 2016
56
shows the proactiveness of local governments in being accountable to their citizens and the effects of the Law on Denunciation and the Law on Complaints. Findings from the 2016 survey reveal that very few citizens want to take actions when they have a frustration or discontent with everyday governance matters.
Of the four types of civic actions addressed in the survey (making a proposal to local authorities, denunciating a local public official about their wrongdoings, lodging a complaint about a local public official about their poor performance, and jointly signing a petition against a local government), the most common civic action was making proposals to local governments to demand improvement. However, the percentage of citizens across all provinces engaging in this action was still low at 22.7%. Quang Binh citizens were more willing to share their proposals with local governments than the rest of the country, at a rate of about 53%, while in Lai Chau only about 9% of citizens said they made proposals. Of those who made proposals across the country, about 89% said theirs were heard. Bac Lieu officials seemed to be most responsive, as almost everyone submitting their proposals were satisfied with the government responses. The other three forms of civic actions were rarely used, and when used, not everyone was satisfied with the results. Only 1.2% of respondents said they lodged complaints, 0.26% denunciated a public official, and 1% signed a petition against local governments. Petitions and complaints also saw the lowest response rate by local governments; about 40-45% of those making petitions or complaints said that their actions had some results.
People’s Inspection Boards. This sub-dimension measures the coverage and effectiveness of PIBs, a grassroots mechanism made up of elected officials that aims to keep local public officials accountable to
citizens. In theory, PIBs should be established in every commune across the country. The 2016 PAPI findings reveal an increase in the rate of citizens’ reporting the presence of PIBs, but a lower level of appreciation of their operation compared to 2015.30 In 2016 about 34% of all respondents said there was a PIB in their locality, while about 77% said they were effective, similar to findings in previous years (see Figure 3.3b). In Hai Duong, 75% of respondents said they had PIBs in their localities, while in Quang Ninh only 17% said this was the case. Among those respondents in Hung Yen who said PIBs were in place, about 94% said PIBs were effective.
Implications. Despite the political support for social feedback and citizen oversight, and the existence of legislation on citizen reception, complaints, and denunciations, not much has been done to encourage citizen actions and to illuminate local governments’ responsiveness to citizen actions. It is important to reiterate the recommendation that local authorities interact more frequently with citizens through regular and ad-hoc meetings. The 2014 Law on Citizen Reception provides the legal framework for better government-citizen interactions. It is expected that with this law, local governments now have concrete interaction mechanisms in place to improve this aspect of governance and local officials will provide timely responses to citizen concerns and requests. It is also recommended that the Viet Nam Fatherland Front, other mass organizations, and civil society at large play a more central role in reviewing and reviving available mechanisms, including PIBs, to call local governments into account. To ensure more effective PIBs, these institutions should be better equipped with technical skills and be provided more resources so they can more actively engage with citizens and civil society organizations.
30 See Table 3.3 in the PAPI 2015 Report (CECODES, VFF-CRT and UNDP, 2016, pp. 55-56).
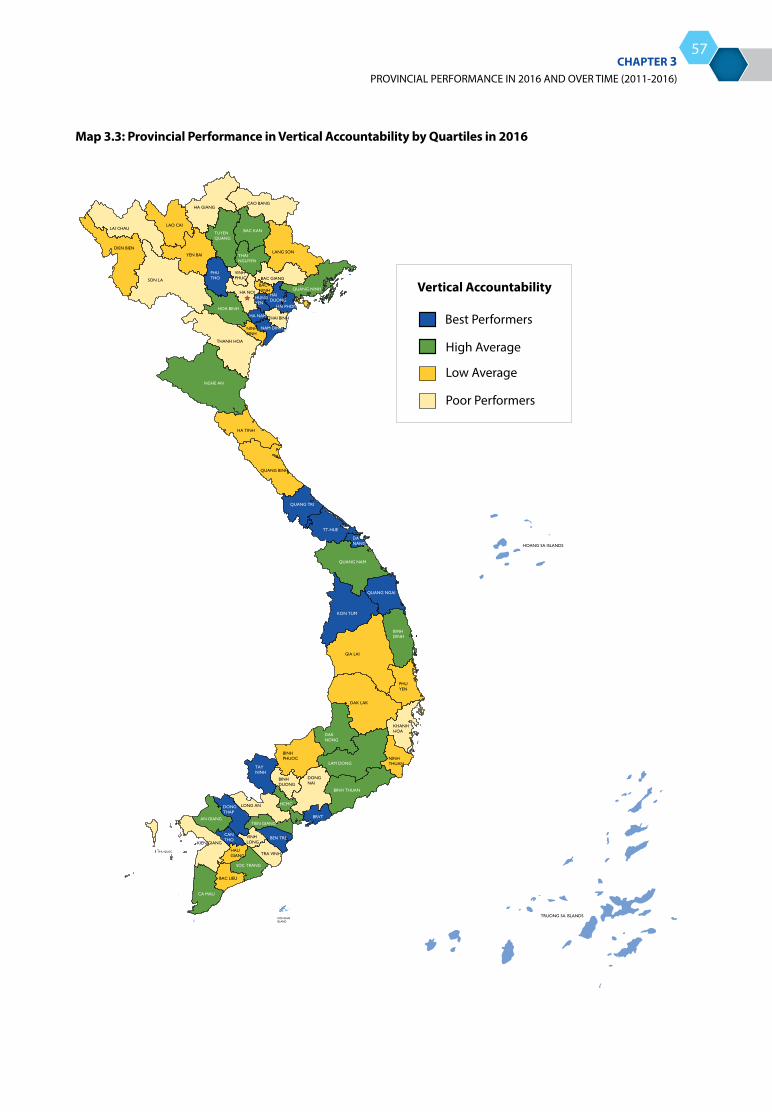
THE VIET NAM PROVINCIAL GOVERNANCE AND PUBLIC ADMINISTRATION PERFORMANCE INDEX PAPI 2016
PROVINCIAL PERFORMANCE IN 2016 AND OVER TIME (2011-2016)CHAPTER 3
57
Map 3.3: Provincial Performance in Vertical Accountability by Quartiles in 2016
Vertical Accountability
Best Performers
High Average
Low Average
Poor Performers
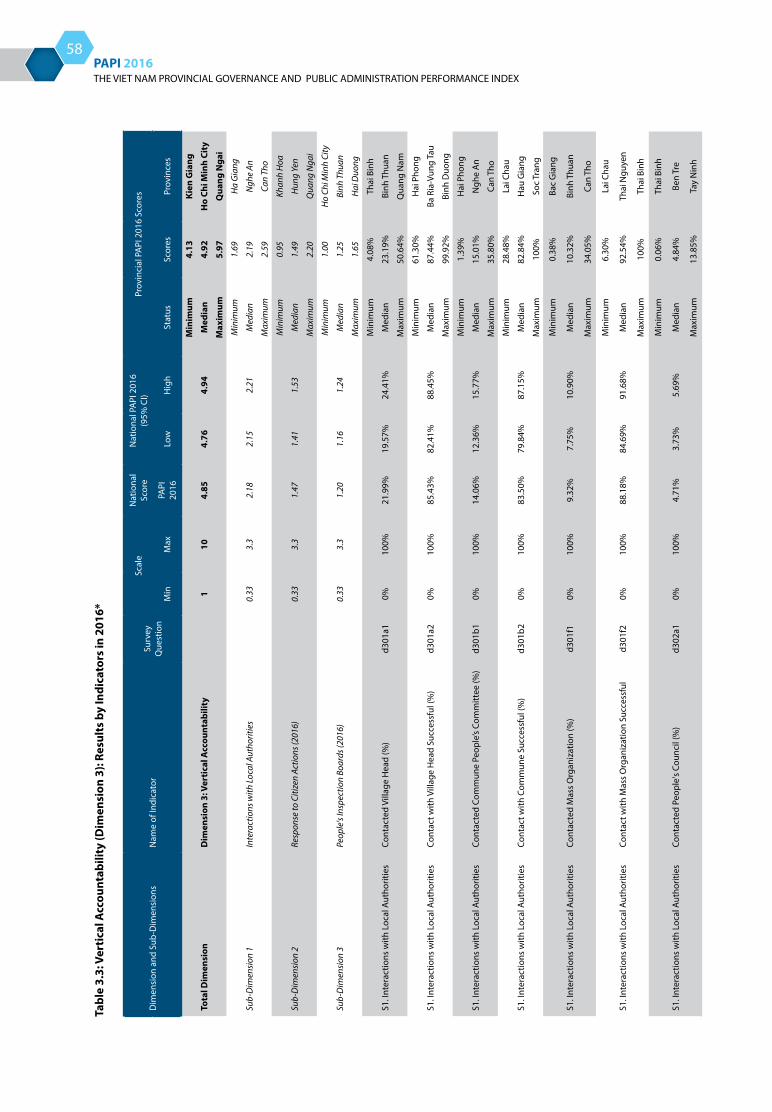
THE VIET NAM PROVINCIAL GOVERNANCE AND PUBLIC ADMINISTRATION PERFORMANCE INDEX PAPI 2016
58
Tabl
e 3.
3: V
erti
cal A
ccou
ntab
ility
(Dim
ensi
on 3
): Re
sult
s by
Indi
cato
rs in
201
6*
Dim
ensi
on a
nd S
ub-D
imen
sion
sN
ame
of In
dica
tor
Surv
ey
Que
stio
n
Scal
eN
atio
nal
Scor
eN
atio
nal P
API
201
6 (9
5% C
I)Pr
ovin
cial
PA
PI 2
016
Scor
es
Min
Max
PAPI
20
16Lo
wH
igh
Stat
usSc
ores
Prov
ince
s
Tota
l Dim
ensi
onD
imen
sion
3: V
erti
cal A
ccou
ntab
ility
110
4.85
4.76
4.94
Min
imum
4.13
Kien
Gia
ng
Med
ian
4.92
Ho
Chi M
inh
City
Max
imum
5.97
Qua
ng N
gai
Sub-
Dim
ensi
on 1
Inte
ract
ions
with
Loca
l Aut
horit
ies
0.33
3.3
2.18
2.15
2.21
Min
imum
1.69
Ha
Gia
ng
Med
ian
2.19
Ngh
e An
Max
imum
2.59
Can
Tho
Sub-
Dim
ensi
on 2
Resp
onse
to C
itize
n Ac
tions
(201
6)0.
333.
31.
471.
411.
53
Min
imum
0.95
Khan
h H
oa
Med
ian
1.49
Hun
g Ye
n
Max
imum
2.20
Qua
ng N
gai
Sub-
Dim
ensi
on 3
Peop
le's
Insp
ectio
n Bo
ards
(201
6)0.
333.
31.
201.
161.
24
Min
imum
1.00
Ho
Chi M
inh
City
Med
ian
1.25
Binh
Thu
an
Max
imum
1.65
Hai
Duo
ng
S1. I
nter
actio
ns w
ith L
ocal
Aut
horit
ies
Cont
acte
d Vi
llage
Hea
d (%
)d3
01a1
0%10
0%21
.99%
19.5
7%24
.41%
Min
imum
4.08
%Th
ai B
inh
Med
ian
23.1
9%Bi
nh T
huan
Max
imum
50.6
4%Q
uang
Nam
S1. I
nter
actio
ns w
ith L
ocal
Aut
horit
ies
Cont
act w
ith V
illag
e H
ead
Succ
essf
ul (%
)d3
01a2
0%10
0%85
.43%
82.4
1%88
.45%
Min
imum
61.3
0%H
ai P
hong
Med
ian
87.4
4%Ba
Ria
-Vun
g Ta
u
Max
imum
99.9
2%Bi
nh D
uong
S1. I
nter
actio
ns w
ith L
ocal
Aut
horit
ies
Cont
acte
d Co
mm
une
Peop
le’s
Com
mitt
ee (%
)d3
01b1
0%10
0%14
.06%
12.3
6%15
.77%
Min
imum
1.39
%H
ai P
hong
Med
ian
15.0
1%N
ghe
An
Max
imum
35.8
0%Ca
n Th
o
S1. I
nter
actio
ns w
ith L
ocal
Aut
horit
ies
Cont
act w
ith C
omm
une
Succ
essf
ul (%
)d3
01b2
0%10
0%83
.50%
79.8
4%87
.15%
Min
imum
28.4
8%La
i Cha
u
Med
ian
82.8
4%H
au G
iang
Max
imum
100%
Soc
Tran
g
S1. I
nter
actio
ns w
ith L
ocal
Aut
horit
ies
Cont
acte
d M
ass
Org
aniz
atio
n (%
)d3
01f1
0%10
0%9.
32%
7.75
%10
.90%
Min
imum
0.38
%Ba
c G
iang
Med
ian
10.3
2%Bi
nh T
huan
Max
imum
34.0
5%Ca
n Th
o
S1. I
nter
actio
ns w
ith L
ocal
Aut
horit
ies
Cont
act w
ith M
ass
Org
aniz
atio
n Su
cces
sful
d301
f20%
100%
88.1
8%84
.69%
91.6
8%
Min
imum
6.30
%La
i Cha
u
Med
ian
92.5
4%Th
ai N
guye
n
Max
imum
100%
Thai
Bin
h
S1. I
nter
actio
ns w
ith L
ocal
Aut
horit
ies
Cont
acte
d Pe
ople
's Co
unci
l (%
)d3
02a1
0%10
0%4.
71%
3.73
%5.
69%
Min
imum
0.06
%Th
ai B
inh
Med
ian
4.84
%Be
n Tr
e
Max
imum
13.8
5%Ta
y N
inh
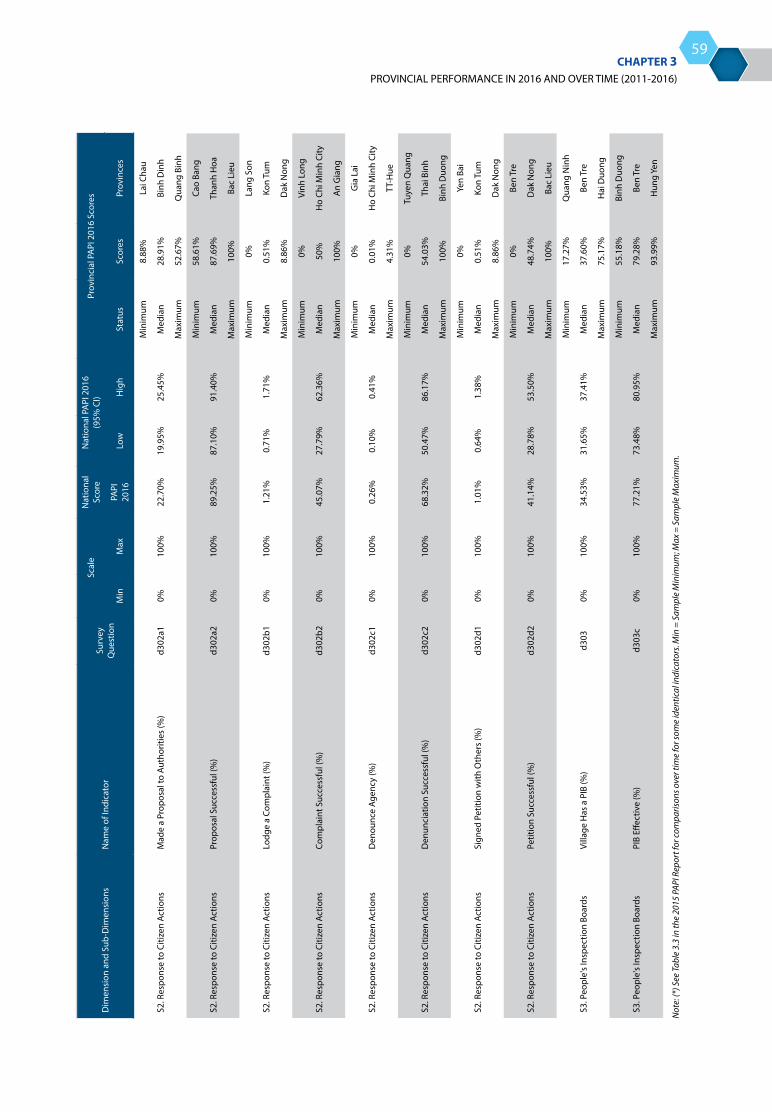
THE VIET NAM PROVINCIAL GOVERNANCE AND PUBLIC ADMINISTRATION PERFORMANCE INDEX PAPI 2016
PROVINCIAL PERFORMANCE IN 2016 AND OVER TIME (2011-2016)CHAPTER 3
59
Dim
ensi
on a
nd S
ub-D
imen
sion
sN
ame
of In
dica
tor
Surv
ey
Que
stio
n
Scal
eN
atio
nal
Scor
eN
atio
nal P
API
201
6 (9
5% C
I)Pr
ovin
cial
PA
PI 2
016
Scor
es
Min
Max
PAPI
20
16Lo
wH
igh
Stat
usSc
ores
Prov
ince
s
S2. R
espo
nse
to C
itize
n Ac
tions
Mad
e a
Prop
osal
to A
utho
ritie
s (%
)d3
02a1
0%10
0%22
.70%
19.9
5%25
.45%
Min
imum
8.88
%La
i Cha
u
Med
ian
28.9
1%Bi
nh D
inh
Max
imum
52.6
7%Q
uang
Bin
h
S2. R
espo
nse
to C
itize
n Ac
tions
Prop
osal
Suc
cess
ful (
%)
d302
a20%
100%
89.2
5%87
.10%
91.4
0%
Min
imum
58.6
1%Ca
o Ba
ng
Med
ian
87.6
9%Th
anh
Hoa
Max
imum
100%
Bac
Lieu
S2. R
espo
nse
to C
itize
n Ac
tions
Lodg
e a
Com
plai
nt (%
)d3
02b1
0%10
0%1.
21%
0.71
%1.
71%
Min
imum
0%La
ng S
on
Med
ian
0.51
%Ko
n Tu
m
Max
imum
8.86
%D
ak N
ong
S2. R
espo
nse
to C
itize
n Ac
tions
Com
plai
nt S
ucce
ssfu
l (%
)d3
02b2
0%10
0%45
.07%
27.7
9%62
.36%
Min
imum
0%Vi
nh L
ong
Med
ian
50%
Ho
Chi M
inh
City
Max
imum
100%
An
Gia
ng
S2. R
espo
nse
to C
itize
n Ac
tions
Den
ounc
e Ag
ency
(%)
d302
c10%
100%
0.26
%0.
10%
0.41
%
Min
imum
0%G
ia L
ai
Med
ian
0.01
%H
o Ch
i Min
h Ci
ty
Max
imum
4.31
%TT
-Hue
S2. R
espo
nse
to C
itize
n Ac
tions
Den
unci
atio
n Su
cces
sful
(%)
d302
c20%
100%
68.3
2%50
.47%
86.1
7%
Min
imum
0%Tu
yen
Qua
ng
Med
ian
54.0
3%Th
ai B
inh
Max
imum
100%
Binh
Duo
ng
S2. R
espo
nse
to C
itize
n Ac
tions
Sign
ed P
etiti
on w
ith O
ther
s (%
)d3
02d1
0%10
0%1.
01%
0.64
%1.
38%
Min
imum
0%Ye
n Ba
i
Med
ian
0.51
%Ko
n Tu
m
Max
imum
8.86
%D
ak N
ong
S2. R
espo
nse
to C
itize
n Ac
tions
Petit
ion
Succ
essf
ul (%
)d3
02d2
0%10
0%41
.14%
28.7
8%53
.50%
Min
imum
0%Be
n Tr
e
Med
ian
48.7
4%D
ak N
ong
Max
imum
100%
Bac
Lieu
S3. P
eopl
e's
Insp
ectio
n Bo
ards
Villa
ge H
as a
PIB
(%)
d303
0%10
0%34
.53%
31.6
5%37
.41%
Min
imum
17.2
7%Q
uang
Nin
h
Med
ian
37.6
0%Be
n Tr
e
Max
imum
75.1
7%H
ai D
uong
S3. P
eopl
e's
Insp
ectio
n Bo
ards
PIB
Effec
tive
(%)
d303
c0%
100%
77.2
1%73
.48%
80.9
5%
Min
imum
55.1
8%Bi
nh D
uong
Med
ian
79.2
8%Be
n Tr
e
Max
imum
93.9
9%H
ung
Yen
Not
e: (*
) See
Tabl
e 3.
3 in
the
2015
PAP
I Rep
ort f
or co
mpa
rison
s ove
r tim
e fo
r som
e id
entic
al in
dica
tors
. Min
= S
ampl
e M
inim
um; M
ax =
Sam
ple
Max
imum
.
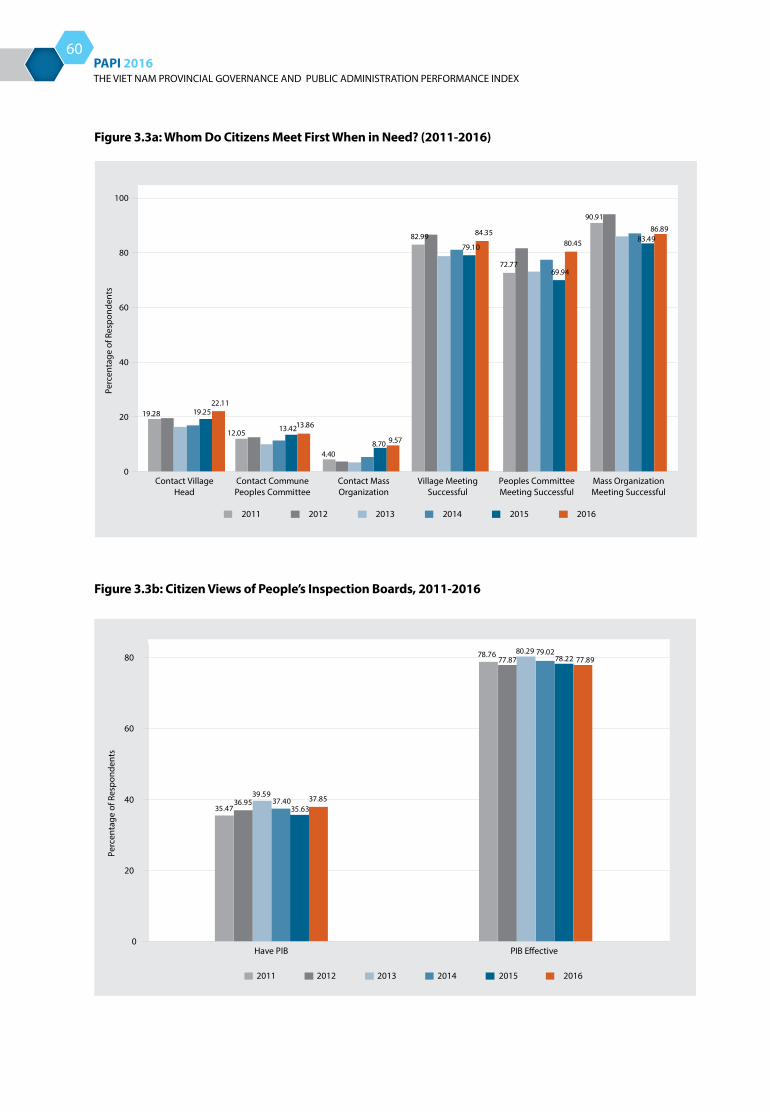
THE VIET NAM PROVINCIAL GOVERNANCE AND PUBLIC ADMINISTRATION PERFORMANCE INDEX PAPI 2016
60
Figure 3.3a: Whom Do Citizens Meet First When in Need? (2011-2016)
Figure 3.3b: Citizen Views of People’s Inspection Boards, 2011-2016
19.28 19.2522.11
12.05 13.4213.86
4.408.70 9.57
82.9979.10
84.35
72.7769.94
80.45
90.91
83.4986.89
Perc
enta
ge o
f Res
pond
ents
Contact VillageHead
Contact CommunePeoples Committee
Contact MassOrganization
Village MeetingSuccessful
Peoples CommitteeMeeting Successful
Mass OrganizationMeeting Successful
2011 2012 2013 2014 2015 2016
80
100
40
60
20
0
0
20
40
60
80
Have PIB PIB E�ective
35.4736.95
39.5937.40
35.6337.85
78.7677.87
80.29 79.0278.22 77.89
2011 2012 2013 2014 2015 2016
Perc
enta
ge o
f Res
pond
ents
THE VIET NAM PROVINCIAL GOVERNANCE AND PUBLIC ADMINISTRATION PERFORMANCE INDEX PAPI 2016
PROVINCIAL PERFORMANCE IN 2016 AND OVER TIME (2011-2016)CHAPTER 3
61
Dimension 4: Control of Corruption in the Public Sector
The ‘Control of Corruption’ dimension is comprised of four sub-dimensions: (i) limits on public sector corruption, (ii) limits on corruption in public service delivery, (iii) equity in state employment, and (iv) willingness to fight corruption. It measures the performance of institutions and local governments in controlling corruption in the public sector. It also shows the tolerance of corruption practices and the willingness to curb corruption by both local governments and citizens. The analysis in this section shows that the public sector needs concerted efforts to address systemically embedded corrupt practices.
Overall provincial performance on this dimension. The trend of declining overall provincial performance in control of corruption in the public sector continued in 2016, with a lower national mean score than in 2015. Table 3.4 shows that the largest declines were seen in two sub-dimensions: ‘limits on public sector corruption’ and ‘willingness to fight corruption’. As Figure 1.15 shows, there were noticeable spikes in the numbers of respondents saying citizens had to pay bribes for state employment, for LURCs, and for teachers’ favouritism, and in cases of public officials diverting state funds at the local levels, compared to previous years. On a more positive note, the sub-dimension ‘limit on corruption in public service delivery’ improved to the 2011 level after declining in 2015. Fewer respondents in 2016 said bribery was needed for public health care at the district level than in previous years. Interestingly, this is contrary to what patients and/or their relatives actually experienced, as presented in Table 1.7 in Chapter 1.
Regional patterns have been strong in this dimension over the last six years. Central and southern provinces tend to do better in anti-corruption efforts than northern provinces. Among the top 16 best performers, eight are Mekong Delta provinces and five are from the central region (see Map 3.4). In 2016, Can Tho, Tien Giang, and Ben Tre were the best performers in this dimension. In fact, Long An remained in the best performing group for six years in a row. At the other end of the spectrum, Ha Noi has stayed in the poorest performing group for six years. Two other
centrally governed municipalities, Ho Chi Minh City and Hai Phong, joined the poor performing group along with other five northern and three Central Highlands provinces in 2016. Binh Duong dropped to the poorest level, with a mean dimensional score of 4.31 points, significantly lower than the highest dimensional score of 7.14 points for Can Tho.
It is worth to noting that 27 provinces significantly improved their performance in 2016 compared to their performance score in 2011 (see Figure 3.4d). Cao Bang’s dimensional score increased by 36% over six years. On the other hand, Binh Duong continued to see a sharp drop, down 40% compared to 2011.
Limits on public sector corruption. This sub-dimension is comprised of three indicators: (i) no diversion of public funds by officials, (ii) no bribes for land titles, and (iii) no kickbacks for construction permits. The indicators reflect whether citizens witness or experience these forms of corrupt practices in everyday interactions with local governments. As Table 3.4 shows, compared to the previous five years, the 2016 findings for all three sub-dimension indicators are less positive. Fewer citizens agreed that public officials did not divert public funds for private use, ask for bribes when handling LURCs, or ask for kickbacks when handling construction permits for citizens. Despite the concerted efforts made in 2016 by the Ministry of Natural Resources and Environment in setting up hotlines for citizens to report on bribery in public administrative services for LURCs,31 only 46% of respondents across the country agreed with the statement that there was no need for bribes to obtain the certificates (the lowest percentage over the past six years). On this indicator, 73% of the respondents in Ha Tinh agreed with the positive statement (that
31 See Decision No. 931/QĐ-BTNMT of the Minister of Natural Resources and Environment on setting up hotlines to collect citizen and business feedback on bribery in the areas of natural resources and environment, including land administration, dated 25 April 2016. It was reported by the Ministry that after three months of operation, the hotline collected nearly 1,700 complaints about bribe asking by land administrators in handling LURCs (see Dan Tri, 04/10/2016).
THE VIET NAM PROVINCIAL GOVERNANCE AND PUBLIC ADMINISTRATION PERFORMANCE INDEX PAPI 2016
62
public officials did not ask for bribes for LURCs in 2016), while only 11% of the respondents in Binh Duong were in agreement.
Limits on corruption in public service delivery. This sub-dimension measures the level of corruption perceived and experienced by citizens when using public health care and primary schools. Citizens are asked about bribes at public district hospitals and bribes for teachers’ favouritism at public primary schools. There was a slight increase in the overall provincial performance in this sub-dimension, bringing it back to its 2011 level after falling in 2014 and 2015 (see Table 3.4). The main contributor to the positive move was a higher percentage of respondents who felt that public health care workers at district hospitals did not request bribes (51%) compared to 2015 (48%). In Dong Thap, 76% of respondents said that users did not have to pay bribes when accessing public health care at district hospitals in the province, while in Binh Duong only 27% were in agreement with this statement. However, in half of the provinces only 27% to 51% of respondents said that users did not have to pay bribes when accessing public health care at district hospitals, indicating that bribery in public hospitals is still widely prevalent.
Similarly, addressing bribery in public primary schools remains a challenge for almost every province. Based on the median value, in half of the country the range of respondents who claim that bribery does not take place at primary schools is 22% (in Binh Duong) to 62% (in Tra Vinh). In the other half of the country, the percentages range from 62% to 86%. Bac Giang was again the best performing province in this indicator in 2016, with 86% of respondents saying that parents did not have to pay bribes to ensure adequate attention by teachers.
Equity in state employment. Equity in state employment contributes significantly to a strong and clean (non-corrupt) state apparatus. However, it seems difficult to reach this goal, especially when personal relationships and informal payments still play an important role among those who wish to
pursue careers in the public sector. This has recently been recognised as a danger to an effective and facilitating government by the Government of Viet Nam, with the Prime Minister requesting dismissal of any bureaucrat whose appointment was influenced by nepotism.32
PAPI findings over the past six years confirm that nepotism in public sector employment has become a systemic problem (see Table 3.4 and Figure 3.4a). Figure 3.4a even shows a downward trend over the past two years in the national average scores on this indicator based on responses to the statement that ‘no relationship is required for state jobs’. Tien Giang had the highest score on the indicator ‘no relationship is required for five commune-level public official posts’, but its score was only 2.04 points on the scale of 0-5 (see Table 3.4 and Figure 3.4b). In Lao Cai, respondents believed that personal relationships are crucial when applying for state employment; respondents there said almost all of the five public sector posts at the commune level were not free from nepotism. In 2016, in Thai Nguyen, only 15% of respondents believed that they do not need to pay a bribe when seeking state employment. In Tra Vinh, the province with the highest score on this indicator, 66% had the same opinion.
Willingness to fight corruption. This sub-dimension reveals the willingness and efforts from both local governments and citizens in combatting corruption in their localities. As shown in Table 3.4, the percentage of respondents (32.6%) agreeing that their provincial leaders were serious about combating corruption in 2016 was the lowest of the past six years. In Quang Binh, 65% said their provincial authorities were serious about addressing corruption cases, while in Binh Duong the percentage was barely 8.6%.
Table 3.4 also shows a stable low trend in citizens’ willingness to denunciate public officials who collect bribes. Similar to previous years, in 2016 very few victims of bribery requests (around 3%) would denunciate corrupt acts by local government officials. While the rate is 0% in most provinces, almost every bribery victim in Quang Ngai said they reported bribe
32 See VN Express International (02/01/2017)
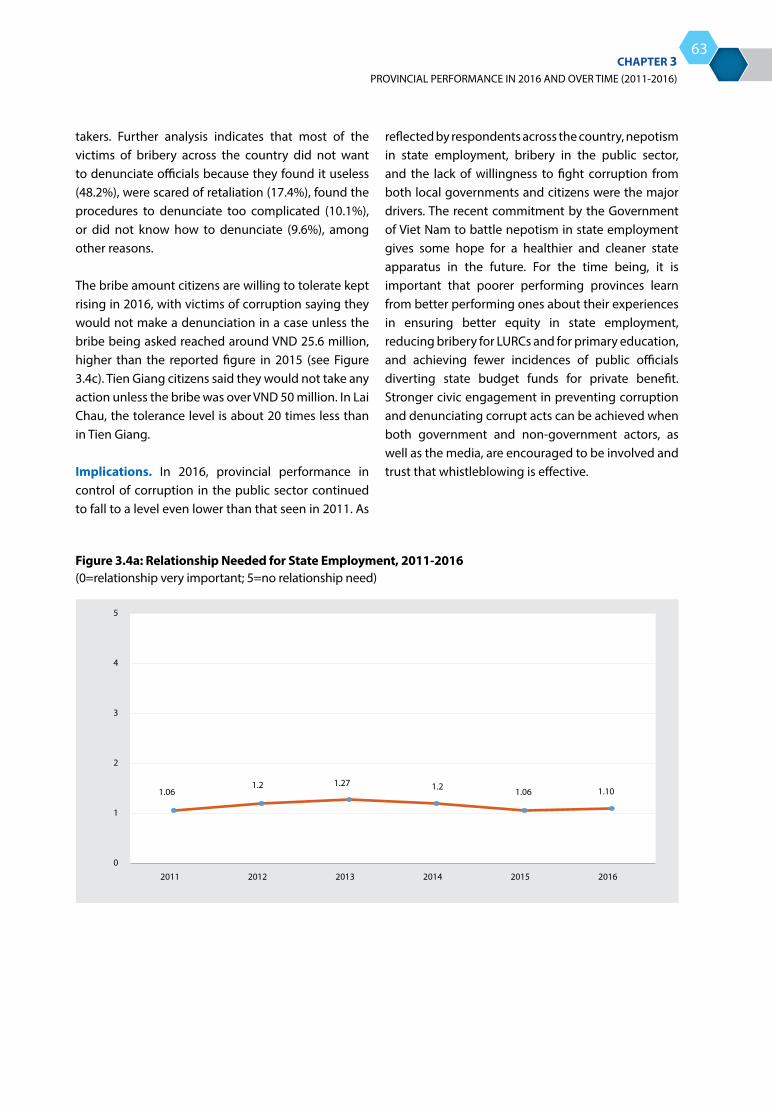
THE VIET NAM PROVINCIAL GOVERNANCE AND PUBLIC ADMINISTRATION PERFORMANCE INDEX PAPI 2016
PROVINCIAL PERFORMANCE IN 2016 AND OVER TIME (2011-2016)CHAPTER 3
63
takers. Further analysis indicates that most of the victims of bribery across the country did not want to denunciate officials because they found it useless (48.2%), were scared of retaliation (17.4%), found the procedures to denunciate too complicated (10.1%), or did not know how to denunciate (9.6%), among other reasons.
The bribe amount citizens are willing to tolerate kept rising in 2016, with victims of corruption saying they would not make a denunciation in a case unless the bribe being asked reached around VND 25.6 million, higher than the reported figure in 2015 (see Figure 3.4c). Tien Giang citizens said they would not take any action unless the bribe was over VND 50 million. In Lai Chau, the tolerance level is about 20 times less than in Tien Giang.
Implications. In 2016, provincial performance in control of corruption in the public sector continued to fall to a level even lower than that seen in 2011. As
reflected by respondents across the country, nepotism in state employment, bribery in the public sector, and the lack of willingness to fight corruption from both local governments and citizens were the major drivers. The recent commitment by the Government of Viet Nam to battle nepotism in state employment gives some hope for a healthier and cleaner state apparatus in the future. For the time being, it is important that poorer performing provinces learn from better performing ones about their experiences in ensuring better equity in state employment, reducing bribery for LURCs and for primary education, and achieving fewer incidences of public officials diverting state budget funds for private benefit. Stronger civic engagement in preventing corruption and denunciating corrupt acts can be achieved when both government and non-government actors, as well as the media, are encouraged to be involved and trust that whistleblowing is effective.
Figure 3.4a: Relationship Needed for State Employment, 2011-2016 (0=relationship very important; 5=no relationship need)
1.061.2 1.27 1.2 1.06 1.10
0
1
2
3
4
5
2011 2012 2013 2014 2015 2016

THE VIET NAM PROVINCIAL GOVERNANCE AND PUBLIC ADMINISTRATION PERFORMANCE INDEX PAPI 2016
64
Map 3.4: Provincial Performance in Control of Corruption in the Public Sector by Quartiles in 2016
Control of Corruption in the Public Sector
Best Performers
High Average
Low Average
Poor Performers
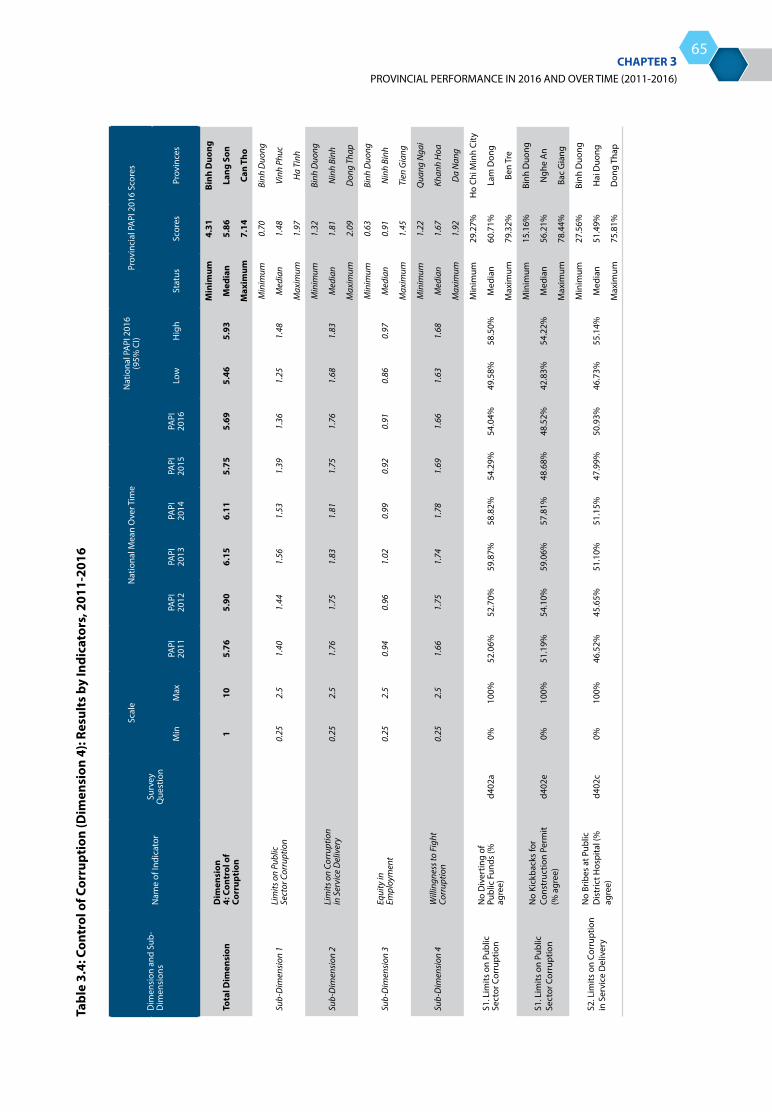
THE VIET NAM PROVINCIAL GOVERNANCE AND PUBLIC ADMINISTRATION PERFORMANCE INDEX PAPI 2016
PROVINCIAL PERFORMANCE IN 2016 AND OVER TIME (2011-2016)CHAPTER 3
65
Tabl
e 3.
4: C
ontr
ol o
f Cor
rupt
ion
(Dim
ensi
on 4
): Re
sult
s by
Indi
cato
rs, 2
011-
2016
Dim
ensi
on a
nd S
ub-
Dim
ensi
ons
Nam
e of
Indi
cato
rSu
rvey
Q
uest
ion
Scal
eN
atio
nal M
ean
Ove
r Tim
eN
atio
nal P
API
201
6 (9
5% C
I)Pr
ovin
cial
PA
PI 2
016
Scor
es
Min
Max
PAPI
20
11PA
PI
2012
PAPI
20
13PA
PI
2014
PAPI
20
15PA
PI
2016
Low
Hig
hSt
atus
Scor
esPr
ovin
ces
Tota
l Dim
ensi
onD
imen
sion
4:
Con
trol
of
Corr
upti
on1
105.
765.
906.
156.
115.
755.
695.
465.
93
Min
imum
4.31
Binh
Duo
ng
Med
ian
5.86
Lang
Son
Max
imum
7.14
Can
Tho
Sub-
Dim
ensi
on 1
Lim
its o
n Pu
blic
Se
ctor
Cor
rupt
ion
0.25
2.5
1.40
1.44
1.56
1.53
1.39
1.36
1.25
1.48
Min
imum
0.70
Binh
Duo
ng
Med
ian
1.48
Vinh
Phu
c
Max
imum
1.97
Ha
Tinh
Sub-
Dim
ensi
on 2
Lim
its o
n Co
rrup
tion
in S
ervi
ce D
eliv
ery
0.25
2.5
1.76
1.75
1.83
1.81
1.75
1.76
1.68
1.83
Min
imum
1.32
Binh
Duo
ng
Med
ian
1.81
Nin
h Bi
nh
Max
imum
2.09
Don
g Th
ap
Sub-
Dim
ensi
on 3
Equi
ty in
Em
ploy
men
t0.
252.
50.
940.
961.
020.
990.
920.
910.
860.
97
Min
imum
0.63
Binh
Duo
ng
Med
ian
0.91
Nin
h Bi
nh
Max
imum
1.45
Tien
Gia
ng
Sub-
Dim
ensi
on 4
Will
ingn
ess t
o Fi
ght
Corr
uptio
n0.
252.
51.
661.
751.
741.
781.
691.
661.
631.
68
Min
imum
1.22
Qua
ng N
gai
Med
ian
1.67
Khan
h H
oa
Max
imum
1.92
Da
Nan
g
S1. L
imits
on
Publ
ic
Sect
or C
orru
ptio
nN
o D
iver
ting
of
Publ
ic F
unds
(%
agre
e)d4
02a
0%10
0%52
.06%
52.7
0%59
.87%
58.8
2%54
.29%
54.0
4%49
.58%
58.5
0%
Min
imum
29.2
7%H
o Ch
i Min
h Ci
ty
Med
ian
60.7
1%La
m D
ong
Max
imum
79.3
2%Be
n Tr
e
S1. L
imits
on
Publ
ic
Sect
or C
orru
ptio
n
No
Kick
back
s fo
r Co
nstr
uctio
n Pe
rmit
(% a
gree
)d4
02e
0%10
0%51
.19%
54.1
0%59
.06%
57.8
1%48
.68%
48.5
2%42
.83%
54.2
2%
Min
imum
15.1
6%Bi
nh D
uong
Med
ian
56.2
1%N
ghe
An
Max
imum
78.4
4%Ba
c G
iang
S2. L
imits
on
Corr
uptio
n in
Ser
vice
Del
iver
y
No
Brib
es a
t Pub
lic
Dis
tric
t Hos
pita
l (%
ag
ree)
d402
c0%
100%
46.5
2%45
.65%
51.1
0%51
.15%
47.9
9%50
.93%
46.7
3%55
.14%
Min
imum
27.5
6%Bi
nh D
uong
Med
ian
51.4
9%H
ai D
uong
Max
imum
75.8
1%D
ong
Thap
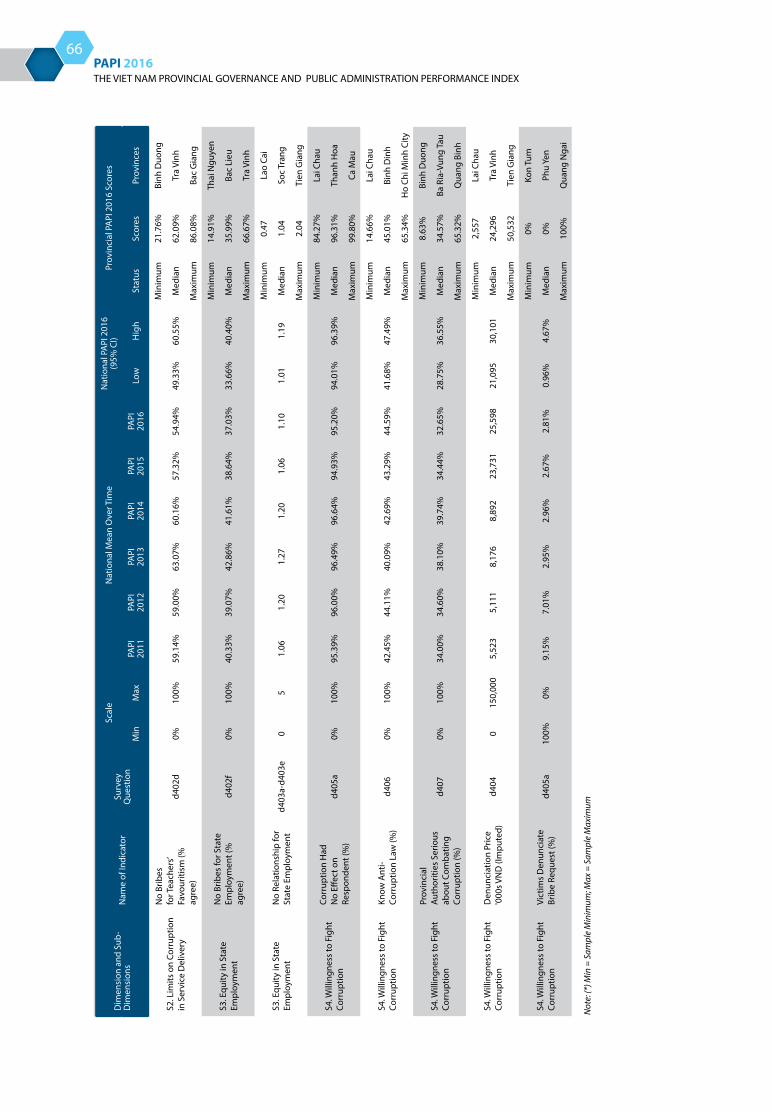
THE VIET NAM PROVINCIAL GOVERNANCE AND PUBLIC ADMINISTRATION PERFORMANCE INDEX PAPI 2016
66
Dim
ensi
on a
nd S
ub-
Dim
ensi
ons
Nam
e of
Indi
cato
rSu
rvey
Q
uest
ion
Scal
eN
atio
nal M
ean
Ove
r Tim
eN
atio
nal P
API
201
6 (9
5% C
I)Pr
ovin
cial
PA
PI 2
016
Scor
es
Min
Max
PAPI
20
11PA
PI
2012
PAPI
20
13PA
PI
2014
PAPI
20
15PA
PI
2016
Low
Hig
hSt
atus
Scor
esPr
ovin
ces
S2. L
imits
on
Corr
uptio
n in
Ser
vice
Del
iver
y
No
Brib
es
for T
each
ers’
Favo
uriti
sm (%
ag
ree)
d402
d0%
100%
59.1
4%59
.00%
63.0
7%60
.16%
57.3
2%54
.94%
49.3
3%60
.55%
Min
imum
21.7
6%Bi
nh D
uong
Med
ian
62.0
9%Tr
a Vi
nh
Max
imum
86.0
8%Ba
c G
iang
S3. E
quity
in S
tate
Em
ploy
men
t
No
Brib
es fo
r Sta
te
Empl
oym
ent (
%
agre
e)d4
02f
0%10
0%40
.33%
39.0
7%42
.86%
41.6
1%38
.64%
37.0
3%33
.66%
40.4
0%
Min
imum
14.9
1%Th
ai N
guye
n
Med
ian
35.9
9%Ba
c Li
eu
Max
imum
66.6
7%Tr
a Vi
nh
S3. E
quity
in S
tate
Em
ploy
men
tN
o Re
latio
nshi
p fo
r St
ate
Empl
oym
ent
d403
a-d4
03e
05
1.06
1.20
1.27
1.20
1.06
1.10
1.01
1.19
Min
imum
0.47
Lao
Cai
Med
ian
1.04
Soc
Tran
g
Max
imum
2.04
Tien
Gia
ng
S4. W
illin
gnes
s to
Fig
ht
Corr
uptio
n
Corr
uptio
n H
ad
No
Effec
t on
Resp
onde
nt (%
)d4
05a
0%10
0%95
.39%
96.0
0%96
.49%
96.6
4%94
.93%
95.2
0%94
.01%
96.3
9%
Min
imum
84.2
7%La
i Cha
u
Med
ian
96.3
1%Th
anh
Hoa
Max
imum
99.8
0%Ca
Mau
S4. W
illin
gnes
s to
Fig
ht
Corr
uptio
nKn
ow A
nti-
Corr
uptio
n La
w (%
)d4
060%
100%
42.4
5%44
.11%
40.0
9%42
.69%
43.2
9%44
.59%
41.6
8%47
.49%
Min
imum
14.6
6%La
i Cha
u
Med
ian
45.0
1%Bi
nh D
inh
Max
imum
65.3
4%H
o Ch
i Min
h Ci
ty
S4. W
illin
gnes
s to
Fig
ht
Corr
uptio
n
Prov
inci
al
Auth
oriti
es S
erio
us
abou
t Com
batin
g Co
rrup
tion
(%)
d407
0%10
0%34
.00%
34.6
0%38
.10%
39.7
4%34
.44%
32.6
5%28
.75%
36.5
5%
Min
imum
8.63
%Bi
nh D
uong
Med
ian
34.5
7%Ba
Ria
-Vun
g Ta
u
Max
imum
65.3
2%Q
uang
Bin
h
S4. W
illin
gnes
s to
Fig
ht
Corr
uptio
nD
enun
ciat
ion
Pric
e '0
00s V
ND
(Im
pute
d)d4
040
150,
000
5,52
35,
111
8,17
68,
892
23,7
3125
,598
21,0
9530
,101
Min
imum
2,55
7La
i Cha
u
Med
ian
24,2
96Tr
a Vi
nh
Max
imum
50,5
32Ti
en G
iang
S4. W
illin
gnes
s to
Fig
ht
Corr
uptio
nVi
ctim
s D
enun
ciat
e Br
ibe
Requ
est (
%)
d405
a10
0%0%
9.15
%7.
01%
2.95
%2.
96%
2.67
%2.
81%
0.96
%4.
67%
Min
imum
0%Ko
n Tu
m
Med
ian
0%Ph
u Ye
n
Max
imum
100%
Qua
ng N
gai
Not
e: (*
) Min
= S
ampl
e M
inim
um; M
ax =
Sam
ple
Max
imum

THE VIET NAM PROVINCIAL GOVERNANCE AND PUBLIC ADMINISTRATION PERFORMANCE INDEX PAPI 2016
PROVINCIAL PERFORMANCE IN 2016 AND OVER TIME (2011-2016)CHAPTER 3
67
Figure 3.4c: Denunciation Price, 2011-2016 (VND, imputed)
Figure 3.4b: Relationship Needed for State Employment by Province, 2016(Branch size = percentage of respondents agreeing that relationship is not important or not important at all; ‘Perfect’ = 100% agreement)
5.523.000 5.111.000
8.176.0008.892.000
23.731.000
25.598.000
0
5.000.000
10.000.000
15.000.000
20.000.000
25.000.000
30.000.000
2011 2012 2013 2014 2015 2016
Land Registry Sta�
Commune Justice O�cer
Policeman
Teacher
People's Committee
Zero Lao Cai Yen Bai Dien Bien Quang Ninh Lai Chau Bac Kan Bac Lieu Binh Duong
Ha Giang Son La Thai Binh Tra Vinh Cao Bang Nghe An Quang Tri Vinh Long Quang Nam
Ha Nam Ca Mau Lang Son Hau Giang Hoa Binh Binh Dinh Ha Noi HCMC Binh Thuan
Thanh Hoa Nam Dinh Kien Giang TT-Hue Dak Lak Soc Trang Ha Tinh BRVT Quang Binh
Khanh Hoa An Giang Ninh Thuan Ninh Binh Hai Phong Quang Ngai Kon Tum Thai Nguyen Tuyen Quang
Binh Phuoc Phu Yen Dong Thap Dong Nai Da Nang Lam Dong Hung Yen Phu Tho Gia Lai
Dak Nong Long An Bac Ninh Vinh Phuc Ben Tre Hai Duong Tay Ninh Bac Giang Can Tho
Tien Giang Perfect
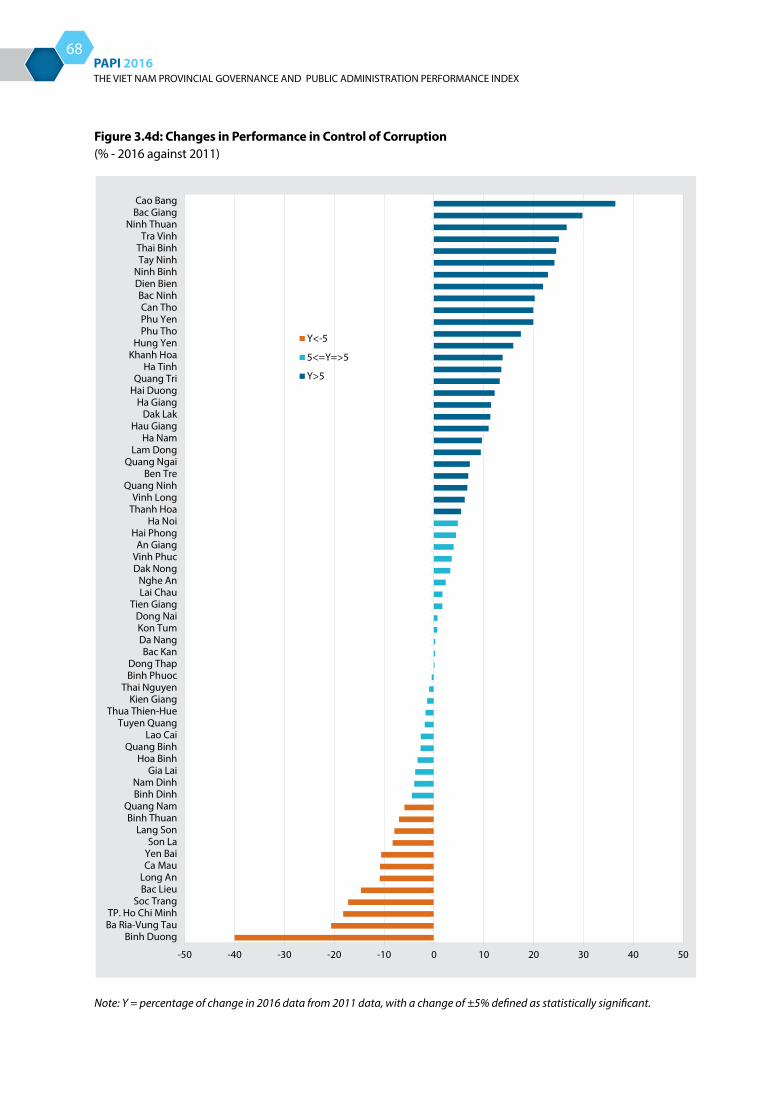
THE VIET NAM PROVINCIAL GOVERNANCE AND PUBLIC ADMINISTRATION PERFORMANCE INDEX PAPI 2016
68
Figure 3.4d: Changes in Performance in Control of Corruption (% - 2016 against 2011)
-50 -40 -30 -20 -10 0 10 20 30 40 50
Binh DuongBa Ria-Vung TauTP. Ho Chi Minh
Soc TrangBac LieuLong AnCa MauYen BaiSon La
Lang SonBinh Thuan
Quang NamBinh DinhNam Dinh
Gia LaiHoa Binh
Quang BinhLao Cai
Tuyen QuangThua Thien-Hue
Kien GiangThai Nguyen
Binh PhuocDong Thap
Bac KanDa NangKon TumDong Nai
Tien GiangLai ChauNghe An
Dak NongVinh PhucAn Giang
Hai PhongHa Noi
Thanh HoaVinh Long
Quang NinhBen Tre
Quang NgaiLam Dong
Ha NamHau Giang
Dak LakHa Giang
Hai DuongQuang Tri
Ha TinhKhanh Hoa
Hung YenPhu ThoPhu YenCan Tho
Bac NinhDien BienNinh Binh
Tay NinhThai Binh
Tra VinhNinh Thuan
Bac GiangCao Bang
Y<-5
5<=Y=>5
Y>5
Note: Y = percentage of change in 2016 data from 2011 data, with a change of ±5% defined as statistically significant.

THE VIET NAM PROVINCIAL GOVERNANCE AND PUBLIC ADMINISTRATION PERFORMANCE INDEX PAPI 2016
PROVINCIAL PERFORMANCE IN 2016 AND OVER TIME (2011-2016)CHAPTER 3
69
Dimension 5: Public Administrative Procedures
This dimension looks at the quality of public administrative services in areas important to citizens. It includes certification services as well as application procedures for construction permits, LURCs, and personal documents. In particular, it looks at how professional and responsive public administrative services are.
As with Chapter 1, the dimensional and sub-dimensional scores in this dimension are not comparable to those in the previous five years. This is because the indicators representing total quality of the four services were streamlined in 2016. For 2016, four of the eight criteria used in the 2011-2015 period33 were maintained: (i) publicity of application fees, (ii) competence of civil servants, (iii) behaviour of civil servants, and (iv) receipt of results within the set deadline. The measure of users’ overall satisfaction with received services has now been changed to a 5-point scale. These revisions aim to capture criteria that show more clearly variation across provinces and eliminate criteria with consistently high levels of satisfaction as observed in the previous cycle. Other indicators in this dimension have been retained and can be compared over time.
Overall provincial dimensional performance. Results in this dimension show good progress made by all provinces in public administrative reforms. Unlike the first four governance dimensions, the variation between the best and the poorest performing provinces (Ha Giang received the lowest score of 6.64 and Quang Binh the best score of 7.67) is minor in this dimension. Also, the provincial dimensional scores range within the high average band on the 1-10-point scale. Similar to previous years’ findings, the regional pattern is insignificant in this dimension (see Map 3.5). Best performers can be found across the country,
though among the poorest performing provinces are four Central Highlands provinces (Gia Lai, Lam Dong, Kon Tum, and Dak Nong).
In 2016, of all four public administrative services, those for LURCs were rated the poorest (1.65 points on the 0.25-2.5-point scale). Next came public certification services undertaken at the provincial, district, and/or commune levels, at 1.75 points. Personal procedures handled at commune People’s Committees gained the highest score, at 1.88 points (see Table 3.5).
Public certification services. This sub-dimension measures provincial performance in providing certification services to citizens at district and commune levels. In 2016, Quang Binh was the top performer with a score of 2.06 points, while Tra Vinh came last with a score of 1.56 on a scale from 0.25-2.5 points (see Table 3.5). One indicator of this sub-dimension asks about the total quality of certification procedures based on four criteria: publicity of application fees, competence of civil servants, behaviour of civil servants, and receipt of results within the set deadline. All provinces were rated highly on this indicator, ranging from 3 points (Binh Duong) to 3.98 points (Ca Mau), based on the 2016 scale of 0-4 points. Figure 3.5a shows that, of the four criteria measured, in 2016 the problematic ones across the country were publicity of fees and competence and attitudes of civil servants in performing the services.
Another indicator in this sub-dimension is overall level of citizen satisfaction with certification services, based on the 2016 scale of 1-5 points. Scores for this indicator were high across the country, ranging from 3.5 points for Kon Tum to 4.5 points for Can Tho.
Findings from these two indicators show that feeling-based assessments do not necessarily correspond to experience-based feedback, as the best and poorest performers for the two indicators differ.
Application procedures for construction permits. This sub-dimension measures the performance of local governments in granting construction permits for civil construction projects (e.g., building, expanding, or remodelling houses in any significant way). In 2016, of the 6.5% of all respondents nationwide who reported
33 During the first five-year cycle of PAPI surveys (2011-2015), eight criteria were used to measure the total quality of the services: (i) clarity of application procedures, (ii) publicity of application fees, (iii) competence of civil servants, (iv) behaviour of civil servants, (v) reasonable paperwork loads, (vi) notification of deadlines, (vii) receipt of results within the set deadline, and (viii) overall service satisfaction.
THE VIET NAM PROVINCIAL GOVERNANCE AND PUBLIC ADMINISTRATION PERFORMANCE INDEX PAPI 2016
70
making applications for construction permits, 93% of them did not have to go to multiple public offices to process their paperwork, a large increase from 69% in 2015. And for all applicants nationally, an average of about 83% received their permits. However, in Hung Yen only about 10% were successful. As shown in Table 3.5, the total quality score for all provinces in services for construction permits (basing on the four criteria of fees displayed, officials competent, treated with respect, and deadline met) in 2016 was 3.55 points on the scale of 0-4 points. Khanh Hoa achieved the highest score. Binh Duong, however, appears to be disappointing applicants the most, as the province scored only 2 points, making it the worst performer for this indicator in 2016. Overall, the level of satisfaction with construction permit services in 2016 was 3.73 points on the 5-point scale. Quang Tri achieved the highest satisfaction from applicants, reaching 4.74 points while Thai Binh had the lowest, at 1.56 points.
Application procedures for land use rights certificates (LURCs). PAPI measures provincial performance in the provision of LURCs for citizens and the quality of LURC-related administrative services. It covers application procedures for new LURCs, LURC renewals, and transferring of LURCs at provincial, district, and commune levels. In 2016, about 9% of the population applied for LURCs across the country. Of those applicants, as Table 3.5 shows, about 79% were able to access the one-stop shop service for land titles, a bit lower than in previous years, and lower than the rate for accessing services for construction permits and personal papers (see Figure 3.5d). In half of all provinces, at least 80% of applicants said they did not have to go to as many locations, or “doors”, for the service to be completed. However, in Bac Lieu, this percentage was the lowest at 21%. Also, while in half of the provinces at least 84% were able to obtain LURCs, in Binh Duong the percentage was barely 1%. In terms of total quality of LURC services, results for
this indicator were the lowest of all four services being measured in PAPI. The national mean score for this indicator was 2.64 point on the 4-point scale. Dien Bien received the highest score of 3.93, while Hung Yen had the lowest score of 0.92 points. Figure 3.5b, which presents the performance for a number of provinces based on the four criteria, shows that the criteria that scored poorly were: delivering results by promised deadlines, competence of public officials in charge of processing the paperwork, and a lack of transparency in fees and charges.
PAPI findings also show that nearly 68.7% of applicants received their land titles within 30 days, as required by law34, an increase of 10% compared to 2015. However, 10% of applicants still had to wait 100 days or more for the final results. Furthermore, about 23% of applicants nationwide still had to pay bribes to get their LURCs processed, 10% had to count on the solicitation from intermediaries for the paperwork to be completed, and 20% had to go back and forth to responsible agencies five times or more.
Application procedures for personal documents at commune level. This sub-dimension measures the performance of commune-level People’s Committees in addressing applications for different types of personal documents.35 In 2016, about 33% of respondents nationwide had their personal documents processed at the commune level. Of these, nearly 95% had a good experience with the one-stop shops at the commune level, as they did not have to visit too many public officials to get the paperwork done. On the total quality indicator, there is a large variance in provincial performance, with Thai Binh getting a score of 3.89 (the highest) while Quang Ninh only scored 2.4 (the lowest). Interestingly, the best and
34 The 30-day period is according to Article 61 of Government Decree No. 43/2014/ND-CP from 15 May 2015 providing guidance on implementation of the 2013 Land Law.
35 These are administrative procedures for personal papers such as birth certificates, marriage certificates, death notifications, ethnicity-related procedures, residency registrations, and housing and employment subsidies. They are selected from the list of administrative procedures that commune-level People’s Committees are delegated to process for citizens.

THE VIET NAM PROVINCIAL GOVERNANCE AND PUBLIC ADMINISTRATION PERFORMANCE INDEX PAPI 2016
PROVINCIAL PERFORMANCE IN 2016 AND OVER TIME (2011-2016)CHAPTER 3
71
poorest performers on this indicator were the same as those found in the 2015 surveys despite the simplified indicators. Poor publicity of fees and charges, and performance by commune public officials, were the main factors lowering scores in most of the provinces.
Implications. Transparency in application fees, meeting deadlines, competence of officials, and behaviours of public officials are key attributes of higher user satisfaction with the four administrative services covered by the PAPI survey. These are the four criteria that PAPI has selected to measure from 2016 onward because results show they remain weak points in public administrative procedures. Ways to increase citizen satisfaction with public administrative services could therefore include relevant local government agencies i) displaying fees
and charges at the one-stop shops, and ii) notifying applicants of any changes to deadlines. More training to enhance competence and improve behaviours for public officials working at one-stop shops should be a priority for the home affairs sector.
In particular, for land title-related services, it is important that provincial departments of environment and natural resources in all provinces strengthen and supervise the functioning of district affiliates in almost every criterion in order to increase user satisfaction. By increasing transparency of fees for handling procedures, meeting promised deadlines for results, and curbing bribery and solicitation by middlemen for LURCs, provision of services will be improved.

THE VIET NAM PROVINCIAL GOVERNANCE AND PUBLIC ADMINISTRATION PERFORMANCE INDEX PAPI 2016
72
Map 3.5: Provincial Performance in Public Administrative Procedures by Quartiles in 2016
Public Administrative Procedures
Best Performers
High Average
Low Average
Poor Performers
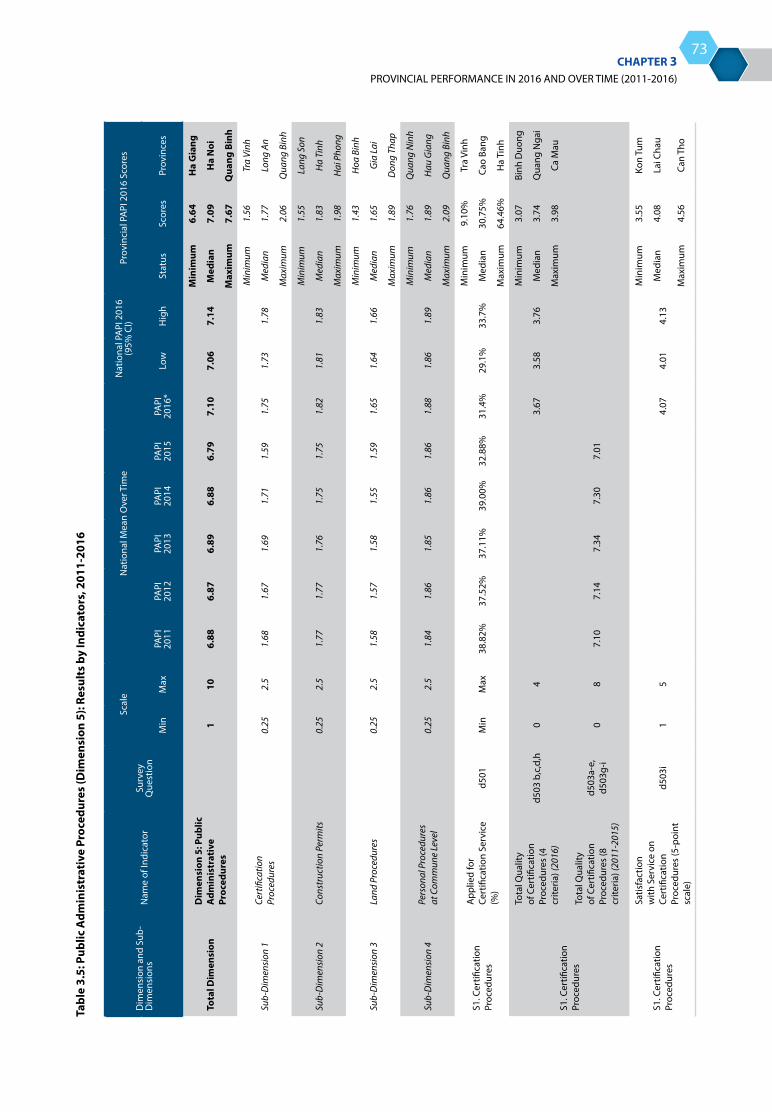
THE VIET NAM PROVINCIAL GOVERNANCE AND PUBLIC ADMINISTRATION PERFORMANCE INDEX PAPI 2016
PROVINCIAL PERFORMANCE IN 2016 AND OVER TIME (2011-2016)CHAPTER 3
73
Tabl
e 3.
5: P
ublic
Adm
inis
trat
ive
Proc
edur
es (D
imen
sion
5):
Resu
lts
by In
dica
tors
, 201
1-20
16
Dim
ensi
on a
nd S
ub-
Dim
ensi
ons
Nam
e of
Indi
cato
rSu
rvey
Q
uest
ion
Scal
eN
atio
nal M
ean
Ove
r Tim
eN
atio
nal P
API
201
6 (9
5% C
I)Pr
ovin
cial
PA
PI 2
016
Scor
es
Min
Max
PAPI
20
11PA
PI
2012
PAPI
20
13PA
PI
2014
PAPI
20
15PA
PI
2016
*Lo
wH
igh
Stat
usSc
ores
Prov
ince
s
Tota
l Dim
ensi
onD
imen
sion
5: P
ublic
A
dmin
istr
ativ
e Pr
oced
ures
110
6.88
6.87
6.89
6.88
6.79
7.10
7.06
7.14
Min
imum
6.64
Ha
Gia
ng
Med
ian
7.09
Ha
Noi
Max
imum
7.67
Qua
ng B
inh
Sub-
Dim
ensi
on 1
Cert
ifica
tion
Proc
edur
es0.
252.
51.
681.
671.
691.
711.
591.
751.
731.
78
Min
imum
1.56
Tra
Vinh
Med
ian
1.77
Long
An
Max
imum
2.06
Qua
ng B
inh
Sub-
Dim
ensi
on 2
Cons
truc
tion
Perm
its0.
252.
51.
771.
771.
761.
751.
751.
821.
811.
83
Min
imum
1.55
Lang
Son
Med
ian
1.83
Ha
Tinh
Max
imum
1.98
Hai
Pho
ng
Sub-
Dim
ensi
on 3
Land
Pro
cedu
res
0.25
2.5
1.58
1.57
1.58
1.55
1.59
1.65
1.64
1.66
Min
imum
1.43
Hoa
Bin
h
Med
ian
1.65
Gia
Lai
Max
imum
1.89
Don
g Th
ap
Sub-
Dim
ensi
on 4
Pers
onal
Pro
cedu
res
at C
omm
une
Leve
l0.
252.
51.
841.
861.
851.
861.
861.
881.
861.
89
Min
imum
1.76
Qua
ng N
inh
Med
ian
1.89
Hau
Gia
ng
Max
imum
2.09
Qua
ng B
inh
S1. C
ertifi
catio
n Pr
oced
ures
App
lied
for
Cert
ifica
tion
Serv
ice
(%)
d501
Min
Max
38.8
2%37
.52%
37.1
1%39
.00%
32.8
8%31
.4%
29.1
%33
.7%
Min
imum
9.10
%Tr
a Vi
nh
Med
ian
30.7
5%Ca
o Ba
ng
Max
imum
64.4
6%H
a Ti
nh
S1. C
ertifi
catio
n Pr
oced
ures
Tota
l Qua
lity
of C
ertifi
catio
n Pr
oced
ures
(4
crite
ria) (
2016
)
d503
b,c
,d,h
04
3.67
3.58
3.76
Min
imum
3.07
Binh
Duo
ng
Med
ian
3.74
Qua
ng N
gai
Max
imum
3.98
Ca M
au
Tota
l Qua
lity
of C
ertifi
catio
n Pr
oced
ures
(8
crite
ria) (
2011
-201
5)
d503
a-e,
d5
03g-
i0
87.
107.
147.
347.
307.
01
S1. C
ertifi
catio
n Pr
oced
ures
Satis
fact
ion
with
Ser
vice
on
Cert
ifica
tion
Proc
edur
es (5
-poi
nt
scal
e)
d503
i1
54.
074.
014.
13
Min
imum
3.55
Kon
Tum
Med
ian
4.08
Lai C
hau
Max
imum
4.56
Can
Tho

THE VIET NAM PROVINCIAL GOVERNANCE AND PUBLIC ADMINISTRATION PERFORMANCE INDEX PAPI 2016
74
Dim
ensi
on a
nd S
ub-
Dim
ensi
ons
Nam
e of
Indi
cato
rSu
rvey
Q
uest
ion
Scal
eN
atio
nal M
ean
Ove
r Tim
eN
atio
nal P
API
201
6 (9
5% C
I)Pr
ovin
cial
PA
PI 2
016
Scor
es
Min
Max
PAPI
20
11PA
PI
2012
PAPI
20
13PA
PI
2014
PAPI
20
15PA
PI
2016
*Lo
wH
igh
Stat
usSc
ores
Prov
ince
s
S2. C
onst
ruct
ion
Perm
its
App
lied
for
Cons
truc
tion
Perm
it (%
)d5
05M
inM
ax4.
89%
4.38
%3.
45%
4.11
%4.
80%
6.46
%4.
37%
8.56
%
Min
imum
0.20
%Q
uang
Nga
i
Med
ian
4.11
%Ye
n Ba
i
Max
imum
29.2
8%H
ai P
hong
S2. C
onst
ruct
ion
Perm
its
Did
not
Use
Man
y W
indo
ws
for
Cons
truc
tion
Perm
it (%
)
d505
d0%
100%
92.8
6%87
.58%
94.6
3%88
.02%
69.1
2%93
.30%
89.3
1%97
.28%
Min
imum
35.2
8%Ba
c Li
eu
Med
ian
96.7
5%So
n La
Max
imum
100%
Hai
Pho
ng
S2. C
onst
ruct
ion
Perm
its
Rece
ived
Co
nstr
uctio
n Pe
rmit
(%)
d505
e0%
100%
91.9
6%92
.70%
92.1
0%94
.16%
94.4
4%83
.58%
71.4
8%95
.68%
Min
imum
10.6
5%H
ung
Yen
Med
ian
95.7
8%Ph
u Ye
n
Max
imum
100%
Yen
Bai
S2. C
onst
ruct
ion
Perm
its
Tota
l Qua
lity
of
Cons
truc
tion
Proc
edur
es (4
cr
iteria
)
d505
f b,c
,d,h
04
3.55
3.25
3.84
Min
imum
2.03
Binh
Duo
ng
Med
ian
3.87
Thai
Ngu
yen
Max
imum
4.00
Khan
h H
oa
Tota
l Qua
lity
of
Cons
truc
tion
Proc
edur
es (8
cr
iteria
)
d505
fa-fe
, d5
05fg
-fi0
86.
826.
556.
706.
666.
20
S2. C
onst
ruct
ion
Perm
its
Satis
fact
ion
with
Ser
vice
on
Cons
truc
tion
Perm
its
(5-p
oint
sca
le)
d505
fi1
53.
733.
454.
00
Min
imum
1.56
Thai
Bin
h
Med
ian
3.93
Hun
g Ye
n
Max
imum
4.74
Qua
ng T
ri
S3. L
and
Proc
edur
esTo
ok P
art i
n La
nd U
se
Righ
ts C
ertifi
cate
s Pr
oced
ures
(%)
d507
0%10
0%10
.64%
8.38
%8.
75%
7.97
%8.
79%
8.88
%7.
52%
10.2
4%
Min
imum
0.49
%TT
-Hue
Med
ian
8.75
%N
inh
Thua
n
Max
imum
28.4
0%G
ia L
ai
S3. L
and
Use
Rig
hts
Cert
ifica
tes
Proc
edur
es
Did
not
Use
Man
y W
indo
ws
for
Land
Use
Rig
hts
Cert
ifica
tes
(%)
d507
e0%
100%
84.6
8%78
.03%
80.7
4%80
.13%
80.6
9%79
.66%
74.4
5%84
.87%
Min
imum
21.1
3%Ba
c Li
eu
Med
ian
82.1
4%D
ong
Thap
Max
imum
100%
Die
n Bi
en
S3. L
and
Use
Rig
hts
Cert
ifica
tes
Proc
edur
esRe
ceiv
ed L
and
Title
(%
)d5
07g
0%10
0%82
.48%
80.7
4%75
.85%
75.3
6%82
.95%
78.5
4%68
.59%
88.4
9%
Min
imum
0.80
%Bi
nh D
uong
Med
ian
84.1
1%D
ak N
ong
Max
imum
100%
Ca M
au
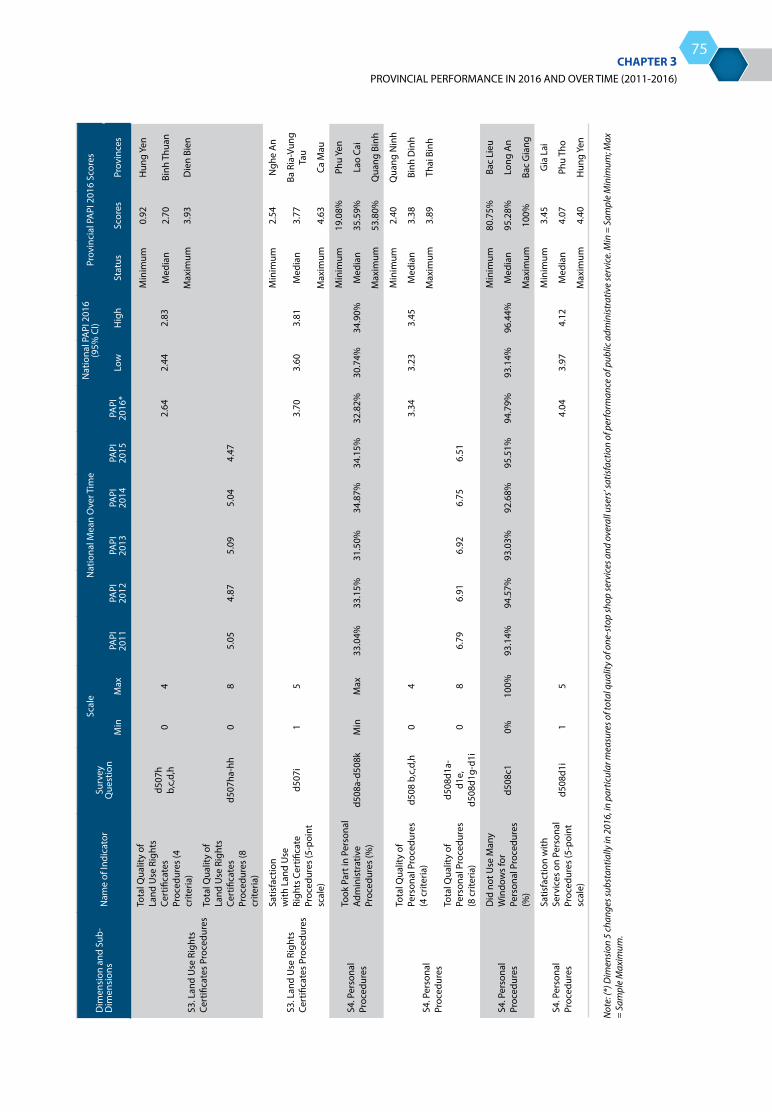
THE VIET NAM PROVINCIAL GOVERNANCE AND PUBLIC ADMINISTRATION PERFORMANCE INDEX PAPI 2016
PROVINCIAL PERFORMANCE IN 2016 AND OVER TIME (2011-2016)CHAPTER 3
75
Dim
ensi
on a
nd S
ub-
Dim
ensi
ons
Nam
e of
Indi
cato
rSu
rvey
Q
uest
ion
Scal
eN
atio
nal M
ean
Ove
r Tim
eN
atio
nal P
API
201
6 (9
5% C
I)Pr
ovin
cial
PA
PI 2
016
Scor
es
Min
Max
PAPI
20
11PA
PI
2012
PAPI
20
13PA
PI
2014
PAPI
20
15PA
PI
2016
*Lo
wH
igh
Stat
usSc
ores
Prov
ince
s
S3. L
and
Use
Rig
hts
Cert
ifica
tes
Proc
edur
es
Tota
l Qua
lity
of
Land
Use
Rig
hts
Cert
ifica
tes
Proc
edur
es (4
cr
iteria
)
d507
h b,
c,d,
h0
42.
642.
442.
83
Min
imum
0.92
Hun
g Ye
n
Med
ian
2.70
Binh
Thu
an
Max
imum
3.93
Die
n Bi
en
Tota
l Qua
lity
of
Land
Use
Rig
hts
Cert
ifica
tes
Proc
edur
es (8
cr
iteria
)
d507
ha-h
h0
85.
054.
875.
095.
044.
47
S3. L
and
Use
Rig
hts
Cert
ifica
tes
Proc
edur
es
Satis
fact
ion
with
Lan
d U
se
Righ
ts C
ertifi
cate
Pr
oced
ures
(5-p
oint
sc
ale)
d507
i1
53.
703.
603.
81
Min
imum
2.54
Ngh
e A
n
Med
ian
3.77
Ba R
ia-V
ung
Tau
Max
imum
4.63
Ca M
au
S4. P
erso
nal
Proc
edur
es
Took
Par
t in
Pers
onal
Ad
min
istr
ativ
e Pr
oced
ures
(%)
d508
a-d5
08k
Min
Max
33.0
4%33
.15%
31.5
0%34
.87%
34.1
5%32
.82%
30.7
4%34
.90%
Min
imum
19.0
8%Ph
u Ye
n
Med
ian
35.5
9%La
o Ca
i
Max
imum
53.8
0%Q
uang
Bin
h
S4. P
erso
nal
Proc
edur
es
Tota
l Qua
lity
of
Pers
onal
Pro
cedu
res
(4 c
riter
ia)
d508
b,c
,d,h
04
3.34
3.23
3.45
Min
imum
2.40
Qua
ng N
inh
Med
ian
3.38
Binh
Din
h
Max
imum
3.89
Thai
Bin
h
Tota
l Qua
lity
of
Pers
onal
Pro
cedu
res
(8 c
riter
ia)
d508
d1a-
d1e,
d5
08d1
g-d1
i0
86.
796.
916.
926.
756.
51
S4. P
erso
nal
Proc
edur
es
Did
not
Use
Man
y W
indo
ws
for
Pers
onal
Pro
cedu
res
(%)
d508
c10%
100%
93.1
4%94
.57%
93.0
3%92
.68%
95.5
1%94
.79%
93.1
4%96
.44%
Min
imum
80.7
5%Ba
c Li
eu
Med
ian
95.2
8%Lo
ng A
n
Max
imum
100%
Bac
Gia
ng
S4. P
erso
nal
Proc
edur
es
Satis
fact
ion
with
Se
rvic
es o
n Pe
rson
al
Proc
edur
es (5
-poi
nt
scal
e)
d508
d1i
15
4.04
3.97
4.12
Min
imum
3.45
Gia
Lai
Med
ian
4.07
Phu
Tho
Max
imum
4.40
Hun
g Ye
n
Not
e: (*
) Dim
ensi
on 5
cha
nges
subs
tant
ially
in 2
016,
in p
artic
ular
mea
sure
s of t
otal
qua
lity
of o
ne-s
top
shop
serv
ices
and
ove
rall
user
s’ sa
tisfa
ctio
n of
per
form
ance
of p
ublic
adm
inis
trat
ive
serv
ice.
Min
= S
ampl
e M
inim
um; M
ax
= Sa
mpl
e M
axim
um.

THE VIET NAM PROVINCIAL GOVERNANCE AND PUBLIC ADMINISTRATION PERFORMANCE INDEX PAPI 2016
76
Figure 3.5a: Total Quality of Public Certification Services, 2016(Branch size = percentage of respondents agreeing with given positive statements; ‘Perfect’ = 100% agreement; ‘Zero’ = 0% agreement)
Figure 3.5b: Total Quality of Public Administrative Services for LURCs, 2016(Branch size = percentage of respondents agreeing with given positive statements; ‘Perfect’ = 100% agreement; ‘Zero’ = 0% agreement)
Fees Displayed
O�cials Competent
Treated with Respect
Deadline Met
Dak Nong
Tay Ninh
Ninh Binh
Long An
Thanh Hoa
Thai Nguyen
Lai Chau
Binh Duong
Kon Tum
Bac Lieu
Binh Dinh
Lang Son
Vinh Long
Quang Binh
Lao Cai
HCMC
Quang Nam
Dien Bien
Ha Nam
Thai Binh
Bac Ninh
Son La
Tien Giang
An Giang
Bac Giang
Quang Tri
Tuyen Quang
Ben Tre
Yen Bai
Dak Lak
Binh Phuoc
Dong Thap
Ha Tinh
Vinh Phuc
Hau Giang
Quang Ninh
Hai Phong
Phu Yen
Binh Thuan
Soc Trang
Da Nang
Ninh Thuan
Gia Lai
TT-Hue
Hoa Binh
Quang Ngai
Dong Nai
Hung Yen
Can Tho
Zero
Khanh Hoa
BRVT
Ha Noi
Bac Kan
Kien Giang
Phu Tho
Ca Mau
Tra Vinh
Ha Giang
Nghe An
Lam Dong
Hai Duong
Cao Bang
Nam Dinh
Perfect
Fees Displayed
O�cials Competent
Treated with Respect
Zero
Hoa Binh
Gia Lai
Quang Binh
Ha Tinh
Bac Giang
Ninh Binh
Dak Nong
Kon Tum
Lai Chau
Thai Nguyen
Bac Lieu
Dak Lak
Thai Binh
Phu Tho
Nghe An
Tay Ninh
Da Nang
Long An
Ben Tre
Can Tho
Tra Vinh
Binh Phuoc
Ha Giang
Binh Thuan
Yen Bai
BRVT
Cao Bang
Dong Nai
Vinh Long
Lam Dong
Hai Duong
Tuyen Quang
Khanh Hoa
Quang Ngai
Tien Giang
Lang Son
HCMC
Thanh Hoa
Hau Giang
Ha Nam
Quang Tri
Vinh Phuc
An Giang
Son La
Ha Noi
Bac Kan
Quang Nam
Dien Bien
Quang Ninh
Lao Cai
Dong Thap
Bac Ninh
Ninh Thuan
Nam Dinh
Perfect
Deadline Met

THE VIET NAM PROVINCIAL GOVERNANCE AND PUBLIC ADMINISTRATION PERFORMANCE INDEX PAPI 2016
PROVINCIAL PERFORMANCE IN 2016 AND OVER TIME (2011-2016)CHAPTER 3
77
Figure 3.5c: Total Quality of Commune-level Public Administrative Services, 2016(Branch size = percentage of respondents agreeing with given positive statements; ‘Perfect’ = 100% agreement; ‘Zero’ = 0% agreement)
Figure 3.5d: Access to One-stop Shops for Public Administrative Services, 2011-2016
Fees Displayed
O�cials Competent
Treated with Respect
Deadline Met
Hai Phong
Quang Nam
Nghe An
Dien Bien
Ninh Thuan
An Giang
Hai Duong
Kien Giang
Ha Giang
Hau Giang
Tien Giang
Ha Nam
Dong Nai
Thai Nguyen
BRVT
Soc Trang
Binh Duong
Hoa Binh
Thanh Hoa
Bac Ninh
Ninh Binh
Gia Lai
Yen Bai
HCMC
Binh Dinh
Phu Yen
Cao Bang
Ha Tinh
Dak Nong
Dak Lak
Kon Tum
Tra Vinh
Ca Mau
Phu Tho
Quang Ngai
Lai Chau
Can Tho
TT-Hue
Quang Tri
Binh Thuan
Tay Ninh
Quang Binh
Vinh Phuc
Son La
Binh Phuoc
Nam Dinh
Vinh Long
Bac Giang
Tuyen Quang
Zero
Lam Dong
Dong Thap
Bac Lieu
Lao Cai
Da Nang
Hung Yen
Thai Binh
Quang Ninh
Bac Kan
Long An
Ha Noi
Lang Son
Khanh Hoa
Ben Tre
Perfect
40%
60%
80%
100%
2011 2012 2013 2014 2015 2016
Perc
enta
ge o
f Res
pond
ents
Did not Use Many Windows for Land Use Rights Certi�cates
Did not Use Many Windows for Construction Permits
Did not Use Many Windows for Personal Procedures
Note: ‘Windows’ refers to different public officials in charge of handling administrative procedures at the one-stop shops.

THE VIET NAM PROVINCIAL GOVERNANCE AND PUBLIC ADMINISTRATION PERFORMANCE INDEX PAPI 2016
78
Dimension 6: Public Service Delivery
The ‘Public Service Delivery’ dimension looks at four public services: health care, primary education, basic infrastructure, and residential law and order. Similar to previous PAPI surveys, citizens were asked about their direct experience with the accessibility, quality, and availability of these services in 2016. This dimension is comparable over time, as no changes has been made to its composition since 2011.
Overall provincial dimensional performance. Findings about provincial performance in public service delivery reveal a wider gap between provinces in 2016 than in the previous five years. As Table 3.6 shows, the difference between the best performing province (Da Nang with a dimensional score of 8.03 points) and the poorest one (Quang Ngai with a score of 6.42) is larger than before. It should also be noted that all provinces have improved their public services over time, as the lowest score in 2016 was higher than before. It is clear that this is due to improvement in accessibility to, and quality of, public education and public health care in 2016. Improvement in law and order were insignificant, while basic infrastructure services appear to have declined quite significantly in 2016.
In this dimension, there has been a change in the performance landscape. In the previous five years the best performing provinces were concentrated more in the South than in other regions of the country.36 In 2016, a more even regional distribution in the best performing group is evident (see Map 3.6). Da Nang, Ho Chi Minh City, and Ba Ria-Vung Tau have consistently been in the best performing group since 2011. Ha Noi is the only centrally governed municipality that falls far below this group. Meanwhile, in 2016, Quang Ngai and Quang Ninh replaced Binh Phuoc and Dak Nong as the poorest performers (these two latter provinces were in the poorest performing group for five consecutive years, from 2011-2015).
As shown in Figure 3.6c, a total of 35 provinces saw some improvement in 2016 compared to 2011 (with
the increase in provincial scores ranging between 5% and 22%), while the rest saw insignificant changes. Dak Nong made the most impressive improvement compared to its 2011 benchmark, with an increase of 22%. Indeed, as also observed in the PAPI 2015 report, none of the provinces have fallen behind dramatically since 2011.
Public health care. This sub-dimension measures the performance of public district hospitals and the quality of public health insurance from a user perspective. It also shows how public policies in health care for children under age 6 and health insurance for poor households are being implemented. Table 3.6 presents findings for this sub-dimension. In particular, user satisfaction with the quality of public hospitals increased substantively in 2016 compared to 2015 (see Figure 3.6a). There was a large variation between the best and poorest performers, with scores ranging from 8.16 in Soc Trang to 1.9 in Gia Lai (see Table 3.6). In general, user feedback shows that public district hospitals continue to face problems with patients sharing beds, long waiting times between entering hospitals and receiving treatment, unclean treatment rooms, ineffective treatment resulting in diseases not being cured or injuries not treated properly, and doctors advising that patients purchase medicine at private pharmacies.
As briefly discussed in Chapter 1, there was a significant increase in 2016 in citizen access to health insurance. Approximately 72.3% of respondents nationwide said they had health insurance, a surge from 54% in 2011 and 61% in 2015. Another encouraging development is that those who have had health insurance were relatively positive about the quality of it (see Table 3.6). In 2016, the nationwide score for the indicator on health insurance quality was the highest over the past six years, at 3.48 points on a 4-point scale.
Public primary education. The key indicators used to construct this sub-dimension are the total quality of primary schools, the distance in kilometres from home to school, and the length of time in minutes required for children to travel to school. Findings from the 2016 survey presented in Table 3.6 show encouraging trends in two important indicators: total quality of primary schools and overall rating of primary schools. The nationwide score for total 36 See CECODES, VFF-CRT and UNDP (2016, pp. 80-91).

THE VIET NAM PROVINCIAL GOVERNANCE AND PUBLIC ADMINISTRATION PERFORMANCE INDEX PAPI 2016
PROVINCIAL PERFORMANCE IN 2016 AND OVER TIME (2011-2016)CHAPTER 3
79
quality of primary schools increased from 4.75 in 2015 to 4.99 points in 2016, a bit lower than the peak of 5.09 points in 2013. Hai Duong seems to have done well in total quality primary school performance, scoring 7.93 points on the 9-point scale, leaving the poorest performer, Quang Ngai, far behind, at only 2.79 points in 2016.
Even for high-performing Hai Duong, the province needs to pay attention to some aspects of primary education, including hygienic conditions of toilets and reducing the number of shifts for primary school children. Since 2011 all provinces have been struggling to meet minimum government quality standards. These standards include the requirements that teachers should not give preferential treatment to students taking extracurricular classes, the maximum number of students in each class should be 36, there should be access to drinking water and clean toilets at schools, and school administrators should inform parents about the school’s revenue and budget expenditures.
On the rating of total quality of primary schools, there was little difference in 2016 between provinces. Can Tho scored the highest at 4.42 points and Nghe An the lowest at 3.44 points on the 5-point scale. The results underline the recommendation that provinces look into the experiential assessment of users in the total quality indicator to better understand where they should improve.
Basic infrastructure. Citizen satisfaction with basic infrastructure provided by local governments is captured in this dimension, including access to electricity, quality of roads nearest houses, frequency of solid waste collection in residential areas, and quality of drinking water. Mountainous and Mekong Delta provinces still face challenges in reaching the level of performance as other, primarily lowland, provinces on this indicator. For instance, in terms of access to the national electricity grid, Dien Bien was the poorest performer with only 70% of respondents saying their households were using electricity from the national grid (see Table 3.6). On quality of roads, Ha Giang remained the poorest performer, as fewer roads in the province were said to be constructed of concrete or asphalt. In Hai Phong, almost every
household has access to tap water at home, according to respondents, while in Gia Lai this is the case for only 2% of households. In Tien Giang, however, 79% of respondents said they still had to use unclean water from canals. In terms of garbage collection, in Hai Phong local public solid waste management agencies provided this service most frequently, while in Hau Giang respondents said they had to dispose of garbage themselves.
Law and Order. The levels of safety experienced by citizens in everyday life is reflected by a trio of indicators: safety levels in localities, changes in safety levels, and crime rates in localities (vehicle theft, robbery, break-ins, and physical violence). The 2016 PAPI results indicate that improvement in law and order at the provincial level since 2011 has been insignificant (see Figure 3.6b). In 2016, about 14% of respondents nationwide reported they were victims of one of the four types of crime, slightly lower than the level seen in 2015. About 44% of respondents in Kon Tum were victims of a crime, as opposed to about 1% in Lao Cai. Respondents living in Can Tho (the best performing province) felt safer in their residential areas than those living in Khanh Hoa (the lowest performing province).
Implications. Provincial performance in public service delivery improved significantly in 2016 thanks primarily to better health insurance coverage and better quality of public health and primary education facilities and services as perceived by citizens. However, performance in basic infrastructure saw a decline, perhaps due to stagnation in public investment in roads, water supply, and solid waste collection in many provinces. Poorer provinces, especially those in the Northwest and Central Highlands regions, need to invest more in public services and basic infrastructure and less in large city halls or squares. For Mekong Delta provinces, more attention should be paid to improving the quality of drinking water, especially as the region is facing salt water intrusion and long droughts. In addition, it is expected that law and order at the provincial level will continue to improve, as citizens were more optimistic on this indicator in 2016 than in previous years.
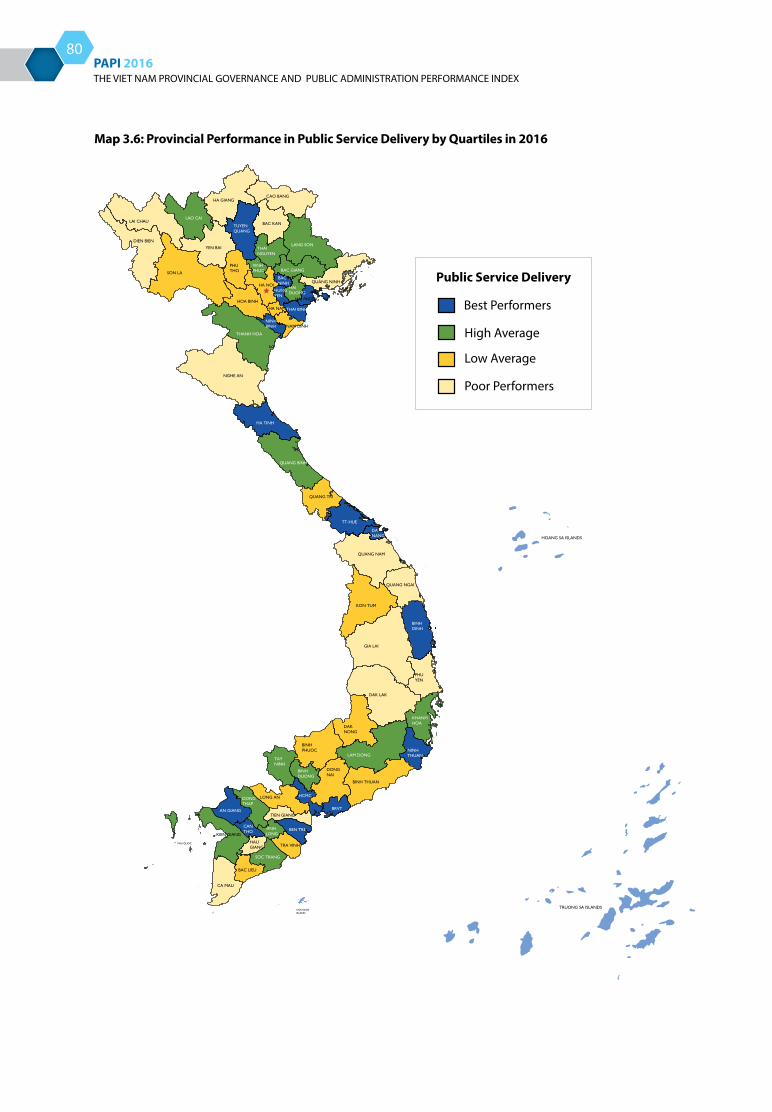
THE VIET NAM PROVINCIAL GOVERNANCE AND PUBLIC ADMINISTRATION PERFORMANCE INDEX PAPI 2016
80
Map 3.6: Provincial Performance in Public Service Delivery by Quartiles in 2016
Public Service Delivery
Best Performers
High Average
Low Average
Poor Performers
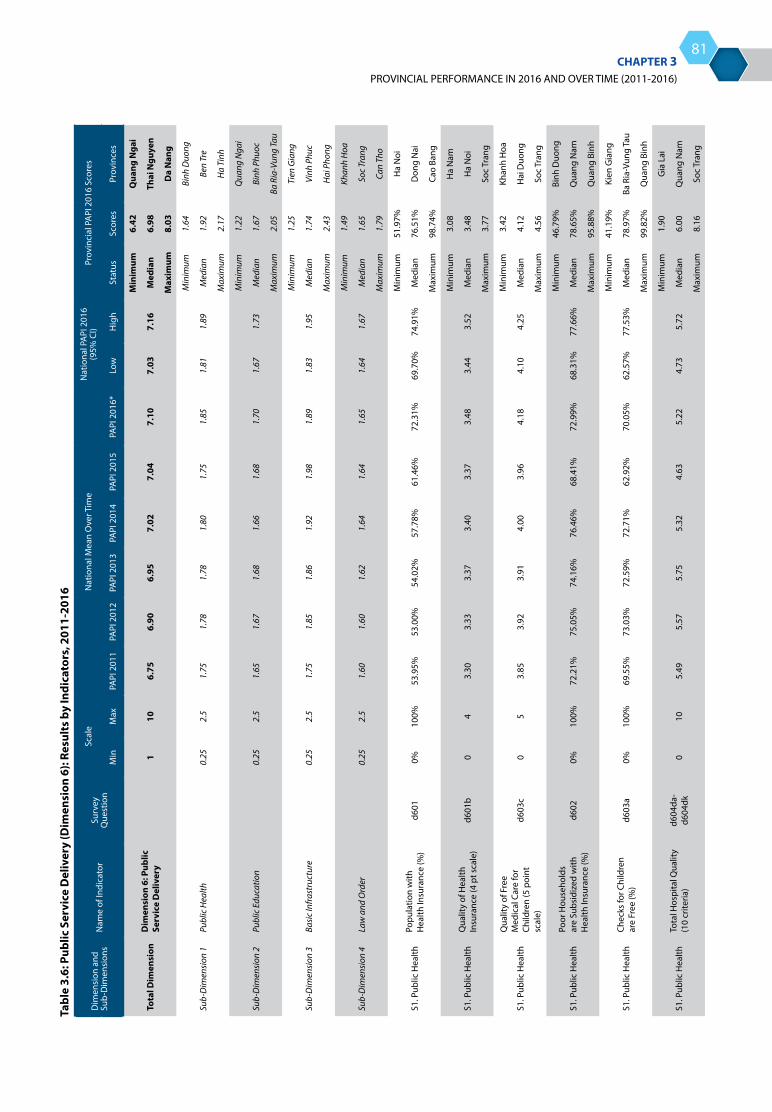
THE VIET NAM PROVINCIAL GOVERNANCE AND PUBLIC ADMINISTRATION PERFORMANCE INDEX PAPI 2016
PROVINCIAL PERFORMANCE IN 2016 AND OVER TIME (2011-2016)CHAPTER 3
81Ta
ble
3.6:
Pub
lic S
ervi
ce D
eliv
ery
(Dim
ensi
on 6
): Re
sult
s by
Indi
cato
rs, 2
011-
2016
Dim
ensi
on a
nd
Sub-
Dim
ensi
ons
Nam
e of
Indi
cato
rSu
rvey
Q
uest
ion
Scal
eN
atio
nal M
ean
Ove
r Tim
eN
atio
nal P
API
201
6 (9
5% C
I)Pr
ovin
cial
PA
PI 2
016
Scor
es
Min
Max
PAPI
201
1PA
PI 2
012
PAPI
201
3PA
PI 2
014
PAPI
201
5PA
PI 2
016*
Low
Hig
hSt
atus
Scor
esPr
ovin
ces
Tota
l Dim
ensi
onD
imen
sion
6: P
ublic
Se
rvic
e D
eliv
ery
110
6.75
6.90
6.95
7.02
7.04
7.10
7.03
7.16
Min
imum
6.42
Qua
ng N
gai
Med
ian
6.98
Thai
Ngu
yen
Max
imum
8.03
Da
Nan
g
Sub-
Dim
ensi
on 1
Publ
ic H
ealth
0.25
2.5
1.75
1.78
1.78
1.80
1.75
1.85
1.81
1.89
Min
imum
1.64
Binh
Duo
ng
Med
ian
1.92
Ben
Tre
Max
imum
2.17
Ha
Tinh
Sub-
Dim
ensi
on 2
Publ
ic E
duca
tion
0.25
2.5
1.65
1.67
1.68
1.66
1.68
1.70
1.67
1.73
Min
imum
1.22
Qua
ng N
gai
Med
ian
1.67
Binh
Phu
oc
Max
imum
2.05
Ba R
ia-V
ung
Tau
Sub-
Dim
ensi
on 3
Basi
c In
frast
ruct
ure
0.25
2.5
1.75
1.85
1.86
1.92
1.98
1.89
1.83
1.95
Min
imum
1.25
Tien
Gia
ng
Med
ian
1.74
Vinh
Phu
c
Max
imum
2.43
Hai
Pho
ng
Sub-
Dim
ensi
on 4
Law
and
Ord
er0.
252.
51.
601.
601.
621.
641.
641.
651.
641.
67
Min
imum
1.49
Khan
h H
oa
Med
ian
1.65
Soc
Tran
g
Max
imum
1.79
Can
Tho
S1. P
ublic
Hea
lthPo
pula
tion
with
H
ealth
Insu
ranc
e (%
)d6
010%
100%
53.9
5%53
.00%
54.0
2%57
.78%
61.4
6%72
.31%
69.7
0%74
.91%
Min
imum
51.9
7%H
a N
oi
Med
ian
76.5
1%D
ong
Nai
Max
imum
98.7
4%Ca
o Ba
ng
S1. P
ublic
Hea
lthQ
ualit
y of
Hea
lth
Insu
ranc
e (4
pt s
cale
)d6
01b
04
3.30
3.33
3.37
3.40
3.37
3.48
3.44
3.52
Min
imum
3.08
Ha
Nam
Med
ian
3.48
Ha
Noi
Max
imum
3.77
Soc
Tran
g
S1. P
ublic
Hea
lth
Qua
lity
of F
ree
Med
ical
Car
e fo
r Ch
ildre
n (5
poi
nt
scal
e)
d603
c0
53.
853.
923.
914.
003.
964.
184.
104.
25
Min
imum
3.42
Khan
h H
oa
Med
ian
4.12
Hai
Duo
ng
Max
imum
4.56
Soc
Tran
g
S1. P
ublic
Hea
lthPo
or H
ouse
hold
s ar
e Su
bsid
ized
with
H
ealth
Insu
ranc
e (%
)d6
020%
100%
72.2
1%75
.05%
74.1
6%76
.46%
68.4
1%72
.99%
68.3
1%77
.66%
Min
imum
46.7
9%Bi
nh D
uong
Med
ian
78.6
5%Q
uang
Nam
Max
imum
95.8
8%Q
uang
Bin
h
S1. P
ublic
Hea
lthCh
ecks
for C
hild
ren
are
Free
(%)
d603
a0%
100%
69.5
5%73
.03%
72.5
9%72
.71%
62.9
2%70
.05%
62.5
7%77
.53%
Min
imum
41.1
9%Ki
en G
iang
Med
ian
78.9
7%Ba
Ria
-Vun
g Ta
u
Max
imum
99.8
2%Q
uang
Bin
h
S1. P
ublic
Hea
lthTo
tal H
ospi
tal Q
ualit
y (1
0 cr
iteria
)d6
04da
-d6
04dk
010
5.49
5.57
5.75
5.32
4.63
5.22
4.73
5.72
Min
imum
1.90
Gia
Lai
Med
ian
6.00
Qua
ng N
am
Max
imum
8.16
Soc
Tran
g
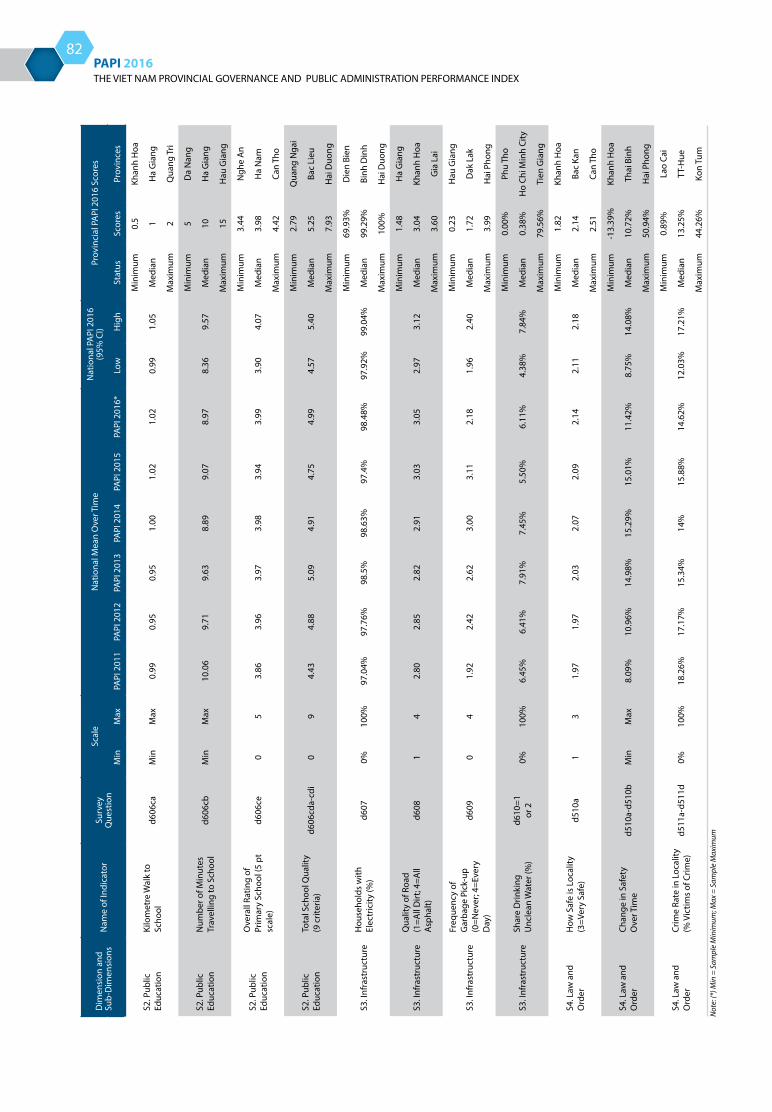
THE VIET NAM PROVINCIAL GOVERNANCE AND PUBLIC ADMINISTRATION PERFORMANCE INDEX PAPI 2016
82
Dim
ensi
on a
nd
Sub-
Dim
ensi
ons
Nam
e of
Indi
cato
rSu
rvey
Q
uest
ion
Scal
eN
atio
nal M
ean
Ove
r Tim
eN
atio
nal P
API
201
6 (9
5% C
I)Pr
ovin
cial
PA
PI 2
016
Scor
es
Min
Max
PAPI
201
1PA
PI 2
012
PAPI
201
3PA
PI 2
014
PAPI
201
5PA
PI 2
016*
Low
Hig
hSt
atus
Scor
esPr
ovin
ces
S2. P
ublic
Ed
ucat
ion
Kilo
met
re W
alk
to
Scho
old6
06ca
Min
Max
0.99
0.95
0.95
1.00
1.02
1.02
0.99
1.05
Min
imum
0.5
Khan
h H
oa
Med
ian
1H
a G
iang
Max
imum
2Q
uang
Tri
S2. P
ublic
Ed
ucat
ion
Num
ber o
f Min
utes
Tr
avel
ling
to S
choo
ld6
06cb
Min
Max
10.0
69.
719.
638.
899.
078.
978.
369.
57
Min
imum
5D
a N
ang
Med
ian
10H
a G
iang
Max
imum
15H
au G
iang
S2. P
ublic
Ed
ucat
ion
Ove
rall
Ratin
g of
Pr
imar
y Sc
hool
(5 p
t sc
ale)
d606
ce0
53.
863.
963.
973.
983.
943.
993.
904.
07
Min
imum
3.44
Ngh
e A
n
Med
ian
3.98
Ha
Nam
Max
imum
4.42
Can
Tho
S2. P
ublic
Ed
ucat
ion
Tota
l Sch
ool Q
ualit
y (9
crit
eria
)d6
06cd
a-cd
i0
94.
434.
885.
094.
914.
754.
994.
575.
40
Min
imum
2.79
Qua
ng N
gai
Med
ian
5.25
Bac
Lieu
Max
imum
7.93
Hai
Duo
ng
S3. I
nfra
stru
ctur
eH
ouse
hold
s w
ith
Elec
tric
ity (%
)d6
070%
100%
97.0
4%97
.76%
98.5
%98
.63%
97.4
%98
.48%
97.9
2%99
.04%
Min
imum
69.9
3%D
ien
Bien
Med
ian
99.2
9%Bi
nh D
inh
Max
imum
100%
Hai
Duo
ng
S3. I
nfra
stru
ctur
eQ
ualit
y of
Roa
d (1
=All
Dirt
; 4=A
ll A
spha
lt)d6
081
42.
802.
852.
822.
913.
033.
052.
973.
12
Min
imum
1.48
Ha
Gia
ng
Med
ian
3.04
Khan
h H
oa
Max
imum
3.60
Gia
Lai
S3. I
nfra
stru
ctur
e
Freq
uenc
y of
G
arba
ge P
ick-
up
(0=N
ever
; 4=E
very
D
ay)
d609
04
1.92
2.42
2.62
3.00
3.11
2.18
1.96
2.40
Min
imum
0.23
Hau
Gia
ng
Med
ian
1.72
Dak
Lak
Max
imum
3.99
Hai
Pho
ng
S3. I
nfra
stru
ctur
eSh
are
Drin
king
U
ncle
an W
ater
(%)
d610
=1
or 2
0%10
0%6.
45%
6.41
%7.
91%
7.45
%5.
50%
6.11
%4.
38%
7.84
%
Min
imum
0.00
%Ph
u Th
o
Med
ian
0.38
%H
o Ch
i Min
h Ci
ty
Max
imum
79.5
6%Ti
en G
iang
S4. L
aw a
nd
Ord
erH
ow S
afe
is L
ocal
ity
(3=V
ery
Safe
)d5
10a
13
1.97
1.97
2.03
2.07
2.09
2.14
2.11
2.18
Min
imum
1.82
Khan
h H
oa
Med
ian
2.14
Bac
Kan
Max
imum
2.51
Can
Tho
S4. L
aw a
nd
Ord
erCh
ange
in S
afet
y O
ver T
ime
d510
a-d5
10b
Min
Max
8.09
%10
.96%
14.9
8%15
.29%
15.0
1%11
.42%
8.75
%14
.08%
Min
imum
-13.
39%
Khan
h H
oa
Med
ian
10.7
2%Th
ai B
inh
Max
imum
50.9
4%H
ai P
hong
S4. L
aw a
nd
Ord
erCr
ime
Rate
in L
ocal
ity
(% V
ictim
s of
Crim
e)d5
11a-
d511
d0%
100%
18.2
6%17
.17%
15.3
4%14
%15
.88%
14.6
2%12
.03%
17.2
1%
Min
imum
0.89
%La
o Ca
i
Med
ian
13.2
5%TT
-Hue
Max
imum
44.2
6%Ko
n Tu
mN
ote:
(*) M
in =
Sam
ple
Min
imum
; Max
= S
ampl
e M
axim
um

THE VIET NAM PROVINCIAL GOVERNANCE AND PUBLIC ADMINISTRATION PERFORMANCE INDEX PAPI 2016
PROVINCIAL PERFORMANCE IN 2016 AND OVER TIME (2011-2016)CHAPTER 3
83
Figure 3.6a: Total District Hospital Quality (based on 10 criteria), 2011-2016
Figure 3.6b: Law and Order, 2011-2016 (How Safe is Your Locality? 0=Very Unsafe; 4=Very Safe)
5.49 5.57 5.755.32
4.63
5.22
0
1
2
3
4
5
6
7
8
9
10
2011 2012 2013 2014 2015 2016
1.97 1.97 2.03 2.07 2.09 2.14
0
1
2
3
4
2011 2012 2013 2014 2015 2016

THE VIET NAM PROVINCIAL GOVERNANCE AND PUBLIC ADMINISTRATION PERFORMANCE INDEX PAPI 2016
84
Figure 3.6c: Changes in Performance in Public Service Delivery (% - 2016 against 2011)
-10 -5 0 5 10 15 20 25
Quang NinhHa Noi
Quang TriLong An
Hau GiangQuang BinhQuang Nam
Lai ChauLang Son
Son LaVinh Phuc
Tien GiangKien GiangVinh Long
Hai DuongQuang Ngai
Nam DinhKon TumDong NaiNghe AnBac Kan
Binh DinhDak LakBac LieuPhu ThoCa Mau
Binh DuongHoa Binh
TP. Ho Chi MinhGia Lai
Ha TinhBen Tre
Thanh HoaLam DongCao Bang
Dong ThapKhanh HoaHai Phong
Tra VinhPhu Yen
Dien BienNinh Thuan
Ba Ria-Vung TauThua Thien-Hue
Bac GiangBinh Thuan
Da NangSoc Trang
Tuyen QuangHa GiangBac NinhAn Giang
Thai NguyenThai Binh
Ha NamYen Bai
Tay NinhLao Cai
Ninh BinhHung Yen
Can ThoBinh Phuoc
Dak Nong
5<=Y=>5
Y>5
Note: Y = percentage change in 2016 data from 2011 data, with a change of ±5% defined as statistically significant.
THE VIET NAM PROVINCIAL GOVERNANCE AND PUBLIC ADMINISTRATION PERFORMANCE INDEX PAPI 2016
PROVINCIAL PERFORMANCE IN 2016 AND OVER TIME (2011-2016)CHAPTER 3
85
Aggregated 2016 PAPI Performance and Implications
This section wraps up Chapter 3 by presenting 2016 provincial aggregate performance by quartiles, calculated by adding up scores in the six dimensions of PAPI. With the aggregate scores, provinces may assess where they are in a comparative perspective with other provinces of similar socio-economic and geographical endowments. In the PAPI report, provincial ranking is de-emphasised because each of the 63 provinces have different local conditions because of their socio-economic, demographic, and geographical conditions. It would be unfair if Ha Giang is compared with Kien Giang, for instance, although both provinces are at the farthest ends of the country. Comparing Ha Giang with Da Nang would be even more problematic.
This section also includes a snapshot of correlations between PAPI 2015 and PAPI 2016 despite changes made to the index composition in Dimension 1, Dimension 3, and Dimension 5, as discussed above. In addition, this section examines the relationship between PAPI 2016 and the Provincial Competitiveness Index (PCI) 2016. Looking at the relationship between these surveys sheds light on the governance context in general, and also assists central and local governments to find ways to balance the different, and sometimes competing, needs of citizens and businesses for human and economic development. The section ends with some recommendations for national and local public institutions, as well as citizens, to consider.
Overall aggregated provincial performance. Despite the changes made to three of the six dimensions, the regional patterns from 2016 are consistent with the 2011-2015 results. Figure 3.7a shows a strong correlation between PAPI 2015 and PAPI 2016 indexes. This confirms that provincial performance over time in different aspects of governance and public administration has a lot to do with proactiveness by local governments in policy implementation and in responsiveness to citizen feedback.
As Map 3.7 and Table 3.7 show, better performing provinces in the areas of governance and public administration in 2016 are primarily found in the Northeast, Central Coast and Mekong Delta regions. Among the 16 best performers are the Northeast provinces of Phu Tho, Hai Duong, Bac Ninh, Bac Giang, Nam Dinh, Thai Binh, Hung Yen, and Ninh Binh; five Central Coast provinces (Ha Tinh, Da Nang, Quang Binh, Quang Tri, and Binh Dinh), and three Mekong Delta provinces (Can Tho, Ben Tre, and Dong Thap). It is worthwhile noting that Nam Dinh, Ha Tinh, Quang Tri, and Da Nang have maintained their overall best performance status for six years in a row.
At the other end of the 2016 performance spectrum are northern-most and southern-most provinces. Provinces like Yen Bai, Lang Son, Cao Bang, Ha Giang, and Lai Chau are in the poorest performing group with Ca Mau, Bac Lieu, Tra Vinh, and Kien Giang. In particular, Lai Chau has been in the poorest performing group since 2011. But not all provinces with less favourable economic and geographical endowments were rated poorer by their respective citizens. Ha Noi joined this group in 2016 together with Khanh Hoa, Quang Ninh, and Binh Duong, and these are places where conditions for socio-economic development are more favourable. Binh Duong, in particular, continued to see a severe decline for the second year in a row with its 2016 aggregate PAPI score the lowest of all provinces at 32.6 points for all six dimensions. This was about 7 points behind Can Tho, whose aggregate PAPI score in 2016 was 39.6 points. With a growing number of migrants coming from other parts of Viet Nam for employment opportunities in expanding industrial zones, Binh Duong may have been overloaded with citizen expectations for good governance and public services for all.
It is also useful to look at the relationship between the PAPI 2016 scores and the PCI, which reflects feedback from businesses about provincial economic governance. Figure 3.7b shows that the relationship between the PAPI 2016 and PCI 2016 37 indices is far from perfect. As discussed in previous PAPI reports, this poor correlation is to be expected. Citizens and
37 See Malesky, Edmund (2017).

THE VIET NAM PROVINCIAL GOVERNANCE AND PUBLIC ADMINISTRATION PERFORMANCE INDEX PAPI 2016
86
businesses have different views as to what constitutes good governance since the two groups tend to have different expectations of government policies and governance measures.38
Implications. The detailed findings presented in Chapter 3 reflect provincial strengths and weaknesses in governance and public administration. As an aggregate index, PAPI can serve is a tool that provides a “first impression” of a province in terms of how it compares to other provinces overall in these areas. The aggregate index is also useful in the sense that it presents the full picture of how a province performed in a certain year in a holistic manner. In order to understand what they can do to improve their performance, provincial leaders need to look into each and every indicator and sub-dimension of the six dimensions presented in this chapter.
Findings at the indicator level reveal where provinces should focus in order to improve their performance, given their mandates to create the best conditions for all citizens to unleash their potentials and contribute to uplifting and sustaining socio-economic development. Indicator-level findings suggest improvements can be made in every component of the policy process, including policy making, policy implementation, and policy monitoring. Shortcomings and weaknesses in provincial performance in governance and public administration, as detailed in the survey results, are evident in the whole state apparatus. They can be found in the poor behaviours and low levels of competence, or in a broader sense, in the weak personal motivation and ability of public officials and civil servants working at different government levels. These shortcomings and weaknesses are also evident in the social context in which public officials and civil servants are not encouraged to be responsive, accountable, and understanding, and citizens are not motivated to provide feedback and comments in a constructive
manner to help local governments perform better. The shortcomings are in fact more structural, as they lie in policies, processes, and procedures that are not consulted during decision-making processes, not publicised, not made transparent, not complied with or not enforceable.
To address these challenges, the central government and local governments may wish to apply a holistic approach, with clear priorities, milestones, outputs, and outcomes assigned to each of the identified challenges. A three-pronged approach can be used with the current institutional settings. First, citizens should be more engaged in policy making, policy implementation, and policy monitoring because engaged citizens inform the government of their needs and expectations and also are enabled in this way to assume greater ownership of, and responsibility for, public policies and solutions. Second, the behaviour and skills of public officials and civil servants can be enhanced by using evidence-based approaches to training and apprenticing. This will help these individuals to gain new skills, allowing them to become enablers, negotiators, and collaborators with their citizen clients. This approach requires concrete job descriptions and performance appraisals for each public sector staff so that they proactively engage with citizens in each stage of policy development and implementation. In addition, it is important to create and promote a culture of openness and transparency from the government side. This requires a robust legislative regime that enables freedom of information, transparency in decision-making, responsiveness towards citizens, and accountable institutions. With the social feedback mechanisms in place like PAPI and PCI, and the receptiveness of an increasing number of provinces of their findings, Viet Nam is confirming its commitment to building a strong, responsive, and accountable government system and realising the Agenda 2030 for Sustainable Development.
38 See the Frequently Asked Questions section of the PAPI website for information about similarities and differences between PAPI and PCI, at http://papi.org.vn/eng/faq.
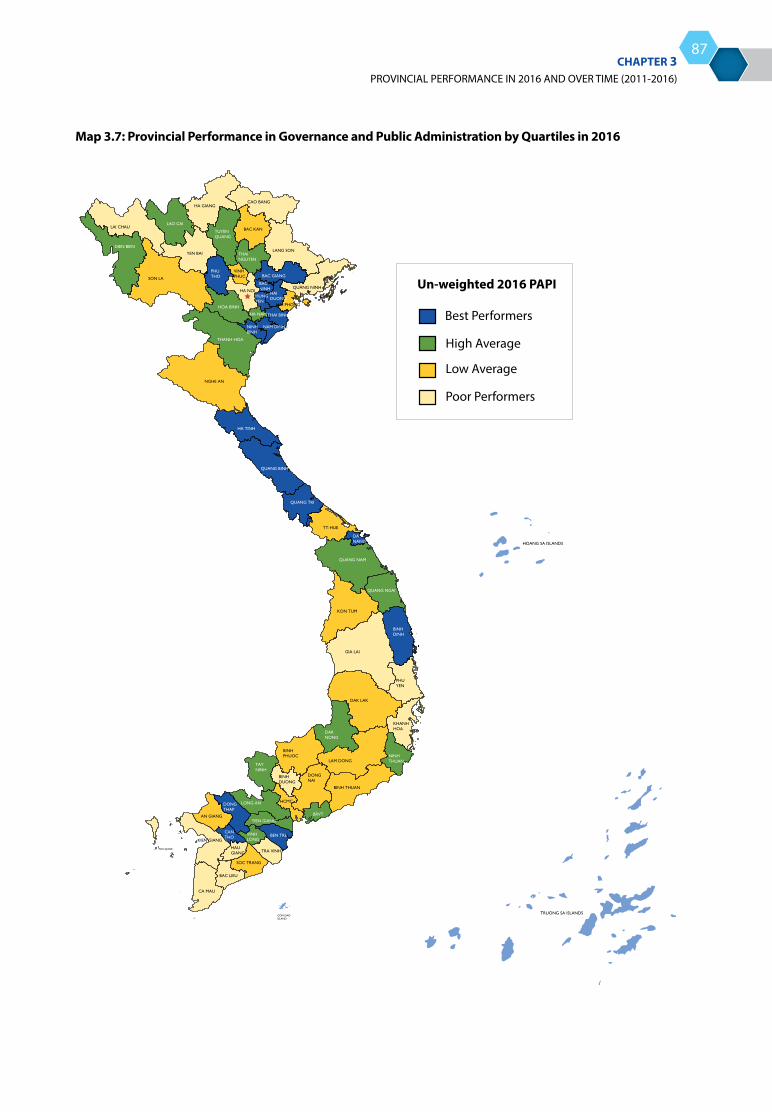
THE VIET NAM PROVINCIAL GOVERNANCE AND PUBLIC ADMINISTRATION PERFORMANCE INDEX PAPI 2016
PROVINCIAL PERFORMANCE IN 2016 AND OVER TIME (2011-2016)CHAPTER 3
87
Map 3.7: Provincial Performance in Governance and Public Administration by Quartiles in 2016
Un-weighted 2016 PAPI
Best Performers
High Average
Low Average
Poor Performers

THE VIET NAM PROVINCIAL GOVERNANCE AND PUBLIC ADMINISTRATION PERFORMANCE INDEX PAPI 2016
88
Table 3.7. Aggregate Performance by Province in 2016
Province Unweighted PAPI 2016
Dimension 1: Participation
at Local Levels*
Dimension 2: Transparency
Dimension 3: Vertical
Accountability *
Dimension 4: Control of
Corruption
Dimension 5: Public
Administrative Procedures*
Dimension 6: Public Service
Delivery Ha Noi 33.81 5.34 5.08 4.26 5.24 7.09 6.80 Ha Giang 33.96 5.34 5.27 4.40 5.82 6.64 6.48 Cao Bang 34.32 5.21 5.50 4.44 5.53 7.02 6.63 Bac Kan 35.61 5.35 5.45 5.05 5.90 7.19 6.68 Tuyen Quang 36.56 5.58 5.63 5.02 5.69 7.38 7.26 Lao Cai 35.72 5.73 5.89 4.89 5.34 6.83 7.03 Dien Bien 36.44 5.55 6.05 4.76 6.18 7.13 6.79 Lai Chau 33.88 5.09 5.37 4.33 5.40 7.23 6.46 Son La 35.55 5.48 5.48 4.53 6.13 7.10 6.83 Yen Bai 34.68 5.50 5.16 4.87 5.16 7.30 6.68 Hoa Binh 36.26 5.70 5.96 5.07 5.53 7.07 6.94 Thai Nguyen 36.99 6.18 6.23 5.17 5.44 6.98 6.98 Lang Son 34.60 5.09 5.17 4.72 5.86 6.76 7.00 Quang Ninh 32.98 4.86 4.94 4.92 4.89 6.94 6.42 Bac Giang 37.77 6.40 6.34 4.29 6.46 7.28 7.01 Phu Tho 38.53 5.61 6.48 5.59 6.67 7.36 6.82 Vinh Phuc 35.42 5.64 5.63 4.17 5.83 7.16 6.99 Bac Ninh 38.03 6.72 6.49 4.63 5.72 7.04 7.43 Hai Duong 38.03 5.94 6.14 5.68 6.18 6.96 7.12 Hai Phong 35.55 4.93 5.41 5.30 4.80 7.30 7.81 Hung Yen 37.46 6.02 5.92 5.28 5.73 7.15 7.38 Thai Binh 37.73 6.24 6.29 4.43 6.36 7.02 7.39 Ha Nam 37.01 5.53 5.49 5.67 6.12 7.26 6.94 Nam Dinh 37.76 5.85 6.33 5.90 5.68 7.10 6.90 Ninh Binh 37.41 5.83 6.34 4.88 6.06 7.00 7.30 Thanh Hoa 36.28 5.47 6.02 4.36 6.05 7.20 7.18 Nghe An 35.57 5.88 5.34 4.98 5.50 7.25 6.61 Ha Tinh 39.32 6.81 6.14 4.91 6.72 7.51 7.22 Quang Binh 38.41 6.16 6.27 4.90 6.28 7.67 7.11 Quang Tri 38.06 5.97 6.08 5.48 6.56 7.11 6.87 Thua Thien-Hue 35.34 5.10 5.14 5.24 5.61 6.75 7.49 Da Nang 38.58 5.27 6.02 5.82 6.10 7.34 8.03 Quang Nam 35.99 5.91 5.44 5.12 5.92 6.82 6.79 Quang Ngai 36.79 5.34 5.89 5.97 5.74 7.44 6.42 Binh Dinh 37.52 5.60 6.11 4.93 6.64 7.01 7.23 Phu Yen 34.74 4.66 5.61 4.64 6.11 7.04 6.69 Khanh Hoa 34.25 4.83 4.94 4.44 5.99 6.95 7.09 Ninh Thuan 37.22 5.48 5.81 4.69 6.50 7.32 7.42 Binh Thuan 34.78 5.02 5.10 5.20 5.41 7.07 6.98 Kon Tum 34.80 5.19 5.15 5.41 5.37 6.80 6.88 Gia Lai 34.46 5.47 5.09 4.85 5.44 6.96 6.65 Dak Lak 35.65 5.79 5.49 4.83 5.60 7.17 6.78 Dak Nong 35.89 5.43 5.61 5.21 5.94 6.78 6.93 Lam Dong 35.20 5.39 5.32 5.17 5.50 6.80 7.02 Binh Phuoc 35.53 5.34 5.94 4.82 5.49 7.05 6.90 Tay Ninh 36.86 5.25 5.61 5.33 6.51 7.00 7.16 Binh Duong 32.59 4.47 5.28 4.45 4.31 6.95 7.13 Dong Nai 34.86 5.03 5.65 4.24 5.91 7.18 6.85 Ba Ria -Vung Tau 36.30 4.88 5.51 5.65 5.47 6.98 7.82 Ho Chi Minh City 34.91 4.70 5.75 4.92 5.03 7.00 7.51 Long An 36.71 5.59 5.85 4.53 6.56 7.23 6.95 Tien Giang 36.56 5.06 5.80 4.94 6.99 7.25 6.52 Ben Tre 38.37 5.14 5.78 5.68 6.98 7.46 7.33 Tra Vinh 33.62 4.43 4.82 4.41 6.16 6.96 6.84 Vinh Long 36.08 5.12 5.53 4.52 6.37 7.43 7.11 Dong Thap 37.88 5.28 5.60 5.47 6.77 7.66 7.09 An Giang 35.63 4.48 5.60 5.04 5.76 7.21 7.54 Kien Giang 33.20 4.57 5.06 4.13 5.66 6.72 7.06 Can Tho 39.57 5.79 5.94 5.69 7.14 7.41 7.60 Hau Giang 34.63 5.18 4.96 4.57 6.40 6.96 6.56 Soc Trang 35.48 5.04 4.82 5.21 5.75 7.43 7.21 Bac Lieu 33.34 4.80 4.81 4.56 5.38 6.82 6.96 Ca Mau 34.22 4.61 4.81 5.11 6.12 7.01 6.57
Notes: (*) Dimensions 1, 3, and 5 were changed substantially in 2016 to re�ect contextual changes in Viet Nam.
Colour Code: Best performer Above 75th percentile High Average Between 50th and 75th percentile
Low Average Between 25th and 50th percentile Poor Performer Below 25th percentile

THE VIET NAM PROVINCIAL GOVERNANCE AND PUBLIC ADMINISTRATION PERFORMANCE INDEX PAPI 2016
PROVINCIAL PERFORMANCE IN 2016 AND OVER TIME (2011-2016)CHAPTER 3
89
Figure 3.7a. Correlation between 2016 PAPI and 2016 PAPI (weighted indexes)
Figure 3.7b: Correlation between 2016 PAPI and 2016 PCI
Ha Noi
Ha Giang Cao Bang
Bac Kan
Tuyen Quang
Lao Cai
Dien Bien
Lai Chau
Son La
Yen Bai
Hoa Binh
Thai Nguyen
Lang Son
Quang Ninh
Bac Giang Phu Tho
Vinh Phuc
Bac Ninh
Hai Duong
Hai Phong
Hung Yen
Thai Binh
Ha Nam
Nam Dinh
Ninh Binh
Thanh Hoa
Nghe An
Ha Tinh
Quang Binh
Quang Tri
TT-Hue
Da Nang
Quang NamQuang Ngai
Binh Dinh
Phu Yen
Khanh Hoa
Ninh Thuan
Binh ThuanKon Tum Gia Lai
Dak Lak
Dak Nong
Lam Dong
Binh Phuoc
Tay Ninh
Binh Duong
Dong Nai
BRVT
HCMC
Long AnTien Giang
Ben Tre
Tra Vinh
Vinh Long
Dong Thap
An Giang
Kien Giang
Can Tho
Hau Giang
Soc Trang
Bac Lieu
Ca Mau
32
34
36
38
40
42
Wei
ghte
d PA
PI 2
016
32 34 36 38 40 42
Weighted PAPI 2015
95% CI
Fitted Values
Observed Values
r=.36
Ha Noi
Hai Phong
Da Nang
HCMC
Can Tho
Thanh Hoa
Nghe An
Ha Tinh
Quang BinhQuang Tri
TT-Hue
Quang Nam
Quang Ngai
Binh Dinh
Phu Yen
Khanh Hoa
Dong Thap
An Giang
Tien Giang
Vinh Long
Ben Tre
Kien Giang
Tra Vinh
Soc Trang
Bac Lieu
Ca Mau
Binh Phuoc
Tay Ninh
Ninh ThuanLong An
Quang Ninh
Hau Giang
BRVT
Bac Ninh
Binh Duong
Binh Thuan
Dong Nai
Ha Nam
Hai Duong
Hung YenNam Dinh
Ninh Binh
Thai Binh
Vinh PhucBac Kan
Bac Giang
Cao Bang
Dak Lak
Dak Nong
Dien Bien
Gia Lai
Hoa Binh
Kon TumLai Chau
Lam DongLang Son
Lao Cai
Phu Tho
Son La
Thai NguyenTuyen Quang
Yen Bai
Ha Giang
32
34
36
38
40
Wei
ghte
d PA
PI 2
016
55 60 65 70
Weighted PCI 2016
95% CI
Fitted Values
r=.10
THE VIET NAM PROVINCIAL GOVERNANCE AND PUBLIC ADMINISTRATION PERFORMANCE INDEX PAPI 2016
90
BIBLIOGRAPHYAndrew Wells-Dang, Le Kim Thai, Nguyen Tran Lam, and Do Thanh Huyen (October 2015). Increasing Citizen
Participation in Governance in Vietnam. In Focus, Vietnam Law and Legal Forum, pp. 10-14, 34, the October 2015 issue. Viet Nam: 2015. Available at http://vietnamlawmagazine.vn/increasing-citizen-participation-in-governance-in-vietnam-5047.html.
Andrew Wells-Dang, Le Kim Thai and Nguyen Tran Lam (2015). Between Trust and Structure: Citizen Participation and Local Elections in Viet Nam. A Joint Policy Research Paper on Governance and Participation commissioned by Oxfam in Viet Nam and the United Nations Development Programme (UNDP) in Viet Nam. Ha Noi, Viet Nam: August 2015. Available at http://www.vn.undp.org/content/vietnam/en/home/library/democratic_governance/citizen-participation-and-local-elections-in-viet-nam.html.
Bach Ngoc Thang, Nguyen Van Thang and Do Thanh Huyen (2015). Combating Corruption for Improved Quality of Public Services in Vietnam. In Focus, Vietnam Law and Legal Forum, pp. 15-18, 34, January 2016 issue. Viet Nam: 2016. Available at http://vietnamlawmagazine.vn/combating-corruption-for-improved-quality-of-public-services-in-vietnam-5203.html.
Bui, Phuong Dinh et al. (2016). Strengthening PAPI Scores: Achieved Results and Lessons Learnt in An Giang, Phu Yen, Bac Lieu and Son La. Series of policy research briefs for select provinces by Bui Phuong Dinh, Le Van Chien, Dang Anh Tuyet and Ha Viet Hung. Hanoi, 2016: HCMA.
CECODES, VFF-CRT & UNDP (2016). The Viet Nam’s Provincial Governance and Public Administration Performance Index (PAPI) 2015: Measuring Citizens’ Experience. Ha Noi. Available at www.papi.org.vn.
CECODES, VFF-CRT & UNDP (2015). The Viet Nam’s Provincial Governance and Public Administration Performance Index (PAPI) 2014: Measuring Citizens’ Experience. Ha Noi. Available at www.papi.org.vn.
CECODES, VFF-CRT & UNDP (2014). The Viet Nam’s Provincial Governance and Public Administration Performance Index (PAPI) 2013: Measuring Citizens’ Experience. Ha Noi. Available at www.papi.org.vn.
CECODES, VFF-CRT & UNDP (2013). The Viet Nam’s Provincial Governance and Public Administration Performance Index (PAPI) 2012: Measuring Citizens’ Experience. Ha Noi. Available at www.papi.org.vn.
CECODES, FR, CPP & UNDP (2012). The Viet Nam’s Provincial Governance and Public Administration Performance Index (PAPI) 2011: Measuring Citizens’ Experience. Ha Noi. Available at www.papi.org.vn.
Dan Tri (04/10/2016). About 1,700 complaints about land corruption received. Available at http://dantri.com.vn/xa-hoi/gan-1700-phan-anh-tieu-cuc-dat-dai-qua-duong-day-nong-20161003213801023.htm.
Delli Carpini, Michael and Scott Keeter (1996). What Americans Know About Politics and Why It Matters. New Haven: Yale University Press.
Galston, William (2001). Political Knowledge, Political Engagement, and Civic Education. Annual Review of Political Science, 2001, (4): pp. 217-234.
Government of Viet Nam (18/11/2016). Resolution 100/NQ-CP dated 18 November 2016 on the issuance of the Action Plan for the 2016-2021 Government. Available at http://www.chinhphu.vn/portal/page/portal/chinhphu/hethongvanban?class_id=509&_page=1&mode=detail&document_id=187221.
Government of Viet Nam (2016). Report on anti-corruption work in 2016 (Report No. 419/BC-CP) to XIV National Assembly in October 2016 [in which PAPI data was cited to reflect local governments’ efforts to improve transparency improvement].
THE VIET NAM PROVINCIAL GOVERNANCE AND PUBLIC ADMINISTRATION PERFORMANCE INDEX PAPI 2016
BIBLIOGRAPHY
91
Government of Viet Nam and United Nations (2012). One Plan 2012 – 2016 Between the Government of the Socialist Republic of Viet Nam and the United Nations in Viet Nam. 27 March. Ha Noi, available at http://www.un.org.vn.
Green Innovation and Development Centre (2016). Air Quality in Viet Nam – 2016. Available at http://en.greenidvietnam.org.vn/view-document/5876ee88a7f821ca088b4567.
Malesky, Edmund (2017). The Viet Nam Provincial Competitiveness Index: Measuring economic governance for private sector development 2016. Viet Nam Chamber of Commerce and Industry and United States Agency for International Development. Ha Noi, Viet Nam [available at http://eng.pcivietnam.org/bao-cao-pci-c17.html].
Malesky, Edmund and Markus Taussig (2015). The Danger of Not Listening: How Broad-Based Business Participation in Government Design of Regulations Can Increase Compliance and Benefit Society. Presented at the 2015 Annual Meeting of the American Political Science Association. August, San Francisco.
Ministry of Education and Training (17/09/2013). Decision No. 3982/2013/QĐ-BGDĐT of the Ministry of Education and Training approving proposal on: Developing Methodology to Measure Citizen Satisfaction with Public Education Services.
Ministry of Health (2013). Decision No 4858/QĐ-BYT on issuance of monitoring and evaluation criteria on hospital quality dated 3 December 2013. Available at http://thuvienphapluat.vn/archive/Quyet-dinh-4858-QD-BYT-nam-2013-thi-diem-Bo-tieu-chi-danh-gia-chat-luong-benh-vien-vb217343.aspx.
Ministry of Home Affairs (2016). Report on the Public Administration Reform (PAR) Index 2015. Ha Noi.
Ministry of Natural Resources and Environment (2016). Decision No. 931/QĐ-BTNMT of the Minister of Natural Resources and Environment on setting up hotlines to collect citizen and business feedback on bribery in the areas of natural resources and environment, including land administration, dated 4 May 2016. Available at http://thuvienphapluat.vn/van-ban/Bo-may-hanh-chinh/Quyet-dinh-931-QD-BTNMT-thanh-lap-duong-day-nong-kien-nghi-tieu-cuc-quan-ly-tai-nguyen-moi-truong-2016-310110.aspx.
Ministry of Planning and Investment (2013). Official Letter No. 1045/BKHĐT-KTĐN on implementation of the Vietnam Development Partnership [in which PAPI is used as an annual means of verification for the Government of Vietnam’s implementation of its commitment to implementing policies and measures on sustainable development and social progress].
National Assembly of Viet Nam XI (2013). Land Law No. 45/2013/QH13.
National Economics University and United Nations Development Programme (2017). A Sectorial Study of Transparency and Corruption in Land Acquisition. A Joint Policy Research Paper on Governance and Participation commissioned by Asia-Pacific Institute of Management (the National Economics University) and the United Nations Development Programme (UNDP) in Viet Nam. Ha Noi, Viet Nam: January 2017. Available at http://www.vn.undp.org/ content/vietnam/en/home/ library/democratic_governance/ a-sectorial-study-of- transparency-and-corruption- in-land-acquisition-in-viet- nam.html.
National Election Council (22/05/2016). National Elections of National Assembly Delegates and People’s Council Members at All Levels [in 2016] Successfully Completed. Available at http://hoidongbaucu.quochoi.vn/tintuc/Pages/tin-hoat-dong-bc.aspx?ItemID=1073.
Nguyen Van Thang, Bach Ngoc Thang, Le Quang Thanh, and Le Quang Canh. (2017). Local governance, corruption, and public service quality: Evidence from a national survey in Vietnam. International Journal of Public Sector Management, Vol. 30(2). Available at http://dx.doi.org/10.1108/IJPSM-08-2016-0128.
THE VIET NAM PROVINCIAL GOVERNANCE AND PUBLIC ADMINISTRATION PERFORMANCE INDEX PAPI 2016
92
Nguyen Van Thang, Bach Ngoc Thang, Le Quang Thanh and Le Quang Canh (2015). Local Governance, Corruption and Public Service Quality: Evidence from a National Survey in Viet Nam. A joint policy research paper on governance and participation commissioned by the Asia-Pacific Institute for Management (the National Economics University) and the United Nations Development Programme (UNDP) in Viet Nam. Ha Noi, Viet Nam: December 2015. Available at http://www.vn.undp.org/content/vietnam/en/home/library/democratic_governance/local-governance-corruption-and-public-service-quality.html.
Nguyen Van Thang, Do Thanh Huyen et al. (2017). Corruption in land-related projects and ways to address it from socially structured perspectives. Vietnam Law and Legal Forum, pp. 42-48, the January-February 2017 issue. Viet Nam: 2017. Available at http://vietnamlawmagazine.vn/corruption-in-land-related-projects-and-ways-to-address-it-from-socially-structured-perspectives-5745.html
Nhan Dan (23/08/2016). About 10% of households found extremely poor in 2015. Available at http://www.nhandan.com.vn/xahoi/item/30490102-ca-nuoc-co-gan-10-ho-ngheo-theo-chuan-ngheo-moi.html
Organisation for Economic Co-operation and Development (2014). Social Cohesion: Policy Review of Viet Nam. Available at http://www.oecd.org/countries/vietnam/social-cohesion-policy-review-of-viet-nam-9789264196155-en.htm.
Petri and Plummer (2016). The Economic Effects of the Trans-Pacific Partnership: New Estimates. Working paper submitted to the US International Trade Commission. February 15, 2016. Available at http://asiapacifictrade.org/wp-content/uploads/2012/09/petri-plummer-USITC-16feb16.pdf
PewResearch Center Global Attitudes and Trends (23/07/2009). Chapter 9: Environmental Issues. In ‘Confidence in Obama Lifts U.S. Image Around the World’. Available at http://www.pewglobal.org/2009/07/23/chapter-9-environmental-issues/
Princeton University (2014). Measuring Citizen Experiences: Conducting a Social Audit in Viet Nam (2009-2013). Report prepared by Rachel Jackson for Innovations for Successful Societies, Princeton University. Available at http://successfulsocieties.princeton.edu/sites/successfulsocieties/files/Rachel_Jackson_PAPI_Vietnam_8Dec14%20final.pdf.
Thoi Bao Kinh Te Sai Gon (05/05/2014): Hiểu rõ về các chỉ số đo lường chất lượng điều hành của Việt Nam (Edmund Malesky, Jairo Acuña-Alfaro, Dau Anh Tuan). An article in response to the article “So sánh chỉ số PAPI và PCI: những câu hỏi còn đó” by Dr Le Dang Doanh, an independent senior economist with Thoi Bao Kinh Te Sai Gon (12/04/2014). Available at http://www.thesaigontimes.vn/114299/.
Tuoi Tre Cuoi Tuan (2014). Quản trị nhà nước: Phải đo lường được để cải thiện, by Dang Hoang Giang, in Tuoi Tre Cuoi Tuan, Issue 13-2014, 13/04/2014.
Tran, Thi Bich (2014). The Cycle of Transparency, Accountability, Corruption, and Administrative Performance: Evidence from Viet Nam. Journal of Economics and Development, Vol.16, No.3, pp. 32-48, December 2014.
The Economist Intelligence Unit (27/05/2015). 2014 PAPI Survey: A Mixed Bag of Results. In Politics, EIU, May 2015 issue. Available at https://country.eiu.com/Vietnam/ArticleList/Analysis/Politics.
Tuoi Tre (5/02/2012). “Vietnam Air Pollution Among the Worst in the World.” Available at http://tuoitrenews.vn/features/482/vietnam-air-pollution-among-the-worst-in-the-world
United Nations in Viet Nam (2014). Viet Nam Country Dialogue on Post 2015, Interim Report: An Overview of Selected Initiatives on Participatory Monitoring for Accountability in Viet Nam.
UNDP Global Centre for Public Service Excellence (2016). Citizen Engagement in Public Service Delivery: The Critical Role of Public Officials. Discussion Paper. Singapore [available at http://www.undp.org/content/undp/en/home/librarypage/capacity-building/global-centre-for-public-service-excellence/CitizenEngagement.html].
THE VIET NAM PROVINCIAL GOVERNANCE AND PUBLIC ADMINISTRATION PERFORMANCE INDEX PAPI 2016
BIBLIOGRAPHY
93
UNDP and Vietnam Academy of Social Sciences (VASS) (2016). Growth that Works for All: Viet Nam Human Development Report 2015 on Inclusive Growth. Ha Noi: Social Sciences Publishing House [available at http://www.vn.undp.org/content/vietnam/en/home/library/poverty/human-development-report-viet-nam-2015/].
United Nations Development Programme (UNDP) (2014). Anti-corruption Strategies: What Works, What Doesn’t and Why – Lessons Learned from the Asia-Pacific Region [available at http://www.asia-pacific.undp.org/content/rbap/en/home/library/democratic_governance/anti-corruption-strategies.html].
Viet Nam Fatherland Front (VFF), Centre for Community Support and Development Studies (CECODES) and United Nations Development Programme (UNDP) (2010). Towards a Public Administration Performance Index (PAPI) at the Provincial Level in Viet Nam. Report on the pilot project. January. Ha Noi [available at www.papi.vn].
VFF, CECODES & UNDP (2011). The Viet Nam Governance and Public Administration Performance Index (PAPI) 2010: Measuring Citizens’ Experiences. Ha Noi.
Viet Nam News (30/06/2016). Formosa blamed for fish death. Available at vietnamnews.vn/society/298928/formosa-blamed-for-fish-death.html
VietNamNet (23/12/2016). Online Chats with Readers: 2016 Heath Insurance – Reforms for the People. Available at http://vietnamnet.vn/vn/suc-khoe/gltt-bao-hiem-y-te-2016-nhieu-doi-moi-vi-dan-347968.html
Viet Nam Lawyers Association and UNDP (2016). 2015 Justice Index: Towards a Justice System for the People. Ha Noi: May 2016. Available at https://chisocongly.vn/en/.
VNExpress International (02/01/2017). Family matters: Vietnam battles nepotism in government offices. Available at http://e.vnexpress.net/news/news/family-matters-vietnam-battles-nepotism-in-government-offices-3488078.html.
VnExpress (28/10/2016). Discussion on the notion of citizens ‘tolerating corruption’, available at http://vnexpress.net/tin-tuc/thoi-su/tranh-luan-ve-nhan-dinh-nguoi-dan-co-tu-tuong-chiu-dung-tham-nhung-3490829.html, for the latest discussion of PAPI at the National Assembly Fall Session (28/10/2016)
VnExpress International (30/06/2016). Formosa in Vietnam: From billion-dollar steel factory to mass fish killer. Available at http://e.vnexpress.net/news/business/companies/formosa-in-vietnam-from-billion-dollar-steel-factory-to-mass-fish-killer-3428701.html.
World Bank and Ministry of Planning and Investment (2016). Viet Nam 2035: Toward Prosperity, Creativity, Equity, and Democracy. Washington DC.: World Bank. Available at https://openknowledge.worldbank.org/handle/10986/23724.
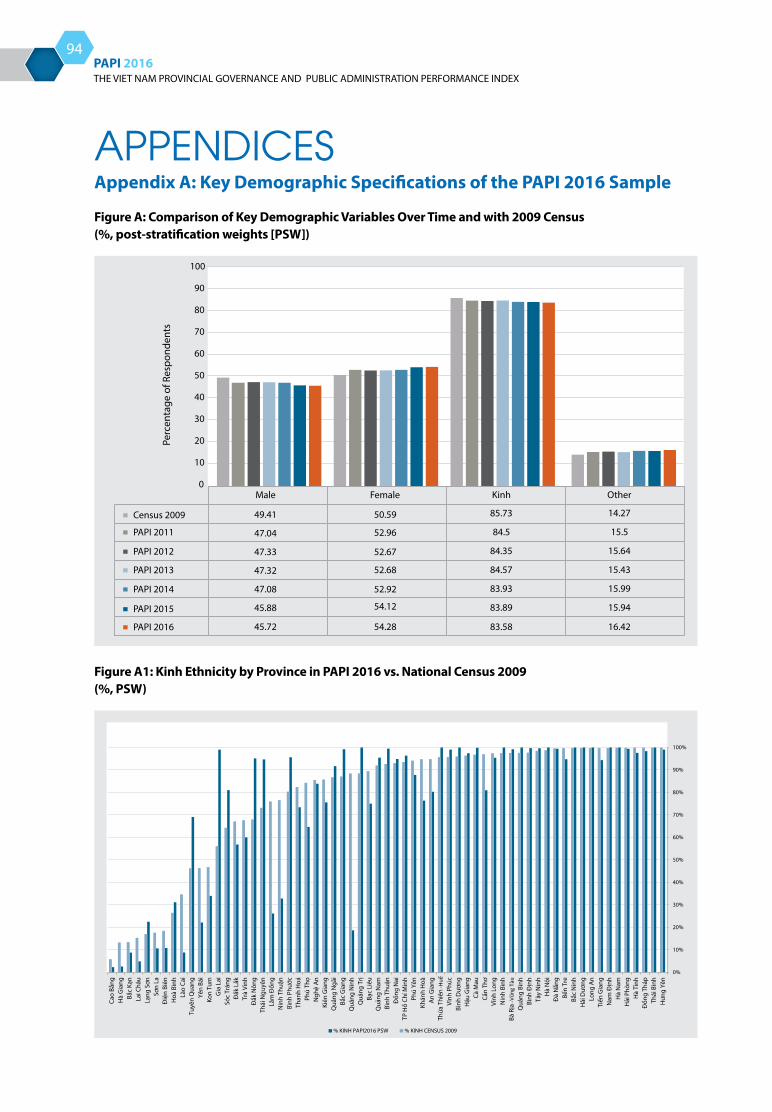
THE VIET NAM PROVINCIAL GOVERNANCE AND PUBLIC ADMINISTRATION PERFORMANCE INDEX PAPI 2016
94
APPENDICESAppendix A: Key Demographic Specifications of the PAPI 2016 Sample
Figure A: Comparison of Key Demographic Variables Over Time and with 2009 Census (%, post-stratification weights [PSW])
Figure A1: Kinh Ethnicity by Province in PAPI 2016 vs. National Census 2009 (%, PSW)
Female
45.72 54.28 83.58 16.42
0
10
20
30
40
50
60
70
80
90
100
Perc
enta
ge o
f Res
pond
ents
Census 2009
PAPI 2011
PAPI 2012
PAPI 2013
PAPI 2014
PAPI 2015
PAPI 2016
49.41
47.04
47.33
47.32
47.08
45.88
Male
50.59
52.96
52.67
52.68
52.92
54.12
85.73
84.5
84.35
84.57
83.93
83.89
14.27
15.5
15.64
15.43
15.99
15.94
Kinh Other
0%
10%
20%
30%
40%
50%
60%
70%
80%
90%
100%
Hưn
g Yê
n
Thái
Bìn
hĐ
ồng
Tháp
H
à Tĩ
nhH
ải P
hòng
H
à N
amN
am Đ
ịnh
Ti
ền G
iang
Lo
ng A
nH
ải D
ương
Bắ
c N
inh
Bế
n Tr
e
Đà
Nẵn
g
Hà
Nội
Tâ
y N
inh
Bình
Địn
h
Quả
ng B
ình
Bà
Rịa
- Vũn
g Tà
u
Nin
h Bì
nhVĩ
nh L
ong
Cần
Thơ
Cà
Mau
Hậu
Gia
ng
Bình
Dươ
ng
Vĩnh
Phú
cTh
ừa T
hiên
-Huế
A
n G
iang
Khán
h H
oàPh
ú Yê
nTP
Hồ
Chí M
inh
Đ
ồng
Nai
Bì
nh T
huận
Q
uảng
Nam
Bạ
c Li
êu
Quả
ng T
rị
Quả
ng N
inh
Bắ
c G
iang
Q
uảng
Ngã
i Ki
ên G
iang
Ngh
ệ A
n
Phú
Thọ
Th
anh
Hoá
Bình
Phư
ớc
Nin
h Th
uận
Lâ
m Đ
ồng
Th
ái N
guyê
nĐ
ắk N
ông
Tr
à Vi
nhĐ
ắk L
ắk
Sóc
Trăn
gG
ia L
aiKo
n Tu
mYê
n Bá
iTu
yên
Qua
ngLà
o Ca
iH
oà B
ình
Điệ
n Bi
ên
Sơn
La
Lạng
Sơn
La
i Châ
uBắ
c Kạ
n
Hà
Gia
ngCa
o Bằ
ng
% KINH PAPI2016 PSW % KINH CENSUS 2009

THE VIET NAM PROVINCIAL GOVERNANCE AND PUBLIC ADMINISTRATION PERFORMANCE INDEX PAPI 2016
APPENDICES
95
Figure A2: Age Distribution in PAPI 2016 Sample vs. National Census 2009(excluding respondents aged 70 or above in PAPI sample)
Figure A4: Education Levels of PAPI 2016 Respondents (%, PSW)
Figure A3: Occupation of PAPI 2016 Respondents (%, PSW)
0.34%
4.06%
6.7%
7.46%
9.5%
12.5%
13.50%
15.56%
13.7%
10.98%
4.85%
0.8%
0.1%
0 2 4 6 8 10 12 14 16 18
18-19
20-24
25-29
30-34
35-39
40-44
45-49
50-54
55-59
60-64
65-69
70-75
75+
2009 CENSUS PAPI 2016 PSW20 22 18
0 5 10 15 20 25 30
No Formal Education
Incomplete Primary
Complete Primary
Incomplete Secondary
Complete Secondary
Incomplete High School
Complete High School
Some University
University Education
Postgraduate Degree
5.98%
14.27%
8.66%
16.29%
24.78%
6.22%
15.69%
0.86%
6.78%
0.40%
0.8%
1.2%
1.6%
1.8%
1.9%
3.7%
5.4%
6.0%
7.1%
8.6%
9.9%
52.2%
Student
Manager/Supervisor
Unemployed
Clerical
Other
Professional
Retired
Homemaker
Household entrepreneur
Non-agricultural, skilled
Non-agricultural, unskilled
Agricultural
0 10 20 30 40 50 60

THE VIET NAM PROVINCIAL GOVERNANCE AND PUBLIC ADMINISTRATION PERFORMANCE INDEX PAPI 2016
96
Appendix B: Provincial Responses to PAPI
No. Provinces Actions in Response to PAPI
1 An Giang - Action Plan No. 147/CTr-UBND dated 22 April 2015- Decision No. 2498/QD-UBND on Establishment of Steering Board on Implementation of PAPI Action Plan 2016-2020, dated 8 Sep 2016
2 Bà Rịa-Vũng Tàu Provincial Plan to organise diagnostic workshop on PAPI, PCI and PAR Index dated 28 Sep 2016 and provincial leaders’ discussion on PAPI findings in 2016
3 Bắc Giang Action Plan No. 1492 KH-UBND dated 6 June 2014 on improving performance for higher provincial PAPI scores
4 Bắc Kạn
5 Bạc Liêu Diagnostic workshop on PAPI findings on 23 November 2016
6 Bắc Ninh Action Plan No. 05/CT-UBND on maintaining and sustaining provincial PAPI scores dated 13 May 2016
7 Bến Tre Action Plan No. 4129/KH-UBND on improving PAPI, dated 13 August 2015
8 Bình Định- Directive No. 13/CT-UBND on improving PAPI, dated 8 August 2013- Directive No. 23/CT-UBND on strengthening responsibilities of heads of agencies in PAR, with a focus on improving PAPI
9 Bình Dương
- Regional diagnostic workshop hosted in Binh Duong on 7 May 2015 with the participation of provincial leaders and key public officials- Prime Minister’s Decision 893/QD-TTg dated 11 June 2014 approving Binh Duong’s socio-economic development plan, with a request to monitor PAPI findings
10 Bình Phước People’s Committee’s official letter requesting departments and districts to improve PAPI
11 Bình Thuận Directive No. 28/CT-UBND dated 13/9/2013 on improving public administration reforms, including PAPI
12 Cà Mau Directive No. 06/CT-UBND dated 17/9/2013 on improving PAPI
13 Cần Thơ Decision No. 1552/QD-UBND dated 1 June 2015 on Action Plan to Improve PAPI from 2015-2017
14 Cao Bằng Provincial diagnostic workshop with provincial leaders and key public officials on 18/09/2012
15 Đà Nẵng- Annual in-depth analysis of PAPI findings by Da Nang People’s Committee - People’s Committee’s leader shared Da Nang’s experience in maintaining high PAPI scores at 2015 PAPI launching event
16 Đắk Lắk- Official Letter No. 2211/UBND-TH dated 03/5/2012- Provincial diagnostic workshop convened by Da Lak Provincial People’s Committee on 2014 PAPI findings on 20 July 2015
17 Đắk Nông Decision No. 276/QĐ-UBND/2013 dated 22/02/2013 with concrete action plan
18 Điện Biên Provincial diagnostics workshop and comparative analysis, 2012, with participation of provincial leaders and key public officials
19 Đồng Nai
20 Đồng Tháp Directive No. 13/CT-UBND on improving PAPI in Dong Thap dated 5/8/2013
21 Gia Lai Action Plan No 3119/CTr-UBND on improving PAPI for the period from 2016-2020
22 Hà Giang
- Resolution No. 118-NQ-HĐND dated 11 December 2013 stressing the importance to increase PAPI scores - Action Plan No. 119/CTr-UBND on improving governance and public administration performance towards 2015 dated 21 July 2014
23 Hà Nam Directive No. 08/CT-UBND on strengthening responsibility of heads of agencies in public administrative procedure reforms, with an objective to improve PAPI

THE VIET NAM PROVINCIAL GOVERNANCE AND PUBLIC ADMINISTRATION PERFORMANCE INDEX PAPI 2016
APPENDICES
97
No. Provinces Actions in Response to PAPI
24 Hà Nội Plan No. 171/KH-UBND on implementation of Directive 03 of Ha Noi Party Committee, with an objective to improve PAPI
25 Hà Tĩnh Decision No. 4114/QD-UBND on PAR Plan in 2015 with an aim to maintain and improve PAPI scores
26 Hải Dương Provincial Resolution on Socio-economic Development of the province, with a focus on PAPI with an aim to be ranked higher by 2020
27 Hải Phòng PAPI defined as a means of verification for PAR monitoring and evaluation in Hai Phong in Provincial People’s Committee Decision No 617/QD-UBND on 17 March 2014
28 Hậu Giang Regional diagnostic workshop hosted in Hau Giang on 4 June 2013 with the participation of provincial leaders and key public officials
29 Hòa Bình Provincial leaders discussed taking PAPI as means of verification for development in the province
30 Hưng Yên Provincial People’s Committee set improving PAPI scores among top five objectives
31 Khánh Hòa - People’s Committee assigning relevant agencies to improve PAPI - Decision No. 942/QD-UBND on dissemination of PAR information, including PAPI findings
32 Kiên Giang
33 Kon Tum - Replicated PAPI survey for nine districts in 2011 - Decision No. 703/QĐ-UBND on improving PAPI dated 3/8/2012
34 Lai Châu Decision No. 1331/QD-UBND on Action Plan to Implement PAR, with reference to PAPI
35 Lâm Đồng
36 Lạng Sơn Action Plan No 108/KH-UBND on improving PAPI in 2016 and following years
37 Lào Cai Plan No 184/KH-UBND on implementation of Government of Viet Nam resolution in improving national competitiveness, with a focus on improving PAPI
38 Long AnRegional diagnostic workshop hosted in Long An on 5 June 2013 with the participation of provincial leaders and key public officials; and Long An provincial leader attended 2012 PAPI launch to share the province’s experiences
39 Nam Định Nam Dinh Provincial People’s Committee shared the province’s experience in addressing citizen needs at 2012 PAPI launch
40 Nghệ An Provincial diagnostic workshop convened by Nghe An Provincial People’s Committee to discuss 2014 PAPI findings on 11 August 2015
41 Ninh Bình Action Plan No. 97/KH-UBND on Public Administration Reforms, with PAPI as an objective
42 Ninh Thuận
- Action Plan No. 302/CTr-UBND dated 15 April 2016 on improving PAPI for the period from 2016-2020- Resolution of Ninh Thuan People’s Council No. 54/2016/NQ-HĐND on queries at 2nd Session of the People’s Council Meeting, with questions about PAPI
43 Phú Thọ- PAPI as a means of verification for overseeing Phu Tho’s Party Resolution for 2015-2020 - Regional workshop on 2015 PAPI findings dissemination hosted by Phu Tho Provincial People’s Committee on 5 July 2016
44 Phú Yên- Action Plan No. 03/CTr-UBND dated 11 April 2014 - Plan No 84/KH-UBND dated 10 June 2016 on implementation of action plan on improving PAPI, among others
45 Quảng Bình- Directive No 06/CT-UBND on strengthening public administrative reforms to improve provincial PAPI scores - Provincial People Committee’s regular monitoring of the province’s performance in PAPI
46 Quảng Nam Resolution No 156/2015/HDND on additional activities on socio-economic development for the second half of 2015, with PAPI improvement as an add-on
47 Quảng Ngãi- Regular monitoring of provincial performance through PAPI - Directive No. 19/CT-UBND on improving PAPI scores dated 29/11/2012 - Resolution No. 08/2013/NQ-HDND dated 10/07/2013 with reference to PAPI
48 Quảng Ninh Decision No. 6568/KH-UBND on improving PAPI dated 18 Nov 2014

THE VIET NAM PROVINCIAL GOVERNANCE AND PUBLIC ADMINISTRATION PERFORMANCE INDEX PAPI 2016
98
No. Provinces Actions in Response to PAPI
49 Quảng Trị Decision No 1339/QD-UBND on Action Plan to Maintain and Strengthen PAPI for 2014-2016
50 Sóc Trăng- Regional diagnostic workshop on 2014 PAPI findings hosted by Soc Trang People’s Committee on 8 May 2015- Provincial diagnostics workshop and comparative analysis, 2012
51 Sơn La Action Plan No. 82/KH-UBND on improving provincial governance and public administration performance (PAPI) on 16 June 2016.
52 Tây Ninh
53 Thái Bình Directive 13/CT-UBND on establishment of hotlines to collect citizen feedback, with an objective to improve PAPI
54 Thái Nguyên- Resolution No. 15/2012/NQ-HDND dated 15/12/2012 - Decision No 3138/QĐ-UBND approving the Action Plan for Higher PAPI Scores for the Period from 2015-2020 dated 31 December 2014
55 Thanh Hóa Decision No 3274/QD-UBND dated 26 August 2016 issuing action plans to strengthen PAR and investment environment, with a focus on improving PAPI
56 Thừa Thiên-Huế Plan No 26/KH-UBND on improving PAPI dated 5 March 2015
57 Tiền Giang PAPI as a measure of the province’s economic integration, as discussed by provincial leaders on 16 April 2014
58 TP Hồ Chí Minh Decision 3292/QĐ-UBND on issuing Ho Chi Minh City’s action plan improving PAPI for the period 2016-2020
59 Trà Vinh- People’s Council members attended training workshop on how to use PAPI for oversight in Vung Tau in late 2015- Provincial diagnostics workshop and comparative analysis, 2012
60 Tuyên Quang Conclusions No. 156/TB-VPCP from Working Session with Tuyen Quang provincial leaders, in which improving PAPI is a vision for the province
61 Vĩnh Long Provincial diagnostics workshop and comparative analysis, December 2014
62 Vĩnh Phúc Directive No 10/CT-UBND on improving PCI and PAPI scores dated 24 July 2013
63 Yên Bái Regional diagnostic workshop on 2012 PAPI findings hosted by Yen Bai People’s Committee on 14 June 2013
Note: ‘Blank’ provinces are those without evidence of provincial responses found from Google search. They might have taken actions in response to PAPI.

THE VIET NAM PROVINCIAL GOVERNANCE AND PUBLIC ADMINISTRATION PERFORMANCE INDEX PAPI 2016
APPENDICES
99
Appendix C: PAPI and the Sustainable Development Goals
C1. Goal 16: Promote peaceful and inclusive societies for sustainable development, provide access to justice for all and build effective, accountable and inclusive institutions at all levels
Goal 16 – Targets relevant to PAPI
Goal 16 –Indicators relevant to PAPI 2016 PAPI Questions Findings from 2016 PAPI
16.1 Significantly reduce all forms of violence andrelated death rates everywhere
16.1.3 Percentage of the population subjected to physical, psychological or sexual violence in the previous 12 months
D511d: question about whether or not citizens were physically attacked by any stranger or robber
About 1% of 14,063 respondents said they were subjected to physical violence by robbers or strangers
16.1.4* Proportion of people that feel safe walking alone around the area they live
D510 c & d: questions about how citizens feel walking alone around the area they live during the day and during the night
About 97% of 14,063 respondents said they felt safe walking alone around the area they live during the day.
About 72% of the respondents said they felt safe walking alone around the area they live during the night.
16.5 Substantially reduce corruption and bribery in all their forms
16.5.1* Percentage of persons who had at least one contact with a public official, who paid a bribe to a public official, or were asked for a bribe by these public officials, in the previous 12 months, disaggregated by age group, sex, region and population group
D405a: question about if respondents or their family members were asked for bribes in the past 12 months
About 5% of 14,063 respondents admitted they were asked for bribes by a public official in the previous 12 months.
D5 questions about paying bribes for public certification services, construction permits, LURCs, and personal papers
When experiential questions were raised, 10% of those who used the service nationwide admitted they paid a bribe for public certification services, 14.3% paid a bribe for construction permits, 23% paid a bribe for LURCs, and 9.6% paid a bribe for personal papers at the commune level.
D6 questions about paying bribes for health care services and primary education
More than 11% had to pay a bribe for their children to be better attended at public primary schools; and about 17% had to pay a bribe to obtain better service at public district hospitals.
16.6 Develop effective, accountable and transparentinstitutions at all levels
16.6.2* Proportion of the population satisfied withtheir last experience of public services
D5 and D6 questions about public services provided by local governments (administrative services, health care, health insurance, primary education, water supply, solid waste collection, access to electricity)
The rating of user satisfaction is presented by types of public services under PAPI 2016 survey:
a. Public Administrative Services (by percentage of users satisfied with the services): - Public certification services: 81%- Public service for construction permits: 71%- Public service for LURCs: 61%- Public service for personal papers: 81%
b. Public Services (by total quality rating): - Health care service at district public hospitals: 5.22 points on the 10-point scale- Public primary schools: 4.99 points on the 9-point scale

THE VIET NAM PROVINCIAL GOVERNANCE AND PUBLIC ADMINISTRATION PERFORMANCE INDEX PAPI 2016
100
Goal 16 – Targets relevant to PAPI
Goal 16 –Indicators relevant to PAPI 2016 PAPI Questions Findings from 2016 PAPI
16.7 Ensure responsive, inclusive, participatory and representative decision-making at all levels
16.7.2 Proportion of population who believe decision-making is inclusive and responsive, by sex, age, disability and population group
D1 questions about citizen participation in local project implementation
- 71% of contributors to projects (34.5% male; 36.5% female) said they participated in making decision on whether the infrastructure project would be done - 44% of those (22.6% male; 21.3% female) participating in discussions on project implementation said they provided comments in project discussions
D2 questions about citizen participation in local land planning
- 18% of the respondents (10% male, 8% female) said they were informed about local land planning- 35% (22% male, 13% female) of those who were informed said they had an opportunity to comment on the land plans, among whom 91% (59% male, 32% female) said their comments were taken into account
SDGs – Targets relevant to PAPI SDGs –Indicators relevant to PAPI Current PAPI Questions Findings from PAPI 2016
Goal 1: End poverty in all its forms everywhere1.4 By 2030, ensure that all men and women, in particular the poor and the vulnerable, have equal rightsto economic resources, as well as access to basic services, ownership and control over land and other forms of property, inheritance, natural resources, appropriate new technology and financial services,including microfinance
1.4.2 Proportion of total adult population with secure tenure rights to land, with legally recognized documentation and who perceive their rights to land as secure, by sex and by type of tenure
D207 battery of questions on land loss
On land ownership (which is state ownership in Viet Nam), about 83% of the respondents said they did not lose land as a result of local land plans in 2016.
Goal 6: Ensure availability and sustainable management of water and sanitation for all6.1 By 2030, achieve universal and equitable access to safe and affordable drinking water for all
6.1.1 Percentage of population using safely managed drinking water services
D610 battery of questions about access to clean water for drinking and cooking
About 49% of the respondents said they had tap water for cooking and drinking.
Still, more than 6% still said they had to use unclean water for cooking and drinking.
Goal 7. Ensure access to affordable, reliable, sustainable and modern energy for all7.1 By 2030, ensure universal access to affordable, reliable and modern energy services
7.1.1 Percentage of population with access to electricity
D607 questions on access to electricity
About 98.5% of the population had access to electricity through the national grid.
C2. Other Goals Relevant to PAPI in Perspective
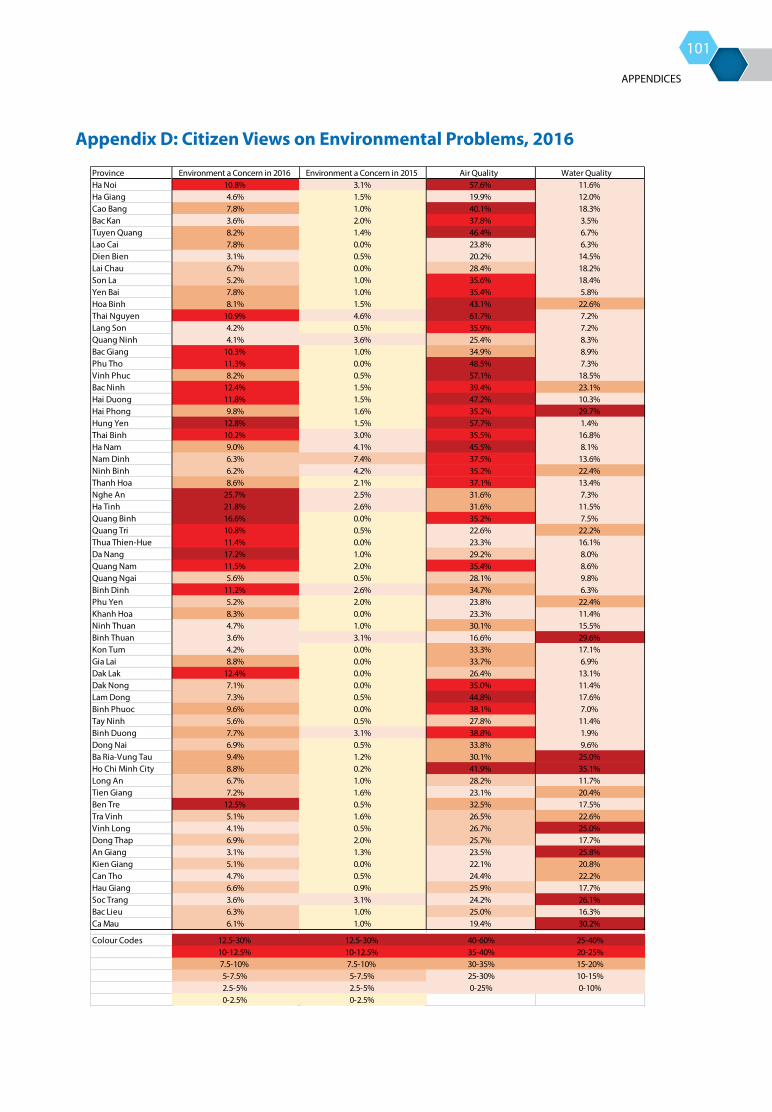
THE VIET NAM PROVINCIAL GOVERNANCE AND PUBLIC ADMINISTRATION PERFORMANCE INDEX PAPI 2016
APPENDICES
101
Appendix D: Citizen Views on Environmental Problems, 2016
Province Environment a Concern in 2016 Environment a Concern in 2015 Air Quality Water QualityHa Noi 10.8% 3.1% 57.6% 11.6%Ha Giang 4.6% 1.5% 19.9% 12.0%Cao Bang 7.8% 1.0% 40.1% 18.3%Bac Kan 3.6% 2.0% 37.8% 3.5%Tuyen Quang 8.2% 1.4% 46.4% 6.7%Lao Cai 7.8% 0.0% 23.8% 6.3%Dien Bien 3.1% 0.5% 20.2% 14.5%Lai Chau 6.7% 0.0% 28.4% 18.2%Son La 5.2% 1.0% 35.6% 18.4%Yen Bai 7.8% 1.0% 35.4% 5.8%Hoa Binh 8.1% 1.5% 43.1% 22.6%Thai Nguyen 10.9% 4.6% 61.7% 7.2%Lang Son 4.2% 0.5% 35.9% 7.2%Quang Ninh 4.1% 3.6% 25.4% 8.3%Bac Giang 10.3% 1.0% 34.9% 8.9%Phu Tho 11.3% 0.0% 48.5% 7.3%Vinh Phuc 8.2% 0.5% 57.1% 18.5%Bac Ninh 12.4% 1.5% 39.4% 23.1%Hai Duong 11.8% 1.5% 47.2% 10.3%Hai Phong 9.8% 1.6% 35.2% 29.7%Hung Yen 12.8% 1.5% 57.7% 1.4%Thai Binh 10.2% 3.0% 35.5% 16.8%Ha Nam 9.0% 4.1% 45.5% 8.1%Nam Dinh 6.3% 7.4% 37.5% 13.6%Ninh Binh 6.2% 4.2% 35.2% 22.4%Thanh Hoa 8.6% 2.1% 37.1% 13.4%Nghe An 25.7% 2.5% 31.6% 7.3%Ha Tinh 21.8% 2.6% 31.6% 11.5%Quang Binh 16.6% 0.0% 35.2% 7.5%Quang Tri 10.8% 0.5% 22.6% 22.2%Thua Thien-Hue 11.4% 0.0% 23.3% 16.1%Da Nang 17.2% 1.0% 29.2% 8.0%Quang Nam 11.5% 2.0% 35.4% 8.6%Quang Ngai 5.6% 0.5% 28.1% 9.8%Binh Dinh 11.2% 2.6% 34.7% 6.3%Phu Yen 5.2% 2.0% 23.8% 22.4%Khanh Hoa 8.3% 0.0% 23.3% 11.4%Ninh Thuan 4.7% 1.0% 30.1% 15.5%Binh Thuan 3.6% 3.1% 16.6% 29.6%Kon Tum 4.2% 0.0% 33.3% 17.1%Gia Lai 8.8% 0.0% 33.7% 6.9%Dak Lak 12.4% 0.0% 26.4% 13.1%Dak Nong 7.1% 0.0% 35.0% 11.4%Lam Dong 7.3% 0.5% 44.8% 17.6%Binh Phuoc 9.6% 0.0% 38.1% 7.0%Tay Ninh 5.6% 0.5% 27.8% 11.4%Binh Duong 7.7% 3.1% 38.8% 1.9%Dong Nai 6.9% 0.5% 33.8% 9.6%Ba Ria-Vung Tau 9.4% 1.2% 30.1% 25.0%Ho Chi Minh City 8.8% 0.2% 41.9% 35.1%Long An 6.7% 1.0% 28.2% 11.7%Tien Giang 7.2% 1.6% 23.1% 20.4%Ben Tre 12.5% 0.5% 32.5% 17.5%Tra Vinh 5.1% 1.6% 26.5% 22.6%Vinh Long 4.1% 0.5% 26.7% 25.0%Dong Thap 6.9% 2.0% 25.7% 17.7%An Giang 3.1% 1.3% 23.5% 25.8%Kien Giang 5.1% 0.0% 22.1% 20.8%Can Tho 4.7% 0.5% 24.4% 22.2%Hau Giang 6.6% 0.9% 25.9% 17.7%Soc Trang 3.6% 3.1% 24.2% 26.1%Bac Lieu 6.3% 1.0% 25.0% 16.3%Ca Mau 6.1% 1.0% 19.4% 30.2%
Colour Codes 12.5-30% 12.5-30%10-12.5% 10-12.5%7.5-10% 7.5-10%5-7.5% 5-7.5%2.5-5% 2.5-5%
25-40%20-25%15-20%10-15%0-10%
40-60%35-40%30-35%25-30%0-25%
0-2.5% 0-2.5%
Centre for Community Support and Development Studies (CECODES)
Established by the Vietnam Union of Science and Technology Associations (VUSTA) from 2007, CECODES is a non-profit, non-governmental organisation specialised in development research and community support. The overall function of CECODES is to carry out evidence-based research to assess policy impact and to implement solutions to strengthening capacity of communities. CECODES works towards contributing to the improvement of governance performance, focusing on facilitating the interactions between the State, the Market, and the Civil Society.
Centre for Research and Training of the Viet Nam Fatherland Front (VFF-CRT)
Established on 28 December 2012 under Decision No. 1725/QĐ-MTTW-BTT by the Central Committee of the Viet Nam Fatherland Front (VFF), the Centre for Research and Training of the Viet Nam Fatherland Front is an autonomous agency operating by state laws and regulations. VFF-CRT has the four mandates, including: (i) to provide training and retraining of VFF personnel from all levels; (ii) to conduct research on theory and practice of great solidarity, institutional settings and operation of the VFF and other relevant areas and thematic issues; (iii) to set up and operationalise VFF Museum; (iv) to coordinate and partner with other research and training institutions home and abroad in research and personnel training.
Real-Time Analytics (RTA)
Real-Time Analytics (RTA) is a leading Data Science firm. It develops Real-Time Survey CAPI platform - a software system that allows to enter interview data and to manage the fieldwork operations in real-time using tablets and smartphones. RTA provides consulting, researching and software services to clients worldwide, including The World Bank, UNDP, ADB, TUFTS University, Ministry of Planning and Investment (MPI), General StatisticS Office (GSO), among others.
United Nations Development Programme (UNDP)
UNDP is the United Nations’ global development organization, a network advocating for change and connecting countries to knowledge, experience and resources to help people build a better life. UNDP is on the ground in 166 countries, working with them on their own solutions to global and national development challenges. As countries develop local capacity, they draw on the people of UNDP and its wide range of partners.
Co-funding Partner
Implementing Partners
Centre for Community Support and Development Studies
PAPI 2016The Viet Nam Provincial Governance
and Public Administration Performance Index
Measuring citizens’ experiences
www.papi.org.vn
Centre for Community Support and Development Studies
Centre for Research and Training of the Viet Nam Fatherland Front
United Nations Development Programme304 Kim Ma, Ha Noi, Viet NamTel: (84 4) 38 500 100Fax: (84 4) 37 265 520Email: [email protected]
Centre for Community Support &Development StudiesRoom 1510, Building JSC 34 Alley 164, Khuat Duy Tien Street Thanh Xuan DistrictHa Noi, Viet NamTel: (04) 22 250 618
www.cecodes.orgFax: (04) 62 861935
Related Documents