International Symposium on TECHNOLOGY, JOBS AND A LOWER CARBON FUTURE: Methods, Substance and Ideas for the Informal Economy (The case of rice in India) 13-14 June 2013 PAPERS Venue Lecture Room II, India International Centre (Annexe) 40, Max Mueller Marg, New Delhi Organised by With support from

Welcome message from author
This document is posted to help you gain knowledge. Please leave a comment to let me know what you think about it! Share it to your friends and learn new things together.
Transcript
International Symposium on
TECHNOLOGY, JOBS AND A LOWER CARBON FUTURE:Methods, Substance and Ideas for the Informal Economy
(The case of rice in India)
13-14 June 2013
PAPERS
Venue
Lecture Room II, India International Centre (Annexe)40, Max Mueller Marg, New Delhi
Organised by
With support from
CONTENTS
1. Introduction
Barbara Harriss-White
2. India’s Informal Economy and The Value of Value Chain Analysis: A Case Study Of Rice
R. Hema
3. Costs, Returns And Value Additions For Four Methods of Rice Production And One Post Harvest
System
R. Hema
4. Baselines and Boundaries For Rice LCA
Alfred Gathorne–Hardy
5. Fusing Life Cycle Assessment (LCA) And Value Chain Analysis (VCA) In The Informal Economy
Alfred Gathorne–Hardy and R. Hema
6. A Life Cycle Assessment Of Four Rice Production Systems: High Yielding Varieties, Rain-Fed Rice,
System Of Rice Intensification And Organic Rice
Alfred Gathorne–Hardy
7. Embodied Emissions and Dis-Embodied Jobs: The Environmental, Social and Economic Implications
of the Rice Production-Supply Chain In South East India
Alfred Gathorne–Hardy
8. SRI Cultivation in Andhra Pradesh: Achievements, Problems and Implications for GHGs and Work
D.N. Reddyand M. Venkataranarayana
9. Production And Exchange Relations In Rain-Fed Agriculture: The Case Of Rice In Odisha
Deepak Mishra
10. Employment, Working Conditions And The Supply-Chain Procurement Process For Rice Retailed In
Chennai
Gautam Mody, Mohan Mani and Meghna Sukumar
11. The Micro-Political-Economy of Gains by Unorganised Workers In India’s Informal Economy
Barbara Harriss-White and Valentina Prosperi
12. The Regulation Of Markets And The Interface Between Formality And Informality
Aseem Prakash
13. ‘Pudumai’- Innovation and Institutional Churning in India’s Informal Economy: A Report From The
Field
Barbara Harriss-White and Gilbert Rodrigo
14. Evaluating Alternative Technologies And Policies: Multicriteria Mapping
Barbara Harriss-White

2
INTRODUCTION
Barbara Harriss-White
3
International Symposium on
TECHNOLOGY, JOBS AND A LOWER CARBON FUTURE:METHODS, SUBSTANCE AND IDEAS FOR THE INFORMAL ECONOMY
(THE CASE OF RICE IN INDIA)
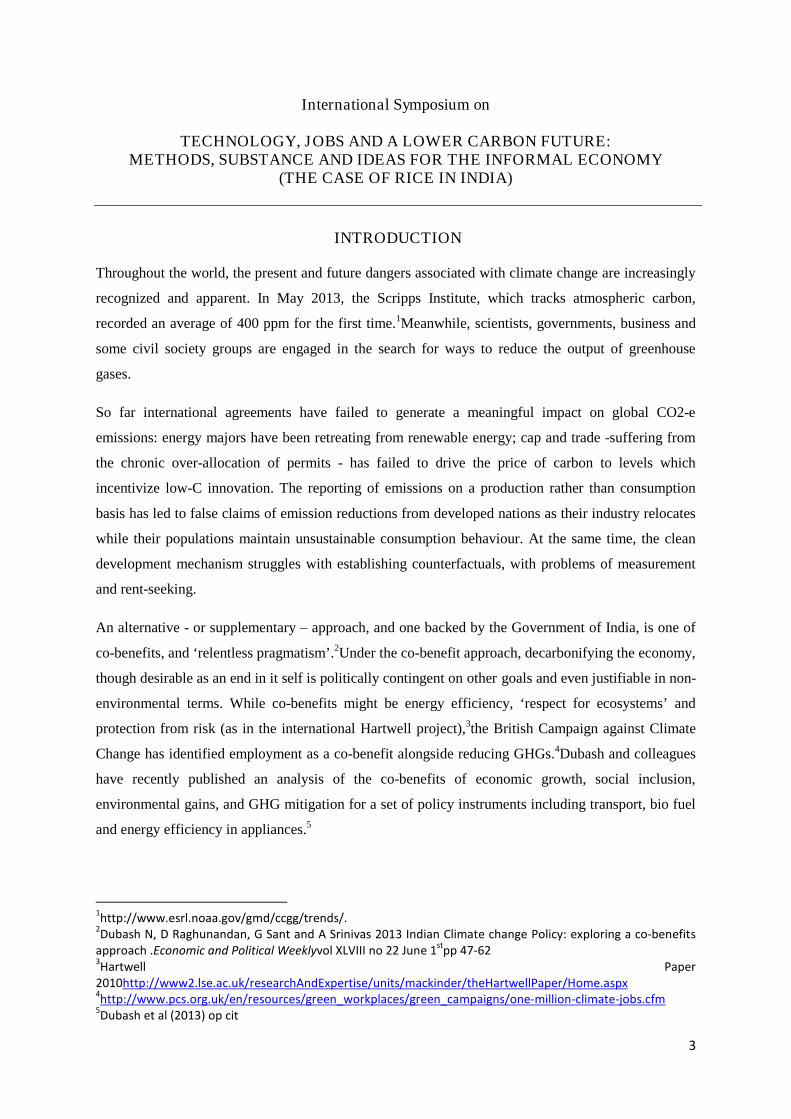
INTRODUCTION
Throughout the world, the present and future dangers associated with climate change are increasingly
recognized and apparent. In May 2013, the Scripps Institute, which tracks atmospheric carbon,
recorded an average of 400 ppm for the first time.1Meanwhile, scientists, governments, business and
some civil society groups are engaged in the search for ways to reduce the output of greenhouse
gases.
So far international agreements have failed to generate a meaningful impact on global CO2-e
emissions: energy majors have been retreating from renewable energy; cap and trade -suffering from
the chronic over-allocation of permits - has failed to drive the price of carbon to levels which
incentivize low-C innovation. The reporting of emissions on a production rather than consumption
basis has led to false claims of emission reductions from developed nations as their industry relocates
while their populations maintain unsustainable consumption behaviour. At the same time, the clean
development mechanism struggles with establishing counterfactuals, with problems of measurement
and rent-seeking.
An alternative - or supplementary – approach, and one backed by the Government of India, is one of
co-benefits, and ‘relentless pragmatism’.2Under the co-benefit approach, decarbonifying the economy,
though desirable as an end in it self is politically contingent on other goals and even justifiable in non-
environmental terms. While co-benefits might be energy efficiency, ‘respect for ecosystems’ and
protection from risk (as in the international Hartwell project),3the British Campaign against Climate
Change has identified employment as a co-benefit alongside reducing GHGs.4Dubash and colleagues
have recently published an analysis of the co-benefits of economic growth, social inclusion,
environmental gains, and GHG mitigation for a set of policy instruments including transport, bio fuel
and energy efficiency in appliances.5
1http://www.esrl.noaa.gov/gmd/ccgg/trends/.
2Dubash N, D Raghunandan, G Sant and A Srinivas 2013 Indian Climate change Policy: exploring a co-benefits
approach .Economic and Political Weeklyvol XLVIII no 22 June 1st
pp 47-623Hartwell Paper
2010http://www2.lse.ac.uk/researchAndExpertise/units/mackinder/theHartwellPaper/Home.aspx4http://www.pcs.org.uk/en/resources/green_workplaces/green_campaigns/one-million-climate-jobs.cfm
5Dubash et al (2013) op cit
4
Yet so far this view has not found much favour in India where a vast majority claims the right to
pollute. In terms of stocks, an incontrovertible argument framed in justice has it that India has played
a negligible role in producing the planetary stock of pollutants. In terms of flows, India defends the
right to use coal-based electricity in a development project to eliminate poverty. Indeed, its emissions
are very low on a per caput basis.
By contrast it is a small minority which suggests that development based on fossil fuel is a luxury
India cannot afford - owing both to the rate of degradation of the natural environment and the rate of
addition to a workforce that is underemployed as a consequence of the current development model.
However moving directly towards a low-C transition involves pioneering development strategies
without precedent: no country – whether so-called advanced or developing – has yet achieved this.
If this were not difficult enough, while the major polluting industries have been comparatively well
studied (iron and steel, energy itself, cement, aluminium, fertilizer and paper/pulp), very little
attention has been paid to greenhouse gas production in the informal sector at both the national and
international scales.
Informal activity dominates the economies of many countries, and is growing globally.6 In countries
like India, 9 out of 10 livelihoods, and 60% or more of GDP, are in the informal economy. The
boundary between the formal and informal -the state-regulated and the socially regulated - economy is
becoming ever more complex. Formally registered big polluters have a growing portion of their
labour forces unregistered and in formalised. The formal sector may ‘leak’ materials into the informal
sector – 25 % of India’s coal has been estimated to seep out to be marketed in this way, and a
significant part of the transmission and distribution losses in India’s electricity grid is being tapped as
a ‘free’ energy source for informal activity.7The informal economy is a major consumer of goods
from the big polluting sectors of the economy. It is also an epicenter of poverty and provides the worst
quality of jobs. India’s trajectory of ‘jobless growth’ does not factor-in the high quantity of low
quality livelihoods in the informal economy. Last but not least, the informal sector is by definition
hard to reach through the normal processes of policy making and implementation. It is where policy
doesn’t directly reach. Beyond a highly contested interface with the state, the informal economy is
regulated through business associations and social institutions, including those of identity.
Any move towards lowering the carbon content of the informal economy should also offer better
quality work if it is to succeed. Knowledge about the roles of informal firms and informal work/
activity is therefore also as essential as is knowledge about GHGs.
6In China it was unknown 30 years ago and now is estimated to account for over 40% of the economy (WIEGO).
In Europe it has been estimated at 20%.7Kuntala LahiriDutt
5
The economy needs to be seen in an integrated way as a provisioning system of capital (technology)
and labour, producing commodities and waste. Waste may be solid, liquid or gaseous.
The research brought together in this symposium set out to measure materiality in the form of inputs –
not confined to conventional factors of production but focusing on energy and water; and outputs - not
confined to products and by e-products but focusing also on gaseous waste - greenhouse gases - in the
informal economy.
Why choose rice?
The honest answer is that most of the team of researchers who joined forces for this project8 have
backgrounds in biological sciences and rural/agrarian development. And though the British
researchers are actively involved in strengthening the inadequate British response to climate change
there, by training they are India specialists.
Rice has been chosen NOT because it is a big polluter (though the global food system and land-based
activity is thought to account for up to 32%9of total GHGs) but because:
i) Rice is bio-physically complex – emitting a range of different GHGs as well as sequestering
carbon, so it is scientifically interesting;
ii) Rice is socio-technically complex – not only in production but also in marketing , hence of
social scientific interest;
iii) Resources, employment and poverty are entwined in production-distribution systems so rice
is of interest for policy;
iv) Production and distribution in rural and urban sites and flows weave in and out of the
informal economy–making it of theoretical and policy interest;
v) Food is said to be generally exempt from the international scenarios lowering emissions
(Anderson/Royal Society 2011) i.e. it is a political special case (but how special?)
The growing literature on climate change and rice10 stresses its vulnerability to temperature rises,
weeds and pests; rain and crop failure. It predicts future yield declines in many areas where rice is
presently grown. These will have a critical impact on food prices and food security especially if there
is no substantial change in access and utilisation (for India’s great achievement in production is not
mirrored in nutrition where 47% of under-5s are malnourished - throughout the income distribution).
8The host is the Institute of Human Development, New Delhi where Prof D Narasimha Reddy represents the
project. Other institutions are: the Madras School of Economics (Prof Hema); Jawarhalal Nehru University (ProfDeepak Mishra); Jindal Global University (Prof Aseem Prakash); National Institute of Rural Development,Hyderabad (Prof D Narasimha Reddy), the New Trade Union Initiatives, Delhi (Mr Gautam Mody), the Centrefor Worker’s Management, Bangalore (Mr Mohan Mani) and Chennai (Ms Meghna Sukumar). The Life CycleAnalyst is Dr Alfred Gathorne–Hardy, Area Studies, Oxford University. The team is co-ordinated by ProfBarbara Harriss-White, Area Studies, Oxford [email protected]://www.southasia.ox.ac.uk/resources-greenhouse-gases-technology-and-jobs-indias-informal-economy-case-rice9Bellarby J, Foereid B, Hastings A and Smith P (2008).Cool farming: climate impacts of agriculture and
mitigation potential. Amsterdam, Greenpeace10
Reviewed inNelson et al, IFPRI, 2009
6
The scientific agenda for the response of rice to climate change homes in on i) crop-livestock
research on inter-relationships of physical stress; ii) irrigation management; iii) biotech innovations
(including hybridity and GM); iv) collective action/farmers’ groups (for information and
dissemination, watershed management and perhaps for economies of scale in marketing).11It is
evident that the agenda has a focus on adaptation rather than mitigation.
The research reported in this symposium however has a normative focus on mitigation rather than
adaptation.
Our research has had to grapple with non-trivial problems of epistemology and method. The way
knowledge is being constructed in the 21stcentury obstructs integrated research. Climate science and
climate change policy, material life cycle assessment, the informal economy, value/supply chains,
labour studies, policy studies, science and technology studies, agriculture, agricultural markets and
rice are all specialist subfields with their own terminology, literatures and career tracks. For instance
the value chain literature neglects labour; as do most climate change scenarios. Science and
technology studies while routinely neglecting labour also neglect the informal economy - and so on.
Multi-disciplinary research rarely succeeds in integrating these knowledge fields. In spanning science
and social science, our research problem is trans-disciplinary and faces even more theoretical and
methodological inconsistencies and quirks than does multi-and inter-disciplinary research.
We have addressed these problems in an on-going process of mutual teaching and learning. 12
Starting with a sector of the economy13 and with the science, life cycle assessment (LCA) has been
grafted onto supply/value chain analysis (VCA). LCA measures GHGs at all stages of a production-
consumption process from raw materials procurement to the waste disposal at the end of a
consumption process. VCA has a similar concept of a ladder/chain and seeks to compute value added,
rents and potential for technological / managerial upgrading. In biophysical and social terms these
subfields from environmental science and management economics take as systems approach, one
which is appropriate for the institutions of production and distribution of rice.
Fieldwork on the physical and economic parameters of every stage of production-distribution has
been conducted in three states (Odisha, Andhra Pradesh and Tamil Nadu) on four systems of rice
production (rain fed, SRI, HYV and organic) and 3-4 distribution circuits (informal; registered firms;
supermarket supply chains and the Public Distribution System (the last is unfinished as yet)). We had
also hoped to differentiate small and large farms and firms but while this was possible for parts of the
11ibid
12http://www.southasia.ox.ac.uk/learning-workshop-materiality-rice-world-institute-sustainable-energy-pune-
and-contemporary-south13
The alternative scientific approach, material flow analysis, takes a unit of territory – a region ( e.g. the EU,country (Austria), town (York and Limerick have been studied) or village (a case in Turkey). It is too dataintensive to be appropriate for a pilot project in the informal economy.
7
distribution system, the data on production is from a set of overwhelmingly small farms. In the Orissa
and Andhra research the micro-level variations in production technologies known and labeled as rain-
fed’ and ‘SRI’ have been explored.
Research on energy and materials efficiency leads to normative questions: how to scope and to
analyse technologies and policies reducing environmental impact in the informal economy? Here we
experiment with one of the family of multi-criteria analytical methods – multi-criteria mapping. These
methods are being developed to examine the trade-offs between multiple objectives (co-benefits) and
incommensurable dimensions of social choices.
Over the past two decades, research on the quality of work and production relations has led to a
conceptual forest of indicators - 125 in the ILO’s Decent Work framework – failing to develop a
multi-dimensional summary indicator fit for comparisons. While labour unions are frequently
airbrushed out of public debate as ‘stakeholders’ of development, an Indian trade union initiative,
with a focus on unorganised as well as unionised labour, has actively contributed to two aspects of the
project. First using their experience to identify key aspects of the quantity and quality of work from
the ILO’s multitude of indicators, and second developing a labourist analysis of the supply chain.
Meanwhile the material life cycle analyst has developed new summary indicators of work by means
of which the trade-offs between costs and returns, work and GHGs may be ascertained.
Finally the research reported here provoked a series of cross-cutting themes, all concerning the
informal economy:
i) Why does regulation formally intended to cover the entire economy not do so? This required
attention to the socio-political limits to the reach of the state’s regulative policy, the interface
between state and non-state regulation, and the forms of regulation of the informal economy.
These have been studied through cases of transport (Haryana) and the parallel electricity
system in Bihar.
ii) Given that real casual wages have been rising since 2005, how does unorganised labour make
gains in the informal economy and what kind of gains have been achieved in the quality of
work? This question generated a review of literature on the macro- and micro-politics of
informal employer-employee relationships.14
iii) The question, relevant to a low carbon transition, whether the informal economy is an
obstacle to innovation and technical change (studied through the case of a town in northern
Tamil Nadu).
14Barbara Harriss-White with Valentina Prosperi 'The Micro-Political-Economy of Gains By Unorganised
Workers in India’s Informal Economy' January 2013 Work in ProgressPapershttp://www.southasia.ox.ac.uk/working-papers-resources-greenhouse-gases-technology-and-jobs-indias-informal-economy-case-rice
8
The purpose of the symposium is to present results, to discuss and defend methods, to open our pilot
project to critical scrutiny, and to speculate about the implications for public action/policy and for
further research.
When all the greenhouse gases are factored in to the systems we have modeled, some of the results
prove to be surprising and the implications for technological alternatives provoke debate. Our pilot
project will be vindicated if further directions are taken for rice15 and if new applications are
developed for other sectors of the informal economy. 16
15Candidates are hybrid/ GM rice; and the integration of biodiversity and resilience to shocks into the rice
production-distribution system.16
The construction sector, and livestock intensification are two possible candidates.
9
INDIA’S INFORMAL ECONOMY AND THE VALUE
OF VALUE CHAIN ANALYSIS: A CASE STUDY OF RICE
R. Hema
10
INDIA’S INFORMAL ECONOMY AND THE VALUE OF VALUE CHAINANALYSIS: A CASE STUDY OF RICE
R. Hema17
Introduction: Climate Change and Agriculture
The total GHG emissions from India in 2007 were estimated to be about 1904.73 million mtCO2e, by
the Indian Network for Climate Change Assessment. The agriculture sector contributed to about 19
percent of these emissions and was the third highest contributor after energy and industry. Within
agriculture, rice cultivation using the puddled-transplanted technique, accounted for 21 percent of the
emissions with bulk of it as methane. Globally, the agriculture sector is estimated to contribute
directly about10 to 12 percent of the total GHG emissions (Smith P et al, 2007, IPCC Fourth
Assessment Report) and by 2030 the emissions from this sector are expected to increase by 50
percent. Hence, there is an increasingly urgent need to tackle the impact of agriculture on climate
change, by mitigating the GHG emissions from this sector.
Climate change is also having an adverse impact on agriculture. Rising mean temperature and
increasing variability/volatility in precipitation rates are expected to have a negative impact on
agricultural yields, more so in tropical and developing countries. In the Indian context, two thirds of
the sown area in the country is drought prone and about 40 million hectares are flood prone which
gives an indication of the degree of vulnerability of agricultural production to climate change. (Centre
for Sustainable Agriculture).It has been estimated that over the forty year time period between the
mid-fifties and mid-nineties, the climate sensitivity of net revenue from agriculture has increased over
time and has been more pronounced between the eighties and nineties (Kavi Kumar, 2009). There is
also growing evidence of declining agricultural productivity during the same period. In the case of
rice in India, climate change is projected negatively to affect the yields of irrigated rice by about 10
percent in the majority of the coastal districts, to increase the yield of rain-fed rice in the east coast by
about 15 percent and reduce the yield of rain-fed rice in the west coast by 20 percent (INCCA, 2010).
Hence, from the perspectives both of mitigation and of adaptation, there is a compelling need to shift
away from the current dominant technologies and farming practices and move towards low carbon,
climate resilient and sustainable crop management systems.
17Madras School of Economics, Gandhi Mandapam Road, Chennai – 600025. E-mail: [email protected]
11
Various technologies and farming methods have been identified that could potentially mitigate the
GHG emissions from agriculture and also sustain ecological balances. Pathak and Aggarwal (2012),
based on a two year on-farm study of rice and wheat in Punjab evaluated twenty technologies in the
production of rice and ten technologies in the production of wheat for their impact on Global
Warming Potential (GWP) and their impact on net returns compared to the conventional puddle-
transplanted rice and conventional tilled wheat. In the case of rice they found that most of the
technologies (e.g. aerobic rice, system of rice intensification, direct seeded rice, sprinkler irrigation,
zero till) that had good potential to lower GWP were also significantly lowering net returns. Hence,
significant transition costs exist in shifting to these regimes and appropriate policy measures and
public interventions would be needed to encourage the adoption of the GWP mitigating technologies
and practices.
The issue is further compounded by the fact that, currently, the agriculture sector in India and large
sections of the population that derive their livelihood from it are in dire straits. Current models of
farming are proving to be economically unviable for millions of farmers (Centre for Sustainable
Agriculture). While public spending on chemical fertilisers is dramatically increasing on the one hand,
the chemical based intensive farming technologies are degrading productive and ecological resources
and causing local environmental health disasters in many regions. The indiscriminate and widespread
use of groundwater is seriously compromising water security. Over 50 percent of the population still
depends on this sector whose contribution to GDP accounts for only 15 percent. Over 50 percent of
India’s poor population are located in rural areas. Moreover, a significant part of agricultural and
related activities are part of the country’s informal economy. This means mitigation and adaptation
policies or public interventions affect those who derive their livelihood from this sector not directly
but instead in indirect and complex ways that may not be immediately evident. In this context, if we
want to move towards an agricultural regime in India that helps reduce its GHG emissions and at the
same time addresses issues of financial viability and livelihood opportunities, we need to have a
holistic understanding of the feedback relation between agricultural technology and climate change.
We need to understand the implications of further technological change for the long-term
financial/economic viability of agriculture, and for the quantity and quality of employment
opportunities. We also need to understand the formal and informal social and economic institutions in
which these technologies are embedded.
This paper critically discusses the advantages of using the value chain analysis (VCA) to study
production and distribution in the context of climate change and informality. First, the conceptual
framework in which VCA has evolved is outlined and its origins and history are traced. The various
contexts in which VCA has been used so far are then briefly surveyed. The paper then discusses
12
critically the merits of using this tool, in tandem with Life Cycle Analysis (LCA), to understand the
multi-dimensional and multi-layered implications of possible shifts towards a lower carbon growth
path (see Gathorne-Hardy, session IV, here). It also presents a methodological framework for its
adaptation to an informal economy, using rice in India as the case study. While the methodological
design has been developed for this application, in a broader and less nuanced sense it would be
applicable to informal economies in other sectors and other locations too.
Value Chain Analysis – Conceptual Background
In his seminal work on ‘The Nature of the Firm’, Coase (1937) raises the following questions: why do
firms exist? Why can’t all transactions happen through market exchanges? Alternatively, why can’t
all production and transactions happen in one giant firm? The ‘market’ is a framework where
production decisions and resource allocations are coordinated by the price mechanism through a series
of exchange transactions by ‘firms’. Inside a firm the price mechanism is superseded by the
entrepreneur/coordinator whose coordination and authority directs production and resource allocations
through a ‘hierarchy’. Coase indicates that the boundaries of the firm are determined by whether it is
cheaper to organise an additional transaction within the firm or to carry out this additional transaction
through a market exchange. (See the Appendix for the concepts and connotations of some of the terms
used in this and following sections).
Williamson (1971, 1973, 1979,) expanded this argument and sharpened the focus on factors
determining the costs of transacting through the market and of transacting within a firm. He
recognized that when buyers and sellers have to make transaction-specific investments in human or
physical capital, the costs of these investments reduce flexibility for the parties involved to transact
with any other seller or buyer. Given the human potential to take advantage of this tie-in and engage
in opportunistic behaviour, he argued that the parties to the transaction would prefer to enter into a
contractual relation. The nature and time-frame of the contract would depend on the degree of asset
specificity and the life of the asset. The costs involved in designing, monitoring and enforcing these
contracts are the costs of transacting through the market. Also, as indicated by Simon (1947), human
rationality is bounded, and hence designing a complete contract that can spell out the terms for all
possible eventualities is almost impossible. Given this, in certain cases, vertical integration may be a
cheaper option. In the case of transactions within a firm, when the firm expands, the information
asymmetry between the owners, managers and workers increases and leads to agency costs and
bureaucracy costs. In response to the nature and magnitude of the costs involved in transacting
through the market vis-à-vis transacting within a firm, ‘governance structures’ evolve to determine
and assign property rights so as to minimise the total transaction costs. Hence, there exists a spectrum
13
of governance structures within which the vertically integrated firm and the market can be envisaged
as governance forms at the two ends of the spectrum with a range hybrid forms in between.
Once we move away from pure market transactions that take place under conditions of perfect
competition, transaction costs can exist. The resulting governance structure determines the property
rights assigned to the different agents engaged in the economic activity and this will have a strong
bearing on the magnitude of economic ‘value’ that is created and on how this value gets to be shared.
Economic ‘rents’ could also be generated and enjoyed by some agents.
The Historical Evolution of Value Chain Analysis
Value chain analysis has evolved for global supply arrangements. The post-world-war years witnessed
a phenomenal growth in technology. Many firms worldwide expanded in terms of their scale of
production and also vertically integrated into backward and forward linkages in order to take
advantage of economies of scale, economies of scope and potential market power. In the early post-
war decades market access was largely within national boundaries and access to international markets
was determined by various bilateral/multilateral trade agreements, barriers/incentives created by the
importing and exporting countries, the existence and role of monopolistic state trading enterprises and
so on.
Since the eighties, with the advent of globalization, the barriers to the global flow of information,
ideas, technology, factors and goods have been reduced. Greater and easier access to international
markets has enabled greater specialization, the exploitation of comparative advantages and the
development of competitive advantages between regions, countries and firms. Firms could access
inputs from anywhere in the world where costs were minimised. They could outsource production of
some of their components or some of their services to wherever it could be done more efficiently and
could expand their markets into new countries. ‘Transnational’ and ‘multinational’entities emerged
and their production and service activities (input sourcing, manufacturing, assembling, marketing etc.)
were dispersed across different parts of the globe. To coordinate activities sited in geographically
dispersed regions, within diverse socio-political institutions and macroeconomic conditions, and to
ensure quality, timely delivery and acceptable environmental standards, significant transaction costs
had to be incurred. In response, non-market governance structures in the form of tightly specified
contractual arrangements evolved to reduce these transaction costs.
In this scenario, the global market share and profit margins of firms in a given sector within a given
country would not only depend on their production efficiencies and on national policies but would
also depend on trade policies in the countries of its final markets, in the market structure for retail in
destination countries, in the degree of market power in input markets (which may be in another
14
country) as well as the governance structure coordinating the activities of the globally dispersed links
within the sector. As a result, the relative shares of labour and capital, of skilled and unskilled labour,
of production activities and marketing services, of the different countries across which the range of
activities happen, in the income generated from the given sector became more complex and dynamic.
The traditional firm-specific or industry-specific approach proved inadequate to unravel these
complexities.
Value Chain Analysis emerged as a useful methodological tool in this context. Value Chain Analysis
(VCA)was developed largely from two strands of literature: the literature on business strategy and
organization following Michael Porter’s Competitive Advantage (1985) and the literature on global
commodity chains following Gereffi and Korzeniewicz (1994). The ‘value chain’ is defined by
Kaplinsky and Morris(2000) as “the full range of activities which are required to bring a product or
service from conception, through the intermediary phases of production, delivery to final consumers,
and final disposal after use”. It is basically a descriptive construct that provides a framework for the
generation of data for the entire range of activities within and across the various links in the chain.
Value chain analysis is similar to the filiere analysis used by French scholars to understand the
processes of contractual agreements and vertical integration in French, French-colonial and ex-
French-colonial agriculture from the sixties.
Value chain analysis is a heuristic framework for the generation of data to document the nature of
inter-linkages, the flow of goods & services and the pattern of value addition or income generation
within a chosen commodity chain. Value chains, however, are seen to be repositories of economic
rents and the role of governance is central to the power relationships within the chain. These power
relations in turn influence the shares that different actors within the chain can appropriate from the
total value addition in the chain. The underlying institutional arrangements (the social, political and
economic environment) in which they are embedded and the nature of comparative advantages or
market power for different links in the chain have a bearing on the governance structure. Hence, the
value chain provides a framework to gain useful insights about the combination of technical,
institutional and governance aspects within and across various links of a chain. Such insights can
inform strategic decision-making and effective policy making.
VCA as an Analytical Tool
The increasing integration of economic activities across the globe starting from the eighties opened up
a lot of opportunities for firms and countries to participate and derive benefits from the process. At the
same time there were also potential dangers for some players, ‘links’ in the new global commodity
chains. As the latter evolved, it was increasingly recognized that production efficiencies alone would
15
not suffice to participate and gain from the global competition. What was needed was systemic
competitiveness, where the entire chain would be ‘lean and efficient’. Firms began to identify their
core competencies and chose to outsource production processes and services that were not part of
their core competencies. The governance structures for these chains were mostly hybrid varieties
between market and hierarchy, involving various forms of contractual arrangement. Dynamic
opportunities and disadvantages were created for different economic agents. In response to changing
opportunities and constraints, the composition of value chains and their governance structures were
constantly changing in bids to lower the sum of production and transaction costs. For example, the
Hong Kong clothing industry initially produced directly for the US market during the regime of the
Multi-Fibre Arrangement which imposed quotas on textile imports. When the HK quotas were
exhausted, the same entrepreneurs shifted position in the value chain and started coordinating the
production of clothes in other countries like China and Mauritius and passing them to final markets in
the US and Europe. Later, they started branding their products and in some cases purchased retail
outlets in Europe and the US to sell their branded items (Kaplinsky and Morris, 2000). In this context,
VCA became an important tool for both industry and the state to inform decision-making, develop
strategies and frame policies.
VCA for Industry
During the nineties, VCA was used largely in the context of industrial manufacturing activities.
Automobiles, leather shoes and accessories, textiles were among the major sectors which started to
outsource in a big way. VCA was used to understand how systemic competitiveness could be
developed; to learn where and how input markets could be tapped for cost efficiencies; to identify
segments in the chain where economic rents would be available and could be exploited; to identify
technologies and management practices for upgrading so as to improve competitiveness and ensure
participation in the chain; to explore and identify potential governance structures that would help
maintain quality, on-time supply, environmental standards etc that would help minimize transaction
costs.
Globalization has also had significant impact on income distribution both between countries and
within countries. Some countries have witnessed immense rising growth, where their economic
activities have been increasing in terms of employment and output but their terms of trade are falling.
The terms of trade for countries specializing in primary commodities declined with respect to
manufactured commodities. Income distribution within countries and between skilled and unskilled
labour became more skewed. In all these cases VCA came to be used as a convenient tool to
understand the income generated– and participants’ shares - in different links of the chain.
16
VCA for Agriculture
In the case of agricultural commodities, Gibbon (2003) indicates that the share of agricultural
products in global trade fell from 35 percent in 1950 to 9 percent in 2000 according to the World
Trade Organization’s (WTO) International Trade Statistics. The terms of trade of agro-commodities
had declined sharply by 66 percent over the twentieth century with a 10 percent decline happening
during the last decade of the century. During the sixties and seventies however, there had been an
unprecedented convergence of interests among aid agencies in promoting healthy agro-commodity
based economies in developing countries. Development thinking and assistance saw agro-
commodities’ production as a critical object of global economic stabilization and an obvious vehicle
for the capitalist modernization of developing countries (Gibbon, 2003). Aid agencies invested
heavily in diffusing agro-commodities and increasing their productivity. In fact, during the eighties
the total volume of global agro-commodities exports went up by 40 percent. This was due to public
interventions which pushed up prices. Since the mid-late eighties many of the classical instruments of
public intervention in relation to agro-commodities like the international commodity agreements,
public marketing boards and national cooperative unions disappeared. Against this background, agro-
commodities were marginalised in development thinking and in the activities of development
agencies.
At the same time, agricultural commodities continued to play a major economic role in many
developing countries and more so in least developed ones. Since 2000, there has been a revival of
interest in agro-commodities and aid agencies have been looking for ways in which developing
countries could participate and gain from the expanding global markets. International business has
been exploring the incorporation of local food production into supermarket supply chains, supported
by international aid agencies, their problem being twofold: first the mobilisation of vast numbers of
suppliers of small market surpluses, sometimes of perishable goods, of variable quality standards and
second, the enforcement of terms and conditions of supply within economic jurisdictions lacking a
legal framework for regulation.
A large number of studies have been undertaken using the VCA approach for agricultural
commodities in developing countries of Africa and Asia. Most of these have been sponsored or
carried out by development banks like the World Bank and Asian Development Bank and by
development aid agencies like AusAID, USAID, and IDRC, Food and Agriculture Organization of the
United Nations, International Food Policy Research Institute and so on. In these studies VCA has
been used to address a whole range of questions and issues which may be summarised as follows:
- Understanding the various links in the chain and the functional aspects of the chain in terms
of technical operations involved, inputs and outputs, economic agents involved, physical
flows along the chain, bottlenecks and opportunities (e.g. wheat and rice value chain, Uttar
Pradesh, India, McCarthy, 2008)
17
- Identifying the potential for upgrading technology, management and organizational structure
for economic agents at different links to enhance efficiencies and financial gains (e.g. green
bean value chain, Kenya, Webber, 2010)
- Understanding the markets for inputs and outputs, the role of market power and the
implications of the market structure for the efficiency, value addition and distribution along
the chain (e.g. mango value chain, Kenya, Bellu, 2013)
- Analysing the institutional set-up within which the chain is embedded and understanding the
nature of organization, contracts and interactions, the potential for synergies and conflicts, the
roles of formal and informal rules, the roles of the public sector through policies, investments
(e.g. diary value chain, Pakistan, Australian Centre for International Agriculture Research)
- Assessing the socio-economic impact of value chains for improving food security, improving
nutrition, improving local welfare, and reducing poverty (e.g. maize value chain, Zimbabwe,
Bellu, 2013,rice value chain, Bhutan, Ghimiray, 2007)
- Understanding and building the potential comparative and competitive advantages for
economic agents effectively to participate and gain enhanced returns (e.g. rice value chain,
Cambodia, AusAID, 2006; African agriculture, Webber, 2010 )
- Organizing a significant number of small, economically weaker, farmers into associations to
enable them to participate directly in the final markets andto increase their financial rewards
(e.g. organic rice chain, Thailand, Van Dooren, 2005)
Decent Work and Value Chain Development
The International Labour Organization (ILO), as part of its ‘Green Jobs Initiative’, has been
‘supporting governments, employers and trade unions to promote environmentally sustainable jobs
and development in an environmentally challenged world’ (Wijesena, 2009, executive summary).
Green jobs are defined as jobs that are environmentally sustainable while also providing ‘decent
work’ for people. The ‘decent work’ concept is based on the notion that work is a source of personal
dignity, family stability, peace in the community, democracies that deliver for people, and economic
growth that expands opportunities for productive jobs and enterprise development (ILO). Through this
initiative, the ILO itself has been instrumental in developing value chains, one in Sri Lanka for the
Waste Management Authority and one in India for the diary cluster in Jabalpur. The approach was to
create a value chain with the involvement and support of local stakeholders and ensure strong
ownership by them. Value chain analysis was used in these cases to understand the segment and help
develop the ‘green’ value chain.
18
VCA and Greenhouse Gases
In the industrial and commercial sector, global companies are recognising that their GHG emissions
stretch well beyond their operations. Any business that is serious about reducing its impact on climate
change must assess the emissions across its entire chain. The Greenhouse Gas Protocol, which is an
international accounting tool for government and business leaders to understand, quantify and manage
GHG emissions, is most widely used in the business sector. For agriculture, there is not much
evidence of assessments of GHG emissions across entire value chains. Bolwig et al (2008) stress the
need for combining value chain analysis with livelihood and environmental analyses by integrating
the vertical and horizontal aspects of the value chains that affect poverty and sustainability. For the
environmental analysis, the paper suggests that it should address the local level impacts in terms of
biodiversity degradation, soil erosion, soil nutrient mining, soil and water contamination and
unsustainable use of water resources and the global impacts in the form of GHG emissions,
acidification, eutrophication, human toxicity and eco-toxicity. They do not explain how. They
emphasise instead the need to assess the rewards and risks of the vertical chain dynamics for the
poverty, gender, labour and environment dimensions within each horizontal element in the chain.
Examining existing social, labour and environmental standards in terms of the basis on which these
are set and implemented and also how they are adopted and verified will alone not suffice. The
literature suggests that the ‘positive’ impact of standards and certifications to protect workers, the
environment and social conditions of production, cannot be taken for granted. Worthy abstract
principles, when eventually applied in concrete situations have a variety of effects on differently
endowed countries, groups and individuals. Hence, in evaluating the costs and benefits of complying
with standards and certifications, it is also important to evaluate the vulnerability, risks and
inequalities faced by small producers or disadvantaged groups and areas (Bolwig, 2008).
The Limitations and Advantages of VCA
A static tool: The value chain analysis is a static accounting framework that captures the technical
aspects, flow and transformation of resources, creation of economic value, and generation and
distribution of income in a partial segment of economic activities that are interlinked. It does not
address the behavioural aspects of economic agents in response to changes in technological,
institutional or economic conditions. Moreover, the composition, relationships, internal governance
structure and market positioning of value chains in the liberalized and globalized economy are
dynamic. A static tool like the VCA in itself cannot capture these dynamic complexities.
Data requirements: To calculate costs and returns at every stage requires a large amount of data at
highly disaggregated levels and the analysis is a calculation-intensive exercise. In order to exploit the
full potential of this tool, the quantitative information capturing the flows of resources, costs, returns
and incomes through the chain must be complemented with a broader understanding of the
organizational/contractual nature of relationships existing between the various links of the chain and
19
between various economic agents, the governance structure that regulates these relationships and the
larger socio-political and economic institutions in and across which the chain is embedded.
Flexibility: However, since it captures and embodies the outcome of multiple factors and dimensions
across interlinked economic activities, it can significantly complement various other analytical
approaches – both quantitative and qualitative, and can be a very useful resource for policy making.
Appropriateness for Policy Applications: While it may not lend itself to a dynamic analysis, it can be
a very useful tool when quantum shifts in technology, policy framework, socio-political and economic
ideology or legal and institutional frameworks are envisaged. We develop this aspect in the next
section.
VCA as a Tool for Policy Making
The Food and Agriculture Organization of United Nations has published an exhaustive and very
comprehensive set of methodological guidelines and a VCA software tool for using value chain
analysis for policy making (Bellu, 2013).18Guidance is provided on how to set the boundaries of the
chain, how to identify important activities and agents, how to quantify the flows of resources and
money, how to estimate the user cost of capital, how to define and assess value addition, and so on. It
demonstrates how the VCA can be used to determine and measure the likely impacts of potential
policy options on the socio-economic system by using a set of appropriate indicators (e.g. net value
added, profit, share of factors in value added etc) and comparing their values for the base or reference
scenario without the policy and the counterfactual scenario with the policy. To build the
counterfactual scenario, appropriate socio-economic models can be used to describe and quantify the
most likely changes that the proposed policy is expected to have on the system. Using this
information, the likely values for the chosen indicators in the counterfactual scenario can be
estimated.
The guidelines also indicate how the value chain can be created and assessed for domestic prices vis-
à-vis international ones and for private (or market) prices vis-à-vis social prices.
A very useful tool, policy analysis matrix (PAM), is also presented which can help compare the
profitability or value added indicators based on market prices with those based on social prices, which
can assess the degree of government protection and un-distort prices affected by taxes and subsidies,
which can evaluate the environmental impacts of the base case scenario with a reference scenario and
so on. The guidelines presented are well complemented with practical case studies and their results.
18These guidelines initiate the users into the conceptual background and key notions involved and provide
detailed inputs for carrying out a value chain analysis in a practical way
20
Informal Economies, Sustainable Development and Value Chain Analysis
Informality: Agriculture and related activities in India (and in many other developing countries) are
largely part of the informal economy. This situation poses a new set of questions for VCA.
First, there is insufficient and deteriorating data available from existing secondary sources which can
capture the rich tapestry of inter-linkages between technology, organizational and governance
structures, jobs, market power, government policies, taxes and subsidies, social relations and
environmental and climate issues. There is no alternative to primary data collection.
Second, the informal economy is not directly regulated by formal policy processes. Its markets consist
of firms which are unregulated or selectively regulated. There is no alternative to empirical enquiry
into the manner in which markets and firms are selectively incorporated into the ambit of regulation
and policy. This enquiry must also examine the alternative institutions of regulation to those of the
state (Prakash, 2013).
Third, VCA has been developed for multi-sited sourcing and for systems of production and
distribution in multiple national jurisdictions, whereas the value chains for an agricultural commodity
like rice in India are not yet governed in a dominant manner by the demand of international
destinations (even if national prices are now affected by the world market for rice and the commodity
is increasingly exported). Our research approaches the adaptation of VCA to local conditions in
several ways. It examines the equivalent to the national jurisdiction in a global VC inside India and
takes sites in several states with their different policy environments. Instead of variation in national
regulative jurisdictions it also examines variation in the effects of agro-ecology (Gathorne-Hardy,
2013; Mishra, 2013; Reddy and Venkata Naranaya 2013). It further sets out to examine the
governance relations in the new scale of (supermarket) business sourcing rice from multiple sites
(Mani, Mody and Sukumar, 2013).
Fourth, the concept of the governance structure has been necessary to develop for vertical integration
and the terms and conditions of outsourcing contracts. In the informal economy the existence of
equivalent relations of governance must be established. Relations of authority governing transactions
in the informal economy are known to be rooted in social institutions and business associations. Debt,
advance payment and delayed repayments are widely used to control the quantity and quality of
supplies (Harriss-White, 2003).
Fifth, production-marketing systems in the informal economy are known to be complex, while the
value chain is stylised. As in the establishment of boundaries for Life Cycle Assessment so here there
is a mismatch between the comprehensive prior knowledge needed to establish the complexity of
informal supply chain structures and relationships in the informal economy– on the one hand – and
the stylised value chain – on the other. This problem is addressed by iteration: in particular by the
choice of regions and technologies for which there is a prior literature, and field researchers with
familiarity drawn from prior experience.
21
Sixth, in the informal economy the ‘entrepreneur’ is a small family firm, self-employed or employing
a small labour force, not a vertically integrated or flexibly specialised, multi-sited or out-sourcing
international firm. Since family labour is not paid wages, the small family firm takes a residual claim
that notionally covers the opportunity costs of family labour, the return on capital investments and
rewards for entrepreneurial effort. This will be addressed by imputing values for family labour and for
the return on capital investments and the balance would be the reward for entrepreneurial effort.
Sustainable Development: As indicated earlier, there is an urgent need to move away from the
currently dominant agricultural technologies and farming practices in India to maintain food security,
to increase financial viability and ‘decent’ livelihood opportunities while also addressing
environmental and climate change challenges. This calls for a quantum shift in technologies and
practices. The choice of the policy regimes to address this will determine technological outcomes and
the institutional arrangements. These in turn will influence the way agricultural and related activities
get organized and governed, the magnitude of value creation and the share of different economic
agents in it, the nature of labour relations and the social, political and economic outcomes. Once there
is a major shift, technology regimes and institutions could get locked in for a long period of time. In
this context, value chain analysis would be a ‘valuable’ tool to assess the likely environmental
implications of emerging technologies, or ‘techno-systems’ and their social, economic and political
relationships.
The VCA methodology could help build a good accounting framework for the baseline scenario.
Additionally VCA can lend itself to be complemented with various other tools and analyses like life
cycle assessment, multi-criteria analysis, cost-benefit analysis, welfare analysis and so on and will
help in evaluating the multidimensional implications of shifts in institutional constraints and
technology regimes for the informal sector.
Case Study of Rice
Our study of rice in India seeks to develop a combination of methods of inquiry and tools
(quantitative and qualitative) that enable a deeper understanding of the relations between costs and
profit (value addition), work, commodities and waste (GHGs)that are determined through a complex
of production-distribution systems or supply chains mostly operating in the informal economy. There
is a strong and urgent need to develop these methods of inquiry. Over 80 percent of the population in
the country depends on the informal economy for its livelihood and the majority of them are among
the disadvantaged groups in the society. Yet we have very little understanding of their incomes, terms
and conditions of work, job securities and so on.
Since this is a cross-sectional study, designed to account for regional variations in technology and
differences in the socio-political and bio-physical environments, four methods of rice production -
High Yielding Variety (HYV), System of Rice Intensification (SRI), rain fed rice and certified
22
organic rice - have been chosen, spread across the three states of Tamil Nadu, Andhra Pradesh and
Orissa. Four post-harvest supply chains – a traditional chain that caters to local markets (Orissa); a
common chain where paddy passes through a series of transactions of regulated markets / traders,
millers and wholesalers before ending up in retail stores whether supermarkets (formal registered
firms) (Tamil Nadu) or small informal firms; the procurement chain for the Public Distribution
System outlets (Tamil Nadu); and the chain for certified organic (Tamil Nadu).
VCA for Rice in India – Outline of a Methodological Framework
For the purpose of our study, the chain of activities from on-farm through trading, milling, transport,
wholesaling and retailing is considered. A basic flow chart of the value chain we are looking at is
presented below. Life Cycle Analysis is also carried out in tandem, for the same chain (Gathorne-
Hardy 2013). The boundaries, links, activities and agents of the chain have been chosen so as to meet
the requirements of VCA and LCA as spelled out in Gathorne-Hardy and Hema, 2013. The
questionnaires were combined for these two analyses and administered simultaneously to the
economic agents. Detailed information on bio-physical processes, technical processes, labour and
animal inputs, capital inputs, water and energy use, use of fertilisers, other operating costs and
revenues have been collected from a sample of economic agents at each stage. Capital costs are
annuitized and allocated to their uses based on acreage share or proportion of time used for rice. All
costs are estimated per hectare and per kilogram of rice, for normalization and for comparison with
GHG emissions per kilogram of rice.
Defining ‘value’ in the VCA
Many of the studies that have analysed value chains examine ‘value’ in terms of financial profits. In
some of these, it is not clear if capital costs and the opportunity costs of family labourhave been
included. In some cases, the value chain is analysed in terms of the share of the final retail price that is
received at each link of the vertical chain. This does not give a clear picture of the value created when
we don’t have information on the costs at each level.
In this study, ‘value’ is defined as the net value added. The value addition would be the difference
between the total revenue realised by a firm (or a farm) and the cost of all intermediate inputs. This
value addition accrues to labour in terms of salaries & wages (plus perks), to capital (including land)
in the form of rents or interest and to entrepreneurial effort and risk in the form of profits. Value
addition for each link in the chain is estimated, and compared, in terms of three conceptions of value
and cost: i) market costs, ii) economic costs and iii) social costs.
Value Addition at Market prices
All costs and revenues are calculated in terms of actual or imputed market prices. In this case, after
deducting payments for labour costs and cost of capital from the net value added amount, what the
23
entrepreneur earns is the financial returns for her/his efforts. Now if there are no distortions in the
market price for all the entrepreneur’s inputs then this would be the economic return too. However, if
large subsidies or taxes exist in some of the input or output markets then the financial return will be
different from the economic return. For example, if a farmer is earning positive returns when s/he
does not have to pay for electricity but ends up with negative returns if s/he were to pay for the true
cost of electricity, then in an economic sense s/he is generating negative value. So the financial returns
based on market value do not capture the true economic benefit of the activity. Hence, value addition
will also be calculated based on economic costs.
Value Addition at Economic Prices
For this, if prices in any of the markets for inputs or outputs are significantly distorted due to large
subsidies or very high taxes then these are undistorted by estimating the true cost to supply and these
costs are used to calculate the net value added. It would neither be feasible nor worthwhile to address
every little distortion in all markets. Hence for our context, only the prices of those inputs which
would be significant in terms of their share in total costs or in terms of their share in contributing to
GHG emission would be undistorted.
Market Imperfections and Value Added
Market prices undistorted by taxes or subsidies would reflect the true costs in an economic sense if the
markets are characterised by perfect competition. When there are market imperfections where some
sellers or some buyers have market power then the market price could be above or below the true
economic cost. In this case there would be some loss of value addition, called dead weight loss, which
occurs because the quantity of output produced in the market would be below the socially optimal
level. Additionally, the party to the exchange which has market power will be able to absorb a larger
share of the total economic surplus from the exchange. In our context we will not address this in the
value addition calculations. To calculate the true economic cost and to calculate the dead-weight loss
for markets characterised by market power would be a complicated exercise and has had be outside
the purview of this study.
Value Addition at Social Prices
Environmental pollution from an economic activity - like the GHGs from growing rice or burning
coal - are known as negative externalities because these are unintended and unvalued negative
consequences of the activity undertaken by producers to meet the needs of consumers. If neither the
producer nor the consumer pays for the damage caused, then the private costs of the activity differ
from the cost that incorporates the damage to society as a whole. In this context, to evaluate the cost
of the negative externality, the cost to society of the damage is calculated and added on. In our study
the social costs of gaseous waste - GHGs - alone will be computed. There are other local or global
24
externalities (solid: soil degradation and biodiversity loss, liquid: agro-chemically polluted water)
which we are not addressing here. Calculating the cost to society of GHG emissions is very complex
though. One way of doing this could be by imputing a price for the carbon. While there is a ‘market’
for carbon, the demand and supply of carbon in this ‘market’ is based on artificial constructs resulting
from decisions on political targets for emission reductions and the mechanisms designed for trade.
Hence the market price of carbon may not be a true indicator of the damage and its cost to society. A
large number of impact studies have been carried out to assess the global damage costs of climate
change. Meta-analyses based on these studies indicate potential damage costs per unit of carbon. This
estimate could be used; or the cost of mitigation needed to reduce one tonne of carbon could be used
as a proxy.
Conclusion
Information about the various concepts of costs, returns and value addition contained in the value
chain for rice can be combined with the information from the life cycle analysis. The relationship
between value added, economic costs and GHG emissions can be compared across the four different
techno-systems for rice and across the different post harvest links of the chain. VCA can also identify
the share of labour in value addition at each stage and the labour-profit relation (distributive share).
These measures can be combined with qualitative information to gain a holistic understanding of
labour benefits and labour relations within and across the different links of the chain.
Appendix
Concepts and Connotations
Agency costs: The costs to the ‘principal’ (shareholders of a company) who hires an agent (corporate
management) to act in its interest. Suppose the agent has different interests and more information and
acts in a manner that does not fully address the principal’s interests then the loss of benefits or the
costs of monitoring the agent or the costs of incentive mechanisms would be agency costs.
Economic agent: An individual, group of individuals or an entity (eg. a business, an authority, a non-
government organization)
Economic gain or surplus: All voluntary transactions take place because the buyer and the seller are
happier with the transaction than without. This means the benefit they get from the transaction is
higher than the cost involved. In the case of a buyer this benefit or surplus is defined as consumer
surplus and in the case of a seller it is producer surplus.
Firm: An entity within which a set of economic transactions are undertaken and are coordinated by
managers rather than through the price mechanism. For example, a freelance journalist exchanges his
services for monetary benefits in the market, whereas the services of a journalist working for a
25
newspaper company are coordinated by the management of the company subject to broad contractual
terms.
Governance Structure: A system of rules plus the instruments that serve to enforce the rules. It is also
an explicit or implicit contractual framework within which a transaction is located.
Institutions: The rules of the game – humanly devised constraints that structure human interactions.
They are made up of formal constraints (rules, laws, constitutions), informal constraints (norms of
behaviour, conventions, codes of conduct) and their enforcement characteristics.
Market: A physical or virtual medium through which buyers and sellers voluntarily transact and
where these transactions are coordinated by the price mechanism. In principle, any buyer or seller is
free to transact with any other seller or buyer. A market is said to be characterised by perfect
competition if there are infinite number of buyers and sellers, free entry and exit possibilities for all
buyers and sellers and full information. This is considered an ideal market where the price notionally
reflects the ‘true’ cost. In markets where relatively few sellers exist compared to the buyers (or the
other way round), agents have market power and they can influence the price to be more in their
favour and hence can derive a larger share of the total surplus. When there is a single seller and a
single buyer then the price is determined through bargaining; and, depending on their bargaining
strengths, the share of each in the surplus will get determined.
Property Rights: The rights vested with an individual or entity over a commodity or asset to own, use,
derive benefits from directly or indirectly, exchange, contract with others on the right to earn income
from or destroy. Such rights could also include right to clean air, right to decision-making, right to be
the residual-claimant in a contract and so on
Transaction: The process of exchange between buyers and sellers for economic gain
Transaction Costs; Costs incurred in executing a transaction e.g. costs of drawing up and enforcing
contracts, search costs, information costs, commissions to intermediaries and costs of bribes.
26
References:
Aghion, Philippe and Holden, Richard, 2011, ‘Incomplete Contracts and the Theory of the Firm:
What we Learned over the past 25 years’, Journal of Economic Perspectives, vol 25, no.2, 181-197
Agrifood Consulting International and Camconsult, 2006, Cambodia Agriculture Sector Diagnostic
Report, prepared for AusAID
Bellu, Lorenzo Giovanni, 2013, Value Chain Analysis for Policy Making: Methodological Guidelines
and Country Cases for a Quantitative Approach, Food and Agriculture Organization of the United
Nations
Bolwig, Simon et al, 2008, ‘Integrating Poverty, Gender and Environmental Concerns into Value
Chain Analysis’, Danish Institute for International Studies, Working Paper no. 2008/16
Centre for Sustainable Agriculture, ‘Sustainable Agriculture in the era of Climate Change’, Position
paper (undated) Civil Society Position Paper, fwsci.com/climate-change/Position-_paper_-_CSA.doc
Coase, R H, 1937, ‘The Nature of the Firm’, Economica, vol4, no.16, 386-405
Gathorne-Hardy, Alfred, 2013, ‘LCA Results for Rice production and Distribution’, InternationalSymposium on Technology, Jobs and a Lower Carbon Future: Methods, Substance and Ideas for theInformal Economy - The Case of Rice in India, New Delhi
Gathorne-Hardy, Alfred and Hema, R, 2013, ‘Fusing Life Cycle Analysis and Value Chain Analysis’,International Symposium on Technology, Jobs and a Lower Carbon Future: Methods, Substance andIdeas for the Informal Economy - The Case of Rice in India, New Delhi
Ghimiray, Mahesh et al. 2007, Rice Commodity Chain Analysis (Bhutan), Food and Agriculture
Organization
Gibbon, Peter, 2003, ‘Commodities, Donors, Value Chain Analysis and Upgrading’, paper prepared
for UNCTAD, Danish Institute for International Studies
Harriss-White B, 2003, India Working: Essays on Economy and Society, Cambridge University Press
Herr, Matthias and Muzira, Taprea, 2009, Value Chain Development for Decent Work: A Guide for
Private Sector Initiatives, Governments and Development Organizations, International Labour Office
INCCA, Ministry of Environment and Forests, Govt. of India, May 2010, ‘India: Greenhouse Gas
Emissions 2007’
INCCA, Ministry of Environment and Forests, Govt. of India, Nov 2010, ‘Climate Change and India:
A 4x4 Assessment - Sectoral and Regional Analysis for 2030s’
Kaplinsky, Raphael and Morriss, Mike, 2000, A Handbook for Value Chain Research, prepared for
the IDRC
Kavikumar, K.S, 2009, ‘Climate Sensitivity of Indian Agriculture’, Madras School of Economics,
Working Paper 43/2009
McCarthy, Stephen et al, 2008, Value Chain Analysis of Wheat and Rice in Uttar Pradesh, India:
Partnership for Innovation and Knowledge in Agriculture, USAID
27
Mishra, Deepak, 2013, ‘Rain fed Rice in Odisha: Production and Exchange Relations’, InternationalSymposium onTechnology, Jobsand a Lower Carbon Future: Methods, Substance and Ideas for theInformal Economy - The Case of Rice in India, New Delhi
Mody, Gautam, Mani, Mohan, Sukumar, Meghna, 2013, ‘Labour in the Supply Chain’, InternationalSymposium on Technology, Jobsand a Lower Carbon Future: Methods, Substance and Ideas for theInformal Economy - The Case of Rice in India, New Delhi
Pathak, H and Aggarwal, P K, (Eds) 2012, Low Carbon Technologies for Agriculture: A Study of
Rice and Wheat Systems in the Indo-Gangetic Plains, Indian Agricultural Research Institute
Prakash, Aseem, 2013 ‘The limits of formal policy processes in the informal economy – social,regulation and its implications for a low carbon transition’, International Symposium on Technology,Jobsand a Lower Carbon Future: Methods, Substance and Ideas for the Informal Economy - The Caseof Rice in India, New Delhi
Reddy, D.N, and Venkataranarayana, M. 2013, ‘SRI Cultivation in Andhra Pradesh: Achievements,Problems and Implications for GHGs and Work’, International Symposium on Technology, Jobs anda Lower Carbon Future: Methods, Substance and Ideas for the Informal Economy - The Case of Ricein India, New Delhi
Smith P et al, 2007, ‘Agriculture in Climate Change 2007: Mitigation’. Contribution of Working
group III, to the Fourth Assessment Report of the Intergovernmental Panel on Climate Change,
Cambridge University Press
Van Dooren, Corne, 2005, Rice Value Chain Analysis, IFAT/EFTA/FLO
Webber, Martin C and Labaste, Patrick, 2010, Building Competitiveness in Africa’s Agriculture: A
Guide to Value Chain Concepts and Applications, World Bank
Williamson, Oliver E, 1971, ‘The Vertical Integration of Production: Market Failure Considerations’,
The American Economic Review, vol. 61, no.2, 112-123
Williamson, Oliver E, 1973, ‘Markets and Hierarchies: Some Elementary Considerations’, The
American Economic Review, vol.63, no.2, 316-325
Williamson, Oliver E, 1979, ‘Transaction-cost Economics: The Governance of Contractual
Relations’, Journal of Law and Economics, vol.22, no.2, 233-261
Wijesena, Gemunu et al, 2009, ‘A green Value Chain Development Exercise in Jabalpur, India’, ILO
& OECD conference “Routes out of the Crisis: Strategies for Local Employments Recovery, Skills
Development and Social protection in Asia”, Indonesia, December.

28
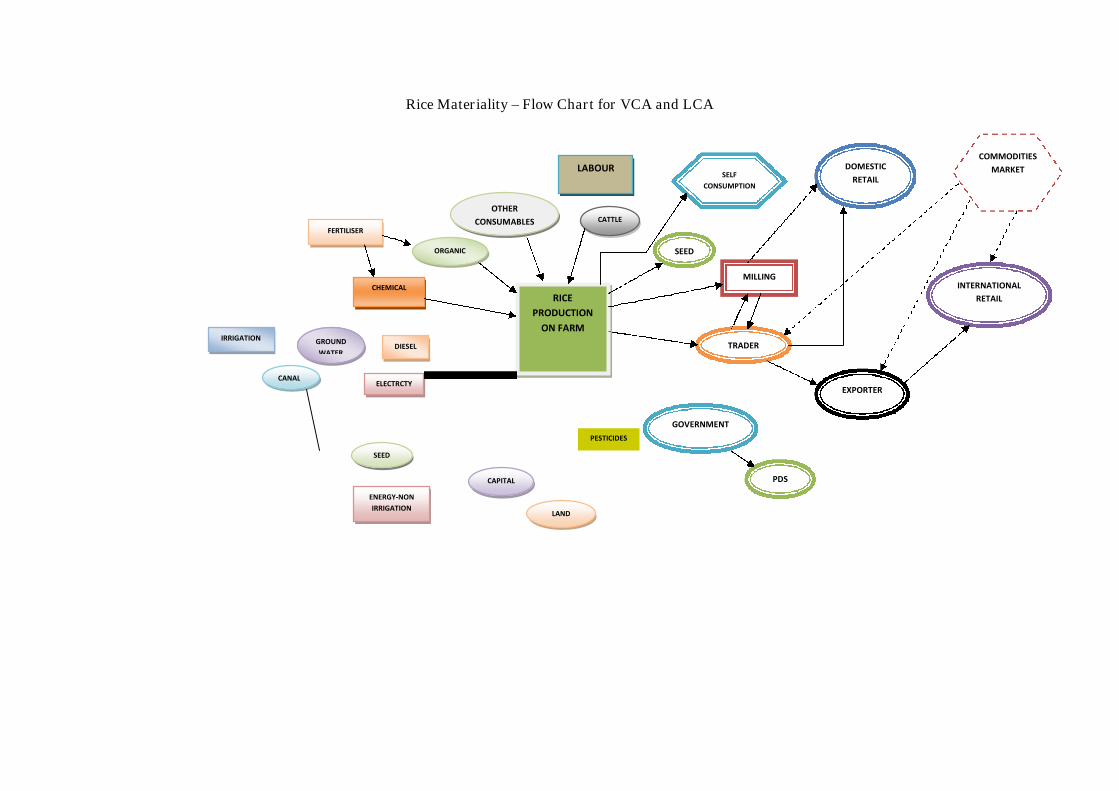
Rice Materiality – Flow Chart for VCA and LCA
RICE
PRODUCTION
ON FARM
FERTILISER
CHEMICAL
ORGANIC
IRRIGATION
CANAL
GROUND
WATER
ELECTRCTY
DIESEL
SEED
LAND
ENERGY-NON
IRRIGATION
LABOUR
PESTICIDES
CAPITAL
CATTLE
SELF
CONSUMPTION
MILLING
TRADER
DOMESTIC
RETAIL
GOVERNMENT
PDS
EXPORTER
INTERNATIONAL
RETAIL
SEED
OTHER
CONSUMABLES
COMMODITIES
MARKET
2
COSTS, RETURNS AND VALUE ADDITIONS FOR FOUR
METHODS OF RICE PRODUCTION AND ONE POST HARVEST SYSTEM
R. Hema
3
COSTS, RETURNS AND VALUE ADDITIONS FOR FOUR METHODS OF
RICE PRODUCTION AND ONE POST HARVEST SYSTEM
R. Hema and Alfred Gathorne-Hardy
Abstract
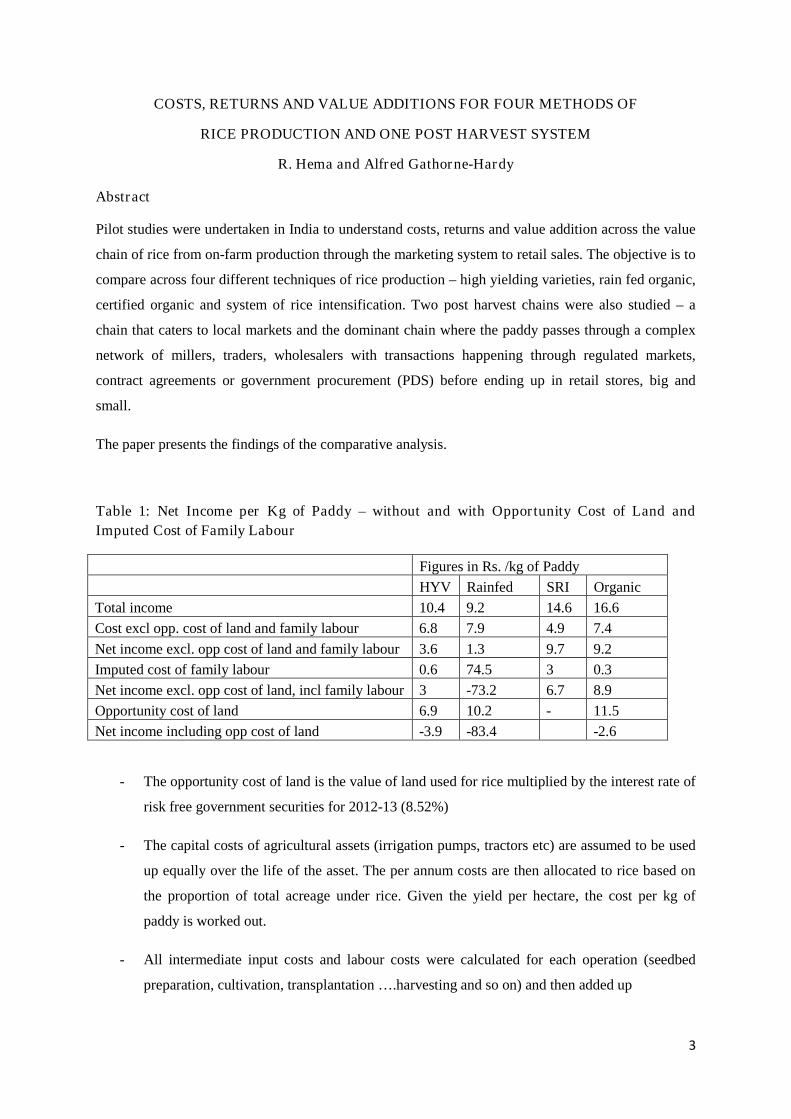
Pilot studies were undertaken in India to understand costs, returns and value addition across the value
chain of rice from on-farm production through the marketing system to retail sales. The objective is to
compare across four different techniques of rice production – high yielding varieties, rain fed organic,
certified organic and system of rice intensification. Two post harvest chains were also studied – a
chain that caters to local markets and the dominant chain where the paddy passes through a complex
network of millers, traders, wholesalers with transactions happening through regulated markets,
contract agreements or government procurement (PDS) before ending up in retail stores, big and
small.
The paper presents the findings of the comparative analysis.
Table 1: Net Income per Kg of Paddy – without and with Opportunity Cost of Land and
Imputed Cost of Family Labour
Figures in Rs. /kg of Paddy
HYV Rainfed SRI Organic
Total income 10.4 9.2 14.6 16.6
Cost excl opp. cost of land and family labour 6.8 7.9 4.9 7.4
Net income excl. opp cost of land and family labour 3.6 1.3 9.7 9.2
Imputed cost of family labour 0.6 74.5 3 0.3
Net income excl. opp cost of land, incl family labour 3 -73.2 6.7 8.9
Opportunity cost of land 6.9 10.2 - 11.5
Net income including opp cost of land -3.9 -83.4 -2.6
- The opportunity cost of land is the value of land used for rice multiplied by the interest rate of
risk free government securities for 2012-13 (8.52%)
- The capital costs of agricultural assets (irrigation pumps, tractors etc) are assumed to be used
up equally over the life of the asset. The per annum costs are then allocated to rice based on
the proportion of total acreage under rice. Given the yield per hectare, the cost per kg of
paddy is worked out.
- All intermediate input costs and labour costs were calculated for each operation (seedbed
preparation, cultivation, transplantation ….harvesting and so on) and then added up
4
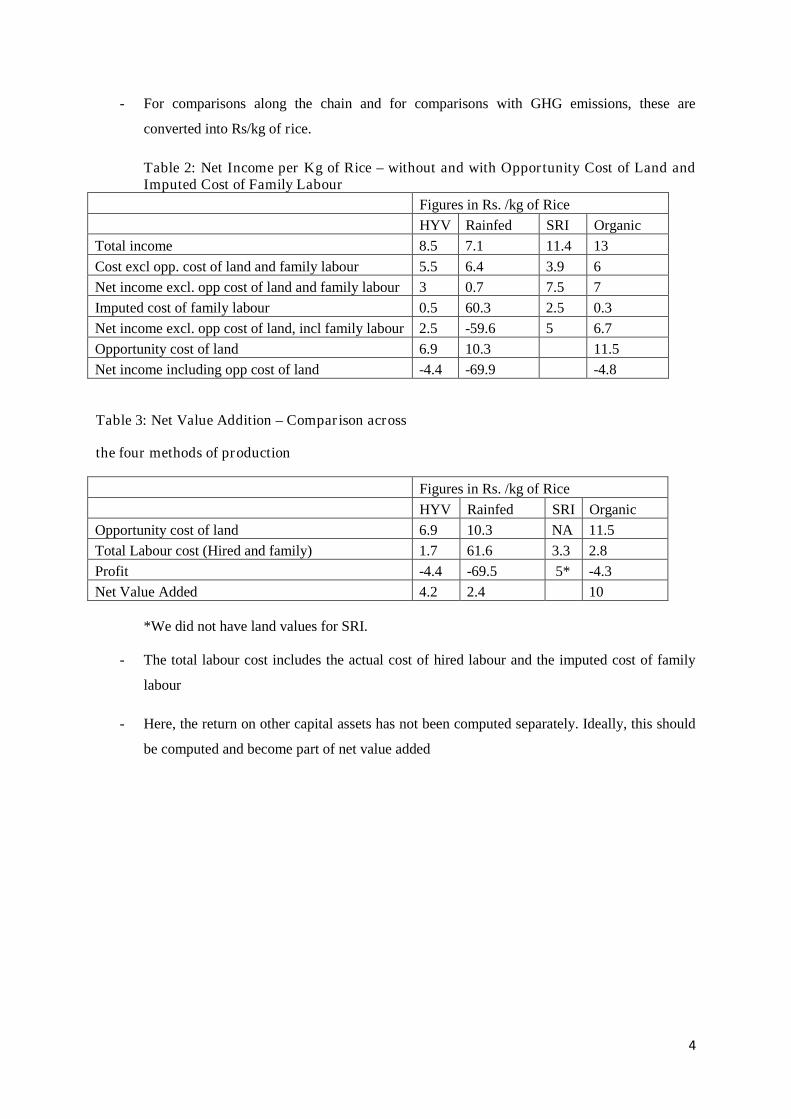
- For comparisons along the chain and for comparisons with GHG emissions, these are
converted into Rs/kg of rice.
Table 2: Net Income per Kg of Rice – without and with Opportunity Cost of Land andImputed Cost of Family Labour
Figures in Rs. /kg of Rice
HYV Rainfed SRI Organic
Total income 8.5 7.1 11.4 13
Cost excl opp. cost of land and family labour 5.5 6.4 3.9 6
Net income excl. opp cost of land and family labour 3 0.7 7.5 7
Imputed cost of family labour 0.5 60.3 2.5 0.3
Net income excl. opp cost of land, incl family labour 2.5 -59.6 5 6.7
Opportunity cost of land 6.9 10.3 11.5
Net income including opp cost of land -4.4 -69.9 -4.8
Table 3: Net Value Addition – Comparison across
the four methods of production
Figures in Rs. /kg of Rice
HYV Rainfed SRI Organic
Opportunity cost of land 6.9 10.3 NA 11.5
Total Labour cost (Hired and family) 1.7 61.6 3.3 2.8
Profit -4.4 -69.5 5* -4.3
Net Value Added 4.2 2.4 10
*We did not have land values for SRI.
- The total labour cost includes the actual cost of hired labour and the imputed cost of family
labour
- Here, the return on other capital assets has not been computed separately. Ideally, this should
be computed and become part of net value added
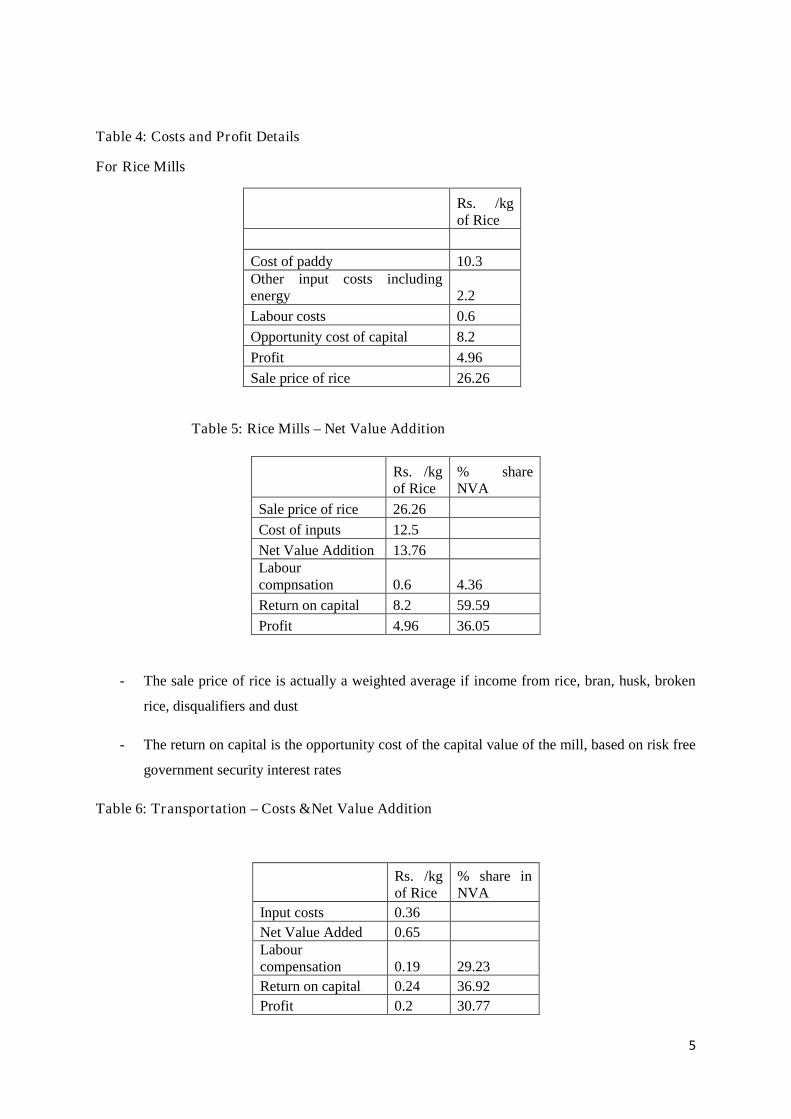
5
Table 4: Costs and Profit Details
For Rice Mills
Rs. /kgof Rice
Cost of paddy 10.3Other input costs includingenergy 2.2
Labour costs 0.6
Opportunity cost of capital 8.2
Profit 4.96
Sale price of rice 26.26
Table 5: Rice Mills – Net Value Addition
- The sale price of rice is actually a weighted average if income from rice, bran, husk, broken
rice, disqualifiers and dust
- The return on capital is the opportunity cost of the capital value of the mill, based on risk free
government security interest rates
Table 6: Transportation – Costs &Net Value Addition
Rs. /kgof Rice
% shareNVA
Sale price of rice 26.26
Cost of inputs 12.5
Net Value Addition 13.76Labourcompnsation 0.6 4.36
Return on capital 8.2 59.59
Profit 4.96 36.05
Rs. /kgof Rice
% share inNVA
Input costs 0.36
Net Value Added 0.65Labourcompensation 0.19 29.23
Return on capital 0.24 36.92
Profit 0.2 30.77

6
- Input costs are basically diesel and maintenance costs
- Labour includes driver and loaders
7
BASELINES AND BOUNDARIES FOR RICE LCA
Alfred Gathorne–Hardy
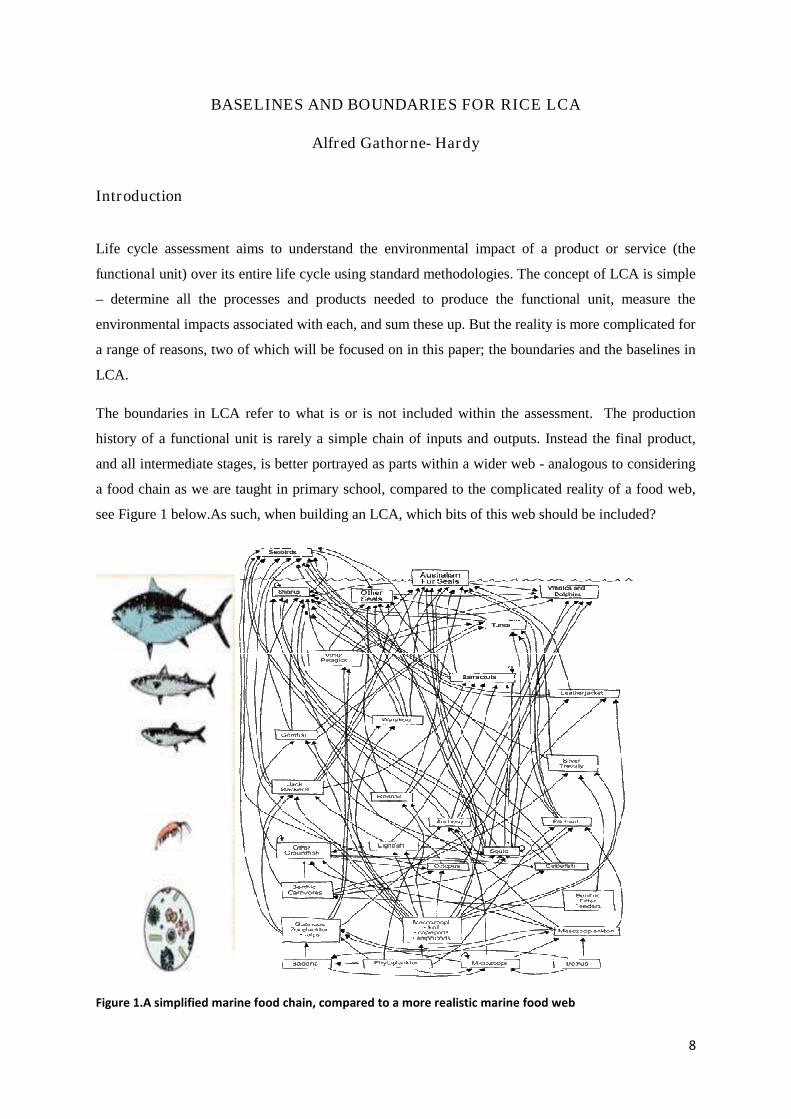
8
BASELINES AND BOUNDARIES FOR RICE LCA
Alfred Gathorne- Hardy
Introduction
Life cycle assessment aims to understand the environmental impact of a product or service (the
functional unit) over its entire life cycle using standard methodologies. The concept of LCA is simple
– determine all the processes and products needed to produce the functional unit, measure the
environmental impacts associated with each, and sum these up. But the reality is more complicated for
a range of reasons, two of which will be focused on in this paper; the boundaries and the baselines in
LCA.
The boundaries in LCA refer to what is or is not included within the assessment. The production
history of a functional unit is rarely a simple chain of inputs and outputs. Instead the final product,
and all intermediate stages, is better portrayed as parts within a wider web - analogous to considering
a food chain as we are taught in primary school, compared to the complicated reality of a food web,
see Figure 1 below.As such, when building an LCA, which bits of this web should be included?
Figure 1.A simplified marine food chain, compared to a more realistic marine food web
9
Baselines are the counterfactuals against which we compare – for example the fuel, food, clothing,
building material that would otherwise have been used if the functional unit was not. When used, the
choice of baselines is important; as it is against these that the functional unit is compared. If an
especially poorly rated alternative is chosen as a counterfactual, the functional unit will appear
unrepresentatively ‘good’, and vice versa. So the baselines and boundaries to any life cycle
assessment are essential to get right before the system is established.
Baselines and boundaries can be simple problems to identify, but often surprisingly complicated
problems to solve. When reading any LCA, or listening to anyone promoting one
technology/product/concept compared to others, consider what they are saying from the perspective of
baselines and boundaries – have they considered them, and if so, have the made the right decisions?
The aim of this paper is to introduce the concept, and then go into some more detail about how
different types of baseline and boundary problems can be solved. It makes heavy use of bio energy
LCA literature, due to its related nature (both bio fuels and rice have to deal with the problems of
agriculture and land use) and tries where possible to relate the issues back to rice production.
Boundaries
Where LCA boundaries should be drawn? For practical reasons, the boundaries should be as tight as
possible, as there is no benefit in collecting/measuring unnecessary information. But for perfect
accuracy all products and flows should be included. So how should the trade-off between practicality
and accuracy be determined in a methodical fashion?
LCA principles are set out in ISO 14040, with key additional guidelines for GHG LCA developed
byPAS2050:2011 (PAS 2050:2011, 2011).PAS 2050 states that boundaries should include “all
emissions and removals within the system boundary that have the potential to make a material
contribution”, which is defined as the contribution from any one source of GHG emission of more
than 1% of the anticipated total GHG emissions, 3.31, PAS 2050:2011 (2011).While PAS 2050 is
only concerned with GHG emissions, could that system be applied to all other measures of an LCA –
energy use, water used, acidification etc?
ISO 14040 suggests an iterative route for determining system boundaries, but without a specific cut-
off point mentioned. Boundaries should initially be established using best available data, and then
using sensitivity analysis the individual components should be explored, and some taken out and
others included that had previously been excluded.
Together these two systems describe a practical approach to system boundaries, yet poorly designed
system boundaries are abundant within the LCA literature. Three specific problems exist: lack of data
10
on deliberately excluded aspects, passive exclusion of components not considered at all, and incorrect
assumptions
Deliberately excluded aspects. Many of the excluded processes may have never been assessed, so it
is possible to underestimate their actual importance (Suh et al., 2004).An example of the importance
of boundaries was shown in a paper looking at the value of recycled paper compared to virgin
paper+incineration, the answer of which is more environmentally friendly was reversed depending
upon the boundary location (Merrild et al., 2008).Examples applicable to rice LCAs could include the
deliberate exclusion of bovine methane emissions when bullocks are used for transport, or off-site
N2O emissions from leached nitrogen fertiliser.
Ignored components. Within the area of bio energy LCAs this has been clear with respect to indirect
land use change(ILUC)19 - this was almost universally ignored from bio fuel LCAs until the issue was
brought to major attention by the Gallgher Review (Gallagher, 2008) and then influentially re-iterated
in Searchinger et al. (2008).Since then the inclusion of ILUC has been more widespread, but is still
widely ignored or misunderstood. A second example is the considering of biomass as carbon neutral
in bio energy LCA’s20(for example Fowles, 2007; Gaunt and Lehmann, 2008; Hammond, 2009;
Obernbergera, 1998; Roberts et al., 2009; Slade et al., 2009; World Energy Council, 2004). This is
important for slow growing sources of biomass, where carbon neutrality will only occur once a tree
has re grown to the original size as the tree that was combusted. It also ignores the role of bio energy
in increasing the demand for biomass, as bio energy uses the feed stocks for paper and pulp, forcing
these industries to source additional biomass with potentially additional influences on GHG
emissions. While recent output, for example by the RSPB(2011), has begun to place this issue into the
policy area, it is still widely ignored in both policy and academic literature.
With respect to rice, both of these issues are important. A novel farming process may produce less
GHG emissions ha-1 or t-1, but if it produces substantially fewer tonnes of rice per hectare then was
previously produced the global implications of reduced food production driving indirectly land use
change need to be understood. Biomass is a key source of energy for producing steam and drying
paddy in rice mills, but the emissions associated with this have never (as far as the author can
discover) been included in carbon accounting of rice. When rice husk is used as a feedstock then the
CO2 can be safely ignored as it was only sequestered in the very recent past, but inefficient boilers are
likely to produce methane in addition to CO2 – radically changing the net global warming potential
from husk combustion. Thus ignoring the emissions from biomass combustion can substantially
change the net carbon balance.
19Indirect land use change is further discussed below under Indirect Effects
20Present IPCC recommendations for calculating GHG emissions suggest that energy from biomass is carbon
neutral, as that energy is from a short term carbon cycle (ie trees) compared to the long term carbon cycle offossil fuels.
11
Incorrect assumptions. Often LCA practitioners find a major, un-fillable gap in their data, and
legitimately have to fudge a figure in order to continue – while this may sound bad practise, avoiding
fudging would result in no LCA’s and a transparent fudging can be more useful than no data at all.
But the problems come when the fudging is very poor, for example if we used wheat N2O emission
factors for rice then this would give very misleading results. In the LCA literature, just such a poor
assumption can be seen in an LCA looking at the production of PV cells. Key components of the PV
cells of interest where made in China and SE Asia, but because it is “not possible” to quantify
emissions from these countries it has been assumed that they have been fabricated from a European
energy supply(Espinosa et al., 2011). The embodied GHG in Chinese electricity is substantially
higher than that from Europe(IEA, 2012), so this was a very poor assumption, and could potentially
significantly impact the final results.
Baselines
Baselines are the counterfactuals against which we compare the results for the functional unit of
interest. Not all LCA projects are designed for comparison – some aim to understand where and when
emissions occur during the manufacture/use of a specific product. But many LCA’s deliberately
compare different systems, for example organic vs conventional, bio fuels vs fossil fuels.
The complication surrounding baselines are the choice of baselines, and the baseline boundaries. If we
are interested in the carbon intensity of a specific bio fuel, it can be compared to a range of bio fuels
and the ‘worse’ the comparator, the better the bio fuel will look.
In this project we will be looking at four different rice production systems, but depending on where
the data is collected we may not be able to treat them as perfect baselines, due to uncontrolled
variables between the systems (for example different soil types, different labour practises, different
ground water tables).If this is the case we can highlight where the different process appear to show
different GHG emissions, but no more than that. This is discussed more in (Gathorne-Hardy, 2013;
Gathorne-Hardy and Harriss-White, 2013).
Baseline boundaries suffer from the same complications as the main product boundaries, but are often
given even less attention. A classic example from the bio energy literature is the assumption that
European domestic wastes would degrade to methane in landfill sites if they were not otherwise burnt
(for example JEC (2007)).Depending on the specifics, this may or may not be the case, but including
this assumption makes the use of that feedstock for bio energy look considerably better than if such an
assumption is ignored.
12
Specific Baseline and Boundary issues
Capital Goods
The inclusion of capital goods in LCA is complicated. They are not ‘used up’, or only marginally so,
in the production of the functional unit (for example land and machinery respectively).They can
contain considerable embodied resource use, but to allocate a fraction of this to each functional unit is
difficult, as it is often unclear what the fraction should be – how long will the machinery last, for
example. For these reasons, PAS2050 states “The manufacturing of production equipment, buildings
and other capital goods shall not be included”(BSI, 2008).In contrast ISO 14040 says that capital
goods should be included (ISO, 2006).
How would the inclusion or not of capital goods influence the results of our project? As this project
goes beyond looking at just environmental implications of rice production, the use of capital is vital
for the socio-economic questions of our research, and as such will be included within this research
anyway, but when are embodied emissions important from the environmental perspective alone?
Nemecek (2005), quoted in Frischknecht et al. (2007), reviewed the role of capital goods in LCA, and
found for agricultural studies, capital goods contributed 20% of fossil fuel demand, and significantly
more in organic agriculture. The higher percentage for organic production arises because while the
machinery use is similar, the lack of synthetic fertiliser use significantly reduces the total fossil fuel
demand. The role of capital goods for overall GHG was lower than this due to the importance of field
based emissions of methane and nitrous oxide.
Although the details of the studies making up the above results are not reported, it is likely that the
majority relate to highly mechanised, intensive agriculture. The figures in some Indian rice production
could be very different, with a far greater reliance on labour rather than capital.
Emission Factors
Once the boundaries of an LCA have been initially drawn, there is often too much information to
gather for effective work to be carried out. For example most rice production uses urea fertiliser, so a
full LCA for rice would include the emission flows that constitute the production of urea, and
similarly for other fertilisers, and for pesticides, and for all machinery, and for the bullock feed and
for the plastic in the electric plug connecting the irrigation pump to the electricity…Eventually an
LCA of rice includes LCAs for almost all the products in the world. Additionally eternal loops are
generated, for example the production of steel requires coal, the extraction of which requires steel, the
production of which requires coal, etc.
Emission factors are essential for cutting through both of these problems. Emission factors are figures
from previous studies that provide an off-the-shelf figure. For example work by the Centre for
13
Science and Environment found that the production of urea in India requires an average of 0.7kgCO2-
equrea kg-1, providing an off the shelf carbon emission factor for urea fertiliser(Centre for Science and
Environment, 2009) so that we do not have to generate our own.
Such use of emission factors is clearly sensible, but emission factors should be treated with caution.
Say that same figure had come from a German urea factory, could it still be used as a proxy for Indian
urea production? German urea factories could be newer, with more sophisticated technology, making
their production significantly more efficient than Indian ones. In which case the figure would provide
an under estimate of emissions associated with urea use. Alternatively higher environmental standards
in Germany may require scrubbers that reduce the efficiency of urea production in Germany
compared to India, so using German figures would result in an over-estimate of emissions associated
with urea use.
Thus while emission factors are essential, they should be used with care. Consideration should be
given to firstly: are they reliable? If the LCA that carried them out was poorly designed and
implemented, then the figure will be of little value.
Secondly: are they representative? The German urea factory is an example of production that may
not be representative.
Thirdly: if they fail the above, does anything else exist? This is a tricky but common situation to be
in when building an LCA. Even if the emissions factors are neither reliable nor representative, they
may have to be used, due to lack of alternative data. If data is un-representative, it may be possible to
apply a correcting factor for the data. For example if you are using a soil process rate (such as organic
matter decomposition) from European research for Indian soils, then applying a q10 of 2, and
doubling the result, may be justified.
With emission factors, as will all aspects of LCAs, all assumptions should be clearly stated, including
judgements on reliability or representatively. Finally the importance of each figures should be
demonstrated using sensitivity analysis.
Allocation Problems
This is a mixture of baselines and boundaries. Do you include co-products within the boundaries of
the LCA, and if you do, what baseline do you compare them too?
It is rare that only one product is produced along a supply chain. For example rice production
produces rice, straw, husks and bran. What share of the GHG burden of rice production should be
allocated to each co-product?
14
Potential Methods of AllocationMass Balance. This is a tempting solution due to relative ease of use, but it often bares little
relationship to the energy content / environmental burden of a product, or the driver behind the
products’ production. A simple example is the production of bio diesel from oilseed rape. For each
tonne of bio diesel, >4t of co-products are produced. Allocation by mass would inaccurately suggest
that bio diesel – the primary driver for production in this case – is only responsible for 20% of the
total emissions.
Energy Allocation (used in the EU RED (Renewable Energy Directive)).This has similar problems to
mass allocation, and unless all the co-products are destined for energy generation, may not reflect
their role in driving the product process. For example DDGS (dried distillers grains with solubles; the
typically protein rich solid residue from ethanol production) or rape meal (the solid residue from oil
seed rape/canola after the oil has been removed) is typically used for animal feed, so measuring its
energy value to either the end user or as a driver for the original crop bares little relation to reality.
Substitution (expanding the boundary).A further option is expanding the boundary to include the
final destinations for the co-products. This is preferred by many LCA practitioners. It has two major
problems, how to choose which product is displaced, and secondly how to know whether the GHG
emissions are actually ‘avoided’ (Kindred et al., 2008).The first problem is very real and also self-
explanatory. The second is more complicated. An example given by Kindred et al is the use of rape
meal (the co-product of rape bio diesel) substituting for soy meal (a key feed in UK livestock rations).
Soy meal is itself a by-product of soy-oil production. If the rape meal substitutes the soy meal then all
the allocation for soy production must be allocated to the soy oil, so although the oilseed rape
biodiesel has a lower apparent GHG burden due to soy substitution, in reality there has been no
change in emissions. A useful discussion of this is provided by Kindred et al (2008)
Price Mechanisms
Allocation by price is the often perceived as the most realistic and practical means of addressing co-
products, but it relies on the assumption that market prices accurately reflect and drive changes in the
real world. Within rural India, price allocation may provide flawed reflection of reality due to market
failures, seasonality, and the ‘field economy’ were people do not necessarily follow the actions
dictated by micro-economics. Kindred et al (2008) recommend that shadow prices ‘based on careful
evaluation, should be adopted for any products and services that are not traded outside the process(es)
under consideration’.
15
What is a co-product vs by-productvs waste?
Waste is defined by ISO 14044 and PAS 2050:2011 as “substances or objects which the holder
intends or is required to dispose of”. It is important to differentiate between those wastes that can be
given away (for example some ashes from a rice mill) compared to those that incur a cost on disposal
such as contaminated waste that should have further treatment before final disposal, or even those that
incur a cost just through transport.
The implication of being a waste is that if any use for that product is found, then it will have a zero
carbon history. This can make a dramatic difference to the embodied GHG of a product. For example
if you compare the embodied GHG of bio diesel made from old chip oil compared to dedicated
vegetable oil, the embodied emissions are dramatically lower from the chip oil, as, generally classified
as a waste, it brings no embodied GHG to the bio diesel.
The guiding principle and ultimate test of any allocation procedure is that it should accuratelyreflect changes that actually happen or are likely to happen in the real world (Kindred et al.,2008).
Indirect effects
Indirect Land Use Change
Indirect land use change (ILUC) occurs when a change in land use in one area leads, via a market
response, to land use change elsewhere. Thus change in production practises on an Indian farm can
indirectly drive land use change many thousands of miles away. For example if there was a dramatic
shift to lower yielding varieties throughout Tamilnadu, then the supply compared to demand of rice
will decrease. This is likely to increases the demand for rice or rice substitutes from others, and
subsequently the price. The global agricultural market compensates for this increased price through
three mechanisms: reduced consumption, increased intensification, and expansion of the global
agricultural area. While intensification of previously agricultural lands can result in important
increases of GHG emissions it is the last point that can lead to the most dramatic emissions of GHGs.
Depending on the habitat into which agriculture expands LUC emissions can range from less than 2 to
greater than 500 tCO2 ha-1 (IPCC, 2006b). ILUC figures used in the literature include 351t CO2-eq
ha-1 (Searchinger et al., 2008), 400t CO2-eq ha-1 (Fritsche et al., 2009) and 385t CO2 ha-1 from
Burney et al (2010). The Gallagher Review gives a useful analysis of this debate (Gallagher, 2008).
Interestingly ILUC is commonly completely ignored when discussing agricultural sustainability, for
example Pretty (2008).
How to actually provide figures for ILUC from changing rice production is highly uncertain, and will
not be covered here, but the potential for dramatic, offsite increases in GHG emissions from reduced
16
production is significant, as is the potential for ILUC credits if rice yields increase and reduce the
pressure at the agricultural margins for further expansion.
This section has massively simplified a very complicated set of interactions, and it is tempting to
ignore the whole area, and to put the boundary simply around the field of rice we are interested in.But
doing this risks ignoring a source of emissions/mitigation that dwarfs all other steps in the rice
production process. For this reason it is best to expand the boundary to include ILUC, while accepting
that there are many uncertainties in how it is best included.
Further Indirect Effects
Changes in supply and demand of rice inputs and co-products can also have indirect effects. For
example there are projects proposed to set up rice straw power stations under the Clean Development
Mechanism. At present rice straw is either returned to the field, used as animal fodder, or used for
domestic fuel consumption. If demand and rewards are high enough, significant quantities of straw
could be used for electricity generation, potentially providing low carbon electricity. But if this occurs
previous end uses will have to find alternatives, and these two should be included within the LCA.
A further class of indirect effects are those that are not produced actually from the field, but are
directly due to action on that field, of which N2Oemissions are the prime example.N2O emitted by
bacteria as a natural part of the nitrogen cycle, but the increased quantities of active (as opposed to
atmospheric nitrogen) increases the amount of N2O released. This is recognised by LCA practitioners,
who use an emission factor, typically 1.25% of applied N from the IPCC, to cover this loss.This
covers both on and off field N2O emissions. In an elegant paper Crutzen (2007)worked backwards
from the total quantity of atmospheric N2O and suggested that this figures should be up to 3x higher,
as N2O was released from waterways and other off site locations, but should still be attributed to the
original N application. This is especially important to HYV rice, as due to the predominantly flooded,
anaerobic soils little N2O is released directly on site, but with an nitrogen use efficiency of around
31%(Cassman et al., 2002)significant quantities of N are lost, often with surface water, and
presumably results in indirect N2O emissions.
Rebound Effects
Increased efficiency of resource use, for example greater efficiency of water use under SRI compared
to traditional high yielding varieties, can sometimes have counter-intuitive implications. For example
the introduction of a more efficient diesel pump, pumping more water from less diesel, is tempting to
allocate a diesel saving too. But on the ground the impact may be less clear. It is possible the reduced
cost of running the pump could encourage the farmer to use more water than he otherwise would
have, reducing the savings. It may even tip the balance of costs for more of the farm, encouraging him
17
to use even more diesel then he used to! A good review of rebound effect can be found by Sorrell
(2007).
Conclusion
Life cycle assessment is a very powerful tool, but can be used either very well or very badly. This
paper has aimed to show a range of areas that should be considered when either building or reading a
LCA, to allow them to be built and read in a more robust fashion. A well designed LCA can be very
useful for giving understanding and pushing policy in the right direction, but a bad LCA can do the
exact opposite.
So, use it, but do it well, explain every step, and be highly suspicious of all other LCA’s that you
read!
References
BSI, (2008) PAS 2050. Specification for the assessment of the life cycle greenhouse gas emissions ofgoods and services, in: Institution, B.S. (Ed.), Available at http://www.bsigroup.com/en/Standards-and-Publications/Industry-Sectors/Energy/PAS-2050/
Cassman, K.G., Dobermann, A., Walters, D.T. (2002) Agroecosystems, nitrogen-use efficiency, andnitrogen management. AMBIO: A Journal of the Human Environment 31, 132-140.
Centre for Science and Environment, (2009) Green Rating Project, Fertilizers,.http://www.cseindia.org/userfiles/79-90%20Fertilizer%281%29.pdf, New Delhi.
Crutzen, P.J., Mosier, A.R., Smith, K.A., Winiwarter, W. (2007) N2O release from agro-biofuelproduction negates global warming reduction by replacing fossil fuels. Atmospheric ChemistryPhysical Discussions, 11191-11205.
Espinosa, N., Garcia-Valverde, R., Krebs, F.C. (2011) Life-cycle analysis of product integratedpolymer solar cells. Energy & Environmental Science 4.
Frischknecht, R., Althaus, H.-J., Bauer, C., Doka, G., Heck, T., Jungbluth, N., Kellenberger, D.,Nemecek, T. (2007) The Environmental Relevance of Capital Goods in Life Cycle Assessments ofProducts and Services. International Journal of Life Cycle Assessment.
Gallagher, E., (2008) The Gallagher review of the indirect effects of biofuels production, in:Department for Transport (Ed.). Renewable Fuels Agency.
Gathorne-Hardy, A., (2013) Life cycle assessment of four rice production systems: High YieldingVarieties, Rainfed, System of Rice Intensification and Organic, in: Harriss-White, B. (Ed.),Technology, Jobs and A Lower Carbon Future: Methods, Substance and Ideas for the InformalEconomy (The case of rice in India) New Delhi.
Gathorne-Hardy, A., Harriss-White, B., (2013) Embodied emissions and dis-embodied jobs: theenvironmental, social and economic implications of the rice production-supply chain in SE India. ,
18
Symposium on Technology, Jobs and a Lower Carbon Future :Methods, substance and ideas for theinformal economy (the case of rice in India). IHD, New Delhi.
IEA, (2012) Understanding Energy Challenges in India Policies, Players and Issues Partner CountrySeries. International Energy Agency, France.
ISO, (2006) Environment Management – Life Cycle Assessment – Principles and Framework. ENISO 14040, in: International Organization for Standardization (ISO) (Ed.), Switzerland.
JEC, (2007) JRC / EICAR / CONCAWE Well to Wheels analysis of future automotive fuels andpowertrain in the European Context, WELL TO TANK report version 2c. JEC,http://www.co2star.eu/publications/Well_to_Tank_Report_EU.pdf.
Kindred, D., Mortimer, N., Sylvester-Bradley, R., Brown, G., Woods, J., (2008) Understanding andmanaging uncertainties to improve biofuel GHG emissions calculations, HGCA Project No. MD-0607-0033. HGCA London.
Merrild, H., Damgaard, A., Christensen, T.H. (2008) Life cycle assessment of waste papermanagement: The importance of technology data and system boundaries in assessing recycling andincineration. Resources, Conservation and Recycling 52, 1391-1398.
PAS 2050:2011, (2011) Specification for the assessment of the life cycle greenhouse gas emissions ofgoods and services. BSI, London.RSPB, (2011) Bionenergy: a burning issue,http://www.rspb.org.uk/Images/Bioenergy_a_burning_issue_1_tcm9-288702.pdf.
Searchinger, T., Heimlich, R., Houghton, R.A., Dong, F., Elobeid, A., Fabiosa, J., Tokgoz, S., Hayes,D., Yu, T.-H. (2008) Use of U.S. Croplands for Biofuels Increases Greenhouse Gases ThroughEmissions from Land-Use Change. Science 319, 1238-1240.
Sorrell, S., (2007) The Rebound Effect: an assessment of the evidence for economy-wide energysavings from improved energy efficiency, Technology and Policy Assessment. UK Energy ResearchCentre, London.Suh, S., Lenzen, M., Treloar, G.J., Hondo, H., Horvath, A., Huppes, G., Jolliet, O., Klann, U.,
Krewitt, W., Moriguchi, Y., Munksgaard, J., Norris, G. (2004) System boundary selection in life-
cycle inventories using hybrid approaches. Environmental Science & Technology 38, 657-664.
19
FUSING LIFE CYCLE ASSESSMENT (LCA) AND VALUE
CHAIN ANALYSIS (VCA) IN THE INFORMAL ECONOMY
Alfred Gathorne–Hardy and R. Hema
20
FUSING LIFE CYCLE ASSESSMENT (LCA) AND VALUE CHAINANALYSIS (VCA) IN THE INFORMAL ECONOMY
Alfred Gathorne-Hardy and Hema R.
Introduction
Informal activity dominates the economy in developing countries and its importance appears to be
growing globally as the formal sector struggles to cope with the economic downturn in western
markets. In India the informal economy is estimated to be responsible for between 83% and 91% of
the labour force, producing around 60% of GDP (Harriss-White, 2003; Harriss-White et al., 2007).
Evenin OECD countries the informal sector is still substantial, responsible for an estimated 18% of
Gross National Income (GNI)(Schneider, 2002).
The informal economy is especially important for poorer and unskilled people, who have the most
limited access to formal jobs. The poorest are also most reliant on natural resources such as
agriculture, forestry and other environmental services both for goods and for employment(Haygarth
and Ritz, 2009; Ring, 2008). In turn this makes them vulnerable to environmental processes and
shocks such as eutrophication and climate change (Barnes et al., 2005; Chambwera et al., 2011).
The close linkages between environmental health, environmental impact, poverty and the informal
economy are largely ignored by national and international policy making arenas where until recently
the informal economy had a weak voice. The informal economy, with its close links to environmental
health, is also marginalised from environmental policy.
One reason for the policy neglect and incoherence is lack of available data relating to the informal
economy. This is not simply due to the lack of government records for it but also due to its
complexity.
It is in this dearth of information that this research project has operated. It aims to gather data using
the rice production supply chain as a case study and to analyse this information in a novel manner. It
fits methods designed to work in the formal sector to the informal economy in order to provide a type
and level of analysis that has not been done before. The two key methods to be tested are life cycle
assessment and value chain analysis. In this paper we provide a brief overview of each method,
followed by an outline of how we plan to marry these methods so as to generate a novel model in
order better to understand how the environmental, economic and labour relationships interact along a
supply chain.
21
Life cycle assessment
Globally there is increasing awareness that better social decisions are needed to regulate the
environmental burden of the products we use and the behaviour we practise. Unfortunately even
good-will can concentrate efforts in wasteful or even damaging areas, such as the first 20 years of EU
agri-environment subsidies or the EU bio fuels policy. In order to make informed decisions, the
environmental burden of individual products/processes must be measured using a rigorous
methodology which allows for meaningful comparisons. In this research project we are interested,
amongst other things, in the environmental product history of rice, and are using Life Cycle
Assessment (LCA)for this purpose.
The concept of life cycle assessment is essentially simple – determine all the activities
(processes/products) needed to produce the item of interest (in our case a kg of rice) and measure the
environmental impacts associated with each activity. The critical advantage of LCA is that it takes
full account of a product’s life cycle from the raw materials marshalled for its production through to
the disposal/recycling of the product when it has ceased to be useful in consumption. This helps avoid
an unwanted shifting of burdens from one area to another (for example i) the use of a high tech
insulating material to reduce on-site energy losses which uses more energy in its creation than it
saves; or ii) the conversion to low input agriculture to reduce emissions by one country which drives
more intensive farming in neighbouring countries to take advantage of the supply restricted price
gains, thereby negating the savings in the first country).
But in order for LCAs to be useful, the process of data gathering has to be controlled. There are
already far too many LCAs that, due to not following a standard methodology, cannot be compared to
others, and so are of little value. For example if we want to understand the relative environmental
costs of a cotton compared to a nylon shirt, but if the two LCAs used unknown or different
methodologies, then that comparison cannot be made.
ISO 14040 and PAS 2050
The basic tenets of LCA now have an international standard, and are set out in ISO 14040 (ISO, 2006)
and carbon foot-printing methods can be found in PAS 2050(BSI, 2008). A very comprehensive guide
based on ISO 14040, published by the Joint Research Centre (JRC), is also heavily relied upon for
LCA (European Commission, 2010)
While PAS 2050 and the ISO standards are set out slightly differently and are reported under different
headings (see Table 1) the methods and results are essentially the same - PAS 2050 builds upon ISO
14040 – except that PAS 2050 is specifically limited to GHG assessment. It does not cover
biodiversity, leaching or other social/economic/ environmental factors. In this project we are
specifically interested to research several of these other factors too. Later in this note we will discuss
the fusion of LCA and VCA to include economic and social factors in the analysis.
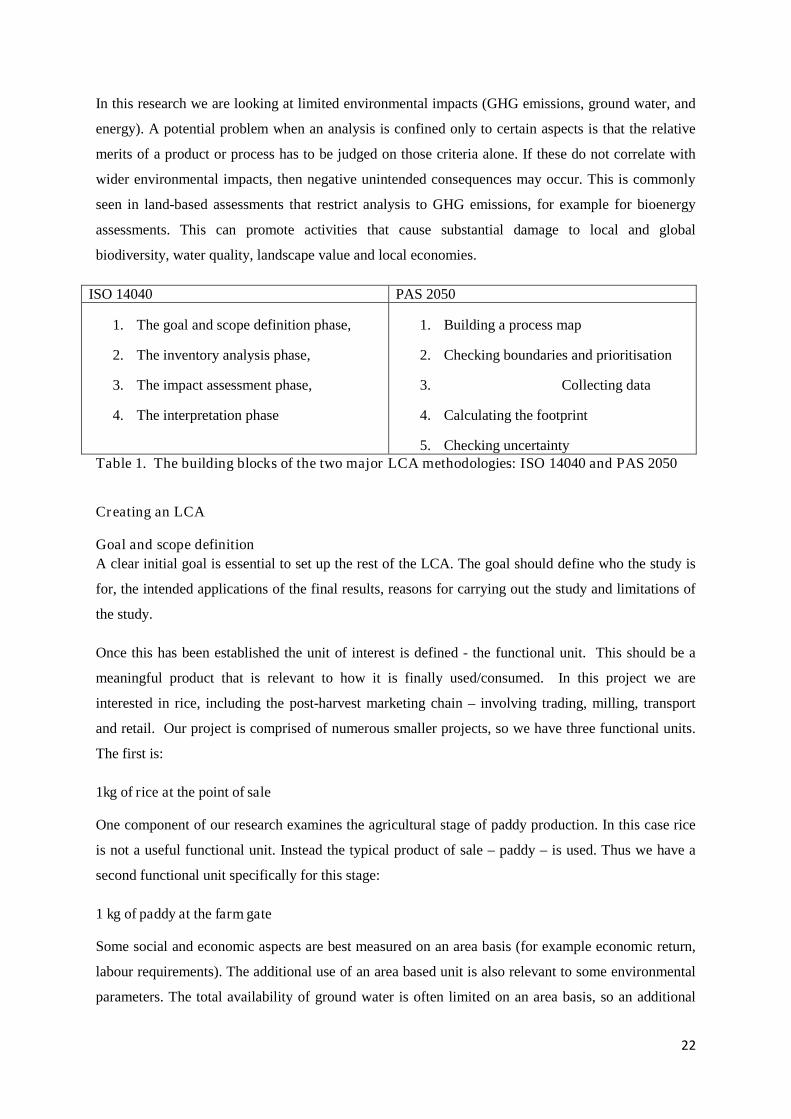
22
In this research we are looking at limited environmental impacts (GHG emissions, ground water, and
energy). A potential problem when an analysis is confined only to certain aspects is that the relative
merits of a product or process has to be judged on those criteria alone. If these do not correlate with
wider environmental impacts, then negative unintended consequences may occur. This is commonly
seen in land-based assessments that restrict analysis to GHG emissions, for example for bioenergy
assessments. This can promote activities that cause substantial damage to local and global
biodiversity, water quality, landscape value and local economies.
ISO 14040 PAS 2050
1. The goal and scope definition phase,
2. The inventory analysis phase,
3. The impact assessment phase,
4. The interpretation phase
1. Building a process map
2. Checking boundaries and prioritisation
3. Collecting data
4. Calculating the footprint
5. Checking uncertaintyTable 1. The building blocks of the two major LCA methodologies: ISO 14040 and PAS 2050
Creating an LCA
Goal and scope definition
A clear initial goal is essential to set up the rest of the LCA. The goal should define who the study is
for, the intended applications of the final results, reasons for carrying out the study and limitations of
the study.
Once this has been established the unit of interest is defined - the functional unit. This should be a
meaningful product that is relevant to how it is finally used/consumed. In this project we are
interested in rice, including the post-harvest marketing chain – involving trading, milling, transport
and retail. Our project is comprised of numerous smaller projects, so we have three functional units.
The first is:
1kg of rice at the point of sale
One component of our research examines the agricultural stage of paddy production. In this case rice
is not a useful functional unit. Instead the typical product of sale – paddy – is used. Thus we have a
second functional unit specifically for this stage:
1 kg of paddy at the farm gate
Some social and economic aspects are best measured on an area basis (for example economic return,
labour requirements). The additional use of an area based unit is also relevant to some environmental
parameters. The total availability of ground water is often limited on an area basis, so an additional
23
area based functional unit is also useful for some environmental criteria. This helps address some of
the problems identified in Section 0, Problems with LCA. Thus the third functional unit is:
1 hectare of paddy production
There are many potential supply chains for these functional units. We are specifically looking at 4
production systems and4-3 distribution systems.21
After defining the functional unit, the project boundaries need to be identified. The boundaries consist
of what is and is not included within the product life history. There is a trade-off between inclusivity
on the one hand and the practicalities of time on the other. This means finding the right point along
the curve of diminishing returns to problem-oriented field-research. It may be useful to work to a
larger scale than the functional unit, for example per field of paddy (because farmers account in this
fashion), and then calibrate it per kg afterwards so that elements of cost and physical inputs can be
gathered in meaningful units for both farmer and analyst. (No farmer for instance will know how
much pesticide he applies per kg of paddy, but is likely to know per field/acre).
Defining the boundaries is not a one off stage, because during the empirical development of the model
new activities will be discovered, and the importance of different elements will become apparent.
Instead it is an iterative process, and made more powerful as a result.
Checking boundaries and prioritisation
The significance of what is and is not included within the analytical boundaries is further developed in
a supplementary paper (Gathorne-Hardy, 2013, ‘Baselines and Boundaries’). For the purpose of PAS
2050 the boundaries should comply with rules set out in ISO 14040, and be of an adequate standard to
create a Product Category Rule. In essence this means including all sources of emissions responsible
for greater than 1% of the total, subject to not more than 5% of total emissions’ being ignored. The
four key points that PAS 2050 suggests should not be included are:
1. Immaterial emissions sources (less than 1% of total footprint)
This is a useful guide to determine when to ignore a stage/process/input etc. Clearly information is
required before the importance of any stage/process/input can be measured, and this is one area where
the iterative practical method of LCAs is relevant. In this instance, if early research shows that the
item of interest is far below the 1% threshold it can be safely ignored. If it is near the 1% threshold
more work will be needed to determine which side of the threshold it sits. Sometimes processes that
are below the threshold will be included if they are of specific interest.
21The research into distribution is not yet complete. To date supply chains which might labelled as separate
show considerable inter-linkages, so the full number studied may be fewer.
24
2. Human inputs in processes
The GHGs directly associated with human beings (i.e. embodied emissions of food, clothing etc) are
not included unless they are specifically related to physical work in the sector under investigation (e.g.
protective clothing). This is largely because these are deemed implausible to substitute as well as very
difficult to measure. This rule comes from PAS 2050, which is only concerned with GHG emissions.
But in the current project we are also interested in wider environmental measures including energy,
where human energy is sometimes directly substitutable by fossil energy. Thus we include the
measurement of non GHG human inputs such as energy.
3. Transport of consumers to retail outlets
If someone goes to the shops to buy rice and milk, and is then tempted to also get sweets, how should
the transport emissions be allocated between these three products? It is the impossibility of effectively
answering this question, together with the difficulty of allocating consumer transport to individual
products, that results in the omission of consumer transport.
4. Animal transport (e.g. farm animals used in agriculture or mining in developing countries)
This is an important issue from the perspective of this project, where animals make an important
contribution to GHG emissions at the farm level. We have included livestock based emissions (the
enteric methane from bullocks) directly against the PAS 2050 guidance, as we have demonstrated that
ignoring these emissions significantly alters the final GHG balance(Gathorne-Hardy, 2013c). But in
order to allow our results to be comparable with other PAS 2050 LCAs we have also calculated
results without these emissions.
Collecting data
Gathering data requires details on both activity and emission factors. An activity is what occurs, for
example transporting a load of rice over 200km may require 50l of fuel. The emission factor is the
amount of GHG that is emitted from, in this case, each litre of fuel (including in the production and
transport of that fuel). Replicable, meaningful data is required for both the data activity and emission
factors – for example our confidence that trucks use50l of fuel to transport that quantity of rice
200km. Were the data collected from a suitable number or trucks, from a representative region, in a
representative time period, etc.?And does the emission factor include the production and transport of
the fuel?
As a general rule primary data should be used, as these indicate actual emissions and give a better
chance of identifying where emissions can be reduced. There are exceptions though, when it is
impractical or unnecessary to collect primary data, for example when there is already adequate data
for that object of research. In our case, the emissions associated with fertiliser production are a good
25
example – already data sets exist for embodied GHG of different fertilisers, and, given our resources,
it is unfeasible to collect additional raw data.
Additionally there are times when it is useful to use standard data, for example the use of global
warming potential (GWP) emission factors. It would be unhelpful if every project tried to establish its
own GWP. PAS 2050 also suggests that standard factors should be used for transport and agricultural
emissions, but we use primary data here. Data collection out of official reach is the purpose of our
research.
Primary data is available from a range of LCA databases. The golden rule is to state why, where and
how each data source was used so that readers can understand, compare and judge models. Often
good data is not available, in which case what is available must be used, but the analyst has to take
care to be transparent and honest about this.
Calculating the footprint
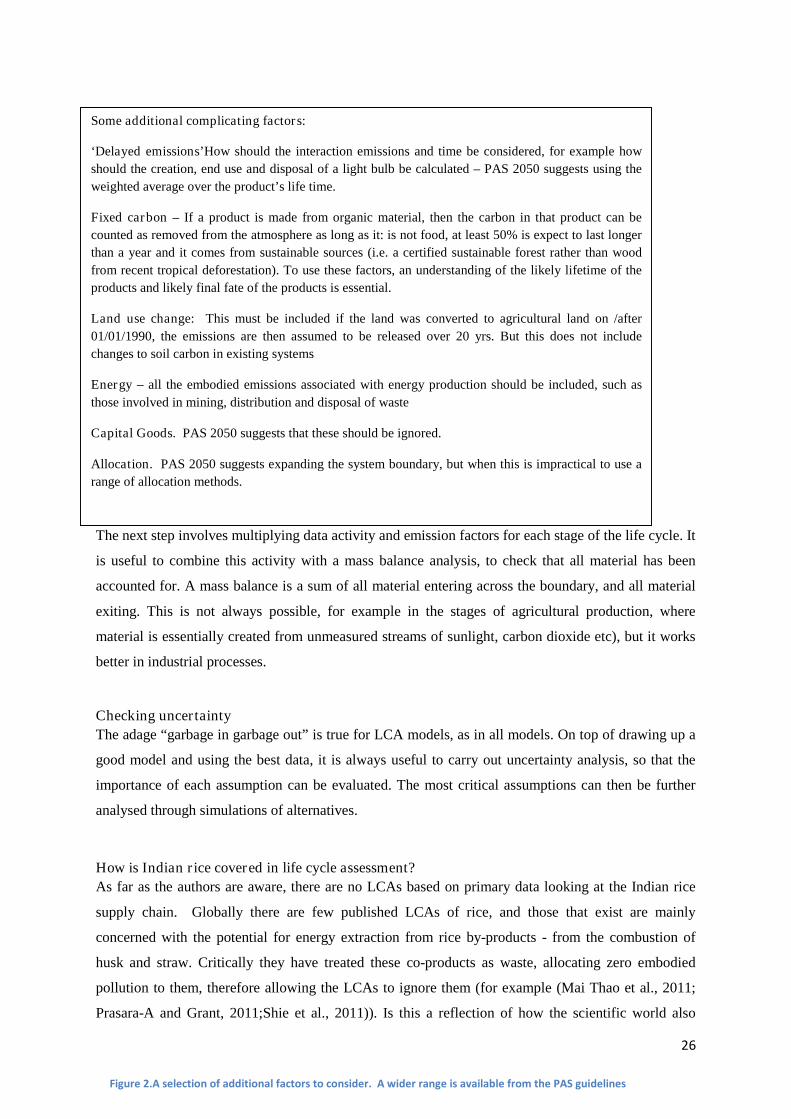
26
The next step involves multiplying data activity and emission factors for each stage of the life cycle. It
is useful to combine this activity with a mass balance analysis, to check that all material has been
accounted for. A mass balance is a sum of all material entering across the boundary, and all material
exiting. This is not always possible, for example in the stages of agricultural production, where
material is essentially created from unmeasured streams of sunlight, carbon dioxide etc), but it works
better in industrial processes.
Checking uncertainty
The adage “garbage in garbage out” is true for LCA models, as in all models. On top of drawing up a
good model and using the best data, it is always useful to carry out uncertainty analysis, so that the
importance of each assumption can be evaluated. The most critical assumptions can then be further
analysed through simulations of alternatives.
How is Indian rice covered in life cycle assessment?
As far as the authors are aware, there are no LCAs based on primary data looking at the Indian rice
supply chain. Globally there are few published LCAs of rice, and those that exist are mainly
concerned with the potential for energy extraction from rice by-products - from the combustion of
husk and straw. Critically they have treated these co-products as waste, allocating zero embodied
pollution to them, therefore allowing the LCAs to ignore them (for example (Mai Thao et al., 2011;
Prasara-A and Grant, 2011;Shie et al., 2011)). Is this a reflection of how the scientific world also
Some additional complicating factors:
‘Delayed emissions’How should the interaction emissions and time be considered, for example how
should the creation, end use and disposal of a light bulb be calculated – PAS 2050 suggests using the
weighted average over the product’s life time.
Fixed carbon – If a product is made from organic material, then the carbon in that product can be
counted as removed from the atmosphere as long as it: is not food, at least 50% is expect to last longer
than a year and it comes from sustainable sources (i.e. a certified sustainable forest rather than wood
from recent tropical deforestation). To use these factors, an understanding of the likely lifetime of the
products and likely final fate of the products is essential.
Land use change: This must be included if the land was converted to agricultural land on /after
01/01/1990, the emissions are then assumed to be released over 20 yrs. But this does not include
changes to soil carbon in existing systems
Energy – all the embodied emissions associated with energy production should be included, such as
those involved in mining, distribution and disposal of waste
Capital Goods. PAS 2050 suggests that these should be ignored.
Allocation. PAS 2050 suggests expanding the system boundary, but when this is impractical to use a
range of allocation methods.
Figure 2.A selection of additional factors to consider. A wider range is available from the PAS guidelines
27
ignores much of the informal economy, except when it clearly interacts with the formal (in this case
for power generation)?
Some studies have looked at rice production using primary data-based LCAs(Kasmaprapruet et al.,
2009; Wang et al., 2010), but none in India. A discussion of them can be found in Gathorne-Hardy
(2013b).
Problems with LCA
Life cycle assessment is not a perfect analytical system. Its limitations are split between
methodological errors such as poor choice of boundaries, discussed in Gathorne-Hardy (2013a), and
fundamental problems which will be discussed here.
1. How impacts and products are measured
While the production and use of products/processes are extended in both time and space, in LCA
emissions tend to be aggregated across time horizons and summed across space (see Finn veden et al
(2009)and Haus child(2005) for further reading). Additionally, in dividing the total emissions into a
functional unit, LCA often gives emissions that are near infinitesimally small compared to the whole.
There are also no obvious links between pathways of different products.
In real life, the time, location and scale of environmental impacts are critical in the impact of many
pollutants, for example the same emission will be far worse if exacerbated by weather/other high
emissions, in vulnerable environments, and if the level is above the absorptive capacity of the sink
environment. From our project GHGs are an exception in respect to the importance of location as the
only GHGs included are long lived enough to mix evenly around the globe. The same applies for
ozone depleting gases listed under the Montreal Protocol for LCAs that include impacts on
stratospheric ozone.
2. Imperfect metric analysis.
In LCAs a ‘basket approach’ is used to allow comparison between different pollutants. This approach
derives from the Montreal Protocol methodology, where different gases are assigned different
pollutant factors depending on how damaging they are to stratospheric ozone. It is very useful in
allowing comparison between different pollutants, but it also provides answers that are magnifications
of the assumptions that went into the calculations - the eternal trade-off between accuracy and
usability!
For example GHGs are all placed in a ‘single basket’. Through the use of Global Warming Potentials
different GHGs are given a value along a single scale, and trade is allowed between gases using this
scale (Daniel et al., 2012). The scale compares the amount of infra-red radiation different GHGs
28
absorb to that of carbon dioxide (CO2). Thus 1kg methane is equivalent to 25kg of carbon dioxide,
and 1kg nitrous oxide is equivalent to 298kg of carbon dioxide(Forster et al., 2007).
But the comparison between different GHGs is not perfect, as they absorb different frequencies of
infra-red, with different absorptive efficiencies, and have different atmospheric life-spans. For
example the atmospheric lifespan of methane is about 11 years. While in the atmosphere it is highly
efficient at retaining heat, but once it has degraded to CO2 (from whence it came - if it originated from
flooded paddy or livestock) its efficiency as a GHG is dramatically reduced. GWPs average out the
differences over different periods of time, but there are debates in the scientific community about how
individual GHGs should be judged. Some call for dramatic action on short-lived climate pollutants
(such as CH4) to provide a big impact quickly (especially as reducing many of them, including
methane, black carbon and NOx will bring associated health benefits, see Shindell et al (2012)). In
contrast others argue that from the long term climate perspective only long lived gases are most
important, so policy makers should be most concerned by atmospheric CO2 (see Allen et al (2009)).
Similarly when wider factors are looked at, they too are reduced to a single metric, for example
eutrophication is reduced to phosphate equivalents, acid rain is reduced to sulphur dioxide
equivalents.
3. It is a top down, not bottom up, system of analysis
How to approach environmental agricultural sustainability is an issue of longstanding debate since
before Malthus. LCA clearly falls into a top-down as opposed to systems based approach to
understanding sustainability. A bottom up approach would build upon what exists on the ground
(from a domestic, catchment, to global scale) so as to understand and optimise production and other
practises using the available materials. In contrast an LCA may suggest that a certain practice is
‘sustainable’ but, without a reference to scale, it may be unsustainable on the ground
4. Simplification.
Finally, from the policy perspective, there is a danger in the results of LCA - as there is in all complex
models – because it can provide apparently simple numbers. LCA will provide answers to the
questions that are asked of it, but this should not be mistaken for a judgement on the relative
sustainability of each functional unit as a whole. A product better from the GHG perspective is not
automatically more sustainable when a wider range of factors are introduced.
Value Chain VCA
The LCA helps us understand the contribution of the rice chain to GHG emissions. Economic
activities in the chain are carried out based on considerations of income security and financial gain.
29
The social and economic outcomes of these activities are determined indirectly by the technology
regime and by the nature of explicit and implicit contracts governing the activities of the chain. Thus,
a shift in the technology regime to lower GHG emissions would result in a new set of social and
economic outcomes. To evaluate the merits and disadvantages of potential shifts in the technology
regime across multiple dimensions and for differently endowed economic agents, a good
disaggregated evidence base for the economic costs and value addition is needed. Value chain
analysis helps develop this knowledge base.
One of the ways in which the outcomes of any economic activity can be measured is by its ‘value
addition’. Technically, value addition is defined as the difference between the ‘value’ (price) of the
output of the economic activity and the ‘cost’ of all the intermediate inputs used in the activity. This
value addition is essentially the sum of (a) income derived by all the labour inputs into that activity
(b) returns earned by all the capital (including land) employed in that activity and (c) profits earned by
the entrepreneur(s) involved in that activity (although these three may be indistinguishable in self-
employment, the commonest form of production in India).
Value chain analysis becomes particularly important, when ‘non-market’ forces govern the intra-link
or the inter-link activities of the chain. If the activities are regulated purely by the price mechanism
then we consider them to be governed by market forces (Hema, 2013). However, in order to minimise
the transaction costs arising from information asymmetry or from assets specific to the transaction or
in order to secure economic rent (windfall economic gains), contractual arrangements may exist
which govern some activity in the chain. Hence, if the quantitative knowledge base of the economic
costs and value additions at the disaggregate level is combined with an understanding of the type of
formal or informal contractual relations at various stages of the chain, a better understanding of the
pathways through which the social and economic outcomes in the system are determined will follow.
Hence, the value chain analysis is the only existing framework from social science to understand, at a
first cut, the implications of an existing commodity system’s shift towards lower carbon production.
This can be complemented with behavioural analysis -to estimate the likely magnitudes of changes
(elasticities) - and with welfare analysis to judge the social welfare implications of existing and
proposed low carbon systems.
Social aspects of the rice production supply system
One of the most important aspects of welfare is work. As discussed in Gathorne-Hardy and Harriss-
White (2013) and in Mani, Mody and Sukumar(2013), both the quality and quantity of work is
critically important in determining the quality of life for those producing goods and services in the
informal sector. Judging the quality of labour is a fraught with difficulties, and a time consuming,
process that mixes up qualitative and quantitative techniques ((ILO, 1999; Lorano, 2005)). This poses
30
an intractable barrier to inclusion in life cycle assessment, so a reductionist alternative, confined to
income and the economic value of benefits in kind is being developed as a compatible substitute.
While missing the holistic aspiration of Decent Work as an analytical tool, this has the benefit of
collectability and can also be scaled, so that it can be compared and contrasted across different
fields(Gathorne-Hardy and Harriss-White, 2013).
Linking LCA to social and economic data
It is perfectly possible to fuse VCA conceptually with LCA. By this we mean that the entire life cycle
can be included as appropriate; what is and is not included within the value chain life cycle boundary
can be clearly identified; and allocation between end products will be accurate. But the practical aim
of this project is not to fuse the two types of model into a single output, due the difficulties of putting
prices on all inputs and outputs. Instead we intend to build a model that allows the two processes to
work in parallel. They share the same functional units, and (where possible/applicable) the same
boundaries. Thus for each functional unit we will have an understanding of the energy, water, and
labour going into it and the GHGs and value it generates. Figuring out how and why these correlate
(positively, negatively or not at all), for different functional units and at different points in the supply
chain is a key aim of our collective research.
As discussed above, the quality of labour has been reduced from its real-world complexities to key
indicators compatible with the modelling aspect of this project. Assessing the quantity of labour
required is immediately quantifiable, but when calibrated against a kg of rice it loses much of its
conventional meaning. While the provision of labour is important for poverty reduction and
development (Chambwera et al., 2011; Gathorne-Hardy and Harriss-White, 2013), what is the
meaning of 3 minute (or 10 hours)of work per kilogram of rice to a village of 800 people? This is an
example of where the lack of dimension to LCA style results restricts their meaning and social
relevance. For this reason, when discussing quality and quantity of work, we gave measures in area
based units too: the quantity of work/hectare
While a parallel LCA VCA model is relatively simple from a theoretical perspective, there are several
complicating factors which have been summarised in a tabulated form in Table 2 – at the end.
Conclusions
The informal economy is closely linked to the environment, yet widely ignored in environmental
policy. Our research aims to provide new data on the informal economy, collating data for the case of
a whole rice production supply chain. In addition it develops a novel analytical tool to improve
understanding of the interactions and synergies between the environmental, economic and social
development goals. To do this it fuses life cycle assessment and value chain analysis, together with

31
measures of both work quality and work quantity. Such a model has not been generated before, and
inevitably its multi-disciplinary origins have required the modification of some concepts and
measures. For example the quality of work will be assessed using numerical rather than more in depth
qualitative variables.
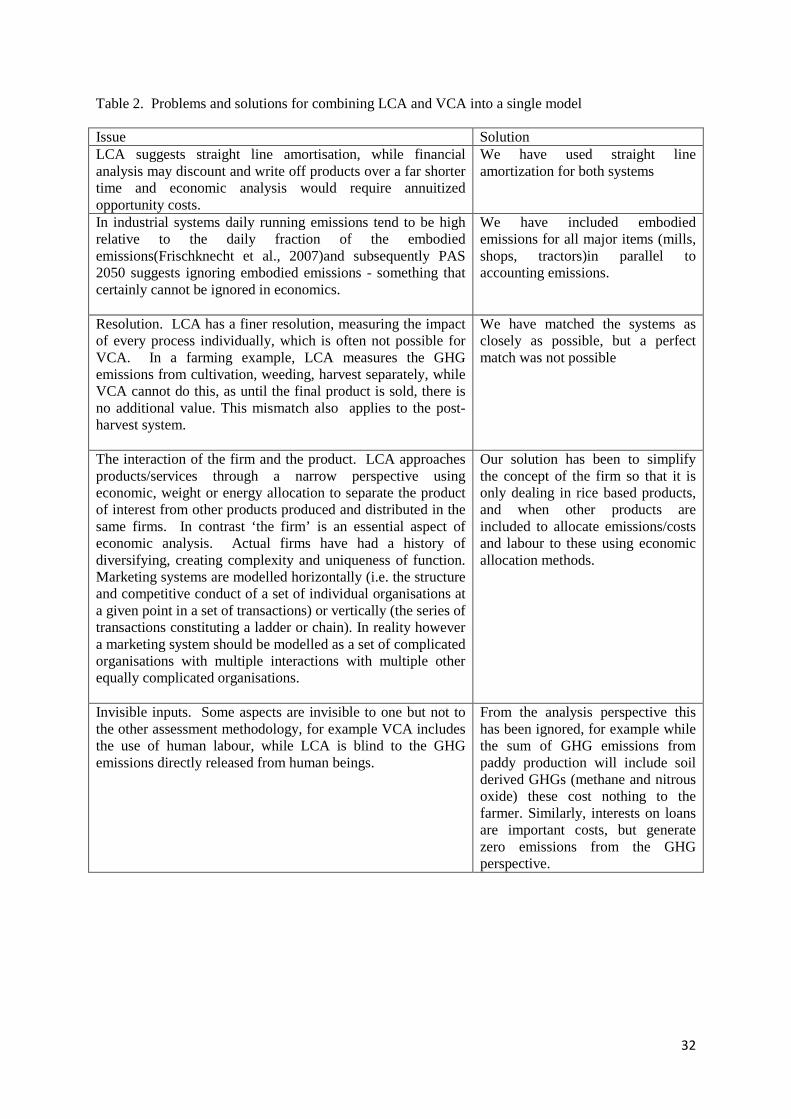
32
Table 2. Problems and solutions for combining LCA and VCA into a single model
Issue SolutionLCA suggests straight line amortisation, while financialanalysis may discount and write off products over a far shortertime and economic analysis would require annuitizedopportunity costs.
We have used straight lineamortization for both systems
In industrial systems daily running emissions tend to be highrelative to the daily fraction of the embodiedemissions(Frischknecht et al., 2007)and subsequently PAS2050 suggests ignoring embodied emissions - something thatcertainly cannot be ignored in economics.
We have included embodiedemissions for all major items (mills,shops, tractors)in parallel toaccounting emissions.
Resolution. LCA has a finer resolution, measuring the impactof every process individually, which is often not possible forVCA. In a farming example, LCA measures the GHGemissions from cultivation, weeding, harvest separately, whileVCA cannot do this, as until the final product is sold, there isno additional value. This mismatch also applies to the post-harvest system.
We have matched the systems asclosely as possible, but a perfectmatch was not possible
The interaction of the firm and the product. LCA approachesproducts/services through a narrow perspective usingeconomic, weight or energy allocation to separate the productof interest from other products produced and distributed in thesame firms. In contrast ‘the firm’ is an essential aspect ofeconomic analysis. Actual firms have had a history ofdiversifying, creating complexity and uniqueness of function.Marketing systems are modelled horizontally (i.e. the structureand competitive conduct of a set of individual organisations ata given point in a set of transactions) or vertically (the series oftransactions constituting a ladder or chain). In reality howevera marketing system should be modelled as a set of complicatedorganisations with multiple interactions with multiple otherequally complicated organisations.
Our solution has been to simplifythe concept of the firm so that it isonly dealing in rice based products,and when other products areincluded to allocate emissions/costsand labour to these using economicallocation methods.
Invisible inputs. Some aspects are invisible to one but not tothe other assessment methodology, for example VCA includesthe use of human labour, while LCA is blind to the GHGemissions directly released from human beings.
From the analysis perspective thishas been ignored, for example whilethe sum of GHG emissions frompaddy production will include soilderived GHGs (methane and nitrousoxide) these cost nothing to thefarmer. Similarly, interests on loansare important costs, but generatezero emissions from the GHGperspective.
33
References
Allen, M.R., Frame, D.J., Huntingford, C., Jones, C.D., Lowe, J.A., Meinshausen, M., Meinshausen,N. (2009) Warming caused by cumulative carbon emissions towards the trillionth tonne. Nature 458,1163-1166.Barnes, J., Nhuleipo, O., Muteyauli, P., MacGregor, J. (2005) Preliminary asset and flow accounts forforest resources in Namibia. DEA Research, Discussion Paper 70.
BSI, (2008) PAS 2050. Specification for the assessment of the life cycle greenhouse gas emissions ofgoods and services, in: Institution, B.S. (Ed.), Available at http://www.bsigroup.com/en/Standards-and-Publications/Industry-Sectors/Energy/PAS-2050/
Chambwera, M., MacGregor, J., Baker, A., (2011) The Informal Economy - A primer fordevelopment professionals on the importance of the informal economy in developing countries.International Institute for Environment and Development, London.
Daniel, J., Solomon, S., Sanford, T., McFarland, M., Fuglestvedt, J., Friedlingstein, P. (2012)Limitations of single-basket trading: lessons from the Montreal Protocol for climate policy. ClimaticChange 111, 241-248.
European Commission, (2010) International Reference Life Cycle Data System (ILCD) Handbook,General guide for Life Cycle Assessment,, in: Joint Research Centre Institute for Environment andSustainability (Ed.), Publications Office of the European Union,.
Finnveden, G., Hauschild, M.Z., Ekvall, T., Guinée, J., Heijungs, R., Hellweg, S., Koehler, A.,Pennington, D., Suh, S. (2009) Recent developments in Life Cycle Assessment. Journal ofEnvironmental Management 91, 1-21.
Forster, P., Ramaswamy, V., Artaxo, P., Berntsen, T., Betts, R., Fahey, D.W., Haywood, J., Lean, J.,Lowe, D.C., Myhre, G., Nganga, J., Prinn, R., Raga, G., Schulz, M., Van Dorland, R., (2007) Changesin atmospheric constituents and in radiative forcing, in: Solomon, S., Qin, D., Manning, M., Chen, Z.,Marquis, M., Averyt, K.B., Tignor, M., Miller, H.L. (Eds.), Climate Change 2007: The PhysicalScience Basis. Contribution of Working Group I to the Fourth Assessment Report of theIntergovernmental Panel on Climate Change. Cambridge University Press, Cambridge, UnitedKingdom and New York, NY, USA pp. 131-234.
Frischknecht, R., Althaus, H.-J., Bauer, C., Doka, G., Heck, T., Jungbluth, N., Kellenberger, D.,Nemecek, T., (): . Int J LCA, D., http://dx.doi.org/10.1065/lca2007.02.308 (2007) The EnvironmentalRelevance of Capital Goods in Life Cycle Assessments of Products and Services. InternationalJournal of Life Cycle Assessment.
Gathorne-Hardy, A. (2013a) Baselines and Boundaries. SIAS internal discussion document.
Gathorne-Hardy, A., (2013b) Greenhouse gas emissions from rice, Working paper,http://www.southasia.ox.ac.uk/sites/sias/files/documents/GHG%20emissions%20from%20rice%20-%20%20working%20paper.pdf.
Gathorne-Hardy, A., (2013c) Life cycle assessment of four rice production systems: High YieldingVarieties, Rainfed, System of Rice Intensification and Organic, in: Harriss-White, B. (Ed.),Technology, Jobs and A Lower Carbon Future: Methods, Substance and Ideas for the InformalEconomy(The case of rice in India)New Delhi.Gathorne-Hardy, A., Harriss-White, B., (2013) Embodied emissions and dis-embodied jobs: theenvironmental, social and economic implications of the rice production-supply chain in SE India. ,
34
Symposium on Technology, Jobs and a Lower Carbon Future :Methods, substance and ideas for theinformal economy (the case of rice in India). IHD, New Delhi.
Harriss-White, B. (2003) India Working: Essays on Society and Economy. Cambridge UniversityPress., Cambridge, UK.
Harriss-White, B., Adam, C., A., S., (2007) Chapter 7: Summary and Conclusions, in: Harriss-White,B., Sinha, A. (Eds.), Trade liberalization and India’s informal economy. Oxford University Press,Oxford.
Hauschild, M.Z. (2005) Assessing environmental impacts in a life cycle perspective. EnvironmentalScience and Technology 39 81-88.
Haygarth, P.M., Ritz, K. (2009) The future of soils and land use in the UK: Soil systems for theprovision of land-based ecosystem services. Land Use Policy 26, Supplement 1, S187-S197.
ILO, (1999) Decent Work: Report of the Director General., International Labour Conference, 87thSessions, Geneva.
ISO, (2006) Environment Management – Life Cycle Assessment – Principles and Framework. ENISO 14040, in: International Organization for Standardization (ISO) (Ed.), Switzerland.
Kasmaprapruet, S., Paengjuntuek, W., Saikhwan, P., Phungrassami, H. (2009) Life Cycle Assessmentof Milled Rice Production: Case Study in Thailand. European Journal of Scientific Research 30, 8.Lorano, E., (2005) Quality in work: Dimension and Indicators in the Framework of the EuropeanEmplyment Strategy, in: UNECE/ILO/Eurostat Seminar on the Quality of Work (Ed.), Working Paperno. 2., Geneva.
Mai Thao, P.T., Kurisu, K.H., Hanaki, K. (2011) Greenhouse gas emission mitigation potential of ricehusks for An Giang province, Vietnam. Biomass and Bioenergy 35, 3656-3666.
Mody, G., Mani, M., Sukumar, M. (2013) Labour patterns within the informal food sector.
Prasara-A, J., Grant, T. (2011) Comparative life cycle assessment of uses of rice husk for energypurposes. The International Journal of Life Cycle Assessment 16, 493-502.
Ring, I. (2008) Integrating local ecological services into intergovernmental fiscal transfers: The caseof the ecological ICMS in Brazil. Land Use Policy 25, 485-497.
Schneider, F. (2002) Size and measurement of the informal economy in 110 countries around theworld. Department of Economics, Johannes Kepler University of Linz, Austria.
Shie, J.-L., Chang, C.-Y., Chen, C.-S., Shaw, D.-G., Chen, Y.-H., Kuan, W.-H., Ma, H.-K. (2011)Energy life cycle assessment of rice straw bio-energy derived from potential gasification technologies.Bioresource Technology 102, 6735-6741.
Shindell, D., Kuylenstierna, J.C.I., Vignati, E., van Dingenen, R., Amann, M., Klimont, Z., Anenberg,S.C., Muller, N., Janssens-Maenhout, G., Raes, F., Schwartz, J., Faluvegi, G., Pozzoli, L., Kupiainen,K., Höglund-Isaksson, L., Emberson, L., Streets, D., Ramanathan, V., Hicks, K., Oanh, N.T.K., Milly,G., Williams, M., Demkine, V., Fowler, D. (2012) Simultaneously Mitigating Near-Term ClimateChange and Improving Human Health and Food Security. Science 335, 183-189.
Wang, M., Xia, X., Zhang, Q., Liu, J. (2010) Life cycle assessment of a rice production system inTaihu region, China. International Journal of Sustainable Development & World Ecology 17, 157-161.

35
36
A LIFE CYCLE ASSESSMENT OF FOUR RICE PRODUCTION SYSTEMS:
HIGH YIELDING VARIETIES, RAIN-FED RICE, SYSTEM OF RICE
INTENSIFICATION AND ORGANIC RICE
Alfred Gathorne–Hardy
37
A LIFE CYCLE ASSESSMENT OF FOUR RICE PRODUCTIONSYSTEMS: HIGH YIELDING VARIETIES, RAIN-FED RICE,
SYSTEM OF RICE INTENSIFICATION AND ORGANIC RICE
Alfred Gathorne-Hardy
Acronyms:
CH4 MethaneFYM Farm Yard ManureGHG Greenhouse gasILUC Indirect Land Use ChangeLCA Life Cycle AssessmentN2O Nitrous oxideNUE Nitrogen use efficiencyTNS Simulated conditions for TN water table
Introduction
Agriculture is driving its own demise
Agriculture is a key driver of environmental degradation. It is directly responsible for
approximately10-12% of global greenhouse gas (GHG) emissions(Smith et al., 2007) and indirectly
for roughly another 10% (Canadell et al., 2007). It is the main driver of land use change and
associated biodiversity loss (Foley et al., 2011), uses 92% of global fresh water (Hoekstra and
Mekonnen, 2012) and approximately 20% of primary energy (Eshel and Martin, 2006).
As well as causing environmental damage, agriculture is, above all other industries, reliant upon a
well-functioning environment. It is vulnerable to temperature extremes, water availability,
atmospheric soil and water pollution, pest and disease outbreaks, biodiversity loss, tropospheric
ozone, high winds - and the list goes on.
The global agricultural system is thus both a driver and a victim of environmental change.
This challenge is intensified with the pressure to respond to an already changing environment at the
same time as increasing agricultural output to meet the expected demand of a global population
growing both in numbers and wealth (Carriger and Vallee, 2007; Foresight, 2011; Singh, 2013; The
Royal Society, 2012). Thus agricultural systems must simultaneously adapt to change, mitigate
further change and increase production.
This paper provides the following: (i) a brief overview of three existing areas of agricultural-
environmental stress, (ii) the methods, results and analysis of research exploring the relations between
stages of rice production and greenhouse gas (GHG) emissions, (iii) the water use and the energy
38
requirements of four different rice production technologies: intensive flooded High Yielding Varieties
(HYV), rain-fed rice, Systems of Rice Intensification (SRI) and organic rice, (see box 1 below).
Three areas of agri-environmental pressure
1.2.1. The impact of greenhouse gas emissions on agricultureWhile the planet warmed by an average of 0.74oC during the last century(Pachauri, 2007), the rate
was uneven. Temperatures are increasing much faster on land compared to the ocean,22 and certain
regions are experiencing especially rapid change, for example the arctic (Duarte et al., 2012; Screen
and Simmonds, 2010) and the Himalayas (Wassmann et al., 2009).
Consequences that were expected at the end of the 21st century are occurring now (Duarte et al., 2012;
Hoegh-Guldberg and Bruno, 2010), and, while ascribing specific weather events to climate change is
difficult, there is increasing statistical evidence to do just this, ranging from the Pakistan floods of
2010 to the Russian heat-waves in the same year (Coumou and Rahmstorf, 2012).
Temperature rises affect agriculture.Rice, in common with many cereals(including wheat and maize),
is especially sensitive to high temperatures during flowering. Much work has been carried out
onIR64, the most common rice variety in the tropics,showing substantial declines in yields if daily
temperatures exceed 35oC. For example, spikelet fertility drops at approximately 7% per degree above
29.6oC(Jagadish et al., 2007); there is a 50% decline in spikelet fertility at 38oC compared to
29oC(Jagadish et al., 2010)and an almost 100% decline at 39oC(Santiaguel et al.). Higher night time
temperatures, which rise faster than day time temperatures with climate change, increase the
respirationrate, using up carbohydrate reserves so that an estimated 10% yield decline is seen with
every 1oC night time temperature increase (Cheng et al., 2006; Peng et al., 2004).
1.2.2. WaterWhile plant breeding can address some aspects of increased temperature (for example by changing the
time of day for pollen dehiscence), for everything but subsistence cropping the variable that describes
most yield variation is precipitation or access to water (Sinclair, 2011). The complexity of the
climate system makes predicting precipitation, as a manifestation of local weather, very difficult, but
physics dictates that higher temperatures increase evaporation and thus the severity of
droughts(Trenberth, 2010). Warmer air can hold more moisture (containing additional latent energy) -
potentially increasing the intensity of rainfall events (Coumou and Rahmstorf, 2012). Thus even for
irrigated farming, the increased evaporation increases demand for irrigation, and the increased
intensity of rainfall increases associated threats from flooding and lodging.
220.24
oC per decade on land compared to 0.13
oC per decade for oceans IPCC, (2007) Observations: Surface and
Atmospheric Climate Change, in: Solomon, S., Qin, D., Manning, M., Chen, Z., Marquis, M., Averyt, K.B., M., T.,H.L., M. (Eds.), Contribution of Working Group I to the Fourth Assessment Report of the IntergovernmentalPanel on Climate Change, 2007. Cambridge University Press, , Cambridge, United Kingdom and New York, NY,USA, p. 237.
39
While water supplies may change with climate change, agriculture is already using the majority of
extracted fresh water globally (Pfister et al., 2011). Assuming water is available, the use of water in
agriculture is a problem when: (a)alternative uses would be better (for nature or society), (b)if water
leaves the site polluted from use, or (c) if inappropriate use (for example over-irrigation) causes local
problems such as salinisation.Forty per cent of the world, including much of India, suffers from water
stress (Oki and Kanae, 2006)and much of the rice growing areas of India show all three problems,
with high water stress, combined with the high water demand of irrigated rice leading to local and
regional water conflicts, rapidly lowering water tables, and enormous demand for energy(Nelson et
al., 2009; Prasad and Nagarajan, 2004).
EnergyEnergy is the currency of nature’s economy(Lindeman, 1942). As a component of nature, agriculture
trades this currency with both inputs (from the sun, human and animal labour and increasingly from
fossil fuels) and outputs (as food or fibre). One of the key developments in agriculture has been the
addition of more energy into the system, for example through fossil fuels and electricity, which has
allowed additional outputs through higher yields(Pelletier et al., 2011). Yet much of this energy
comes at a cost - both directly (burning fossil fuels releases greenhouse gases into the environment)
and indirectly allowing wider environmental damage (for example the pollution of waterways with
pesticides and fertilisers or over-extraction of water).
Looking at agricultural energy use up to the farm gate it is useful to split it between direct and indirect
energy. Direct energy is that expended directly on the farm, for example diesel for tractors or
electricity for irrigation, while indirect energy is the embodied energy in products used on the farm,
for example the embodied energy in the production of a tractor or of fertiliser. In conventional high
yielding agriculture, indirect energy is often more important than the direct energy, but so far little
work has been done looking at the energy balance in small scale, dry-land/organic/extensive rice
production in India.
The importance of rice
Rice is important crop socially, economically and environmentally. In terms ofhuman nutrition, rice
is the most important agricultural crop - while similar quantities of wheat and maize are grown
globally, a substantial proportion of these are used for animal feed (and increasingly biofuels). By
contrast rice is the staple food for 50- 60% of the world’s population (Carriger and Vallee, 2007;
Stoop et al., 2009), and in India represents 31% of total calorie intake (Anonymous, 2011b).
Economically it is equally important, providing employment globally for ca. 1bn people (Dawe,
40
2000), and represents a major fraction of India’s agricultural sector, which accounts for a fifth of
GDP23and yet which employs 57% of India’s workforce (Lerche, 2011).
From 1961 to 2007, Indian rice production has increased by 3 times to over 140m tonnes, minimally
oscillating around 21% of global rice production throughout this time(FAOSTAT, 2008). During this
periodthe use of fertiliser (for all crops) in India increased by approximately 40 times and India
switched from being a net importer of rice to a major exporter, responsible for between 8 and 24% of
global milled rice exports in the first 8 yrs of the 21st century(FAO).
The environmentalimportance of rice is due to the magnitude of its physical footprint, accentuatedby
the practise of irrigation. Globally 157m hectares are down to rice, over 44m hectares of these in
India (Anonymous, 2011a). Rice is unique among major crops in having flooded production
conditions. Irrigated rice is responsible for most rice production – worldwide 79m hectares of
irrigated lowland rice produce 75% of the annual global rice output(IRRI, 2013). This rice has been
estimated to use 34-43% of global irrigated water, or 24-30% of the total freshwater
withdrawals(Bouman et al., 2007). The implications of widespread production and flooded
production conditions are a high dependence on energy, and a complicated set of greenhouse gas
emissions. All large-scale water extraction brings with it social and environmental burdens, from
dams, rivers, artificial rivers, and from large scale mining of ground water aquifers. The direct
capture and use of precipitation is the least damaging, although even this can have a significant impact
on water availability downstream (Belluscio, 2009).
Life cycle research
There is very little published life cycle research into the greenhouse gas emissions of Indian rice. For
example the web of science has zero returns from the search ‘life cycle rice India.’
While the larger project of which this is a component, examines social, economic and ecological
implications of the entire rice supply chain, here we assess three measures of environmental impact:
GHG emissions, energy use and groundwater use. These were chosen due to their importance, their
ability to be measured, and their ability to act as proxy measures for wider environmental impacts
(Huijbregts et al., 2010). We have chosen to study rice as a case study system for three reasons: its
importance for food, its importance for employment, and its complicated environmental impacts.
We look specifically at four different types of rice production: i) HYV rice, as typified across much of
India, and a direct grandchild of the green revolution. ii) Organic rice production, which is a largely
unregulated industry in India that was initially led by the export market, but now has increasing levels
23having declined from over 50% at Independence Planning Commission, (2008) Eleventh Five Year Plan,
(2007–2012). Agriculture, Rural Development, Industry, Services and Physical Infrastructure, in: India, G.o.(Ed.), New Delhi.
41
of dedicated rice grown for domestic consumption. iii)The System of Rice Intensification, and iv)
Rain-fed rice. See Table 3.
The main GHG from rice production is methane (CH4). Of the 49Tg of anthropogenic CO2–eq24
emitted worldwide in 2004, CH4 made up about 14% (Pachauri, 2007). Rice was estimated to be
responsible for about 11% of this (USEPA, 2006), and of that 97% is from developing
countries(Smith et al., 2007). Demand for rice is expected to increase, so there is pressure to produce
more rice with fewer GHG emissions.
If humanity is to meet this challenge then rice, as the single most important food product globally,
will have a key role. Rice, while feeding an increasingly urbanised and growing population will need
increased output on the same land, with less water, a challenge recognised by the Indian
government(Singh, 2013)
Methods
The most robust technique for determining the repercussions of different production techniques is to
use the experimental method, where only the variable of interest differs between examined
populations. Yet there are situations in both natural and social scienceswhen such a set-up is
impossible. While this paper examines environmental variables, it is part of a larger project looking at
socio-economicvariables and institutions – a range of variables too large for experimental control.
Indeed any effort to control a large range of complex variables would require such manipulation that
the results would be unreliable.Thereforethis project has used a comparative observational approach,
where two or more methods for achieving the same result (production of paddy in this case) are
compared on common attributes (Ott and Longnecker, 2010). As is accepted practice in social
science research, we use reported practices and outcomes to ascribe different attributes to each rice
production technique(Ly et al., 2012).
Data was collected using recall surveys, carried out by 3 different research teamsacross the four
technological systems.
Locations
The research took place in semi-arid regions of South and East India. Data for each rice techno-
system was collected from different regions, with the exception of an additional subset of HYV farms
collected in conjunction with the SRI farmers as a local control in Andhra Pradesh. Intensive, High
Yielding Variety rice (HYV) rice data was collected from Thiruvannamalai district, in northern Tamil
Nadu, SRI paddy data was collected from Warangal district, in northern AP, data on rainfed paddy
production was collected from Koraput district, in south-eastern Odisha, and data for organic paddy
24CO2-eq is a form of standardising GHGs into a common baseline against carbon dioxide, as explained in
section 2.1.3.
42
was collected from Thiruvallur, SE Tamil Nadu. At each site, a standard questionnaire was used to
collect data for the previous year, but only the data for a single season – the highest (average)
producing from each farm –had been intensively analysed for each production process.
LCA model of paddy from different production systems
Our objective is to understand howthe production of paddy from four different rice farming processes
affects key environmental criteria. Life cycle assessment (LCA) methodology was used to analyse the
data, based on ISO 14040, PAS 2050 and the ILCD handbook (European Commission, 2010; ISO,
2006; PAS 2050:2011, 2011).
System boundaries and functional unitThe functional unit for this part of the study is:
1kg of paddy at the farm gate
That is: all the processes that go into producing the paddy but, in this paper, not those processes that
convert paddy to rice(Gathorne-Hardy, 2013b).
Establishing appropriate baseline and boundaries is critical for accurate, meaningful and
representative results. In our study the baselines – the objects of comparison - are to a large extent
taken care of, as we are comparingproduction technologies. Setting the boundaries correctly means
addressing the balance between knowing which aspects can be ignored without compromising the
final result, and making sure the study is practically feasible.
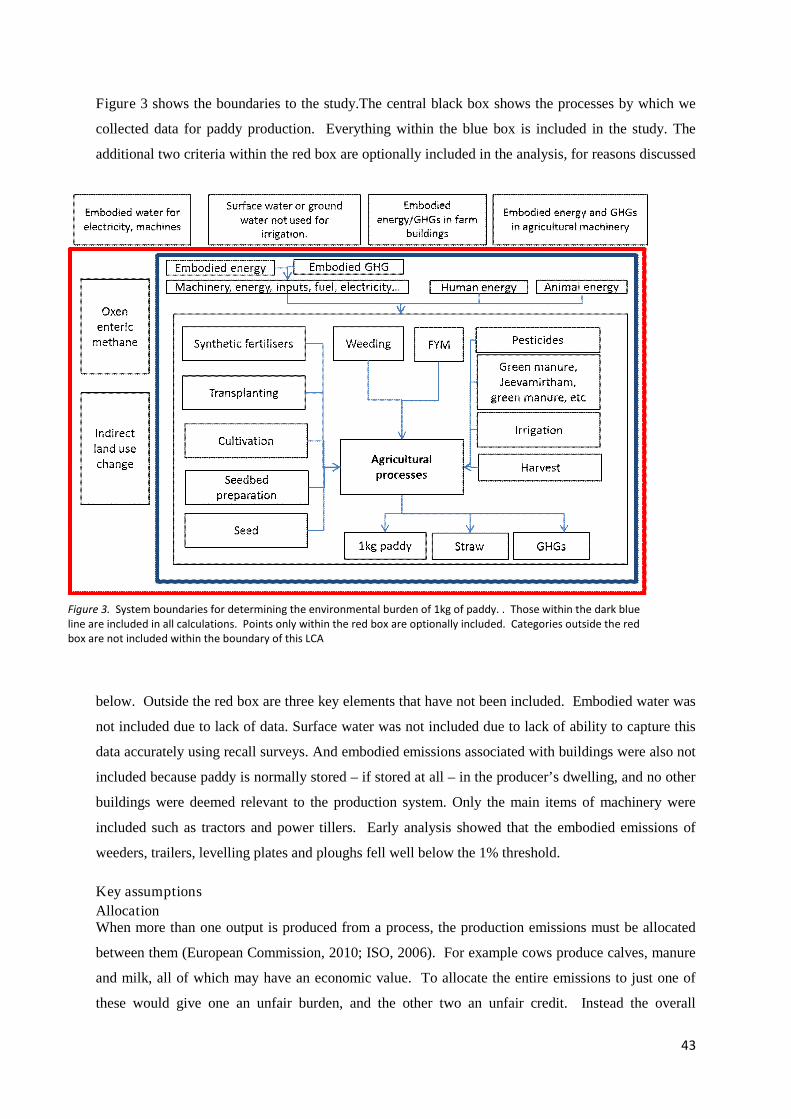
43
Figure 3 shows the boundaries to the study.The central black box shows the processes by which we
collected data for paddy production. Everything within the blue box is included in the study. The
additional two criteria within the red box are optionally included in the analysis, for reasons discussed
below. Outside the red box are three key elements that have not been included. Embodied water was
not included due to lack of data. Surface water was not included due to lack of ability to capture this
data accurately using recall surveys. And embodied emissions associated with buildings were also not
included because paddy is normally stored – if stored at all – in the producer’s dwelling, and no other
buildings were deemed relevant to the production system. Only the main items of machinery were
included such as tractors and power tillers. Early analysis showed that the embodied emissions of
weeders, trailers, levelling plates and ploughs fell well below the 1% threshold.
Key assumptions
AllocationWhen more than one output is produced from a process, the production emissions must be allocated
between them (European Commission, 2010; ISO, 2006). For example cows produce calves, manure
and milk, all of which may have an economic value. To allocate the entire emissions to just one of
these would give one an unfair burden, and the other two an unfair credit. Instead the overall
Figure 3. System boundaries for determining the environmental burden of 1kg of paddy. . Those within the dark blueline are included in all calculations. Points only within the red box are optionally included. Categories outside the redbox are not included within the boundary of this LCA
44
emissions must be allocated between them. Allocation can occur through a range of measures,
including by mass, energy content, or value (Directive 2009/28/EC., 2009),but allocation of co-
products via economic burdens, as recommended by Williams et al (2006), normally reflects the
drivers of production. In economic allocation, the proportional value of each co-product represents the
proportional allocation of emissions, on the assumption that the co-products drive the total production
in proportion to their economic value. The most important allocations in this research are in the
livestock sub-system and between straw and grain yield. Both are described below.
2.3.1.1. Straw.
Rice production is a multifunctional process, producing straw as well as paddy, yet in rice LCAs rice
straw is commonly not allocated to the emissions of rice ((Blengini and Busto, 2009) or is even more
commonly not mentioned (Blengini and Busto, 2009; Hokazono and Hayashi, 2012; Wang et al.,
2010). As a useful by-product, it should be allocated a share of the environmental burden associated
with rice production.Approximately equal weight and energy of straw and paddy are produced from
each crop, so using mass or energy, the straw and paddy would be allocated environmental
costs/benefits equally. This very poorly reflects the drivers for paddy farming which isled by paddy
production, with straw considered by producers as a potentially useful by-product.
Allocation to straw is made more difficult within this study for three reasons: there is rarely a market
for the straw, few farmers know how much straw they harvest while straw that leaves the field can
sometimes but not always return to the field as manure. Only in NE Tamil Nadu did farmers (65% of
them) report selling their straw, no straw was sold in any of the other farming systems investigated,
with the exception of one organic rice producer. In some cases straw is burnt, which would suggest an
economic value close to zero, or even a negative value, if the labour associated with burring the straw
is included. This did not occur on any of the farms we studied. Instead there is a household demand
for straw to feed livestock for milk, traction or meat. We used prices from Tamil Nadu, which
averaged at Rs0.51 kg-1 (standard deviation 0.043), for imputing straw prices in all regions.
We calculated the yield of straw by proxy, using the harvest index. Although the harvest index (the
proportion of grain to total above-ground biomass) for intensive in-bred rice is approximately 50%
(Islam et al., 2010; Khush, 2001), this does not account for the actual availability of straw to harvest –
inevitably a portion is left in the field. We have therefore assumed the harvestable yield of straw to be
90% of total straw; thus the total straw yield is assumed to be 90% of the paddy yield (0.5*2*90%)
for organic, SRI and HYV rice, and 126% for traditional varieties (where the harvest index is more
commonly 0.3) (0.7*2*90%) (Khush, 2001).
Inventory analysis and data sources
This section explains how the collected data were adapted for use in the LCA model, and sources of
data.
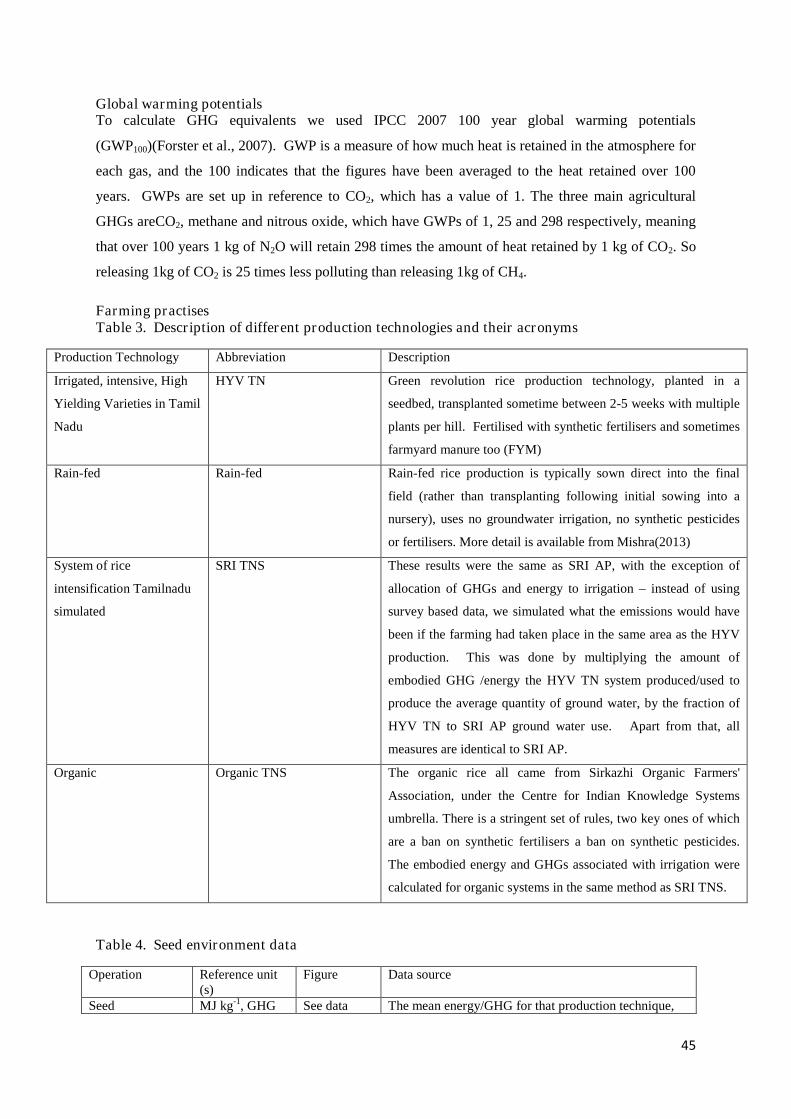
45
Global warming potentialsTo calculate GHG equivalents we used IPCC 2007 100 year global warming potentials
(GWP100)(Forster et al., 2007). GWP is a measure of how much heat is retained in the atmosphere for
each gas, and the 100 indicates that the figures have been averaged to the heat retained over 100
years. GWPs are set up in reference to CO2, which has a value of 1. The three main agricultural
GHGs areCO2, methane and nitrous oxide, which have GWPs of 1, 25 and 298 respectively, meaning
that over 100 years 1 kg of N2O will retain 298 times the amount of heat retained by 1 kg of CO2. So
releasing 1kg of CO2 is 25 times less polluting than releasing 1kg of CH4.
Farming practisesTable 3. Description of different production technologies and their acronyms
Production Technology Abbreviation Description
Irrigated, intensive, High
Yielding Varieties in Tamil
Nadu
HYV TN Green revolution rice production technology, planted in a
seedbed, transplanted sometime between 2-5 weeks with multiple
plants per hill. Fertilised with synthetic fertilisers and sometimes
farmyard manure too (FYM)
Rain-fed Rain-fed Rain-fed rice production is typically sown direct into the final
field (rather than transplanting following initial sowing into a
nursery), uses no groundwater irrigation, no synthetic pesticides
or fertilisers. More detail is available from Mishra(2013)
System of rice
intensification Tamilnadu
simulated
SRI TNS These results were the same as SRI AP, with the exception of
allocation of GHGs and energy to irrigation – instead of using
survey based data, we simulated what the emissions would have
been if the farming had taken place in the same area as the HYV
production. This was done by multiplying the amount of
embodied GHG /energy the HYV TN system produced/used to
produce the average quantity of ground water, by the fraction of
HYV TN to SRI AP ground water use. Apart from that, all
measures are identical to SRI AP.
Organic Organic TNS The organic rice all came from Sirkazhi Organic Farmers'
Association, under the Centre for Indian Knowledge Systems
umbrella. There is a stringent set of rules, two key ones of which
are a ban on synthetic fertilisers a ban on synthetic pesticides.
The embodied energy and GHGs associated with irrigation were
calculated for organic systems in the same method as SRI TNS.
Table 4. Seed environment data
Operation Reference unit(s)
Figure Data source
Seed MJ kg-1, GHG See data The mean energy/GHG for that production technique,

46
kg-1 source +5% to account for handling and losses
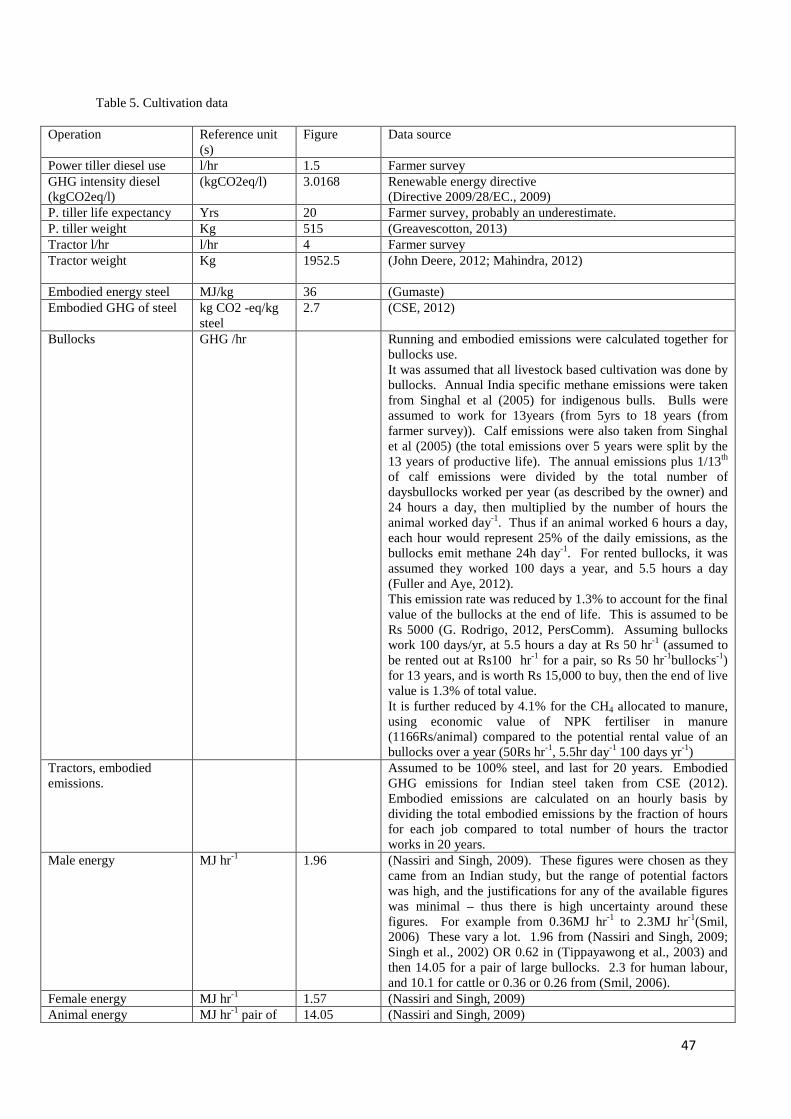
47
Table 5. Cultivation data
Operation Reference unit(s)
Figure Data source
Power tiller diesel use l/hr 1.5 Farmer surveyGHG intensity diesel(kgCO2eq/l)
(kgCO2eq/l) 3.0168 Renewable energy directive(Directive 2009/28/EC., 2009)
P. tiller life expectancy Yrs 20 Farmer survey, probably an underestimate.P. tiller weight Kg 515 (Greavescotton, 2013)Tractor l/hr l/hr 4 Farmer surveyTractor weight Kg 1952.5 (John Deere, 2012; Mahindra, 2012)
Embodied energy steel MJ/kg 36 (Gumaste)Embodied GHG of steel kg CO2 -eq/kg
steel2.7 (CSE, 2012)
Bullocks GHG /hr Running and embodied emissions were calculated together forbullocks use.It was assumed that all livestock based cultivation was done bybullocks. Annual India specific methane emissions were takenfrom Singhal et al (2005) for indigenous bulls. Bulls wereassumed to work for 13years (from 5yrs to 18 years (fromfarmer survey)). Calf emissions were also taken from Singhalet al (2005) (the total emissions over 5 years were split by the13 years of productive life). The annual emissions plus 1/13th
of calf emissions were divided by the total number ofdaysbullocks worked per year (as described by the owner) and24 hours a day, then multiplied by the number of hours theanimal worked day-1. Thus if an animal worked 6 hours a day,each hour would represent 25% of the daily emissions, as thebullocks emit methane 24h day-1. For rented bullocks, it wasassumed they worked 100 days a year, and 5.5 hours a day(Fuller and Aye, 2012).This emission rate was reduced by 1.3% to account for the finalvalue of the bullocks at the end of life. This is assumed to beRs 5000 (G. Rodrigo, 2012, PersComm). Assuming bullockswork 100 days/yr, at 5.5 hours a day at Rs 50 hr-1 (assumed tobe rented out at Rs100 hr-1 for a pair, so Rs 50 hr-1bullocks-1)for 13 years, and is worth Rs 15,000 to buy, then the end of livevalue is 1.3% of total value.It is further reduced by 4.1% for the CH4 allocated to manure,using economic value of NPK fertiliser in manure(1166Rs/animal) compared to the potential rental value of anbullocks over a year (50Rs hr-1, 5.5hr day-1 100 days yr-1)
Tractors, embodiedemissions.
Assumed to be 100% steel, and last for 20 years. EmbodiedGHG emissions for Indian steel taken from CSE (2012).Embodied emissions are calculated on an hourly basis bydividing the total embodied emissions by the fraction of hoursfor each job compared to total number of hours the tractorworks in 20 years.
Male energy MJ hr-1 1.96 (Nassiri and Singh, 2009). These figures were chosen as theycame from an Indian study, but the range of potential factorswas high, and the justifications for any of the available figureswas minimal – thus there is high uncertainty around thesefigures. For example from 0.36MJ hr-1 to 2.3MJ hr-1(Smil,2006) These vary a lot. 1.96 from (Nassiri and Singh, 2009;Singh et al., 2002) OR 0.62 in (Tippayawong et al., 2003) andthen 14.05 for a pair of large bullocks. 2.3 for human labour,and 10.1 for cattle or 0.36 or 0.26 from (Smil, 2006).
Female energy MJ hr-1 1.57 (Nassiri and Singh, 2009)Animal energy MJ hr-1 pair of 14.05 (Nassiri and Singh, 2009)
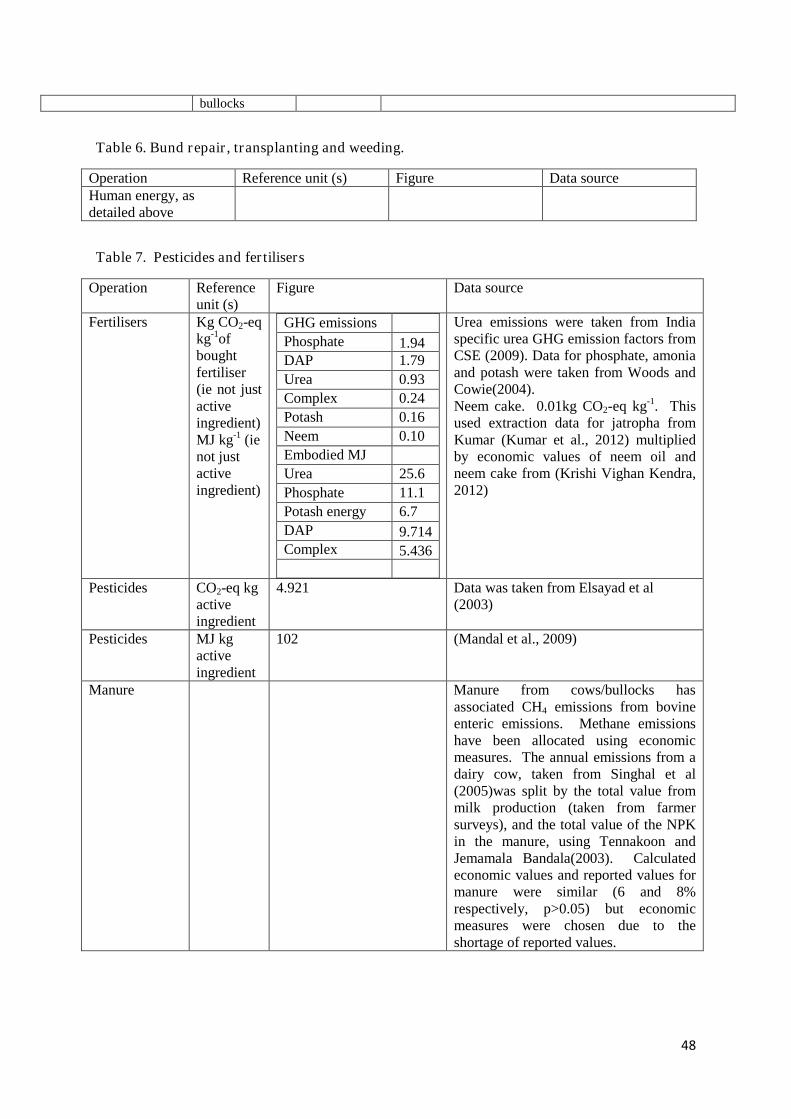
48
bullocks
Table 6. Bund repair, transplanting and weeding.
Operation Reference unit (s) Figure Data sourceHuman energy, asdetailed above
Table 7. Pesticides and fertilisers
Operation Referenceunit (s)
Figure Data source
Fertilisers Kg CO2-eqkg-1ofboughtfertiliser(ie not justactiveingredient)MJ kg-1 (ienot justactiveingredient)
GHG emissions
Phosphate 1.94DAP 1.79
Urea 0.93
Complex 0.24
Potash 0.16
Neem 0.10
Embodied MJ
UreaUroductionmj/kg
25.6
Phosphateenergy (mj/kg)
11.1
Potash energy(mj/kg)
6.7
DAP 9.714Complex 5.436
Urea emissions were taken from Indiaspecific urea GHG emission factors fromCSE (2009). Data for phosphate, amoniaand potash were taken from Woods andCowie(2004).Neem cake. 0.01kg CO2-eq kg-1. Thisused extraction data for jatropha fromKumar (Kumar et al., 2012) multipliedby economic values of neem oil andneem cake from (Krishi Vighan Kendra,2012)
Pesticides CO2-eq kgactiveingredient
4.921 Data was taken from Elsayad et al(2003)
Pesticides MJ kgactiveingredient
102 (Mandal et al., 2009)
Manure Manure from cows/bullocks hasassociated CH4 emissions from bovineenteric emissions. Methane emissionshave been allocated using economicmeasures. The annual emissions from adairy cow, taken from Singhal et al(2005)was split by the total value frommilk production (taken from farmersurveys), and the total value of the NPKin the manure, using Tennakoon andJemamala Bandala(2003). Calculatedeconomic values and reported values formanure were similar (6 and 8%respectively, p>0.05) but economicmeasures were chosen due to theshortage of reported values.
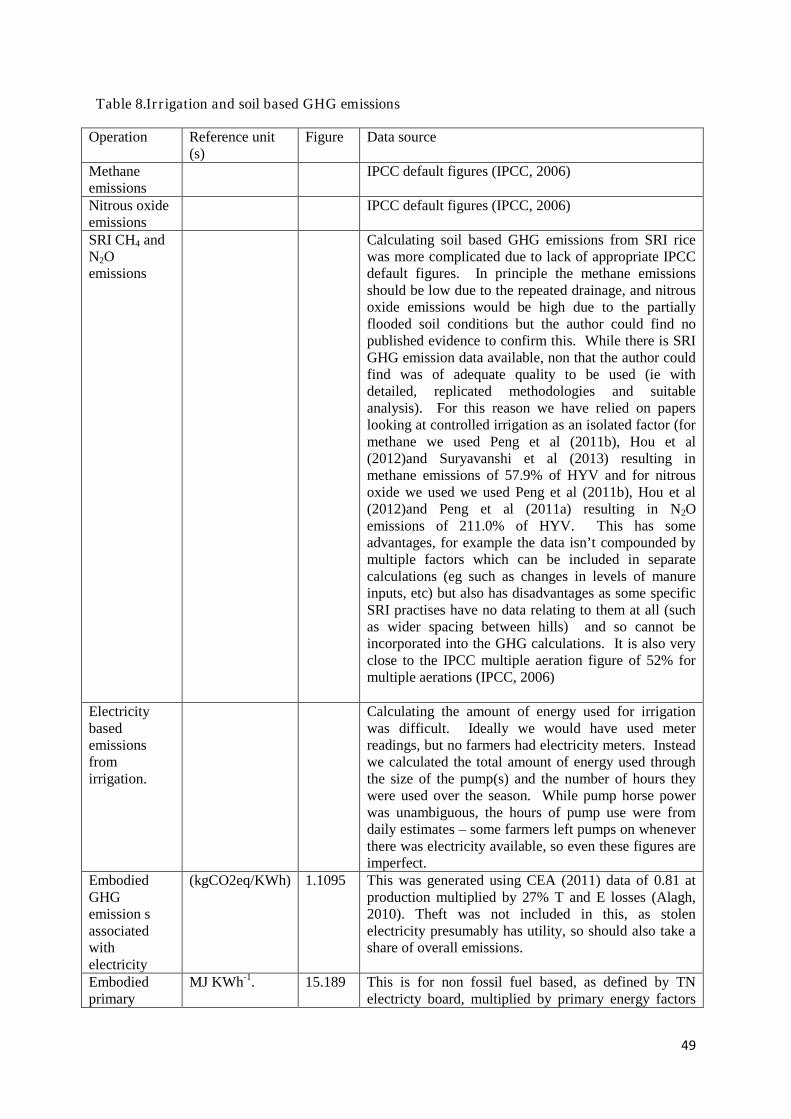
49
Table 8.Irrigation and soil based GHG emissions
Operation Reference unit(s)
Figure Data source
Methaneemissions
IPCC default figures (IPCC, 2006)
Nitrous oxideemissions
IPCC default figures (IPCC, 2006)
SRI CH4 andN2Oemissions
Calculating soil based GHG emissions from SRI ricewas more complicated due to lack of appropriate IPCCdefault figures. In principle the methane emissionsshould be low due to the repeated drainage, and nitrousoxide emissions would be high due to the partiallyflooded soil conditions but the author could find nopublished evidence to confirm this. While there is SRIGHG emission data available, non that the author couldfind was of adequate quality to be used (ie withdetailed, replicated methodologies and suitableanalysis). For this reason we have relied on paperslooking at controlled irrigation as an isolated factor (formethane we used Peng et al (2011b), Hou et al(2012)and Suryavanshi et al (2013) resulting inmethane emissions of 57.9% of HYV and for nitrousoxide we used we used Peng et al (2011b), Hou et al(2012)and Peng et al (2011a) resulting in N2Oemissions of 211.0% of HYV. This has someadvantages, for example the data isn’t compounded bymultiple factors which can be included in separatecalculations (eg such as changes in levels of manureinputs, etc) but also has disadvantages as some specificSRI practises have no data relating to them at all (suchas wider spacing between hills) and so cannot beincorporated into the GHG calculations. It is also veryclose to the IPCC multiple aeration figure of 52% formultiple aerations (IPCC, 2006)
Electricitybasedemissionsfromirrigation.
Calculating the amount of energy used for irrigationwas difficult. Ideally we would have used meterreadings, but no farmers had electricity meters. Insteadwe calculated the total amount of energy used throughthe size of the pump(s) and the number of hours theywere used over the season. While pump horse powerwas unambiguous, the hours of pump use were fromdaily estimates – some farmers left pumps on wheneverthere was electricity available, so even these figures areimperfect.
EmbodiedGHGemission sassociatedwithelectricity
(kgCO2eq/KWh) 1.1095 This was generated using CEA (2011) data of 0.81 atproduction multiplied by 27% T and E losses (Alagh,2010). Theft was not included in this, as stolenelectricity presumably has utility, so should also take ashare of overall emissions.
Embodiedprimary
MJ KWh-1. 15.189 This is for non fossil fuel based, as defined by TNelectricty board, multiplied by primary energy factors
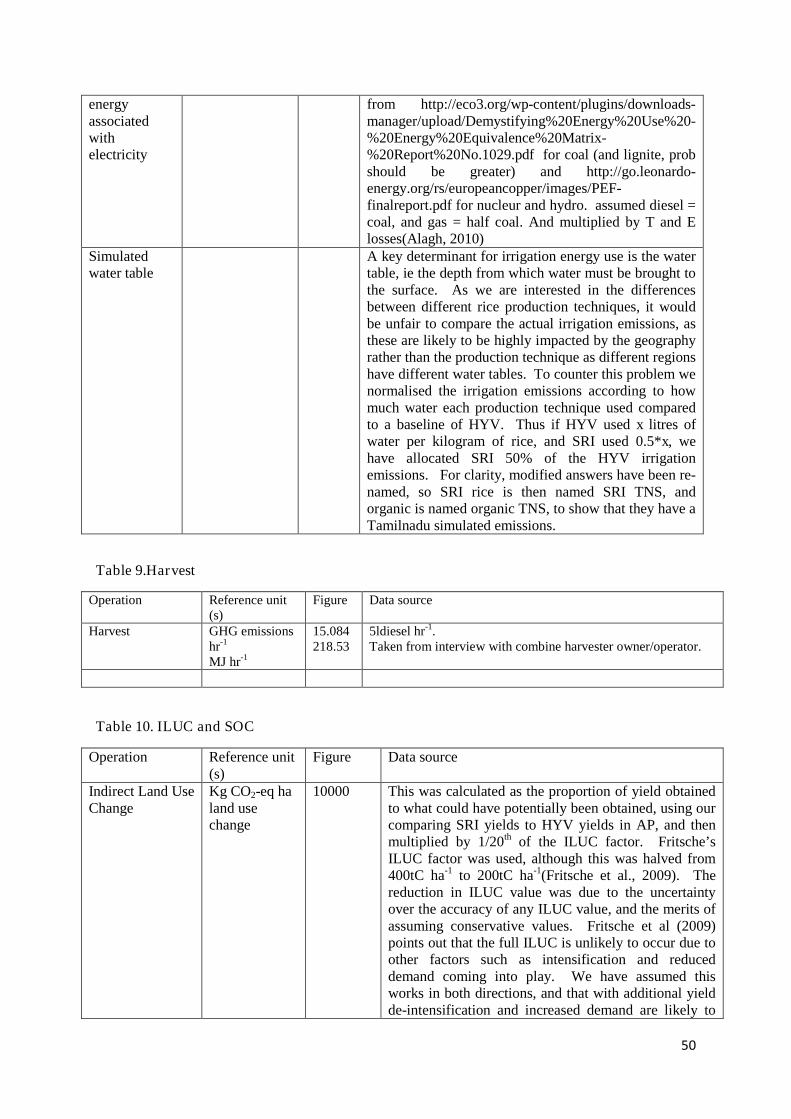
50
energyassociatedwithelectricity
from http://eco3.org/wp-content/plugins/downloads-manager/upload/Demystifying%20Energy%20Use%20-%20Energy%20Equivalence%20Matrix-%20Report%20No.1029.pdf for coal (and lignite, probshould be greater) and http://go.leonardo-energy.org/rs/europeancopper/images/PEF-finalreport.pdf for nucleur and hydro. assumed diesel =coal, and gas = half coal. And multiplied by T and Elosses(Alagh, 2010)
Simulatedwater table
A key determinant for irrigation energy use is the watertable, ie the depth from which water must be brought tothe surface. As we are interested in the differencesbetween different rice production techniques, it wouldbe unfair to compare the actual irrigation emissions, asthese are likely to be highly impacted by the geographyrather than the production technique as different regionshave different water tables. To counter this problem wenormalised the irrigation emissions according to howmuch water each production technique used comparedto a baseline of HYV. Thus if HYV used x litres ofwater per kilogram of rice, and SRI used 0.5*x, wehave allocated SRI 50% of the HYV irrigationemissions. For clarity, modified answers have been re-named, so SRI rice is then named SRI TNS, andorganic is named organic TNS, to show that they have aTamilnadu simulated emissions.
Table 9.Harvest
Operation Reference unit(s)
Figure Data source
Harvest GHG emissionshr-1
MJ hr-1
15.084218.53
5ldiesel hr-1.Taken from interview with combine harvester owner/operator.
Table 10. ILUC and SOC
Operation Reference unit(s)
Figure Data source
Indirect Land UseChange
Kg CO2-eq haland usechange
10000 This was calculated as the proportion of yield obtainedto what could have potentially been obtained, using ourcomparing SRI yields to HYV yields in AP, and thenmultiplied by 1/20th of the ILUC factor. Fritsche’sILUC factor was used, although this was halved from400tC ha-1 to 200tC ha-1(Fritsche et al., 2009). Thereduction in ILUC value was due to the uncertaintyover the accuracy of any ILUC value, and the merits ofassuming conservative values. Fritsche et al (2009)points out that the full ILUC is unlikely to occur due toother factors such as intensification and reduceddemand coming into play. We have assumed thisworks in both directions, and that with additional yieldde-intensification and increased demand are likely to
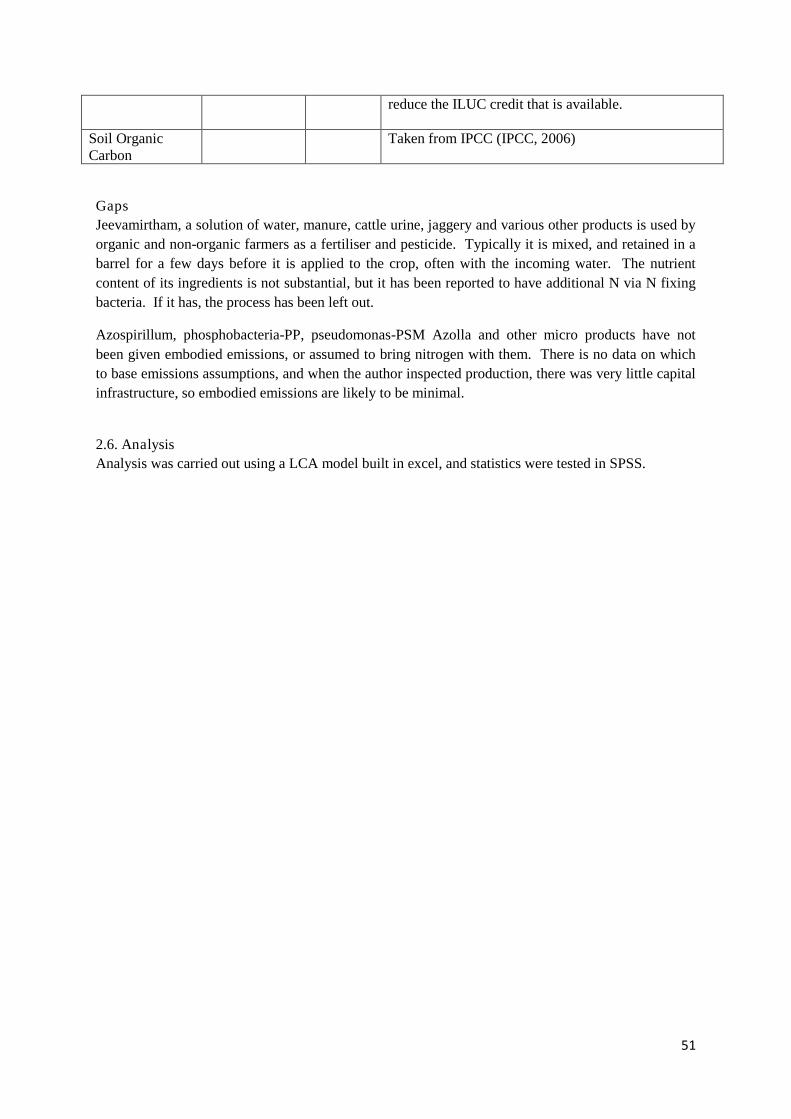
51
reduce the ILUC credit that is available.
Soil OrganicCarbon
Taken from IPCC (IPCC, 2006)
Gaps
Jeevamirtham, a solution of water, manure, cattle urine, jaggery and various other products is used by
organic and non-organic farmers as a fertiliser and pesticide. Typically it is mixed, and retained in a
barrel for a few days before it is applied to the crop, often with the incoming water. The nutrient
content of its ingredients is not substantial, but it has been reported to have additional N via N fixing
bacteria. If it has, the process has been left out.
Azospirillum, phosphobacteria-PP, pseudomonas-PSM Azolla and other micro products have not
been given embodied emissions, or assumed to bring nitrogen with them. There is no data on which
to base emissions assumptions, and when the author inspected production, there was very little capital
infrastructure, so embodied emissions are likely to be minimal.
2.6. Analysis
Analysis was carried out using a LCA model built in excel, and statistics were tested in SPSS.
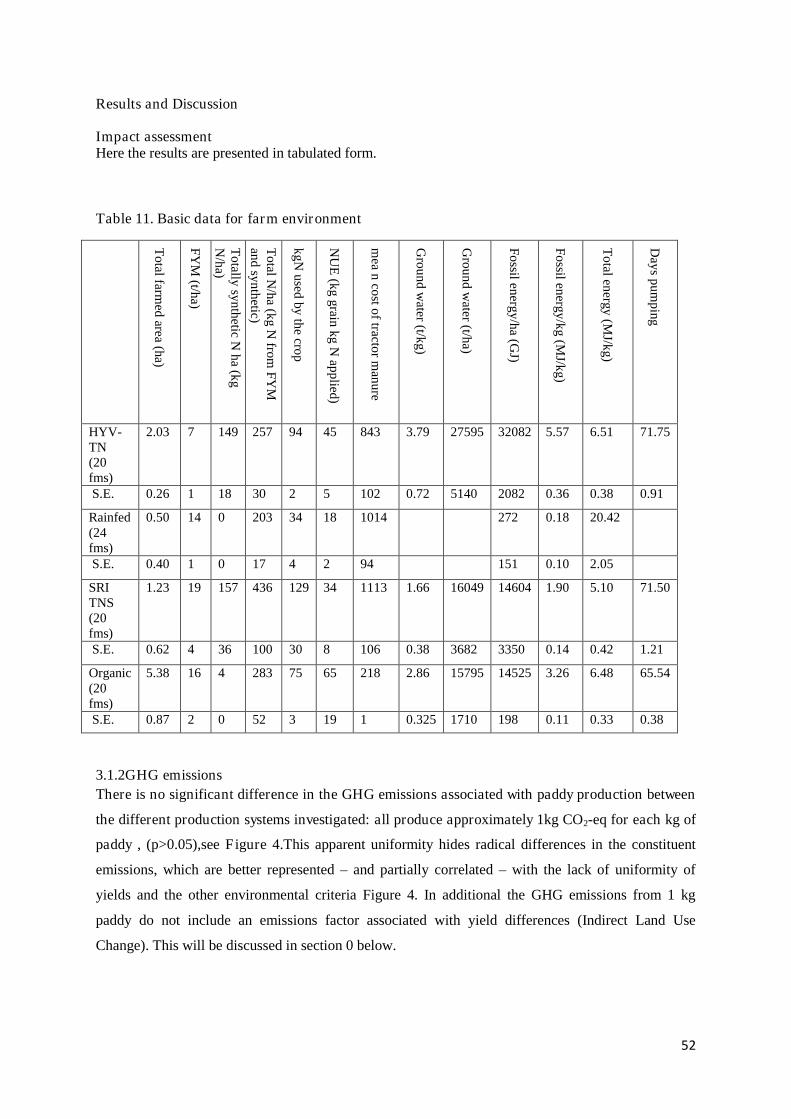
52
Results and Discussion
Impact assessmentHere the results are presented in tabulated form.
Table 11. Basic data for farm environment
To
talfarm
edarea
(ha)
FY
M(t/h
a)
To
tallysy
nth
eticN
ha
(kg
N/h
a)
To
talN
/ha
(kg
Nfrom
FY
Man
dsy
nth
etic)
kg
Nu
sedby
the
crop
NU
E(k
ggrain
kgN
app
lied)
mea
nco
sto
ftracto
rm
anu
re
Gro
un
dw
ater(t/k
g)
Gro
un
dw
ater(t/h
a)
Fo
ssilen
ergy
/ha
(GJ)
Fo
ssilen
ergy
/kg
(MJ/k
g)
To
talen
ergy(M
J/kg
)
Day
sp
um
ping
HYV-TN(20fms)
2.03 7 149 257 94 45 843 3.79 27595 32082 5.57 6.51 71.75
S.E. 0.26 1 18 30 2 5 102 0.72 5140 2082 0.36 0.38 0.91
Rainfed(24fms)
0.50 14 0 203 34 18 1014 272 0.18 20.42
S.E. 0.40 1 0 17 4 2 94 151 0.10 2.05
SRITNS(20fms)
1.23 19 157 436 129 34 1113 1.66 16049 14604 1.90 5.10 71.50
S.E. 0.62 4 36 100 30 8 106 0.38 3682 3350 0.14 0.42 1.21
Organic(20fms)
5.38 16 4 283 75 65 218 2.86 15795 14525 3.26 6.48 65.54
S.E. 0.87 2 0 52 3 19 1 0.325 1710 198 0.11 0.33 0.38
3.1.2GHG emissions
There is no significant difference in the GHG emissions associated with paddy production between
the different production systems investigated: all produce approximately 1kg CO2-eq for each kg of
paddy , (p>0.05),see Figure 4.This apparent uniformity hides radical differences in the constituent
emissions, which are better represented – and partially correlated – with the lack of uniformity of
yields and the other environmental criteria Figure 4. In additional the GHG emissions from 1 kg
paddy do not include an emissions factor associated with yield differences (Indirect Land Use
Change). This will be discussed in section 0 below.
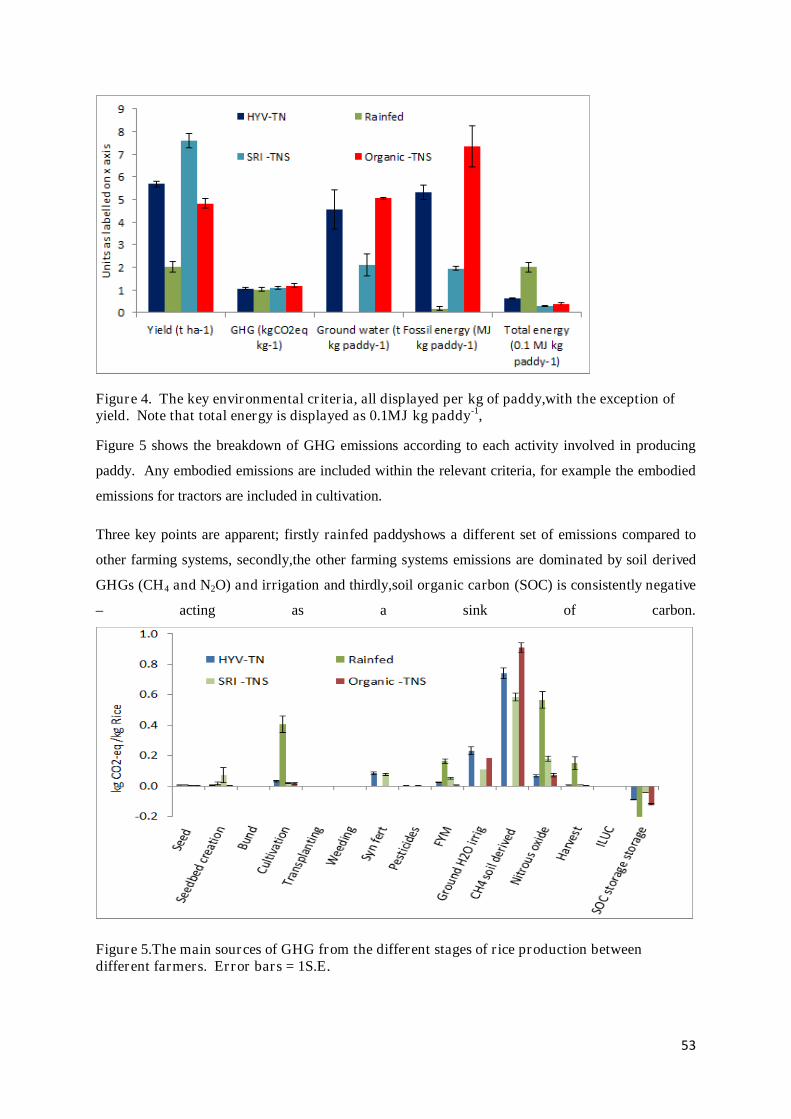
53
Figure 4. The key environmental criteria, all displayed per kg of paddy,with the exception ofyield. Note that total energy is displayed as 0.1MJ kg paddy-1,
Figure 5 shows the breakdown of GHG emissions according to each activity involved in producing
paddy. Any embodied emissions are included within the relevant criteria, for example the embodied
emissions for tractors are included in cultivation.
Three key points are apparent; firstly rainfed paddyshows a different set of emissions compared to
other farming systems, secondly,the other farming systems emissions are dominated by soil derived
GHGs (CH4 and N2O) and irrigation and thirdly,soil organic carbon (SOC) is consistently negative
– acting as a sink of carbon.
Figure 5.The main sources of GHG from the different stages of rice production betweendifferent farmers. Error bars = 1S.E.
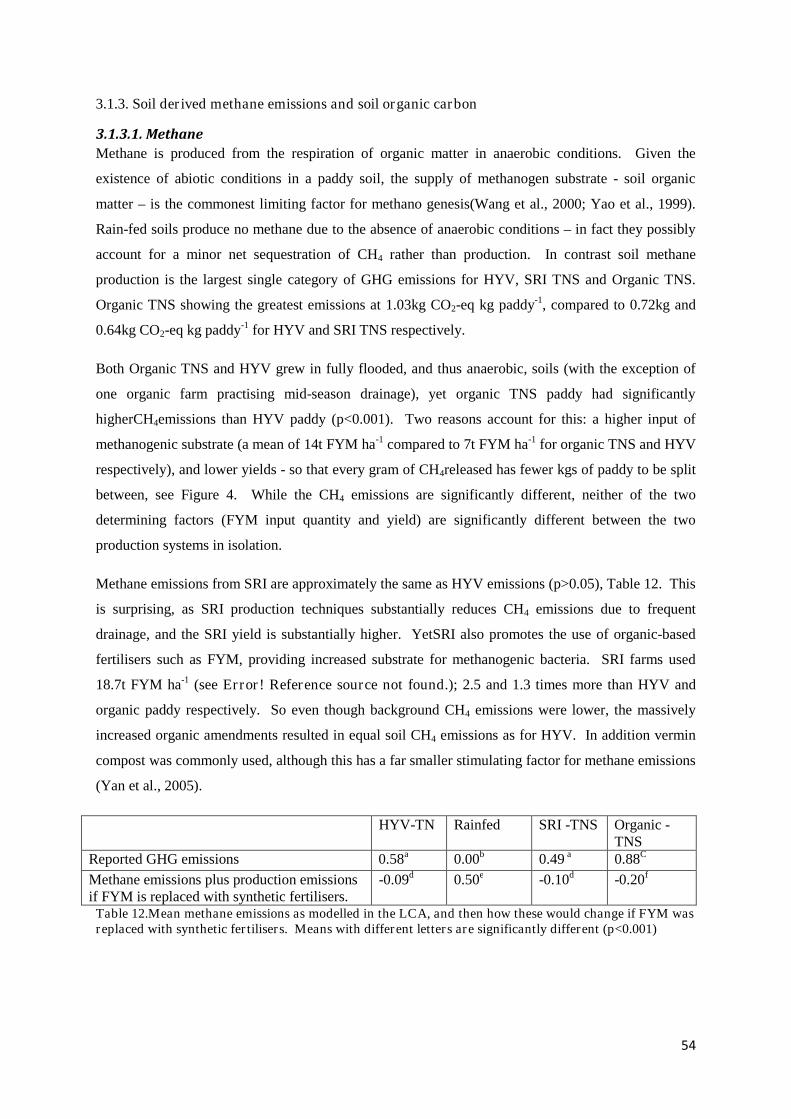
54
3.1.3. Soil derived methane emissions and soil organic carbon
3.1.3.1. Methane
Methane is produced from the respiration of organic matter in anaerobic conditions. Given the
existence of abiotic conditions in a paddy soil, the supply of methanogen substrate - soil organic
matter – is the commonest limiting factor for methano genesis(Wang et al., 2000; Yao et al., 1999).
Rain-fed soils produce no methane due to the absence of anaerobic conditions – in fact they possibly
account for a minor net sequestration of CH4 rather than production. In contrast soil methane
production is the largest single category of GHG emissions for HYV, SRI TNS and Organic TNS.
Organic TNS showing the greatest emissions at 1.03kg CO2-eq kg paddy-1, compared to 0.72kg and
0.64kg CO2-eq kg paddy-1 for HYV and SRI TNS respectively.
Both Organic TNS and HYV grew in fully flooded, and thus anaerobic, soils (with the exception of
one organic farm practising mid-season drainage), yet organic TNS paddy had significantly
higherCH4emissions than HYV paddy (p<0.001). Two reasons account for this: a higher input of
methanogenic substrate (a mean of 14t FYM ha-1 compared to 7t FYM ha-1 for organic TNS and HYV
respectively), and lower yields - so that every gram of CH4released has fewer kgs of paddy to be split
between, see Figure 4. While the CH4 emissions are significantly different, neither of the two
determining factors (FYM input quantity and yield) are significantly different between the two
production systems in isolation.
Methane emissions from SRI are approximately the same as HYV emissions (p>0.05), Table 12. This
is surprising, as SRI production techniques substantially reduces CH4 emissions due to frequent
drainage, and the SRI yield is substantially higher. YetSRI also promotes the use of organic-based
fertilisers such as FYM, providing increased substrate for methanogenic bacteria. SRI farms used
18.7t FYM ha-1 (see Error! Reference source not found.); 2.5 and 1.3 times more than HYV and
organic paddy respectively. So even though background CH4 emissions were lower, the massively
increased organic amendments resulted in equal soil CH4 emissions as for HYV. In addition vermin
compost was commonly used, although this has a far smaller stimulating factor for methane emissions
(Yan et al., 2005).
HYV-TN Rainfed SRI -TNS Organic -TNS
Reported GHG emissions 0.58a 0.00b 0.49 a 0.88C
Methane emissions plus production emissionsif FYM is replaced with synthetic fertilisers.
-0.09d 0.50e -0.10d -0.20f
Table 12.Mean methane emissions as modelled in the LCA, and then how these would change if FYM wasreplaced with synthetic fertilisers. Means with different letters are significantly different (p<0.001)
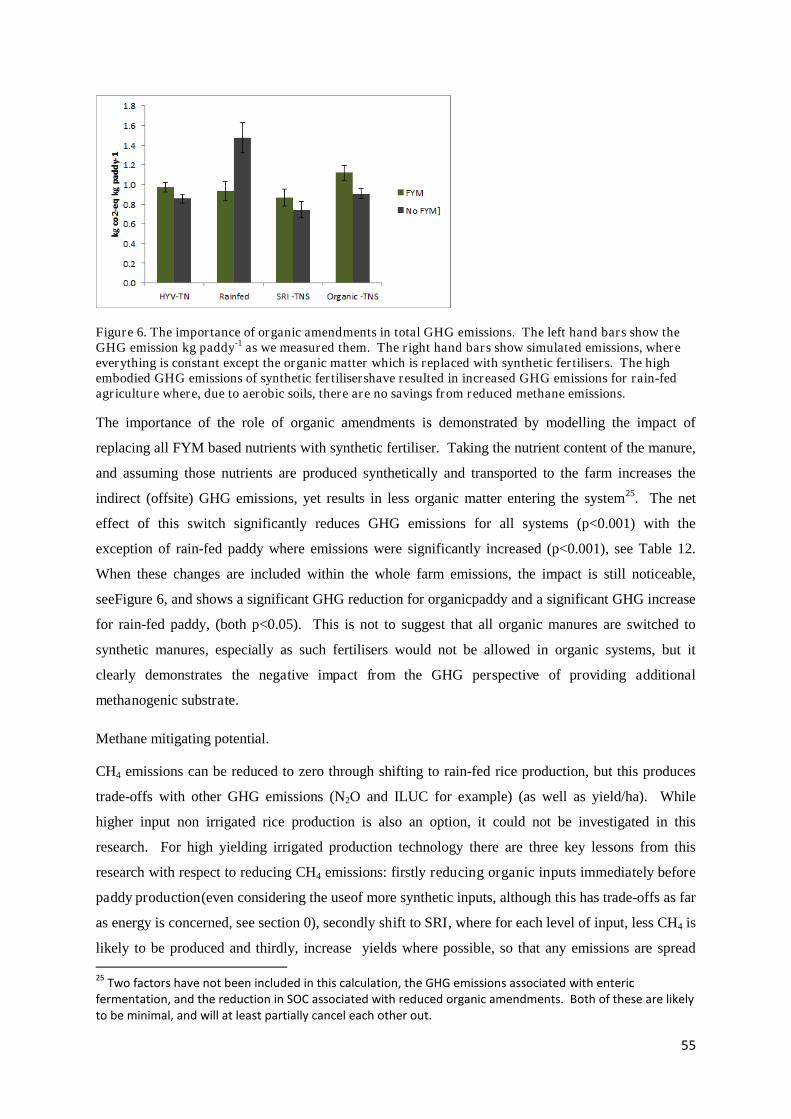
55
Figure 6. The importance of organic amendments in total GHG emissions. The left hand bars show theGHG emission kg paddy-1 as we measured them. The right hand bars show simulated emissions, whereeverything is constant except the organic matter which is replaced with synthetic fertilisers. The highembodied GHG emissions of synthetic fertilisershave resulted in increased GHG emissions for rain-fedagriculture where, due to aerobic soils, there are no savings from reduced methane emissions.
The importance of the role of organic amendments is demonstrated by modelling the impact of
replacing all FYM based nutrients with synthetic fertiliser. Taking the nutrient content of the manure,
and assuming those nutrients are produced synthetically and transported to the farm increases the
indirect (offsite) GHG emissions, yet results in less organic matter entering the system25. The net
effect of this switch significantly reduces GHG emissions for all systems (p<0.001) with the
exception of rain-fed paddy where emissions were significantly increased (p<0.001), see Table 12.
When these changes are included within the whole farm emissions, the impact is still noticeable,
seeFigure 6, and shows a significant GHG reduction for organicpaddy and a significant GHG increase
for rain-fed paddy, (both p<0.05). This is not to suggest that all organic manures are switched to
synthetic manures, especially as such fertilisers would not be allowed in organic systems, but it
clearly demonstrates the negative impact from the GHG perspective of providing additional
methanogenic substrate.
Methane mitigating potential.
CH4 emissions can be reduced to zero through shifting to rain-fed rice production, but this produces
trade-offs with other GHG emissions (N2O and ILUC for example) (as well as yield/ha). While
higher input non irrigated rice production is also an option, it could not be investigated in this
research. For high yielding irrigated production technology there are three key lessons from this
research with respect to reducing CH4 emissions: firstly reducing organic inputs immediately before
paddy production(even considering the useof more synthetic inputs, although this has trade-offs as far
as energy is concerned, see section 0), secondly shift to SRI, where for each level of input, less CH4 is
likely to be produced and thirdly, increase yields where possible, so that any emissions are spread
25Two factors have not been included in this calculation, the GHG emissions associated with enteric
fermentation, and the reduction in SOC associated with reduced organic amendments. Both of these are likelyto be minimal, and will at least partially cancel each other out.
56
across greater paddy/ ha. If FYM is used, then adding it before a dry period rather than immediately
before rice production will reduce emissions, as a portion of the organic matter will have decomposed
aerobically without CH4 production.
3.1.3.2. Soil organic carbon (SOC)
As well as determining soil CH4 emissions, soil water conditions and organic amendments are also
two key assumptions for SOC storage. However, these are only crudely accounted for using IPCC
default figures in our model, with the result that the fully flooded organic and HYV rice both have a
high SOC storage allocated to them per hectare (525kg CO2-eq), while rain-fed and SRI rice have
lower (379 and 330 kg CO2-eq ha-1 yr-1 respectively). The difference between these figuresis less than
the differences in reported yields, so the results more closely reflect the inverse of the yields. Thus
the highest SOC storage is associated with rain-fed (-0.24kg CO2-eq kg paddy-1), the lowest from SRI.
One problem with these figures is that they suggest that an increase in organic amendments will result
in a net increase in soil organic carbon. This is a poor counterfactual, as it suggests that if those
amendments were not used on the farm, they would otherwise not be used in agriculture. While this
may be the case – i.e. they might otherwise be burnt for fuel – we found relatively little use of manure
for fuel, so increased demand from SRI or organic rice production technologies may simply result in
less FYM for conventional systems – we are robbing Peter to pay Paul. The biggest difference is
whether it is used in aerobic or anaerobic situations. In aerobic situations there will be less SOC
gain, but also less methane emitted: another trade-off.
3.1.3.3. Nitrous oxideWhile flooded conditions increase CH4 emissions and SOC storage, they reduce N2O emissions.
Globally, nitrous oxide is the dominant GHG from arable crops, especially for intensively managed
crops where abundant nitrogen is applied. For example it is responsible for approximately 80% of
GHG emissions for UK wheat (Woods et al., 2008). Yet in fully anaerobic soils N2O emissions
areminimal asthe N2O is rapidly oxidised by soil biota(discussed in Gathorne-Hardy (2013a).
This is partially reflected in Figure 5, where N2O emissions from aerobic rain-fed rice are 6 and 8
times greater than anaerobic organic TNS and HYV rice respectively. Some of this difference is due
to the lower yields of rain-fed rice, yet N2O emissions are also 2.5 times greater in rain-fed than
either organic or HYVriceon an area basis. In contrast the difference between rain-fed and SRI TNS
is entirely due to lower yields – SRI N2Oemissions are 1.4 times greater than rain-fed on an area
basis, but with a yield 3.8 times higher the allocation per kg of paddy is significantly more for rain-fed
rice than for SRI.
Yet these direct emissions only account for a portion of total N2O emissions associated with N
fertiliser use. A minor fraction of applied Nis used up on site, as shown by the low nitrogen use
57
efficiencies, see Error! Reference source not found.. The remaining N is typically lost through
volatilisation of ammonia, surface runoff or leaching (Xu et al., 2012). A portion of this still active N
will be converted to N2O off-site, and these emissions are still attributable to the original fertiliser
application. This is an important process, whichfor fully irrigated systems can more than equal the
on-site emissions. Interestingly the Government of India emission factors, taken from Pathak(Pathak
et al., 2002), appear to ignore off-site emissions (Gathorne-Hardy, 2013a). In contrast, Crutzen et al
(2007)suggest that IPCC figures for indirect N2O emissions are far too low. Crutzen et al. used a
budgeting approach starting with the total atmospheric load of N2O, and suggested that in order for
the maths to be consistent, indirect emissions from fertiliser must be 3 - 5 times higher than the
emission factor commonly used. Previous analysis by others had suggested lower figures (x2
(Nevison et al., 2007) or x2.5 (Galloway et al., 2004)) but still substantially above the 1%
recommended by the IPCC.
The key driver of N2O emissions is the amount of nitrogen applied, and interestingly the proportion of
N estimated to be taken up by the crop is relatively high compared to other NUE estimates for rice,
for example (Haefele et al., 2008). Although nitrogen use efficiencies tend to be low in rice (Xu et al.,
2012), the extremely low rates shown in Error! Reference source not found. suggest that there may
be some room for cutting N without reducing yield, and corresponding GHG emissions.Interestingly
there is a significant correlation between total N and yield for both HYV and rain-fed rice (p<0.05),
but not for organic TNS or SRI TNS, suggesting that for them, nitrogen was not the yield-limiting
factor.
Organic TNS rice showed the greatest NUE at 65%. This is very high, even for aerobic systems, and
so should be treated with caution. One potential reason why such a high NUE is reported could be
that lack of inclusion of some fixed nitrogen associated with added azospirillum that is not accounted
for within this model due to lack of data. Any nitrogen fixed by azospirillumhas the advantage of no
embodied GHG or energy associated with it, but is likely to stimulateN2O emissions at a similar rate
to other sources of N.
Ground water irrigation
Irrigation by definition requires water, which in south and eastern India commonly means pumping
ground water, normally using electric pumps. Lifting a tonne of water without resistance requires
9800J. Multiplying this by low generating efficiency, and factoring-in transmission lossesgenerate
significant irrigation-driven GHG emissions. GHG emissions from water are directly associated with
the quantity of irrigation used, so the absolute amount of irrigation based emissions is directly
proportional to the amount of ground water required.
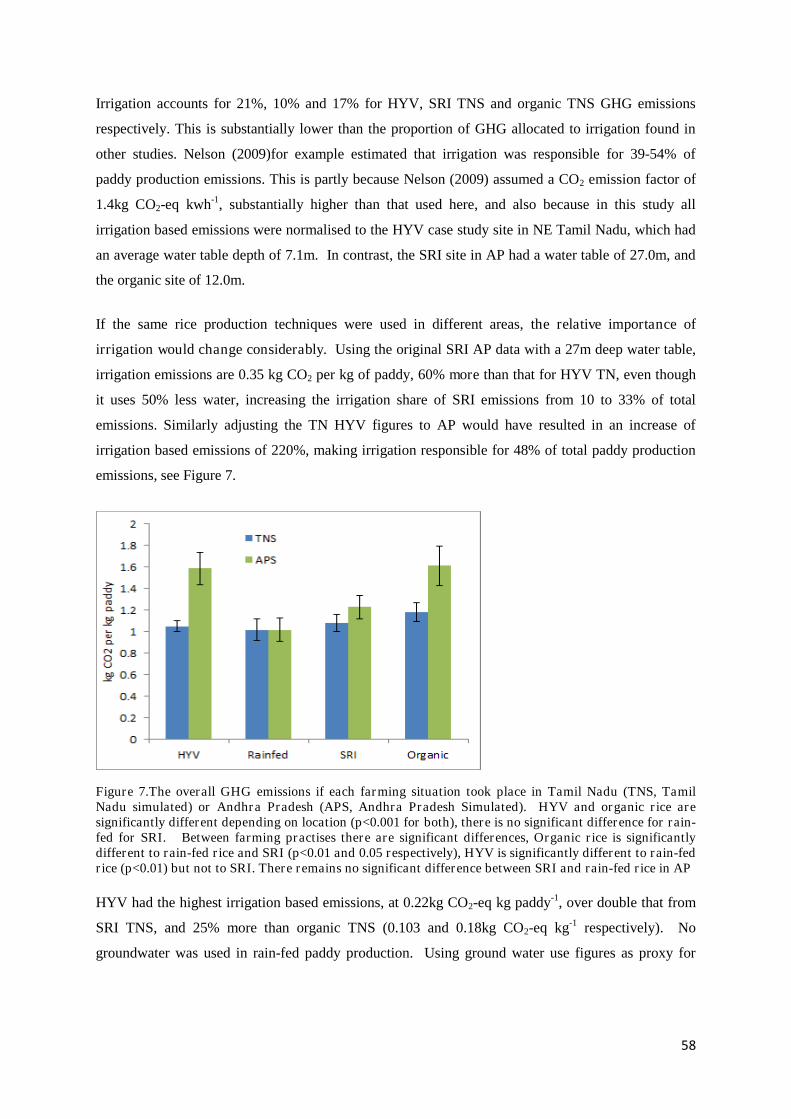
58
Irrigation accounts for 21%, 10% and 17% for HYV, SRI TNS and organic TNS GHG emissions
respectively. This is substantially lower than the proportion of GHG allocated to irrigation found in
other studies. Nelson (2009)for example estimated that irrigation was responsible for 39-54% of
paddy production emissions. This is partly because Nelson (2009) assumed a CO2 emission factor of
1.4kg CO2-eq kwh-1, substantially higher than that used here, and also because in this study all
irrigation based emissions were normalised to the HYV case study site in NE Tamil Nadu, which had
an average water table depth of 7.1m. In contrast, the SRI site in AP had a water table of 27.0m, and
the organic site of 12.0m.
If the same rice production techniques were used in different areas, the relative importance of
irrigation would change considerably. Using the original SRI AP data with a 27m deep water table,
irrigation emissions are 0.35 kg CO2 per kg of paddy, 60% more than that for HYV TN, even though
it uses 50% less water, increasing the irrigation share of SRI emissions from 10 to 33% of total
emissions. Similarly adjusting the TN HYV figures to AP would have resulted in an increase of
irrigation based emissions of 220%, making irrigation responsible for 48% of total paddy production
emissions, see Figure 7.
Figure 7.The overall GHG emissions if each farming situation took place in Tamil Nadu (TNS, TamilNadu simulated) or Andhra Pradesh (APS, Andhra Pradesh Simulated). HYV and organic rice aresignificantly different depending on location (p<0.001 for both), there is no significant difference for rain-fed for SRI. Between farming practises there are significant differences, Organic rice is significantlydifferent to rain-fed rice and SRI (p<0.01 and 0.05 respectively), HYV is significantly different to rain-fedrice (p<0.01) but not to SRI. There remains no significant difference between SRI and rain-fed rice in AP
HYV had the highest irrigation based emissions, at 0.22kg CO2-eq kg paddy-1, over double that from
SRI TNS, and 25% more than organic TNS (0.103 and 0.18kg CO2-eq kg-1 respectively). No
groundwater was used in rain-fed paddy production. Using ground water use figures as proxy for
59
irrigation based GHG emissions26SRI TNS emits significantly less GHG due to irrigationcontrasted
with organic TNS or HYV rice (p<0.01). But there is no significant difference in emissions between
HYV and organic rice.
Indian electricity is extremely GHG intensive, due to three factors – the heavy use of coal, the
inefficiency of production, and the inefficiency of the grid. India-wide, coal - the most carbon
intensive fossil fuel per unit energy - accounted for 71% of electricity generated in 2010, with nearly
all generating plantsconsisting of the less efficient subcritical technology (with average generation
efficiencies of just 34%, compared to 36% and 39% for subcritical plants in China and the USA
respectively) (IEA, 2012). This situation of high coal dependence and low efficiency is exacerbated
by large transmission and distribution losses, estimated at 27% in 2007-08 (Alagh, 2010). These
losses are before ‘commercial losses’ are factored in. The latter are the revenue losses from theft/non-
payment/non-billing or misclassification (i.e. as agricultural rather than for domestic use). The
inclusion of these losses generates aggregated transmission and commercial losses of 31% nation-
wide, reaching over 60% in certain states (Jammu & Kashmir) (IEA, 2012). We have not included
theft in our assessment, as while this represents a commercial burden, the electricity is presumably
used, presumably in the informal economy, which should bear its share of the initial GHG burden of
electricity production.
The combination of these three points results in a GHG burden of 1.1kg CO2-eq kwh-1, which is
about double the UK electricity GHG burden of 0.5 (Defra, 2012).
Mitigation options.
A shift to rain-fed production clearly avoids the problem of ground water emissions entirely, but has
wider trade-offs associated with yield, ILUC and N2O, as discussed below.
Assuming irrigation will continue then there are four potential methods to mitigate emissions: use less
water, raise the water table so less energy is needed per unit water, increase yields so that any burden
is shared amongst more paddy, and decarbonise the electricity supply. Shifting to SRI production
techniques generates significant savings via the first and third of these – it requires less water
(although not significantly so on an area basis – 16,049t water/ha for SRI, and 27,595 tonnes of water
ha-1 for HYV, but p>0.05). SRI generates substantial increases in yield, and thus a significant
reduction in water use kg-1 (p<0.001). Increasing the water table is possible using ground water
recharge techniques, but these are best done at a larger scale than individual farms. It was not a
popular idea when talking to farmers, whose preferred solutions were to build deeper tube wells (with
larger loans) rather than invest in catchment scale artificial recharge.
26It is not possible directly to generate statistics for ground water GHG emissions as these were calculated as
a proportion of the HYV TN emissions based on the average quantity of water used for each productiontechnique compared to the average quantity of water used by HYV TN
60
The final point, decarbonising the electricity supply, is in state/industry control. Reducing the
massive T and D losses would clearly bring substantial benefits not just to GHG savings, but to wider
society. It can occur with present technology. The generation of more efficient coal power plants,
which is occurring under the Clean Development Mechanism (CDM), is an example of an
interestingly politicised counterfactual. If present generating efficiencies are compared to those of
new plants, the latter can produce substantially cleaner electricity. But ifefficient coal-powered
electricity is compared with renewable electricity, new coal plants are highly inefficient in GHG
terms. By providing more profitable coal plants, it could be argued that the CDM is encouraging long
term dependence on coal. But this is too complicated a political issue to be within the scope of our
project.
BullocksPAS 2050 specifically states not to include emissions associated with animal transport (PAS
2050:2011, 2011).Figure 4 and Figure 5 include bullocks derived GHG emissions, and these
dominate total emissions for rain-fed rice. For example on comparing Figure 5 and Figure 8, rain-
fedrice cultivation and harvest emissions almost disappear, and the entire total GHG emissions per kg
of paddy are reduced by 51% (when ILUC is not included). Thus the impact of including, or not
including, bullock-based emissions is crucial. We have included them because they are an inherent
part of the production process. Not including them would falsely represent the emissions from all rice
production practices.In contrast to rain-fed rice production, excluding livestock based emissions
makes little difference to the other production technologiesdue to the predominance of tractors and
harvesters. Without livestock, the total GHGs would be reduced by only 0.7, 5.6 and 0.3% for HYV,
SRI TNS and organic TNS respectively.
Measured by the task, i.e. the emissions used to plough a field, tractors produce 45% of the GHG
emissionsthat bullocks do per hectare (p<0.001) (32 and 68 kg CO2-eq ha-1 for tractors and
bullocksrespectively)27. Comparing the same task from the energy perspective rather than that of
GHGs,bullocks come out best, tractors using 219% more energy than bullocks (p<0.05) (467 and 213
MJ ha-1 for tractors and bullocks respectively). Clearly when only measuring fossil energy, the
difference is considerably greater!
This trade-off shows how GHG intensive every unit of bullock energy is. This is likely to be because
the bullock energy factor includes the energy used during the actual hours of work, while the GHG
factor includes 24hr emissions, suggesting that the bullock energy is underestimated. It is also not
clear whether the quality of the bullock ploughing is consistent with that of tractors. Rain-fed rice
farmers ploughed each field with bullocksan average of 5.3 times, more than in any other production
technology (p<0.05). Yet while such a practice might reflect the quality of ploughing, it could also
27See Table 5 in Methods for details of how the GHG emissions are calculated.
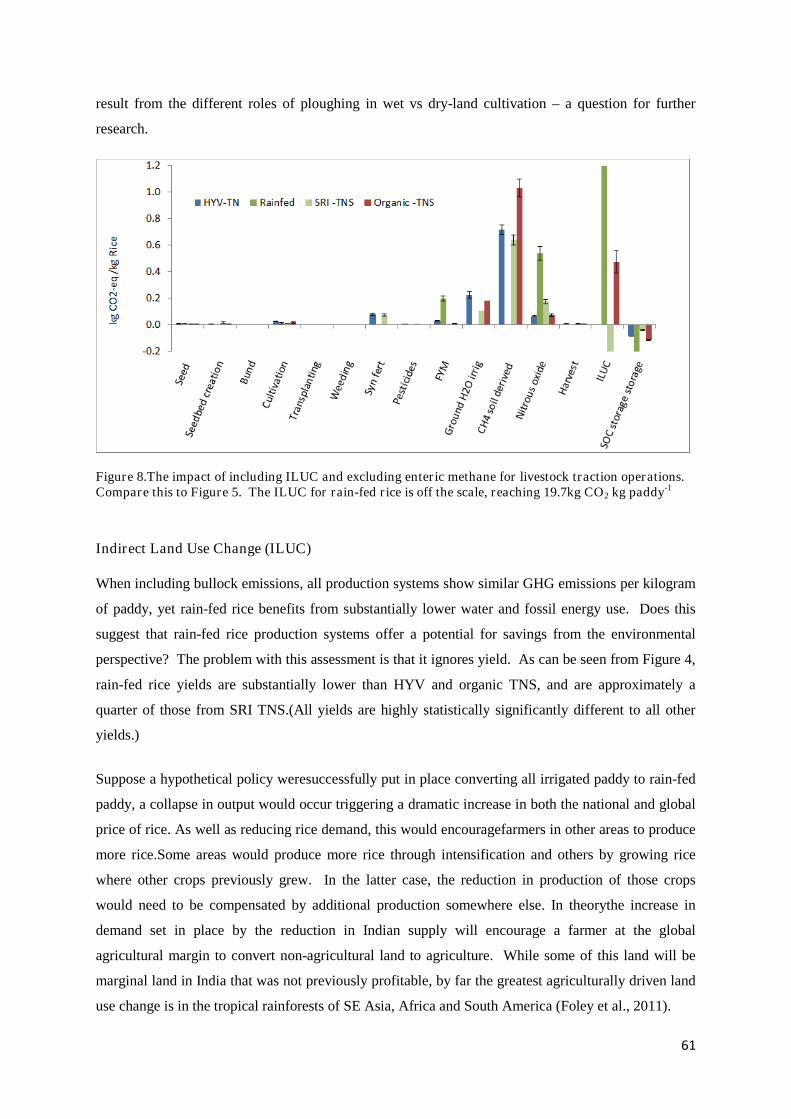
61
result from the different roles of ploughing in wet vs dry-land cultivation – a question for further
research.
Figure 8.The impact of including ILUC and excluding enteric methane for livestock traction operations.Compare this to Figure 5. The ILUC for rain-fed rice is off the scale, reaching 19.7kg CO2 kg paddy-1
Indirect Land Use Change (ILUC)
When including bullock emissions, all production systems show similar GHG emissions per kilogram
of paddy, yet rain-fed rice benefits from substantially lower water and fossil energy use. Does this
suggest that rain-fed rice production systems offer a potential for savings from the environmental
perspective? The problem with this assessment is that it ignores yield. As can be seen from Figure 4,
rain-fed rice yields are substantially lower than HYV and organic TNS, and are approximately a
quarter of those from SRI TNS.(All yields are highly statistically significantly different to all other
yields.)
Suppose a hypothetical policy weresuccessfully put in place converting all irrigated paddy to rain-fed
paddy, a collapse in output would occur triggering a dramatic increase in both the national and global
price of rice. As well as reducing rice demand, this would encouragefarmers in other areas to produce
more rice.Some areas would produce more rice through intensification and others by growing rice
where other crops previously grew. In the latter case, the reduction in production of those crops
would need to be compensated by additional production somewhere else. In theorythe increase in
demand set in place by the reduction in Indian supply will encourage a farmer at the global
agricultural margin to convert non-agricultural land to agriculture. While some of this land will be
marginal land in India that was not previously profitable, by far the greatest agriculturally driven land
use change is in the tropical rainforests of SE Asia, Africa and South America (Foley et al., 2011).
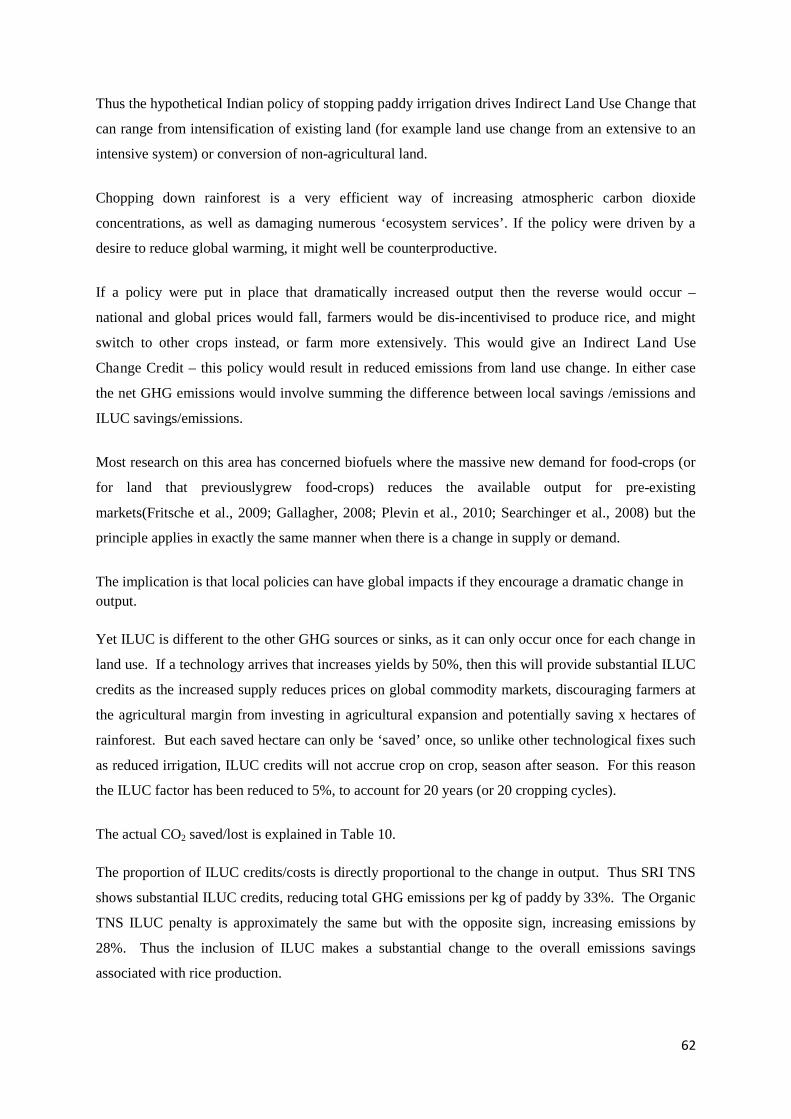
62
Thus the hypothetical Indian policy of stopping paddy irrigation drives Indirect Land Use Change that
can range from intensification of existing land (for example land use change from an extensive to an
intensive system) or conversion of non-agricultural land.
Chopping down rainforest is a very efficient way of increasing atmospheric carbon dioxide
concentrations, as well as damaging numerous ‘ecosystem services’. If the policy were driven by a
desire to reduce global warming, it might well be counterproductive.
If a policy were put in place that dramatically increased output then the reverse would occur –
national and global prices would fall, farmers would be dis-incentivised to produce rice, and might
switch to other crops instead, or farm more extensively. This would give an Indirect Land Use
Change Credit – this policy would result in reduced emissions from land use change. In either case
the net GHG emissions would involve summing the difference between local savings /emissions and
ILUC savings/emissions.
Most research on this area has concerned biofuels where the massive new demand for food-crops (or
for land that previouslygrew food-crops) reduces the available output for pre-existing
markets(Fritsche et al., 2009; Gallagher, 2008; Plevin et al., 2010; Searchinger et al., 2008) but the
principle applies in exactly the same manner when there is a change in supply or demand.
The implication is that local policies can have global impacts if they encourage a dramatic change in
output.
Yet ILUC is different to the other GHG sources or sinks, as it can only occur once for each change in
land use. If a technology arrives that increases yields by 50%, then this will provide substantial ILUC
credits as the increased supply reduces prices on global commodity markets, discouraging farmers at
the agricultural margin from investing in agricultural expansion and potentially saving x hectares of
rainforest. But each saved hectare can only be ‘saved’ once, so unlike other technological fixes such
as reduced irrigation, ILUC credits will not accrue crop on crop, season after season. For this reason
the ILUC factor has been reduced to 5%, to account for 20 years (or 20 cropping cycles).
The actual CO2 saved/lost is explained in Table 10.
The proportion of ILUC credits/costs is directly proportional to the change in output. Thus SRI TNS
shows substantial ILUC credits, reducing total GHG emissions per kg of paddy by 33%. The Organic
TNS ILUC penalty is approximately the same but with the opposite sign, increasing emissions by
28%. Thus the inclusion of ILUC makes a substantial change to the overall emissions savings
associated with rice production.
63
It is important to note this already substantial impact is a conservative estimate. The ILUC factor –
the quantity of GHG lost or saved through ILUC, was reduced by half to account for uncertainty, so
this impact could be considerably greater (seeTable 10).
Rain-fed rice is an interesting case for ILUC. The ILUC bar in Figure 8 goes off the scale, reaching
20kg CO2-eq kg paddy, increasing the original GHG burden from paddy by almost 20 times, and
totally dwarfing all other types of rice production with respect to emissions. If we believed this figure
it would suggest that rain-fed rice is a terrible method of paddy production from the climate change
perspective, yet this figure suggests an inaccurate counterfactual. In the site where rain-fed data was
collected, irrigation facilities did not exist. Thus comparing rain-fed to HYV rice is inappropriate.
What the high ILUC from rain-fed rice indicates is that from the GHG emissions perspective, we
should not promote low yielding rain-fed paddy production where higher yielding alternatives are
available.
Figure 9.GHG emissions including ILUC with the exception of rainfed. In contrast to Figure 4, SRI issignificantly less than HYV, and Organic TNS is significantly higher than all other production methods(p<0.001)
If we include ILUC, the GHG burden for each form of paddy production as shown in Figure 4
changes dramatically, see Figure 8. SRI TNS becomes a lower-emitting production system compared
with HYV and organic TNS rice (p<0.01) while rain-fed rice is substantially higher-emitting
(p<0.01). Yet while understanding the impact that ILUC can have on the GHG emissions of different
rice production systems it is probably unwise to include ILUC in headline calculations for three
reasons: first, it is not generally recognised, second, it is not used in other models, making
comparisons difficult, and third, there is uncertainty over the precise figures that should be used28.
28This is increased as we are forcing an essentially consequential style LCA methodology into an attribution
model.
64
Energy
All farming systems show a positive Energy Return on Investment (EROI)29 for fossil energy, see
Error! Reference source not found.. Rain-fed rice is at one extreme, with 256 units of energy
created from every unit of fossil energy deployed. The benefits from other farming systems are far
less extreme, at 2.9, 11.0 and 3.4 for HYV, SRI TNS and organic TNS rice respectively.
How energy is measured however makes a big difference to the apparent energy efficiency of
different forms of crop production. Fossil energy use is substantially greater for HYV rice compared
with all other farming systems: 5.31MJ of fossil energy kg paddy-1, compared to 0.16, 2.00 and 3.41
MJ kg paddy-1 for rain-fed, SRI TNS and organic TNS rice respectively. The high dependence on
fossil fuel of HYV rice is due to its use of both synthetic fertilisers and irrigation -forms of indirect
energy which represented 35 and 55% of total fossil energy use respectively. In contrast, no synthetic
fertilisers were used for rain-fed or organic rice, and minimal amounts for SRI TNS; no irrigation
energy was needed for rain-fed rice, and minimal for SRI TNS. Field preparation by tractor- or power
tiller, although the most apparent form of fossil energy use, was of minimal importance, representing
less than 10% for HYV, SRI TNS and organic rice.30
The use of bullocks represents an interesting trade-off between different forms of energy, and GHG
emissions, as well as the wider sustainability indicators discussed below. Bullocks produce more
GHG emissions for specific operations (i.e. ploughing) than tractors. Yet they require less than half
the energy (213 compared to 525 MJ ha-1, p<0.05). They also require no fossil energy.
29The ratio of the energy available in the final product to the energy that went into making that product.
30It represents a large fraction of rain-fed rice, but this is due to the very low total, rather than reflecting the
importance of field preparation. Only 2 farmers used tractors for cultivation, and both used them only oncewhile ploughing multiple times with bullocks, yet the low alternative fossil energy use allows these two farmsto distort the apparent importance of fossil based field preparation in rain-fed systems.
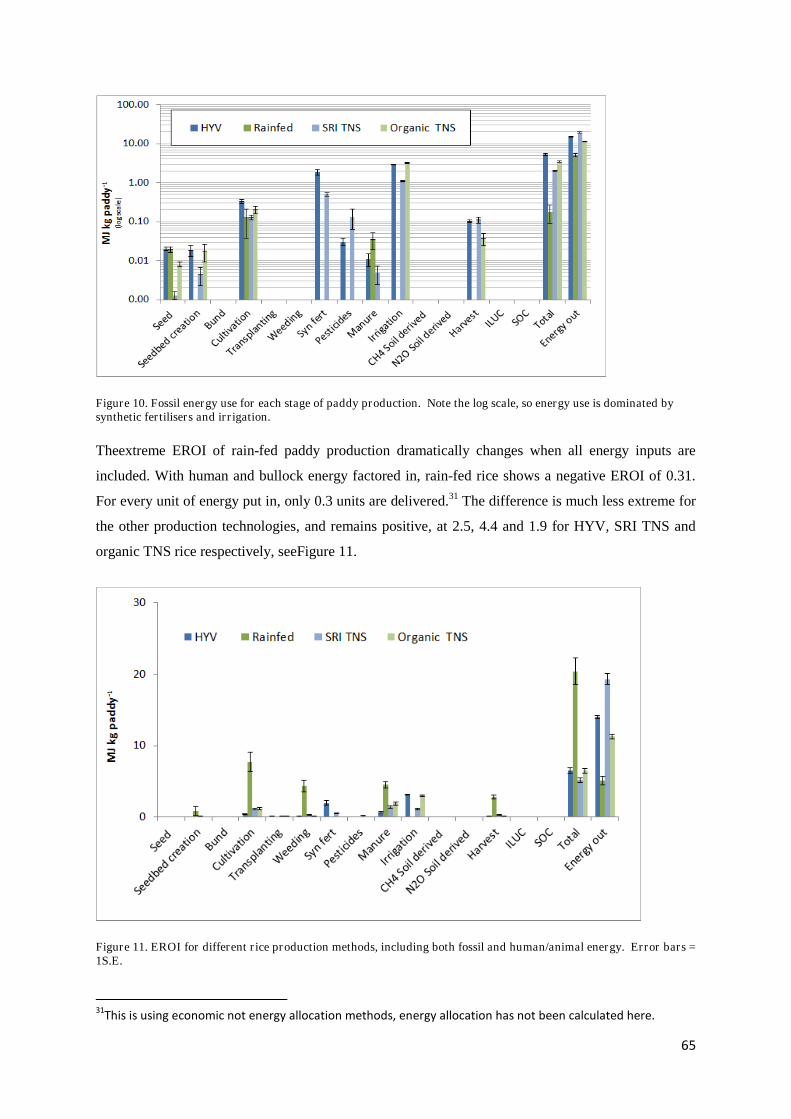
65
Figure 10. Fossil energy use for each stage of paddy production. Note the log scale, so energy use is dominated bysynthetic fertilisers and irrigation.
Theextreme EROI of rain-fed paddy production dramatically changes when all energy inputs are
included. With human and bullock energy factored in, rain-fed rice shows a negative EROI of 0.31.
For every unit of energy put in, only 0.3 units are delivered.31 The difference is much less extreme for
the other production technologies, and remains positive, at 2.5, 4.4 and 1.9 for HYV, SRI TNS and
organic TNS rice respectively, seeFigure 11.
Figure 11. EROI for different rice production methods, including both fossil and human/animal energy. Error bars =1S.E.
31This is using economic not energy allocation methods, energy allocation has not been calculated here.
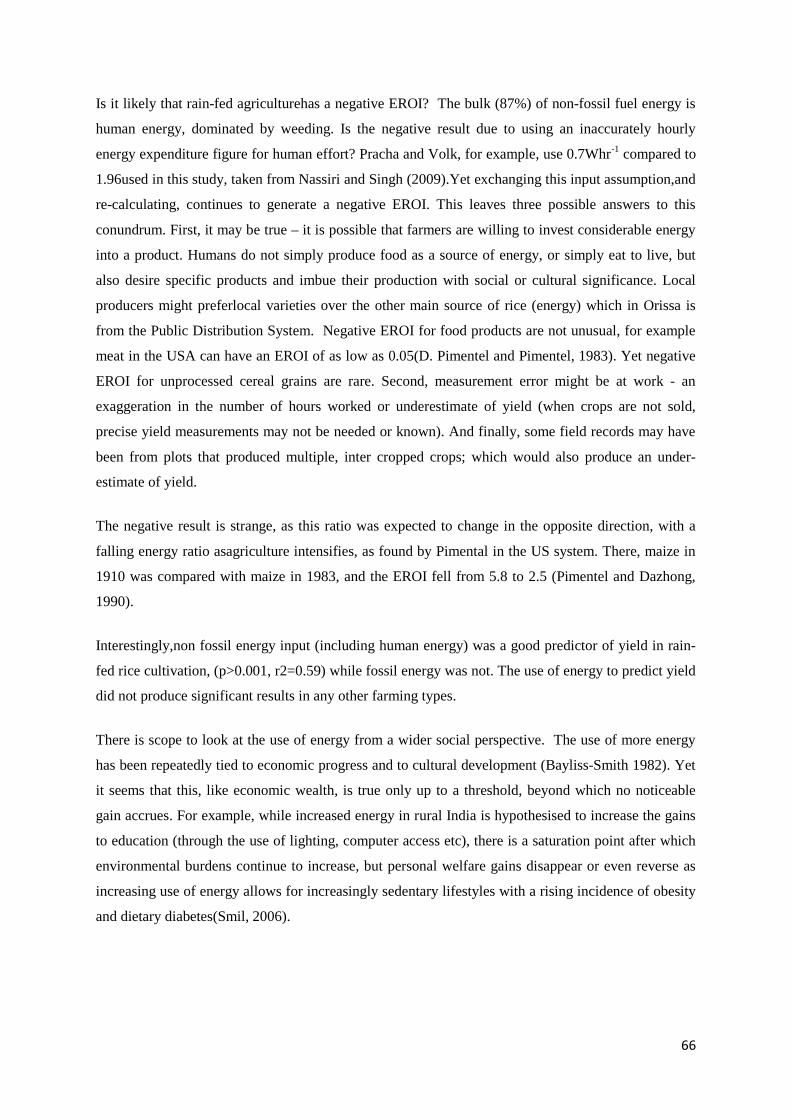
66
Is it likely that rain-fed agriculturehas a negative EROI? The bulk (87%) of non-fossil fuel energy is
human energy, dominated by weeding. Is the negative result due to using an inaccurately hourly
energy expenditure figure for human effort? Pracha and Volk, for example, use 0.7Whr-1 compared to
1.96used in this study, taken from Nassiri and Singh (2009).Yet exchanging this input assumption,and
re-calculating, continues to generate a negative EROI. This leaves three possible answers to this
conundrum. First, it may be true – it is possible that farmers are willing to invest considerable energy
into a product. Humans do not simply produce food as a source of energy, or simply eat to live, but
also desire specific products and imbue their production with social or cultural significance. Local
producers might preferlocal varieties over the other main source of rice (energy) which in Orissa is
from the Public Distribution System. Negative EROI for food products are not unusual, for example
meat in the USA can have an EROI of as low as 0.05(D. Pimentel and Pimentel, 1983). Yet negative
EROI for unprocessed cereal grains are rare. Second, measurement error might be at work - an
exaggeration in the number of hours worked or underestimate of yield (when crops are not sold,
precise yield measurements may not be needed or known). And finally, some field records may have
been from plots that produced multiple, inter cropped crops; which would also produce an under-
estimate of yield.
The negative result is strange, as this ratio was expected to change in the opposite direction, with a
falling energy ratio asagriculture intensifies, as found by Pimental in the US system. There, maize in
1910 was compared with maize in 1983, and the EROI fell from 5.8 to 2.5 (Pimentel and Dazhong,
1990).
Interestingly,non fossil energy input (including human energy) was a good predictor of yield in rain-
fed rice cultivation, (p>0.001, r2=0.59) while fossil energy was not. The use of energy to predict yield
did not produce significant results in any other farming types.
There is scope to look at the use of energy from a wider social perspective. The use of more energy
has been repeatedly tied to economic progress and to cultural development (Bayliss-Smith 1982). Yet
it seems that this, like economic wealth, is true only up to a threshold, beyond which no noticeable
gain accrues. For example, while increased energy in rural India is hypothesised to increase the gains
to education (through the use of lighting, computer access etc), there is a saturation point after which
environmental burdens continue to increase, but personal welfare gains disappear or even reverse as
increasing use of energy allows for increasingly sedentary lifestyles with a rising incidence of obesity
and dietary diabetes(Smil, 2006).
67
Ground water
Ground water abstraction rates varied considerably between the four productions technologies.
Clearly rain-fed rice is the most efficient, producing 35% of HYV yields, with zero ground water.
While rain-fed rice production methods are the only possible kind of agriculture in many areas, there
are major environmental problems associated with low yield, as discussed under ILUC above. Thus
the extreme of zero irrigation is unlikely to be universally appropriate.
The other three production systems all relied upon ground water pumping, but to different degrees.
SRI used significantly less ground water than HYV or organic rice (p<0.001) per kg of paddy (1.66
tonnes of water per kg of paddy compared to 2.86 and 3.6t H2O per kg paddy for organic and HYV
respectively) but not significantly less on an area basis - at 12,600tonnes/ha compared to 20,500 for
HYV rice.Although there was a large difference in the mean water use between organic and HYV rice
production methods, see Figure 4, the difference was not statistically significant.
Conclusions
GHG emissions are generated from all forms of rice production.For exampleN2O is an inevitable by-
product of arable agriculture. Flooded conditions will produce CH4. The research reported here has
aimed to identify where the main emissions occur, how these vary between production systems, and
where emissions might be reduced in the future.
Irrigation is a key point for all productionsystems, and appropriate water management may offer a
series of environmental wins without any major environmental apparent losses. Reducing demand for
water reduces the associated embodied GHG and energy demands as well as potentially reducing
ground-water-based GHG emissions.
If area based water demand could be reduced this would not only minimise the wider environmental
damage associated with ground water extraction, but, through raising the water table, would also
reduce the embodied GHG and energy needed to extract every unit of groundwater. Yet ground water
tables are hard to manage at the farm scale. Instead panchayat- or even water-shed/river-basin-level
action - would deliver greater gains, because on many of the small farms, active recharge is a difficult
and un-popular activity, due to lack of physical space.
Using an area metric, switching to SRI production appears to substantially increasepaddy yields and,
with less flooding, it could also reduce CH4 emissions if excessive FYM is not applied. The increase in
N2O is likely to be less than potential savings from reduced CH4, so with appropriate management
conditions, our results suggest that SRI promotion is a sensible policy from the GHG perspective. Yet
importantly, while converting to SRI would reduce water requirements per kg of paddy,our data
68
showed no significant reduction in the total water extracted per hectare (although there was a mean
40% reduction in area based use, high variability left this statistically insignificant) sothe conversion
of HYV to SRI may maintainpressure on the local ground water supplies.
Any savings associated with reduced pumping could be significantly enhanced at the state/national
level effort if the efficiency of both electricity generation and distribution could be improved. T and D
efficiencies would produce substantial savings in GHG emissions, as well as reducing pressure on
limited electricity supplies(Glaeser, 2013).
Yet all of these suggestions are vulnerable to rebound effects (Sorrell, 2007) from both agriculture
and other electricity users;if more electricity is available, it may encourage investment in deeper wells
(or more air conditioning units), perhaps encouraging some farmers to switch back from SRI, or to be
lazy and keep pumps working continuously, thereby risking damaging their own soil structure as well
as wasting both water and energy.
Emissions from organic rice approximatedthose from HYV in most instances, and there is no reason
why more organic farmers would have a more difficult conversion to SRI than HYV farmers.
Organic production showed the highest nitrogen use efficiency compared to all system. There is a
chance that in order to maintain yields, additional FYM inputs would be needed, with the inevitable
CH4 emissions. We have not managed to include the role of azospirillum within our model due to
lack of data, so it is possible that this is providing additional nitrogen that is not accounted for in the
NUE calculation.
Manyfactors have trade-offsnot considered here. For example the switch from bullocks to tractors
may save GHG emissions, but the wider socio-ecological-economic relations of livestock may make
the switch unfeasible.
Primary research measuring GHG emissions from SRI compared to other production systems is
needed to narrow down the range of uncertainty surrounding the GHG emissions from SRI.
Overall, SRI systems have potential to increase yields and reduce the use of water per kg of paddy, as
well as to reduce water and associated energy demand per unit area. From the environmental criteria
we have included, there are no downsides to SRI systems, as long as excessive manure is not used.
The development of SRI in organic systems would see further gains, with significantly reduced
energy demand and potentially wider environmental gains associated with reduced pesticides and
synthetic fertiliser use.

69
Yet the spread of SRI is unlikely to be determined by environmental gains, instead it is a socio-
economic and political question, that is discussed in a sister paper (Reddy and Venkatanarayana,
2013).
70
References
Alagh, Y., (2010) Transmission and Distribution of Electricity in India Regulation, Investment andEfficiency. OECD, Indian Institute of Rural Management, Anand (Gijarat).
Anonymous, (2011a) Harvested area of rough rice, by country and geographical region -FAO. IRRI,http://solutions.irri.org/index.php?option=com_content&task=view&id=250&Itemid=186.
Anonymous, (2011b) Rice calorie supply as percentage of total calorie supply by country andgeographical region, 1961–2005. IRRI,http://solutions.irri.org/index.php?option=com_content&task=view&id=250&Itemid=186.
Belluscio, A., (2009) Planting trees can shift water flow, in: Nature (Ed.), Nature. Nature,http://www.nature.com/news/2009/091107/full/news.2009.1057.html.
Blengini, G.A., Busto, M. (2009) The life cycle of rice: LCA of alternative agri-food chainmanagement systems in Vercelli (Italy). Journal of Environmental Management 90, 1512-1522.Bouman, B.A.M., Lampayan, R.M., Tuong, T.P. (2007) Water management in irrigated rice: copingwith water scarcity, Los Baños (Philippines).
Canadell, J.G., Le Quéré, C., Raupach, M.R., Field, C.B., Buitenhuis, E.T., Ciais, P., Conway, T.J.,Gillett, N.P., Houghton, R.A., Marland, G. (2007) Contributions to accelerating atmospheric CO2growth from economic activity, carbon intensity, and efficiency of natural sinks. Proceedings of theNational Academy of Sciences 104, 18866-18870.
Carriger, S., Vallee, D. (2007) More crop per drop. . Rice Today 6, 10-13.
CEA, (2011) CO2 Baseline Databas for the Indian Power Sector, User Guide, version 6.0. CentralElectricity Authority, Ministry of Powrer, Sewa Bhawan, New Delhi, India.
Centre for Science and Environment, (2009) Green Rating Project, Fertilizers,.http://www.cseindia.org/userfiles/79-90%20Fertilizer%281%29.pdf, New Delhi.
Cheng, W., Yagi, K., Sakai, H., Kobayashi, K. (2006) Effects of Elevated Atmospheric CO2Concentrations on CH4 and N2O Emission from Rice Soil: An Experiment in Controlled-environment Chambers. Biogeochemistry 77, 351-373.
Coumou, D., Rahmstorf, S. (2012) A decade of weather extremes. Nature Clim. Change 2, 491-496.Crutzen, P.J., Mosier, A.R., Smith, K.A., Winiwarter, W. (2007) N2O release from agro-biofuelproduction negates global warming reduction by replacing fossil fuels. Atmospheric ChemistryPhysical Discussions, 11191-11205.
CSE, (2012) Into the Furnace. Green rating project of Indian Iron and Steel Sector., in: CSE (Ed.).CSE, Delhi, India, p. 256.
D. Pimentel, Pimentel, M. (1983) The future of American agriculture. AVI Publishing Co. Inc,,Westport, Connecticut, USA.
Dawe, D., (2000) The contribution of rice research to poverty alleviation, in: J.E. Sheehy, P.L.M.,Hardy, B. (Eds.), Studies in Plant Science. Elsevier, pp. 3-12.
71
Deepak, K.M., (2013) Rain fed Rice in Odisha: Production and Exchange Relations, Technology,Jobs and A Lower Carbon Future: Methods, Substance and Ideas for the Informal Economy (The caseof rice in India), New Delhi, India.Defra, (2012) 2012 Guidelines to Defra / DECC’s GHG Conversion Factors for Company Reporting:Methodology Paper for Emission Factors, PB 13792.
Directive 2009/28/EC., (2009) On the promotion of the use of energy from renewable sources andamending and subsequently repealing Directives 2001/77/EC and 2003/30/EC, in: Union, O.J.o.t.E.(Ed.), http://eur-lex.europa.eu/LexUriServ/LexUriServ.do?uri=Oj:L:2009:140:0016:0062:en:PDF.Duarte, C.M., Lenton, T.M., Wadhams, P., Wassmann, P. (2012) Abrupt climate change in the Arctic.Nature Clim. Change 2, 60-62.
Elsayed M.A., Matthews R., N.D., M., (2003) Carbon and energy balances for a range of biofuelsoptions. Project No. B/B6/00784/REP URN 03/836. Project carried out as part of the DTI SustainableEnergy Programme, http://www.dti.gov.uk/files/file14925.pdf?pubpdfdload=03%2F836.
Eshel, G., Martin, P.A. (2006) Diet, Energy, and Global Warming. Earth Interactions 10, 1-17.
European Commission, (2010) International Reference Life Cycle Data System (ILCD) Handbook,General guide for Life Cycle Assessment,, in: Joint Research Centre Institute for Environment andSustainability (Ed.), Publications Office of the European Union,.
FAO, Greening Agriculture in India An Overview of Opportunities & Constraints.FAOSTAT, (2008) Rough rice production, by country and geographical region-FAO.http://solutions.irri.org/index.php?option=com_content&task=view&id=250&Itemid=186.
Foley, J.A., Ramankutty, N., Brauman, K.A., Cassidy, E.S., Gerber, J.S., Johnston, M., Mueller, N.D.,O/'Connell, C., Ray, D.K., West, P.C., Balzer, C., Bennett, E.M., Carpenter, S.R., Hill, J., Monfreda,C., Polasky, S., Rockstrom, J., Sheehan, J., Siebert, S., Tilman, D., Zaks, D.P.M. (2011) Solutions fora cultivated planet. Nature 478, 337-342.
Foresight, (2011) The Future of Food and Farming, Final Project Report, in: The Government Officefor Science (Ed.), London.
Forster, P., Ramaswamy, V., Artaxo, P., Berntsen, T., Betts, R., Fahey, D.W., Haywood, J., Lean, J.,Lowe, D.C., Myhre, G., Nganga, J., Prinn, R., Raga, G., Schulz, M., Van Dorland, R., (2007) Changesin atmospheric constituents and in radiative forcing, in: Solomon, S., Qin, D., Manning, M., Chen, Z.,Marquis, M., Averyt, K.B., Tignor, M., Miller, H.L. (Eds.), Climate Change 2007: The PhysicalScience Basis. Contribution of Working Group I to the Fourth Assessment Report of theIntergovernmental Panel on Climate Change. Cambridge University Press, Cambridge, UnitedKingdom and New York, NY, USA pp. 131-234.
Fritsche, U.R., Hennenberg, K.J., Hermann, A., Hünecke, K., SchulzeF., Wiegmann, K., (2009)Sustainable Bioenergy: Current Status and Outlook, in: Federal Ministry for Environment NatureProtection and Nuclear Safety (Ed.). Öko-Institut, Darmstadt.
Fuller, R.J., Aye, L. (2012) Human and animal power – The forgotten renewables. Renewable Energy48, 326-332.
Gallagher, E., (2008) The Gallagher review of the indirect effects of biofuels production, in:Department for Transport (Ed.). Renewable Fuels Agency.
Galloway, J.N., Dentener, F.J., Capone, D.G., Boyer, E.W., Howarth, R.W., Seitzinger, S.P., Asner,G.P., Cleveland, C.C., Green, P.A., Holland, E.A., Karl, D.M., Michaels, A.F., Porter, J.H.,
72
Townsend, A.R., Vörösmarty, C.J. (2004) Nitrogen Cycles: Past, Present, and Future.Biogeochemistry 70, 153-226.
Gathorne-Hardy, A., (2013a) Greenhouse gas emissions from rice, Working paper,,http://www.southasia.ox.ac.uk/sites/sias/files/documents/GHG%20emissions%20from%20rice%20-%20%20working%20paper.pdf.
Gathorne-Hardy, A. (2013b) The greenhouse gas emissions, energy and water use from four differentrice production systems. Working paper, SIAS, .Glaeser, B. (2013) The Green Revolution Revisited, Critique and Alternatives. Routledge London.Greavescotton, (2013) Greaves power tiller,http://www.greavescotton.com/Upload/AgroEquipFiles/powertiller.pdf.
Gumaste, S.G., Embodied energy computations in buildings Department of Civil Engg., WalchandCollege of Engineering, Vishrambag, Sangli,.
Haefele, S.M., Jabbar, S.M.A., Siopongco, J.D.L.C., Tirol-Padre, A., Amarante, S.T., Sta Cruz, P.C.,Cosico, W.C. (2008) Nitrogen use efficiency in selected rice (Oryza sativa L.) genotypes underdifferent water regimes and nitrogen levels. Field Crops Research 107, 137-146.
Hoegh-Guldberg, O., Bruno, J.F. (2010) The Impact of Climate Change on the World’s MarineEcosystems. Science 328, 1523-1528.
Hoekstra, A.Y., Mekonnen, M.M. (2012) The water footprint of humanity. Proceedings of theNational Academy of Sciences 109, 3232-3237.
Hokazono, S., Hayashi, K. (2012) Variability in environmental impacts during conversion fromconventional to organic farming: a comparison among three rice production systems in Japan. Journalof Cleaner Production 28, 101-112.
Hou, H., Peng, S., Xu, J., Yang, S., Mao, Z. (2012) Seasonal variations of CH4 and N2O emissions inresponse to water management of paddy fields located in Southeast China. Chemosphere 89, 884-892.Huijbregts, M.A.J., Hellweg, S., Frischknecht, R., Hendriks, H.W.M., Hungerbu ̈hler, K., Hendriks,A.J. (2010) Cumulative Energy Demand As Predictor for the Environmental Burden of CommodityProduction. Environmental Science & Technology 44, 2189-2196.
IEA, (2012) Understanding Energy Challenges in India Policies, Players and Issues Partner CountrySeries. International Energy Agency, France.
IPCC (2006) National Guidelines for Greenhouse Gas Inventories.
IPCC, (2007) Observations: Surface and Atmospheric Climate Change, in: Solomon, S., Qin, D.,Manning, M., Chen, Z., Marquis, M., Averyt, K.B., M., T., H.L., M. (Eds.), Contribution of WorkingGroup I to the Fourth Assessment Report of the Intergovernmental Panel on Climate Change, 2007.Cambridge University Press, , Cambridge, United Kingdom and New York, NY, USA, p. 237.
IRRI, (2013) Rice production and processinghttp://www.irri.org/index.php?option=com_k2&view=item&layout=item&id=9151&lang=en.
Islam, M., Peng, S., Visperas, R., Bhuiya, M., Hossain, S., Julfiquar, A. (2010) Comparative study onyield and yield attributes of hybrid, inbred, and NPT rice genotypes in a tropical irrigated ecosystem.Bangladesh Journal of Agricultural Research 35, 343-353.
ISO, (2006) Environment Management – Life Cycle Assessment – Principles and Framework. ENISO 14040, in: International Organization for Standardization (ISO) (Ed.), Switzerland.
73
Jagadish, S., Craufurd, P., Wheeler, T. (2007) High temperature stress and spikelet fertility in rice(Oryza sativa L.). Journal of Experimental Botany 58, 1627-1635.Jagadish, S.V.K., Muthurajan, R., Oane, R., Wheeler, T.R., Heuer, S., Bennett, J., Craufurd, P.Q.(2010) Physiological and proteomic approaches to address heat tolerance during anthesis in rice(Oryza sativa L.). Journal of Experimental Botany 61, 143-156.
John Deere, (2012) Tractor Specifications,http://www.deere.com/en_IN/home_page/ag_home/products/5104_45HP/5104_45HP.html.
Khush, G.S. (2001) Green revolution: the way forward. Nat Rev Genet 2, 815-822.
Krishi Vighan Kendra, (2012). http://kvkpudukkottai.com/front_line_demonstrations.html.
Kumar, S., Singh, J., Nanoti, S.M., Garg, M.O. (2012) A comprehensive life cycle assessment (LCA)of Jatropha biodiesel production in India. Bioresource Technology 110, 723-729.
Lerche, J. (2011) Agrarian Crisis and Agrarian Questions in India. Journal of Agrarian Change 11,104-118.
Lindeman, R.L. (1942) The Trophic-Dynamic Aspect of Ecology. Ecology 23, 399-417.
Ly, P., Jensen, L.S., Bruun, T.B., Rutz, D., de Neergaard, A. (2012) The System of RiceIntensification: Adapted practices, reported outcomes and their relevance in Cambodia. AgriculturalSystems 113, 16-27.
Mahindra, (2012) Tractor specifications, http://www.mahindratractorworld.com/Bangladesh-en/Products-Tractors-MKM-NBP-SERIES-30-50HP/575-DI-MKM-NBP-45HP.
Mandal, K.G., Hati, K.M., Misra, A.K. (2009) Biomass yield and energy analysis of soybeanproduction in relation to fertilizer-NPK and organic manure. Biomass and Bioenergy 33, 1670-1679.Nassiri, S.M., Singh, S. (2009) Study on energy use efficiency for paddy crop using data envelopmentanalysis (DEA) technique. Applied Energy 86, 1320-1325.
Nelson, G.C., Robertson, R., Msangi, S., Zhu, T., Liao, X., Jawajar, P., (2009) Greenhouse GasMitigation. Issues for Indian Agriculture. In IFPRI Discussion Paper 00900. International Food PolicyResearch Unit, Washington.
Nevison, C.D., Mahowald, N.M., Weiss, R.F., Prinn, R.G. (2007) Interannual and seasonal variabilityin atmospheric N2O. Global Biogeochemical Cycles 21.
Oki, T., Kanae, S. (2006) Global Hydrological Cycles and World Water Resources. Science 313,1068-1072.
Ott, R.L., Longnecker, M.T. (2010) An Introduction to Statistical Methods and Data Analysis, 6thEdition. Duxbury Press Belmont, USA.
Pachauri, R., (2007) Climate Change 2007: Synthesis Report IPCC Secretariat, Geneva.
PAS 2050:2011, (2011) Specification for the assessment of the life cycle greenhouse gas emissions ofgoods and services. BSI, London.
Pathak, H., Bhatia, A., Prasad, S., Singh, S., Kumar, S., Jain, M.C., Kumar, U. (2002) Emission ofNitrous Oxide from Rice-Wheat Systems of Indo-Gangetic Plains of India. Environmental Monitoringand Assessment 77, 163-178.
74
Pelletier, N., Audsley, E., Brodt, S., Garnett, T., Henriksson, P., Kendall, A., Kramer, K.J., Murphy,D., Nemecek, T., Troell, M. (2011) Energy Intensity of Agriculture and Food Systems. AnnualReview of Environment and Resources 36, 223-246.
Peng, S., Hou, H., Xu, J., Mao, Z., Abudu, S., Luo, Y. (2011a) Nitrous oxide emissions from paddyfields under different water managements in southeast China. Paddy and Water Environment 9, 403-411.
Peng, S., Huang, J., Sheehy, J.E., Laza, R.C., Visperas, R.M., Zhong, X., Centeno, G.S., Khush, G.S.,Cassman, K.G. (2004) Rice yields decline with higher night temperature from global warming.Proceedings of the National Academy of Sciences of the United States of America 101, 9971-9975.Peng, S., Yang, S., Xu, J., Gao, H. (2011b) Field experiments on greenhouse gas emissions andnitrogen and phosphorus losses from rice paddy with efficient irrigation and drainage management.SCIENCE CHINA Technological Sciences 54, 1581-1587.
Pfister, S., Bayer, P., Koehler, A., Hellweg, S. (2011) Environmental Impacts of Water Use in GlobalCrop Production: Hotspots and Trade-Offs with Land Use. Environmental Science & Technology 45,5761-5768.
Pimentel, D., Dazhong, W., (1990) Technological Changes in Energy Use in U.S. AgriculturalProduction, in: Carroll, C.R., Vandermeer, J.H., Rosset, P. (Eds.), Agroecology. McGraw-HillPublishing Company, New York.
Planning Commission, (2008) Eleventh Five Year Plan, (2007–2012). Agriculture, RuralDevelopment, Industry, Services and Physical Infrastructure, in: India, G.o. (Ed.), New Delhi.
Plevin, R.J., O’Hare, M., Jones, A.D., Torn, M.S., Gibbs, H.K. (2010) Greenhouse Gas Emissionsfrom Biofuels’ Indirect Land Use Change Are Uncertain but May Be Much Greater than PreviouslyEstimated. Environmental Science & Technology 44, 8015-8021.
Prasad, R., Nagarajan, S. (2004) Rice-wheat cropping system - food security and sustainability.Current Science 87, 1334-1335.
Santiaguel, A.F., Howell, G., Jagadish, K., "Cooler rice" for a warming planet, Annual Report 2010.IRRI.
Screen, J.A., Simmonds, I. (2010) Increasing fall-winter energy loss from the Arctic Ocean and itsrole in Arctic temperature amplification. Geophysical Research Letters 37, L16707.
Searchinger, T., Heimlich, R., Houghton, R.A., Dong, F., Elobeid, A., Fabiosa, J., Tokgoz, S., Hayes,D., Yu, T.-H. (2008) Use of U.S. Croplands for Biofuels Increases Greenhouse Gases ThroughEmissions from Land-Use Change. Science 319, 1238-1240.
Sinclair, T.R., (2011) Precipitation: The Thousand-Pound Gorilla in Crop Response to ClimateChange, in: D., H., Rosenzweig, C. (Eds.), Handbook Of Climate Change And AgroecosystemsImpacts, Adaptation, and Mitigation. Imperial College Press, London.
Singh, H., Mishra, D., Nahar, N.M. (2002) Energy use pattern in production agriculture of a typicalvillage in arid zone, India––part I. Energy Conversion and Management 43, 2275-2286.
Singh, Y.V. (2013) Crop and water productivity as influenced by rice cultivation methods underorganic and inorganic sources of nutrient supply. Paddy and Water Environment 11, 531-542.
75
Singhal, K.K., Mohini, M., Jha, A.K., Gupta, P.K. (2005) Methane emission estimates from entericfermentation in Indian livestock: Dry matter intake approach. Current Science 88, 119-127.
Smil, V. (2006) Energy In Nature And Society General Energetics of Complex Systems. MIT Press,Boston.Smith, P., Martino, D., Cai, Z., Gwary, D., Janzen, H.H., Kumar, P., McCarl, B., Ogle, S., O’Mara, F.,Rice, C., Scholes, R.J., Sirotenko, O., Howden, M., McAllister, T., Pan, G., Romanenkov, V., Rose,S., Schneider, U., Towprayoon, S., (2007) Agriculture. Chapter 8, in: B. Metz, O.R.D., P.R. Bosch, R.Dave, L.A. Meyer (Ed.), Climate Change 2007: Mitigation. Contribution of Working Group III to theFourth Assessment Report of the Intergovernmental Panel on Climate Change Cambridge UniversityPress, Cambridge, United Kingdom and New York, NY, USA.
Sorrell, S., (2007) The Rebound Effect: an assessment of the evidence for economy-wide energysavings from improved energy efficiency, Technology and Policy Assessment. UK Energy ResearchCentre, London.
Stoop, W.A., Adam, A., Kassam, A. (2009) Comparing rice production systems: A challenge foragronomic research and for the dissemination of knowledge-intensive farming practices. AgriculturalWater Management 96, 1491-1501.
Suryavanshi, P., Singh, Y.V., Prasanna, R., Bhatia, A., Shivay, Y.S. (2013) Pattern of methaneemission and water productivity under different methods of rice crop establishment. Paddy and WaterEnvironment 11, 321-329.
Tennakoon, N.A., Hemamala Bandara, S.D. (2003) Nutrient content of some locally available organicmaterials and their potential as alternative sources of nutrients for coconut. COCOS 15, 23-30.
The Royal Society, (2012) People and the planet, in: The Royal Society Science Policy Centre (Ed.).The Royal Society London
Tippayawong, N., Pittayapak, A., Jompakdee, W. (2003) Analysis of Energy Requirement forVegetable Oil Production in Northern Thailand ’s Farms. CMU Journal 2, 37.
Trenberth, K.E. (2010) Changes in precipitation with climate change. Climate Research 47, 123-138USEPA, (2006) Global Anthropogenic Non-CO2 Greenhouse Gas Emissions: 1990 – 2020. U.S.Environmental Protection Agency, Washington.
Wang, M., Xia, X., Zhang, Q., Liu, J. (2010) Life cycle assessment of a rice production system inTaihu region, China. International Journal of Sustainable Development & World Ecology 17, 157-161.
Wang, Z.Y., Xu, Y.C., Li, Z., Guo, Y.X., Wassmann, R., Neue, H.U., Lantin, R.S., Buendia, L.V.,Ding, Y.P., Wang, Z.Z. (2000) A Four-Year Record of Methane Emissions from Irrigated Rice Fieldsin the Beijing Region of China. Nutrient Cycling in Agroecosystems 58, 55-63.
Wassmann, R., Jagadish, S.V.K., Sumfleth, K., Pathak, H., Howell, G., Ismail, A., Serraj, R., Redona,E., Singh, R.K., Heuer, S., (2009) Chapter 3 Regional Vulnerability of Climate Change Impacts onAsian Rice Production and Scope for Adaptation, in: Donald, L.S. (Ed.), Advances in Agronomy.Academic Press, pp. 91-133.
Williams, A.G., Audsley, E., Sandars, D.L., (2006) Determining the environmental burdens andresource use in the production of agricultural and horticultural commodities. Cranfield University andDefra, Bedford.
76
Wood S, Cowie A, (2004) A Review of Greenhouse Gas Emission Factors for Fertiliser Production,in: IEA Bioenergy Task 38 (Ed.). Research and Development Division, State Forests of New SouthWales.
Woods, J., Brown, G., Gathorne-Hardy, A., Sylvester-Bradley, R., Kindred, D., Mortimer, N., (2008)Facilitating carbon (GHG) accreditation schemes for biofuels, feedstock production REPORT 435Part 1 HGCA.Xu, J., Peng, S., Yang, S., Wang, W. (2012) Ammonia volatilization losses from a rice paddy withdifferent irrigation and nitrogen managements. Agricultural Water Management 104, 184-192.Yan, X., Yagi, K., Akiyama, H., Akimoto, H. (2005) Statistical analysis of the major variablescontrolling methane emission from rice fields. Global Change Biology 11, 1131-1141.
Yao, H., Conrad, R., Wassmann, R., Neue, H.U. (1999) Effect of soil characteristics on sequentialreduction and methane production in sixteen rice paddy soils from China, the Philippines, and Italy.Biogeochemistry 47, 269-295.
77
EMBODIED EMISSIONS AND DIS-EMBODIED JOBS: THE
ENVIRONMENTAL, SOCIAL AND ECONOMIC IMPLICATIONS OF
THE RICE PRODUCTION-SUPPLY CHAIN IN SOUTH EAST INDIA
Alfred Gathorne–Hardy
78
EMBODIED EMISSIONS AND DIS-EMBODIED JOBS: THEENVIRONMENTAL, SOCIAL AND ECONOMIC IMPLICATIONS OF THE
RICE PRODUCTION-SUPPLY CHAIN IN SE INDIA
Alfred Gathorne-Hardy with Barbara Harriss-White 32
Introduction
“Men with machines have conquered men as machines and a millennia of craft and art, celebration
and belief has vanished in a decade or two, sunk from sight”(Blythe, 2011), p. 26.
Although originally describing British post war agriculture, Blythe could equally well be describing
many aspects of India’s contemporary food system. To many, the ‘conquerors’ are liberators, freeing
individuals from the drudgery of being machines. To others they generate substantial collateral
damage; not just the lost ‘craft and art, celebration and belief’, but also fundamental aspects of food
security and human welfare – the quantity and quality of jobs and livelihoods, productivity, and
environmental quality.
Simultaneously other transformations are taking place in India, including unprecedented economic
growth; social, demographic, health and nutrition transitions; transformations in citizenship; and a
political rebalancing of the tensions between capital and labour, growth and redistribution. These are
all set within the less politically visible but ever shifting environment of climate change, water-
shortages and competition, soil mining and degradation and the exponential rise in solid, liquid and
gaseous waste.
What are the impacts of these changes? Should development policy continue to encourage them, or
should it aim to modify them to maximise benefits and minimise costs? If so what kind of costs,
where and how? These questions motivated our collective research project.
Social, environmental and economic spheres are inter-related, so trying to research any of them
through a single discipline risks missing important trade-offs and synergies, which may in turn be a
source of unintended consequences from any policy generated from our research.
This paper makes a small contribution to this knowledge void. We collected information from the
perspectives of multiple disciplines, and present it here as baseline information that is currently
32With gratitude to D N Reddy and M Venkatanarayana, D.K.Mishra and Dinesh Kumar, Hema and
Chandrasekharan, Gilbert Rodrigo, Gautam Mody, Mohan Mani and Meghna Sukumar and their team, Kavithaand Josephine for all their contributions.
79
missing from the development debates in any of the social, economic or environmental fields. We are
not trying to provide solutions or answers.33
The social sphere
The importance of work, and work qualityPoor people derive most of their income from work – ranging from those employed inside the formal
sector to subsistence producers, self-employed firms and farmers (Hull, 2009). As the ILO has
argued, an adequate (‘decent’) quality and quantity of work is essential not only for economic growth
but also for food security and the satisfaction of basic needs as well as wider quality of life
capabilities including, in most societies, self-respect and social adulthood. While the quantity of work
seems a relatively simple measure, in fact the working day is measured in terms of shifts, or hours, or
through specified piece work - whether for an individual or in a gang. So in practice work quantity is
complicated and our measure – hours per unit of output or land - is the severest kind of summary.
By contrast, the terms and condition of work – its ‘quality’ - is long established as measurable in
many ways. Intensive research by the International Labour Organisation (ILO, 1999), and the EU
(Lorano, 2005), suggest such an extremely large set of criteria - 125 variables in the case of the
ILO’s Decent Work34 - that their conceptual refinements are un-implementable and thus irrelevant for
most practical research. A reductionist alternative, confined to income and the economic value of
benefits in kind, while missing the holistic aspiration of Decent Work as an analytical tool, has the
benefit of collectability and can be scaled – ie , so that it can be compared and contrasted across
different fields. In this paper we are forced to use income as a proxy for the quality of work. A fuller
picture of work quality in the Indian food system using a subset of the 125 ILO variables selected on
grounds of their relevance to worker mobilisation is being produced concurrently (Mody et al.,
2013b).
From the individual perspective, Job quality and the quantity of work have been theorised as being
related. In the original backward-bending labour supply curve, as suggested by Robbins in 1930, an
individual increases his/her employment as the wage increases until s/he decides to cut back to spend
more leisure time. In developing countries among poor workers the initial curve will be reversed –
the amount of labour an individual needs is inversely related to the pay (Abraham, 2008). Our
research looks at pay from the employer’s perspective, but there are two points to make about this:
first, that for poor agricultural labourers, the total pay (in cash and/or kind) is critical to their food
33A social sounding of possible alternatives addressing GHG hotspots and labour black spots is outlined in
Harriss-White 2013 a and b.
80
security, and second, that the NREGA could be a game-changer, allowing labourers to escape the S-
shape curve and poverty trap of low pay, low productivity.
The first point suggests more work is better work, but is this always the case? In order to decide if
something is ‘better’ or ‘worse’ then the right baseline or counterfactual is necessary. But what is the
counterfactual to an agricultural labourer’s job – a better job, or no job? At its simplest, and with the
exception of sanitary work, agricultural jobs are some of the ‘worst’ jobs that exist in terms of
physical conditions of work, employer-employee relationships and pay. So fewer agricultural jobs
will represent progress. But it can be counter-argued that there is a section of society, who for reasons
of caste, religion, gender, site (and the inter-section of these identities) cannot escape rural labour
markets or rural work. For these individuals, the counterfactual is no job, and any job is better than
none. For decades, both before and after liberalisation, the Indian government has promoted labour
displacing technologies (through for instance subsidies on tractors , milling equipment
etc(Binswanger, 1985; Harriss, 1977a, b)) - a practice carrying the assumption that the rural labour
surplus will be absorbed by industry and services. Yet at present India’s economic growth is
characterised as jobless. For example 60% of growth between 1990-2005 was in services, a relatively
small-employing sector compared with the industry which has dominated China’s growth (Corbridge
et al., Forthcoming). So the displacement of agricultural labour, well attested by the spreading
negative labour elasticities of agriculture and the growing literature on migration35 results instead in
increased un- or under-employment in the informal economy.36
Behind this paper therefore lies an assumption that must be made explicit: people stay in agricultural
labour due to lack of alternative options, and more jobs are better than no jobs.
The informal economy
Although the informal economy dominates developing counties (and estimates of informal
employment in India range between 83% and 91% of the labour force producing around 60% of GDP
(Harriss-White, 2003; Harriss-White et al., 2007)) it is little understood; and relatively little official
data pertaining to it is collected. In the informal economy social, economic and environmental laws
81
are widely flouted and many regulative policies intended to cover the entire economy do not reach it
directly (see Prakash 2013). The food system is no exception.
The informal economy is usually ignored when discussing sustainable food security, with major
implications for achieving it. How do you manage water use when not even the farmers know how
much they are using? How can food systems mitigate greenhouse gas emissions when no-one knows
what is emitted or where? How can you improve the wellbeing of the poor when they have no
knowledge of their own rights?
The environmental web
The poor state of the environment is well covered elsewhere (Crutzen, 2002; Foresight, 2011;
Gathorne-Hardy, 2013b; Godfray et al., 2010; Rockstrom et al., 2009; Searchinger et al., 2008).
Essentially there is a set of interlinked environmental threats that range in both importance and scale.
Three of them are climate change, water availability and energy. Climate change is a global problem
– driven by the atmospheric stock of global emissions – that is largely but not solely linked to the use
of fossil fuels to meet societies’ increasing demands for energy. Water is an essential pre-requisite to
life and needed in the quantities that make long distance transport rarely practical in the way that it is
for energy. Water is often a seen as a local issue, yet its local use can be heavily dependent upon
(fossil) energy, and its local availability is in part driven by climate change.37 Finally, energy use is
often correlated with wider environmental concerns (Pelletier et al., 2011).
Thus these three measures are useful ‘canaries’38 for wider environmental concerns due to the pivotal
positions they hold in relation to themselves, society and the economy.
Rice
The importance of rice rests upon three qualities: its significance for food, its importance for
employment, and its environmental impacts (as discussed in Gathorne-Hardy, 2013). But rice
farming and post-harvest processing and distribution is not an industry in isolation, instead it is
enmeshed in complex socio-economic-environmental relations. The route by which paddy leaves the
farm and reaches the consumer can be highly complex, with the paddy, straw, husk and bran passing
through numerous hands, sometimes only on paper, before finally reaching the shop. Below is a
representation of the West Bengal marketing system for rice in about 2005.
37Water use is under increasing competition between agriculture, industry and domestic needs.
38Canaries were used in British mines to detect noxious gases underground that could not be detected by
smell.
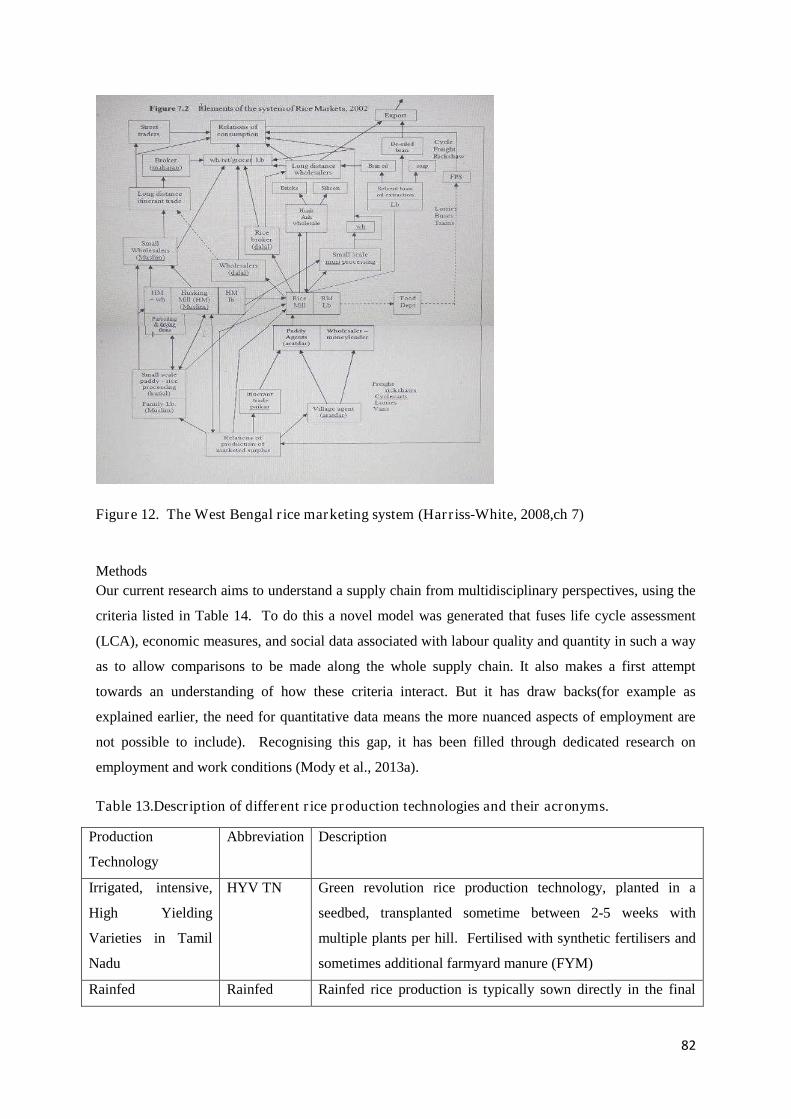
82
Figure 12. The West Bengal rice marketing system (Harriss-White, 2008,ch 7)
Methods
Our current research aims to understand a supply chain from multidisciplinary perspectives, using the
criteria listed in Table 14. To do this a novel model was generated that fuses life cycle assessment
(LCA), economic measures, and social data associated with labour quality and quantity in such a way
as to allow comparisons to be made along the whole supply chain. It also makes a first attempt
towards an understanding of how these criteria interact. But it has draw backs(for example as
explained earlier, the need for quantitative data means the more nuanced aspects of employment are
not possible to include). Recognising this gap, it has been filled through dedicated research on
employment and work conditions (Mody et al., 2013a).
Table 13.Description of different rice production technologies and their acronyms.
Production
Technology
Abbreviation Description
Irrigated, intensive,
High Yielding
Varieties in Tamil
Nadu
HYV TN Green revolution rice production technology, planted in a
seedbed, transplanted sometime between 2-5 weeks with
multiple plants per hill. Fertilised with synthetic fertilisers and
sometimes additional farmyard manure (FYM)
Rainfed Rainfed Rainfed rice production is typically sown directly in the final
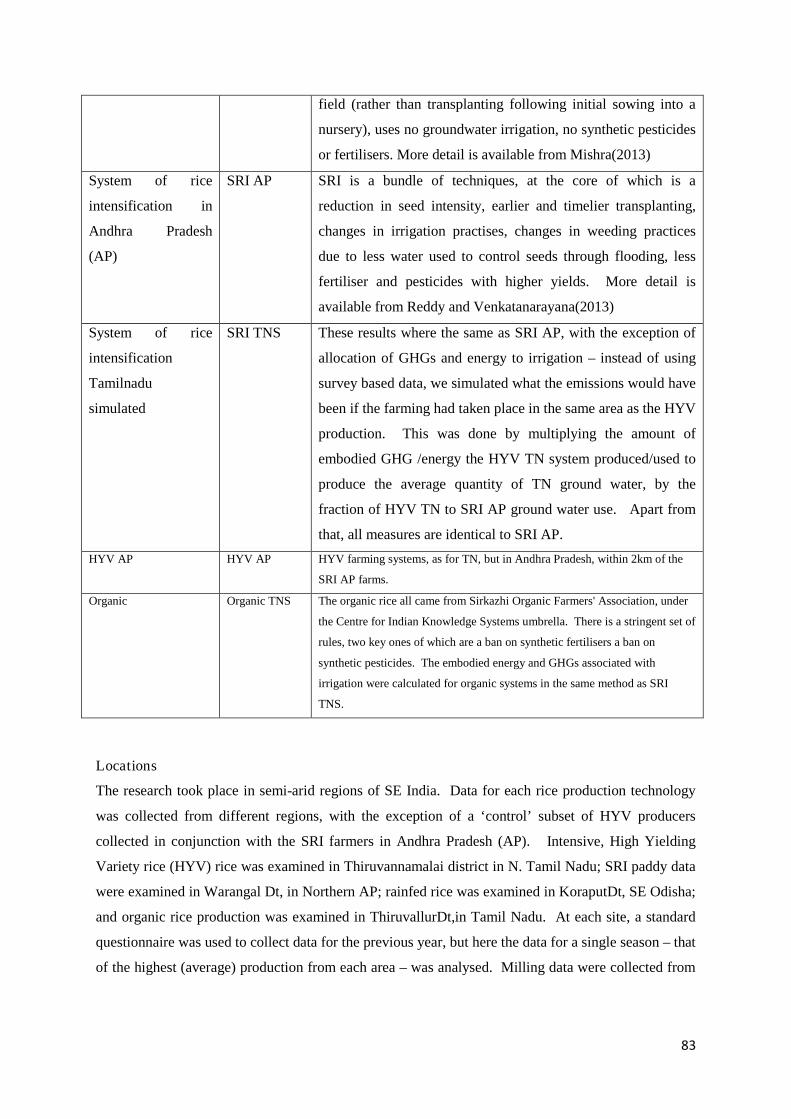
83
field (rather than transplanting following initial sowing into a
nursery), uses no groundwater irrigation, no synthetic pesticides
or fertilisers. More detail is available from Mishra(2013)
System of rice
intensification in
Andhra Pradesh
(AP)
SRI AP SRI is a bundle of techniques, at the core of which is a
reduction in seed intensity, earlier and timelier transplanting,
changes in irrigation practises, changes in weeding practices
due to less water used to control seeds through flooding, less
fertiliser and pesticides with higher yields. More detail is
available from Reddy and Venkatanarayana(2013)
System of rice
intensification
Tamilnadu
simulated
SRI TNS These results where the same as SRI AP, with the exception of
allocation of GHGs and energy to irrigation – instead of using
survey based data, we simulated what the emissions would have
been if the farming had taken place in the same area as the HYV
production. This was done by multiplying the amount of
embodied GHG /energy the HYV TN system produced/used to
produce the average quantity of TN ground water, by the
fraction of HYV TN to SRI AP ground water use. Apart from
that, all measures are identical to SRI AP.
HYV AP HYV AP HYV farming systems, as for TN, but in Andhra Pradesh, within 2km of the
SRI AP farms.
Organic Organic TNS The organic rice all came from Sirkazhi Organic Farmers' Association, under
the Centre for Indian Knowledge Systems umbrella. There is a stringent set of
rules, two key ones of which are a ban on synthetic fertilisers a ban on
synthetic pesticides. The embodied energy and GHGs associated with
irrigation were calculated for organic systems in the same method as SRI
TNS.
Locations
The research took place in semi-arid regions of SE India. Data for each rice production technology
was collected from different regions, with the exception of a ‘control’ subset of HYV producers
collected in conjunction with the SRI farmers in Andhra Pradesh (AP). Intensive, High Yielding
Variety rice (HYV) rice was examined in Thiruvannamalai district in N. Tamil Nadu; SRI paddy data
were examined in Warangal Dt, in Northern AP; rainfed rice was examined in KoraputDt, SE Odisha;
and organic rice production was examined in ThiruvallurDt,in Tamil Nadu. At each site, a standard
questionnaire was used to collect data for the previous year, but here the data for a single season – that
of the highest (average) production from each area – was analysed. Milling data were collected from
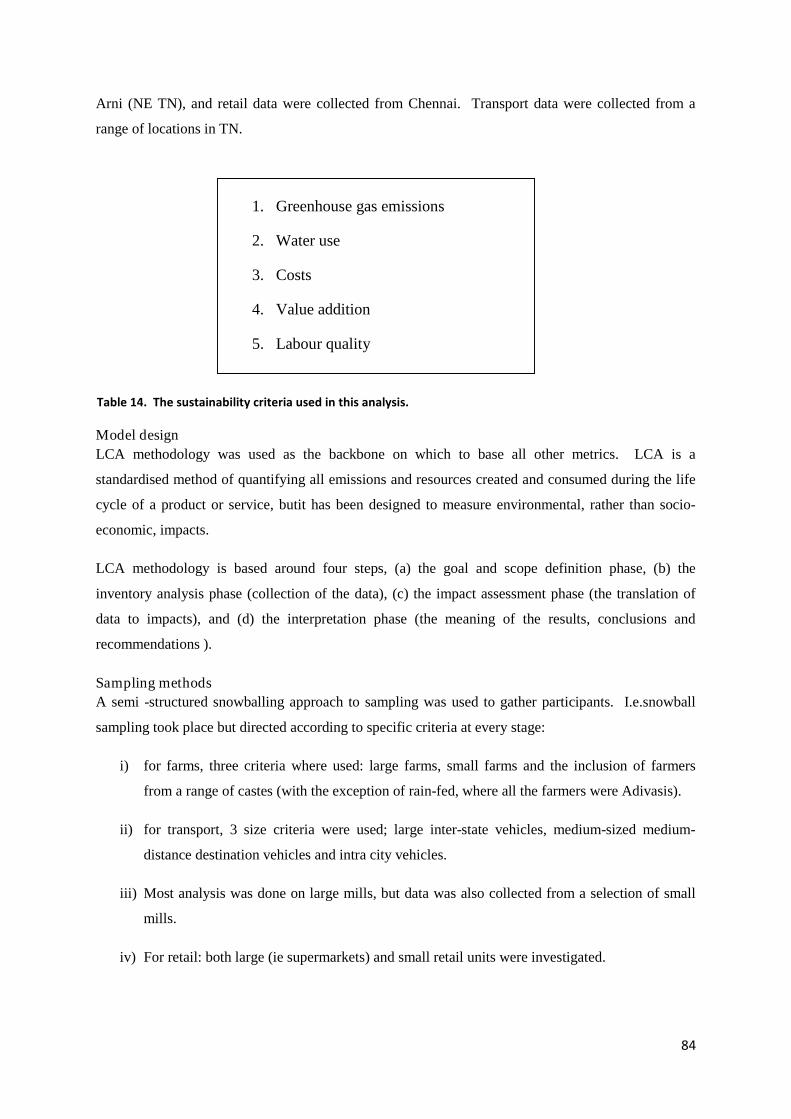
84
Arni (NE TN), and retail data were collected from Chennai. Transport data were collected from a
range of locations in TN.
Model design
LCA methodology was used as the backbone on which to base all other metrics. LCA is a
standardised method of quantifying all emissions and resources created and consumed during the life
cycle of a product or service, butit has been designed to measure environmental, rather than socio-
economic, impacts.
LCA methodology is based around four steps, (a) the goal and scope definition phase, (b) the
inventory analysis phase (collection of the data), (c) the impact assessment phase (the translation of
data to impacts), and (d) the interpretation phase (the meaning of the results, conclusions and
recommendations ).
Sampling methods
A semi -structured snowballing approach to sampling was used to gather participants. I.e.snowball
sampling took place but directed according to specific criteria at every stage:
i) for farms, three criteria where used: large farms, small farms and the inclusion of farmers
from a range of castes (with the exception of rain-fed, where all the farmers were Adivasis).
ii) for transport, 3 size criteria were used; large inter-state vehicles, medium-sized medium-
distance destination vehicles and intra city vehicles.
iii) Most analysis was done on large mills, but data was also collected from a selection of small
mills.
iv) For retail: both large (ie supermarkets) and small retail units were investigated.
1. Greenhouse gas emissions
2. Water use
3. Costs
4. Value addition
5. Labour quality
Table 14. The sustainability criteria used in this analysis.
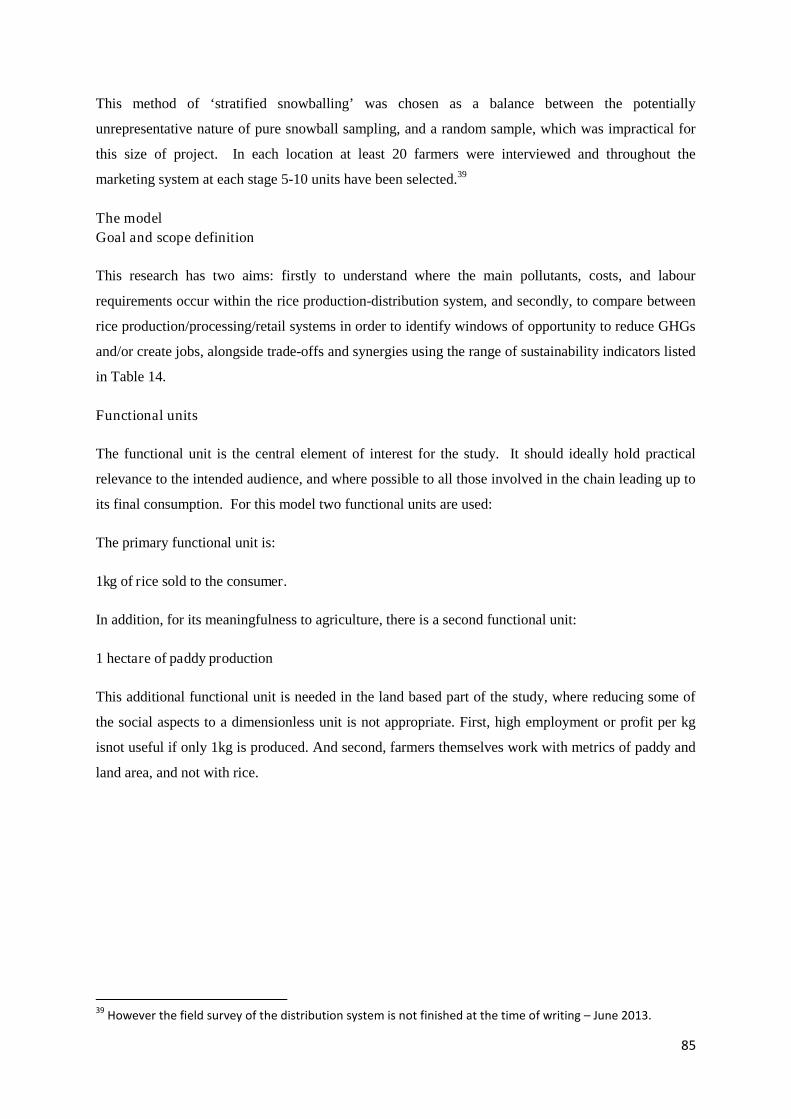
85
This method of ‘stratified snowballing’ was chosen as a balance between the potentially
unrepresentative nature of pure snowball sampling, and a random sample, which was impractical for
this size of project. In each location at least 20 farmers were interviewed and throughout the
marketing system at each stage 5-10 units have been selected.39
The model
Goal and scope definition
This research has two aims: firstly to understand where the main pollutants, costs, and labour
requirements occur within the rice production-distribution system, and secondly, to compare between
rice production/processing/retail systems in order to identify windows of opportunity to reduce GHGs
and/or create jobs, alongside trade-offs and synergies using the range of sustainability indicators listed
in Table 14.
Functional units
The functional unit is the central element of interest for the study. It should ideally hold practical
relevance to the intended audience, and where possible to all those involved in the chain leading up to
its final consumption. For this model two functional units are used:
The primary functional unit is:
1kg of rice sold to the consumer.
In addition, for its meaningfulness to agriculture, there is a second functional unit:
1 hectare of paddy production
This additional functional unit is needed in the land based part of the study, where reducing some of
the social aspects to a dimensionless unit is not appropriate. First, high employment or profit per kg
isnot useful if only 1kg is produced. And second, farmers themselves work with metrics of paddy and
land area, and not with rice.
39However the field survey of the distribution system is not finished at the time of writing – June 2013.
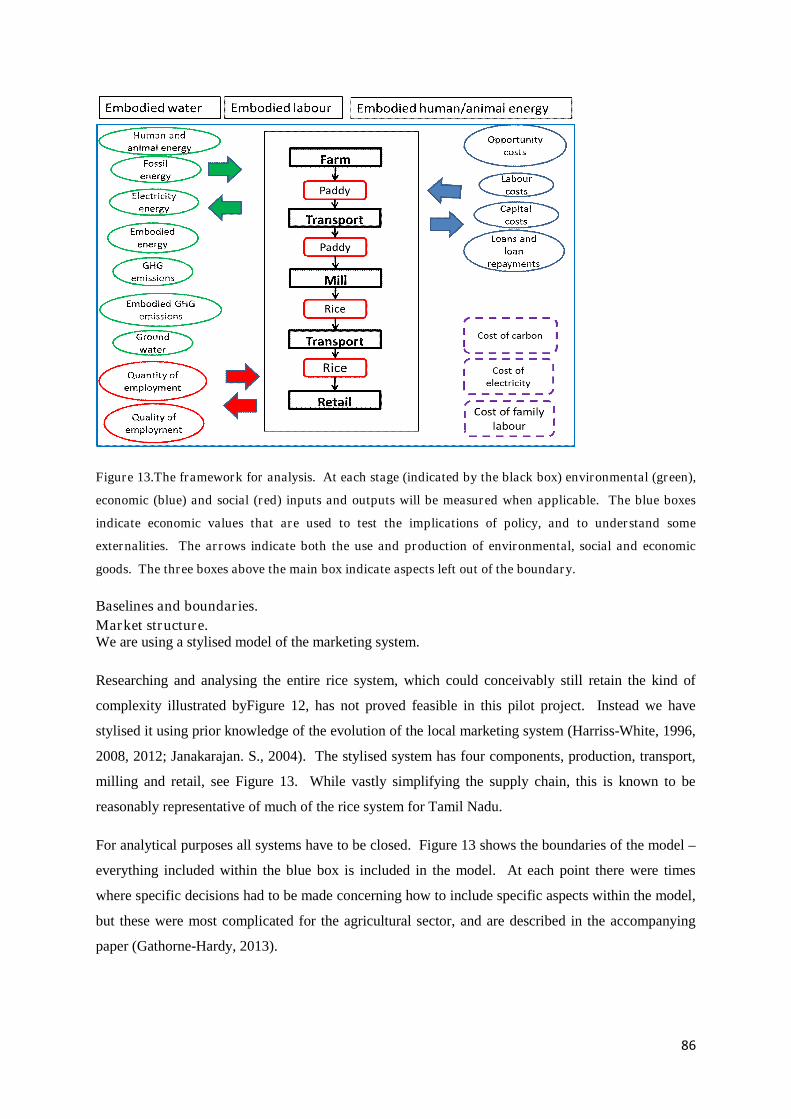
86
Figure 13.The framework for analysis. At each stage (indicated by the black box) environmental (green),
economic (blue) and social (red) inputs and outputs will be measured when applicable. The blue boxes
indicate economic values that are used to test the implications of policy, and to understand some
externalities. The arrows indicate both the use and production of environmental, social and economic
goods. The three boxes above the main box indicate aspects left out of the boundary.
Baselines and boundaries.
Market structure.We are using a stylised model of the marketing system.
Researching and analysing the entire rice system, which could conceivably still retain the kind of
complexity illustrated byFigure 12, has not proved feasible in this pilot project. Instead we have
stylised it using prior knowledge of the evolution of the local marketing system (Harriss-White, 1996,
2008, 2012; Janakarajan. S., 2004). The stylised system has four components, production, transport,
milling and retail, see Figure 13. While vastly simplifying the supply chain, this is known to be
reasonably representative of much of the rice system for Tamil Nadu.
For analytical purposes all systems have to be closed. Figure 13 shows the boundaries of the model –
everything included within the blue box is included in the model. At each point there were times
where specific decisions had to be made concerning how to include specific aspects within the model,
but these were most complicated for the agricultural sector, and are described in the accompanying
paper (Gathorne-Hardy, 2013).
87
The ‘boundaries40’ were kept constant where possible, but this was not always so. For example
environmental boundaries included embodied GHG and energy, but not embodied water. Economic
boundaries included all costed elements upstream of the system depicted in Figure 13, as these are
assumed to be embodied in inputs purchase prices. Social boundaries were largely limited to social
relations directly investigated – no attempt was made to calculate the embodied jobs of goods and
services not directly covered by the new model (see the three boxes outside the blue box in Figure
13). This is potentially important when considering capital-intensive labour-saving machinery such as
tractors, which will have been physically produced with considerable (but unknown) factory labour.
How this factory employment compares with the agricultural labour displaced over a 20 year tractor
lifespan has never to our knowledge been researched.
Allocation.As part of the baselines and boundaries of the model, it is important that the allocation of emissions
between different co-products is transparent and defensible. In our research we have used economic
allocation methods, as explained in Gathorne-Hardy (2013b). This is uncontroversial standard practice
for environmental goods (Blengini and Busto, 2009; Williams et al., 2006), but as far as the authors
are aware, it has not been used for social or economic activity before. For example only a certain
amount of GHG emissions associated with the mill is allocated to the rice; some needs allocating to
the bran, husk and broken rice too. A further question is the analytical handling of un-commercialised
factors of production. Should the LCA use imputed values for these too? Imputed values were
generated for the allocation of emissions between straw and paddy for example,in order to understand
farm decisions and their influences. We did this, partially based on the assumption that the
deployment of labour is decided by the farmer in the same manner that many activities with
environmental impacts are. More importantly, since the primary aim of this work is to understand
how different sustainability indicators interact along a supply chain, consistency in units of
measurement was essential.
Allocation issues not covered in Gathorne-Hardy (2013b) are defined below.
Agricultural baselines.The most robust technique for determining the repercussion of different production techniques is to
use the experimental method, where it is only the variable of interest that differs between tested
populations. Yet there are many situations when such a set-up is impossible, with implications for
both natural and social science approaches to understanding. In this project we are interested in socio-
economic-environmental variables – a range of variables too large to control. Indeed any effort to
40The boundaries define what is to be included and what excluded from analysis. LCAs are iterative processes,
and a rule of thumb from PAS 2050 is to ignore anything that is less than 1% of the total. Clearly some initialanalysis is needed in order to judge where issues fit with respect to this 1% boundary and none are rejectedunless they are clearly substantially below it
88
control this range of complex variables would require such manipulation that the results would be
unreliable. Consequently our research design takes the form of a natural experiment in which different
regions are used to explore the impact of different paddy production techniques and post-harvest
supply chains on social, economic and environmental indicators.
This still leaves a problem for comparison between-technological systems – how much of the
observed difference is due to the different production-distribution technologies and institutions, and
how much to geography? When it was possible, comparative data were collected from each site, for
example SRI data were collected from Andhra Pradesh, and data from 10 HYV farms within 2km
were also collected for comparison. It was not possible to gather evidence for the range of
technologies we studied at every site so the question of comparing and explaining observed
differences cannot be perfectly answered. However so as to refine the comparative analysis, where
possible we collected data on an HYV ‘control’.
As explained in Gathorne-Hardy (2013b), a key problem in comparisons between the different
farming techno-systems was the impact of different water table depths in the different districts and
states. In order to control for this, the results were modified to simulate all farming techno-systems as
if they operated with a northern TN water table as explained in Table 13. We refer to the simulated
farming techno-systems as TN simulated (TNS), thus SRI AP has been simulated for TN water table
as ‘SRI TNS’, (SRI Tamil Nadu simulated). The same goes for organic rice. Rain-fed rice did not use
groundwater, so such a simulation is not required. See Table 13
The life cycle inventory.All aspects of the rice production, transport, milling and retail were studied for their emissions.
Where possible data for the precise location or for India were used (i.e. India specific data was
available for cement) but when local co-efficients for converting activity into emissions were not
available data was collected from global sources. All capital goods (i.e. tractors, lorries, mills) were
assumed to last for 20 years with the exception of pumps, which were assumed, on local advice, to
last 10 years. For non -pumps, this is likely a conservative estimate considering the multiple re-use of
many machines in an Indian context.41 For this reason end of life credit/costs were not included for
machinery.
The modelling approach was based on the material flows at every stage in the production-distribution
system see Figure 13. The flow of materials was assessed at the appropriate stage for each criterion.
Thus while environmental and cost implications could be measured at divisions within each stage (for
example on-farm assessments for each task: cultivation/ploughing, irrigation, weeding etc) such
41In 1980 Harriss-White found cotton ginning machines a century old in use - together with a nation-wide
market for second hand machinery Harriss-White, B. (1996) A Political Economy of Agricultural Markets ofSouth India: Masters of the Countryside. Sage Publications, New Delhi.
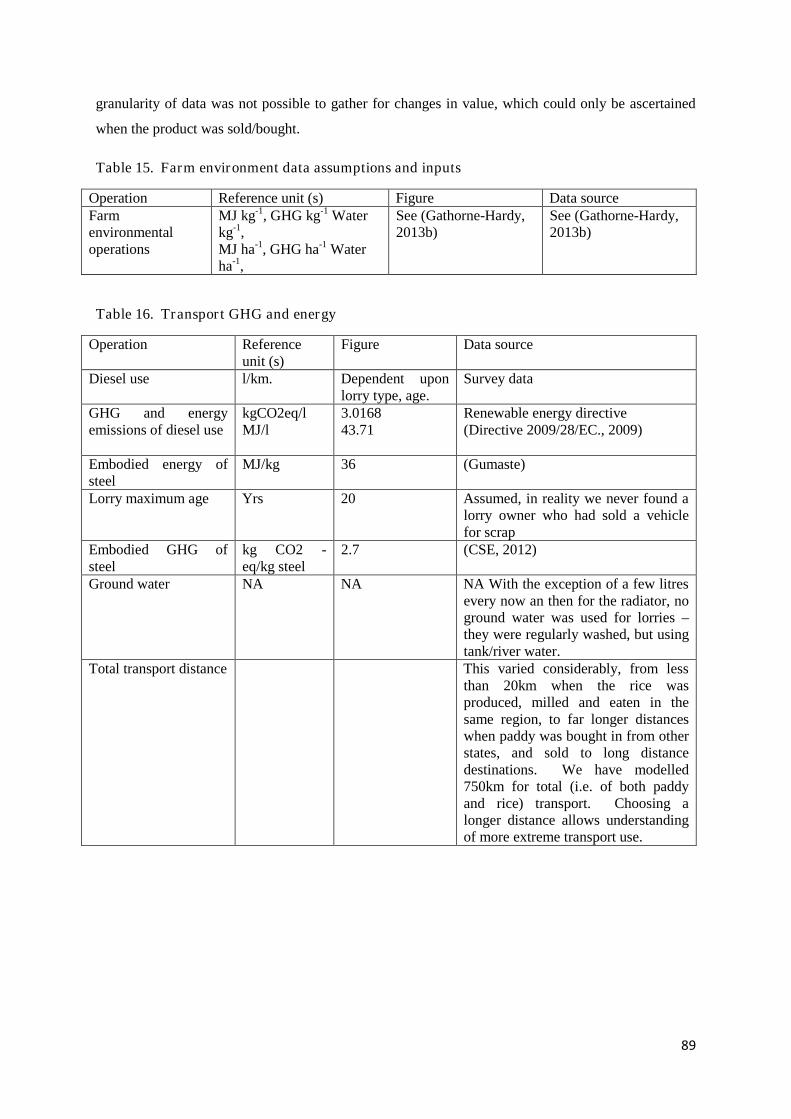
89
granularity of data was not possible to gather for changes in value, which could only be ascertained
when the product was sold/bought.
Table 15. Farm environment data assumptions and inputs
Operation Reference unit (s) Figure Data sourceFarmenvironmentaloperations
MJ kg-1, GHG kg-1 Waterkg-1,MJ ha-1, GHG ha-1 Waterha-1,
See (Gathorne-Hardy,2013b)
See (Gathorne-Hardy,2013b)
Table 16. Transport GHG and energy
Operation Referenceunit (s)
Figure Data source
Diesel use l/km. Dependent uponlorry type, age.
Survey data
GHG and energyemissions of diesel use
kgCO2eq/lMJ/l
3.016843.71
Renewable energy directive(Directive 2009/28/EC., 2009)
Embodied energy ofsteel
MJ/kg 36 (Gumaste)
Lorry maximum age Yrs 20 Assumed, in reality we never found alorry owner who had sold a vehiclefor scrap
Embodied GHG ofsteel
kg CO2 -eq/kg steel
2.7 (CSE, 2012)
Ground water NA NA NA With the exception of a few litresevery now an then for the radiator, noground water was used for lorries –they were regularly washed, but usingtank/river water.
Total transport distance This varied considerably, from lessthan 20km when the rice wasproduced, milled and eaten in thesame region, to far longer distanceswhen paddy was bought in from otherstates, and sold to long distancedestinations. We have modelled750km for total (i.e. of both paddyand rice) transport. Choosing alonger distance allows understandingof more extreme transport use.
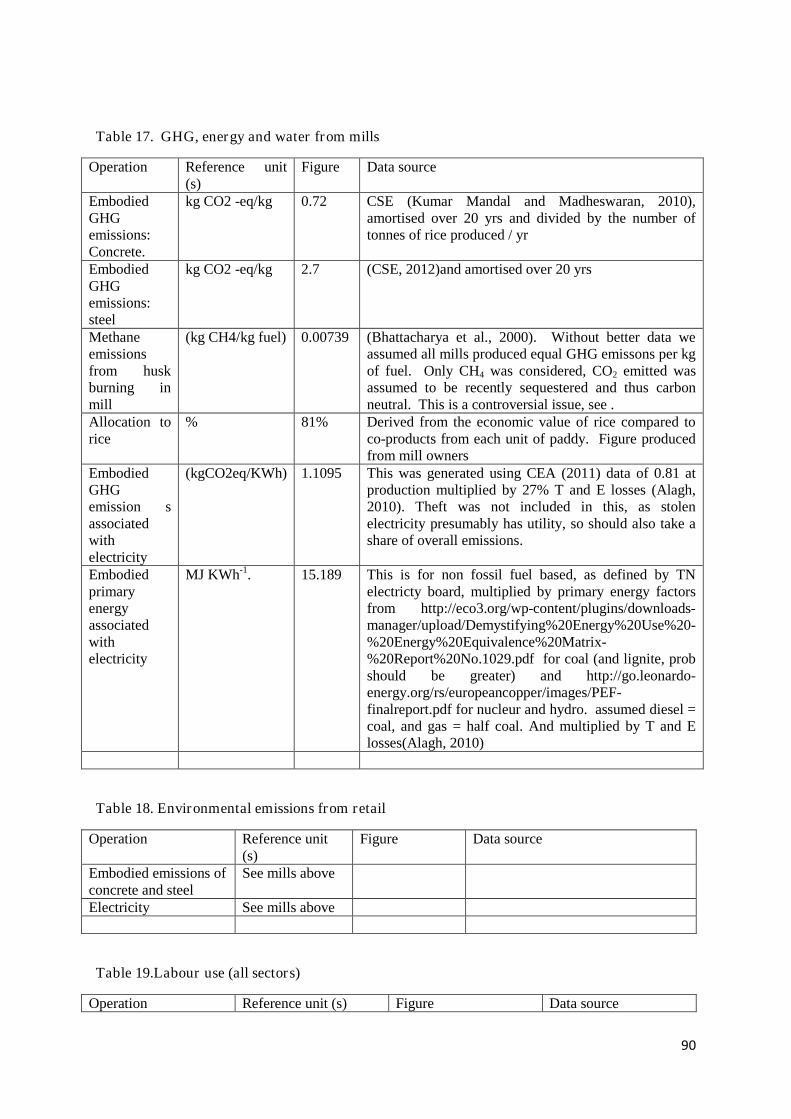
90
Table 17. GHG, energy and water from mills
Operation Reference unit(s)
Figure Data source
EmbodiedGHGemissions:Concrete.
kg CO2 -eq/kg 0.72 CSE (Kumar Mandal and Madheswaran, 2010),amortised over 20 yrs and divided by the number oftonnes of rice produced / yr
EmbodiedGHGemissions:steel
kg CO2 -eq/kg 2.7 (CSE, 2012)and amortised over 20 yrs
Methaneemissionsfrom huskburning inmill
(kg CH4/kg fuel) 0.00739 (Bhattacharya et al., 2000). Without better data weassumed all mills produced equal GHG emissons per kgof fuel. Only CH4 was considered, CO2 emitted wasassumed to be recently sequestered and thus carbonneutral. This is a controversial issue, see .
Allocation torice
% 81% Derived from the economic value of rice compared toco-products from each unit of paddy. Figure producedfrom mill owners
EmbodiedGHGemission sassociatedwithelectricity
(kgCO2eq/KWh) 1.1095 This was generated using CEA (2011) data of 0.81 atproduction multiplied by 27% T and E losses (Alagh,2010). Theft was not included in this, as stolenelectricity presumably has utility, so should also take ashare of overall emissions.
Embodiedprimaryenergyassociatedwithelectricity
MJ KWh-1. 15.189 This is for non fossil fuel based, as defined by TNelectricty board, multiplied by primary energy factorsfrom http://eco3.org/wp-content/plugins/downloads-manager/upload/Demystifying%20Energy%20Use%20-%20Energy%20Equivalence%20Matrix-%20Report%20No.1029.pdf for coal (and lignite, probshould be greater) and http://go.leonardo-energy.org/rs/europeancopper/images/PEF-finalreport.pdf for nucleur and hydro. assumed diesel =coal, and gas = half coal. And multiplied by T and Elosses(Alagh, 2010)
Table 18. Environmental emissions from retail
Operation Reference unit(s)
Figure Data source
Embodied emissions ofconcrete and steel
See mills above
Electricity See mills above
Table 19.Labour use (all sectors)
Operation Reference unit (s) Figure Data source

91
All operations Minutes/kgHours/ha
Dependent uponindividual operation
From survey data
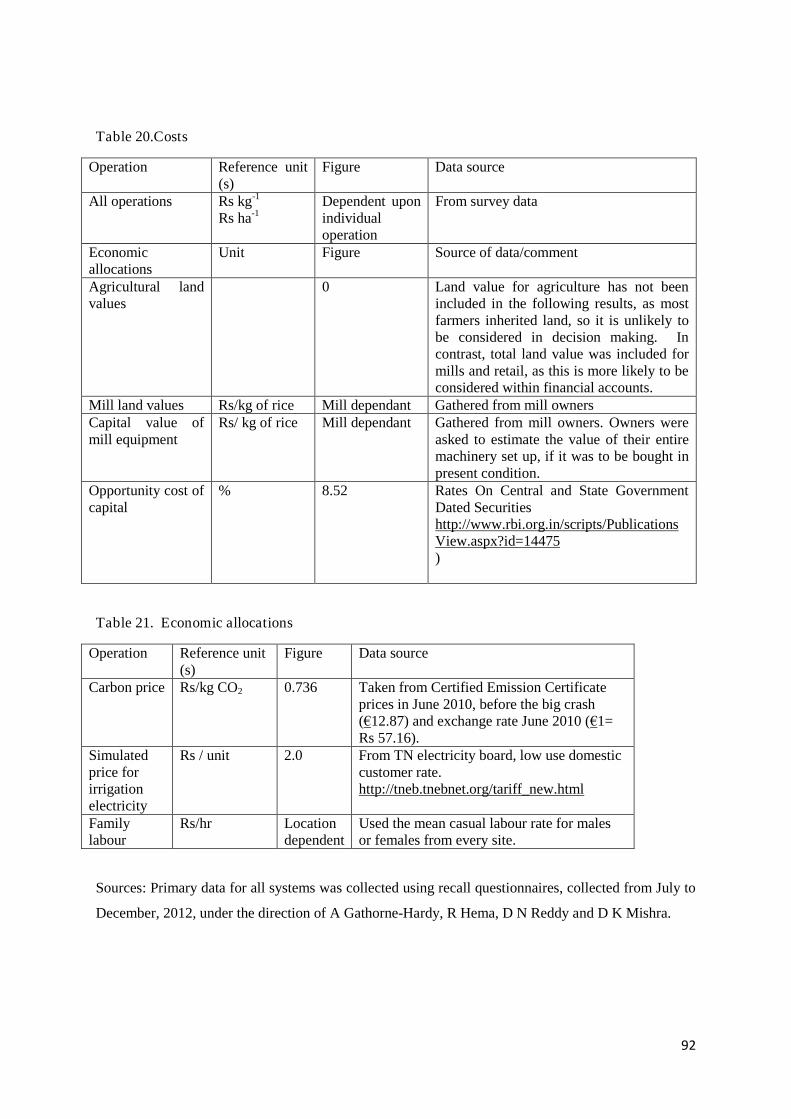
92
Table 20.Costs
Operation Reference unit(s)
Figure Data source
All operations Rs kg-1
Rs ha-1Dependent uponindividualoperation
From survey data
Economicallocations
Unit Figure Source of data/comment
Agricultural landvalues
0 Land value for agriculture has not beenincluded in the following results, as mostfarmers inherited land, so it is unlikely tobe considered in decision making. Incontrast, total land value was included formills and retail, as this is more likely to beconsidered within financial accounts.
Mill land values Rs/kg of rice Mill dependant Gathered from mill ownersCapital value ofmill equipment
Rs/ kg of rice Mill dependant Gathered from mill owners. Owners wereasked to estimate the value of their entiremachinery set up, if it was to be bought inpresent condition.
Opportunity cost ofcapital
% 8.52 Rates On Central and State GovernmentDated Securitieshttp://www.rbi.org.in/scripts/PublicationsView.aspx?id=14475)
Table 21. Economic allocations
Operation Reference unit(s)
Figure Data source
Carbon price Rs/kg CO2 0.736 Taken from Certified Emission Certificateprices in June 2010, before the big crash(€12.87) and exchange rate June 2010 (€1=Rs 57.16).
Simulatedprice forirrigationelectricity
Rs / unit 2.0 From TN electricity board, low use domesticcustomer rate.http://tneb.tnebnet.org/tariff_new.html
Familylabour
Rs/hr Locationdependent
Used the mean casual labour rate for malesor females from every site.
Sources: Primary data for all systems was collected using recall questionnaires, collected from July to
December, 2012, under the direction of A Gathorne-Hardy, R Hema, D N Reddy and D K Mishra.
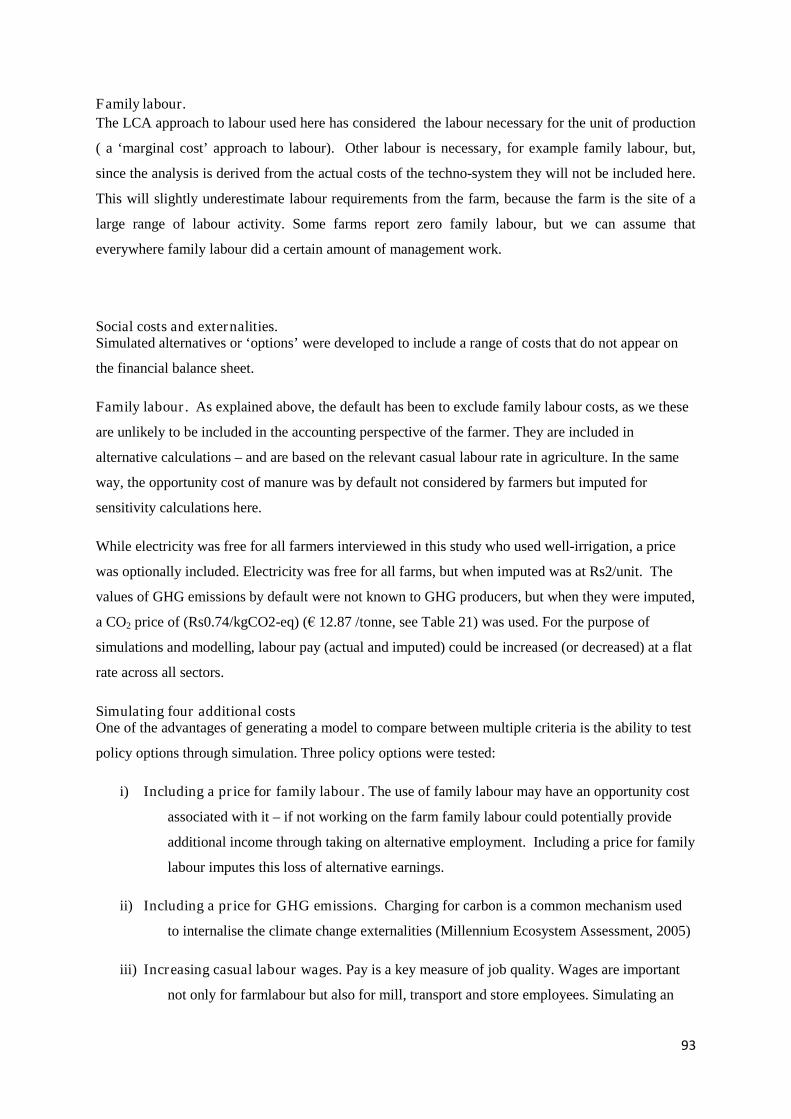
93
Family labour.
The LCA approach to labour used here has considered the labour necessary for the unit of production
( a ‘marginal cost’ approach to labour). Other labour is necessary, for example family labour, but,
since the analysis is derived from the actual costs of the techno-system they will not be included here.
This will slightly underestimate labour requirements from the farm, because the farm is the site of a
large range of labour activity. Some farms report zero family labour, but we can assume that
everywhere family labour did a certain amount of management work.
Social costs and externalities.Simulated alternatives or ‘options’ were developed to include a range of costs that do not appear on
the financial balance sheet.
Family labour. As explained above, the default has been to exclude family labour costs, as we these
are unlikely to be included in the accounting perspective of the farmer. They are included in
alternative calculations – and are based on the relevant casual labour rate in agriculture. In the same
way, the opportunity cost of manure was by default not considered by farmers but imputed for
sensitivity calculations here.
While electricity was free for all farmers interviewed in this study who used well-irrigation, a price
was optionally included. Electricity was free for all farms, but when imputed was at Rs2/unit. The
values of GHG emissions by default were not known to GHG producers, but when they were imputed,
a CO2 price of (Rs0.74/kgCO2-eq) (€ 12.87 /tonne, see Table 21) was used. For the purpose of
simulations and modelling, labour pay (actual and imputed) could be increased (or decreased) at a flat
rate across all sectors.
Simulating four additional costsOne of the advantages of generating a model to compare between multiple criteria is the ability to test
policy options through simulation. Three policy options were tested:
i) Including a price for family labour. The use of family labour may have an opportunity cost
associated with it – if not working on the farm family labour could potentially provide
additional income through taking on alternative employment. Including a price for family
labour imputes this loss of alternative earnings.
ii) Including a price for GHG emissions. Charging for carbon is a common mechanism used
to internalise the climate change externalities (Millennium Ecosystem Assessment, 2005)
iii) Increasing casual labour wages. Pay is a key measure of job quality. Wages are important
not only for farmlabour but also for mill, transport and store employees. Simulating an
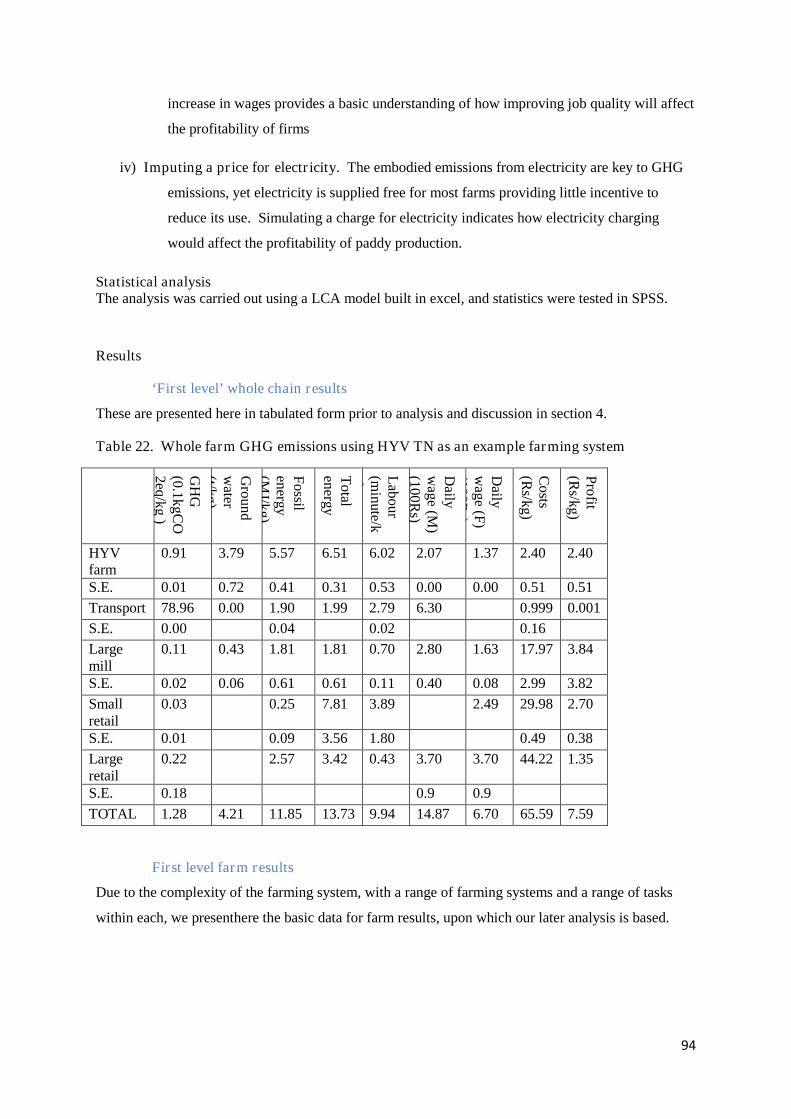
94
increase in wages provides a basic understanding of how improving job quality will affect
the profitability of firms
iv) Imputing a price for electricity. The embodied emissions from electricity are key to GHG
emissions, yet electricity is supplied free for most farms providing little incentive to
reduce its use. Simulating a charge for electricity indicates how electricity charging
would affect the profitability of paddy production.
Statistical analysisThe analysis was carried out using a LCA model built in excel, and statistics were tested in SPSS.
Results
‘First level’ whole chain results
These are presented here in tabulated form prior to analysis and discussion in section 4.
Table 22. Whole farm GHG emissions using HYV TN as an example farming system
GH
G(0
.1k
gC
O2
eq/k
g)
Gro
un
dw
ater(t/k
g)
Fo
ssilen
ergy(M
J/kg)
To
talen
ergy
Lab
ou
r(m
inute/k
g)
Daily
wag
e(M
)(1
00
Rs)
Daily
wag
e(F
)(1
00
Rs)
Co
sts(R
s/kg)
Pro
fit(R
s/kg)
HYVfarm
0.91 3.79 5.57 6.51 6.02 2.07 1.37 2.40 2.40
S.E. 0.01 0.72 0.41 0.31 0.53 0.00 0.00 0.51 0.51
Transport 78.96 0.00 1.90 1.99 2.79 6.30 0.999 0.001
S.E. 0.00 0.04 0.02 0.16
Largemill
0.11 0.43 1.81 1.81 0.70 2.80 1.63 17.97 3.84
S.E. 0.02 0.06 0.61 0.61 0.11 0.40 0.08 2.99 3.82
Smallretail
0.03 0.25 7.81 3.89 2.49 29.98 2.70
S.E. 0.01 0.09 3.56 1.80 0.49 0.38
Largeretail
0.22 2.57 3.42 0.43 3.70 3.70 44.22 1.35
S.E. 0.18 0.9 0.9
TOTAL 1.28 4.21 11.85 13.73 9.94 14.87 6.70 65.59 7.59
First level farm results
Due to the complexity of the farming system, with a range of farming systems and a range of tasks
within each, we presenthere the basic data for farm results, upon which our later analysis is based.
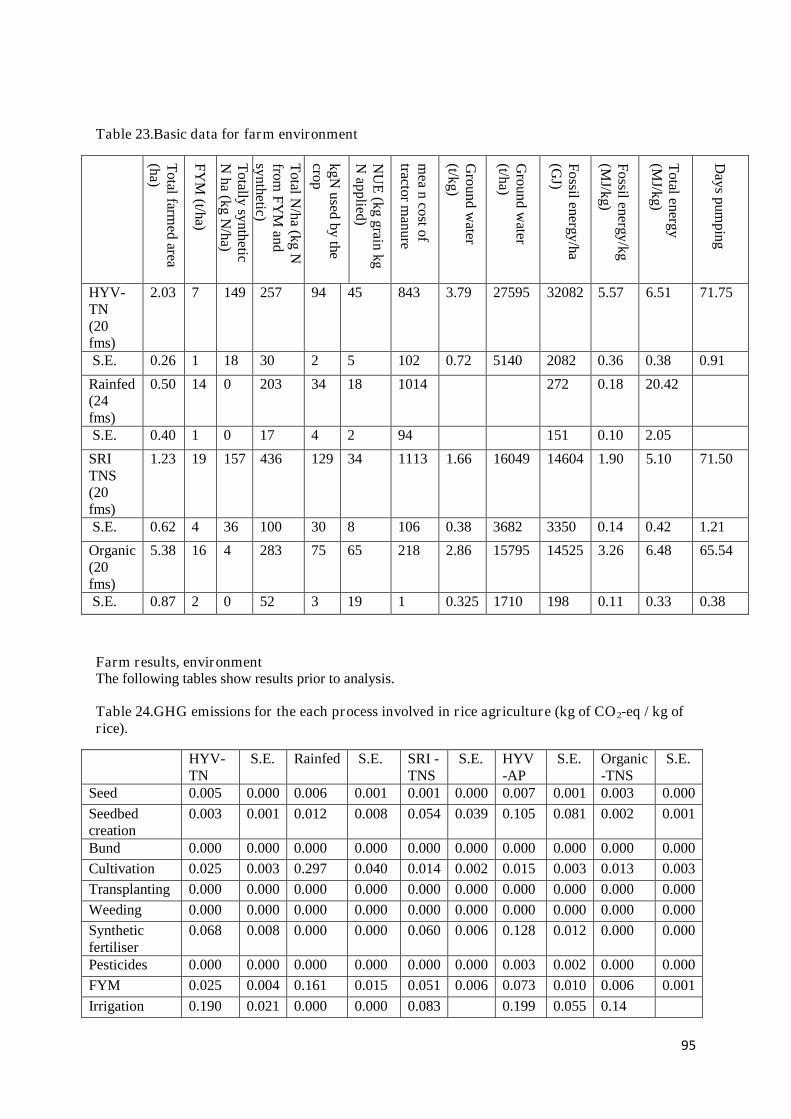
95
Table 23.Basic data for farm environment
To
talfarm
edarea
(ha)
FY
M(t/h
a)
To
tallysy
nth
eticN
ha
(kg
N/h
a)
To
talN
/ha
(kg
Nfrom
FY
Man
dsy
nthetic)
kg
Nu
sedby
thecro
p
NU
E(k
gg
rainkg
Nap
plied)
mea
nco
stof
tractorm
anure
Gro
un
dw
ater(t/k
g)
Gro
un
dw
ater(t/h
a)
Fo
ssilenergy
/ha(G
J)
Fo
ssilenergy
/kg
(MJ/k
g)
To
talen
ergy
(MJ/k
g)
Day
sp
ump
ing
HYV-TN(20fms)
2.03 7 149 257 94 45 843 3.79 27595 32082 5.57 6.51 71.75
S.E. 0.26 1 18 30 2 5 102 0.72 5140 2082 0.36 0.38 0.91
Rainfed(24fms)
0.50 14 0 203 34 18 1014 272 0.18 20.42
S.E. 0.40 1 0 17 4 2 94 151 0.10 2.05
SRITNS(20fms)
1.23 19 157 436 129 34 1113 1.66 16049 14604 1.90 5.10 71.50
S.E. 0.62 4 36 100 30 8 106 0.38 3682 3350 0.14 0.42 1.21
Organic(20fms)
5.38 16 4 283 75 65 218 2.86 15795 14525 3.26 6.48 65.54
S.E. 0.87 2 0 52 3 19 1 0.325 1710 198 0.11 0.33 0.38
Farm results, environmentThe following tables show results prior to analysis.
Table 24.GHG emissions for the each process involved in rice agriculture (kg of CO2-eq / kg ofrice).
HYV-TN
S.E. Rainfed S.E. SRI -TNS
S.E. HYV-AP
S.E. Organic-TNS
S.E.
Seed 0.005 0.000 0.006 0.001 0.001 0.000 0.007 0.001 0.003 0.000
Seedbedcreation
0.003 0.001 0.012 0.008 0.054 0.039 0.105 0.081 0.002 0.001
Bund 0.000 0.000 0.000 0.000 0.000 0.000 0.000 0.000 0.000 0.000
Cultivation 0.025 0.003 0.297 0.040 0.014 0.002 0.015 0.003 0.013 0.003
Transplanting 0.000 0.000 0.000 0.000 0.000 0.000 0.000 0.000 0.000 0.000
Weeding 0.000 0.000 0.000 0.000 0.000 0.000 0.000 0.000 0.000 0.000
Syntheticfertiliser
0.068 0.008 0.000 0.000 0.060 0.006 0.128 0.012 0.000 0.000
Pesticides 0.000 0.000 0.000 0.000 0.000 0.000 0.003 0.002 0.000 0.000
FYM 0.025 0.004 0.161 0.015 0.051 0.006 0.073 0.010 0.006 0.001
Irrigation 0.190 0.021 0.000 0.000 0.083 0.199 0.055 0.14
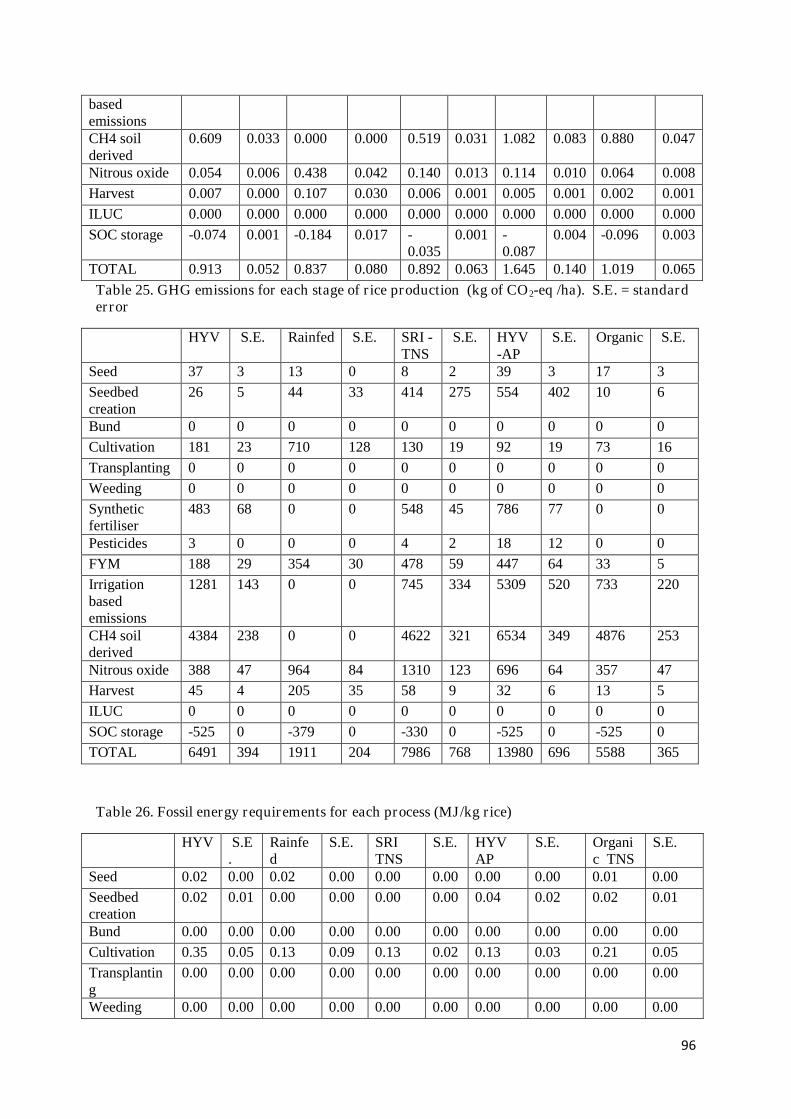
96
basedemissionsCH4 soilderived
0.609 0.033 0.000 0.000 0.519 0.031 1.082 0.083 0.880 0.047
Nitrous oxide 0.054 0.006 0.438 0.042 0.140 0.013 0.114 0.010 0.064 0.008
Harvest 0.007 0.000 0.107 0.030 0.006 0.001 0.005 0.001 0.002 0.001
ILUC 0.000 0.000 0.000 0.000 0.000 0.000 0.000 0.000 0.000 0.000
SOC storage -0.074 0.001 -0.184 0.017 -0.035
0.001 -0.087
0.004 -0.096 0.003
TOTAL 0.913 0.052 0.837 0.080 0.892 0.063 1.645 0.140 1.019 0.065
Table 25. GHG emissions for each stage of rice production (kg of CO2-eq /ha). S.E. = standarderror
HYV S.E. Rainfed S.E. SRI -TNS
S.E. HYV-AP
S.E. Organic S.E.
Seed 37 3 13 0 8 2 39 3 17 3
Seedbedcreation
26 5 44 33 414 275 554 402 10 6
Bund 0 0 0 0 0 0 0 0 0 0
Cultivation 181 23 710 128 130 19 92 19 73 16
Transplanting 0 0 0 0 0 0 0 0 0 0
Weeding 0 0 0 0 0 0 0 0 0 0
Syntheticfertiliser
483 68 0 0 548 45 786 77 0 0
Pesticides 3 0 0 0 4 2 18 12 0 0
FYM 188 29 354 30 478 59 447 64 33 5
Irrigationbasedemissions
1281 143 0 0 745 334 5309 520 733 220
CH4 soilderived
4384 238 0 0 4622 321 6534 349 4876 253
Nitrous oxide 388 47 964 84 1310 123 696 64 357 47
Harvest 45 4 205 35 58 9 32 6 13 5
ILUC 0 0 0 0 0 0 0 0 0 0
SOC storage -525 0 -379 0 -330 0 -525 0 -525 0
TOTAL 6491 394 1911 204 7986 768 13980 696 5588 365
Table 26. Fossil energy requirements for each process (MJ/kg rice)
HYV S.E.
Rainfed
S.E. SRITNS
S.E. HYVAP
S.E. Organic TNS
S.E.
Seed 0.02 0.00 0.02 0.00 0.00 0.00 0.00 0.00 0.01 0.00
Seedbedcreation
0.02 0.01 0.00 0.00 0.00 0.00 0.04 0.02 0.02 0.01
Bund 0.00 0.00 0.00 0.00 0.00 0.00 0.00 0.00 0.00 0.00
Cultivation 0.35 0.05 0.13 0.09 0.13 0.02 0.13 0.03 0.21 0.05
Transplanting
0.00 0.00 0.00 0.00 0.00 0.00 0.00 0.00 0.00 0.00
Weeding 0.00 0.00 0.00 0.00 0.00 0.00 0.00 0.00 0.00 0.00
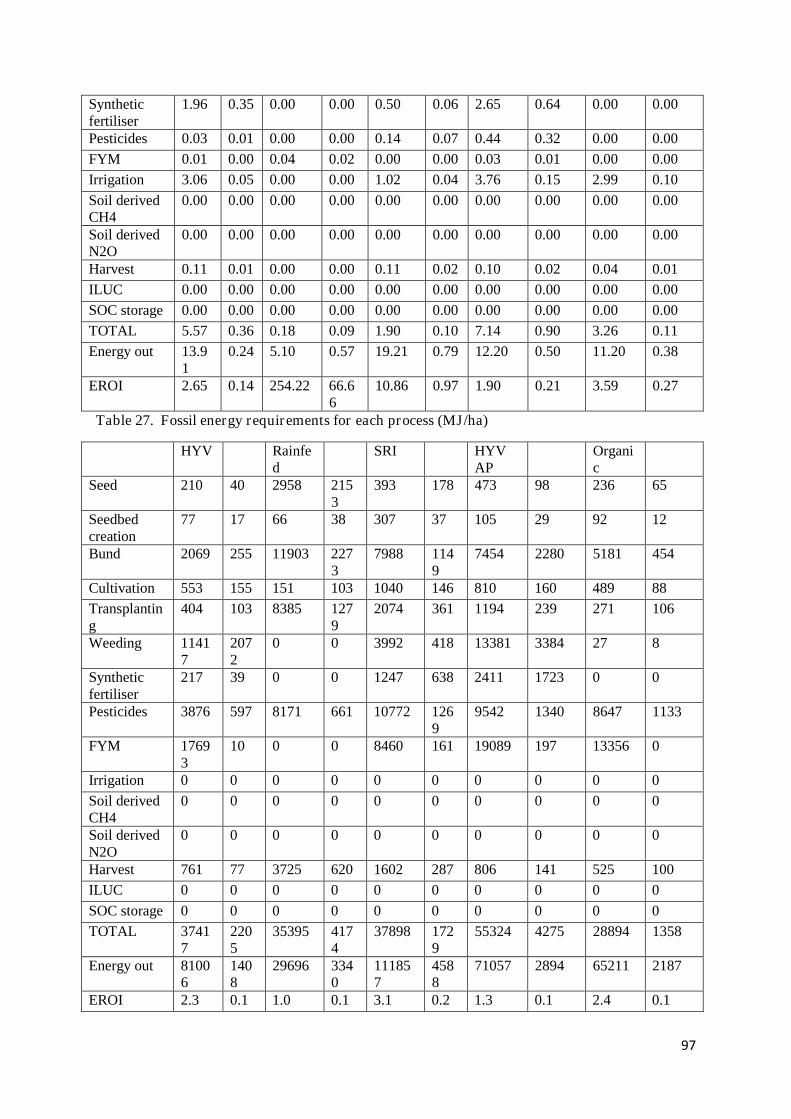
97
Syntheticfertiliser
1.96 0.35 0.00 0.00 0.50 0.06 2.65 0.64 0.00 0.00
Pesticides 0.03 0.01 0.00 0.00 0.14 0.07 0.44 0.32 0.00 0.00
FYM 0.01 0.00 0.04 0.02 0.00 0.00 0.03 0.01 0.00 0.00
Irrigation 3.06 0.05 0.00 0.00 1.02 0.04 3.76 0.15 2.99 0.10
Soil derivedCH4
0.00 0.00 0.00 0.00 0.00 0.00 0.00 0.00 0.00 0.00
Soil derivedN2O
0.00 0.00 0.00 0.00 0.00 0.00 0.00 0.00 0.00 0.00
Harvest 0.11 0.01 0.00 0.00 0.11 0.02 0.10 0.02 0.04 0.01
ILUC 0.00 0.00 0.00 0.00 0.00 0.00 0.00 0.00 0.00 0.00
SOC storage 0.00 0.00 0.00 0.00 0.00 0.00 0.00 0.00 0.00 0.00
TOTAL 5.57 0.36 0.18 0.09 1.90 0.10 7.14 0.90 3.26 0.11
Energy out 13.91
0.24 5.10 0.57 19.21 0.79 12.20 0.50 11.20 0.38
EROI 2.65 0.14 254.22 66.66
10.86 0.97 1.90 0.21 3.59 0.27
Table 27. Fossil energy requirements for each process (MJ/ha)
HYV Rainfed
SRI HYVAP
Organic
Seed 210 40 2958 2153
393 178 473 98 236 65
Seedbedcreation
77 17 66 38 307 37 105 29 92 12
Bund 2069 255 11903 2273
7988 1149
7454 2280 5181 454
Cultivation 553 155 151 103 1040 146 810 160 489 88
Transplanting
404 103 8385 1279
2074 361 1194 239 271 106
Weeding 11417
2072
0 0 3992 418 13381 3384 27 8
Syntheticfertiliser
217 39 0 0 1247 638 2411 1723 0 0
Pesticides 3876 597 8171 661 10772 1269
9542 1340 8647 1133
FYM 17693
10 0 0 8460 161 19089 197 13356 0
Irrigation 0 0 0 0 0 0 0 0 0 0
Soil derivedCH4
0 0 0 0 0 0 0 0 0 0
Soil derivedN2O
0 0 0 0 0 0 0 0 0 0
Harvest 761 77 3725 620 1602 287 806 141 525 100
ILUC 0 0 0 0 0 0 0 0 0 0
SOC storage 0 0 0 0 0 0 0 0 0 0
TOTAL 37417
2205
35395 4174
37898 1729
55324 4275 28894 1358
Energy out 81006
1408
29696 3340
111857
4588
71057 2894 65211 2187
EROI 2.3 0.1 1.0 0.1 3.1 0.2 1.3 0.1 2.4 0.1
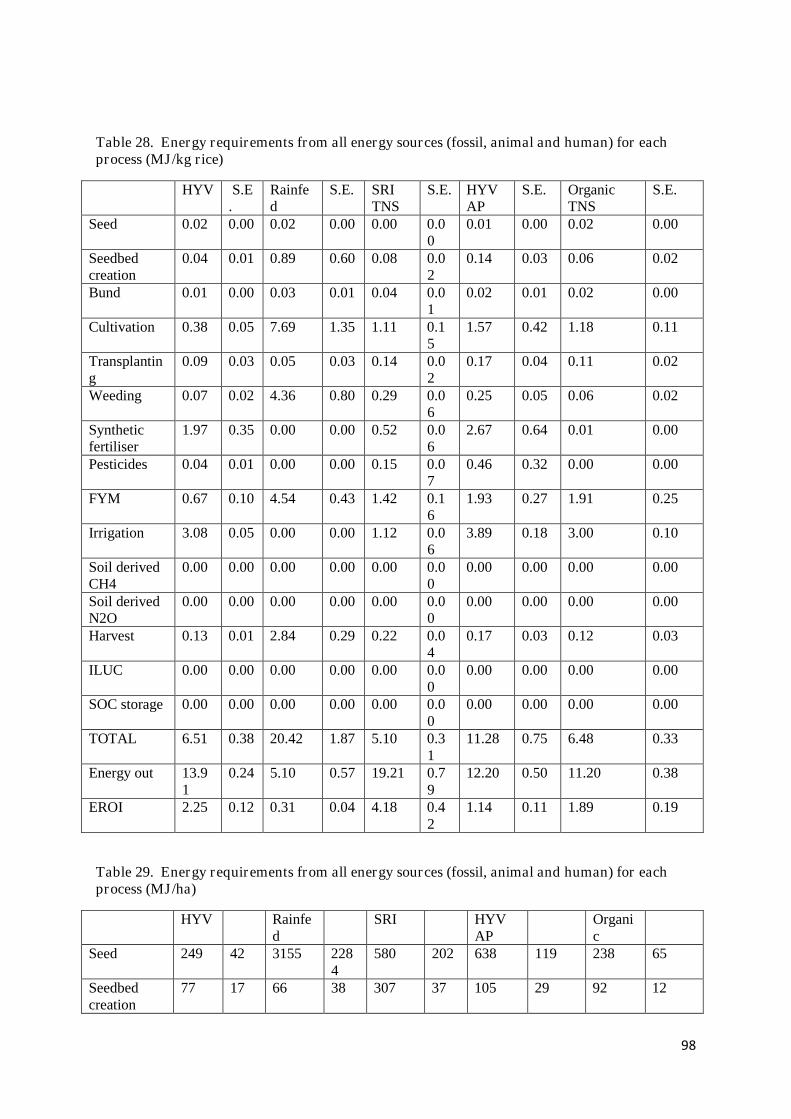
98
Table 28. Energy requirements from all energy sources (fossil, animal and human) for eachprocess (MJ/kg rice)
HYV S.E.
Rainfed
S.E. SRITNS
S.E. HYVAP
S.E. OrganicTNS
S.E.
Seed 0.02 0.00 0.02 0.00 0.00 0.00
0.01 0.00 0.02 0.00
Seedbedcreation
0.04 0.01 0.89 0.60 0.08 0.02
0.14 0.03 0.06 0.02
Bund 0.01 0.00 0.03 0.01 0.04 0.01
0.02 0.01 0.02 0.00
Cultivation 0.38 0.05 7.69 1.35 1.11 0.15
1.57 0.42 1.18 0.11
Transplanting
0.09 0.03 0.05 0.03 0.14 0.02
0.17 0.04 0.11 0.02
Weeding 0.07 0.02 4.36 0.80 0.29 0.06
0.25 0.05 0.06 0.02
Syntheticfertiliser
1.97 0.35 0.00 0.00 0.52 0.06
2.67 0.64 0.01 0.00
Pesticides 0.04 0.01 0.00 0.00 0.15 0.07
0.46 0.32 0.00 0.00
FYM 0.67 0.10 4.54 0.43 1.42 0.16
1.93 0.27 1.91 0.25
Irrigation 3.08 0.05 0.00 0.00 1.12 0.06
3.89 0.18 3.00 0.10
Soil derivedCH4
0.00 0.00 0.00 0.00 0.00 0.00
0.00 0.00 0.00 0.00
Soil derivedN2O
0.00 0.00 0.00 0.00 0.00 0.00
0.00 0.00 0.00 0.00
Harvest 0.13 0.01 2.84 0.29 0.22 0.04
0.17 0.03 0.12 0.03
ILUC 0.00 0.00 0.00 0.00 0.00 0.00
0.00 0.00 0.00 0.00
SOC storage 0.00 0.00 0.00 0.00 0.00 0.00
0.00 0.00 0.00 0.00
TOTAL 6.51 0.38 20.42 1.87 5.10 0.31
11.28 0.75 6.48 0.33
Energy out 13.91
0.24 5.10 0.57 19.21 0.79
12.20 0.50 11.20 0.38
EROI 2.25 0.12 0.31 0.04 4.18 0.42
1.14 0.11 1.89 0.19
Table 29. Energy requirements from all energy sources (fossil, animal and human) for eachprocess (MJ/ha)
HYV Rainfed
SRI HYVAP
Organic
Seed 249 42 3155 2284
580 202 638 119 238 65
Seedbedcreation
77 17 66 38 307 37 105 29 92 12
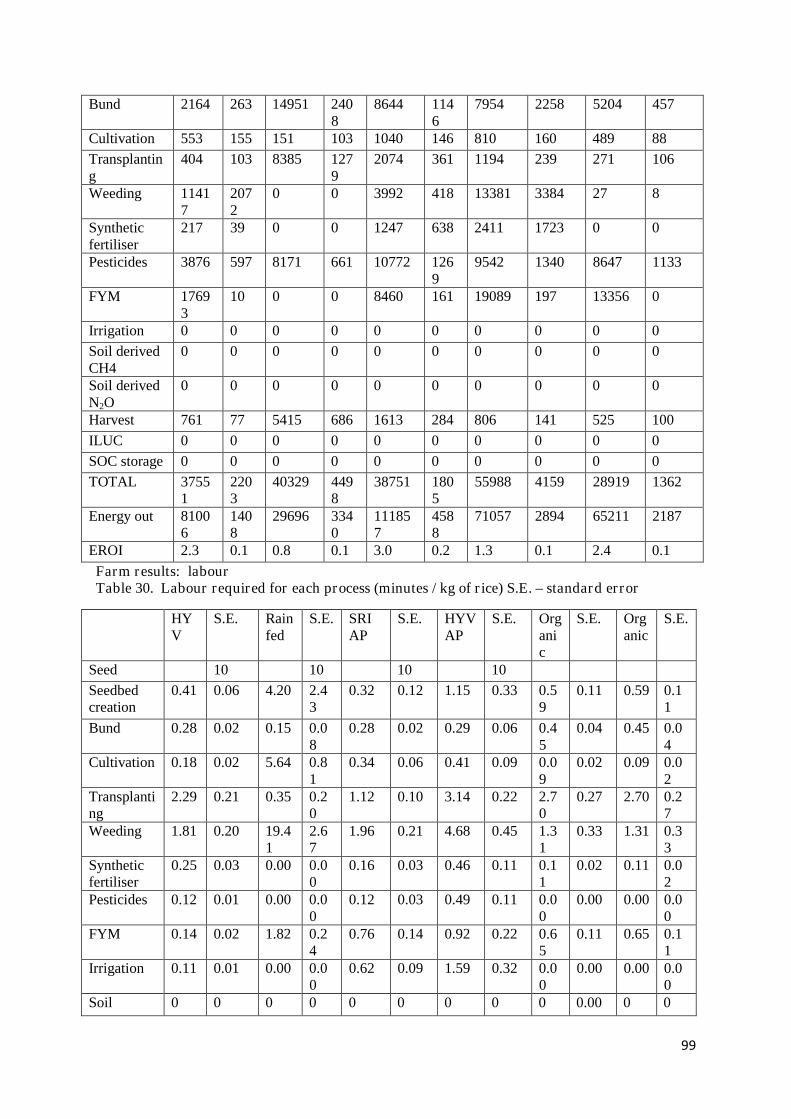
99
Bund 2164 263 14951 2408
8644 1146
7954 2258 5204 457
Cultivation 553 155 151 103 1040 146 810 160 489 88
Transplanting
404 103 8385 1279
2074 361 1194 239 271 106
Weeding 11417
2072
0 0 3992 418 13381 3384 27 8
Syntheticfertiliser
217 39 0 0 1247 638 2411 1723 0 0
Pesticides 3876 597 8171 661 10772 1269
9542 1340 8647 1133
FYM 17693
10 0 0 8460 161 19089 197 13356 0
Irrigation 0 0 0 0 0 0 0 0 0 0
Soil derivedCH4
0 0 0 0 0 0 0 0 0 0
Soil derivedN2O
0 0 0 0 0 0 0 0 0 0
Harvest 761 77 5415 686 1613 284 806 141 525 100
ILUC 0 0 0 0 0 0 0 0 0 0
SOC storage 0 0 0 0 0 0 0 0 0 0
TOTAL 37551
2203
40329 4498
38751 1805
55988 4159 28919 1362
Energy out 81006
1408
29696 3340
111857
4588
71057 2894 65211 2187
EROI 2.3 0.1 0.8 0.1 3.0 0.2 1.3 0.1 2.4 0.1
Farm results: labourTable 30. Labour required for each process (minutes / kg of rice) S.E. – standard error
HYV
S.E. Rainfed
S.E. SRIAP
S.E. HYVAP
S.E. Organic
S.E. Organic
S.E.
Seed 10 10 10 10
Seedbedcreation
0.41 0.06 4.20 2.43
0.32 0.12 1.15 0.33 0.59
0.11 0.59 0.11
Bund 0.28 0.02 0.15 0.08
0.28 0.02 0.29 0.06 0.45
0.04 0.45 0.04
Cultivation 0.18 0.02 5.64 0.81
0.34 0.06 0.41 0.09 0.09
0.02 0.09 0.02
Transplanting
2.29 0.21 0.35 0.20
1.12 0.10 3.14 0.22 2.70
0.27 2.70 0.27
Weeding 1.81 0.20 19.41
2.67
1.96 0.21 4.68 0.45 1.31
0.33 1.31 0.33
Syntheticfertiliser
0.25 0.03 0.00 0.00
0.16 0.03 0.46 0.11 0.11
0.02 0.11 0.02
Pesticides 0.12 0.01 0.00 0.00
0.12 0.03 0.49 0.11 0.00
0.00 0.00 0.00
FYM 0.14 0.02 1.82 0.24
0.76 0.14 0.92 0.22 0.65
0.11 0.65 0.11
Irrigation 0.11 0.01 0.00 0.00
0.62 0.09 1.59 0.32 0.00
0.00 0.00 0.00
Soil 0 0 0 0 0 0 0 0 0 0.00 0 0
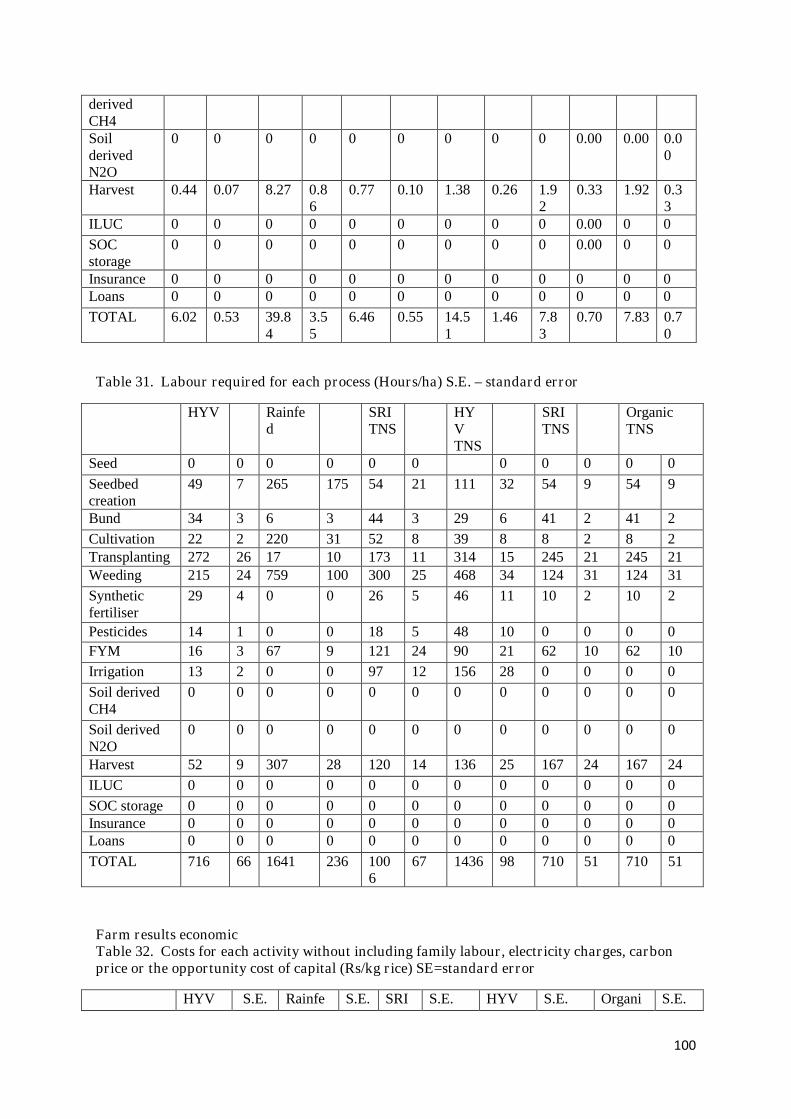
100
derivedCH4SoilderivedN2O
0 0 0 0 0 0 0 0 0 0.00 0.00 0.00
Harvest 0.44 0.07 8.27 0.86
0.77 0.10 1.38 0.26 1.92
0.33 1.92 0.33
ILUC 0 0 0 0 0 0 0 0 0 0.00 0 0
SOCstorage
0 0 0 0 0 0 0 0 0 0.00 0 0
Insurance 0 0 0 0 0 0 0 0 0 0 0 0Loans 0 0 0 0 0 0 0 0 0 0 0 0
TOTAL 6.02 0.53 39.84
3.55
6.46 0.55 14.51
1.46 7.83
0.70 7.83 0.70
Table 31. Labour required for each process (Hours/ha) S.E. – standard error
HYV Rainfed
SRITNS
HYVTNS
SRITNS
OrganicTNS
Seed 0 0 0 0 0 0 0 0 0 0 0
Seedbedcreation
49 7 265 175 54 21 111 32 54 9 54 9
Bund 34 3 6 3 44 3 29 6 41 2 41 2
Cultivation 22 2 220 31 52 8 39 8 8 2 8 2Transplanting 272 26 17 10 173 11 314 15 245 21 245 21Weeding 215 24 759 100 300 25 468 34 124 31 124 31
Syntheticfertiliser
29 4 0 0 26 5 46 11 10 2 10 2
Pesticides 14 1 0 0 18 5 48 10 0 0 0 0
FYM 16 3 67 9 121 24 90 21 62 10 62 10
Irrigation 13 2 0 0 97 12 156 28 0 0 0 0
Soil derivedCH4
0 0 0 0 0 0 0 0 0 0 0 0
Soil derivedN2O
0 0 0 0 0 0 0 0 0 0 0 0
Harvest 52 9 307 28 120 14 136 25 167 24 167 24
ILUC 0 0 0 0 0 0 0 0 0 0 0 0
SOC storage 0 0 0 0 0 0 0 0 0 0 0 0Insurance 0 0 0 0 0 0 0 0 0 0 0 0Loans 0 0 0 0 0 0 0 0 0 0 0 0
TOTAL 716 66 1641 236 1006
67 1436 98 710 51 710 51
Farm results economicTable 32. Costs for each activity without including family labour, electricity charges, carbonprice or the opportunity cost of capital (Rs/kg rice) SE=standard error
HYV S.E. Rainfe S.E. SRI S.E. HYV S.E. Organi S.E.
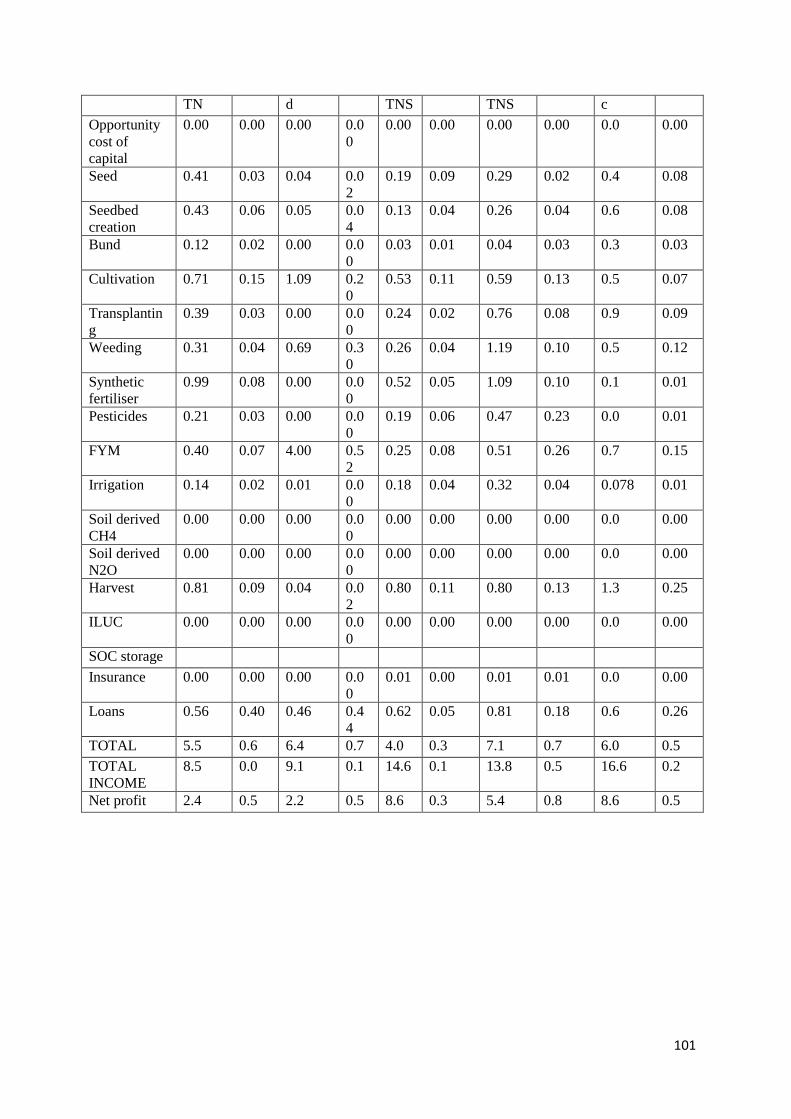
101
TN d TNS TNS c
Opportunitycost ofcapital
0.00 0.00 0.00 0.00
0.00 0.00 0.00 0.00 0.0 0.00
Seed 0.41 0.03 0.04 0.02
0.19 0.09 0.29 0.02 0.4 0.08
Seedbedcreation
0.43 0.06 0.05 0.04
0.13 0.04 0.26 0.04 0.6 0.08
Bund 0.12 0.02 0.00 0.00
0.03 0.01 0.04 0.03 0.3 0.03
Cultivation 0.71 0.15 1.09 0.20
0.53 0.11 0.59 0.13 0.5 0.07
Transplanting
0.39 0.03 0.00 0.00
0.24 0.02 0.76 0.08 0.9 0.09
Weeding 0.31 0.04 0.69 0.30
0.26 0.04 1.19 0.10 0.5 0.12
Syntheticfertiliser
0.99 0.08 0.00 0.00
0.52 0.05 1.09 0.10 0.1 0.01
Pesticides 0.21 0.03 0.00 0.00
0.19 0.06 0.47 0.23 0.0 0.01
FYM 0.40 0.07 4.00 0.52
0.25 0.08 0.51 0.26 0.7 0.15
Irrigation 0.14 0.02 0.01 0.00
0.18 0.04 0.32 0.04 0.078 0.01
Soil derivedCH4
0.00 0.00 0.00 0.00
0.00 0.00 0.00 0.00 0.0 0.00
Soil derivedN2O
0.00 0.00 0.00 0.00
0.00 0.00 0.00 0.00 0.0 0.00
Harvest 0.81 0.09 0.04 0.02
0.80 0.11 0.80 0.13 1.3 0.25
ILUC 0.00 0.00 0.00 0.00
0.00 0.00 0.00 0.00 0.0 0.00
SOC storage
Insurance 0.00 0.00 0.00 0.00
0.01 0.00 0.01 0.01 0.0 0.00
Loans 0.56 0.40 0.46 0.44
0.62 0.05 0.81 0.18 0.6 0.26
TOTAL 5.5 0.6 6.4 0.7 4.0 0.3 7.1 0.7 6.0 0.5
TOTALINCOME
8.5 0.0 9.1 0.1 14.6 0.1 13.8 0.5 16.6 0.2
Net profit 2.4 0.5 2.2 0.5 8.6 0.3 5.4 0.8 8.6 0.5
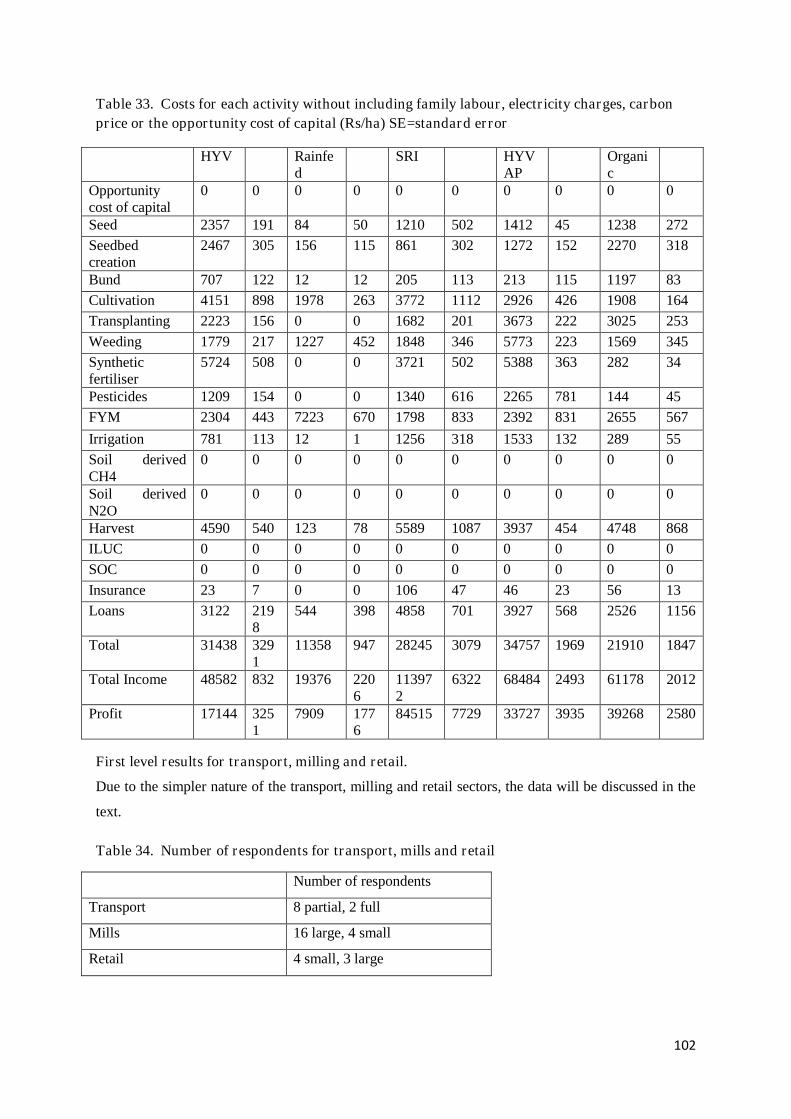
102
Table 33. Costs for each activity without including family labour, electricity charges, carbon
price or the opportunity cost of capital (Rs/ha) SE=standard error
HYV Rainfed
SRI HYVAP
Organic
Opportunitycost of capital
0 0 0 0 0 0 0 0 0 0
Seed 2357 191 84 50 1210 502 1412 45 1238 272
Seedbedcreation
2467 305 156 115 861 302 1272 152 2270 318
Bund 707 122 12 12 205 113 213 115 1197 83
Cultivation 4151 898 1978 263 3772 1112 2926 426 1908 164
Transplanting 2223 156 0 0 1682 201 3673 222 3025 253
Weeding 1779 217 1227 452 1848 346 5773 223 1569 345
Syntheticfertiliser
5724 508 0 0 3721 502 5388 363 282 34
Pesticides 1209 154 0 0 1340 616 2265 781 144 45
FYM 2304 443 7223 670 1798 833 2392 831 2655 567
Irrigation 781 113 12 1 1256 318 1533 132 289 55
Soil derivedCH4
0 0 0 0 0 0 0 0 0 0
Soil derivedN2O
0 0 0 0 0 0 0 0 0 0
Harvest 4590 540 123 78 5589 1087 3937 454 4748 868
ILUC 0 0 0 0 0 0 0 0 0 0
SOC 0 0 0 0 0 0 0 0 0 0
Insurance 23 7 0 0 106 47 46 23 56 13
Loans 3122 2198
544 398 4858 701 3927 568 2526 1156
Total 31438 3291
11358 947 28245 3079 34757 1969 21910 1847
Total Income 48582 832 19376 2206
113972
6322 68484 2493 61178 2012
Profit 17144 3251
7909 1776
84515 7729 33727 3935 39268 2580
First level results for transport, milling and retail.
Due to the simpler nature of the transport, milling and retail sectors, the data will be discussed in the
text.
Table 34. Number of respondents for transport, mills and retail
Number of respondents
Transport 8 partial, 2 full
Mills 16 large, 4 small
Retail 4 small, 3 large
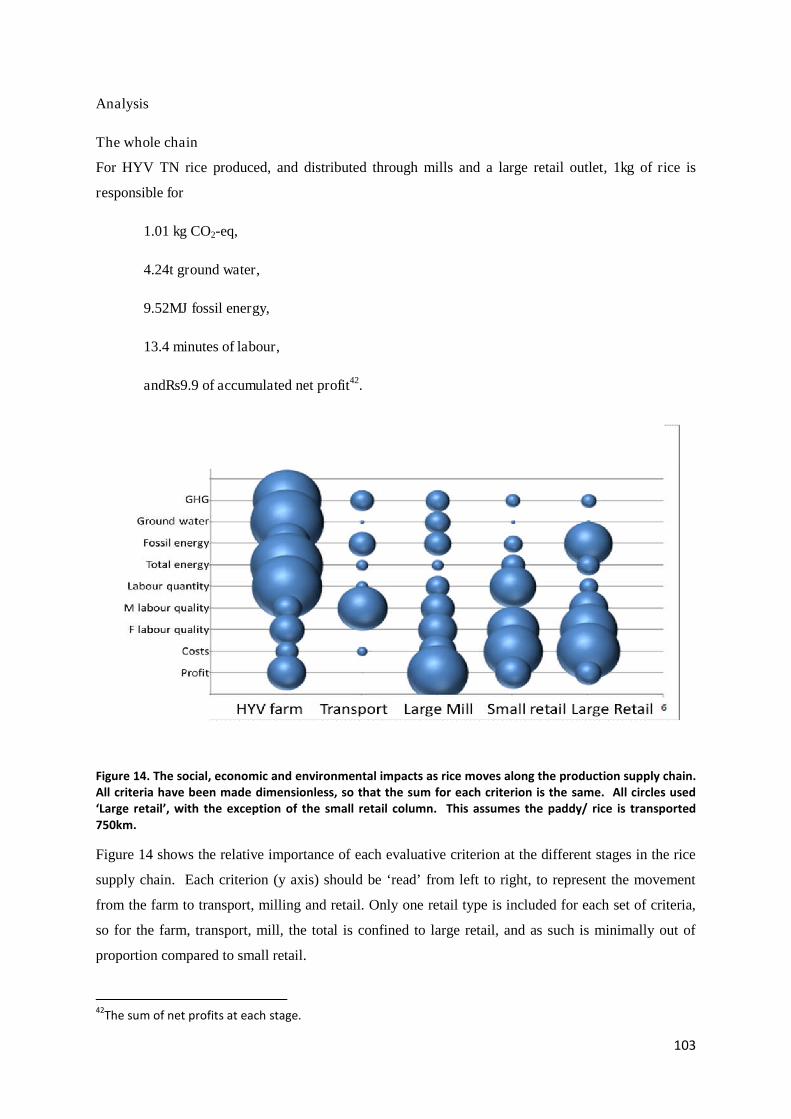
103
Analysis
The whole chain
For HYV TN rice produced, and distributed through mills and a large retail outlet, 1kg of rice is
responsible for
1.01 kg CO2-eq,
4.24t ground water,
9.52MJ fossil energy,
13.4 minutes of labour,
andRs9.9 of accumulated net profit42.
Figure 14. The social, economic and environmental impacts as rice moves along the production supply chain.All criteria have been made dimensionless, so that the sum for each criterion is the same. All circles used‘Large retail’, with the exception of the small retail column. This assumes the paddy/ rice is transported750km.
Figure 14 shows the relative importance of each evaluative criterion at the different stages in the rice
supply chain. Each criterion (y axis) should be ‘read’ from left to right, to represent the movement
from the farm to transport, milling and retail. Only one retail type is included for each set of criteria,
so for the farm, transport, mill, the total is confined to large retail, and as such is minimally out of
proportion compared to small retail.
42The sum of net profits at each stage.
104
From the environmental indicators, production rather than post-harvest processing and distribution
dominates the supply chain with the exception of total energy. production is responsible for 78%,
90%, 57% and 32% of GHG emissions, water use, fossil and total energy use respectively. The
difference between the proportion of GHG emissions and fossil energy is indicative of agricultural
based systems where substantial GHG emissions are not connected to energy use. In this case it
represents soil based methane and nitrous oxide emissions.Production also dominates the deployment
of labour(responsible for 56% of total labour requirements). Labour quality (pay) is highest for males
in transport (drivers) and for females in retail, while profits / rates of return are highest from the mill
sector. Costs, as shown in Figure 14, are highest at later stages of the supply chain as expected, as the
purchase price of rice/paddy embodies all the costs (and profit) of previous stages in the chain.
Why does agriculture dominate the environmental indicators?
One factor is agriculture’s large footprint. Farming has the largest physical footprint of any of the
stages in the supply chain, by several orders of magnitude. It takes between 1.3 and 5 m-2 of field
space to produce 1kg of paddy, while the most land- efficient modern rice mills can process over
400kg paddy from a single square meter of mill land over a single season, or three times that over a
year (0.002 m-2 or 0.0008 m-2 to process each kg of paddy per season year respectively). The most
‘area efficient’ unit of production is retail, where the smallest shop examined in our research delivered
15,500kg of rice for every square metre. (This result uses uses an economic allocation of floor space.
Simply dividing the quantity of rice sold by the entire shop area, although still a large throughput per
sqmetre, drops to 3,100kg rice m2)43. But while direct footprints can correlate well with obligate land-
based environmental impacts such as biodiversity (Foley et al., 2011), they are not always efficient
indicators of the metrics we are concerned with: GHG emissions, energy use, water or labour use.
For example a single large power station can release substantially more CO2 than an area of
agricultural land many thousands of times larger.
Agriculture.
EnvironmentIt is widely accepted that sustainable development must build from environmental sustainability, as
environmental sustainability dictates the limits to total sustainability. This logic, together with Figure
14, suggest that rain-fed rice and SRI rice should be promoted, because compared to either HYV TN
or organic rice they produce equal GHG emissions, and use substantially less ground water or fossil
energy per kilogram (p<0.001 for both measures). Of these two systems, rain-fed rice delivers
substantially lower yields, 26% of SRI and 36% of HYV TN. Yields are important for two reasons:
43We have not included transport or traders here, due to lack of appropriate data to calculate their footprint
105
first, if translated into Indirect Land Use Change44 (ILUC), low yields dramatically increase GHG
emissions (Gathorne-Hardy, 2013b), and second, because food production must continue to increase
both within India and worldwide (Foresight, 2011; Singh, 2013). Yet the disadvantages of low yield
are only relevant if irrigated production were to be shifted to rain-fed, as otherwise an irrigated
counterfactual is inappropriate. Unirrigated rain-fed rice technology, however, is in a separate
environmental category, and it would be impossible to change production methods from irrigated to
rain-fed. Hence where appropriate rain-fed rice production willbe treated as a separate category of rice
production.
Yet while the use of environmental sustainability as an absolute goal makes sense on paper, in reality
it could only work with a centrally-planned state with powers of discipline and enforcement, while
actions on the ground are more commonly determined by self-motivated behaviour - and for farming,
the key actor is likely to be the farmer/farm family.
Social and economic patterns of different production methods.Comparing social and economic factors associated with the different farming systems is difficult due
to the structures of socio-economic differences associated with the different regions from which the
data was collected. For example in HYV TN, weeding was solely a female activity, while 33% of
weeding hours for HYV in AP were done by men. And while we could control for some aspects of the
environmental differences (such is irrigation and energy) this is not possible for socio-economic
relations and institutions.
44The unintended consequences of globalland use change driven by changes in output or demand from the
site of interest. A full definition and description is given in Gathorne-Hardy, A., (2013a) Greenhouse gasemissions from rice, Working paper,,http://www.southasia.ox.ac.uk/sites/sias/files/documents/GHG%20emissions%20from%20rice%20-%20%20working%20paper.pdf.
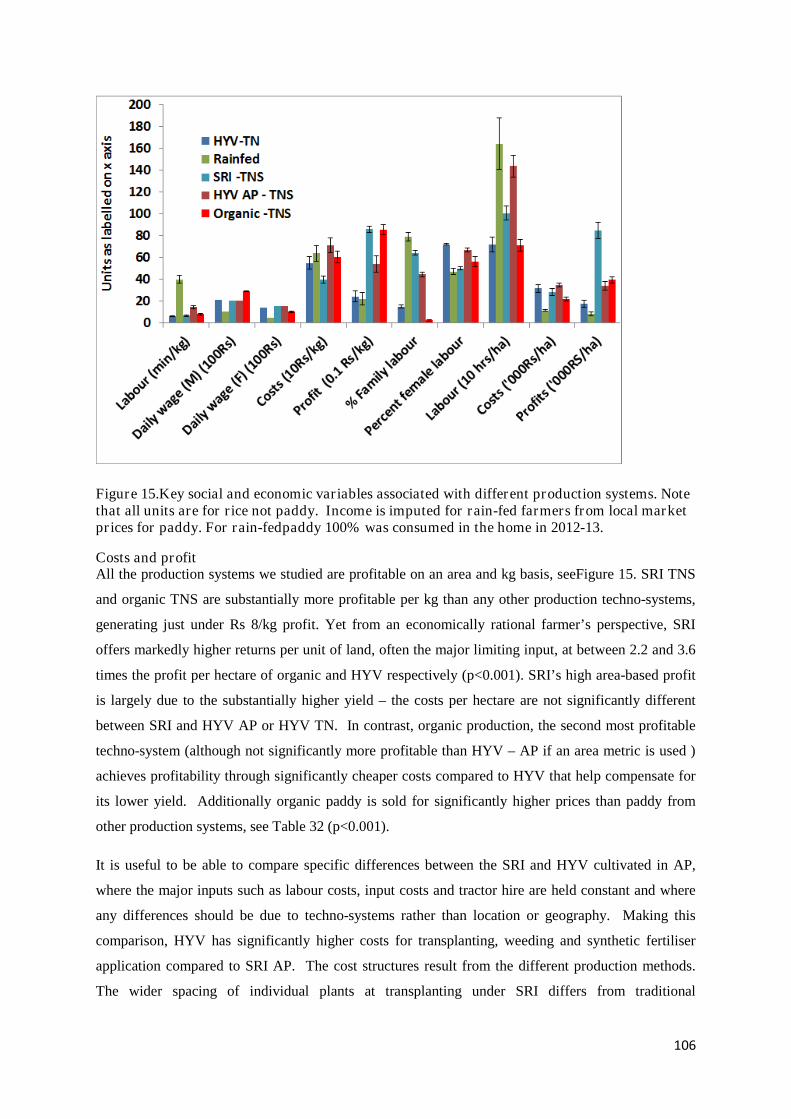
106
Figure 15.Key social and economic variables associated with different production systems. Notethat all units are for rice not paddy. Income is imputed for rain-fed farmers from local marketprices for paddy. For rain-fedpaddy 100% was consumed in the home in 2012-13.
Costs and profitAll the production systems we studied are profitable on an area and kg basis, seeFigure 15. SRI TNS
and organic TNS are substantially more profitable per kg than any other production techno-systems,
generating just under Rs 8/kg profit. Yet from an economically rational farmer’s perspective, SRI
offers markedly higher returns per unit of land, often the major limiting input, at between 2.2 and 3.6
times the profit per hectare of organic and HYV respectively (p<0.001). SRI’s high area-based profit
is largely due to the substantially higher yield – the costs per hectare are not significantly different
between SRI and HYV AP or HYV TN. In contrast, organic production, the second most profitable
techno-system (although not significantly more profitable than HYV – AP if an area metric is used )
achieves profitability through significantly cheaper costs compared to HYV that help compensate for
its lower yield. Additionally organic paddy is sold for significantly higher prices than paddy from
other production systems, see Table 32 (p<0.001).
It is useful to be able to compare specific differences between the SRI and HYV cultivated in AP,
where the major inputs such as labour costs, input costs and tractor hire are held constant and where
any differences should be due to techno-systems rather than location or geography. Making this
comparison, HYV has significantly higher costs for transplanting, weeding and synthetic fertiliser
application compared to SRI AP. The cost structures result from the different production methods.
The wider spacing of individual plants at transplanting under SRI differs from traditional
107
transplanting methods, and the rows it produces will slow canopy closure and thus encourage weeds,
but also allow quicker weeding using a mechanical weeder. SRI AP fields are weeded significantly
more often than HYV AP (mean 3.1 vs 2.1 times, p<0.001), yet the length of time taken is
significantly less (p<0.001) due to the use of weeders. The increased number of weedings is likely to
be due to the more aerobic nature of the soils allowing a greater number of weeds to grow in addition
to slower canopy closure. The economic flexibility brought about by the greater speed substantially
reduces the costs (2154Rs ha-1 for SRI compared to 6924 Rs ha-1 for SRI control).In much SRI
literature, SRI is reported to require 17-30% more labour forweeding (Latif et al (2005) providing a
range of references for Madagascan SRI research). In contrast, more recent work - also in Andhra
Pradesh - found savings associated with both transplanting and weeding (Adusumilli and Bhagya
Laxmi, 2011). Perhaps the improved learning that Uphoffdiscusses for SRI technologies is leading to
increased efficiency in Indian SRI (Uphoff, 2008).
A second difference between HYV AP and SRI AP is in labour use for irrigation, which is likely to be
linked to the reduced irrigation. A third difference - the increased use of labour for HYV AP
transplanting - is more surprising, as the ‘fiddliness’ of transplanting single, young rice seedlings is
often quoted as a deterrent factor for SRI.
Another useful comparison is between HYV in AP and HYV in TN. There are few important
differences, but the areas of cost that do vary significantly include irrigation. We obtained data for
purchase costs and repair bills, and, on local advice, it was assumed that all would last for 10 years.
All annual costs were split by the gross annual area of irrigated land. Irrigation costs are significantly
higher in AP compared to TN, probably due to the greater workload in AP due to the deeper water
table, requiring bigger pumps with more frequent repairs. The labour time for irrigation was
substantially higher for HYV AP, compared to HYV TN, even though there was no difference in total
water supply. A range of different, and not mutually exclusive, explanations occur for this: increased
physical effort required to get the same volume of water – as above, different pump types (where
more sophisticated TN pumps may be turned on from a mobile phone signal, or automatically turned
on/off with the available current. Finally the differences could be due to variations in how the farmers
allocated time – some may have allocated time to irrigation work during which the pump was working
but farmers/workers were not directly handling the pumps for example.
Weeding cost significantly more in AP compared to TN, due to a mixture of higher wages (mean
female wage for weeding in TN was Rs 46.5 day-1, compared to Rs 120 day-1 in AP, p<0.001,
although AP days were 6.2hrs compared to 4.6 in TN, p<0.001) with substantially longer hours of
weeding. Interestingly there was no significantly difference in synthetic fertiliser costs, even though
AP HYV farmers used substantially more than TN HYV. This was due to the significantly higher
fertiliser prices in TN (with the exception of urea (7, 66 and 66% higher costs for DAP, complex and
108
potash respectively)), allowing AP farmers to spend the same, while applying 1.9, 2, 1.5 and 3.4 times
more urea, DAP, complex and phosphate respectively. Why did the AP farmers apply so much more
fertiliser? Does price have an influence, or is it a function of poorer soils, or of more active
advertising and marketing? Either way, it has resulted in a Nitrogen Use Efficiency45 (NUE) of less
than half that of TN (p<0.001), representing a waste of money, a source of water pollution and
substantial additional GHG burden.
Overall, this range of differences for individual farm-level production practices means that it is not
possible to use HYV in AP as a comparison with HYV in TN, even though there is no significant
difference in total costs/ha.
The reduced synthetic fertiliser costs in AP are also attributable to SRI, as SRI specifically promotes
FYM, and encourages reduced synthetic fertiliser use. While there is a reduction in synthetic fertiliser
use in SRI, for example 69% of HYV AP synthetic nitrogen, there is no significant increase in FYM
compared to HYV production in AP (18.7t ha-1 compared to 17 t ha-1 for SRI and HYV respectively,
p>0.05) and no significant difference in the total application of N (p>0.05). Yet importantly the NUE
is significantly higher for SRI (p<0.01). This is because approximately the same quantity of overall N
produced a substantially increased yield. All other costs (bund repair, cultivation etc) are, as expected,
not significantly different between the two AP production systems.
Rainfed Rice
Consistent with its ecology, rain-fed rice production is the odd-one-out in its structure of costs and
returns. Rain-fed production makes a minimal profit. While costs per hectare are significantly lower
than all other production systems (p<0.01), these costs are spread across such a low yield that the final
(estimated) profit is only 1.1Rs/kg of rice, significantly lower than the other techno-systems (p<0.01).
The structure of rain-fed costs is also markedly different to other systems. It is dominated by farm-
yard manure (FYM), costing Rs 4.0 for every kg of rice - 63% of the total costs. This is the highest of
all input costs for all production systems (over 3 times the next greatest single input cost (Rs 1.2/kg
for weeding in HYV TNS)), and significantly higher than any other systems spend on FYM - organic
is the next highest, at Rs 0.8/kg or 16% of total costs. Most of rain-fed FYM costs are for vehicle
(tractor) hire and the manure itself, only 5% of these costs are associated with labour.
Why rain-fed famers would choose to invest money in manure initially seems bizarre, but it is not
necessarily an economically unsound action. After water stress, nutrients tend to be the most limiting
factor in rain-fed rice (Haefele et al., 2008), so investing in manure in a situation where synthetic
45The percentage of nitrogen taken up by the plant compared to the total N applied from synthetic and
organic sources
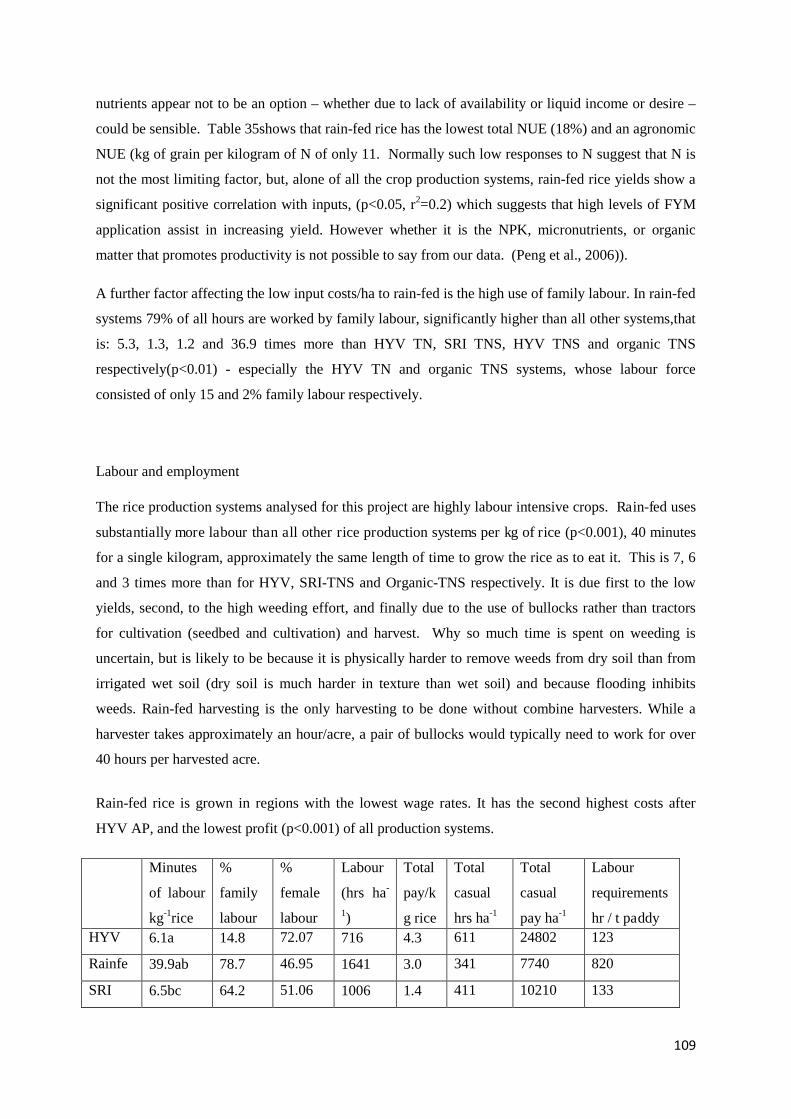
109
nutrients appear not to be an option – whether due to lack of availability or liquid income or desire –
could be sensible. Table 35shows that rain-fed rice has the lowest total NUE (18%) and an agronomic
NUE (kg of grain per kilogram of N of only 11. Normally such low responses to N suggest that N is
not the most limiting factor, but, alone of all the crop production systems, rain-fed rice yields show a
significant positive correlation with inputs, (p<0.05, r2=0.2) which suggests that high levels of FYM
application assist in increasing yield. However whether it is the NPK, micronutrients, or organic
matter that promotes productivity is not possible to say from our data. (Peng et al., 2006)).
A further factor affecting the low input costs/ha to rain-fed is the high use of family labour. In rain-fed
systems 79% of all hours are worked by family labour, significantly higher than all other systems,that
is: 5.3, 1.3, 1.2 and 36.9 times more than HYV TN, SRI TNS, HYV TNS and organic TNS
respectively(p<0.01) - especially the HYV TN and organic TNS systems, whose labour force
consisted of only 15 and 2% family labour respectively.
Labour and employment
The rice production systems analysed for this project are highly labour intensive crops. Rain-fed uses
substantially more labour than all other rice production systems per kg of rice (p<0.001), 40 minutes
for a single kilogram, approximately the same length of time to grow the rice as to eat it. This is 7, 6
and 3 times more than for HYV, SRI-TNS and Organic-TNS respectively. It is due first to the low
yields, second, to the high weeding effort, and finally due to the use of bullocks rather than tractors
for cultivation (seedbed and cultivation) and harvest. Why so much time is spent on weeding is
uncertain, but is likely to be because it is physically harder to remove weeds from dry soil than from
irrigated wet soil (dry soil is much harder in texture than wet soil) and because flooding inhibits
weeds. Rain-fed harvesting is the only harvesting to be done without combine harvesters. While a
harvester takes approximately an hour/acre, a pair of bullocks would typically need to work for over
40 hours per harvested acre.
Rain-fed rice is grown in regions with the lowest wage rates. It has the second highest costs after
HYV AP, and the lowest profit (p<0.001) of all production systems.
Minutes
of labour
kg-1rice
%
family
labour
%
female
labour
Labour
(hrs ha-
1)
Total
pay/k
g rice
Total
casual
hrs ha-1
Total
casual
pay ha-1
Labour
requirements
hr / t paddy
HYV
TN
6.1a 14.8 72.07 716 4.3 611 24802 123
Rainfe
d
39.9ab 78.7 46.95 1641 3.0 341 7740 820
SRI
TNS
6.5bc 64.2 51.06 1006 1.4 411 10210 133
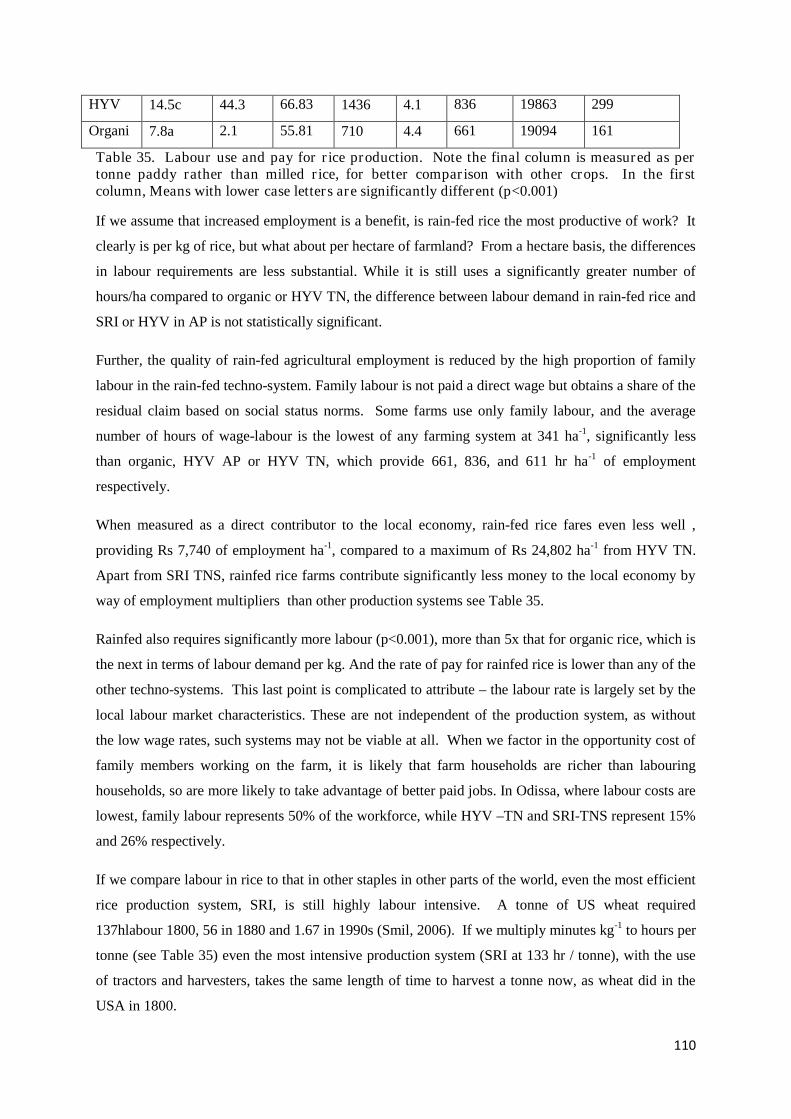
110
HYV
AP
14.5c 44.3 66.83 1436 4.1 836 19863 299
Organi
c
7.8a 2.1 55.81 710 4.4 661 19094 161
Table 35. Labour use and pay for rice production. Note the final column is measured as pertonne paddy rather than milled rice, for better comparison with other crops. In the firstcolumn, Means with lower case letters are significantly different (p<0.001)
If we assume that increased employment is a benefit, is rain-fed rice the most productive of work? It
clearly is per kg of rice, but what about per hectare of farmland? From a hectare basis, the differences
in labour requirements are less substantial. While it is still uses a significantly greater number of
hours/ha compared to organic or HYV TN, the difference between labour demand in rain-fed rice and
SRI or HYV in AP is not statistically significant.
Further, the quality of rain-fed agricultural employment is reduced by the high proportion of family
labour in the rain-fed techno-system. Family labour is not paid a direct wage but obtains a share of the
residual claim based on social status norms. Some farms use only family labour, and the average
number of hours of wage-labour is the lowest of any farming system at 341 ha-1, significantly less
than organic, HYV AP or HYV TN, which provide 661, 836, and 611 hr ha-1 of employment
respectively.
When measured as a direct contributor to the local economy, rain-fed rice fares even less well ,
providing Rs 7,740 of employment ha-1, compared to a maximum of Rs 24,802 ha-1 from HYV TN.
Apart from SRI TNS, rainfed rice farms contribute significantly less money to the local economy by
way of employment multipliers than other production systems see Table 35.
Rainfed also requires significantly more labour (p<0.001), more than 5x that for organic rice, which is
the next in terms of labour demand per kg. And the rate of pay for rainfed rice is lower than any of the
other techno-systems. This last point is complicated to attribute – the labour rate is largely set by the
local labour market characteristics. These are not independent of the production system, as without
the low wage rates, such systems may not be viable at all. When we factor in the opportunity cost of
family members working on the farm, it is likely that farm households are richer than labouring
households, so are more likely to take advantage of better paid jobs. In Odissa, where labour costs are
lowest, family labour represents 50% of the workforce, while HYV –TN and SRI-TNS represent 15%
and 26% respectively.
If we compare labour in rice to that in other staples in other parts of the world, even the most efficient
rice production system, SRI, is still highly labour intensive. A tonne of US wheat required
137hlabour 1800, 56 in 1880 and 1.67 in 1990s (Smil, 2006). If we multiply minutes kg-1 to hours per
tonne (see Table 35) even the most intensive production system (SRI at 133 hr / tonne), with the use
of tractors and harvesters, takes the same length of time to harvest a tonne now, as wheat did in the
USA in 1800.
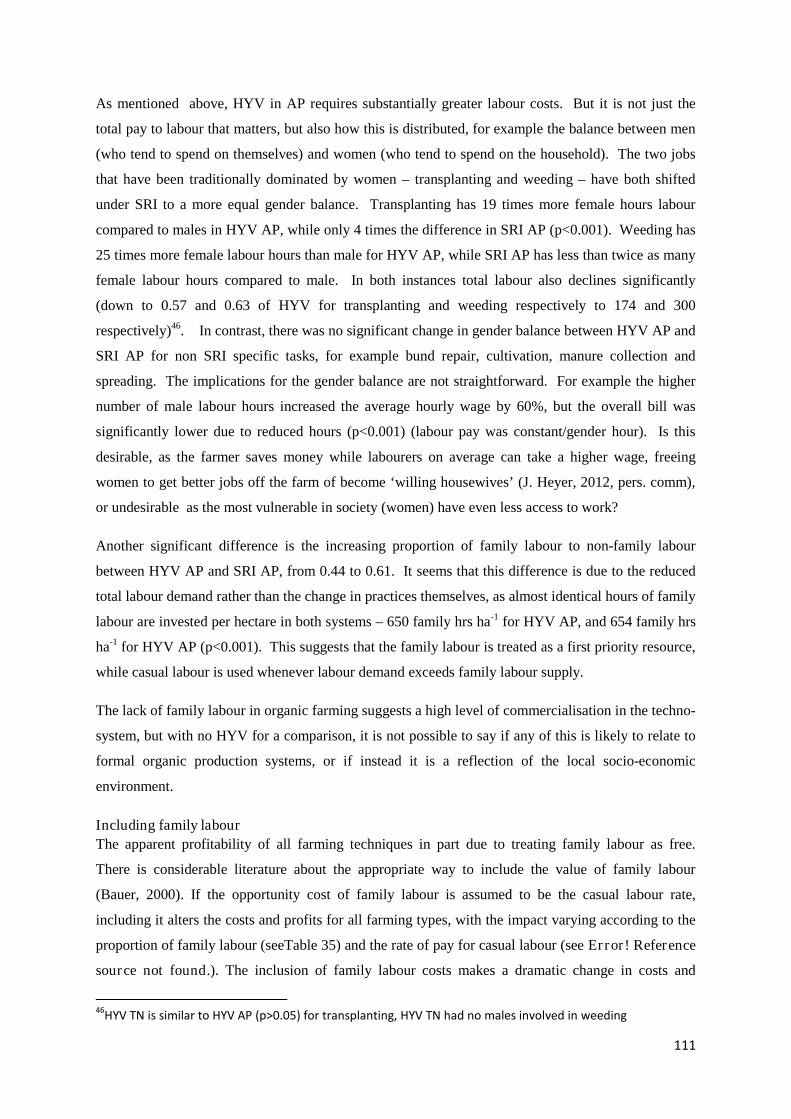
111
As mentioned above, HYV in AP requires substantially greater labour costs. But it is not just the
total pay to labour that matters, but also how this is distributed, for example the balance between men
(who tend to spend on themselves) and women (who tend to spend on the household). The two jobs
that have been traditionally dominated by women – transplanting and weeding – have both shifted
under SRI to a more equal gender balance. Transplanting has 19 times more female hours labour
compared to males in HYV AP, while only 4 times the difference in SRI AP (p<0.001). Weeding has
25 times more female labour hours than male for HYV AP, while SRI AP has less than twice as many
female labour hours compared to male. In both instances total labour also declines significantly
(down to 0.57 and 0.63 of HYV for transplanting and weeding respectively to 174 and 300
respectively)46. In contrast, there was no significant change in gender balance between HYV AP and
SRI AP for non SRI specific tasks, for example bund repair, cultivation, manure collection and
spreading. The implications for the gender balance are not straightforward. For example the higher
number of male labour hours increased the average hourly wage by 60%, but the overall bill was
significantly lower due to reduced hours (p<0.001) (labour pay was constant/gender hour). Is this
desirable, as the farmer saves money while labourers on average can take a higher wage, freeing
women to get better jobs off the farm of become ‘willing housewives’ (J. Heyer, 2012, pers. comm),
or undesirable as the most vulnerable in society (women) have even less access to work?
Another significant difference is the increasing proportion of family labour to non-family labour
between HYV AP and SRI AP, from 0.44 to 0.61. It seems that this difference is due to the reduced
total labour demand rather than the change in practices themselves, as almost identical hours of family
labour are invested per hectare in both systems – 650 family hrs ha-1 for HYV AP, and 654 family hrs
ha-1 for HYV AP (p<0.001). This suggests that the family labour is treated as a first priority resource,
while casual labour is used whenever labour demand exceeds family labour supply.
The lack of family labour in organic farming suggests a high level of commercialisation in the techno-
system, but with no HYV for a comparison, it is not possible to say if any of this is likely to relate to
formal organic production systems, or if instead it is a reflection of the local socio-economic
environment.
Including family labour
The apparent profitability of all farming techniques in part due to treating family labour as free.
There is considerable literature about the appropriate way to include the value of family labour
(Bauer, 2000). If the opportunity cost of family labour is assumed to be the casual labour rate,
including it alters the costs and profits for all farming types, with the impact varying according to the
proportion of family labour (seeTable 35) and the rate of pay for casual labour (see Error! Reference
source not found.). The inclusion of family labour costs makes a dramatic change in costs and
46HYV TN is similar to HYV AP (p>0.05) for transplanting, HYV TN had no males involved in weeding
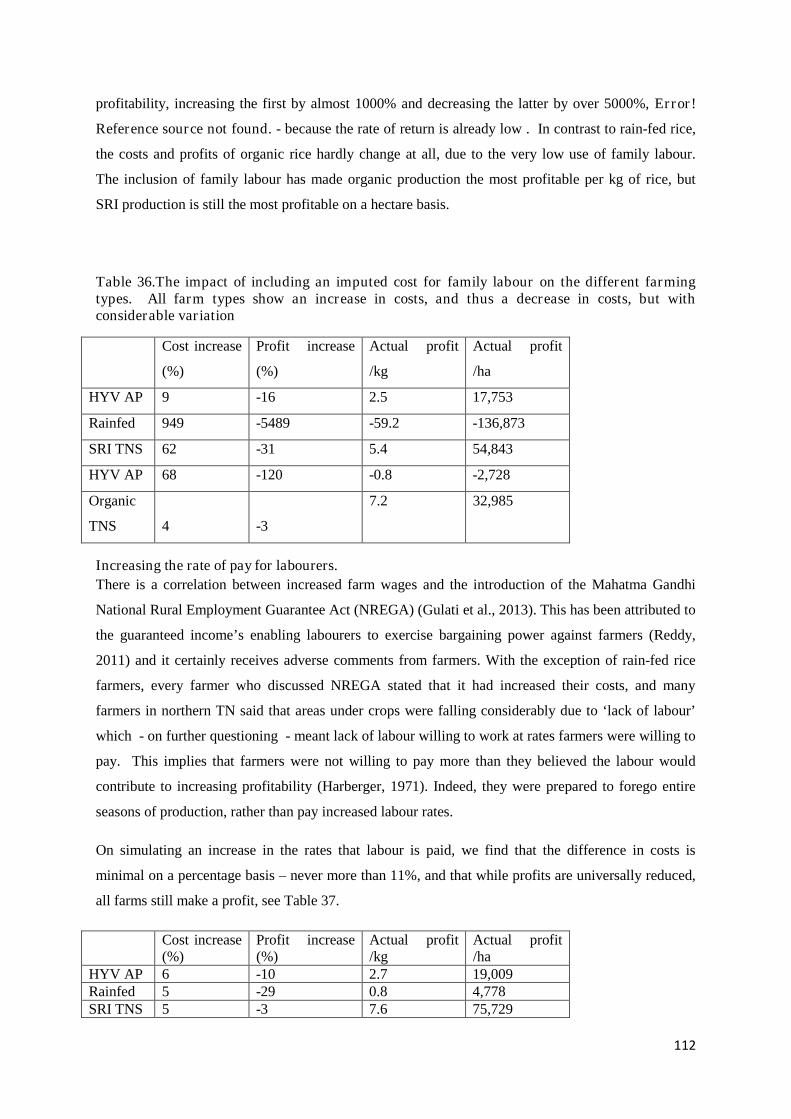
112
profitability, increasing the first by almost 1000% and decreasing the latter by over 5000%, Error!
Reference source not found. - because the rate of return is already low . In contrast to rain-fed rice,
the costs and profits of organic rice hardly change at all, due to the very low use of family labour.
The inclusion of family labour has made organic production the most profitable per kg of rice, but
SRI production is still the most profitable on a hectare basis.
Table 36.The impact of including an imputed cost for family labour on the different farmingtypes. All farm types show an increase in costs, and thus a decrease in costs, but withconsiderable variation
Cost increase
(%)
Profit increase
(%)
Actual profit
/kg
Actual profit
/ha
HYV AP 9 -16 2.5 17,753
Rainfed 949 -5489 -59.2 -136,873
SRI TNS 62 -31 5.4 54,843
HYV AP 68 -120 -0.8 -2,728
Organic
TNS 4 -3
7.2 32,985
Increasing the rate of pay for labourers.
There is a correlation between increased farm wages and the introduction of the Mahatma Gandhi
National Rural Employment Guarantee Act (NREGA) (Gulati et al., 2013). This has been attributed to
the guaranteed income’s enabling labourers to exercise bargaining power against farmers (Reddy,
2011) and it certainly receives adverse comments from farmers. With the exception of rain-fed rice
farmers, every farmer who discussed NREGA stated that it had increased their costs, and many
farmers in northern TN said that areas under crops were falling considerably due to ‘lack of labour’
which - on further questioning - meant lack of labour willing to work at rates farmers were willing to
pay. This implies that farmers were not willing to pay more than they believed the labour would
contribute to increasing profitability (Harberger, 1971). Indeed, they were prepared to forego entire
seasons of production, rather than pay increased labour rates.
On simulating an increase in the rates that labour is paid, we find that the difference in costs is
minimal on a percentage basis – never more than 11%, and that while profits are universally reduced,
all farms still make a profit, see Table 37.
Cost increase(%)
Profit increase(%)
Actual profit/kg
Actual profit/ha
HYV AP 6 -10 2.7 19,009Rainfed 5 -29 0.8 4,778SRI TNS 5 -3 7.6 75,729
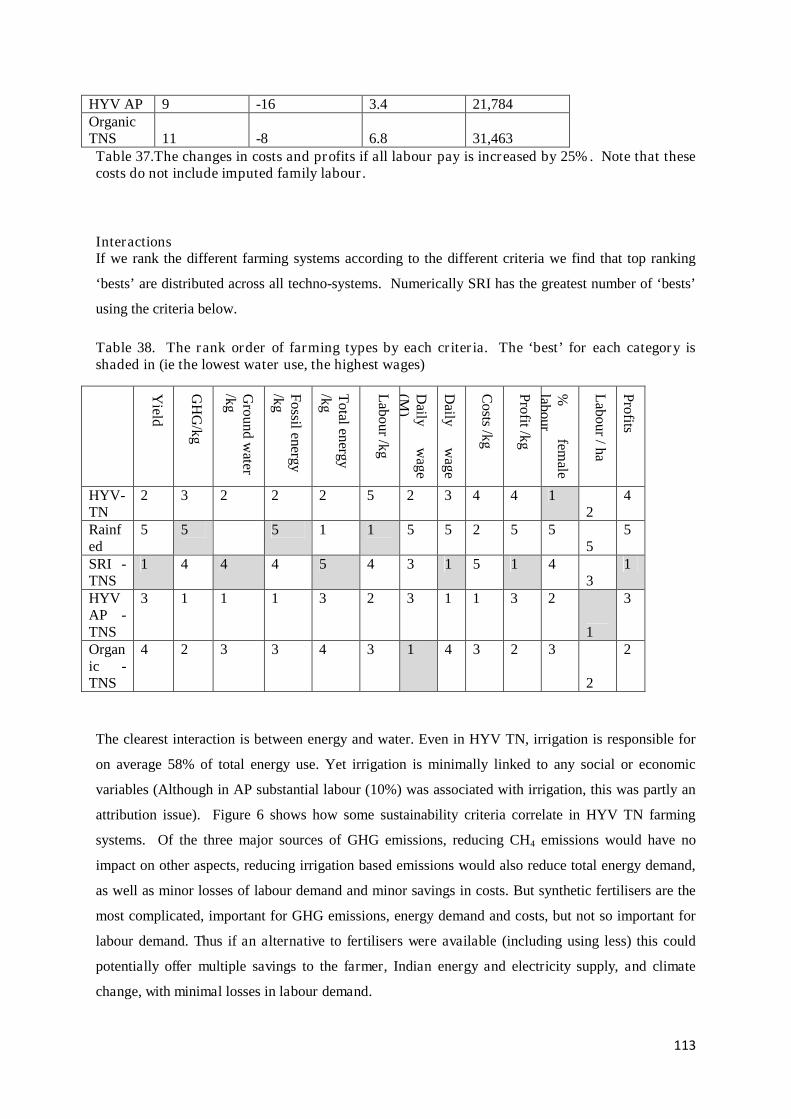
113
HYV AP 9 -16 3.4 21,784OrganicTNS 11 -8 6.8 31,463Table 37.The changes in costs and profits if all labour pay is increased by 25%. Note that thesecosts do not include imputed family labour.
InteractionsIf we rank the different farming systems according to the different criteria we find that top ranking
‘bests’ are distributed across all techno-systems. Numerically SRI has the greatest number of ‘bests’
using the criteria below.
Table 38. The rank order of farming types by each criteria. The ‘best’ for each category isshaded in (ie the lowest water use, the highest wages)
Yield
GH
G/k
g
Gro
un
dw
ater/k
g
Fo
ssilenergy
/kg
To
talen
ergy
/kg
Lab
ou
r/k
g
Daily
wag
e(M
)
Daily
wag
e(F
)
Co
sts/k
g
Pro
fit/k
g
%fem
alelab
our
Lab
ou
r/
ha
Pro
fits/h
a
HYV-TN
2 3 2 2 2 5 2 3 4 4 12
4
Rainfed
5 5 5 1 1 5 5 2 5 55
5
SRI -TNS
1 4 4 4 5 4 3 1 5 1 43
1
HYVAP -TNS
3 1 1 1 3 2 3 1 1 3 2
1
3
Organic -TNS
4 2 3 3 4 3 1 4 3 2 3
2
2
The clearest interaction is between energy and water. Even in HYV TN, irrigation is responsible for
on average 58% of total energy use. Yet irrigation is minimally linked to any social or economic
variables (Although in AP substantial labour (10%) was associated with irrigation, this was partly an
attribution issue). Figure 6 shows how some sustainability criteria correlate in HYV TN farming
systems. Of the three major sources of GHG emissions, reducing CH4 emissions would have no
impact on other aspects, reducing irrigation based emissions would also reduce total energy demand,
as well as minor losses of labour demand and minor savings in costs. But synthetic fertilisers are the
most complicated, important for GHG emissions, energy demand and costs, but not so important for
labour demand. Thus if an alternative to fertilisers were available (including using less) this could
potentially offer multiple savings to the farmer, Indian energy and electricity supply, and climate
change, with minimal losses in labour demand.
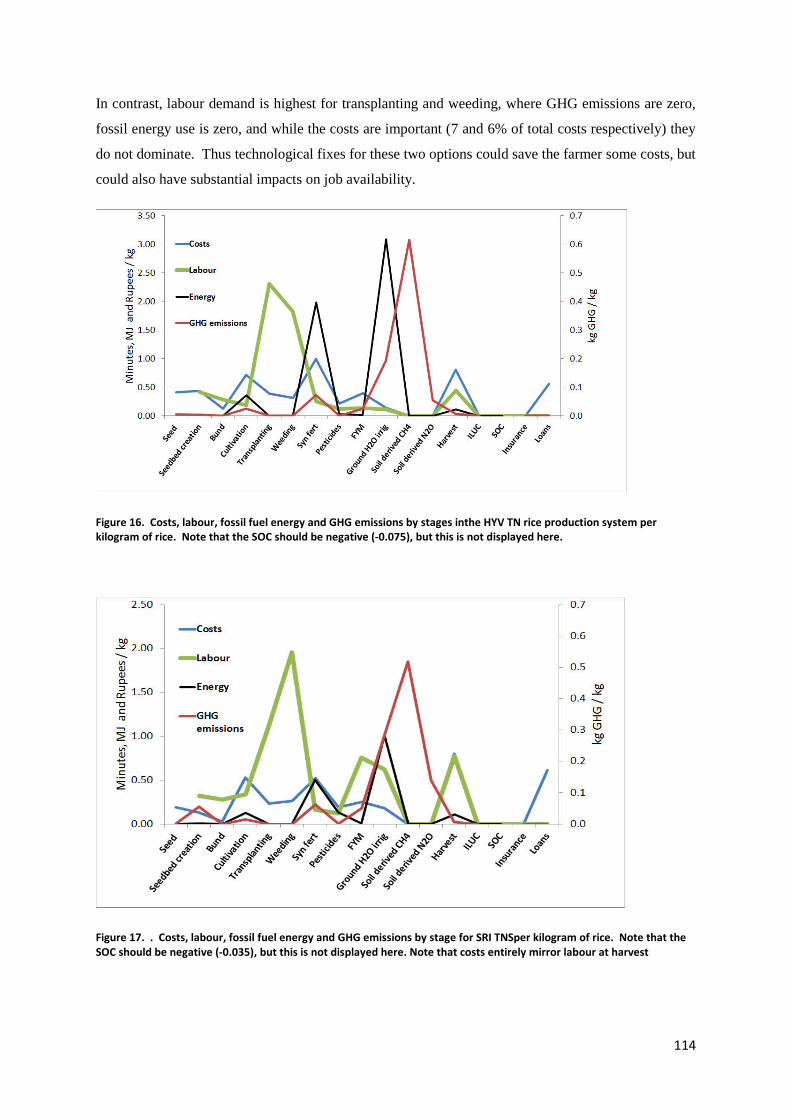
114
In contrast, labour demand is highest for transplanting and weeding, where GHG emissions are zero,
fossil energy use is zero, and while the costs are important (7 and 6% of total costs respectively) they
do not dominate. Thus technological fixes for these two options could save the farmer some costs, but
could also have substantial impacts on job availability.
Figure 16. Costs, labour, fossil fuel energy and GHG emissions by stages inthe HYV TN rice production system perkilogram of rice. Note that the SOC should be negative (-0.075), but this is not displayed here.
Figure 17. . Costs, labour, fossil fuel energy and GHG emissions by stage for SRI TNSper kilogram of rice. Note that theSOC should be negative (-0.035), but this is not displayed here. Note that costs entirely mirror labour at harvest
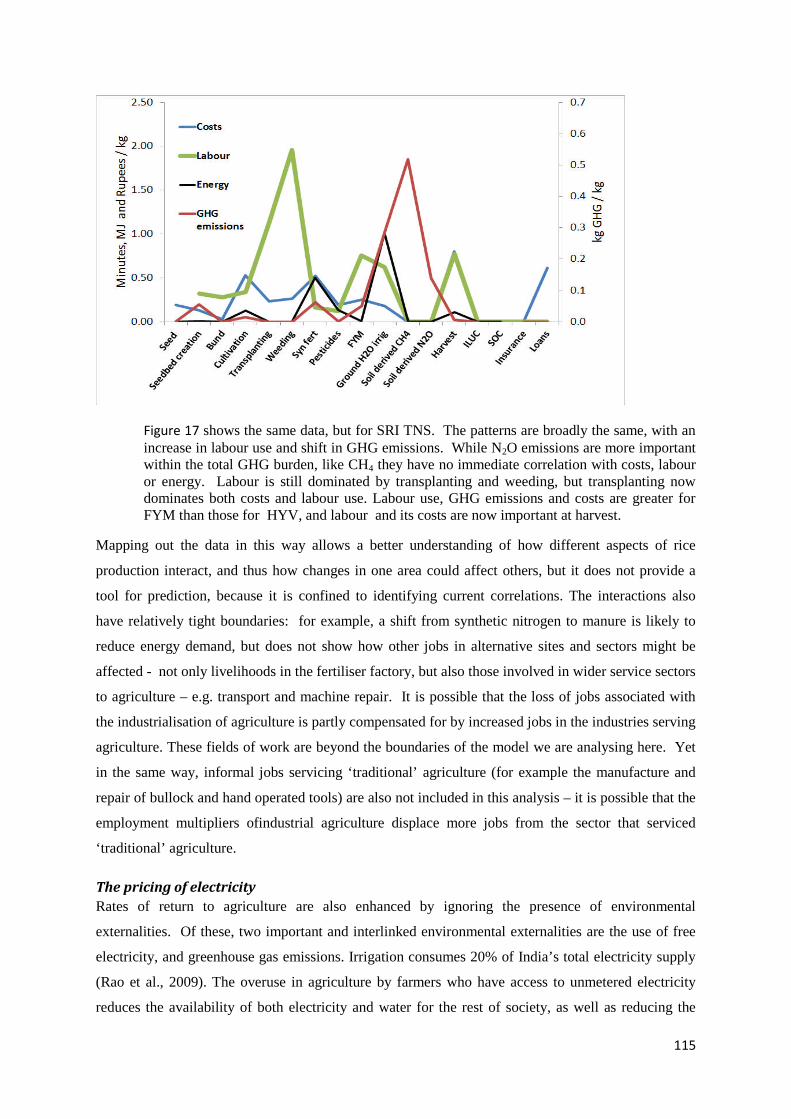
115
Figure 17 shows the same data, but for SRI TNS. The patterns are broadly the same, with anincrease in labour use and shift in GHG emissions. While N2O emissions are more importantwithin the total GHG burden, like CH4 they have no immediate correlation with costs, labouror energy. Labour is still dominated by transplanting and weeding, but transplanting nowdominates both costs and labour use. Labour use, GHG emissions and costs are greater forFYM than those for HYV, and labour and its costs are now important at harvest.
Mapping out the data in this way allows a better understanding of how different aspects of rice
production interact, and thus how changes in one area could affect others, but it does not provide a
tool for prediction, because it is confined to identifying current correlations. The interactions also
have relatively tight boundaries: for example, a shift from synthetic nitrogen to manure is likely to
reduce energy demand, but does not show how other jobs in alternative sites and sectors might be
affected - not only livelihoods in the fertiliser factory, but also those involved in wider service sectors
to agriculture – e.g. transport and machine repair. It is possible that the loss of jobs associated with
the industrialisation of agriculture is partly compensated for by increased jobs in the industries serving
agriculture. These fields of work are beyond the boundaries of the model we are analysing here. Yet
in the same way, informal jobs servicing ‘traditional’ agriculture (for example the manufacture and
repair of bullock and hand operated tools) are also not included in this analysis – it is possible that the
employment multipliers ofindustrial agriculture displace more jobs from the sector that serviced
‘traditional’ agriculture.
The pricing of electricity
Rates of return to agriculture are also enhanced by ignoring the presence of environmental
externalities. Of these, two important and interlinked environmental externalities are the use of free
electricity, and greenhouse gas emissions. Irrigation consumes 20% of India’s total electricity supply
(Rao et al., 2009). The overuse in agriculture by farmers who have access to unmetered electricity
reduces the availability of both electricity and water for the rest of society, as well as reducing the
116
water table and thus water availability for farmers who do not have access to agricultural electricity.
Electricity subsidies to farmers were first introduced in India in the 1970s, and are highly politicised.
In1991 the electricity subsidy was increased to 100% in Tamil Nadu (Janakarajan. S., 2004). How
would it affect farm budgets if charges were re-introduced?
A simulated electricity charge of Rs 2 /unit increases average costs and significantly reduces profits,
of HYV, SRI TNS, HYV AP and organic TNS farming systems (seeTable 36) (p<0.01). But all
systems still record a profit. If the baseline water table were set at the law levels of AP rather than that
of northern TN, then the amount of electricity, and thus the fraction of costs associated with
electricity, would increase dramatically, the simulation yielding a 38% reduction in profits associated
with HYV AP.
But charging for electricity is only useful if it encourages a reduction in electricity use. As a cost lever
it is quite strong (for example it would increase the portion of total costs associated with irrigation
from 2.5 – 8%), and this change is likely to be politically resisted. Excluding rain-fed rice, the loss of
profit due to simulated electricity charging was least with SRI TNS production techniques, due to the
reduced water used. But switching to SRI is a complicated procedure that requires skills-acquisition
from an expert extension service(Reddy and Venkatanarayana, 2013). If electricity charges were to
be introduced, then this would best happen in conjunction with high quality extension support to teach
farmers how they can farm with reduced water consumption.
Table 39.The impact of charging Rs 2 /unit for electricity in agriculture
Cost increase
(%)
Profit increase
(%)
Actual profit
/kg
Actual profit
/ha
HYV AP 6 -11 2.6 18,742
Rainfed 0 0 1.1 5,536
SRI TNS 6 -3 7.6 75,454
HYV AP 22 -38 2.5 16,005
Organic TNS 10 -7 6.8 31,603
.
Charging for GHG emissions
Putting a Rs 0.736 / kg CO2 price on GHG emissions (a form of ‘Payment for Environmental
Services’ PES (Millennium Ecosystem Assessment, 2005)), eliminates most of the profit from paddy
production, see
Table 40. But that is assuming a baseline of no carbon emissions, such that every kg
117
Table 40.The impact of installing a carbon price at Rs 0.736 / kg CO2 (the price based on a 2010
CER, see Table 21).
Cost increase
(%)
Profit increase
(%)
Actual profit
/kg
Actual profit
/ha
HYV AP 78 -140 -1.0 -7442
Rainfed 12 -27 1.6 6561
SRI TNS 80 -30 6.0 60755
HYV AP 101 -109 -0.5 -1897
Organic
TNS 19 -11 7.6 35196
would be paid for. If instead HYV TN were simulated as a baseline for present GHG emissions, then
SRI TNS and rain-fed rice would receive a minor compensatory payment (Rs 0.06 and 0.19 /kg) as
long as the baseline is measured per unit rice and not on an area basis. SRI GHG emissions are
higher on an area basis compared to HYV, so if HYV was used as a baseline, it would act as a tax for
SRI compared to HYV of Rs 1,100/ha.
It is very important to set appropriate baselines that reward the behaviour that is intended to be
promoted.
Transport
Transport is an anomaly throughout the supply chain, increasingly critical as rice is transported
greater distances, but of relatively little environmental importance, responsible for just 3, <1 and 7%
of GHG emissions, water and fossil energy use, for 750km of travel.
GHG emissionsGHG emissions from transport are based on diesel fuel. The lorry is assumed to last for 20 years (a
conservative estimate), so that running emissions account for 0.1kg CO2-eq/kg/750km journey
(compared to 0.003 kg CO2-eq/kg/750km). These represent 97% of total transport emissions, the
remaining 3% associated with embodied emissions from the manufacture of the lorry. This pattern of
low ‘embodied’vshigher ‘use’ emissions is typical for high (fossil) energy using systems such as
lorries using diesel and factories using electricity.
Costs.In contrast to all other parts of the system, for transport there is a strong correlation between the
sources of GHG emissions and costs. Together, diesel and capital costs (excluding loans) account for
50% of total costs. Yet when compared to the breakdown of the transport GHG profile, capital costs
are out of proportion; capital costs account for approximately equal costs to maintenance costs, while
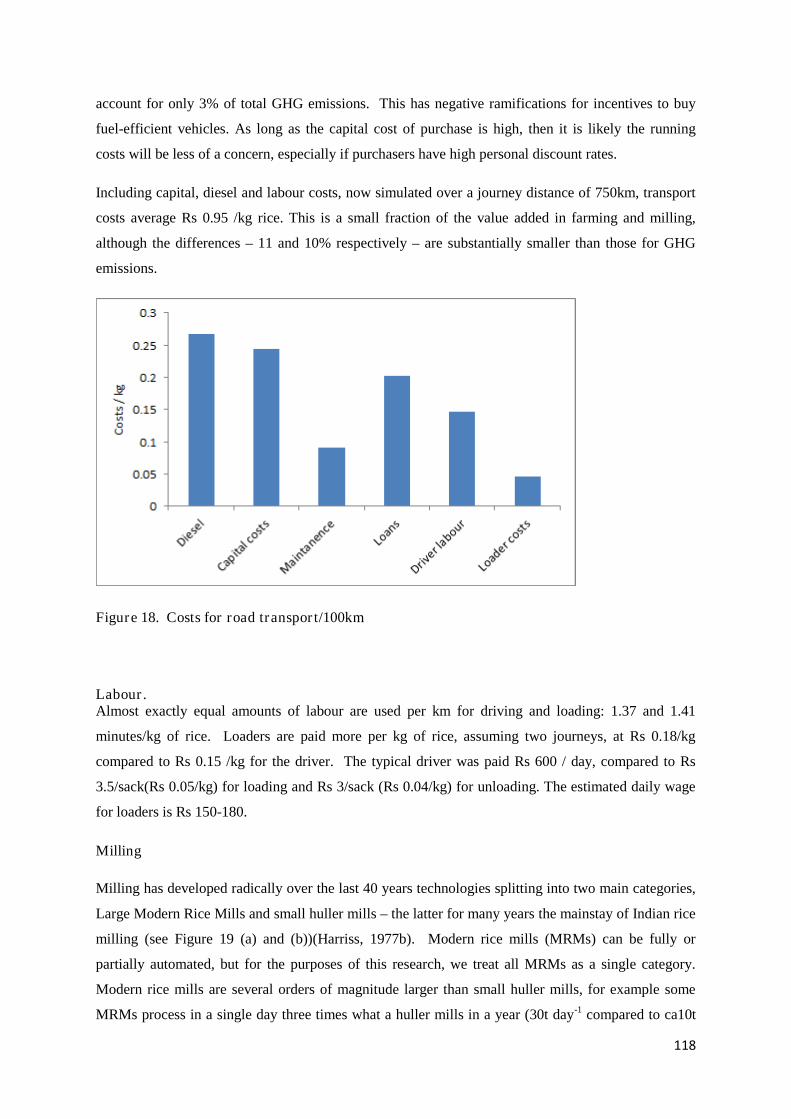
118
account for only 3% of total GHG emissions. This has negative ramifications for incentives to buy
fuel-efficient vehicles. As long as the capital cost of purchase is high, then it is likely the running
costs will be less of a concern, especially if purchasers have high personal discount rates.
Including capital, diesel and labour costs, now simulated over a journey distance of 750km, transport
costs average Rs 0.95 /kg rice. This is a small fraction of the value added in farming and milling,
although the differences – 11 and 10% respectively – are substantially smaller than those for GHG
emissions.
Figure 18. Costs for road transport/100km
Labour.Almost exactly equal amounts of labour are used per km for driving and loading: 1.37 and 1.41
minutes/kg of rice. Loaders are paid more per kg of rice, assuming two journeys, at Rs 0.18/kg
compared to Rs 0.15 /kg for the driver. The typical driver was paid Rs 600 / day, compared to Rs
3.5/sack(Rs 0.05/kg) for loading and Rs 3/sack (Rs 0.04/kg) for unloading. The estimated daily wage
for loaders is Rs 150-180.
Milling
Milling has developed radically over the last 40 years technologies splitting into two main categories,
Large Modern Rice Mills and small huller mills – the latter for many years the mainstay of Indian rice
milling (see Figure 19 (a) and (b))(Harriss, 1977b). Modern rice mills (MRMs) can be fully or
partially automated, but for the purposes of this research, we treat all MRMs as a single category.
Modern rice mills are several orders of magnitude larger than small huller mills, for example some
MRMs process in a single day three times what a huller mills in a year (30t day-1 compared to ca10t
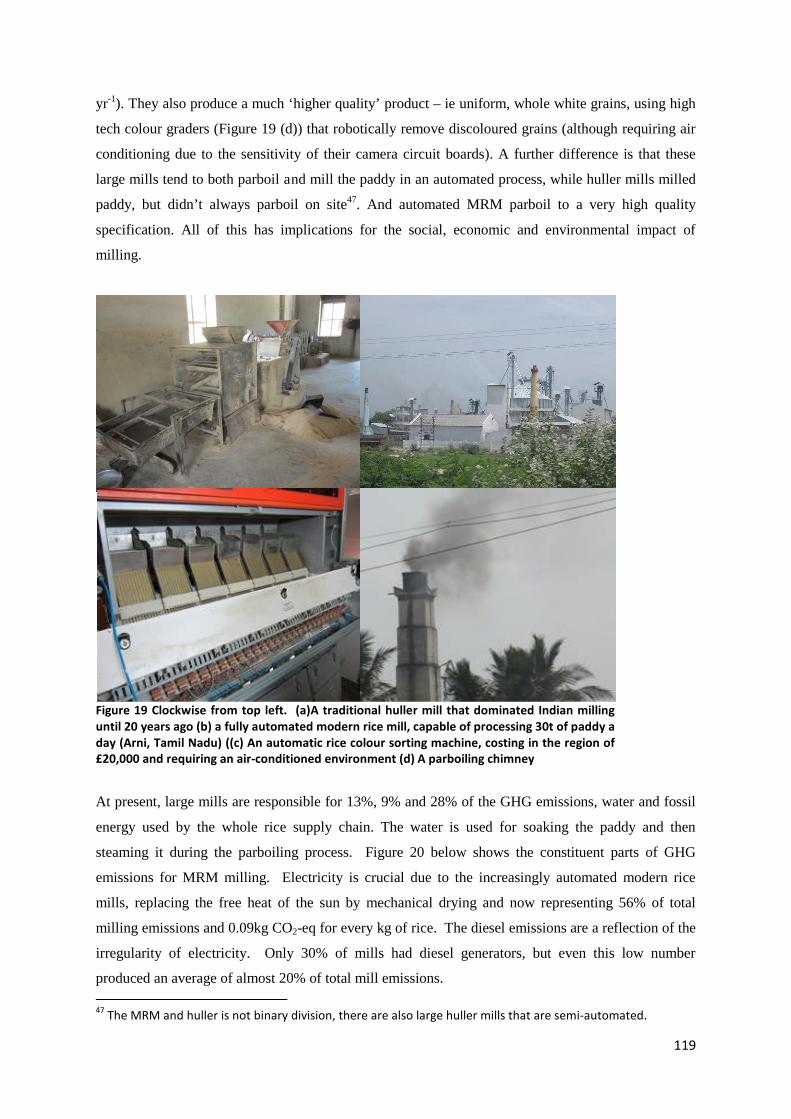
119
yr-1). They also produce a much ‘higher quality’ product – ie uniform, whole white grains, using high
tech colour graders (Figure 19 (d)) that robotically remove discoloured grains (although requiring air
conditioning due to the sensitivity of their camera circuit boards). A further difference is that these
large mills tend to both parboil and mill the paddy in an automated process, while huller mills milled
paddy, but didn’t always parboil on site47. And automated MRM parboil to a very high quality
specification. All of this has implications for the social, economic and environmental impact of
milling.
At present, large mills are responsible for 13%, 9% and 28% of the GHG emissions, water and fossil
energy used by the whole rice supply chain. The water is used for soaking the paddy and then
steaming it during the parboiling process. Figure 20 below shows the constituent parts of GHG
emissions for MRM milling. Electricity is crucial due to the increasingly automated modern rice
mills, replacing the free heat of the sun by mechanical drying and now representing 56% of total
milling emissions and 0.09kg CO2-eq for every kg of rice. The diesel emissions are a reflection of the
irregularity of electricity. Only 30% of mills had diesel generators, but even this low number
produced an average of almost 20% of total mill emissions.
47The MRM and huller is not binary division, there are also large huller mills that are semi-automated.
Figure 19 Clockwise from top left. (a)A traditional huller mill that dominated Indian millinguntil 20 years ago (b) a fully automated modern rice mill, capable of processing 30t of paddy aday (Arni, Tamil Nadu) ((c) An automatic rice colour sorting machine, costing in the region of£20,000 and requiring an air-conditioned environment (d) A parboiling chimney
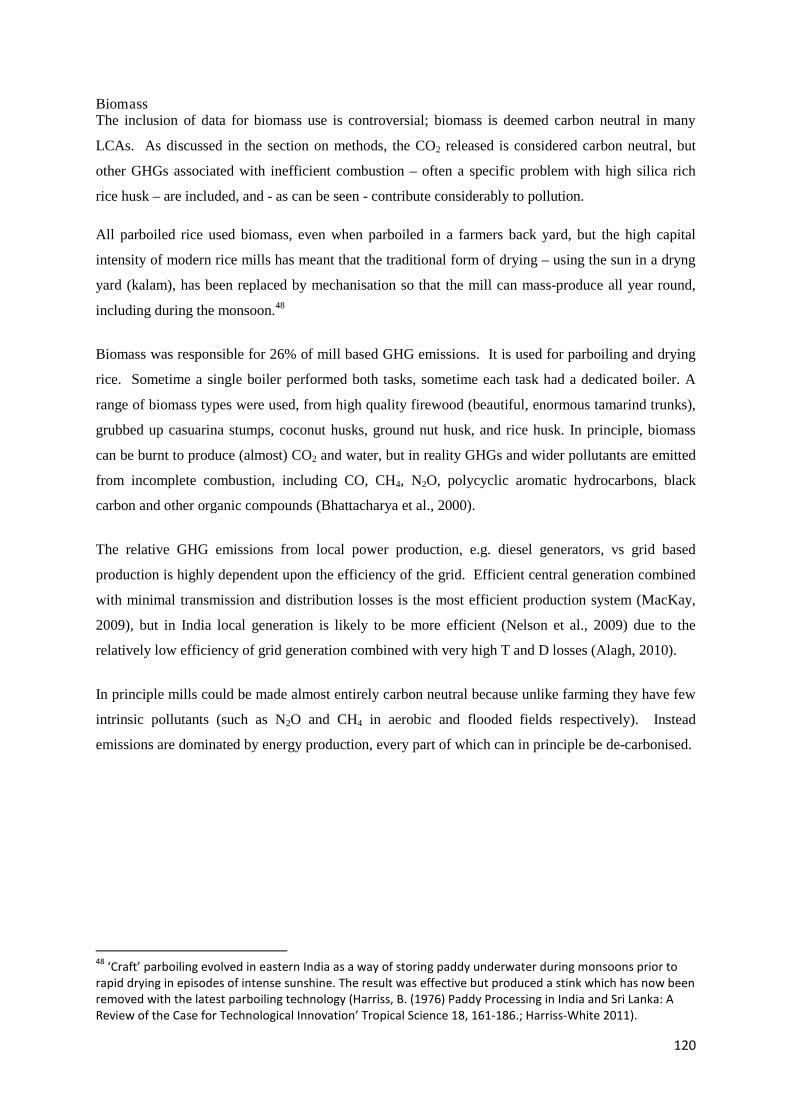
120
BiomassThe inclusion of data for biomass use is controversial; biomass is deemed carbon neutral in many
LCAs. As discussed in the section on methods, the CO2 released is considered carbon neutral, but
other GHGs associated with inefficient combustion – often a specific problem with high silica rich
rice husk – are included, and - as can be seen - contribute considerably to pollution.
All parboiled rice used biomass, even when parboiled in a farmers back yard, but the high capital
intensity of modern rice mills has meant that the traditional form of drying – using the sun in a dryng
yard (kalam), has been replaced by mechanisation so that the mill can mass-produce all year round,
including during the monsoon.48
Biomass was responsible for 26% of mill based GHG emissions. It is used for parboiling and drying
rice. Sometime a single boiler performed both tasks, sometime each task had a dedicated boiler. A
range of biomass types were used, from high quality firewood (beautiful, enormous tamarind trunks),
grubbed up casuarina stumps, coconut husks, ground nut husk, and rice husk. In principle, biomass
can be burnt to produce (almost) CO2 and water, but in reality GHGs and wider pollutants are emitted
from incomplete combustion, including CO, CH4, N2O, polycyclic aromatic hydrocarbons, black
carbon and other organic compounds (Bhattacharya et al., 2000).
The relative GHG emissions from local power production, e.g. diesel generators, vs grid based
production is highly dependent upon the efficiency of the grid. Efficient central generation combined
with minimal transmission and distribution losses is the most efficient production system (MacKay,
2009), but in India local generation is likely to be more efficient (Nelson et al., 2009) due to the
relatively low efficiency of grid generation combined with very high T and D losses (Alagh, 2010).
In principle mills could be made almost entirely carbon neutral because unlike farming they have few
intrinsic pollutants (such as N2O and CH4 in aerobic and flooded fields respectively). Instead
emissions are dominated by energy production, every part of which can in principle be de-carbonised.
48‘Craft’ parboiling evolved in eastern India as a way of storing paddy underwater during monsoons prior to
rapid drying in episodes of intense sunshine. The result was effective but produced a stink which has now beenremoved with the latest parboiling technology (Harriss, B. (1976) Paddy Processing in India and Sri Lanka: AReview of the Case for Technological Innovation’ Tropical Science 18, 161-186.; Harriss-White 2011).
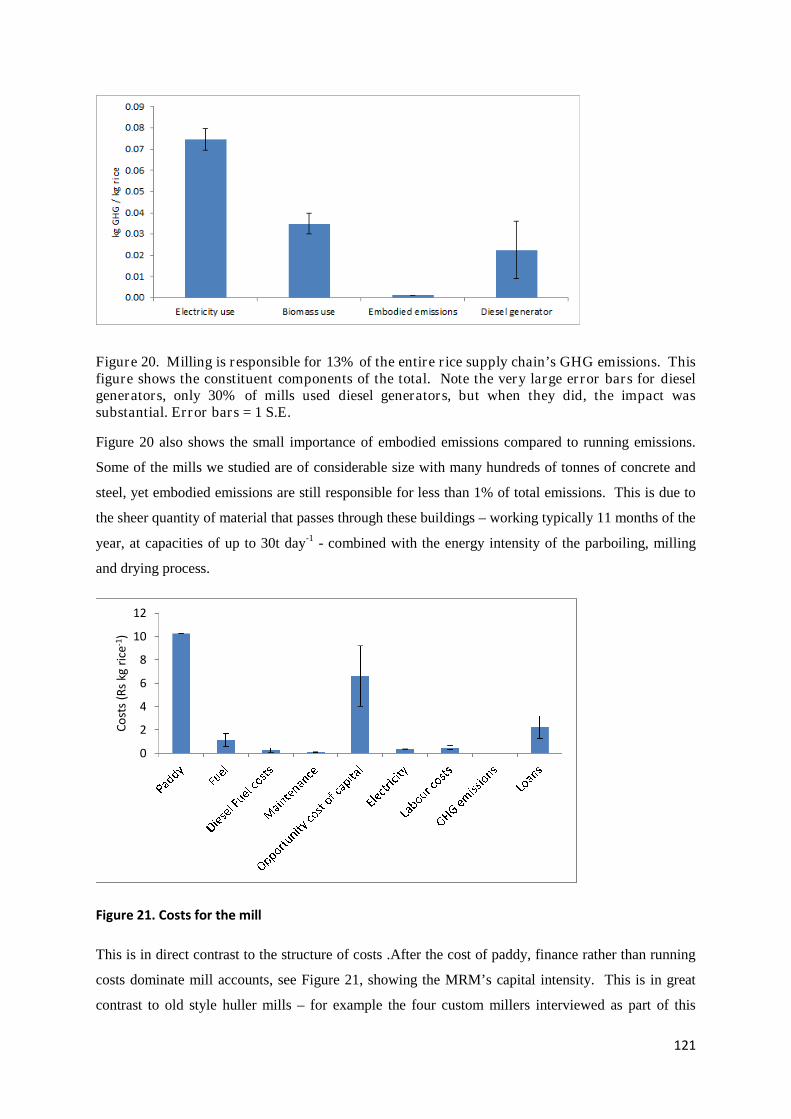
121
Figure 20. Milling is responsible for 13% of the entire rice supply chain’s GHG emissions. Thisfigure shows the constituent components of the total. Note the very large error bars for dieselgenerators, only 30% of mills used diesel generators, but when they did, the impact wassubstantial. Error bars = 1 S.E.
Figure 20 also shows the small importance of embodied emissions compared to running emissions.
Some of the mills we studied are of considerable size with many hundreds of tonnes of concrete and
steel, yet embodied emissions are still responsible for less than 1% of total emissions. This is due to
the sheer quantity of material that passes through these buildings – working typically 11 months of the
year, at capacities of up to 30t day-1 - combined with the energy intensity of the parboiling, milling
and drying process.
0
2
4
6
8
10
12
Co
sts
(Rs
kgri
ce-1
)
Figure 21. Costs for the mill
This is in direct contrast to the structure of costs .After the cost of paddy, finance rather than running
costs dominate mill accounts, see Figure 21, showing the MRM’s capital intensity. This is in great
contrast to old style huller mills – for example the four custom millers interviewed as part of this
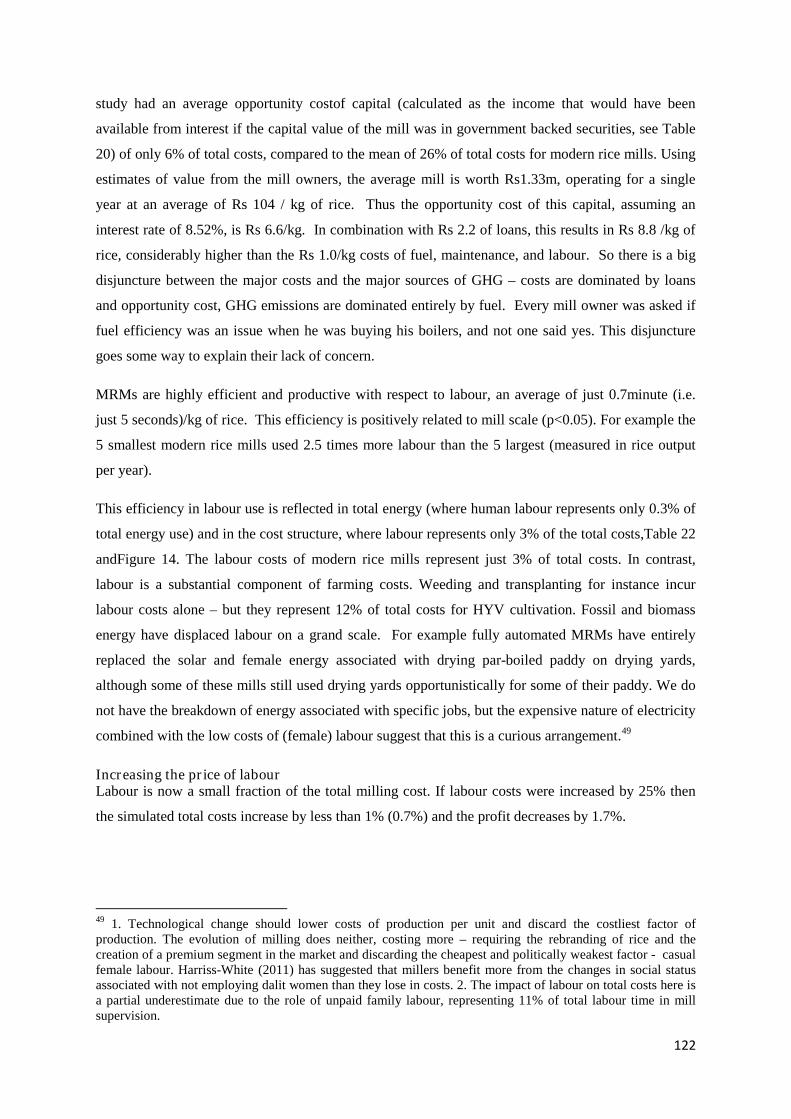
122
study had an average opportunity costof capital (calculated as the income that would have been
available from interest if the capital value of the mill was in government backed securities, see Table
20) of only 6% of total costs, compared to the mean of 26% of total costs for modern rice mills. Using
estimates of value from the mill owners, the average mill is worth Rs1.33m, operating for a single
year at an average of Rs 104 / kg of rice. Thus the opportunity cost of this capital, assuming an
interest rate of 8.52%, is Rs 6.6/kg. In combination with Rs 2.2 of loans, this results in Rs 8.8 /kg of
rice, considerably higher than the Rs 1.0/kg costs of fuel, maintenance, and labour. So there is a big
disjuncture between the major costs and the major sources of GHG – costs are dominated by loans
and opportunity cost, GHG emissions are dominated entirely by fuel. Every mill owner was asked if
fuel efficiency was an issue when he was buying his boilers, and not one said yes. This disjuncture
goes some way to explain their lack of concern.
MRMs are highly efficient and productive with respect to labour, an average of just 0.7minute (i.e.
just 5 seconds)/kg of rice. This efficiency is positively related to mill scale (p<0.05). For example the
5 smallest modern rice mills used 2.5 times more labour than the 5 largest (measured in rice output
per year).
This efficiency in labour use is reflected in total energy (where human labour represents only 0.3% of
total energy use) and in the cost structure, where labour represents only 3% of the total costs,Table 22
andFigure 14. The labour costs of modern rice mills represent just 3% of total costs. In contrast,
labour is a substantial component of farming costs. Weeding and transplanting for instance incur
labour costs alone – but they represent 12% of total costs for HYV cultivation. Fossil and biomass
energy have displaced labour on a grand scale. For example fully automated MRMs have entirely
replaced the solar and female energy associated with drying par-boiled paddy on drying yards,
although some of these mills still used drying yards opportunistically for some of their paddy. We do
not have the breakdown of energy associated with specific jobs, but the expensive nature of electricity
combined with the low costs of (female) labour suggest that this is a curious arrangement.49
Increasing the price of labourLabour is now a small fraction of the total milling cost. If labour costs were increased by 25% then
the simulated total costs increase by less than 1% (0.7%) and the profit decreases by 1.7%.
49 1. Technological change should lower costs of production per unit and discard the costliest factor ofproduction. The evolution of milling does neither, costing more – requiring the rebranding of rice and thecreation of a premium segment in the market and discarding the cheapest and politically weakest factor - casualfemale labour. Harriss-White (2011) has suggested that millers benefit more from the changes in social statusassociated with not employing dalit women than they lose in costs. 2. The impact of labour on total costs here isa partial underestimate due to the role of unpaid family labour, representing 11% of total labour time in millsupervision.
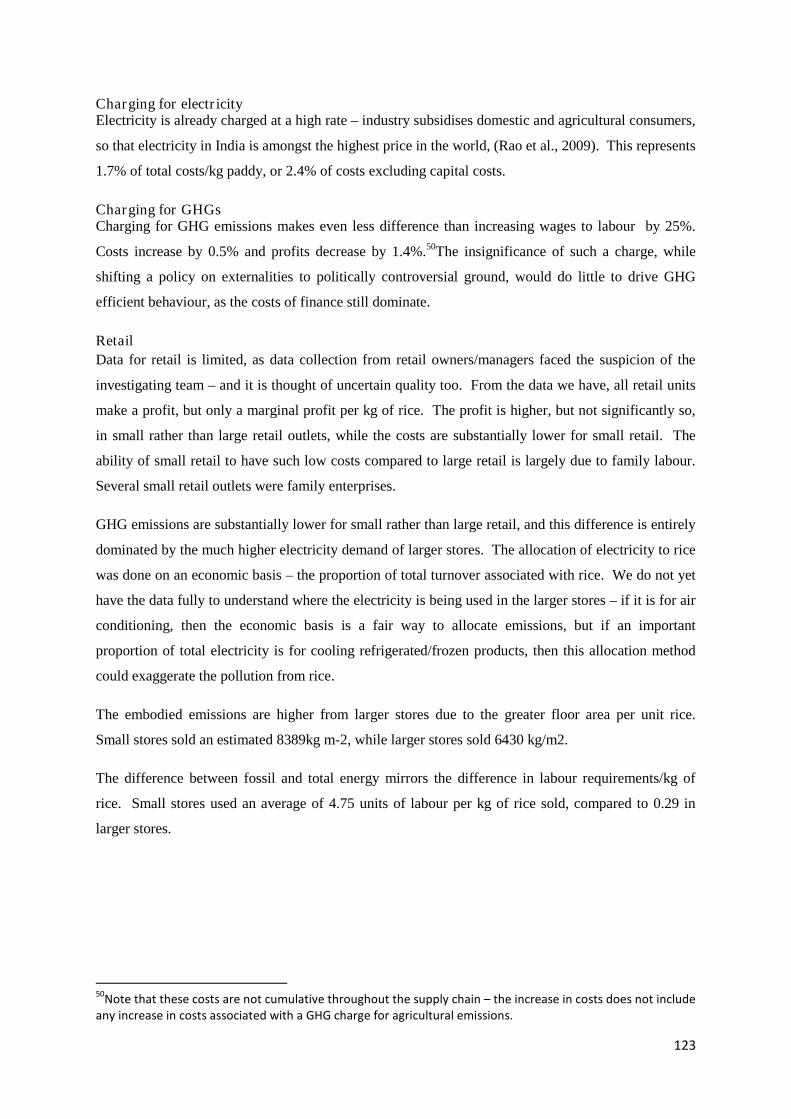
123
Charging for electricityElectricity is already charged at a high rate – industry subsidises domestic and agricultural consumers,
so that electricity in India is amongst the highest price in the world, (Rao et al., 2009). This represents
1.7% of total costs/kg paddy, or 2.4% of costs excluding capital costs.
Charging for GHGsCharging for GHG emissions makes even less difference than increasing wages to labour by 25%.
Costs increase by 0.5% and profits decrease by 1.4%.50The insignificance of such a charge, while
shifting a policy on externalities to politically controversial ground, would do little to drive GHG
efficient behaviour, as the costs of finance still dominate.
Retail
Data for retail is limited, as data collection from retail owners/managers faced the suspicion of the
investigating team – and it is thought of uncertain quality too. From the data we have, all retail units
make a profit, but only a marginal profit per kg of rice. The profit is higher, but not significantly so,
in small rather than large retail outlets, while the costs are substantially lower for small retail. The
ability of small retail to have such low costs compared to large retail is largely due to family labour.
Several small retail outlets were family enterprises.
GHG emissions are substantially lower for small rather than large retail, and this difference is entirely
dominated by the much higher electricity demand of larger stores. The allocation of electricity to rice
was done on an economic basis – the proportion of total turnover associated with rice. We do not yet
have the data fully to understand where the electricity is being used in the larger stores – if it is for air
conditioning, then the economic basis is a fair way to allocate emissions, but if an important
proportion of total electricity is for cooling refrigerated/frozen products, then this allocation method
could exaggerate the pollution from rice.
The embodied emissions are higher from larger stores due to the greater floor area per unit rice.
Small stores sold an estimated 8389kg m-2, while larger stores sold 6430 kg/m2.
The difference between fossil and total energy mirrors the difference in labour requirements/kg of
rice. Small stores used an average of 4.75 units of labour per kg of rice sold, compared to 0.29 in
larger stores.
50Note that these costs are not cumulative throughout the supply chain – the increase in costs does not include
any increase in costs associated with a GHG charge for agricultural emissions.
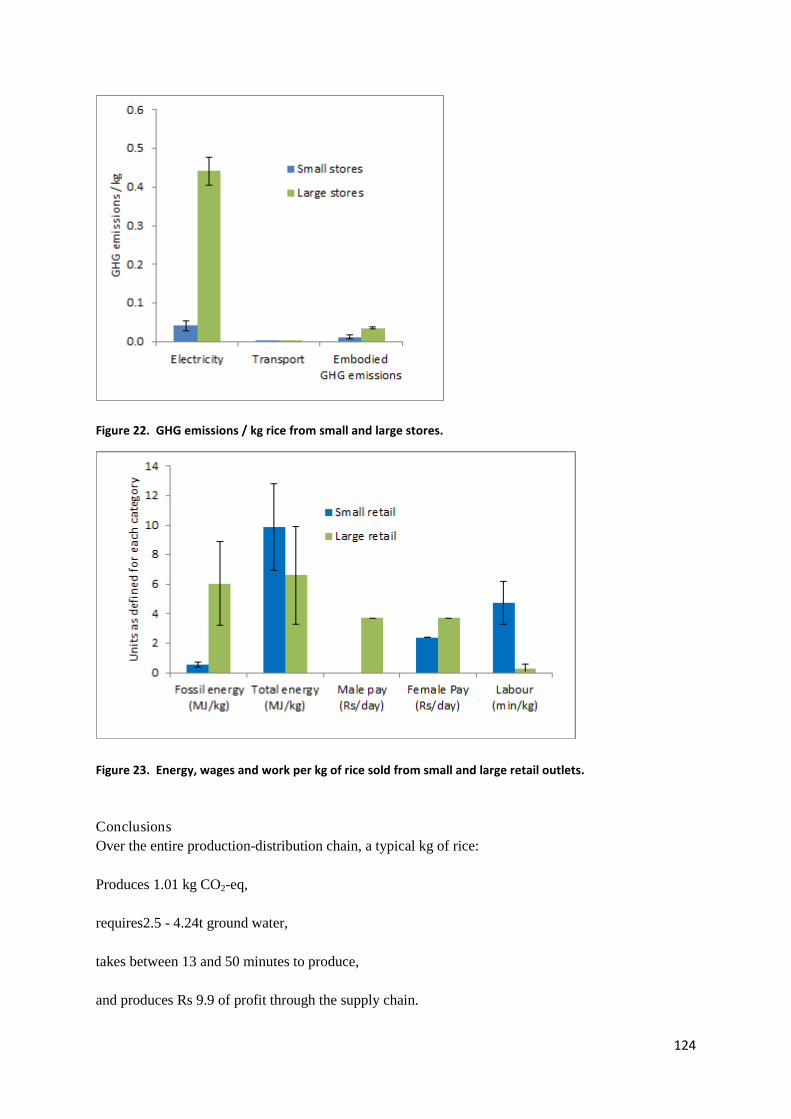
124
Figure 22. GHG emissions / kg rice from small and large stores.
Figure 23. Energy, wages and work per kg of rice sold from small and large retail outlets.
Conclusions
Over the entire production-distribution chain, a typical kg of rice:
Produces 1.01 kg CO2-eq,
requires2.5 - 4.24t ground water,
takes between 13 and 50 minutes to produce,
and produces Rs 9.9 of profit through the supply chain.
125
Within the supply chain, agriculture dominates the environmental impacts and labour demand, but has
the poorest quality of labour – pay is highestin transport for men and in retail for women.
In the different production techno-systems, the GHG emissions are not significantly different from
each other - at just under 1kg CO2-eq / kg of rice. But the constituent emissions vary considerably.
HYV and organic are dominated by soil methane and Co2 from irrigation, SRI is dominated by soil
derived methane and fertiliser derived nitrous oxide emissions (from manufacture, on site and off site
locations), while rain-fed is dominated by nitrous oxide, followed by bullock derived methane.
Irrigation water use was highest in the HYV production systems, and lowest - zero - for rain-fed rice,
but interestingly, when measured on an area basis, while rain-fed rice used less water than HYV
systems, the difference was not statistically significant.
Rain-fed rice requires the largest quantity of labour per kg of rice (40 minutes), but while it is also the
largest single user of labour per hectare (1641 hrs ha-1) it is not significantly different per unit area to
SRI (1006 hr ha-1). Combined with the very high proportion of family labour in rain-fed agriculture,
the number of casual labour hours is lowest for rain-fed agriculture out of all the production systems.
In terms of profit, excluding land values from the cost structure, SRI was significantly more profitable
than the other rice production systems.
Yet SRI is not proving as popular on the ground as these results would suggest, possibly due to the
additional hassle factor associated with transplanting of younger seedlings, combined with the
narrower window of time for transplanting and the unpopular nature of lone weeding (Reddy and
Venkatanarayana, 2013).
Organic paddy benefits from a high paddy value, compensating for its marginally lower yields. It also
saves both costs and GHG emissions through avoiding synthetic fertilisers or pesticides. But the
overall emissions are still elevated due to the average yield combined with high levels of the kind of
inputs producing high methane emissions. Were organic agriculture to use SRI techniques, and the
yield benefit to be maintained in the new system, organic SRI would offer substantial gains on all
measures compared to other production technologies.
The cost of labouris a very small part of the total cost for agriculture, transport and mills, although it
can be an important component in retail, especially in large stores.
Labour quality, as measured by pay, improves going up the supply chain. Agricultural labour tends to
be the worst paid (with exceptions in some areas for specific jobs such as ploughing), and retail the
126
best. At every stage in the supply chain wages could bebe increased by 25% without substantial
changes to the profit of the enterprises.
At present there is little incentive to reduce environmental impacts byany sector in the supply chain
with the exception of transport, where emissions are relatively closely correlated with costs. Yet
transport is only responsible for 3% of total GHG emissions. One way to increase the correlation
between costs and emissions would be the introduction of electricity charges. This is politically very
sensitive (Janakarajan. S., 2004), but our simulation of electricity charging has a substantial impact on
costs. Indeed, assuming a water table comparable to that in AP, it would make HYV farming
unprofitable.
The interactions of employment, food provision, pollution and profit are highly variable; even for a
single supply chain in a single region of one country. Yet mapping the system shows where hotspots
occur and trade-offs occur. There is no silver bullet to improve any aspect of the rice supply chain.
Sustainability criteria always face trade-offs. And all options discussed in this paper are controversial
or could only be implemented with major interventions.
127
References
Abraham, V., (2008) Employment growth in rural India: distress driven?, Working Paper, Centre forDevelopment Studies, Trivandrum.Adusumilli, R., Bhagya Laxmi, S. (2011) Potential of the system of rice intensification for systemicimprovement in rice production and water use: the case of Andhra Pradesh, India. Paddy and WaterEnvironment 9, 89-97.Alagh, Y., (2010) Transmission and Distribution of Electricity in India Regulation, Investment andEfficiency. OECD, Indian Institute of Rural Management, Anand (Gijarat).Bauer, K. (2000) Modelling Agricultural labour response to market developments during transition.idara Working Paper.Bhattacharya, S.C., Abdul Salam, P., Sharma, M. (2000) Emissions from biomass energy use in someselected Asian countries. Energy 25, 169-188.Binswanger, H.P., (1985) Agricultural mechanization: a comparative historical perspective., WorldBank Research Observer. World Bank,, Washington, DC, USA.Blengini, G.A., Busto, M. (2009) The life cycle of rice: LCA of alternative agri-food chainmanagement systems in Vercelli (Italy). Journal of Environmental Management 90, 1512-1522.Blythe, R. (2011) At the Yeoman's House, p26. Enitharmon, London, UK.CEA, (2011) CO2 Baseline Databas for the Indian Power Sector, User Guide, version 6.0. CentralElectricity Authority, Ministry of Powrer, Sewa Bhawan, New Delhi, India.Corbridge, S., Harriss, J., C., J., (Forthcoming) ‘Lopsided’, ‘Failed’, or ‘Tortuous’: India’sProblematic Transition and its Implications for Labour, in: Davin, D., B., H.-W. (Eds.), China-India:Paths of Economic and Social Development. Proceedings of the British Academy, London,.Crutzen, P.J. (2002) Geology of mankind. Nature 415, 23-23.CSE, (2012) Into the Furnace. Green rating project of Indian Iron and Steel Sector., in: CSE (Ed.).CSE, Delhi, India, p. 256.Deepak, K.M., (2013) Rain fed Rice in Odisha: Production and Exchange Relations, Technology,Jobs and A Lower Carbon Future: Methods, Substance and Ideas for the Informal Economy (The caseof rice in India), New Delhi, India.Directive 2009/28/EC., (2009) On the promotion of the use of energy from renewable sources andamending and subsequently repealing Directives 2001/77/EC and 2003/30/EC, in: Union, O.J.o.t.E.(Ed.), http://eur-lex.europa.eu/LexUriServ/LexUriServ.do?uri=Oj:L:2009:140:0016:0062:en:PDF.Foley, J.A., Ramankutty, N., Brauman, K.A., Cassidy, E.S., Gerber, J.S., Johnston, M., Mueller, N.D.,O/'Connell, C., Ray, D.K., West, P.C., Balzer, C., Bennett, E.M., Carpenter, S.R., Hill, J., Monfreda,C., Polasky, S., Rockstrom, J., Sheehan, J., Siebert, S., Tilman, D., Zaks, D.P.M. (2011) Solutions fora cultivated planet. Nature 478, 337-342.Foresight, (2011) The Future of Food and Farming, Final Project Report, in: The Government Officefor Science (Ed.), London.Gathorne-Hardy, A., (2013a) Greenhouse gas emissions from rice, Working paper,,http://www.southasia.ox.ac.uk/sites/sias/files/documents/GHG%20emissions%20from%20rice%20-%20%20working%20paper.pdf.Gathorne-Hardy, A., (2013b) Life cycle assessment of four rice production systems: High YieldingVarieties, Rainfed, System of Rice Intensification and Organic, in: Harriss-White, B. (Ed.),Technology, Jobs and A Lower Carbon Future: Methods, Substance and Ideas for the InformalEconomy (The case of rice in India) New Delhi.Godfray, H.C.J., Beddington, J.R., Crute, I.R., Haddad, L., Lawrence, D., Muir, J.F., Pretty, J.,Robinson, S., Thomas, S.M., Toulmin, C. (2010) Food Security: The Challenge of Feeding 9 BillionPeople. Science 327, 812-818.Gulati, A., Jain, S., Satija, N., (2013) Rising Farm Wages in India The ‘Pull’ and ‘Push’ Factors,Discussion Paper No. 5 Commission for Agricultural Costs and Prices, New Delhi, India.Gumaste, S.G., Embodied energy computations in buildings Department of Civil Engg., WalchandCollege of Engineering, Vishrambag, Sangli,.Haefele, S.M., Jabbar, S.M.A., Siopongco, J.D.L.C., Tirol-Padre, A., Amarante, S.T., Sta Cruz, P.C.,Cosico, W.C. (2008) Nitrogen use efficiency in selected rice (Oryza sativa L.) genotypes underdifferent water regimes and nitrogen levels. Field Crops Research 107, 137-146.
128
Harberger, A.C. (1971) On Measuring the Social Opportunity Cost of Labour. International LaborReview 103, 559Harriss-White, B. (1996) A Political Economy of Agricultural Markets of South India: Masters of theCountryside. Sage Publications, New Delhi.Harriss-White, B. (2003) India Working: Essays on Society and Economy. Cambridge UniversityPress., Cambridge, UK.Harriss-White, B. (2008) Rural Commercial Capital: Agricultural Markets in West Bengal. OUP,Oxford.Harriss-White, B. (2012) Urbanography: Long-term urban studies, theory, methods and finsings inArni and its region.Harriss-White, B., Adam, C., A., S., (2007) Chapter 7: Summary and Conclusions, in: Harriss-White,B., Sinha, A. (Eds.), Trade liberalization and India’s informal economy. Oxford University Press,Oxford.Harriss, B. (1976) Paddy Processing in India and Sri Lanka: A Review of the Case for TechnologicalInnovation’ Tropical Science 18, 161-186.Harriss, B., (1977a) Paddy Milling: Problems in Policy and the Choice of Technology’ in: Farmer,B.H. (Ed.), Green Revolution? Macmillan pp. 276-300.Harriss, B. (1977b) Piecemeal planning in rice markets : the effects of partial government interventionon marketing efficiency in a South Indian district. School of Development Studies, University of EastAnglia Norwich.Hull, K., (2009) Understanding the Relationship between Economic Growth, Employment andPoverty Reduction, in: DAC Network on Poverty Reduction (POVNET) (Ed.), Promoting Pro-PoorGrowth: Employment OECD, , http://www.oecd.org/dac/povertyreduction/43514554.pdf.ILO, (1999) Decent Work: Report of the Director General., International Labour Conference, 87thSessions, Geneva.Janakarajan. S., (2004) Populism and Electricity in Rural Tamil Nadu, in: Harriss-White, B., S., J.(Eds.), Rural India facing the 21st Century, Essays on Long Term Village Change and Recentdevelopment Policy. Wimbledon Publishing Company, Wimbledon, London, p. 231.Kumar Mandal, S., Madheswaran, S. (2010) Environmental efficiency of the Indian cement industry:An interstate analysis. Energy Policy 38, 1108-1118.Latif, M.A., Islam, M.R., Ali, M.Y., Saleque, M.A. (2005) Validation of the system of riceintensification (SRI) in Bangladesh. Field Crops Research 93, 281-292.Lorano, E., (2005) Quality in work: Dimension and Indicators in the Framework of the EuropeanEmplyment Strategy, in: UNECE/ILO/Eurostat Seminar on the Quality of Work (Ed.), Working Paperno. 2., Geneva.MacKay, D.J.C. (2009) Sustainable Energy: Without the Hot Air. Cambridge, UIT, Cambridge.Millennium Ecosystem Assessment, (2005) Ecosystems and human well-being: the assessment series(four volumes and summary). Read more: http://www.esajournals.org/doi/full/10.1890/080025,Washington, DCMody, G., Mani, M., Sukumar, M., (2013a) Employment and working conditions, and theprocurement process for commodities in retail - a case study of rice in Chennai.http://www.southasia.ox.ac.uk/resources-greenhouse-gases-technology-and-jobs-indias-informal-economy-case-rice.Mody, G., Mani, M., Sukumar, M. (2013b) Labour patterns within the informal food sector.Nelson, G.C., Robertson, R., Msangi, S., Zhu, T., Liao, X., Jawajar, P., (2009) Greenhouse GasMitigation. Issues for Indian Agriculture. In IFPRI Discussion Paper 00900. International Food PolicyResearch Unit, Washington.Pelletier, N., Audsley, E., Brodt, S., Garnett, T., Henriksson, P., Kendall, A., Kramer, K.J., Murphy,D., Nemecek, T., Troell, M. (2011) Energy Intensity of Agriculture and Food Systems. AnnualReview of Environment and Resources 36, 223-246.Peng, S., Buresh, R.J., Huang, J., Yang, J., Zou, Y., Zhong, X., Wang, G., Zhang, F. (2006) Strategiesfor overcoming low agronomic nitrogen use efficiency in irrigated rice systems in China. Field CropsResearch 96, 37-47.Rao, N., Sant, G., Rajan, S.C., Gambhir, A., Gadag, G., (2009) An overview of Indian Energy Trends:Low Carbon Growth and Development Challenges. Prayas, Pune, India.
129
Reddy, D.N. (2011) NREGS and Indian Agriculture: Opportunities and Challenges. Bepresshttp://works.bepress.com/cgi/viewcontent.cgi?article=1013&context=narasimha_reddy.Reddy, D.N. and Venkataranarayana M., (2013) SRI Cultivation in Andhra Pradesh: Achievements,Problems and Implications for GHGs and Work, in: Harriss-White, B. (Ed.), Technology, Jobs and ALower Carbon Future: Methods, Substance and Ideas for the Informal Economy (The case of rice inIndia) Delhi.Rockstrom, J., Steffen, W., Noone, K., Persson, A., Chapin, F.S., Lambin, E.F., Lenton, T.M.,Scheffer, M., Folke, C., Schellnhuber, H.J., Nykvist, B., de Wit, C.A., Hughes, T., van der Leeuw, S.,Rodhe, H., Sorlin, S., Snyder, P.K., Costanza, R., Svedin, U., Falkenmark, M., Karlberg, L., Corell,R.W., Fabry, V.J., Hansen, J., Walker, B., Liverman, D., Richardson, K., Crutzen, P., Foley, J.A.(2009) A safe operating space for humanity. Nature 461, 472-475.Searchinger, T., Heimlich, R., Houghton, R.A., Dong, F., Elobeid, A., Fabiosa, J., Tokgoz, S., Hayes,D., Yu, T.-H. (2008) Use of U.S. Croplands for Biofuels Increases Greenhouse Gases ThroughEmissions from Land-Use Change. Science 319, 1238-1240.Singh, Y.V. (2013) Crop and water productivity as influenced by rice cultivation methods underorganic and inorganic sources of nutrient supply. Paddy and Water Environment 11, 531-542.Smil, V. (2006) Energy In Nature And Society General Energetics of Complex Systems. MIT Press,Boston.Uphoff, N., (2008) The System of Rice Intensification (SRI) as a System of Agricultural Innovation,http://repository.ipb.ac.id/handle/123456789/43778.Williams, A.G., Audsley, E., Sandars, D.L., (2006) Determining the environmental burdens andresource use in the production of agricultural and horticultural commodities. Cranfield University andDefra, Bedford.
130
SRI CULTIVATION IN ANDHRA PRADESH: ACHIEVEMENTS,
PROBLEMS AND IMPLICATIONS FOR GHGS AND WORK
D.N. Reddy
131
SRI CULTIVATION IN ANDHRA PRADESH: ACHIEVEMENTS, PROBLEMS AND
IMPLICATIONS FOR GHGS AND WORK
D. Narasimha Reddy€ and M. Venkatanarayana£¥
System of Rice Intensification (SRI): Evidence for its Superiority
1.1 Introduction
Rice is one of the most important staple food-grains, and ranks third in production among food-grain
crops in the world next to maize and wheat. It is also the most irrigation-intensive crop in the world:
more than two-thirds of irrigated area is under rice cultivation. However, it is the only cereal crop that
can grow under both flooded and dry conditions. The practices of rice cultivation have undergone
changes over time from simple broadcasting to systematic transplantation. Though an enduring
feature of rice is water intensity, it is cultivated not only in the humid and high rainfall areas but also
in semi-arid regions, by tapping ground water resources.
However, the increasing demand and the resulting pressure on scarce water resources, particularly
ground water, calls for water use efficiency in agriculture, semi-arid tropical rice in particular. Water
efficiency has also become an important issue in the context of climate change and the rising emission
of greenhouse gases (GHGs). The major greenhouse gases are carbon dioxide (CO2), methane and
nitrous oxide. Many anthropogenic activities contribute to the release of these greenhouse gases.
Agricultural activities in general and rice cultivation -following the conventional flood or submerge
method in particular - contribute to emissions (see Gathorne-Hardy 2013). In the submerge method,
standing water in the rice fields generates water evaporation, methane and nitrous oxide; fertiliser
generates nitrous oxide. Especially in semi-arid regions, ground water is lifted using energy
generated through the combustion of fossil fuels which are powerful emitters of carbon
dioxide (CO2).
Strategies and solutions to meet the challenges of GHGs call for new methods and technologies.
Potential options for the rice industry sector to contribute to the mitigation of, and adaptation to,
climate change by increasing rice production in a physically sustainable manner are attracting
growing research interest. One such area of interest is the new method of rice cultivation: the System
of Rice Intensification (SRI). SRI is an innovative approach to rice cultivation but not a technology as
€Professor, S R Sankaran Chair (Rural Labour), NIRD, Hyderabad.£Junior Research Officer, S R Sankaran Chair, NIRD, Hyderabad.¥The authors are grateful to Prof. Barbara Harriss White for her helpful comments on earlier drafts of the paper.(This is one of the background papers of the project “Measuring Materiality in Informal Production-DistributionSystems”).
132
such. Unlike conventional rice cultivation methods that use flooding/submergence and are prone to
the emission of greenhouse gases, the SRI method requires substantially less water, resulting in
important energy savings from pumping. In turn this not only improves water use efficiency but also
increases yields and- with less seed, water, pesticides and chemical fertilizers - results in reduced
costs of cultivation as will be evident from the data presented later in this paper. The net effect is that
SRI is able to improve household incomes and food security while reducing the negative
environmental impacts of rice production, and making food production more resilient
(Africare_Oxfam AmericaWWF-ICRISAT Project, 2010).
The evolution of the SRI technique of rice cultivation has shown that the core components of the
Green Revolution–high doses of fertilisers, pesticides and water - are not necessary to achieve
increased yields (Uphoff, ud 1).The principles of SRI contest the belief that rice plants do better in
saturated soils, and prove that rice plants can grow in soils under modest moisture condition without
being continuously flooded. The development of SRI also established that farmers are not always at
the receiving end of science and technology developed by research establishments, for farmers
themselves have been shown to make innovations in farming methods and practices.
1.2 The Shift to SRI: Readjustments in Agronomic Practices and Operational Methods
The shift from conventional rice cultivation to SRI involves changes in some agronomic practices.
For instance certain studies identify the use of single seedlings per hill, transplanting younger
seedlings of less than 15 days, square planting (25 x 25 cm) and cona-weeding as the four core SRI-
practices (Laulanie, 1992 & 2011, Palanisami et.al. 2013). Timely scheduling acquires considerable
significance so will be discussed briefly here.
Unlike transplanting relatively older (30 to 45 days) seedlings oat the density of three or four per hill
as is the convention, for SRI, the seedlings are young (8 to 14 days old at the two-leaf stage) and
single seedlings are transplanted in a wider square grid laid out with the help of a marker. The sparse
transplanting of single seedlings under SRI reduces the seed requirement to an eighth to a tenth of that
of conventional transplanting, and reduces labour requirement by almost half. But the transplanting of
single, young seedlings is a delicate operation, requiring skill gained through experience.
Transplanting continues to be an operation confined to women, but with reduced numbers and
improved skills, which women acquire without difficulty.
Weeding is a second SRI operation differing from conventional cultivation practices in a number of
respects. First, for SRI, manual weeding is displaced by a mechanical weeder. Whereas under
conventional rice production, weeding is an entirely female operation, in SRI it is evolving into male
133
work, though there are exceptional instances of female labour. Then, SRI requires early and more
frequent weeding, from the tenth day after transplanting, and followed by three or four iterations with
a gap of ten days in between. Early and frequent mechanical weeding crushes tender weeds into the
soil to serve as a green manure, enriching both the soil and the crop. One observation often heard at
the field level, is that mechanical weeding is arduous and monotonous, especially when a lone worker
is engaged in it.
The most critical aspect of transition from the conventional system to SRI is the need for timely and
intensive crop management. While conventional practices cope with the need for flexibility at all
stages of growth, right from the possibility of transplanting older seedlings (30 to 45 days), through
random and relatively thick transplanting (by using five or six seedlings at a spot and inundating the
field with irrigation water without any need to drain it. By contrast, SRI requires early and more
systematic transplanting, timely and frequent weeding and ‘alternate wetting and drying’ instead of
flooding.
1.3SRI and Greenhouse Gases (GHGs)
As mentioned above, the greenhouse gases with high global warming potentials (GWP) in the
atmosphere are, in order of their importance, Carbon Dioxide (CO2), Methane (CH4), and Nitrous
Oxide (N2O). The contribution of each gas to the greenhouse effect depends on the quantity emitted,
the radiative force and their atmospheric life-time. Rice cultivation under conditions of flooded
irrigation is one of the major man-made sources of these GHGs..
There is a considerable debate over the global warming potentials (GWP)of rice cultivation under
different irrigation and water management systems(Jayadev et al, 2009; Quin et al, 2010; and Peng et
al, 2011). A recent study in China found that under controlled irrigation, the GWP of rice cultivation
is relatively low (Peng et al, 2011a&b). Global warming potentials of methane and nitrous oxide are
62.23gCO2 m−2for rice-paddy under controlled irrigation, 68.0% lower than for rice grown under
irrigation by flooding (Peng et al, 2011). Due to large reductions in seepage and surface drainage
under efficient conditions of irrigation and drainage and compared with ‘traditional’ practices, the
Chinese research found nitrogen and phosphorous losses through leaching were reduced by 40.1%
and 54.8%, and nitrogen and phosphorous losses through surface drainage by 53.9% and 51.6%.
Nitrogen loss through ammonia volatilization was reduced by 14.0%. The Chinese study shows how
efficient irrigation and drainage management helps to mitigate greenhouse gases emissions, nitrogen
and phosphorus losses and their pollution on groundwater and surface water (ibid).In the context of
challenges due to metereological variability, the principles and practices of SRI have other strengths
like drought-coping capacities (SDTT, 2009).
134
1.4Evidence for Yield and Cost Advantages
Studies of SRI cultivation in various parts of the world, in Andhra Pradesh, the site of our field
studies, and elsewhere in India have shown that both yield rates and water use efficiency have
improved (see for instance Uphoff, ud1; Lin et al, 2011; Kassam et al, 2011, Thakur et al, 2011,
Ravindra and Laxmi, 2011, V & A Programme, 2009). SRI cropping methods can outperform the
conventional management of rice in flooded, wetland paddy agriculture - whether evaluated in terms
of output (yield), productivity (efficiency), profitability, or resource conservation (Kassam et al,
2011).. A macro-level study covering 13 major rice-growing states in India, indicates that fields with
SRI have 22.4 percent higher average yield compared to non-SRI fields. However the superiority of
SRI yields varies across the states from 12 percent in Assam to 53.6 percent in Gujarat (Palanisami
et.al. 2013). SRI’s advantages also accrue to income and reduced costs. On average, the gross
earnings from SRI are 18 percent higher than non-SRI, and average per hectare costs are 29 percent
less in SRI than for non-SRI production. Further, yield levels vary positively with the variation in the
extent to which the core practices of SRI are adopted.
Evidence from Andhra Pradesh also supports the observations of higher yield rates of rice under SRI
cultivation (Rao, 2011; Ravindra and Laxmi, 2011; and V & A Programme, 2009). A study of the
economics and sustainability of SRI and traditional methods of paddy cultivation in the North Coastal
Zone51, concludes that the benefit-cost ratio (BCR) was higher for SRI (1.76) than for traditional
methods (1.25) for the same crop variety. (Rao, 2011). It also found a 31 per cent yield gap between
SRI and traditional methods. Operating practices had a stronger effect than input use (20.15% versus
10.85%) in explaining this gap.
Field studies have also shown that water use efficiency varies with different rice cultivation systems.
Compared to the conventional methods, water use/consumption under SRI is substantially lower and
water use efficiency is higher (Ravindra and Laxmi, 2011; Reddy et al, 2006). These relationships
hold for both tank and tube/shallow well based irrigation systems. The use of other inputs such as
chemical fertilisers and pesticides is substantially lower for SRI52(Ravindra and Laxmi, 2011; V & A
Programme, 2009). With the savings in water and other inputs, and the consequent reduction in
cultivation costs, the overall gains of SRI cultivation are found to be substantially higher than for
conventional modes of cultivation (Ravindra and Laxmi, 2011; V & A Programme, 2009).
51The reference agriculture year is 2008–09 and based on the data of costs and returns of crop. The analytical
methods used included budgeting techniques, benefit-cost ratio (BCR), yield gap analysis, sustainability indexand response priority index.52
It is due to the practice weeding using rotary/conoweeder coverts the weeding into organic fertilizer andwider space between plants allows soil aeration and improves the soil biota. The wider space between riceplant hills is relatively aerated and allows sunrays and thus reduces the chances of pest attack.
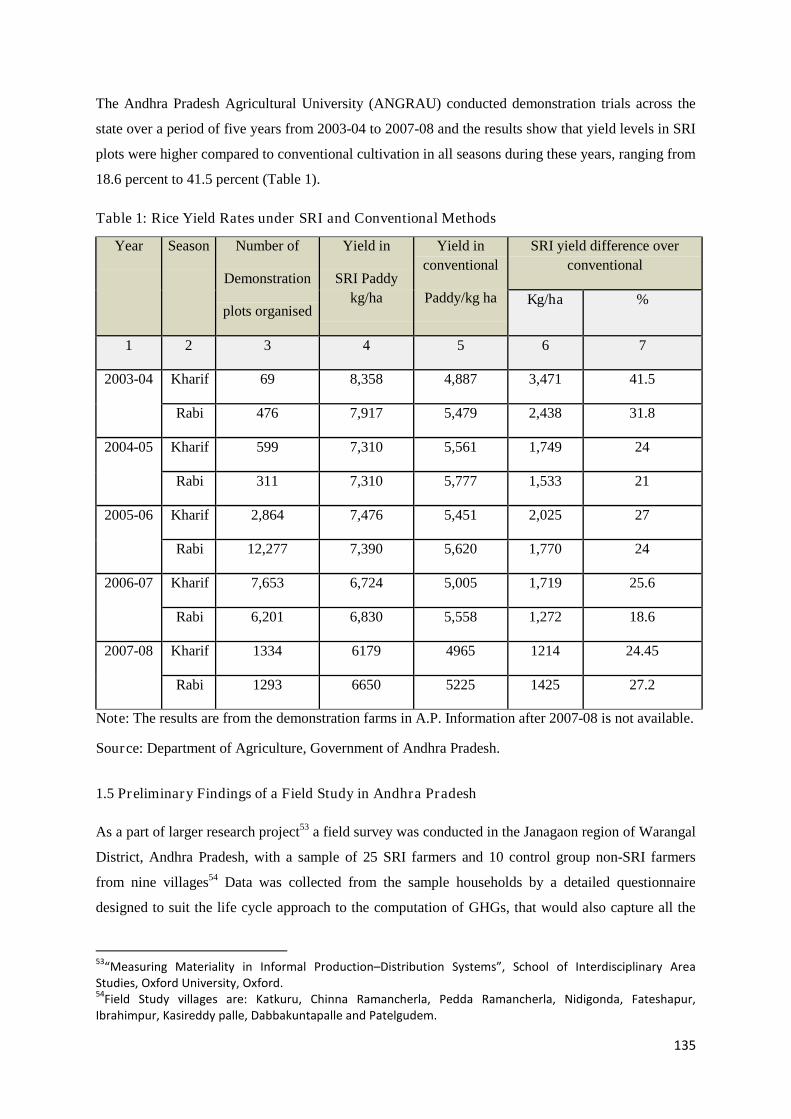
135
The Andhra Pradesh Agricultural University (ANGRAU) conducted demonstration trials across the
state over a period of five years from 2003-04 to 2007-08 and the results show that yield levels in SRI
plots were higher compared to conventional cultivation in all seasons during these years, ranging from
18.6 percent to 41.5 percent (Table 1).
Table 1: Rice Yield Rates under SRI and Conventional Methods
Year Season Number of
Demonstration
plots organised
Yield in
SRI Paddy
kg/ha
Yield in
conventional
Paddy/kg ha
SRI yield difference over
conventional
Kg/ha %
1 2 3 4 5 6 7
2003-04 Kharif 69 8,358 4,887 3,471 41.5
Rabi 476 7,917 5,479 2,438 31.8
2004-05 Kharif 599 7,310 5,561 1,749 24
Rabi 311 7,310 5,777 1,533 21
2005-06 Kharif 2,864 7,476 5,451 2,025 27
Rabi 12,277 7,390 5,620 1,770 24
2006-07 Kharif 7,653 6,724 5,005 1,719 25.6
Rabi 6,201 6,830 5,558 1,272 18.6
2007-08 Kharif 1334 6179 4965 1214 24.45
Rabi 1293 6650 5225 1425 27.2
Note: The results are from the demonstration farms in A.P. Information after 2007-08 is not available.
Source: Department of Agriculture, Government of Andhra Pradesh.
1.5 Preliminary Findings of a Field Study in Andhra Pradesh
As a part of larger research project53 a field survey was conducted in the Janagaon region of Warangal
District, Andhra Pradesh, with a sample of 25 SRI farmers and 10 control group non-SRI farmers
from nine villages54 Data was collected from the sample households by a detailed questionnaire
designed to suit the life cycle approach to the computation of GHGs, that would also capture all the
53“Measuring Materiality in Informal Production–Distribution Systems”, School of Interdisciplinary Area
Studies, Oxford University, Oxford.54
Field Study villages are: Katkuru, Chinna Ramancherla, Pedda Ramancherla, Nidigonda, Fateshapur,Ibrahimpur, Kasireddy palle, Dabbakuntapalle and Patelgudem.
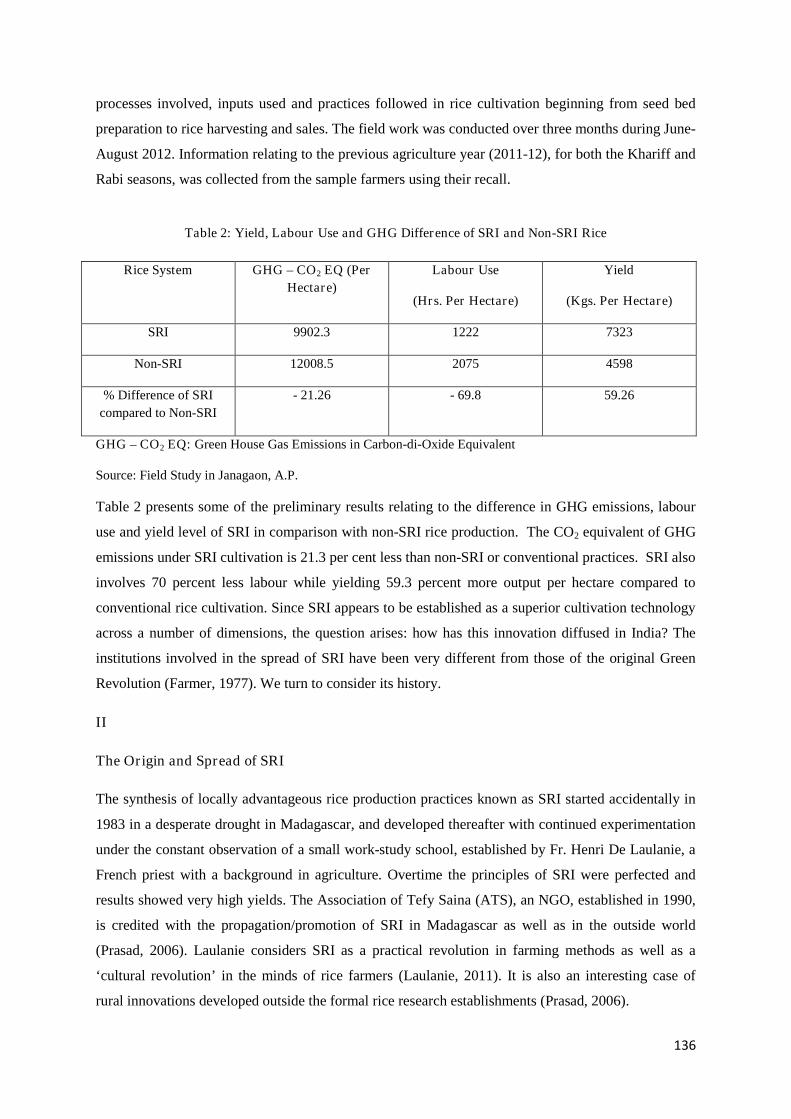
136
processes involved, inputs used and practices followed in rice cultivation beginning from seed bed
preparation to rice harvesting and sales. The field work was conducted over three months during June-
August 2012. Information relating to the previous agriculture year (2011-12), for both the Khariff and
Rabi seasons, was collected from the sample farmers using their recall.
Table 2: Yield, Labour Use and GHG Difference of SRI and Non-SRI Rice
Rice System GHG – CO2 EQ (Per
Hectare)
Labour Use
(Hrs. Per Hectare)
Yield
(Kgs. Per Hectare)
SRI 9902.3 1222 7323
Non-SRI 12008.5 2075 4598
% Difference of SRI
compared to Non-SRI
- 21.26 - 69.8 59.26
GHG – CO2 EQ: Green House Gas Emissions in Carbon-di-Oxide Equivalent
Source: Field Study in Janagaon, A.P.
Table 2 presents some of the preliminary results relating to the difference in GHG emissions, labour
use and yield level of SRI in comparison with non-SRI rice production. The CO2 equivalent of GHG
emissions under SRI cultivation is 21.3 per cent less than non-SRI or conventional practices. SRI also
involves 70 percent less labour while yielding 59.3 percent more output per hectare compared to
conventional rice cultivation. Since SRI appears to be established as a superior cultivation technology
across a number of dimensions, the question arises: how has this innovation diffused in India? The
institutions involved in the spread of SRI have been very different from those of the original Green
Revolution (Farmer, 1977). We turn to consider its history.
II
The Origin and Spread of SRI
The synthesis of locally advantageous rice production practices known as SRI started accidentally in
1983 in a desperate drought in Madagascar, and developed thereafter with continued experimentation
under the constant observation of a small work-study school, established by Fr. Henri De Laulanie, a
French priest with a background in agriculture. Overtime the principles of SRI were perfected and
results showed very high yields. The Association of Tefy Saina (ATS), an NGO, established in 1990,
is credited with the propagation/promotion of SRI in Madagascar as well as in the outside world
(Prasad, 2006). Laulanie considers SRI as a practical revolution in farming methods as well as a
‘cultural revolution’ in the minds of rice farmers (Laulanie, 2011). It is also an interesting case of
rural innovations developed outside the formal rice research establishments (Prasad, 2006).
137
However, until 1994, SRI was unknown to the rest of the world until the Cornell International
Institute for Food, Agriculture and Development (CIIFAD) mounted a collaborative project with ATS
to propagate the Madagascar innovations. In particular, credit is due to Dr. Norman Uphoff of
Cornell55 for bringing SRI to the notice of others. Following his three-year study of Malagassy
farmers, Uphoff carried the idea to Asian farmers and from 1997 started to promote SRI in Asia (V &
A Programme, 2009). Since 1999, with the efforts of CIIFAD efforts, the local phenomenon grew to a
global movement with farmers in 50 countries, especially in semi-arid regions, attempting to adopt
SRI to varying degrees (V & A Programme, 2009). In Asia, along with India, Sri Lanka, the
Philippines, Malaysia and Vietnam have made notable progress.
2.1 SRI in India
In India rice cultivation occupies around one-fourth of the total cropped area. It is the largest crop
produced in the country, accounting for two-fifths of total food grains production. The green
revolution technology intensified rice cultivation in India using irrigation and other inputs such as
chemical fertilisers and pesticides. Around 60% of the rice cultivation in India takes place in irrigated
areas - one-third of total irrigated area in India is down to rice (GoI, 2011). Innovations in rice
production have been led by a combination of state and market. The origins of SRI were different.
Initially brought to India through a pamphlet carried by a tourist visiting Pondicherry in 1999, SRI
trials were immediately conducted in Aurovelli there. Later a scientist from Tamil Nadu Agricultural
University participated in an international seminar dealing with innovations in rice cultivation, and
after his return in 2002 a modified version involving principles of SRI was experimented with in
Tamil Nadu (Prasad, 2006).
Initially SRI principles and practices were subject to experiments by progressive farmers and
promoted by civil society organisations (national and international NGOs). Over the years, state
organisations (research establishments, relevant Departments and Ministries) have promoted SRI
(Prasad, 2006). At an All-India level, the National Food Security Mission (NFSM) promoted SRI in
several states, joined more recently by NABARD. Several Indian states have responded positively to
the adoption of SRI practices – but at a very slow pace. So far there has not been a policy framework
that disseminates SRI nationally
Of the 600 plus districts in India, more than a third have instances of where farmers were initiated into
SRI, but there is no information on how much of it has been sustained. Civil society groups have
made the case for including SRI in the National Rural Employment Guarantee Scheme (NREGS)
programme. The proposal is to use the innovative institutional mechanisms established for NREGS to
55Cornell International Institute for Food and Agriculture (Ithaca, USA).
138
support the transition of rice production to SRI by providing incentives to both farmers and
workers/labourers to learn the necessary skills and using NREGS to buffer the transition to new
methods. Rather than giving a direct labour subsidy to farmers practising SRI (NCS, 2012), the
NREGS programme would pay labourers helping small or medium SRI farmers to practise these new
SRI transplanting and weeding methods...
Andhra Pradesh is among the several states considered as ‘SRI-adopting’ so its diffusion process is of
scientific interest. We move in the following sections to contextualise the position and problems of
rice in the agricultural economy of Andhra Pradesh (section III), then to analyse critically the place of
SRI in the context of the rice economy (section IV) before turning to a case study of best practice
within SRI (section 4.3) and the lessons that may be learned from it. We conclude by assessing some
institutional and policy developments that would improve the prospects for SRI in Andhra Pradesh.
III
Performance of Agriculture and Rice Cultivation in Andhra Pradesh
3.1 Agriculture in Andhra Pradesh’s Economy
Andhra Pradesh is the fifth largest state in India in terms of population, and the fourth largest in terms
of geographical area. It is the fourth largest economy in India next to Maharashtra, Uttar Pradesh and
Tamil Nadu. With respect to value-added in agriculture it ranks second, after Uttar Pradesh. While
accounting for 7% of the population, AP contributes approximately11% of India’s total agricultural
GDP. It is the fourth largest state in terms of area under cultivation and irrigated area, the third largest
in food-grain production and the second largest in terms of the value of livestock production. Andhra
Pradesh is one of the states which adopted the green revolution from the earliest stages. In 2008-9, it
was the fourth largest state in terms of area under rice cultivation, next to Uttar Pradesh, West Bengal
and Orissa. And about a quarter of the total value of output from crop production in the state is from
paddy. In recent years agricultural GSDP in the state has been growing at 5% per annum,
considerably above the All-India average. However, Table 3 shows that the share of agriculture and
allied activities in the GSDP of the state and the share of crop sector within agriculture have been on a
trend of decline. Here we analyse basic physical and economic parameters of rice production in the
state before turning to the problems and challenges arising from them.
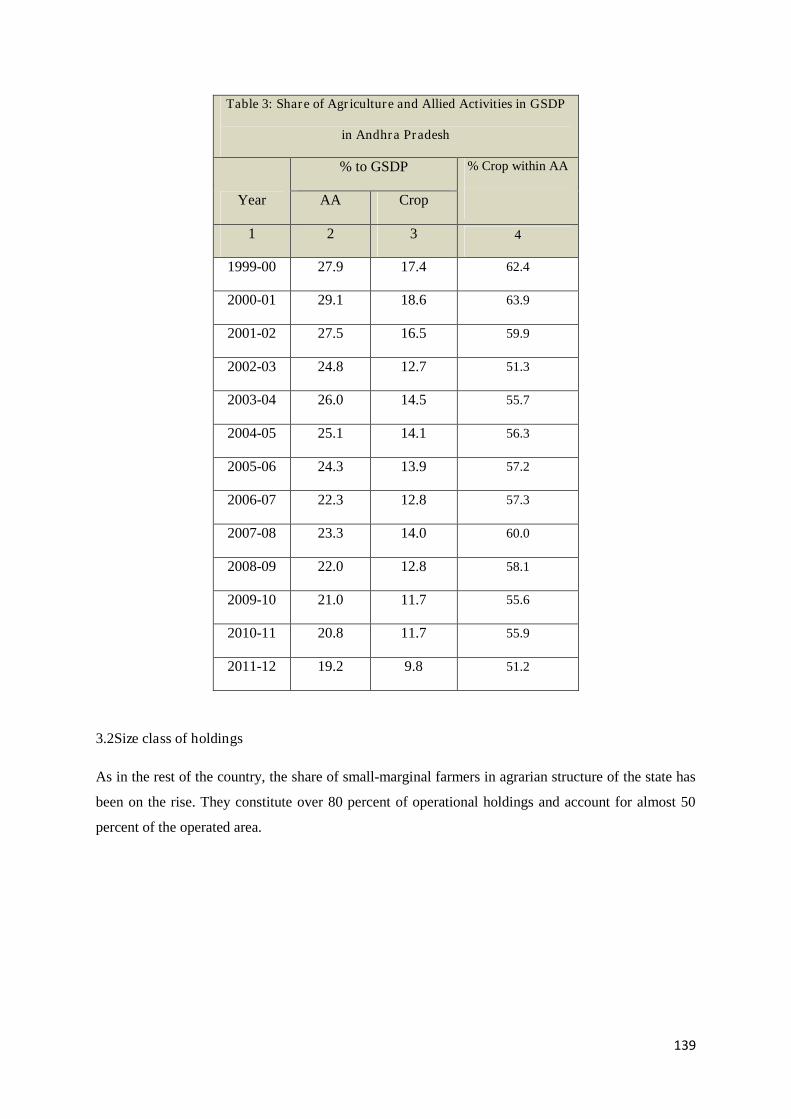
139
Table 3: Share of Agriculture and Allied Activities in GSDP
in Andhra Pradesh
Year
% to GSDP % Crop within AA
AA Crop
1 2 3 4
1999-00 27.9 17.4 62.4
2000-01 29.1 18.6 63.9
2001-02 27.5 16.5 59.9
2002-03 24.8 12.7 51.3
2003-04 26.0 14.5 55.7
2004-05 25.1 14.1 56.3
2005-06 24.3 13.9 57.2
2006-07 22.3 12.8 57.3
2007-08 23.3 14.0 60.0
2008-09 22.0 12.8 58.1
2009-10 21.0 11.7 55.6
2010-11 20.8 11.7 55.9
2011-12 19.2 9.8 51.2
3.2Size class of holdings
As in the rest of the country, the share of small-marginal farmers in agrarian structure of the state has
been on the rise. They constitute over 80 percent of operational holdings and account for almost 50
percent of the operated area.
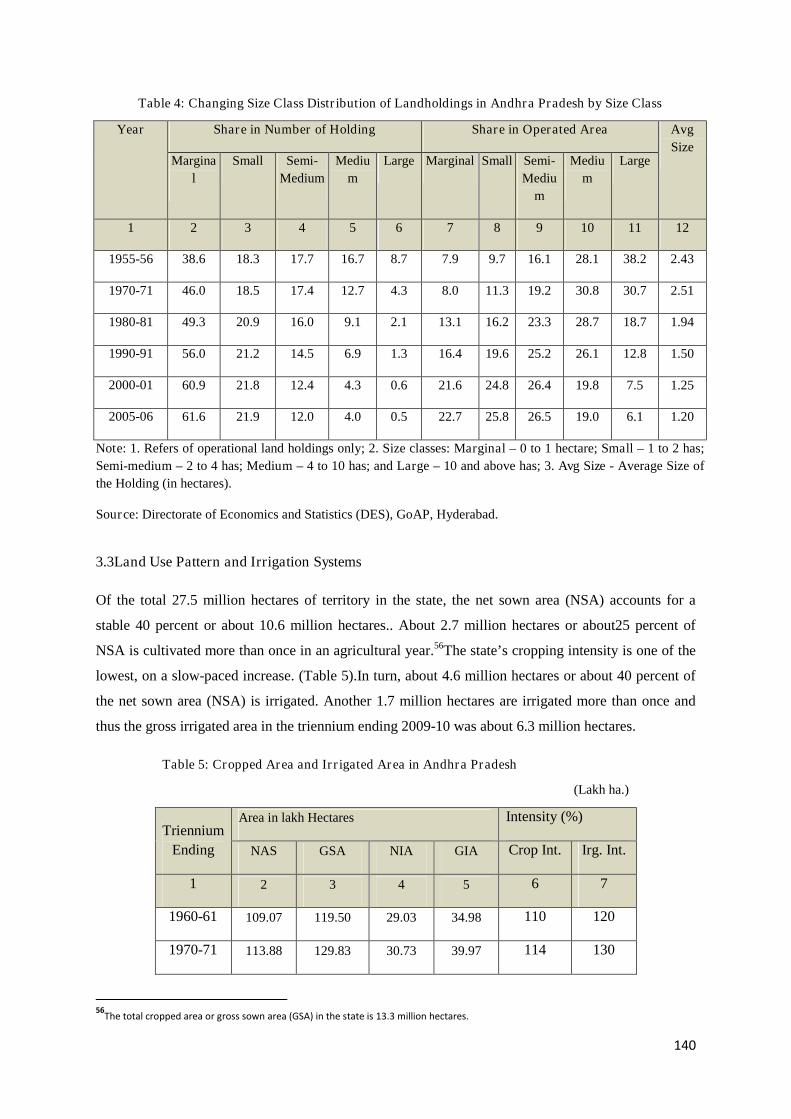
140
Table 4: Changing Size Class Distribution of Landholdings in Andhra Pradesh by Size Class
Year Share in Number of Holding Share in Operated Area Avg
SizeMargina
l
Small Semi-
Medium
Mediu
m
Large Marginal Small Semi-
Mediu
m
Mediu
m
Large
1 2 3 4 5 6 7 8 9 10 11 12
1955-56 38.6 18.3 17.7 16.7 8.7 7.9 9.7 16.1 28.1 38.2 2.43
1970-71 46.0 18.5 17.4 12.7 4.3 8.0 11.3 19.2 30.8 30.7 2.51
1980-81 49.3 20.9 16.0 9.1 2.1 13.1 16.2 23.3 28.7 18.7 1.94
1990-91 56.0 21.2 14.5 6.9 1.3 16.4 19.6 25.2 26.1 12.8 1.50
2000-01 60.9 21.8 12.4 4.3 0.6 21.6 24.8 26.4 19.8 7.5 1.25
2005-06 61.6 21.9 12.0 4.0 0.5 22.7 25.8 26.5 19.0 6.1 1.20
Note: 1. Refers of operational land holdings only; 2. Size classes: Marginal – 0 to 1 hectare; Small – 1 to 2 has;
Semi-medium – 2 to 4 has; Medium – 4 to 10 has; and Large – 10 and above has; 3. Avg Size - Average Size of
the Holding (in hectares).
Source: Directorate of Economics and Statistics (DES), GoAP, Hyderabad.
3.3Land Use Pattern and Irrigation Systems
Of the total 27.5 million hectares of territory in the state, the net sown area (NSA) accounts for a
stable 40 percent or about 10.6 million hectares.. About 2.7 million hectares or about25 percent of
NSA is cultivated more than once in an agricultural year.56The state’s cropping intensity is one of the
lowest, on a slow-paced increase. (Table 5).In turn, about 4.6 million hectares or about 40 percent of
the net sown area (NSA) is irrigated. Another 1.7 million hectares are irrigated more than once and
thus the gross irrigated area in the triennium ending 2009-10 was about 6.3 million hectares.
Table 5: Cropped Area and Irrigated Area in Andhra Pradesh
(Lakh ha.)
Triennium
Ending
Area in lakh Hectares Intensity (%)
NAS GSA NIA GIA Crop Int. Irg. Int.
1 2 3 4 5 6 7
1960-61 109.07 119.50 29.03 34.98 110 120
1970-71 113.88 129.83 30.73 39.97 114 130
56The total cropped area or gross sown area (GSA) in the state is 13.3 million hectares.
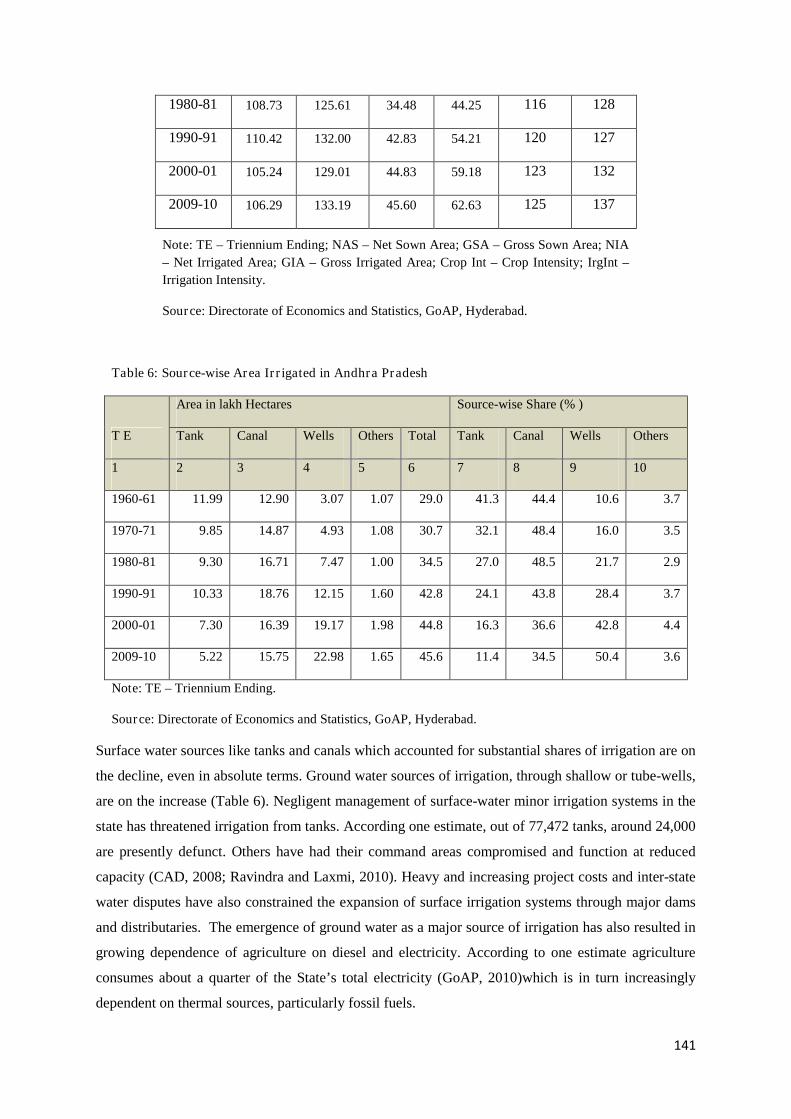
141
1980-81 108.73 125.61 34.48 44.25 116 128
1990-91 110.42 132.00 42.83 54.21 120 127
2000-01 105.24 129.01 44.83 59.18 123 132
2009-10 106.29 133.19 45.60 62.63 125 137
Note: TE – Triennium Ending; NAS – Net Sown Area; GSA – Gross Sown Area; NIA
– Net Irrigated Area; GIA – Gross Irrigated Area; Crop Int – Crop Intensity; IrgInt –
Irrigation Intensity.
Source: Directorate of Economics and Statistics, GoAP, Hyderabad.
Table 6: Source-wise Area Irrigated in Andhra Pradesh
T E
Area in lakh Hectares Source-wise Share (% )
Tank Canal Wells Others Total Tank Canal Wells Others
1 2 3 4 5 6 7 8 9 10
1960-61 11.99 12.90 3.07 1.07 29.0 41.3 44.4 10.6 3.7
1970-71 9.85 14.87 4.93 1.08 30.7 32.1 48.4 16.0 3.5
1980-81 9.30 16.71 7.47 1.00 34.5 27.0 48.5 21.7 2.9
1990-91 10.33 18.76 12.15 1.60 42.8 24.1 43.8 28.4 3.7
2000-01 7.30 16.39 19.17 1.98 44.8 16.3 36.6 42.8 4.4
2009-10 5.22 15.75 22.98 1.65 45.6 11.4 34.5 50.4 3.6
Note: TE – Triennium Ending.
Source: Directorate of Economics and Statistics, GoAP, Hyderabad.
Surface water sources like tanks and canals which accounted for substantial shares of irrigation are on
the decline, even in absolute terms. Ground water sources of irrigation, through shallow or tube-wells,
are on the increase (Table 6). Negligent management of surface-water minor irrigation systems in the
state has threatened irrigation from tanks. According one estimate, out of 77,472 tanks, around 24,000
are presently defunct. Others have had their command areas compromised and function at reduced
capacity (CAD, 2008; Ravindra and Laxmi, 2010). Heavy and increasing project costs and inter-state
water disputes have also constrained the expansion of surface irrigation systems through major dams
and distributaries. The emergence of ground water as a major source of irrigation has also resulted in
growing dependence of agriculture on diesel and electricity. According to one estimate agriculture
consumes about a quarter of the State’s total electricity (GoAP, 2010)which is in turn increasingly
dependent on thermal sources, particularly fossil fuels.
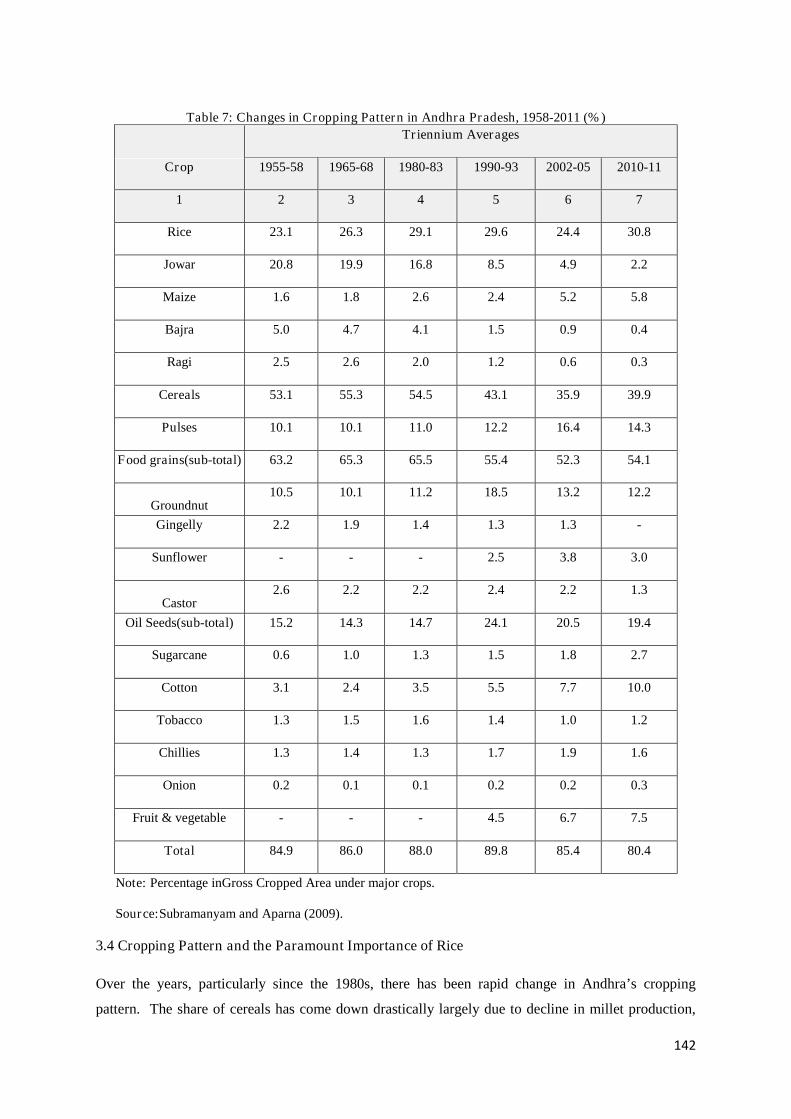
142
Table 7: Changes in Cropping Pattern in Andhra Pradesh, 1958-2011 (%)
Crop
Triennium Averages
1955-58 1965-68 1980-83 1990-93 2002-05 2010-11
1 2 3 4 5 6 7
Rice 23.1 26.3 29.1 29.6 24.4 30.8
Jowar 20.8 19.9 16.8 8.5 4.9 2.2
Maize 1.6 1.8 2.6 2.4 5.2 5.8
Bajra 5.0 4.7 4.1 1.5 0.9 0.4
Ragi 2.5 2.6 2.0 1.2 0.6 0.3
Cereals 53.1 55.3 54.5 43.1 35.9 39.9
Pulses 10.1 10.1 11.0 12.2 16.4 14.3
Food grains(sub-total) 63.2 65.3 65.5 55.4 52.3 54.1
Groundnut10.5 10.1 11.2 18.5 13.2 12.2
Gingelly 2.2 1.9 1.4 1.3 1.3 -
Sunflower - - - 2.5 3.8 3.0
Castor2.6 2.2 2.2 2.4 2.2 1.3
Oil Seeds(sub-total) 15.2 14.3 14.7 24.1 20.5 19.4
Sugarcane 0.6 1.0 1.3 1.5 1.8 2.7
Cotton 3.1 2.4 3.5 5.5 7.7 10.0
Tobacco 1.3 1.5 1.6 1.4 1.0 1.2
Chillies 1.3 1.4 1.3 1.7 1.9 1.6
Onion 0.2 0.1 0.1 0.2 0.2 0.3
Fruit & vegetable - - - 4.5 6.7 7.5
Total 84.9 86.0 88.0 89.8 85.4 80.4
Note: Percentage inGross Cropped Area under major crops.
Source:Subramanyam and Aparna (2009).
3.4 Cropping Pattern and the Paramount Importance of Rice
Over the years, particularly since the 1980s, there has been rapid change in Andhra’s cropping
pattern. The share of cereals has come down drastically largely due to decline in millet production,
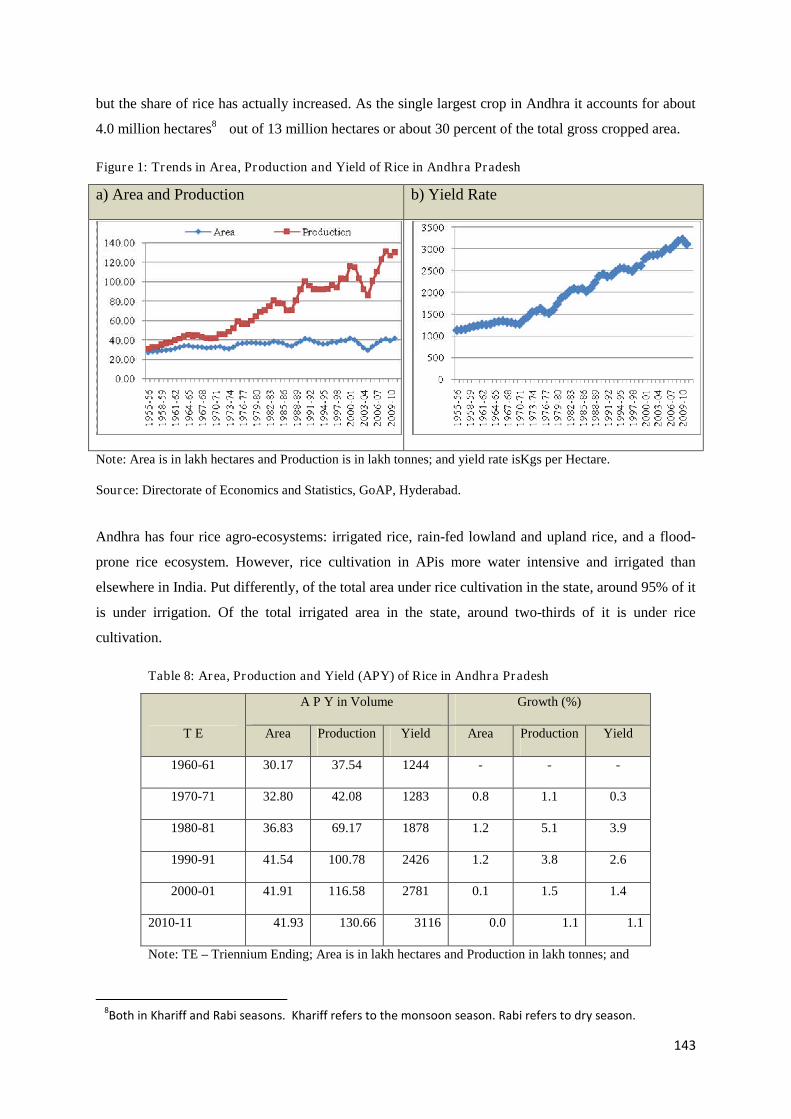
143
but the share of rice has actually increased. As the single largest crop in Andhra it accounts for about
4.0 million hectares857 out of 13 million hectares or about 30 percent of the total gross cropped area.
Figure 1: Trends in Area, Production and Yield of Rice in Andhra Pradesh
a) Area and Production b) Yield Rate
Note: Area is in lakh hectares and Production is in lakh tonnes; and yield rate isKgs per Hectare.
Source: Directorate of Economics and Statistics, GoAP, Hyderabad.
Andhra has four rice agro-ecosystems: irrigated rice, rain-fed lowland and upland rice, and a flood-
prone rice ecosystem. However, rice cultivation in APis more water intensive and irrigated than
elsewhere in India. Put differently, of the total area under rice cultivation in the state, around 95% of it
is under irrigation. Of the total irrigated area in the state, around two-thirds of it is under rice
cultivation.
Table 8: Area, Production and Yield (APY) of Rice in Andhra Pradesh
T E
A P Y in Volume Growth (%)
Area Production Yield Area Production Yield
1960-61 30.17 37.54 1244 - - -
1970-71 32.80 42.08 1283 0.8 1.1 0.3
1980-81 36.83 69.17 1878 1.2 5.1 3.9
1990-91 41.54 100.78 2426 1.2 3.8 2.6
2000-01 41.91 116.58 2781 0.1 1.5 1.4
2010-11 41.93 130.66 3116 0.0 1.1 1.1
Note: TE – Triennium Ending; Area is in lakh hectares and Production in lakh tonnes; and
578Both in Khariff and Rabi seasons. Khariff refers to the monsoon season. Rabi refers to dry season.
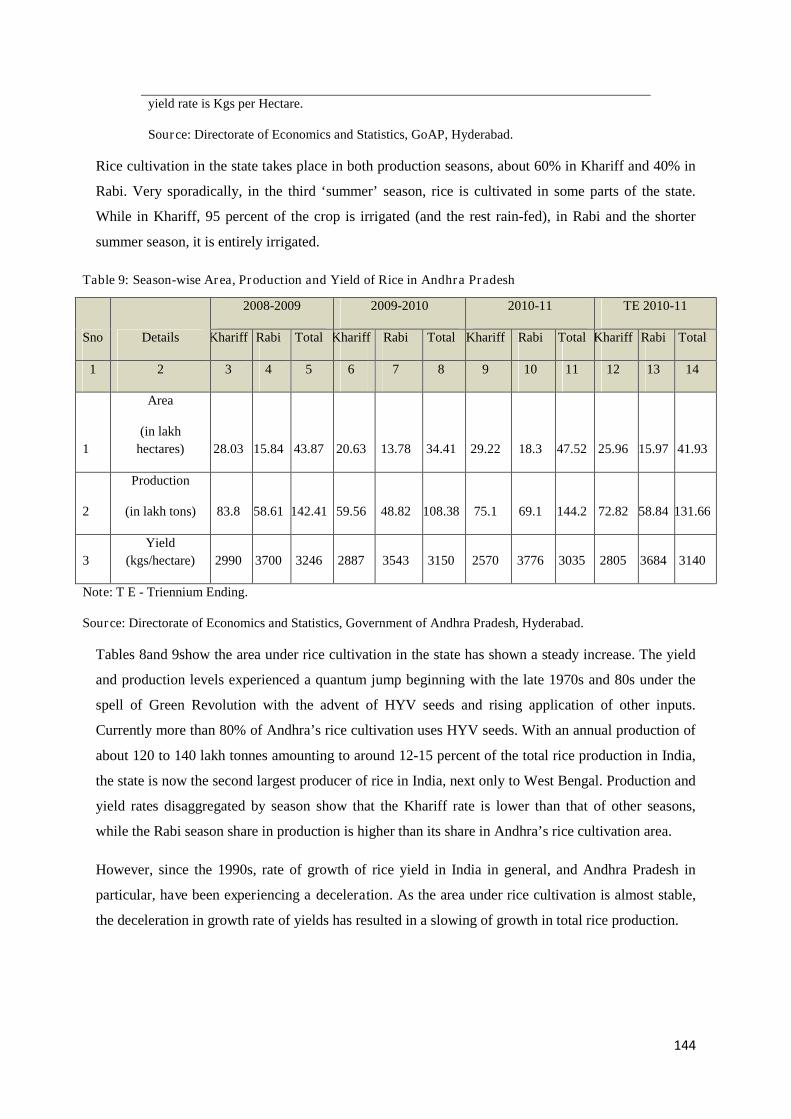
144
yield rate is Kgs per Hectare.
Source: Directorate of Economics and Statistics, GoAP, Hyderabad.
Rice cultivation in the state takes place in both production seasons, about 60% in Khariff and 40% in
Rabi. Very sporadically, in the third ‘summer’ season, rice is cultivated in some parts of the state.
While in Khariff, 95 percent of the crop is irrigated (and the rest rain-fed), in Rabi and the shorter
summer season, it is entirely irrigated.
Table 9: Season-wise Area, Production and Yield of Rice in Andhra Pradesh
Sno Details
2008-2009 2009-2010 2010-11 TE 2010-11
Khariff Rabi Total Khariff Rabi Total Khariff Rabi Total Khariff Rabi Total
1 2 3 4 5 6 7 8 9 10 11 12 13 14
1
Area
(in lakh
hectares) 28.03 15.84 43.87 20.63 13.78 34.41 29.22 18.3 47.52 25.96 15.97 41.93
2
Production
(in lakh tons) 83.8 58.61 142.41 59.56 48.82 108.38 75.1 69.1 144.2 72.82 58.84 131.66
3
Yield
(kgs/hectare) 2990 3700 3246 2887 3543 3150 2570 3776 3035 2805 3684 3140
Note: T E - Triennium Ending.
Source: Directorate of Economics and Statistics, Government of Andhra Pradesh, Hyderabad.
Tables 8and 9show the area under rice cultivation in the state has shown a steady increase. The yield
and production levels experienced a quantum jump beginning with the late 1970s and 80s under the
spell of Green Revolution with the advent of HYV seeds and rising application of other inputs.
Currently more than 80% of Andhra’s rice cultivation uses HYV seeds. With an annual production of
about 120 to 140 lakh tonnes amounting to around 12-15 percent of the total rice production in India,
the state is now the second largest producer of rice in India, next only to West Bengal. Production and
yield rates disaggregated by season show that the Khariff rate is lower than that of other seasons,
while the Rabi season share in production is higher than its share in Andhra’s rice cultivation area.
However, since the 1990s, rate of growth of rice yield in India in general, and Andhra Pradesh in
particular, have been experiencing a deceleration. As the area under rice cultivation is almost stable,
the deceleration in growth rate of yields has resulted in a slowing of growth in total rice production.
145
3.5 Problems and Challenges of Rice Cultivation in A.P.
While the area under rice has increased over the years, rice cultivation is fraught with problems. One
problem is the emergence of water-logging in the Krishna-Godavari delta region. A second is the
increase in the cultivation costs in general, butrice in particular (GoAP, 2011, Laxminarayana et
al, 2011; Ramana Murthy, 2011)58. Then third, the national minimum support price (MSP) is much
lower than the cost of cultivation according to farmers in the State. There have been widespread
protests by the farmers and threats of a ‘crop holiday’ in which farmers stop producing the crop for
market (GoAP, 2011, Laxminarayana et al, 2011). Fourth, there is increasing pressure on ground-
water resources especially in the semi-arid region of Andhrawhere rice is cultivated by water-lifting.
SRI has the potential to mitigate problems of lower yield and higher water consumption and thus
address some of these environmental and economic problems.
IV
SRI in Andhra Pradesh
To see how SRI might mitigate the serious agricultural challenges in AP, we examine the history of
the transfer of this technology and the institutions involved in its adoption, adaptation and spread
(Table 9). Despite the neo-liberal era, it is the state and civil society, not the market, that have
pioneered the propagation of SRI.
4.1 Agencies Propagating SRI in A.P
In Andhra Pradesh, SRI was initiated in Khariff 2002 by a progressive organic farmer, Narayan
Reddy of Karnataka, who experimented with it on his farm prior to sharing his experience with a civil
society organisation, Timbaku Collective, in Anantapur district. The Timbaku Collective began
introducing SRI to a few pioneering farmers in Anantapur district. Prior to these activities, as early as
2001, Ajay Kallam, the Commissioner of Agriculture, Government of Andhra Pradesh had published
an article on SRI in Padipantalu, a magazine published by the State Government on matters relating
to agriculture. But his effort was limited to diffusing knowledge of the method through the popular
press and sharing the ideas with other officials but not to direct trials of SRI (Prasad, 2006).
58These will be supplied when they have been computed from field data gathered in the project ‘Measuring
Materiality in Informal Production-Distribution Systems” – see Hema 2013.
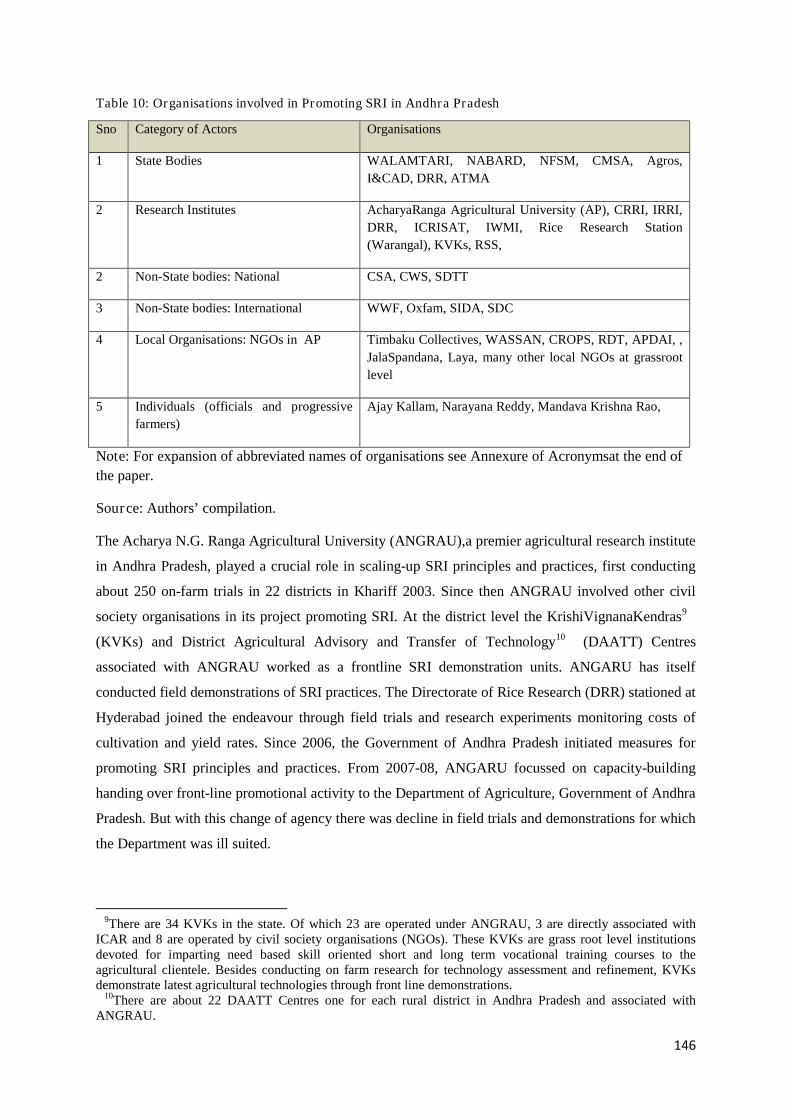
146
Table 10: Organisations involved in Promoting SRI in Andhra Pradesh
Sno Category of Actors Organisations
1 State Bodies WALAMTARI, NABARD, NFSM, CMSA, Agros,
I&CAD, DRR, ATMA
2 Research Institutes AcharyaRanga Agricultural University (AP), CRRI, IRRI,
DRR, ICRISAT, IWMI, Rice Research Station
(Warangal), KVKs, RSS,
2 Non-State bodies: National CSA, CWS, SDTT
3 Non-State bodies: International WWF, Oxfam, SIDA, SDC
4 Local Organisations: NGOs in AP Timbaku Collectives, WASSAN, CROPS, RDT, APDAI, ,
JalaSpandana, Laya, many other local NGOs at grassroot
level
5 Individuals (officials and progressive
farmers)
Ajay Kallam, Narayana Reddy, Mandava Krishna Rao,
Note: For expansion of abbreviated names of organisations see Annexure of Acronymsat the end of
the paper.
Source: Authors’ compilation.
The Acharya N.G. Ranga Agricultural University (ANGRAU),a premier agricultural research institute
in Andhra Pradesh, played a crucial role in scaling-up SRI principles and practices, first conducting
about 250 on-farm trials in 22 districts in Khariff 2003. Since then ANGRAU involved other civil
society organisations in its project promoting SRI. At the district level the KrishiVignanaKendras959
(KVKs) and District Agricultural Advisory and Transfer of Technology1060 (DAATT) Centres
associated with ANGRAU worked as a frontline SRI demonstration units. ANGARU has itself
conducted field demonstrations of SRI practices. The Directorate of Rice Research (DRR) stationed at
Hyderabad joined the endeavour through field trials and research experiments monitoring costs of
cultivation and yield rates. Since 2006, the Government of Andhra Pradesh initiated measures for
promoting SRI principles and practices. From 2007-08, ANGARU focussed on capacity-building
handing over front-line promotional activity to the Department of Agriculture, Government of Andhra
Pradesh. But with this change of agency there was decline in field trials and demonstrations for which
the Department was ill suited.
599There are 34 KVKs in the state. Of which 23 are operated under ANGRAU, 3 are directly associated withICAR and 8 are operated by civil society organisations (NGOs). These KVKs are grass root level institutionsdevoted for imparting need based skill oriented short and long term vocational training courses to theagricultural clientele. Besides conducting on farm research for technology assessment and refinement, KVKsdemonstrate latest agricultural technologies through front line demonstrations.6010There are about 22 DAATT Centres one for each rural district in Andhra Pradesh and associated withANGRAU.
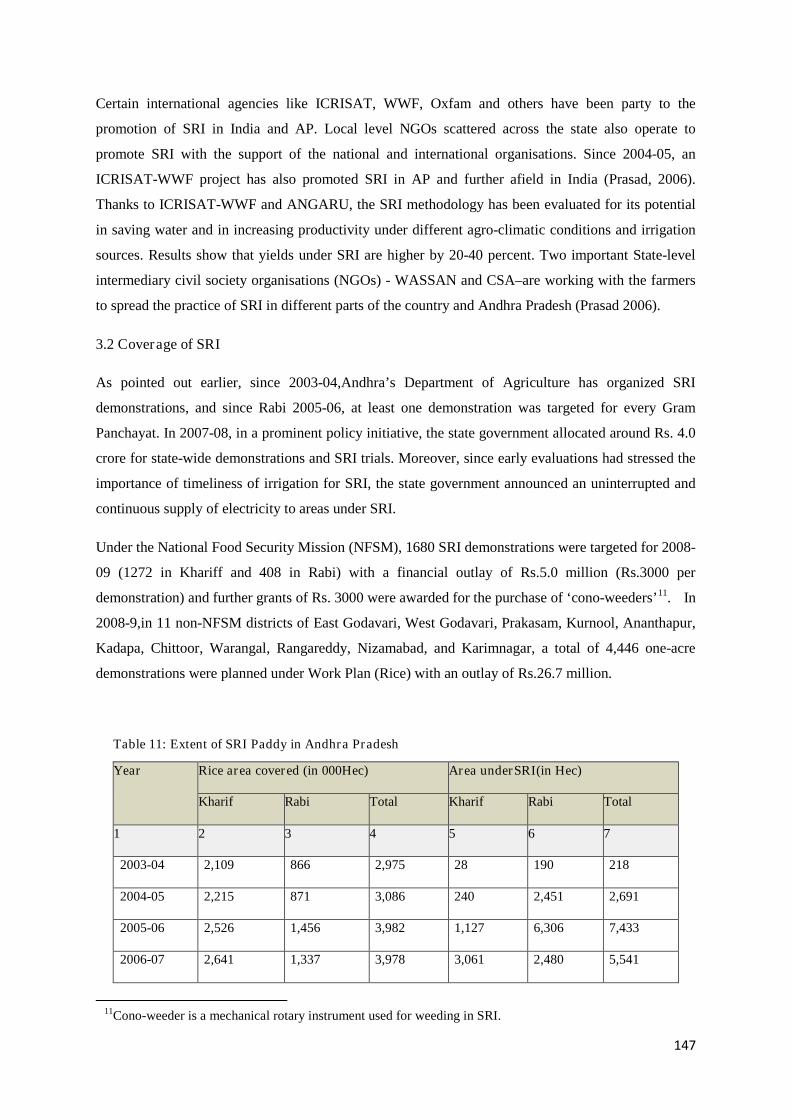
147
Certain international agencies like ICRISAT, WWF, Oxfam and others have been party to the
promotion of SRI in India and AP. Local level NGOs scattered across the state also operate to
promote SRI with the support of the national and international organisations. Since 2004-05, an
ICRISAT-WWF project has also promoted SRI in AP and further afield in India (Prasad, 2006).
Thanks to ICRISAT-WWF and ANGARU, the SRI methodology has been evaluated for its potential
in saving water and in increasing productivity under different agro-climatic conditions and irrigation
sources. Results show that yields under SRI are higher by 20-40 percent. Two important State-level
intermediary civil society organisations (NGOs) - WASSAN and CSA–are working with the farmers
to spread the practice of SRI in different parts of the country and Andhra Pradesh (Prasad 2006).
3.2 Coverage of SRI
As pointed out earlier, since 2003-04,Andhra’s Department of Agriculture has organized SRI
demonstrations, and since Rabi 2005-06, at least one demonstration was targeted for every Gram
Panchayat. In 2007-08, in a prominent policy initiative, the state government allocated around Rs. 4.0
crore for state-wide demonstrations and SRI trials. Moreover, since early evaluations had stressed the
importance of timeliness of irrigation for SRI, the state government announced an uninterrupted and
continuous supply of electricity to areas under SRI.
Under the National Food Security Mission (NFSM), 1680 SRI demonstrations were targeted for 2008-
09 (1272 in Khariff and 408 in Rabi) with a financial outlay of Rs.5.0 million (Rs.3000 per
demonstration) and further grants of Rs. 3000 were awarded for the purchase of ‘cono-weeders’11.61 In
2008-9,in 11 non-NFSM districts of East Godavari, West Godavari, Prakasam, Kurnool, Ananthapur,
Kadapa, Chittoor, Warangal, Rangareddy, Nizamabad, and Karimnagar, a total of 4,446 one-acre
demonstrations were planned under Work Plan (Rice) with an outlay of Rs.26.7 million.
Table 11: Extent of SRI Paddy in Andhra Pradesh
Year Rice area covered (in 000Hec) Area underSRI(in Hec)
Kharif Rabi Total Kharif Rabi Total
1 2 3 4 5 6 7
2003-04 2,109 866 2,975 28 190 218
2004-05 2,215 871 3,086 240 2,451 2,691
2005-06 2,526 1,456 3,982 1,127 6,306 7,433
2006-07 2,641 1,337 3,978 3,061 2,480 5,541
6111Cono-weeder is a mechanical rotary instrument used for weeding in SRI.
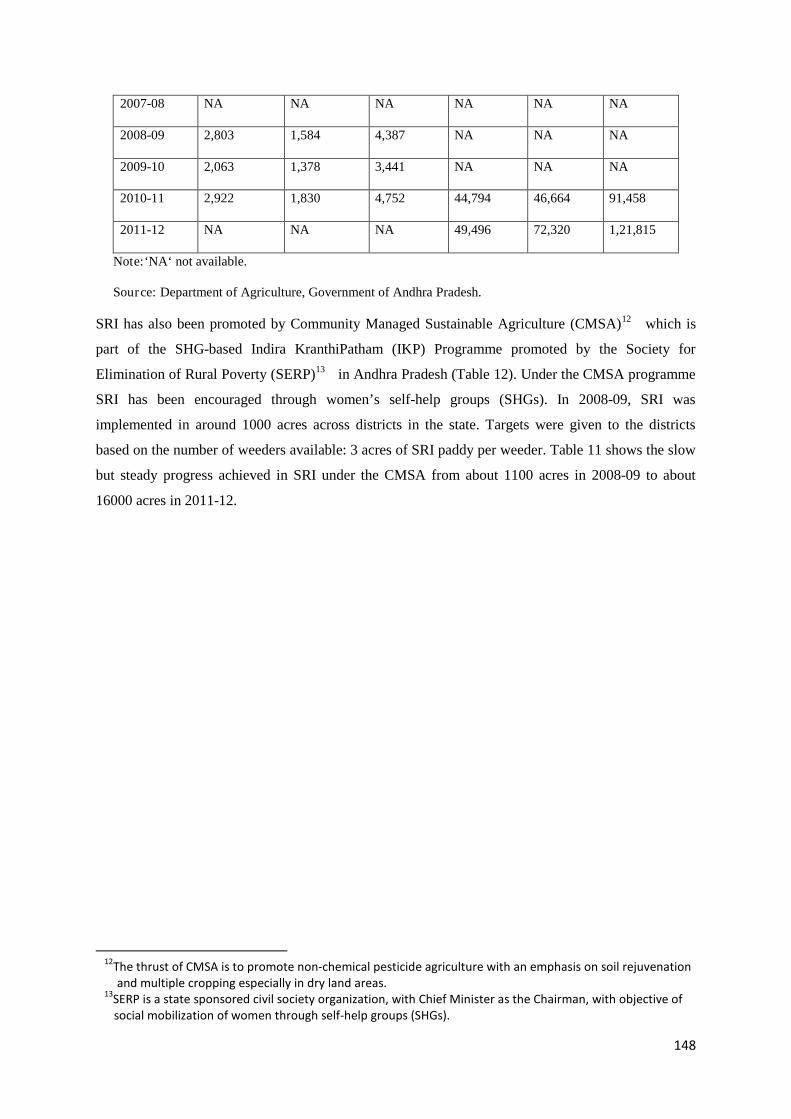
148
2007-08 NA NA NA NA NA NA
2008-09 2,803 1,584 4,387 NA NA NA
2009-10 2,063 1,378 3,441 NA NA NA
2010-11 2,922 1,830 4,752 44,794 46,664 91,458
2011-12 NA NA NA 49,496 72,320 1,21,815
Note:‘NA‘ not available.
Source: Department of Agriculture, Government of Andhra Pradesh.
SRI has also been promoted by Community Managed Sustainable Agriculture (CMSA)1262 which is
part of the SHG-based Indira KranthiPatham (IKP) Programme promoted by the Society for
Elimination of Rural Poverty (SERP)1363 in Andhra Pradesh (Table 12). Under the CMSA programme
SRI has been encouraged through women’s self-help groups (SHGs). In 2008-09, SRI was
implemented in around 1000 acres across districts in the state. Targets were given to the districts
based on the number of weeders available: 3 acres of SRI paddy per weeder. Table 11 shows the slow
but steady progress achieved in SRI under the CMSA from about 1100 acres in 2008-09 to about
16000 acres in 2011-12.
6212The thrust of CMSA is to promote non-chemical pesticide agriculture with an emphasis on soil rejuvenationand multiple cropping especially in dry land areas.
6313SERP is a state sponsored civil society organization, with Chief Minister as the Chairman, with objective ofsocial mobilization of women through self-help groups (SHGs).
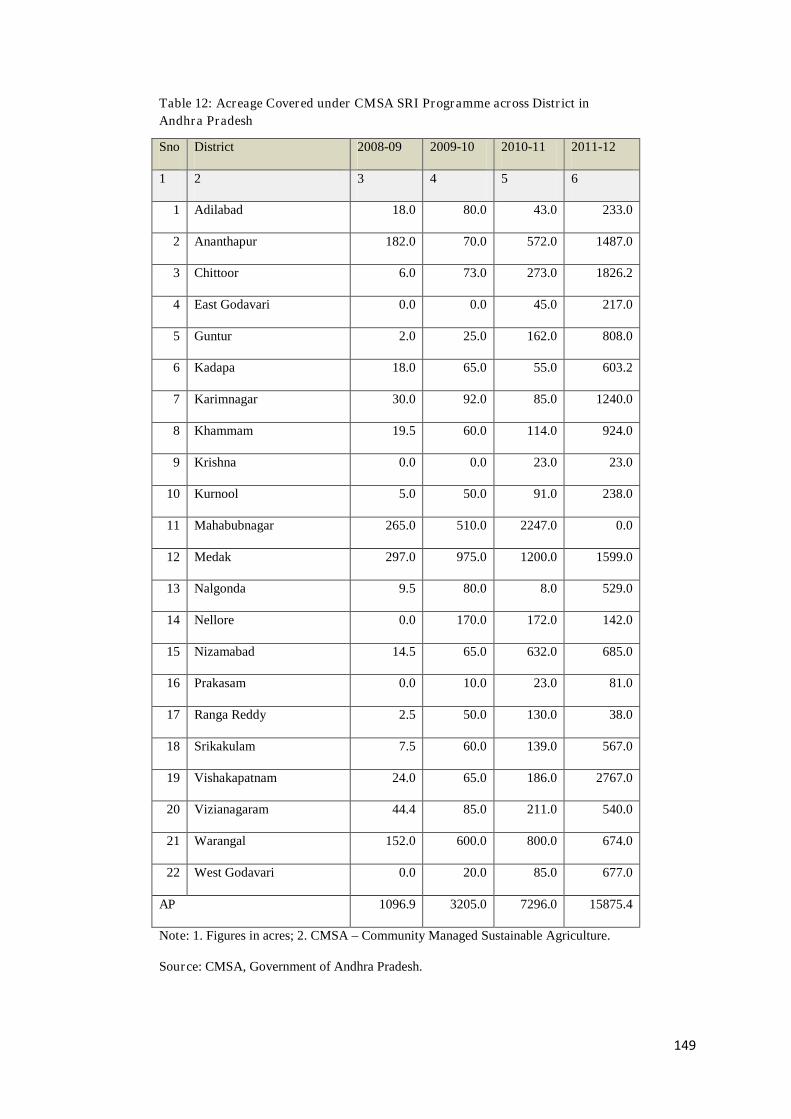
149
Table 12: Acreage Covered under CMSA SRI Programme across District in
Andhra Pradesh
Sno District 2008-09 2009-10 2010-11 2011-12
1 2 3 4 5 6
1 Adilabad 18.0 80.0 43.0 233.0
2 Ananthapur 182.0 70.0 572.0 1487.0
3 Chittoor 6.0 73.0 273.0 1826.2
4 East Godavari 0.0 0.0 45.0 217.0
5 Guntur 2.0 25.0 162.0 808.0
6 Kadapa 18.0 65.0 55.0 603.2
7 Karimnagar 30.0 92.0 85.0 1240.0
8 Khammam 19.5 60.0 114.0 924.0
9 Krishna 0.0 0.0 23.0 23.0
10 Kurnool 5.0 50.0 91.0 238.0
11 Mahabubnagar 265.0 510.0 2247.0 0.0
12 Medak 297.0 975.0 1200.0 1599.0
13 Nalgonda 9.5 80.0 8.0 529.0
14 Nellore 0.0 170.0 172.0 142.0
15 Nizamabad 14.5 65.0 632.0 685.0
16 Prakasam 0.0 10.0 23.0 81.0
17 Ranga Reddy 2.5 50.0 130.0 38.0
18 Srikakulam 7.5 60.0 139.0 567.0
19 Vishakapatnam 24.0 65.0 186.0 2767.0
20 Vizianagaram 44.4 85.0 211.0 540.0
21 Warangal 152.0 600.0 800.0 674.0
22 West Godavari 0.0 20.0 85.0 677.0
AP 1096.9 3205.0 7296.0 15875.4
Note: 1. Figures in acres; 2. CMSA – Community Managed Sustainable Agriculture.
Source: CMSA, Government of Andhra Pradesh.
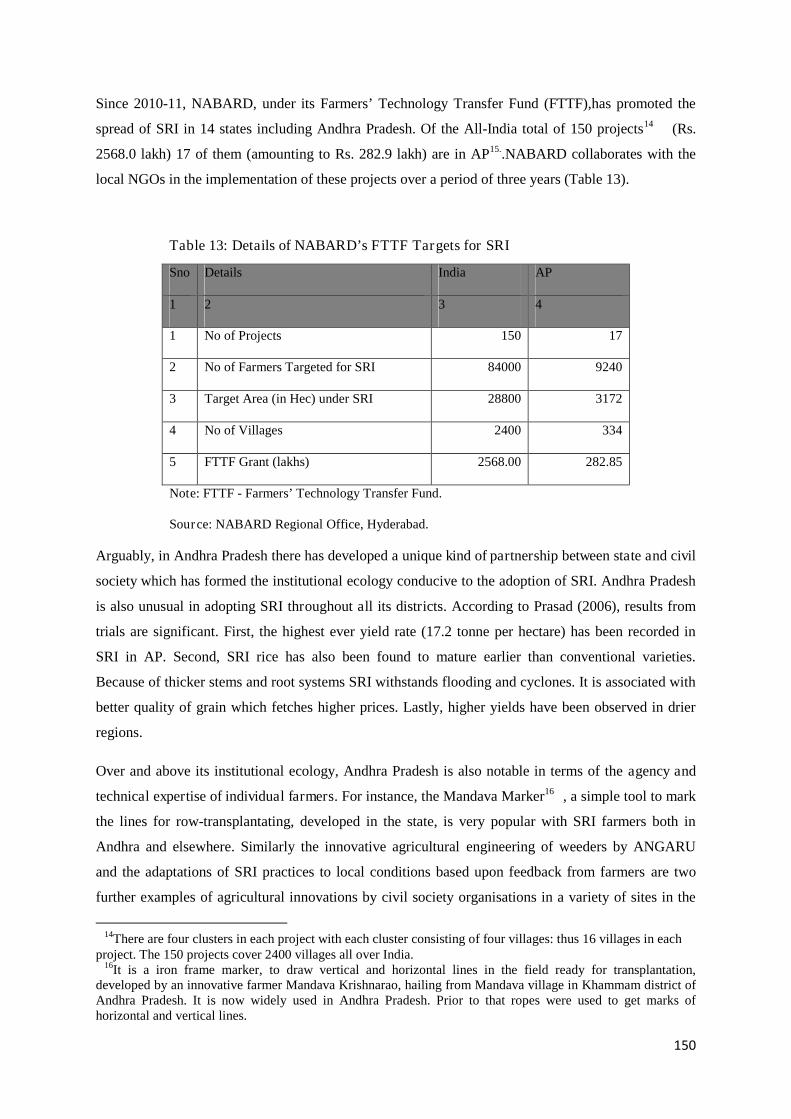
150
Since 2010-11, NABARD, under its Farmers’ Technology Transfer Fund (FTTF),has promoted the
spread of SRI in 14 states including Andhra Pradesh. Of the All-India total of 150 projects1464 (Rs.
2568.0 lakh) 17 of them (amounting to Rs. 282.9 lakh) are in AP15..NABARD collaborates with the
local NGOs in the implementation of these projects over a period of three years (Table 13).
Table 13: Details of NABARD’s FTTF Targets for SRI
Sno Details India AP
1 2 3 4
1 No of Projects 150 17
2 No of Farmers Targeted for SRI 84000 9240
3 Target Area (in Hec) under SRI 28800 3172
4 No of Villages 2400 334
5 FTTF Grant (lakhs) 2568.00 282.85
Note: FTTF - Farmers’ Technology Transfer Fund.
Source: NABARD Regional Office, Hyderabad.
Arguably, in Andhra Pradesh there has developed a unique kind of partnership between state and civil
society which has formed the institutional ecology conducive to the adoption of SRI. Andhra Pradesh
is also unusual in adopting SRI throughout all its districts. According to Prasad (2006), results from
trials are significant. First, the highest ever yield rate (17.2 tonne per hectare) has been recorded in
SRI in AP. Second, SRI rice has also been found to mature earlier than conventional varieties.
Because of thicker stems and root systems SRI withstands flooding and cyclones. It is associated with
better quality of grain which fetches higher prices. Lastly, higher yields have been observed in drier
regions.
Over and above its institutional ecology, Andhra Pradesh is also notable in terms of the agency and
technical expertise of individual farmers. For instance, the Mandava Marker1665, a simple tool to mark
the lines for row-transplantating, developed in the state, is very popular with SRI farmers both in
Andhra and elsewhere. Similarly the innovative agricultural engineering of weeders by ANGARU
and the adaptations of SRI practices to local conditions based upon feedback from farmers are two
further examples of agricultural innovations by civil society organisations in a variety of sites in the
6414There are four clusters in each project with each cluster consisting of four villages: thus 16 villages in eachproject. The 150 projects cover 2400 villages all over India.6516It is a iron frame marker, to draw vertical and horizontal lines in the field ready for transplantation,developed by an innovative farmer Mandava Krishnarao, hailing from Mandava village in Khammam district ofAndhra Pradesh. It is now widely used in Andhra Pradesh. Prior to that ropes were used to get marks ofhorizontal and vertical lines.
151
State. However, in spite of all these efforts to popularise SRI, its coverage remains very low. As
recently as in 2011-12, only about two per cent of the total area under rice in the State was under SRI.
There are a number of factors that hinder its sustained adoption.
4.2Problems of SRI in AP
Debates about the adoption of SRI practices focus on SRI’s being more-labour intensive than
conventional methods. Labour intensity here does not refer to labour per unit of output, rather to
labour being timely and skilled. In SRI crop production, labour costs are relatively lower than those of
conventional practices. But SRI is a more rigorous and exact regime that needs precision-timed
operations and constant supervision. The modern factory-like production regime of SRI struggles to
penetrate a culture of flexible and less precise practices associated with rice cultivation. There is also
a certain physical agility needed for the use of weeders, line markers and for the transplanting single
seedlings. The intensity of labour requires male/female labour with sufficient physical energy to use
the weeder and skills in the use of the marker while female labour also requires new skills for
transplanting. Since its invention, the weederhas been improved to make it move with less friction,
and it was observed in the field that the employment of two labourers weeding together reduces the
fatigueand isolation associated with the monotony of working alone.
There appear to be no clear specifications regarding the designs of markers and weeders appropriate
to different soil types. Labourers are slow to take to SRI practices, particularly in using weeders in
their currently designed forms. So farmers face operational difficulties in adopting SRI especially on
larger areas.
Of the three critical stages/operations of SRI cultivation (nursery, transplantation and weeding), a
study of the economics of SRI observed that the most important constraint in SRI cultivation is
‘nursery to transplanting management’ (Rao, 2011), because this stage is relatively labour-intensive,
and needs certain management skills and constant supervision. The preparations of the nursery need
co-ordination with those of the plot awaiting transplanting. Small farmers balance their limited
ground-water resources against rainfall but the Khariff rains frequently confound this balancing act.
With meagre ground water, producers prepare their nursery expecting the monsoon to help them ready
the main plot. If the rain fails or is delayed, the nursery seedlings will cross the 8 to 15 days threshold
beyond which older seedlings are inappropriate for SRI. The older practice of flexible transplanting
between 25 to 45 days accommodates the vagaries of the weather but SRI does not. R & D to evolve
varieties that would reduce the vulnerability of seedlings to their transplanting age is urgently needed.
Another major concern is that dis-adoption rates exceed those of adoption (Reddy et al, 2006). In
many cases when supported by civil society organisations or other organisations encouraging SRI,
farmers adopt SRI with an eye to support measures such as free fertilisers. Once this is stopped they
152
tend to switch to conventional system. Indeed, there are many instances of withdrawal from SRI once
the agency sponsorship end.
Despite Andhra Pradesh’s vigorous initiatives, the diffusion of SRI is now lagging behind that of the
neighbouring state of Tamil Nadu. One of the factors behind the faster progress of SRI paddy in
Tamil Nadu is that the state government provides a financial incentive of Rs. 4,000 per hectare for a
farmer adopting SRI. TN’s promotional methods also differ. For instance, neither the state
government, research bodies nor civil society organisations insist on strict adherence to all the SRI
principles and practices. Instead SRI principles are followed flexibly. In Andhra Pradesh there is no
financial incentive to producers and the extension advice is rigid.
4.3 The Case of an NGO (‘CROPS’) in promoting SRI in Andhra Pradesh
Here we present a case study of a civil society organisation (NGO), CROPS17,66working to propagate
SRI principles mainly among farmers in Janagaon division of Warangal District of Andhra Pradesh
but also further afield. CROPS is a registered non-profit, non -religious, non-governmental, social
development grass-root organization established in 1991.
In the dry-land agriculture of Janagaon division, the only irrigated crop is paddy, mostly grown using
ground-water. When the traditional system of dry land farming shifted to modern technology with the
use of chemical pesticides, the cost of cultivation increased and so did farmers’ environmental
problems such as soil and water contamination with chemical residues. Over-use of these chemical
inputs resulted in reduced soil fertility and increased resistance to pests. Pesticide consumption
peaked when the cropping pattern shifted from coarse cereals to cotton cultivation. It was at this stage,
in the mid 1990s that CROPS, supported by the Centre for World Solidarity (CWS) started to promote
non-chemical pesticide management techniques18.67.
6617An acronym for Centre for Rural Operations Programme Society (CROPS).6718Besides, the organisation is also involved in formation of thrift groups of women called Sanghams at village
level. Sri Shakti is a registered Mutually Aided Cooperative Society (MACS) for Women, initiated by
CROPS. Under this programme the whole village is a unit, Sangham. Sri Shakti Women MACS was
established in the year 1995 with merely 5 groups and 40 members and in due course it developed to 44 groups
and 5,467 members. Women in more than 40 villages formed as Sangham thrift groups facilitated by the
CROPS. Presently there are 7,467 women actively involved in 74 groups. The savings worth Rs. 91.93 lakhs
were pooled from these members and against this credit worthiness Messrs. Andhra Bank has sanctioned loan
worth of Rs. 1.3 lakhs to SRI SHAKTI MACS and also total loans amounted to Rs. 363.27 lakhs have been
issued to these members for various productive purposes.
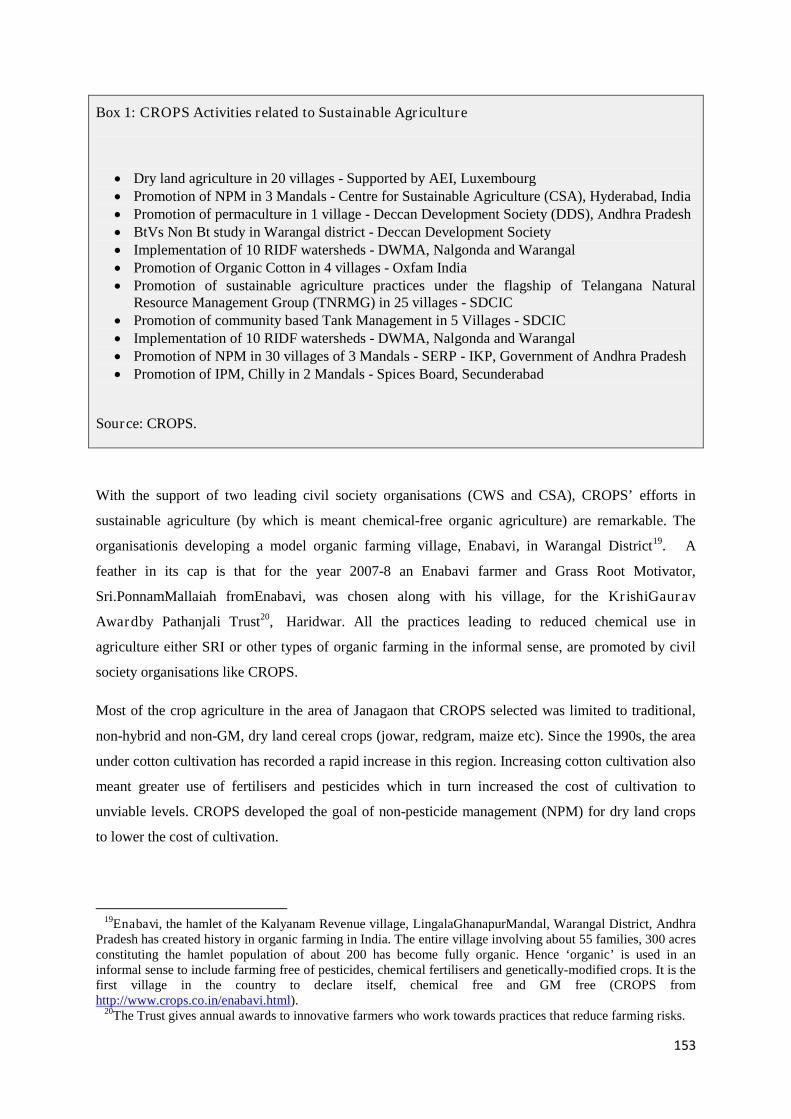
153
Box 1: CROPS Activities related to Sustainable Agriculture
Dry land agriculture in 20 villages - Supported by AEI, Luxembourg Promotion of NPM in 3 Mandals - Centre for Sustainable Agriculture (CSA), Hyderabad, India Promotion of permaculture in 1 village - Deccan Development Society (DDS), Andhra Pradesh BtVs Non Bt study in Warangal district - Deccan Development Society Implementation of 10 RIDF watersheds - DWMA, Nalgonda and Warangal Promotion of Organic Cotton in 4 villages - Oxfam India Promotion of sustainable agriculture practices under the flagship of Telangana Natural
Resource Management Group (TNRMG) in 25 villages - SDCIC Promotion of community based Tank Management in 5 Villages - SDCIC Implementation of 10 RIDF watersheds - DWMA, Nalgonda and Warangal Promotion of NPM in 30 villages of 3 Mandals - SERP - IKP, Government of Andhra Pradesh Promotion of IPM, Chilly in 2 Mandals - Spices Board, Secunderabad
Source: CROPS.
With the support of two leading civil society organisations (CWS and CSA), CROPS’ efforts in
sustainable agriculture (by which is meant chemical-free organic agriculture) are remarkable. The
organisationis developing a model organic farming village, Enabavi, in Warangal District19.68. A
feather in its cap is that for the year 2007-8 an Enabavi farmer and Grass Root Motivator,
Sri.PonnamMallaiah fromEnabavi, was chosen along with his village, for the KrishiGaurav
Awardby Pathanjali Trust20,69,Haridwar. All the practices leading to reduced chemical use in
agriculture either SRI or other types of organic farming in the informal sense, are promoted by civil
society organisations like CROPS.
Most of the crop agriculture in the area of Janagaon that CROPS selected was limited to traditional,
non-hybrid and non-GM, dry land cereal crops (jowar, redgram, maize etc). Since the 1990s, the area
under cotton cultivation has recorded a rapid increase in this region. Increasing cotton cultivation also
meant greater use of fertilisers and pesticides which in turn increased the cost of cultivation to
unviable levels. CROPS developed the goal of non-pesticide management (NPM) for dry land crops
to lower the cost of cultivation.
6819Enabavi, the hamlet of the Kalyanam Revenue village, LingalaGhanapurMandal, Warangal District, AndhraPradesh has created history in organic farming in India. The entire village involving about 55 families, 300 acresconstituting the hamlet population of about 200 has become fully organic. Hence ‘organic’ is used in aninformal sense to include farming free of pesticides, chemical fertilisers and genetically-modified crops. It is thefirst village in the country to declare itself, chemical free and GM free (CROPS fromhttp://www.crops.co.in/enabavi.html).6920The Trust gives annual awards to innovative farmers who work towards practices that reduce farming risks.
154
Moreover, the availability of, and access to, bore well technology over the last two decades, increased
the number of bore wells, in turn increasing the area under irrigated crops particularly rice. Prior to
the 1990s, rice was not a major crop sold in the local grain markets. But from 1990s onwards, it came
to prominence along with cotton and maize. The volume of rice traded in the local grain market
increased from 3000 to 30,000-40,000 quintals per day over the last fifteen years. Twenty commercial
rice mills, mostly parboiling mills, were established. The procurement of rice by the Food Corporation
of India (FCI) has also increased. The first FCI go down in this area, Janagaon, was established in
2002 with a capacity of 30,000 MT. A second go down with a capacity of 1,50,000 MT started
working in 2009. The phenomenal increase in rice trading is due to local increase in rice production,
due to expansion in area as well as yield.
Most of the rice cultivation in this area has become ground-water dependent, through bore wells.
Historically rice cultivation was confined to a limited area with tanks as the main source of water. In a
few cases rice was cultivated to a limited extent and for home consumption with open wells
constrained by the availability of water.. Changes in the last two decades mean that even the rice
fields under tank irrigation are watered from bore wells replenished from tanks. Many farming
communities under the tank command areas agreed to abandon the tank for direct irrigation. While
tanks allowed the cultivation of rice only in the Khariff season, irrigation using ground water permits
rice to be grown in both main seasons. Irrigation with bore-wells or open-wells also facilitates the
water control sometimes associated with better yields. However, the increased reliance on ground-
water has depleted subterranean water resources and has increased energy consumption (mostly
electricity) by lift irrigation. Water and energy saving methods of rice cultivation are therefore needed
in the region.
As regards SRI cultivation methods, in Janagaon division since Rabi 2007-8 CROPS2170 has taken up
certain initiatives for SRI (Table 14). CROPS is one of the collaborators involved with the ICRISAT-
WWF Project to develop SRI in AP as well as All-India. Under the WWF project, for seven
continuous seasons, CROPS has spread SRI cultivation to seven villages in two mandals
(Bachannapet and Maddoor) in Janagaon division. And with the support of ICRISAT, it introduced
SRI in 26 more villages in three other mandals2271 (LingalGhanpur, Janagaon and Devaruppala).
Under these two projects, the number of farmers and acreage under SRI cultivation promoted by
CROPS increased gradually. But both the WWF and ICRISAT support was limited to a few seasons
until Rabi 2010-11. After that the number of farmers and acreage under SRI drastically declined.
Under the NABARD support, CROPS implemented SRI in 16 more villages in two mandals
7021With the support of the WWF project.7122Mandals, which cover population of about 30,000, are administrative units below District Administration. InAndhra Pradesh erstwhile Taluks/Blocks were replaced with Mandals in the early 1980s.
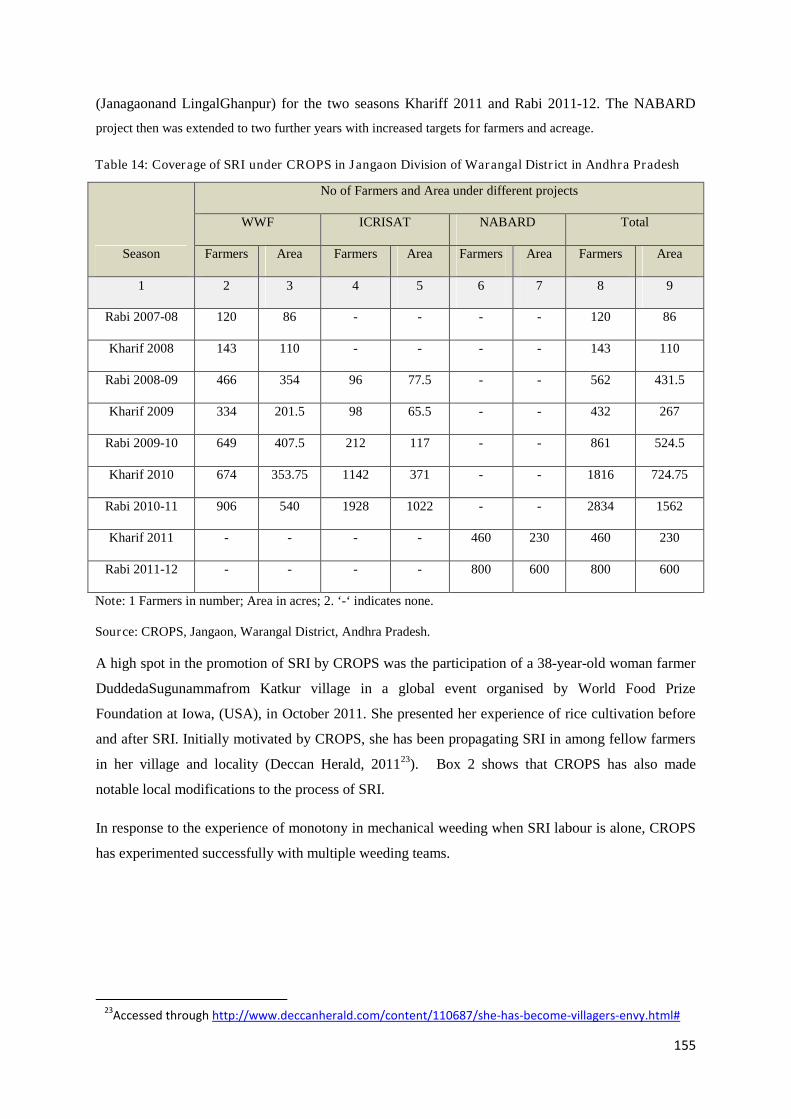
155
(Janagaonand LingalGhanpur) for the two seasons Khariff 2011 and Rabi 2011-12. The NABARD
project then was extended to two further years with increased targets for farmers and acreage.
Table 14: Coverage of SRI under CROPS in Jangaon Division of Warangal District in Andhra Pradesh
Season
No of Farmers and Area under different projects
WWF ICRISAT NABARD Total
Farmers Area Farmers Area Farmers Area Farmers Area
1 2 3 4 5 6 7 8 9
Rabi 2007-08 120 86 - - - - 120 86
Kharif 2008 143 110 - - - - 143 110
Rabi 2008-09 466 354 96 77.5 - - 562 431.5
Kharif 2009 334 201.5 98 65.5 - - 432 267
Rabi 2009-10 649 407.5 212 117 - - 861 524.5
Kharif 2010 674 353.75 1142 371 - - 1816 724.75
Rabi 2010-11 906 540 1928 1022 - - 2834 1562
Kharif 2011 - - - - 460 230 460 230
Rabi 2011-12 - - - - 800 600 800 600
Note: 1 Farmers in number; Area in acres; 2. ‘-‘ indicates none.
Source: CROPS, Jangaon, Warangal District, Andhra Pradesh.
A high spot in the promotion of SRI by CROPS was the participation of a 38-year-old woman farmer
DuddedaSugunammafrom Katkur village in a global event organised by World Food Prize
Foundation at Iowa, (USA), in October 2011. She presented her experience of rice cultivation before
and after SRI. Initially motivated by CROPS, she has been propagating SRI in among fellow farmers
in her village and locality (Deccan Herald, 201123).72).Box 2 shows that CROPS has also made
notable local modifications to the process of SRI.
In response to the experience of monotony in mechanical weeding when SRI labour is alone, CROPS
has experimented successfully with multiple weeding teams.
7223Accessed through http://www.deccanherald.com/content/110687/she-has-become-villagers-envy.html#
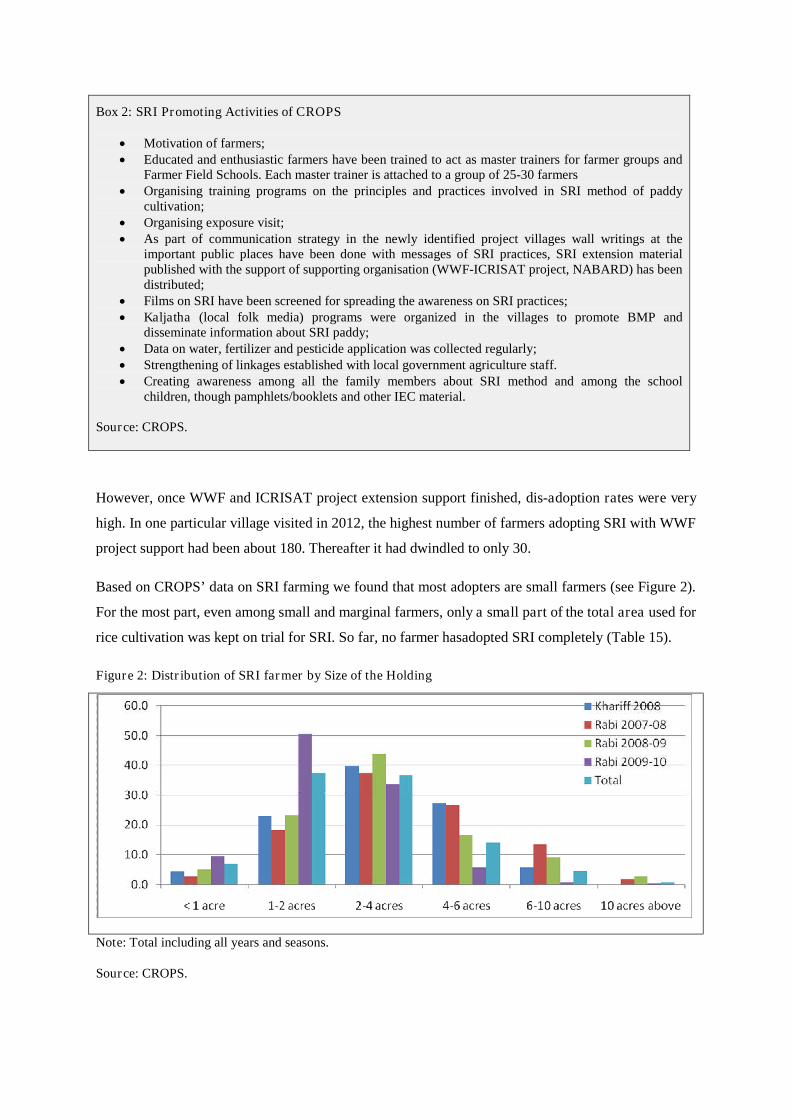
Box 2: SRI Promoting Activities of CROPS
Motivation of farmers; Educated and enthusiastic farmers have been trained to act as master trainers for farmer groups and
Farmer Field Schools. Each master trainer is attached to a group of 25-30 farmers Organising training programs on the principles and practices involved in SRI method of paddy
cultivation; Organising exposure visit; As part of communication strategy in the newly identified project villages wall writings at the
important public places have been done with messages of SRI practices, SRI extension materialpublished with the support of supporting organisation (WWF-ICRISAT project, NABARD) has beendistributed;
Films on SRI have been screened for spreading the awareness on SRI practices; Kaljatha (local folk media) programs were organized in the villages to promote BMP and
disseminate information about SRI paddy; Data on water, fertilizer and pesticide application was collected regularly; Strengthening of linkages established with local government agriculture staff. Creating awareness among all the family members about SRI method and among the school
children, though pamphlets/booklets and other IEC material.
Source: CROPS.
However, once WWF and ICRISAT project extension support finished, dis-adoption rates were very
high. In one particular village visited in 2012, the highest number of farmers adopting SRI with WWF
project support had been about 180. Thereafter it had dwindled to only 30.
Based on CROPS’ data on SRI farming we found that most adopters are small farmers (see Figure 2).
For the most part, even among small and marginal farmers, only a small part of the total area used for
rice cultivation was kept on trial for SRI. So far, no farmer hasadopted SRI completely (Table 15).
Figure 2: Distribution of SRI farmer by Size of the Holding
Note: Total including all years and seasons.
Source: CROPS.
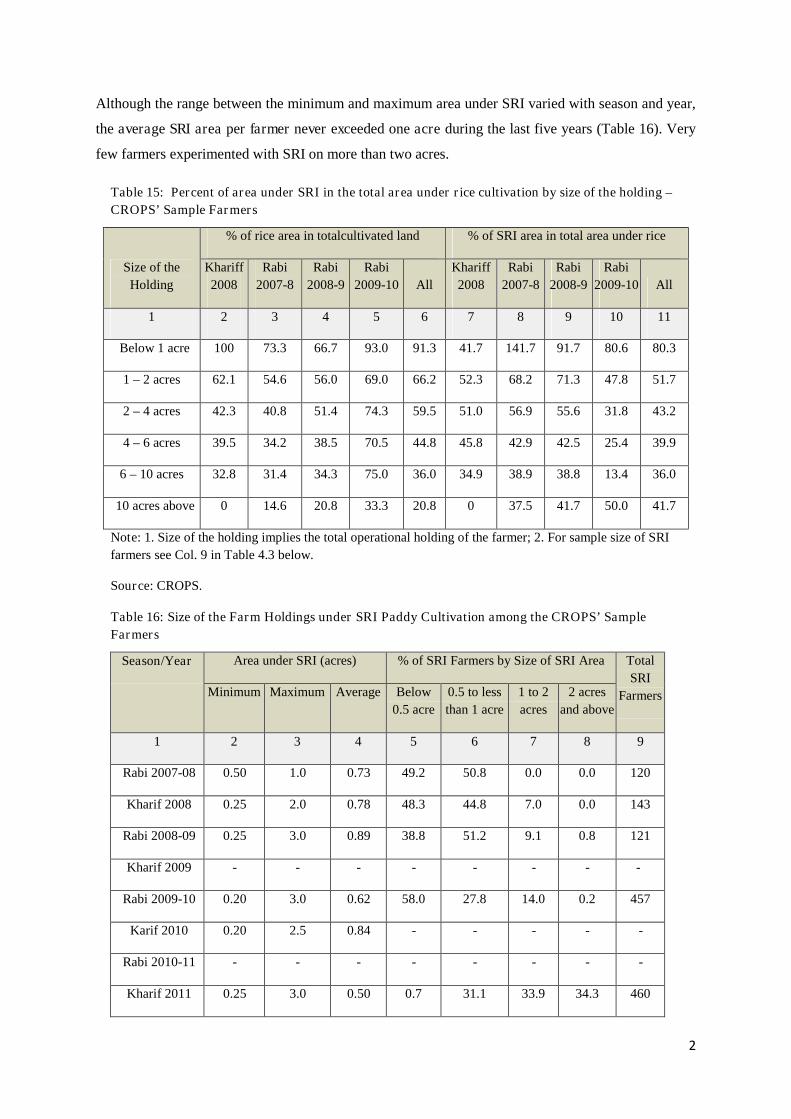
2
Although the range between the minimum and maximum area under SRI varied with season and year,
the average SRI area per farmer never exceeded one acre during the last five years (Table 16). Very
few farmers experimented with SRI on more than two acres.
Table 15: Percent of area under SRI in the total area under rice cultivation by size of the holding –
CROPS’ Sample Farmers
Size of the
Holding
% of rice area in totalcultivated land % of SRI area in total area under rice
Khariff
2008
Rabi
2007-8
Rabi
2008-9
Rabi
2009-10 All
Khariff
2008
Rabi
2007-8
Rabi
2008-9
Rabi
2009-10 All
1 2 3 4 5 6 7 8 9 10 11
Below 1 acre 100 73.3 66.7 93.0 91.3 41.7 141.7 91.7 80.6 80.3
1 – 2 acres 62.1 54.6 56.0 69.0 66.2 52.3 68.2 71.3 47.8 51.7
2 – 4 acres 42.3 40.8 51.4 74.3 59.5 51.0 56.9 55.6 31.8 43.2
4 – 6 acres 39.5 34.2 38.5 70.5 44.8 45.8 42.9 42.5 25.4 39.9
6 – 10 acres 32.8 31.4 34.3 75.0 36.0 34.9 38.9 38.8 13.4 36.0
10 acres above 0 14.6 20.8 33.3 20.8 0 37.5 41.7 50.0 41.7
Note: 1. Size of the holding implies the total operational holding of the farmer; 2. For sample size of SRI
farmers see Col. 9 in Table 4.3 below.
Source: CROPS.
Table 16: Size of the Farm Holdings under SRI Paddy Cultivation among the CROPS’ Sample
Farmers
Season/Year Area under SRI (acres) % of SRI Farmers by Size of SRI Area Total
SRI
FarmersMinimum Maximum Average Below
0.5 acre
0.5 to less
than 1 acre
1 to 2
acres
2 acres
and above
1 2 3 4 5 6 7 8 9
Rabi 2007-08 0.50 1.0 0.73 49.2 50.8 0.0 0.0 120
Kharif 2008 0.25 2.0 0.78 48.3 44.8 7.0 0.0 143
Rabi 2008-09 0.25 3.0 0.89 38.8 51.2 9.1 0.8 121
Kharif 2009 - - - - - - - -
Rabi 2009-10 0.20 3.0 0.62 58.0 27.8 14.0 0.2 457
Karif 2010 0.20 2.5 0.84 - - - - -
Rabi 2010-11 - - - - - - - -
Kharif 2011 0.25 3.0 0.50 0.7 31.1 33.9 34.3 460
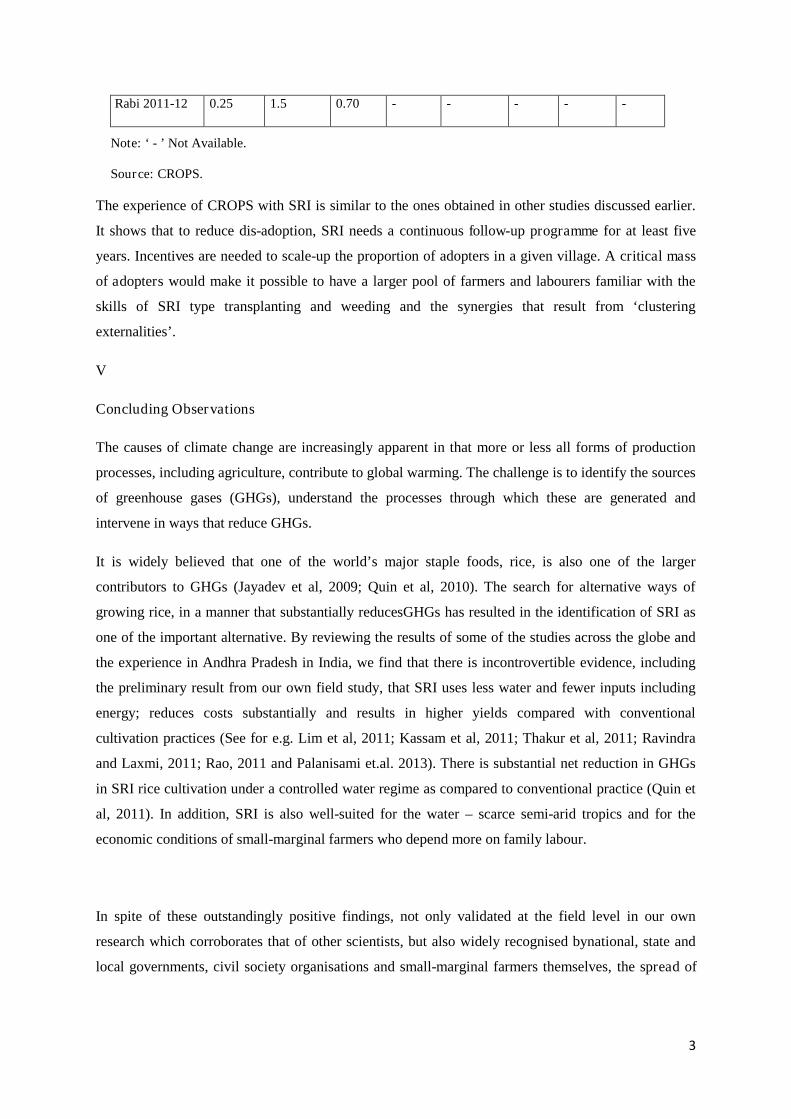
3
Rabi 2011-12 0.25 1.5 0.70 - - - - -
Note: ‘ - ’ Not Available.
Source: CROPS.
The experience of CROPS with SRI is similar to the ones obtained in other studies discussed earlier.
It shows that to reduce dis-adoption, SRI needs a continuous follow-up programme for at least five
years. Incentives are needed to scale-up the proportion of adopters in a given village. A critical mass
of adopters would make it possible to have a larger pool of farmers and labourers familiar with the
skills of SRI type transplanting and weeding and the synergies that result from ‘clustering
externalities’.
V
Concluding Observations
The causes of climate change are increasingly apparent in that more or less all forms of production
processes, including agriculture, contribute to global warming. The challenge is to identify the sources
of greenhouse gases (GHGs), understand the processes through which these are generated and
intervene in ways that reduce GHGs.
It is widely believed that one of the world’s major staple foods, rice, is also one of the larger
contributors to GHGs (Jayadev et al, 2009; Quin et al, 2010). The search for alternative ways of
growing rice, in a manner that substantially reducesGHGs has resulted in the identification of SRI as
one of the important alternative. By reviewing the results of some of the studies across the globe and
the experience in Andhra Pradesh in India, we find that there is incontrovertible evidence, including
the preliminary result from our own field study, that SRI uses less water and fewer inputs including
energy; reduces costs substantially and results in higher yields compared with conventional
cultivation practices (See for e.g. Lim et al, 2011; Kassam et al, 2011; Thakur et al, 2011; Ravindra
and Laxmi, 2011; Rao, 2011 and Palanisami et.al. 2013). There is substantial net reduction in GHGs
in SRI rice cultivation under a controlled water regime as compared to conventional practice (Quin et
al, 2011). In addition, SRI is also well-suited for the water – scarce semi-arid tropics and for the
economic conditions of small-marginal farmers who depend more on family labour.
In spite of these outstandingly positive findings, not only validated at the field level in our own
research which corroborates that of other scientists, but also widely recognised bynational, state and
local governments, civil society organisations and small-marginal farmers themselves, the spread of
4
SRI to rice growing areas is extremely slow, if not retarded. It has failed to make any significant dent
on conventional practices and technologies.
Obstacles like the need to follow rigid, time-bound practices, the shift to relatively monotonous
isolated work like mechanical weeding, are shown to be not insurmountable. Ingenious modifications
to tools and practices have been invented. But a further array of factors such as :
i) the lack of resources for research and development in breeding appropriate varieties to
overcome the rigid short-duration transplanting schedule,
ii) the appropriate type of weeder including simple mechanised ones that would remove the
psychological strain from using the current designs of weeders,
iii) the failure to develop a major agricultural extension programme for SRI and
iv) political resistance to adopt a framework to integrate training in SRI practices with NREGS
so as to overcome certain perceived skill deficiencies,
all show that the role of the state in promoting SRI leaves much to be desired. Unlike the agri-
technologies for hybrids, GMOs, the design of combine harvesters, and other agricultural
machinery, the corporate sector does not see a profitable market in the promotion of SRI. On the
contrary, there may be corporate lobbies preventing the state from launching major programmes
for SRI. The next-step seems to be in public mobilisation in favour of increased public investment
and in the design of appropriate strategies for the spread of SRI. Another sensible strategy is to
pay attention to the varying ways farmers try to adopt SRI depending on their local conditions. It
is evident now that only 20 percent of adopters of SRI take to all the four core practices of SRI,
and the rest of the 80 percent are either partial or low adopters (Palansami et.al. 2013). So
finally, farmers need encouragement to adopt incrementally those specific components of SRI that
suit them while also helping toincrease yields, reduce costs and in so doing generate the co-
benefit of lower greenhouse gases.
5
References
Adhikari, P; D Sen and N Uphoff (Undated) “System of Rice Intensification as a ResourceConserving Methodology: Contributing to Food Security in an Era of a Climate Change”,PRAGATI,Koraput.
Africare, Oxfam America, WWF-ICRISAT Project (2010)More Rice for People, More Water for thePlanet, WWF-ICRISAT Project, Hyderabad, India.
Berkhout, E. and Glover, D. (2011) The Evolution of the System of Rice Intensification as a Socio-technical Phenomenon: A report to the Bill & Melinda Gates Foundation, Wageningen, NL:Wageningen University and Research Centre.
Biksham, Gujja and T M Thiyagrajan (2010) New Hope for Indian Food Security ?: the System ofRice Intensification, Gatekeeper series, IIED, London.
Deccan Herald (2011) “She has become villagers' envy: The woman who won the ‘rice’ againsthunger”, accessed through http://www.deccanherald.com/content/110687/she-has-become-villagers-envy.html#
Farmer B. H. (ed) Green Revolution? Macmillan
Gathorne-Hardy A. 2013‘Greenhouse gas emissions from rice’RGTW Working Paper no 3, CSASP,SIAS, Oxford
GoI (2011) Agricultural Statistics at a Glance 2011, Department of Agriculture and Co-operation,Government of India, New Delhi.
GoAP (2011) Report of theState Level Committee To Study The Problems Of Farmers In CropHoliday Affected Mandals Of East Godavari District of Andhra Pradesh, Government of AndhraPradesh, Hyderabad.
Jayadeva, H.M; T.K. PrabhakaraSetty; R.C. Gowda; R. Devendra; G.B. Mallikarjun; and A.G. Bandi(2009) “Methane Emission as influenced by different Crop Establishment Techniques and OrganicManure”, Agricultural Science Digest, Vol. 29 (4), pp.241-245.
Kassam, Amir; Willem Stoop; and Norman Uphoff (2011) “Review of SRI modifications in rice cropand water managementand research issues for making further improvementsin agricultural and waterproductivity”, Paddy and Water Environment, Vol. 9, pp. 163-180.
Laxminarayana, K; , N Purendra Prasad; SudheerKilaru; and VamsiVakulabharanam (2011)“Understanding the Andhra Crop Holiday”, Economic and Political Weekly, Vol - XLVI No. 50,December 10, 2011
Laulanie, H De (1992) “Technical Presentation of the System of Rice Intensification, based onKatayama’s Tillering Model”, Association TefySaina (ATS), Antananarivo, Madgascar.
Laulanie, H De (2011) “Intensive Rice Farming in Madgascar”, Technical Notes, Tropicultura, Vol.29 (3), pp.183-187.
Lin, Xianqing; Defeng Zhu; and Xinjun Lin (2011) “Effects of water management and organicfertilization with SRI crop practices on hybrid rice performance and rhizospheredynamics”,Paddy andWater Environment, Vol. 9, pp. 33-39.
6
National Consortium on SRI (NSC, 2012) “Enhancing Employment and Substituting Production”,National Consortium on SRI, New Delhi.
NCAER (2007) “Socio-Economic and Ecological Concerns for Productivity Enhancing and ResourceConservation Practices in Rice: A Case of SRI in the Peninsular India”, National Centre forAgricultural Economics and Policy Research, New Delhi.
Palanisami, K., K.R. Karunakaran, Upali Amarasinghe and C.R. Ranganathan (2013) “DoingDifferent Things or Doing It Differently: Rice Intensification Practices in 13 States of India”,Economic and Political Weekly, Vol. XLVIII, No. 8, February 23, pp. 51-67.
Patra, ParthaSarathi and SamsulHaque (2011) “Effect of Seedling Age on Tillering Pattern And Yieldof Rice (OryzaSativaL.) under System of Rice Intensification”, ARPN Journal of Agricultural andBiological Sciences, Vol. 6 (11).
Prasad, C Shambu (2006) System of Rice Intensification in India: Innovation History and InstitutionalChallenges, WWF-ICRISAT Dialogue Project, Xavier Institute of Management, Bubaneswar.
Prasad, C Shambu; KoenBeumer; and DebasisMohanty (2007)Towards a Learning Alliance: SRI inOrissa, WWF International-ICRISAT Dialogue Project, Hyderabad.
Prasad, C Shambu; DebasisMohapatra; and Piyush Mishra (2008)Strengthening the LearningAlliance, Xavier Institute of Management, Bubaneswar.
Peng, ShiZhang; ShiHong Yang; JunZengXu; and HuanZhiGao (2011a) “Field experiments onGreen house gas emissions and nitrogen and phosphorus losses from rice paddy with efficientirrigation and drainage management”, Science China-Technological Science, Vol. 54 (6), pp. 1581-1587.
Peng, Shi-Zhang; Shi-Hong Yang; Jun-ZengXu; Yu-FengLuo; and Hui-Jing Hou (2011b) “Nitrogen
and phosphorus leaching losses from paddy fields with different water and nitrogen managements”,
Paddy and Water Environment, Vol. 9 (3), pp. 333-342.
Qin, Yanmei; Shuwei Liu; YanqinGuo; Qiaohui Liu; and JianwenZou (2010) “Methane and nitrousoxide emissions from organic and conventional rice cropping systems in Southeast China”, Biologyand Fertility of Soils, Vol. 46 (8), pp.825-834.
Ramana Murthy, R V (2011) “Paddy Glut and Farmer Distress in Andhra Pradesh”, Economic andPolitical Weekly, Vol - XLVI No. 29, July 16, 2011
Rao, IVY Rama (2011) “Estimation of Efficiency, Sustainability and Constraints in SRI (System ofRice Intensification) vis-a-vis Traditional Methods of Paddy Cultivation in North Coastal Zone ofAndhra Pradesh”, Agricultural Economics Research Review, Vol. 24, pp. 325-331.
Ravindra, Asusumilli and S. BhagyaLaxmi (2010) “Potential of the System of Rice Intensification forSystemic Improvement in Rice Production and Water Use: The Case of Andhra Pradesh, India”,Paddy and Water Environment, Vol. 9, pp 89-97.
Reddy, V Ratna; P Prudhvikar Reddy; M Srinivasa Reddy; and D Sree Rama Raju (2005) “WaterUse Efficiency: A Study of System of Rice Intensification (SRI) Adoption in Andhra Pradesh”, IndianJournal of Agricultural Economics, Vol. 60 (3), July-Sept.
7
SDTT (2009) “A Comparative Study on Drought coping ability of SRI and Conventional method ofPaddy Cultivation”, Sir Dorabji Tata Trust, Mumbai.
Styger, Erika, GoumarAboubacrine, MalickAttaher, and Norman Uphoff(2011)“The system of riceintensification as a sustainable agricultural innovation: Introducing, adapting and scaling up a systemof rice intensification practices in the Timbuktu region of Mali”, International Journal of AgriculturalSustainability, Vol. 9, pp. 67-75.
Subramanyam and Aparna (2009) “Agriculture in Andhra Pradesh”, in S. Mahendra Dev, C Ravi andM. Venkatanarayana (eds.) Human Development in Andhra Pradesh: Experiences, Issues andChallenges, Centre for Economic and Social Studies, Hyderabad.
Thakur, Amod K; SreelataRath; D U Patil; andAshwani Kumar (2011) “Effects on rice plantmorphology and physiology of waterand associated management practices of the system ofrice intensification and their implications for crop performance”, Paddy and Water Environment, Vol.9, pp. 13-24.
Uphoff, Norman (2007) “Envisioning ‘Post-Modern Agriculture’: A Thematic Research Paper”,Cornell Univerisity, Ithacca: Accessed through WAASAN Website.
Uphoff, Norman (Undated 1) “Development of the System of Rice Intensification (SRI) inMadgascar”, accessed through http://sri.ciifad.cornell.edu/aboutsri/origin/index.html.
Uphoff, Norman (Undated 2) “Agro-ecological Approaches to help “Climate Proof” Agriculturewhile Raising Productivity in the Twenty-First Century, accessed through V & A Programme (2009)Vulnerability and Adaptation Experiences from Rajasthan and Andhra Pradesh: The System of RiceIntensification, SDC V & A Programme, India.
Abbreviations
ATA - Association of TefySaina
ANGRAU - Acharya N G Ranga Agricultural University
ATMA - Agricultural Technology Management Agency
CIIFAD - Cornel International Institute for Food, Agriculture and Development
CMSA - Community Managed Sustainable Agriculture
CROPS - Centre for Rural Operations Programme Society
CRRI - Central Rice Research Institute
8
CSA - Centre for Sustainable Agriculture
CWS - Centre for World Solidarity
DAATT - District Agricultural Advisory and Transfer of Technology
DRR - Directorate of Rice Research
FTTF - Farmer’s Technology Transfer Fund
ICRISAT - International Crop Research Institute for Semi-Arid Tropics
IIED - International Institute for Environment and Development
IRRI - International Rice Research Institute
KVK - KrishiVignana Kendra
MSSRF - M S Swaminathan Research Foundation
NABARD - National Bank for Agriculture and Rural Development
NADP - National Agricultural Development Programme
NGO - Non-Governmental Organisation
NFSM - National Food Security Mission
NREGS/A - National Rural Employment Guarantee Scheme/Act
PRADAN - Professional Action Development Action Network
SDC - Swiss Agency for Development and Cooperation
SDTT - Sir Dorabji Tata Trust
SIDA - Swedish International DevelopmentCooperation Agency
SRI - System of Rice Intensification
TNAU - Tamil Nadu Agricultural University
WASSAN - Watershed Support Services and Activities Network
WWF - Worldwide Fund for Nature

9
10
PRODUCTION AND EXCHANGE RELATIONS IN RAIN-FED
AGRICULTURE: THE CASE OF RICE IN ODISHA
Deepak Mishra
PRODUCTION AND EXCHANGE RELATIONS IN RAIN-FED AGRICULTURE: THE
CASE OF RICE IN ODISHA
- Deepak K Mishra
Abstract: This paper examines the production and exchange relations in rice production systems in
rain-fed agriculture. The three objectives were i) to capture the essential features of ‘traditional’
rain-fed agriculture persisting into the 21st century, ii) to contribute material parameters for rain-fed
rice to a life cycle assessment of energy, water and greenhouse gases (Gathorne-Hardy, 2013) iii) to
examine the rice sector as a system – involving distribution as well as production two districts:
Koraput and Nuapara (part of undivided Kalahandi) were chosen for field-survey. A complete census
of two purposively chosen villages, one from each of the selected districts, was undertaken to
understand production relations in dry-land agriculture. The paper presents the findings of this
survey in relation to agrarian structure and relations in paddy production, post-harvest processing
and marketing. It locates the changes in rain-fed rice cultivation in the context of changing
livelihoods, introduction of green revolution techniques in new areas and state interventions for rural
development.
I. Introduction
Rain-fed agriculture is typically perceived as low in productivity and is intrinsically linked to poverty
and nutrition insecurity in India. Practiced on nearly two thirds of the total cropped area of the
country, it supports 40 per cent of India's population and contributes 44 per cent to India's food
basket. Nearly 55 per cent of rice, 91 per cent of coarse grains, 90 per cent of pulses, 85 per cent of
oilseeds and 65 per cent of cotton are grown under rain-fed conditions (Yadav 2009 cited in Angles et
al, 2011; ). The linkages between poverty and rain-fed agriculture have also been thoroughly
investigated (Garikipati et al, 2008).
Rice is an important crop in India. Rice, however, is produced under diverse conditions (Yadav and
Subba Rao, 2001; Frolking et al, 2006). The regional specificities of rice production systems require a
nuanced and differentiated approach towards understanding the basic features of paddy production
(Barah and Pandey,2005). The diversity of rice production includes the following crucial dimensions:
(a) there is diversity in ecological conditions, production relations and exchange relations - associated
with rice. Yadav and Subba Rao (2001) report, for 17 of India’s 27 states, 105 crop rotations that
include rice;
Associate Professor, Centre for the Study of Regional Development, School of Social Sciences, JawaharlalNehru University, New Delhi-67Acknowledgements: The contribution of Dinesh Kumar Nayak, CSRD, JNU in conducting the field-survey andanalysing the results of the survey is gratefully acknowledged. The author is also grateful to Abha Gupta andAwadhesh Kumar for their research assistance at various stages of the work. The paper benefitted from thecomments and suggestions from Barbara Harriss-White, D Narasimha Reddy and other team members of theproject. Comments and discussions in two workshops at MSE, Chennai and NIRD, Hyderabad, where earlierversions were presented have also helped in revising the paper. The usual disclaimers apply.
2
(b) rice is cultivated both as a subsistence crop as well as a ‘cash crop’- sometimes even as an ‘export
crop’;
(c) rice is produced with or without irrigation; with little or high levels of mechanisation;73
(d) farmers of all size classes cultivate rice using both family and wage labour along with significant
use of female and (seasonally) migrant labour in many cases.
This paper presents research into the production, exchange relations and distribution of paddy in two
relatively less developed districts of Odisha. The wider objective is to examine changes in rain-fed
rice cultivation in the context of changing livelihoods, the belated introduction of green revolution
techniques into new ‘laggard’ areas and state interventions for rural development. This paper is
organised as follows: in the next section, we explain the significance of paddy in the rural agrarian
economy of Odisha. Then, we present findings from a primary survey in two villages. Following the
discussion on livelihood scenarios, agrarian relations and production conditions, we turn to discuss the
post-harvesting processing and marketing system. The final section concludes.
II. Rice in Odisha Agriculture: A Brief Outline
Odisha is not only among the poorest states of India, its record in poverty reduction has been
consistently less impressive than many other less developed states of the country. In the poor and less
developed state, agrarian livelihoods are the key to the survival of the poor. However, it needs to be
emphasized that poverty in Odisha is also highly concentrated – both spatially and socially (de Haan
and Dubey, 2005; Shah et al, 2005; Mishra, 2009; Panda, 2008). It is interior districts of South
Odisha, and, to a lesser extent North Odisha, where the incidence of poverty is higher and rates of
poverty reduction considerably slower. Among social groups, it is the scheduled castes and scheduled
tribes who account for bulk of the poor population. These marginalised social groups also have a
relatively higher share in population in the South and North Odisha NSS regions. Even among the
SCs and STs, those living in South Odisha live in far greater poverty than those living in the coastal
region. Thus spatial and social vulnerabilities reinforce each other.74
73 Approximately 55% of India’s rice crop is irrigated, the fraction of rice area that is irrigated varies
by state from <50% in Madhya Pradesh, Maharashtra, and Bihar, to >90% in Punjab, Tamil Nadu,
Andhra Pradesh, and Haryana. Rainfed rice occupied 13 Mha, plus 5.45 Mha of upland rice and 1.35
Mha of deepwater rice (>1 m flooding depth 1999-2000).
74 This phenomenon has much deeper socio-historical roots and cannot be explored here. For Odisha asa whole, the incidence of poverty among the ST and the SC is higher than that among the others. Between 1993-94 and 2004-05, poverty ratio in fact, has increased among the STs and SCs in the northern and southerndistricts (de Haan and Dubey, 2005; Mishra, 2010).
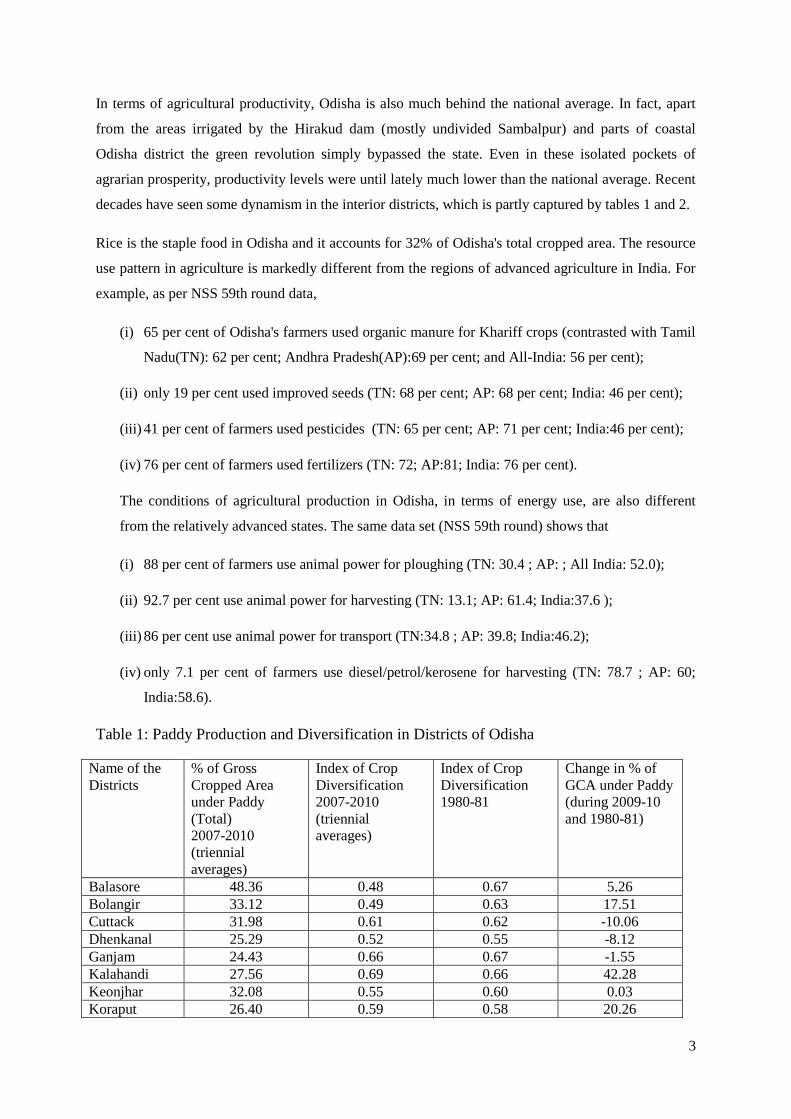
3
In terms of agricultural productivity, Odisha is also much behind the national average. In fact, apart
from the areas irrigated by the Hirakud dam (mostly undivided Sambalpur) and parts of coastal
Odisha district the green revolution simply bypassed the state. Even in these isolated pockets of
agrarian prosperity, productivity levels were until lately much lower than the national average. Recent
decades have seen some dynamism in the interior districts, which is partly captured by tables 1 and 2.
Rice is the staple food in Odisha and it accounts for 32% of Odisha's total cropped area. The resource
use pattern in agriculture is markedly different from the regions of advanced agriculture in India. For
example, as per NSS 59th round data,
(i) 65 per cent of Odisha's farmers used organic manure for Khariff crops (contrasted with Tamil
Nadu(TN): 62 per cent; Andhra Pradesh(AP):69 per cent; and All-India: 56 per cent);
(ii) only 19 per cent used improved seeds (TN: 68 per cent; AP: 68 per cent; India: 46 per cent);
(iii) 41 per cent of farmers used pesticides (TN: 65 per cent; AP: 71 per cent; India:46 per cent);
(iv) 76 per cent of farmers used fertilizers (TN: 72; AP:81; India: 76 per cent).
The conditions of agricultural production in Odisha, in terms of energy use, are also different
from the relatively advanced states. The same data set (NSS 59th round) shows that
(i) 88 per cent of farmers use animal power for ploughing (TN: 30.4 ; AP: ; All India: 52.0);
(ii) 92.7 per cent use animal power for harvesting (TN: 13.1; AP: 61.4; India:37.6 );
(iii) 86 per cent use animal power for transport (TN:34.8 ; AP: 39.8; India:46.2);
(iv) only 7.1 per cent of farmers use diesel/petrol/kerosene for harvesting (TN: 78.7 ; AP: 60;
India:58.6).
Table 1: Paddy Production and Diversification in Districts of Odisha
Name of theDistricts
% of GrossCropped Areaunder Paddy(Total)2007-2010(triennialaverages)
Index of CropDiversification2007-2010(triennialaverages)
Index of CropDiversification1980-81
Change in % ofGCA under Paddy(during 2009-10and 1980-81)
Balasore 48.36 0.48 0.67 5.26Bolangir 33.12 0.49 0.63 17.51Cuttack 31.98 0.61 0.62 -10.06Dhenkanal 25.29 0.52 0.55 -8.12Ganjam 24.43 0.66 0.67 -1.55Kalahandi 27.56 0.69 0.66 42.28Keonjhar 32.08 0.55 0.60 0.03Koraput 26.40 0.59 0.58 20.26
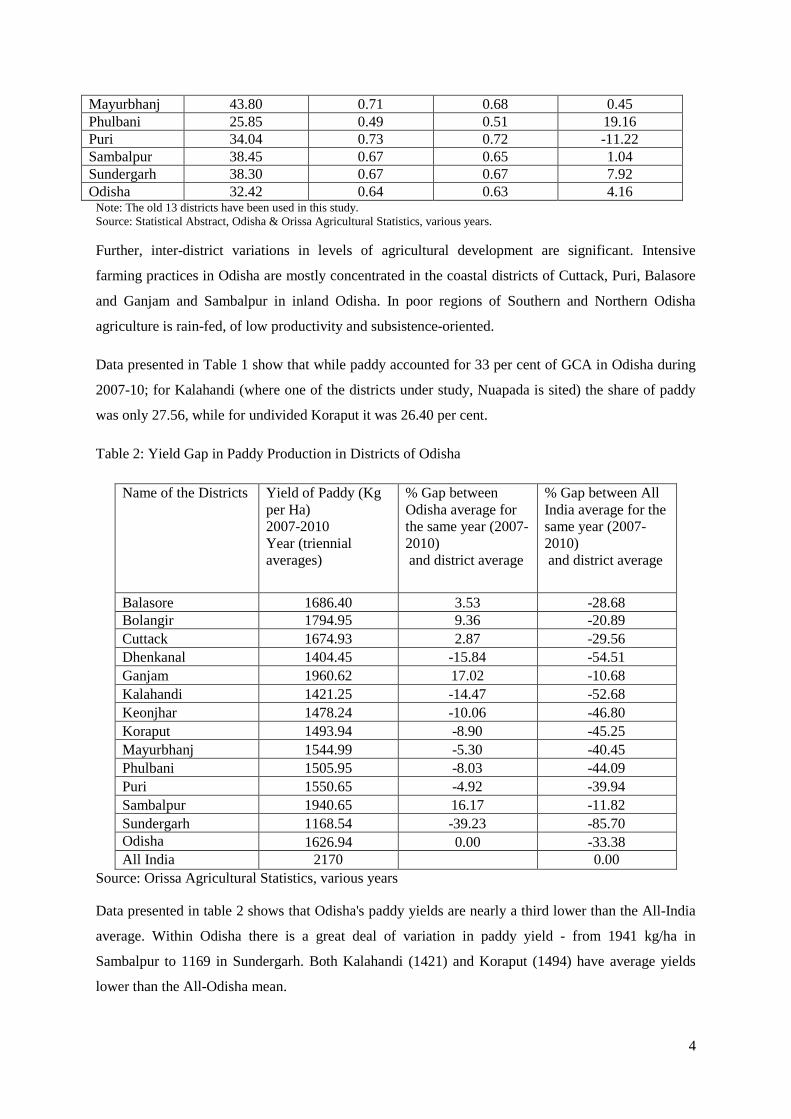
4
Mayurbhanj 43.80 0.71 0.68 0.45Phulbani 25.85 0.49 0.51 19.16Puri 34.04 0.73 0.72 -11.22Sambalpur 38.45 0.67 0.65 1.04Sundergarh 38.30 0.67 0.67 7.92Odisha 32.42 0.64 0.63 4.16
Note: The old 13 districts have been used in this study.Source: Statistical Abstract, Odisha & Orissa Agricultural Statistics, various years.
Further, inter-district variations in levels of agricultural development are significant. Intensive
farming practices in Odisha are mostly concentrated in the coastal districts of Cuttack, Puri, Balasore
and Ganjam and Sambalpur in inland Odisha. In poor regions of Southern and Northern Odisha
agriculture is rain-fed, of low productivity and subsistence-oriented.
Data presented in Table 1 show that while paddy accounted for 33 per cent of GCA in Odisha during
2007-10; for Kalahandi (where one of the districts under study, Nuapada is sited) the share of paddy
was only 27.56, while for undivided Koraput it was 26.40 per cent.
Table 2: Yield Gap in Paddy Production in Districts of Odisha
Name of the Districts Yield of Paddy (Kgper Ha)2007-2010Year (triennialaverages)
% Gap betweenOdisha average forthe same year (2007-2010)and district average
% Gap between AllIndia average for thesame year (2007-2010)and district average
Balasore 1686.40 3.53 -28.68Bolangir 1794.95 9.36 -20.89
Cuttack 1674.93 2.87 -29.56
Dhenkanal 1404.45 -15.84 -54.51
Ganjam 1960.62 17.02 -10.68
Kalahandi 1421.25 -14.47 -52.68
Keonjhar 1478.24 -10.06 -46.80
Koraput 1493.94 -8.90 -45.25
Mayurbhanj 1544.99 -5.30 -40.45
Phulbani 1505.95 -8.03 -44.09
Puri 1550.65 -4.92 -39.94
Sambalpur 1940.65 16.17 -11.82
Sundergarh 1168.54 -39.23 -85.70Odisha 1626.94 0.00 -33.38All India 2170 0.00
Source: Orissa Agricultural Statistics, various years
Data presented in table 2 shows that Odisha's paddy yields are nearly a third lower than the All-India
average. Within Odisha there is a great deal of variation in paddy yield - from 1941 kg/ha in
Sambalpur to 1169 in Sundergarh. Both Kalahandi (1421) and Koraput (1494) have average yields
lower than the All-Odisha mean.
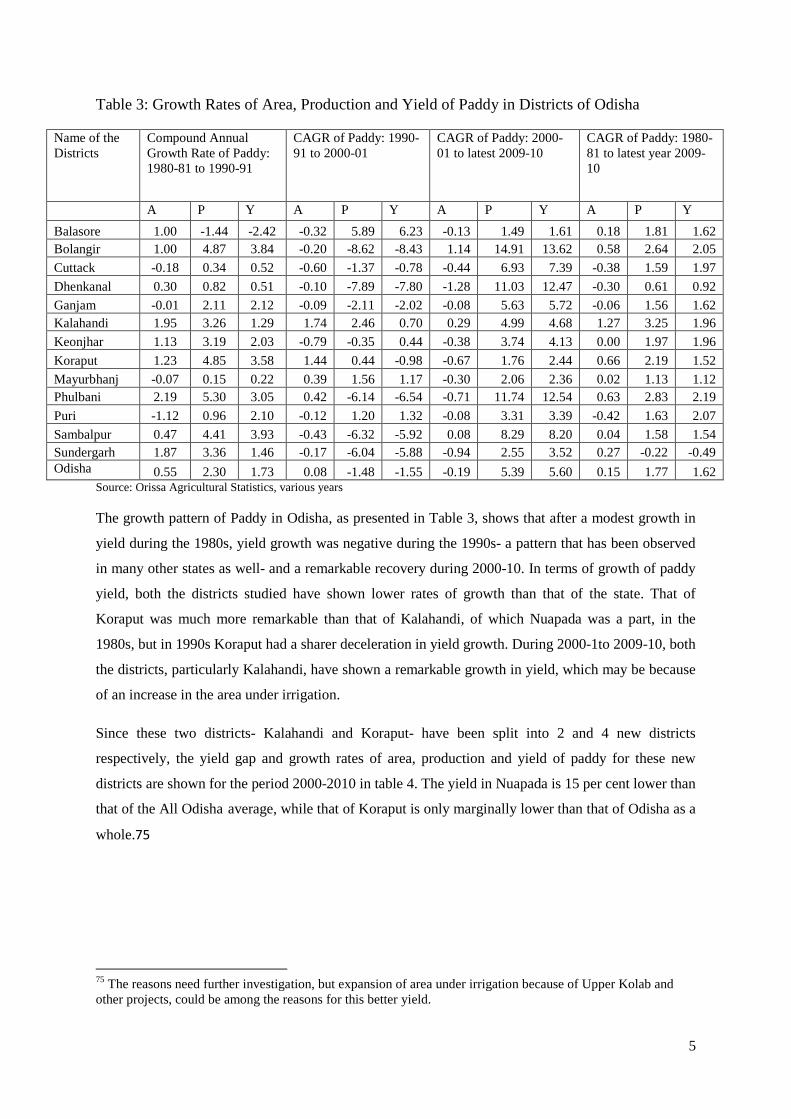
5
Table 3: Growth Rates of Area, Production and Yield of Paddy in Districts of Odisha
Name of theDistricts
Compound AnnualGrowth Rate of Paddy:1980-81 to 1990-91
CAGR of Paddy: 1990-91 to 2000-01
CAGR of Paddy: 2000-01 to latest 2009-10
CAGR of Paddy: 1980-81 to latest year 2009-10
A P Y A P Y A P Y A P Y
Balasore 1.00 -1.44 -2.42 -0.32 5.89 6.23 -0.13 1.49 1.61 0.18 1.81 1.62
Bolangir 1.00 4.87 3.84 -0.20 -8.62 -8.43 1.14 14.91 13.62 0.58 2.64 2.05
Cuttack -0.18 0.34 0.52 -0.60 -1.37 -0.78 -0.44 6.93 7.39 -0.38 1.59 1.97
Dhenkanal 0.30 0.82 0.51 -0.10 -7.89 -7.80 -1.28 11.03 12.47 -0.30 0.61 0.92
Ganjam -0.01 2.11 2.12 -0.09 -2.11 -2.02 -0.08 5.63 5.72 -0.06 1.56 1.62
Kalahandi 1.95 3.26 1.29 1.74 2.46 0.70 0.29 4.99 4.68 1.27 3.25 1.96
Keonjhar 1.13 3.19 2.03 -0.79 -0.35 0.44 -0.38 3.74 4.13 0.00 1.97 1.96
Koraput 1.23 4.85 3.58 1.44 0.44 -0.98 -0.67 1.76 2.44 0.66 2.19 1.52
Mayurbhanj -0.07 0.15 0.22 0.39 1.56 1.17 -0.30 2.06 2.36 0.02 1.13 1.12
Phulbani 2.19 5.30 3.05 0.42 -6.14 -6.54 -0.71 11.74 12.54 0.63 2.83 2.19
Puri -1.12 0.96 2.10 -0.12 1.20 1.32 -0.08 3.31 3.39 -0.42 1.63 2.07
Sambalpur 0.47 4.41 3.93 -0.43 -6.32 -5.92 0.08 8.29 8.20 0.04 1.58 1.54
Sundergarh 1.87 3.36 1.46 -0.17 -6.04 -5.88 -0.94 2.55 3.52 0.27 -0.22 -0.49Odisha 0.55 2.30 1.73 0.08 -1.48 -1.55 -0.19 5.39 5.60 0.15 1.77 1.62
Source: Orissa Agricultural Statistics, various years
The growth pattern of Paddy in Odisha, as presented in Table 3, shows that after a modest growth in
yield during the 1980s, yield growth was negative during the 1990s- a pattern that has been observed
in many other states as well- and a remarkable recovery during 2000-10. In terms of growth of paddy
yield, both the districts studied have shown lower rates of growth than that of the state. That of
Koraput was much more remarkable than that of Kalahandi, of which Nuapada was a part, in the
1980s, but in 1990s Koraput had a sharer deceleration in yield growth. During 2000-1to 2009-10, both
the districts, particularly Kalahandi, have shown a remarkable growth in yield, which may be because
of an increase in the area under irrigation.
Since these two districts- Kalahandi and Koraput- have been split into 2 and 4 new districts
respectively, the yield gap and growth rates of area, production and yield of paddy for these new
districts are shown for the period 2000-2010 in table 4. The yield in Nuapada is 15 per cent lower than
that of the All Odisha average, while that of Koraput is only marginally lower than that of Odisha as a
whole.75
75 The reasons need further investigation, but expansion of area under irrigation because of Upper Kolab andother projects, could be among the reasons for this better yield.
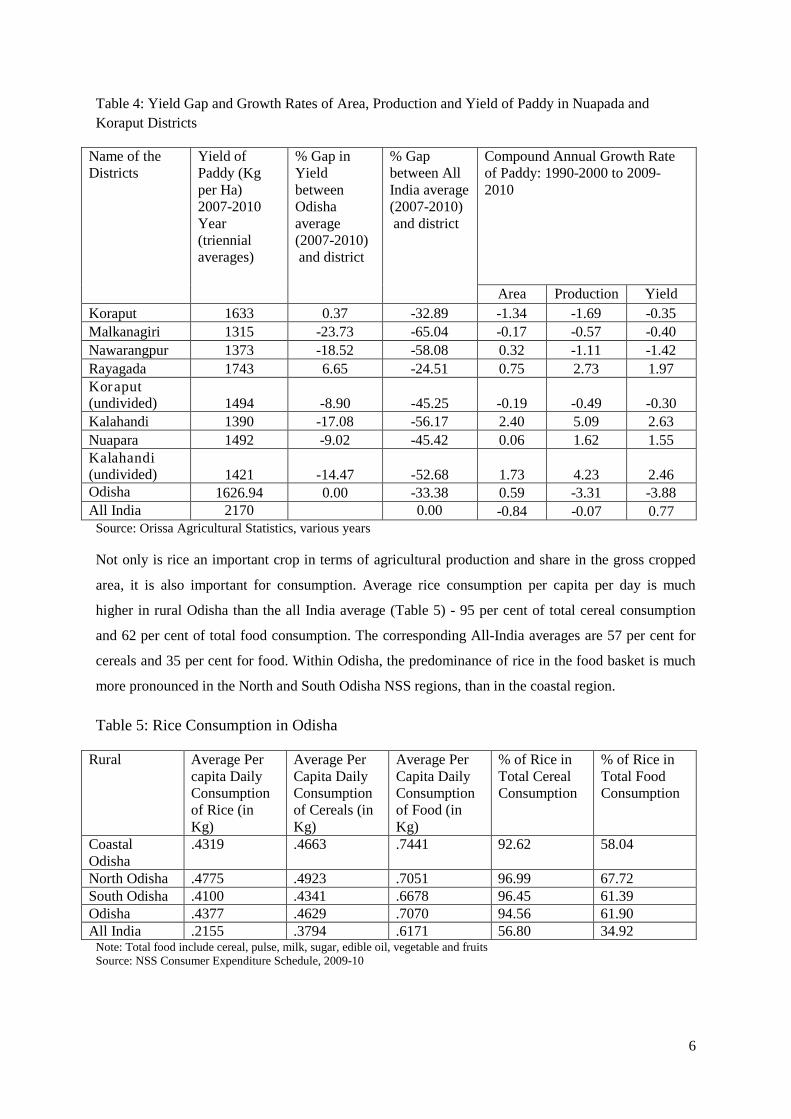
6
Table 4: Yield Gap and Growth Rates of Area, Production and Yield of Paddy in Nuapada and
Koraput Districts
Name of theDistricts
Yield ofPaddy (Kgper Ha)2007-2010Year(triennialaverages)
% Gap inYieldbetweenOdishaaverage(2007-2010)and district
% Gapbetween AllIndia average(2007-2010)and district
Compound Annual Growth Rateof Paddy: 1990-2000 to 2009-2010
Area Production Yield
Koraput 1633 0.37 -32.89 -1.34 -1.69 -0.35
Malkanagiri 1315 -23.73 -65.04 -0.17 -0.57 -0.40
Nawarangpur 1373 -18.52 -58.08 0.32 -1.11 -1.42
Rayagada 1743 6.65 -24.51 0.75 2.73 1.97Koraput(undivided) 1494 -8.90 -45.25 -0.19 -0.49 -0.30Kalahandi 1390 -17.08 -56.17 2.40 5.09 2.63
Nuapara 1492 -9.02 -45.42 0.06 1.62 1.55Kalahandi(undivided) 1421 -14.47 -52.68 1.73 4.23 2.46Odisha 1626.94 0.00 -33.38 0.59 -3.31 -3.88All India 2170 0.00 -0.84 -0.07 0.77
Source: Orissa Agricultural Statistics, various years
Not only is rice an important crop in terms of agricultural production and share in the gross cropped
area, it is also important for consumption. Average rice consumption per capita per day is much
higher in rural Odisha than the all India average (Table 5) - 95 per cent of total cereal consumption
and 62 per cent of total food consumption. The corresponding All-India averages are 57 per cent for
cereals and 35 per cent for food. Within Odisha, the predominance of rice in the food basket is much
more pronounced in the North and South Odisha NSS regions, than in the coastal region.
Table 5: Rice Consumption in Odisha
Rural Average Percapita DailyConsumptionof Rice (inKg)
Average PerCapita DailyConsumptionof Cereals (inKg)
Average PerCapita DailyConsumptionof Food (inKg)
% of Rice inTotal CerealConsumption
% of Rice inTotal FoodConsumption
CoastalOdisha
.4319 .4663 .7441 92.62 58.04
North Odisha .4775 .4923 .7051 96.99 67.72South Odisha .4100 .4341 .6678 96.45 61.39Odisha .4377 .4629 .7070 94.56 61.90All India .2155 .3794 .6171 56.80 34.92
Note: Total food include cereal, pulse, milk, sugar, edible oil, vegetable and fruitsSource: NSS Consumer Expenditure Schedule, 2009-10

7
Further, the consumption of rice is higher among the poor than among the non-poor population,
higher among the agricultural labourers than cultivators, as is the share of rice in total food
consumption. Among the poor, among agricultural labourers and cultivators, the share of rice in total
food-grain consumption is higher in the North and South Odisha regions than that in the coastal
region. So the consumption of rice, though relatively high for all population groups in rural Odisha,
has marked associations with spatial and socio-economic characteristics of the population. The culture
of rice is associated with poverty and backwardness. In this setting the conditions of production and
distribution are investigated in subsequent sections.
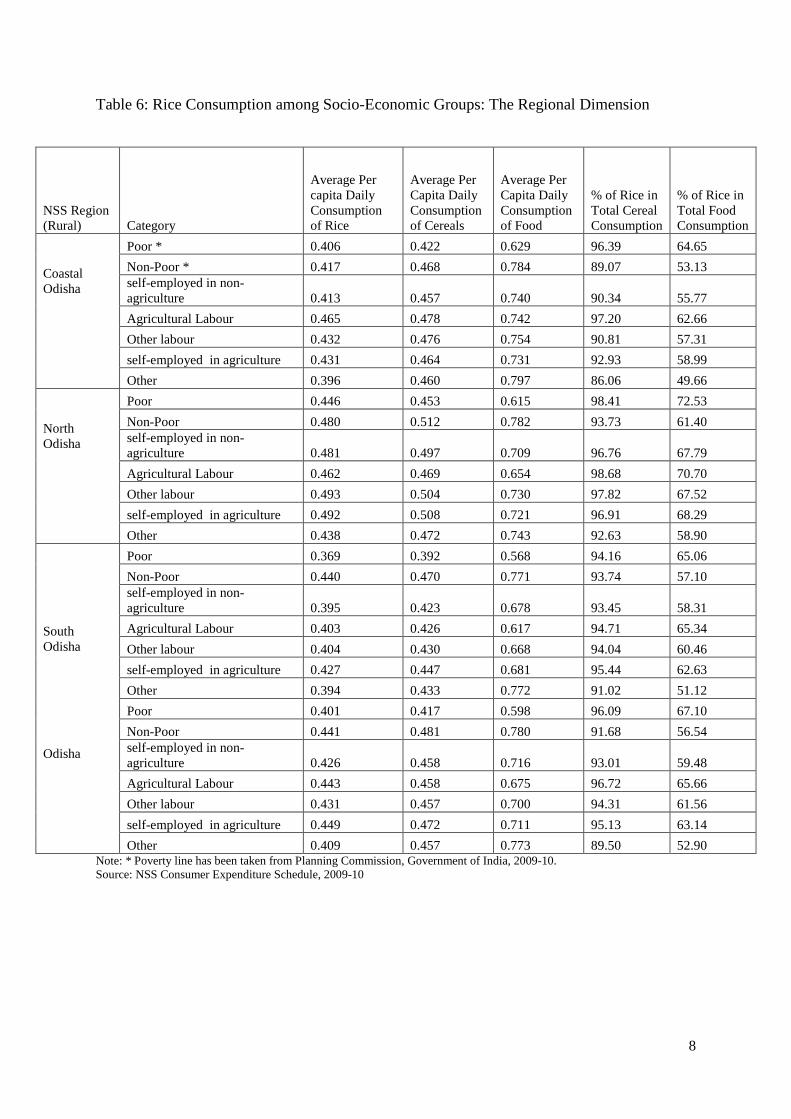
8
Table 6: Rice Consumption among Socio-Economic Groups: The Regional Dimension
Note: * Poverty line has been taken from Planning Commission, Government of India, 2009-10.Source: NSS Consumer Expenditure Schedule, 2009-10
NSS Region(Rural) Category
Average Percapita DailyConsumptionof Rice
Average PerCapita DailyConsumptionof Cereals
Average PerCapita DailyConsumptionof Food
% of Rice inTotal CerealConsumption
% of Rice inTotal FoodConsumption
CoastalOdisha
Poor * 0.406 0.422 0.629 96.39 64.65
Non-Poor * 0.417 0.468 0.784 89.07 53.13self-employed in non-agriculture 0.413 0.457 0.740 90.34 55.77
Agricultural Labour 0.465 0.478 0.742 97.20 62.66
Other labour 0.432 0.476 0.754 90.81 57.31
self-employed in agriculture 0.431 0.464 0.731 92.93 58.99
Other 0.396 0.460 0.797 86.06 49.66
NorthOdisha
Poor 0.446 0.453 0.615 98.41 72.53
Non-Poor 0.480 0.512 0.782 93.73 61.40self-employed in non-agriculture 0.481 0.497 0.709 96.76 67.79
Agricultural Labour 0.462 0.469 0.654 98.68 70.70
Other labour 0.493 0.504 0.730 97.82 67.52
self-employed in agriculture 0.492 0.508 0.721 96.91 68.29
Other 0.438 0.472 0.743 92.63 58.90
SouthOdisha
Odisha
Poor 0.369 0.392 0.568 94.16 65.06
Non-Poor 0.440 0.470 0.771 93.74 57.10self-employed in non-agriculture 0.395 0.423 0.678 93.45 58.31
Agricultural Labour 0.403 0.426 0.617 94.71 65.34
Other labour 0.404 0.430 0.668 94.04 60.46
self-employed in agriculture 0.427 0.447 0.681 95.44 62.63
Other 0.394 0.433 0.772 91.02 51.12
Poor 0.401 0.417 0.598 96.09 67.10
Non-Poor 0.441 0.481 0.780 91.68 56.54self-employed in non-agriculture 0.426 0.458 0.716 93.01 59.48
Agricultural Labour 0.443 0.458 0.675 96.72 65.66
Other labour 0.431 0.457 0.700 94.31 61.56
self-employed in agriculture 0.449 0.472 0.711 95.13 63.14
Other 0.409 0.457 0.773 89.50 52.90
9
III. Production Conditions in Rainfed Paddy Cultivation: Insights from a Village
Survey
Study Area and Survey Design
To explore the production and exchange relations in rain-fed paddy production systems which do not
use the bio-chemical inputs of the green revolution, a detailed primary survey was undertaken in 2012
in two of the new districts of Odisha: Nuapada and Koraput. These two districts had lower levels of
both productivity and irrigation. Two study villages were selected purposively according to the
following criteria:
(a) rain-fed paddy cultivation;
(b) no use of electricity in agriculture;
(c) no/ little use of chemical fertilizers and pesticides.
The objectives were threefold. First, to capture the essential features of ‘traditional’ rain-fed
agriculture persisting into the 21st century, second, to measure material parameters (energy, water and
the production of waste GHGs) for rice, and third, to examine the rice sector as a system – involving
distribution as well as production. This research has not been done before. Primary data was collected
from households on the basis of two different schedules. Firstly, all the households in the selected
villages were interviewed on the basis of a detailed questionnaire, through which information about
all aspects of farming, allied agricultural activities and livelihoods sources were collected. Secondly,
twenty-four randomly selected farmers cultivating rice were asked detailed questions about paddy
cultivation in one representative paddy plot cultivated by the household. Information generated from
this exercise from 48 plots in a comparative framework has been used for the LCA-VCA model to
calculate greenhouse gases, while information from the general household questionnaire has been
used in this paper to investigate conditions of production and exchange in the study villages76. This
has been supplemented by focus group discussions and in-depth interviews with traders, wholesalers,
grocery shop owners, officials with regulated market cooperative societies, commission agents, rice
mill owners, researchers, hauler-owners, officers managing the PDS, labourers, transport workers and
owners to gather information about post-harvest processing, marketing and distribution of paddy.
The two districts: Koraput and Nuapara (part of undivided Kalahandi) are part of KBK-region- which
has a special policy identity. Two phases of the Biju KBK yojana have been implemented by the state
government with assistance from the planning commission and the central government. In the 1980s,
Kalahandi, Balangir and Koraput (KBK) region came to be recognized as synonymous with mass
76 That is why, there are some discrepancies between in the figures generated through the analysis of plot-leveldata and data generated through household-level information.
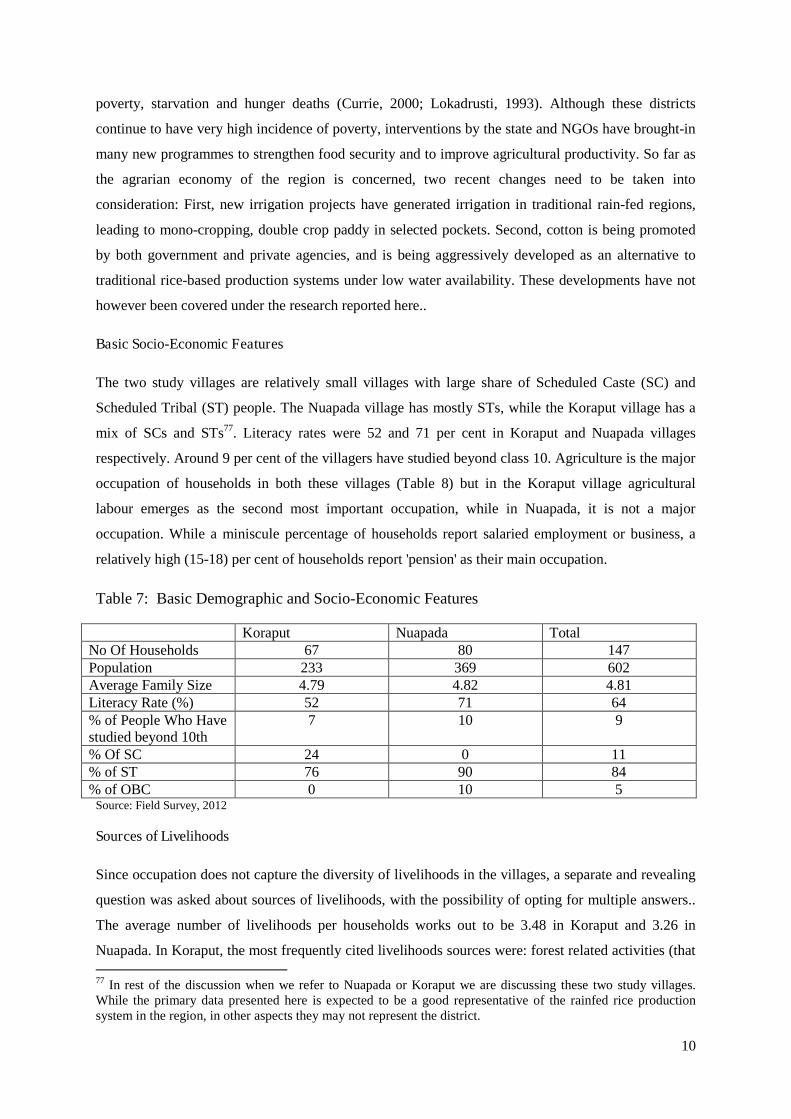
10
poverty, starvation and hunger deaths (Currie, 2000; Lokadrusti, 1993). Although these districts
continue to have very high incidence of poverty, interventions by the state and NGOs have brought-in
many new programmes to strengthen food security and to improve agricultural productivity. So far as
the agrarian economy of the region is concerned, two recent changes need to be taken into
consideration: First, new irrigation projects have generated irrigation in traditional rain-fed regions,
leading to mono-cropping, double crop paddy in selected pockets. Second, cotton is being promoted
by both government and private agencies, and is being aggressively developed as an alternative to
traditional rice-based production systems under low water availability. These developments have not
however been covered under the research reported here..
Basic Socio-Economic Features
The two study villages are relatively small villages with large share of Scheduled Caste (SC) and
Scheduled Tribal (ST) people. The Nuapada village has mostly STs, while the Koraput village has a
mix of SCs and STs77. Literacy rates were 52 and 71 per cent in Koraput and Nuapada villages
respectively. Around 9 per cent of the villagers have studied beyond class 10. Agriculture is the major
occupation of households in both these villages (Table 8) but in the Koraput village agricultural
labour emerges as the second most important occupation, while in Nuapada, it is not a major
occupation. While a miniscule percentage of households report salaried employment or business, a
relatively high (15-18) per cent of households report 'pension' as their main occupation.
Table 7: Basic Demographic and Socio-Economic Features
Koraput Nuapada TotalNo Of Households 67 80 147Population 233 369 602Average Family Size 4.79 4.82 4.81Literacy Rate (%) 52 71 64% of People Who Havestudied beyond 10th
7 10 9
% Of SC 24 0 11% of ST 76 90 84% of OBC 0 10 5
Source: Field Survey, 2012
Sources of Livelihoods
Since occupation does not capture the diversity of livelihoods in the villages, a separate and revealing
question was asked about sources of livelihoods, with the possibility of opting for multiple answers..
The average number of livelihoods per households works out to be 3.48 in Koraput and 3.26 in
Nuapada. In Koraput, the most frequently cited livelihoods sources were: forest related activities (that
77 In rest of the discussion when we refer to Nuapada or Koraput we are discussing these two study villages.While the primary data presented here is expected to be a good representative of the rainfed rice productionsystem in the region, in other aspects they may not represent the district.
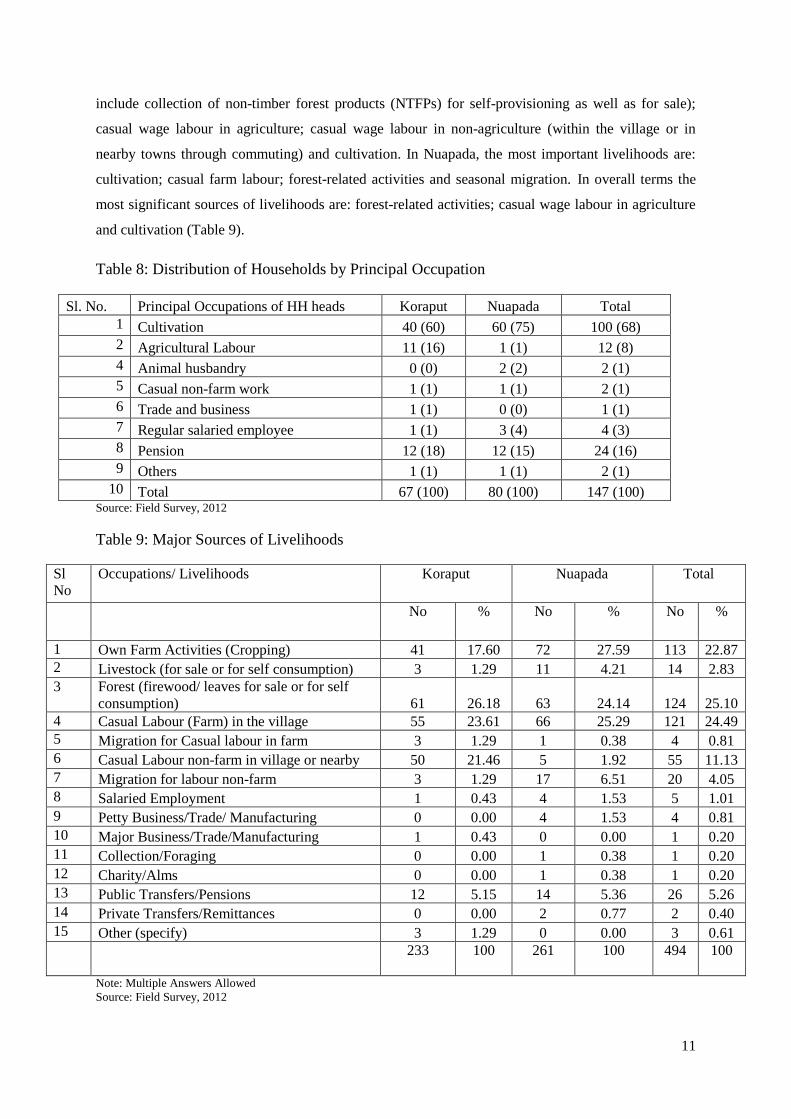
11
include collection of non-timber forest products (NTFPs) for self-provisioning as well as for sale);
casual wage labour in agriculture; casual wage labour in non-agriculture (within the village or in
nearby towns through commuting) and cultivation. In Nuapada, the most important livelihoods are:
cultivation; casual farm labour; forest-related activities and seasonal migration. In overall terms the
most significant sources of livelihoods are: forest-related activities; casual wage labour in agriculture
and cultivation (Table 9).
Table 8: Distribution of Households by Principal Occupation
Sl. No. Principal Occupations of HH heads Koraput Nuapada Total1 Cultivation 40 (60) 60 (75) 100 (68)2 Agricultural Labour 11 (16) 1 (1) 12 (8)4 Animal husbandry 0 (0) 2 (2) 2 (1)5 Casual non-farm work 1 (1) 1 (1) 2 (1)6 Trade and business 1 (1) 0 (0) 1 (1)7 Regular salaried employee 1 (1) 3 (4) 4 (3)8 Pension 12 (18) 12 (15) 24 (16)9 Others 1 (1) 1 (1) 2 (1)
10 Total 67 (100) 80 (100) 147 (100)Source: Field Survey, 2012
Table 9: Major Sources of Livelihoods
SlNo
Occupations/ Livelihoods Koraput Nuapada Total
No % No % No %
1 Own Farm Activities (Cropping) 41 17.60 72 27.59 113 22.872 Livestock (for sale or for self consumption) 3 1.29 11 4.21 14 2.833 Forest (firewood/ leaves for sale or for self
consumption) 61 26.18 63 24.14 124 25.104 Casual Labour (Farm) in the village 55 23.61 66 25.29 121 24.495 Migration for Casual labour in farm 3 1.29 1 0.38 4 0.816 Casual Labour non-farm in village or nearby 50 21.46 5 1.92 55 11.137 Migration for labour non-farm 3 1.29 17 6.51 20 4.058 Salaried Employment 1 0.43 4 1.53 5 1.019 Petty Business/Trade/ Manufacturing 0 0.00 4 1.53 4 0.8110 Major Business/Trade/Manufacturing 1 0.43 0 0.00 1 0.2011 Collection/Foraging 0 0.00 1 0.38 1 0.2012 Charity/Alms 0 0.00 1 0.38 1 0.2013 Public Transfers/Pensions 12 5.15 14 5.36 26 5.2614 Private Transfers/Remittances 0 0.00 2 0.77 2 0.4015 Other (specify) 3 1.29 0 0.00 3 0.61
233 100 261 100 494 100
Note: Multiple Answers AllowedSource: Field Survey, 2012
12
Since a number of different livelihoods are combined by rural households, the predominant
livelihoods combinations have also been examined (Table 10). With some simplifications, 33
different livelihood combinations were identified for the 147 households under study. The following
are the most important combinations in the Koraput village: (crop cultivation+ casual farm labour+
forest); (crop cultivation+ casual non-farm labour+ forest); (casual labour in farm+ casual labour in
non-farm+ forest) and (crop farming+casual labour in farm+ casual labour in non-farm). Similarly, for
the Nuapada village, the most important livelihoods combinations are (crop cultivation+ casual non-
farm labour+ forest); (cultivation+ casual farm labour + seasonal migration to non-farm).
Even this highly simplified mapping of livelihoods brings out their diversity in the study area. The
key aspects of the livelihoods strategies that emerge from the analysis are:
(i) the significance of forest-resources as a supplementary source of livelihoods;
(ii) the participation of cultivator households in the wage labour market;
(iii) the significance of non-farm wage labour, both within and outside the villages. It is in this
context that production conditions in paddy cultivation need to be analysed and understood.
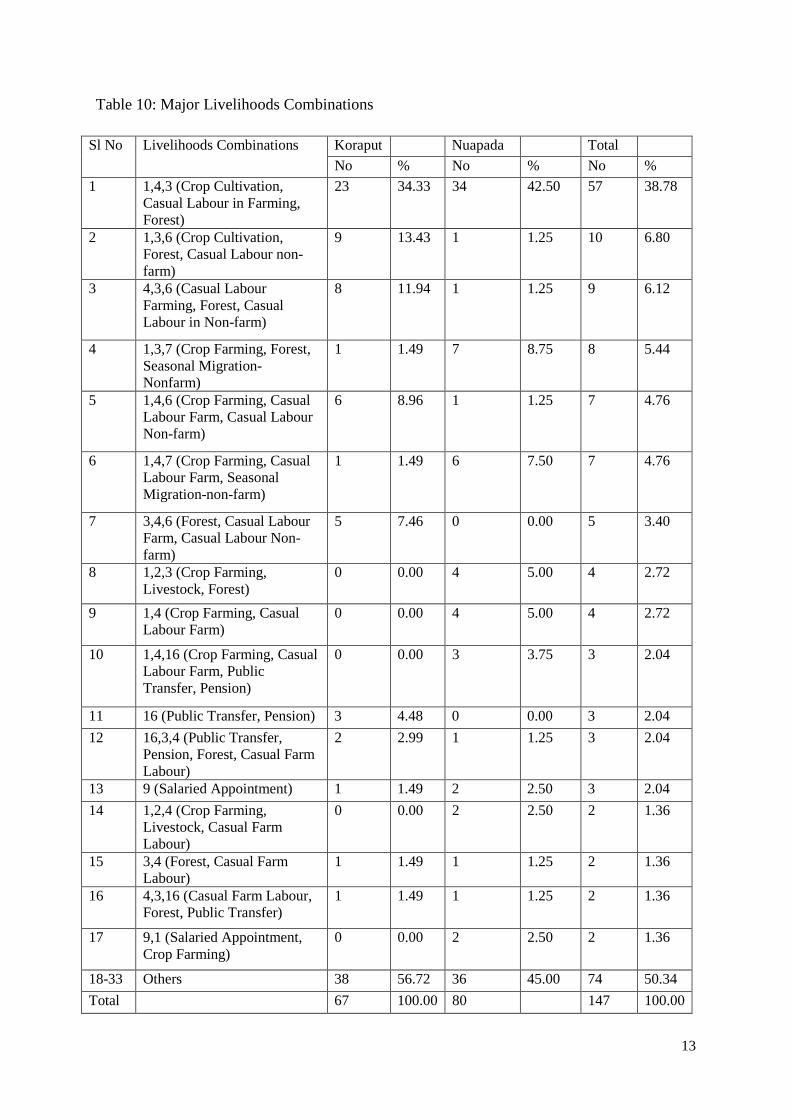
13
Table 10: Major Livelihoods Combinations
Sl No Livelihoods Combinations Koraput Nuapada Total
No % No % No %
1 1,4,3 (Crop Cultivation,Casual Labour in Farming,Forest)
23 34.33 34 42.50 57 38.78
2 1,3,6 (Crop Cultivation,Forest, Casual Labour non-farm)
9 13.43 1 1.25 10 6.80
3 4,3,6 (Casual LabourFarming, Forest, CasualLabour in Non-farm)
8 11.94 1 1.25 9 6.12
4 1,3,7 (Crop Farming, Forest,Seasonal Migration-Nonfarm)
1 1.49 7 8.75 8 5.44
5 1,4,6 (Crop Farming, CasualLabour Farm, Casual LabourNon-farm)
6 8.96 1 1.25 7 4.76
6 1,4,7 (Crop Farming, CasualLabour Farm, SeasonalMigration-non-farm)
1 1.49 6 7.50 7 4.76
7 3,4,6 (Forest, Casual LabourFarm, Casual Labour Non-farm)
5 7.46 0 0.00 5 3.40
8 1,2,3 (Crop Farming,Livestock, Forest)
0 0.00 4 5.00 4 2.72
9 1,4 (Crop Farming, CasualLabour Farm)
0 0.00 4 5.00 4 2.72
10 1,4,16 (Crop Farming, CasualLabour Farm, PublicTransfer, Pension)
0 0.00 3 3.75 3 2.04
11 16 (Public Transfer, Pension) 3 4.48 0 0.00 3 2.04
12 16,3,4 (Public Transfer,Pension, Forest, Casual FarmLabour)
2 2.99 1 1.25 3 2.04
13 9 (Salaried Appointment) 1 1.49 2 2.50 3 2.04
14 1,2,4 (Crop Farming,Livestock, Casual FarmLabour)
0 0.00 2 2.50 2 1.36
15 3,4 (Forest, Casual FarmLabour)
1 1.49 1 1.25 2 1.36
16 4,3,16 (Casual Farm Labour,Forest, Public Transfer)
1 1.49 1 1.25 2 1.36
17 9,1 (Salaried Appointment,Crop Farming)
0 0.00 2 2.50 2 1.36
18-33 Others 38 56.72 36 45.00 74 50.34
Total 67 100.00 80 147 100.00
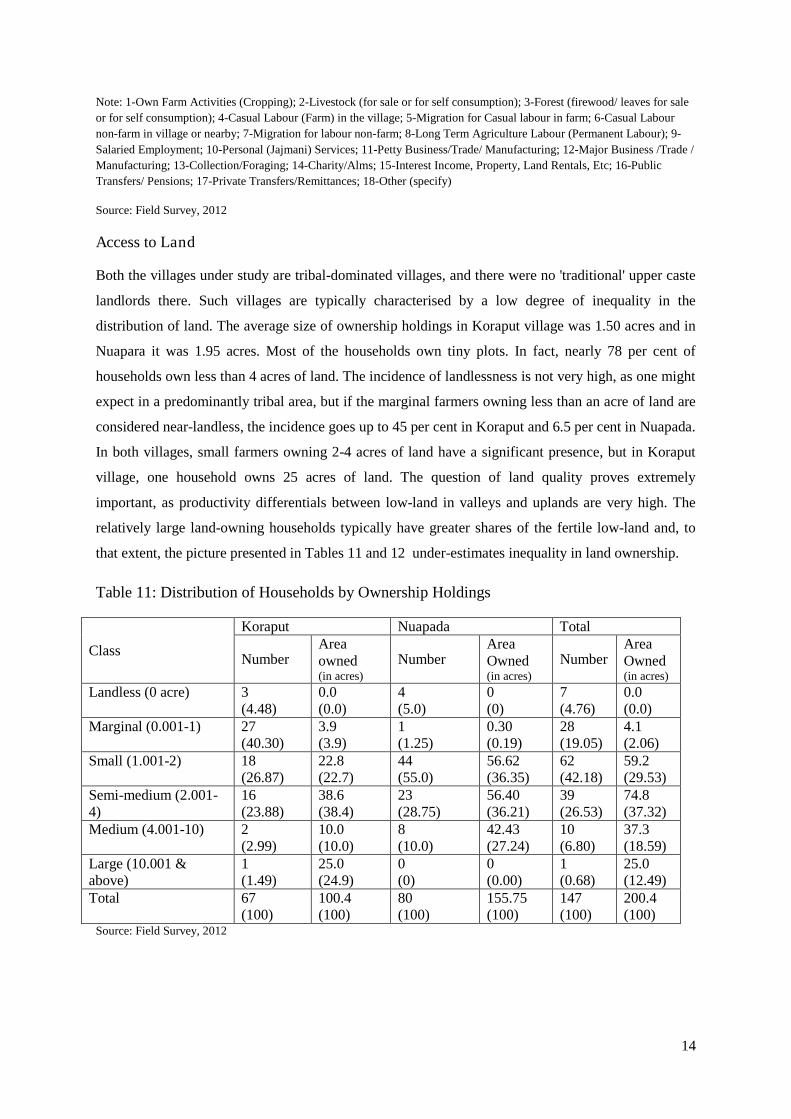
14
Note: 1-Own Farm Activities (Cropping); 2-Livestock (for sale or for self consumption); 3-Forest (firewood/ leaves for sale
or for self consumption); 4-Casual Labour (Farm) in the village; 5-Migration for Casual labour in farm; 6-Casual Labour
non-farm in village or nearby; 7-Migration for labour non-farm; 8-Long Term Agriculture Labour (Permanent Labour); 9-
Salaried Employment; 10-Personal (Jajmani) Services; 11-Petty Business/Trade/ Manufacturing; 12-Major Business /Trade /
Manufacturing; 13-Collection/Foraging; 14-Charity/Alms; 15-Interest Income, Property, Land Rentals, Etc; 16-Public
Transfers/ Pensions; 17-Private Transfers/Remittances; 18-Other (specify)
Source: Field Survey, 2012
Access to Land
Both the villages under study are tribal-dominated villages, and there were no 'traditional' upper caste
landlords there. Such villages are typically characterised by a low degree of inequality in the
distribution of land. The average size of ownership holdings in Koraput village was 1.50 acres and in
Nuapara it was 1.95 acres. Most of the households own tiny plots. In fact, nearly 78 per cent of
households own less than 4 acres of land. The incidence of landlessness is not very high, as one might
expect in a predominantly tribal area, but if the marginal farmers owning less than an acre of land are
considered near-landless, the incidence goes up to 45 per cent in Koraput and 6.5 per cent in Nuapada.
In both villages, small farmers owning 2-4 acres of land have a significant presence, but in Koraput
village, one household owns 25 acres of land. The question of land quality proves extremely
important, as productivity differentials between low-land in valleys and uplands are very high. The
relatively large land-owning households typically have greater shares of the fertile low-land and, to
that extent, the picture presented in Tables 11 and 12 under-estimates inequality in land ownership.
Table 11: Distribution of Households by Ownership Holdings
Class
Koraput Nuapada Total
NumberAreaowned(in acres)
NumberAreaOwned(in acres)
NumberAreaOwned(in acres)
Landless (0 acre) 3(4.48)
0.0(0.0)
4(5.0)
0(0)
7(4.76)
0.0(0.0)
Marginal (0.001-1) 27(40.30)
3.9(3.9)
1(1.25)
0.30(0.19)
28(19.05)
4.1(2.06)
Small (1.001-2) 18(26.87)
22.8(22.7)
44(55.0)
56.62(36.35)
62(42.18)
59.2(29.53)
Semi-medium (2.001-4)
16(23.88)
38.6(38.4)
23(28.75)
56.40(36.21)
39(26.53)
74.8(37.32)
Medium (4.001-10) 2(2.99)
10.0(10.0)
8(10.0)
42.43(27.24)
10(6.80)
37.3(18.59)
Large (10.001 &above)
1(1.49)
25.0(24.9)
0(0)
0(0.00)
1(0.68)
25.0(12.49)
Total 67(100)
100.4(100)
80(100)
155.75(100)
147(100)
200.4(100)
Source: Field Survey, 2012
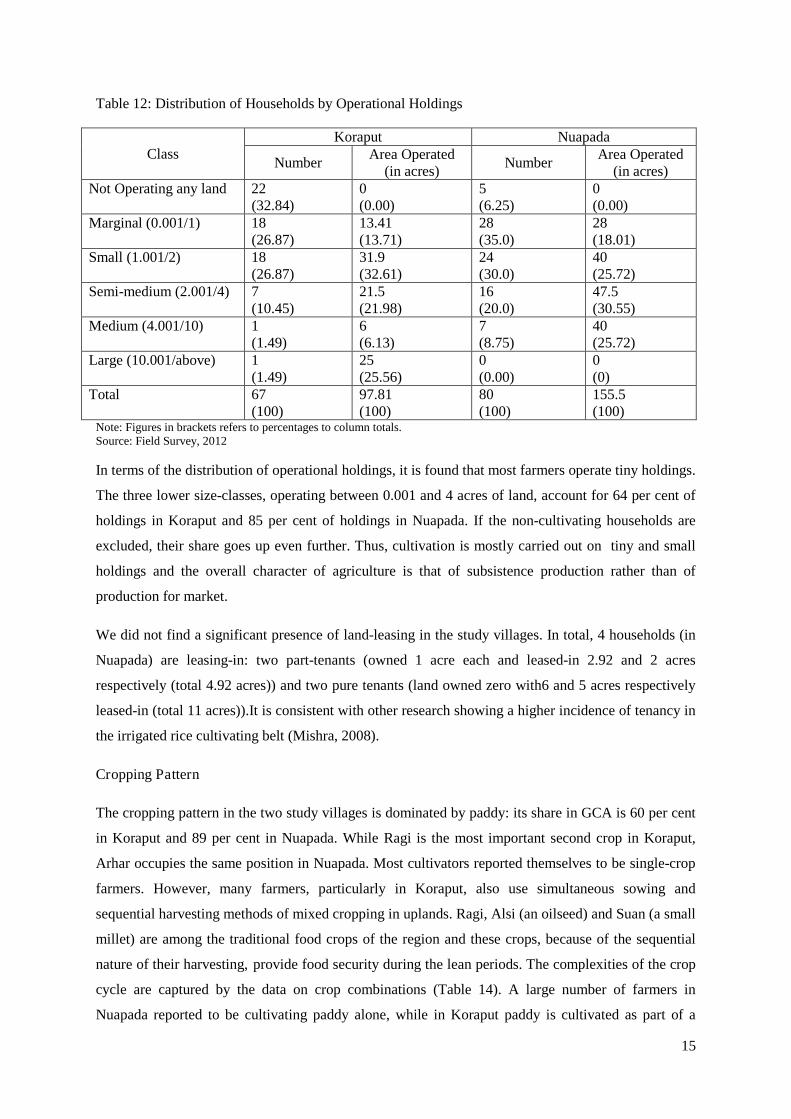
15
Table 12: Distribution of Households by Operational Holdings
ClassKoraput Nuapada
NumberArea Operated
(in acres)Number
Area Operated(in acres)
Not Operating any land 22(32.84)
0(0.00)
5(6.25)
0(0.00)
Marginal (0.001/1) 18(26.87)
13.41(13.71)
28(35.0)
28(18.01)
Small (1.001/2) 18(26.87)
31.9(32.61)
24(30.0)
40(25.72)
Semi-medium (2.001/4) 7(10.45)
21.5(21.98)
16(20.0)
47.5(30.55)
Medium (4.001/10) 1(1.49)
6(6.13)
7(8.75)
40(25.72)
Large (10.001/above) 1(1.49)
25(25.56)
0(0.00)
0(0)
Total 67(100)
97.81(100)
80(100)
155.5(100)
Note: Figures in brackets refers to percentages to column totals.Source: Field Survey, 2012
In terms of the distribution of operational holdings, it is found that most farmers operate tiny holdings.
The three lower size-classes, operating between 0.001 and 4 acres of land, account for 64 per cent of
holdings in Koraput and 85 per cent of holdings in Nuapada. If the non-cultivating households are
excluded, their share goes up even further. Thus, cultivation is mostly carried out on tiny and small
holdings and the overall character of agriculture is that of subsistence production rather than of
production for market.
We did not find a significant presence of land-leasing in the study villages. In total, 4 households (in
Nuapada) are leasing-in: two part-tenants (owned 1 acre each and leased-in 2.92 and 2 acres
respectively (total 4.92 acres)) and two pure tenants (land owned zero with6 and 5 acres respectively
leased-in (total 11 acres)).It is consistent with other research showing a higher incidence of tenancy in
the irrigated rice cultivating belt (Mishra, 2008).
Cropping Pattern
The cropping pattern in the two study villages is dominated by paddy: its share in GCA is 60 per cent
in Koraput and 89 per cent in Nuapada. While Ragi is the most important second crop in Koraput,
Arhar occupies the same position in Nuapada. Most cultivators reported themselves to be single-crop
farmers. However, many farmers, particularly in Koraput, also use simultaneous sowing and
sequential harvesting methods of mixed cropping in uplands. Ragi, Alsi (an oilseed) and Suan (a small
millet) are among the traditional food crops of the region and these crops, because of the sequential
nature of their harvesting, provide food security during the lean periods. The complexities of the crop
cycle are captured by the data on crop combinations (Table 14). A large number of farmers in
Nuapada reported to be cultivating paddy alone, while in Koraput paddy is cultivated as part of a
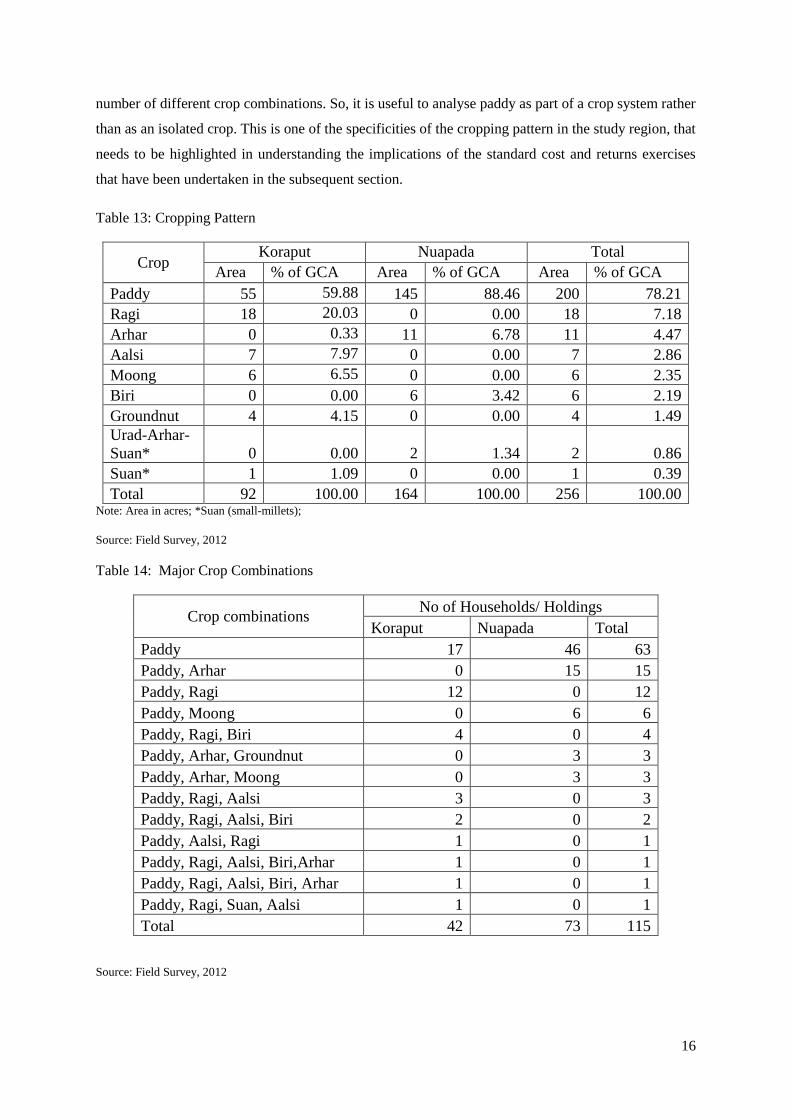
16
number of different crop combinations. So, it is useful to analyse paddy as part of a crop system rather
than as an isolated crop. This is one of the specificities of the cropping pattern in the study region, that
needs to be highlighted in understanding the implications of the standard cost and returns exercises
that have been undertaken in the subsequent section.
Table 13: Cropping Pattern
CropKoraput Nuapada Total
Area % of GCA Area % of GCA Area % of GCA
Paddy 55 59.88 145 88.46 200 78.21
Ragi 18 20.03 0 0.00 18 7.18
Arhar 0 0.33 11 6.78 11 4.47
Aalsi 7 7.97 0 0.00 7 2.86
Moong 6 6.55 0 0.00 6 2.35
Biri 0 0.00 6 3.42 6 2.19
Groundnut 4 4.15 0 0.00 4 1.49Urad-Arhar-Suan* 0 0.00 2 1.34 2 0.86
Suan* 1 1.09 0 0.00 1 0.39
Total 92 100.00 164 100.00 256 100.00Note: Area in acres; *Suan (small-millets);
Source: Field Survey, 2012
Table 14: Major Crop Combinations
Crop combinationsNo of Households/ Holdings
Koraput Nuapada Total
Paddy 17 46 63
Paddy, Arhar 0 15 15
Paddy, Ragi 12 0 12
Paddy, Moong 0 6 6
Paddy, Ragi, Biri 4 0 4
Paddy, Arhar, Groundnut 0 3 3
Paddy, Arhar, Moong 0 3 3
Paddy, Ragi, Aalsi 3 0 3
Paddy, Ragi, Aalsi, Biri 2 0 2
Paddy, Aalsi, Ragi 1 0 1
Paddy, Ragi, Aalsi, Biri,Arhar 1 0 1
Paddy, Ragi, Aalsi, Biri, Arhar 1 0 1
Paddy, Ragi, Suan, Aalsi 1 0 1
Total 42 73 115
Source: Field Survey, 2012
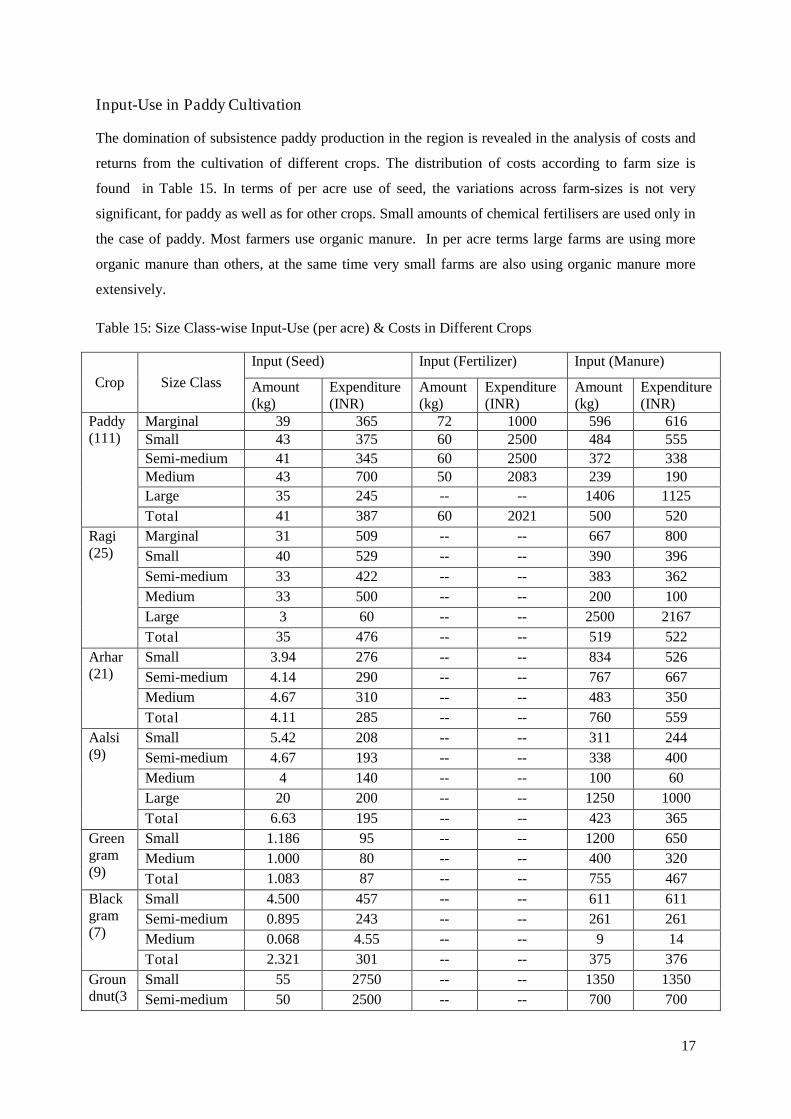
17
Input-Use in Paddy Cultivation
The domination of subsistence paddy production in the region is revealed in the analysis of costs and
returns from the cultivation of different crops. The distribution of costs according to farm size is
found in Table 15. In terms of per acre use of seed, the variations across farm-sizes is not very
significant, for paddy as well as for other crops. Small amounts of chemical fertilisers are used only in
the case of paddy. Most farmers use organic manure. In per acre terms large farms are using more
organic manure than others, at the same time very small farms are also using organic manure more
extensively.
Table 15: Size Class-wise Input-Use (per acre) & Costs in Different Crops
Crop Size Class
Input (Seed) Input (Fertilizer) Input (Manure)
Amount(kg)
Expenditure(INR)
Amount(kg)
Expenditure(INR)
Amount(kg)
Expenditure(INR)
Paddy(111)
Marginal 39 365 72 1000 596 616Small 43 375 60 2500 484 555
Semi-medium 41 345 60 2500 372 338Medium 43 700 50 2083 239 190
Large 35 245 -- -- 1406 1125
Total 41 387 60 2021 500 520
Ragi(25)
Marginal 31 509 -- -- 667 800
Small 40 529 -- -- 390 396
Semi-medium 33 422 -- -- 383 362
Medium 33 500 -- -- 200 100
Large 3 60 -- -- 2500 2167
Total 35 476 -- -- 519 522
Arhar(21)
Small 3.94 276 -- -- 834 526
Semi-medium 4.14 290 -- -- 767 667
Medium 4.67 310 -- -- 483 350
Total 4.11 285 -- -- 760 559
Aalsi(9)
Small 5.42 208 -- -- 311 244
Semi-medium 4.67 193 -- -- 338 400
Medium 4 140 -- -- 100 60
Large 20 200 -- -- 1250 1000
Total 6.63 195 -- -- 423 365
Greengram(9)
Small 1.186 95 -- -- 1200 650
Medium 1.000 80 -- -- 400 320
Total 1.083 87 -- -- 755 467
Blackgram(7)
Small 4.500 457 -- -- 611 611
Semi-medium 0.895 243 -- -- 261 261
Medium 0.068 4.55 -- -- 9 14
Total 2.321 301 -- -- 375 376
Groundnut(3
Small 55 2750 -- -- 1350 1350
Semi-medium 50 2500 -- -- 700 700
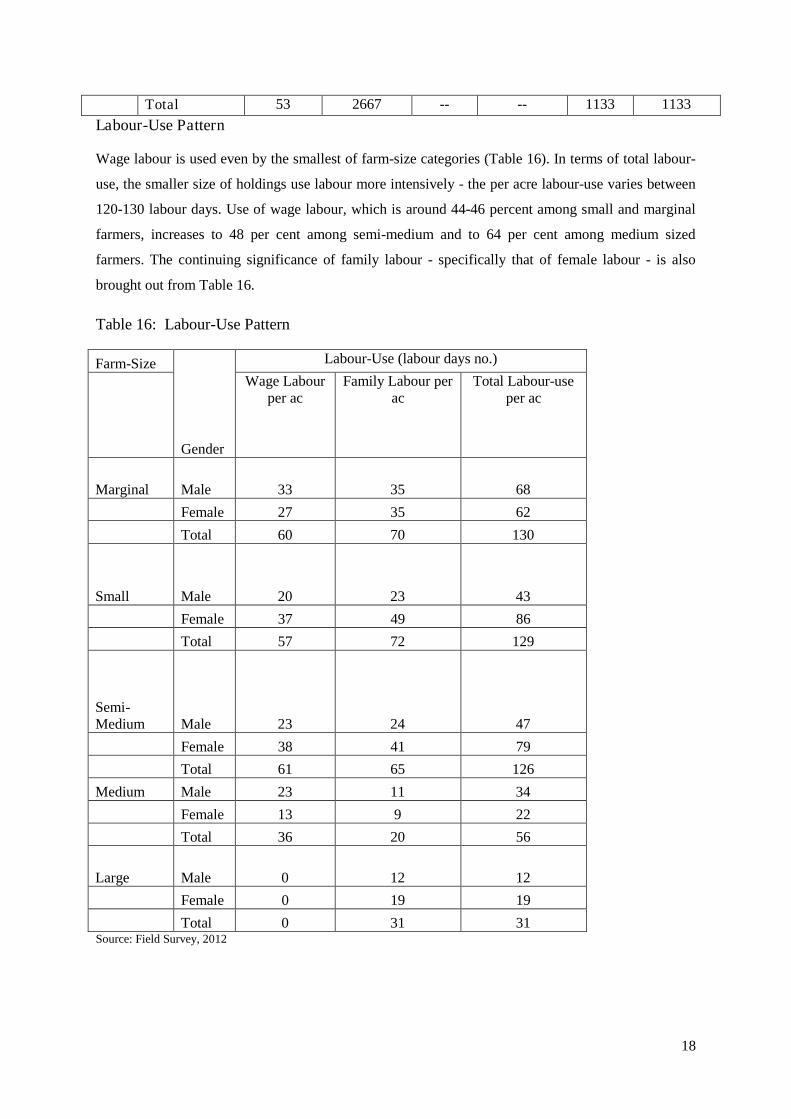
18
Total 53 2667 -- -- 1133 1133
Labour-Use Pattern
Wage labour is used even by the smallest of farm-size categories (Table 16). In terms of total labour-
use, the smaller size of holdings use labour more intensively - the per acre labour-use varies between
120-130 labour days. Use of wage labour, which is around 44-46 percent among small and marginal
farmers, increases to 48 per cent among semi-medium and to 64 per cent among medium sized
farmers. The continuing significance of family labour - specifically that of female labour - is also
brought out from Table 16.
Table 16: Labour-Use Pattern
Farm-Size
Gender
Labour-Use (labour days no.)
Wage Labourper ac
Family Labour perac
Total Labour-useper ac
Marginal Male 33 35 68
Female 27 35 62
Total 60 70 130
Small Male 20 23 43
Female 37 49 86
Total 57 72 129
Semi-Medium Male 23 24 47
Female 38 41 79
Total 61 65 126
Medium Male 23 11 34
Female 13 9 22
Total 36 20 56
Large Male 0 12 12
Female 0 19 19
Total 0 31 31Source: Field Survey, 2012
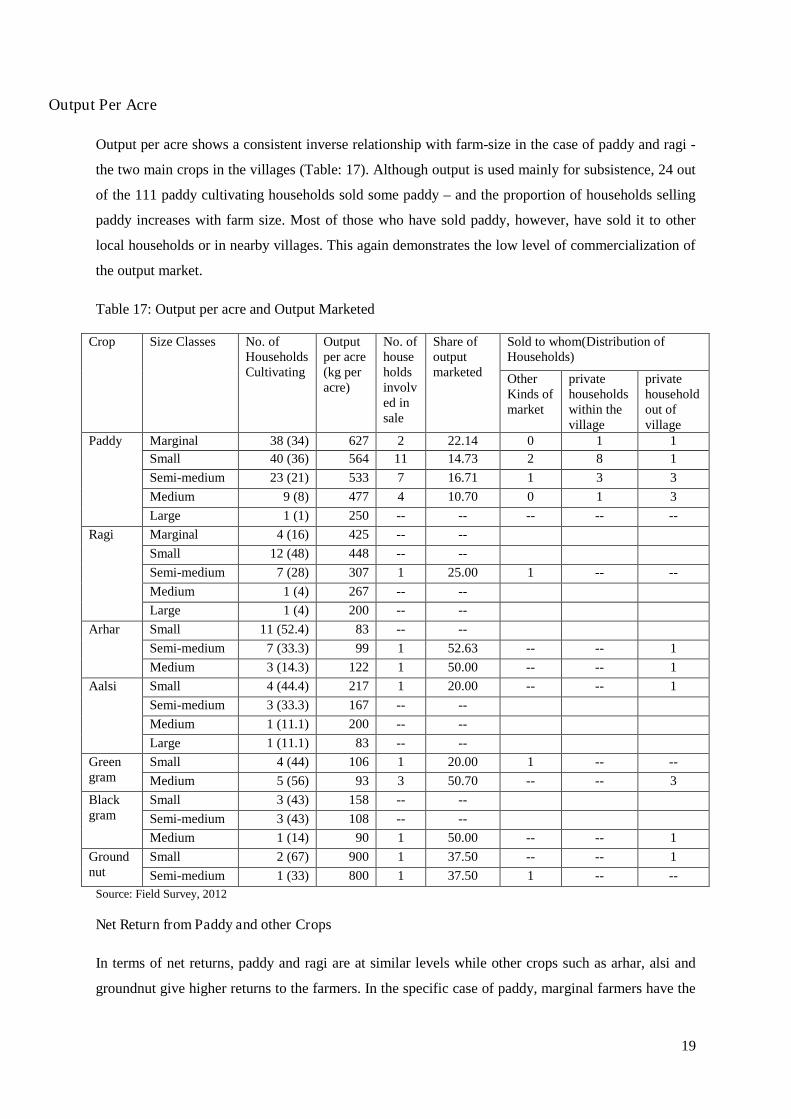
19
Output Per Acre
Output per acre shows a consistent inverse relationship with farm-size in the case of paddy and ragi -
the two main crops in the villages (Table: 17). Although output is used mainly for subsistence, 24 out
of the 111 paddy cultivating households sold some paddy – and the proportion of households selling
paddy increases with farm size. Most of those who have sold paddy, however, have sold it to other
local households or in nearby villages. This again demonstrates the low level of commercialization of
the output market.
Table 17: Output per acre and Output Marketed
Crop Size Classes No. ofHouseholdsCultivating
Outputper acre(kg peracre)
No. ofhouseholdsinvolved insale
Share ofoutputmarketed
Sold to whom(Distribution ofHouseholds)
OtherKinds ofmarket
privatehouseholdswithin thevillage
privatehouseholdout ofvillage
Paddy Marginal 38 (34) 627 2 22.14 0 1 1
Small 40 (36) 564 11 14.73 2 8 1
Semi-medium 23 (21) 533 7 16.71 1 3 3
Medium 9 (8) 477 4 10.70 0 1 3
Large 1 (1) 250 -- -- -- -- --
Ragi Marginal 4 (16) 425 -- --
Small 12 (48) 448 -- --
Semi-medium 7 (28) 307 1 25.00 1 -- --
Medium 1 (4) 267 -- --
Large 1 (4) 200 -- --
Arhar Small 11 (52.4) 83 -- --
Semi-medium 7 (33.3) 99 1 52.63 -- -- 1
Medium 3 (14.3) 122 1 50.00 -- -- 1
Aalsi Small 4 (44.4) 217 1 20.00 -- -- 1
Semi-medium 3 (33.3) 167 -- --
Medium 1 (11.1) 200 -- --
Large 1 (11.1) 83 -- --
Greengram
Small 4 (44) 106 1 20.00 1 -- --
Medium 5 (56) 93 3 50.70 -- -- 3
Blackgram
Small 3 (43) 158 -- --
Semi-medium 3 (43) 108 -- --
Medium 1 (14) 90 1 50.00 -- -- 1
Groundnut
Small 2 (67) 900 1 37.50 -- -- 1
Semi-medium 1 (33) 800 1 37.50 1 -- --
Source: Field Survey, 2012
Net Return from Paddy and other Crops
In terms of net returns, paddy and ragi are at similar levels while other crops such as arhar, alsi and
groundnut give higher returns to the farmers. In the specific case of paddy, marginal farmers have the
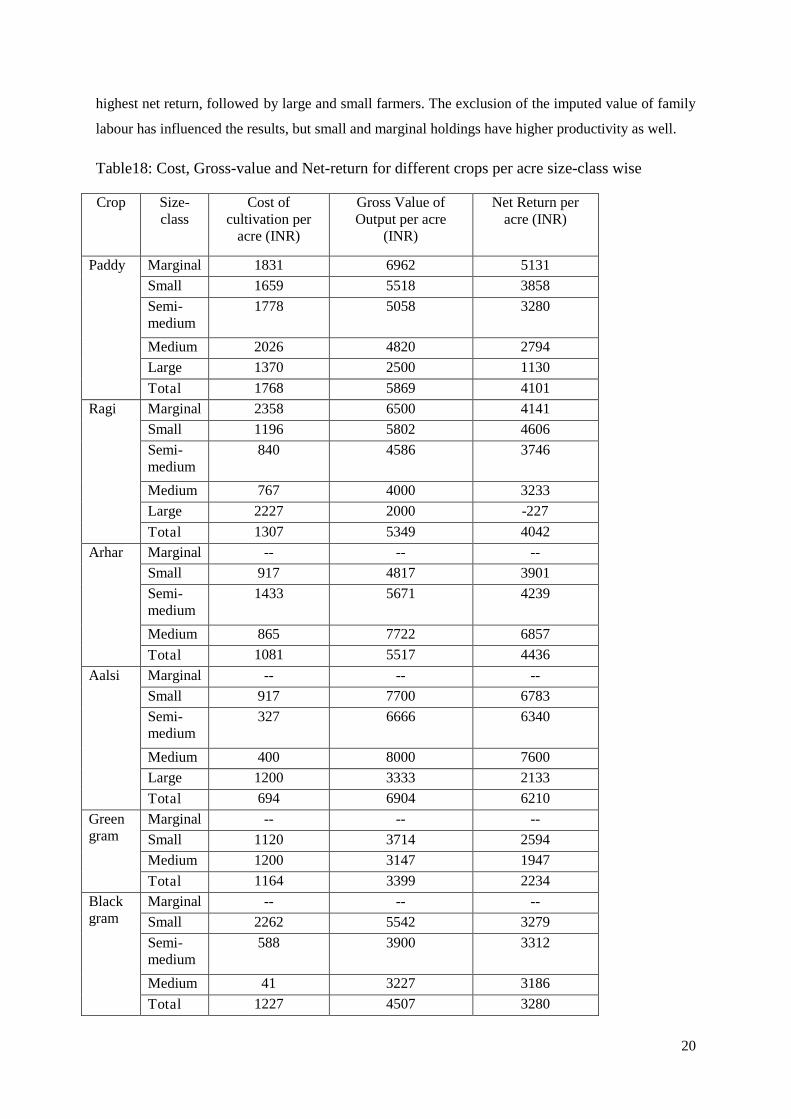
20
highest net return, followed by large and small farmers. The exclusion of the imputed value of family
labour has influenced the results, but small and marginal holdings have higher productivity as well.
Table18: Cost, Gross-value and Net-return for different crops per acre size-class wise
Crop Size-class
Cost ofcultivation per
acre (INR)
Gross Value ofOutput per acre
(INR)
Net Return peracre (INR)
Paddy Marginal 1831 6962 5131
Small 1659 5518 3858
Semi-medium
1778 5058 3280
Medium 2026 4820 2794
Large 1370 2500 1130
Total 1768 5869 4101
Ragi Marginal 2358 6500 4141
Small 1196 5802 4606
Semi-medium
840 4586 3746
Medium 767 4000 3233
Large 2227 2000 -227
Total 1307 5349 4042
Arhar Marginal -- -- --
Small 917 4817 3901
Semi-medium
1433 5671 4239
Medium 865 7722 6857
Total 1081 5517 4436
Aalsi Marginal -- -- --
Small 917 7700 6783
Semi-medium
327 6666 6340
Medium 400 8000 7600
Large 1200 3333 2133
Total 694 6904 6210
Greengram
Marginal -- -- --
Small 1120 3714 2594
Medium 1200 3147 1947
Total 1164 3399 2234
Blackgram
Marginal -- -- --
Small 2262 5542 3279
Semi-medium
588 3900 3312
Medium 41 3227 3186
Total 1227 4507 3280
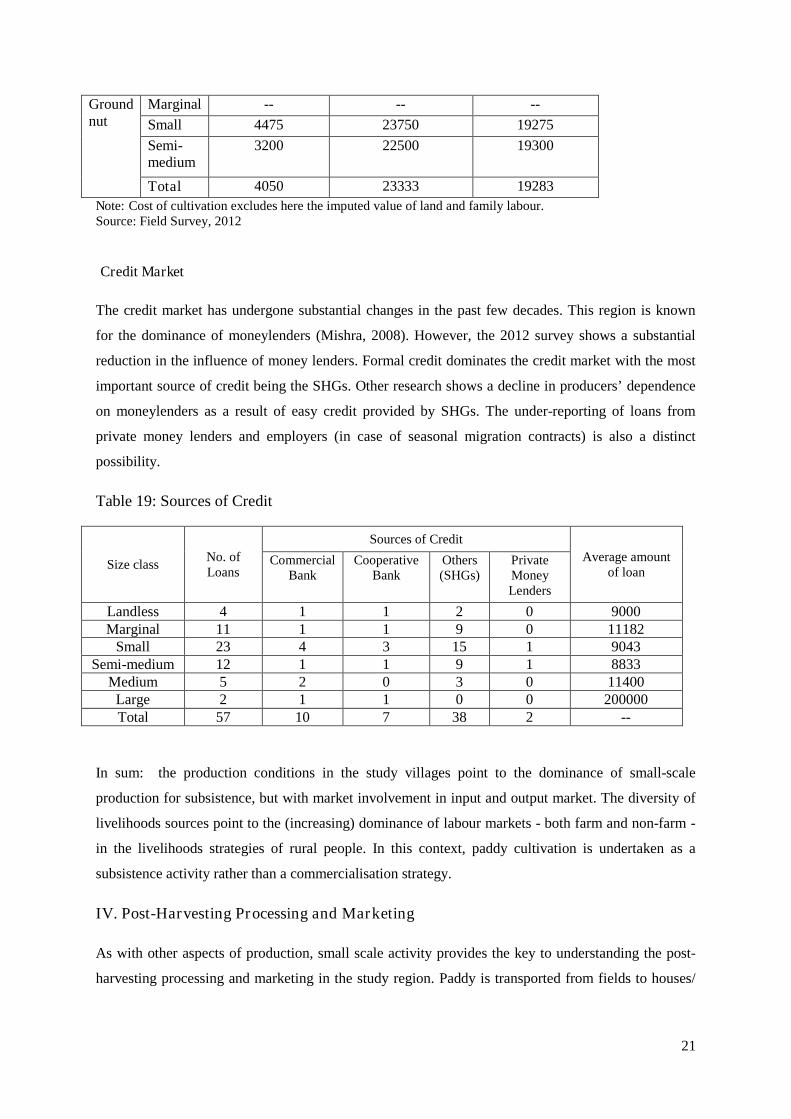
21
Groundnut
Marginal -- -- --
Small 4475 23750 19275
Semi-medium
3200 22500 19300
Total 4050 23333 19283
Note: Cost of cultivation excludes here the imputed value of land and family labour.Source: Field Survey, 2012
Credit Market
The credit market has undergone substantial changes in the past few decades. This region is known
for the dominance of moneylenders (Mishra, 2008). However, the 2012 survey shows a substantial
reduction in the influence of money lenders. Formal credit dominates the credit market with the most
important source of credit being the SHGs. Other research shows a decline in producers’ dependence
on moneylenders as a result of easy credit provided by SHGs. The under-reporting of loans from
private money lenders and employers (in case of seasonal migration contracts) is also a distinct
possibility.
Table 19: Sources of Credit
Size classNo. ofLoans
Sources of Credit
Average amountof loan
CommercialBank
CooperativeBank
Others(SHGs)
PrivateMoneyLenders
Landless 4 1 1 2 0 9000Marginal 11 1 1 9 0 11182
Small 23 4 3 15 1 9043Semi-medium 12 1 1 9 1 8833
Medium 5 2 0 3 0 11400Large 2 1 1 0 0 200000Total 57 10 7 38 2 --
In sum: the production conditions in the study villages point to the dominance of small-scale
production for subsistence, but with market involvement in input and output market. The diversity of
livelihoods sources point to the (increasing) dominance of labour markets - both farm and non-farm -
in the livelihoods strategies of rural people. In this context, paddy cultivation is undertaken as a
subsistence activity rather than a commercialisation strategy.
IV. Post-Harvesting Processing and Marketing
As with other aspects of production, small scale activity provides the key to understanding the post-
harvesting processing and marketing in the study region. Paddy is transported from fields to houses/
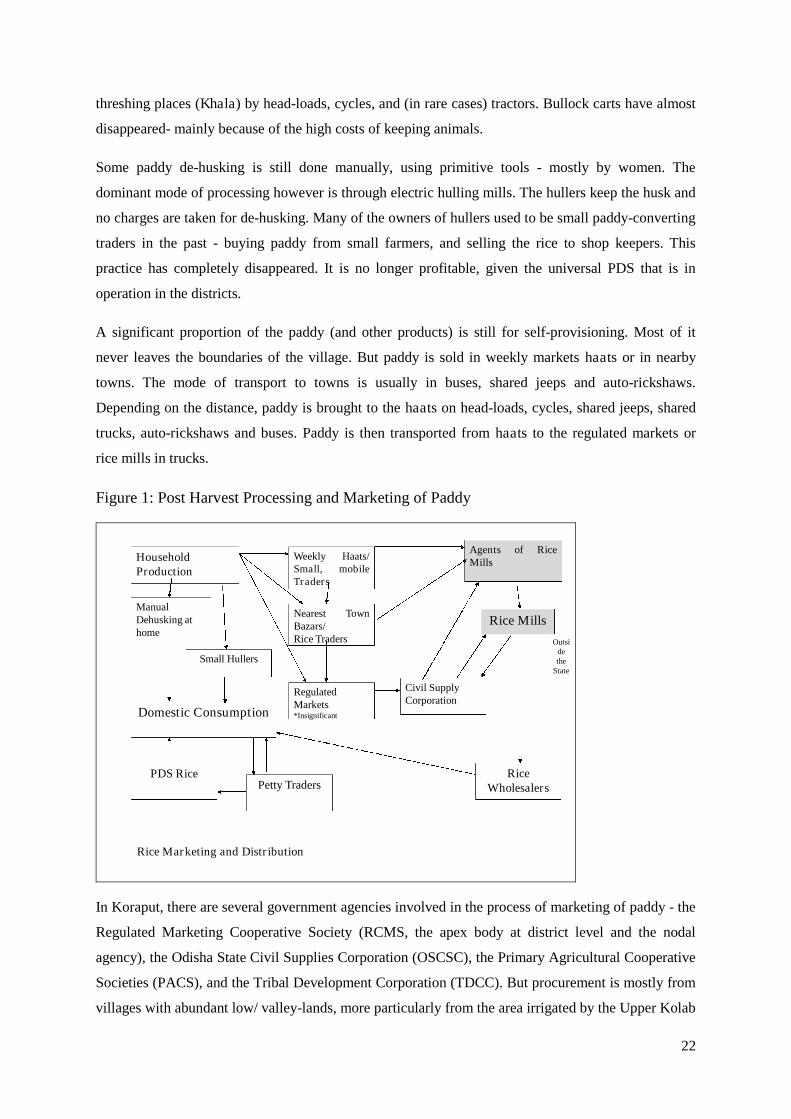
22
threshing places (Khala) by head-loads, cycles, and (in rare cases) tractors. Bullock carts have almost
disappeared- mainly because of the high costs of keeping animals.
Some paddy de-husking is still done manually, using primitive tools - mostly by women. The
dominant mode of processing however is through electric hulling mills. The hullers keep the husk and
no charges are taken for de-husking. Many of the owners of hullers used to be small paddy-converting
traders in the past - buying paddy from small farmers, and selling the rice to shop keepers. This
practice has completely disappeared. It is no longer profitable, given the universal PDS that is in
operation in the districts.
A significant proportion of the paddy (and other products) is still for self-provisioning. Most of it
never leaves the boundaries of the village. But paddy is sold in weekly markets haats or in nearby
towns. The mode of transport to towns is usually in buses, shared jeeps and auto-rickshaws.
Depending on the distance, paddy is brought to the haats on head-loads, cycles, shared jeeps, shared
trucks, auto-rickshaws and buses. Paddy is then transported from haats to the regulated markets or
rice mills in trucks.
Figure 1: Post Harvest Processing and Marketing of Paddy
HouseholdProduction
Weekly Haats/Small, mobileTraders
Agents of RiceMills
Nearest TownBazars/Rice Traders
RegulatedMarkets*Insignificant
Civil SupplyCorporation
Rice Mills
RiceWholesalersPetty Traders
PDS Rice
Domestic Consumption
Small Hullers
ManualDehusking athome
Outsidethe
State
Rice Marketing and Distribution
In Koraput, there are several government agencies involved in the process of marketing of paddy - the
Regulated Marketing Cooperative Society (RCMS, the apex body at district level and the nodal
agency), the Odisha State Civil Supplies Corporation (OSCSC), the Primary Agricultural Cooperative
Societies (PACS), and the Tribal Development Corporation (TDCC). But procurement is mostly from
villages with abundant low/ valley-lands, more particularly from the area irrigated by the Upper Kolab
23
Dam Project. Although RCMS authorities claimed that only genuine farmers bring their paddy to the
markets, and are paid through the banks, it was clear to us that there is active collusion between rice
millers, RCMS and other official agencies and relatively big farmers engaged in the procurement
operations - but this has more to do with surpluses in irrigated rice zones rather than with rain-fed
rice.
Paddy cultivation practices were found to be remarkably different in irrigated/ low-land and rain-fed
areas of the district. Dongar dhan, the paddy varieties cultivated in uplands are not purchased by the
procurement agencies. Hence even within the same region, and sometimes in adjoining villages,
different paddy cultivation and procurement practices are noticed.
Rice traders claim that 'Rs2 a kilo rice' has reduced their profits. They procure rice from small
farmers, from retail traders who pick up bags of rice from weekly haats and also from rice mills.
Some of the wholesalers procure rice at longer distances from neighbouring Andhra Pradesh and also
from the neighbouring district of Nawarangpur in Odisha.
The earlier practice of purchasing rice from farmers through interlinked credit transactions has been
replaced by a system where the farmer has to take the marketed surplus to the trader. Credit advances
against a standing crop, which usually carries a high interest burden, seem to have disappeared
altogether. Commission agents were less visible - but they are active in the irrigated belt.
V. Concluding Observations
Both villages studied are located in relatively less-developed districts of Odisha and are representative
of rainfed agriculture. The livelihoods scenario that emerged from the analysis, broadly supports the
contention that in large parts of rural India, peasant households are no longer able to survive simply
by depending upon agriculture. Livelihoods diversification, often under duress, seems to be the only
option to survive the livelihoods crisis facing households. That is why such a high percentage of
households have, at least partly, started to depend on the wage labour market for survival. This
dependence of rural households in general and 'independent' producers in particular upon the labour
market (local or distant; farm or non-farm) signals the gradual integration of the relatively isolated
local economies into the circuits of capital. But this is happening without much commercialisation of
agriculture, at least in our study villages. Crop cultivation in general and paddy farming in particular
remains a subsistence activity for a large proportion of households. We therefore find the coexistence
of a vibrant labour market in non-agriculture and stagnation and subsistence in rain-fed paddy
production. State intervention through the universal PDS has no doubt had a limited impact on food
security in the region, but a procurement policy biased to lowland paddy has left farmers cultivating
traditional varieties in uplands with no option but to continue farming as a subsistence activity. This
24
has led to a strategy of avoiding the ‘green revolution’ by some categories of farmers, while others,
who have access to lowlands and irrigation have already started to produce for the market.
References:
Angels, S. and M. Chinnadurai and A Sundar (2011) 'Awareness on Impact of Climate Change on
Dryland Agriculture and Coping Mechanisms of Dryland Farmers', Indian Journal of Agricultural
Economics, 66 (3): 365-372.
Barah, B.C. and Sushil Pandey (2005) 'Rainfed Rice Systems in Eastern India: An On-farm Diagnosis
and Policy Alternatives', Indian Journal of Agricultural Economics, 60 (1): 110-135.
de Haan, Arjan and Amaresh Dubey (2005) Poverty, Disparities, or the Development of
Underdevelopment in Odisha, Economic and Political Weekly, May 28-June 4, pp. 2321-2329.
Deshpande, R.S. (2008) 'Rapporteur's Report on Rainfed Agriculture: Myriad of Issues', Indian
Journal of Agricultural Economics, 63 (3): 565-576.
Frolking, Steve , Jagadeesh Babu Yeluripati, Ellen Douglas (2006) New district-level maps of rice
cropping in India: A foundation for scientific input into policy assessment’, Field Crops Research 98,
(2–3): 164–177.
Garikipati S. and B Harriss-White (2008) 'India's Semi Arid Rural Economy: Livelihoods, Seasonal
Migration and Gender' European Journal of Development Research (Special Issue)20 ( 4).
Mishra, Deepak K. (2008) ‘Structural Inequalities and Interlinked Transactions in Agrarian Markets:
Results of a Field Survey’ In S.K. Bhaumik (ed) Reforming Indian Agriculture: Towards Employment
Generation and Poverty Reduction, Sage, New Delhi pp. 231-268.
Mishra, Srijit (2009) Poverty and Agrarian Distress in Odisha, Working Paper, WP-2009-006, IGIDR,
Mumbai.
Panda, Manoj (2008) Economic Development in Odisha: Growth without Inclusion, Working Paper,
WP-2008-025, IGIDR, Mumbai.
Ramakrishna, R and D. Tata Rao (2008) 'Strengthening Indian Agriculture through Dryland Farming:
Need for Reforms', Indian Journal of Agricultural Economics, 63 (3): 460-476.
Sarap, K. (1991a): ‘Changing Contractual Arrangement in Agricultural Labour Market: Evidence
from Odisha’, Economic and Political Weekly, 26 (52): A-167-176.
Sarap, K. (1991b): Interlinked Agrarian Markets in Rural India, Sage, New Delhi
Shah, Amita, Saroj Kumar Nayak and Bipin Das (2005) ‘Remoteness and Chronic Poverty in a Forest
Region in Southern Odisha: A Tale of Entitlement Failure and State’s Apathy’, Paper Presented at
CPRC-IIPA Seminar on ‘Chronic Poverty: Emerging Policy Options and Issues’, 29th and 30th
September, 2005, Indian Institute of Public Administration, New Delhi.
Yadav, R.L., Subba Rao, A.V.M.,( 2001). Atlas of Cropping Systems in India. PDCSR Bulletin No.
2001-2, Project Directorate for Cropping Systems Research, Modipam, Meerut, India
25
EMPLOYMENT, WORKING CONDITIONS AND THE SUPPLY-CHAIN
PROCUREMENT PROCESS FOR RICE RETAILED IN CHENNAI
Gautam Mody, Mohan Mani and Meghna Sukumar
26
EMPLOYMENT, WORKING CONDITIONS AND THE SUPPLY-CHAIN PROCUREMENT PROCESS FOR RICE RETAILED IN
CHENNAI
Mohan Mani, Gautam Mody and Meghna Sukumar78
Background
Our research on labourseekscritically to examine questions of employment practices and working
conditionsat all the various stages ofthe procurement and retailsupply chain for rice. We have
focussed the research on the distribution and retail of rice in and around Chennai.
This paper is an exploratory component of the larger supply-chain research.79 It seeks to understand
retail business in a sector that continues to be primarilydominated by small business and informal
relations of employment. Its policy aspect is the question whether fresh investment in the sector, and
in particular whether and to what extent the entry of large corporate interests in retail, change the rules
of the game.
The past understanding of labour relations suggested a clear cut difference between situations of
employment in the formal and informal sectors, these sectors being defined by different ownership
patterns and legal regimes that governed their existence. Consequently, the enterprises of large
business interests were seen as existing in the formal sector, with strict requirements of legal
compliance of all aspects of business including employment relationships. Today, with the growth of
new employment practices, including the spread of contract employment and outsourced work, the
clear differences between the formal and informal sectors may not exist, especially where labour
relations are concerned. We see growing informality in the formal sector. Consequently, the retail
sector is of particular interest, given this is a sector primarily in the informal economythat is opening
up to corporate business interests. Will this lead to changes in the sector? To what extent will these
changes effect employment relations?
Modern urban retail is seen as a sector employing women in large numbers. In the past, women in
metro cities have been entering the labour marketat the lower end of formal employment. The
garment industry is a case in point, with factory based garment work employing an estimated two
78
79Its relevance to the even larger project on greenhouse gases and livelihoods of which it is a component is
that a low C transition would necessarily involve new scales of capital and create new kinds of employment.The future potential of improving the quality as well as quantity of jobs is therefore tested here againstexisting trends in new scales of capital and in the conditions of work amid the formalising of a hithertoinformal sector – that of retail.
27
hundred thousand workers in the city of Chennai, the large majority of them being women. While
employment in the sector is formally covered by labour legislation that guarantees tenure of
employment and rights of minimum wages, regulated hours of work and social security, in reality
workers are found without any of these rights. Employers’understand thatthe feminisation of labour
enables them to reduce the regulation of employment relations. So this experience in garments
suggests another aspect of retail industry that needs to be studied and understood.
Retail commodity trade is the final end of a supply chain linking rural production to urban
consumption. The relations within the system are also a matter of interest. What are the major links in
this production and procurement chain? What is the nature of business interest that dominates this
system? How will they also be impacted by entry of big business interests? These are all matters of
research interest. They are also of particular interest today in India, in a situation where retail trade
and government regulation are matters of immediate political contestation. While the research
reported here has tried to touch on some aspects of the procurement chain, this has not been its main
focus.
The present study seeks to explore the foregoing questions through a study of retail trade in rice
covering aspects of employment practices and working conditions in different retail employment
categories. The paper is divided into three sections, the first dealing with the study of the retail sector;
the second with procurement practices in the supply chain, from the retail end to milling of rice; and
the third discussing some of the important lessons we can draw from this study.
I. Employment and working conditions in retail
Methodology
Questionnaire:
One questionnaire (a checklist of questions) was prepared for administration to workers in retail
shops. The questionnaire was discussed with other members of the study team. 80It was pilot-tested for
ease of understanding and relevance, before finalisation. The principal researcher conducted the
80Research Team: The interviews were carried out by a team comprising Kavitha and Josephine. Kavitha, the
primary interviewer and Josephine who assisted in making initial contacts and conducting interviews have beenlifetime residents of Ambattur . They are both college graduates, with Tamil as their primary language ofcommunication, and a working knowledge of English. Both have been volunteering with Penn ThozhilalargalSangam (Women Workers’ Union) an all-women union representing informal sector workers in Chennai, for thelast 2-3 years. They are generally well acquainted with the local union activists in the area and the area itself.They were assisted by other union activists of Penn Thozhilalargal Sangam from different localities in Ambattur,the site of our field research.
28
preliminary set of interviews along with the other members of the research team (all union activists in
the informal sector, with some knowledge of English) to ensure uniformity in asking questions and
reporting discussions.The involvement of union activists in this field research served two purposes.
First it ensured researcher empathy, as the researchers came from the same social and economic
background as the retail employees being researched. Second, the practice satisfied an important
capacity-building objective of the project, to enable women activists in the informal sector to gain
first-hand experience of conducting survey and doing basic research.We were less successful in
obtaining responses on quantities, costs and prices despite the fact that these interviews were carried
out by the lead field researcher. There was significant resistance to answering questions even when
the academic nature of the research and confidentiality were stressed.
Study location:
The field-study of employment practices was conducted in Ambattur and Anna Nagar in Chennai. We
chose Ambattura location about 15 kms to the west of the city centre as it is an old industrial belt of
the cityfamiliar to the researchers81.Several small scale and medium scale industries in the Ambattur
Industrial Estate are located there alongside larger factories like TI Cycles, Tube India and
Dunlop.Several of the small scale industrial units are being closed down and converted into IT parks
causing real estate values and rents to go up. The area has a population of around 478,000 as per the
2011 provisional census data. Ambatturused to be a Municipalityuntila yearago.It is now for all
practical purposes a part of the extended Chennai Corporation. While our focus was on Ambattur, we
also conducted a few interviews in Anna Nagar where Star Bazaar and some of the other smaller
stores are located. Anna Nagar is a more middle /upper middle class locality.
Interview process:
We interviewed 37 retail and wholesale workers during the months September 2012–October 2012
and January - February2013. They includedtenwho work in big supermarket chains - Star Bazaar,
Nilgiris, Reliance Fresh and Subhiksha; and nine in medium size local supermarkets and departmental
stores-Farm Bazaar, Ponnu supermarket and Raja stores. Fourteenworkers were employed in small
81The study area was chosen for the following reasons:
i. A cross section of all economic classes live in the region.ii. The region has small neighbourhood shops as well as bigger retailers.iii. The Penn Thozhilalargal Sangam has strong presence in this area. This helped create interviewed
workers’ trust in the study and therefore ensure veracity of information collected during interviews.
iv.
29
retail shops and wholesale shops. Four workers were employed by the Chintamani cooperative a Fair
Price Shop in Ambattur.82
The categorisation of retail outlets into big, medium and small was based on the form of ownership,
the activity mix as well as the scale of the establishment. The big supermarkets are corporate
enterprises with multiple branches, extending across the city and even to other cities. The medium
size enterprises are large multi-product stores, with walk-in selection of goods- but they are stand-
alone establishments, with at most 2-3 branches. The small retail shops deal with customers across the
counter, with a more limited product range.
Despite the field research team’s social rapport, it proved not at all easy to interview workers.83Most
of the interviews at the big and medium size retail stores were conducted outside the store during
breaks or after work hours especially when the manager or supervisor was away; or at the workers’
homes.84 In some cases the interviewer had to say that she was a college student doing research on
working women and in other cases, she would pretend to be looking for a job. In Star Bazaar and
Reliance Fresh stores, many of the experienced workers refused to talk, but no such difficulty arose in
interviewing workers from the smaller stores. Curiously workers at the fair price shop in Annanagar
refused to be interviewed as they suspected that the interviews were part of a vigilance process.
Main findings
In this section we describe the social background of the workers.
Gender and age:
82 Though this could not be a random sample it is illustrative of the relations and processes we wish to study.While generalisations about magnitudes cannot be made from this sample, the cases can be used to illustratehigher order statements about processes.83The interview schedule was pilot tested with one worker from each of the categories – i.e small, medium andbig retail. These interviews were jointly conducted by Meghna and Kavitha, and changes in the interviewschedule were made based on the interviews.To ensure that all details were obtained, repeat visits were made with each interviewee.Every 2-3 days the team met to consolidate the data and check for omissions or additional clarificationsrequired. In the case of interviews with the big retail stores, many attempts were made to get copy ofemployment contracts, but workers were too afraid to give copies or claimed that they did not have them. All theworkers did not want their names to be revealed in any publication.
84 Initial contact with retail workers was made through the Penn ThozhilalargalSangam. The benefit of this wasan opportunity to build trust with the workers and get accurate information, dispelling any fear of adverseconsequences by ensuring that anonymity would be maintained. Many retail workers were able to give contactof other co-workers. For workers in the ration shops of the Government run cooperatives (PDS), contact withworkers was established through the General Secretary of Labour Progressive Front, the largest among unionsrepresenting workers in the Tamil Nadu Civil Supplies Department.
30
Both experience and the literature85 tell us that the workforce in small retail is primarily male often
with a kinship relationship with the employer. This is marked by a significant shift in both medium
and large retail with a significantly lower age and a largely female workforce.
Of the 19workers in the sample employed in the big and medium retails stores, sevenwere 20 years or
below, and another eight were in the age group 20-25 years, with four above 25 years of age.
Seventeen of them were women. Only two workers were men. Discussions with the workers revealed
that this was the norm for employee profile in the new retail sector – primarily women, and a young
workforce.
Asa for the reasons for working in retail, many of the women sought employment in retail
storesbecause they were close to home and required minimum travel86. Four of the workershad been
forced to discontinueschool of college midway because of financial problems in the family(death of
father/ breadwinner of the family)so as to find work. Many sawretail work as a temporary form of
employment87. It was difficult to find women workers in retail stores who had more than 2-3years
experience. Older women were typically employed in packing work and not directly in sales in the
retail area. The oldest worker in the sample was 56 years old, employed in the packing section, and
earned only Rs.3400 per month which is significantly lower than wages in all three levels of retail for
work in the shop. In the case of Ponnu supermarket and Raja stores we found that older women
usually sat in a separate room or outside the shop on the pavement to carry out packing functions.
This signifies further degradation of tasks performed by women workers.
In the small retail stores, as expected, men were clearly preferred by shop owners. All fourteen
workers in the sample were men. Six of them were 25 and below, and threewerein the age group of
25- 30 years. Employers also recruited from among relatives/ family acquaintances, very often from
the hometown of the owner in the sector. Eightof the 14 workersin the sample were migrants from
Tuticorin district (528 kms by road from Chennai) and distant relatives or known to someone from the
same village as the store owner. These employees were very dependent upon their employer. Most of
the young men belonged to families who owned small pieces of land, and whose families were
involved in agriculture and/or agricultural labour. They move to Chennai and sought employment to
85
86This is contributed at least in part by the insecurity of women travelling after hours.87Discussions with union activists at Penn ThozhilalargalSangam and Garments and Fashion Workers Union
(union representing garment workers in Chennai) pointed to a similar employee profile among the workforce in
the garments sector. The activists discussed how women garment workers also often saw their employment in
the sector as temporary and stop-gap, but ended up in the industry for years.
31
supplement family income, and gain experience- possibly toopen their own retail store. In contrast to
the women in bigger stores, they did not regard the work as temporary.
Educational qualification and recruitment:
In small stores workers lack formal education and is substituted by apprenticeship in the store for
skilling and training. In large retail in contrast there is a minimum level of formal education
required88.
First we look at education levels. A minimum threshold of education was needed in all kinds of store.
Only three workers out of the total sample of 37 hada college education. Allthese were employed at
the Fair Price Shop. One male worker discontinued studies for an ITI (diploma) qualifications and
joined work with the intention of later starting his own retail store. Two women in large retail stores
were doing higher education correspondence courses while working. Most other workers had finished
their 10th or 12th standard schooling before starting work.While in small retail shops education did not
seem to play any major role in deciding the nature of tasks,in big retail there is a hierarchy of tasks.
And i,f the worker had the aptitude and had completed 12th standard, she was usually considered for
posting into the billing section.
Turning to demand factors, most, even formally registered firms, used informal institutions.All the
Fair Price Shop workers were recruited through the Employment Exchange.The workers in the private
retail stores approachedstores in their locality where ‘Wanted’ signs had been posted; or were referred
to job openings by friends informed about work by their employers. Only two workers reported some
form of formal recruitment process. One employed in the Star Bazaar responded to a hand bill
advertising an opening, followed by a short interview, while the other employed with Shubhiksha had
to attend a short interview at the head office.These informal means of recruitment meant that most
workers had no idea about regulations regarding confirmation of employment, probation, termination,
etc. Workers in the bigger stores merely had to submit photocopies of their ration cards and/or
10th/12thclass school certificates.
Work conditions
Wages and other legally mandated economic benefits:
Wages
The primary question is to whether the minimum wage is paid and what divergence emerges in bothtasks and pay across gender and store categories.
Table1 gives details of wages of workers and normal working hours.
88
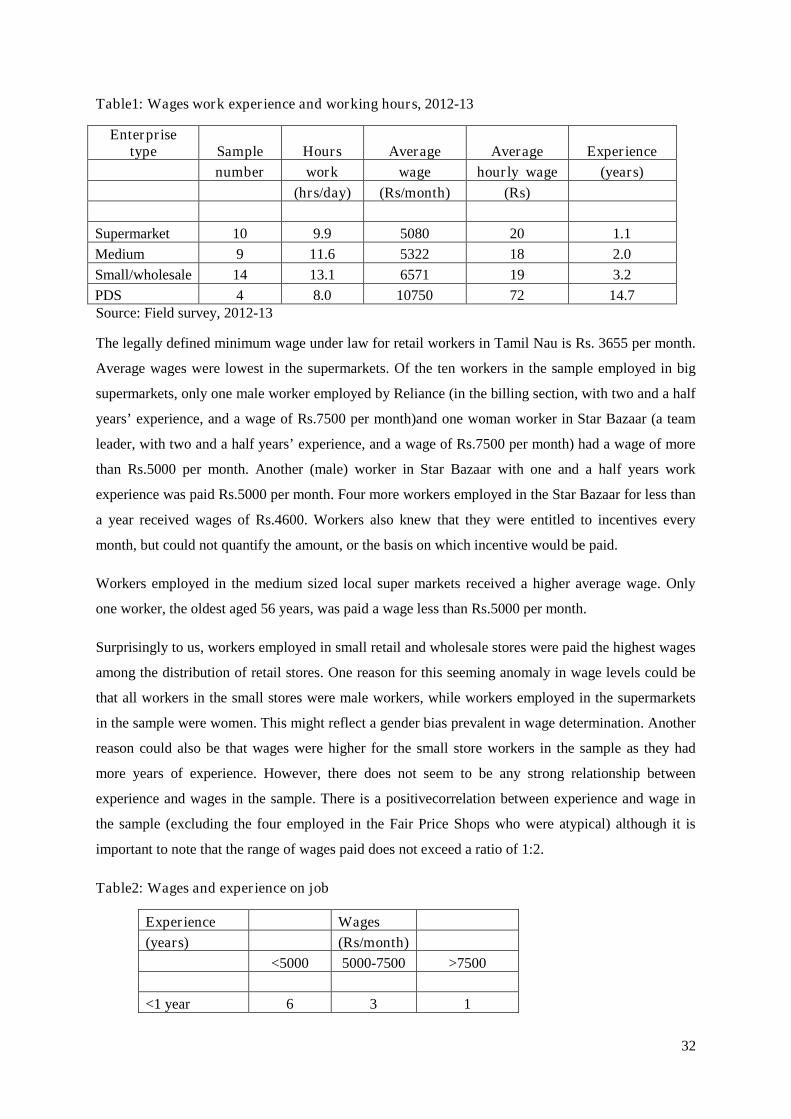
32
Table1: Wages work experience and working hours, 2012-13
Enterprisetype Sample Hours Average Average Experience
number work wage hourly wage (years)
(hrs/day) (Rs/month) (Rs)
Supermarket 10 9.9 5080 20 1.1
Medium 9 11.6 5322 18 2.0
Small/wholesale 14 13.1 6571 19 3.2
PDS 4 8.0 10750 72 14.7Source: Field survey, 2012-13
The legally defined minimum wage under law for retail workers in Tamil Nau is Rs. 3655 per month.
Average wages were lowest in the supermarkets. Of the ten workers in the sample employed in big
supermarkets, only one male worker employed by Reliance (in the billing section, with two and a half
years’ experience, and a wage of Rs.7500 per month)and one woman worker in Star Bazaar (a team
leader, with two and a half years’ experience, and a wage of Rs.7500 per month) had a wage of more
than Rs.5000 per month. Another (male) worker in Star Bazaar with one and a half years work
experience was paid Rs.5000 per month. Four more workers employed in the Star Bazaar for less than
a year received wages of Rs.4600. Workers also knew that they were entitled to incentives every
month, but could not quantify the amount, or the basis on which incentive would be paid.
Workers employed in the medium sized local super markets received a higher average wage. Only
one worker, the oldest aged 56 years, was paid a wage less than Rs.5000 per month.
Surprisingly to us, workers employed in small retail and wholesale stores were paid the highest wages
among the distribution of retail stores. One reason for this seeming anomaly in wage levels could be
that all workers in the small stores were male workers, while workers employed in the supermarkets
in the sample were women. This might reflect a gender bias prevalent in wage determination. Another
reason could also be that wages were higher for the small store workers in the sample as they had
more years of experience. However, there does not seem to be any strong relationship between
experience and wages in the sample. There is a positivecorrelation between experience and wage in
the sample (excluding the four employed in the Fair Price Shops who were atypical) although it is
important to note that the range of wages paid does not exceed a ratio of 1:2.
Table2: Wages and experience on job
Experience Wages
(years) (Rs/month)
<5000 5000-7500 >7500
<1 year 6 3 1
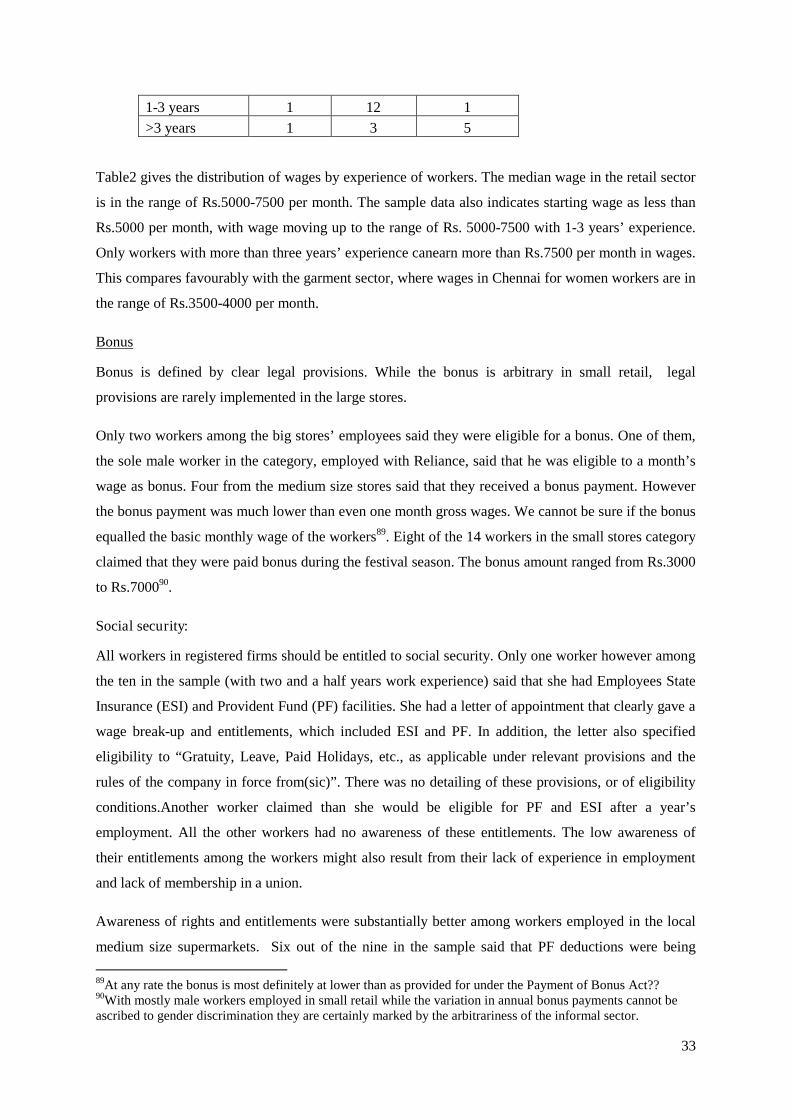
33
1-3 years 1 12 1
>3 years 1 3 5
Table2 gives the distribution of wages by experience of workers. The median wage in the retail sector
is in the range of Rs.5000-7500 per month. The sample data also indicates starting wage as less than
Rs.5000 per month, with wage moving up to the range of Rs. 5000-7500 with 1-3 years’ experience.
Only workers with more than three years’ experience canearn more than Rs.7500 per month in wages.
This compares favourably with the garment sector, where wages in Chennai for women workers are in
the range of Rs.3500-4000 per month.
Bonus
Bonus is defined by clear legal provisions. While the bonus is arbitrary in small retail, legal
provisions are rarely implemented in the large stores.
Only two workers among the big stores’ employees said they were eligible for a bonus. One of them,
the sole male worker in the category, employed with Reliance, said that he was eligible to a month’s
wage as bonus. Four from the medium size stores said that they received a bonus payment. However
the bonus payment was much lower than even one month gross wages. We cannot be sure if the bonus
equalled the basic monthly wage of the workers89. Eight of the 14 workers in the small stores category
claimed that they were paid bonus during the festival season. The bonus amount ranged from Rs.3000
to Rs.700090.
Social security:
All workers in registered firms should be entitled to social security. Only one worker however among
the ten in the sample (with two and a half years work experience) said that she had Employees State
Insurance (ESI) and Provident Fund (PF) facilities. She had a letter of appointment that clearly gave a
wage break-up and entitlements, which included ESI and PF. In addition, the letter also specified
eligibility to “Gratuity, Leave, Paid Holidays, etc., as applicable under relevant provisions and the
rules of the company in force from(sic)”. There was no detailing of these provisions, or of eligibility
conditions.Another worker claimed than she would be eligible for PF and ESI after a year’s
employment. All the other workers had no awareness of these entitlements. The low awareness of
their entitlements among the workers might also result from their lack of experience in employment
and lack of membership in a union.
Awareness of rights and entitlements were substantially better among workers employed in the local
medium size supermarkets. Six out of the nine in the sample said that PF deductions were being
89At any rate the bonus is most definitely at lower than as provided for under the Payment of Bonus Act??90With mostly male workers employed in small retail while the variation in annual bonus payments cannot beascribed to gender discrimination they are certainly marked by the arbitrariness of the informal sector.
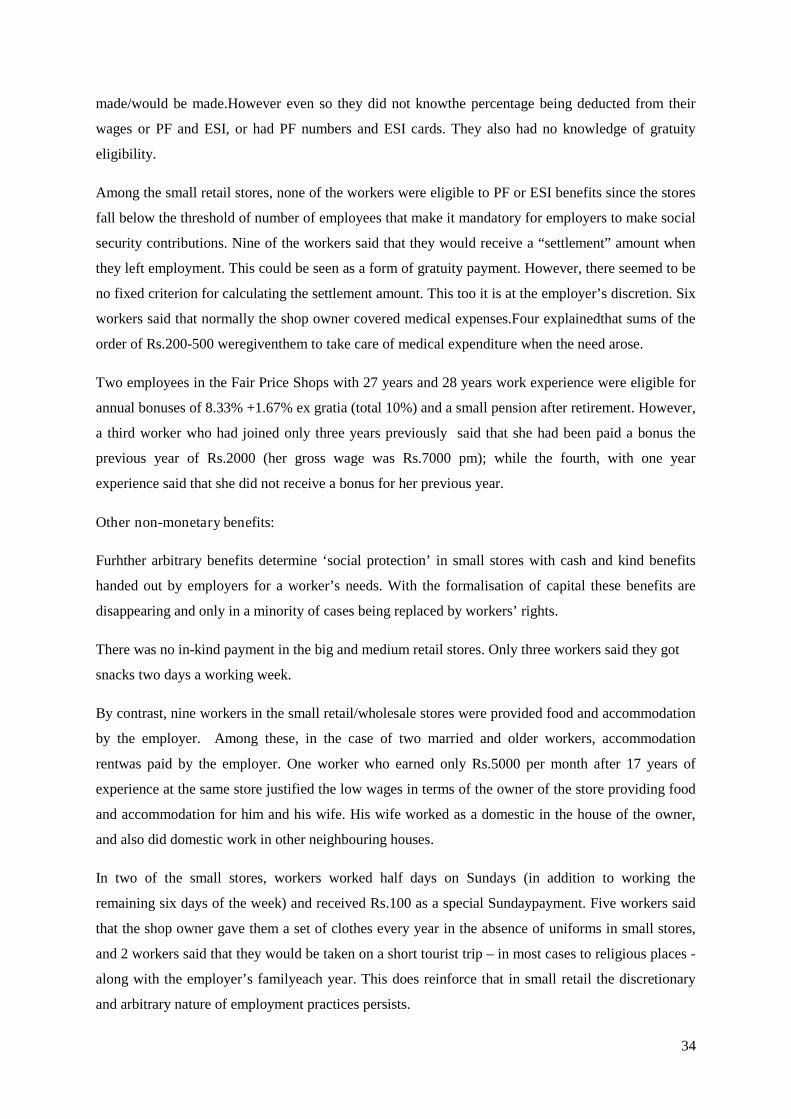
34
made/would be made.However even so they did not knowthe percentage being deducted from their
wages or PF and ESI, or had PF numbers and ESI cards. They also had no knowledge of gratuity
eligibility.
Among the small retail stores, none of the workers were eligible to PF or ESI benefits since the stores
fall below the threshold of number of employees that make it mandatory for employers to make social
security contributions. Nine of the workers said that they would receive a “settlement” amount when
they left employment. This could be seen as a form of gratuity payment. However, there seemed to be
no fixed criterion for calculating the settlement amount. This too it is at the employer’s discretion. Six
workers said that normally the shop owner covered medical expenses.Four explainedthat sums of the
order of Rs.200-500 weregiventhem to take care of medical expenditure when the need arose.
Two employees in the Fair Price Shops with 27 years and 28 years work experience were eligible for
annual bonuses of 8.33% +1.67% ex gratia (total 10%) and a small pension after retirement. However,
a third worker who had joined only three years previously said that she had been paid a bonus the
previous year of Rs.2000 (her gross wage was Rs.7000 pm); while the fourth, with one year
experience said that she did not receive a bonus for her previous year.
Other non-monetary benefits:
Furhther arbitrary benefits determine ‘social protection’ in small stores with cash and kind benefits
handed out by employers for a worker’s needs. With the formalisation of capital these benefits are
disappearing and only in a minority of cases being replaced by workers’ rights.
There was no in-kind payment in the big and medium retail stores. Only three workers said they got
snacks two days a working week.
By contrast, nine workers in the small retail/wholesale stores were provided food and accommodation
by the employer. Among these, in the case of two married and older workers, accommodation
rentwas paid by the employer. One worker who earned only Rs.5000 per month after 17 years of
experience at the same store justified the low wages in terms of the owner of the store providing food
and accommodation for him and his wife. His wife worked as a domestic in the house of the owner,
and also did domestic work in other neighbouring houses.
In two of the small stores, workers worked half days on Sundays (in addition to working the
remaining six days of the week) and received Rs.100 as a special Sundaypayment. Five workers said
that the shop owner gave them a set of clothes every year in the absence of uniforms in small stores,
and 2 workers said that they would be taken on a short tourist trip – in most cases to religious places -
along with the employer’s familyeach year. This does reinforce that in small retail the discretionary
and arbitrary nature of employment practices persists.
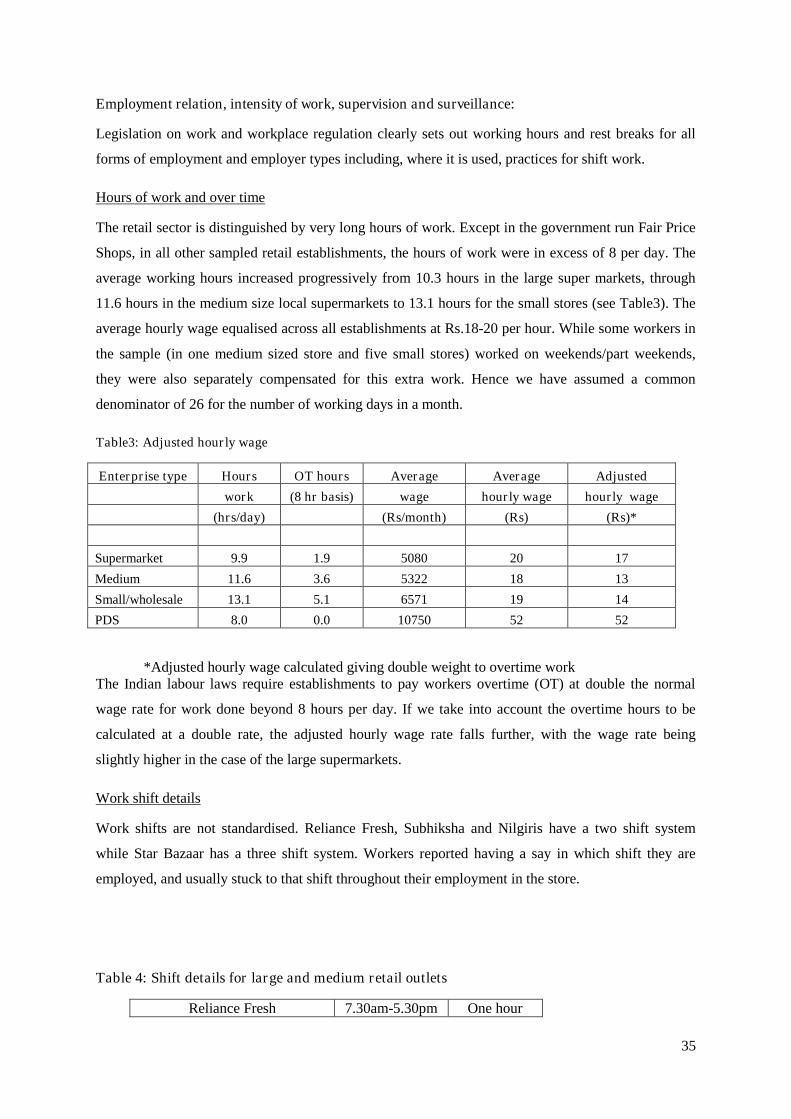
35
Employment relation, intensity of work, supervision and surveillance:
Legislation on work and workplace regulation clearly sets out working hours and rest breaks for all
forms of employment and employer types including, where it is used, practices for shift work.
Hours of work and over time
The retail sector is distinguished by very long hours of work. Except in the government run Fair Price
Shops, in all other sampled retail establishments, the hours of work were in excess of 8 per day. The
average working hours increased progressively from 10.3 hours in the large super markets, through
11.6 hours in the medium size local supermarkets to 13.1 hours for the small stores (see Table3). The
average hourly wage equalised across all establishments at Rs.18-20 per hour. While some workers in
the sample (in one medium sized store and five small stores) worked on weekends/part weekends,
they were also separately compensated for this extra work. Hence we have assumed a common
denominator of 26 for the number of working days in a month.
Table3: Adjusted hourly wage
Enterprise type Hours OT hours Average Average Adjusted
work (8 hr basis) wage hourly wage hourly wage
(hrs/day) (Rs/month) (Rs) (Rs)*
Supermarket 9.9 1.9 5080 20 17
Medium 11.6 3.6 5322 18 13
Small/wholesale 13.1 5.1 6571 19 14
PDS 8.0 0.0 10750 52 52
*Adjusted hourly wage calculated giving double weight to overtime workThe Indian labour laws require establishments to pay workers overtime (OT) at double the normal
wage rate for work done beyond 8 hours per day. If we take into account the overtime hours to be
calculated at a double rate, the adjusted hourly wage rate falls further, with the wage rate being
slightly higher in the case of the large supermarkets.
Work shift details
Work shifts are not standardised. Reliance Fresh, Subhiksha and Nilgiris have a two shift system
while Star Bazaar has a three shift system. Workers reported having a say in which shift they are
employed, and usually stuck to that shift throughout their employment in the store.
Table 4: Shift details for large and medium retail outlets
Reliance Fresh 7.30am-5.30pm One hour
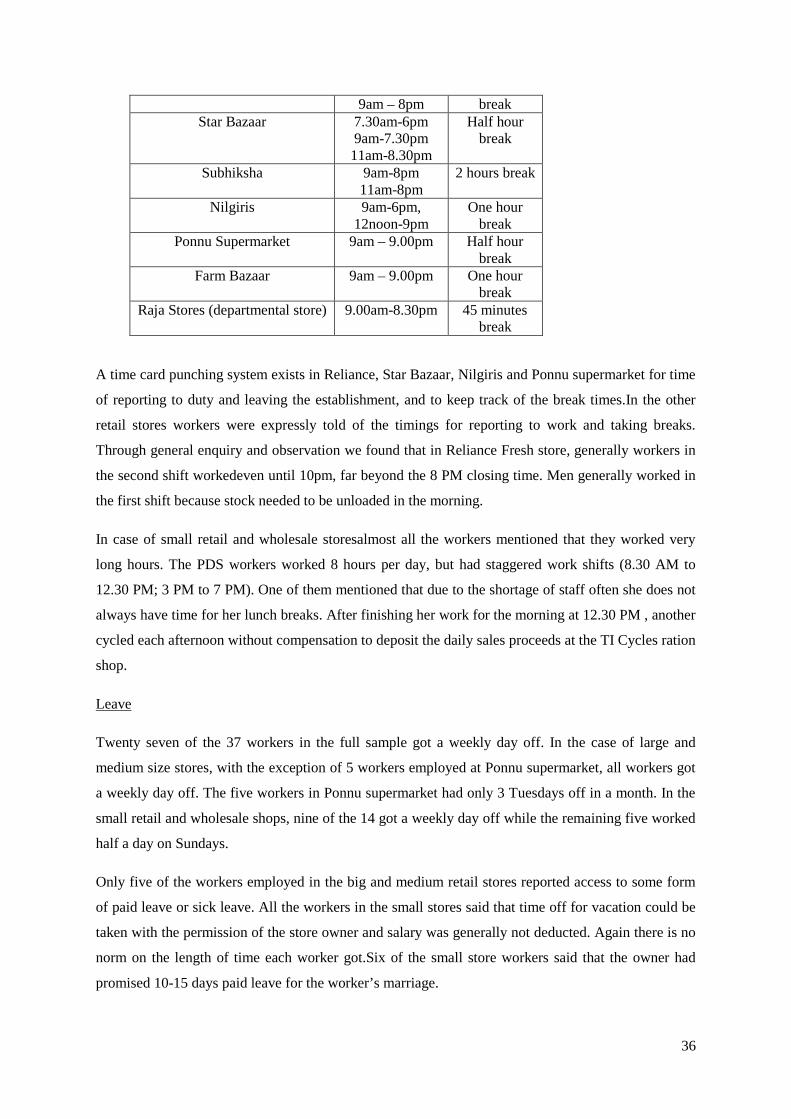
36
9am – 8pm breakStar Bazaar 7.30am-6pm
9am-7.30pm11am-8.30pm
Half hourbreak
Subhiksha 9am-8pm11am-8pm
2 hours break
Nilgiris 9am-6pm,12noon-9pm
One hourbreak
Ponnu Supermarket 9am – 9.00pm Half hourbreak
Farm Bazaar 9am – 9.00pm One hourbreak
Raja Stores (departmental store) 9.00am-8.30pm 45 minutesbreak
A time card punching system exists in Reliance, Star Bazaar, Nilgiris and Ponnu supermarket for time
of reporting to duty and leaving the establishment, and to keep track of the break times.In the other
retail stores workers were expressly told of the timings for reporting to work and taking breaks.
Through general enquiry and observation we found that in Reliance Fresh store, generally workers in
the second shift workedeven until 10pm, far beyond the 8 PM closing time. Men generally worked in
the first shift because stock needed to be unloaded in the morning.
In case of small retail and wholesale storesalmost all the workers mentioned that they worked very
long hours. The PDS workers worked 8 hours per day, but had staggered work shifts (8.30 AM to
12.30 PM; 3 PM to 7 PM). One of them mentioned that due to the shortage of staff often she does not
always have time for her lunch breaks. After finishing her work for the morning at 12.30 PM , another
cycled each afternoon without compensation to deposit the daily sales proceeds at the TI Cycles ration
shop.
Leave
Twenty seven of the 37 workers in the full sample got a weekly day off. In the case of large and
medium size stores, with the exception of 5 workers employed at Ponnu supermarket, all workers got
a weekly day off. The five workers in Ponnu supermarket had only 3 Tuesdays off in a month. In the
small retail and wholesale shops, nine of the 14 got a weekly day off while the remaining five worked
half a day on Sundays.
Only five of the workers employed in the big and medium retail stores reported access to some form
of paid leave or sick leave. All the workers in the small stores said that time off for vacation could be
taken with the permission of the store owner and salary was generally not deducted. Again there is no
norm on the length of time each worker got.Six of the small store workers said that the owner had
promised 10-15 days paid leave for the worker’s marriage.
37
Toilet/ breaks
Eleven workers in the big and medium retail stores said that they could use the toilet or restroom for
20 minutes during the day but had to inform the supervisor or manager before they did so. The others
said that there was no restriction on toilet breaks. In the case of small retail storesthree workers said
that 30 minutes could be taken during the course of the day.The others said that there was more or less
no restriction.
Supervision and surveillance
All the workers in the big retail stores were very aware of the presence of surveillance cameras.This
constantwatch affects their actions and the work atmosphere. Workers in Ponnu stores, Star Bazaar,
Nilgiris and Reliance Fresh reported surveillance cameras in their stores. In some cases, women
workers reported that they were afraid to sit or talk to one another because of the high levels of
surveillance. This was in stark contrast to the small retail stores where no such monitoring mechanism
existed and there seemed to be more freedom and flexibility.
Fifteenrespondents in the sample said talking to the supervisor or the shop owner was the only way by
which problems at work could be solved. The presence of surveillance cameras clearly makes any
form of collective action and workers have little choice but, to seek an individual resolution to their
problems with management. In small retail stores, sixworkers also said that they would sometimes
approach the wife of the owner if problems arose.
Some workers in the big and medium stores reported supervisors being very “strict”, and “shouting”
at workers for making mistakes. However, most of them said that there was not much harassment at
the workplace from supervisors. In Farm Bazaar, the workers said that the supervisors were not bad,
but the lady manager/ owner could be quite abusive.
Work intensity and health problems
About half of the workers interviewed specifically mentioned that in the normal course of their
working day, the work involved some form of strenuous activity. In the case of the small retail and
wholesale shops, these included workers who were engaged in home deliveries and had to cycle long
distances to deliver orders. In the case of big retail chains, six workers said that standing for long
periods of time was difficult and caused leg pain or back pain. Two workers mentioned dust allergy in
the storage area because of poor storage conditions. Heavy unloading work of sacks delivered from
the miller/ wholesalers is mainly handled by contract workers who accompanied the delivery, though
male workers were also sometimes required to lend a hand.
Improving work conditions
38
Nine of the 14 workers currently employed in small retail or wholesale stores (all men) said that their
only reason for working was to gain experience and save money. They would improve their work
conditions by opening a new store themselves. The cases of the women who worked in larger stores
were dififerent -eight workers saying that they would report to the manager or owner if they wanted to
improve their work conditions, while some also said that to do this they would either look for another
job, or continue their studies after saving some money.
Wages and expenditure – impact on life – debt:
We would generally expect that employment in retail, with low wages would only be viable in
families with more than one wage earner, where typically the wage earned supplemented the existing
family earnings.
Migrants
Nineof the 10 migrants in the sample (displaced to Chennai from other districts in Tamil Nadu)
remitted money home. Most of them were from Tuticorin, Thirunelveli and Kovilpatti. Seven remitted
more than half of their monthly earning to support their families at home.
All the migrant workers’ families were able to save some money. Six were able to save Rs.1000-
Rs.3000 from their monthly earnings.
Wage adequacy
Only four of the 37 workers interviewed were the sole wage earners for their families. All of them
were older male workers living with their spouses.
Fourteen workers contributed more than 50% of the total family expenditure while eight workers
contributed around one-third of the total family expenditure.91Twenty one workers said that they were
able to ‘save money at the end of the month’. Yet there was also a significant incidence of
indebtedness: 17 workers among those employed in the large, medium and small private stores(nearly
50 percentof the sample) had debts against them, ranging from Rs.2000 to Rs.200,000. So some both
save and simultaneously incur debt.92
This evidence calls to question the argument that women’s employment is a secondary supplement to
male incomes and hence wages in sectors employing women can be kept low.
II. The procurement/supply process for rice
91This is again in line with the reported experience of garment workers in Chennai as discussed with activists of
the Garment and Fashion Workers Union.
92C.f. Guerin,I, S. Morvant and M. Villareal (eds) (forthcoming), Microfinance, debt and overindebtedness.Juggling with money.(OUP New Delhi)
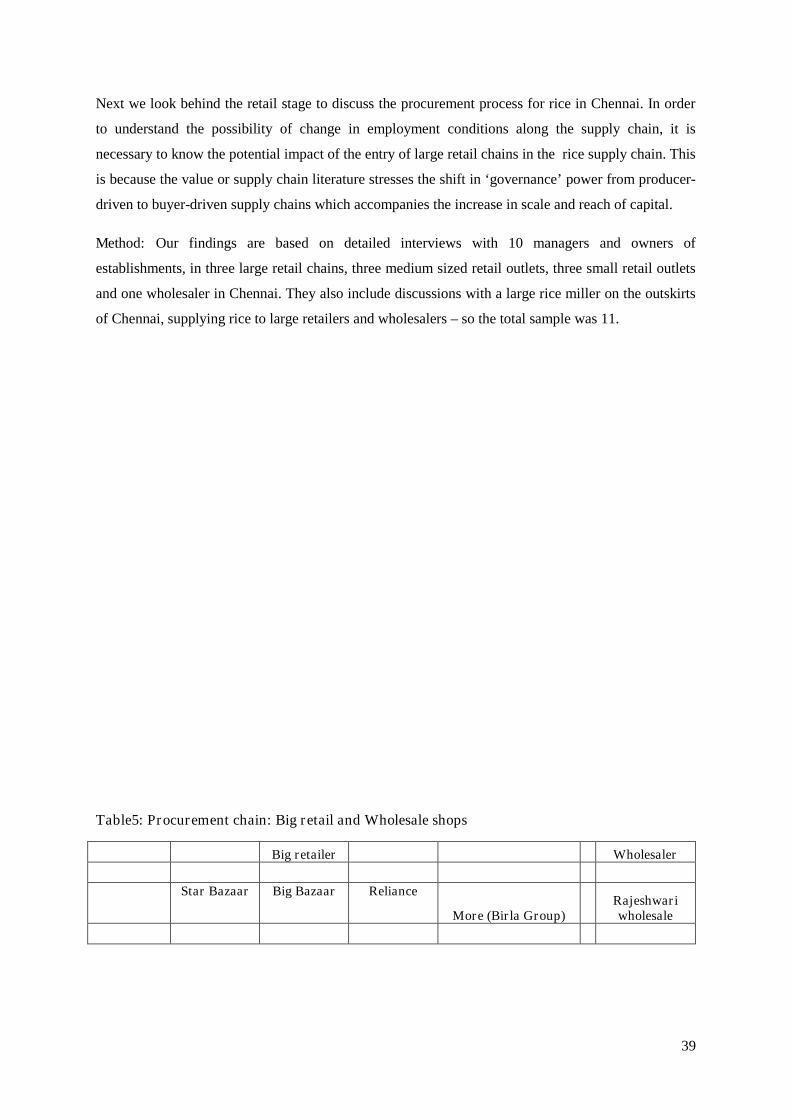
39
Next we look behind the retail stage to discuss the procurement process for rice in Chennai. In order
to understand the possibility of change in employment conditions along the supply chain, it is
necessary to know the potential impact of the entry of large retail chains in the rice supply chain. This
is because the value or supply chain literature stresses the shift in ‘governance’ power from producer-
driven to buyer-driven supply chains which accompanies the increase in scale and reach of capital.
Method: Our findings are based on detailed interviews with 10 managers and owners of
establishments, in three large retail chains, three medium sized retail outlets, three small retail outlets
and one wholesaler in Chennai. They also include discussions with a large rice miller on the outskirts
of Chennai, supplying rice to large retailers and wholesalers – so the total sample was 11.
Table5: Procurement chain: Big retail and Wholesale shops
Big retailer Wholesaler
Star Bazaar Big Bazaar Reliance
More (Birla Group)Rajeshwariwholesale
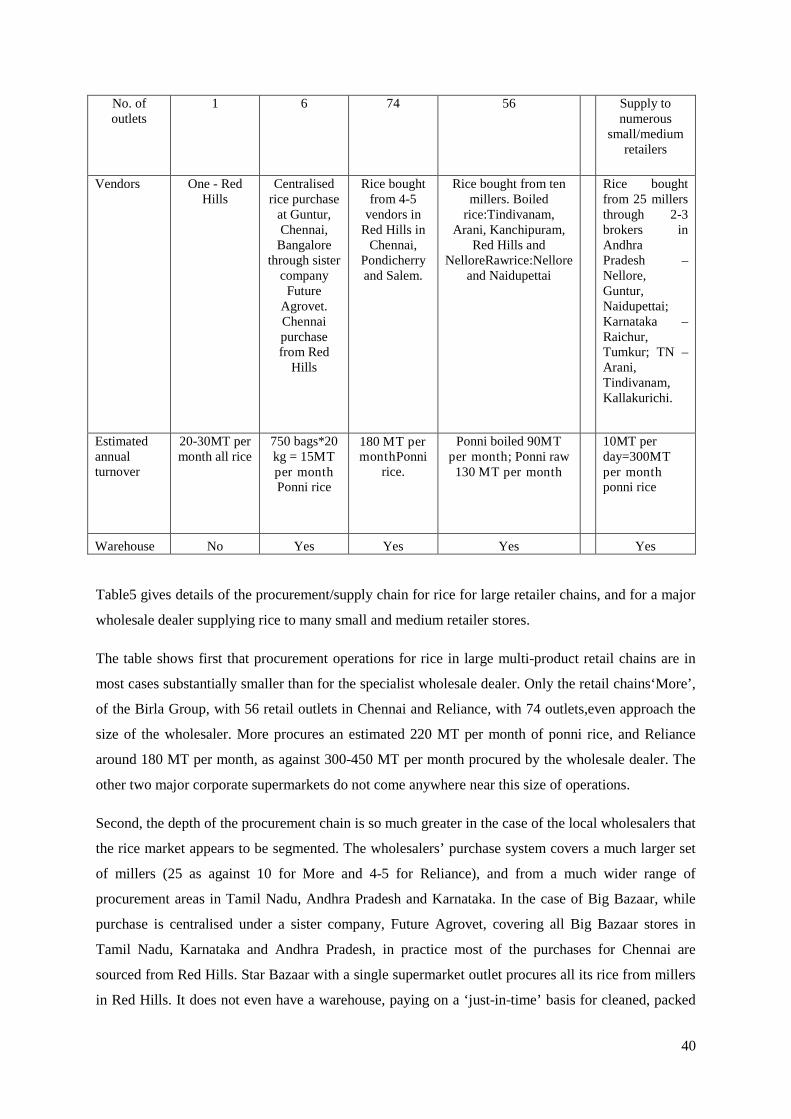
40
No. ofoutlets
1 6 74 56 Supply tonumerous
small/mediumretailers
Vendors One - RedHills
Centralisedrice purchase
at Guntur,Chennai,
Bangalorethrough sister
companyFuture
Agrovet.Chennaipurchasefrom Red
Hills
Rice boughtfrom 4-5
vendors inRed Hills in
Chennai,Pondicherryand Salem.
Rice bought from tenmillers. Boiled
rice:Tindivanam,Arani, Kanchipuram,
Red Hills andNelloreRawrice:Nellore
and Naidupettai
Rice boughtfrom 25 millersthrough 2-3brokers inAndhraPradesh –Nellore,Guntur,Naidupettai;Karnataka –Raichur,Tumkur; TN –Arani,Tindivanam,Kallakurichi.
Estimatedannualturnover
20-30MT permonth all rice
750 bags*20kg = 15MTper monthPonni rice
180 MT permonthPonni
rice.
Ponni boiled 90MTper month; Ponni raw130 MT per month
10MT perday=300MTper monthponni rice
Warehouse No Yes Yes Yes Yes
Table5 gives details of the procurement/supply chain for rice for large retailer chains, and for a major
wholesale dealer supplying rice to many small and medium retailer stores.
The table shows first that procurement operations for rice in large multi-product retail chains are in
most cases substantially smaller than for the specialist wholesale dealer. Only the retail chains‘More’,
of the Birla Group, with 56 retail outlets in Chennai and Reliance, with 74 outlets,even approach the
size of the wholesaler. More procures an estimated 220 MT per month of ponni rice, and Reliance
around 180 MT per month, as against 300-450 MT per month procured by the wholesale dealer. The
other two major corporate supermarkets do not come anywhere near this size of operations.
Second, the depth of the procurement chain is so much greater in the case of the local wholesalers that
the rice market appears to be segmented. The wholesalers’ purchase system covers a much larger set
of millers (25 as against 10 for More and 4-5 for Reliance), and from a much wider range of
procurement areas in Tamil Nadu, Andhra Pradesh and Karnataka. In the case of Big Bazaar, while
purchase is centralised under a sister company, Future Agrovet, covering all Big Bazaar stores in
Tamil Nadu, Karnataka and Andhra Pradesh, in practice most of the purchases for Chennai are
sourced from Red Hills. Star Bazaar with a single supermarket outlet procures all its rice from millers
in Red Hills. It does not even have a warehouse, paying on a ‘just-in-time’ basis for cleaned, packed
41
rice supplied directly to the store premises.Two of the medium size retail stores did not depend on the
wholesaler for their rice purchases, going directly to the millers. One of them, Demaris Stores in
Ambattur specified that they made their purchases from millers in Arni as the millers there used old
technology for drying rice, resulting in better quality rice. All three small stores purchased rice from
the wholesaler.
Third, the large retail chains use the same transport system, with trucks taken on hire, as the existing
wholesale dealers. While Big Bazaar has a dedicated transport service for expensive white goods, all
its commodity purchasesare transported using private transporters on hire.
Fourth, the wholesaler deals solely in rice, and makes all his profits from that single commodity. The
wholesaler reported a net profit margin of around 5%. A single commodity primary wholesale
operation allows for much lower costs of inventory and with no retailing costs. For the retailer
however, rice is a small fraction of the total turnover, with low profit margins. The large retail chains
gave their gross mark-up on rice as between 2-5%93, which hardly covered the cost of inventory and
shelf space. As the Manager at Tesco (joint partner with Tata in Star Enterprises) explained,“the profit
margins are deliberately kept less for certain essential items like rice , pulses, spices, eggs etc because
customers will purchase other items if they feel that prices are generally lower.” In effect,for these
large retail stores rice along with other staple commodities is a loss leader, being cross-subsidised by
other products. Rice attracts customers, while other high value items provide profits.
Further down the supply chain is the paddy milling stage – with a single case study so f ar. The rice
miller in Red Hills gave the following details of the rice milling operations. The mill has been in
operation for the past 70 years, being modernisedin 2009. The mill operated at 500 MT per month
capacity. All operations were mechanised except for packaging. Around 80% of the rice processed
was parboiled rice, the remaining 20% beingraw rice.
The sourcing of different varieties of paddy was done on a daily basis depending on demand, from 4-5
rice private wholesale mandis in Red Hills. Certainly types of paddy were available only seasonally.
There was no storage warehouses (which is unusual for Northern Tamil Nadu) , and so paddy had to
be milled within the week.
Processing costs: The miller provided processingcosts as follows. There was no procurement cost as
paddy was purchased locally, and delivered by the mandi paddy trader. Onward transportation cost
for rice varied from Rs.0.50 per kg (for local delivery to the Big Bazaar warehouse at Red Hills) to
R.1 - 1.50 for delivery in other parts of Chennai. The cost of processing was estimated at Rs.120 per
75 kg boiled rice, of which labour cost was Rs.30. Packing costs varied from Rs.0.30 per 1 kg bag to
93This margin is much lower than for small retail.
42
Rs.0.70 for a 20 kg bag. The miller estimated his net profit margin as 5-7%. This is lower than the
norm and would be almost double if the returns on bran are included94.
The miller gave his procurement cost for paddy as Rs.1200-1800 per 75kg bag (Rs 16 –24 per kg
paddy), while he sold his costliest variety of rice to Big Bazaar at Rs.48 per kg. Assumingthe rice out-
turn from paddy as being 65%95, the weighted cost of paddy for 1 kg rice with paddy at Rs.1800 per
75 kg would be around Rs.36.90.The milling cost at Rs.120 per 75 kg is Rs.2.40 per kg. The miller’s
total cost is therefore around Rs.39.50 per kg. On top of transformation there is a trade return to
milling too. Adding another R.0.50 per kg for transport and Rs.0.30 per kg for packing the landed
cost at the Big Bazaar would be around Rs.40 per kg.
The profit margin with a sales price of Rs.48 per kg to Big Bazaar is 16.67%. This is quite substantial
compared to the downstream retail activities. We do not know if this level of profit couldattract large
business houses into rice milling. The disincentive here would be competing with the entrenched
interests of existing millers with their supply networks resulting from long-standing and in-depth
knowledge of local growing and crop patterns. If a new large scale of capital enters the milling stage
of the supply chain, large business houses might also look to modernising the networks and relations
of supply. At present however, although the rice miller reported having been approached by Walmart
seeking to explore procurement options, the motivation to establish backward or ‘upstream’ linkages
in this region of India appears low..
Supply chain logistics and employment: Currently, the entry of large retail business houses has little
impact on employment relations in activities related to the supply chain of rice. We have details of
employment in Big Bazaar at their warehouse in Red Hills. The warehouse has two managers, one
commercial person looking after administration and stocks, 3 as store vehicle escorts, and 2 to
supervise loading and unloading. All actual transportation, loading, unloading are done by contract
workers. We see that the procurement activities in 2012-13 do not create many regulated jobs. In
comparison the wholesaler employed five workers, all on daily contract. He specialised in rice,
whereas the Big Bazaar warehouse dealt with a wide range of commodities. About 25% of the Big
Bazaar storage space was devoted to rice. The milling operations also did not employ many tenured
workers.The entire rice mill was operated by two technical staff, each earning Rs.1500 per month.
There were 5 men and 3 women on contract for all other activities of lifting and loading (done by
men) and cleaning and packing (done by women). The entire team was paid at piece ratesof Rs.1 per
kg rice milled, amounts which they divided among themselves.
III. Discussion
94
95According to the International Rice Research Institute, Philippines, while the maximum rice recovery frompaddy by weight is around 69-70%, commercial millers would be satisfied with around 65% milling recovery.
43
Here a number of general conclusions from our discussion of the field material are set out.
First, the field study revealedthe increase in regulation with the scaleof ownership from small store to
large retailer. Hours of work are significantly lower in the large retail chain. This indicates a greater
concern for work regulation in corporate retail. However, even in the large retail chains, the hours of
work are still longer than 8-hours per day and no overtime is paid. The workers interviewed for this
research not have an understanding of the law about the working-day, including the 8-hour day norm
and the requirement for overtime regulation and compensation of overtime work.
Second, wages (average wages) decline counter-intuitively from the small store through the medium
size store to large supermarkets. We have explained this partly as because of longer hours of work in
the small stores, with the hourly wage being roughly the same across the sample (excluding the Fair
Price Shops). But it may also be because women in big retail have the least work experience. The
wage divide mayalso reflect a gender-segmented labour market - with men paid higher wages.
However, these explanations do not seem adequate. We wish to suggest that part of the reason is that
employment in small stores mobilises kinship relations or ties of locality. The worker in the small
store is related to the owner by relationships of family, kinship, friendship and/or old village ties. The
employer then also pays for trust and loyalty. In some instances the worker is treated as family, with
board and lodging, and medical expenses paid – in a parody of occupation-based social security. The
worker in the small store is therefore willing to stay with the job for longer periods of time. Yet
another reason is that from their job descriptions, workers in the small shops are given much higher
levels of responsibility, including on occasion managing the shop on their own when the owner is not
around. The higher wage would also be a return for the worker’s handling much higher responsibility,
and the owner having to retain the trust of the worker.
The statutory MinimumWage in Tamil Nadu (notification wef April 1, 2012) for Shops and
Commercial Establishmentsis Rs.140.57 per day, or Rs.3654.82 per month for 26 working days in a
month. This is a very low wage. However this assumes an 8-hr work day. If we take up employment
in the large retail sector with average hours of work as 10.3, the overtime wages for 2.3 hours
overtime work should be Rs.80.65, giving a legally minimum wage of Rs.241 per day, or Rs.6226 per
month for 26 working days. We similarly compute, for the average hours of work of 11.6 in the
medium size stores, the legal minimum wage as being Rs.6922; and for 13.1 hours in the small, store
as Rs.8290. Taking into account the 8-hr norm and double overtime payment, across thesample
private retail employers are paying wages below the legal minimum wage.
The interview with a woman worker atfrom Star Bazaar raised some interesting issues. She had a
letter of appointment of sometime in 2010, which defined her wage component. She had a basic wage
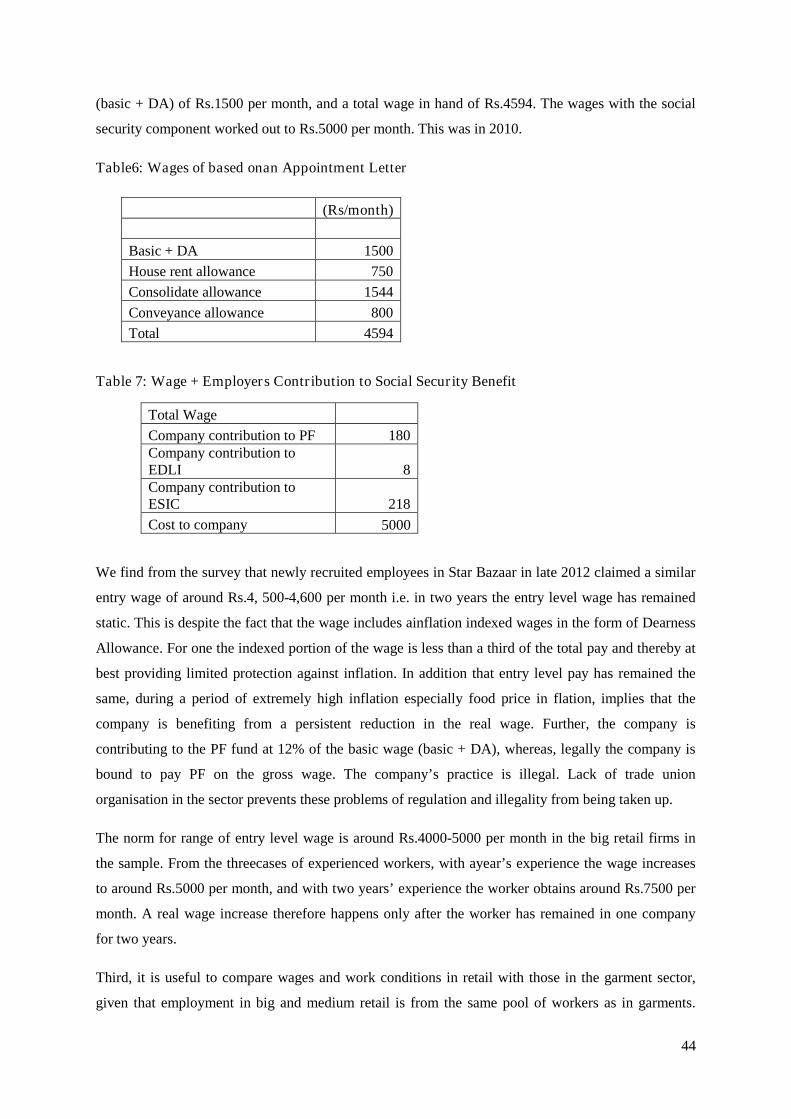
44
(basic + DA) of Rs.1500 per month, and a total wage in hand of Rs.4594. The wages with the social
security component worked out to Rs.5000 per month. This was in 2010.
Table6: Wages of based onan Appointment Letter
(Rs/month)
Basic + DA 1500
House rent allowance 750
Consolidate allowance 1544
Conveyance allowance 800
Total 4594
Table 7: Wage + Employers Contribution to Social Security Benefit
Total Wage
Company contribution to PF 180Company contribution toEDLI 8Company contribution toESIC 218
Cost to company 5000
We find from the survey that newly recruited employees in Star Bazaar in late 2012 claimed a similar
entry wage of around Rs.4, 500-4,600 per month i.e. in two years the entry level wage has remained
static. This is despite the fact that the wage includes ainflation indexed wages in the form of Dearness
Allowance. For one the indexed portion of the wage is less than a third of the total pay and thereby at
best providing limited protection against inflation. In addition that entry level pay has remained the
same, during a period of extremely high inflation especially food price in flation, implies that the
company is benefiting from a persistent reduction in the real wage. Further, the company is
contributing to the PF fund at 12% of the basic wage (basic + DA), whereas, legally the company is
bound to pay PF on the gross wage. The company’s practice is illegal. Lack of trade union
organisation in the sector prevents these problems of regulation and illegality from being taken up.
The norm for range of entry level wage is around Rs.4000-5000 per month in the big retail firms in
the sample. From the threecases of experienced workers, with ayear’s experience the wage increases
to around Rs.5000 per month, and with two years’ experience the worker obtains around Rs.7500 per
month. A real wage increase therefore happens only after the worker has remained in one company
for two years.
Third, it is useful to compare wages and work conditions in retail with those in the garment sector,
given that employment in big and medium retail is from the same pool of workers as in garments.
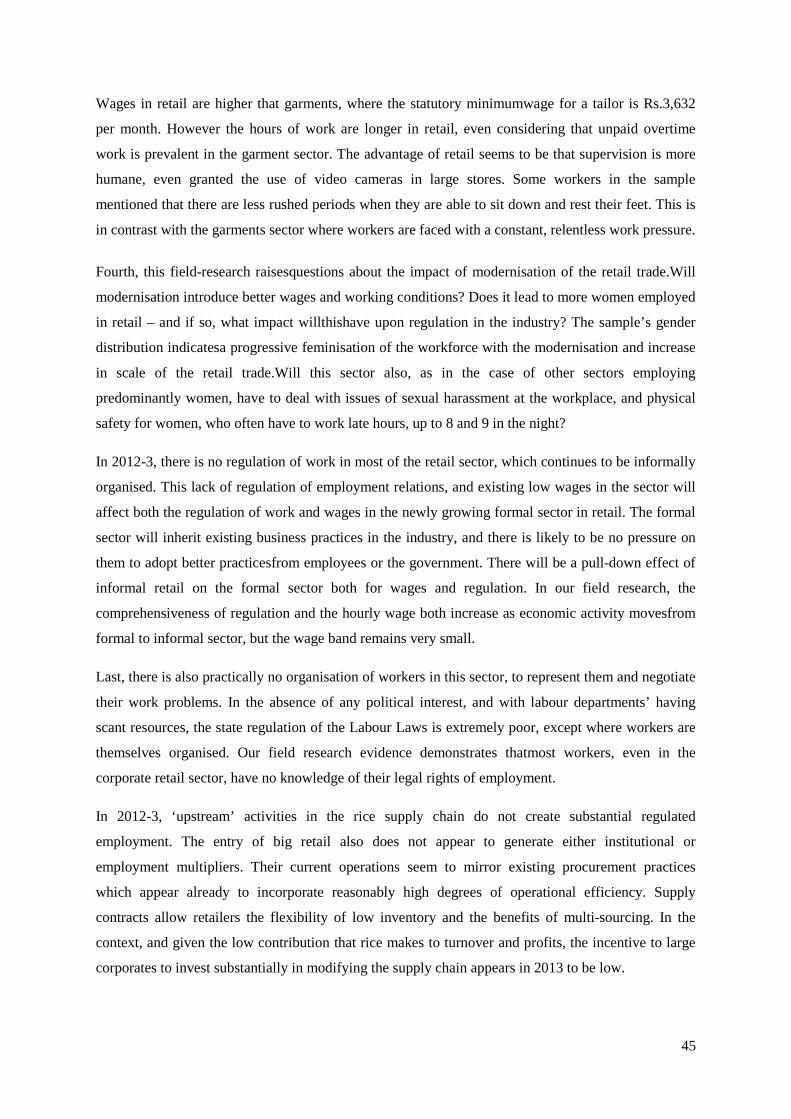
45
Wages in retail are higher that garments, where the statutory minimumwage for a tailor is Rs.3,632
per month. However the hours of work are longer in retail, even considering that unpaid overtime
work is prevalent in the garment sector. The advantage of retail seems to be that supervision is more
humane, even granted the use of video cameras in large stores. Some workers in the sample
mentioned that there are less rushed periods when they are able to sit down and rest their feet. This is
in contrast with the garments sector where workers are faced with a constant, relentless work pressure.
Fourth, this field-research raisesquestions about the impact of modernisation of the retail trade.Will
modernisation introduce better wages and working conditions? Does it lead to more women employed
in retail – and if so, what impact willthishave upon regulation in the industry? The sample’s gender
distribution indicatesa progressive feminisation of the workforce with the modernisation and increase
in scale of the retail trade.Will this sector also, as in the case of other sectors employing
predominantly women, have to deal with issues of sexual harassment at the workplace, and physical
safety for women, who often have to work late hours, up to 8 and 9 in the night?
In 2012-3, there is no regulation of work in most of the retail sector, which continues to be informally
organised. This lack of regulation of employment relations, and existing low wages in the sector will
affect both the regulation of work and wages in the newly growing formal sector in retail. The formal
sector will inherit existing business practices in the industry, and there is likely to be no pressure on
them to adopt better practicesfrom employees or the government. There will be a pull-down effect of
informal retail on the formal sector both for wages and regulation. In our field research, the
comprehensiveness of regulation and the hourly wage both increase as economic activity movesfrom
formal to informal sector, but the wage band remains very small.
Last, there is also practically no organisation of workers in this sector, to represent them and negotiate
their work problems. In the absence of any political interest, and with labour departments’ having
scant resources, the state regulation of the Labour Laws is extremely poor, except where workers are
themselves organised. Our field research evidence demonstrates thatmost workers, even in the
corporate retail sector, have no knowledge of their legal rights of employment.
In 2012-3, ‘upstream’ activities in the rice supply chain do not create substantial regulated
employment. The entry of big retail also does not appear to generate either institutional or
employment multipliers. Their current operations seem to mirror existing procurement practices
which appear already to incorporate reasonably high degrees of operational efficiency. Supply
contracts allow retailers the flexibility of low inventory and the benefits of multi-sourcing. In the
context, and given the low contribution that rice makes to turnover and profits, the incentive to large
corporates to invest substantially in modifying the supply chain appears in 2013 to be low.

46
THE MICRO-POLITICAL-ECONOMY OF GAINS BY UNORGANISED
WORKERS IN INDIA’S INFORMAL ECONOMY
Barbara Harriss-White and Valentina Prosperi
47
THE MICRO-POLITICAL-ECONOMY OF GAINS BY UNORGANISED WORKERS IN
INDIA’S INFORMAL ECONOMY
Barbara Harriss-White with Valentina Prosperi96
Abstract
In this review of literature, given the real wage rises since about 2005 and the ubiquity of informal
labour contracts, the question of the micro-political mechanisms by mean of which unorganised
labour makes gains in wages and other terms and conditions of work is posed. After examining the
micro-level impacts of demand and supply factors (focussing on the non-farm economy and on the
suite of state interventions of which NREGA is likely the most influential), we look at pressures on
employers to concede gains to labour - focussing on CSR and trusteeship, patronage and paternalism.
Lastly, the ploys open to labour appear to involve self-employment, migration and shifts in sector,
loyalty and the mobilisation of collective identity. More research is not just of scholarly interest, the
topic is of some practical relevance to labour organisations, possibly to employers and certainly to
informal workers themselves.
Key words: labour markets, gains at work, labour politics
Background
Since the era of globalised capital has not vanquished poverty or secured decent work conditions for
the vast mass of workers97 the ‘perverse’ question we try to address here is how un-unionised workers
in the unorganised or informal economy improve their wages and other aspects of the terms and
conditions of work.
Our starting point is that India’s informal economy is the actually existing form taken by
contemporary capitalism. Informal work is not residual, it is the commonest kind; it is not the reserve
army or a separate ‘needs economy’ with a non-accumulative logic,98 it is the real economy, it does
not consist of ‘invisible others’99 – in (non-metropolitan) India it is impossible to avoid; nor are its
actors forgotten - it is not so much marginalised by the state as it is the object of a mass of inadequate
regulative interventions with incoherent and contradictory purposes.100 So far, the 21st century has
been marked by increasing informalisation, by serious and extensive deficits in decent work101 and by
growing shares of the work force excluded from accumulation of any sort by relations of exploitation
96Barbara Harriss-White is a Senior Research Fellow in the Contemporary South Asian Studies Programme,
Oxford University. Valentina Prosperi is with Rome University and a labour consultant. Contact barbara.harriss-white@qeh.,ox.ac.uk97Hensman, 201098See Jan’s critique of Sanyal, 2007: Jan, 201299 Chakrabarti et al , 2008100 Harriss-White, 2012101 Kantor et al, 2006
48
and/or exchange.102Despite the growth of rights-based politics, formal access to social protection has
atrophied103, income instability has flourished alongside an expansion of casual labour and distress-
induced self-employment without access to any work rights – all indicators of deteriorating
vulnerability at work. The first 21st century decade has also witnessed the sporadic forced entry and
participation of women engaged in smoothing and supplementing their incomes.104
The political response to this vulnerability is widely taken to be the mobilisation and organisation of
informal workers.105 Yet most labour experts reason that formal or organised labour is weak in India
(evinced by a reduction in industrial disputes and the growing incidence of disputes confined to
individual companies)that organised labour is unable to expand as a workers’ movement and that the
working class ‘in itself’ is unable to act as a class ‘for itself’. In the informal economy types of
contract (regular versus casual), labour processes (subcontracting, outsourcing and home working),
social stratification and discrimination (by locality, caste, ethnicity, religion, gender, age and health
status) do not only structure the informal economy106 and differentiate returns to work, but they also
make it extremely difficult to organise workers. Further, what Gooptu (2009) has termed an
individualistic ‘enterprise culture’ is seeping progressively into production relations in all sectors,
further sapping collective political strength. For the vast mass of workers, the most that the literature
acknowledges is acts of ‘everyday’ or ‘silent resistance’ for example through squatting for home
plots107– often distinguishing the politics of poverty outside work from the politics of work itself,
while workers see such acts as a seamless part of their life-world.108 In the work place there are a few
noted cases of the informal organisation of workers by sector and site (e.g. in the construction sector,
coastal fishing and beedi wrapping) together with SEWA’s achievement in organising 1 million self-
employed women.109 Even then, the point is often made that ‘informally organised’ workers struggle
for welfare rights rather than work rights and against the state rather than against employers. 110
Yet of late, in particular since the round of NSSO data gathering in 2005,wages for both regular and
casual employment in the informal economy and real wages (adjusted for price inflation) appear to
have bottomed out and started to increase, though until recently and through most of India their
growth rates were far below the rate of growth of GDP.111
102 Harriss-White, 2012103Sharma and Arora, no date104 Corbridge, Harriss and Jeffrey, forthcoming105 see Bhalla, 1999106 The informal economy is termed ‘unorganised’ in India but it would be incorrect to argue that it is eith4rchaotic or disorganised – quite the opposite (Harriss-White, 2003).107 In the case of Dharavi slum, in Mumbai, see Mukhija, 2003108 Gooptu, 2001109 Jhabvala and Subramaniam, 2000110 see Vijayabaskar, 2011;Lerche, 2010111 Chakravarty, 2011; Kar 2011; Gulati and Jena, 2012
49
Between 2005-10, the number of openly unemployed people declined;112 real ‘All-India’ average
wages for casual agricultural labour were on an upward trend113; those of women increasing by 14.6
% in real terms and men at 7% between 2005-10.114 And, with expenditure regarded as a more reliable
indicator of poverty than income, the consumption expenditure of the bottom quintile (20%) was also
found to have increased over this period.115When inflation is high and rising,then nominal rates of
wage increases will appear to be dramatic. While the distributive share between wages and profit
continuesto be adverse to labour116 and while the All India average is known to hide significant
regional differences in levels and trends, the paradox of increasing vulnerability alongside increasing
real wages prompts us to seek to understandhow vulnerable, un-unionised workers make gains at
work in the informal economy.
The question is not confined to academic interest but is of some practical relevance to labour
organisations, possibly to employers and certainly to informal workers themselves.
Method:Beyond the abstractions of labour supply facing greater demand, however, and beyond the
impact of state interventions on raising the reservation floor for wages, there is no theory, even of an
institutional kind, to guide the search for answers. We therefore examine these conventional
approaches first; and then turn to summarise a scoping review of the Indian literature on the political
economy, institutions and practices of informal labour gains.117
Macro-level explanations of gains by informal labour:
1.Markets: demand for labour. Where the non-farm economy has flourished (as in Northern Tamil
Nadu)118and/or sectors are booming (notably in construction throughout India)119and /or demand for
specific skills rises (e.g.in the handloom silk industry in South India),120and where transport and
communications infrastructure has reduced the transactions costs of work and widened local fields of
labour supply through commuting, 121real wage gains to labour have been recorded.
In the agricultural economy, higher agricultural product prices, when not matched by higher bio-
chemo-mechanical inputs prices, have been found to enable higher agricultural wages to be conceded,
112 Ray, 2011113 According to the NCEUS, 2008, they had increased from Rs 34 per day in 1993-4 to Rs 43in 2004-5.114Gulati and Jena , 2012115 Nathan and Sarkar, 2012. It has subsequently dipped to a 7 year low in 2012http://india.nydailynews.com/newsarticle/50215dbbc3d4ca5129000005/india-consumer-spending-weakest-in-seven-years-as-slowdown-bites116 Allirajan,2013117 See Prosperi, 2010 and forthcoming for analyses in the construction industry, garments and textiles, foodprocessing and agriculture..118Harriss-White and Janakarajan, 2004119 Prosperi , forthcoming120 Roman, 2008121 Carswell and de Neve 2013
50
irrespective of the effects of the Employment Guarantee Scheme and the real wage effects on net
consumers.122
Where a new technology enhances net labour demand (as is said to have happened in the case of Bt
cotton), other things being equal, agricultural wages have also been found to have risen. 123
But the literature on these gains is content to stay at the level of description; it does not account for
the micro-political means whereby these real wage increases have been gained.
2. The state and supply. While the ILO caught the world’s attention by developing the concept of
Decent Work – involving rights to work, at work, to labour organisation (or ‘dialogue’) and to social
security, far less attention has been paid to forms of political mobilisation which could actually secure
Decent Work rights. In India in late 2005 a significant concession was secured through an
employment guarantee that grants 100 days of work (in practice about half that) to all self-selected
work-seekers at levels of pay at or above the local minimum wage.124 If confined to the rural slack
season this intervention has income smoothing effects. When clashing with peak agricultural demand,
by being an alternative it has the potential to set a wage floor. There is sharp and inconclusive debate
over the varied local effects of the employment guarantee. At less than 1 % GDP it can hardly drive
national wage-rate gains. Gaiha records supportive effects on slack season agricultural wages.125 In
three states of India studied by Reddy and Upendranadh (2009) there was significant female
participation on the NREGA when due process was fair and ‘minimum wages’ on the scheme
exceeded agricultural wages.126In rural Tamil Nadu, Heyer has observed employers’ willingness to
follow the rises in NREGA rates under conditions when not matching NREGA pay affects the supply
of labour.127
The employment guarantee can be seen as a component of a slowly emerging and fragile welfare
state. The PDS is the oldest and central element of this bundle of policies – developing from 1965 and
actually strengthening its performance in the current era - amid criticism and proposals for
alternatives.128 A national social assistance programme was put before parliament in 1995.129Social
security bills for informal workers were placed in the Lok Sabha(Parliament) in 2008; a (much
debated) food security bill in 2012 and there is expert as well as public mobilisation for wide reforms
to health and education. Threatened by the policy turn towards cash transfers and vulnerable to the
122 Rao, 2011123 Subramaniam and Qaim, 2010124 Reddy and Upendranadh, 2009125Gaiha , 1997126 Reddy et al, 2010127 Judith Heyer, Pers Comm, 2012
128Khere, 2011129 Justino, 2003
51
health of the budget, this skeletal welfare state aims to improve conditions outside work and
compensate those incapable of working.
Its impact on wages and working conditions in the informal economy is thought to be traced indirectly
- first through expanding the capacity of workers to withdraw from the most degrading and oppressive
conditions of work to devote time to other aspects of domestic work, to themselves, child-care 130or
education131and second through notable improvements in the respect paid to labour through the
language and idioms of work.132 At the same time, in failing to address work conditions and focussing
on welfare outside work, this suite of interventions does nothing if not legitimate informal labour. One
hypothesis needing further exploration across the federation of Indian states is that the extent to
which the state assumes the role of patron and develops a welfare state is related positively to gains
in informal sector wages. 133
These state welfare rights are being secured in a vulnerable and drawn-out process involving civil
society movements and academic activism together with left party pressure whenever this is
politically possible. They have not been secured directly by informal workers themselves. And both
the political and the analytical framing of gains is confined to the wage level – no other aspect of
work is well addressed.
So the macro-level literature shows that the question of the tactics and institutions through which
gains are secured is ageneral question that requires micro-level and detailed, context-rich research
for its answers.
Micro level explanations: Moving beyond descriptions of levels and trends, demand and supply, we
first examine explanations involving action by employers before turning to employees.
Employers
1..Trusteeship – Corporate Social Responsibility (CSR). Pressurised by campaigns on the part of
consumers and civil society representatives, highly selective and limited improvements in labour
standards have been imposed on informal producers by registered global companies under ‘CSR’
(Ruthven, 2008). Case studies document elaborate evasive tactics as well as strategically selective
success.134 In the case of IKEA for example, gains have been made in health and safety and in
environmental standards. But the IKEA work-forces’ own demands reflect different priorities (e.g.
lack of over-time pay and undercutting by contract labour) and these have not been addressed under
130 Heyer, 2011, a and b131 V Prosperi, forthcoming.132Judith Heyer, Personal Communication, 2012133 Harriss-White, 2010, reviewed literature to argue the reverse however – that even in the informal economy,work status had a major impact on access to social security.134 Samy and Vijayabaskar, 2006
52
CSR. Rights to organise have not been honoured, nor has social discrimination in the workplace been
countered.135
2.Patronage and Paternalism; the Roles of Labour Contractors and Gang-masters. Increasingly daily
wages are being replaced by piece rates and, though the practice is still not widespread, farmers’ own
searches for labour are being outsourced to labour contractors. There is a growing literature on the
hold of contractors over agricultural –especially migrant – labour136 but labour contractors are now
spreading through the informal economy. In a case from the construction industry, Prosperi found
contractors able to discriminate in wages between individual gang members, based on personal
relations of loyalty, reliability and trust. With power to divide the work force, they may concede gains
to individuals at the expense of the collective. Some gang labour has been found to be seasonally
bonded. Gang-masters may also organise housing, food, health care and communication for groups of
migrant labour, though this is certainly not a common occurrence.137 The extent to which they mediate
claims with employers on behalf of labour awaits a dedicated study of contractors.
The body of evidence about employers’ actions invokes cause and effect, mostly by inference. Gains
to labour are not conceived as a micro-political struggle.
Employees:
1 .Assets and the Role of Self Employment. In a closely observed case study of women’s work in rural
Andhra Pradesh, Garikipati shows that the ownership of assets relates to stronger bargaining power.
She argues that this result from self-employment’s being an alternative to wage work. Indeed experts
on labour often see self-employment as ‘good quality work’ 138since the distribution of earnings from
self-employment has a higher and longer right-handed tail than that from wage work and since
‘autonomy’ is found to be a valued attribute of work.139The ‘shift to self-employment’ is conceived as
a gain in work quality rather than asa form of production or trade generating an opportunity to
accumulate.
In fact, while it is true that self-employment is now the commonest form of work in India accounting
for 53% of the workforce,140 much evidence shows it to be propelled by the compulsions of poverty
rather than entrepreneurial prospects for accumulation. Self-employment may be understood as self-
exploitation, or undertaken part-time or in slack seasonal employment troughs. Or it is the preserve of
135Prosperi , 2010; forthcoming136 See Breman et al, 2009137Harriss-White, 2010; Picherit, 2009138 Sundaram, 2007139 ,Ruthven, 2008; see also Chandrasekhar and Ghosh, 2007140This is driven by the agricultural sector and varies greatly within the non-agricultural economy. Seereferences in Harriss-White, 2012
53
women returned to home working after a period (1999-2005 judging by the labour statistics) spent in
wage work as a result of agricultural distress.141
It is a matter of some importance that self-employment is classified by labour economists and lawyers
alike as ‘disguised wage labour’ because with no consensus on its terminology, self-employment/petty
production/own account enterprise/ micro-enterprise/cottage industry/ the tiny sector etc is
consensually interpreted as a positive shift in the terms, conditions and returns to labour.
In fact, there appears to be a continuum of forms of self-employment from hardly disguised wage
work to complete autonomy. Its distinctiveness takes several forms: first, while labour is exploited on
labour markets , self-employed workers can be exploited on (rental) markets for property, raw
materials , money and finished products – they may shift the balance of power towards them in
exchange relations on four markets (contracts may shift adversely too).Second, self-employed people
can operate a distinctive logic of super-exploitation or super-efficiency in which production is
maximised rather than (marginal) productivity (in which improvements would be indicated,
perversely, by reductions in production).Third, exchange relations contrive to prevent accumulation
and self-employment expands instead by multiplication; so the question whether an expansion in self-
employment is an indication of social gains to labour or rather a signal of the power of relations
preventing accumulation (or both) is an open one. Fourth, self-employed workers are disenfranchised
in labour law when they cannot identify a single employer against whom to bring a grievance to court
(the multiple exchange relations in which the self-employed are entangled making this impossible).
The possession of assets may make it possible to bargain higher wages, but the turn to self-
employment is not a solid indicator of gains by labour.
4.Migration. Migrant labour appears to bring mixed effects on labour markets. On the one hand, an
increase in the supply of (compliant) labour threatens employment opportunities as well as wages of
workers in the destination sector and site – worse for women than for men and worse for older rather
than younger workers. On the other hand migrant labour often manages to improve wages over and
above rates in the origin.142 The effects of migration on migrants themselves are far from
homogeneous. They may involve bondage or they may include social liberation, especially for
oppressed dalit labour.143 Migration is also structured through institutions of caste, gender, locality,
kinship and friendship but the literature suggests that while these relationships are vital in recruitment
per se, their effectiveness in bettering work conditions is not well researched or established. As with
the case of individualised relations with contractors so here with entire groups of migrants, low wages
may be accepted in the interest of stable work opportunities. There is little evidence of migrants
141141 Corbridge, Harriss and Jeffrey, forthcoming142Picherit, 2009 andPattenden, 2012143 Rogaly and Coppard 2003
54
themselves attempting to improve work conditions. One case of informal labour mobilisation
observed by Prosperi was a frustrated reaction to non- and extremely delayed payment of wages.144
5.Shifts in sector/ location. Net of migration, other shifts may result in better working conditions.
Moves from agriculture to the rural or local non-farm economy, and from rural to urban work have
long been associated with increased earnings.145 So much so that the local urban non-farm economy
may become a segmented redoubt – barring women and low caste aspirants.146 Entry for them is a
political struggle.
2.Long Term Loyalty: Case material demonstrates that, despite contractual precarity, wages may
increase with the length of ‘service’ with a given employer.147 One the one hand this may be a
customary norm; on the other it may reflect individual skill and experience. Gains are slow and
individualised. Employers may also seek to bind long term informal employees without written
contracts who they desire to retain, using loans.
3.Deployment of Collective Identities: In village studies in Tamil Nadu148 networks and social
relations among agricultural labour based upon kinship, friendship and caste are described as being
deployed to raise wages and improve conditions. Unorganised labour may also organise itself by
village of origin and locality (where it can restrict entry, operate a closed shop, and negotiate
periodically and in the collective interest against a set of employers).149Research in Haryana
demonstrates that collective identity may be as much a structure of control as it is one of enabling and
empowerment.150How localised the gains achieved by the mobilisation of social identities are - and
whether they are made at the expense of other groups of workers – has not been established. The
dynamics of such processes have mainly been researched in the context of migration.
Conclusions:
While India’s informal economy provides evidence of on-going vulnerability, there is recent evidence
for real wage gains. Yet the question of the micro-political practices by means of which gains in
wages and improvements in working conditions are achieved by un-unionised, un-organised labour in
the informal economy is one that does not seem to have been researched explicitly. It is also a general
question whose answers have to be sought at the micro level.
The literature of case material does not appear to be abundant. Time series or historical evidence
hardly exists and the trend of All-India real gains appears to be too recent for research cycles to have
144 Prosperi ,2010145 Jayaraj 2004; Jha nd146 Haggblade et al 2010147Prosperi, 2010; forthcoming; Harriss, 1981; Harriss-White 1996148Ramachandran et al 2001149 E.g. marketplace porters in the town of Arni, South India: source - author’s field interviews, 2012.150Rawal, 2006
55
been completed. To date answers have to be found between the lines of research which has other
objectives. Much of the existing evidence associates certain economic conditions with certain labour-
market outcomes inferring cause and effect. Even literature rich in the details of working conditions
(in agriculture in particular) ignores the question of the tactics used to struggle for wage gains or for
changes in non-monetary gains, such as respect.
Surprisingly little is known substantively. Relations of clientelism or loyalty may bring gains to
individuals. The existence of alternative work at higher rates (state-supplied / self-employment/
different sectors / different locations) with the option of not working, or not working as many days
may force employers to raise wages. They then start to worry about the timing of labour supply - they
may try to treat labour better - ‘like a bride’151 - not merely offering higher wages but also better
conditions. Not enough is known about how they resist or capitulate.
Labour may organise for objectives outside work – conditioning their life-world and their
reproductive space – when mobilising to improve conditions at work is currently faced with
insuperable obstacles. Collective identities may be deployed in the search for work but are rarely
recorded as the basis for struggles for improved conditions. If non market forms of exchange, co-
ownership, solidary institutions, co-operative and collective practices of labour protection play roles
in the securing of gains to men and women workers, they are not yet identified and recorded.
For a wide constituency of public interests, and since there is no sign of anything other than further
informalisation, systematic research is needed into the means whereby informal labour reduces its
vulnerabilities and achieves improvements in its working conditions.
Acknowledgements
We are grateful to Judith Heyer, Gautam Mody, D N Reddy and M Vijayabaskarfordiscussions over
this topic and comments on the first draft. The research is part of the project RESOURCES,
GREENHOUSE GAS EMISSIONS, TECHNOLOGY AND WORK IN PRODUCTION AND
DISTRIBUTION SYSTEMS: RICE IN INDIA (RES-167-25-MTRUYG0; ES/1033768/1) funded
jointly by the UK’s Economic and Social Research Council and the Department for International
Development. Views expressed here are the authors’ and not policy of either funding institution.
151 Judith |Heyer, Personal Communication, 2012
56
References
Allirajan M. 2013India’s Q3 profits to grow 26% on lower costs Times of India Jan 2nd
http://articles.timesofindia.indiatimes.com/2013-01-02/india-business/36110741_1_interest-costs-cmie-march-quarter
Bhalla, S. 1999 Liberalisation, rural labour markets and the mobilisation of farm workers: TheHaryana story in an all‐India context, Journal of Peasant Studies, 26:2-3, 25-70.
Breman J., I. Guerin and A. Prakash (eds) 2009 India’s Unfree Workforce: Of bondage old and new ,New Delhi, OUP
Carswell G and G. De Neve, 2013 Labouring for Global Markets: Conceptualising Labour Agency inGlobal Production Networks. Geoforum 44: 62-70.
Chakravarty M. 2011Decline in share of wages in GDP must be reversed,http://www.livemint.com/2011/09/07200029/Decline-in-share-of-wages-in-G.html (accessed the 10thof July 2012).
Chakrabarti, A., A. Chaudhury and S. Cullenberg 2008 Global order and the new economic policy inIndia: The (post)colonial formation of the small-scale sector. Cambridge Journal of Economics, 33(6),1169–86.
Chandrasekhar C. P. and J. Ghosh 2007 Self-employment as Opportunity or ChallengeMacroscanhttp://www.macroscan.org/fet/mar07/pdf/Self_employment.pdf
Corbridge S., J. Harriss and C. Jeffrey, forthcoming, ‘Lopsided’, ‘Failed’, or ‘Tortuous’: India’sProblematic Transition and its Implications for Labourin (eds) D. Davin and B. Harriss-White China-India: Paths of Economic and Social Development, London, Proceedings of the British Academy
Gaiha R. 1997Do rural public works influence agricultural wages? The case of the employmentguarantee scheme in India, Oxford Agrarian Studies, 25:3, 301-31.
Gooptu N. 2001 The Politics of the Urban Poor in Early-Twentieth Century India, Cambridge,Cambridge University Press
Gooptu, N. 2009 ‘Neoliberal Subjectivity, Enterprise Culture and New Workplaces: Organised Retailand Shopping Malls in India’, Economic and Political Weekly, 44, 22, 45-54
Gulati A. and A. Jena 2012 Rural Prosperity No Mirage Economic Times October4thm.economictimes.com/.../rural-prosperity-no-mirage...rural.../16662...
Haggblade S., P. B.R. Hazell and T. Reardon 2010 The Rural Nonfarm Economy: Prospects forGrowth and Poverty Reduction,WorldDevelopment38,10,1429-1441
Harriss. B. 1981 Transitional Trade and Rural Development, Delhi, Vikas
Harriss-White B. 1996 A political Economy of Agricultural Markets: Masters of the Countryside,New Delhi, Sage
57
Harriss-White B. 2003 India Working: Essays in Economy and Society , Cambridge, CambridgeUniversity Press
Harriss-White B. 2010 ‘Work and wellbeing in Informal Economies : The regulative roles ofinstitutions of identity and the state’, World Development , 38,2,170-183)
Harriss-White B., 2012, ‘Capitalism and the Common Man’ Agrarian South: Journal of PoliticalEconomy 1,2, 109–160
Harriss-White B. and S. Janakarajan 2004 Rural India facing the 21st Century, London, Anthem
Hensman, Rohini, 2010, "Labour and Globalization: Union Responses in India," GlobalLabourJournal 1, 1, 112-131
Heyer J 2011a Social Policy and Labour Standards: A South Indian Case Study paper presented in theContemporary and HistoricalAspects of Labour Regulations and Labour Standards Panel of the 21stEuropeanConference on Modern South Asian Studies (ECMSAS), 26-29th July 2010, Bonnhttp://www.esrc.ac.uk/my-esrc/grants/RES-167-25-0296/outputs/read/d56e64ec-442a-445c-bea2-65486c472ef7
Heyer J 2011 b Dalit women becoming 'house wives : lessons from the Tiruppur region, 1981/2 to2008/9 Paper presented at the Conference on Mobility or Marginalisation: Dalits in Neo-Liberal India,Oxford University, 1-2 September 2010http://www.esrc.ac.uk/my-esrc/grants/RES-167-25-0296/outputs/read/575f358c-cdb4-4975-a405-4ed28631b8e2
Jan M.A. 2012 ‘Ideal-types’ and the diversity of capital: A review of Sanyal
http://www.southasia.ox.ac.uk/sites/sias/files/documents/ali%20jan%20sanyal-review-final.pdf
[Jayaraj D 2004 Social Institutions and the Structural transformation of the Non-Farm Economy, ch 1-6pp175-194in Harriss-White B and S Janakarajan Ryural India facing the 21st Century, LondonAnthem
Jha B no date Rural Non-Farm Employment in India: Macro trends, micro evidence and policyoptions Institute of Economic Growth (New Delhi) Working Paper 267http://iegindia.org/workpap/wp267.pdf
Jhabvala, R.and S. Subramanian (eds.) 2000The Unorganised Sector: Social Security. New Delhi:Sage Publications
Justino P. 2003Social Security in Developoing Countries : Myth or Necessity? Evidence from IndiaPRUS Working Paper No. 20http://aajeevika.in/studies/important-analysis/Social-Security-in-Developing-Countries-Myth0-or-Necessity-Evidence-from-India.pdf
Kantor P., U. Rani and J. Unni 2006Decent Work Deficits in Informal Economy: Case of SuratEconomic and Political Weekly 41, 21, 2089-2097
Kar S. 2011 Issues in Informality, WIEGO Research Conference, CapeTown S Africahttp://wiego.org/sites/wiego.org/files/resources/files/Kar-India-Panel.pdf
Khere R. 2011 Revival of the Public Distribution System: Evidence and Explanations Economic andPolitical Weekly, Nov 5th46, 44 & 45,36-50
Lerche J. 2010. From ‘rural labour’ to ‘classes of labour’: Class fragmentation, caste and classstruggle at the bottom of the Indian labour hierarchy.(pp. 64–85)in B. Harriss-White and J. Heyer
58
(eds), The comparative politicaleconomy of development: Africa and South Asia compared London,Routledge
Mukhija V. 2003 Squatters as Developers: Slum Redevelopment in Mumbai London, Ashgate
Nathan, D. and S. Sarkar 2012 Global inequality, rising powers and labour standards, Capturing theGains Working Paper 2012/09, http://www.capturingthegains.org/pdf/ctg-wp-2012-09.pdf
NCEUS 2008Report on Conditions of Work and Promotion of Livelihoods in the Unorganised Sector,New Delhi,Government of India.
Pattenden, J. 2012 "Migrating Between Rural Raichur and Boomtown Bangalore: Class Relations andthe Circulation of Labour in South India," Global Labour Journal3,1, 163-190. http://digitalcommons.mcmaster.ca/globallabour/vol3/iss1/8/
Picherit D. 2009 ‘Workers, trust us!’: Labour middlemen and the rise of the lower castes in AndhraPradesh, pp. 259-283in J. Breman, I. Guérin and A. Prakash (ed.), India’s Unfree Workforce. OfBondage Old and New, Delhi, Oxford University Press[Prosperi, V. 2010 Informal Migrant Workers in the Indian Economy. The Case of the ConstructionIndustry, La Sapienza University of Rome, PhD thesis.
Prosperi V forthcomingHow informal labour in India improves its conditions and wages: the micro-political economy of gains,Working Paper,Technology.. research project, CSASP, SIAS, OxfordUniversityhttp://www.southasia.ox.ac.uk/resources-greenhouse-gases-technology-and-jobs-indias-informal-economy-case-rice.
Ramachandran V.K., M Swaminathanand V.Rawal2001 How have hired workers fared? A case studyof women workers from an Indian village, 1977 to 1999, Centre for Development Studies, TrivandrumWorking Paper,Centre for Development Studies, Trivandrum,
Rao, S. 2011 Work and Empowerment: Women and Agriculture in South India, Journal ofDevelopment Studies, 47, 2, 294–315.
Rawal, V. 2006 The Labour Process in Rural Haryana (India): A Field-Report from two villages,Journal of Agrarian Change, 6, 4, 538-583.
Ray, A. 2011 Growth has become more inclusive. Real wages, employment and per capitaconsumption have risen across rural and urban India,The Hindu BusinessLinehttp://www.thehindubusinessline.com/opinion/columns/alok-ray/article2313892.ece(accessed the10th of July 2012).
Reddy D.N. and C. Upendranath 2009 National Rural Employment Guarantee: Issues Concerns andProspectsPaper for the Workshop on Inclusive Development. November, Institute for HumanDevelopment / Oxfam India, New Delhi
Reddy D.N., C. Upendranadh, R Tankha and A N Sharma 2010 ‘NREG as a Social Protection: Roleof Institutions and Governance’ Institute of Human Development, New Delhi
59
Rogaly B. and D. Coppard 2003 They Used To Go to Eat, Now They Go to Earn’: The ChangingMeanings of Seasonal Migration from Puruliya District in West Bengal, India Journal of AgrarianChange 3,3, 395–433
Roman, C , 2008, 2008 Learning and Innovation in Clusters: Case Studies from the Indian SilkIndustry, D.Phil. Thesis Oxford University
Samy L. A. and M. Vijayabaskar 2006 Codes of Conduct and Supplier Response in the IKEA ValueChain. The Case of Handloom Home Furnishing Suppliers in Karur, south India,http://www.inmotionmagazine.com/global/lasamy_ikea.html (accessed on the 28th of June 2012).
Sanyal K. 2007Rethinking Capitalist Development : Primitive Accumulation, Governmentality andPost-Colonial Capitalism, London, Routledge
Sharma A. and D. Arora, no date, Social Protection in India: Issues and Challenges Institute ofHuman Developmenthttp://wiego.org/sites/wiego.org/files/resources/files/Sharma-Social_Protection_in_India_Issues_and_Challenges.pdf
Subramanian, A. and M. Qaim 2010, The Impact of Bt Cotton on Poor Households in Rural India,Journal of Development Studies, 46, 2, 295–311.
Sundaram, K. 2007Employment and Poverty in India, 2000-2005,, Economic and Political Weekly,42,30 , 3121-3131 27th
Vijaybaskar M. 2011 Global Crises, Welfare Provision and Coping Strategies of Labour inTiruppur,Economic and Political Weekly46, 22, 38-45
60
THE REGULATION OF MARKETS AND THE INTERFACE
BETWEEN FORMALITY AND INFORMALITY
Aseem Prakash
61
THE REGULATION OF MARKETS AND THE INTERFACE
BETWEEN FORMALITY AND INFORMALITY
Dr Aseem Prakash,152
Abstract
Any future low carbon transition would have to be guided by policy and would have to negotiate the
informal market economy. Markets are important institutions that propel economic growth on one
hand and also configure the relationship between social groups and individuals. Following Polanyi we
understand that, over and above being regulated by the state, market exchanges are embedded in non-
economic as well as economic institutions. Formal policy pertains only to the powers of the state. The
line between formally state-regulated and informal social- regulated activity has been called ‘blurred’
(Akhil Gupta). The research developed here seeks to improve the precision of understanding the
boundary between state policy levers and the informal economy.
Accordingly, it explores three different physical kinds of markets to understand the regulation of
economic transactions and outcomes.
a) Commercial Transport Sector (goods transport) in Sonipat, Haryana
b) Electricity Distribution in Madhepura district of Bihar
c) Land Acquisition and Real Estate Development in the National Capital Territory of Delhi
It focuses on formal institutions and how they interact with informal institutions in order to
‘efficiently’ regulate market outcomes. It examines in detail the interface between formal and
informal structures; the institution, instruments and practices which help informalise the formal
structure and vice versa; and the process of regulation, showing the rationale for the limits of formal
regulatory instruments.
Excerpt:
Case –study c): The Politics of Land: The Real Estate-Housing Business on the Urban Periphery
I: Introduction
Importance and speed of growth:A recent report by a unit specialising in the sale and purchase of
property pointed out that the Indian real estate market has shown robust growth in 2013, althoughthe
economy and economic growth has taken a downward turn. The report mentions that the 7 top
cities/areas, which are driving growth in the real estate sector, are – Delhi-NCR, Kolkata, Mumbai,
152 Professor and Assistant Dean, School of Government and Public Policy, Jindal Global University AseemPrakash ([email protected])
62
Bangalore, Pune, and Hyderabad. The capital value growth in Delhi-NCR and Kolkata has grown at
20 and 17 percent respectively while other cities have experienced a price appreciation of 12-15
percent over the last one year153.The latest Economic Survey of the Government of India indicates that
financing, insurance, real estate & business services contributed 11.7 % to the GDP in the year 2011-
12154. As per the estimate of the Federation of Indian Chambers of Commerce and Industry (FICCI),
the real estate- housing sector contributes 5-6 per cent to India’s GDP155. Thus, one can safely
conclude that real-estate housing is one of the fastest growing economic sectors in India.
Multipliers:This sector not only generates a high quantum of direct employment, but also propels a
demand in over 250 ancillary industries, such as cement, steel, paint, brick, building materials,
consumer durables and so on156. Given the current growth rate and extremely positive future
prospects, this case study attempts to understand the regulation of this particular sector by exploring
the experience of real estate firms. By examining their interaction with various decision-making
andregulatory bodies and the instruments used by such firms to conduct business with the state’s
regulatory bodies, it starts to unpack the political frontiers between the formal and informal policy and
the formal and informal economies.
II: Field Method
The study was conducted with the help of partially structured open ended interviews with 13 real
estate developers (proprietors), 7 government officers in the Office of the Town and Country
Planning, 4 property liaisoning officers and 3 local politicians including a politically powerful
Member of Legislative Assembly and 2 leaders of caste Panchayat, also known as Khap in Haryana.
Before the interviews, carefulbriefing and preparation was made though interacting with real estate
brokers (property dealers) which in turn helped us to ask relevant and pin-pointed questions.
III: Urban Periphery in the Real Estate Business
The real estate sector has seen phenomenal growth in the last decade. The sector has seen the entry of
several new domestic players as well as arrival of many foreign real estate investment companies. The
factors fuelling such massive expansion are many and include continuous growth in population, in-
migration to urban areas in the rapidly growing service sector, the increase in household income
153Property Price Trends Across, 99 acres.com154Economic Survey 2012-13, Government of India, Ministry of Finance, New Delhi155Overview and Sector Profile of Real Estate, Federation of Indian Federation of Indian Chambers ofCommerce and Industry, New Delhi, available at http://www.cci.in/pdfs/surveys-reports/Real-Estate-Sector-in-India.pdf156 Ibid.
63
coupled with an expanding middle class, the rising number of nuclear families and easy availability of
finance etc. It has been estimated that the housing shortage in urban areas, which was nearly 15.1
million units in 2005, increased to 19.3 million units at the end of 2008 and is expected to reach 21.7
million units by the end of 2014157.Geographically, one of the fastest growing areas in real estate-
housing in India is that around Delhi. Spiralling costs of property are making it impossible for many
aspiring house owners to purchase in the main city and they are increasingly investing in property at
the periphery.
Peripheral transformations: It is here that the pattern ofeconomic development in the urban periphery
becomes important. Despite dissimilarities, urban development in the peripheries of Indian citiesis
characterised by following common attributes158.
First, a major portion of urban growth occurs inperipheral areas as people move outwards from the
congestion of central cities. This movement propels the parallel development of commercial real
estate (offices etc.), organised retail real estate (malls etc.), hospitality real estate (hotels etc.) special
economic zones and residential real estate.The development of commercial real estate in Delhi is also
due to a desire to stay close to the national capital. In the absence of sufficient affordable office space
in the city, commercial establishments are increasingly moving to the satellite towns of NOIDA,
Gurgaon, Faridabad etc.
Second, as commercial establishments and business and residential areas move out of the main city,
property / asset pricesin peripheral areas escalate.
Third, these two processes are contingent onpolicy changes in land use patterns, that is, the shift from
agriculture to commercial use including housing. The latter in India is achieved through the
preparation of master plans thatallot land for different developmental uses (commercial, housing,
industrial, hospitality etc.). This point will be further discussed in the subsequent section.
Fourth, it triggers a structuraltransformation in the region, that is, from a (capitalist) agricultural
based economy to an economy based on capitalist networks of trade and services linked to national
and global capital.
Fifth, it further accentuates the class differentiation of the local economy.The middle and large
landholders whose land is acquired by private players are found to diversify toother service providing
157 Estimation of the Urban Housing: Report of the Technical Group, 11th Five Year Plan ( 2017-2012),Ministry of Housing and Urban Poverty Alleviation, New Delhi158 The discussion is largely based on the inferences drawn from the region of National Capital Territory (NCR)of Delhi. Although this will be largely true for any region in India where land acquisition has been throughmarket mechanism.
64
sectors like transport, cable television, general store, real estate business159, construction etc. Several
of them may retain a portion of their land and continue to invest time and money in agriculture along
with the diversificationof their economic effortto include the service sector. Further, with the
development of the area, the price of land increases exponentially. This gives them either control over
large sums of money (if they choose to sell the remaining land) or a potential future source of capital.
This particular class of people are then seen to have a large amount of disposable income, often
invested in lavish consumer goods. Small farmers who choose to sell their land in the initial phase are
either content with small-scale service sector opportunities or have frittered their newly acquired
wealth in conspicuous consumption. The landless, as per local observers, constitute 20-30 per cent of
the population. Although, they are absorbed into the local economy, they command a relatively
meagre incomein the unorganised service sector. Lastly, the service sector creates substantial
opportunities and drawsboth professional and unskilled migrant workers from various parts of the
country. The professionals provide an important basis for real estate housing business development
either through the purchase of new properties or the renting out of accommodation in the new
residential sites developed in the area. The other class of migrant peopleare thelarge number of wage
labourers who are drawn by the labour opportunities provided by the unorganised service sector. They
survive on bare minimum wages/earnings and live in miserable conditions.
Sixth, real estate development has led to the emergence of a fresh class of economic agents who act as
facilitators of different types in the property business. They are often the primary human agency
through which real estate development has unfolded in the periphery. The first categories of economic
agents are the big real estate players who have massive presence not only in the region of our case
study-NCR of Delhi- but also in other big metros of India. This includes big firms like DLF,
AnsalsAPI, Chintel, Bestech etc. The second category of economic agents are big farmers of the
region who have sold a portion of their agricultural land and have used the surplus as seed money to
start small real estate projects- both commercial and housing – on their own land. The third category
of economic agents are the power brokers who facilitate the interaction between the regulators and the
real estate developers. This may include small time politicians who have access to the corridors of
power as well as professional brokers who have made this particular economic activity as the
mainstay of their earning and livelihood. This point will be further taken for discussion in the
following sections.
IV: Master Plan: An Insight from Gurgaon, NCR of Delhi
A master plan lays down the vision for the long term development of the city. The document
endeavours to outline the guidelines, policies and space requirements for various socio economic
159 Real estate business is discussed further in the following paragraph.
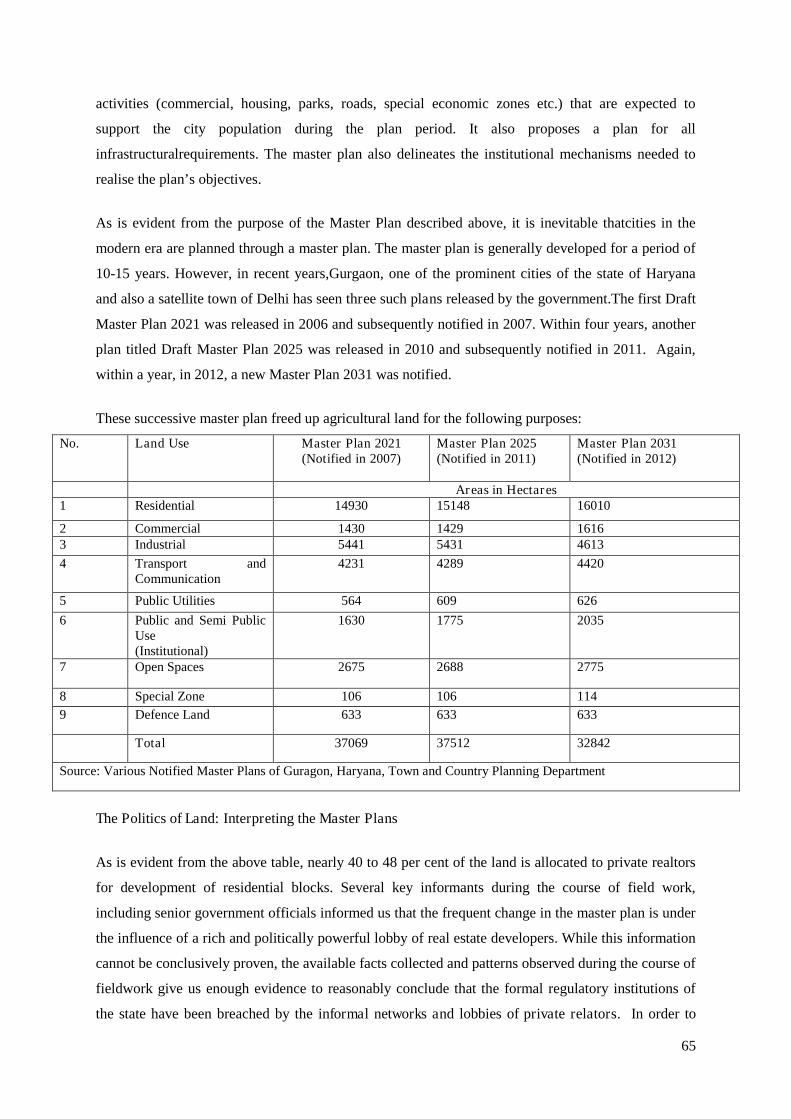
65
activities (commercial, housing, parks, roads, special economic zones etc.) that are expected to
support the city population during the plan period. It also proposes a plan for all
infrastructuralrequirements. The master plan also delineates the institutional mechanisms needed to
realise the plan’s objectives.
As is evident from the purpose of the Master Plan described above, it is inevitable thatcities in the
modern era are planned through a master plan. The master plan is generally developed for a period of
10-15 years. However, in recent years,Gurgaon, one of the prominent cities of the state of Haryana
and also a satellite town of Delhi has seen three such plans released by the government.The first Draft
Master Plan 2021 was released in 2006 and subsequently notified in 2007. Within four years, another
plan titled Draft Master Plan 2025 was released in 2010 and subsequently notified in 2011. Again,
within a year, in 2012, a new Master Plan 2031 was notified.
These successive master plan freed up agricultural land for the following purposes:
No. Land Use Master Plan 2021(Notified in 2007)
Master Plan 2025(Notified in 2011)
Master Plan 2031(Notified in 2012)
Areas in Hectares1 Residential 14930 15148 16010
2 Commercial 1430 1429 16163 Industrial 5441 5431 4613
4 Transport andCommunication
4231 4289 4420
5 Public Utilities 564 609 626
6 Public and Semi PublicUse(Institutional)
1630 1775 2035
7 Open Spaces 2675 2688 2775
8 Special Zone 106 106 114
9 Defence Land 633 633 633
Total 37069 37512 32842
Source: Various Notified Master Plans of Guragon, Haryana, Town and Country Planning Department
The Politics of Land: Interpreting the Master Plans
As is evident from the above table, nearly 40 to 48 per cent of the land is allocated to private realtors
for development of residential blocks. Several key informants during the course of field work,
including senior government officials informed us that the frequent change in the master plan is under
the influence of a rich and politically powerful lobby of real estate developers. While this information
cannot be conclusively proven, the available facts collected and patterns observed during the course of
fieldwork give us enough evidence to reasonably conclude that the formal regulatory institutions of
the state have been breached by the informal networks and lobbies of private relators. In order to
66
pursue this line of argument, the following institutional process of land conversion should be taken
into account.
a) There are two stages in the preparation of the Master plan. First,a draft Master Plan is prepared and
subsequently the Master Plan is officially notified. It was pointed out that the Draft Master Plan of
2021 was changed substantially by the time it could be notified such that many public and semi-
public spaces/public utilities were converted to residential and commercial use. The process was
repeated at every successive graduation of draft Master Plan to the notification stage.
The breach of the formal regulatory process can be gauged by the fact that many of the realtors had
bought a significant amount of agricultural land even before the draft Master Plan was announced.
However, a few realtors found that the land purchased by them was notified as designated for
public and semi-public spaces/public utilities. However, in the final notified Master Plan muchof
the land designated for public use was re-designated for commercial/residential use.
The process underlying such re-designation is crucial to understanding the politics of land. First, it
is more than possible that the realtors had inside information about the forthcoming Master Plan
and hence the mad scramblefor purchase of agricultural land just before every successive draft
Master Plan was announced.
b) Further, as evident from the above table, each successive master plan increased the residential
category by 1080 hectares. A senior official in the Town Planning Department explained that this
addition was achieved through political intervention at the highest level at the behest of the private
realtors lobby thereby enormously benefitting few select builders.
c) The state government while rushing the Master Plan 2031 announced that 4570 hectares of land
earmarked for Special Economic Zones was to be developed for commercial and residential use.
The rationale given by the notified Master Plan 2013 was “The scenario regarding setting up of
SEZs has undergone sea change since notification of these plans and virtually there are no more
takers for SEZs now. Even the already notified SEZs are not being implemented and resultantly,
the landowners of such land were demanding replanning of their land so that they are able to utilise
the same for some other purpose.”160The chief beneficiaries of this process were some big real
estate companies. Therefore, the state government simply choose to go by the interest of the
realtors instead of protecting the interests of the farmers whose land was originally acquired and
who were ignored.
160 Master Plan 2013, Town and Country Planning Department, Haryana Government, 15 November, 2012, Pg 1
67
The above cited frequent changes in the Master Plan as well several crucial policy changes ( for
instance, increasing the density per acre from 80 to 100 persons in 2009) indicate several informal
political processes which are interacting with the formal regulatory processes, a fact repeatedly
attested by scores of informants during the course of the field trip. This process involves breaching of
the formal mechanisms through a collusion of the bureaucracy, private realtors and political
leaders.Therefore one aspect of the “politics of land” can be described as the influence of informal
processes on formal processes in such a way thatthe interests of the private economic agents are
formalised through the state’s formal policy pronouncements.
But the politics of land is not limited to macro-policymaking; it also operates at the micro level during
the actual real estate development, a process documented below.
V: The Politics of Land Seen through the Process of Actual Development of Real Estate-
Housing
The following narrative captured through several detailed interviews of real estate developers captures
another aspect of the politics of land. The narrative captures the policy mechanism of how real estate
agents interact with the formal policy processes once the land has been cleared for a real-estate
housing project (group housing).
The Formal Process
The first stage in real estate-housing development is to obtain a ‘letter of intent’ (LOI). In order to
obtain the LOI, the file has to be approved by the office of the Senior Town Planner, District Town
Planner (DTP) and by the Financial Commissioner (FC). After all the clearances, the file goes to the
Principal Secretary in the Office of the Chief Minister. The latter is due to the fact that the current
Chief Minister holds the portfolio of Town & Country Planning and Urban Estates. This process
involves the following steps:
Office of the District Town Planner: In the DTP office, two officers are responsible for scrutinizing
the proposed housing project. They are Planning Assistant (PA) and Junior Draftsman (JD). These
two officers are responsible for approving that the proposed site has the required access, the map of
the proposed scheme, plotting scheme. There seems to be no universal format and guidelines for
submitting these details which in turn gives lot of leverage to the PA and JD to use their discretion.
Office of the Senior Town Planner: The STP re-scrutinises the file and attests if the DTP has correctly
approved the proposed site and is deemed fit for initiating construction.
68
Office of the Director General Town and Country Planning: The file is sent back to the DTP office
where the Director General has to give her approval.
Office of the Finance Commissioner: Once all the approvals are procured, the file is sent to the
Finance Commissioner who has to attest all the earlier approvals.
Office of the Chief Minister: The file is finally sent to the Office of the Chief Minister (since the
current Chief Minister holds the portfolio of Town & Country Planning and Urban Estates).
Technically the file has to be cleared by the Principal Secretary of the department but in the current
government, this is done by the Principal Secretary to the Chief Minister.
Once all the approvals are obtained, the LOI is granted to the real estate developer, though certain
conditionalities are placed. These conditionalities demand deposition of External Development
Charges, Internal Development Charges, License Fee and Scrutiny fee. Once the LOI is obtained and
conditionalities are fulfilled, the real estate developer has to apply for a license. The license can be
obtained on providing the following documents:
1. Master Plan of the proposed housing project
2. Building Plan
3. No Objection Certificates. The certificates are to be obtained from 8 different departments.
They are Municipal Corporation, Director, Urban Local Body, Haryana Urban Development
Authority ( local office as well as main head office), Pollution Control Board (local office as
well as main head office), Department of Forest, Department of Irrigation, National Highway
Authority of India, Office of the Electricity Distribution ( local office and main head office)
Once the license is procured, the real estate developer has to submit the following documents to the
office of DTP, STP, and DGTP and take their respective approval.
1. Zoning plan ( it indicates the entrance and connection to the main access road)
2. Service Estimate ( it indicates the plan for internal road, electricity, drainage, sewerage)
3. Building Plan
Once all the approvals have been procured and adhered to as per the approved plan, the completion
certificate is granted
Informal Process of Obtaining Approval
69
The politics of land at the micro level or at the stage of execution is similar to the one discussed above
while presenting various aspects of the master plans. The approval by various regulatory authorities is
never obtained through the merit of the case but by breaching the formal institutions through informal
means. The real estate developers informed us about various informal institutional means to get the
clearances from various regulatory authorities. The same are discussed below.
a) LiaisonAgents: These are the locally influential people, often coming from the local dominant
caste. They have presence in local politics and known to have access to political leaders and
bureaucracy. They act as professionals and are hired at a fixed sum by the private real estate
developers to get the clearance and approvals at various stages of the regulatory processes.
The big real estate developers have such agents on their pay rolls, while the small time real
estate developers hire them on a case-to-case basis. Often, the agents specialise in procuring
approvals for the realtors from a specific office/ regulator. In such a case more than one agent
is hired.
The cost of the agent depends on her proximity to the office/ minister/ local politician. If the
agent herself reaches the concerned regulator through another contact the cost is higher since
a portion of the money also has to be paid to this particular contact. The real estate developers
informed us that the latter not only results in cost escalation but also delay in terms of time.
b) Political Network: A strong political network with the right ministers and other (senior)
elected representatives results in smooth facilitation of the procurement of the approvals.
However such a network is not without cost. The cost is contingent on the proximity of the
facilitator with the concerned minister.
Facilitators who use the political network take money from the real estate developer. We were
told that these facilitators are often conduits/agents of relevant ministers or they provide
political funding during elections and claim their ‘return favour’ by facilitating the
procurement of various approvals for real estate developers.
c) Caste Network: The caste leaders are also understood to have access to political leaders who
operate on the lines of the political network discussed above.
Mode of Payment of the “Approval” Fee to the Political and Bureaucratic Decision Makers
The payments made to the various decision makers acquire different form. The interviewees informed
us that cash seems to be preferredonly by liaisoning agents.
70
Other may prefer something in kind (though this is not always necessary) which may be later en-
cashed. At times some flats/land/commercial spaces are allotted to the relatives of decision makers at
prices much lower than the market price. However, this kind of “approval” fee is only given to
facilitators belonging to political and caste networks, who in turn divide the “approval” fee between
them and the decision makers. The reason being that they are able to provide, what was described as,
‘single window clearance’. In other words, politically influential facilitators are able to secure all
approvals and the real estate developer is saved the trouble of hiring multiple agents for various
regulatory authorities.
Another form of popular payment method is gold and other precious metals. Two small real estate
developers informed us that they had presented a luxury car to a senior bureaucrat for obtaining a
necessary clearance.
VI: Conclusion: The Politics of Land
The politics of land thus consists of two essential aspects. While the state creates the market in land
and real estate-housing, it also in-formalises itself and in return shapes the formal processes of policy
making in the interest of private real estate agents. The other aspect of politics of land caters to the
regulation of the actual development of the land. Here, the regulatory arms of the statecomplicates and
delays the decision making process so as to extract rent. Again the regulatory process is breached
through informal channels to procure formal decisions for real estate development.
71
‘PUDUMAI’- INNOVATION AND INSTITUTIONAL CHURNING IN
INDIA’S INFORMAL ECONOMY: A REPORT FROM THE FIELD
Barbara Harriss-White and Gilbert Rodrigo
72
‘PUDUMAI’- INNOVATION AND INSTITUTIONAL CHURNING IN
INDIA’S INFORMAL ECONOMY: a report from the field161
Barbara Harriss-White and Gilbert Rodrigo
1. CONTEXT
Given the unfolding changes to global climate, established beyond reasonable doubt as anthropogenic
in cause, a low carbon/low matter industrial and agricultural revolution is very urgently needed
(Anderson, 2011).Since the ‘silver bullets’of market mediated responses - cap and trade, and the clean
development mechanism - have not yet shown any sign of reducing global GHG emissions,and since
climate change is a very politically sensitive topic, the alternative – an approach of ‘silver buckshot’ –
can only be a multitude of new, low C activities whichhave‘co-benefits’other than climate change as
theirobjectives.162Co-benefits might be poverty reduction and/or an expansion of the size and quality
of the labour force and/or the quality of work.163 Lowering CO2 – or other environmental benefits –
would find political favour on these other grounds.India has formally adopted a co-benefits approach
to climate change policy.164
Despite the fact that the informal economy accounts for about two thirds of GDP and 90% of
employment165, the informal economyseems absent from almost all discussionsof any kind of low-C
revolution.166Poor consumers are least responsible for GHGs,but many of the products of the formally
registered and regulated industries which cause 70 % India’s pollutionare retailed in the informal
economy.167 So does it play such a negligible role in pollution as most people have assumed?168
Another significantquestion is whether India’s informal economy would be an obstacle to a low
carbon revolution.Our wider research has tackled both these questions but it is thesecond question that
provoked the exploratory project reported here. While the technological and organisational
161 References are at present incomplete162162Lohmann 2006; (Prins and Rayner, 2007 The wrong trousers; Hartwell Paper, 2010) .163Dubash et al 2013, have used the co-benefit approach in a novel multi-criteria analysis of climate changepolicy for growth, inclusion and environment. (Dubash N, D Raghunandan, G Sant and A Sreenivas2013Indian Climate Change Policy: Exploring a Co-benefits Approach. Economic and Political Weekly June 1stvolXLVIII pp 47-62164 Expert Group 2012 Low Carbon Strategies for Inclusive Growth, 12th Five Year Plan, PlanningCommission, citied in Dubash et al ,2013.165 While space is regulated: land titles are registered throughout India and forests are properties of the state,the agricultural and forest economies are officially part of the unorganised sector.166 One South Asian exception is Manchester university’s research into climate change adaptation by lowincome groups in Bangladeshi cities.167 Iron and steel cement, aluminium, fertiliser, energy, paper pulp (CSE 2012)168 While all land-based agricultural activity and agro-industry is estimated at 45% of global GHGs, theproportion in the informal economy is not known.
73
components of a low-C revolution have been modelled in scenarios,169 here we focus on the sector’s
own capacity to adopt the kind of technological and organisational changes that would be needed – in
short to innovate. We ask whether and how innovationtakes place in the informal economy.
The paper has three parts. We first introduce and try to clarify the complex and often ‘fuzzy’structure
of knowledge within which the question has to be answered. We then present the case material from
our fieldwork, before welding it into an argument relating to the sets of ideas with which we start. An
appendix of evidence may be found at http://www.southasia.ox.ac.uk/resources-greenhouse-gases-
technology-and-jobs-indias-informal-economy-case-rice
PART ONE
2. A UNIVERSE OF FUZZY CONCEPTS AND SUB-FIELDS
THE INFORMAL ECONOMY
The term informal economy is a fuzzy concept with multiple interpretations and meanings (e.g. small /
primitive activity; unlicensed / unregistered; untaxed; work without rights). Poverty and illiteracy
reside in the informal economy. For the most part, the informal economy also lies below the state’s
radar (Kanbur et al, 2012).170Illegal activity evading the law overlaps with behaviour that pre-emptive
the law, or which occurs in areas where regulations are not enforced or where they are neglected by
the state. It overlaps with behaviour that doesn’t come under the ambit of regulation at all, or that
doesn’t conform with it, or that developed prior to the imposition of regulation. .171
It is the relation of the economy to state regulation that makes informality particularly interesting. In
relation to climate change, the informal sector is significant because the state cannot enforce policies
in it; efforts to do so typically lead to extortion and police action and complicity but not to
compliance.
169http://www.cccep.ac.uk/Research/Programmes/climate-change-mitigation/home.aspx; ref Tim Foxton.
170The National Policy on Urban Street Vendors 2009 has been analysed by TeL intelo as a means of evicting
them on phyto-sanitary grounds. The 11th and 12th Five Year Plans have sections on Inclusive Cities (focussing
on sites for street vendors, housing for informal settlements, the integration of rag pickers into the municipal
solid waste process chain etc. In Mumbai, planners are identifying specific zones for informal settlements and
activity (Champaka, Pers. Comm., 2013).171Labour, migration status, civil rights, tax, health and safety, land use, environmental damage are increasingly
prominent theatres of informality in the so-called developed economies of the west (Larsen, 1992) J. Larsen
1992 in f illegality and enforcement Yale Law and Policy |Review
74
India’s informal economy is now linked directly through supply chains to consumption processes all
over the globe, with all stages of a production-distribution system weaving in and out of it.172In
addition, many if not most firms in the informal sector have aspects that are subject to regulation and
some that are not: e.g. being licensed but not paying taxes or complying with labour laws or
environmental standards. So,in the institutional matrix underpinning innovation, formal and informal
are intertwined.
INNOVATION
In Lundvall’s authoritative review of the concept (1992), innovationis also a fuzzy term, but at the
core of its multiple meanings and strategic vagueness there is, at least, novelty. Innovation is an
interactive process, generating not only new products but also new processes and technology,
substituting new factors of production in an unaltered finished product capable of changing the social
relations of work, e.g. through new labour requirements173). New forms of organisation (the
organisation and institutionalisation of supply / exchange relations for the assembly of raw materials,
the interactive processes of production and distribution, controls over finance, commodities and
labour) are innovations. In new markets, two processes are at work, both of which involve innovation:
i) invention to compete by reducing costs or to not compete by securing and defending a market share
and ii) commodification, the conversion of things and activities into commodities in order that profit
may be made from them. 174New activities can create further markets for the product or service and
give rise to other multipliers through invention and commodification.175 New kinds of persuasion
create new forms of consumption and need. Kline and Resenberg in their (1986) overview of
innovation also point out that improvements in the methods of innovation are themselves innovations,
and to this we should add that the discarding of old practices is also distinctive part of the process of
innovation, and one little examined in the literature. Innovation is often said to precede regulation
(Dickson, 1988), from which it is a short step to argue both that innovators resist regulation and/or
that regulation stifles innovation.
NEWNESS/NOVELTY
Innovation emphasises ‘newness’ but newness is itself also a repertoire of concepts. Schumpeter
defined the innovator as an entrepreneur who invents new ways of linking factors of production.
Invention is a process distinguished in two ways: on the one hand it differs from adoption / diffusion/
172 Forty % of India’s manufactured exports are estimated to be produced there.173The labour processesthemselves are often neglected by scholars of innovation174http://www.opendemocracy.net/ourkingdom/colin-leys-barbara-harriss-white/commodification-essence-of-our-time175Manufacturing and service provision in the informal economy have been recognised as continual, dynamic
active processes with indirect multiplier effects (‘indirect network effects’) and formal-informal inter-
connections throughout the system – from raw materials supplies, to final effective demand.
75
‘transfer’,and on the other hand it differs from adaptation, which fits a transfer to the circumstances of
a local society and region and may involve pure invention along the way. Yet even adoption and
transfer may involve unadulterated novelty, physical courage and unprecedented risk-taking as it
diffuses to a new a region or social group (the retailing by a dalit of symbolically ‘pure’ milled rice in
1973 in Vellore being one such example).
DEVELOPMENT
Development is such a fuzzy term that textbooks are rare and encyclopaedias common.176For
Schumpeter development was a continuous process of innovation. The centre of gravity of the idea of
development has shifted from industrialisation, state-building and citizenship and the sustaining of
those excluded from the process, to the aid-driven ‘war on poverty’ and a set of dematerialised
conceptions of human development and improvement in the human condition, spawning hundreds of
thematic subfields along the way. Some recent inter presentations of development for example that of
Paul Richards in his 1985 ‘Indigenous Agricultural Revolution’,177bear witness to Schumpeter, in
conceiving development as embodying the constant adaptive innovations - in his case by West
African farmers- and stress an indigenous capacity to innovate, unconfined to research
institutes178.The relation between technology, work and employment, influentially invoked as a route
out of poverty also stresses inappropriate technology transfer and the lack of indignity as being at the
heart of the problem of slow development.179Lant Prichett has provided a good analogy of how it is
supposed to work in developing countries: entrepreneurship there is a matter of adopting transfers
invented, developed and protected elsewhere. But the transfers of technology to DCs frequently fail
when transferred to a new environment ‘trees’ are transferred without their organic ‘roots’. In India
the organic/institutional roots, certainly for livelihoods and the mass of the labour force, are in the
informal economy.
TECHNOLOGY
Technology is as central to any response to climate change as it is to development, involving the
social application of knowledge. But what knowledge, and applied to what part of society?
176Textbooks – Cowen and Shenton, Leys. Dictionary - Sachs, Encyclopaedias - Corbridge, Forsyth, Clark,Desai177 1985 Indigenous Agricultural Revolution: Ecology and Food Production in West Africa, Hutchinson178See also Anil Gupta, 1999, Science, Sustainability and Social Purposehttp://www.hks.harvard.edu/sustsci/ists/TWAS_0202/gupta_300199.pdf).179F Stewart and F Shumacher.proviso that tech is appropriate for factor endowment and benefits resultingMore
notes from. Fitzgerald Heyer and Thorp Introduction in eds (FHT Overcoming the persistence of Poverty and
Inequality pp1-18
76
A major stream of science and technology literature180 is concerned with high tech frontiers and
cutting edges – where human control over machinery/technology is often remote and mediated. This
science and technology literature (SCITECHLIT) also makes the assumption that innovations happen
in laboratories, with their distinctive social cultures 181(whether such labs are corporate, university or
state institutions).They are then protected by property rights and developed and diffused with
financial support, or learning by doing, and with further spill-over effects beyond the sphere to which
they are first diffused182Many questions arise when the conditions of this institutional scenario are
relaxed. What are the factors really driving the choice of a production technique? What effect does the
introduction of a technique have on production relations outside the immediate adoption process?
How do the most efficient technologies in terms of competitiveness in global markets influence labour
markets?Is this beneficial or detrimental to labour? What is the role of public policy institutions in this
regardwhen it comes to the informal economy?183
FIRMS AND SOCIO-TECHNICAL SYSTEMS
Yet another subfield addresses these questions. Innovation through technological change is generally
taken to be about firms responding to opportunities for which there is as yet either no demand or no
supply, or neither. Yet firms cannot be understood solely in terms of markets and in isolation from
non-market institutions due to i) externalities ii) the lumpiness and indivisibilities of innovation, iii)
scale economies which need appropriate finance and iv) technological discontinuities which affect
other firms (Roman, 2008). So the study of technical change needs to understand not only firms as
institutions, but also their institutional ‘ecosystem’. The disruptions due to innovation, especially the
consequences of capital-biased technological transfers, may include ‘public bads’ which need to be
regulated by public intervention (Dickson, 1988).But can we impose these conceptual frames onto the
informal economy, and ask the same kinds of questions about the informal institutional preconditions
of innovation?
INNOVATION SYSTEMS
Science and technology studies have developed the concept of an innovation system(IS): the public
and private sector institutions and information needed for an innovation to be (commercially)
developed and diffused. ‘Agricultural innovation systems (AIS)’ for instance ‘are systems of
individuals, organizations and enterprises that bring new products, processes and forms of
organization into social and economic use to achieve food security, economic development and
180 Another stream sees science and society as inseparable; a third deals normatively with the public outreachand engagement of science.181Sunder Rajan , 2006, Biocapital182 Fu, X. (2012) 'Foreign Direct Investment and Managerial Knowledge Spillovers’183Vijaybaskarperscomm 2012
77
sustainable natural resource management’.184The AIS includes a multitude of potential actors, such as
producer organizations, research organizations, extension and advisory services, universities and
educational bodies, governments and civil society organizations, co-coordinating bodies, individual
farmers and farm labourers, and the private sector (including traders, processors, supermarkets
etc.).185This approach is useful because it allows for a great diversity of possibilities, consistent with
real-world complexity.
For its proponents, what the concept of an Innovation System implies is thati)that if innovation can be
a process as well as a product, the institutional matrix through which innovative knowledge and
technology are created and transferred matters; ii) that the institutional matrix in innovation hotspots
can be stylised into models of best practice ; iii) that this will involve a laboratory - > property rights -
> scaling up diffusion; iv) that the creative act of innovation can be standardised and v)that deviations
from best practice – ‘innovation deficits’- can be a) identified and b) filled. Empirical studies of IS are
inherently trans-national ,comparative and macro-social: societies or companies with good innovation
systems are then seen as able to leapfrog over long-drawn out / failed stages of lagged development.
But in our wider research[measuring costs, GHGs and human labour in the informal economy with a
view to ascertaining alternatives as components of a new industrial revolution with low-carbon,
decent-work co-benefits]there is no already-identified ground on which leapfrogging is to land,
whether in ACs or DCs. The idea of the innovation system has also come under convincing attack
(Floysand and Jakobsen2011186) for treating innovation as something purely technical when it is
always a social and political process operating in what the authors call, with strategic vagueness,
‘social fields’. ‘Social fields’, for Floys and Jakobsen, are social sub-‘systems’ at various (interacting)
scales capable of generating social economic and political multipliers and requiring complementary
institutional preconditions they call ‘super modularities’ (i.e. packages of institutions) which can also
include culture, the household, and institutions of work. While their case studies are in the formal
economy of Scandinavia, in being expansive, the Floysand-Jakobsen approach is more useful than the
orthodox IS, in which social structure is exogenous, for the context of an informal economy; although
they completely neglect class relations.
INDOVATION
184http://agro-ecoinnovation.eu/wp-content/uploads/2012/07/The_role_of_knowledge_in_agro_eco_systems.pdf185From: Global Forum on Agricultural Research <[email protected]>To: kassamamir<[email protected]>Sent: Fri, Jun 1, 2012 7:25 pmSubject: [EGFAR newsletter] Agricultural Innovation Systems and Family Farming - AnFAO E-mail Conference - June, 2012186Fløysand, A. and Jakobsen, S.E. (2011): The complexity of innovation: a relational turn. Progress in HumanGeography 35 (3),328-344
78
A new family of concepts provoked by the Bottom of the Pyramid(BoP)movement in corporate
marketing 187appears to have addressed these questions. But appearances are deceptive. ‘Indovation’
is a concept meant to encapsulate the idea that (Indian) poverty leads to creativity. Although the
relevance of this insight to the informal economy cannot be doubted,188the examples invoked – the
Nano car, solar lights - are unfortunate in having origins far removed from the abode of the poor.
Another concept is ‘Jugaad’, a North Indian word for a cost-cutting quick-fix, possibly unsafe, nearly
always ‘bending the law’ or ignoring it completely. It is a peculiarly Indian contribution to the
literature on ‘Frugal Innovation’,itself a powerful term which is focussed on (multi-national)
corporates. Its allure derives once more from its fuzziness. First, it celebrates least-cost ways to
maximise profit. Second, this may at the same time involve an improvisatory and flexible approach to
innovation (rejecting the research labs/innovation systems) and an exploration of the many sites inside
a corporation where new ideas may originate. Third, further sites of frugal innovation include
consumers themselves, normally regarded as ‘the market’ outside the organisation. In this literature
the BoP is relabelled the poor, marginalised and excluded, un-bankable, sick and disabled, ignorant
and ageing consumer whose living conditions can be greatly improved by corporate innovations able
to be paid for by them.189
The argument for the desirability of jugged or frugal innovation is built up from case material and
inductive generalisations. The cases selected in this literature are very distinctive – innovators are
educated people capable of scaling up. The cases provide ‘lessons’, targeted at and driven by
corporates. Now, while frugal innovation will certainly have an impact on the informal economy (in
many instances formalising it), the entire family of concepts is geared to the business school, to a
possible strategic option inside a big firm, rather than to the informal economy. We may indeed find
frugal innovation in a literal sense in the informal economy but we must distinguish its application in
self-employment from the concept developed for the corporate sector.
INNOVATION AND THE EXPANDED CONCEPT OF ENTERPRISE
Nandini Gooptuand colleagues (2009; forthcoming) have taken the debate forward in finding that in
contemporary India all kinds of agency are being considered as ‘enterprising’, with the connotation of
being innovative,. Gooptu argues that the idea of enterprise is being generalised to an ‘enterprise
culture’ in which innovation inside and outside work loses its original Schumpeterian meaning and
acquires others appropriate to conforming as a subject to the totalising neo-liberal era. For an
overeducated segment of the labour force even mundane work for a wage in a supermarket is
187Though it is nothing new. Shampoo and soap were being retailed in sachets in periodic marketplaces in SouthIndia in the early 1970s.188Its implicit romanticisation of poverty is another problem.189 See N Radjou, J Prabhu and S Ahuja 2012 Jugaad Innovation: a frugal and flexible approach to innovationfor the 21st century Random House
79
relabelled as ‘enterprise’, carrying no implication of entrepreneurship in a Schumpeterian sense. A
focus on wage work for corporates also ignores the explicit characteristic of the informal economy:
self-employment.190In the same way the idea promoted by some scholars that self-employment is
‘good or better quality employment’(better than wage work),191and that enterprise automatically
includes innovation is a watered-down re-deployment of the concept of entrepreneurship which
suffused the early Green Revolution literature of the 1970s.192In this literature the entrepreneur at best
managed the risks of a small business and at worst was driven into self-employment by poverty and
the lack of wage-work. To avoid the circular conclusion that since self-employment is enterprise and
the informal economy is dominated by self-employment, so it must be enterprising and innovative,
enterprise as a loaded term must be deconstructed and used critically in explorations of innovation in
the informal economy.
INSIGHTS FROM OTHER WAYS OF KNOWING: THE CLASS STRUCTURE OF
KNOWLEDGEAND INNOVATION
From the critique of perspectives that view technologies and innovations in isolation from their social
economic context, science and technology studies have scrupulously researched the social relations,
work practices and discoveries of the labs.193 But anthropologists of work have also shown that
innovation requires a bed of existing knowledge and practice, nowhere more so than in the informal
economy.194There are at least two aspects to it. First, technologies combine external tools and our
‘internal tools’ (body organs including our brains) in order to shape our environment. Brain-hand-
foot-body co-ordination is a set of learned skills and a physiological state –which, as in hand-weaving,
may require long periods of time to develop. The capacity to adapt to the physical rigours of practice
is often built into apprenticeships and even less formalised processes of childhood learning and
socialisation to work (Roman, 2008).
Second, innovation, even of a jugaad kind, does not happen out of the blue: existing knowledge
resources feed innovation. Whether these resources / ‘repertoires’ are competitive bodies of
knowledge or complementary ones, how they are kept secret or controlled or released publicly in the
informal economy are all empirical questions. The implication for our understanding of innovation is
that a systematic and embedded analytical approach to technology, product innovation and
organisational change is needed. The relation between change and continuity in knowledge resources
needs integrating into any analysis of innovation dynamics. Eric Ohlin Wright (2012)195 distinguishes
190 The NCEUS is an expression of the ambiguity of ‘enterprise’ see Corbridge et al in British Academy book191 See for instance Sundaram in Corbridge et al in British Academy China-India book192 As in many publications from FAO’s agricultural services division, itself a euphemism for trade in inputs andproducts.193Kaushik Sunder Rajan 2003 Biocapital194 Lave195 E Ohlin Wright 2012 Worker-owned Co-operatives DPRI, May 23rd, Oxford
80
the various kinds of institutional churning into ‘interstitial’ versus ‘ruptural’ versus ‘symbioticchange’
interlocked in a pluralist arrangement of laws and social norms.
A political anthropological approach to innovation i) admits class and sees labour as well as capital as
able to innovate; ii) sees innovation in every aspect of the production-distribution ecology; iii)
explores multipliers and effects of innovation (both interstitial and ruptural); iv) acknowledges the
continuity of the existing knowledge base as a vital precondition for innovation; v) regards the state
which only indirectly regulates the informal economy as being vital for innovation, especially through
its role in providing infrastructure and communications; and vi) finds a range of motivations for
innovation (over and above the profit/ CSR196/ social enterprise motives of the mainstream literature).
These often powerful motives include securing livelihoods, power (especially over labour), pleasure
(reducing drudgery, satisfaction in skill) collegiality and political solidarity, altruism and nurture
(Roman, forthcoming).
So the existing dynamics of informal innovation need understanding, because the next stages of
development, or a response to climate change, will emerge from existing socio-technical
configurations. If India’s regulative structure is not to undergo radically disruptive change, a new
‘green’ industrial revolution / a low carbon transition would develop out (or in and out) of direct state
control.
To sum up, we take from these knowledge fields the following ideas. While the basic unit of
production, self-employment, is an enterprise, it is not to be supposed to be entrepreneurial or free of
the coercions of poverty. However, while there are no research labs in the informal economy, this is
not to deny the possibility of three kinds of innovation: invention, adaptive innovation and adoption or
transfer in new circumstances. Innovation may happen as a product, a process or a technological
repertoire throughout the institutions in which it occurs, including in derived markets such as
transport; it may need protection and incentives to develop and diffuse. The labour force may
innovate too, for it is a repository of knowledge that forms a crucible for innovation. While not
directly regulated by the state, the informal economy is regulated by an institutional ecosystem, or
socio-technical system, even generating hybrid institutions and practices combining both formally
regulated and socially regulated behaviour..But the identification of the most significant facilitating
and obstructing institutions is an empirical question. So also is discovering the ways in which they act
as incentives or disincentives. All forms of innovation arise through the continuities of history and
will have effects through spill-overs and multipliers which the method of field research must try to
capture. Last but not least, to innovate means to destroy previous habits and products (one of many
insights from Schumpeter) and their destruction is part of the process of innovation. People we
196 Corporate social responsibility activity
81
interviewed didn’t conceive the last aspect of innovation naturally as part of their accounts but it
proved significant as we will see.
3. PRACTICAL METHOD
We returned in 2012 to a small town, Arni, in Northern Tamil Nadu that has been studied
systematically, every 10 years from 1972 to the mid nineties and almost continuously though less
systematically throughout the 21st century – nonetheless over a uniquely long 40 year period. It has
grown from about 30,000 to well over 100,000 inhabitants as it receives rural-urban migrants and
engulfs villages outside its formal boundary.
While there can be no representative town or local non-farm economy, this town has been accepted as
a useful site in which to study rural-urban relations and local capitalism. (Nagaraj et al, 2004; Arisi,
forthcoming; Srinivasan 2011;Basile,2013).The town is used here as a historically specific case, but
one which generates examples that we think are of wider relevance. Local more or less registered
business associations have long had a crucial role in regulating the urban economy, representing
sectors, negotiating particularistic interests with the government and controlling threats to their
hegemony (Harriss, 1981). Presidents of Business Associations are elected as knowledgeable
representatives and were also assumed able to tell stories that might be sensitive from a comfortable
‘third person’ perspective. We discussed change and innovation with them.197Taking the population of
67 business and caste associations and major trade unions last studied in 1997in this town (Basile and
Harriss-White, 2000), we had resources to interview a randomly selected 40% of the presidents, along
with a smaller number of office bearers of salaried workers unions – totalling 34.198
We had with us a note in Tamil and English explaining our familiarity with the past of the town, the
project’s background and our exploratory purposes and seeking verbal consent. We also had a
template questionnaire (Appendix 1) which was learned by heart and never shown to respondents. In
none of the interviews was the full set of questions completed- an expected and routine feature of this
kind of fieldwork. Establishing rapport with busy businessmen requires allowing them to lead the
encounter while the researcher attempts to structure it. The ‘incomplete’ method generates a data base
like an un-finishable jigsaw puzzle which requires much imputation afterwards to use it for a
regression-style analytical approach, but which more straightforwardly provides the elements for
analytical profiling and narrative.
197Our questionnaire template is appended, though few interviews approached being complete.198The population of business associations may have been expanded through the self-organisation of firmsdealing in commodities new to the town since 1997.
82
The response was unexpectedly positive. Several of the interviews were prepared for in advance by
the presidents concerned, who organised groups of up to 10 people to meet us (electricians, teachers,
transport and sanitary workers). These were not ‘focus groups’ but generated very wide- rangingand
informative conversations ‘outside the box’. So the total number of people to whom we talked about
innovation and change was in the region of 75. The fieldwork took a month with two researchers
familiar with the region.
The narratives provide a series of snapshots and micro-histories. While they are not comprehensive,
they proved much richer than anticipated (and too many to write up as case studies). This very
richness has generated a problem for analysis, since a book-length treatment– the method of ‘Jugaad
Innovation’ for instance - is impracticable Instances of novelty and innovation have been rearranged
and listed by type and themes.199We then did a content analysis to establish an account which stresses
relations, institutions and processes, rather than quantitative generalisations, - leading to conclusions
which engage with the ideas that provoked the research questions in the first place. We also absorb
quotations into the narrative as illustrative of the claims and comments that men (and some women) in
Arni make as they struggle to make sense of their contemporary conditions.
Does the informal economy innovate? If so, what kinds of innovations emerge from non-formal
institutions?
PART TWO:
4. THE TOWN
‘Arni is not a poor town’. ‘Arni’s economy is in good shape.’ (President of Arni’s Chamber of
Commerce, June, 2012)
Though we have argued that Arni is a useful site, it is a particular settlement with its own distinctive
history.
THE SPATIAL ARRANGEMENT OF THE ECONOMY –Economic power in Arnihas been
reconfigured and relocated a number of times since Independence. Then, the heart of the bazaar was
located in what is now an impassably narrow, pigand rat-infested side street, just wide enough for a
single van. The weekly market site near the old centre no longer exists, having been transformed into
a bus-stand. Its former regional role in the marketing of cattle has also disappeared with the
replacement of animal traction by fossil fuel (Gathorne-Hardy, 2013). The pre-Independence site of
the town is still the heart of the congested informal business economy. To the west, the by-pass to this
throbbing heart, incongruously named Gandhi Market Road where statues of the Mahatma and
Ambedkar vie for public space, there is now a post-1960s central business district, but in 2011the road
199 See the Appendix at http://www.southasia.ox.ac.uk/resources-greenhouse-gases-technology-and-jobs-indias-informal-economy-case-rice
83
was reinforced and widened and a motorway style central barrier erected to prevent customers from
crossing. The wide, earth verges, which used to accommodate lines of cycles, motorbikes and
squatter-stalls, have been tarmacked over for traffic, making the mall very difficult to park on the now
narrow metalled verges. Though it is often filthy, the town is not run-down. New residential quarters
sprawl further west, while the relatively neat silk quarter, a product of the 50s and 60s, occupies the
south of the town. There, dyeing, spinning, weaving and marketing compete for space with residential
housing. Rice go-downs [warehouses] used to line a number of streets in the heart of town but are
now located on the periphery where their owners profit from lower land values/rent. A new by-pass
encircling the entire town is rapidly becoming a ‘ring of steel’ for fully automatic rice mills. North of
the bypass, but umbilical connected to the town through roads and transport, residential demand and
low-order service jobs, a huge tract of agricultural land has been turned into a private higher education
cluster by a single investor – the former AIADMK MLA and MP.
ECONOMY- The town’s economic base has been agricultural marketing, general retail, energy retail,
and administration, together with a small industrial district for silk handloom weaving and a cluster of
goldsmiths and pawn brokers. Now the bazaar economy of more or less independent small family
businesses is being threatened by a new scale of sub-national and national capital, currently with
branch firms and agents for sectors such as cement, dairy products, fuel-oil. For the future there is
also the perceived threat of supermarkets.
The town’s engagement with the global economy is at best indirect. It is linked through the export of
silk products to S.E. Asia, brokered by wholesale firms in Chennai (some silk material now even
reaches China, from where until recently the raw material was imported);the export of fodder from
rice mill bye-products (via Chennai to Europe);and the import of clothing and laminated wooden
computer-furniture. Arni is being globalised by pre-emptive responses to threats, rumours and images,
rather than by the active intervention of global supply chains. The latter are sited nearby. Every day
vehicles from Nokia and other factories on the Chennai-Bangalore corridor to the north east and from
the leather export factories around Vellore to the north west scoop upa (semi)educated labour force
from the town and its hinterland- enabling it to commute quite long distances for work.
POLITICS- After the North Arcot District was split in two in 1990, Arnibecameeven more remote
from the new (Tiruvannamalai)district HQ than it had been from Vellore before. Its positioning then
disadvantaged it in post 1990 district politics. Before 1990 the ruling party MLA in Cheyyar to the
east had exercisedsuch a powerful patronage(courts, colleges etc) on behalf of that much smaller town
that Arniwas politically emasculated. Meanwhile Arni’s own MLA accumulated land for private
purposes. It is reportedlocally that outrage and shame at the national 2G scam which broke in 2011-
12, implicating Tamil Nadu’s then ruling political elite, propelled Arni voters further into the
oppositional wilderness through their support for the minor DMDK party of actor Vijay Kant. ‘Now’,
84
said a cynic in 2012‘Arni is better taxed but there is no quid pro quo’.Cutting tax evasion is one way
the state keeps an eye on the informal economy.
5. FORMS OF 21st CENTURY INNOVATION IN ARNI’S INFORMAL ECONOMY
There is no scholarly consensus over the typology of innovation. In the separate appendix200we have
summarised the innovations described by our respondents. Here our analytical narrative focuses on
examples which we judge most richly illustrate the political economy of innovation in the informal
economy.
SCHUMPETERIAN INVENTION –
Three examples are captured in the field survey (under-specification while ‘maintaining safety’ in
reinforced concrete; site design in rice mills; and phase change by electricians, which is explored
here).From only 85 in 2000, the town’s electrician work force has grown to about 730,320 of whom
are registered; only 20 of these have any formal qualification, some of the rest having inherited
licences from their relatives. The association has started to issue certificates based on experience.
Most electricians are self-styled as ‘under-educated’ and low-caste village men who learn as a ‘hand’
on the job while they work for self-employed seniors, all of whom are keen to experiment. Being an
electrician is a physically dangerous occupation and the association for registered electricians has a
strong esprit de corps. ‘The work we do is not illegal but it is informal’ explained the president of
Arni’s electricians’ sangam.’ Vague about the date of the invention, but faced with a chronic
inadequate and unreliable supply of electrical power for irrigation pump-sets, and a constant demand
for repairs to breakdowns, Arni’s electricians have succeeded in modifying 3 phase technology for 2
phase power supply.201Thisenables pump-setsto ride oscillations in power rather than break down.202
This innovation involves adapting a condenser (a device to store energy and to release it in spurts) by
switching fuses. The TN Electricity Board standard for capacitators is high but local power consumers
use poor-quality sub-standard models so the 3-2 switch aids efficiency. In 2012 it cost Rs 600-1000 to
purchase and install, and is reckoned to last 2-5 years. Electricians continue to work on new ways of
compensating for irregular power through battery inverters (coping with a sudden total power cut, or
one phase being down), voltage stabilisation, and what is known as power factor correction.
200http://www.southasia.ox.ac.uk/resources-greenhouse-gases-technology-and-jobs-indias-informal-economy-case-rice201Three phase electricity comes in three separate streams (for which three separate wires are needed) designedto oscillate in sequence to generate power.202 This is not to argue that this invention does not exist elsewhere but the Arni electricians do not know of aparallel invention. See Shah and Verma 2008 Co-management of electricity and groundwater EPW for a similarcase in Gujarat.
85
There is some dispute about the inventor (‘was it Anandan or Annamalai’?) - but as invention yields
no innovation rents, individual entrepreneurship is not as important as the invention. Electricians
describe themselves as ‘open’ and constantly learning and passing on knowledge. They experiment on
the job. (For an example at one extreme a bottled cow dung paste to help motors start with two-phase
power; and at the other an exploration of borders between electrical and electronics: using electronics
to operate small power generators by remote control.)The risk of on-site experiments is explained to
the ‘owner’on whose equipment the work takes place. ‘If experiments fail, we repair the failure’ said
an unregistered electrician.
It was independently corroborated that the Arni invention has been formally scaled-up and developed
with an automatic switch application that is being mass-produced by a Bangalore engineering firm –
‘after consulting’ Arni electricians. Not to be outdone, the electricians are adapting the mass product
further.
In sum: a growth in numbers together with increasing in formalisation(lack of registration) both co-
exist in this case with informal formalisation (certification). The state’s own inability to enforce
standards in supplies, in its own utilities, or in consumers’ appliances, creates economic problems
that have generated entrepreneurial responses. Property rights are irrelevant to the local
development and diffusion stage, but scaling up has been achieved through free transfer and private
appropriation by a company with access to finance and marketing. A combination of the trade
association and customers’ appliances is the informal equivalent of the research lab, and a continual
interaction between formal firm and informal labour enables diffusion (albeit with large difference
between the two in the returns to work).
ADAPTIVE INNOVATION
Four cases are recorded in Appendix 2.Tucked away on an upper floor of a poorly constructed
building in a narrow alley is a ‘computer centre’ established in 2010in which innovations have been
cleverly adapted to the local economy and society. The ‘centre’ – a room with a balcony – is
collectively owned in a complex way by 5 young graduates, two of whom manage the Arni centre for
the other micro-investors. They work part-time there and part time in salaried work in another town at
some distance, since otherwise it would not break even. Its stated objective is ‘software training’. A
three-month course in the rudiments of computer-aided design (CAD) and 3-D design is the basis for
which certificates are issued from the ‘centre’. The clientele are village-based and too poor to pay the
Rs 3,000 fee as a lump-sum. So the introduction of instalment payment has increased the centre’s
social reach. And there is a social benefit: through this training, ‘customers’ schooled in Tamil are
forced to acquire ‘screen’ street wisdom in English.
86
This is a novel adaptive organisational response to lack of adequate capital or adequate demand in
which formal educational skills are being diffused to the informal Tamil-language economy in return
for an informal formalisation through certification.
In the ring of 40 licensed automated rice mills203which started to hug the bypass in 2010, many
adaptive innovations have taken place- over and above site design by local freelance engineers.New
parboiling processes without stench create a new type of rice that islightly parboiled for middle class
consumers. A new post-harvest process has transformed a commodity – rice - into a new category of
‘processed food’. A quantum leap in capacity(each mill processing as much as the entire town
processed annually in the early 1980s) has required aquantum leap in long-distance year-wise scoping
of raw material which has in turn segmented the local paddy market. The new mega oligopolists
source most of their supplies from outside the region, while the smaller and older Modern Rice Mills
tend to source locally.
These automatic rice mills are formally licensed but otherwise unregulated. Despite their scale, they
are not necessarily a revolutionary and ruptural innovation since it is not yet clear whether they
reduce costs of production. The branding of ‘new’ types of process may yet create consumer demand
for a costlier product and vindicate automation. The’ring of steel’drives differentiating exchange
relations in the local rice economy but the possibility that many independent individual decisions may
result in collective over-capacity cannot be ruled out.
ADOPTION
Adoption is by far the commonest route to innovation. It is what local people understand as
innovation, and the rest of the discussion of field material is devoted to the derivative spread of
technologies, products and practices developed elsewhere. This is nothing new: the Green Revolution
epitomised development in the form of continuous innovation-adoption and creative destruction.204 In
the non-agricultural economy, formerly un-commodified or semi-craft commodities or practices have
continuously disappeared, to be replaced by new mass-produced commodities(crushed sea shells by
paints / turmeric by cosmetics / dhobi services by dry cleaning/ the barber by sound services (for
barbers are musicians too) / open defecation - to some extent - by sanitary-ware). On a micro scale
this process has combined capital bias with caste continuity resulting in economic differentiation
within castes. But what our 2012 field evidence recorded is happening at a revolutionary scale, at a
pace and with a scope never before encountered.
203Rs 3-4crore each - £750k-£1m204 Harriss, 1971
87
THE ADOPTION OF NEW PROCESS TECHNOLOGY
We were given six examples. One Arni tailor pioneered electrically-powered sewing machines from
China (through Chennai) at 2/3 the cost of Indian ‘power’ machines but with ambivalent outcomes.
Positive: the tailor not only increased the competitive productivity of his own firm but established a
new agency and many machines were sold initially. Negative: despite productivity advantages, due to
the erratic and fluctuating electricity supply power, machines are being abandoned in a technological
reversion to manual sewing machines.
This case emphasises the importance of infrastructure for competition through process innovation in
the informal economy. Infrastructure is also found to be constraininginnovation through the
commodification of processes – for instance in the case of deep freezer–cold chains for industrially
processed milk products.
THE ADOPTION OF NEW PRODUCTS
We discuss three from a large set of examples here. The first is the transformation of the nature,
quality and symbolic meaning of basic food (exemplified by the very rapid rise in high quality
parboiled rice marketed, not only to the metropolis but also locally, for nutritional and health
benefits). Whereas high quality rice was sold raw in the past for the highest status clientele, by 2012
only 2% of all rice was estimated to be un-parboiled. A similar example is new sources of cooking oil
generally endorsed and specifically prescribed by medical doctors: e.g. sunflower oil ‘for cholesterol’,
while new palmolene oil is being sold to informal petty street vendors for ‘healthy’ deep frying of
snack foods. It is left to individual reputation, rather than state inspection, to assure the quality and
healthy properties of these Tamil ‘fast foods’. The long-standing association between properties of
food and health (hot and cold, pure and impure, vegetarian and non-veg) has long been being
replaced by modern medical reasoning in which science is yoked to advertising. And now this is
pervading the informal food economy of Arni.
A second example of new products is alcohol. From 10 outlets in 2000 to over 100 in 2012. Sales are
formally heavily ‘regulated’ but in practice the state fails to prevent large scale dilution, or black
market sales of alcohol hoarded from weekdays for out of hours sales on closing day. Among spirits,
arrack has disappeared, substituted for by brandy, whisky and rum in ‘Bottom of the Pyramid’ bottles
of 150ml.
Third, but by far the most important, is the banking revolution. After an invasion of both nationalised
and private banks and ATMs unleashed between 2007 and 2009,205transactions that used to be
personalised and reimbursed with asymmetrical lags – which for cehigher working capital
205After the retreat of rural banking during early liberalisation
88
requirements on the weaker party 206 -have been very rapidly replaced since 2010by almost
instantaneous transactions using ‘NEFT’(the National Electronic Fund Transfer)technology. NEFT
vastly reduces transactions costs, and depersonalises market exchange. It combines with the
replacement of family labour by informal wage workers (reported later – which destroys trust
relationships between owners and consumers) to destroy sales on credit. A few shops selling lower
quality equipment to a poorer clientele continue to attract custom with credit and instalment-
repayment.
Private and public banking technology requires licensing to create accounts and title deeds to access
loans. It is a powerful incentive for a formalisation confined to these eligibility criteria. Butit is
inevitably accompanied by further informalisation. Informal innovation using bank loans may be
benign (take-away food from ‘meals hotels’) but not necessarily so(adulteration). Formal innovation
may destroy informal commodity economy (the disappearance of toddy and arrack production).
THE CREATION OF NEW MARKETS
We were given many examples.207Handloom silk and the re-branding of the town: Threatened with
extinction by power loom competition, the local handloom industry has reorganised itself spatially
and has merged brands. Arnisarees have been rebranded as ‘Made in Kancheepuram’. The cost of
production of these ‘Kancheesarees’ is much lower when outsourced to Arni.208 In turn, Arni is
outsourcing its inferior brand to Salem. The outcome is a huge local revival in informal craft silk
production, the only limit to firm size being the supply of skilled supervisors of artisan production.
The quality of Arni’s production has improved. Returns to weaving have increased. From 2007 to
2012, the industry increased by 50% to 300 firms and its structure concentrated. It is dominated by an
oligopoly of 10 big firms, making ever closer links with Chennai-based exporters. A new buyer-
governed supply chain is emerging in which export markets in Europe, S.E.Asia and the USA drive
design a longside more supplier-governed production for domestic demand at weddings and festivals
(such as Deepawali and Pongal).
Even in the informal economy of weaving, the manufacture of image is vital to marketing and so to
production. In this case relabeling has had a significant impact on process, product and sources of
innovation.
206BHW Credit, finance and contractual synchrony in a South Indian Market Town’ in (eds) I Guerin, S.Morvant and M. Villareal, Microfinance, debt and over indebtedness. Juggling with money.(OUP New Delhi)207 See the appendix at http://www.southasia.ox.ac.uk/resources-greenhouse-gases-technology-and-jobs-indias-informal-economy-case-rice208Arni weavers can make Rs 2 lakh sarees in a fortnight (for which they might earn Rs 25k). ( A lakh is100,000). The conditions of Arni’s silk labour market which enable weavers to be paid less need furtherinvestigation.
89
NEW SITES
In a forthcoming paper Guerin argues that change in local economies is driven by the specific social
configurations of sites, and that small towns are increasingly attractive sites for investment due to
improvements in the quality of the labour force, which arein turn the result of education and the
relative quality of the public health environment.209 From our field research we have reason to doubt
that education attracts inward investment to Arni, so much as outward migration, and the public health
environment is increasingly hazardous, but within the town site definitely matters. Lefebvre reminds
us that site is a socially constructed aspect of production and reproduction relations, mapped onto
space.210What is innovative about site in this small town? First, the 21st century has seen the
consolidation of a new bourgeois residential quarter at one remove from the congested centre, a
western suburb resembling that of TV advertisements - spacious and well laid-out, but built by
unregistered masons and builders with informal quality inspection. In response, the high-rent central
town is being demolished plot by plot, with multi-storeyed cement houses and mini-malls replacing
the single storey tiled, courtyard houses, again built by informally qualified workers. And over and
above the new residential lay-out and the new sites of production around the ring road and in the
regulated market new forms of regulated consumption practice by pass the local town altogether.
Local elites use the district HQ, Tiruvannamalai, and Chennai for higher-order consumer durables and
leisure activity.
Wealth, spatial reach and the formally regulated economy appear to converge. In fact they all rest on
infrastructure and construction industries based heavily on informal labour and informal relations of
raw material supply.
NEW WAYS OF KNOWING
In the 21st century, the means of knowledge aboutinnovation in products and processes has developed
from word of mouth (pump-sets), cards and pamphlets (groceries) to i) TV, Fairs, Internet - about
supply and demand as far away as China (wooden furniture, ready-made clothes, silk); and
ii)Advertisements- with their dual roles of information and ensnaring loyalty have been newly
localised in many ways. For one example, mill brands for rice: whereas 10 years ago the town itself
was used to brand rice (e.g. Arni Airplane Rice), now a single mill may use three separate own-brands
for different social destinations. In another case, groceries, branding is reproduced at micro level.
Using family labour at weekends, owners have started to package dry food in plastic, complete with
improvised expiry dates. Branded plastic shopping bags are also the mandatory replacement for
209 Guerin I forthcoming Labour in Contemporary South India in (eds) Harriss-White and Heyer IndianCapitalism in Development,Routledge210Lefebvre, H. (1991) The Production of Space, Oxford:Blackwell
90
durable cloth bags. In a third example, tailored clothing, brands are now advertised on the outside of
clothes rather than inside as formerly. They are also not optional. Arni is part of the logo-turn: the
medium is the message.
In some sectors incentives for informal innovation have even been introduced: the Tailors Association
president has a fund for incentives and regular prizes are offered for best new practices developed in
the town or imported from outside.
Visions of change in the media and threats of change in formal legal regulation trigger imitative
informal innovation.
NEW EXCHANGE RELATIONS
The role of the banking sector’s payment revolution, described above, has been of paramount
importance in the destruction of personalised exchange, with widespread ramifications. One
ramification is its role (amid the proliferation of new informal financial institutions (Polzin 2007,
forthcoming)) in the emergence of the Regulated Market site for grain transactions, after decades of
marketed surplus avoiding it due to production debts that were repaid in kind at sites specified by the
trader-lender. The first transaction between producer and trader is now formalised though the open
auction of paddy. A new registered and organised labour force works there too. Informal aggregators
– lending to, and bulking up the small surpluses of marginal farmers – have found niches there in
which they pass themselves off as primary producers. A second ramification of new exchange
possibilities is the facilitating of pan-Indian supplies in groceries and foods, and international flows in
textiles – all brokered through known intermediaries but from unknown suppliers, and using NEFT
bank transfers. The removal of trade restriction on bank loans has permitted new scales of finance for
working capital: e.g.‘a crore in a store’211 for rice mills, some of which are insuring their stocks for
the first time. But the commonest new element in the bazaar is new models of price formation: out
with haggling (for old irrigation ironware, for example); in with fixed prices associated with branding
and packaging, even for activities not regulated by the state (unregulated new hardware and interior
decoration, state-regulated agrochemicals and pharmaceuticals).
New technology and an expanded role for banking enable a new scale of formally regulated exchange
relations.But these leave niches for informal business.212
211 A crore is 10,000,000212 Theorised by Michel Crozier
91
ADOPTIVE INNOVATION IN LABOUR PROCESSES
In her study of Arni’s silk industry, Camilla Roman (2008) discovered the capacity of the skilled but
informal labour force to be innovative. She also stressed the continuity of the workforce’s information
base, in which their small-scale but disruptive innovations are nurtured. In addition, she traced how
innovation has consequences for the labour force. Here we order our discussion of innovation by
distinguishing these different theatres of agency and innovation.
AGENCY AND INNOVATION BY LABOUR
Notable 21st century changesin workforce agency involves two-way flows of labour (lagging by at
least a decade the caste–stratified two-way flows of capital of the 1990s).213In-migrating labour from
Orissa finds ‘6-month’ niches in the labour forces of rice mills and meals hotels (the latter providing
language training for migrants while they work under constant supervision).214Meanwhile educated
labour out-migratesto the Chennai-Bangalore corridor(‘There is more to life than Arni’) while
uneducated labour flocks in gangs to the brick kilns and construction sites of the metropoles. Elite
children are forced to migrate long distances to be incarcerated in private English language boarding
schools.215 The local workforce has also been reconfigured by activity and site with the entry of
women. There is a massive increase in outsourcing and home working in Arni, with women becoming
specialist tailors for women’s clothes,for instance. The genders are integrated into the market, then
subject to a change in industrial structure and then segregated.216
A second aspect of the agency of Arni’s informal labour force –its innovation in the labour process -
and the response of its employers is change in apprenticeships and increased ‘entrepreneurial hurry’.
For tailors, the training is long- boys start with the sewing of buttons and the stitching of holes and
progress by hand and machine over 3 years. Of late the balance between the demand for and supply of
apprentices has been disturbed by the existence of alternatives for better-educated boys and men,
resulting in. an acute shortage of male tailoring labour. Market incentives have resulted in incomplete
apprenticeships becoming the norm – with the result that informal tailors are constantly threatened
with undercutting from apprentices who abscond and set up on their own. Supply no longer matches
demand and the outcomes have been dramatic. First a slowing of the velocity of production (from 2
hour shirts (‘made while you visit the cinema’) in 2005 to 20 days in 2012).Second, strong incentives
213 BHW and Janakarajan 2004 Rural India facing the 21st Century Anthem214In 2012 there were over 100 in Arni. Recruited through contractors in Madurai, Chennai and Coimbatore.The migrant labour force is housed by employers without other perqs or rights and employed for 6 month stintsi.e. two shifts a year. Wages are paid directly to the migrant who deals with contractor. ‘Management pays’ iflabour is sick. Though migrants are normally thought to be paid less, wages to migrants are higher than to localworkers because migrants are on call 24/7/30.215In towns not dissimilar to Arni such as Erode, Salem, Tiruchangode, Uthangarai, Namakkal where privateschools have been extensively advertised on TV.216Cf Sneha Krishnan D Phil
92
are accidentally created for the expansion of ready-made clothing. Third, the entry of women brings a
gender differentiation which intensifies with the segmentation of work. Women emerge from their
homes to acquire new kinds of learning, not through apprenticeships but in informal training
institutes. Several of these have been founded recently in Arni: one train as many as 60 women at a
time. Female tailors then lobby, through an un-registered union, for ‘certificates’ from the business
association. Similar kinds of repercussion or ‘spill-over effect’ have been reported for electricians and
construction workers. Long-employed in the public domains of the local state and in teaching, the
entry of educated girls and women 217into the local commercial workforce and market-place is an
ambivalent process because the available local work is not necessarily commensurate with their
qualifications (e.g. general retail sales, cool drinks, ready-mades, sweets and bakery work at Rs
150/day).
The unprecedentedly massive exercise of agency on the part of semi-skilled and skilled labour has
produced innovation in the informal labour process. Employers have had to support this via
certification and further innovation (language training), as well as via increased surveillance (of
migrant labour).
Camilla Roman (2008) has reported innovation, as opposed to agency,by labour rin craft weaving,
especially improvements in design. She sees it resulting from the continuity of technological
knowledge, through in formal on-the-job training, lived experience and experimentation.
Developmental adaptations to looms are also said to be driven by the desire for reduced physical
effort and lower physical risks (though these are often traded off against each other), and the existence
nearby of related professional skills/ complementary knowledge (such as computer aided design
(CAD).
It is as much by the innovative behaviour of the craft-producing work-force as by the branding
entrepreneurship of employers that the threat to the industrial district for handloom weaving (at its
peak involving thousands of looms) has been turned into a stimulus.
AGENCY AND INNOVATION BY EMPLOYERS FOR LABOUR
Employers routinely respond in locally innovative ways to demand – pulls (socially constructed
through investments in information and through advertising). In their adoptive/ innovative responses,
many factors play roles: the existence nearby of technology and complementary technology (silk),
networks of contacts with shared repertoires of understanding (through commerce and through the
business associations), loyalty in the labour force (lack of which slows up construction projects), the
availability of working capital and investment loans ( resulting from the banking revolution), and
217Cf Gooptu 2009 and CWM research in our project – Mani, Mody and Sukumar 2013.
93
returns which compensate for un-revolutionary increased costs of production for transformed and
processed products (food).218
Changes in the class-structured knowledge base for innovation. The social origins and competences
of the local capitalist class are changing. Rice mill innovation no longer requires a background in
agriculture, as it did in earlier decades, but instead, in one example, has been based on a background
in engineering, steel (metal rods retail) and electricals. As observed for electricians at the start,
collegiality is more common than protective secrecy among innovators. Operators of FAMRMs219 in
Karnataka allow Arni’slocal engineers to view their sites and machinery – and even train
Arni’sskilled labour.
At the demand of labour: Local business associations have been under pressure from workers
informally to formalise apprenticeships. The electricians, for instance, have developed a new and
informal hierarchy of certificates after various lengths of experience and some exams. This makes it
possible for electricians to find work on grounds other than personal recommendation. A similar
system of qualification as a precursor to self-employment and outmigration is found in the
construction industry. Arni is an informal training ground but as one engineer told us ‘It means the
construction workforce is constantly learning and constantly changing’.
The division of low-skilled labour is becoming increasingly specialised.‘ Jobs are classified’ said a
builder. In the construction industry, the following tasks are recognised as needing distinctive skills:
foundation labour; masonry; concrete labour; centring labour; steel fabrication labour; carpentry;
transport; plumbing. Contradictory processes of wage work are developing inside the town. On the
one hand the urban economy is undergoing an explosion of self-employment using the skills of the
contemporary economy220, but on the other the biggest companies (engineering, mills,etc) are
gradually integrating formerly self-employed workers into their paid wage-labour force.
Labour Displacement:Changes in post-harvest processing and rice mill automationgenerate massive
labour displacement and masculinisation – employers seems to have an active dislike of low-caste
unskilled and female labour. Before full automation a mill with the capacity of a FAMRM221 would
employ 50 women and 30 men222. With full automation, there are just 5 women and 12 men.
Innovation in the labour process by employers of labour often involves further scales of
commodification of the technologies and processes of production. For this level of sophistication, a
218Roman (2008), for silk also noted that the capacity to introduce discontinuities depended upon ties ofkinship, of fictive kinship, of spatiality, of commensality, shared social functions, and the regulative experienceof business associations.219 Fully automatic modern rice mills220E.g. electricians from 85 in2000 to 730 in 2012.221Fully automatic modern rice mill222 While women would work on the sun-drying yard , half the men would work in management andengineering (‘staff’) while half casual for unloading and loading and parboiling.
94
social background unconnected with agriculture or the local rural economy is often necessary.
Process commodification creates new elements in the structure of prices. New levels of complexity in
the labour market involve contradictory as well as complementary social processes: specialisation,
the vertical integration of labour skills, self-employment and labour displacement. Local employers
also concede demands for the ‘informal formalisation’ of labour force skills which they know will
lead to reduced dependence of workers on them, the depersonalisation of market transactions, and in
the case of men, migration out of Arni.
CHANGES IN THE ORGANISATION OF FAMILY BUSINESSES
‘Men don’t want to work for others’. ‘Self-employment is an aspirational state’ (President of the
Tailors)
Under the Indian constitution the private sphere, the family, is regulated by customary law derived
from a plurality of religions. It is then contrasted with the relative secularity of the state-regulated
public sphere. But in self-employment and in the family firm the private meets the public. The
customarily regulated family is the building block of the economy. Informality is hard-wired into it.
In Arni there has been a massive expansion of small firms which are run by under-educated self-
employed people. They are associated with many of the process and product innovations described
above e.g. the electricians who have grown from 85 in 2000 to 730 in 2012, or pumpset retail and
repair mechanics who have increased from 10 shops to70. The new skills needed for such work (e.g.
boring for tube-wells)are ‘learned by doing’. Throughout India this expansion of modern artisanal
activity is an uncelebrated feature of liberalisation.223
At the same time firms undergo specialisation and complexification, Even tailoring has reorganised
itself to handle demand, througha gendered ‘vertical integration’ on a micro scale, with separate
‘firms’ specialising in repairing cutting, sewing and pressing.
Family business is being re-organised in a ruptural change: In the central ‘bazaar’ (that hosted the
dominant forms of market trade and jobs in the modern economy of the 1970s)the mass exit of the
educated younger generation to salaried jobs in nearby IT, electronics and auto industries is causing a
decline in family labour. This is compensated for by an increase in wage labour. ‘Only scions with ‘
business level education’ (low) stay in the bazaar economy - it’s hard work – long hours –
competition – no holidays - with the further problems of apprenticeships’ a pump-set dealer told us.
The entry of wage labour into tiny firms rein forces the shift in the ‘crafts and craftiness’ of the bazaar
in which trust-based haggling over price, credit and debt is replaced by norms.
STASIS AND DESTRUCTION WITHIN THE FLUX IN LIVELIHOODS
223Bhw 2012 Capitalism and the Common Man Agrarian South
95
In this account of innovation and change, the case of dalits is striking in contrast. We interviewed the
representatives of marketplace porters, transport workers, fruit and vegetable sellers and sanitary
work, activities dominated by dalits. The contrast between their current work conditions and their
aspirations for their children is also very marked.
The erosion of caste exclusivityworks perversely for sanitary workers, permitting a new
downwardsstatus mobility, while reducing work opportunities for dalits. Between 6 to 8 non SCs have
entered Arni’s state controlled sanitary workforcewho clean streets, drains and latrines. They are all
socially disadvantaged: Naidus and Mudaliars without anyeducation,or‘people in cross caste
marriages’ (a stigmatised novelty),or the widow of a low level government employee given work on
compassionate grounds. Here and elsewhere the deliberate lack of change is a technique of labour
force control, actively preventing emancipation in the labour force.
Low caste and dalit market-place loaders are controlled differently, having had no wage re-
negotiation for five years despite inflation; their wage ‘after liquor’ is equal to that of agricultural
labour. Sources of demand for their work have shifted location: bulk lorries bypass the centre of town,
and factories on the periphery develop their own loading labour force. They have been undercut and
their territory informally encroached upon by ethnically networked casual labour from Sri Lankan
refugees whose desperation doubles the supply of loaders. As a result, work and rates and gang sizes
are shrinking and the organisation of labour is on the defensive. Divided by team and village of origin,
the Loaders’ Union is weak.
Extinction: The negative experience of complete destruction of labour practices was difficult to elicit
from Association presidents. Child labour has been reported to be on the increase in some parts of
India,224 but the opposite is widely reported to hold for Arni. TheRotary Societ ypresidentreported ‘no
child labour’. The teachers spoke of ‘a few truants in the bazaar’, unknown to their parents, as well as
of child migrants who have gone from Arnito ‘Salem and Bihar’ for brick kiln and construction work.
Arni’s tailors now have a strict rule not to take child labour in the interests of children’s education (a
practice also noted for silk labour by Arasi (forthcoming). Education is also responsible for a wave of
technological regression not requiring child labour in loom work). ‘Education is atrophying the supply
of labour’ said a Silk Merchant.
CREATIVE DESTRUCTION AND JOBLESS GROWTH?
224 Corbridge et al forthcoming (British Academy paper)
96
For at least the first decade of the 21st century, India’s liberalisation has been associated with jobless
growth, a general feature of registered formal economy. Some analysts see this seeming paradox of
growth as being resolved by the recorded expansion of livelihoods in the informal economy. 225 But
the town of Arni is generating jobless growth in the informal economy.
Between the contradictory forces of proliferation of new forms of petty production, versus labour
displacement, versus the exit of family labour, versus the integration of general wage labour in family
firms and specialist wage labour in bigger firms, the net balance is an acute labour shortage at all skill
levels and in all sectors of the informal economy. We have seen that this drives three kinds of change
in the labour process: i) mechanisation and labour displacement (e.g. rice mills); ii) feminisation in a
new increase in home-working e.g. tailors and silk; iii) in-migration from North India (e.g. the
hotel/catering industry).
What has enabled the 21st century exodus of family labour?
6. INNOVATION IN EDUCATION
In reviewing macro-economic educational endowments and total factor productivity, the development
economist Frances Stewart found that education does not so much affect productivity directly through
the labour force. Rather productivity was affected by education indirectly through improvements in
capabilities to absorb technology, particularly in access to infrastructure, finance and skilled work -
and in the education needed for the two-way process of influence between commercial firms and state
regulative policy. (Heyer, Fitzgerald and Thorp, 2012, p6).
In the 21st century, education in Arni follows the pattern of Stewart’s reasoning, being significant not
so much for innovation per se as for the dynamo of change it releases within the town. The key to
upward mobility is not seen as being informal innovation. Upward mobility requires exit, and
education and competence in English are the key credentials for upward mobility and several kinds of
exit. First, from agriculture. Spurred by water scarcities, adverse price structures and labour scarcity
(the impact of NREGA),the flight from agriculture fuels a rush of land sales to non-local real estate
speculators and mineral water companies. Second,from Arni itself. Spurred by the desire to escape the
parochialism and patriarchal authority relations of the family firm, people embark on daily
commuting as well as seasonal and permanent migration.
‘Arni is becoming an education hub’.‘Education is using land to take the place of land’.‘The
knowledge economy is an extractive industry.’ ‘The state encourages education but has effectively
wrecked it’226
225 A Sinha 2007 in BHW and Sinha Trade Liberalisation and India’s Informal Economy OUP2262012 interview with a group of state high school teachers.
97
In the 21st centurya massive college education cluster has appeared on a tract of dry-land to the north
of town, while25 pre-school nurseries , and about 100 new private English-medium schools have been
establishedin the Arniregion.227The town has transformed itself, in an unprecedented way and at great
speed,into an education hub. This is a new and non-trivial sector in the local economy. Everyone we
interviewed - poor and rich, female and male, dalit and forward caste - had education as their central
concern and was aware of the rapid changes. More a compulsion than a demand, this transformation
in social aspirations took place at a time when the public education system in Tamil was embroiled in
a politics of non-expansion. Whether deliberately intended to incentivise private education or not, this
has reinforced local pressure for alternative private English schooling.
Private schools (‘mostly big businessmen’s playthings’ a teacher explained) are formally registered,
regulated and state-inspected. But this process is flawed and vulnerable to informal practices such as
low and individualised pay, capitation fees (bribes for entry), unregulated teaching standards, even the
corruption of examinations. The underfunded state system acts as a social safety net when it receives
drop-outs from the private system.
But there is another aspect to informality in education.
For those children educated in Tamil in the state system, and for some in private school sin Arni, there
is also a large and growing informal economy of private tuition. Whereas in 2005-, there were 50-60
private tuition centres, by 2012 there were well over 100. These were mostly manned by fresh
graduates, often women or retired teachers, with classes ranging from 15 to 20 at the low end, to 200
at the extreme high end. Regular state teachers are not allowed to do this (though a few break the
rules228).Competition between these tuition centres – effectively a parallel informal education system -
is fierce, with more or less misleading advertisements of success crowding the advertising hoardings
in the town centre. Popular subjects are the gateways to IT and engineering – 90% of tuition centres
cover physics, chemistry and maths, taught in Tamil. Only 20-30% of pupils take English which,
though it is sought-after as a medium, is not taken as a subject because the discipline of English is
given a low weighting in the aggregate marks.
In this way, the state government dis-incentivises the informal acquisition of the language of the
national market, English. For the future labour force, this informal private tuition involves a gruelling
2-3 hours of extra study after a long day’slearning (after 9.30 -4.30 at school and 2 hours of
homework).229
227 Not to mention the displacement of demand through long distance migration to private boarding schools.228Unregulated fees range from Rs 2k per subject to Rs 8k, averaging Rs 6k, for teaching the school syllabus,testing and correcting over the 8 month January to August semester.229 It is also a way of obtaining after school child care (Hodges, PersComm, 20013)
98
Speaking to public sector teachers about innovation unleashed a torrent of examples, all drawn from
the state system From smaller class sizes through new curricula and the prohibition of physical
punishment to the introduction of Activity Based Learning, it seems that the practice of teaching is so
receptive to innovation that state education most resembles a model innovation system. At the same
time party politics has swung between a freeze on teacher recruitment (DMK) and the failure to
allocate recruited teachers to positions (ADMK), resulting in dysfunctional class sizes, wrecking the
capacity of the public system to respond to the legal requirement of 100% enrolment and forcing
surplus teachers into the private and informal sectors.
We encountered one case of informal invention in education.230For children forced to drop out for
weeks at a time due to parental sickness and/or the peaked compulsions of work, the PTAs have
innovatively organised evening classes to help such children to catch up. AnNGO is also working
with state schools in Arni to expand this initiative.
THE PARADOX OF FORMAL EDUCATION AND INNOVATION
Many inventors and adaptive innovators have high levels of education (e.g. the self-
employed/capitalist architect –engineer; rice mill automaters), and new levels of skilled engineering
labour are now employed to install and maintain more technologically sophisticated machinery. But
we learned from representatives of both banks and petrol stations that education contains its own
paradox. Higher education which can produce high competence and the ability to manage complex
(remote control) systems and IT, is essential for a corporate career. But a complex state or private
corporate organisation, requires a compliant passivity of its skilled and educated employees in which
local innovation and experimentation is forbidden. High educational qualifications are not by
themselves indicative of a capacity to innovate.
7. THE STATE AND INFORMAL INNOVATION
The state is normally assumed to be inefficient and un-entrepreneurial.231 As with the case of
education, so more generally, however, our discussions with the business association presidents, an
Electricity Board director, the representative of Arni’s lawyers, and the leader of the transport workers
disclosed the existence of a constant stream of adoptive innovation. (These are listed in the separate
Appendix).232Here we focus on tendencies in the more or less circumstantial evidence we gathered in
2012 that reveali) the ways in which formal state policy affects the informal economy, ii) how the
230 Actually suggested in BHW with Camilla Roman 2003 On the Insecure lives of Tamil Nadu’s Silk WeavingFamilies=Frontline vol 20 no 24231 References to economics texts in particular232http://www.southasia.ox.ac.uk/resources-greenhouse-gases-technology-and-jobs-indias-informal-economy-case-rice
99
informalisation of the state affects the informal economy,233iii) how innovation takes place in and
around the ‘informalised state’ and finally iv) the question of how the state regulates the informal
economy – formally and informally.
1. How formal state policy affects the informal economy. First, it may indirectly protect the informal
economy. For example, formal import controls have been imposed protecting Indian silk yarn,and the
silk fabric industry dependent on it, from Chinese competition; similarly state subsidies and incentives
to school-goers incentivise private informal tuition. Secondly it provides indispensible hard
infrastructure (transport and communications) and soft infrastructure (schooling) for the informal
economy. Third, it can destroy elements of the informal economy – as when road widening and
tarmacking over the ‘central business district’ frontages removed the sites for dalit fruit and vegetable,
flowers and street food selling. Fourth, it may place an economic safety net under it – with NREGA
which in the Arni region provides 100 days of work during seasons of peak competition as well as
during slack times. Fifth, it may passively tolerate the informal economy – as inside the Municipal;
market. While the state has policies covering the informal economy, it has no coherent development
project for it.
2.How the informalisation of the state affects the informal economy. When the state operates through
informal practices or parallel institutions, then informal economic practices are governed by non-
state-legitimised forms of authority. For example politicians may regulate the conduct of private
schools or may prevent dalits from exercising rights to their municipal housing, even when they fulfil
the eligibility conditions. ‘What an irony that the municipality doesn’t implement its own laws’,
declared a sanitary worker unable to secure housing in retirement despite being eligible. The exercise
of private status and private interests in selectively implemented state interventions has produced a
large literature on the nexus of private and public economic power and the role of politics in
reproducing intermediate classes.234But it also has effects on the conditions of reproduction of the
informal labour force.
3. How innovation takes place in and around the informalised state. A case we encountered concerns
the Public Works Department, which was reported to have not recruited engineers to permanent jobs
since 1989. There is no alternative but for free-lance PWD engineers to build private businesses to do
work that is routinely subcontracted by the state. In and around Arni some 20 such businesses, heavily
dependent on state patronage, are not regulated or inspected. Qualified engineers then compete for
233And vice versa – to be developed.In half-formulated, half-implemented administrative procedures (forexample, in the acquisition of land, building occupation permits) multiple procedures are mandatory- only oneor two of them are followed and the rest left open to informal interpretation. The constitution of jurisdictions isalso informalised in such ways (Champaka, Pers. Comm. 2013)234 McCartney and Harriss-White 2000
100
contracts against the unqualified and unsupervised masons who carry out about a third of the
construction work (state and private) in Arni.
4. How the state regulates the informal economy – formally and informally. The formal state
regulation of the informal economy is by neglect of its own laws. The state regulates selectively.235
‘Provided I pay taxes, the state doesn’t bother with storage, procurement’. ‘It leaves big rice mills and
wholesalers alone.’(a miller – this is a significant change from the nexus of interests profiting
privately from selective and partially implemented interventions in the late 20th century –no miller
then would have been able to say that the stage left them alone) ‘Market forces regulate the market
now’ (a lorry agent). There are rules for the spacing of irrigation wells to protect the water table, but
these are honoured in the breach and the spacing of wells is still fixed by divining twigs and coconuts
(a pump-set seller). ‘There is less regulation than in the past’ (an engineer). Less state regulation may
become dysfunctional for quality standards which, despite the tendencies towards de-personalisation,
will then be regulated by reputation alone. On the Food Control Inspectorate: ‘There is one office for
the district. They will arrive by bus and check the biggest shops next to the bus stand! They are often
not educated people.’ (a grocer). This neglect not only allows informal regulative practices to flourish,
but also fuels informal practices that parody social protection. The ad hoc character and extreme
unreliability of state welfare has long been a negative predisposing condition for collective action
and/or individual savings to cover misfortune – there is no change in this. People continue to work till
they are too infirm – there is neither an age of retirement nor a concept of retirement in the informal
economy.
Whereas in the past what was neglected was the result of careful brokering by collective political
pressure mediated through bribery by business associations236, now the evidence points to a severe
lack of state capacity and under-provision of many services (as in the example of refuse collection,
below).
Turning to informal state regulation of the informal economy, we find that it is done by threat, pre-
emption, interference and bribery. On threat, the laws designed to regulate big retail and FDI are
already having a shadow impact in the informal economy, where a compressed process of imitation of
a form of retailing that has not yet arrived is introducing much change in the retail food economy.
Hitherto it has relied on a local culture of modernity involving deep social embedding (through loans,
235 Despite the GIS/GPS surveillance culture of the TN government (Hodges, PersComm, 2013)236 Bribery is theorised as the privatisation of or creation of a market in public resources by officials (patrons)charging citizens (clients) (Krueger 1974, Wade 1984). In earlier field research, collective bribery was found tobe initiated by business associations and powerful ‘clients’ to speed access to resources (licences,infrastructure), to waive obligations to the state (tax), to avoid disciplinary regulation (movement of goods,safety, labour rights etc) to delay or subvert the implementation of market regulation (packaging, transparentprice formation, site, in a reversal of the orthodox theory’s role of patron and client (White and Harriss-White,1996). Clearly both balances of power between the state and capital are possible.
101
a personal clientele, leeway for negotiation (haggling) and variable quality) the changing nature of the
purchases made by cash-strapped yet discriminating consumers. Pending the ‘earthquake’ – the arrival
of big retail and supermarkets –the crowded sector of small grocers already faces competition via
branding and TV advertisements, discounts and cross-pricing, and the deliberate creation of
conditions conducive to impulse-buying. In anticipation of future regulation two grocery shops have
already computerised their receipts, stock and accounts. The image consistent with examples on TV
and cinema allows a modern impersonalised fixed-price marketing in which chicanery with
(‘900grams dressed up as a kg’) is still possible.
On interference, it is police rather than check-post guards who now regulate freight, for example. The
regulative principle has shifted from a concern with the nature of the load and its degree of over-
weight to the state of repair of the vehicle. States of transgression which lorry men feel are often quite
minor and arbitrary are (privately) fined.
Regulative deficits (which may be caused by deliberate capture, or by lack of staff or equipment
(transport, computers)) are reinforced by the prevailing ideology of market efficiency to encourage
the informal economy by neglect. Yet we have evidence that the state is capable of being innovative as
well as efficient. Informal contriving to protect state practices from public scrutiny achieve long-run
‘efficiency’, at the expense of costly transparency. Collective responsibility for constant changes in
state practices to propitiate informal interests is also an ‘efficient’ response for the officials
involved.237
8. THE STATE AND NATURE
THE NON-ADOPTION OF INNOVATION- THECASE OF THE SOLID WASTE
ECONOMY
All economic activity produces solid, liquid and gaseous waste. Our research examined waste water
as an externality and the GHG implications of water lifting and use; we measured compost as an
input, but we have not measured physical waste. It is important to record there markable lack of
innovation in relation to waste when new, effective technologies exist.238
While residents are fastidious about waste in domestic space, in Arnit here is no public consciousness
about waste outside. ‘The town is sinking in garbage. No-one cares about clean streets’ (sanitary
worker). The size of the municipal sanitary labour force with its primitive trucks and equipment has
remained unchanged over two decades in which solid and liquid waste has multiplied impressively
(by a factor of five, some respondents thought). Sanitary workers’ pay has been computerised but
bank opening hours coincide with their shifts, which makes access very awkward for the dalit workers
237 Champaka, Pers. Comm. 2013238 www.exnora.org
102
we interviewed to obtain cash to buy food, while the fact that they do have access is a symbolically
polluting ‘menace’ to other customers. The sanitary labour force feels that nobody cares about them.
The under-provision of municipal cleaning and refuse collection then incentivises a big sector of the
informal economy: moonlighting; the hiring of private services within neighbourhoods; a roving
circuit of tribal irular waste pickers; a thriving informal recycling business for metal, plastic, card and
glass organised in Arnit hrough Chennai by Muslims; and every day a field day for pigs and rats.
NEW SCALES OF ENVIRONMENTAL PREDATION
Like everywhere else,the town is heavily and increasingly dependent on energy from fossil fuel.
Competition to control energy is conducted outside the arena of the town. The number of petrol
stations doubled to 12 between 2007 and 2012; demand for diesel and petrol tripled and continues to
rise, currently being reckoned to average 300 tonnes per station per week. Fuel is not only used for
lorries and cars (neither of which can negotiate the central maze of narrow alleys);in the region in and
around Arni motorbike ownership is expanding at an expert-estimated rate of 1,000 per month, while
demand for diesel power generators is rocketing to substitute for (and complement) the deteriorating
electricity supply.
The bourgeois western suburb issaid to be mining the water table as unsustainably as if paddy were
being cultivated there. The appetite of the fully automated rice mill paddy driers requires wood as well
as husk for firing – up to 30-50 tonnes per month per rice mill. Some wood comes from casuarina
farms in a radius of 50 km from the town but some is hacked from common land (‘I know this is
destructive’said an innovating miller). ‘Wood cutting’ is a further serious problem for the construction
industry; for which sand is also mined illegally from the bed of the now permanently dry Palarriver.
Over wide tracts of land, agricultural topsoil is also lifted to provide clay for bricks.
Much of this activity is not just informal but illegal. None of this depredation appears to be regulated
in practice by the state.
9. THE SOCIAL STRUCTURE OF INFORMAL INNOVATION
Social institutions combine to form a structure which for new institutional economists is a constraint
on (profit-maximising) activity. For old institutionalists it makes economic activity possible in the
first place; for the ‘social structure of accumulation’ school it is a matrix stabilising capitalist
accumulation and controlling conflict; for Marxist institutionalists it contains forms of economic
authority which detract from class formation. All these approaches differ in respect of the institutions
considered to be indispensible, some arguing that this is an empirical question, others using the
103
circuits of production and re-production as a guide to what is most important239, other using ideas of
dominance and prominence, or the concept of pre-capitalist institutional ‘outliers’. In the absence of
anything resembling a formal innovation system in the informal economy, the questions at issue here
are empirical ones: which institutions nurture informal innovation and which form obstacles? Do they
form a structure? This tentative attempt to answer them from a pilot field projects naturally
contestable. Here we tie the evidence from the case material into a higher order narrative.
Over and above the threats to, and transformations of, the family firm (working as self-employed,with
or without other family members and wage workers),and the regulative activity of the state, both of
which have been handled above , three other kinds of institution stand out for the frequency with
which they were mentioned: education, banks and business associations (the latter is hardly surprising
since we interviewed their presidents). All are formally registered but they affect informal innovation.
It was also clear that informal institutions of identity and gender matter to agency and innovation and
we will link the two kind of institution in discussing education here.
Institutions of education are diverse ecosystem involving state, registered private and informal private
ownership (tuition centres, apprenticeships, learning by doing, absorbing media messages etc). A high
level of formal education by itself does not predispose individuals towards innovation but it facilitates
the evaluation of information (as in the media) and access to supportive institutions (like banks). ‘Arni
has increasingly educated people who read adverts, watch TV and are influenced by the media’ said
the Chair of the Chamber of Commerce. Education and/or competence in an informal knowledge base
(e.g. weaving, electrical repair) provide the continuity that enables the adoption of new practices and
other kinds of agency in which material technology and behavioural norms are transformed. Lack of
these capabilities hampers innovative agency.
Education however is deeply embedded in institutions of identity and their intersection affects agency
and innovation. While women are well represented among classes of workers enduring chronically
oppressive conditions, and have entered the labour market as home-workers, no woman was
mentioned as an entrepreneur. Educated girls and women aspire to salaried jobs, an educated groom
and reduced dowries. Modestly educated dalits work in occupations not requiring their education -
fruit and veg, sanitation and recycling, portering, ‘rooftop work’, blacksmithing, lorry driving and
lately informal finance. Though one dalit is the administrator of Arni’s municipal bureaucracy and
another is a high-ranking teacher, the well-known role models for dalits are three illegal moneylenders
239E. O. Wright’s ‘predisposing factors’ for innovative risk taking in worker managed firms for instance include
credit markets (subsidised interest); stable income flows to labour; associational democratic governance; risk
pooling; geographical anchors; and the known existence of technologies lowering diseconomies of small scale.
104
with large houses, compounds and swimming pools (an innovation in Arni) whose financial careers
emerged from portering and fruit and vegetable selling and are owed to street wisdom rather than
formal education.240.Other Dalit aspirations for ‘exit’ are different from those mentioned by the
‘purer’ castes: the police, the army, chauffeuring. For the minorities, Muslims and Christians, new
reservations, each at 3.5%, have been carved out in state employment. Muslim children are educated
in Urdu until 6th standard, after which they go to government Tamil schools where they are reported
‘not always to perform well’. Muslim girls are also starting to obtain education but ‘do not transform
it into work afterwards’ (a teacher).The lower status identity groups, in encountering social obstacles
to the exercise of agency, experience formal education as necessary but far from sufficient.
The aspirations unleashed through education and often thwarted in the marketplace are not only
expressed through changes in norms and economic mobility, but also through changes in motive and
behaviour. Although profit and a higher standard of living are reported as proof of the benefits of
adopting new products and processes, other less obviously economic motives such as collegiality, the
expression of social status and the desire to nurture talent in others are evident when they clash with
profit and still prevail.241
Banks and finance: The effects of the influx of formally registered national banks can hardly be
overestimated. First they encourage innovation in new scales of technology, with subsidised loans
encouraging capital bias, which in turn requires high rates of capacity utilisation. Banks also allow
working capital loans for pure commerce (forbidden until the end of the 20th century).There is no
monitoring of envirement or onwards lending into the informal money markets. ‘As long as were-pay
the instalments the bank doesn’t interfere at all.’
By virtue of their collateral requirements (title deeds,etc) banks may play a role in formalising the
informal economy along the lines advocated so influentially by de Soto (2000)242. Loans for education
and housing have rapidly increased in size and frequency. Formal property may secure (multiple)
loans from (multiple) formal accounts that are subsequently invested in the informal economy or lent
onwards to others. These are impossible for banks to monitor (bank manager). Title may be vested in
a collective (the family) under the customary laws embedded in the constitution, and hard to associate
exclusively with an individual. And ‘there have been problems with duplicate (forged) title deeds in
Arni’. Certain banks do not require collateral to lend to some occupation groups. Tailors mentioned
their ease of access to formal loans which had been altogether denied them ten years earlier. Dalit
sanitary workers in receipt of computerised salary transfers may be awarded loans of up to 10 times
their salary and are accumulating formal debt for the first time ever. 243Yet the new banks are far from
240They are said to lend at 5-20% per week and occasionally 10% per day.241 Electricians, carpenters242Soto, H. de, 2000, The Mystery of Capital, Basic Books Perseus Books Group243up to Rs 1 lakh Rs 1-2k is reported to be a usual outstanding amount for dalit sanitary workers.
105
routing the big informal financiers in Arni who remain businessmen (traders and agents), landlords
and ‘finance corporations’ (in which a group of savers, including government employees, invest).
Innovation requires risk-taking. For electricians and construction workers this risk may be physical,
but for the most part it is financial. We have no direct evidence about the equivalent in the informal
economy of venture capital but, since no-one mentioned it, conclude that lack of it is a constraint on
disruptive innovation. (As already mentioned, the scaling up of the electricians’ invention has been
taken over by a large registered company in Bangalore). Innovation through adoption and through the
exercise of agency is far less risky in money terms. Nonetheless, risk does permeate the informal
economy. ‘Half the town is saving against shocks’ (Chamber of Commerce). Sickness, marriage
alliances (despite the downward drift and increasing optionality of dowries), and private school and
college education are as ‘shocking’ to the budget of a small firm as weather related downturns or
business losses. For shock-absorption purposes, bank interest is not high enough to compete with
returns from property and gold, which can be cashed or mortgaged easily in the town. In response to
the demand for gold, a big jewellery-company from Chennai is setting up in the town. And yet, as
with informal money-lending, the biggest savers are widely said to be government officials with the
least shock-prone work conditions and contracts.
Business associations: beyond the state’s reach informal economic activity is regulated either as
though the law were being enforced,244 or through decisions of business associations. These
organisations span the entire spectrum from the formal and nationally federated to the local and non-
registered. Basile (2013) studied them closely in 1997.245 She sees caste as a crucial element in a
corporatist system of economic regulation in which the ideology of caste (defined as a hierarchy of
social status associated increasingly loosely with occupations), is secularised and increasingly
internally differentiated, while the institutions of caste move from the domain of culture to that of the
economy and are more or less mapped onto business associations. These are ‘manifestations of the
social order’: defining behaviour, co-opting members across class and thwarting the development of
class consciousness. Their regulative roles may include screening entry, apprenticeship, defining
contractual measures and types, credit, price control in the ‘market’ especially for labour and derived
markets such as portering and transport246, working conditions, the guarantee of livelihoods,
mobilisation to compensate for accidents and premature death, poverty and social distress. Basile
stresses the importance of the state in business association activity: the needs to limit the state’s
244Olsen, W.K., and J. Morgan."Institutional Change From Within the Informal Sector in Indian Rural LabourRelations." International Review of Sociology 20, no. 3(2010) : 535-555.245Basile uses the lens of Gramsci’s theory of hegemony - in which the economic interests of capitalism usenon-economic, political and cultural means to co-opt subaltern classes.246Arni’s silk association has a long history of state-connived containment of informal wages for weavers.
106
intrusiveness (e.g. from the Labour Act; the Packaging of Commodities Act and VAT)247, to protect
members from the police, to appeal against discrimination, while campaigning (often using bribes) for
preferment and for infrastructure, for social rights and contracts. Two questions arise. How have the
business associations themselves innovated since the 1997 research; and what role do the trade
associations play in informal innovation?
Many associations exist reactively, spurred into action when threatened by the state or needed by
members. Only 7 or 8 of the total of 67 have real clout248 enhanced by federation and political
influence at ministerial level. 249But federation is one innovation that has gathered strength over the
last 15 years in Arni. A second is business association support for informal training and the provision
of accreditation for skills, a human ‘collateral’ which in turn permits the development of de-
personalised transactions and migration for work. A third is the circulation of trade information,
useful for the adoption of innovations from elsewhere. A fourth is the cosmopolitanisation of
membership, such that the alignment between caste and trade associations is increasingly weak and
acquired skill replaces ascribed merit.
In the process of informal innovation we found sharp contrasts between on the one hand, the
oppressive conditions of wage/salaried workers (e.g. for transport workers: delayed payments, partial
payments, refusal to renegotiate fixed wages, refusal to employ on permanent contract etc) which are
not conductive to innovation; and, on the other, collegial support for invention, adaptive innovation
and adoption on the part of petty artisans and small capitalist firms achieved not only through trade
associations but also commercial contacts and access to banks.
So all forms of knowledge and education are preconditions forinstances of all types of innovation. Yet,
despite the town’s being a ‘low-caste place’, it is clear that being a dalit, belonging to areligious
minority and being a womanconfine work possibilities for roughly two thirds of its population
topositions where it is much harder to innovate in the informal market place.250 And the combination
of education, banks and business associations do not yet form a coherent structure of innovation. The
equivalent in the informal economy of the innovation system modelled in science and technology
studies spans the bounds of formal and informal regulation in idiosyncratic ways and seems to
operate with few inter-linkages – even informal ones. Alternatively laws, regulations and
administrative procedures that can be amorphous or over-specified interact to trigger innovation in
247Requiring published maximum retail price indication, lists of inventory , certified weights and measures andquality control in retail, none of which was being observed in Arni, which was resolved (conceded by the state)by an agreement for incremental and delayed implementation.248including those for rice, silk cloth, groceries, gold, the Red Cross (reflecting human rights impulses in town),the Lions, Rotary and the chamber of commerce.249 Achievements include a reduction of power-cuts for rice mills and an agreement to let women enter tailoring.250 Muslims and Christians are about 10% of the population, Dalits about 15%, women 50%.
107
ways that have not been traced here. Further research on the social determinants of individual
economic agency would be valuable.
10. CONCLUSION
Is the informal economy an obstacle to innovation? Pudumai – the Tamil word for innovation - means
miracle as well as modern. There can be no doubting the miracles of individual resourcefulness
showcased in this essay. While rural people are the poorest educated and while many ambitious young
people leave Arni, those who remain are not detached from the growth process. India’s growth,
whether at 5or at 9 per cent, is translated into a fast-paced engagement with innovation and
institutional churning, and innovation is a precondition for growth.
What kinds of innovation? While most Indian enterprises are in the informal economy it does not
follow that the informal economy is the abode of enterprise. Enterprise and innovation are both fuzzy
concepts, defined in many ways. But however these concepts are defined, the fieldwork reported here
revealed examples of i) Schumpeterian entrepreneurship - the inventive bridging factors of production
to create new production methods and technologies, in commodification, in cost-competition,
products and forms of organisation; ii) adaptive technological and organisational innovation; iii) the
transfer and diffusion of known technologies, processes, products and organisation into new social
contexts, iv) the diffusion of knowledge through new roles for the media and education, new images
just as capable of transforming local production relations as of feeding new social and economic
aspirations; v) other motives for innovation than the realisation of social aspiration and status (not
only profit, livelihood and the standard of living but also the problem-solving mentality celebrated by
Jugaad, the need to respond to selective state failures in provision, regulation and enforcement, pre-
emptive reactions to threatened change, collegiality/collective advancement and nurture); vi)
innovation and agency by labour and for labour as well as by and for capital; vii) radical disruptive
innovation (the NEFT of banks) as well as incremental innovation (cases of informal invention are all
incremental); viii) the under-development of innovation rents permitting rapid copying and extensive
multipliers and spill-overs with further impacts on the interface between the formal and informal
economy and the state; ix) exit and exodus as innovation; x) creative destruction (of child labour,
work, technologies, cultures and relations of of exchange, products, forms of organisation, and forms
of finance); xi) the continuity of the informally acquired knowledge base as vital to the engagement
with novelty. Far removed from the stereotype of ‘rural idiocy’251 and conservatism, these are all
evidence of the abundant social and economic resources and relations - and of the range of
motivations that might be put to work in a low C transition.
251 For Marx who coined the phrase, it meant isolation, ignorance and an inability to co-operate.
108
What roles are played by informal institutions? Key institutions which regulate innovation in the
informal economy, incentivising or discouraging novel practices, have been found to include the
family-firm, social identity, education (formal and informal), banks (formal) and finance, and more or
less well registered and active business associations. The exchange with the state, itself fully capable
of innovation, includes the redefinition of the boundary between formal and informal activity
(education, energy), selective enforcement (licences), tolerance of informal formalisation
(certification) and neglect (in turn the product variously of capture, or of the scarcity of personnel
and/or equipment). The informal equivalent of the research lab is the individual guinea-pig in society
and the business association. Risk is borne by the innovator, buttressed by savings in which gold still
plays an important role. Business associations/guilds grounded in caste are gate-keepers for entry as
well as screeners of innovation. In a politics of representation, regulation and mediation, this set of
corporatist interests negotiates collegiality within a sector just as it controls the erosion of social
barriers to entry. Formal education most resembles an innovation system, but one where formal and
informal knowledge institutions intertwine. While some kinds of innovation need training, skills and
education, and while English is a passport to economic mobility, education generates its own
paradoxes. Much knowledge is learned on the job in various ways - and through self-skilling. People
with low education are not uninnovative.252 People with high education are not necessarily given to
innovation or required to innovate inside complex organisations.
Is there an informal structure of innovation resembling an innovation system? The meshing of formal
and informal institutions counters the idea that they are discrete epistemological universes (Gupta,
1999) but this does not mean that the formal-informal distinction should be abandoned or that this
hybrid ‘ecosystem’ works in a co-ordinated or systematic way or that it is immune from
contradictions. Institutions serving useful roles in the structure of accumulation (gender for instance)
may be barriers to agency and innovation. A coherent informal structure of innovation has yet to
emerge and may never do so.
What are the implications of these findings about innovation for a new low-carbon industrial
revolution that is not yet happening at a pace appropriate to the problem? Although this is not an
Indian problem but a global one, the scope of informality is distinctively Indian, and the informal
economy is moving in the opposite direction to a low-carbon economy. For every single example of
energy efficiency (notably the three to two phase switching here) there are many more requiring
energy from fossil fuel or the un-sustainable plundering of local natural resources.
That the direction of travel is negative is not the product of the informal economy per se. It reflects
the entire Post-Independence thrust of industrialisation. A low carbon economy is a radical novelty as
252 Indeed Anil Gupta has referred to the poor as knowledge rich and devoted his life to recording the vitality ofinnovations by poor people in agriculture and rural development (1999, Science, Sustainability and SocialPurpose http://www.hks.harvard.edu/sustsci/ists/TWAS_0202/gupta_300199.pdf).
109
yet far from being accepted discursively as ‘development’. Indeed advocates of development often
resist the idea that carbon emissions must be reduced. Appropriate and superior technology exists that
can reduce carbon emissions, obstructed not by patent law but if at all by licensing. It is currently
designed for a scale above that of the small town informal economy – one challenge is therefore to
scale-down (size of new technology) while scaling-up (industrial output). However, the difference in
capital intensity between the bazaar and current low C innovation is further exacerbated because
many new renewable energy technologies have high capital costs relative to variable (‘running’) costs
- and up-front investment costs are unattractive to banks.
But national policy for climate change implies a confrontation with technological / innovation systems
already constructed by specific political interests, vested in existing arrangements, path dependent and
dense in their demands for fossil fuel. This is reflected not in policy statements - for India is
committed discursively to solar energy - but in a knot of poorly co-ordinated regulations: subsidies,
tariffs, practices of bank lending, profit extraction and asset ownership, which together lock India into
the fossil fuel usage that dominates public support and infrastructure subsidies. Low carbon
development is currently conceived as the product of a research, development and diffusion process
which cannot do without planning and is assumed to be formally state-regulated.253 (Formal) market
forces alone cannot create the new institutions and destroy the old ones for the new industrial
revolution.
In the policy literature on informality the institutions of property rights and finance have pride of
place is enjoyed by.254 But property rights were rarely mentioned to us as problems in the informal
economy: the impossibility of protecting innovation rents dynamises rapid diffusion. Even if protected
by patents / IP, attempts will be made to reverse-engineer products and technology in the informal
economy. Lack of access to formal investment finance is indeed an impediment to those lacking
formal titles to property. But bank credit does not always require collateral255 and once obtained it is
easily vired into the informal economy. The scale of capital requirements can also be an impediment
to innovation, where it tends at present to be small-scale and labour-intensive, but there is evidence of
novel forms of collective organisation to scale up collective venture capital.256Lack of knowledge is
an obstacle too, but there is an insatiable thirst for knowledge and evidence of informal institutions
which provide it. The energy sector is where low carbon transitions must start, and some of the
liveliest capabilities are to be found among informally qualified electricians and engineers. The
embedding of the informal economy in institutions of identity might even privilege dalits, the most
253 Harriss-White, Rohra and Singh 2009 EPW254 De Soto 2000255 It may rely on collective guarantees, on reputation or on stable income flows256 Sunali Rohra, 2012 PersComm, see also http://www.ceew.in/blog/
110
socially under-privileged workers, for, despite the chronically oppressive conditions in which they
work, they are expert in energy, waste and refuse.
A non-marginal change in political capabilities would be needed, however, to address the two
problems of the sluggish transition to low-carbon technology and the pervasive nature of India’s
informal economy whose innovative capabilities are not harnessed by the state, and there is no
indication in our work so far how it might emerge.
Last, this study of innovation is embedded in a research project on the materiality of the economy, the
waste gases from economic activity, and the prospects for a low C transition which negotiates the fact
that most economic activity in India is in the informal economy. Anew research agenda emerges from
this pilot project, first and foremost to make progress in the search for a low C transition but also
carrying important implications for other research fields:
i)the material stock and flow accounts of a small town, including its energy economy and
construction sector;
ii)the waste economy and its institutions: solid, liquid and gaseous
iii) the roles of dalits in the management of solid and liquid waste and their potential as
leaders in the management of gaseous waste;
iv) green innovation in the informal economy (exceptionally difficult to locate);
v) the education hub and the knowledge economy, informal knowledge and the informal
economy;
vi) liberalisation, partial state intervention, fiscal non-compliance and local capitalism;
vii) the motors and effects of formalisation (the roles of banks, corporate capital and the
state).
ACKNOWLEDGEMENTS
Bhw wishes to thank the following people and organisations for the opportunity of presenting the
aspect of a collective research project that is reported here: Prof KalpanaKannabiran and the Centre
for Social Research Hyderabad, November 2012; Prof Pravin Jha and the Long Term Village Studies
Conference JNU, New Delhi, November 2012, Prof Francois Combarnous, Universite Bordeaux IV,
March 2013; Prof Xiaolan Fu and the TMD Centre, Oxford/Tsinghua Universities Conference on
Innovation and Entrepreneurship for Inclusive and Sustainable Development(August 2013); Prof
David Booth and the ClimUrb Conference, Manchester ( September 2013). She is grateful to R
Champaka and to Dr Sarah Hodges for their searching comments on the early draft.
REFERENCES (incomplete)
111
1. Camilla Roman, forthcoming, ‘Old is gold but change is permanent: understanding technological
change and innovation’ in (ed) B Harriss-White Dynamism of Middle India, Palgrave;
2. F Stewart 1977 Technology and Underdevelopment Macmillan;
3. E O Wright 2012 Worker Managed Firms, Dept of I. R. and Politics, Oxford
4. Fitzgerald Heyer and Thorp Introduction in eds (FHT Overcoming thpersistence of Poverty and
Inequality pp1-18
112
APPENDIX 1: ARNI 2012 QUESTIONNAIRE
TO BUSINESS ASSOCIATION PRESIDENTS AND OTHER NOTABLE REPRESENTATIVES
ABOUT INNOVATION IN THE INFORMAL ECONOMY
1. Your sector – how big –number of firms - structure –castes – immigrants
What has been the biggest change in your sector over the last 50-10 years? A technique?A change
in organisation?The structure of the sector?Something else?infrastructure? Let’s choose the most
important for you.
2. Where and when did it arrive? Would you say it was incremental or a big disruptive change?
3. Was it invented in Arni? Was it heard of somewhere else and transferred here? From where?
By whom?
4. How was the knowledge acquired for the innovation? How did it affect work and thre social
composition of the workforce? Did it have implications for womens’ work? How?
5. If a worker innovated how were they involved and were they rewarded?
6. What were the most significant barriers to the innovation? Raw materials? Energy?
Transport? Markets?
7. How was new technology adapted to local conditions?
8. What was needed by way of other skills – here and elsewhere? Other techniques and
technologies (mobile phone)? Here and elsewhere?
9. What were the costs involved in acquiring these skills and technologies? Who covered them?
How? ( private loans/ government incentives/ tax breaks/ micro-finance loans?)
10. How was the innovation protected. How did it diffuse? Why?
11. Was it risky to introduce or develop? How were the risks dealt with? Did it result in failure
and losses? How were they overcome? Did luck play a role?
12. Who opposed the innovation/ was there hostility? From whom? How expressed? Who lost out
because of it? How and why?
13. How did the business association help at various stages? If not the business association , the
caste association? The town organisations? An NGO?A political or religious organisation?
Another kind of organisation outside the firm?
14. Was the government involved in any way? How? TN govt / parastatals /local municipality /?
Did licences and vigilance play a role at all/ ? Where some policies helpful and others not –
working in opposite directions? If so what?
15. What role did banks and bog companies play?
16. Were local private colleges and training facilities involved? How? Any informal institutions
of learning?

113
17. How has the change affected the structure of your sector? \profits? Use of profits? Has it
made entry more difficult?
18. Have there been further innovations that depend on the one you describe? What has been the
impact on work in your sector? In the town? In the rural region?
19. Do you recall any failed innovations – ones which did not spread and were abandoned? Why
do you think they failed?
20. Are there any important questions about innovation in your sector that we haven’t asked you?
21. What do you want for your children’s future?
114
EVALUATING ALTERNATIVE TECHNOLOGIES AND
POLICIES: MULTICRITERIA MAPPING
Barbara Harriss-White
115
EVALUATING ALTERNATIVE TECHNOLOGIES AND POLICIES: MULTICRITERIA
MAPPING
Barbara Harriss-White257
Introduction
In a set of production and distribution technologies and institutions that combine to make a supply
chain in an economic sector like rice, if a systemic analysisof emissions at each stage is associated
with the detail of costs, returns and the organisation of labour, then the highest-emitting part(s) of the
system can be identified along with the worst conditions for workers.
It should next be possible to scope alternatives and make a social evaluation of them. This brief essay
is about the methods that may be used.
Social Cost Benefit analysis and its problems:
Conventional appraisals of technological options take the form of social cost benefit analysis (SCBA),
an attempt to enable rigorous comparisons of the stream of costs and returns from alternative
(technological / policy) choices throughout the life of a ‘project’. This is the only method that could
inform the policy question whether to invest resources in a Kenyan hospital system or an Indian steel
plant. Costs are estimated in (international) border prices for tradable goods and ‘shadow’ prices for
domestic non-tradable ones. These pricesreflect real costs to society by un-distorting the effects of
market imperfections (and subsidies and taxes) and by incorporating values for positive and negative
externalities. Both costs and returns may include weights for the impact of a given choice upon
saving, investments and income distribution as well as for certain political goals (or ‘merit wants’) –
for instance employment and current consumption.Future costs and benefits are discounted back to
the present by a social rate of interest that represents the opportunity cost of capital to the economy in
real terms.
The point about this method is that all values are expressed in money terms.
SCBA has been criticised not only for the difficulties and subjective judgements involved in making
money accounts of complex inputs and outputs. Since neither domestic economies nor the world
economy work in equilibrium states of perfect competition, why create something that doesn’t exist
for the purpose of comparison? Weights for savings, consumption and investment contain value
judgements, have social implications and are political decisions. The comparative analyses are usually
narrow: between two or a few options (with or without streams of benefits); or a single project is
evaluated, without any comparator, to ascertain its positive net present value. In practice SCBA is
257 With thanks to Minerva Singh, Rebecca White, Andy Stirling and Alfy Gathorne-Hardy. Referencesincomplete
116
often performed ex post rather than ex ante and justifies choices that have already been made for
reasons other than the economic.258CBA is closed to divergent values, ‘hubristic about uncertainty’.
Itrequires auniquely authoritative solution as its objective. It suppresses dissent or public deliberation
and denies the political nature of technological change.259 Last but not least it ignores any dimension
that cannot be reduced to money values.
Alternatives: MCA and MCM:
A range of social agentsmay not only generate different economic valuations but may also
deploydifferent decision parameters, in different combinations and with different weights. With
origins in military logistics in WW2, and now best developed for policy in Europe, Multi-Criteria
Decision Making or Multi-Criteria Analysis is a class of decision-analytical tools developedover the
last half century for evaluative criteria which may conflict. (Cost, quality and safety are regularly
invoked as examples).260 A given technology may not perform equally well in all criteria. In this kind
of common problem, when there is no unique optimal solution/technology/policy that performs best
on all criteria, a choice rests ona set of ‘non-dominated’ solutions/technologies/policies in which any
other choice is impossible without sacrifice inat least one criterion. Typically there are large numbers
of possibilities for criteria. Sopractical social choices then require criteria to be simplified and trade-
offs to be calculable.
This family of approachesthen splits between methods to calculate trade-offs using one numeraire ($)
(which have the same strengths and weaknesses as SCBA) and those exploring either a defined set or
an open set of decision parameters that are not commensurable: for example, the social benefits of
alternative biofuels or GM crops, their economic benefits, externalities, risks and environmental
damage. In Analytical Decision Hierarchies, alternatives are ranked by pairwise comparisons of each
criterion in a set of classes or preference-orderings. MCA can then be used to obtain a technical
solution. The sub-field of engineering and economics is highly technically sophisticated - applied “to
differing degrees and with varying success in fields such as transport and land-use planning, siting,
energy policy, waste management, medicine, commercial decisionmaking, and sometimes technology
assessment.”261… “There is a thriving “market in methods” (Stirling and Mayer, 2001, 533).
But the approach can also be used heuristically to explore dimensions ofchange - in Multi-criteria
Mapping (MCM).262MCMis a variation on the MCA approach which builds on the fact that socio-
economic (class/occupational) position may shape evaluation. Instead of a politics in which all social
258 Stewart F 1975 A Note on Social Cost Benefit Analysis and Class Conflict in LDCs World Development3,1,31-40259 Stirling and Mayer 2001260M Singh 2011261The literature is cited in Stirling and Mayer, 1999262 ‘Deliberative mapping, briefing 5’: www.deliberative-mapping.org
117
evaluation is compressed and reduced to $ in order to make comparisons and analyse trade-offs, the
MCM approach to decisions recognises a plurality of social interests and formally incorporates
consultation and deliberation into social decision-making. Rather than leave policy problems as
‘implications for policy’ directed from a technical bridge ‘above’ the ship of state, it directly initiates
a social and political conversation about policy implications.
The methodstructuresinformation about social agents’ perceptions and judgments about a series of
options.“An explicit (and, as will be seen, somewhat contrived) working distinction betweenthe
ostensibly `technical' concept of performance `scores' and the more openly subjective notion of
criteria `weightings' is an idea common to all multi-criteria approaches.This offers an especially
important feature in exploring the relationship between scientific and socio-political factors in
appraisal” (Stirling and Mayer, 2001, p532) .Numerical scores have to be developed to reflect the
weights of different social agents across a set of appraisal criteria. Assumptions about the role of
politics, risk, uncertainty, the physical environment etc may be built in. Agents may weight the
appraisal criteria themselves.The MCM tool computes scores, explores uncertainty, establishes social
weights, ranks alternatives, identifies conflicts and consensus, and suggests social outcomes.
MCM software computes quantitative scores, uncertainties (differences between most optimistic and
pessimistic scenarios), weights, and final ranks, transcripts of the interview and textual notes. The
analysis is iterative and inductive. The usefulness and problems with MCM will become clear through
a brief account of two applications.
Example 1.SPRU, 2006: An evaluation of policy options for obesity.263 Policies need to have social
support to be well implemented.There is plentiful evidence that evidence-based policy needs ‘stake
holder’ support. Science, expert opinion, stakeholders and political drivers are pre-identified as the
institutions responsible for the diffusion of a social response to a problem – the ‘stakeholders’. The
MCM exercise in question was framed by reviewing the scale, trends social victims and drivers of
obesity before introducing and characterising (in a ‘full description’) a set of 20 varied policy options
either proposed or in course of implementation in selected EU countries – all with the specific
objective of reducing obesity. Because of the laboriousness of the MCM interviews a small subset of
these policies (7) were regarded as a core set, the remainder being discretionary. Next a set of 'criteria'
were developed to represent different values or underlying issues which participants use when
appraising those options.264 Then the options were evaluated using each criterion in turn with
numerical 'scores' to reflect the performance of each option under each criterion. Representatives from
263SPRU 2006 Policy options for responding to obesity: evaluating the options Sussex University264 Common criteria in policy analysis are : “Effectiveness: likely to achieve the intended result, Utility: clearbenefits to individuals or population groups Proportionality: costs are acceptable for the gains Equality: noincrease in discrimination or disadvantage Accountability: open to public scrutiny andchallenge SPRU 2006 Policy options for responding to obesity: evaluating the options Sussex University
118
21 ‘stakeholder categories’ were invited to make optimistic and pessimistic weightings using
specified scenarios.Finally a quantitative ‘weighting' was applied to each criterion, in order to reflect
its relative importance.265 Each option was then mapped across criteria and stakeholders to generate a
set of consensus proposals for policy and a set of controversial ones.In the event, those interviewed
generated a vast range of factors that they took into consideration in discussing and ranking the
options.
Example 2.Stirling and Mayer 2001: An application of MCM to GM crops266Here the MCM exercise
is framed in terms of the political tension generated by different social evaluations of risk, and the
path dependence of a host of ramifying institutions when a risky decision is implemented. It was
thought possible that stakeholders might conceive risk in ways that are incommensurable; and it is
now well established that experts are but one constituency in the policy process, a constituency armed
with a great variety of methods of analysing risk and decision making which in itself is a source of
confusion to other stakeholders. MCM may be used to integrate a new generation of precautionary,
deliberative or participative approaches to decision making with scientific methods such as SCBA.
The substantive topic, the risk/safety of releasing GM crops in Europe, was framed in terms of 6
alternative production technologies. The stakeholders were 12 significant, authoritative protagonists
in UK debates. Criteria were generated by the protagonists themselves – up to 12 each. General
criteria such as precaution, efficiency, sustainability were interrogated in individual discussion. The
interviews were long – 2-3 hours – but were claimed to be considerably shorter to the individuals
concerned than other types of participatory method. Policy options/technologies were scored on a
cardinal rating scale against criteria with reference to a set of specified scientific factors (e.g.
employment versus cancer risks).267So were the criteria themselves. Normalised performance scores
could then be multiplied by the importance weighting that expresses the relative subjective priority of
each criterion for each stakeholder. The options were then ranked. Subsequently, the wide range of
criteria invoked (117 in this exercise, many thought ex ante by the researchers to be of only indirect,
of even scant, relevance to the problem of choice) were grouped (6 were actually generated – see the
Table below), the sensitivity analysis of weightings could be explored, and consensus and
controversial outcomes derived – along with reasons given for them. Participants were sent the results
and asked to comment on the method and the substantive results. These interactions are described in
detail in Strling and Mayer, 2001. Policies both for agriculture and for regulatory appraisal methods
were generated from the MCM.
265, SPRU, 2006, p10266 Stirling A and S Mayer 2001 A novel approach to the appraisal of technological risk: a multicriteria mappingstudy of a genetically modified crop Environment and Planning C : Government and Policyvol 19 pp 529-555267 “Explicit `anchor points' proved useful for the assignment of scores: for example, reference to the currentstatus quo as a mid-range score, or zero risk as a maximum score. In all cases a high numerical scorecorresponded with high performance and vice versa.” Stirling and Mayer 2001 p534
119
Some Comments and Criticisms:
1. MCM explicitly allows for the ‘variability of perspectives, interdependency and
conditionality among options’ (S/M 2001 p1) if not outright conflicts of interest to be made
explicit(S/M 2001 pp18-19). It therefore both captures politics and makes it explicit in the
social valuation. Policy does not remain off-stage as an implication as is usual in research
projects, with all the normative assumptions about state recourses and capacities that this
procedure embodies, but is directly incorporated into the research process. Nonetheless, in
comparison with analyses of the strategies and technologies of power exercised in policy
processes (in the establishment of the discursive agenda, in the creation of procedure/law, in
the raising of resources (financial and human) and in the organisation of social access to the
state268), which disturb the assumptions used in framing policy impacts by implication, MCM
works with a stylised and simplified model of the politics of policy.
2. The framing of the question for MCM is vital to the exerciseEven when the objective is very
clear the method generates complexity. In contradistinction to most social science, the
analytical procedure is non-reductionist.
3. Little theoretical rigour guides the choice of ‘options’ (technologies / policies). SPRU
explains (2006, p533) that options were ‘pre-selected by researchers’ – ‘somewhat stylised’
but participants could add to them. Stirling and Mayer describe ‘various measures being
discussed’ (p6), ‘to cover a range of fields’ (p10). Commonly, options are legitimised through
expert consensus - at best through defining a specific policy field. This is a ‘sandpit-event’269
approach to the legitimation of options. More systematic approaches have involved consulting
a set of documents considered to be authoritative. This is a directive approach to the
identification of alternatives. When in 1990, the entire sample of interests in a system of rural
markets in West Bengal was systematically asked what policies would help them, there were
two significant results,: first, many imaginative suggestions were advanced, few of which
were currently reflected in regulative policy; second, many had objectives conflicting with
those of other economic interests in the system.270 In MCM while core options are directed,
the extent to which other options suggested by stakeholders can be included is optional and
268see Bina Fernandez, 2012, for a fine deconstruction of the policy process (after Schaffer, 1984).Fernandez,B. 2012.Transformative Policy for Poor Women: A New Feminist Framework. Burlington, VT and Surrey, UK:Ashgate.269 Adopted by the UK’s Natural Environmental Research Council, sandpit events are a deliberatelyempiricist collaborative and time-bound approach to research design in which preselected experts from avariety of fields are assembled to address a preselected theme in a short and intense period of interaction fromwhich authority flows.http://www.nerc.ac.uk/research/programmes/mre/events/ao-sandpit.asp?cookieConsent=A270BHW 2008 Rural Commercial Capital, OUP ch 6.
120
the extent to which interests in them conflict is a function of the method of choice of
stakeholders.
4. The concept of stakeholders is a metaphor: stakes may be held in many fields of interest with
varying power, materiality and relevance.Important roles are played by the individual, often
with no means of sampling for representivity.Theirchoice is a matter of judgment rather than
theory: it is achieved through ‘spanning a diverse range of institutional interests and
perspectives’. (SPRU,2006 ,p 533) through ‘consultation of the literature, discussions with
potential participants, debates within the research team’ (S/M 2001, p9, p11). Choice of
stakeholdermay be used to bias and engineer results and to suppress dissent.271Willingness of
stakeholders to be consulted also shapes the results. Without theory, stakeholders who may be
part of the problem may be invited to generate solutions. It is not clear how the selection is
weighted so as not to provide a desired result.
5. Criteria may be imposed or be chosen by stakeholders (S/M 2001 p13) and then classified
and grouped ex post. Certain exercises identify a small set of core criteria and a larger
imposed or open ended discretionary set. Subjective judgments are required here. In the EU
exercise on obesity, common ‘meta’-criteria included ‘effectiveness (likelihood to achieve the
chosen result) utility (clear benefits to defined groups in society) proportionality (costs are
acceptable for gains) equality (no increase in disadvantage) accountability (open to public
scrutiny)’ (ibid). Open-ended criteria generate large quantities of information needing to be
systematised across all options for them to be meaningful and for interviews not to be
‘prejudiced rants’.
6. Scores and weightings are individually subjective and may be contrived. Normalisation
doesn’t solve this problem.
7. The interview process is reported to be laborious (SPRU p535)
Other points:
1. Policy / decision making has become a science, focussed on the decision and its rationality.
Bernard Schaffer was one of the first among many to argue that the decision is an embattled
process – his case study of the decision to drop the atomic bomb was a one of a decision that
was never actually taken – a consensus moved towards a position in which there was no
alternative, an act with fateful consequences to this day.272 We saw earlier that the policy
process has many elements. MCM systematises the contested and consensual elements of the
decision but has not yet been extended to other dimensions of the policy process.
271Monbiot Stirling and Mayer272 Schaffer 1984 Towards Responsibility
121
2. Entire policy fieldsare technically labelled, a practice that is necessary but exclusionary.
Nutrition policy for instance regularly excludes public food distribution or the alcohol
industry and its consequences, both of which may overwhelm the effects of nutrition policy
per se.273 MCM could be used to open up a policy field to question but so far it is used to
elicit rigorous evaluation of alternatives within a policy field or frame - which is taken as
given.
3. Options: technologies, policies and organisational structures do not simply slot into a socio-
economic system but have dynamic multiplier and spill-over effects throughout a system and
over time. The Value Chain literature has contributedinsights into systemic repercussions in
research on supplier versus producer driven governance. While it will be possible to open
such effects up for discussion in MCM, the method by itself does not enable us to model
dynamic consequences of technological change.
However, paraphrasing Joshi on CBA and begging a lot of further questions – a method is good
enough if it gives us (shadow prices) that are simply derived, approximately right and which will lead
the economy in the right direction’(!)274
Questions about our experiment.
1.Framing: An MCM exercise within our project has to question how to identify and then evaluate
alternatives to the existing arrangements that either reduce GHGs or improve labour arrangements OR
both.Should the question of options be framed in terms of social priorities over time, orof ranking the
trade-offs between the evaluative criteria among the options? Or should there be a series of options to
meet a fixed material goal? How much iterationbetween stakeholders and researchers over the results
might it be possible to accommodate in practice? Can the method substitute for other approaches to
impact and be justified in terms of the debate triggered by the set of interviews? Each of these
questions involves a different approach to framing.
2. Choice of options: What are the type of optionswhich reduce GHGs while generating decent jobs?
Science and technology studies and innovation studies have not generated a scoping methodology.
Arrays of alternatives are often confined to particular institutions (e.g. in agricultural innovations from
the CGIAR, or the IARI) or from a more or less systematic‘literature review’. Property rights and
commercial secrecy constrain what may be gathered from the internet. Some studies aspire to
objectivity through key texts.
In our case we have had to await the results of the measurement stage of the project to know where
the GHG hotspots and employment blackspots are sited. Candidates are alternative land use (millets),
273 BHW and Janakarajan 2004274 V Joshi 1970 in ed W Eltis and M Scott Essays in Honour of Sir Roy Harrod’ OUP
122
production technologies (organic/ SRI) energy (renewable), water (solar pumps), cows
(mechanisation). Full and comparable descriptions of all possible alternatives will need to be
developed. These have to be read in advance by interviewees. [See Appendix here for a draft
example.]
3. Stakeholders: How to theorise stakeholders? What does bias mean and how to avoid it? How to
handle differences in literacy and language, individual and group interviews (the latter almost
unavoidable in India)? How important will gender and caste be in the identification of stakeholders?
(Candidatestakeholderswould be: farmers, labourers, machine providers, cattle industry, wholesalers,
rice millers, their labour, lorry owners, supermarket owners/managers, their labour) – market creators
/ advertisers – educators – insurance – planners – policy makers (IAS officers (finance, agriculture,
labour, environment, industry, PDS) ,lobbies and business associations: CII, chambers of commerce,
rice industry organisations) – politicians - NGOs and think tanks – labour - journalists.)
Where to be sited? A new approach to site will be needed for this experiment: New Delhi, Chennai,
small towns, villages. As well as being multi sited, the method will use Tamil and English.
4. What criteria are being used? (Alternatives may require unfeasible amounts of data) See appendix
list.
Costs/returns
costs of not acting
benefit in GHGs
implications for quality and quantity of labour (and how best to summarise this?)
What factors/principles influence a rejection of the criteria? and options?
5. Sensitivity/ scenarios How to develop the political economy? Do we leave this to stakeholders? Do
we formally internalise a narrative about the political changes needed for the alternative options to be
developed? How are risks to be identified and internalised?
-------------------------------------------------------------------------------
Research path/ procedure:
1. framing ->:
2. Options (policies/technologies) ->
3. Identification of stakeholders
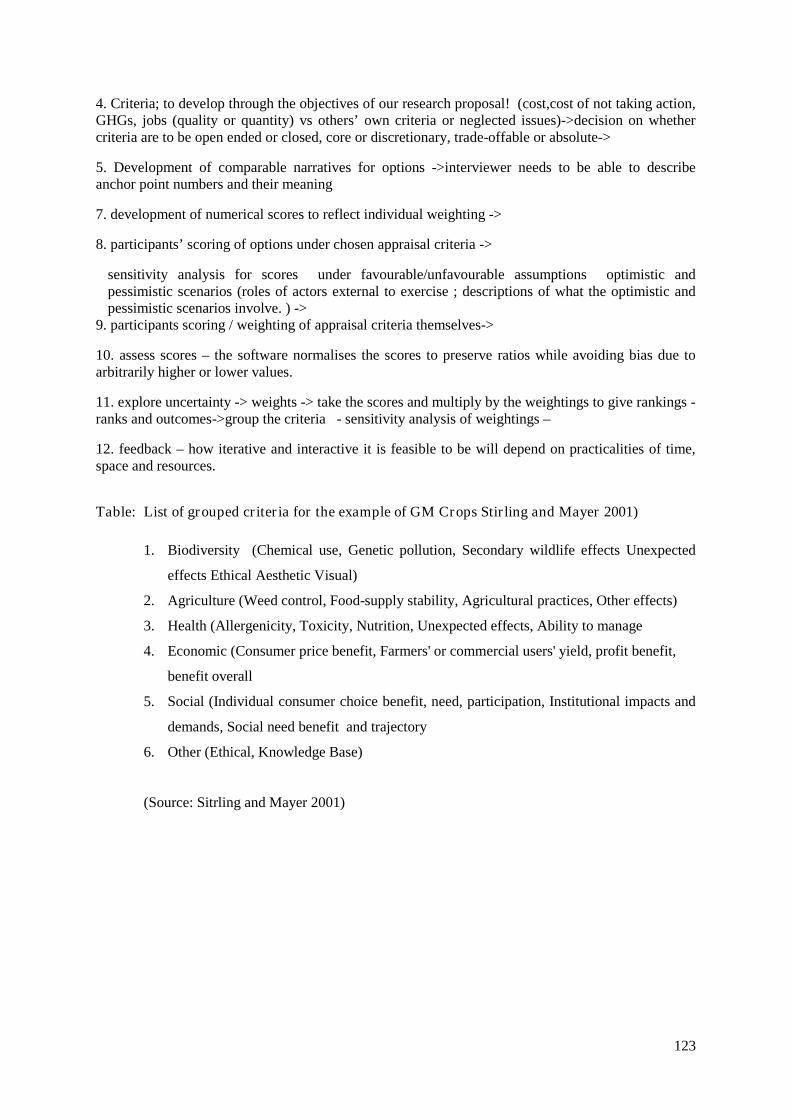
123
4. Criteria; to develop through the objectives of our research proposal! (cost,cost of not taking action,GHGs, jobs (quality or quantity) vs others’ own criteria or neglected issues)->decision on whethercriteria are to be open ended or closed, core or discretionary, trade-offable or absolute->
5. Development of comparable narratives for options ->interviewer needs to be able to describeanchor point numbers and their meaning
7. development of numerical scores to reflect individual weighting ->
8. participants’ scoring of options under chosen appraisal criteria ->
sensitivity analysis for scores under favourable/unfavourable assumptions optimistic andpessimistic scenarios (roles of actors external to exercise ; descriptions of what the optimistic andpessimistic scenarios involve. ) ->
9. participants scoring / weighting of appraisal criteria themselves->
10. assess scores – the software normalises the scores to preserve ratios while avoiding bias due toarbitrarily higher or lower values.
11. explore uncertainty -> weights -> take the scores and multiply by the weightings to give rankings -ranks and outcomes->group the criteria - sensitivity analysis of weightings –
12. feedback – how iterative and interactive it is feasible to be will depend on practicalities of time,space and resources.
Table: List of grouped criteria for the example of GM Crops Stirling and Mayer 2001)
1. Biodiversity (Chemical use, Genetic pollution, Secondary wildlife effects Unexpected
effects Ethical Aesthetic Visual)
2. Agriculture (Weed control, Food-supply stability, Agricultural practices, Other effects)
3. Health (Allergenicity, Toxicity, Nutrition, Unexpected effects, Ability to manage
4. Economic (Consumer price benefit, Farmers' or commercial users' yield, profit benefit,
benefit overall
5. Social (Individual consumer choice benefit, need, participation, Institutional impacts and
demands, Social need benefit and trajectory
6. Other (Ethical, Knowledge Base)
(Source: Sitrling and Mayer 2001)
Related Documents