Paper proceedings of Agri Animal 2013

Welcome message from author
This document is posted to help you gain knowledge. Please leave a comment to let me know what you think about it! Share it to your friends and learn new things together.
Transcript
Paper proceedings of Agri
Animal 2013
Paper Proceedings of Agri Animal 2013 - ISSN 2279-3682
ii
Paper proceedings of Agri Animal 2013
ISSN 2279-3682
Published by :
International Center for Research and Development
858/6,
Kaduwela Road,
Thalangama North,
Sri Lanka
Email : [email protected]
Web: www.theicrd.com
© ICRD- 2013
All rights reserved.
Paper Proceedings of Agri Animal 2013 - ISSN 2279-3682
iii
AgriAnimal 2013
Conference Convener
Prabhath Patabendi
International Centre for Research & Development (ICRD)
ORGANIZERS
International Centre for Research & Development (ICRD),
Sri Lanka
Chungnam National University
Republic of Korea
THE SCIENCETIFIC COMMITTEE
Prof. S.L. .Ranamukaarachchi ( Thailand)
Dr. Mahanama D Zoysa ( South Korea)
Prof . Bae-Keun Park ( South Korea)
Prof. Shin-Hyun Jin ( South Korea)
Prof. S Mandal ( India)
Dr. Baba Jakusco ( Nigeria)
Paper Proceedings of Agri Animal 2013 - ISSN 2279-3682
iv
Suggested citation
DISCLAIMER:
All views expressed in these proceedings are those of the authors and do not necessarily represent
the views of, and should not be attributed to, the Institute of International Center for Research &
Development , Sri Lanka and Chungnam National University,Republic of Korea..The publishers do not
warrant that the information in this report is free from errors or omissions.
The publishers do not accept any form of liability, be it contractual, tortuous, or otherwise, for the
contents of this report for any consequences arising from its use or any reliance place on it.
The information, opinions and advice contained in this report may not relate to, be relevant to, a
reader’s particular interest.
Portions of this work are copyrighted. Except as permitted under the Copyright Act, the copyrighted
parts may not be reproduced by any process, electronic or otherwise, without the specific written
permission of the copyright owners. Neither may information be stored electronically in any form
whatsoever without such permission.
International Center for Research and Development
858/6,
Kaduwela Road,
Thalangama North,
Sri Lanka
Tel : +94112744306
Fax: +94112744306
Email : [email protected]
Web: www.theicrd.com
Paper Proceedings of Agri Animal 2013 - ISSN 2279-3682
v
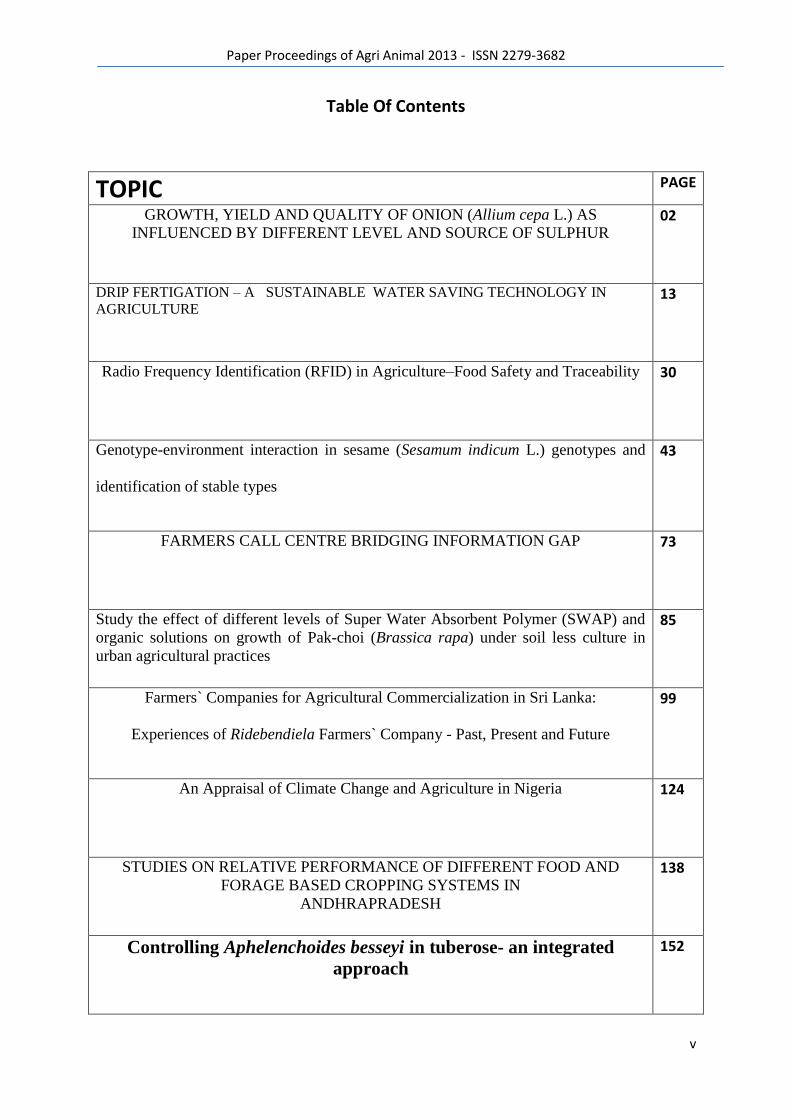
Table Of Contents
TOPIC PAGE
GROWTH, YIELD AND QUALITY OF ONION (Allium cepa L.) AS
INFLUENCED BY DIFFERENT LEVEL AND SOURCE OF SULPHUR
02
DRIP FERTIGATION – A SUSTAINABLE WATER SAVING TECHNOLOGY IN
AGRICULTURE
13
Radio Frequency Identification (RFID) in Agriculture–Food Safety and Traceability
30
Genotype-environment interaction in sesame (Sesamum indicum L.) genotypes and
identification of stable types
43
FARMERS CALL CENTRE BRIDGING INFORMATION GAP
73
Study the effect of different levels of Super Water Absorbent Polymer (SWAP) and
organic solutions on growth of Pak-choi (Brassica rapa) under soil less culture in
urban agricultural practices
85
Farmers` Companies for Agricultural Commercialization in Sri Lanka:
Experiences of Ridebendiela Farmers` Company - Past, Present and Future
99
An Appraisal of Climate Change and Agriculture in Nigeria
124
STUDIES ON RELATIVE PERFORMANCE OF DIFFERENT FOOD AND
FORAGE BASED CROPPING SYSTEMS IN
ANDHRAPRADESH
138
Controlling Aphelenchoides besseyi in tuberose- an integrated
approach
152
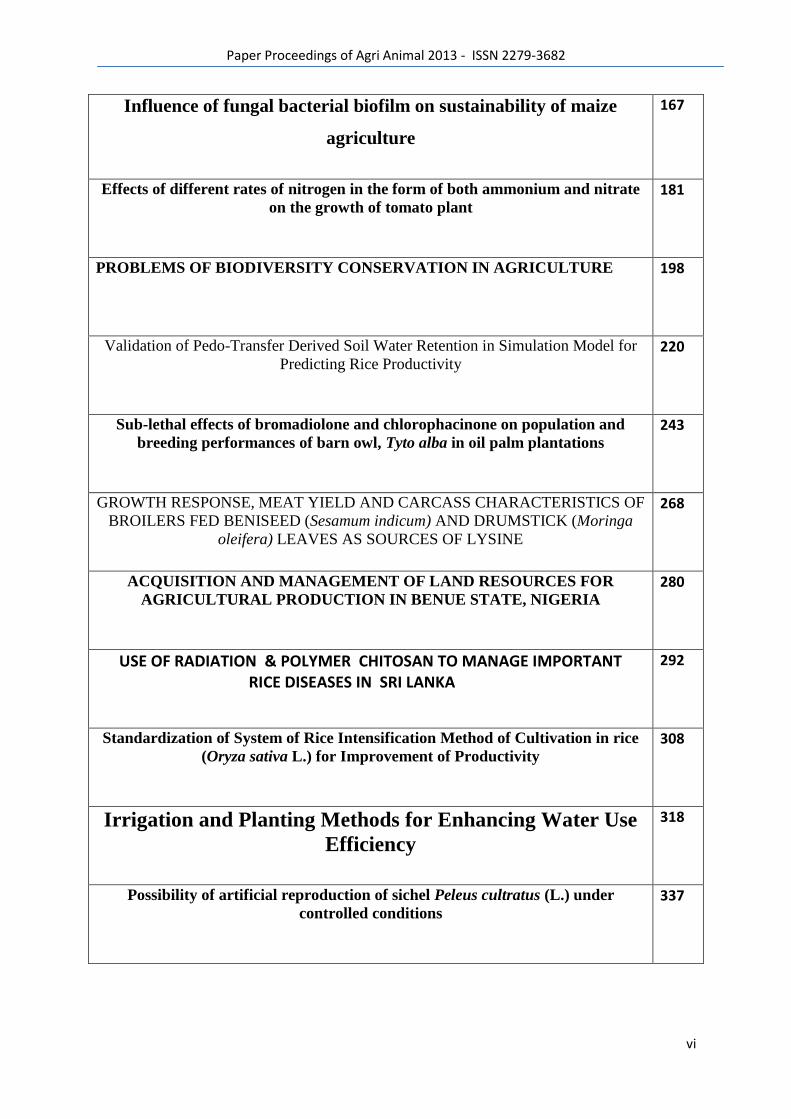
Paper Proceedings of Agri Animal 2013 - ISSN 2279-3682
vi
Influence of fungal bacterial biofilm on sustainability of maize
agriculture
167
Effects of different rates of nitrogen in the form of both ammonium and nitrate
on the growth of tomato plant 181
PROBLEMS OF BIODIVERSITY CONSERVATION IN AGRICULTURE
198
Validation of Pedo-Transfer Derived Soil Water Retention in Simulation Model for
Predicting Rice Productivity
220
Sub-lethal effects of bromadiolone and chlorophacinone on population and
breeding performances of barn owl, Tyto alba in oil palm plantations 243
GROWTH RESPONSE, MEAT YIELD AND CARCASS CHARACTERISTICS OF
BROILERS FED BENISEED (Sesamum indicum) AND DRUMSTICK (Moringa
oleifera) LEAVES AS SOURCES OF LYSINE
268
ACQUISITION AND MANAGEMENT OF LAND RESOURCES FOR
AGRICULTURAL PRODUCTION IN BENUE STATE, NIGERIA
280
USE OF RADIATION & POLYMER CHITOSAN TO MANAGE IMPORTANT RICE DISEASES IN SRI LANKA
292
Standardization of System of Rice Intensification Method of Cultivation in rice
(Oryza sativa L.) for Improvement of Productivity 308
Irrigation and Planting Methods for Enhancing Water Use
Efficiency
318
Possibility of artificial reproduction of sichel Peleus cultratus (L.) under
controlled conditions
337
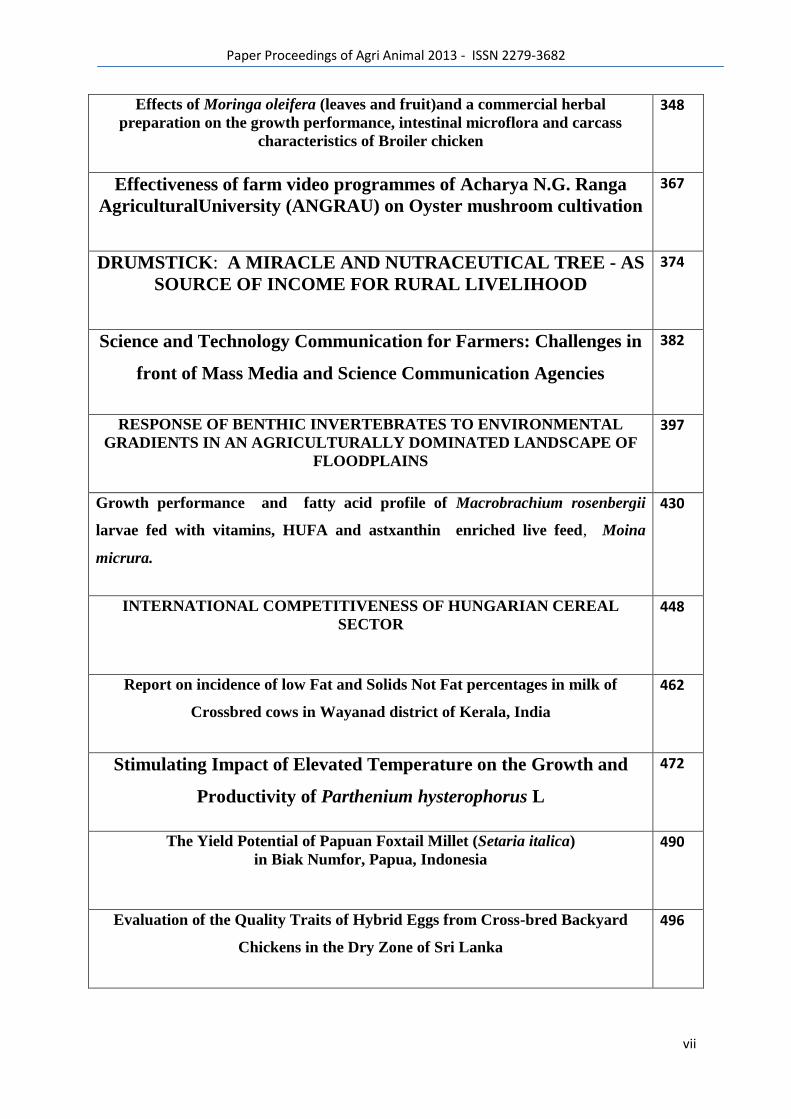
Paper Proceedings of Agri Animal 2013 - ISSN 2279-3682
vii
Effects of Moringa oleifera (leaves and fruit)and a commercial herbal
preparation on the growth performance, intestinal microflora and carcass
characteristics of Broiler chicken
348
Effectiveness of farm video programmes of Acharya N.G. Ranga
AgriculturalUniversity (ANGRAU) on Oyster mushroom cultivation
367
DRUMSTICK: A MIRACLE AND NUTRACEUTICAL TREE - AS
SOURCE OF INCOME FOR RURAL LIVELIHOOD
374
Science and Technology Communication for Farmers: Challenges in
front of Mass Media and Science Communication Agencies
382
RESPONSE OF BENTHIC INVERTEBRATES TO ENVIRONMENTAL
GRADIENTS IN AN AGRICULTURALLY DOMINATED LANDSCAPE OF
FLOODPLAINS
397
Growth performance and fatty acid profile of Macrobrachium rosenbergii
larvae fed with vitamins, HUFA and astxanthin enriched live feed, Moina
micrura.
430
INTERNATIONAL COMPETITIVENESS OF HUNGARIAN CEREAL
SECTOR
448
Report on incidence of low Fat and Solids Not Fat percentages in milk of
Crossbred cows in Wayanad district of Kerala, India
462
Stimulating Impact of Elevated Temperature on the Growth and
Productivity of Parthenium hysterophorus L
472
The Yield Potential of Papuan Foxtail Millet (Setaria italica)
in Biak Numfor, Papua, Indonesia
490
Evaluation of the Quality Traits of Hybrid Eggs from Cross-bred Backyard
Chickens in the Dry Zone of Sri Lanka
496
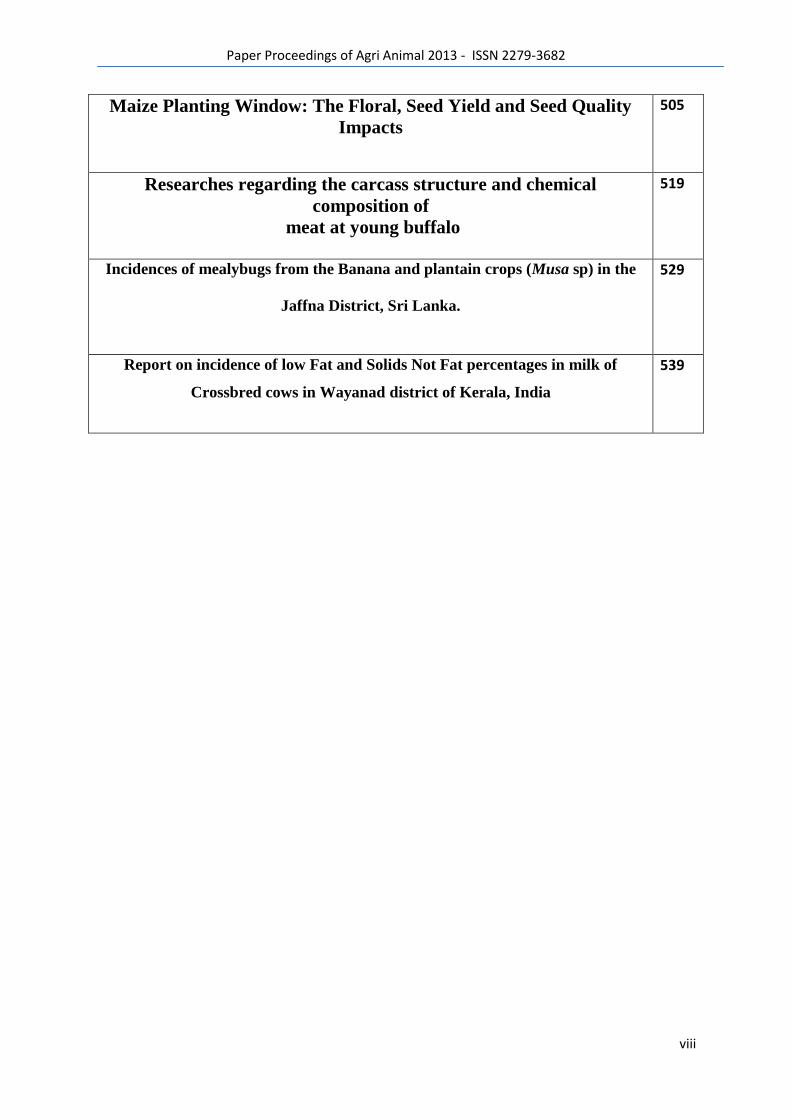
Paper Proceedings of Agri Animal 2013 - ISSN 2279-3682
viii
Maize Planting Window: The Floral, Seed Yield and Seed Quality
Impacts
505
Researches regarding the carcass structure and chemical
composition of
meat at young buffalo
519
Incidences of mealybugs from the Banana and plantain crops (Musa sp) in the
Jaffna District, Sri Lanka.
529
Report on incidence of low Fat and Solids Not Fat percentages in milk of
Crossbred cows in Wayanad district of Kerala, India
539

Paper Proceedings of Agri Animal 2013 - ISSN 2279-3682
1
1
Paper Proceedings of Agri Animal 2013 - ISSN 2279-3682
2
GROWTH, YIELD AND QUALITY OF ONION (Allium cepa L.) AS
INFLUENCED BY DIFFERENT LEVEL AND SOURCE OF SULPHUR
Anupam Pariari * and Salauddin Khan
Department of Spices and Plantation Crops, Faculty of Horticulture
Bidhan Chandra Krishi Viswavidyalaya
Mohanpur – 741252, Nadia, West Bengal, INDIA
ABSTRACT
An experiment was conducted at Horticultural Research Station, Mondouri, Bidhan
Chandra Krishi Viswavidyalaya, Nadia situatedin Gangetic Alluvial Plains of West Bengal,
India. In addition to recommended dose of NPK , onion (Allium cepa L.) cv. Sukhsagar was
manured with two doses of sulphur from four varying sources i.e. SSP, elemental sulphur,
K2SO4 and nitrosulf during rabi seasonin Gangetic alluvial plains (soil pH 6.9). The
experiment was laid out in Randomized block design with 9 treatments and 3 replications.
The result showed that the highest plant height was observed with nitrosulf at the rate of 0.5
lit/100 lit/ ha, whereas, the total number of leaves per plant and maximum basal girth were
recorded with application of S at the rate of 60 kg/ha through single super phosphate (SSP).
Application of nitrosulf at the rate of 0.5 l/100 lit/ha produced maximum bulb diameter and
bulb yield (20.25 t/ha). Among the qualitative parameters, the moisture and protein content
was highest (86.55% and 1.42%) in nitrosulf at 0.5 lit/100 lit/ha, whereas the increase dose of
nitrosulf i.e. 0.625 lit/100 lit/ha produced bulb with highest dry weight (14.99%) and TSS
(14.85%). Ascorbic acid and sulphur content was maximum (6.84 mg/ 100g and 0.494%)
under the treatments S at 60 kg/ha in the form of SSP.
Key words: Growth, K2SO4,Nitrosulf, onion, quality, SSP, and yield.
Paper Proceedings of Agri Animal 2013 - ISSN 2279-3682
3
INTRODUCTION
Onion (Allium cepa L., Family: Alliaceae) is an important bulb crop cultivated
throughout India and grown for pungent bulbs and leaves. It is one of the largest producers in
the world, with 16% of area and 10% of production and occupies the second place. From 5.28
lakh ha cultivated area a production of 6.66 million tonnes of bulb was obtained and 5300
metric tonnes with a value of Rs 3530 million was exported during 2006-07. For increasing
demand in foreign and domestic market it deserves our serious consideration for higher
production of the crop. Onion is a gross feeder, hence requires heavy manuring for better
yield. In addition to N, P and K nutrients, sulphur has been found to be very beneficial
nutrient for onion. Sulphur remains in plant tissues chiefly in the form of proteins, volatile
compounds and sulphates. Sulphur also helps in chlorophyll formation (Miller, 1938). In
view of the beneficial effect of sulphur fertilization, an investigation was carried out on onion
cv. Sukhsagar to find out the optimum level and suitable source of sulphur for better growth,
yield and quality in gangetic alluvial plains.
MATERIALS AND METHODS
The field experiment was conducted during 2008-09 and 2009-10 at Horticultural Research
Station, Mondouri, Bidhan Chandra Krishi Viswavidyalaya, Nadia situatedin Gangetic
Alluvial Plains of West Bengal, India. The soil was texturally sandy clay loam in nature
containing low organic carbon (4.1 g/kg) and total nitrogen (0.05%), medium in available
phosphorus (21.1kg/ha), available potassium (178.8 kg/ha) and pH of 6.9. The experiment
was laid out in Randomized block design with 9 treatments and 3 replications with onion cv.
Sukhsagar, which suits better in this region. The plants were transplanted at 20 cm x 15 cm
spacing i.e., 100 plants/plot. Sulphur was applied from 4 sources and with 2 different doses.
The treatment details were: T1: S at the rate of 30 kg/ha in the form of SSP, T2: S at the rate
of 60 kg/ha in the form of SSP, T3: S at the rate of 30 kg/ha in the form of Elemental sulphur,
Paper Proceedings of Agri Animal 2013 - ISSN 2279-3682
4
T4: S at the rate of 60 kg/ha in the form of Elemental sulphur, T5: S at the rate of 30 kg/ha in
the form of K2SO4, T6: S at the rate of 60 kg/ha in the form of K2SO4, T7: Nitrosulf at the rate
of 0.5 lit/100 lit/ha, T8: Nitrosulf at the rate of 0.625 lit/100 lit/ha and T9: control (no
sulphur). The observations were recorded on plant height, number of leaves per plant, basal
girth of plant and yield parameters such as bulb diameter, bulb weight and bulb yield of
onion. The pooled data for two years were analysed statistically by method suggested by
Gomez and Gomez (1984) and presented in Table 1.
RESULTS AND DISCUSSION
Growth parameters
It is evident from Table 1 that the growth parameters like plant height, number of
leaves per plant and plant basal girth were significantly increased with application of sulphur
from different sources and doses. The highest (70.96 cm) plant height was observed with
application of S at the rate of 60 kg/ha in the form of SSP as compared to control (60.60 cm),
whereas the lowest height (62.10 cm) was obtained with T3 (S at the rate of 30 kg/ha in the
form of elemental sulphur). The control (without sulphur) plots produced the most inferior
result regarding all the growth parameters. Similar result was also found by Jana and Kabir
(1990) in onion in another experiment. On the other hand, the maximum leaf number (10.38)
was recorded in T7 (Nitrosulf at the rate of 500 ml/ 100 lit/ ha) and minimum (8.95) was
recorded in T9 i.e. control. Alam et al. (1999) reported the highest number of leaves per plant
in onion with application of sulphur at the rate of 40 kg/ha. The highest basal girth (5.25 cm)
was recorded in T2 i.e. with application of S at the rate of 60 kg/ha in the form of SSP, which
was statistically at par with T7 (5.14 cm). The lowest basal girth (3.48 cm) was recorded in T9
(control). Among the sources, SSP followed by nitrosulf were found highly responsive in
improving basal girth.
Paper Proceedings of Agri Animal 2013 - ISSN 2279-3682
5
Yield parameters
Yield parameters of onion in this experiment i.e. bulb diameter and bulb length were
significantly influenced by both sources and levels of sulphur applied (Table 1). The
maximum bulb diameter (6.38 cm) and bulb length (7.89 cm) were recorded in T7 (Nitrosulf
at the rate of 0.5 lit/ 100 lit/ ha) and the minimum (4.69 cm & 6.69 cm, respectively) were
obtained in T9 i.e. control plots. Nagaich et al. (2003) observed a significant increase in bulb
diameter in onion with application of sulphur at the rate of 60 kg/ha. But reverse effect was
observed by them in case of application of nitrosulf at the rate of 0.625 lit/100 lit/ha, which
might be due to toxic effect of sulphur.
Bulb yield (t/ha)
The bulb yield per plot as well as per hectare was also significantly influenced by
different level and source of sulphur (Table 1). From the result it was found that the highest
(30.25 t/ha) yield was obtained under T7 treatment (Nitrosulf at the rate of 0.5 lit/ 100 lit/ ha),
whereas untreated plots (T9) produced the lowest yield (21.58 t/ha). Rajas et al. (1993) found
highest onion bulb yield (28.11 t/ha) with application of sulphur at the rate of 80 kg/ha,
whereas 30-33% increased in onion bulb yield was reported by Jaggi and Dixit (1995) with S
at the rate of 60 kg/ha over control in Palam Velley (HP). The positive response of varied
sources and levels of sulphur might be due to that sulphur increased the chlorophyll content
of the plant, which enhanced photosynthetic activity with a result of greater vegetative
growth that directly related with the bulb yield. Among the sources, nitrosulf produced the
most promising result regarding yield. The reason behind the result might be that nitrosulf
contains the nitrogen component (12%) along with sulphur, which definitely leave some
influence on the incremental effect of yield.
Paper Proceedings of Agri Animal 2013 - ISSN 2279-3682
6
Qualitative parameters
Moisture percentage
It is evident from the data (Table 2) that application of different level and source of
sulphur had significant effect on moisture percentage. The maximum moisture percentage
(86.55%) was recorded under the treatment nitrosulf at the rate of 0.5 lit /100 lit/ha (T7)
followed by S at the rate of 30kg/ha (SSP form) 86.40% and 86.36% with S at the rate of 60
kg/ha (K2SO4 form). Minimum moisture content (85.01%) was observed with nitrosulf at
high concentration.
Dry weight percentage
Dry weight percentage was observed maximum (14.99%) with nitrosulf at the rate of
0.625 lit/ 100 lit/ ha followed by elemental sulphur at the rate of 30 kg S/ha 14.91 % and
14.85% with control. Minimum dry weight percentage (13.45%) was observed with nitrosulf
at the rate of 0.5 lit /100 lit/ha.
Protein percentage
In case of protein content the maximum data (1.42%) was observed under treatment
nitrosulf at the rate of 500ml /100 lit/ha followed by nitrosulf at the rate of 0.625 lit /100
lit/ha (1.40%) and 1.39% with S at the rate of 60 kg/ha (SSP form) as compared to lowest
protein percentage (1.12%) under control. Application of different sulphur levels had
significant effort on the increasing protein percentage in onion (Poonam and Abidi, 2004).
Total Soluble Solid percentage
The maximum total TSS content (14.85%) was observed under treatment nitrosulf at
the rate of 0.625 lit/ 100 lit/ ha followed by (14.59%) S at the rate of 60 kg/ha (SSP form) and
Paper Proceedings of Agri Animal 2013 - ISSN 2279-3682
7
14.12 % with nitrosulf at the rate of 0.5 ml /100 lit/ha. Minimum (12.79%) TSS content was
obtained under control treatment.
Ascorbic acid (mg/100g)
In case of ascorbic acid content the maximum concentration (6.84 mg/100 g) was
observed under S at the rate of 60 kg/ha (SSP form) followed by nitrosulf at the rate of 0.625
lit /100 lit/ha (6.04 mg/100g) and 5.95 mg/100g with S at the rate of 60 kg/ha (K2SO4 form)
as compared to minimum ascorbic acid content (4.05 mg/100g) under control. These result
are also in agreement to the findings of Jaggi (2004) as ascorbic acid continued to increase
upto S level of 60 kg/ha in onion crop. This result is also similar to the findings of Hamilton
et al. (1997).
Sulphur concentration (%)
The maximum S content (0.494%) was found in the treatment with at the rate of 60
kg/ha (SSP form) followed be nitrosulf at the rate of 0.5 lit/ 100lit/ ha (0.480%) and with
0.625 lit/ 100lit/ ha (0.463%). The lowest S content (0.237%) was recorded in control.
The sources in the above respect had significant variation, but SSP was more effective
followed by nitrosulf, K2SO4 and elemental sulphur. Their result is closely related to the
findings of Singh and Pandey (1995) where they recorded that, among the sources
ammonium sulphate exhibited the higher S content and the lowest by elemental sulphur.
CONCLUSION
The result of the present experiment indicates that the application of sulphur at the
rate of 60 kg/ha in the form of SSP or foliar spay of nitrosulf at the rate of 0.5 lit / 100 lit /ha
for two times at 30 and 60 DAP along with other inorganic fertilizers in onion play a positive
role in boosting up of crop production in gangetic alluvial plains.
Paper Proceedings of Agri Animal 2013 - ISSN 2279-3682
8
It appears that regarding source of sulphur, both SSP and nitrosulf are effective but
considering the overall cost of SSP application, spaying of nitrosulf is suggested for
achieving better yield and quality of onion.
REFERECES
Alam, M.D., Rahim, M.A. and Sultana, M.S. 1999. Effect of paclobutrazol and sulphur
fertilizer on growth and yield of garlic. Bangladesh J. Training and Development,
Vol. 12, no. 1, pp. 223-30.
Gomez, K.A. and Gomez, A.A. 1984. Statistical procedure for agricultural result (2nd
ed.). A
Wily- Interscience Publication (Johan wily and Sons), New York, pp. 20-30.
Hamilton, B.K., Pike, L.M. and Yoo, K.S. 1997. Clonal variations of pungency, sugar content
and bulb weight of onions due to sulphur nutrition.Scientia Hort., Vol. 71, no. 3-4,
pp. 131-36.
Jaggi, R.C. 2004. Effect of sulphur levels and sources on composition and yield of onion
(Allium cepa). Indian Journal of Agricultural Sciences, Vol. 74, no. 4, pp. 219- 20.
Jaggi, R.C. and Dixit, S.P. 1995. Response of onion to sulphur and molybdenum in vegetable
growing area of Palam Vally. J. Indian Soc. Soil Sci., Vol. 43, no. 2, pp. 229-31.
Jana, B.K. and Kabir, J. 1990. Effect of sulphur on growth and yield of onion Nasik Red.
Crop Res. Hisar, Vol. 3, no. 2, pp. 241-43.
Miller, E.C. 1938. Plant physiology. Mc. Graw Hill. Book Co., Inc. New York, pp. 324.
Nagaich, K.N., Trivedi, S.K. and Lekhi, R. 2003. Effect of sulphur and potash on growth,
yield and quality of garlic (Allium sativum L.). Scientific Horticulture, Vol. 8, pp.
43-47.
Paper Proceedings of Agri Animal 2013 - ISSN 2279-3682
9
Poonam, Y. and Abidi, A.B. 2004. Effect gibberellic acid and sulphur on quality onion bulbs.
Plant Arohives, Vol. 4, no. 1, pp. 175-77.
Rajas, R.N., Ghulaxe, S.N. and Tayde, S.R. 1993. Effect of varying levels of sulphur and
spacing compared with frequencies of irrigation on yield of onion grown in
Vidarbha. J. soils and crops, Vol. 3, no. 1, pp. 37-40.
Singh, D.K. and Pandey, R.N. 1995. Effect of applied sulphur on dry matter yield and sulphur
uptake by onion indifferent soil series of Delhi. Annals of Agricultural Research,
Vol. 16, no. 3, pp. 248-50.
Paper Proceedings of Agri Animal 2013 - ISSN 2279-3682
10
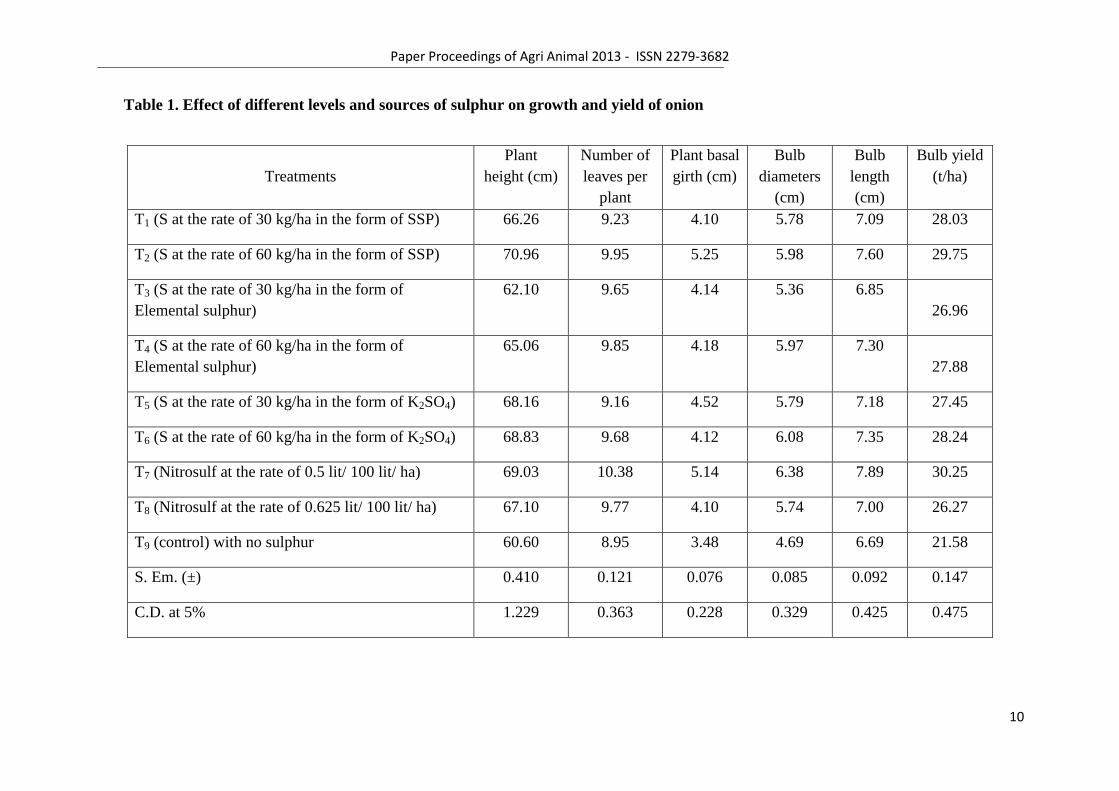
Table 1. Effect of different levels and sources of sulphur on growth and yield of onion
Treatments
Plant
height (cm)
Number of
leaves per
plant
Plant basal
girth (cm)
Bulb
diameters
(cm)
Bulb
length
(cm)
Bulb yield
(t/ha)
T1 (S at the rate of 30 kg/ha in the form of SSP) 66.26 9.23 4.10 5.78 7.09 28.03
T2 (S at the rate of 60 kg/ha in the form of SSP) 70.96 9.95 5.25 5.98 7.60 29.75
T3 (S at the rate of 30 kg/ha in the form of
Elemental sulphur)
62.10 9.65 4.14 5.36 6.85
26.96
T4 (S at the rate of 60 kg/ha in the form of
Elemental sulphur)
65.06 9.85 4.18 5.97 7.30
27.88
T5 (S at the rate of 30 kg/ha in the form of K2SO4) 68.16 9.16 4.52 5.79 7.18 27.45
T6 (S at the rate of 60 kg/ha in the form of K2SO4) 68.83 9.68 4.12 6.08 7.35 28.24
T7 (Nitrosulf at the rate of 0.5 lit/ 100 lit/ ha) 69.03 10.38 5.14 6.38 7.89 30.25
T8 (Nitrosulf at the rate of 0.625 lit/ 100 lit/ ha) 67.10 9.77 4.10 5.74 7.00 26.27
T9 (control) with no sulphur 60.60 8.95 3.48 4.69 6.69 21.58
S. Em. (±) 0.410 0.121 0.076 0.085 0.092 0.147
C.D. at 5% 1.229 0.363 0.228 0.329 0.425 0.475
Paper Proceedings of Agri Animal 2013 - ISSN 2279-3682
11
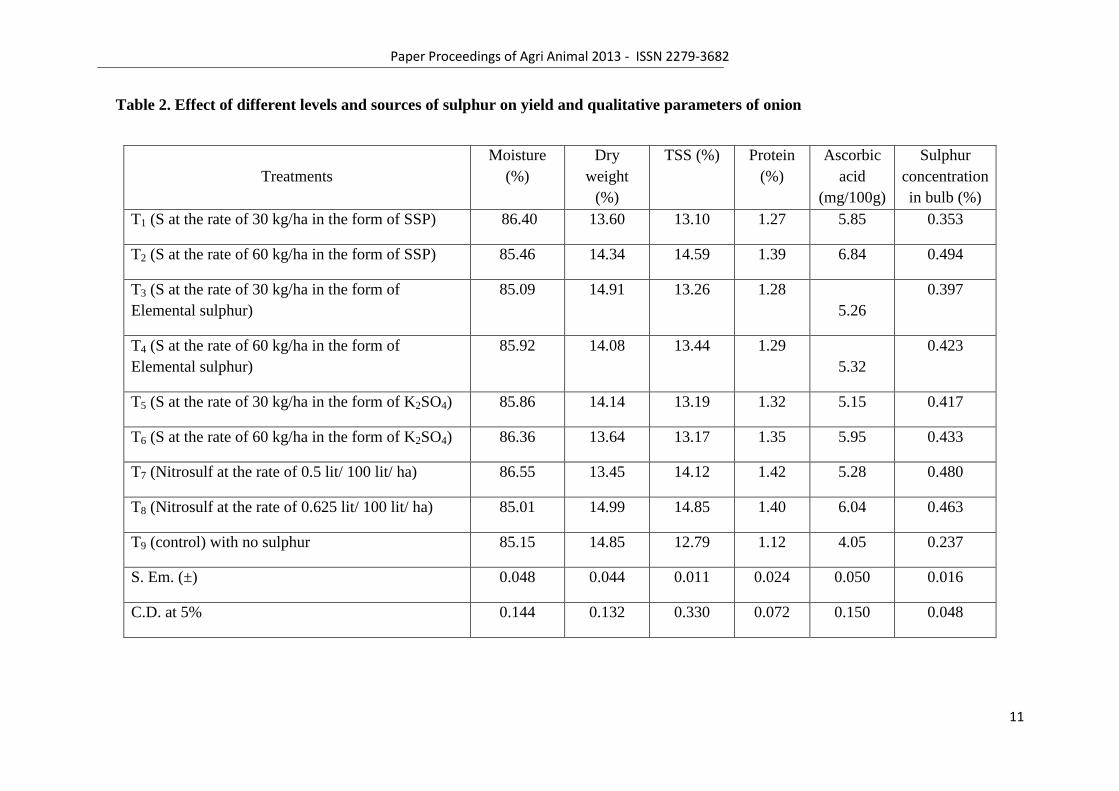
Table 2. Effect of different levels and sources of sulphur on yield and qualitative parameters of onion
Treatments
Moisture
(%)
Dry
weight
(%)
TSS (%) Protein
(%)
Ascorbic
acid
(mg/100g)
Sulphur
concentration
in bulb (%)
T1 (S at the rate of 30 kg/ha in the form of SSP) 86.40 13.60 13.10 1.27 5.85 0.353
T2 (S at the rate of 60 kg/ha in the form of SSP) 85.46 14.34 14.59 1.39 6.84 0.494
T3 (S at the rate of 30 kg/ha in the form of
Elemental sulphur)
85.09 14.91 13.26 1.28
5.26
0.397
T4 (S at the rate of 60 kg/ha in the form of
Elemental sulphur)
85.92 14.08 13.44 1.29
5.32
0.423
T5 (S at the rate of 30 kg/ha in the form of K2SO4) 85.86 14.14 13.19 1.32 5.15 0.417
T6 (S at the rate of 60 kg/ha in the form of K2SO4) 86.36 13.64 13.17 1.35 5.95 0.433
T7 (Nitrosulf at the rate of 0.5 lit/ 100 lit/ ha) 86.55 13.45 14.12 1.42 5.28 0.480
T8 (Nitrosulf at the rate of 0.625 lit/ 100 lit/ ha) 85.01 14.99 14.85 1.40 6.04 0.463
T9 (control) with no sulphur 85.15 14.85 12.79 1.12 4.05 0.237
S. Em. (±) 0.048 0.044 0.011 0.024 0.050 0.016
C.D. at 5% 0.144 0.132 0.330 0.072 0.150 0.048

Paper Proceedings of Agri Animal 2013 - ISSN 2279-3682
12
2
_______________________________________________________________________________________
1. K.Bhanu Rekha ,Assistant Professor, Department of Agronomy, College of Agriculture, ANGRAU,
Rajendranagar, Andhra Pradesh, Hyderabad, India E-mail : [email protected]
Contact No: 001-91-9440308227(M)
2. K.Mahavishnan , Department of Agronomy, Research Scientist, Organization: ITC, R&D, Peenya
Enclave, Bangalore, India , E-mail:[email protected],
Contact No:001 – 91 – 99890 58453(M)
DRIP FERTIGATION – A SUSTAINABLE WATER SAVING TECHNOLOGY IN
AGRICULTURE
K.Bhanu Rekha1 and K.Mahavishnan
2
ABSTRACT:
A field investigation was carried out on drip fertigation in Lady‘s finger for two consecutive years
during rainy seasons of 2003 and 2004 at Student farm, College of Agriculture, Acharya
N.G.Ranga Agricultural University Rajendranagar, Hyderabad, Andhra Pradesh, India. Results of
the investigation revealed drip fertigation scheduled at 1.00 E pan + 120 kg nitrogen ha-1
recorded
higher number of branches (4.4 and 4.8), pods plant-1
(33.15 and 34.0), pod length (15.42 and14.34
cm) and highest mean pod yield (4171 kg ha-1
). Highest water use efficiency (8.23 and 8.10 kg ha-1
mm-1
) and Benefit -cost ratio (1.11 and 1.09) were accrued for the same treatment.
INTRODUCTION:
Water and fertiliser are the two important inputs for agricultural production which are interrelated
in their effect on crop growth and yield. Being costly inputs every effort must be done to enhance
their use efficiency by reducing wastage.Increasing demographic pressure coupled with escalating
demand for water for agricultural and non – agricultural purposes, faster depletion and over
exploitation of ground water and very remote chance of increasing the area under irrigation
accentuates the need for scientific and efficient use of available water resources to increase crop
production and to sustain the productivity levels. Fertigation - a technique of application of both
water and fertilizer via an irrigation system is very effective in achieving higher water and fertilizer
use efficiency. In this method both water and fertilizer are delivered precisely in the crop root zone
Paper Proceedings of Agri Animal 2013 - ISSN 2279-3682
14
as per the crop needs and crop development phase The water saving ranges from 40 – 70 per cent
and yield advantage of 7 to 43 per cent due to drip irrigation (Sivanappan,1994).
Lady‘s finger (Abelmoschus esculentus L.Moench) commonly known as okra or bhendi is one of
the important vegetable crops well adapted to tropics and profitably grown during summer season.
The pod contains 6.4 g carbohydrates, 1.9 g protein, 0.2 g fat, 0.7 g minerals and 1.2 g fibre per 100
g of edible portion (Gopalan, 1989).Due to the high iodine content the fruit is considered to be
useful for the control of goitre. It is extensively marketed in the canned and dehydrated form for off
season consumption and has a vast potential for earning foreign exchange.
Farmers commonly raise bhendi under surface method of irrigation (Furrow and check basin)
wherein losses through conveyance, application, evaporation and percolation are common besides
having adverse effects of cyclic over irrigation or water stress. Drip irrigation is the most effective
way to supply water to the plant which not only saves water but also increases yield due to
continuous maintenance of moisture near field capacity.
Conventional nitrogen application in light soils causes greater loss through leaching and
volatalisation. Fertilizer application through drip (fertigation) offers a means to satisfy the ‗N‘
demand of the crop in accordance with the need at different growth phases. Since nutrients are
applied to a limited soil area the use efficiency is high. With the scarce water resources available
for agriculture drip fertigation is a suitable technology and need of the hour for enhancing the yields
in a sustainable way. Hence, the present investigation on the effect of drip fertigation in lady‘s
finger was initiated.
MATERIAL AND METHODS
An investigation on effect of drip fertigation in lady‘s finger (Abelmoschus esculentus L.Moench)
was taken up at Student farm, (Longitude 78o 28‘ E to 79
o 0‘E, Latitude 17
o 19‘ N and altitude 534
Paper Proceedings of Agri Animal 2013 - ISSN 2279-3682
15
MSL) College of Agriculture, Acharya N.G.Ranga Agricultural University College of Agriculture,
Rajendranagar, Hyderabad, India. The period of experimentation was for two consecutive rainy
seasons of 2003 and 2004.The experimental soil was sandy loam (Alfisol) in texture and had the
following physico – chemical properties viz; pH 7.5 (1:2 soil: water ratio), Electrical Conductivity
0.36 dSm-1
(1:2 soil: water ratio), organic carbon 0.49 % (Walkley and Black, 1934), 181.7, 25.7
and 321.7 kg ha-1
of available N (Subbaiah and Asija, 1956), P (Olsen et al. 1954) and K (Jackson,
1967) respectively. A total rainfall of 200.4 and 45.0 mm was distributed in 4 rainy days during the
experimental period (2003 and 2004). The experiment was laid in a randomised block design
consisting of twelve (12) treatments and replicated thrice. The treatment details are as follows:
T1 - Furrow irrigation +120kg N ha-1
, T2 - Drip fertigation at 0.50 Epan + 60 kg N ha-1
,
T3 - Drip fertigation at 0.50 Epan + 90kg N ha-1
, T4 - Drip fertigation at 0.50 Epan + 120 kg N ha-1
,
T5 - Drip fertigation at 0.75 Epan + 60 kg N ha-1
,T6 - Drip fertigation at 0.75 Epan + 90 kg N ha-1
T7 -- Drip fertigation at 0.75 Epan + 120 kg N ha-1
, T8 -Drip fertigation at 1.00 Epan + 60 kg N ha-1
T9 - Drip fertigation at 1.00 Epan + 90 kg N ha-1
, T1 0 - Drip fertigation at 1.00 Epan + 120 kg N ha-1
T11-Family drip + 120 kg N ha-1
(Soil application), T12- Drip fertigation at 1.00 Epan + 0 kg N ha-1
* EPan – daily Pan evaporation value
A uniform dose of P and K (50 kg ha-1
each) was applied as basal (soil application) to all the
treatments. The nutrients were applied through urea, single super phosphate, muriate of potash.
Treatment wise N fertigation through drip was scheduled at 4 days interval starting from 15 days
after sowing (DAS) to 71 DAS (15 splits) on alternate days. The quantity of N applied per split
through drip was 8.0, 6.0 and 4.0 kg ha-1
in 120, 90 and 60 kg N treatments. In furrow irrigation and
family drip treatments 120 kg N ha-1
was applied through soil application in three equal splits as
basal , at 30 DAS and 60 DAS respectively.
The crop (Mahyco - hybrid No.) was sown on 17th
February in 2003 and 1st Feb in 2004 @ 1 seed
/hill adopting a spacing of 22.5 cm x 20 cm (paired row planting 45/20 cm) in drip plots (flat bed)
and at 60 x 20 cm in ridge and furrow and family drip (flat bed) treatments. After sowing the seed
common flood irrigation (50 mm) was given uniformly to all the treatments.
IRRIGATION SCHEDULING:
Paper Proceedings of Agri Animal 2013 - ISSN 2279-3682
16
In drip treatments, irrigation was given on alternate days as per the (Epan) treatments. Total volume
of water required at each irrigation in 1.0 Epan was calculated by the formula.
V= Epan x 1.0 x A
Where,
V- Quantity of water applied in litres per plot
Epan - pan evaporation values from class A open pan evaporimeter for two days (mm)
A- Area of plot in m2
FAMILY DRIP SYSTEM:
In this treatment, a tank (1000 L) was filled to its full capacity and the crop was irrigated (based on
gravity) to required amount calculated by the formula.
V= Epan x 0.75 x A
Where,
V- Quantity of water applied in litres per plot
Epan - pan evaporation values from class A open pan evaporimeter for two days (mm)
A-Area of plot in m2
FURROW SYSTEM:
Paper Proceedings of Agri Animal 2013 - ISSN 2279-3682
17
The irrigation was scheduled at 1.00 IW/CPE ratio. At each irrigation 50 mm water was given and
the quantity of water was calculated by using the formula.
Q = A x d x 1000
Where,
Q- Quantity of water applied in litres per plot
A-Area of plot in m2
d- depth of irrigation in mm
Weeds were controlled by following manual weeding at 20 and 40 DAS. The crop was raised by
following recommended package of practices. Harvesting of pods was done from 58 DAS to 81
DAS during 2003 and from 57 DAS to 82 DAS during 2004. Totally eight pickings were done
during both theyears of experimentation. Cost of cultivation under drip system was calculated
taking the life of system as 10 years, interest and cost of depreciation @ 10 % each.
RESULTS AND DISCUSSION
Growth parameters:
Plant height (cm)
Crop irrigated through drip at 1.00 Epan + 120 kg N ha-1
recorded tallest plants (72.1 and 68.5cm)
and was significantly superior to rest of the treatments during both the years of experimentation.
Drip irrigation at 0.75 Epan and fertigation of 120 kg N ha-1
was on par with family drip system
(Table-1).
Improved plant height under drip at 1.00 Epan + 120 kg N ha-1
was due to the consistent
availability of soil moisture and nutrients that increased assimilate synthesis and consequently the
Paper Proceedings of Agri Animal 2013 - ISSN 2279-3682
18
apical meristamatic activity. At a constant level of irrigation, improvement in plant height with
incremental nitrogen application was probably due to enhanced cell division and elongation
accompanied by more chlorophyll synthesis. (Ahmed and Tanki, 1997).
Leaf area (cm2)
During both the years of study, crop irrigated through drip at 1.00 Epan + 120 kg N ha-1
proved its
superiority over rest of the treatments by recording significantly higher leaf area values followed by
fertigation with 90 kg N ha-1
at the same level of irrigation. While, furrow irrigated crop produced
identical leaf area as that of drip fertigation with 90 or 120 N ha-1
at 0.75 Epan. Lowest leaf area
was recorded by the crop grown without fertigation.
Constant and adequate supply of moisture under the treatment 1.00 Epan + 120 kg N ha-1
had led to
efficient use of additional assimilates synthesised with higher dose of N that promoted better
carbohydrate utilisation to form more protoplasm and cells, thus leading to higher leaf number
reflecting in more leaf area .These results are in line with those of (Bobade et al., 2002).
Number of branches per plant
A close perusal of data on number of branches plant-1
indicated that it was significantly
influenced by the level of water and fertilizer application. At harvest, maximum numbers of
branches (4.4 and 4.8) were recorded with the crop irrigated through drip at 1.0 Epan and fertigated
with 120 kg N ha-1
and was on par with drip irrigation at 1.0 Epan and fertigated with 90 kg N ha-1
(3.93 and 4.30) and was superior over rest of the treatment combinations.
In determinate crops like bhendi, the number of branches is one of the important growth characters
which influence the total pod yield. Maximum number of branches per plant was noticed in drip
irrigation at 1.00 Epan with 120 kg N ha-1
which was significantly superior to rest of the treatments.
Higher frequency of irrigation and nitrogen application under this treatment had led to effective
Paper Proceedings of Agri Animal 2013 - ISSN 2279-3682
19
absorption and translocation of nutrients and resulted in production of more number of new nodes.
The enhanced meristematic activity and consequent vertical extension of growth due to consistent
availability of water and nutrients increased the branching (Tumbare et al., 1999).
YIELD ATTRIBUTES AND YIELD
Total pods per plant
Pods per plant differed significantly among different treatments during both the years. At a
given level of water applied, there was a significant increase in pod number per plant with
successive increase in nitrogen level. Drip at 1.00 Epan and fertigation with 120 kg N ha1 resulted
in maximum number of pods (33.15 and 34.0). Drip at 1.00 Epan and fertigation with 90 kg N ha1
was on par with 0.75 Epan + 120 kg N ha1. This was followed by drip at 0.75 Epan fertigated with
90 kg N ha1 was similar to that of drip at 0.5 Epan and fertigation either with 90 or 120 kg N ha
1
and drip at 0.75 Epan + 60 kg N ha1 in pod number and were inferior to all other treatments except
no fertigation (Table-1).
Pod length (cm)
The differences in pod length among different treatments were apparent in both the years. In
general drip irrigation at 1.00 Epan maintained its superiority over 0.75 and 0.5 Epan. Mean pod
length recorded was maximum (15.42 and 14.34 cm) in drip at 1.00 Epan and fertigation with 120
kg N ha1 and it was significantly superior to rest of the treatments. Drip at 0.75 Epan fertigated
with 60 or 90 kg N ha1, furrow irrigation and family drip system resulted in similar pod length. Drip
irrigation without fertigation being on par with drip at 0.5 Epan + 60 kg N ha-1
remained inferior to
rest of the treatments during both the years of experimentation.
Pod weight (g)
Paper Proceedings of Agri Animal 2013 - ISSN 2279-3682
20
Different levels of irrigation and nitrogen significantly influenced the pod weight. Drip
irrigation maintained its superiority over furrow irrigation in influencing pod weight.
During 2003, drip irrigation scheduled at 1.00 Epan was found superior over 0.75 and 0.50 Epan.
Maximum pod weight was recorded with drip at 1.00 Epan and fertigated with 120 kg N ha-1
(15.74
and 15.10 g) followed by 90 and 60 kg N ha1. Similarly pod weight among the irrigation treatments
scheduled through drip at 0.75 and 0.50 Epan, there was increase in the pod weight with successive
increment of nitrogen. Furrow irrigated crop recorded more pod weight than drip at 0.75 Epan
fertigated either with 60 or 90 kg N ha-1
and drip at 0.50 Epan with all irrigation at 0.75 Epan + 60
kg N ha-1
. The treatment consisting no fertigation was inferior to all other treatments and recorded
lowest pod weight.
During 2004, the trends in pod weight followed the same as 2003 except that pod weight
noted with furrow irrigation (11.71g) was comparable with drip at 0.75 Epan and fertigated with
120 kg N ha1 (11.51g).
Pod yield per plant (g)
Irrigation and nitrogen levels had marked influence on pod yield per plant in both the years.
When the crop was irrigated through drip at 1.0 Epan pod yield per plant increased significantly
with successive increase in nitrogen levels and fertigation of 120 kg N ha-1
produced significantly
higher pod yield per plant ( 463.2 and 454.9 g plant-1
) than rest of the treatments. But at 0.75 Epan
and 0.50 Epan fertigation of 90 kg N ha-1
produced the same pod yield per plant as 120 kg N ha-1
at
the respective level of irrigation. Drip at 0.75 Epan and fertigation either with 90 or 120 kg N ha-1
was similar to furrow irrigation in terms of pod yield per plant. However, fertigation of 60 kg N ha1
at 0.75 Epan and family drip system were comparable with each other. Among all the treatments,
crop grown without fertigation produced the lowest pod yield per plant.
Paper Proceedings of Agri Animal 2013 - ISSN 2279-3682
21
Number of pods plant-1
, pod length and pod weight increased significantly with increase in the
amount of water and nitrogen applied. Maximum values for all these parameters were recorded
with the crop irrigated through drip at 1.00 Epan with 120 kg N ha-1
which were superior to
remaining treatments. Taller plants, more number of branches and higher leaf area associated with
this treatment favoured the development of more number of nodes and consequently there were
more number of pods per plant. Reduction in depth of irrigation water from 1.00 to 0.5 Epan and
quantity of nitrogen from 120 to 60 kg N ha-1
significantly reduced the yield attributes. At higher
levels of irrigation and nitrogen the photosynthetic area was more that helped in the increased
production and translocation of photosynthates in the plant which subsequently accelerated the
formation of more number and large sized pods (Patel and Rajput, 2003).
Pod yield (kg ha1)
A perusal of data on pod yield ha-1
revealed that amount of irrigation and nitrogen levels
had significantly influenced the pod yield during both the years of experimentation (Table-2).
In 2003, pod yield increased with increase in the level of irrigation from 0.50 Epan to 1.00
Epan. At a given level of irrigation pod yield increased with successive increment of nitrogen and
application of 120 kg N ha-1
at 1.00 Epan produced the highest pod yield. Drip at 0.75 Epan and
fertigation either with 90 or 120 kg N ha-1
produced comparable yield as that of furrow irrigation.
Fertigation of 60 kg N ha1 at 0.75 Epan was identical to family drip system. Crop grown without
fertigation recorded the lowest pod yield among all the treatments.
Similar results were recorded during 2004 except that application of 120 kg N ha-1
did not
significantly increase the yield over drip at 0.75 Epan and 90 kg N ha-1
.
Data on pooled yield indicated that crop irrigated through drip at 1.00 Epan and fertigated
with 120 kg N ha-1
produced significantly higher pod yield (4171.3 kg ha-1
) than other treatments.
Paper Proceedings of Agri Animal 2013 - ISSN 2279-3682
22
With each successive increase in the nitrogen level the pod yield increased significantly at 0.75 and
1.00 Epan irrigation schedules. However, at 0.5 Epan the differences in terms of pod yield among
60 and 90 kg N ha-1
or 90 and 120 kg N ha-1
were not significant. Drip irrigation at 0.75 Epan
fertigated with 90 kg N ha-1
was as good as furrow irrigation applied with 120 kg N ha-1
. Yield
recorded with family drip irrigation was comparable to drip irrigation at 0.50 Epan fertigated with
120 kg N ha-1
. Lowest pod yield (678.9 kg ha-1
) was recorded with crop grown without fertigation.
The increase in pod yield with drip irrigation at 1.00 Epan and fertigation with 120kg N ha-1
over
with furrow irrigation was 54 percent in 2003 and 57 percent in 2004. The cyclic regulation and
continuous wetting of soil through drip irrigation maintained optimum moisture in the crop root
zone. Due to this the force exerted by the plant to extract water and nutrients would be less. Further,
application of nutrients in more number of splits in drip fertigation resulted in minimum or no
wastage of nutrients either through deep percolation or evaporation as reported by Kadam et al.
(1995), leading to higher uptake of nutrients. This enabled the crop to put forth better growth, yield
attributes and reap generous yield.
In case of surface irrigation (furrow) uniform level of soil moisture was not maintained between
two successive irrigations. Although sufficient moisture was available immediately after irrigation,
it continuously declined till next irrigation. This fluctuation in soil moisture status has been found
to adversely influence the plant water relations, growth and yield. Surface irrigation not only results
in wastage of water through deep percolation below root zone, but also sets a chain of undesirable
reactions such as leaching of available plant nutrients and consequent development of nutrient
deficiencies and poor aeration (Bafna et al., 1993).
Crop irrigated through drip at 0.75 Epan with 90 kg N ha-1
received 14 and 22 per cent less
amount of water than furrow irrigated crop during 2003 and 2004 respectively, yet the yields
registered were comparable. Furrow irrigated crop received 120 kg N ha-1
as against 90 kg N ha-
Paper Proceedings of Agri Animal 2013 - ISSN 2279-3682
23
1received by former treatment indicating a saving of 25 per cent nitrogen in fertigation. Such a
saving of nitrogen in bhendi through trickle fertigation as compared to band placement in furrows
with not adverse effect on pod yield was also recorded by Narda and Lubana (1999).
WATER USE STUDIES
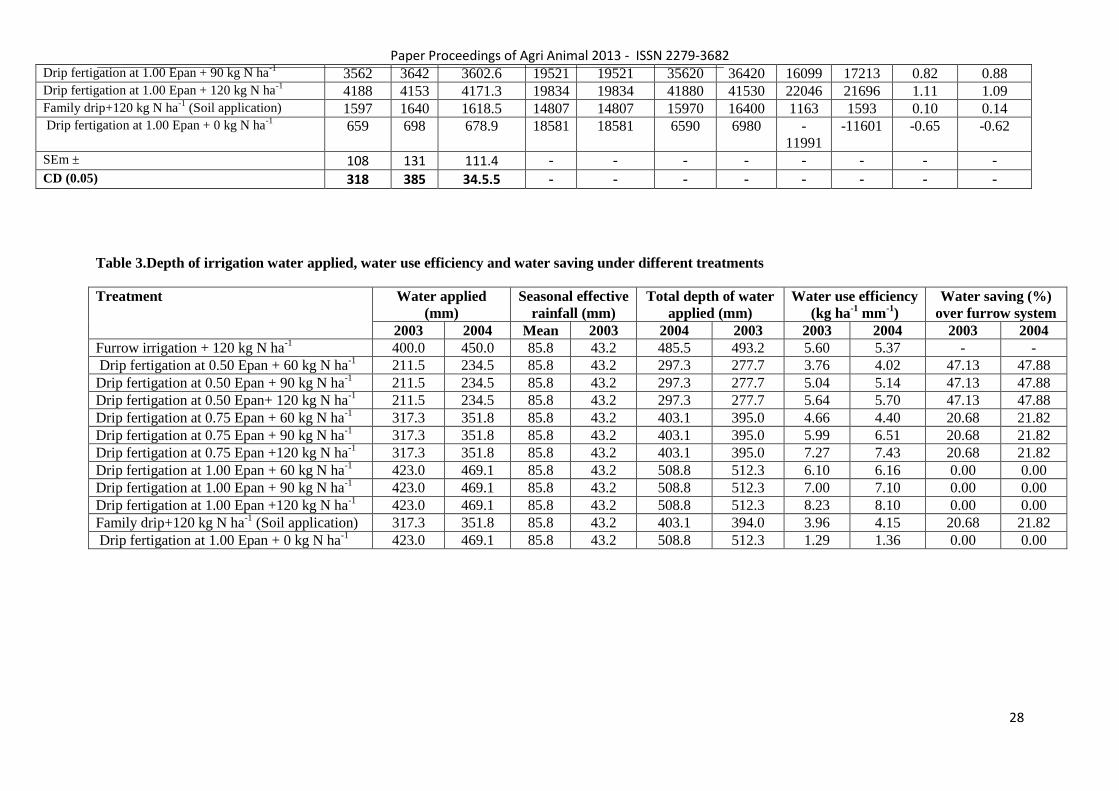
Total water applied (mm)
During 2003, 400 mm of irrigation water was applied to furrow irrigated crop. While it was 423
mm in drip irrigation scheduled at 1.00 Epan. The amount of water applied through drip irrigation
at 0.50 and 0.75 Epan was 47.1 and 20.7 per cent lower than furrow irrigation. The quantity of
irrigation water applied through family drip was same as that of drip at 0.75 Epan (Table-3).
During 2004, the amount of water applied in furrow irrigation was 450 mm. in drip system
it was 234.5, 351.8 and 469.1 mm at 0.50, 0.75 and 1.00 Epan schedules respectively. In family
drip system, it was equal to that of drip at 0.75 Epan.
Water use efficiency (kg ha-1
mm-1
)
Both irrigation and nitrogen levels had significant influence on water use efficiency (WUE).
Crop irrigated through drip at 1.00 Epan and fertigated with 120 kg N ha-1
recorded significantly
higher WUE ( 8.23 and 8.10 kg ha-1
mm-1
) followed by drip at 0.75 Epan and fertigated with 120 kg
N ha-1
. However, fertigation of 120 kg N ha-1
at 0.75Epan remained on par with fertigation of 90 kg
N ha-1
at 1.00 Epan. The WUE of 0.75 Epan + 90 kg N ha-1
was comparable to drip at 0.50 Epan
and fertigated either with 90 or 120 kg N ha-1
and furrow irrigation. Family drip system was similar
to fertigation of 60 kg N ha-1
at 0.50 and 0.75 Epan in WUE. Lowest WUE was observed with crop
grown without fertigation (1.29 and 1.36 kg ha-1
mm-1
) in both the years.
Maximum mean WUE (8.17 kg N ha-1
mm-1
) was recorded with drip fertigation at 1.00 Epan with
120 kg N ha-1
. Drip irrigation at 0.75 Epan + 90 kg N ha-1
was comparable to furrow irrigation
Paper Proceedings of Agri Animal 2013 - ISSN 2279-3682
24
(1.00 IW/CPE) + 120 kg N ha-1
indicating a saving of 21.25 per cent in water and 25 per cent in
nitrogen. The favourable effect of water and nitrogen on crop growth and pod yield in drip
irrigation resulted in higher water use efficiency. Low water use efficiency under drip irrigation at
0.5 Epan as compared to 0.75 Epan and 1.00 Epan was primarily due to reduction in fresh fruit
yield. Considerably higher water use efficiency recorded in drip fertigation as the volume of water
applied through drip system was equal to the consumptive use of plants, thereby minimizing
conventional losses that are common under furrow irrigation (Gorantiwar et al., 1991). Increase in
water use efficiency in drip system over furrow irrigation was mainly due to the controlled amount
of water applied near the crop root zone (Punamhoro, 2003b).
ECONOMICS
The cost of cultivation and gross returns increased with increase in the level of irrigation
and fertigation in both the years.
Highest gross returns ( 41,880 and 41,530 ha-1), net returns ( 22,046 and 21,696 ha
-1) and B:C
ratio (1.11 and 1.09) were realised with the crop irrigated through drip at 1.00 Epan and fertigated
with 120 kg N ha-1
followed by furrow irrigation. Although drip irrigation at 0.75 Epan recorded
similar pod yield as that of furrow treatment the B: C ratio recorded was lower on account of high
cost of installation. The negative B: C ratio recorded under 0.5 Epan was due to the lower pod yield
coupled with high cost of drip installation.
CONCLUSIONS
From the above study, it can be concluded that drip fertigation at 1.00 Epan + 120 kg N ha-1
to
lady‘s finger resulted in improved growth parameters, yield attributes , higher pod yield, water use
efficiency apart from realising higher monetary returns as compared to conventional furrow
Paper Proceedings of Agri Animal 2013 - ISSN 2279-3682
25
irrigation. There was a saving of 25 per cent of nitrogen through drip fertigation at 0.75 Epan with
90 kg N ha-1
which recorded yield comparable with furrow irrigation at 1.00 IW/CPE ratio.
REFERENCES
Ahmed N and Tanki M I.1997. Effect of nitrogen and phosphorus on growth and yield of
okra. Indian Journal of Horticulture 54(2):156-159.
Bafna A M Draftardar S Y, Khade K K ,Patel P V and Dhotre R S .1993. Utilisation of nitrogen and
water by tomato under drip irrigation system. Journal of water Management 1 (1): 1-5.
Bobade V, Asokaraja N and Murali Arthanari P .2002. Effect of drip irrigation and nitrogen levels
on yield and water use efficiency of brinjal .Crop Research 24 (3): 481-486.
Gopalan C, Rama Sastri B V, Balasubramanian S C. 1989.nutritive value of Indian foods. National
Institute of Nutrition , ICMR, Hyderabad, India.
Gorantiwar S D, Pingale L V, Pampattewar P S, Pagar V N and Saradesai M A .1991. Evaluation of
drip irrigation for Lady‘s finger (Abelmoschus esculentus L.Moench).Maharashtra Journal of
Horticulture. 5 : 93-97.
Jackson M L .1967. Soil chemical analysis. Prentice Hall of India private Limited, New Delhi.
Kadam J R, Dukre M V and Firake M N. 1995. Nitrogen saving through Biwall subsurface
irrigation in okra. Journal of Maharashtra Agricultural University 20 93): 475- 476.
Narda N K and Lubana S P .1999. Growth dynamics studies of tomatoes under sub – surface drip
irrigation. Journal of Research Punjab Agricultural University. 36 (3-4): 222-223.
Olsen S R, Cole C V, Watanable F S and Dean L A .1954. Estimation of available phosphorus in
soils by extraction with sodium bicarbonate USDA, Circular No. 939.
Patel N and Rajput T B S .2003. Yield response of some vegetable crops to different levels of
fertigation. Annals of Agricultural Research 24 (3):542-545.
Punam horo, Chowdhary B M, Prasad B N and Sunitha Kandeyang.2003b.Performance of different
irrigation methods in okra (Abelmoschus esculentus L.Moench).Journal of Research BAU 15 (2) :
205-210.
Sivanappan, R. K. 1994. ―Prospects of Micro Irrigation in India‖, Irrigation and Drainage System.
8(1):49-58.
Subbaiah, B.V and Asija, G.L. 1956. A rapid procedure for determination of available nitrogen in
soil. Current Science. 25: 259-260.
Tumbare A D, Shinde B N and Bhoite S U .1999. Effect of liquid fertiliser through drip irrigation
on growth and yield of okra (Abelmoschus esculentus L.Moench).Indian Journal of Agronomy. 44
(1): 176-178.

Paper Proceedings of Agri Animal 2013 - ISSN 2279-3682
26
Walkley, A and Black, C.A. 1934. An Examination of Degitigaroff method for determining soil
organic matter and proposed modification of the chromic acid titration method. Soil Science. 37:
29-34.
Paper Proceedings of Agri Animal 2013 - ISSN 2279-3682
27
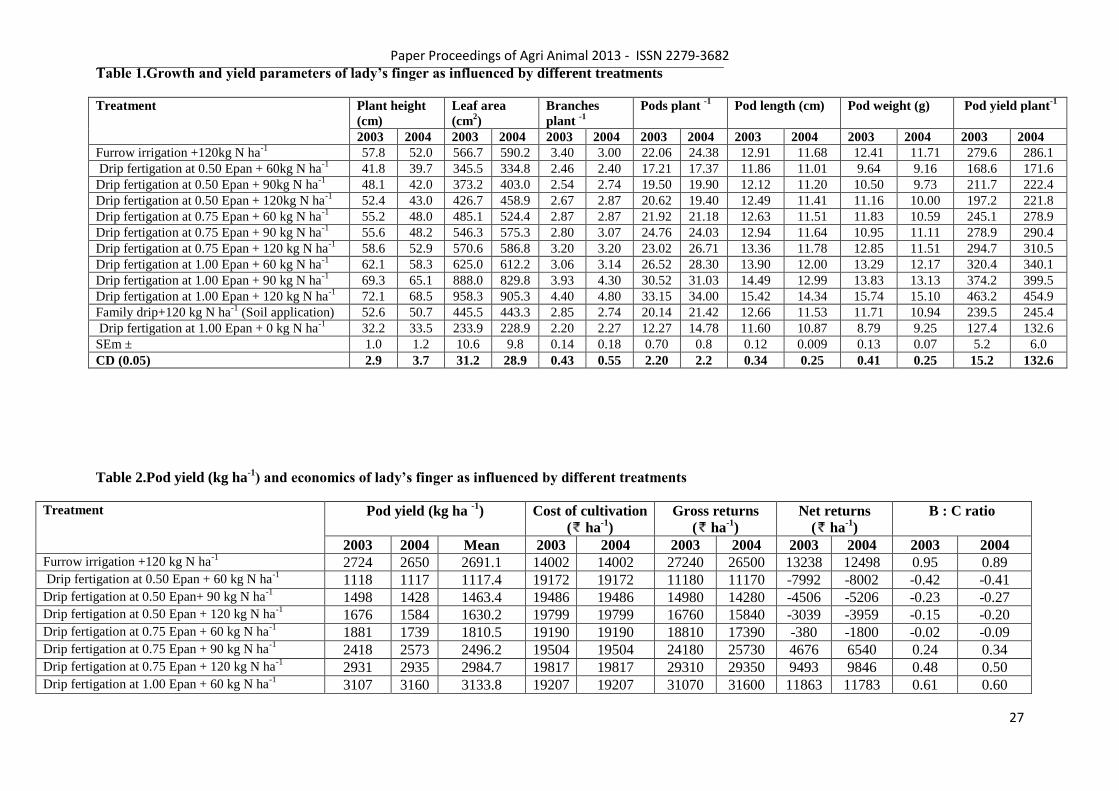
Table 1.Growth and yield parameters of lady’s finger as influenced by different treatments
Treatment
Plant height
(cm)
Leaf area
(cm2)
Branches
plant -1
Pods plant -1
Pod length (cm) Pod weight (g) Pod yield plant-1
2003 2004 2003 2004 2003 2004 2003 2004 2003 2004 2003 2004 2003 2004
Furrow irrigation +120kg N ha-1
57.8 52.0 566.7 590.2 3.40 3.00 22.06 24.38 12.91 11.68 12.41 11.71 279.6 286.1
Drip fertigation at 0.50 Epan + 60kg N ha-1
41.8 39.7 345.5 334.8 2.46 2.40 17.21 17.37 11.86 11.01 9.64 9.16 168.6 171.6
Drip fertigation at 0.50 Epan + 90kg N ha-1
48.1 42.0 373.2 403.0 2.54 2.74 19.50 19.90 12.12 11.20 10.50 9.73 211.7 222.4
Drip fertigation at 0.50 Epan + 120kg N ha-1
52.4 43.0 426.7 458.9 2.67 2.87 20.62 19.40 12.49 11.41 11.16 10.00 197.2 221.8
Drip fertigation at 0.75 Epan + 60 kg N ha-1
55.2 48.0 485.1 524.4 2.87 2.87 21.92 21.18 12.63 11.51 11.83 10.59 245.1 278.9
Drip fertigation at 0.75 Epan + 90 kg N ha-1
55.6 48.2 546.3 575.3 2.80 3.07 24.76 24.03 12.94 11.64 10.95 11.11 278.9 290.4
Drip fertigation at 0.75 Epan + 120 kg N ha-1
58.6 52.9 570.6 586.8 3.20 3.20 23.02 26.71 13.36 11.78 12.85 11.51 294.7 310.5
Drip fertigation at 1.00 Epan + 60 kg N ha-1
62.1 58.3 625.0 612.2 3.06 3.14 26.52 28.30 13.90 12.00 13.29 12.17 320.4 340.1
Drip fertigation at 1.00 Epan + 90 kg N ha-1
69.3 65.1 888.0 829.8 3.93 4.30 30.52 31.03 14.49 12.99 13.83 13.13 374.2 399.5
Drip fertigation at 1.00 Epan + 120 kg N ha-1
72.1 68.5 958.3 905.3 4.40 4.80 33.15 34.00 15.42 14.34 15.74 15.10 463.2 454.9
Family drip+120 kg N ha-1
(Soil application) 52.6 50.7 445.5 443.3 2.85 2.74 20.14 21.42 12.66 11.53 11.71 10.94 239.5 245.4
Drip fertigation at 1.00 Epan + 0 kg N ha-1
32.2 33.5 233.9 228.9 2.20 2.27 12.27 14.78 11.60 10.87 8.79 9.25 127.4 132.6
SEm ± 1.0 1.2 10.6 9.8 0.14 0.18 0.70 0.8 0.12 0.009 0.13 0.07 5.2 6.0
CD (0.05) 2.9 3.7 31.2 28.9 0.43 0.55 2.20 2.2 0.34 0.25 0.41 0.25 15.2 132.6
Table 2.Pod yield (kg ha-1
) and economics of lady’s finger as influenced by different treatments
Treatment
Pod yield (kg ha
-1) Cost of cultivation
( ha-1
)
Gross returns
( ha-1
)
Net returns
( ha-1
)
B : C ratio
2003 2004 Mean 2003 2004 2003 2004 2003 2004 2003 2004 Furrow irrigation +120 kg N ha
-1 2724 2650 2691.1 14002 14002 27240 26500 13238 12498 0.95 0.89
Drip fertigation at 0.50 Epan + 60 kg N ha-1
1118 1117 1117.4 19172 19172 11180 11170 -7992 -8002 -0.42 -0.41 Drip fertigation at 0.50 Epan+ 90 kg N ha
-1 1498 1428 1463.4 19486 19486 14980 14280 -4506 -5206 -0.23 -0.27
Drip fertigation at 0.50 Epan + 120 kg N ha-1
1676 1584 1630.2 19799 19799 16760 15840 -3039 -3959 -0.15 -0.20 Drip fertigation at 0.75 Epan + 60 kg N ha
-1 1881 1739 1810.5 19190 19190 18810 17390 -380 -1800 -0.02 -0.09
Drip fertigation at 0.75 Epan + 90 kg N ha-1
2418 2573 2496.2 19504 19504 24180 25730 4676 6540 0.24 0.34 Drip fertigation at 0.75 Epan + 120 kg N ha
-1 2931 2935 2984.7 19817 19817 29310 29350 9493 9846 0.48 0.50
Drip fertigation at 1.00 Epan + 60 kg N ha-1
3107 3160 3133.8 19207 19207 31070 31600 11863 11783 0.61 0.60
Paper Proceedings of Agri Animal 2013 - ISSN 2279-3682
28
Drip fertigation at 1.00 Epan + 90 kg N ha-1
3562 3642 3602.6 19521 19521 35620 36420 16099 17213 0.82 0.88 Drip fertigation at 1.00 Epan + 120 kg N ha
-1 4188 4153 4171.3 19834 19834 41880 41530 22046 21696 1.11 1.09
Family drip+120 kg N ha-1
(Soil application) 1597 1640 1618.5 14807 14807 15970 16400 1163 1593 0.10 0.14 Drip fertigation at 1.00 Epan + 0 kg N ha
-1 659 698 678.9 18581 18581 6590 6980 -
11991
-11601 -0.65 -0.62
SEm ± 108 131 111.4 - - - - - - - -
CD (0.05) 318 385 34.5.5 - - - - - - - -
Table 3.Depth of irrigation water applied, water use efficiency and water saving under different treatments
Treatment
Water applied
(mm)
Seasonal effective
rainfall (mm)
Total depth of water
applied (mm)
Water use efficiency
(kg ha-1
mm-1
)
Water saving (%)
over furrow system
2003 2004 Mean 2003 2004 2003 2003 2004 2003 2004
Furrow irrigation + 120 kg N ha-1
400.0 450.0 85.8 43.2 485.5 493.2 5.60 5.37 - -
Drip fertigation at 0.50 Epan + 60 kg N ha-1
211.5 234.5 85.8 43.2 297.3 277.7 3.76 4.02 47.13 47.88
Drip fertigation at 0.50 Epan + 90 kg N ha-1
211.5 234.5 85.8 43.2 297.3 277.7 5.04 5.14 47.13 47.88
Drip fertigation at 0.50 Epan+ 120 kg N ha-1
211.5 234.5 85.8 43.2 297.3 277.7 5.64 5.70 47.13 47.88
Drip fertigation at 0.75 Epan + 60 kg N ha-1
317.3 351.8 85.8 43.2 403.1 395.0 4.66 4.40 20.68 21.82
Drip fertigation at 0.75 Epan + 90 kg N ha-1
317.3 351.8 85.8 43.2 403.1 395.0 5.99 6.51 20.68 21.82
Drip fertigation at 0.75 Epan +120 kg N ha-1
317.3 351.8 85.8 43.2 403.1 395.0 7.27 7.43 20.68 21.82
Drip fertigation at 1.00 Epan + 60 kg N ha-1
423.0 469.1 85.8 43.2 508.8 512.3 6.10 6.16 0.00 0.00
Drip fertigation at 1.00 Epan + 90 kg N ha-1
423.0 469.1 85.8 43.2 508.8 512.3 7.00 7.10 0.00 0.00
Drip fertigation at 1.00 Epan +120 kg N ha-1
423.0 469.1 85.8 43.2 508.8 512.3 8.23 8.10 0.00 0.00
Family drip+120 kg N ha-1
(Soil application) 317.3 351.8 85.8 43.2 403.1 394.0 3.96 4.15 20.68 21.82
Drip fertigation at 1.00 Epan + 0 kg N ha-1
423.0 469.1 85.8 43.2 508.8 512.3 1.29 1.36 0.00 0.00

Paper Proceedings of Agri Animal 2013 - ISSN 2279-3682
29
3
Paper Proceedings of Agri Animal 2013 - ISSN 2279-3682
30
Radio Frequency Identification (RFID) in Agriculture–Food Safety and Traceability
Blaž GERMŃEK1, Anton PLETERŃEK
2
Abstract
Radio Frequency Identification (RFID) is a modern technology which is also being more and more
enforced in agriculture. RFID is a technology for wireless data transfer between the reader (data
collection centre) and the electronic smart label that measures, captures and sends the information on
request to the reader. The labels are of different forms, composed of integrated circuit (a chip), sensors
and an antenna. The original functionality of the RFID systems is the automatic identification of persons
and animals. However, the RFID system, supplemented with the so-called Smart Label, enables automatic
recording of physical and chemical parameters everywhere the label is fastened to or glued to an object.
Besides confirming the presence of a product they provide an automatic, flexible, smart tracking system
capable of contactless measuring, logging of transport conditions, and verification of the environmental
impacts on items.
In 2012, at a trial plantation of apple-trees of the Sadjarski center Maribor (The fruit growing
centre Maribor) we began to test the prototypes of the labels placed on the apple-trees, which were
equipped with humidity, light and temperature sensors, and enable continual data collection in the
observed measuring period. With these measurements, we wanted to find out the accuracy of the data
measurement, how the labels and the sensors react to different weather conditions (rain, wind, sun,
cold...), to find out the capacity of the wireless data transfer and the battery endurance. The aim of the test
was to develop or propose a new selection of sensors and to determine the parameters for the
development of future: dedicated tags‘ ICs and sensors for different needs of prediction in agricultural
branches. The data from these labels could cheapen the tracking of microclimatic conditions and alleviate
the prediction of illness and pest development.
Keywords: RFID, Smart Label, tracking of microclimatic conditions, sensor, apples.
1 INTRODUCTION
In the process of agricultural production there are many factors which influence the quality and the
amount of the harvest in different fruit sorts. Because the majority of agricultural production is taking
place outdoors, we can assume that it heavily depends on the micro and macro weather conditions. The
success of the agricultural production depends on meteorological variables such as air temperature,
humidity, the sun shining and the amount of precipitation as well as on frequency of inconvenient events
such as drought, floods, hail, and strong winds. Studying the influence of weather conditions and other
factors on the agricultural production, enables us to use the weather conditions as much as possible while
planning, and in that way achieve the best possible quality and amount of harvest per surface unit. The
climate changes in time and in place due to different factors. In the last decades, however, we have
witnessed distinctive changeability of the climate, for what the humans are greatly responsible. The
temperature is an important ecological factor, on which depend the dynamic of the growth and the
development of the plant itself.
The accurate tracking of micro and macro weather conditions is very important to reach the
optimisation in the agricultural branch. By processing these data, we can build computer models to
predict the quality parameters and consequently predict the optimal term to harvest the fruit. This is an
important project of the agriculture, as good prediction enables us to plan the sale, the necessary
1 Mag., Keter Organica, Titova cesta 2a, 2000 Maribor, e-mail:[email protected]
2 Dr., ams AG, Tehnolońki park 21, 1000 Ljubljana, e-mail: [email protected]
Paper Proceedings of Agri Animal 2013 - ISSN 2279-3682
31
manpower, organisation and schedules for the manpower, and optimal preparation of storage capacities.
With the help of prediction, we can plan the purpose of fruit and vegetable consumption, the type and
amount of packaging, and other processing capabilities (processing into juice, vinegar, spirits, dried
fruit...). All this data is important for setting the price during the harvest period (Stanjko in Vidniń 2011).
The biological processes in the European climate for the apple-tree (Malus domestica) begin in
spring, on the day, when the average daily air temperature is higher than 3 and up to 4 °C for several
consecutive days. The optimal growth for the apple-tree begins when the temperatures are between 12 and
18 °C. The lowest temperature for a normal growth during the growth season is 12 °C. In the period from
the cutting to the onset of the technological ripeness, the apple-tree needs a sum of effective temperatures
from 2700 to 2900 °C.
The apple-tree is a very demanding plant regarding the water consumption. Numerous experts
estimate that the apple-tree needs from 500 to 600 mm/m2 of precipitation in the growth season. However,
the water supply for the plants does not depend solely on the amount of precipitation, but also on its
disposition.
The daylight intensity and the length of illumination are important factors for the growth and the
development of the plants. The length of the day influences the plants in several ways, the most known
being their reaction to the beginning of their blooming (Jazbec et al. 1995).
The RDIF with smart labels is relatively new technology which has a huge potential in
agriculture. With new technologies we want to get a better view over different ways of cultivating
different rural cultures. Expected results are dependent on algorithms used, and therefore on adequate
developed software tools that cannot be generalized for the entire agriculture. RFID technology is already
present in the global agriculture, used by the most successful companies in the global agricultural
production. They already alleviate labelling and ‗smart‘ tracking of their products. By using RFID
traceability, monitoring chains of food product and suppliers, the complete control of production, storage
conditions, transportation, sales regulations, and automatic calculation of the remaining shelf-life of the
product are available.
The SL900A is an EPC Class 3 (cool-Log™) sensory tag chip enabling affordable RFID
automatic data logging applications with sensor functions. This sophisticated chip from ams AG company
() makes it practical and affordable to automatically track, monitor, time-stamp, and record information
about any goods in any supply chain or cold chain transport. The battery-assisted feature allows its
sensors to take temperature and other readings in the absence of a reader, which are then stored over long
periods of time. With the built-in shelf-life algorithm, it enables a simultaneous calculation and showing
of the remaining life period of a certain product or expiration date of a food item (the customer simply
reads this data on a mobile phone that is placed near a labelled product on a store shelf).
Present presentation is organized as follows: Planting and natural resources in Slovenia is
discussed in first chapter, materials and monitoring methods in a trial plantation of apple-trees is
presented next, the use of RFID for monitoring of environmental conditions and fruit tracking is presented
in 4th section, followed by discussion and conclusions.
2. Planting and natural resources in Slovenia
Natural resources in Slovenia are appropriate for planting different fruit sorts. In spite of that, numerous
surfaces, especially appropriate for fruit growing, are poorly exploited or even are not at all. The
inconvenient property structure and fragmentation which increase the cost of production are among the
main reasons for that. The role of the fruit growing in Slovenia is important in several ways, mostly for
the agricultural activity that offers an income to an important share of farms. We also cannot neglect the
meaning of keeping traditions and people‘s health as well as the social and economical meaning and the
great possibilities it offers for further development. In 2010, 22,377 farm households had an orchard or an
olive-tree garden which represented 30 % of all rural economies in Slovenia. The orchards and olive tree
gardens occupied 10,415 hectares or 2 % of Slovenia‘s agricultural surfaces in 2010. Fruit and olive-trees
represent 8 % in the collective amount of agricultural production. In average, the Slovenian rural
Paper Proceedings of Agri Animal 2013 - ISSN 2279-3682
32
economy had 0.3 hectare of an orchard or olive-tree garden in the year 2000, but up to the year 2010 the
average size of orchards and olive-tree gardens increased to 0.5 hectare per farm. In 2010, 39 % of all
surfaces harvest the fruit in the integrated manner (Kobal 2006), and the ecological fruit harvest occupied
about 9 % of the surfaces. The biggest share in the fruit harvest in Slovenia is represented by the apples
(Malus domestica), namely in the last years an average of 74 %. In the last twenty years, the fruit harvest
has increased altogether by 58 %, and the apple harvest has nearly tripled (Kobal 2008).
2.1 Research toward Monitoring of growing conditions
Only adequately ripen fruit is qualitative with developed flavour, high sugar and acid content, and still
firm enough to eat and proper for storage. When we are making the decision, when to harvest the fruit, we
need to know what is going to happen to the fruit after it is harvested. The fruit which we want to storage
for a longer time needs to be harvested sooner, less ripe than the fruit intended for immediate usage (fresh
or processed). It is important that we know that also the early harvested fruit does not possess good
storage abilities, as the fruit skin is not developed enough and it does not protect the fruit, but instead
withers and decays sooner than the fruit, which is harvested at the optimum ripeness. With the suitable
technology of the production and the harvest home at an optimum ripeness, we can successfully storage
the fruit for a longer time without having too great a loss. This is mostly true for apples from the intensive
plantations which are meant for storage in cooling rooms under different regimes (e.g. controlled
atmosphere, ULO...). During the ripening process, the starch in the fruit is being decomposed into sugars,
and parallel flavours and other substances are formed, which causes the firmness of the fruit and the acid
content to drop. To have good taste of the fruit, high sugar content in harmony with a right content of acid
is preferable, which gives the fruit a harmonic flavour.
A too early fruit harvest means lower mass of fruit, irregular form, lack of flavour, tenacious
consistency, and poor storage capability. On the other hand, a belated harvest means fruit falling down,
watercore, soft fruit, lack of acid and consequently poor storage capability. The literature that states basic
characteristics of the sorts also states frame deadlines for harvesting individual sorts. The time and speed
of ripening are heavily connected to weather conditions, and that is why these are only frame terms which
we cannot keep in professional fruit growing, as the micro climatic factors bear too much importance
(Kobal 2006).
To predict the harvest or the development stage of certain illnesses and pests, the farmers usually
use meteorological data which are several kilometres away (sometimes over 30 km). Such data is
inaccurate or even deceiving. At present, the competition does not allow us make any mistakes. The ―real
time‖ micro climatic data are a reflexion of time and professionalism of agricultural production; that
means they are available in real time and from a real environment.
The higher basic standards of trade chains and the contents of state laws, conscious consumers,
and the pressure of cheap goods from neighbouring countries are only a few basic factors that demand
inclusion of new technologies into the agricultural branch.
Integrated functions in a single chip tag enables contactless measuring, logging of transport
conditions, and verification of the environmental impacts on items. Thus, physical parameters like
temperature, time stamp, humidity, chemicals, pressure, stress, etc. can be successfully acquired and
stored in a so-called ―Smart Active Label‖ (SAL), also named a smart tag, which is mounted as a label on
palettes, items. It enables contact-free communication with the readers of different producers, as the
whole UHF RFID (Ultra High Frequency RFID) infrastructure of the ams AGcompany is conformable
with the international standard (EPC, Gen2, and ISO18000-6c). This is a standard which describes the
signals, commands, and communication protocols that are built into the RFID infrastructure chips
(interrogator and transponder).
The purpose of the research is to:
- find out the adequacy of different sensors for recording weather parameters (precipitation,
temperature, solar radiation) in fruit growing and other agricultural branches,
Paper Proceedings of Agri Animal 2013 - ISSN 2279-3682
33
- find out the reaction and the durability of the labels through different weather factors (rain, wind,
snow, sun...),
- use weather data to predict the optimal term of harvesting different apple sorts,
- test the sensors for steering the irrigation system through RFID technology,
- use the weather data to predict different stages of illnesses and pests, and to predict the optimal
suppression of illnesses and pests,
- decrease the cost of monitoring the weather data in permanent plantations and other agricultural
branches.
- to demonstrate the new concepts and solutions in real agro-environments.
3 MATERIALS AND WORK METHODS
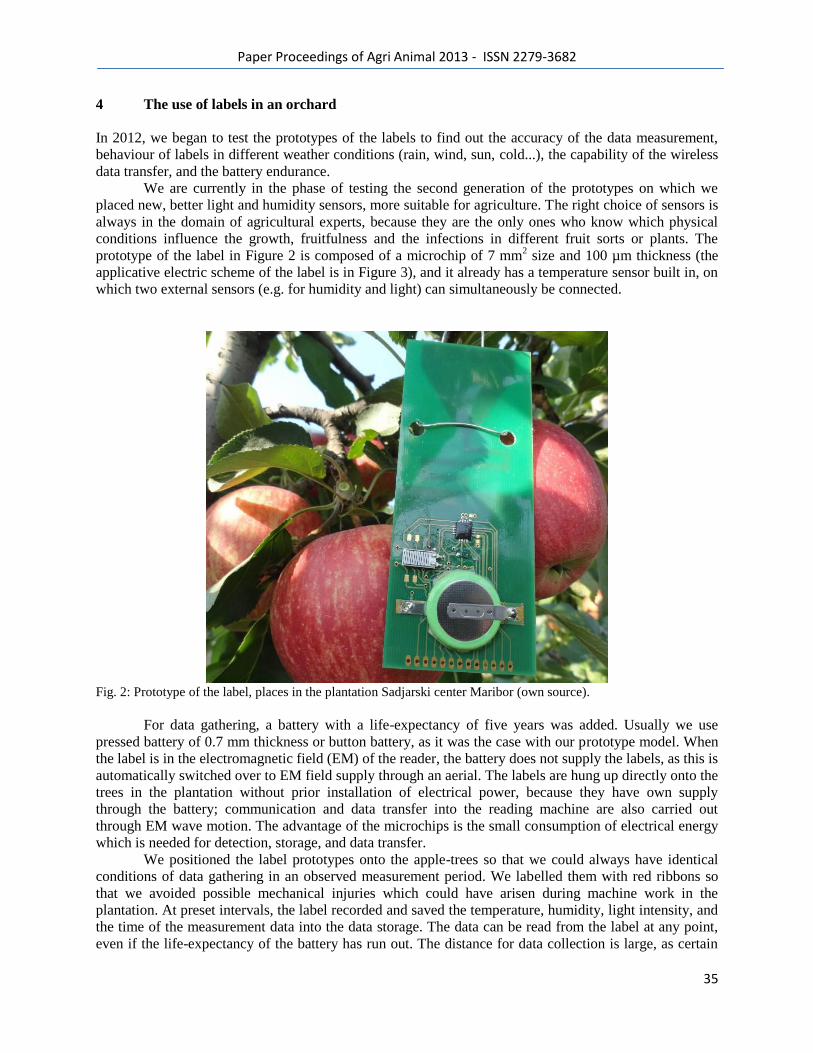
In 2012, we began to test the RFID technology in fruit growing with the help of the company IDS from
Ljubljana which specializes in planning of analogue and analogue-digital consignee integrated circuits
and systems, and deals with different industrial technologies. The labels which record the temperature
(°C), the light (nm), and relative air humidity (%), have been tested in a plantation of apple-trees, trees of
the sort Gala/M9 EMLA, clone Brookfield, under the anti-hail net Wiesel (Fruit Security GmbH, St.
Ruprecht, Austria) at the Sadjarski center Maribor (The Fruit Growing Centre Maribor which is a part of
the KGZS – Institute (Chamber of Agriculture and Forestry of Slovenia) Maribor. The trees of the
sort‗Gala-Brookfield‘ were planted in 2003 and bred as a slim spindle-shaped bush. The apple growing
was done according to the rules of integrated production. The ground in the plantation was taken care of
according to a system of a tended fallow, and the plantation has an arranged dripping system of irrigation.
The analysis of the ground in 2004 showed a slight high pH (7.7) for the fruit-growing, a middle content
of phosphorus, magnesium, boron and organic substance (5.1 %) in the ground, and a higher content of
calcium (Chart 1).
Chart 1: The content of the ground elements before the creation of the plantation in 2003
P2O5
(mg/100 g soil)
K2O
(mg/100 g soil) pH Humus %
4.2 52.4 7.7 5.1
(KGZS – Zavod Maribor 2003)
3.1 Climate conditions
The Fruit Growing Centre Maribor is under the influence of the continental and Alpine climate and lies at
270–310 m above the sea level. In the thirty-year period (1961–1990), the Maribor area had 1122.5 mm
precipitation, and 681.5 mm precipitation in the vegetation period (April–September). The average annual
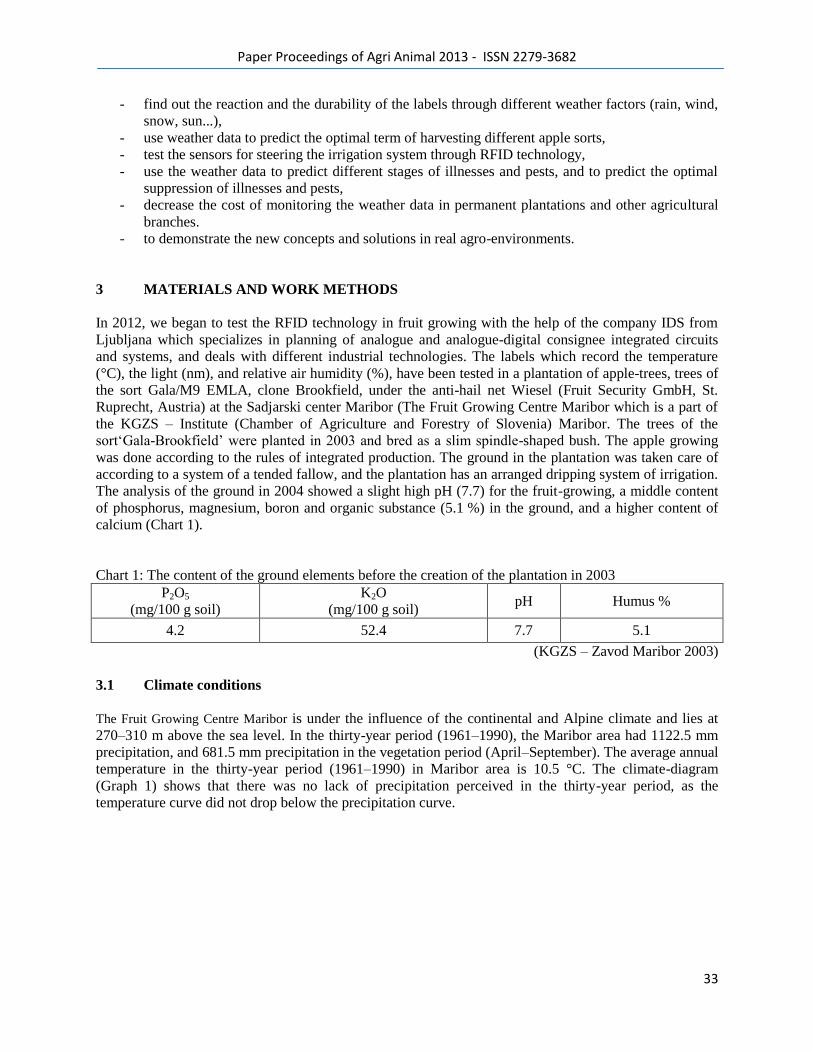
temperature in the thirty-year period (1961–1990) in Maribor area is 10.5 °C. The climate-diagram
(Graph 1) shows that there was no lack of precipitation perceived in the thirty-year period, as the
temperature curve did not drop below the precipitation curve.
Paper Proceedings of Agri Animal 2013 - ISSN 2279-3682
34
Fig. 1: The modified Walter and Gaussen climate diagram for the thirty-year period (1960–1990) with the
temperature : precipitation ratio being 1:4 (Hočevar and Petkovńek 1995)
3.2 Vegetal material
2.3.1 General description of the apple-tree (Malus domestica B.) sort Gala Brookfield
Gala is a diploid sort of a New Zealand origin, arisen by crossbreeding (Kidd‘s orange x Golden
Delicious). It ripens late in August. It belongs to the semi-lush sorts of apple-trees. It blooms late and
pollinates well. It bears fruit in the second year and after that bears regularly and well with proper care. It
tends to alternate bearing fruit. It is semi-sensitive to winter cold, mould (Erysiphaceae sp), and Venturia.
The fruit is smaller, yellow, with pale-red tint. The fruit meat is juicy, sweet, and very fragrant. The
colour of the fruit meat is yellow white (Jazbec et al. 1995). It can be stored in the domestic cellar up to
November and up to March in a cooling room.
3.2.1 Rootstocks M9
Rootstocks M9 is the most important vegetative apple-tree rootstocks. The M9 is fairly resilient to rotting
on the root neck, it is sensitive to the Erysiphaceae sp and Venturia, and it is very sensitive to Eriosoma
lanigerum and Erwinia amylovora (Burrill). It is sensitive to excessive humidity in the ground and harsh
winters, and it also does not tolerate drought very well. A vole likes to eat it away. It is poorly grounded
and that is why it needs wooden poles and firm wire support. It likes to drive away root outgrowths. With
intensive care it gives excellent production results. It does best in deep, humus, moderately humid, and
permeable ground. On an inoculation spot it gets more or less thickened. The apple-tree on M9 rootstocks
generally breeds early, in the second or exceptionally the third year. With intensive care, which includes
thinning of flowers and fruits, the fruitfulness is regular and abundant. The durability of the fruits can be
slightly worse in the first years in larger and over-ripened fruits (Smole in Črnko 2000).
0.0
20.0
40.0
60.0
80.0
100.0
120.0
02468
1012141618202224262830
jan.
fer.
mar.
apr.
maj
juni
juli
avg.
sep.
okto
.
no
v.
dec.
Sum
of
rain
fal
l in
mm
/m2
The
aver
age
tem
per
ature
in °
Crain. (mm/m2)
temp. (°C)
Paper Proceedings of Agri Animal 2013 - ISSN 2279-3682
35
4 The use of labels in an orchard
In 2012, we began to test the prototypes of the labels to find out the accuracy of the data measurement,
behaviour of labels in different weather conditions (rain, wind, sun, cold...), the capability of the wireless
data transfer, and the battery endurance.
We are currently in the phase of testing the second generation of the prototypes on which we
placed new, better light and humidity sensors, more suitable for agriculture. The right choice of sensors is
always in the domain of agricultural experts, because they are the only ones who know which physical
conditions influence the growth, fruitfulness and the infections in different fruit sorts or plants. The
prototype of the label in Figure 2 is composed of a microchip of 7 mm2 size and 100 µm thickness (the
applicative electric scheme of the label is in Figure 3), and it already has a temperature sensor built in, on
which two external sensors (e.g. for humidity and light) can simultaneously be connected.
Fig. 2: Prototype of the label, places in the plantation Sadjarski center Maribor (own source).
For data gathering, a battery with a life-expectancy of five years was added. Usually we use
pressed battery of 0.7 mm thickness or button battery, as it was the case with our prototype model. When
the label is in the electromagnetic field (EM) of the reader, the battery does not supply the labels, as this is
automatically switched over to EM field supply through an aerial. The labels are hung up directly onto the
trees in the plantation without prior installation of electrical power, because they have own supply
through the battery; communication and data transfer into the reading machine are also carried out
through EM wave motion. The advantage of the microchips is the small consumption of electrical energy
which is needed for detection, storage, and data transfer.
We positioned the label prototypes onto the apple-trees so that we could always have identical
conditions of data gathering in an observed measurement period. We labelled them with red ribbons so
that we avoided possible mechanical injuries which could have arisen during machine work in the
plantation. At preset intervals, the label recorded and saved the temperature, humidity, light intensity, and
the time of the measurement data into the data storage. The data can be read from the label at any point,
even if the life-expectancy of the battery has run out. The distance for data collection is large, as certain
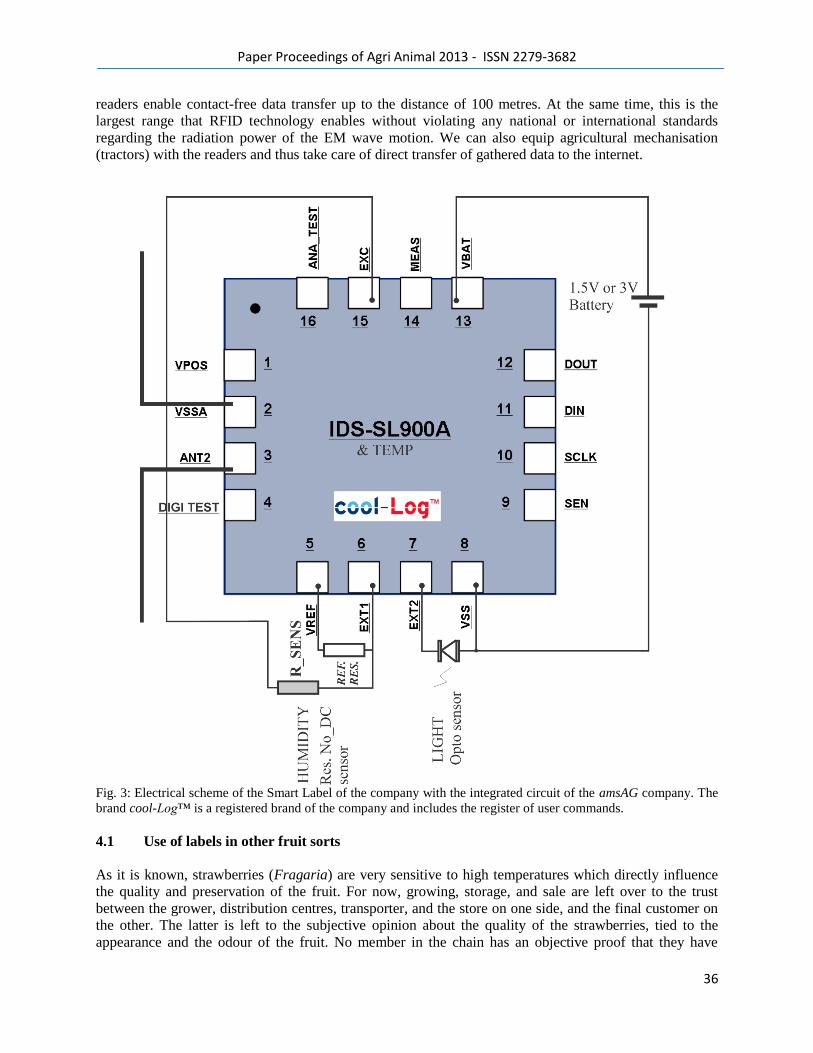
Paper Proceedings of Agri Animal 2013 - ISSN 2279-3682
36
readers enable contact-free data transfer up to the distance of 100 metres. At the same time, this is the
largest range that RFID technology enables without violating any national or international standards
regarding the radiation power of the EM wave motion. We can also equip agricultural mechanisation
(tractors) with the readers and thus take care of direct transfer of gathered data to the internet.
Fig. 3: Electrical scheme of the Smart Label of the company with the integrated circuit of the amsAG company. The
brand cool-Log™ is a registered brand of the company and includes the register of user commands.
4.1 Use of labels in other fruit sorts
As it is known, strawberries (Fragaria) are very sensitive to high temperatures which directly influence
the quality and preservation of the fruit. For now, growing, storage, and sale are left over to the trust
between the grower, distribution centres, transporter, and the store on one side, and the final customer on
the other. The latter is left to the subjective opinion about the quality of the strawberries, tied to the
appearance and the odour of the fruit. No member in the chain has an objective proof that they have
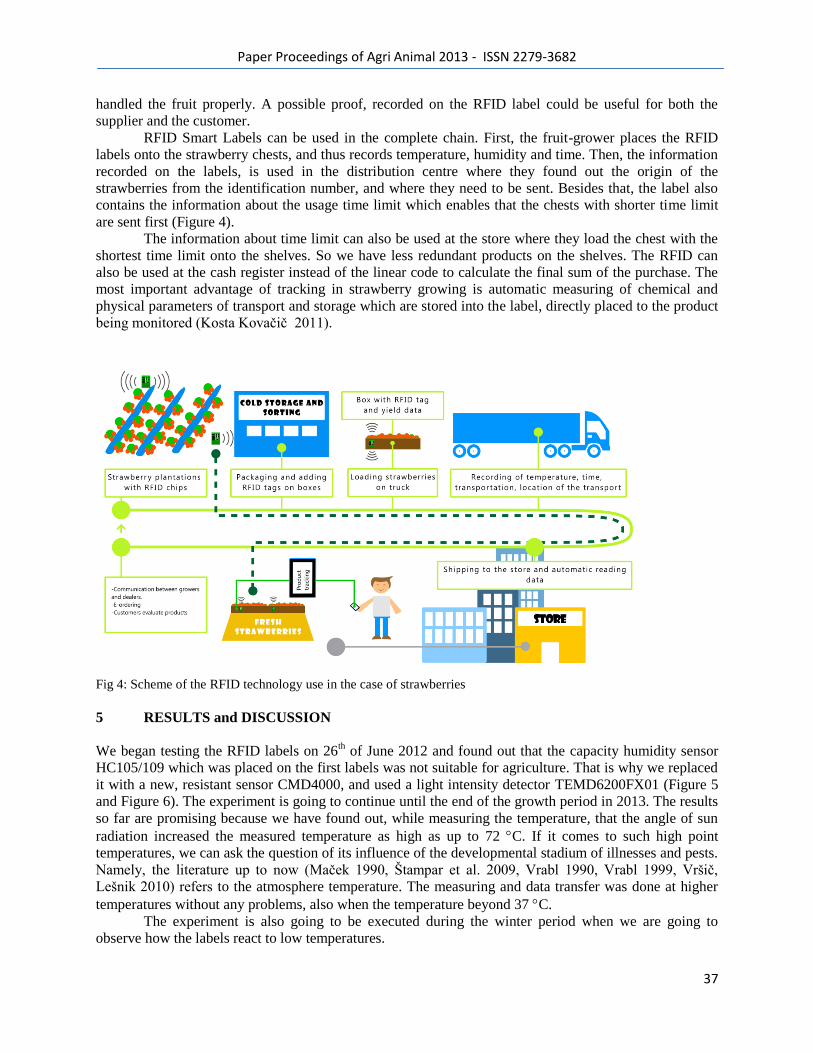
Paper Proceedings of Agri Animal 2013 - ISSN 2279-3682
37
handled the fruit properly. A possible proof, recorded on the RFID label could be useful for both the
supplier and the customer.
RFID Smart Labels can be used in the complete chain. First, the fruit-grower places the RFID
labels onto the strawberry chests, and thus records temperature, humidity and time. Then, the information
recorded on the labels, is used in the distribution centre where they found out the origin of the
strawberries from the identification number, and where they need to be sent. Besides that, the label also
contains the information about the usage time limit which enables that the chests with shorter time limit
are sent first (Figure 4).
The information about time limit can also be used at the store where they load the chest with the
shortest time limit onto the shelves. So we have less redundant products on the shelves. The RFID can
also be used at the cash register instead of the linear code to calculate the final sum of the purchase. The
most important advantage of tracking in strawberry growing is automatic measuring of chemical and
physical parameters of transport and storage which are stored into the label, directly placed to the product
being monitored (Kosta Kovačič 2011).
Fig 4: Scheme of the RFID technology use in the case of strawberries
5 RESULTS and DISCUSSION
We began testing the RFID labels on 26th of June 2012 and found out that the capacity humidity sensor
HC105/109 which was placed on the first labels was not suitable for agriculture. That is why we replaced
it with a new, resistant sensor CMD4000, and used a light intensity detector TEMD6200FX01 (Figure 5
and Figure 6). The experiment is going to continue until the end of the growth period in 2013. The results
so far are promising because we have found out, while measuring the temperature, that the angle of sun
radiation increased the measured temperature as high as up to 72 C. If it comes to such high point
temperatures, we can ask the question of its influence of the developmental stadium of illnesses and pests.
Namely, the literature up to now (Maček 1990, Ńtampar et al. 2009, Vrabl 1990, Vrabl 1999, Vrńič,
Leńnik 2010) refers to the atmosphere temperature. The measuring and data transfer was done at higher
temperatures without any problems, also when the temperature beyond 37 C.
The experiment is also going to be executed during the winter period when we are going to
observe how the labels react to low temperatures.
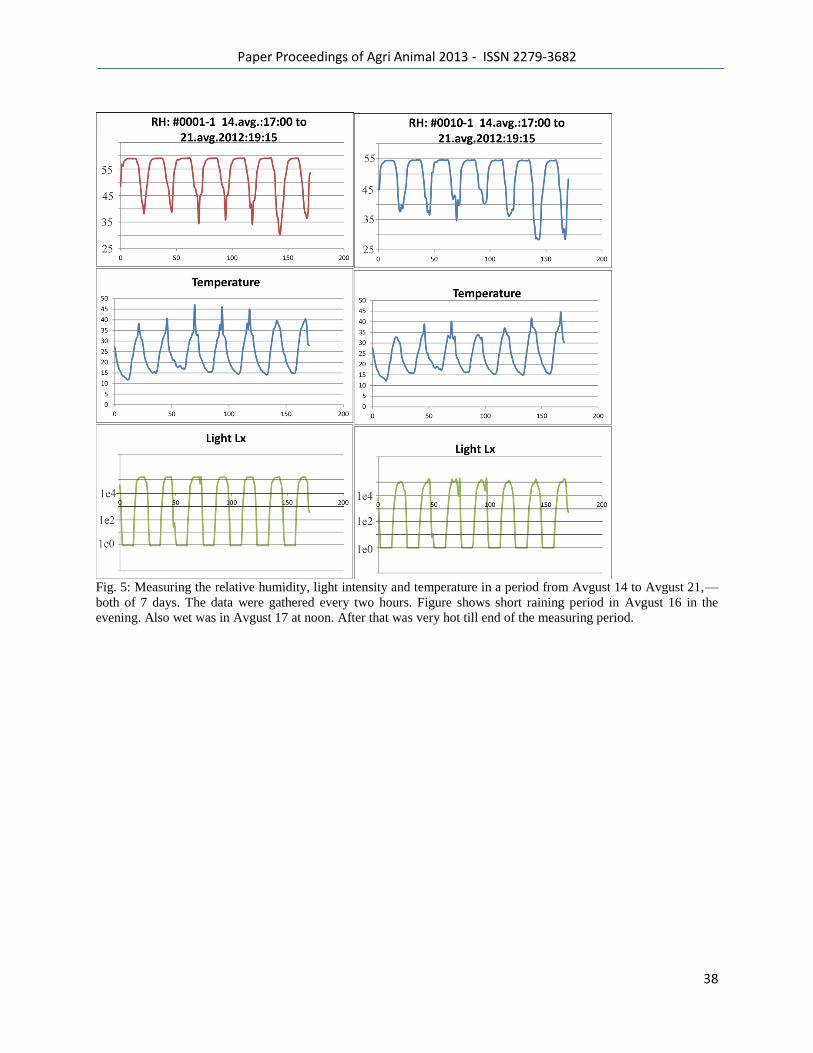
Paper Proceedings of Agri Animal 2013 - ISSN 2279-3682
38
Fig. 5: Measuring the relative humidity, light intensity and temperature in a period from Avgust 14 to Avgust 21,—
both of 7 days. The data were gathered every two hours. Figure shows short raining period in Avgust 16 in the
evening. Also wet was in Avgust 17 at noon. After that was very hot till end of the measuring period.
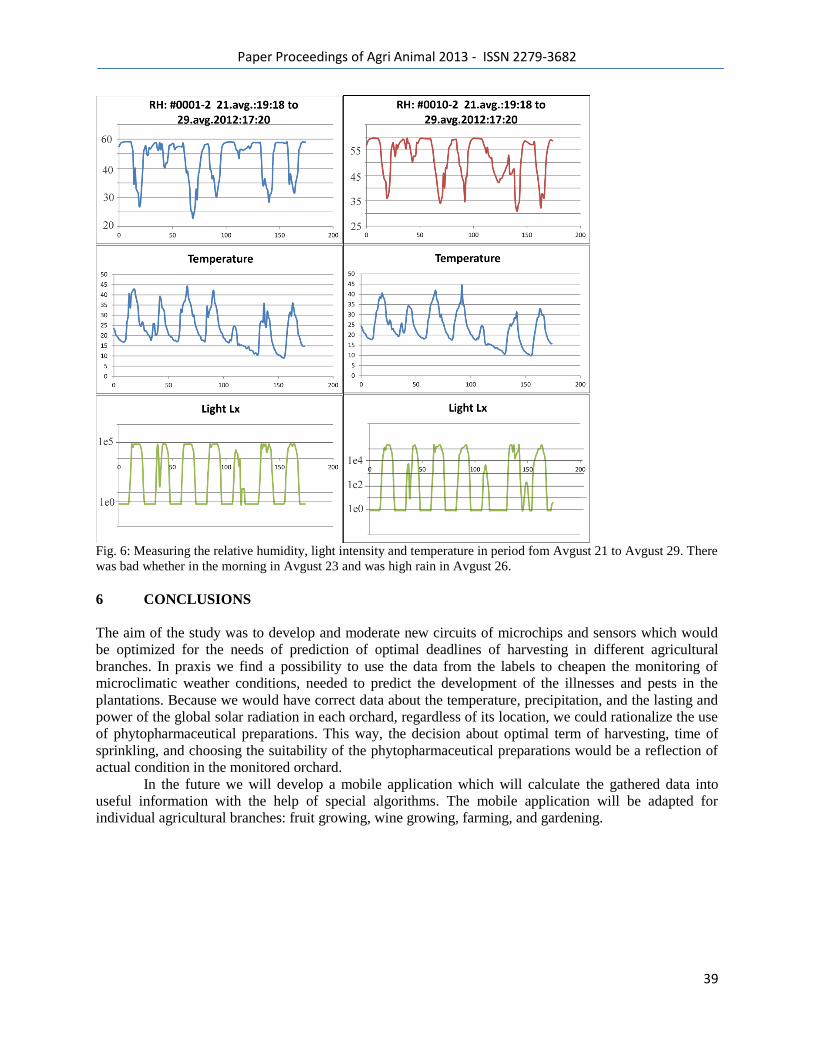
Paper Proceedings of Agri Animal 2013 - ISSN 2279-3682
39
Fig. 6: Measuring the relative humidity, light intensity and temperature in period fom Avgust 21 to Avgust 29. There
was bad whether in the morning in Avgust 23 and was high rain in Avgust 26.
6 CONCLUSIONS
The aim of the study was to develop and moderate new circuits of microchips and sensors which would
be optimized for the needs of prediction of optimal deadlines of harvesting in different agricultural
branches. In praxis we find a possibility to use the data from the labels to cheapen the monitoring of
microclimatic weather conditions, needed to predict the development of the illnesses and pests in the
plantations. Because we would have correct data about the temperature, precipitation, and the lasting and
power of the global solar radiation in each orchard, regardless of its location, we could rationalize the use
of phytopharmaceutical preparations. This way, the decision about optimal term of harvesting, time of
sprinkling, and choosing the suitability of the phytopharmaceutical preparations would be a reflection of
actual condition in the monitored orchard.
In the future we will develop a mobile application which will calculate the gathered data into
useful information with the help of special algorithms. The mobile application will be adapted for
individual agricultural branches: fruit growing, wine growing, farming, and gardening.
Paper Proceedings of Agri Animal 2013 - ISSN 2279-3682
40
5 BIOGRAPHICAL NOTE
Blaz Germsek, mag. is currently with Keter Organica as Assistant project manager. He is also a Ph.D
student at University of Maribor, Faculty of Agriculture and Life Sciences. His major research is quality
prediction in fruit production, he is co-author of journal article Effect of location in the canopy on the
colour development of three apple cultivars during growth published in Wiley Online Library, and many
other articles. He is also GLOBALG.A.P inspector in Institute for Inspection and Certification, University
of Maribor. He really enjoy in researching of modern technology as is RFID, machine learning
implementation, smart tracking and other techniques.
Dr. Anton Pletersek is currentlywith FE, department of microelectronics LMFE in University of Ljubljana and with
the ams R&D in Ljubljana. Hisresearch interests include mixed-signal ASIC design, device physics related
tosubmicron devices and integrated silicon based sensors and sensory processing inCMOS and BiCMOS
technologies. He has authored numerous journal articles(Journal of Solid-State Circuit - IEEE, Electron eng.,
Analog Integrated Circuit andSignal Processing - springs publisher, Inf. Modem, Bentham Science, etc.). He holds
14 patents and is coauthor of the first Slovenian patent numbered #00001. He isan author of the design book titled
Design of Analog Integrated Circuit in CMOS and BiCMOS technology. He is currently Associate Professor for the
Microelectronics SystemIntegration at the FE, Ljubljana and for Integrated Circuits in FERI Maribor. He was a co-
founder of the IDS-microchip hi-tech company, now ams R&D.
Dr. Anton Pleterńek received the National Award for the best innovations for the year 2010 (CCIS`s Award for best
Innovation) granted by Chamber of Commerce and Industry of Slovenia.
6 LITERATURE
GS1 EPC Global., 2012. "EPC™ Radio-Frequency Identity Protocols: Class-1 Generation-2 UHF RFID
Protocol for Communications at 860 MHz-960 MHz, Version 1.2.0". Available at:
http://www.gs1.org/gsmp/kc/epcglobal/uhfc1g2 (13. 12. 2012).
Hočevar, Andrej. Petkovńek, Zdravko. 1995. Meteorologija – osnove in nekatere aplikacije. Ljubljana,
Biotehnična fakulteta: 132–134.
Jazbec, Milena. Vrabl, Stojan. Juvanc, Jože. Babnik, Marko. Koron, Darinka (ed.). 1995. Sadni vrt.
Kmečki glas, Ljubljana: 97−105.
Kobal, Zlatka 2008. Gospodarske razmere v Slovenskem sadjarstvu (jabolke) specialistka za sadjarstvo
pri KGZS – Zavod Maribor. 1–3.
Kovačič, Kosta. 2010. Integriran mikrosistem za brezkontaktno identifikacijo in beleženje. Doktorska
disertacija: 7–25.
Kovačič, Kosta. 2011. Fleksibilna reńitev za identifikacijo in beleženje. Kakovost, marec 2011: 24–27.
Kovačič, Kosta. Pleterńek, Anton. Vodopivec, Andrej. Roberts, William Peyton. Alminde, Oluf.2010.
Postopek za varno obstojno beleženje v aktivni RFID nalepki procesa v oblepljenem predmetu: SI 22957
(A), 2010-07-30. Ljubljana: Urad Republike Slovenije za intelektualno lastnino, 2010.
Pleterńek, Anton. Kovačič, Kosta. Vodopivec, Andrej. 2012. RFID Label Comprising an Interface to
External Sensors, US020120206240A1, Publication date: 16.08.2012.
Paper Proceedings of Agri Animal 2013 - ISSN 2279-3682
41
Lukežič, Marjan. 2006. Težave pri implementaciji RFID-tehnologije v prakso. Globalna varnost, Bled 13.
in 14. 10. 2006: 189–195.
Maček, Jože. 1990. Posebna fitopatologija. Patologija sadnega drevja in vinske trte, Ljubljana:
Biotehnińka fakulteta, VTOZD za agronomijo, 1990: 22–27.
Stanjko, Denis. Vindiń, Peter. 2011 Napoved pridelka jabolk in hruńk z metodo analize slike, Fakulteta za
kmetijstvo in biosistemske vede Univerze v Mariboru., 2011, 2–21.
Smole, Julijana. Črnko, Jernej. 2000. Razmnoževanje sadnih rastlin. Založba Kmečki glas, Ljubljana,
102–106.
Ńtampar, Franci. Leńnik, Mario. Veberič Robert. Solar, Anita. Koron, Darinka. Usednik, Valentina.
Hudina, Metka. Osterc, Gregor 2009. Sadjarstvo., dopolnjena izdaja. Ljubljana: Kmečki glas, 2009: 34–
36.
Ńtraus, Darko. Kovačič, Kosta. 2010 Self-heating compensation in temperature sensor RFID transponders
= Kompenzacija lastnega segrevanja pri merjenju temperature z RFID značko. Inf. MIDEM, jun. 2010,
Vol. 40, Issue 2: 144–150.
Pleterńek, Anton. Sok, Mihael. Trontelj, Janez. 2012. Monitoring, control and diagnostics using RFID
infrastructure. Journal of medical systems, Vol., 36, Issue 6: 1–7.
Vrabl, Stojan. 1990. Varstvo kmetijskih rastlin pred boleznimi in ńkodljivci. I., Splońni del / Stojan Vrabl,
Maribor: Vińja agronomska ńola, 1990: 6–32.
Vrabl, Stojan. 1999. Posebna entomologija – ńkodljivci in koristne vrste na sadnem drevju in vinski trti,
Maribor: Fakulteta za kmetijstvo: 4–12.
Vrńič, Stanko. Leńnik, Mario. 2010. Vinogradnińtvo, Ljubljana: Kmečki glas: 22–56.
Trebar, Mira, Grah, Andrej, Fonda, Irena, Lotrič, Metka, Pleterńek, Anton, Kovačič, Kosta.
RFID-enabled food safety and cold chain in tracebility system. Trendi in izzivi v živilstvu, prehrani,
gostinstvu in turizmu : zbornik prispevkov 2. mednarodne strokovne konference, 16.–17. november 2012,
Ljubljana, Slovenija: 2nd International Professional Conference proceedings, November 16th–17th 2012,
Ljubljana, Slovenia. Ljubljana: Biotehnińki izobraževalni center, Biotehnical Educational Centre,
Vocational College, 2012, str. 201–209.

Paper Proceedings of Agri Animal 2013 - ISSN 2279-3682
42
4
Paper Proceedings of Agri Animal 2013 - ISSN 2279-3682
43
Genotype-environment interaction in sesame (Sesamum indicum L.) genotypes and
identification of stable types
Arna Das*, Sarita Pandey, Tapash Dasgupta
Abstract
Sesame, an oilseed crop has potential to meet the projected demand for oil in India, but
the crop is environmental sensitive. West Bengal, a state in Eastern India contributes
significantly to total sesame production of the country. But the state‘s wide climatic variation
leads to fluctuation in yield and quality of sesame. This restricts acceptance of sesame for
cultivation in extended areas. So, it is of great importance to develop high yielding stable
genotypes over a wide range of environments with quality produce, to combat the interaction of
genotype and environment (GEI).
In the present investigation, Eberhart and Russell‘s model has been followed for stability
analysis of 26 sesame mutants, developed from Calcutta University, over seven environments
across West Bengal. Significant GEI were obtained for nine observed morphological traits.
Performance of genotypes for 8 traits was predictable for having high linear component (%).
Four genotypes were identified as stable and three genotypes were found suitable for favorable
environments. Stability parameters, μi and bi were found to be significantly correlated for 6
traits; also SDS-PAGE of the soluble seed storage protein revealed three bands common to stable
genotypes. Hence selection for either of these would help in identifying stable genotypes.
Key words - Sesamum, GEI, correlation
Paper Proceedings of Agri Animal 2013 - ISSN 2279-3682
44
Introduction
Sesame, used as an oilseed since ancient time (Bedigian, 2004) is evidently originated in
India (Bedigian et al., 1986). Apart from its favorable amino acid and mineral content, the
oilseed is famous for its high content of omega-6 type of mono unsaturated and poly unsaturated
fatty acids, high lignan and high Vitamin E content and zero content of cholesterol. The lignans
act as excellent antioxidants. Due to these unique nutritional properties of the oilseed,
consumption of Sesamum helps in reducing risk of many ailments, to name a few are heart, skin
and kidney diseases. Moreover, sesame rich diet evidently reduces growth of cancerous cells
(Miyahara et al. 2001). The high antioxidants content imparts sesame oil with long shelf life,
hence good storage capacity (Suja et al., 2004) and high smoke point. Sesame seeds find its use
in various culinary preparations around the world, while sesame oil has application in industries
like, edible oil, beauty products, pesticide and ayurveda.
Oilseeds are the 2nd
largest agricultural commodity in India and demand for edible oil is at par
with increasing population. Sesamum as an oilseed crop has potential to meet the projected
demand for edible oil in India collectively with other major oilseeds of the country. The crop was
a neglected one, cultivated mainly in the marginal lands of developing countries but the demand
of sesame is increasing due to its beneficiary nutritional properties. India is one of the leading
producers of sesame along with China and Myanmar (www.faostat.fao.org).
Climatic variation has a profound effect on crop cultivation. Varying environments
interact closely with genotypes making them to express differently. Like other crops, sesame
being an environmental sensitive crop, its yield varies widely depending upon prevailing
environment. This hinders the acceptance of sesame by the farmers for cultivation in extended
areas.
Paper Proceedings of Agri Animal 2013 - ISSN 2279-3682
45
West Bengal, a state in Eastern India contributes significantly to the total share of sesame
production of the country and ranks top in production and productivity
(http://eands.dacnet.nic.in). Sesame productivity in the state (~950Kg/Ha) (Directorate of
Agriculture, Govt. of West Bengal, India) is almost double than the country‘s national average
(~430 Kg/Ha) (www.faostat.org). But wide climatic range in this zone due to variation in altitude
and/or rainfall leads to inconsistency in yield and quality of sesame production.
Similar experience of variation in genotypic expression of sesame due to interaction of
genotype with seasons, years and locations were also reported by Mahdy, et al. (1988), John,
Subbaraman and Jebbaraj (2001), BoShim, et al. (2003), Mekonnen and Mohammed (2009)
Were, et al. (2006).
This hinders the acceptance of sesame by the farmers for cultivation in extended areas.
The primary reason for such apparent bottleneck is unavailability of suitable genotypes capable
of satisfying the farmers‘ expectations and bringing more economic return in domestic and
foreign market. This affirms the paramount importance of the evaluation of sesame genotypes
over multi-environment situation and identification of adaptable genotypes of sesame to enhance
productivity.
In general, the genotypic and environmental interaction, more popularly termed as GEI
disguises the genotypic effect in crop plants, but no breeding procedure or analytical method
circumvents its effect completely. Identification of stable genotypes with desired economic traits
under multiple environmental conditions is the alternative way (Rao et al., 2002) for increasing
the efficiency of breeding procedures (Yan and Hunt, 1998). This can be achieved through the
study of GEI and significance of linear regression analysis of GEI (Wright, 1976) is well
recognized. This affirms the paramount importance of the evaluation of sesame genotypes over
Paper Proceedings of Agri Animal 2013 - ISSN 2279-3682
46
multi-environment situation and identification of adaptable genotypes of sesame to enhance
productivity
In the present investigation, 26 selected superior sesame mutant lines along with their
respective parents were chosen for stability testing in seven different agro-climatic conditions of
West Bengal and were also investigated for seed storage protein polymorphism between the
screened stable and inconstant genotypes.
Materials and Methods
Field Experimentation
26 different mutant lines of sesame along with three control varieties namely, Rama
(Control 1), SI 1666 (Control 2) and IC 21706 (Control 3), collected from the Department of
Genetics and Plant Breeding, Institute of Agricultural Science, Calcutta University, were grown
in five different sub-agro-climatic zones (Table 1) of West Bengal over a period of three years
(including year-site combination) from 2006 to 2008 for stability analysis. The trial was designed
as randomized block with three replicates. Each plot was 4m long and 3m wide, the spacing was
maintained at 45 cm between rows and 10 cm between plants. Recommended cultural practices
were followed.
Recording of morphological data
Nine morphological quantitative characters, namely, plant height (cm), days to 50%
flowering, days to maturity, number of primary branches/plant, capsule length (cm), number of
capsules/plant, number of seeds/capsule, 1000 seed weight (gm) and seed yield/plant (gm) were
Paper Proceedings of Agri Animal 2013 - ISSN 2279-3682
47
recorded for both parents and mutants in ten randomly selected plants per replication. The data
were then averaged.
Seed storage protein marker assay
To study the soluble seed storage protein polymorphism among parental and mutant
genotypes, soluble protein was first extracted from seed samples following modified Lowry‘s
method (Lowry, et al. 1953) and then Sodium Dodoecyl Sulphate-Polyacrylamide Gel
Electrophoresis (SDS-PAGE) (12% separating gel and 4% percent stacking gel) was carried out
following modified method of Laemmli (1970) in a regular mini (10 cm x 10 cm) vertical gel
system (Biotech Laboratories, India). Standard marker protein, Dalton Mark VI (Sigma, USA)
was used. Molecular weights (MW) and Rm values of sample protein bands were then estimated
through the Life Sciences Software available with gel documentation unit (UVP GelDoc It).
Statistical analysis
Morphological data analysis
Phenotypic stability of the experimental genotypes was carried out with Spar Ver. 2.0
(Ahuja, et al. no year) following Eberhart and Russell (1966) model, based on simple regression
analysis. Linear component (%) was calculated as percentage (%) of ratio of G x E linear
variance to the sum total of estimates for G x E linear variance and pooled deviation.

Paper Proceedings of Agri Animal 2013 - ISSN 2279-3682
48
Eberhart and Russell model (1966)
A function was fitted for the regression of each individual genotype on the mean performance of
all the twenty nine genotypes in every individual location, for all the seven different
environments for every single character.
The model is statistically expressed as follows:
Let there be v genotypes whose performance are to be tested in n environments. Then, the mean
performance of a genotype in an environment is written as:
Yij = µi + bi Ij + δij (i =1, 2,…., v and j = 1, 2,…..n)
Where,
Yij = The dependent variable, mean of the ith
genotype at the jth
environment
µi = Mean of the ith
genotype over all environments
bi = Regression coefficient of ith
genotype on the environmental indices
Ij = Independent variable, Environmental index which is the mean of all genotypes at jth
environment with grand mean value subtracted from it
Ij = ∑ Yij / v - ∑ ∑ (Yij / vn) for ∑ Ij = 0
i i j j
δij = Deviation from regression of the ith
genotype on the environmental indices i.e. at the jth
environment
The two stability parameters namely, regression coefficient (bi) and mean squared deviation
from regression (s2di) were calculated as follows:
bi = ∑ Yij Ij / ∑ I2
j
j j
s 2di was computed as follows:
s2di= [∑ δ
2ij / (n-2)] - Se
2 /r
j
Paper Proceedings of Agri Animal 2013 - ISSN 2279-3682
49
Where,
Se2
/r = The estimate of the pooled error
The deviation from regression for each genotype was tested by the following formula:
F = [∑ δ2
ij / (n– 2)] / pooled error
j
The regression coefficient bi for each genotype was tested by the following formula:
t = (bi – 1) / SE (bi)
Where,
SE (bi) = √ (MS due to pooled deviation of the ith
genotype/ ∑I2
j)
calculated ‗t‘ was tested against table value of ‗t‘ at pooled error d.f.
Hence according to Eberhart and Russell (1966), the parameters to identify stable genotypes are:
Mean performance, Regression coefficient and Deviation from regression
Considering the parameters for stability according to Eberhart and Russell (1966) model,
genotypes with mean values greater than the population mean were only considered for other
parameters. Eberhart and Russell (1966) reported bi as the measure of responsiveness; A
genotype with regression coefficient (bi) of unity or near unity with mean square deviation (s2di)
not significantly different from ‗0‘ was identified as stable or genotype having wide adaptability.
Simple correlation coefficients among different parameters were calculated using
Microsoft Excel Ver.7.0 (Microsoft. Inc., Redmond. WA).
˄
Paper Proceedings of Agri Animal 2013 - ISSN 2279-3682
50
Results and Discussion
Analysis of variance (ANOVA)
In analysis of variance (Table 2) for GEI over all the environments, the genotypes, the
environments, combined effect of environment and GEI appeared significantly different for all
the nine observed characters. Linear and non linear components of G x E interaction coupled
with pooled deviation were also significantly different for most of the traits. The higher
magnitudes of linear components (> 50%) for environment variance and G x E variance than that
of their non linear components indicated that the performance of genotypes was predictable.
Hence identification of stable genotypes for the nine traits would be effective.
Genotypic performance over environment based on mean values
Most of the mutants, in general, surpassed the check variety Rama. It can be observed
from Table 3, that only the mutant CUMS 23 was better performer for its superior and consistent
expression for seed yield/plant along with number of primary branches/plant, capsule length,
number of capsules/plant and seeds/capsule. No other genotypes registered uniformly good
performance for yield coupled with component traits.
Three genotypes namely, CUMS 3, CUMS 17 and CUMS 18 also drew attention being
the top three performers for mean seed yield/plant over the environments and having high mean
values for some of the component traits. The genotype, CUMS 3 with highest mean seed
yield/plant was an early maturing genotype with early flowering. On the other hand, both CUMS
17 and CUMS 18 genotypes matured quite late.
Paper Proceedings of Agri Animal 2013 - ISSN 2279-3682
51
Stable genotypes
In the present study, one of the stability parameter, mean square deviation (s2di) was not
included in the results as usefulness of this parameter is contradicted (Lin, et al. 1986). Hence
stable genotypes were identified on the basis of mean values and regression coefficients.
Genotypes showing bi = 1 or close to 1, and mean (μi) value, larger than population mean value,
for a trait were considered in identification of average stable genotypes for the concerned
trait.Genotypes with μi values lower than the population mean for any trait were not considered
under any group except for days to 50% flowering and days to maturity as poor performance for
economic characters under any circumstances was unacceptable. Genotypes with larger bi values
were considered as highly responsive to environmental factors having below average stability
and suitable for cultivation in favorable environments only, because it would always lead to
lower yield in unfavorable environments and omission of the genotype from competition
(Ferreira, et al. 2006). On the contrary, genotypes with bi < 1, were considered as less responsive
to environmental factors with above average stability, suitable for cultivation in unfavorable
environments.
The stability level appeared to be specific for individual character for a genotype and
was not common to all the characters for that genotype. Yield and main component trait,
capsules/plant was taken into account while identifying stable genotypes.
A graphical summary is depicted which helps to identify the stable genotypes more
easily. A two dimensional (2D) graph was plotted with bi values on the X axis and mean (μi)
values on the Y axis, to identify the genotypes clearly at their relative positions according to their
stability performance.
Paper Proceedings of Agri Animal 2013 - ISSN 2279-3682
52
The first quadrant (top right) of the 2D graph represented high bi values (bi > 1.0)
combined with high μi values (greater than the population mean), second quadrant (top left)
represented low bi values (bi < 1.0) but high μi values (greater than the population mean), while
third (bottom left) and fourth (bottom right) quadrant represented low bi values with low μi
values (bi < 1.0, lower than the population mean) and high bi values with low μi values (bi > 1.0,
lower than the population mean) respectively. The genotypes appearing in the third and fourth
quadrants were not considered for the low mean values compared to population mean. The
average stable genotypes positioned close to the reference line of bi =1. The genotypes CUMS 1,
CUMS 5, CUMS 9 and CUMS 11 showed (Figure 1) average stability and high mean
performance for seed yield/plant and were considered to be adapted to all environments. CUMS
9 can be considered as one of the outstanding genotypes with average stability for seed
yield/plant along with number of capsules/plant (Figure 2). Some genotypes though appeared
stable for capsules/plant did not perform well for seed yield/plant.
Environmental characterization
Environmental index was calculated as per model of Eberhart & Russell (1966). It is
observed that, the environment E4, representing central alluvial plain, appeared to be the best
environment (Table 4) especially in respect to seed yield and its components, like plant height,
number of primary branches/plant, capsule length, number of capsules/plant, number of seeds/
capsule and 1000 seed weight over all environments. The soil in this location was sandy-loam
textured and acidic (pH 5.7), thus evinced with good porosity i.e. percolation with moderate
water holding capacity.
Paper Proceedings of Agri Animal 2013 - ISSN 2279-3682
53
All the genotypes expressed most favorably in environment four (E4) for almost all
characters except days to 50% flowering and days to maturity. Interestingly, from the breeders‘
point of view early days to 50% flowering and early days to maturity are always desirable
attributes in intensive cropping pattern. Naturally, genotypes having mean values lower than
population mean for these two traits were always favorable.
The three environments E1, E3 and E6 represented saline and coastal zone of West
Bengal having high water holding capacity and poor percolation. On the contrary, the two
environments E2 and E7 represented the zone of alluvium soils, while E5 represented barind
plain (old alluvial). Hence all the locations were characterized by diverse climatic factors.
Genotype x environment interaction effect varied with each genotype making the scenario
complicated and upholding the importance of identifying stable genotypes. The environment E2,
though represented the same location as that of E4, but for another year with different date of
sowing (Table 1) which might have played role in the altered expression of the genotypes for
different traits.
Genotypes with below average stability (bi > 1.0) performed well in E4 (favorable
environment), for all the traits except for days to 50% flowering and days to maturity. The
genotypes having bi > 1.0 (below average stability), were identified as potential genotypes in
environment 7 (E7) and environment 2 (E2), respectively, for days to 50% flowering and days to
maturity (Table 4). On the contrary, the environment 6 (E6) was identified as most unfavorable
environment for most of the characters except number of seeds /capsule and 1000 seed weight
(Table 4) and genotypes with above average stability (bi < 1.0) performed well in this
environment.
Paper Proceedings of Agri Animal 2013 - ISSN 2279-3682
54
The genotypes CUMS 1, CUMS 5, CUMS 9 and CUMS 11 had wide stability over the
environments. The genotypic performance was in general, best in environment 4 (E4) and so the
genotypes CUMS 1, CUMS 5, CUMS 9 and CUMS 11 exhibited best performance in the
environment 4 (E4).
Suitability of Eberhart and Russell model (1966) in the present study
Most of the measures of stability analysis are based on linear regression methodology,
among which, the methods described by Eberhart and Russell (1966), Perkins and Jinks (1968)
and Freeman and Perkins (1971) are most widely used. All the three models have three stability
parameters, namely, mean performance, regression coefficient and deviation from regression.
Finlay and Wilkinson (1963) was the first to consider regression coefficient as stability
parameter. Eberhart and Russell model (1966) modified this method in two ways:
i) Environmental index was formulated, whichwas defined as the deviation of the average
performance of all the genotypes at a given environment from the overall average performance
of the genotypes at all environments and accordingly the environments can be ranked
ii)The total variance was partitioned into two components, viz. Genotypes and Environment plus
interaction i.e. E + G x E. The second component was then further subdivided into three
components, namely, Environment linear, Genotype x Environment linear and Pooled deviation
Perkins and Jinks (1968) partitioned the total variance into three components, namely
Genotype, Environment and G x E. The G x E was subdivided into Heterogeneity due to
regression and Sum of squares due to remainder. In this model, the sum of squares due to linear
component of environment is same as sum of squares due to environment (joint regression) of
Paper Proceedings of Agri Animal 2013 - ISSN 2279-3682
55
Eberhart and Russell method; sum of squares due to remainder is equal to sum of squares due to
pooled deviations of Eberhart and Russell (1966) method, still in this method, the degree of
freedom is e-2 instead of 1 which is not proper.
Freeman and Perkins (1971) further refined the partitioning of total variance. Firstly, the
total variance was divided into three components: Genotypes, Environments and Interactions (G
x E). The environmental sum of squares has two components, Combined regression and Residual
one, while the interaction variance was also subdivided into Homogeneity of regression and
Residual. The two residual sums of squares formed the pooled deviation in this model.
Unlike the previous two models proposed by Eberhart and Russell (1966) and Perkins
and Jinks (1968), Freeman and Perkins (1971) model provided independent estimation of mean
performance and environmental index,hence more costly than the first two methods and requires
very complex calculation methods.
The above discussion revealed that among the three methods, Eberhart & Russell (1966)
model was the most suitable to identify stable varieties from the field experimentation followed
in the present investigation.
Correlation study
The correlation coefficient estimates between mean values and bi values for nine traits
were significant for plant height, days to maturity, number of primary branches/plant, number of
capsules/plant, 1000 seed weight and seed yield/plant. In other words, the results highlighted that
for those six traits only one parameter out of the two would suffice for identifying stable
genotypes (Table 5).
Paper Proceedings of Agri Animal 2013 - ISSN 2279-3682
56
Seed storage protein polymorphism
The seed storage protein profiles of the genotypes were analyzed using SDS-PAGE,
following the method of Laemlli, (1970). Genotypes interact with environment strongly resulting
in variation of character expression in different environments. Protein being a biochemical
marker is sensitive to environment and so it is a better tool to characterize the genotypes in
changing environment. The objective of the investigation was to observe the pattern of protein
polymorphism that existed among the stable and environmental sensitive genotypes. Reports on
SDS-PAGE in sesame are very rare; that too for stability analysis is almost unavailable. One
earlier report by Akhila and Beevy, (2011) suggested a maximum of 14 bands while assessing
diversity between some genotypes of sesame through SDS-PAGE.
In the present study, the SDS-PAGE banding pattern (Figure 3)1 of the twenty nine
genotypes revealed a total of 22 bands. The banding pattern of the 29 genotypes is represented in
a zymogram (Figure 4).
The six standard bands of marker protein were identified as MI, M2, M3, M4, M5 and
M6 of molecular weight 66 KD, 45 KD, 34.7 KD, 24 KD, 18.4 KD and 14.4 KD, respectively,
from top to bottom (Figure 4). The heaviest band i.e. band with highest molecular weight
(125.49 KD) showed least Rm value (least moving, observed at the top) (0.1818) while the
lightest band with least molecular weight (12.19 KD) exhibited greatest Rm value (farthest
moving, observed at bottom) (0.9465). All the other bands had intermediary molecular weights
and Rm values.
Seven zones were identified based on the movement of the six marker bands (Figure 3 &
4). Each zone from zone I to zone VI ended with marker bands, namely, M1, M2, M3, M4, M5,
M6 respectively. Bands lying below M6 were clustered in Zone VII. The analysis demonstrated
Paper Proceedings of Agri Animal 2013 - ISSN 2279-3682
57
that majority of the bands migrated below the top most marker protein band, M1. The genotypes
showed significantly different banding pattern revealing seed storage protein polymorphism.
In the present study, among 22 bands, band no. 1, 2, 3, 4, 5, 8, 11, 12, 13, 16, 17, 19 and
21 were polymorphic. The other bands were common to the species.
In an attempt to focus further insight into the stable mutants namely, CUMS 1, CUMS 5,
CUMS 9 and CUMS 11, it was found that only band no. 5 and 11 was common to all four
genotypes. Apart from that, a number of bands namely, band no. 1, 2, 4, 8 and 19 were found to
be present in any two stable varieties out of four, while, band no. 12, 13, 16 and 21 were present
in any three of the stable varieties out of the four. This gave a slight encouragement about any
general trend of bands. Nevertheless, presence of those bands in many of the other mutants was a
disheartening feature. Interestingly band no. 1 and band no. 2 were present only in a limited
number of mutants including stable genotypes CUMS 5 and CUMS 11. The limited presence of
band no. 11 in a few genotypes including the four stable genotypes was very much encouraging.
It is evident from the above discussion that protein polymorphism of sesame observed in
the present study through SDS-PAGE, was able to distinguish the stable genotypes, though
vaguely, from the inconsistent genotypes.
Genotypic profiling of the mutants and their check varieties based on the fractionation of
protein might reveal some specific pattern which could be linked clearly to morphological
expression of characters. Therefore, it is suggested that this arena of research should follow the
present work for more specific characterization.
Reports on SDS-PAGE in sesame are very rare; that too for stability analysis is almost
unavailable. One earlier report by Akhila and Beevy, (2011) suggested a maximum of 14 bands
while assessing diversity between some genotypes of sesame through SDS-PAGE.
Paper Proceedings of Agri Animal 2013 - ISSN 2279-3682
58
Conclusion
Adaptability study helped to identify stable genotypes across different environments in
sesame. The genotypes, namely, CUMS 1, CUMS 5, CUMS 9 and CUMS 11 can be grown
extensively in different parts of West Bengal without deterring yield performance. SDS-PAGE
analysis of seed storage protein emphasized that 3 protein bands, (band no. 1, 2 and 11) can
distinguish stable and inconsistent genotypes in sesame to some extent. Hence these three bands
can be utilized in identification of desirable genotypes in stability testing of sesame. Perhaps,
genotypic profiling of the mutants and their check varieties based on fractionation of protein
markers might reveal some specific pattern which could be linked to morphological expression
of characters.
Adaptability trait can be transferred through breeding to other genotypes. CUMS 3,
CUMS 17 and CUMS 18 occupied top three positions for seed yield/plant but exhibited below
average stability for seed yield/plant and number of capsules/plant. These three genotypes can
be crossed with any of the four stable genotypes identified for seed yield/plant.
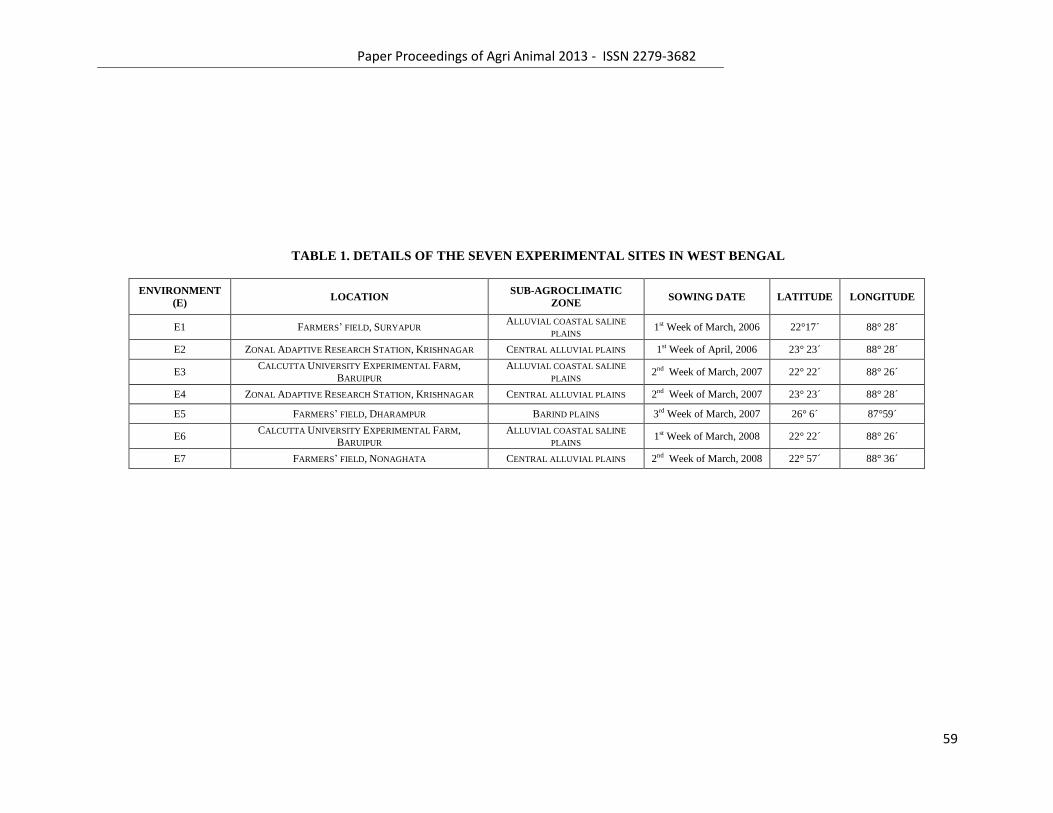
Paper Proceedings of Agri Animal 2013 - ISSN 2279-3682
59
TABLE 1. DETAILS OF THE SEVEN EXPERIMENTAL SITES IN WEST BENGAL
ENVIRONMENT
(E) LOCATION
SUB-AGROCLIMATIC
ZONE SOWING DATE LATITUDE LONGITUDE
E1 FARMERS‘ FIELD, SURYAPUR ALLUVIAL COASTAL SALINE
PLAINS 1st Week of March, 2006 22°17´ 88° 28´
E2 ZONAL ADAPTIVE RESEARCH STATION, KRISHNAGAR CENTRAL ALLUVIAL PLAINS 1st Week of April, 2006 23° 23´ 88° 28´
E3 CALCUTTA UNIVERSITY EXPERIMENTAL FARM,
BARUIPUR
ALLUVIAL COASTAL SALINE
PLAINS 2nd Week of March, 2007 22° 22´ 88° 26´
E4 ZONAL ADAPTIVE RESEARCH STATION, KRISHNAGAR CENTRAL ALLUVIAL PLAINS 2nd Week of March, 2007 23° 23´ 88° 28´
E5 FARMERS‘ FIELD, DHARAMPUR BARIND PLAINS 3rd Week of March, 2007 26° 6´ 87°59´
E6 CALCUTTA UNIVERSITY EXPERIMENTAL FARM,
BARUIPUR ALLUVIAL COASTAL SALINE
PLAINS 1st Week of March, 2008 22° 22´ 88° 26´
E7 FARMERS‘ FIELD, NONAGHATA CENTRAL ALLUVIAL PLAINS 2nd Week of March, 2008 22° 57´ 88° 36´
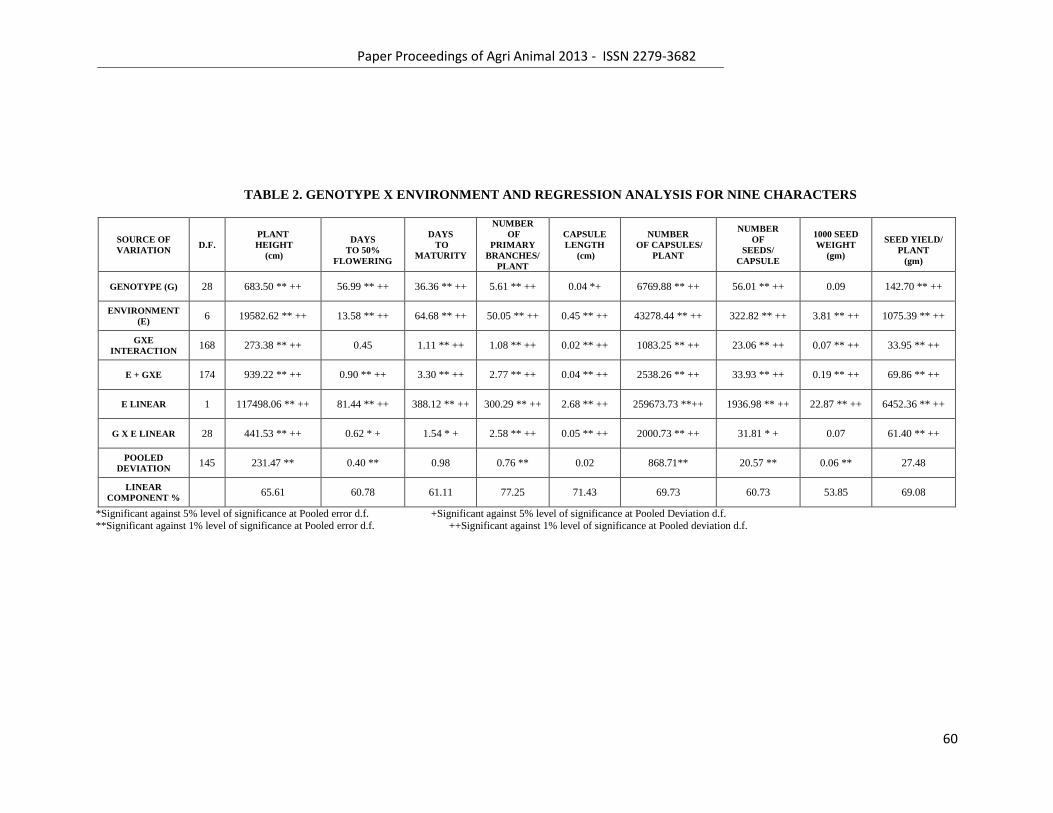
Paper Proceedings of Agri Animal 2013 - ISSN 2279-3682
60
TABLE 2. GENOTYPE X ENVIRONMENT AND REGRESSION ANALYSIS FOR NINE CHARACTERS
SOURCE OF
VARIATION D.F.
PLANT
HEIGHT
(cm)
DAYS
TO 50%
FLOWERING
DAYS
TO
MATURITY
NUMBER
OF
PRIMARY
BRANCHES/
PLANT
CAPSULE
LENGTH
(cm)
NUMBER
OF CAPSULES/
PLANT
NUMBER
OF
SEEDS/
CAPSULE
1000 SEED
WEIGHT
(gm)
SEED YIELD/
PLANT
(gm)
GENOTYPE (G) 28 683.50 ** ++ 56.99 ** ++ 36.36 ** ++ 5.61 ** ++ 0.04 *+ 6769.88 ** ++ 56.01 ** ++ 0.09 142.70 ** ++
ENVIRONMENT
(E) 6 19582.62 ** ++ 13.58 ** ++ 64.68 ** ++ 50.05 ** ++ 0.45 ** ++ 43278.44 ** ++ 322.82 ** ++ 3.81 ** ++ 1075.39 ** ++
GXE
INTERACTION 168 273.38 ** ++ 0.45 1.11 ** ++ 1.08 ** ++ 0.02 ** ++ 1083.25 ** ++ 23.06 ** ++ 0.07 ** ++ 33.95 ** ++
E + GXE 174 939.22 ** ++ 0.90 ** ++ 3.30 ** ++ 2.77 ** ++ 0.04 ** ++ 2538.26 ** ++ 33.93 ** ++ 0.19 ** ++ 69.86 ** ++
E LINEAR 1 117498.06 ** ++ 81.44 ** ++ 388.12 ** ++ 300.29 ** ++ 2.68 ** ++ 259673.73 **++ 1936.98 ** ++ 22.87 ** ++ 6452.36 ** ++
G X E LINEAR 28 441.53 ** ++ 0.62 * + 1.54 * + 2.58 ** ++ 0.05 ** ++ 2000.73 ** ++ 31.81 * + 0.07 61.40 ** ++
POOLED
DEVIATION 145 231.47 ** 0.40 ** 0.98 0.76 ** 0.02 868.71** 20.57 ** 0.06 ** 27.48
LINEAR
COMPONENT % 65.61 60.78 61.11 77.25 71.43 69.73 60.73 53.85 69.08
*Significant against 5% level of significance at Pooled error d.f. +Significant against 5% level of significance at Pooled Deviation d.f. **Significant against 1% level of significance at Pooled error d.f. ++Significant against 1% level of significance at Pooled deviation d.f.
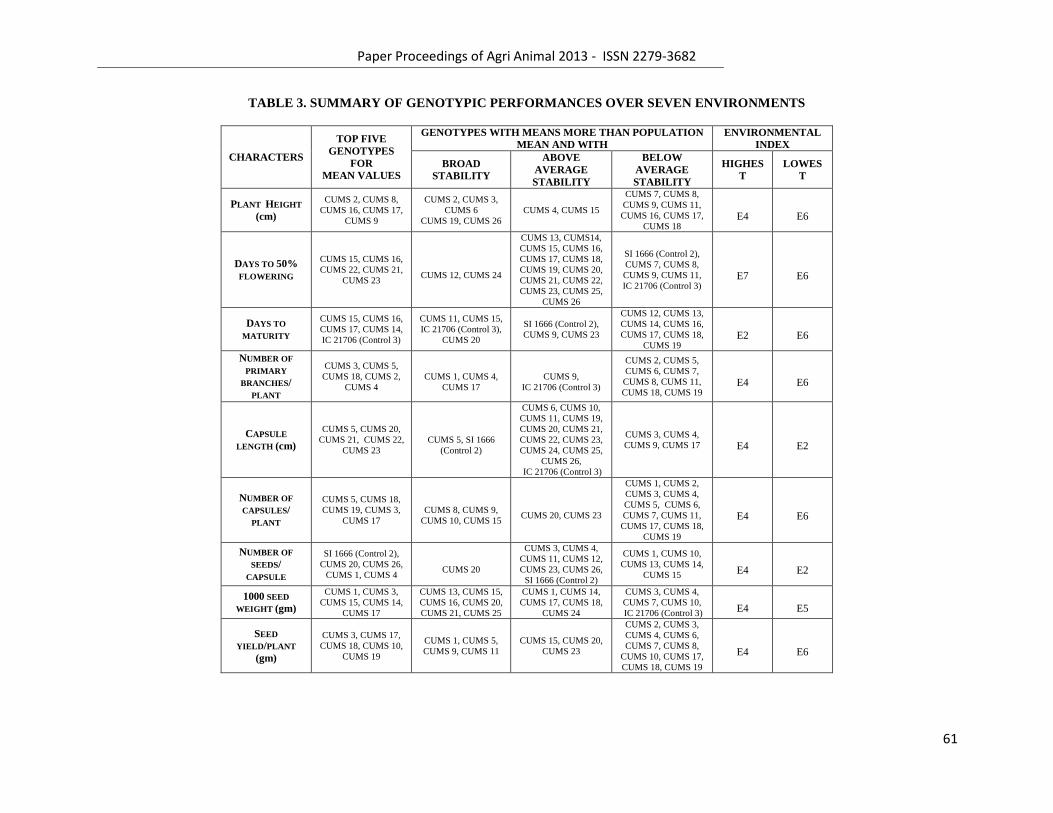
Paper Proceedings of Agri Animal 2013 - ISSN 2279-3682
61
TABLE 3. SUMMARY OF GENOTYPIC PERFORMANCES OVER SEVEN ENVIRONMENTS
CHARACTERS
TOP FIVE
GENOTYPES
FOR
MEAN VALUES
GENOTYPES WITH MEANS MORE THAN POPULATION
MEAN AND WITH
ENVIRONMENTAL
INDEX
BROAD
STABILITY
ABOVE
AVERAGE
STABILITY
BELOW
AVERAGE
STABILITY
HIGHES
T
LOWES
T
PLANT HEIGHT
(cm)
CUMS 2, CUMS 8,
CUMS 16, CUMS 17,
CUMS 9
CUMS 2, CUMS 3,
CUMS 6
CUMS 19, CUMS 26
CUMS 4, CUMS 15
CUMS 7, CUMS 8,
CUMS 9, CUMS 11,
CUMS 16, CUMS 17,
CUMS 18
E4
E6
DAYS TO 50%
FLOWERING
CUMS 15, CUMS 16,
CUMS 22, CUMS 21,
CUMS 23
CUMS 12, CUMS 24
CUMS 13, CUMS14,
CUMS 15, CUMS 16,
CUMS 17, CUMS 18,
CUMS 19, CUMS 20,
CUMS 21, CUMS 22,
CUMS 23, CUMS 25,
CUMS 26
SI 1666 (Control 2),
CUMS 7, CUMS 8,
CUMS 9, CUMS 11,
IC 21706 (Control 3)
E7
E6
DAYS TO
MATURITY
CUMS 15, CUMS 16,
CUMS 17, CUMS 14,
IC 21706 (Control 3)
CUMS 11, CUMS 15,
IC 21706 (Control 3),
CUMS 20
SI 1666 (Control 2),
CUMS 9, CUMS 23
CUMS 12, CUMS 13,
CUMS 14, CUMS 16,
CUMS 17, CUMS 18,
CUMS 19
E2
E6
NUMBER OF
PRIMARY
BRANCHES/
PLANT
CUMS 3, CUMS 5,
CUMS 18, CUMS 2,
CUMS 4
CUMS 1, CUMS 4,
CUMS 17
CUMS 9,
IC 21706 (Control 3)
CUMS 2, CUMS 5,
CUMS 6, CUMS 7,
CUMS 8, CUMS 11,
CUMS 18, CUMS 19
E4
E6
CAPSULE
LENGTH (cm)
CUMS 5, CUMS 20,
CUMS 21, CUMS 22,
CUMS 23
CUMS 5, SI 1666
(Control 2)
CUMS 6, CUMS 10,
CUMS 11, CUMS 19,
CUMS 20, CUMS 21,
CUMS 22, CUMS 23,
CUMS 24, CUMS 25,
CUMS 26,
IC 21706 (Control 3)
CUMS 3, CUMS 4,
CUMS 9, CUMS 17
E4
E2
NUMBER OF
CAPSULES/
PLANT
CUMS 5, CUMS 18,
CUMS 19, CUMS 3,
CUMS 17
CUMS 8, CUMS 9,
CUMS 10, CUMS 15
CUMS 20, CUMS 23
CUMS 1, CUMS 2,
CUMS 3, CUMS 4,
CUMS 5, CUMS 6,
CUMS 7, CUMS 11,
CUMS 17, CUMS 18,
CUMS 19
E4
E6
NUMBER OF
SEEDS/
CAPSULE
SI 1666 (Control 2),
CUMS 20, CUMS 26,
CUMS 1, CUMS 4
CUMS 20
CUMS 3, CUMS 4,
CUMS 11, CUMS 12,
CUMS 23, CUMS 26,
SI 1666 (Control 2)
CUMS 1, CUMS 10,
CUMS 13, CUMS 14,
CUMS 15
E4
E2
1000 SEED
WEIGHT (gm)
CUMS 1, CUMS 3,
CUMS 15, CUMS 14,
CUMS 17
CUMS 13, CUMS 15,
CUMS 16, CUMS 20,
CUMS 21, CUMS 25
CUMS 1, CUMS 14,
CUMS 17, CUMS 18,
CUMS 24
CUMS 3, CUMS 4,
CUMS 7, CUMS 10,
IC 21706 (Control 3)
E4
E5
SEED
YIELD/PLANT
(gm)
CUMS 3, CUMS 17,
CUMS 18, CUMS 10,
CUMS 19
CUMS 1, CUMS 5,
CUMS 9, CUMS 11
CUMS 15, CUMS 20,
CUMS 23
CUMS 2, CUMS 3,
CUMS 4, CUMS 6,
CUMS 7, CUMS 8,
CUMS 10, CUMS 17,
CUMS 18, CUMS 19
E4
E6
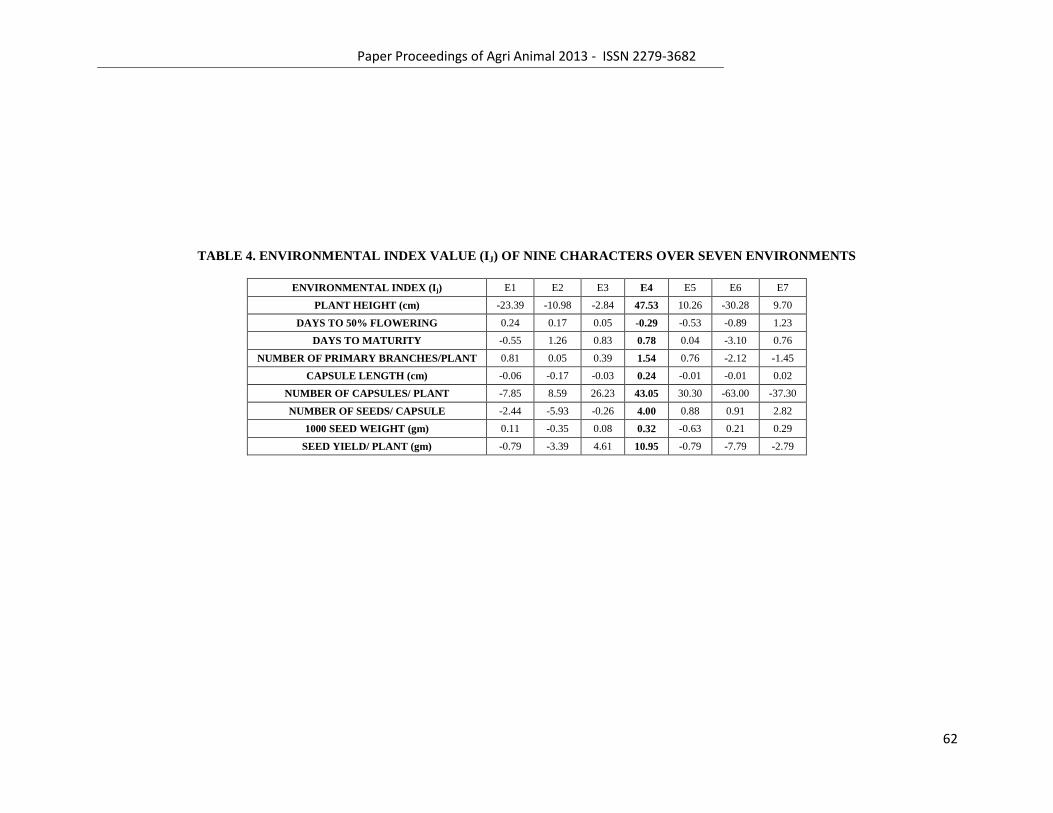
Paper Proceedings of Agri Animal 2013 - ISSN 2279-3682
62
TABLE 4. ENVIRONMENTAL INDEX VALUE (IJ) OF NINE CHARACTERS OVER SEVEN ENVIRONMENTS
ENVIRONMENTAL INDEX (Ij) E1 E2 E3 E4 E5 E6 E7
PLANT HEIGHT (cm) -23.39 -10.98 -2.84 47.53 10.26 -30.28 9.70
DAYS TO 50% FLOWERING 0.24 0.17 0.05 -0.29 -0.53 -0.89 1.23
DAYS TO MATURITY -0.55 1.26 0.83 0.78 0.04 -3.10 0.76
NUMBER OF PRIMARY BRANCHES/PLANT 0.81 0.05 0.39 1.54 0.76 -2.12 -1.45
CAPSULE LENGTH (cm) -0.06 -0.17 -0.03 0.24 -0.01 -0.01 0.02
NUMBER OF CAPSULES/ PLANT -7.85 8.59 26.23 43.05 30.30 -63.00 -37.30
NUMBER OF SEEDS/ CAPSULE -2.44 -5.93 -0.26 4.00 0.88 0.91 2.82
1000 SEED WEIGHT (gm) 0.11 -0.35 0.08 0.32 -0.63 0.21 0.29
SEED YIELD/ PLANT (gm) -0.79 -3.39 4.61 10.95 -0.79 -7.79 -2.79
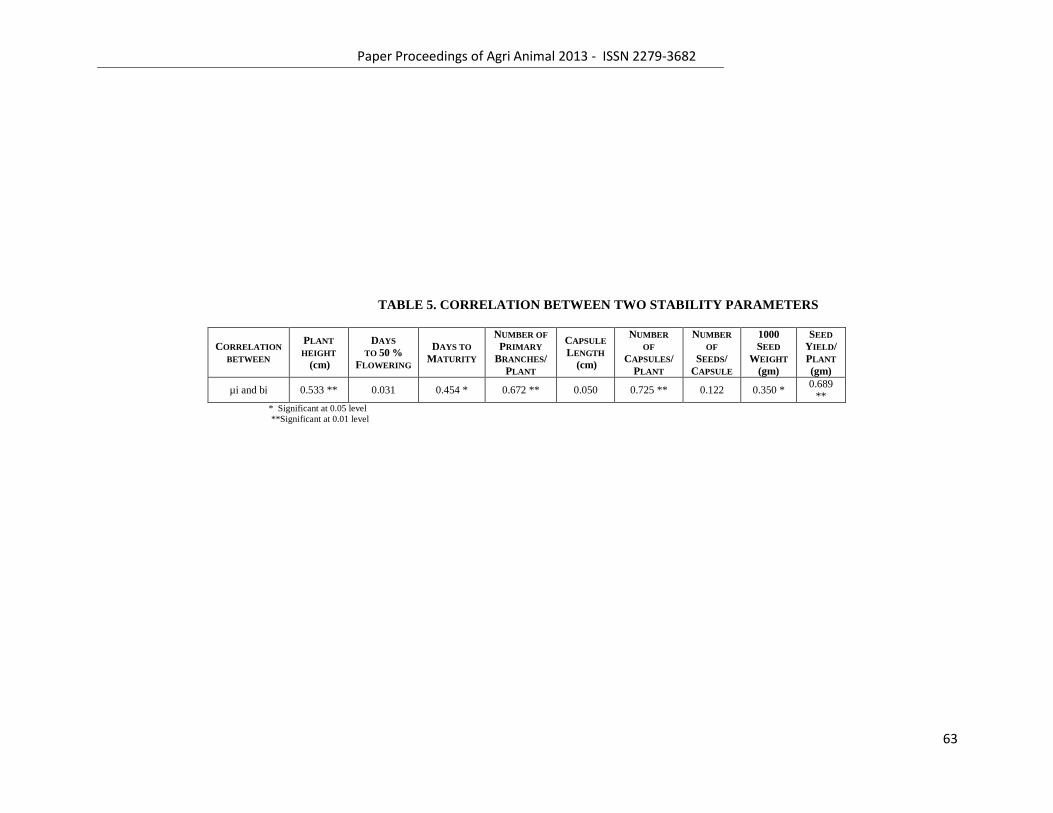
Paper Proceedings of Agri Animal 2013 - ISSN 2279-3682
63
TABLE 5. CORRELATION BETWEEN TWO STABILITY PARAMETERS
CORRELATION
BETWEEN
PLANT
HEIGHT
(cm)
DAYS
TO 50 %
FLOWERING
DAYS TO
MATURITY
NUMBER OF
PRIMARY
BRANCHES/
PLANT
CAPSULE
LENGTH
(cm)
NUMBER
OF
CAPSULES/
PLANT
NUMBER
OF
SEEDS/
CAPSULE
1000
SEED
WEIGHT
(gm)
SEED
YIELD/
PLANT
(gm)
µi and bi 0.533 ** 0.031 0.454 * 0.672 ** 0.050 0.725 ** 0.122 0.350 * 0.689
** * Significant at 0.05 level
**Significant at 0.01 level
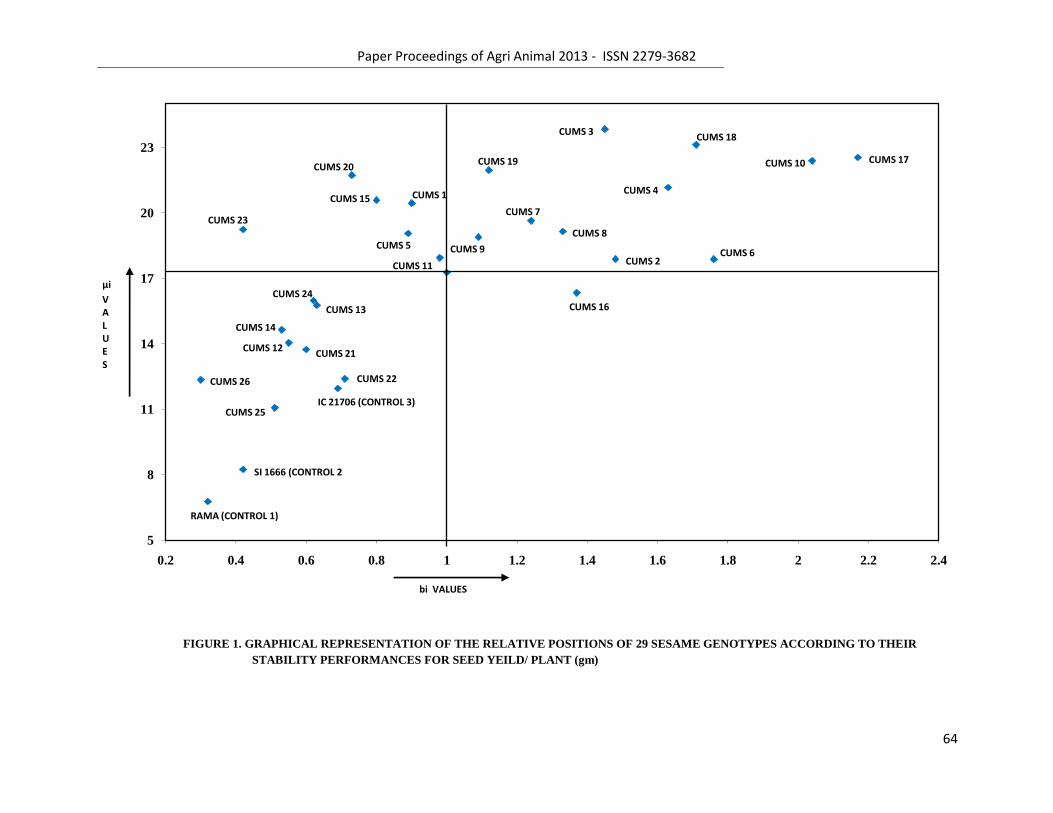
Paper Proceedings of Agri Animal 2013 - ISSN 2279-3682
64
5
8
11
14
17
20
23
0.2 0.4 0.6 0.8 1 1.2 1.4 1.6 1.8 2 2.2 2.4
CUMS 17CUMS 10
CUMS 18
CUMS 4
CUMS 6CUMS 2
CUMS 3
CUMS 19
CUMS 8
CUMS 7
CUMS 9
CUMS 16
CUMS 11
CUMS 5
CUMS 1CUMS 15
CUMS 20
CUMS 23
RAMA (CONTROL 1)
SI 1666 (CONTROL 2)
CUMS 25
CUMS 26
IC 21706 (CONTROL 3)
CUMS 22
CUMS 21CUMS 12
CUMS 14
CUMS 13
CUMS 24μi
V A L U E S
FIGURE 1. GRAPHICAL REPRESENTATION OF THE RELATIVE POSITIONS OF 29 SESAME GENOTYPES ACCORDING TO THEIR
STABILITY PERFORMANCES FOR SEED YEILD/ PLANT (gm)
bi VALUES
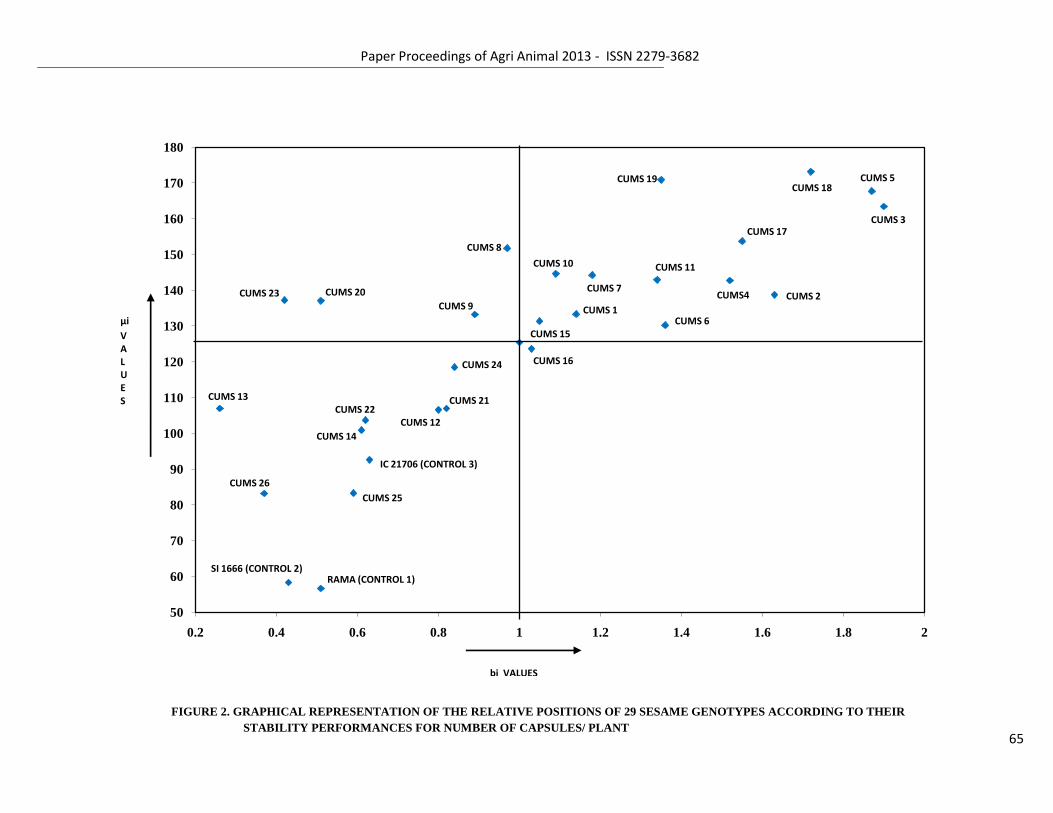
Paper Proceedings of Agri Animal 2013 - ISSN 2279-3682
65
50
60
70
80
90
100
110
120
130
140
150
160
170
180
0.2 0.4 0.6 0.8 1 1.2 1.4 1.6 1.8 2
CUMS 3
CUMS 5CUMS 18
CUMS 2
CUMS 17
CUMS 19
CUMS4
CUMS 6
CUMS 11
CUMS 7
CUMS 1
CUMS 10
CUMS 15
CUMS 8
CUMS 9
CUMS 20CUMS 23
CUMS 13
CUMS 26
SI 1666 (CONTROL 2)RAMA (CONTROL 1)
CUMS 25
IC 21706 (CONTROL 3)
CUMS 14
CUMS 22CUMS 21
CUMS 12
CUMS 24 CUMS 16
FIGURE 2. GRAPHICAL REPRESENTATION OF THE RELATIVE POSITIONS OF 29 SESAME GENOTYPES ACCORDING TO THEIR
STABILITY PERFORMANCES FOR NUMBER OF CAPSULES/ PLANT
bi VALUES
μi
V A L U E S
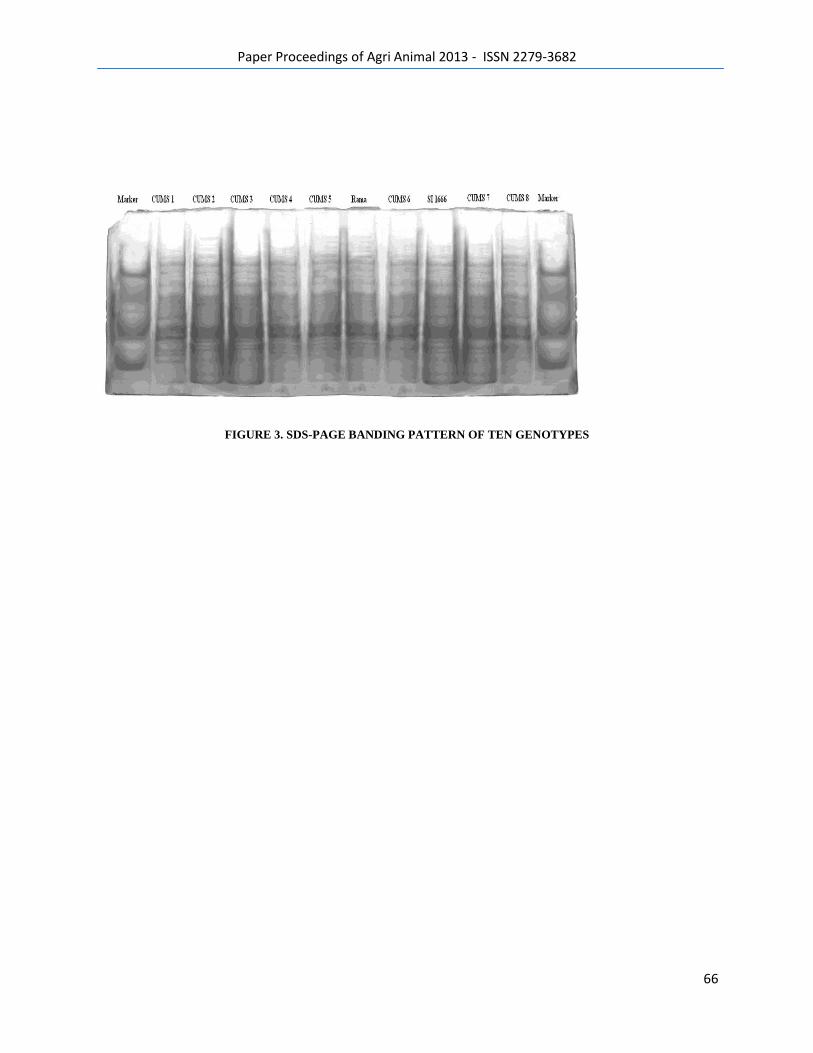
Paper Proceedings of Agri Animal 2013 - ISSN 2279-3682
66
FIGURE 3. SDS-PAGE BANDING PATTERN OF TEN GENOTYPES
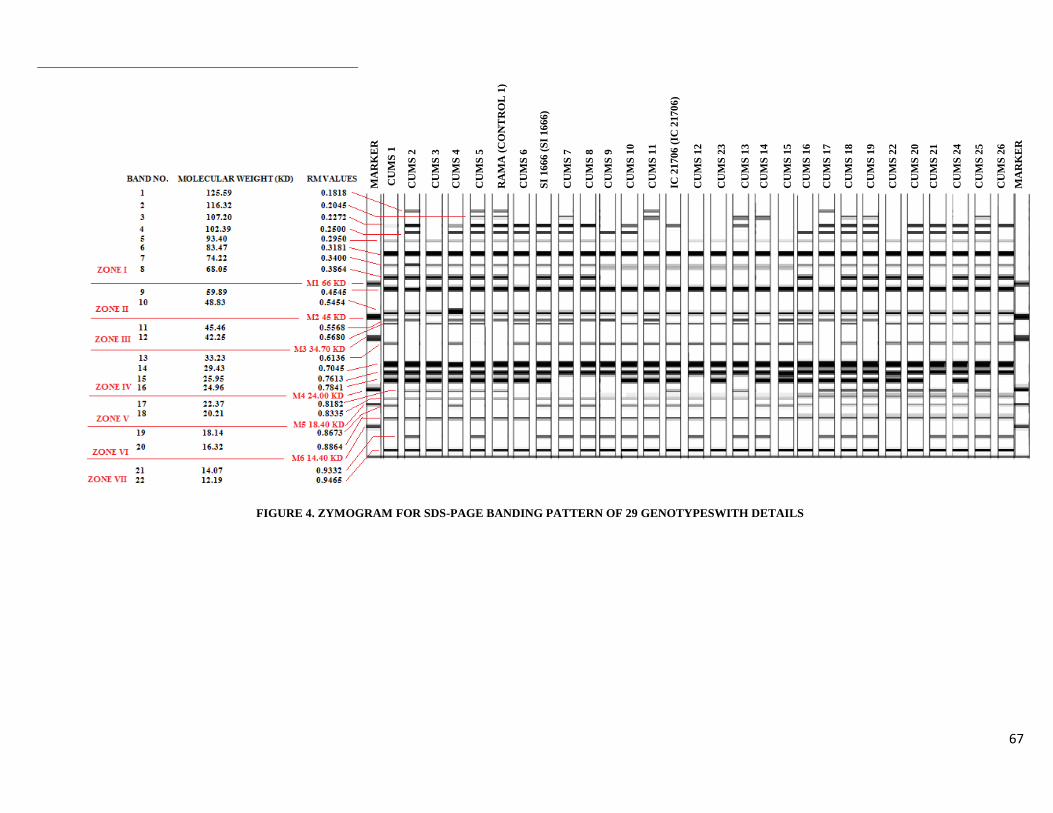
Paper Proceedings of Agri Animal 2013 - ISSN 2279-3682
67
FIGURE 4. ZYMOGRAM FOR SDS-PAGE BANDING PATTERN OF 29 GENOTYPESWITH DETAILS
MA
RK
ER
C
UM
S 1
CU
MS
2
CU
MS
3
CU
MS
4
CU
MS
5
RA
MA
(C
ON
TR
OL
1)
CU
MS
6
SI
16
66
(S
I 16
66
) C
UM
S 7
CU
MS
8
CU
MS
9
CU
MS
10
CU
MS
11
IC 2
1706
(IC
2170
6)
CU
MS
12
CU
MS
23
CU
MS
13
CU
MS
14
CU
MS
15
CU
MS
16
CU
MS
17
CU
MS
18
CU
MS
19
CU
MS
22
CU
MS
20
CU
MS
21
CU
MS
24
CU
MS
25
CU
MS
26
MA
RK
ER
Paper Proceedings of Agri Animal 2013 - ISSN 2279-3682
68
References
Agricultural statistics. Department of agriculture and cooperation, Ministry of agriculture,
Government of India. [online], Available at:
http://eands.dacnet.nic.in/LAPY_Data/12%20years%20(Ending%202007-
08)/Oilseeds/Sesamum.xls (Accessed on December 12, 2012)
Ahuja, S., Malhotra, P. K., Bhatia, V. K., Prasad, R., Gupta V. H., No Year. Spar: Statistical
package for agricultural research, version 2.0, Indian Agricultural Statistics Research
Institute, Library Avenue, Pusa, New Delhi.
Akhila, H., Suhara Beevy, S., 2011. Morphological and seed protein characterization of the
cultivated and the wild taxa of Sesamum L. (Pedaliaceae). Plant Systematics and
Evolution, Vol.293, No. 1-4, May, pp. 65-70.
Annual report. 2011-12. Evaluation wing, Directorate of Agriculture, Government of West
Bengal. Pp.
Bedigian D., Smyth C.A. and Harlan J.R. 1986. Patterns of morphological variation in
sesame. Economic Botany, 40: 353–365.
Bedigian, D. 2004. History and lore of sesame in Southwest Asia. Economic Botany, 58: 329-353.
BoShim, K., Churl-Whan, K., Dong-Hee, K., Jangwhang, P., 2003. Interpretation of genotype
by environment interaction effect on yield in sesame (Sesamum indicum L.). Sesame
and Safflower Newsletter, Vol.18, pp. 20–24.
Eberhart, S.A., Russell, W.A., 1966. Stability parameters for comparing varieties. Crop
Science, Vol.6, No. 1, pp. 36-40.
FAOSTAT. Food and Agriculture Organization of the United Nations. [online] Available at:
http://faostat.fao.org/site/339/default.aspx (accessed on December 12, 2012).
Ferreira, D. F., Demétrio, C. G. B., Manly, B. F. J., Machado, A. A., Venkovsky, R., 2006.
Statistical models in agriculture: Biometrical methods for evaluating phenotypic
stability in plant breeding. Cerne, Vol.12, No.3, pp. 373-388.
Paper Proceedings of Agri Animal 2013 - ISSN 2279-3682
69
Finlay K. W. and Wilkinson G.N. 1963. The analysis of adaptation in a plant breeding
programme. Australian Journal Agricultural Research, 14:742-754.
Freeman G.H. and Perkins J.M. 1971. Environmental and genotype-environmental
components of variability. VIII. Relations between genotypes grown in different
environments and measures of these environments. Heredity, 27: 15-23.
John, A., Subbaraman, N., Jebbaraj, S., 2001. Genotype by environment interaction in sesame
(Sesamum indicum L.). Sesame and Safflower Newsletter, Vol.16, pp.13-15.
Laemmli, U.K., 1970. Cleavage of structural proteins during the assembly of the head of
bacteriophage T4. Nature, Vol.227, No. 5259, pp. 680-685.
Lin, C. S., Binns, M. R., Lefkovitch, L. P., 1986. Stability analysis: Where do we stand?
Crop Science, Vol.26, No. 5, pp. 894-900.
Lowry, O. H., Rosebrough, N. J., Farr, A. L., Randall, R. J., 1953. Protein measurement with
the folin-phenols reagent. Journal of Biological Chemistry, Vol.193, No. 1, pp. 265-
275.
Mahdy, E.E., Bakheit B.R., El-Hifny, M.Z., El-Shimy, A., 1988. Genotypic stability analysis
of yield and several traits of sesame, Sesamum indicum. Assiut Journal of
Agricultural Sciences, Vol.19, pp. 19-34.
Mekonnen Z. and Mohammed H. 2009. Study on genotype x environment Interaction of oil
content in sesame (Sesamum indicum L.). Middle-East Journal of Scientific Research,
Vol.4, pp. 100-104.
Microsoft Excel Ver.7.0 (Microsoft. Inc., Redmond. WA)
Miyahara Y., Hibasami H., Katsuzaki H., Imai K. and Komiya T. 2001. Sesamolin from
sesame seed inhibits proliferation by inducing apoptosis in human lymphoid leukemia
Molt 4B cells. International Journal of Molecular Medicine, 7: 369–371.
Perkins J.M. and Jinks J.L. 1968. Environmental and genotype-environmental component of
variability. III. Multiple lines and crosses. Heredity, 23: 339-356.
Paper Proceedings of Agri Animal 2013 - ISSN 2279-3682
70
Rao, M.S.S., Mullinix, B.G., Rangappa, M., Cebert, E., Bhagasri, A.S., Sapra, V.T., Joshi,
J.M. Dadson R.B., 2002. Genotype x environment interaction and yield stability of
food-grade soybean genotype. Agronomy Journal, Vol.94, No. 1, pp.72-80.
Suja K. P., Abraham J. T., Thamizh S. N., Jayalekshmy A. and Arumughan C. 2004.
Antioxidant efficacy of sesame cake extract in vegetable oil protection. Food
Chemistry, 84: 393-400.
Were, B.A., Onkware, A.O., Gudu, S., Welander, M. Carlsson, A.S., 2006. Seed oil content
and fatty acid composition in East African sesame (Sesamum indicum L.) accessions
evaluated over 3 years. Field Crops Research, Vol.97, No. 2-3, June, pp. 254–260.
Wright, A.J. 1976. The significance for breeding of linear regresión análisis of genotype-
environment interactions. Heredity, Vol.37, No. 1, pp. 83-93.
Yan, W. Hunt, L. A., 1998. Genotype by environment interaction and crop yield. Plant
Breeding Reviews, Vol.16, pp.135-178.

Paper Proceedings of Agri Animal 2013 - ISSN 2279-3682
71
Endnote 1: As the gel apparatus was small, only few lanes were available for loading of
sample protein and standard marker protein. So, SDS-PAGE of 29 genotypes was carried out
separately in three groups. One such picture is given in this paper and banding pattern for all
the genotypes is represented through a zymogram for better understanding.

Paper Proceedings of Agri Animal 2013 - ISSN 2279-3682
72
5
Paper Proceedings of Agri Animal 2013 - ISSN 2279-3682
73
FARMERS CALL CENTRE BRIDGING INFORMATION GAP
Dr.K.P.Vani & Dr.V.Bharathi
Department of Agronomy, College of Agriculture, ANGRAU, A.P, India
Abstract
Indian Agriculture is on the threshold of a second revolution. It is clear that
the next leap will come from the information and knowledge intensity transfer to the
agriculture sector. With the decrease in the number of extension workers it has been felt
that telecom network can be effectively used for delivering knowledge and information to
the farming community. Towards this, for benefit of farmers,Farmers Call Centre was
launched, in Andhra Pradesh, India operating on toll free numbers 1100 or 1800 425
1110to make agriculture knowledge available at free of cost to the farmers as and when
desired. Scientistspositioned at call centre answer a repertoire of questions related to
agriculture and allied fields instantly in the local language, on continuous basis. The data
on the calls received and answered will be saved in the format as programmed by ICT. In
the present study the calls received from 2008-2011on various crop production(13,076)
and protection(15484) aspects were analyzed and interpreted showing the need of the call
centre in solving farmers issues. Hence with the availability of telephone and internet, it is
now possible to bridge the gap between the farmers and scientists to quite a large extent
showing a paradigm shift from blanket technology dissemination to modern information
technology.
Introduction
Indian Agriculture is on the threshold of a second revolution. It is clear that the
next leap will come from the information and knowledge intensity transfer to the
agriculture sector, together with the other traditional inputs and interventions. The real
challenge before the policy makers is to overcome the information asymmetry between the
farmer and farmer, village and village, region and region and the country as a whole versus
other countries. Fortunately, the developments in the field of communication and
information technology (Bentz and Sofranko 1997) make it possible to attempt this task.
The country today has an impressive telecom network both in the private and government
sector. It has been felt that telecom network and ICT can be effectively used for delivering
Paper Proceedings of Agri Animal 2013 - ISSN 2279-3682
74
knowledge and information to the farming community(Jones, 1997). With the decrease in
the number of extension workers, there is a need to use the latest technologies for
delivering extension services. Towards this, the Department of Agriculture and
Information and Communication &Technology has been working on schemes to use both
Mass-Media and telecom network for the delivery of extension services.
First and foremost in the history of Indian Agriculture, proving skeptics wrong,
for benefit of farmers,Farmers Call Centre was launched by Govt. of A.P. Department of
Agriculture, Information and Communication Technology&Acharya N.G. Ranga
Agriculture University, in Andhra Pradesh on July 1st, 2003 operating on toll free numbers
1100 or 1800 425 1110, with the following objectives .
OBJECTIVES
1. To strengthen research-extension-farmer linkages on issues related to Agriculture and
allied sectors.
2. Disseminate the technical knowhow to the farmers through information technology and
communication.
3. Serves as a single point of contact and direct interaction of farmers with the scientists
and department officials for obtaining information and clarification of doubts.
4. Online solutions for the problems encountered day to day on field and horticultural crops
on production and protection aspects.
SOFT WARE :
The software support is being provided by the Centre for Good Governance (CGG).
The software is a web based online application developed in open source technologies
using Apache Tomcats application server and Portuguese database.
The departmental functionaries/district collectors/Heads of Dept. can log into
application from any location and update their responses to the citizen‘s queries.
The data base gets updated dynamically which enables the faster flow of
information.
Paper Proceedings of Agri Animal 2013 - ISSN 2279-3682
75
Methodology:
The call centre functions at two levels, first level –operators and second level –
Agricultural Scientists coached to be patient hearing,farmer-friendly,speak in the
farmer'sdialect. Using the above soft ware the program is so formulated that as soon as
farmer‘s call is landed, the calls are received by first level operators taking the farmer‘s
general details ( Name, contact number, village, query) which is referred as Primary Data.
After taking the pre-liminary information, the operators transfer the calls to the concerned
discipline like crop production, crop protection, horticulture and department of
agriculture,(Fig.1.) where in the scientist will speak to the farmer in his dialect, referred as
–Secondary data. After interaction of the scientist on phone line with the farmer the
queries are displayed on the computer screen which is already programmed and formatted
by the soft ware. (Fig.2.).Then the scientist will open the application, types and saves the
query with the answers in the prescribed format. Likewise each call and queries received
by the scientists of different disciplines per day/week /month, and over a period of years
are recorded and saved. The so received calls over four years from different agro- climatic
zones of the state, are critically observed and presented in the following article.
The query raised by farmers on different crops in crop production and protection is
listed below.
1. CROP PRODUCTION which include queries on crops (Field crops, Pulses, Oil
seeds, Commercial crops, Fibre crops, Fodder crops etc..) on various aspects viz;
Varietal recommendations based on locations, Soil related problems & reclamation,
Improved package of practices (varieties, seed rate ,spacing, method of sowing
etc.),Fertilizer management, (INM, Vermicompost, Bio-fertilizers, Green
manuring),Nutrient disorders (Fe,Zn etc…) and corrections, Weed and Water
management, Harvest and post-harvest care, Weather risk factors, contingency crop
planning – for delayed monsoon and late receipt of canal water, SRI cultivation-
Method of sowing nursery, transplanting ,weeding, etc…..
2. CROP PROTECTION includes queries on Pest and disease identification and control,
Seed Treatment, Use of Biological agents, Bio-pesticides, Nematode management,
Storage pests management, Rat control, Bird control Termite control on Field crops,
Pulses, Oil seeds, Commercial crops, Fibre crops, Fodder crops etc..
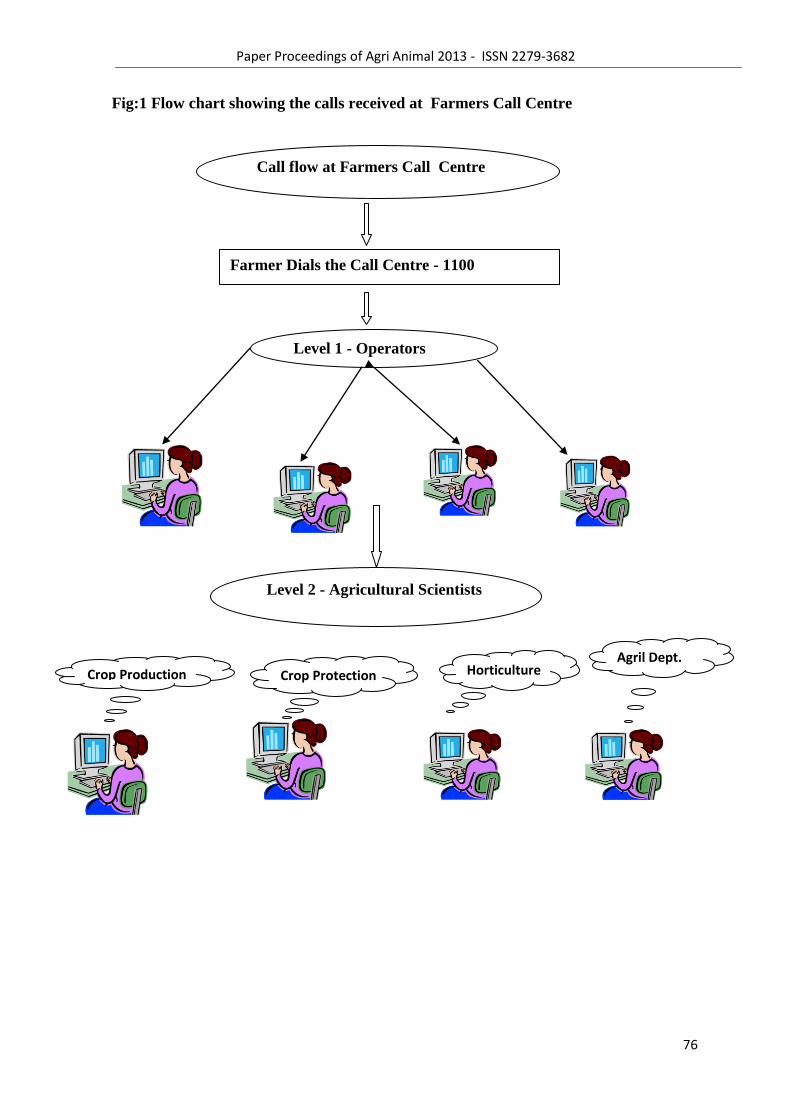
Paper Proceedings of Agri Animal 2013 - ISSN 2279-3682
76
Fig:1 Flow chart showing the calls received at Farmers Call Centre
Farmer Dials the Call Centre - 1100
Level 1 - Operators
Level 2 - Agricultural Scientists
Call flow at Farmers Call Centre
Horticulture
Crop Protection
Crop Production
Agril Dept.
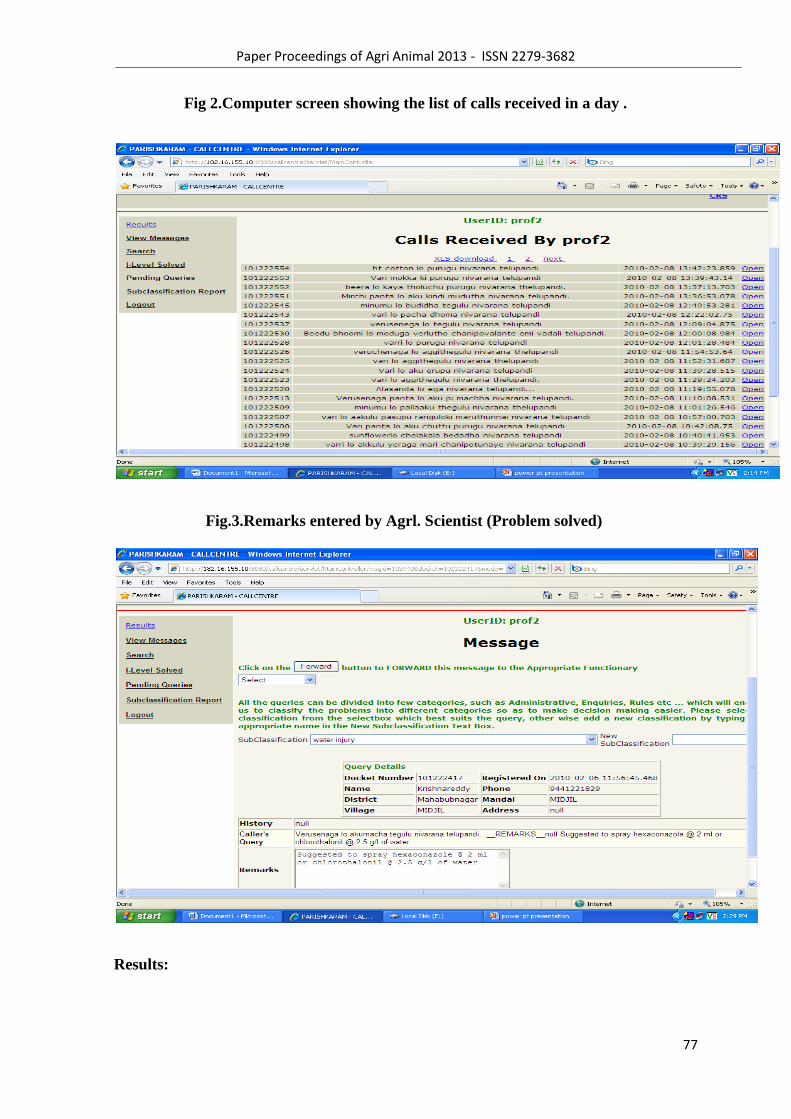
Paper Proceedings of Agri Animal 2013 - ISSN 2279-3682
77
Fig 2.Computer screen showing the list of calls received in a day .
Fig.3.Remarks entered by Agrl. Scientist (Problem solved)
Results:
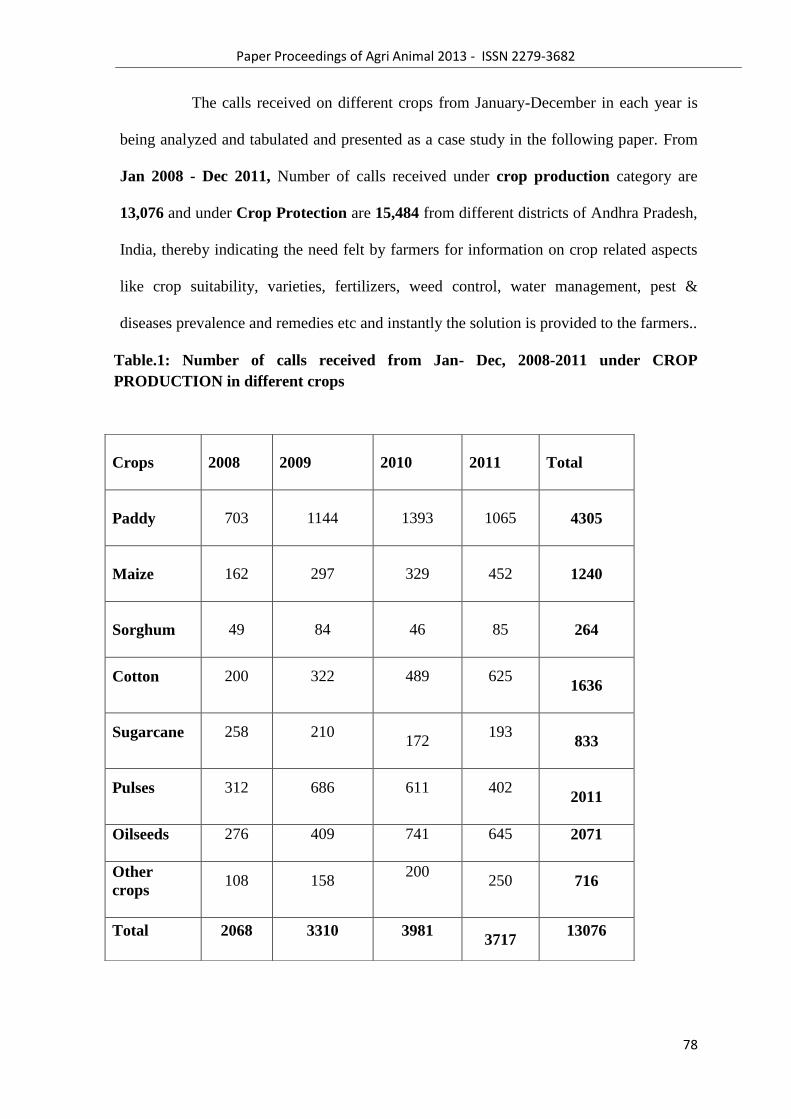
Paper Proceedings of Agri Animal 2013 - ISSN 2279-3682
78
The calls received on different crops from January-December in each year is
being analyzed and tabulated and presented as a case study in the following paper. From
Jan 2008 - Dec 2011, Number of calls received under crop production category are
13,076 and under Crop Protection are 15,484 from different districts of Andhra Pradesh,
India, thereby indicating the need felt by farmers for information on crop related aspects
like crop suitability, varieties, fertilizers, weed control, water management, pest &
diseases prevalence and remedies etc and instantly the solution is provided to the farmers..
Table.1: Number of calls received from Jan- Dec, 2008-2011 under CROP
PRODUCTION in different crops
Crops
2008
2009
2010
2011
Total
Paddy 703 1144 1393 1065
4305
Maize 162 297 329 452
1240
Sorghum 49 84 46 85
264
Cotton
200
322
489
625
1636
Sugarcane
258
210
172
193
833
Pulses
312
686
611
402
2011
Oilseeds
276
409
741
645
2071
Other
crops
108
158
200
250
716
Total
2068
3310
3981
3717
13076
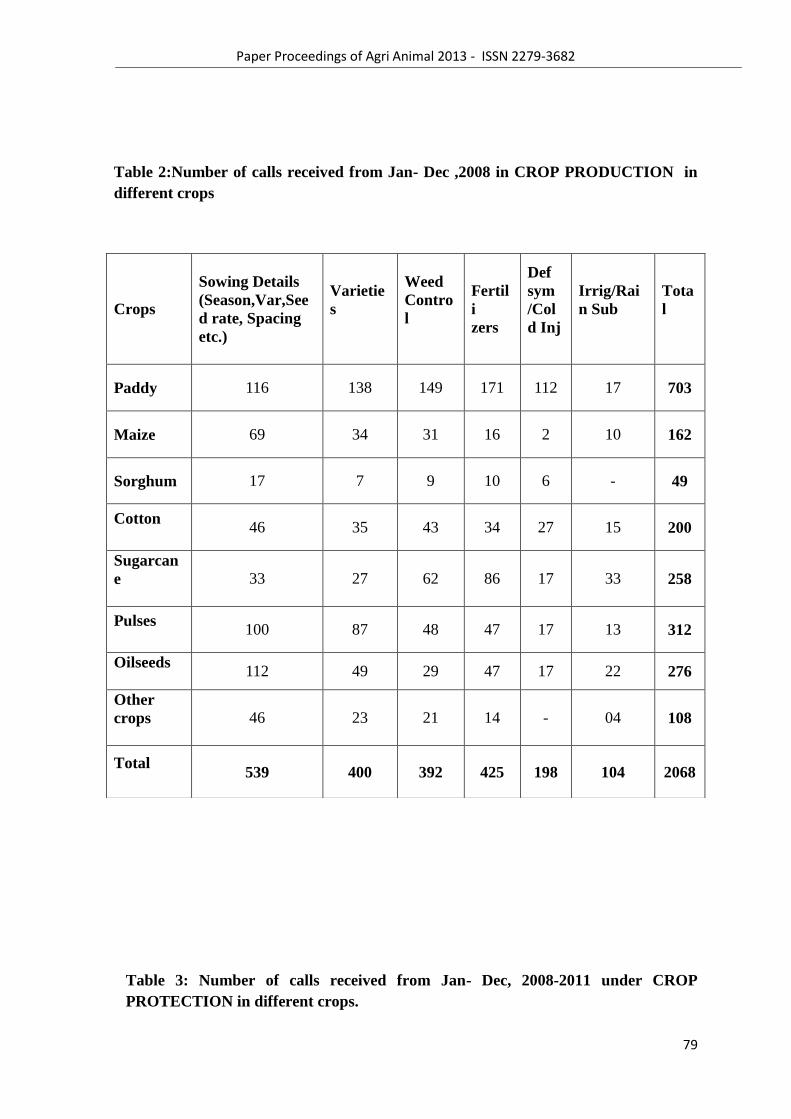
Paper Proceedings of Agri Animal 2013 - ISSN 2279-3682
79
Table 2:Number of calls received from Jan- Dec ,2008 in CROP PRODUCTION in
different crops
Table 3: Number of calls received from Jan- Dec, 2008-2011 under CROP
PROTECTION in different crops.
Crops
Sowing Details
(Season,Var,See
d rate, Spacing
etc.)
Varietie
s
Weed
Contro
l
Fertil
i
zers
Def
sym
/Col
d Inj
Irrig/Rai
n Sub
Tota
l
Paddy 116 138 149 171 112 17 703
Maize 69 34 31 16 2 10 162
Sorghum 17 7 9 10 6 - 49
Cotton
46 35 43 34 27 15 200
Sugarcan
e
33 27 62 86 17 33 258
Pulses
100 87 48 47 17 13 312
Oilseeds
112 49 29 47 17 22 276
Other
crops
46 23 21 14 - 04 108
Total
539 400 392 425 198 104 2068
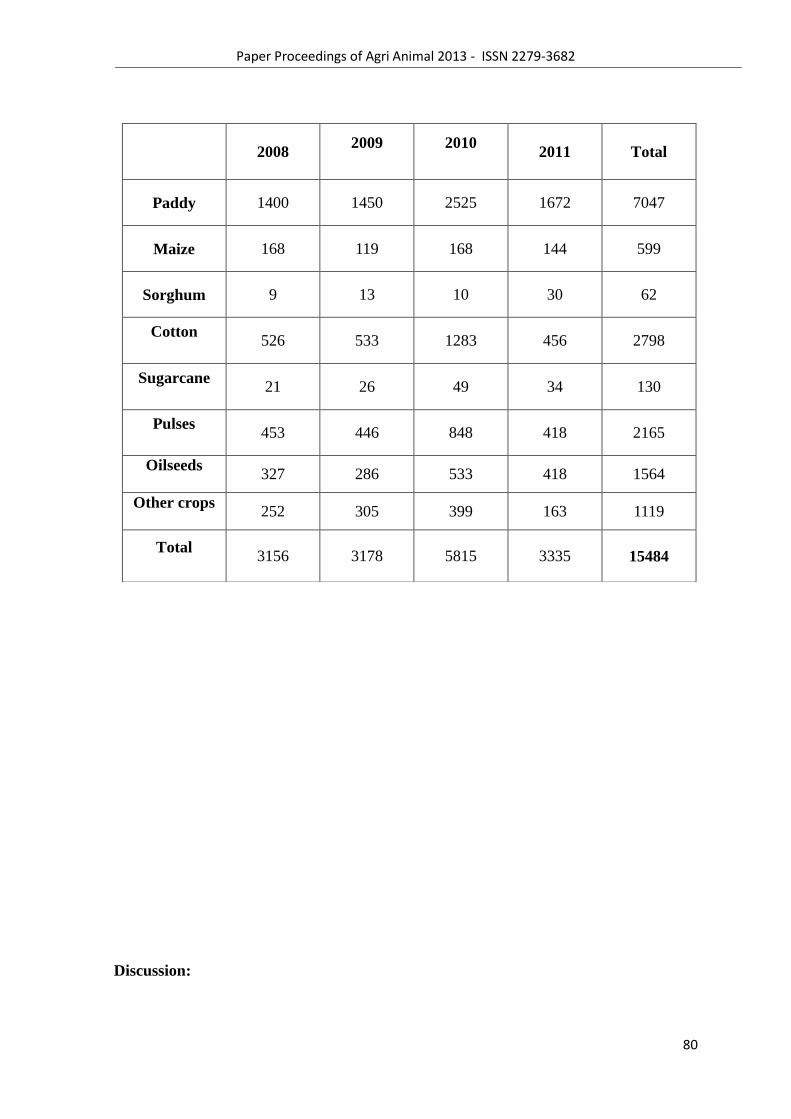
Paper Proceedings of Agri Animal 2013 - ISSN 2279-3682
80
Discussion:
2008
2009
2010
2011
Total
Paddy 1400 1450 2525 1672 7047
Maize 168 119 168 144 599
Sorghum 9 13 10 30 62
Cotton
526 533 1283 456 2798
Sugarcane
21 26 49 34 130
Pulses
453 446 848 418 2165
Oilseeds
327 286 533 418 1564
Other crops
252 305 399 163 1119
Total
3156 3178 5815 3335 15484
Paper Proceedings of Agri Animal 2013 - ISSN 2279-3682
81
From the above two tables it can be interpreted that Table 1. shows the
number of calls received from January- December in different crops like paddy, maize,
jowar, sugarcane, cotton, pulses, oilseeds etc, from 2008-2011, while the table 2.shows the
categorization of calls received from January- December in a year (ex.2008) in different
crops under various categories of crop management aspects (crop suitability, season,
varieties, seed rate, seed treatment, weed control, fertilizers, etc). From table 1. it is
revealed that the number of calls received from 2008 -2011 in crop production is 13,076
which increased linearly from 2008 to 2011. Calls were found to be higher in paddy crop
(4305) by providing the farmers with location specific varieties/hybrids, using
transplanters, fertilizer recommendation based on soil test values, organic manures, usage
of herbicides in labor scarce areas and to take up aerobic rice/ SRI rice method in water
shortage regions. By continuous cautioning to the farmers about the ground water scarcity,
the area under pulses, oilseeds and short duration commercial crops which are alternative
and remunerative to paddy had increased, though paddy being the predominant crop,
which is reflected by number of calls received in different crops other than
paddy.(Table1.) Apart from the above listed crops in table1.the calls were also received
under other crops category (minor millets, tobacco, jute, Mesta, fodder crops, teak,
jatropha etc.) which were also encouraged based on the agro-climatic zone of the state.
The table 2. is presented here only to show detailed list of calls received
from January to December in a year, (for ex.2008) under different categories like season,
crop suitability, seed rate, seed treatment, spacing, varieties, weed control, fertilizers,
nutrient deficiencies or injury, water management etc. It is clear from the table 2. that the
calls were received based on the need of the hour of the farmer during the season. For ex.
In paddy crop calls ranged from 17 to 171, which included calls on package of practices,
varietal recommendation, weedicides usage, foliar sprays when paddy was reddened due to
extreme low temperatures(cold injury), and so on,etc. Thus the information through ICT
provides access to new sources of sustainable development by interacting with the subject
specialists (Zijp, 1994).
From the table 3, as per the data on the calls received from the farmers of different
districts of AP, the major pests / diseases of different crops has been examined and is
presented. It is evident that out of total calls received in crop protection (15,484)
maximum calls were received in 2010 i.e.38% of the respondents benefitted in the year
2010,followed by 20% (2008), 21% (2009) and 22% (2011).Maximum calls (7047) were
Paper Proceedings of Agri Animal 2013 - ISSN 2279-3682
82
received in paddy which is reflected due to higher calls in 2010 (2525), because of
exclusive calls on control of stem borer and stem rot disease, where the scientists
advised for spraying of compatible fungicide and pesticides. Calls on the cotton crop
were second highest (2798), because the Bt-cotton is predominantly cultivated in the
state, which inhabits sucking pest complex, for which the scientists advised timely and
judicious sprays of pesticides. Frequency of calls and by two way communication (Shah,
2012) scientist could identify severe incidence of yellow mosaic virus disease in the both
green gram and black gram (2011)
Timely advises given to the farmer on various aspects like:
On the suitability of crops, varieties, usage of weedicides, right dosages, types and
quantity of fertilsers, by appropriate water management methods, nutrient deficiency
corrections, harvest and post harvest care there by reducing the cost of cultivation and
increasing the yields and monitory returns.
By giving prompt solutions on timely sowing and to take up alternative contingent
crops if any crop failure situations to continuous rains or dry spell occur.
Suggestions to maintain soil heath by applying organic manures, bio-fertilizers,
decomposed farm waste, incorporating green manures, or growing nitrogen fixing
trees, there by maintaining and improving soil fertility status.
Usage of minimum pesticides and fungicides which are compatible in mixtures
instead of spraying separately
To take up foliar sprays of nutrients in dry spell period and salt sprays during floods to
avoid sprout or pre harvest germination of the grains.
Encouraging the farmers to be innovative by adopting the latest machinery on farm
implements, tractors, seed drills, weeders etc, under labor scarce areas and periods to
minimize the cost of cultivation
To adopt cop rotations to minimize the risk of pest and disease incidence.
In addition, based on the repeated queries in particular period and area, problem is
known and identified by the scientists (ex. pest incidence).Hence the solution was timely
provided to the farmers and the message also communicated to other districts and villages
through radio or other media like doordarshan and newspaper etc. During the floods attack
in 2009 and 2010 kharif season, farmers call centre was transformed into a helping room
providing preventive solutions to reduce crop damage across the Andhra Pradesh state
there by helping the farmers to prevent sprouting of the seed and save the crop.
Paper Proceedings of Agri Animal 2013 - ISSN 2279-3682
83
It is concluded that out of the total calls received per year were found to be related
to crop production & crop protection issues. The farmers can be benefited with this type of
horizontal and vertical dissemination of scientific knowledge related to agriculture and
allied subjects with the free service of the public extension mechanism at free of cost.
CONSTRAINTS: Frequent interruption of calls due to problems in BSNL lines, non-
connectivity of other telephone exchanges in the state. Farmers are unable to contact due to
busy lines during release of various examination results
(Tenth/Intermediate/Degree/Eamcet and other Competitive exams), election results, other
calls from electricity dept. GHMC, Health calls, govt. schemes etc.
CONCLUSIONS:
One of the draw-backs experienced in the current human resource based extension service
has been that the monitoring authorities are not able to get a clear feedback on the quality
of extension services being delivered in the villages. Hence the call centers, single-
knowledge pool extension service catering knowledge and information are proving as a
boon for the farming community, which can also keep a record of what is being delivered
to the farmers .The information through ICT provide access to new sources of sustainable
development by bridging the gap between research-extension-farmers in the developing
countries and by two-way communication.
References:
Jones G E 1997 The history, development and the future of agricultural extension. In B, E.
Swanson,
Bentz R. P and Sofranko A. J. (1997) Improving agricultural extension - a reference
manual. Rome: FAO.
Zijp W (1994) Improving the transfer and use of agricultural information - a guide to
information Technology Washington DC World Bank.
Shahid Shah,2012, FAP developing call centre for
farmers.http://www.thenews.com.pk/Todays-News-3-130836-FAP-developing-call-centre-
for-farmers

Paper Proceedings of Agri Animal 2013 - ISSN 2279-3682
84
6
Paper Proceedings of Agri Animal 2013 - ISSN 2279-3682
85
Study the effect of different levels of Super Water Absorbent Polymer (SWAP) and
organic solutions on growth of Pak-choi (Brassica rapa) under soil less culture in
urban agricultural practices
T.N. Fernando1, A.G.B. Aruggoda
1, C. K. Disanayaka
2 and S. Kulathunge
2
1Department of Agricultural and Plantation Engineering, Faculty of Engineering
Technology,
The Open University of Sri Lanka, Nawala, Nugegoda. 2Atomic Energy Authority, No 60/460, Baseline road, Orugodawatta, Wellampitiya,
Colombo,
Sri Lanka. [email protected],
Abstract
The aim of the present study was to evaluate the effect of different levels of imported
Super Water Absorbent Polymer (SWAP) - GAMsorb from Vietnam on soil less culture
using Pak-choi (Brassica rapa) under semi control plant growth facilitator in rooftop
garden.Fermented leaves, cattle manure and wormy wash were organic solutions and de-
ionized water was the control. pH, Electrical conductivity (Ec), nitrogen, phosphorus,
potassium concentrations, solution density and swelling ratio were measured. Pots with
250 g of medium were arranged in completely randomizes design with three replicates.
SWAPs 0 g, 2 g, 4 g, 6 g, 8 g were treatments. Same volume of organic solutions was
applied three days/week. According to measured parameters; pH, Ec and nutrient
concentration of solutions were suitable for proper plant growth and pH, Ec and solution
density were affected swelling ratio of SWAPs. De ionized water was the best for soaking
SWAP. The probability values of the effect of different rates of polymer on organic
solutions were significant for plant fresh and dry weights, leaf area, number of
leaves/plant, relative water content of plants and moisture content of porous media
(P<0.05). The mean plant fresh weight, dry weight, leaf area and number of leaves/plant
were highest at the 2 g and lowest at 8 g of SWAP. Control had highest mean plant fresh
and dry weights, leaf area and number of leaves/plant when compared to the rates of 4 g, 6
g and 8 g. Best SWAP rates for proper growth of Pak-choiwas less than 2 g for 250 g of
porous medium.
Key words: Super water absorbent polymers, organic solutions, Pak-choi (Brassica
rapa)
Introduction
Supper Water Absorbent Polymers (SWAPs) are compounds that absorb water and swell
in to many times than their original size and weight. They are lightly cross-linked networks
of hydrophilic polymer chains. The network can swell in water and hold a large amount of
water, while maintaining physical dimension structure (Buchholz and Graham, 1997,
Mahdavinia et al 2004). It was known that commercially used water-absorbent polymeric
materials employed are partial neutralization products of cross linked polyacrylic acids,
partial hydrolysis products of starch acrylonitrile copolymers and starch acrylic acid graft
copolymers.
Paper Proceedings of Agri Animal 2013 - ISSN 2279-3682
86
Most authors agree that when super water absorbent polymers are incorporated in the soil,
the following can be observed; control of soil erosion and water runoff (Wallace &
Wallace, 1990), increasing infiltration capacity (Zhang & Miller, 1996), increasing soil
aggregate size (Wallace et al, 1986), reducing soil bulk density (Al-Harbi et al, 1999),
increasing water retention (Johnson, 1984; Bres et al, 1993), improving the survival of
seedlings subjected to drought (Huttermann et al, 1999) ), lengthening shelf-life of pot
plants (Gehring et al, 1980), improving nutrient recovery from applied fertilizers (Smith et
al, 1991; Bes et al, 1993), improving nutrient uptake by plants grown in poor soil,
minimizing nutrient losses through leaching under highly leached conditions, (Mikkelsen,
1994) and reducing irrigation frequency (Taylor et al, 1986).
SWAPs mostly used in arid and semi arid regions of the World to overcome water scarcity
problems. At present urban people in Sri Lanka and in the world are interested on
practicing crop cultivation with organic farming as a hobby and as a way to generate an
income to support the economy of the family. One of the major problems urban
agriculturists face in Sri Lanka is severe water scarcity especially in Colombo area due to
heavy evapotranspiration during the day time., Further, highly polluted environment in
urban city limits increases the temperature, hence increasing soil water evaporation. This
will result in wilting of plant leaves during the daytime. Therefore, watering in the
morning as well as in the evening is inevitable. However, frequent watering requires
labour, time and money, in addition to water that may waste away during application.
Apart from above, during the rainy seasons and when frequent watering is practiced,
nutrient deficiency problems are prominent among the cultivated crops due to wash off of
soil nutrients and fertilizers, followed by soil degradation.
Gardening in roof tops are common practice in urban agriculture to have the greenery all
around. This has become a common practice today to avoid the high environmental
temperature increase. Moreover, an urban garden can supplement the diets of the
community it feeds with fresh produce and provide a tangible tie to food production.
Rooftop agriculture allows for the retention of traditional or cultural gardening practices,
while local choice of plants can preserve heritage species and maintain diversity in diet.
(http://commons.bcit.ca/greenroof/). However, finding suitable soil for proper plant growth
is a limitation and at the same time transporting soil to the roof top becoming a major
issue. SWAP is commonly applying in soil cultivations however there is a possibility to
apply the SWAP to the soilless culture. According to the Bes et al, 1993 SWAP could be
used to find out the influence of gel additives on nitrate, ammonium and water retention
ability and better growth of tomato in soilless medium. Soilless culture is a technology for
growing plants in nutrient solutions that supply all macro and micro nutrient elements
needed for optimum plant growth with or without use of an inert medium such as coir dust,
paddy husks and saw dust etc. to provide mechanical support. The commonly used nutrient
solution for soilless culture in Sri Lanka is Albert‘s solution. Albert solution should not
mix with SWAP because it trend to collapse. Therefore, we test organic solutions with
SWAP for soil less culture.
The present study focused to evaluate the application of SWAPs to soilless cultivation by
applying different organic solutions to evaluate the growth of Pak-choi (Brassica
rapa)under urban rooftop agriculture.
Paper Proceedings of Agri Animal 2013 - ISSN 2279-3682
87
Methodology
The study was designed to evaluate the effect of organic solution reaction on SWAP and to
evaluate the effect of different levels of SWAP on soilless cultivation applying SWAP and
organic solution as the media. Reaction effects of diluted organic solutions on SWAP were
evaluated under laboratory conditions. Fermented leaves (L), cattle manure (C), wormy
wash (W) were used as treatments, and de-ionized (D) water was used as the control
solution. 1 kg of fresh Gliricidia(Gliricidia sepium), Ipil Ipli (Leucaena leucocephala) and
Undu Piyaliya (Desmodium triflorum) Leaves at 1:1:1 were fermented in deionized water
for two weeks. Fresh cattle manure (few hours old) fermented for three weeks in deionized
water. In addition, wormy wash was prepared according to the method in ISBN 955-8699-
13-6 book.
The organic solutions prepared were diluted according to the ratio of; fermented leaves
1:9, cattle manure1:9 and wormy wash1:5 using de-ionized water. Amount of major
nutrient elements; nitrogen, phosphorus and potassium were estimated in all three diluted
organic solutions using spectrophotometer. In addition, pH, Electric conductivity of each
solution was measured. Four treatments were applied, by using 100 ml of each of three
organic solutions separately and adding 1 g of SWAP and the control with 100 ml of
deionized water and 1 g of SWAP. 180 ml plastic containers were selected and added with
each treatment combinations separately. Treatments were replicated four times. Plastic
containers were closed with the lid and were left for overnight. Later SWAP was drained
out to remove excess water using a net. Rate of absorbance was measured, assuming
closed containers were not having any other water losses. Weight of each experimental
sample was recorded after water was drained. Amount of degrading the SWAP crystals
produced when adding organic solutions and de-ionized water was observed visually in
each day for a period of six weeks. Suitable organic solution/solutions was/were identified
to evaluate the effect of different levels of SWAP and organic solutions on soilless culture.
The study was carried out in a semi control plant growth facilator at the rooftop of the
department of Botany, faculty of Natural Science, at the Open University of Sri Lanka.
Aggregate system was used as soilless culture. Same portions of Coir dust and burned
paddy husks were used for aggregate system according to Day Ananda et al. Five treatment
combinations were applied. Coir dust and burned paddy husks were selected as the highly
porous media after sterilizing in an oven at 180 0C for one day and mixed 1:1 ratio by
adding 250 g from each media for treatment combinations. Bottom of each plastic pot was
laid with gravels and treatment was added top of that layer. SWAPs were added as 2 g, 4 g,
6 g, 8 g for four treatments and control was maintained without adding SWAP. Volume of
organic solution required fulfilling the field capacity (FC) of the media combination of coir
dust and paddy husk; 1:1 was measured using pressure plate. Selected organic solution/
solutions were applied to each treatment to fulfill the field capacity as measured in every
Monday, Wednesday and Friday for 5 weeks. Experimental design was completely
randomized design with three replicates. Plant fresh weight, leaf area and number of leaves
per plant were measured after harvesting. Plant samples were oven dried at 60 0C to a
constant weight to determine growth on a dry weight. Moisture content of media was
measured one week after harvesting by following oven dry method at 105 0C until reached
to a constant weight. Relative water content of leaves was measured according to Islam et
al, 2011.
Result
Paper Proceedings of Agri Animal 2013 - ISSN 2279-3682
88
Table 1 explains the analyzed data of the effect of different organic solutions and
deionized water on the reactions of SWAP. According to the table 1, average pH values
of solutions were between 6.77 and 7.4 and electric conductivity were varied among 0.1
mS and 5.1 mS. According to the measured pH values and electric conductivity, all
solutions were low in acidity and alkalinity. Moreover, all organic solutions were with high
amount of nitrogen, and the highest nitrogen was observed in wormy wash compared to
other two organic solutions. Fermented leaf solution had the highest phosphorous level.
Highest amount of potassium concentration was observed in cattle manure solution
compared to other two solutions.
Figure 1, 2 and 3 present the crystal formation of SWAP after absorbing deionized water
and other organic solutions, three days, one week and three weeks later respectively.
Crystal formations did not show any difference three days after adding deionized water and
organic solutions to SWAP. The conditions of the SWAPs one week after were shown in
figure 2. Cattle manure, wormy wash and leaf solutions absorbed SWAP showed gel like
appearance with the time by degrading the polymer structure. Among them fermented
leafy solution added SWAP showed lesser amount of dissolving comparatively. Highest
water released rate was observed in cattle manure liquid absorbed SWAP crystals. At the
starting of three weeks cattle manure absorbed SWAP crystals were visualized as a glue
type formation therefore discarded. Wormy wash absorbed crystals degrade faster than the
fermented leafy solution absorbed crystals. Therefore at the end of three week‘s wormy
wash absorbed crystals showed glue type formations. Deionized water absorbed SWAP
crystals did not change the structure in any way until 1 1/2 months.
The statistical analysis revealed that effect of different rate of polymer on soilless
cultivation applying organic solution were significant for plant fresh as well as dry
weights, leaf area, number of leaves per plant, relative water content of leaves and
moisture content of porous media one week after harvesting ( P<0.05) (table 2). The mean
plant fresh weight, plant dry weight, leaf area and number of leaves per plant were highest
at the rate of 2 g of SWAP and lowest at the rate of 8 g of SWAP. Control without SWAP
had the highest mean plant fresh weight, plant dry weight, leaf area and number of leaves
per plant when compare to the rates of SWAP 4 g, 6 g and 8 g.
According to figure 4, all measured growth parameters were highest at the rate of 2 g of
SWAP and thereafter comparatively decreased at the rates of 4 g, 6 g and 8 g of SWAP.
Figure 4 (E) and (F) shows the variation of the mean Relative Water Content of plant leaf
and moisture content of media. According to these figures relative water content and
moisture content of media were highest with increasing amount of polymer.
Paper Proceedings of Agri Animal 2013 - ISSN 2279-3682
89
Table 1 Characteristic of organic solutions
De-ionized
water (D)
Wormy wash
(W)
Leaf solution
(L)
Cattle
manure (C)
pH 7.0 6.77 7.4 7.1
Electrical conductivity 0.1 4.1 5.1 1.7
Nitrogen content (mg/l) - 360 300 320
Phosphorous content (mg/l) - 22 152 37
Potassium content (mg/l) - 360 60 450
Relative density of solution 1.0 1.0 1.0 1.1
Average swelling ratio 40.65 40.0 40.1 39.9
Figure 1 Crystal formation three days after soaking;
A- De ionized water absorbed SWAPB- Wormy wash absorbed SWAP, C-Leaves solution
absorbed SWA, and D- Cattle manure absorbed SWAP
A
A
B
C D
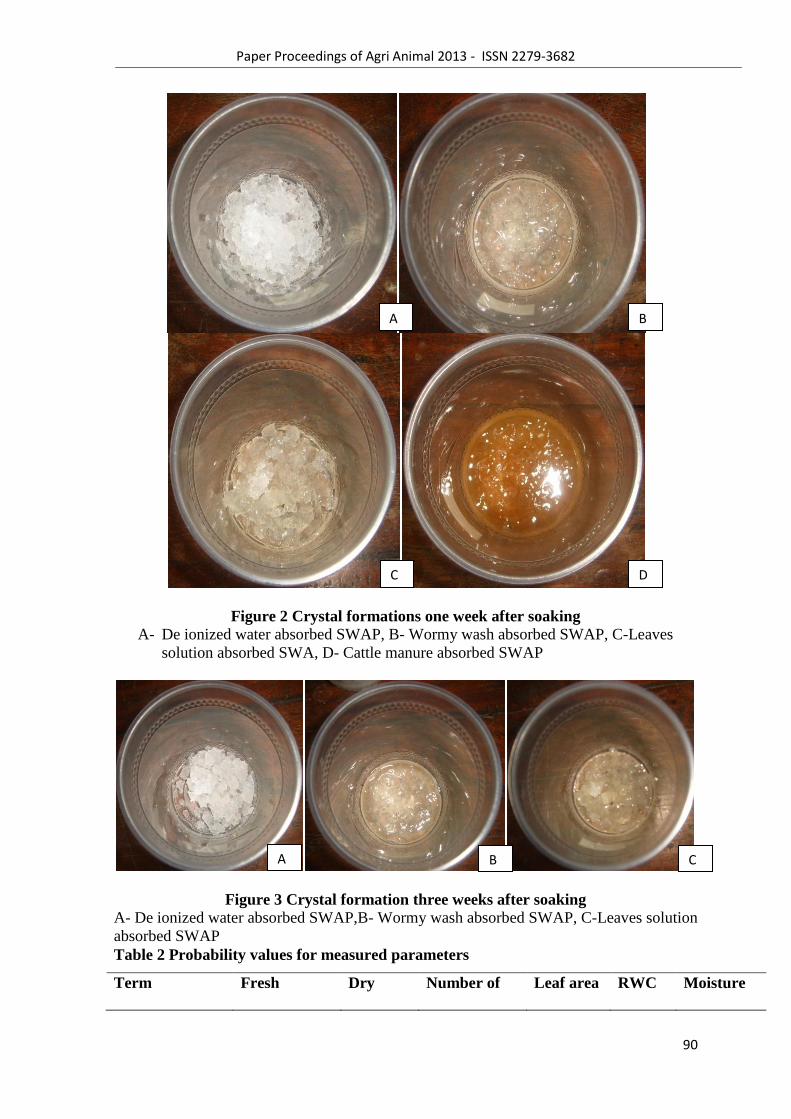
Paper Proceedings of Agri Animal 2013 - ISSN 2279-3682
90
Figure 2 Crystal formations one week after soaking
A- De ionized water absorbed SWAP, B- Wormy wash absorbed SWAP, C-Leaves
solution absorbed SWA, D- Cattle manure absorbed SWAP
Figure 3 Crystal formation three weeks after soaking
A- De ionized water absorbed SWAP,B- Wormy wash absorbed SWAP, C-Leaves solution
absorbed SWAP
Table 2 Probability values for measured parameters
Term Fresh Dry Number of Leaf area RWC Moisture
A B
C D
A B C
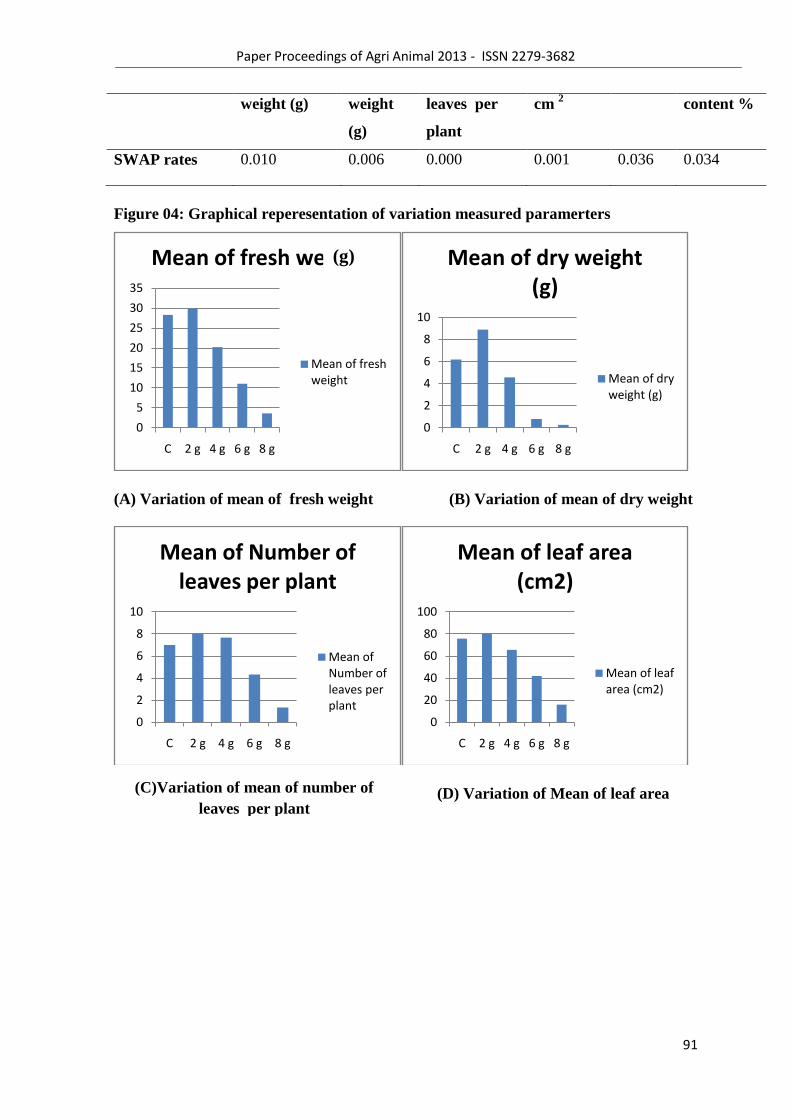
Paper Proceedings of Agri Animal 2013 - ISSN 2279-3682
91
weight (g) weight
(g)
leaves per
plant
cm 2 content %
SWAP rates 0.010 0.006 0.000 0.001 0.036 0.034
Figure 04: Graphical reperesentation of variation measured paramerters
(A) Variation of mean of fresh weight (B) Variation of mean of dry weight
(D) Variation of Mean of leaf area
0
5
10
15
20
25
30
35
C 2 g 4 g 6 g 8 g
Mean of fresh weight
Mean of fresh weight
0
2
4
6
8
10
C 2 g 4 g 6 g 8 g
Mean of dry weight (g)
Mean of dry weight (g)
0
2
4
6
8
10
C 2 g 4 g 6 g 8 g
Mean of Number of leaves per plant
Mean of Number of leaves per plant
0
20
40
60
80
100
C 2 g 4 g 6 g 8 g
Mean of leaf area (cm2)
Mean of leaf area (cm2)
(C)Variation of mean of number of
leaves per plant
(g)
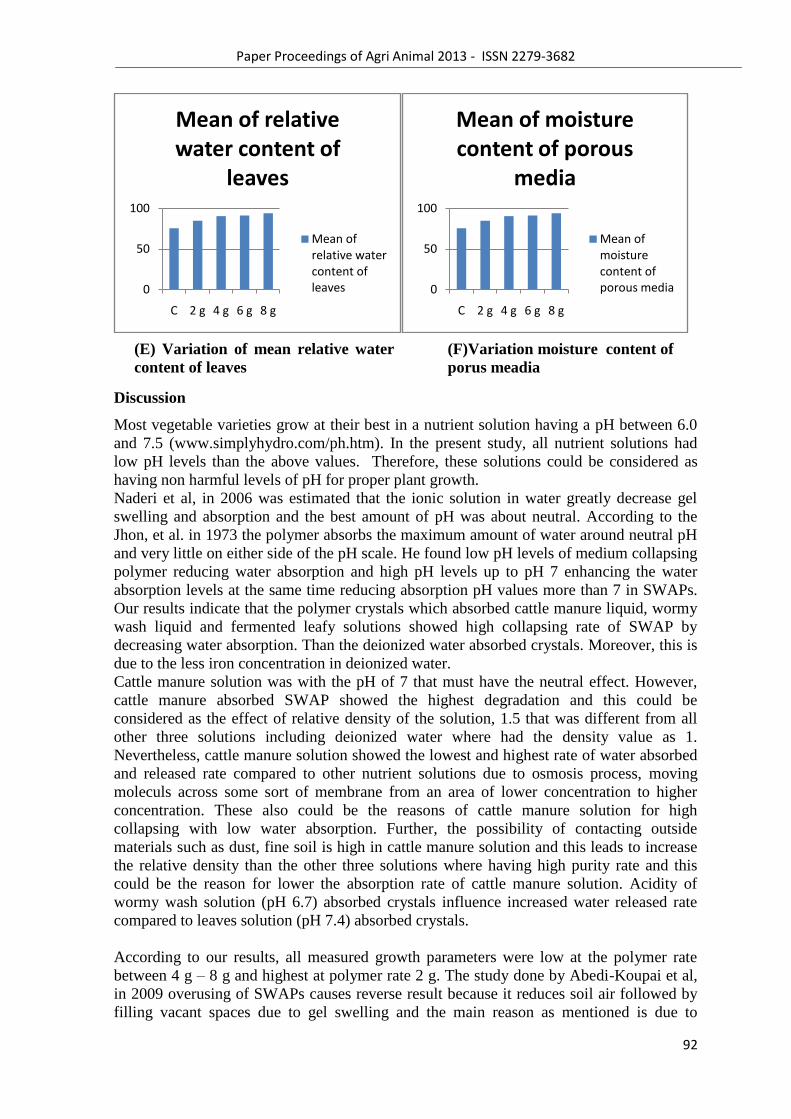
Paper Proceedings of Agri Animal 2013 - ISSN 2279-3682
92
Discussion
Most vegetable varieties grow at their best in a nutrient solution having a pH between 6.0
and 7.5 (www.simplyhydro.com/ph.htm). In the present study, all nutrient solutions had
low pH levels than the above values. Therefore, these solutions could be considered as
having non harmful levels of pH for proper plant growth.
Naderi et al, in 2006 was estimated that the ionic solution in water greatly decrease gel
swelling and absorption and the best amount of pH was about neutral. According to the
Jhon, et al. in 1973 the polymer absorbs the maximum amount of water around neutral pH
and very little on either side of the pH scale. He found low pH levels of medium collapsing
polymer reducing water absorption and high pH levels up to pH 7 enhancing the water
absorption levels at the same time reducing absorption pH values more than 7 in SWAPs.
Our results indicate that the polymer crystals which absorbed cattle manure liquid, wormy
wash liquid and fermented leafy solutions showed high collapsing rate of SWAP by
decreasing water absorption. Than the deionized water absorbed crystals. Moreover, this is
due to the less iron concentration in deionized water.
Cattle manure solution was with the pH of 7 that must have the neutral effect. However,
cattle manure absorbed SWAP showed the highest degradation and this could be
considered as the effect of relative density of the solution, 1.5 that was different from all
other three solutions including deionized water where had the density value as 1.
Nevertheless, cattle manure solution showed the lowest and highest rate of water absorbed
and released rate compared to other nutrient solutions due to osmosis process, moving
moleculs across some sort of membrane from an area of lower concentration to higher
concentration. These also could be the reasons of cattle manure solution for high
collapsing with low water absorption. Further, the possibility of contacting outside
materials such as dust, fine soil is high in cattle manure solution and this leads to increase
the relative density than the other three solutions where having high purity rate and this
could be the reason for lower the absorption rate of cattle manure solution. Acidity of
wormy wash solution (pH 6.7) absorbed crystals influence increased water released rate
compared to leaves solution (pH 7.4) absorbed crystals.
According to our results, all measured growth parameters were low at the polymer rate
between 4 g – 8 g and highest at polymer rate 2 g. The study done by Abedi-Koupai et al,
in 2009 overusing of SWAPs causes reverse result because it reduces soil air followed by
filling vacant spaces due to gel swelling and the main reason as mentioned is due to
0
50
100
C 2 g 4 g 6 g 8 g
Mean of relative water content of
leaves
Mean of relative water content of leaves 0
50
100
C 2 g 4 g 6 g 8 g
Mean of moisture content of porous
media
Mean of moisture content of porous media
(E) Variation of mean relative water
content of leaves
(F)Variation moisture content of
porus meadia
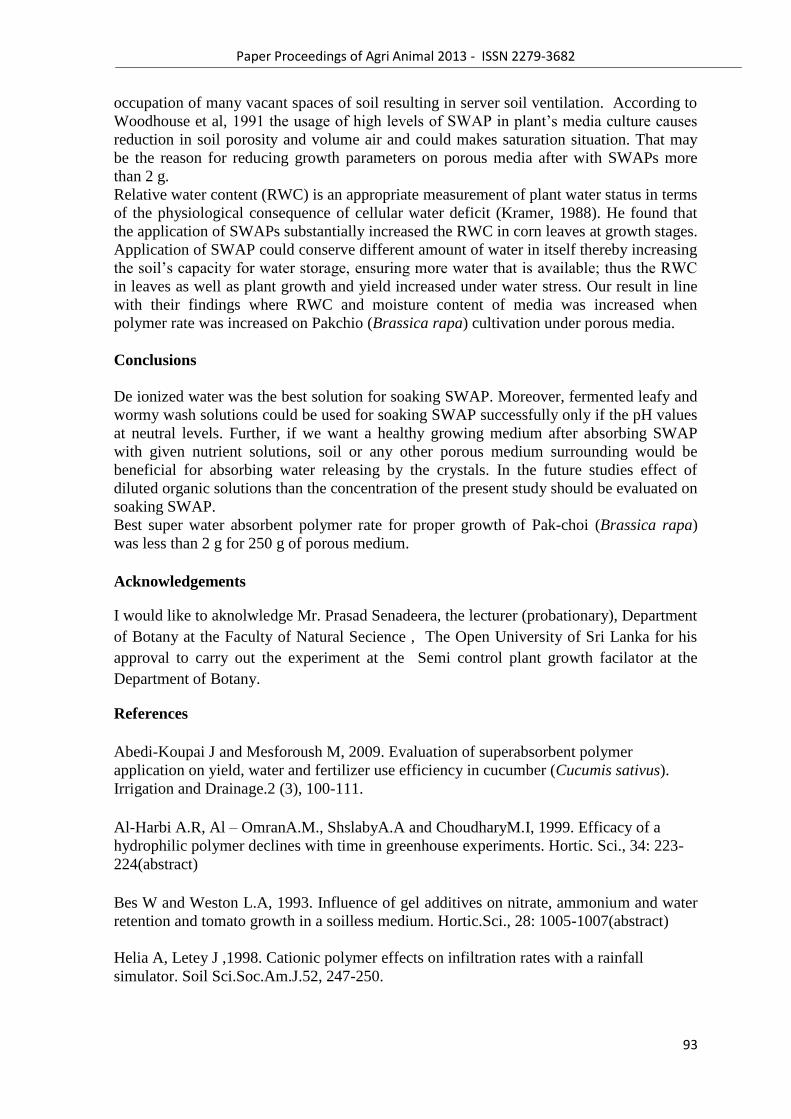
Paper Proceedings of Agri Animal 2013 - ISSN 2279-3682
93
occupation of many vacant spaces of soil resulting in server soil ventilation. According to
Woodhouse et al, 1991 the usage of high levels of SWAP in plant‘s media culture causes
reduction in soil porosity and volume air and could makes saturation situation. That may
be the reason for reducing growth parameters on porous media after with SWAPs more
than 2 g.
Relative water content (RWC) is an appropriate measurement of plant water status in terms
of the physiological consequence of cellular water deficit (Kramer, 1988). He found that
the application of SWAPs substantially increased the RWC in corn leaves at growth stages.
Application of SWAP could conserve different amount of water in itself thereby increasing
the soil‘s capacity for water storage, ensuring more water that is available; thus the RWC
in leaves as well as plant growth and yield increased under water stress. Our result in line
with their findings where RWC and moisture content of media was increased when
polymer rate was increased on Pakchio (Brassica rapa) cultivation under porous media.
Conclusions
De ionized water was the best solution for soaking SWAP. Moreover, fermented leafy and
wormy wash solutions could be used for soaking SWAP successfully only if the pH values
at neutral levels. Further, if we want a healthy growing medium after absorbing SWAP
with given nutrient solutions, soil or any other porous medium surrounding would be
beneficial for absorbing water releasing by the crystals. In the future studies effect of
diluted organic solutions than the concentration of the present study should be evaluated on
soaking SWAP.
Best super water absorbent polymer rate for proper growth of Pak-choi (Brassica rapa)
was less than 2 g for 250 g of porous medium.
Acknowledgements
I would like to aknolwledge Mr. Prasad Senadeera, the lecturer (probationary), Department
of Botany at the Faculty of Natural Secience , The Open University of Sri Lanka for his
approval to carry out the experiment at the Semi control plant growth facilator at the
Department of Botany.
References
Abedi-Koupai J and Mesforoush M, 2009. Evaluation of superabsorbent polymer
application on yield, water and fertilizer use efficiency in cucumber (Cucumis sativus).
Irrigation and Drainage.2 (3), 100-111.
Al-Harbi A.R, Al – OmranA.M., ShslabyA.A and ChoudharyM.I, 1999. Efficacy of a
hydrophilic polymer declines with time in greenhouse experiments. Hortic. Sci., 34: 223-
224(abstract)
Bes W and Weston L.A, 1993. Influence of gel additives on nitrate, ammonium and water
retention and tomato growth in a soilless medium. Hortic.Sci., 28: 1005-1007(abstract)
Helia A, Letey J ,1998. Cationic polymer effects on infiltration rates with a rainfall
simulator. Soil Sci.Soc.Am.J.52, 247-250.
Paper Proceedings of Agri Animal 2013 - ISSN 2279-3682
94
Buchholz F.L and Graham A.T, 1997.Modern Superabsorbent polymer Technology, wiley,
New York.
Dayananda M.A.I1 and Ahundeniya W.M.K.B
2 (year is not mention) Effect of different
hydroponic systems and media on growth of lettuce under protected culture. 1Department
of horticulture and Landscape Gardening Faculty of Agriculture and Plantation
management,Wayamba university of Sri lanka, Makandura,Ganawila. 2Horticutural crops
reaearch and development institute Department of Agricuture,Gannoruwa,Peradeniya.
agrilearning.goviya.lk/Protected Agri/research/Protected.../13.pdf.
Huttermann A, Zommorodia M, Reise K, 1999. Addition of hydrogel to soil for prolonging
the survival of pinushalepensisseedimgs subjected to drought. Soil Till.Res., 50: 295-304.
Mahdavinia G.R, Pourjavadi A, Hosseinzadeh H and Zohuriaan M.J, 2004. Modified
chitosan 4Superabsorbent hydrogels from poly(acrylic acid-co-acrylamide) grafted
chitosan with salt- andpH-responsiveness properties, European Polymer Journal, 40,
1399-1407.
http://commons.bcit.ca/greenroof/
Gehring J.M andLewis A.J, 1980. Effect of polymer on wilting and moisture stress of
bedding plants. J. Am. Soc. Hort. Sci., 105:511-513.
Johnson M.S 1984. The effect of gel-forming polyacrylamides on moisture storage in
sandy soils. J. Sci. Food Agric., 35: 1196-1200.
Jhon, M.S and Andrade, J.D, 1973. Water and Hydrogels. Journ. Biomed. Mat. Res.vol. 7.
Kramer P.J, 1988. Measurement of plant water status. Historical perspectives and current
concerns. Irrigation Science,9: 275-287.
Mikkelsen, R.L, 1994. Using hydrophilic polymers to control nutrient release. Fertilizer
Res., 38:53-59.
Naderi F and Vasheghani Farahani, 2006. Increasing soil water holding capacity by
hydrophilic polymers. J. Sci. Wat. Soil. Iran. 20(1), 64-72.
Pille A.S, Indrani D.J. A book ―Cabanika Gewattakata Prayogika Athpotha‖. ISBN 955-
8699-13-6. [email protected]
Smith J. D. and Harrison H. C, 1991. Evaluation of polymers for controlled release
Properties when incorporated with fertilizer solutions. Communications in Soil Science
and Plant Analysis 22, 559-573.
Taylor K.C, Halfacre R.G,1986. The effect of hydrophilic polymer on meadia water
retrntion and nutrient availability to Ligustrumlucidum. Hort.Sci.,21: 1159-1161.
Paper Proceedings of Agri Animal 2013 - ISSN 2279-3682
95
Wallance A and G.A. Wallance, 1986. Control of soil erosion by polymeric soil
conditioners. Soil Science, 141:377-380.
Wallance A and WallanceG.A, 1990. Interactions encountered when supply nitrogen and
phosphorus fertilizer and a water soluble polyacrylamide to soil. J.PlantNutr., 13:3-4,343-
347.
Woodhous .J.M and Johnson M.S,1991. Effects of soluble salts and fertilizer on water
storage by gel forming soil conditioners. Acta Hort. 294,261-269
www.simplyhydro.com/ph.htm.
www.tps.com.au/hydroponics/pheffect.htm.
Yazdani F, Allahdadi I, Akbari G.A,2007. Impact of superabsorbent polymer on yield and
growth analysis of soybean (Glycine max L.) under drought stress condition, pak.J, Biol.
Sci., 10:4190-4196.
Zhang, X.C and MillerW.P, 1996. Polyacrylamide effect on infiltration and erosion in
furrows. Soil sci. Soc.Am. J., 60: 866-872.
7
Paper Proceedings of Agri Animal 2013 - ISSN 2279-3682
96
Farmers` Companies for Agricultural Commercialization in Sri Lanka:
Experiences of Ridebendiela Farmers` Company - Past, Present and Future
Sanduni KUMARI
Graduate School of Science and Engineering, Saga University, Japan
Theme: Agricultural Economics - Agribusiness
Abstract
Paper Proceedings of Agri Animal 2013 - ISSN 2279-3682
97
As in most of developing nations, lack of market access has become a prominent challenge
for small-holder farmers in Sri Lanka. National Development Council, established in 1996,
introduced Farmers` Companies (FC) as a strategy to commercialize small holder
agriculture. The objective of the study was to analyze past, present and future prospects of
FCs. The field data was obtained from 70 shareholders, who are farmers, of Ridebendiela
FC (RFC) through a structured questionnaire. Informal discussions were done with FC
staff and government officers. The business profile of the FC has changed with the time.
At present, seed paddy, poultry buy back system and fertiliser subsidy distribution are the
main businesses of FC. Seventy six percent of farmers sell their seed paddy to the FC as it
provides a high price. Seventy six percent of farmers believed that their socio-economic
status was improved after joining with FC and 48.6% of respondents wanted to engage
more business activities with FC. The problems related to management and financial
stability was identified as the main risks for the future survival of the FC. Building more
commercial links with private sector, developing a good business plan and
entrepreneurship training for the management will help RFC to perform better in
agricultural commercialization in Sri Lanka.
Key Words: Farmers` Company, Agricultural Commercialization, Sri Lanka
INTRODUCTION
The fundamental role that agriculture plays in development has long been recognized.
Agriculture makes the main pillar of economy in most of the developing countries. The
majority of communities in such countries have engaged in small-holder farming which
utilizes limited amount of resources, including Sri Lanka where agriculture contributes
11.2% to the national GDP and 32.9% of the employed persons have engaged in
Paper Proceedings of Agri Animal 2013 - ISSN 2279-3682
98
agricultural sector employments (Department of Census and Statistics Sri Lanka, 2011).
Unfortunately, small-holders often face specific constraints, including extreme poverty,
weak property rights, poor access to markets and financial services, vulnerability to shocks
and limited ability to tolerate risk. Therefore, farmers in many low and middle-income
countries face an unconducive environment and weak incentives to invest in agriculture
(FAO, 2012, p.xii). Specially, lack of market access for farmer products, has created a
serious economic risk for the farmers and it has made them poor. Therefore, agriculture-
for-development strategies need to focus on the small-holder sector, understand the
challenges they face and find ways to make them more productive (World Bank, 2007).
Lack of access to agricultural markets can be identified as one of the biggest challenges
and various strategies have taken by various countries in order to improve the market
access of such small-holder farmers.
In Sri Lanka, the formation of FC is a strategy adapted by the government to transform
traditional small-holder farming into commercialized business ventures (Senanayake,
2004,p.1). It was introduced by National Development Council established in 1996.
Ministry of Irrigation and Mahaweli1 Authority are the main facilitators in establishing
FCs. FCs are investor-owned companies established under the companies act as `Peoples‘
companies` (Eshamand Usami,2007,p.87). The farmers in the area become the
shareholders (SH) and director board of the company. Hence, the study defined this model
as the ―farmer-owned, farmer-managed, self-reliant, profit-oriented business model which
ensures farm-based and non-farm based economic and social benefits to SHs while
providing them opportunities to participate in profitable economic activities for their self-
development‖. There were 32 registered FCs at the end of March 2001 (Batuwitage,2003,
p.37). But, there was little information on their performance. As for March 2012, there
were only 8 FCs found remaining islandwide, including RFC, which is one of the initial
Paper Proceedings of Agri Animal 2013 - ISSN 2279-3682
99
FC. The study aims to examine the following aspects of RFC in particular: to identify the
process of establishing the company, to identify the chronological changes of businesses of
the company, to measure the current impact of FC to farmers, to identify the drawbacks
and to suggest potential solutions for better future performances of RFC.
RESEACH METHODOLOGY
a. Background of the Study Area
The study was carried out in Ridebendiela, belongs to Nikaweratiya Divisional Secretariat
(DS) division2 which has an area of 181km
2 with a population of 53,166. Largely, the area
is situated in Kurunegala district, the capital of the north-western province of Sri Lanka.
Locating 94km from Colombo, the capital, and 116m above sea level, Kurunegala itself is
a busy commercial city and a transport hub connecting to other main commercial cities
including Colombo. The area is considered as one of the granary areas in the country with
a high cereal production specially, Paddy. In addition, it accounts for higher coconut
production in the country, locating within the `coconut triangle`3. Hence, paddy farming,
rearing livestock (dairy, poultry) and coconut cultivation are the main sources of income
for the people in the area. Paddy is cultivated mainly in small holdings in rural areas. The
district bears 11 percent of cattle and 33 percent of the chicken population of the country
(Department of Census and Statistics, 2011), representing its significant contribution to the
livestock sector. Poultry production is carried out mainly as backyard production.
b. Sample, Methodology of Data Collection and Analysis
The study was based on a field survey and a comprehensive literature survey. A Random
and purposive sampling methods was used to select the respondents. The field survey data,
were collected from 70 SHs in RFC through face to face interviews and a structured
Paper Proceedings of Agri Animal 2013 - ISSN 2279-3682
100
questionnaire was used to collect data. Additionally, informal discussions were done with
SHs of other few FCs (located in Bakamuna, Minneriya and Huruluwewa areas) and with
the government officers attached to Ministry of Irrigation and Mahaweli Authority of Sri
Lanka. Data was also collected through the literary survey based on the financial and other
reports of FCs, published and unpublished data including books, research journals and
internet. Data were analyzed using Statistical Package of Social Sciences (SPSS) version
17 and data were explained by using descriptive statistics and Co-relation tests.
RESULTS AND DISCUSSION
Establishment of RFC
According to literature, the concept of FC has been first used by Shared Control of Natural
Resources (SCOR) project (Figure 1). The project aimed to test strategies for sustainable
use of resources, especially land and water resources, towards increased agricultural
productivity and livelihood development. It was hypothesized that the natural resource
base, particularly land and water, can be conserved and their productivity could be
sustained if environmental and conservation concerns are incorporated into the production
process (Wijayaratna, 1998, p.1). Appropriateness of this strategy was tested in two pilot
watersheds in Sri Lanka, Huruluwewa in the North Central Province and Nilaweli in the
Southern province. In these pilot areas, appropriate production and conservation
techniques and technologies have been used to augment and sustain the resource base and
its productivity through active involvement of small farmers in competitive markets,
participatory processes, novel modes of tenurial arrangements and state-user partnerships.
As profit is a major determinant in the adoption of conservation based production and in
order to achieve the scale of economies as well as adequate bargaining power SCOR
facilitated the formation of three FCs in pilot areas. In the SCOR pilot areas, resource
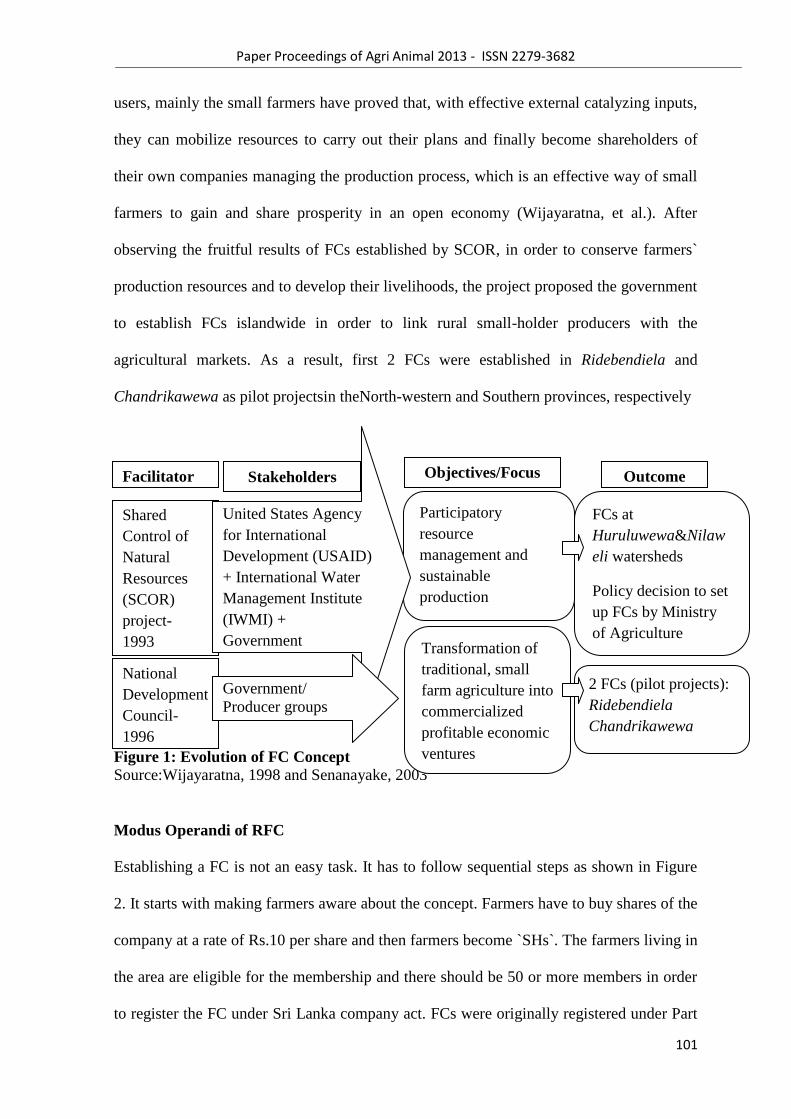
Paper Proceedings of Agri Animal 2013 - ISSN 2279-3682
101
users, mainly the small farmers have proved that, with effective external catalyzing inputs,
they can mobilize resources to carry out their plans and finally become shareholders of
their own companies managing the production process, which is an effective way of small
farmers to gain and share prosperity in an open economy (Wijayaratna, et al.). After
observing the fruitful results of FCs established by SCOR, in order to conserve farmers`
production resources and to develop their livelihoods, the project proposed the government
to establish FCs islandwide in order to link rural small-holder producers with the
agricultural markets. As a result, first 2 FCs were established in Ridebendiela and
Chandrikawewa as pilot projectsin theNorth-western and Southern provinces, respectively
Figure 1: Evolution of FC Concept
Source:Wijayaratna, 1998 and Senanayake, 2003
Modus Operandi of RFC
Establishing a FC is not an easy task. It has to follow sequential steps as shown in Figure
2. It starts with making farmers aware about the concept. Farmers have to buy shares of the
company at a rate of Rs.10 per share and then farmers become `SHs`. The farmers living in
the area are eligible for the membership and there should be 50 or more members in order
to register the FC under Sri Lanka company act. FCs were originally registered under Part
Outcome Objectives/Focus
Shared
Control of
Natural
Resources
(SCOR)
project-
1993
National
Development
Council-
1996
FCs at
Huruluwewa&Nilaw
eli watersheds
Policy decision to set
up FCs by Ministry
of Agriculture
2 FCs (pilot projects):
Ridebendiela
Chandrikawewa
Participatory
resource
management and
sustainable
production
Transformation of
traditional, small
farm agriculture into
commercialized
profitable economic
ventures
United States Agency
for International
Development (USAID)
+ International Water
Management Institute
(IWMI) +
Government
Government/
Producer groups
Facilitator Stakeholders
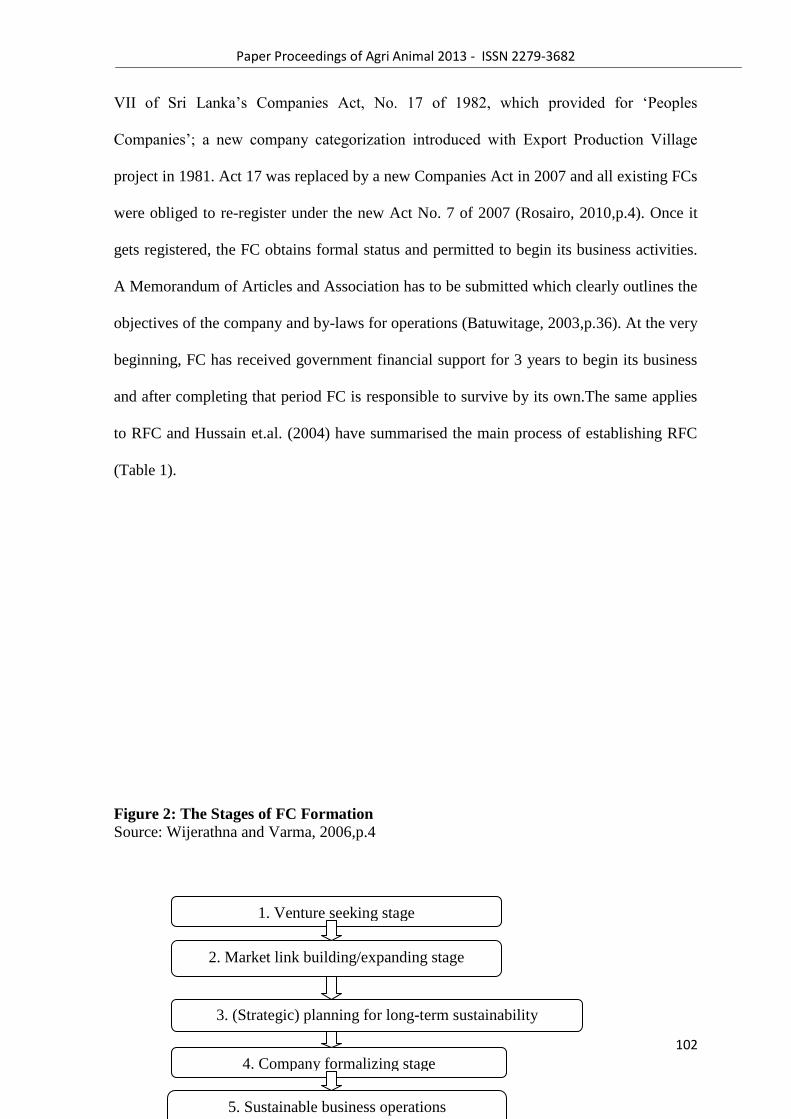
Paper Proceedings of Agri Animal 2013 - ISSN 2279-3682
102
VII of Sri Lanka‘s Companies Act, No. 17 of 1982, which provided for ‗Peoples
Companies‘; a new company categorization introduced with Export Production Village
project in 1981. Act 17 was replaced by a new Companies Act in 2007 and all existing FCs
were obliged to re-register under the new Act No. 7 of 2007 (Rosairo, 2010,p.4). Once it
gets registered, the FC obtains formal status and permitted to begin its business activities.
A Memorandum of Articles and Association has to be submitted which clearly outlines the
objectives of the company and by-laws for operations (Batuwitage, 2003,p.36). At the very
beginning, FC has received government financial support for 3 years to begin its business
and after completing that period FC is responsible to survive by its own.The same applies
to RFC and Hussain et.al. (2004) have summarised the main process of establishing RFC
(Table 1).
Figure 2: The Stages of FC Formation
Source: Wijerathna and Varma, 2006,p.4
1. Venture seeking stage
2. Market link building/expanding stage
3. (Strategic) planning for long-term sustainability
4. Company formalizing stage
5. Sustainable business operations
(high degree of autonomy and self-reliance

Paper Proceedings of Agri Animal 2013 - ISSN 2279-3682
103
Table 1. Process Followed in the Formation of RFC
Activities Date
1. Awareness for agency officials
2. Awareness for local politicians
3. Field visit of FRs to Huruluwewa farmer company
4. Awareness for FRs
5. Field visit of FRs to Dambadeniya farmer company
6. Awareness for farmers
June 1997
June 1997
June 1997
July 1997
July 1997
July 1997

Paper Proceedings of Agri Animal 2013 - ISSN 2279-3682
104
7. Conducting baseline survey
8.Briefing FRs on formation of farmer company, discussion on
company law and preparation of Articles of Association
9. Calling for share applications
10. Appointment of board of directors
11.Registration of the company and certification for commencing
business
12. Collection of share capital
13. Training for board of directors
14. Commencement of business activities
15. Provision of office building and handing over of assets
16. Provision of first year capital and operational cost
17. Holding of first general meeting
18. Recruitment of staff
19. Preparation of the MOU for handing over O&M
20. Signing of the O&M tri-partite agreement
21. Implementing system operation and maintenance
Sept. 1997
Oct. - Nov. 1997
Feb. 1998
March 1998
April 1998
March 1998
March 1998
May 1998
June 1998
June 1998
July 1998
Sept. 1998
Aug. 1999
Feb. 2000
March 2000
Source: Hussain, and Perera,2004,p.17FR=Farmer Representatives
Farmers in Ridebendiela utilised the advantage of studying already established similar
cases in Huruluewa and Dambadeniya areas in order to form their own FC in Ridebendiela
(Table 1). The initial step was to launch broad extension programs to make farmers aware
about the concept. Officers attached to Ministry of Irrigation, including residential project
managers and farmer organisation leaders supported this process.
Since this is a company, shares can be sold. The farmers buy shares at a rate of Rs.10 per
share. At the beginning, there were 400 shareholders belonged to 14 farmer organizations.
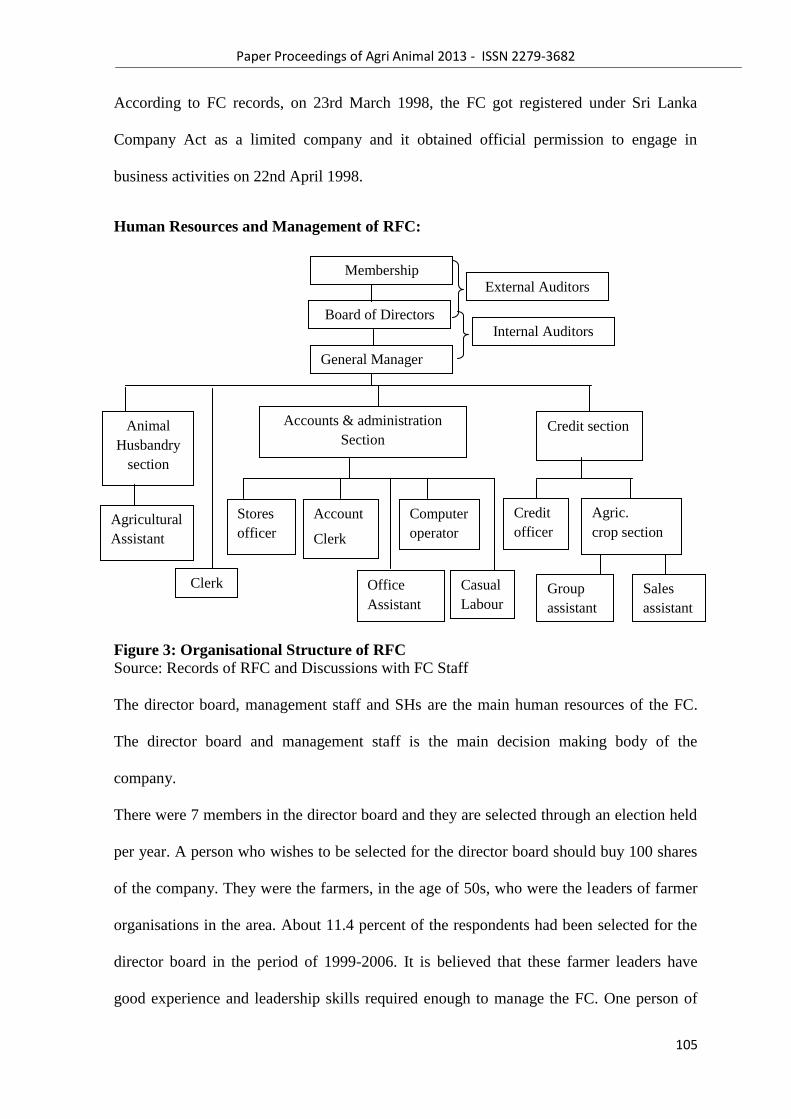
Paper Proceedings of Agri Animal 2013 - ISSN 2279-3682
105
According to FC records, on 23rd March 1998, the FC got registered under Sri Lanka
Company Act as a limited company and it obtained official permission to engage in
business activities on 22nd April 1998.
Human Resources and Management of RFC:
Figure 3: Organisational Structure of RFC
Source: Records of RFC and Discussions with FC Staff
The director board, management staff and SHs are the main human resources of the FC.
The director board and management staff is the main decision making body of the
company.
There were 7 members in the director board and they are selected through an election held
per year. A person who wishes to be selected for the director board should buy 100 shares
of the company. They were the farmers, in the age of 50s, who were the leaders of farmer
organisations in the area. About 11.4 percent of the respondents had been selected for the
director board in the period of 1999-2006. It is believed that these farmer leaders have
good experience and leadership skills required enough to manage the FC. One person of
Membership
General Manager
Board of Directors
Office
Assistant
Agricultural
Assistant
Accounts & administration
Section
Clerk
Credit section Animal
Husbandry
section
Computer
operator
Stores
officer
Account
Clerk
Casual
Labour
Agric.
crop section
Credit
officer
Sales
assistant
section
Group
assistant
section
External Auditors
Internal Auditors
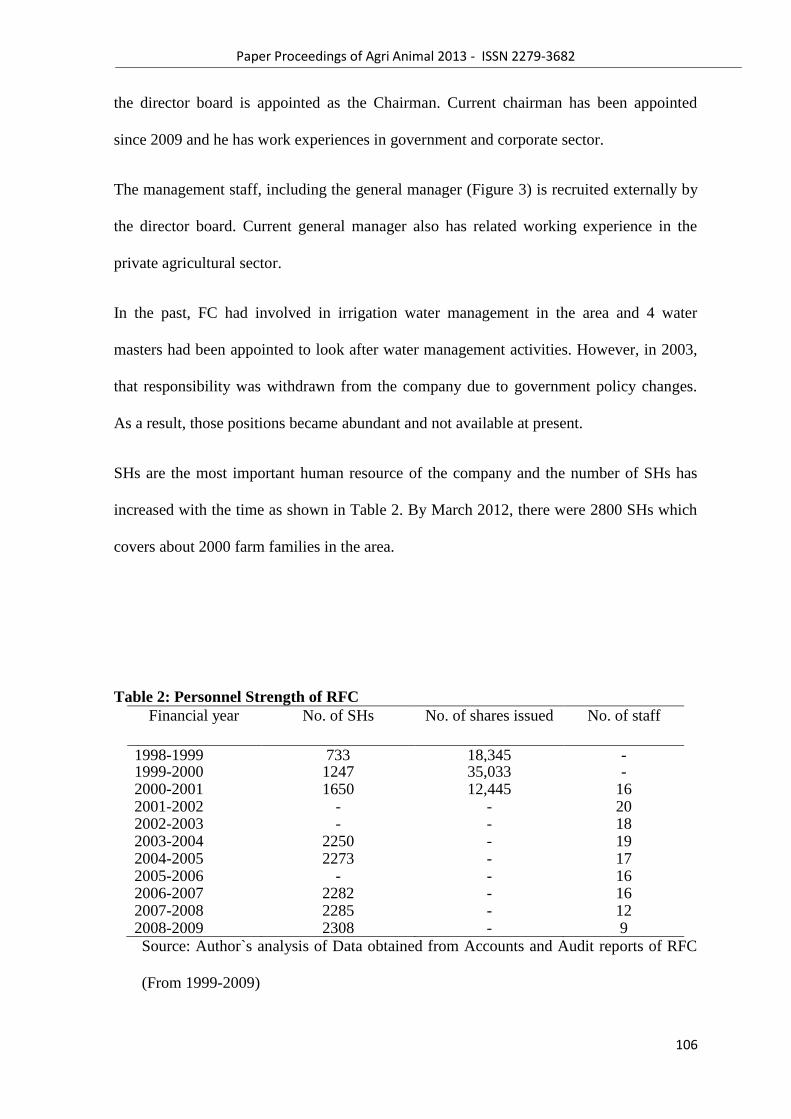
Paper Proceedings of Agri Animal 2013 - ISSN 2279-3682
106
the director board is appointed as the Chairman. Current chairman has been appointed
since 2009 and he has work experiences in government and corporate sector.
The management staff, including the general manager (Figure 3) is recruited externally by
the director board. Current general manager also has related working experience in the
private agricultural sector.
In the past, FC had involved in irrigation water management in the area and 4 water
masters had been appointed to look after water management activities. However, in 2003,
that responsibility was withdrawn from the company due to government policy changes.
As a result, those positions became abundant and not available at present.
SHs are the most important human resource of the company and the number of SHs has
increased with the time as shown in Table 2. By March 2012, there were 2800 SHs which
covers about 2000 farm families in the area.
Table 2: Personnel Strength of RFC
Financial year No. of SHs No. of shares issued No. of staff
1998-1999 733 18,345 - 1999-2000 1247 35,033 - 2000-2001 1650 12,445 16 2001-2002 - - 20 2002-2003 - - 18 2003-2004 2250 - 19 2004-2005 2273 - 17 2005-2006 - - 16 2006-2007 2282 - 16 2007-2008 2285 - 12 2008-2009 2308 - 9 Source: Author`s analysis of Data obtained from Accounts and Audit reports of RFC
(From 1999-2009)
Paper Proceedings of Agri Animal 2013 - ISSN 2279-3682
107
Even though farmers` response is not much positive at the beginning, gradually farmers
used to buy shares of FC and become SHs since it provided them good agricultural market
and other financial and social benefits which led to higher farm income. According to field
survey, 64.1 percent of the respondents had 10-50 shares while 31.3 percent of the
respondents had 51-100 shares. According to Table 3, the majority have joined with FC at
the very beginning i.e.1998-2000.
Table 3: Distribution of SHs Based on the Year of Membership
Year of Membership No. of SHs Percent
1998-2000 34 48.5
2001-2003 17 24.4
2004-2006 11 15.7
2007< 5 7.2
Missing 3 4.2
Total 70 100.0
Source: Field Data Survey, March 2012
Business Profile of RFC
Since this is a company, in order to sustain in the competitive market, FC should earn
profits via effective business strategies, same as normal private companies. Entrepreneurial
decision making ability of the director board and other management staff is extremely
important in this regard.
According to the survey results, the initial businesses of the FC included production and
marketing of seed paddy, marketing of agro-chemicals and group loan programme. Esham
et. al.(2007) found that group loan programme was the core business of the company. In
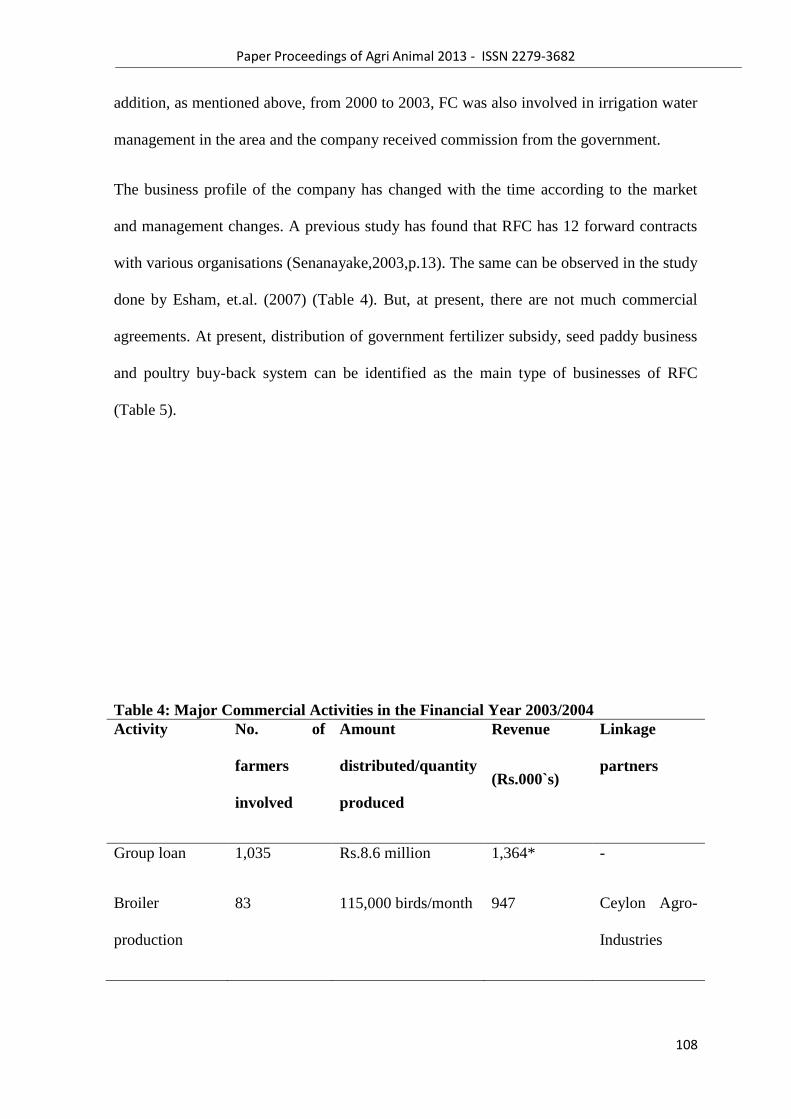
Paper Proceedings of Agri Animal 2013 - ISSN 2279-3682
108
addition, as mentioned above, from 2000 to 2003, FC was also involved in irrigation water
management in the area and the company received commission from the government.
The business profile of the company has changed with the time according to the market
and management changes. A previous study has found that RFC has 12 forward contracts
with various organisations (Senanayake,2003,p.13). The same can be observed in the study
done by Esham, et.al. (2007) (Table 4). But, at present, there are not much commercial
agreements. At present, distribution of government fertilizer subsidy, seed paddy business
and poultry buy-back system can be identified as the main type of businesses of RFC
(Table 5).
Table 4: Major Commercial Activities in the Financial Year 2003/2004
Activity No. of
farmers
involved
Amount
distributed/quantity
produced
Revenue
(Rs.000`s)
Linkage
partners
Group loan 1,035 Rs.8.6 million 1,364* -
Broiler
production
83 115,000 birds/month 947 Ceylon Agro-
Industries
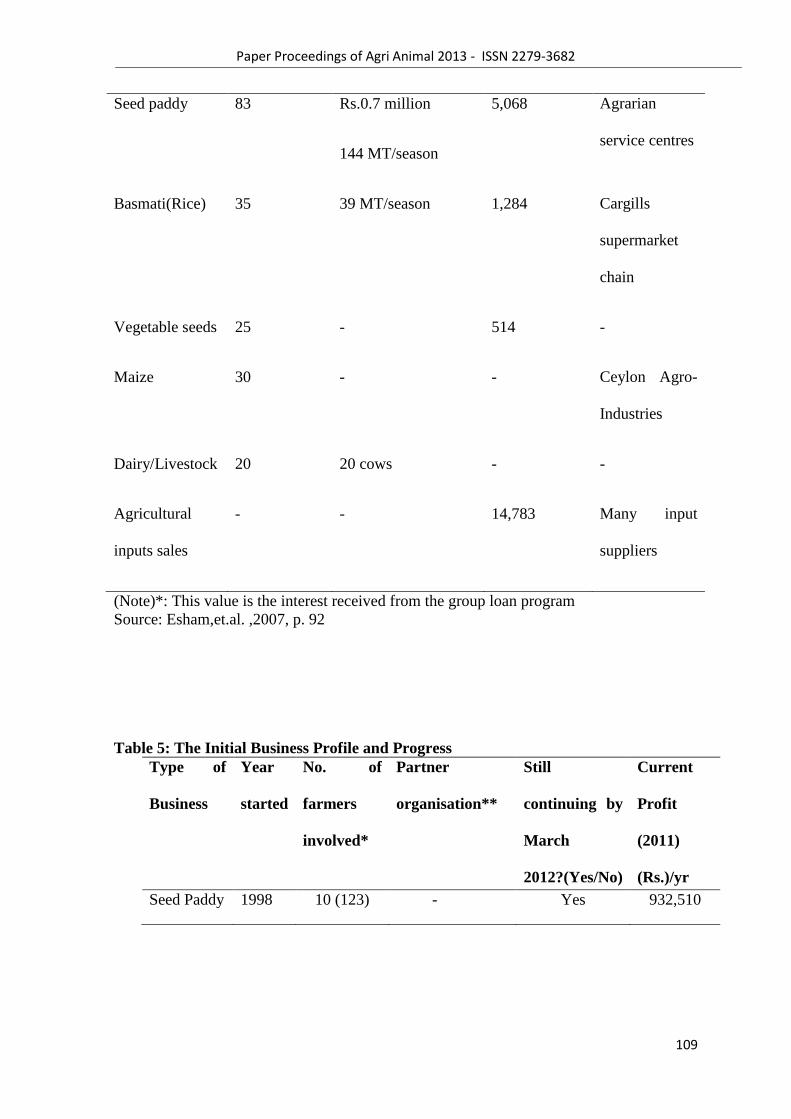
Paper Proceedings of Agri Animal 2013 - ISSN 2279-3682
109
Seed paddy 83 Rs.0.7 million
144 MT/season
5,068 Agrarian
service centres
Basmati(Rice) 35 39 MT/season 1,284 Cargills
supermarket
chain
Vegetable seeds 25 - 514 -
Maize 30 - - Ceylon Agro-
Industries
Dairy/Livestock 20 20 cows - -
Agricultural
inputs sales
- - 14,783 Many input
suppliers
(Note)*: This value is the interest received from the group loan program
Source: Esham,et.al. ,2007, p. 92
Table 5: The Initial Business Profile and Progress
Type of
Business
Year
started
No. of
farmers
involved*
Partner
organisation**
Still
continuing by
March
2012?(Yes/No)
Current
Profit
(2011)
(Rs.)/yr
Seed Paddy 1998 10 (123) - Yes 932,510
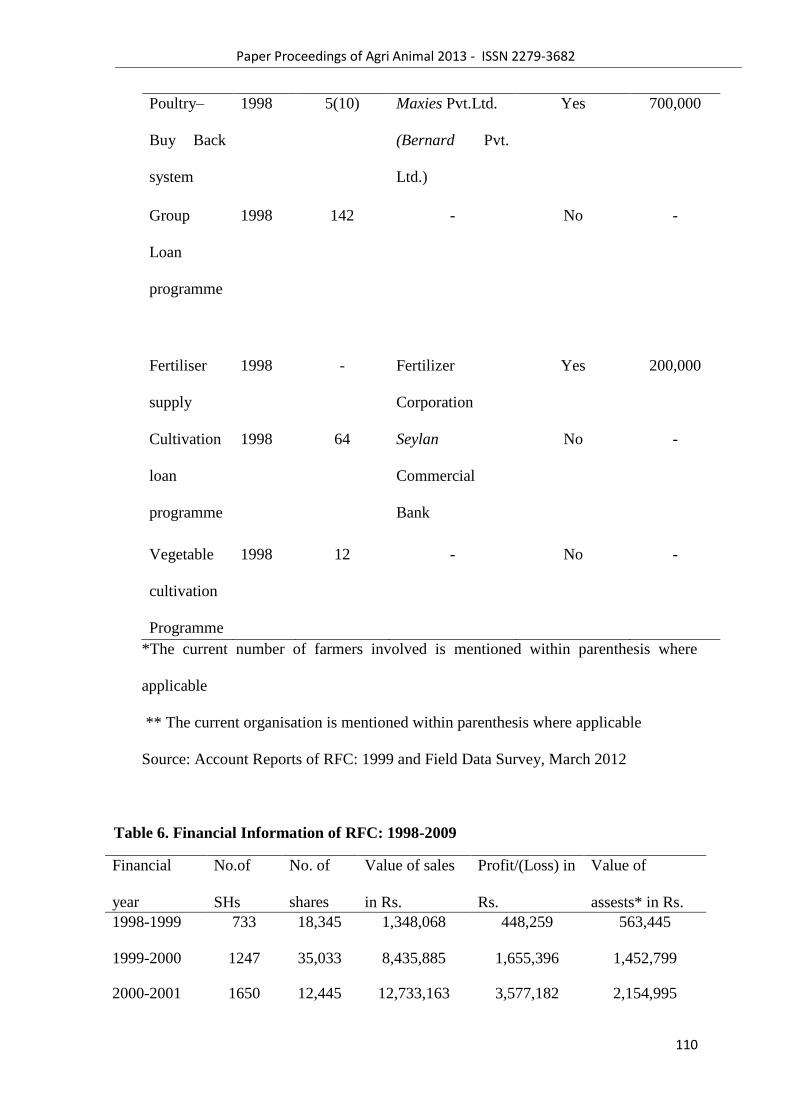
Paper Proceedings of Agri Animal 2013 - ISSN 2279-3682
110
Poultry–
Buy Back
system
1998 5(10) Maxies Pvt.Ltd.
(Bernard Pvt.
Ltd.)
Yes 700,000
Group
Loan
programme
1998 142 - No -
Fertiliser
supply
1998 - Fertilizer
Corporation
Yes 200,000
Cultivation
loan
programme
1998 64 Seylan
Commercial
Bank
No -
Vegetable
cultivation
Programme
1998 12 - No -
*The current number of farmers involved is mentioned within parenthesis where
applicable
** The current organisation is mentioned within parenthesis where applicable
Source: Account Reports of RFC: 1999 and Field Data Survey, March 2012
Table 6. Financial Information of RFC: 1998-2009
Financial
year
No.of
SHs
No. of
shares
issued
Value of sales
in Rs.
Profit/(Loss) in
Rs.
Value of
assests* in Rs.
1998-1999 733 18,345 1,348,068 448,259 563,445
1999-2000 1247 35,033 8,435,885 1,655,396 1,452,799
2000-2001 1650 12,445 12,733,163 3,577,182 2,154,995
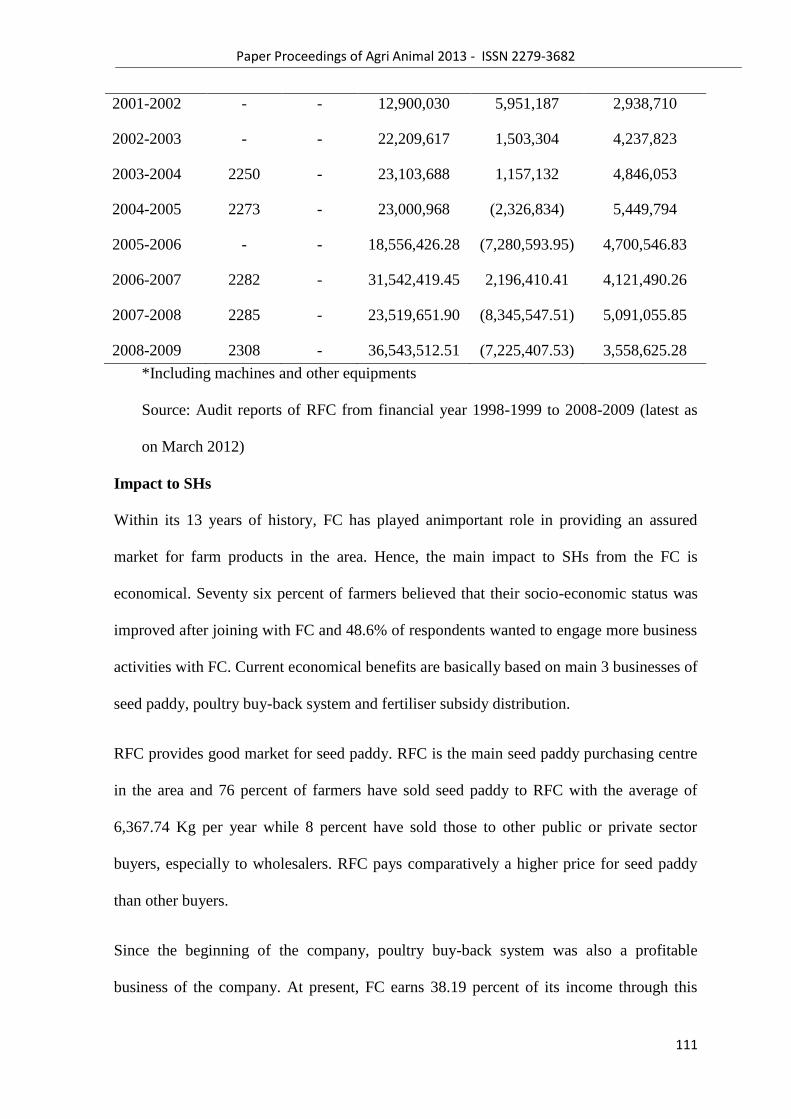
Paper Proceedings of Agri Animal 2013 - ISSN 2279-3682
111
*Including machines and other equipments
Source: Audit reports of RFC from financial year 1998-1999 to 2008-2009 (latest as
on March 2012)
Impact to SHs
Within its 13 years of history, FC has played animportant role in providing an assured
market for farm products in the area. Hence, the main impact to SHs from the FC is
economical. Seventy six percent of farmers believed that their socio-economic status was
improved after joining with FC and 48.6% of respondents wanted to engage more business
activities with FC. Current economical benefits are basically based on main 3 businesses of
seed paddy, poultry buy-back system and fertiliser subsidy distribution.
RFC provides good market for seed paddy. RFC is the main seed paddy purchasing centre
in the area and 76 percent of farmers have sold seed paddy to RFC with the average of
6,367.74 Kg per year while 8 percent have sold those to other public or private sector
buyers, especially to wholesalers. RFC pays comparatively a higher price for seed paddy
than other buyers.
Since the beginning of the company, poultry buy-back system was also a profitable
business of the company. At present, FC earns 38.19 percent of its income through this
2001-2002 - - 12,900,030 5,951,187 2,938,710
2002-2003 - - 22,209,617 1,503,304 4,237,823
2003-2004 2250 - 23,103,688 1,157,132 4,846,053
2004-2005 2273 - 23,000,968 (2,326,834) 5,449,794
2005-2006 - - 18,556,426.28 (7,280,593.95) 4,700,546.83
2006-2007 2282 - 31,542,419.45 2,196,410.41 4,121,490.26
2007-2008 2285 - 23,519,651.90 (8,345,547.51) 5,091,055.85
2008-2009 2308 - 36,543,512.51 (7,225,407.53) 3,558,625.28
Paper Proceedings of Agri Animal 2013 - ISSN 2279-3682
112
poultry buy-back business. RFC acts as the middleman and facilitator between `Bernard
private company and livestock farmers. Farmers receive 1day old chicks, feeds, and
medicine and extension services through the FC. It has reduced the transaction cost and
increased bargaining power of farmers. Farmers sell birds after 35-40 days. Bernard
private company pays Rs.42 per bird and the farmer receives Rs.40 while Rs.2 goes to FC.
The following profiles of two SHs, gives an adequate emphasis on the economic impact of
the FC towards their lives.
Mr. X (case 1) was a 36 yrs old, married male who had completed secondary level
education. Paddy farming including seed paddy, rearing poultry and cattle were the main
sources of income for his family. Supported by the buy-back system, he has been rearing
birds totaling up to 4000, for 8 years. He had 7.5 acres of land (3.5acres - coconut and
grass / 4 acres – has been rented out) and he has joined the FC in 2001 with 100 shares. His
main relationship with the FC was for seed paddy and poultry.
Mr. Y (case 2) was a 30 yrs old married male, and had 11 years of schooling. Paddy
farming, rearing poultry and business collectively has made his livelihood and he had 3
acres of land. His mother has joined the FC in 1998 with 50 shares. But now, instead of his
mother, he is the person who is actively engaged with the FC`s commercial activities
including the buy-back system.
According to Table 6, the FC contributes 86% of monthly income of Mr. X while it was
60% for Mr. Y.
Table 6: Income Profile of Case 1 and Case 2
Business Commercial
Partner
Annual Income(Rs.) Monthly Income (Rs.)
Case 1 Case 2 Case 1 Case 2
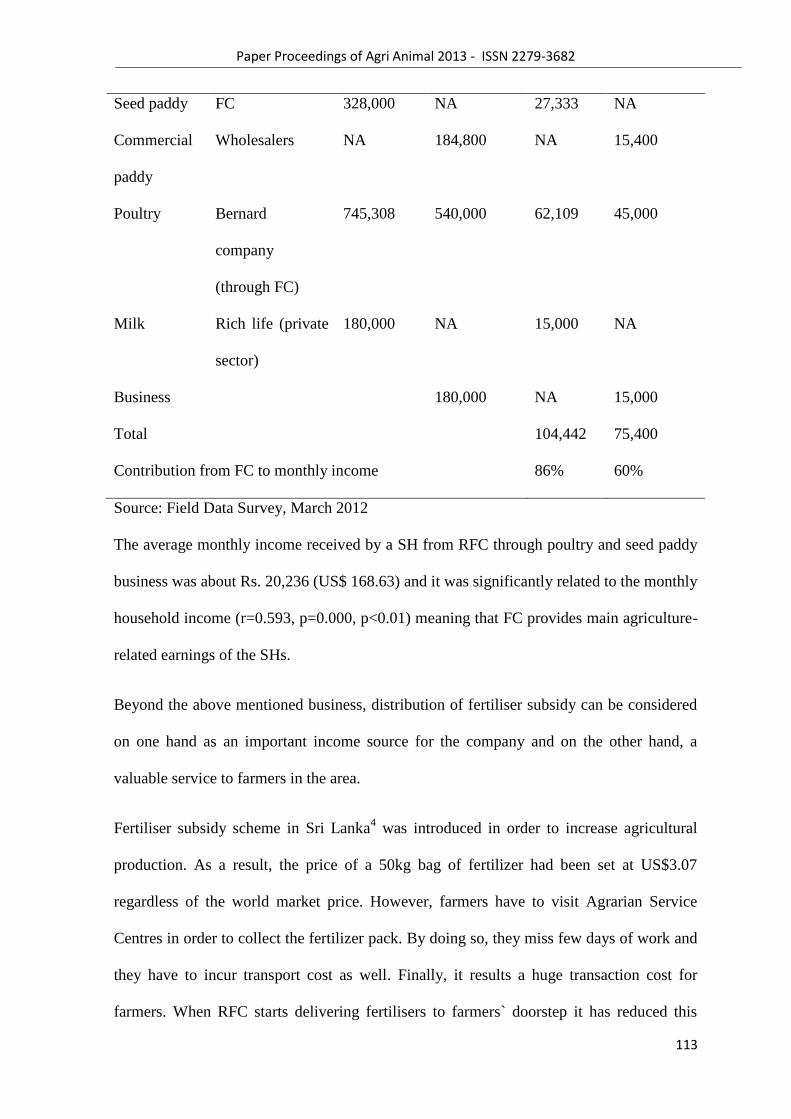
Paper Proceedings of Agri Animal 2013 - ISSN 2279-3682
113
Seed paddy FC 328,000 NA 27,333 NA
Commercial
paddy
Wholesalers NA 184,800 NA 15,400
Poultry Bernard
company
(through FC)
745,308 540,000 62,109 45,000
Milk Rich life (private
sector)
180,000 NA 15,000 NA
Business 180,000 NA 15,000
Total 104,442 75,400
Contribution from FC to monthly income 86% 60%
Source: Field Data Survey, March 2012
The average monthly income received by a SH from RFC through poultry and seed paddy
business was about Rs. 20,236 (US$ 168.63) and it was significantly related to the monthly
household income (r=0.593, p=0.000, p<0.01) meaning that FC provides main agriculture-
related earnings of the SHs.
Beyond the above mentioned business, distribution of fertiliser subsidy can be considered
on one hand as an important income source for the company and on the other hand, a
valuable service to farmers in the area.
Fertiliser subsidy scheme in Sri Lanka4 was introduced in order to increase agricultural
production. As a result, the price of a 50kg bag of fertilizer had been set at US$3.07
regardless of the world market price. However, farmers have to visit Agrarian Service
Centres in order to collect the fertilizer pack. By doing so, they miss few days of work and
they have to incur transport cost as well. Finally, it results a huge transaction cost for
farmers. When RFC starts delivering fertilisers to farmers` doorstep it has reduced this
Paper Proceedings of Agri Animal 2013 - ISSN 2279-3682
114
transaction cost of farmers in receiving fertiliser. RFC is the only FC in the country having
authority to distribute fertiliser subsidy among farmers and almost all the respondents were
receiving fertilisers through RFC.
In the past, FC is not only involving in marketing of agricultural outputs.
Agricultural inputs are provided by the main sales centre owned by the company and the
other nine sub-sales centers financed by the company and managed by private
entrepreneurs. The farmers are able to buy agricultural inputs at a lower price compared to
the open market, as the company only retains a low profit margin to cover up its
operational costs. (Esham,et.al,2007).
However, agrochemical sales centre owned by the company is not functioning at present.
Issues of RFC
According to the field survey 90% respondents have identified various issues of RFC
which has affected its` performance. Problems related to management and financial
stability were the main two problems identified by the majority. Respondents believe that
the management, including the director board, which consisted of farmers, do not have
required entrepreneurial decision making skills required enough to manage the company
and its business activities. However, since the director board is selected through an
election, SHs have ability to appoint desired, qualified leaders for the company. It depends
on the level of SH participation in FC.
The rules and regulations applicable to a FC and its activities (as a normal business) has
been clearly mentioned in the Memorandum of Articles and Association, at the company
establishment. It is a legal requirement to hold an Annual General Meeting (AGM) of SHs
once per year. It is the responsibility of the Management to organise the AGM and inform
Paper Proceedings of Agri Animal 2013 - ISSN 2279-3682
115
about it to SHs. On the other hand, it is SHs` duty to attend those meetings in order to be
informed about company`s decisions and to raise their own opinions. So that, they will also
have an opportunity to select the desired leaders for the FC. But, the study revealed that
both FC and SHs have neglected their duties. On one hand, the FC has not had an AGM
for 3 years and the Director Board has not changed, even though their official service
period is 3 years. On the other hand when an AGM was organised once, the Management
had to cancel it due to poor attendance of SHs.
Additionally, even though FC provides market for farm products farmers do not receive
punctual payments from the company. There is a tendency that dissatisfied farmers move
away from the company. It may weaken farmer participation in FC activities.
Future Prospects
On the company side, it has few future plans such as re-opening the agrochemical sales
centre, promoting cultivation of vegetables and traditional rice varieties, expand the seed
paddy cultivation etc.
CONCLUSION
Being an initial FC in Sri Lanka established 13 years ago, RFC had a sufficient period of
time to play a significant role in agricultural commercialization in the area. It has
performed extremely well at the beginning and there was a positive image among the SHs
towards the company. Previous studies have shown that most of the initially established
Paper Proceedings of Agri Animal 2013 - ISSN 2279-3682
116
FCs were collapsed due to various reasons, most frequently due to inefficienciesin the
company management coupled with their wrong business decisions. However, RBC was
able to survive with its wise management and the company was blessed with its
geographical location as well. Being closer to the country`s Capital Colombo, RBC had an
competitive advantage in building profitable business links with outsiders than other FCs.
These factors have supported RBC to survive in the venture. However, there are some
unique factors which affected to the performance of the company.
Most importantly, the period of 2002-2003, can be considered as a turning point of the
company and it‘s the time when irrigation water management responsibility was
withdrawn from the company due to government policy changes. Until then, farmers have
always gathered around FC, because it made them satisfied to participate in irrigation
water management, which is a very valuable farm input, through their owned company.
With the above mentioned policy changes, farmers` interest and trust towards the FC
seems to be weaken. FC had a variety of business activities and it was even able to develop
their own brands in the market. (eg.Ridebendi rice). The management was a deciding
factor for the success of the company.
It is noteworthy that even among various challenges and changes; RFC has been able to
survive in the changing market economy and supporting agricultural commercialisation in
the area. However, compared to the past, at present, RFC is showing a lethargic behaviour
in its performance and urgent strategies are required to confirm the future survival of the
company. Current business activities alone will not repair the financial instability of the
company. More profit-oriented commercial linkages should be developed with the external
sector. FC is already having some future plans. Those plans may not be successfully
implemented unless the management and FC staff become trained on entrepreneurship,
money management, human resource management etc. and until FC becomes a `business`

Paper Proceedings of Agri Animal 2013 - ISSN 2279-3682
117
rather than being another farmer organisation. If a proper request is made, such type of
training can be obtained even from universities. FC office space should be organised in an
appealing way and financial and other records should be properly maintained in order to
monitor the performance of the company.
Further, there is a low tendency in following rules and regulations (including holding
punctual meetings) by the FC and its stakeholders. If this is going to be continued, it will
definitely chase out the company from the legal status. Therefore, in order to identify and
exclude the drawbacks, measures such as reviewing and revising the existing legal
framework and legal punishments to the deviants, who do not follow the rules, will be very
important.
The company has sufficient amount of resources and it has a good potential to perform
better in the future in agricultural commercialisation. However, developing an effective
business plan with the participation of all the stakeholders and identifying immediate
strategies to get the participation of SHs in FC activities will be crucial factors which will
decide the future of the company.
NOTES
Mahaweli Authority, , was established in 1979 to implement the Mahaweli Development
Programme based on water resources of Mahaweli, the longest river, and allied six river
basins. Mahaweli Authority is responsible for maintenance & rehabilitation of irrigation
net work, land administration, increase agricultural production and post settlement
activities of the area (Official website of Ministry of Irrigation and Water Resources
Management, Sri Lanka-
Paper Proceedings of Agri Animal 2013 - ISSN 2279-3682
118
http://www.irrigationmin.gov.lk/web/index.php?option=com_content&view=article&id=1
13&Itemid=85&lang=en).
2 The `districts` which are sub-divisions of provinces of Sri Lanka are divided into
administrative sub-units known as `Divisional Secretariats‘.
3 Coconut is an important export crop of Sri Lanka. The areas of Colombo, Kurunegala
and Puttalam make the highest coconut production hence the area collectively is called as
`coconut triangle`.
4 Fertiliser subsidy program was initiated in 1962 with the main objective of encouraging
farmers to switch from traditional rice varieties to high-yielding varieties (HYVs) that are
highly responsive to chemical fertilizers (Weerahewa,et.al,2010). The subsidy policy has
evolved over time. Since 2005, the subsidy has been expanded to cover all three types of
fertilisers; Nitrogen(N),Phosphorus(P) and Potassium(K)
REFERENCES
Batuwitage G.,2003. Farmer Companies: Can They Stand up to Expectations in the
Changing Economy?.Agrarian Reforms and Agricultural Productivity. Asain Productivity
Organisation .pp. 32-41
Paper Proceedings of Agri Animal 2013 - ISSN 2279-3682
119
Department of Census and Statistics Sri Lanka [online] Available at:
<http://www.statistics.gov.lk/> [Accessed 2 July 2012]
Esham, M, and Usami, K.,2007. Evaluating the Performance of Farmer Companies in Sri
Lanka: A Case Study of Ridi Bendi Ela Farmer Company. [online] Available
at:<http://www.sab.ac.lk/journal_agri/papers/agri_vol_3_2_2007/agri_vol_3_2_2007_artic
le_5.pdf>[Accessed 10 January 2012]
Hussain I and Perera LR, 2004. Improving Agricultural Productivity through Integrated
Service provision with Public-Private Sector Partnerships. Colombo, Sri Lanka.
International Water Management Institute, p. 66
Ministry of Irrigation and Water Resources Management, Sri Lanka[online]Available
at:<http://www.irrigationmin.gov.lk/web/index.php?option=com_content&view=article&i
d=113&Itemid=85&lang=en [Accessed 19August 2012]
Rosairo HSR,2010. Factors Affecting the Performance of Farmer Companies in Sri Lanka.
Lincoln University. pp 53-54.
Senanayake, MS.,2003. What is Ailing Farmer Companies of Sri Lanka in their
Transformation into Successful Business Entities? : Over view of Policy Issues. Huazhong
University of Science and Technology, Wuhan. 430074. PR, China.
The state of Food and Agriculture 2012, Food and Agricultural Organisation [online]
Available at:<http://www.fao.org/docrep/017/i3028e/i3028e.pdf>[Accessed 09August
2012]
Weerahewa J, Kodithuwakku SS, Ariyawardana A.2010, Case Study, "The Fertilizer
Subsidy Program in Sri Lanka". In: Per Pinstrup-Andersen et.al. (eds), "Food Policy for
Developing Countries: Case Studies.pp.7-11.
Paper Proceedings of Agri Animal 2013 - ISSN 2279-3682
120
Wijayaratna CM, Jayawardena K., Shared Control of Natural Resources (SCOR).A Market
Oriented Watershed Management Strategy
Wijerathna D and Varma SA,2006. Farmers‘ Company for Better Price: The Case of
Chandrika Wewa Farmer Company, Sri Lanka. Research Workshop on Collective Action
and Market Access for Smallholders. Colombia, p. 6.
ACKNOWLEDGEMENT
The financial support provided by Monbukagakusho Japanese governmentscholarship for
the study is greatly acknowledged.

Paper Proceedings of Agri Animal 2013 - ISSN 2279-3682
121
8
Paper Proceedings of Agri Animal 2013 - ISSN 2279-3682
122
An Appraisal of Climate Change and Agriculture in Nigeria
Suleiman Iguda Ladan (Authuor)
Department of Basic and Applied Sciences
Hassan Usman Katsina Polytechnic, Katsina, Katsina State, Nigeria
E-mails:(1)[email protected] (2)[email protected]
Abstract
Climate change is a phenomenon that has the potential of affecting all natural and human
systems and may be a threat to human development. This is particularly the case in
developing countries. This paper is a theoretical article that uses secondary sources of data
including weather events that occurred recently to appraise climate change and agriculture
in Nigeria. The results have shown that human activities are largely responsible for climate
change experienced in different parts of the globe today. These activities have led to
increase concentration of greenhouse gases into the atmosphere and they associated with
the industrialised countries and some emerging nations. Agriculture in Nigeria is entirely
dependent on climate and changes in climate are bound to affect it. This paper found out
that climate change has already had a negative impact on agriculture in Nigeria especially
in the last few years. It is therefore recommended that conscious efforts should be made
towards mitigating the impacts of climate change on agriculture in Nigeria.
Keywords: Climate Change, Agriculture, Nigeria
Introduction
Changes in global climates are not new in the earth‘s history. For example the glaciation
period or ice sheet age indicates large fluctuations in the last 200,000 years [1]. Such
events occurred naturally, but changes today appear to be largely the result of human
activities. Climate change is evidently linked to human actions and in particular from the
burning of fossil fuels and changes in global patterns of land use[2].
The United Nations Environmental Programme (UNEP) defines climate change as extreme
reactions of the weather phenomenon which creates negative impacts on agriculture, water
resources, human health, depletion of ozone layer, vegetations, soil and doubling of carbon
dioxide in the ecosphere [3]. According to the Nigerian climates reports 490, climate
change is any long term change in the statistics to averages, extreme or other measures,
and may occur in a specific region or the earth as a whole [4]. Climate change has the
Paper Proceedings of Agri Animal 2013 - ISSN 2279-3682
123
potential of affecting all natural and human systems and maybe a threat to human
development and survival socially, politically and economically [4].
Agriculture is a major form of human activity on the surface of the earth. It involves
cultivating the soil, producing crops and raising livestock and in varying degrees the
preparation and marketing of the resultant products. In the developing countries
agriculture is a major branch of the economy not only providing employment to a very
large percentage of the population but also providing a source of food, raw materials and
item of trade and commerce. It is thus the main basis of the livelihood of the vast majority
of the population as they engage in agriculture for their daily food supply, source of
income and employment.
Agriculture is a primary activity that depends on natural conditions that is it is largely
controlled solely by physical conditions such as temperature, precipitation and water
supply, soil (edaphic factors), wind, altitude, angle of scope and aspect [5]. This is the
situation in developing countries where agriculture is highly dependent on the climate
elements such as temperature, precipitation and water supply.
Nigeria is located entirely in the tropical region between latitude 4o – 14
o north of the
Equator and longitude 3o – 15
o East of GMT and positioned on the west coast of Africa
between the Bight of Benin to the fringes of Sahara desert between Benin Republic and
Cameroon. The country has a land area of 923,768km2 with a coastline of 853km. Based
on the 2006 National Population Census the country has 140,431,790 people which make it
the most populous in Africa. The 2012 estimates are 170,123,740 people which make it
the 7th
most populous country in the world [6]. In terms of physical setting the climate is
varied sub-equatorial climate in the south and tropical continental in the north. The
vegetation consists of forests in the south and savannah grassland in the north. The
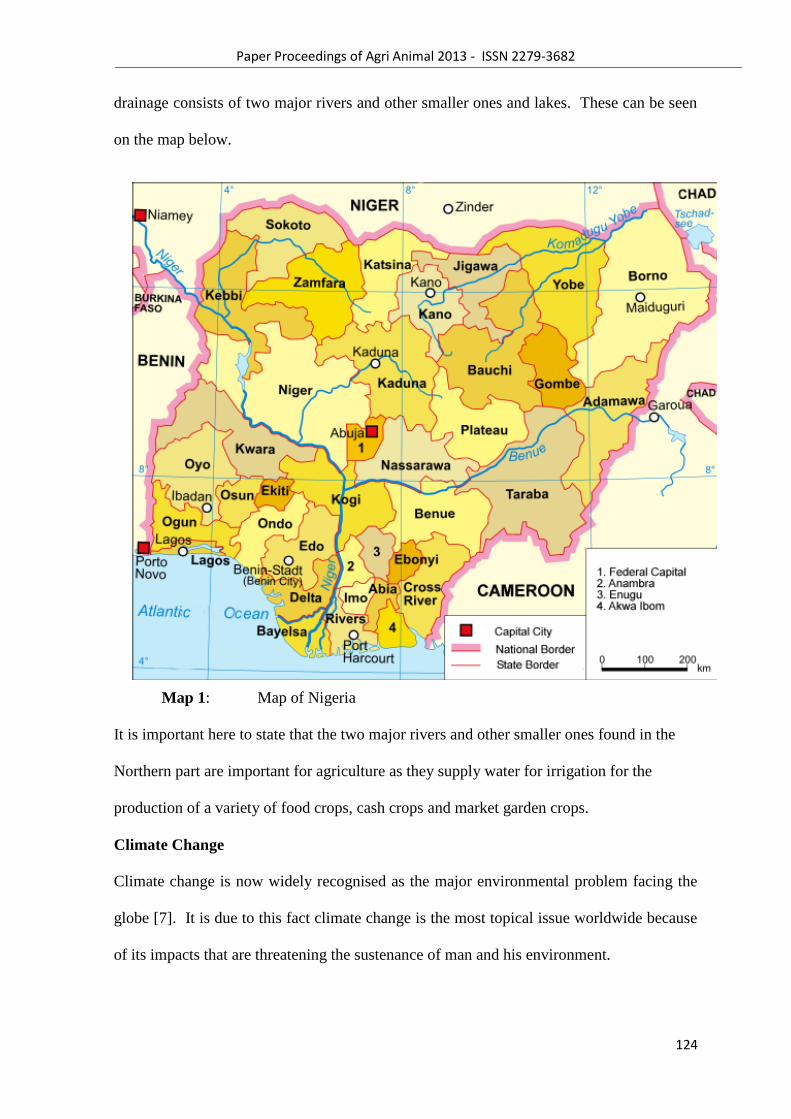
Paper Proceedings of Agri Animal 2013 - ISSN 2279-3682
124
drainage consists of two major rivers and other smaller ones and lakes. These can be seen
on the map below.
Map 1: Map of Nigeria
It is important here to state that the two major rivers and other smaller ones found in the
Northern part are important for agriculture as they supply water for irrigation for the
production of a variety of food crops, cash crops and market garden crops.
Climate Change
Climate change is now widely recognised as the major environmental problem facing the
globe [7]. It is due to this fact climate change is the most topical issue worldwide because
of its impacts that are threatening the sustenance of man and his environment.
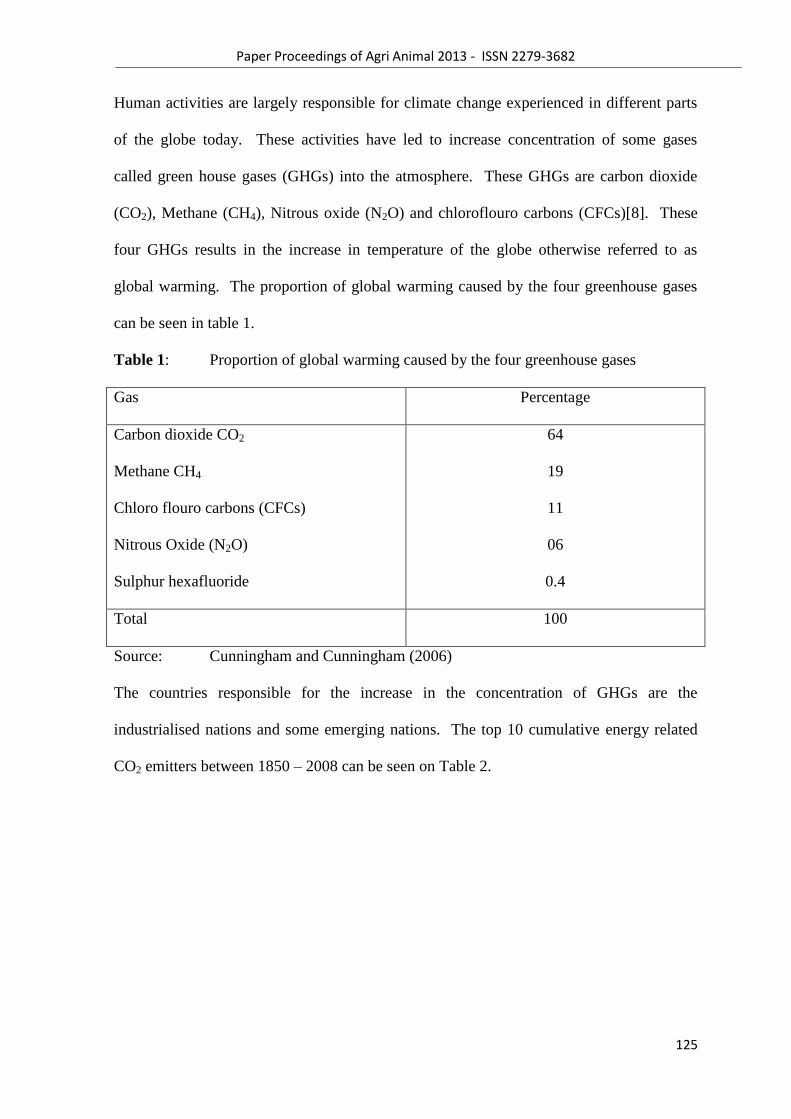
Paper Proceedings of Agri Animal 2013 - ISSN 2279-3682
125
Human activities are largely responsible for climate change experienced in different parts
of the globe today. These activities have led to increase concentration of some gases
called green house gases (GHGs) into the atmosphere. These GHGs are carbon dioxide
(CO2), Methane (CH4), Nitrous oxide (N2O) and chloroflouro carbons (CFCs)[8]. These
four GHGs results in the increase in temperature of the globe otherwise referred to as
global warming. The proportion of global warming caused by the four greenhouse gases
can be seen in table 1.
Table 1: Proportion of global warming caused by the four greenhouse gases
Gas Percentage
Carbon dioxide CO2
Methane CH4
Chloro flouro carbons (CFCs)
Nitrous Oxide (N2O)
Sulphur hexafluoride
64
19
11
06
0.4
Total 100
Source: Cunningham and Cunningham (2006)
The countries responsible for the increase in the concentration of GHGs are the
industrialised nations and some emerging nations. The top 10 cumulative energy related
CO2 emitters between 1850 – 2008 can be seen on Table 2.
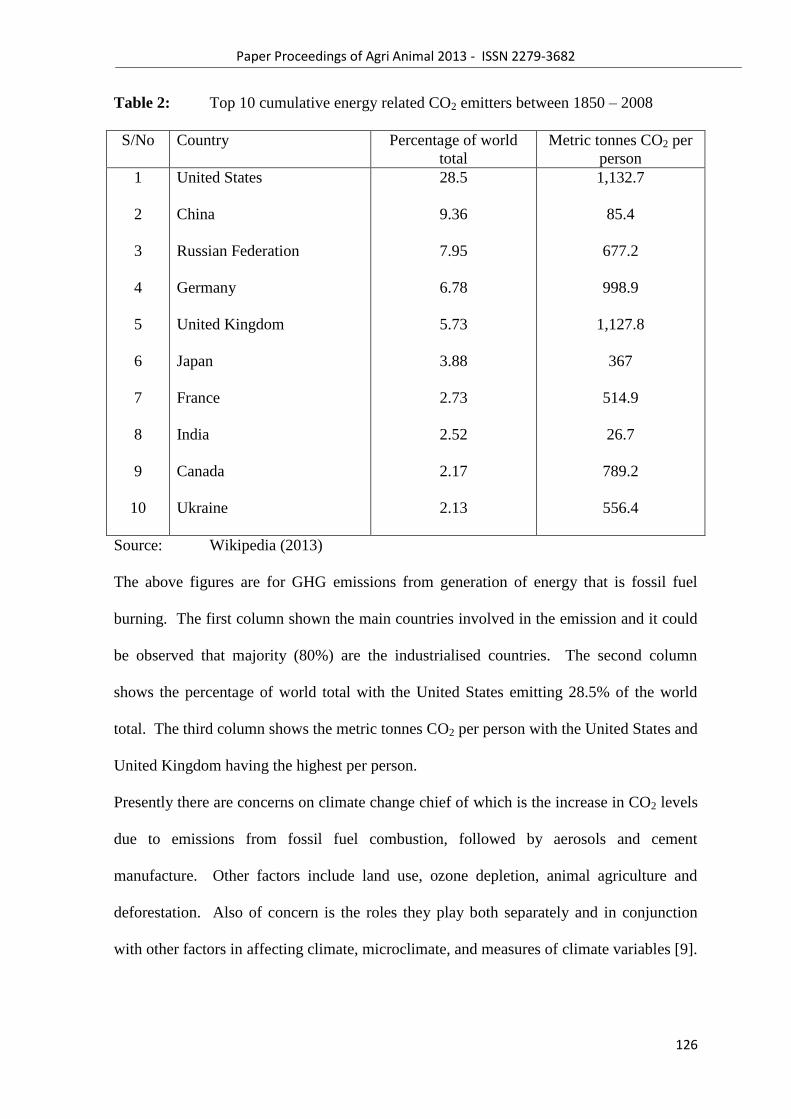
Paper Proceedings of Agri Animal 2013 - ISSN 2279-3682
126
Table 2: Top 10 cumulative energy related CO2 emitters between 1850 – 2008
S/No Country Percentage of world
total
Metric tonnes CO2 per
person
1
2
3
4
5
6
7
8
9
10
United States
China
Russian Federation
Germany
United Kingdom
Japan
France
India
Canada
Ukraine
28.5
9.36
7.95
6.78
5.73
3.88
2.73
2.52
2.17
2.13
1,132.7
85.4
677.2
998.9
1,127.8
367
514.9
26.7
789.2
556.4
Source: Wikipedia (2013)
The above figures are for GHG emissions from generation of energy that is fossil fuel
burning. The first column shown the main countries involved in the emission and it could
be observed that majority (80%) are the industrialised countries. The second column
shows the percentage of world total with the United States emitting 28.5% of the world
total. The third column shows the metric tonnes CO2 per person with the United States and
United Kingdom having the highest per person.
Presently there are concerns on climate change chief of which is the increase in CO2 levels
due to emissions from fossil fuel combustion, followed by aerosols and cement
manufacture. Other factors include land use, ozone depletion, animal agriculture and
deforestation. Also of concern is the roles they play both separately and in conjunction
with other factors in affecting climate, microclimate, and measures of climate variables [9].
Paper Proceedings of Agri Animal 2013 - ISSN 2279-3682
127
Since the beginning of the Industrial Revolution in the 1750s, atmospheric concentration of
carbon dioxide has increased by nearly 30%, methane concentrations has doubled and
nitrous oxide concentration has risen by about 15%. These increases have enhanced the
heat trapping capacity of the earth‘s atmosphere. Increase concentrations of greenhouse
gases are likely to accelerate the rate of climate change [10].
It is these atmospheric emissions and subsequent concentrations of GHGs over the years
that have now reached optimum level leading to disruptions in the atmospheric patterns
that have caused climate change [11].
African countries in general contribute the least to the emissions that caused climate
change. Nigeria like other developing countries contributes insignificantly to the
greenhouse emissions. The areas of contribution are in gas flaring, animal agriculture and
deforestation which constitute small percentage in comparison to other countries [11].
Agriculture in Nigeria
Agriculture used to be the principal foreign exchange earner of Nigeria from independence
in 1960 up to the mid 1970s, at that time Nigeria was the world‘s largest of groundnuts,
cocoa and palm oil and a significant producer of cocoanuts, citrus fruits, maize, pearl
millet, cassava, yam and sugar cane. About 60% of Nigerians work in the agricultural
sector and Nigeria has vast areas of underutilised arable land [12].
In Nigeria today agriculture is the main source of food and employer of labour employing
about 60 – 70 percent of the population. It is a significant sector of the economy and
source of raw materials used in processing industries as well as source of foreign exchange
earnings for the country [13].
Paper Proceedings of Agri Animal 2013 - ISSN 2279-3682
128
Agriculture in Nigeria is mostly rain fed. In the north where rainfall is seasonal farmers
clear their land and await the commencement of the rains mostly in May/June. Food crops
produced are mainly grains and cereals such as millet, guinea-corn, maize, rice, wheat,
beans etc. cash crops include cotton, groundnut, sugar cane. The occurrences of droughts
since the 1970s have necessitated the building of dams to supply water for irrigation
agriculture. Examples include Tiga and Kadawa dams in Kano and Jigawa States, Zobe
and Jibia in Katsina State, Goronyo and Bakalori dams in Sokoto State.
In the Middle Belt food crops produced are mainly root crops like yams, cassava,
cocoyam, potatoes, bean seeds. There are also highland temperate mixed crops produced
on the high plateaux of Jos and Adamawa and examples are Irish potatoes, tea, temperate
fruits like apple etc.
In the southern part the main crops are roots and tree crops such as yams, cocoa yams,
plantations, cocoa, rubber, palm produce, kola nuts etc. There is double maxima rainfall in
the south which favours the growth of these crops. Some of these crops are grown for
commercial purposes in plantations. Shifting cultivation remains the major farming
system among the peasant/local farmers who produce a large percentage of the total food
supplies in the country [14].
Forestry is another major activity in Nigeria. In 2005 forestry production shows that
86.7% of the wood is used as fuel while the remaining 18.3% of the wood is used for
producing sawn wood, veneer, railways sleepers, pulp and other products[15]. These are
products mainly from the southern forest region and some from the Middle belt and the
north where there are forest reserves, communal forest areas within the savannah
vegetation zones. Deforestation is however severe in the northern and southern parts and
moderate within the north central and middle belt areas of Nigeria. Desertification is
severe along the extreme north and moderate in areas the surrounding areas.
Paper Proceedings of Agri Animal 2013 - ISSN 2279-3682
129
Cattle rearing are predominantly practiced in the northern part by the Fulani herdsmen who
are nomadic in nature. They move in search of pasture grass and water for their cattle
from the north to the middle belt up to the southern parts of Nigeria. There are also mixed
farmers who rear cattle and sedentary rearers found in different parts especially in the
northern parts. The main livestock reared are sheep, goats, pigs, cattle and poultry and the
products include lamb and mutton, goat meat, pork, beef, milk and eggs [16].
Fishing is carried out on inland rivers, fish farms lakes and dams and along coastal waters.
Fish production for the year 2005 shows that fishing on fish farms account for 8.6%, and
inland rivers and lakes 40.78%, coastal waters 44.7%, shrimps 2.8% and fish 3.2%[15].
Fish production for the year 2006 was 620,000 tonnes. Fishing is a major source of
income and occupation to many people along inland rivers, riverine areas of the Niger
Delta and the coastal areas of Nigeria.
Climate change and agriculture in Nigeria
The effects of climate change have already been felt in many parts of the country with the
modification of intensity and seasonal nature of the rains, elevation of average annual
temperatures, and intense frequency of widespread, high impact weather phenomena
including drought and flooding. These effects of climate change directly have an impact
on agriculture in Nigeria. Agricultural activities in Nigeria such as rain fed agriculture,
livestock rearing, fisheries and forest products extraction are sensitive to climate change
[2].
Climate change has impact on agriculture in Nigeria in the following ways:
i) Increase in temperature especially in the semi arid region has resulted in the less
farm work as farmers and other farm workers get tired easily due to dehydration
annd constant sweating. Besides farmers continue to complain of that agricultural
produce have been very poor these days due to weather fluctuations [17].
Paper Proceedings of Agri Animal 2013 - ISSN 2279-3682
130
ii) Due to drought in the north east, the Lake Chad is receeding at a very fast rate so
much so that the quantity of water is one third of its original volume. This has
affected farming activities around the lake particularly dry season farming.
iii) In 2010, there was serious flooding due to heavy rains in different parts of the
country which destroys vast fertile farmlands at that time and subsequently results
in higher food prices, increasing the fear of food insecurity and aggravating rural
poverty. The problem of incessant floods and erosion continue to expose peasant
farmers to the hazards of climate change.
iv) In 2011, there were severe floods in different parts of the country which directly
affected agriculture. For example a heavy down pour that lasted six hours on 26th
August, 2011 in Ibadan, Oyo state swept away poultry farms and fish ponds filled
with chicken and fishes worth millions of Naira [18].
v) Again in 2012, the worst floods in over five decades submerged and destroyed
farmlands of rice, yams cassava, maize, melon as well as plantain and banana in the
State around River Niger,Benue and Cross River as the rivers were filled to
capacity by heavy rains and thus over flow from their banks. This has also
occurred in the far northern states of Katsina, Jigawa and Kano where farmlands of
millet, guinea corn, maize etc were destroyed by the floods [19].
vi) Weather fluctuations arising from climate change causes insurgence of infectious
diseases such as malaria, cholera and meningitis particularly among rural dwellers
thereby affecting their output in farming activities. This affects the health of
farmers and market transactions, reducing their quality of life and agricultural
output.
vii) Gas flaring in the Niger Delta area has over the years raised the heat level in many
host communities (e.g Ode in Edo State) which creates environmental hazards that
Paper Proceedings of Agri Animal 2013 - ISSN 2279-3682
131
destroy the environment and makes it difficult for agricultural activities such as
fishing and farming to thrive due to increase in heat arising from thermal pollution.
viii) Besides floods and drought, there is another extreme weather event as hailstones
that accompanied heavy rains caused widespread destruction of houses of rural
farmers, farmlands and agricultural products in some local government areas of
Jigawa and Katsina States in September 2012[20].
ix) Drought conditions created by climate change especially in the north eastern part
leads to decrease in pasture grass and water availability. This leads to decrease in
livestock production resulting in an impaired availability of milk, meat, egg and
animal products such as hides and skin. The decrease in pasture grass can cause
migration of herdsmen further down South and can increase the rate of Farmers-
Fulani clashes as was recently witnessed near Abuja, the federal capital territory
x) Increase in the number of environmental refugees has drastically increased as
people were forced to leave their homes in search of relief from harsh
environmental conditions. These include heat, drought, storm, pest incidence etc
[20]. For example many victims of 2012 devastating floods who were farmers
were still living in displacement camps as at January 2013 which is bound to affect
food security as many farmlands are idle and unprepared for the coming planting
season.
Conclusion
Climate change is now a reality and its effects are felt all over the globe. These effects are
largely negative and have serious repercussion for human beings, their source of livelihood
and the environment. It is due to this that climate change is the single biggest
environmental issue facing the world today. Nigeria is one of the most vulnerable
countries to climate change in Africa due to her varied climatic zones, coastal location and
Paper Proceedings of Agri Animal 2013 - ISSN 2279-3682
132
more people are living and working in climate change prone areas. Agriculture in Nigeria
is largely dependent on the climatic conditions and changes in these conditions can have
impact of agricultural activities. Based on the discussions in this article it could be
observed that climate change has brought negative impacts on agriculture in Nigeria.
However, conscious efforts must be made towards mitigating the impacts of climate
change on agriculture in Nigeria.
References
[1] Buham Boult, Blades, heather, Hancock John and Ridout, Mike 1999
PeopleThemesandPlaces Oxford, Heinemann.
[2] Salami, Abayomi 2010 Climate Change Mitigation and Adaptation Options: The
Nigeria Experience. Retrieved from ncee.org.ng/...34_clmiate_change
[3] Ezra, Jekayin 2010 Creating Climate Change Awareness on the Nigerian Citizens:
Challenges for Social Studies Curriculum Planners and Implementers. Retrieved
from www.unilorin.edu.nh/publications
[4] Ali, Yusuf Olaolu 2011 Legal Profession and Climate Change in Nigeria.
Retrieved from www.yusufali.net/.../legal-profession
[5] Waugh, David, 1995 GeographyAnintegratedApproach second edition. Survey UK
Thomas Nelson and Sons Ltd.
[6] Wikipedia 2013 Nigeria-Wikipedia the free encyclopaedia. Retrieved from
http://en.wikipedia.org/wiki/nigeria
[7] United Nations Environmental Problem (NUEP) climate change-home-retrieved
from www.unep.org/climatechange
Paper Proceedings of Agri Animal 2013 - ISSN 2279-3682
133
[8] Cunningham, William and Cunningham, Mary Ann 2004
PrinciplesofEnvironmentalScience: InquiryandApplications second edition, Boston
McGraw Hill.
[9] Wikipedia 2013 climate change Wikipedia, the free encyclopaedia. Retrieved from
http://en.wikipedia.org/wiki/climate_change
[10] Ayuba, Haruna K. 2005 EnvironmentalScience: AnIntroductoryText, Kaduna Apani
Publications.
[11] Ladan, Suleiman Iguda 2011 Assessment of the Effects of Climate Change on the
Continent of Africa. Paper presented at 53rd
Annual Conference of Association of
Nigerian Geographers Usmanu Danfodio University Sokoto.
[12] Wikipedia 2013 Agriculture in Nigeria Wikipedia the free encyclopaedia.
Retrieved from http://en.wikipedia.org/wiki/agriculture-in-nigeria
[13] Ayinde, O. E., Muchie M. and Olatunji G. B. 2011 Effects of climate change on
Agricultural Productivity in Nigeria: A Co-integration Model Approach
JournalofHumanEcology 35(2).
[14] Akor, Gorge 2012. Climate Change and Agriculture. The Nigerian Story.
Conference Presentation FES Ghana, Accra 10 – 11 April 2012. Retrieved from
www.wepnigeria.net/..../Ghana-FES-WEP
[15] Macmillan Nigeria 2007 Social Studies Atlas Oxford Macmillan Education.
[16] Macmillan Nigeria 2006 Secondary Atlas Macmillan Ibadan Nigeria .
[17] Kuta, Dahiru Awaisu 2011 Climate Change and Agriculture in Nigeria. Retrieved
from www.leadership.ng/.../climate-change-and-agric-Nigeria
[18] Sunday Tribune 2011 Hundreds dead in Ibadan floods Sunday Tribune 28th
August,
Ibadan African Newspapers Plc.

Paper Proceedings of Agri Animal 2013 - ISSN 2279-3682
134
[19] Ibekwe, Nathaniel 2012 Floods: sad Tale from affected states
ERAQ/FOEN.Retrieved from http://www.premiumtimesng.com/news
[20] Gwaram, Muhammad, Tijjani, Bala and Mustapha Sani 2004 Climate Change: Its
Implications on Food Security and Environmental Safety. Biological and
Environmental Sciences Journal for the Tropics 1(2).

Paper Proceedings of Agri Animal 2013 - ISSN 2279-3682
135
9
Paper Proceedings of Agri Animal 2013 - ISSN 2279-3682
136
STUDIES ON RELATIVE PERFORMANCE OF DIFFERENT FOOD AND
FORAGE BASED CROPPING SYSTEMS IN ANDHRAPRADESH
Suneetha Devi K.B, Madhusudhan Reddy D, Padmaja G and Soumya, B
AICRP on Forage Crops, Livestock Research Institute, Rajendranagar, Hyderabad
ABSTRACT
A Field experiment was conducted at AICRP on Forage crops, Hyderabad in a randomized
block design with four replications to evaluate six Food -
Forage crop based cropping systems under irrigated conditions during 2001-02 to 2005-06.
The treatments were viz., best food crop rotation of the region (Sorghum+ Redgram-
Redgram-Tomato), best forage crop rotation of the region (Maize-Berseem-Cowpea),
inclusion of best kharif forage crop in the rotation {Sorghum +cowpea(F) -Castor(SP)},
inclusion of best rabi forage crop in the rotation {Maize(G) -Lucerne(F) -Lucerne (SP)},
inclusion of best summer forage crop in the rotation {Sunflower(G) -Cowpea(G) -Multicut
sorghum(F)} and round the year forage crop rotation {NB hybrid (perennial) + (cowpea-
berseem)/NB hybrid}.
The forage based cropping system i.e., NB hybrid + cowpea (kharif)/ berseem (Rabi)
system recorded significantly higher forage equivalent yield (213.02 t ha-1
), system
productivity (0.58 t/ha/day) and production efficiency (Rs. 161.20 /ha/day) over other
cropping systems and was followed by Sorghum + Redgram-Tomato system with forage
equivalent yield of 205.75 t ha-1
, system productivity (0.56 t/ha/day) and production
efficiency of Rs. 148.01/ha/day. Maize, berseem or Lucerne and multicut sorghum or
cowpea crops were identified as profitable forage crops and recommended during kharif,
rabi and summer seasons, respectively in existing food based cropping systems. Net
returns (Rs. 61,190 /ha/year) and benefit cost ratio was maximum (2.86) with NB hybrid
+cowpea (kharif)/ erseem (rabi) system followed y Sorghum (G) + Redgram (G)- tomato
fruit (2.69) and maize (G)- Lucerne (F) -Lucerne (G) system (2.63). Physical properties of
Paper Proceedings of Agri Animal 2013 - ISSN 2279-3682
137
soil i.e. pH and electrical conductivity of soil showed marginal variations but organic
carbon, nitrogen and potassium were slightly reduced due to intensive cropping systems.
KEY WORDS: Food-Forage based cropping system, System productivity, B:C ratio
INTRODUCTION
Dairying has become one of the important component of farming systems of different
regions of Andhra Pradesh. Therefore, due importance has to be given to forage crop
production along with food crop production. It is established that forages provide 5-15
times cheaper source of digestible crude protein and total digestible nutrients than
concentrates as animal feed. Hence, forage need to be integrated in the existing food based
cropping system as crop intensification either in space (intercropping) or in time
(sequential cropping) or both and is found to be feasible option left to the farmers for
enhancing the fodder production. Efficient cropping system with respect to biological
potential along with increased efficiencies of land and water are to be evaluated for
specific regions (Yadav et al, 1998). Therefore, the present study was designed to evaluate
and find out most remunerative food-forage based system under irrigated conditions of
Andhra Pradesh.
MATERIALS AND METHODS
A Field experiment was conducted for five years during 2001 to 2006 at AICRP on forage
crops, Livestock Research Institute, Rajendranagar. The soil of experimental field at the
start of the experiment was slightly alkaline (PH 7.8), red sandy loam in texture, medium in
organic carbon (0.6 %), low in available nitrogen (180.5 kg/ha), medium in available
phosphorus (12.27 kg/ha) and potassium (253.15 kg/ha). The total rainfall of 840 mm,
641.6 mm, 1031.6 mm, 768.0 mm and 1040.6 mm was received in 47, 46, 51, 46 and 58
rainy days during five years (2001-06) respectively. Average mean maximum (34.7, 34.1,
34.8, 32.4 and 34.10 C) and mean minimum (19.7, 20.8, 19.2, 18.9 &19.3
0C) were
Paper Proceedings of Agri Animal 2013 - ISSN 2279-3682
138
recorded in experimental years from 2001 to 2006. The treatments consisted of six crop
sequences viz., best food crop rotation of the region (Sorghum + Redgram-Redgram-
Tomato fruit), best forage crop rotation of the region (Maize -Berseem-Cowpea), inclusion
of best kharif forage crop in the rotation{Sorghum + cowpea(F) -Castor(SP)}, inclusion of
best rabi forage crop in the rotation{Maize(G)-Lucerne(F) –Lucerne (SP)}, inclusion of
best summer forage crop in the rotation{Sunflower(G)-Cowpea(G)-Multicut
sorghum(F)}and round the year forage crop rotation{NB Hybrid (perennial) + (cowpea in
kharif /berseem in rabi) / NB hybrid}. The experiment was laid out in RBD with 4
replications.
The varieties of different crops used were: Sorghum-APDS 2 for seed, APFS 5-3 for
forage single cut and SSG 59-3 for multicut. Red gram-LRG 30, Maize-African tall for
forage and DHM 105 for seed, Cow pea-Russian Giant, NB hybrid: APBN 1, Berseem-
Wardhan, Castor- PCS 4, Lucerne- Anand 2 and Tomato- Marutham. Sowing of
kharif,rabi and summer crops was done in the first week of July, first week of November
and second week of February, respectively. The crops were raised under irrigated
conditions with recommended package of practices of the region. Rooted slips of BN
hybrid ―APBN 1‖ were planted in July at a spacing of 1mX 0.5 m and the crop was
maintained as perennial stand. Cowpea in kharif and summer and berseem in rabi were
planted as intercrop between 2 wider rows of napier babra hybrid. After three years, the
dead tussocks of napier bajra hybrid were thinned for accommodation of inter-crops during
kharif and rabi. Grain crops were harvested at maturity. Among forage crops, single cut
species were harvested at 50 % flowering stage. In sorghum (multi-ct), Lucerne and
berseem,first cut 65 days stage and 55 days stage and subsequent cuts were taken at 25 and
30 days interval, respectively. After first cut, interval for subsequent cuts for napier bajra
was 45 days. Data on growth and yield was taken at appropriate harvesting schedules of
Paper Proceedings of Agri Animal 2013 - ISSN 2279-3682
139
the crops. In multi-cut forage crops, cut wise yield data was taken and the yield of all cuts
was pooled to workout total biomass yield. Grain yields of food crops were recorded at the
time of crop maturity and green fodder yields of forage crops were recorded at 50 per cent
flowering stage. Gross returns, net returns and benefit: cost ratio was computed to the
cropping sequence as a whole. For comparing the treatmental differences ,Crop equivalent
yield (q/ha) was calculated and expressed as hybrid bajra napier equivalent yield in 6th
treatment as it is an important perennial forage based cropping system followed in southern
states of India.
Production efficiency was worked out by dividing the total production of a sequence by
total duration of the crops in that sequence (Tomar and Tiwari, 1990). The initial and final
physical and chemical properties of the soil were estimated as per procedure given by
Jackson, 1967. Economics of different treatments was calculated for pooled results by
considering current market prices of labor wages, inputs and outputs. The observations
during cause of investigation were subjected to analysis statistically using analysis of
variance techniques (ANOVA) for randomized block design as prescribed by Panse and
Sukhatme (1985). Standard error of mean and the critical difference were computed at 5%
level of probability.
RESULTS AND DISCUSSION
Crop productivity:
Production potential of component crops in food-forage based cropping sequences showed
less variation over five years as the crops were grown under assured conditions. Hence
rainfall variability did not influence the yield levels. The yield of all component crops was
gradually decreased due to continuous cropping. The crops extract nutrients from the
uniform zone of the root atmosphere. The successive crops after 2 years are not able to get
sufficient nutrients for their growth and development resulting in reduction of yield.
Paper Proceedings of Agri Animal 2013 - ISSN 2279-3682
140
Among the forages, yield variations were more evident with perennial napier bajra hybrid
registering 14.65, 20.16, 32.4 and 32.2 per cent reduction in successive years over first
year (2001-02). Yield of intercrops in napier bajra hybrid (cowpea in kharif and berseem in
rabi) was higher in initial year and gradually reduced over successive years due to increase
in the growth of main crop. Yield of napier bajra hybrid during rabi was less due to poor
growth owing to low temperature. Islam and Thakuria (2002) reported similar winter
dormancy in NB Hybrid during rabi season and therefore inclusion of cowpea or berseem
as intercrop in the existing NB Hybrid would supplement green fodder yield and
compensate the yield loss due to less number of cuttings of NB Hybrid.
NB Hybrid equivalent yield and System productivity:
Pooled data indicated variation in system productivity interms of NB Hybrid equivalent
yield of food forage and forage-based cropping sequence. Among all the tested systems,
Perennial forage based cropping system (NB Hybrid + (cowpea- NB Hybrid +berseem- NB
hybrid) produced highest NB hybrid equivalent yield (213.02 t/ha/yr) and system productivity
(0.58) was at par with predominant food based cropping system (Sorghum + Redgram–Tomato)
that produced NB equivalent yield of 205.75 t/ha/year and system productivity of 0.50. This clearly
indicates that forage based cropping system is equally productive with that of food based cropping
system and also additional income is expected from livestock production. NB Hybrid + cowpea-
NB Hybrid +berseem- NB Hybrid system registered an increase of 91.88, 69.48 and 70.05
percent over cropping system having Forage crop in kharif (Sorghum+ cowpea(F)-
castor(G):annual forage based cropping system and forage crop in summer {Sunflower (G)-
cowpea(G)-multicut sorghum(F)}. Addition of Lucerne as fodder during rabi and for seed during
summer season increased the NB Hybrid equivalent yield (174.9 t/ha/yr) and system
productivity (0.48). Lower NB Hybrid equivalent yield (111.02 t/ha/yr) was recorded with
sorghum (single cut forage +cowpea (F)- castor (G) system.
Paper Proceedings of Agri Animal 2013 - ISSN 2279-3682
141
Employment generation efficiency (man days/ha/day) was found highest (1.1) in year round
perennial forage production system{NB Hybrid +cowpea- NB Hybrid +berseem -NB hybrid}due
to intensification through perennial component and seasonal intercropping of forage legumes. The
annual forage based cropping system (Maize-berseem-cowpea) obtained next higher employement
generation efficiency (0.88) but could not convert into higher net returns due to more cost of
cultivation and poor yields. Employment generation efficiency of food based cropping system
(Sorghum +Redgram-Tomato) was less (0.54). Singh et al. (2002) also reported that perennial
forage based system NB hybrid and guinea grass recorded highest employment generation
efficiency (1.12 man days/ha/day).
Economics:
Gross and net returns of individual crops:
Comparison of food and forage crops (Table 2) in different seasons was done to identify
the profitable forage / grain crop during that particular season. In kharif season, sorghum
(G), maize (F), sorghum + cowpea (F), maize (G), sunflower (G) and NB hybrid + cowpea
(F) were evaluated in different cropping systems. Highest gross and net returns were
obtained by growing NB hybrid + cowpea followed by maize (G) and maize (F). The
productivity of NB hybrid was found higher from April to September and was supported
by Islam and Thakuria, 2002. Sorghum (G) reported lowest gross and net returns among all
crops. During rabi season, crops tested in different cropping systems were redgram (G),
berseem (F), castor (G), Lucerne (F), cowpea (G) and NB hybrid + berseem (F). The
results indicated that maximum gross and net returns were associated with cowpea (G)
followed by berseem (F) and Lucerne (F). Maximum grain yield of cowpea (1.527 t ha-1
)
was registered because of favorable weather conditions and no pest problems. NB Hybrid
gave green fodder yield of 40.50 t/ha in 3 cuts in rabi season as against 96.44 t ha-1
in
kharif (4 cuts) and 78.44 t ha-1
in summer season (4 cuts). This clearly indicated that winter
dormancy character in NB hybrid is prevalent and reduced the number of cuttings in
Paper Proceedings of Agri Animal 2013 - ISSN 2279-3682
142
rabiseason. Islam and Thakuria (2002) also reported similar winter dormancy in NB
Hybrid during rabi season (November to March) and therefore inclusion of legume as
intercrops in the existing NB hybrid would supplement green fodder yield and compensate
the yield loss due to less number of cuttings of NB Hybrid. Berseem and lucerne as
intercrop supplemented green fodder yield of NB hybrid during rabi season.
During summer season, crops tested in different cropping systems (Table.2) were tomato,
cowpea (F), castor (G), lucerne (G), multicut sorghum (F) and hybrid bajra napier (F).
Among them, highest gross and net returns were achieved with tomato crop followed by
NB hybrid. Tomato crop fetched higher market prices during summer season and gave
highest gross and net returns.
Gross and net returns of cropping systems:
The pooled data of different cropping systems over 5 years (Table 3) revealed that NB
Hybrid + cow pea - NB Hybrid +berseem - NB Hybrid system gave significantly higher
gross (Rs. 93,990/-) and net returns (Rs. 61,190/-) than other cropping systems and was
followed by Sorghum + redgram (G) – tomato (Rs. 80,820 and Rs. 50,820). Lowest gross
(Rs. 46,710) and net returns (Rs. 26,710) were obtained with Sorghum + cowpea (F) –
Castor (G). Maize(G)–Lucerne(F)-Lucerne(F) system produced gross and net returns of
Rs. 73,760/ha/yr and Rs. 45,760 /ha/yr at par with food based cropping system (Sorghum
+Redgram-Tomato) and sorghum + cowpea (F)- castor (G) system. Thus NB Hybrid-
cowpea+ NB Hybrid -NB hybrid system found to be ideal forage based system in the study
area of Andhra Pradesh. This was supported by Patel et al. (2003) who suggested perennial
forage based cropping system of NB hybrid + cowpea (kharif) + lucerne (rabi) as an ideal
cropping system for realizing maximum returns through year round forage production and
supply under irrigated conditions of Gujarat.
Paper Proceedings of Agri Animal 2013 - ISSN 2279-3682
143
Benefit: cost ratio was maximum (2.86) with NB Hybrid +cowpea+ NB Hybrid-berseem -
NB hybrid and sorghum + redgram- tomato (2.69) and was closely followed by Maize(G)–
Lucerne(F)-Lucerne(G) 2.63. Similar increase in B: C ratio (3.05) was observed by
growing Lucerne (F) in the cropping system as reported by Chellamuthu et al. (1998).
Lucerne (F) and Lucerne (G) reported to have contributed gross returns of Rs. 24,530 and
Rs. 22,800 to the total gross returns of system. It was found to be at par with the
contribution of maize (G) (Rs. 26,430) to the gross returns of the system. This clearly
shows the profitability of productive forage crops under intensive cropping situations.
Likewise, perennial based cropping system i.e. NB Hybrid (perennial) + (cowpea/berseem)
-NB hybrid recorded at par Benefit cost ratio with predominant food based cropping
system under irrigated dry conditions of Andhra Pradesh. Lowest B:C ratio (2.33) was
reported with cropping system of sorghum + cowpea (F)-castor(G).
Soil fertility:
After five years of experimentation, it was observed that (Table 5) there was not much
variation in soil pH, electrical conductivity (E.C) and Organic carbon. Available nitrogen
and potassium were reduced due to intensive cropping followed in different cropping
systems. However, phosphorus content of the soil increased slightly in different cropping
systems. Perennial forage based cropping system of NB Hybrid (perennial) +
(cowpea/berseem) -NB hybrid showed higher depletion of soil nutrients because of its
exhaustive nature of crop. In case of Maize (G)-Lucerne (F) –Lucerne (G) cropping system, the
available P and K increase was high due to inclusion of the Lucerne which enhanced them by
nitrogen fixation and phosphorus solubilisation. In other cropping systems where legumes were
included like cowpea, berseem and redgram, nutrient status of the soil was maintained. Yadav et al.
(1998) also opined that inclusion of legumes in cropping systems resulted in better physic-chemical
status of soil.
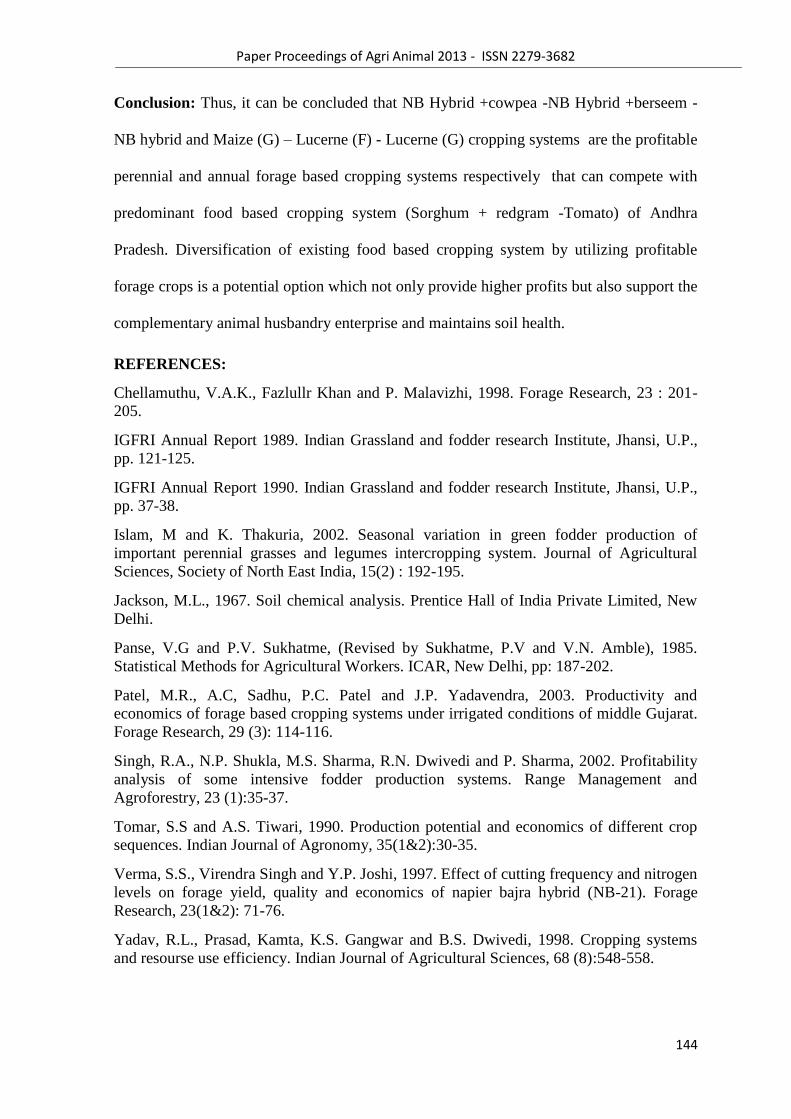
Paper Proceedings of Agri Animal 2013 - ISSN 2279-3682
144
Conclusion: Thus, it can be concluded that NB Hybrid +cowpea -NB Hybrid +berseem -
NB hybrid and Maize (G) – Lucerne (F) - Lucerne (G) cropping systems are the profitable
perennial and annual forage based cropping systems respectively that can compete with
predominant food based cropping system (Sorghum + redgram -Tomato) of Andhra
Pradesh. Diversification of existing food based cropping system by utilizing profitable
forage crops is a potential option which not only provide higher profits but also support the
complementary animal husbandry enterprise and maintains soil health.
REFERENCES:
Chellamuthu, V.A.K., Fazlullr Khan and P. Malavizhi, 1998. Forage Research, 23 : 201-
205.
IGFRI Annual Report 1989. Indian Grassland and fodder research Institute, Jhansi, U.P.,
pp. 121-125.
IGFRI Annual Report 1990. Indian Grassland and fodder research Institute, Jhansi, U.P.,
pp. 37-38.
Islam, M and K. Thakuria, 2002. Seasonal variation in green fodder production of
important perennial grasses and legumes intercropping system. Journal of Agricultural
Sciences, Society of North East India, 15(2) : 192-195.
Jackson, M.L., 1967. Soil chemical analysis. Prentice Hall of India Private Limited, New
Delhi.
Panse, V.G and P.V. Sukhatme, (Revised by Sukhatme, P.V and V.N. Amble), 1985.
Statistical Methods for Agricultural Workers. ICAR, New Delhi, pp: 187-202.
Patel, M.R., A.C, Sadhu, P.C. Patel and J.P. Yadavendra, 2003. Productivity and
economics of forage based cropping systems under irrigated conditions of middle Gujarat.
Forage Research, 29 (3): 114-116.
Singh, R.A., N.P. Shukla, M.S. Sharma, R.N. Dwivedi and P. Sharma, 2002. Profitability
analysis of some intensive fodder production systems. Range Management and
Agroforestry, 23 (1):35-37.
Tomar, S.S and A.S. Tiwari, 1990. Production potential and economics of different crop
sequences. Indian Journal of Agronomy, 35(1&2):30-35.
Verma, S.S., Virendra Singh and Y.P. Joshi, 1997. Effect of cutting frequency and nitrogen
levels on forage yield, quality and economics of napier bajra hybrid (NB-21). Forage
Research, 23(1&2): 71-76.
Yadav, R.L., Prasad, Kamta, K.S. Gangwar and B.S. Dwivedi, 1998. Cropping systems
and resourse use efficiency. Indian Journal of Agricultural Sciences, 68 (8):548-558.
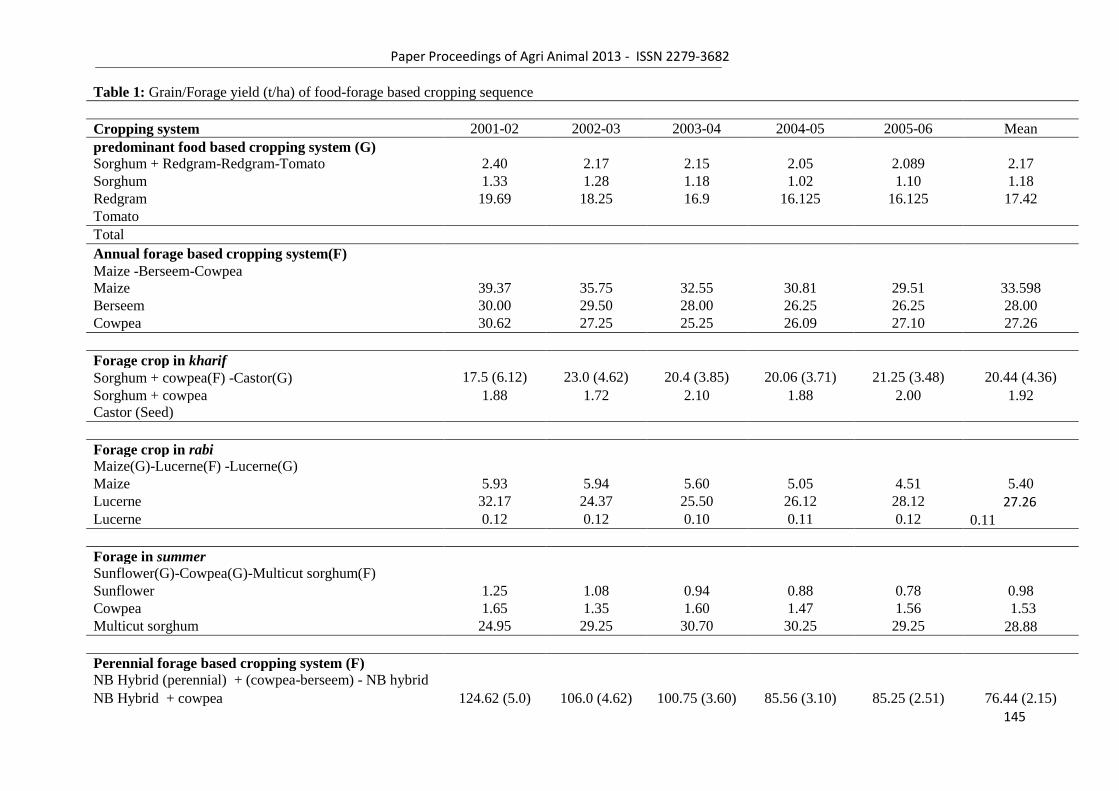
Paper Proceedings of Agri Animal 2013 - ISSN 2279-3682
145
Table 1: Grain/Forage yield (t/ha) of food-forage based cropping sequence
Cropping system 2001-02 2002-03 2003-04 2004-05 2005-06 Mean
predominant food based cropping system (G)
Sorghum + Redgram-Redgram-Tomato 2.40 2.17 2.15 2.05 2.089 2.17
Sorghum 1.33 1.28 1.18 1.02 1.10 1.18
Redgram 19.69 18.25 16.9 16.125 16.125 17.42
Tomato
Total
Annual forage based cropping system(F)
Maize -Berseem-Cowpea
Maize 39.37 35.75 32.55 30.81 29.51 33.598
Berseem 30.00 29.50 28.00 26.25 26.25 28.00
Cowpea 30.62 27.25 25.25 26.09 27.10 27.26
Forage crop in kharif
Sorghum + cowpea(F) -Castor(G) 17.5 (6.12) 23.0 (4.62) 20.4 (3.85) 20.06 (3.71) 21.25 (3.48) 20.44 (4.36)
Sorghum + cowpea 1.88 1.72 2.10 1.88 2.00 1.92
Castor (Seed)
Forage crop in rabi
Maize(G)-Lucerne(F) -Lucerne(G)
Maize 5.93 5.94 5.60 5.05 4.51 5.40
Lucerne 32.17 24.37 25.50 26.12 28.12 27.26 Lucerne 0.12 0.12 0.10 0.11 0.12 0.11
Forage in summer
Sunflower(G)-Cowpea(G)-Multicut sorghum(F)
Sunflower 1.25 1.08 0.94 0.88 0.78 0.98
Cowpea 1.65 1.35 1.60 1.47 1.56 1.53
Multicut sorghum 24.95 29.25 30.70 30.25 29.25 28.88
Perennial forage based cropping system (F)
NB Hybrid (perennial) + (cowpea-berseem) - NB hybrid
NB Hybrid + cowpea 124.62 (5.0) 106.0 (4.62) 100.75 (3.60) 85.56 (3.10) 85.25 (2.51) 76.44 (2.15)
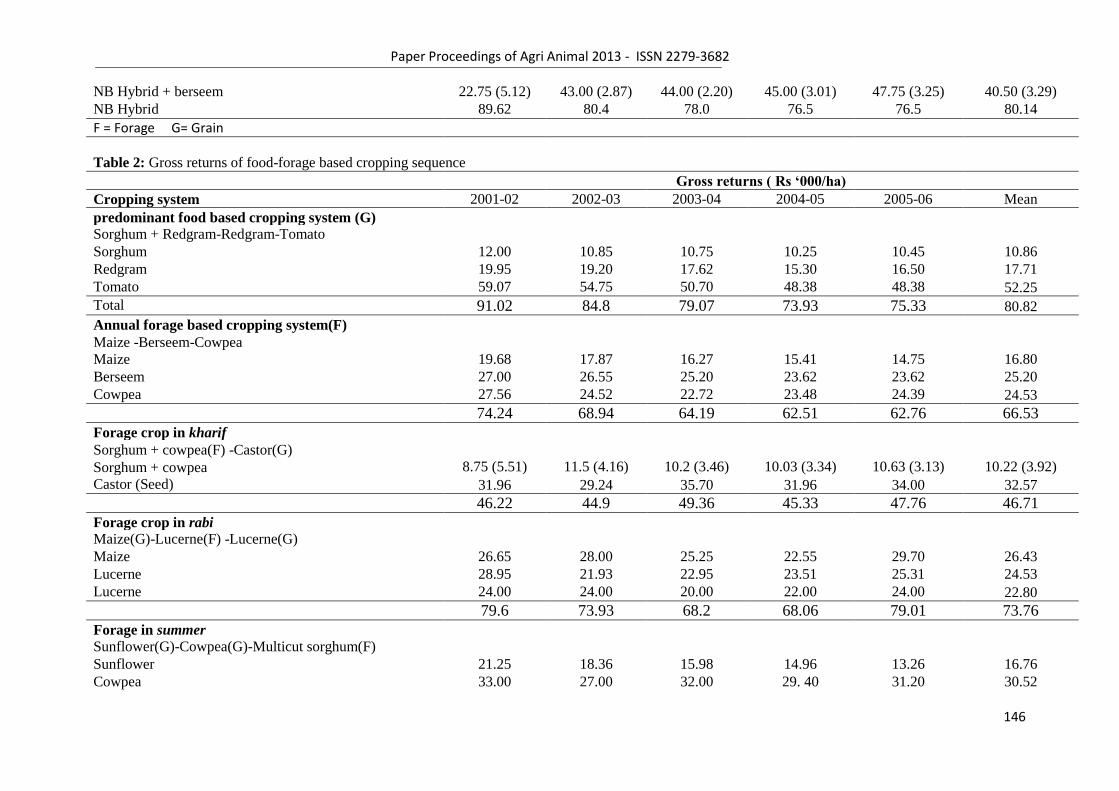
Paper Proceedings of Agri Animal 2013 - ISSN 2279-3682
146
NB Hybrid + berseem 22.75 (5.12) 43.00 (2.87) 44.00 (2.20) 45.00 (3.01) 47.75 (3.25) 40.50 (3.29)
NB Hybrid 89.62 80.4 78.0 76.5 76.5 80.14
F = Forage G= Grain
Table 2: Gross returns of food-forage based cropping sequence
Gross returns ( Rs ‘000/ha)
Cropping system 2001-02 2002-03 2003-04 2004-05 2005-06 Mean
predominant food based cropping system (G)
Sorghum + Redgram-Redgram-Tomato
Sorghum 12.00 10.85 10.75 10.25 10.45 10.86
Redgram 19.95 19.20 17.62 15.30 16.50 17.71
Tomato 59.07 54.75 50.70 48.38 48.38 52.25
Total 91.02 84.8 79.07 73.93 75.33 80.82
Annual forage based cropping system(F)
Maize -Berseem-Cowpea
Maize 19.68 17.87 16.27 15.41 14.75 16.80
Berseem 27.00 26.55 25.20 23.62 23.62 25.20
Cowpea 27.56 24.52 22.72 23.48 24.39 24.53
74.24 68.94 64.19 62.51 62.76 66.53
Forage crop in kharif
Sorghum + cowpea(F) -Castor(G)
Sorghum + cowpea 8.75 (5.51) 11.5 (4.16) 10.2 (3.46) 10.03 (3.34) 10.63 (3.13) 10.22 (3.92)
Castor (Seed) 31.96 29.24 35.70 31.96 34.00 32.57
46.22 44.9 49.36 45.33 47.76 46.71
Forage crop in rabi
Maize(G)-Lucerne(F) -Lucerne(G)
Maize 26.65 28.00 25.25 22.55 29.70 26.43
Lucerne 28.95 21.93 22.95 23.51 25.31 24.53
Lucerne 24.00 24.00 20.00 22.00 24.00 22.80
79.6 73.93 68.2 68.06 79.01 73.76
Forage in summer
Sunflower(G)-Cowpea(G)-Multicut sorghum(F)
Sunflower 21.25 18.36 15.98 14.96 13.26 16.76
Cowpea 33.00 27.00 32.00 29. 40 31.20 30.52
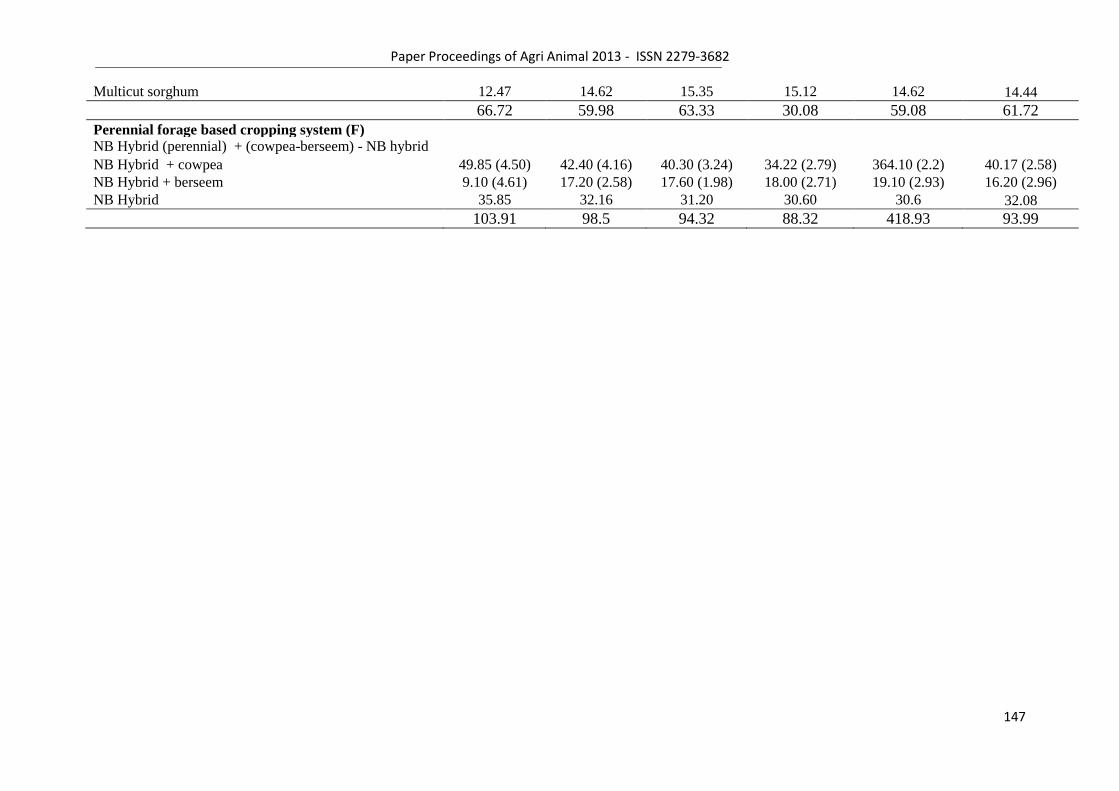
Paper Proceedings of Agri Animal 2013 - ISSN 2279-3682
147
Multicut sorghum 12.47 14.62 15.35 15.12 14.62 14.44
66.72 59.98 63.33 30.08 59.08 61.72
Perennial forage based cropping system (F)
NB Hybrid (perennial) + (cowpea-berseem) - NB hybrid
NB Hybrid + cowpea 49.85 (4.50) 42.40 (4.16) 40.30 (3.24) 34.22 (2.79) 364.10 (2.2) 40.17 (2.58)
NB Hybrid + berseem 9.10 (4.61) 17.20 (2.58) 17.60 (1.98) 18.00 (2.71) 19.10 (2.93) 16.20 (2.96)
NB Hybrid 35.85 32.16 31.20 30.60 30.6 32.08
103.91 98.5 94.32 88.32 418.93 93.99
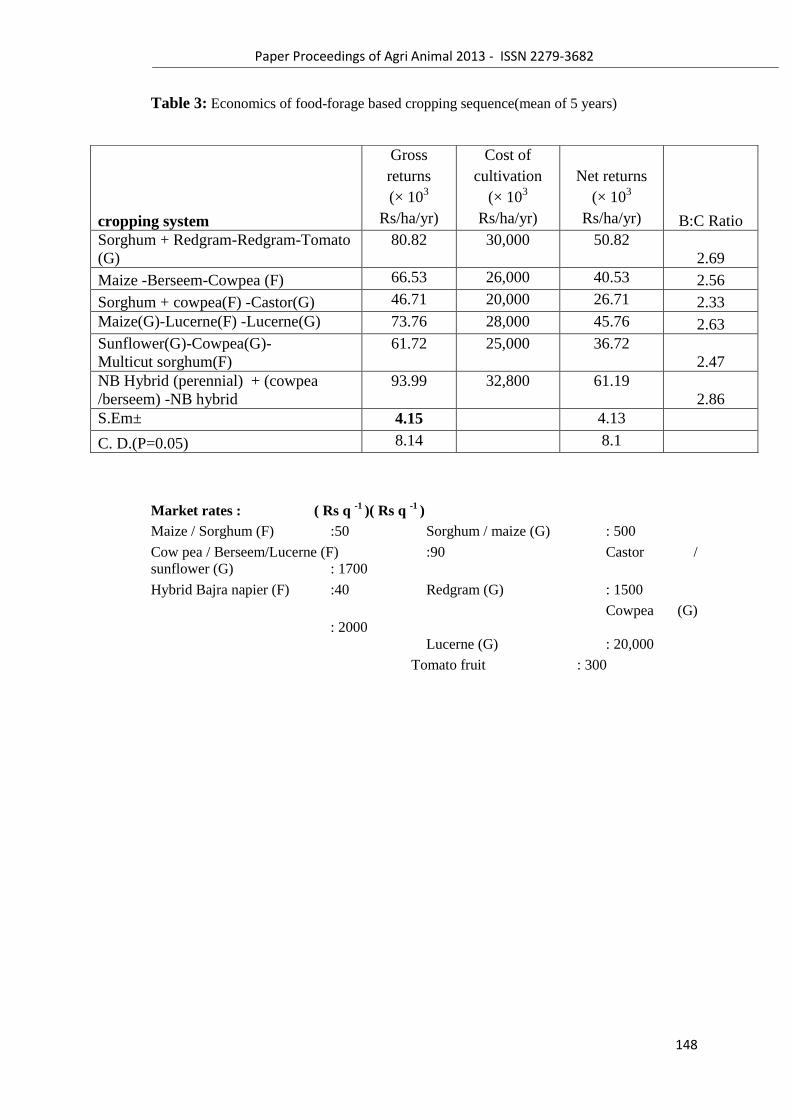
Paper Proceedings of Agri Animal 2013 - ISSN 2279-3682
148
Table 3: Economics of food-forage based cropping sequence(mean of 5 years)
Market rates : ( Rs q -1
)( Rs q -1
)
Maize / Sorghum (F) :50 Sorghum / maize (G) : 500
Cow pea / Berseem/Lucerne (F) :90 Castor /
sunflower (G) : 1700
Hybrid Bajra napier (F) :40 Redgram (G) : 1500
Cowpea (G)
: 2000
Lucerne (G) : 20,000
Tomato fruit : 300
cropping system
Gross
returns
(× 103
Rs/ha/yr)
Cost of
cultivation
(× 103
Rs/ha/yr)
Net returns
(× 103
Rs/ha/yr) B:C Ratio
Sorghum + Redgram-Redgram-Tomato
(G)
80.82 30,000 50.82
2.69
Maize -Berseem-Cowpea (F) 66.53 26,000 40.53 2.56
Sorghum + cowpea(F) -Castor(G) 46.71 20,000 26.71 2.33
Maize(G)-Lucerne(F) -Lucerne(G) 73.76 28,000 45.76 2.63
Sunflower(G)-Cowpea(G)-
Multicut sorghum(F)
61.72 25,000 36.72
2.47
NB Hybrid (perennial) + (cowpea
/berseem) -NB hybrid
93.99 32,800 61.19
2.86
S.Em± 4.15
4.13
C. D.(P=0.05) 8.14
8.1
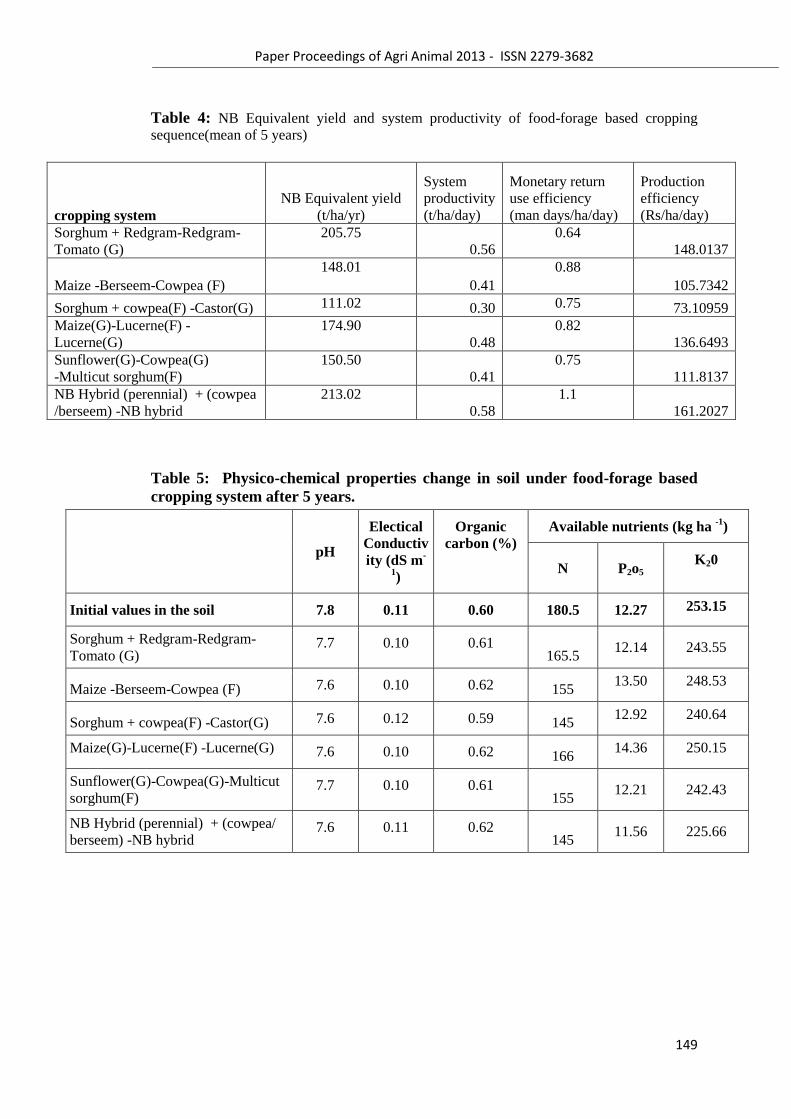
Paper Proceedings of Agri Animal 2013 - ISSN 2279-3682
149
Table 4: NB Equivalent yield and system productivity of food-forage based cropping
sequence(mean of 5 years)
cropping system
NB Equivalent yield
(t/ha/yr)
System
productivity
(t/ha/day)
Monetary return
use efficiency
(man days/ha/day)
Production
efficiency
(Rs/ha/day)
Sorghum + Redgram-Redgram-
Tomato (G)
205.75
0.56
0.64
148.0137
Maize -Berseem-Cowpea (F)
148.01
0.41
0.88
105.7342
Sorghum + cowpea(F) -Castor(G) 111.02 0.30 0.75 73.10959
Maize(G)-Lucerne(F) -
Lucerne(G)
174.90
0.48
0.82
136.6493
Sunflower(G)-Cowpea(G)
-Multicut sorghum(F)
150.50
0.41
0.75
111.8137
NB Hybrid (perennial) + (cowpea
/berseem) -NB hybrid
213.02
0.58
1.1
161.2027
Table 5: Physico-chemical properties change in soil under food-forage based
cropping system after 5 years.
pH
Electical
Conductiv
ity (dS m-
1)
Organic
carbon (%)
Available nutrients (kg ha -1
)
N P2o5 K20
Initial values in the soil 7.8 0.11 0.60 180.5 12.27 253.15
Sorghum + Redgram-Redgram-
Tomato (G) 7.7 0.10 0.61
165.5 12.14 243.55
Maize -Berseem-Cowpea (F) 7.6 0.10 0.62 155 13.50 248.53
Sorghum + cowpea(F) -Castor(G) 7.6 0.12 0.59 145 12.92 240.64
Maize(G)-Lucerne(F) -Lucerne(G) 7.6 0.10 0.62 166 14.36 250.15
Sunflower(G)-Cowpea(G)-Multicut
sorghum(F) 7.7 0.10 0.61
155 12.21 242.43
NB Hybrid (perennial) + (cowpea/
berseem) -NB hybrid 7.6 0.11 0.62
145 11.56 225.66

Paper Proceedings of Agri Animal 2013 - ISSN 2279-3682
150
10
Paper Proceedings of Agri Animal 2013 - ISSN 2279-3682
151
Controlling Aphelenchoides besseyi in tuberose- an integrated
approach
Arun Kumar Pal
1, Sreela Gonsalves
1, Kusal Roy
2, and Goutam Saha
3
1 Department of Floriculture & Landscaping,
2AICRP on Plant Parasitic Nematodes,
3 Department of Agricultural Meteorology & Physics
Bidhan Chandra Krishi Viswavidyalaya, Nadia-741252, West Bengal, India
Corresponding Author- [email protected]
Abstract A field experiment was carried out at the Horticultural Research Station of Bidhan Chandra Krishi
Viswavidyalaya, Mondouri, Nadia, West Bengal (India) during 2009-2011 to study the effect of
nematicidal treatments of bulbs on the population dynamics of foliar nematode (Aphelenchoides
besseyi) on tuberose. For this, three varieties of tuberose (V1=Calcutta Single, V2=Calcutta Double and
V3=Prajwal) were planted at three different dates (D1=17th
February‘09, D2=17th
March‘09, D3=17th
April‘09) at two spacings (S1=20cm×20cm, S2=30cm×30cm) with treated bulbs (T1= overnight
presoaking of bulbs in plain water followed by dipping in carbosulfan 25EC @ 1000ppm for 6 hrs+
three foliar sprayings of carbosulfan 25EC@500ppm at 10 days interval commencing from floral spike
emergence) and untreated bulbs (T2). Nematode population was, found minimum during the month of
January, 2010 (2.30 / plant) in D3 (17th
April‘09), while the wider planting S2 (30cm×30cm) also
supported lesser population (1744.78/plant). The bulb dipping as well as foliar spray in carbosulfan
(T1) caused reduction in A. besseyi population. Again no population was detected in the variety Prajwal
(V3), but the variety Calcutta Double (V2) harbored the maximum population of A. besseyi
(5651.53/plant). Thus integrating all the treatments (planting of bulbs in mid April, variety like
Prajwal, 30cm×30cm spacing and nematicidal treatment) will be helpful in controlling one of the
biggest threats in tuberose cultivation in West Bengal, India.
Keywords- Tuberose, Aphelenchoides besseyi, planting dates,carbosulfan
Paper Proceedings of Agri Animal 2013 - ISSN 2279-3682
152
Introduction
Aphelenchoides besseyi was reported as a serious pest of tuberose and found
widespread in all the tuberose growing areas of West Bengal, India (Khan et al.,1999;
Khan and Pal, 2001) in greenhouse, open field, nurseries and landscape. The floral
malady of tuberose due to A. besseyi was first time reported from West Bengal by
Chakraborti and Ghosh (1993). Mukhopadhyay et al., (2010) identified five blocks of
North 24 Parganas and one block of South 24 Parganas districts, as hot spots for the
A. besseyi with frequency of occurrence of 14-82%. The higher temperatureand
longer growing season induce more nematode generations and consequently an
increased nematode population. The pest A.besseyi cause cent percent loss in the
second year crop in Single cultivar of tuberose, while in the cultivar Double, 30% to
40% flowering stalks rendered unsaleable (Khan and Pal, 2001). As a result of its
devastating attack, earning of the flower growers has been reportedly reduced by
about fifty percent (Bala et al., 2011).An ideal nematicide, besides having other
desirable characteristics, would be the one for preplanting application to remain
effective for 2 to 4 years on perennials and yet be without undesirable effects.
Carbosulfan (2,3-dihydro-2, 2-dimethyl-7-benzofuran-7-yl (dibutylaminothio) methyl
carbamate)is one of the systemic nematicides, which is systemic in action, effective at
lower dosages, safe and easy to handle, relatively non-volatile and non-persistant,
have little operational hazard and may have environmental acceptance
Materials and Methods
The tuberose bulbs of three varieties (V1=Calcutta Single, V2=Calcutta Double and
V3=Prajwal) were planted at two spacings (S1=20cm×20cm, S2=30cm×30cm) in plots of
1.5mt×1.2mt size at three planting dates (D1=17thFebruary‘09, D2=17
th March‘09, D3=17
th
April‘09). Presoaked tuberose bulbs were treated for 6 hrs with nematicide solution (T1)
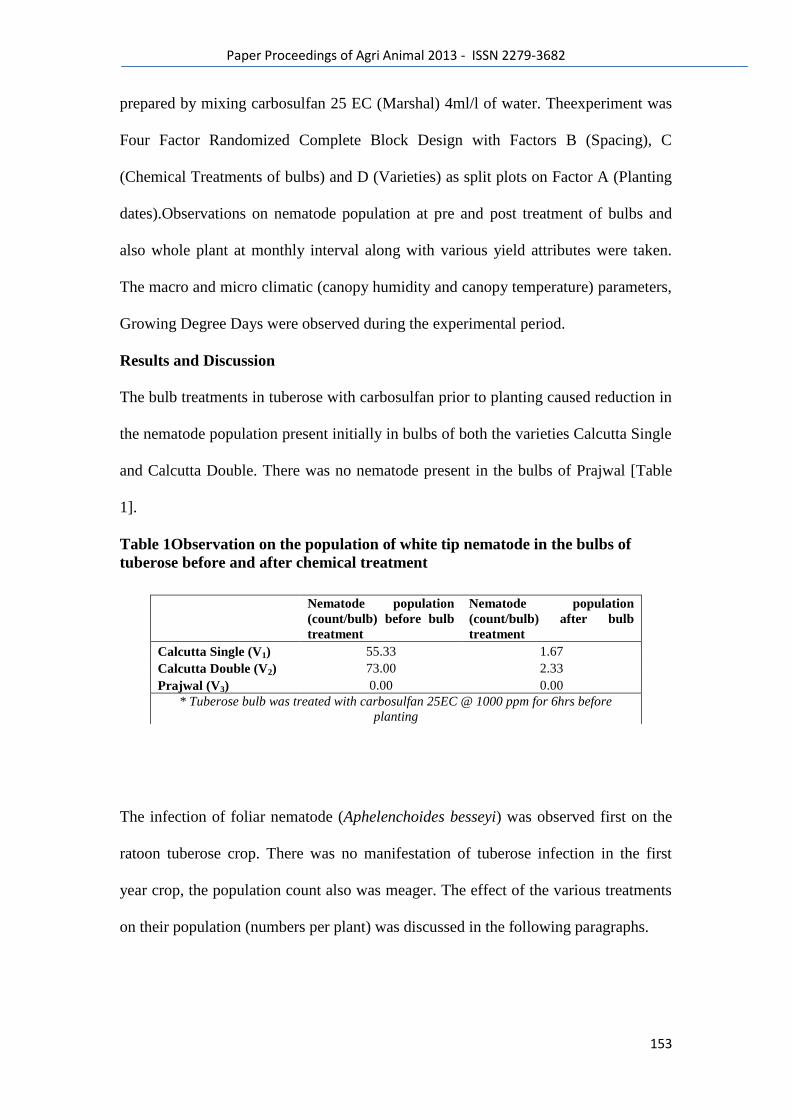
Paper Proceedings of Agri Animal 2013 - ISSN 2279-3682
153
prepared by mixing carbosulfan 25 EC (Marshal) 4ml/l of water. Theexperiment was
Four Factor Randomized Complete Block Design with Factors B (Spacing), C
(Chemical Treatments of bulbs) and D (Varieties) as split plots on Factor A (Planting
dates).Observations on nematode population at pre and post treatment of bulbs and
also whole plant at monthly interval along with various yield attributes were taken.
The macro and micro climatic (canopy humidity and canopy temperature) parameters,
Growing Degree Days were observed during the experimental period.
Results and Discussion
The bulb treatments in tuberose with carbosulfan prior to planting caused reduction in
the nematode population present initially in bulbs of both the varieties Calcutta Single
and Calcutta Double. There was no nematode present in the bulbs of Prajwal [Table
1].
Table 1Observation on the population of white tip nematode in the bulbs of
tuberose before and after chemical treatment
The infection of foliar nematode (Aphelenchoides besseyi) was observed first on the
ratoon tuberose crop. There was no manifestation of tuberose infection in the first
year crop, the population count also was meager. The effect of the various treatments
on their population (numbers per plant) was discussed in the following paragraphs.
Nematode population
(count/bulb) before bulb
treatment
Nematode population
(count/bulb) after bulb
treatment
Calcutta Single (V1) 55.33 1.67
Calcutta Double (V2) 73.00 2.33
Prajwal (V3) 0.00 0.00
* Tuberose bulb was treated with carbosulfan 25EC @ 1000 ppm for 6hrs before
planting
Paper Proceedings of Agri Animal 2013 - ISSN 2279-3682
154
3.1 Effect of planting date
Population of A. besseyi per plant was found significantly more in the early planting
(D1=17th
February‘09) date and gradually increased up to August, 2010 (5913.29 /
plant) (Table 2). Afterwards, a gradual decline in nematode population was noted in
all the planting dates. This observation was found to be established by the fact that
there lies a significant correlation between nematode population and the prevailing
relative humidity in the atmosphere [Table 4.]
Even the early planted plants had a higher leaf moisture content ,which support a
higher nematode population. The low population was observed in January, 2010 and
again in February, 2011 and a comparatively low population of A. besseyi ranging
from 2.30-477.42 / plant was found in the late planting date (D3=17th
April‘09).
Similar observation was also recorded by Khan (2004). A. besseyi often entered into
anhydrobiotic stage (physiologically inactive stage) when crop reaches to maturity
and during dry and cooler climatic condition (Sivakumar, 1987); this might be the
reason behind their decline from November‘2010 onwards.The high population of A.
besseyi was observed by Khan and Ghosh (2011) when tuberose crop growing faster
and producing greater flowers (April-July) and low population was recorded when the
crop was entering into senescence during September to December months coinciding
with low temperature, rainfall and relative humidity. The present investigation was
also in parity with the findings of Khan and Ghosh (2011). The correlation studies
corroborates with the findings that relative humidity and the temperature were highly
correlated with the nematode population [Table 3]. Even the canopy humidity was
found to be highly correlated with the population of A. besseyi [Table 4].
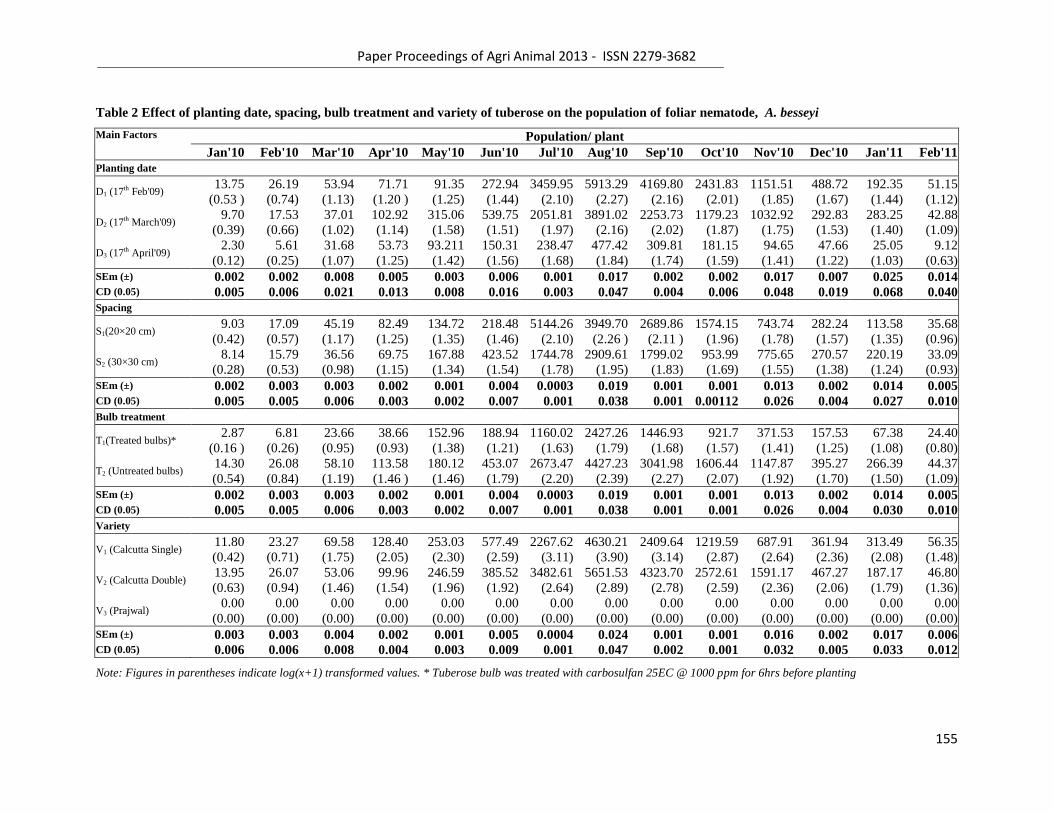
Paper Proceedings of Agri Animal 2013 - ISSN 2279-3682
155
Table 2 Effect of planting date, spacing, bulb treatment and variety of tuberose on the population of foliar nematode, A. besseyi
Main Factors Population/ plant
Jan'10 Feb'10 Mar'10 Apr'10 May'10 Jun'10 Jul'10 Aug'10 Sep'10 Oct'10 Nov'10 Dec'10 Jan'11 Feb'11
Planting date
D1 (17th Feb'09) 13.75
(0.53 )
26.19
(0.74)
53.94
(1.13)
71.71
(1.20 )
91.35
(1.25)
272.94
(1.44)
3459.95
(2.10)
5913.29
(2.27)
4169.80
(2.16)
2431.83
(2.01)
1151.51
(1.85)
488.72
(1.67)
192.35
(1.44)
51.15
(1.12)
D2 (17th March'09) 9.70
(0.39)
17.53
(0.66)
37.01
(1.02)
102.92
(1.14)
315.06
(1.58)
539.75
(1.51)
2051.81
(1.97)
3891.02
(2.16)
2253.73
(2.02)
1179.23
(1.87)
1032.92
(1.75)
292.83
(1.53)
283.25
(1.40)
42.88
(1.09)
D3 (17th April'09) 2.30
(0.12)
5.61
(0.25)
31.68
(1.07)
53.73
(1.25)
93.211
(1.42)
150.31
(1.56)
238.47
(1.68)
477.42
(1.84)
309.81
(1.74)
181.15
(1.59)
94.65
(1.41)
47.66
(1.22)
25.05
(1.03)
9.12
(0.63)
SEm (±) 0.002 0.002 0.008 0.005 0.003 0.006 0.001 0.017 0.002 0.002 0.017 0.007 0.025 0.014 CD (0.05) 0.005 0.006 0.021 0.013 0.008 0.016 0.003 0.047 0.004 0.006 0.048 0.019 0.068 0.040
Spacing
S1(20×20 cm) 9.03
(0.42)
17.09
(0.57)
45.19
(1.17)
82.49
(1.25)
134.72
(1.35)
218.48
(1.46)
5144.26
(2.10)
3949.70
(2.26 )
2689.86
(2.11 )
1574.15
(1.96)
743.74
(1.78)
282.24
(1.57)
113.58
(1.35)
35.68
(0.96)
S2 (30×30 cm) 8.14
(0.28)
15.79
(0.53)
36.56
(0.98)
69.75
(1.15)
167.88
(1.34)
423.52
(1.54)
1744.78
(1.78)
2909.61
(1.95)
1799.02
(1.83)
953.99
(1.69)
775.65
(1.55)
270.57
(1.38)
220.19
(1.24)
33.09
(0.93)
SEm (±) 0.002 0.003 0.003 0.002 0.001 0.004 0.0003 0.019 0.001 0.001 0.013 0.002 0.014 0.005 CD (0.05) 0.005 0.005 0.006 0.003 0.002 0.007 0.001 0.038 0.001 0.00112 0.026 0.004 0.027 0.010
Bulb treatment
T1(Treated bulbs)* 2.87
(0.16 )
6.81
(0.26)
23.66
(0.95)
38.66
(0.93)
152.96
(1.38)
188.94
(1.21)
1160.02
(1.63)
2427.26
(1.79)
1446.93
(1.68)
921.7
(1.57)
371.53
(1.41)
157.53
(1.25)
67.38
(1.08)
24.40
(0.80)
T2 (Untreated bulbs) 14.30
(0.54)
26.08
(0.84)
58.10
(1.19)
113.58
(1.46 )
180.12
(1.46)
453.07
(1.79)
2673.47
(2.20)
4427.23
(2.39)
3041.98
(2.27)
1606.44
(2.07)
1147.87
(1.92)
395.27
(1.70)
266.39
(1.50)
44.37
(1.09)
SEm (±) 0.002 0.003 0.003 0.002 0.001 0.004 0.0003 0.019 0.001 0.001 0.013 0.002 0.014 0.005 CD (0.05) 0.005 0.005 0.006 0.003 0.002 0.007 0.001 0.038 0.001 0.001 0.026 0.004 0.030 0.010
Variety
V1 (Calcutta Single) 11.80
(0.42)
23.27
(0.71)
69.58
(1.75)
128.40
(2.05)
253.03
(2.30)
577.49
(2.59)
2267.62
(3.11)
4630.21
(3.90)
2409.64
(3.14)
1219.59
(2.87)
687.91
(2.64)
361.94
(2.36)
313.49
(2.08)
56.35
(1.48)
V2 (Calcutta Double) 13.95
(0.63)
26.07
(0.94)
53.06
(1.46)
99.96
(1.54)
246.59
(1.96)
385.52
(1.92)
3482.61
(2.64)
5651.53
(2.89)
4323.70
(2.78)
2572.61
(2.59)
1591.17
(2.36)
467.27
(2.06)
187.17
(1.79)
46.80
(1.36)
V3 (Prajwal) 0.00
(0.00)
0.00
(0.00)
0.00
(0.00)
0.00
(0.00)
0.00
(0.00)
0.00
(0.00)
0.00
(0.00)
0.00
(0.00)
0.00
(0.00)
0.00
(0.00)
0.00
(0.00)
0.00
(0.00)
0.00
(0.00)
0.00
(0.00)
SEm (±) 0.003 0.003 0.004 0.002 0.001 0.005 0.0004 0.024 0.001 0.001 0.016 0.002 0.017 0.006 CD (0.05) 0.006 0.006 0.008 0.004 0.003 0.009 0.001 0.047 0.002 0.001 0.032 0.005 0.033 0.012
Note: Figures in parentheses indicate log(x+1) transformed values. * Tuberose bulb was treated with carbosulfan 25EC @ 1000 ppm for 6hrs before planting
Paper Proceedings of Agri Animal 2013 - ISSN 2279-3682
156
Even the comparative graphs [Fig 2, 3, 4] show that with late planting, the chances of
coinciding of monthly yield of spikes with peak nematode population increases. This
asks for avoiding late planting.
3.2 Effect of spacing
With regard to the spacing the highest population of A. besseyi (5144.26 / plant) was
observed in S1 (20×20cm) during July‘2010, while the maximum (2909.61/ plant) was
found in S2 (30×30cm) during August‘ 2010 (Table 2). Here closer spacing supported
more population of foliar nematode than the wider spacing. Dissemination of nematode
mostly happens by passive means e.g. wind, water, farm implements etc. As observed
by Dunn (1997) there must have free moisture on the leaf surfaces to ease the
movement of foliar nematode. They spread easily from one plant to other when foliage
of two plants comes into direct contact. Here in closer spacing there might have every
possibility of infected leaves to come in close contact with the healthy leaves and help
to disseminate nematodes from one plant to the other, while wider spacing might have
reduced the dissemination of nematodes from infected to healthy plants.Swain and Das
(1989) found vertical movement was greater in surface continuously moistened with
water than in smooth surfaces.Foliar nematode (A. besseyi) being an aerial ectoparasite
of plants, prefer dense foliage. Wider spacing could be addressed to the growers for
planting of tuberose for their successful cultivation in A. besseyi endemic areas.
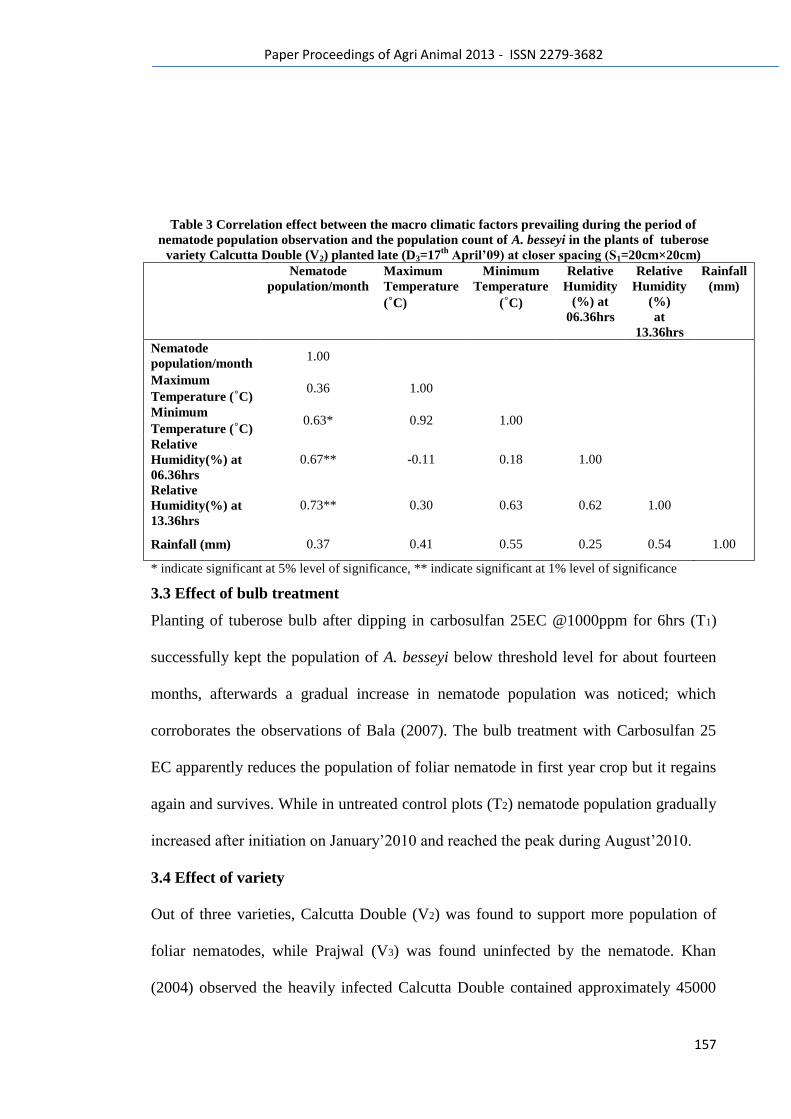
Paper Proceedings of Agri Animal 2013 - ISSN 2279-3682
157
Table 3 Correlation effect between the macro climatic factors prevailing during the period of
nematode population observation and the population count of A. besseyi in the plants of tuberose
variety Calcutta Double (V2) planted late (D3=17th
April’09) at closer spacing (S1=20cm×20cm)
Nematode
population/month
Maximum
Temperature
(˚C)
Minimum
Temperature
(˚C)
Relative
Humidity
(%) at
06.36hrs
Relative
Humidity
(%)
at
13.36hrs
Rainfall
(mm)
Nematode
population/month 1.00
Maximum
Temperature (˚C) 0.36 1.00
Minimum
Temperature (˚C) 0.63* 0.92 1.00
Relative
Humidity(%) at
06.36hrs
0.67** -0.11 0.18 1.00
Relative
Humidity(%) at
13.36hrs
0.73** 0.30 0.63 0.62 1.00
Rainfall (mm) 0.37 0.41 0.55 0.25 0.54 1.00
* indicate significant at 5% level of significance, ** indicate significant at 1% level of significance
3.3 Effect of bulb treatment
Planting of tuberose bulb after dipping in carbosulfan 25EC @1000ppm for 6hrs (T1)
successfully kept the population of A. besseyi below threshold level for about fourteen
months, afterwards a gradual increase in nematode population was noticed; which
corroborates the observations of Bala (2007). The bulb treatment with Carbosulfan 25
EC apparently reduces the population of foliar nematode in first year crop but it regains
again and survives. While in untreated control plots (T2) nematode population gradually
increased after initiation on January‘2010 and reached the peak during August‘2010.
3.4 Effect of variety
Out of three varieties, Calcutta Double (V2) was found to support more population of
foliar nematodes, while Prajwal (V3) was found uninfected by the nematode. Khan
(2004) observed the heavily infected Calcutta Double contained approximately 45000
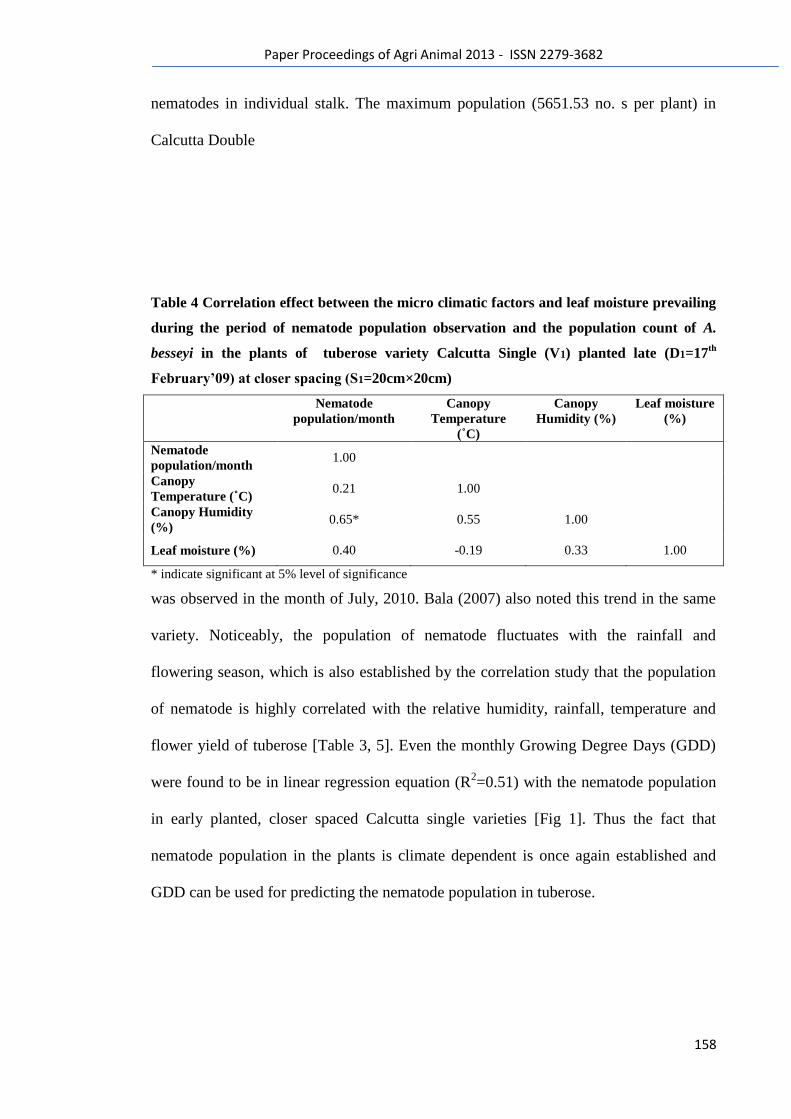
Paper Proceedings of Agri Animal 2013 - ISSN 2279-3682
158
nematodes in individual stalk. The maximum population (5651.53 no. s per plant) in
Calcutta Double
Table 4 Correlation effect between the micro climatic factors and leaf moisture prevailing
during the period of nematode population observation and the population count of A.
besseyi in the plants of tuberose variety Calcutta Single (V1) planted late (D1=17th
February’09) at closer spacing (S1=20cm×20cm)
Nematode
population/month
Canopy
Temperature
(˚C)
Canopy
Humidity (%)
Leaf moisture
(%)
Nematode
population/month 1.00
Canopy
Temperature (˚C) 0.21 1.00
Canopy Humidity
(%) 0.65* 0.55 1.00
Leaf moisture (%) 0.40 -0.19 0.33 1.00
* indicate significant at 5% level of significance
was observed in the month of July, 2010. Bala (2007) also noted this trend in the same
variety. Noticeably, the population of nematode fluctuates with the rainfall and
flowering season, which is also established by the correlation study that the population
of nematode is highly correlated with the relative humidity, rainfall, temperature and
flower yield of tuberose [Table 3, 5]. Even the monthly Growing Degree Days (GDD)
were found to be in linear regression equation (R2=0.51) with the nematode population
in early planted, closer spaced Calcutta single varieties [Fig 1]. Thus the fact that
nematode population in the plants is climate dependent is once again established and
GDD can be used for predicting the nematode population in tuberose.
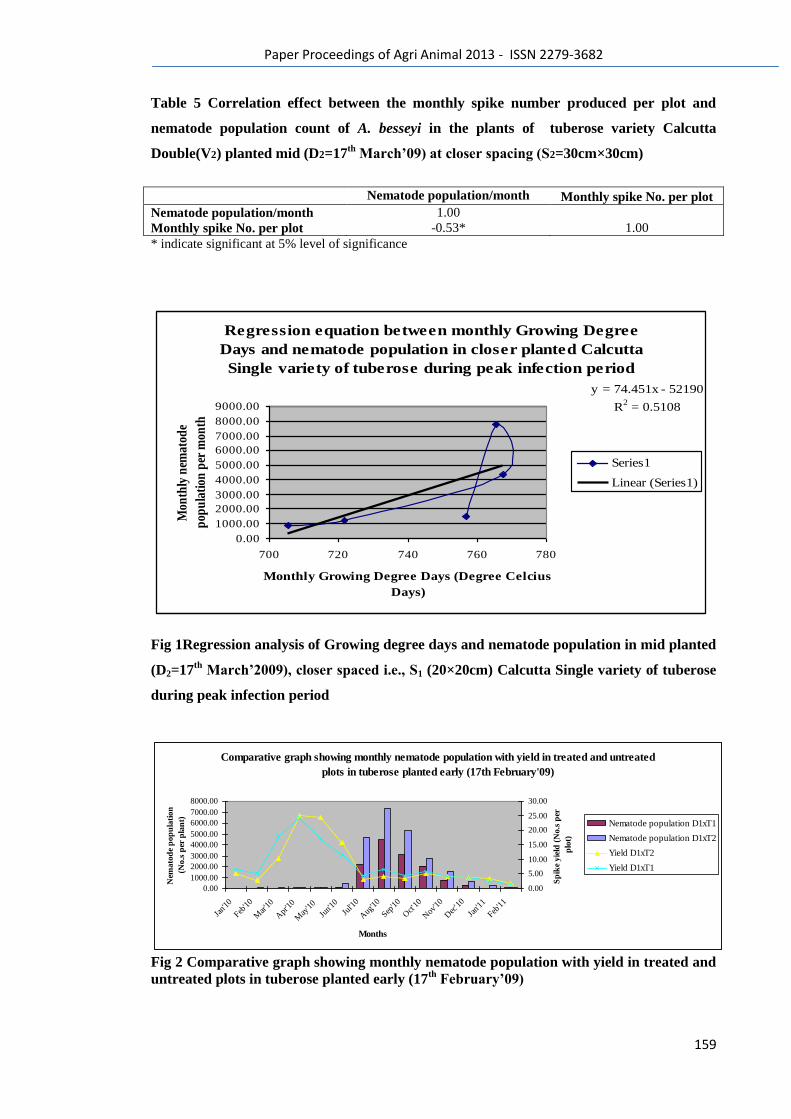
Paper Proceedings of Agri Animal 2013 - ISSN 2279-3682
159
Table 5 Correlation effect between the monthly spike number produced per plot and
nematode population count of A. besseyi in the plants of tuberose variety Calcutta
Double(V2) planted mid (D2=17th
March’09) at closer spacing (S2=30cm×30cm)
Nematode population/month Monthly spike No. per plot
Nematode population/month 1.00
Monthly spike No. per plot -0.53* 1.00
* indicate significant at 5% level of significance
Fig 1Regression analysis of Growing degree days and nematode population in mid planted
(D2=17th
March’2009), closer spaced i.e., S1 (20×20cm) Calcutta Single variety of tuberose
during peak infection period
Fig 2 Comparative graph showing monthly nematode population with yield in treated and
untreated plots in tuberose planted early (17th
February’09)
Regression equation between monthly Growing Degree
Days and nematode population in closer planted Calcutta
Single variety of tuberose during peak infection period
y = 74.451x - 52190
R2 = 0.5108
0.00
1000.00
2000.00
3000.00
4000.00
5000.00
6000.00
7000.00
8000.00
9000.00
700 720 740 760 780
Monthly Growing Degree Days (Degree Celcius
Days)
Mon
thly
nem
atod
e
pop
ula
tion
per
mon
th
Series1
Linear (Series1)
Comparative graph showing monthly nematode population with yield in treated and untreated
plots in tuberose planted early (17th February'09)
0.00
1000.00
2000.00
3000.00
4000.00
5000.00
6000.00
7000.00
8000.00
Jan'10
Feb'10
Mar
'10
Apr
'10
May
'10
Jun'10
Jul'1
0
Aug
'10
Sep'10
Oct'1
0
Nov
'10
Dec
'10
Jan'11
Feb'11
Months
Nem
ato
de
pop
ula
tion
(No.s
per
pla
nt)
0.00
5.00
10.00
15.00
20.00
25.00
30.00
Sp
ike
yie
ld (
No.s
per
plo
t)
Nematode population D1xT1
Nematode population D1xT2
Yield D1xT2
Yield D1xT1
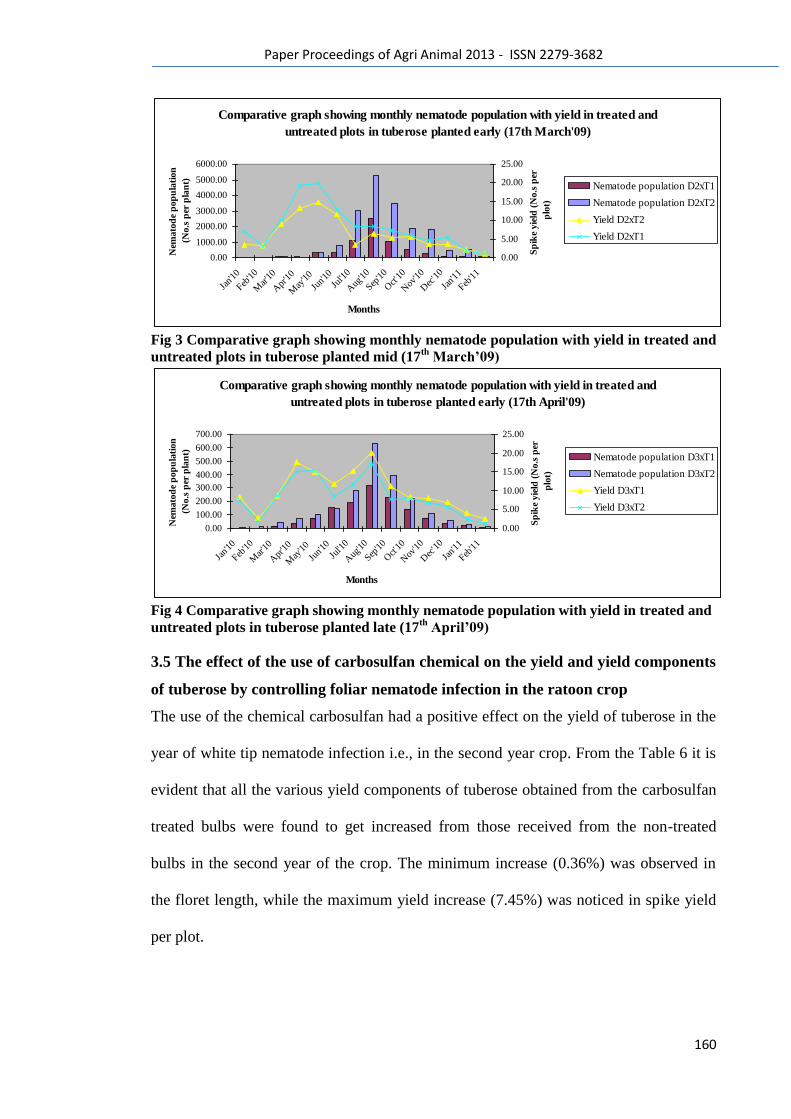
Paper Proceedings of Agri Animal 2013 - ISSN 2279-3682
160
Fig 3 Comparative graph showing monthly nematode population with yield in treated and
untreated plots in tuberose planted mid (17th
March’09)
Fig 4 Comparative graph showing monthly nematode population with yield in treated and
untreated plots in tuberose planted late (17th
April’09)
3.5 The effect of the use of carbosulfan chemical on the yield and yield components
of tuberose by controlling foliar nematode infection in the ratoon crop
The use of the chemical carbosulfan had a positive effect on the yield of tuberose in the
year of white tip nematode infection i.e., in the second year crop. From the Table 6 it is
evident that all the various yield components of tuberose obtained from the carbosulfan
treated bulbs were found to get increased from those received from the non-treated
bulbs in the second year of the crop. The minimum increase (0.36%) was observed in
the floret length, while the maximum yield increase (7.45%) was noticed in spike yield
per plot.
Comparative graph showing monthly nematode population with yield in treated and
untreated plots in tuberose planted early (17th March'09)
0.00
1000.00
2000.00
3000.00
4000.00
5000.00
6000.00
Jan'10
Feb'10
Mar
'10
Apr
'10
May
'10
Jun'10
Jul'1
0
Aug
'10
Sep'10
Oct'1
0
Nov
'10
Dec
'10
Jan'11
Feb'11
Months
Nem
ato
de
po
pu
lati
on
(No
.s p
er p
lan
t)
0.00
5.00
10.00
15.00
20.00
25.00
Sp
ike
yie
ld (
No
.s p
er
plo
t)
Nematode population D2xT1
Nematode population D2xT2
Yield D2xT2
Yield D2xT1
Comparative graph showing monthly nematode population with yield in treated and
untreated plots in tuberose planted early (17th April'09)
0.00
100.00
200.00
300.00
400.00
500.00
600.00
700.00
Jan'10
Feb'10
Mar
'10
Apr
'10
May
'10
Jun'10
Jul'1
0
Aug
'10
Sep'10
Oct'1
0
Nov
'10
Dec
'10
Jan'11
Feb'11
Months
Nem
ato
de
pop
ula
tion
(No.s
per
pla
nt)
0.00
5.00
10.00
15.00
20.00
25.00
Sp
ike
yie
ld (
No.s
per
plo
t)
Nematode population D3xT1
Nematode population D3xT2
Yield D3xT1
Yield D3xT2
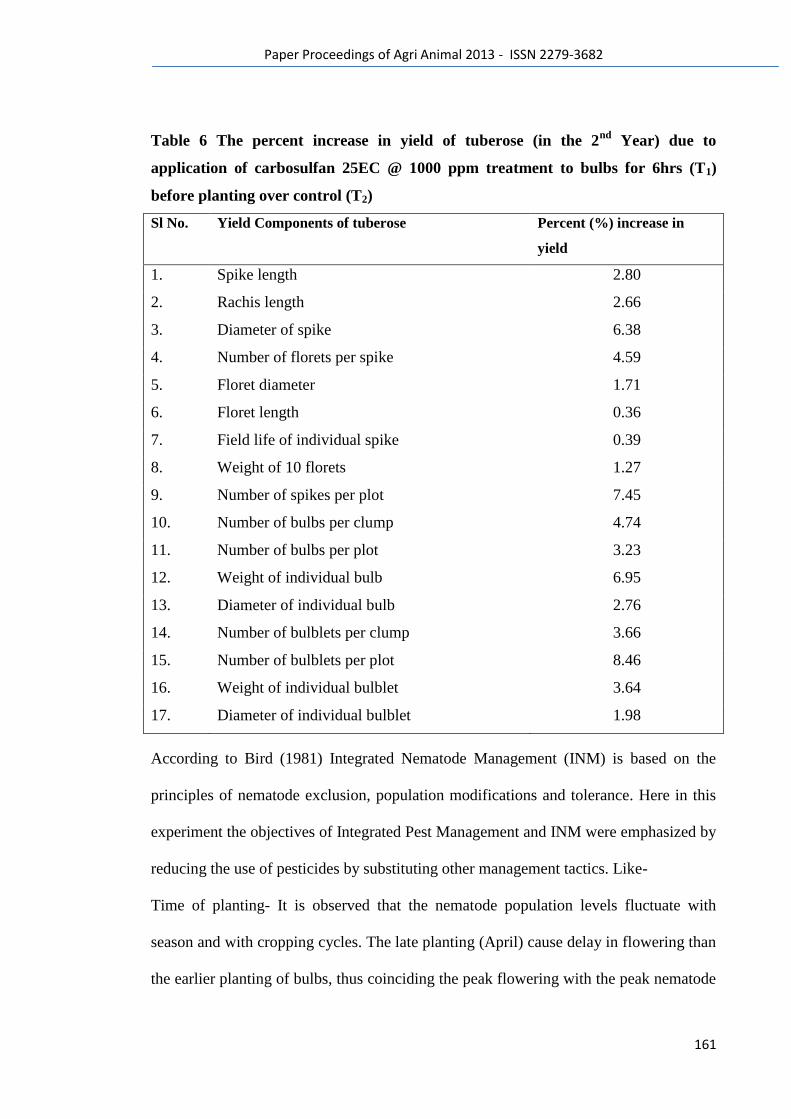
Paper Proceedings of Agri Animal 2013 - ISSN 2279-3682
161
Table 6 The percent increase in yield of tuberose (in the 2nd
Year) due to
application of carbosulfan 25EC @ 1000 ppm treatment to bulbs for 6hrs (T1)
before planting over control (T2)
Sl No. Yield Components of tuberose Percent (%) increase in
yield
1. Spike length 2.80
2. Rachis length 2.66
3. Diameter of spike 6.38
4. Number of florets per spike 4.59
5. Floret diameter 1.71
6. Floret length 0.36
7. Field life of individual spike 0.39
8. Weight of 10 florets 1.27
9. Number of spikes per plot 7.45
10. Number of bulbs per clump 4.74
11. Number of bulbs per plot 3.23
12. Weight of individual bulb 6.95
13. Diameter of individual bulb 2.76
14. Number of bulblets per clump 3.66
15. Number of bulblets per plot 8.46
16. Weight of individual bulblet 3.64
17. Diameter of individual bulblet 1.98
According to Bird (1981) Integrated Nematode Management (INM) is based on the
principles of nematode exclusion, population modifications and tolerance. Here in this
experiment the objectives of Integrated Pest Management and INM were emphasized by
reducing the use of pesticides by substituting other management tactics. Like-
Time of planting- It is observed that the nematode population levels fluctuate with
season and with cropping cycles. The late planting (April) cause delay in flowering than
the earlier planting of bulbs, thus coinciding the peak flowering with the peak nematode
Paper Proceedings of Agri Animal 2013 - ISSN 2279-3682
162
infection [Fig 2, Fig 3 and Fig 4]. Hence the control of nematodes can be obtained by
manipulating the dates to avoid periods of peak nematode activity and prevent reduction
in yield.
Tolerant cultivars- Growing nematode resistant cultivar- Prajwal (Khan & Ghosh, 2007)
give the grower an assured yield under the nematode infection threat and also suiting the
need of the grower.
Spacing-Using different spacings, modification of natural environment can be made.
Here it is obvious that the closer spacing increase the nematode infection providing
congenial environment to nematode population increase.
Chemical control- Judicious use of nematicides can protect the crop from nematode
infection without undesirable effects on the environment. Here the use of non-fumigant
nematicide- carbosulfan caused 7.45% increase in yield in the second year over the non
treated ones.
Conclusions
The control of nematodes can be obtained by manipulating the dates to avoid periods of
peak nematode activity and prevent reduction in yield. Growing nematode resistant
cultivar Prajwal give the grower an assured yield of tuberose flower. The closer spacing
increases the nematode infection providing congenial environment to nematode
population increase, thus wider recommended spacing is followed. Judicious use of
nematicides can protect the tuberose from nematode infection without undesirable
effects on the environment. Here the use of non-fumigant nematicide- carbosulfan
caused 7.45% increase in yield in the second year over the non treated ones.
Paper Proceedings of Agri Animal 2013 - ISSN 2279-3682
163
References
Bala, S. C. 2007. Studies on the foliar nematode, Aphelenchoides besseyi Christie
infesting tuberose, Polianthes tuberosa L. in West Bengal. Ph.D Thesis, Department of
Entomology. Bidhan Chandra Krishi Viswavidyala, Nadia,West Bengal.
Bala, S. C., Sengupta, A. and Mukhopadhyay, A. K. 2011. Investigation on influence of
climatic factors on damage potentiality of foliar nematode Aphelenchoides besseyi
Christie infesting tuberose, Polianthes tuberosa L. Paper presented in the International
Conference on ‘Tropical IslandEcosystems: Issues related to Livelihood, Sustainable
Development andClimate Change’ held at the Central Agricultural Research Institute,
ICAR, Port Blair, Andaman & Nicobar Islands, India on and from 23-26th March,2011.
Bird, G.W. 1981. Integrated Nematode Management for plant production. In: Plant
parasitic Nematodes. Vol-III (Eds- B.M. Zuckerman & R.A. Rhode) Academic Press.
USA. pp 355-372.
Chakraborti, H. S. and Ghosh, S. C. 1993. Studies on the floral malady of Polianthes
tuberosa L. in West Bengal. J. Mycopathol. Res., 31: 109-115.
Dunn, R. A. 1997. Foliar nematodes as pests of plants. SP221, one of a series of
theDepartment of Entomology and Nematology, Florida Cooperative Extension Service,
Institute of Food and Agricultural Sciences, University of Florida. Available online
http://edis.ifas.ufl.edu.
Khan, M. R. 2004. Observation on foliar nematode, Aphelenchoides besseyi in tuberose
(Polianthes tuberosa L) in West Bengal. Ann. Pl. Protect. Sci., 12(1): 106-109.
Khan, M. R. and Ghosh, S. 2011. Survival and population dynamics of foliar
nematode, Aphelenchoides besseyi infecting tuberose in West Bengal, India. Indian J.
Nematolo., 41(1): 47-51.
Paper Proceedings of Agri Animal 2013 - ISSN 2279-3682
164
Khan, M. R. and Ghosh, S. 2007. Evaluation of tuberose cultivars against foliar
nematode Aphelenchoides besseyi. In: National Symposium on Nematology in21st
Century: Emerging Paradigms Nov, 22-23, Nematological Society ofIndia held at
Assam, India. pp77.
Khan, M. R. and Pal, A. K. 2001. Plant parasitic nematodes associated with tuberose
(Polianthes tuberosa L.) in West Bengal. Ann. Pl. Protec. Sci., 9 357-359.
Khan, M. R., Karmakar, S. G. and Maiti, C. S. 1999. Investigation on severe infestation
by Aphelenchoides besseyi in tuberose (Polianthes tuberosa). Nat.Sem. On
Nematological Res. In India, Challenges and Preparedness for theNew Millenium,
C.S.A. Univ. of Agri & Tech., Kanpur, Dec17. N.S.I., NewDelhi, pp20.
Mukhopadhyay, A. K., Bala, S.C. and Goswami, T. N. 2010. Investigation on the
occurrence and distribution of Aphelenchoides besseyi Christie on tuberose in West
Bengal. Paper presented in the National Symposium on ‘FloricultureScenario in the
Changing Global Perspective’ organized by the Department ofFloriculture and
Landscaping and held at the FTC, Bidhan Chandra Krishi Viswavidyalaya, Mohanpur,
Nadia, West Bengal, India, from 16th-18th April.
Sivakumar, C. V. 1987. The rice white tip nematode in Kanyakumari district, Tamil
Nadu, India. Indian J. Nemat., 17(1): 72-75.
Swain, P. K. and Das, S. N. 1989. Studies on the behaviour of white tip nematode,
Aphelenchoides besseyi. Orissa J. Agril. Res., 2(2): 111-114.

Paper Proceedings of Agri Animal 2013 - ISSN 2279-3682
165
11
Paper Proceedings of Agri Animal 2013 - ISSN 2279-3682
166
Influence of fungal bacterial biofilm on sustainability of maize
agriculture
U.V.A. Buddhika1*
, G. Senevirtane1, C.L. Abayasekara
2
1Institue of fundamental studies, Hantana road, Kandy Sri Lanka
2Department of Botany, University of Peradeniya, Sri Lanka
Abstract
Nitrogen fixing bacteria with rhizosphere fungi form fungal bacterial biofilms which
can be developed as biofilmed biofertilizers (BFBF) as an extension of biofertilizer
research Application of BFBF could save chemical fertilizer use (CF) in 50% for many
crops with wide range of beneficial biological functions Therefore, present study
focused to evaluate the effect of developed BFBF for maize cultivation under reduced
CF input and to investigate soil health Experiment was conducted in three farmer fields
Treatments were 100% CF (positive control) and50% CF+BFBF At the harvest standard
yield parameters were taken and differentially treated soil from one site was tested
compared to the home garden soil (without agrochemicals application) as the control for
seedling vigor Results showed 50% CF+BFBF gave a comparable yield with 100% CF,
and confirm biofilm action to compensate nutrient reduction Amongst, two farmer
fields gave significant yield increase in the application of 50% CF+BFBF over the
100% CF This indicates the biofilm action in maize rhizosphere for enhanced nutrient
use efficiency for yield increase which could address the maize demand worldwide In
addition, seedling vigor was not significant in 50% CF+BFBF and home garden soil,
whereas the reduced vigor in 100% CF application This indicates the effects of
community based approach of microbial biofilms in increasing soil health for the
sustainability of the maize agroecosystems to restore depleted agroecosystems due to
CF application
Key words: Biofilms, Biofilmed biofertilizers, Seedling vigor, Maize, rhizoremediation
Paper Proceedings of Agri Animal 2013 - ISSN 2279-3682
167
Introduction:
Plant growth promoting rhizobacteria (PGPR) as biofertilizer have been investigated by
many microbiologists, since their significant biological functions. Biological nitrogen
fixation, production of plant growth regulators, detoxiafication of heavy metals and
organic toxins, pathogen suppression are most important biological functions exerted by
the PGPR. Different genera including Pseudomonas sp, Bacillus sp, Frankia sp, etc are
established in rhizosphere have been identified as alternatives to CF use, thus reduce
enhance dependencies on it. Because, they increase nutrient use efficiency (Alikhani et
al, 2006), produce plant growth regulators (Tien et al, 1979) and convert atmospheric
nitrogen into plant available forms through biological nitrogen fixation (BNF) (Tiwary
et al, 1998). In addition, they improve soil properties, such as organic matter content,
total N in soil (Wu et al, 2004) and increase soil porosity by gluing soil particles
together Furthermore, PGPR play an important role in plant health through the
induction of systemic resistance providing host defenses against plant pathogens
(Ramamoorthy et al, 2001).
Heavy metal contamination in soil losses the soil health which leads for loss of soil
fertility and crop yield in long run. Microorganisms from some genera are having an
inherent ability to remove xenobiotics and the toxic products in soil and rhizosphere.
There by bioremediation technology was arisen and the microorganisms are adopted to
replace conventional methods of remediation. For instances heavy metal adapted
rhizobacteria were tested in phytoremediation strategies and they play a significant role
for enhance plant growth through the enhancing soil fertility by detoxifying them. The
mechanisms involved in the transfer and mobilization of heavy metals by rhizobacteria
is very important, since it has been found out that the large communities of
microorganisms are effectively enrolled with this (Yan et al, 2007).
However, biofilm formation of diverse microbes in the ecosystem provides more
resistance to the environmental perturbation (Boles et al, 2004). Furthermore, the
presence of functionally diverse bacteria are able to increases the ability of biofilms to
resist an environmental stress Therefore, self-generated diversity in biofilms provides a
form of biological insurance to protect plants from adverse conditions (Boles et al,
2004; Seneviratne and Kulasooriya, 2013). Mostly, soil microbes are found attached to
surfaces, in multicellular assemblies known as biofilms. Individual cells of microbes
Paper Proceedings of Agri Animal 2013 - ISSN 2279-3682
168
adhere to surfaces and also to each other through the secretion of complex matrix
comprising a variety of extracellular polymeric substances (EPS) including
exopolysaccharides, proteins and DNA (Ramey et al, 2004)
Such beneficial biofilms that is being developed in vitro using nitrogen fixing bacteria
and rhizosphere fungi are called biofilmed biofertilizer (BFBFs). Development of such
biofertilizers provides a new mean in biofertilizer research to address current issues
arising in the agriculture (Seneviratne, 2009). Developed BFBF have performed over
mono or mixed cultures of biofertilizers in many ways, such as increased nitrogenase
activity (Seneviratne and Jayasinghearachchi, 2003; Buddhika et al, 2012a), maize seed
germination and vigor (Buddhika et al, 2012a), increased soil ammonium availability in
maize soil (Buddhika et al, 2012b) In addition, it has been reported the developed BFBF
reduce CF use in 50% for tea cultivation (Seneviratne et al, 2011), rice (Weeraratna et
al, 2012) Also, previous studies for maize in green house condition showed the role of
BFBF in reducing CF use in 50% (Buddhika et al, 2012) Therefore present study is
focused to evaluate the effect of developed BFBF for maize growth in field condition
under reduced CF input of 50% and to check the possibility of BFBF to increase the soil
health in subsequent season.
Material Methodology
Research was carried out in three farmer fields of maize growing regions in Sri Lanka,
Kand eketiya, Mahiyanganaya during a successive seasons in 2012. These fields were
previously cultivated by application of CF Soil characyeristics of these fields were
mentioned in the table 1.
Inoculums
Developed BFBF for maize at IFS has used in the study It was developed by using
Aspergillus sp with seven bacterial species (Azorhizobium sp, Rhizobium sp,
Acetobactor sp, Azotobactor sp and Azospirillum sp and two unidentified gram –
nitrogen fixing bacterial species) All microorganisms were inoculated in to law costly
Paper Proceedings of Agri Animal 2013 - ISSN 2279-3682
169
developed medium and let them to biofilm formation (Seneviratne et al, 2011). Cell
concentration of the inoculum is 10 10
.
Seed materials:
Maize seed material, a hybrid variety (Pasific) which was recommended by Department
of Agriculture was used in the experiment
Innoculation and fertilizer application
The rate of BFBF application is 10L/ha. In the inoculation of BFBF, both soil and seed
inoculation were done. Seed inoculation was done after diluting it with the ratio of 1:16
with water and followed by the seeds soaking in the suspension of BFBF for two hour
Remaining solution was used for spraying the field Seeds which were selected to be
sowed in the full CF treatments were soaked in tap water during the time of soaking. In
CF application, the soil was fertilized with N, P and K at rate of 200, 100 and 50 kg ha-1
as urea, triple super phosphate and muriate of potash, respectively Half of nitrogen was
applied at sowing time and residue at the start of reproductive stage after one month as
fertilizer to dressing was applied. At the same time BFBF was applied at above rate
Seeds were placed at 5 cm depth.
Land preparation
Land preparation was done in both fields according to the recommended method of the
Department of Agriculture, Sri Lanka. The experiment was conducted with two
fertilizer treatments; 100% CF (recommended dose as mentioned above as positive
control), 50% CF + BFBF. BFBF only treatment was not used, since it is not
recommended by the BFBF inventors (Seneviratne et al, 2011). The treatments were
applied to existing field blocks of about half acre. At harvest, plant samples were
collected from three squares of 2 x 2 m2 in random positions of the blocks Yield
parameters of number of seeds in a cob, thousand seed weight, total seed weight and
total number of seeds in a cob were recorded Plant density of each square was recorded
since seeding by different farmers was inconsistent.
Paper Proceedings of Agri Animal 2013 - ISSN 2279-3682
170
Effect of BFBF on soil health
Soil samples after the harvest was collected from the treatments of 100% CF, 50% CF +
BFBF to do this experiment A garden soil collected from the IFS served as the control,
since it was not fertilized with any CF Three pots (replicates) under one treatment were
arranged in a CRD from the above treatments and seeds were sown and watered daily
After seven days, number of germinated seeds was counted, shoots and root lengths
were measured, in order to calculate germination percentage and vigor index Vigor
index was calculated using following formula Vigor index = (mean root length + mean
shoot length) × percentage germination (Abdul-Baki and Anderson, 1973)
Experimental design and statistical analysis
Three blocks were separated from the half acre of the area under the treatment and
therefore, there is no true replication Therefore, data analysis was done considered them
as pseudoreplicates using general liner mixed model ANOVA to overcome the errors
from spatially autocorrelation Normality of data was determined by the Anderson-
Darling test and normality and the constancy were confirmed using MINITAB 14
Means of diverse characters were compared using probability difference test (PDIFF)
using SAS 1998 Lowest probability differences than 005 were selected as significant at
95% probability level
Vigor index was analyzed using one way ANOVA and means were compared using
Tukey‘s multiple mean comparison test Normality of data was determined by the
Anderson-Darling test and normality and the constancy were confirmed using
MINITAB 14
Results and discussion:
Results showed a comparable yield in the application of 50%CF + BFBF compared to
100% CF application in all growth parameters except seed yield in farmer fields 2 and 3
(Fig 1) Because there was a significant yield increase in farmer fields 2 and 3 compared
to full recommended CF application This results agree with the previous reports of the
Paper Proceedings of Agri Animal 2013 - ISSN 2279-3682
171
effects of BFBFs for tea cultivation (Senevirathne et al, 2011), rice (Weerarathne et al,
2012) in Sri Lanka under 50% reduction of chemical fertilizer inputs and also, agreed
with our previous results for maize in green house condition (Buddhika et al, 2012)
Thus, results confirm the reduction of 50 % CF (NPK) is not affected to all growth and
yield parameters since, reduced amount of CF has been compensated by the biofilm
action in soil-plant system of maize Biofilm microbes in rhizosphere and their dense
colonization on root surfaces (Seneviratne and Jayasinghearachchi, 2005) support to
increase nutrient use efficiency for maize growth, under 50% reduction of CF use It has
been found the increased soil ammonium availability and reduced Phosphate in the
application of BFBF to maize cultivation under 50% reduction of CF (Buddhika et al,
2012c) to regulate nutrient demand.
Application of biofertilizers as mono or combine culture for maize have been reported
for their efficacy in enhancing growth and development for Maize (Wu et al, 2004,
Gholami et al, 2009, Nezarat and Gholami, 2009) However, present results confirms,
biofilm action on replacing 50% CF and yield increase over 100% CF application Yield
increase of BFBF in this manner over 100% CF application could save 50% of expenses
for CF import and would address the issue of maize demand in Sri Lank.
Results showed a variation of vigor index in different fertilizer treatments. When the
reduced dose of CF was coupled with BFBFs, seedling vigor enhanced significantly
(Fig 2). Vigor index of BFBF treated soil was not significantly different from that of the
garden soil Nevertheless, 100% CF treated soil reduced seedling vigor significantly in
comparison to the 50% CF+BFBF and garden soil. Therefore, results confirm the effect
of CF on reducing seedling vigor when the same soil was used in the subsequent season
for cultivation. That is because, continuous cultivation of the same crop results in
accumulation and auto inhibition of plants due to the secreted alellochemicals (Singh et
al, 1999). Further, toxicity increases with CF application, due to phytotoxins in
rhizosphere (Monnier et al, 2011). However, reduced rates of CF, when coupled with
BFBF allow detoxification of allelochemicals (i.e phenolic compounds). Microbial
community in soil-plant system was observed to be effective in detoxification, as
described by Zeng and Mallik (2006) in mycorrhizae.
Application of BFBFs to agricultural soil induces dormant microbial cells, to be
transferred them to active cells, thereby reinstate depleted soil microbiome and
Paper Proceedings of Agri Animal 2013 - ISSN 2279-3682
172
consequences the increased microbial diversity (Seneviratne and Kulasooriya, 2013).
Diversity of soil microbes in soil-plant system assists for enormous rolls, since
microbial diversity is the major indicator in soil quality and health to build up a robust
soil and thus to lead for sustainable agroecosystems (Tilman et al, 1996). These results
agreed with the previous report of Seneviratne et al (2011) to restore the degraded
agroecosystems in the application of BFBF in tea cultivation. Effect of BFBF on
rhizoremediation in this manner aids for sustainability of maize agriculture in Sri Lanka
with increased biological functioning which cannot be observed in the CF application. It
has been found out that the large communities of microorganisms are effectively
enrolled with detoxification of toxins accumulated in rhizosphere (Yan et al, 2007).
They mobilize heavy metals through release of chelating agents, organic acids,
phosphate solubilization and redox changes to results to making them available for
plants (Mohammad et al, 2008) and then enhanced the seedling vigor. Therefore,
effective selection of proper microbial isolates from rhizosphere promotes crop
productivity through their significance in rhizoremediation and, would be specific in
restoration programmes. Therefore, application of BFBF contributes to strengthen
biodiversity-ecosystem functioning relationship (Langenheder et al, 2010) through
reduced CF use and improved microbial action.
Conclusion
Biofilmed biofertilizers which turned a new page in biofertilizer research opened
avenues for microbiologist to handle microbes in microbial communities for sustainable
agriculture Halving CF use in the BFBFs application could save half of the expanse for
CF import, thus contributing to country‘s economy Biological functions of biofilm
microbes seemingly aid to detoxification of toxins accumulated in the soil-plant system
during cropping with the CF input Thus, they assist to build up a robust soil in
agroecosystems for increased seed germination and vigor even in the subsequent season
This could protect agricultural soils, steering to sustainable agroecosystems Therefore,
the BFBFs can be recommended strongly as soil microbial ameliorator in the
development of sustainable agroecosystems that could gain both economical and
ecological benefits
Paper Proceedings of Agri Animal 2013 - ISSN 2279-3682
173
Acknowledgements:
We are thank full to Mr. Ekanayaka and Mr. Kosala at IFS for their assistance in doing
field experiments. Futther, we would like to thank Ms. Karunaratne and MA Lal,
senior technical officer and laboratory attendant, respectively for their assistance in
dong laboratory studies.
REFERENCE
Abdul, Baki AA & Anderson, JD 1973, ‗Vigor determination in soy bean seed by
multiple criteria‘, Crop Science, vol. 13, pp. 630-633
Alikhani, HA, Saleh-Rastin, N & Antoun, H 2006, ‗Phospphate Solubilization activity
of Rhizobia native to Iranian Soils‘, Plant & Soil vol. 287, pp. 35-41
Boles, B R, Thoendel, M & Singh, P K 2004, ‗Self-generated diversity produces
‗insurance effects‘‘, Proc Natl Acad Sci U S A vol. 101, pp. 16630–16635
wwwpnasorg_cgi_doi_101073_pnas0407460101
Gholami, A, Shahsavani, S, & Nezarat, S 2009, ‗The Effect of Plant Growth Promoting
Rhizobacteria (PGPR) on germination, seedling growth and yield of maize‘, World
Academy of Science, Engineering &Technology, vol. 49, pp. 19- 24.
Langenheder, S, Bulling, MT, Solan, M & Prosser, JI 2010, ‗Bacterial biodiversity
ecosystem functioning relations are modified by environmental complexity, PLoS ONE,
vol. 5, no. 5, e10834 doi,101371/journalpone0010834
Monier, JM, Lindow, SE 2004, ‗Frequency, size, &localization of bacterial aggregates
on bean leaf surfaces‘, Applied & Environmental Microbiology, vol.70, pp. 346-355.
Nezarat, S &Gholami, A 2009, ‗Screening plant growth promoting rhizobacteria for
improving seed germination, seedling growth &yield of maize‘, Pakisthan Journal of
Biologicl Science vol. 12, no. 1, pp. 26-32.
Ramamoorthy, V, Viswanathan, R, Raguchander, T, Prakasam, V & Samiyappan, R,
2001, ‗Induction of systemic resistance by plant growth promoting rhizobacteria in crop
plants against pests &diseases‘, Crop Protection, vol. 20, pp. 11
Paper Proceedings of Agri Animal 2013 - ISSN 2279-3682
174
Ramey BE, Maria K, von Bodman SB & Clay F 2004, ‗Biofilm Formation in Plant-
Microbe Associations‘, Plant Science ArticlesPaper,
18http://digitalcommonsuconnedu/plsc_articles/18
Seneviratne, G & Kulasooriya, SA 2013, ‗Reinstating soil microbial diversity in
agroecosystems: The need of the hour for sustainability and health‘, Agricultural
&Ecosystem Environment, vol. 164, pp. 181-182
Seneviratne, G 2009,‘Collapse of beneficial microbial communities &deterioration of
soil health: a cause for reduced crop productivity‘, Current Science, vol. 20, pp. 5
Seneviratne, G, Jayasekare, APDA, De Silva, MSDL & Abeysekera, UP
2011,‘Developed microbial biofilms can restore deteriorated conventional agricultural
soils‘, Soil Biology & Biochemistry, vol. 43, no 5, pp. 1059-1062.
Singh HP, Batish DR, Kohli RK 1999, ‗Autotoxicity, concept, organisms,
&ecologicalsignificance‘, Crit Rev Plant Sci, vol. 18, pp. 757–72
Tien, TM, Gaskin, MH, Hubbel, DH 1979, ‗Plant growth substances produced by
Abrasilense and their effect on the growth of pearlmillet (Pennisetum americanum L.)‘
Applied and Environmenatl Microbiology, vol. 37, pp. 1016–1024
Tilman, D, Wedin, D, Knops, J 1996, ‗Productivity &sustainability influenced by
biodiversity in grassl&ecosystems; Nature, vol. 379, pp. 718-720
Tiwary, DK, Abuhasan, MD & Chattopadhyay 1998, ‗ Studies on the effect of
inoculation with Azotobactor &Azospirillum on growth, Yield &quality of banana‘,
Indian Journal of Agriculture, vol. 42, pp. 235- 240
Wu, SC, Cao, ZH, Li, ZG, Cheong, KC & Wong, MH 2005, ‗effects of biofertilizers
containing N fixer, P &K solubilizers & AM fungi on maize growth: A green house
trial‘, Geoderma, vol. 125, pp. 155-166.
Zeng R, Mallik A 2006, ‗Selected ectomycorrhizal fungi of black spruce (Picea
mariana) can detoxify phenolic 484 compounds of Kalmia angustifolia’,Journal of
Chemical Ecology, vol. 32, pp. 1473-1489.
Seneviratne, G & Jayasinghearachchi, HS 2003, ‗Mycelial colonization by
bradyrhizobia & azorhizobia‘, Journal of Bioscience, vol. 28, pp. 243-247
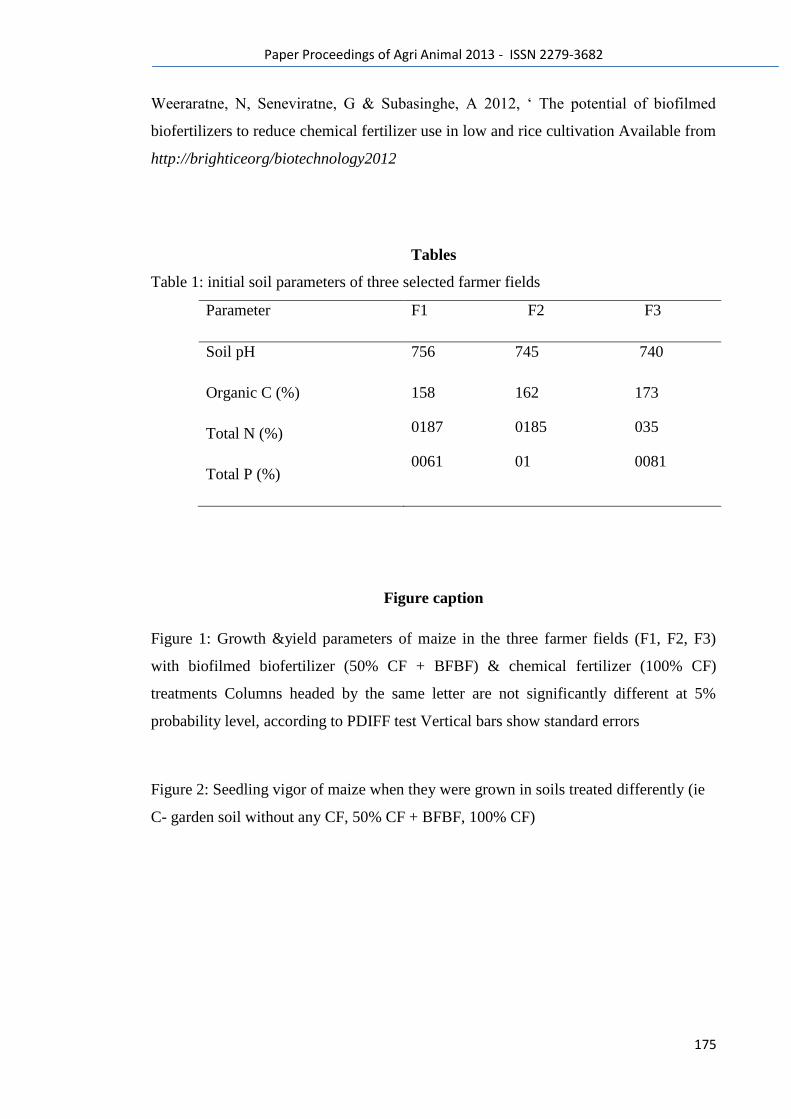
Paper Proceedings of Agri Animal 2013 - ISSN 2279-3682
175
Weeraratne, N, Seneviratne, G & Subasinghe, A 2012, ‗ The potential of biofilmed
biofertilizers to reduce chemical fertilizer use in low and rice cultivation Available from
http://brighticeorg/biotechnology2012
Tables
Table 1: initial soil parameters of three selected farmer fields
Parameter F1 F2 F3
Soil pH
Organic C (%)
Total N (%)
Total P (%)
756 745 740
158 162 173
0187 0185 035
0061 01 0081
Figure caption
Figure 1: Growth &yield parameters of maize in the three farmer fields (F1, F2, F3)
with biofilmed biofertilizer (50% CF + BFBF) & chemical fertilizer (100% CF)
treatments Columns headed by the same letter are not significantly different at 5%
probability level, according to PDIFF test Vertical bars show standard errors
Figure 2: Seedling vigor of maize when they were grown in soils treated differently (ie
C- garden soil without any CF, 50% CF + BFBF, 100% CF)
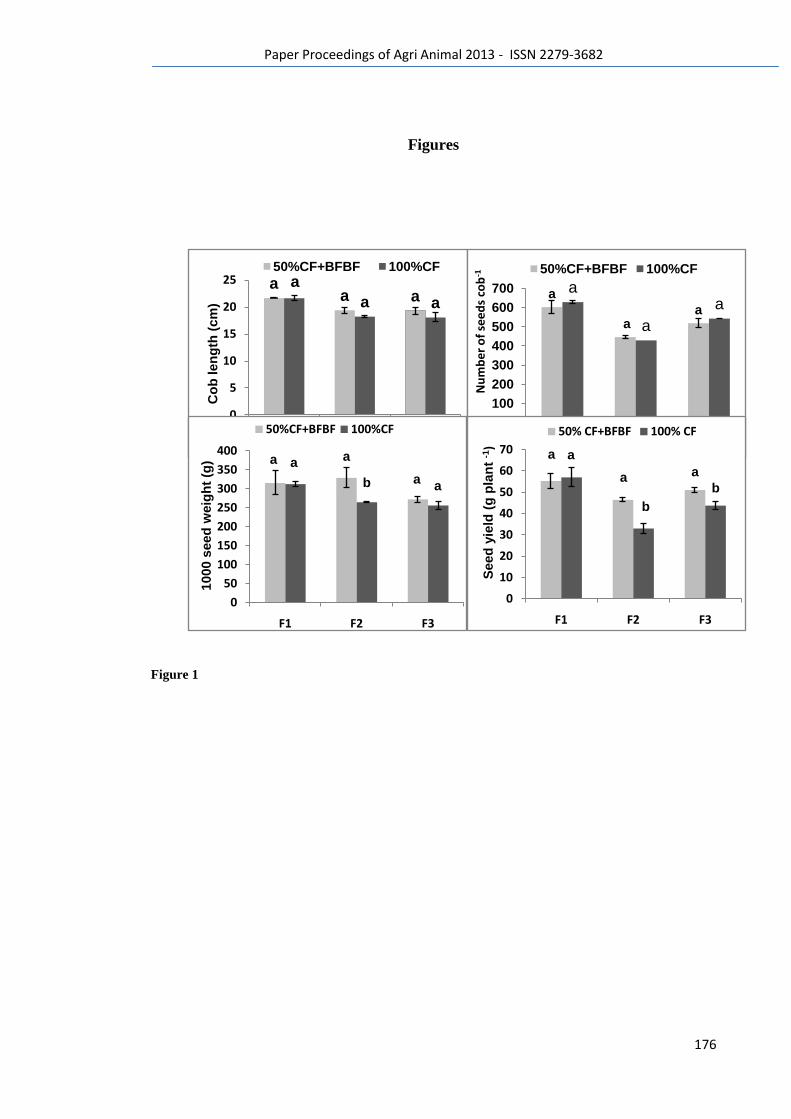
Paper Proceedings of Agri Animal 2013 - ISSN 2279-3682
176
aa a
a
a a
0
5
10
15
20
25
F1 F2 F3
50%CF+BFBF 100%CF
Co
b len
gth
(cm
)
a
aa
a
a
a
0
100
200
300
400
500
600
700
F1 F2 F3
Nu
mb
er
of
see
ds
cob
-1 50%CF+BFBF 100%CF
Figures
Figure 1
a a
a
a
b a
0
50
100
150
200
250
300
350
400
F1 F2 F3
50%CF+BFBF 100%CF
1000 s
eed
weig
ht
(g)
a
a a
a
b
b
0
10
20
30
40
50
60
70
F1 F2 F3
50% CF+BFBF 100% CF
Seed
yie
ld (
g p
lan
t -1
)
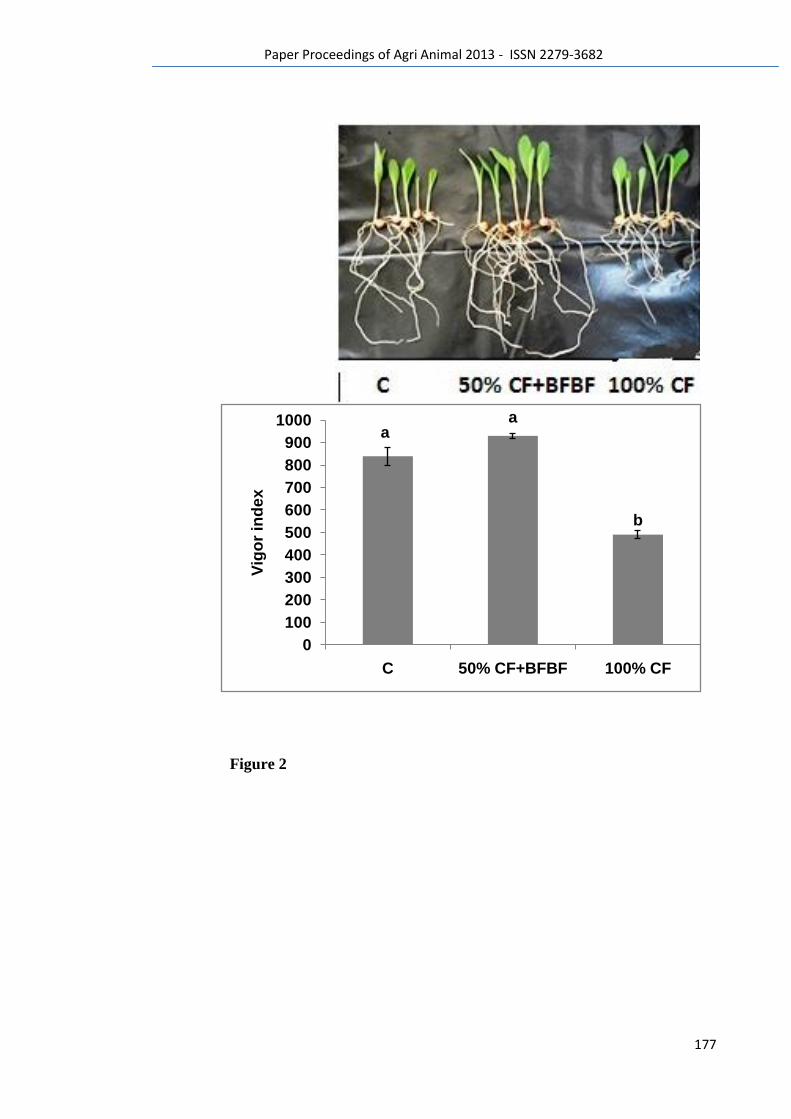
Paper Proceedings of Agri Animal 2013 - ISSN 2279-3682
177
Figure 2
aa
b
0
100
200
300
400
500
600
700
800
900
1000
C 50% CF+BFBF 100% CF
Vig
or
ind
ex

Paper Proceedings of Agri Animal 2013 - ISSN 2279-3682
178
12
Paper Proceedings of Agri Animal 2013 - ISSN 2279-3682
179
Effects of different rates of nitrogen in the form of both ammonium and nitrate on
the growth of tomato plant.
Astill M. Nafa1 and Zedan .F. Omar
Faculty of agricultural, Al zytona University, Airport road Ben waaled city. Libya.
Abstract
Thegrowth of tomato plants in this experiment was comparable under different supply
rate and forms of nitrogen.As high concentrations of ammonium were toxic to tomato
growth, a supply rate of 1 mM nitrogen was identified as a low supply rate and 4 mM
nitrogen as a high supply rate. The growth of the tomato plants at each concentration
were comparable irrespective of N form allowing the effect of N forms and supply rate
to be compared directly. Although the growth of the plants was comparable under each
condition, there was significant effect on other factor such as foliar P. Tomato plants
supplied with 1 mM and 4 mM nitrate, increasing supply rates of N in the form of
ammonium led to a decrease in total P content. The growth of tomato and total content
of nitrogen in plant tissue were affected by both nitrogen form and supply rate.
Key words: Nitrogen form, supply rate and plant growth
1.1 Introduction
Nitrogen is the main component of amino acids, proteins, nucleic acids and
other cellular constituents that are necessary for plant development; therefore the
availability of nitrogen is often the major nutrient factor limiting the yield of crop
plants (Manuel Ruiz and Romero, 1999; Boquet and Breitenbeck, 2000; Nagel et al.,
2001; Cechin and de Fatima Fumis, 2004, Lea and Morot-Gaudry, 2001)). Not only is
the supply rate of nitrogen important to plant growth but also the form of nitrogen,
either as inorganic forms such as nitrate and ammonium (Clarkson and Hanson, 1980;
Cramer and Lewis, 1993) or organic forms such as amino acids (Nasholm and Persson,
2001).
The impact of nitrogen form and supply rate on the plant growth has received
great attention by plant physiologists, biologists and ecologists; and has increased the
current understanding of nitrogen metabolism in plants(Trapani et al., 1999,Walch-Liu
et al., 2000). Also it has been reported that abundant nitrogen supply increases the
number of meristems produced by plants and their growth, thus encouraging shoot
formation and growth in most plants (Lawlor et al., 1988; Lawlor et al., 1989). The
impact of nitrogen form and supply rate on plant is not only restricted to plant
Paper Proceedings of Agri Animal 2013 - ISSN 2279-3682
180
morphology, but extends to the underlying physiology including photosynthesis
(Lawlor et al., 1989)(Claussen and Lenz, 1999; Cechin and de Fatima Fumis, 2004), the
activity of a number of plant enzymes and hormones (Lawlor et al., 1989; Claussen and
Lenz, 1999; Nagel et al., 2001; Collier et al., 2003), the total content of nitrogen-
containing compounds such as amino acids and proteins (Sanchez et al.,
2004),carbohydrate content (Paul and Driscoll, 1997) and the interaction with uptake of
a number of mineral elements such as Fe, K+, Ca
2+, Mg
2+ and P (Zou et al., 2001;
Zubillaga et al., 2002). In order to accommodate these influences of both nitrogen form
and supply rate, plants must be able to adapt their growth, development and metabolism
accordingly. For example, plants adjust the balance between shoot growth and root
growth in response to changing nitrogen supply. When nitrate (but not ammonium) is
detected by the root, a systemic signal is generated that stimulates leaf expansion
(Walch-Liu et al., 2000); however the accumulation of nitrate in shoot has a negative
effect on root growth (Scheible et al., 1997).
Root-to-shoot signalling mechanisms include the potential role of nitrate itself as
a long-distance signal communicating nitrogen availability (Wang et al., 2002). It is
clear that plant morphology, physiology and biochemistry are affected by nitrogen form
and supply rate; however nitrogen alters plant composition much more than any other
mineral nutrient.(Walch-Liu et al., 2005; Takei et al., 2001; Takei et al., 2002;
Sakakibara, 2003; Jang et al., 1997; Moore et al., 2003; Beuve et al., 2004). The aims
of those experiments were firstly to characterise plant growth, development and
composition under these growth conditions by measuring the plant height, the
accumulation and partitioning of dry matter in shoots and roots, shoot: root ratio.
Secondly, to identify the appropriate supply regimes for tomato plants for subsequent
experiments.
2.2 Materials and methods
2.2.1 Growth conditions of tomato plants
Seeds of tomato plants (Lycopersicon esculentum) Mill. cultivar Moneymaker
(Cf0- susceptible to Cladosporium fulvum) were incubated in darkness on moist filter
paper for 6 days at 25 oC to promote germination. Germinated seeds were transplanted
individually (1 plant per pot) to black plastic pots (13.5 13.5 13 cm) filled with
Paper Proceedings of Agri Animal 2013 - ISSN 2279-3682
181
vermiculite (Medium size) (East Riding Horticulture) and then grown in greenhouse
conditionsfor 6 weeks.
2.2.2 Nitrogen nutrient treatments
Plants were watered with 40% Long Ashton Nutrient Solution (pH 6) modified
to contain different concentrations of nitrogen as NO3-
(supplied as KNO3) or NH4+
(supplied as (NH4)2SO4). Plants were watered with 0.5, 1, 2, 4 and 8mM NO3- or 1, 2, 4,
and 8mM NH4+. Nutrient solution (250 ml) was applied daily. Plants were kept
moistened with water throughout the experimental period by standing each pot on a
damp piece of capillary matting. Each treatment consisted of 8 replicate plants
randomly distributed within the cabinet in the greenhouse.
2.2.3 Measurements of plant growth
The measurements of the plant height started fourteen days after transplanting and
continued until the end of experiment at the rate of once a week. The relative growth
rate (RGR) of the plants was calculated based on the change in shoot length per week
over the growth period. For the measurement of the dry weight of shoots and roots,
tomato plants were harvested six weeks after transplanting. At harvest, the fresh shoots
and roots of tomato plants were separated at the crown region. Roots were washed to
remove vermiculite residues, rinsed three times in tap water and then blotted dry. Both
fresh shoots and roots of tomato plants were placed in separate envelopes and dried at
54 oC for two weeks.
2.2.4 Determination of total N and P content
On the day of harvesting (42 days post-transplantation), leaf material was harvested,
placed in a paper envelope and dried at 54˚C for two weeks for determination of the
total amount of nitrogen and phosphorus using the Kjeldahl method. This method
converts all of the nitrogenous and phosphate-containing compounds in a tissue sample
into ammonia and orthophosphate respectively via the Kjeldahl digestion technique
(Allen, 1989). The amount of ammonium and phosphate can be then determined using
a spectrophotometer (N is measured at 590nm and P at 690nm).
Approximately 30-100 mg of dry plant material per replicate was weighed and
then placed in a 30 ml boiling tube. Boiling tubes and glass marbles large enough to
stopper the end of each tube were acid washed prior to use. Five ml of acid solution (3
Paper Proceedings of Agri Animal 2013 - ISSN 2279-3682
182
parts conc. sulphuric acid and 1 part salicylic acid) and then 1 level spatula of catalyst
(1 part copper sulphate to 9 parts lithium sulphate) were added to each sample. A
marble was placed on each tube to allow reflux of the acid solution during the digestion
and prevent the sample from drying out. The samples were heated at 370-390 o
C for 8
hours in a fume hood. Once cooled the samples were diluted with distilled water to a
total volume of 50 ml. After thorough mixing 15 ml was used for N and P analysis.
Samples were analysed for ammonium and orthophosphate via flow injection analysis
(Tecator Flow injection analysis system). Recovery of a certified reference hay powder
was used for both N and P.
2.2.5 Statistical analyses
Analysis of variance (ANOVA) was used to determine statistically significant
differences between the measurements (Minitab 13.3; Minitab Inc., State College, PA,
USA).
3.3 Results
3.3.1 The impact of nitrogen form and supply rate on the growth of tomato plants.
The effect of varying nitrogen supply rate, supplied as nitrate or ammonium, on
the growth of tomato plants is shown in Figure 1.1. Plant height was greatest when
plants were supplied with 8 mM nitrate - lower concentrations of nitrate resulted in
progressively smaller plants (Fig. 1.1 A). The relative growth rate (RGR) of plants
grown on nitrate was greatest 3 weeks after transplantation and then declined (Fig 1.1
B). This peak in RGR was observed in all nitrate treatments. The greater the RGR at
week three, the larger the eventual size of the plant. In contrast, plants grew less well
when supplied with ammonium and toxicity effects were apparent at the highest
concentration (8 mM) supplied. The RGR was much more constant throughout the
course of the experiment and the height of the plants at the end of the experiment did
not vary as much as in nitrate-fed plants (Fig.1.1 C, D).
Figure 1.2 shows pictures of the plants taken at the end of the experiment, 6
weeks after transplantation. The observed plant growth at the end of the experiment
was consistent with the measurements of the plant height made throughout the
experiment. Plants supplied with 8 mM nitrate were large and bushy with well
developed root systems whilst those grown on 0.5 mM and 1 mM nitrate were much
smaller and had less developed root systems. Although a gradation in size was apparent
Paper Proceedings of Agri Animal 2013 - ISSN 2279-3682
183
in plants supplied with ammonium, the differences were less marked and there was a
less striking effect on root development.
Figure 1.3 shows the dry weight of these plants and the root: shoot ratio (RSR).
When nitrogen was supplied as nitrate, the dry weight of shoots and roots was greater
than that of tomato plants that had been supplied with ammonium (Fig. 1.3 A & B). An
increase in nitrogen supply rate of both forms (nitrate and ammonium) was associated
with an increase in shoots of tomato plants, except at the highest concentration (8 mM)
of ammonium. The roots of tomato plants were also affected by nitrogen form and
supply rate (Fig 1.2 C, D). The highest dry weight of roots was recorded in plants fed
with 8 mM nitrate (Fig.1.3 A), while the lowest dry weight of roots was found in plants
fed with 8 mM ammonium (Fig.1.3 B). The RSR of plants supplied with nitrate was
highly responsive to concentration.
The RSR was greatest in plants supplied with 0.5 mM nitrate (RSR = 0.356 +/- 0.017)
and was least in plants fed with 8 mM nitrate (0.164 +/- 0.008). .In contrast, the RSR
was much less responsive to ammonium supply rate - there was no statistically
significant difference in RSR of plants supplied with 1, 2 or 4 mM ammonium and was
only reduced in plants fed 8 mM ammonium where toxicity effects were apparent.
3.3.2 The total content of nitrogen and phosphorus in tomato leave
The total nitrogen and phosphorus content of leaves of tomato plants grown at
different supply rates of nitrate or ammonium are presented in Figure 1.4. There was no
significant difference in the total nitrogen content of tomato leaves supplied with 0.5
mM, 1 mM and 2 mM nitrate; however a significant increase in nitrogen content was
observed when the supply rate of nitrate was increased to 4 mM or 8 mM (Fig 1.4 A).
The impact of increasing supply rates of ammonium on total content of nitrogen in
tomato leaves is presented in Figure 1.4 B. Again, the total foliar content of nitrogen
increased with an increase in the supply rate of ammonium; however the highest content
of nitrogen was recorded in tomato leaves fed with 8 mM ammonium. There was no big
difference in total content of nitrogen in tomato leaves fed with 1 mM of nitrate or
ammonium (~ 17 and ~20 mg g-1
dry weight of leaves) respectively, also ~ 28 mg g-1
in
tomato leaves treated with 4 mM nitrate or ammonium (Fig 1.4 A,B).
No significant differences in the total content of P were found in tomato leaves grown
with different supply rates of nitrate (Fig 1.4 C); however, the total content of P differed
significantly in tomato leaves fed with ammonium (Fig 1.4 D). The phosphorus content
of tomato leaves declined with increased supply rates of ammonium, except at the
Paper Proceedings of Agri Animal 2013 - ISSN 2279-3682
184
highest supply rate of ammonium (8 mM) when toxicity was apparent and the total
content of phosphorus increased (Fig 1.4 D).
4.4 Discussion
4.4.1 The impact of nitrogen form and supply rate on the growth of tomato plants
In order to understand the impact of nitrogen form and supply rates on the
growth of tomato plants, plants were grown with different supply rates of nitrogen in the
form of nitrate or ammonium and various measurements of plant growth and
development made. Increasing supply rates of nitrate from 0.5 mM to 8 mM led to a
marked increase in plant growth.
Plant height and dry matter accumulation increased over the entire range of nitrate
supply rates examined. This finding is consistent with nitrogen as a major determining
factor of plant growth and development (Schortemeyer et al., 1997; Trapani et al.,
1999). Although measurements of relative growth rate peaked at 3 weeks after
transplantation and then declined, these measurements were made on plant height and
did not account for the development of side branches which were numerous in 8 mM
nitrate-fed plants. This is consistent with an abundant nitrogen supply increasing the
number of meristems produced by plants and their growth, thus encouraging shoot
formation and growth in most plants (Lawlor et al., 1988; Lawlor et al., 1989). In
contrast, plants supplied with nitrogen in the form of ammonium showed a more
complex growth response. Increasing supply rates of ammonium from 1 mM to 4 mM
led to an increase in plant growth, although the RGR was relatively uniform throughout
the study period. However, plants supplied with 8 mM ammonium were smaller than
those supplied with 4 mM ammonium.
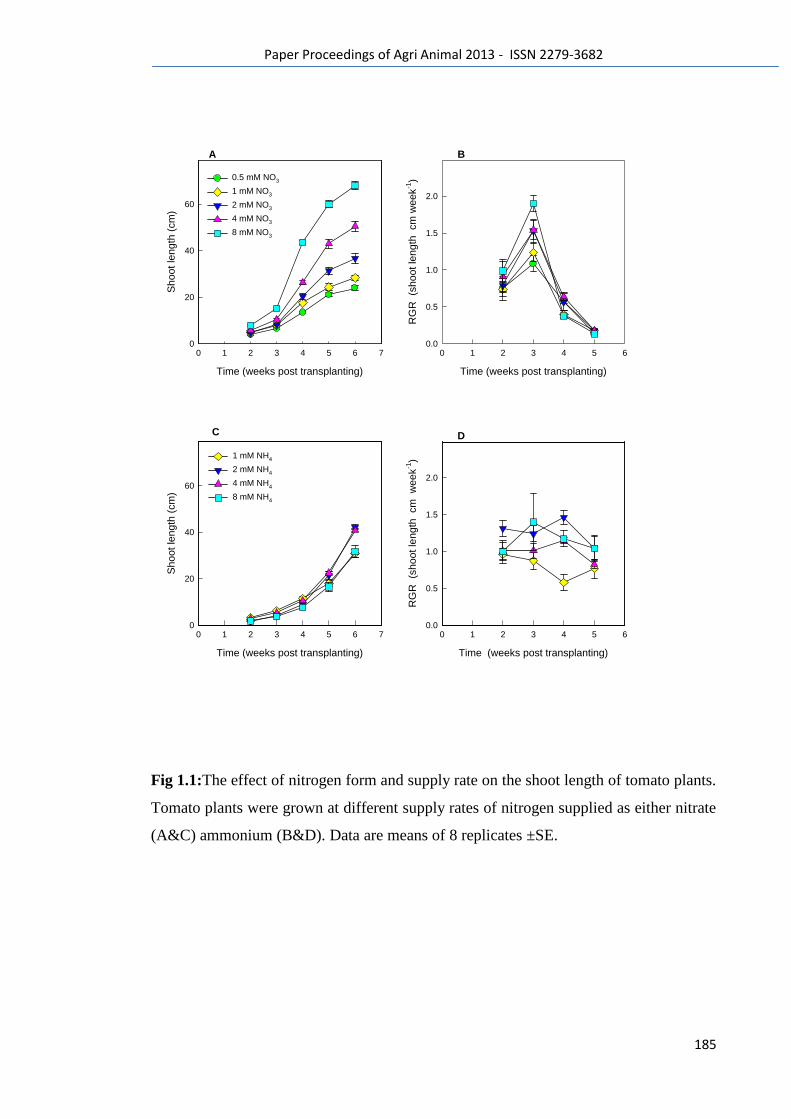
Paper Proceedings of Agri Animal 2013 - ISSN 2279-3682
185
Fig 1.1:The effect of nitrogen form and supply rate on the shoot length of tomato plants.
Tomato plants were grown at different supply rates of nitrogen supplied as either nitrate
(A&C) ammonium (B&D). Data are means of 8 replicates ±SE.
A
Time (weeks post transplanting)
0 1 2 3 4 5 6 7
Shoot le
ngth
(cm
)
0
20
40
60
0.5 mM NO3
1 mM NO3
2 mM NO3
4 mM NO3
8 mM NO3
C
Time (weeks post transplanting)
0 1 2 3 4 5 6 7
Shoot le
ngth
(cm
)
0
20
40
60
1 mM NH4
2 mM NH4
4 mM NH4
8 mM NH4
D
Time (weeks post transplanting)
0 1 2 3 4 5 6
RG
R (s
hoot le
ngth
cm
w
eek
-1)
0.0
0.5
1.0
1.5
2.0
B
Time (weeks post transplanting)
0 1 2 3 4 5 6
RG
R (s
hoot le
ngth
cm
week
-1)
0.0
0.5
1.0
1.5
2.0
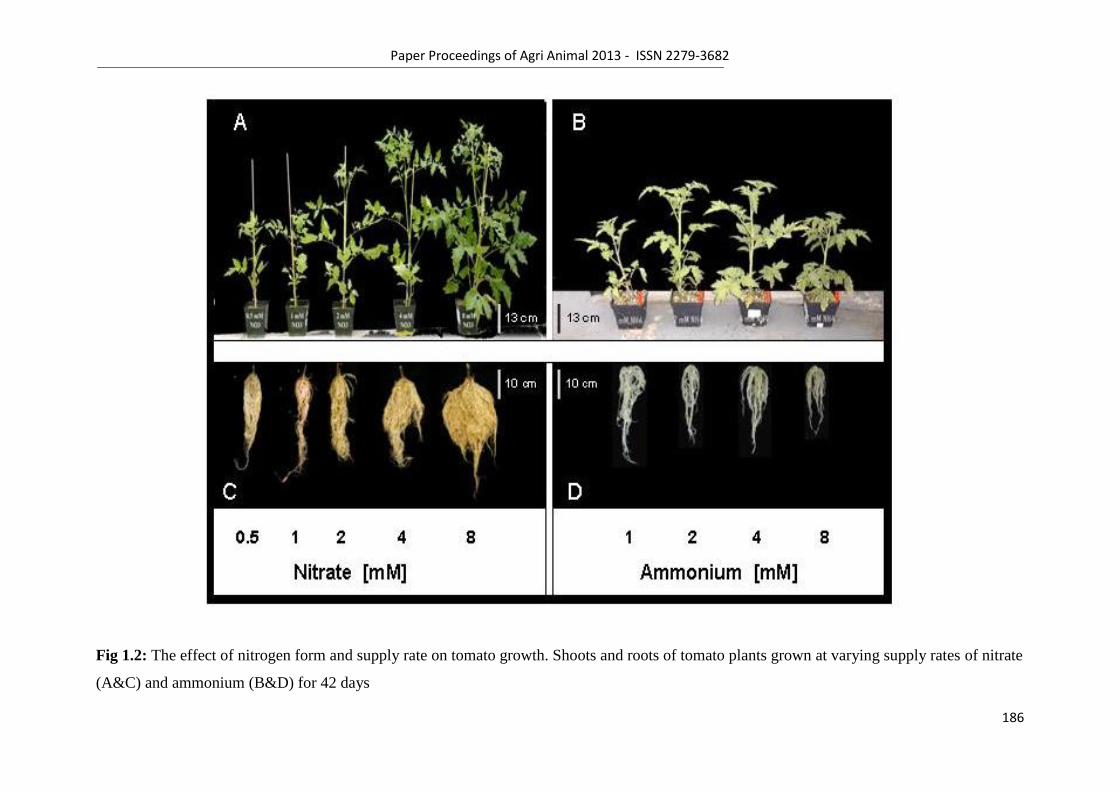
Paper Proceedings of Agri Animal 2013 - ISSN 2279-3682
186
Fig 1.2: The effect of nitrogen form and supply rate on tomato growth. Shoots and roots of tomato plants grown at varying supply rates of nitrate
(A&C) and ammonium (B&D) for 42 days
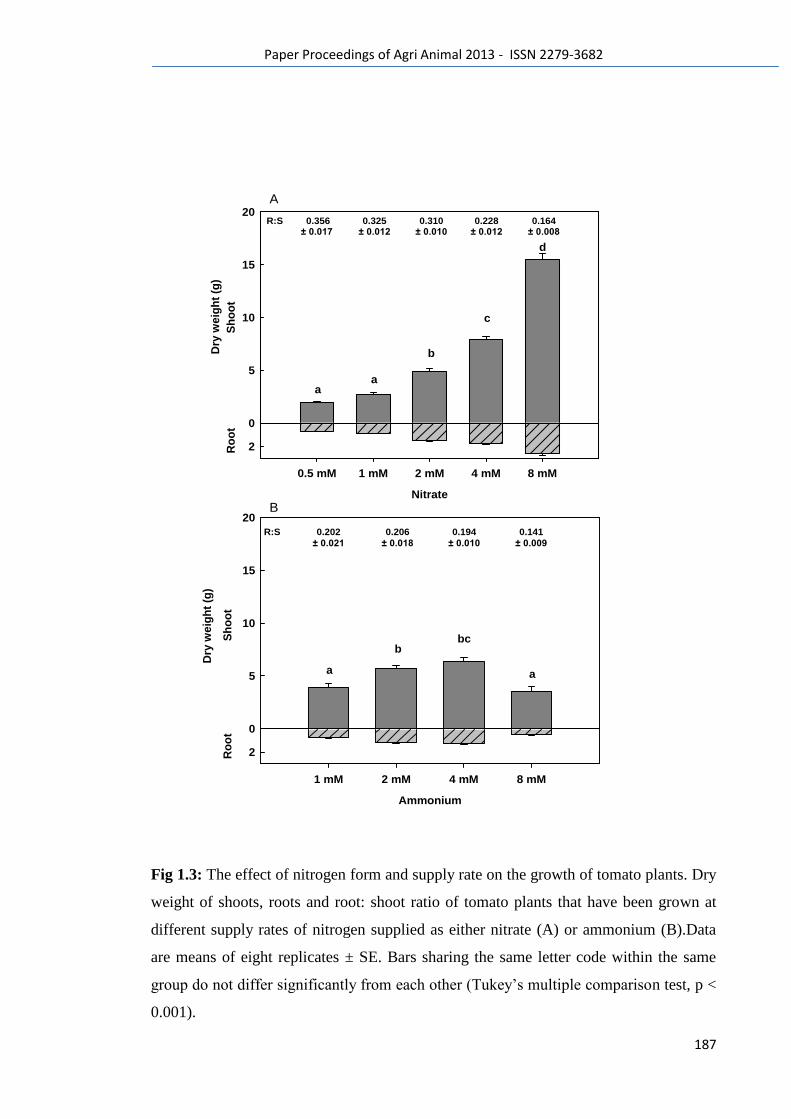
Paper Proceedings of Agri Animal 2013 - ISSN 2279-3682
187
Fig 1.3: The effect of nitrogen form and supply rate on the growth of tomato plants. Dry
weight of shoots, roots and root: shoot ratio of tomato plants that have been grown at
different supply rates of nitrogen supplied as either nitrate (A) or ammonium (B).Data
are means of eight replicates ± SE. Bars sharing the same letter code within the same
group do not differ significantly from each other (Tukey‘s multiple comparison test, p <
0.001).
Sh
oo
t
0
5
10
15
20
Nitrate
0.5 mM 1 mM 2 mM 4 mM 8 mM
Ro
ot
2
Dry
we
igh
t (g
)R:S 0.356
± 0.017 0.325
± 0.0120.310
± 0.0100.228
± 0.0120.164
± 0.008
aa
b
c
d
Sh
oo
t
0
5
10
15
20
Ammonium
1 mM 2 mM 4 mM 8 mM
Ro
ot
2
a
bbc
a
Dry
we
igh
t (g
)
0.202
± 0.021
0.206
± 0.018
0.194
± 0.010
0.141
± 0.009
R:S
A
B
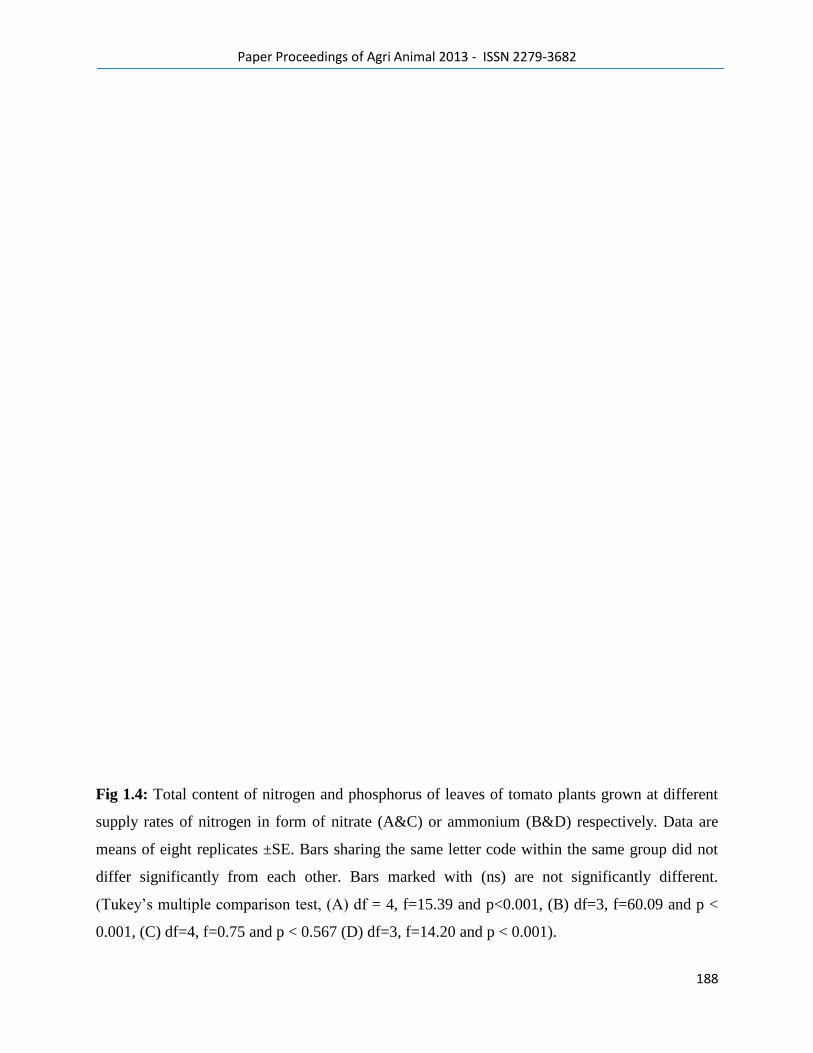
Paper Proceedings of Agri Animal 2013 - ISSN 2279-3682
188
Fig 1.4: Total content of nitrogen and phosphorus of leaves of tomato plants grown at different
supply rates of nitrogen in form of nitrate (A&C) or ammonium (B&D) respectively. Data are
means of eight replicates ±SE. Bars sharing the same letter code within the same group did not
differ significantly from each other. Bars marked with (ns) are not significantly different.
(Tukey‘s multiple comparison test, (A) df = 4, f=15.39 and p<0.001, (B) df=3, f=60.09 and p <
0.001, (C) df=4, f=0.75 and p < 0.567 (D) df=3, f=14.20 and p < 0.001).
A
Nitrate [mM]
0.5 1 2 4 8
N (
mg g
-1 d
ry m
atter
of le
aves)
0
10
20
30
40
50
60C
Nitrate [mM]
0.5 1 2 4 8
P (
mg g
-1 d
ry m
atter
of le
aves)
0
2
4
6
8
10
B
Ammonium [mM]
1 2 4 8
N (
mg g
-1 d
ry m
atter
of le
aves)
0
10
20
30
40
50
60D
Ammonium [mM]
1 2 4 8
P (
mg g
-1 d
ry m
atter
of le
aves)
0
2
4
6
8
10
a a a
b
bns
ns
ns
ns
ns
a
ab
b
c
a
b
c
a
Paper Proceedings of Agri Animal 2013 - ISSN 2279-3682
189
Toxicity caused by ammonium nutrition observed in many plant species is thought to
occur for several reasons including proton extrusion that is associated with ammonium uptake,
cytosolic pH disturbances, displacement of crucial cations such as K+ and Mg
2+, shifts in plant
carbohydrate status (Kronzucker et al., 2001) and the high energetic cost of pumping NH4+
back
out of cells (Britto et al., 2001; Britto and Herbert, 2002). It has been demonstrated that high
ammonium supply impairs the growth of plants compared to nitrate–grown plants (van
Beusiichem et al., 1988; Cramer and Lewis, 1993). This finding is consistent with the results in
this chapter that tomato plants grew best when nitrogen was supplied in the form of nitrate and
that high supply rates of ammonium (8mM) were toxic to tomato plants.
In addition to plant growth, the root:shoot ratio (RSR) was significantly affected by
nitrogen form and supply rate. The RSR of plants was greatest at low nitrogen supply rates
although tomato plants were much more responsive to nitrate than to ammonium. The well-
documented increase in root to shoot ratio under nitrogen deficiency has been correlated to shift
in endogenous phytohormone levels, with an increase in the abscisic acid and decrease in
cytokinins in particular (Palmer et al., 1996). The greater effect of nitrate on RSR compared
with ammonium is consistent with nitrate acting as the principal signal influencing RSR as
described in section 1.1.
As 8 mM ammonium resulted in toxicity effects, 1 mM and 4 mM nitrogen treatments
were selected as ‗low‘ and ‗high‘ nitrogen supply rates for further experiments. Plants grew to a
comparable extent when supplied with these concentrations of nitrogen whether supplied as
nitrate or ammonium. Plants supplied with high nitrogen were approximately twice the size of
those supplied with low nitrogen. It is important to recognise, however, that plant growth at
‗high‘ supply rates was still N limited as further increases in height and biomass accumulation
could be achieved with greater supply rates of nitrate.
4.4.2 Did nitrogen form and supply rate alter the total content of N and P in tomato leaves?
In order to understand the impact of nitrogen form and supply rate on the total nitrogen
and phosphorus content of tomato leaves, samples of six week old tomato leaves were harvested
Paper Proceedings of Agri Animal 2013 - ISSN 2279-3682
190
and the total content of N and P determined as described in section 2.2.3. The total content of
nitrogen in leaves of tomato plants grown at 4 mM and 8 mM nitrate was greater (~1.5-fold) than
that of leaves from plants grown at 0.5 - 2 mM nitrate. However, a much greater effect was
observed in plants grown with different supply rates of ammonium. Whilst the N content of
plants grown at 1, 2 and 4 mM ammonium increased with increasing supply rate, and were
comparable to nitrate fed plants, the N content of plants supplied with 8 mM ammonium were
much greater than in any other treatment. This finding might be interpreted as a result of
increased nitrogen assimilation and subsequent growth in nitrate–grown plants. While the
activity of nitrate reductase (NR) and other essential enzymes that are responsible for nitrogen
assimilation in plants were clearly affected by different factors including the external supply of
nitrogen (Claussen and Lenz, 1999; Stohr, 1999; Imai et al., 2005), it can be assumed that
nitrate-grown plants have been able to assimilate nitrate efficiently at a rate appropriate to
support the observed growth. This is also likely to be true of plants supplied with 1 - 4 mM
ammonium. However, at the 8 mM ammonium supply rate, the toxicity effects of high
ammonium have inhibited plant growth leading to an accumulation of N within the foliar tissue.
This increase may not be attributed to an increased activity of NR and other related enzymes of
nitrogen assimilation but to the impact of ammonium toxicity on general metabolic processes of
these plants.
Whilst there were no significant differences in the total content of P of tomato leaves
supplied with different concentrations of nitrate, the P content of tomato plants supplied with
ammonium declined with increasing N supply over the 1 - 4 mM range, but then increased
significantly at the 8 mM supply rate. The latter can again be attributed to the toxicity of high
ammonium supply rates limiting plant growth hence P taken up by the root system, albeit
inefficiently, accumulated in the foliar tissues. The reduction in P content of tomato leaves
supplied with 1 - 4 mM ammonium might be attributed to increased proton extrusion as a result
of ammonium assimilation. The decreased pH of the medium would result in a decrease in the
uptake of P by the plant roots. Such decreases in P content have been shown to have great effects
on both the rate of leaf expansion and photosynthetic rate per leaf area of sunflower suggesting
that phosphorus allowed more efficient use of supplied nitrogen (Lawlor, 1993; Rodraguez et al.,
1998; Zubillaga et al., 2002).
Paper Proceedings of Agri Animal 2013 - ISSN 2279-3682
191
References
Allen, S.E. (1989). Chemical analysis of ecological mateials. (Blackwell Scientific Publications).
Beuve, N., Rispail, N., Laine, P., Cliquet, J. B., Ourry, A., and Ledeunff, E. (2004). Putative
role of γ-aminobutyric acid (GABA) as a long-distance signal in up-regulation of nitrate uptake
in Brassica napus L. Plant, Cell and Environment, 27, 1035-1046.
Boquet, D.J., and Breitenbeck, G.A. (2000). Nitrogen rate effect on partitioning of nitrogen
and dry matter by cotton. Crop Science, 40, 1685-1693.
Britto, D.T., and Herbert, J.K. (2002). NH4+ toxicity in higher plants: a critical review. Journal
of Plant Physiology, 159, 567-584.
Britto, D.T., Siddiqi, M.Y., Glass, A.D.M., and Kronzucker, H.J. (2001). Futile
transmembrane NH4+ cycling: A cellular hypothesis to explain ammonium toxicity in plants.
Plant Biology, 98, 4255-4258.
Cechin, I., and de Fatima Fumis, T. (2004). Effect of nitrogen supply on growth and
photosynthesis of sunflower plants grown in the greenhouse. Plant Science, 166, 1379-1385.
Clarkson, D.T., and Hanson, J.B. (1980). The mineral nutrition of higher plants. Annual
Review of Plant Physiology, 31, 239-298.
Claussen, W., and Lenz, F. (1999). Effect of ammonium or nitrate nutrition on net
photosynthesis, growth, and activity of the enzymes nitrate reductase and glutamine synthetase in
blueberry, raspberry and strawberry. Plant and Soil, 208, 95-102.
Collier, M., Fotelli, M., Nahm, M., Kopriva, S., Renneberg, H., Hanke, D., and Gessler, A.
(2003). Regulation of nitrogen uptake by Fagus sylvatica on a whole plant level - interactions
between cytokinins and soluble N compounds. Plant, Cell and Environment, 26, 1549-1560.
Cramer, M.D., and Lewis, O.A.M. (1993). The influence of nitrate and ammonium nutrition on
the growth of wheat (Triticum aestivum ) and maize (Zea mays ) Plants. Annals of Botany, 72,
359-365.
Imai, K., Suzuki, Y., Makino, A., and Mae, T. (2005). Effects of nitrogen nutrition on the
relationships between the levels of rbcS and rbcL mRNAs and the amount of ribulose 1.5-
bisphosphate carboxylaseoxygenase synthesized in the eighth leaves of rice from emergence
through senescence. Plant, Cell and Environment, 28, 1589-1600.
Paper Proceedings of Agri Animal 2013 - ISSN 2279-3682
192
Jang, J.C., Leon, P., Zhou, L., and Sheen, J. (1997). Hexokinase as a sugar sensor in higher
plants. The Plant Cell, 9, 5-19.
Kronzucker, H.J., Britto, D.T., Davenport, R.J., and Tester, M. (2001). Ammonium toxicity
and the real cost of transport. Trends in Plant Science, 6, 335-337.
Lawlor, D. (1993). Photosynthesis: molecular, physiological and environmental processes.
(Burnt Mill, Harlow: London Scientific and Technical.).
Lawlor, D., Kontturi, M., and Young, A. (1989). Photosynthesis by flag leaves of wheat in
relation to protein, ribulose bisphosphate carboxylase activity and nitrogen supply. Journal of
Experimental Botany, 40, 43-52.
Lawlor, D., Boyle, F., Keys, A., Kendall, A., and Young, A. (1988). Nitrate nutrition and
temperature effects on wheat: a synthesis of plant growth and nitrogen uptake in relation to
metabolic and physiological processes. Journal of Experimental Botany, 39, 329-343.
Lea, P.J., and Morot-Gaudry, J.F. (2001). Plant Nitrogen. Berlin; London: Springer, pp.344-
364.
Lichtenthaler HK, Wellburn WR. 1983. Determination of total carotenoids and chlorophylls a
and b of leaf extracts in different solventsBiochem. Soc. Trans591- 592.
Manuel Ruiz, J., and Romero, L. (1999). Cucumber yield and nitrogen metabolism in response
to nitrogen supply. Scientia Horticulturae, 82, 309-316.
Moore, B., Zhou, L., Rolland, F., Hall, Q., Cheng, W.-H., Liu, Y.-X., Hwang, I., Jones, T.,
and Sheen, J. (2003). Role of the Arabidopsis glucose sensor HXK1 in nutrient, light, and
hormonal signaling. Science, 300, 332-336.
Nagel, O.W., Konings, H., and Lambers, H. (2001). Growth rate and biomass partitioning of
wildtype and low-gibberellin tomato (Solanum lycopersicum ) plants growing at a high and low
nitrogen supply. Physiologia Plantarum, 111, 33-39.
Nasholm, T., and Persson, J. (2001). Plant acquisition of organic nitrogen in boreal forests.
Physiologia Plantarum, 111, 419-426.
Palmer, S., Berridge, D., McDonald, A., and Davies, W. (1996). Control of leaf expansion in
sunflower (Helianthus annuus L.) by nitrogen nutrition. Journal of Experimental Botany, 47,
359-368.
Paul, M., and Driscoll, S. (1997). Sugar repression of photosynthesis: the role of carbohydrates
in signalling nitrogen deficiency through source: sink imbalance. Plant, Cell and Environment,
20, 110-116.
Paper Proceedings of Agri Animal 2013 - ISSN 2279-3682
193
Rodraguez, D., Zubillaga, M.M., Ploschuk, E.L., Keltjens, W.G., Goudriaan, J., and
Lavado, R.S. (1998). Leaf area expansion and assimilate production in sunflower (Helianthus
annuus L.) growing under low phosphorus conditions. Plant and Soil, 202, 133-147.
Sakakibara, H. (2003). Nitrate-specific and cytokinin-mediated nitrogen signaling pathways in
plants. Journal of Plant Research, 116, 253-257.
Sanchez, E., Rivero, R.M., Ruiz, J.M., and Romero, L. (2004). Changes in biomass,
enzymatic activity and protein concentration in roots and leaves of green bean plants (Phaseolus
vulgaris L. cv. Strike) under high NH4NO3 application rates. Scientia Horticulturae, 99, 237-
248.
Scheible, W.R., Gonzalez-Fontes, A., Lauerer, M., Muller-Rober, B., Caboche, M., and
Stitt, M. (1997). Nitrate acts as a signal to induce organic acid metabolism and repress starch
metabolism in tobacco. The Plant Cell, 9,783-798.
Schortemeyer, M., Stamp, P., and Feil, B. (1997). Ammonium Tolerance and carbohydrate
status in maize cultivars. Annals of Botany, 79, 25-30.
Stohr, C. (1999). Relationship of nitrate supply with growth rate, plasma membrane-bound and
cytosolic nitrate reductase, and tissue nitrate content in tobacco plants. Plant, Cell and
Environment, 22, 169-177.
Takei, K., Sakakibara, H., Taniguchi, M., and Sugiyama, T. (2001). Nitrogen-dependent
accumulation of cytokinins in root and the translocation to leaf: Implication of cytokinin species
that induces gene expression of maize response regulator. Plant and Cell Physiology, 42, 85-93.
Takei, K., Takahashi, T., Sugiyama, T., Yamaya, T., and Sakakibara, H. (2002). Multiple
routes communicating nitrogen availability from roots to shoots: a signal transduction pathway
mediated by cytokinin. Journal of Experimental Botany, 53, 971-977.
Trapani, N., Hall, A., and Weber, M. (1999). Effects of constant and variable nitrogen supply
on sunflower (Helianthus annuus L.) leaf cell number and size. Annals of Botany, 84, 599-606.
Van Beusiichem, M.L., Kirkby, E.A., and Baas, R. (1988). Influence of nitrate and ammonium
nutrition on the uptake, assimilation, and distribution of nutrients in Ricinus communis. Plant
Physiology, 86, 914-921.
Walch-Liu, P., Neumann, G., Bangerth, F., and Engels, C. (2000). Rapid effects of nitrogen
form on leaf morphogenesis in tobacco. Journal of Experimental Botany, 51, 227-237.
Paper Proceedings of Agri Animal 2013 - ISSN 2279-3682
194
Walch-Liu, P., Filleur, S., Gan, Y., and Forde, B.G. (2005). Signaling mechanisms integrating
root and shoot responses to changes in the nitrogen supply. Photosynthesis Research, 83, 239-
250.
Wang, X., Wu, P., Xia, M., Wu, Z., Chen, Q., and Liu, F. (2002). Identification of genes
enriched in rice roots of the local nitrate treatment and their expression patterns in split-root
treatment. Gene, 297, 93-102.
Zou, C., Shen, J., Zhang, F., Guo, S., Rengel, Z., and Tang, C. (2001). Impact of nitrogen
form on iron uptake and distribution in maize seedlings in solution culture. Plant and Soil, 235,
143-149.
Zubillaga, M.M., Aristi, J.P., and Lavado, R.S. (2002). Effect of phosphorus and nitrogen
fertilization on sunflower (Helianthus annus L.) nitrogen uptake and yield. Journal of
Agronomy and Crop Science, 188, 267-274.

Paper Proceedings of Agri Animal 2013 - ISSN 2279-3682
195
13
Paper Proceedings of Agri Animal 2013 - ISSN 2279-3682
196
PROBLEMS OF BIODIVERSITY CONSERVATION IN AGRICULTURE
Katarzyna Brodzińska
Department of Agribusiness and Environmental Economics, University of Warmia and Mazury
in Olsztyn, Poland
The problem of biodiversity loss in agriculture is associated with both the excessive
intensification of agricultural production and the cessation of the agricultural use of the land.In
view of the above, under the EU‘s CAP, measures are taken for the conservation of
biodiversity.An instrument of a specific nature, in which Polish farmers have been participating
since 2004, is the agri-environmental programme (AEP).The experiences of the implementation
of Polish AEP are presented based on results of the study conducted in 2011 in the region of
Mazury. The study involved approx. 8.5 % of farmers participating in the programme.The study
results indicate the need for more significant diversification and adaptation of the A-EP packages
to the regional environmental determinants.Independently of the designated Natura 2000 areas,
records must be taken of the patches of habitats of particular natural and ornithological
values.This will allow a considerable facilitation of the procedures associated with the
implementation of the nature AEP packages, and contribute to the enhancement of the effects of
the funds allocated for that purpose.Another important issue is the strengthening of the market
position of organic production holdings which promote the preservation of biodiversity and
operate principally thanks to agricultural subsidies.
Key words: biodiversity, agriculture, agri-environmental programme (AEP)
Introduction
The abundant existing forms of life are not distributed evenly across the Earth, since they
are primarily concentrated in humid equatorial forests, coral reefs, and thickets of the South
Africa and Western Australia.The European countries are relatively poor in this regard.This does

Paper Proceedings of Agri Animal 2013 - ISSN 2279-3682
197
not mean, however, that the conservation of biodiversity should only focus on the areas being
most valuable in terms of the diversity of plant and animal forms of life.
The largest contributor to the conservation of biodiversity was the Earth Summit in Rio
de Janeiro, held in 1992, at which the Convention on Biological Diversity was ratified.The
Convention changes the notion of being valuable, and assumes that all species and habitats, and
not only the rare and vanishing ones, are valuable.It was signed by most states of the world,
which thus undertook to study, protect and use in a sustainable manner the species comprising
the national biodiversity.This is of major significance, since never in the history has the process
of species extinction been faster than it currently is (Pimm, Gilpin, 1989; Haczek 2010).The
estimates as cited most frequently in the relevant literature mention 27 thousand of species
becoming extinct annually (Wilson, 1999), and the rate of extinction being 1,000 above the
normal background rate (Millenium ... 2005).The rate of species extinction has been on the
constant increase, and, most importantly, the causes of the extinction indicate human activities
associated with the following:
destruction of habitats, including the takeover of land (for the purposes of urban
development as well as agricultural, industrial, etc.), changes in habitats (resulting from,
inter alia, eutrophication, drainage, soil acidification, etc.),and fragmentation of
ecosystems;
direct exploitation, including over-exploitation of both the utilisable species populations
(hunting, poaching) and the areas used for agricultural purposes (pest and weed control,
over-intensification of production);
introduction and transfer of alien species;
secondary extinction, which is a consequence of the relationships between organisms.
Paper Proceedings of Agri Animal 2013 - ISSN 2279-3682
198
In view of the above, it can be concluded that agriculture contributes significantly to the
loss of biodiversity.The global resources of agricultural land include approx. 32 % of the total
land area, and the largest area thereof is located in China (523.3 million ha), Australia
(409.0 million ha), the United States (403.5 million ha), Russia (215.6 million ha), India
(180.0 million ha) and the EU countries (188.4 million ha).
The impact of agriculture on the loss of biodiversity may be considered in two
dimensions.Firstly, old varieties of crop plants become extinct irretrievably, secondly, with the
change in both the crop structure and production systems, entire ecosystems, which have been
formed as a result of extensive agricultural production, are becoming depleted or vanishing.It
should also be stressed that the impact of agriculture on the environment may be both negative
and positive.The negative impact manifests itself as, inter alia, groundwater pollution, soil
deterioration, the reduction in the biodiversity, and adverse changes in the landscape.The
positive impact is associated with generating the positive externalities, primarily related with the
extensification of production, and provision of environmental services.Therefore, for the
conservation of biodiversity, it is not only important to effectively prevent the negative
externalities, but also to enhance the positive effects.Such measures are possible through the
integration of agricultural policy with environmental policy.Since such a process takes place
under the European Union‘s Common Agricultural Policy (CAP), the aim of the paper is to
present the EU‘s instruments for environmental protection, which are particularly important in
the context of the conservation of biodiversity in agriculture.Moreover, the Poland‘s experiences
in this regard are presented herein, with the use of the results of research as carried out under the
research project NN 305296340.
Paper Proceedings of Agri Animal 2013 - ISSN 2279-3682
199
Conservation of Biodiversity Under the European Union’s Common Agricultural Policy
In 1957, six European Economic Community (EEC) countries (France, Germany, Italy,
the Netherlands, Belgium and Luxembourg) established the Common Agricultural Policy (CAP)
which, for 30 years, primarily served the purpose of furthering the production objectives.Indeed,
it is the CAP which, through supporting the intensification of agricultural production, contributed
significantly to the degradation and loss of biodiversity in the EU Member States.The gradual
integration of agricultural policy with environmental policy under the CAP started with the
MacSharry reform in 1992, which resulted in the introduction of direct payments, afforestation
of agricultural land and AEP.The subsequent CAP reforms maintained that direction through
enhancing the instruments encouraging the application of environmentally-friendly agricultural
practices.Currently, the European Union consists of 27 states which are not only diverse in terms
of the level of socio-economic development, but also the state of natural environment.As for the
environmental protection, many issues are governed by EU Directives which set out the general
guidelines and areas of activities requiring regulations, while allowing the Member States the
freedom as regards the specific regulations.The key Directives which govern the issues
associated with the conservation of biodiversity include:the Birds Directive (79/409/EEC), and
the Habitat Directive (92/43/EEC).Under those Directives, since the beginning of the 1990‘s, the
Natura 2000 network has been developed on the European continent, which is the world‘s
biggest network of protected areas, covering approx.17 % of the EU territory.Its objective is to
protect the so-called Natura 2000 species (i.e. bird species, habitats, and animal and plant species
populations as listed in Annexes to those Directives).
The idea behind the Natura 2000 departs from the conservatory trend in environmental
protection.Generally, under the traditional forms of protection based on prohibitions and
Paper Proceedings of Agri Animal 2013 - ISSN 2279-3682
200
restrictions, local communities get involved in the environmentally-oriented activities to a small
extent only (Slootweg, 2005; Mandal, 2011; Bołtromiuk, 2012).Moreover, the above-mentioned
forms provide an insufficient and rather ineffective solution as regards the conservation of
biodiversity in the areas used for agricultural purposes.Consequently, the introduction of both the
Natura 2000 network and the instruments incentive to taking measures aimed at environmental
protection, provided in a form of financial incentives, seems a good step towards the more
effective conservation of biodiversity, particularly in the areas used for agricultural purposes.
Another issue is the problem of valuation of the environmental contributions as made by
farmers.This primarily refers to the determination of the level of costs of manufacturing of public
(merit) goods (Musgrave 2008) which should be considered a compensation for the negative
externalities being generated by agriculture.Under the EU‘s CAP, the level concerned has been
determined under the cross-compliance.Those are obligatory environmental contributions which
are, so to speak, the ―reference level‖ for receiving payments arising from the CAP.The
standards as determined under the cross-compliance provide public goods to a limited extent,
since they only restrict direct practices which are harmful to the environment, and do not require
active management of the ecosystems being rich in biodiversity.In view of the above, the
measures going beyond those standards are financed under other CAP measures, and particularly
under the AEPs (EC COM 2010).
Agri-Environmental Programmes – the CAP Instrument for Environmental Protection
Agri-environmental programmes are the obligatory CAP instrument for all EU Member
States.The EU‘s legal bases set out the general nature, scope and methods for the implementation
thereof, yet each Member States is responsible for the preparation of its own AEP.The
Paper Proceedings of Agri Animal 2013 - ISSN 2279-3682
201
programme should accurately reflect the priorities arising from the determinants of the
development of agriculture in a given country, its natural values and the environmental
protection indications (Agri-environment ... 2005; Smallshire et al., 2004).Under the agri-
environmental programmes, farmers undertake to provide environmental services, on a voluntary
basis and in return for an appropriate remuneration.The payments for ecosystem services should
encourage farmers to maintain and enhance the environmentally-friendly agricultural practices,
and thus contribute to countering the loss of biodiversity.Another important thing is the proper
valuation of services provided in this respect, which should take account of the compensation for
the use of property rights for the resources to the extent necessary to provide public goods,
payment for the lost income (not using the means of production for gainful purposes), and
covering the transaction costs (Klejn, Sutherland 2003; Kallas et. al. 2007; Defrancesco
et.al.2008, Stoate et.al. 2009).
The available measures for which the farmer receives a financial support under the agri-
environmental payments made in the EU countries, are primarily related to the protection of
meadows and pastures, protection of rare livestock breeds and crop plant varieties, organic
farming, and preservation of the nature and landscape including habitats of wild animal and plant
species.It should be stressed that the AEPs are also an important tool for the implementation of
the environmental network Natura 2000. The measures being implemented under the AEPs in the
areas concerned are given priority.
In the so-called old EU Member States (15), one can already observe positive effects of
the measures implemented under the A-EPs as regards the improvement of the state of
biodiversity in the areas used for agricultural purposes.Those include, inter alia: the strips of
vegetation being formed together with bee-keepers in France, evaluation of the habitat of Iberian
Paper Proceedings of Agri Animal 2013 - ISSN 2279-3682
202
lynx in Portugal, maintenance of old orchards in Austria, enhancement of wading bird population
in The Netherlands or steppe birds in Portugal (Pinto et al., 2005; Melman et al., 2008;
Biodiversity in ... 2010).In the countries which joined the EU in 2004 and 2007, the effects of the
AEP measures are less evident, but in all countries EU had a positive overall effect [Donald et
al., 2006; Ekholm et, al, 2007; Stoate et al., 2009). The eight-year experiences related to the
implementation of theAEP in Poland indicate the need for greater flexibility as regards the
application of that environmental protection instrument in the Member States.
Material and methods
The research material included the data of the Central Statistical Office (GUS) and the Agency
for Restructuring and Modernisation of Agriculture (ARMA) i.e. Polish paying agency
implementing the CAP measures, as well as the results of field research as carried out under the
research projectEnvironmental and Socio-Economic Determinants of the Implementation of Agri-
Environmental Programme” carried out in 2010-2012 in the administrative region of
Warmińsko-Mazurskie province.
The region of Mazury has specific natural values, and is distinguished at both the national
and European level thanks to the diversity and richness of the natural environment.The biggest
number of the Poland‘s lakes (approx. 3 thousand) are situated there,along with large forest
complexes, numerous swampy grounds, and meadows, fields and groves, which provide
excellent breeding sites for many bird species.The particular natural values of the region in
question is demonstrated by the fact that Mazury was selected as one of the 14 finalists of the
2012 competition ―7 New Wonders of Nature‖ (as organised by the Swiss New7Wonders
Foundation).Although Mazury was not selected as the New Wonder of Nature, yet on the way to
Paper Proceedings of Agri Animal 2013 - ISSN 2279-3682
203
the final the region defeated, inter alia,Maldives, Galapagos, the Grand Canyon, or the Angel
Falls in Venezuela.
The field research was conducted in 2011, and involved 588 farmers, i.e. approx.8.5 % of
all beneficiaries fulfilling the AEP. For the research, the structured interview technique was
applied, whereas some numerical data (due to the reliability thereof) was collected based on the
data from agri-environmental plans, and the applications for direct payments as submitted to the
ARMA.The causal research (deterministic) method was applied for the purpose of the study.
The main research hypothesis assumes that the AEP being implemented in Poland
pursues, to a limited extent, the environmental and socio-economic objectives arising from the
assumptions of the programme.
Poland’s Agri-Environmental Programme
In May 2004, Poland joined the European Union, an in September farmers could apply
for support under the A-EP 2004-2006. In the first year of the implementation, the support could
only be granted to the farmers who owned a certified organic production holding.Since 2005, all
7 packages of the AEP have already been under implementation, whereas 4 packages (organic
farming, protection of soil and water – the package associated with the application of catch
crops, buffer zones, and the package for preservation of local livestock breeds) have been
implemented horizontally, across the country.The remaining packages (sustainable farming, and
two packages associated with the retaining of extensive meadows and pastures) have only been
implemented in the so-called priority zones, i.e. areas of either outstanding natural and landscape
values, or the environmental concern.The areas concerned covered approx.32 % of the country‘s
area.
Paper Proceedings of Agri Animal 2013 - ISSN 2279-3682
204
Under the A-EP 2007-2013, changes were introduced in both the offer of packages and
the availability criteria, as well as the payments for the measures being implemented.A package
was introduced for the preservation of genetic plant resources in agriculture, and the packages
for the preservation of permanent grassland were diversified in order to provide the nature
packages, and packages associated with the extensive use of permanent grassland.Moreover, the
priority zones were abandoned, while a higher support (by approx.10-15 %) was introduced for
the nature packages being implemented in the Natura 2000 areas. In Poland, the Special
Protection Areas (SPAs) as protected under the Natura 2000 cover 17.8 % of the country‘s area,
while the Special Areas of Conservation (SACs) cover 12.1 %, out of which approx.1/3 of the
total area is the agricultural land (AL).
The number of farmers fulfilling the agri-environmental commitments under the A-EP in
the years 2004-2012 was increasing steadily, although the growth rate over the last three years
has slowed down(Fig.1). The ARMA (The Agency for Restructuring and Modernisation of
Agriculture, ARiMR) data shows that as at 31 December 2011, the total area supported for the
agri-environmental commitments amounted to 1,399.35 thousand ha of agricultural land, while
the supported area of the physical land (without aggregating the area receiving, at the same time,
the support under the packages which did not exclude each other) amounted to
1,104.58 thousand ha, i.e. 5.9 % of the AL (Report ... 2011).
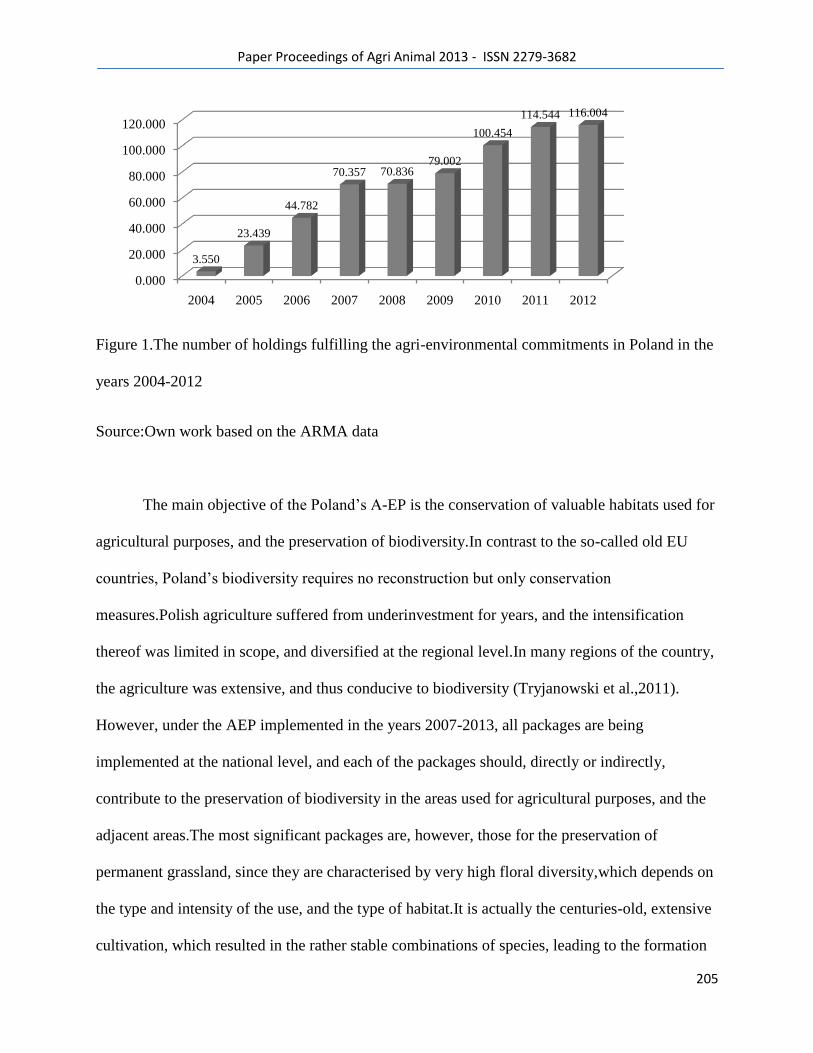
Paper Proceedings of Agri Animal 2013 - ISSN 2279-3682
205
Figure 1.The number of holdings fulfilling the agri-environmental commitments in Poland in the
years 2004-2012
Source:Own work based on the ARMA data
The main objective of the Poland‘s A-EP is the conservation of valuable habitats used for
agricultural purposes, and the preservation of biodiversity.In contrast to the so-called old EU
countries, Poland‘s biodiversity requires no reconstruction but only conservation
measures.Polish agriculture suffered from underinvestment for years, and the intensification
thereof was limited in scope, and diversified at the regional level.In many regions of the country,
the agriculture was extensive, and thus conducive to biodiversity (Tryjanowski et al.,2011).
However, under the AEP implemented in the years 2007-2013, all packages are being
implemented at the national level, and each of the packages should, directly or indirectly,
contribute to the preservation of biodiversity in the areas used for agricultural purposes, and the
adjacent areas.The most significant packages are, however, those for the preservation of
permanent grassland, since they are characterised by very high floral diversity,which depends on
the type and intensity of the use, and the type of habitat.It is actually the centuries-old, extensive
cultivation, which resulted in the rather stable combinations of species, leading to the formation
0.000
20.000
40.000
60.000
80.000
100.000
120.000
2004 2005 2006 2007 2008 2009 2010 2011 2012
3.550
23.439
44.782
70.357 70.83679.002
100.454
114.544 116.004
Paper Proceedings of Agri Animal 2013 - ISSN 2279-3682
206
of naturally valuable meadow communities.Since the main causes for the depletion of the
biodiversity of grassland include both the intensive management and the abandonment thereof, it
is important to use them extensively (Benton et al. 2003; Fisher, Lindenmayer, 2007).
In 2011, the extensive management on the PG (permanent grassland) in Poland was
supported under three A-EP packages:extensive use of the PG – 252.4 thousand ha; protection of
endangered species of birds and natural habitats in the Natura 2000 areas – 66.3 thousand ha, and
protection of endangered species of birds and natural habitats outside the Natura 2000 areas –
38.6 thousand ha.For the preservation of the biodiversity of meadow and pasture ecosystems, it
is of particular importance to implement the nature packages under which the habitats of
particular natural values (including, inter alia, moss-covered areas, and semi-natural fresh and
moist meadows) are protected.Under the nature packages, the breeding habitats of endangered
birds are also protected.
Since the threat to biodiversity also concerns the crop plants and livestock breeds, they
were included in the AEP conservation measures as well.Poland is one of the forerunners of the
animal species conservation, and has significant achievements in the protection of native
breeds.In 2011, a total of 87 livestock breeds were brought under protection, including 4 cattle
breeds, 3 swine breeds and 13 ovine breeds, which are protected under the AEP.In 2011, the
support covered a total of 53,227 females in 2,850 holdings. The in situ conservation is
considered the preferred method for the conservation of livestock populations‘ biodiversity under
the traditional production systems.It allows both the retaining and adaptive use of the animal
genetic resources in the production landscapes, and thus the preservation of their cultural values
(Gandini, Villa, 2003).The plant genetic resources under the Poland‘s AEP have been protected
since 2008, and the area thereof in 2011 amounted to approx.11.9 thousand ha.A national
Paper Proceedings of Agri Animal 2013 - ISSN 2279-3682
207
indicator of the target area as planned under the AEP was achieved at a high level of 91.16 %,
while the indicator of number of variants only amounted to 4.47 %.
For the conservation of biodiversity in agriculture, the natural ecosystems are of
significance.This primarily concerns the boundary strips, woodlots, roadsides and other marginal
environments, which ensure the existence of insects under the conditions of anthropogenic
impact.It has been proven that with the increase in the number and area of the marginal
environments, the average density of bees and other pollinators in the agricultural landscape
increases (Banaszak 1997; Engels et al., 1994, Hunter2002), which is of key importance for the
preservation of biodiversity. In view of the above, buffer zones were introduced in the A-EP.The
package concerned was designed to create and protect boundary strips and buffer zones (2 or 5-
meter wide strips along watercourses, which were excluded from the intensive use).In 2011, it
was implemented in 127 holdings over a length of only approx.34.6 km.
A production system being conducive to the preservation of biodiversity is the organic
farming.Support for that production system under the AEP resulted in a significant increase in
both the number of organic production holdings and the area thereof.In 2004, under the system
of organic farming, 3,760 agricultural holdings operated over the area of82.7 thousand ha, while
in 2011 there were as many as 23,449 agricultural holdings over the area of 605.5 thousand ha.
Conservation of Biodiversity in the Areas of Natural Value
One of the indicators of the appropriate allocation of the AEP is the implementation
thereof in the areas of natural values.The area under the legal protection in the region concerned
amounts to approx.46.6 % of the total area, and the agricultural land covers approx.54.7 %. The
ARMA data shows that in the region, the area supported under the AEP in 2011 amounted to
Paper Proceedings of Agri Animal 2013 - ISSN 2279-3682
208
248.6 thousand ha, while the estimated physical area amounts to 196.2 thousand ha, i.e.
approx.12.8 % of the AL (more than twice the Poland‘s average), which demonstrates the
appropriate allocation of the AEP at the national level.
In the region of Mazury, the percentage of PG in the structure of agricultural land exceeds
30 %, and is significantly higher than the Poland‘s average (approx.20 %). In 2011, a total of
12 % of the PG was covered by protective measures under the AEP.The package for the
extensive permanent grassland (approx.8.1 % of the PG) was implemented over the largest
area.The research showed that the farmers most frequently implemented it along with the
package for the organic farming, and the nature packages. Agri-environmental commitments
under that package were taken by 34.2 % of all respondents, and the animal production was
carried out by 57 % of those holdings.This is significant because the implementation of that
package involves the use for hay-growing, pasturing, or hay-growing-and-pasturing purposes,
and the extensive pasturing use is particularly favourable for the preservation of biodiversity,
since grazing is the oldest method for the use of gramineous ecosystems, and the effects thereof
on the vegetation are different than those of mowing (Gandini, Villa, 2003).
The analyses show that in 2011, in the region of Masuria, environmental services under
the nature packages were provided over the area of approx.6.1 thousand ha (1.8 % of the PG)
located within the Natura 2000 areas, and approx.7.1 thousand ha (2.1 % of the PG) outside
those areas (Fig. 2).
Paper Proceedings of Agri Animal 2013 - ISSN 2279-3682
209
Figure 2. The implementation of selected packages under the agri-environmental programme in
Poland and the region of Mazury in 2011 (OF – organic farming % of the AL, EPG – extensive
permanent grassland % of the PG, PESBH – protection of endangered species of birds and
habitats % of the PG)
Source:Own work based on the GUS (Central Statistical Office) and ARMA data
The nature packages have been implemented since 2009, yet the implementation thereof
in the region of Masuria raises many objections.The protection of breeding habitats of birds
accounted for as much as 95.7 % of the area supported under the agri-environmental package in
the Natura 2000 areas, and 90.3 % outside those areas.The procedures for the application for the
implementation of agri-environmental packages also seem improper.An expert evaluation of the
habitat and ornithological aspects, which allows the classification of PGs in the nature packages,
is carried out as commissioned by the farmer.Therefore, those are frequently small fragments of
the patch of habitats, although it is known that for the preservation of biodiversity, the processes
occurring at the landscape level are not less significant than the modes of the use of habitats.The
size of the habitat patch, and the extent of the connection with the other patches, influence the
number of species found therein (Helm, et al.2006). Therefore, expert evaluations of the natural
0
2
4
6
8
10
OF EPG PESBH in Natura
2000
PESBH outside
Natura 2000
3.4
7.7
2.01.2
7.7 8.1
1.8 2.1
Poland Mazury
Paper Proceedings of Agri Animal 2013 - ISSN 2279-3682
210
and ornithological aspects should be carried out for the entire patches fulfilling the criteria of the
AEP.This will allow the reduction of costs and facilitate procedures, and will certainly contribute
to better allocation of the nature packages.Such a scheme operates in the countries neighbouring
with Poland.In the Czech Republic, the package focused on the protection of birds is available in
the plots located within the meadows indicated in the database of the paying agency.A database
containing a list of naturally valuable PG has also been used for the AEP in Latvia.In Poland,
such an evaluation of habitats and the creation of a database is also necessary, in particular with
regard to the protection of breeding habitats of birds.The so-called―key bird species‖ as defined
in the Birds Directive are found in quite large numbers and over a significant area in
Poland.Therefore, the protection measures must be concentrated in the places where they are
found in the largest numbers, in order to achieve the effect of synergy (Tryjanowski et al.
2011).It should also be stressed that the research being carried out in the Western Europe
provides good examples of the effects of agri-environmental packages on birds.It follows from
the research concerned that the agri-environmental programmes may provide evident support for
the birds of the agricultural landscape, whereas their effectiveness is highly diversified at the
local level (Kleijn et al.,2006; Whittingham et al.2007). It is the diversification that should
provide the basis for the more flexible approach to the conservation of biodiversity.
The protection of genetic plant resources in agriculture under the AEP in the region of
Mazury has been mainly supported within the framework of commodity production and the
production of seeds of the local crop plant varieties over the area of
approx.2.1 thousand ha.Traditional orchards have been supported over the area of
only10.5 thousand ha.In the region, no seed production as commissioned by the gene bank has
been carried out.The research showed that the farmers were very sceptical about the
Paper Proceedings of Agri Animal 2013 - ISSN 2279-3682
211
implementation of the package concerned.They are reluctant to implement it, mainly due to the
strict criteria, a high degree of the difficulty of the implementation, and the relatively low level
of support.They are definitely more willing to implement the package associated with the
protection of animal genetic resources.
The research shows that the farmers‘ insignificant interest (at the level of both the country
and the region) is primarily associated with the too low level of support, and the exclusion of the
area of those zones from direct payments.It is also worth stressing that during the first years of
Poland‘s membership in the EU, the process of elimination of both boundary strips and marginal
habitats valuable in terms of biodiversity was noticeable.The cause for those measures was the
increase in the area eligible for direct payments.
What is conducive to the preservation of biodiversity is the extensive production
system.In view of the above, the increase in the area of the agricultural land (AL) under the
organic management system is favourable.In the region under the study, the area in question,
supported under the AEP, was more than twice as large as the Poland‘s average, and in 2011 it
accounted for 7.7 % of the AL (Fig.2). However, the research shows that the organic
production holdings being supported under the AEP differ from the traditional organic
production holdings.The relatively high support of the organic crops resulted in that group
being special in some respects.These are, to a large extent, newly-established holdings; as many
as 44.9 % of respondents became the owners of the holdings only after the Poland‘s accession
to the EU, and 26.6 % did so after the year 2008. What is interesting, the users of the holdings
concerned are persons with higher education degrees (44.1 %), yet only 12 % had higher
agricultural education degrees.A large proportion of the holdings implementing the package for
organic farming were holdings with no habitat (28.1 %), and holdings with no livestock
Paper Proceedings of Agri Animal 2013 - ISSN 2279-3682
212
(66.7 %).Moreover, as many as 43.7 % of those holdings supported themselves exclusively
from agricultural subsidies, i.e. they did not gain income from the sale of agricultural
produce.Surveys show that the main motivation for taking the agri-environmental commitments
by the owners of the holdings concerned were the financial benefits.However, those holdings
meet the criteria as required under the AEP, whereas the organisation thereof is limited
primarily to the low-input crops highly supported financially under the AEP.Therefore, the
holdings concerned produce organic foodstuffs to only a small extent, yet play an important
role in the conservation of biodiversity.In 58 % of those holdings, papilionaceous plants were
recorded, and in 23.6 % papilionaceous plants along with grasses accounted for 100 % of the
structure of crops.This is significant in view of the fact that the papilionaceous plants contribute
to the increase in the population of wild pollinators (bees, bumblebees, etc.), the presence of
which is necessary to pollinate other plant species. Biodiversity of agri-ecosystems is also
enhanced by the catch crops as applied in the organic farming.The presence thereof in the crop
rotation provides favourable conditions for the occurrence of numerous organisms of various
biosystematic units, the development of food chains, and ecological relationships.The catch
crops also provide an ecological link for numerous insects, including the pollinators (Engels
et al.,1994). Therefore, it is necessary to support the diversified approach to the organic
farming, and the production functions thereof should be separated from the provision of
environmental services.
Conclusion
Poland‘s experiences as regards the implementation of the AEP indicate the need for
more significant diversification of the AEP packages, depending on the regional environmental
Paper Proceedings of Agri Animal 2013 - ISSN 2279-3682
213
determinants.An important issue is the concentration of the measures in question in the areas of
particular natural values.The studies showed that higher support under the nature packages, as
received by the farmers in the Natura 2000 areas, does not contribute, in a tangible manner, to an
increase in the area under protection.In view of the above, due to the need for enhancement of
the effectiveness of measures for the conservation of biodiversity, an evaluation must be carried
out for, and records taken of the patches of habitats of particular natural and ornithological
values.This will allow facilitation of the procedures associated with the implementation of the
natural AEP packages, and contribute to the enhancement of the environmental effects.
The research also indicates that a significant part of the AEP beneficiaries have
purchased agricultural holdings in order to join the AEP, since this is profitable business.This
primarily concerns the organic production holdings.There is, therefore, a risk that in case of
restricted support, the farmers will search for more profitable solutions which may pose a threat
to the biodiversity of agricultural land.The key issue is, therefore, the adjustment of the level of
support under the package in question to the costs incurred, and strengthening of organic
production holdings in the market.
References
Agri-environment Measures. Overview on General Principles, Types of measures and
Application. European Commission. 2005,
http://ec.europa.eu/agriculture/publi/reports/agrienv/rep_en.pdf;access 04 March 2013
Banaszak J., 1997. Local changes in the population of wild bees. Nature Conservation, 54: 119-
130.
Benton T.G., Vickery J.A., Wilson J.D., 2003. Farmland biodiversity: is habitat heterogeneity the
key? Trend in Ecology and Evolution 18; 182-188.
Biodiversity in agriculture. 2010. www.copa-cogeca.be/img/user/file /3236_p.pdf; access 02
March 2013
Paper Proceedings of Agri Animal 2013 - ISSN 2279-3682
214
Bołtromiuk A., 2012. Natura 2000 – The Opportunities and Dilemmas of the Rural Development
within European Ecological Network. Problems of Sustainable Development, vol 7, no 1: 117-
128.
Defrancesco E., Gatto p., Runge F., Trestini S., 2008. Factors affecting farmers‘ participation in
agrienvironmental measures: A Northern Italian Perspective. Journal of Agricultural Economics,
The Agricultural Economics Society, 59(1): 114-131.
Donald P.F., Evans A.D., 2006. Habitat connectivity and matrix restoration: the wider
implications of agri-environment schemes. Journal of Applied Ecology 43: 209-218.
EC COM 2010. Communication from the Commision to the European Parliament, the Council,
the European Economic and Social Committee and the Committee of the Regions. The CAP
towards 2020. Meetting the food, natural resources and territorial challenges of the future, 672
final.
Ekholm P., Granlund K., Kappila P., Mitikka S., Niemi J., Rankinen K., Räike A., Räsänen J.,
2007. Influence of EU policy on agricultural nutrient losses and the state of receiving surface
waters in Finland. Agricultural and Food Science 4: 282-300.
Engels W., Schulz U., Rädle M. 1994. Use of the Tübingen Mix for bee pasture in Germany. In
A. Matheson (ed.). Forage for bees in an agricultural landscape. International Bee Research
Association, Cardiff, UK: 57-65.
Fisher J., Lindenmayer D.B., 2007. Landscape modification and habitat fragmentation: synthesis.
Global Ecol. and Biogeogr. 16(3): 265-280.
Gandini G., Villa E., 2003. Analysis of the cultural value of livestock breeds: a methodology. J.
Animal Breed. Gen., 120: 1-11.
Haczek B., 2010. Ecosystem services within framework of the convention on biological
diversity. Economics and Environment. Journal of European Association of Environmental and
Resource Economists 1(37): 78-84.
Helm A. Hanski I., Pärtel M., 2006. Slow response of plant species richness to habitat loss and
fragmentation. Ecology Letters 9:72-77.
Hunter M. D. 2002. Landscape structure, habitat fragmentation, and the ecology of insects.
Agric. Forest Entomol. 4, 159–166.
Kallas Z., Gomez-Limon J.A., Arriaza M. 2007. Are citizens willing to pay for agricultural
multifunctionality? Agricultural Economics t. 36(3): 307-321.
Kleijn D., Baquero R.A., Clough Y., Diaz M., De Estaban J., Fernandez F., Gabriel D., Herzog
F., Holzschuh A., Jahl R., Knop E., Kruess A., Marshall E.J.P., Steffan-Dewenter I., Tscharntke
Paper Proceedings of Agri Animal 2013 - ISSN 2279-3682
215
T., Verhulst J., West T.M., Yela J.L., 2006. Mixed biodiversity benefits of agrienvironment
schemes in five European countries. Ecol. Lett. 9: 243-254.
Kleijn D., W. J. Southerland 2003. How effective are agri-environment schemes in conserving
and biodiversity? J. Apl. Ecol. 40: 947-967.
Mandal F.B., 2011. Human Behavior and Biodiversity Loss: A theoretical Analysis, Journal of
Human Behavior in the Social Environment, 21: 601-605.
Melman T.C.P., Schotman A.G.M., Hutnik S., de Snoo G.R., 2008. Evaluation of meadow bird
management, especially Black-tailed Godwit (Limosa limosa L.), in the Netherlands. Journal of
Nature Conservation 16, 88-95.
Millenium Ecosystem Assessment 2005. Ecosystems And Human Well-Being. Synthesis, Island
Press, Washington, www.maweb.org/en/index.aspx, access 06 February 2013.
Musgrave, R. A. 2008. Merit goods. The New Palgrave Dictionary of Economics. Second
Edition. Eds. Steven N. Durlauf and Lawrence E. Blume. Palgrave Macmillan, The New
Palgrave Dictionary of Economics Online. www.dictionaryofeconomics.com
Pimm S.L., Gilpin M.E., 1989. Theoretical issues in conservation biology [in] Perspectives in
ecological theory, J Roughgarden (red.) Princeton University Press, Princeton: 287-305.
Pinto M., Rocha P., Moreira F., 2005. Long-term trends in great bustard (Otis tarda) populations
in Portugal suggest concentration in single high Quality area. Biological Conservation 124, 415-
423.
Report on the implementation of the Rural Development Programme for 2007-2013. Report for
2011 No 5/2011 www.minrol.gov.pl; access 23 February 2013.
Slootweg R., 2005. Biodiversity assessment framework: making biodiversity part of corporate
social responsibility, Impact Assessment and Project Appraisal, 23:1: 37-46.
Smallshire D., Robertson P., Thompson P., 2004. Policy into practice: the development and
delivery of agri-environment schemes and supporting advice in England. Ibis 146 (Suppl. 2),
250-258.
Stoate C., Bảldi A., Beja P., Boatman N.D., Herzon I., van Doorn A., de Snoo G.R., Rakosy L.,
Ramwell C., 2009. Ecological impacts of early 21st century agricultural change in Europe – A
review. J. Environ. Manag., 91: 22-46.
Tryjanowski P., Dajdok Z., Kujawa K., Kałuski T., Mrówczyński M., 2011. Threats to
biodiversity in farmland: Are results from Western Europe good solutions for Poland? Polish
Journal of Agronomy, 7: 113-119.

Paper Proceedings of Agri Animal 2013 - ISSN 2279-3682
216
Whittingham M.J., Krebs J.S., Swetnam R.D., Vickery J,A., Wilson J.D., Freckleton R.P., 2007.
Should conservation strategies consider spatial generality? Farmland Birds show regional not
national patterns of habitat association. Ecol. Lett. 10: 25-35.
Wilson E.O., 1999. The Diversity of Life, PIW, Warszawa.

Paper Proceedings of Agri Animal 2013 - ISSN 2279-3682
217
14
Paper Proceedings of Agri Animal 2013 - ISSN 2279-3682
218
Validation of Pedo-Transfer Derived Soil Water Retention in Simulation Model for Predicting
Rice Productivity
GOURANGA KAR* and ASHWANI KUMAR
Directorate of Water Management, Bhubaneswar, Odisha, PIN-751023
Abstract:
Crop simulation models and their associated decision support system have been used
successfully in many countries around the world for evaluating soil-plant-atmosphere
relationships and to estimate crop growth and yield. As a case study to determine soil water
retention using pedo-transfer functions and assessing their utility in simulation model for
predicting rice growth and yield, soil samples were collected at various depths (0-0.15, 0.15-
0.30, 0.30-0.45, 0.45-0.60, 0.60-0.90, 0.90-1.20 m) from 3 locations viz Satyabadi, Kanas,
Dhenkanal of Odisha, representing land ecologies of moderate surface waterlogging (0.5-0.75
m), severe surface waterlogging (>1.0 m) and non-waterlogged upland soils, respectively. The
mechanical composition of the soils revealed that soils were clay in texture at all depths at Kanas
and Satyabadi whereas texture of the Dhenkanal soils ranged from sandy clay loam to clay loam.
Soil moisture retention at field capacity (0.033 MPa) ranged between 0.381 to 0.603 m3m
-3 at
Kanas, 0.335 to 0.503 m3m
-3 in Satyabadi and 0.319 to 0.446 m
3m
-3 in Dhenkanal at different
depths. At permanent wilting point (1.5 MPa), the moisture content varied from 0.185 to 0.262,
0.172 to 0.246 and 0.108 to 0.139 m3m
-3 at Kanas, Satyabadi and Dhenkanal, respectively. Pedo-
transfer functions in the form of linear equations were developed for estimating soil water
retention at field capacity and wilting point using basic soil properties. These pedo-transfer
functions derived soil water constants were used in soil module of DSSAT 4.5 model for
predicting rice crop growth and yield and results were compared with the actual values.
Key words: Soil physical properties, soil moisture retention, hydraulic conductivity, pedo-
transfer functions, simulation model
* Corresponding author (Email: [email protected])
Paper Proceedings of Agri Animal 2013 - ISSN 2279-3682
219
Crop simulation models and their associated decision support system have been used
successfully in many countries around the world for evaluating soil-plant-atmosphere
relationships and to estimate crop growth and yield(Tsuji et al.1998; Hoogenboom 2000; Jones et
al. 2003; Bannayan et al. 2003). The Decision Support System for Agro-technology Transfer
(DSSAT) (Tsuji et al.1998; Hoogenboom et al. 2004; Jintrawet 1995; Ritchie et al. 1998; Jones
et al. 2003; Bannayan et al. 2003;Sarkar and Kar 2006) is a widely used decision support system
which requires daily weather data (maximum and minimum temperature, rainfall, solar
radiation), soil data (layer wise physical and chemical properties), genetic coefficients, crop
management information to simulate rice crop growth and yield. (Kropff et al.2001; Timsina
and Connor 2001;Kumar and Sharma 2004; Sarkar and Kar 2006; Timsina and Humphreys
2006).Soil water retention characteristics (SWRC) are the basic requirement for understanding
basic soil plant-water relationship in the simulation model. But, direct measurement of SWRC is
time consuming, labour intensive, and expensive. The required instrument, Pressure plate
apparatus is also not available in most of the laboratories in India to measure the moisture
retention at different suction. One of the common techniques widely used is to determine soil
moisture retention through pedo-transfer functions using readily available soil parameters like
texture, bulk density, organic matter (Bell and van Keulen, 1995; Kar et al; 2004; Adhikari et al;
2008). Pedo-transfer functions in the form of complex methods like artificial natural networks
(ANN), nonparametric nearest neighbour were also reported by many authors (Pachepsky et al.,
1996; Nemes et al., 2003; Baker and Ellison, 2008). Although, numerous works on PTFs were
conducted in many countries still there is a paucity of information on validation of those to
predict crop growth and yield through simulation model. But the PTF derived soil water
retention can be explored to use as input in soil module of simulation model or decision support
system for crop growth and yield prediction when actual soil water retention is not available.
In this study, PTFs in the form of linear regressions were derived using soil profile data
of three locations of Odisha and the same was validated with field data. After validating PTFs,
the same was used to derive soil moisture at field capacity and permanent wilting point. These
PTFs derived soil moisture data were used in the soil module of DSSAT 4.5 model for predicting
growth and yield of rice crop.
Paper Proceedings of Agri Animal 2013 - ISSN 2279-3682
220
Materials and Methods
Soil sample collection
Soil samples were collected after digging profile of 1 m width and 1.2 m depth at 3 locations of
Odisha,India viz., Satyabadi, Kanas and Dhenkanal, representing moderate waterlogging, severe
waterlogging, and rainfed upland soils of Odisha, respectively. Three soil profiles were dug in each
location and results were averaged. For determining the saturated hydraulic conductivity and bulk
density, the undisturbed soil samples were collected at the depths of 0-0.15, 0.15-0.30, 0.30-0.45,
0.45-0.60, 0.60-0.90, 0.90-1.20 m with the help of stainless steel core sampler of 5 cm inner diameter
and 5.1 cm height. Along with undisturbed core samples, disturbed soil samples were taken from the
same depth of the profile for analysis of soil pH, EC, texture (% sand, % silt and % clay), organic carbon
content.). The water content at different suctions viz., 0.033 (field capacity), 0.1, 0.3, 0.5, 1.0 and 1.5
MPa (permanent wilting point) was measured using pressure plate apparatus (Soil Moisture Equipment
Corporation, USA) (Klute, 1986) to derive soil moisture characteristics curve (matric suction-soil
moisture relationship) in each location and depths. The final soil moisture contents were calculated
gravimetrically as per the following relationships.
% water content (by weight), θw = [(Wbws – Wbds)/( Wbds - Wb)] * 100
% water content (by volume), θv = θw * Bulk Density (BD)
Where,
Wb = weight of moisture box, g, Wbws = weight of moisture box + wet soil, g ; Wbds = weight of
moisture box + dry soil, g
Soil texture
Soil texture was determined using Bouyoucos Hydrometer method as per the following
relationships :
Per cent silt + clay
Per cent clay
Per cent silt
Per cent sand
R1 = Corrected hydrometer reading at 4 minutes,
R2 = Corrected hydrometer reading at 2 hours, W = Weight of the soil, g
Paper Proceedings of Agri Animal 2013 - ISSN 2279-3682
221
Since, the hydrometer was calibrated at temperature of 67 (94 the hydrometer reading was
corrected at working temperature. The correction was equal to the difference between the
experimental temperature and 67 multiplied by 0.2. If the temperature of the suspension is
above 67OF, the correction is added and if below 67
OF, the correction is subtracted.
Porosity and Particle density
Porosity (f) being the ratio of volume of pore space to the total volume of soil was calculated as:
Porosity (%) = [1-(BD/PD)]* 100
Particle density (PD) being the ratio of soil mass to volume of soil solid was determined by the
water pycnometer,
PD = Ms/Vs
Where,
Ms = mass of soil taken, 10 g, Vs = volume of soil solid, cm3
The volume of soil particles was determined by measuring the weight of water displaced
by the particles i.e. the mass of water displaced (as water having density 1 g cm-3
):
Vs = Mpw + Ms - Mpsw
= Mpw + 10 - Mpsw
Where,
Mpw = mass of water filled pycnometer, g
Mpw = mass of pycnometer + water + soil, g
Soil organic carbon stock
Organic carbon (%) in soil was determined by Walkley and Black (1934) method and the
SOC stock of the profile (Mg ha-1
) was computed by multiplying the SOC concentration (g kg-1
)
by the bulk density( Mg m-3
), depth (m) and factor by 10. Soil pH and electrical conductivity
were determined in 1:2 soil-water suspensions as per the procedure given by Jackson (1973).
Development of Pedo-transfer functions
Thelinear regression equations were developed in SAS statistical software to correlate soil water
retention values at suction of 0.033 and 0.15 MPa with the measured soil physical parameters to
develop pedo-transfer functions (PTFs). The accuracies of the PTFs derived soil water retention
were determined based on the values of coefficient of determination (R2) and RMSE values and
compared with actual values (Fig. 5). After validating PTFs, these were used to determine soil
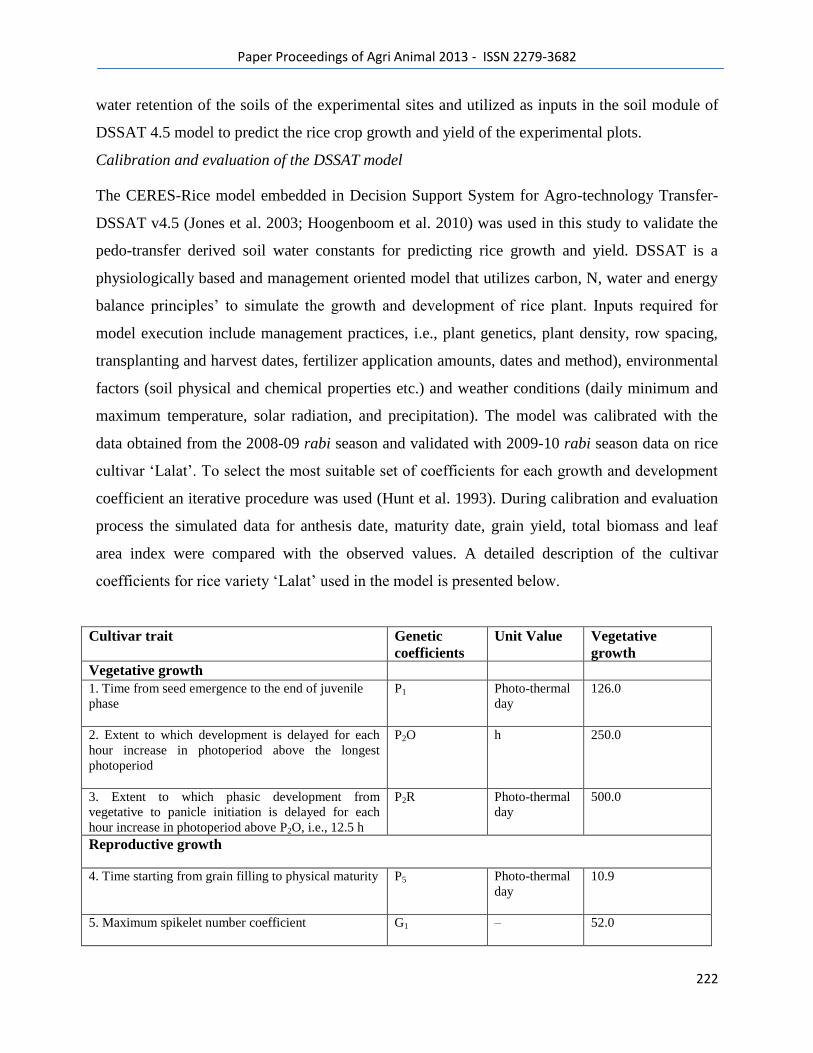
Paper Proceedings of Agri Animal 2013 - ISSN 2279-3682
222
water retention of the soils of the experimental sites and utilized as inputs in the soil module of
DSSAT 4.5 model to predict the rice crop growth and yield of the experimental plots.
Calibration and evaluation of the DSSAT model
The CERES-Rice model embedded in Decision Support System for Agro-technology Transfer-
DSSAT v4.5 (Jones et al. 2003; Hoogenboom et al. 2010) was used in this study to validate the
pedo-transfer derived soil water constants for predicting rice growth and yield. DSSAT is a
physiologically based and management oriented model that utilizes carbon, N, water and energy
balance principles‘ to simulate the growth and development of rice plant. Inputs required for
model execution include management practices, i.e., plant genetics, plant density, row spacing,
transplanting and harvest dates, fertilizer application amounts, dates and method), environmental
factors (soil physical and chemical properties etc.) and weather conditions (daily minimum and
maximum temperature, solar radiation, and precipitation). The model was calibrated with the
data obtained from the 2008-09 rabi season and validated with 2009-10 rabi season data on rice
cultivar ‗Lalat‘. To select the most suitable set of coefficients for each growth and development
coefficient an iterative procedure was used (Hunt et al. 1993). During calibration and evaluation
process the simulated data for anthesis date, maturity date, grain yield, total biomass and leaf
area index were compared with the observed values. A detailed description of the cultivar
coefficients for rice variety ‗Lalat‘ used in the model is presented below.
Cultivar trait Genetic
coefficients Unit Value Vegetative
growth Vegetative growth 1. Time from seed emergence to the end of juvenile
phase
P1 Photo-thermal
day
126.0
2. Extent to which development is delayed for each
hour increase in photoperiod above the longest
photoperiod
P2O h 250.0
3. Extent to which phasic development from
vegetative to panicle initiation is delayed for each
hour increase in photoperiod above P2O, i.e., 12.5 h
P2R Photo-thermal
day
500.0
Reproductive growth
4. Time starting from grain filling to physical maturity P5 Photo-thermal
day
10.9
5. Maximum spikelet number coefficient G1 – 52.0
Paper Proceedings of Agri Animal 2013 - ISSN 2279-3682
223
6. Maximum possible single grain size G2 g 0.0235
7. Scalar vegetative growth coefficient for tillering
relative to IR64
G3 – 1.03
8. Temperature tolerance scalar coefficient G4 – 0.90
Results and Discussion
Basic soil properties of 3 study sites
Results of physico-chemical properties of the soil samples collected from the three sites of
Odisha are presented in Table 1(a,b). Average soil sample data of three profiles in each locations
indicate that soils were acidic to near neutral in soil reaction as the pH of the soils ranged from
5.8 to 6.8, 6.0 to 6.8; and 5.2 to 6.2 in ‗Satyabadi‘, ‗Kanas‘ and ‗Dhenkanal‘, respectively. The
electrical conductivity (EC, dS m-1
) was low in the upland soils of ‗Dhenkanal‘; while the
salinity levels were comparatively higher in both ‗Satyabadi‘ (0.40-0.90) and ‗Kanas‘ (0.70-
0.91). The location of ‗Satyabadi‘ and ‗Kanas‘ near to coast of the Bay of Bengal might lead to
higher level of salinity as compared to the inland district of ‗Dhenkanal‘.
The bulk density of ‗Satyabadi‘ and ‗Kanas‘ site was above 1.50 Mg m-3
in all the depths except
at 0-0.15 m. The porosity in both sites followed the same trend as in the case of bulk density.
Among three sites, Dhenkanal had relatively lower bulk density (1.34 to 1.48 Mg m-3
), higher
particle density (2.15 to 2.61 Mg m-3
) as well as higher porosity (34.4 to 48.7%) as compared to
the other two sites. Due to low porosity, the saturated hydraulic conductivity (Ks) was low (0.11
to 0.70 m d-1
) at ‗Kanas‘ and ‗Satyabadi‘ except at surface layer (0.397 to 0.415 m d-1
). Result
showed that owing to higher clay texture, Kanas had 20% less average saturated hydraulic
conductivity than that of Satyabadi while the average Ks of upland soils of Dhenkanal was 86 to
89% higher than both the sites of coastal waterlogged plains. Dhenkanal soil had moderate to
high Ks values (0.258 to 1.67 m d-1
) at different depths of the soil profile. Due to low Ks values,
coastal plains of Puri district (Satyabadi and Kanas) possess waterlogging problem.In regard to
soil organic carbon (SOC) the value decreased with the depth in most cases. The SOC content at
0-15 cm depth was lower (4.0 g kg-1
) at Dhenkanal than at Satyabadi (5.75 g kg-1
) and Kanas
(4.88 g kg-1
), respectively. The profile soil organic carbon (PSOC) stock was also determined
from the SOC content, bulk density and depth and used to develop pedo-transfer function for
Paper Proceedings of Agri Animal 2013 - ISSN 2279-3682
224
moisture content at field capacity. The PSOC stock within 1.2 m depth was 78.87, 66.96 and
59.26 Mg ha-1
at Dhenkanal, Satyabadi and Kanas, respectively.
The soils of coastal waterlogged soils were found to be clay in texture throughout the
profile (except at 0.90-1.20 m depth in Kanas which had sandy clay texture). But, Dhenkanal
site, representing mid central table land agro-ecological zone and inland districts of Odisha had
clay loam texture except at 0-0.15 and 0.90-1.20 m depth (Sandy clay loam in texture). The
average clay content of the three study sites were found in following order: Kanas (60%) >
Satyabadi (52%) > Dhenkanal (29%). Dhenkanal soils had 45 and 51% less clay content than
that of Satyabadi and Kanas, respectively and accordingly the soil moisture retention was also
varied among three sites.
Soil moisture retention characteristics
Moisture content data at 0.033 MPa (field capacity), 0.1 , 0.3 , 0.5 , 1.0 and 1.5 MPa
(wilting point) revealed that higher the clay content greater is the moisture retention capacity of
the soil (Fig. 1a to 1f). The soil moisture characteristics curves were found to be fitted well in
power function as given in the figures (Fig. 1a to 1f). The higher values of R2 (>0.90, except at
90-120 cm depth of Dhenkanal)and lower values of standard error of estimate, SEE (0.41 to
2.34) were obtained throughout the profiles in power curve. Soils of Satyabadi and Kanas had 13
and 27 % higher moisture content at the lower suction of (0.033 MPa); while at higher suction of
(1.5 MPa) the moisture retention was 43 and 48 % more in Kanas and Satyabadi than that of
Dhenkanal. The soil metric suction-moisture content relationship displayed a sharp decrease in
moisture content from initially higher to lower values; from 0.033 to 0.1 or 0.3 MPa following a
gradual decline till 0.5 MPa; and the change became negligible thereafter. It is worthy to mention
that the rate of decline from 0.033 MPa to 0.1 MPa was 18 and 16 % in case of Dhenkanal and
Satyabadi; respectively while the decline rate for Kanas was only 4 %. Results indicate the fact
that difference in clay content between coastal plain of Puri district and Mid central table land of
Dhenkanal district might have played crucial role for variation in moisture content throughout
the whole suction range. The variation had increased sharply at higher suctions indicating the
dominant role of texture at higher suction in retaining soil moisture rather than the structure. The
soil moisture retention at field capacity and wilting points are presented in Table-1.
Paper Proceedings of Agri Animal 2013 - ISSN 2279-3682
225
Interrelationships between soil hydro-physical parameters and development of pedo-transfer
functions
The soil moisture retention at field capacity (FC) and Permanent Wilting Point (WP) were
regressed against clay and sand content (Fig. 2a and 2b), bulk density (Fig. 2c) as well as
saturated hydraulic conductivity (Fig. 3a). The relationship was positive when moisture retention
was regressed with clay content and bulk density whereas the slope was negative for porosity
and sand. The relation between moisture content at field capacity and permanent wilting point
and saturated hydraulic conductivity was also developed (Fig.3a). The logarithmic regression
equations were found to be the best to predict soil moisture retention based on saturated
hydraulic conductivity. The logarithmic response curves (Fig. 3a) revealed that at low values of
Ks (< 10 m d-1
), with slight decline in Ks, relatively larger increase in moisture retention at both
FC and WP was observed. The interrelationship between saturated hydraulic conductivity and
clay content and bulk density was also established (Fig. 3b and Fig. 3c).
When Ks were regressed with both the clay content (Fig. 3b) and inverse of bulk density (Fig. 3c)
the power (R2
= 0.87, SEE = 13.18) an exponential (R2
= 0.83, SEE = 17.03) form of regression
equations were found to be fitted best for clay and bulk density, respectively. The inverse of bulk
density is an indicator of compaction as well as porosity of soil. The power form of response
curve indicate a very low Ks (<10 m d-1
) at higher clay content (> 50 %) and a sharp increase in
Ks in less clay containing (<30 %) soil. Similar kind of relation was obtained by Adhikari et al.,
2008 when Ks was regressed with silt plus clay content and steady in
filtration rate with clay content. However, Ks was found to be exponentially increased with the
increased value of inverse of bulk density.
The porosity (%) was plotted with sand and silt content (Fig. 4). As expected porosity was
negatively related with clay content and positively related with sand content. Available water
capacity (AWC) was also observed to be negatively correlated with porosity.
The Pedo-transfer functions in terms of multiple linear regressions were developed to predict
moisture estimation (m3m
-3) at field capacity (θfc) and wilting point (θwp) (Table -2):
θfc= 0.418 - (0.0058*sand) + (0.0021*clay) + (0.0258*PSOC) ………………. (1)
θwp= 0.3989 – (0.0039*sand) - (0.00384*silt) ………………..(2)
Paper Proceedings of Agri Animal 2013 - ISSN 2279-3682
226
θwp= 0.0238 + (0.0038*clay) ………..…….. (3)
For this study, the water retention at field capacity and PWP was derived using above
equations and measured versus pedo-transfer derived water retention at field capacity and
permanent wilting point (PWP) were presented in Fig-5. The associated statistics i.e. R2,
Adjusted R2, MSE (Mean sum of error) and RMSE (Root of the mean squared error) showed a
reasonably good predictive potential of the PTFs to predict soil moisture retention at FC and
PWP. However, PTFs to determine moisture retention at WP (eq. 2) were closer to the observed
values than at FC.
Results depicted that water content at higher suction (1.5 MPa) was largely determined by
texture (especially that of clay), thus the influence of profile soil organic carbon (PSOC)
(aggregation or structure) was minimum (eq. 2 and 3). However, PSOC stock had significant
impact on moisture content at field capacity (eq. 1) Similar observations were also made by
Rawls et al., 2003 and Kar et al., 2004.
As the PTFs derived and observed water retention was found closer, attempt was made to
derive soil water retention with basic soil data sets of rice experimental field of Alisha,
Satyabadi, Puri to predict crop growth and yield of rice under optimum nutrient management
using DSSAT4.5 model. The measured soil properties of experimental field are given in table 4.
Using pedo-transfer function (eq. 1 and 2), soil water retention of the experiential plots at field
capacity and permanent wilting point were determined and are depicted in Fig. 6(a) and Fig.
6(b), respectively. Both actual and pedo-transfer derived soil water retention of the experimental
field were used as inputs in the soil module of DSSAT 4.5 model for calibration (Table-5) and
validation (Table 6, a & 6, b) of crop growth and yield.
Calibration of DSSAT model
The DSSAT model was calibrated with experimental data collected during the 2008-09 rice
crop season using derived cultivar coefficients for ‗Lalat‘ cultivar that determine vegetative (P1,
P2O, and P2R) and reproductive (P5, G1, G2, G3, and G4) growth and development. During
calibration, a close agreement was obtained between observed and simulated values for rice
phenology. The model predicted the dates from transplanting to anthesis and transplanting to
maturity with a difference of 2 days between observed and simulated dates for rice cultivar
‗Lalat‘ (Table 5). The simulated and observed values were in good agreement for LAI and total
Paper Proceedings of Agri Animal 2013 - ISSN 2279-3682
227
above-ground biomass at different phenological stages (Fig. 5). The lower values for error (-5.22
and -4.46 %, respectively) reflected that the model predicted LAI and above-ground biomass
were close to the observed values. At final harvest, the simulated grain yield was also in good
agreement with the observed values and the error was only 2.97 % for the grain yield. The lower
percentage of error between simulated and observed LAI and dry biomass shows the ability of
model to simulate rice growth and development under irrigated conditions for tropical monsoon
climate of eastern India.
Model evaluation
The CSM-CERES-Rice model was evaluated with the experimental data collected during the
2009-10 and run with both the actual and pedo-transfer derived water retention values (Table- 6,
a and 6, b). A perfect match was obtained between the observed and simulated values for rice
phenology both with actual and pedo-transfer derived water retention. The model predicted the
dates from transplanting to anthesis with 2 (two) difference dates and transplanting to maturity
with 1 (one) day difference between the observed and simulated dates when actual water
retention value was taken with error of -2.78% and -0.96%, respectively. (Table 6(a). With prod-
transfer derived soil water retention the difference of observed and simulated anthesis date was 3
days with the error of -4.11%. The simulated and observed values for leaf area index (LAI) and
total above-ground biomass at different phenological stages were in good agreement. With actual
soil moisture data, the error (%) for LAI was 4.03%, while the error for total biomass and grain
yield was -2.13 and -4.90%, respectively (Table 6, a). With pedo-transfer derived soil moisture
data, the lower error (%) for maximum LAI was -2.39 %, while the error (%) for maximum dry
biomass and grain yield were -4.46 and -6.73, respectively. The lower errors indicate that the
model predicted LAI and above-ground biomass closely. In general, the results for model
evaluation with the observed data sets indicate that the DSSAT 4.5 model was able to simulate
yield accurately for transplanted rice with pedo-transfer derived soil water retention as well.
Conclusions
In this study, pedo-transfer functions (PTFs) in the form of linear regressions were derived using
soil profile data of three locations of Odisha. The soil water constants were derived using PTFs
and used as inputs in the soil module of DSSAT 4.5 model for predicting growth and yield of
rice crop. The soil organic carbon stock plays significant role in lower suction range. The lower
Paper Proceedings of Agri Animal 2013 - ISSN 2279-3682
228
error (%) indicates that the predicted LAI and above-ground biomass by the model was matched
quite well with the observed values. In general, the results for model evaluation with the
observed data sets indicated that the DSSAT 4.5 model was able to simulate yield accurately for
transplanted rice with pedo-transfer derived soil water retention as well.
References:
Adhikary, P.P., Chakraborty, D., Kalra, N., Sachdev, C.B., Patra, A.K., Kumar, S., Tomar, R.K.,
Chandna, P., Raghav, D., Agarwal, K.and Sehgal, M. 2008. Pedotransfer functions for predicting the
hydraulic properties of Indian soils‖ Soil Res., Vol. 46, no. 5, pp. 476-484.
Baker, L. and Ellison, D. 2008. Optimisation of pedotransfer functions using an artificial neural network
ensemble method‖ Geoderma, Vol. 144, pp. 212–224.
Bannayan, M., Crout, N. M. J., and Hoogenboom, G. 2003. Application of the CERES-wheat model for
within season prediction of winter wheat yield in the United Kingdom‖ Agronomy Journal Vol. 95, pp.
114–125.
Bell, A.M. and van Keulen, H. 1995. Soil pedotransfer functions for four Mexican soils‖ Soil Sci. Soc.
Am. J. Vol. 59, pp. 865–871.
Hunt, L. A., Pararajasingham, S., Jones, J. W., Hoogenboom, G., Imamura, D. T., & Ogoshi, R. M. 1993.
GENCALC: Software to facilitate the use of crop models for analyzing field experiments‖ Agronomy
Journal, Vol. 85, pp. 1090–1094.
Hoogenboom, G. 2000. Contribution of agro-meteorology to the simulation of crop production and its
applications‖ Agriculture and Forest Meteorology, Vol. 103, pp. 137–157.
Hoogenboom, G., Jones, J. W., Wilkens, P. W., Porter, C. H., Batchelor, W. D., Hunt, L. A., et al. 2004.
Decision support system for agro-technology transfer (DSSAT) version 4.0. Honolulu: University of
Hawaii, CD-ROM.
Hoogenboom, G., Jones, J. W., Wilkens, P. W., Porter, C. H., Batchelor, W. D., Hunt, L. A., et al. 2010.
Decision support system for agrotechnology transfer, (DSSAT) version 4.5. Honolulu: University of
Hawaii, CD-ROM.
Jackson, J.L. 1973. Soil Chemical Analysis. Prentice Hall of India Pvt. Ltd., New Delhi.
Paper Proceedings of Agri Animal 2013 - ISSN 2279-3682
229
Jintrawet, A. 1995. A decision support system for rapid assessment of lowland rice-based cropping
alternatives in Thailand‖ Agricultural System, Vol. 47, pp. 245–258.
Jones, J. W., Hoogenboom, G., Porter, C. H., Boote, K. J., Batchelor, W. D., Hunt, L. A., et al. 2003. The
DSSAT cropping system model‖ European Journal of Agronomy, Vol. 18, pp. 235–265.
Kar, G., Singh, R.and Verma, H.N. 2004. Spatial variability studies of soil hydro-physical properties
using GIS for sustainable crop planning of a watershed of eastern India and its testing in a rainfed rice
area‖ Aus. J. of Soil. Res., Vol. 42, pp. 369-379.
Klute, A. 1986. Water retention: laboratory methods. In: Klute, A. (Ed.), Methods of Soil Analysis Part-I,
ASA, Monograph, Madison, Wisconsin, USA, pp. 635–662.
Kropff, M. J., Bouma, J., and Jones, J. W. 2001. Systems approaches for the design of sustainable
agroecosystems‖ Agricultural System, Vol. 70, pp. 369–393.
Kumar, R., and Sharma, H. L. 2004. Simulation and validation of CERES-Rice (DSSAT) model in
northwestern Himalayas‖ Indian Journal of Agricultural Sciences, Vol. 74, pp 133–137.
Nemes, A., Schaap, M.G., Wosten, J.H.M. 2003. Functional Evaluation of Pedotransfer Functions
Derived from Different Scales of Data Collection‖ Soil Sci. Soc. Am. J., Vol 67, pp. 1093–1102.
Pachepsky, Y.A., Timlin, D. and Varallyay, G. 1996. Artificial neural networks to estimate soil water
retention from easily measurable data‖ Soil Sci. Soc. Am. J., Vol. 60, pp. 727–733.
Rawls, W.J., Pachepsky, Y.A., Ritchie, J.C., Sobecki, T.M. and Bloodworth, H. 2003. Effect of soil
organic carbon on soil water retention‖ Geoderma, Vol.116, pp. 61–76.
Ritchie, J. T., Singh, U., Godwin, D. C., and Bowen, W. T. 1998. Cereal growth, development and yield.
In G. Y. Tsuji, G. Hoogenboom, & P. K. Thornton (Eds.), Understanding options for agricultural
production Dordrecht: Kluwer Academic. pp. 79–98.
Sarkar, R., and Kar, S. 2006. Evaluation of management strategies for sustainable rice-wheat cropping
system, using DSSAT seasonal analysis‖ Journal of Agricultural Sciences, Vol. 144, pp. 421–434.
Paper Proceedings of Agri Animal 2013 - ISSN 2279-3682
230
Timsina, J., and Connor, D. J. 2001. Productivity and management of rice-wheat cropping systems: Issues
and challenges‖ Field Crops Research, Vol. 69, pp. 93–132.
Timsina, J., and Humphreys, E. 2006. Performance of CERES-rice and CERES-wheat models in rice-
wheat systems: A review. Agricultural System, Vol. 90, pp. 5–31.
Tsuji, G. Y., Hoogenboom, G., and Thornton, P. K. 1998. Understanding options for agricultural
production. Systems approaches for sustainable agricultural development. Dordrecht: Kluwer Academic.
Walkley, A., and Black, I.A. 1934. An examination of the Degtjareff method for determining soil organic
matter and a proposed modification of the chromic acid titration method‖ Soil Sci. Vol. 37, pp. 29–38.
Paper Proceedings of Agri Animal 2013 - ISSN 2279-3682
231
Fig. 1 : Soil moisture characteristics curves at six soil depths in the three sites of Odisha
Fig. 1 : Soil moisture characteristics curves at six soil depths in the three sites of Odisha
y = 3E+15x-10.409
R2 = 0.93, SEE = 1.14
y = 9E+06x-4.6936
R2 = 0.94, SEE = 2.12
y = 5615.9x-2.4386
R2 = 0.84, SEE = 1.08
0.0
0.2
0.4
0.6
0.8
1.0
1.2
1.4
1.6
1.8
0.00 0.10 0.20 0.30 0.40 0.50 0.60 0.70
Ma
tric
Su
cti
on
(M
Pa
)
Moisture Content (m3 m-3)
Satyabadi
Kanas
Dhenkanal
y = 3E+08x-5.3035
R2 = 0.97, SEE = 0.74
y = 3E+07x-4.4617
R2 = 0.94, SEE = 1.11
y = 1E+06x-4.0931
R2 = 0.99, SEE = 0.41
0.0
0.2
0.4
0.6
0.8
1.0
1.2
1.4
1.6
1.8
0.00 0.10 0.20 0.30 0.40 0.50 0.60 0.70
Ma
tric
Su
cti
on
(M
Pa
)
Moisture Content (m3 m-3)
Satyabadi
Kanas
Dhenkanal
y = 9E+08x-5.485
R2 = 0.98, SEE = 0.61
y = 5E+07x-4.5096
R2 = 0.94, SEE = 1.32
y = 152310x-3.4647
R2 = 0.98, SEE = 0.51
0.0
0.2
0.4
0.6
0.8
1.0
1.2
1.4
1.6
1.8
0.00 0.10 0.20 0.30 0.40 0.50 0.60 0.70
Ma
tric
Su
cti
on
(M
Pa
)
Moisture Content (m3 m-3)
Satyabadi
Kanas
Dhenkanal
y = 392956x-3.7525
R2 = 0.92, SEE = 2.34
y = 9E+06x-4.2942
R2 = 0.95, SEE = 0.65
y = 316100x-3.8932
R2 = 0.98, SEE = 0.92
0.0
0.2
0.4
0.6
0.8
1.0
1.2
1.4
1.6
1.8
0.00 0.10 0.20 0.30 0.40 0.50 0.60 0.70
Ma
tric
Su
cti
on
(M
Pa
)
Moisture Content (m3 m-3)
Satyabadi
Kanas
Dhenkanal
(0-15 cm)
y = 5E+07x-4.7702
R2 = 0.96, SEE = 1.72
y = 7E+07x-4.5814
R2 = 0.94, SEE = 1.22
y = 108226x-3.2162
R2 = 0.95, SEE = 0.81
0.0
0.2
0.4
0.6
0.8
1.0
1.2
1.4
1.6
1.8
0.00 0.10 0.20 0.30 0.40 0.50 0.60 0.70
Ma
tric
Su
cti
on
(M
Pa
)
Moisture Content (m3 m-3)
Satyabadi
Kanas
Dhenkanal
y = 1E+08x-5.1982
R2 = 0.94, SEE = 2.10
y = 1E+07x-4.1519
R2 = 0.95, SEE = 0.55
y = 263651x-3.5807
R2 = 0.96, SEE = 0.61
0.0
0.2
0.4
0.6
0.8
1.0
1.2
1.4
1.6
1.8
0.00 0.10 0.20 0.30 0.40 0.50 0.60 0.70
Ma
tric
Su
cti
on
(M
Pa
)
Moisture Content (m3 m-3)
Satyabadi
Kanas
Dhenkanal
(30-45 cm) (15-30 cm)
(45-60 cm) (60-90 cm) (90-120 cm)
Paper Proceedings of Agri Animal 2013 - ISSN 2279-3682
232
Fig. 2 : Moisture content at field capacity and wilting point in relation to clay, sand and bulk density
y = 0.49x + 23.58R2 = 0.85, SEE = 3.82
y = 0.38x + 2.38R2 = 0.97, SEE = 1.26
0.00
0.10
0.20
0.30
0.40
0.50
0.60
0.70
0 10 20 30 40 50 60 70 80
Mo
istu
re c
on
ten
t a
t F
C a
nd
WP
(m
3m
-3)
Clay content (%)
FC WP
(a)
y = -0.51x + 62.19R2 = 0.81, SEE = 4.23
y = -0.35x + 30.86R2 = 0.76, SEE = 3.44
0.00
0.10
0.20
0.30
0.40
0.50
0.60
0.70
0 10 20 30 40 50 60 70
Mo
istu
re c
on
ten
t a
t F
C a
nd
WP
(m
3m
-3)
Sand content (%)
FC WP(b)
y = 62.06x - 44.55R2 = 0.50, SEE = 6.89
y = 42.78x - 42.80R2 = 0.46, SEE = 5.12
0.00
0.10
0.20
0.30
0.40
0.50
0.60
0.70
1.30 1.35 1.40 1.45 1.50 1.55 1.60 1.65 1.70
Mo
istu
re c
on
ten
t a
t F
C a
nd
WP
(m
3m
-3)
Bulk density (Mg m-3)
FC WP
(c)
Paper Proceedings of Agri Animal 2013 - ISSN 2279-3682
233
Fig. 3 : Saturated hydraulic conductivity in relation to (a) moisture content at field
capacity and wilting point (b) clay content and (c) inverse of bulk density as obtained
from the measured dataset
y = -1.25x + 85.89
R2 = 0.76, SEE = 8.4
0
10
20
30
40
50
60
70
80
0 10 20 30 40 50 60
Porosity (%)
Cla
y c
on
ten
t (%
)
y = 1.22x - 8.52
R2 = 0.91, SEE = 4.49
0
10
20
30
40
50
60
70
0 10 20 30 40 50 60
Porosity (%)
Sa
nd
co
nte
nt
(%)
y = -0.28x + 34.59
R2 = 0.66, SEE = 2.52
0
5
10
15
20
25
30
35
40
0 10 20 30 40 50 60
Porosity (%)
Av
aila
ble
wa
ter
ca
pa
cit
y (
%)
(a)
y = 4E-09e31.31x
R2 = 0.83, SEE = 17.03
0.0
0.4
0.8
1.2
1.6
2.0
0.50 0.55 0.60 0.65 0.70 0.75 0.80
Sa
tura
ted
hyd
rau
lic c
on
du
cti
vit
y (m
d-1
)
1/Bulk density (m3 Mg-1)
y = 5E+07x-4.1625
R2 = 0.87, SEE = 13.18
0.0
0.4
0.8
1.2
1.6
2.0
0 10 20 30 40 50 60 70 80
Sa
tura
ted
hyd
rau
lic
co
nd
uc
tiv
ity (
m d
-1)
Clay content (%)
y = -4.32Ln(x) + 56.89R2 = 0.83, SEE = 2.89
y = -3.22Ln(x) + 27.65R2 = 0.90, SEE = 4.51
0.00
0.10
0.20
0.30
0.40
0.50
0.60
0.70
0.0 0.4 0.8 1.2 1.6 2.0Mo
istu
re c
on
ten
t a
t F
C a
nd
WP
(m
3m
-3)
Saturated hydraulic conductivity (m d-1)
FC WP
(a)
(b)
(c)
Paper Proceedings of Agri Animal 2013 - ISSN 2279-3682
234
Fig. 4 : Variation of porosity in relation to clay, sand and available water capacity (%)
from the measured dataset
R2 = 0.97, Adjusted R2 = 0.96MSE = 1.60, RMSE = 1.26
0.00
0.05
0.10
0.15
0.20
0.25
0.30
0.35
0.00 0.05 0.10 0.15 0.20 0.25 0.30 0.35
Sim
ula
ted
mo
istu
re c
on
ten
t a
t W
P (
m3
m-
3 )
Measured moisture content at WP (m3 m-3)
R2 = 0.97, Adjusted R2 = 0.97MSE = 1.41, RMSE = 1.19
0.00
0.05
0.10
0.15
0.20
0.25
0.30
0.35
0.00 0.05 0.10 0.15 0.20 0.25 0.30 0.35
Sim
ula
ted
mo
istu
re c
on
ten
t a
t W
P (
m3 m
-
3 )
Measured moisture content at WP (m3 m-3)
R2 = 0.92, Adjusted R2 = 0.89MSE = 9.38, RMSE = 3.06
0.20
0.30
0.40
0.50
0.60
0.70
0.2 0.3 0.4 0.5 0.6 0.7
Sim
ula
ted
mo
istu
re c
on
ten
t a
t F
C (
m3 m
-3)
Measured moisture content at FC (m3 m-3)
(b)
(a)
(c)
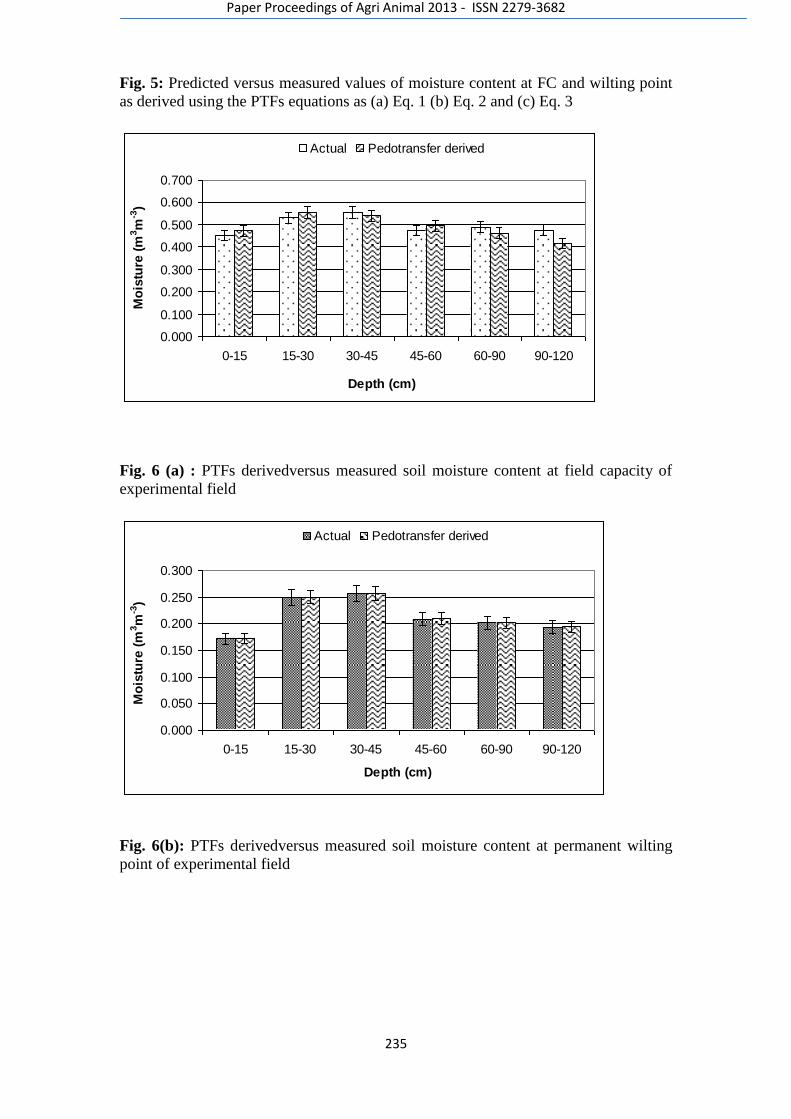
Paper Proceedings of Agri Animal 2013 - ISSN 2279-3682
235
Fig. 5: Predicted versus measured values of moisture content at FC and wilting point
as derived using the PTFs equations as (a) Eq. 1 (b) Eq. 2 and (c) Eq. 3
Fig. 6 (a) : PTFs derivedversus measured soil moisture content at field capacity of
experimental field
Fig. 6(b): PTFs derivedversus measured soil moisture content at permanent wilting
point of experimental field
0.000
0.100
0.200
0.300
0.400
0.500
0.600
0.700
0-15 15-30 30-45 45-60 60-90 90-120
Depth (cm)
Mo
istu
re (
m3m
-3)
Actual Pedotransfer derived
0.000
0.050
0.100
0.150
0.200
0.250
0.300
0-15 15-30 30-45 45-60 60-90 90-120
Depth (cm)
Mo
istu
re (
m3m
-3)
Actual Pedotransfer derived
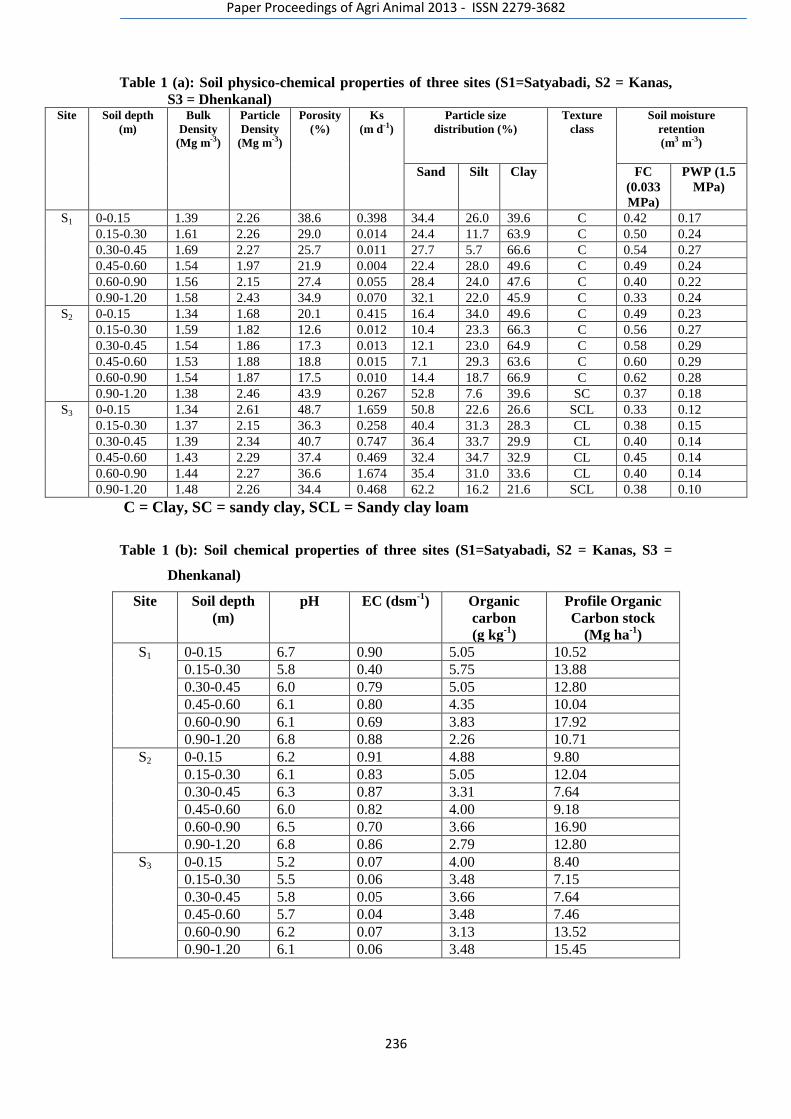
Paper Proceedings of Agri Animal 2013 - ISSN 2279-3682
236
Table 1 (a): Soil physico-chemical properties of three sites (S1=Satyabadi, S2 = Kanas,
S3 = Dhenkanal) Site Soil depth
(m)
Bulk
Density
(Mg m-3)
Particle
Density
(Mg m-3)
Porosity
(%)
Ks
(m d-1)
Particle size
distribution (%)
Texture
class
Soil moisture
retention
(m3 m-3)
Sand Silt Clay FC
(0.033
MPa)
PWP (1.5
MPa)
S1 0-0.15 1.39 2.26 38.6 0.398 34.4 26.0 39.6 C 0.42 0.17
0.15-0.30 1.61 2.26 29.0 0.014 24.4 11.7 63.9 C 0.50 0.24
0.30-0.45 1.69 2.27 25.7 0.011 27.7 5.7 66.6 C 0.54 0.27
0.45-0.60 1.54 1.97 21.9 0.004 22.4 28.0 49.6 C 0.49 0.24
0.60-0.90 1.56 2.15 27.4 0.055 28.4 24.0 47.6 C 0.40 0.22
0.90-1.20 1.58 2.43 34.9 0.070 32.1 22.0 45.9 C 0.33 0.24
S2 0-0.15 1.34 1.68 20.1 0.415 16.4 34.0 49.6 C 0.49 0.23
0.15-0.30 1.59 1.82 12.6 0.012 10.4 23.3 66.3 C 0.56 0.27
0.30-0.45 1.54 1.86 17.3 0.013 12.1 23.0 64.9 C 0.58 0.29
0.45-0.60 1.53 1.88 18.8 0.015 7.1 29.3 63.6 C 0.60 0.29
0.60-0.90 1.54 1.87 17.5 0.010 14.4 18.7 66.9 C 0.62 0.28
0.90-1.20 1.38 2.46 43.9 0.267 52.8 7.6 39.6 SC 0.37 0.18
S3 0-0.15 1.34 2.61 48.7 1.659 50.8 22.6 26.6 SCL 0.33 0.12
0.15-0.30 1.37 2.15 36.3 0.258 40.4 31.3 28.3 CL 0.38 0.15
0.30-0.45 1.39 2.34 40.7 0.747 36.4 33.7 29.9 CL 0.40 0.14
0.45-0.60 1.43 2.29 37.4 0.469 32.4 34.7 32.9 CL 0.45 0.14
0.60-0.90 1.44 2.27 36.6 1.674 35.4 31.0 33.6 CL 0.40 0.14
0.90-1.20 1.48 2.26 34.4 0.468 62.2 16.2 21.6 SCL 0.38 0.10
C = Clay, SC = sandy clay, SCL = Sandy clay loam
Table 1 (b): Soil chemical properties of three sites (S1=Satyabadi, S2 = Kanas, S3 =
Dhenkanal)
Site Soil depth
(m) pH EC (dsm
-1) Organic
carbon (g kg
-1)
Profile Organic
Carbon stock (Mg ha
-1)
S1 0-0.15 6.7 0.90 5.05 10.52 0.15-0.30 5.8 0.40 5.75 13.88 0.30-0.45 6.0 0.79 5.05 12.80 0.45-0.60 6.1 0.80 4.35 10.04 0.60-0.90 6.1 0.69 3.83 17.92 0.90-1.20 6.8 0.88 2.26 10.71
S2 0-0.15 6.2 0.91 4.88 9.80 0.15-0.30 6.1 0.83 5.05 12.04 0.30-0.45 6.3 0.87 3.31 7.64 0.45-0.60 6.0 0.82 4.00 9.18 0.60-0.90 6.5 0.70 3.66 16.90 0.90-1.20 6.8 0.86 2.79 12.80
S3 0-0.15 5.2 0.07 4.00 8.40 0.15-0.30 5.5 0.06 3.48 7.15 0.30-0.45 5.8 0.05 3.66 7.64 0.45-0.60 5.7 0.04 3.48 7.46 0.60-0.90 6.2 0.07 3.13 13.52 0.90-1.20 6.1 0.06 3.48 15.45
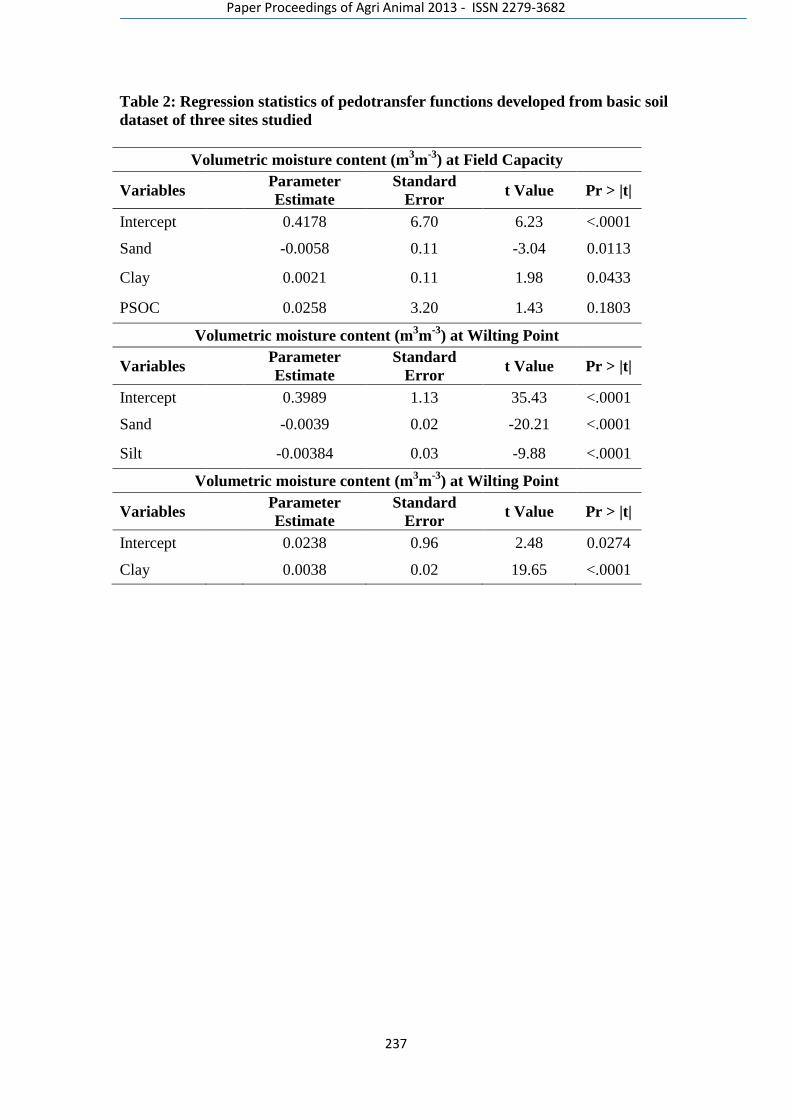
Paper Proceedings of Agri Animal 2013 - ISSN 2279-3682
237
Table 2: Regression statistics of pedotransfer functions developed from basic soil
dataset of three sites studied
Volumetric moisture content (m3m
-3) at Field Capacity
Variables Parameter
Estimate
Standard
Error t Value Pr > |t|
Intercept 0.4178 6.70 6.23 <.0001
Sand -0.0058 0.11 -3.04 0.0113
Clay 0.0021 0.11 1.98 0.0433
PSOC 0.0258 3.20 1.43 0.1803
Volumetric moisture content (m3m
-3) at Wilting Point
Variables Parameter
Estimate
Standard
Error t Value Pr > |t|
Intercept 0.3989 1.13 35.43 <.0001
Sand -0.0039 0.02 -20.21 <.0001
Silt -0.00384 0.03 -9.88 <.0001
Volumetric moisture content (m3m
-3) at Wilting Point
Variables Parameter
Estimate
Standard
Error t Value Pr > |t|
Intercept 0.0238 0.96 2.48 0.0274
Clay 0.0038 0.02 19.65 <.0001
Paper Proceedings of Agri Animal 2013 - ISSN 2279-3682
238
Table-3: Measured soil profile data of the experimental field utilized as input of
DSSAT 4.5 model for calibration and validation
Soil parameters Soil profile depth (m)
0-0.15
0.15-0.30
0.30-0.45
0.45-0.60
0.60-0.90
0.90-1.20
Lower limit (m
3m
-3) of soil moisture
0.193
0.232
0.254
0.235
0.211
0.223
Upper limit, drained (m
3m
-3) of soil
moisture
0.452
0.532
0.555
0.472
0.488
0.448
Upper limit, saturated (m
3m
-3) of soil
moisture
0.586
0.637
0.641
0.594
0.592
0.554
Root growth factor (0—1)
1.000
1.000
0.607
0.497
0.368
0.172
Sat. Hydraulic conductivity,
macropore (cm h-1
)
39.3
3.24
7.87
1.63
1.63
1.63
Bulk density (Mg m
-3)
1.45
1.54
1.59
1.54
1.57
1.61
Organic carbon (g kg
-1)
6.11
5.01
5.25
4.95
3.85
3.12
Clay (<0.002 mm) (%)
41.6
61.6
63.5
51.2
49.2
47.2
Silt (0.05—0.002) (%)
25.4
17.1
11.3
21.2
23.3
21.2
pH in water
6.8
6.8
6.2
6.3
6.4
6.5
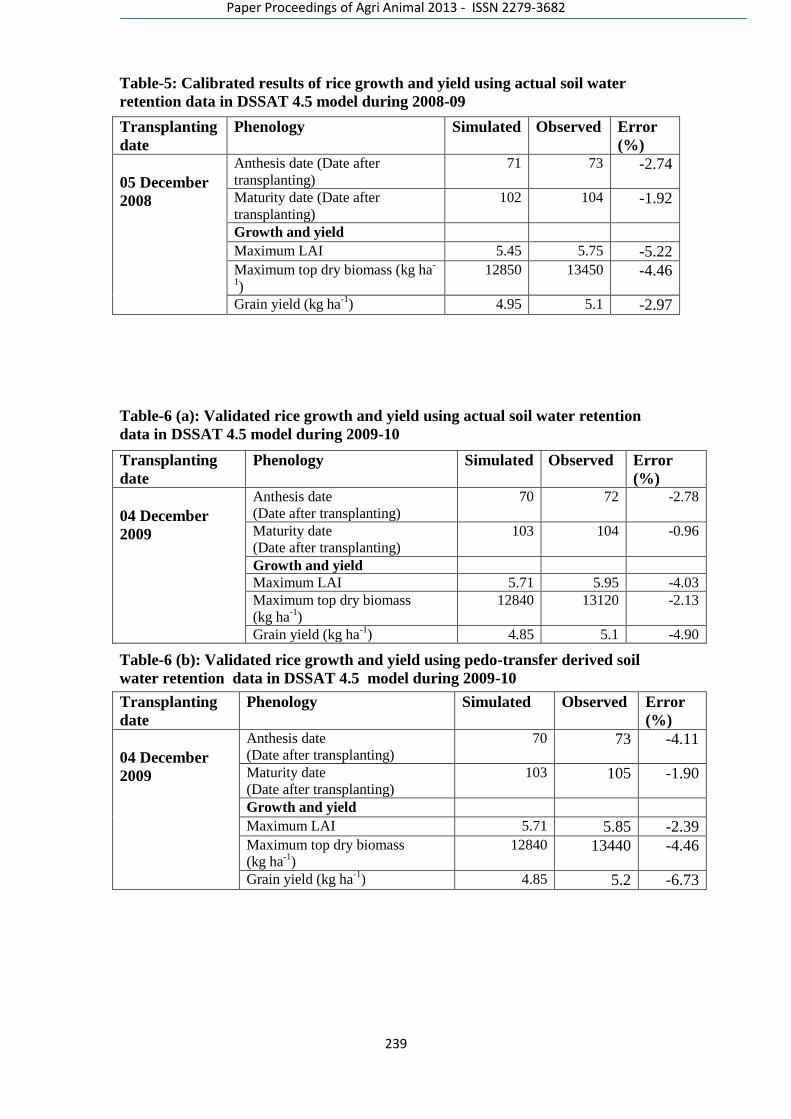
Paper Proceedings of Agri Animal 2013 - ISSN 2279-3682
239
Table-5: Calibrated results of rice growth and yield using actual soil water
retention data in DSSAT 4.5 model during 2008-09
Transplanting
date
Phenology Simulated Observed Error
(%)
05 December
2008
Anthesis date (Date after
transplanting) 71 73 -2.74
Maturity date (Date after
transplanting) 102 104 -1.92
Growth and yield Maximum LAI 5.45 5.75 -5.22 Maximum top dry biomass (kg ha
-
1)
12850 13450 -4.46
Grain yield (kg ha-1
) 4.95 5.1 -2.97
Table-6 (a): Validated rice growth and yield using actual soil water retention
data in DSSAT 4.5 model during 2009-10
Transplanting
date
Phenology Simulated Observed Error
(%)
04 December
2009
Anthesis date (Date after transplanting)
70 72 -2.78
Maturity date (Date after transplanting)
103 104 -0.96
Growth and yield Maximum LAI 5.71 5.95 -4.03 Maximum top dry biomass (kg ha
-1)
12840 13120 -2.13
Grain yield (kg ha-1
) 4.85 5.1 -4.90
Table-6 (b): Validated rice growth and yield using pedo-transfer derived soil
water retention data in DSSAT 4.5 model during 2009-10
Transplanting
date
Phenology Simulated Observed Error
(%)
04 December
2009
Anthesis date (Date after transplanting)
70 73 -4.11
Maturity date (Date after transplanting)
103 105 -1.90
Growth and yield Maximum LAI 5.71 5.85 -2.39 Maximum top dry biomass (kg ha
-1)
12840 13440 -4.46
Grain yield (kg ha-1
) 4.85 5.2 -6.73

Paper Proceedings of Agri Animal 2013 - ISSN 2279-3682
240
15
Paper Proceedings of Agri Animal 2013 - ISSN 2279-3682
241
Sub-lethal effects of bromadiolone and chlorophacinone on population and
breeding performances of barn owl, Tyto alba in oil palm plantations.
Hasber Salim1*
, Hafidzi Mohd Noor1, Noor Hisham Hamid
2,
Dzolkhifli Omar1, and Azhar Kasim
3
1 Department of Plant Protection, Faculty of Agriculture, Universiti Putra Malaysia, Serdang, Selangor, Malaysia.
2 Crop Protection Division, FELDA Agricultural Services Sdn Bhd (FASSB) , PPP Tun Razak, Pahang, Malaysia
3Department of Animal Science, Faculty of Agriculture, Universiti Putra Malaysia, Serdang, Selangor, Malaysia.
ABSTRACT
The sub-lethal effects of anticoagulant rodenticide, bromadiolone and
chlorophacinone on population and breeding performances of barn owls, Tyto alba in
oil palm plantations were evaluated. In general, the results of the study shows
occupancy rate of nest boxes, clutch size, hatching success, brood size and fledging
success of T. alba in rodenticides treated areas were lower compared to rodenticides
free area. Residue analysis of regurgitated pellets was used to indicate the level of
anticoagulant rodenticides exposure to T. alba in the field. Of the total number of
collected pellets, 20.56% (mean residue: 1.335 ± 0.073 µg/g) and 28.89% (mean
residue: 0.777 ±0.032 µg/g) contained bromadiolone and chlorophacinone residue
respectively. The lower reproductive performance in both the chlorophacinone and
bromadiolone treated plots were due to the sub-lethal effects of secondary poisoning
to the parents and nestling of T. alba. This is substantiated by the detection of residues
in the pellets collected in both the rodenticide treated plots. Single application of
rodenticides during the off breeding season (April – June) of T. alba could lower
damage to fruit bunches of oil palm and reduce the risk of secondary poisoning to T.
alba populations
Key words: Tyto alba, Secondary poisoning, rodenticides
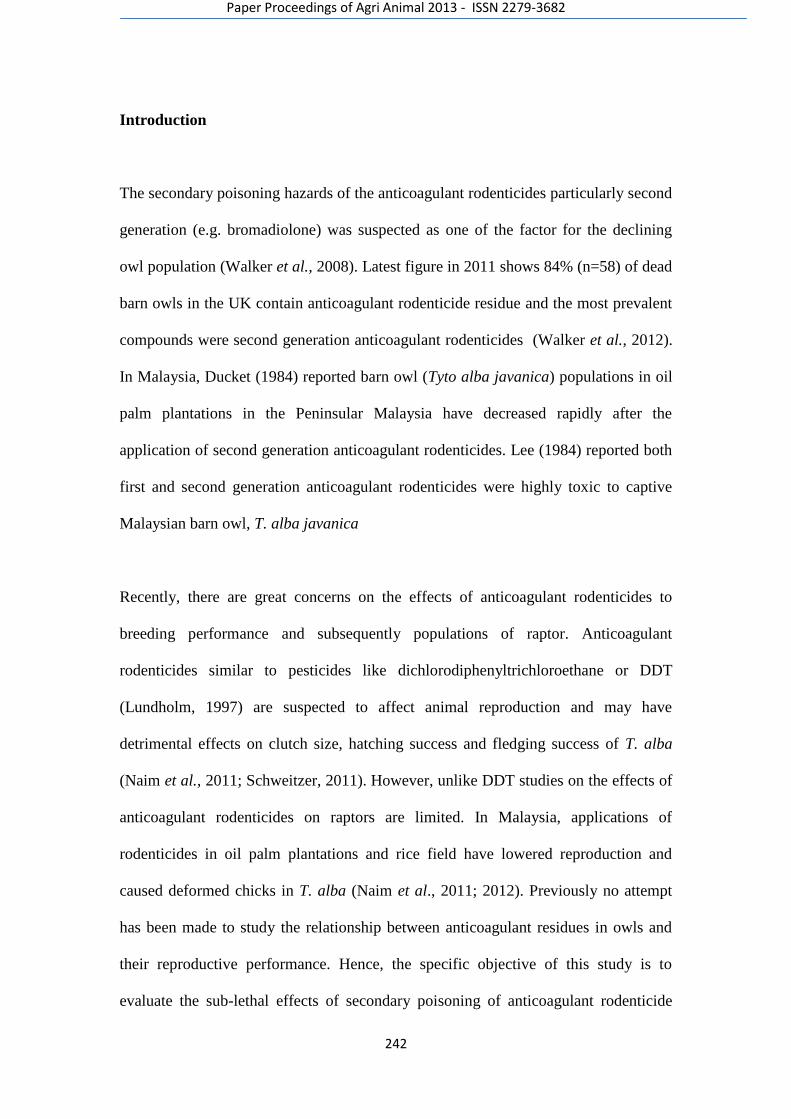
Paper Proceedings of Agri Animal 2013 - ISSN 2279-3682
242
Introduction
The secondary poisoning hazards of the anticoagulant rodenticides particularly second
generation (e.g. bromadiolone) was suspected as one of the factor for the declining
owl population (Walker et al., 2008). Latest figure in 2011 shows 84% (n=58) of dead
barn owls in the UK contain anticoagulant rodenticide residue and the most prevalent
compounds were second generation anticoagulant rodenticides (Walker et al., 2012).
In Malaysia, Ducket (1984) reported barn owl (Tyto alba javanica) populations in oil
palm plantations in the Peninsular Malaysia have decreased rapidly after the
application of second generation anticoagulant rodenticides. Lee (1984) reported both
first and second generation anticoagulant rodenticides were highly toxic to captive
Malaysian barn owl, T. alba javanica
Recently, there are great concerns on the effects of anticoagulant rodenticides to
breeding performance and subsequently populations of raptor. Anticoagulant
rodenticides similar to pesticides like dichlorodiphenyltrichloroethane or DDT
(Lundholm, 1997) are suspected to affect animal reproduction and may have
detrimental effects on clutch size, hatching success and fledging success of T. alba
(Naim et al., 2011; Schweitzer, 2011). However, unlike DDT studies on the effects of
anticoagulant rodenticides on raptors are limited. In Malaysia, applications of
rodenticides in oil palm plantations and rice field have lowered reproduction and
caused deformed chicks in T. alba (Naim et al., 2011; 2012). Previously no attempt
has been made to study the relationship between anticoagulant residues in owls and
their reproductive performance. Hence, the specific objective of this study is to
evaluate the sub-lethal effects of secondary poisoning of anticoagulant rodenticide
Paper Proceedings of Agri Animal 2013 - ISSN 2279-3682
243
with particular reference to bromadiolone and chlorophacinone on breeding
performance e.g. clutch size, hatching success, brood size and fledging success of T.
alba in oil palm plantation
Materials and Methods
Study sites and treatments
The study was conducted in a mature oil palm plantation in phase 1 of FELDA Jengka
24 (N=03°45´, E= 102°25), phase 123R in FELDA PPPTR (N=03°53´, E= 102°30)
and phase 3(10) 2 of FELDA Kota Gelanggi 5 (N=03°57´, E= 102°35´), Jerantut in
the State of Pahang, Malaysia. Distance between each site was approximately15 to 20
kilometers. The sites were sufficiently far apart to prevent barn owls from hunting
across different sites. Forty two artificial nest boxes (14 nest boxes /area) were chosen
for this study. The nest boxes were made from highly durable fiberglass (50 width x
115 cm length x 61 cm height). The Nest boxes were installed at a height of 7 m
above ground. The boxes were approximately distributed at a density of one box per
15 ha. Each study site was approximately 200 ha with a total hectare of 600 ha.
Two types of anticoagulant rodenticides; chlorophacinone (0.005% a.i – BUTIK S®)
and bromadiolone (0.005% a.i – BUTIK G2) were applied at FELDA PPPTR and
FELDA Kota Gelanggi 5 respectively. FELDA Jengka 24 was kept rodenticide free as
the control plot. Previously all areas were baited with chlorophacinone in a single
application a year. However, FELDA Jengka 24 has applied rodenticide baits six
months prior to the commencement of the study. Baiting was conducted twice a year
Paper Proceedings of Agri Animal 2013 - ISSN 2279-3682
244
during the study period in March and September which coincided with the peak
breeding season of T. alba. Each campaign involved two baiting rounds. Baits were
placed at the base of the palm trees at a bait density of one bait per palm. The duration
of the study was two year (1st January 2011 until 31
st December 2012), involving four
baiting campaigns or eight rounds in both rodenticide treated sites.
Nest boxes occupancy, number of eggs laid and hatched; brood size and number of
juvenile fledged were recorded at weekly intervals for all selected nest boxes
throughout the study period. Fresh regurgitated T. alba pellets were collected from all
occupied nest boxes at weekly intervals during the development of owlets in each
breeding season (approximately 9 weeks). The regurgitated pellets from each nest box
were counted, weighed, pooled and labelled before sent to the laboratory. The pellets
were stored in a deep freezer at -20oC and thawed to ambient temperature shortly
prior to laboratory analysis. The residue content in the pellets from all three plots was
then quantified by using high performances liquid chromatography (HPLC) analysis.
Residue analysis and Chromatography condition
Chemical analysis was conducted at the Toxicology laboratory, Department of Plant
Protection, Faculty of Agriculture, University Putra of Malaysia, Serdang, Malaysia.
The HPLC system (Water, USA) consist of a controller (model 600) with multi-
solvent delivery system, plus an auto-sampler (model 717), an ultra violet (UV)
detector (model 2996) and a fluorescence detector (model 2475). A reversed-phase
C18 column (5 µm particle size, 4.6 mm (ID) x 250 mm (L)) was used for analysis
(Nucleosil & Nucleodur®, Macherey-Nagel, Strasbourg, France). The column was
placed in a oven and temperature was held constant at 30 ºC. The mobile phase for
Paper Proceedings of Agri Animal 2013 - ISSN 2279-3682
245
detection of chlorophacinone was acetonitrile : ortho phosphoric acid, 0.5% (90:10 for
v/v), while the mobile phase for detection of bromadiolone was Methanol : distilled
water : acetic acid glacial (70:25: 5 for v/v). The mobile phase flow rate was 1.0 ml /
min. The UV detector was monitored from 240 to 340 nm with quantification done at
285 nm for detection of chlorophacinone. The fluorescence detector was set at 310 nm
excitation and 390 nm emissions with gain at 1 and bandwidth 18nm for detection of
bromadiolone. The injection volume of working standards and samples were set at 20
µL. Recordings of chromatograms and quantitative measurement of peak area were
performed with a computer connected to the Empower software (Waters, USA).
Sample preparation and extraction
The regurgitated pellets of the owls were fortified according to the procedures
described by Adison et al. (1982) and Naim (2010). The whole samples were placed
in a 100 mL polypropylene tube. For method validation, the pellets samples were
spiked at this point with the standard solution. Forty mL of extraction solvent,
acetone–chloroform mixture (1:1, v/v) and two gram anhydrous sodium sulphate were
then added to the tube. The mixture was then homogenized by shaking in vortex for 3
minute and left to stand for approximately one hour. The mixture was filtered with
filter paper and re-extracted with the extraction solvent (20 mL) and the combined
filtrates evaporated to dryness. The resulting residue was dissolved with 10 mL
methyl tert-butyl ether. The extract was cleaned up on an aminopropyl column,
eluting with 10 mL methyl tert-butyl ether–acetic acid glacial (90:10,v/v) after
conditioned with 2mL methyl tert-butyl ether. The extract was again evaporated to
dryness and reconstituted with 1 mL mobile phase of respective analysis of
Paper Proceedings of Agri Animal 2013 - ISSN 2279-3682
246
anticoagulant and filtered by using Cronus Filter Yellow. The solution was then
transferred into vials and placed in the auto-sampler for HPLC analysis.
Standard and calibration curve
Chlorophacinone and bromadiolone standard (Pestanal®) with 98.4% and 97.6% were
respectively obtained from Sigma-Aldrich, Germany. A stock standard solution of
chlorophacinone was prepared in acetonitrile; while for bromadiolone in methanol –
dicholoromethane (60:40, v/v). A stock solution of 100 ppm was prepared by
dissolving 5 mg analytical standard in 50 mL of solvents. Working standard, ranging
in concentration from 0.01 to 10 ppm were prepared from the stock standard solution.
The working standard solutions were then used to prepare standard curve and spiking
for the blood samples and regurgitated pellets. All standard solutions were stored in
refrigerator at 5 ºC. In HPLC system, response of both rodenticides was linear for 6
standard solutions at concentration of 0.01, 0.1, 0.5, 1, 5 and 10 ppm. Linearity of
calibration was assessed from a linear regression of response (area) versus
concentration of rodenticides, resulting in an r2
of 0.999. The average retention time of
bromadiolone and chlorophacinone was 4.5 minute and 6.0 minute respectively.
Fortification and recovery percentage
For method validation, the samples of pellets and blood were spiked with three
fortification concentration of 1.0, 5.0 and 10.0 ppm of each standard. Recovery rates
were assessed from spiked control samples of rodenticides in regurgitated pellets with
the fortification concentration. It was evident that both rodenticides showed good
Paper Proceedings of Agri Animal 2013 - ISSN 2279-3682
247
recoveries at low and high concentration ranged from 83% to 90% respectively. All
concentration data were presented on a wet weight basis.
Limit of detection (LOD) and limit of Quantitation (LOQ)
Detection limits for each rodenticide were assessed from calibration standards using
statistical regression with three replications. The estimated LOD and LOQ of the
bromadiolone were 0.005 ppm and 0.008 ppm respectively. For analysis of
chlorophacinone the LOD and LOQ were 0.002 ppm and 0.003 ppm respectively.
Quality control (QC) samples
A blank containing purely acetonitrile and methanol was injected between each
sample to monitor for any possible contamination due to carry over. Blank samples of
pellets and blood were also prepared and extracted similar to samples. All blank
solvent and blanks samples were below the analytical limit of detection (LOD) for
both rodenticides tested.
Data analysis
Nest boxes occupancy rate, clutch size, mean hatching success and mean fledging
success were analysed using the Statistical Analysis System (SAS) for Windows
version 9.2. The percentage of rat damage was square-root transformed because data
was not normally distributed. Parametric variables were compared using one-way
analysis of variance (ANOVA). Significant F value was further tested using the Tukey
test to detect significant difference between means of each parameter. Associations
Paper Proceedings of Agri Animal 2013 - ISSN 2279-3682
248
between breeding performances (nest boxes occupancy, clutch size, brood size and
fledging success) with levels of residue detected in regurgitated pellet and numbers of
pellets detected with anticoagulant rodenticides were analyzed using Pearson
correlation test. Values of P <0.05 were considered statistically significant.
Results and Discussions
Occupancy rate of nest boxes
The occupancy rates of all selected nest boxes in all study sites are shown in Table
1.1. The occupancy rate in rodenticides free area showed increasing pattern with
occupancy of 100% achieved in the third and fourth breeding season. All 14 selected
nest boxes were occupied in both breeding seasons. On the other hand occupancy rate
of nest boxes in bromadiolone treated area shows decreasing pattern. The lowest
occupancy rate was 28.57% and the highest rate 57.14% found in the fourth and
second breeding season respectively. In chlorophacinone treated area, the occupancy
rate fluctuated between 42.86% and 64.29% in the four breeding seasons evaluated.
Mean occupancy rate in rodenticides free plots for four breeding seasons was 85.71%
and this value was significantly different (P <0.05) and almost double as compared to
bromadiolone and chlorophacinone total mean occupancy rates which were 37.20%
and 51.%respectively. In general, the breeding season of T. alba in all study sites
shows two main breeding season in a year which were December to April and July to
November. The off breeding period was detected in May to June during the study.
Smal (1988) reported T. alba in oil palm plantation had two breeding peaks but the
owls can breed throughout year when the food supply is abundant.
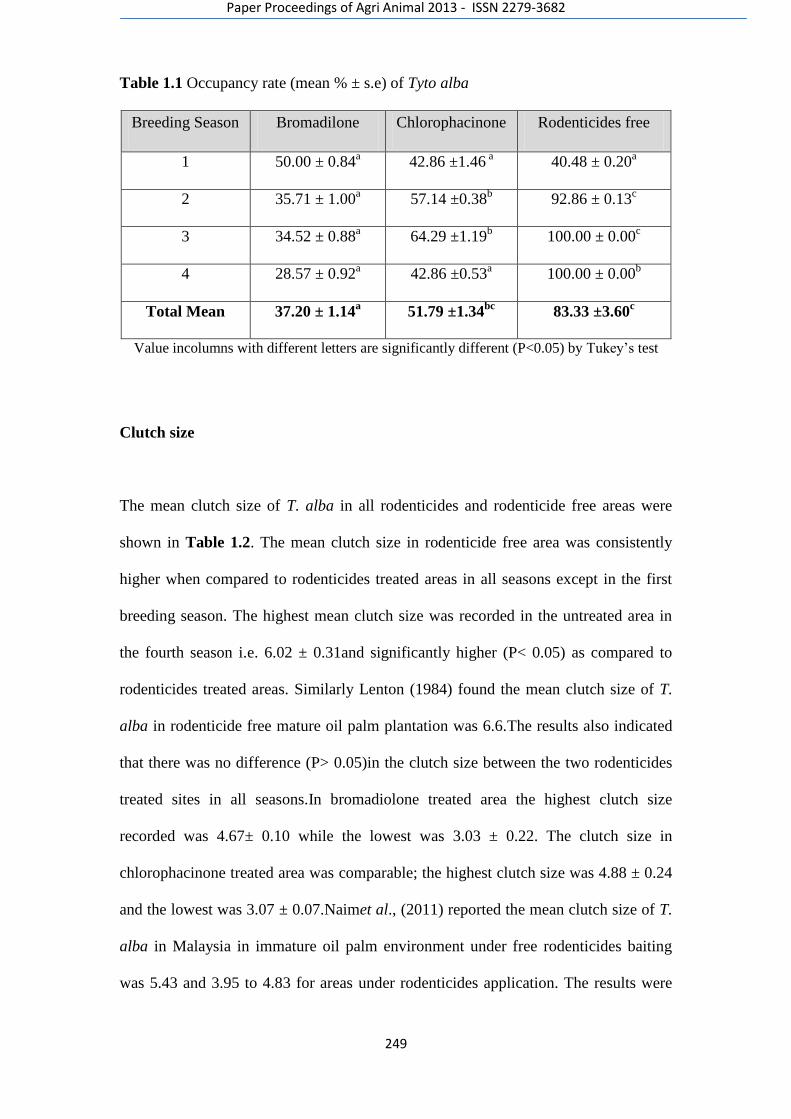
Paper Proceedings of Agri Animal 2013 - ISSN 2279-3682
249
Table 1.1 Occupancy rate (mean % ± s.e) of Tyto alba
Breeding Season Bromadilone Chlorophacinone Rodenticides free
1 50.00 ± 0.84a 42.86 ±1.46
a 40.48 ± 0.20
a
2 35.71 ± 1.00a 57.14 ±0.38
b 92.86 ± 0.13
c
3 34.52 ± 0.88a 64.29 ±1.19
b 100.00 ± 0.00
c
4 28.57 ± 0.92a 42.86 ±0.53
a 100.00 ± 0.00
b
Total Mean 37.20 ± 1.14a 51.79 ±1.34
bc 83.33 ±3.60
c
Value incolumns with different letters are significantly different (P<0.05) by Tukey‘s test
Clutch size
The mean clutch size of T. alba in all rodenticides and rodenticide free areas were
shown in Table 1.2. The mean clutch size in rodenticide free area was consistently
higher when compared to rodenticides treated areas in all seasons except in the first
breeding season. The highest mean clutch size was recorded in the untreated area in
the fourth season i.e. 6.02 ± 0.31and significantly higher (P< 0.05) as compared to
rodenticides treated areas. Similarly Lenton (1984) found the mean clutch size of T.
alba in rodenticide free mature oil palm plantation was 6.6.The results also indicated
that there was no difference (P> 0.05)in the clutch size between the two rodenticides
treated sites in all seasons.In bromadiolone treated area the highest clutch size
recorded was 4.67± 0.10 while the lowest was 3.03 ± 0.22. The clutch size in
chlorophacinone treated area was comparable; the highest clutch size was 4.88 ± 0.24
and the lowest was 3.07 ± 0.07.Naimet al., (2011) reported the mean clutch size of T.
alba in Malaysia in immature oil palm environment under free rodenticides baiting
was 5.43 and 3.95 to 4.83 for areas under rodenticides application. The results were
Paper Proceedings of Agri Animal 2013 - ISSN 2279-3682
250
similar to the present study even though both studies were conducted in different
environment (mature versus immature) and applying different type of anticoagulant
rodenticide
Rodenticides application could decrease clutch size in T. alba due to lower prey
availability as a direct consequence of baiting. It could also be attributed by the effects
of secondary poisoning on the breeding owls which lead to lower reproduction rate
i.e. lower clutch size.The high efficacy of both rodenticides in the field has reduced
food supply for T. alba which subsequently resulted in smaller clutch size. Taylor
(1994) reckoned clutch size of T. alba was correlated with food supply; i.e. the greater
the food availability the higher the clutch size and vice versa. Hafidzi et al., (2007)
found that clutch size can be as high as 5.38 even under baiting with brodifacoum.
They also found that eggs production was high during the drier season when rat
population was higher. This suggests that T. alba may respond in a functional way
towards prey availability i.e. higher food intake leads to a higher clutch size (Erlinge
et al., 1984; Gese and Knolton, 2001). In suburban and farm areas in Canada with less
usage of rodenticides, the clutch size of T. alba was 6.5 ± 3.5 in condition of good
supply of foods (Andrusiak and Cheng, 1997)
Even though it was difficult to assess the effects of rodenticides on egg development,
indirect assessment in this study could give some indication on the detrimental effects
of rodenticide on egg reproduction. In the field of medicine, anticoagulant compound
has been linked to arterial calcification (atherosclerosis) and in the case of long-term
use to increase risk of osteoporosis. Osteoporosis is characterized by a decrease in
bone mass and density, causing bones to become fragile and increasing the risk of
fractures (Larsen, 2010). The development of bone was similar to egg structure
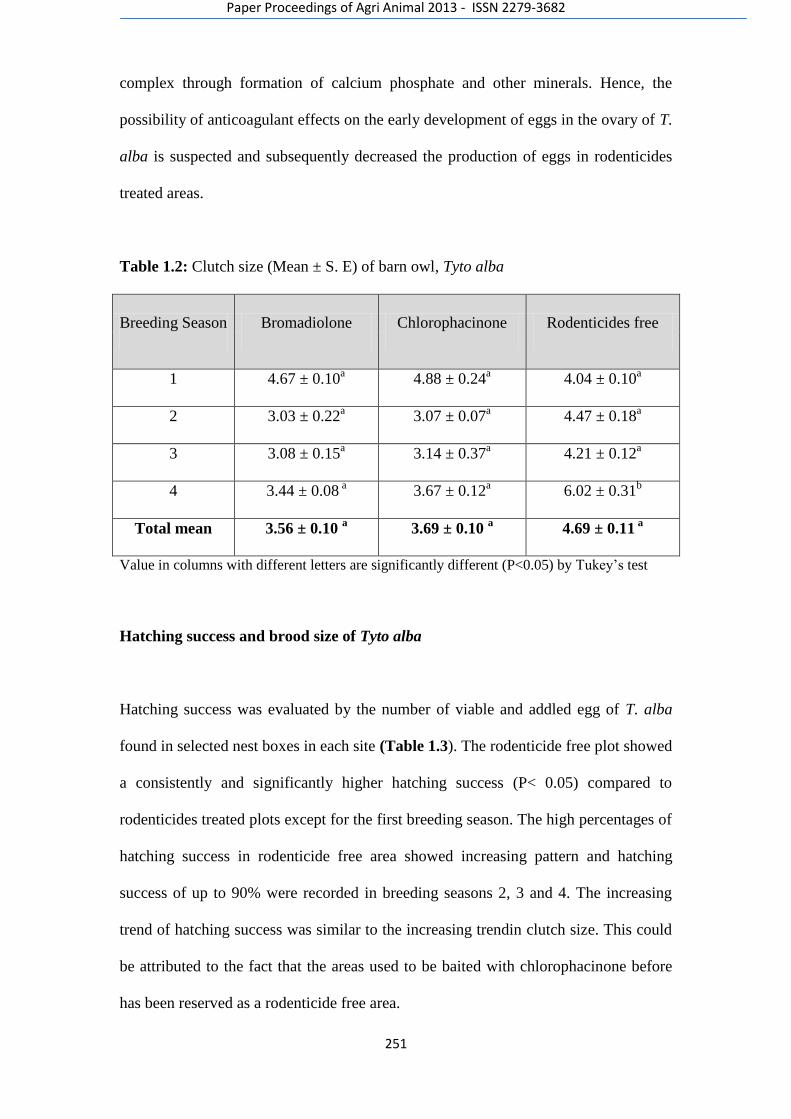
Paper Proceedings of Agri Animal 2013 - ISSN 2279-3682
251
complex through formation of calcium phosphate and other minerals. Hence, the
possibility of anticoagulant effects on the early development of eggs in the ovary of T.
alba is suspected and subsequently decreased the production of eggs in rodenticides
treated areas.
Table 1.2: Clutch size (Mean ± S. E) of barn owl, Tyto alba
Breeding Season Bromadiolone Chlorophacinone Rodenticides free
1 4.67 ± 0.10a 4.88 ± 0.24
a 4.04 ± 0.10
a
2 3.03 ± 0.22a 3.07 ± 0.07
a 4.47 ± 0.18
a
3 3.08 ± 0.15a 3.14 ± 0.37
a 4.21 ± 0.12
a
4 3.44 ± 0.08 a 3.67 ± 0.12
a 6.02 ± 0.31
b
Total mean 3.56 ± 0.10 a 3.69 ± 0.10
a 4.69 ± 0.11
a
Value in columns with different letters are significantly different (P<0.05) by Tukey‘s test
Hatching success and brood size of Tyto alba
Hatching success was evaluated by the number of viable and addled egg of T. alba
found in selected nest boxes in each site (Table 1.3). The rodenticide free plot showed
a consistently and significantly higher hatching success (P< 0.05) compared to
rodenticides treated plots except for the first breeding season. The high percentages of
hatching success in rodenticide free area showed increasing pattern and hatching
success of up to 90% were recorded in breeding seasons 2, 3 and 4. The increasing
trend of hatching success was similar to the increasing trendin clutch size. This could
be attributed to the fact that the areas used to be baited with chlorophacinone before
has been reserved as a rodenticide free area.
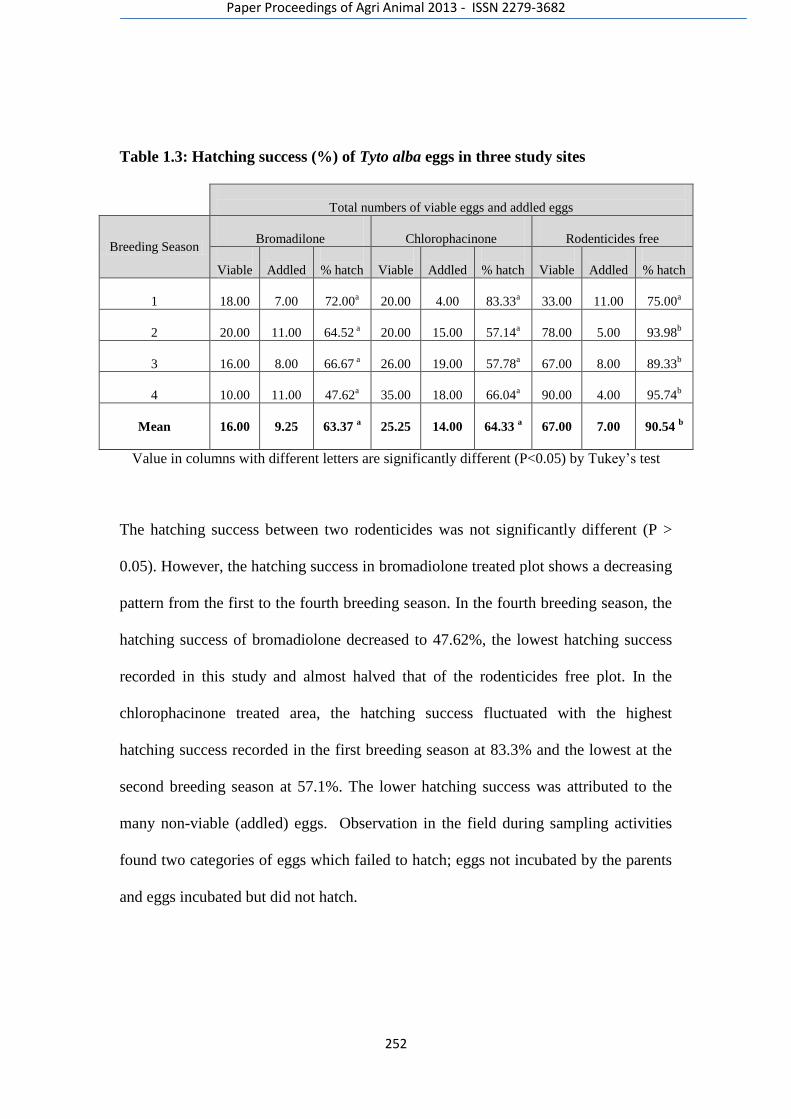
Paper Proceedings of Agri Animal 2013 - ISSN 2279-3682
252
Table 1.3: Hatching success (%) of Tyto alba eggs in three study sites
Total numbers of viable eggs and addled eggs
Breeding Season
Bromadilone
Chlorophacinone
Rodenticides free
Viable
Addled
% hatch
Viable
Addled
% hatch
Viable
Addled
% hatch
1
18.00
7.00
72.00a
20.00
4.00
83.33a
33.00
11.00
75.00a
2
20.00
11.00
64.52 a
20.00
15.00
57.14a
78.00
5.00
93.98b
3
16.00
8.00
66.67 a
26.00
19.00
57.78a
67.00
8.00
89.33b
4
10.00
11.00
47.62a
35.00
18.00
66.04a
90.00
4.00
95.74b
Mean
16.00
9.25
63.37 a
25.25
14.00
64.33 a
67.00
7.00
90.54 b
Value in columns with different letters are significantly different (P<0.05) by Tukey‘s test
The hatching success between two rodenticides was not significantly different (P >
0.05). However, the hatching success in bromadiolone treated plot shows a decreasing
pattern from the first to the fourth breeding season. In the fourth breeding season, the
hatching success of bromadiolone decreased to 47.62%, the lowest hatching success
recorded in this study and almost halved that of the rodenticides free plot. In the
chlorophacinone treated area, the hatching success fluctuated with the highest
hatching success recorded in the first breeding season at 83.3% and the lowest at the
second breeding season at 57.1%. The lower hatching success was attributed to the
many non-viable (addled) eggs. Observation in the field during sampling activities
found two categories of eggs which failed to hatch; eggs not incubated by the parents
and eggs incubated but did not hatch.
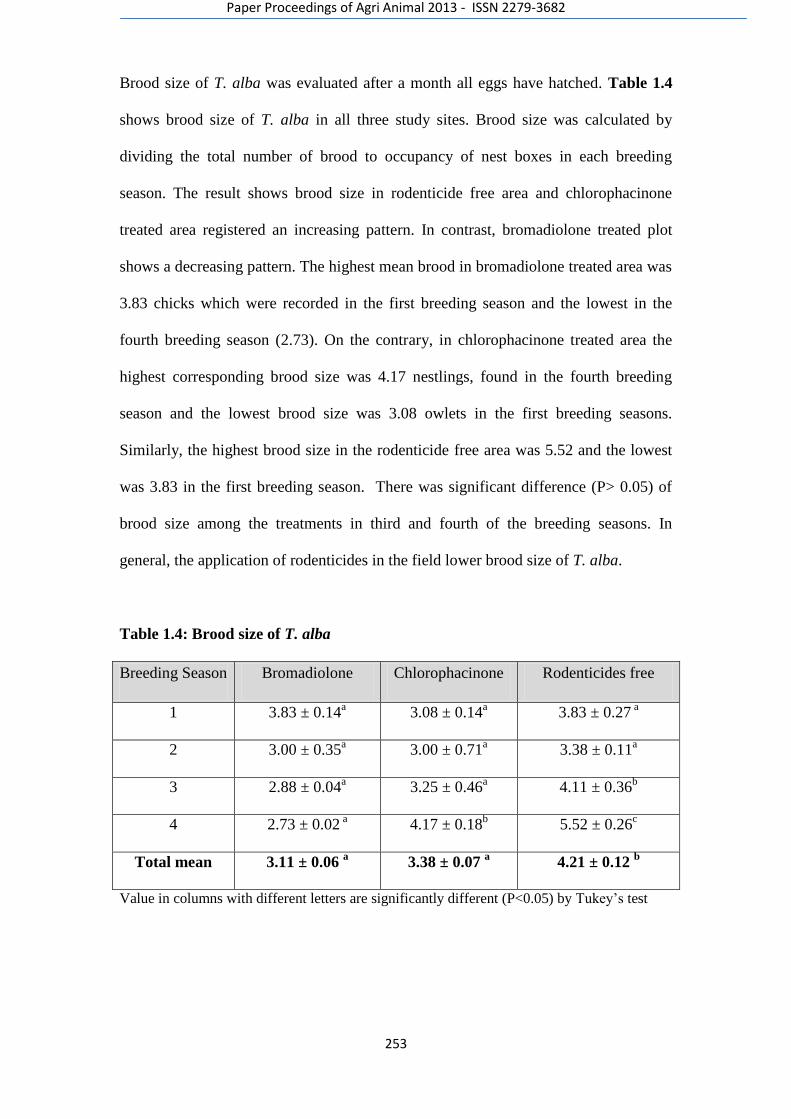
Paper Proceedings of Agri Animal 2013 - ISSN 2279-3682
253
Brood size of T. alba was evaluated after a month all eggs have hatched. Table 1.4
shows brood size of T. alba in all three study sites. Brood size was calculated by
dividing the total number of brood to occupancy of nest boxes in each breeding
season. The result shows brood size in rodenticide free area and chlorophacinone
treated area registered an increasing pattern. In contrast, bromadiolone treated plot
shows a decreasing pattern. The highest mean brood in bromadiolone treated area was
3.83 chicks which were recorded in the first breeding season and the lowest in the
fourth breeding season (2.73). On the contrary, in chlorophacinone treated area the
highest corresponding brood size was 4.17 nestlings, found in the fourth breeding
season and the lowest brood size was 3.08 owlets in the first breeding seasons.
Similarly, the highest brood size in the rodenticide free area was 5.52 and the lowest
was 3.83 in the first breeding season. There was significant difference (P> 0.05) of
brood size among the treatments in third and fourth of the breeding seasons. In
general, the application of rodenticides in the field lower brood size of T. alba.
Table 1.4: Brood size of T. alba
Breeding Season Bromadiolone Chlorophacinone Rodenticides free
1 3.83 ± 0.14a 3.08 ± 0.14
a 3.83 ± 0.27
a
2 3.00 ± 0.35a 3.00 ± 0.71
a 3.38 ± 0.11
a
3 2.88 ± 0.04a 3.25 ± 0.46
a 4.11 ± 0.36
b
4 2.73 ± 0.02 a 4.17 ± 0.18
b 5.52 ± 0.26
c
Total mean 3.11 ± 0.06 a 3.38 ± 0.07
a 4.21 ± 0.12
b
Value in columns with different letters are significantly different (P<0.05) by Tukey‘s test
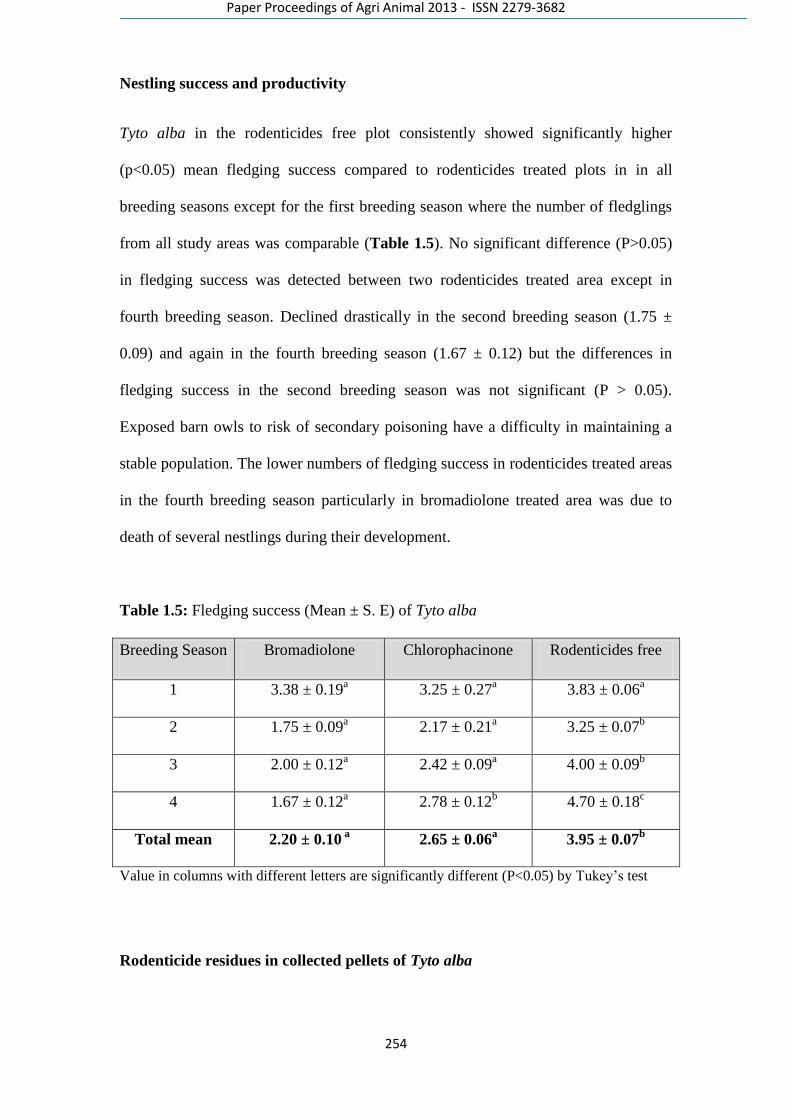
Paper Proceedings of Agri Animal 2013 - ISSN 2279-3682
254
Nestling success and productivity
Tyto alba in the rodenticides free plot consistently showed significantly higher
(p<0.05) mean fledging success compared to rodenticides treated plots in in all
breeding seasons except for the first breeding season where the number of fledglings
from all study areas was comparable (Table 1.5). No significant difference (P>0.05)
in fledging success was detected between two rodenticides treated area except in
fourth breeding season. Declined drastically in the second breeding season (1.75 ±
0.09) and again in the fourth breeding season (1.67 ± 0.12) but the differences in
fledging success in the second breeding season was not significant (P > 0.05).
Exposed barn owls to risk of secondary poisoning have a difficulty in maintaining a
stable population. The lower numbers of fledging success in rodenticides treated areas
in the fourth breeding season particularly in bromadiolone treated area was due to
death of several nestlings during their development.
Table 1.5: Fledging success (Mean ± S. E) of Tyto alba
Breeding Season Bromadiolone Chlorophacinone Rodenticides free
1 3.38 ± 0.19a 3.25 ± 0.27
a 3.83 ± 0.06
a
2 1.75 ± 0.09a 2.17 ± 0.21
a 3.25 ± 0.07
b
3 2.00 ± 0.12a 2.42 ± 0.09
a 4.00 ± 0.09
b
4 1.67 ± 0.12a 2.78 ± 0.12
b 4.70 ± 0.18
c
Total mean 2.20 ± 0.10 a 2.65 ± 0.06
a 3.95 ± 0.07
b
Value in columns with different letters are significantly different (P<0.05) by Tukey‘s test
Rodenticide residues in collected pellets of Tyto alba
Paper Proceedings of Agri Animal 2013 - ISSN 2279-3682
255
Residual analysis of rodenticides in regurgitated pellets has been acknowledged by
many researchers as the most useful non-invasive technique to study the risk of
secondary poisoning of owls through consumption of rodenticide ingested prey
(Newton et al., 1990; Gray et al., 1994; Eadsforth et al., 1995; Naim, 2010). The
residues of rodenticides i.e. bromadiolone and chlorophacinone in regurgitated pellets
were evaluated to access the risks of secondary poisoning to T. alba and subsequently
the impact on the reproductive performances of T. alba
The analysis of pellets regurgitated by T. alba in all breeding seasons shows
bromadiolone and chlorophacinone was successfully detected in pellets samples
collected from the rodenticides treated sites (Table 1.6 and 1.7). Due to large
samples, only 45 samples were analysed in each treatment in each breeding season.
Of the 180 pellets collected from the four breeding seasons in the bromadiolone plot,
20.56% of regurgitated samples contained bromadiolone with a mean residue of1.335
±0.073. The highest residue was detected in the third breeding season with a mean
residue of 1.970 µg/g. In chlorophacinone treated plot, 28.89% (n=180) contained
residue ranging from 0.550 to 1.144g/g wet weight (SE = 0.032). No residue was
detected in all (n=180) samples collected from rodenticides free plot.
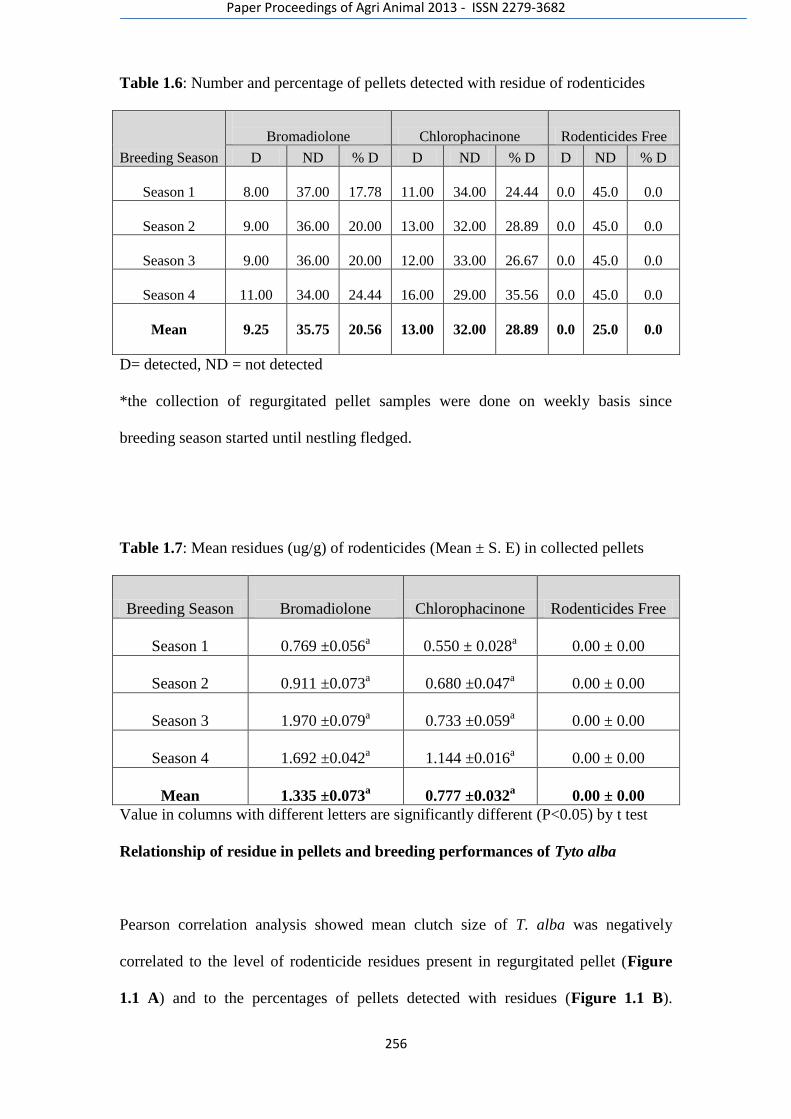
Paper Proceedings of Agri Animal 2013 - ISSN 2279-3682
256
Table 1.6: Number and percentage of pellets detected with residue of rodenticides
Breeding Season
Bromadiolone Chlorophacinone Rodenticides Free
D ND % D D ND % D D ND % D
Season 1 8.00 37.00 17.78 11.00 34.00 24.44 0.0 45.0 0.0
Season 2 9.00 36.00 20.00 13.00 32.00 28.89 0.0 45.0 0.0
Season 3 9.00 36.00 20.00 12.00 33.00 26.67 0.0 45.0 0.0
Season 4 11.00 34.00 24.44 16.00 29.00 35.56 0.0 45.0 0.0
Mean
9.25
35.75
20.56
13.00
32.00
28.89
0.0
25.0
0.0
D= detected, ND = not detected
*the collection of regurgitated pellet samples were done on weekly basis since
breeding season started until nestling fledged.
Table 1.7: Mean residues (ug/g) of rodenticides (Mean ± S. E) in collected pellets
Breeding Season
Bromadiolone Chlorophacinone Rodenticides Free
Season 1 0.769 ±0.056a 0.550 ± 0.028
a 0.00 ± 0.00
Season 2 0.911 ±0.073a 0.680 ±0.047
a 0.00 ± 0.00
Season 3 1.970 ±0.079a 0.733 ±0.059
a 0.00 ± 0.00
Season 4 1.692 ±0.042a 1.144 ±0.016
a 0.00 ± 0.00
Mean 1.335 ±0.073a 0.777 ±0.032
a 0.00 ± 0.00
Value in columns with different letters are significantly different (P<0.05) by t test
Relationship of residue in pellets and breeding performances of Tyto alba
Pearson correlation analysis showed mean clutch size of T. alba was negatively
correlated to the level of rodenticide residues present in regurgitated pellet (Figure
1.1 A) and to the percentages of pellets detected with residues (Figure 1.1 B).
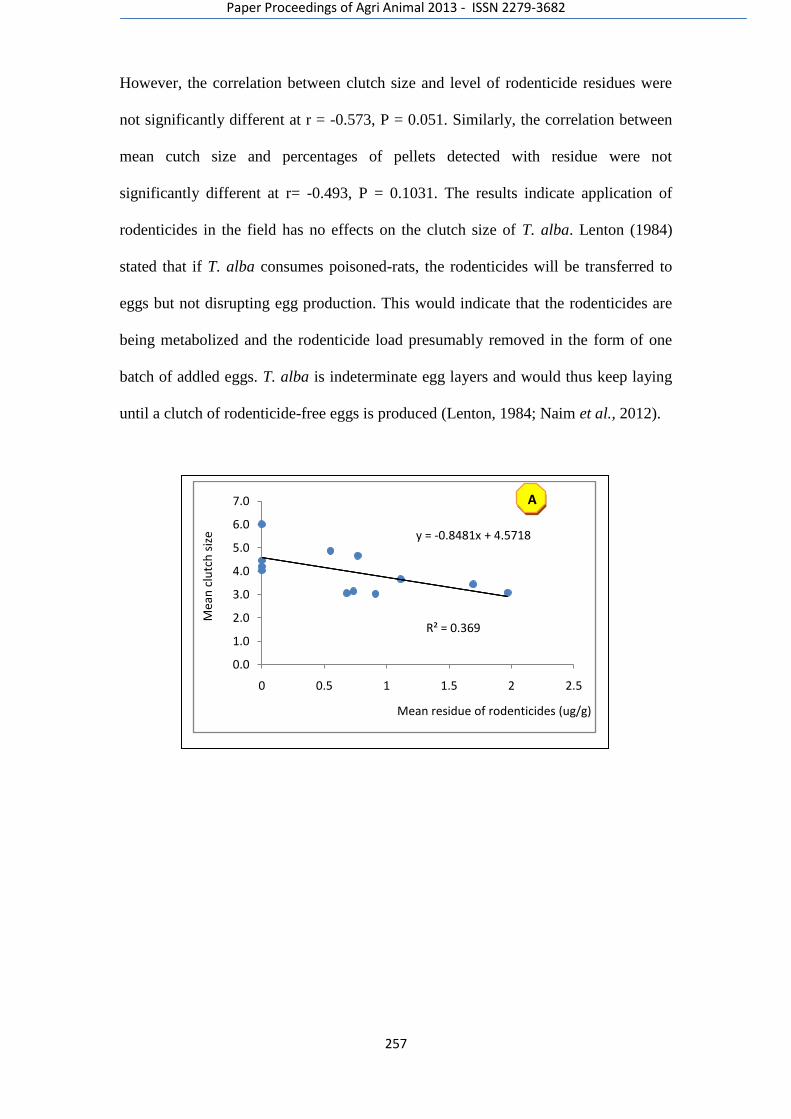
Paper Proceedings of Agri Animal 2013 - ISSN 2279-3682
257
However, the correlation between clutch size and level of rodenticide residues were
not significantly different at r = -0.573, P = 0.051. Similarly, the correlation between
mean cutch size and percentages of pellets detected with residue were not
significantly different at r= -0.493, P = 0.1031. The results indicate application of
rodenticides in the field has no effects on the clutch size of T. alba. Lenton (1984)
stated that if T. alba consumes poisoned-rats, the rodenticides will be transferred to
eggs but not disrupting egg production. This would indicate that the rodenticides are
being metabolized and the rodenticide load presumably removed in the form of one
batch of addled eggs. T. alba is indeterminate egg layers and would thus keep laying
until a clutch of rodenticide-free eggs is produced (Lenton, 1984; Naim et al., 2012).
y = -0.8481x + 4.5718
R² = 0.369
0.0
1.0
2.0
3.0
4.0
5.0
6.0
7.0
0 0.5 1 1.5 2 2.5
Mea
n c
lutc
h s
ize
Mean residue of rodenticides (ug/g)
A
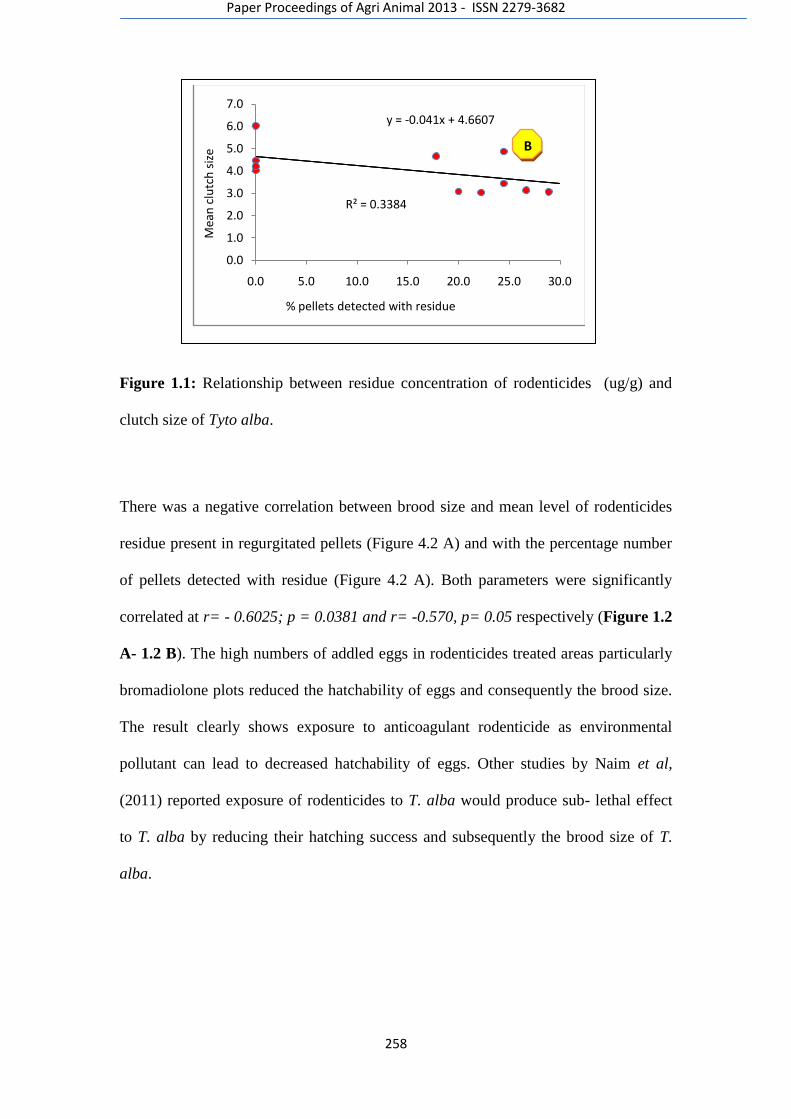
Paper Proceedings of Agri Animal 2013 - ISSN 2279-3682
258
Figure 1.1: Relationship between residue concentration of rodenticides (ug/g) and
clutch size of Tyto alba.
There was a negative correlation between brood size and mean level of rodenticides
residue present in regurgitated pellets (Figure 4.2 A) and with the percentage number
of pellets detected with residue (Figure 4.2 A). Both parameters were significantly
correlated at r= - 0.6025; p = 0.0381 and r= -0.570, p= 0.05 respectively (Figure 1.2
A- 1.2 B). The high numbers of addled eggs in rodenticides treated areas particularly
bromadiolone plots reduced the hatchability of eggs and consequently the brood size.
The result clearly shows exposure to anticoagulant rodenticide as environmental
pollutant can lead to decreased hatchability of eggs. Other studies by Naim et al,
(2011) reported exposure of rodenticides to T. alba would produce sub- lethal effect
to T. alba by reducing their hatching success and subsequently the brood size of T.
alba.
y = -0.041x + 4.6607
R² = 0.3384
0.0
1.0
2.0
3.0
4.0
5.0
6.0
7.0
0.0 5.0 10.0 15.0 20.0 25.0 30.0
Mea
n c
lutc
h s
ize
% pellets detected with residue
B
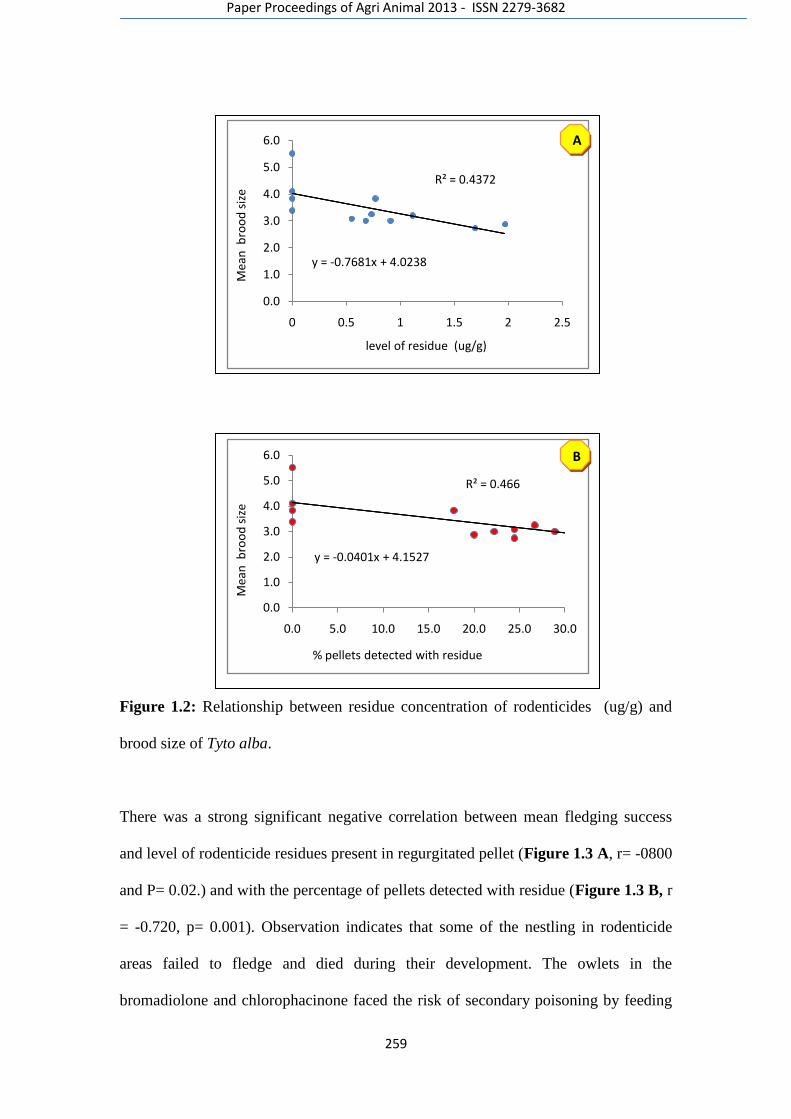
Paper Proceedings of Agri Animal 2013 - ISSN 2279-3682
259
Figure 1.2: Relationship between residue concentration of rodenticides (ug/g) and
brood size of Tyto alba.
There was a strong significant negative correlation between mean fledging success
and level of rodenticide residues present in regurgitated pellet (Figure 1.3 A, r= -0800
and P= 0.02.) and with the percentage of pellets detected with residue (Figure 1.3 B, r
= -0.720, p= 0.001). Observation indicates that some of the nestling in rodenticide
areas failed to fledge and died during their development. The owlets in the
bromadiolone and chlorophacinone faced the risk of secondary poisoning by feeding
y = -0.7681x + 4.0238
R² = 0.4372
0.0
1.0
2.0
3.0
4.0
5.0
6.0
0 0.5 1 1.5 2 2.5
Mea
n b
roo
d s
ize
level of residue (ug/g)
y = -0.0401x + 4.1527
R² = 0.466
0.0
1.0
2.0
3.0
4.0
5.0
6.0
0.0 5.0 10.0 15.0 20.0 25.0 30.0
Mea
n b
roo
d s
ize
% pellets detected with residue
A
B
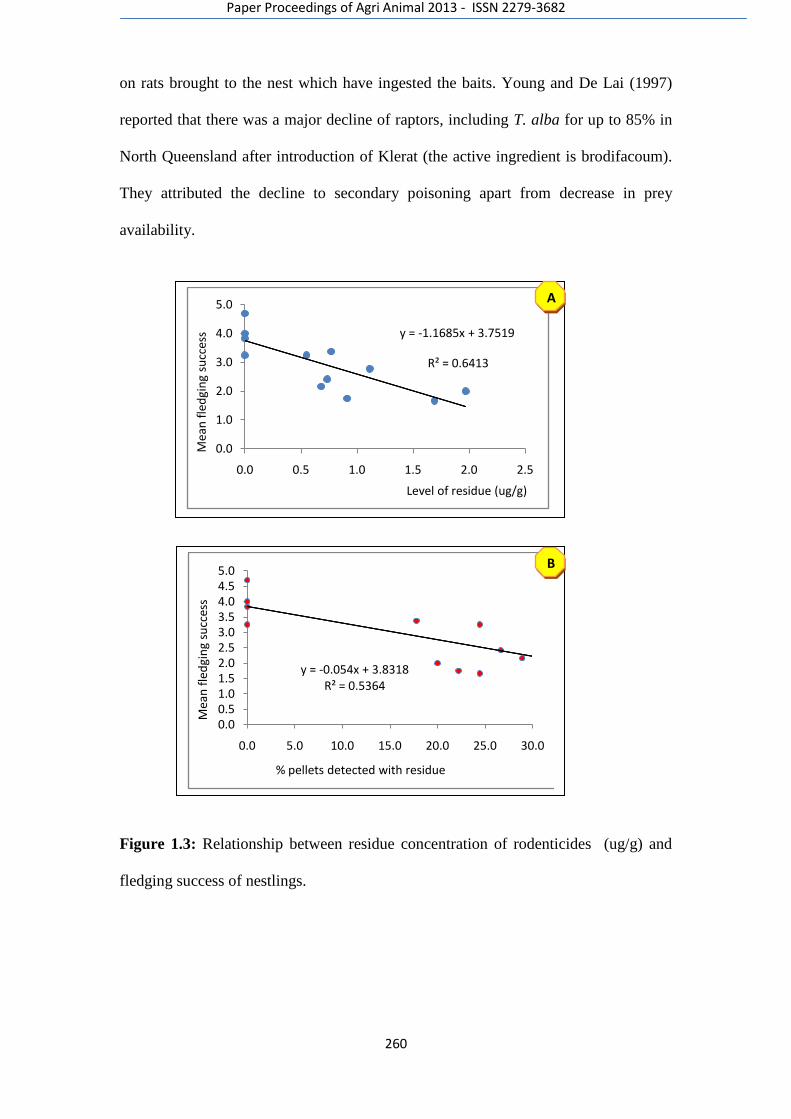
Paper Proceedings of Agri Animal 2013 - ISSN 2279-3682
260
on rats brought to the nest which have ingested the baits. Young and De Lai (1997)
reported that there was a major decline of raptors, including T. alba for up to 85% in
North Queensland after introduction of Klerat (the active ingredient is brodifacoum).
They attributed the decline to secondary poisoning apart from decrease in prey
availability.
Figure 1.3: Relationship between residue concentration of rodenticides (ug/g) and
fledging success of nestlings.
B
y = -0.054x + 3.8318R² = 0.5364
0.00.51.01.52.02.53.03.54.04.55.0
0.0 5.0 10.0 15.0 20.0 25.0 30.0
Mea
n f
led
gin
g su
cces
s
% pellets detected with residue
y = -1.1685x + 3.7519
R² = 0.6413
0.0
1.0
2.0
3.0
4.0
5.0
0.0 0.5 1.0 1.5 2.0 2.5
Mea
n f
led
gin
g su
cces
s
Level of residue (ug/g)
A
B
Paper Proceedings of Agri Animal 2013 - ISSN 2279-3682
261
Conclusions
Occupancy of nest boxes, mean clutch size, hatching success, mean brood size and
fledging success of T. alba in rodenticides treated plots were lower compared to
untreated plot. The poisoned-rat ingested by T. alba poses risk of secondary poisoning
and produce detrimental effect on breeding performance of T. alba. The lower
reproductive performance in both the chlorophacinone and bromadiolone treated plots
were due to the sub-lethal effect of secondary poisoning risks to the parents and
nestling of T. alba, substantiated by the detection of residue in the pellets regurgitated
by T. alba in both rodenticide treated plots. The other factors that could have affected
the reproduction of T. alba are rat population in the rodenticides treated areas had
decreased by the high efficacy of both anticoagulants. Single application of
rodenticides in off breeding season (April – June) of T. alba could minimize damage
to fruit bunches of oil palm and conserve T. alba populations at the same time.
Paper Proceedings of Agri Animal 2013 - ISSN 2279-3682
262
Reference
1. Adison, J. B.1982. Improved method for high pressure liquid chromatography
determination of chlorophacinone in mouse tissue. Journal association off
anal. Chem.65: 1299 – 1301
2. Andrusiak, L. A. and Cheng, K. M. 1997.Breeding Biology of the Barn Owl
(Tyto alba) in the Lower Mainland of British Columbia. In: Duncan, James
R.; Johnson, David H.; Nicholls, Thomas H., eds. Biology and conservation of
owls of the Northern Hemisphere: 2nd International owl symposium. Pp 38-46
3. British Trust for Ornithology. 2007. Breeding Birds of the Wider Countryside:
Tawny Owl. Available at http://www.bto.org/birdtrends2003/wcrtawow.htm,
2007.
4. Duckett, D. E. 1984. Barn Owls (Tyto alba) and the ―second generation‖ rat-
baits ulitised in oil palm plantations in Peninsular Malaysia. The Planter 60: 3-
11.
5. Eadsforth, C. V., Gray, A. and Harrison, G. 1996. Monitoring the Exposure of
Barn Owls to Second-Generation Rodenticides in Southern Eire. Pesticide
Science 47: 225-233.
6. Erlinge, S., G. Gbransson, G. Hogstedt, G. Jansson, 0. Liberg, J. Loman, I.
Nilsson, N. Von Schantz, T. and Sylvkn,M. 1984. Can vertebrate predators
regulate their prey? American Naturalist23:125-133.
7. Gese, E. M. and Knowlton, F. F. 2001. The Role of Predation in Wildlife
Population Dynamics. USDA National Wildlife Research Center - Staff
Publications 542. Internet version available at:
http://digitalcommons.unl.edu/icwdm_usdanwrc/542
8. Gray, A., Eadsforth, C.V. Dutton, A.J. and Vaughan, J.A. 1994a. Toxicity of
three second generation rodenticides to barn owls. Pesticide Science42:179-
184.
9. Gray, A., Eadsforth, C.V., Dutton, A.J., 1994b. Non-invasive method for
monitoring the exposure of barn owls to second-generation rodenticides.
Pesticide Science. 41, 339–343.
10. Hafidzi, M. N., Zulkifli, A. and Kamaruddin, A. A. 1999. Barn owl as a
biological control agent of rats in paddy fields. Symposium on Biological
Control in the Tropics. Mardi Training Centre. Serdang. Malaysia. p 85-88.
11. Larsen, H. R. 2011. Living with walfarin. The AFIB report. 15 pp
12. Lee, C.H. 1994. Secondary toxicity of some rodenticides to barn owls. 4th
International Conference of Plant Protection in the Tropics, 28-31 March,
Kuala Lumpur, Malaysia, pp. 161-163.
Paper Proceedings of Agri Animal 2013 - ISSN 2279-3682
263
13. Lenton, G. M. 1984. The Feeding and Breeding ecology of Barn Owl, Tyto
alba in Peninsular Malaysia. Ibis 126: 551-575.
14. Lundholm, C. E. 1997. DDE-Induced Eggshell Thinning in Birds: Effects of
p,p‘-DDE on the Calcium and Prostaglandin Metabolism of the Eggshell
Gland. Comparative Biology and Physiology 118 (2): 113-128.
15. Naim, M. 2010. Effects of secondary poisoning from anticoagulants and
biological rodenticides on barn owls, Tyto alba javanica in an immature oil
palm plantation. Universiti Putra Malaysia. Ph.D Thesis. Unpublished. 167 p
16. Naim, M., Hafidzi M. N., Sudharto, P. and Caliman,J. P. 2012. Detection of
Rodenticide Residues for Raptor Conservation (abstract). In proceeding 3rd
International Conference on Oil Palm and Environment (ICOPE), Bali,
Indonesia.
17. Naim, M., Hafidzi, M. N., Kassim, A., and Abu, J. 2011. Comparison of the
breeding performance of the barn owl Tyto alba javanica under chemical and
bio based rodenticide baiting in immature oil palms in Malaysia. Dynamic
Biochemistry, Process Biotechnology and Molecular Biology @ Global
Science Books5 (2):5-11
18. Newton, I., Wyllie, I., Gray, A. and Eadsforth, C. V. 1994. The toxicity of the
rodenticide flocoumafen to barn owls and its elimination via pellets. Pesticide
Science 41: 187–193.
19. Noor Hisham, H., Hasber, S., Sukri, T. I. and Samsudin, A. 2007. Integrated
approach and effective control measures of major pests and diseases in oil
palm cultivation in FELDA- FASSB experiensis Seminar APS Kumpulan
Perladangan FELDA, Jerantut Pahang. Pp 45-57
20. Schweitzer, A. 2011. Why Do Poisons Matter?. UrbanCarnivores.com.
Retrieved 20 October 2011 from http://www.urbancarnivores.com/poisons/
21. Smal, C. M. 1988. Barn Owl (Tyto alba) for the control of rats in Agricultural
Crops in the tropics. In: Symposium on Biological control of Pests in Tropical
Agricultural System. June 1-3. Bogor. p 21.
22. Taylor, I. 1994. Barn Owls: Predator-Prey Relationships and Conservation.
Cambridge: Cambridge University Press.
23. Toms, M.P., Crick, H.Q.P. & Shawyer, C.R. 2001. The status of breeding
Barn Owls Tyto alba in the United Kingdom 1995-1997. Bird Study 48:23-37.
24. Young, J. and De Lai, L. 1997. Population declines of predatory birds
coincident with the introduction of Klerat rodenticide in North
Queensland. Australian Bird Watcher 17: 160-167.
Paper Proceedings of Agri Animal 2013 - ISSN 2279-3682
264
Walker, L. A., Shore, R. F., Turk, A., Pereira, M. G. & Best, J. 2008. The
Predatory Bird Monitoring Scheme: Identifying chemical risks to top predators
in Britain. Ambio37: 466-471
25. Walker, L.A., Llewellyn, N.R., Pereira M.G., Potter, E.D., Sainsbury, A.W. &
Shore, R.F. 2012. Anticoagulant rodenticides in predatory birds 2010: a
PredatoryBird Monitoring Scheme (PBMS) report. Centre for Ecology &
Hydrology, Lancaster, UK. 17pp.

Paper Proceedings of Agri Animal 2013 - ISSN 2279-3682
265
16
Paper Proceedings of Agri Animal 2013 - ISSN 2279-3682
266
GROWTH RESPONSE, MEAT YIELD AND CARCASS CHARACTERISTICS OF
BROILERS FED BENISEED (Sesamum indicum) AND DRUMSTICK (Moringa
oleifera) LEAVES AS SOURCES OF LYSINE.
E. Z. Jiya*., B.A. Ayanwale., A. B. Ibrahim and H. Ahmed
Deparment of Animal Production. Federal University of Technology Minna, Niger
state, Nigeria.
Abstract One hundred and thirty five day old chicks of Abor acre breed of birds with average weight of 40.00g
were used to evaluate growth response, meat yield and carcass characteristics of broilers fed beniseed
and drumstick leaves as sources of lysine. The birds were randomly allotted to three treatment groups
with forty five birds per treatment. Each treatment had three replicates with fifteen birds per replicate.
The treatments were designated as T1, T2 and T3. T1 had 0.2 % lysine, T2 had 6 % beniseed and T3 had
15 % drumstick leaves. The amount of 6 % beniseed and 15 % drumstick leaves included were
calculated to supply 0.2 % lysine which was the control. The result of the experiment at the end of the
seventy days feeding trial were not significantly (P>0.05) different in body weight, body weight gain
and feed conversion ratio. The crude fibre digestibility was significantly (P<0.05) different. The
average live weight of the birds, breast, back and wing were significantly (P<0.05) different. It was
concluded that 6 % beniseed and 15 % drumstick leaves can substitute 0.20 % industrial lysine in
broilers diets without any deleterious effect and with optimum broilers performance.
Key words: Broilers carcass, beniseed, drumstick leaves, lysine.
Introduction
Poultry is one of the most popular industry/enterprise and also a source of animal
protein to the ever growing Nigerian population, thus, making significant contribution
to human nutrition and economic development (Idowu et al., 2005). The industry
contributes more than 75 % of the total livestock production in Nigeria (Alabi and
Osipo, 2004). Feeding has a great effect on poultry growth, production and meat
quality. The evaluation of growth and carcass characteristics of hybrid broilers
carrying fizzle and normal feathering genes is desirable since this will provide base-
like information for the improvement and development of highly producing
indigenous chicken stocks. Apart from the preference of the consumer for heavily
looking birds, the live weights of the birds determine to some extent the component
of the body parts. Aina (1990) reported that other body parts increase with
increasing body weight. The fizzle chicken is known to be a heavy bird (Omlet, 2006)
that converts feed efficiently (Lin et al., 2006). The effect of diet on the yield of
broilers carcass and cut-up parts is expected to be positively significant though some
body parts are less sensitive than others. Wesley (1980) reported that the cut-up
pieces of yield are significant decrease in eviscerated yield, giblet yield, wing yield as
well as boneless breast meat yield when birds are given restricted feeding. He also
reported a substantial decrease in live weight and lower feed conversion efficiency in
diet with 90% NRC recommended diet. The yield of poultry meat depends on the
culture of the processor. In European and American dressing culture, carcass and
giblets, head and shank are considered edible and the yield is about 70%. In Nigeria,
where carcass, giblets, head and shank are considered edible yield as it is often 78%.
Paper Proceedings of Agri Animal 2013 - ISSN 2279-3682
267
When the cleared out-gut is added to the edible yield as often is the case, the yield is
80.4% (Aduku and Iji, 1990). Yield is also designated dressing percent which is the
yield weight divided by live weight of the bird
There are approximately twenty-eight commonly known amino acids that are combined in various ways to create 150 or more other intermediates inside the body as well as the more than 40,000 proteins known so far to science (Gong et al., 2005). The essential amino acids are those that the body cannot synthesize in sufficient quantities to satisfy the nutritional requirements for good health and that they must be included in the diet. The nine essential amino acids are histidine, isoleucine, leucine, lysine, methionine, phenylalanine, threonine, tryptophan and valine; their best sources are meat, fish, fowl, eggs and dairy products. In addition,cysteine (cystine) and tyrosine, sometimes classified as non essential amino acids, are now considered semi-essential because if the diets contain them (meat, milk, fish, poultry and legumes are good sources), the body can use them in place of two essential amino acids methionine and phenylalanine, respectively to make protein. The nonessential amino acids are alanine, arginine, asparagine, aspartic acid, glutamic acid, glutamine, glycine, proline, serine and taurine. (Gong et al., 2005). The NRC (1994) recommended that broilers receive 1.1 and 1.0 % lysine of diets at starter and grower periods respectively. Aduku (2004) recommended 1.25 and 1.1 % lysine and 0.86 and 0.75 methionine for starter and finisher diets. Some research have shown that, is higher for male than for the female during starter and grower period (Han and Baker, 1994). D’mello (1999) reported that lysine requirement was higher for improved feed consumption and feed conversion than is required for weight gain. The effect of lysine on the body weight and feed conversion showed consistently that NRC (1994) recommendation are low and do not meet the needs of modern broiler, when diets are adapted to commercial feeding regime. Increasing dietary lysine level 1.25 % of NRC (1994) requirement resulted in high breast yield at 42 days of age in broilers but the difference was not statistically significant (P>0.05). Performance of broilers is affected by lysine HCl from 1-42 days of age. It is a well known fact that lysine is considered as an important factor which affects the performance and carcass characteristics of growing chicks, so dietary requirement of protein is usually a requirement for lysine contained in the protein (Baker and Itan, 1994). Amino acids requirements of broilers have been widely studied and
interactions with crude protein level (Sterling et al., 2002). The importance of
utilizing correct amount of balanced dietary protein and amino acid for poultry is of
high priority issue (Nasir et al., 2011). The authors attributed this to two issues. The
first being the most expensive cost of protein and amino acids in feeds per unit weight
and the second as the environmental concerns about nitrogen losses in poultry wastes.
Lysine requirements of broiler chicks during different growth phases has been well
established (Han and Baker, 1994; Knowles and Southern, 1998; Mack et al., 1999;
Baker, 2003; Corzo et al., 2003). Most of these studies are conducted under the
―standard‖ conditions i.e. feeding high nutrient-density basal diets (3,200 kcal per kg
ME; 20-23 % CP) to chickens kept under thermo-neutral conditions. But actual
raising and feeding conditions can be much different from these ―standard‖
conditions, which would affect lysine requirement. (Usama et al., 2007). The authors
recorded in their results that feed intake, body weight gain and feed efficiency were
significantly (P<0.05) depressed by the un supplemented basal diets. Supplementation
of increments of lysine to the basal diets improved feed intake, body weight gain and
Paper Proceedings of Agri Animal 2013 - ISSN 2279-3682
268
feed conversion ratio. Furthermore, chickens are mostly reared in open sided houses
and are exposed to chronic heat stress during the summer season.
It is important that nutritional regimes meet the broiler birds' needs for maintenance
and growth so that breast meat accretion is optimized. Lysine is one of the most
limiting aminoacids in practical corn-soybean meal and sorghum-soybean meal diets
for broilers. The level of dietary Lysine needed in the grower/finisher period to
optimize breast meat yield may be higher than that needed for optimallive
performance traits [Moran et al., 1990; Kidd et al., 1997 and kidd et al 1998. Sibbald
and Wolynetz (1986) demonstrated that the amount of Lysine required to maximize
protein accretion in 10-day-old male chicks was higher than that needed to maximize
BW gain. Similarly, Holsheimer and Ruesink (1993) found that breast meat was
increased in 49-day-old male broilers fed diets containing increased Lysine levels
from 1-14 days of age. However, the broilers were not affected by dietary Lysine
from 15 to 49 days of age (Kidd et al., 1998). There is controversy as to the level of
Lysine required in a starting chick diet. Because the level of Lysine in a starter diet
may affect breast meat yield in finish weight of broilers. This situation has created the
need to look for cheap, locally available and less competitive source of protein rich in
lysine, an essential amino acid required for the normal and proper utilisation of feed
by broiler chicken. An essential amino acid such as lysine needs to be supplemented in the animal diet in order to ensure the adequate absorption of calcium, production of antibodies, hormones and enzymes as its deficiency could lead to tiredness, inability to concentrate, irritability, bloodshot eyes, retarded growth, hair loss, anemia and reproductive problems. Industrial lysine is one ingredient of high cost in poultry diet today. Hence, the imperative need to substitute it for cheap, available and less competitive sources. The use of leguminous multipurpose trees and shrubs has been suggested to be a
viable alternative source of lysine, methionine, vitamins and minerals for poultry
feeding (Church, 1991). Plant source of amino acids such as beniseed, contains 24.2
% protein, 49 % oil and good source of methionine (0.75 %) but poor in lysine (0.37
%) (Aduku, 2004). Moringa (drumstick) leaves are also rich in vitamins and minerals.
Leaves (100 g) contain 440 mg Ca, 70 mg P, 7 mg Fe, 110 mg Cu, 5.1 mg I, 11,300 IU
pro-vitamin A, 120 mg vitamin B, 0.8 mg nicotinic acid, 220 mg ascorbic acid, and 7.4
mg tocopherol per 100 g. Beniseed (Sesamum indicum) and drumstick leaves
(Moringa oleifera) are good sources of lysine and methionine. They are natural
compared to the industrial lysine and methionine (Makker and Baker, 1997) which are
scarce and expensive in developing countries. Beniseed is an herbaceous plant
growing up to 15 m high, it has purple, pink or white flower and fruits are cotton
capsule which contain several seeds from 2-5 mm long. It contains protein rich in
lysine, methionine, leucine and arginine. The seed contains 0.35 % lysine and 0.75 %
methionine (Aduku, 2005). Beniseed is a rich source of protein, carbohydrate,
minerals and vitamins, also rich in essential amino acids like lysine, methionine,
arginine and tryptophan. It contains 24.2 % crude protein, 4971 kcal/kg metabolism
energy, 1.02 % calcium, 0.76 % phosphorus, 0.75 % methionine, 0.37 % lysine, 1.59 %
arginine and 0.11 % tryptophan respectively (Aduku, 2005). Beniseed is a rich source
of edible oil with its oil content generally varying from 46-52 %. The seeds can be
processed by frying with a mixture of sugar to give sweet taste; its oil is used in
southern India for cooking. Recent research has shown that Beniseed protein has
Paper Proceedings of Agri Animal 2013 - ISSN 2279-3682
269
certain advantages over other oil seed protein in processed foods, which increases
its potential market (Johnson et al., 1997; McDonald et al., 1998). Beniseed after
extraction contains about 44 % crude protein (Peace corps, 1990; Manputu and
Bhur, 1991). The oil contains 50-60 % oil and fibre content of 2.7-6.7 % (Beckstoom-
stenberg and Duke 1994).
Drumstick (Moringa oleifera) belongs to the genus moringaceae with 13 species. It is
native ti subhimalayan region in India and is now naturalized in many countries in
Africa, Arabia, South East Asia, Caribean Island and South America (Ramachandra et
al., 1980). Drumstick is a fast growing leguminous tree which can 12m height at
maturity, yielding up to 120 tonnes Dm/ha/yr when planted very densely for use as
forage (Makkar and Becker, 1997). Drumstick goes by many names, in Philippines
where the leaves of the Moringa are cooked and fed to babies; it is called mother’s
best friend and malunggay. Other names include benzolive tree (Haiti), Hoseradish
tree (Florida) and Nebeday (Senegal). Drumstick leaves are usually small in diameter
and retain its greenish colour when properly processed by drying. The drumstick
leaves are highly nutritious containing significant quantities of lysine, methionine,
vitamins A, B and C, calcium, iron, phosphorus and protein. Drumstick leaves are
outstanding as a source of vitamin A and when raw in vitamin C. The composition of
amino acids in its leaf protein is well balanced. Laboratory analysis has shown that the
protein concentrate in its leaf is about 27 % and 29 %, methionine of 0.35 % and
lysine of 1.32 % respectively with a negligible amount of tannins (1-23 g/kg) in all
fraction of the drumstick plant (Makker and Becker, 1997). The high protein content
must be balanced with other energy foods. Care must be taken to avoid excessive
protein intake. Too much protein in pig diet may increase muscle development at
the expense of fat production. In cattle, too much protein can be fatal (from
alteration of the nitrogen cycle). Extensive trails using Moringa leaves as cattle feed,
(beef and dairy cow), swine feed and poultry feed, with Moringa leaves constituting
40 %-50 % of feed. Milk yield for dairy cow and daily weight gain for beef cattle
increases by 30 %. Birth weight averaging 22kg for Local jersey cattle, increased by 3-
5 kg (Martin, 2000). Nutrient value for Moringa can be increased for poultry and
swine through the addition of an enzyme (phytase) to break down the phytate,
leading to increased absorption of phosphorus found in Moringa. The enzymes
should be mixed with the leaves without heating, at 1kg of enzyme to 3,333 kg of
broiler chicken diet and 1 kg to 5,555 kg of layers diet (Martin, 2000). These could be
richly used by the birds. The aim and objective of this study was to determine the
growth performance, meat yield and carcass characteristics of broilers fed on beniseed
and drumstick leaves as sources of lysine.
Materials and method
Experimental design: A total of 135 day old broiler chicks of Abor acre breed were
used in the research. The birds were purchased from Tuns farms Osogbo. The birds
were managed under a deep litre system with three (3) treatment groups and three
Paper Proceedings of Agri Animal 2013 - ISSN 2279-3682
270
replicates per treatment. 15 chicks were randomly allotted to each replicate in a
complete randomised design arrangement.
Management: Series of medication including vaccination was given to the birds in the
course of the experiment. Feed and water were supplied to the birds‘ ad-libitum
throughout the seventy days of the experiment.
Source of ingredient and processing: the beniseed, maize and palm oil used were
purchased from Central Market Minna. Other feed ingredients such as fish meal,
groundnut cake, rice offal, bone meal, limestone, industrial lysine, methionine,
broilers premix and salt were purchased from Dominion feed mill Minna. The
beniseed was of the early planting grown in part of Niger state, the beniseed was
subjected to roasting to remove the anti nutritional factors. Roasted seeds samples
were collected and subjected to chemical analysis according to A.O.A.C (1990)
before inclusion into the experimental diets. The drumstick leaves used was purchased
from Central Market, Mariga, Niger state. The drumstick tree was planted, harvested
and sundried by the local farmers. The dried drumstick leaves were grinded to powder
and was subjected to chemical analysis according to A.O.A.C (1990) before it was
mixed with other feed ingredient.
Experimental diet: Three experimental diets were formulated. Diet T1 served as the
control and contained 0 % Beniseed and drumstick leaves, T2 contained 6 % Beniseed
and T3 contained 15 % Drumstick leaves respectively as shown in Table 1.
Chemical analysis: The chemical analysis of the diets and faecal samples were
determined according to A.O.A.C (1990) methods.
Data collection: Data collected for ascertaining the performance of the birds includes;
initial body weight which was collected by taking the weight of the day old birds at
arrival from the farm using a weighing scale, final body weight was collected at the
last day of the experiment using the same weighing scale. Body weight gain was
calculated by subtracting the initial body weight from the final body weight. Feed
intake was calculated by subtracting the amount of feed refused from the amount of
feed offered the birds. Feed conversion ratio was calculated by dividing the feed
intake by the body weight gain. The digestibility trial was conducted by selecting two
birds from each replicate of the treatments which were weighed and transferred into
the metabolism cages. The birds continued to receive their diets for five days of the
adjustment period. the faecal droppings from each replicate separately collected daily
were weighed and oven dried at 80oc until a constant weight was obtained. After
drying, the droppings from each treatment were bulked together and sub-samples for
proximate analysis were taken and the final body weights of the birds were also
recorded.
The meat yield and carcass characteristics were determined at the end of the
experiment by selecting randomly, one bird from each replicate. The selected birds
were starved of feed and water over night. Before slaughtering, the individual weight
of the birds was recorded. Thereafter, the birds were slaughtered by cutting the jugular
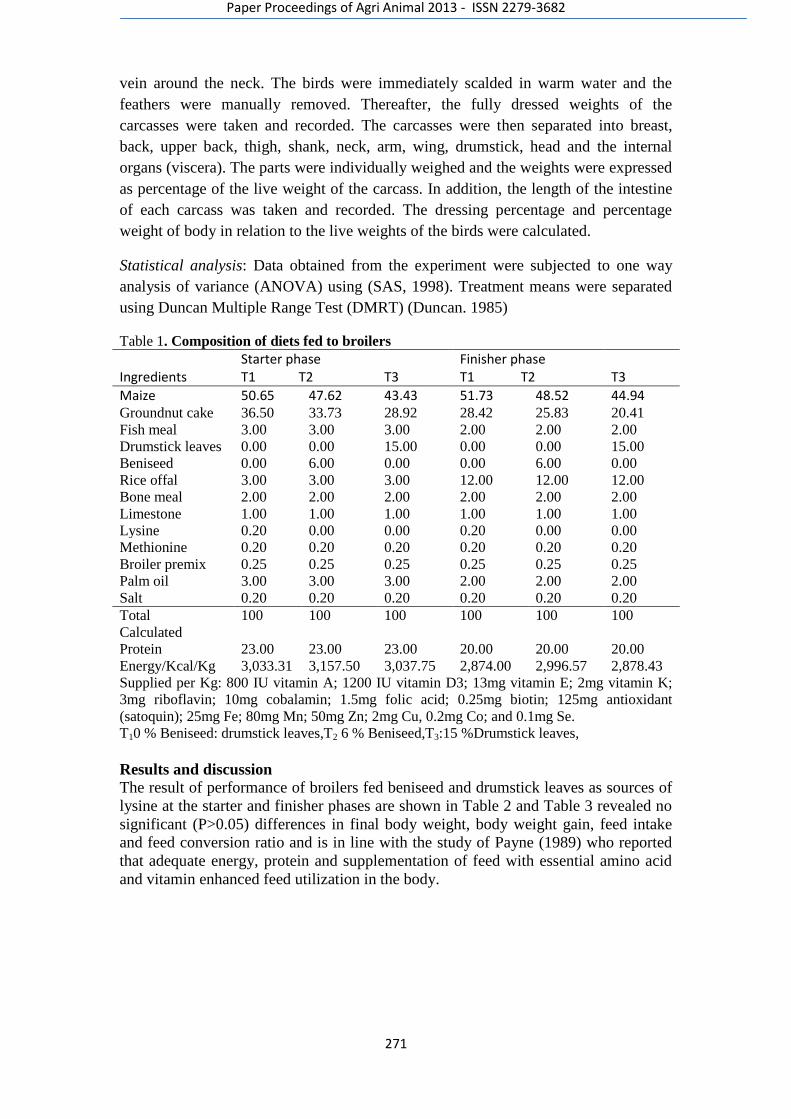
Paper Proceedings of Agri Animal 2013 - ISSN 2279-3682
271
vein around the neck. The birds were immediately scalded in warm water and the
feathers were manually removed. Thereafter, the fully dressed weights of the
carcasses were taken and recorded. The carcasses were then separated into breast,
back, upper back, thigh, shank, neck, arm, wing, drumstick, head and the internal
organs (viscera). The parts were individually weighed and the weights were expressed
as percentage of the live weight of the carcass. In addition, the length of the intestine
of each carcass was taken and recorded. The dressing percentage and percentage
weight of body in relation to the live weights of the birds were calculated.
Statistical analysis: Data obtained from the experiment were subjected to one way
analysis of variance (ANOVA) using (SAS, 1998). Treatment means were separated
using Duncan Multiple Range Test (DMRT) (Duncan. 1985)
Table 1. Composition of diets fed to broilers
Ingredients
Starter phase T1 T2
T3
Finisher phase T1 T2
T3
Maize 50.65 47.62 43.43 51.73 48.52 44.94 Groundnut cake 36.50 33.73 28.92 28.42 25.83 20.41
Fish meal 3.00 3.00 3.00 2.00 2.00 2.00
Drumstick leaves 0.00 0.00 15.00 0.00 0.00 15.00
Beniseed 0.00 6.00 0.00 0.00 6.00 0.00
Rice offal 3.00 3.00 3.00 12.00 12.00 12.00
Bone meal 2.00 2.00 2.00 2.00 2.00 2.00
Limestone 1.00 1.00 1.00 1.00 1.00 1.00
Lysine 0.20 0.00 0.00 0.20 0.00 0.00
Methionine 0.20 0.20 0.20 0.20 0.20 0.20
Broiler premix 0.25 0.25 0.25 0.25 0.25 0.25
Palm oil 3.00 3.00 3.00 2.00 2.00 2.00
Salt 0.20 0.20 0.20 0.20 0.20 0.20
Total 100 100 100 100 100 100
Calculated
Protein 23.00 23.00 23.00 20.00 20.00 20.00
Energy/Kcal/Kg 3,033.31 3,157.50 3,037.75 2,874.00 2,996.57 2,878.43
Supplied per Kg: 800 IU vitamin A; 1200 IU vitamin D3; 13mg vitamin E; 2mg vitamin K;
3mg riboflavin; 10mg cobalamin; 1.5mg folic acid; 0.25mg biotin; 125mg antioxidant
(satoquin); 25mg Fe; 80mg Mn; 50mg Zn; 2mg Cu, 0.2mg Co; and 0.1mg Se.
T10 % Beniseed: drumstick leaves,T2 6 % Beniseed,T3:15 %Drumstick leaves,
Results and discussion
The result of performance of broilers fed beniseed and drumstick leaves as sources of
lysine at the starter and finisher phases are shown in Table 2 and Table 3 revealed no
significant (P>0.05) differences in final body weight, body weight gain, feed intake
and feed conversion ratio and is in line with the study of Payne (1989) who reported
that adequate energy, protein and supplementation of feed with essential amino acid
and vitamin enhanced feed utilization in the body.
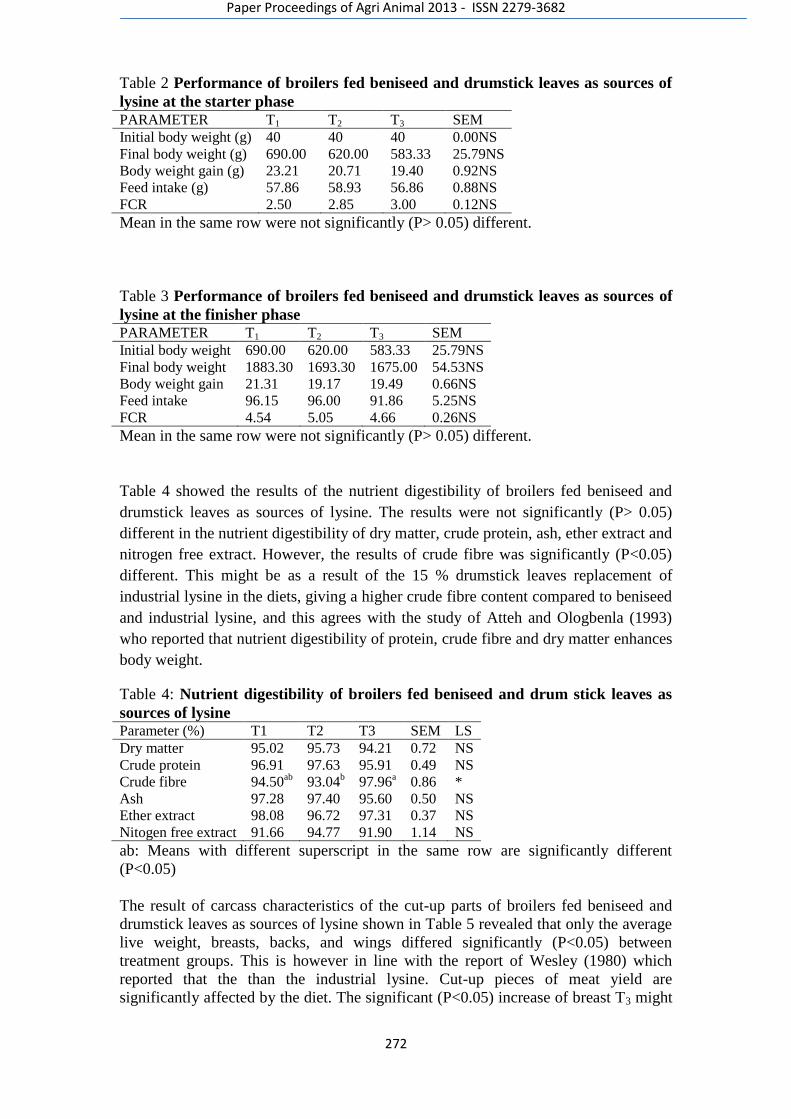
Paper Proceedings of Agri Animal 2013 - ISSN 2279-3682
272
Table 2 Performance of broilers fed beniseed and drumstick leaves as sources of
lysine at the starter phase PARAMETER T1 T2 T3 SEM
Initial body weight (g) 40 40 40 0.00NS
Final body weight (g) 690.00 620.00 583.33 25.79NS
Body weight gain (g) 23.21 20.71 19.40 0.92NS
Feed intake (g) 57.86 58.93 56.86 0.88NS
FCR 2.50 2.85 3.00 0.12NS
Mean in the same row were not significantly (P> 0.05) different.
Table 3 Performance of broilers fed beniseed and drumstick leaves as sources of
lysine at the finisher phase PARAMETER T1 T2 T3 SEM
Initial body weight 690.00 620.00 583.33 25.79NS
Final body weight 1883.30 1693.30 1675.00 54.53NS
Body weight gain 21.31 19.17 19.49 0.66NS
Feed intake 96.15 96.00 91.86 5.25NS
FCR 4.54 5.05 4.66 0.26NS
Mean in the same row were not significantly (P> 0.05) different.
Table 4 showed the results of the nutrient digestibility of broilers fed beniseed and
drumstick leaves as sources of lysine. The results were not significantly (P> 0.05)
different in the nutrient digestibility of dry matter, crude protein, ash, ether extract and
nitrogen free extract. However, the results of crude fibre was significantly (P<0.05)
different. This might be as a result of the 15 % drumstick leaves replacement of
industrial lysine in the diets, giving a higher crude fibre content compared to beniseed
and industrial lysine, and this agrees with the study of Atteh and Ologbenla (1993)
who reported that nutrient digestibility of protein, crude fibre and dry matter enhances
body weight.
Table 4: Nutrient digestibility of broilers fed beniseed and drum stick leaves as
sources of lysine Parameter (%) T1 T2 T3 SEM LS
Dry matter 95.02 95.73 94.21 0.72 NS
Crude protein 96.91 97.63 95.91 0.49 NS
Crude fibre 94.50ab
93.04b
97.96a
0.86 *
Ash 97.28 97.40 95.60 0.50 NS
Ether extract 98.08 96.72 97.31 0.37 NS
Nitogen free extract 91.66 94.77 91.90 1.14 NS
ab: Means with different superscript in the same row are significantly different
(P<0.05)
The result of carcass characteristics of the cut-up parts of broilers fed beniseed and
drumstick leaves as sources of lysine shown in Table 5 revealed that only the average
live weight, breasts, backs, and wings differed significantly (P<0.05) between
treatment groups. This is however in line with the report of Wesley (1980) which
reported that the than the industrial lysine. Cut-up pieces of meat yield are
significantly affected by the diet. The significant (P<0.05) increase of breast T3 might
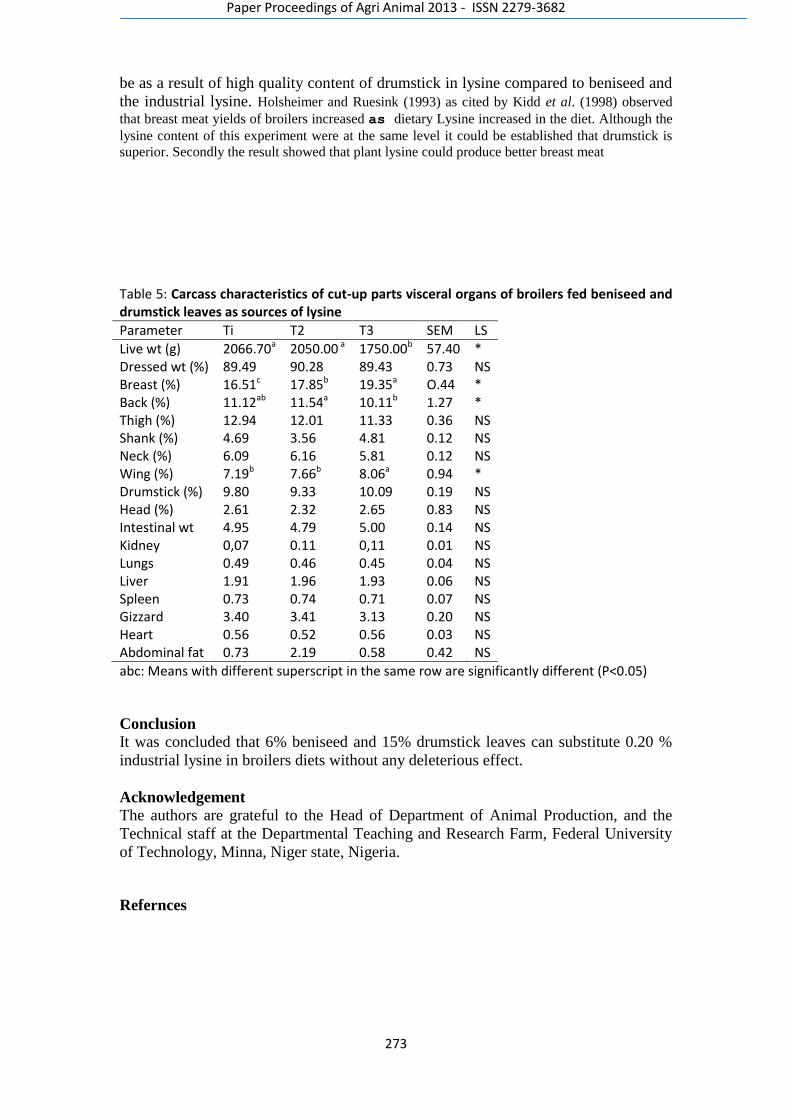
Paper Proceedings of Agri Animal 2013 - ISSN 2279-3682
273
be as a result of high quality content of drumstick in lysine compared to beniseed and
the industrial lysine. Holsheimer and Ruesink (1993) as cited by Kidd et al. (1998) observed
that breast meat yields of broilers increased as dietary Lysine increased in the diet. Although the
lysine content of this experiment were at the same level it could be established that drumstick is
superior. Secondly the result showed that plant lysine could produce better breast meat Table 5: Carcass characteristics of cut-up parts visceral organs of broilers fed beniseed and drumstick leaves as sources of lysine
Parameter Ti T2 T3 SEM LS
Live wt (g) 2066.70a 2050.00 a 1750.00b 57.40 * Dressed wt (%) 89.49 90.28 89.43 0.73 NS Breast (%) 16.51c 17.85b 19.35a O.44 * Back (%) 11.12ab 11.54a 10.11b 1.27 * Thigh (%) 12.94 12.01 11.33 0.36 NS Shank (%) 4.69 3.56 4.81 0.12 NS Neck (%) 6.09 6.16 5.81 0.12 NS Wing (%) 7.19b 7.66b 8.06a 0.94 * Drumstick (%) 9.80 9.33 10.09 0.19 NS Head (%) 2.61 2.32 2.65 0.83 NS Intestinal wt 4.95 4.79 5.00 0.14 NS Kidney 0,07 0.11 0,11 0.01 NS Lungs 0.49 0.46 0.45 0.04 NS Liver 1.91 1.96 1.93 0.06 NS Spleen 0.73 0.74 0.71 0.07 NS Gizzard 3.40 3.41 3.13 0.20 NS Heart 0.56 0.52 0.56 0.03 NS Abdominal fat 0.73 2.19 0.58 0.42 NS
abc: Means with different superscript in the same row are significantly different (P<0.05)
Conclusion
It was concluded that 6% beniseed and 15% drumstick leaves can substitute 0.20 %
industrial lysine in broilers diets without any deleterious effect.
Acknowledgement
The authors are grateful to the Head of Department of Animal Production, and the
Technical staff at the Departmental Teaching and Research Farm, Federal University
of Technology, Minna, Niger state, Nigeria.
Refernces
Paper Proceedings of Agri Animal 2013 - ISSN 2279-3682
274
A.O. A. C. 1990. Association of analytical Chemists. Official Methods of Analysis,
15thedition. Arlington, Virginia, U.S.A pp 807-809
Aduku A. O and Iji, P. A 1990. The effect of offal on yield and demand for dressed live broilers.
Tropical Science in press.
Aduku, A. O. 2004. Animal nutrition in the tropics: Feeds and feeding, pasture management,
monogastric and ruminant nutrition. Davon computers and ventures Samaru, Zaria, Pp 95 – 102.
Aduku, A. 0. 2005. Tropical Feeding stuff. Analysis Table. Department of Animal Science
Facultyof Agriculture. Ahmadu BelloUniversity, Saniaru, Zaria, Nigeria.
Aina, A. B. J 1990. Replacement of maize with cassava peel in finisher ration for cockerel: The
effect on cut-up pieces of eviscerated carcass. Nigeria Journal of Animal Production 11: 12 – 22.
Alabi R.A and Osipo, A. A. 2004. Contributory role of animal production in national
development. Proceeding of 9th
(ASAN) conference 13th
-16th
Sept. 2004. Ebonyi state University
Abakaliki Nigeria Page 117-180.
Atteh, J.O. and Ologbenla, F.O. 1993. Replacement of fish with maggots in broiler diets. Effect
on performance and nutrient. Nigeria journal of Animal production 20:44-49.
Baker, D. H (2003) partitioning of nutrients for growth and other metabolic functions; efficiency and
priority consider ration. Poultry science 70: 1797 – 1805.
Baker, D. H and Itan . Y (1994) Ideal Amino acid profile for broiler chicks during the first three weeks
post. Poultry science 73: 1441- 1447.
Beckstoom-stenberg, S.M and Duke, J.A (1994). The phytochemical database.
http://genome.cornell.edu/cgibin/webace
Church, D.C. 1991. Livestock feed and feeding 3rd
edition. Prentice Hall, Eagle Wood Cliff, New
Jersey, pp 546
Corzo, A., E. T. Moran and D. Hoehler. 2003. Lysine needs of summer-reared male broilers
form six to eight weeks of age. Poult. Sci. 82:1602-1607.
D‘mello, J.P.F (1999) Amino acid in farm animal Nutrion 2nd
Edition. Formally of the Scottish
Agricultural College, Edinburgh, U.K., pp 544
Duncan, D.B. 1985. Multiple ranges and multiple F: tests. Biometric 11: 1 – 42
Gong, L. M., C. H. Lai, S. Y. Qiao, Defa Li, Y. X. Ma and Y. L. Lin. 2005. Growth
performance, carcas cheracteristics, nutrient digestibility, and serum biochemical parameters of
broilers fed low protien diets supplemented with various ratios of threonine
to lysine. Asian-Aust. J. Anim. Sci. 18(8):1164-1170.

Paper Proceedings of Agri Animal 2013 - ISSN 2279-3682
275
Han, Y.M and baker, D.H 1994. Lysine requirement of male and female broiler chicks during the
period of three to six weeks post hatching. Poultry Science 73: 1739-1745.
Holsheimer, J.P. and EW.Ruesink, 1993. Effect onperformance, carcass composition, yield, and
financial return of dietary energy and lysine levels in starter and finisher diets fed to broilers.
Poultry Sci. 72: 806-815.
Idowu, A.O., O.M.O., Bambose, A.M., jegede, A.U., Sule, R and Enubetina, D. 2005. Effect of
replacing of cassava peel with cassava root on performance and egg quality characteristic of
laying hens, Animal conference animal science association of Nigeria (ASAN) Sept 12th
-15th
,
2005. 135-139.
Johnson, L.A, Suleiman, T.M and Lucas, E.W 1997 Sesame protein. A review and prospect,
American journal Organisation. Chemistry society. 56(30) 463-468.
Kidd, M.T., BJ. Kerr, and N.B. Anthony, 1997. Dietary interactions between lysine and
threonine in broilers. Poultry Sci. 76:608-614.
Kidd, M. T., B. J Kerr, K. M Halpin, G. W. Mcward and C. L Quarles. 1998. Lysine levels in
starter and grower finisher diets affect broiler performance and carcass traits. Journal appl.
Poultry Res. 7: 351 – 358.
Knowles, T. A. and L. L. Southern. 1998. The lysine requirement and ratio of total sulfur
containing amino acids to lysine for chicks fed adequate or inadequate lysine. Poult. Sci. 77: 564
- 569.
Lin, H. C., Jiao, H. C., Buyse, J and Decupyere, E 2006. Strategies for preventing heat stress in
poultry. World poultry Science 62 (1) 71 - 85
Maker, H.P.S., Becker, K. 1997. Nutrients and antiquality factors in different morphological
parts of the Moringa oleifera tree. Journal of Agricultural Science. Cambridge 128: 311-322
Manputu, M and Buhr, R. J 1991 effect of substituting sesame meal for soybean meal on layers
performance. Journal of Poultry Science. 70:70.
Mack, S., D. Bercovici, G. De Groote, B. Leclercq, M. Pack, J. B. Schutte and Van
Cauwenberghe. 1999. Ideal amino acid profile and dietary lysine specifications for broiler
chickens from 20 to 40 days of age. Br. Poult. Sci. 40:257-265.
Martin, L. P 2000. The moringa Tree. Echo Technical note. www.echonet.org
Paper Proceedings of Agri Animal 2013 - ISSN 2279-3682
276
McDonald, p., Edward, R. A., Green Heigh, J. F. D. 1989. Animal Nutrition, 4th
Edition,
Longman, London.
Moran, E T.,Jr. and S. F. Bilgili, 1990. Processing losses, carcass quality, and meat yield of
broiler chickens as influenced by dietary lysine. Poultry Sci. 69702709.
Nasir J., Kheiri F., Solati A., A Hajibabaci and Senemari M 2011. The efficiency of energy and
protein of broiler chickens fed on diets with different lysine concentrations. Journal of Animal
and Veterinary advances 10 (18): 2394 – 2397.
Nigerian Research Council 1994. Nutrient Requirements of poultry 9th
revised edition. National
Academy of Pres, Washington D. C.
Omlet 2006. Omlet United States of America breed information chicken frizzle.
http://www.omlet/us/breed.
Payne, W. S. A. 1990. An Introduction to Animal Husbandry in the Tropics. 4th
Edition.
Longman group Ltd. Pp 684-721SAS, Statistical Analysis Institute (2000).
Peace Corps, 1990. New crop production Hand Book, Information collection and exchange,
Yermanos, D. M (Eds). Washington D. C. 20526, U. S. A.
Ramachandra, C., Pefer, K. V and Gopalakrishan, P. K 1980. Drumstick (Moringa oleifera): A
multipurpose Indian Vegetable. Economy, Botany, 34 (3), 276 – 283.
SAS. 1998. Statistical Analysis System Institute, Users guide. SAS Institute Inc.Carry N. C.Cary,
USA, pp 943.
Sibbald, 1.R and M.S. Wolynetz, 1986. Effects of dietary lysine and feed intake onenergy
utilization and tissue synthesis by broiler chicks. Poultry Sci. 6598-105.
Sterling K. G, G. M Pesti and R. I Bakalli 2002. The response of broiler chickens to dietary
lysine and crude protein with different amino acid profiles. Poult. Sci. 81: 26 – 36.
Usama A. M., Ashraf, A., mumtaz and Jiang, Z. 2007. Lysine requirement of broiler chickens
fed low density diets under tropical conditions. Asian – Ust. J. Animal. Sci. Vol. 20; (6) 939 –
943.
Wesley, R.D, Adams, R.L and Stadelman, W.J. 1980. Effects of Amino acid Restrictions and
Age on weights and meat yield of turkeys. Poultry Science 60: 1422-1428
Paper Proceedings of Agri Animal 2013 - ISSN 2279-3682
277
17
Paper Proceedings of Agri Animal 2013 - ISSN 2279-3682
278
ACQUISITION AND MANAGEMENT OF LAND RESOURCES FOR AGRICULTURAL
PRODUCTION IN BENUE STATE, NIGERIA
Job N. Nmadu, Williams O. Inalegwu and Halima Sallawu
Dept. of Agricultural Economics and Extension Technology, Federal University of Technology,
Minna, Nigeria
ABSTRACT: The study investigated the manner and strategies adopted in acquisition and
management of land resources for agricultural production in Benue State, Nigeria. A sample of
80 respondents was selected for the study through simple random sampling technique and data
were collected from them using a structured questionnaire. It was found that a greater per cent
(48.75%) of the respondent acquired land through inheritance indicating that no change has taken
place in method of land acquisition over the years. This also underscores the near absence of
land markets in most states of Nigeria. The size of holding continues to be small (≤5.58ha) which
has not accentuated the commercialization of agriculture in Nigeria. The sale and purchase of
land is done in a mix of market situation like exchange of farm produce, cash and other socio-
cultural methods. The study recommends that policies and agricultural programmes in Nigeria
should take into cognizance the existing land tenure systems and the problems that emanate from
them. In addition, problems associated with small sized farms and dispersal of holdings can be
resolved through a method of land reform in which the fragments are accumulated together and
the land is shared among owners so that each person‘s holding is in one location.
Keywords: Agriculture, Land supply, Farm size, Land tenure, land transactions
Introduction
Land is one of the most critical resources for the rural poor dependent on farming for their
livelihoods. Inappropriate land management, particularly in areas with high population density
and growth rates, further increases loss of productivity (World Bank, 2006). The problem of land
tenure could be interpreted based on the duplicity of ownership of land with consequent
excessive transaction costs, fragmentation of land into uneconomic sized tracts. Most of the land
purchases are done by wealthy non-farmers who held the land idle, waiting to capitalize on an
appropriate market situation, while food production is on the decline (Fabiyi, 1976). Ukaejiofo
(2007) showed that traditional tenure system placed major constraints upon the achievement of
efficient agricultural production and physical development, which led to the promulgation of
Land Use Act by the Nigeria government in 1978. However, the Act failed to take into sufficient
consideration the modifications that have taken place in the traditional tenure system by treating
land as a free good. Most elements of the Act are disregarded by the majority of the land owners.
The inequitable distribution of land has contributed to the declining state of resources thereby
creating the conditions that leads to food insecurity (Place and Otsakal, 2001). According to
Nmadu et at (2012), Daramola (2004) and World Bank (2010), the average farm size per farmers
in Nigeria is between 1 and 5 hectares while the average Age farmer is between 50-60 years but
Nigeria has a total land area of 92.4 million hectares and ninety one million of this is adjudged
suitable for cultivation and only about forty-five million hectares of potential agricultural land is
however put into use for our industrial crops and staple crops. The other important factor
affecting land management in Nigeria is inappropriate land policies which constitute a serious
constraint on economic and social development. Insecure land tenure and dysfunctional land
institutions discourage private investment and overall economic growth. In Nigeria, the typical
Paper Proceedings of Agri Animal 2013 - ISSN 2279-3682
279
villager recognizes land as his entity and share it with the entire biotic complex and any policy
on land ownership and use must recognize that the very existence of some people rests on their
having access to a piece of land and any attempt to squeeze this from them would be strongly
resisted. Fadahunsi (2008) identified different classes of land holding to include Community
lands, Chieftaincy lands, Kola tenancy, Pledge, Leasehold tenure, State land etc. He further
identified other forms of land tenure to include contracted and individual tenure. Land tenure
system in Nigeria varies with tribe, clans, state or community villages, families etc. they can be
broadly classified into Communal land tenure system, Tenure based on individual inheritance of
free-hold land ownership, Lease-hold tenure or landlord- tenant agreement, State or government
ownership. The mode of transactions in land that take place in Africa can best be described as
involving both market and non-market transfers (Moyo, 2000; Place, 2002). This means that
non-market transactions have increased the flexibility of customary systems to cope with
population pressure, commercialization of agriculture and other driving forces (Place, 2002)
Land availability is changing because of urbanization and other land-use purposes, and thus the
land productivity is also changing because of environmental conditions. One of the most
important environmental factor affecting land productivity is ‗land degradation‘. Land
degradation is an aggregate definition indicating loss of land quality due to several reasons.
Proper rights to resources such as land, water, and trees have been found to play a fundamental
role at the nexus of poverty reduction, resource management, and environmental management.
The property rights held by poor people represent key household and community assets that may
provide income opportunities, ensure access to essential household subsistence needs and insure
against livelihood risk. Poorer groups tend to rely more heavily on customary or informal rights.
It is unlikely that sustainable land management can be achieved in the absence of explicit
attention to property rights (World Bank, 2006). The problem of land tenure which implies
property use rights of soil, water, fauna and flora resources based on national systematic, and
lawful land registration program has inspired a variety of land reforms with a general trend
toward market-oriented access to, and privatization of, land through private entitlement, on the
premise that individualized tenure offers the best certainty in land rights, which provides
incentive and facilitates access to credit for investment in agriculture and natural resources and,
thereby, contributes to increasing agricultural productivity and improving natural-resource
stewardship.
Observation of vegetation in Benue state revealed that land is under pressure from the increased
human population for housing, infrastructure, settlement development and other industrial and
development-propelled development rather than for increased food production (Benue State
Agricultural Summit, 2005). Land tenure and struggles over land have been growing in the last
decade in a context of growing poverty, landlessness, homelessness and distress in Africa. The
last few years have witnessed the increased organization of politics around land and the literal,
physical assertion of attempts to gain land rights by some communities. So it is important to
know the accessibility of available land for agricultural expansion in Benue State, since Benue
State with enormous potential is known for agricultural production. In this study, acquisition and
management of land resources for agricultural production in Benue State, Nigeria was
investigated. This study seeks to describe the socio-economic characteristic of the respondents in
the study area, describe the land tenure systems operational in the study area, determine the trend
in farm size change in the study area over a period of five years, determine the trend in Land
Paper Proceedings of Agri Animal 2013 - ISSN 2279-3682
280
supply to the market in the last five years, and determine the land tenure system that is dynamic
in land supply to agricultural production.
Methodology
This study was carried out in Benue State of Nigeria. Makurdi Local Government Area was
purposively selected for the study, being the state capital with a diverse population of farmers,
businessmen, merchants, civil and public servants which helped to ensure that the stated
objectives of the study are achieved. Makurdi local government was created in 1970 out of the
defunct Tiv Native Authority. The L.G headquarters also serves as the state capital. Makurdi lies
between longitude 80 20
0 East, latitude of 7
0 20
0 North and 8
0 North. Makurdi have a population
of 300,377 people (N.P.C, 2006). Makurdi covers a landmass of 80kilometer square. A very
important feature of the Local Government Area is the presence of River Benue. The River
enters Nigeria from the Cameroon Republic, flowing South-West. It has an extensive flood plain
for a distance of 187km.The climate is characterized by uniformly high temperature which
fluctuates between 230C – 30
0C and the rainy season lasts from April to October with annual
rainfall in the range 1500-1800mm. This adequate rainfall coupled with the vital fertile soil
makes Makurdi the leading agricultural State capital, which earned Benue State the name ―Food
Basket of the Nation‖. The major ethnic groups are Tiv, Idoma, Igede, Jukun, Etulo. The major
occupations are Civil service, farming, livestock production and fisheries. And the tributaries of
River Benue that drain through the Local Government Area provide good source for irrigation
and fishing. The Local Government Area is made up of eleven (11) council wards namely: North
Bank I, North Bank II, Mbalagh ward, Bar ward, Fiidi council ward, Madikpo ward, Clerk
ward/Central mission, Ankpa/Wadata ward, Modern market ward, Walomayo ward and Agan
ward. Agriculture forms the backbone of the State economy, engaging more than 70% of the
population. Food and cash crop produced in the state are yam, cassava, sweet potatoes, sorghum,
maize, millet, groundnut, ginger, sugar cane, soybeans, beniseed, rice, sweet orange, mangoes
and cashew. A lot of vegetable crops- leafy, okra, tomatoes, garden eggs and many others are
produced under irrigation.
The data for this study were obtained from both primary sources. Five wards were randomly
selected from the eleven wards. Then one village each was randomly selected from the five
wards above and 16 farmers were randomly selected from each of the villages, giving a total 80
respondents for the study.
Quantitative (econometric) and descriptive techniques were employed to analyze the data
collected. Descriptive statistics such as mean, frequency distribution, percentage (%), and
ranking were used to analyze the socio-economic characteristics of the respondents, the land
tenure system operational in the area, and the trend in land supply to the market in the last five
years.
The land tenure system that is dynamic in land supply to agricultural production was measured
using a five (5) point likert scale. The five point likert scale was graded as highly effective=5,
effective=4, Not highly effective=3 Not effective=2, Not sure=1. Based on this grading the level
of effectiveness of land tenure system on agricultural production was ranked using weighted
mean. The average weighted mean score of the correspondent based on 5 point likert was
5+4+3+2+1=10. 15 5 = 3 (cut off point). Using the internal scale of 0.05 i.e. 5% probability
Paper Proceedings of Agri Animal 2013 - ISSN 2279-3682
281
level, the upper limit cutoff point was 3+0.05=3.05 and lower limit cut off will be 3-0.05=2.95
there 4 weighted mean. The mean score above 3.05 was ranked highly effective while any mean
score between 3.04 and 2.99 was ranked as effective and mean score between to 3.0 and 2.94
was ranked not sure, mean score of 2.95 was ranked as not highly effective and below 2.95 was
ranked as not effective.
Results and Discussion The description of the socio-economic characteristics of the respondents are presented on Table
1 showing that majority of the respondents are male around 48 years of age and with moderate
formal educational status. Majority of the respondents are married and possess about 5.58ha of
farm lands and has about 26 years of farming experience. Table 2 shows the distribution of
respondents based on their main and other occupations showing that majority of the respondents
are farmers, although the respondents also engage in some other non-farm vocations. The farm
and nonfarm income per annum is presented on Table 3 showing that farm income is higher than
non-farm income although there is wider disparity in the distribution of non-farm income. Table
4 shows the distribution of respondents based on the method of land acquisition and sources of
farm labour while Table 5 shows the distribution of respondent based on rating and perception of
land tenure system showing that majority of the respondents acquired their land through
inheritance and the most effective tenure system in the study area is inheritance. Tables 6, 7, 8, 9,
10 and 11 give the trend analysis of land stock and the management skills used in either
purchasing of selling land, The data also shows the motivation for sale of land and the
constraints against successful land purchase.
The results in Table 1 show that the mean farm size and age are quite higher than what has been
reported in many similar studies in Nigeria (e.g. Adebayo, 2006, Nmadu, 1997, Nmadu and
Ibiejemite, 2007, Nmadu et.al., 2008, Nmadu et.al., 2008a, Onu, 2011). The mean age is around
the life expectancy of Nigeria which means the respondents are past the productive stage when
they could supply labour to the carry out the various farm operations since Nigerian agriculture
is still very much of low and crude technology. Hence there could be low productivity as a result
of low labour or untimely supply and that further dampens the prospect of self-sufficiency in
food production. The result also reveal that the farmers in this area have spent more than half of
their lifetime in farming, thus they must have acquired a lot of experience in the various farm
operations including managing of land resources. However, their long stay on the farm seems to
be at the expense of acquiring adequate formal education, as most of them only acquired
secondary education, typical of most Nigerian farming communities. The findings on Table s 2
and three also show a similar trend in most Nigerian communities where people engage in more
than one vocation earning income from a variety of sources. This is normally done to utilise off-
farm season labour or to ensure steady supply of income to meet up ever-increasing family
obligations. However, it could be observed that most of the respondents earn less than
NGN500,000 per annum or about USD8 per day or USD0.78 per day per capita. This is grossly
inadequate.
The results on Table 4 and 5 show that inheritance is the predominant tenure system and the
method of acquiring land in this study area, It therefore indicate that the Act has not made much
impact on land economy in Nigeria. And that has hampered farm expansion as this system only
encourages fragmentation. It has also made mechanisation difficult as well as commercialisation
of agriculture in Nigeria as production system is family-based and is attached to a lot of socio-
Paper Proceedings of Agri Animal 2013 - ISSN 2279-3682
282
cultural obligations. This is further confirmed by the number of the respondents that utilise
family labour for agricultural production in this study area.
The results on Tables 6-11 shows the dynamics of land supply and demand and the trend
between 2007 and 2012. The results show that there is no uniform method of selling or
purchasing land in the study area. Hence there is total absence of land markets. This is so
because there is no standard measure and the lands are sold and bought without any defined
pricing system. Hence land is sold by barter, exchanged with farm produce or rented at whatever
the seller demands. The results also show that the reasons why people decide to put land in the
market are far less than economic reasons. However, the constraint militating against purchase
seems to be economic, making the transaction hectic. It was also observed that the dynamics
seems to be increasing from almost zero transaction in 2007 as more transactions are recorded
from 2009 to 2012, indicating the likely improvement in economic status of the respondents. The
situation of land economy in the study area and by extension Nigeria has slowed down economic
development as many developmental projects are land-dependent and that has made the Nigerian
government to set up the Presidential Committee on Land Reforms. In addition, there have been
a lot of calls for the amendment of the Act so that the land markets would be liberalised and
policies re-aligned to make land administration and transactions much more open and
transparent. In view of this, the current move to amend the Act must take cognisance of the
peculiarities associated with the cultural and family ties to land. The finding also reveals that
although majority of the respondents are farmers, the transactions involving land in the study
area does not is not for agricultural reasons, again making the dream of poverty reduction and
self-sufficiency in food production a myth.
Conclusion and recommendation
This study which examine the acquisition and management of land resources in Benue State.
Descriptive analytical tool, multiple regression, and five point likert scale were used to analyze
data. The result of the analysis shows that a greater per cent (48.75) of the respondent acquired
land through inheritance indicating that no change has taken place in land acquisition over the
years. This also underscores the near absence of land markets in most states of Nigeria. The size
of holding continues to small (5.58ha) which has not accentuated the commercialization of
agriculture in Nigeria. The sale and purchase of land is done in a mix of market situation like
exchange of farm produce, cash and other socio-cultural methods. The study recommends that
policies and agricultural programmes in Nigeria should take into cognizance the existing land
tenure systems and the problems that emanate from them. In addition, problems associated with
small sized farms and dispersal of holdings can be resolved through the provision of
infrastructural facilities in the rural areas.
REFERENCES
Abubakar B. Saraki (2005). Investing in Nigerias competitive advantage ―commercial farming‖
This day Vol.2 NO. 3664 0f Wednesday 4th
of May, 20 page 20-21.
Adebayo A.O (2006). ―Role of credit in financing Agriculture in Lavun Local Government Niger
State Nigeria.(Unpublished) M.Sc thesis, Department of Agricultural Economics and Extension,
FUT Akure.
Adeniyi, M.O., Undeoglanya, A.C.C., Okeke, I.C., Abdullahi, Y., Iheukwumere, C.A. (1991).
Countdown to Senior SecondaryCertificate Examination Agricultural Science.
Benue State Agricultural Summit (2005) www.n-point consulting.com/../soil html.
Paper Proceedings of Agri Animal 2013 - ISSN 2279-3682
283
Fabiyi, Y. L. (1976) The place of agrarian reform in Nigeria agricultural development policy.
Department of Agricultural Economics, University of Ife, Ile-Ife, Nigeria.
Fadahunsi J.T (2008) ―Assessment of land Registration under the land Use Act of 1978 in ogun
State‘‘ proceedings, 43rd
AGM/conference of the NIS, Abeokuta, Ogun State 5th
-9th
may; 2008.
Federal Government of Nigeria land use Decree No.6, 1978.
Moyo, S. (2000) ―The Land Question and Land Reform in Southern Africa‖, work in
progress.
National Population Commission (2006), Population Census, official Gazatte (FGP 71/52007/2,
500(OL24, also available on www.nigerianstat.gov.ng
Nmadu, J.N (1997):- Impact of Bejin-Doko community Bank (NIG) LTD on the Income of
Small Scale farmers in Doko and Jima District of Niger State: An M.Sc Seminar Paper Presented
to the Department of Agricultural Economics and Rural Sociology Ahmadu Bello University,
Zaria.
Nmadu, J.N. and J.O. Ibiejemite. 2007. Economic analysis of fertilizer use on yam production
in Kabba Bunu local government area of Kogi State, Nigeria. In: U. Haruna, S.A. Jibril, Y.P.
Mancha and M. Nasiru (eds). Consolidation of Growth and Development of Agricultural Sector.
Proceedings of the 9th Annual National Conference of the Nigerian Association of Agricultural
Economists held at ATBU, Bauchi, 5th – 8th November.
Nmadu J. N., E.P.O Egwa And A. Ogaji 2008a. Factors affecting loan acquisition among small
scale farmers in Otukpo Local Government Area of Benue State, Nigeria. In the Proceedings of
the 10th Annual Conference of the NAAE held at 750 Seater Lecture Theatre, University of
Abuja Permanent Site (Opposite Nmandi Azikiwe International Airport), Abuja. October 7th –
10th, 2008.
Nmadu, J.N., A. Haruna and O. Jiya. 2008. Socio-economic structure of farmers displaced by
the establishment of large-scale farming in Edu local government of Kwara State, Nigeria.
Proceedings of the 2008 SOGARD Conference held at University of Agriculture, Markurdi, May
25th to 28th.
Onu , J. O (2011) : Analysis of credit acquisition and utilization by farmers in Minna Metropolis
M. Tech. Thesis, Department of Agricultural Economics and Extension Technology, Federal
University of Technology Minna, Nigeria.
Place, F. (2002) Land Markets in sub-Saharan Africa: Preconditions, Potentials and Limitations
Place, F. and otsaka, K. (2001) land tenure and Natural Resource management: a comparative
study of Agrarian communities in Asia and Africa, Baltimore. Johns Hopkins university press.
Ukaejiofo, N.(2007) The future of land Administration in Nigeria, a paper presented at the
Cambridge conference held at St. John College Cambridge, United Kingdom, July 15-20.
World Bank (2006) Sustainable land management: Challenges, Opportunities, and Trade-offs.
http://go.worldbank.org/vu10C5LNNO.
Table 1: Socio-economic characteristics of respondents
Variables Frequency Percentage Rank
Gender
Female 7 8.8 2nd
Male 73 91.3 1st
Age group
31-40 16 20.0 3rd
41-50 33 41.3 1st
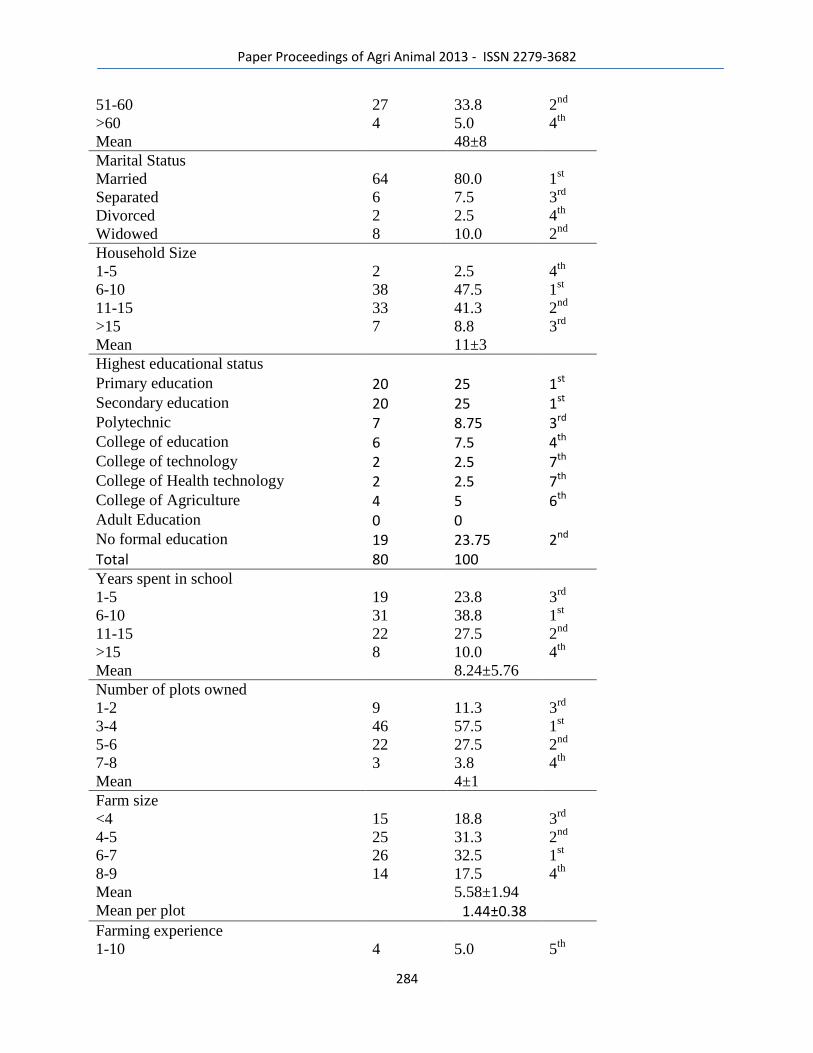
Paper Proceedings of Agri Animal 2013 - ISSN 2279-3682
284
51-60 27 33.8 2nd
>60 4 5.0 4th
Mean 48±8
Marital Status
Married 64 80.0 1st
Separated 6 7.5 3rd
Divorced 2 2.5 4th
Widowed 8 10.0 2nd
Household Size
1-5 2 2.5 4th
6-10 38 47.5 1st
11-15 33 41.3 2nd
>15 7 8.8 3rd
Mean 11±3
Highest educational status Primary education 20 25 1st Secondary education 20 25 1st Polytechnic 7 8.75 3rd College of education 6 7.5 4th College of technology 2 2.5 7th College of Health technology 2 2.5 7th College of Agriculture 4 5 6th Adult Education 0 0 No formal education 19 23.75 2nd Total 80 100 Years spent in school
1-5 19 23.8 3rd
6-10 31 38.8 1st
11-15 22 27.5 2nd
>15 8 10.0 4th
Mean 8.24±5.76
Number of plots owned
1-2 9 11.3 3rd
3-4 46 57.5 1st
5-6 22 27.5 2nd
7-8 3 3.8 4th
Mean 4±1
Farm size
<4 15 18.8 3rd
4-5 25 31.3 2nd
6-7 26 32.5 1st
8-9 14 17.5 4th
Mean 5.58±1.94
Mean per plot 1.44±0.38
Farming experience
1-10 4 5.0 5th
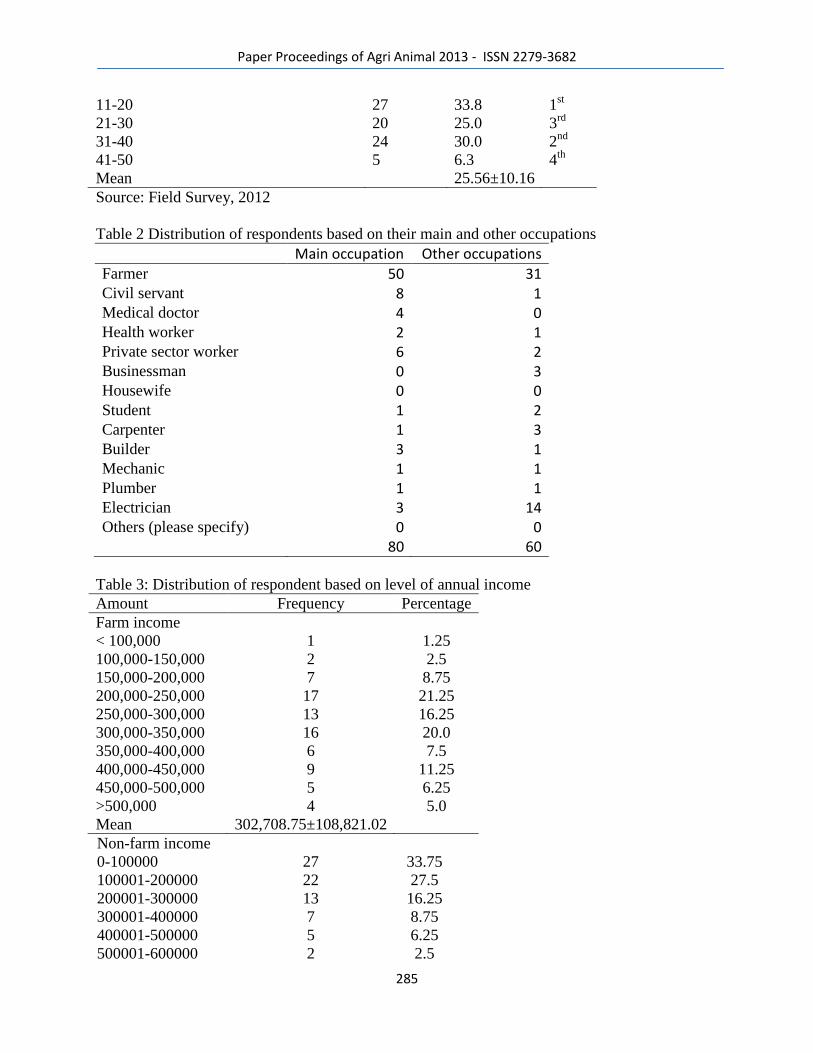
Paper Proceedings of Agri Animal 2013 - ISSN 2279-3682
285
11-20 27 33.8 1st
21-30 20 25.0 3rd
31-40 24 30.0 2nd
41-50 5 6.3 4th
Mean 25.56±10.16
Source: Field Survey, 2012
Table 2 Distribution of respondents based on their main and other occupations
Main occupation Other occupations Farmer 50 31 Civil servant 8 1 Medical doctor 4 0 Health worker 2 1 Private sector worker 6 2 Businessman 0 3 Housewife 0 0 Student 1 2 Carpenter 1 3 Builder 3 1 Mechanic 1 1 Plumber 1 1 Electrician 3 14 Others (please specify) 0 0
80 60
Table 3: Distribution of respondent based on level of annual income
Amount Frequency Percentage
Farm income
< 100,000 1 1.25
100,000-150,000 2 2.5
150,000-200,000 7 8.75
200,000-250,000 17 21.25
250,000-300,000 13 16.25
300,000-350,000 16 20.0
350,000-400,000 6 7.5
400,000-450,000 9 11.25
450,000-500,000 5 6.25
>500,000 4 5.0
Mean 302,708.75±108,821.02
Non-farm income
0-100000 27 33.75
100001-200000 22 27.5
200001-300000 13 16.25
300001-400000 7 8.75
400001-500000 5 6.25
500001-600000 2 2.5
Paper Proceedings of Agri Animal 2013 - ISSN 2279-3682
286
600001-700000 0
700001-800000 3 3.75
800001-960000 1 1.25
Mean 199,650.00±219,633.94
Source: Field Survey, 2012.
Table 4 Distribution of respondents based on the method of land acquisition and sources of farm
labour
Variables Frequency Percentage Rank
Land acquisition
Inheritance 39 48.75 1st
Gift 6 7.5 4th
Purchase 2 2.5 5th
Owned 12 15.0 3rd
Rent 21 26.25 2nd
Labour
Hired 5 6.25 3rd
Family 45 56.25 1st
Communal 3 3.75 4th
Hired and Family 27 33.75 2nd
Source: Field survey, 2012.
Table 5: Distribution of respondent based on rating and perception of land tenure system
Tenure
system
Highly
Effective Effective
Not
sure
Not
Effective
Not Highly
Effective
Weighted
mean Ranking
Communal 0 4 29 33 14 1.913 5th
Inheritance 47 30 0 0 2 4.55 1st
Individual 43 13 3 7 14 4.075 2nd
Leasehold 4 31 7 9 29 3.2 4th
State/L.G.A 0 0 23 47 10 1.838 6th
Rent 14 47 2 3 13 3.813 3rd
Source: Field survey, 2012
Table 6 Respondents‘ intentions to either increase or decrease their land stock
Yes No No
intention
have you been able to increase your farm size 12 54 14
have you intended to decrease your farm size 14 52 12
have you intended to buy land before 29 51
if yes did you get it 3 26
Source: Field survey, 2012.
Table 7 Distribution of respondent based on trend of land holdings (2007-2012)
SUPPLY 2007 2008 2009 2010 2011 2012 Total Per cent
Increase 0 0 1 2 8 3 14 17.5
Decrease 0 0 0 5 8 1 14 17.5
Paper Proceedings of Agri Animal 2013 - ISSN 2279-3682
287
None 0 0 0 0 0 0 52 65
TOTAL 0 0 1 7 16 4 80 100 Source: Field survey, 2012.
Table 8 Management skills on acquisition and disposal of land (average responses)
2007 2008 2009 2010 2011 2012
how many hectares were added 0 0 0.025 0.15 0.5125 0.175
if purchase, how much did you pay 0 0 0 0 0 0
if kind, how many quantity of
commodity was exchanged in kg 0 0 0 0.05 0.1375 0.175
if rent, how much did you pay in
naira 0 0 500 900 2100.025 150
and how long are you expected to
use the land in years 0 0 0.05 0.0375 0.2125 0.0625
how many hectares was the decrease 0 0 0 0.125 0.2375 0.125
if, rent how much did you receive 0 0 0 825 2275 525
how many years was it rented out 0 0 0 0.075 0.1875 0.05
was the decrease through sale 0 0 0 0.0375 0.05 0.0125
if sale, how much was it sold for in
naira 0 0 0 9125 18250 6875
Table 9 Method of land disposal used by the respondents
2007 2008 2009 2010 2011 2012
Decrease through sale
3 4 1
Amount Sold
290,000 340,000 550,000
320,000 470,000
760,000 450,000
220,000
Hectares
1 1 1
1 1
1
2 1
1
Other forms
Rent
2 4
Amount Paid
54,000 24,000
24,000 24,000
24,000
24,000
Years of rent
3 2
2 2
2
2
Source: Field survey, 2012
Table 10 Method of land purchase used by the respondents
Paper Proceedings of Agri Animal 2013 - ISSN 2279-3682
288
2007 2008 2009 2010 2011 2012
Forms of increase
Rent
1 2 4
2
Exchange -
- 4
1
Items for Exchange
Cash
1 2 4
2
Kind
4
Cash and Kind
1
Amount (Naira)
14,000
1
1
24,000
1
28,000
1
1
36,000
1
42,000
1
52,000 1
54,000
1
Commodity
1 bag of Rice
1
2 bags of Rice
3
1 bag of Benniseed
1
Size in Hectares
2 1
1 7
3
3
1 1
Number of Years
1
2
2
2
1 6
1
3
1
4 1
Source: Field survey, 2012
Table 11 Motivation for sale and constraints to purchase of land
Factors responsible for sale of
your land
Factors responsible for inability to
buy land
to generate more money 2 Refusal to sale by the owner 5 to pay children school fees 5 high cost 21 distance from home 1 government interest 0 high cost of labour 1 high tax rate 0 low productivity 3
others 0

Paper Proceedings of Agri Animal 2013 - ISSN 2279-3682
289
18
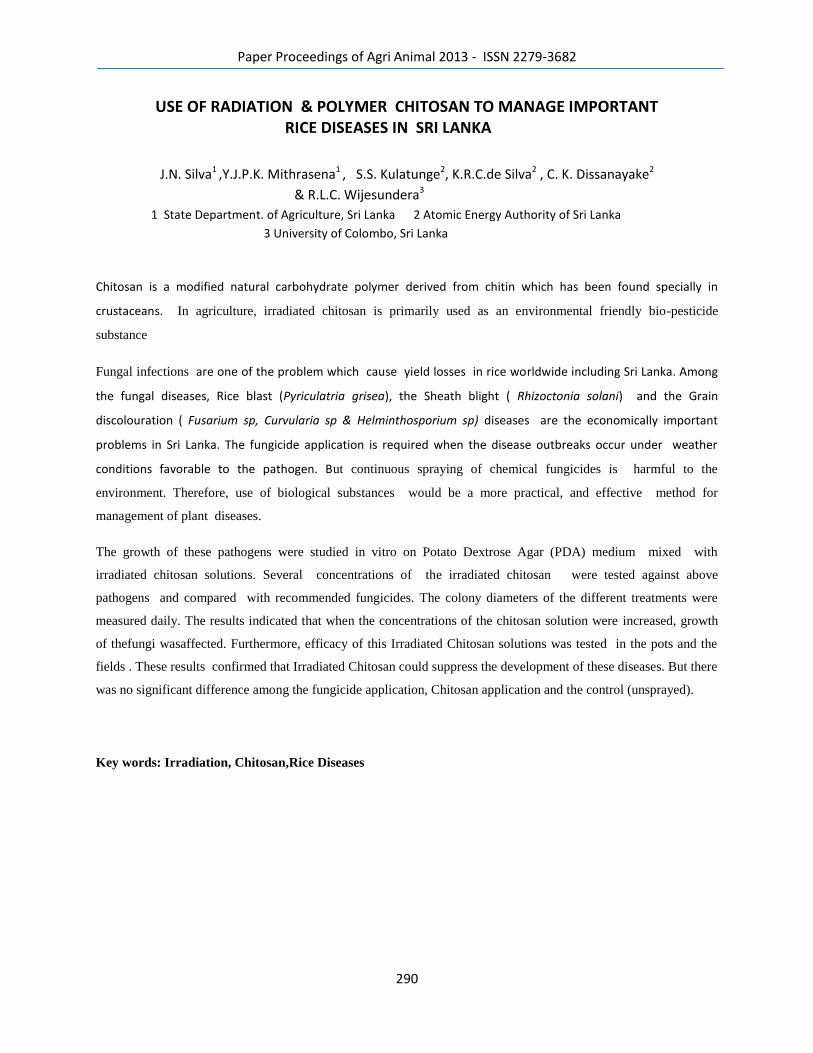
Paper Proceedings of Agri Animal 2013 - ISSN 2279-3682
290
USE OF RADIATION & POLYMER CHITOSAN TO MANAGE IMPORTANT RICE DISEASES IN SRI LANKA
J.N. Silva1 ,Y.J.P.K. Mithrasena1 , S.S. Kulatunge2, K.R.C.de Silva2 , C. K. Dissanayake2
& R.L.C. Wijesundera3
1 State Department. of Agriculture, Sri Lanka 2 Atomic Energy Authority of Sri Lanka
3 University of Colombo, Sri Lanka
Chitosan is a modified natural carbohydrate polymer derived from chitin which has been found specially in
crustaceans. In agriculture, irradiated chitosan is primarily used as an environmental friendly bio-pesticide
substance
Fungal infections are one of the problem which cause yield losses in rice worldwide including Sri Lanka. Among
the fungal diseases, Rice blast (Pyriculatria grisea), the Sheath blight ( Rhizoctonia solani) and the Grain
discolouration ( Fusarium sp, Curvularia sp & Helminthosporium sp) diseases are the economically important
problems in Sri Lanka. The fungicide application is required when the disease outbreaks occur under weather
conditions favorable to the pathogen. But continuous spraying of chemical fungicides is harmful to the
environment. Therefore, use of biological substances would be a more practical, and effective method for
management of plant diseases.
The growth of these pathogens were studied in vitro on Potato Dextrose Agar (PDA) medium mixed with
irradiated chitosan solutions. Several concentrations of the irradiated chitosan were tested against above
pathogens and compared with recommended fungicides. The colony diameters of the different treatments were
measured daily. The results indicated that when the concentrations of the chitosan solution were increased, growth
of thefungi wasaffected. Furthermore, efficacy of this Irradiated Chitosan solutions was tested in the pots and the
fields . These results confirmed that Irradiated Chitosan could suppress the development of these diseases. But there
was no significant difference among the fungicide application, Chitosan application and the control (unsprayed).
Key words: Irradiation, Chitosan,Rice Diseases
Paper Proceedings of Agri Animal 2013 - ISSN 2279-3682
291
1. INTRODUCTION
Rice diseases are one of the major biological constrains that cause yield losses worldwide
including in Sri Lanka. Among the diseases, Bacterial leaf blight, Rice blast, Sheath blight and
Brown spot are the most economically important diseases in Sri Lanka. The present
recommended varieties of Sri Lanka which have emerged from the rice varietal improvement
programme of Department of Agriculture (DOA) posses favorable levels of disease resistance to
Bacterial leaf blight and Rice leaf blast diseases. Majority of farmers (63.5%) use resistant
varieties and most of them cultivate rice according to the recommendations of the DOA.
Depending on the weather conditions prevailing during both Yala (March-August) and Maha
(September- February) seasons, majority (about 55%) of the farmers use chemical fungicides to
control diseases (Kumara et al., 2008). Furthermore, 42% of farmers have adopted both
chemicals and cultural control methods whereas only 3% of farmers have applied integrated
methods for the management of such diseases.
Rice blast caused by fungus Pyricularia grisea is considered as the principal fungal
disease of rice considering its‘ destructiveness and worldwide distribution (Ou, 1986). Rice
seedlings or plants at the tillering stage are often completely killed due to this disease. The
lesions are typically elliptical with more or less pointed ends. The center of the lesions is usually
gray or whitish and margin is usually brown or reddish brown.The use of resistant varieties
against rice blast disease caused by Pyricularia grisea is more practicable. However, fungicide
application is required when the disease outbreaks occur under favorable weather conditions.
Sheath blight caused by fungus Rhizoctonia solani is also a very common in rice fields in
wet zone of Sri Lanka causing considerable damage. The first symptom is an oblong, water
soaked lesions on leaf sheaths at or near the water line. As the development of the lesions will
have a grayish-white center surrounded by dark purplish or reddish brown margin. It will cause
Paper Proceedings of Agri Animal 2013 - ISSN 2279-3682
292
premature plant death. Sometimes panicle is also be infected by the pathogen.Since, no disease
resistant rice varieties have been identified for sheath blight disease caused by Rhizoctonia
solani, fungicide application is the only solution for the management of this disease.
Brown leaf spot of rice caused by Fusrium sp., Curvularia sp. , Helminthosporium sp.,
and Colletotricum sp. , is ranked third of the fungal diseases behind rice blast & Sheath blight in
economic importance. Symptoms of brown spot appear on the leaves and the panicles also
causes grain spotting. On the husk of the grain , the fungus caused black or dark brown spots .
In sever cases the spots may cover the entire seed coat or husk. The kernels become shriveled
and discoloured. Estimated yield losses due to this disease to be 5-30 % of total production.
As a biological substance, irradiated chitosan has become a popular in the present world
(Rodriguez et al.,2007). In agriculture, irradiated chitosan is being primarily used as a natural
seed treatment, plant growth enhancer, and environmental friendly bio-pesticide substance that
boosts the innate ability of the plants to defend themselves against fungal infections. However,
long term continuous spraying of chemical fungicides is harmful to the environment as well as
man and animals. Therefore, use of biological substance would be more practical, effective and
environmental friendly method for management of such diseases.
2.Materials & Methods
Irradiated Chitosan samples
The Irradiated Chitosan samples in Table 01 with different viscosity average and Molecular
weights (Da) were obtained from the Atomic Energy Authority of Sri Lanka to test their
fungicidal effect in both vitro and vivo.
2.1.Effect of irradiated chitosan on radial mycelia growth of Pyricularia grisea the causal
organism of Rice blast disease ( in vitro).
The fungus P. grisea was isolated from blast infected rice plant. Pure cultures were maintained on PDA
medium at 300 C. The Irradiated Chitosan samples were tested in vitro on PDA medium against
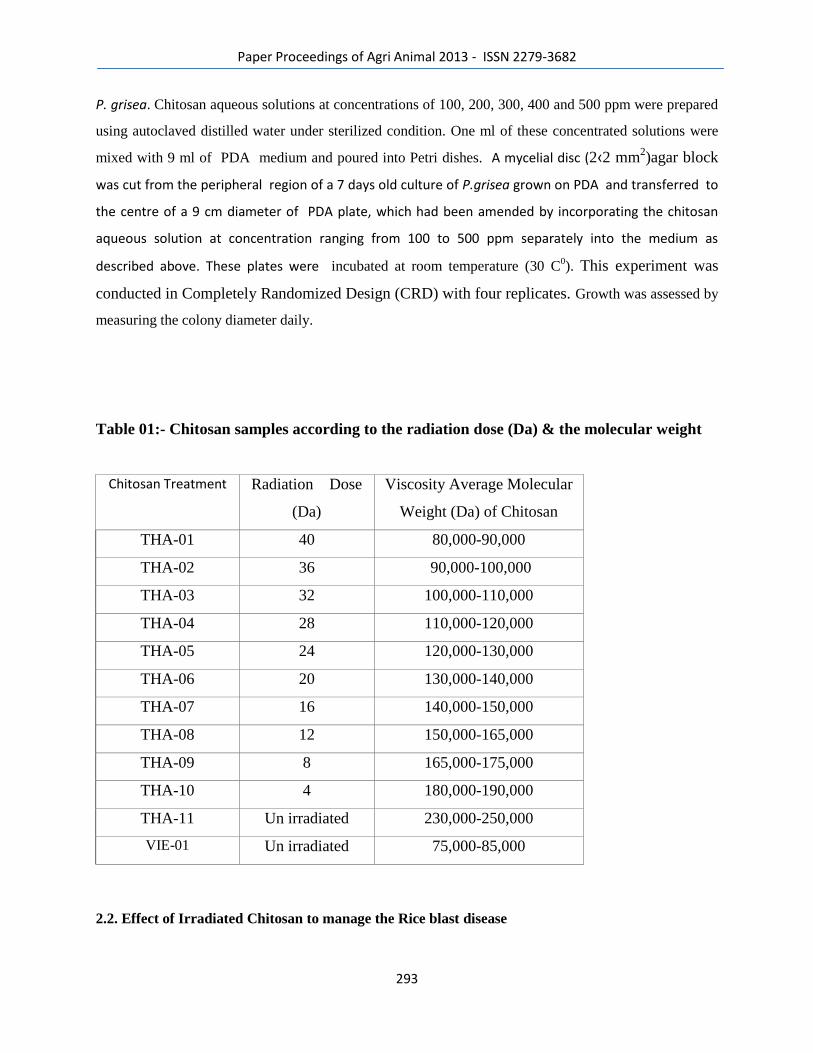
Paper Proceedings of Agri Animal 2013 - ISSN 2279-3682
293
P. grisea. Chitosan aqueous solutions at concentrations of 100, 200, 300, 400 and 500 ppm were prepared
using autoclaved distilled water under sterilized condition. One ml of these concentrated solutions were
mixed with 9 ml of PDA medium and poured into Petri dishes. A mycelial disc (2‹2 mm2)agar block
was cut from the peripheral region of a 7 days old culture of P.grisea grown on PDA and transferred to
the centre of a 9 cm diameter of PDA plate, which had been amended by incorporating the chitosan
aqueous solution at concentration ranging from 100 to 500 ppm separately into the medium as
described above. These plates were incubated at room temperature (30 C0). This experiment was
conducted in Completely Randomized Design (CRD) with four replicates. Growth was assessed by
measuring the colony diameter daily.
Table 01:- Chitosan samples according to the radiation dose (Da) & the molecular weight
Chitosan Treatment Radiation Dose
(Da)
Viscosity Average Molecular
Weight (Da) of Chitosan
THA-01 40 80,000-90,000
THA-02 36 90,000-100,000
THA-03 32 100,000-110,000
THA-04 28 110,000-120,000
THA-05 24 120,000-130,000
THA-06 20 130,000-140,000
THA-07 16 140,000-150,000
THA-08 12 150,000-165,000
THA-09 8 165,000-175,000
THA-10 4 180,000-190,000
THA-11 Un irradiated 230,000-250,000
VIE-01 Un irradiated 75,000-85,000
2.2. Effect of Irradiated Chitosan to manage the Rice blast disease
Paper Proceedings of Agri Animal 2013 - ISSN 2279-3682
294
Variety Bg 94-1 was established in the upland nursery beds in the rice blast screening site at the
Regional Rice Research & Development Center, Bombuwela .These nursery establishment and
management was done according to International Rice Blast Nursery establishment and management by
International Rice Research Institute (IRRI). When the pin point size Blast lesions appeared under natural
conditions 400 ppm concentrationofirradiated Chitosan samples were sprayed. The recommended
fungicide Tebuconazole (Folicur) was also sprayed as a treatment. All treatments were replicated in four
in Completely Randomized Design (CRD). These treated plants were covered with colorless polythene
in the night to increase the humidity in order to enhance the development of the disease symptoms. After
3 weeks of spraying the disease developments were evaluated following the scale for blast nursery of
IRRI Standard Evaluation System (IRRI SES 2002).
Table 02. Scale for blast nursery (IRRI SES 2002)
0 - No lesion observed
1- Small brown specks or pin –point size or larger brown specks without sporulating Center.
2-Small roundish to slightly elongated, necrotic gray spots, about 1-2 mm in diameter, with a distinct
brown margin
3- Lesion type in is the same as in scale 2, but a significant number of lesions are on the upper leaves.
4- Typical susceptibility blast lesions 3 mm or longer, infecting less than 4% of the leaf area
5-Typical blast lesion infecting 4-10% of the leaf area
6-Typical blast lesion infecting 11-25% of the leaf area
7-Typical blast lesion infecting 26-50% of the leaf area
8-Typical blast lesion infecting 51-75% of the leaf area
9-More than 75% leaf area affected
2.3. Effect of irradiated chitosan on radial mycelia growth of Rhizoctonia solani the causal
organism of Rice Sheath blight disease (in vitro).
The fungus R. solani was isolated from sheath blight infected rice plant. Pure cultures were maintained on
Potato Dextrose Agar (PDA) medium at 300 C.Irradiated Chitosan samples were tested in vitro on PDA
medium against R. solani.
Chitosan aqueous solutions at concentrations of 100, 200, 300, 400 and 500 ppm were prepared using
autoclaved distilled water under sterilized condition. One ml of these concentrated solutions were mixed
with 9 ml of PDA medium and poured into Petri dishes. A single sclerotium of R . solani from a 10 day
old culture was transferred to the centre of a 9 cm diameter of chitosan amended Petri dishes and
Paper Proceedings of Agri Animal 2013 - ISSN 2279-3682
295
incubated at room temperature (300C). Growth was assessed by measuring the colony diameter daily until
the growth reached to the edge of the Petridish.The recommended fungicide Hexaconazole (Eraser)
was also tested. Plates incorporated with sterile distilled water served as control. This study was
conducted in completely Randomized Design (CRD) with four replicates.
2.4. Effect of Irradiated Chitosan on the Sheath Blight disease
Three weeks old seedlings of variety; Bg 94-1 were planted in plastic pots. These plants were maintained
under green house conditions . Six weeks after transplanting, plants were artificially inoculated by placing
10 day old 2-3 sclerotia of Rhizoctonia solani in the middle of the hill. The 400 ppm
concentrationofirradiated Chitosan samples were sprayed 24 hrs. after inoculation. The recommended
fungicide Hexaconazole (Eraser) was also sprayed as a treatment. Plants without inoculation were
kept as control. All treatments were replicated in five times and arranged in Complete Randomized
Design (CRD) .The test plants were covered with colorless polythene in the night to increase the
humidity in order to enhance the development of the disease symptoms. The disease developments were
evaluated 3 weeks after inoculation as follows.
% of Relative lesion height = Maximum lesion height x 100
Plant height
2.5. Effect of irradiated chitosan on radial mycelia growth of of Helminthosporium spp,
Curvularia spp and Fusarium spp some of the causal agents of Rice Grain Discoloration
disease (in vitro)
Although several fungi were responsible for grain discoloration disease, common pathogens
Fusarium spp, Curvularia spp and Helminthosporium spp were used in this study. Concentration
series of each Chitosan solutions and PDA amended plates were prepared as same as the
above experiments. 2‹2 mm2
agar blocks of each pure culture of, Fusarium sp, Curvularia sp
and, Helminthosporium sp cultures were inoculated into the centre of the PDA amended Petri
dishes having different concentration of Chitosan solutions under aseptic condition. The
recommended fungicide Tebuconazole (Folicur) was also tested. Four replicates were maintained
in each treatment for each fungus.
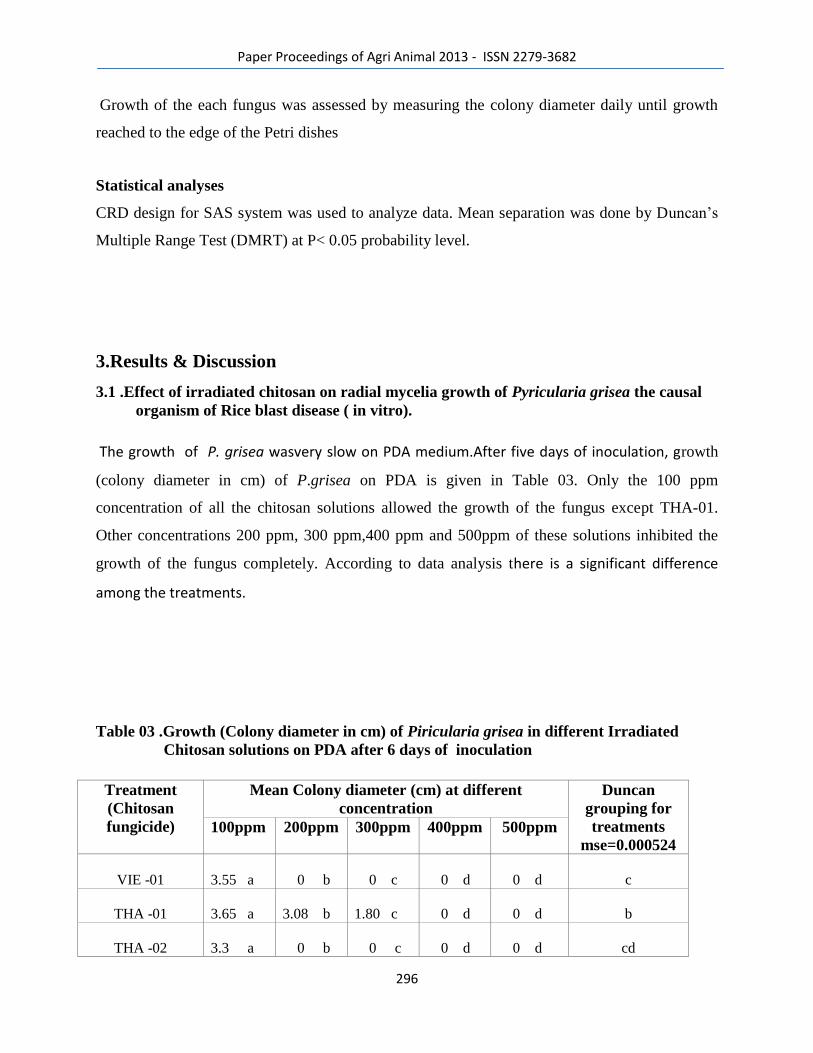
Paper Proceedings of Agri Animal 2013 - ISSN 2279-3682
296
Growth of the each fungus was assessed by measuring the colony diameter daily until growth
reached to the edge of the Petri dishes
Statistical analyses
CRD design for SAS system was used to analyze data. Mean separation was done by Duncan‘s
Multiple Range Test (DMRT) at P< 0.05 probability level.
3.Results & Discussion
3.1 .Effect of irradiated chitosan on radial mycelia growth of Pyricularia grisea the causal
organism of Rice blast disease ( in vitro).
The growth of P. grisea wasvery slow on PDA medium.After five days of inoculation, growth
(colony diameter in cm) of P.grisea on PDA is given in Table 03. Only the 100 ppm
concentration of all the chitosan solutions allowed the growth of the fungus except THA-01.
Other concentrations 200 ppm, 300 ppm,400 ppm and 500ppm of these solutions inhibited the
growth of the fungus completely. According to data analysis there is a significant difference
among the treatments.
Table 03 .Growth (Colony diameter in cm) of Piricularia grisea in different Irradiated
Chitosan solutions on PDA after 6 days of inoculation
Treatment
(Chitosan
fungicide)
Mean Colony diameter (cm) at different
concentration Duncan
grouping for
treatments
mse=0.000524 100ppm 200ppm 300ppm 400ppm 500ppm
VIE -01
3.55 a
0 b
0 c
0 d
0 d
c
THA -01
3.65 a
3.08 b
1.80 c
0 d
0 d
b
THA -02
3.3 a
0 b
0 c
0 d
0 d
cd
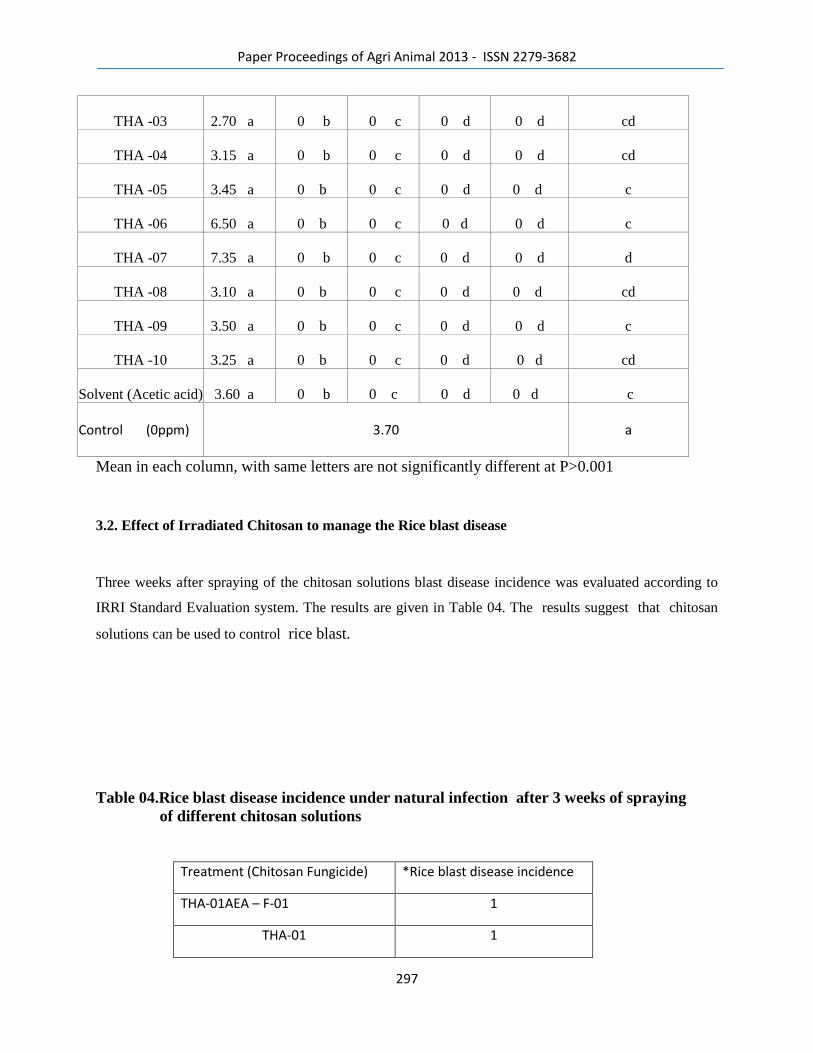
Paper Proceedings of Agri Animal 2013 - ISSN 2279-3682
297
THA -03
2.70 a
0 b
0 c
0 d
0 d
cd
THA -04
3.15 a
0 b
0 c
0 d
0 d
cd
THA -05
3.45 a
0 b
0 c
0 d
0 d
c
THA -06
6.50 a
0 b
0 c
0 d
0 d
c
THA -07
7.35 a
0 b
0 c
0 d
0 d
d
THA -08
3.10 a
0 b
0 c
0 d
0 d
cd
THA -09
3.50 a
0 b
0 c
0 d
0 d
c
THA -10
3.25 a
0 b
0 c
0 d
0 d
cd
Solvent (Acetic acid)
3.60 a
0 b
0 c
0 d
0 d
c Control (0ppm)
3.70
a
Mean in each column, with same letters are not significantly different at P>0.001
3.2. Effect of Irradiated Chitosan to manage the Rice blast disease
Three weeks after spraying of the chitosan solutions blast disease incidence was evaluated according to
IRRI Standard Evaluation system. The results are given in Table 04. The results suggest that chitosan
solutions can be used to control rice blast.
Table 04.Rice blast disease incidence under natural infection after 3 weeks of spraying
of different chitosan solutions
Treatment (Chitosan Fungicide) *Rice blast disease incidence
THA-01AEA – F-01 1
THA-01 1
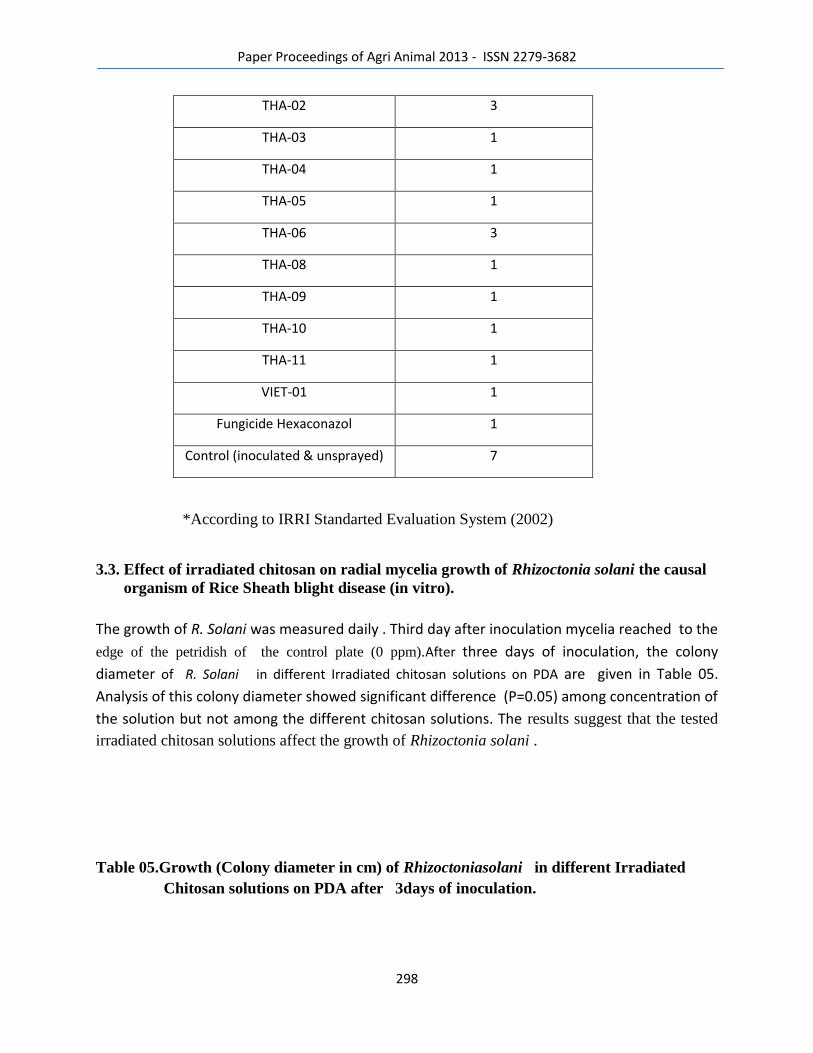
Paper Proceedings of Agri Animal 2013 - ISSN 2279-3682
298
THA-02 3
THA-03 1
THA-04 1
THA-05 1
THA-06 3
THA-08 1
THA-09 1
THA-10 1
THA-11 1
VIET-01 1
Fungicide Hexaconazol 1
Control (inoculated & unsprayed) 7
*According to IRRI Standarted Evaluation System (2002)
3.3. Effect of irradiated chitosan on radial mycelia growth of Rhizoctonia solani the causal
organism of Rice Sheath blight disease (in vitro).
The growth of R. Solani was measured daily . Third day after inoculation mycelia reached to the
edge of the petridish of the control plate (0 ppm).After three days of inoculation, the colony
diameter of R. Solani in different Irradiated chitosan solutions on PDA are given in Table 05.
Analysis of this colony diameter showed significant difference (P=0.05) among concentration of
the solution but not among the different chitosan solutions. The results suggest that the tested
irradiated chitosan solutions affect the growth of Rhizoctonia solani .
Table 05.Growth (Colony diameter in cm) of Rhizoctoniasolani in different Irradiated
Chitosan solutions on PDA after 3days of inoculation.
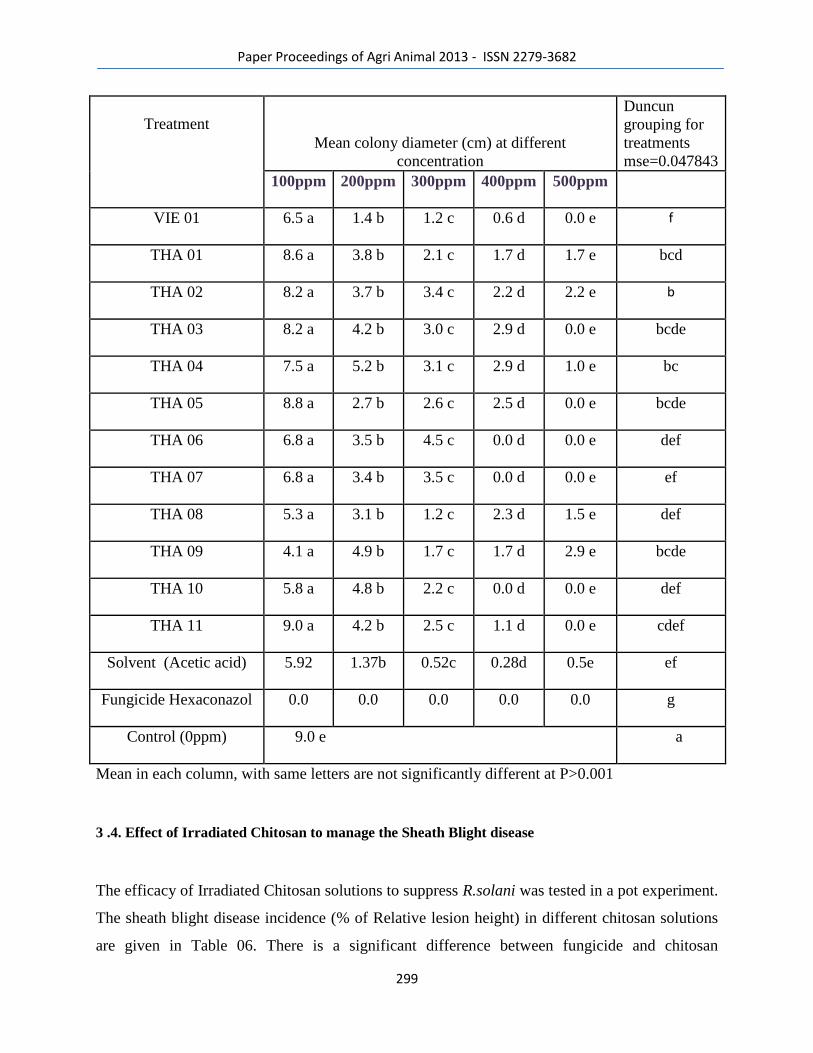
Paper Proceedings of Agri Animal 2013 - ISSN 2279-3682
299
Treatment
Mean colony diameter (cm) at different
concentration
Duncun
grouping for
treatments
mse=0.047843
100ppm 200ppm 300ppm 400ppm 500ppm
VIE 01 6.5 a 1.4 b 1.2 c 0.6 d 0.0 e f
THA 01 8.6 a 3.8 b 2.1 c 1.7 d 1.7 e bcd
THA 02 8.2 a 3.7 b 3.4 c 2.2 d 2.2 e b
THA 03 8.2 a 4.2 b 3.0 c 2.9 d 0.0 e bcde
THA 04 7.5 a 5.2 b 3.1 c 2.9 d 1.0 e bc
THA 05 8.8 a 2.7 b 2.6 c 2.5 d 0.0 e bcde
THA 06 6.8 a 3.5 b 4.5 c 0.0 d 0.0 e def
THA 07 6.8 a 3.4 b 3.5 c 0.0 d 0.0 e ef
THA 08 5.3 a 3.1 b 1.2 c 2.3 d 1.5 e def
THA 09 4.1 a 4.9 b 1.7 c 1.7 d 2.9 e bcde
THA 10 5.8 a 4.8 b 2.2 c 0.0 d 0.0 e def
THA 11 9.0 a 4.2 b 2.5 c 1.1 d 0.0 e cdef
Solvent (Acetic acid) 5.92 1.37b 0.52c 0.28d 0.5e ef
Fungicide Hexaconazol 0.0 0.0 0.0 0.0 0.0 g
Control (0ppm) 9.0 e a
Mean in each column, with same letters are not significantly different at P>0.001
3 .4. Effect of Irradiated Chitosan to manage the Sheath Blight disease
The efficacy of Irradiated Chitosan solutions to suppress R.solani was tested in a pot experiment.
The sheath blight disease incidence (% of Relative lesion height) in different chitosan solutions
are given in Table 06. There is a significant difference between fungicide and chitosan
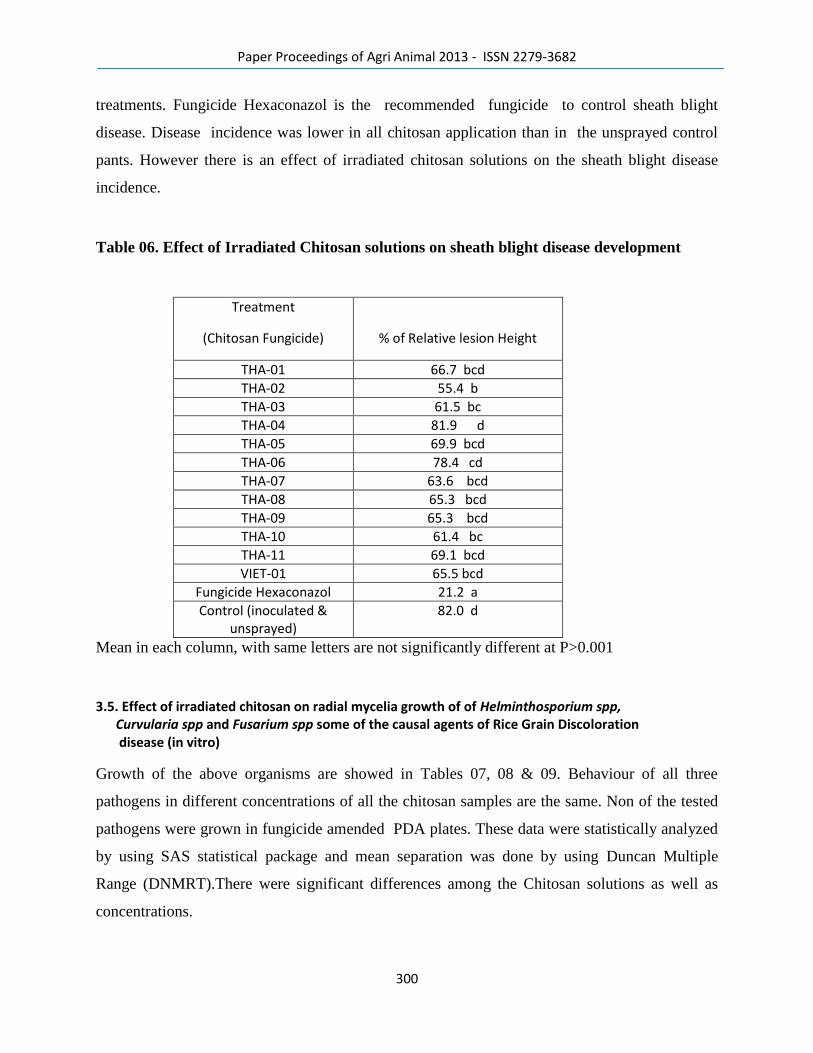
Paper Proceedings of Agri Animal 2013 - ISSN 2279-3682
300
treatments. Fungicide Hexaconazol is the recommended fungicide to control sheath blight
disease. Disease incidence was lower in all chitosan application than in the unsprayed control
pants. However there is an effect of irradiated chitosan solutions on the sheath blight disease
incidence.
Table 06. Effect of Irradiated Chitosan solutions on sheath blight disease development
Treatment
(Chitosan Fungicide)
% of Relative lesion Height
THA-01 66.7 bcd
THA-02 55.4 b
THA-03 61.5 bc
THA-04 81.9 d
THA-05 69.9 bcd
THA-06 78.4 cd
THA-07 63.6 bcd
THA-08 65.3 bcd
THA-09 65.3 bcd
THA-10 61.4 bc
THA-11 69.1 bcd
VIET-01 65.5 bcd
Fungicide Hexaconazol 21.2 a
Control (inoculated & unsprayed)
82.0 d
Mean in each column, with same letters are not significantly different at P>0.001
3.5. Effect of irradiated chitosan on radial mycelia growth of of Helminthosporium spp, Curvularia spp and Fusarium spp some of the causal agents of Rice Grain Discoloration disease (in vitro)
Growth of the above organisms are showed in Tables 07, 08 & 09. Behaviour of all three
pathogens in different concentrations of all the chitosan samples are the same. Non of the tested
pathogens were grown in fungicide amended PDA plates. These data were statistically analyzed
by using SAS statistical package and mean separation was done by using Duncan Multiple
Range (DNMRT).There were significant differences among the Chitosan solutions as well as
concentrations.
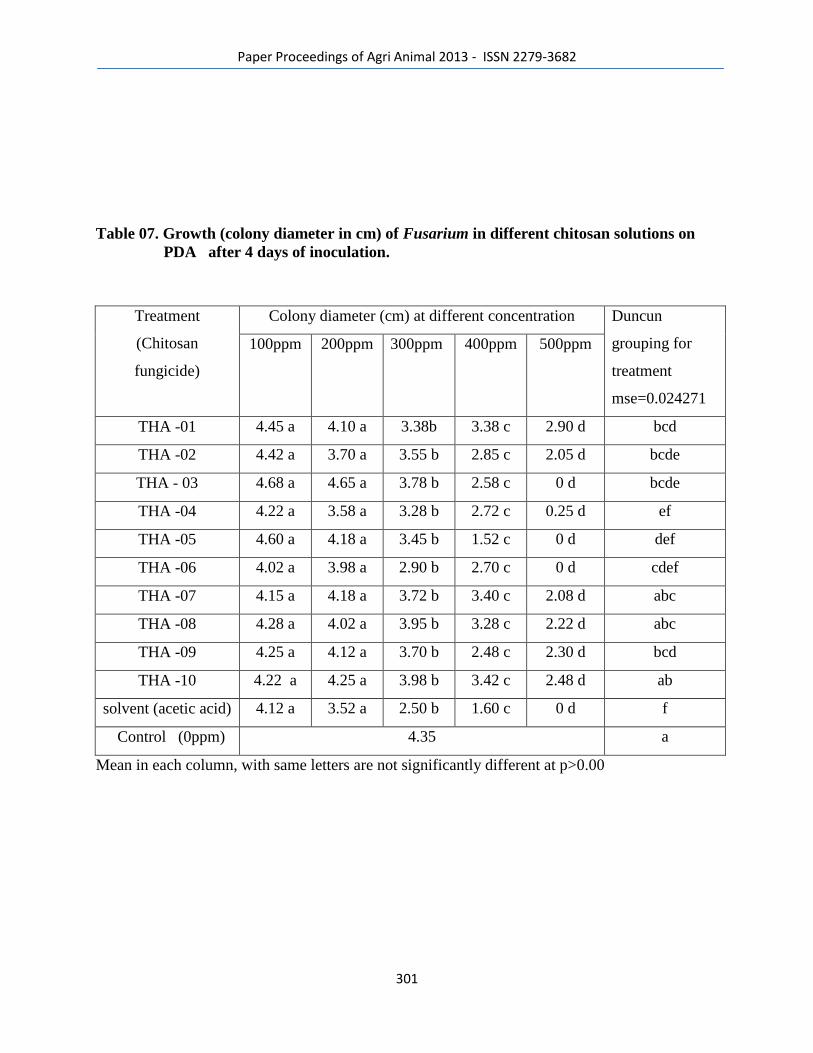
Paper Proceedings of Agri Animal 2013 - ISSN 2279-3682
301
Table 07. Growth (colony diameter in cm) of Fusarium in different chitosan solutions on
PDA after 4 days of inoculation.
Treatment
(Chitosan
fungicide)
Colony diameter (cm) at different concentration Duncun
grouping for
treatment
mse=0.024271
100ppm 200ppm 300ppm 400ppm 500ppm
THA -01 4.45 a 4.10 a 3.38b 3.38 c 2.90 d bcd
THA -02 4.42 a 3.70 a 3.55 b 2.85 c 2.05 d bcde
THA - 03 4.68 a 4.65 a 3.78 b 2.58 c 0 d bcde
THA -04 4.22 a 3.58 a 3.28 b 2.72 c 0.25 d ef
THA -05 4.60 a 4.18 a 3.45 b 1.52 c 0 d def
THA -06 4.02 a 3.98 a 2.90 b 2.70 c 0 d cdef
THA -07 4.15 a 4.18 a 3.72 b 3.40 c 2.08 d abc
THA -08 4.28 a 4.02 a 3.95 b 3.28 c 2.22 d abc
THA -09 4.25 a 4.12 a 3.70 b 2.48 c 2.30 d bcd
THA -10 4.22 a 4.25 a 3.98 b 3.42 c 2.48 d ab
solvent (acetic acid) 4.12 a 3.52 a 2.50 b 1.60 c 0 d f
Control (0ppm) 4.35 a
Mean in each column, with same letters are not significantly different at p>0.00
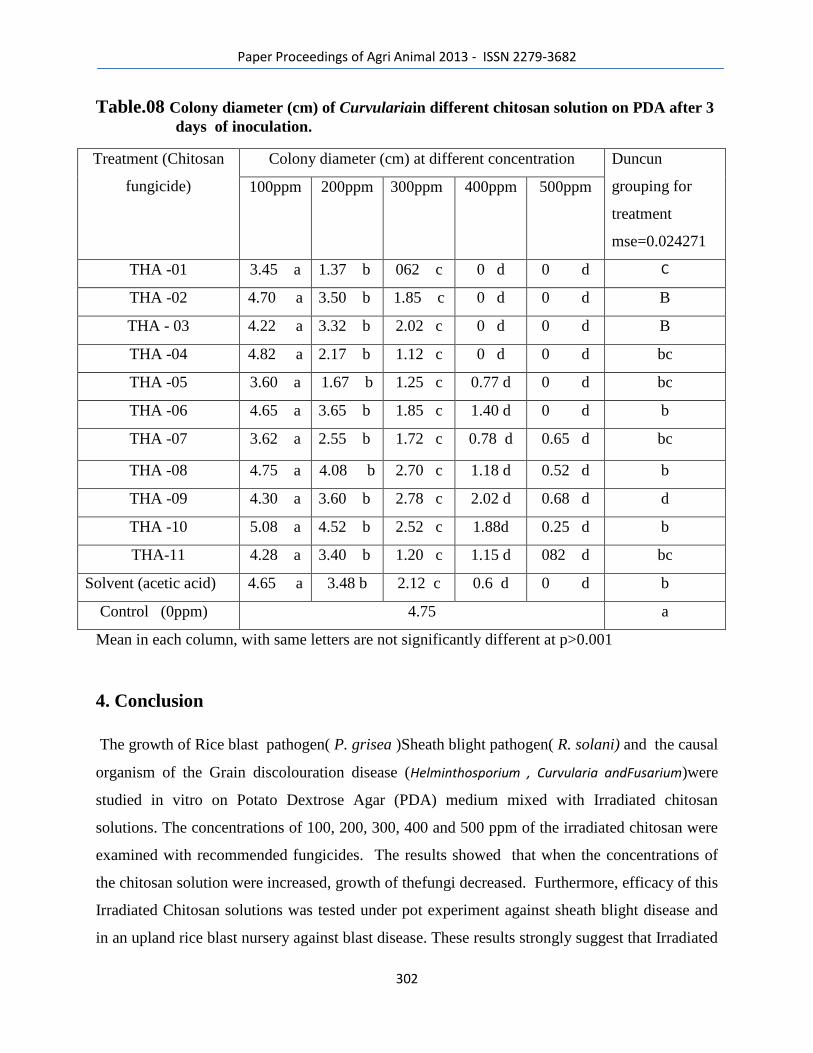
Paper Proceedings of Agri Animal 2013 - ISSN 2279-3682
302
Table.08 Colony diameter (cm) of Curvulariain different chitosan solution on PDA after 3
days of inoculation.
Treatment (Chitosan
fungicide)
Colony diameter (cm) at different concentration Duncun
grouping for
treatment
mse=0.024271
100ppm 200ppm 300ppm 400ppm 500ppm
THA -01 3.45 a 1.37 b 062 c 0 d 0 d C
THA -02 4.70 a 3.50 b 1.85 c 0 d 0 d B
THA - 03 4.22 a 3.32 b 2.02 c 0 d 0 d B
THA -04 4.82 a 2.17 b 1.12 c 0 d 0 d bc
THA -05 3.60 a 1.67 b 1.25 c 0.77 d 0 d bc
THA -06 4.65 a 3.65 b 1.85 c 1.40 d 0 d b
THA -07 3.62 a 2.55 b 1.72 c 0.78 d 0.65 d bc
THA -08 4.75 a 4.08 b 2.70 c 1.18 d 0.52 d b
THA -09 4.30 a 3.60 b 2.78 c 2.02 d 0.68 d d
THA -10 5.08 a 4.52 b 2.52 c 1.88d 0.25 d b
THA-11 4.28 a 3.40 b 1.20 c 1.15 d 082 d bc
Solvent (acetic acid) 4.65 a 3.48 b 2.12 c 0.6 d 0 d b
Control (0ppm) 4.75 a
Mean in each column, with same letters are not significantly different at p>0.001
4. Conclusion
The growth of Rice blast pathogen( P. grisea )Sheath blight pathogen( R. solani) and the causal
organism of the Grain discolouration disease (Helminthosporium , Curvularia andFusarium)were
studied in vitro on Potato Dextrose Agar (PDA) medium mixed with Irradiated chitosan
solutions. The concentrations of 100, 200, 300, 400 and 500 ppm of the irradiated chitosan were
examined with recommended fungicides. The results showed that when the concentrations of
the chitosan solution were increased, growth of thefungi decreased. Furthermore, efficacy of this
Irradiated Chitosan solutions was tested under pot experiment against sheath blight disease and
in an upland rice blast nursery against blast disease. These results strongly suggest that Irradiated
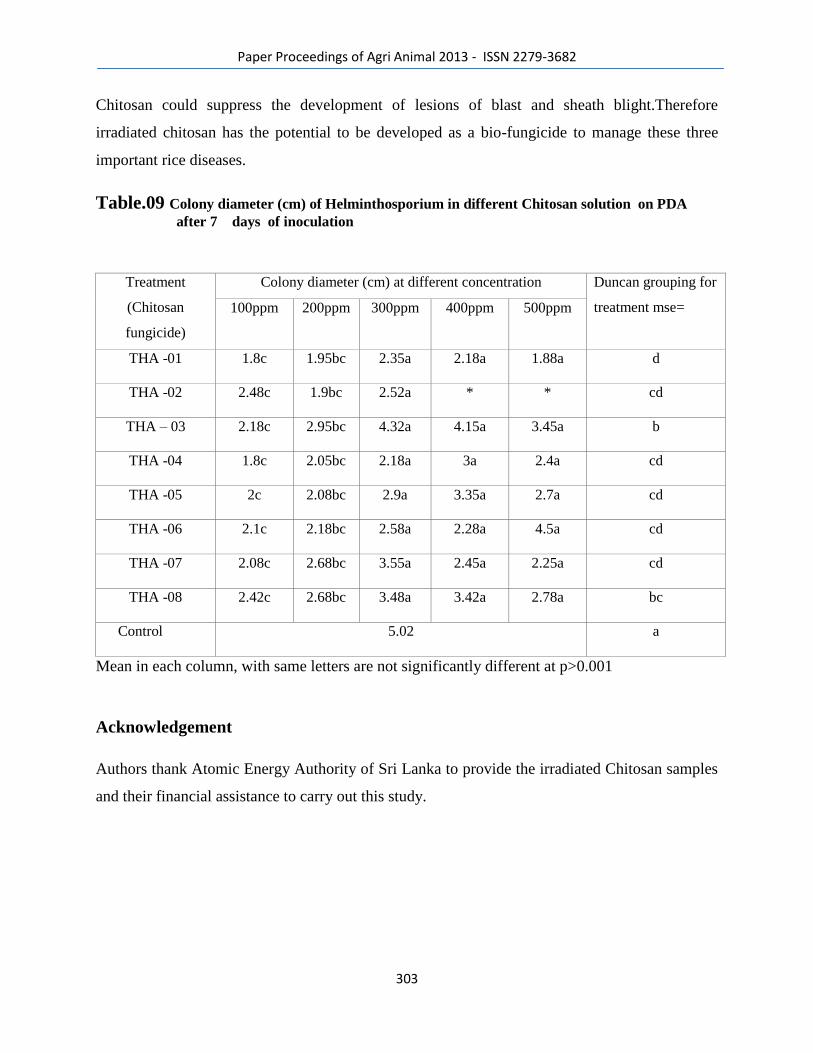
Paper Proceedings of Agri Animal 2013 - ISSN 2279-3682
303
Chitosan could suppress the development of lesions of blast and sheath blight.Therefore
irradiated chitosan has the potential to be developed as a bio-fungicide to manage these three
important rice diseases.
Table.09 Colony diameter (cm) of Helminthosporium in different Chitosan solution on PDA
after 7 days of inoculation
Treatment
(Chitosan
fungicide)
Colony diameter (cm) at different concentration Duncan grouping for
treatment mse= 100ppm 200ppm 300ppm 400ppm 500ppm
THA -01 1.8c 1.95bc 2.35a 2.18a 1.88a d
THA -02 2.48c 1.9bc 2.52a * * cd
THA – 03 2.18c 2.95bc 4.32a 4.15a 3.45a b
THA -04 1.8c 2.05bc 2.18a 3a 2.4a cd
THA -05 2c 2.08bc 2.9a 3.35a 2.7a cd
THA -06 2.1c 2.18bc 2.58a 2.28a 4.5a cd
THA -07 2.08c 2.68bc 3.55a 2.45a 2.25a cd
THA -08 2.42c 2.68bc 3.48a 3.42a 2.78a bc
Control 5.02 a
Mean in each column, with same letters are not significantly different at p>0.001
Acknowledgement
Authors thank Atomic Energy Authority of Sri Lanka to provide the irradiated Chitosan samples
and their financial assistance to carry out this study.
Paper Proceedings of Agri Animal 2013 - ISSN 2279-3682
304
References
Jayawardana, S.D.G. , Peris,R. and Dissanayake, S.C.J. 1987. A total concept in rice research and
development through gene base and varietal spread pattern analysis. Proc. rice Research Workshop,
Central Rice Breeding Station, Batalagoda, Sri Lanka.63-88
Kumara, K.L.W. and Kusumalatha, L. G.2008. Survey on pests and diseases of rice and their
management in Matara district, Proc. of the National symposium 2008, Faculty of Agriculture, University
of Ruhuna, 23rd
and 24th October ,2008, Mapalana, Sri Lanka, 37p.
Mithrasena, Y.J.P.K., Adikari W.P. and Wickramasingha D.L. 1989. Studies on Sheath Blight of Rice
in the low country wet zone. Tropical Agriculturist , vol.145, 75-87
Ou, S.H. 1985. Rice Diseases. Second Edition. Common wealth Mycological Institute,Kew,Surrey,
UK.380p
Rodriguez,A..T., Ramirea, M.A., Cardenas, R.M., Hernandez, A.N., Velazquez , M.G. and Bautista, S.
2007. Induction of defense response of Oryza sativa L. against Pyricularia grisea(Cooke) Sacc. By
treating seeds with chitosan and hydrolyzed chitosan. Science Direct 89., 206-215

Paper Proceedings of Agri Animal 2013 - ISSN 2279-3682
305
19
Paper Proceedings of Agri Animal 2013 - ISSN 2279-3682
306
Standardization of System of Rice Intensification Method of Cultivation in rice
(Oryza sativa L.) for Improvement of Productivity
K. Kanaka Durga1, M. Sudha Rani
2, Sandeep Varma V
3 and A. Vishnuvardha Reddy
4
1. Senior Scientist (Plant Breeding), Seed Research and Technology Centre,
Rajendranagar, Hyderabad-30.
2. Scientist (Plant Breeding), Seed Research and Technology Centre, Rajendranagar,
Hyderabad-30.
3. Student, M.Sc (Ag), Department of Seed Science and Technology, College of
Agriculture, Rajendranagar, Hyderabad- 30.
4. Director (Seeds), Seed Research and Technology Centre, Rajendranagar, Hyderabad-30
E-mail:[email protected]
Studies on potentiality of SRI method for rice seed production were conducted at Seed
Research and Technology Centre, Hyderabad during Rabi, 2011-12 to standardize the SRI
method of cultivation. Significant differences were noticed among the two management practices
and 14 % improvement in yield was noticed with SRI (60.42 q ha-1
) over conventional method
(53.01 q ha-1
). Similarly, 64.29 % improvement in productive tillers and 12 % improvement in
spikelet fertility were noticed with SRI. Among the varieties, MTU 1010 had great potential
(76.99 q ha-1
) for seed production under SRI and also recorded good seedling vigour index
(1742). The plants in SRI method has better partitioning of dry matter which lead to increase in
the filled spikelets (80.3) per panicle and increasing the spikelet fertility (94%). Though, non
significant differences were noticed between the two management practices for germination and
total seedling length, seeds produced under SRI showed significantly higher seedling vigour
index I (1450) than the conventional method (1359). Therefore, use of 10-12 days old seedlings,
3 weedings with cono weeder at 45, 60 and 75 DAS and maintaining saturated conditions of
water during the entire crop growth period was found to be effective over the conventional
method.
Key words: SRI, Seed Yield and Seed quality
INTRODUCTION
India is the second most popular nation and largest producer of rice next to China in the world.
Increased and sustained production of rice is essential for food security in India. To achieve this,
two important strategies are development of location specific cultivars and improved crop
management practices. Production potential of rice in terms of genetic potential of irradiated rice
Paper Proceedings of Agri Animal 2013 - ISSN 2279-3682
307
is almost plateaued. But phenotypic expression of a plant varies with different G x E interactions.
So there is an ample scope for increasing the production of rice by altering the environmental
conditions which ultimately modifies microclimate. Under low input conditions except man days
requirement, this change might trigger root growth and shoot growth with simultaneous
increment in yield component in so called System of Rice Intensification (SRI).
System of Rice Intensification (SRI) developed in Madagascar in the 1980s, has spread in
the three years to more than 15 other countries in Asia, Africa, and Latin America. Generally 25-
30 days old single seedlings are transplanted in rice seed production by maintaining the spacing
of 20 x 20 cm or 15 x 15 cm with a thin film of water during the entire period of crop growth.
The annual average rainfall in many areas has declined by 10 – 15 % for the last 10 years leading
to the depletion in natural water resources. Most of the farmers / seed growers are raising the rice
seed production under tanks / bore wells / open wells system of irrigation where water has
become a limiting factor. Hence, an alternative system of rice cultivation is experimented to
produce quality breeder seed using the limited water resources.
MATERIALS AND METHODS
Present investigation on ―Standardization of System of Rice Intensification Method of
Cultivation in rice (Oryza sativa L.) for Improvement of Productivity‖ was laid out at Seed
Research and Technology Centre, Rajendranagar, Hyderabad during late kharif, 2011–12. The
experiment was laid out in a split plot design with methods of cultivation (SRI and conventional
methods) as main treatments and seven promising cultivars of rice varieties (MTU 1001, MTU
1010, MTU 7029, BPT 5204, RNR M7, JGL 1798 and RP Bio 226) as sub treatments. The
experiment was replicated thrice and all the recommended agronomic practices were followed
and plant protection measures were taken as per the recommended schedule. Five plants were
Paper Proceedings of Agri Animal 2013 - ISSN 2279-3682
308
selected randomly from each treatment replication wise and the data were assessed for growth
parameters like plant height, no. of tillers per m2, no. of effective tillers per m
2, dry matter
production at flowering and harvest stage, days to 50% flowering and yield attributes such as
panicle length, number of grains per panicle, number of filled grains per panicle, high density
grains per panicle and grain and straw yield (q ha-1
). Average values were computed and the
analysis is done as per the procedure suggested by Panse and Sukhatme (1985).
RESULTS AND DISCUSSION
Significant differences were noticed among the treatments for all the characters under study.
Seed yield is a complex product of a number of attributing traits. By observing the data, it is
clear that SRI method (60.42 q ha-1
) resulted in 14% yield increase over the conventional
method (53.01 q ha-1
) and is significantly different (Table 1). In present study, tall plants (74.04
cm) are produced with SRI method of cultivation where as short plants (67.01 cm) were
produced by conventional planting method. JGL 1798 produced tallest plant (89.0 cm) with SRI
planting where as RP Bio 226 produced shortest plant both with conventional (57.4 cm) and SRI
(67.1 cm) methods of planting. The number of tillers per hill (18.90) was significantly higher in
SRI method of cultivation over conventional method (11.51) and resulted in 64.29% increase
over the conventional method. Planting in square method with wider spacing of 25 x 25 cm
might have resulted in profuse tillering under SRI cultivation, which might have facilitated plants
for better utilization of the resources. Spacing hills farther apart, in a square pattern and with
single seedlings per hill having only about 12–20 plants per square meter minimizes plant
competition below and above ground, thereby encouraging greater root and canopy growth and
distribution. Plant canopies have more uniform access to solar radiation while soil nutrients can
be captured from a larger soil-root zone. At the same time, the photosynthetic process is
Paper Proceedings of Agri Animal 2013 - ISSN 2279-3682
309
prolonged and there is greater translocation to the panicles of the carbohydrates and nutrients
stored in the rest of the plant. This advantage of SRI method in enhancing tiller numbers has
been reported earlier by Udaykumar (2005).
In SRI method of planting, the increase in the productive tillers was 64.29 % than the
conventional method. Among the varieties, RNR M7 produced more number of productive tillers
per hill (22.1) while JGL 1798 (162) and BPT 5204 (16.4) produced less number of productive
tillers in SRI method of planting where as BPT 5204 produced very less number of productive
tillers per hill (9.1) in conventional method of planting and is significantly different from the
other varieties. The increase in the productive tillers per plant might be due to the better spacing
provided to the plants by planting in square method. This might have facilitated better utilization
of resources by the plants converting majority of the tillers into productive tillers (Gani et al,
2002; Sarath and Tilak, 2004). SRI method has recorded significantly higher seed yield (60.42 q
ha-1
) as compared to the traditional method (53.01 q ha-1
). The percent increase in seed yield ha-1
under SRI method was 14 % over conventional method. Similar results recorded by Krupakar
Reddy (2004), Uday Kumar (2005) and Krishna et al., (2008). SRI methods were found to raise
paddy yields in the coastal delta region by 1.2 t ha-1
, while in the interior Rayalseema region, the
added yield achieved with SRI management averaged to 4.7 t ha-1
(Satyanarayana et al. 2007).
SRI farmers in Vietnam were growing mulched no-till potatoes in rotation with SRI rice with
good results: 8–20% yield with 40–70% less labor and 31% higher income per hectare (Dung,
2010). SRI methods produced 0.68 g of paddy per kilogram of water, while conventional
practice produced 0.36 g (Thakur et al. 2011). Such comparisons show that very substantial
increases in the productivity of water are possible. Highest seed yield was observed in MTU
1010 (76.99 q ha-1) with SRI method of planting. SRI method provides better aeration, more
Paper Proceedings of Agri Animal 2013 - ISSN 2279-3682
310
spacing and less competition, which enable the plants grow vigorously. The plants in SRI
method had better partitioning of dry matter, which lead to increase in the number of high
density spikelets (80.3) per panicle and increasing the spikelet fertility percent (94), which is
observed in the same cultivar i.e MTU 1010.
Seed quality characters like germination and seedling vigour also play an important role
in adjudging the quality of seed. Seed germination did not vary significantly due to methods of
cultivation (Table 2). Seeds produced under SRI method showed significantly higher
germination percentage (100). It is very interesting to note that all the cultivars in SRI method
showed 100 % germination. Seeds that are produced under SRI method showed significantly
higher seedling vigour index I (1450) than the conventional method (1359) and is significantly
different. With respect to individual cultivars, MTU 1010 showed higher shoot length (5.7 cm),
total seedling length (17.6 cm) and seedling vigour index I (1742) when planted in conventional
method.
CONCLUSION
Among the two management practices 14 % improvement in yield was noticed with SRI
(60.42 q ha-1
) over conventional method (53.01 q ha-1
). Similarly, 64.29 % improvement in
productive tillers and 12 % improvement in spikelet fertility were noticed with SRI. Among the
varieties, MTU 1010 had great potential for seed production under SRI followed by MTU 1001
and MTU 7029 and were found superior w.r.t yield under both Conventional and SRI method of
raising seed. Seed obtained by SRI method has recorded good germination (100%) and seedling
vigour index I (1450) as compared to the control (98% and 1359, respectively).
Paper Proceedings of Agri Animal 2013 - ISSN 2279-3682
311
REFERENCES
Dung, N.T. 2010. SRI application in Vietnam. Presentation to SRI Day, Hanoi, Nov 8.
http://www.slideshare.net/SRI.CORNELL/ sri-application-in-vietnam.
Gani, A., Rahman, A., Dahono Rustam and Hengsdijk, H. 2002. Water management experiments
in Indonesia. In: Int. symp. Water Wise Rice Production., IARI, New Delhi, Nov, 2-3, pp.
29-37.
Krishna, A., Biradir Patil, N. K. and Channappagoudar, B. B. 2008. Influence of System of rice
intensification (SRI) cultivation on seed yield and quality. Karnataka Journal of
Agricultural Sciences., 21(3):369-372.
Krupakar Reddy, G. 2004. Varietal performance and spatial requirement of rice under system of
rice intensification during kharif season. M.Sc (Ag) thesis, ANGRAU. Hyd.
Panse, V.G and Sukhatme, P. T. 1985. Statistical Methods for Agricultural Workers, EDS Indian
Council of Agricultural Resaearch, New Delhi. pp. 145
Sarath, P. N and Tilak, B. 2004. Comparison of productivity of system of rice intensification and
conventional rice farming systems in dry zones of Srilanka. 4th
international Crop Science
Congress, http://www.regional.org.au/au/cs
Satyanarayana, A., Thiyagarajan, T.M. and Uphoff, N. 2007. Opportunities for water saving with
higher yield from the system of rice intensification. Irrigation Science., 25:99–115.
Thakur, A.K., Rath, S., Patil, D.U. and Kumar, A. 2011. Effects on rice plant morphology and
physiology of water and associated management practices of the System of Rice
Paper Proceedings of Agri Animal 2013 - ISSN 2279-3682
312
Intensification and their implications for crop performance. Paddy Water
Environment.,9(1). doi:10.1007/s10333-010-0236-0.
Uday Kumar. 2005. Studies on system of rice intensification (SRI) for seed yield and seed
quality. M. Sc thesis, ANGRAU, HYD.
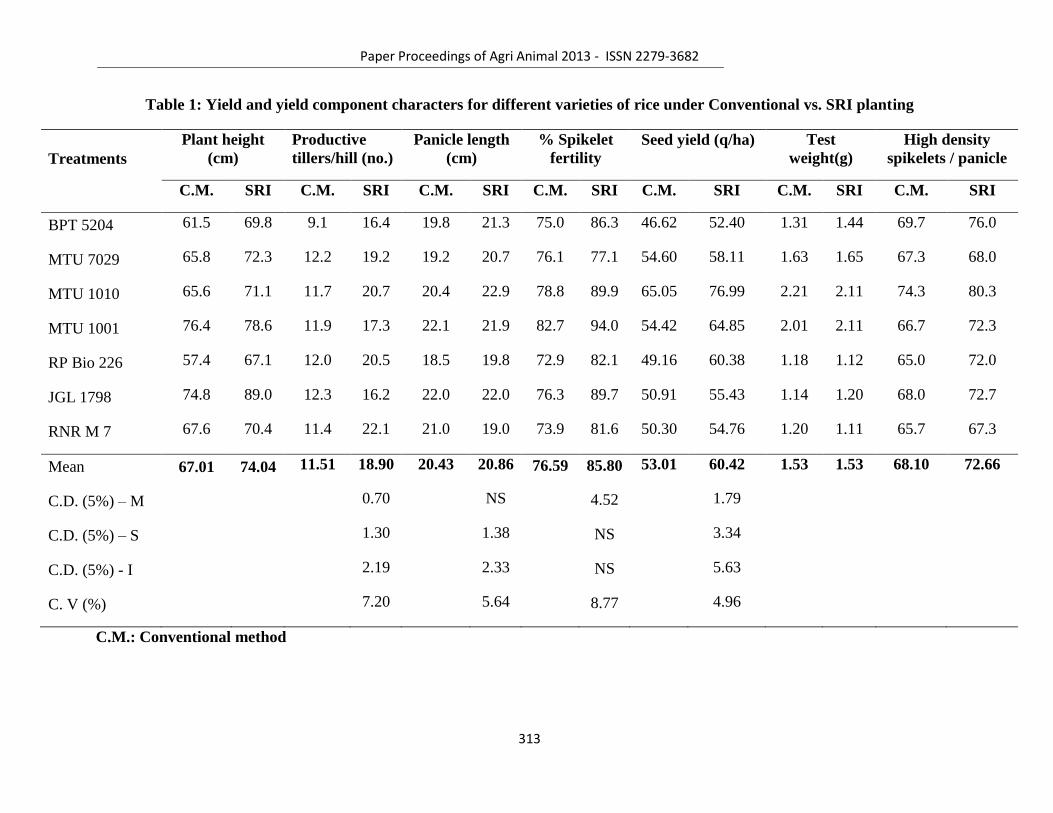
Paper Proceedings of Agri Animal 2013 - ISSN 2279-3682
313
Table 1: Yield and yield component characters for different varieties of rice under Conventional vs. SRI planting
Treatments
Plant height
(cm)
Productive
tillers/hill (no.)
Panicle length
(cm)
% Spikelet
fertility
Seed yield (q/ha) Test
weight(g)
High density
spikelets / panicle
C.M. SRI C.M. SRI C.M. SRI C.M. SRI C.M. SRI C.M. SRI C.M. SRI
BPT 5204 61.5 69.8 9.1 16.4 19.8 21.3 75.0 86.3 46.62 52.40 1.31 1.44 69.7 76.0
MTU 7029 65.8 72.3 12.2 19.2 19.2 20.7 76.1 77.1 54.60 58.11 1.63 1.65 67.3 68.0
MTU 1010 65.6 71.1 11.7 20.7 20.4 22.9 78.8 89.9 65.05 76.99 2.21 2.11 74.3 80.3
MTU 1001 76.4 78.6 11.9 17.3 22.1 21.9 82.7 94.0 54.42 64.85 2.01 2.11 66.7 72.3
RP Bio 226 57.4 67.1 12.0 20.5 18.5 19.8 72.9 82.1 49.16 60.38 1.18 1.12 65.0 72.0
JGL 1798 74.8 89.0 12.3 16.2 22.0 22.0 76.3 89.7 50.91 55.43 1.14 1.20 68.0 72.7
RNR M 7 67.6 70.4 11.4 22.1 21.0 19.0 73.9 81.6 50.30 54.76 1.20 1.11 65.7 67.3
Mean 67.01 74.04 11.51 18.90 20.43 20.86 76.59 85.80 53.01 60.42 1.53 1.53 68.10 72.66
C.D. (5%) – M 0.70 NS 4.52 1.79
C.D. (5%) – S 1.30 1.38 NS 3.34
C.D. (5%) - I 2.19 2.33 NS 5.63
C. V (%) 7.20 5.64 8.77 4.96
C.M.: Conventional method
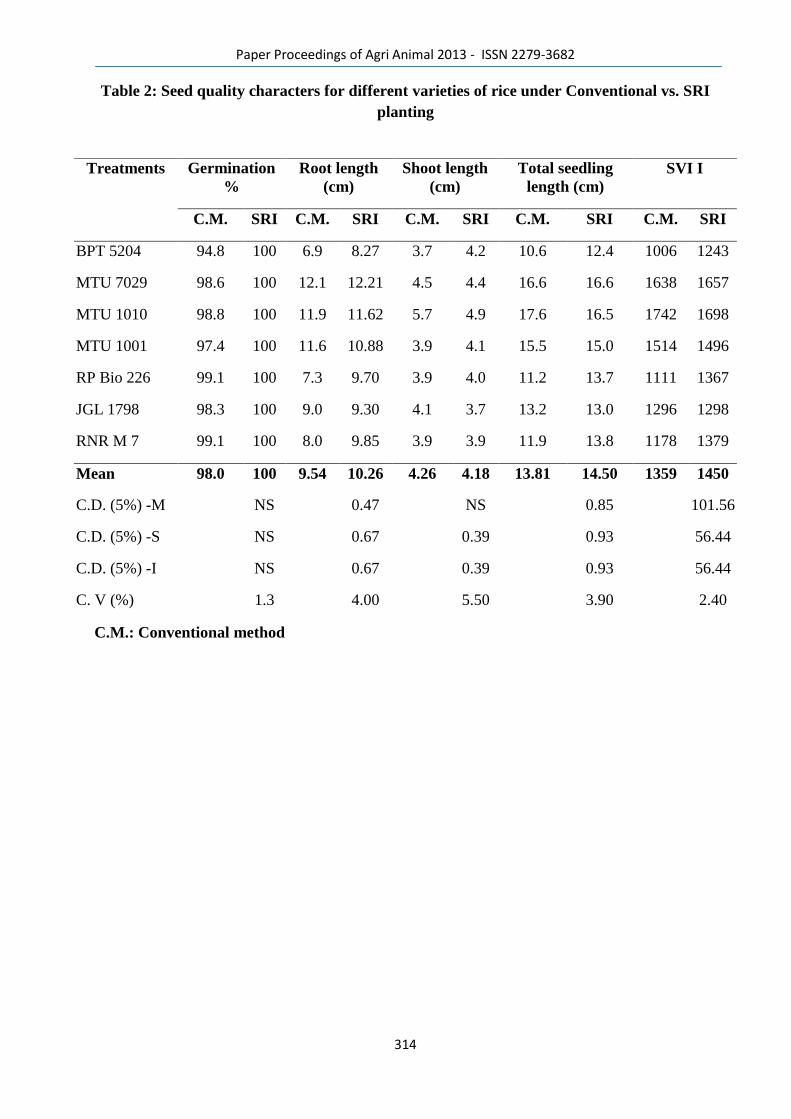
Paper Proceedings of Agri Animal 2013 - ISSN 2279-3682
314
Table 2: Seed quality characters for different varieties of rice under Conventional vs. SRI
planting
C.M.: Conventional method
Treatments Germination
%
Root length
(cm)
Shoot length
(cm)
Total seedling
length (cm)
SVI I
C.M. SRI C.M. SRI C.M. SRI C.M. SRI C.M. SRI
BPT 5204 94.8 100 6.9 8.27 3.7 4.2 10.6 12.4 1006 1243
MTU 7029 98.6 100 12.1 12.21 4.5 4.4 16.6 16.6 1638 1657
MTU 1010 98.8 100 11.9 11.62 5.7 4.9 17.6 16.5 1742 1698
MTU 1001 97.4 100 11.6 10.88 3.9 4.1 15.5 15.0 1514 1496
RP Bio 226 99.1 100 7.3 9.70 3.9 4.0 11.2 13.7 1111 1367
JGL 1798 98.3 100 9.0 9.30 4.1 3.7 13.2 13.0 1296 1298
RNR M 7 99.1 100 8.0 9.85 3.9 3.9 11.9 13.8 1178 1379
Mean 98.0 100 9.54 10.26 4.26 4.18 13.81 14.50 1359 1450
C.D. (5%) -M NS 0.47 NS 0.85 101.56
C.D. (5%) -S NS 0.67 0.39 0.93 56.44
C.D. (5%) -I NS 0.67 0.39 0.93 56.44
C. V (%) 1.3 4.00 5.50 3.90 2.40

Paper Proceedings of Agri Animal 2013 - ISSN 2279-3682
315
20
Paper Proceedings of Agri Animal 2013 - ISSN 2279-3682
316
Irrigation and Planting Methods for Enhancing Water Use
Efficiency
KRISHNA G. MANDAL3, DILIP K. KUNDU2, AMOD K. THAKUR1,
POTHULA S. BRAHMANAND1 and ASHWANI KUMAR1
1Directorate of Water Management (ICAR), Bhubaneswar- 751 023, Odisha, India 2Division of Crop Production,CRIJAF (ICAR), Barrackpore-700 120, West Bengal, India
ABSTRACT Enhancing water use efficiency (WUE) of crops, and rice production in aerobic conditions, especially in the era of increasing water scarcity, holds promise in Asia. Results from 3-year field experiments revealed that efficient planting technique saved irrigation water and increased WUE of groundnut and potato. The pod yield of groundnut in ridge-and-furrow and paired-row planting were significantly greater (13-20%) than the flat bed due to better soil moisture extraction and interception of photosynthetically active radiation. The extent of water saving was 27 and 41% in ridge-and-furrow and paired-row method of planting, respectively compared to the flat method. Paired-row method of planting in potato saved irrigation water (21-32%) significantly compared to normal planting without reducing tuber yield. By drip irrigation method, water saving was 29, 13 and 30% in maize, sunflower and tomato, respectively compared to furrow irrigation. The rice varieties viz. ‘Surendra’ and ‘Lalat’ were found suitable for growing under aerobic condition with yield potential of 3.9-4.6 t ha-1. Water input as a pre-sowing irrigation was 54-62 mm only for aerobic rice as compared to 362-401 mm for traditional flooded rice. In total, water saving potential of aerobic rice was estimated as 42-60% when compared to traditional flooded rice. KEYWORDS Irrigation, water use efficiency, planting methods, groundnut, potato, aerobic rice
INTRODUCTION Water is a precious asset and there are several concerns regarding water resources in the country.
Agriculture is the largest user of fresh water; this irrigation water is under severe competition with
industry, energy, domestic and other sectors. Per capita availability of fresh water is also decreasing
and is projected to go below the scarcity level in future. Hence, it is a challenge before us to irrigate
crop with less amount of water; enhancing crop water use efficiency is the need of the hour. To
meet this challenge, efficient planting techniques, micro-irrigation and aerobic method of rice
cultivation are potential options for saving of irrigation water, especially for post-rainy season crops.
The primary focus of this paper is presenting the research findings of irrigation water saving
experiments for post-rainy season crops under rice-based cropping systems; and to highlight the
potential technologies for crop production and saving of irrigation water.
The previous research work on different planting techniques for saving of irrigation and
enhancing WUE is reflected on paired row planting of cotton (Aujla et al. 2005); ridge and bed
planting for oilseed rape (Brassica napus L.) (Buttar et al., 2006), broad-bed and furrow method of
Address correspondence to Krishna G. Mandal, Directorate of Water Management (ICAR), Bhubaneswar-
751 023, India. Fax: +91-674-2301651, Email: [email protected]
Paper Proceedings of Agri Animal 2013 - ISSN 2279-3682
317
sowing in vertisols (Mandal et al. 2013). Since soil moisture plays a crucial role in plant growth,
mineral nutrition and microbial activity in soil, its availability has to be increased in the soil profile.
Ramesh and Devasenapathy (2007) showed that moisture conservation through tied ridging along
with mulching recorded significantly higher soil moisture at all critical stages of pigeonpea.
Integrated plant nutrient supply to crops increases water-use efficiency by increasing the evapo-
transpiration (ET), particularly the transpiration (T) component of ET and transpiration efficiency
of the crop. The field experiments on wheat showed that, judicious application of limited irrigation
water and enhancing water use efficiency (WUE) through integrated nutrient management could
boost the productivity of wheat and enhance WUE of the crop (Mandal et al. 2005, 2006). For
Indian mustard in central Indian vertisols, it was found that the scope of improving WUE and yield
exists in the integrated management of organic manure and inorganic fertilizer (Mandal et al. 2010).
There was no reporting on irrigation water saving techniques through planting technique for eastern
Indian condition.
Water requirement for rice production by flooded-transplanted method of cultivation, starting
from puddling operation to maintenance of standing water during crop growth period in the field is
2-3 folds higher than any other crop which are grown with aerobic soil environment. As irrigated
rice is the major consumer of fresh water, rice producers need to produce more rice with less water.
Further, traditional wet method of low land rice cultivation is blamed for methane and nitrous oxide
emissions to the atmosphere. Hence, it was necessitated to search for an alternative method of rice
cultivation. In Asia, 17 million ha of irrigated rice areas might experience physical water scarcity and
22 million ha is projected to experience economic water scarcity by 2025 (Tuong and Bouman
2001). Therefore, a more efficient management of water is needed for rice production. Several
strategies are being pursued to reduce rice water requirements, such as saturated soil culture (Borell
et al. 1997), alternate wetting and drying (Tabbal et al. 2002), system of rice intensification (Stoop et
al. 2002), aerobic rice (Bouman et al. 2007). Research on different aspects of aerobic rice- its varietal
performance, agronomic management, N economy, challenges, causes of low yield, water saving has
got momentum in Asia (Belder et al. 2005; Bouman et al. 2005), but the site, soil and agro-ecosystem
specific appropriate technology packages are essential. Information on potential of aerobic rice,
suitable varieties, management options are lacking in eastern region of the country. Hence, attempts
were made through field experiments: i) to explore the feasibility of planting in paired rows and
ridge & furrow for saving of irrigation water and enhancing WUE of post-rainy season crops, ii) to
study the drip irrigation to winter season crops for saving of irrigation water, iii) to study the water
saving potential and water productivity under aerobic method of cultivation of rice.
Paper Proceedings of Agri Animal 2013 - ISSN 2279-3682
318
MATERIALS AND METHODS Experiment site, weather conditions and soil characteristics
The study site is located near Bhubaneswar in the Khurda district of Odisha, India (Figure 1). The
area is under Deras minor irrigation command, which is located in the eastern part of India. The
Deras minor command irrigates an area of 398.53 ha through canal system with the supply of water
from a storage reservoir viz. Deras (Nanda and Panda 1998). Command area is actually meant for
the entire cultivable area under a reservoir system. The region experiences a hot and moist sub-
humid climatic condition. Annual rainfall (years 2000-2010) in the area varies from 1000 to 1600
mm. This rainfall meets out about 80 per cent of the potential evapotranspiration (ET) leaving a
deficit of 500 to 700 mm of water per year. Mean annual rainfall and evaporation was 1590.4 and
55.8 mm, respectively. The study area received 81.7% of total annual rainfall during monsoon period
(i.e. June to September); remaining 18.3% occurred during post-monsoon, winter and pre-monsoon
period. Long-term average minimum air temperature varied from 13.3 to 26.2 0C whereas maximum
air temperature was 28 to 37.6 0C.
The field experiments were carried out at the Research Farm of Directorate of Water
Management (20° 17' N latitude and 85° 41' E longitude), Mendhasal under Deras Minor Irrigation
command. Soil moisture regime is Typic Ustic and the area comes under hyperthermic soil
temperature regime. The saturated hydraulic conductivity was 1.14-1.78 cm h-1, pH 5.6-6.5, and CEC
9-15 cmol (+) kg-1 soil. Soil was consisted of 46% coarse sand, 17% fine sand, 16% silt and 21% clay;
thus the textural class is sandy clay loam. The relative contribution of both the coarse and find sand
fractions are declined towards greater depth of the soil, and the clay fraction is increased with the
soil depth. The average bulk density was 1.44 Mg m-3.
Treatments, design of experiments and crop management Three-year field experiments were conducted on post-rainy season groundnut and potato for testing
the planting techniques with the aim to save irrigation water.
For groundnut, treatments were as follows:
Irrigation treatments-four
I1: 1 irrigation (flowering & pegging)
I2: 2 irrigation (flowering & pegging, pod development)
I3: 3 irrigation (vegetative, flowering & pegging, pod development)
I4: 4 irrigation (vegetative, flowering & pegging, pod formation, pod development)
Planting technique –three
S1: Flat method of sowing/ planting at 30 x 10 cm spacing
S2: Ridge and furrow planting: planting at 30 x 10 cm spacing and making ridges in the crop row
after emergence; single row on a ridge
S3: Paired row planting at 45 x 15 cm spacing and making ridges in the crop row after emergence;
paired row at 15 cm row spacing on a ridge
Design of experiment was split-plot with three replication.
The experiment on groundnut was conducted for three years (2008-2010) with irrigation
treatments in the main-plots and planting techniques in the sub-plots. The irrigations were
scheduled in critical growth stages viz. vegetative, flowering, pod formation and pod development.
The plot size was 6 m x 3 m. Before final land preparation, organic manure was applied and
Paper Proceedings of Agri Animal 2013 - ISSN 2279-3682
319
incorporated into the soil. The fertilizers were applied @ 20, 40 and 40 kg ha-1 as N, P2O5 and K2O,
respectively. The groundnut variety, ‘TAG 24’ was sown during the dry season on January every
year; and need based management of the crop like weeding, hoeing and plant protection measures
were taken. Observations on soil moisture, plant growth, physiological parameters, light
interception, root growth, yield attributes, yield and water use were recorded for groundnut grown
during dry season (January to April) every year.
For potato, treatments were as follows:
Number of irrigation- four
I1: 2 irrigation (stolonization, tuberization)
I2: 3 irrigation (stolonization, tuberization, tuber bulking)
I3: 4 irrigation (vegetative, stolonization, tuberization, tuber bulking)
I4: 5 irrigation (vegetative, stolonization, tuberization-2, tuber bulking)
Planting technique -three
S1: Normal planting at 50 x 15 cm spacing (planting in 50 x 15 cm spacing and making ridges in the
crop row after emergence, i.e., furrow spacing 50 cm.
S2: Paired row planting at 75 x 20 cm spacing (planting of 2 rows at 25 cm spacing, and making of 1
ridge with 2 rows); furrow spacing 70 cm.
S3: Paired row planting at 100 x 15 cm spacing (planting of 2 rows at 50 cm spacing and making of 1
ridge with 2 rows); furrow spacing 100 cm.
Design of experiment was split-plot with three replication.
Field experiments on potato were conducted during 2008-09 to 2010-11. The irrigations were
scheduled in critical growth stages viz. vegetative, stolonization, tuberization and tuber bulking.
Before final land preparation, organic manure was applied and incorporated into the soil. The
fertilizers were applied @ 150, 100 and 100 kg ha-1 as N, P2O5 and K2O, respectively; sources as
urea, DAP and MOP. The variety, ‘Kufri Jyoti’ was sown after seed tuber treatment with pesticides.
Other agronomic practices like weeding, hoeing, earthing up and spraying of pesticides were made
for every treatment.
Measurements, analyses and calculation Measurement of photosynthetically active radiation (PAR) was made on different Julian days using a
line quantum sensor (Model EMS 7 of S.W. & W.S., U.K.). Core sampling was done for
determination of soil bulk density. Particle size distribution was determined by the hydrometer
method and soil texture class was determined by following the procedure of USDA classification;
soil pH with a digital pH meter (pHTestr30, Malaysia), and electrical conductivity (EC) by EC meter
(ECtestr model); field capacity (FC) and permanent wilting point (PWP) was determined by pressure
plate apparatus (Eijkelkamp, Model 505); available water capacity (AWC) of soils, expressed as
volume of water per unit volume of soil, was estimated as the difference between field capacity and
permanent wilting point. The soil parameters were determined using standard procedures.
Irrigations were scheduled as per the treatments, and measured by RBC flume 13.17.02.
The irrigation water use efficiency (WUE) was estimated as the crop yields divided by total
irrigation water applied (Mishra and Ahmed, 1987); water use efficiency (WUE) = Crop yield/ ET.
Drip irrigation experiment on winter season crops In a separate experiment, drip irrigation was tested. The post-rainy season crops viz maize, cowpea,
sunflower and tomato were grown with standard package of agronomic practices after harvest of
Paper Proceedings of Agri Animal 2013 - ISSN 2279-3682
320
rainy season rice. Sowing/ planting were done manually by the 3 to 4 week of November. The
spacing was 50 cm row-to-row and 30 cm plant-to-plant on the beds separated with furrows. Drip
irrigation was compared with furrow irrigation. Two crop rows per bed were maintained. One unit
of bed and furrow was 1 m in width. The drip irrigation was given on drippers (4 l hr-1 with a
uniformity coefficient of 90%) placed on the bed with a 30-cm dripper spacing in between two crop
rows. For furrow irrigation, the irrigation water was measured through RBC flume (model 13.17.02).
For maize, seed rate was 18 kg ha-1. Entire dose of P and K was applied as basal; N was applied in 3
splits- 25% as basal, 50% at 3 weeks stage and 25% at 6-7 weeks stage. The seed rate for cowpea was
30 kg ha-1. Entire dose of fertilizer was applied as basal. The seed rate for sunflower was 5 kg ha-1;
entire P and K, and 50% of N was applied as basal, and rest 50% N was applied at flowering stage.
For tomato, 25 kg N, 50 kg P2O5 and 20 kg K2O was incorporated at the time of transplanting.
Remaining 100 kg N and 80 kg K2O was applied in two equal splits at 15 and 30 days after
transplanting. Intercultural operation and plant protection was done as per need.
Experiments on water saving in aerobic rice The field experiments were conducted during dry seasons of 2007-08 to 2009-10. Three rice
varieties viz. ‘Surendra’, ‘Lalat’ and ‘Khandagiri’ and four irrigation regimes viz. irrigating the crop at
80-90% of field capacity soil moisture content throughout season (I1), at 60-70% of field capacity
during vegetative and at 80-90% of field capacity from panicle initiation to maturity (I2), and at 60-
70% of field capacity soil moisture throughout season (I3) and were imposed on aerobic rice
cultivation, and traditional flooded transplanted rice i.e., TFR (I4). The design of experiment was
split- plot. Nitrogen fertilizer was applied in 3 splits- 25% at four weeks after sowing, 50% at eight
weeks after sowing and the remaining 25% at twelve weeks after sowing. Sowing was done in the
first week of January with spacing of 20 x 10 cm. Other agronomic management practices were
followed as per the needs. The irrigation water input was measured through RBC flume (model
13.17.02).
The water productivity (WP) with respect to grain yield (GY) and straw yield (SY) was
estimated as:
WPGY = {Grain yield/ (irrigation input + rainfall)}, and
WPSY = {Straw yield/ (irrigation input + rainfall)}.
These WP parameters are expressed as kg grain or straw per ha per mm water.
Statistical analyses The analysis of variance (ANOVA) technique was carried out on the data for each parameter as
applicable to split-plot design with equal replications (Gomez and Gomez 1984). The significance of
the treatment effect was determined using F-test at 5% level. The mean differences between
treatments were compared using the least significant difference (LSD) and the ordering of
treatments was done by using Duncan’s multiple range test (DMRT) at 5% level of probability.
RESULTS AND DISCUSSION
Pod and haulm yield of groundnut as influenced by irrigation and planting methods
Paper Proceedings of Agri Animal 2013 - ISSN 2279-3682
321
Pooled data over three years on groundnut revealed that both pod and haulm yields in S2 and S3
were significantly greater than S1 (Table 1). However, S2 and S3 were statistically at par. Total dry
biomass production i.e., pod plus haulm yield, was also influenced significantly by planting
techniques. The higher pod yield by 13-20% in S2 and S3 was might be due to the better soil
moisture extraction and greater interception of photosynthetically active radiation (IPAR) by the
crop canopy, as was evident from the recorded data on interception of PAR (Figure 2). Regarding
irrigation treatments, higher irrigation regimes led to greater yield; highest yield was being in I4,and
the lowest in I1. As there was very less rainfall received during the crop growing period, a continuous
and positive response to applied irrigation was recorded even at highest irrigation regime; and the
interaction between irrigation and planting treatment was also significant. However, the harvest
index was statistically similar for both irrigation and planting treatments.
The intercepted PAR (IPAR) was 46.3 to 57.7% in S1, 52.8 to 61.8% in S2 and 64.5 to 74.4%
in S3 in the year 2009; I3 and I4 treatments had significantly greater interception than I1. In the year
2009, the observed physiological parameters viz. maximum fluorescence efficiency (Fv/Fm) and
actual fluorescence efficiency (ФPS II) showed higher values in the higher irrigation regimes (I3 and
I4) than the lowest irrigation (I1) treatment.
Tuber yield and haulm dry matter of potato Fresh tuber yield of potato in S1 (15.09 t ha-1) was statistically at par with S2 (14.78 t ha-1), and both
S1 and S2 was significantly greater than S3 (12.71 t ha-1) (Table 2). It implies that by paired row
method i.e., planting of two rows on a bed, tuber yield was not reduced significantly. Haulm dry
matter was significantly higher in S1 (30.52 g m-2) than S2 (28.57 g m-2) and S3 (24.13 g m-2). Irrigation
treatments showed significant variation; highest tuber yield was recorded with I4, and it was similar
with I3. The lowest yield was obtained in I1. Similar trend was observed in haulm dry matter of this
crop. However, irrigation x planting technique interactions for both fresh tuber yield and haulm dry
matter yield was significant.
Evapotranspiration (ET) and water use efficiency (WUE) of groundnut and potato Irrigation water depth was 10.6 and 13.3 cm in S3 and S2, respectively compared to 18.2 cm in S1 for
groundnut; implying a significant reduction in irrigation water requirement by 41 and 27% in S3 and
S2, respectively compared to S1 (Table 3). The crop WUE and irrigation water use efficiency (IWUE)
of groundnut was also significantly greater in S3 and S2 than in S1. The crop WUE was significantly
greater in S3 (7.03) than S2 (6.30) and S1 (4.75 kg pod ha-1 mm-1ET), implying a considerable
enhancement of WUE of the crop. The evapotranspiration (ET) decreased in S2 and S3 compared to
S1; the irrigation water use efficiency (IWUE) was 10.06, 16.30 and 20.63 kg pod mm-1 depth of
irrigation in S1, S2 and S3, respectively. The depth of irrigation and ET increased with increase in
irrigation regimes, the highest being in I4 and the lowest in I1; and both the crop and irrigation water
use efficiency decreased with increase in irrigation regimes.
Total depth of irrigation water to potato, ET, crop water use efficiency (WUE) and irrigation
water use efficiency (IWUE) were significantly influenced by irrigation and planting technique
treatments (Table 4). The depth of irrigation increased with increase in irrigation regimes from I1
through I4. On the contrary, it decreased in S2 (17.73 cm) and S3 (15.21 cm) compared to S1 (22.49
cm). This implies a significant reduction in irrigation water requirement by 21 and 32% in S2 and S3,
respectively compared to S1. The ET increased due to increase in irrigation regimes. The higher ET
was estimated for I4 and I3, and the lowest in I1. Thus, the increase in amount of irrigation water
Paper Proceedings of Agri Animal 2013 - ISSN 2279-3682
322
increased ET; and again ET decreased significantly in S2 and S3 compared to S1; irrigation x planting
technique interaction was also significant. The increase in ET with higher irrigation levels (I4)
decreased crop WUE because of not recording commensurate increase in tuber yield; the irrigation
treatment for WUE was significant. However, the efficient planting techniques, S2 (44.11)
significantly enhanced the crop WUE when compared to S1 (40.75) and S3 (41.07 kg tuber per ha
mm water). The IWUE decreased with higher irrigation regimes, and planting techniques showed
similar trend as with crop WUE. By paired row method of planting, irrigation water was saved and
WUE increased for other crops in India viz. sugarcane and its ratoon (More and Bhoi 2004); for
maize, maize/ greengram and maize/ soybean intercropping (Shivoy and Singh 2003); for rainfed
hybrid pearl millet (Kaur et al. 2005).
Evaluation of drip irrigation to winter crops Though the crop yields under drip and furrow irrigation system were similar (Table 5), water saving
was more in drip irrigation than furrow irrigation. The irrigation water use and WUE of crops differ
with the type of crops grown. By drip irrigation method water saving was 29, 3, 13 and 30% in
maize, cowpea, sunflower and tomato, respectively over the furrow irrigation method. The percent
increase in irrigation WUE (kg ha-1 mm-1) was 11-36% depending upon the type of crop, water use
and their yield. Similar results were also obtained by Singandhupe et al. (2003), they reported an
increase in fruit yield of tomato by 3.7-12.5% with a saving of water by 31-37% and an increase in
water use efficiency by 68-77% in the drip system as compared to the furrow irrigation in Rahuri,
India. In other findings, there was an increase in tomato yield and water use efficiency when drip
method of irrigation was adopted on a deep clay loam soil at Dire Dawa, Ethiopia (Yohannes and
Tadesse 1998).
Irrigation water saving potential through aerobic rice The average water application as pre-sowing irrigation for the aerobic rice (under I1, I2 and I3
regimes) was 54-62 mm, and for the TFR (under I4) it was 362-401 mm during wet land preparation
for transplanting of rice seedlings (Table 6). Irrigation during crop growth stage under aerobic rice
was 341-573 mm in year 2008 and 466-644 mm in 2009. In aerobic rice, total water input including
rainfall received was 525 to 753 mm in 2008 and 529 to 709 mm in 2009. The rainfall received was
very less in the second year; hence irrigation was more to maintain the treatment requirements under
I1, I2 and I3. The total water input in TFR was 1317 and 1341 mm in 2008 and 2009, respectively.
The water input during crop growth under aerobic rice plots decreased in I2 compared to I1 and
further decreased in I3 due to treatments conditions. Our results clearly show the potential of saving
of irrigation water if aerobic rice cultivation methods are followed. Actually, aerobic soils even with
irrigation at 80-90% of field capacity throughout the rice growing period require less water than
flooded transplanted rice with maintenance of standing water of about 1-2 cm. The water amounts
to about 350-400 mm, which is required for puddling and transplanting of rice seedlings, could be
saved. In our experiment, the saving of water input in total was 42-47% in I1, 51-53% in I2 and 60%
in I3 under aerobic rice when compared to traditional flooded rice (I4). During the crop growth
stage, the saving of water input was 30-31% in I1, 40-44% in I2 and 58-60% in I3 under aerobic rice
when compared to traditional flooded rice (I4). Bouman et al. (2005) estimated the total water input
was 1240-1880 mm in flooded fields and 790-1430 mm in aerobic fields. The saving of water due to
aerobic method of rice cultivation was also reported by previous researchers (Belder et al. 2005;
Bouman et al. 2005). On average, the mean yield of some varieties was 32% lower under aerobic
Paper Proceedings of Agri Animal 2013 - ISSN 2279-3682
323
conditions than under flooded conditions in the dry season and 22% lower in the wet season
(Bouman et al. 2005).
The grain yield ranged from 2.39 to 3.36 t ha-1 under aerobic treatments (I1, I2 and I3) with the
highest being in I1 (Table 7). However, the highest grain yield under I1 was significantly lower than
the grain yield under TFR (I4). Similar was the trend in straw yield. Our results showed a reduction
in yield under aerobic treatments. This yield reduction, as compared to traditional flooded rice, was
to the extent of 16-40% depending on the variation in irrigation regimes in our study; yield
reduction in I1 (16%) was much less than I2 (22%) and I3 (40%) treatment. In aerobic condition, the
highest grain and straw yield was recorded in variety ‘Surendra’; however, it was at par with variety
‘Lalat’. The yield reduction due to aerobic method of cultivation was also observed by previous
researchers (Bouman et al. 2005). Peng et al. (2006) reported that the yield difference between
aerobic and flooded rice ranged from 8-69% depending on the number of seasons that aerobic rice
had been continuously grown, dry and wet seasons, and varieties.
Water productivity (WPGY and WPSY) varied significantly due to aerobic rice and traditional
flooded rice. However, both WPGY and WPSY did not vary significantly within the aerobic irrigation
regimes (I1, I2 and I3). The average WPGY and WPSY(mean of values under I1, I2 and I3) under aerobic
were significantly greater than those with TFR (I4). Though the grain and straw yield under TFR was
higher, WP was lower than aerobic irrigation regimes due to much greater water input for TFR.
Water productivity was greater in the varieties, ‘Surendra’ and ‘Lalat’ compared to ‘Khandagiri’,
because of lower yield in the latter. In our study, hence, water productivity of rice (with respect to
rainfall and irrigation water input) under aerobic conditions was 49-57% higher than under
traditional flooded conditions.
CONCLUSIONS The research findings indicated that there was definitive yield advantage of 18-20% with paired row
planting of groundnut and irrigation water saving to the extent of 27 and 41%. The paired row
method of planting for potato at 75 x 20 cm have the potential to save a significant amount of
irrigation water compared to normal planting without significant reduction in fresh tuber yield. The
depth of irrigation would also be decreased in paired row planting compared to normal to the extent
of 21-32%. The paired row method of planting potato at 75 x 20 cm spacing significantly enhanced
the crop water use efficiency. The results have been demonstrated to the farmers and discussed for
up scaling. The improved planting technique for potato and groundnut would save irrigation water.
The canal water irrigating the dry season crops would also be utilized efficiently. The adoption of
drip irrigation method for post-rainy season crops should be popularized as this is an efficient water
saving technique.
We conclude from our aerobic rice experiment that rice varieties viz. ‘Surendra’ and ‘Lalat’
may be recommended for the eastern Indian condition. Though there was a reduction in grain yield
of rice under aerobic condition compared to traditional flooded method, aerobic method of rice
cultivation holds promise in future, especially in situations of increasing water scarcity. The large
volume of water, which is required for land preparation under flooded method, may be avoided in
aerobic systems. Hence, the total amount of water input would be reduced by 42-60% when
compared to flooded rice. Water productivity with respect to rainfall and irrigation input would be
enhanced by aerobic culture; the enhancement could be to the tune of 49-57% compared to
traditional flooded conditions. We recommend for maintenance of soil moisture for aerobic rice as
Paper Proceedings of Agri Animal 2013 - ISSN 2279-3682
324
80-90% of field capacity throughout the crop growing season; and in this irrigation regime the yield
reduction would be about 16% compared to flooded rice.
REFERENCES
Aujla, M.S., Thind, H.S. and Buttar, G.S., 2005. Cotton yield and water use efficiency at various levels of water and N through drip irrigation under two methods of planting. Agricultural Water Management 71 (2): 167-179.
Belder, P., J.H.J. Spiertz, B.A.M. Bouman, G. Lu and T.P. Tuong, 2005. Nitrogen economy and water productivity of lowland rice under water saving irrigation. Field Crops Research 93:169-185.
Borell, A., Garside, A. and Shu, F.K. 1997. Improving efficiency of water for irrigated rice in a semi-arid tropical environment. Field Crops Research52: 231-248.
Bouman, B.A.M., Feng, L., Tuong, T.P., Lu, G., Wang, H.Q. and Feng, Y. 2007. Exploring options to grow rice under water-short conditions in northern China using a modelling approach. II: Quantifying yield, water balance components, and water productivity. Agricultural Water Management 88(1/3): 23-33.
Bouman, B.A.M., Peng, S., Castaneda, A.R. and Visperas, R.M. 2005. Yield and water use of irrigated tropical aerobic systems. Agricultural Water Management74: 87-105.
Buttar, G.S., Thind, H.S., and Aujla, M.S. 2006. Methods of planting and irrigation at various levels of nitrogen affect the seed yield and water use efficiency in transplanted oilseed rape (Brassica napus L.). Agricultural Water Management 85 (3): 253-260.
Gomez, K.A., Gomez, A.A., 1984. Statistical Procedures for Agricultural Research, John Wiley and Sons, New York.
Kaur, A., Anureet Kaur, Singh, V. P. 2005. Moisture extraction pattern, consumptive use of water and water use efficiency of hybrid pearl millet as influenced by planting methods, mulching and weed control under rainfed conditions. Research on Crops 6(2): 199-201.
Mandal, K.G., Hati, K.M. Misra, A.K. Bandyopadhyay, K.K. 2010. Root biomass, crop response and water-yield relationship of mustard (Brassica juncea L.) grown under combinations of irrigation and nutrient application. Irrigation Science 28: 271-280.
Mandal, K.G., Hati, K.M., Misra, A.K., Bandyopadhyay, K.K. and Mohanty, M. 2005. Irrigation and nutrient effects on growth and water-yield relationship of wheat (Triticum aestivum L.) in central India. Journal of Agronomy & Crop Science 191 (6): 416-425.
Mandal, K.G., Hati, K.M., Misra, A.K., Bandyopadhyay, K.K. and Mohanty, M. 2006. Assessment of irrigation and nutrient effects on growth, yield and water use efficiency of Indian mustard (Brassica juncea) in central India. Agricultural Water Management85: 279-286.
Mandal, K.G., Hati, K.M., Misra, A.K., Bandyopadhyay, K.K. and Tripathi, A.K. 2013. Land surface modification and crop diversification for enhancing productivity of a Vertisol. International Journal Plant Production 7 (3): 455-472.
Misra, R.D., Ahmed, M., 1987. Manual on Irrigation Agronomy, Oxford & IBH Pub.Co. Pvt. Ltd., New Delhi. pp. 205–47.
More, S.M., Bhoi, P.G. 2004. Economic analysis of suru sugarcane (CO-86032) and its ratoon under drip irrigation and wide row planting system. Indian Sugar 54 (6): 447-452.
Nanda, P., Panda, R.K. 1998. Agricultural productivity in Deras command- A case study. Research Bulletin No. 6, Directorate of Water Management (formerly Water Technology Centre for Eastern Region), ICAR, p. 1-19.
Peng, S., Bouman, B.A.M., Visperas, R.M., Castañeda, A, Nie, L. and Park, H.K. 2006. Comparison between aerobic and flooded rice in the tropics: agronomic performance in an eight-season experiment. Field Crops Research 96: 252-259.
Ramesh, T. and Devasenapathy, P. 2007. Natural resources management on sustainable productivity of rainfed pigeonpea (Cajanus cajan L.). Research Journal of Agriculture and Biological Sciences 3(3): 124-128.
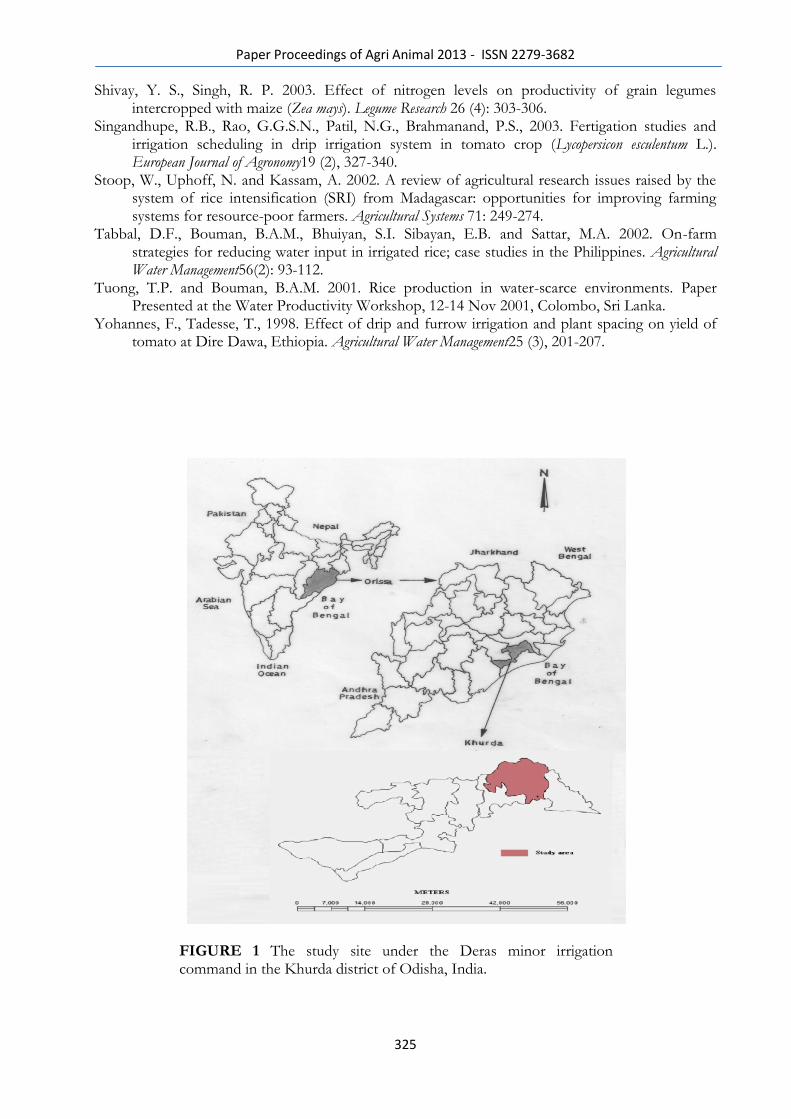
Paper Proceedings of Agri Animal 2013 - ISSN 2279-3682
325
Shivay, Y. S., Singh, R. P. 2003. Effect of nitrogen levels on productivity of grain legumes intercropped with maize (Zea mays). Legume Research 26 (4): 303-306.
Singandhupe, R.B., Rao, G.G.S.N., Patil, N.G., Brahmanand, P.S., 2003. Fertigation studies and irrigation scheduling in drip irrigation system in tomato crop (Lycopersicon esculentum L.). European Journal of Agronomy19 (2), 327-340.
Stoop, W., Uphoff, N. and Kassam, A. 2002. A review of agricultural research issues raised by the system of rice intensification (SRI) from Madagascar: opportunities for improving farming systems for resource-poor farmers. Agricultural Systems 71: 249-274.
Tabbal, D.F., Bouman, B.A.M., Bhuiyan, S.I. Sibayan, E.B. and Sattar, M.A. 2002. On-farm strategies for reducing water input in irrigated rice; case studies in the Philippines. Agricultural Water Management56(2): 93-112.
Tuong, T.P. and Bouman, B.A.M. 2001. Rice production in water-scarce environments. Paper Presented at the Water Productivity Workshop, 12-14 Nov 2001, Colombo, Sri Lanka.
Yohannes, F., Tadesse, T., 1998. Effect of drip and furrow irrigation and plant spacing on yield of tomato at Dire Dawa, Ethiopia. Agricultural Water Management25 (3), 201-207.
FIGURE 1 The study site under the Deras minor irrigation command in the Khurda district of Odisha, India.

Paper Proceedings of Agri Animal 2013 - ISSN 2279-3682
326
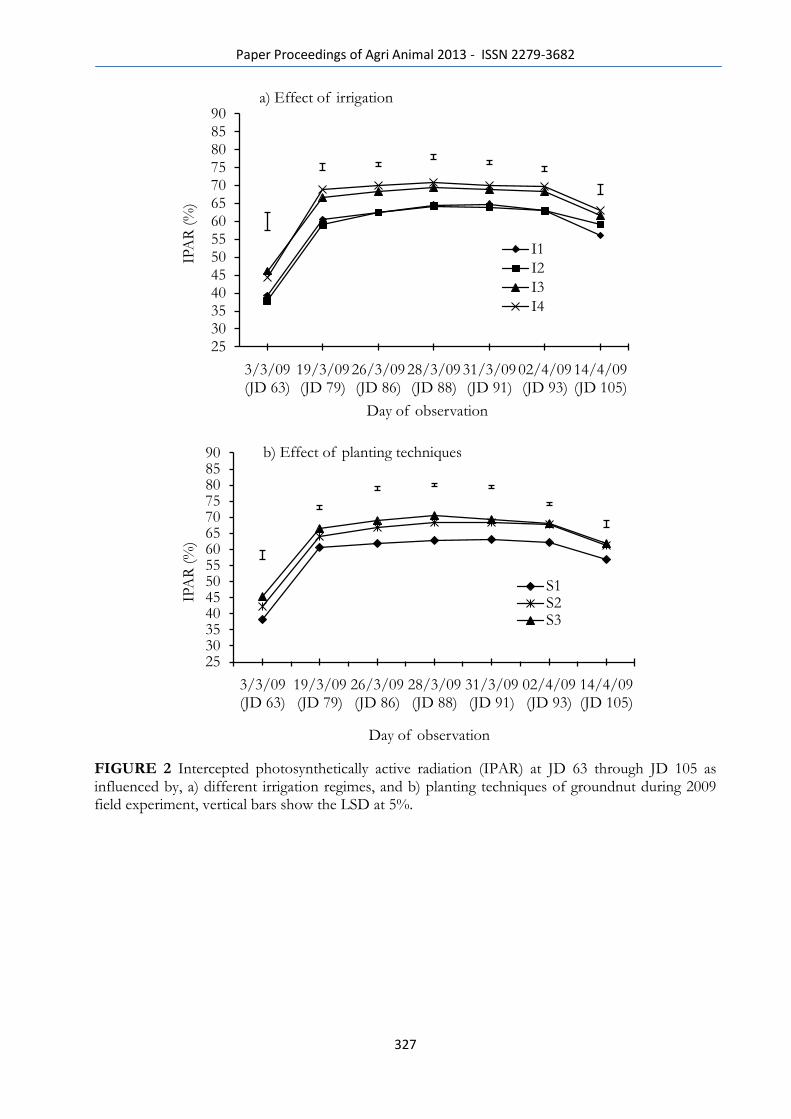
Paper Proceedings of Agri Animal 2013 - ISSN 2279-3682
327
FIGURE 2 Intercepted photosynthetically active radiation (IPAR) at JD 63 through JD 105 as influenced by, a) different irrigation regimes, and b) planting techniques of groundnut during 2009 field experiment, vertical bars show the LSD at 5%.
2530354045505560657075808590
3/3/09 (JD 63)
19/3/09 (JD 79)
26/3/09 (JD 86)
28/3/09 (JD 88)
31/3/09 (JD 91)
02/4/09 (JD 93)
14/4/09 (JD 105)
IPA
R (
%)
Day of observation
a) Effect of irrigation
I1
I2
I3
I4
2530354045505560657075808590
3/3/09 (JD 63)
19/3/09 (JD 79)
26/3/09 (JD 86)
28/3/09 (JD 88)
31/3/09 (JD 91)
02/4/09 (JD 93)
14/4/09 (JD 105)
IPA
R (
%)
Day of observation
b) Effect of planting techniques
S1S2S3
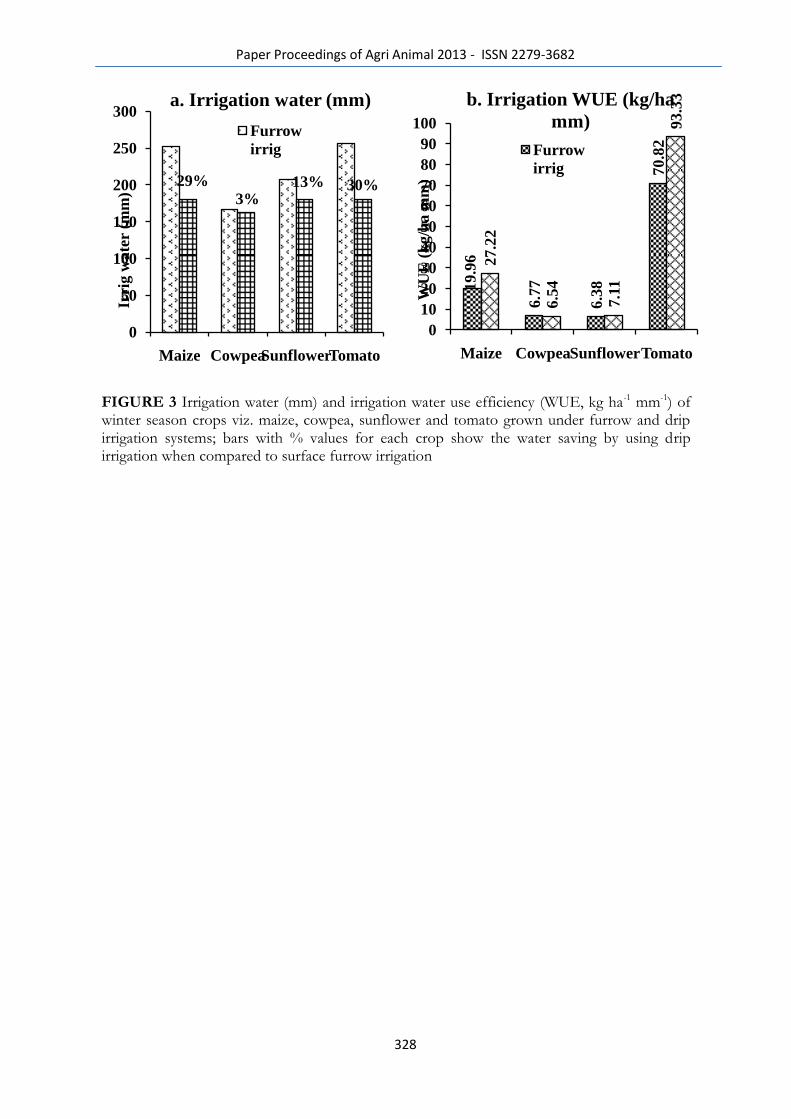
Paper Proceedings of Agri Animal 2013 - ISSN 2279-3682
328
FIGURE 3 Irrigation water (mm) and irrigation water use efficiency (WUE, kg ha-1 mm-1) of winter season crops viz. maize, cowpea, sunflower and tomato grown under furrow and drip irrigation systems; bars with % values for each crop show the water saving by using drip irrigation when compared to surface furrow irrigation
29%
3%13% 30%
0
50
100
150
200
250
300
Maize CowpeaSunflowerTomato
Irri
g w
ate
r (m
m)
a. Irrigation water (mm)
Furrow
irrig
19.9
6
6.7
7
6.3
8
70.8
2
27.2
2
6.5
4
7.1
1
93.3
3
0
10
20
30
40
50
60
70
80
90
100
Maize CowpeaSunflowerTomato
WU
E(k
g/h
am
m)
b. Irrigation WUE (kg/ha
mm)
Furrow
irrig
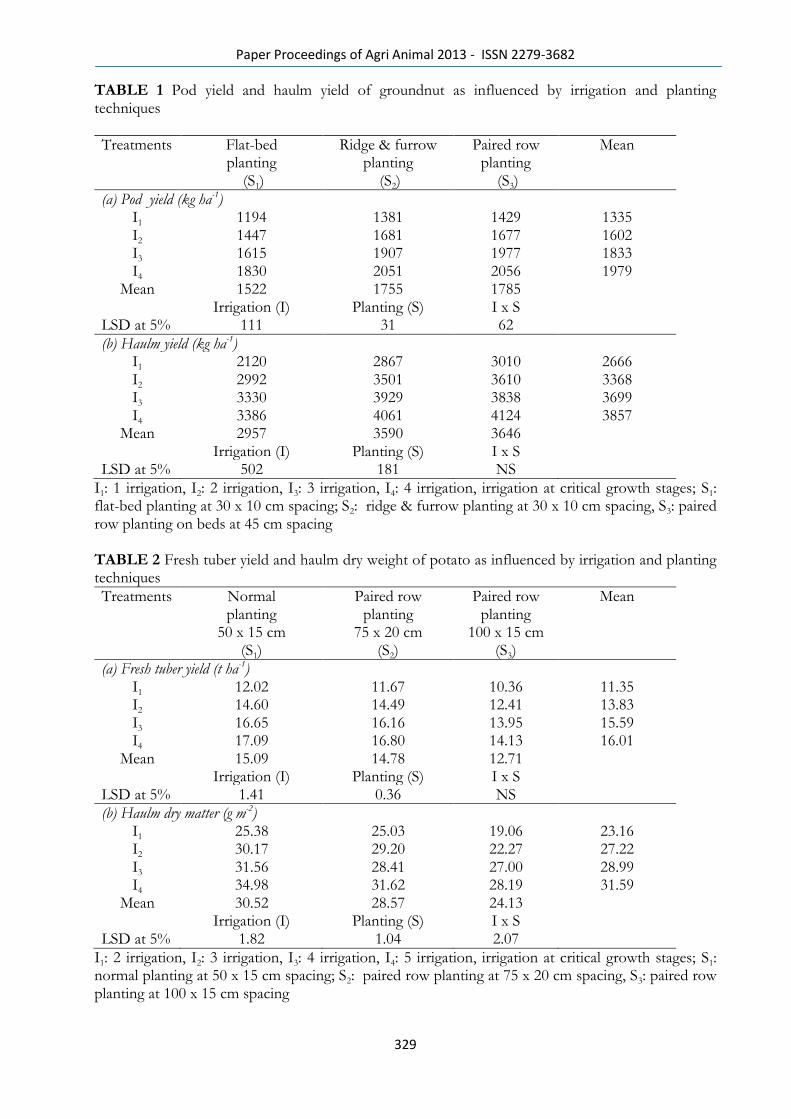
Paper Proceedings of Agri Animal 2013 - ISSN 2279-3682
329
TABLE 1 Pod yield and haulm yield of groundnut as influenced by irrigation and planting techniques
Treatments Flat-bed planting
(S1)
Ridge & furrow planting
(S2)
Paired row planting
(S3)
Mean
(a) Pod yield (kg ha-1) I1 1194 1381 1429 1335 I2 1447 1681 1677 1602 I3 1615 1907 1977 1833 I4 1830 2051 2056 1979
Mean 1522 1755 1785 Irrigation (I) Planting (S) I x S LSD at 5% 111 31 62
(b) Haulm yield (kg ha-1) I1 2120 2867 3010 2666 I2 2992 3501 3610 3368 I3 3330 3929 3838 3699 I4 3386 4061 4124 3857
Mean 2957 3590 3646 Irrigation (I) Planting (S) I x S LSD at 5% 502 181 NS
I1: 1 irrigation, I2: 2 irrigation, I3: 3 irrigation, I4: 4 irrigation, irrigation at critical growth stages; S1: flat-bed planting at 30 x 10 cm spacing; S2: ridge & furrow planting at 30 x 10 cm spacing, S3: paired row planting on beds at 45 cm spacing TABLE 2 Fresh tuber yield and haulm dry weight of potato as influenced by irrigation and planting techniques
Treatments Normal planting
50 x 15 cm (S1)
Paired row planting
75 x 20 cm (S2)
Paired row planting
100 x 15 cm (S3)
Mean
(a) Fresh tuber yield (t ha-1) I1 12.02 11.67 10.36 11.35 I2 14.60 14.49 12.41 13.83 I3 16.65 16.16 13.95 15.59 I4 17.09 16.80 14.13 16.01
Mean 15.09 14.78 12.71 Irrigation (I) Planting (S) I x S LSD at 5% 1.41 0.36 NS
(b) Haulm dry matter (g m-2) I1 25.38 25.03 19.06 23.16 I2 30.17 29.20 22.27 27.22 I3 31.56 28.41 27.00 28.99 I4 34.98 31.62 28.19 31.59
Mean 30.52 28.57 24.13 Irrigation (I) Planting (S) I x S LSD at 5% 1.82 1.04 2.07
I1: 2 irrigation, I2: 3 irrigation, I3: 4 irrigation, I4: 5 irrigation, irrigation at critical growth stages; S1: normal planting at 50 x 15 cm spacing; S2: paired row planting at 75 x 20 cm spacing, S3: paired row planting at 100 x 15 cm spacing
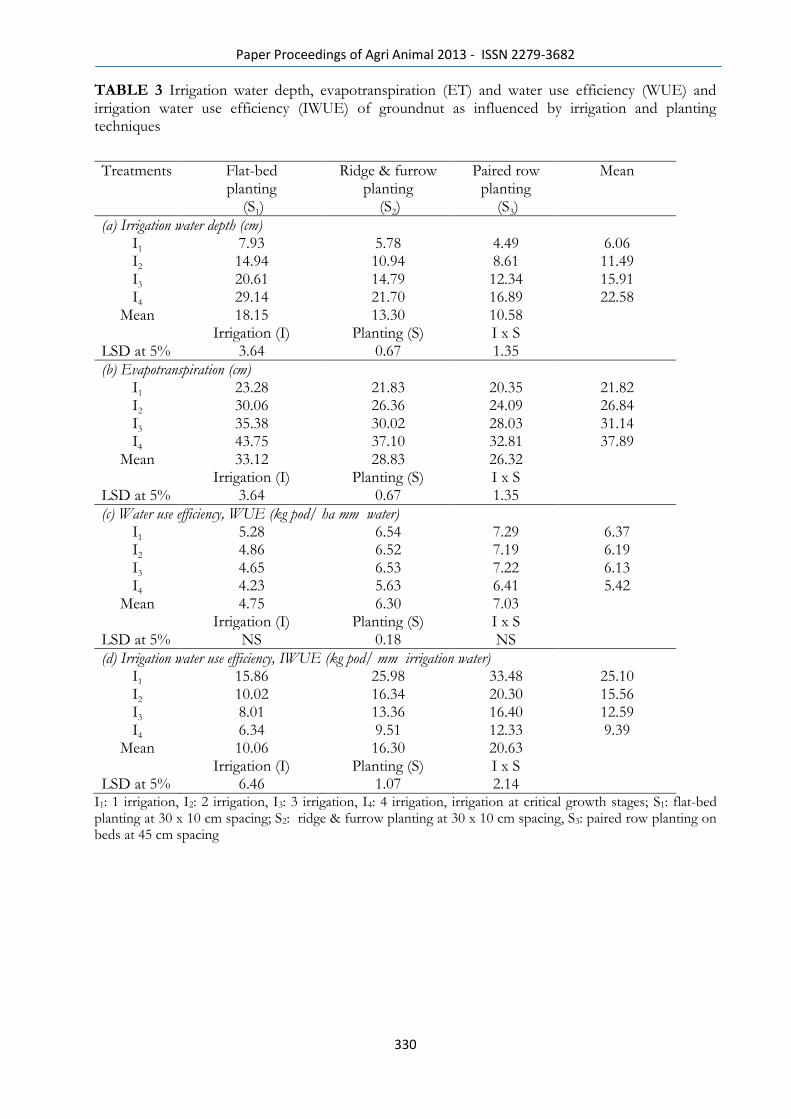
Paper Proceedings of Agri Animal 2013 - ISSN 2279-3682
330
TABLE 3 Irrigation water depth, evapotranspiration (ET) and water use efficiency (WUE) and irrigation water use efficiency (IWUE) of groundnut as influenced by irrigation and planting techniques
Treatments Flat-bed planting
(S1)
Ridge & furrow planting
(S2)
Paired row planting
(S3)
Mean
(a) Irrigation water depth (cm) I1 7.93 5.78 4.49 6.06 I2 14.94 10.94 8.61 11.49 I3 20.61 14.79 12.34 15.91 I4 29.14 21.70 16.89 22.58
Mean 18.15 13.30 10.58 Irrigation (I) Planting (S) I x S LSD at 5% 3.64 0.67 1.35
(b) Evapotranspiration (cm) I1 23.28 21.83 20.35 21.82 I2 30.06 26.36 24.09 26.84 I3 35.38 30.02 28.03 31.14 I4 43.75 37.10 32.81 37.89
Mean 33.12 28.83 26.32 Irrigation (I) Planting (S) I x S LSD at 5% 3.64 0.67 1.35
(c) Water use efficiency, WUE (kg pod/ ha mm water) I1 5.28 6.54 7.29 6.37 I2 4.86 6.52 7.19 6.19 I3 4.65 6.53 7.22 6.13 I4 4.23 5.63 6.41 5.42
Mean 4.75 6.30 7.03 Irrigation (I) Planting (S) I x S LSD at 5% NS 0.18 NS
(d) Irrigation water use efficiency, IWUE (kg pod/ mm irrigation water) I1 15.86 25.98 33.48 25.10 I2 10.02 16.34 20.30 15.56 I3 8.01 13.36 16.40 12.59 I4 6.34 9.51 12.33 9.39
Mean 10.06 16.30 20.63 Irrigation (I) Planting (S) I x S LSD at 5% 6.46 1.07 2.14
I1: 1 irrigation, I2: 2 irrigation, I3: 3 irrigation, I4: 4 irrigation, irrigation at critical growth stages; S1: flat-bed planting at 30 x 10 cm spacing; S2: ridge & furrow planting at 30 x 10 cm spacing, S3: paired row planting on beds at 45 cm spacing
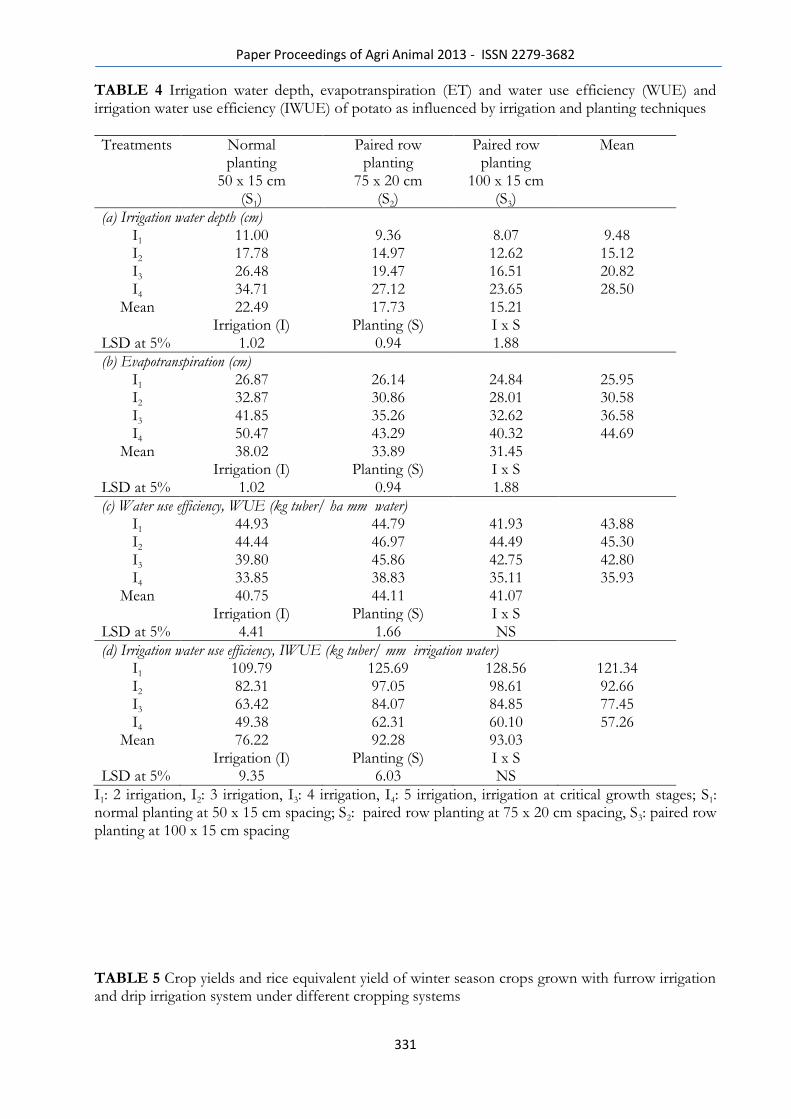
Paper Proceedings of Agri Animal 2013 - ISSN 2279-3682
331
TABLE 4 Irrigation water depth, evapotranspiration (ET) and water use efficiency (WUE) and irrigation water use efficiency (IWUE) of potato as influenced by irrigation and planting techniques
Treatments Normal planting
50 x 15 cm (S1)
Paired row planting
75 x 20 cm (S2)
Paired row planting
100 x 15 cm (S3)
Mean
(a) Irrigation water depth (cm) I1 11.00 9.36 8.07 9.48 I2 17.78 14.97 12.62 15.12 I3 26.48 19.47 16.51 20.82 I4 34.71 27.12 23.65 28.50
Mean 22.49 17.73 15.21 Irrigation (I) Planting (S) I x S LSD at 5% 1.02 0.94 1.88
(b) Evapotranspiration (cm) I1 26.87 26.14 24.84 25.95 I2 32.87 30.86 28.01 30.58 I3 41.85 35.26 32.62 36.58 I4 50.47 43.29 40.32 44.69
Mean 38.02 33.89 31.45 Irrigation (I) Planting (S) I x S LSD at 5% 1.02 0.94 1.88
(c) Water use efficiency, WUE (kg tuber/ ha mm water) I1 44.93 44.79 41.93 43.88 I2 44.44 46.97 44.49 45.30 I3 39.80 45.86 42.75 42.80 I4 33.85 38.83 35.11 35.93
Mean 40.75 44.11 41.07 Irrigation (I) Planting (S) I x S LSD at 5% 4.41 1.66 NS
(d) Irrigation water use efficiency, IWUE (kg tuber/ mm irrigation water) I1 109.79 125.69 128.56 121.34 I2 82.31 97.05 98.61 92.66 I3 63.42 84.07 84.85 77.45 I4 49.38 62.31 60.10 57.26
Mean 76.22 92.28 93.03 Irrigation (I) Planting (S) I x S LSD at 5% 9.35 6.03 NS
I1: 2 irrigation, I2: 3 irrigation, I3: 4 irrigation, I4: 5 irrigation, irrigation at critical growth stages; S1: normal planting at 50 x 15 cm spacing; S2: paired row planting at 75 x 20 cm spacing, S3: paired row planting at 100 x 15 cm spacing
TABLE 5 Crop yields and rice equivalent yield of winter season crops grown with furrow irrigation and drip irrigation system under different cropping systems
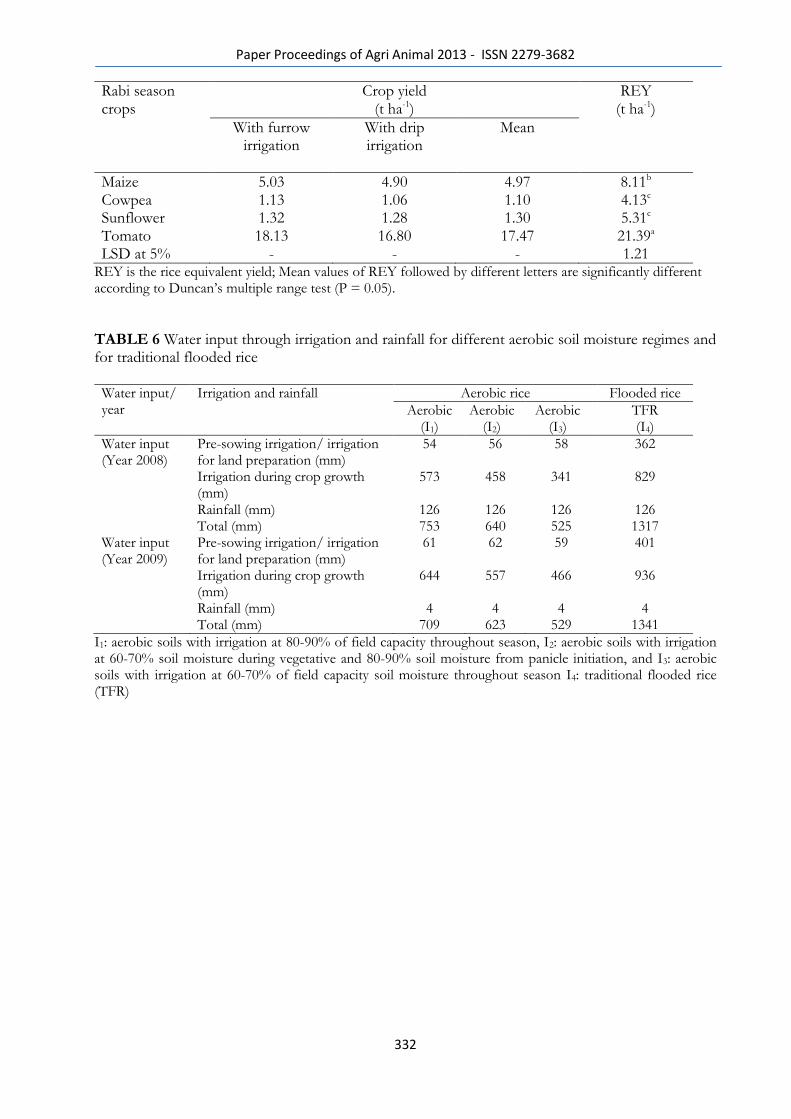
Paper Proceedings of Agri Animal 2013 - ISSN 2279-3682
332
Rabi season crops
Crop yield (t ha-1)
REY (t ha-1)
With furrow irrigation
With drip irrigation
Mean
Maize 5.03 4.90 4.97 8.11b Cowpea 1.13 1.06 1.10 4.13c Sunflower 1.32 1.28 1.30 5.31c Tomato 18.13 16.80 17.47 21.39a LSD at 5% - - - 1.21
REY is the rice equivalent yield; Mean values of REY followed by different letters are significantly different according to Duncan’s multiple range test (P = 0.05).
TABLE 6 Water input through irrigation and rainfall for different aerobic soil moisture regimes and for traditional flooded rice Water input/ year
Irrigation and rainfall Aerobic rice Flooded rice
Aerobic (I1)
Aerobic (I2)
Aerobic (I3)
TFR (I4)
Water input (Year 2008)
Pre-sowing irrigation/ irrigation for land preparation (mm)
54 56 58 362
Irrigation during crop growth (mm)
573 458 341 829
Rainfall (mm) 126 126 126 126 Total (mm) 753 640 525 1317 Water input (Year 2009)
Pre-sowing irrigation/ irrigation for land preparation (mm)
61 62 59 401
Irrigation during crop growth (mm)
644 557 466 936
Rainfall (mm) 4 4 4 4 Total (mm) 709 623 529 1341
I1: aerobic soils with irrigation at 80-90% of field capacity throughout season, I2: aerobic soils with irrigation at 60-70% soil moisture during vegetative and 80-90% soil moisture from panicle initiation, and I3: aerobic soils with irrigation at 60-70% of field capacity soil moisture throughout season I4: traditional flooded rice (TFR)
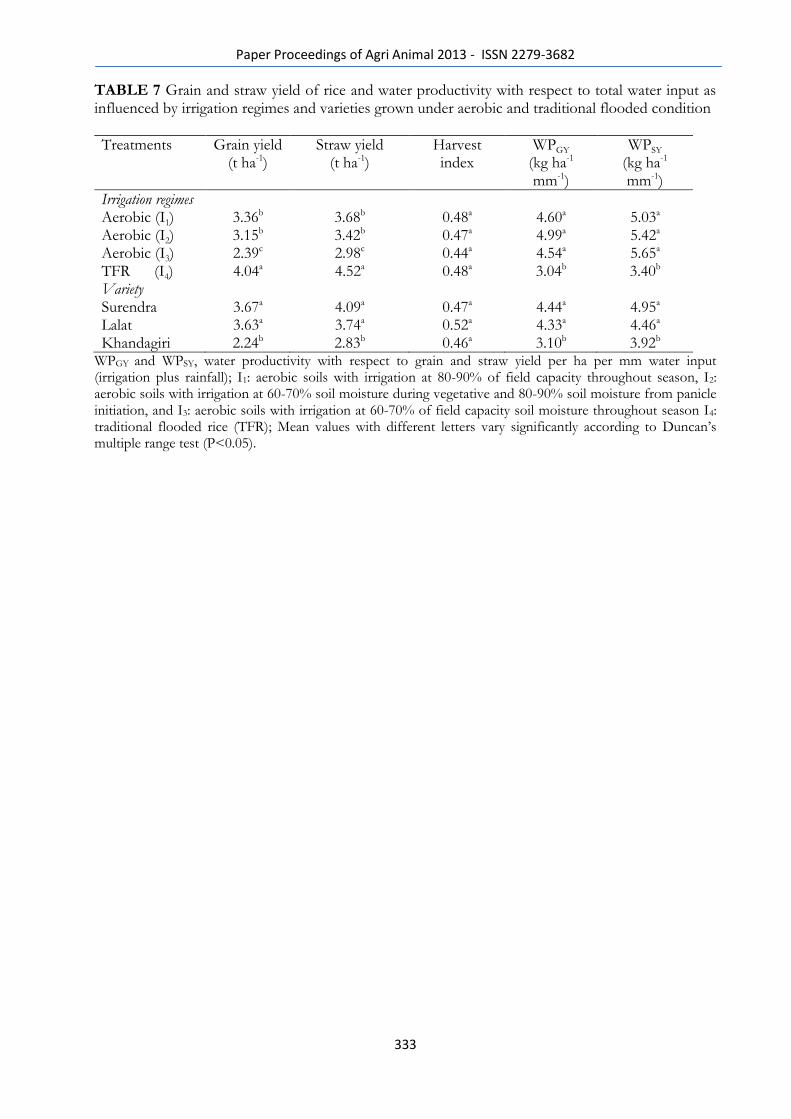
Paper Proceedings of Agri Animal 2013 - ISSN 2279-3682
333
TABLE 7 Grain and straw yield of rice and water productivity with respect to total water input as influenced by irrigation regimes and varieties grown under aerobic and traditional flooded condition
Treatments Grain yield (t ha-1)
Straw yield (t ha-1)
Harvest index
WPGY (kg ha-1 mm-1)
WPSY (kg ha-1 mm-1)
Irrigation regimes Aerobic (I1) 3.36b 3.68b 0.48a 4.60a 5.03a Aerobic (I2) 3.15b 3.42b 0.47a 4.99a 5.42a Aerobic (I3) 2.39c 2.98c 0.44a 4.54a 5.65a TFR (I4) 4.04a 4.52a 0.48a 3.04b 3.40b Variety Surendra 3.67a 4.09a 0.47a 4.44a 4.95a Lalat 3.63a 3.74a 0.52a 4.33a 4.46a Khandagiri 2.24b 2.83b 0.46a 3.10b 3.92b
WPGY and WPSY, water productivity with respect to grain and straw yield per ha per mm water input (irrigation plus rainfall); I1: aerobic soils with irrigation at 80-90% of field capacity throughout season, I2: aerobic soils with irrigation at 60-70% soil moisture during vegetative and 80-90% soil moisture from panicle initiation, and I3: aerobic soils with irrigation at 60-70% of field capacity soil moisture throughout season I4: traditional flooded rice (TFR); Mean values with different letters vary significantly according to Duncan’s multiple range test (P<0.05).

Paper Proceedings of Agri Animal 2013 - ISSN 2279-3682
334
21
Paper Proceedings of Agri Animal 2013 - ISSN 2279-3682
335
Possibility of artificial reproduction of sichel Peleus cultratus (L.) under controlled
conditions
Roman, KUJAWA1; Dariusz KUCHARCZYK, Andrzej MAMCARZ, Grażyna FURGAŁA-
SELEZNIOW
Department of Lake and River Fisheries, Faculty on Environmental Sciences, University of
Warmia and Mazury, Poland
E-mail address: (1) [email protected]
ABSTRACT Sichel Pelecus cultratus (L.) is the only representative of fish similar to flying tropical fish that
lives in Poland. In recent years, populations of this species in coastal bays of the Baltic Sea have
decreased dramatically. Similar changes have also been reported in waters of other countries in
Europe. According to the IUCN/WCU classification, sichel is considered to be endangered (EN).
It reproduces naturally in rivers and flow into coastal lagoons or in lagoons, and pelagic eggs are
carried by a water current. During this period, eggs, embryos and yolk sac larvae are highly
vulnerable to adverse environmental conditions.
In order to restore the local population of sichel, research on development of technologies of
reproduction under controlled conditions using hormonal stimulation with hCG, CPH, Ovopel
and Ovaprim has been carried out. Injections were performed as single doses of the preparations.
Twelve hours after the last injection, the spawners were checked. Milt for egg fertilization
originated from 5 males. The study shows that spawners are very sensitive to any kind of
manipulation and therefore the number of hormonl injections should be the lowest possible to
reduce stress. In the study reported in this paper, best results were obtained after application of
Ovopel.
Keywords: Pelecus cultratus, sichel,reproduction, hormonal injections
INTRODUCTION Controlled fish reproduction, especially artificial spawning, is now a popular method
applied to support populations of fish valuable for angling, fisheries and general economy, and to
restore natural populations of fish at risk of becoming extinct. Sichel Pelecus cultratus (L.) is
one of the fish species whose further existence in Europe, including Poland, is genuinely
threatened. Sichel is the only representative of indigenous cyprinid fish (Cyprinidae) whose body
conformation resembles that of the tropical marine flying fish Exocoetidae. The body is
extremely compressed and the fish is equipped with large pectoral fins, set horizontally. When in
danger, it can leap out of water, like tropical flying fish. It prefers flowing waters and brackish
marine lagoons or bays, in which the water salinity varies between 0.3 to 5.0‰.
The territory over which sichel used to dwell was quite vast, covering the systems of large rivers
in the basins of the Caspian Sea (the Ural, the Volga), the Black Sea (from the Kuban to the
Danube) and the Baltic Sea (from the Oder to the Neva Rivers) (Brylińska, 2000). Unfortunately,
over the recent years, the area populated by this species has been drastically diminishing,
especially in Europe. For many years, sichel has been treated as a common species in the inland
fisheries. Recently, however, the attitude to this fish has changed to the extent that now its
catches in most of coastal waters are forbidden.
Studies carried out in Poland on the ichthyofauna of our rivers have indicated that the abundance
of sichel has declined catastrophically (Witkowski, 1996, Witkowski and Heese, 1996,
Witkowski et al., 1999, 2000). According to the IUCN/WCU classification, sichel is an
endangered species (EN). It is listed in the Polish Red Book of Animals among the species
threatened with extinction. In is a protected species in all Polish waters except the Vistula
Paper Proceedings of Agri Animal 2013 - ISSN 2279-3682
336
Lagoon (Wieser, 1992, Witkowski et al., 1999), which has quite a strong population of this fish,
although even there its abundance fluctuates and tends to decrease.
The world literature provides modest information about sichel. The few reports that are available
deal mainly with the morphology and nutrition of representatives of this species in different
water bodies (Terlecki, 1980, 1987ab, Stolarski, 1995, Krzykawski and Wiecaszek, 1997a,b). In
contrast, data on reproduction of sichel under controlled conditions or on rearing up of juvenile
stages are lacking. Development of a biotechnology for reproduction of sichel is essential if we
intend to maintain and support endangered populations. Without successful protection
programmes that will include possible mass production of fish stock material of sichel under
controlled conditions, its status can quickly change form ‗threatened‘ to ‗extinct‘.
In the late 1990s, as the technology of keeping spawners under controlled conditions had been
improved and preparations containing synthetic GnRH analogues as well as a substance blocking
dopamine had become available (Kucharczyk et al., 2008), the range of research on reproduction
of rheophilic cyprinid fish increased considerably.
In the earliest studies on controlled reproduction of sichel, researchers tried to make use of the
experience gained while investigating reproduction of other cyprinid fish. Special attention was
paid to the results of studies on reproduction of rheophilic cyprinid fish in which spawners were
stimulated with homogenate from the carp‘s pituitary gland (Cieśla and Ostaszewska, 1997,
Kucharczyk et al., 1997, Kujawa et al., 1998). Also, the results of other research in which other
reproduction stimulants were used, e.g. Ovipel (Kucharczyk et al., 1999, Targońska-Dietrich et
al., 2004, Jamróz et al., 2008, Kujawa et al., 2011a), Ovaprim (Kucharczyk et al., 2007, Jamróz
et al., 2008) oraz hCG (Kucharczyk et al., 1996, Kucharczyk et al., 1997, Kucharczyk et al.
2008), were taken into consideration.
The purpose of this paper has been to present the results of reproduction of sichel under
controlled conditions.
MATERIAL AND METHODS
The reproduction experiments on sichel were carried out in spring 2012, at the
Aquaculture Hall (hatchery) of the Department of Lake and River Fisheries, Faculty on
Environmental Sciences, University of Warmia and Mazury, Poland. Sichel spawners were
obtained from the Vistula Lagoon at the end of May and beginning of June 2012, that is during
the natural spawning season of that fish. Fish were captured into stationary fishing gear - traps.
Having gently removed the fish from the fishing gear, they were placed in containers with water,
which was intensively aerated (Kujawa et al., 2011b).
All the fish handling was done with the utmost care. Fish taken out of a net act very
energetically, which makes them extremely vulnerable to loss of scales. Lack of scales on a large
area of the body disturbs osmotic regulation, which soon causes death of fish. Once the fishing
boat reached the shore, the fish were placed in transport sacks with water, filled up with oxygen.
On delivery to the laboratory, the fish were divided according to the gender and placed in
separate spawning tanks (Kujawa et al., 1999), slightly adapted to specific requirements of
sichel. The tanks, each holding 1000 dm3 of water, were made of plastic. They were equipped
with independent systems for water oxygenation, stepless water temperature control, outside
filters with a biological bed and UV lamps for water treatment. The temperature of water in the
tanks did not differ from the water temperature in the Vistula Lagoon at the time when the fish
were caught.
It was not difficult to distinguish male from female fish. Immediately before the spawning
season, females have a distinctly larger ventral part of the body and males produce small
amounts of semen when pressed near the genital papilla. Outside the spawning season, the sexual
dimorphism is very weakly marked. The reproductive readiness of females was determined by
visual examination and by intravitally sampling oocytes according to the methodology described
by Kujawa and Kucharczyk (1996). The sampled oocytes were immersed in Serra liquid to
obtain their full transparency. The oocytes were classified being in the third maturity stage
Paper Proceedings of Agri Animal 2013 - ISSN 2279-3682
337
(Bruzska and Bieniarz, 1977), which is an optimum moment for stimulation of cyprinid fish
(Kozłowski, 1994, Kujawa et al., 1998). 100 females and 30 males were used for the study.
Twelve hours after the fish were brought to the hatchery, the temperature of the water in the
tanks was raised to 18oC and stimulation with hormonal preparations began. Only females were
stimulated because males produced semen under slight pressure near the genital aperture.
Four preparations were applied:
- carp pituitary homogenate (CPH) (Argent, USA),
- a Hungarian preparation sold under the commercial name Ovopel, which contains an analogue
of the mammalian GnRH (D-Ala6, Pro
9-Net-mGnRH) and metoclopramide as an antagonist of
dopamine receptors (Unic-trade, Hangary) (Horvath et al., 1997),
- a Canadian preparation called Ovaprim, containing an analogue of the salmonid GnRH (D-
Arg6, Pro
9-Net-sGnRH) and domperidone as an antagonist of dopamine receptors (Syndel,
Canada) (Peter et al., 1993),
- hCG - human chorionic gonadotropin (Argent, USA).
Powdered homogenate of the carp‘s pituitary gland CPH and the preparation Ovopel was
made in a mortar and then mixed in 0.9% solution of NaCL. All hormonal injections were made
intraperitoneally, under the base of the ventral fin. Doses of each preparation are given in table 1.
Ovulating females from particular experimental groups were tagged with Floy-tags (Basavaraju
et al., 1998, Audun et al., 2002). Control group consisted of fish injected normal saline.
When the females had been injected a full dose of an appropriate hormonal preparation, the
water temperature in the tanks was raised to 20°C (± 0.5°C). The females were first checked 12
hours after the injections had been completed. Afterwards, they were checked every hour. All
manipulations were performed on individuals anesthetized with a solution of 2-phenoxyethanol
(0.3 ml 2-phenoxyethano dm-3
of water).
The spawn obtained from the females from particular groups was collected separately in
plastic containers and then fertilized with milt from a few males. Next, the spawn from each
female was rinsed several times with water from the hatchery and placed in 2.0 dm3Weiss
incubation mini-jars set in a closed laboratory circulation system (Kujawa et al., 2000). As the
spawn of sichel is not sticky, it is unnecessary to apply solutions which make spawn less
adhesive before it is placed in incubation jars. Out of each jar containing spawn from a particular
experimental treatment, samples were taken randomly to determine amounts of live spawn in the
eye-egged stage relative to the total number of spawn submitted to observations [%] and the
amount of actively swimming hatched larvae relative to the total number of spawn grains
submitted to observation [%].
During the experiment, the following parameters were recorded:
weight of the body of ovulating females before spawning during injections – the fish
were weighed on an electronic scales with accuracy to 0.5g.
latency period – the time elapsing between an application of a stimulating preparation
and the onset of ovulation [h],
number of ovulating females versus stimulated ones [%],
mass of the spawn obtained from each ovulating female – weighed on an electronic
scales with accuracy to 0.5 g;
mortality of ovulating females in each group [%].
The significance of differences within the analyzed characteristics was assessed by a one-
factorial analysis of variance and multiple comparisons of means according to Fisher‘s procedure
(LSD). The level of significance was set at 0.05. Statistical analyses were carried out using
Statistica 10.0 software.
RESULTS
The body mass of ovulating females used for experimental reproduction was within 402 and
558.5 g (Tab. 2). Differences in the mean body weight range of females from particular groups
Paper Proceedings of Agri Animal 2013 - ISSN 2279-3682
338
were relatively small. The statistical analysis did not reveal significant differences between
individual females from particular groups (Tab. 3).
The smallest number of ovulating females (2 individuals) among the females submitted to
stimulation was obtained in group IV, where hCG had been administered (Tab. 2). In the other
groups, the number of ovulating females ranged from 4 to 8, which corresponded to 20-40% of
the stimulated females in each group.
The shortest latency period was found in the case of females stimulated with Ovopel (group II).
In this group, ovulation started 12 hours after the administration of the hormonal preparation.
Spawning events were closely synchronized – all females spawned at the same time (Tab. 2). In
the other groups, the time elapsing from the injection of a given hormonal preparation to
ovulation was much prolonged, on average 2-3 hours longer. In group III, in which females were
stimulated with Ovaprim, ovulation was extended over a much longer period. The time between
the ovulation of the first and the last female was up to 5 hours.
High variation in the survivability of fish was found depending on the type of preparation used to
induce ovulation. The highest loss evidently occurred among the females stimulated with hCG.
In this group, 60% of the spawners were lost (Tab. 2). The survivability of females stimulated
with Ovopel was nearly two-fold higher. When Ovaprim or CHG were used, the survivability
was 50 and 60%, respectively.
The highest mass of spawn from a single female, 84.5 g on average, was achieved in group II,
where females had been stimulated with Ovopel (Tab. 3). The smallest spawn mass was
produced by females from groups III and IV, but the differences were not statistically significant.
The groups were not found to differ much in the survivability of spawn to the eye-egged stage
or in the number of swimming larvae (Tab. 3). Overall success of fertilization, expressed by the
number of live embryos in the yolk sac stage was relatively high, reaching 72.6% in group IV to
84.8% in group II, with statistically significant differences. Also, the number of actively
swimming hatched larvae was high. In group II, it was the highest (81.6%), falling to 68.9% in
group IV. These differences were also statistically significant.
DISCUSSION
In most of wild fish species, hormonal stimulation is recommended if our aim is to obtain sexual
products (Donaldson, 1996). This is especially important in the case of rheophilic cyprinid fish,
whose reproduction in a hatchery without hormonal injection is often impossible. Injections of
suspension of homogenized carp pituitary gland CPH administered in order to induce ovulation
in females and to obtain more semen from males are to some extent replaced today by
application of other hormonal preparations, such as Ovopel or Ovaprim (Horvath et al., 1997,
Ciesla, 1998, Brzuska and Adamek, 1999, Brzuska, 2000). Its manufacturer Syndel claims that
Ovaprim shortens and synchronizes the spawning period, reduces stress among fish, increases
production of milt and prolongs its activity as well as improves the success of spawning. Practice
however looks different. In many cases, especially among cyprinid fish, reproductive results
after administration of Ovaprim are not satisfactory, particularly in terms of the percentage of
ovulating females or the biological quality of spawn (Ahmad Tajuddin et al., 1986; Thalathiah et
al., 1988). Therefore, artificial or pure (isolates) hormones as well as combinations of hormones
and pituitary injections are more often applied. Effect of various hormonal preparations in
different dosages is tested in order to develop a biotechnique of reproduction. This seems of
special importance for cyprinid fish, which vary with respect to reproduction. Fish with a single
spawning event during a season must be often given hormonal preparations with dopamine
antagonists (Horvath et al., 1997, Brzuska and Grzywaczewski, 1999, Brzuska 1999, 2000,
2001). In contrast, fish which present a batch spawning strategy should be given other hormones
Paper Proceedings of Agri Animal 2013 - ISSN 2279-3682
339
or different doses of same hormones (Kucharczyk et al., 1996, 1997). Among the recommended
substances is human chorionic gonadotropin hCG, which is used as a hormone supporting
traditional methods of controlled reproduction. The first unsuccessful attempt at using this
gonadotropin as an exclusive substance stimulating ovulation of bream females was made by
Kucharczyk et al., (1997). However, subsequent studies in which hCG injections were combined
with injections of extract from pituitary glands yielded very good results. The reproductive
results were much better, consisting in a higher percentage of ovulating females, better biological
quality of spawn (a higher percentage of hatched larvae) or both (Ahmad Tajuddin et al., 1986;
Thalathiah et al., 1988). hCG injections are applied once or twice. When combined with
injections of pituitary extract, they are repeated two or three times. In recent years, a successful
attempt has been made to induce artificially ovulation in fish using a single injection of hCG.
Outstanding successes have been achieved in Cyprinidae, batch spawning fish, especially the
ones of the genus Carassius, and in Cobitidae (Kim et al., 1994, Kucharczyk et al., 1996) and
Percidae (Kucharczyk et al., 1996). Regarding artificial reproduction of marine fish, hGC
injections are most often applied twice at an interval of a few hours. The doses are highly varied,
ranging from 500 do 6000 IU kg-1
of the female body in total.
Studies on controlled reproduction of sichel using hormonal preparations have relied on the
research on reproduction of rheophilic cyprinid fish. However, some previous investigations had
demonstrated that multiple injections were unadvisable in this fish due to the stress they cause
among spawners and consequent inferior survivability. Administration of a single dose limits the
stress evoked by extra manipulation. In this study, other hormonal preparations applied were
extract from carp pituitary gland (CPH) and Ovopel. These preparations are very frequently used
in artificial reproduction of carp and cyprinid fish (Drori et al., 1994, Yaron, 1995, Kulikovsky et
al., 1996, Brzuska, 2000). Despite their similar final reproductive effects, these preparations
produce different influence on fish. CPH has a direct effect on the maturation of gametes, while
GnRH produces an indirect effect – by acting on endocrine glands of fish, which in turn produce
own gonadoliberns, thus leading to the maturation of gametes (Yaron, 1995, Targońska et al.,
2010).
Our tests have demonstrated that all the preparations, i.e. CPH, Ovopel, hCG and Ovaprim, can
be used to induce ovulation in sichel females captured in the wild. However, administration of
hCG only slightly affects the ovulation of sichel females while simultaneously causing high
mortality among spawners. The most effective method seems to be the administration of Ovopel.
Its effect in the sense of spawned females, synchronization of spawning incidents and amounts of
obtained spawn was much superior to that observed in the other groups. Because this preparation
was given to females in a single dose, the manipulations required to perform on spawners were
limited to the absolute minimum. Thus, an improved survivability of embryos in the yolk sac
stage derived from Ovopel-stimulated females was observed compared to the spawn produced by
females stimulated with the other preparations. It is extremely important to ensure that all
females from the same group coped well with all the manipulations associated with artificial
reproduction. Their survivability to the moment their sexual products were obtained reached
80% (tab. 3). Moreover, Ovopel is a relatively inexpensive preparation and its application is not
labour-consuming.
Raising the percentage of ovulating females under controlled reproduction is of great importance
because in many cases females which have not spawned but still survived are not suitable for
further breeding. Considering how much effort must be made to obtain spawners, the material
losses must be seen as high. At present, there is some ongoing research to rear sichel spawners
under controlled conditions. It is assumed that fish at least partly tames will be less sensitive to
handling during an artificial reproduction procedure. A similar effect of higher mortality among
ide captured from natural water bodies and stimulated with hormones is described by
Kucharczyk et al. (1999).
Paper Proceedings of Agri Animal 2013 - ISSN 2279-3682
340
The success of CPH was lower than that of Ovopel. The mortality of females was
surprisingly high. The effect of administration of Ovaprim should also be evaluated as less
satisfactory than attained after the stimulation of females with Ovopel. With respect to CPH
injections, 25% of ovulating females were obtained. The survivability of spawn was only slightly
lower than that of the spawn produced by females injected Ovopel. These results suggest that
Ovopel should be recommended to use on sichel females obtained from the wild. Ovipel is a
very effective preparation, while being also safe for stimulated females. The survivability of
females was the same as in the control sample. When hCG was used for stimulation of females,
its success rate was very low and so was the survivability of spawn or the percentage of
swimming larvae.
CONCLUSIONS
Sichel spawners were observed to be highly vulnerable to all manipulations associated with
reproduction under controlled conditions,
Ovopel proved to be the best stimulating preparation under controlled conditions,
When Ovopel was administered, the survivability of females under sexual products were
obtained was the highest.
High percentage of fertilization and high survivability of larvae were achieved in groups of
females stimulated with Ovopel or CPH.
Lower survivability of females was noticed after administration of hCG.
ACKNOWLEDGMENTS This research has been financed by the NCN the Polish National Science Centre under the
research project number NN 304 302 640
REFERENCES
Ahmad Tajuddin, Z., Chuah, H.P., Haron, A., Zahari, A., 1986. Induced breeding techniques for
some of the cyprinid foodfishes in Malacca. Proc. Intl. Conf. Dev. Managt. Trop. Living Aquat.
Resources. Serdang, Malaysia. 2-5 Aug., 1993: 44-51.
Audun H. Rikardsen, Mary Woodgate, Daniel A. Thompson 2002. A comparison of floy and soft
vialpha tags on hatchery arctic charr, with emphasis on tag retention, growth and survival.
Environmental Biology of Fishes, Volume 64, Issue 1-3, 269-273.
Basavaraju, Y Renuka Devi B S., Mukthayakka G, Purushotham Reddy L, Mair G C, Roderick E
E, Penman D .J. 1998. Evaluation of marking and tagging methods for genetic studies in carp J.
Biosci., 23, No.5, 585-593.
Brylińska, M. 2000. Ryby słodkowodne Polski (Polish inland water fish). PWN, Warszawa, 322-
328 (in Polish).
Brzuska E., Bieniarz K. 1977. A method for intravital determination of sexual maturity of carp
females for injections of carp pituitary homogenate. Broszury IRŚ Olsztyn, 105, 27 (In Polish).
Brzuska, E., Grzywaczewski, R., 1999. Artificial spawning of carp Cyprinus carpio L.:
differences between the effects on reproduction in females of Israeli strain Dor-70 and its cross-
breed treated with carp pituitary and Ovopel. Aquaculture Research, 30: 559-570.
Brzuska, E., Adamek, J., 1999. Artificial spawning of European catfish, Silurus glanis L.:
stimulation of ovulation using LHRH-a, Ovaprim and carp pituitary extract. Aquaculture
Research, 30: 59-64.
Paper Proceedings of Agri Animal 2013 - ISSN 2279-3682
341
Brzuska, E., 1999. Artificial spawning of herbivorous fish: use of an LHRH-a to induce
ovulation in grass carp Ctenopharyngodon idella (Valenciennes) and silver carp
Hypophthalmichthys molitrix (Valenciennes). Aquaculture Research, 30: 849-856.
Brzuska, E., 2000. Artificial spawning of carp Cyprinus carpio L.: differences between the
effects on reproduction in females of Polish and Hungarian provenance treated with carp
pituitary and (D-Ala6) GnRH ProNHEt (Kobarelin). Aquaculture Research, 31: 457-465.
Brzuska, E., 2001. Artificial spawning of carp (Cyprinus carpio L.); the use of Aquaspawn and
carp pituitary extract to induce ovulation in females of Lithuanian line B. Aquaculture Research,
32: 357-364.
Ciesla, M. 1998. The results of a study on methodology of artificial spawning of ide Leuciscus
idus (L.). In: Karpiowate Ryby Reofilne: PZW, Warszawa. (in Polish) 41-49.
Donaldson, E.M., 1996. Manipulation of reproduction farmed fish. Animal Reproduction
Science, 42: 381-392.
Drori, S., Ofir, M., Levavi-Sivan, B., Yaron, Z., 1994. Spawning induction in common carp
(Cyprinus carpio) using pituitary extract or GnRH superactive analogue combined with
metoclopramidae: analysis of hormone profile, progress of oocyte maturation and dependence on
temperature. Aquaculture, 119: 393-407.
Horvath, L., Szabo T., Burke J. 1997. Hatchery testing of GnRH analogue containing pellets on
ovulation in four cyprinid species. Pol. Arch. Hydrobiol., 44, 281-292.
Jamroz, M., Kucharczyk, D., Hakuc-Błażowska, A., Krejszeff, S., Kujawa, R., Kuprem, K.,
Kwiatkowski, M., Targońska, K., Żarski, D., Cejko, B.I., Głogowski, J. 2008. Comparing the
effectiveness of Ovopel, Ovaprim and LH-RH analogue used in the controlled reproduction of
Ide, Leucicus idus (L.). Arch. Pol. Fish., 16, 363-370.
Kim, S.D., Jo, J.Y., Lee, T.Y., 1994. Induction of triploidy in mud loach (Misgurnus mizolepis)
and its effect on gonad development and growth. Aquaculture, 120: 263-270.
Kozlowski B., 1994, Practice of hormonal stimulation of artificial spawning in cyprinid fishes.
Broszura Instytutu Rybactwa Srodladowego (Olsztyn). (In Polish).162, 41pp.
Krzykawski, S., Wiecaszek, B. 1997a. Biometric characteristics of sabrefish Pelecus cultratus
(L.), saithe Pollachius virens (L.) and sea bass Dicentrarchus labrax (L.) from new localities in
Polish waters. Acta Ichthyologica et Piscatoria. 2: 3-15.
Krzykawski, S., Więcaszek, B. 1997b. New locality of sabrefish Pelecus cultratus (L.1758)
(Pisces: Cyprinidae), a very rare species in northwest Poland. Przegląd Zoologiczny, 41 (1-
2):79-82.
Kucharczyk D., Kujawa R., Mamcarz A., Skrzypczak A., Wyszomirska E., 1998, Out of season
spawning of asp Aspius aspius, ide and chub under artificial conditions. In: Karpiowate Ryby
Reofilne:PZW, Warszawa. (In Polish). 57-64.
Kucharczyk, D., Kujawa, R., Mamcarz, A., Skrzypczak, A., Wyszomirska, E. 1996. Induced
spawning in perch (Perca fluviatilis L.) using carp pituitary extract and HCG. Aquaculture
Research., 27: 847-852.
Kucharczyk, D. Kujawa, R., Luczynski, M., Glogowski, J., Babiak, I., Wyszomirska , E. 1997.
Induced spawning in bream, Abramis brama (L.), using carp pituitary extract and hCG.
Aquaculture Research, 28: 139-144.
Kucharczyk, D., Kujawa, R., Mamcarz, A., Wyszomirska, E., Ulikowski, D. 1999. Artificial
spawning of ide (Leuciscus idus ) under controlled conditions. EJPAU 2(2),
http://www.ejpau.media.pl/volume2/issue2/fisheries/abs-05.html.
Paper Proceedings of Agri Animal 2013 - ISSN 2279-3682
342
Kucharczyk, D., Kujawa, R., Mamcarz, A., Targońska, K., Krejszeff, S., Wyszomirska, E., 2007.
Artifitial spawning of common tench (Tinca tinca L.) collected from wild populations. Pol. J.
Natur. Sc., 22 (1): 107-115.
Kucharczyk, D., Targońska, K., Żarski, D., Kujawa, R., Mamcarz, A. 2008. A review of the
reproduction biotechnology for fish from the genus Leuciscus. Arch. Pol. Fish., 16, 319-340.
Kujawa R., Kucharczyk D., 1996. A method of in vivo designating oocytes from cyprinid and
percid fish using catheter, Komunikaty Rybackie, Olsztyn, (In Polish).4: 20-21.
Kujawa, R., Mamcarz, A., Kucharczyk, D. 1998. Biotechnology of reproduction and breeding of
asp (Aspius aspius L.). Czech J. Anim. Sci., 43: 396-396.
Kujawa, R., Mamcarz, A., Kucharczyk, D., Skrzypczak, A. 2000. An experimental unit for
rearing of larval freshwater fish. Folia Universitatis Agriculturae Stetinensis, Piscaria, 205: 103-
108.
Kujawa, R., Kucharczyk, D., Mamcarz, A. 1999. A model system for keeping spawners of wild
and domestic fish before artificial spawning. Aquacultural Engineering, 20: 85-89.
Kujawa, R., Kucharczyk, D., Mamcarz, A., Żarski, D., Targońska, K. 2011a. Artificial spawning
of common tench Tinca tinca (Linnaeus, 1758), obtained from wild and domestic stocks.
Aquaculture International, 19: 513-521.
Kujawa, R., Pol, P., Mamcarz, A. Furgała-Selezniow, G. 2011b. Preliminary studies on fishing
and transport of the sichel (Pelecus cultratus L., 1758) for reproduction under controlled
conditions. In: Fish management in a water environmental. Ed.: Jankun M, Furgała – Selezniow
G., Woźniak M., Wiśniewska A. M Fish Will. 201-205.
Kulikovsky, Z., Martin, F.J.B., Yaron, Z.,, 1996. A comparison of two spawning-inducing agents
for common carp. Isr. J. Aquacult. - Bamidgeh 48: 108-111.
Peter, R.E., Lin, H.R., van der Kraak, G., Little, M., 1993. Releasing hormones, dopamine
antagonists and induced spawning. In: Muir, J.P., Roberts, R.J. (Eds.) Recent Advances in
Aquaculture, vol IV. Institute of Aquaculture, Blackwell Scientific Publications, Oxford, 25–30.
Stolarski, J. 1995. Sichel(Pelecus cultratus L.) from the Vistula Lagoon. Bulletin of Sea
Fisheries Institute, 2 (135): 11-21.
Targońska – Dietrich, K., Zielazny, T., Kucharczyk, D., Mamcarz, A., Kujawa, R. 2004. Out-of-
season spawning of cultured ide (Leuciscus idus L.) under controlled conditions. EJPAU 7(2),
http://www.ejpau.media.pl/volume7/issue2/fisheries/art-02.html.
Targońska, K., Kucharczyk, D., Kujawa, R., Mamcarz, A., Żarski, D. 2010.
Controlled reproduction of asp, Aspius aspius (L.) using luteinizing
hormone releasing hormone (LHRH) analogues with dopamine inhibitors.
Aquaculture. 306: 407-410.
Terlecki, J. 1980.Meristic and biometric features of Pelecus cultratus (L.) from the Vistula
Lagoon. Acta Acad. Agricult. Techn. Olst., Protect. Aqu. Pisc (In Polish).10: 193-203.
Terlecki, J. 1987a.Growth of Pelecus cultratus (L.) from the Vistula Lagoon. Acta Acad.
Agricult. Techn. Olst., Protect. Aqu. Pisc (In Polish).15: 27-36.
Terlecki, J. 1987b.Individual fecundity of Pelecus cultratus (L.) from the Vistula Lagoon. Acta
Acad. Agricult. Techn. Olst., Protect. Aqu. Pisc, (In Polish).15: 37-47.
Thalathiah, S., Ahmad, A.O., Zaini, M.S., 1988. Induced spawning techniques practised at Batu
Berendam, Melaka, Malaysia. Aquaculture, 74: 23-33.
Paper Proceedings of Agri Animal 2013 - ISSN 2279-3682
343
Wieser, T.1992. Polish Red Book of Animals. Red. Głowaciński Z. PWRiL, Warszawa. (In
Polish).
Witkowski, A. 1996. Changes in the fish fauna of Polish rivers: native species ind
introduced.Zoologica Poloniae, (In Polish) 41: 29-40.
Witkowski, A., Błachuta, J. Kotusz, J. 1999. Red List of freshwater fish fauna Polish.Chrońmy
Przyrodę Ojczystą (In Polish) (55), 4: 5-19.
Witkowski, A., Błachuta, J., Kotusz, J., Kusznierz, J. 2000. Lampreys and fishes of the upper
and middle Odra basin (Silesia, SW Poland). The present situation. Acta Hydrobiologica, 42:
283-303.
Witkowski, A., Heese, T. 1996. Protection of rare and endangered fish in Poland, current status
and perspectives.Zoologica Poloniae, (In Polish) 41: 1-195.
Yaron, Z. 1995. Endocrine control of gametogenesis and spawning induction in the carp.
Aquaculture, 129: 49-73.
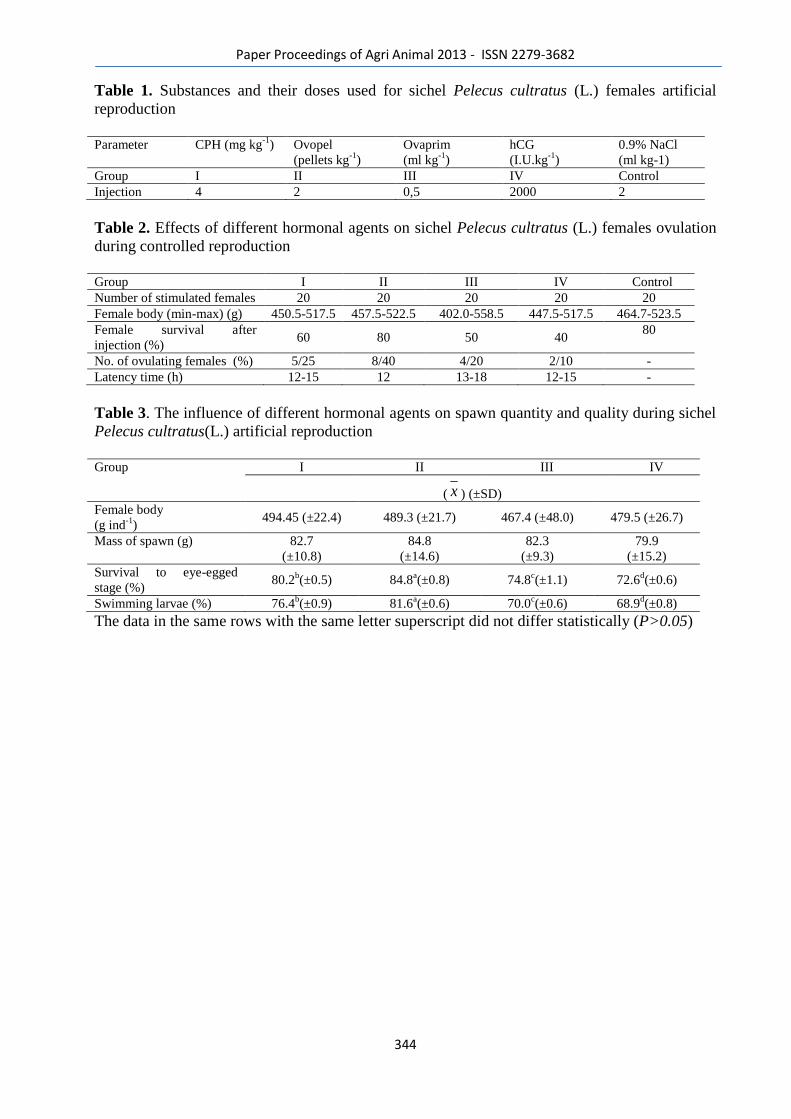
Paper Proceedings of Agri Animal 2013 - ISSN 2279-3682
344
Table 1. Substances and their doses used for sichel Pelecus cultratus (L.) females artificial
reproduction
Parameter CPH (mg kg
-1) Ovopel
(pellets kg-1
)
Ovaprim
(ml kg-1
)
hCG
(I.U.kg-1
)
0.9% NaCl
(ml kg-1)
Group I II III IV Control
Injection 4 2 0,5 2000 2
Table 2. Effects of different hormonal agents on sichel Pelecus cultratus (L.) females ovulation
during controlled reproduction
Group I II III IV Control
Number of stimulated females 20 20 20 20 20
Female body (min-max) (g) 450.5-517.5 457.5-522.5 402.0-558.5 447.5-517.5 464.7-523.5
Female survival after
injection (%) 60 80 50 40
80
No. of ovulating females (%) 5/25 8/40 4/20 2/10 -
Latency time (h) 12-15 12 13-18 12-15 -
Table 3. The influence of different hormonal agents on spawn quantity and quality during sichel
Pelecus cultratus(L.) artificial reproduction
Group I II III IV
( x ) (±SD)
Female body
(g ind-1
) 494.45 (±22.4) 489.3 (±21.7) 467.4 (±48.0) 479.5 (±26.7)
Mass of spawn (g) 82.7
(±10.8)
84.8
(±14.6)
82.3
(±9.3)
79.9
(±15.2)
Survival to eye-egged
stage (%) 80.2
b(±0.5) 84.8
a(±0.8) 74.8
c(±1.1) 72.6
d(±0.6)
Swimming larvae (%) 76.4b(±0.9) 81.6
a(±0.6) 70.0
c(±0.6) 68.9
d(±0.8)
The data in the same rows with the same letter superscript did not differ statistically (P>0.05)

Paper Proceedings of Agri Animal 2013 - ISSN 2279-3682
345
22
Paper Proceedings of Agri Animal 2013 - ISSN 2279-3682
346
Effects of Moringa oleifera (leaves and fruit)and a commercial herbal preparation on the
growth performance, intestinal microflora and carcass characteristics of Broiler chicken
L. S. David, J. K. Vidanarachchi, K. Samarasinghe and H. W. Cyril
ABSTRACT
A cage experiment was conducted to study the effects of Moringa oleifera and a commercial
herbal preparation Zigbir
on the performance of broiler chicken. Total of 224 (Cobb) day-old,
male chicks were distributed into seven experimental diets; diet without additives, 0.0125%
flavomycin (positive control), 0.1% and0.05% Moringa leaf powder (MLP), 0.035% Zigbir
,
0.1% and 0.05% Moringa fruit powder (MFP), in a complete randomized design. Each diet was
fed to 32 birds in four replicates. The body weights and feed consumption were recorded weekly
and the body weight gains and feed conversion ratio were calculated. Microbial study was
performed on day 38 for the enumeration of coliform and total viable anaerobic bacteria in
caecum and ileum contents. On day 42, weights of birds before killing, after bleeding and after
defeathering were recorded. Weights of viscera, carcass, abdominal and subcutaneous fat
contents were measured. The body weight gain and the feed intake were significantly increased
by 0.1% MFP and flavomycin. The positive control, Zigbir
and 0.1% MFP diet significantly
increased live weight and weights after bleeding and defeathering of broilers. No treatment
effects were observed on gut microflora, dressing percentage and the fat content except the
gizzard fat which was increased by 0.05% MLP.
Keywords: Broiler chicken, body weight, Moringa,Zigbir
Paper Proceedings of Agri Animal 2013 - ISSN 2279-3682
347
INTRODUCTION
Antibiotic growth promoters have been used to improve the productivity of poultry birds. The
disadvantage of using antibiotics in feeds is that resistant strains of microorganisms may
ultimately be developed. However, the prolonged use of antibiotics in livestock feeds at
recommended levels is unlikely to become a health hazard to the consumers of animal products
(FAO, 2004). Consequently, many countries have banned the use of sub-therapeutic levels of
antibiotics in animal rations. European Union banned the use of antibiotics as growth promoters
since 1st January 2006 (Castanon, 2007). To prevent a potential economic hardship and alleviate
problems associated with antibiotic resistance, phytogenic feed additives have been developed as
alternatives to antibiotics.
Moringa oleifera is the most widely cultivated plant species in the sub-Himalayan tracts of India,
Pakistan, Bangladesh and Afghanistan. This rapidly-growing tree was utilized by the ancient
Romans, Greeks and Egyptians. It is now widely cultivated and has become naturalized in many
locations in the tropics. According to Fuglie (1999), the many uses of Moringa include, alley
cropping (biomass production), animal forage, biogas, domestic cleaning agent, blue dye,
fencing, fertilizer, foliar nutrient, green manure, gum, honey and sugar cane juice clarifier,
honey, medicine, ornamental plantings, biopesticide, pulp, rope, tannin for tanning hides and
water purification. Moringa seed oil (yield 30-40% by weight), also known as Ben oil, is a sweet
non-sticking, non-drying oil that resists rancidity. Moringa leaves are the richest natural sources
of vitamins and minerals on the face of the earth. M. oleifera leaves are potential plant material
to enhance immune responses and improve intestinal health of broilers (Yang, et al.,
2006).Moringa should be promoted for the broiler chicken diet to improve nutrition and
strengthen immune functions.
Zigbir
is a commercially available herbal feed additive which is a synergistic blend of
phytochemical actives with performance enhancing characteristics. The four herbal plant
Paper Proceedings of Agri Animal 2013 - ISSN 2279-3682
348
partsAndrographis paniculata, Solanum nigrum, Phylanthus niruri and Boerhavia diffusa are
used in the preparation of Zigbir
. It has been shown that these herbs have beneficial effect on
liver health and productivity of animals (Kapil et al., 1993). In this regard, this experiment was
designed with the objective to study the beneficial effects of Moringa based feed additives as
well as the commercial herbal feed additive on the growth performance, gut microflora and
carcass quality of broiler chicken. It was hypothesized in this study that the selected herbal feed
additives would improve the growth performance of broiler chicken without any negative
consequence for broiler chicken‘s health and performance.
MATERIALS AND METHODS
Experimental Design and Animals
This experiment was carried out in the Poultry unit of the Department of Animal Science,
University of Peradeniya. Two hundred and twenty four Cobb strain, male broiler day old chicks
were purchased from Our Lady of Lourdes Poultry Breeding Farm (Pvt.) Ltd. in Badalgama and
assigned into seven dietary treatments in a complete randomized design. After two weeks of
brooding period in the electrically heated floor brooder, each group was divided into four
replicates of eight chicks in each. The chicks were housed in battery cages. The brooder
temperature was maintained at 32 °C during the first week using electric bulbs and gradually
decreased thereafter by switching off the lights during day times while considering the behaviour
pattern of the chicks. The relative humidity of the brooder and floor pens during the experiment
was around 70%.
Experimental Diet and Dietary Treatments
Corn-soya based broiler starter and finisher basal diets which served as the negative control diets
were formulated according to the ingredient composition given in Table 1. Five test diets were
then prepared by adding 0.05% and 0.1% MFP, 0.05% and 0.1% MLP and 0.035% commercial
herbal preparation Zigbir
to the basal diets. Basal diet supplemented with 0.0125% flavomycin
served as positive control, thus making seven experimental diets in total. Starter diets and
Paper Proceedings of Agri Animal 2013 - ISSN 2279-3682
349
finisher diets were offered adlibitum from day 1 to 21 and from day 22 to 42, respectively. Clean
water was provided adlibitum all the time. The birds were vaccinated twice for Gumboro
(Infectious Bursal Disease) on day 11 and 19 and for Newcastle Disease on day 7.
Table 1. Ingredient composition and estimated nutrient composition of broiler starter and
finisher basal diets
Ingredient Broiler Starter
%
Broiler Finisher
%
Maize 49.00 40.00
Rice polish 8.00 21.00
Fish meal 4.80 0.00
Soybean meal 27.70 21.00
Coconut poonac 5.00 10.00
Shell grit powder 2.08 2.70
DCP 0.50 0.40
L-Lysine 0.10 0.50
D.L.Methionine 0.20 0.40
Coconut oil 2.00 3.40
Salt 0.30 0.30
Coccidiostat 0.02 0.00
Vitamin and mineral Premix 0.30 0.30
Calculated nutrient composition
Metabolizable energy (kcal/kg) 3100 3100
Crude protein (%) 21.30 18.90
Calcium (%) 1.50 1.50
Phosphorus (%) 0.78 0.70
Lysine (%) 1.16 0.96
Methionine (%) 0.53 0.52
Methionine + Cystine (%) 0.93 0.89
Estimated composition, % of dry matter
Ether extract 7.24 10.09
Crude fibre 6.91 7.27
Ash 6.38 6.82
Nitrogen free extract 48.03 47.24
Body weights and feed intake
The average group body weights and feed consumption were recorded on 7th
, 14th
, 21st, 28
th, 35
th
and 42nd
days during the experimental period. Body weight gains and feed conversion ratio
(FCR) were calculated using these measurements.

Paper Proceedings of Agri Animal 2013 - ISSN 2279-3682
350
Intestinal microflora
On 38th
day the digesta samples of ileum and caeca were collected from one bird from each
replicate. Nearly one gram of digesta samples of the ileum and caecae were collected into pre
autoclaved, labeled and weighed sample bottles containing 10 mL peptone water. Standard
microbial enumeration methods were used for enumeration of Coliform and total viable
anaerobic bacteria. All the equipment such as, culture media, glassware and micro pipette tips
were autoclaved at 121 ºC for 20 minutes. Screw cap tubes were filled with 9ml peptone water
and autoclaved at 121 ºC for 20 minutes. According to the manufacturer‘s recommendations,
MacConkey agar (Oxoid CM0007, UK) and Wilkins-chalgren anaerobe agar (Oxoid CM0619,
UK) were prepared day before the sample collection and kept in the refrigerator. The gut
samples were brought to the microbiology laboratory as soon as possible and weighed. Sample
bottles were mixed thoroughly using vortex mixture. The dilution series of samples were
prepared (1 mL of sample into 9 mL of peptone water) up to required dilutions. Coliforms were
enumerated on MacCkonkey agar according to the spread plate technique and total viable
anaerobic bacteria were enumerated on Wilkins-Chalgren anaerobe agar according to the pour
plate method. Prepared Wilkins-Chalgren anaerobe agar culture plates were placed inside the
polycarbonate anaerobic jars along with AnaeroGen sachet (Oxoid AN0025A, UK), to maintain
the anaerobic conditions (<1% oxygen and 9-13% carbon dioxide). The Wilkins-chalgren
anaerobe agar culture plates were incubated at 37º C and colonies were counted after 72 hours
and MacConkey agar plates were incubated at 37 °C and colonies were counted after 24 hours.
The coliforms and total viable anaerobicbacteria colonies were identified by pink colour in the
MacConkey agar and straw colour in the Wilkins-chalgren anaerobe agar respectively.The
figures from the bacterial counts were recorded as Log CFU/g.
Carcass quality test
The birds were slaughtered at 42nd
day after withdrawal of feed 12 hours before slaughtering.
The birds were slaughtered by cutting the jugular vein. After complete bleeding, the weights of
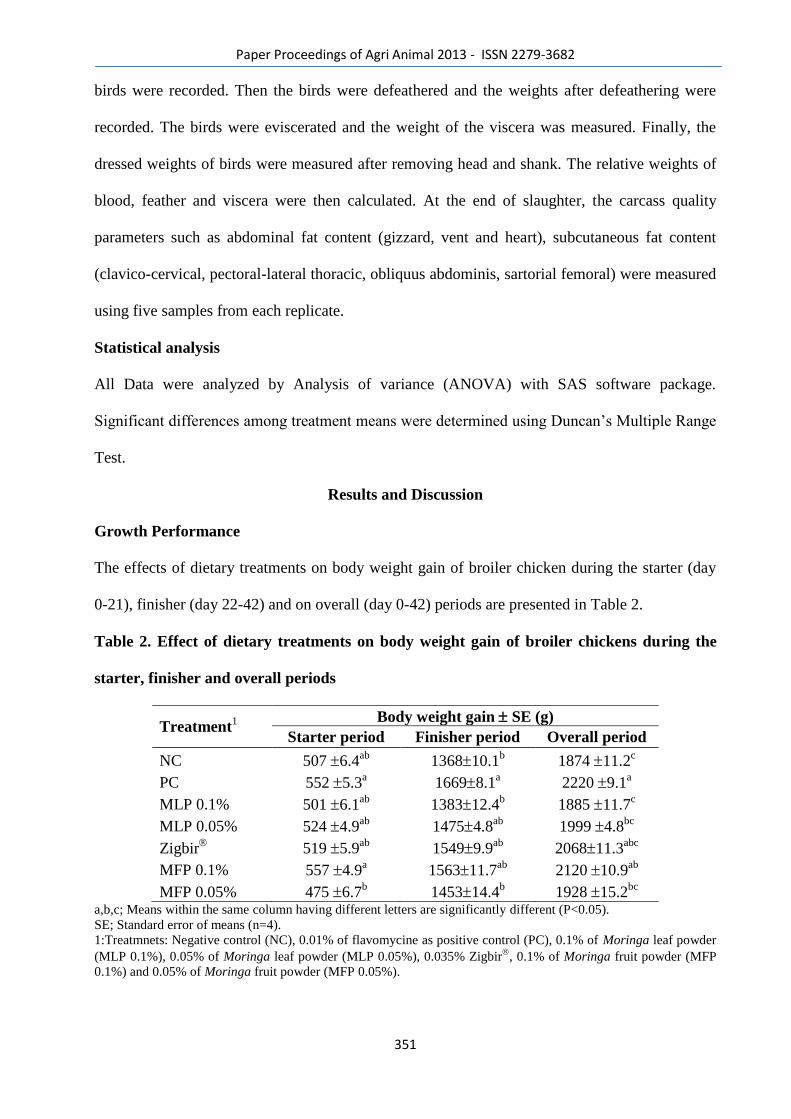
Paper Proceedings of Agri Animal 2013 - ISSN 2279-3682
351
birds were recorded. Then the birds were defeathered and the weights after defeathering were
recorded. The birds were eviscerated and the weight of the viscera was measured. Finally, the
dressed weights of birds were measured after removing head and shank. The relative weights of
blood, feather and viscera were then calculated. At the end of slaughter, the carcass quality
parameters such as abdominal fat content (gizzard, vent and heart), subcutaneous fat content
(clavico-cervical, pectoral-lateral thoracic, obliquus abdominis, sartorial femoral) were measured
using five samples from each replicate.
Statistical analysis
All Data were analyzed by Analysis of variance (ANOVA) with SAS software package.
Significant differences among treatment means were determined using Duncan‘s Multiple Range
Test.
Results and Discussion
Growth Performance
The effects of dietary treatments on body weight gain of broiler chicken during the starter (day
0-21), finisher (day 22-42) and on overall (day 0-42) periods are presented in Table 2.
Table 2. Effect of dietary treatments on body weight gain of broiler chickens during the
starter, finisher and overall periods
Treatment1
Body weight gain SE (g)
Starter period Finisher period Overall period
NC 507 6.4ab
136810.1b 1874 11.2
c
PC 552 5.3a 16698.1
a 2220 9.1
a
MLP 0.1% 501 6.1ab
138312.4b 1885 11.7
c
MLP 0.05% 524 4.9ab
14754.8ab
1999 4.8bc
Zigbir
519 5.9ab
15499.9ab
206811.3abc
MFP 0.1% 557 4.9a 156311.7
ab 2120 10.9
ab
MFP 0.05% 475 6.7b 145314.4
b 1928 15.2
bc
a,b,c; Means within the same column having different letters are significantly different (P<0.05). SE; Standard error of means (n=4).
1:Treatmnets: Negative control (NC), 0.01% of flavomycine as positive control (PC), 0.1% of Moringa leaf powder
(MLP 0.1%), 0.05% of Moringa leaf powder (MLP 0.05%), 0.035% Zigbir
, 0.1% of Moringa fruit powder (MFP
0.1%) and 0.05% of Moringa fruit powder (MFP 0.05%).
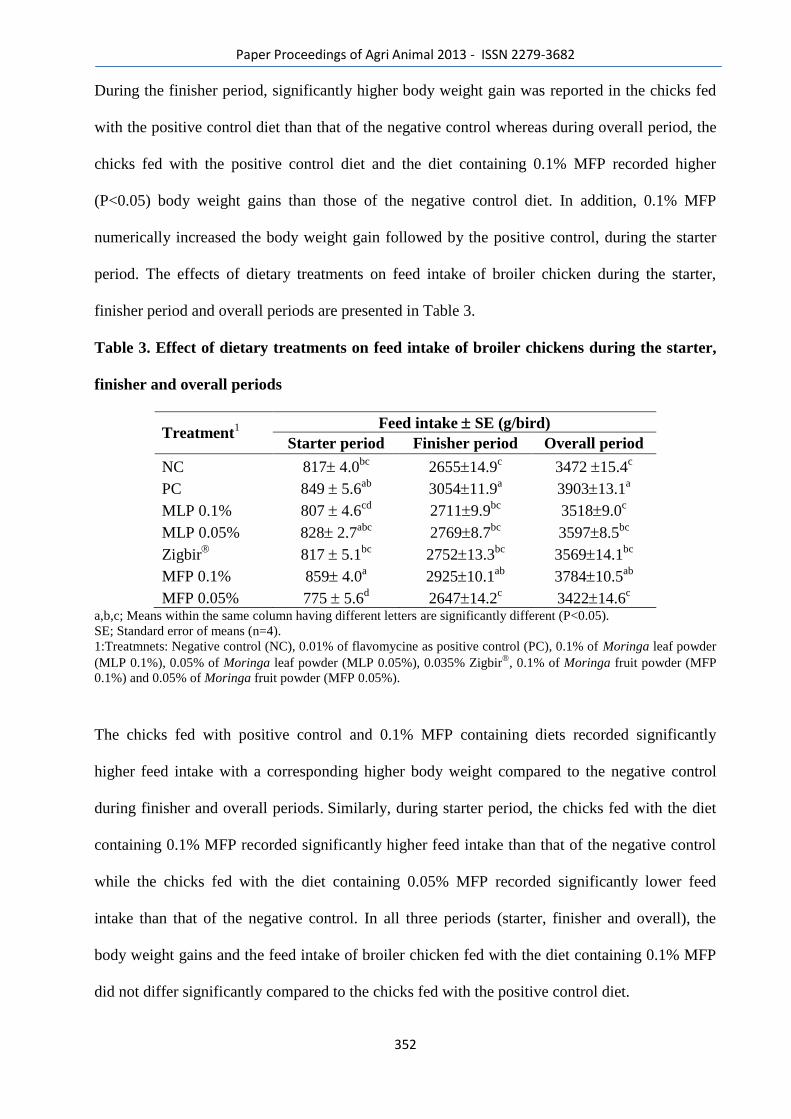
Paper Proceedings of Agri Animal 2013 - ISSN 2279-3682
352
During the finisher period, significantly higher body weight gain was reported in the chicks fed
with the positive control diet than that of the negative control whereas during overall period, the
chicks fed with the positive control diet and the diet containing 0.1% MFP recorded higher
(P<0.05) body weight gains than those of the negative control diet. In addition, 0.1% MFP
numerically increased the body weight gain followed by the positive control, during the starter
period. The effects of dietary treatments on feed intake of broiler chicken during the starter,
finisher period and overall periods are presented in Table 3.
Table 3. Effect of dietary treatments on feed intake of broiler chickens during the starter,
finisher and overall periods
Treatment1
Feed intake SE (g/bird)
Starter period Finisher period Overall period
NC 817 4.0bc
265514.9c 3472 15.4
c
PC 849 5.6ab
305411.9a 390313.1
a
MLP 0.1% 807 4.6cd
27119.9bc
35189.0c
MLP 0.05% 828 2.7abc
27698.7bc
35978.5bc
Zigbir
817 5.1bc
275213.3bc
356914.1bc
MFP 0.1% 859 4.0a 292510.1
ab 378410.5
ab
MFP 0.05% 775 5.6d 264714.2
c 342214.6
c
a,b,c; Means within the same column having different letters are significantly different (P<0.05).
SE; Standard error of means (n=4).
1:Treatmnets: Negative control (NC), 0.01% of flavomycine as positive control (PC), 0.1% of Moringa leaf powder
(MLP 0.1%), 0.05% of Moringa leaf powder (MLP 0.05%), 0.035% Zigbir
, 0.1% of Moringa fruit powder (MFP
0.1%) and 0.05% of Moringa fruit powder (MFP 0.05%).
The chicks fed with positive control and 0.1% MFP containing diets recorded significantly
higher feed intake with a corresponding higher body weight compared to the negative control
during finisher and overall periods. Similarly, during starter period, the chicks fed with the diet
containing 0.1% MFP recorded significantly higher feed intake than that of the negative control
while the chicks fed with the diet containing 0.05% MFP recorded significantly lower feed
intake than that of the negative control. In all three periods (starter, finisher and overall), the
body weight gains and the feed intake of broiler chicken fed with the diet containing 0.1% MFP
did not differ significantly compared to the chicks fed with the positive control diet.
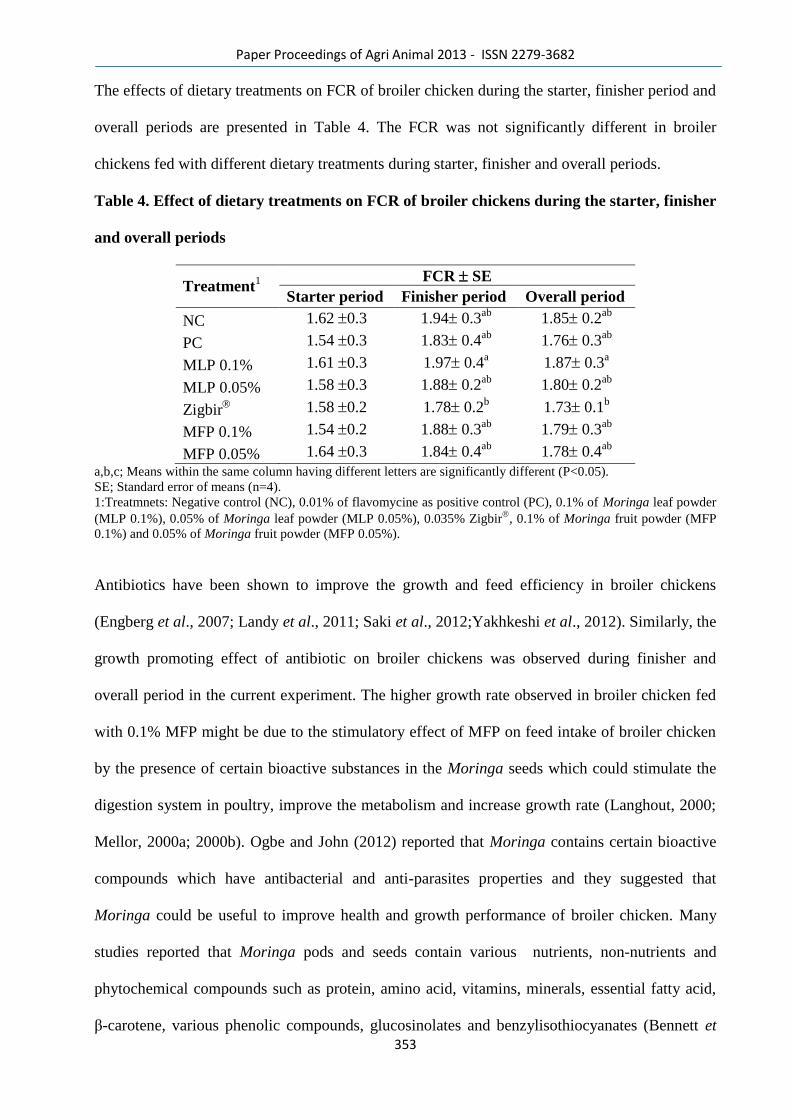
Paper Proceedings of Agri Animal 2013 - ISSN 2279-3682
353
The effects of dietary treatments on FCR of broiler chicken during the starter, finisher period and
overall periods are presented in Table 4. The FCR was not significantly different in broiler
chickens fed with different dietary treatments during starter, finisher and overall periods.
Table 4. Effect of dietary treatments on FCR of broiler chickens during the starter, finisher
and overall periods
Treatment1
FCR SE
Starter period Finisher period Overall period
NC 1.62 0.3 1.94 0.3ab
1.85 0.2ab
PC 1.54 0.3 1.83 0.4ab
1.76 0.3ab
MLP 0.1% 1.61 0.3 1.97 0.4a 1.87 0.3
a
MLP 0.05% 1.58 0.3 1.88 0.2ab
1.80 0.2ab
Zigbir
1.58 0.2 1.78 0.2b 1.73 0.1
b
MFP 0.1% 1.54 0.2 1.88 0.3ab
1.79 0.3ab
MFP 0.05% 1.64 0.3 1.84 0.4ab
1.78 0.4ab
a,b,c; Means within the same column having different letters are significantly different (P<0.05).
SE; Standard error of means (n=4).
1:Treatmnets: Negative control (NC), 0.01% of flavomycine as positive control (PC), 0.1% of Moringa leaf powder
(MLP 0.1%), 0.05% of Moringa leaf powder (MLP 0.05%), 0.035% Zigbir
, 0.1% of Moringa fruit powder (MFP
0.1%) and 0.05% of Moringa fruit powder (MFP 0.05%).
Antibiotics have been shown to improve the growth and feed efficiency in broiler chickens
(Engberg et al., 2007; Landy et al., 2011; Saki et al., 2012;Yakhkeshi et al., 2012). Similarly, the
growth promoting effect of antibiotic on broiler chickens was observed during finisher and
overall period in the current experiment. The higher growth rate observed in broiler chicken fed
with 0.1% MFP might be due to the stimulatory effect of MFP on feed intake of broiler chicken
by the presence of certain bioactive substances in the Moringa seeds which could stimulate the
digestion system in poultry, improve the metabolism and increase growth rate (Langhout, 2000;
Mellor, 2000a; 2000b). Ogbe and John (2012) reported that Moringa contains certain bioactive
compounds which have antibacterial and anti-parasites properties and they suggested that
Moringa could be useful to improve health and growth performance of broiler chicken. Many
studies reported that Moringa pods and seeds contain various nutrients, non-nutrients and
phytochemical compounds such as protein, amino acid, vitamins, minerals, essential fatty acid,
β-carotene, various phenolic compounds, glucosinolates and benzylisothiocyanates (Bennett et
Paper Proceedings of Agri Animal 2013 - ISSN 2279-3682
354
al., 2003; Farooq et al., 2007; Amaglo et al., 2010; Cheenpracha et al., 2010). Perhaps one or
combinations of these compounds would have positively affected the growth performance of
broiler birds. Moreover, the body weight gain of broiler chicken was increased with the
increasing percentage of MFP during starter, finisher and overall periods and this could be due to
a significant increase in the feed intake during these periods. Hence, it could be suggested that
the stimulatory effect of MFP on feed intake of broiler chicken would increase with the
increasing percentage of MFP. However, the body weight gain and feed intake of broiler chicks
during starter, finisher and overall periods were reduced with the increasing percentage of MLP.
The reduction in feed intake and body weight gain of broiler chicken with the increasing
percentage of MLP could be due to the increasing percentage of certain anti-nutritional
compounds in the MLP (Ogbe and John, 2012) with the increasing amounts. Similar reduction in
the body weight gain of broiler chicken was observed when high level (10%) of Moringa leaf
meal was added into broiler diets (Olugbemi et al., 2010).
The results related to the FCR of broiler chicken agree with the findings reported by Hernandez
et al. (2004), Sarica et al. (2005), Tekeli et al. (2006), Barreto et al. (2008) and Han et al. (2012)
in which they failed to observe significant differences in the FCR of broiler chicken fed with
antibiotic and plant extracts.Even though no significant differences observed for the FCR of
broiler chicken fed with different dietary treatments in the current experiment, the chicks fed
with the commercial herbal preparation Zigbir
recorded numerically the lowest FCR during
finisher and overall periods.
Intestine microflora
The effect of dietary treatments on ileal and caecal microflora of broiler chicken on day 38 is
presented in Table 5. The results revealed that none of the dietary treatments had any significant
effect on both caecal and ileal coliforms and total viable anaerobic bacteria counts.However, all
selected dietary treatments numerically reduced the caecal coliform counts in the broiler chicken
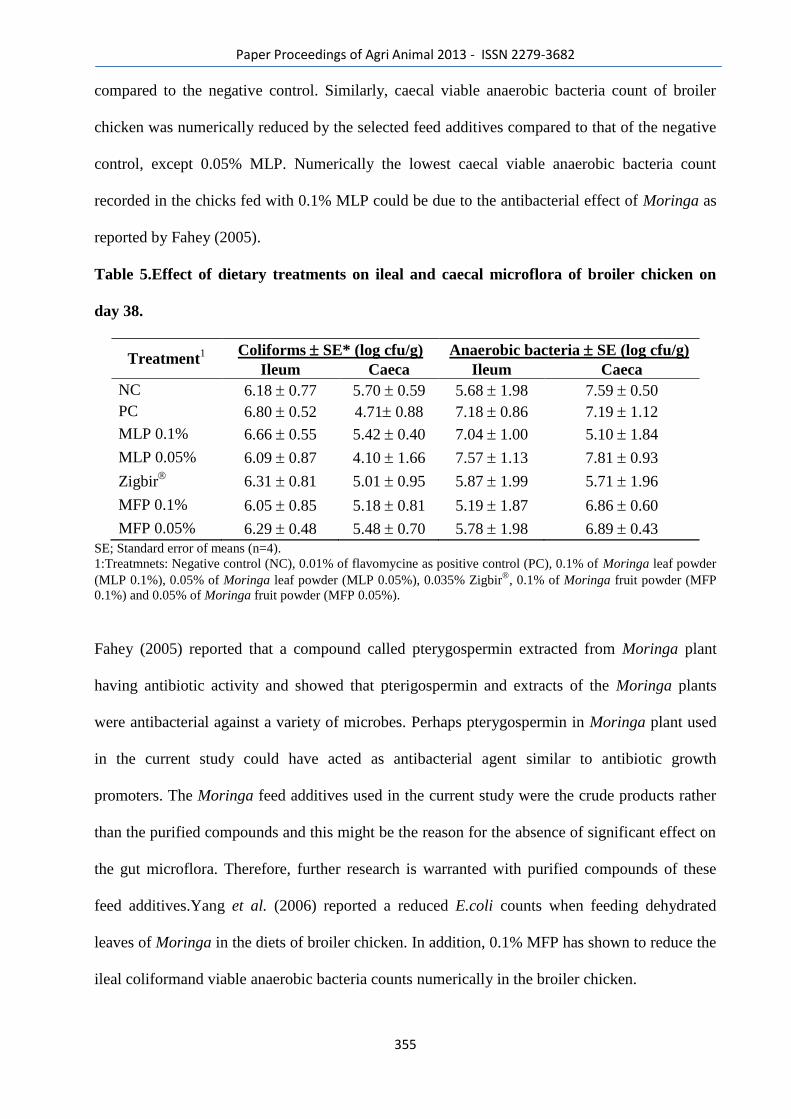
Paper Proceedings of Agri Animal 2013 - ISSN 2279-3682
355
compared to the negative control. Similarly, caecal viable anaerobic bacteria count of broiler
chicken was numerically reduced by the selected feed additives compared to that of the negative
control, except 0.05% MLP. Numerically the lowest caecal viable anaerobic bacteria count
recorded in the chicks fed with 0.1% MLP could be due to the antibacterial effect of Moringa as
reported by Fahey (2005).
Table 5.Effect of dietary treatments on ileal and caecal microflora of broiler chicken on
day 38.
Treatment1
Coliforms SE* (log cfu/g) Anaerobic bacteria SE (log cfu/g)
Ileum Caeca Ileum Caeca
NC 6.18 0.77 5.70 0.59 5.68 1.98 7.59 0.50
PC 6.80 0.52 4.71 0.88 7.18 0.86 7.19 1.12
MLP 0.1% 6.66 0.55 5.42 0.40 7.04 1.00 5.10 1.84
MLP 0.05% 6.09 0.87 4.10 1.66 7.57 1.13 7.81 0.93
Zigbir
6.31 0.81 5.01 0.95 5.87 1.99 5.71 1.96
MFP 0.1% 6.05 0.85 5.18 0.81 5.19 1.87 6.86 0.60
MFP 0.05% 6.29 0.48 5.48 0.70 5.78 1.98 6.89 0.43
SE; Standard error of means (n=4).
1:Treatmnets: Negative control (NC), 0.01% of flavomycine as positive control (PC), 0.1% of Moringa leaf powder
(MLP 0.1%), 0.05% of Moringa leaf powder (MLP 0.05%), 0.035% Zigbir
, 0.1% of Moringa fruit powder (MFP
0.1%) and 0.05% of Moringa fruit powder (MFP 0.05%).
Fahey (2005) reported that a compound called pterygospermin extracted from Moringa plant
having antibiotic activity and showed that pterigospermin and extracts of the Moringa plants
were antibacterial against a variety of microbes. Perhaps pterygospermin in Moringa plant used
in the current study could have acted as antibacterial agent similar to antibiotic growth
promoters. The Moringa feed additives used in the current study were the crude products rather
than the purified compounds and this might be the reason for the absence of significant effect on
the gut microflora. Therefore, further research is warranted with purified compounds of these
feed additives.Yang et al. (2006) reported a reduced E.coli counts when feeding dehydrated
leaves of Moringa in the diets of broiler chicken. In addition, 0.1% MFP has shown to reduce the
ileal coliformand viable anaerobic bacteria counts numerically in the broiler chicken.
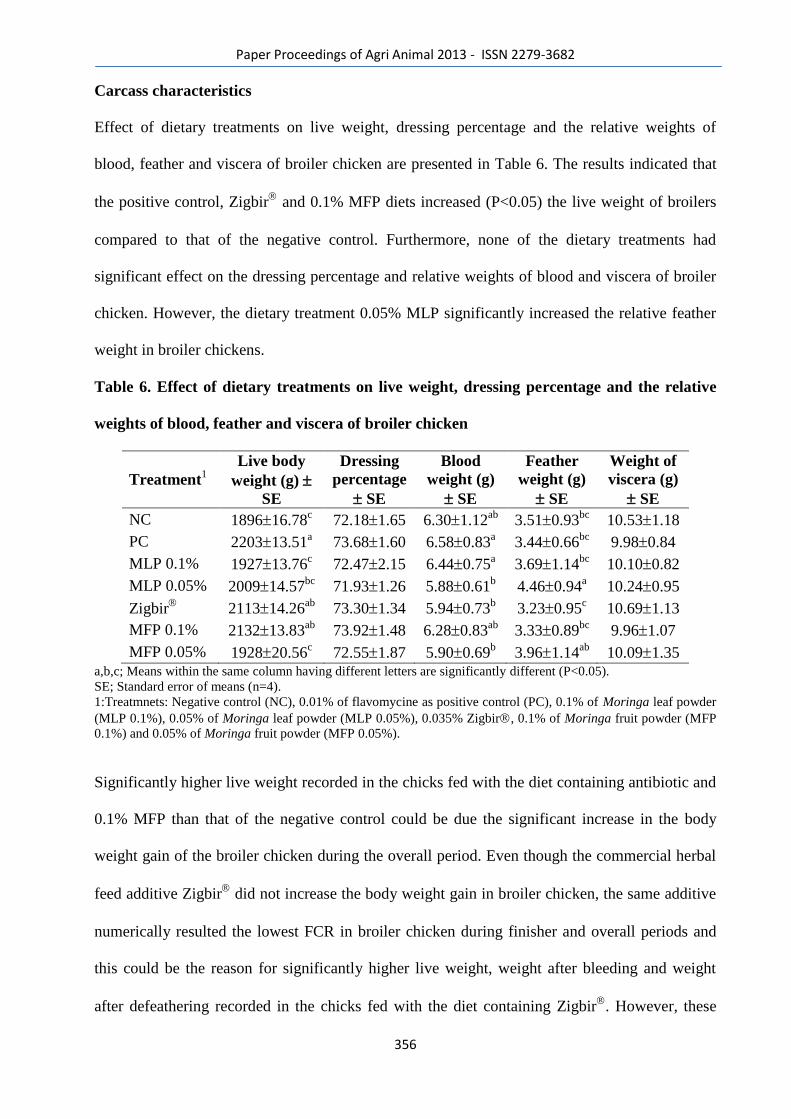
Paper Proceedings of Agri Animal 2013 - ISSN 2279-3682
356
Carcass characteristics
Effect of dietary treatments on live weight, dressing percentage and the relative weights of
blood, feather and viscera of broiler chicken are presented in Table 6. The results indicated that
the positive control, Zigbir
and 0.1% MFP diets increased (P<0.05) the live weight of broilers
compared to that of the negative control. Furthermore, none of the dietary treatments had
significant effect on the dressing percentage and relative weights of blood and viscera of broiler
chicken. However, the dietary treatment 0.05% MLP significantly increased the relative feather
weight in broiler chickens.
Table 6. Effect of dietary treatments on live weight, dressing percentage and the relative
weights of blood, feather and viscera of broiler chicken
Treatment1
Live body
weight (g)
SE
Dressing
percentage
SE
Blood
weight (g)
SE
Feather
weight (g)
SE
Weight of
viscera (g)
SE
NC 189616.78c 72.181.65 6.301.12
ab 3.510.93
bc 10.531.18
PC 220313.51a 73.681.60 6.580.83
a 3.440.66
bc 9.980.84
MLP 0.1% 192713.76c 72.472.15 6.440.75
a 3.691.14
bc 10.100.82
MLP 0.05% 200914.57bc
71.931.26 5.880.61b 4.460.94
a 10.240.95
Zigbir
211314.26ab
73.301.34 5.940.73b 3.230.95
c 10.691.13
MFP 0.1% 213213.83ab
73.921.48 6.280.83ab
3.330.89bc
9.961.07
MFP 0.05% 192820.56c 72.551.87 5.900.69
b 3.961.14
ab 10.091.35
a,b,c; Means within the same column having different letters are significantly different (P<0.05).
SE; Standard error of means (n=4).
1:Treatmnets: Negative control (NC), 0.01% of flavomycine as positive control (PC), 0.1% of Moringa leaf powder
(MLP 0.1%), 0.05% of Moringa leaf powder (MLP 0.05%), 0.035% Zigbir, 0.1% of Moringa fruit powder (MFP
0.1%) and 0.05% of Moringa fruit powder (MFP 0.05%).
Significantly higher live weight recorded in the chicks fed with the diet containing antibiotic and
0.1% MFP than that of the negative control could be due the significant increase in the body
weight gain of the broiler chicken during the overall period. Even though the commercial herbal
feed additive Zigbir
did not increase the body weight gain in broiler chicken, the same additive
numerically resulted the lowest FCR in broiler chicken during finisher and overall periods and
this could be the reason for significantly higher live weight, weight after bleeding and weight
after defeathering recorded in the chicks fed with the diet containing Zigbir
. However, these
Paper Proceedings of Agri Animal 2013 - ISSN 2279-3682
357
feed additives (positive control, 0.1% MFP and Zigbir
) did not show a significant effect on the
dressing percentage of broiler chicken except a numerical increase. Similar to the current study,
Sarica et al. (2005), Tekeli et al. (2006) andGarcia et al. (2007) did not find any significant
effect of various plant extracts and AGPs on the carcass yield of broiler chicken when fed with
the diet containing antibiotic and plant extracts. Cabuk et al. (2006) reported that, commercial
essential oil mixture had no significant effect on the carcass characteristics of broiler chicks
originating from young and old breeder flocks.
Effect of dietary treatments on fat content of broiler chicken is presented in Table 7. The results
revealed that the dietary herbal supplement of 0.05% MLP significantly increased the gizzard fat
content of broiler chicken when compared to that of the negative control diet. This increased
gizzard fat content could be due to alteration in the fatty acid profile of broiler chicken by 0.05%
MLP. Fat accumulation in abdominal area represents a waste product to consumers from the
nutritional and health points of view. According to Clement et al. (2010), the broilers with
heavy deposit of abdominal fat indicate poor finishing. In the current experiment, none of the
dietary treatments have significantly reduced the abdominal fat content of broiler chicken.
Ferrini et al. (2008) indicated that the dietary polyunsaturated fatty acid (PUFA) reduces the
abdominal fat content in broiler chicken. Even though the Moringa leaves contain considerable
amount of PUFA, the 0.05% of MLP used in the current study could be inadequate to reduce the
gizzard fat content. Perhaps, this could be the reason for increased gizzard fat content in the
broiler chickens fed with the diet containing 0.05% MLP. Furthermore, the results indicated that
none of the dietary treatments had significant effect on the subcutaneous fat content (neck, breast
and leg) of broiler chicken. However, in the current study all herbal feed additives numerically
reduced the subcutaneous fat content of broiler chicken than the negative control. Adisakwattana
and Chanathong (2011) reported a lipid-lowering mechanism of Moringaoleifera leaf extract.
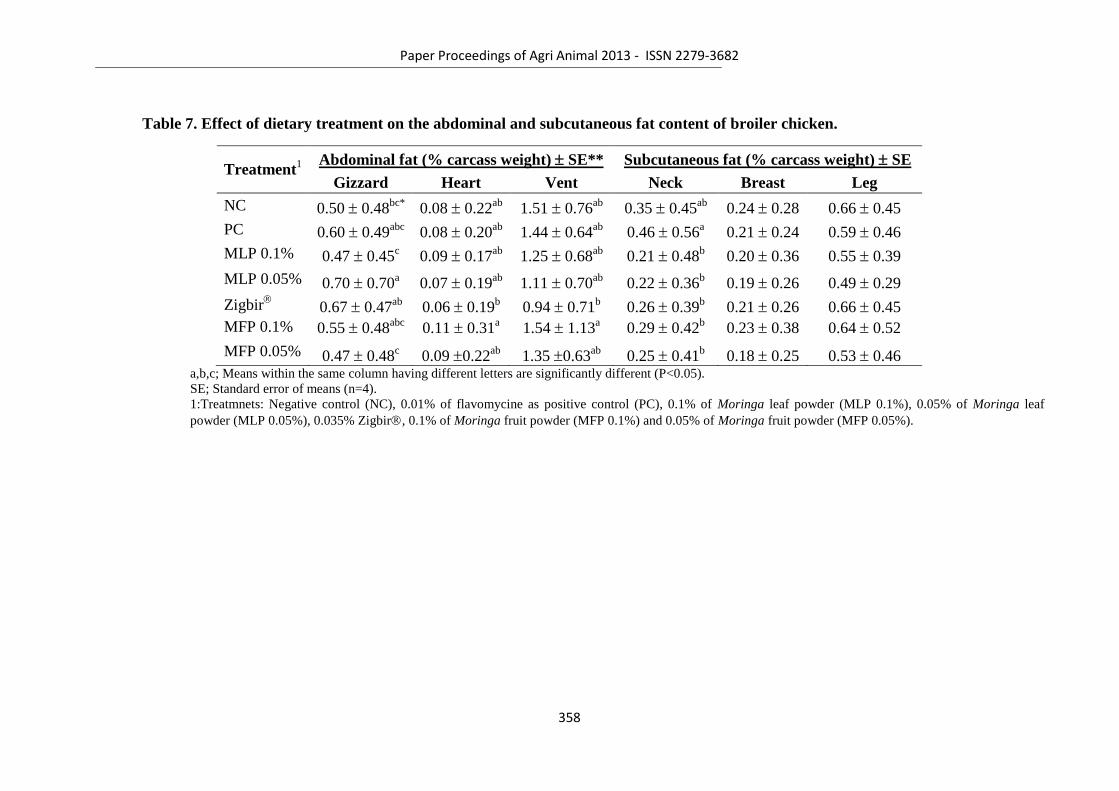
Paper Proceedings of Agri Animal 2013 - ISSN 2279-3682
358
Table 7. Effect of dietary treatment on the abdominal and subcutaneous fat content of broiler chicken.
Treatment1
Abdominal fat (% carcass weight) SE** Subcutaneous fat (% carcass weight) SE
Gizzard Heart Vent Neck Breast Leg
NC 0.50 0.48bc*
0.08 0.22ab
1.51 0.76ab
0.35 0.45ab
0.24 0.28 0.66 0.45
PC 0.60 0.49abc
0.08 0.20ab
1.44 0.64ab
0.46 0.56a 0.21 0.24 0.59 0.46
MLP 0.1% 0.47 0.45c 0.09 0.17
ab 1.25 0.68
ab 0.21 0.48
b 0.20 0.36 0.55 0.39
MLP 0.05% 0.70 0.70a 0.07 0.19
ab 1.11 0.70
ab 0.22 0.36
b 0.19 0.26 0.49 0.29
Zigbir
0.67 0.47ab
0.06 0.19b 0.94 0.71
b 0.26 0.39
b 0.21 0.26 0.66 0.45
MFP 0.1% 0.55 0.48abc
0.11 0.31a 1.54 1.13
a 0.29 0.42
b 0.23 0.38 0.64 0.52
MFP 0.05% 0.47 0.48c 0.09 0.22
ab 1.35 0.63
ab 0.25 0.41
b 0.18 0.25 0.53 0.46
a,b,c; Means within the same column having different letters are significantly different (P<0.05).
SE; Standard error of means (n=4).
1:Treatmnets: Negative control (NC), 0.01% of flavomycine as positive control (PC), 0.1% of Moringa leaf powder (MLP 0.1%), 0.05% of Moringa leaf
powder (MLP 0.05%), 0.035% Zigbir, 0.1% of Moringa fruit powder (MFP 0.1%) and 0.05% of Moringa fruit powder (MFP 0.05%).
Paper Proceedings of Agri Animal 2013 - ISSN 2279-3682
359
Conclusion
The study concludes that 0.1% MFP has the potential to stimulate the feed intake and thereby
increase the body weight and weight gain in broiler chickens similar to the antibiotic growth
promoter. In addition, the commercial herbal product Zigbir
likely to improve the live weight
in broiler chickens.
Acknowledgement
Financial support by Council for Agricultural Research Policy (CARP) to this experiment is
gratefully acknowledged.
References
Adisakwattana, S & Chanathong, B 2011, ‗α-glucosidase inhibitory activity and lipid-
lowering mechanisms of Moringa oleifera leaf extract‘, European Review for Medical and
Pharmacological Sciences, vol.15, pp. 803-808.
Amaglo, NK, Bennet, R N & Rosario, B 2010, ‗Profiling selected phytochemicals and
nutrients in different tissues of the multipurpose tree Moringa oleifera L. grown in Ghana‘,
Food Chemistry, vol.122, pp. 1047-1054.
Barreto, MSR, Menten, JFM, Racanicci, AMC, Pereira, PWZ & Rizzo, PV 2008, ‗Plant
extracts used as growth promoters in broilers‘, Brazilian Journal of Poultry Science, vol. 10,
no. 2, pp. 109-115.
Bennett, RN, Mellon, FA & Foidl, N 2003, ‗Profiling glucosinolates and phenolics in
vegetative and reproductive tissues of the multipurpose trees Moringa oleifera L. (horseradish
tree) and Moringa stenopetala‘, Journal of Agricultural and Food Chemistry, vol. 51, pp.
3546-3553.
Paper Proceedings of Agri Animal 2013 - ISSN 2279-3682
360
Cabuk, M, Bozkurt, M Alcicek, A, Cath, AU & Baser, KHC 2006, ‗Effect of a dietary
essential oil mixture on performance of laying hens in the summer season‘, South African
Journal of Animal Science, vol. 36, pp. 215-221.
Castanon, JI 2007, ‗History of the use of antibiotic as growth promoters in European poultry
feeds‘, Poultry Science, vol. 86, no.11, pp. 2466-2471.
Cheenpracha, S, Park, EJ & Yoshida, WY 2010, ‗Potential antiinflammatory phenolic
glycosided from the medicinal plant Moringa oleifera fruits‘, Bioorganic and Medicinal
Chemistry Letters, vol. 8, pp. 6598-6602.
Clement, IM, Ibrahim, DK, Joseph, I, Iro, N, Ibrahim, DM & Bruce, H 2010, ‗Carcass and
blood components of broiler chickens fed sorghum or millet as replacement for maize in the
semi arid zone of Nigeria‘, Agriculture and Biology Journal of North America, vol. 1, pp.
326-329.
Engberg, RM, Jensen, BB & Hojberg, O 2007, ‗Plant of the Juglandaceae family as
alternative to antibiotic growth promoters in broiler production‘, Proceedings of the 16th
European Symposium on Poultry Nutrition, August 26-30, 2007: World Poultry Science
Association, University of Aarhus, Denmark.
Fahey, JW 2005, ‗Moringa oleifera: A Review of the Medical Evidence for Its Nutritional,
Therapeutic, and Prophylactic Properties: Part 1‘, Trees for Life Journal, viewed 25 May
2012, <www.treesforlifejournal.org>.
Farooq, A, Sajid, L, Muhammad, A & Anwarul, HG 2007, ‗Moringa oleifera: a food plant
with multiple medicinal uses‘ Phototherapy Research, vol. 21, pp. 17-25.
Paper Proceedings of Agri Animal 2013 - ISSN 2279-3682
361
Ferrini, G, Baucells, MD, Esteve-Garcia, E and Barroeta, AC 2008, ‗Dietary polyunsaturated
fat reduces skin fat as well as abdominal fat in broiler chicken‘, Poultry Science, vol. 87, no.3,
pp. 528-535.
Food and Agriculture Organization of the United Nations, 2004, ‗Assessing quality and safety
of Animal feeds‘, FAO Animal production and health, viewed 22 January 2012,
<http://www.fao.org/docrep/007/y5159e/ y5159e00.htm#Contents>.
Fuglie, LJ (ed.) 2001, ‗The Miracle Tree: The Multiple Attributes of Moringa’, Dakar:
Senegal.
Han, X, Piao, XS, Zhang, HY, Li, PF, Yi, JQ, Zhang, Q and Li, P 2012, ‗Forsythia suspensa
extract has the potential to substitute antibiotic in broiler chicken‘, Asian-Australian Journal
of Animal Science, vol. 25, no. 4, pp. 569-576.
Hernandez, F, Madrid, J, Garcia, V, Orengo, J and Megisa, MD 2004, ‗Influence of two plant
extracts on broilers performance, digestibility and digestive organ size‘. Poultry Science, vol.
84, pp. 634-643.
Kapil, A, Koul, IB, Banerjee, SK & Gupta, BD 1993, ‗Antihepatotoxic effects of major
diterpenoids constituents of Andrographis paniculata‘, Bichemicl Pharmacology, vol. 46, pp.
182–185.
Landy, N, Ghalamkari, GH & Toghyani, M 2011, ‗Performance, carcass characteristics, and
immunity in broiler chickens fed dietary neem (Azadirachta indica) as alternative for an
antibiotic growth promoter‘, Short communication. Livestock Science, vol. 142, pp. 305-309.
Langhout, P 2000, ‗New additives for broiler chickens‘, Feed Mix, vol. 18, no. 6, pp. 24-27.
Paper Proceedings of Agri Animal 2013 - ISSN 2279-3682
362
Mellor, S 2000a, ‗Antibiotics are not the only growth promoters‘, World Poultry, 16(1): 14-
15.
Mellor, S. 2000b, ‗Nutraceuticals-alternatives to antibiotics‘, World Poultry, vol. 16, pp. 30-
33.
Ogbe AO & John PA 2012, ‗Effect of Polyherbal Aqueous Extracts (Moringa oleifera, Gum
arabic and wild Ganoderma lucidum) in Comparison with Antibiotic on Growth Performance
and Haematological Parameters of Broiler Chickens‘, Research Journal of Recent Sciences,
vol. 1, no. 7, pp. 10-18.
Olugbemi, TS, Mutayoba, SK & Lekule, FP 2010, ‗Effect of Moringa (Moringa oleifera)
inclusion in cassava based diets fed to broiler chickens‘, International Journal of Poultry
Science, vol. 9, no. 4, pp. 363-367.
Saki, AA, Harcini, RN, Rahmatnejad, E & Salary, J 2012, ‗Herbal additives and organic acids
as antibiotic alternatives in broiler chickens diet for organic production‘,African Journal of
Biotechnology, vol.11, no. 8, pp. 2139-2145.
Sarica, S, Ciftci, A, Demir, E, Kilinc, K & Yildirim, Y 2005, ‗Use of an antibiotic growth
promoter and two herbal natural feed additives with and without exogenous enzymes in wheat
based broiler diets‘, South African Journal of Animal Science, vol. 35, pp. 61-72.
Tekeli, A, Celik, L, Kutlu, HR, & Gorgulu, M, 2006, ‗Effect of dietary supplemental plant
extracts on performance, carcass characteristics, digestive system development, intestinal
microflora and some blood parameters of broiler chicks‘, Proceedings of 12th European
Poultry Conference, September 10-14, 2006: Verona, Italy.
Yakhkeshi, S, Rahimi, S and Hemati Matin, HR 2012, ‗Effects of Yarrow (Achillea
millefolium L.), Antibiotic and Probiotic on Performance, Immune Response, SerumLipids
Paper Proceedings of Agri Animal 2013 - ISSN 2279-3682
363
and Microbial Population of Broilers‘, Journal of Agricultural Science and Technology, Vol.
14, pp. 799-810.
Yang, R, Chang, LC, Hsu, JC, Weng, BBC, Palada, MC, Chadha, ML & Levasseur, V, 2006,
‗Nutritional and Functional Properties of Moringa Leaves -From Germplasm, to Plant, to
Food, to Health‘, Moringa and other highly nutritious plant resources: Strategies, standards
and markets for a better impact on nutrition in Africa. Accra, Ghana. viewed 25 May 2012,
<www.treesforlifejournal.org>.

Paper Proceedings of Agri Animal 2013 - ISSN 2279-3682
364
23
Paper Proceedings of Agri Animal 2013 - ISSN 2279-3682
365
Effectiveness of farm video programmes of Acharya N.G. Ranga
AgriculturalUniversity (ANGRAU) on Oyster mushroom cultivation
R.NEELA RANI AND Dr. I. SREENIVASA RAO
Department of Agricultural Extension, College of Agriculture, Acharya N.G. Ranga Agricultural
University, Rajendranagar, Hyderabad- 500030
ABSTRACT
The study was conducted in the Mahaboobnagar district of Andhra Pradesh during
2012. The study indicated that majority of the respondents (53.75%) had low level knowledge
with regard to oyster mushroom cultivation before exposure to video programme and
(56.88%) were in the category of medium level of knowledge on oyster mushroom cultivation
after exposure to video programme in experimental group. In case of control group majority
of the respondents (77.50%) and (62.50%) were in the category of low level knowledge with
regard to oyster mushroom cultivation before exposure and after exposure (not exposed) to
video programme .The study indicated that there was significant difference of mean scores of
knowledge between before exposure and after exposure in oyster mushroom cultivation in
experimental group. Whereas Non significant in control group.
INTRODUCTION
Video education has got tremendous scope for changing the knowledge and attitude of the
farmers and farm women. Many agricultural universities, research institutions and other training
centers have started making use of video for educating their clientele groups for successful results, as
the research findings on methods of exposure to extension information of farm families indicated that
changing behavior increases from 35 per cent to 98 per cent. Experience has confirmed that video
boosts self-confidence and encourages self-development. Thus video can easily be used to
transmit knowledge to farm women, even information can be updated as per requirement any
number of times. Thus video not only saves time and money in repeating the things again and
again but also helps in presenting educational information in an interesting and coherent
manner. Keeping this in view, an Experimental design was used for studying the effectiveness of farm
video programmes of ANGRAU in respect of knowledge on oyster mushroom cultivation .
MATERIAL AND METHODS
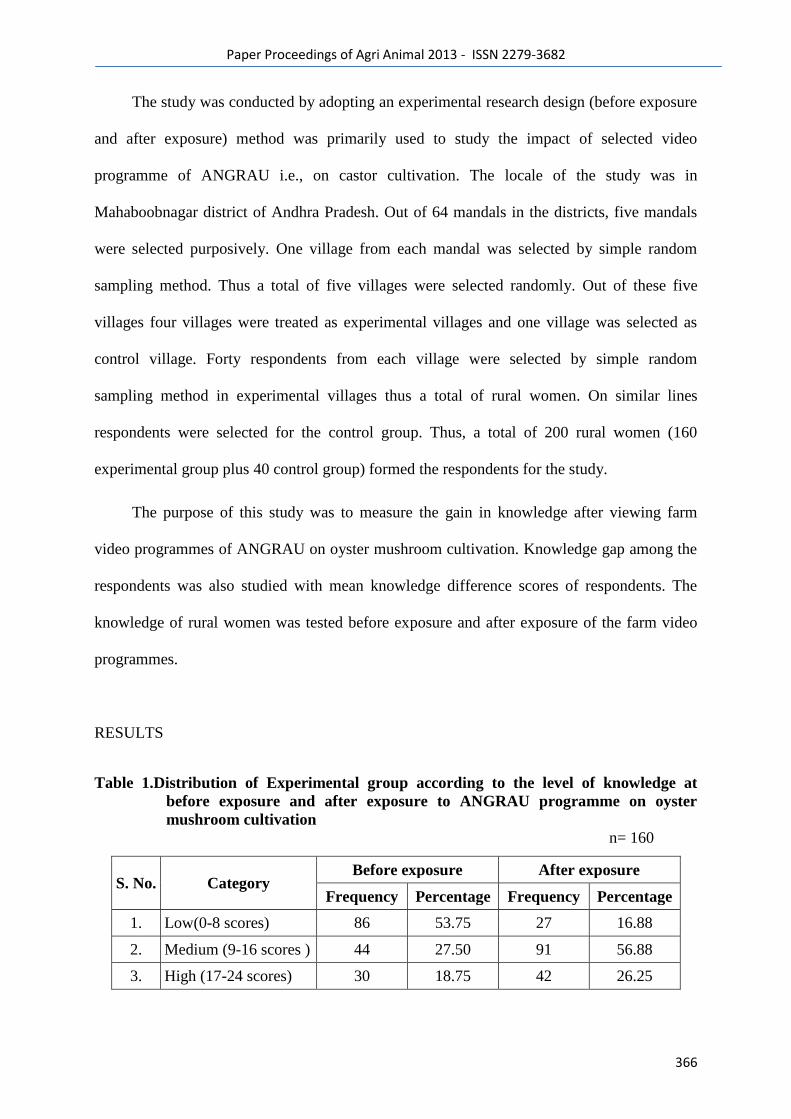
Paper Proceedings of Agri Animal 2013 - ISSN 2279-3682
366
The study was conducted by adopting an experimental research design (before exposure
and after exposure) method was primarily used to study the impact of selected video
programme of ANGRAU i.e., on castor cultivation. The locale of the study was in
Mahaboobnagar district of Andhra Pradesh. Out of 64 mandals in the districts, five mandals
were selected purposively. One village from each mandal was selected by simple random
sampling method. Thus a total of five villages were selected randomly. Out of these five
villages four villages were treated as experimental villages and one village was selected as
control village. Forty respondents from each village were selected by simple random
sampling method in experimental villages thus a total of rural women. On similar lines
respondents were selected for the control group. Thus, a total of 200 rural women (160
experimental group plus 40 control group) formed the respondents for the study.
The purpose of this study was to measure the gain in knowledge after viewing farm
video programmes of ANGRAU on oyster mushroom cultivation. Knowledge gap among the
respondents was also studied with mean knowledge difference scores of respondents. The
knowledge of rural women was tested before exposure and after exposure of the farm video
programmes.
RESULTS
Table 1.Distribution of Experimental group according to the level of knowledge at
before exposure and after exposure to ANGRAU programme on oyster
mushroom cultivation
n= 160
S. No. Category Before exposure After exposure
Frequency Percentage Frequency Percentage
1. Low(0-8 scores) 86 53.75 27 16.88
2. Medium (9-16 scores ) 44 27.50 91 56.88
3. High (17-24 scores) 30 18.75 42 26.25
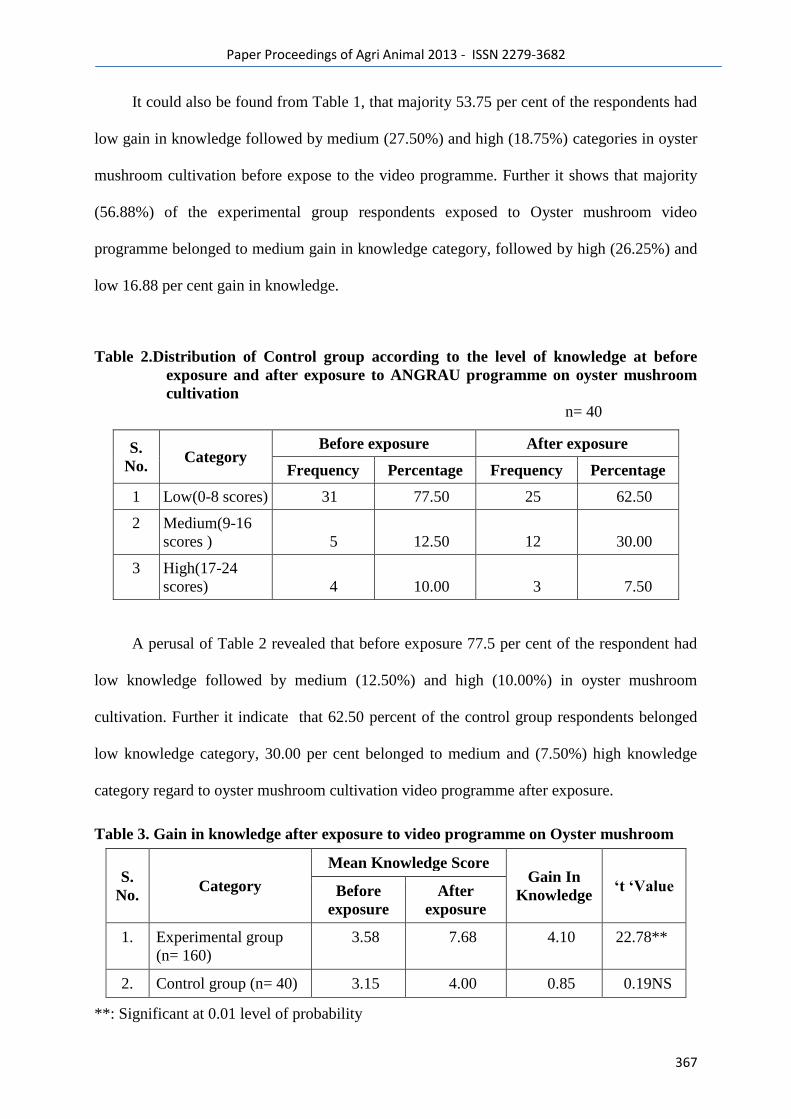
Paper Proceedings of Agri Animal 2013 - ISSN 2279-3682
367
It could also be found from Table 1, that majority 53.75 per cent of the respondents had
low gain in knowledge followed by medium (27.50%) and high (18.75%) categories in oyster
mushroom cultivation before expose to the video programme. Further it shows that majority
(56.88%) of the experimental group respondents exposed to Oyster mushroom video
programme belonged to medium gain in knowledge category, followed by high (26.25%) and
low 16.88 per cent gain in knowledge.
Table 2.Distribution of Control group according to the level of knowledge at before
exposure and after exposure to ANGRAU programme on oyster mushroom
cultivation
n= 40
S.
No. Category
Before exposure After exposure
Frequency Percentage Frequency Percentage
1 Low(0-8 scores) 31 77.50 25 62.50
2 Medium(9-16
scores ) 5 12.50 12 30.00
3 High(17-24
scores) 4 10.00 3 7.50
A perusal of Table 2 revealed that before exposure 77.5 per cent of the respondent had
low knowledge followed by medium (12.50%) and high (10.00%) in oyster mushroom
cultivation. Further it indicate that 62.50 percent of the control group respondents belonged
low knowledge category, 30.00 per cent belonged to medium and (7.50%) high knowledge
category regard to oyster mushroom cultivation video programme after exposure.
Table 3. Gain in knowledge after exposure to video programme on Oyster mushroom
S.
No. Category
Mean Knowledge Score Gain In
Knowledge ‘t ‘Value Before
exposure
After
exposure
1. Experimental group
(n= 160)
3.58 7.68 4.10 22.78**
2. Control group (n= 40) 3.15 4.00 0.85 0.19NS
**: Significant at 0.01 level of probability
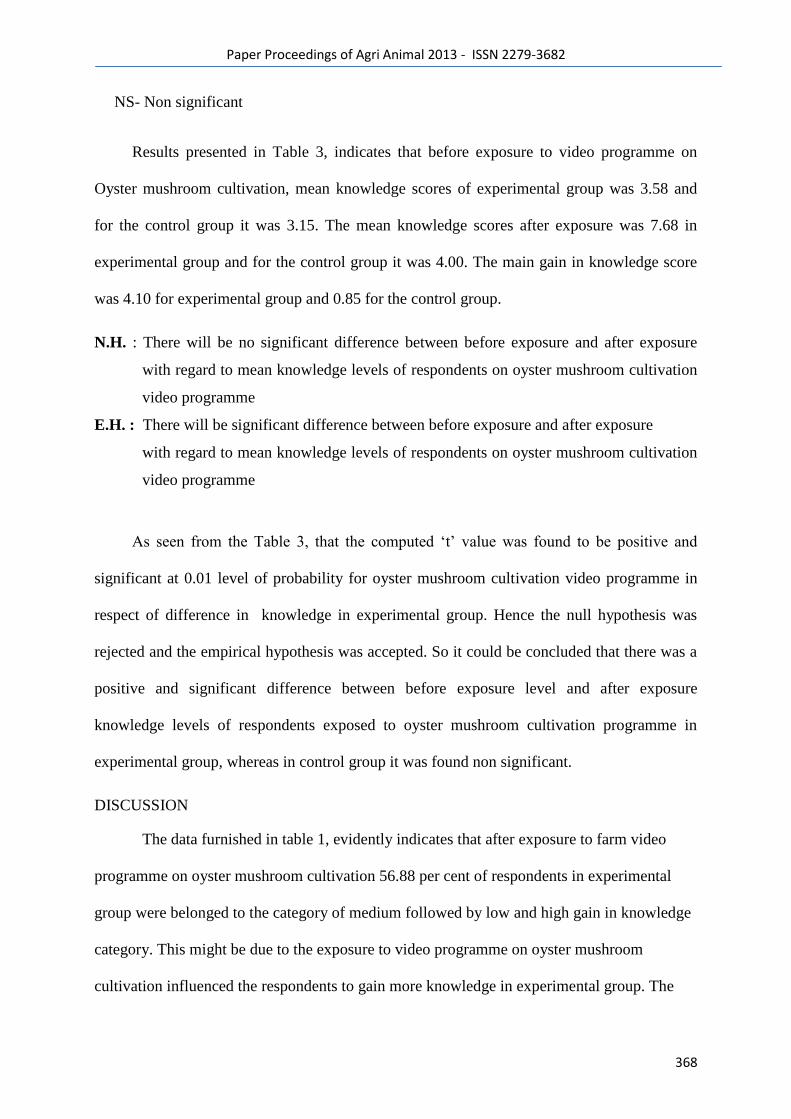
Paper Proceedings of Agri Animal 2013 - ISSN 2279-3682
368
NS- Non significant
Results presented in Table 3, indicates that before exposure to video programme on
Oyster mushroom cultivation, mean knowledge scores of experimental group was 3.58 and
for the control group it was 3.15. The mean knowledge scores after exposure was 7.68 in
experimental group and for the control group it was 4.00. The main gain in knowledge score
was 4.10 for experimental group and 0.85 for the control group.
N.H. : There will be no significant difference between before exposure and after exposure
with regard to mean knowledge levels of respondents on oyster mushroom cultivation
video programme
E.H. : There will be significant difference between before exposure and after exposure
with regard to mean knowledge levels of respondents on oyster mushroom cultivation
video programme
As seen from the Table 3, that the computed ‗t‘ value was found to be positive and
significant at 0.01 level of probability for oyster mushroom cultivation video programme in
respect of difference in knowledge in experimental group. Hence the null hypothesis was
rejected and the empirical hypothesis was accepted. So it could be concluded that there was a
positive and significant difference between before exposure level and after exposure
knowledge levels of respondents exposed to oyster mushroom cultivation programme in
experimental group, whereas in control group it was found non significant.
DISCUSSION
The data furnished in table 1, evidently indicates that after exposure to farm video
programme on oyster mushroom cultivation 56.88 per cent of respondents in experimental
group were belonged to the category of medium followed by low and high gain in knowledge
category. This might be due to the exposure to video programme on oyster mushroom
cultivation influenced the respondents to gain more knowledge in experimental group. The
Paper Proceedings of Agri Animal 2013 - ISSN 2279-3682
369
video programme has affected both the senses of eyes and ears in the form of video clippings
involving motion. The details on such clippings were clearly shown to the rural women,
where more senses are involved then the learning will be higher. The above may be
considered as the reasons for gaining more knowledge through video presentation. A Chinese
proverb says.: "Tell me, I forget. Show me, I remember. Involve me, I understand". Unless a
person bestows rapt attention he or she will not be able to gain complete information.
However, the rural women falling in low gain in knowledge of oyster mushroom cultivation
should be encouraged to bestow careful attention to grasp well while seeing video
presentation. The result was in conformity with Vikram (2000) and Reddy (2002).
The findings of the table 2 that before and after exposure to the farm video programme
on oyster mushroom cultivation the knowledge of respondents in control group was low
followed by medium and high gain in knowledge category. This might be due to knowledge
level low i.e. they have absolutely little ideas about the concepts of oyster mushroom
cultivation. This could be probably because they have not been exposed to these concepts.
Similar observation made by Singh and Verma (1987).
From the findings of the table 3, it could be inferred that there was positive significant
difference between the before exposure mean knowledge scores and after exposure score. The
probable reason could be that the experimental groups were exposed to the farm video
programme giving vivid information on the subject oyster mushroom cultivation might be that
the selected subject proven one having no controversy, consists of many sub items. The item
wise answers as a response to the sequence of clear questions with a variability in the voice
and without voice overlapping might have attracted the viewers to concentrate with full
attention and thereby gain in knowledge. Further due to their satisfaction with the suitability
Paper Proceedings of Agri Animal 2013 - ISSN 2279-3682
370
of the content to their needs as well as their level of understanding, coverage of the contents
as most satisfied, with respect to classification of content into parts, adequate message and
clarity of the picture. Whereas the control group was not exposed and found to be non
significant. This finding were in conformity with the findings of Mrutyunjayam (1987),
Cherian and Chandra (1989) and Pandian et al. (2002).
REFERENCES
Mrutyunjayam, N. 1987. A critical analysis of farm telecast programme - An experimental
study.
Ph.D Thesis.Andhra Pradesh Agricultural University, Hyderabad.
Singh, P and Verma, T. 1987. Effectiveness of synchronized tape-cum- slide projector for
imparting nutritional information to rural women. Indian Journal of Extension
Education.vol.23, pp.17-22.
Cherian, A and Chandra, A.1989. Impact of television on acquisition and retention of
knowledge by rural people. Indian journal of Extension Education. Vol 25, pp. 29-32.
Vikram, K. 2000. A study on Annadata Velugubata- A district education programme in
Chittoor district of Andhra Pradesh. M.Sc. (Ag.) Thesis. Acharya N.G. Ranga
Agricultural University, Hyderabad.
Pandian, S., Radhakrishnan, T and Sivakumar, P.S. 2002. Video education an tool for
knowledge gain. Agricultural Extension Review. Vol 14, no.3, pp. 3-5.
Reddy, K. 2002. A critical analysis of Annadata Velugubata - Farm telecast programme in
Andhra Pradesh. M.sc. (Ag) Thesis. Acharya N.G. Ranga Agricultural University,
Hyderabad.

Paper Proceedings of Agri Animal 2013 - ISSN 2279-3682
371
24

Paper Proceedings of Agri Animal 2013 - ISSN 2279-3682
372
DRUMSTICK: A MIRACLE AND NUTRACEUTICAL TREE - AS
SOURCE OF INCOME FOR RURAL LIVELIHOOD
Neeraja Prabhakar, B* ; Manohar Rao, A**
Department of Horticulture, College of Agriculture, Rajendranagar, ANGRAU,
Hyderabad, Andhra Pradesh-500030. INDIA.
Key words: Moringa, Cancer, Agro Forestry System, Multipurpose Tree Species
ABSTRACT
Drumstick ( Moringa oleifera Lam) is a tropical perennial tree vegetable, belongs to family
Moringaceae and having large ecological plasticity because of its wider adoptability to diversified soil and
climatic conditions. Moringa contains more than 90 nutrients and 46 types of antioxidants in it‘s leaf and fruit
helps in avoiding malnutrition, anemia, tuberculosis, asthama, cold, bronchitis, functional sterility etc.
Consumption of moringa leaves is claimed to cure about 300 ailments of human beings.The high antioxidant
/radical scavenging effects are observed in this plant. Moringa leaf extract could kill 70-86% of abnormal cells
harvested from patients with acute lymphoblastic leukemia. Moringa is the most suited tree for traditional
agroforestry systems in homegardens/agroforestry systems, since it‘s canopy allows diffusion of light which
facilitates intercropping and it‘s deep root system avoids resource competition with under-storey crops. Moringa
is a multipurpose tree species (MPT) and plays an important role to alleviate poverty of rural people providing
livelihood by selling fruits, leaves, fuelwood, seedsoil, seedcake as manure and biopesticide . In Ethiopia,
Moringa stenopetala is known as ―Mother of Farmers‖ because of it‘s priceless food value obtained during
drought. Because of it‘s numerous nutraceutical values and most suitable in agroforestry system can be called
―MIRACLE TREE‖.
Introduction
Drumstick( Moringa oleifera Lam ) is tropical perennial tree vegetable species which
is known by several regional names such as benzolive, drumstick tree, kelor, marango, French
Jasmine, acacia , mlonga, mulangay, nebeday, sahijna, sajna Horse-Radish tree.
* Professor, Department of Horticulture, College of Agriculture, Rajendranagar, ANGRAU, Hyderabad, Andhra
Pradesh, INDIA-500 030, email: [email protected]
**Professor and Univ.Head, Department of Horticulture, College of Agriculture, Rajendranagar, ANGRAU,
Hyderabad, Andhra Pradesh, INDIA-500 030, email: [email protected]
It is mainly cultivated for fruit (pod) which is a economic part and used in sambhar,
vegetable curries and pickles etc. In the same way leaves are used as fresh leafy vegetable (
Paper Proceedings of Agri Animal 2013 - ISSN 2279-3682
373
non-wilting condition is better) or dry leaf powder form. It is also a plant which can be used
as wind breaks, green manure, green fodder, hog gum production.
Moringa genus containing 14 species and belongs to the family Moringaceae.
Moringa oleifera, (Moringa.pterygosperma), Moringa.stenopetala are two important species
under cultivation in India and Ethiopia respectively. The important varieties under cultivation
are : annual moringa : PKM-1, PKM-2, Dhanraj ., Perennial moringa : Jaffna (Sri Lanka),
Chavakancheri, Chemmuurungal, Kodikal murungal etc. In India it is cultivated in an area of
38,000 ha with annual production of 1.1-1 3 million tones of fruit production. Andhra Pradesh
leads in both area ( 15,665 ha) and production followed by Karnataka and Tamilnadu.
The Moringa oleifera Lam is considered to have large ecological plasticity because
of it‘s adaptability to the most diversified soil and climatic conditions. Drumstick is growing
throughout India under tropical and sub-tropical climatic conditions. It can tolerate dry
conditions and can be grown at sea level to 500M- altitude, the maximum temperate ranges is
38 to 480C and minimum is -1 to -3
0C and annual rainfall of 750-2000 mm . It is also drought
and frost hardy tree. (Singh, 1995).
Moringa grows very well under deep sandy loam soil having a pH of 6.0-7.5. How
ever one of the study revealed that the moringa seedlings survived upto 41 ESP showing it‘s
high salt tolerance. ( Valia, 2005).
The brief the package of practices for annual moringa : Seed rate: 625g/ha, Pit
size: 45x45x45 cm, time of planting: June, Spacing: 2.5 x 2.5 m. Manuring: Urea (100g),
Super Sulphate Phosphate (100g), Murate of Potassium (50 g) and Gypsum (50g) as a basal
application and top dressing with urea (100g) every 3 months after first-application .Pruning:
Pinch the seedlings at 75 cm height to encourage the side branches for higher fruit production.
Ratooning : The trees are cut at 1 m height and apply recommended dose of fertilizers .
Ratooned stems come to bearing fruits with in 4-5 months ( Kaithiresan et al 1999)
Paper Proceedings of Agri Animal 2013 - ISSN 2279-3682
374
Nutritional value:
Moringa contains more than 90 nutrients and 46 types of antioxidants and is very
effective to over come various physiological disorders. Drum stick leaves contains 7 times
more vitamin ‗C‘ than orange, 4 times more ‗Ca‘ than milk, 4 times more vitamin ‗A‘ than
carrot, 3 times more ‗K‘ than banana and 2 times more protein than milk of equal quantities
and also rich in iron.
Malnutrition is a serious human health problem which may be extruded by using
Moringa leaves to meet nutritional deficiency
Drumstick,a low acid vegetable known for it is high vitamin ‗C‘ content (118 mg/100
gr edible portion) has export potential as a canned product. It retains it‘s wholosomeness and
quality interms of vitamin –‗C‘ after canning ( Ranjith . and Arther 2002). The dried leaves of
Moringa can be safely preserved for future use without any loss in it‘s nutritional value. The
WHO has recommended about 40% leaf powder to be added in children‘s food in mid-day
meal It helps in increasing breast milk as well as reduces blood loss in women (Amar Singh
Kashyap et al 2009).
Moringa as nutraceutical tree:
Moringa is rich in glucasinolates and isothioyanates. The recent research has shown to
be potent inhibitors of phorbol easter in lynaphoblastoid cells and thus could be useful in
cancer therapy .The drumstick leaf extracts (ethanol or hot water extracts) could kill 70-86%
of the abnormal cells among primary cells harvested from 10 patients with acute
lymphoblastic lukemia ( ALL) and 15 with acute myeloid leukemia (AML) and culture of
lepatocarcinoma cells (75% death). This concludes that Moringa oliefera may have potential
for use as source of natural treatment for cancer ( Khalafalla et al 2010).
Paper Proceedings of Agri Animal 2013 - ISSN 2279-3682
375
A soup prepared with handful of Moringa oleifera leaves helps in avoiding the
malnutrition, anaemia, tuberculosis, asthama, cold, branchitis, functional nervousness and
functional sterility.
Atawodi et al (2010) reported that different plant parts containing polypehols and in
vitro antioxidant and the methanol extract of the leaves of Moringa oliefera contained organic
acid, rutin, quercetin, glucoside and kaempferol, rhamnoglucoside, where as in the root and
stem barks several procyanidins were detected. The high antioxidant /radical scavenging
effects observed, may have impact on the cancer. Consumption of moringa leaves is claimed
to cure about 300 ailments of human beings.
As multipurpose tree suitable to grow in Agroforestry system and Rural livelihood:
Moringa is MPT‘s and play a important role to alleviate poverty of rural people providing
livelihood by selling fruits, leaves, fodder, fuel wood. Drumstick inter planted with hybrid
napier and guinea grass recorded significantly higher plant height throughout the crop growth
period in horti pasture system ( Kumari et al 2008). Moringa is the most suited tree for
traditional agroforestry systems in home gardens since it‘s canopy will allow diffusion of
light which facilitates intercropping and it‘ s deep root system avoids resource competition
with under storey crops
Annual drumstick has been grown as intercrop in tamarind plantation to draw the
income in initial stages of plant growth by selling drumstick leaves and fruits and was proved
as successful intercrop.
Rural livelihood: In Ethiopia Moringa.stenopetala species is known as cabbage tree is
cultivated widely and known as ―Mother of Farmers‖ because of it‘s priceless food value
obtained during years of drought. About 20-50 moringa trees are enough to support a family
with 10-15 members by providing food supply even in situations when no other sources of
food are available (Tenaye et al 2009).
Paper Proceedings of Agri Animal 2013 - ISSN 2279-3682
376
A farmer from Tamil Nadu could earned about Rs. 6 lakh in a year by selling 2.5 lakh
seedlings of ―PAVM‖ variety which yields from 5th
-6th
month after planting . Which form as
a source of income for his livelihood. (Prabhu 2009).
Multiple uses:
1. Food: The tender green pods, leaves and flowers are used as vegetable. The leaves contain
38% protein with all essential amino acids which fulfil the diet needs of
vegetarians. A ordinary tree can yield about 150 kg leaves and 250-270 fruits/year.
2. Fodder: Leaves are used as a quality fodder. It helps to increase 30-40% milk in cows,
buffaloes and goats
3. Wood: Drumstick wood is soft light corkes and perishable and also used for shuttles and
picking sticks for textile industry.
4. Seed:
a) Seed oil: Moringa seed oil is known as ‗Benoil‘ hence the tree is often called
‗benoil tree‘. This oil is edible and resembles olive oil in it‘s fatty acid composition and is
desirable to replace polyunsaturated vegetable oils with monounsaturated fatty acids which is
current trend. Seed oil is also used as lubricant and in perfumes and hair dressing.
b) Seed powder: is used to clarify turbid, dirty water it is mixed with water for
purification. Moringa seeds and pods are effective sorbets for removal of heavy metal and
volatile organic compounds in the aqueous system (Singh, 2011).
c) Seed cake: This is used asorganic manure whichis rich in crude protein (38%).
(Singh, 1995).
Paper Proceedings of Agri Animal 2013 - ISSN 2279-3682
377
6. Biopesticide: Root and seed powder exhibited comparatively lower YVMV disease
incidence, white fly population and also recorded higher fruit yield in okra
( Srabani, 2004).
Conclusion:
The Moringa oleifera Lam is considered to have large ecological plasticity because
of it‘s adaptability to the most diversified soil and climatic conditions.
At present the area under moringa is very meager. Because of it‘s numerous
nutritional value and nutraceutical value and considering as a nutraceutical tree
Moringa is the most suited tree for traditional agroforestry systems in home gardens
since it‘s canopy will allow diffusion of light which facilitates intercropping and it‘ s deep
root system avoids resource competition with under storey crops
Now being a under-exploited vegetable may be exposed as major perennial vegetable
tree crop in future for the coming new generation. Moringa can play a vital role to meet
nutritional deficiency as well as to help to alleviate rural poverty.
Paper Proceedings of Agri Animal 2013 - ISSN 2279-3682
378
REFERENCES:
Amarsingh Kashyap, Arun Bohartiya and Suresh Kumar 2009 Moringa to supply food, fodder
and drugs: Indian. Horticulture – 54(1): 51-52.
Kathiresan. Manoharan, Velusamy 1999. Package of practices for drumstick PKM-1: Indian
Horticulture-44(2):pp.32.
Khalafalla, Abdellatef, Dafalla, Nassrallah, Aboul-Enein, Light foot, El-Deeb, Shemy,
2010: Active principle from Moringa olieferia.L leaves effective against two leukemias and a
hepato carcinoma.- African. Journal of Biotechnology 9:49, 8467-8471.28 ref.
Kumari , Nanjundappa, Hattappa. 2008 . Drumstick in horti- pasture system under
protective irrigation – Environment and Ecology 2008: 26:1A, pp-465-466
Prabhu, 2009. A farmer‘s experimentation leads to highly popular drumstick variety: Hindu
News Paper dt. 29-01-2009.
Ranjith, Arther. 2002. Effect of different thermal treatments on vitamin – C and microbial
sterility of canned drumstick (Moringa oleifera) . Journal of Food Science and Technology
(Mysore).39:2, pp.161-163.
Singh. 2011 Exploring R & D,Potential of moringa for nutrition and health care. Indian
Horticulture .56(1) : pp 3-8.
Singh. 1995. Favourite Agroforestry trees. Agro-tech publishing Academy. Udaipur
(Rajasthan) pp.216-219.
Srabani Debnath Nath. 2004. searching for potential biopesticide against yellow vein mosaic
virus disease of okra. 6th
1FAOM – Asia scientific conference yangpyung, Korea, 7-11
September 2004. ―Benign environment and safe food‖ 2004, 492-499.
Tenaya, Geta, Herberal. 2009. Multipurpose cabbage tree (M.stenopetala): Production
utilization and marketing in SNNPR, Ethiopia.- Acata Hort.806 pp.115-120.

Paper Proceedings of Agri Animal 2013 - ISSN 2279-3682
379
25
Paper Proceedings of Agri Animal 2013 - ISSN 2279-3682
380
Science and Technology Communication for Farmers: Challenges in front
of Mass Media and Science Communication Agencies
Nimish Kapoor
Scientist ‗D‘
Vigyan Prasar
(a national institute for science and technology communication
under the Department of Science & Technology, Government of India)
A - 50, Sector - 62, Noida - 201 309, India
Abstract
Agriculture is the backbone of Indian economy and approximately 65% of Indian population
depends directly on agriculture. It is necessary to increase farmer‘s awareness and
understanding on improved farming practices for their upliftment. The success of agricultural
development programmes in India largely depends on the communication strategies in which
mass media and science communication agencies play an important role in mobilization of
farmers towards new agriculture technologies and improved farming practices. In India many
government agencies, regional TV channels and community radio are focusing on science
communication for farmers. At the same time science communicators are facing challenges
with the language variation and understanding level of the target groups. These challenges can
be overcome with clarity in communication strategies and its proper implementation such as:
What kind of scientific messages we are communicating? Are we trying to throw our message
without knowing the requirements and level of our target audiences? Is our communication
strategy designed so well which may attract stakeholders towards informed decision making?
In this paper challenges of Science and Technology communication for farmers and its
possible solutions has been discussed.
Key words: Communication strategies, mass media, Science and Technology
communication.
Introduction
Paper Proceedings of Agri Animal 2013 - ISSN 2279-3682
381
Why Indian farmers need communication?
India is well-known as ‗Land of Farmers‘ where agriculture production plays a major role in
elevating the economic growth of the country (Singh, 2011). Indian agriculture history has
recorded large agricultural lands surrounded by fresh water resources and India‘s green
revolution is another sign of India‘s rich agricultural practices (Parayil, 1992). However, as
the time passes on, with the extra ordinary growth of population, change in climatic
conditions, declination of water resources (Yadav et al. 2012), shrinking of land resources,
short or no rainfall, soil health problem (Sharma and Abrol, 2012), low awareness level and
communication gaps on improved farming practices (Wani, 2004) and related problems are
directly affecting to Indian farmers. These issues are the major challenges on which science
and technology communication especially for rural communities is necessary and important.
Science communication is the core area in science, technology or agriculture based research
and development to bridge the gaps among researchers, farmers, entrepreneurs and related
stake holders. Proper communication for informed decision making and penetration of the
scientific knowledge at the remote area or reach to unreached are the challenges in front of
scientists, science communicators, journalists who are working for rural masses and farmers.
Agricultural research generates several technologies and strategies which need to be
communicated. This is challenge for science communicators to make new researches
available in an appropriate language and incorporate demands for research by the users.
Generally scientists and researchers communicate researches within their own community but
it must be communicated at grass root level including industry and farmers to enrich their
level of awareness and knowledge (Tollefson, 1996). The Indian media especially public
broadcasting system is also facing these challenges (Matthew and Dietram, 2009) in the
production of news report, popular articles, films or any other form to make it simple, clear,
communicable and easy to understand by farmers as well as rural masses of various regional
languages and dialects. Indian agencies and centers associated with science and technology
communication/extension, public broadcasting system and other media agencies are facing
problems due to shortage of trained science communicators and less interaction among
scientists, farmers and journalists. Development of resource material at popular level in
various Indian languages and its proper dissemination to masses is another challenge (Mohan,
2008). Generally scientists are not interested in science communication or popular writing
and their language as well as level of communication are highly technical to understand by a
farmer or layperson. This paper highlights the crisis in the present science communication
Paper Proceedings of Agri Animal 2013 - ISSN 2279-3682
382
practices and explores the possibilities to bridge the communication gaps among scientists,
science communication agencies, media, farmers and rural communities in India.
What are the crises in present science communication strategies in India?
Scientists are involved in their research in their laboratories and they are not involved in
direct communication with farmers and journalists. Now-a-days media, especially news
channels and newspapers want to turn science into a series of breaking news and it seems that
there is no space for news related with agriculture science and technology (Kapoor, 2012).
Scientists really have to get more expertise in science communication on the issues like
climate change, water management, new farming technologies and issues related to
genetically modified crops which should be addressed for farmers. The popular science
magazines and books have become an important source of knowledge. There are some
monthly and quarterly magazines in Hindi like Kheti, Phalphool, Kurukshetra etc. published
from various government organizations in India especially for farmers or rural community.
Due to lack of proper marketing strategy these magazines have limited readers. It has been
found that research reports or popular articles published in popular science magazines in
Hindi and regional languages are generally translation of English research papers or articles
(Patairiya, 2007). India is a country of language diversity. There are small numbers of
scientists or science communicators in India who are involved in science communication
through regional languages. It is a big challenge in front of science communicators to
communicate national or international research to Indian masses in their regional languages.
There are 22 official languages and more than 400 living languages in India.Scientists are
enthusiastically involved in their researches but at the same time interaction among scientists,
farmers and journalists must be promoted. Farmers have lot of unanswered problems which
can be addressed during direct contact with scientists. Similarly media can be attracted to
create more space and scope for science communication by regular interactions between
scientists and journalists. There are TV and radio programmes on agriculture and science but
interactive programmes with the involvement of scientists and farmers are insufficient.
Self-motivated Science Communicators are required in Krishi Vigyan Kendras – KVKs
(Agriculture Science Centres)
Indian Council of Agriculture Research, Government of India has established a country wide
network of Krishi Vigyan Kendras - KVKs (Agriculture Science Centres) which are playing a
catalytic role in the transfer and dissemination of location specific crop technologies and
Paper Proceedings of Agri Animal 2013 - ISSN 2279-3682
383
information on improved farming practices in the country at grass root level (www.icar.org).
A KVK is a district level agriculture extension and science communication centre established
for spreading the scientific agricultural knowledge upto the farmer field. KVK has various
extension activities like training, exhibition, field days, seminars, publications, extension and
communication and they may also contribute their knowledge in mass media like All India
Radio and Doordarshan programmes. KVKs have been established as main communication
centre where a lay farmer can get various information and updates. But due to less publicity
of KVKs and large number of farming population, many farmers especially from remote areas
are untouched with KVK activities. Studies reveal that KVK needs to play a role of key
extension system to develop the farming communities. Studies indicate that to manage and
run KVKs as per its mandate, self-motivated young science communicators or extension
workers are required who are committed to work with farmers with the clear understanding of
local problems and issues to be communicated (Arnon, 1989). For this purpose priority must
be given to local, rural or semi-urban candidates who can speak local dialects with good
communication skills (Chauhan, 2011; Patil and Kokate, 2011).
Science and Agriculture Broadcasting for Farmers in India and its Challenges
Radio has been proved as effective medium of communication for farmers as India‘s post-
independence experiments with ICT use in agricultural development started with radio. A
network of All India Radio (AIR) stations were established across the country that broadcast
agricultural programmes in regional languages. Radio agriculture programmes produced by
All India radio were focused on new technological information on agriculture and other allied
subjects to the farmers. Krishi Jagat is the most popular programme aired by All India radio,
New Delhi. Community Radio is also an effective tool for agricultural communication (Singh
et al. 2010). This form of participatory communication has proved to be very successful as a
tool for social and economic development at grass root level. Many community radio stations
are involved in agricultural and rural programming in our country. Directorate of Extension,
Department of Agriculture and Cooperation, Government of India initiated a new scheme
―Mass Media Support to Agriculture Extension‖ (www.agricoop.nic) with a view to promote
extension services in the country by using electronic media. There is lot of efforts going on to
promote science through radio, but less number of scientists is interested in popular writing
for radio as it needs simple words or sentences and no technical language . To produce
programmes covering a wide spectrum of topics in agriculture and allied field for bringing the
latest information and knowledge to the farming community through radio, there is a need of
Paper Proceedings of Agri Animal 2013 - ISSN 2279-3682
384
regular radio broadcasting trainings for scientists and science communicators. As radio has
limitation of words, there is no visual presentation is possible, so that radio scripts must be
developed in entertaining form, with an effective manner otherwise rural audiences will lose
their interest as scientific jargons and technical terminology has no role to catch the
audiences. The art of radio science writing and communication for rural audiences must be
learned by scientists if they are involved in science popularization. It is important to note that
the suitability of different media depends upon the message, target audience and social
environment. Radio and television are more appropriate for reaching variety of audience
quickly with relatively simple ideas in easy to understand language (Irfan et al. 2006; Lahiri
and Mukhopadhyay, 2013). The television and radio programmes should be designed based
on the day to day needs of the farming community incorporating latest information and
technology for best agricultural output. These programmes can create awareness to improve
the agricultural productivity and quality of the country‘s farming community.
There is no doubt that availability of satellite TV channels provides more space for
communication and gives the chance of wide access of information. But TV channels are
least involved in communicating science and technology for better agriculture practices for
farmers. In India, there is no dedicated TV channel for farmers is available, only Krishi
Darshan (aired by National TV channel - Doordarshan) and Chaupal (aired by regional
Doordarshan centres) are the programmes dedicated to farmers. Some private TV channel like
Eenadu group of Hyderabad, Andhra Pradesh is producing a TV programme for farming
community entitled Annadata, where interactive programmes directly from fields are
produced. In reality, the connectivity of TV channels are still largely available only to urban
population and the contents provided by scientists are in a language that farmers do not use or
communicate in, have little relevance to their needs. The framework on Effective Rural
Communication for Development developed byFAO(www.fao.org) recommended that
science communicators should focus on ―CCC‖ (Connectivity, Content, and Context) which
should be the bottom-line for effective use of electronic media during the broadcasting of
science programmes for farmers. Scientists have to be assured to realise the potential of
information technologies. When scientist or science communicator is involved in the
development of a television or radio science programme, he/she must understand that what
are the aim and objectives of the programme? Scientists, science communicators, extension
workers, journalists and farmers have to consider each other as equal and important
communication partners and they need to have a common language, especially for audio
Paper Proceedings of Agri Animal 2013 - ISSN 2279-3682
385
visual media. Farmers speak common, local language with rural or traditional dialects. It is
difficult for farmers to understand language of a scientific research paper. There is need to use
a simple, lucid, easy to understand language with the examples from daily life. Science and
technology research and experimentation have lot of scope to create its message with the
mandate of information and entertainment. Scientists involved in science communication or
public broadcasting must understand that farmers are more experienced, keen observers and
have rich traditional knowledge, which give them enough potential to grasp the information
(Halakatti et al. 2010). It has been found that through science TV programmes audiences
knowledge level and behavior can be influenced or their way of thinking can be changed
(Nazari and Hassan, 2011).
Focused Communication Strategy is required for Science News Reporting
Besides the above mentioned scope, efforts and challenges in science communication for
farmers, science news media is another powerful source of communication which depends
upon the interactions between scientists and journalists. Journalists try to get science news
from various sources where role of scientists is very crucial to check their information and
sources from where the information or facts are being gathered. Here the big problem is that
scientists are not trained to communicate their research findings to the media and masses
(Kapoor, 2012 a). On the other hand scientists can explain their research findings in seminars
or in group discussion with other scientists. Sometimes it has been found that the need for
science to be understood by the public are not appreciated by many scientists or institutions.
Science communicators are generally not appreciated by other scientists involved only in
research. When we are talking on science communication for farmers, scientists involved in
agriculture and related technological development must come forward and share their research
and development information to the news reporters. Regular interaction between scientists
and journalists is required where scientists can understand the requirement of media that what
kind of press notes and press briefs are required and journalists can learn how to communicate
factual scientific information with the scientific message to the target groups (Guidelines for
scientists on communicating with the media). At present there is no communication strategy
or mechanism responsible for providing authentic scientific information and data to media on
science, agriculture, environment or energy sector from a single window. Without availability
of required information, it is difficult for a journalist to prepare a science news report within
deadlines. A focused communication strategy is required in collaboration with scientists,
science communicators and journalists where authentic information from various sources

Paper Proceedings of Agri Animal 2013 - ISSN 2279-3682
386
could be collected, reviewed, designed, packaged as per the science news requirement and
disseminated across the country through various news media.
Training of scientists and journalists in science communication
There should be proper training for scientists and journalists for development of their skills in
translating jargon and explaining the scientific research in simple manner. Strong and
effective group of science communicators is an important concern in research and
development organizations and science communication institutions as well as media
establishments. Science communicators require transparent and science-based discussion and
debate between scientists and rural community for decision making
(www.sirc.org/messenger/).
Opportunities are needed to enhance scientists‘ communication skills such as dealing with
media, popular writing for newspaper and answering farmers‘ questions in simple language.
Scientists and journalists must be trained in the techniques to select relevant information from
research and scientific developments for masses, popularizing technical information into
concepts easily understandable to non-scientific audiences and engaging with the media. The
literature reveals that there is lack of trained science journalists in media establishments -
newspapers and TV channels (Salwi, 2002). Generally a reporter or writer who reports or
writes political stories or cover campus issues is given the responsibility of science and
agriculture coverage. Without the training of science communication it is difficult for a
reporter or writer to understand science, translate scientific jargon and repackage technical
information into a form that is interesting and relevant to readers, listeners or audiences. To
meet these challenges, science communication workshops must be organised regularly by
various institutions associated with science and media. These workshops will be helpful
among scientists, journalists and other stakeholders to update them with scientific and
technological developments and equip them with the necessary skills and practices to impart
key messages to be communicated for variety of audiences. As a result of these workshops
and related activities such as laboratory or academic visits, exchange programme, new
generation of science communicators may be developed from the different sectors such as
research and development organisations, media, science communication agencies, academics,
and farming groups. Right now a very few young researchers or scholars are taking interest in
popular science activities. IndianUniversities are creating trained science communicators from
its master‘s level science & technology communication courses. Trained young science

Paper Proceedings of Agri Animal 2013 - ISSN 2279-3682
387
communicators can contribute their services in various research, centres and organizations
where science communication for farmers and other stakeholders are required. New scope and
new job opportunities have to be generated in government and non-government sectors where
science communicators could be promoted to work on science communication strategies
(Kapoor, 2012 b).
Effective Science Communication Strategy in a Science Communication Model
Success of an effective science communication strategy may be summarised in the following
questions which must be asked by a scientist or science communicator when he or she is
engaged in science communication or extension: What are we really trying to achieve? What
is the actual problem that needs to be solved? Are we trying to give knowledge to the people,
change their attitudes or alter their behavior? Do we want to engage people or stakeholders
proactively with two-way communication? or simply inform them of what we are doing so
that they passively support or do not resist it? Are our communications goals clear, realistic
and achievable? Are our stakeholders too ambitious or too weak?
Identification of target audiences is another challenge for a science communication strategy.
For example climate change should concern everybody. In addition to farmers who are
directly affected by climate change, possible target audiences can include policymakers,
community leaders, industry leaders, panchayat members, technical experts, women and
youth. After identification of target group, we must assess their knowledge, attitudes,
behaviors and interest. Sharp and clear messages are another important aspect in science
communication strategy. When elaborating a message, be sure to use language that is
accessible and attractive to the target audience. Keep the message as simple as possible.
Science communicator should avoid jargon, acronyms and unnecessary detail. Put yourself in
their place and give them what they need. Be prepared to vary the message depending upon
the particular target audience. The message must be realistic and focus on behavior or action
that are relevant and that they can actually pursue. Only once we are confident about our
audience and our messages, then only we can consider the best way to transmit our message.
One of the most effective ways of reaching any target audience, of course, is through the
media. Developing an effective working relationship with the media is an extremely
worthwhile investment. Journalists are always looking for good stories and other current
affairs which may offer many possibilities. But we should avoid bombardment on the press
for information because press has limitation of time and space.
Paper Proceedings of Agri Animal 2013 - ISSN 2279-3682
388
As a part of communication strategy, evaluating the effectiveness of a communication effort
can be extremely difficult. However, we may get an idea with some key questions like: Has
our message been received? Understood? Acted upon? Feedback on these questions from the
target audience can be obtained through follow-up interviews or survey and from close
observation of changes in behavior. Such feedback is useful for future programmes.
A model of science communication especially targeted for farmers may contain an
interpersonal communication strategy, including extension workers or science
communicators, group discussion and meeting, outreach activities and demonstrations are
best suited for farmers or rural community for their capacity building, behavioural and
attitudinal changes. Based on Lionberger‘s (1968) model of adoption process, Campbell and
Barker (1997) recommended a strategy which may be adopted by Krishi Vigyan Kendras or
other science communication agencies. Under this communication strategy mass media and
nukkad natak(street palys) are suitable to provide value addition or additional information
(Dhawan and Sharma, 2008) and it is defined as awareness stage. In the interest stage group
discussions, radio and field days are also very important to increase knowledge level of
farmers. Demonstration of results and methods and farmers‘ exchange programmes improves
skills of farmers which come under evaluation stage. Trial stage covers on demonstrations to
induce behavioural changes among farmers. Recognition to farmers, competitions and
motivate them to incorporate practices (Shearer, 1987) to farming system to consolidate
attitudinal change come under adoption stage.
As a successful and effective communication strategy, Government of India has identified
Information Village Project of the M S Swaminathan Research Foundation, Chennai, India
which has greater impact at grass root level and now been adopted as a major component of
India‘s rural development strategy (Ponniah et al. 2008). This strategy consists of a value-
addition centre as hub station at one place, which is connected to ten village knowledge
centres through a network of computers, telephones, VHF duplex radio devices and
facilitating both voice and data transfer. The content of science communication is prepared
locally using indigenous knowledge combined with research and development, including
experts‘ suggestions. Mostly women volunteers are being deployed in the project that gather
the information and feed it into the intranet. The village knowledge centres disseminate this
information using display boards, computers, public address system, paper clippings as per

Paper Proceedings of Agri Animal 2013 - ISSN 2279-3682
389
requirements. Involvement of local people in content development in regional language to
assess information needs and collection of indigenous knowledge is another feature of this
strategy which prepare user friendly resource material in regional language. This model of
science communication can be considered as a successful communication strategy and it
should be followed in all the states of India as well as other parts of Asia for rural
development.
Recommendations and Possible Solutions for Effective Science Communication for
Farmers
Science and technology communication is a specialized field and has been accepted as
a new discipline of higher education by Indian and Foreign universities. Every year
large number of students are being produced by the universities as science
communicators. They can be an excellent driving force to promote scientific temper
among the rural and farmer communities. There is urgent need to create job
opportunities for young science communicators in scientific and technological centers
and institutions engaged with agriculture extension, rural and corporate
communication and science communication etc.
Laboratories and research institutions must collaborate with science communication
agencies and media for science popularization, after identifying those scientists who
are interested in science outreach or science communication activities. These scientists
should be trained for science communication. Trained science communicators can act
as master resource persons for science communication workshops to motivate other
scientists towards science communication.
There is a need to develop a platform for interactive communication in each scientific
institution to promote direct interaction among stakeholders like scientists, farmers,
rural communities and journalists. Well-developed communication skills should be
developed in all stakeholders that favour and support the interaction. This must
include the resources to enable sufficient institutional, technical, information and
methodological capacities for effective interaction between all the stakeholders.
Participatory learning process is an important part of any communication strategy. In
many cases, a two-way learning process is developed involving a reciprocal exchange
of knowledge and ideas among farmers, technicians, extension workers and scientists.
Such participatory learning is valuable for the transfer and spread of knowledge. With
Paper Proceedings of Agri Animal 2013 - ISSN 2279-3682
390
the involvement of two-way development and exchange of ideas, participatory
learning can enhance decision-making and management capacities in farmers.
Cooperation between scientists and journalists or broadcasters is required in media
and public broadcasting system which will promote equal segments of rural
development scheme and hard-core agriculture programmes like animal husbandry,
dairy technologies, pearl culture, poultry, fisheries, dryland, wetland and wasteland
agriculture and also on segments dwelling on employment schemes, loan and training
facilities, sanitation, health, hygiene and nutrition etc. Apart from telecast/broadcast in
national language broadcasting should be aimed to disseminate programmes in
regional languages and local dialects for the specific needs of different regions
covered under the scheme.
There is a need of science news agency at national level to provide authentic news and
factual data to the news channels and newspapers.
References:
Arnon, I. 1989. The Structure of National Agricultural Extension Services. In: Agricultural
Research and Technology Transfer. Elsevier Applied Science, London and New York: pp.
697-735.
Campbell, D. A. and Barker, C. 1997. Selecting Appropriate Content and Methods in
Programme Delivery. Improving Agricultural Extension: a Reference Manual.Ed. E. B.
Swanson, R. P. Bentz and A. J. Sofronko. Rome: Food and Agricultural Organization.
Chauhan, N. M. 2011. Aptitude of the Programme Coordinators of Krishi Vigyan Kendras of
India. Indian Research Journal of Extension Education.11(3): 19-24.
Dhawan, A. K. and Sharma, A. 2008. Creating Awareness Amongst the Farmers Towards
Judicious Use of Pesticides: Impact of Dramatization as a Tool. Indian Journal of Science
Communication. 7 (1): 3-5.
Paper Proceedings of Agri Animal 2013 - ISSN 2279-3682
391
Guidelines for scientists on communicating with the media. The Social Issues Research
Centre, Oxford, United Kingdom and Amsterdam School of Communications Research,
Amsterdam, The Netherlands (www.sirc.org/messenger/).
Halakatti, S. V., Gowda, D. S. M. and Natikar K. V. 2010. Role of Mass Media in Transfer of
Agricultural Technologies. Research Journal of Agricultural Sciences. 1(3): 290-291.
Irfan, M., Muhammad, S., Khan, G. A., and Asif, M. 2006. Role of Mass Media in the
Dissemination of Agricultural Technologies Among Farmers. International Journal of
Agriculture Biology. 08(3): 417-419.
Kapoor, N.2012 a. A Science Information Resource Hub for Sustainable Science
Communication in India. In: Proceedings of International Conference on Science
Communication for Scientific Temper, 10-12 January 2012, New Delhi: pp. 98-103.
Kapoor, N. 2012 b. Science Communication as a Discipline in Higher Education: Promotion
of Scientific Temper. Issues and Challenges on Higher Education: Book. (Ed. D.P. Singh and
N.S.Singh). Publisher: Words Worth India, New Delhi: pp.273-283.
Lahiri, B. and Mukhopadhyay, S. D. 2013. Credibility of Farm Information Disseminated
Through Newspapers and Radio Programme: A Case Study. Indian Research Journal of
Extension Education. 13 (1): 1-8.
Lionberger, H. F. 1968. Adoption of new ideas and practices. Ames, IA: Iowa State
University Press.
Matthew, C. N. and Dietram, A. S. 2009. What‘s next for Science Communication?
Promising directions and lingering distractions. American Journal of Botany. 96(10): 1767–
1778.
Mohan, K. R. K. 2008. Science Communication in Regional Media in the Changed Scenario.
Indian Journal of Science Communication. 7 (1): 20-21.
Paper Proceedings of Agri Animal 2013 - ISSN 2279-3682
392
Nazari, M. R. and Hassan, M.S.B.H. 2011.The role of television in the enhancement of
farmers‘ agricultural knowledge. African Journal of Agricultural Research. 6(4): 931-936.
Parayil, G.1992.The Green Revolution in India: A Case Study of Technological Change.
Technology and Culture: Society for the History of Technology. 33(4 ): 737-756.
Patairiya, M. 2007. Science Journalism in India.The Pantaneto Forum Home Page. 25:
January 2007 www.pantaneto.co.uk/issue25/patairiya.htm
Patil, S. S. and Kokate, K.D. 2011. Training Need Assessment of Subject Matter Specialists
of Krishi Vigyan Kendras. Indian Research Journal of Extension Education. 11(1):19-22.
Ponniah, A., Puskur, R., Workneh, S. and Hoekstra, D. 2008. Concepts and practices in
agricultural extension in developing countries: A source book. Improving Productivity and
Market Success (IPMS) of Ethiopian farmers project. International Livestock Research
Institute (ILRI), Addis Ababa, Ethiopia.
Salwi, D. 2002. Science in Indian Media. Book published by VigyanPrasar, Noida, India
Sharma, P. and Abrol, V. 2012. Tillage Effects on Soil Health and Crop Productivity: A
Review. Crop Production Technologies. Edited by Sharma, P. Publisher: InTech: pp.245-
262.
Shearer, M.N. 1987.Developing Effective Extension Irrigation Programs in Third World
Countries. In: 13th International Congress on Irrigation and Drainage, Casablanca, Morocco:
pp.1-8.
Singh, A. 2011. The changing landscape of public expenditure and investments in Indian
agriculture: Indian Journal of Agricultural Economics. 66 (3): 301-313.
Singh, B.K., Kumar K.R., Yadav, V.P., Singh, D. and Singh, H.L. 2010. Social Impact of
Community Radio in Karnataka. Indian Research Journal of Extension Education. 10 (2): 10-
14.
Paper Proceedings of Agri Animal 2013 - ISSN 2279-3682
393
Tollefson, L. 1996. Requirements for improved interactive communication between
researchers, managers, extensionists and farmers. Irrigation scheduling: From theory to
practice. FAO - Food and agriculture Organization of the United Nations.
Wani, G. M. 2004. Role of communication in enhancing Agricultural Production - a Vision.
Leading talk presented in National Workshop on Communication support for sustaining
Extension Services during 17-18 February 2004 at Institute of Agricultural Sciences, Banaras
Hindu University, Varanasi, India.
www.agricoop.nic.in/PolicyIncentives/mass_media_b_N.htm
www.cida-ecco.org/IPMS/IPMS_SourceBook/IPMS_SourceBook.pdf
www.fao.org/nr/com/gtzworkshop/a0892e00.pdf
www.icar.org.in/krishi-vigyan-kendra.htm
www.thehindu.com/todays-paper/tp-national/tp-otherstates/shrinking-farm-land-a-cause-for-
concern-says-icar/article2776708.ece (Shrinking farm land a cause for concern, says ICAR)
Yadav, G. S., Ndatuwong, L. G. and Singh, S.K. 2012. Mapping the spatial extend of
groundwater declination using Geostatistical techniques: A case study around the area of
Rajatalab, Varanasi, U.P. India. Scholars Research Library. Archives of Applied Science
Research. 4(1): 236-245.

Paper Proceedings of Agri Animal 2013 - ISSN 2279-3682
394
26
Paper Proceedings of Agri Animal 2013 - ISSN 2279-3682
395
RESPONSE OF BENTHIC INVERTEBRATES TO ENVIRONMENTAL
GRADIENTS IN AN AGRICULTURALLY DOMINATED LANDSCAPE OF
FLOODPLAINS
KRYSTIAN OBOLEWSKI1* , KATARZYNA GLIŃSKA-LEWCZUK
2, AGNIESZKA STRZELCZAK
3
1Department of Ecology, Pomeranian University in Słupsk, 76-200 Słupsk, e-mail:[email protected],
POLAND,
2 Department of Land Reclamation and Environmental Management, University of Warmia and Mazury,
3Faculty of Food Sciences and Fisheries, West Pomeranian University of Technology, Papieża Pawła VI 3, 71-
459 Szczecin, Poland
Abstract: Five oxbow lakes of the Łyna River located in an agricultural area were
investigated seasonally in 2005 and 2008. The EPT index (abundance of Ephemeroptera,
Plecoptera and Trichoptera larvae) as well as their proportion to Chironomidae (EPT : C)
indicated, that groups sensitive to environmental conditions occurred at low abundance,
similar between different hydrological types of oxbow lakes. Family Biotic Index (FBI),
Biological Monitoring Working Part index adapted to Polish conditions (BMWP-PL) and
Average Score per Taxon (ASPT) revealed low water quality regardless of the level of
hydrological connectivity. In turn, the indices of biodiversity Margalef (d) and Probability of
Interspecific Encounters (PIE) indicated good or satisfactory water quality. pH correlated
positively with the total abundance of aquatic invertebrates, while lower macrozoobenthos
abundance was observed in turbid waters of lentic oxbows with high content of total dissolved
solids (TDS). This study shows that the structure of invertebrate communities inhabiting
oxbow lakes reflects physico-chemical conditions of water and can be a valuable source of
monitoring data, indispensable to the management and protection of these important aquatic
ecosystems. Canonical correspondence analysis (CCA) showed that hydrological connectivity
was the main factor responsible for the value of monitoring indices, followed by the physical
and chemical parameters of the local environment.
Key words: monitoring, wetlands, agriculture lowland, indicators of sustainability
Paper Proceedings of Agri Animal 2013 - ISSN 2279-3682
396
INTRODUCTION
Sustainable agriculture is based on a biological paradigm best described as
―ecological‖. Therefore, the techniques and technologies of reductionist science are not
readily incorporated in sustainable agriculture. However, sustainable agriculture will replace
―conventional‖ agriculture only when a new (or modified) social science paradigm of
nonreductionist character is adopted. An emerging community-centered ‗problem-solving‘
perspective might offer a starting place for such a paradigm (Lyson 2002).
Transformation from traditional, extensive to sustainable agriculture is a long-term and
difficult process. During those changes we need to cope with negative effects of extensive
cultivation and farming. Therefore, ecological restoration of ecosystems affected by
agriculture seems to be an important contribution to sustainability.
Meandering is a natural feature of large rivers. In the result of this process, river
fragments get cut off in the course of time and form oxbow lakes. For smaller rivers, i.e. those
flowing in the early glacial river basins of Poland, mainly agriculturally used, the appearance
of such ecosystems is in general the result of reclamation works (Glińska-Lewczuk and
Burandt2011; Obolewski2011). Straightening of rivers contributes to the appearance of
numerous cut-off meanders(Ward et. al. 2002). Regardless of their origin, oxbow lakes
undergo similar natural, biological processes (Amoros and Bornette 2002; Tockner et al
1999). They change from lotic to lentic ecosystems through succession. That phenomenon
involves increased accumulation of organic matter and shallowing which bring to the decrease
in biodiversity due to considerable domination of species resistant to bad quality of the
environment (Mandaville 2002). The pace of changes depends considerably on the level of
hydrological connectivity with the mother river (Tockner et al 1999; Ward et al. 2002).
Glińska-Lewczuk (2009) distinguished three main types of oxbows based on the strength of
oxbow-mother river hydrological connectivity, i.e. open (lotic), semi-open (semi-lotic) and
Paper Proceedings of Agri Animal 2013 - ISSN 2279-3682
397
closed (lentic). Declining biodiversity is a threat mainly to lentic oxbow lakes, where the high
loads of nutrients from for example arable lands cause eutrophication and trigger the
development of phytoplankton, followed by the decrease in water transparency and the
elimination of stenotopic species (Tockner et al 1999).
Among hydrobionts, benthos is particularly sensitive to unfavourable environmental
changes. The abundance and taxonomic composition of benthic communities reflect the state
of water bodies. Some benthic species are known as particularly demanding with regard to
trophic relationships, water quality, substratum and the composition of plant communities
(Lew et al. 2011). If such preferences are recognized, the presence of a given species may
indicate particular habitats or condition type (Hellawell 1986). The concept of bioindicators
that use benthic invertebrates has been developed based on their diversity, abundance and
distribution with respect to physico-chemical characteristics of habitats (Arscott et al. 2005;
Tockner et al 1999). Information given by indicator species is used to assess the quality of the
environment and to identify potential threats (Mandaville 2002). At present, physico-chemical
elements of monitoring (quality elements) in aquatic reservoirs are considered to be
insufficient for a complete assessment of their ecological state and may not allow the
detection of the negative effects of anthropopression (Directive 2000/60/EC). Therefore, they
are now mostly treated as an addition (=supporting) to more objective biological assessment
(Cullen 1990; Hellawell 1986).
The aim of this study was to determine quality elements (biological and chemical) in five
oxbow lakes of the lowland Łyna River (N Poland) differing in their hydrological
connectivity with riverchannel using bioindicative indices based on the abundance and
composition of macrozoobenthos. This investigation was also intended to answer the question
if, or to what extent, the quality of oxbow lakes can be assessed with the help of indices
developed for flowing waters.
Paper Proceedings of Agri Animal 2013 - ISSN 2279-3682
398
Study area
The Łyna River belongs to the largest watercourses in the region in terms of catchment
area (7126 km2) and river length (264 km). It flows northward to Pregoła River in the
Kaliningrad District (Russia). The river shows a meandering character in its middle course in
the vicinity of the towns of Dobre Miasto and Lidzbark Warmiński. At the channel cross-
section in Smolajny, the Łyna River drains a 2290 km2 area. The river valley is located there
at an altitude of 70 m a.m.s.l. The floodplain on both sides of the river constitutes an area
prone to flooding as the river landscape has changed over the last century. Before 1940, the
river valley was reclaimed and at the end of the 1970s the meandering section located near the
village of Smolajny, constituting almost 5 km of length, was straightened to prevent
agricultural areas from flooding. Five oxbow lakes were selected for this investigation. They
are located near the village of Smolajny (Fig. 1).
Figure 1
In the area vicinity of the village of Smolajny, a diverse mixture of extensive croplands,
wetlands and small farms dominate. The conventional type of agricultural practice prevails in
the area. Main cultivated crops are: cereals, corn and potatoes and average annual mineral
fertilization with NPK does not exceed 120 kg NPK per ha. The farm fields are artificially
drained, and thus inundation during the growing season is avoided except for a zone adjacent
to the river channel. In the riparian landscape dominate patches of grasslands and extensively
used meadows taking ca. 75% of the floodplain. The riparian zone consists also on wetlands
included areas of wooded, shrub/scrub, and emergent vegetation, along with aquatic
depressions filled with water. The riparian zone plays an isolating role of the river segment
against pollution from non-point sources. Hardwood forest create a dense cover along both
sides of the river channel between Smolajny and Łaniewo (Glińska-Lewczuk, Burandt 2011).
Paper Proceedings of Agri Animal 2013 - ISSN 2279-3682
399
Water bodies selected for this study are located at a 25 km long river section between
Smolajny and Łaniewo. Their morphometric parameters are give in Table 1.
Table 1
Oxbow lake OXL2 is located above Smolajny and connected to the river with its
descending arm (semi-lotic). It is a sinusoidal water body (S=5.4) and the central part of the
oxbow is relatively deep (2.6 m). OXL3 is a water body of highly sinusoidal shape (S=6.7)
and small area. Both arms of the oxbow lake are connected to the river by pipes which allow
drying up, dredging of bottom sediments and limit overgrowing. However, such operations
have not been conducted for many years now and, therefore, the oxbow was classified in this
study as a lentic floodplain lake. Another oxbow lake (OXL4) was also cut off from the river
and later its descending arm was reconnected to the riverbed with a pipe (semi-lotic oxbow
lake). It is the largest reservoir among the studied water bodies with the area nearly 3 ha. The
only truly lotic oxbow lake (OXL5) is located on the right bank and is highly sinusoidal. It
was formed 10 years ago. Its area is the smallest among the studied floodplain lakes. The
central part of the reservoir is the deepest. The last oxbow lake investigated in this study was
OXL8 – an old, big paleomeander totally cut off from the river (lentic floodplain lake).
Considerable accumulation of bottom sediments contributes to the shallowing of that oxbow.
Seasonal spates in the Łyna River basin occur in early spring (March-April) and in
autumn (November). High river stages (34.9 m3/s, 5-year cycle, Fig. 2A) were noted between
20 January and 30 April 2004-2008. The rise in the wetland water table led to a complete
flooding of oxbow lakes with river waters.
Figure 2
Except for this single flood event, the river was marked by average water levels
throughout (average monthly flow rate between 2004 and 2008 at the test site in Smolajny =
14.8 m3/s, Fig. 2A). They last on average 25 days (Glińska-Lewczuk and Burandt2011).
Paper Proceedings of Agri Animal 2013 - ISSN 2279-3682
400
During these events water level exceeds the height of river banks, i.e. 70.22 m a.s.l. (Fig. 2B)
and water floods the river basin, connecting oxbow lakes and river into one hydrological
system. During this investigation spates were not observed and the studied floodplain lakes
kept their original hydrological types – lotic, semi-lotic and lentic. As a result of an
engineering project to connect the analyzed oxbow lakes with Łyna's River bed, the studied
wetlands became part of a cohesive hydrological system. The project supported a biological
evaluation of the wetlands' inclusion into a uniform floodplain.
MATERIALS AND METHODS
In 2005 and 2008, water and invertebrate samples were collected at three-month intervals
from different locations (arms and central water bodies) at five test oxbow lakes. Each year
sampling was performed at the same time of the day (from 10 am to 16 pm) on days: 10 May,
10 August and 10 October. Altogether 90 samples for physico-chemical analyses of oxbow
waters were taken and the same amount for biological analyses.
Physico-chemical analyses of oxbow waters first were performed in situthree times at
each site – in the middle upper arm (site A), in the central zone (site B) and in the middle
lower arm (site C). With the help of a multiparametric probe (YSI 6600 Yellow-Spring
Instrument, USA) the following parameters were recorded: temperature (T), conductivity
(EC), pH, concentrations of dissolved oxygen (DO and DO%), N-NO3, N-NO2, N-NH4 and
total dissolved solids (TDS). Water samples subjected to laboratory analyses were collected in
5-liter polyethylene bottles and kept cold in darkness until analyzed within 12 hours. Samples
were filtered through Whatman®
GF/F glass fibre filters (pre-combusted at 450 oC for 4 h) to
determine the amount of suspended, dissolved and ash-free solids. Laboratory analyses
followed the standards described in APHA (1989). The samples were analyzed by ion
spectrophotometer (DR-2800 Hach-Lange Instruments, UK) to identify the level of chemical
Paper Proceedings of Agri Animal 2013 - ISSN 2279-3682
401
oxygen demand (COD), concentrations of total phosphorus (T-P) and dissolved cations and
anions (Cl-, P-PO4
3-, HCO3
-, K
+, Ca
2+, Mg
2+ and Na
+).
Trophic state of the studied oxbow lakes was determined with indices proposed by
Carlson (1977), Kratzer and Brezonik (1981). They are based on summer concentrations of
phosphorus and total nitrogen in the surface water layer. The following equations were
applied:
TSITP= 14.42 × ln(TP ) + 4.15
TSITN=54.45+14.43·ln(TN)
In general, values of those indices below 40 correspond to oligotrophy, between 40 and
60 – mesotrophy, between 60 and 80 – eutrophy and above 80 – hypertrophy.
Bottom sediments with benthic fauna were sampled using the Ekman‘s grab sampler
(surface 225 cm2) three times at each site simultaneously with physico-chemical sampling and
at the same sites. The depth from which samples were taken exceeded 0.5m and sites denoted
as ―B‖ were located in the deepest parts of oxbows. The sediments were sieved through a 0.5
mm mesh size sieve, placed in glass containers and fixed in 4% formalin. Then, aquatic
invertebrates were separated from sediments in a laboratory and sorted on Petri dishes.
Benthofauna representatives were identified to species using the identification key. Large
aquatic invertebrates were identified with the naked eye while smaller individuals were
examined with a microscope. All the samples were stored in flasks with 80% ethanol. The
quality of water in the studied oxbow lakes of different hydrological types was determined
with the most commonly used biological indices which indicate environmental conditions
(Water Action Volunteers 2003). Calculations of the applied indices of biomonitorg were
based on the taxonomic level of family. Those indices, mainly used for lotic ecosystems (they
were created for them) were: FBI (Family Biotic Index), BMWP-PL (Polish biotic index),
ASPT (Average Score Per Taxon), EPT% (the share of Ephemeroptera, Plecoptera and
Paper Proceedings of Agri Animal 2013 - ISSN 2279-3682
402
Trichoptera larvae), ratio of EPT and Chironomidae (Armitage et al. 1983; Mandaville 2002).
They were used to classify water quality according to the standardized classification (Table
2).
Table 2
In turn, lower number of invertebrate taxa, mostly tolerant of poor water quality, can be
found in polluted ecosystems. Organisms collected in this study were used to determine
species richness, dominance structure and species diversity with the Margalef (d) and
Hurlbert (PIE) indices. Similarity of species compositions between oxbow lakes of different
hydrological types was assessed with the Jaccard index (JI).
Hydrological classification of the studied floodplain lakes
River regulation and limited fluctuation in water levels had an adverse effect on all tested
sites. The river and the adjacent oxbow lake form a cohesive hydrological system which is
disrupted by regulatory and land improvement works. To restore the system's connectivity,
floodplain lakes have to be included in the river's ecosystem through revitalization measures
that involve the re-opening of oxbow lakes in part or in whole. The hydrological connectivity
of the river valley protects oxbow-lake against natural succession. The absence of
hydrological connectivity supports the growth of veget plants and sedimentation tanks.
During this study the oxbows were classified into three categories (Type 1, 2 and 3),
connected into a single hydrological system to a varied degree (connected on both sides,
connected via one arm, not connected). For this reason, hydrological connectivity was not
regarded as a continuous variable but as typology which reflected the changes taking place in
the entire flood plain of the river valley.
Paper Proceedings of Agri Animal 2013 - ISSN 2279-3682
403
Statistical analyses
To reduce the effect of absolute values, the biological indices were square-root transformed
(√(X+1)), very low value indices were downweighted and environmental data were log-
transformed (log10 (X+l)) (ter Braak and Śmilauer, 2002). To further identify patterns in the
values of 5 biological indices, indirect ordination methods, such as Detrended
Correspondence Analysis (DCA) (ter Braak and Ńmilauer, 2002) were used. The length of the
first DCA axis >4 (unimodal responses) indicated Canonical Correspondence Analysis (CCA;
ter Braak and Ńmilauer, 2002) to be the proper one in order to investigate relationships
between biomonitoring indices and environmental parameters. To identify the primary
environmental gradients affecting the values of monitoring and biodiversity indices,
Canonical Correspondence Analysis (CCA; ter Braak and Śmilauer, 2002) was used between
18 environmental variables (T, pH, DO, DO%, TDS, COD, N-NO3, N-NO2, N-NH4, P-PO4, T-
P, Cl-, HCO3
-, K
+, Ca
2+, Mg
2+, Na
+ and hydrological connectivity) and 7 monitoring indices
(BMWP-PL, FBI, ASPT, EPT, EPT%, TSITP, TSITN) and two biodiversity indices (PIE, d).
Hydrological connectivity was introduced as three dummy variables (Type 1 – semi-lotic,
Type 2 –lentic, Type 3- lotic) along with the rest of the physical and chemical variables.
Because environmental gradients had not previously been evaluated in the study area, we ran
a manual, forward-selection CANOCO procedure, which included variables that had a
conditional effect significant at the 5 % level (p <0.05). P-values were calculated using the
Monte Carlo Permutation Test (ter Braak and Śmilauer, 2002).
To assess the general differences among oxbow lakes, biological indices and hydro-chemical
data were subjected to non-parametric analysis of variance (Kruskal-Wallis test - H, p< 0.05)
and precisestatistical significance of differences in analyzed components between the studied
objects and sites was determined with the Mann-Whitney test (U, p< 0.05). In turn,
Paper Proceedings of Agri Animal 2013 - ISSN 2279-3682
404
relationships between water quality and benthic invertebrate abundance and diversity indices
were assessed with the Spearman‘s rank correlation coefficients (R) (StatSoft 2011).
RESULTS AND DISSUSION
Physical and chemical quality of water in oxbow lakes and impact on the River Łyna
The parameters of water quality in consecutive zones of the oxbow lakes investigated in
this study are presented in Table 3.
Table 3
pH differed significantly between closed and open water bodies (U, p = 0.007) as well as
between semi-open and open oxbows (U, p = 0.004) while the values of EC were only
significantly different between closed and semi-open water bodies (U, p = 0.04). However,
this parameter distinguished also oxbow arms (U, p = 0.003) and differed significantly
between the centres and lower arms (U, p< 0.001). Significant differences were also observed
for nitrite nitrogen between closed and semi-open oxbows (U, p = 0.005), between closed and
opened (U, p = 0.000) as well as between semi-open and open (U, p = 0.002). The contents of
ammonium nitrogen differed between closed and semi-open floodplain lakes (U, p = 0.02) as
well as between closed and open (U, p = 0.04). As for nitrate nitrogen, its concentrations were
significantly different in various oxbow types (closed – semi-open: U, p = 0.01; closed –
open: U, p = 0.000) and also in consecutive oxbow zones (lower arms – upper arms: U, p =
0.04; central zones – upper arms: U, p = 0.01; central zones – lower arms: U, p = 0.04).
Those results indicate considerable concentrations of nutrients, particularly phosphorus
compounds, which are largely a consequence of intensive agricultural use of the Łyna River
Basin (Glińska-Lewczuk and Burandt 2011). Another cause could be the release of nutrients
from sediment materials accumulated in lentic habitats. All the studied water bodies,
regardless of hydrological connectivity with the river, were characterized by hypertrophic
Paper Proceedings of Agri Animal 2013 - ISSN 2279-3682
405
waters according to TSITP while TSITN indicated water of variable trophic status (Carlson
1977; Kratzer and Brezonik 1981). Values of that index classified water in lentic oxbow lakes
as eutrophic, in semi-lotic as mesotrophic and in lotic as intermediate oligo-mesotrophic
(Table 2). Statistically significant differences in TSITP were observed between closed and
semi-open water bodies (U, p = 0.004) as well as between open and closed oxbows (U, p =
0.002). In turn, the values of TSITN differed significantly only between closed and open
oxbow lakes (U, p = 0.02). Considerable concentrations of inorganic phosphorus contribute to
the productivity of oxbow ecosystems and they can then resemble typical lakes (Gallardo et
al. 2008). Oxbow lakes, regardless of the level of connectivity with river, loose their original
lotic character in respect of water chemistry and turn into lentic ecosystems.
Composition of macrozoobenthos
Altogether 2840 macrozoobenthos individuals were identified in the oxbows of the Łyna
River, which represented 30 families and 74 species. Table 3 presents the composition and
distribution of macroinvertebrate communities in the studied water bodies in respect of
consecutive zones (upper arm – site A, central part – site B, lower arm – site C). The highest
number of invertebrates was found in the semi-lotic OXL2 (16 355 indiv. m-2
) and the lowest
in closed OXL3 (2 696 indiv. m-2
). The average macroinvertebrate abundance in oxbow lakes
followed the order: semi-lotic<lotic<lentic (Fig. 3a).
Figure 3
However, differences in abundance between the oxbow types were insignificant (p =
0.565). The Jaccard index of similarity revealed that macroinvertebrates community in semi-
lotic water bodies resembled more the community in lentic water bodies (JI=0.38) than lotic
(JI=0.29). The longer the period of disconnection between meanders and mother river, the
more zoocenoses in semi-lotic oxbow lakes develop into those characteristics for standing
Paper Proceedings of Agri Animal 2013 - ISSN 2279-3682
406
waters (Tockner et al. 1999; Ward et al. 2002). Semi-lotic water bodies investigated in this
study were formed almost 90 years ago and this period is long enough for oxbow lakes to
loose their original, lotic habitat.
In general, invertebrates were dominated by Diptera (52.57%), Oligochaeta (25.83%) and
Gastropoda (12.03%). However, the structure of domination differed in dependence on
oxbow-river hydrological connectivity. Oligochaeta (46.93%) and Diptera (25.25%) prevailed
in the lotic oxbow lake (OXL5) as well as in lentic water bodies (50.52% and 39.45%) while
semi-lotic oxbows were predominated by Diptera (72.91%) and Gastropoda (18.67%) (Fig.
3b). Such compositions indicates advanced succession of the oxbows and simplified
qualitative structure of zoobenthos (Kajak 1988). That situation is often observed in lentic
oxbow lakes, more seldom in semi-lotic and lotic water bodies (Gallardo et al. 2008; Glińska-
Lewczuk 2009; Obolewski 2011; Rybak and Pasternak 2010). Ephemeroptera and
Trichoptera larvae were infrequent components of benthofauna which also confirms bad
ecological conditions of the oxbows regardless of their connectivity to the river (Gallardo et
al. 2008).
The number of Isopoda (Asellus aquaticus L.) representatives fluctuated considerably in
the studied oxbow lakes and that taxon did not reveal any clear preferences for a specific type
of hydrological connectivity. Statistically significant difference was recorded between both
semi-lotic ecosystems (U, p = 0.034) as well as between lotic OXL5, semi-lotic OXL2 and
lentic OXL3 (in both cases: U, p = 0.033). The biggest differences were obtained for
Megaloptera (Sialis lutaria L.) abundance, particularly between semi-lotic OXL2 and the
opened oxbow (U, p = 0.014). The abundance of Gastropoda (e.g. Viviparus contectusMillet,
Potamopyrgus antipodarum Gray, Valvata piscinalisMüller, Lymnaea stagnalis L. and
Planorbarius corneus L.) differed significantly between both semi-lotic floodplain lakes (U, p
= 0.005) as well as between closed OXL3 and open OXL5 (U, p = 0.014). Bivalvia
Paper Proceedings of Agri Animal 2013 - ISSN 2279-3682
407
representatives were the most abundant in open OXL5 (Pisidium amnicumMüller and
Anadonta anatina L.) and their density was significantly higher than in semi-lotic OXL4 (U, p
= 0.014) and closed OXL3 (only Dreissena polymorpha Pall. – U, p = 0.045). Research
conducted by Strzelec and Królczyk (2004) indicated that the distribution of molluscs in a
riverine system does not depend on water physico-chemistry but the occurrence of vascular
flora (microhabitats), which in turn depends on the quality of bottom sediments, water flow
rate and depth.
The total abundance of macrozoobenthos differed considerably between sampling sites
(Fig. 3c). The number of individuals in the central part of oxbows was significantly higher
than in lower arms (U, p = 0.028). The abundance differed also between the upper and lower
arms (U, p< 0.001). As for the number of taxa, significant differences were observed between
the upper arms and the central part of oxbows (U, p < 0.001) as well as between the arms (U,
p = 0.006). Oligochaeta reached considerable abundance in lotic and lentic oxbow lakes, even
a half of the total abundance of benthic fauna (Fig. 3d) but their dominance was observed
only in the arms. The other parts of the oxbows were dominated by Diptera larvae, which
constituted 75% of benthofauna abundance (Fig. 3d). More diverse composition was recorded
for semi-lotic oxbow lakes, particularly in the upper arms, while the lower arms and the
central zone were predominated by Diptera larvae.
The results of the CCA (Fig. 4A) showed that the first two CCA axes accounted for density
54.5% of the taxon-environment relationship (F = 4.15, p = 0.002). Axis 1 explained 37.5% of
the total variance and was connected positively with HCO3 and EC and negatively with pH.
N-NO3, and DO contributed positively while P-PO4 and COD negatively to axis 2 (17.0% of
the total variance).
Figure 4
Paper Proceedings of Agri Animal 2013 - ISSN 2279-3682
408
Forward selection revealed that from the input environmental variables listed in Table 3,
chemical elements were significant in explaining patterns of occurrence and abundance of
macroinvertebrate taxa in floodplain lakes in Łyna river (Fig. 4A). It turned out, that Isopoda,
Bivalvia and Trichoptera larvae preferred higher DO and pH, mainly lotic oxbow lake (Type
3). Arachnida, Gastropoda, Ephemeroptera larvae and Heteroptera revealed preferences to
higher levels of pH, observed in lotic (Type 3) and semi-lotic (Type 1) water bodies. In lotic
oxbow lakes (Type 2) observed only small preference Diptera larvae (e.g. Procladius Skuse,
Chironomusplumosus L. and Chaoboruscrystallinus De Geer) and Odonata larvae (Lestes
dryas L., Epitheca bimaculata Charp).
Macroinvertebrate communities as bioindicators
The applied set of biotic indices based on macroinvertebrate communities reflected the
ecological conditions not only in a given oxbow lake as a whole but also in consecutive
fragments of the oxbows (Table 4).
Table 4
Analyses of water quality in small water bodies using a number of biotic indices are
sporadic (Rybak and Pasternak 2010). In this study, water quality was assessed as the worst
with the EPT index, i.e. the share of Ephemeroptera, Plecoptera and Trichoptera larvae. All
those three taxonomic groups were not abundant in the studied oxbow lakes (Plecoptera
individuals did not occur at all). They reached the highest percentage share in lentic OXL5
(3.15%), in lotic it was 1.57% and the lowest in semi-lotic (0.20%). Representatives of EPT
are considered as very sensitive to environmental stress so they are used as potential
bioindicators. Their low density in this study indicated bad quality of the environment. The
abundance of Ephemeroptera differed significantly between lentic (OXL8) and two semi-
lotic oxbow lakes (U, p = 0.034). As for Diptera larvae (mainly Ch. crystallinus and
Paper Proceedings of Agri Animal 2013 - ISSN 2279-3682
409
Procladius spp., Ch.plumosus), they occurred abundantly, particularly in the semi-lotic
ecosystem (72.91%) while in the lotic reservoir no representatives of Chaoboridae family
were observed. Chironomidae individuals were a constant component of benthic macrofauna
and adapted to habitats both with standing and flowing water. According to Hellawell (1986),
Chironomidae larvae (e.g. Chironomus f.l. plumosus) indicated strong eutrophication of
oxbow lake and high rise of water level (1.5 m above the average) washed out the silt with
fauna. The EPT:C index revealed the quantitative predominance of Chironomidae larvae -
1:12 in total, 1:8 in semi-lotic and lentic oxbows and in the lotic water bodies 1:16. Among
the other benthic fauna representatives were Oligochaeta whose abundance differed
significantly between the oxbow lakes: semi-lotic OXL4 – lotic OXL5 (U, p = 0.014), OXL4
– lentic OXL8 (U, p = 0.035), OXL4 – OXL2 (U, p = 0.035). According to Kasprzak (1987)
the density of Oligochaeta is determined by water level and the age of silt. Decreased water
level in a river basin forms conditions favourable to the development of that group of
organisms. Due to cooler climate in the Łyna River basin comparing to other lowland river
basins of northern Poland such situation occurs there in autumn, not in summer (Glińska-
Lewczuk 2009).
The results of the CCA (Figure 4B) showed that the first two CCA axes accounted for
73.3 % of the monitoring indices-environment relationship (F = 3.18, p = 0.022). High
percentage of the variance explained indicates that all the indices of biodiversity and
monitoring indices are connected with hydro-chemical parameters. The most distinct
relationships can be observed for pH, nitrogen and phosphorus compounds, Na, Cl and K. The
highest values of biotic and abiotic indices occur at moderate levels of hydro-chemical
parameters. Only EPT index is highly positively correlated with pH. The lowest values of
EPT are observed in closed oxbow lakes, which confirms its applicability in the assessment of
ecological conditions only lentic habitats.
Paper Proceedings of Agri Animal 2013 - ISSN 2279-3682
410
According to EPT index, water at almost all sites was classified as class V. The only
exception was the centre of OXL8, where it was class IV. The EPT index is based on the
abundance of three the most sensitive families of insect larvae - Ephemeroptera, Plecoptera
and Trichoptera. Plecoptera individuals prefer clean and well oxygenated waters with strong
current (Lenat and Penrose, 1996). Such conditions incidentally occurred in the oxbow lakes
and mainly in lotic water bodies, particularly at sites were riverine waters contact with oxbow
waters. The absence of Ephemeroptera representatives determined the results of water quality
classification with the EPT index. Therefore, it would be advisable to not use that index in the
monitoring of oxbow lakes (specific ecosystems). However, it should be noticed, that only the
values of EPT indicated the same level of trophy as the chemical index TSITP.
FBI was another biotic index used for the comparison between oxbow lakes. According
to that method the lowest class V was obtained for lentic OXL8 and lotic OXL5, which was
connected with a low number of invertebrate families in those water bodies. For the
remaining oxbows, in general the values of FBI indicated quite different trophic levels
compared to chemical indices. The values of FBI did not differ significantly between the
oxbow lakes (H, p = 0.161).
According to BMWP-PL, water in lentic and semi-lotic oxbows was classified as class
III-IV while in lotic as class III, which was highly comparable with the values of TSITN. The
differences in BMWP-PL between the water bodies were statistically insignificant (H, p =
0.339), but significant differences were observed between oxbow arms (U, p = 0.013).
The worst ecosystem conditions at almost all sites (except for lotic OXL5) were indicated
by ASPT method, which greatly corresponded with chemical indices. The only exception was
the classification of water quality in OXL2. Differences in the values of ASPT between
oxbows were statistically insignificant (H, p = 0.490). According to that system of
assessment, 60% of oxbows were classified in class V of water quality and only semi-lotic
Paper Proceedings of Agri Animal 2013 - ISSN 2279-3682
411
OXL2 and lotic OXL5 in class IV. The values of ASPT confirmed bad ecological state of the
oxbows and were the lowest among the biotic indices applied. ASPT method is based on
arithmetic mean while the rest of indices on weighted mean. As a result, ASPT takes into
consideration the number of families but ignores the abundance of species in consecutive
taxa.
The values of Margalef (d) index indicated considerable differences in water quality
between oxbow zones (Table 5).
Table 5
In general, that index classified oxbow water quality in class II-III (mesotrophic), in case
of lentic oxbow lakes much higher than using chemical indices. The values of Margalef index
were compared with the PIE index, which determines the probability that two individuals
found accidentally belong to different species (Ward et al. 2002). The relationship turned out
to be of a moderate strength (R=0.64). The highest averaged values of d and PIE were
obtained for oxbow arms: upper (sites A) and lower (sites C). Such a situation was typical of
semi-lotic water bodies while in lentic the values of d index decreased along the oxbows and
PIE was at a stable level (0.500±0.031). Different situation was observed in the lotic
reservoir, where the highest value of d index was found in the upper arm and in the remaining
zones was at a stable level.
The structure and abundance of invertebrate fauna can be greatly affected by predation.
Schneider and Winemiller (2008) reported an increase in benthos abundance in the floodplain
lakes caused by fish poisoning. Fish feed on older individuals and, thus, contribute to higher
productivity (young benthic individuals grow faster). The influence of fish on benthos can be
considered as direct (decrease in the number of individuals caused by predation) and indirect
(transformations of the environment). Foraging fish intensify the cycling of matter, destroy
benthic algae, feed on benthic predators, rejuvenate benthic population and increase the share
Paper Proceedings of Agri Animal 2013 - ISSN 2279-3682
412
of forms with short live cycle. That indirect influence is usually stronger than direct.
Moreover, fish predation makes place for new generation of benthos and decrease the
competition inside that community. Benthos can compensate the decrease in abundance,
which is affected more by trophic conditions than predation. Low values of biotic indices in
lotic and semi-lotic oxbow lakes in this study can be partially ascribed to fish activity.
CONCLUSIONS
In general, water quality in oxbow lakes of the Łyna River differing in hydrological
connectivity can be assessed – based on chemical and biotic indices – as very low (from
mesotrophic to hypertrophic conditions). The numbers of benthic individuals and families did
not differ significantly between oxbow lakes. The ratio of EPT to Chironomidae was higher at
sites where riverine waters had contact with oxbow waters, which indicated the positive
influence of mother river on the quality of water in oxbows. However, the EPT index turned
out to be the least suitable in the biomonitoring of lotic-lentic ecosystems. The remaining
indices used in this study (FBI, BMWP-PL and ASPT-PL) revealed unsatisfactory conditions
in oxbow lakes (class IV-V of water quality). Higher values, corresponding with class II and
III, were obtained with the Margalef (d) index of biodiversity (which does not take into
consideration the actual composition of fauna). However, they were only moderately
correlated with the values of another biodiversity index, i.e. PIE. Therefore, the use of d index
in the biomonitoring of oxbow lakes seems to be problematic. The updated list of aquatic
invertebrates inhabiting small floodplain lakes in the Łyna River basin allowed to assess
ecological conditions of that part of the valley directly connected with the water course. To
sum up, the distribution of benthic communities reflects environmental conditions and
contribute to the understanding of appropriate methods of water supply protection.
Paper Proceedings of Agri Animal 2013 - ISSN 2279-3682
413
Acknowledgements
This study was supported financially by the Polish Ministry of Education and Science. Grant
no. NN 305 1423 40.
REFERENCES
Amoros, Bornette. 2002. Connectivity and biocomplexity in waterbodies of riverine
floodplains. Freshwater Biology, vol. 47, no. 4, April, pp. 761–776.
Armitage, Moss, Wright, Furse. 1983. The performance of a new biological water quality
score system based on macroinvertebrates over a wide range of unpolluted running-water
sites. Water Research, vol. 17, no. 3, March, pp. 333-347.
APHA. 1989. Standard Methods for the Examination of Water and Wastewater. 17Th
ed.
American Public Health Association (APHA), Washington
Arscott, Tockner, Ward JV. 2005. Lateral organization of aquatic invertebrates along the
corridor of a braided floodplain river. Journal of the North American Benthological
Society, vol. 24, no. 4, pp. 934-954.
Carlson. 1977. A trophic state index for lakes. Limnology and Oceanogrphy, vol. 22, no. 2,
pp. 361-369.
Cullen. 1990. Biomonitoring and environmental management.Environmental Monitoring and
Assessment, vol. 14, no. 2-3, May, pp. 107-114.
Directive 2000/60/EC of the European Parliament and of the Council establishing a
framework for the Community action in the field of water policy.Official Journal (OJ L
327).
Gallardo, Garcia, Cabezas, Gonzalez, Gonzalez, Ciancarelli, Comin. 2008. Macroinvertebrate
patterns along environmental gradients and hydrological connectivity within a regulated
river-floodplain. Aquatic Sciences, vol. 70, no. 3, August, pp. 248-258.
Paper Proceedings of Agri Animal 2013 - ISSN 2279-3682
414
Gazette 2004 no. 32 pos. 284.Decree of the Minister of Environment dated 11.02.2004 on the
classification of surface and ground water quality, monitoring and the interpretation of its
results. (in Polish)
Glińska-Lewczuk. 2009. Water quality dynamics of oxbow lakes in young-glacial landscape
of NE Poland in relation to their hydrological connectivity. Ecological Engineering, vol.
35, no. 1, January, pp. 25-37.
Glińska-Lewczuk, Burandt.2011. Effect of river straightening on the hydrochemical
properties of floodplain lakes: Observations from the Łyna and Drwęca Rivers, N
Poland.Ecological Engineering, vol. 37, no. 5, May, pp. 786-795
Hellawell. 1986. Biological indicators of freshwater pollution and environmental
management. Elsevier Science Publisher Ltd., New York
Kasprzak. 1987. Comments on annelids in Poland (Oligochaeta). VI Annelids of lake shores
and standing waters in the Greater Poland. Physiographic research in the Western Poland,
vol. 35, no. C, pp. 73-79 (in Polish).
Kratzer, Brezonik. 1981. A Carlson-type trophic state index for nitrogen in Florida lakes.
JAWRA Journal of the American Water Resources Association, vol. 17, no. 4, August, pp.
713-715.
Lenat, Penrose. 1996. History of the EPT taxa richness metric.Bulletin North American
Benthological Society, vol. 13, no. 2, pp. 12-14.
Lew, Lew, Szarek, Babińska. 2011. Seasonal patterns of the bacterioplankton community
composition a lake Threatened by a pesticide disposal site. Environmental Science and
Pollution Research, vol. 18, no. 3, March, pp. 376-385.
Lyson. 2002. Advanced agricultural biotechnologies and sustainable agriculture.TRENDS in
Biotechnology, vol. 20, no. 5, pp. 193-196.
Paper Proceedings of Agri Animal 2013 - ISSN 2279-3682
415
Mandaville. 2002. Benthic macroinvertebrates in freshwaters – taxa tolerance values,
metrics, and protocols. Soil & Water Conservation Society of Metro Halifax, Nova Scotia
Obolewski. 2011. Macrozoobenthos patterns along environmental gradients and hydrological
connectivity of oxbow lakes. Ecological Engineering, vol. 37, no. 5, May, pp. 796–805.
Obolewski, Glińska-Lewczuk, Kobus. 2009. Effect of hydrological connectivity on the
molluscan community structure in oxbow lakes of the Łyna river. Oceanology and
Hydrobiology Studies, vol. 38, no. 4, December, pp. 75-88.
Rybak, Pasternak. 2010. Analysis of water quality in the area of Wroclaw‘s aquiferous layers
with macroinvertebrates as bioindicators. Ochrona Środowiska, vol. 32, no. 2, April-June,
pp. 27-34
Schneider, Winemiller. 2008. Structural complexity of woody debris patches influences fish
and macroinvertebrate species richness in a temperate floodplain-river system.
Hydrobiologia, vol. 610, pp. 235–244.
StatSoft. 2011. STATISTICA for Windows [Computer program manual]. Tulsa, OK:
StatSoft, Inc., 2300 East 14th Street, Tulsa, OK 74104, phone: (918) 749-1119, fax: (918)
749-2217, email: [email protected], WEB: http://www.statsoft.com.
Strzelec, Królczyk. 2004. Factors affecting snail (Gastropoda) community structure in the
upper course of the Warta river (Poland). Biologia, vol. 59, no. 2, pp. 159-163.
Tockner, Schiemer, Baumgartner, Kum, Weigand, Zweimuller, Ward. 1999. The Danube
restoration project: Species diversity patterns across connectivity gradients in the
floodplain system. Regulated Rivers: Research & Management, vol. 15, no. 1-3, January-
June, pp. 245–258.
Water Action Volunteers. 2003. Volunteer stream monitoring factsheet series: Citizen
Monitoring Biotic Index.University of Wisconsin, Department of Natural Resources 33.

Paper Proceedings of Agri Animal 2013 - ISSN 2279-3682
416
Ward, Tockner, Arscott, Claret. 2002. Riverine landscape diversity. Freshwater Biology, vol.
47, no. 4, April, pp. 517 – 539.
Paper Proceedings of Agri Animal 2013 - ISSN 2279-3682
417
List of figure captions
Figure 1.Study site locations (five wetlands) in the Middle Łyna River Floodplain lakes,
Poland.
Figure 2.Hydrograph of the Łyna River, Poland, between 2004-2007 (Smolajny gauging
station). A – flow of the Łyna River (Qav. – average flow; Qav.-S – average flow in summer‘s
period, Qav.-W - average flow in winter‘s period, QH – high flow, QL – low flow), B- water
level of the Łyna River
Figure 3. Macroinvertebrate structure in the studied oxbow lakes: (a) average abundance in
oxbow types (indiv.); (b) structure of domination (%) in oxbow types; (c) average abundance
in oxbow zones (A- Upper arm; B – Centre; C – Lower arm); (d) structure of domination (%)
in oxbow zones.
Figure 4. Results of Canonical Correspondence analysis performed with monitoring
indices and environmental data from the Łyna River Floodplain using forward selection of
variables (p <0.05). A. Triplot of significant environmental variables, macrozoobenthos
taxa and hydrological types of wetlands of axis 1 and 2, B. Triplot of significant
environmental variables, monitoring indices and hydrological types of wetlands of axis 1
and 2.
Paper Proceedings of Agri Animal 2013 - ISSN 2279-3682
418
Fig. 1.
Paper Proceedings of Agri Animal 2013 - ISSN 2279-3682
419
Fig.2
Paper Proceedings of Agri Animal 2013 - ISSN 2279-3682
420
Fig. 3.
Paper Proceedings of Agri Animal 2013 - ISSN 2279-3682
421
Fig. 4
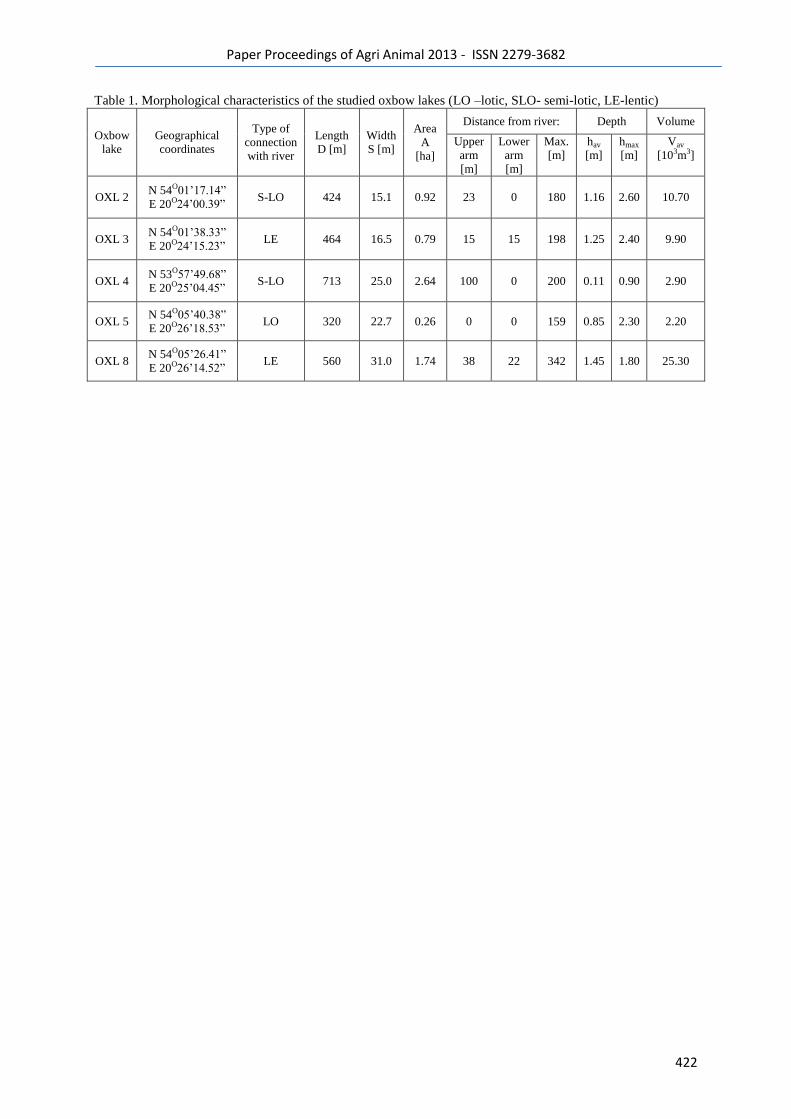
Paper Proceedings of Agri Animal 2013 - ISSN 2279-3682
422
Table 1. Morphological characteristics of the studied oxbow lakes (LO –lotic, SLO- semi-lotic, LE-lentic)
Oxbow
lake
Geographical
coordinates
Type of
connection
with river
Length
D [m]
Width
S [m]
Area
A
[ha]
Distance from river: Depth Volume
Upper
arm
[m]
Lower
arm
[m]
Max.
[m]
hav
[m]
hmax
[m]
Vav
[103m3]
OXL 2 N 54O01‘17.14‖
E 20O24‘00.39‖ S-LO 424 15.1 0.92 23 0 180 1.16 2.60 10.70
OXL 3 N 54O01‘38.33‖
E 20O24‘15.23‖ LE 464 16.5 0.79 15 15 198 1.25 2.40 9.90
OXL 4 N 53O57‘49.68‖
E 20O25‘04.45‖ S-LO 713 25.0 2.64 100 0 200 0.11 0.90 2.90
OXL 5 N 54O05‘40.38‖
E 20O26‘18.53‖ LO 320 22.7 0.26 0 0 159 0.85 2.30 2.20
OXL 8 N 54O05‘26.41‖
E 20O26‘14.52‖ LE 560 31.0 1.74 38 22 342 1.45 1.80 25.30
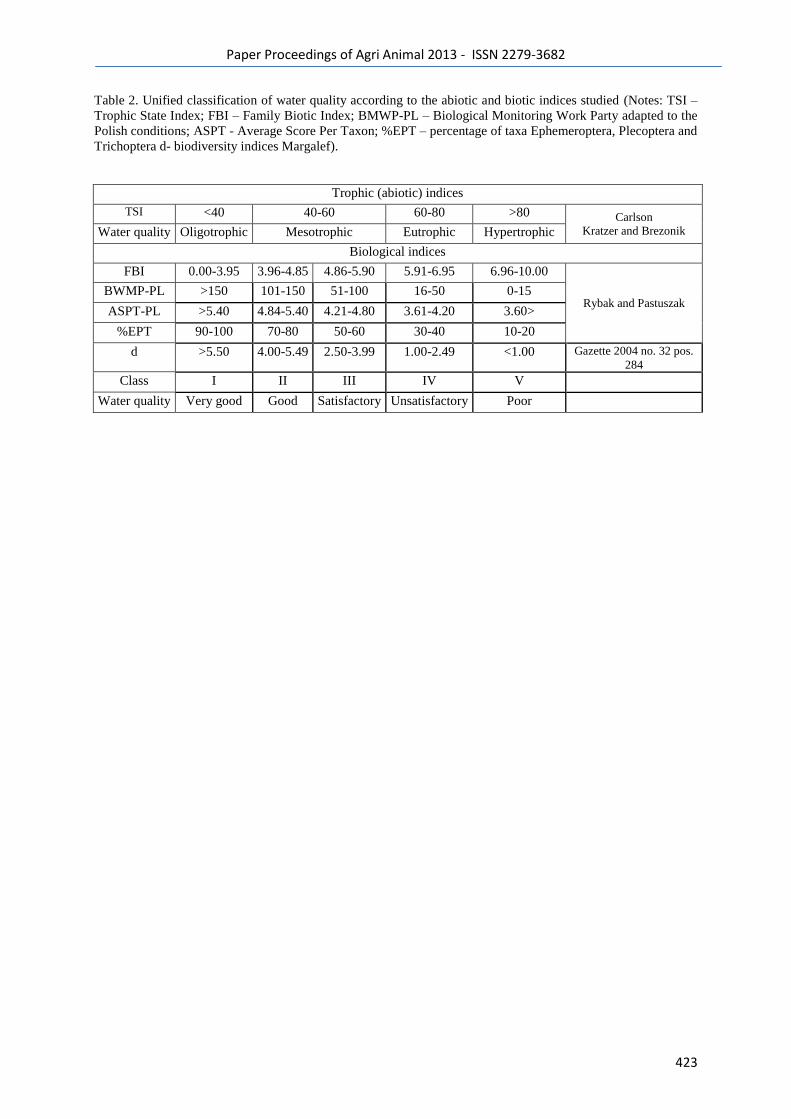
Paper Proceedings of Agri Animal 2013 - ISSN 2279-3682
423
Table 2. Unified classification of water quality according to the abiotic and biotic indices studied (Notes: TSI –
Trophic State Index; FBI – Family Biotic Index; BMWP-PL – Biological Monitoring Work Party adapted to the
Polish conditions; ASPT - Average Score Per Taxon; %EPT – percentage of taxa Ephemeroptera, Plecoptera and
Trichoptera d- biodiversity indices Margalef).
Trophic (abiotic) indices
TSI <40 40-60 60-80 >80 Carlson
Kratzer and Brezonik Water quality Oligotrophic Mesotrophic Eutrophic Hypertrophic
Biological indices
FBI 0.00-3.95 3.96-4.85 4.86-5.90 5.91-6.95 6.96-10.00
Rybak and Pastuszak BWMP-PL >150 101-150 51-100 16-50 0-15
ASPT-PL >5.40 4.84-5.40 4.21-4.80 3.61-4.20 3.60>
%EPT 90-100 70-80 50-60 30-40 10-20
d >5.50 4.00-5.49 2.50-3.99 1.00-2.49 <1.00 Gazette 2004 no. 32 pos.
284
Class I II III IV V
Water quality Very good Good Satisfactory Unsatisfactory Poor
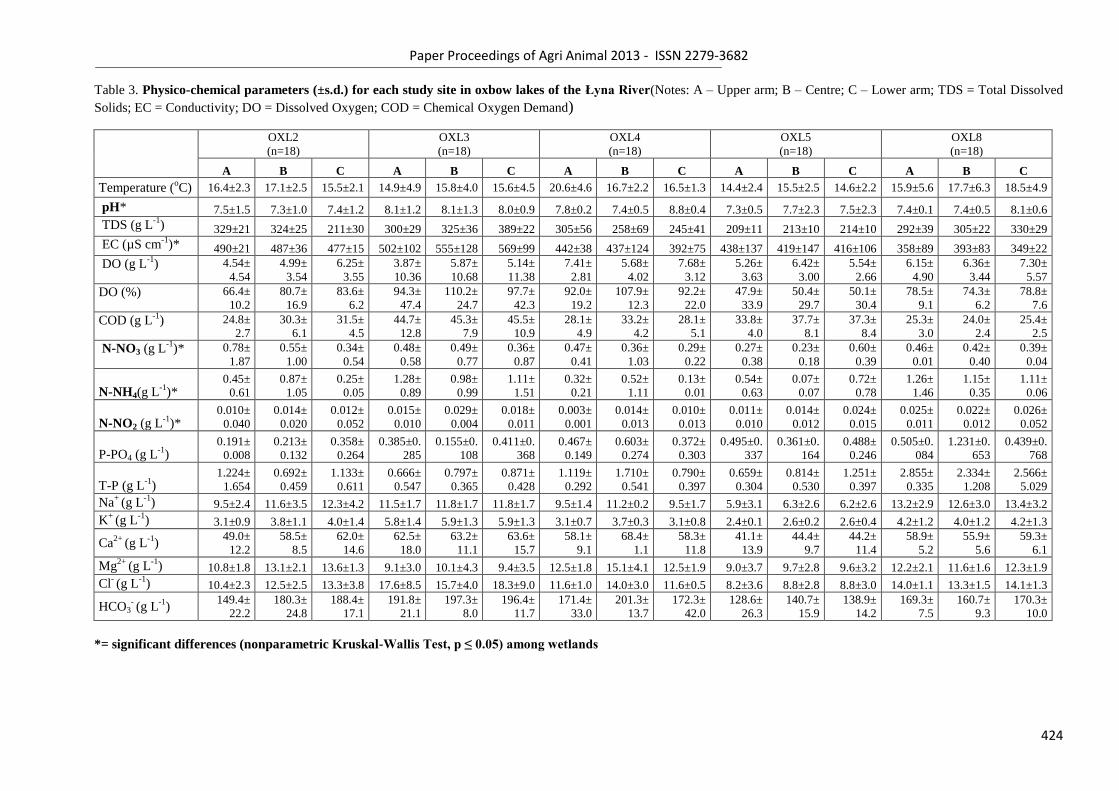
Paper Proceedings of Agri Animal 2013 - ISSN 2279-3682
424
Table 3. Physico-chemical parameters (±s.d.) for each study site in oxbow lakes of the Łyna River(Notes: A – Upper arm; B – Centre; C – Lower arm; TDS = Total Dissolved
Solids; EC = Conductivity; DO = Dissolved Oxygen; COD = Chemical Oxygen Demand)
OXL2
(n=18)
OXL3
(n=18)
OXL4
(n=18)
OXL5
(n=18)
OXL8
(n=18)
A B C A B C A B C A B C A B C
Temperature (oC) 16.4±2.3 17.1±2.5 15.5±2.1 14.9±4.9 15.8±4.0 15.6±4.5 20.6±4.6 16.7±2.2 16.5±1.3 14.4±2.4 15.5±2.5 14.6±2.2 15.9±5.6 17.7±6.3 18.5±4.9
pH* 7.5±1.5 7.3±1.0 7.4±1.2 8.1±1.2 8.1±1.3 8.0±0.9 7.8±0.2 7.4±0.5 8.8±0.4 7.3±0.5 7.7±2.3 7.5±2.3 7.4±0.1 7.4±0.5 8.1±0.6
TDS (g L-1
) 329±21 324±25 211±30 300±29 325±36 389±22 305±56 258±69 245±41 209±11 213±10 214±10 292±39 305±22 330±29
EC (µS cm-1
)* 490±21 487±36 477±15 502±102 555±128 569±99 442±38 437±124 392±75 438±137 419±147 416±106 358±89 393±83 349±22
DO (g L-1
) 4.54±
4.54
4.99±
3.54
6.25±
3.55
3.87±
10.36
5.87±
10.68
5.14±
11.38
7.41±
2.81
5.68±
4.02
7.68±
3.12
5.26±
3.63
6.42±
3.00
5.54±
2.66
6.15±
4.90
6.36±
3.44
7.30±
5.57
DO (%) 66.4±
10.2
80.7±
16.9
83.6±
6.2
94.3±
47.4
110.2±
24.7
97.7±
42.3
92.0±
19.2
107.9±
12.3
92.2±
22.0
47.9±
33.9
50.4±
29.7
50.1±
30.4
78.5±
9.1
74.3±
6.2
78.8±
7.6
COD (g L-1
) 24.8±
2.7
30.3±
6.1
31.5±
4.5
44.7±
12.8
45.3±
7.9
45.5±
10.9
28.1±
4.9
33.2±
4.2
28.1±
5.1
33.8±
4.0
37.7±
8.1
37.3±
8.4
25.3±
3.0
24.0±
2.4
25.4±
2.5
N-NO3 (g L-1
)* 0.78±
1.87
0.55±
1.00
0.34±
0.54
0.48±
0.58
0.49±
0.77
0.36±
0.87
0.47±
0.41
0.36±
1.03
0.29±
0.22
0.27±
0.38
0.23±
0.18
0.60±
0.39
0.46±
0.01
0.42±
0.40
0.39±
0.04
N-NH4(g L-1
)* 0.45±
0.61
0.87±
1.05
0.25±
0.05
1.28±
0.89
0.98±
0.99
1.11±
1.51
0.32±
0.21
0.52±
1.11
0.13±
0.01
0.54±
0.63
0.07±
0.07
0.72±
0.78
1.26±
1.46
1.15±
0.35
1.11±
0.06
N-NO2 (g L-1
)* 0.010±
0.040
0.014±
0.020
0.012±
0.052
0.015±
0.010
0.029±
0.004
0.018±
0.011
0.003±
0.001
0.014±
0.013
0.010±
0.013
0.011±
0.010
0.014±
0.012
0.024±
0.015
0.025±
0.011
0.022±
0.012
0.026±
0.052
P-PO4 (g L-1
) 0.191±
0.008
0.213±
0.132
0.358±
0.264
0.385±0.
285
0.155±0.
108
0.411±0.
368
0.467±
0.149
0.603±
0.274
0.372±
0.303
0.495±0.
337
0.361±0.
164
0.488±
0.246
0.505±0.
084
1.231±0.
653
0.439±0.
768
T-P (g L-1
) 1.224±
1.654
0.692±
0.459
1.133±
0.611
0.666±
0.547
0.797±
0.365
0.871±
0.428
1.119±
0.292
1.710±
0.541
0.790±
0.397
0.659±
0.304
0.814±
0.530
1.251±
0.397
2.855±
0.335
2.334±
1.208
2.566±
5.029
Na+
(g L-1
)
9.5±2.4 11.6±3.5 12.3±4.2 11.5±1.7 11.8±1.7 11.8±1.7 9.5±1.4 11.2±0.2 9.5±1.7 5.9±3.1 6.3±2.6 6.2±2.6 13.2±2.9 12.6±3.0 13.4±3.2
K+
(g L-1
)
3.1±0.9 3.8±1.1 4.0±1.4 5.8±1.4 5.9±1.3 5.9±1.3 3.1±0.7 3.7±0.3 3.1±0.8 2.4±0.1 2.6±0.2 2.6±0.4 4.2±1.2 4.0±1.2 4.2±1.3
Ca2+
(g L-1
) 49.0±
12.2
58.5±
8.5
62.0±
14.6
62.5±
18.0
63.2±
11.1
63.6±
15.7
58.1±
9.1
68.4±
1.1
58.3±
11.8
41.1±
13.9
44.4±
9.7
44.2±
11.4
58.9±
5.2
55.9±
5.6
59.3±
6.1
Mg2+
(g L-1
)
10.8±1.8 13.1±2.1 13.6±1.3 9.1±3.0 10.1±4.3 9.4±3.5 12.5±1.8 15.1±4.1 12.5±1.9 9.0±3.7 9.7±2.8 9.6±3.2 12.2±2.1 11.6±1.6 12.3±1.9
Cl- (g L
-1)
10.4±2.3 12.5±2.5 13.3±3.8 17.6±8.5 15.7±4.0 18.3±9.0 11.6±1.0 14.0±3.0 11.6±0.5 8.2±3.6 8.8±2.8 8.8±3.0 14.0±1.1 13.3±1.5 14.1±1.3
HCO3- (g L
-1)
149.4±
22.2
180.3±
24.8
188.4±
17.1 191.8±
21.1
197.3±
8.0
196.4±
11.7
171.4±
33.0
201.3±
13.7
172.3±
42.0
128.6±
26.3
140.7±
15.9
138.9±
14.2
169.3±
7.5
160.7±
9.3
170.3±
10.0
*= significant differences (nonparametric Kruskal-Wallis Test, p ≤ 0.05) among wetlands
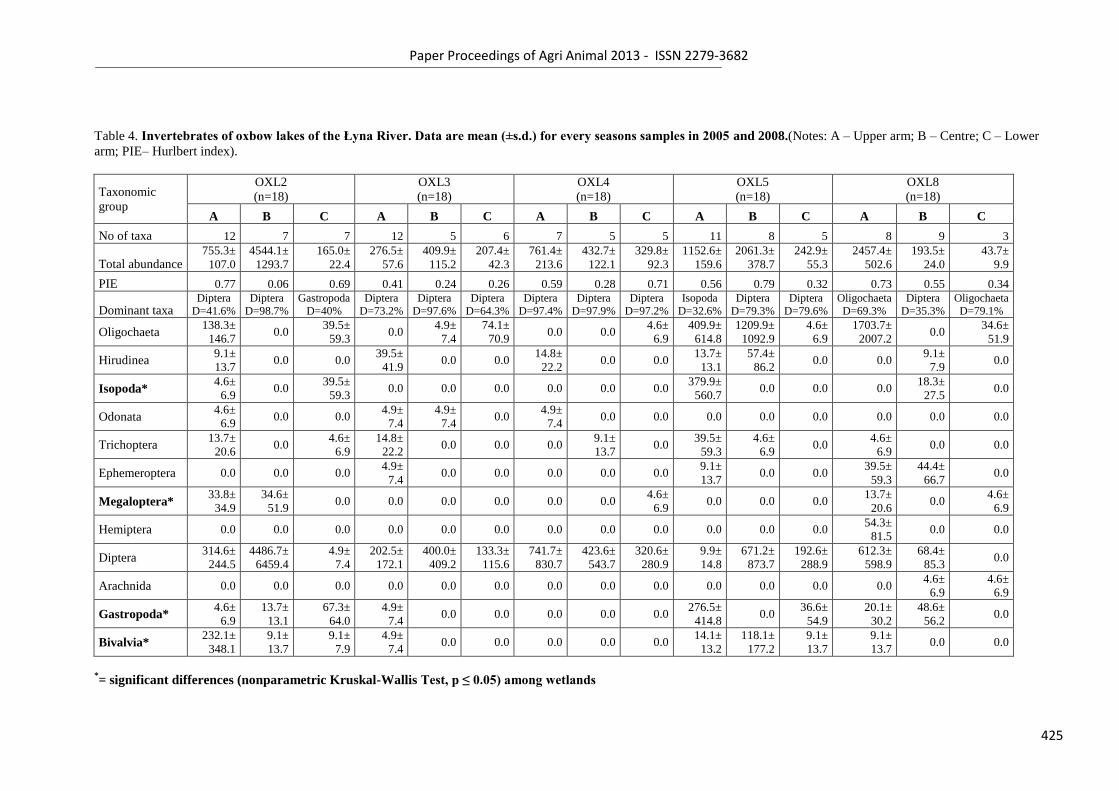
Paper Proceedings of Agri Animal 2013 - ISSN 2279-3682
425
Table 4. Invertebrates of oxbow lakes of the Łyna River. Data are mean (±s.d.) for every seasons samples in 2005 and 2008.(Notes: A – Upper arm; B – Centre; C – Lower
arm; PIE– Hurlbert index).
Taxonomic
group
OXL2
(n=18)
OXL3
(n=18)
OXL4
(n=18)
OXL5
(n=18)
OXL8
(n=18)
A B C A B C A B C A B C A B C
No of taxa 12 7 7 12 5 6 7 5 5 11 8 5 8 9 3
Total abundance 755.3±
107.0
4544.1±
1293.7
165.0±
22.4
276.5±
57.6
409.9±
115.2
207.4±
42.3
761.4±
213.6
432.7±
122.1
329.8±
92.3
1152.6±
159.6
2061.3±
378.7
242.9±
55.3
2457.4±
502.6
193.5±
24.0
43.7±
9.9
PIE 0.77 0.06 0.69 0.41 0.24 0.26 0.59 0.28 0.71 0.56 0.79 0.32 0.73 0.55 0.34
Dominant taxa Diptera
D=41.6%
Diptera
D=98.7%
Gastropoda
D=40%
Diptera
D=73.2%
Diptera
D=97.6%
Diptera
D=64.3%
Diptera
D=97.4%
Diptera
D=97.9%
Diptera
D=97.2%
Isopoda
D=32.6%
Diptera
D=79.3%
Diptera
D=79.6%
Oligochaeta
D=69.3%
Diptera
D=35.3%
Oligochaeta
D=79.1%
Oligochaeta 138.3±
146.7 0.0
39.5±
59.3 0.0
4.9±
7.4
74.1±
70.9 0.0 0.0
4.6±
6.9
409.9±
614.8
1209.9±
1092.9
4.6±
6.9
1703.7±
2007.2 0.0
34.6±
51.9
Hirudinea 9.1±
13.7 0.0 0.0
39.5±
41.9 0.0 0.0
14.8±
22.2 0.0 0.0
13.7±
13.1
57.4±
86.2 0.0 0.0
9.1±
7.9 0.0
Isopoda* 4.6±
6.9 0.0
39.5±
59.3 0.0 0.0 0.0 0.0 0.0 0.0
379.9±
560.7 0.0 0.0 0.0
18.3±
27.5 0.0
Odonata 4.6±
6.9 0.0 0.0
4.9±
7.4
4.9±
7.4 0.0
4.9±
7.4 0.0 0.0 0.0 0.0 0.0 0.0 0.0 0.0
Trichoptera 13.7±
20.6 0.0
4.6±
6.9
14.8±
22.2 0.0 0.0 0.0
9.1±
13.7 0.0
39.5±
59.3
4.6±
6.9 0.0
4.6±
6.9 0.0 0.0
Ephemeroptera 0.0 0.0 0.0 4.9±
7.4 0.0 0.0 0.0 0.0 0.0
9.1±
13.7 0.0 0.0
39.5±
59.3
44.4±
66.7 0.0
Megaloptera* 33.8±
34.9
34.6±
51.9 0.0 0.0 0.0 0.0 0.0 0.0
4.6±
6.9 0.0 0.0 0.0
13.7±
20.6 0.0
4.6±
6.9
Hemiptera 0.0 0.0 0.0 0.0 0.0 0.0 0.0 0.0 0.0 0.0 0.0 0.0 54.3±
81.5 0.0 0.0
Diptera 314.6±
244.5
4486.7±
6459.4
4.9±
7.4
202.5±
172.1
400.0±
409.2
133.3±
115.6
741.7±
830.7
423.6±
543.7
320.6±
280.9
9.9±
14.8
671.2±
873.7
192.6±
288.9
612.3±
598.9
68.4±
85.3 0.0
Arachnida 0.0 0.0 0.0 0.0 0.0 0.0 0.0 0.0 0.0 0.0 0.0 0.0 0.0 4.6±
6.9
4.6±
6.9
Gastropoda* 4.6±
6.9
13.7±
13.1
67.3±
64.0
4.9±
7.4 0.0 0.0 0.0 0.0 0.0
276.5±
414.8 0.0
36.6±
54.9
20.1±
30.2
48.6±
56.2 0.0
Bivalvia* 232.1±
348.1
9.1±
13.7
9.1±
7.9
4.9±
7.4 0.0 0.0 0.0 0.0 0.0
14.1±
13.2
118.1±
177.2
9.1±
13.7
9.1±
13.7 0.0 0.0
*= significant differences (nonparametric Kruskal-Wallis Test, p ≤ 0.05) among wetlands
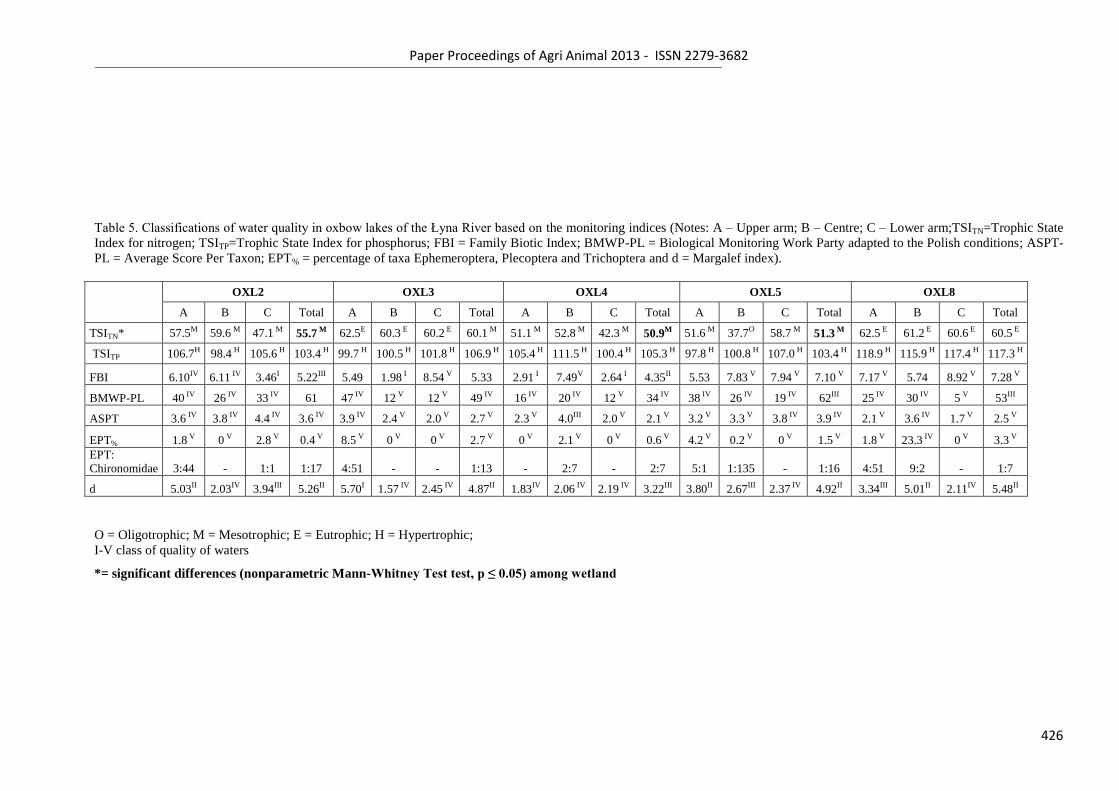
Paper Proceedings of Agri Animal 2013 - ISSN 2279-3682
426
Table 5. Classifications of water quality in oxbow lakes of the Łyna River based on the monitoring indices (Notes: A – Upper arm; B – Centre; C – Lower arm;TSITN=Trophic State
Index for nitrogen; TSITP=Trophic State Index for phosphorus; FBI = Family Biotic Index; BMWP-PL = Biological Monitoring Work Party adapted to the Polish conditions; ASPT-
PL = Average Score Per Taxon; EPT% = percentage of taxa Ephemeroptera, Plecoptera and Trichoptera and d = Margalef index).
OXL2 OXL3 OXL4 OXL5 OXL8
A B C Total A B C Total A B C Total A B C Total A B C Total
TSITN* 57.5M 59.6 M 47.1 M 55.7 M 62.5E 60.3 E 60.2 E 60.1 M 51.1 M 52.8 M 42.3 M 50.9M 51.6 M 37.7O 58.7 M 51.3 M 62.5 E 61.2 E 60.6 E 60.5 E
TSITP 106.7H 98.4 H 105.6 H 103.4 H 99.7 H 100.5 H 101.8 H 106.9 H 105.4 H 111.5 H 100.4 H 105.3 H 97.8 H 100.8 H 107.0 H 103.4 H 118.9 H 115.9 H 117.4 H 117.3 H
FBI 6.10IV 6.11 IV 3.46I 5.22III 5.49 1.98 I 8.54 V 5.33 2.91 I 7.49V 2.64 I 4.35II 5.53 7.83 V 7.94 V 7.10 V 7.17 V 5.74 8.92 V 7.28 V
BMWP-PL 40 IV 26 IV 33 IV 61 47 IV 12 V 12 V 49 IV 16 IV 20 IV 12 V 34 IV 38 IV 26 IV 19 IV 62III 25 IV 30 IV 5 V 53III
ASPT 3.6 IV 3.8 IV 4.4 IV 3.6 IV 3.9 IV 2.4 V 2.0 V 2.7 V 2.3 V 4.0III 2.0 V 2.1 V 3.2 V 3.3 V 3.8 IV 3.9 IV 2.1 V 3.6 IV 1.7 V 2.5 V
EPT% 1.8 V 0 V 2.8 V 0.4 V 8.5 V 0 V 0 V 2.7 V 0 V 2.1 V 0 V 0.6 V 4.2 V 0.2 V 0 V 1.5 V 1.8 V 23.3 IV 0 V 3.3 V
EPT:
Chironomidae 3:44 - 1:1 1:17 4:51 - - 1:13 - 2:7 - 2:7 5:1 1:135 - 1:16 4:51 9:2 - 1:7
d 5.03II 2.03IV 3.94III 5.26II 5.70I 1.57 IV 2.45 IV 4.87II 1.83IV 2.06 IV 2.19 IV 3.22III 3.80II 2.67III 2.37 IV 4.92II 3.34III 5.01II 2.11IV 5.48II
O = Oligotrophic; M = Mesotrophic; E = Eutrophic; H = Hypertrophic;
I-V class of quality of waters
*= significant differences (nonparametric Mann-Whitney Test test, p ≤ 0.05) among wetland

Paper Proceedings of Agri Animal 2013 - ISSN 2279-3682
427
27
Paper Proceedings of Agri Animal 2013 - ISSN 2279-3682
428
Growth performance and fatty acid profile of Macrobrachium rosenbergii larvae fed with
vitamins, HUFA and astxanthin enriched live feed, Moina micrura.
Parakarma, M.G.I,S1., Rawat, K.D
2., Venkateshwarlu, G
3. and Reddy, A.K.
4
1 Corresponding author. National Aquatic Resources Research and Development Agency, Crow
Island, Colombo 15, Sri Lanka Tel : 0094718384496,
2 Aquaculture Division, Central Institute of Fisheries Education, (ICAR) Mumbai, India
3 Division of Fish Nutrition and Bio chemistry, Central Institute of Fisheries Education, (ICAR)
Mumbai, India
4 Division of Fish Genetics and Biotechnology, Central Institute of Fisheries Education, (ICAR)
Mumbai, India
ABSTRACT
A study was carried out to determine the effect of feeding emulsified vitamin E, vitamin D, highly
unsaturated fatty acid (HUFA) rich Cod Liver Oil (CLO) and astaxanthin enriched Moina micrura
(MC- Non enriched Moina, M1- Moina enriched with vitamin E, M2- Moina enriched with vitamin D,
M3- Moina enriched with CLO and M4- Moina enriched with Astaxanthin) on growth, survival and
fatty acid composition of Macrobrachiumrosenbergii (de Man) larvae (TC- MC fed larvae, T1- M1
fed larvae, T2- M2 fed larvae, T3- M3 fed larvae and T4- M4 fed larvae). Growth was expressed as
the time taken in to the settlement of 95% post larvae. Maximum growth i.e. the lowest time taken to
the 95% PL settlement (39 days) and the maximum survival percentage (67%) was observed in T3.
Minimum growth (42.5±0.50 days for 95% PL settlement) and survival (33.0±1.50 %) was in
unenriched Moina fed larvae (TC). The n-3 fatty acids (n-3 HUFA) showed a remarkable increment in
cod liver oil enriched Moina. T3 showed a higher percentage of EPA, DHA and HUFA levels
(5.37±0.05, 3.37±0.16 and 14.34±0.57 respectively). Significantly different (p<0.05) highest n- 3
HUFA level (8.74±0.11) and n-3/n-6 ratio (0.82±0.00) were also obtained by T3.
Paper Proceedings of Agri Animal 2013 - ISSN 2279-3682
429
Introduction
One of the major factors limiting the economic success in any commercial culture of a fish species is
the food requirement. The larval feed should be available throughout the year, of suitable nutritional
value, inexpensive, convenient in feeding, suitable sizes relative to gape size of larvae, capable of
floating or drifting over the water surface and efficiently utilized by the larvae (Boonyaratpalin and
Chittivan, 2003). Therefore, the most suitable feed type for larval rearing is live feed as they fulfill
those requirements. Most people tend to use Artemia as the larval feed. Because of the increasing
demand for Artemia in world wide aquaculture (Bengtson et al.,1991), its cysts are likely to be costly
and occasionally scarce, especially in developing countries. In addition, ecological changes in the
Grate Salt Lake, USA, which produces 80% of the world Artemia, are likely to cause a serious
limitation to the aquaculture industry (Lavens and Sorgeloos, 2000). As the food and feeding in prawn
hatcheries account for about 60% of total operational costs (Hagwood and Willis, 1976) enrichment of
Artemia and its use will add additional expenses and may not be accessible to hatchery operators,
particularly in developing countries (Alam et al., 1995). As a result people are increasingly looking for
the use of low cost live feed as Moina or any other alternative. Although live feed has identified as a
good source of nutrition, all live feed such as Artemia, Moina, copepods, rotifers or other zooplanktons
may not be rich in all required nutritional qualities for fish and crustacean larvae. A lot of work has
been done on unsaturated fatty acid during the early developmental stages of fresh water and marine
fish as well as crustaceans (Owen et.al., 1975; Kanazawa et.al., 1979; Watanabe, 1982; Devrese
et.al.,1990). Enrichment of live feeds found to be a better practice for the enhancement of nutritive
quality of live feed. Several researchers have used a variety of enrichment media for the same purpose,
are unicellular alga ( Watanabe et al., 1980; Cho et al., 2001), emulsions (McEvoy et al., 1995;
Immanuel et al., 2001; Liddy et al., 2005; Moren et al., 2006; Das, 2006; Prabitha, 2007), Liposomes
(Monroig et al., 2006), vitamins (Kolkovski et al., 2000; Tarui et al., 2006), microencapsulated diets
(Sauthgate and Lou, 1995), antibiotics (Gil et al., 2001) and amino acids (Tonheim et al., 2000).
Materials and Methods
a. Stocking and maintenance of larvae
Experiment with five treatments with three replicates, each to follow a completely randomized design,
was conducted for 45 days duration. This experiment was conducted in 50 l capacity plastic round
tubs. Aeration was provided using 2HP centralized air blowers through air stones and plastic regulators
of required diameter to control the air intensity uniformly in all tanks.
Paper Proceedings of Agri Animal 2013 - ISSN 2279-3682
430
Larvae (stage III) were kept at a density of 50 individuals/ liter in 45 liter of 12 ppt salinity water for
each treatment. Salinity was gradually reduced to 8 ppt by adding fresh water as the larvae began to
metamorphose in to post larvae. Growth of larvae was expressed as the number of days until the first
appearance of post larvae and the number of days until 95% of the larvae metamorphosed in to post
larvae. The survival (%) was taken as the final number of the animals as a percentage of the initial
number of the animals.
b. Enrichment ofMoina micrura
Harvested Moina were thoroughly washed and grouped into equal parts. Each Moina group was kept
in separate bucket containing 5 liters of water and was added with different enrichment emulsion at the
rate of 1ml per liter of water.Composition of the Emulsions Used for Moina Enrichment wasgiven in
Table 1.The enrichment was conducted for a time period of 24 hrs. Those enriched Moina were again
harvested with strainers and rinsed with water before feeding experimental larvae.
c. Feeding schedule
During the experiment M. rosenbergii larvae were fed with egg custard, and live feed Moinamicrura
enriched with different enrichment media per treatment. Feeding frequency of larvae was five times a
day. i.e. 7.00 am - egg custard, 10.30 am - Moina, 3.00 pm - egg custard, 6.00 pm- Moina and 09.00
pm. - Artemia.
d. Lipid extraction, Fatty Acid Methyl Ester and Fatty acid analysis
Total lipid of both enriched Moina and test larvae were extracted following the Folch et.al.,1957
method.The AOAC (1995) method was followed to esterify the lipid extract and fatty acid methyl
esters (FAME) were prepared. From that FAME, fatty acid composition of both samples were analysed
by using Gas Chromatography, Mass spectrometry (Shimadzu QP2010). The fatty acids were
identified referring to the retention time and GCMS library and presented in area percentage of total
identified fatty acids
Statistical analysis
Results were presented as means ± standard error of means (S.E.M.). Difference among the control and
treatment means were analyzed by one-way analysis of variance (One Way ANOVA) followed by
Duncan‘s new multiple range tests. Differences were considered statistically significant when P < 0.05.
Statistical analysis were carried out using the SPSS statistical package (SPSS Inc., Chicago, IL, USA).
Paper Proceedings of Agri Animal 2013 - ISSN 2279-3682
431
Results and discussion
In aquaculture practices the high growth rate is more important to limit or minimize the production
cost in the rearing period. Supplying highly nutritive and balanced diet is much more important to
achieve the target. Hence, the enrichment of live and/or artificial feed is an alternative to improve the
food quality and hence the growth of the culture organisms.
a. Growth
Thequick appearance of first post larvae during the experimental period was in T3 (fed with Moina
enriched with cod liver oil) group (28.5±0.50 days). The lowest time (highest growth),significantly
(p<0.05) lowest larval rearing period was also observed in T3 group (39.0±0.0 days) (Table 2). Hence
the best growth in this experiment was observed in T3. It was further observed, best growth in
treatment T3, which is fed with CLO enriched Moina which also showed the best survival. Further, it
was observed that, in the M3 Moina group (enriched with CLO), had a higher arachidonic acid (ARA)
level (5.43±0.20).
It could be a good dietary ARA level for the larvae of T3 group. According to the results it can be
suggested that dietary ARA level could also affect to the growth rate of Macrobrachium rosenbergii
larvae. Significantly improved larval growth was observed from the diet containing 1% dry weight
ARA in the diet (Bessonart et al., 1999). Lower mortality has been recorded by Koven et al., (2001 a)
while fed with ARA enriched diet. Nghia et al. 2001 suggested that the supplementation with algae
rich in ARA improved growth rate and moulting success in a crustacean, the mud crab Scylla
paramamosin. Since EPA and DHA are effective in improving growth and survival in crustaceans,
such as penaeid shrimps, it is likely that ARA will also be an essential fatty acid and supplemental
dietary ARA may also provide benefits (Bell and Sargent, 2003).
Also higher n-3 HUFA level was observed in the M3 enrichment. It can be suggested that high dietary
HUFA level would have helped to gain a better growth in T3 treatment. Use of HUFA source as
enrichment media was practiced by several authors. Rani et al. (2006) has revealed a considerable
reduction of larval rearing period (7- 8 days earlier 1st post larval settlement and 11- 12 days earlier
95% PL settlement) of M. rosenbergii larvae fed with cod liver oil and probiotic emulsion enriched
Artemia. Our results are in agreement with them as the larvae showed 3.5 days earlier first and 95% PL
Paper Proceedings of Agri Animal 2013 - ISSN 2279-3682
432
settlement. Czesny et al. (1999) observed that, walleye juveniles (Stizostedion vitreum) fed with
Artemia enriched with a combination of CLO and n-3 HUFA concentrate, grew faster than those fed
with 100% n-3 HUFA enriched Artemia. They further observed that, their survival was better, when
fed with 100% CLO than fed with lower levels of CLO. Incorporation of HUFA in diet was studied by
Read (1981) for Penaeus indicus. Supplementation of dietary n-3 HUFA increased growth of M.
rosenbergii juveniles (Sheen and D‘Abramo, 1990) and survival of Penaeus spp and M. rosenbergii
(Bengston et al.,1991). Artemia nauplii enriched with HUFA rich cod liver oil improved the
metamorphosis of M. rosenbergii larvae (Murthy, 1998). Present study results are in agreement with
their findings. However, according to Glencross and Smith , 2001) increasing the level of both EPA
and DHA above a certain inclusion level resulted in a decreased growth. Increasing the level of both
EPA and DHA affected the n-3 : n-6 balance and consequently it adversely affected the growth. The
highest time period (42.5±0.5 days), taken for the appearance of 95% PL was in control treatment
group, hence the lowest growth was observed in the control treatment (Table 2).
b. Survival
In this study, the highest percentage survival (67.0±2.0%) was also shown in T3 treatment group fed
with Moina enriched with cod-liver oil emulsion (Table 2) whereas, the lowest survival (33.0±1.5) was
obtained from the control treatment.The higher survival rate (70.7%) has been observed by Pillai et al.,
(2003) when HUFA enriched (75%) Artemia + enriched Isochrysis galbana fed to M. rosenbergii
larvae. According to the present results it seems that feeding with CLO enriched feed enhances the
survival percentage of M. rosenbergii. Comparing the fatty acids in dietary level of the larvae, it could
be seen that, a high n-3 and n-6 HUFA levels are also recorded in M3 enrichment. This study results
indicate that the high dietary n-3 and n-6 HUFA level significantly affected to the growth as well as
survival of the M. rosenbergii larvae positively in T3 treatment. Supplementation of HUFA enriched
Artemia nauplii improved the survival and growth in shrimp larval stages (Chamberlain 1988, Leger
and Sorgeloos, 1994). Present results in the study are in agreement with their suggestions. Alam et al.
(1995) observed, higher mortality of larvae during the first seven days on feeding Moina alone which
resulted in significantly lower production of M. rosenbergii larvae. Rees et al. (1994) observed that
increased n-3 HUFA namely EPA and DHA level did not improve the growth and survival of P.
monodon post larvae. Above results in the present study was not in agreement with their suggestions.
According to Kolkovski et al., (2000), supplementation of vitamin E did not affect fish survival
significantly. In our study it was observed that, enrichment of Moina with vitamin E had significantly
low survival (38.5± 1.5), but higher than the control treatment, may be due to low nutrient value of the
Paper Proceedings of Agri Animal 2013 - ISSN 2279-3682
433
unenriched Moina and/or that early stage larvae might have difficulty in capturing and ingesting
relatively large Moina (Alam et al., 1995). Alam et al. (1993a) observed that development and
production of M. rosenbergii larvae feeding on Artemia or Moina were greatly influenced by the
differences in catch and ingestion efficiencies in different larval stages
c. Fatty acid composition of enriched Moina micrura
The fatty acid profile of enriched M. micrura is summarized in Table 3. The total saturated fatty acid
level was highest in M4 (Moina enriched with astaxanthin) (59.64±0.24%) and lowest (41.08±1.57%)
was in M3 (enriched with cod liver oil). Mono unsaturated fatty acid level was high (37.11±0.43%)in
M3, whereas, lowest level (30.94±0.36%) was found in M4. Linoleic (C18:2n-6) acid was dominant
among Poly unsaturated fatty acid in all five treatment groups, and linolenic acid also could be found
in satisfied amounts except M2, where it was not detected. The lowest total PUFA level (8.87±0.47%)
was recorded in M3. Among highly unsaturated fatty acids, the highest arachidonic acid (ARA; 20:4n-
6), eicosapentaenoic acid (EPA; 20:5n-3) and docosahexaenoic acid (DHA:22;6n-3) levels were found
in M3 (Moina enriched with cod liver oil).
d. Fatty acid profile of M. rosenbergii larvae fed with Moina micrura enriched with different
experimental emulsions
Among saturated fatty acids, palmitic acid (C16:0) was present in appreciable amount in
everytreatmentgroup, T4 (larvae fed with Moina enriched with astaxanthin) had the highest mean
value (31.99±0.02%), whereas, the control treatment group had 24.93±0.38 % (Table 4). The lowest
value of palmitic acid (23.74±0.61%) was recorded in treatment T2 (larvae fed with vitamin D
enriched Moina). In M. rosenbergii larval tissue, palmitic acid (C16:0) and oleic acid (C18:1n-9)
appeared in larger quantities than other fatty acids (Table 3). It has been shown that palmitic acid is
biosynthesized sufficiently in crustaceans from shorter fatty acids (Guary et al., 1976) and that the acid
could be converted to other fatty acids by desaturation and chain elongation (Morris and Sargent,
1973, Jones et al., 1979). The relative percentage of this acid in the enriched groups was comparatively
more or less equal.
Control treatment (TC group) had the highest C18:0 (stearic acid) mean value (13.05±0.51%), while
the lowest value (10.37±0.08%) was recorded in T1 (larvae fed with vitamin E enriched Moina). Oleic
acid (C18:1n-9) percentage being highest (32.93±0.18) in T4 (Moina enriched with astaxanthin fed
Paper Proceedings of Agri Animal 2013 - ISSN 2279-3682
434
larvae) whereas, the lowest value (24.86±0.27%) was found in T1. Linoleic acid (C18:2n-6)
percentage of the control treatment (TC) had the lowest value (8.96±0.05%) and was maximum
(11.20±0.18%) in T1. Elongation and desaturation of linoleic (18: 2n-6) acid apparently occurred in
the larval freshwater prawn (Prabitha, 2007). In this experiment it was evident that relatively less
proportions of linoleic acid were in their body tissue compared to the relevant Moina groups. It
indicates that C18: 2n-6 was apparently not synthesized de novo by M. rosenbergii. Reigh and
Stickney (1989) have mentioned this earlier.
Composition of linolenic acid (C18:3n-3) was maximum (4.74±0.27%) in T1 and was minimum
(2.32b±0.21) in T2. However linolenic acids could not be detected in some groups of both Moina and
larval tissue. The levels of C18: 3n-3 in larval body tissue also indicates that synthesis of linolenic acid
apparently did not occur (Reigh and Stickney, 1989).
The highest arachidonic acid (C20: 4n-6) percentage was recorded (6.54±0.22%) in treatment T1 . In
the control, it was 5.30±0.04%. Therefore, it can be concluded that T1 is the better treatment for
obtaining high ARA level. Arachidonic acid is an elongation and desaturation product of C18:2n-6. In
all treatment groups slightly equal levels of ARA were observed. Those levels were much higher than
the respective Moina groups (Das, 2006). Also it was found that the dietary ARA level was not
reflected in the prawn tissue, where, the levels were much higher than those found in Moina. These
results are in agreement with Das, (2006) and Prabitha, (2007). However, D‘Abramo and Sheen (1993)
reported increased levels of arachidonic acid in tissues of freshwater prawns that were provided with
the dietary supply.
EPA (C20: 5n-3) and DHA (C22: 6n-3) are two of the more abundant polyenoic fatty acids in fresh
water prawn M. rosenbergii. Percentage of EPA (C20: 5n-3) was highest (5.37±0.05%) in T3 (cod
liver oil enriched Moina fed larvae), and was lowest (3.54±0.22%) in T4. In the control treatment
amount of EPA was 4.20±0.05%. Hence in this study the better treatment for getting higher EPA level
was obtained with T3. The study results show that the feeding of larvae with cod liver oil enriched
Moina which, enhanced the EPA level of body tissue. Losses of nutrient may take place if the live feed
is not fed to the fish or crustacean larvae immediately after enrichment, or if the retention time for the
prey in the fish tanks is too long (Olsen et al., 2000). This fact also can affect the variation in the
results.
Paper Proceedings of Agri Animal 2013 - ISSN 2279-3682
435
Among different enrichment groups, DHA content was highest (3.37d±0.16%) in T3 (Cod liver oil
enriched Moina fed larvae) and was lowest (0.53±0.05%) in control treatment. In this study, higher
DHA level was obtained from T3 treatment, hence, the better treatment for getting higher DHA level is
T3.
Despite the absence of DHA in the Moina in some groups, larvae in the relevant treatment groups
(control, T1, T2 and T4) (Table 3) contained DHA. The enriched Moina, when fed to Macrobrachium
larvae, influences the highly unsaturated fatty acids (20:4n-6, 20:5n-3 and 22:6n-3) of larval tissues.
Generally, the dietary lipid levels through the fatty acid composition will reflects the body tissue fatty
acids in animals (Roustaian et al., 1999). Further, they reported that M. rosenbergii larvae and post
larvae have the bio conversion ability in chain elongation and desaturation of 16:0, to stearic acid 18:0.
They also reported that M. rosenbergii is capable of converting 18:2n-6 and 18:3n-3, to long chain
highly unsaturated fatty acids such as 20:4n-6 and 20:5n-3.
The highest total HUFA level (14.34±0.57) was observed from the treatment T3, clearly shows the
successful enrichment practice with cod liver oil as an emulsion and the reflection of dietary fatty acids
in the larval body tissue. It is known that, fatty acid retention percentages have the capacity to
synthesize HUFA. In this study, fatty acids which show a low retention may be preferentially oxidized
by the fish, while a high retention indicates a selective deposition.
In the present study both n-3 and n-6 HUFA contents were lowest in T4 group (9.82 ± 0.21) which was
fed with M4, astaxanthin enriched Moina group with the lowest HUFA level (0.19± 0.00). Whereas,
treatment T4 shows the lowest n-3 PUFA level and the lowest n3:n6 ratio too. It clearly shows that
they reflect the dietary low levels of n3:n6 level (M4 – 0.09± 0.00) accordingly.
The n-3 to n-6 ratios in M. rosenbergii larvae all treatments ranged between 0.47± 0.02 to 0.82± 0.00.
In present study n-6 and n-3 fatty acid levels of M. rosenbergii differed in treatment groups. But it was
observed that increased n-6 resulted decrease in n-3 fatty acid group showing an inverse relation
between the two. A number of authors have studied the competitive inhibition between n-6 and n-3
fatty acids (Rahm and Holman, 1964; Sendifer and Joseph, 1976; Deshimaru et al., 1979). Present
study results are in agreement with those observations.
Conclusion
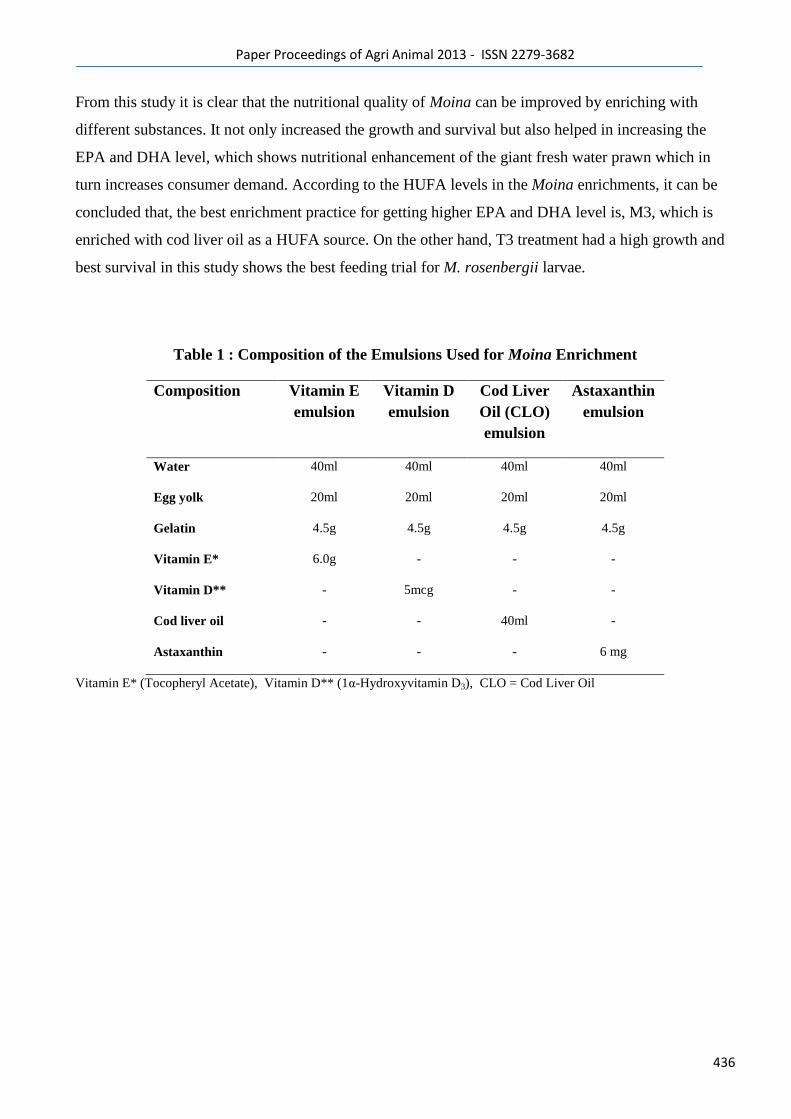
Paper Proceedings of Agri Animal 2013 - ISSN 2279-3682
436
From this study it is clear that the nutritional quality of Moina can be improved by enriching with
different substances. It not only increased the growth and survival but also helped in increasing the
EPA and DHA level, which shows nutritional enhancement of the giant fresh water prawn which in
turn increases consumer demand. According to the HUFA levels in the Moina enrichments, it can be
concluded that, the best enrichment practice for getting higher EPA and DHA level is, M3, which is
enriched with cod liver oil as a HUFA source. On the other hand, T3 treatment had a high growth and
best survival in this study shows the best feeding trial for M. rosenbergii larvae.
Table 1 : Composition of the Emulsions Used for Moina Enrichment
Composition Vitamin E
emulsion
Vitamin D
emulsion
Cod Liver
Oil (CLO)
emulsion
Astaxanthin
emulsion
Water 40ml 40ml 40ml 40ml
Egg yolk 20ml 20ml 20ml 20ml
Gelatin 4.5g 4.5g 4.5g 4.5g
Vitamin E* 6.0g - - -
Vitamin D** - 5mcg - -
Cod liver oil - - 40ml -
Astaxanthin - - - 6 mg
Vitamin E* (Tocopheryl Acetate), Vitamin D** (1α-Hydroxyvitamin D3), CLO = Cod Liver Oil
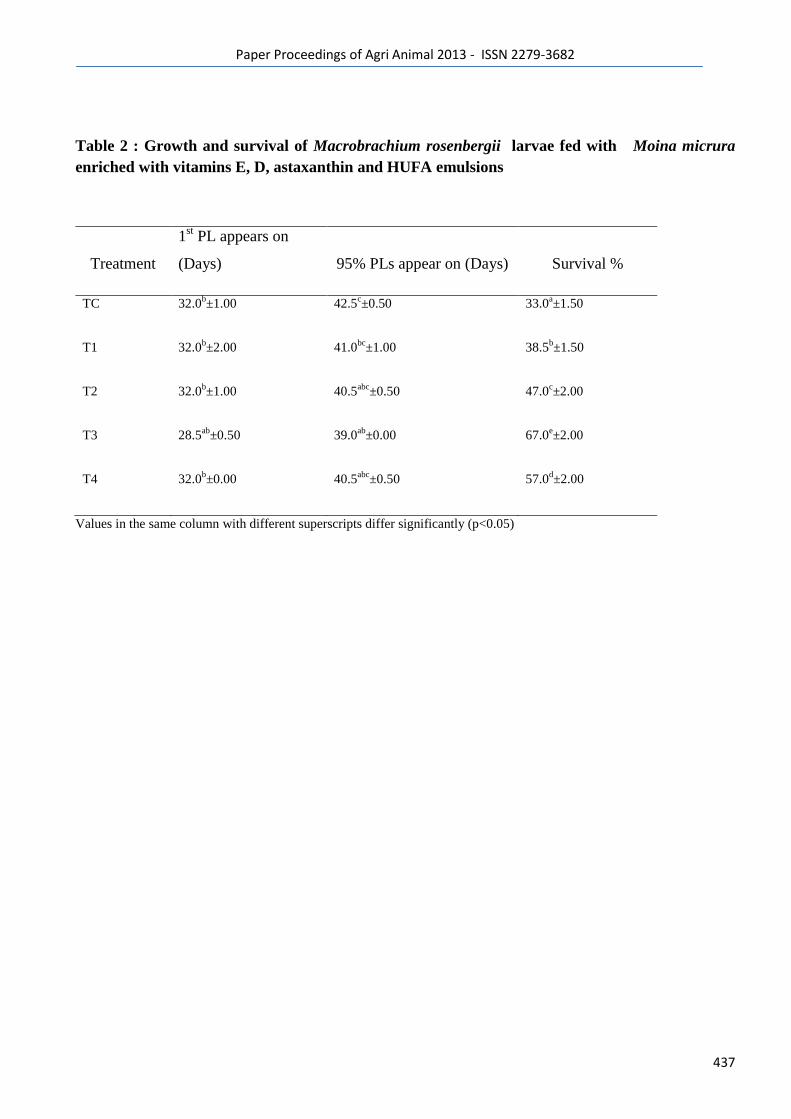
Paper Proceedings of Agri Animal 2013 - ISSN 2279-3682
437
Table 2 : Growth and survival of Macrobrachium rosenbergii larvae fed with Moina micrura
enriched with vitamins E, D, astaxanthin and HUFA emulsions
Treatment
1st PL appears on
(Days) 95% PLs appear on (Days) Survival %
TC 32.0b±1.00 42.5
c±0.50 33.0
a±1.50
T1 32.0b±2.00 41.0
bc±1.00 38.5
b±1.50
T2 32.0b±1.00 40.5
abc±0.50 47.0
c±2.00
T3 28.5ab
±0.50 39.0ab
±0.00 67.0e±2.00
T4 32.0b±0.00 40.5
abc±0.50 57.0
d±2.00
Values in the same column with different superscripts differ significantly (p<0.05)
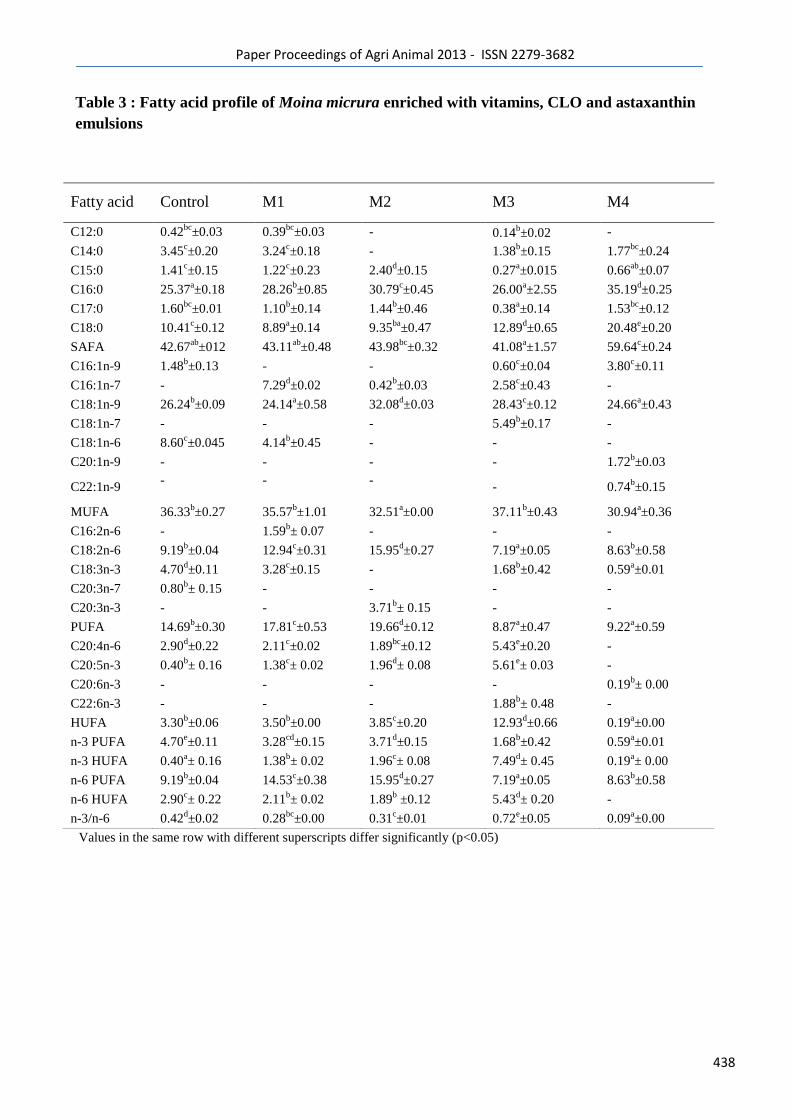
Paper Proceedings of Agri Animal 2013 - ISSN 2279-3682
438
Table 3 : Fatty acid profile of Moina micrura enriched with vitamins, CLO and astaxanthin
emulsions
Values in the same row with different superscripts differ significantly (p<0.05)
Fatty acid Control M1 M2 M3 M4
C12:0 0.42bc
±0.03 0.39bc
±0.03 - 0.14b±0.02 -
C14:0 3.45c±0.20 3.24
c±0.18 - 1.38
b±0.15 1.77
bc±0.24
C15:0 1.41c±0.15 1.22
c±0.23 2.40
d±0.15 0.27
a±0.015 0.66
ab±0.07
C16:0 25.37a±0.18 28.26
b±0.85 30.79
c±0.45 26.00
a±2.55 35.19
d±0.25
C17:0 1.60bc
±0.01 1.10b±0.14 1.44
b±0.46 0.38
a±0.14 1.53
bc±0.12
C18:0 10.41c±0.12 8.89
a±0.14 9.35
ba±0.47 12.89
d±0.65 20.48
e±0.20
SAFA 42.67ab
±012 43.11ab
±0.48 43.98bc
±0.32 41.08a±1.57 59.64
c±0.24
C16:1n-9 1.48b±0.13 - - 0.60
c±0.04 3.80
c±0.11
C16:1n-7 - 7.29d±0.02 0.42
b±0.03 2.58
c±0.43 -
C18:1n-9 26.24b±0.09 24.14
a±0.58 32.08
d±0.03 28.43
c±0.12 24.66
a±0.43
C18:1n-7 - - - 5.49b±0.17 -
C18:1n-6 8.60c±0.045 4.14
b±0.45 - - -
C20:1n-9 - - - - 1.72b±0.03
C22:1n-9 - - -
- 0.74b±0.15
MUFA 36.33b±0.27 35.57
b±1.01 32.51
a±0.00 37.11
b±0.43 30.94
a±0.36
C16:2n-6 - 1.59b± 0.07 - - -
C18:2n-6 9.19b±0.04 12.94
c±0.31 15.95
d±0.27 7.19
a±0.05 8.63
b±0.58
C18:3n-3 4.70d±0.11 3.28
c±0.15 - 1.68
b±0.42 0.59
a±0.01
C20:3n-7 0.80b± 0.15 - - - -
C20:3n-3 - - 3.71b± 0.15 - -
PUFA 14.69b±0.30 17.81
c±0.53 19.66
d±0.12 8.87
a±0.47 9.22
a±0.59
C20:4n-6 2.90d±0.22 2.11
c±0.02 1.89
bc±0.12 5.43
e±0.20 -
C20:5n-3 0.40b± 0.16 1.38
c± 0.02 1.96
d± 0.08 5.61
e± 0.03 -
C20:6n-3 - - - - 0.19b± 0.00
C22:6n-3 - - - 1.88b± 0.48 -
HUFA 3.30b±0.06 3.50
b±0.00 3.85
c±0.20 12.93
d±0.66 0.19
a±0.00
n-3 PUFA 4.70e±0.11 3.28
cd±0.15 3.71
d±0.15 1.68
b±0.42 0.59
a±0.01
n-3 HUFA 0.40a± 0.16 1.38
b± 0.02 1.96
c± 0.08 7.49
d± 0.45 0.19
a± 0.00
n-6 PUFA 9.19b±0.04 14.53
c±0.38 15.95
d±0.27 7.19
a±0.05 8.63
b±0.58
n-6 HUFA 2.90c± 0.22 2.11
b± 0.02 1.89
b ±0.12 5.43
d± 0.20 -
n-3/n-6 0.42d±0.02 0.28
bc±0.00 0.31
c±0.01 0.72
e±0.05 0.09
a±0.00
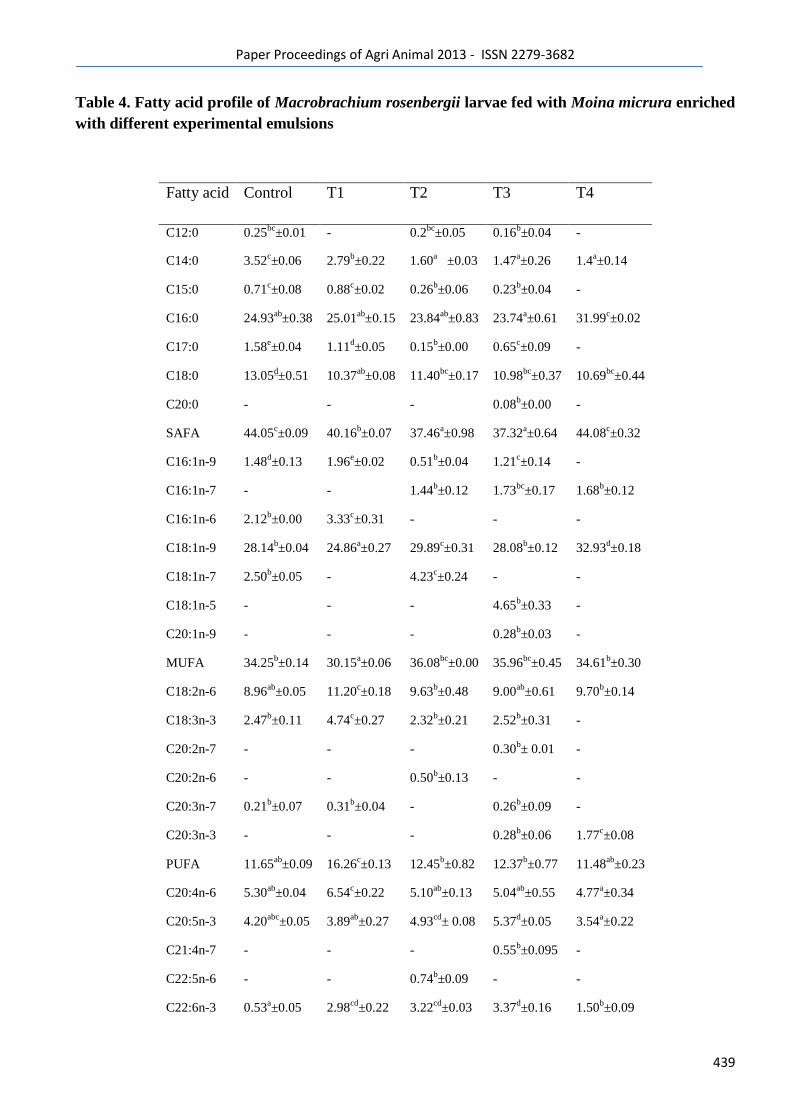
Paper Proceedings of Agri Animal 2013 - ISSN 2279-3682
439
Table 4. Fatty acid profile of Macrobrachium rosenbergii larvae fed with Moina micrura enriched
with different experimental emulsions
Fatty acid Control T1 T2 T3 T4
C12:0 0.25bc
±0.01 - 0.2bc
±0.05 0.16b±0.04 -
C14:0 3.52c±0.06 2.79
b±0.22 1.60
a ±0.03 1.47
a±0.26 1.4
a±0.14
C15:0 0.71c±0.08 0.88
c±0.02 0.26
b±0.06 0.23
b±0.04 -
C16:0 24.93ab
±0.38 25.01ab
±0.15 23.84ab
±0.83 23.74a±0.61 31.99
c±0.02
C17:0 1.58e±0.04 1.11
d±0.05 0.15
b±0.00 0.65
c±0.09 -
C18:0 13.05d±0.51 10.37
ab±0.08 11.40
bc±0.17 10.98
bc±0.37 10.69
bc±0.44
C20:0 - - - 0.08b±0.00 -
SAFA 44.05c±0.09 40.16
b±0.07 37.46
a±0.98 37.32
a±0.64 44.08
c±0.32
C16:1n-9 1.48d±0.13 1.96
e±0.02 0.51
b±0.04 1.21
c±0.14 -
C16:1n-7 - - 1.44b±0.12 1.73
bc±0.17 1.68
b±0.12
C16:1n-6 2.12b±0.00 3.33
c±0.31 - - -
C18:1n-9 28.14b±0.04 24.86
a±0.27 29.89
c±0.31 28.08
b±0.12 32.93
d±0.18
C18:1n-7 2.50b±0.05 - 4.23
c±0.24 - -
C18:1n-5 - - - 4.65b±0.33 -
C20:1n-9 - - - 0.28b±0.03 -
MUFA 34.25b±0.14 30.15
a±0.06 36.08
bc±0.00 35.96
bc±0.45 34.61
b±0.30
C18:2n-6 8.96ab
±0.05 11.20c±0.18 9.63
b±0.48 9.00
ab±0.61 9.70
b±0.14
C18:3n-3 2.47b±0.11 4.74
c±0.27 2.32
b±0.21 2.52
b±0.31 -
C20:2n-7 - - - 0.30b± 0.01 -
C20:2n-6 - - 0.50b±0.13 - -
C20:3n-7 0.21b±0.07 0.31
b±0.04 - 0.26
b±0.09 -
C20:3n-3 - - - 0.28b±0.06 1.77
c±0.08
PUFA 11.65ab
±0.09 16.26c±0.13 12.45
b±0.82 12.37
b±0.77 11.48
ab±0.23
C20:4n-6 5.30ab
±0.04 6.54c±0.22 5.10
ab±0.13 5.04
ab±0.55 4.77
a±0.34
C20:5n-3 4.20abc
±0.05 3.89ab
±0.27 4.93cd
± 0.08 5.37d±0.05 3.54
a±0.22
C21:4n-7 - - - 0.55b±0.095 -
C22:5n-6 - - 0.74b±0.09 - -
C22:6n-3 0.53a±0.05 2.98
cd±0.22 3.22
cd±0.03 3.37
d±0.16 1.50
b±0.09
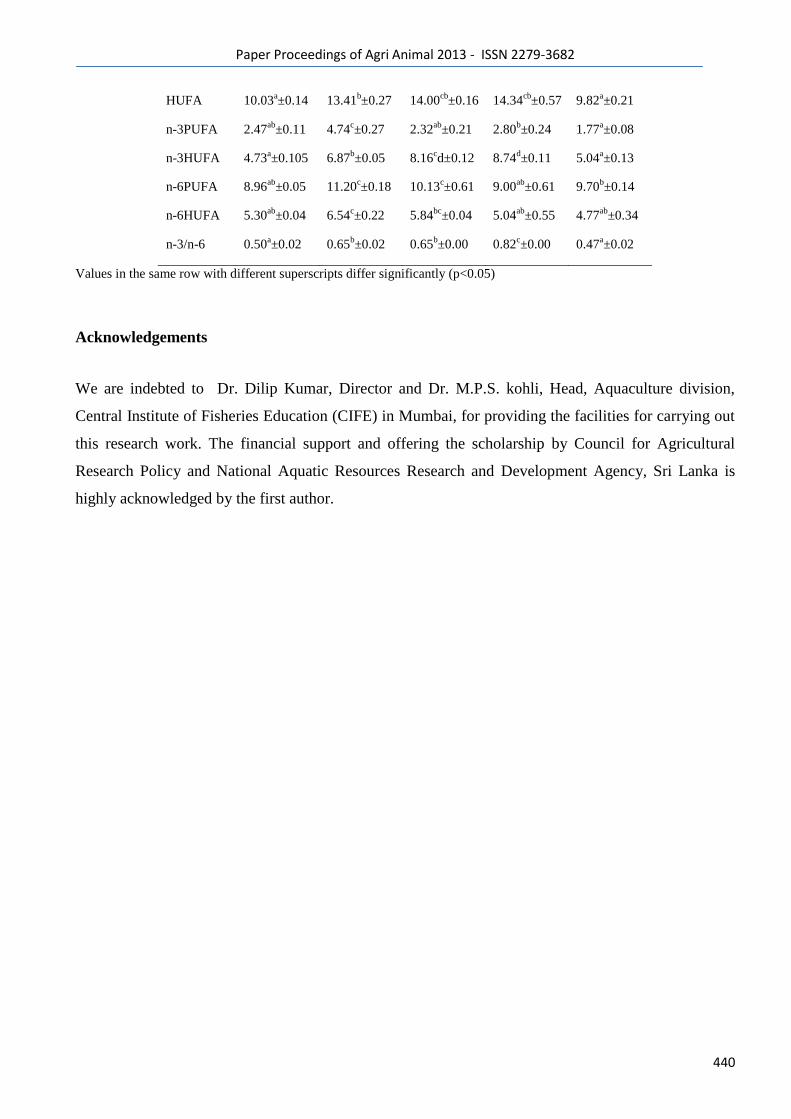
Paper Proceedings of Agri Animal 2013 - ISSN 2279-3682
440
HUFA 10.03a±0.14 13.41
b±0.27 14.00
cb±0.16 14.34
cb±0.57 9.82
a±0.21
n-3PUFA 2.47ab
±0.11 4.74c±0.27 2.32
ab±0.21 2.80
b±0.24 1.77
a±0.08
n-3HUFA 4.73a±0.105 6.87
b±0.05 8.16
cd±0.12 8.74
d±0.11 5.04
a±0.13
n-6PUFA 8.96ab
±0.05 11.20c±0.18 10.13
c±0.61 9.00
ab±0.61 9.70
b±0.14
n-6HUFA 5.30ab
±0.04 6.54c±0.22 5.84
bc±0.04 5.04
ab±0.55 4.77
ab±0.34
n-3/n-6 0.50a±0.02 0.65
b±0.02 0.65
b±0.00 0.82
c±0.00 0.47
a±0.02
Values in the same row with different superscripts differ significantly (p<0.05)
Acknowledgements
We are indebted to Dr. Dilip Kumar, Director and Dr. M.P.S. kohli, Head, Aquaculture division,
Central Institute of Fisheries Education (CIFE) in Mumbai, for providing the facilities for carrying out
this research work. The financial support and offering the scholarship by Council for Agricultural
Research Policy and National Aquatic Resources Research and Development Agency, Sri Lanka is
highly acknowledged by the first author.
Paper Proceedings of Agri Animal 2013 - ISSN 2279-3682
441
.References
Alam, M. J., Ang, K. J. and Cheah, S. H., 1993a.Use of Moina micrura (kurz) as an Artemia
substitute in the production of Macrobrachium rosenbergii (de Man) post larvae. Aquaculture
,109:337-349.
Alam, M. J., Ang K. J. and Begum M., 1995. Use of egg custard augmented with cod liver oil and
Moina micrura on production of fresh water prawn larvae . Aquaculture International, 3:249-259.
AOAC, 1995. Official Methods of Analysis of AOAC International, Vol.1, 16th
edn. (Ed. Cunniff,
P.A.). AOAC International, Arlington, USA.
Bell, J. G., sergeant, J. R. 2003. Arachidonic acid in aquaculture feeds: Current
status and future opportunities . Aquaculture, 218: 491-499
Bengston, D. A., Leger, P. and Sorgeloos, P., 1991. Use of Artemia as a food source for aquaculture.
Artemia Biology (eds. R. A. Browne, P. Sorgeloos and C. N. A. Trotman). CRC Press Inc., Boca
Raton, FL. pp 255-285.
Bessonart, M., Izquierdo, M. S., Salhi, M., Hernandez-Cruz, C. M., Gonzalez, M. M. and Fernandez-
Palacios, H., 1999. Effect of dietary arachidonic acid levels on growth and survival of gilthead sea
bream (Sparus aurata L.) larvae. Aquaculture, 179: 265– 27
Boonyaratpalin, M. and Chittivan, V. 2003. Macrobrachium Nutrition: feed and
feeding. In: Fresh water prawns. Advances in biology, Aquaculture and Marketing. Proceedings of the
International Symposium on Freshwater Prawns, Kerala Agricultural University.(ed. Nair, C.M.;
Nambudiri, D. D.; Jose, S.; Sankaran, T. M.; Jayachandran, K.V and Salin, K.R.) pp. 521-534. Allied
Publishers Pvt. Ltd.
Cavalli, R. O., Vanden Berghe, E., Lavens, P., Thuy, N. T. T., Wille, M. and Sorgeloos, P., 2000.
Ammonia toxicity as a criterion for the evaluation of larval quality in the prawn Macrobrachium
rosenbergii.Comp. Biochem. Physiol., 125C: 333– 343.
Chamberlain, G. W. 1988. Shrimp hatcheries.Aquaculture, 5: 1-9.
Cho, S. H., Hur , .B. and Jo, J.Y. 2001. Effect of enriched live feeds on survival and growth rules in
larval Korean rock fish, Sebastes schlegeliAquaculture Research, 32: 199-208
Czesny, S., kokowski. S., Dabrowski, K. and David, C., 1999. Growth, survival and quality of
juvenile Walleye Stizostedium vitreum as influenced by n-3 HUFA enriched Artemia nauplii,
Aquaculture, 178:103-115.
D‘Abramo, L. R. and Sheen, S. S., 1993. Polyunsaturated fatty acid nutrition in juvenile freshwater
prawn Macrobrachium rosenbergii. Aquaculture, 115: 63–86.
Paper Proceedings of Agri Animal 2013 - ISSN 2279-3682
442
Das, S. K., 2006. Growth, survival and fatty acid profile of Macrobrachium rosenbergii (De Man,
1879) post larvae fed HUFA enriched Moina micrura. Master‘s thesis, Central Institute of Fisheries
Education, India.
Deshimaru, O., Kuroki, K. and Yone, Y., 1979. The composition and level of dietary lipid appropriate
for growth of prawn. Bull. Jpn. Soc. Sci. Fish. 45: 591–594.
Devrese, B. , Roamchane, M. S., Buzzi, M., Razowo, J., Leger, P., Brown, J. and Sorgloos, P.,1990.
Improved larviculture outputs in the Giant fresh water prawn, Macrobrachium rosenbergii fed diet of
Artemia enriched with (n-3) HUFA and phospholipid .World Aquaculture, 21 (2): 123-125.
Folch, J., Lees, M. and Slone - Satanley, G. H. 1957. A simple method for the isolation and
purification of total lipids from animal tissues. J. Biolo. Chem., 226. 497- 509
Gil, B. G., Ramos, J. C., Brambila, S. P. and Roque, A. 2001. standardization of the bio-encapsulation
of enroflaxacin and oxytetracycline in Artemia franciscana Kellogg, 1906.
Glencross, B. D. and Smith, D. M. 2001. Optimizing the essential fatty acids, eicosapentaenoic and
docosahexaenoic acid, in the diet of the prawn, P. monodon. Aquaculture Nutrition 7: 101-112
Guary, J. C., Kayama, M., Murakami, Y. and Ceccaldi, H. J., 1976. The effects of a fat-free diet and
compounded diets supplemented with various oils on molt, growth and fatty acid composition of
prawn, Penaeus japonicus Bate. Aquaculture, 7: 245-254.
Hagwood, R.W. and Willis, S.A., 1976. Cost comparison of rearing larvae of freshwater shrimp,
Macrobrachium acanthrus and M. rosenbergi juveniles, Aquaculture ,7:69-74.
Immanuel, G., Palavesan, A. and Petermarian, M., 2001. Effects of feeding lipid enriched Artemia
nauplii on survival , growth, fatty acids and stress resistance of post larvae Penaeus indicus. Asian
fisheries science, 14:377- 388.
Jones, D. A., Kanazawa, A. and Ono, K., 1979: Studies on the nutritional requirements of the larval
stages of Penaeus japonicus using microencapsulated diets. Mar. Biol., 54: 261–267.
Kanazawa, A., Teshima, S., Ono, K. and Chalayondeja, K. 1979. Biosynthesis of fatty acids from
acetate in the prawns, Penaeus monodon and Penaeus merguensis. Mem. Fac. Fish. Kagoshima Univ.,
28:21-26
Kolkovski, S., Czesny, S., Yackey, C., Moreau, R., Cihla, F., Mahan, D. and Dabrowski, K., 2000.
The effects of vitamins C and E in (n-3) highly unsaturated fatty acids-enriched Artemia nauplii on
growth, survival, and stress resistance of fresh water walleye Stizostedion vitreum larvae. Aquacult.
Nutr., 6:199– 206.
Koven, W., Barr, Y., Lutzky, S., Ben-Atia, I., Harel, M., Behrens, P., Weiss, R. and Tandler, A., 2001
a. The effect of dietary arachidonic acid 20:4n-6 on growth survival and stress in gilthead seabream,
Sparus aurata larvae. Aquaculture, 193, 107-122
Lavens, P. and Sorgeloos, P., 2000. The history, present, status and prospects of the availability of
Artemia cysts for aquaculture. Aquaculture 181: 397-403.
Paper Proceedings of Agri Animal 2013 - ISSN 2279-3682
443
Liddy, G.C., Kolkovski, S., Nelson, M.M., Nichols, P.D., Phillips, B. F. and Maguire, G.B. 2005. The
effect of PUFA enriched Artemia on growth, survival and lipid composition of western rock lobster,
Panulirus cygnus phyllosoma. Aquaculture Nutrition, 11: 375- 384.
Leger, P. and Sorgeloos, P., 1994. International study on Artemia XXIX. nutritional evaluation of
Artemia nauplii from different geographical origin for the marine crustacean Mysidopsisbahia. Mar.
Ecol. Prog. Ser., 15: 307- 309
McEvoy, L. A., Navarro, J. C., Bell, J. G., Sargent, J. R., 1995. Autoxidation of oil emulsions during
the Artemia enrichment process. Aquaculture,134: 101–112.
Monroig, O., Navarro, J.C., Amat, F., Gonzalez, P., Bermejo, A. and Hontoria, F. 2006. Enrichment of
Artemia nauplii in essential fatty acids with different types of liposomes and their use in the rearing of
gilthead sea bream (Sparus aurata) larvae. Aquaculture. 251: 491- 508.
Moren, M., Opstad, I., Meeren, T.V.D. and Hamre, K. 2006. Iodine enrichment of
Artemia and enhanced levels of iodine in Atlantic halibut larvae (Hippoglossushippoglossus L.) fed the
enriched Artemia. Aq. Nutrition. 12: 97-102
Morris R.J. and Sargent, J. R., 1973. Studies on the lipid metabolism of some oceanic crustaceans.
Mar. Biol., 22: 75-83.
Murthy, H.S.2003. Relent advances in fresh water prawn farming and hatching seed production in
India- An insight. Proceedings of the international symposium on Fresh water prawns. College of
Fisheries, Kerala Agricultural University, Kochi, Kerala, India. Pages 61-65.
Nghia, T. T., Wille, M., Sorgloos, P. 2001. Influence of the content and ratio of essential HUFA‘s in
the live food on larviculture success of the mud crab (Scylla paramamosain). In: Hendry C.I., Van
Stappen,G., Wille, M., Sorgeloos,P. (Eds). Larvi 01 – Fish and shellfish larviculture symposium,
European Aquaculture Society, special publication, vol.30.Oostende, Belgium. pp 430-433.
Nevejan, N., Saez, I., Gajardo, G. and Sorgloos, P. 2003. Supplementation of EPA and DHA
emulsions to a Dunaliella tertiolecta diet: effect on growth and lipid composition of scallop larvae,
Agropecton purpuratus. Aquaculture. 217: 613-632.
Olsen, A., Maeland, A., Waagbo, R. and Olsen, Y., 2000. Effect of algal addition on stability of fatty
acids and some water soluble vitamins in juvenile Artemia franciscana. Aquaculture Nutrition, 6: 263-
273
Owen, J. M., Adron, J. W.,Middleton, C. and Cowey, C. B.,1975.Elongation and desaturation of
dietary fatty acids in turbot (Scophthalmus maximus) and rainbow trout (Salmo gairdneri).Lipids
,10:525-531
Paper Proceedings of Agri Animal 2013 - ISSN 2279-3682
444
Pillai, D., James, T., Joshep, A. and Vadher, K.H. 2003. Enrichment of live feed with HUFA: Effect
on Macrobrachium rosenbergii (de Man). Proceedings of the international symposium on Fresh water
prawns. College of Fisheries, Kerala Agricultural University, Kochi, Kerala, India. pp 541-544.
Prabita, T.P. 2007. Evaluation of HUFA, vitamins C and E enriched Moina for post larvae of
Macrobrachium rosenbergii (de Man) Master‘s thesis, Central Institute of Fisheries Education, India.
Rahm, J. J. and Holman, R. T., 1964. Effect of linoleic acid upon the metabolism of linolenic acid. J.
Nutr., 84: 15-19.
Rani, A. M. B., Reddy, A.K. and Sahu, N.P. 2006. Growth enhancement and survival of
Macrobrachium rosenbergii larvae fed Artemia nauplii enriched with cod liver oil and/or
Lactobacillus. The Israeli Journal of Aquaculture: Bamidgeh 58 (3) 183- 190
Read, G.H L., 1981.The response of Penaeus indicus to purified and compound diets of varying fatty
acid composition. Aquaculture, 24: 245-246.
Rees, J. F. and Cure, K., Piyatiratitivorakul, S., Sorgeloos, P. and Menasveta, P., 1994. Highly
unsaturated fatty acid requirements of Penaeus monodon post larvae: An experimental approach based
on Artemia enrichment. Aquaculture, 122: 193-207.
Reigh, R. C. and Stickney, R. R., 1989. Effects of purified fatty acids of the fatty acid composition of
the fresh water shrimp, Macrobrachium rosenbergii. Aquaculture, 77: 157-174.
Sandifer, P. A. and Joseph, J. D., 1976. Growth responses and fatty acid composition of juvenile
prawns (Macrobrachium rosenbergii) fed a prepared ration augmented with shrimp head oil.
Aquaculture, 8: 129–138.
Sheen, S. S. and D‘Abramo, L. R. 1990. Response of juvenile freshwater prawn Macrobrachium
rosenbergii to different levels of cod liver oil / corn oil mixture in a semi purified diet. Aquaculture,
93: 121- 134.
Southgate, P. C. and Lou, D. C., 1995. Improving the n-3 HUFA composition of Artemia using
microcapsules containing marine oils. Aquaculture, 134: 91–99.
Tarui, F., Haga, Y., Ohta, K., Shima, Y. and Takenchi, T. 2006. Effect of Artemia nauplii enriched
with vitamin A palmitate on hypermelanosis on the blind side in juvenile Japanese flonder
Paralichthys olivaceus. Fisheries Science. 72: 256-262
Tonheim, S.K., Koven, W. and Ronnested, I. 2000. Enrichment of Artemia with free methionin.
Aquaculture, 190. 223-235
Watanabe, T.,1982. Lipid nutrition in fish.Comp.Biochem.Physiol.,7313: 3-15.
Watanabe, T., Oowa, F., Kitajima, C. and Fujita, S., 1980. Relationship between dietary value of brine
shrimp Artemia salina and their content of w3-PU-FAs. Bull. Japan. Soc. Sci. Fish. 46(1): 35-41.

Paper Proceedings of Agri Animal 2013 - ISSN 2279-3682
445
28
Paper Proceedings of Agri Animal 2013 - ISSN 2279-3682
446
INTERNATIONAL COMPETITIVENESS OF HUNGARIAN CEREAL SECTOR
Peter Karacsony
University of West-Hungary, Faculty of Agricultural and Food Sciences, Department of Economics,
Mosonmagyarovar, Hungary,
ABSTRACT
The primary aim of making of this study was to showcase the production situation and competitiveness
of cereals, one of the most important produce of the plant growing branch of the Hungarian
agricultural economy. Competitiveness – as many other scientific branches use this term – has an
especially rich international special literature. A number of ways and indicators have been developed
in the past decades to measure and define competitiveness, but because of its complexity it has no
generally accepted general definition or measuring method. In my study I use the „Porter‘s diamond
model" to explore the competitiveness of Hungarian cereal sector.
INTRODUCTION
Prior to the political and economic transition, agriculture was Hungary‘s most successful industry. It
produced 17% of GDP - including the processing, trade and other industrial activities of the large
farms – and employed about the same percentage of the labor force. The share of food exports was
22% of total exports. These proportions have decreased, between 1989 and 2007, agricultural
production fell by about 25%. Gross agricultural production in 2007 (a year in which the harvest was
extremely poor) was 31% lower than in 1989. The major decrease took place at the beginning of
1990s. At that time, animal production fell to 63% and the crop production to 70% of their pre-1990s‘
level. Crop production has recovered since then –with cereals accounting for a growing – but animal
production has continued to decrease (Burger, 2011).
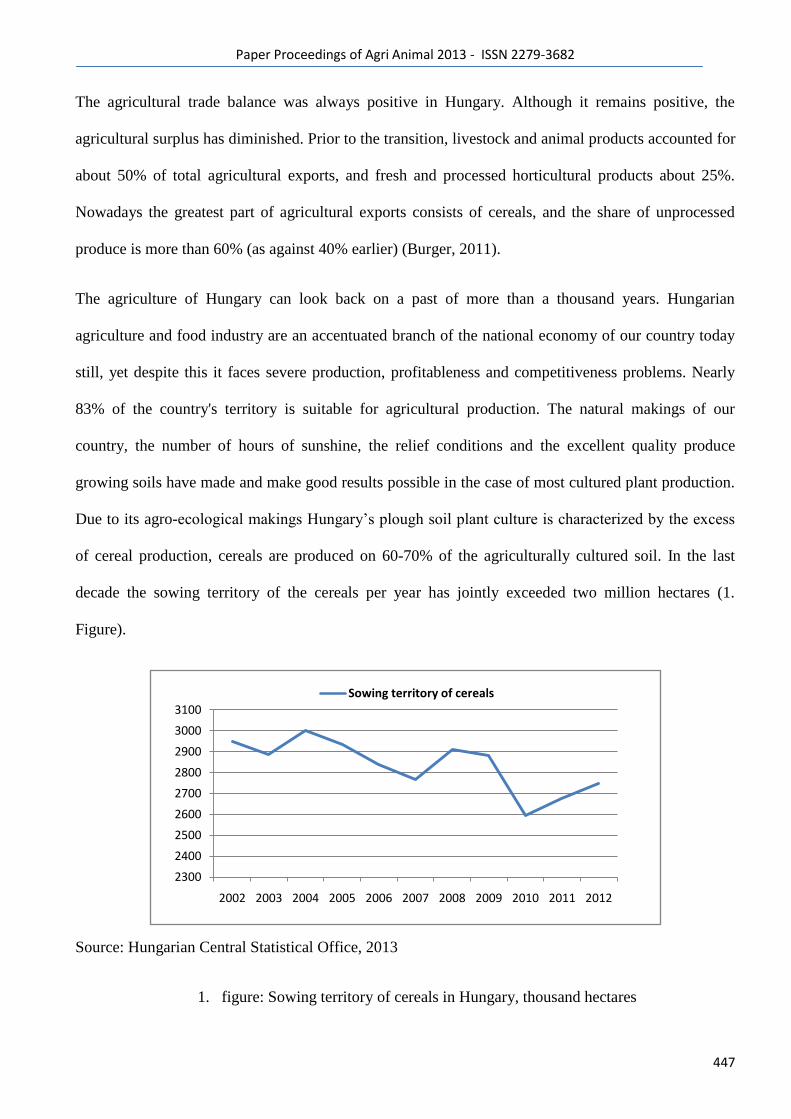
Paper Proceedings of Agri Animal 2013 - ISSN 2279-3682
447
The agricultural trade balance was always positive in Hungary. Although it remains positive, the
agricultural surplus has diminished. Prior to the transition, livestock and animal products accounted for
about 50% of total agricultural exports, and fresh and processed horticultural products about 25%.
Nowadays the greatest part of agricultural exports consists of cereals, and the share of unprocessed
produce is more than 60% (as against 40% earlier) (Burger, 2011).
The agriculture of Hungary can look back on a past of more than a thousand years. Hungarian
agriculture and food industry are an accentuated branch of the national economy of our country today
still, yet despite this it faces severe production, profitableness and competitiveness problems. Nearly
83% of the country's territory is suitable for agricultural production. The natural makings of our
country, the number of hours of sunshine, the relief conditions and the excellent quality produce
growing soils have made and make good results possible in the case of most cultured plant production.
Due to its agro-ecological makings Hungary‘s plough soil plant culture is characterized by the excess
of cereal production, cereals are produced on 60-70% of the agriculturally cultured soil. In the last
decade the sowing territory of the cereals per year has jointly exceeded two million hectares (1.
Figure).
Source: Hungarian Central Statistical Office, 2013
1. figure: Sowing territory of cereals in Hungary, thousand hectares
2300
2400
2500
2600
2700
2800
2900
3000
3100
2002 2003 2004 2005 2006 2007 2008 2009 2010 2011 2012
Sowing territory of cereals
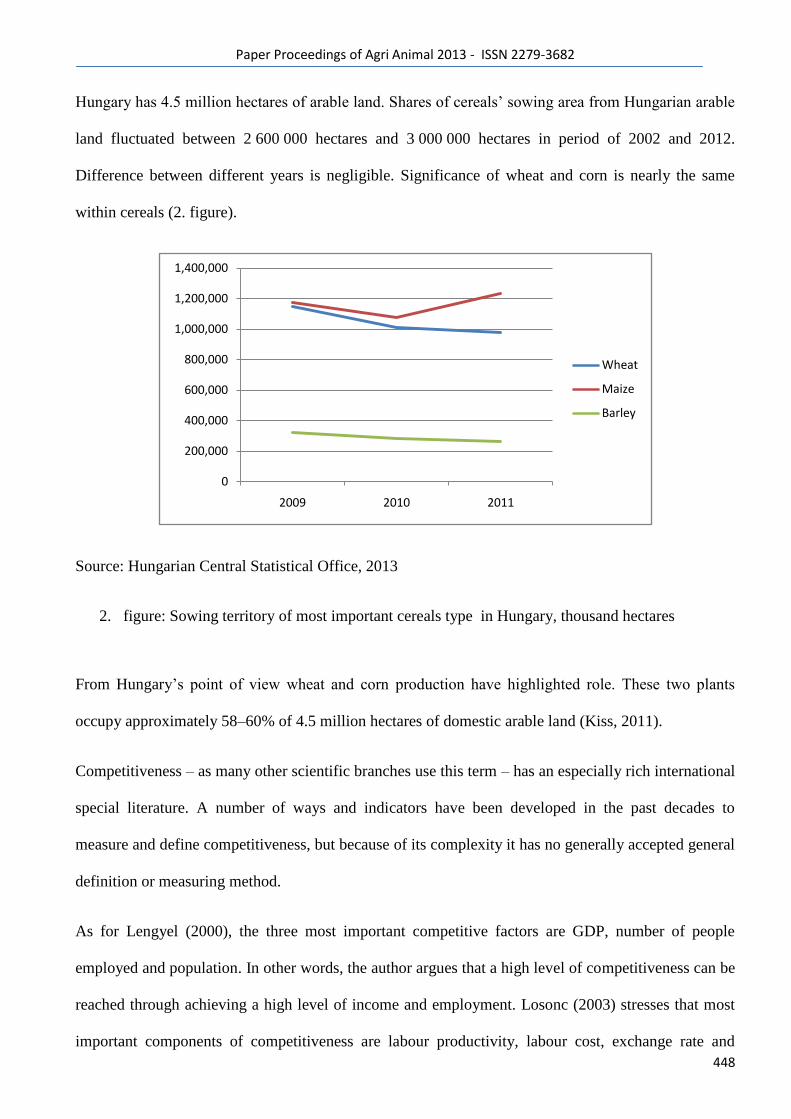
Paper Proceedings of Agri Animal 2013 - ISSN 2279-3682
448
Hungary has 4.5 million hectares of arable land. Shares of cereals‘ sowing area from Hungarian arable
land fluctuated between 2 600 000 hectares and 3 000 000 hectares in period of 2002 and 2012.
Difference between different years is negligible. Significance of wheat and corn is nearly the same
within cereals (2. figure).
Source: Hungarian Central Statistical Office, 2013
2. figure: Sowing territory of most important cereals type in Hungary, thousand hectares
From Hungary‘s point of view wheat and corn production have highlighted role. These two plants
occupy approximately 58–60% of 4.5 million hectares of domestic arable land (Kiss, 2011).
Competitiveness – as many other scientific branches use this term – has an especially rich international
special literature. A number of ways and indicators have been developed in the past decades to
measure and define competitiveness, but because of its complexity it has no generally accepted general
definition or measuring method.
As for Lengyel (2000), the three most important competitive factors are GDP, number of people
employed and population. In other words, the author argues that a high level of competitiveness can be
reached through achieving a high level of income and employment. Losonc (2003) stresses that most
important components of competitiveness are labour productivity, labour cost, exchange rate and
0
200,000
400,000
600,000
800,000
1,000,000
1,200,000
1,400,000
2009 2010 2011
Wheat
Maize
Barley
Paper Proceedings of Agri Animal 2013 - ISSN 2279-3682
449
internal prices. While Salvatore (2002) writes that competitiveness is the ability of a nation to create a
higher level of welfare than its competitors.
Globalization has enhanced the importance of international competitiveness. On the international level,
an economy’s external competitiveness can be regarded as the ability to form its social and scientific
environment suitable to generate value-added income, preferably in the long run (Korom and Sági,
2005).
Competitiveness is, in a sense, a strategy initiated by a nation to achieve some particular goal-a
strategy or distortion employed to offset some natural or pure comparative disadvantage (Vollrath,
1985, Dunmore, 1986).
In special literature it is not defined what they mean by competitiveness, or with which level of
competitiveness do they wish to deal with. However, when talking about levels of competitiveness we
differentiate between the comprehension levels of international, regional, branch, company and
product. Módos has incorporated the factors defining competitiveness into the following groups in
2003:
a) comparative advantages (technological, productivity differences, natural makings ),
b) competitive abilities (leadership and organization abilities cost-yield-income indicators),
c) the role of the state (education, research, macro environment, infrastructure, regulations).
Porter delineates in his 1990 Competitive Advantage of Nations study that in the changing
environment of world economy we can no longer talk about comparative advantages, just competitive
advantages.
Competitiveness generally is depends on economic conditions (prices, costs, income, market
conditions, subsidies and absorptions) on the one hand, and natural (climate, soil conditions, moisture)
and factory conditions (factory type, structure, resources-provision) on the other hand.
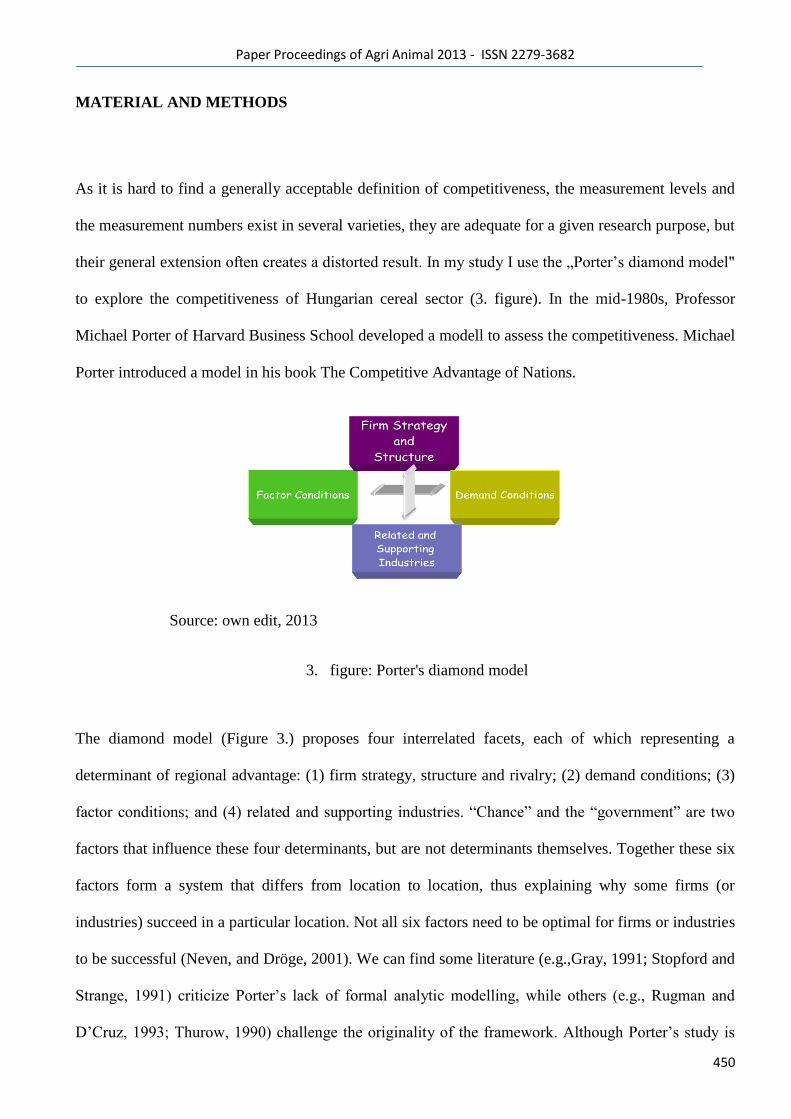
Paper Proceedings of Agri Animal 2013 - ISSN 2279-3682
450
MATERIAL AND METHODS
As it is hard to find a generally acceptable definition of competitiveness, the measurement levels and
the measurement numbers exist in several varieties, they are adequate for a given research purpose, but
their general extension often creates a distorted result. In my study I use the „Porter‘s diamond model"
to explore the competitiveness of Hungarian cereal sector (3. figure). In the mid-1980s, Professor
Michael Porter of Harvard Business School developed a modell to assess the competitiveness. Michael
Porter introduced a model in his book The Competitive Advantage of Nations.
Source: own edit, 2013
3. figure: Porter's diamond model
The diamond model (Figure 3.) proposes four interrelated facets, each of which representing a
determinant of regional advantage: (1) firm strategy, structure and rivalry; (2) demand conditions; (3)
factor conditions; and (4) related and supporting industries. ―Chance‖ and the ―government‖ are two
factors that influence these four determinants, but are not determinants themselves. Together these six
factors form a system that differs from location to location, thus explaining why some firms (or
industries) succeed in a particular location. Not all six factors need to be optimal for firms or industries
to be successful (Neven, and Dröge, 2001). We can find some literature (e.g.,Gray, 1991; Stopford and
Strange, 1991) criticize Porter‘s lack of formal analytic modelling, while others (e.g., Rugman and
D‘Cruz, 1993; Thurow, 1990) challenge the originality of the framework. Although Porter‘s study is
Paper Proceedings of Agri Animal 2013 - ISSN 2279-3682
451
replicated for many countries, there are few attempts to ‗test‘ it, probably because it is rather difficult
to conduct a formal test for the proposed model (Öz, 2002).
According to Porter the nation are capable of competitiveness in the branches where the diamond
provides the most favorable makings.
RESULTS
Applying the factors of the Porter‘s model the competitiveness of the Hungarian cereal sector has
shown the following results (1. table).
Factor
conditions
Demand
conditions
Related and
Supporting
Industries
Firm Strategy,
Structure and
Rivalry
The role of
chance
The role of
government
H M H M H L
Key: the effect of the diamond element high (H), medium (M) or low (L)
Source: own edit, 2003
1. Table: summary table of research findings
Factor conditions
In the introduction I already mentioned that Hungary's agro ecological potential provides excellent
conditions for the production of grains. Both the environment and production potential for cereals are
excellent in Hungary, but the yields per hectare fluctuate widely, because of climatic variability, and a
result of the farmers‘ financial problems their input side.
Taking into account the technical-technological conditions the tender opportunities available after
joining the EU have helped a great deal in the replacement and modernization of the used, old machine
pool. At the same time we can still find power and boom machines of inadequate technical quality in
Paper Proceedings of Agri Animal 2013 - ISSN 2279-3682
452
the machine pool of the farmers. In order to increase effectiveness these out-of date machines need to
be replaced urgently.
Taking capital provision into account we can state that from the beginning of the 1990's capital
provision has worsened, the number and amount of loans drawn into agriculture has increased and the
majority of farmers are facing the threat of becoming indebted. The share of the growers from the
revenues generated in agriculture has decreased, whilst the profit quota of merchants and forestallers
has increased.
The infrastructure of the branch has improved because the storage capacity of grains has increased in
the country and the attention put into the maintenance of the quality has developed.
The most common mode of cereal transportation is on road by truck or train. The problem here is that
our loading capacities are limited as well as our special grain transporting wagon capacities, and the
transportation costs are high.Transport by rail, ismuch slower partly because of the extra times need in
loading and also because the railway network is old.In my opinion, the speedy development of new
railway network and ship transportation could be the solution.
In the case of human resources factors the number of people employed in agriculture had decreased
significantly after the change in the political system. The number of agricultural employees has falling,
so that in 2012 agricultural employees accounted for only 5 percent of total employed workforce. At
the same time there was a change in structure, in the sector the number of people with intermediate or
higher education degrees has increased.
Demand conditions
The main characteristics of local consumption: in our country the consumption of cereals continuously
decreases. The cereal consumption is 90% wheat based. In Hungary, wheat is used primary for human
consumption (bread, biscuits, breakfast cereals) and the remainder is used as animal feed, seed an
industrial uses such as production of alcohol. Within domestic use, the milling and baking sectors
Paper Proceedings of Agri Animal 2013 - ISSN 2279-3682
453
represent about 53 percent of wheat used. Due to the unpredictability and fluctuation of the forage
consuming animals' sector (pigs, poultry) the grain utilization for forage alimentation purposes has also
significantly decreased. Wheat used for animal feed represents about 35 percent of domestic use. Seed
use represents about 10 percent and industrial use is the remaining 2 percent.
Export market trends: wheat is one of the biggest of agricultural mass products in world trade. In the
past decades traditional wheat exporting and wheat importing countries have emerged. Hungary is by
tradition a wheat exporting country. The amount of export-due to the significant growth of the yield
averages fluctuated between 1-2 million tons. In the 1990's our country's wheat export has shown great
extremes: in some years we exported just some ten thousand tons, whereas in years' with record yield
we exported as much as 2.5 million tons.
In our country wheat export is carried out mainly by trading companies or forwarding companies, the
amount of manufacturers' or growers' export is small. Hungary is a country with large excess of grains,
weak logistics background and is without a sea port.
Related and supporting industries
The main characteristics of input industries: the majority of the types of grain produced in Hungary (70
percent) are locally bred grains. The types produced in the Grain Research Institute of Szeged are
marked with the letters "Gk" after these letters some kind of a name is added (eg: Gk-Öthalom). The
plant seed market is strongly concentrated and is primarily dominated by foreign companies.
The majority of artificial fertilizers used in production are imported from primarily from Slovakia and
Romania these are complex fertilizers which contain nitrogen, phosphor, and potassium. n the mid
1980s, the rate of fertilizer application exceeded 270 kg/ha in Hungary. By the early 1990s this figure
had fallen significantly. The problem is that artificial fertilizer usage is fluctuating and the reasons for
this are the well-known financing problems in the background. Regarding the utilized plant protection
Paper Proceedings of Agri Animal 2013 - ISSN 2279-3682
454
products the foreign made herbicides are the wide-spread ones primarily. The market of plant
protection products is similar to the above mentioned two markets, that is, it is strongly concentrated.
The position of output industries: the superscripts for flour consumption are fluctuating since 1990,
and show a slightly decreasing tendency. According to the Hungarian Central Statistics Office
consumption hit rock bottom in 2012 (84.1 kg/head) while the population consumed the largest
amount of cereals in 1990 (110.3 kg/head). The behavior of the consumer side is characterized by price
sensitivity. When buying the primary aspect is the price, followed by quality. Food product trade has
become concentrated, foreign owned companies appear on the Hungarian market in an ever bigger
ratio. The cooperation between the farmers and the milling sector sometimes is inadequate. It would be
important for consistent quality of commodity.
Company strategy and structure
Medium strength concentrated characterizes grain industry and forage production. The degree of
product differentially is low in grain production and medium in the processing industry.
After observing the product path segments it can be said that procurement and trade are strongly
concentrated, so this part of the product verticum is in the hands of the companies specializing in this.
The few co-ops which have remained after the change in the political system are present almost
exclusively in the production only.
The systems which can be regarded as company strategy organizations are the production systems, the
processing industry integrations and the franchise systems. In order to ensure a more successful
strategy the strengthening of the cooperation between the small and the medium companies would be
needed.
Paper Proceedings of Agri Animal 2013 - ISSN 2279-3682
455
The co-ops can play an important role in the upswing our agriculture. Cooperation and alliance is the
only way to let the producers achieve higher positions on the market. Cooperation between small farms
could create a better bargaining position for agriculture. The cooperation could reduce production costs
and stabilize producers‘ prices; and could encourage the use of proper cultivation methods, grow
technologies and environmentally friendly methods.
Government regulations
The national and international regulations (export and import regulations as well as exchange rate
policy, inflation management etc.) can be listed among government actions.
The funding structure of agricultural subsidies has changed since Hungary is member of European
Union. In our country a significant ratio of grain production subsidies is comprised of the so-called
direct payments which the farmers receive on the basis of the base area and the base yield.
The export and import actions are also regulated within the frame of the Common Agricultural Policy
of the European Union. The WTO (World Trade Organization) agreement has a great influence on the
shaping of both actions, as it forces the Union to decrease its protectionist policy.
Chance
The European Union has developed a single market. European Union policies aim to ensure the free
movement of people, goods, services, and capital. The value of Hungary‘s agriculture foreign trade
with EU member states is significant. The shares of the European Union were 85% in export value and
93% in import value.
The competitiveness of the grain sector was significantly influenced by our joining the European
Union. On a market which struggles with excess production in the case of several products only those
can be successful who continuously meet the strict quality, transport, financial and other conditions.

Paper Proceedings of Agri Animal 2013 - ISSN 2279-3682
456
At the same time the Hungarian farmers have to face a competition from the imported grains flooding
our country from the member EU states. The greatest change on the demand side of the grain market
was caused by the introduction of the intervention system after our joining the Union.
Hungarian market risks mainly come from the fluctuation of internal production and the price
fluctuations which are a result of those previous fluctuations. Natural risk factors were and are ever
present influences in grain production and in particular drought, floods and rainy harvest periods have
left their strong mark.
CONCLUSIONS
Traditionally cereals have been one of Hungary‘s most important agricultural sectors. After the change
in the political system Hungarian agriculture has suffered its greatest losses during the transitional
period due to the deteriorating external and internal economic environment. Farms cut back on capital
investments to offset rising costs. Farms were forced to reduce their use of inputs and services to
survive. This strategy had a long term detrimental effect on yields in cereal.
It can be said about the most important type‘s grains which are wide spread in public production that
they are competitive when compared internationally. Cereals are worth producing even when the
applied minimum grain market prices and import duties are higher than in the previous years, and even
when other fields which do not enjoy further comparative advantages have to be put into production.
In order to improve sector competitiveness bettering information streaming, risk management, and
incentives to create quality production programs are a must, and so is the replacement of the old, out of
date machine pool which is maintained at significant expenses.
Paper Proceedings of Agri Animal 2013 - ISSN 2279-3682
457
Stronger producer integration, more cooperatives, comprehensive market regulation and new risk
management tools are required.
After the change of political system the Hungarian agriculture and food industry become fragmented,
this caused a considerable reduction of competitiveness of agricultural production. A new land
distribution was carried out which created an agricultural system based on smallholdings. In my
opinion on scattered parcels of land could not be mechanized or only at great expense, and they could
not be cultivated effectively. The only out way of this situation is farm-concentration and the
cooperation of smallholdings.
Hungary‘s natural conditions are excellent, its traditions are unique and we must exploit these.
Hungary and its rural areas require a strong and diverse agriculture, which is characterized by the
balance between animal husbandry and crop production, locally produced goods and sustainable
farming.
REFERENCES
Burger, A. 2009. The situation og Hungarian agriculture. Paper Presented at International Scientific
Conference, May 27-29., Vilnius, Lithuania
Dunmore, J. C. 1986. Competitiveness and comparative advantage of U.S. agriculture. Increasing
Understanding of Public Problems and Policies. Farm Foundation. USA
Gray, H. P. 1991. International competitiveness: a review article (review of the competitive advantage
of nations). International Trade Journal, Vol. 5., No. 5., pp. 503 –517.
Kiss, I. 2011. Significances of wheat production in world economy and position of Hungary in it.
Applied Studies in Agribusiness and Commerce, Vol. 05, No. 1-2.
Korom, E. and Sági, J. 2005. Measures of competitiveness in agriculture. Journal of Central European
Agriculture. Vol. 6., No. 3., pp. 375-380
Lengyel, I. 2000. On Regional Competitiveness. Közgazdasági Szemle, Vol. 47. pp. 962-987.
Paper Proceedings of Agri Animal 2013 - ISSN 2279-3682
458
Losonc, M. 2003. International Competitiveness. Cégvezetés, Vol. 11., 7th issue
Módos, Gy. 2003. A versenyképesség összetevői és mérése. Agroinform Kiadó, Budapest, Hungary
Neven, D. and Droge, C. 2001. A Diamond for the Poor? Assessing Porter‘s Diamond Model for the
Analysis of Agro-Food Clusters in the Developing Countries. Proceedings of the 11th Annual World
Food and Agribusiness Forum and Symposium. Australia. June 25-28.
Öz, Ö. 2002. Assessing Porter‘s framework for national advantage: the case of Turkey. Journal of
Business Research No. 55., pp. 509– 515.
Porter, M. E. 1990. The competitive advantage of nations. The Free Press, New York
Rugman, A. M. and D‘Cru,z R. 1993. The ‗double diamond‘ model of international competitiveness:
the Canadian experience. Manager Int. Rev. Vol. 2., No. 33., pp. 17 – 39.
Salvatore, D. 2002. International competitiveness, multifactor productivity and growth in the United
States. MTA VKI, Budapest, Hungary
Stopford, J. M. 1991. Strange S. Rival states, rival firms: competition for world market shares.
Cambridge. Cambridge Univ. Press
Thurow, L. C. 1990. Competing nations: survival of the fittest. Sloan Manager Review. Vol. 32., No.
1., pp. 95 – 7.
Vollrath, T. 1985. Dynamics of Comparative Advantage and the Resistance to Free Trade. Washington
DC., USDA

Paper Proceedings of Agri Animal 2013 - ISSN 2279-3682
459
29
Paper Proceedings of Agri Animal 2013 - ISSN 2279-3682
460
Report on incidence of low Fat and Solids Not Fat percentages in milk of Crossbred cows in
Wayanad district of Kerala, India
Radhika, G*., Ajithkumar, S.** and Rani, A.
College of Veterinary and Animal Sciences, Mannuthy, Kerala Veterinary and Animal Sciences
University, Pookode, Wayanad.
Abstract:
Fat and solids not fat (SNF) contents of milk decide the milk price and consumer acceptance of cow milk and
hence a scientific study on major constituents of milk was conducted in the hilly district of Wayanad, Kerala state, India.
268 Cows from five centres of Wayanad were selected and 929 morning and evening milk samples were analyzed for fat
and solids not fat (SNF) in different stages of lactation. The overall least squares mean for milk fat and SNF were 3.515 ±
0.080 and 8.359 ± 0.042 respectively. 47.3 per cent of cows in early stage of lactation were found to have morning milk fat
below the Prevention of Food Adulteration Act standards of 3.5 %. As far as SNF percentage is concerned, considering all
the stages of lactation together, 60.1 per cent in morning milk and 77.6 per cent of cows in evening milking had SNF
percentage below the prescribed legal standards of 8.5%. Crossbred cows of Wayanad have more of Holstein Friesian
inheritance which might be a genetic reason towards low level of milk fat percentage. Other non genetic factors for low fat
and SNF include sub clinical mastitis and anemia due to incidence of hemoparasites, which is quite high in Wayanad due to
its proximity to forest areas.
Keywords : milk fat, solids not fat, crossbred cows
Introduction
The pricing system for cow milk in milk societies of Kerala is based on the percentages of milk
fat and Solids Not Fat (SNF). Thus milk constituents like fat and SNF not only determines consumer‘s
receptivity of milk, but also decides the milk price. Prevention of Food Adulteration Act has fixed the
minimum fat percentage as 3.5 and SNF percentage as 8.5 for Kerala state, India. Milk with less than
3.5% fat and/or 8.5% SNF will fetch only lesser price to the farmer. Widespread complaints persist
among farmers of the state regarding low fat and SNF for their crossbred dairy cattle. Instances, where
allegation of adulteration of milk creating problems to the farmer, have also been not rare. Hence a
detailed study was conducted to probe into the existing milk fat and SNF percentages of crossbred
Paper Proceedings of Agri Animal 2013 - ISSN 2279-3682
461
cows in Wayanad district of Kerala. Wayanad district located 700 – 2100 m above mean sea level, on
the north-east of Kerala, is the second largest milk producing district in the state, with a production of
4,00,25,322 litres in 2004-05 (Karshakasree, 2005).
Materials and Methods
The study was conducted in the northern hilly district of Wayanad, which seriously lacks
scientific data on milk yield and constituents. Geographic terrain of Wayanad district with plain lands
and steep hilly areas demanded selection of Crossbred Cows from five different centres namely -
Ambalavayal, Sulthan Bathery, Meenangadi, Vythiri and Veterinary College Livestock Farm, Pookode
. 268 cows which calved from April to July 2007 were selected. A total number of 929 milk samples
from 244 cows were collected in morning and evening during early, middle and late lactation and were
analyzed for fat, solids not fat and total solids. Milk fat was estimated using electronic Milk Fat Tester
and the equipment was calibrated with Gerber‘s method. SNF was estimated using lactometer with
frequent calibration with gravimetric method for total solids estimation. Least square means were
calculated after nullifying the effects of centre, season and parity using SPAB – 2 package (Sethi
2002). The model used was,
Yijkl = µ + Ci + Sj + Pk + eijkl
Where, Yijkl=lth
observation of kth
parity of jth
season of ith
centre; µ=overall mean; Ci = effect of ith
centre; Sj = effect of jth
season; Pk = effect of kth
parity and eijkl = random error.
Results and Discussion
Prevention of Food Adulteration Act has set up the minimum standards of milk fat and
SNF percentages as 3.5 and 8.5 percentages in Kerala. Since the pricing of milk in milk societies is
based on fat and SNF, any value beneath the prescribed standards will fetch less price to the milk sold
and hence is a matter of serious concern to the farmers. 47.3 per cent of cows in early stage of lactation
had morning milk fat below 3.5 percent, whereas in the case of evening milk samples 11.8 per cent of
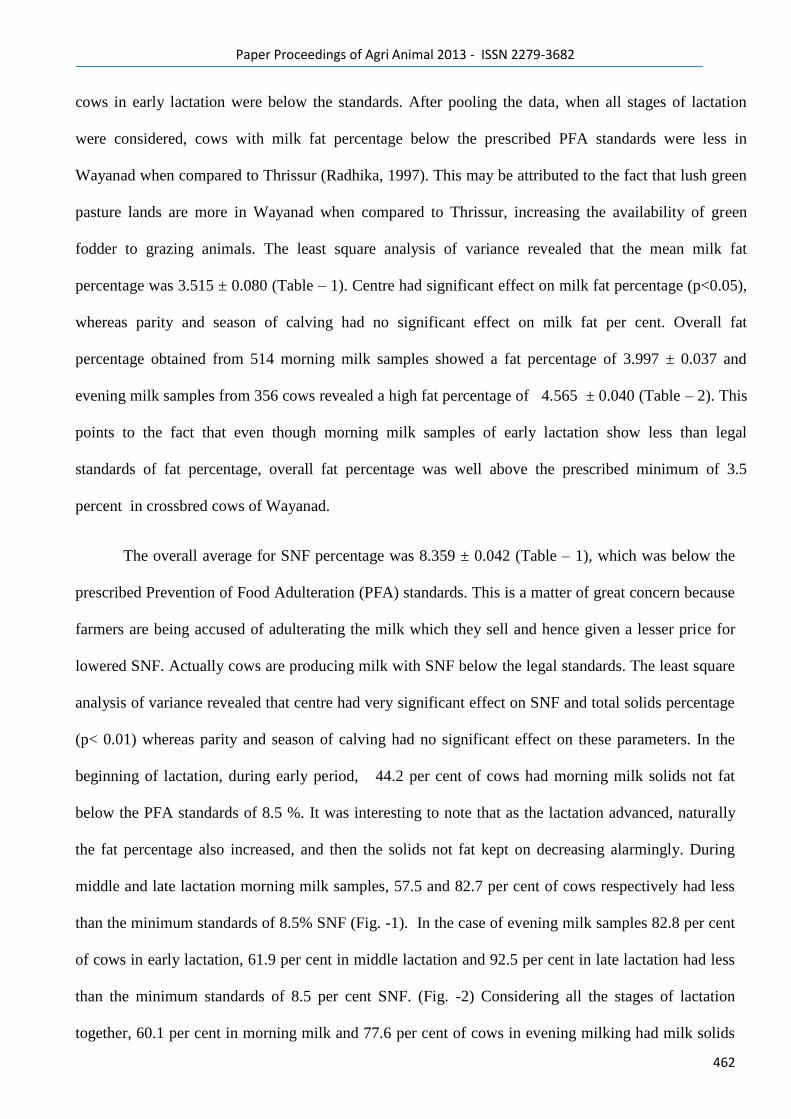
Paper Proceedings of Agri Animal 2013 - ISSN 2279-3682
462
cows in early lactation were below the standards. After pooling the data, when all stages of lactation
were considered, cows with milk fat percentage below the prescribed PFA standards were less in
Wayanad when compared to Thrissur (Radhika, 1997). This may be attributed to the fact that lush green
pasture lands are more in Wayanad when compared to Thrissur, increasing the availability of green
fodder to grazing animals. The least square analysis of variance revealed that the mean milk fat
percentage was 3.515 ± 0.080 (Table – 1). Centre had significant effect on milk fat percentage (p<0.05),
whereas parity and season of calving had no significant effect on milk fat per cent. Overall fat
percentage obtained from 514 morning milk samples showed a fat percentage of 3.997 ± 0.037 and
evening milk samples from 356 cows revealed a high fat percentage of 4.565 ± 0.040 (Table – 2). This
points to the fact that even though morning milk samples of early lactation show less than legal
standards of fat percentage, overall fat percentage was well above the prescribed minimum of 3.5
percent in crossbred cows of Wayanad.
The overall average for SNF percentage was 8.359 ± 0.042 (Table – 1), which was below the
prescribed Prevention of Food Adulteration (PFA) standards. This is a matter of great concern because
farmers are being accused of adulterating the milk which they sell and hence given a lesser price for
lowered SNF. Actually cows are producing milk with SNF below the legal standards. The least square
analysis of variance revealed that centre had very significant effect on SNF and total solids percentage
(p< 0.01) whereas parity and season of calving had no significant effect on these parameters. In the
beginning of lactation, during early period, 44.2 per cent of cows had morning milk solids not fat
below the PFA standards of 8.5 %. It was interesting to note that as the lactation advanced, naturally
the fat percentage also increased, and then the solids not fat kept on decreasing alarmingly. During
middle and late lactation morning milk samples, 57.5 and 82.7 per cent of cows respectively had less
than the minimum standards of 8.5% SNF (Fig. -1). In the case of evening milk samples 82.8 per cent
of cows in early lactation, 61.9 per cent in middle lactation and 92.5 per cent in late lactation had less
than the minimum standards of 8.5 per cent SNF. (Fig. -2) Considering all the stages of lactation
together, 60.1 per cent in morning milk and 77.6 per cent of cows in evening milking had milk solids

Paper Proceedings of Agri Animal 2013 - ISSN 2279-3682
463
not fat percentage below the prescribed PFA standards. This was much higher than the figures
obtained in a similar study conducted in crossbred cows at Thrissur, where 47% of cows, irrespective
of lactation stage and time of milking, recorded an SNF percentage below the legal standards of 8.5.
(Radhika et al., 1999). According to Sebastian and Geevarghese (1995) there is a possibility of
obtaining milk with fat and SNF below minimum standards prescribed in PFA Act for many states in
India. Malabar Regional Co-operative Milk Producer‘s Union Ltd., Kozhikode (MRCMPU) (1995)
reported 73.8 per cent animals with milk SNF below legal standards.
Factors affecting fat and solids not fat - Milk composition varies considerably among breeds of
dairy cattle with Jersey and Guernsey breeds yielding milk of higher fat and protein content than
Holstein Friesian cows. Indigenous cows yield less amount ofmilk containing high fat percentage. But
Kerala, at present has a crossbred cattle population with mosaic inheritance from, Jersey, Brown Swiss
and Holstein Freisian along with genes from indigenous cattle. Wayanad district has congenial climate
and low temperature which favours rearing of high milk producing cattle and hence Holstein Freisian
is the preferred breed. Major genetic factor leading to a decline in milk fat percentage must be the
increased inheritance of Holstein Freisian among crossbred cows of Wayanad. Genetic variability
between animals is also a factor which has to be taken into consideration.
Though heredity determines milk production and composition, environment and various
physiological factors greatly influence the quantity and quality of milk that is actually produced. One
of the major non genetic factors that have been reported to affect fat and solids not fat in milk
production is nutrition. Harris and Beckman (1988), reported that when extra energy was fed to high
producing cows, SNF increased by about 0.2 percentage units. Cows in Wayanad are high yielding
animals and the low level of SNF might be an indication towards insufficient energy intake. Addition
of whole cottonseed or added fat to dairy cattle rations may also reduce the SNF content of milk.
Forage quality and quantity also affects milk SNF. Good quality hay tends to increase SNF, but poor
quality hay may reduce both intake and SNF. Effect of centre on fat and SNF points to the fact that

Paper Proceedings of Agri Animal 2013 - ISSN 2279-3682
464
different feeding patterns existing in different areas, influence the level of fat and SNF in milk.
Alfonso-Avila et al (2011) reported that Multiple regression analysis showed no significant (P > 0.05)
model relating intake of feed groups and milk fat content, but milk protein and SNF contents were
significantly explained by intake of High Crude Protein in the feed stuff. Supplementation of protected
nutrients to buffaloes increased milk production and unsaturated fatty acids content in milk fat and
persistence of lactation after supplements were withdrawn. (Shelke et al, 2012)
Another major reason for decline in SNF, protein, and lactose content is associated with sub
clinical and clinical mastitis. Incidence of mastitis among crossbred cows in Kerala is quite high. As per
2006 disease surveillance report by the Kerala Government, the annual economic loss due to mastitis is
estimated to be 36.54 crores in cattle. Batavani et al. (2007) reported that protein fractions were
significantly different in normal and subclinical mastitis milk. Ogole (2007) also reported that clinical
and subclinical mastitis produced significant changes in composition of milk. Anemia is another reason
for decline in SNF and since incidence of hemoparasites is quite high in Wayanad due to its proximity to
forest areas; this could be a major reason. Perry and Randolph (1999) reported great economic losses in
productivity of dairy cattle due to parasitism.
SNF content of milk decreases with age of the cow. Within any given lactation, SNF content is
relatively high the first month, drops to a low the second, then rises as lactation progresses. As far as this
study is concerned, SNF was low throughout, irrespective of stage of lactation and during the later stages
of lactation when fat percentage increased; there was considerable reduction in SNF. The overall average
for milk solids not fat percentage for morning and evening were 8.354 ± 0.020 and 8.208 ± 0.026 (Table-
2), which was below the prescribed PFA standards of 8.5%. Mech (2008) also reported that SNF did not
vary with different stages of lactation. But in another study in Northern India by Jadhav and Patange
(2009) on newly evolved genotype namely ―Phule triveni‖ revealed that fat, total solids and SNF, being
significantly (P<0.05) affected by the stage of lactation. Least square analysis for milk solids not fat
percentage revealed that the effect of centre was highly significant, whereas parity and season had no
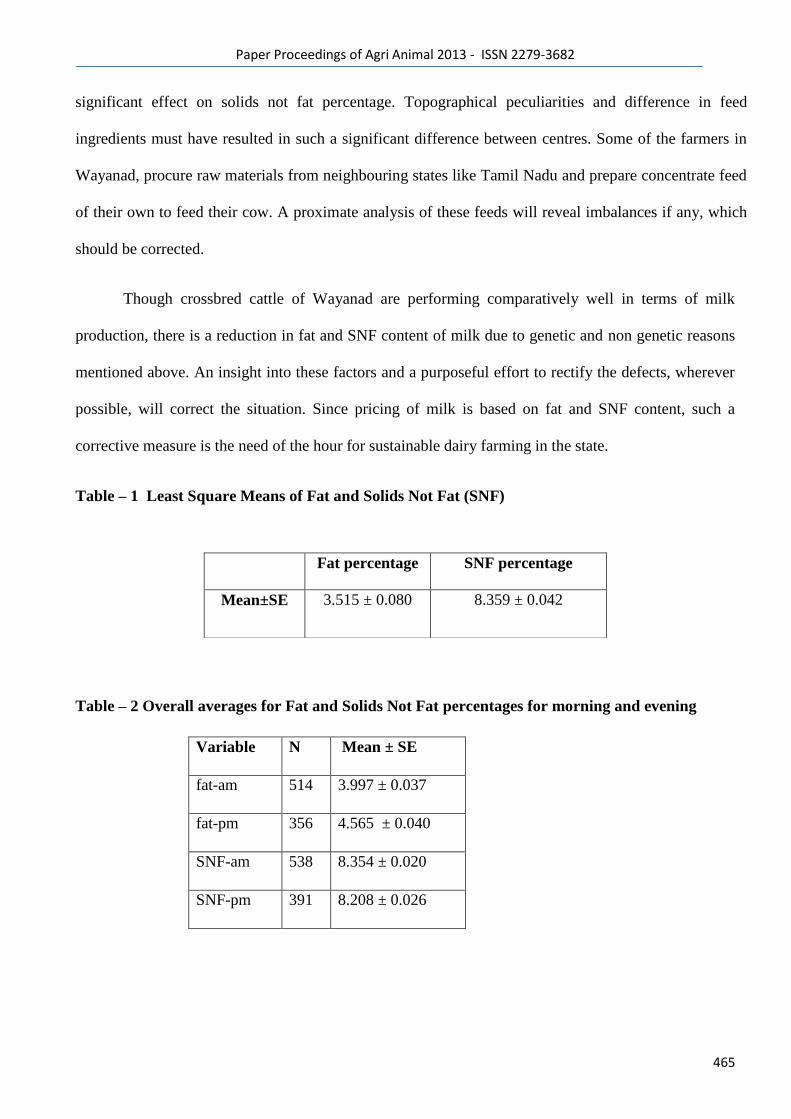
Paper Proceedings of Agri Animal 2013 - ISSN 2279-3682
465
significant effect on solids not fat percentage. Topographical peculiarities and difference in feed
ingredients must have resulted in such a significant difference between centres. Some of the farmers in
Wayanad, procure raw materials from neighbouring states like Tamil Nadu and prepare concentrate feed
of their own to feed their cow. A proximate analysis of these feeds will reveal imbalances if any, which
should be corrected.
Though crossbred cattle of Wayanad are performing comparatively well in terms of milk
production, there is a reduction in fat and SNF content of milk due to genetic and non genetic reasons
mentioned above. An insight into these factors and a purposeful effort to rectify the defects, wherever
possible, will correct the situation. Since pricing of milk is based on fat and SNF content, such a
corrective measure is the need of the hour for sustainable dairy farming in the state.
Table – 1 Least Square Means of Fat and Solids Not Fat (SNF)
Table – 2 Overall averages for Fat and Solids Not Fat percentages for morning and evening
Fat percentage
SNF percentage
Mean±SE
3.515 ± 0.080
8.359 ± 0.042
Variable N Mean ± SE
fat-am
514 3.997 ± 0.037
fat-pm
356 4.565 ± 0.040
SNF-am 538 8.354 ± 0.020
SNF-pm 391 8.208 ± 0.026
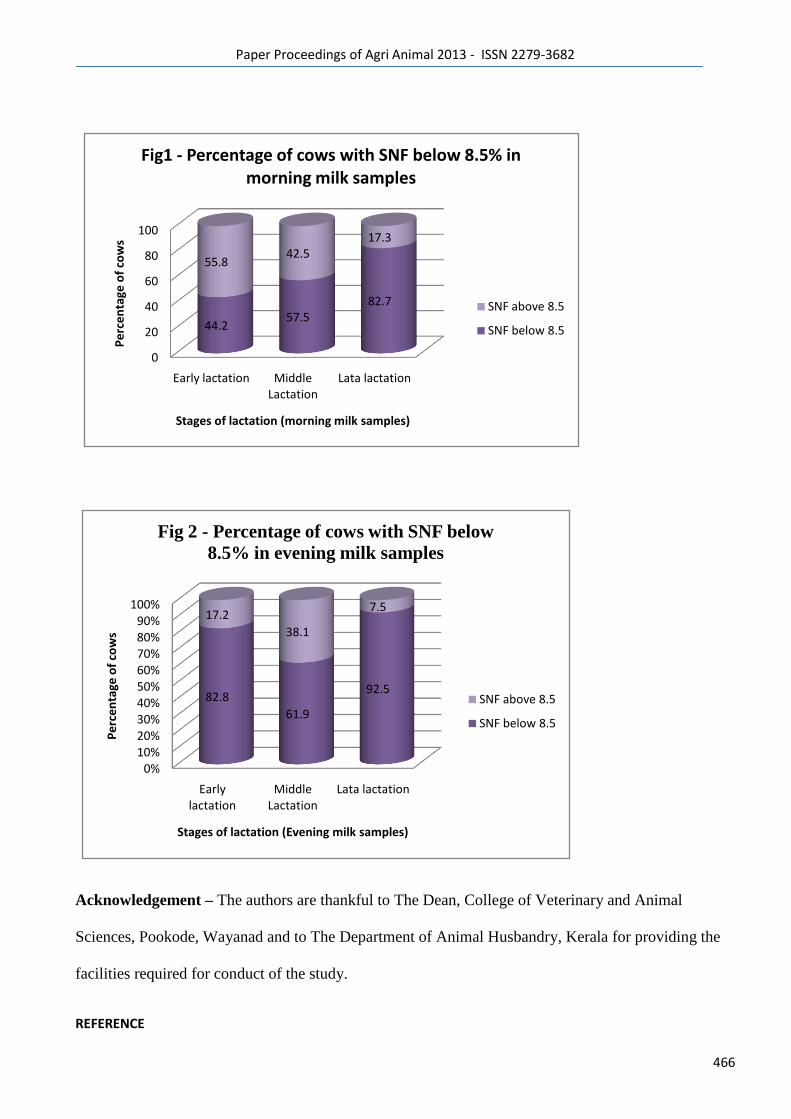
Paper Proceedings of Agri Animal 2013 - ISSN 2279-3682
466
Acknowledgement – The authors are thankful to The Dean, College of Veterinary and Animal
Sciences, Pookode, Wayanad and to The Department of Animal Husbandry, Kerala for providing the
facilities required for conduct of the study.
REFERENCE
0
20
40
60
80
100
Early lactation Middle Lactation
Lata lactation
44.257.5
82.7
55.842.5
17.3
Pe
rce
nta
ge o
f co
ws
Stages of lactation (morning milk samples)
Fig1 - Percentage of cows with SNF below 8.5% in morning milk samples
SNF above 8.5
SNF below 8.5
0%10%20%30%40%50%60%70%80%90%
100%
Early lactation
Middle Lactation
Lata lactation
82.8
61.9
92.5
17.2
38.1
7.5
Pe
rce
nta
ge o
f co
ws
Stages of lactation (Evening milk samples)
Fig 2 - Percentage of cows with SNF below
8.5% in evening milk samples
SNF above 8.5
SNF below 8.5
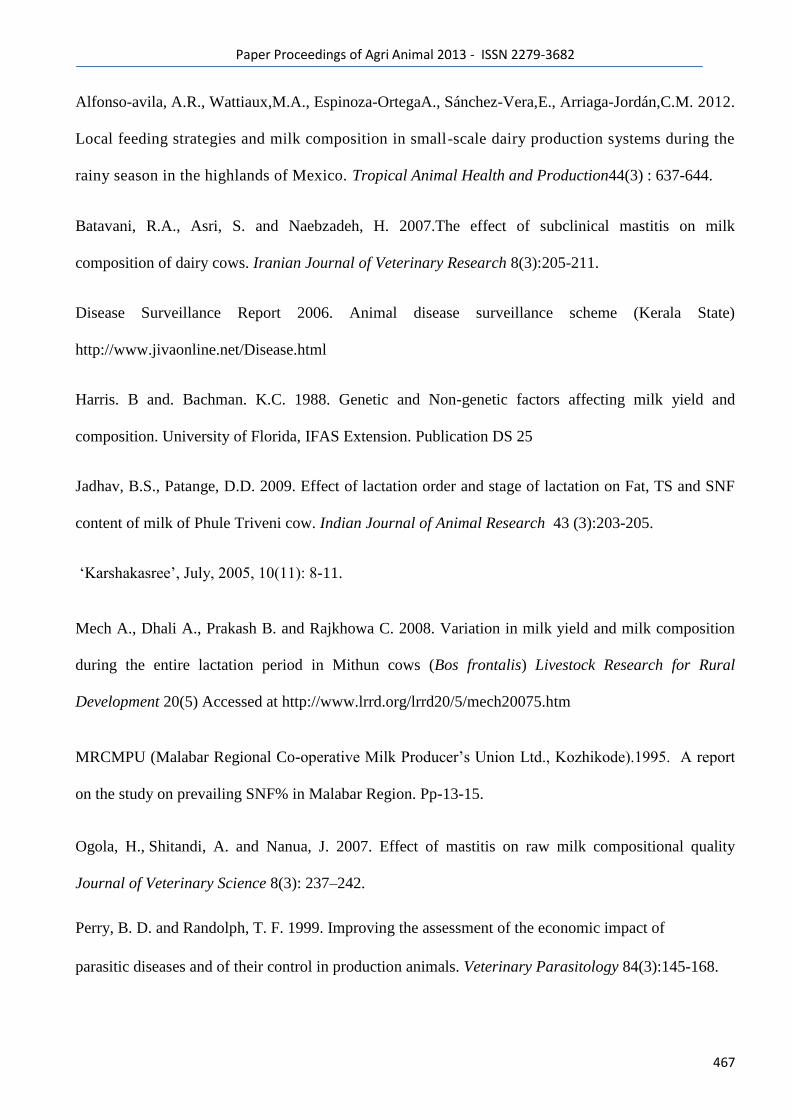
Paper Proceedings of Agri Animal 2013 - ISSN 2279-3682
467
Alfonso-avila, A.R., Wattiaux,M.A., Espinoza-OrtegaA., Sánchez-Vera,E., Arriaga-Jordán,C.M. 2012.
Local feeding strategies and milk composition in small-scale dairy production systems during the
rainy season in the highlands of Mexico. Tropical Animal Health and Production44(3) : 637-644.
Batavani, R.A., Asri, S. and Naebzadeh, H. 2007.The effect of subclinical mastitis on milk
composition of dairy cows. Iranian Journal of Veterinary Research 8(3):205-211.
Disease Surveillance Report 2006. Animal disease surveillance scheme (Kerala State)
http://www.jivaonline.net/Disease.html
Harris. B and. Bachman. K.C. 1988. Genetic and Non-genetic factors affecting milk yield and
composition. University of Florida, IFAS Extension. Publication DS 25
Jadhav, B.S., Patange, D.D. 2009. Effect of lactation order and stage of lactation on Fat, TS and SNF
content of milk of Phule Triveni cow. Indian Journal of Animal Research 43 (3):203-205.
‗Karshakasree‘, July, 2005, 10(11): 8-11.
Mech A., Dhali A., Prakash B. and Rajkhowa C. 2008. Variation in milk yield and milk composition
during the entire lactation period in Mithun cows (Bos frontalis) Livestock Research for Rural
Development 20(5) Accessed at http://www.lrrd.org/lrrd20/5/mech20075.htm
MRCMPU (Malabar Regional Co-operative Milk Producer‘s Union Ltd., Kozhikode).1995. A report
on the study on prevailing SNF% in Malabar Region. Pp-13-15.
Ogola, H., Shitandi, A. and Nanua, J. 2007. Effect of mastitis on raw milk compositional quality
Journal of Veterinary Science 8(3): 237–242.
Perry, B. D. and Randolph, T. F. 1999. Improving the assessment of the economic impact of
parasitic diseases and of their control in production animals. Veterinary Parasitology 84(3):145-168.
Paper Proceedings of Agri Animal 2013 - ISSN 2279-3682
468
Radhika.G, 1997. Evaluation of Holstein Crossbred bulls based on milk composition of progenies.
MVSc. Thesis submitted to Kerala Agricultural University.
Radhika,G.; Iype,S.1999. Studies on solids-not-fat content of milk of crossbred cows under village
conditions and organized farms of Kerala.Indian Journal of Animal Science 69(7) : 522-524.
Sebastian, M. and Geevarghese, P.I. 1995. A new lactometric model for estimation of total solids in
milk. Indian Journal of Dairy Science 48(7):465-468.
Sethi, I.C. 2002. Project Report. Statistical Package for Animal Breeding. Indian Agricultural Statistics
Research Institute, New Delhi, 57p
Shelke,S.K., Thakur,S.S. and Amrutkar, S.A. 2012. Effect of feeding protected fat and proteins on
milk production, composition and nutrient utilization in Murrah buffaloes (Bubalus bubalis) Animal
Feed Science and Technology 171(2):98-107. i

Paper Proceedings of Agri Animal 2013 - ISSN 2279-3682
469
30
Paper Proceedings of Agri Animal 2013 - ISSN 2279-3682
470
Stimulating Impact of Elevated Temperature on the Growth and
Productivity of Parthenium hysterophorus L.
Riti Thapar Kapoor
Plant Physiology Laboratory
Amity Institute of Biotechnology
Amity University, Noida - 201 303
Uttar Pradesh, India
Abstract
Invasive alien weeds are posing a great threat to our biodiversity by suppressing the native flora and
cause negative impact on crop yield. Parthenium hysterophorus L. an exotic weed has been reported as
a main source of nuisance and health hazard to mankind and animals and danger to environment.In the
present study, experiments were conducted during summer and winter season to know the impact of
different temperature conditions on the growth of Parthenium weed. The pot studies which were
conducted under 22-300C temperature conditions were considered as control. During summer season at
35-450C temperature regime different growth parameters of Parthenium weed such as number of
leaves/ plant, length of the leaves, number of branches/plant, plant height, number of capitula/plant and
number of seeds/ five capitula were significantly increased at 30 and 60 DAS in comparison to 7-150C
temperature regime in winter season. Different biochemical constituents were also higher in the leaves
of Parthenium hysterophorus during summer season in comparison to winter season. The present
investigation clearly indicates that growth and productivity of Parthenium weed was directly
proportional to the increase in atmospheric temperature indicating the possibility of the influence of
rising temperature on the invasiveness of Partheniumhysterophorus.
Key words: Climate change, Parthenium hysterophorus, temperature
Introduction
The process of economic development has resulted in large scale of environmental degradation across
the world. Rapid industrialization, increase in greenhouse gases in the atmosphere, climate change,
loss of biodiversity, deforestation and environmental pollution have become a matter of serious
concern. Climate change is a global phenomenon and increase in global atmospheric concentration of
Paper Proceedings of Agri Animal 2013 - ISSN 2279-3682
471
carbon dioxide and other greenhouse gases like methane, nitrous oxide and chlorofluorocarbons
beyond their natural level caused by anthropogenic activities such as burning of fossil fuel and
developmental activities are responsible for increase in average temperature of earth i.e. global
warming. Global atmospheric carbon dioxide (CO2) concentration is predicted to rise to 550 ppmv by
the middle of the present century (Prentice et al.2001) and it has been predicted that there will be
reduction in rainfall in future in comparison to the present rainfall pattern. This trend is consistent with
an increase in green house gases and such type of climatic changes will adversely affect the entire
agricultural production system through direct or indirect effect on crop, livestock and pests and there
will be significant change in the distribution and abundance of certain kinds of weeds as a result of
these changing climatic conditions (Houghton et al.1990). The Intergovernmental Panel on Climate
Change (IPCC) in its fourth assessment report indicated that many of the developing countries tend to
be more vulnerable to climate change as they largely depend on climate sensitive sectors.
Invasive alien weeds are aggressive invaders outside their natural range and they adversely affect
proper utilization of land, biodiversity and environment. Weeds have a greater genetic diversity than
crop plants and they show positive responses to elevated temperature and carbon dioxide level in
comparison to crop plants. Parthenium hysterophorus popularly known as gajar grass, carrot weed,
feverfew, star weed and whitetop and it belongs to the family Asteraceae. Parthenium hysterophorus
has got a position among the list of top ten worst weeds of the world. Parthenium hysterophorus is
native of North - east Mexico, probably introduced in India along with wheat grains under PL 480
scheme from USA and spread alarmingly to almost all the states in India. Parthenium weed can be
seen lavishly growing in wasteland, roadsides, railway tracks, vacant sites and construction sites and it
can reduce crop yield up to 40% (Khosla and Sobti, 1981). Parthenium hysterophorus begins to flower
within a month after seedling emergence and it can continue to flower profusely until senescence
(Tamado et al. 2002). Parthenium hysterophorus is considered as a noxious weedbecause of its prolific
seed production ability and plasticity in physiological behaviour (Haseler, 1976), allelopathic effecton
the neighbouring plants (Adkins andSowerby, 1996), strong competitiveness with crops(Tamadoet al.
2002) and health hazards to human - beings (Pasricha, 2010) as well as animals (Chippendale
andPanetta, 1994).Parthenium weed can adversely affect agriculture, environment and biodiversity,
thus contribute to social and economic instability by placing constraints for sustainable development,
economic growth and food security (Kohli et al. 2006).
Biochemical and molecular responses are not well documented in literature it may be due to a lack
of understanding about the regulatory mechanisms, metabolic signaling and physiological changes in
plants under elevated temperature conditions. However, a critical perusal of the literature revealed few
reports on changes in growth and physiological processes of various crop plants exposed to different
temperature regimes (Mavi and Tupper, 2004; Marina and Natalja, 2010; Ribeiro et al. 2012).
Paper Proceedings of Agri Animal 2013 - ISSN 2279-3682
472
Partheniumhysterophorus can be seen in all the stages of its growth round the year but it has been
observed that Parthenium weed grows very fast during summer season. However, no effort seems to
have been made to study the impact of different temperature regimes on the growth and productivity of
Parthenium weed. In order to bridge the gap in literature and to test the above hypothesis, this study
was designed to provide first hand data on the comparative assessment of the different temperature
regimes due to seasonal variation on the growth and productivity of Parthenium weed.
Materials and methods
The experiments were conducted at Amity University, Noida, India to study the impact of change in
atmospheric temperature conditions on the growth and productivity of Partheniumhysterophorus L.
Geographical position of the study site
Noida is located in Gautam Budh Nagar district of Uttar Pradesh state, India. The latitude and
longitude of Noida are 28057‘N and 77
032‘E respectively. It lies at an average elevation of 200 m
above mean sea level and has a flat topography. Noida is about 20 kilometers south - east of New
Delhi and it occupies an area of about 203 sq km and the total population of the region is
approximately 6,42,381 as per the 2011 census.
Climate conditions of the study area
Noida experiences three seasons in a year i.e. summer (April - June), rainy (July - August) and winter
season (November - February). The annual mean temperature of Noida is 25 - 330C, the mean
maximum temperature is 42.50C recorded in summer season (May - June) and the mean minimum
temperature is 4.50C recorded in winter season (December - January).
Experimental design
The pot studies were conducted in the Botanical Garden of Amity University, Noida, India.
Parthenium hysterophorus were grown under three different temperature regimes (35 - 450C,7 - 15
0C
and 22 - 300C) represented typical warm, cool and control (intermediate time period in between
summer and winter season) conditions respectively with photoperiod of 10 hours and a relative
humidity was 65% .
The soil and its preparation
The earthen pots of 25 cm deep and 25 cm in diameter were used for the study. The pots with their
drainage holes plugged with cotton were filled with equal weights of sandy loam soil 10 kg and 80 gm
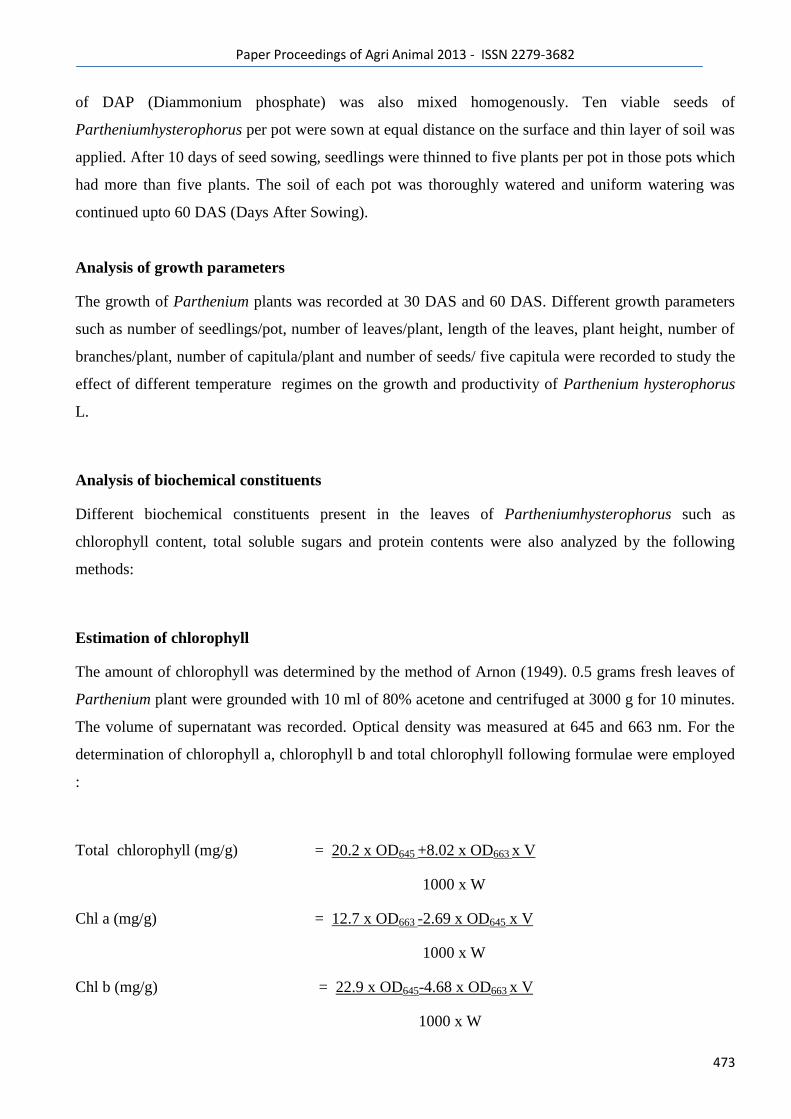
Paper Proceedings of Agri Animal 2013 - ISSN 2279-3682
473
of DAP (Diammonium phosphate) was also mixed homogenously. Ten viable seeds of
Partheniumhysterophorus per pot were sown at equal distance on the surface and thin layer of soil was
applied. After 10 days of seed sowing, seedlings were thinned to five plants per pot in those pots which
had more than five plants. The soil of each pot was thoroughly watered and uniform watering was
continued upto 60 DAS (Days After Sowing).
Analysis of growth parameters
The growth of Parthenium plants was recorded at 30 DAS and 60 DAS. Different growth parameters
such as number of seedlings/pot, number of leaves/plant, length of the leaves, plant height, number of
branches/plant, number of capitula/plant and number of seeds/ five capitula were recorded to study the
effect of different temperature regimes on the growth and productivity of Parthenium hysterophorus
L.
Analysis of biochemical constituents
Different biochemical constituents present in the leaves of Partheniumhysterophorus such as
chlorophyll content, total soluble sugars and protein contents were also analyzed by the following
methods:
Estimation of chlorophyll
The amount of chlorophyll was determined by the method of Arnon (1949). 0.5 grams fresh leaves of
Parthenium plant were grounded with 10 ml of 80% acetone and centrifuged at 3000 g for 10 minutes.
The volume of supernatant was recorded. Optical density was measured at 645 and 663 nm. For the
determination of chlorophyll a, chlorophyll b and total chlorophyll following formulae were employed
:
Total chlorophyll (mg/g) = 20.2 x OD645 +8.02 x OD663 x V
1000 x W
Chl a (mg/g) = 12.7 x OD663 -2.69 x OD645 x V
1000 x W
Chl b (mg/g) = 22.9 x OD645-4.68 x OD663 x V
1000 x W
Paper Proceedings of Agri Animal 2013 - ISSN 2279-3682
474
Where, V = volume of the supernatant in ml, W = fresh weight of the sample in grams and OD =
optical density.
Estimation of total soluble sugars
Parthenium leaves were harvested at 60 DAS and placed in an electric oven with forced air circulation
at 70ºC for 96 hours. The leaf dry matter was lyophilized and leaf powder was kept in glass containers,
which remained kept in the dark at 15ºC until biochemical analysis. Carbohydrate content was
determined with 50 mg of dry leaf powder and incubated with 5 ml of distilled water at 100ºC for 30
minutes. Subsequently the homogenized solution was centrifuged at 2000 g for 5 minutes at 20ºC and
supernatant was removed. Quantification of total soluble sugars was carried out at 490 nm according to
the method of Dubois et al. (1956) by using glucose as standard.
Protein estimation
Quantitative estimation of protein was done by the method of Lowry et al. (1951). Stock solution of
the following reagents were prepared :
(a). Alkaline sodium carbonate solution (0.2 % Na2CO3 in 0.1 N NaOH)
(b). Copper sulphate - sodium potassium tartarate solution (0.5% CuSO4. 5H2O in
1% sodium potassium tartarate)
(c). Alkaline copper reagent: Mixed 50 ml of reagent A and 1 ml of reagent B
(d). Folin - ciocalteu reagent, dilute the reagent with equal volume of water just before use
(e). 1 N NaOH.
0.5 grams fresh leaves of Parthenium plants were homogenized with 1 ml of 1 N NaOH for 5 minutes
at 1000C. Added 5 ml of alkaline copper reagent to it and allowed the mixture to stand at room
temperature for 10 minutes. Added 0.5 ml of Folin - ciocalteu reagent immediately and mixed the
contents properly in the test tube. The absorbance of the solution was measured at 650 nm after 30
minutes. The amount of protein was calculated with reference to standard curve of lysozyme.
Statistical analysis
All the experiments were laid out in a complete randomized block design with three replicates
(Snedecor, 1957)
Paper Proceedings of Agri Animal 2013 - ISSN 2279-3682
475
Results and Discussion
To study the impact of seasonal variation in atmospheric temperature on the growth and productivity
of Partheniumhysterophorus L., the pot experiments were conducted in three different temperature
regimes i.e. summer season (35-450C), winter season (7-15
0C) and control condition (22-30
0C) i.e.
intermediate time period in between summer and winter season. In summer season, seeds begin to
germinate after 5 DAS but in control and winter season seed germination was delayed with lesser
number of seedlings. At 10 DAS, maximum number of Parthenium seedlings were observed in the
pots in which seed sowing was done in summer season and number of seedlings/pot was reduced to
22.27% in winter season (Table - 1). At 30 DAS, different growth parameters such as number of
leaves/plant, length of the leaves and plant height were measured at three different temperature
regimes. During summer season at temperature range (35-450C) significant growth in number of
leaves, length of leaves and plant height was observed in comparison to control and winter season.
Growth of the plants can be determined best by taking plant height into consideration. Inhibition in all
the above growth parameters was prominent in winter season at 30 DAS. Maximum reduction 19.16%
in the number of Parthenium leaves/plant, 29.53% in length of the Parthenium leaves and 9.42% in
plant height was observed during winter season at 30 DAS (Table - 2). At 60 DAS, different growth
parameters such as number of leaves/plant, length of the leaves, plant height, number of
branches/plant, number of capitula/plant and number of seeds/five capitula were measured. During
summer season at temperature regime (35-450C), maximum number of Parthenium leaves, length of
leaves, plant height, number of branches and capitula/plant and number of seeds/five capitula were
observed in comparison to control and winter season (Table - 3). Maximum reduction 17.99% in
number of Parthenium leaves/plant, 24.93% reduction in length of the Parthenium leaves, 29.96%
plant height, 20.11% and 13.09% reduction in number of branches and capitula/plant and 30.43%
reduction in number of seeds/five capitula were observed during winter season in comparison to
control and summer season at 60 DAS. Different biochemical constituents such as chlorophyll content,
total soluble sugars and protein contents were also observed at 60 DAS. In control, total chlorophyll
content was 2.73 mg/g which significantly reduced in winter season (Table - 4). Maximum inhibition
29.67% in total chlorophyll content was observed in Parthenium leaves in winter season. In control,
total sugar content was 2.52 mg/g which significantly reduced to 1.93 mg/g in winter season.
Maximum inhibition 23.41% in total sugar content was observed in Parthenium leaves in winter
season (Table - 5). The highest amount of protein 123µg/ml was recorded in Parthenium leaves in
summer season which was reduced to71 µg/ml in winter season and slightly increased to 98 µg/ml in
control (Table - 6).
Paper Proceedings of Agri Animal 2013 - ISSN 2279-3682
476
Climate change directly affects the population dynamics, invasive capacity and decline and
extinction of plant species and it can provide opportunity for weeds to invade into new ecosystems.
Temperature and atmospheric CO2 are considered as climatic variables that can alter plant invasiveness
(Bradley et al. 2010). Parthenium hysterophorus L. is reported to be physiologically adaptable and
thereby tolerant to wide range of temperature regimes, lower rainfall and elevated CO2 level(Hegde
and Patil, 1980). A similar type of trend was noticed in the present investigation in which Parthenium
seedlings exhibited significant growth in summer season at higher temperature regime (Table - 2 and
3). It has been observed that rising atmospheric temperature may give competitive advantage to C4
plants than C3 plants and majority of weeds are C4 plants (Singh et al. 2011). Moore et al.(1987) and
Tirumala Devi and Raghavendra (1993) have reported that Parthenium weed is C3 - C4 intermediate
plant and upper leaves of Parthenium weed seem to use the C3 photosynthetic pathway while the
leaves in the middle and at the base of the plant have the typical kranz leaf anatomy associated with C4
photosynthesis, therefore Parthenium weed is most likely to increase its growth in an elevated
temperature and CO2 concentration in atmosphere. The seed is reproductive unit of plant and seed
germination is the resumption of active growth of embryo and it results in the breaking of seed coat
and emergence of young seedling. Germination starts with the uptake of water by the seed through
imbibition and it completes when radicle extends to penetrate the structures that surround it (Bewley
and Black, 1994). For the seed germination different physical factors such as adequate moisture,
oxygen supply, temperature and light are required. Water is the basic requirement for seed germination
and it is essential for enzymatic activities, translocation and use of reserve food material for various
metabolic activities. In the present investigation, higher percentage of Parthenium hysterophorus seed
germination was observed during summer season (Table - 1). Ahlawat et al. (1979) reported that
Parthenium seeds treated at 400C for 24 hours prior to germination brought down the seed germination
to 40% whereas treatment at 900C showed only 8% seed germination. Nguyen et al. (2010) have
reported that the highest number of Parthenium seeds approximately 26,628 were produced under
warm conditions as compared with lowest number of seeds approximately 15,510 were produced
under cool condition with maximum number 60% of unfilled seeds under cool condition. They also
found that warm and dry conditions may produce Parthenium seeds only after 50 days of seedling
emergence while cool and wet conditions may produce seeds after 75 days. Warm conditions may
promote the reproductive ability of Parthenium weed by increasing seed production and seed fill
percentage and produces seed with the capacity to live longer in the soil seed bank. Higher temperature
during seed development increases seed germinability in many species (Llorens et al. 2008).
According to Long et al. (2008) warm temperature at the time of Parthenium seed production enables
the seed once shed to persist in the soil for > 3 years whereas cool temperature enables the seed once
Paper Proceedings of Agri Animal 2013 - ISSN 2279-3682
477
shed to persist in the soil only for 1 - 3 years. The above - mentioned results are in consistent with our
findings.
Growth is due to the increase in number and size of cells which is affected by cell division and
extensibility leading to expansion and elongation of cells. Inhibition of growth parameters under the
influence of low temperature might be due to inhibition in synthesis of gibberellins, auxin and other
growth hormones. The growth inhibition caused by lowring of atmospheric temperature and short
photoperiod could be due to interference with many plant growth processes like cell division, cell
enlargement, inhibition in nutrient uptake, reduction in dry matter production due to inhibition of
metabolic processes such as photosynthesis and respiration etc. Reduction in Parthenium plant height
might be due to inhibition of CO2 fixing efficiency or delaying of seed germination coupled with low
efficiency in dry matter production at low temperature. Carbohydrates are the main energy source for
most of the plant physiological processes such as respiration and cell growth. In this context, our
results are showing variation in total soluble sugar content during exposure of Parthenium plants to
different temperature regimes as highest amount of total soluble sugar 3.46 mg/g was present in the
Parthenium leaves in summer season. According to Bewley and Black (1994) among different
accumulating solutes, sugars represent the major reserve material in the seeds which maximally
synthesized during germination and mobilized to various tissues like stem and internodes in the form
of sucrose that are readily transportable to such sites where they are required for growth and
maintenance of the osmotic regulation of cells. Further, Toh et al. (2011) have reported that increase in
temperature enhances growth of Parthenium weed and enlarges the plant canopy size and structure and
also accelerates the growth rate resulting in a shortened life cycle of Parthenium weed. These findings
are also supported by Entz and Fowler (1991) in wheat and Pandey et al. (2003) in Parthenium weed.
Singh and Singh (2010) reported the extensive coverage of vacant cultivated land during summer
season by Parthenium hysterophorus signifies that in case of increased temperature, more number of
Parthenium seeds will be produced and further facilitating spread of Parthenium weed to new areas.
Growth enhancing effects of CO2 enrichment will increase with increasing temperature and it would
also tend to increase the water utilization efficiency of Parthenium weed because of huge biomass
(Idso, 1990).
The quantity of biochemical constituents in different plant parts varies with the advancement of
season. Proteins play a significant role in biological processes and protein synthesis regulates growth,
development and reproduction ability of plants. At low temperature, inhibition of protein synthesis
might have resulted in inhibition of biosynthesis of chlorophyll molecules, photosystem I, II, ATPase
and other enzymes required for photosynthesis.Reduced rate of photosynthesis caused decreased
synthesis of carbohydrates which are the important constituents of cell wall and they are starting point
for the synthesis of proteins, lipids and other cellular constituents. Findings of the present paper clearly
indicates the inhibition in photosynthesis due to low light intensity and short photoperiod in winter
Paper Proceedings of Agri Animal 2013 - ISSN 2279-3682
478
season which may lead to decreased amount of photosynthates might be due to decreased biosynthesis
of chlorophyll resulting less biomass production in winter season. This might have resulted in overall
reduction of Parthenium growth and development in winter season. Naidu and Swamy (2009) reported
that Eugenia jambolana, Terminalia arjuna and Chukrasia tabularis plants grown under high light
intensity showed more biochemical constituents such as carbohydrate, protein and lipids in all the
plant parts as compared to low light intensity grown plants. Goodchild et al. (1972) also reported that
shaded plants show lower protein content than the sun grown plants and low protein content in shade
grown plants is associated with lower activity of RUBPcarboxylase (Bjorkman, 1968) and nitrate
reductase than the high light intensity grown plants (Naidu and Swamy, 1993). Similar results were
observed in Erythrina variegate by Muthuchelian et al. (1989) and in Pongamia pinnata by Naidu and
Swamy (1993).Consequently, our study is the first contribution to understand the physiological events
that occur during Parthenium seed germination and early development of Parthenium seedlings in
summer season at higher temperature regime. Further investigations are needed to enhance our
understanding of the impact of different temperature regimes on Parthenium weed.
Conclusion
The findings of the present investigation support our hypothesis and clearly indicate that
Partheniumhysterophorus is likely to accelerate its growth under changing climatic conditions and it
will become more aggressive due to the warmer climatic conditions in future. The data of the present
paper can help in development of predictive models of weed emergence in the agricultural lands and
may generate significant information that can be useful for the development of integrated management
strategies for the control of Parthenium weed.
Acknowledgements
The author is thankful to Prof. K. C. Upadhyaya, Director, Amity Institute of Biotechnology, Amity
University, Noida, India for providing necessary laboratory and library facilities.
References
Adkins, S. W. and Sowerby, M. S. 1996. Allelopathic potential of the weed Parthenium hysterophorus
L. in Australia. PlantProtection Quarterly. 11:20-23.
Paper Proceedings of Agri Animal 2013 - ISSN 2279-3682
479
Ahlawat, A. S., Dagar, J. C. and Singh, V. P. 1979. Seed germination studies on
Partheniumhysterophorus L. In: Proceedings of Indian National Science Academy. B 45 (6): 613 -
616.
Arnon, D.T. 1949. Copper enzymes in isolated chloroplasts polyphenoloxidase in Beta vulgaris. Plant
Physiology. 24: 1-5.
Bewley, J. D. and Black, M. 1994. Seeds: Physiology of Development and Germination. 2nd
Edition,
Plenum Press, New York.
Bjorkman, O. 1968. Carboxydismutase activity in shade adapted and sun adapted species of higher
plants. Plant Physiology. 21:1-10.
Bradley, B. A., Blumenthal, D. M., Wilcove, D. S. and Ziska, L. H. 2010. Predicting plant invasions in
an era of global change. Trends in Ecology and Evolution.25: 310-318.
Chippendale, J. F., Panetta, F. D. 1994. The cost of Parthenium weed in the Queensland cattle
industry. Plant ProtectionQuarterly. 9 : 73-76.
Dubois, M., Gillas, K. A., Hamilton, J. K., Roberts, P. A. and Smith, F. 1956. Colorimetric method for
determination of sugars and related substances. Analytical Chemistry. 28: 350-356.
Entz, M. H. and Fowler, D.B. 1991. Agronomic performance of winter versus spring wheat.
Agronomy Journal. 83: 527-532.
Goodchild, O. J., Bjorkmann, O. and Pyliotis, N. A. 1972. Chloroplast ultrastructure, leaf anatomy and
content of chlorophyll and soluble protein in rainforest species. Carnegie Inst. 71 : 102-107.
Haseler, W. H. 1976. Parthenium hysterophorous L. in Australia. Pest Articles and News Summaries
(PANS). 22: 515-517.
Hegde, B. A., and Patil, T. M. 1980. Physiological studies on Parthenium hysterophorus Linn. Under
different ecological conditions. Biovigyanam.6: 15-19.
Paper Proceedings of Agri Animal 2013 - ISSN 2279-3682
480
Houghton, J.T., Jenkins, G. J. and Ephraums, J. J. 1990. Climate Change: the IPCC Scientific
Assessment. Cambridge University Press, Cambridge.
Idso, S. B. 1990. Carbon dioxide and global change: Earth in transition. IBR Press, Institute for
Biospheric Research, Inc. Arizona, USA.
Khosla, S. N. and Sobti, S. N. 1981.Effective control of Parthenium hysterophorus L. Pesticides
15:18-19.
Kohli, R. K., Batish, D. R., Singh, H. P. and Dogra, K. 2006. Status, invasiveness and environmental
threats of three tropical American invasive Weeds (Parthenium hysterophorus L., Ageratum
conyzoides L., Lantana camara L.). Biological Invasions. 8: 1501-1510.
Llorens, L., Pons, M., Gil L. and Boira, H. 2008. Seasonality of seed production and germination
trends of Fumana ericoides (Cistaceae) in the west semiarid Mediterranean region. Journal of Arid
Environments. 72: 121-126.
Long, R. L., Panetta, F. D., Steadman, K. J., Bekker, R. M., Brooks, S. and Adkins, S.W. 2008. Seed
persistence in the field may be predicted by laboratory- controlled aging. Weed Science. 56: 523-528.
Lowry, O. H., Rosebrough, N.J., Fan A. L. and Randal, R. J. 1951. Protein measurement with the
Folin-phenol reagent. Journal of Biological Chemistry. 193: 265-275.
Mavi H. S. and Tupper G. J. 2004. Agrometeorology: Principles and Applications of Climate Studies
in Agriculture.HaworthPress. pp. 50 - 64.
Moore, B. D., Franceschi, V.R., Cheng, S., Wu, J. and Ku, M.S.B. 1987. Photosynthetic
characteristics of the C3-C4 intermediate Parthenium hysterophorus. Plant Physiology. 85: 984 -989.
Muthuchelian, K., Paliwal, K., Gnanam, A. and Paliwal, K. 1989. Influence of shading on net
photosynthetic and transpiration rate, stomatal diffusive resistance, nitrate reductase and biomass
productivity of wood legume tree species (Erythrina variegata Lam.). Proceedings of Indian Academy
of Sciences (Plant Sciences). 99 (6): 539-565.
Paper Proceedings of Agri Animal 2013 - ISSN 2279-3682
481
Naidu, C.V. and Swamy, P.M. 1993. Effect of shade on growth, biomass production and associated
physiological parameters in Pongamia pinnata L. Pierre. Indian Journal of Plant Physiology. 36: 212-
214.
Naidu, C.V. and Swamy, P.M. 2009. Effect of low light on lipid protein and carbohydrate content in
different plant parts of some tropical decidous tree species. Journal of Indian Botanical Society.
88(3&4): 186 - 189.
Nguyen, Thi. L. T., Navie, Sheldon C. and Adkins, Steve W. 2010. The reproductive capacity of
Parthenium weed under different climatic conditions. In Proceedings : Seventeenth Australasian
Weeds Conference, Published by New Zealand Plant Protection Society (Ed. S. M. Zydenbos). 26 -
30th
September. pp. 124-127.
Pandey, D. K., Palni, L.M.S. and Joshi, S.C. 2003. Growth, reproduction, and photosynthesis of
ragweed Parthenium (Parthenium hysterophorus). Weed Science. 51(2): 191-201.
Pasricha, J. S. 2010. The problem of Parthenium in India. In Proceedings: Scientific Presentations on
Parthenium. Third Intarnational Conference on Parthenium organized by Indian Agricultural Research
Institute, New Delhi from December 8-10.pp. 4-6.
Prentice, I. C., Farquhar, G.D. and Fasham, M. J. R. 2001. The carbon cycle and atmospheric carbon
dioxide. In: Climate change 2001: the scientific basis. Contribution of Working Group I to the Third
Assessment Report of the Intergovernmental Panel on Climate Change. (Eds. J.T. Houghton, Y. Ding,
D.J. Griggs, M. Noguer, P.J. van der Linden, D. Xiaosu). New York: Cambridge University Press. pp.
183-239.
Ribeiro Rafael Vasconcelos, Eduardo Caruso Machado, Erick Espinoza-Núñez, Rômulo Augusto
Ramos, Daniela Favero São Pedro Machado 2012. Moderate warm temperature improves shoot
growth, affects carbohydrate status and stimulates photosynthesis of sweet orange plants. Brazilian
Journal of Plant Physiology. 24(1): 37- 46.
Paper Proceedings of Agri Animal 2013 - ISSN 2279-3682
482
Marina, Savicka and Natalja, Skute. 2010. Effects of high temperature on malondialdehyde content,
superoxide production and growth changes in wheat seedlings (Triticum aestivum L.). Ekologija. 56:
26-33.
Singh, M. K. and Singh, R. K. 2010. Alien invasive weeds - an emerging threat to agricultural
biodiversity in India. Souvenir - cum Abstract, SAARC Workshop on Biodiversity Conservation,
September 21- 22, Department of Plant Physiology, Institute of Agricultural Sciences, BHU, Varanasi.
pp.91.
Singh, R. P, Singh, R. K. and Singh, M. K.2011. Impact of climate and carbon dioxide change on
weeds and their management - A review. Indian Journal of Weed Science. 43(1&2): 1- 11.
Snedecor, W. 1957. Statistical Methods. Ames, USA : Iowa State University Press. pp. 594.
Tamado, T., Schutz, W. and Milberg, P. 2002. Germination ecology of the weed
Partheniumhysterophorus in eastern Ethiopia. Annals of Applied Biology. 140: 263-270.
Tirumala Devi, M. and Raghavendra, A. S. 1993. Photorespiration in C3 - C4 intermediate species of
Alternanthera and Parthenium: Reduced ammonia production and increased capacity of CO2
refixation in the light. Photosynthetic Research. 38: 177-184.
Toh, R., Hanan, J., Dhileepan, K., Shivas, R. G. and Adkins, S. W. 2011. Stimulation of Parthenium
weed canopy under changing climate using L - systems. 19th
International Congress on Modelling and
Stimulation, Perth, Australia. 12 - 16th
December. pp. 1009-1015.
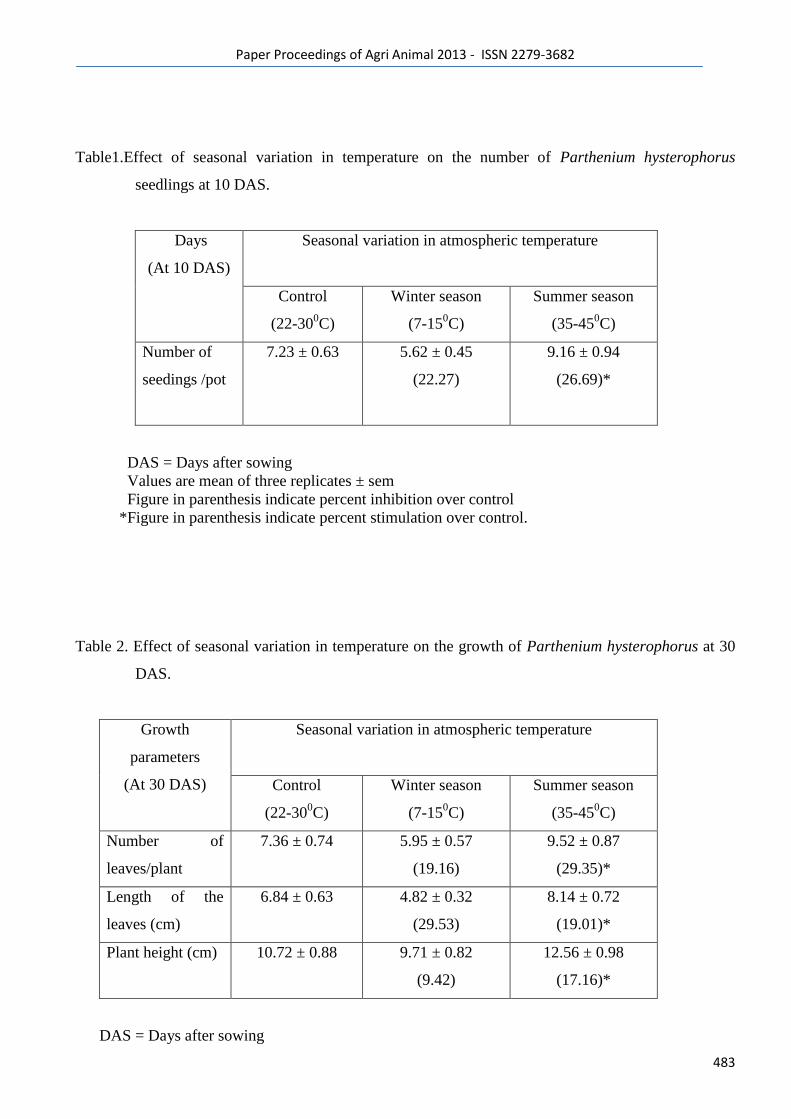
Paper Proceedings of Agri Animal 2013 - ISSN 2279-3682
483
Table1.Effect of seasonal variation in temperature on the number of Parthenium hysterophorus
seedlings at 10 DAS.
Days
(At 10 DAS)
Seasonal variation in atmospheric temperature
Control
(22-300C)
Winter season
(7-150C)
Summer season
(35-450C)
Number of
seedings /pot
7.23 ± 0.63 5.62 ± 0.45
(22.27)
9.16 ± 0.94
(26.69)*
DAS = Days after sowing
Values are mean of three replicates ± sem
Figure in parenthesis indicate percent inhibition over control
*Figure in parenthesis indicate percent stimulation over control.
Table 2. Effect of seasonal variation in temperature on the growth of Parthenium hysterophorus at 30
DAS.
Growth
parameters
(At 30 DAS)
Seasonal variation in atmospheric temperature
Control
(22-300C)
Winter season
(7-150C)
Summer season
(35-450C)
Number of
leaves/plant
7.36 ± 0.74 5.95 ± 0.57
(19.16)
9.52 ± 0.87
(29.35)*
Length of the
leaves (cm)
6.84 ± 0.63 4.82 ± 0.32
(29.53)
8.14 ± 0.72
(19.01)*
Plant height (cm) 10.72 ± 0.88 9.71 ± 0.82
(9.42)
12.56 ± 0.98
(17.16)*
DAS = Days after sowing

Paper Proceedings of Agri Animal 2013 - ISSN 2279-3682
484
Values are mean of three replicates ± sem
Figures in parentheses indicate percent inhibition over control
*Figures in parentheses indicate percent stimulation over control.
Table 3. Effect of seasonal variation in temperature on the growth of Parthenium hysterophorus at 60
DAS.
Growth
parameters
(At 60 DAS)
Seasonal variation in atmospheric temperature
Control
(22-300C)
Winter season
(7-150C)
Summer season
(35-450C)
Number of
leaves/plant
23.95 ± 0.93 19.64 ±0.73
(17.99)
29.36 ± 0.85
(22.59)*
Length of the
leaves (cm)
13.92 ± 0.12 10.45 ± 0.09
(24.93)
15.12 ± 0.23
(8.62)*
Plant height (cm) 45.30 ± 0.59 31.73 ± 0.25
(29.96)
54.95 ± 0.46
(21.30)*
Number of
branches/plant
7.31 ± 0.08 5.84 ± 0.03
(20.11)
8.26 ± 0.09
(12.99)*
Number of
capitula/plant
275 ± 0.96 239 ± 0.86
(13.09)
288 ± 0.64
(4.73)*
Number of
seeds/five
capitula
23 ± 0.07 16 ± 0.05
(30.43)
25 ± 0.19
(8.69)*
DAS = Days after sowing
Values are mean of three replicates ± sem
Figures in parentheses indicate percent inhibition over control
*Figures in parentheses indicate percent stimulation over control.
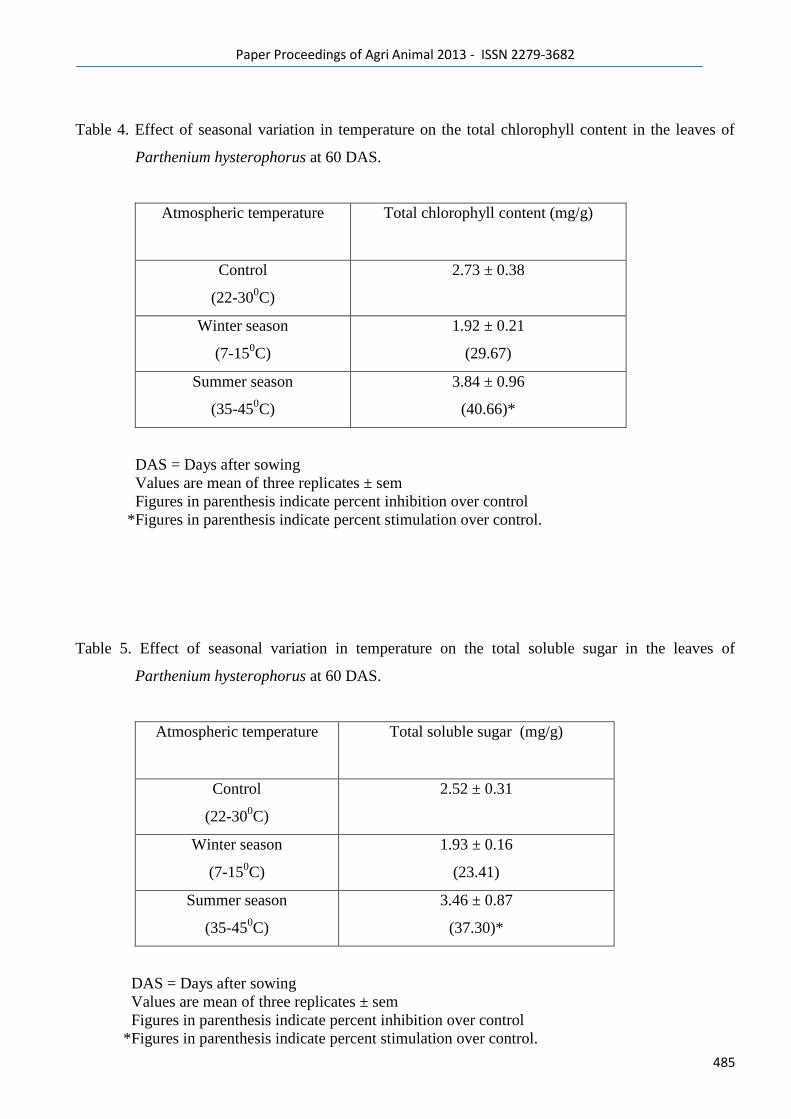
Paper Proceedings of Agri Animal 2013 - ISSN 2279-3682
485
Table 4. Effect of seasonal variation in temperature on the total chlorophyll content in the leaves of
Parthenium hysterophorus at 60 DAS.
Atmospheric temperature Total chlorophyll content (mg/g)
Control
(22-300C)
2.73 ± 0.38
Winter season
(7-150C)
1.92 ± 0.21
(29.67)
Summer season
(35-450C)
3.84 ± 0.96
(40.66)*
DAS = Days after sowing
Values are mean of three replicates ± sem
Figures in parenthesis indicate percent inhibition over control
*Figures in parenthesis indicate percent stimulation over control.
Table 5. Effect of seasonal variation in temperature on the total soluble sugar in the leaves of
Parthenium hysterophorus at 60 DAS.
Atmospheric temperature Total soluble sugar (mg/g)
Control
(22-300C)
2.52 ± 0.31
Winter season
(7-150C)
1.93 ± 0.16
(23.41)
Summer season
(35-450C)
3.46 ± 0.87
(37.30)*
DAS = Days after sowing
Values are mean of three replicates ± sem
Figures in parenthesis indicate percent inhibition over control
*Figures in parenthesis indicate percent stimulation over control.
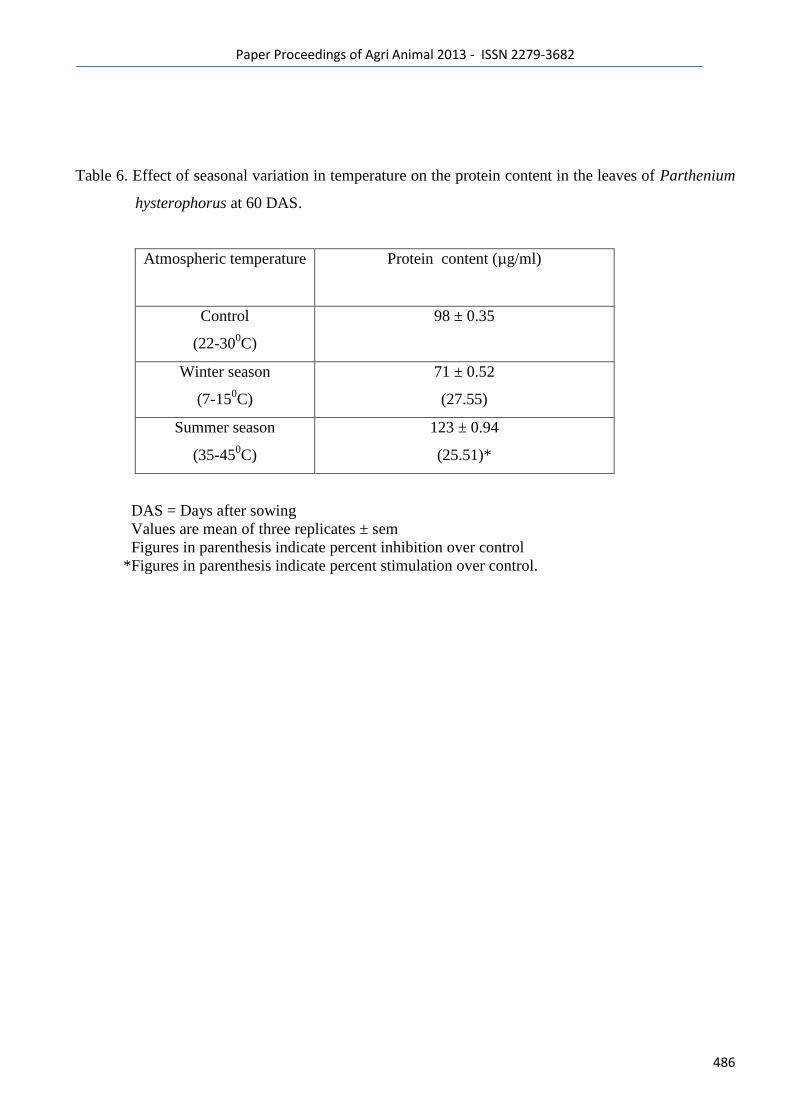
Paper Proceedings of Agri Animal 2013 - ISSN 2279-3682
486
Table 6. Effect of seasonal variation in temperature on the protein content in the leaves of Parthenium
hysterophorus at 60 DAS.
Atmospheric temperature Protein content (µg/ml)
Control
(22-300C)
98 ± 0.35
Winter season
(7-150C)
71 ± 0.52
(27.55)
Summer season
(35-450C)
123 ± 0.94
(25.51)*
DAS = Days after sowing
Values are mean of three replicates ± sem
Figures in parenthesis indicate percent inhibition over control
*Figures in parenthesis indicate percent stimulation over control.

Paper Proceedings of Agri Animal 2013 - ISSN 2279-3682
487
31
Paper Proceedings of Agri Animal 2013 - ISSN 2279-3682
488
The Yield Potential of Papuan Foxtail Millet (Setaria italica)
in Biak Numfor, Papua, Indonesia
Saraswati Prabawardani, Wasgito D. Purnomo, Nouke L. Mawikere, and Diyah A. Aribowo
Faculty of Agriculture, the State University of Papua
Jl. Gunung Salju, Manokwari, Papua Barat, Indonesia 98314
Foxtail millet which locally called Pokem is grown for human consumption and play significant role as
non-conventional staple food in certain areas of Papua, Indonesia. It has long been consumed by
people of Biak Numfor, Papua. Millet cultivation is expected to increase the local food diversification,
and to support the government program on food security. The exploration and characterization on
morphological and agronomic properties were previously been carried out at the Warkapi village, Biak
Numfor. Millet seeds were taken for subsequent trial to the field research station of the State
University of Papua. The research was aimed to identify and examined its growth and potential yield.
The experiment was laid in a randomized block design. Five foxtail millet accessions which were
identified as red, black, brown, yellow and hotong (introduced) types were tested with 4 replications. It
revealed that the number of seedlings can be used as selection criteria for millet accession types which
are high yielding. Red type Millet (Verik) produced the highest yield 937.4 g / plot with a productivity
of 1.56 tones / hectare.
Keywords: Setaria italica, yield, diversification, food, Papua.
INTRODUCTION
Millets are the major food and feed sources in arid and semi-arid regions of the world. Among the
most widely-cultivated species of worldwide production is foxtail millet (Setaria italica L. Beauv).
Foxtail millet or locally called "Pokem" has long been consumed by people in Biak Numfor, Papua,
Indonesia (Rumbrawer, 2003). Nowadays, the cultivation of foxtail millet has spread to other parts of
West Papua, Indonesia, such as Manokwari and Tambrauw. Foxtail millet is not only consumed in the
form of porridge and steam, but it can also be consumed in the processed form, such as cakes and
noodles. The seeds of Foxtail millet contain 81.32% of carbohydrates, 14.05% protein, 3.37% fat,
1.26% ash and 9.03% water (Herodian, 2011). It also produces energy of about 359 kcal in 100 gram
of seed. Based on this nutrient content, foxtail millet has a great potential as an alternative food in
supporting food diversification and security. In addition, foxtail millet contains antioxidant, as much as
0.22% of tannin and 50.9 ppm of vitamin E (Herodian, 2011). Both of these antioxidants play a role in
the formation of red blood cells, prevent cell and tissue damage (Balentine and Paetau-Robinson,
2000).
The average grain yield of foxtail millet under subsistence farmer management in area Biak Numfor
remain low. Despite their considerable importance for food and feed, very little work has been done on
these cultivars. There have been no intensive cultivation and utilization of this plant by the local
people. There has also been lack of information on cultivation technology and its processing. This
plant has been traditionally cultivated between edge of the staple crops, such as root crops (sweet
potato and taro) and banana. A good agronomic practice for this plant is needed in order to increase
yield and to expand its utilization.
Based on exploration and collection conducted earlier, it is expected that the millet accessions have
good agronomic characters including high yield potential. Germplasm of foxtail millet with
Paper Proceedings of Agri Animal 2013 - ISSN 2279-3682
489
morphological and agronomic characters will be used in a breeding program for the development of
high yielding varieties and also will be studied in connection with their tolerance to biotic and abiotic
stresses. The present study was carried out to: (1) analyze agronomic characters that can be used as
selection criteria for a high yield, and (2) to observe the yield potential of collected foxtail millet from
the exploration study.
MATERIALS AND METHODS
Research was conducted from May to November 2012 in the Experimental Farm of Agriculture
Faculty, the State University of Papua. Chicken manure was applied to improve the soil condition.
Four of eleven accessions collected from earlier study and 1 introduced accession (as a comparison)
obtained from Plant Breeding Laboratory, Bogor Agriculture Institute (IPB Bogor) were tested in this
trial.
The experiment was laid in a randomized block design. Five foxtail millet accessions which were
identified as red, black, brown, yellow and hotong (introduced) types were tested with 4 replications,
and hence there were 20 experimental units. The size of each experimental unit/plot was 2 x 3 m.
Seeds were planted in array with a spacing between array was 40 cm. One week after planting the
seedlings was thinned into two plants per point, and the distance between points was 10 cm. Plant
growth maintenance such as watering, fertilizing, pest control and weeding was carried out during the
trial period. Chicken manure was applied as a basal fertilizer a day before planting at 6 kg per plot.
Fungicide and insecticide were used to control pests and diseases. Observed variables consist of
growth and yield components, namely: plant height, number of tillers per hill, stem diameter, panicle
length, panicle diameter, seed dry weight, and grain yield.
Data was analyzed using descriptive statistics included mean of standard deviation, coefficient of
variation, and the correlation between quantitative characters, and also by the analysis of F tests to
determine differences between the accessions. Treatment means were separated using 95% of DMRT
test.
RESULTS AND DISCUSSION
Agronomic characters of Papuan foxtail millet
The agronomic characters observed were plant height, tiller number, stem diameter, panicle length,
panicle diameter and seed dry weight. The analysis of coefficient values showed that the agronomic
diversity characters of Papuan foxtail millet ranged from 7.9% to 27.4% (Table 1). According to
Suhartini (2010), the variability coefficient of Graminae family, such as Oryza spp.is more than 20%,
and this shows a wide diversity of Oryza spp., whereas less than 20% of coefficient variability is
considered relatively narrow diversity.
Table 1.Agronomic characters of Papuan foxtail millet accessions.
Characters Max. Min. Mean Variety CV (%)
Plant height (cm) 103,6 81,4 92,6 8,2 8,8
Tiller number 6,8 3,2 4,7 1,3 27,4
Stem diameter (mm) 7,5 5,2 6,7 0,7 11,0
Panicle length (cm) 22,4 15,2 18,3 2,2 12,2
Panicle diameter (mm) 18,6 14,7 16,6 1,3 7,9
Seed dry weight (g/tan) 12,5 8,7 11,0 1,3 12,3
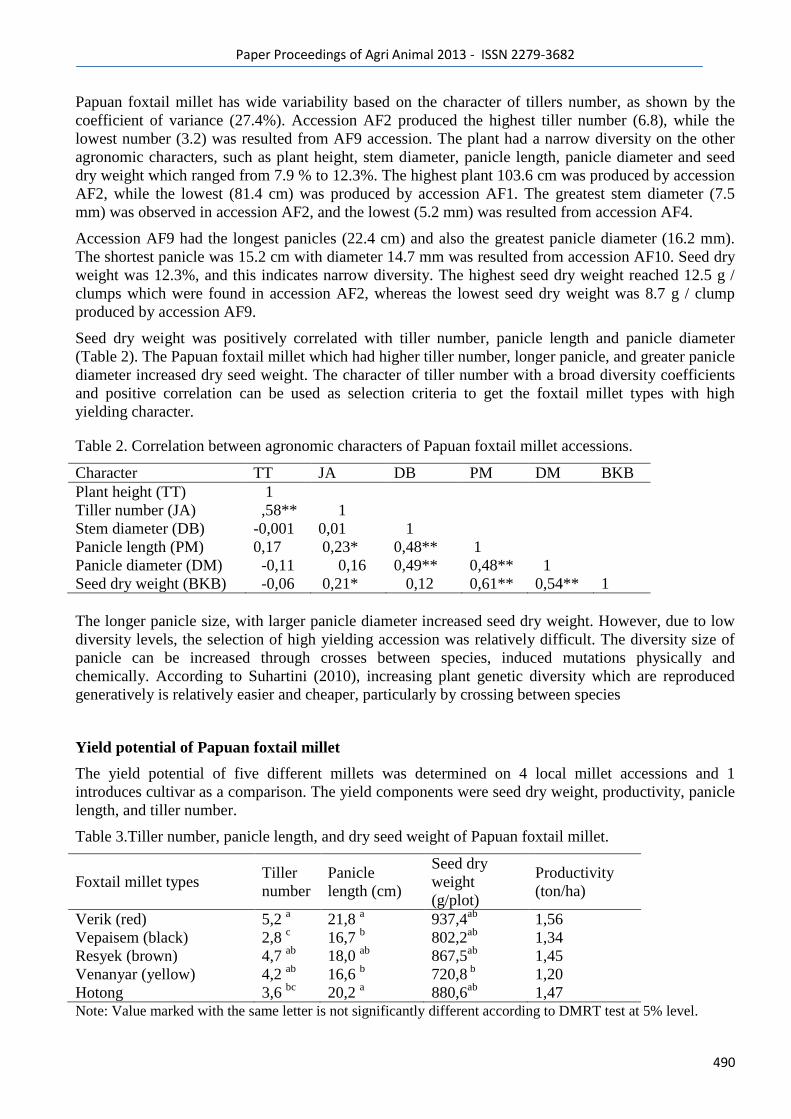
Paper Proceedings of Agri Animal 2013 - ISSN 2279-3682
490
Papuan foxtail millet has wide variability based on the character of tillers number, as shown by the
coefficient of variance (27.4%). Accession AF2 produced the highest tiller number (6.8), while the
lowest number (3.2) was resulted from AF9 accession. The plant had a narrow diversity on the other
agronomic characters, such as plant height, stem diameter, panicle length, panicle diameter and seed
dry weight which ranged from 7.9 % to 12.3%. The highest plant 103.6 cm was produced by accession
AF2, while the lowest (81.4 cm) was produced by accession AF1. The greatest stem diameter (7.5
mm) was observed in accession AF2, and the lowest (5.2 mm) was resulted from accession AF4.
Accession AF9 had the longest panicles (22.4 cm) and also the greatest panicle diameter (16.2 mm).
The shortest panicle was 15.2 cm with diameter 14.7 mm was resulted from accession AF10. Seed dry
weight was 12.3%, and this indicates narrow diversity. The highest seed dry weight reached 12.5 g /
clumps which were found in accession AF2, whereas the lowest seed dry weight was 8.7 g / clump
produced by accession AF9.
Seed dry weight was positively correlated with tiller number, panicle length and panicle diameter
(Table 2). The Papuan foxtail millet which had higher tiller number, longer panicle, and greater panicle
diameter increased dry seed weight. The character of tiller number with a broad diversity coefficients
and positive correlation can be used as selection criteria to get the foxtail millet types with high
yielding character.
Table 2. Correlation between agronomic characters of Papuan foxtail millet accessions.
Character TT JA DB PM DM BKB
Plant height (TT) 1
Tiller number (JA) ,58** 1
Stem diameter (DB) -0,001 0,01 1
Panicle length (PM) 0,17 0,23* 0,48** 1
Panicle diameter (DM) -0,11 0,16 0,49** 0,48** 1
Seed dry weight (BKB) -0,06 0,21* 0,12 0,61** 0,54** 1
The longer panicle size, with larger panicle diameter increased seed dry weight. However, due to low
diversity levels, the selection of high yielding accession was relatively difficult. The diversity size of
panicle can be increased through crosses between species, induced mutations physically and
chemically. According to Suhartini (2010), increasing plant genetic diversity which are reproduced
generatively is relatively easier and cheaper, particularly by crossing between species
Yield potential of Papuan foxtail millet
The yield potential of five different millets was determined on 4 local millet accessions and 1
introduces cultivar as a comparison. The yield components were seed dry weight, productivity, panicle
length, and tiller number.
Table 3.Tiller number, panicle length, and dry seed weight of Papuan foxtail millet.
Foxtail millet types Tiller
number
Panicle
length (cm)
Seed dry
weight
(g/plot)
Productivity
(ton/ha)
Verik (red) 5,2 a 21,8
a 937,4
ab 1,56
Vepaisem (black) 2,8 c 16,7
b 802,2
ab 1,34
Resyek (brown) 4,7 ab
18,0 ab
867,5ab
1,45
Venanyar (yellow) 4,2 ab
16,6 b 720,8
b 1,20
Hotong 3,6 bc
20,2 a 880,6
ab 1,47
Note: Value marked with the same letter is not significantly different according to DMRT test at 5% level.
Paper Proceedings of Agri Animal 2013 - ISSN 2279-3682
491
There was no statistical differences in dry seed weight produced by the local Papuan accessions and
introduced accession. Yields of the red foxtail tended to be higher than the other types, as shown that
grain yield reached 937.4 g / plot, with 1.56 tons / hectare of productivity.
The increase in seed dry weight was associated with the number of tillers and panicle length, as
indicated by the correlation analysis (Table 5). The red millet type produced the highest tiller number
with long panicles, and this produced higher dry seed weight. The highest tiller number (5.2 seedlings)
with the panicles length of 21.8 cm was produced by the red millet accession. This result shows that
there was significantly different. Te yellow millet accession produced the lowest tillers number (2.8
seedlings) with panicle length of 16.6 cm. The productivity of Papuan foxtail millet ranged from 1.20
to 1.56 tons / ha, and it is higher compared to other researches which the productivity was 0.91 tons /
ha (Malik, 2008). Considering lack of cultivation techniques, productivity of the local foxtail millet is
still likely to be increased. Improvement on cultivation techniques through the right planting spacing
and application of organic fertilizer is necessary to increase the yield of local millet.
CONCLUSION
The number of seedlings can be used as selection criteria for selection of foxtail millet types which
produce high yield. Red type of foxtail millet (Verik) had the high yield potential by producing the
highest yield (937.4 g / plot) with a productivity of 1.56 tons / ha.
ACKNOWLEDGEMENTS
Thanks go to the Indonesian Higher Education Department (Dikti) for funding this research through
DP2M DIPA DGHE 2012, in accordance with the National Strategic Research Implementation
Scheme, with the contract number: 041/SP2H/PL/Dit.Littabmas/III/2012.
REFERENCES
Anggiarini A.N. 2004. Formulation of sweet potato flakes prepared foods rich in protein energy
[Thesis]. Bogor: IPB Faculty of Agricultural Technology.
Apriyantono A. 1989. Food Analysis. Bogor: PAU Food and Nutrition IPB. Bogor.
Balentine D.A. and I. Paetau-Robinson 2000.Tea as a source of dietary antioxidants with a potential
role in prevention of chronic diseases. In: Mazza G, Oomah BD, eds. Herbs, Botanicals and Teas.
Pennsylvania, USA: Technomic Pub. Com. Inc. p. 265-287.
Budi I. M. 2003. Utilization of wheat Papua (Pokem) as a source of alternative food for supporting
community food security in Papua. Jayapura: Local Specific Food Workshop in Papua.
Dad Resiworo J.S. 1992. Control weeds with plant spacing and weeding method on soybean.
Proceedings of the Conference on Weed Science Society of Indonesia.Ujungpandang. 247-250.
FAO. 2011. Setaria italica (L.) Beauv. http://www.fao.org/ag/AGP/AGPC/doc/
Gbase/data/pf000314.htm. Accessed on 18 April 2011.
Francisco B. and L.I. Prochnow. 2007. Thermal treatment of aluminous phosphates of the crandallite
group (CaAl3 (PO4) 2 (OH) 5.H2O) and its effect on phosphorus solubility. www.scielobr /
scielophp.script-sci. Scientiaagricilo print. Sci.agric. Piracicoba, Braz.vol 64.3. Piracicoba.
(Accessed on: 08/5/2008).
Germplasm Resources Information Network (GRIN). 2008. Setaria italica (L.) Beauv.United States
Departemant of Agriculture (USDA). Agricultural Service, Beltsville Area. http://www.ars-
grin.gov/cgi-bin/npgs/html/taxon.pl. Accessed on 21 April 2011.
Paper Proceedings of Agri Animal 2013 - ISSN 2279-3682
492
Herodian S. 2011. Hotong rush development (Setaria italica (L) Beauv) as a staple food source
alternative [Research Report]. Bogro: FakultasTeknologi Agriculture IPB.
Kharisun A. 2003. Thresher hotong (Setaria italica) performance test in various sizes Puli II [Thesis].
Bogor: Faculty of Agricultural Technology, Bogor Agricultural University.
Krishiworld (The Pulse of Indian Agriculture). 2005. Crops fields ofSetaria italica (L.) Beauv.
http://www.krishworld.com/strartsearch.asp. Accessed on 19 April 2011.
Mayadewi N.N.A. 2007. Effect of type of manure and spacing on weed growth and yield of sweet
corn. Agritop 26 (4): 153-159.
Malik A. 2008. Pokem, alternative food sources in Papua.http://www.litbang.deptan.go.id/
berita/one/627/. Accessed on 21 April 211.
Prabowo B. 2010. Study of the physic chemical properties of the yellow and red millet flour [Thesis].
Surakarta. Faperta UNS.
Rai K.N., S.K. Gupta, R. Bhattacharjee, V.N. Kulkarni, A.K. Singh, U.S. Rao. 2009. Morphological
characteristics of ICRISAT-bred pearl millet hybrid seed parents. SAT eJournal 7: 1-7.
Rumbrawer F. 2003. Indonesia wheat pokem winning the future. Laboratory of Anthropology Faculty
of Social and Political Science University of Cenderawasih. Jayapura.
Santoso B., P. Istalaksana I. Silamba W. P. Safe, S.O. Gultom. 2009. Study of nutrient-rich
formulations sago plate. Journal Agrotek. 1(7) :25-32.
Sato M., and T. Kokubu. 1988. Morphological differences of Italian millet (Setaria italicaBeauv)
among seed collecting areas. Mem. Fac. Agr. Kagosima Univ. 24:101-109.
Suarni 2004. Evaluation of physical properties and chemical content of sorghum seed (Sorghum
vulgare). Stigma Journal. 12(1): 88-91.
Suhartini H. 2010. The diversity of morphological characters of wild rice germplasm (Oryza spp.).
Plasmanutfah Bulletin 16(1) :17-28.

Paper Proceedings of Agri Animal 2013 - ISSN 2279-3682
493
32
Paper Proceedings of Agri Animal 2013 - ISSN 2279-3682
494
Evaluation of the Quality Traits of Hybrid Eggs from Cross-bred Backyard Chickens in the Dry
Zone of Sri Lanka
Subalini Elango., Chrishanthan, Victor Arulanandam and Rameskaran Mahendrarasa
Faculty of Agriculture
Eastern University, Sri Lanka
Chenkalady
Abstract
A study was designed to analyze the quality traits of hybrid eggs from cross-bred backyard chicken.
For this study forty backyard chickens were randomly allocated to four different crossing
combinations. Each combination consisted of ten hens and a cockerel. The crossing was designed in
between village chicken hen and Cobb cockerel, village chicken hen and Kirirajah cockerel, Naked-
neck hen and Cobb cockerel and Naked-neck hen and Kirirajah cockerel. Fifty hybrid eggs from each
crossing were selected for analysis using Statistical Analysis Software (Version 9.0). The results of the
study revealed that the egg weight (53.15±1.01g), albumin weight (29.24±1.67g), shell weight
(5.79±2.76g), specific gravity (1.07±0.002) and shape index (77±2.04) were significantly higher
(P>0.05) in the eggs from Naked-neck X Kirirajah cross. Fertility (71.24±3.11%), shell thickness
(0.51± 0.003mm) and egg yolk weight (18±1.54g) were significantly higher in eggs from Naked-neck
X Cobb cross. Eggs collected from all the crosses were brown except the eggs collected from Village
chicken X Cobb cross. Further, egg yolk colour was deep yellow in cross between Village chicken X
Kirirajah and Village chicken X Cobb while the colour was paler in other crosses. It was concluded
that the hybrid eggs from Naked-neck and Kirirajah cross was comparatively good in terms of quality
parameters.
Key words: Backyard chicken, Cobb, Hybrid eggs, Naked-neck chicken, Village chicken,
Paper Proceedings of Agri Animal 2013 - ISSN 2279-3682
495
Introduction
Poultry occupies a unique position in terms of its contribution to the provision of high quality protein
in human food. Poultry meat and egg production accounted for more than 28% of the total animal
protein produced worldwide in 1997 (Tadelle, et al., 2003). The proportional contribution of poultry
by the year 2020 is believed to increase to 40%, the major increase being in the developing world
(Delgado et al., 2003). Most of the poultry production system in the rural areas of Sri Lanka is
characterized by smallholder free range scavenging operations. The system is characterized by small
flocks of local type of chicken (Tadelle and Ogle, 2001). These local chickens remain predominant in
most of the villages despite the introduction of exotic and crossbred types, because farmers have not
been able to afford the high input requirement of introduced breeds. However, the productivity is low
in village chicken under scavenging system. A long-term programme on village chicken improvement
resulted in substantial improvements in the contribution of the chickens to household food production
and welfare in Southeast Asia (Johnston, 1993).
The Naked Neck is a breed of chicken that is naturally devoid of feathers on its neck and vent. Despite
its highly unusual appearance, the breed is not particularly known as an exhibition bird, and is a dual-
purpose utility chicken. They lay a respectable number of light brown eggs, and are considered
desirable for meat production because they need less plucking and they have a meaty body. They are
very good foragers and are immune to most diseases. This breed has approximately half the feathers of
other chickens, making it resistant to hot weather and easier to pluck (Garces, 2001). They are happy
to free range or be confined in runs and are not known as being particularly good fliers. Crossbred
chicken achieve the benefits of hybrid vigor and are better egg producers than either of the parent
breeds. Crossbreeding also combines many other desirable traits such as low body weight (resulting in
reduced feed costs) and non-broodiness.
To date there are few crossing methods applied to improve the local chicken genotypes in Sri Lanka.
However, no fully scientific evaluation was done yet to find the performance of the crosses. Thus, the
present study will be conducted with the objective of getting progeny with high performing potential
and to evaluate their performance.
The present study was mainly focused on evaluating egg quality parameters. Eggs from chicken have
been traditionally considered as an important source of nutrients for humans (Nau et al., 2003). They
represent a cheap source of animal proteins and lipids (Nys and Sauveur, 2004). Nowadays, it is
widely recognized that eggs are more than a source of nutrients, numerous studies describing
biological properties potentially exploitable by pharmaceutical, food-processing and cosmetic
Paper Proceedings of Agri Animal 2013 - ISSN 2279-3682
496
industries (Mine and Kovacs-Nolan, 2004). In the context of the growing demand eggs (Harms and
Hussein, 1993; Tixier-Boichard et al.,2006), egg dry matter efficiency, both in terms of yield and
quality, is of substantial interest (Hartmann and Wilhemson, 2001; Suk and Park, 2001).
Methodology
This study was conducted at Poultry Unit, Livestock Farm, EUSL. For this study the local genotypes
of chicken such as village and naked-neck were used. Girirajah, dual purpose breed and the Cobb
cockrel were used as sire in the crossing programme. Ten local hens and one cockerel were allocated
for each treatment. The cockerel: hen ratio of 1:10 were maintained throughout the experimental
period. Each flock was maintained under intensive system with regular feeding. Average age of dam
and sire were one year. Fresh eggs were collected and used to take measurements. Fifty eggs from
each treatment were collected for evaluation done. The fertility was measured 9th
day of incubation
with candling instruments. The parameters measured were the egg weight, shape index, shell weight,
egg yolk percentage, shell thickness, yolk: albumin ratio, shell colour, shell thickness, fertility and
yolk colour of hybrid eggs.
Measurements started with weighing of eggs. Then, length and width of eggs were measured manually
to calculate egg shape index, defined as the ratio between length and width multiplied by 100. In an
attempt not to distort results about eggshell strength and internal quality, all eggs were checked for
cracks and cracked eggs were excluded from further measurements. To define the internal egg quality,
eggs were broken onto a flat surface. The yolks were carefully separated from the albumen. The shell,
including membranes and yolks were weighted separately. Albumen weight was determined by
subtracting yolk and shell weights from total egg weight. The shell thickness was measured at three
different random points in the equatorial shell zone. The SAS software (SAS Version 9) was used for
all statistical analyses.
Results and discussion
Exterior egg quality is defined as texture, color, soundness, cleanliness and shape of the shell. The
shell of each egg should be smooth, clean and free of cracks and eggs should be uniform in color, size
and shape (Coutts et al., 2006).Table 3.1 presents the results of external egg quality traits.
Paper Proceedings of Agri Animal 2013 - ISSN 2279-3682
497
Table 3.1: Least square means (mean ± SE) for exterior egg quality traits of different crosses of
chicken
Exterior egg
quality traits
Kirirajah X
Village
chicken
Kirirajah X
Naked-neck
Cobb X
Village
chicken
Cobb X
Naked-
neck
Egg shape index (%) 65.61±2.12a 77.00±2.04
b 68.82±2.32
c 70.62±2.16
c
Egg weight (g) 49.54±1.67a 53.15±1.01
b 48.12±1.64
a 50.64±0.97
a
Specific gravity 0.97±0.002a 1.07±0.002
b 1.00±0.001
c 0.99±0.001
a
Fertility (%) 66.21±1.23a 66.39±1.30
a 68.11±1.27
a 71.24±3.11
b
Numbers followed by different letters are significantly different (P<0.05)
Egg shape index
Egg shape index was significantly higher (P<0.05) in hybrid egg from Kirirajah X Naked-neck
Chicken (Table 3.1). Among the backyard chicken naked-neck in general has improved characteristics
such as cockerel weight (2.07kg), weight of hen (1.31kg) mean monthly egg production productive
period (12 months), mean life time (1.75 years), hatchability (91.8%) (Subalini et al. 2010). Egg shape
index was comparatively lower in Cobb X Village chicken (68.82±2.32%). It is agreed with the report
made by Subalini et al. 2010, where the mean egg size for village chicken was 41.4g. The shape
indices obtained in the present study for all the genetic groups are lower than 0.83±0.04 reported by
Ikeobi et al. (1999) for Nigeria local chickens, but are closely similar with the values of 0.76, 0.763
and 0.79 reported by Olurede and Longe (2002), Chineke (2001) and Ukachukwu and Akpan (2007),
respectively, for some exotic chickens in Nigeria.
Egg weight
Egg weight was significantly higher in Kirirajah X Naked-neck as its egg shape index is high.
However, no significant difference was observed among other crosses. The egg quality determinants
reported in present study were simulating the values recorded for the eggs of improved laying hens by
Panda (1998) and Winton and Barber Winton (2003). The average egg weight recorded in present
study was not too low as per the Indian weight classification of eggs. The present results on egg weight
conform to those reported earlier by Islam (2006), Chatterjee et al.(2006; 2007), Niranjan et al. (2008),
Olawumi and Ogunlade (2008) and Jones et al. (2010).
It is an established fact that the weight of an egg is a direct proportion of albumen, yolk and shell that
it contains and this varies significantly between strains of hen (Pandey et al. 1986).
Paper Proceedings of Agri Animal 2013 - ISSN 2279-3682
498
Specific gravity
Specific gravity was significantly higher (P<0.05) in Kirirajah X Naked-neck (1.07±0.002). Lowest
value for gravity was observed in Kirirajah X Village chicken crosses. The results indicated that the
specific gravity is directly proportional to egg weight. This was agreed with
report made by Yeasmin and Howlider (1998), Nahar et al. (2007), Onagbesan et al. (2007), Jones et
al. (2010) and Momoh et al. (2010).
Fertility
Fertility percent was significantly higher (P<0.05) in Cobb X Naked-neck (71.24±3.11%). No
significant difference was observed for fertility among other crosses. Hatchability of eggs is largely
influenced by fertility.
Table 3.2: Least square means (mean ± SE) for egg composition traits of different crosses of
chicken
Egg composition traits Kirirajah X
Village
chicken
Kirirajah X
Naked-neck
Cobb X
Village
chicken
Cobb X
Naked-neck
Albumin weight (g) 25.23±1.21a 29.24±1.67
b 25.22±1.02
a 24.16±1.76
a
Yolk weight (g) 14.72±1.62a 13.99±1.97
a 15.01±1.04
b 18.00±1.54
c
Yolk: Albumin ratio 0.58±0.02a 0.47±0.01
b 0.59±0.00
a 0.74±0.01
c
Egg shell weight (g) 9.59±1.30a 9.92±1.45
a 7.89±1.07
b 6.44±1.20
b
Average shell thickness (mm) 0.37± 0.002a 0.39± 0.001
a 0.37± 0.003
a 0.51± 0.003
b
Numbers followed by different letters are significantly different (P<0.05)
Albumin weight
Among the internal egg quality parameters, albumen and yolk weight are very important from
nutritional (Bain 2005) and cholesterol content (Abdullahi et al. 2003; Sparks 2006) viewpoints.
Albumin weight was significantly higher (P<0.05) in Kirirajah X Naked-neck (29.24±1.67) as these
crosses produced more number of eggs (Table 3.2). Comparatively lower weight (24.16±1.76) was
recorded in Cobb X Naked-neck crosses. Values for the trait reported in the present study are
comparable with those obtained by Yeasmin and Howlider (1998), Chatterjee et al. (2007), Olawumi
and Ogunlade (2008), Wang et al. (2009) and Momoh et al. (2010) for chickens of Bangladesh,
Andaman (India), Nigeria, China and Nigeria, respectively.
Paper Proceedings of Agri Animal 2013 - ISSN 2279-3682
499
Yolk weight
Egg yolk weight was significantly higher (P<0.05) in crosses between Cobb X Naked-neck chicken
(18.00±1.54). Yolk weight was proportional to nutrient content of the egg. Therefore higher egg
weight is the desirable trait.
Yolk:Albumin ratio
Yolk:Albumin ratio was significantly higher (P<0.05) in Cobb X Naked-neck chicken (0.74±0.01) as
their yolk weight is high and which was agreed with the values reported by other workers (Niranjan et
al., 2008; Chatterjee et al., 2007) for rural birds of Indian. It was significantly lowest in Kirirajah X
Naked-neck (0.47±0.01) crosses.
Egg shell weight
Egg shell weight was significantly higher (P<0.05) in Kirirajah X Village chicken cross and Kirirajah
X Naked-neck cross as the egg shape index was comparatively higher in these crossbreds. The leathery
and too high weight egg shell are the undesirable traits for hatching.
Shell thickness
Shell thickness was significantly higher (P<0.05) in crossbred of Cobb X Naked-neck. No significant
difference was observed among other treatments on shell thickness. Eggs with thick shell are desirable
to withstand externally applied force, thus preventing breakage of eggs. This
would improve the marketing quality of the eggs. However, excessive shell thickness decreases
hatchability. Mean shell thickness of 0.39 had been reported for two backyard poultry varieties in
Indian by Niranjan et al. (2008). This is less than the values reported here for two ecotypes of Nigeria
local chicken and their F1 reciprocal crosses.
Conclusion
The results of the study revealed that the most of the quality traits such as egg shape index, egg weight,
specific gravity and albumin weight were higher in crossbreds of Kiriraja X Naked neck. However,
rest of the egg quality traits were higher in crossbreds of Cobb X Naked neck. For further confirmation
the findings should be taken subsequent generations of consequent cross breeding programmes.
Paper Proceedings of Agri Animal 2013 - ISSN 2279-3682
500
Reference
Chatterjee, R.N., R.B. Rai., A. Kundu., S. Senani and S. Jai, 2007: Egg quality traits of Indigenous
breeds of chicken of Andaman. Indian Vet. J. 84, 206-208.
Chatterjee, R.N., Sharma, R.P., Niranjan M, Reddy B.L.N and Mishra, A. 2006. Genetic studies on
egg quality traits in different White Leghorn populations. Indian J. Anim.Genet. Breeding 27: 51-54.
Coutts, J.A., G.C. Wilson, S. Fernandez, E. Rasales, G. Weber, J.M. Hernandez, 2006: Optimum Egg
Quality - A Practical Approach. 5m Publishing: Shefield Uk, P 63.
Harms, R.H and S.M. Hussein, 1993: Variations In Yolk: Albumen Ratio In Hen Eggs From
Commercial Flocks. J. Appl. Poult. Res. 2, 166-170.
Hartmann, C and M. Wilhemson, 2001: The Hen‘s egg yolk: A source of biologically active
substances. World’s Poult. Sci. J.57, 13-28.
Niranjan, M., Sharma R.P., Rajkumar, U., Chatterjee, R.N, Reddy, B.L.N and Battacharya, T.k. 2008.
Egg quality traits in chicken varieties developed for backyard poultry farming in India. Livestock Res.
Rural Dev. 20: 131-137.
Olawumi, S.O and Ogunlade, J.T. 2008. Phenotypic correlations between some external and internal
egg quality traits in the exotic ISA brown layer breeders. Asian J.Poult. Sci. 2(1): 30-35.
Onagbesan, O., Bruggeman, V., Desmit, L., Debonne, M., Witters, A., Tona, K., Everaert, N and
Decuypere, E. 2007. Gas exchange during storage and incubation of avian eggs: Effects on
embryogenesis, hatchability, chick quality and Post-Hatch Growth. World's Poult. Sci. J. 63: 557-573.
Pandey, N.K., Mahapatra, C.M., Verma, S.S and Johari, D.C. 1986. Effect of strain on physical egg
quality characteristics in White leghorn chickens. J. Poult. Sci. 21: 304-307.
Sparks, N.H.C, 2006. The hen's egg - Is its role in human nutrition changing? World's Poult. Sci. J. 62:
308-315.
Suk, Y.O and C. Park, 2001: Effect of breed and age of hens on the yolk to albumen ratio in two
different genetic stocks. Poult. Sci. 80, 855-858.
Paper Proceedings of Agri Animal 2013 - ISSN 2279-3682
501
Tixier-Boichard, M., C. Joffrin., D. Gourichon and A. Bordas, 2006: Improvement of yolk percentage
by crossbreeding between a commercial brown-egg layer and a local breed, the fayoumi. in: 8th
World
Congress on genetics applied to livestock production. Belo Horizonte, Mg.,Brasil.
Wang, X.l., Zheng, J.X., Ning, Z.H., Qu, L.J, Xu, G.Y and Yang N. 2009. Laying performance and
egg quality of blueshelled layers as affected by different housing systems. Poult. Sci. 88:1485-1492.
Yeasmin, T and Howlider, M.A.R. 1998. Comparative physical features on egg production and egg
quality characteristics of normal and dwarf indigenous (Deshi) hens. Bangladesh J. Anim. Res. 13:
191-196.

Paper Proceedings of Agri Animal 2013 - ISSN 2279-3682
502
33
Paper Proceedings of Agri Animal 2013 - ISSN 2279-3682
503
Maize Planting Window: The Floral, Seed Yield and Seed Quality Impacts
V Sandeep Varma1, K Kanaka Durga
2, K Keshavulu
1, M R Sudarshan
3 and N Sunil
4
1 Department of Seed Science and Technology, College of Agriculture, Acharya N G Ranga
Agricultural University, Rajendranagar, Hyderabad, Andhra Pradesh, India
2 Seed Research and Technology Centre, Acharya N G Ranga Agricultural University,
Rajendranagar, Hyderabad, Andhra Pradesh, India
3 Maize Research Centre, ARI, Acharya N G Ranga Agricultural University, Rajendranagar,
Hyderabad, Andhra Pradesh, India
4 National Bureau of Plant Genetic Resources, Regional Station, Rajendranagar, Hyderabad,
Andhra Pradesh, India
ABSTRACT
The present investigation evaluated the effect of planting dates on floral traits and seed yield in hybrid
seed production of maize conducted during Kharif, 2012. The female (BML 6) and male (BML 7)
parents of DHM 117 were planted at fortnightly intervals (from 1st June to 15
th September) in 4:1 row
ratio in RBD with three replications. The results showed that first pollen shed (57.3 days), 50 % pollen
shed (60.7 days),first silking (54.3 days) and 50 % silking (59.7 days) were early when maize was
sown during August second fortnight, while high pollen viability (97.52 per cent) was recorded during
June second fortnight. Sowing in June second fortnight recorded significantly high number of seeds
row-1
(30.1) and cob yield plant-1
(114.74 g). Sowing in August first fortnight recorded significantly
high seed yield plant-1
(88.11 g). The germination per cent (99 per cent) was high during the second
fortnight of June and root length (15.3 cm), shoot length (10.7 cm) and total seedling length (26.0 cm)
was comparatively more during June first fortnight. It was determined that, June 15th
and August 1st
sowings were better for achieving maximum synchronization of male and female lines and also
realizing good seed yield.
Key words: Maize, Sowing dates, Floral behaviour, Seed yield and Seed quality.
INTRODUCTION
Maize (Zea mays L., 2n=24) occupies third position among the cereal crops after rice and wheat in
world. It is a versatile crop with wider adaptability in varied agro-ecologies. Yield and the
development of seed depend on genetic, environmental and agronomic factors as well as the
interaction between them (Sidlauskas and Bernotas, 2003). Therefore, there is a scope to increase the
yield level of maize by using hybrids and by adopting proper management practices such as date of
seeding, seed rate, irrigation, fertilizer application and other cultural operations. Successful seed
production of maize requires an understanding of various management practices as well as
Paper Proceedings of Agri Animal 2013 - ISSN 2279-3682
504
environmental conditions that affect crop performance (Eckert, 1995). Selection of appropriate
planting window is the non monetary and free input in seed production.
Environmental changes (sunshine, temperature and relative humidity) associated with different
sowing dates, have a modifying effect on the growth and development of maize. Each hybrid has an
optimum sowing date and greater the deviation from this optimum (early or late sowing), the greater
the yield loss (Sarvari and Futo, 2000; Berzsenyi and Lap, 2001). Planting date was reported to affect
the growth and yield of maize significantly. Proper selection of sowing date can optimize maize yield.
In India less work has been done on the effect of sowing date on performance of maize. Therefore,
present work was carried out to identify the possible causes of yield differences in different sowing
dates and also to study the effect of sowing dates on floral behaviour, seed yield and seed quality of
maize.
MATERIALS AND METHODS
Scope of the Study
The present experiment was carried out at Seed Research and Technology Centre, Rajendranagar,
Hyderabad during Kharif, 2012-2013. The parental lines of recently released maize hybrid, DHM 117
(Female: BML 6 and Male: BML 7) were sown in different planting dates with fortnightly intervals i.e.
from June 1st to September 1
st in three replications at 4:1 (female: male) row ratio in an equal plot size
of 49.25 m2. All the recommended agronomic practices were followed to raise a healthy crop.
Data Collection
The meteorological data (temperature, rainfall, relative humidity and sunshine hours) during planting
period at fortnightly interval were collected and presented in Table 1. Observations were recorded for
tassel characters like days to first pollen shed, days to 50 per cent pollen shed and silk characters like
days to first silking and days to 50 per cent silking on plot basis. Pollen was tested for viability using
Paper Proceedings of Agri Animal 2013 - ISSN 2279-3682
505
iodine-potassium iodide solution (I-KI), on five randomly selected plants in each replication. Various
seed yield parameters like number of rows per cob, number of seeds per cob, seed yield per plant (g),
cob yield per plant (g), 100 seed weight (g) and shelling percentage were calculated on ten randomly
selected plants after harvest. Seeds were cleaned, dried and analyzed for various seed quality
parameters like germination percentage by between paper method as per the procedure described by
ISTA (1985), root length (cm), shoot length (cm), total seedling length (cm) and seedling vigour
indices I and II (Abdul-Baki and Anderson, 1973).
Data Analysis
Analysis of variance (ANOVA) was used to compare differences between the various planting dates.
The significant difference of sowing dates means were determined using least significance difference
(LSD) at both 5% and 1 % level of probability (Steel and Torrie, 1980). The data was statistically
analyzed using randomized block design as per procedure given by Panse and Sukhatme (1985).
RESULTS AND DISCUSSION
Floral Behaviour
The days of planting differed significantly for days to first pollen shed, days to 50 per cent pollen shed,
days to first silking, days to 50 per cent silking and pollen viability at both 5 % and 1 % levels of
significance (Table 2). The first pollen shed was early in August second fortnight sowing (57.3 days)
followed by June second fortnight (60.7 days) and were significantly different from each other.
Similarly, 50 per cent pollen shed was observed early in August second fortnight sowing (60.7 days)
and was significantly different from June second fortnight (64.7 days). Comparatively, high
temperature (32.50 °C), low relative humidity (60.30 per cent) and very less rainfall (0.3 mm)
conditions prevailed during the June first fortnight sowing causing poor growth of the plants. As the
temperature has reached high limits for the crop, the rate of food used by respiration might have
Paper Proceedings of Agri Animal 2013 - ISSN 2279-3682
506
exceeded the rate at which food was manufactured by photosynthesis causing delay in growth habit of
the crop.
In common, pollen viability was more at 9 AM (95.2 percent) than at 2 PM (91.8 per cent).
Generally dehiscence normally occurs in mid-morning and as the temperature is typically increasing,
relative humidity decreasing, and radiation load increasing pollen loses viability quickly. Hence,
decrease in pollen viability at 2 PM was observed. Sowing in June second fortnight recorded higher
pollen viability (97.5 per cent) followed by August second fortnight (97.3 per cent) sowing and was
statistically on par with each other and with other sowing dates except July sowings (Fig 1). Pollen
viability was more in early plantings (June) and slowly decreased for July sowings and further
increased during late sowing (August and September). Changes that occurred in the weather conditions
i.e. high rainfall of 16.6 mm coupled with low sunshine hours (6.3) might have contributed to low
pollen viability for July sowings. In contrast, Schoper et al. (1986) reported that high temperatures had
negative effect on pollen viability in maize. Similarly, Vara Prasad et al. (2006) also reported that
growing grain sorghum at temperatures beyond 36 °C significantly decreased pollen production and
pollen viability. Lower pollen viability at high temperatures could be related to degeneration of
tapetum layer (Suzuki et al., 2001), and/or decreased carbohydrate metabolism (Datta et al., 2001) and
this could significantly influence nourishment of pollen mother cells thereby leading to infertile pollen.
Sowing in August second fortnight recorded significantly higher pollen viability at 2 PM (96.5 per
cent) followed by June first fortnight (96.3 per cent), September first fortnight (94.6 per cent) sowing
and June second fort night sowing (93.9 per cent) and were significantly different from pollen viability
recorded in July and first fort night of August. Wide variations noticed in minimum and maximum
temperatures during July and first fortnight of August might have led to decreased pollen viability.
Pressman et al. (2002) reported that the effect of heat stress on pollen viability was associated with
carbohydrate metabolism during anther development. Under optimal temperature soluble sugar
concentration gradually increased in pollen. Continuous high temperature prevented the increase in
starch concentration and led to decrease in soluble sugar in mature pollen. These reasons possibly
Paper Proceedings of Agri Animal 2013 - ISSN 2279-3682
507
caused the decrease in pollen viability. It has been concluded that continuous high temperature reduced
the total number of pollen, pollen germination and viability.
First silking was early in August second fortnight sowing (54.3 days) followed by June second
fortnight (56.7 days) whereas, 50 per cent silking was early in August second fortnight sowing (59.7
days) and was significantly different from September first fortnight (64.3 days). During the August
second fortnight sowing, maize crop was subjected to optimum temperature (26.31 ºC), comparatively
high relative humidity (85.63 per cent) and high rainfall (4.6 mm), which enhances the crop vegetative
growth, so that the plants may reach the reproductive phase very quickly. This was supported by
Tamura et al. (1989) who reported that environmental parameters like temperature and rainfall had a
significant effect on flowering behaviour of maize where in development of silk and air temperature
followed a sigmoid curve and days to flowering had a negative correlation with temperature. William
et al. (1977) reported that differences in development rate from time of planting to half-silk (when 50
per cent of plants have silked) varied by location and planting date within a location.
Seed Yield
The yield and yield attributing characters such as number of rows per cob, cob yield per plant, seed
yield per plant differed significantly with different dates of sowing at 5 % level of significance (Table
3). Non significant difference in number of rows per cob was noticed with dates of sowing except
when the crop was sown in July which recorded less number of rows per cob. High rainfall and low
bright sunshine hours must have indirectly contributed to less number of rows per cob. This was
further confirmed by low pollen viability and improper synchronization between male and female
parents which might have contributed to decrease in yield attributing characters. The number of rows
per cob was more in September first fortnight sowing (15.6) followed by June second fortnight (15.5)
and August second fort night sowing (15.4) and was significantly different from July sowings. Higher
number of rows per cob could be due to the correct synchronization between the male and female
parents, high pollen viability and moderate temperatures (about 26 ºC) during these planting dates.
Paper Proceedings of Agri Animal 2013 - ISSN 2279-3682
508
Similar results had been obtained by Green et al. (1985) who reported that a delay in planting date
beyond a given optimum date resulted in a progressive reduction in the yield and yield components of
the crop because of increased proportion of the available solar radiation was not intercepted by the
crop canopy.
Sowing in June second fortnight recorded significantly high number of seeds per row (30.1)
and was different from other sowing dates like June first fortnight (26.5) and August first fortnight
(25.5) sowing. The reason might be due to high pollen viability and proper synchronization between
male and female parents which could have resulted in more number of seeds per row during June
second fortnight sowing. Otegui and Melon (1997) found that variation in planting dates influenced the
number of grains per ear and number of cobs per plant. The authors reported that higher cob number
per plant for maize planted earlier in the season than maize planted later in the season. The increase in
seeds per cob or seeds per row at optimum planting date was in contrast with results of Harris et al.
(1984) who found that variation in planting date had negligible influence on the number of seeds per
cob. Significantly higher cob yield per plant was recorded for June second fortnight sowing (114.74 g)
followed by September first fortnight (109.54 g), August first fortnight (104.85 g) and June first
fortnight (104.61 g) and were significantly different from other sowing dates. The decrease in cob
yield per plant during July first fortnight sowing may be due to less crop growth as depicted in plant
height, leaf area and other leaf characters, there by significantly reducing the amount of photosynthates
that can be translocated from source (leaves) to sink (seeds) and thus retarded the growth and
development of cobs. Previous investigations on the effect of planting date on grain yield and yield
components have found a positive correlation between cob weight, number of seeds per row and seed
yield (Ahmadi et al., 1993). Otequi et al. (1995) reported that optimum planting date resulted in higher
grain yield than early and late planting dates because of higher cob number and greater seed number
per cob. This could be attributed to the fact that there was enough rainfall and temperatures during the
crop growth period at the specific location.
Paper Proceedings of Agri Animal 2013 - ISSN 2279-3682
509
Seed yield per plant is an important criterion which is based on the synchronization of female
and male parents. Non significant differences were noticed in seed yield per plant between June,
August first fortnight and September first fortnight sowing. Sowing in August first fortnight recorded
significantly high seed yield per plant (88.11 g) followed by June first fortnight (87.10 g) and June
second fortnight (86.52 g). It was noticed that delay in sowings from June second fort night to July
first fortnight decreased total seed yield per plant by 32 per cent. June sowings were more appropriate
than the July sowings because there was a drastic reduction in the seed yield during July first fort night
sowing (58.64 g) and July second fort night sowing (70.04 g). There are several reasons for such
inconsistencies and unexpected results. First, the soil conditions at different planting dates will
inevitably be different and unfavorable conditions (excess or deficiency of soil moisture and soil
nutrients etc.) can occur at almost any point during the normal planting dates. Consequently, the
observed differences in the performance of crops sown on different dates are commonly a reflection of
differences in established plant density. Secondly, crops sown at different dates pass through each
developmental stage at slightly different times and, therefore, under different environmental conditions
(especially photoperiod and temperature); thus any one of the developmental stages which determine
the components of yield could conceivably occur under more or less favorable conditions in late-sown
crops. These findings were supported by Rastegar (2004) who reported that delay in sowing from April
25th
to June 9th
decreased total yield of corn by 38 per cent. Lobell and Asner (2003) evaluated maize
and soybean production relative to climatic variation in the United States, reported a 17 percent
reduction in yield for every 1 ºC rise in temperature, but this response is unlikely because the
confounding effect of rainfall was not considered. Also, Kresovic et al. (1997) in sweet corn suggested
that delay in sowing from June 21st to July 11
th decreased total yield of corn as second crop. The
results obtained concur partly with observations made by Namakka et al. (2008) who reported that the
total yield decreased with delay in sowing of maize.
Seed Quality Characters
Paper Proceedings of Agri Animal 2013 - ISSN 2279-3682
510
Good quality seed is the most important basic input and is characterized in terms of
germination and vigour. Seed quality characters such as germination percentage, root length, shoot
length, total seedling length and seedling vigour index II were significantly different for dates of
sowing at 5 per cent level of significance (Table 4). High germination per cent (99 per cent) was
recorded during the second fortnight of June followed by first fortnight of June (97 per cent) and
significantly differ from first fortnight of July and August sowings. The variation between the
germination percentages of different sowing dates might be due to variation in environmental
conditions during seed filling stage which leads to prevention of expression of seed quality characters.
The seedling vigour index was the one of the most important vigour parameter to know the potentiality
of the seed. Maize sown during the June first fortnight (2519) recorded highest seedling vigour index I
and was on par with August sowings (2234 and 2458). Sowing in first fortnight of August was found
superior for majority of seed quality characters like shoot length (11.6 cm), total seedling length (25.1
cm) and seedling vigour index I (2234) while sowing in second fortnight of June exhibited superiority
for seedling dry weight (0.32 g), seedling vigour index I (2324) and seedling vigour index II (31.39).
CONCLUSION
Thus, based on the results obtained, it may be concluded that sowing date significantly influenced the
floral behaviour, yield attributing characters and seed quality parameters in maize seed production.
Sowing of maize hybrid in June second fortnight and August first fortnight was found optimum and
highly remunerative as it recorded maximum synchronization between male and female lines, recorded
high seed yield and yield attributing characters besides good germination and seedling vigour index.
Paper Proceedings of Agri Animal 2013 - ISSN 2279-3682
511
REFERENCES
Abdul- Baki, A. and J.D. Anderson. 1973. Vigor determination in Soybean seed by multiple criteria.
Crop Science. 13: 630-633.
Ahmadi, M., Wiebold, W.L., Beuerlein, J.E., Eckert, D.J and Schoper, J. 1993. Agronomic practices
that affect corn kernel characteristics. Agronomy Journal. 85 : 615-619.
Berzsenyi, Z and Lap, D. Q. 2001. Effect of sowing time and N fertilisation on the yield and yield
stability of maize (Zea mays L.) hybrids between 1991–2000. Acta Agronomica Hungarica 50: 309-
331.
Datta, R., Chourey, P. S., Pring, D. R and Tang, H. V. 2001. Gene-expression analysis of sucrose-
starch metabolism during pollen maturation in cytoplasmic male-sterile and fertile lines
of sorghum. Sexual Plant Reproduction 14: 127-134.
Eckert, D. 1995. Corn production in Ohio, Food and Agricultural Organisation (FAO). Year book
of Maize Production 45:265.
Green, T. S., Ender, M and Mock, J. J. 1985. Effect of sowing dates on maize yields. Agricultural Sciences
20: 51- 63.
Harris, R. E., Moll, R. H and Stuber, C. W. 1984. Control and inheritance of prolificacy in maize. Crop
Science16: 843-850.
International Seed Testing Association (ISTA). 1985. International rules for seed testing. Seed Science
and Technology, 27(Suppl.): 30–35.
Karni, L and Aloni, B. 2002. Fructokinase and hexokinase from pollen grains of bell pepper
(Capsicum annuum L.): Possible role in pollen germination under conditions of high
temperature and CO2 enrichment. Annals of Botany 90: 607-612.
Kresovic B., Vasic C., Tolimikr M and Pajic Z. 1997. Growing of sweet corn as second or
stubble crop. Journal of Scientific Agricultural Research 58: 23-30.
Lobell, D.B and G.P. Asner, 2003. Climate and management contributions to recent trends in U.S.
agricultural yields. Science, 299: 1032.
Namakka, A., Abubakar, I. U., Sadik, I. A., Sharifai, A. I and Hassas, A. H. 2008. Effect of
sowing date and nitrogen level on yield and yield components of two extra early maize
Paper Proceedings of Agri Animal 2013 - ISSN 2279-3682
512
varieties (Zea mays L.) in Sudan savanna of Nigeria. ARPN Journal of Agricultural and
Biological Science 3(2):1-5.
Otegui, M. E and Melon, S. 1997. Kernel set and flower synchrony within the ear of maize. I. Sowing
date effects. Crop Science, 37: 441-447.
Otegui, M. E., Nicolini, M. G., Ruiz, R. A and Dodds, P. A. 1995. Sowing date effects on grain yield
components for different maize genotypes. Agronomy Journal. 87: 29-33.
Panse, V. G and Sukhatme P. T. 1985. Statistical Methods for Agricultural Workers, EDS Indian
Council of Agricultural Research, New Delhi. pp. 145
Pressman, E., Peet, M. M and Pharr, D. M. 2002. The effect of heat stress on tomato pollen
characteristics is associated with changes in carbohydrate concentration in the developing
anthers. Annals of Botany 90: 631-636.
Rastegar, M. 2004. Cultivation of Forage Crops, Berahmand Publication. pp. 501.
Sarvari, M and Futo, Z. 2000. Correlation between the sowing date, yield and grain moisture
content of maize hybrids on chernozem soil. Debreceni Egyetem Agrartudomanyi Kozlemenyek
Journal 1:32-41.
Schoper, J. B., Lambert, R. J and Vasilas, B. L. 1986. Maize pollen viability and ear receptivity under
water and high temperature stress. Crop Science 26:1029-1033.
Sidlauskas, S. A and Bernotas, S. 2003. Some factors affecting seed yield of spring oilseed rape
(Brassica napus L.). Agronomy Research 1(1): 229-243.
Steel R.G.D and Torrie, J.H. 1980. Principles and Procedures of Statistics, Second Edition, New
York: McGraw-Hill Book Co.
Suzuki, K., Tsukaguchi, T., Takeda, H and Egawa, Y. 2001. Decrease of pollen stainability of green
bean at high temperatures and relationship to heat tolerance. Journal of the American Society
for Horticultural Science. 126: 571-574.
Tamura, Y., Takezaw, A. K., Konno, T., Ona, S., Sein, O. H and Monma, E. 1989. Prediction of
silking stage in maize based on temperature response evaluated by a non- parametric method.
Japanese Journal of Crop Science 58(1): 48-54.
Paper Proceedings of Agri Animal 2013 - ISSN 2279-3682
513
Vara Prasad, P. V., Kenneth, J. B and Allen, L. H. J. 2006. Adverse high temperature effects on pollen
viability, seed-set, seed yield and harvest index of grain-sorghum (Sorghum bicolor (L.)
Moench) are more severe at elevated carbon dioxide due to higher tissue temperatures.
Agricultural and Forest Meteorology, 139: 237–251.
William, G.D., Donald L.S and William, A.W. 1977. Sunlight and Temperature effects on corn growth
and yield. California Agriculture, August, pp. 13-14.
Table 1: Fortnightly distribution of mean maximum, mean minimum, mean temperature
(°C), rainfall (mm), relative humidity (%) and sunshine (hours) during crop
growth period from June to September first fortnight.
Date of Sowing Min. temp.
(° C)
Max temp.
(° C)
Mean temp.
(° C)
Relative
humidity (%)
Rainfall
(mm)
Sunshine
(Hours)
Jun first fortnight 27.0 38.0 32.50 60.30 0.3 7.4
Jun second fortnight 24.0 32.2 28.10 82.90 9.0 3.6
Jul first fortnight 23.4 31.2 27.30 80.60 4.0 4.6
Jul second fortnight 22.8 29.2 26.00 73.10 12.6 1.7
Aug First fortnight 22.5 30.2 26.35 87.27 1.7 5.5
Aug second fortnight 22.5 30.1 26.31 85.63 4.6 4.5
Sep first fortnight 22.2 29.3 25.70 88.90 4.7 4.6
Table 2: Flowering behaviour of the parental lines of maize hybrid, DHM 117 during Kharif, 2012
Date of
Sowing
Days to first
tasseling
Days to 50 %
tasseling
Days to first
silking
Days to 50 %
silking
Pollen Viability (%)
9 AM 2 PM
01-06-2012 66.3 68.0 59.3 70.7 96.7 96.3
15-06-2012 60.7 64.7 56.7 72.3 97.5 93.9
01-07-2012 65.3 69.7 67.5 70.0 93.2 85.6
15-07-2012 65.7 68.0 61.5 69.3 90.7 83.1
01-08-2012 62.7 75.3 59.7 71.3 95.4 92.6
15-08-2012 57.3 60.7 54.3 59.7 97.3 96.5
01-09-2012 62.7 66.0 59.3 64.3 95.2 94.6
Gr. Mean 62.95 67.47 59.66 68.23 95.15 91.80
S. Em + 0.926 0.792 1.011 0.640 0.910 1.165
S. Ed 1.309 1.120 1.429 0.905 1.287 1.648
C.D. (0.05) 2.854 2.441 3.115 1.974 2.805 3.592
C.V. (%) 2.547 2.033 2.933 1.625 1.657 2.198
Paper Proceedings of Agri Animal 2013 - ISSN 2279-3682
514
Table 3: Yield and yield components of maize hybrid, DHM 117 during Kharif, 2012
Date of
Sowing
No. of rows
per cob
No. of seeds
per row
Cob yield per
plant (g)
Seed yield per
plant (g)
Shelling
percentage (%)
100 seed
weight (g)
01-06-2012 14.8 26.5 104.61 87.10 83.2 24.31
15-06-2012 15.5 30.1 114.74 86.52 82.0 24.63
01-07-2012 14.5 23.4 73.34 58.64 79.8 20.63
15-07-2012 14.6 23.8 88.02 70.04 79.5 21.91
01-08-2012 14.9 24.6 104.85 88.11 84.1 25.26
15-08-2012 15.4 25.5 98.24 73.03 74.5 23.77
01-09-2012 15.6 24.2 109.54 79.25 72.4 25.05
Gr. Mean 15.04 25.43 99.05 77.52 79.36 23.65
S. Em + 0.300 0.806 3.946 3.740 3.686 1.594
S. Ed 0.424 1.140 5.579 5.289 5.212 2.254
C.D. (0.05) 0.925 2.486 12.162 11.529 11.363 4.914
C.V. (%) 3.453 5.491 6.900 8.356 8.045 11.675
Table 4: Seed quality characters of maize hybrid, DHM 117 during Kharif, 2012
Date of
Sowing
Germination
percentage
Root length
(cm)
Shoot
length
(cm)
Total
seedling
length (cm)
Seedling
dry weight
(g)
SVI I SVI II
01-06-2012 97 15.3 10.7 26.0 0.29 2519 28.18
15-06-2012 99 13.7 9.6 23.4 0.32 2324 31.39
01-07-2012 80 14.2 9.8 24.1 0.16 1909 12.51
15-07-2012 90 13.0 10.3 23.3 0.18 2108 16.06
01-08-2012 89 13.6 11.6 25.1 0.16 2234 14.06
15-08-2012 93 15.4 11.0 26.5 0.27 2458 24.60
01-09-2012 91 12.95 8.6 21.5 0.27 1962 24.45
Gr. Mean 91.2 14.02 10.21 24.27 0.23 2216.3 21.604
S. Em + 2.806 0.422 0.422 0.685 0.019 106.991 1.5981
S. Ed 3.967 0.597 0.596 0.968 0.027 151.285 2.25971
C.D. (0.05) 8.648 1.301 1.300 2.111 0.059 329.801 4.92617
C.V. (%) 5.329 5.213 7.148 4.886 14.185 8.36112 12.8119
Paper Proceedings of Agri Animal 2013 - ISSN 2279-3682
515
Fig 1: Effect of sowing date on pollen viability at different sowing dates
96.7 97.5
93.2
90.7
95.4
97.2
95.22
96.3
93.9
85.2
83.1
92.6
96.5
94.62
75
80
85
90
95
100
JUNE 1 JUNE
15
JULY 1 JULY 15 AUG 1 AUG 15 SEP 1
Poll
en v
iab
ilit
y (
%)
Date of sowing
9:00 AM
2.00 PM

Paper Proceedings of Agri Animal 2013 - ISSN 2279-3682
516
34
Paper Proceedings of Agri Animal 2013 - ISSN 2279-3682
517
Researches regarding the carcass structure and chemical composition of
meat at young buffalo Livia VIDU
1*,Cristiana DIACONESCU
1, Ion CĂLIN
1, Vasile BĂCILĂ
1, Mariana BRAN
2
1University of Agricultural Sciences and Veterinary Medicine Bucharest, Faculty of Animal Science,
Marasti Blvd. 59, Bucharest, Romania, 2Academy of Economic Studies, Roman Square 6, Bucharest, Romania
ABSTRACT
The meat of buffalo is an organic meat because growing technology is simple, involve only local feed
resources, the risk of contamination is low and their resistance to diseases does not involve
consumption of drugs. The buffaloes contribute at total meat production with 1.3% and at beef
production with 5.0%. This study aims to present the structure of buffalo carcasses in the slaughter
components and chemical composition (dry matter, cholesterol levels and amino acids). The study was
conducted on a total of 57 young male of Romanian buffalo breed, 17 months old. Of analyzes carried
out we found the following: dry matter had an average of 26.002%, protein 21.8% and fat 2.9%. The
buffalo meat contains a larger quantity of collagen and hydroxyproline.Following the analysis that we
performed in buffalo muscles the cholesterol is 31 mg/100 g meat, very low value if we compare with
the beef where the average is 70 mg/100 g, pork with 70 mg/100 g and venison with 110 mg/100 g.
The buffalofatischaracterized by a0.94 saturated/unsaturatedfatty acids ratio. The iron content is 10
times higher in buffalo meat than beef cattle. Buffalo meat is darker because of it.
Keywords: carcass, chemical composition, meat buffalo
INTRODUCTION
Of animal products that are found inthe humandiet, meat is situatedfirst,because of the
highproteincontent, highdigestibilityand suitabilityof preparationinvariousfoodproducts. The meatand
meat productsare the majorsource ofhigh qualityprotein. The nutritional value ofmeatdepends
primarily onthe chemical composition, which varies fromspecies to species. The development and
modernization of production meansfor obtaining specific productsof superior qualityandlowcostleads
to the use of complexprocessesandnew formsof organization. The largest share of the average quantity
ofprotein frommeat is nowprovided by porkprotein. Beefis the second, after pork. Studies
performedalong thetimehave shownthe following:meatprovides10% of totalenergy, about 11% of total
protein, 38% of animal proteinand29% of pure fat needs.
Meat of bovinescontains on average32.7%dry matter, 20.0%protein,10.7%fatand 1.1%
minerals. Thishas anenergy valueof1815calories/ kgandbiological valueof69.9. Beefcontains18 amino
acids(it isrich inleucine,isoleucine, valine, phenylalanine, glycine, etc.); 12 vitaminsincludingA,D-
reduced,E,B1, B3, B5, B6, B7, B9, B12. There are 18mineralsincluding 7macroelements(being rich
inK, S andP) and 11microelements(very rich inZnandFe).
As food, beef is ahighly appreciatedsourceofhigh qualityproteinwithhigh biological value. The
buffalomeatis part of beef, it‘s biological valueis lowerthan thatof cattle meat and ithas aseries of
peculiaritiesgiven below. Thus, they are the following: totalproteinsare lowerby 0.12%,
collagen(protein fibril, which is highly resistant tothe action ofphysical agentsandenzymes thatconvert
proteins) is higherforbuffalomeatby over 10% compared thebeef, the hydroxyproline(nonessential
amino acid) concentrationishigher by14.5%comparedwiththat found inbeef, tryptophanis
Paper Proceedings of Agri Animal 2013 - ISSN 2279-3682
518
lowerinbuffalomeat, with90 mgper 100gprotein) the ratiotryptophan/hydroxyprolineis3.34/6.09.
Consequently,buffalomeatcontains alarger quantity
ofcollagenandhydroxyprolineandlowertryptophan(Georgescu Gheorghe &al,2008 [4]). Buffalo
meatisa rich source ofprotein, minerals, vitamins, especially of the B complexand the liveris very
largeand is anexcellent sourcefor vitaminsA andD). In essence, beef meatisan indispensable elementfor
humannutritionofhealthy and sick persons. Thus, it is recommended to beusedinfoodconvalescent,
tiredpeople, children, pregnant women andlactating women. The biological value
ofmeatvariesdependingon age,state offattening andslaughterregion. The meat derived fromadult
animalshas alowerbiological valuethanthe young ones, the meat withafat contentishigher inamino
acidcontent. The quantityof essential amino acidsis higher inregionsrich inmuscles. The meat isrich
insaturated fatty acids. The energy valuevaries greatlywith the statefattening, age and
anatomicalregionorbutchers. The fatty meathas the energy valueof50-80%higher thannonfatmuscles
(Vidu, Livia, 2006 [5]). Regarding theconsumption ofbuffalo meat, Borghese, Antonio etal (2005)
predicteda consumption ofbuffalo meat25 kgper capitathe year 2010and30 kgofbuffalomeatin2025 [2].
MATERIALS AND METHODS
The biological materialstudiedwas obtained by youngmale from Romanian BuffaloBreed, aged
17 months.The animals wereslaughteredin twoslaughter housesin Romaniafor a period ofone month.
The animals wereweighedbefore slaughterand afterslaughter. The carcasswas divided
intoregions, each region was analyzedinterms oftotalweight, weightof meat, bones andfat.
To determine thechemical compositionin youngbuffalomeat the samples were takenfrom the
joint, steak, andshoulders.
The methods usedforchemical analysesare
theclassicKjeldahlmethodthatKjeltecAuto1030analyzerforprotein,extractionwithorganic
solventSoxhletmethodforfat, crudeashby calcinations.
Gas chromatography was used to determinefatty acidsand the cholesterolfrom meat. Gas
chromatographyis aphysical-chemicalmethodofqualitative and quantitative
analysiswheregaseousconstituents of themixtureare separatedwhile thesamplepassesover
astationaryliquid or solidphase. To highlightthe total fattyacidsby
gaschromatographymeatsamplewassubjected toextraction processbyschemeno.1.
Gaschromatographicanalysiswas performedusing agas
chromatographCARLOERBAFRACTOVAP-2400 equipped withflame ionizationdetector(FID) and
hydrogen(hydrogen generator ELHYGENMILTONROY)[6].
The determination ofamino acidsinmeatwas doneusingautomaticanalyzerBIOCHROM30.
Amino acidanalyzeris afully automaticdevicethat allowsdeterminingtheamino
acidcompositionofproteins. The fundamental stepsin the analysis ofamino acidcompositionof aprotein
(amino acids linked) are proteinhydrolysisto releaseconstituentamino acids, separation ofamino
acidspresent inhydrolysedof the analyzer; quantification ofvariousamino acids. The techniquefor
determining theamino acidsis based onion exchangechromatography, using cationicresins. Eachamino
acidhas, however,isoelectricpointandasitis higherso muchthe amino acidwill beretained by theresin,
and thus itwill separate. Allamino acidsexit from thecolumnare harvestedin differentfractionsand
determinedcolorimetricallyaftera reactionwithninhidrina with heat release.
The determinationof mineral saltswas done byatomicabsorptionspectrophotometry. The
atomicabsorptionspectrophotometryis a spectrophotometric methodfor determining theconcentration of
achemical elementthatthe radiationis absorbed byatomsinthe vapor phasefreeexcitement. Absorption
ofradiation respect Lambert's lawand thus it will be directlyproportional to the numberof atomsper unit
volumeandthicknessof substance. It isused to determinevery lowconcentrationsof elements indifferent
biological samples, solutions, soil and air. Atomicabsorptionspectrophotometryis usedto determineof
meat, milk, etc...iron, zinc, magnesium, manganese and copper, but also whenthere is a suspicion
ofheavy metalspollution.
Paper Proceedings of Agri Animal 2013 - ISSN 2279-3682
519
Atomic absorption spectrophotometerPerkin-Elmer-USA, equippedwith burner and
cathodelampspecific metals as well as specific annexes(acetylene cylinder, air compressor) was used
in order to determine minerals. The basic principle ofmeasurementsatomic absorption is attenuation
backgroundradiationspecific to aparticular elementdue to the absorptionsuffered bytheatomizedsample.
The ratio betweeninitialandattenuatedradiationprovides informationaboutconcentrationthat element
inthe sample used.
The determination ofvitamins inmeatwas done byhigh performance
liquidchromatography(HPLC). HPLCcoupled withUV-Vis detectoris themost used methodof the
identificationandquantificationofantioxidant vitaminsdue tohighresolution,
highsensitivityandefficiency. Fractionatedsamplesare passed throughchromatographiccolumnsfilled
withspecialmaterial(stationary phase) athigh pressure (1000-6000 psi). Depending on the stateof
aggregation of the stationary phase, liquid (liquid-liquid chromatography) or solid(solid-liquid
chromatography) columnchromatographypackswithpellicularparticlesormicroparticles. The
sampleinjectionis made withhigh-pressuresyringes. The deviceis equipped withsoftwarefor
measuringpeaksandcalculatingconcentration of eachvitamin [6].
RESULTS AND DISCUSSION
For the meat industry the share of different butchery regions is important because it determines
the quantitative and qualitative indicators of meat products.
Differences between buffalo and cattle carcass structure are the following: the buffalo youth
provides a lower carcass (-7.7 kg), but with more total fat (3% coming especially from tallow which is
more than 4% higher) and with a little more conjunctive tissue;
the buffalo youth carcass is with almost 8 kg heavier than that of young bulls, and has a high
percentage of bone in the carcass, but less tallow and better meat marbling.
Borghese Antonio & al. (2005) analyzed the slaughter indicators in both species (youth valued
at 16 months) and had the following conclusions: buffalo weight (465.7 kg) and cattle (479 kg), the
difference of 13.5 kg is in favor of the cattle species, carcass weight 242.7 / 262.3 kg, the differences
were almost 20 kg, also in favor of the cattle species, killing out percentage (warm carcass) was 52.11
/ 54.73% and in the case of cold carcasses (56.64 / 60.56), very significant differences between species
[2] (figure no.1).
GeorgescuGheorghe &ViduLivia(2008)analyzedresultsobtained by youth of the Italian buffalo
breedcompared tothose obtainedin Romaniafromlocalbuffalobreed youth [4].
Italianyoungbuffaloeswereslaughteredearlierby 2.3monthscompared to that ofRomania, carcass
weightwas234.6 kgcompared to240.8 kg, differencesof only6.2 kg, even thoughthe agedifferenceat
which they were slaughtered wasof over 2months moreat youngbuffaloesfrom
Romania;meatincarcassweightwas62.0/53.2%, 9.8% higher at youngbuffaloesfrom Italy; the percent of
bones in carcass weight (16.87 / 15.25%) was 1.62% higher at young Italian buffaloes, carcass fat
percentage (21.13 / 26.64%) was higher at young buffaloes from Romania, with 5.51%, because the
slaughter age was higher by 2.3 months.
Table 1 presents the main butchery regions and the share of meat, bone and fat in each region.It
was observed that the percentage of meat in the analyzed butchery regions is 64.47%, bones have a
share of 32.56% and the fat 2.97%.Earlier studies conducted by Gheorghe Georgescu & al (1995)
revealed that at young buffaloes and cattle at equal slaughter age and the same system of fattening, the
muscle tissue has less weight at buffaloes (53-58% in buffalo compared to 52-70% in cattle) [3].
In the between-rib steak I the muscle tissue had a share of 54-55%, fat 23% and bones 21-22%.
At the buffalo, the proportion of carcass tallow and connective tissue is much higher (26-27%) than
cattle (13-16%), which affects the quality of meat.
Paper Proceedings of Agri Animal 2013 - ISSN 2279-3682
520
Afterslaughterbesidescarcass resultsalso thefifth quarter, this represents about 25% of the
weight of cattle and buffaloes.
Generally, the fifth quarter consists of the following:products- leather, tallow, horns and nails,
which have a weight of 55% of the fifth quarter;whiteproducts- stomach, intestinesandextremities(legs)
andfrom cowsandbuffalo cows-the udder,which represents20%of the weight ofthe fifthquarter; redor
offalproducts - organs-liver, heart, lungs, kidneys, spleen, pancreas, glands, tongue, head- brain,
masseterandlipmuscles, which represents 25% ofthefifth quarter. Average valuesof the main
componentsofthe fifthquarterin youngmalebuffaloesare given inTable 2.
Generally, the fifthquarterin youngbuffaloesis well representedbyskin, liver, lungs andheart.
The previous researchesrevealedsomedifferences compared withcattleorgans(liver, tongue, heart,
kidneys) that are heaviertobuffalo. ThusGeorgescu Gheorghe. &al(1995) foundin malesbuffaloaged15
monthsfollowingweights fororgans: liver -4.26 kilograms (kg),tongue-1,10 kg, heart- 1.52 kg, kidneys-
0.91 kg, lungs -2.47 kg, intestines -14.40 kg and full stomach-33.9 kg [3].
The chemical composition of meat from young buffaloes
The twomain components ofmeat, respectivelywateranddry mattervariesverywidely
dependingon a numberof factors(age, state offattening, sex). The dry matterof the fleshvariesbetween
25-50% in inverse ratiowith water.
In thebuffalo meat the dry mattercontenthasan average value of26.002grams/100 grams
sample.Thiscan be seenintable 3. This value ishigher than thatfound byGeorgescu Gheorghe(1995)in
youngbuffaloes(24.57 g), and also that found by thesameauthorat youngcattle males(23.7 g) [3]. The crude proteinregistred anaverage value of21.80g, with a variabilityof 4.24%, which is
comparable to thatfound byGheorgheGeorgescu(1995)in youngbuffaloes(21.22 g). The meatprotein
contentis higherin young buffaloes thanin youngcattleof the same age(differenceof 2.27g), and also the
variabilityis higher. Buffalo meatis appreciateddueto the protein with highbiological value, although it
has a larger amountof collagenandhydroxyproline. Buffalomeatis classifiedaccording
toItalianstandards, as anaveragequality meat.
The lipids from analyzedbuffalo meatsamples had an average value of2.918g, higher than the
valuefound byGheorgheGeorgescu(1995) (2.29gat youngbuffaloes, and 2 gat young cattle) [3].
The ashesfromthe laboratory analysishadan average value of1.029, with avery lowvariability,
comparablewith values found inthe literature forbeef.
The acidity of meat represents the concentration of organic acids of meat,includingsubstances
with acid character. The pH of meat decreases graduallyafter the animal is slaughtered, becausemuscle
tissue passes in phase of anaerobiosis. ThepH ofbeefdecreases graduallyfrom7.10-7.14immediately
after slaughter, to 5.5- 5.3at an interval of24 hours.
Incattleandbuffalomeatare presentalso other substances, such as cholesterol, a substance that is
found ineveryanimalcell,located incellular membranesand which is necessaryfor the cell existenceand
functioning. We have analyzed themeatand we obtainedthe
following:cholesterolis31mg/100gmusclebuffalo,very low valueif wecomparewiththe beefwherethe
averageis 70mg/100g,pork(70mg/100g), andwithvenison meat(110mg/100g).
In thecomposition ofmeat lipidsis aconstantcomponent(glycerol) anda variable component(fatty
acids) (Table 4).
The quality of the fat of meatdepends on the natureand the proportion offatty
acids.Theyare:saturated,withdifferent numbers ofcarbon atoms andunsaturated, withdoublelinksand
twodouble links.
Generally, the proportion ofsaturated fatty acidsdecreases from internalcavity fatdeposits to the
surface, sothatkidneyandpelviccavity tallowismore consistentthanintramuscularfat. As thelevel
offattening increasesand therefore the total quantity offat increases toin thecarcass, the percentage of
saturated fatty acids(mainlystearic acid) decreasesin beef(unlikepigs)andincreases that ofthemono-
unsaturated acids.
Inthe beef, myristicacidhas a value of4%, while atporkis 2%, similar to thatfoundby us in
buffalomeat.
Paper Proceedings of Agri Animal 2013 - ISSN 2279-3682
521
The buffalofatis characterizedby a ratioof 0.94 saturated/unsaturatedfatty acids. The
proportionof differentfatty acidsis as follows: oleicacid(39.22%), stearic acid (21.11%)
andpalmiticacid(24.75%). Inthe beeffatty acidshavethe following shares: oleicacid(42%),
palmiticacid(27%) andstearic(20%). Inthe pork, the share in thefat of these fatty acidsis as follows:
oleicacid(46%), palmiticacid(25%) andstearic acid (18%).
The meat, regardless of species, especially that fromregionswithmoremuscle tissue, is highinall
essential amino acids(Banu Constantin,2009 [1]). Generally, beefisrich inleucine,isoleucine, valine,
phenylalanine, lysine, glycine, thanpork andsheep meat.As a whole, inmeat,essential and
nonessentialamino acidratiois about1/1 (Table 5).
The asparticacidis anonessentialamino acidandhas a shareof 1.81inbuffalo meat, the same as
inbeef, butlower thanpoultry(2.04) and higher thanporkandsheep(1.55 to 1.43).
The glutamic acidinbuffalo meatshoweda valueof 1.12, lower than that existingin beef(2.93).
Alsoserine(0.40) registered a lowervaluethan that of beef(0.81), as well asproline.
The methionine(essential amino acid) has an average value of0.56,with avariabilityof16.56%,
lower than that availableinbeef(0.89), but higher than in pork(0.40) and sheep(0.37).
The biological value ofbeef and vealvaries accordingby age,state offattening
andbutcheryregion. Most ofamino acidscan be foundinregionsrich inmuscle(steak, sirloin, joint)
compared withfleank,forelimbquickie and hind limb quickie.
Generally, the nutritional value ofbeefand specially that of buffalo meat is given also by its
contentinmacroand microelements(Table 6). Inorganicconstituentsof muscle tissue are found insmall
quantities(about1% ofdry matter) andtheyhavelowlimits.Phosphorus isin a larger proportion(0.337
gper 100 g).
The calcium in buffalo meat is in a quantity of 0.104 grams /100 grams meat and the beef
content is only 0.027 g/100 g. Also, iron is in a proportion 10 times higher in buffalo meat than beef,
which explains the darker color of flesh.
Of microelements, buffalo meat has a content of 14.88 mg Zn / kg meat, 1.30 mg Cu/ kg meat
and 0.026 mg Mn/ kg meat.
The mineral salts of meat have an important role in the functionality of the various systems and
organs, in the meat biochemistry, in muscle contractile activity and meat maturation.
CONCLUSIONS
Buffalo meat is an important source of quality food. In many parts of the world buffalo meat is
a local food resource.
Chemical analyzes have shown that in buffalo meat dry weight had an average value of 26,002
per 100 g sample. The crude protein showed an average value of 21.80 g, with a variability of 4.24%.
The buffalo meat lipids from analyzed samples had average values of 2.918 g. Buffalo muscle has a
cholesterol content of 31 mg/100 g sample, very low value if we compare with the beef where the
average is 70 mg/100 g. The buffalofatis characterizedby a 0.94 saturated/unsaturatedfatty acidsreport.
The proportionof differentfatty acidsis as follows: 39.22 % oleicacid, 21.11 % stearic acid and 24.75 %
palmiticacid. The iron content is 10 times higher in buffalo meat than beef cattle. Buffalo meat is
darker because of it.
BIBLIOGRAPHY
1. Banu, Constantin 2009. Treaty of food industry, ASAB Publishing House, Bucharest.
2. Borghese, Antonio 2005. Buffalo production and research, FAO, Rome.
3. Georgescu, Gheorghe and al. 1995 - Treaty of cattle, vol. 3, Ceres Publishing House,
Bucharest.
4. Georgescu, Gheorghe, Vidu, Livia 2008 The Monograph buffalos in Romania and worldwide,
Ceres Publishing House, Bucharest.
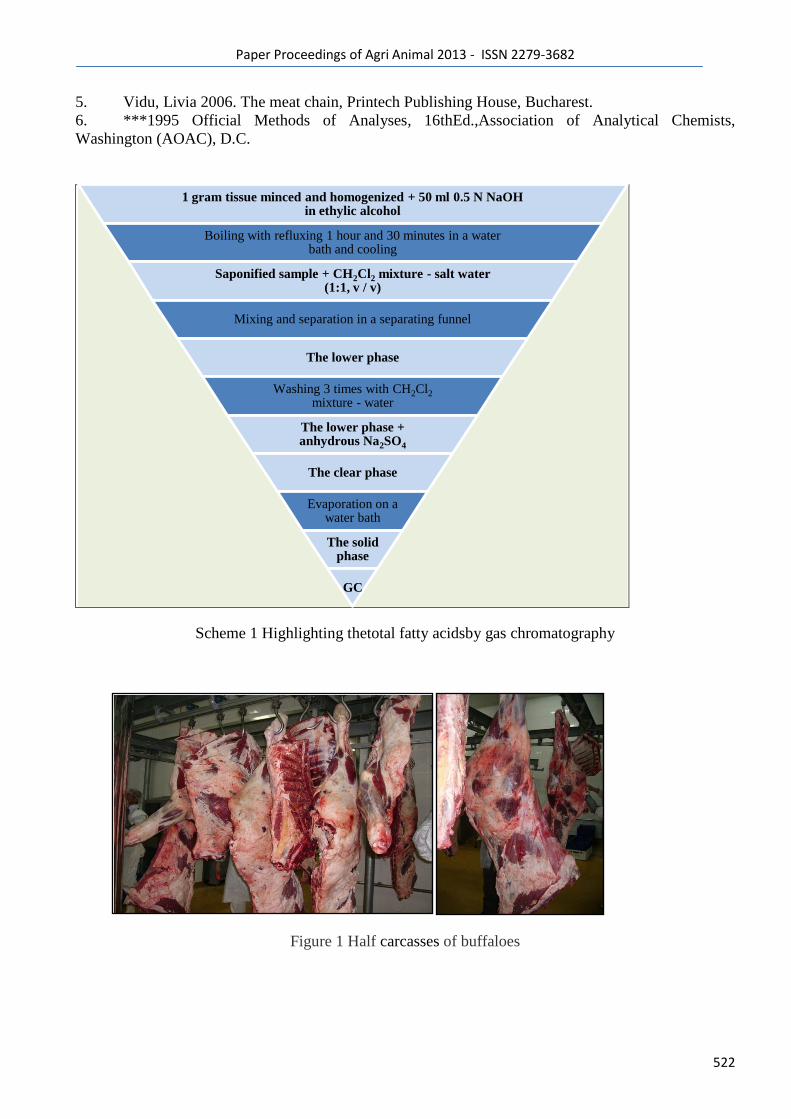
Paper Proceedings of Agri Animal 2013 - ISSN 2279-3682
522
5. Vidu, Livia 2006. The meat chain, Printech Publishing House, Bucharest. 6. ***1995 Official Methods of Analyses, 16thEd.,Association of Analytical Chemists,
Washington (AOAC), D.C.
Scheme 1 Highlighting thetotal fatty acidsby gas chromatography
Figure 1 Half carcasses of buffaloes
1 gram tissue minced and homogenized + 50 ml 0.5 N NaOH in ethylic alcohol
Boiling with refluxing 1 hour and 30 minutes in a water bath and cooling
Saponified sample + CH2Cl2 mixture - salt water (1:1, v / v)
Mixing and separation in a separating funnel
The lower phase
Washing 3 times with CH2Cl2
mixture - water
The lower phase + anhydrous Na2SO4
The clear phase
Evaporation on a water bath
The solid phase
GC
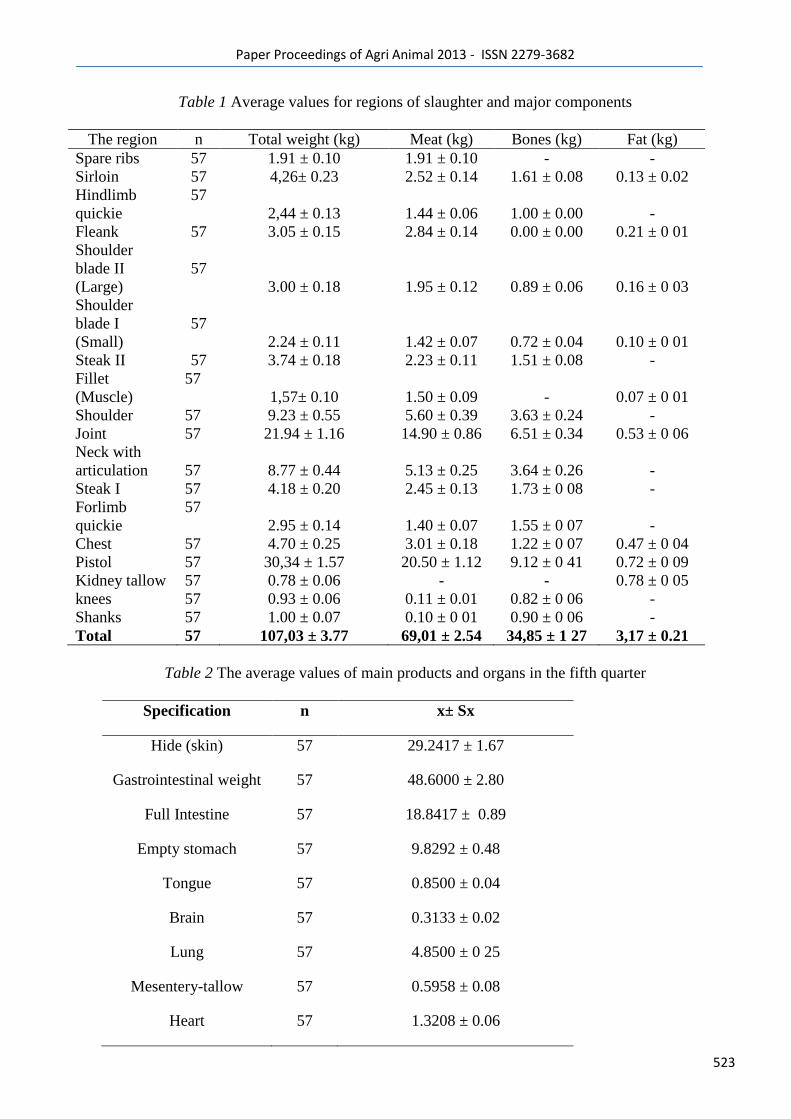
Paper Proceedings of Agri Animal 2013 - ISSN 2279-3682
523
Table 1 Average values for regions of slaughter and major components
The region n Total weight (kg) Meat (kg) Bones (kg) Fat (kg)
Spare ribs 57 1.91 ± 0.10 1.91 ± 0.10 - -
Sirloin 57 4,26± 0.23 2.52 ± 0.14 1.61 ± 0.08 0.13 ± 0.02
Hindlimb
quickie
57
2,44 ± 0.13 1.44 ± 0.06 1.00 ± 0.00 -
Fleank 57 3.05 ± 0.15 2.84 ± 0.14 0.00 ± 0.00 0.21 ± 0 01
Shoulder
blade II
(Large)
57
3.00 ± 0.18 1.95 ± 0.12 0.89 ± 0.06 0.16 ± 0 03
Shoulder
blade I
(Small)
57
2.24 ± 0.11 1.42 ± 0.07 0.72 ± 0.04 0.10 ± 0 01
Steak II 57 3.74 ± 0.18 2.23 ± 0.11 1.51 ± 0.08 -
Fillet
(Muscle)
57
1,57± 0.10 1.50 ± 0.09 - 0.07 ± 0 01
Shoulder 57 9.23 ± 0.55 5.60 ± 0.39 3.63 ± 0.24 -
Joint 57 21.94 ± 1.16 14.90 ± 0.86 6.51 ± 0.34 0.53 ± 0 06
Neck with
articulation
57 8.77 ± 0.44 5.13 ± 0.25 3.64 ± 0.26 -
Steak I 57 4.18 ± 0.20 2.45 ± 0.13 1.73 ± 0 08 -
Forlimb
quickie
57
2.95 ± 0.14 1.40 ± 0.07 1.55 ± 0 07 -
Chest 57 4.70 ± 0.25 3.01 ± 0.18 1.22 ± 0 07 0.47 ± 0 04
Pistol 57 30,34 ± 1.57 20.50 ± 1.12 9.12 ± 0 41 0.72 ± 0 09
Kidney tallow 57 0.78 ± 0.06 - - 0.78 ± 0 05
knees 57 0.93 ± 0.06 0.11 ± 0.01 0.82 ± 0 06 -
Shanks 57 1.00 ± 0.07 0.10 ± 0 01 0.90 ± 0 06 -
Total 57 107,03 ± 3.77 69,01 ± 2.54 34,85 ± 1 27 3,17 ± 0.21
Table 2 The average values of main products and organs in the fifth quarter
Specification n x± Sx
Hide (skin) 57 29.2417 ± 1.67
Gastrointestinal weight 57 48.6000 ± 2.80
Full Intestine 57 18.8417 ± 0.89
Empty stomach 57 9.8292 ± 0.48
Tongue 57 0.8500 ± 0.04
Brain 57 0.3133 ± 0.02
Lung 57 4.8500 ± 0 25
Mesentery-tallow 57 0.5958 ± 0.08
Heart 57 1.3208 ± 0.06
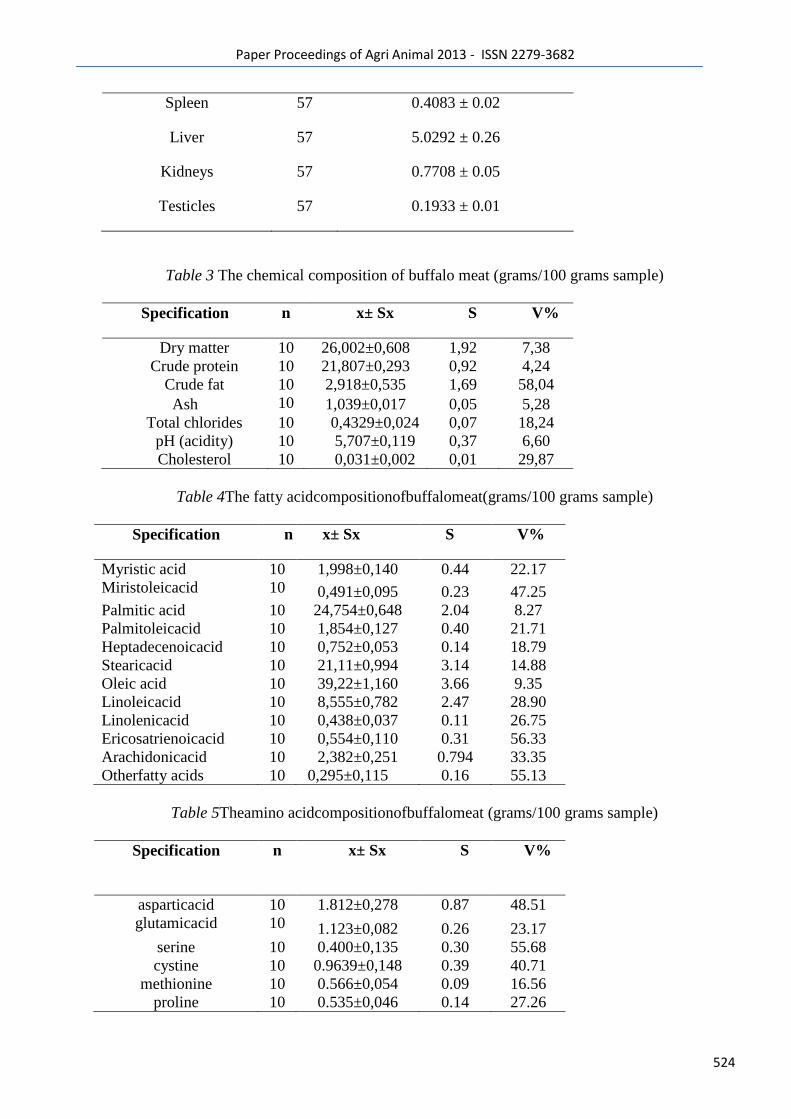
Paper Proceedings of Agri Animal 2013 - ISSN 2279-3682
524
Spleen 57 0.4083 ± 0.02
Liver 57 5.0292 ± 0.26
Kidneys 57 0.7708 ± 0.05
Testicles 57 0.1933 ± 0.01
Table 3 The chemical composition of buffalo meat (grams/100 grams sample)
Specification n x± Sx S V%
Dry matter 10 26,002±0,608 1,92 7,38
Crude protein 10 21,807±0,293 0,92 4,24
Crude fat 10 2,918±0,535 1,69 58,04
Ash 10 1,039±0,017 0,05 5,28
Total chlorides 10 0,4329±0,024 0,07 18,24
pH (acidity) 10 5,707±0,119 0,37 6,60
Cholesterol 10 0,031±0,002 0,01 29,87
Table 4The fatty acidcompositionofbuffalomeat(grams/100 grams sample)
Specification n x± Sx S V%
Myristic acid 10 1,998±0,140 0.44 22.17
Miristoleicacid 10 0,491±0,095 0.23 47.25
Palmitic acid 10 24,754±0,648 2.04 8.27
Palmitoleicacid 10 1,854±0,127 0.40 21.71
Heptadecenoicacid 10 0,752±0,053 0.14 18.79
Stearicacid 10 21,11±0,994 3.14 14.88
Oleic acid 10 39,22±1,160 3.66 9.35
Linoleicacid 10 8,555±0,782 2.47 28.90
Linolenicacid 10 0,438±0,037 0.11 26.75
Ericosatrienoicacid 10 0,554±0,110 0.31 56.33
Arachidonicacid 10 2,382±0,251 0.794 33.35
Otherfatty acids 10 0,295±0,115 0.16 55.13
Table 5Theamino acidcompositionofbuffalomeat (grams/100 grams sample)
Specification n x± Sx S V%
asparticacid 10 1.812±0,278 0.87 48.51
glutamicacid 10 1.123±0,082 0.26 23.17
serine 10 0.400±0,135 0.30 55.68
cystine 10 0.9639±0,148 0.39 40.71
methionine 10 0.566±0,054 0.09 16.56
proline 10 0.535±0,046 0.14 27.26
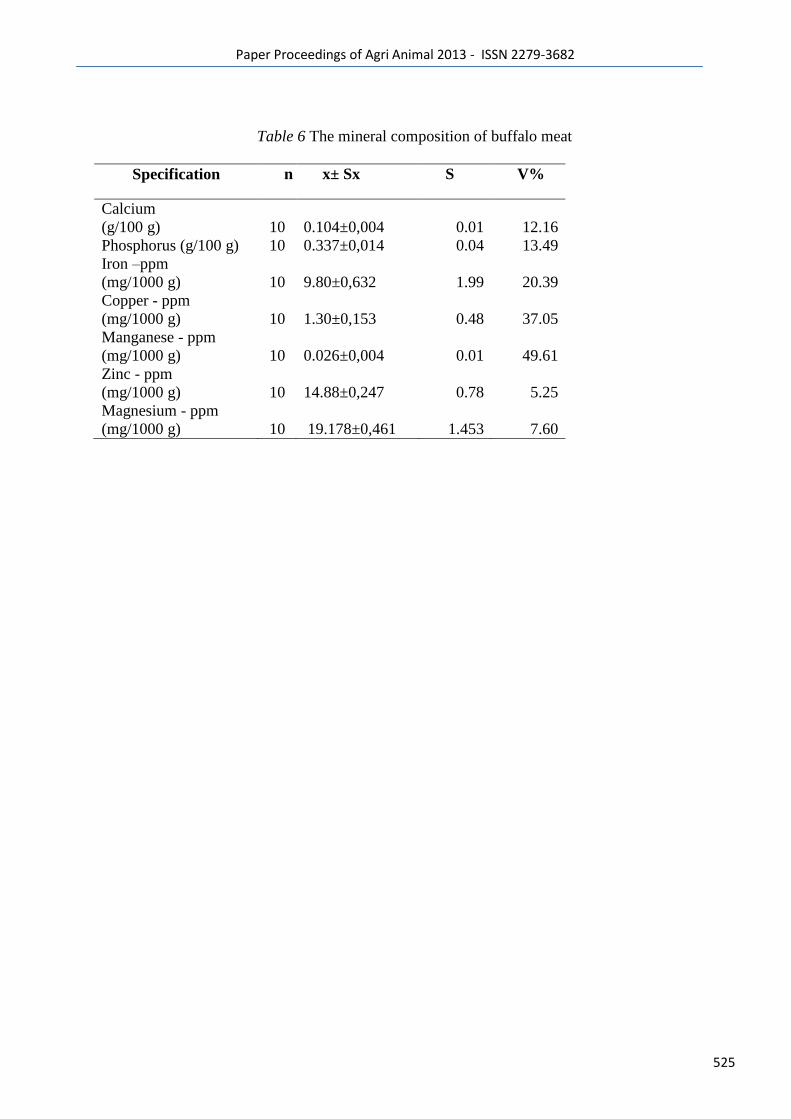
Paper Proceedings of Agri Animal 2013 - ISSN 2279-3682
525
Table 6 The mineral composition of buffalo meat
Specification n x± Sx S V%
Calcium
(g/100 g)
10 0.104±0,004 0.01 12.16
Phosphorus (g/100 g) 10 0.337±0,014 0.04 13.49
Iron –ppm
(mg/1000 g)
10 9.80±0,632 1.99 20.39
Copper - ppm
(mg/1000 g)
10 1.30±0,153 0.48 37.05
Manganese - ppm
(mg/1000 g)
10 0.026±0,004 0.01 49.61
Zinc - ppm
(mg/1000 g)
10 14.88±0,247 0.78 5.25
Magnesium - ppm
(mg/1000 g) 10 19.178±0,461 1.453 7.60

Paper Proceedings of Agri Animal 2013 - ISSN 2279-3682
526
35

Paper Proceedings of Agri Animal 2013 - ISSN 2279-3682
527
Report on incidence of low Fat and Solids Not Fat percentages in milk of Crossbred cows in
Wayanad district of Kerala, India
Radhika, G*., Ajithkumar, S.** and Rani, A.
College of Veterinary and Animal Sciences, Mannuthy, Kerala Veterinary and Animal Sciences
University, Pookode, Wayanad.
Abstract:
Fat and solids not fat (SNF) contents of milk decide the milk price and consumer acceptance of cow milk and
hence a scientific study on major constituents of milk was conducted in the hilly district of Wayanad, Kerala state, India.
268 Cows from five centres of Wayanad were selected and 929 morning and evening milk samples were analyzed for fat
and solids not fat (SNF) in different stages of lactation. The overall least squares mean for milk fat and SNF were 3.515 ±
0.080 and 8.359 ± 0.042 respectively. 47.3 per cent of cows in early stage of lactation were found to have morning milk fat
below the Prevention of Food Adulteration Act standards of 3.5 %. As far as SNF percentage is concerned, considering all
the stages of lactation together, 60.1 per cent in morning milk and 77.6 per cent of cows in evening milking had SNF
percentage below the prescribed legal standards of 8.5%. Crossbred cows of Wayanad have more of Holstein Friesian
inheritance which might be a genetic reason towards low level of milk fat percentage. Other non genetic factors for low fat
and SNF include sub clinical mastitis and anemia due to incidence of hemoparasites, which is quite high in Wayanad due to
its proximity to forest areas.
Keywords : milk fat, solids not fat, crossbred cows
Introduction
The pricing system for cow milk in milk societies of Kerala is based on the percentages of milk
fat and Solids Not Fat (SNF). Thus milk constituents like fat and SNF not only determines consumer‘s
receptivity of milk, but also decides the milk price. Prevention of Food Adulteration Act has fixed the
minimum fat percentage as 3.5 and SNF percentage as 8.5 for Kerala state, India. Milk with less than
3.5% fat and/or 8.5% SNF will fetch only lesser price to the farmer. Widespread complaints persist
among farmers of the state regarding low fat and SNF for their crossbred dairy cattle. Instances, where
allegation of adulteration of milk creating problems to the farmer, have also been not rare. Hence a
detailed study was conducted to probe into the existing milk fat and SNF percentages of crossbred

Paper Proceedings of Agri Animal 2013 - ISSN 2279-3682
528
cows in Wayanad district of Kerala. Wayanad district located 700 – 2100 m above mean sea level, on
the north-east of Kerala, is the second largest milk producing district in the state, with a production of
4,00,25,322 litres in 2004-05 (Karshakasree, 2005).
Materials and Methods
The study was conducted in the northern hilly district of Wayanad, which seriously lacks
scientific data on milk yield and constituents. Geographic terrain of Wayanad district with plain lands
and steep hilly areas demanded selection of Crossbred Cows from five different centres namely -
Ambalavayal, Sulthan Bathery, Meenangadi, Vythiri and Veterinary College Livestock Farm, Pookode
. 268 cows which calved from April to July 2007 were selected. A total number of 929 milk samples
from 244 cows were collected in morning and evening during early, middle and late lactation and were
analyzed for fat, solids not fat and total solids. Milk fat was estimated using electronic Milk Fat Tester
and the equipment was calibrated with Gerber‘s method. SNF was estimated using lactometer with
frequent calibration with gravimetric method for total solids estimation. Least square means were
calculated after nullifying the effects of centre, season and parity using SPAB – 2 package (Sethi
2002). The model used was,
Yijkl = µ + Ci + Sj + Pk + eijkl
Where, Yijkl=lth
observation of kth
parity of jth
season of ith
centre; µ=overall mean; Ci = effect of ith
centre; Sj = effect of jth
season; Pk = effect of kth
parity and eijkl = random error.
Results and Discussion
Prevention of Food Adulteration Act has set up the minimum standards of milk fat and
SNF percentages as 3.5 and 8.5 percentages in Kerala. Since the pricing of milk in milk societies is
based on fat and SNF, any value beneath the prescribed standards will fetch less price to the milk sold
and hence is a matter of serious concern to the farmers. 47.3 per cent of cows in early stage of lactation
had morning milk fat below 3.5 percent, whereas in the case of evening milk samples 11.8 per cent of

Paper Proceedings of Agri Animal 2013 - ISSN 2279-3682
529
cows in early lactation were below the standards. After pooling the data, when all stages of lactation
were considered, cows with milk fat percentage below the prescribed PFA standards were less in
Wayanad when compared to Thrissur (Radhika, 1997). This may be attributed to the fact that lush green
pasture lands are more in Wayanad when compared to Thrissur, increasing the availability of green
fodder to grazing animals. The least square analysis of variance revealed that the mean milk fat
percentage was 3.515 ± 0.080 (Table – 1). Centre had significant effect on milk fat percentage (p<0.05),
whereas parity and season of calving had no significant effect on milk fat per cent. Overall fat
percentage obtained from 514 morning milk samples showed a fat percentage of 3.997 ± 0.037 and
evening milk samples from 356 cows revealed a high fat percentage of 4.565 ± 0.040 (Table – 2). This
points to the fact that even though morning milk samples of early lactation show less than legal
standards of fat percentage, overall fat percentage was well above the prescribed minimum of 3.5
percent in crossbred cows of Wayanad.
The overall average for SNF percentage was 8.359 ± 0.042 (Table – 1), which was below the
prescribed Prevention of Food Adulteration (PFA) standards. This is a matter of great concern because
farmers are being accused of adulterating the milk which they sell and hence given a lesser price for
lowered SNF. Actually cows are producing milk with SNF below the legal standards. The least square
analysis of variance revealed that centre had very significant effect on SNF and total solids percentage
(p< 0.01) whereas parity and season of calving had no significant effect on these parameters. In the
beginning of lactation, during early period, 44.2 per cent of cows had morning milk solids not fat
below the PFA standards of 8.5 %. It was interesting to note that as the lactation advanced, naturally
the fat percentage also increased, and then the solids not fat kept on decreasing alarmingly. During
middle and late lactation morning milk samples, 57.5 and 82.7 per cent of cows respectively had less
than the minimum standards of 8.5% SNF (Fig. -1). In the case of evening milk samples 82.8 per cent
of cows in early lactation, 61.9 per cent in middle lactation and 92.5 per cent in late lactation had less
than the minimum standards of 8.5 per cent SNF. (Fig. -2) Considering all the stages of lactation
together, 60.1 per cent in morning milk and 77.6 per cent of cows in evening milking had milk solids
Paper Proceedings of Agri Animal 2013 - ISSN 2279-3682
530
not fat percentage below the prescribed PFA standards. This was much higher than the figures
obtained in a similar study conducted in crossbred cows at Thrissur, where 47% of cows, irrespective
of lactation stage and time of milking, recorded an SNF percentage below the legal standards of 8.5.
(Radhika et al., 1999). According to Sebastian and Geevarghese (1995) there is a possibility of
obtaining milk with fat and SNF below minimum standards prescribed in PFA Act for many states in
India. Malabar Regional Co-operative Milk Producer‘s Union Ltd., Kozhikode (MRCMPU) (1995)
reported 73.8 per cent animals with milk SNF below legal standards.
Factors affecting fat and solids not fat - Milk composition varies considerably among breeds of
dairy cattle with Jersey and Guernsey breeds yielding milk of higher fat and protein content than
Holstein Friesian cows. Indigenous cows yield less amount ofmilk containing high fat percentage. But
Kerala, at present has a crossbred cattle population with mosaic inheritance from, Jersey, Brown Swiss
and Holstein Freisian along with genes from indigenous cattle. Wayanad district has congenial climate
and low temperature which favours rearing of high milk producing cattle and hence Holstein Freisian
is the preferred breed. Major genetic factor leading to a decline in milk fat percentage must be the
increased inheritance of Holstein Freisian among crossbred cows of Wayanad. Genetic variability
between animals is also a factor which has to be taken into consideration.
Though heredity determines milk production and composition, environment and various
physiological factors greatly influence the quantity and quality of milk that is actually produced. One
of the major non genetic factors that have been reported to affect fat and solids not fat in milk
production is nutrition. Harris and Beckman (1988), reported that when extra energy was fed to high
producing cows, SNF increased by about 0.2 percentage units. Cows in Wayanad are high yielding
animals and the low level of SNF might be an indication towards insufficient energy intake. Addition
of whole cottonseed or added fat to dairy cattle rations may also reduce the SNF content of milk.
Forage quality and quantity also affects milk SNF. Good quality hay tends to increase SNF, but poor
quality hay may reduce both intake and SNF. Effect of centre on fat and SNF points to the fact that
Paper Proceedings of Agri Animal 2013 - ISSN 2279-3682
531
different feeding patterns existing in different areas, influence the level of fat and SNF in milk.
Alfonso-Avila et al (2011) reported that Multiple regression analysis showed no significant (P > 0.05)
model relating intake of feed groups and milk fat content, but milk protein and SNF contents were
significantly explained by intake of High Crude Protein in the feed stuff. Supplementation of protected
nutrients to buffaloes increased milk production and unsaturated fatty acids content in milk fat and
persistence of lactation after supplements were withdrawn. (Shelke et al, 2012)
Another major reason for decline in SNF, protein, and lactose content is associated with sub
clinical and clinical mastitis. Incidence of mastitis among crossbred cows in Kerala is quite high. As per
2006 disease surveillance report by the Kerala Government, the annual economic loss due to mastitis is
estimated to be 36.54 crores in cattle. Batavani et al. (2007) reported that protein fractions were
significantly different in normal and subclinical mastitis milk. Ogole (2007) also reported that clinical
and subclinical mastitis produced significant changes in composition of milk. Anemia is another reason
for decline in SNF and since incidence of hemoparasites is quite high in Wayanad due to its proximity to
forest areas; this could be a major reason. Perry and Randolph (1999) reported great economic losses in
productivity of dairy cattle due to parasitism.
SNF content of milk decreases with age of the cow. Within any given lactation, SNF content is
relatively high the first month, drops to a low the second, then rises as lactation progresses. As far as this
study is concerned, SNF was low throughout, irrespective of stage of lactation and during the later stages
of lactation when fat percentage increased; there was considerable reduction in SNF. The overall average
for milk solids not fat percentage for morning and evening were 8.354 ± 0.020 and 8.208 ± 0.026 (Table-
2), which was below the prescribed PFA standards of 8.5%. Mech (2008) also reported that SNF did not
vary with different stages of lactation. But in another study in Northern India by Jadhav and Patange
(2009) on newly evolved genotype namely ―Phule triveni‖ revealed that fat, total solids and SNF, being
significantly (P<0.05) affected by the stage of lactation. Least square analysis for milk solids not fat
percentage revealed that the effect of centre was highly significant, whereas parity and season had no
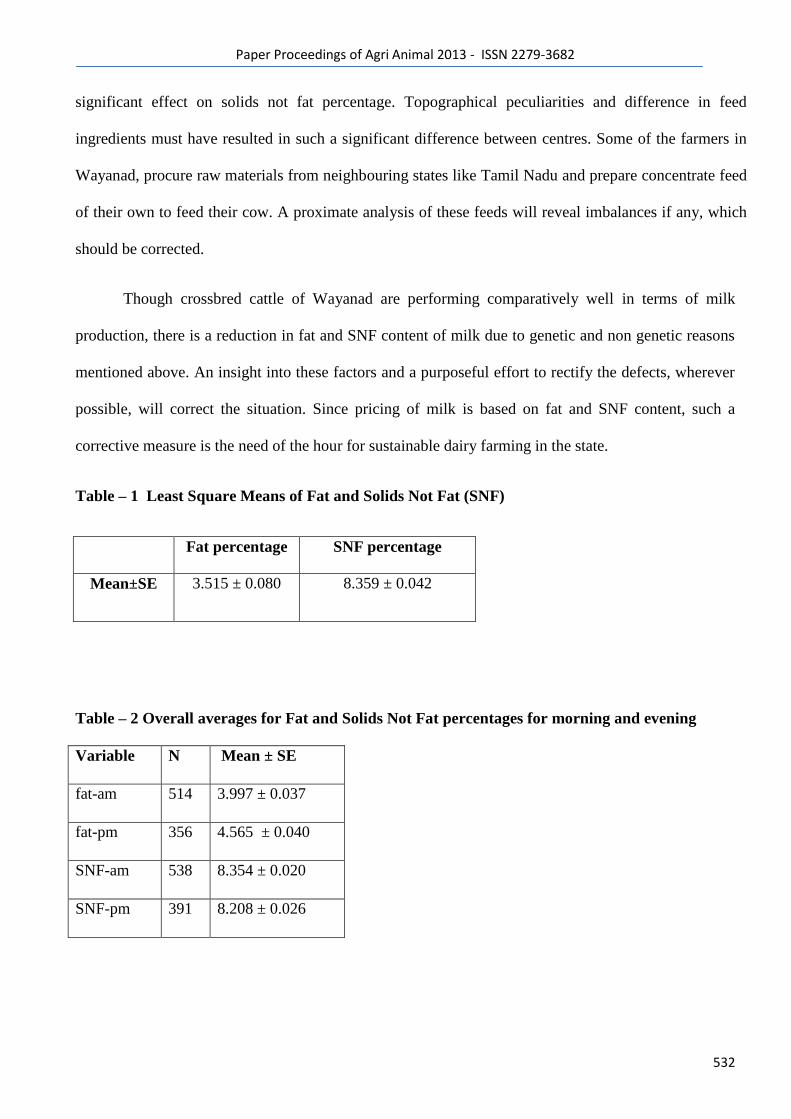
Paper Proceedings of Agri Animal 2013 - ISSN 2279-3682
532
significant effect on solids not fat percentage. Topographical peculiarities and difference in feed
ingredients must have resulted in such a significant difference between centres. Some of the farmers in
Wayanad, procure raw materials from neighbouring states like Tamil Nadu and prepare concentrate feed
of their own to feed their cow. A proximate analysis of these feeds will reveal imbalances if any, which
should be corrected.
Though crossbred cattle of Wayanad are performing comparatively well in terms of milk
production, there is a reduction in fat and SNF content of milk due to genetic and non genetic reasons
mentioned above. An insight into these factors and a purposeful effort to rectify the defects, wherever
possible, will correct the situation. Since pricing of milk is based on fat and SNF content, such a
corrective measure is the need of the hour for sustainable dairy farming in the state.
Table – 1 Least Square Means of Fat and Solids Not Fat (SNF)
Fat percentage
SNF percentage
Mean±SE
3.515 ± 0.080
8.359 ± 0.042
Table – 2 Overall averages for Fat and Solids Not Fat percentages for morning and evening
Variable N Mean ± SE
fat-am
514 3.997 ± 0.037
fat-pm
356 4.565 ± 0.040
SNF-am 538 8.354 ± 0.020
SNF-pm 391 8.208 ± 0.026
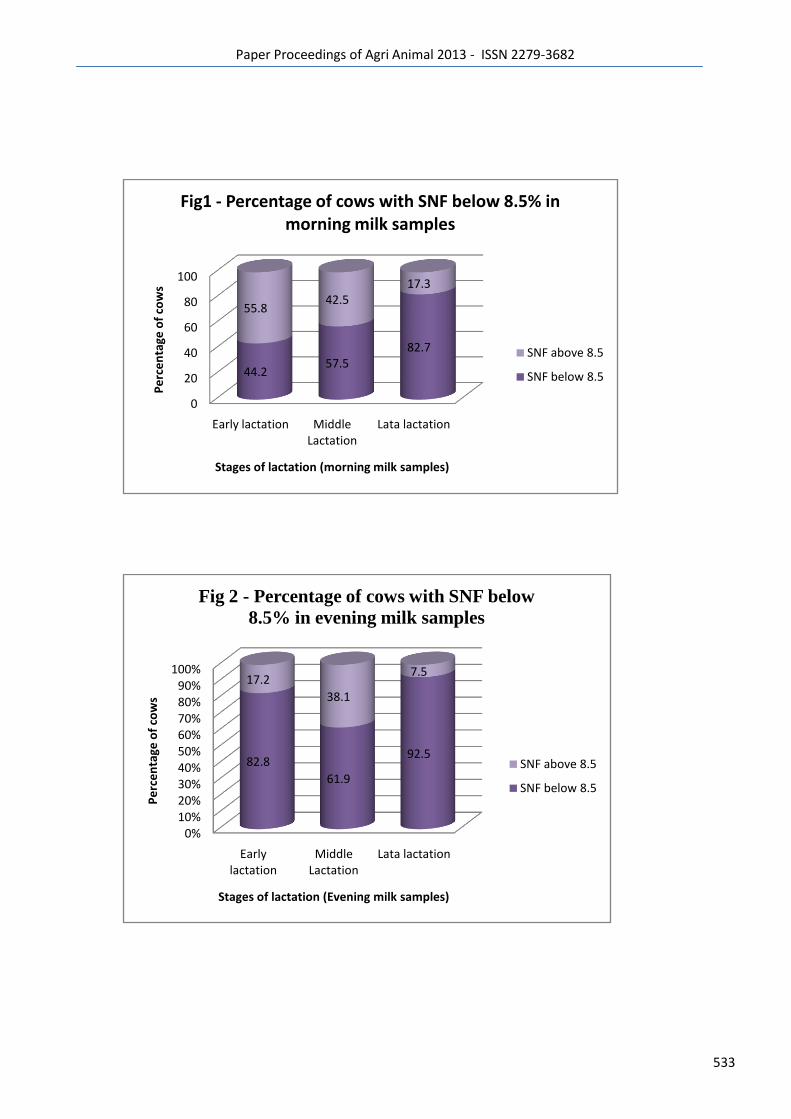
Paper Proceedings of Agri Animal 2013 - ISSN 2279-3682
533
0
20
40
60
80
100
Early lactation Middle Lactation
Lata lactation
44.257.5
82.7
55.842.5
17.3
Pe
rce
nta
ge o
f co
ws
Stages of lactation (morning milk samples)
Fig1 - Percentage of cows with SNF below 8.5% in morning milk samples
SNF above 8.5
SNF below 8.5
0%10%20%30%40%50%60%70%80%90%
100%
Early lactation
Middle Lactation
Lata lactation
82.8
61.9
92.5
17.2
38.1
7.5
Pe
rce
nta
ge o
f co
ws
Stages of lactation (Evening milk samples)
Fig 2 - Percentage of cows with SNF below
8.5% in evening milk samples
SNF above 8.5
SNF below 8.5
Paper Proceedings of Agri Animal 2013 - ISSN 2279-3682
534
Acknowledgement – The authors are thankful to The Dean, College of Veterinary and Animal
Sciences, Pookode, Wayanad and to The Department of Animal Husbandry, Kerala for providing the
facilities required for conduct of the study.
REFERENCE
Alfonso-avila, A.R., Wattiaux,M.A., Espinoza-OrtegaA., Sánchez-Vera,E., Arriaga-Jordán,C.M. 2012.
Local feeding strategies and milk composition in small-scale dairy production systems during the
rainy season in the highlands of Mexico. Tropical Animal Health and Production44(3) : 637-644.
Batavani, R.A., Asri, S. and Naebzadeh, H. 2007.The effect of subclinical mastitis on milk
composition of dairy cows. Iranian Journal of Veterinary Research 8(3):205-211.
Disease Surveillance Report 2006. Animal disease surveillance scheme (Kerala State)
http://www.jivaonline.net/Disease.html
Harris. B and. Bachman. K.C. 1988. Genetic and Non-genetic factors affecting milk yield and
composition. University of Florida, IFAS Extension. Publication DS 25
Jadhav, B.S., Patange, D.D. 2009. Effect of lactation order and stage of lactation on Fat, TS and SNF
content of milk of Phule Triveni cow. Indian Journal of Animal Research 43 (3):203-205.
‗Karshakasree‘, July, 2005, 10(11): 8-11.
Mech A., Dhali A., Prakash B. and Rajkhowa C. 2008. Variation in milk yield and milk composition
during the entire lactation period in Mithun cows (Bos frontalis) Livestock Research for Rural
Development 20(5) Accessed at http://www.lrrd.org/lrrd20/5/mech20075.htm
MRCMPU (Malabar Regional Co-operative Milk Producer‘s Union Ltd., Kozhikode).1995. A report
on the study on prevailing SNF% in Malabar Region. Pp-13-15.
Paper Proceedings of Agri Animal 2013 - ISSN 2279-3682
535
Ogola, H., Shitandi, A. and Nanua, J. 2007. Effect of mastitis on raw milk compositional quality
Journal of Veterinary Science 8(3): 237–242.
Perry, B. D. and Randolph, T. F. 1999. Improving the assessment of the economic impact of
parasitic diseases and of their control in production animals. Veterinary Parasitology 84(3):145-168.
Radhika.G, 1997. Evaluation of Holstein Crossbred bulls based on milk composition of progenies.
MVSc. Thesis submitted to Kerala Agricultural University.
Radhika,G.; Iype,S.1999. Studies on solids-not-fat content of milk of crossbred cows under village
conditions and organized farms of Kerala.Indian Journal of Animal Science 69(7) : 522-524.
Sebastian, M. and Geevarghese, P.I. 1995. A new lactometric model for estimation of total solids in
milk. Indian Journal of Dairy Science 48(7):465-468.
Sethi, I.C. 2002. Project Report. Statistical Package for Animal Breeding. Indian Agricultural Statistics
Research Institute, New Delhi, 57p
Shelke,S.K., Thakur,S.S. and Amrutkar, S.A. 2012. Effect of feeding protected fat and proteins on
milk production, composition and nutrient utilization in Murrah buffaloes (Bubalus bubalis) Animal
Feed Science and Technology 171(2):98-107. 1

Paper Proceedings of Agri Animal 2013 - ISSN 2279-3682
536
36
Paper Proceedings of Agri Animal 2013 - ISSN 2279-3682
537
Incidences of mealybugs from the Banana and plantain crops (Musa sp) in the Jaffna District,
Sri Lanka.
1Prishanthini Muthulingam,
2Muthuladchumy Vinobaba and
3Rajendramani Gnaneswaran
1Department of Zoology, Faculty of Science, Eastern University, Sri Lanka
2Department of Zoology, Faculty of Science, Eastern University, Sri Lanka
3Department of Zoology, Faculty of Science, University of Jaffna, Sri Lanka
Abstract
Banana is the most widely consumed fruit in Sri Lanka with highest production. It is an attractive
perennial fruit crop for small farmers of Jaffna district of the Northern Sri Lanka and it contributes
significantly to local agricultural production. A field survey was conducted to identify mealybug
species, nature of damage and distribution associated Musa sp plants in some selected areas of Jaffna
district, Sri Lanka during the period from August 2011 and November 2012. Thirty randomly selected
locations from sixteen villages covering five divisional secretariats were surveyed and mealybugs were
collected once in a month throughout the study period. Sampling locations included large and small
scale commercial banana plantations and home gardens. Throughout the survey more than 3000 plants
were checked and among them 73 percentage of plants were found with mealybug infestations. The
pest was identified as Dysmicoccus neobrevipes Beardsley commonly called as Annona mealybug or
Grey pineapple mealybug. Higher infestations observed on the Ambun (Etharai) banana varieties
i.e.45%. Maintenance of hygienic farm environment is recommended as a good management practice
for this pest. Further studies and close monitoring on this pest are essential and also important to
handle the pest problems in the near future.
Key words: Dysmicoccus neobrevipes, Musa sp. Pseudostem, Vector
Paper Proceedings of Agri Animal 2013 - ISSN 2279-3682
538
INTRODUCTION
In Sri Lanka mealybugs (Hemiptera: Pseudococcidae) are a group of scale insects that are of special
interest because of the local introduction of invasive mealybug species in recent years. Fifty-five
mealybug species belong to twenty-five genera have been recorded so far from Sri Lanka and It has
been stated that five species were responsible for the epidemic in the country i.e. Papaya mealybug,
Paracoccus marginatus Williams and Granara de Willink on papaw and Plumeria spp.ii (Galanihe et
al. 2010); Gray pineapple mealybug (Dysmicoccus neobrevipes Beardsley) on banana (Musa spp.)iii
(Anon 2009); Cotton mealybug (Phenacoccus solenopsis Tinsley) on a wide range of crops and
weedsiv
(Prishanthini and Vinobaba, 2009); Rastrococcus invadens Williams, on Ficus &Plumeria
v(Williams 2004); and R. rubellus Williams, on Plumeria a new record for Sri Lanka. Recently three
new species recorded by Sirisena et al (2012)vi
were Antonina thaiensis Takahashi 1942, Ferrisia
malvestra Mc Daniel 1962, and Pseudococcus jackbeardsleyi Gimpel& Miller 1996. These mealybugs
cause serious threats for a profitable agricultural production as well as affect the aesthetic value of
plants.
Banana (Musa sp.) is the most widely cultivated and consumed fruit in Sri Lanka. It is also an
attractive perennial fruit crop for farmers due to its high economic gains throughout the year. It plays a
very important role among the fruit crops in Sri Lanka interms of extent of production and
consumptionvii
(Kudagamage, 2003). Sri Lanka‘s per capita consumption of fruits and vegetables
remains far below the required average daily intake. There is an increasing demand for fruits and
vegetables in the local markets and the supply has to be increased to match the increasing demand. The
opening up of the North and the East, which are mainly agriculture producing areas increases the
potential to grow fruits and vegetables in Sri Lanka. The Sri Lankan banana varieties are in high
demand abroad. However, a major challenge faced by exporters is finding exportable quality fruits in
sufficient quantities for export.
Paper Proceedings of Agri Animal 2013 - ISSN 2279-3682
539
According to the Government Statistics, domestic production of banana in 2009 is 383784 mt and
exports are 2649 mt this is 0.7% of the total exports viii
(Anon, 2009). The potential average yield under
good management is around 25 t/ha. Banana is grown all over the island except in higher elevation.
Cultivation of banana is popular among farmers in Jaffna peninsula due to its higher demand and
suitability to dry zone and it serves as a main source of income to 4000 farm families in Jaffna
peninsula and the average monthly income is ranging from LKR 18,500 to 21,000ix
(Thiruchelvan et
al, 2012).The extent of banana in the Jaffna district was 975.5 ha as in the year 2011x (Anon, 2012).
Nowadays cultivation of banana in Jaffna peninsula shows an increasing trend both in extent and
production. It has been reported that Urumpiray, Uduvil and Puthoor divisions contribute 58% of the
production of Jaffna peninsula and the rest from other divisions (Personal communication). In
addition it is grown in all home gardens to provide leaf and the fruits. Among major local banana
cultivars, Kathali is cultivated as higher percentage as (59%) after that Itharai (34%) and others
Kappal and Monthan (Thiruchelvam et al, 2012).Table 1 shows the local names of popular varieties of
Musa sp being cultivated in Jaffna district.
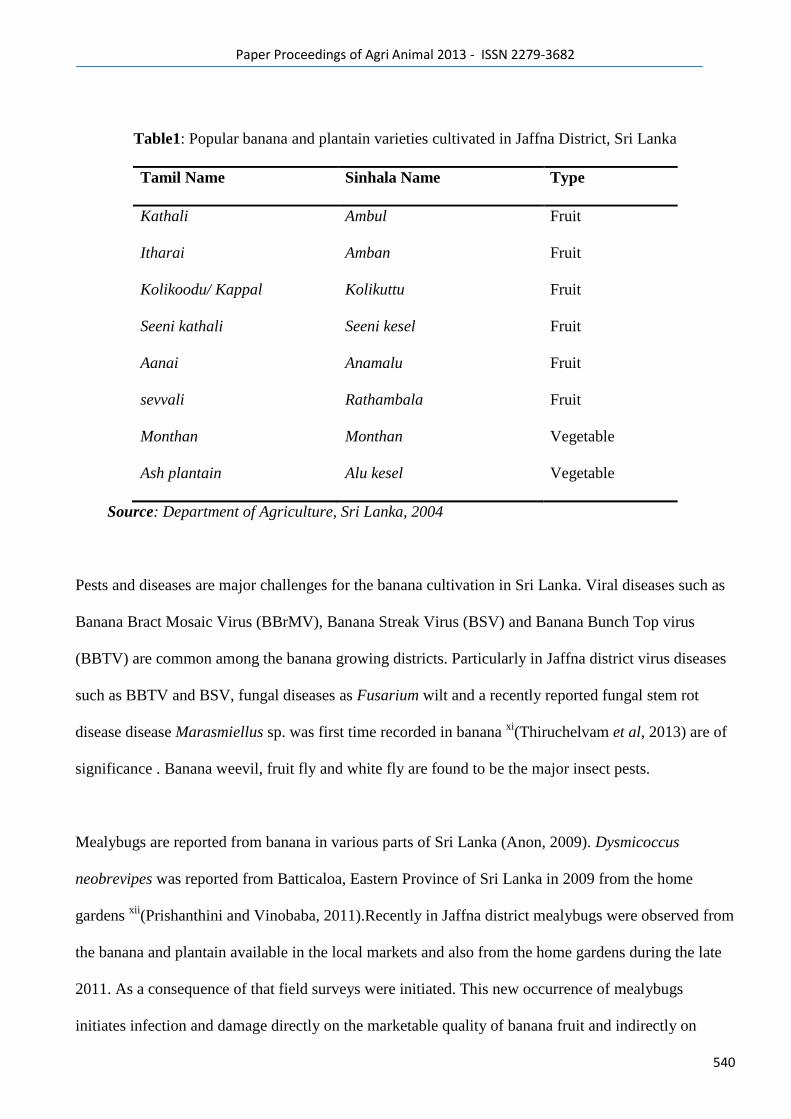
Paper Proceedings of Agri Animal 2013 - ISSN 2279-3682
540
Table1: Popular banana and plantain varieties cultivated in Jaffna District, Sri Lanka
Tamil Name Sinhala Name Type
Kathali Ambul Fruit
Itharai Amban Fruit
Kolikoodu/ Kappal Kolikuttu Fruit
Seeni kathali Seeni kesel Fruit
Aanai Anamalu Fruit
sevvali Rathambala Fruit
Monthan Monthan Vegetable
Ash plantain Alu kesel Vegetable
Source: Department of Agriculture, Sri Lanka, 2004
Pests and diseases are major challenges for the banana cultivation in Sri Lanka. Viral diseases such as
Banana Bract Mosaic Virus (BBrMV), Banana Streak Virus (BSV) and Banana Bunch Top virus
(BBTV) are common among the banana growing districts. Particularly in Jaffna district virus diseases
such as BBTV and BSV, fungal diseases as Fusarium wilt and a recently reported fungal stem rot
disease disease Marasmiellus sp. was first time recorded in banana xi
(Thiruchelvam et al, 2013) are of
significance . Banana weevil, fruit fly and white fly are found to be the major insect pests.
Mealybugs are reported from banana in various parts of Sri Lanka (Anon, 2009). Dysmicoccus
neobrevipes was reported from Batticaloa, Eastern Province of Sri Lanka in 2009 from the home
gardens xii
(Prishanthini and Vinobaba, 2011).Recently in Jaffna district mealybugs were observed from
the banana and plantain available in the local markets and also from the home gardens during the late
2011. As a consequence of that field surveys were initiated. This new occurrence of mealybugs
initiates infection and damage directly on the marketable quality of banana fruit and indirectly on
Paper Proceedings of Agri Animal 2013 - ISSN 2279-3682
541
banana leaves as well as its fruits production. It is expected to become a serious problem in
forthcoming periods due to its mode of dispersal and the prevailing ecological conditions. This study
aims to identify the mealybug pests occurring in banana and plantain crops and to study its
distribution, host range and diagnose the problems and severity of infection along with their farm
management practices.
MATERIALS AND METHODS
Study area
This study constitutes part of a larger study on the bionomics of mealybug species occurring in the low
country dry zone of Sri Lanka. Investigations were carried out at the Department of Zoology, Eastern
University, Sri Lanka and the Department of Zoology, University of Jaffna, Sri Lanka, and surveys
and sample collections were conducted from some selected home gardens and farms from Jaffna
district. Field studies were conducted during the period from August 2011 and November 2012. Fifty
randomly selected locations from sixteen villages covering five divisional secretariats as mentioned in
the Table 2 were surveyed. Figure 1 shows the map locating the sampling localities. Sampling
locations included large and small scale commercial banana and plantain cultivations s and home
gardens.
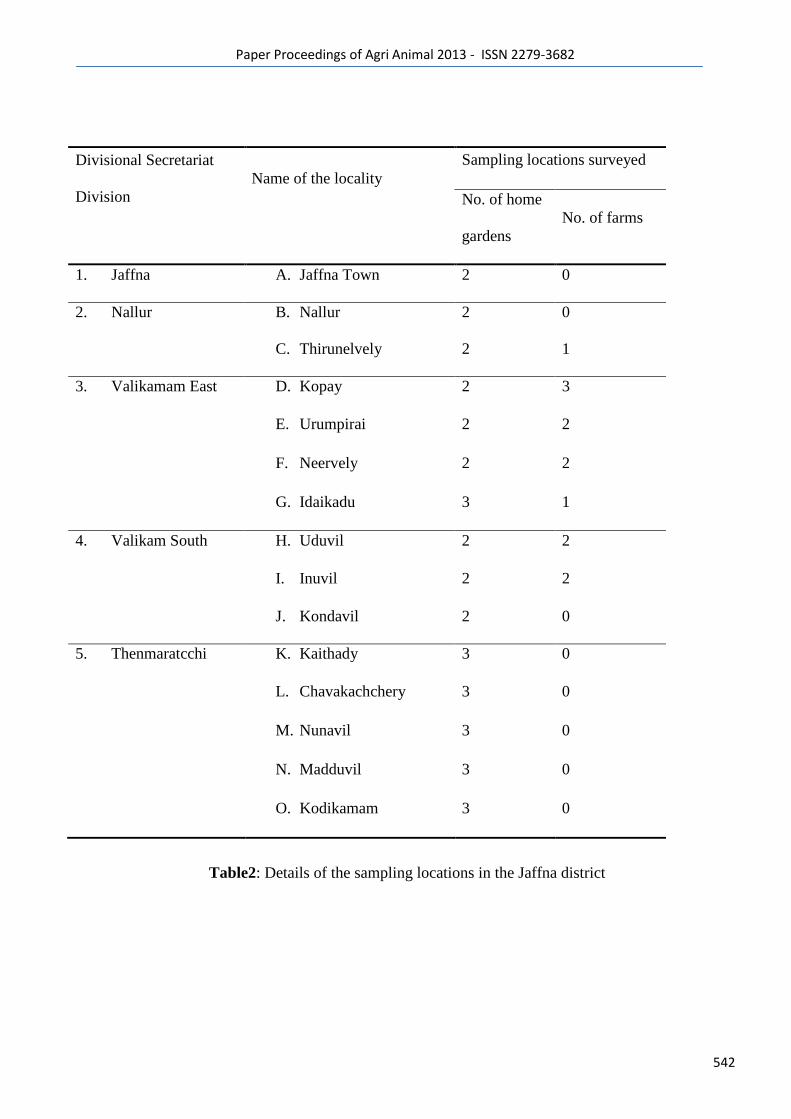
Paper Proceedings of Agri Animal 2013 - ISSN 2279-3682
542
Table2: Details of the sampling locations in the Jaffna district
Divisional Secretariat
Division
Name of the locality
Sampling locations surveyed
No. of home
gardens
No. of farms
1. Jaffna A. Jaffna Town 2 0
2. Nallur B. Nallur 2 0
C. Thirunelvely 2 1
3. Valikamam East D. Kopay 2 3
E. Urumpirai 2 2
F. Neervely 2 2
G. Idaikadu 3 1
4. Valikam South H. Uduvil 2 2
I. Inuvil 2 2
J. Kondavil 2 0
5. Thenmaratcchi K. Kaithady 3 0
L. Chavakachchery 3 0
M. Nunavil 3 0
N. Madduvil 3 0
O. Kodikamam 3 0
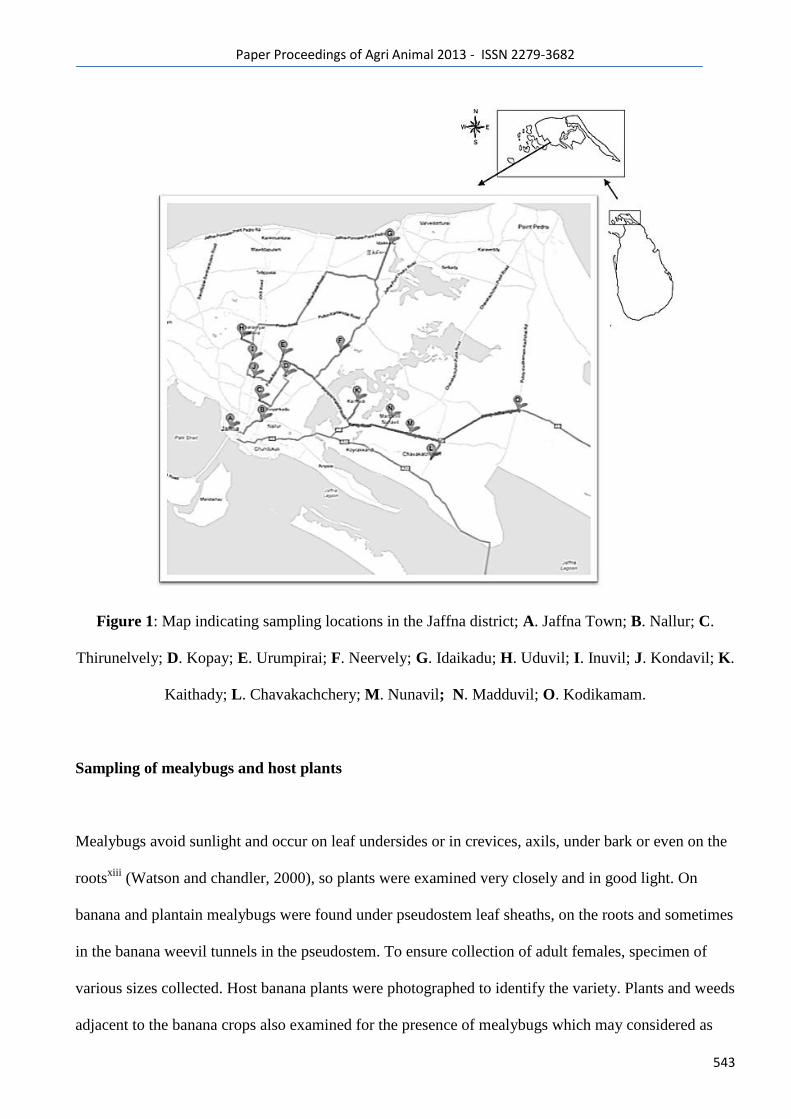
Paper Proceedings of Agri Animal 2013 - ISSN 2279-3682
543
Figure 1: Map indicating sampling locations in the Jaffna district; A. Jaffna Town; B. Nallur; C.
Thirunelvely; D. Kopay; E. Urumpirai; F. Neervely; G. Idaikadu; H. Uduvil; I. Inuvil; J. Kondavil; K.
Kaithady; L. Chavakachchery; M. Nunavil; N. Madduvil; O. Kodikamam.
Sampling of mealybugs and host plants
Mealybugs avoid sunlight and occur on leaf undersides or in crevices, axils, under bark or even on the
rootsxiii
(Watson and chandler, 2000), so plants were examined very closely and in good light. On
banana and plantain mealybugs were found under pseudostem leaf sheaths, on the roots and sometimes
in the banana weevil tunnels in the pseudostem. To ensure collection of adult females, specimen of
various sizes collected. Host banana plants were photographed to identify the variety. Plants and weeds
adjacent to the banana crops also examined for the presence of mealybugs which may considered as
Paper Proceedings of Agri Animal 2013 - ISSN 2279-3682
544
alternate hosts. Pieces of infested plants were collected into polythene bags, kept inside a regiform box
and transported to the laboratory. Appearance of the mealybugs was noted and photographed using a
dissection microscope and incident illumination.
Preservation and identification of mealybugs
Mealybug samples were collected from Musa sp. and were preserved in glass vials containing 70%
alcohol. For initial identifications the collected mealybugs were laboratory reared on unripe banana of
kathali variety. Both field collected and laboratory reared were cleared and prepared for microscopic
examination and identification by the method described by Watson and Chandler (2000). Slide
mounted adult females were examined using a Trinocular fluorescent microscope (Labomed, USA),
photographed and identified using the taxonomic key provided by Williams (2004).
RESULTS AND DISCUSSION
The pest was identified as Dysmicoccus neobrevipes Beardsley, 1959 commonly called as Annona
mealybug or Grey pineapple mealybug by the first author and taxonomically confirmed by the third
author.
Description of Dysmicoccus neobrevipes
Adult female
Field characteristics: In life the body was oval or rotund; gray or gray-orange; legs yellowish brown;
body covered by flocculent white mealy wax, without bare areas on dorsum; dorsal ovisac absent, a
few filamentous strands on venter; with 17 pairs of conspicuous lateral wax filaments, often slightly
curved, posterior pairs longest, one-third to one-half as long as body, anterior filaments shorter than
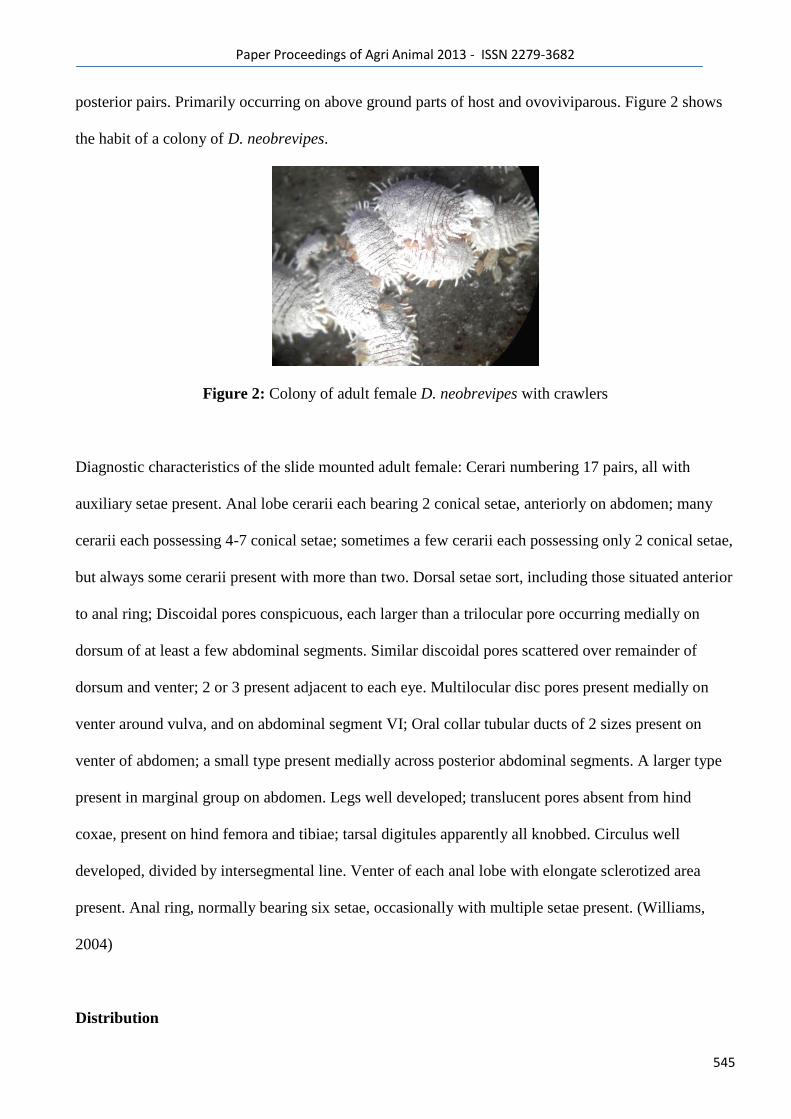
Paper Proceedings of Agri Animal 2013 - ISSN 2279-3682
545
posterior pairs. Primarily occurring on above ground parts of host and ovoviviparous. Figure 2 shows
the habit of a colony of D. neobrevipes.
Figure 2: Colony of adult female D. neobrevipes with crawlers
Diagnostic characteristics of the slide mounted adult female: Cerari numbering 17 pairs, all with
auxiliary setae present. Anal lobe cerarii each bearing 2 conical setae, anteriorly on abdomen; many
cerarii each possessing 4-7 conical setae; sometimes a few cerarii each possessing only 2 conical setae,
but always some cerarii present with more than two. Dorsal setae sort, including those situated anterior
to anal ring; Discoidal pores conspicuous, each larger than a trilocular pore occurring medially on
dorsum of at least a few abdominal segments. Similar discoidal pores scattered over remainder of
dorsum and venter; 2 or 3 present adjacent to each eye. Multilocular disc pores present medially on
venter around vulva, and on abdominal segment VI; Oral collar tubular ducts of 2 sizes present on
venter of abdomen; a small type present medially across posterior abdominal segments. A larger type
present in marginal group on abdomen. Legs well developed; translucent pores absent from hind
coxae, present on hind femora and tibiae; tarsal digitules apparently all knobbed. Circulus well
developed, divided by intersegmental line. Venter of each anal lobe with elongate sclerotized area
present. Anal ring, normally bearing six setae, occasionally with multiple setae present. (Williams,
2004)
Distribution
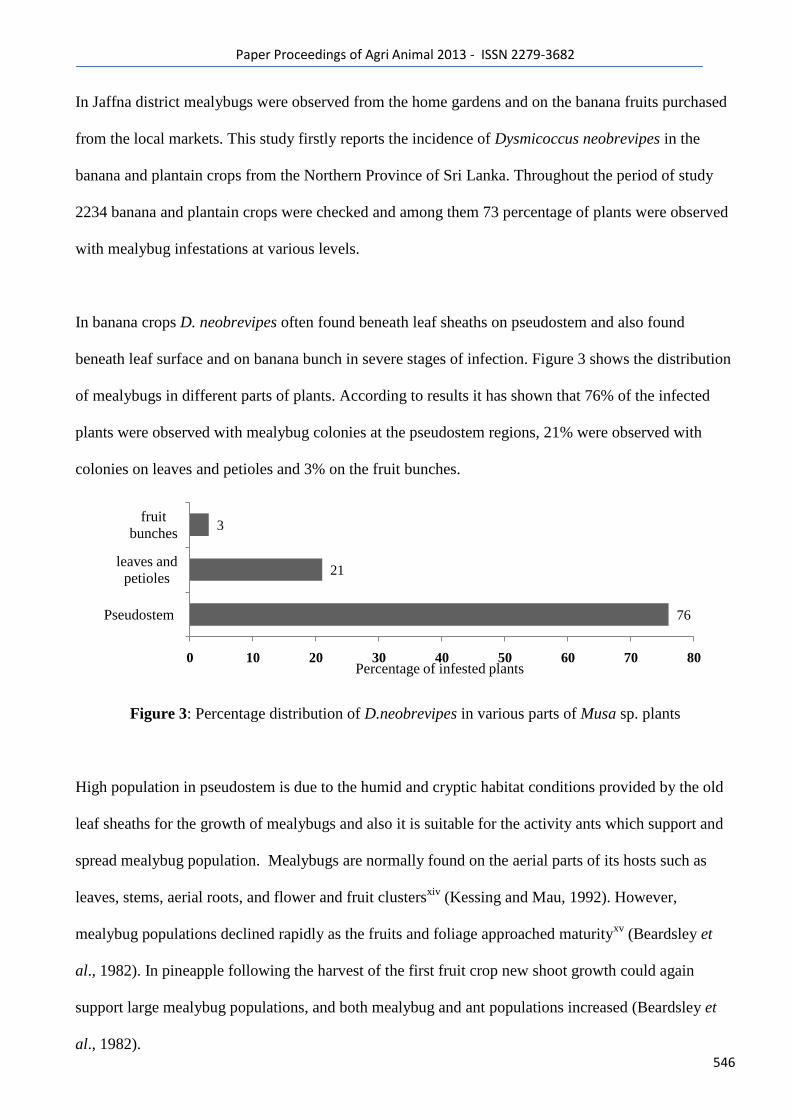
Paper Proceedings of Agri Animal 2013 - ISSN 2279-3682
546
In Jaffna district mealybugs were observed from the home gardens and on the banana fruits purchased
from the local markets. This study firstly reports the incidence of Dysmicoccus neobrevipes in the
banana and plantain crops from the Northern Province of Sri Lanka. Throughout the period of study
2234 banana and plantain crops were checked and among them 73 percentage of plants were observed
with mealybug infestations at various levels.
In banana crops D. neobrevipes often found beneath leaf sheaths on pseudostem and also found
beneath leaf surface and on banana bunch in severe stages of infection. Figure 3 shows the distribution
of mealybugs in different parts of plants. According to results it has shown that 76% of the infected
plants were observed with mealybug colonies at the pseudostem regions, 21% were observed with
colonies on leaves and petioles and 3% on the fruit bunches.
Figure 3: Percentage distribution of D.neobrevipes in various parts of Musa sp. plants
High population in pseudostem is due to the humid and cryptic habitat conditions provided by the old
leaf sheaths for the growth of mealybugs and also it is suitable for the activity ants which support and
spread mealybug population. Mealybugs are normally found on the aerial parts of its hosts such as
leaves, stems, aerial roots, and flower and fruit clustersxiv
(Kessing and Mau, 1992). However,
mealybug populations declined rapidly as the fruits and foliage approached maturityxv
(Beardsley et
al., 1982). In pineapple following the harvest of the first fruit crop new shoot growth could again
support large mealybug populations, and both mealybug and ant populations increased (Beardsley et
al., 1982).
76
21
3
Pseudostem
leaves and
petioles
fruit
bunches
0 10 20 30 40 50 60 70 80Percentage of infested plants
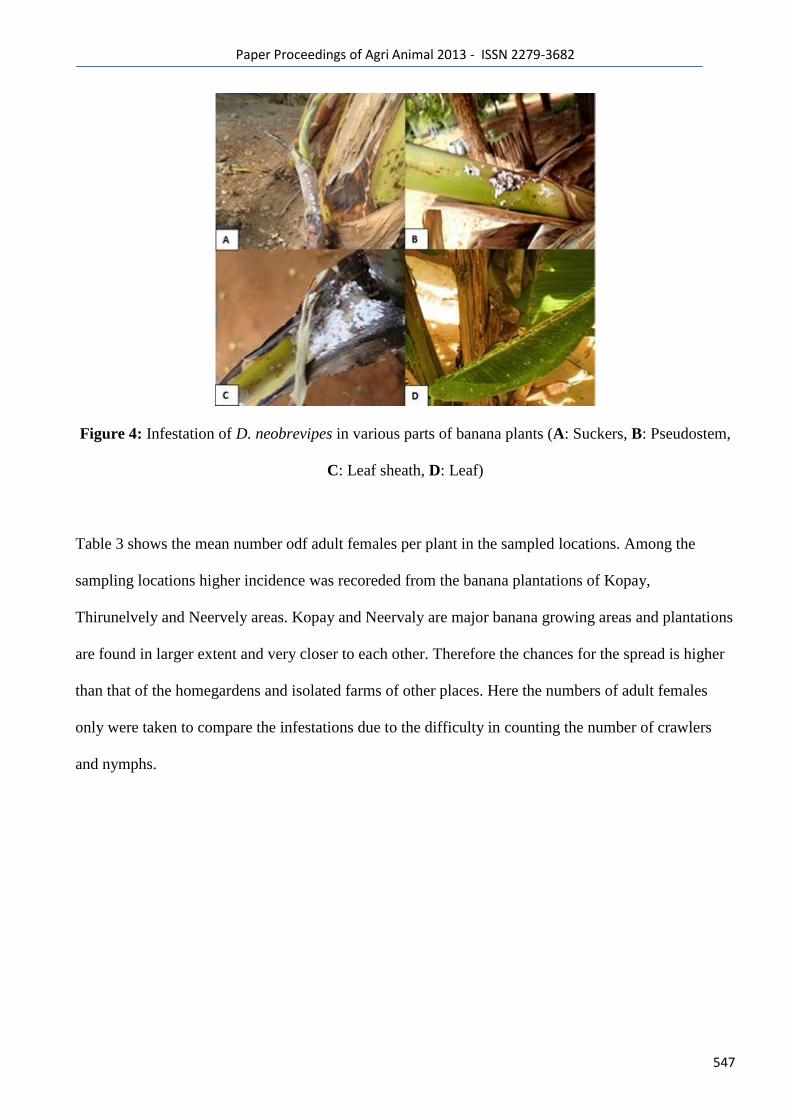
Paper Proceedings of Agri Animal 2013 - ISSN 2279-3682
547
Figure 4: Infestation of D. neobrevipes in various parts of banana plants (A: Suckers, B: Pseudostem,
C: Leaf sheath, D: Leaf)
Table 3 shows the mean number odf adult females per plant in the sampled locations. Among the
sampling locations higher incidence was recoreded from the banana plantations of Kopay,
Thirunelvely and Neervely areas. Kopay and Neervaly are major banana growing areas and plantations
are found in larger extent and very closer to each other. Therefore the chances for the spread is higher
than that of the homegardens and isolated farms of other places. Here the numbers of adult females
only were taken to compare the infestations due to the difficulty in counting the number of crawlers
and nymphs.
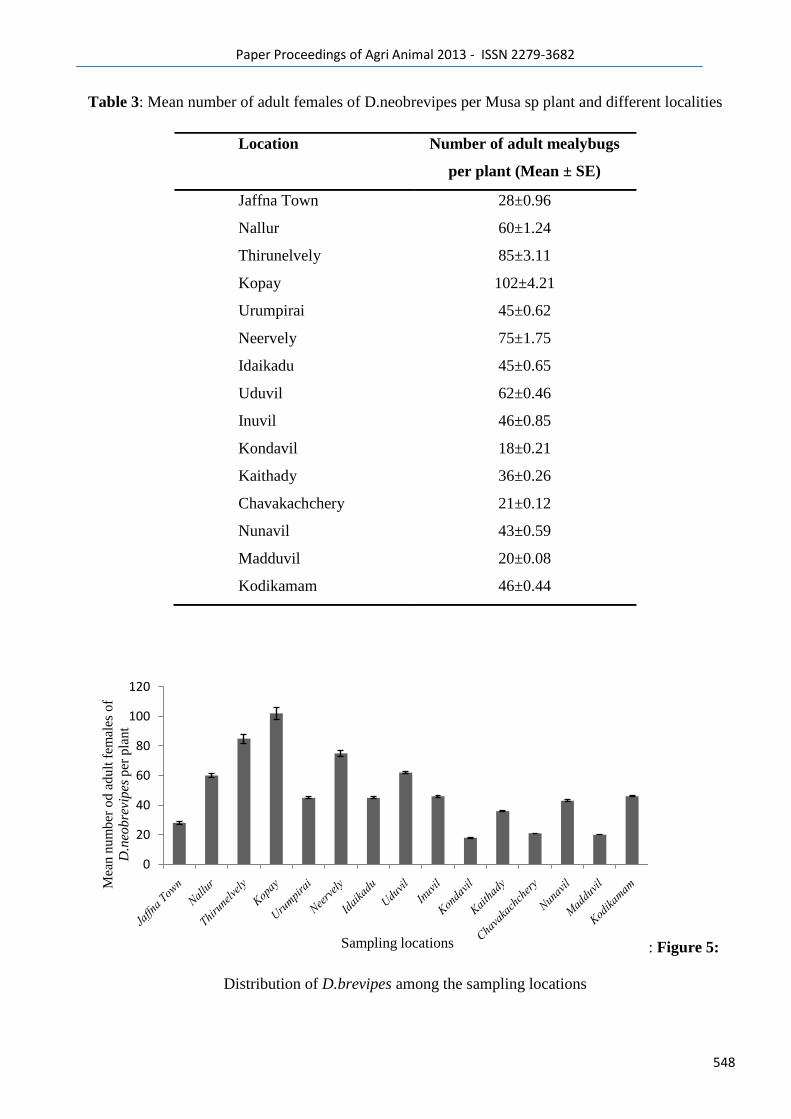
Paper Proceedings of Agri Animal 2013 - ISSN 2279-3682
548
Table 3: Mean number of adult females of D.neobrevipes per Musa sp plant and different localities
: Figure 5:
Distribution of D.brevipes among the sampling locations
0
20
40
60
80
100
120
Mea
n n
um
ber
od a
dult
fem
ales
of
D.n
eobre
vipes
per
pla
nt
Sampling locations
Location Number of adult mealybugs
per plant (Mean ± SE)
Jaffna Town 28±0.96
Nallur 60±1.24
Thirunelvely 85±3.11
Kopay 102±4.21
Urumpirai 45±0.62
Neervely 75±1.75
Idaikadu 45±0.65
Uduvil 62±0.46
Inuvil 46±0.85
Kondavil 18±0.21
Kaithady 36±0.26
Chavakachchery 21±0.12
Nunavil 43±0.59
Madduvil 20±0.08
Kodikamam 46±0.44
Paper Proceedings of Agri Animal 2013 - ISSN 2279-3682
549
Host range
Mealybugs collected from banana crops of all the sampled localities were similar in all taxonomic
features and confirmed as the same Dysmicoccus neobrevipes, the only species of mealybug infecting
Musa sp plants of the study area. Other than this major host specimen were collected from some other
hosts listed in the Table 4. This species was collected from several localities of Sri Lanka from
different host plants. Dysmicoccus neobrevipes was found mainly in the Western province (Anon,
2009). It was also reported from Eastern province in the later part of 2009. In addition to banana they
attack mainly on Annona sp and Psidium guajava. It isreported from 7 host plants from 5 families in
the Batticaloa district (Prishanthini and Vinobaba, 2012). Worldwide it is reported from 84 plant
species from 41 families xvi
(Ben Dov et al, 2012).
Table 4: Host plants of D. neobrevipes in Jaffna district
Family Scientific name English / Vernacular name
Anacardiaceae Mangifera indica Mango
Annonaceae Annona reticulata Custard apple
Annonaceae Annona squamosa Custard apple
Arecaceae Cocos nucifera Coconut
Caesalpiniaceae Cassia fistula
The golden shower tree
(konrai*)
Cucurbitaceae Cucurbita maxima Pumpkin
Dioscoreaceae Dioscorea alata Rasavalli*
Myrtaceae Psidium guajava Guava
Musaceae Musa sp. Plantain and Banana
*Local Tamil names
Paper Proceedings of Agri Animal 2013 - ISSN 2279-3682
550
Among the different varieties of banana and plantain crops infestation levels varied with varieties and
the Etharai banana varieties found with higher infestations. Infestations were observed higher in the
Etharai varieties (45%), kathali, Monthan, Seenikathali ranked 2nd
, 3rd
and fourth respectively.
Damages caused by Dysmicoccus neobrevipes
Affected matured plants particularly did not show any symptoms. However, small suckers showed
stunted growth drying and ultimately death. Mealybugs cause direct and indirect damage to the plants.
Direct damage is by feeding on leaves or fruits, and this is usually by sucking out sap from plants.
Indirect damage is by secretion of honeydew, whose fermentation results to formation of sooty mould
fungus. As population of the bug increases, concentration of honey dew and sooty fungi also increases.
This changes the colour of the fruits from green or yellow to black and thus affecting their aesthetic
value (not attractive to customers) Because of this most fruits are usually rejected leading to
considerable loss of marketable fruits. Since they feed by sucking out sap, it might be possible for
them to transmit diseases from one plant to another. The mealybug population reaches its peak in the
late dry season and is sometimes found on some flowering plants and cassava nearer the plantations.
Mealybugs have been little studied as vectors of virus diseases, although there is evidence for
transmission of BSV in bananas by D. neobrevipes, no records available from Sri Lanka in this
context. The spread of mealybugs the potential vectors for banana viral diseases in the study area is in
a faster trend. Therefore there is an urgent need for intensive studies on the viral transmission
capabilities of these mealybugs.
Paper Proceedings of Agri Animal 2013 - ISSN 2279-3682
551
Natural enemies and association of ants
During the one year period of sampling no natural enemy population was observed on mealybug
colonies found in banana and plantain crops in the surveyed fields. Absence of natural enemies is may
be due to the following reasons: (1) The activity of ants on mealybug colonies may prevent the natural
enemies to establish on pests; (2) absence of food source for the adult stages of parasitoid in the farms
and (3) population dynamics and the comparatively low density of pest may not support the
establishment of natural enemy populations. In the field studies the fire ant Solenopsis geminata (Sub
family – Mymircinae), Crematogaster sp.(Sub family – Mymircinae), Tapinoma melanocepalum (Sub
family –Dolichoderinae) and Meranoplus bicolor (Sub family – Mymircinae) were observed with
associations with D. neobrevipes. Inpineapple fields in Hawaii, D. neobrevipes is tended
by Pheidole megacephala (big-headed ant). This ant greatly encourages the mealybug by interfering
with their natural enemies, and maintaining the health of the mealybug colony by removing excess
honeydew (Beardsley et al., 1982). Ants move mealybugs from one plant to another, and control of
mealybugs depends on control of the ants (Beardsley et al., 1982; xvii
Carter, 1973; xviii
McEwen et al.,
1979). However, in the absence of natural enemies and inclement weather, the ants do not move
mealybugs from one plant to another and do not cause an increase in mealybug populationsxix
(Jahn
and Beardsley, 1996). Attempts to use natural enemies to control mealybugs have been unsuccessful
unless the ants were also controlled xx
(Rohrbach et al., 1988).
Management of mealybug D.neobrevipes.
Based on the preliminary observations plantations and home gardens properly maintained were with
lowered mealybug infestation. Inaddition to that some different kinds of farmimg and farm
management practices affects the abundance of mealybugd in plantaions. These practices were:
provision of water conservation structutes (water bunds), application of an organic mulch, regular
desuckering, regular detrashing, manure application, regular weeding and intercropping or
monocropping. The practices of detrashing and desuckering that improve illumination and aeration in
Paper Proceedings of Agri Animal 2013 - ISSN 2279-3682
552
plantations reduced mealybug abundance, possibly because dark, warm humid conditions are
favourable for the reproduction and colonization of mealybugs. Other practices targetting soil
improvementand water conservation not directly affect meaybug population but they provide suitable
habitat for ants. Ants serve as main carriers of mealybugs from plant to plant and the crawlers able to
spread by wind, human and animals. When ants encounter a fence or wall they are likely to travel the
course of the fence rather than up and over the fence to forage on the other side. Physical barriers such
as ant fences running parallel to the field periphery are partially successful in keeping ants out of the
field, and subsequently controlling mealybug populations. Previously infested fields should be
ploughed and crop residue removed or burned. Crop residues and grass roots left in the field can
harbor mealybug populations and often provide an in field source of insects that will infest the new
crop.However banana fields with intercrops supports more mealybug colonies than those with banana
alone, probably because the intercrops act as alternate hosts. Field borders should be kept clean of
weeds and debris that may support mealybugs between plantings. Weeds also provide alternative food
sources that maintain ant populations between periods where mealybug infestations are small.
Maintenance of hygienic farm and homegarden environment is recommended as a best controlling
measure for this pest.
CONCLUSION
Dysmicoccus neobrevipes is the only mealybug species observed in the banana and plantain crops in
the study areas of Jaffna district and it has a potential to emerge as a serious pest. Banana cultivations
from the Kopay, Neerveli, and Uduvil areas and home gardens from Thirunelvely showed high
infestations. Other than Musa sp plants few other fruit crops also identified as potential hosts. So far no
natural enemy populations were identified and two ant species found to be associated with mealybug
colonies in Musa sp. Further studies have to be carried out to estimate and to prevent the post-harvest
losses in banana due to mealybugs and their role in viral disease transmission.
Paper Proceedings of Agri Animal 2013 - ISSN 2279-3682
553
ACKNOWLEDGEMENT
Financial support for this study through National Research Council, Sri Lanka Grant (NRC-11-192) is
kindly acknowledged.
References
*Assistant Professor, Dept. of Animal Breeding, Genetics and Biostatistics, CVAS, Mannuthy,
KVASU
** Professor and Head, Dept. of Veterinary Clinical medicine, CVAS, KVASU, Pookode, Wayanad iiGalanihe, L. D., M. U. P. Jayasundera, A. Vithana, N. Asselaarachchi, and G. W. Watson. 2011.
Occurrence, distribution and control of papaya mealybug, Paracoccus marginatus (Hemiptera:
Pseudococcidae), an invasive alien pest in Sri Lanka. Tropical Agricultural Research &
Extension 13(3):81–96.
iii Anonymous. 2009. Banana mealybug, identification and control (in Sinhala). Leaflet. Plant
Protection Service, Department of Agriculture, Peradeniya, Sri Lanka.
iv Prishanthini, M. and Vinobaba, M. 2012, Diversity of Mealybugs in home gardens of the Eastern
Province, Sri Lanka: Implications of the threat of invasive pests, Proceedings of the symposium,
Conservation Sri Lanka 2012, Institute of Biology, Biodiversity Secretariat, Ministry of Environment,
Sausiripaya, Colombo, 6th July 2012.
v Williams, D.J. 2004. Mealybugs of Southern Asia. The Natural History Museum, Kuala Lumpur:
Southdene SDN. BHD.. 896 pp.
Paper Proceedings of Agri Animal 2013 - ISSN 2279-3682
554
vi
Sirisena, U.G.A.I., Watson, G.W., Hemachandra, K.S. & Wijayagunasekara, H.N.P. (2012)
Mealybugs (Hemiptera: Pseudococcidae) introduced recently to Sri Lanka, with three new country
records. The Pan-Pacific Entomologist, 88(3): 365-367.
vii Kudagamage. C. 2005. Banana in Sri Lanka: Status and prospects. In: Advancing banana and
plantain R & D in Asia and the Pacific Vol. 12. Proceedings of the 3rd
BAPNET Steering Committee
Meeting. [Compte-rendu de la 3ème réunion du Comité de Pilotage BAPNET], Guangzhou (CHN),
2004/11/23-26.
viii Anonymous. 2009. Banana mealybug, identification and control (in Sinhala). Leaflet. Plant
Protection Service, Department of Agriculture, Peradeniya, Sri Lanka.
ix Thiruchchelvan, N. Thirukkumaran G. and Mikunthan, G. 2012. In vitroBiological Control of
Marasmiellus sp. The Causal of Stem Rot of Banana Grown in Jaffna Peninsula, Sri Lanka. Academic
Journal of Plant Sciences 5 (3): 94-101.
x Annonymous (2012), Statistical Information 2012, Northern Provincial Council, Jaffna
http://www.scribd.com/doc/105082011/Statistical-Information-2012-Northern-Province Accessed on
3rd
March 2013.
xi N. Thiruchchelvan, G. Thirukkumaran and G. Mikunthan, 2013, In vitro assessment of fungicides
against banana stem rot fungus, Marasmiellus sp. Annals of Biological Research, 4 (2):115-118
(http://scholarsresearchlibrary.com/archive.html)
xii Prishanthini, M. and Vinobaba, M. 2011. A survey of mealybugs and their natural enemies in home
gardens of Batticaloa, Sri Lanka, Proceedings of the 10th Annual Research Session.2011,Eastern
university, Sri Lanka, 202-208.
Paper Proceedings of Agri Animal 2013 - ISSN 2279-3682
555
xiii Watson, G.W and Chandler, L.R. 2000. Identification of mealybugs important in the carribean
region. Second edition (revised). Commomwealth science Council and CAB international,
Wallingford, UK.40 pp.
xivKessing, J.L.M. and Mau, R.F.L. (1992). Crop Knowledge Master. Dysmicoccus
neobrevipes (Beardsley).http://www.extento.hawaii.edu/kbase/crop/Type/d_neobre.htm
xvBeardsley, J.W. Jr, Su, T.H., McEwen, F.L. and Gerling, D. (1982). Field investigations on the
interrelationships of the big-headed ant, the gray pineapple mealybug, and pineapple wilt disease in
Hawaii. Proceedings of the Hawaiian Entomological Society 24, 51–67.
xvi Ben-Dov, Y., Miller, D.R. & Gibson, G.A.P. 2012, ScaleNet, Hosts of a Scale Query results.
http://www.sel.barc.usda.gov/scalecgi/hostsof.exe?Family=Pseudococcidae&genus=
Dysmicoccus&species=neobrevipes&subspecies= Accessed 20 March 2013.
xviiCarter, W. (1973). Insects in Relation to Plant Disease (Second edition). (New York, USA: John
Wiley and Sons), pp. 274–308.
xviiiMcEwen, F.L., Beardsley, J.W. Jr, Hapai, M. and Su, T.H. (1979). Laboratory tests with candidate
insecticides for control of the big-headed ant, Pheidole megacephala (Fabricius). Proceedings of the
Hawaiian Entomological Society 13, 119–123.
xixJahn, G.C. and Beardsley, J.W. (1996). Effects of Pheidole megacephala (Hymenoptera:
Formicidae) on survival and dispersal of Dysmicoccus neobrevipes (Homoptera:
Pseudococcidae). Journal of Economic Entomology 89, 1124–1129.

Paper Proceedings of Agri Animal 2013 - ISSN 2279-3682
556
xxxx
Rohrbach, K.G., Beardsley, J.W., German, T.L., Reimer, N.J. and Sanford, W.G. (1988). Mealybug
wilt, mealybugs, and ants on pineapple. Plant Disease 72, 558–565.
Related Documents
![Agri-A4a Information AGRI Oh! e O Oh! SERIES]](https://static.cupdf.com/doc/110x72/5acab7477f8b9a42358e1546/agri-a4a-information-agri-oh-e-o-oh-series-agri-800mm-d-w-oomm-h-agri-800mm.jpg)


