Archaeometry 49, 4 (2007) 795–813 doi: 10.1111/j.1475-4754.2007.00336.x *Received 28 October 2005; accepted 27 September 2006 †Corresponding author: email [email protected] © University of Oxford, 2007 Blackwell Publishing Ltd Oxford, UK ARCH Archaeometry 0003-813X © University of Oxford, 2007 XXX Original Articles Clustering Neolithic ceramics from Aegean and Asia Minor using XRF I. Papageorgiou and I. Liritzis *Received 28 October 2005; accepted 27 September 2006 MULTIVARIATE MIXTURE OF NORMALS WITH UNKNOWN NUMBER OF COMPONENTS: AN APPLICATION TO CLUSTER NEOLITHIC CERAMICS FROM AEGEAN AND ASIA MINOR USING PORTABLE XRF * IOULIA PAPAGEORGIOU† Department of Statistics, Athens University of Economics and Business, Patission 76, 10334 Athens, Greece and IOANNIS LIRITZIS Laboratory of Archaeometry, Dept of Mediterranean Studies, University of the Aegean, 1 Demokratias Ave, Rhodes 85100, Greece Multivariate techniques and especially cluster analysis have been commonly used in archaeometry. Exploratory and model-based techniques of clustering have been applied to geochemical (continuous) data of archaeological artefacts for provenance studies. Model- based clustering techniques such as classification maximum likelihood and mixture maximum likelihood have been used to a lesser extent in this context and, although they seem to be suitable for such data, they either present practical difficulties—such as high dimensionality of the data—or their performance gives no evidence that they are superior to standard methods. In this paper standard statistical methods (hierarchical clustering, principal components analysis) and the recently developed model-based multivariate mixture of normals with an unknown number of components, are applied and compared. The data set provides chemical compositions of 188 ceramic samples derived from the Aegean islands and surrounding areas. KEYWORDS: CERAMIC COMPOSITIONS, CLUSTER ANALYSIS, MIXTURE MAXIMUM LIKELIHOOD, REVERSIBLE JUMP, OUTLIERS, PORTABLE XRF, AEGEAN INTRODUCTION Provenance studies of the raw materials used during the prehistoric lithic industry are of key importance in research on ancient humans. Such studies provide information on the extension of the territory exploited by small groups of hunter–gatherers during the Palaeolithic. In the Neolithic and Bronze Age, provenance studies contribute to the knowledge of long-distance circulation and exchange of raw materials and goods, hence on the chaines operatoires of lithic and clay artefacts. Indeed, reconstructing mobility strategies is a major goal of researchers interested in prehistoric hunter–gatherers, and the use of geochemical source characterization of ceramics found at sites in a region offers a way to reconstruct the procurement range, or distance travelled by prehistoric groups to obtain resources. Pottery, due to its remarkable storage properties, was a vital item used in the food activities of everyday life. Not only these uses, but aesthetic qualities, too, were frequently used by ancient humans. Ceramics are also preferred materials in provenance studies as their

Welcome message from author
This document is posted to help you gain knowledge. Please leave a comment to let me know what you think about it! Share it to your friends and learn new things together.
Transcript
Archaeometry
49
, 4 (2007) 795–813 doi: 10.1111/j.1475-4754.2007.00336.x
*Received 28 October 2005; accepted 27 September 2006 †Corresponding author: email [email protected]© University of Oxford, 2007
Blackwell Publishing LtdOxford, UKARCHArchaeometry0003-813X© University of Oxford, 2007XXXOriginal Articles
Clustering Neolithic ceramics from Aegean and Asia Minor using XRFI. Papageorgiou and I. Liritzis
*Received 28 October 2005; accepted 27 September 2006
MULTIVARIATE MIXTURE OF NORMALS WITH UNKNOWN NUMBER OF COMPONENTS: AN
APPLICATION TO CLUSTER NEOLITHIC CERAMICS FROM AEGEAN AND ASIA MINOR USING PORTABLE XRF
*
IOULIA PAPAGEORGIOU†
Department of Statistics, Athens University of Economics and Business, Patission 76, 10334 Athens, Greece
and IOANNIS LIRITZIS
Laboratory of Archaeometry, Dept of Mediterranean Studies, University of the Aegean, 1 Demokratias Ave, Rhodes 85100, Greece
Multivariate techniques and especially cluster analysis have been commonly used inarchaeometry. Exploratory and model-based techniques of clustering have been applied togeochemical (continuous) data of archaeological artefacts for provenance studies. Model-based clustering techniques such as classification maximum likelihood and mixturemaximum likelihood have been used to a lesser extent in this context and, although they seemto be suitable for such data, they either present practical difficulties—such as highdimensionality of the data—or their performance gives no evidence that they are superiorto standard methods. In this paper standard statistical methods (hierarchical clustering,principal components analysis) and the recently developed model-based multivariate mixtureof normals with an unknown number of components, are applied and compared. The dataset provides chemical compositions of 188 ceramic samples derived from the Aegean islandsand surrounding areas.
KEYWORDS
: CERAMIC COMPOSITIONS, CLUSTER ANALYSIS, MIXTURE MAXIMUM LIKELIHOOD, REVERSIBLE JUMP, OUTLIERS, PORTABLE XRF, AEGEAN
INTRODUCTION
Provenance studies of the raw materials used during the prehistoric lithic industry are of keyimportance in research on ancient humans. Such studies provide information on the extensionof the territory exploited by small groups of hunter–gatherers during the Palaeolithic. In theNeolithic and Bronze Age, provenance studies contribute to the knowledge of long-distancecirculation and exchange of raw materials and goods, hence on the
chaines operatoires
oflithic and clay artefacts. Indeed, reconstructing mobility strategies is a major goal of researchersinterested in prehistoric hunter–gatherers, and the use of geochemical source characterizationof ceramics found at sites in a region offers a way to reconstruct the procurement range, ordistance travelled by prehistoric groups to obtain resources.
Pottery, due to its remarkable storage properties, was a vital item used in the food activitiesof everyday life. Not only these uses, but aesthetic qualities, too, were frequently usedby ancient humans. Ceramics are also preferred materials in provenance studies as their
796
I. Papageorgiou and I. Liritzis
© University of Oxford, 2007,
Archaeometry
49
, 4 (2007) 795–813
physico-chemical properties are most often different at a major, minor but mainly trace elementlevel, because of their mode of formation from characteristic clay sources.
Early ceramic provenance studies were based on bulk physical properties, such as typology,technology, etc., as well as on petrography. Although useful for sample description, theseobservations generally do not provide valuable criteria for provenance studies.
An important advance in characterization studies was made during the 1960s whenspectroscopic methods allowed the determination of elemental compositions from small-sizedsamples. Since then nearly all provenance studies have been based on elemental composition.Among the destructive methods of analysis are electron microprobe (for about 10 majorelements), neutron activation analysis (up to
∼
27 major to trace elements), ICP-MS/AES, withup to more than 50 elements determined, optical emission spectroscopy, atomic absorptionspectroscopy, PIXE and XRF, depending on instrumentation availability and allowance tosample in a destructive manner (Pollard and Heron 1996). However, non-destructive analysisis progressively used, employing X-ray fluorescence (Liritzis
et al.
2002).In the present study the characterization of the analysed ceramics was enabled by
application of standard statistical methods, such as hierarchical clustering analysis and principalcomponents analysis, as well as model-based clustering of multivariate mixture of normalswith an unknown number of components (see Dellaportas and Papageorgiou 2006).
Statistical analysis and data reduction employing multivariate techniques lead to a number ofvariables that characterize a certain group of objects (ceramic in this context). The problem is todefine groups in the data set, based on their compositional proximity. Such a comparison wouldresult in groupings of ceramics and the raw materials they are derived from. Because of the natureof the data (a number of continuous variables) and the problem of identification of such distinctgroups, cluster analysis is the most appropriate multivariate method to use and has been widelyused in archaeology, together with principal components analysis (PCA) (Papageorgiou
et al
. 2001).The standard methods in cluster analysis are heuristic and consist of two main stages: (1) measur-
ing the distance between data samples; and (2) application of a criterion to merge or split groups. Alarge number of standard methods that already exist can be adopted as a result of the variousmeasures of distances in combination with the variety of the merging/splitting criteria. All of themare heuristic and distribution free, which means they make no use of data distribution assumptions.
In the model-based techniques, the groups are the results of an assumed distribution—usually the multivariate normal—that the data derive from. The two best-known model-basedtechniques are classification maximum likelihood and mixture maximum likelihood.
In the next section we briefly describe mixture maximum likelihood, since the innovativetechnique employed in this work is directly linked with this methodology. In fact this approachtends to overcome the disadvantages of mixture maximum likelihood. A brief presentation andthe idea behind the novel methodology is given. This is a Bayesian methodology, and a Bayesianapproach to deal with problems in archaeology is not new (see, for example, Buck
et al.
1996).A case study applying the techniques to the chemical composition of ceramics derived from
prehistoric settlements in the wide region of the Aegean, and its results, are presented in thesection entitled ‘Statistical analysis’. Finally, the obtained groupings are discussed along withcurrent archaeological evidence and statistical evaluation.
STATISTICAL MODEL-BASED METHODOLOGIES FOR CLUSTERING
Model-based statistical methodologies assume that the observations forming the data aregenerated from a distribution. Usually the distribution is normal and because the dimension of
Clustering Neolithic ceramics from Aegean and Asia Minor using XRF
797
© University of Oxford, 2007,
Archaeometry
49
, 4 (2007) 795–813
the data is higher than one, it is multivariate normal. The assumption of normality is not essential,but quite common in such techniques. The mixture maximum likelihood approach assumes amixture of multivariate normals regarding the data distribution. Let
x
=
(
x
1
,
x
2
, . . . ,
x
n
) denotethe data table, with
x
j
a p-vector, representing the
j
th observation (a ceramic sherd in thiscontext) and p is the dimension of the data (number of variables that for each case we havemeasurements). Under this approach the data are coming from a population with density
w
1
ƒ(
x
; μμμμ
1
,
ΣΣΣΣ
1
)
+
w
2
ƒ(
x
; μμμμ
2
,
ΣΣΣΣ
2
)
+
. . .
+
w
g
ƒ(
x
; μμμμ
g
,
ΣΣΣΣ
g
) (1)
where ƒ(
x
; μμμμ
k
,
ΣΣΣΣ
k
) is the density of the multivariate normal distribution, the mixture is assumedto be finite, consisting of
g
components with the same distributions, but different parameters,and
w
k
,
k
=
1, 2, . . . ,
g
are the weights with ΣΣΣΣ
w
k
=
1. Weights
w
k
represent the probabilitiesthat a case
x
j
belongs to the
k
th component. Moreover, intuitively speaking, equation (1) modelsa data set with observations that are coming from
g
different populations. These populationscan be described with the same form of distribution, but parameters differ among them.Weights in equation (1) are the probabilities or proportions from each population in the totaldistribution, if a sample has been taken. The simplest case of finite mixture is when
g
=
2(Everitt and Hand 1981). For example if
x
measures the height of children of a certain age,then a mixture of two normal distributions as in equation (1) could be adopted in order to cap-ture the difference we expect in boys and girls in a sample of children with mixed boys and girls.A descriptive measure of such a sample would probably reveal a two-mode feature, indicatingthat a single normal would not be appropriate to describe the data. Formulating the problemunder mixture densities, it could be assumed that the first component is the normal thatdescribes height in the boys’ population, and the same for the second component in girls. Bothcan be seen as normals if we look at them separately, with means and variances that differ.Weights in equation (1) are now the probabilities of a member of the population being a boyor a girl. In an archaeological context and especially in provenance problems, the assumptionof a finite mixture can find application, if each group of observations having a similar compo-sition can be seen as a subpopulation that is described from one component of the mixture.Formalizing the problem in provenance studies under this approach we provide a model-based(not distribution-free) methodology for clustering observations and obtain all the merits ofinference coming from this. Moreover, although it is probably quite difficult to find a singledistribution that fits the data altogether, because of the presence of different groups, it is easierto fit a distribution to each separate group. This distribution can have a common form, such asthe normal density for example. The likelihood function for a sample of size
n
, will be
Clustering the data will result after estimating the unknown parameters in the population, μμμμ
k
,ΣΣΣΣ
k
,
w
k
(
k
=
1, . . . ,
g
). μμμμ
k
is a vector of
k
parameters and ΣΣΣΣ
k
is a symmetric matrix, thus there arep
×
(p
+
1)/2 parameters for each of the
g
matrices. Following the estimation of the parametersand weights in the mixture, clustering the data in groups (components) will be performedon the basis of
w
k
. More precisely, an observation
x
j
is classified to the component with thelargest weight
w
k
(McLachlan and Basford 1988).There are two disadvantages of a different nature in this technique. A practical one, that
induces problems in the progress of the method, and a rather fundamental and methodologicalone. The practical problem arises from the fact of the large number of parameters that need to
( ; , ). w fk k kk
g
i
n
x μμ ΣΣ==
∑∏11
798
I. Papageorgiou and I. Liritzis
© University of Oxford, 2007,
Archaeometry
49
, 4 (2007) 795–813
be estimated in contrast with the small number of observations available from excavation.Estimation suffers and a way to overcome this is to restrict ourselves by imposing constraintson the parameters among components to minimize the total number. The most usual constraintis to assume that matrices ΣΣΣΣ
k
are equal across
k
=
1, . . . ,
g
. Expectation-Maximization Mixture(EMMIX) is an algorithm discussed in McLachlan
et al.
(1999) that implements mixturemaximum likelihood.
The second problem is more fundamental. It is necessary to predetermine the number of thecomponents in the mixture in order for the technique to work. This leads to the necessity ofreliable statistical tests to define the number of components in the finite mixture as a separateproblem from the estimation. The methodology of maximum likelihood has to be executedfor a variety of values for
g
(the number of components) and at a later separate stage, tests likethe approximate weight of evidence AWE (Banfield and Raftery 1993) and the Bayesianinformation criterion BIC (Fraley and Raftery 1998) suggest the best
g
value. UnfortunatelyAWE, BIC and other similar tests are all approximate tests. As a result, they might not evenprovide the same suggested g value (Fraley and Raftery 1998).
In an attempt to deal with the problems of estimation and choice of the number of componentsin the finite mixture simultaneously, another approach, based in Bayesian inference, wasdeveloped and presented in Dellaportas and Papageorgiou (2006). The assumption for the basisof the problem is the same: a finite mixture with an unknown number of normal components.Making use of the powerful Bayesian technique of Reversible Jump Markov Chain MonteCarlo (RJMCMC) (Richardson and Green 1997) that allows the testing of models with a differentnumber of unknown parameters, it is possible to estimate the parameters in a mixture of kcomponents and compare this with another mixture of l components with l ≠ k.
Some applications of univariate normal mixtures that use RJMCMC are presented in Nobileand Green (2000), Robert et al. (2000), Green and Richardson (2001), Fernandez and Green(2002), Bottolo et al. (2003). An extension to multivariate mixtures is the novelty in theapproach by Dellaportas and Papageorgiou (2006). The multivariate context is appropriatefor the application in clustering and, moreover, there are no constraints in the form of variance–covariance matrices of the components.
Under this methodology a mixture of normals, as in equation (1), is assumed for the popula-tion density. With the Bayesian approach the data vector, say xj, given the set of parametersθ = (μμμμ, ΣΣΣΣ, w) follows a multivariate normal, i.e., [xi|θ] ∼ Np(μμμμ, ΣΣΣΣj), where Np denotes the p-dimensional normal distribution. In the parameter vector θ , μμμμ represents the vector of the meansof the set of components, μμμμ = (μμμμ1, μμμμ2, . . . , μμμμk), where μμμμj is the mean of the jth component, andin the same way ΣΣΣΣ = (ΣΣΣΣ1, ΣΣΣΣ2, . . . , ΣΣΣΣk) and w = (w1, w2, . . . , wk). The Bayesian formulationassumes prior distributions for the parameter θ. Given a known number of k, conjugate priorsare assumed for the above situation. Priors for μμμμj given ΣΣΣΣj are assumed to be normal with themean depending on a partition of the data range (following Richardson and Green 1997) andvariance ΣΣΣΣj/cj, where cj are precision parameters. For ΣΣΣΣj an inverse Wishart distribution isassumed, with scale parameter Ξ a p-diagonal matrix given a gamma prior to each of the pelements. Parameters of gamma depend again on hyperparameters and range of the data. Finally,the prior for w, the vector of weights, is chosen to be a Dirichlet p-dimensional distributionwith parameters all equal to delta, where delta is a hyperparameter. For the analytical technicaldetails on how to choose the priors, we refer to Dellaportas and Papageorgiou (2006).
The powerful Bayesian technique of RJMCMC (Green 1995) is then applied for ‘jumping’between mixtures of different numbers of components. The tool for this is to have available analgorithm for the merging/splitting of components. Among the existing components a randomly
Clustering Neolithic ceramics from Aegean and Asia Minor using XRF 799
© University of Oxford, 2007, Archaeometry 49, 4 (2007) 795–813
selected one is a candidate to split into two in the ‘split’ move, so that the resulting mixturewill be increased by one in the total number of components. In the ‘merge’ move, two com-ponents (again randomly selected among all) are merged into one, and the total number ofcomponents in the mixture is reduced by one. The algorithm must be a one-by-one mathematicalfunction so that it can be inverted and any move can be reversible. This means that starting fromone component and after applying the ‘split’ move, we should be able to compose the tworesulting smaller components with the help of the opposite ‘merge’ move and resulting in onethat coincides with the original—before split—component. Because of this reversibility, thereis no need to give expressions for both moves. We present the mathematical details for the‘split’ move in equation (2). Inverting the mathematical expressions in equation (2) can giveus the complete details for the ‘merge’ move.
Say that μμμμ* is the mean, ΣΣΣΣ * the covariance matrix and w* the weight of the candidate com-ponent for split. Then the split algorithm that provides the weights, the means and the covariancematrices for the two new components, is
(2)
where w1, w2 are the new weights that add to one, μμμμ1, μμμμ2 are the new means and V*, λλλλ* thematrices of eigenvectors and eigenvalues after spectral decomposition of ΣΣΣΣ *. Following thesame notation V1, λλλλ1 and V2, λλλλ2 correspond to ΣΣΣΣ1 and ΣΣΣΣ2 respectively. u1, u2, u3, P are randomin order to complete the algorithm (same total number of variables between one componentand two components). They are generated from certain distributions assumed. Matrix I is thep-dimensional identity matrix.
The method works iteratively and each iteration includes a stage of testing whether a move(either split or merge) would be accepted, or whether the same number of components shouldremain, and in any case estimating the parameters of the mixture based on the data. A moredetailed technical description is presented in Dellaportas and Papageorgiou (2006).
CLUSTERING DATA FROM THE AEGEAN AND ANATOLIA
The present new clustering approach was applied to a large data set. In fact this was initiallyconsidered to serve as a test rather than a provenance question, but the latter can not beexcluded in the light of new finds. The data set under study consisted of 188 samples, derivedfrom eight archaeological excavation sites of Mesolithic, Neolithic and Bronze Age: Ftelia atMykonos, Yali and Pergoussa near Nissiros (Dodecanese), Kalithies cave on the island ofRhodes, Sarakinos cave in Boeotia, central Greece, two settlements in Cyprus and Ulucak in
w u ww u w
uw
w
uw
w
diag u diag u diag
i
i
i i
i
i
i i
1 1
2 1
1 21
2
1
2 21
1
2
1 3 2
1 ( )
( ) ( ) (
*
*
* * *
* * *
== −
= −⎛
⎝⎜
⎞
⎠⎟
= +⎛
⎝⎜
⎞
⎠⎟
= −
=
=
∑
∑
μμ μμ λλ
μμ μμ λλ
ΛΛ
π
π
V
V
I I ) ( ) ( ) ( ) ( ) ( )
* *
* *
*
*
+= − − +== ′
u w wdiag u diag u diag u w w
2 1
2 3 2 2 2
1
2
ΛΛΛΛ ΛΛ
//I I I
V PVV P V
800 I. Papageorgiou and I. Liritzis
© University of Oxford, 2007, Archaeometry 49, 4 (2007) 795–813
Asia Minor near Smyrna (data available in our web sites: www.rhodes.aegean.gr/tms andwww.stat-athens.aueb.gr/~ioulia). The project investigating the chemical analysis andprovenance of prehistoric pottery from the Aegean, Cyprus and Anatolia started in 2000,funded by the Ministry of the Aegean. Most samples have an age overlap during the LateNeolithic and Bronze Age and a question of interest was to provide statistical evidence forexchange of goods and ideas via a chaines operatoires model. This question was pursued in thelight of recent excavation evidence and further at the recommendation of field archaeologists(Professor A. Sampson, University of the Aegean Rhodes, 2005 and Professor Altan Cilingiroglu,University Ege, Smyrna, 2005, personal communications).
Although distant sites (e.g., Boeotia and Cyprus) may exclude any possible contact, in spiteof the overlapping period, nevertheless cultural contact between Neolithic and Bronze Agesites in Asia Minor and the Aegean has been documented. Evidence from settlements andspecific areas involved include Youra, Euboea, Skyros, Boeotia, Nea Makri Attica, Tigani atSamos, Vathi in Kalymnos, Ulucak central Anatolia, St. George’s cave Kalithies Rhodes andAgio Gala Chios (Furness 1956; French 1965; Hood 1981; Kamil 1982; Özdogan and Pendik1983; Yakar 1985; Seher 1990; Eslick 1992; Mountjoy 1998; Sampson 2006).
Moreover, Aegean population theories since the onset of the Holocene, assigning humanmovements from the Orient and the Balkans are also proposed (Ammerman and Cavalli-Sforza 1984; Cherry 1985, 1990; Van Andel and Runnels 1988; Runnels 1995; Broodbank2000). Various practical matters concerning seafaring have affected the navigation, explorationand colonization of the Aegean. The travelling of long distances through navigation is not asurprise. Melian obsidian has been found in the cave of Cyclops in Youra, north-west Aegean,some 300 km from Melos, and at Maroulas Mesolithic site in Kythnos (Sampson et al. 2002),indicating a knowledge of navigation in the Aegean as early as the Holocene (Keegan andDiamond 1987; Davies 1992). In addition, the stone industry at Youra shows such contacts/similarities with other Anatolian caves, while the most recent field work (summer 2005) hasrevealed three Mesolithic sites on Icaria island, off the Anatolian coast, where stone artefactshave many similarities with those of Maroulas in Kythnos (Sampson and Koslowski 1999;Kaczanowska and Kozlowski 2006).
On the other hand, several similarities have been observed between western Asia Minor andthe Aegean during the 9th to 7th millennia bc, which are synchronized away from south-eastAnatolia. Thus, at Dodecanese, the pottery shapes and decoration of 6th to 5th millennia bcKalithies and Koumelo caves derive from various Anatolian and Aegean LN prototypes(Sampson 1984, 1987; Melas 1988). Although the pottery distribution is not uniform, no clearborders can be set or recognized for separating cultural or even stylistical zones. This situationstresses the role of interaction and exchange from this early period. For example, the presenceof obsidian at Kalithies underlines these contacts, especially when 80% of it comes fromMelos and the rest from Yiali and a source in central Anatolia (Sampson 1984, 72). It isremarkable that when the Aegean shifted to a full pottery Neolithic economy around 6500–6300 bc, almost at the same time as in mainland Greece, the islands and Crete, followingsimilar developments in Anatolia and the Near East, Cyprus although fully neolithicized,developed a distinct aceramic culture, after a hiatus postdating Shillourokambos (Stanley-Price 1979; Lebrun et al. 1987). Architectural similarities (circular huts) between Cyprus andKythnos during the Mesolithic, indicate association of both sites with an archaistic mentality, anidiosyncratic conservatism, although their economies are different. Even if we exclude populationmovements between these distant islands by the sea, it would be realistic to argue a gradualspread of ideas through indirect contacts, taking into account the lower sea level by about
Clustering Neolithic ceramics from Aegean and Asia Minor using XRF 801
© University of Oxford, 2007, Archaeometry 49, 4 (2007) 795–813
40–50 metres during the 9th to 7th millennia bc (Efstratiou and Mantzourani 1997; Pirazzoli2000; Katsarou-Tzeveleki 2001). This is postulated by Katsarou-Tzeveleki and Sampson(2006, 112) as Moreover, a likely introduction of the pre-pottery terminology in our analysisof the Aegean corroborates the typical view of the East as the birthplace and the Aegean asthe periphery. And as the recent discovery of the Cypriote preceramic phase highlighted thenaval background of the SW Asian civilizations, linking them with the Aegean seafarers bycommon provenance, the domestication techniques and the circular architecture of the Aegeanare degraded to just another diffusion symptom. However, navigation techniques developedprogressively and were highly established by the Late Neolithic (5th millennium bc). There-after large islands (e.g., Cyprus, Crete) broke their isolation and were capable of maintainingcontinuous contact with the surrounding areas (Aegean, Near East), . . . which discouragesconservatism and ensures renovation and normal cultural sequence (Katsarou-Tzeveleki 2001).During the Early Bronze Age several socio-economic and technological (pyrometallurgical)changes took place in the Aegean and south-eastern Mediterranean, highlighting the role ofexchange, contacts and maritime networks. Contacts and interaction allowed the circulation ofideas, symbols and objects between Rhodes and Anatolia, Cyclades and eastern Greece(French 1968; Marketou 1990).
Cultural overlapping is a common image in the Aegean throughout its prehistory, underlyingthe significance of interaction and not necessarily revealing cultural domination from someadjacent cultures. Autochthonous and semi-autochthonous development seems to be the caseof cultural interaction affected by local and inter-regional development.
With these points in mind, we attempted to cluster characteristic pottery finds from theaforementioned sites in the Aegean, western Asia Minor and Cyprus, even if the latter seemsa remote possibility.
Samples were derived from well-stratified archaeological sections dated by 14C andrepresented characteristic typology provided by the excavator in each case. Table 1 lists thesites involved, the sampled code number used in the present analysis, the dating and respectivereferences.
Table 1 Samples classified by origin of excavation, dating, archaeological period and references
Site Code (labels) Date, BC References
Ulucak, Asia Minor, near Smyrna, Turkey
RHO-38 to RHO-108
c. 6000–2000 (Late Neolithic, LN), (Middle Neolithic, MN), (Late Chalcolithic, LC)
Professor A. Ciliniroglou (MAA 2005; Liritzis 2005)
Ftelia Neolithic settlement, Mykonos
MFC1–28 c. 4500–5100 (LN) Sampson, 2002
Kalithies cave Rhodes KR1–10 c. 5300–4500 (LN) Sampson, 1987Yali Neolithic settlement,
near Nissyros and PergoussaYNB . . . , PERG
c. 5000–3000 (LN), (Early Bronze Age, EBA)
Sampson, 1988
Sarakinos cave, Boeotia SARA . . . c. 5800–2500 (LN, EBA)
Professor A. Sampson, personal communication
Cyprus, Koufovounos and Sotiras
CK1–6 and CS1–11
c. 4000–2500 (later part of LN, EBA)
Mantzourani and Liritzis, 2006
802 I. Papageorgiou and I. Liritzis
© University of Oxford, 2007, Archaeometry 49, 4 (2007) 795–813
Sample preparation
In all ceramic sherds the outer surface was discarded to avoid the effects of weathering—leaching/infiltration of ions, thus altering elemental composition. Solid pieces of ceramics andsoils were powdered (< 90 μm), dried, and measured using a portable ED-X-ray fluorescenceanalyser (ED-XRF).
The ED-XRF analyser
The ED-XRF field portable analyser Spectrace 9000 TN (Tracor Northern) was used with amercuric iodide (HgI2) detector, which has a spectral resolution of about 260 eV FWHM (FullWidth Half Maximum) at 5.9 keV, and three excitation sources of radioisotopes within theprobe unit: americium Am-241 (26.4 KeV K-line and 59.6 KeV L-lineV) measuring Ag, Cd,Sn, Ba, Sb; cadmium Cd-109 (22.1 K-line, 87.9 K- and L-line KeV) measuring Cr, Mn, Fe,Co, Ni, Cu, Zn, As, Se, Sr, Zr, Mo, Hg, Pb, Rb, Th, U; and iron Fe-55 (5.9 KeV K-line)measuring K, Ca, Ti, Cr.
The system was calibrated on several standard clays and bricks, and the application soft-ware ‘Fine particle of soil application’ was used.
The performance of the portable XRF instrumentation in the laboratory has already beenreported (Potts et al. 1995, 2001). Here, a wide range of silicate rock reference materials wereanalysed as powder pellets to evaluate accuracy, precision and detection limits. Referencesamples included Bonn clay, University of Bonn; Montana soil NIST (National Institute ofStandards and Technology); CFA ash NIST; brick clay NIST. The study showed the capabilityof the instrument to determine major and minor elements (K, Fe, Ca, Mn, Ti, Cr) and selectedtrace elements (Sr, Zr, Rb, Ba, Ni, Ag). Other trace elements were not measured because theirlower counting sensitivities meant that the concentrations were near to or below detection limits.
STATISTICAL ANALYSIS AND DISCUSSION
For the total number of samples (188) the analyser described above provided us with measure-ments of nine elements: Ba, Fe, Rb, K, Ti, Mn, Sr, Zr, Ca. The set of nine elements was thecommon subset of elements for which measurements were available for all the samples.
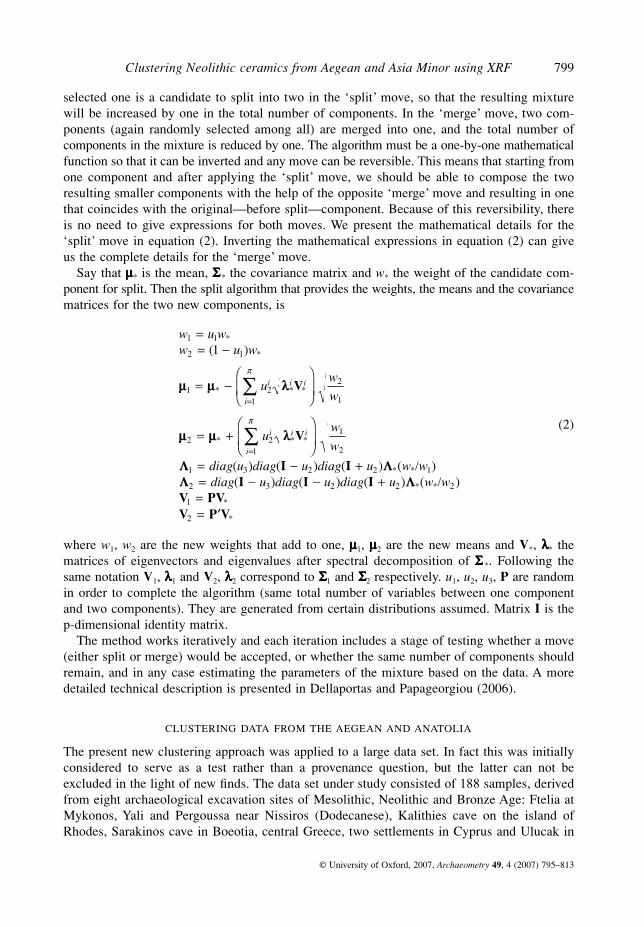
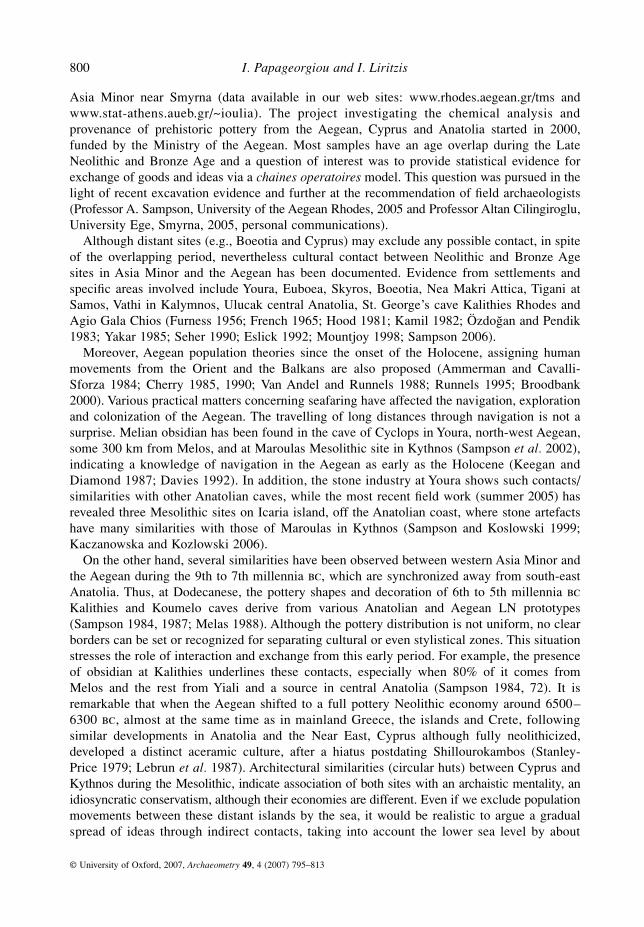
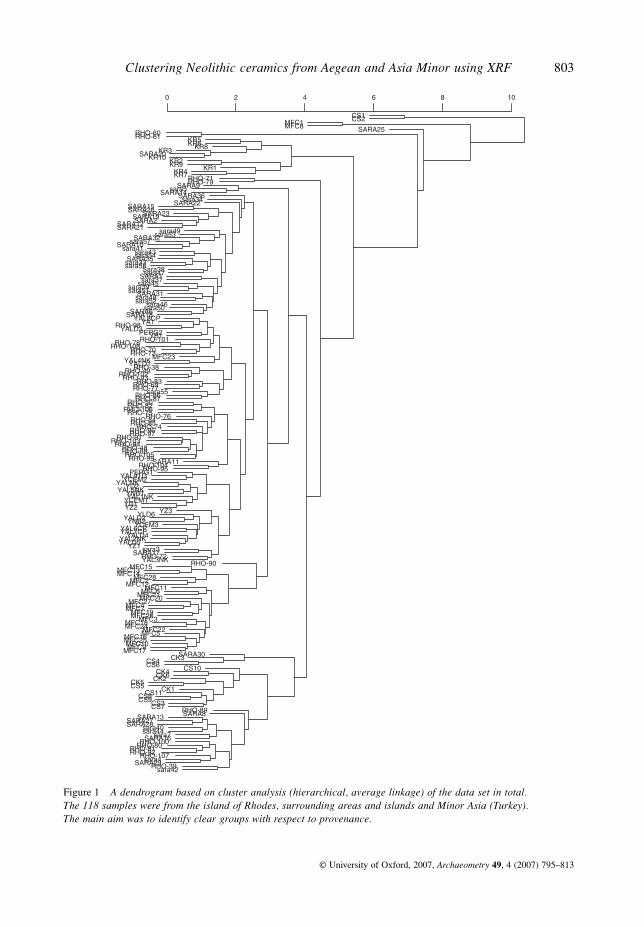
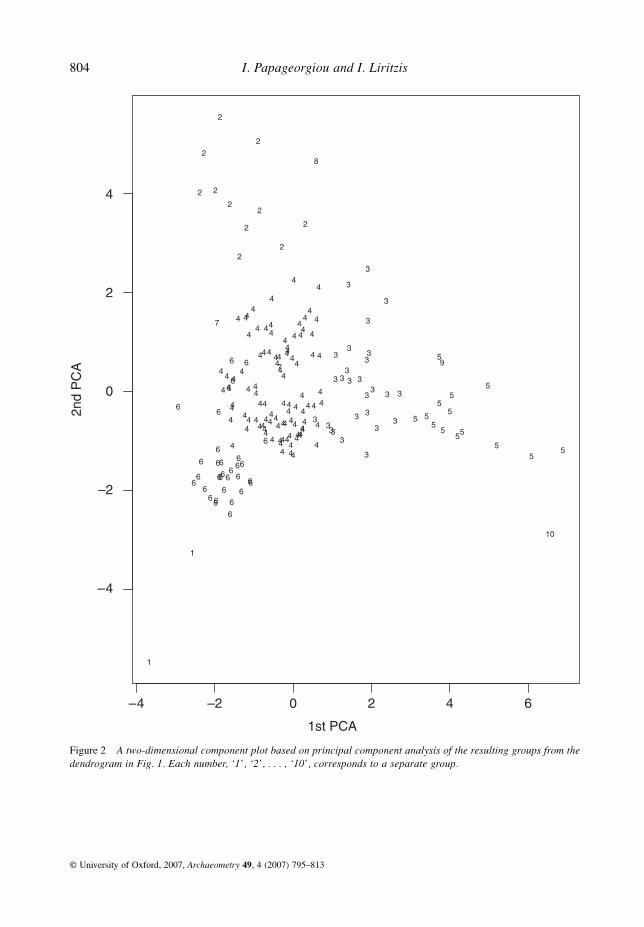
Thus the processed data set was a nine-dimensional (188 × 9) data matrix. An initial hierar-chical clustering allowed us to separate some very clear and compact groups that separatedwell from the remaining items. Several hierarchical techniques, like complete linkage, averagelinkage, single linkage and Ward’s method have been applied and all agreed about this issue.Figure 1 shows the dendrogram of average linkage of the standardized data set of the 188 samples.The result of this clustering is plotted in the first two principal components and presented in Figure 2.The obvious groups (and singletons/outliers) are groups noted by ‘1’s, ‘2’s, ‘5’s, ‘6’s, ‘7’, ‘8’,‘9’ and ‘10’ (the last four are singletons, e.g., groups of size one). By comparing the figuresand studying each branch of the tree, the distinct groups could be identified as shown in Table 2.
The second stage of the analysis was to remove the above-described clear groups of Ftelia,Kalithies, Cyprus and singletons/outliers like SARA-25 (group ‘8’ in Fig. 2) and to continuefurther analysis with the remaining samples. After this ‘peeling-off’ procedure of the data weended up with 125 samples, mainly consisting of Ulucak, Yali and Sarakinos.
For this remaining data set, both hierarchical clustering and model-based (with RJMCMC)techniques were applied and results were compared. The algorithm converged rather quickly
Clustering Neolithic ceramics from Aegean and Asia Minor using XRF 803
© University of Oxford, 2007, Archaeometry 49, 4 (2007) 795–813
Figure 1 A dendrogram based on cluster analysis (hierarchical, average linkage) of the data set in total. The 118 samples were from the island of Rhodes, surrounding areas and islands and Minor Asia (Turkey). The main aim was to identify clear groups with respect to provenance.
804 I. Papageorgiou and I. Liritzis
© University of Oxford, 2007, Archaeometry 49, 4 (2007) 795–813
Figure 2 A two-dimensional component plot based on principal component analysis of the resulting groups from thedendrogram in Fig. 1. Each number, ‘1’, ‘2’, . . . , ‘10’, corresponds to a separate group.
Clustering Neolithic ceramics from Aegean and Asia Minor using XRF 805
© University of Oxford, 2007, Archaeometry 49, 4 (2007) 795–813
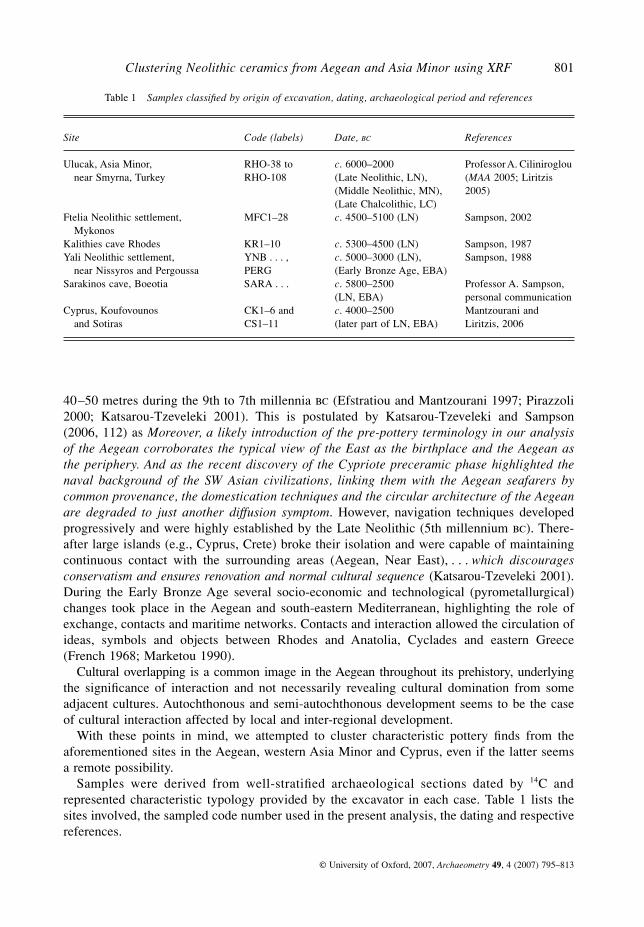
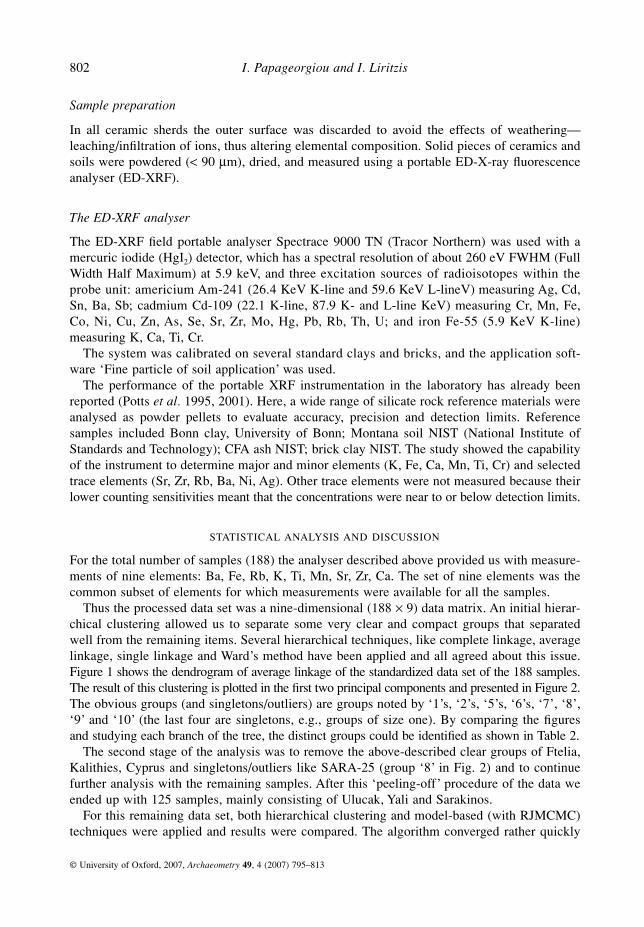
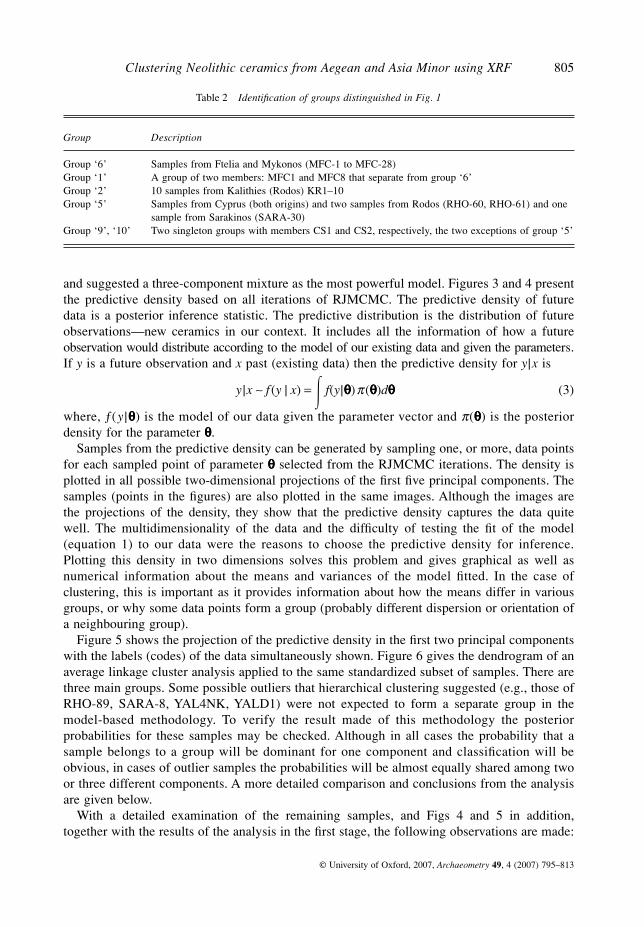
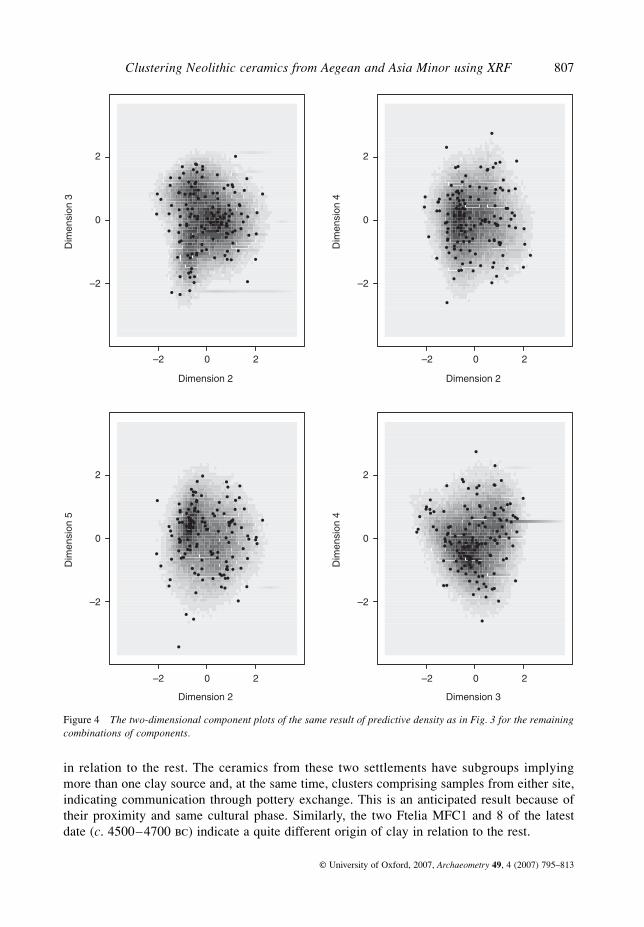
and suggested a three-component mixture as the most powerful model. Figures 3 and 4 presentthe predictive density based on all iterations of RJMCMC. The predictive density of futuredata is a posterior inference statistic. The predictive distribution is the distribution of futureobservations—new ceramics in our context. It includes all the information of how a futureobservation would distribute according to the model of our existing data and given the parameters.If y is a future observation and x past (existing data) then the predictive density for y|x is
y |x ∼ f(y | x) = � f(y|θθθθ)π (θθθθ)dθθθθ (3)
where, ƒ(y |θθθθ) is the model of our data given the parameter vector and π(θθθθ) is the posteriordensity for the parameter θθθθ.
Samples from the predictive density can be generated by sampling one, or more, data pointsfor each sampled point of parameter θθθθ selected from the RJMCMC iterations. The density isplotted in all possible two-dimensional projections of the first five principal components. Thesamples (points in the figures) are also plotted in the same images. Although the images arethe projections of the density, they show that the predictive density captures the data quitewell. The multidimensionality of the data and the difficulty of testing the fit of the model(equation 1) to our data were the reasons to choose the predictive density for inference.Plotting this density in two dimensions solves this problem and gives graphical as well asnumerical information about the means and variances of the model fitted. In the case ofclustering, this is important as it provides information about how the means differ in variousgroups, or why some data points form a group (probably different dispersion or orientation ofa neighbouring group).
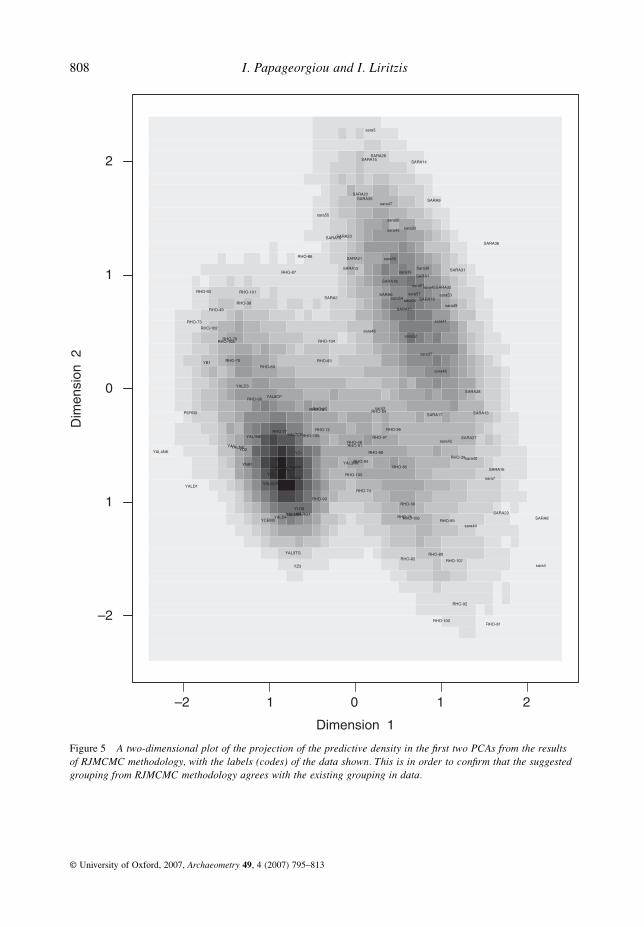
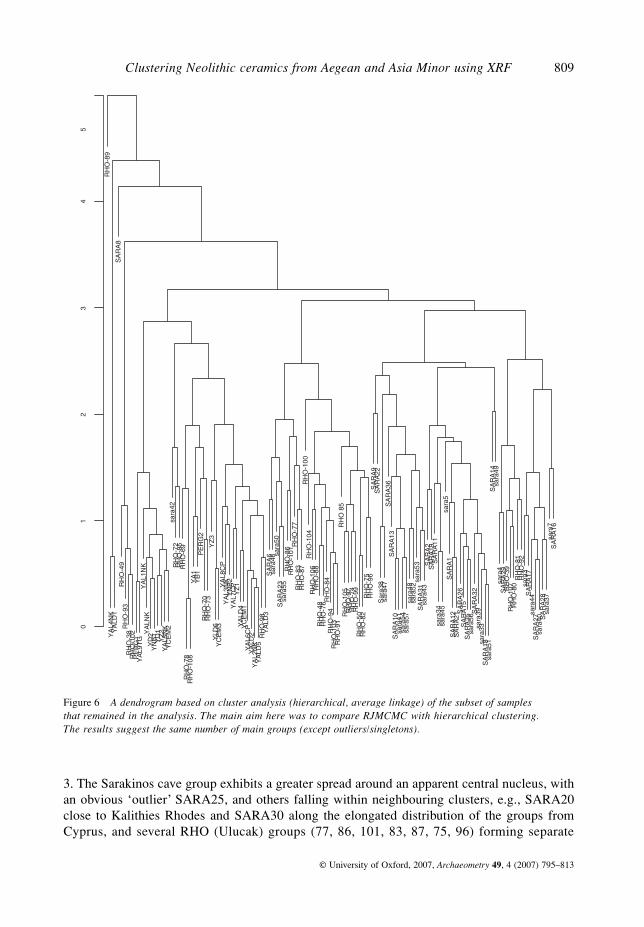
Figure 5 shows the projection of the predictive density in the first two principal componentswith the labels (codes) of the data simultaneously shown. Figure 6 gives the dendrogram of anaverage linkage cluster analysis applied to the same standardized subset of samples. There arethree main groups. Some possible outliers that hierarchical clustering suggested (e.g., those ofRHO-89, SARA-8, YAL4NK, YALD1) were not expected to form a separate group in themodel-based methodology. To verify the result made of this methodology the posteriorprobabilities for these samples may be checked. Although in all cases the probability that asample belongs to a group will be dominant for one component and classification will beobvious, in cases of outlier samples the probabilities will be almost equally shared among twoor three different components. A more detailed comparison and conclusions from the analysisare given below.
With a detailed examination of the remaining samples, and Figs 4 and 5 in addition,together with the results of the analysis in the first stage, the following observations are made:
Table 2 Identification of groups distinguished in Fig. 1
Group Description
Group ‘6’ Samples from Ftelia and Mykonos (MFC-1 to MFC-28)Group ‘1’ A group of two members: MFC1 and MFC8 that separate from group ‘6’Group ‘2’ 10 samples from Kalithies (Rodos) KR1–10Group ‘5’ Samples from Cyprus (both origins) and two samples from Rodos (RHO-60, RHO-61) and one
sample from Sarakinos (SARA-30)Group ‘9’, ‘10’ Two singleton groups with members CS1 and CS2, respectively, the two exceptions of group ‘5’
806 I. Papageorgiou and I. Liritzis
© University of Oxford, 2007, Archaeometry 49, 4 (2007) 795–813
1. The pottery from the eight sites indicate a clear intra- and inter-site interaction. Robustclusters of the major sites are clearly seen. For example, the Ftelia group, the Yali group, theKalithies and Sarakinos caves, the two Cyprus settlements.2. There appears to be an intrasite distribution and occasionally extremely distant ‘outliers’.This is the case with Sotiras CS2 and Koufovounos, Cyprus, CK2. In fact, these two are acombed bowl and a monochrome flask, respectively, derived from different floors and phases
Figure 3 The two-dimensional component plots of the predictive density derived from RJMCMC methodologyapplied in the first five PCAs of the reduced data set.
Clustering Neolithic ceramics from Aegean and Asia Minor using XRF 807
© University of Oxford, 2007, Archaeometry 49, 4 (2007) 795–813
in relation to the rest. The ceramics from these two settlements have subgroups implyingmore than one clay source and, at the same time, clusters comprising samples from either site,indicating communication through pottery exchange. This is an anticipated result because oftheir proximity and same cultural phase. Similarly, the two Ftelia MFC1 and 8 of the latestdate (c. 4500–4700 bc) indicate a quite different origin of clay in relation to the rest.
Figure 4 The two-dimensional component plots of the same result of predictive density as in Fig. 3 for the remainingcombinations of components.
808 I. Papageorgiou and I. Liritzis
© University of Oxford, 2007, Archaeometry 49, 4 (2007) 795–813
Figure 5 A two-dimensional plot of the projection of the predictive density in the first two PCAs from the results of RJMCMC methodology, with the labels (codes) of the data shown. This is in order to confirm that the suggested grouping from RJMCMC methodology agrees with the existing grouping in data.
Clustering Neolithic ceramics from Aegean and Asia Minor using XRF 809
© University of Oxford, 2007, Archaeometry 49, 4 (2007) 795–813
3. The Sarakinos cave group exhibits a greater spread around an apparent central nucleus, withan obvious ‘outlier’ SARA25, and others falling within neighbouring clusters, e.g., SARA20close to Kalithies Rhodes and SARA30 along the elongated distribution of the groups fromCyprus, and several RHO (Ulucak) groups (77, 86, 101, 83, 87, 75, 96) forming separate
Figure 6 A dendrogram based on cluster analysis (hierarchical, average linkage) of the subset of samples that remained in the analysis. The main aim here was to compare RJMCMC with hierarchical clustering. The results suggest the same number of main groups (except outliers/singletons).
810 I. Papageorgiou and I. Liritzis
© University of Oxford, 2007, Archaeometry 49, 4 (2007) 795–813
distinct subgroups within the SARA main cluster. Although some Ulucak sherds (RHO39EBA, RHO107 LN, RHO80 LC, RHO81 LN, RHO92 LN) of Late Neolithic (LN), EarlyBronze Age (EB) and Late Chalcolithic (LC) periods, overlap with some SARA groups (4EBA, 29 EBA, 3 MN, 17 MN) from Early Bronze and Middle Neolithic, SARA42 of LN Ia–b period belongs to the same subgroup as RHO: 72 LC, 95 LN and 69 LC. This interestingpattern implies possible interactions (exchange of ceramics and/or sharing the same claysource), enhanced by the fact they are of the same period, i.e., Late Chalcolithic/EarlyBronze Age (4000–2500 bc), Late Neolithic and Middle Neolithic. This finding needs furtherverification.4. Two soil samples from the local floor of the Ulucak settlement (RHO60, 61), form a group,as expected. In all techniques they both are quite distant from the main Ulucak cluster(s),which consisted of ceramics. This is expected because although the origin is the same, thesource of their production is not clay. Clay is, on the other hand, the source of productionfor pottery.5. Yali and Pergoussa ceramics form distinct subgroups. Several RHO (Ulucak) ones (49, 93,38, 102, as well as 72, 95, 69, 78, 108) fall within Yali subgroups but form distinct clusters,and RHO-102 is close to Pergoussa 1, both of the LN period but on another tree branch. Also,RHO98 resembles Yali YALD3, both also of the LN period. Such an interaction is possibleduring the Late Chalcolithic (for Ulucak) and Late Neolithic (Greek Neolithic at Yali). Thetwo sites are close to the Asia Minor coastline, Ulucak being c. 15 km from Smyrna.6. In Ulucak, a quite interesting observation is the apparent use of a particular clay sourcethroughout the long period of successive cultural phases (Early Bronze, Late Chalcolithic,Late Neolithic, late Early Neolithic), evidenced from subgroups containing ceramic sherdsfrom these periods.
The extremely interesting Ulucak–Yali–Pergoussa and Sarakinos–Ulucak interactionsshould be verified further.
CONCLUSION
The attempted characterization of a diverse set (temporal, contemporary and geographical) ofpottery samples, mainly to test the success of the novel grouping model-based method, hasproved highly satisfactory. An additional advantage in contrast with the non-model-basedclustering techniques, is that full estimation of the parameters exist after model-based clas-sification and it is possible to classify a new incoming sample to one of the existing groups(discriminant analysis).
The obtained results provide useful information regarding long-distance trade exchange, useof the same clay source by successive cultural phases, and interaction of settlements via searoutes. Some ‘outliers’ imply very different clay sources.
The standard methods in cluster analysis used here are distribution free, which means theymake no use of data distribution assumptions. However, in the applied model-based techniquesthe resulting groups follow the multivariate normal. The recently introduced iterative meth-odology that is applied in this paper is a model-based technique with the same philosophy asmixture maximum likelihood, under a different formulation (Bayesian) and improved in thesense that it is devoid of the disadvantages that mixture maximum likelihood has. Standardand model-based techniques were used in our application of a case study on the chemicalelement composition of ceramics derived from prehistoric settlements in the wide region ofthe Aegean.
Clustering Neolithic ceramics from Aegean and Asia Minor using XRF 811
© University of Oxford, 2007, Archaeometry 49, 4 (2007) 795–813
This is the first time to our knowledge that this endeavour to group prehistoric ceramicfabric derived from seemingly distant cultures in and across the Aegean has been undertaken.Questions posed by archaeologists often refer to the use of common clay sources, exchangetrade routes and diachronical accessibility of the same clay source.
ACKNOWLEDGEMENTS
We thank Professor A. Sampson, Professor E. Mantzourani and Professor A. Cilingiroglu forproviding samples and the Greek Ministry of Culture for granting permission, the GeneralSecretariat for Research and Technology for partial funding of the project and the Ministry ofthe Aegean for funding the initial stages of the project.
REFERENCES
Ammerman, A. J., and Cavalli-Sforza, L. L., 1984, The Neolithic tradition and the genetics of populations in Europe,Princeton University Press, Princeton.
Banfield, J. D., and Raftery, A. E., 1993, Model-based Gaussian and non-Gaussian clustering, Biometrics, 49, 803–21.
Bottolo, L., Consonni, G., Dellaportas, P., and Lijoi, A., 2003, Bayesian analysis of extreme values by mixturemodeling, Extremes, 6, 25–47.
Broodbank, C., 2000, An island archaeology of the Early Cyclades, Cambridge University Press, Cambridge.Buck, C. E., Cavanagh, W. G., and Litton, C. D., 1996, Bayesian approach to interpreting archaeological data, John
Wiley & Sons, New York.Cherry, J. F., 1985, Islands out of the stream: isolation and interaction in early east Mediterranean insular prehistory,
in Prehistoric production and exchange: the Aegean and eastern Mediterranean (eds. A. B. Knapp and T. Stetch),12–29, UCLA Institute of Archaeology, Monograph 25, Institute of Archaeology, Los Angeles.
Cherry, J. F., 1990, The first colonization of the Mediterranean islands: a review of recent research, Journal ofMediterranean Archaeology, 3, 145–221.
Davies, J. L., 1992, Review of Aegean prehistory I: the islands of the Aegean, American Journal of Archaeology, 96,699–756.
Dellaportas, P. and Papageorgiou, I., 2006, Multivariate mixtures of Normals with unknown number of components,Statistics and Computing, 16(1), 57–68.
Efstratiou, N. and Mantzourani, E., 1997, The beginning of the Neolithic period in Greece and Cyprus: Commonresearch and interpretation problems, in Cyprus and the Aegean in Antiquity. From the Prehistoric period to 7th c.B.C., Proceedings of an International Congress, Nicosia, 7–20.
Eslick, C., 1992, Elmalı-Karatas I, The Neolithic and Chalcolithic Period, Bryn Mayr, Commentaries, ThomasLibrary Bryn Mayr College.
Everitt, B. S., and Hand, D. J., 1981, Finite mixture distributions, Chapman & Hall, London.Fernandez, C., and Green, P. J., 2002, Modelling spatially correlated data via mixtures: a Bayesian approach, Journal
of the Royal Statistical Society, Series B, 64, 805–26.Fraley, C., and Raftery, A. E., 1998, How many clusters? Which clustering method? Answers via model-based cluster
analysis, Computer Journal, 41, 578–88.French, D. H., 1965, Early pottery sites from western Anatolia, Bulletin of the Institute of Archaeology, 5, 15–24.French, D. H., 1968, Anatolia and the Aegean in the third millenium B.C., PhD thesis, University of Cambridge.Furness, A., 1956, Some early pottery from Samos, Kalimnos and Chios, PPS, 22, 173.Green, P. J., 1995, Reversible jump Markov chain Monte Carlo computation and Bayesian model determination,
Biometrika, 82, 711–32.Green, P. J., and Richardson, S., 2001, Modelling heterogeneity with and without the Dirichlet process, Scandinavian
Journal of Statistics, 28, 355–76.Hood, S., 1981, Excavations at Chios 1938–55. Prehistoric Emborio and Agio Gala, Thames and Hudson, London.Kaczanowska, M., and Kozlowski, J., 2006, Palaeolithic traditions, Mesolithic adaptations and Neolithic innovations
as seen through lithic industries, in The prehistory of the Aegean, Palaeolithic–Mesolithic–Neolithic (ed. A. Sampson),Atrapos, Athens, 67–87.
812 I. Papageorgiou and I. Liritzis
© University of Oxford, 2007, Archaeometry 49, 4 (2007) 795–813
Kamil, T., 1982, Yortan cemetery in the Early Bronze Age of western Anatolia, BAR International Series 145, Oxford.Katsarou-Tzeveleki, S., 2001, Aegean and Cyprus in the early Holocene: Brothers or distant relatives? Mediterranean
Archaeology and Archaeometry, 1(1), 43–55.Katsarou-Tzeveleki and Sampson (2006) The first settlements in Cyprus and the impact on the discussion on the
Aegean Neolithic, in The prehistory of the Aegean, Palaeolithic–Mesolithic–Neolithic (ed. A. Sampson), 88–114,Atrapos, Athens (in Greek with extended English version).
Keegan, W., and Diamond, J., 1987, Colonization of islands by humans: a biogeographical perspective, Advances inArchaeological Method and Theory, 10, 49–92.
Lebrun, A., Cluzan, S., Davis, S., Hansen, J., and Renault-Miskovski, J., 1987, Le neolithique preceramique deCypre, L’Anthropologie, 91, 283–316.
Liritzis, I., in press, ULUCAK (Smyrna, Turkey): chemical analysis with clustering of ceramics and soils and obsidianhydration dating, Mediterranean Archaeology and Archaeometry, 5(special issue).
Liritzis, I., Drakonaki, S., Vafiadou, A., Sampson, A., and Boutsika, T., 2002, Destructive and non-destructive analysisof ceramics, artifacts and sediments of Neolithic ftelia (Mykonos) by portable EDXRF spectrometer: first results,in The Neolithic settlement at Ftelia, Mykonos (ed. A. Sampson), 251–71, Department of Mediterranean Studies,University of the Aegean, Rhodes, Greece.
MAA (2005) Ulucak Hoyuk Project, Mediterranean Archaeology and Archaeometry, 5(special issue), 33–45.Mantzourani, H., and Liritzis, I., 2006, Notes on the chemical analysis of pottery samples from Kantou-Kouphovounos
and Sotira-Tepes (Cyprus): a comparative approach, Reports of Department of Antiquities, Cyprus, 63–76.Marketou, T., 1990, Asomatos and Seraglio: EBA production and interconnections, Hydra, Working Papers in Middle
Bronze Age Studies, 7, 40–8.McLachlan, G. J., and Basford, K. E., 1988, Mixture models: inference and applications to clustering, Marcel Dekker,
New York. McLachlan, G. J., Peel, D., Basford, K. E., and Adams, P., 1999, The EMMIX algorithm for the fitting of mixtures
of normal and t-components, Journal of Statistical Software, 4, 2.Melas, E. M., 1988, The Dodecanese and West Anatolia in prehistory: interrelationships ethnicity and political
geography, Anatolian Studies, 38, 109–20.Mountjoy, P. A., 1998, The east Aegean–west Anatolian interface in the Late Bronze age: Myceneans and the kingdom
of Ahhiyawa, Anatolian Studies, 48, 33–68.Nobile, A., and Green, P. J., 2000, Bayesian analysis of factorial experiments by mixture modelling, Biometrika, 87,
15–35.Özdogan, M., and Pendik, A., 1983, A Neolithic site of Fikirtepe Culture in the Marmara Region, in Beitrage zur
Altertumskunde Kleinasiens, Feschrift für Kurt Bittel (eds. R. M. Boehmer and H. Hauptmann), 401–11, Mainz. Papageorgiou, I., Baxter, M. J., and Cau, M. A., 2001, Model-based clustering techniques in archaeological ceramic
provenance studies, Archaeometry, 43(4), 571–88.Pirazzoli, P. A., 2000, Sea level changes. The last 20,000 years, J. Wiley & Sons, Chichester, England.Pollard, M., and Heron, C., 1996, Archaeological chemistry, The Royal Society of Chemistry, London.Potts, J. P., Webb, P. C., and Williams-Thorpe, O., 1995, Analysis of silicate rocks using field-portable X-ray fluorescence
instrumentation incorporating a mercury (II) iodide detector: a preliminary assessment of analytical performance,Analyst, 120, 1273–8.
Potts, J. P., Ellis, A. T., Kregsamer, P., Marshall, J., Streli, Ch., West, M., and Wobrauschek, P., 2001, Atomic spectrometryupdate. X-ray fluorescence spectrometry, Journal of Analytical and Atomic Spectroscopy, 16, 1217–37.
Richardson, S., and Green, P. J., 1997, On the Bayesian analysis of mixtures with an unknown number of components(with discussion), Journal of the Royal Statistical Socisety, Series B, 59, 731–92.
Robert, C. P., Rydén, T., and Titterington, D. M., 2000, Bayesian inference in hidden Markov models throughthe reversible jump Markov chain Monte Carlo method, Journal of the Royal Statistical Society, Series B, 62, 57–76.
Runnels, C., 1995, Review of Aegean prehistory IV: The Stone age in Greece from the Palaeolithic to the advent ofthe Neolithic, American Journal of Archaeology, 99, 699–728.
Sampson, A., 1984, The Neolithic of the Dodecanese and Aegean Neolithic, Annals of the British School at Athens,79, 239–49.
Sampson, A., 1987, Neolithic period in Dodecanesse, Ministry of Culture, TAPA, Athens.Sampson, A., 1988, The Neolithic habitation at Yali, Nisyros, Evoiki Archeofilos Etaeria, Athens (in Greek with English
summary).Sampson, A. (ed.), 2002, The Neolithic settlement at Ftelia, Mykonos, Department of Mediterranean Studies, Univer-
sity of the Aegean, Rhodes, Greece.
Clustering Neolithic ceramics from Aegean and Asia Minor using XRF 813
© University of Oxford, 2007, Archaeometry 49, 4 (2007) 795–813
Sampson, A., 2006, The prehistory of the Aegean, Palaeolithic–Mesolithic–Neolithic, 112, Atrapos, Athens (in Greekwith extended English version).
Sampson, A., and Koslowski, J., 1999, The cave of cyclope in the northern Aegean: a specialized fishing shelter ofthe Mesolithic and Neolithic periods, Neo-lithic, 3, 5–7.
Sampson, A., Koslowski, J., Kaszanowska, M., and Giannouli, B., 2002, The Mesolithic settlement at Maroulas,Kythnos, Mediterranean Archaeology and Archaeometry, 2(1), 45–67.
Seher, J., 1990, Coskuntepe-Anatolische Neolithikum am Nordostufer der Agais, Istmitt 40, 9–15.Stanley-Price, N., 1979, Early prehistoric settlement in Cyprus: a review and gazetteer of sites, c. 6500–3000 BC,
BAR International Series 65, Oxford.Van Andel, Tj. H., and Runnels, C. N., 1988, An essay on the ‘emergence of civilization’ in the Aegean world,
Antiquity, 62, 234–47.Yakar, J., 1985, The later prehistory of Anatolia. The Late Chalcolithic and Early Bronze Age, BAR International
Series 268, Oxford.
Related Documents