ANNUAL REPORT 2013 Panoro Energy

Welcome message from author
This document is posted to help you gain knowledge. Please leave a comment to let me know what you think about it! Share it to your friends and learn new things together.
Transcript

PA
NO
RO
EN
ER
GY
AN
NU
AL
RE
PO
RT
20
13
A N N U A L R E P O R T 2 0 1 3
P a n o r o E n e r g y

C O M PA N Y O V E R V I E W
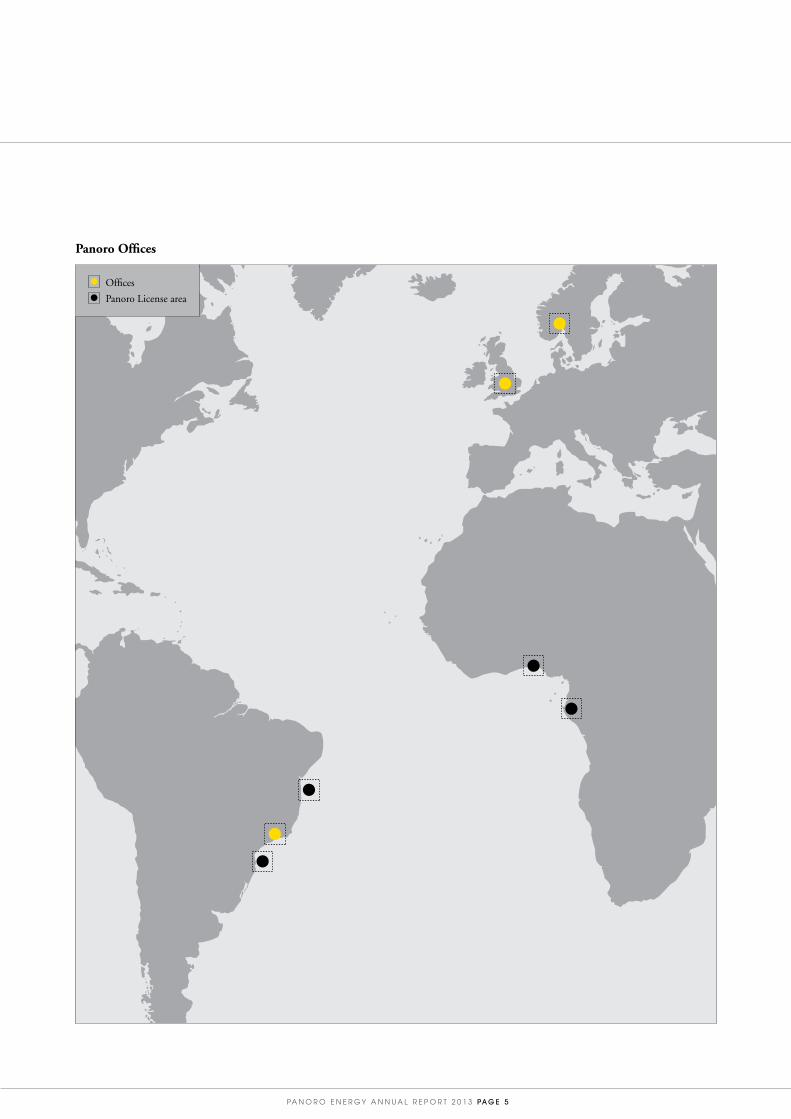
Panoro Energy ASA is an independent E&P company with assets
in the South Atlantic region. The Company has offices in Oslo,
London and Rio de Janeiro. The Company is listed on the Oslo Stock
Exchange with ticker “PEN”.
PA G E 2 PA N O R O E N E R G Y A N N U A L R E P O R T 2 0 1 3
FINANCIAL CALENDAR
May 15, 2014First quarter 2014 results and Annual General Meeting
August 14, 2014Second quarter 2014 results
November 6, 2014Third quarter 2014 results
CONTENTS
Company Overview 2
Assets 4
CEO letter 6
Company Operations 8
Reserves and Contingent Resources 12
Directors’ Report 2013 16
Board of Directors 24
Senior Management 26
Consolidated Statement of Comprehensive Income 28
Notes to the Consolidated Financial Statements 32
Panoro Energy ASA Parent Company Income Statement 68
Panoro Energy ASA Notes to the Financial Statements 71
Auditor’s Report 84
Statement on Corporate Governance in Panoro Energy ASA 86
Corporate Social Responsibility/ Ethical Code of Conduct 92
Glossary and Definitions 94

PA N O R O E N E R G Y A N N U A L R E P O R T 2 0 1 3 PA G E 3
C O M PA N Y O V E R V I E W
KEY FIGURES 2013
Net revenues (USD million) 54.1
EBITDA (USD million) 29.4
EBIT (USD million) (21.8)
Net profit/loss (USD million) (54.8)
2P Reserves (MMBOE) 10.0
2C Contingent Resources (MMBOE) 65.5
2013 Production of gas and condensate (BOE/day) 3,822
Share price December 31, 2013 (NOK) 3.05
0
500
1,000
1,500
2,000
2,500
3,000
3,500
4,000
2011 20132012
BOE/day
2
3
4PanoroNOK/share
January 2013 December 2013
OSEBX
SHARE PRICE DEVELOPMENTMANATI NET PRODUCTION
HIGHLIGHTS AND EVENTS
• EBITDA of USD 29.4 million• Group production of 3,822 BOE/day (gas plus condensate)• Drilled a discovery well in Gabon• Entered into agreement to sell the Brazilian subsidiary Rio das
Contas for USD 140 million plus a contingent earn out of up to USD 20 million
• Divested the Mengo-Kundji-Bindi asset, onshore Republic of Congo (Brazzaville)
• Impairment charge of USD 46.2 million on BS-3 assets and USD 0.6 million on Round 9 assets in Brazil
• Concluded on the strategic review process and decided to put the Company up for sale
2013 HIGHLIGHTS
PA G E 4 PA N O R O E N E R G Y A N N U A L R E P O R T 2 0 1 3
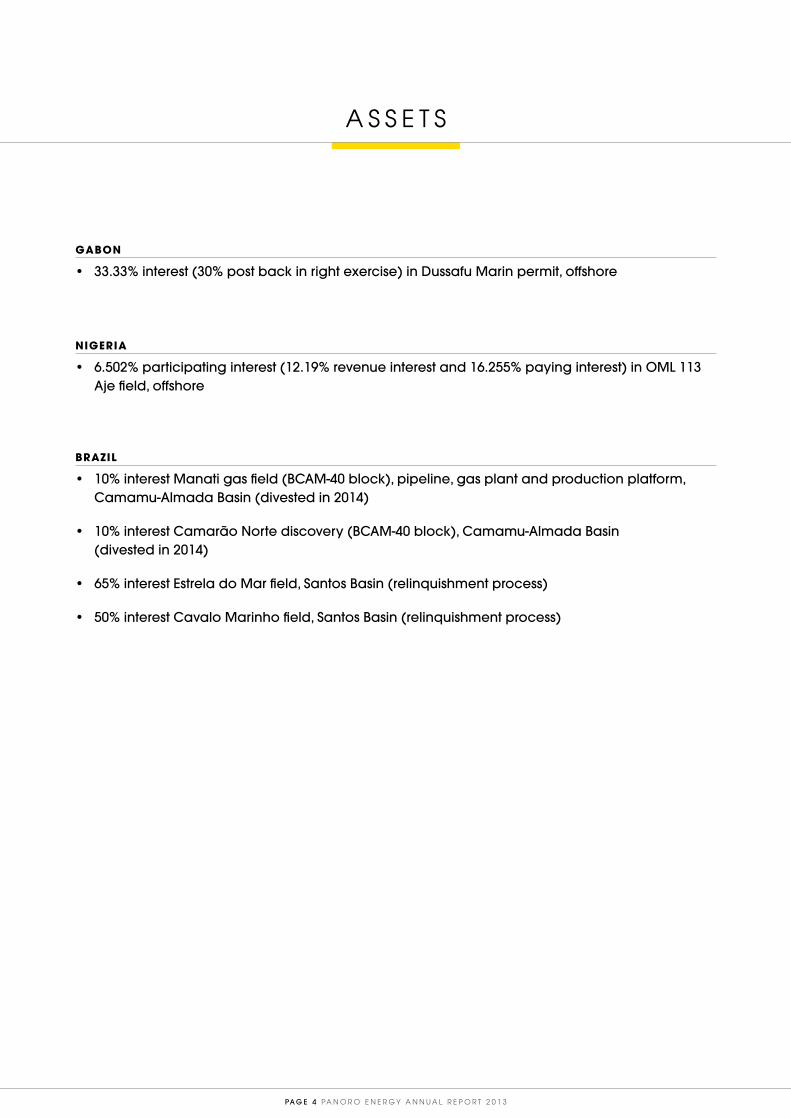
GABON
• 33.33% interest (30% post back in right exercise) in Dussafu Marin permit, offshore
NIGERIA
• 6.502% participating interest (12.19% revenue interest and 16.255% paying interest) in OML 113 Aje field, offshore
BRAZIL
• 10% interest Manati gas field (BCAM-40 block), pipeline, gas plant and production platform, Camamu-Almada Basin (divested in 2014)
• 10% interest Camarão Norte discovery (BCAM-40 block), Camamu-Almada Basin (divested in 2014)
• 65% interest Estrela do Mar field, Santos Basin (relinquishment process)
• 50% interest Cavalo Marinho field, Santos Basin (relinquishment process)
A S S E T S
PA N O R O E N E R G Y A N N U A L R E P O R T 2 0 1 3 PA G E 5
Offices
Panoro License area
Panoro Offices

PA G E 6 PA N O R O E N E R G Y A N N U A L R E P O R T 2 0 1 3
C E O L E T T E R
Dear Shareholders,2013 was an eventful year for Panoro Energy during which our main focus was to execute on the announced divestment strategy, reduce G&A cost and reshape the Company. This was necessary in order to position the Company as an attractive investment opportunity. A strategic review process in close dialog with our shareholders was undertaken which concluded that the preferred way forward would be to divest the Company. This process is currently ongoing.
In May 2013, Panoro entered into a Sales and Purchase Agreement with GeoPark to sell the Brazilian subsidiary Rio das Contas which holds the 10% interest in the Manati field. The transaction with GeoPark was concluded in March 2014 and Panoro received the settlement of USD 140 million. The majority of the funds were used to repay the outstanding bond debt which resulted in a debt free company. The sale of Rio das Contas was part of the strategic decision to exit Brazil.
In June 2013, the Company entered into an agreement to divest our interest in the OML 113 asset in Nigeria to Lekoil. However, Lekoil decided to terminate the Sale and Purchase Agreement and as a result paid Panoro USD 7 million in break-fee compensation.
In July 2013, we successfully divested our 20% working interest in the onshore MKB asset in Congo to the Congolese national oil company Societe Nationale des Petroles du Congo (SNPC).
The production from the Manati field continued to be strong throughout the year and the periodic five year shutdown was successfully completed as planned with no significant findings. Panoro will continue to have an indirect interest in Manati going forward through the agreement for an earn-out payment linked to the future production of the field which can add up to USD 20 million.Divesting the asset allowed us to repay all our debt and market ourselves as a pure play West African focused company. Panoro has two near term production assets in Nigeria and Gabon. Both assets have the potential to become “company makers”.
In Gabon, the Tortue exploration campaign was completed in February 2013 and resulted in an oil discovery in the offshore wildcat well Dussafu Tortue Marin. Hydrocarbons were discovered in both the pre-salt Gamba reservoir and the Dentale reservoir. Together with the previous discoveries made in the Dussafu permit the field is believed to have sufficient recoverable reserves to allow for a field development. The partners are preparing for a fast-track cluster development of Tortue, Ruche and Walt Whitman with first oil being targeted in 2016. We are excited about the development of this asset.
In the last quarter of 2013, a 3D seismic acquisition program was executed covering the outboard area of the permit previously only covered by 2D, as well as overshooting the Tortue and Ruche
discoveries. The interpretation of the new seismic is expected to be completed in the second half of 2014 and we hope this will provide improved data that could upgrade some very significant size leads into drillable prospects.
In Nigeria, the Joint Venture partners in the OML113 license are moving forward with the plan to commercialize the Aje field. In Q1 2014 the Joint Venture partners received approval of the Field Development Plan (FDP) from the Nigerian authorities. The FDP is primarily focused on the development of the Cenomanian Oil reservoir and includes two subsea production wells, tied back to a leased FPSO. The FDP envisages first oil commencing in Q4 2015. The Aje Joint Venture will take a Final Investment Decision in the next few months. Future phases of the project will likely target additional Cenomanian wells and a later Turonian/Albian gas condensate project is currently considered as a separate development in the future.
The Coral asset in Brazil was relinquished in 2013 and ANP sent a notice requesting relinquishment of the two remaining BS-3 assets Cavalo Marinho and Estrela do Mar based on the assertion that the consortia had not met the development requirements set by the ANP. These requirements included the drilling of one ADR (Advanced Data Recovery) well to test the B-1 zone on each of the concessions. These wells were not part of the original development plan and the requirements would force the concession holders to conduct potentially uneconomic development activities. As a result, the partners decided to initiate a joint farm out process which included offering operatorship of all the BS-3 blocks, however, due to lack of interest from potential buyers the process was terminated in Q1 2014 and the Company took actions to exit the licenses. Consequently, the Company impaired the remaining two licenses in BS-3; Cavalo Marinho and Estrela do Mar at year end.
2013 has been a transformational year for Panoro and the Company is now well positioned ahead of the sale process that has been initiated. We have made solid progress in our plan to reduce core G&A costs throughout the year to align the size of the organization with the activity level. Following the closing of the divestment of Rio das Contas in the first quarter of 2014 the Company had 10 employees compared with 30 at the end of 2012. We have cleaned up our balance sheet and we have a solid financial platform that will ensure that we can meet all financial commitments. We have two exciting assets that are located in two highly attractive hydrocarbon rich areas.
The Company is now positioned to take the next step and demonstrate value creation to our shareholders. I would like to thank shareholders for their feedback, support and continued commitment.
Jan Kielland CEO, Panoro Energy ASA

PA G E 8 PA N O R O E N E R G Y A N N U A L R E P O R T 2 0 1 3
C O M PA N Y O P E R A T I O N S
Panoro Energy currently has assets in West-Africa and Brazil. In West Africa, the Company is
engaged in projects in Gabon and Nigeria, having divested its interest In Congo Brazzaville during
2013. The Company has announced that it will exit Brazil, but at year end 2013 the Company still
had interests in three projects in Brazil of which one is a producing field.
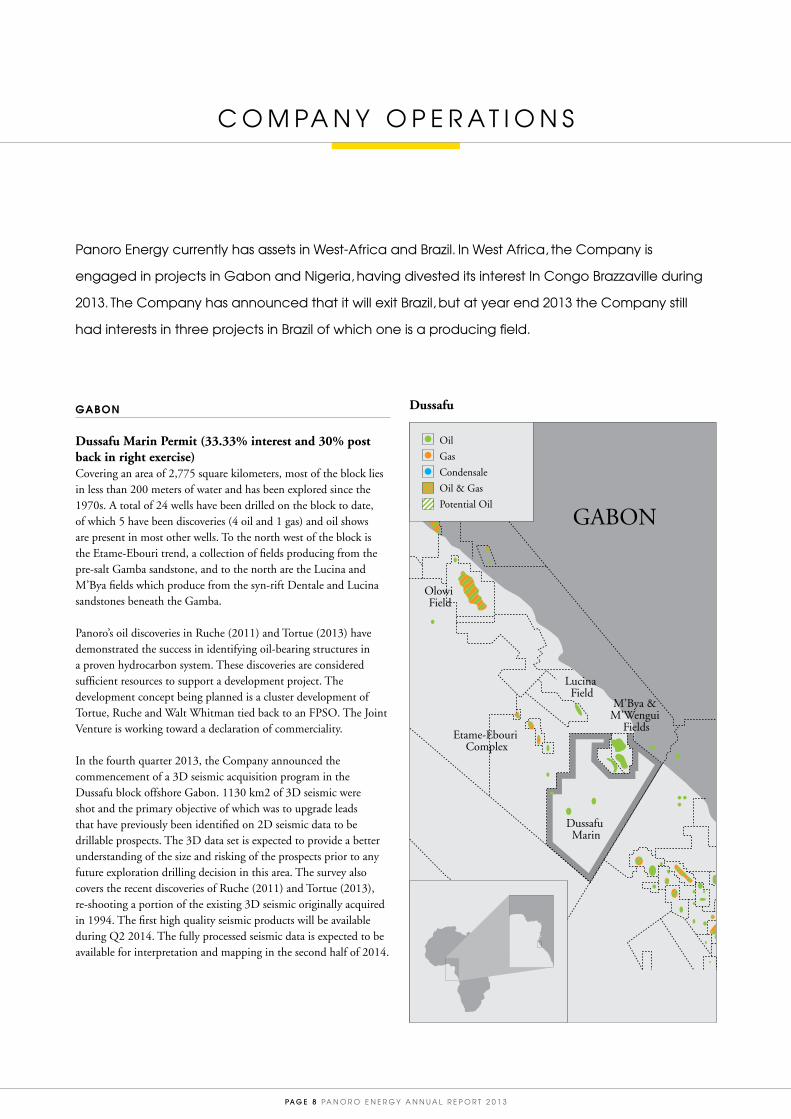
GABON
Dussafu Marin Permit (33.33% interest and 30% post back in right exercise)Covering an area of 2,775 square kilometers, most of the block lies in less than 200 meters of water and has been explored since the 1970s. A total of 24 wells have been drilled on the block to date, of which 5 have been discoveries (4 oil and 1 gas) and oil shows are present in most other wells. To the north west of the block is the Etame-Ebouri trend, a collection of fields producing from the pre-salt Gamba sandstone, and to the north are the Lucina and M’Bya fields which produce from the syn-rift Dentale and Lucina sandstones beneath the Gamba.
Panoro’s oil discoveries in Ruche (2011) and Tortue (2013) have demonstrated the success in identifying oil-bearing structures in a proven hydrocarbon system. These discoveries are considered sufficient resources to support a development project. The development concept being planned is a cluster development of Tortue, Ruche and Walt Whitman tied back to an FPSO. The Joint Venture is working toward a declaration of commerciality.
In the fourth quarter 2013, the Company announced the commencement of a 3D seismic acquisition program in the Dussafu block offshore Gabon. 1130 km2 of 3D seismic were shot and the primary objective of which was to upgrade leads that have previously been identified on 2D seismic data to be drillable prospects. The 3D data set is expected to provide a better understanding of the size and risking of the prospects prior to any future exploration drilling decision in this area. The survey also covers the recent discoveries of Ruche (2011) and Tortue (2013), re-shooting a portion of the existing 3D seismic originally acquired in 1994. The first high quality seismic products will be available during Q2 2014. The fully processed seismic data is expected to be available for interpretation and mapping in the second half of 2014.
Olowi Field
Lucina Field
Etame-Ebouri Complex
Dussafu Marin
M’Bya & M’Wengui
Fields
GABON
Dussafu
Oil
Gas
Condensale
Oil & Gas
Potential Oil
PA N O R O E N E R G Y A N N U A L R E P O R T 2 0 1 3 PA G E 9
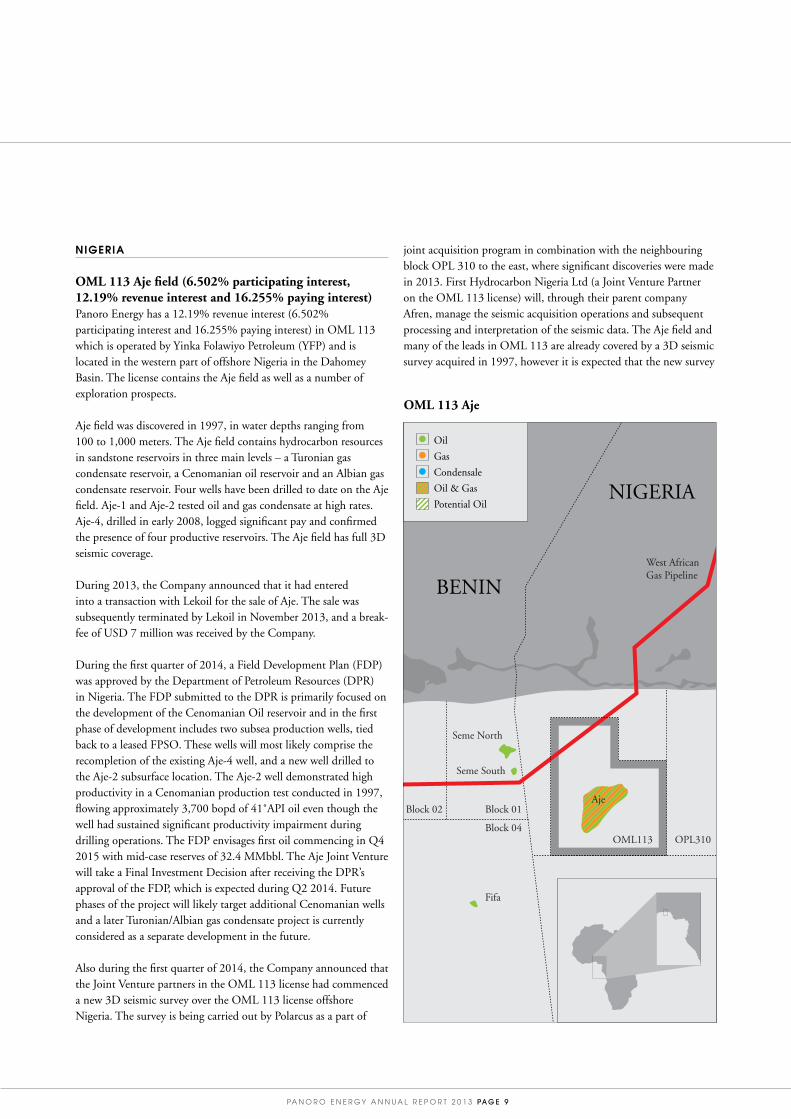
NIGERIA
OML 113 Aje field (6.502% participating interest, 12.19% revenue interest and 16.255% paying interest)Panoro Energy has a 12.19% revenue interest (6.502% participating interest and 16.255% paying interest) in OML 113 which is operated by Yinka Folawiyo Petroleum (YFP) and is located in the western part of offshore Nigeria in the Dahomey Basin. The license contains the Aje field as well as a number of exploration prospects.
Aje field was discovered in 1997, in water depths ranging from 100 to 1,000 meters. The Aje field contains hydrocarbon resources in sandstone reservoirs in three main levels – a Turonian gas condensate reservoir, a Cenomanian oil reservoir and an Albian gas condensate reservoir. Four wells have been drilled to date on the Aje field. Aje-1 and Aje-2 tested oil and gas condensate at high rates. Aje-4, drilled in early 2008, logged significant pay and confirmed the presence of four productive reservoirs. The Aje field has full 3D seismic coverage.
During 2013, the Company announced that it had entered into a transaction with Lekoil for the sale of Aje. The sale was subsequently terminated by Lekoil in November 2013, and a break-fee of USD 7 million was received by the Company.
During the first quarter of 2014, a Field Development Plan (FDP) was approved by the Department of Petroleum Resources (DPR) in Nigeria. The FDP submitted to the DPR is primarily focused on the development of the Cenomanian Oil reservoir and in the first phase of development includes two subsea production wells, tied back to a leased FPSO. These wells will most likely comprise the recompletion of the existing Aje-4 well, and a new well drilled to the Aje-2 subsurface location. The Aje-2 well demonstrated high productivity in a Cenomanian production test conducted in 1997, flowing approximately 3,700 bopd of 41˚API oil even though the well had sustained significant productivity impairment during drilling operations. The FDP envisages first oil commencing in Q4 2015 with mid-case reserves of 32.4 MMbbl. The Aje Joint Venture will take a Final Investment Decision after receiving the DPR’s approval of the FDP, which is expected during Q2 2014. Future phases of the project will likely target additional Cenomanian wells and a later Turonian/Albian gas condensate project is currently considered as a separate development in the future.
Also during the first quarter of 2014, the Company announced that the Joint Venture partners in the OML 113 license had commenced a new 3D seismic survey over the OML 113 license offshore Nigeria. The survey is being carried out by Polarcus as a part of
joint acquisition program in combination with the neighbouring block OPL 310 to the east, where significant discoveries were made in 2013. First Hydrocarbon Nigeria Ltd (a Joint Venture Partner on the OML 113 license) will, through their parent company Afren, manage the seismic acquisition operations and subsequent processing and interpretation of the seismic data. The Aje field and many of the leads in OML 113 are already covered by a 3D seismic survey acquired in 1997, however it is expected that the new survey
Seme North
Block 02
West AfricanGas Pipeline
Block 01
Block 04OML113 OPL310
Aje
Fifa
Seme South
NIGERIA
BENIN
OML 113 Aje
Oil
Gas
Condensale
Oil & Gas
Potential Oil
PA G E 1 0 PA N O R O E N E R G Y A N N U A L R E P O R T 2 0 1 3
will provide a considerable improvement in data quality over the existing 3D data. It is envisaged that the data will enable better development planning for the second phase of development drilling on Aje and provide improved data to fully evaluate the exploration potential over the whole of the OML 113 license, including the exciting synrift exploration play that was significantly de-risked though the discovery made in OPL 310. The survey is expected to be completed by end of May 2014.
BRAZIL
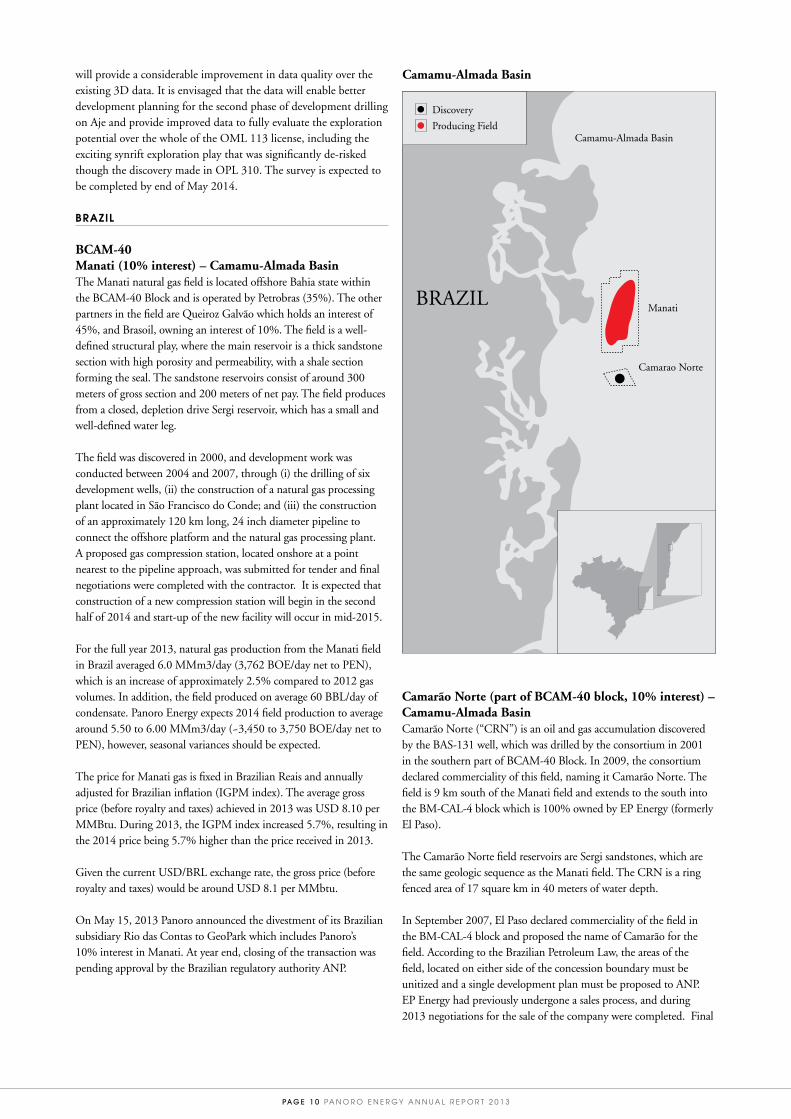
BCAM-40Manati (10% interest) – Camamu-Almada BasinThe Manati natural gas field is located offshore Bahia state within the BCAM-40 Block and is operated by Petrobras (35%). The other partners in the field are Queiroz Galvão which holds an interest of 45%, and Brasoil, owning an interest of 10%. The field is a well-defined structural play, where the main reservoir is a thick sandstone section with high porosity and permeability, with a shale section forming the seal. The sandstone reservoirs consist of around 300 meters of gross section and 200 meters of net pay. The field produces from a closed, depletion drive Sergi reservoir, which has a small and well-defined water leg.
The field was discovered in 2000, and development work was conducted between 2004 and 2007, through (i) the drilling of six development wells, (ii) the construction of a natural gas processing plant located in São Francisco do Conde; and (iii) the construction of an approximately 120 km long, 24 inch diameter pipeline to connect the offshore platform and the natural gas processing plant. A proposed gas compression station, located onshore at a point nearest to the pipeline approach, was submitted for tender and final negotiations were completed with the contractor. It is expected that construction of a new compression station will begin in the second half of 2014 and start-up of the new facility will occur in mid-2015.
For the full year 2013, natural gas production from the Manati field in Brazil averaged 6.0 MMm3/day (3,762 BOE/day net to PEN), which is an increase of approximately 2.5% compared to 2012 gas volumes. In addition, the field produced on average 60 BBL/day of condensate. Panoro Energy expects 2014 field production to average around 5.50 to 6.00 MMm3/day (~3,450 to 3,750 BOE/day net to PEN), however, seasonal variances should be expected.
The price for Manati gas is fixed in Brazilian Reais and annually adjusted for Brazilian inflation (IGPM index). The average gross price (before royalty and taxes) achieved in 2013 was USD 8.10 per MMBtu. During 2013, the IGPM index increased 5.7%, resulting in the 2014 price being 5.7% higher than the price received in 2013.
Given the current USD/BRL exchange rate, the gross price (before royalty and taxes) would be around USD 8.1 per MMbtu.
On May 15, 2013 Panoro announced the divestment of its Brazilian subsidiary Rio das Contas to GeoPark which includes Panoro’s 10% interest in Manati. At year end, closing of the transaction was pending approval by the Brazilian regulatory authority ANP.
Camarão Norte (part of BCAM-40 block, 10% interest) – Camamu-Almada BasinCamarão Norte (“CRN”) is an oil and gas accumulation discovered by the BAS-131 well, which was drilled by the consortium in 2001 in the southern part of BCAM-40 Block. In 2009, the consortium declared commerciality of this field, naming it Camarão Norte. The field is 9 km south of the Manati field and extends to the south into the BM-CAL-4 block which is 100% owned by EP Energy (formerly El Paso).
The Camarão Norte field reservoirs are Sergi sandstones, which are the same geologic sequence as the Manati field. The CRN is a ring fenced area of 17 square km in 40 meters of water depth.
In September 2007, El Paso declared commerciality of the field in the BM-CAL-4 block and proposed the name of Camarão for the field. According to the Brazilian Petroleum Law, the areas of the field, located on either side of the concession boundary must be unitized and a single development plan must be proposed to ANP. EP Energy had previously undergone a sales process, and during 2013 negotiations for the sale of the company were completed. Final
Manati
Camamu-Almada Basin
Camarao Norte
BRAZIL
Camamu-Almada Basin
Discovery
Producing Field

PA N O R O E N E R G Y A N N U A L R E P O R T 2 0 1 3 PA G E 1 1
closing of the sale of EP Energy is contingent on final approval by the ANP, after which it is expected that unitization discussions and plans for development will be brought forward by the purchasing party. Panoro’s 10 % interest in CRN will be divested along with Rio das Contas.
BS-3BS-3 Project – Cavalo Marinho (50% interest) and Estrela do Mar (65% interest) – Santos BasinPanoro acquired interests in the BS-3 area in a series of negotiations conducted between 2001 and 2006, resulting in the interests shown above as of the end of 2013. As of year-end 2013, Panoro continued its participation in Petrobras operated partnerships in the Cavalo Marinho and Estrela do Mar fields, which are among several shallow water offshore Guaruja carbonate oilfields located in the South Santos Basin of Brazil. Cavalo Marinho and Estrela do Mar have never been produced, however two adjacent fields in the trend, Caravela (100% Petrobras) and Coral (35% Panoro in partnership with Petrobras, Brasoil and QGEP), cumulatively produced over 32 mmbo between 1993 and 2008. Technical data indicates that all of these fields have very good quality 40 degree API oil, with most of the reservoirs having excellent producing characteristics.
During 2012 and 2013, Panoro continued to work with the consortium to configure development plans that would lead to economic exploitation of the fields. The technical work performed by both Panoro and the operator, Petrobras, led to the submissions of development plans to the National Petroleum Agency (ANP). Despite technical arguments presented in technical reports and presented in multiple technical meetings, the ANP would not relent on two key points: 1) The development plan must include drilling wells to test the low-permeability B-1 zone in every field, including long-term production testing and contingent pilot injection, and 2) The development plan must include a gas offtake plan to comply with regulations put in place after the Caravela and Coral fields were produced.
The combination of the requirements for B1 tests and a gas solution add substantial cost to the project, and therefore have a significantly negative impact on the economics. While the economic analysis of a project including B1 tests and a gas solution indicates a positive net present value these factors significantly reduce the attractiveness of the project. The most recent economic evaluations show that the project is only marginally economic. During the latter part of 2013, Panoro and its partners Petrobras and Brasoil embarked on a process to attempt to farmout the BS-3 assets, in an attempt to monetize the asset and to test the perceived value of this project within the industry. During the process, over 30 companies were contacted, but a limited number of these companies elected to conduct an evaluation, and of these no company was willing to demonstrate strong interest by submitting an Indicative Offer or a Letter of Interest.
Given the difficulties in defining an economically attractive development plan and the general perception of limited value remaining in the BS-3 blocks, the decision was made to surrender the blocks during early 2014. Note that as of year-end 2012 the reserves associated with the remaining BS-3 fields were re-categorized as contingent resources.
Coral field, 35% interestThe Coral license was relinquished back to the Brazilian regulatory authorities ANP during 2013.
BM-S-63, BM-S-71 & BM-S-72 exploration blocks (15% interest) – Santos BasinAll three blocks were relinquished back to the Brazilian regulatory authorities ANP during 2013 after evaluation showed that the discoveries were considered sub-commercial for a standalone development project by Panoro.
CONGO-BRAZZAVILLE
Mengo-Kundji-Bindi (20% interest)In July 2013 the Company completed the sale of its 20% interest in the MKB permit to Société Nationale des Pétroles du Congo (“SNPC”) the operator of the MKB Permit in the Republic of Congo.
Santos Basin
Piracuca
SidonTiroTubarao
Estrela do Mar
Coral
CaravelaCaravela Sul
Cavalo Marinho
1-BSS.070
BM-S-63
BM-S-71
BM-S-72
Oil
Gas
Condensale
Oil & Gas
Potential Oil

PA G E 1 2 PA N O R O E N E R G Y A N N U A L R E P O R T 2 0 1 3
R E S E R V E S A N D C O N T I N G E N T R E S O U R C E S
Panoro’s classification of reserves and resources complies with the guidelines established by the Oslo Stock Exchange and are based on the definitions set by the Petroleum Resources Management System (PRMS-2007), sponsored by the Society of Petroleum Engineers/World Petroleum Council/ American Association of Petroleum Geologists/ Society of Petroleum Evaluation Engineers (SPE/WPC/AAPG/SPEE) as issued in March 2007.
Reserves are the volume of hydrocarbons that are expected to be produced from known accumulations:
• In production• Under development • With development committed
Reserves are also classified according to the associated risks and probability that the reserves will be actually produced.
1P Proven reserves represent volumes that will be recovered with 90% probability
2P Proven + Probable represent volumes that will be recovered with 50% probability
3P Proven + Probable + Possible volumes that will be recovered with 10% probability
Contingent resources are the volume of hydrocarbons that is expected to be produced from known accumulations:
• In planning phase• Where development is likely• Where development is unlikely with present basic assumptions• Under evaluation Contingent resources are reported as 1C, 2C and 3C reflecting similar probabilities as reserves.
Panoro Energy’s reserve report per end 2013 is summarized in the table below:
Contingent resources are reported as 1C, 2C and 3C reflecting similar probabilities as reserves. Panoro Energy’s reserve report per end 2013 is summarized in the table below:
Asset1P reserves
MMBOE2P reserves
MMBOE
Manati 9.3 10.0
Panoro total 9.3 10.0
2C Contingent resources summary (MMBOE)
Asset
Dussafu* 11.0
Aje 26.6
Cavalo Marinho 11.0
Estrela do Mar 15.6
Caravela Sul 0.4
Camarão Norte 0.9
Panoro total 65.5
* Dussafu working interst share.
As of year-end 2013, Panoro was producing reserves from one asset, being the Manati gas field in Brazil.
In addition, Panoro had six assets with contingent resources.
A summary description of each asset with status as of year-end 2013 is included below. In addition we refer to the company web-site for background information on each asset.
2013 2C RESOURCES BY FIELD (MMBOE) - TOTAL 65.5 MMBOE2013 2P RESERVES (MMBOE) - TOTAL 10.0 MMBOE
10
n Manati
1111
0.4
26.6
15.6
0.9
n Cavalo Marinhon Estrela do Marn Caravela Suln Ajen Dussafun Camarao Norte

PA N O R O E N E R G Y A N N U A L R E P O R T 2 0 1 3 PA G E 1 3
Unless otherwise specified, all numbers quoted below are net to Panoro’s interest.
DUSSAFU: OFFSHORE GABON, OPERATOR HARVEST NATURAL RESOURCES, PANORO 33.33%
Dussafu is a large exploration block with several small oil fields, the most recent being the Ruche and Tortue discoveries. The 2C Contingent Resources reported by the operator are 49 MMbbl oil in the Ruche, Tortue, Moubenga and Walt Whitman fields. This figure does not include the GMC-1X gas field which has 2C resources of 142 bcf gas and 5 MMbbl oil.
The recent GCA certified (3rd party) potentially recoverable 2C contingent Resources are 33.4 MMbbl, based on a commercial evaluation of a development scenario, which is being considered as the basis for the declaration of commerciality. This evaluation yields 2C potentially recoverable resources net to Panoro of 11.0 MMbbls of oil. These 2C Contingent Resources are Panoro’s Working Interest fraction of the Gross Field Resources; they do not represent Panoro’s actual Net Entitlement under the terms of the PSC that governs the asset, which would likely be lower.
Studies to evaluate Dussafu development options continue. The conceptual plan is to aggregate the established accumulations with shared infrastructure. The JV is moving towards a Declaration of Commerciality and submission of a Field Development Plan for Dussafu in 2014.
AJE: OFFSHORE NIGERIA, OPERATOR YINKA FOLAWIYO PETROLEUM (YFP), PANORO 12.1913%
The Aje discovery, close to the border with Benin, is predominantly a gas discovery with significant condensate, but also contains a separate oil leg.
As of year-end a Field Development Plan (FDP) was pending to be submitted to the Department of Petroleum Resources during the first quarter of 2014. The FDP focuses on a two-well development of the Cenomanian oil reservoir only, with mid-case reserves of 32.4 MMbbls. Panoro’s entitlement of this is equal to 4.4 MMbbls. Aje volumes for all reservoirs as reported by TRACS in December 2013 are included as contingent resources with a best estimate – 2C of 26.6 MMBOE net to Panoro’s share.
MANATI: GAS FIELD OFFSHORE BRAZIL, OPERATOR PETROBRAS, PANORO 10%
The original development plan for Manati called for seven producing wells, but based on initial production experience and reservoir understanding, the Operator concluded that six wells could potentially suffice to drain the reservoirs. The consortium consequently has decided to postpone the decision to drill the seventh well.
With the exception of a scheduled maintenance shut-down for three week period in April, production remained at high levels throughout 2013.
Total production for the field during the year 2013 was 218.287 MMm3 gas and 3,510 m3 of condensate, which is 1.395 MMBOE when stated in equivalent units, compared to 1.436 MMBOE in 2012.
As of year-end 2013 the Manati field had cumulative gas production (100%) of 13.24 Bm3. Compression is now planned to be operational beginning in mid-2015.
The Manati reserves report for year end 2013 reflects a reserves adjustment made by GCA during 2013, based on updated Manati reservoir pressure data and the resulting update to the simulation model, as reported by the operator. As a result of this adjustment, the ultimate 1P recovery was increased by 0.9 MMBOE, while 2P ultimate recovery was reduced slightly.
As of the publication date of this report, this asset has now been sold, along with interest in the Camarão Norte field.
CAMARÃO NORTE: OFFSHORE BRAZIL, OPERATOR PETROBRAS, PANORO 10%
Camarão/Camarão Norte is a discovery extending into the area previously designated as the BCAM-40 (Manati) block. It straddles the block boundary with the neighboring block to the south (BM-CAL-4, 100% owned and operated by a third party). Camarão Norte was declared commercial in July 2009. Five wells have been drilled on the structure (four in block BM-CAL-4), proving the presence of both oil and gas.
A Unitization process will be required and volumes are included as Contingent Resources, best estimate - 2C - of 0.9 MMBOE. This includes both oil and gas volumes considered inside the BCAM-40 ring fence with a 50-50 resource estimate scenario between the blocks. As of the publication date of this report, this asset has now been sold, along with interest in the Manati field.

PA G E 1 4 PA N O R O E N E R G Y A N N U A L R E P O R T 2 0 1 3
BS-3: OFFSHORE BRAZIL, OPERATOR PETROBRAS, PANORO 50-65%
The BS-3 area offshore in the southern part of the Santos basin holds two Panoro assets: the Cavalo Marinho, and Estrela-do-Mar oil fields. The Coral field was relinquished during 2013.
Generally, in all the BS3 fields, hydrocarbons are present in up to four separate, vertically stacked carbonate reservoir zones (B1-B4), where commercial production so far has been associated with the lower three. The uppermost zone (referred to as B1), holds significant hydrocarbon volumes in place but has low permeability and has not been proven to be commercially producible with conventional technology.
Planning for development of these fields has been complicated by the ANP requirements for testing of the low permeability B1 zone and by the requirement for a gas solution. The consortia have worked together to attempt to resolve these complicating issues for several years, but have not been able to configure a commercial solution to develop the fields.
As of year-end, Panoro was involved in a farmout process for the BS-3 assets, and this process had attracted some interest from several qualified companies. The farmout process was ongoing as of the end of the year 2013, with confidentiality agreements having been signed, and data rooms had been either held or scheduled, however no company demonstrated interest in entering into serious negotiations. As of the date of publication of this reserves report, faced with increasing pressure from the ANP, all partners have agreed to relinquish the BS-3 blocks. It is expected that this relinquishment will proceed without any major obstacles.
MANAGEMENT DISCUSSION AND ANALYSIS
Panoro uses the services of Gaffney, Cline & Associates (GCA) for 3rd party verifications of its reserves.
All evaluations are based on standard industry practice and methodology for production decline analysis and reservoir modelling based on geological and geophysical analysis.
The following discussions are a comparison of the volumes reported in previous reports, along with a discussion of the consequences for the year-end 2013 ASR:
• Dussafu: The block has made significant progress towards a future development sanction. The joint venture has now agreed that the discoveries can result in a commercial development and discussions are ongoing with the Direction Generale des Hydrocarbures in Gabon to pass though the Declaration of Commerciality milestone defined under the Production Sharing Contract. There is now increased confidence that a Field Development Plan will be approved by the Government in the future and these Contingent Resources will be reclassified as Reserves.
• Aje: The block has undergone some partnership changes which have resulted in significant re-alignment of the Joint Venture
group. With the Cenomanian Oil Development plan now submitted to the Department of Petroleum Resources in Nigeria for approval, tangible progress toward a field development has been made. These factors, improve the likelihood of a future re-classification of the Resource Volumes as Reserves.
• Manati: Reserves are carried forward from a slight upward revision performed by Gaffney Cline during 2013, after the publication of the Year End 2012 reserve report. The 2013 Gaffney Cline revision was based on the Operator’s revised technical assessment, using updated production data and newly acquired reservoir pressure data. As of the publication date of this report, this asset has now been sold, along with interest in the Camarão Norte field.
• BS3: Estrela do Mar and Cavalo Marinho Contingent Resources are unchanged, as Panoro is continued during 2013 to seek solutions through interaction with all major stakeholders, as well as pursuing a farmout. The major issues that affected development of the fields are: 1) Gas export solution, and 2) Plan to assess the B1 zone through a pilot program, with the aim being eventual development. As of the date of publication of this reserves report, faced with increasing pressure from the ANP, all partners have agreed to relinquish the BS-3 blocks. It is expected that this relinquishment will proceed without any major obstacles.
ASSET ACQUISITIONS/DISPOSALS DURING 2013
The BM-S-63, BM-S-71 and BM-S-72 blocks and the Coral field were relinquished in 2013. Additionally, the MKB asset was sold during 2013.
ASSUMPTIONS
The commerciality and economic tests for the December 31, 2013 Manati reserves volumes were based on condensate and gas sales prices as shown in the following table. Gas price is fixed in Brazilian Reais according to the sales contract, allowing annual escalation with the domestic market inflation. GCA estimates that the balance between that escalation and the exchange ratio to the US Dollar would give a net escalation close to 1% per year. Condensate price was based on GCA’s future scenario for Brent crude oil price with a USD 2.07/Bbl location discount and a USD 0.07/Bbl quality premium.
Both gas and condensate prices were grossed up for taxes, which are 21.25% for gas (PIS, PASEP, COFINS and ICMS taxes) and 9.25% for condensate (PIS and COFINS taxes).
YearCondensate
US$/BblGas
US$/MMBtu
2014 111.28 8.76
2015 106.69 9.02
2016 104.19 9.29
2017 107.67 9.57
2018 109.76 9.86
Thereafter +2% per year +3% per year

PA N O R O E N E R G Y A N N U A L R E P O R T 2 0 1 3 PA G E 1 5
Converting gas volumes to oil-equivalents is done using a conversion factor of 6.29 bbl/m3.
Panoro’s total 1P reserves at end of 2013 amount to 9.26 MMBOE.
This reflects adjusting for 2013 production, a reduction to account for the sale of the MKB asset and an interim 2013 adjustment for the Manati field, conducted by Gaffney Cline & Associates, to reflect updated pressure data and revisions to the 3D simulation model as performed by the operator.
Panoro’s 2P reserves after similar adjustment is 10.0 MMBOE.
Panoro’s Contingent Resource base includes discoveries of varying degrees of maturity towards development decisions. By end of 2013, Panoro’s assets contain a total 2C volume of 65.5 MMBOE.
Oslo, April 2014
Jan KiellandCEO

PA G E 1 6 PA N O R O E N E R G Y A N N U A L R E P O R T 2 0 1 3
D I R E C T O R S ’ R E P O R T 2 0 1 3
Panoro Energy ASA (“Panoro” or the “Company”) is an independent E&P company with assets
offshore West-Africa and offshore Brazil. The Company’s business activities comprise exploration and
production of oil and natural gas in Gabon, Nigeria and Brazil. The Company has offices in Oslo,
Norway, London, United Kingdom and Rio de Janeiro, Brazil. Panoro Energy is listed on the Oslo Stock
Exchange (OSE) under the ticker symbol “PEN”.
As of year-end 2013, Panoro had one asset classified with reserves and six with contingent resources. Proved and probable (2P) reserves as of year-end 2013 were 10.0 MMBOE and best estimate (2C) contingent resources as of year-end 2013 were 65.5 MMBOE. Of this 27 MMBOE were (2C) contingent resources related to BS-3. At the end of 2013, the Company impaired the Company’s assets in the BS-3 area in the Southern Santos Basin offshore Brazil. Refer to the “Reserves and contingent resources” section of the report for further information.
OPERATIONS
Operations in GabonCovering an area of 2,775 square kilometers, most of the block lies in less than 200 meters of water and has been explored since the 1970s. A total of 24 wells have been drilled on the block to date, of which 5 have been discoveries (4 oil and 1 gas) and oil shows are present in most other wells. To the north west of the block is the Etame-Ebouri trend, a collection of fields producing from the pre-salt Gamba sandstone, and to the north are the Lucina and M’Bya fields which produce from the syn-rift Dentale and Lucina sandstones beneath the Gamba.
Panoro’s oil discoveries in Ruche (2011) and Tortue (2013) have demonstrated the success in identifying oil-bearing structures in a proven hydrocarbon system. These discoveries are considered sufficient resources to support a development project. The development concept being planned is a cluster development of Tortue, Ruche and Walt Whitman tied back to an FPSO. The Joint venture is working toward a declaration of commerciality.
In the fourth quarter 2013, the Company announced the commencement of a 3D seismic acquisition program in the Dussafu block offshore Gabon. 1,130 km2 of 3D seismic were shot and the primary objective of which was to upgrade leads that have previously been identified on 2D seismic data to be drillable prospects. The 3D data set is expected to provide a better
understanding of the size and risking of the prospects prior to any future exploration drilling decision in this area. The survey also covers the recent discoveries of Ruche (2011) and Tortue (2013), re-shooting a portion of the existing 3D seismic originally acquired in 1994. The first high quality seismic products are expected to be available during Q2 2014. The fully processed seismic data is expected to be available for interpretation and mapping in the second half of 2014.
Net 2C contingent resources for this field as per GCA report were 11.0 MMbbls per year-end 2013. However, the operator’s number was 16,5 MMBOE.
Operations in NigeriaPanoro Energy has a 12.19% revenue interest (6.502% participating interest and 16.255% paying interest) in OML 113 which is operated by Yinka Folawiyo Petroleum (YFP) and is located in the western part of offshore Nigeria in the Dahomey Basin. The license contains the Aje field as well as a number of exploration prospects.
Aje field was discovered in 1997, in water depths ranging from 100 to 1,000 meters. The Aje field contains hydrocarbon resources in sandstone reservoirs in three main levels – a Turonian gas condensate reservoir, a Cenomanian oil reservoir and an Albian gas condensate reservoir. Four wells have been drilled to date on the Aje field. Aje-1 and Aje-2 tested oil and gas condensate at high rates. Aje-4, drilled in early 2008, logged significant pay and confirmed the presence of four productive reservoirs. The Aje field has full 3D seismic coverage.
During 2013, the Company announced that it had entered into a transaction with Lekoil for the sale of Aje. The sale was subsequently terminated by Lekoil in November 2013, and a break-fee of USD 7 million was received by the Company.
During the first quarter of 2014, a Field Development Plan (FDP)

PA N O R O E N E R G Y A N N U A L R E P O R T 2 0 1 3 PA G E 1 7
was submitted to the Department of Petroleum Resources (DPR) in Nigeria. The FDP submitted to the DPR is primarily focused on the development of the Cenomanian Oil reservoir and in the first phase of development includes two subsea production wells, tied back to a leased FPSO. These wells will most likely comprise the recompletion of the existing Aje-4 well, and a new well drilled to the Aje-2 subsurface location. The Aje-2 well demonstrated high productivity in a Cenomanian production test conducted in 1997, flowing approximately 3,700 bopd of 41˚API oil even though the well had sustained significant productivity impairment during drilling operations. The FDP envisages first oil commencing in Q4 2015 with mid-case reserves of 32.4 MMbbl. The Aje Joint Venture will take a Final Investment Decision after receiving the DPR’s approval of the FDP, which is expected during Q2 2014. Future phases of the project will likely target additional Cenomanian wells and a later Turonian/Albian gas condensate project is currently considered as a separate development in the future.
Also during the first quarter of 2014 the Company announced that the Joint Venture partners in the OML 113 license had commenced a new 3D seismic survey over the OML 113 license offshore Nigeria. The survey is being carried out by Polarcus as a part of joint acquisition program in combination with the neighbouring block OPL 310 to the east, where significant discoveries were made in 2013. First Hydrocarbon Nigeria Ltd (a Joint Venture Partner on the OML 113 license) will, through their parent company Afren, manage the seismic acquisition operations and subsequent processing and interpretation of the seismic data. The Aje field and many of the leads in OML 113 are already covered by a 3D seismic survey acquired in 1997, however it is expected that the new survey will provide a considerable improvement in data quality over the existing 3D data. It is envisaged that the data will enable better development planning for the second phase of development drilling on Aje and provide improved data to fully evaluate the exploration potential over the whole of the OML 113 license, including the exciting synrift exploration play that was significantly de-risked though the discovery made in OPL 310. The survey is expected to be completed by end of May 2014.
2C contingent resources related to the OML 113 license stood at 26.6 MMbbls per year-end 2013.
Operations in Congo-BrazzavillePanoro Energy held a 20% working interest in Mengo-Kundji-Bindi (“MKB”) in Congo-Brazzaville, which was sold to SNPC.
Operations in BrazilPanoro had three licenses in Brazil at the end of 2013, of which two are located in the Santos Basin and one in the Camamu-Almada Basin. Four blocks were relinquished to the ANP in 2013. After completion of a three-well exploration program on blocks BM-S-63, BM-S-71 and BM-S-72 the discoveries were considered sub commercial for a stand-alone development project by the partners. The Coral license was also relinquished back to ANP.
Panoro Energy’s production is from the Manati field in Brazil in the BCAM-40 block in the Camamu-Almada basin, where the Company holds a 10% interest. The field commenced production in 2007 and daily natural gas production averaged 6.0 MMm3 per
day in 2013 (3,762 boe per day net to Panoro), representing an increase of approximately 2.5% from 2012. Panoro‘s 2P reserves on Manati were 10.0 MMBOE per the end of 2013.
The Company also has a 10% interest in the Camarão Norte discovery, which is located 9 km south of the Manati field in the same block. This field was discovered in 2001. Camarão Norte extends southwards into the BM-CAL-4 block, which is 100% owned by EP Energy (formerly El Paso). Unitization discussions and plans for this field are pending discussions with EP Energy. Panoro Energy’s 2C contingent resources in this field amounted to 0.9 MMBOE per year-end 2013.
In May 2013, Panoro announced the divestment of its Brazilian subsidiary Rio das Contas to GeoPark which includes Panoro’s 10% interest in the BCAM-40 block. At year end the closing of the transaction was pending approval from the Brazilian Regulatory authorities ANP. This transaction was completed in 2014.
In the Santos Basin, the Company has ownership in two discoveries in the BS-3 area; Cavalo Marinho (50% interest) and Estrela do Mar (65% interest). Panoro Energy and its partners initiated a farmout process for their interests in the fields in the BS-3 area without success and as a result made a decision after year end to discontinue the farmout process. The operator will submit an abandonment plan for the BS-3 to ANP during 2014. As a result of the decision to withdraw from the BS-3 licenses, Panoro Energy charged the Income Statement for 2013 with a write-down of USD 46.2 million, leaving the remaining book value related to these assets at USD nil at the end of 2013.
As described above, the Company and its partners relinquished the BM-S-63, BM-S-71 and BM-S-72 licenses to ANP in 2013. Following the transfer of operatorship and a 35% working interest to Vanco, Panoro Energy held a 15% working interest in the three exploration licenses. Vanco carried Panoro’s cost of drilling for the three exploration wells in 2012. As a result of the unsuccessful drilling in the three blocks, Panoro Energy charged the Income Statement for 2013 with a write-down of the assets of USD 0.6 million, and recognized no remaining value related to these assets in the statement of financial position per the end of 2013.
Above divestment, relinquishments and exit from BS-3 leaves the Company with no further assets in Brazil.
The Company has through its subsidiary Rio das Contas an ongoing Research and Development project with the Federal University of Bahia (UFBA) using sequence stratigraphical methods to re-evaluate the hydrocarbon bearing layers in the Reconcavo basin.
THE ACCOUNTS
The Board of Directors confirms that the annual financial statements have been prepared pursuant to the going concern assumption, in accordance with §3-3a of the Norwegian Accounting Act, and that this assumption was realistic at the time the accounts were approved. The going concern assumption

PA G E 1 8 PA N O R O E N E R G Y A N N U A L R E P O R T 2 0 1 3
is based upon the financial position of the Company and the development plans currently in place. In the Board of Directors’ view, the annual accounts give a true and fair view of the group’s assets and liabilities, financial position and results. The Board of Directors is not aware of any factors that materially affect the assessment of the group’s position as of December 31, 2013, or the loss for 2013, other than those presented in the Directors’ Report or that otherwise follow from the financial statements.
Panoro Energy ASA prepares its financial statements in accordance with the International Financial Reporting Standards (IFRS), as provided for by the EU and the Norwegian Accounting Act.
The financial statements reflect the activities in 2013, and the Company’s financial position is considered to be sound. The consolidated accounts are presented in US dollars.
The below analysis compares 2013 with 2012 figures:
FINANCIAL PERFORMANCE AND ACTIVITIES
Condensed Consolidated Income Statement (Amounts in USD 000) 2013 2012
Total revenues (net revenues) 54,146 46,830
Operating expenses
Production costs (10,877) (5,557)
Exploration related costs (922) (903)
General and administrative costs (10,723) (16,312)
Strategic review costs (2,190) -
Total operating expenses (24,712) (22,772)
Earnings before interest, tax, depreciation and amortisation (EBITDA) 29,434 24,058
Depreciation (2,459) (7,713)
Asset write-off and impairment (46,815) (47,150)
Loss on disposal of assets (1,681) (75)
Share based payments (235) (1,150)
Earnings before interest and tax (EBIT) (21,756) (32,030)
Net financial items (22,176) (20,362)
Loss before taxes (43,932) (52,392)
Income tax benefit / (expense) (10,821) 4,580
Net loss for the year (54,753) (47,812)
Income statementTotal revenues amounted to USD 54.1 million in 2013 compared to USD 46.8 million in 2013. This includes other income of USD 10.5 million in 2013 representing USD 7 million earned from termination of sale agreement with Lekoil and USD 3.5 millionreversal of milestone liabilities against BS-3 licences that are no longer payable with the imminent relinquishment of the licences. In comparison other income in 2012 was USD 0.9 million.
The remaining amount of revenue is driven from oil and gas sales that amounted to USD 43.6 million in 2013, a decrease of 5% revenues from USD 45.9 million in 2012, with gas sales volumes declining 2.8% to 3,592 boe/day. The decrease relates to lower production at the Manati field, which was subdued in 2013 due to planned maintenance and repair work conducted in April 2013. The gas sale price is fixed in BRL and therefore subject to currency movements on translation to USD for reporting purposes. Measured in USD, the average gas price declined from USD 8.25/MMbtu in 2012 to USD 8.10/MMbtu in 2013.
Production cost for the full year was USD 10.9 million in 2013. This was an increase from USD 5.6 million in 2012 which was driven by scheduled maintenance in April 2013 and decommissioning costs incurred on BAS-128 well in the BCAM-40 licence area.
Exploration related costs remained consistent at USD 0.9 million for both years.
General and administration costs (G&A) declined to USD 10.7 million in 2013 from USD 16.3 million in 2012. The cost reduction has been achieved through implementation of Group’s aggressive plans of cost control.
Strategic review costs in 2013 amounted to USD 2.2 million, representing identifiable overheads incurred on the ongoing divestment program. Parts of these costs are incremental selling costs, which will be reclassified to the gain/loss on disposal upon completion of the Rio das Contas sale. These costs are of a one-off nature and will discontinue once these processes are concluded. There were no strategic review costs in 2012.
Earnings before interest, taxes, depreciation and amortisation (EBITDA) hence amounted to USD 29.4 million in 2013, up from USD 24.1 million in 2012. The increase mainly reflects higher income from other sources including USD 7 million termination fee and USD 3.5 million reversal of liabilities no longer payable offset by a higher production cost in 2013.
Depreciation amounted to USD 2.5 million in 2013, down from USD 7.7 million in 2012. This reflects that the depreciation of production assets and equipment has been suspended after classification of Rio das Contas as a held for sale investment with effect from April 1, 2013.
Panoro Energy recognized impairment charges of USD 46.8 million related to the operations in Brazil in 2013. This mainly relates to write-down of BS-3 licenses (Cavalo Marinho and Estrela do Mar) and small expenditure on Round-9 blocks and Coral prior to relinquishment. In November 2013, consortium partners were advised by ANP to meet the requirement of ADR wells in the development plan or risk forced relinquishment. Since then, the JV partners have attempted a farm-out of the licences which did not bring any success. As a result, it is imminent that the licences will be surrendered due to the non-commercial restrictions of ADR wells imposed by ANP and henceforth Panoro’s interest in the BS-3 area has been fully impaired and the carrying value of BS-3 licences as of December 31, 2013 is nil.

PA N O R O E N E R G Y A N N U A L R E P O R T 2 0 1 3 PA G E 1 9
Impairment charge of USD 47.2 million in 2012, represents write-down of BS-3 and Round-9 licences respectively by USD 42 million and USD 5.2 million.
Loss on disposal of the Company’s MKB permit in Republic of Congo was USD 1.7 million, which was recognised during 2013.
Share based payment charges were USD 0.2 million in the current year, compared to USD 1.2 million in 2012. The decline is mainly due to leavers and a declining balance of unvested options compared to prior year.
Earnings before interest and taxes (EBIT) were hence a negative USD 21.8 million for the full year 2013, compared to a negative USD 32 million in the previous year. The improvement is a result of lower G&A and depreciation and higher other income in 2013.
Net financial items amounted to a negative USD 22.2 million for the current year, including net interest costs of USD 13.0 million, net other financial costs of USD 1.2 million, a net foreign exchange gain of USD 0.7 million, and a USD 8.7 million charge to recognise reassessment of bond liability under IAS 39. The latter represents a discounted value of bond liability assuming a maximum of three month redemption assumption and is expected to coincide with the closing of the sale transaction of Rio das Contas to GeoPark. The outstanding bond liability was fully repaid subsequent to year end, after closing of Manati sale transaction to GeoPark.
This compared to net financial items of a negative USD 20.4 million in 2012, including net interest costs of USD 11.9 million, net other financial costs of USD 3.5 million, and a net foreign exchange loss of USD 4.9 million.
The net loss before tax was hence USD 43.9 million in 2013, compared to a net loss before tax of USD 52.4 million in 2012. The change mainly reflects reversal of deferred tax assets, which are less likely to be available for utilisation after completion of Rio das Contas sale.
The Group reflected an income tax charge of USD 10.8 million in 2013, compared to a tax benefit of USD 4.6 million in 2012. This mainly reflects recognition of deferred tax assets arising on tax losses in Brazil in 2012.
The reported net loss was thus USD 54.8 million in 2013, compared to a net loss of USD 47.8 million in 2012.
Other comprehensive loss was USD 19.1 million in 2013, reflecting a non-cash loss arising on the translation of Brazilian subsidiaries from BRL to USD for reporting purposes. BRL (Brazilian Reais) weakened 14.6% against the USD during the year. In 2012, other comprehensive loss was USD 18.4 million.
Total comprehensive loss was USD 73.9 million for 2013, compared to USD 66.2 million for 2012. All of the comprehensive loss was attributable to shareholders of the parent company.
Statement of financial positionThe Group’s total assets of USD 261.4 million at the end of 2013 correspond to a decline of USD 106.9 million from USD 368.3 million at the end of 2012. The Brazilian operations including held for sale items accounted for USD 116.4 million of total assets (2012: USD 179.0 million) and the West Africa operations for USD 94.5 million (2012: USD 135.9 million), with the remaining USD 50.5 million in corporate entities (2012: USD 53.4 million).
The decline in total assets partially reflects the negative effect of USD 46.8 million impairments of licenses and exploration assets in Brazil, USD 8.2 million decline in deferred tax assets, USD 19.1 million exchange loss arising on currency translations from BRL to USD and a reduction in cash balances due to repayment of bond loan and related interest.
Total non-current assets declined to USD 106.8 million (2012: USD 275.8 million) due to write-down of BS-3 asset and divestment of MKB. Total current assets stood at USD 57.7 million at the end of 2013 (2012: USD 92.5 million). The decline mainly reflects a reduction of the holding of cash and cash equivalents to USD 56.8 million including restricted cash (2012: USD 73.5 million). Trade and other receivables stood at USD 1.0 million at December 31, 2103 (2012: 19.0 million) with the decline representing reclassification of Rio das Contas related receivables as held for sale items.
During the year, the Group entered into an agreement with GeoPark to sell the entire shareholding in its subsidiary Rio das Contas for a cash consideration of USD 140 million. The transaction is effective from April 1, 2013 and as such all balances related to Rio das Contas have been classified as assets held for sale which stood at USD 96.9 million at the end of 2013. This classification is in accordance with IFRS 5.
Equity declined to USD 118.4 million (2012: USD 192.1 million), reflecting mainly the net loss for the year and a negative movement in currency translation reserve. There were no changes in the share capital during the year. The equity ratio declined to 45% (2012: 52%), reflecting both lower equity and a reduced total asset base.
Non-current liabilities were USD 4.4 million, a decline of USD 126.2 million from USD 130.6 million at the end of 2012. The decrease mainly reflects reclassification of interest-bearing debt to current liabilities and reclassification of Rio das Contas related liabilities as held for sale items. Current liabilities amounted to USD 124.2 million (2012: USD 45.6 million), with the increase mainly due to reclassification of bond liability as current partly offset by settlement of MKB related outstanding liabilities on disposal.
Total interest bearing debt (net of issue costs) totalled USD 118.9 million at the end of 2013 (2012: USD 126.3 million), which includes a USD 8.7 million of re-measurement effect incorporating a 6% early redemption premium. The decrease in liability can mainly be attributed to repayment of principal amount in November 2013, minor currency movements on the NOK tranche, and amortisation of debt issue costs offset by the re-measurement

PA G E 2 0 PA N O R O E N E R G Y A N N U A L R E P O R T 2 0 1 3
effects. The entire bond liability was repaid subsequent to year end on completion on Manati sale in April 2014.
Liabilities directly associated with assets classified as held for sale amounted to USD 14.4 million (2012: USD nil) and represents reclassifications of divested balances in relation to Rio das Contas (Manati) in accordance with the requirements of IFRS 5.
Cash flowsNet cash flow from operating activities amounted to USD 18.3 million in 2013, compared to USD 19.8 million in 2012. The decline is primarily explained by higher production costs incurred in 2013.
Net cash flow from investing activities was an inflow of USD 3.0 million in 2013, compared to an outflow of USD 21.8 million in 2012. The cash inflow in 2013 mainly relate to part divestment of West African portfolio and termination fee received from Lekoil offset by expenditure on drilling activity in Dussafu in Gabon and reclassification of USD 17.0 million of cash equivalents as held for sale.
Net cash flow from financing activities represented a cash outflow of USD 29.0 million in 2013, mainly comprising paid net financial charges of USD 15.4 million and bond repayments of USD 13.9 million. This compares to a cash outflow from financing activities of USD 33.1 million in 2012, including USD 19.1 million in net financial charges and USD 14.1 million of bond repayment.
Foreign exchange impact on cash balances was a negative USD 8.7 million in 2013 and a negative USD 2.3 million in 2012.
Cash and cash equivalents thus declined to USD 54.2 million (2012: USD 70.6 million), not including restricted cash balances of USD 2.6 million (2012: USD 2.9 million).
ALLOCATION OF PROFITS AND LOSSES
Parent company financial information
(Amounts in USD 000) 2013 2012
Total revenues 101 529
Operating expenses
Depreciation (6) (22)
General and administrative costs (3,670) (4,512)
Intercompany recharges (3,434) (3,508)
Share based payments (99) (230)
Loss on disposal of tangible assets - (75)
Impairment of investment in subsidiary (111,660) (23,425)
Write-down of capitalised exploration costs (512) -
Total operating expenses (119,381) (31,772)
Earnings before interest and tax (EBIT) (119,280) (31,243)
Net interest and financial items (16,069) (10,161)
Loss before taxes (135,349) (41,404)
Income tax benefit / (expense) - -
Net loss (135,349) (41,404)
The total comprehensive loss of USD 135.3 million for 2013 was in its entirety attributable to the shareholders of the parent company.
The parent company Panoro Energy ASA had a net result of USD 135.3 million loss in 2013 (2012: USD 41.4 million loss). The Board of Directors propose that the net loss is allocated to other equity. Distributable equity in Panoro Energy ASA as per December 31, 2013 was nil. The Board of Directors does not propose an ordinary dividend for 2013.
Revenue in the parent company amounted to USD 0.1 million in 2013 (2012: USD 0.5 million), reflecting primarily management fee income from subsidiaries. EBIT was a negative USD 119.3 million (2012: negative USD 31.2 million), comprising general and administrative costs of USD 3.7 million (2012: USD 4.5 million), USD 111.7 million in impairment of investment in subsidiaries (2012: USD 23.4 million), USD 0.5 million of exploration costs write-downs (2012: USD nil) and USD 3.4 million in intercompany charges (2012: USD 3.5 million).
Net financial items were a negative USD 16.1 million (2012: USD negative 10.2 million) mainly representing bond interest expenses partially offset by finance income. The 2013 charge also includes USD 8.7 million non-cash effect of re-measurement of bond liability to include an anticipated 6% early redemption premium. There was no such adjustment in 2012.
The parent company had total assets of USD 298.8 million per December 31, 2013 (2012: USD 442.0 million), representing mainly investments and loans to subsidiaries of USD 247.7 million (2012: USD 389.0 million), cash balances of USD 48.9 million (2012: USD 50.4 million), and other assets of USD 2.2 million (2012: USD 2.6 million). Investments and intercompany receivables have declined, mainly reflecting impairment during the year. The decline in the cash balance mainly reflects funding of investments in Africa and servicing of bond commitments offset by proceeds from collection of intercompany loans.
Total liabilities in the parent company amounted to USD 125.1 million (2012: USD 133.2 million), comprising USD 118.9 million of bond loans (2012: USD 126.3 million) and USD 6.2 million relating to accounts and other payables (2012: USD 6.9 million).
Equity amounted to USD 173.7 million at December 31, 2013 (2012: USD 308.8 million) which has primarily declined due to loss for the year.

PA N O R O E N E R G Y A N N U A L R E P O R T 2 0 1 3 PA G E 2 1
FUNDING
The Company had focus on cash preservation and asset divestments during 2013. With challenging markets and a time consuming divestment process for the West Africa portfolio, the Company had focus on balancing its cash preservation with carefully honouring its investment commitments. During the year the Company’s cash position was mainly reduced due to investments in Dussafu and Manati. The cumulative cash balance as of December 31, 2013 was USD 56.8 million which excludes USD 17.0 million that has been classified as held for sale. This compared to USD 73.5 million of cash resources as of December 31, 2012. On an overall basis the cash position remained consistent since the close of 2012.
Panoro regards itself as being in a healthy financial situation due to its cash position and with the sale of Rio das Contas fully completed with bond repayment in April 2014, the Company is debt free with sufficient cash resources to fund its commitments.
RISK FACTORS
The development of oil and gas fields in which the Company is involved is associated with technical risk, alignment in consortiums with regards to development plans, and on obtaining necessary licenses and approvals from the authorities. Disruptions of operations might lead to cost overruns and production shortfall, or delays compared to the schedules laid out by the operator of the fields. As a non-operator, the Company has limited influence on operational risks related to exploration and development of the licenses and fields in which it has interests.
As the Company is exiting Brazil there are potential tax liabilities related among others to the divestment of Rio das Contas. In addition there are uncertainties related to the abandonment costs of BS-3 licenses.
The Company’s ability to successfully bid on and acquire additional property rights, to discover reserves, to participate in drilling opportunities and to identify and enter into commercial arrangements with customers will be dependent upon developing and maintaining close working relationships with industry partners, joint operators and authorities, as well as its ability to select and evaluate suitable properties, and complete transactions in a highly competitive environment.
Financial risk factorsFinancial risk is managed by the finance department in close co-operation with the business units, under policies approved by the Board of Directors. The overall risk management program seeks to minimize the potential adverse effects of unpredictable fluctuations in financial and commodity markets on financial performance, i.e., risks associated with currency exposures, debt servicing and oil and gas prices. Financial instruments such as derivatives, forward contracts and currency swaps are continuously being evaluated for the hedging of such risk exposures.
The Company has no interest rate risk exposure on its long-term borrowings, which exclusively consists of fixed-rate debt
arrangements. The Company’s cash holdings and bank balances are held in various currencies in different countries, and are subject to interest rate risk and credit risk.
Panoro Energy held cash and bank balances amounting to USD 56.8 million per December 31, 2013, including restricted cash of USD 2.6 million, which is sufficient liquidity given the Company’s current operations, debt service requirements and capital expenditure commitments. Gross interest bearing debt stood at USD 118.9 million at the end of 2013, of which USD 14 million is due for repayment in 2014.
Panoro Energy had an estimated USD 3.2 million of contractual commitments as of December 31, 2013. Further capital expenditure requirements may arise, i.e. in both the Dussafu permit offshore Gabon and Aje licence offshore Nigeria, pending partnership investment decisions on Field Development planning. Beyond 2014, the Company has not made any capital expenditure commitments.
ORGANIZATION AND HEALTH, SAFETY AND ENVIRONMENT (HSE)
The management of the Company is led by CEO Jan Kielland. Mr. Kielland holds a MSc in Petroleum Engineering and more than 30 years of experience working with oil and gas companies. He is supported by CFO and Country Manager Brazil Anders Kapstad working out of Rio de Janeiro and COO Nishant Dighe working out of London.
At the end of 2013, Panoro Energy employed 23 persons (including part-time employees), 2 in Norway, 6 in UK and 15 in Brazil. This was a decline from 30 people at the end of 2012. As of January 1, 2014, Panoro Energy employed 19 persons, 1 in Norway, 6 in UK and 12 in Brazil. The workforce has been reduced to 10 full time employees following the divestment of Rio das Contas as a result of the ongoing efforts to reduce G&A costs.
The Company emphasizes the importance of a good working environment both for the individual employee and for the work to achieve Company goals and objectives. The objective is to create a constructive working environment characterized by a spirit where ideas and initiatives are welcome, founded on mutual trust between employees, management and the Board of Directors.
Panoro Energy’s vision for Health, Safety and Environment (HSE) is to avoid accidents and incidents and minimize the impact of its activities on the environment. Panoro performs all its activities with focus on and respect for people and the environment. The Board believes this is a key condition for creating value in a very demanding business. The Company’s vision for health, environment, safety and quality (HSEQ) is zero accidents and zero unwanted incidents in all activities. The Company strives towards performing all its activities with no harm to people or the environment. Panoro experienced no major accidents, injuries, incidents or any environmental claims during the year.
Company time lost due to employee illness or accidents was less than 1 per cent of total hours worked during the year. Employee

PA G E 2 2 PA N O R O E N E R G Y A N N U A L R E P O R T 2 0 1 3
safety is of the highest priority, and company policies imply continuous work towards identifying and employing administrative and technical solutions that ensure a safe and efficient work-place.
The Company has established a set of operational guidelines building on its principles of Corporate Governance, covering critical operational aspects ranging from ethical issues and practical travel advice to delegation of authority matrices.
The asset bases in South America and West Africa means frequent travel, and the Company seeks to ensure adequate safety levels for employees travelling. An emergency preparedness organization has been established, in which membership in International SOS is a key factor. International SOS provides updated risk assessments, medical support and evacuation services worldwide.
As a non-operator, Panoro is dependent on the efforts of the operators with respect to achieving physical results in the field. However, the Company has chosen to take an active role in all license committees with the conviction that high safety standards are the best means to achieve successful operations. Through this involvement, the Company can influence the choice of technical solutions, vendors and quality of applied procedures and practices.
The Company’s operations have been conducted by the operators on behalf of the licensees, at acceptable HSE standards. No accidents that resulted in loss of human lives or serious damage to people or property have been reported.
Panoro Energy is committed to work towards minimizing waste and pollution as a consequence of its activities. Operations at the main offices in Rio de Janeiro and London do not pollute the environment. A video-conferencing system has been installed to reduce travel requirements, reducing both operational costs and carbon footprint.
As described above, all operating activities are being conducted by operators on behalf of the Company, and to the best of the Company’s knowledge, all operations have been conducted within the limits set by approved environmental regulatory authorities.
CORPORATE GOVERNANCE
The main objective for Panoro Energy ASA’s Corporate Governance is to develop a strong, sustainable and competitive company in the best interest of the shareholders, employees and society at large, within the laws and regulations of the respective country. The Board and management aim for a controlled and profitable development and long-term creation of growth through well-founded governance principles and risk management.
Panoro Energy acknowledges that successful value-added business is profoundly dependent upon transparency and internal and external confidence and trust. Panoro Energy believes that this is achieved by building a solid reputation based on our financial performance, our values and by fulfilling our promises. Thus, good corporate governance combined with Panoro Energy’s Code of Conduct is an important tool in helping the Board to ensure that we properly discharge our duty.
The composition of the Board ensures that the Board represents the common interests of all shareholders and meets the Company’s need for expertise, capacity and diversity. The members of the Board represent a wide range of experience including shipping, offshore, energy, banking and investment. The composition of the Board ensures that it can operate independently of any special interests. Members of the Board are elected for a period of two years. Recruitment of members of the Board will be phased so that the entire Board is not replaced at the same time. The Chairman of the Board of Directors is elected by the General Meeting.
Any acquisition of own shares will be at market price, and the Company will not deviate from the principle of equal treatment of all shareholders. Any decision to deviate from the principle of equal treatment by waiving the pre-emption rights of existing shareholders to subscribe for shares in the event of an increase in share capital will be justified. Such deviation will be made only if in the common interest of the shareholders and the Company.
The Board may be given a power of attorney by the General Meeting to acquire the Company’s own shares. If the Board of Directors resolves to carry out an increase in share capital on the basis of a mandate granted to the Board, the justification for waiving pre-emption rights of existing shareholders will be disclosed in the stock exchange announcement of the increase in share capital.
In the event that the Company carries out any transactions in its own shares, these will be carried out through a regulated marketplace at market price. If there is limited liquidity in the Company’s shares at the time of such transaction, the Company will consider other ways to ensure equal treatment of all shareholders.
The Company has not granted any loans or guarantees to anyone in the management or any of the directors.
The Board acknowledges the Norwegian Code of Practice for Corporate Governance of October 23, 2012 and the principle of comply or explain. Panoro Energy has implemented the Code and will use its guidelines as the basis for the Board’s governance duties. A summary of the corporate governance policy is incorporated in a separate section of this report and a lengthier version of the policy is posted on the Company’s website at www.panoroenergy.com.
The Company has implemented a policy for Ethical Code of Conduct and work diligently to comply with these guidelines. The full policy is enclosed in this annual report (see section Ethical Code of Conduct
DISCRIMINATION AND EQUAL EMPLOYMENT OPPORTUNITIES
Panoro Energy is an equal opportunity employer, with an equality concept integrated in its human resources policies. A diversified working environment is embraced, and the Company’s personnel policies promote equal opportunities and rights and prevent discrimination based on gender, ethnicity, colour, language, religion or belief. All employees are governed by Panoro Energy’s Code of
PA N O R O E N E R G Y A N N U A L R E P O R T 2 0 1 3 PA G E 2 3
Conduct, to ensure uniformity in behaviour across a workforce representing 8 different nationalities.
Panoro Energy is a knowledge-based company in which a majority of the workforce has earned college or university level educations, or has obtained industry-recognized skills and qualifications specific to their job requirements. Employees are remunerated exclusively based upon skill level, performance and position.
57% of the employees were men and 43% women (67% and 33%, respectively in Q4-2012). There are currently no women in Panoro Energy’s senior management.
DIRECTORS AND SHAREHOLDERS
According to its articles of association, the Company shall have a minimum of three and a maximum of eight directors on its Board. The number of Board members was five at year end 2013 (reduced to four in January 2014), all non-executive directors. The members have varied backgrounds and experience, offering the Company valuable perspectives on industrial, operational and financial issues. Two of the four current Board members are female. The Board held 13 meetings during the year.
OUTLOOK
Panoro Energy has been narrowing its geographical focus during 2013 with core focus on Gabon and Nigeria in West Africa as the Company is in the process of exiting Brazil. The Company’s main asset, the Manati field was divested by the end of Q1 2014.
Panoro Energy has had discussions with the operator and Brazilian authorities (ANP) with regards to the BS-3 licenses in the Santos Basin, but as the farm out attempt did not yield results the Company has decided to relinquish these assets. Commercialising the fields faces significant challenges including the need to deal with the associated gas as well as the obligation that the ANP imposed on the joint ventures to the drill multiple high cost B1 wells.
The Dussafu development conceptual engineering studies continued and the partnership has agreed that the fields are commercial and is working towards a formal Declaration of Commerciality with the Gabonese authorities. The partnership also embarked on a seismic survey on the outboard part of the license following the success of the Dentale exploration play in the Tortue discovery well. This Dentale exploration trend has attracted interest from many companies seen in recent bidding rounds in neighbouring areas. Future exploration activity in this outboard part of the permit is of a material size with total gross unrisked prospective resources estimated at 500-600 MMbbl.
In Nigeria, the partners in OML 113 have continued to move forward on the development of the Aje field, with a development plan expected to be approved in H1 2014 and first oil expected in late 2015. The neighbouring Ogo-1 and Ogo-1 ST discoveries (in OPL 310) are very positive for OML 113 and the partnership have recently initiated a joint 3D seismic survey in conjunction with the OPL 310 partners, which could give indications whether this play is extending into the OML 113.
2013 results were in line with last year’s predictions. We are optimistic about the financial situation and adequately funded for current investment commitments.
Panoro Energy initiated a strategic review process during 2013 and the Board of Directors concluded as part of the process by the end of the year to put the Company up for sale. It is believed this will provide the best prospect of near term upside for shareholders. Evercore Partners Ltd. have been retained as financial advisors to run the process and the ambition is to conclude by 2014. Upon completion of the Manati transaction the Company will be debt free and with exciting assets Panoro should be an attractive target for growth companies.
The Board of Directors wishes to thank the staff and shareholders for their continued commitment to the Company.
Oslo, April 21, 2014The Board of Directors
Panoro Energy ASA
Endre Ording SundChairman of the Board
Silje Christine AugustsonNon-Executive Director
Bjørn Kristian StadheimNon-Executive Director
Tone Kristin Omsted Non-Executive Director
Jan KiellandChief Executive Officer

PA G E 2 4 PA N O R O E N E R G Y A N N U A L R E P O R T 2 0 1 3
B O A R D O F D I R E C T O R S
Mr. Sund is working as an independent advisor in the finance and E&P sector and has a wide spanning career over more than 35 years in the oil, energy and finance sector. This includes positions in Chevron Texaco and as CEO/Chairman (11 years) in the A Wilhelmsen Group and the listed Awilco Offshore/ Shipping. He later joined SEB Enskilda ASA as a Director of Corporate Finance, being responsible for energy and shipping related business and thereafter as partner in Sector Asset Management. In 2002, he was instrumental in the establishment of the venture capital firm Energy Ventures and served as a chairman there for 5 years. He has also served on various other boards, including Petroleum Geo
Services (PGS), Kenor ASA, the Norwegian Shareholders Association, the Norwegian Shipowners Association and the Golar Nor group of companies. He has broad international Board experience as Chairman /Board member in various shipping, offshore, finance and E&P companies. His board memberships today include Ferd Holding AS, Canamens Limited, Vertech Offshore AS and Melberg Partners. Sund is educated from the Royal Naval Academy, the Norwegian School of Economy and finance (BI) and Harvard Business School (PMD)
Mr. Sund is a Norwegian citizen and resides in Oslo, Norway.
Ms Omsted has over 14 years of experience from corporate finance transactions and advisory services within Investment Banking in SEB Enskilda . She has been involved in a large number of IPOs, capital market and M&A transactions within several industries. She is currently working as an independent advisor in Entra Eiendom within Investment Management and Investor
Relations. Tone holds a BA (Hons) degree in Finance from University of Strathclyde in Scotland.
Ms. Omsted is a Norwegian citizen and resides in Oslo, Norway.
Ms. Augustson has significant experience from the capital markets and the financial services industry mainly working out of London. Her experience spans from roles within equity sales and research in investment banking, to business development, strategy and investor capital fundraising in the alternative asset management industry. Since 2004, she has held several board directorships in the area of fund management participating in fund restructuring situations as well taking lead roles in activist investor campaigns. Ms. Augustson has held positions with JP Morgan, The Brunswick Group, Theorema Asset
Management, Belay Asset Management and is currently consulting through Peak Alliance Group Limited, a firm she founded in 2005. She is on the board of the Storm Nordic Fund, the Storm Bond Fund and SurfSide Holding AS. She holds a Deug in Economics from the University of Toulouse UT1 (1996), and a Master in European Management/Diplome de Grande Ecole from ESCP-EAP (1999).
Ms. Augustson is a Norwegian citizen and resides in Valais, Switzerland.
ENDRE ORDING SUNDChairman of the Board
TONE KRISTIN OMSTEDNon-Executive Director
SILJE CHRISTINE AUGUSTSONNon-Executive Director

PA N O R O E N E R G Y A N N U A L R E P O R T 2 0 1 3 PA G E 2 5
Dr. Watkins holds a BSc in Mining, a PhD in Geophysics and an MSc in Management as well as an honorary degree of Doctor of Engineering DEng from Heriot Watt University. He has nearly 45 years’ experience in the oil and gas industry. Dr. Watkins began his career with Shell as a geophysicist in the Netherlands and Australia before moving to Conoco. He worked for Conoco for the next 30 years, starting as a geophysicist in the UK and then as Vice President Exploration and Production, North America. From 1993 until 2002 he was Chairman and Managing Director of Conoco UK Ltd. For the last 10 years, he has held a number of non‐
executive directorships at companies including Paladin Resources plc, Abbot Group plc, Production Services Network (PSN) Ltd and the Defence Procurement Agency. He is currently chairman of Petro Matad Limited, an AIM listed company operating in Mongolia. He was made CBE in 2000 for services to the UK oil and gas industry.
Dr. Watkins is a UK citizen and resides in Hampshire, UK.
DR. GEORGE EDWARD WATKINS (RESIGNED IN JANUARY 2014)Non-Executive Director
Mr. Bjørn Kristian Stadheim is a private investor and owner of BKS Capital AS. Previous work experience includes bond trader and stock broker with various Norwegian financial institutions. Mr. Stadheim holds a degree in Finance from Handelshøyskolen BI.
Mr. Stadheim is a Norwegian citizen and resides in Oslo, Norway.
BJØRN KRISTIAN STADHEIMNon-Executive Director

PA G E 2 6 PA N O R O E N E R G Y A N N U A L R E P O R T 2 0 1 3
S E N I O R M A N A G E M E N T
Mr. Kielland has over 30 years of experience working with oil and gas companies. He has a broad experience base ranging from starting as a Petrophysical Engineer with Shell International Petroleum Maatschappij to management positions within Saga Petroleum ASA. Mr. Kielland has held senior positions with DNO ASA, Lundin Petroleum and Sector Asset Management. During this time with Sector, he was elected as Chairman of the Board of EER Oil & Gas Limited from 2008 to
2009 and Pan Petroleum (Holding) Cyprus Limited from 2008 to 2010. In 2010, Mr. Kielland joined Canamens Limited as their CEO, being instrumental in restructuring and sale of assets. He has his MSc in Petroleum Engineering.
Mr. Kielland is a Norwegian citizen and resides in Oslo, Norway.
Mr. Kapstad has over 20 years of experience within various roles in investment banking and the oil industry. Prior to joining Panoro Energy in 2010 he was the Group CFO in Norse Energy from 2005 until the demerger in 2010. He holds a Bachelor of Science degree from the University of San Francisco and an MBA from SDA Bocconi in Milan, Italy. Mr. Kapstad has a long
investment banking experience, holding positions within equity sales, portfolio management, private banking and corporate finance.
Mr. Kapstad is a Norwegian citizen and resides in Rio de Janeiro, Brazil.
Mr. Dighe obtained a first class Master of Engineering degree in Chemical Engineering from Imperial College, University of London, a Master of Science degree in Petroleum Engineering also from Imperial College, and an MBA from Warwick University. Mr. Dighe held positions in Mobil and later ExxonMobil in the UK and US on assets located in Europe, USA, Middle East and Africa. Following his MBA, Mr. Dighe joined Marakon Associates, a value-based management consultancy, gaining experience in a number of different sectors. In
2002, Mr. Dighe re-joined the E&P sector working as a consultant to Sasol Petroleum International. In 2005, Mr. Dighe joined Energy Equity Resources, as Vice President Technical and Commercial, and in late 2007 Mr. Dighe co-founded Pan-Petroleum which ultimately merged with Norse Energy’s assets in Brazil to create Panoro Energy.
Mr. Dighe is a British citizen and resides in London, UK.
JAN KIELLANDChief Executive Officer
NISHANT DIGHEChief Operating Officer
ANDERS KAPSTADCountry Manager Brazil and Group Chief Financial Officer

PA N O R O E N E R G Y A N N U A L R E P O R T 2 0 1 3 PA G E 2 7

PA G E 2 8 PA N O R O E N E R G Y A N N U A L R E P O R T 2 0 1 3
C O N S O L I D A T E D S T A T E M E N T O F C O M P R E H E N S I V E I N C O M E
For the year ended December 31, 2013
USD 000 Note 2013 2012
Revenue
Oil and gas revenue 3 43,646 45,939
Other income 3 10,500 891
Expenses
Production costs (10,877) (5,557)
Exploration related costs (922) (903)
General and administrative costs 4 (10,723) (16,312)
Strategic review costs 4 (2,190) -
Impairment and write downs 8,10 (46,815) (47,150)
Depreciation 9,10 (2,459) (7,713)
Loss on disposal of assets 11 (1,681) (75)
Share based payments 20 (235) (1,150)
Total operating expenses (75,902) (78,860)
Operating profit/(loss) 4 (21,756) (32,030)
Net foreign exchange gain/(loss) 707 (4,926)
Finance income 5 3,017 5,653
Interest expense and other charges 5 (17,206) (21,089)
Effect of re-measurement of bond liability 16.2 (8,694) -
Loss before income taxes (43,932) (52,392)
Income tax benefit / (expense) 6 (10,821) 4,580
Net loss (54,753) (47,812)
Exchange differences arising from translation of foreign operations 15 (19,138) (18,400)
Other comprehensive loss (19,138) (18,400)
Total comprehensive loss (73,891) (66,212)
Net loss attributable to:
Equity holders of the parent (54,753) (47,812)
Total comprehensive loss attributable to:
Equity holders of the parent (73,891) (66,212)
Earnings per share (basic and diluted) - USD 7 (0.23) (0.20)
The annexed notes form an integral part of these financial statements.

PA N O R O E N E R G Y A N N U A L R E P O R T 2 0 1 3 PA G E 2 9
C O N S O L I D A T E D S T A T E M E N T O F F I N A N C I A L P O S I T I O N
As at December 31, 2013
USD 000 Note 2013 2012
ASSETS
Non-current assets
Intangible assets
Licenses and exploration assets 8 94,755 182,569
Deferred tax assets 6 11,899 20,140
Total intangible assets 106,654 202,709
Tangible assets
Production assets and equipment 9 - 69,417
Property, furniture, fixtures and equipment 10 189 1,021
Other non-current assets - 2,632
Total tangible assets 189 73,070
Total non-current assets 106,843 275,779
Current assets
Trade and other receivables 12 969 19,019
Cash and cash equivalents 13 54,152 70,623
Restricted cash 13 2,604 2,880
Total current assets 57,725 92,522
Assets classified as held for sale 14 96,856 -
TOTAL ASSETS 261,424 368,301
EQUITY AND LIABILITIES
Equity
Share capital 15 56,333 56,333
Share premium 288,858 288,858
Additional paid-in capital 66,021 65,786
Total paid-in equity 411,212 410,977
Other equity (292,764) (218,874)
Total equity attributable to shareholder of the parent 118,448 192,103
Non-current liabilities
Non-current interest bearing debt 16 - 110,801
Deferred tax liability 6 4,376 10,817
Other non-current liabilities 17 - 6,130
Asset retirement obligation 18 - 2,823
Total non-current liabilities 4,376 130,571
Current liabilities
Accounts payable and accrued liabilities 19 5,268 29,785
Current interest bearing debt 16 118,912 15,496
Corporation tax liability - 346
Total current liabilities 124,180 45,627
Liabilities directly associated with assets classified as held for sale 14 14,420 -
TOTAL EQUITY AND LIABILITIES 261,424 368,301
The annexed notes form an integral part of these financial statements.
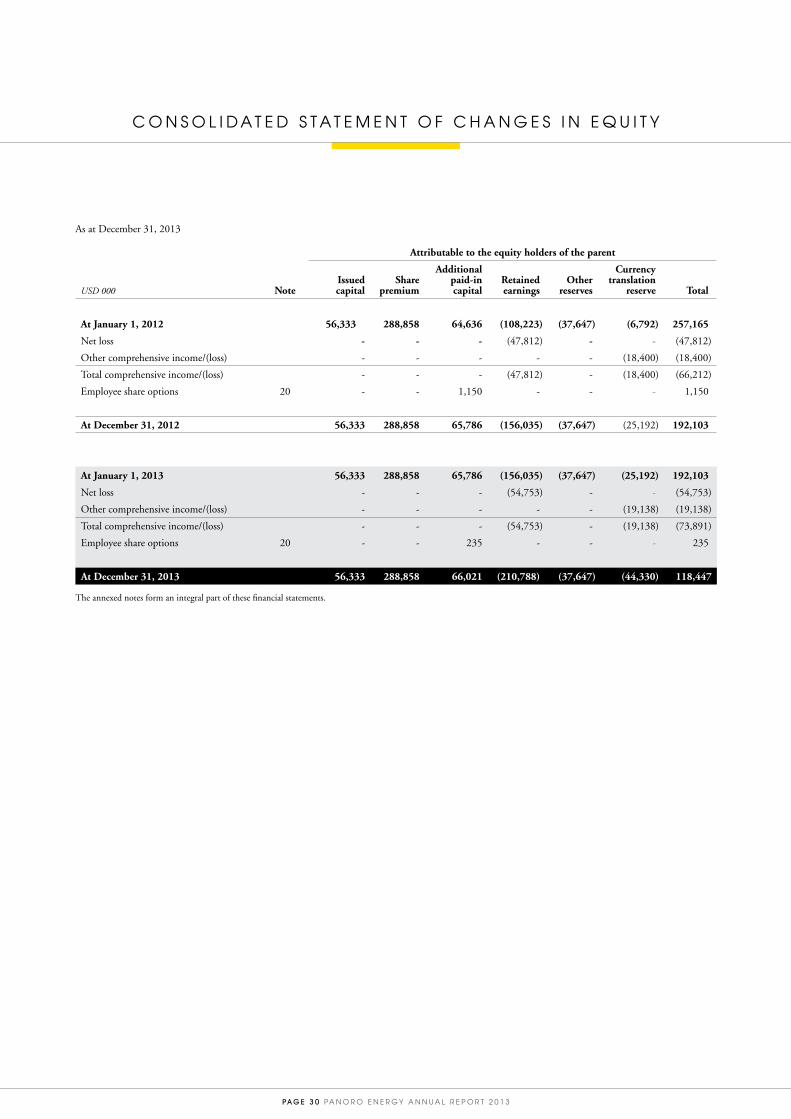
PA G E 3 0 PA N O R O E N E R G Y A N N U A L R E P O R T 2 0 1 3
C O N S O L I D A T E D S T A T E M E N T O F C H A N G E S I N E Q U I T Y
Attributable to the equity holders of the parent
USD 000 NoteIssued capital
Share premium
Additional paid-in capital
Retained earnings
Other reserves
Currency translation
reserve Total
At January 1, 2012 56,333 288,858 64,636 (108,223) (37,647) (6,792) 257,165
Net loss - - - (47,812) - - (47,812)
Other comprehensive income/(loss) - - - - - (18,400) (18,400)
Total comprehensive income/(loss) - - - (47,812) - (18,400) (66,212)
Employee share options 20 - - 1,150 - - - 1,150
At December 31, 2012 56,333 288,858 65,786 (156,035) (37,647) (25,192) 192,103
At January 1, 2013 56,333 288,858 65,786 (156,035) (37,647) (25,192) 192,103
Net loss - - - (54,753) - - (54,753)
Other comprehensive income/(loss) - - - - - (19,138) (19,138)
Total comprehensive income/(loss) - - - (54,753) - (19,138) (73,891)
Employee share options 20 - - 235 - - - 235
At December 31, 2013 56,333 288,858 66,021 (210,788) (37,647) (44,330) 118,447
The annexed notes form an integral part of these financial statements.
As at December 31, 2013

PA N O R O E N E R G Y A N N U A L R E P O R T 2 0 1 3 PA G E 3 1
C O N S O L I D A T E D C A S H F L O W S T A T E M E N T
USD 000 Note 2013 2012
Cash flows from operating activities
Net (loss)/ income for the year before tax (43,932) (52,392)
Adjusted for:
Depreciation 9,10 2,459 7,713
Effect of re-measurement of bond liability 16.2 8,694 -
Other income 3 (10,500) (891)
Impairment and asset write off 8 46,815 47,150
Loss on disposal of assets 11 1,681 75
Net finance costs 5 14,189 15,436
Share-based payments 20 235 1,150
Foreign exchange gains/losses (707) 4,926
Increase/(decrease) in trade and other payables 2,584 (5,404)
(Increase)/decrease in trade and other receivables 1,177 5,023
Taxes paid (4,432) (3,022)
Net cash flows from operating activities 18,263 19,764
Cash flows from investing activities
Investment in exploration, production and other assets 8,9,10 (22,030) (21,777)
Proceeds from sale of property and farm-out of interest 11 35,000 16
Incidental income on termination of sale agreement 3 7,000 -
Cash and cash equivalents classified as held for sale (17,015) -
Net cash flows from investing activities 2,955 (21,761)
Cash flows from financing activities
Interest paid (16,254) (18,929)
Interest received 3,017 5,653
Other financial expenses (2,166) (5,821)
Repayment of bond 16 (13,850) (14,070)
Movement in restricted cash balance 276 100
Net cash flows from financing activities (28,977) (33,067)
Effect of foreign currency translation adjustment on cash balances (8,712) (2,252)
Change in cash and cash equivalents during the period (16,471) (37,316)
Cash and cash equivalents at the beginning of the period 70,623 107,939
Cash and cash equivalents at the end of the period 54,152 70,623
The annexed notes form an integral part of these financial statements.
For the year ended December 31, 2013

PA G E 3 2 PA N O R O E N E R G Y A N N U A L R E P O R T 2 0 1 3
N O T E S T O T H E C O N S O L I D A T E D F I N A N C I A L S T A T E M E N T S
NOTE 1. CORPORATE INFORMATION
The parent company, Panoro Energy ASA (“the Company”), was incorporated on April 28, 2009 as a public limited company under the Norwegian Public Limited Companies Act. The registered organization number of the Company is 994 051 067 and its registered office is Dronning Maudsgt. 1-3, 0124 Oslo, Norway.
The Company and its subsidiaries are engaged in the exploration and production of oil and gas resources in Brazil and West Africa. The consolidated financial statements of the Group for the year ended December 31, 2013 were authorised for issue by the Board of Directors on April 21, 2014.
The Board of Directors confirms that the annual financial statements have been prepared pursuant to the going concern assumption, in accordance with §3-3a of the Norwegian Accounting Act, and that this assumption was realistic at the time the accounts were approved. The going concern assumption is based upon the financial position of the Group and the development plans currently in place.
The Company’s shares are traded on the Oslo Stock Exchange under the ticker symbol PEN and its tranches of corporate bonds are quoted on Oslo Alternative Bond market under tickers PEN 01 PRO and PEN 02 PRO.
NOTE 2. BASIS OF PREPARATION
The consolidated financial statements of Panoro Energy ASA and its subsidiaries (“Panoro” or the “Group”) have been prepared in accordance with International Financial Reporting Standards (IFRS) as adopted by the European Union (“EU”). The consolidated financial statements are prepared on a historical cost basis, except for certain financial instruments which have been measured at fair value.
The principal accounting policies applied in the preparation of these consolidated financial statements are set out below. These policies have been consistently applied to all years presented, unless otherwise stated.
The consolidated financial statements are presented in USD, which is the functional currency of Panoro Energy ASA. The amounts in these financial statements have been rounded to the nearest USD thousand unless otherwise stated.
NOTE 2.1 BASIS OF CONSOLIDATION
The consolidated financial statements include Panoro Energy ASA and its subsidiaries as of December 31 for each year.
Subsidiaries are fully consolidated from the date of acquisition, being the date on which the Group obtains control, and continue to be consolidated until the date that such control ceases.
The financial statements of the subsidiaries are prepared for the same reporting period as the parent company, using consistent accounting policies.
All intra-group balances, transactions and unrealised gains and losses resulting from intra-group transactions and dividends are eliminated in full.
Non-controlling interests in subsidiaries are identified separately from the Group’s equity therein. Total comprehensive income is attributed to non-controlling interests even if this results in the non-controlling interests having a deficit balance.
A change in the ownership interest of a subsidiary, without a loss of control, is accounted for as an equity transaction. If the Group loses control over a subsidiary, it:
• Derecognises the assets (including goodwill) and liabilities of the subsidiary• Derecognises the carrying amount of any NCI• Derecognises the cumulative translation differences recognised in equity

PA N O R O E N E R G Y A N N U A L R E P O R T 2 0 1 3 PA G E 3 3
• Recognises the fair value of the consideration received• Recognises the fair value of any investment retained• Recognises any surplus or deficit in profit or loss• Reclassifies the parent’s share of components previously recognised in other comprehensive income to profit or loss or retained earnings,
as appropriate
The purchase method of accounting is applied for business combinations. The cost of the acquisition is measured as the aggregate of the fair values, at the date of exchange, of assets given, liabilities incurred or assumed, and equity instruments issued by the acquirer, in exchange for control of the acquirer.
If the initial accounting for a business combination can only be determined provisionally, then provisional values are used. However, these provisional values may be adjusted within 12 months from the date of the combination.
NOTE 2.2 SIGNIFICANT ACCOUNTING JUDGMENTS, ESTIMATES AND ASSUMPTIONS
a. Estimates and assumptionsThe preparation of the financial statements in conformity with IFRS as adopted by the EU requires management to make estimates and assumptions that affect the reported amounts of assets, liabilities and contingent liabilities at the date of the consolidated financial statements and reported amounts of revenues and expenses during the reporting period. Estimates and judgments are continuously evaluated and are based on management’s experience and other factors, including expectations of future events that are believed to be reasonable under the circumstances. However, actual outcomes can differ from these estimates.
In particular, significant areas of estimation uncertainty considered by management in preparing the consolidated financial statements are as follows:
Hydrocarbon reserve and resource estimatesHydrocarbon reserves are estimates of the amount of hydrocarbons that can be economically and legally extracted from the Group’s oil and gas properties. The Group estimates its commercial reserves and resources based on information compiled by appropriately qualified persons relating to the geological and technical data on the size, depth, shape and grade of the hydrocarbon body and suitable production techniques and recovery rates. Commercial reserves are determined using estimates of oil and gas in place, recovery factors and future commodity prices, the latter having an impact on the total amount of recoverable reserves and the proportion of the gross reserves which are attributable to the host government under the terms of the Production-Sharing Agreements. Future development costs are estimated using assumptions as to the number of wells required to produce the commercial reserves, the cost of such wells and associated production facilities, and other capital costs.
The Group estimates and reports hydrocarbon reserves in line with the principles contained in the SPE Petroleum Resources Management Reporting System (PRMS) framework and generally obtains independent evaluations for each asset whenever new information becomes available that materially influences the reported results. As the economic assumptions used may change and as additional geological information is obtained during the operation of a field, estimates of recoverable reserves may change. Such changes may impact the Group’s reported financial position and results, which include:
• The carrying value of exploration and evaluation assets; oil and gas properties; property, plant and equipment; and goodwill may be affected due to changes in estimated future cash flows
• Depreciation and amortisation charges in the statement of profit or loss and other comprehensive income may change where such charges are determined using the UOP method, or where the useful life of the related assets change
• Provisions for decommissioning may change — where changes to the reserve estimates affect expectations about when such activities will occur and the associated cost of these activities
• The recognition and carrying value of deferred tax assets may change due to changes in the judgements regarding the existence of such assets and in estimates of the likely recovery of such assets

PA G E 3 4 PA N O R O E N E R G Y A N N U A L R E P O R T 2 0 1 3
Exploration and evaluation expendituresThe application of the Group’s accounting policy for exploration and evaluation expenditure requires judgement to determine whether future economic benefits are likely, from future either exploitation or sale, or whether activities have not reached a stage which permits a reasonable assessment of the existence of reserves. The determination of reserves and resources is itself an estimation process that requires varying degrees of uncertainty depending on how the resources are classified. These estimates directly impact when the Group defers exploration and evaluation expenditure. The deferral policy requires management to make certain estimates and assumptions about future events and circumstances, in particular, whether an economically viable extraction operation can be established. Any such estimates and assumptions may change as new information becomes available. If, after expenditure is capitalised, information becomes available suggesting that the recovery of the expenditure is unlikely, the relevant capitalised amount is written off in the statement of profit or loss and other comprehensive income in the period when the new information becomes available.
Asset retirement costs and obligationsAsset retirement costs will be incurred by the Group at the end of the operating life of certain Group facilities and properties. The ultimate asset retirement costs are uncertain and cost estimates can vary in response to many factors including changes to relevant legal requirements, the emergence of new restoration techniques or experience at other production sites. The expected timing and amount of expenditure can also change, for example in response to changes in reserves or changes in laws and regulations or their interpretation. As a result, there could be significant adjustments to the provisions established which would affect future financial results.
Income taxesThe Group recognises the net future tax benefit related to deferred income tax assets to the extent that it is probable that the deductible temporary differences will reverse in the foreseeable future. Assessing the recoverability of deferred income tax assets requires the Group to make significant estimates related to expectations of future taxable income. Estimates of future taxable income are based on forecast cash flows from operations and the application of existing tax laws in each jurisdiction, to the extent that future cash flows and taxable income differ significantly from estimates. The ability of the Group to realise the net deferred tax assets recorded at the date of the statement of financial position could be impacted.
Additionally future changes in tax laws in the jurisdictions in which the Group operates could limit the ability of the Group to obtain tax deductions in future periods.
b. JudgmentsIn the process of applying the Group’s accounting policies, the directors have made the following judgments, apart from those involving estimates, which have the most significant effect on the amounts recognised in the consolidated financial statements:
Impairment indicatorsThe Group assesses each cash-generating unit annually to determine whether an indication of impairment exists. When an indication of impairment exists, a formal estimate of the recoverable amount is made.
The recoverable amounts of cash-generating units and individual assets have been determined based on the higher of value-in-use calculations and fair values less costs to sell. These calculations require the use of estimates and assumptions. It is reasonably possible that the oil price assumption may change which may then impact the estimated life of the field and may then require a material adjustment to the carrying value of tangible assets. The Group monitors internal and external indicators of impairment relating to its tangible and intangible assets.
Technical risk in development of oil and gas fields and production start-upThe development of the oil and gas fields, in which the Group has an ownership, is associated with significant technical risk and uncertainty with regards to timing of production start. Risks include, but are not limited to, cost overruns, production disruptions as well as delays compared to initial plans laid out by the operator. Some of the most important risk factors are related to the determination of reserves, the recoverability of reserves, and the planning of a cost efficient and suitable production method. There are also technical risks present in the production phase that may cause cost overruns, failed investment and destruction of wells and reservoirs.
Technical risk in development of oil and gas fields and production start-upThe development of the oil and gas fields, in which the Group has an ownership, is associated with significant technical risk and uncertainty with regards to timing of production start. Risks include, but are not limited to, cost overruns, production disruptions as well as delays compared to initial plans laid out by the operator. Some of the most important risk factors are related to the determination of reserves, the recoverability of reserves, and the planning of a cost efficient and suitable production method. There are also technical risks present in the production phase that may cause cost overruns, failed investment and destruction of wells and reservoirs.
Asset retirement obligationsAsset retirement costs will be incurred by the Group at the end of the operating life of some of the Group’s facilities and properties. The Group assesses its retirement obligation at each reporting date. The ultimate asset retirement costs are uncertain and cost estimates can vary in response to many factors, including changes to relevant legal requirements, the emergence of new restoration techniques or experience at other production sites. The expected timing, extent and amount of expenditure can also change, for example in response to changes in reserves or changes in laws and regulations or their interpretation. Therefore, significant estimates and assumptions are made in determining the provision for asset retirement obligation. As a result, there could be significant adjustments to the provisions established which would affect future financial results. The provision at reporting date represents management’s best estimate of the present value of the future asset retirement costs required.

PA N O R O E N E R G Y A N N U A L R E P O R T 2 0 1 3 PA G E 3 5
Recovery of deferred tax assetsJudgement is required to determine which types of arrangements are considered to be a tax on income in contrast to an operating cost. Judgement is also required in determining whether deferred tax assets are recognised in the statement of financial position. Deferred tax assets, including those arising from un-utilised tax losses, require management to assess the likelihood that the Group will generate sufficient taxable earnings in future periods, in order to utilise recognised deferred tax assets. Assumptions about the generation of future taxable profits depend on management’s estimates of future cash flows. These estimates of future taxable income are based on forecast cash flows from operations (which are impacted by production and sales volumes, oil and natural gas prices, reserves, operating costs, decommissioning costs, capital expenditure, dividends and other capital management transactions) and judgement about the application of existing tax laws in each jurisdiction. To the extent that future cash flows and taxable income differ significantly from estimates, the ability of the Group to realise the net deferred tax assets recorded at the reporting date could be impacted.
In addition, future changes in tax laws in the jurisdictions in which the Group operates could limit the ability of the Group to obtain tax deductions in future periods.
Contingencies By their nature, contingencies will only be resolved when one or more future events occur or fail to occur. The assessment of contingencies inherently involves the exercise of significant judgment and estimates of the outcome of future events.
NOTE 2.3 SUMMARY OF SIGNIFICANT ACCOUNTING POLICIES
a. Interests in joint venturesIFRS defines joint control as contractually agreed sharing of control over an economic activity, and exists only when the strategic financial and operating decisions relating to the activity require the unanimous consent of the parties sharing control (the ventures).
(i) Jointly controlled assetsA jointly controlled asset involves joint control and offers joint ownership by the Group and other ventures of assets contributed to or acquired for the purpose of the joint venture, without the formation of a corporation, partnership or other entity.
Where the Group’s activities are conducted through JCAs, the Group recognises its share of the jointly controlled assets and liabilities it has incurred, its share of any liabilities jointly incurred with other ventures, income from the sale or use of its share of the joint venture’s output, together with its share of the expenses incurred by the joint venture, and any expenses it incurs in relation to its interest in the joint venture and a share of production. The Group combines its share of the jointly controlled assets and liabilities, income and expenses of the JCA with similar items, line by line, in its consolidated financial statements.
(ii) Reimbursement of costs of the operator of the joint arrangementWhen the Group, acting as an operator or manager of a joint arrangement, receives reimbursement of direct costs recharged to the joint arrangement, such recharges represent reimbursements of costs that the operator incurred as an agent for the joint arrangement and therefore have no effect on profit or loss.
When the Group charges a management fee (based on a fixed percentage of total costs incurred for the year) to cover other general costs incurred in carrying out the activities on behalf of the joint arrangement, it is not acting as an agent. Therefore, the general overhead expenses and the management fee are recognised in the statement of profit or loss and other comprehensive income as an expense and income, respectively.
b. Foreign Currency translationItems included in the financial statements of each of the Group’s entities are measured using the currency of the primary economic environment in which the entity operates (‘the functional currency’).
The functional currency of the Group’s subsidiaries incorporated in Gabon, Nigeria, Cyprus, Netherlands, British Virgin Islands, Republic of Congo and the Cayman Islands is the US dollar (‘USD’). The functional currency of the Group’s Brazilian subsidiaries is Reais (‘BRL’) and for the British subsidiaries is the Pound Sterling (‘GBP’).
In the consolidated financial statements, the assets and liabilities of non-USD functional currency subsidiaries are translated into USD at the rate of exchange ruling at the balance sheet date. The results and cash flows of non-USD functional currency subsidiaries are translated into USD using applicable average rates as an approximation for the exchange rates prevailing at the dates of the different transactions. Foreign exchange adjustments arising when the opening net assets and the profits for the year retained by non-USD functional currency subsidiaries are translated into USD are taken to a separate component of equity.

PA G E 3 6 PA N O R O E N E R G Y A N N U A L R E P O R T 2 0 1 3
The foreign exchange rates applied were:
2013 2012
Average rate Reporting date rate Average rate Reporting date rate
Norwegian Kroner/USD 5.8797 6.0750 5.8189 5.5806
Brazilian Real/USD 2.1605 2.3426 1.9550 2.0435
USD/British Pound 1.5644 1.6528 1.5851 1.6168
Transactions in foreign currencies are initially recorded at the functional currency spot rate ruling at the date of the transaction. Monetary assets and liabilities denominated in foreign currencies are retranslated at the functional currency spot rate of exchange ruling at the reporting date. All differences are taken to the income statement. Non-monetary items that are measured in terms of historical cost in foreign currency are translated using the spot exchange rates as at the dates of the initial transactions. Non-monetary items measured at fair value in a foreign currency are translated using the exchange rates at the date when the fair value was determined.
c. Business combinations and goodwillBusiness combinations are accounted for using the acquisition method. The cost of an acquisition is measured as the aggregate of the consideration transferred, measured at acquisition date fair value and the amount of any NCI in the acquiree. For each business combination, the Group elects whether to measure NCI in the acquiree at fair value or at the proportionate share of the acquiree’s identifiable net assets. Acquisition related costs are expensed as incurred and included in administrative expenses.
When the Group acquires a business, it assesses the assets and liabilities assumed for appropriate classification and designation in accordance with the contractual terms, economic circumstances and pertinent conditions as at the acquisition date. This includes the separation of embedded derivatives in host contracts by the acquiree. Those acquired petroleum reserves and resources that can be reliably measured are recognised separately in the assessment of fair values on acquisition. Other potential reserves, resources and rights, for which fair values cannot be reliably measured, are not recognised separately, but instead are subsumed in goodwill.
If the business combination is achieved in stages, any previously held equity interest is re-measured at its acquisition date fair value, and any resulting gain or loss is recognised in the statement of profit or loss and other comprehensive income. It is then considered in the determination of goodwill.
Any contingent consideration to be transferred by the acquirer will be recognised at fair value at the acquisition date. Contingent consideration classified as an asset or liability that is a financial instrument and within the scope of IAS 39 Financial Instruments: Recognition and Measurement is measured at fair value, with changes in fair value recognised either in the statement of profit or loss or as a change to other comprehensive income. If the contingent consideration is not within the scope of IAS 39, it is measured in accordance with the appropriate IFRS. Contingent consideration that is classified as equity is not re-measured, and subsequent settlement is accounted for within equity.
Goodwill is initially measured at cost, being the excess of the aggregate of the consideration transferred and the amount recognised for NCI over the fair value of the identifiable net assets acquired and liabilities assumed. If the fair value of the identifiable net assets acquired is in excess of the aggregate consideration transferred (bargain purchase), before recognising a gain, the Group reassesses whether it has correctly identified all of the assets acquired and all of the liabilities assumed and reviews the procedures used to measure the amounts to be recognised at the acquisition date. If the reassessment still results in an excess of the fair value of net assets acquired over the aggregate consideration transferred, then the gain is recognised in the statement of profit or loss and other comprehensive income.
After initial recognition, goodwill is measured at cost less any accumulated impairment losses. For the purpose of impairment testing, goodwill acquired in a business combination is, from the acquisition date, allocated to each of the Group’s CGUs that are expected to benefit from the combination, irrespective of whether other assets or liabilities of the acquiree are assigned to those units.
Where goodwill forms part of a CGU and part of the operation in that unit is disposed of, the goodwill associated with the disposed operation is included in the carrying amount of the operation when determining the gain or loss on disposal. Goodwill disposed of in these circumstances is measured based on the relative values of the disposed operation and the portion of the CGU retained.
d. License interests, exploration and evaluation assets, and field investments, and depreciationThe Group applies the ‘successful efforts’ method of accounting for Exploration and Evaluation (‘E&E’) costs, in accordance with IFRS 6 ‘Exploration for and Evaluation of Mineral Resources’. E&E expenditure is capitalised when it is considered probable that future economic benefits will be recoverable. Costs that are known at the time of incurrence to fail to meet this criterion are generally charged to expense in the period they are incurred.
E&E expenditure capitalised as intangible assets includes license acquisition costs, and exploration drilling, geological and geophysical costs and any other directly attributable costs.
E&E expenditure, which is not sufficiently related to a specific mineral resource to support capitalization, is expensed as incurred.
E&E assets are carried forward, until the existence, or otherwise, of commercial reserves have been determined subject to certain limitations including review for indications of impairment. If no reserves are found the costs to drill exploratory wells, including exploratory geological and geophysical costs and costs of carrying and retaining unproved properties, are written off.

PA N O R O E N E R G Y A N N U A L R E P O R T 2 0 1 3 PA G E 3 7
Once commercial reserves have been discovered, the carrying value after any impairment loss of the relevant E&E assets is transferred to development tangible and intangible assets. No depreciation and/or amortisation are charged during the exploration and development phase. If however, commercial reserves have not been discovered, the capitalised costs are charged to expense after the conclusion of appraisal activities.
Development tangible and intangible assets Expenditure on the construction, installation or completion of infrastructure facilities such as platforms, pipelines and the drilling of commercially proven development wells, is capitalised within property, plant and equipment and intangible assets according to nature. When development is completed on a specific field, it is transferred to production assets. No depreciation or amortisation is charged during the Exploration and Evaluation phase.
Farm-outs – in the exploration and evaluation phaseThe Group does not record any expenditure made by the farmee on its account. It also does not recognise any gain or loss on its exploration and evaluation farm-out arrangements, but redesignates any costs previously capitalised in relation to the whole interest as relating to the partial interest retained. Any cash consideration received directly from the farmee is credited against costs previously capitalised in relation to the whole interest with any excess accounted for by the farmor as a gain on disposal.
Development costsExpenditure on the construction, installation or completion of infrastructure facilities such as platforms, pipelines and the drilling of development wells, including unsuccessful development or delineation wells, is capitalised within oil and gas properties. Oil & gas production assets Development and production assets are accumulated on a cash-generating unit basis and represent the cost of developing the commercial reserves discovered and bringing them into production together with E&E expenditures incurred in finding commercial reserves transferred from intangible E&E assets as outlined in accounting policy above.
The cost of development and production assets also includes the cost of acquisitions and purchases of such assets, directly attributable overheads and the cost of recognising provisions for future restoration and decommissioning.
Where major and identifiable parts of the production assets have different useful lives, they are accounted for as separate items of property, plant and equipment. Costs of minor repairs and maintenance are expensed as incurred.
Depreciation/amortisation Oil and gas properties and intangible assets are depreciated or amortised using the unit-of-production method. Unit-of-production rates are based on proved and probable reserves, which are oil, gas and other mineral reserves estimated to be recovered from existing facilities using current operating methods. Oil and gas volumes are considered produced once they have been measured through meters at custody transfer or sales transaction points at the outlet valve on the field storage tank.
Field infrastructure exceeding beyond the life of the field is depreciated over the useful life of the infrastructure using a straight line method.
Depreciation/amortisation on assets held for sale is ceased from the date of such classification.
Impairment – exploration and evaluation assets Exploration and evaluation assets are tested for impairment when reclassified to development tangible or intangible assets, or whenever facts and circumstances indicate impairment and prior to year-end in an annual review. An impairment loss is recognised for the amount by which the exploration and evaluation assets’ carrying amount exceeds their recoverable amount. The recoverable amount is the higher of the exploration and evaluation assets’ fair value less costs to sell and their value in use.
Impairment – proved oil and gas production properties and intangible assets Proven oil and gas properties and intangible assets are reviewed annually for impairment whenever events or changes in circumstances indicate that the carrying amount may not be recoverable. An impairment loss is recognised for the amount by which the asset’s carrying amount exceeds its recoverable amount. The carrying value is compared against the expected recoverable amount of the asset, generally by net present value of the future net cash flows, expected to be derived from production of commercial reserves. The cash generating unit applied for impairment test purposes is generally the field, except that a number of field interests may be grouped together where there are common facilities.
f. Non-current assets held for sale or for distribution to equity holders of the parent and discontinued operationsThe Group classifies non-current assets and disposal groups as held for sale or for distribution to equity holders of the parent if their carrying amounts will be recovered principally through a sale or distribution rather than through continuing use. Such non-current assets and disposal groups classified as held for sale or as held for distribution are measured at the lower of their carrying amount and fair value less costs to sell or to distribute. Costs to distribute are the incremental costs directly attributable to the distribution, excluding the finance costs and income tax expense.

PA G E 3 8 PA N O R O E N E R G Y A N N U A L R E P O R T 2 0 1 3
The criteria for held for distribution classification is regarded as met only when the distribution is highly probable and the asset or disposal group is available for immediate distribution in its present condition. Actions required to complete the distribution should indicate that it is unlikely that significant changes to the distribution will be made or that the distribution with be withdrawn. Management must be committed to the distribution expected within one year from the date of the classification. Similar considerations apply to assets or a disposal group held for sale.
Production assets, property, plant and equipment and intangible assets are not depreciated or amortised once classified as held for sale or as held for distribution.
Assets and liabilities classified as held for sale or for distribution are presented separately as current items in the statement of financial position.
A disposal group qualifies as discontinued operation if it is:• A component of the Group that is a CGU or a group of CGUs• Classified as held for sale or distribution or already disposed in such a way, or• A major line of business or major geographical area
Discontinued operations are excluded from the results of continuing operations and are presented as a single amount as profit or loss after tax from discontinued operations in the statement of profit or loss.
g. Financial assetsInitial recognition and measurementFinancial assets are classified, at initial recognition, as financial assets at fair value through profit or loss, loans and receivables, held-to-maturity investments, available-for-sale (AFS) financial assets, or derivatives designated as hedging instruments in an effective hedge, as appropriate. All financial assets are recognised initially at fair value plus, in the case of financial assets not recorded at fair value through profit or loss, transaction costs that are attributable to the acquisition of the financial asset.
Purchases or sales of financial assets that require delivery of assets in a timeframe established by regulation or convention in the market place (regular way trades) are recognised on the trade date, i.e., the date at which the Group commits to purchase or sell the asset.
The Group’s financial assets include cash and cash equivalents and certain trade and other receivables.
Subsequent measurementFor purposes of subsequent measurement financial assets are classified into four categories:• Financial assets at fair value through profit or loss• Trade and other receivables• Held-to-maturity investments — the Group has no held-to-maturity investments• AFS financial investments — the Group has no AFS financial assets
Financial assets at fair value through profit or lossFinancial assets at fair value through profit or loss include financial assets held for trading and financial assets designated upon initial recognition at fair value through profit or loss. Financial assets are classified as held for trading if they are acquired for the purpose of selling or repurchasing in the near term. Derivatives, including separated embedded derivatives, are also classified as held for trading unless they are designated as effective hedging instruments, as defined by IAS 39. Financial assets at fair value through profit or loss are carried in the statement of financial position at fair value with net changes in fair value presented as finance costs (negative changes in fair value) or finance revenue (positive net changes in fair value) in the statement of profit or loss and other comprehensive income. The Group has not designated any financial assets at fair value through profit or loss.
Derivatives embedded in host contracts are accounted for as separate derivatives and recorded at fair value if their economic characteristics and risks are not closely related to those of the host contracts and the host contracts are not held for trading or designated at fair value though profit or loss. These embedded derivatives are measured at fair value, with changes in fair value recognised in the statement of profit or loss and other comprehensive income. Reassessment occurs only if there is a change in the terms of the contract that significantly modifies the cash flows that would otherwise be required or there is a reclassification of a financial asset out of the fair value through profit or loss category. The group has no embedded derivatives as of December 31, 2013.
Trade and other receivables This category is most relevant to the Group. Trade and other receivables are non-derivative financial assets with fixed or determinable payments that are not quoted in an active market. After initial measurement, such financial assets are subsequently measured at amortised cost using the effective interest rate method, less impairment. Amortised cost is calculated by taking into account any discount or premium on acquisition and fees or costs that are an integral part of the effective interest rate. The effective interest rate amortisation is included in finance income in the statement of profit or loss and other comprehensive income. The losses arising from impairment are recognised in the statement of profit or loss and other comprehensive income in finance costs for loans and in cost of sales or other operating expenses for receivables.

PA N O R O E N E R G Y A N N U A L R E P O R T 2 0 1 3 PA G E 3 9
Cash and cash equivalents Cash and cash equivalents includes cash at hand, and deposits held on call with banks. Restricted cash with banks is not considered as a cash equivalent. Cash balances in current accounts, short-term deposits and placement with maturity of six months or less in highly liquid investments are classified as cash and cash equivalents.
Impairment of financial assetsThe Group assesses at each reporting date whether a financial asset or group of financial assets are impaired. Details of impairment principles for financial assets is included in note 2.5(r).
h. Financial liabilitiesFinancial liabilities are classified, at initial recognition, as financial liabilities at fair value through profit or loss, loans and borrowings, payables, or as derivatives designated as hedging instruments in an effective hedge, as appropriate.
All financial liabilities are recognised initially at fair value and, in the case of loans and borrowings and payables, net of directly attributable transaction costs.
The Group’s financial liabilities include trade and other payables, loans and borrowings including bank overdrafts and derivative financial liabilities.
The Group’s financial liabilities include trade and other payables, and loans and borrowings.
Subsequent measurementThe measurement of financial liabilities depends on their classification, as described below:
Trade payables Trade payables are recognised initially at fair value and subsequently measured at amortised cost using the effective interest method.
Loans and borrowingsAll borrowings are initially recorded at fair value. Interest-bearing loans and overdrafts are initially recorded at the proceeds received, net of directly attributable issue costs. Finance charges, including premiums payable on settlement or redemption and direct issue costs, are accounted for on an accruals basis in the income statement using the effective interest method and are added to the carrying amount of the instrument to the extent that they are not settled in the period in which they arise.
Under the requirements of IAS 39 AG8, any revisions to the estimates of payments or receipts in relation to a financial instrument are adjusted to reflect the actual and revised estimated cashflows. The change in estimated cashflows are remeasured by computing the present value of estimated cashflows at the financial instrument’s original effective interest rate. The adjustment is recognised in the statement of comprehensive income as Income or expense. The guidance is relevant to the Group’s bond liability which is contractually payable over several years, however, due to the pending sale of Group’s Brazilian assets it is highly likely that the bond liability will be settled in foreseeable future together with the contractual early redemption charges. As a result, the bond liability has been remeasured per the guidance IAS 39 AG8 in these financial statements.
i. ProvisionsGeneralProvisions are recognised when the Group has a present obligation (legal or constructive) as a result of a past event, it is probable that an outflow of resources embodying economic benefits will be required to settle the obligation and a reliable estimate can be made of the amount of the obligation. Where the Group expects some or all of provision to be reimbursed, for example under an insurance contract, the reimbursement is recognised as a separate asset but only when the reimbursement is virtually certain. The expense relating to any provision is recognised through profit and loss net of any reimbursement. If the effect of the time value of money is material, provisions are discounted using a current pre-tax rate that reflects, where appropriate, the risks specific to the liability. Where discounting is used, the increase in the provision due to the passage of time is recognised as interest expense. The present obligation under onerous contracts is recognised as a provision.
j. Asset retirement obligationAn asset retirement liability is recognised when the Group has a present legal or constructive obligation as a result of past events, and it is probable that an outflow of resources will be required to settle the obligation, and a reliable estimate of the amount of obligation can be made. A corresponding amount equivalent to the obligation is also recognised as part of the cost of the related production plant and equipment. The amount recognised in the estimated cost of asset retirement, discounted to its present value. Changes in the estimated timing of asset retirement or asset retirement cost estimates are dealt with prospectively by recording an adjustment to the provision, and a corresponding adjustment to production plant and equipment. The unwinding of the discount on the asset retirement provision is included as a finance cost.
PA G E 4 0 PA N O R O E N E R G Y A N N U A L R E P O R T 2 0 1 3
k. Income taxIncome tax expense represents the sum of the tax currently payable and movement in deferred tax. Current taxCurrent income tax assets and liabilities for the current and prior periods are measured at the amount expected to be recovered from or paid to the taxation authorities. The tax rates and tax laws used to compute the amount are those that are enacted or substantively enacted by the reporting date, in the countries where the Group operates and generates taxable income. Current income tax relating to items recognised directly in equity is recognised in equity and not in the income statement. Management periodically evaluates positions taken in the tax returns with respect to situations which applicable tax regulations are subject to interpretation and established provisions where appropriate.
Deferred taxDeferred tax is provided using the liability method on temporary differences at the reporting date between the tax bases of assets and liabilities and their carrying amounts for financial reporting purposes.
Deferred income tax liabilities are recognised for all taxable temporary differences, except:
• Where the deferred tax liability arises from the initial recognition of goodwill or of an asset or liability in a transaction that is not a business combination and, at the time of the transaction, affect neither the accounting profit nor taxable profit or loss; and
• In respect of taxable temporary differences associated with investments in subsidiaries, associates and interest in joint ventures, where the timing of the reversal of the temporary differences can be controlled and it is probable that the temporary differences will not reverse in the foreseeable future.
Deferred tax assets are recognised for all deductible temporary differences; carry forward to unused tax credits and unused tax losses, to the extent that it is probable that future taxable profit will be available against which the deductible temporary differences and the carry forward of unused tax credits and unused tax losses can be utilized except:
• Where the deferred income tax asset relating to the deductible temporary difference arises from the initial recognition of an asset or liability in a transaction that is not a business combination and, at the time of the transaction, affects neither the accounting profit nor taxable profit or loss; and
• In respect of deductible temporary differences associate with investments in subsidiaries, associate and interest in joint ventures, deferred income tax assets are recognised only to the extent that it is probable that the temporary differences will reverse in the foreseeable future and taxable profit will be available against which the temporary differences can be utilized.
The carrying amount of deferred tax assets is reviewed at each reporting date and reduced to the extent that it is no longer probable that sufficient future taxable profit will be available to allow all or part of the deferred tax asset to be utilized. Unrecognized deferred tax assets are reassessed at each reporting date and are recognized to the extent that it has become probable that future taxable profit will allow the deferred tax asset to be recovered.
Deferred tax assets and liabilities are measured at the tax rates that are expected to apply to the year when the asset is realized or the liability is settled, based on tax rates (and tax laws) that have been enacted or substantively enacted at the reporting date.
Deferred tax relating to items recognized directly in equity is recognized in equity and not in the income statement.
Deferred tax assets and deferred tax liabilities are offset, if a legally enforceable right exists to set off current tax assets against current tax liabilities and the deferred taxes relate to the same taxable entity and the same taxation authority.
Tax benefits acquired as part of a business combination, but not satisfying the criteria for separate recognition at that date, would be recognised subsequently if new information about facts and circumstances arose. The adjustment would either be treated as a reduction to goodwill (as long as it does not exceed goodwill) if it occurred during the measurement period or in profit or loss.
Production-sharing arrangements According to the production-sharing arrangement (PSA) in certain licenses, the share of the profit oil to which the government is entitled in any calendar year in accordance with the PSA is deemed to include a portion representing the corporate income tax imposed upon and due by the Group. This amount will be paid directly by the government on behalf of Group to the appropriate tax authorities. This portion of income tax and revenue are presented net in income statement.
Sales taxRevenues, expenses and assets are recognised net of the amount of sales tax except:
Where the sales tax incurred on a purchase of assets or services is not recoverable from the taxation authority, in which case, the sales tax is recognised as part of the cost of acquisition of the asset or as part of the expense item as applicable

PA N O R O E N E R G Y A N N U A L R E P O R T 2 0 1 3 PA G E 4 1
Receivables and payables that are stated with the amount of sales tax included
The net amount of sales tax recoverable from, or payable to, the taxation authority is included as part of receivables or payables in the statement of financial position.
l. Revenue recognition Revenue from petroleum productsRevenue from the sale petroleum products is recognized as income using the “entitlement method“. Under this method, revenue is recorded on the basis of the asset’s proportionate share of total gas produced from the affected fields. Revenue is stated net of value-added tax and royalties.
Revenue from test production is recognised as a direct off-set to the capitalised cost of the exploration and evaluation asset.
Interest income and financial instruments measured at amortised costInterest income is recognized on an accruals basis. For all financial instruments measured at amortised cost and interest-bearing financial assets classified as available for sale, interest income or expense is recorded using the effective interest rate (EIR), which is the rate that exactly discounts the estimated future cash payments or receipts through the expected life of the financial instrument or a shorter period, where appropriate, to the net carrying amount of the financial asset or liability. Interest revenue is included in finance income in income statement. Rendering of servicesSales of services are recognized in the accounting period in which the services are rendered, and it is probable that the economic benefits associated with the transaction will flow to the entity, by reference to completion of the specific transaction assessed on the basis of the actual service provided as a proportion of the total services to be provided.
m. LeasesThe determination of whether an arrangement is, or contains, a lease is based on the substance of the arrangement at inception date: whether fulfilment or the arrangement is dependent on the use of a specific asset or assets or the arrangement conveys a right to use the asset.
For arrangements entered into prior to January 1, 2005, the date of inception is deemed to be January 1, 2005 in accordance with the transitional requirements of IFRIC 4.
Group as a lesseeFinance leases, which transfer to the Group substantially all the risks and benefits incidental to ownership of the leased item, are capitalized at the inception of the lease at the fair value of the leased property or, if lower, at the present value of the minimum lease payments. Lease payments are apportioned between finance charges and reduction of the lease liability so as to achieve a constant rate of interest on the remaining balance of the liability. Finance charges are reflected in the income statement.
Capitalized leased assets are depreciated over the shorter of the estimated useful life of the asset and the lease term, if there is no reasonable certainty that the Group will obtain ownership by the end of the lease term.
Operating lease payments are recognized as an expense in the income statement on a straight line basis over the lease term.
n. Property, plant and equipmentProperty, plant and equipment not associated with exploration and production activities are carried at cost less accumulated depreciation. These assets are also evaluated for impairment. Depreciation of other assets is calculated on a straight line basis as follows:
Computer equipment 20-33.33%Furniture, Fixtures & fittings 10-33.33%
o. Defined contribution pension planThe Group pays contributions into a defined contribution plan. Obligations for contributions to defined contribution pension plans are recognised as an expense in the income statement in the periods during which services are rendered by employees.
p. Share-based payment transactionsEmployees (including senior executives) of the Group receive remuneration in the form of share-based payment transactions, whereby employees render services as consideration for equity instruments (equity-settled transactions).

PA G E 4 2 PA N O R O E N E R G Y A N N U A L R E P O R T 2 0 1 3
Equity-settled transactionsThe cost of equity-settled transactions is recognised, together with a corresponding increase in additional paid in capital reserve in equity, over the period in which the performance and/or service conditions are fulfilled. The cumulative expense recognised for equity-settled transactions at each reporting date until the vesting date reflects the extent to which the vesting period has expired and the Group’s best estimate of the number of equity instruments that will ultimately vest. The income statement expense or credit for a period represents the movement in cumulative expense recognised as at the beginning and end of that period and is recognised in share-based payments expense. No expense is recognised for awards that do not ultimately vest, except for equity-settled transactions for which vesting are conditional upon a market or non-vesting condition. These are treated as vesting irrespective of whether or not the market or non-vesting condition is satisfied, provided that all other performance and/or service conditions are satisfied.
When the terms of an equity-settled transaction award are modified, the minimum expense recognised is the expense as if the terms had not been modified, if the original terms of the award are met. An additional expense is recognised for any modification that increases the total fair value of the share-based payment transaction, or is otherwise beneficial to the employee as measured at the date of modification.
When an equity-settled award is cancelled, it is treated as if it vested on the date of cancellation, and any expense not yet recognised for the award is recognised immediately. This includes any award where non-vesting conditions within the control of either the entity or the employee are not met. However, if a new award is substituted for the cancelled award, and designated as a replacement award on the date that it is granted, the cancelled and new awards are treated as if they were a modification of the original award, as described in the previous paragraph.
The dilutive effect of outstanding options is reflected as additional share dilution in the computation of diluted earnings per share.
q. Fair value measurementThe Group measures derivatives at fair value at each balance sheet date and, for the purposes of impairment testing, uses fair value less costs of disposal to determine the recoverable amount of some of its non-financial assets.
Fair value is the price that would be received to sell an asset or paid to transfer a liability in an orderly transaction between market participants at the measurement date. The fair value measurement is based on the presumption that the transaction to sell the asset or transfer the liability takes place either:• In the principal market for the asset or liability, or• In the absence of a principal market, in the most advantageous market for the asset or liability
The principal or the most advantageous market must be accessible by the Group.
The fair value of an asset or a liability is measured using the assumptions that market participants would use when pricing the asset or liability, assuming that market participants act in their economic best interest.
A fair value measurement of a non-financial asset takes into account a market participant’s ability to generate economic benefits by using the asset in its highest and best use or by selling it to another market participant that would use the asset in its highest and best use.
The Group uses valuation techniques that are appropriate in the circumstances and for which sufficient data are available to measure fair value, maximising the use of relevant observable inputs and minimising the use of unobservable inputs.
All assets and liabilities for which fair value is measured or disclosed in the financial statements are categorised within the fair value hierarchy, described as follows, based on the lowest-level input that is significant to the fair value measurement as a whole:
• Level 1 — Quoted (unadjusted) market prices in active markets for identical assets or liabilities• Level 2 — Valuation techniques for which the lowest-level input that is significant to the fair value measurement is directly or indirectly
observable• Level 3 — Valuation techniques for which the lowest-level input that is significant to the fair value measurement is unobservable
For assets and liabilities that are recognised in the financial statements on a recurring basis, the Group determines whether transfers have occurred between levels in the hierarchy by reassessing categorisation (based on the lowest-level input that is significant to the fair value measurement as a whole) at the end of each reporting period.
For the purpose of fair value disclosures, the Group has determined classes of assets and liabilities based on the nature, characteristics and risks of the asset or liability and the level of the fair value hierarchy as explained above.
r. ImpairmentsNon-financial assetsAssets that are subject to amortisation or depreciation are reviewed for impairment whenever events or changes in circumstances indicate that the carrying amount may not be recoverable. Goodwill is assessed for impairment on an annual basis. An impairment loss is recognised for the amount by which the asset’s carrying amount exceeds its recoverable amount. The recoverable amount is the higher of an asset’s fair value less costs to sell and value in use. In assessing value in use, the estimated future cash flows are discounted to their present value using a pre-tax discount rate that reflects current market assessments of the time value of money and the risks specific to
PA N O R O E N E R G Y A N N U A L R E P O R T 2 0 1 3 PA G E 4 3
the asset. For the purposes of assessing impairment, assets are grouped at the lowest levels for which there are separately identifiable cash inflows (cash-generating units). Non-financial assets that were previously impaired are reviewed for possible reversal of the impairment at each reporting date.
A previously recognised impairment loss is reversed only if there has been a change in the estimates used to determine the asset’s recoverable amount since the last impairment loss was recognised. If that is the case, the carrying amount of the asset is increased to its recoverable amount. That increased amount cannot exceed the carrying amount that would have been determined, net of depreciation, had no impairment loss been recognised for the asset in prior years. Such a reversal is recognised in the income statement. After such a reversal the depreciation charge is adjusted in future periods to allocate the asset’s revised carrying amount, less any residual value, on a systematic basis over its remaining useful life.
Financial assets
Assets carried at amortised costIf there is objective evidence that an impairment loss on assets carried at amortised cost has been incurred, the amount of the loss is measured as the difference between the assets’ carrying amount and the present value of estimated future cash flows (excluding future expected credit losses that have not been incurred) discounted at the financial asset’s original effective interest rate (ie the effective interest rate computed at initial recognition). The carrying amount of the asset is reduced through use of an allowance account. The amount of the loss shall be recognised in the income statement.
If, in a subsequent period, the amount of the impairment loss decreases and the decrease can be related objectively to an event occurring after the impairment was recognised, the previously recognised impairment loss is reversed, to the extent that the carrying value of the asset does not exceed its amortised cost at the reversal date, any subsequent reversal of an impairment loss is recognised in the income statement.
In relation to trade receivables, a provision for impairment is made when there is objective evidence (such as the probability of insolvency or significant financial difficulties of the debtor) that the Group will not be able to collect all of the amounts due under the original terms of the invoice. The carrying amount of the receivable is reduced through use of an allowance account. Impaired debts are derecognised when they are assessed as uncollectible.
s. Current versus non-current classificationThe Group presents assets and liabilities in the statement of financial position based on current/non-current classification. An asset is current when it is either:• Expected to be realised or intended to be sold or consumed in the normal operating cycle• Held primarily for the purpose of trading• Expected to be realised within 12 months after the reporting period• Cash or cash equivalent unless restricted from being exchanged or used to settle a liability for at least 12 months after the reporting
period
All other assets are classified as non-current.
A liability is current when either:• It is expected to be settled in the normal operating cycle• It is held primarily for the purpose of trading• It is due to be settled within 12 months after the reporting period• There is no unconditional right to defer the settlement of the liability for at least 12 months after the reporting period
The Group classifies all other liabilities as non-current.
Deferred tax assets and liabilities are classified as non-current assets and liabilities.
NOTE 2.4 NEW AND AMENDED STANDARDS AND INTERPRETATIONS
There were a number of new standards and interpretations, effective from January 1, 2013, that the Group applied for the first time in the current year. These mainly included IFRS 13 Fair Value Measurement. While none of these standards required a restatement of previous financial statements, they did result in, certain disclosures being updated.
Several other amendments apply for the first time in 2013. However, they do not impact the annual consolidated financial statements of the Group or the interim condensed consolidated financial statements of the Group.
The nature and the impact of each new relevant standard and/or amendment is described below. Other than the changes described below, the accounting policies adopted are consistent with those of the previous financial year.
IFRS 13 Fair Value MeasurementIFRS 13 establishes a single source of guidance under IFRS for all fair value measurements. IFRS 13 does not change when an entity is required to use fair value, but rather provides guidance on how to measure fair value under IFRS when fair value is required or permitted. IFRS 13 defines fair value as an exit price. As a result of the guidance in IFRS 13, the Group re-assessed its policies for measuring fair
PA G E 4 4 PA N O R O E N E R G Y A N N U A L R E P O R T 2 0 1 3
values — in particular, its valuation inputs such as non-performance risk for fair value measurement of liabilities. IFRS 13 also requires additional disclosures.
Application of IFRS 13 has not materially impacted the fair value measurements of the Group. Additional disclosures, where required, are provided in the individual notes relating to the assets and liabilities whose fair values were determined.
NOTE 2.5 STANDARDS ISSUED BUT NOT YET EFFECTIVE
The standards and interpretations that are issued but not yet effective up to the date of issuance of the Group’s financial statements are discussed below. These are the changes the Group reasonably expects will have an impact on disclosures, financial position or performance when applied at a future date. The Group intends to adopt these standards and interpretations, if applicable, when they become effective.
IAS 27 Separate Financial Statements (as revised in 2011) As a consequence of the new IFRS 10 and IFRS 12, what remains of IAS 27 is limited to accounting for subsidiaries, jointly controlled entities and associates in separate financial statements. The Group does not present separate financial statements impacted by these standards. The amendment becomes effective for annual periods beginning on or after January 1, 2014.
IAS 28 Investments in Associates and Joint ventures (as revised in 2011) As a consequence of the new IFRS 11 and IFRS 12, IAS 28 has been renamed IAS 28 Investments in Associates and Joint Ventures, and describes the application of the equity method to investments in joint ventures in addition to associates. The amendment becomes effective for annual periods beginning on or after January 1, 2014.
IFRS Financial InstrumentsIFRS 9, as issued, reflects the first phase of the IASB’s work on the replacement of IAS 39 and applies to classification and measurement of financial assets and financial liabilities, as defined in IAS 39. The standard was initially effective for annual periods beginning on or after January 1, 2013, but Amendments to IFRS 9 Mandatory Effective Date of IFRS 9 and Transition Disclosures, issued in December 2011, moved the mandatory effective date to January 1, 2015. In subsequent phases, the IASB is addressing hedge accounting and impairment of financial assets. The adoption of the first phase of IFRS 9 may have an effect on the classification and measurement of the Group’s financial assets but will not have an impact on classification and measurements of the Group’s financial liabilities. The Group will quantify the effect in conjunction with the other phases, when the final standard including all phases is issued.
IFRS 10 Consolidated Financial Statements and IAS 27 Separate Financial StatementsIFRS 10 replaces the portion of IAS 27 Consolidated and Separate Financial Statements that addresses the accounting for consolidated financial statements. It also addresses the issues covered in SIC-12 Consolidation — Special Purpose Entities. IFRS 10 establishes a single control model that applies to all entities including structured entities (previously referred to as special purpose entities). The changes introduced by IFRS 10 require management to exercise significant judgement to determine which entities are controlled and therefore are required to be consolidated by a parent, compared with the requirements that were in IAS 27. The application of IFRS 10 and IAS 27 is not expected to impact the Group’s accounting for its interests in subsidiaries. The standard becomes effective from periods beginning on or after January 1, 2014.
IFRS 11 Joint Arrangements and IAS 28 Investment in Associates and Joint VenturesIn May 2011, the IASB issued IFRS 11 ‘Joint Arrangements’, one of a suite of standards relating to interests in other entities and related disclosures. IFRS 11 establishes a principle that applies to the accounting for all joint arrangements, whereby parties to the arrangement account for their underlying contractual rights and obligations relating to the joint arrangement. IFRS 11 identifies two types of joint arrangements. A ‘joint venture’ is a joint arrangement whereby the parties that have joint control of the arrangement have rights to the net assets of the arrangement. A ‘joint operation’ is a joint arrangement whereby the parties that have joint control of the arrangement have rights to the assets, and obligations for the liabilities, relating to the arrangement. Investments in joint ventures are accounted for using the equity method. Investments in joint operations are accounted for by recognizing the group’s assets, liabilities, revenue and expenses relating to the joint operation. This standard becomes effective for annual periods beginning on or after January 1, 2014. The Group is not expected to have a major impact after adoption of this standard on its financial position and /or performance, disclosures and stated accounting policies.
IFRS 12 Disclosure of Interests in Other EntitiesIFRS 12 includes all of the disclosures that were previously in IAS 27 related to consolidated financial statements, as well as all of the disclosures that were previously included in IAS 31 and IAS 28. These disclosures relate to an entity’s interests in subsidiaries, joint arrangements, associates and structured entities. A number of new disclosures are also required. This standard becomes effective for annual periods beginning on or after January 1, 2014.
IFRIC Interpretation 21 Levies (IFRIC 21)IFRIC 21 clarifies that an entity recognises a liability for a levy when the activity that triggers payment, as identified by the relevant legislation, occurs. For a levy that is triggered upon reaching a minimum threshold, the interpretation clarifies that no liability should be anticipated before the specified minimum threshold is reached. IFRIC 21 is effective for annual periods beginning on or after January 1, 2014. The adoption of IFRIC 21 is expected to have an insignificant impact on the Group’s accounting for production and similar taxes, which do not meet the definition of an income tax in IAS 12.
The Group has not early adopted any other standard, interpretation or amendment that was issued but is not yet effective.
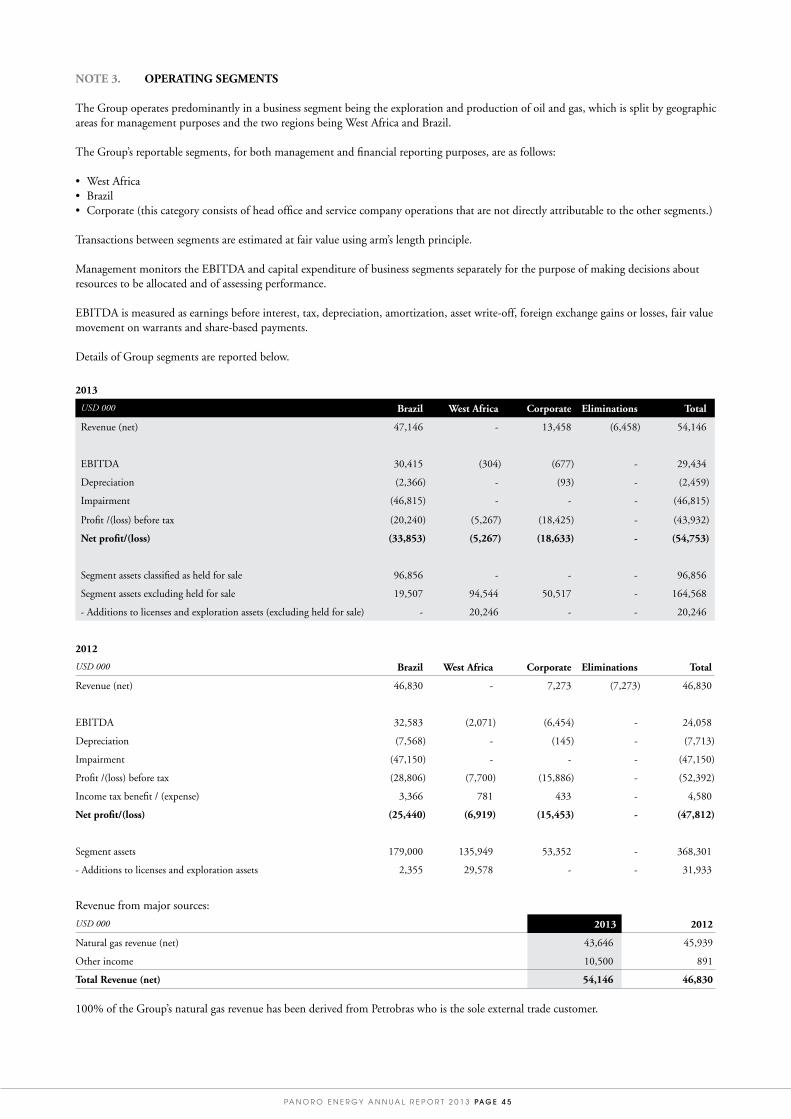
PA N O R O E N E R G Y A N N U A L R E P O R T 2 0 1 3 PA G E 4 5
NOTE 3. OPERATING SEGMENTS
The Group operates predominantly in a business segment being the exploration and production of oil and gas, which is split by geographic areas for management purposes and the two regions being West Africa and Brazil.
The Group’s reportable segments, for both management and financial reporting purposes, are as follows:
• West Africa • Brazil • Corporate (this category consists of head office and service company operations that are not directly attributable to the other segments.)
Transactions between segments are estimated at fair value using arm’s length principle.
Management monitors the EBITDA and capital expenditure of business segments separately for the purpose of making decisions about resources to be allocated and of assessing performance.
EBITDA is measured as earnings before interest, tax, depreciation, amortization, asset write-off, foreign exchange gains or losses, fair value movement on warrants and share-based payments.
Details of Group segments are reported below.
2013
USD 000 Brazil West Africa Corporate Eliminations Total
Revenue (net) 47,146 - 13,458 (6,458) 54,146
EBITDA 30,415 (304) (677) - 29,434
Depreciation (2,366) - (93) - (2,459)
Impairment (46,815) - - - (46,815)
Profit /(loss) before tax (20,240) (5,267) (18,425) - (43,932)
Net profit/(loss) (33,853) (5,267) (18,633) - (54,753)
Segment assets classified as held for sale 96,856 - - - 96,856
Segment assets excluding held for sale 19,507 94,544 50,517 - 164,568
- Additions to licenses and exploration assets (excluding held for sale) - 20,246 - - 20,246
2012
USD 000 Brazil West Africa Corporate Eliminations Total
Revenue (net) 46,830 - 7,273 (7,273) 46,830
EBITDA 32,583 (2,071) (6,454) - 24,058
Depreciation (7,568) - (145) - (7,713)
Impairment (47,150) - - - (47,150)
Profit /(loss) before tax (28,806) (7,700) (15,886) - (52,392)
Income tax benefit / (expense) 3,366 781 433 - 4,580
Net profit/(loss) (25,440) (6,919) (15,453) - (47,812)
Segment assets 179,000 135,949 53,352 - 368,301
- Additions to licenses and exploration assets 2,355 29,578 - - 31,933
Revenue from major sources:
USD 000 2013 2012
Natural gas revenue (net) 43,646 45,939
Other income 10,500 891
Total Revenue (net) 54,146 46,830
100% of the Group’s natural gas revenue has been derived from Petrobras who is the sole external trade customer.

PA G E 4 6 PA N O R O E N E R G Y A N N U A L R E P O R T 2 0 1 3
The other income of USD 10.5 million includes USD 7 million of fee received from Lekoil on termination of agreement to sell Panoro’s interest in OML-113. The remaining USD 3.5 million represent release of liabilities towards certain stakeholders that was linked to commercialisation and development milestones of BS-3 assets. Since, the relinquishment of these licences is imminent, it is highly unlikely that such liabilities will be triggered and as such have been reversed to the statement of comprehensive income.
There are no differences in the nature of measurement methods used on segment level compared with the consolidated financial statements.
NOTE 4. OPERATING PROFIT
Operating profit is stated after charging/(crediting):
USD 000 Note 2013 2012
Employee benefits expense 6,598 8,921
Depreciation 9,10 2,459 7,713
Asset write-off and impairment 8 46,815 47,150
Operating lease payments 823 1,009
NOTE 4a. EMPLOYEE BENEFIT EXPENSES
General and administrative expenses include wages, employers’ contribution and other compensation as detailed below:
USD 000 2013 2012
Salaries 3,899 5,242
Employers contribution 1,815 1,955
Pension costs 440 460
Other compensation 444 1,264
Total 6,598 8,921
The number of employees in the Group as at year end is detailed below:
2013 2012
Number of employees 17 30
NOTE 4b. BOARD OF DIRECTORS STATEMENT ON REMUNERATION OF EXECUTIVES
Statement for the current year (2013)In accordance with the Norwegian Public Limited Liability Companies Act §6-16a, the Board of Directors must prepare a statement on remuneration of executives.
The remuneration of the members of the Board is determined on a yearly basis by the Company at its annual general meeting. The directors may also be reimbursed for, inter alia, travelling, hotel and other expenses incurred by them in attending meetings of the directors or in connection with the business of Panoro Energy ASA. A director who has been given a special assignment, besides his/her normal duties as a director of the Board, in relation to the business of Panoro Energy ASA may be paid such extra remuneration as the directors may determine.
Panoro Energy ASA has established a compensation program for executive management that reflects the responsibility and duties as management of an international oil and gas company and at the same time contributes to add value for the Company’s shareholders. The goal for the Board of Directors has been to establish a level of remuneration that is competitive both in domestic and international terms to ensure that the Group is an attractive employer that can obtain a qualified workforce.
Remuneration for executive management consists of both fixed and variable elements. The fixed elements consist of salaries and other benefits (free phone, electronic communication, newspapers, etc.), while the variable elements consist of a performance based bonus arrangement and a share option scheme that was approved by the Board of Directors in 2013. The annual bonus will be determined based on the achievement of certain pre-set targets.
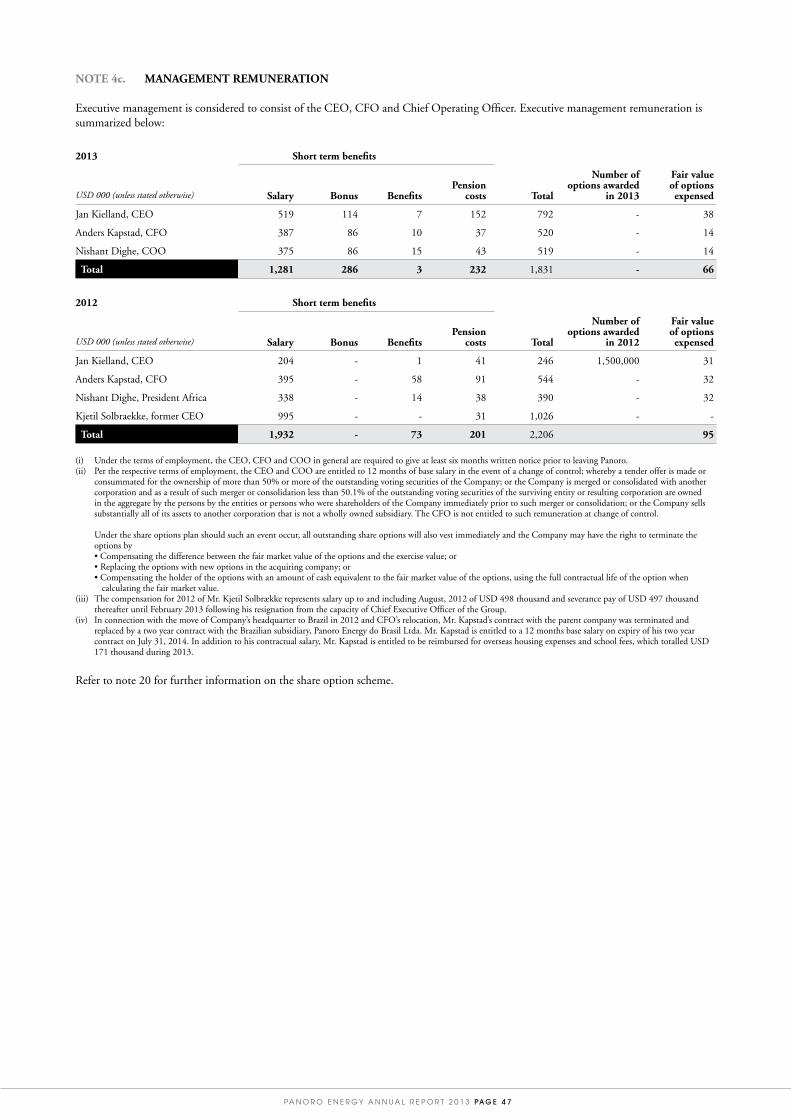
PA N O R O E N E R G Y A N N U A L R E P O R T 2 0 1 3 PA G E 4 7
NOTE 4c. MANAGEMENT REMUNERATION
Executive management is considered to consist of the CEO, CFO and Chief Operating Officer. Executive management remuneration is summarized below:
2013 Short term benefits
USD 000 (unless stated otherwise) Salary Bonus BenefitsPension
costs Total
Number of options awarded
in 2013
Fair value of options expensed
Jan Kielland, CEO 519 114 7 152 792 - 38
Anders Kapstad, CFO 387 86 10 37 520 - 14
Nishant Dighe, COO 375 86 15 43 519 - 14
Total 1,281 286 3 232 1,831 - 66
2012 Short term benefits
USD 000 (unless stated otherwise) Salary Bonus BenefitsPension
costs Total
Number of options awarded
in 2012
Fair value of options expensed
Jan Kielland, CEO 204 - 1 41 246 1,500,000 31
Anders Kapstad, CFO 395 - 58 91 544 - 32
Nishant Dighe, President Africa 338 - 14 38 390 - 32
Kjetil Solbraekke, former CEO 995 - - 31 1,026 - -
Total 1,932 - 73 201 2,206 95
(i) Under the terms of employment, the CEO, CFO and COO in general are required to give at least six months written notice prior to leaving Panoro. (ii) Per the respective terms of employment, the CEO and COO are entitled to 12 months of base salary in the event of a change of control; whereby a tender offer is made or
consummated for the ownership of more than 50% or more of the outstanding voting securities of the Company; or the Company is merged or consolidated with another corporation and as a result of such merger or consolidation less than 50.1% of the outstanding voting securities of the surviving entity or resulting corporation are owned in the aggregate by the persons by the entities or persons who were shareholders of the Company immediately prior to such merger or consolidation; or the Company sells substantially all of its assets to another corporation that is not a wholly owned subsidiary. The CFO is not entitled to such remuneration at change of control.
Under the share options plan should such an event occur, all outstanding share options will also vest immediately and the Company may have the right to terminate the options by• Compensating the difference between the fair market value of the options and the exercise value; or • Replacing the options with new options in the acquiring company; or• Compensating the holder of the options with an amount of cash equivalent to the fair market value of the options, using the full contractual life of the option when
calculating the fair market value.(iii) The compensation for 2012 of Mr. Kjetil Solbrække represents salary up to and including August, 2012 of USD 498 thousand and severance pay of USD 497 thousand
thereafter until February 2013 following his resignation from the capacity of Chief Executive Officer of the Group.(iv) In connection with the move of Company’s headquarter to Brazil in 2012 and CFO’s relocation, Mr. Kapstad’s contract with the parent company was terminated and
replaced by a two year contract with the Brazilian subsidiary, Panoro Energy do Brasil Ltda. Mr. Kapstad is entitled to a 12 months base salary on expiry of his two year contract on July 31, 2014. In addition to his contractual salary, Mr. Kapstad is entitled to be reimbursed for overseas housing expenses and school fees, which totalled USD 171 thousand during 2013.
Refer to note 20 for further information on the share option scheme.
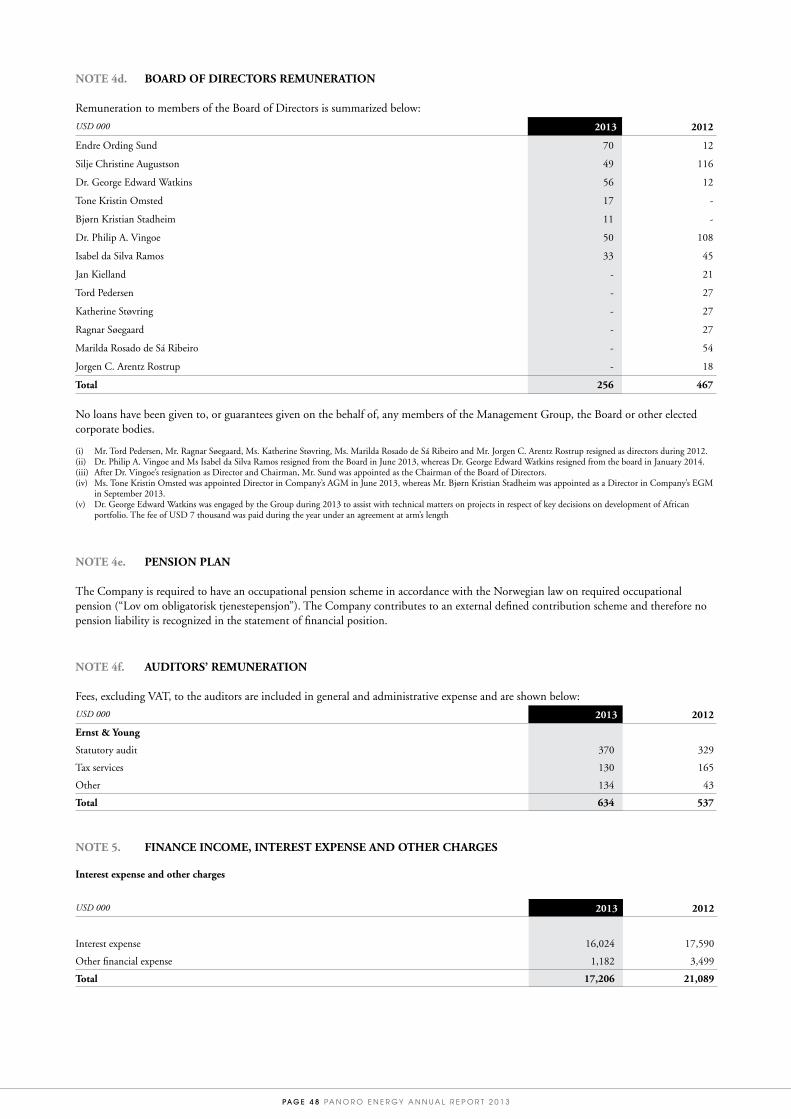
PA G E 4 8 PA N O R O E N E R G Y A N N U A L R E P O R T 2 0 1 3
NOTE 4d. BOARD OF DIRECTORS REMUNERATION
Remuneration to members of the Board of Directors is summarized below:
USD 000 2013 2012
Endre Ording Sund 70 12
Silje Christine Augustson 49 116
Dr. George Edward Watkins 56 12
Tone Kristin Omsted 17 -
Bjørn Kristian Stadheim 11 -
Dr. Philip A. Vingoe 50 108
Isabel da Silva Ramos 33 45
Jan Kielland - 21
Tord Pedersen - 27
Katherine Støvring - 27
Ragnar Søegaard - 27
Marilda Rosado de Sá Ribeiro - 54
Jorgen C. Arentz Rostrup - 18
Total 256 467
No loans have been given to, or guarantees given on the behalf of, any members of the Management Group, the Board or other elected corporate bodies.
(i) Mr. Tord Pedersen, Mr. Ragnar Søegaard, Ms. Katherine Støvring, Ms. Marilda Rosado de Sá Ribeiro and Mr. Jorgen C. Arentz Rostrup resigned as directors during 2012. (ii) Dr. Philip A. Vingoe and Ms Isabel da Silva Ramos resigned from the Board in June 2013, whereas Dr. George Edward Watkins resigned from the board in January 2014. (iii) After Dr. Vingoe’s resignation as Director and Chairman, Mr. Sund was appointed as the Chairman of the Board of Directors. (iv) Ms. Tone Kristin Omsted was appointed Director in Company’s AGM in June 2013, whereas Mr. Bjørn Kristian Stadheim was appointed as a Director in Company’s EGM
in September 2013. (v) Dr. George Edward Watkins was engaged by the Group during 2013 to assist with technical matters on projects in respect of key decisions on development of African
portfolio. The fee of USD 7 thousand was paid during the year under an agreement at arm’s length
NOTE 4e. PENSION PLAN
The Company is required to have an occupational pension scheme in accordance with the Norwegian law on required occupational pension (“Lov om obligatorisk tjenestepensjon”). The Company contributes to an external defined contribution scheme and therefore no pension liability is recognized in the statement of financial position.
NOTE 4f. AUDITORS’ REMUNERATION
Fees, excluding VAT, to the auditors are included in general and administrative expense and are shown below:
USD 000 2013 2012
Ernst & Young
Statutory audit 370 329
Tax services 130 165
Other 134 43
Total 634 537
NOTE 5. FINANCE INCOME, INTEREST EXPENSE AND OTHER CHARGES
Interest expense and other charges
USD 000 2013 2012
Interest expense 16,024 17,590
Other financial expense 1,182 3,499
Total 17,206 21,089

PA N O R O E N E R G Y A N N U A L R E P O R T 2 0 1 3 PA G E 4 9
Finance income
USD 000 2013 2012
Interest income from placements and deposits 3,017 5,653
Total 3,017 5,653
NOTE 6. INCOME TAX
Income taxThe major components of income tax in the consolidated statement of comprehensive income are:
USD 000 2013 2012
Income Taxes
Current income tax 4,882 2,957
Deferred income tax 5,939 (7,532)
Tax charge / (benefit) for the period 10,821 (4,580)
A reconciliation of the income tax expense applicable to the accounting profit before tax at the statutory income tax rate to the expense at the Group’s effective income tax rate is as follows:
USD 000 2013 2012
Loss before taxation (43,932) (52,392)
Tax calculated at domestic tax rates applicable to profits in the respective countries (13,573) (15,248)
Expenses not deductible 352 2,837
Differences due to functional currency effects in subsidiaries (4,369) (3,024)
Tax effect of losses not utilised in the period 32,005 16,902
Effect of differing tax rates (2,414) (4,833)
Prior year adjustments (433)
Others (1,180) (781)
Tax charge / (benefit) 10,821 (4,580)
Deferred taxThe analysis of deferred tax assets and deferred tax liabilities is as follows
USD 000 2013 2012
Deferred tax assets
- to be reversed within 12 months 11,899 -
- to be reversed after more than 12 months - 20,140
Total deferred tax assets 11,899 20,140
Deferred tax liabilities
- to be reversed within 12 months - -
- to be reversed after more than 12 months 4,376 10,817
Total deferred tax liabilities 4,376 10,817
Net deferred tax assets 7,523 9,323

PA G E 5 0 PA N O R O E N E R G Y A N N U A L R E P O R T 2 0 1 3
The gross movement on the deferred income tax account is as follows:
USD 000 2013 2012
As at January 1 9,323 2,452
Movement for the period (1,800) 6,871
As at December 31 7,523 9,323
The movement in deferred income tax assets and liabilities, without taking into consideration the offsetting balances within the same jurisdiction, is as follows:
2013
Deferred tax assets
USD 000 Tax lossesOil and
gas assetsProvisions and others Total
As at January 1, 2013 7,430 14,880 (2,170) 20,140
(Charged) / credited to the statement of comprehensive income 12,364 (21,328) 723 (8,241)
Classified as held for sale - - - -
As at December 31, 2013 19,794 (6,448) (1,447) 11,899
Deferred tax liabilities
USD 000Tangible and
production assetsExploration
assetsProvisions and
others Total
As at January 1, 2013 3,566 7,014 237 10,817
Charged / (credited) to the statement of comprehensive income 4,750 (3,331) (237) 1,182
Classified as held for sale (8,316) 693 - (7,623)
As at December 31, 2013 - 4,376 - 4,376
2012
Deferred tax assets
USD 000 Tax lossesOil and
gas assetsProvisions and others Total
As at January 1, 2012 11,109 (114) (730) 10,265
(Charged) / credited to the statement of comprehensive income (3,679) 14,994 (1,440) 9,875
As at December 31, 2012 7,430 14,880 (2,170) 20,140
Deferred tax liabilities
USD 000Tangible and
production assetsExploration
assetsProvisions and
others Total
As at January 1, 2012 18 7,795 - 7,813
Charged / (credited) to the statement of comprehensive income 3,548 (781) 237 3,004
As at December 31, 2012 3,566 7,014 237 10,817
Recognition of deferred tax assets in 2013 is primarily driven by creation of tax losses in Brazil due to impairments which are expected to be utilized in 2014 against available income from sale of shares in Rio das Contas to GeoPark. Reversal of deferred tax assets in 2013 is primarily driven by limitation of income in Brazil after sale of Rio das Contas and as such there is little likelihood that remaining losses will be utilisable.
The movement in deferred tax assets also factors in the reversal of currency translation adjustments that had accumulated over time on these balances.
Deferred tax assets are recognised for tax loss carry-forwards to the extent that the realization of the related tax benefits through future taxable profits is probable. The deferred taxes as of the year end have only been recognized in Brazil using forecasts where management believes that future taxable income will be available to realize the tax losses and credits.
The Group did not recognise deferred income tax assets of USD 57.0 million (2012: USD 36.6 million) in respect of losses that can be carried forward against future taxable income.
The Group has accumulated tax losses as of year end that will be indefinitely available to offer future taxable income in the respective jurisdictions.
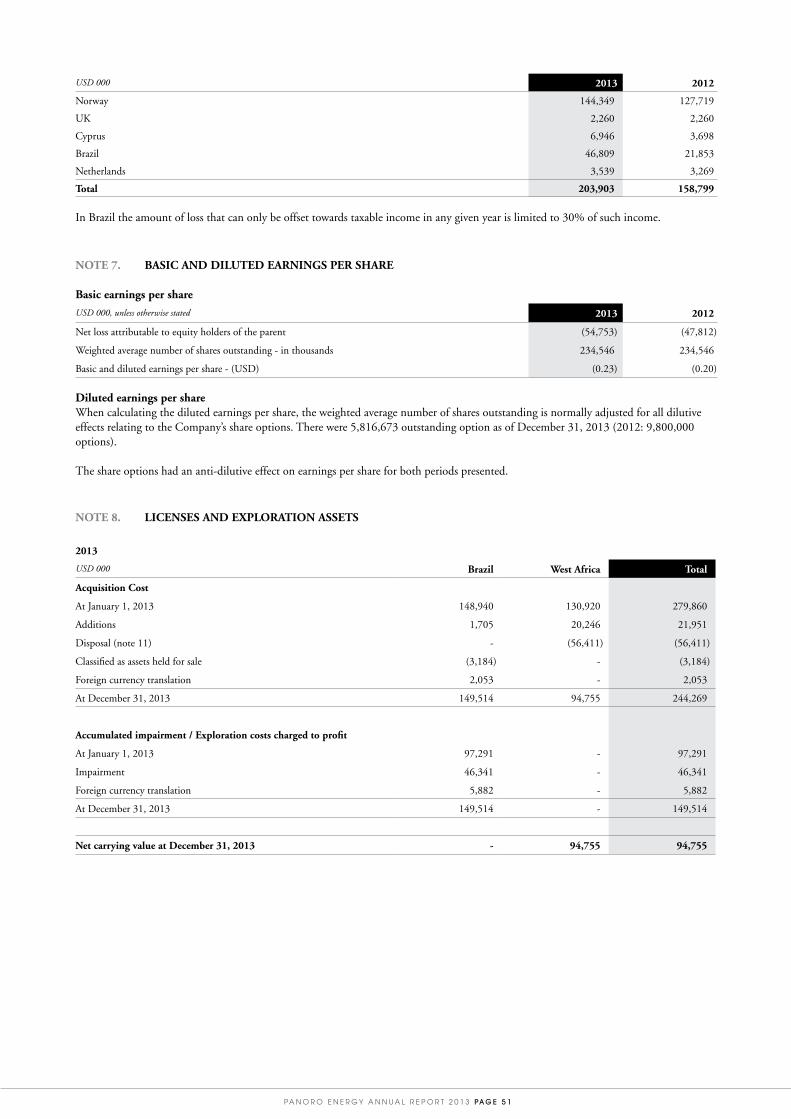
PA N O R O E N E R G Y A N N U A L R E P O R T 2 0 1 3 PA G E 5 1
USD 000 2013 2012
Norway 144,349 127,719
UK 2,260 2,260
Cyprus 6,946 3,698
Brazil 46,809 21,853
Netherlands 3,539 3,269
Total 203,903 158,799
In Brazil the amount of loss that can only be offset towards taxable income in any given year is limited to 30% of such income.
NOTE 7. BASIC AND DILUTED EARNINGS PER SHARE
Basic earnings per share
USD 000, unless otherwise stated 2013 2012
Net loss attributable to equity holders of the parent (54,753) (47,812)
Weighted average number of shares outstanding - in thousands 234,546 234,546
Basic and diluted earnings per share - (USD) (0.23) (0.20)
Diluted earnings per shareWhen calculating the diluted earnings per share, the weighted average number of shares outstanding is normally adjusted for all dilutive effects relating to the Company’s share options. There were 5,816,673 outstanding option as of December 31, 2013 (2012: 9,800,000 options).
The share options had an anti-dilutive effect on earnings per share for both periods presented.
NOTE 8. LICENSES AND EXPLORATION ASSETS
2013
USD 000 Brazil West Africa Total
Acquisition Cost
At January 1, 2013 148,940 130,920 279,860
Additions 1,705 20,246 21,951
Disposal (note 11) - (56,411) (56,411)
Classified as assets held for sale (3,184) - (3,184)
Foreign currency translation 2,053 - 2,053
At December 31, 2013 149,514 94,755 244,269
Accumulated impairment / Exploration costs charged to profit
At January 1, 2013 97,291 - 97,291
Impairment 46,341 - 46,341
Foreign currency translation 5,882 - 5,882
At December 31, 2013 149,514 - 149,514
Net carrying value at December 31, 2013 - 94,755 94,755

PA G E 5 2 PA N O R O E N E R G Y A N N U A L R E P O R T 2 0 1 3
2012
USD 000 Brazil West Africa Total
Acquisition cost
At January 1, 2012 160,581 101,292 261,873
Additions 2,305 29,628 31,933
Foreign currency translation (13,946) - (13,946)
At December 31, 2012 148,940 130,920 279,860
Accumulated impairment / Exploration costs charged to profit
At January 1, 2012 54,624 - 54,624
Impairment 47,150 - 47,150
Foreign currency translation (4,483) - (4,483)
At December 31, 2012 97,291 - 97,291
Net carrying value at December 31, 2012 51,649 130,920 182,569
Licence area Panoro interest CountryExpiry of current phase Additional information
Cavalo Marinho 50% Brazil August 2030 Concession under relinquishment.
Estrela do Mar 65% Brazil August 2025 Concession under relinquishment.
OML 113 6.502% Nigeria June 2018
Dussafu Marin permit 33.33% Gabon May 2016
ImpairmentDuring the year 2013, the Group has recognised an impairment charge of USD 46.8 million predominately relating to Brazilian assets. Of this amount USD 0.2 million was written-off directly to the statement of comprehensive income and the capitalised amount of USD 46.6 million was impaired. The impairment represents USD 45.9 million for BS-3 discoveries (Estrela do Mar and Cavalo Marinho) which are expected to be relinquished due to lack of project sanction and non-commercial terms imposed by ANP for inclusion in the development plan and USD 0.7 million of costs expensed for Round-9 and Coral blocks which have been surrendered in 2013. The impairment of BS-3 was triggered by ANP’s request to voluntary surrender the blocks in November 2013.
The remaining impairment of USD 0.2 million represents write-down of furniture fixtures and equipment in Brazil.
No impairment triggers were observed for other exploration and evaluation assets in Gabon and Nigeria.
During the year 2012, the Group recognised an impairment charge of USD 47.2 million in Brazil. Of this USD 5.2 million is in respect of Round 9 blocks which have been written down to zero after an unsuccessful drilling campaign. USD 42 million of impairment was triggered on discoveries in BS-3 area (Cavalo Marinho and Estrela do Mar) where the previously classified reserves were restated to resources due to project delays and lack of ANP approval on project sanction. The impairment charge has been estimated through determining a fair value less cost to sell of the BS-3 assets using risked resources and estimated USD/bbl prices for similar assets.
The breakdown of the net impairment expense is:
USD 000 2013 2012
Capitalised exploration and evaluation / PP&E assets impaired 46,688 47,150
Expenditure on impaired assets directly charged to statement of comprehensive income 127 -
Total impairment expensed 46,815 47,150

PA N O R O E N E R G Y A N N U A L R E P O R T 2 0 1 3 PA G E 5 3
NOTE 9. PRODUCTION ASSETS AND EQUIPMENT
USD 000 2013 2012
Acquisition cost
At January 1 109,372 129,150
Additions 1,352 662
Change in present value of asset retirement obligation 3,407 (9,842)
Foreign currency translation (8,899) (10,598)
At December 31 105,232 109,372
Accumulated Depreciation
At January 1 39,955 35,754
Depreciation charge for the year 2,202 7,362
Foreign currency translation (343) (3,161)
At December 31 41,814 39,955
Net carrying value at December 31 63,418 69,417
Classified as non-current assets held for sale (63,418) -
Net carrying value at December 31 - 69,417
All of the production assets and equipment related to Brazilian operations.
Net book value of production assets and equipment of December 31, 2013 is split in the following categories and classified as assets held for sale:
USD 000Cost Accumulated
depreciationNet Book Value
2013Net Book Value
2012
Field and structures 81,703 (35,118) 46,585 53,997
Pipeline network 14,279 (2,261) 12,018 13,914
Abandonment provision 5,339 (524) 4,815 1,506
Total 101,321 (37,903) 63,418 69,417
Depreciation method/rates Depreciation for the gathering systems and the transmission lines are computed using the straight-line method over a twenty and thirty-year useful life, respectively. Field investments are depreciated over the life of the field using the unit-of-production method. With effect from April 30, 2013, the Group entered into an agreement to sell 100% stake in its subsidiary Rio das Contas to Geopark. As a result, production assets and equipment has been reclassified to assets held for sale and no depreciation has been charged since April 30, 2013.
During the year, the Group has re-evaluated the asset retirement obligation for the Manati field in light of the recent expenditure on decommissioning BAS-128 well. Based on the current operator sourced estimates, the asset retirement obligation provision has increased and as a result an addition of the difference has also been made to the production asset and equipment.

PA G E 5 4 PA N O R O E N E R G Y A N N U A L R E P O R T 2 0 1 3
NOTE 10. PROPERTY, FURNITURE, FIXTURES AND EQUIPMENT
2013
USD 000
Furniture, Fixture
and FittingsComputer
Equipment Total
Acquisition cost
At January 1, 2013 1,117 1,153 2,270
Additions 2 171 173
Disposals / write-downs (304) (578) (882)
Classified as held for sale (336) (233) (569)
Transfer (240) 240 -
Currency translation (91) (148) (239)
At December 31, 2013 148 605 753
Accumulated depreciation
At January 1, 2013 582 667 1,249
Depreciation charge for the year 63 194 257
Disposals / write-downs (199) (336) (535)
Classified as held for sale (117) (184) (301)
Transfer (188) 188 -
Currency translation (37) (69) (106)
At December 31, 2013 104 460 564
Net carrying value at December 31, 2013 44 145 189
During 2013 the transfer is made to reclassify some UK office equipment from Furniture, Fixtures and Fittings category to Computer Equipment category.
2012
USD 000
Furniture, Fixture
and FittingsComputer
Equipment Total
Acquisition cost
At January 1, 2012 1,251 717 1,968
Additions 48 502 550
Disposals / write-downs (122) (6) (128)
Currency translation (60) (60) (120)
At December 31, 2012 1,117 1,153 2,270
Accumulated depreciation
At January 1, 2012 475 534 1,009
Depreciation charge for the year 155 196 351
Disposals / write-downs (31) (5) (36)
Currency translation (17) (58) (75)
At December 31, 2012 582 667 1,249
Net carrying value at December 31, 2012 535 486 1,021
Depreciation method and rates
Category Straight-line depreciation Useful life
Furniture, fixtures and fittings 10-33.33% 3 - 10 years
Computer equipment 20-33.33% 3 - 5 years

PA N O R O E N E R G Y A N N U A L R E P O R T 2 0 1 3 PA G E 5 5
NOTE 11. DISPOSAL OF ASSETS
MKB permitOn July 2, 2013, the Company’s wholly owned subsidiary, Prevail Energy Congo SAU received the net proceeds from the sale of its 20% interest in the MKB permit to Société Nationale des Pétroles du Congo (“SNPC”) the operator of the MKB Permit in the Republic of Congo. The transaction resulted in a net loss of USD 1.7 million which has been recognised in the statement of comprehensive income. The loss resulted after derecognition of net captitalised costs of USD 56.4 million offset by associated liabilities of USD 23.4 million and deferred tax credit of USD 2.6 million. In addition, the associated cost of divestment was USD 1 million and positive working capital adjustments against receivables was USD 5.3 million.
Under the obligations of the Sale Agreement Panoro Energy is restricted from providing further details of the transaction.
NOTE 12. ACCOUNTS AND OTHER RECEIVABLES
USD 000 2013 2012
Accounts receivable 9,546 15,668
Other receivables and prepayments 3,999 3,351
Classified as held for sale (note 14) (12,576) -
At December 31 969 19,019
Accounts receivables are non-interest bearing and generally on 30-120 days payment terms.
At December 31, 2013 and 2012 the allowance for impairment of receivables was USD nil.
Risk information for the receivable balances is disclosed in note 22.
NOTE 13. CASH AND BANK BALANCES
USD 000 2013 2012
Cash and bank balances 56,756 73,503
Less: Restricted cash (2,604) (2,880)
Cash and cash equivalents at December 31 54,152 70,623
In addition to the cash and bank balances of USD 56.8 million, cash and cash equivalents of USD 17.0 million held in the Company’s subsidiary Rio das Contas have been classified as assets held for sale per requirements of IFRS 5. The Company will be entitled to approximately USD 0.7 million from these funds at the closing of transaction.
Cash and cash equivalents at period end did not include any investment fund placements. In 2012, USD 31.2 million of placements were held in high yield bond funds, invested through Pareto Securities, Merrill Lynch/Bank of America and Swedbank.
Restricted cashRestricted cash relates to cash held in debt service reserve account in accordance with the requirement of the Senior Secured Callable Bond agreement.
Overdraft facilitiesThe Group had no bank overdraft facilities as at December 31, 2013 and 2012.

PA G E 5 6 PA N O R O E N E R G Y A N N U A L R E P O R T 2 0 1 3
NOTE 14. ASSETS CLASSIFIED AS HELD FOR SALE AND LIABILITIES DIRECTLY ASSOCIATED WITH ASSETS CLASSIFIED AS HELD FOR SALE
BrazilOn May 14, 2013, the Company’s wholly owned subsidiary Panoro Energy do Brasil Ltda has entered into a sales and purchase agreement (SPA) to divest its Brazilian subsidiary Rio das Contas to GeoPark Brasil Ltda for a total consideration of USD 140 million plus contingent earn-out. Rio das Contas is the direct beneficial owner of 10% of the BCAM-40 Block in the Camamu-Almada basin offshore Brazil, which includes the Manati and Camarão Norte fields where Panoro Energy holds a 10% interest. Cash proceeds from the transaction is to be used to redeem Panoro Energy’s outstanding bond loans (ISIN NO 001 059097.9 and NO 001 059096.1) which will leave the Company debt free.
The purchase consideration for the shares in Rio das Contas comprises an initial payment of USD 140 million, adjusted by working capital, with effective date of the transaction April 30, 2013 to be paid in cash upon closing. In addition, a contingent earn-out will be paid in cash over the 5-year period from January 1, 2013 to December 31, 2017. The annual earn-out payments will equal 45 % of the annual net cash flow exceeding USD 25 million. The total earn-out is capped at USD 20 million.
On March 26, 2014, the Brazilian Petroleum Agency (ANP) approved the sale of RdC to GeoPark by replacing the parental guarantee which was one of the main conditions to completion. Subsequent to ANP approval, all shares in RdC have been transferred to Geopark and the consideration received has been used to repay the bond liability in full.
Under the requirements of IFRS 5 “Non-current assets Held for Sale and Discontinued Operations”, the asset and certain directly related liabilities have been classified as Held for Sale in the statement of financial position.
The breakdown of assets classified as held for sale together with the related liabilities are disclosed in the following table:
Assets
USD 000 2013
Licenses and exploration assets (BCAM-40) 3,184
Production assets and equipment (Manati) 63,418
Other non-current assets 663
Trade and other receivables 12,576
Cash and cash equivalents 17,015
Total assets classified as held for sale 96,856
Liabilities
USD 000 2013
Trade and other payables 3,775
Income tax payable 727
Asset retirement obligation 6,671
Deferred tax liability 3,247
Total liabilities directly associated with assets classified as held for sale 14,420
NOTE 15. SHARE CAPITAL AND RESERVES
Share capital
Amounts in USD 000 unless otherwise statedNumber of shares
Nominal Share Capital
January 1, 2013 / 2012 and December 31, 2013 234,545,786 56,333
All shares are fully paid-up and have a par value of NOK 1.460471768 and carry equal voting rights. The Company is incorporated in Norway and the share capital is denominated in NOK. The share capital given above is translated to USD at the foreign exchange rate in effect at the time of each share issue.

PA N O R O E N E R G Y A N N U A L R E P O R T 2 0 1 3 PA G E 5 7
Shares owned by the CEO, Board members and key management, directly and indirectly, at December 31, 2013 are:
Shareholder Position Number of shares % of total
Bjørn Kristian Stadheim (i) Director 2,530,000 1.08%
Nishant Dighe Chief Operating Officer 1,309,669 0.56%
Anders Kapstad (ii) Country Manager Brazil and CFO 60,850 0.03%
(i) Mr. Stadheim has a beneficial interest in BKS Capital AS which directly holds shares in the Company. (ii) Mr. Kapstad indirectly holds 40,250 shares through La Barra Capital AS in which he has a beneficial interest.
ReservesShare premiumShare premium reserve represents excess of subscription value of the shares over the nominal amount.
Other reservesOther reserves represent items arising on consolidation of PEdB as comparatives and execution of merger.
Additional paid-in capitalAdditional paid-in capital represents reserves created under the continuity principle on demerger. Share-based payments credit is also recorded under this reserve.
Currency translation reserveThe translation reserve comprises all foreign exchange differences arising from the translation of the financial statements of foreign operations.
NOTE 16. INTEREST-BEARING DEBT
USD 000 Note 2013 2013 2012 2012
Current Non-current Current Non-current
NOK denominated loan 16.1 26,838 - 4,062 28,709
USD denominated loan 16.1 83,380 - 11,434 82,092
Effects of re-measurement of bond liability 16.2 8,694 - - -
At December 31 118,912 - 15,496 110,801

PA G E 5 8 PA N O R O E N E R G Y A N N U A L R E P O R T 2 0 1 3
NOTE 16.1 SENIOR SECURED CALLABLE BOND
In November 2010, the Company issued bonds of USD 140 million “Panoro Energy Senior Secured Callable Bond Issue 2010/2018”.
The bond issue is denominated in NOK and USD with tranches of NOK 205 million and USD 105 million carrying fixed interest rates of respectively 13.5% and 12% per annum. Interest is payable semi-annually. As of December 31, 2013, the outstanding principal amounts to NOK 164 million and USD 84 million. The standard repayment every year on November 15 to the year 2017 is NOK 20.5 million for NOK tranche and USD 10.5 million for USD tranche. The remaining principal amounts of NOK 82 million and USD 42 million are repayable at the bond redemption date on November 15, 2018.
The bondholders carry a first priority pledge over Company’s shares in Brazilian subsidiaries (Rio das Contas and PEdB) which effectively hold 10% working interest in Manati gas field. In addition to this, the bond agreement also stipulates issue of unconditional and irrevocable on-demand guarantees in favour of the Bond Trustee by the Brazilian subsidiaries.
The main covenants of the bond loan are as follows: • The issuer shall maintain at all times, a Book Equity ratio of the Group of minimum 25% which needs to be measured at every quarter
end date. The Book Equity ratio measures the proportion of the Group’s equity compared to total assets.• The issuer shall not declare or make any dividend payments or other distributions or loans to its shareholders and should not engage in
any activity having the effect of reducing capital or equity in the parent company. • The Company shall not provide loans to any of its Brazilian subsidiaries, except to the extent such loans are subject to a first priority
pledge to secure the obligations of the bond issuer. • The Company shall not provide guarantees or other credit support to, or make investments in, any person or entity, other than in the
conditions as prescribed in the loan agreement.
The amount above includes accrued interest to December 31, 2013 and is net of unamortised bond issue costs of USD 2.5 million (2012: USD 3.2 million).
Subsequent to year end, on completion of the sale of Group’s subsidiary RdC to GeoPark, the outstanding bond liability was repaid in full under the terms of the agreement with bondholders.
NOTE 16.2 EFFECT OF RE-MEASUREMENT OF BOND LIABILITY
The Company has entered into a sale agreement with GeoPark Holdings to sell its entire share capital in its fully owned subsidiary Rio das Contas (RdC) which also holds Manati field. The shares in RdC and Manati are pledged as security under the bond agreement which requires mandatory redemption of the loan on completion of sale transaction. Panoro management believes that the completion of the sale transaction is expected within one year of the balance sheet date and as such the entire bond loan has been reclassified as a current liability. Under the terms of the bond agreement, mandatory redemption will be at premium of 6% should the transaction complete before November 15, 2014. Considering the expected changes in cash flow profile of the bond loan, the bond liability has been re-measured using expected cash flows assuming a mandatory redemption date falling before November 15, 2014 discounted to the reporting date using the original effective interest rate. The difference of USD 8,694 thousand between the re-measured liability and the original carrying value has been expensed in the statement of comprehensive income with a corresponding adjustment to the carrying value in the statement of financial position. The expected redemption date has been assumed as March 31, 2014 for the purpose of re-measurement.
The bonds are listed on Oslo ABM under quotes “PEN 01 PRO” and “PEN 02 PRO”.

PA N O R O E N E R G Y A N N U A L R E P O R T 2 0 1 3 PA G E 5 9
NOTE 17. OTHER NON-CURRENT LIABILITIES
USD 000 2013 2012
At December 31 - 6,130
As of December 31, 2012, the Group had acquisition related liabilities related to various acquisitions that occurred in 2005, 2006 and 2010. These liabilities were dependent upon certain operational milestones being achieved and consisted of USD 3.5 million related to Estrela do Mar and Cavalo Marinho and USD 2.6 million related to MKB permit.
USD 3.5 million in relation to Estrela do Mar and Cavalo Marinho has been reversed to other income in the statement of comprehensive income since the licences are expected to be relinquished in forseeable future and it is highly unlikely that these payments will be triggered (refer to note 3). The remaining USD 2.6 million has also been adjusted against the loss on disposal of exploration and evaluation assets because the disposal values did not meet the criteria of the defined milestones (refer to note 11).
NOTE 18. ASSET RETIREMENT OBLIGATION
In accordance with the agreements and legislation, the wellheads, production assets, pipelines and other installations may have to be dismantled and removed from oil and natural gas fields when the production ceases. The exact timing of the obligations is uncertain and depend on the rate the reserves of the field are depleted. However, based on the existing production profile of Manati field and the size of the reserves, it is expected that expenditure on retirement is likely to be after more than ten years.
The asset retirement obligation relates to Manati field and since the Group’s subsidiary Rio das Contas is held for sale, such liability has been classified as held for sale as of December 31, 2013. The following table presents a reconciliation of the beginning and ending aggregate amounts of the obligations associated with the retirement of oil and natural gas properties:
USD 000 2013 2012
Balance for provision at December 31, 6,671 2,823
Classified as held for sale (note 14) (6,671) -
At December 31 - 2,823
All of the obligations are expected to be fulfilled after more than one year from the date of the statement of financial position. For the year ended December 31, 2013, included in the asset retirement obligation is USD 6.7 million (2012: USD 2.8 million) for Brazil and is based on an appraisal report prepared by the operator of Manati field’s engineers to Agencia Nacional de Petroleo (Petroleum National Agency, “ANP”).
During the year, the present value of the asset retirement obligation has been re-assessed using inputs relevant to the date of the statement of financial position. A reassessment was necessary after conclusion of the retirement expenditure on BAS-128 well on which higher than expected amounts were expended. As a result, a reassessment of the entire liability has been made through operator sourced information. The effect of the change in estimate has increased the potential expenditure for wellhead removal rig days and as such the discounted provision has been increased by USD 3.4 million with the corresponding amount capitalized amount under production assets. The liability has been discounted back to the present value from yearend 2025 when major expenditure on dismantling is expected to be undertaken. The Company has used a discount rate of 12% to determine the liability.
A movement of asset retirement obligation since previous year is as follows:
USD 000 2013 2012
Obligation at January 1 2,823 12,665
Accretion of interest 441 -
Change in estimated liability 3,407 (9,842)
Total 6,671 2,823
Classified as held for sale (note 14) (6,671) -
At December 31 - 2,823

PA G E 6 0 PA N O R O E N E R G Y A N N U A L R E P O R T 2 0 1 3
NOTE 19. ACCOUNTS PAYABLE AND ACCRUED LIABILITIES
USD 000 2013 2012
Accounts payable 1,483 1,383
Accruals and other payables 7,560 28,402
Trade and other payables directly associated with assets classified as held for sale (note 14) (3,775) -
At December 31 5,268 29,785
NOTE 20. SHARE-BASED PAYMENT PLANS
Share Option PlanFollowing the merger in June 2010, the Company established an option plan (the “Panoro Option Plan”) whereby options were granted to the key management and employees on various dates.
The Panoro Option Plan governs all future grants of options by the Company to Directors, officers, key employees and certain consultants of the Group. Options are granted under the Panoro Options Plan at the discretion of the Board of Directors. No changes were made to the options plan during the current and previous financial year.
No options were allocated to employees during the year (2012: 1,925,000 options). Vesting of all these options will be over a three year period, with 1/3 of the options exercisable each year. The exercise price of the options set at the time of issue is to be increased by 8 percent after year two and additional 8 percent annually thereafter. The exercise price for the options is as follows:
2010 awards2,333,333 options had a vesting period until August 17, 2011 and can be exercised until August 17, 2012 at NOK 6.00 or until August 17, 2013 at NOK 6.48;
2,333,333 options had a vesting period until August 17, 2012 and can be exercised until August 17, 2013 at NOK 6.48 or until August 17, 2014 at NOK 7.00 and
2,333,334 options have a vesting period until August 17, 2013 and can be exercised until August 17, 2014 at NOK 7.00 or until August 17, 2015 at NOK 7.56.
2011 awards1,640,000 options had a vesting period until December 21, 2012 and can be exercised until December 21, 2013 at NOK 6.00 or until December 21, 2014 at NOK 6.48;
1,640,000 options have a vesting period until December 21, 2013 and can be exercised until December 21, 2014 at NOK 6.48 or until December 21, 2015 at NOK 7.00; and
1,640,000 options have a vesting period until December 21, 2014 and can be exercised until December 21, 2015 at NOK 7.00 or until December 21, 2016 at NOK 7.56.
2012 awards641,666 options have a vesting period until November 8, 2013 and can be exercised until November 8, 2014 at NOK 6.00 or until November 8, 2015 at NOK 6.48;
641,666 options have a vesting period until November 8, 2014 and can be exercised until November 8, 2015 at NOK 6.48 or until November 8, 2016 at NOK 7.00 and
641,668 options have a vesting period until November 8, 2015 and can be exercised until November 8, 2016 at NOK 7.00 or until November 8, 2017 at NOK 7.56.
Options will be considered as vested if an employee stays in employment of the Company or its subsidiaries over the full length of the individual vesting period of each tranche granted. Should any of the Group companies or an employee decide to terminate their employment prior to the start of exercise period, the options shall expire without any further compensation. All options under the plan will be settled in shares.
The Company calculates the value of share-based compensation using a Black-Scholes option pricing model to estimate the fair value of share options at the date of grant. The estimated fair value of options is amortised to expense over the options’ vesting period. USD 235 thousand (2012: USD 1,150 thousand) has been charged to the statement of comprehensive income since grant dates during 2013 and the same amount credited to additional paid-in capital.
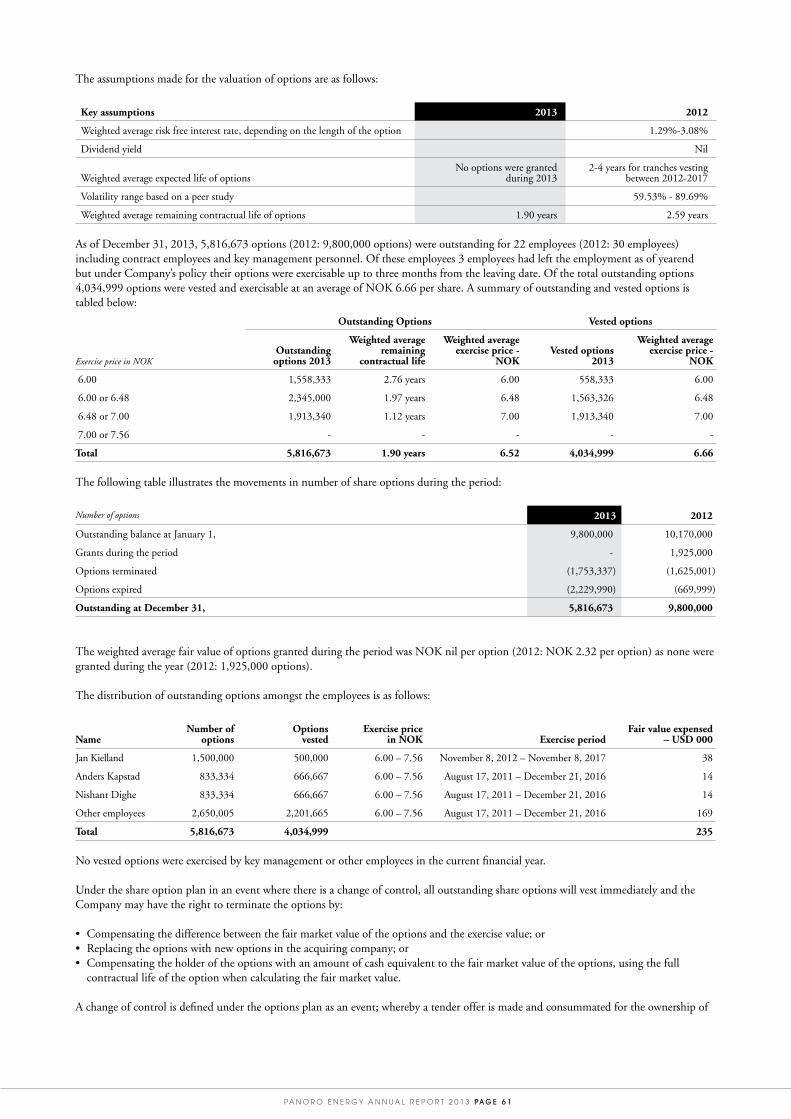
PA N O R O E N E R G Y A N N U A L R E P O R T 2 0 1 3 PA G E 6 1
The assumptions made for the valuation of options are as follows:
Key assumptions 2013 2012
Weighted average risk free interest rate, depending on the length of the option 1.29%-3.08%
Dividend yield Nil
Weighted average expected life of optionsNo options were granted
during 20132-4 years for tranches vesting
between 2012-2017
Volatility range based on a peer study 59.53% - 89.69%
Weighted average remaining contractual life of options 1.90 years 2.59 years
As of December 31, 2013, 5,816,673 options (2012: 9,800,000 options) were outstanding for 22 employees (2012: 30 employees) including contract employees and key management personnel. Of these employees 3 employees had left the employment as of yearend but under Company’s policy their options were exercisable up to three months from the leaving date. Of the total outstanding options 4,034,999 options were vested and exercisable at an average of NOK 6.66 per share. A summary of outstanding and vested options is tabled below:
Outstanding Options Vested options
Exercise price in NOKOutstanding options 2013
Weighted average remaining
contractual life
Weighted average exercise price -
NOKVested options
2013
Weighted average exercise price -
NOK
6.00 1,558,333 2.76 years 6.00 558,333 6.00
6.00 or 6.48 2,345,000 1.97 years 6.48 1,563,326 6.48
6.48 or 7.00 1,913,340 1.12 years 7.00 1,913,340 7.00
7.00 or 7.56 - - - - -
Total 5,816,673 1.90 years 6.52 4,034,999 6.66
The following table illustrates the movements in number of share options during the period:
Number of options 2013 2012
Outstanding balance at January 1, 9,800,000 10,170,000
Grants during the period - 1,925,000
Options terminated (1,753,337) (1,625,001)
Options expired (2,229,990) (669,999)
Outstanding at December 31, 5,816,673 9,800,000
The weighted average fair value of options granted during the period was NOK nil per option (2012: NOK 2.32 per option) as none were granted during the year (2012: 1,925,000 options).
The distribution of outstanding options amongst the employees is as follows:
NameNumber of
optionsOptions
vestedExercise price
in NOK Exercise periodFair value expensed
– USD 000
Jan Kielland 1,500,000 500,000 6.00 – 7.56 November 8, 2012 – November 8, 2017 38
Anders Kapstad 833,334 666,667 6.00 – 7.56 August 17, 2011 – December 21, 2016 14
Nishant Dighe 833,334 666,667 6.00 – 7.56 August 17, 2011 – December 21, 2016 14
Other employees 2,650,005 2,201,665 6.00 – 7.56 August 17, 2011 – December 21, 2016 169
Total 5,816,673 4,034,999 235
No vested options were exercised by key management or other employees in the current financial year.
Under the share option plan in an event where there is a change of control, all outstanding share options will vest immediately and the Company may have the right to terminate the options by:
• Compensating the difference between the fair market value of the options and the exercise value; or • Replacing the options with new options in the acquiring company; or• Compensating the holder of the options with an amount of cash equivalent to the fair market value of the options, using the full
contractual life of the option when calculating the fair market value.
A change of control is defined under the options plan as an event; whereby a tender offer is made and consummated for the ownership of

PA G E 6 2 PA N O R O E N E R G Y A N N U A L R E P O R T 2 0 1 3
more than 50% or more of the outstanding voting securities of the Company; or the Company is merged or consolidated with another corporation and as a result of such merger or consolidation less than 50.1% of the outstanding voting securities of the surviving entity or resulting corporation are owned in the aggregate by the persons by the entities or persons who were shareholders of the Company immediately prior to such merger or consolidation; or the Company sells substantially all of its assets to another corporation that is not a wholly owned subsidiary.
NOTE 21. FINANCIAL INSTRUMENTS
Fair ValueSet out below is a comparison by category of carrying amounts and fair values of all the Group’s financial instruments that are carried in the financial statements:
Carrying amount Fair value
USD 000Financial instrument classification 2013 2012 2013 2012
Fair value hierarchy
Financial assets
Cash and bank balances Fair value through the P&L 56,756 73,503 56,756 73,503 Level 3
Accounts receivable Loans and receivables - 15,668 - 15,668 Level 3
Financial liabilities
Accounts payable and accrued liabilities Other financial liabilities 5,268 29,785 5,268 29,785 Level 3
Interest-bearing loans and borrowings Other financial liabilities 118,912 126,297 117,656 135,522 Level 2
Determination of fair valueThe fair value of interest bearing loans and borrowings is determined by reference to the quotation trades of the bond instrument in the secondary market at period end.
The carrying amount of cash and bank balances is equal to fair value since all financial instruments entered into during 2013 were disposed of prior to year-end. Similarly, the carrying amount of accounts receivables and accounts payables is equal to fair value since they are entered into on “normal” terms and conditions.
NOTE 22. FINANCIAL RISK MANAGEMENT
The Group’s principal financial liabilities comprise accounts payable and bond loans. The main purpose of these financial instruments is to manage short-term cash flow and raise finance for the Group’s capital expenditure program. The Group has various financial assets such as accounts receivable and cash which arise directly from its operations.
It is, and has been throughout the year ending December 31, 2013 and December 31, 2012, the Group’s policy that no speculative trading in derivatives shall be undertaken.
The main risks that could adversely affect the Group’s financial assets, liabilities or future cash flows are interest rate risk, foreign currency risk, liquidity risk and credit risk. The management reviews and agrees policies for managing each of these risks which are summarized below.
The following discussion also includes a sensitivity analysis that is intended to illustrate the sensitivity to changes in the market variables on the Group’s financial instruments and show the impact on profit or loss and shareholders’ equity, where applicable. Financial instruments affected by market risk include bank loans, accounts receivables, accounts payable and accrued liabilities.
The sensitivity has been prepared for periods ending December 31, 2013 and 2012 using the amounts of debt and other financial assets and liabilities held as at those reporting dates.
Commodity price riskThe Group at present is not exposed to the risk of fluctuations in prevailing market commodity prices on the gas production in Brazil due to fixed price contracts.
The Group’s policy is to manage commodity price risk through a mix of fixed and floating price contracts.
Interest rate riskThe Group’s exposure to the risk of changes in market interest rates relates primarily to the Group’s cash balances. All long term borrowings as of December 31, 2013 have fixed interest rates.
The following table demonstrates the sensitivity to a reasonably possible change in interest rates, with all other variables held constant, of

PA N O R O E N E R G Y A N N U A L R E P O R T 2 0 1 3 PA G E 6 3
the Group’s profit before tax through the impact on floating rate borrowings and cash and cash equivalents.
USD 000 2013 2012
+100bps -100bps +100bps -100bps
Cash 545 (545) 536 (536)
Net effect 545 (545) 536 (536)
Foreign currency riskThe Company operates internationally and is exposed to risk arising from various currency exposures, primarily with respect to the Norwegian Kroner (NOK), the Pound Sterling (GBP) and the Brazilian Real (BRL). From a financial statements perspective, subsidiaries in Brazil have a BRL functional currency and are exposed to fluctuations for presentation purposes in these financial statements. The volatility in BRL has resulted in a translation loss of USD 19.1 million as of December 31, 2013 (2012: USD 18.4 million loss).
The Group has transactional currency exposures. Such exposure arises from sales or purchases in currencies other than the respective functional currency.
The Group reports its consolidated results in USD, any change in exchange rates between its operating subsidiaries’ functional currencies and the USD affects its consolidated income statement and balance sheet when the results of those operating subsidiaries are translated into USD for reporting purposes.
Group companies are required to manage their foreign exchange risk against their functional currency.
The Group evaluates on a continuous basis to use cross currency swaps if deemed appropriate by management in order to hedge the forward foreign currency risk associated with its foreign currency denominated bond loans.
A 20% strengthening or weakening of the USD against the following currencies at December 31, 2013 would have increased / (decreased) equity and profit or loss by the amounts shown below.
The Group’s assessment of what a reasonable potential change in foreign currencies that it is currently exposed to have been changed as a result of the changes observed in the world financial markets. This hypothetical analysis assumes that all other variables, including interest rates and commodity prices, remain constant.
USD 000 2013 2012
USD vs NOK +20% -20% +20% -20%
Cash (6,134) 6,134 (64) 64
Loans 5,790 (5,790) 6,554 (6,554)
Receivables (9) 9 - -
Payables 127 (127) 135 (135)
Net effect (226) 226 6,625 (6,625)
USD vs GBP +20% -20% +20% -20%
Cash (26) 26 (70) 70
Receivables (11) 11 (108) 108
Payables 32 (32) 45 (45)
Net effect (5) 5 (133) 133
USD vs BRL +20% -20% +20% -20%
Cash (4,813) 4,813 (4,332) 4,332
Receivables (2,576) 2,576 (2,473) 2,473
Payables 1,039 (1,039) 1,178 (1,178)
Net effect (6,350) 6,350 (5,627) 5,627
Liquidity risk
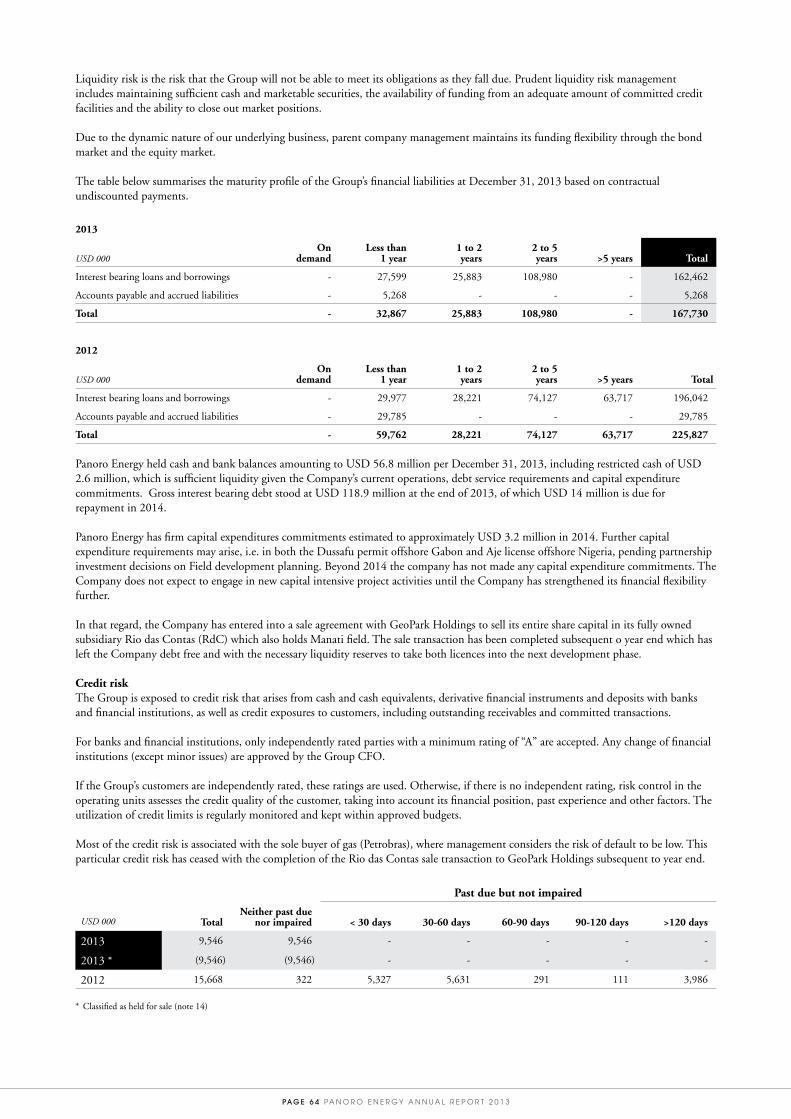
PA G E 6 4 PA N O R O E N E R G Y A N N U A L R E P O R T 2 0 1 3
Liquidity risk is the risk that the Group will not be able to meet its obligations as they fall due. Prudent liquidity risk management includes maintaining sufficient cash and marketable securities, the availability of funding from an adequate amount of committed credit facilities and the ability to close out market positions.
Due to the dynamic nature of our underlying business, parent company management maintains its funding flexibility through the bond market and the equity market.
The table below summarises the maturity profile of the Group’s financial liabilities at December 31, 2013 based on contractual undiscounted payments.
2013
USD 000On
demandLess than
1 year1 to 2 years
2 to 5 years >5 years
Total
Interest bearing loans and borrowings - 27,599 25,883 108,980 - 162,462
Accounts payable and accrued liabilities - 5,268 - - - 5,268
Total - 32,867 25,883 108,980 - 167,730
2012
USD 000
On demand
Less than 1 year
1 to 2 years
2 to 5 years >5 years Total
Interest bearing loans and borrowings - 29,977 28,221 74,127 63,717 196,042
Accounts payable and accrued liabilities - 29,785 - - - 29,785
Total - 59,762 28,221 74,127 63,717 225,827
Panoro Energy held cash and bank balances amounting to USD 56.8 million per December 31, 2013, including restricted cash of USD 2.6 million, which is sufficient liquidity given the Company’s current operations, debt service requirements and capital expenditure commitments. Gross interest bearing debt stood at USD 118.9 million at the end of 2013, of which USD 14 million is due for repayment in 2014.
Panoro Energy has firm capital expenditures commitments estimated to approximately USD 3.2 million in 2014. Further capital expenditure requirements may arise, i.e. in both the Dussafu permit offshore Gabon and Aje license offshore Nigeria, pending partnership investment decisions on Field development planning. Beyond 2014 the company has not made any capital expenditure commitments. The Company does not expect to engage in new capital intensive project activities until the Company has strengthened its financial flexibility further.
In that regard, the Company has entered into a sale agreement with GeoPark Holdings to sell its entire share capital in its fully owned subsidiary Rio das Contas (RdC) which also holds Manati field. The sale transaction has been completed subsequent o year end which has left the Company debt free and with the necessary liquidity reserves to take both licences into the next development phase.
Credit riskThe Group is exposed to credit risk that arises from cash and cash equivalents, derivative financial instruments and deposits with banks and financial institutions, as well as credit exposures to customers, including outstanding receivables and committed transactions.
For banks and financial institutions, only independently rated parties with a minimum rating of “A” are accepted. Any change of financial institutions (except minor issues) are approved by the Group CFO.
If the Group’s customers are independently rated, these ratings are used. Otherwise, if there is no independent rating, risk control in the operating units assesses the credit quality of the customer, taking into account its financial position, past experience and other factors. The utilization of credit limits is regularly monitored and kept within approved budgets.
Most of the credit risk is associated with the sole buyer of gas (Petrobras), where management considers the risk of default to be low. This particular credit risk has ceased with the completion of the Rio das Contas sale transaction to GeoPark Holdings subsequent to year end.
Past due but not impaired
USD 000 TotalNeither past due
nor impaired < 30 days 30-60 days 60-90 days 90-120 days >120 days
2013 9,546 9,546 - - - - -
2013 * (9,546) (9,546) - - - - -
2012 15,668 322 5,327 5,631 291 111 3,986
* Classified as held for sale (note 14)

PA N O R O E N E R G Y A N N U A L R E P O R T 2 0 1 3 PA G E 6 5
Capital ManagementThe Company had strong focus on cash preservation during 2013. With challenging markets and a time consuming divestment process the company had focus on balancing its cash preservation with carefully honouring its investment commitments. During the year the company’s cash position were mainly reduced by investments in Dussafu and servicing of callable bond. Panoro has communicated a clear strategy of capitalizing on its underlying assets as a funding source before embarking on future investments apart from its core portfolio of assets.
Panoro still regards itself as having a relatively healthy financial position with its cash position and relatively low investment commitments. With the sale of Rio das Contas imminent, the Company will be in a position to repay the debt in entirety with the proceeds of USD 140 million.
As part of the bond agreements the Group is required to maintain an equity ratio of 25%. Management regularly monitor equity ratio to ensure covenant compliance.
USD 000 2013 2012
Non-current debt - (110,801)
Current debt (118,912) (15,496)
Cash and bank balances (including restricted cash) 56,756 73,503
Net debt (62,156) (52,794)
Book Equity Ratio (Assets to Equity ratio) 45% 52%
NOTE 23. GUARANTEES AND PLEDGES
BrazilThe bondholders carry a first priority pledge over Company’s shares in Brazilian subsidiaries (Rio das Contas and PEdB) which effectively hold 10% working interest in Manati gas field. In addition to this, the bond agreement also stipulates issue of unconditional and irrevocable on-demand guarantees in favour of the Bond Trustee by the Brazilian subsidiaries. All liens and charges by the bondholders were released subsequent to year end on full repayment of bond liability.
The Company has provided a performance guarantee to the Brazilian directorate ANP, in terms of which the Company is liable for the commitments of Coral, Estrela do Mar, Cavalo Marinho and BCAM-40 licenses in accordance with the given concessions of the licenses. The guarantee is unlimited. Subsequent to year end, the guarantee pursuant to BCAM-40 was released by ANP on completion of the sale of Rio das Contas to GeoPark.
UKUnder section 479C of the UK Companies Act 2006; two of the Company’s indirect subsidiaries Panoro Energy Limited (Registration number: 6386242) and African Energy Equity Resources Limited (Registration number: 5724928) have availed exemption for audit of their statutory financial statements pursuant to guarantees issued by the Company to indemnify the subsidiaries of any losses that may arise in the financial year ended December 31, 2013.
NOTE 24. OTHER COMMITMENTS AND CONTINGENT LIABILITIES
Leasing arrangementsOperating leases relate to leases of office space with lease terms between 1 to 10 years.
Non - cancellable operating lease commitments
USD 000 2013 2012
Not later than 1 year 485 658
Later than 1 year and not later than 5 years 112 387
Later than 5 years - -
At December 31 597 1,045
Uncertainties surrounding abandonment liabilitiesThe Company has provided performance guarantee to ANP in order to fulfil all commitments on its licences in Brazil. A recent review of retirement obligations on abandoned wells in BS-3 licences (Cavalo Marinho and Estrela do Mar) has highlighted certain work on wells which could be performed as a best practice measure. However, the Operator’s and consortia’s interpretation on ANP guidelines applicable to dismantled wells fulfil the minimum requirements and at present there is a low probability that a major expenditure will be required. Should the regulator require further work on these wells, the cost of such retirement works could be considerable, although it is expected that a risk of such request from the regulator is low and considered to be contestable.

PA G E 6 6 PA N O R O E N E R G Y A N N U A L R E P O R T 2 0 1 3
NOTE 25. RELATED PARTIES TRANSACTIONS
The only related party transactions during the year relate to directors’ remuneration which is disclosed in note 4d.
NOTE 26. SUBSIDIARIES
Details of the Group’s subsidiaries as of December 31, 2013, are as follows:
SubsidiaryPlace of incorporation
and ownershipOwnership interest
and voting power
Panoro Energy do Brasil Ltda Brazil 100%
Rio das Contas Produtora de Petroleo Ltda (held for sale) Brazil 100%
Panoro Energy Limited UK 100%
African Energy Equity Resources Limited UK 100%
Pan-Petroleum (Holding) Cyprus Limited Cyprus 100%
Pan-Petroleum Holding B.V. Netherlands 100%
Pan-Petroleum Gabon B.V. Netherlands 100%
Pan-Petroleum Gabon Holding B.V. Netherlands 100%
Pan-Petroleum Nigeria Holding B.V. Netherlands 100%
Pan-Petroleum Services Holding B.V. Netherlands 100%
Pan-Petroleum AJE Limited Nigeria 100%
Energy Equity Resources AJE Limited Nigeria 100%
Energy Equity Resources Oil and Gas Limited Nigeria 100%
Syntroleum Nigeria Limited Nigeria 100%
PPN Services Limited Nigeria 100%
Prevail Energy Congo Limited British Virgin Islands 100%
Prevail Energy Congo (MKB) Limited British Virgin Islands 100%
Prevail Energy Congo SAU Congo 100%
Energy Equity Resources (Cayman Islands) Limited Cayman Islands 100%
Energy Equity Resources (Nominees) Limited Cayman Islands 100%
NOTE 27. EVENTS SUBSEQUENT TO REPORTING DATE
During the first quarter of 2014, a Field Development Plan (FDP) was approved by the Department of Petroleum Resources (DPR) in Nigeria. The FDP submitted to the DPR is primarily focused on the development of the Cenomanian Oil reservoir and is the first phase of the development that includes two sub-sea production wells, tied back to a leased FPSO.
On March 26, 2014, the Brazilian Petroleum Agency (ANP) approved the sale of Rio das Contas to GeoPark by replacing the parental guarantee which was one of the main conditions to completion. Subsequent to ANP approval, all shares in Rio das Contas have been transferred to GeoPark and the consideration received has been used to repay the bond liability in full.

PA N O R O E N E R G Y A N N U A L R E P O R T 2 0 1 3 PA G E 6 7
NOTE 28. RESERVES (UNAUDITED)
The Group has adopted a policy of regional reserve reporting using external third party companies to audit its work and certify reserves and resources according to the guidelines established by the Oslo Stock Exchange (“OSE”). Reserve and contingent resource estimates comply with the definitions set by the Petroleum Resources Management System (“PRMS”) issued by the Society of Petroleum Engineers (“SPE”), the American Association of Petroleum Geologists (“AAPG”), the World Petroleum Council (“WPC”) and the Society of Petroleum Evaluation Engineers (“SPEE”) in March 2007. Panoro uses the services of Gaffney, Cline & Associates (“GCA”) for 3rd party verifications of its reserves.
The following is a summary of key results from the reserve reports (net of the Group’s share):
Asset1P reserves (MMBOE)
2P reserves (MMBOE)
Manati 9.3 10.0
Panoro Total 9.3 10.0
During 2013, the Group had the following reserve development:
2P reserves (MMBOE)
Balance (previous ASR) as of December 31, 2012 12.1
Production 2013 (1.4)
Revision of previous estimates 0.1
Disposal of interest in MKB (Congo) (0.8)
Balance (current ASR) as of December 31, 2013 10.0
Definitions:1P) Proved Reserves Proved Reserves are those quantities of petroleum, which by analysis of geoscience and engineering data, can be estimated with reasonable certainty to be commercially recoverable, from a given date forward, from known reservoirs and under defined economic conditions, operating methods, and government regulations.
2P) Probable Reserves Probable Reserves are those additional reserves which analysis of geoscience and engineering data indicate are less likely to be recovered than Proved Reserves but more certain to be recovered than Possible Reserves.
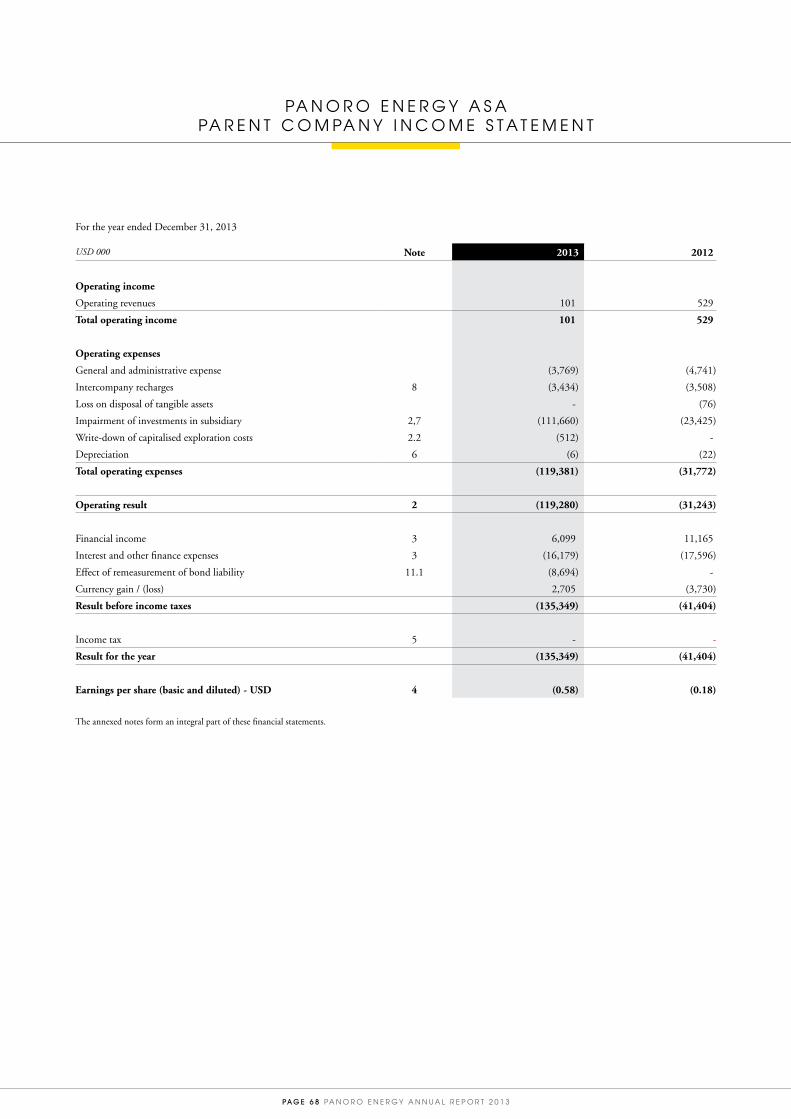
PA G E 6 8 PA N O R O E N E R G Y A N N U A L R E P O R T 2 0 1 3
PA N O R O E N E R G Y A S A PA R E N T C O M PA N Y I N C O M E S T A T E M E N T
For the year ended December 31, 2013
USD 000 Note 2013 2012
Operating income
Operating revenues 101 529
Total operating income 101 529
Operating expenses
General and administrative expense (3,769) (4,741)
Intercompany recharges 8 (3,434) (3,508)
Loss on disposal of tangible assets - (76)
Impairment of investments in subsidiary 2,7 (111,660) (23,425)
Write-down of capitalised exploration costs 2.2 (512) -
Depreciation 6 (6) (22)
Total operating expenses (119,381) (31,772)
Operating result 2 (119,280) (31,243)
Financial income 3 6,099 11,165
Interest and other finance expenses 3 (16,179) (17,596)
Effect of remeasurement of bond liability 11.1 (8,694) -
Currency gain / (loss) 2,705 (3,730)
Result before income taxes (135,349) (41,404)
Income tax 5 - -
Result for the year (135,349) (41,404)
Earnings per share (basic and diluted) - USD 4 (0.58) (0.18)
The annexed notes form an integral part of these financial statements.

PA N O R O E N E R G Y A N N U A L R E P O R T 2 0 1 3 PA G E 6 9
PA N O R O E N E R G Y A S APA R E N T C O M PA N Y B A L A N C E S H E E T
As at December 31, 2013
USD 000 Note 2013 2012
ASSETS
Non-current assets
Furniture, fixtures and office equipment 6 7 13
Investment in subsidiaries 7 207,637 319,297
Loans to subsidiaries 8 - 12,274
Intercompany receivables 8 2,043 2,416
Total non-current assets 209,687 334,000
Current assets
Loans to subsidiaries 8 40,080 57,431
Other current assets 158 149
Cash and cash equivalent 46,251 47,527
Restricted cash 9 2,604 2,880
Total current assets 89,093 107,987
TOTAL ASSETS 298,780 441,987
EQUITY AND LIABILITIES
EQUITY
Paid-in capital
Share capital 10 56,333 56,333
Share premium reserve 10 288,858 288,858
Additional paid-in capital 66,023 65,786
Total paid-in capital 411,214 410,977
Other equity
Other reserves 10 (237,554) (102,205)
Total other equity (237,554) (102,205)
TOTAL EQUITY 173,660 308,772
LIABILITIES
Non-current liabilities
Bond loan 11 - 110,801
Total non-current liabilities - 110,801
Current liabilities
Accounts payable 325 273
Bond loan 11 118,912 15,496
Intercompany payables 5,572 6,243
Other current liabilities 12 311 402
Total current liabilities 125,120 22,414
TOTAL LIABILITIES 125,120 133,215
TOTAL EQUITY AND LIABILITIES 298,780 441,987

PA G E 7 0 PA N O R O E N E R G Y A N N U A L R E P O R T 2 0 1 3
PA N O R O E N E R G Y A S A PA R E N T C O M PA N Y S T A T E M E N T O F C A S H F L O W
USD 000 Note 2013 2012
CASH FLOW FROM OPERATING ACTIVITIES
Net income / (loss) for the year (135,349) (41,404)
Adjusted for:
Depreciation 6 6 22
Impairment of investment in subsidiary 7 116,660 23,425
Write-down of capitalised exploration costs 512 -
Share based payments 2 99 230
Financial Income 3 (6,099) (11,165)
Financial Expenses 3 24,873 17,596
Loss on disposal of tangible assets - 75
Foreign exchange gains/losses (2,705) 3,730
(Increase)/decrease in trade and other receivables 34 49
Increase/(decrease) in trade and other payables (39) 163
(Increase)/decrease in intercompany receivables - (970)
Increase/(decrease) in intercompany payables (670) 860
Net cash flows from operating activities (2,678) (7,389)
CASH FLOWS FROM INVESTING ACTIVITIES
Additions to furniture and fixtures - (8)
Proceeds for disposal of furniture and fixtures - 16
Net proceeds from loans to subsidiaries 55,275 26,130
Loans to subsidiaries (25,650) (20,500)
Net cash flows from investing activities 29,625 5,638
CASH FLOWS FROM FINANCING ACTIVITIES
Repayment of borrowing (13,850) (14,070)
Interests paid (15,681) (17,362)
Interests received 738 4,025
Movement in restricted cash 276 100
Net cash flows from financing activities (28,517) (27,307)
Effect of foreign currency translation adjustment on cash balances 294 (490)
Net increase in cash and cash equivalents (1,276) (29,548)
Cash and cash equivalents at the beginning of the year 47,527 77,075
Cash and cash equivalents at the end of financial year 46,251 47,527
For the year ended December 31, 2013

PA N O R O E N E R G Y A N N U A L R E P O R T 2 0 1 3 PA G E 7 1
PA N O R O E N E R G Y A S A N O T E S T O T H E F I N A N C I A L S T A T E M E N T S
NOTE 1. ACCOUNTING PRINCIPLES
The annual accounts for the parent company Panoro Energy ASA (the “Company”) are prepared in accordance with the Norwegian Accounting Act and accounting standards and practices generally accepted in Norway. The consolidated financial statements have been prepared under International Financial Reporting Standards (“IFRS”) as adopted by the European Union (“EU”) and are presented separately from the parent company.
The accounting policies under IFRS are described in note 2 of the consolidated financial statements. The accounting principles applied under NGAAP are in conformity with IFRS unless otherwise stated in the notes below.
The Company’s annual financial statements are presented in US Dollars (USD) and rounded to the nearest thousand, unless otherwise stated. USD is the currency used for accounting purposes and is the functional currency. Shares in subsidiaries and other shares are recorded in Panoro Energy ASA’s accounts using the cost method of accounting and reduced by impairment, if any. Bond loans are booked net of the unamortized transaction costs which are amortized over the loan period. The bond liability is also remeasured at the date of the balance sheet in line with the Group policy which has been detailed in note 11.1.
NOTE 2. GENERAL AND ADMINISTRATIVE EXPENSES
Operating resultOperating result is stated after charging/(crediting):
USD 000 2013 2012
Employee benefits expense (note 2.1) 1,324 1,847
Impairment of investment in subsidiary (note 7) 111,660 23,425
Write-down of capitalised exploration costs (note 2.2) 512 -
Depreciation (note 8) 6 22
Loss on disposal of tangible assets (note 8) - 75
Operating lease payments 65 163
Intercompany recharges 3,434 3,508
2.1 Employee benefits expense
a) SalariesThe Company had 2 employees at December 31, 2013 (2012: 3 employees), and an average of 2 employees during the year (2012: 4 employees). Wages and salaries for these employees are included in general and administrative expenses.
The Company has an option program amounting to a total of 5.8 million outstanding shares, approved in the General Meetings. For further details on this program see share-based payment section.

PA G E 7 2 PA N O R O E N E R G Y A N N U A L R E P O R T 2 0 1 3
Employee related expenses:
USD 000 2013 2012
Salaries 595 1,024
Employer's contribution 175 202
Pension costs 234 164
Other compensation 222 227
Share-based payments 99 230
Total 1,324 1,847
For details relating to remuneration of CEO and CFO, refer to note 4c in the consolidated financial statements.
b) Directors’ remunerationPlease refer to note 4d of the Group financial statements for details on how directors’ remuneration is determined.
Remuneration to members of the Board of Directors is summarized below:
USD 000 2013 2012
Dr. Philip A. Vingoe 50 108
Tord Pedersen - 27
Katherine Støvring - 27
Ragnar Søegaard - 27
Marilda Rosado de Sá Ribeiro - 54
Jan Kielland - 21
Jorgen C. Arentz Rostrup - 18
Silje Christine Augustson 49 116
Isabel da Silva Ramos 33 45
Dr. George Edward Watkins 49 12
Tone Kristin Omsted 17 -
Bjørn Kristian Stadheim 11 -
Endre Ording Sund 70 12
Total 279 467
No loans have been given to, or guarantees given on the behalf of, any members of the Management Group, the Board or other elected corporate bodies.
(i) Mr. Tord Pedersen, Mr. Ragnar Søegaard, Ms. Katherine Støvring and Ms. Marilda Rosado de Sá Ribeiro, Mr. Jorgen C. Arentz Rostrup resigned as directors during 2012. (ii) Mr. Philip A. Vingoe and Ms. Isabel da Silva Ramos resigned from the Board in June 2013, whereas Dr. George Edward Watkins resigned from the board in January 2014. (iii) After Mr. Vingoe’s resignation as Director and Chairman, Mr. Sund was appointed as the Chairman of the Board of Directors. (iv) Ms. Tone Kristin Omsted was appointed Director in Company’s AGM in June 2013, whereas Mr. Bjørn Kristian Stadheim was appointed as a Director in Company’s EGM
in September 2013. (v) Mr. Jan Kielland was appointed as a director during 2012, however, after resignation of the former CEO, he assumed the position of the CEO from August 30, 2012. Mr.
Kielland’s remuneration as CEO of the Company is covered in note 4c of the Group accounts.(vi) Dr. George Edward Watkins was engaged by the Company’s subsidiary during 2013 to assist with technical matters on projects in respect of key decisions on development of
African portfolio. The fee of USD 7 thousand was paid during the year and under an agreement at arm’s length.
No pension benefits were received by the directors during 2013 and 2012.
There are no severance payment arrangements in place for directors.
c) PensionsThe Company is required to have an occupational pension scheme in accordance with the Norwegian law on required occupational pension (“Lov om obligatorisk tjenestepensjon”). The Company contributes to an external defined contribution scheme and therefore no pension liability is recognized in the balance sheet.
d) AuditorFees (excluding VAT) to the Company’s auditors are included in general and administrative expenses and are shown below. The other fees related to advisory services provided in respect of consultations on corporate matters during the year. No auditors’ fee was charged directly to equity.

PA N O R O E N E R G Y A N N U A L R E P O R T 2 0 1 3 PA G E 7 3
USD 000 2013 2012
Ernst & Young
Statutory audit 119 94
Tax services 11 48
Other 66 22
Total 196 164
e) Share based paymentShare Option PlanFollowing the merger in June 2010, the Company established an option plan (the “Panoro Option Plan”) whereby options were granted to the key management and employees on various dates.
The Panoro Option Plan governs all future grants of options by the Company to Directors, officers, key employees and certain consultants of the Group. Options are granted under the Panoro Options Plan at the discretion of the Board of Directors. No changes were made to the options plan during the current and previous financial year.
No options were allocated to employees during the year (2012: 1,925,000 options). Vesting of all these options will be over a three year period, with 1/3 of the options exercisable each year. The exercise price of the options set at the time of issue is to be increased by 8 percent after year two and additional 8 percent annually thereafter. The exercise price for the options is as follows:
2010 awards2,333,333 options had a vesting period until August 17, 2011 and can be exercised until August 17, 2012 at NOK 6.00 or until August 17, 2013 at NOK 6.48;
2,333,333 options had a vesting period until August 17, 2012 and can be exercised until August 17, 2013 at NOK 6.48 or until August 17, 2014 at NOK 7.00 and
2,333,334 options have a vesting period until August 17, 2013 and can be exercised until August 17, 2014 at NOK 7.00 or until August 17, 2015 at NOK 7.56.
2011 awards1,640,000 options had a vesting period until December 21, 2012 and can be exercised until December 21, 2013 at NOK 6.00 or until December 21, 2014 at NOK 6.48;
1,640,000 options have a vesting period until December 21, 2013 and can be exercised until December 21, 2014 at NOK 6.48 or until December 21, 2015 at NOK 7.00; and
1,640,000 options have a vesting period until December 21, 2014 and can be exercised until December 21, 2015 at NOK 7.00 or until December 21, 2016 at NOK 7.56.
2012 awards641,666 options have a vesting period until November 8, 2013 and can be exercised until November 8, 2014 at NOK 6.00 or until November 8, 2015 at NOK 6.48;
641,666 options have a vesting period until November 8, 2014 and can be exercised until November 8, 2015 at NOK 6.48 or until November 8, 2016 at NOK 7.00 and
641,668 options have a vesting period until November 8, 2015 and can be exercised until November 8, 2016 at NOK 7.00 or until November 8, 2017 at NOK 7.56.
Options will be considered as vested if an employee stays in employment of the Company or its subsidiaries over the full length of the individual vesting period of each tranche granted. Should any of the Group companies or an employee decide to terminate their employment prior to the start of exercise period, the options shall expire without any further compensation. All options under the plan will be settled in shares.
The Company calculates the value of share-based compensation using a Black-Scholes option pricing model to estimate the fair value of share options at the date of grant. The estimated fair value of options is amortised to expense over the options’ vesting period. USD 99

PA G E 7 4 PA N O R O E N E R G Y A N N U A L R E P O R T 2 0 1 3
thousand (2012: USD 230 thousand) has been charged to the statement of comprehensive income during 2013 and the same amount credited to additional paid-in capital. Of the total share-based payment charge of USD 235 thousand (2012: USD 1,150 thousand) for the Group, USD 136 thousand relates to the Company’s direct and indirect subsidiaries and such amount has been recorded as an intercompany balance with the corresponding credit taken to additional paid-in capital.
The assumptions made for the valuation of options are as follows:
Key assumptions 2013 2012
Weighted average risk free interest rate, depending on the length of the option 1.29%-3.08%
Dividend yield Nil
Weighted average expected life of options No options were granted during 2013
2-4 years for tranches vesting between 2012-2017
Volatility range based on a peer study 59.53% - 89.69%
Weighted average remaining contractual life of options 1.90 years 2.59 years
As of December 31, 2013, 1,666,667 options were outstanding for two employees (2012: 2,625,000 options for four employees) including the Chairman and key management personnel and of these 666,667 options were vested and exercisable at an average NOK 6.66 per share. A summary of outstanding and vested options is tabled below:
Outstanding Options Vested options
Exercise price in NOKOutstanding options 2013
Weighted average remaining
contractual life
Weighted average exercise price -
NOKVested options
2013
Weighted average exercise price -
NOK
6.00 1,558,333 2.76 years 6.00 558,333 6.00
6.00 or 6.48 2,345,000 1.97 years 6.48 1,563,326 6.48
6.48 or 7.00 1,913,340 1.12 years 7.00 1,913,340 7.00
7.00 or 7.56 - - - - -
Total 5,816,673 1.90 years 6.52 4,034,999 6.66
The following table illustrates the movements in number of share options during the period:
Number of options 2013 2012
Outstanding balance at January 1, 2013 9,800,000 10,170,000
Grants during the period - 1,925,000
Options terminated (1,753,337) (1,625,001)
Options expired (2,229,990) (669,999)
Outstanding at December 31, 2013 5,816,673 9,800,000
The weighted average fair value of options granted during the period was NOK nil per option (2012: NOK 2.32 per option) as none were granted during the year (2012: 1,925,000 options).
The distribution of outstanding options amongst the employees is as follows:
NameNumber of
options Options vestedExercise price
in NOK Exercise periodFair value expensed –
USD 000
Jan Kielland 1,500,000 500,000 6.00 – 7.56 November 8, 2012 – November 8, 2017 38
Other employees 166,667 166,667 6.48 – 7.56 August 17, 2011 – December 21, 2016 61
Total 1,666,667 666,667 99
No vested options were exercised by key management or other employees in the current financial year.
Under the share option plan in an event where there is a change of control, all outstanding share options will vest immediately and the Company may have the right to terminate the options by:
• Compensating the difference between the fair market value of the options and the exercise value; or • Replacing the options with new options in the acquiring company; or• Compensating the holder of the options with an amount of cash equivalent to the fair market value of the options, using the full
contractual life of the option when calculating the fair market value.
A change of control is defined under the options plan as an event; whereby a tender offer is made and consummated for the ownership of

PA N O R O E N E R G Y A N N U A L R E P O R T 2 0 1 3 PA G E 7 5
more than 50% or more of the outstanding voting securities of the Company; or the Company is merged or consolidated with another corporation and as a result of such merger or consolidation less than 50.1% of the outstanding voting securities of the surviving entity or resulting corporation are owned in the aggregate by the persons by the entities or persons who were shareholders of the Company immediately prior to such merger or consolidation; or the Company sells substantially all of its assets to another corporation that is not a wholly owned subsidiary.
2.2 Write-down of capitalised exploration costsThe capitalised exploration costs pertaining to intercompany PEdB in Brazil and was spent in prior years on BS-3 related projects. The cost has been expensed to the income statement considering imminent relinquishment of BS-3 licences in 2014.
NOTE 3. FINANCIAL ITEMS
The financial expense breakdown is below:
USD 000 2013 2012
Interest income from subsidiaries 5,314 7,984
Other interest income 784 3,181
Total 6,099 11,165
Interest income from subsidiaries represents an interest on the intercompany loans. Refer to Note 8 for further information on these balances.
The interest and other finance expense breakdown is below:
USD 000 2013 2012
Interest expense on bond loans 15,381 16,910
Amortisation of debt issue costs 643 680
Bank and other financial charges 155 6
Total 16,179 17,596
The 2013 and 2012 interest expense on bond loans and the amortisation of debt issue costs relate to Panoro Energy Senior Secured Callable Bond Issue 2010/2018.
NOTE 4. EARNINGS PER SHARE
Basic earnings per share
USD 000 unless otherwise stated 2013 2012
Net result for the period (135,349) (41,404)
Weighted average number of shares outstanding - in thousands 234,546 234,546
Basic and diluted earnings per share – (USD) (0.58) (0.18)
Diluted earnings per shareWhen calculating the diluted earnings per share, the weighted average number of shares outstanding is normally adjusted for all dilutive effects relating to the Company’s options. As of December 31, 2013, 5.8 million options were outstanding (2012: 9.8 million options). Since the Company had a net loss for the year ended December 31, 2013 and 2012, the options have an anti-dilutive effect and therefore not considered when calculating diluted earnings per share.

PA G E 7 6 PA N O R O E N E R G Y A N N U A L R E P O R T 2 0 1 3
NOTE 5. INCOME TAX
USD 000 2013 2012
Tax payable - -
Change in deferred tax - -
Income tax expense - -
Specification of the basis for tax payable:
USD 000 2013 2012
Result before income tax (135,349) (41,404)
Effect of permanent differences 113,521 22,475
Tax losses not utilised 21,828 18,929
Basis for tax payable - -
Specification of deferred tax:
USD 000 2013 2012
Losses carried forward 144,349 127,719
Taxable temporary differences (742) (3,240)
Basis for tax payable 143,607 124,479
Calculated deferred tax asset at 27% (2012: 28%) 38,774 34,854
Unrecognised deferred tax asset (38,774) (34,854)
Deferred tax asset recognised on Balance Sheet - -
The tax losses carried forward are available indefinitely to offset against future taxable profits.
The deferred tax asset is not recognized on the balance sheet due to uncertainty of income.

PA N O R O E N E R G Y A N N U A L R E P O R T 2 0 1 3 PA G E 7 7
NOTE 6. FURNITURE, FIXTURES AND OFFICE EQUIPMENT
USD 000
Permanent building fixtures
and fittingsFurniture and
fixtures IT and office
equipment Total
Acquisition cost at January 1, 2013 - - 110 110
Additions - - - -
Acquisition cost at December 31, 2013 - - 110 110
Accumulated depreciation at December 31, 2013 - - (103) (103)
Net carrying value at December 31, 2013 - - 7 7
Depreciation for the year - - 6 6
Acquisition cost at January 1, 2012 62 60 108 230
Additions - - 8 8
Disposals (62) (60) (6) (128)
Acquisition cost at December 31, 2012 - - 110 110
Accumulated depreciation at December 31, 2012 - - (97) (97)
Net carrying value at December 31, 2012 - - 13 13
Depreciation for the year 4 3 15 22
IT and office equipment is depreciated over three years on a straight-line basis, furniture and fixtures are depreciated over ten years also on a straight-line basis.
NOTE 7. INVESTMENT IN SUBSIDIARIES
Investments in subsidiaries are carried at the lower of cost and fair market value. As of December 31, 2013, the holdings in subsidiaries consist of the following:
USD 000
Headquarters
Ownership interest and voting rights
Panoro Energy do Brasil Ltda (PEdB) Rio de Janeiro, Brazil 100%
Pan-Petroleum (Holding) Cyprus Ltd (PPHCL) Limassol, Cyprus 100%
PEdB PPHCL Total
Investment at cost
At January 1, 2013 236,414 129,106 365,520
Investments during the year - - -
At December 31, 2013 236,414 129,106 365,520
Provision for impairment
At January 1, 2013 - (46,223) (46,223)
Charge for the year (89,318) (22,342) (111,660)
At December 31, 2013 (89,318) (68,565) (157,883)
Total investment in subsidiaries at December 31, 2013 147,096 60,541 207,637
Total investment in subsidiaries at December 31, 2012 236,414 82,883 319,297
Impairment charge of USD 111.7 million represents loss in value of Company’s investment in shares of Panoro Energy do Brasil Ltda by approximately USD 89.3 million and in Pan-Petroleum (Holding) Cyprus Limited by approximately USD 22.4 million (2012: USD 23.4 million). The impairment has been determined by comparing estimated recoverable value of the underlying investment with the carrying amount.

PA G E 7 8 PA N O R O E N E R G Y A N N U A L R E P O R T 2 0 1 3
NOTE 8. RELATED PARTY TRANSACTIONS AND BALANCES
Operating revenues relate to administrative services provided to subsidiaries.
The Company’s loans of USD 12.3 million outstanding at December 31, 2012, to the Brazilian subsidiary Panoro Energy do Brasil Ltda. was settled during 2013 in full.
The Company’s loan to the Cypriot subsidiary Pan-Petroleum (Holding) Cyprus Limited was classified as current and amounted to USD 40.1 million as at December 31, 2013 (2012: USD 57.4 million ). This loan carries an interest rate of 10% and is repayable on demand.
The intercompany recharges and other balances due from subsidiaries to the Company are classified as non-current and amounted to USD 2.0 million as at December 31, 2013 (2012: USD 2.4 million). Payable balance on account of intercompany recharges was USD 5.6 million to Company’s indirect subsidiary Panoro Energy Limited, which provides technical services (2012: USD 6.2 million). These balances do not carry an interest rate and have no maturity date.
See note 2 for details regarding directors’ remuneration and related party transactions.
NOTE 9. RESTRICTED CASH
As of December 31, 2013, USD 2.6 million (2012: USD 2.9 million) is restricted cash in relation to contributions in the debt service accounts as per the requirements of the Senior Secured Callable bond agreement.
NOTE 10. SHAREHOLDERS’ EQUITY AND SHAREHOLDER INFORMATION
Nominal share capital in the Company at December 31, 2013 and 2012 amounted to NOK 342,547,500 (USD 56,333,267) consisting of 234,545,786, shares at a par value of NOK 1.460471768. All shares in issue are fully paid-up and carry equal voting rights.
The table below shows the changes in equity in the Company during 2013 and 2012:
USD 000Share
capitalShare premium
reserveAdditional
paid-in capitalOther equity Total
At January 1, 2012 56,333 288,858 64,636 (60,801) 349,026
Loss for the year - - - (41,404) (41,404)
Share-based payments - - 1,150 - 1,150
At December 31, 2012 56,333 288,858 65,786 (102,205) 308,772
Loss for the year - - - (135,349) (135,349)
Share-based payments - - 237 - 237
At December 31, 2013 56,333 288,858 66,023 (237,554) 173,660

PA N O R O E N E R G Y A N N U A L R E P O R T 2 0 1 3 PA G E 7 9
Ownership structureThe Company had 4,694 shareholders per December 31, 2013 (2011: 4,938). The twenty largest shareholders were:
Shareholder Number of shares Holding in %
1 GOLDMAN SACHS INTERNATIONAL EQUITY 18,042,160 7.7 %
2 STOREBRAND VEKST 10,260,603 4.4 %
3 KLP AKSJE NORGE VPF 9,800,000 4.2 %
4 EUROCLEAR BANK S.A./N.V. ('BA') 8,814,624 3.8 %
5 KOMMUNAL LANDSPENSJONSKASSE 7,300,000 3.1 %
6 VARMA MUTUAL PENSION INSURANCE 7,077,551 3.0 %
7 STATE STREET BANK & TRUST COMPANY 6,000,000 2.6 %
8 ORAKEL ODDSCONSULT AS 5,000,000 2.1 %
9 JP MORGAN CHASE BANK, NA 3,815,000 1.6 %
10 MP PENSJON PK 3,613,960 1.5 %
11 SWEDBANK AS 3,280,742 1.4 %
12 GOLDMAN SACHS & CO EQUITY SEGREGAT 3,070,544 1.3 %
13 VERDIPAPIRFONDET DNB SMB 2,775,000 1.2 %
14 TOLUMA NORDEN AS 2,750,000 1.2 %
15 NORDNET BANK AB 2,699,889 1.2 %
16 CITIBANK, N.A. 2,629,961 1.1 %
17 KAMPEN INVEST AS 2,550,000 1.1 %
18 BKS CAPITAL AS 2,530,000 1.1 %
19 UBS AG, LONDON BRANCH 2,000,000 0.9 %
20 OLE KETIL TEIGEN 2,000,000 0.9 %
Top 20 shareholders 106,010,034 45.2 %
Other shareholders 128,535,752 54.8 %
Total shares 234,545,786 100.0 %
Shares owned by the CEO, board members and key management, directly and indirectly, at December 31, 2013:
Shareholder Position Number of shares % of total
Bjørn Kristian Stadheim (i) Director 2,530,000 1.08%
Anders Kapstad (ii) Group Chief Financial Officer and Country Manager Brazil 60,850 0.03%
Nishant Dighe Chief Operating Officer 1,309,669 0.56%
(i) Mr. Stadheim has a beneficial interest in BKS Capital AS which directly holds shares in the Company. (ii) Mr. Kapstad indirectly holds 40,250 shares through La Barra Capital AS in which he has a beneficial interest.
Shareholder distribution per December 31, 2013:
Amount of shares # of shareholders % of total # of shares Holding in %
1 - 1,000 1,978 42.14% 760,994 0.32%
1,001 - 5,000 1,140 24.29% 3,079,528 1.31%
5,001 - 10,000 417 8.88% 3,333,937 1.42%
10,001 - 100,000 884 18.83% 31,195,253 13.30%
100,001 - 1,000,000 234 4.99% 61,744,021 26.32%
1,000,001 + 41 0.87% 134,432,053 57.33%
Total 4,694 100.00% 234,545,786 100.00%

PA G E 8 0 PA N O R O E N E R G Y A N N U A L R E P O R T 2 0 1 3
NOTE 11. BOND LOANS
In November 2010, the Company issued bonds of USD 140 million “Panoro Energy Senior Secured Callable Bond Issue 2010/2018”.
The bond issue is denominated in NOK and USD with tranches of NOK 205 million and USD 105 million carrying fixed interest rates of respectively 13.5% and 12% per annum. Interest is payable semi-annually. As of December 31, 2013, the outstanding principal amounts to NOK 164 million and USD 84 million. The standard repayment every year on November 15 to the year 2017 is NOK 20.5 million for NOK tranche and USD 10.5 million for USD tranche. The remaining principal amounts of NOK 82 million and USD 42 million are repayable at the bond redemption date on November 15, 2018.
The bondholders carry a first priority pledge over Company’s shares in Brazilian subsidiaries (Rio das Contas and PEdB) which effectively hold 10% working interest in Manati gas field. In addition to this, the bond agreement also stipulates issue of unconditional and irrevocable on-demand guarantees in favour of the Bond Trustee by the Brazilian subsidiaries.
The main covenants of the bond loan are as follows: • The issuer shall maintain at all times, a Book Equity ratio of the Group of minimum 25% which needs to be measured at every quarter
end date. The Book Equity ratio measures the proportion of the Group’s equity compared to total assets.• The issuer shall not declare or make any dividend payments or other distributions or loans to its shareholders and should not engage in
any activity having the effect of reducing capital or equity in the parent company.• The Company shall not provide loans to any of its Brazilian subsidiaries, except to the extent such loans are subject to a first priority
pledge to secure the obligations of the bond issuer.• The Company shall not provide guarantees or other credit support to, or make investments in, any person or entity, other than in the
conditions as prescribed in the loan agreement.
The amount above includes accrued interest to December 31, 2013 and is net of unamortised bond issue costs of USD 2.5 million (2012: USD 3.2 million).
Subsequent to year end, on completion of the sale of Group’s subsidiary Rio das Contas to GeoPark, the outstanding bond liability was repaid in full under the terms of the agreement with bondholders.
NOTE 11.1 EFFECT OF REMEASUREMENT OF BOND LIABILITY
The Company has entered into a sale agreement with GeoPark Holdings to sell its entire share capital in its fully owned subsidiary Rio das Contas which also holds Manati field. The shares in RdC and Manati are pledged as security under the bond agreement which requires mandatory redemption of the loan on completion of sale transaction. Panoro management believes that the completion of the sale transaction is expected within one year of the balance sheet date and as such the entire bond loan has been reclassified as a current liability. Under the terms of the bond agreement, mandatory redemption will be at premium of 6% should the transaction complete before November 15, 2014. Considering the expected changes in cash flow profile of the bond loan, under the requirements of IAS 39 AG8, the bond liability has been remeasured using expected cash flows assuming a mandatory redemption date falling before November 15, 2014 discounted to the reporting date using the original effective interest rate. The difference of USD 8,694 thousand between the remeasured liability and the original carrying value has been expensed in the statement of comprehensive income with a corresponding adjustment to the carrying value in the statement of financial position. The expected redemption date has been assumed as March 31, 2014 for the purpose of remeasurement.
The bonds are listed on Oslo ABM under quotes “PEN 01 PRO” and “PEN 02 PRO”.
NOTE 12. OTHER CURRENT LIABILITIES
The breakdown of other current liabilities is below:
USD 000 2013 2012
Accruals 87 119
Employee related costs payable (including taxes) 224 283
At December 31 311 402

PA N O R O E N E R G Y A N N U A L R E P O R T 2 0 1 3 PA G E 8 1
NOTE 13 COMMITMENTS
Non cancelable operating lease commitments
USD 000 2013 2012
Not later than 1 year 70 71
At December 31 70 71
Non-cancellable operating lease commitments relate to office premises rental.
NOTE 14. FINANCIAL MARKET RISK AND BUSINESS RISK
See details in Note 22 in the consolidated financial statements.
NOTE 15. GUARANTEES AND PLEDGES
The bondholders carry a first priority pledge over Company’s shares in Brazilian subsidiaries (Rio das Contas and PEdB) which effectively hold 10% working interest in Manati gas field. In addition to this, the bond agreement also stipulates issue of unconditional and irrevocable on-demand guarantees in favour of the Bond Trustee by the Brazilian subsidiaries. All liens and charges by the bondholders were released subsequent to year end on full repayment of bond liability.
The Company has provided a performance guarantee to the Brazilian directorate ANP, in terms of which the Company is liable for the commitments of Estrela do Mar, Cavalo Marinho and BCAM-40 licenses in accordance with the given concessions of the licenses. The guarantee is unlimited. Subsequent to year end, the guarantee pursuant to BCAM-40 was released by ANP on completion of the sale of Rio das Contas to GeoPark.
Under section 479C of the UK Companies Act 2006; two of the Company’s indirect subsidiaries Panoro Energy Limited (Registration number: 6386242) and African Energy Equity Resources Limited (Registration number: 5724928) have availed exemption for audit of their statutory financial statements pursuant to guarantees issued by the Company to indemnify the subsidiaries of any losses that may arise in the financial year ended December 31, 2013.
NOTE 16. EVENTS SUBSEQUENT TO REPORTING DATE
Subsequent events can be referred to in note 27 to the Group financial statements.

PA G E 8 2 PA N O R O E N E R G Y A N N U A L R E P O R T 2 0 1 3
S T A T E M E N T O F D I R E C T O R S ’ R E S P O N S I B I L I T Y
We confirm to the best of our knowledge that the financial statements for the period January 1 to December 31, 2013 have been prepared in accordance with International Financial Reporting Standards (IFRS) as adopted by the European Union, as well as additional information requirements in accordance with the Norwegian Accounting Act, that the financial statements for the parent company for 2013 have been prepared in accordance with the Norwegian Accounting Act and generally accepted accounting practice in Norway, and that the information presented in the financial statements gives a true and fair view of the assets, liabilities, financial position and profit or loss of the Company and the Group taken as a whole, and that the Board of Directors‘ report includes a fair review of the development and performance of the business and the position of the Company and the Group taken as a whole, together with a description of the principal risks and uncertainties that they face.
Oslo, April 21, 2014The Board of Directors
Panoro Energy ASA
Endre Ording SundChairman of the Board
Silje Christine AugustsonNon-Executive Director
Bjørn Kristian StadheimNon-Executive Director
Tone Kristin Omsted Non-Executive Director
Jan KiellandChief Executive Officer

PA N O R O E N E R G Y A N N U A L R E P O R T 2 0 1 3 PA G E 8 3

PA G E 8 4 PA N O R O E N E R G Y A N N U A L R E P O R T 2 0 1 3
A U D I T O R ’ S R E P O R T

PA N O R O E N E R G Y A N N U A L R E P O R T 2 0 1 3 PA G E 8 5

PA G E 8 6 PA N O R O E N E R G Y A N N U A L R E P O R T 2 0 1 3
S T A T E M E N T O N C O R P O R A T E G O V E R N A N C E I N PA N O R O E N E R G Y A S A
Panoro Energy ASA (“Panoro” or “the Company”) aspires to ensure confidence in the Company
and the greatest possible value creation over time through efficient decision making, clear division
of roles between shareholders, management and the Board of Directors (“the Board”) as well as
adequate communication.
Panoro Energy seeks to comply with all the requirements covered in The Norwegian Code of Practice for Corporate Governance. The latest version of the Code of October 23, 2012 is available on the website of the Norwegian Corporate Governance Board, www.ncgb.no. The Code is based on the “comply or explain” principle, in that companies should explain alternative approaches to any specific recommendation.
1. IMPLEMENTATION AND REPORTING ON CORPORATE GOVERNANCE
The main objective for Panoro’s Corporate Governance is to develop a strong, sustainable and competitive company in the best interest of the shareholders, employees and society at large, within the laws and regulations of the respective country. The Board of Directors (the Board) and management aim for a controlled and profitable development and long-term creation of growth through well-founded governance principles and risk management.
The Board will give high priority to finding the most appropriate working procedures to achieve, inter alia, the aims covered by these Corporate Governance guidelines and principles.
The Norwegian Code of Practice for Corporate Governance as of October 23, 2012 comprises 15 points. The complete version of the Corporate Governance report is available on the Company’s webpage www.panoroenergy.com.
2. BUSINESS
Panoro Energy ASA is an international independent oil & gas company with offices in Oslo, London and Rio de Janeiro. The Company holds a balanced portfolio of production, development and exploration assets in Brazil and West Africa. Panoro Energy was formed through the merger of Norse Energy’s former Brazilian
business and Pan-Petroleum on June 29, 2010. The Company is listed on the Oslo Stock Exchange with ticker PEN.
The Company’s business is defined in the Articles of Association §2, which states:
“The Company’s business shall consist of exploration, production, transportation and marketing of oil and natural gas and exploration and/or development of other energy forms, sale of energy as well as other related activities. The business might also involve participation in other similar activities through contribution of equity, loans and/or guarantees.“
Panoro Energy currently has two distinct reportable segments with exploration and production of oil and gas, by geographic area being Brazil and West Africa. In Brazil, Panoro Energy participates in a number of oil and gas licenses located in the Santos basin outside the south-east coast of Brazil and in the Camamu-Almada basin in the state of Bahia. In West Africa, the Company participates in a number of licenses in Nigeria and Gabon. Currently the only commercial production is from the Manati field in Brazil.
Vision statementOur vision is to use our experience and competence in enhancing value in projects in the South Atlantic basin to the benefit of the countries we operate in and the shareholders of the Company.
3. EQUITY AND DIVIDENDS
Panoro Energy’s Board of Directors will ensure that the Company at all times has an equity capital at a level appropriate to its objectives, strategy and risk profile. The oil and gas E&P business is highly capital dependent, requiring Panoro Energy to be sufficiently capitalized. The Board needs to be proactive in order for Panoro Energy to be prepared for changes in the market.

PA N O R O E N E R G Y A N N U A L R E P O R T 2 0 1 3 PA G E 8 7
Mandates granted to the Board to increase the Company’s share capital are restricted to defined purposes.
Mandates granted to the Board for issue of shares for different purposes will each be considered separately by the General Meeting. Mandates granted to the Board are limited in time to the following year’s Annual General Meeting.
Panoro Energy is in a phase where investments in the Company’s operations are required to enable future growth, and is therefore not in a position to distribute dividends. Payment of dividends will be considered in the future, based on the Company’s capital structure and dividend capacity as well as the availability of alternative investments.
4. EQUAL TREATMENT OF SHAREHOLDERS AND TRANSACTIONS WITH CLOSE ASSOCIATES
Panoro Energy has one class of shares representing one vote at the Annual General Meeting. The Articles of Association contains no restriction regarding the right to vote.
Any acquisition of own shares will be at market price, and the Company will not deviate from the principle of equal treatment of all shareholders. Any decision to deviate from the principle of equal treatment by waiving the pre-emption rights of existing shareholders to subscribe for shares in the event of an increase in share capital will be justified. Such deviation will be made only if in the common interest of the shareholders and the Company.
The Board has at the AGM in 2013 been granted a power of attorney by the General Meeting to acquire 10% the Company’s own shares. The power of attorney is valid for one year from the date of AGM. If the Board of Directors resolves to carry out an increase in share capital on the basis of a mandate granted to the Board, the justification for waiving pre-emption rights of existing shareholders will be disclosed in the stock exchange announcement of the increase in share capital.
In the event that the Company carries out any transactions in its own shares, these will be carried out through a regulated marketplace at market price. If there is limited liquidity in the Company’s shares at the time of such transaction, the Company will consider other ways to ensure equal treatment of all shareholders.
All Board members, employees of the Company and close associates must clear transactions in the Company’s shares or other financial
instruments related to the Company prior to any transaction. All transactions between the Company and shareholders, shareholder’s parent company, members of the Board of Directors, executive personnel or close associates of any such parties, are governed by the Code of Practice and the rules of the Oslo Stock Exchange in addition to statutory law. Any transaction with close associates will be evaluated by an independent third party, unless the transaction requires the approval of the General Meeting pursuant to the requirements of the Norwegian Public Limited Liabilities Companies Act. Independent valuations will also be arranged in respect of transactions between companies in the same Group where any of the companies involved have minority shareholders. Any transactions with related parties, primary insiders or employees shall be made in accordance with Panoro Energy’s own instructions for Insider Trading.
The Company has guidelines to ensure that members of the Board and executive personnel notify the Board if they have any material direct or indirect interest in any transaction entered into by the Company.
5. FREELY NEGOTIABLE SHARES
The Panoro Energy ASA share is listed on the Oslo Stock Exchange. There are no restrictions on negotiability in Panoro Energy’s Articles of association.
6. GENERAL MEETINGS
Panoro Energy’s Annual General Meeting will be held by the end of June each year. The Board of Directors take the following necessary steps to ensure that as many shareholders as possible may exercise their rights by participating in General Meetings of the Company, and to ensure that General Meetings are an effective forum for the views of shareholders and the Board. An invitation and agenda (including proxy) will be sent out 21 days prior to the meeting to all shareholders in the Company. The invitation will also be distributed as a stock exchange notification. The invitation and support information on the resolutions to be considered at the General Meeting will furthermore be posted on the Company’s website www.panoroenergy.com no later than 21 days prior to the date of the General Meeting.
The recommendation of the Nomination Committee will normally be available on the Company’s website at the same time as the notice.

PA G E 8 8 PA N O R O E N E R G Y A N N U A L R E P O R T 2 0 1 3
Panoro Energy will ensure that the resolutions and supporting information distributed are sufficiently detailed and comprehensive to allow shareholders to form a view on all matters to be considered at the meeting.
According to Article 7 of the Company’s Articles of Association, registrations for the Company’s General Meetings must be received at least five calendar days before the meeting is held.
The Chairman of the Board and the CEO of the Company are normally present at the General Meetings. Other Board members and the Company’s auditor will aim to be present at the General Meetings. Members of the Nomination Committee are requested to be present at the AGM of the Company. An independent chairman for the General Meeting will, to the extent possible, be appointed. Normally the General Meetings will be chaired by the Company’s corporate lawyer. Shareholders who are unable to attend in person will be given the opportunity to vote. The Company will nominate a person who will be available to vote on behalf of shareholders as their proxy. Information on the procedure for representation at the meeting through proxy will be set out in the notice for the General Meeting. A form for the appointment of a proxy, which allows separate voting instructions for each matter to be considered by the meeting and for each of the candidates nominated for elections will be prepared. Dividend, remuneration to the Board and the election of the auditor, will be decided at the AGM. After the meeting, the minutes are released on the Company’s website.
No deviations from the Code of Practice, save that the recommendations of the Nomination Committee for the 2013 AGM and EGM was made available on the Company’s website later than the notice to the meetings
7. NOMINATION COMMITTEE
The Company shall have a Nomination Committee consisting of 2 to 3 members to be elected by the Annual General Meeting for a two year period. The AGM elects the members and the Chairperson of the Nomination Committee and determines the committee’s remuneration. The Company will provide information on the membership of the Nomination Committee on its website. The Company will further give notice on its website, in good time, of any deadlines for submitting proposals for candidates for election to the Board of Directors and the Nomination Committee.
The Company aims at selecting the members of the Nomination Committee taking into account the interests of shareholders in general. The majority of the Nomination Committee shall as a rule be independent of the Board and the executive management. The Nomination Committee currently consists of three members, whereof two are independent of the Board and the executive management.
The Nomination Committee’s duties are to propose to the General Meeting shareholder elected candidates for election to the Board, and to propose remuneration to the Board. The
Nomination Committee justifies its recommendations and the recommendations take into account the interests of shareholders in general and the Company’s requirements in respect of independence, expertise, capacity and diversity.
The AGM will stipulate guidelines for the duties of the Nomination Committee.
8. CORPORATE ASSEMBLY AND BOARD OF DIRECTORS – COMPOSITION AND INDEPENDENCE
The composition of the Board ensures that the Board represents the common interests of all shareholders and meets the Company’s need for expertise, capacity and diversity. The members of the Board represent a wide range of experience including shipping, offshore, energy, banking and investment. The composition of the Board ensures that it can operate independently of any special interests. Members of the Board are elected for a period of two years. Recruitment of members of the Board will be phased so that the entire Board is not replaced at the same time. The Chairman of the Board of Directors is elected by the General Meeting. The Company has not experienced a need for a permanent deputy Chairman. If the Chairman cannot participate in the Board meetings, the Board will elect a deputy Chairman on an ad-hoc basis. The Company’s website and annual report provides detailed information about the Board members expertise and independence. The Company has a policy whereby the members of the Board of Directors are encouraged to own shares in the Company, but to dissuade from a short-term approach which is not in the best interests of the Company and its shareholders over the longer term.
9. THE WORK OF THE BOARD OF DIRECTORS
The Board has the overall responsibility for the management and supervision of the activities in general. The Board decides the strategy of the Company and has the final say in new projects and/or investments. The Board’s instructions for its own work as well as for the executive management have particular emphasis on clear internal allocation of responsibilities and duties. The Chairman of the Board ensures that the Board’s duties are undertaken in efficient and correct manner. The Board shall stay informed of the Company’s financial position and ensure adequate control of activities, accounts and asset management. The Board member’s experience and skills are crucial to the Company both from a financial as well as an operational perspective. The Board of Directors evaluates its performance and expertise annually. The CEO is responsible for the Company’s daily operations and ensures that all necessary information is presented to the Board.
An annual schedule for the Board meetings is prepared and discussed together with a yearly plan for the work of the Board.
Should the Board need to address matters of a material character in which the Chairman is or has been personally involved, the matter will be chaired by another member of the Board to ensure a more independent consideration.

PA N O R O E N E R G Y A N N U A L R E P O R T 2 0 1 3 PA G E 8 9
In addition to the Nomination Committee elected by the General Meeting, the Board has an Audit Committee and a Remuneration Committee as sub-committees of the Board. The members are independent of the executive management.
10. RISK MANAGEMENT AND INTERNAL CONTROL
Financial and internal control, as well as short- and long term strategic planning and business development, all according to Panoro Energy’s business idea and vision and applicable laws and regulations, are the Board’s responsibilities and the essence of its work. This emphasizes the focus on ensuring proper financial and internal control, including risk control systems.
The Board approves the Company’s strategy and level of acceptable risk, as documented in the guiding tool “Risk Management”.
The Board carries out an annual review of the Company’s most important areas of exposure to risk and its internal control arrangements.
For further details on the use of financial instruments, refer to relevant note in the consolidated financial statements in the Annual Report and the Company’s guiding tool “Financial Risk Management” described in relevant note in the consolidated financial statements in the Annual Report.
11. REMUNERATION OF THE BOARD OF DIRECTORS
The remuneration to the Board will be decided at the Annual General Meeting each year.
Panoro Energy is a diversified company, and the remuneration will reflect the Board’s responsibility, expertise, the complexity and scope of work as well as time commitment.
The remuneration to the Board is not linked to the Company’s performance, and share options will normally not be granted to Board members. Remuneration in addition to normal director’s fee will be specifically identified in the Annual Report.
Members of the Board generally do not take on specific assignments for the Company in addition to their appointment as a member of the Board. The Company has, however, entered into a consultancy agreement with one of the board members, George Edward Watkins (resigned from the Board January 2014). The agreement has been disclosed to the full Board. The Board considers the agreement to be entered into arm’s length terms and has approved the remuneration for the additional assignments to Watkins in this respect.
12. REMUNERATION OF THE EXECUTIVE PERSONNEL
The Board has established guidelines for the remuneration of the executive personnel. The guidelines set out the main principles applied in determining the salary and other remuneration of the
executive personnel. The guidelines ensure convergence of the financial interests of the executive personnel and the shareholders.
Panoro Energy has appointed a Remuneration Committee (RC) which meets regularly. The objective of the committee is to determine the compensation structure and remuneration level of the Company’s CEO. Remuneration to the CEO shall be at market terms and decided by the Board and made official at the AGM every year. Remuneration to other key executives shall be proposed by the CEO to the RC.
The remuneration shall, both with respect to the chosen kind of remuneration and the amount, encourage addition of values to the Company and contribute to the Company’s common interests – both for management as well as the owners.
Detailed information about options and remuneration for executive personnel and Board members is provided in the Annual Report. The guidelines are presented to the AGM as an attachment to the AGM notice.
13. INFORMATION AND COMMUNICATION
The Company has established guidelines for the Company’s reporting of financial and other information available on the Company’s website.
The Company publishes an annual financial calendar including the dates the Company plans to publish the quarterly results and the date for the Annual General Meeting. The calendar can be found on the Company’s website, and will also be distributed as a stock exchange notification and updated on Oslo Stock Exchange’s website. The calendar is published at the end of a fiscal year, according to the continuing obligations for companies listed on the Oslo Stock Exchange. The calendar is also included in the Company’s quarterly financial reports.
All shareholders information is published simultaneously on the Company’s web site and to appropriate financial news media.
Panoro Energy normally makes four quarterly presentations a year to shareholders, potential investors and analysts in connection with quarterly earnings reports. The quarterly presentations are normally simultaneously broadcasted over the Internet to facilitate participation by all interested shareholders, potential investors and members of the financial community.
The Company also makes investor presentations at conferences in and out of Norway. The information packages presented at such meetings are published simultaneously on the Company’s web site.
The Chairman, CEO, CFO and Investor Relations of Panoro Energy are the only people who are authorized to speak to, or be in contact with the press, unless otherwise described or approved by the Chairman, CEO and/or CFO.

PA G E 9 0 PA N O R O E N E R G Y A N N U A L R E P O R T 2 0 1 3
14. TAKEOVERS
Panoro Energy has established guiding principles for how the Board of Directors will act in the event of a take-over bid.
As of today the Board does not hold any authorizations as set forth in Section 6-17 of the Securities Trading Act, to effectuate defence measures if a takeover bid is launched on Panoro Energy.
The Board may be authorized by the General Meeting to acquire its own shares, but will not be able to utilize this in order to obstruct a takeover bid, unless approved by the General Meeting following the announcement of a takeover bid.
The Board of Directors will generally not hinder or obstruct take-over bids for the Company’s activities or shares.
As a rule the Company will not enter into agreements that act to limit the Company’s ability to arrange other bids for the Company’s shares unless it is clear that such an agreement is in the common interest of the Company and its shareholders. As a starting point the same applies to any agreement on the payment of financial compensation to the bidder if the bid does not proceed. Any financial compensation will as a rule be limited to the costs the bidder has incurred in making the bid. The Company will generally seek to disclose agreements entered into with the bidder that are material to the market’s evaluation of the bid no later than at the same time as the announcement that the bid will be made is published.
In the event of a take-over bid for the Company’s shares, the Board of Directors will not exercise mandates or pass any resolutions with the intention of obstructing the take-over bid unless this is approved by the General Meeting following announcement of the bid.
If an offer is made for the Company’s shares, the Board will issue a statement evaluating the offer and making a recommendation as to whether shareholders should or should not accept the offer. The Board will also arrange a valuation with an explanation from an independent expert. The valuation will be made public no later than at the time of the public disclosure of the Board’s statement. Any transactions that are in effect a disposal of the Company’s activities will be decided by a General Meeting.
15. AUDITOR
The Auditor will be appointed at the General Meeting every year. Ernst & Young has previously been appointed.
The Board has appointed an Audit Committee as a sub-committee of the Board, which will meet with the auditor regularly. The objective of the committee is to focus on internal control, independence of the auditor, risk management and the Company’s financial standing.
The auditors will send a complete Management Letter/Report to the Board – which is a summary report with comments from the
auditors including suggestions of any improvements if needed. The auditor participates in meetings of the Board of Directors that deal with the annual accounts, where the auditor reviews any material changes in the Company’s accounting principles, comments on any material estimated accounting figures and reports all material matters on which there has been disagreement between the auditor and the executive management of the Company.
In view of the auditor’s independence of the Company’s executive management, the auditor is also present in at least one Board meeting each year at which neither the CEO nor other members of the executive management are present.
Panoro Energy places importance on independence and has established guidelines in respect of retaining the Company’s external auditor by the Company’s executive management for services other than the audit.
The Board reports the remuneration paid to the auditor at the Annual General Meeting, including details of the fee paid for audit work and any fees paid for other specific assignments.
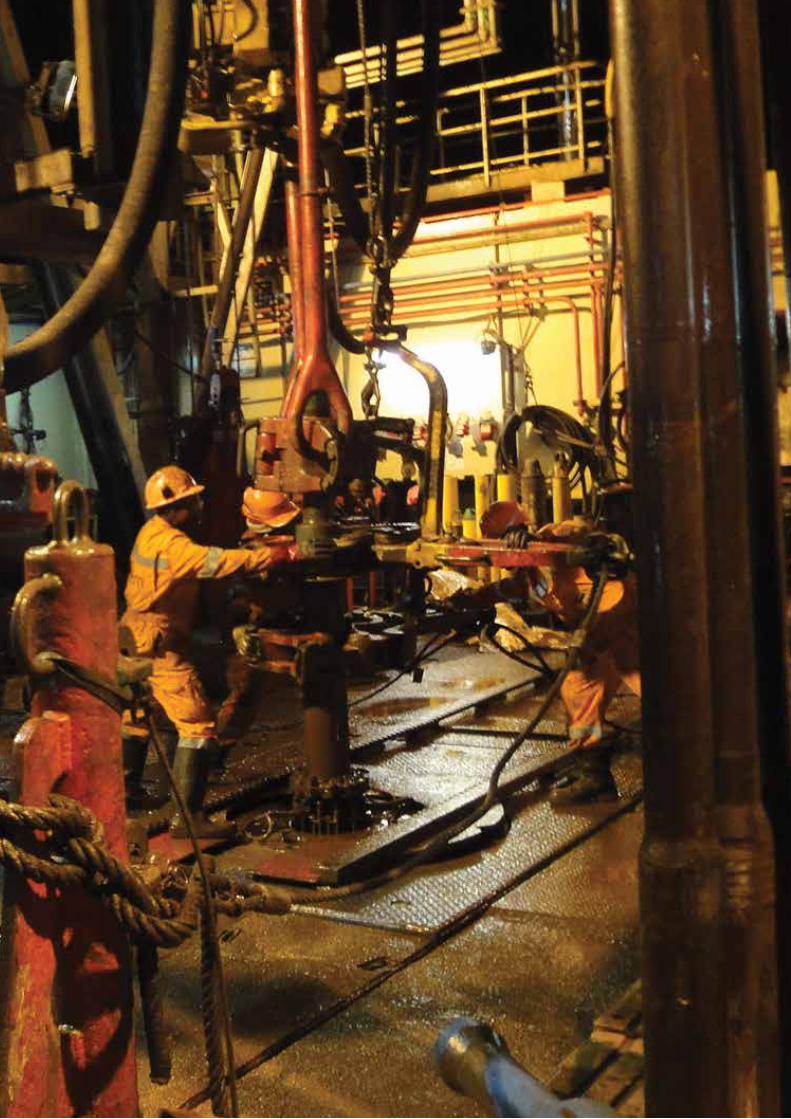
PA N O R O E N E R G Y A N N U A L R E P O R T 2 0 1 3 PA G E 9 1

PA G E 9 2 PA N O R O E N E R G Y A N N U A L R E P O R T 2 0 1 3
1. ABOUT PANORO
Panoro Energy ASA is an international independent oil and gas company with offices in Oslo, London and Rio de Janeiro. The Company holds a balanced portfolio of production, development and exploration assets in Brazil and West Africa.
Panoro’s main purpose is to capitalize on the value of its assets. However, the Company acknowledges its responsibility for the methods by which this is achieved. The principles set out below seek to ensure that Panoro operates in a socially and environmentally responsible manner, encouraging a positive impact through its activities and those of its partners and other stakeholders.
2. MESSAGE FROM THE CEO
The world’s need for energy creates challenges and is pushing us to explore in new areas. This also creates dilemmas, as we face both geographical and political challenges in our work.
Being a commercial entity, Panoro is focused on maximizing its assets, and thus shareholder value. Nevertheless, we are mindful of the impact of our activities to achieve this goal; we are firmly committed to embracing our social and environmental responsibility, and to honouring the letter and the spirit of the UN Global Compact principles. We believe that this is the right approach for all our stakeholders, including the host countries, the local communities, our shareholders and business partners.
We are committed to ensuring that our presence has a positive impact wherever we work and invest. We have therefore adopted this Ethical Code of Conduct (“ECOC”) in March 2011.
3. FRAMEWORK AND SCOPE OF THE ETHICAL CODE OF CONDUCT OF PANORO
3.1 Panoro as a company, as well as its individual employees, will commit to follow this ECOC.
3.2 Equally, we will work through our stakeholders and partners to ensure that we adhere to the values expressed in the ECOC.
3.3 Finally, the ECOC is based on the ten principles expressed in the UN Global Compact.
4. THE UN GLOBAL COMPACT PRINCIPLES
The UN Global Compact’s ten principles in the areas of human rights, labour, the environment and anti-corruption enjoy universal consensus and are derived from:
• The Universal Declaration of Human Rights• The International Labour Organization’s Declaration on
Fundamental Principles and Rights at Work• The Rio Declaration on Environment and Development• The United Nations Convention Against Corruption
The UN Global Compact asks companies to embrace, support and enact, within their sphere of influence, a set of core values in the areas of human rights, labour standards, the environment and anti-corruption::
Human Rights• Principle 1: Businesses should support and respect the protection
of internationally proclaimed human rights; and• Principle 2: make sure that they are not complicit in human
rights abuses
Labour• Principle 3: Businesses should uphold the freedom of association
and the effective recognition of the right to collective bargaining;• Principle 4: the elimination of all forms of forced and
compulsory labour;• Principle 5: the effective abolition of child labour; and• Principle 6: the elimination of discrimination in respect of
employment and occupation
C O R P O R A T E S O C I A L R E S P O N S I B I L I T Y / E T H I C A L C O D E O F C O N D U C T

PA N O R O E N E R G Y A N N U A L R E P O R T 2 0 1 3 PA G E 9 3
Environment• Principle 7: Businesses should support a precautionary approach
to environmental challenges;• Principle 8: undertake initiatives to promote greater
environmental responsibility; and• Principle 9: encourage the development and diffusion of
environmentally friendly technologies
Anti-Corruption• Principle 10: Businesses should work against corruption in all its
forms, including extortion and bribery
5. HOST COUNTRIES AND LOCAL COMMUNITIES
In addition to these principles, Panoro is concerned with the responsibility of the Company and its operations to the host country and the local community. Wherever Panoro operates, the Company will be committed to:
• observe local laws and rules• respect the sovereignty of the state
• observe and, through our example and that of our stakeholders, promote the rule of law
• encourage the employment of local staff• engage in capacity building, through the transfer of skills and
technologies• work with local communities by contributing to improve their
health, education and welfare• respect indigenous people and their traditions• minimize disturbances that may be caused by our operations• be mindful of the impact of our security arrangements on local
communities• refrain from any involvement in tribal or internal armed conflicts
or acts of violence
6. STAKEHOLDERS
The stakeholders of Panoro are defined as entities that are influenced by, or have influence on, the development of Panoro’s assets. Panoro aims to commit to its ethical principles by working through its stakeholders, as well as monitoring how those stakeholders view Panoro’s implementation of its ECOC.
Stakeholder Influence Implementation of ECOC
Employees Panoro recognizes its influence and its responsibility to its employees, as well as to their close surroundings. Equally, the Company recognizes the importance of attracting and retaining talent in order to fulfil its business and ethical goals.
Panoro will consistently train its employees to adhere to company standards and procedures. Each employee is expected to learn about and to undertake training on the ECOC on a regular basis.
Partners Panoro operates and maximizes the value of its assets mainly in partnership with other entities.
Through partnership agreements, as well as through formal and informal communication, Panoro will seek to use its influence to implement its ECOC throughout its joint operations.
Operators The operators are the entities that conduct the actual operation of the assets.
Through joint operation agreements, as well as through formal and informal communication, Panoro will seek to maintain the highest ethical standards in all operations; focusing on HS&Q, environment and all other principles listed above in sections 4 and 5.
Shareholders The Panoro shareholders, including potential shareholders.
Panoro will seek to minimize shareholder risk and maximize value creation by adhering to the highest ethical standards in terms of environmental, legal and other risks based on the above principles. Panoro follows a strict code of governance based on international law and business practice.
Local community The communities in which the Panoro assets are placed include national authorities and different government bodies, as well as local unions, tribes and other community members.
Each asset has formal meeting points and communication lines set up within its operational structure. Panoro will seek to use these to address issues of interest based on the ECOC, including corruption, HS&Q and any other issues listed above.

PA G E 9 4 PA N O R O E N E R G Y A N N U A L R E P O R T 2 0 1 3
Bbl One barrel of oil, equal to 42 US gallons or 159 litersBm3 Billion cubic metersBOE Barrel of oil equivalentBtu British Thermal Units, the energy content needed to heat one pint of water by one degree FahrenheitM3 Cubic metersMMbbls Million barrels of oilMMBOE Million barrels of oil equivalentsMMBtu Million British thermal unitsMMm3 Million cubic meters
CONVERSION FACTORS
Natural gas and LNGTo billion cubic
metres NGBillion cubic
feet NGMillion tonnes
oil equivalentMillion tonnes
LNGTrillion British
thermal unitsMillion barrels oil equivalent
From Multiply by
1 billion cubic metres NG 1.00 35.30 0.90 0.73 36.00 6.29
1 billion cubic feet NG 0.028 1.00 0.026 0.021 1.03 0.18
1 million tonnes oil equivalent 1.111 39.20 1.00 0.805 40.40 7.33
1 million tonnes LNG 1.38 48.70 1.23 1.00 52.00 8.68
1 trillion British thermal units 0.028 0.98 0.025 0.02 1.00 0.17
1 million barrels oil equivalent 0.16 5.61 0.14 0.12 5.80 1.00
G L O S S A R Y A N D D E F I N I T I O N S


Panoro Energy ASAP.O. Box 1885 Vika, 0124 OsloDr. Maudsgt. 1-3, 0250 OsloNorway
Tel: +47 23 01 10 00
Panoro Energy Ltd43-45 Portman SquareLondon W1H 6LYUnited Kingdom
Tel: +44 (0) 20 3405 1060Fax: +44 (0) 20 3004 1130
Panoro Energy do Brasil LtdaPraia de Botafogo 228, Sala 801 – bloco A22.250-906 Rio de Janeiro – RJ Brazil
Tel: +5521 3078-7475Fax: +5521 3078-7451
COMPANY ADDRESSES
2141
045
· Bol
t Com
mun
icat
ion
AS
· bol
tcom
mun
icat
ion.
no
Related Documents


