As discussed in Chapter 1, a global slowdown in activity, led by a sharp downturn in the United States and the spreading crisis in financial markets, will create more difficult external conditions for all regions of the world. This chapter examines in more detail how different regions are likely to fare in this environment and the policy challenges that are likely to arise. 1 United States and Canada: How Long Will the Slowdown Last? The U.S. economy slowed markedly to grow 2.2 percent in 2007, down from almost 3 per- cent in 2006 (Table 2.1). The pace of activity weakened sharply in the fourth quarter to only 0.6 percent (at an annualized rate). With the housing correction continuing full blast, the contraction of residential investment sliced a full percentage point off growth in 2007. Con- sumption and business investment also softened markedly toward the end of the year, as senti- ment soured and lending conditions tightened significantly after the outbreak of financial tur- bulence in August, despite the Federal Reserve’s aggressive turn to monetary easing. Rising oil prices helped dampen consump- tion, while also boosting 12-month headline inflation to 3.4 percent in February (measured using the personal consumption expenditure deflator). Core inflation has remained at about 2 percent, the top of the Federal Reserve’s implicit comfort zone. The one area of strength has been net exports, which have grown in response to the dollar’s sustained depreciation and the sluggishness of the U.S. economy rela- tive to those of its trading partners. As a result, the current account deficit declined to less than 5 percent of GDP in the fourth quarter of 2007, 1 Further analysis of trends and prospects in different regions is provided in the spring 2008 issues of Regional Economic Outlook. down 1½ percent of GDP from the peak in 2006 (Table 2.2). The economy is slowing rapidly in early 2008, as falling house prices and tightening credit availability take a toll on consumption even as residential investment continues to drop, with inevitable knock-on effects on business investment. Credit spreads have widened mark- edly since late February, despite some recent improvement after the Federal Reserve widened access to the discount window to investment banks. The near-collapse of the fifth largest investment bank, Bear Stearns, in early March further heightened concerns about counterparty risk and put additional pressure on bank capital in an environment in which bank lending stan- dards were already being tightened rapidly. At the same time, there are clear signs that hous- ing weakness is now feeding through into labor markets and consumption. Nonfarm payrolls fell in January and February, real consumption has been at a standstill since December, and rapidly weakening consumer and corporate sentiment suggest that downward pressure on domestic spending and incomes will intensify. The key question is how long the present downturn will last. Previous U.S. recessions have typically been followed by quite vigorous recov- eries, as sharp corrections generally help resolve imbalances and monetary and fiscal stimuli kick in. Key determinants of the economy’s ability to rebound quickly from the current period of weak performance are the future course of the housing correction and the financial sector crisis, and the ensuing impact on household and business finances. Looking first to the housing market, the relationship between housing activity and the business cycle has changed markedly in recent years. Until recently, as observed by Leamer (2007), swings in residential investment have been at the core of the cycle—eight of the ten 65 2 CHAPTER COUNTRY AND REGIONAL PERSPECTIVES

Panorama Economico Mundial Fmi
May 18, 2015
Panorama Económico Mundial publicado por el FMI
Welcome message from author
This document is posted to help you gain knowledge. Please leave a comment to let me know what you think about it! Share it to your friends and learn new things together.
Transcript

As discussed in Chapter 1, a global slowdown in activity, led by a sharp downturn in the United States and the spreading crisis in financial markets, will create more difficult external conditions for all regions of the world. This chapter examines in more detail how different regions are likely to fare in this environment and the policy challenges that are likely to arise.1
United States and Canada: How Long Will the Slowdown Last?
The U.S. economy slowed markedly to grow 2.2 percent in 2007, down from almost 3 per-cent in 2006 (Table 2.1). The pace of activity weakened sharply in the fourth quarter to only 0.6 percent (at an annualized rate). With the housing correction continuing full blast, the contraction of residential investment sliced a full percentage point off growth in 2007. Con-sumption and business investment also softened markedly toward the end of the year, as senti-ment soured and lending conditions tightened signifi cantly after the outbreak of fi nancial tur-bulence in August, despite the Federal Reserve’s aggressive turn to monetary easing.
Rising oil prices helped dampen consump-tion, while also boosting 12-month headline infl ation to 3.4 percent in February (measured using the personal consumption expenditure defl ator). Core infl ation has remained at about 2 percent, the top of the Federal Reserve’s implicit comfort zone. The one area of strength has been net exports, which have grown in response to the dollar’s sustained depreciation and the sluggishness of the U.S. economy rela-tive to those of its trading partners. As a result, the current account defi cit declined to less than 5 percent of GDP in the fourth quarter of 2007,
1Further analysis of trends and prospects in different regions is provided in the spring 2008 issues of Regional Economic Outlook.
down 1½ percent of GDP from the peak in 2006 (Table 2.2).
The economy is slowing rapidly in early 2008, as falling house prices and tightening credit availability take a toll on consumption even as residential investment continues to drop, with inevitable knock-on effects on business investment. Credit spreads have widened mark-edly since late February, despite some recent improvement after the Federal Reserve widened access to the discount window to investment banks. The near-collapse of the fi fth largest investment bank, Bear Stearns, in early March further heightened concerns about counterparty risk and put additional pressure on bank capital in an environment in which bank lending stan-dards were already being tightened rapidly. At the same time, there are clear signs that hous-ing weakness is now feeding through into labor markets and consumption. Nonfarm payrolls fell in January and February, real consumption has been at a standstill since December, and rapidly weakening consumer and corporate sentiment suggest that downward pressure on domestic spending and incomes will intensify.
The key question is how long the present downturn will last. Previous U.S. recessions have typically been followed by quite vigorous recov-eries, as sharp corrections generally help resolve imbalances and monetary and fi scal stimuli kick in. Key determinants of the economy’s ability to rebound quickly from the current period of weak performance are the future course of the housing correction and the fi nancial sector crisis, and the ensuing impact on household and business fi nances.
Looking fi rst to the housing market, the relationship between housing activity and the business cycle has changed markedly in recent years. Until recently, as observed by Leamer (2007), swings in residential investment have been at the core of the cycle—eight of the ten
65
2CHAPTER
COUNTRY AND REGIONAL PERSPECTIVES

CHAPTER 2 COUNTRY AND REGIONAL PERSPECTIVES
66
postwar recessions were preceded by a housing downturn, and all major housing downturns since 1970 have been followed by recessions (Figure 2.1). However, the liberalization of bank regulations and the shift of housing fi nance into securities markets has broken the tight link between rising interest rates, the availability of mortgage fi nancing, and residential investment (Bernanke, 2007). At the same time, as dis-cussed in Chapter 3, the increasing development of the mortgage market seems to have strength-ened the “fi nancial accelerator” impact of rising
house prices on consumption. The house price boom continued even as monetary policy was tightened from 2002, as fi nancing availability was maintained through securitization techniques that allowed a weakening of loan conditions (rising loan-to-value ratios, use of low “teaser” interest rates, and inadequate documentation) and rising fi nancial sector leverage.
After peaking in the latter part of 2005, the housing market has already undergone a major correction, with house prices dropping 0–10 per-cent during 2007, depending on the measure
Table 2.1. Advanced Economies: Real GDP, Consumer Prices, and Unemployment(Annual percent change and percent of labor force)
Real GDP Consumer Prices Unemployment2006 2007 2008 2009 2006 2007 2008 2009 2006 2007 2008 2009
Advanced economies 3.0 2.7 1.3 1.3 2.4 2.2 2.6 2.0 5.7 5.4 5.6 5.9United States 2.9 2.2 0.5 0.6 3.2 2.9 3.0 2.0 4.6 4.6 5.4 6.3Euro area1 2.8 2.6 1.4 1.2 2.2 2.1 2.8 1.9 8.2 7.4 7.3 7.4
Germany 2.9 2.5 1.4 1.0 1.8 2.3 2.5 1.6 9.8 8.4 7.9 7.7France 2.0 1.9 1.4 1.2 1.9 1.6 2.5 1.7 9.2 8.3 7.8 7.9Italy 1.8 1.5 0.3 0.3 2.2 2.0 2.5 1.9 6.8 6.0 5.9 5.8Spain 3.9 3.8 1.8 1.7 3.6 2.8 4.0 3.0 8.5 8.3 9.5 10.4Netherlands 3.0 3.5 2.1 1.6 1.7 1.6 2.4 1.8 3.9 3.2 2.8 2.9Belgium 2.9 2.7 1.4 1.2 2.3 1.8 3.1 1.9 8.2 7.5 7.6 8.3Austria 3.3 3.4 1.9 1.7 1.7 2.2 2.8 1.9 4.8 4.4 4.4 4.5Finland 4.9 4.4 2.4 2.1 1.3 1.6 2.8 1.9 7.7 6.8 6.7 6.7Greece 4.2 4.0 3.5 3.3 3.3 3.0 3.5 2.7 8.9 8.3 7.5 7.4Portugal 1.3 1.9 1.3 1.4 3.0 2.4 2.4 2.0 7.7 7.7 7.6 7.4Ireland 5.7 5.3 1.8 3.0 2.7 3.0 3.2 2.1 4.4 4.6 5.3 5.0Luxembourg 6.1 5.4 3.1 3.2 2.7 2.3 2.9 2.1 4.5 4.4 4.8 4.9Slovenia 5.7 6.1 4.1 3.5 2.5 3.6 4.0 2.4 5.9 4.8 4.8 5.0Cyprus 4.0 4.4 3.4 3.5 2.2 2.2 4.0 2.9 4.6 3.9 3.9 3.9Malta 3.4 3.8 2.2 2.0 2.6 0.7 3.4 2.5 7.3 6.3 6.5 6.8
Japan 2.4 2.1 1.4 1.5 0.3 — 0.6 1.3 4.1 3.9 3.9 3.9United Kingdom1 2.9 3.1 1.6 1.6 2.3 2.3 2.5 2.1 5.4 5.4 5.5 5.4Canada 2.8 2.7 1.3 1.9 2.0 2.1 1.6 2.0 6.3 6.0 6.1 6.3
Korea 5.1 5.0 4.2 4.4 2.2 2.5 3.4 2.9 3.5 3.3 3.1 3.0Australia 2.8 3.9 3.2 3.1 3.5 2.3 3.5 3.3 4.8 4.4 4.3 4.3Taiwan Province of China 4.9 5.7 3.4 4.1 0.6 1.8 1.5 1.5 3.9 3.9 3.9 3.8Sweden 4.1 2.6 2.0 1.7 1.5 1.7 2.8 2.1 7.0 6.1 6.6 7.1Switzerland 3.2 3.1 1.3 0.9 1.0 0.9 2.0 1.4 3.3 2.5 3.2 4.1Hong Kong SAR 7.0 6.3 4.3 4.8 2.0 2.0 3.6 4.5 4.8 4.1 3.9 3.8Denmark 3.9 1.8 1.2 0.5 1.9 1.7 2.3 2.0 4.0 2.8 3.1 3.2Norway 2.5 3.5 3.1 2.3 2.3 0.8 3.1 2.6 3.4 2.5 2.5 3.0Israel 5.2 5.3 3.0 3.4 2.1 0.5 2.6 2.0 8.4 7.3 6.7 6.7Singapore 8.2 7.7 4.0 4.5 1.0 2.1 4.7 2.5 2.7 2.1 2.1 2.2New Zealand2 1.5 3.0 2.0 2.1 3.4 2.4 3.4 2.7 3.8 3.6 4.1 4.4Iceland 4.4 3.8 0.4 0.1 6.8 5.0 5.5 2.7 1.3 1.0 3.2 2.9
MemorandumMajor advanced economies 2.7 2.2 0.9 0.9 2.4 2.2 2.4 1.8 5.8 5.5 5.7 6.0Newly industrialized Asian economies 5.6 5.6 4.0 4.4 1.6 2.2 3.0 2.7 3.7 3.4 3.3 3.2
1Based on Eurostat’s harmonized index of consumer prices.2Consumer prices excluding interest rate components.

67
used, and house starts dropping over 50 percent from their peak by early 2008. Nevertheless, the market remains far from equilibrium, with inventories of unsold houses still close to record levels and home value indicators still elevated well above historical norms (see Figure 2.1). Moreover, the adjustable-rate sector of the subprime mortgage market has virtually disap-peared, and spreads have now widened even on conforming mortgages. Rising negative
Table 2.2. Advanced Economies: Current Account Positions(Percent of GDP)
2006 2007 2008 2009
Advanced economies –1.5 –1.2 –1.1 –1.1United States –6.2 –5.3 –4.3 –4.2Euro area1 –0.1 –0.2 –0.7 –0.9
Germany 5.0 5.6 5.2 4.9France –1.3 –1.3 –2.4 –2.5Italy –2.6 –2.2 –2.4 –2.3Spain –8.6 –10.1 –10.5 –10.3Netherlands 8.3 6.6 5.9 5.6Belgium 2.7 3.2 2.9 2.8Austria 2.4 2.7 2.9 2.9Finland 4.6 4.6 3.8 3.9Greece –11.0 –13.9 –13.9 –14.1Portugal –9.4 –9.4 –9.5 –9.5Ireland –4.2 –4.5 –3.2 –2.9Luxembourg 10.3 9.5 8.2 7.3Slovenia –2.8 –4.8 –4.8 –4.9Cyprus –5.9 –7.1 –7.7 –7.1Malta –6.7 –6.2 –6.1 –5.8
Japan 3.9 4.9 4.0 3.9United Kingdom –3.9 –4.9 –4.8 –4.4Canada 1.6 0.9 –0.9 –1.2
Korea 0.6 0.6 –1.0 –0.9Australia –5.5 –6.2 –6.3 –5.3Taiwan Province of China 6.7 8.3 7.8 8.1Sweden 8.5 8.3 6.4 6.7Switzerland 15.1 17.2 15.4 13.8Hong Kong SAR 12.1 12.3 9.9 8.3Denmark 2.7 1.1 0.7 1.3Norway 17.3 16.3 20.0 20.4Israel 6.0 3.1 1.8 1.7Singapore 21.8 24.3 20.6 18.9New Zealand –8.6 –8.1 –7.1 –7.1Iceland –25.4 –15.6 –8.0 –5.3
MemorandumMajor advanced economies –2.3 –1.8 –1.6 –1.5Euro area2 –0.2 0.1 –0.5 –0.8Newly industrialized Asian
economies 5.2 6.0 4.5 4.31Calculated as the sum of the balances of individual euro area
countries.2Corrected for reporting discrepancies in intra-area transactions.
1970 75 80 85 90 95 00 050
2
4
6
8
10
12
14
0
100
200
300
400
500
600
700
0
2
4
6
8
-50
-25
0
25
50
75
-15
0
15
30
NAROFHEO
50
75
100
125
150
175
200
225
250
25
50
75
100
125
150
175
1970 75 80 85 90 95 00 050
500
1000
1500
2000
2500
3000
Figure 2.1. United States: Housing Cycles in Perspective
Sources: Davis, Lehnert, and Martin (2007); Haver Analytics; and IMF staff calculations. National Association of Realtors; three-month moving average of 12-month percent change. Office of Federal Housing Enterprise Oversight (OFHEO). Ratio of OFHEO house price index to personal disposable income per capita. Inverse of the rent-price ratio for the aggregate stock of owner-occupied housing. Index equal to 100 median family income qualifies for an 80 percent mortgage on a median-priced existing single-family home, reindexed to 1995 = 100. Percent of GDP average during 1970–2007. Thousands of new single family homes for sale. Months of inventory at current sales pace.
The current housing cycle is already the longest since the 1970s. Moreover, various valuation indicators remain elevated, suggesting that the downswing still has a substantial way to go.
Real House Prices(index, 1995 = 100)
Real Residential InvestmentHousing Affordability(index, 1995 = 100)
1
House Price Inflation(12-month percent change)
1
23
Starts and Sales of New Homes(thousands, seasonally adjusted at annual rates)
Inventories of New Homes
Jan. 08
Feb. 08
4
Case-Shiller2
NAROFHEO
1 Case-Shiller2
Percent of GDP(left scale)
Four-quarter percent change(right scale)
Average6
Starts
SalesMonths of inventory
(left scale)
Thousands of new homes(right scale)
7
8
6
5
Jan.08
1970 75 80 85 90 95 2000
3Price-to-income
ratioPrice-to-rent
ratio4
Affordabilityindex5
78
05
Feb.08
1970 75 80 85 90 95 2000 05Feb.08
1970 75 80 85 90 95 2000 05
07:Q4
1970 75 80 85 90 95 2000 05
UNITED STATES AND CANADA: HOW LONG WILL THE SLOWDOWN LAST?

CHAPTER 2 COUNTRY AND REGIONAL PERSPECTIVES
68
equity on home ownership and resets of vari-able-rate mortgages are likely to push defaults and foreclosures up still higher, putting further downward pressure on house prices, which will ratchet up incentives to default. Refl ecting these concerns, the baseline scenario for the U.S. economy assumes a 14–22 percent drop in house prices during 2007–08 (depending on the index used)—unprecedented for the United States, although not elsewhere.
Turning to fi nancial markets, the question is how much of a drag will be imposed on activ-ity by the spreading fi nancial market crisis. The concern is that fi nancial and housing markets are in mutually reinforcing cycles of tightening credit conditions, falling asset values, and weak-ening activity. Risk spreads have widened, nota-bly on high-yield bonds, although the impact has been somewhat cushioned by the decline in risk-free rates and the lower cost of funds. Moreover, capital is being eroded—the baseline scenario envisages that losses to U.S. bank capi-tal from mortgage-related exposures and struc-tured credits will amount to about 2 percentage points of risk-weighted assets. Pressure on capital is being further exacerbated as banks absorb special-purpose vehicles and intended securitiza-tion deals back onto their balance sheets. Bank lending conditions have already been tightened, certain types of fi nancing—such as asset-backed commercial paper and credits for leveraged buyouts—have largely dried up, and spreads on other types of asset-backed borrowing—notably credit cards and commercial real estate loans—have widened sharply. All these effects threaten to have a signifi cant restraining effect on activity, pushing up default rates and lowering underly-ing asset values, with further adverse impact on fi nancial markets.
Partially counteracting these forces, capital in commercial banks had built up to comfort-able levels after 2000, and banks have been able to tap new sources to raise additional capital in recent months, helping to keep the ratio of tier 1 capital to risk-weighted assets for the commercial banking system above 10 percent at end-2007. Corporate profi tability and balance
sheets remain strong, reducing their need for fi nancing. Finally, resources for provision of mortgage fi nancing have been made available to banks by the Federal Home Loan Banks and by an easing of constraints on the main govern-ment-sponsored enterprises. Thus, although credit has been squeezed, a full-blown credit crunch has not developed so far (see Box 1.1).
Refl ecting these considerations, the baseline projections envisage that the economy will tip into modest recession in 2008, followed by a gradual recovery starting in 2009 that will be somewhat slower than that following the 2001 recession as household and fi nancial balance sheets are repaired. (Chapter 2 of the April 2003 World Economic Outlook analyzed how balance sheet problems in the wake of hous-ing busts were responsible for particularly slow recoveries.) On an annual basis, growth will slow to 0.5 percent in 2008, before rising modestly to 0.6 percent in 2009. The trajectory is clearer when measured on a fourth-quar-ter-to-fourth-quarter basis. On this metric, the economy is projected to decline 0.7 percent dur-ing 2008—down from the 0.9 percent increase projected in the January 2008 World Economic Outlook Update—before recovering to grow a still-below-par 1.6 percent during 2009. All major components of domestic demand will be sickly during 2008. Residential investment will con-tinue to drop; consumption will decline in the face of adverse wealth effects, tight credit, and deteriorating labor market conditions, despite tax credits in the recently enacted fi scal stimulus package; and business investment will also turn down. In 2009, consumption will remain slug-gish, as households continue to raise their saving rate after a long period during which personal wealth was boosted by buoyant capital gains on assets rather than by savings from income. Net exports will continue to be a bright spot, bring-ing the current account defi cit down further to about 4.2 percent of GDP, notwithstanding sustained high oil prices.
Risks around this lower baseline are still somewhat weighted to the downside, particu-larly for 2009. Negative fi nancial and housing

69
feedbacks could push activity down below the baseline. Nevertheless, concerns have been partially alleviated by vigorous policy responses, particularly the provision of liquidity to fi nan-cial markets.
Given this outlook, the Federal Reserve may well need to continue easing interest rates for some time, depending on the emerging evi-dence on the extent of the downturn. The fed-eral funds rate has already been lowered by 300 basis points since summer 2007, and markets expect a further 50-basis-point cut over the next 12 months. With core infl ation still somewhat elevated and prospects for continued high and volatile energy and food prices, there are linger-ing concerns about infl ation, but these risks should be blunted by the projected widening output gaps and the soft labor market.
Fiscal policy should also be used to provide valuable support for a faltering economy after several years of consolidation. Automatic stabiliz-ers in the United States are less strong than in western Europe, refl ecting the smaller size of government. Government revenues are likely to be quite sensitive to a downturn, and the recent surge in capital gains taxes could be reversed, although the benefi ts would accrue mainly to higher-income groups with lower marginal propensity to consume. The recently enacted stimulus package provides tax relief to low- and middle-income households, as well as increased incentives for business investment, and should provide an effective boost to demand in the second half of 2008, based on the effects of the stimulus package implemented in 2001 (Box 2.1).
Public support for housing and fi nancial markets could help these markets stabilize, although care should be taken to avoid undue moral hazard. At the same time, however, care should also be taken to avoid weakening the fi scal trajectory on a permanent basis, given continuing long-term pressures on fi scal spend-ing from population aging and rising healthcare costs, which have yet to be seriously addressed. In this respect, the authorities’ commitment to achieving a budget surplus by fi scal year 2012
is welcome but will be achieved only with very tight budgetary control.
The authorities are moving to address particu-lar problems in the housing and fi nancial sec-tors. The Federal Reserve has acted prudently to increase the effectiveness of its instruments for providing liquidity by broadening the range of collateral accepted and the range of institu-tions with access to its windows and by acting forcefully to maintain systemic stability, while gearing its monetary policy decisions toward its macroeconomic mandates. The government has also helped coordinate an industry agree-ment to facilitate a freeze on interest-rate resets on subprime loans with excessive loan-to-value ratios, which should help to relieve social strains although without a major effect on market dynamics. Although recent steps to temporarily raise limits on the role of government-sponsored enterprises should provide some support to the mortgage market, they risk eroding already-weak capital cushions. Further initiatives could be considered to facilitate mortgage refi nanc-ing in the face of house price declines, includ-ing through the judicious use of public funds, in order to reduce the risk that unnecessary foreclosures would put further downward pres-sure on house prices. In addition, steps will be needed to address systemic weaknesses that have been exposed. Recent proposals to overhaul the fractured fi nancial regulatory system using an objectives-based approach are suitably ambitious, although details will need to be worked out carefully. Also needed are measures to tighten consumer protection against fraudulent lending activity and ensure more prudent lending and securitization practices, as recently proposed by an interagency taskforce.
After several years of strong growth, the Canadian economy also slowed toward the end of 2007. It is expected to grow 1.3 percent in 2008, before regaining momentum in 2009. The slowdown mainly refl ects the combined effect of weaker external demand and tighter credit conditions, both of which are sources of additional downside risk. The Bank of Canada has appropriately responded to the more
UNITED STATES AND CANADA: HOW LONG WILL THE SLOWDOWN LAST?

CHAPTER 2 COUNTRY AND REGIONAL PERSPECTIVES
70
The idea that discretionary fi scal policy can be an effective countercyclical policy tool is the subject of a long-standing debate among economists. Traditional supporters of an activist approach have argued that economies lack an inherent mechanism to achieve full resource utilization. However, failed policy experiments during the 1970s and theoretical advances led to widespread rejection of this premise. Critics argued that, if markets operated freely, competi-tion would ensure full employment, and a fi scal stimulus would, in any case, be ineffective owing to agents’ offsetting responses to anticipated future fi scal reversals (Ricardian equivalence).
A more nuanced view has developed since then in the literature: fi scal policy can be effec-tive, but the necessary conditions may or may not be available at a given time or place. After a period of rising defi cits during the 1980s, empirical studies highlighted the stifl ing effects of high debt levels, defi cit bias, and macroeco-nomic vulnerabilities on the impact of fi scal stimulus.1 At the same time, theoretical advances identifi ed a variety of circumstances under which fi scal policy can be effective. Models with credit-constrained consumers or fi nite planning hori-zons generated positive output effects and were also supported by microstudies. Other modeling approaches relied on nominal wage and price stickiness and imperfect competition among pro-ducers, both of which can raise real wages and output in response to a fi scal demand shock.2 Not only were these assumptions considered realistic extensions of the classical approach, they also generated credible macroeconomic patterns if incorporated into calibrated dynamic general equilibrium models.3 As these models
Note: The main authors of this box are Stephan Danninger, Michael Kumhof, and Doug Laxton, with input from Steven Symansky.
1See, for example, Giavazzi and Pagano (1990).2For other factors, see Blinder (2004).3Even in a frictionless economy, fi scal policy can
raise growth via a supply response (Baxter and King, 1993). For other explanations see Ravn, Schmitt-Grohé, and Uribe (2006); Linneman and Schabert (2003); and Galí, López-Salido, and Javier Vallés (2007). Recent applications of calibrated dynamic
have grown in number, theory has generated a profusion of possible transmission mechanisms.
It is therefore an empirical question: what impact can discretionary fi scal policy have in stimulating demand? Recent episodes generate a mixed impression about the effectiveness of fi scal policy (table). The 2001 U.S. income tax rebates are generally considered to have been successful in strengthening domestic demand with an estimated multiplier of around 0.5. The tax rebates were, however, part of a larger fi scal package and were given in anticipation of per-manent cuts to follow. The 1995 stimulus pack-age in Japan—preceded by a series of smaller programs—is estimated to have raised growth by 1 percent in the short term. However, Japan continued to grow slowly as it struggled to deal with a heavy load of bad bank loans after the collapse of the asset price bubble, and stimulus packages continued to be provided through-out the decade. A third example is Finland’s response to the 1991 output shock, which combined a structural fi scal loosening with full operation of automatic stabilizers. The fi scal loosening is thought to have been largely inef-fective and possibly even a negative input owing to the concerns it raised about sustainability, given the permanent nature of the shock. Lacking counterfactuals, these experiences offer only anecdotal insights, but they do raise questions about the size and durability of fi scal policy effects, particularly when the underlying reasons for growth slowdowns are permanent in nature.
More generally, cross-country studies based on empirical models fi nd quite small fi scal multipliers. Recent studies using vec-tor autoregression methods conclude that in many large economies, fi scal multipliers have declined over time and may even have become negative (Perotti, 2005; first figure).4
stochastic general equilibrium models are discussed in Botman, Karam, Laxton, and Rose (2007).
4An alternative approach, using historical fi scal expansion episodes to assess output effects (dummy variable approach), fi nds positive consumption and real wage effects (Perotti, 2007).
Box 2.1 When Does Fiscal Stimulus Work?

71
Possible explanations are increased leakage through the trade channel as economies have become more open, a decline in the num-ber of credit-constrained consumers as more consumers have gained access to lending, and a stronger focus of monetary policy on curtailing infl ation, which offsets some of the fi scal effects. However, there is large cross-country variation in the estimated effects, and this likely refl ects diffi culties in identifying fi scal shocks and interactions with other policy responses.5
5In Italy, estimates of spending multipliers are generally larger than 1, while tax multipliers are small and statistically insignifi cant (Sgherri, 2006; and Giordano and others, 2007). Estimates of spending and tax multipliers in Japan range between 0.5 and 1 (Hemming, Kell, and Mahfouz,
Estimates from macro models––empirical or calibrated––show somewhat stronger multiplier effects, in the range of 0.3 to 1.2 on impact, with expenditure measures generally having a larger effect than tax measures (Hemming, Kell, and Mahfouz, 2002; and Botman, 2006). The size of the effect depends critically, however, on the assumptions about underlying parameters (such as elasticity of substitution, pervasiveness
2002; and Kuttner and Posen, 2002). Impulse responses to fi scal shocks in Spain are small initially but turn negative in the medium term (Catalán and Lama, 2006; and De Castro Fernández and Hernán-dez de Cos, 2006). For Germany, Heppke-Falk, Ten-hofen, and Wolff (2006) fi nd that only expenditure measures have positive short-term output effects, with a multiplier of 0.6 on impact, which disappears after three years.
Recent Examples of Fiscal Stimulus GDP Growth1
Stimulus Trigger
Measure and Size
(percent of GDP)
Previousthree years(average) T
Next threeyears
(average) Comment
United States2001–02
Bursting of dot-com bubble and fallout from global terrorism
Income tax rebate: ½ percent
4.1 0.8 2.6 Shapiro and Slemrod (2003) and Johnson, Parker, and Souleles (2004) estimate that between four-tenths and two-thirds of the tax rebate was consumed in the first six months
Japan 1995 Protracted period of slow growth after bursting of asset price bubble and prolonged banking sector stress
Public investment program combined with income tax cut: 1½ percent
0.8 1.9 0.8 Kuttner and Posen (2002) find a short-term growth effect of 1 percent of GDP (in 1996) but argue that the stimulus was ultimately too small to prevent a backsliding of growth. Announcement effects tended to be large, but actual implementation was much smaller (Mühleisen, 2000; Posen, 1998). Bayoumi (2001) uses a vector autoregression methodology and finds a positive but small government expenditure multiplier of 0.6 for the 1990s
Finland 1991 Loss of export market following disintegration of Soviet Union and bursting of real estate and asset bubbles
Full operation of automatic stabilizers (4.2 percent) and structural deterioration (1¾ percent)
4.7 0.1 –3.6 Corsetti and Roubini (1996) find that fiscal policy had little stabilizing effect on output due to the permanent nature of the economic shock
1Forward- and backward-looking GDP growth (T – 1, T + 1) refer to a three-year average.
UNITED STATES AND CANADA: HOW LONG WILL THE SLOWDOWN LAST?

CHAPTER 2 COUNTRY AND REGIONAL PERSPECTIVES
72
of liquidity constraints, and labor supply elastic-ity) and other factors.
Even if fi scal policy measures have a posi-tive multiplier effect, to be useful they must be implemented at the right time and supported by favorable macroeconomic conditions. Some fi scal measures have implementation lags similar to that of monetary policy, and the cyclical position is often only known with signifi cant lags. For this reason, the fi rst line of fi scal policy response is the use of automatic stabilizers (the variation of revenue and expenditure over the economic cycle). The size of such stabilizers varies across countries, however, and is small in many coun-tries, such as the United States and Japan, that have relatively small governments (second figure). Even when discretionary measures can be adopted in a timely manner, their effective-ness is likely to depend on a range of dimensions such as macroeconomic vulnerabilities (such as external imbalance) and fi scal conditions (such
as sustainability or debt levels). Unfavorable conditions can magnify the offsetting responses to a fi scal stimulus.
Box 2.1 (continued)
0.25 0.30 0.35 0.40 0.45 0.50 0.55 0.60 0.6525
30
35
40
45
50
55
60
Sensitivity of Fiscal Balance and Government Size
Source: Girouard and André (2005). Elasticity of the budget balance in percent of GDP, with respect to the output gap.
Denmark
UnitedStates
SwedenFrance
Austria BelgiumItalyGermanyNetherlandsPortugalNorway
Canada
GreeceUnited Kingdom
SwitzerlandSpain
Japan
Ireland
New Zealand
Gove
rnm
ent e
xpen
ditu
re (p
erce
nt o
f GDP
)
Semi-elasticity of fiscal balance 1
1
Fiscal Multipliers from SVAR Models(Cumulative GDP response at 4 and 12 quarters)
Source: Perotti (2005).
1960–80 1980–2001
After 4 quartersAfter 12 quarters
Tax cut equal toone percent of GDP
1960–80 1980–2001
Spending increase equal to one percent of GDP
-1
0
1
2
3
4United States
-2
-1
0
1Germany
-2
-1
0
1United Kingdom
-3
-2
-1
0
1
2Canada
-2
-1
0
1
2Australia
1960–80 1980–2001 1960–80 1980–2001
1960–80 1980–2001 1960–80 1980–2001
1960–80 1980–2001 1960–80 1980–2001
1960–80 1980–2001 1960–80 1980–2001

73
Model Simulations
To illustrate these points, the economic effects of discretionary fi scal and monetary pol-icy responses to a sizable demand shock in the United States were modeled using a fi ve-country annual version of the Global Integrated Mon-etary and Fiscal Model (GIMF).6
The baseline scenario, shown as the solid black lines in the third figure, assumes an exogenous shock to domestic U.S. consumption and investment, with maximum impact after one year. Monetary policy is assumed to follow a Taylor rule that responds to lower infl ation by lowering nominal and, therefore, real interest rates. As for fi scal policy, the elasticity of the government defi cit with respect to the output gap under automatic stabilizers is assumed to be –0.25, which is signifi cantly lower than in other advanced economies, and is assumed to operate through an increase in debt-fi nanced transfers to households. With this set of policies, the baseline scenario generates a contraction of GDP (relative to its trend path) of 1.3 percent in the fi rst year, followed by a slow four-year recovery.7
The three alternative scenarios shown in the fi gure illustrate the effects of a discretion-
6GIMF is a multicountry dynamic stochastic general equilibrium model and includes strong non-Ricardian features whereby fi scal policies have signifi cant real effects. It also includes signifi cant nominal and real rigidities, making it a useful tool to study both the short-term and the long-term implica-tions of supply and demand shocks. The country blocks are United States, euro area, Japan, emerg-ing Asia, and remaining countries. Trade linkages among these countries were calibrated using the 2006 matrix of world trade fl ows. For a description of the structure of the model, see Kumhof and Laxton (2007).
7The simulation assumes an equal distribution across households, but the effects would be larger if the transfers were targeted specifi cally at credit-con-strained households. Because the assumed underly-ing shock is to demand, infl ation falls by about 0.8 percentage point in the fi rst two years and then slowly returns to its long-run value. The monetary policy response is to aggressively lower nominal interest rates by 130 basis points to stimulate an early recovery in demand.
0 1 2 3 4 50.0
0.4
0.8
1.2
1.6
United States: Discretionary Fiscal Expansion Scenarios
Source: IMF staff calculations. Expansion through transfers is defined as a one percentage point increase in debt-financed transfers in year one and 0.5 percentage point in year two. Expansion through labor tax cuts is defined as a reduction in the labor income tax rate by 1.5 and 0.75 percentage points in year one and year two. Expansion through government investment is defined as a combination of higher transfers and an increase in productive government investment by 0.25 and 0.125 percent of GDP in year one and year two.
Government Deficit (percent of GDP)
Baseline shockTransfers
1
Public investmentLabor tax cuts
Without Monetary Accommodation
With Monetary Accommodation
0 1 2 3 4 50.0
0.4
0.8
1.2
1.6
0 1 2 3 4 5-1.5
-1.2
-0.9
-0.6
-0.3
0.0
Real GDP (percent)
0 1 2 3 4 5-1.5
-1.2
-0.9
-0.6
-0.3
0.0
0 1 2 3 4 5-1.0
-0.8
-0.6
-0.4
-0.2
0.0
0.2
0.4
Inflation (percentage points)
0 1 2 3 4 5-1.0
-0.8
-0.6
-0.4
-0.2
0.0
0.2
0.4
0 1 2 3 4 5-1.4-1.2-1.0-0.8-0.6-0.4-0.20.00.2
Nominal Policy Rate (percentage points)
0 1 2 3 4 5-1.4-1.2-1.0-0.8-0.6-0.4-0.20.00.2
1
(Years on x-axis)
UNITED STATES AND CANADA: HOW LONG WILL THE SLOWDOWN LAST?

CHAPTER 2 COUNTRY AND REGIONAL PERSPECTIVES
74
ary fi scal stimulus that raises the government defi cit-to-GDP ratio by 1 additional percentage point in the year of the shock and 0.5 additional percentage point in the following year. The main results are as follows.• Expenditure and tax measures help allevi-
ate the slowdown, but the output effects are small at about 0.1–0.3 percent of GDP on impact (left column of third fi gure). Expansions involving government invest-ment have the largest effect because they stimulate demand and supply at the same time, although it would be diffi cult to ensure timely implementation. Expansions that are well targeted to credit-constrained households—such as rebates for low-income workers—are also likely to be more effective (fourth figure).
• If fi scal policy is accommodated by monetary policy, the immediate output effects are twice as large, in the range of 0.2–0.6 percentage point (right column of third fi gure), with the largest impact again coming from the invest-ment stimulus.8
• Larger output effects come at the cost of higher infl ation, especially under monetary accommodation. A reduction in labor taxes is the most benign approach because of its positive effects on labor supply and productive capacity, which can help offset the infl ation impact.These results are sensitive to alternative
assumptions about the duration of the dis-cretionary stimulus. The size of the short-run effects depends crucially on whether a fi scal expansion is expected to be permanent and what fi scal measures are to be taken in the future to stabilize the defi cit-to-GDP ratio. The short-term stimulus to output is generally larger when a fi scal expansion is expected to be temporary rather than permanent, mainly
8The results would differ in the event of a supply-side shock. Discretionary demand management may still help to cushion the blow, but infl ation would turn out to be higher, with repercussions for longer-term output growth.
Box 2.1 (concluded)
-0.4
-0.2
0.0
0.2
0.4
-2
-1
0
1
2
Source: IMF staff calculations. Interest rate is defined in real terms as nominal interest rate minus consumer price inflation. Short-term effects on output show the direct first-year impact net of the effects of the negative demand shock. A temporary expansion is defined as a deterioration of the deficit by 1 percentage point of GDPin the first year and by half a percentage point in the second year, a permanent expansion by a permanent deterioration of the deficit by 1 percentage point of GDP. The share of liquidity-constrained households was alternated between 25 and 50 percent. Long-run deviations from baseline—calculated by using the steady-state model—is reported only for GDP.
United States: Additional Discretionary Fiscal Expansion Scenarios(GDP and real interest rate in percent; current account in percent of GDP)
Higher Transfers
Long-run deviation from baseline due to a permanent fiscal expansion (right scale) 2
1
Fewer Liquidity- Constrained Consumers
More Liquidity- Constrained Consumers
GDP Interestrate
Currentaccount
-0.4
-0.2
0.0
0.2
0.4
-2
-1
0
1
2
GDP Interestrate
Currentaccount
-0.4
-0.2
0.0
0.2
0.4
-2
-1
0
1
2
Lower Labor Income Taxes
-0.4
-0.2
0.0
0.2
0.4
-2
-1
0
1
2
Short-term deviation from baseline due to a permanent fiscal expansion (left scale)
Short-term deviation from baseline due to a temporary fiscal expansion (left scale)
1
2
GDP Interestrate
Currentaccount
GDP Interestrate
Currentaccount

75
unsettled outlook by changing from a tighten-ing to an easing posture, including interest rate cuts in late 2007 and early 2008. A package of tax cuts has provided a timely fi scal stimulus of about ¾ percent of GDP for 2008, while main-taining a small budget surplus consistent with Canada’s budget framework. More broadly, the Canadian economy has responded fl exibly to terms-of-trade gains and the growing importance of the resource sector, which has contributed to the real appreciation of the Canadian dol-lar. The Canadian dollar’s value seems in line with fundamentals, but moving ahead with the government’s structural policy agenda should help increase competitiveness and productivity growth to underpin longer-term prospects.
Western Europe: Can a Sharp Slowdown Be Averted?
For most of 2007, activity in western Europe continued to expand at a robust pace. The euro area grew by 2.6 percent in 2007 as a whole, close to the rapid pace achieved in 2006 and still well above potential. Similarly, growth in the United Kingdom registered a strong 3.1 percent
increase despite woes in the banking sector. Robust domestic demand was fueled by steady employment growth and buoyant investment, supported by healthy corporate balance sheets and strong global demand.
Signs of strain increased toward the end of 2007, however. In the fourth quarter, GDP growth slowed to 1.5 percent in the euro area and to 2.5 percent in the United Kingdom on an annualized basis. Consumer and business senti-ment deteriorated in response to fi nancial sector dislocation and the impact of rising oil prices on real disposable income. Euro appreciation and a weaker export market also diminished growth expectations. These effects were not felt equally across Europe. Smaller European coun-tries, such as Austria, the Netherlands, Sweden, and Switzerland, continued to grow well above potential in the second half of 2007. Recent indicators point to a continued deceleration in activity in early 2008, with high oil prices and ris-ing risk spreads beginning to have an increasing impact on investment and consumption growth.
To what extent will the momentum of western European economies be sapped by the U.S. slowdown? Economic links between
because a temporary stimulus leads to a lower buildup of public debt and a smaller increase in real interest rates.9 The crowding-out effect from a persistent defi cit can be ameliorated if the stimulus measures reduce distortions––for example, by lowering taxes on labor income, which raises lifetime income (fourth fi gure, lower left panel). Nonetheless, over the long run, the rising public debt associated with per-manent measures and the necessary offsetting measures will lead to a lower growth trajectory. This underscores the advantage of temporary discretionary fi scal actions.
9For empirical evidence on the effects of govern-ment debt on real interest rates, see Ford and Laxton (1999).
Conclusions
Both empirical work and model simulations suggest that fi scal stimulus can be effective in providing some temporary support to an economy under stress. To be successful, how-ever, a number of factors need to be taken into account: (1) the stimulus must be well timed, requiring early identifi cation of a develop-ing problem; (2) it must avoid undermining long-term fi scal stability, which would weaken multiplier effects; and (3) it must be temporary and well targeted to maximize the impact on aggregate demand. Even satisfying these criteria, there are limits to the boost that fi scal policy can provide, which underlines the importance of dealing directly with the deeper problems that may be holding back economic performance.
WESTERN EUROPE: CAN A SHARP SLOWDOWN BE AVERTED?

CHAPTER 2 COUNTRY AND REGIONAL PERSPECTIVES
76
western Europe and the United States remain signifi cant. The traditional trade channel is still important, although the weight of the U.S. mar-ket has declined with the strengthening of trade with Asia, emerging Europe, and the Middle East. But fi nancial sector linkages appear to be the main source of spillovers in the current environment. Exposure to the U.S. subprime mortgage market—directly or through conduits and structured investment vehicles—has already strained banks’ capital in a number of countries and forced them to expand their balance sheets. As a result, credit conditions are tightening and risk spreads are rising, with negative repercus-sions for domestic demand (see Box 1.1).
In the baseline projection, growth in the euro area is forecast to decelerate to 1.4 percent in 2008 and 1.2 percent in 2009. With the impact of the U.S. slowdown feeding through with a short lag, on a fourth-quarter-to-fourth-quarter basis, growth will come down to 0.9 percent in 2008, before picking up to a still-below-par 1.6 percent in 2009. Export growth will likely hold up through the fi rst half of 2008, based on full order books, especially in Germany, but it is projected to taper off thereafter as a moderation of global demand and euro appreciation slow export growth. In the United Kingdom, growth is forecast to slow to 1.6 percent in 2008, as the lagged effects of the 2007 monetary tighten-ing, a turning in the house price cycle, and the fi nancial turbulence are projected to slow activity, despite monetary policy easing. Only a moderate recovery is foreseen for 2009.
Relative to the new lower baseline, risks to the growth outlook are seen as broadly balanced, with fi nancial and external risks to the downside and domestic demand risks to the upside. The most prominent downside risk is a protracted period of strain in the European fi nancial sector. The continuing revelation of losses to European banks from the U.S. housing market downturn has already undermined confi dence and prompted a signifi cant tightening of credit standards, and further blows to bank capital could start to have a greater impact on lending for business investment and the housing sector
(Figure 2.2). Corporations in Europe in general rely more heavily on banks for fi nancing than those in the United States, and a slowdown in mortgage lending could accelerate the so-far-gradual adjustment of housing prices in a num-ber of countries with elevated valuations (such as Belgium, the Netherlands, Ireland, Spain, the United Kingdom, and to a lesser extent France), with potentially severe repercussions for pri-vate consumption and investment in buildings and structures in some of these countries (see Box 3.1). Moreover, residential investment activity is signifi cantly above trend in a num-ber of countries, especially Belgium, France, Italy, and Spain, and less so in Ireland and the Netherlands. Other sources of downside risk are further euro appreciation, a deeper U.S. reces-sion, high oil price volatility, and bank exposure to losses in emerging Europe if this region were to run into diffi culties. On the upside, domestic demand could turn out to be more resilient than projected, supported by a moderation in the food and energy prices projected in the baseline and by relatively strong labor markets.
A concerted effort to improve fi nancial trans-parency and reduce uncertainty could help calm markets and lower risk spreads. Large write-downs and losses by U.S. banks in early 2008 surprised markets and raised fears of larger-than-anticipated losses by European fi nancial institutions from U.S. subprime markets. These fears were underscored by recent revelations about French and German banks’ previously unidentifi ed exposures. In this environment, a coordinated effort by European Union supervi-sors and regulators to encourage more disclo-sure and more consistent accounting treatment could allay market concern and help lower risk premiums and fi nancial market volatility.
Despite prospects for moderating growth, infl ation pressures remain a major source of concern. Headline infl ation in the euro area rose to 3.5 percent (year over year) in March 2008, considerably exceeding the European Central Bank’s (ECB’s) infl ation threshold of 2 percent. The surge was largely in energy and food prices, which have risen sharply since mid-

77
2007. Core infl ation2 remained stable through-out 2007 at just under 2 percent, against a background of moderate wage increases and the dampening effect of euro appreciation, but it picked up in early 2008. Headline infl ation is expected to come down within the ECB’s policy ceiling in 2009, refl ecting diminished resource utilization, slower food and energy price infl a-tion, and the uncertainty of base effects from past administrative price and indirect tax increases. Nonetheless, concerns about second-round price effects have increased, especially with unemployment at its lowest level since the early 1990s and with wage demands having risen recently, especially in Germany. In the United Kingdom, infl ation is projected to rise mod-erately from 2.0 percent in December 2007 to 2.5 percent in 2008 because of high energy and food prices. Although core infl ation began to decelerate in the second half of 2007, infl ation expectations have increased recently despite a weakening of the growth momentum.
Following a period of tightening, the ECB has held rates constant since June 2007. However, given that headline infl ation is projected to moderate back below 2 percent during 2009, in the context of an increasingly negative outlook for activity, the ECB can afford some easing of the policy stance. Similarly, while high infl ation remains a concern in the United Kingdom, the deterioration in the outlook for activity should alleviate infl ation pressures and provide room for further monetary policy easing.
Taking advantage of the economic upswing, most governments in western Europe signifi -cantly lowered their fi scal defi cits in 2007. In the euro area, the general government defi cit fell by almost 1 percentage point to 0.6 percent of GDP. Large structural fi scal adjustments of more than 1 percent of GDP in Germany and Italy led this effort, while fi scal defi cits in France and the United Kingdom remained high at 2.4 percent and 3.0 percent of GDP, respectively. This over-all improvement was an important step toward
2Based on Eurostat’s harmonized index of consumer prices, excluding energy, tobacco, alcohol, and food.
-20
0
20
40
60
-20
0
20
40
60
Sources: European Central Bank (ECB); Eurostat; OECD; and IMF staff calculations. Credit standard is defined as the difference between the sum of the percentages for “tightened considerably” and “tightened somewhat” and the sum of the percentages for “eased somewhat” and “eased considerably.” Residential property indices deflated by the consumer price indices are from the OECD for countries, and from the ECB for the
Credit to Enterprises: Changes in Credit Standards and Reasons Given
Figure 2.2. Western Europe: Tightening Lending Standards
Lending standards tightened in the euro area at the end of 2007, for reasons including deteriorating expectations about the economic outlook, sector-specific factors, and weak housing market prospects. Constraints on lending pose risks because corporations in Europe tend to rely more on bank financing, and residential property prices are at elevated levels.
2005:Q4
Net percent of banks reporting overall tightening of credit standards over the previous three months
Net percent of banks reporting tightening of credit standards
0
20
40
60
80
100 Real Credit Outstanding(percent of real GDP)
2000 03 04 0501 07:Q4
06 50
100
150
200
250
300Residential Property Price(index, 1997 = 100)
Spain
Costs related to banks’ capital
Expectations ofgeneral economic
activity
Industry- or firm- specific outlook
Net percent of banks reporting overall tightening of credit standardsover the following three months
06:Q4
08:Q1
-10
0
10
20
30
40
-10
0
10
20
30
40Loans for House Purchase: Changes in Credit Standards and Reasons Given
Housing market prospects
Expectations ofgeneral economic
activity
Cost of funds
02
Euro area
United Kingdom
France
Ireland
1
07:Q4
05:Q4
06:Q4
07:Q4
05:Q4
06:Q4
07:Q4
05:Q4
06:Q4
07:Q4
Euro area corporations
U.S. corporations
1995 97 99 2001 03 05
United States
2005:Q4
06:Q4
08:Q1
05:Q4
06:Q4
07:Q4
05:Q4
06:Q4
07:Q4
05:Q4
06:Q4
07:Q4
1
euro area.
WESTERN EUROPE: CAN A SHARP SLOWDOWN BE AVERTED?

CHAPTER 2 COUNTRY AND REGIONAL PERSPECTIVES
78
sustainability and strengthened the credibility of the new Stability and Growth Pact after repeated breaches of the 3 percent defi cit ceiling in sev-eral countries.
Past fi scal consolidation has created some room for countercyclical fi scal support. Indeed, in 2008 the fi scal defi cit in the euro area is expected to widen again by ½ percent of GDP, mainly as a result of the growth slowdown but also because of an increase in the structural defi cits in Germany and Italy and a decline in the structural surplus in Spain. Given Europe’s larger public sectors and broader safety nets, automatic stabilizers are larger than in other regions and should be the main policy instru-ment. Countries that are already close to the medium-term objectives laid out in their stability programs could allow these automatic stabiliz-ers to operate in full. However, countries that are close to the 3 percent defi cit limit—such as France, Italy, and Greece—should offset at least part of their automatic stabilizers, except in the case of a recession, in which event the Stability and Growth Pact would allow a temporary and small breach of the defi cit limit. The hard-won adjustment gains achieved during recent years should not be jeopardized during the coming slowdown, as demographic changes are rapidly affecting the cost of European old-age and health care systems.
Advanced Asia: How Resilient Is Growth in Japan to a Global Slowdown?
Preliminary GDP data for the fourth quarter of 2007 indicate that the Japanese economy remained resilient to the global slowdown through the end of the year. GDP grew at an annualized rate of 3.5 percent, led by robust net exports and business investment. Exports continued to be supported by strong demand from Asia and Europe, and business investment rebounded after contracting during the fi rst half of the year. Following the tightening of build-ing standards in June, the slump in residential investment continued and household spend-ing remained weak. The growth momentum
entering 2008, however, appears to have slowed with deteriorating business and consumer confi dence, and export growth shows signs of moderating.
The main direct channel for spillovers to economic activity from a global slowdown would be through slowing export growth, a risk under-scored by the strong role of net exports in the recovery of output in recent years (Figure 2.3). In this context, the continued strength of domestic demand—and investment in particu-lar—in emerging Asian economies remains a key support for Japanese exports, as evidenced by the resilience of capital goods shipments in the fourth quarter of 2007. Moreover, emerging Asian economies now account for nearly one-half of Japanese exports, while the share of the United States and the euro area has declined to slightly over a third of the total. Overall, as long as emerging economy growth continues to remain relatively insulated from the slowdown in the United States and western Europe, Japa-nese export performance should remain well supported.
The prospects for domestic demand are another source of downside risk to the near-term outlook. Higher food and fuel prices and sluggish wages continue to weigh on consump-tion, and business investment could weaken if the global market turmoil were to intensify and credit conditions were to tighten further. Equity prices have already fallen sharply on concerns over the economic outlook, and further declines represent a potential risk for bank and cor-porate balance sheets, although the Japanese fi nancial system has limited direct exposure to U.S. subprime securities. On the upside, hous-ing starts appear to have bottomed out in the third quarter of 2007, and residential investment is expected to provide some support to growth in the fi rst half of 2008.
Refl ecting the above considerations, growth for Japan is projected at 1.4 percent in 2008 and 1.5 percent in 2009, down from 2.1 percent growth in 2007. Underlying this baseline, export growth is expected to weaken, and consump-tion is expected to moderate further. Residential
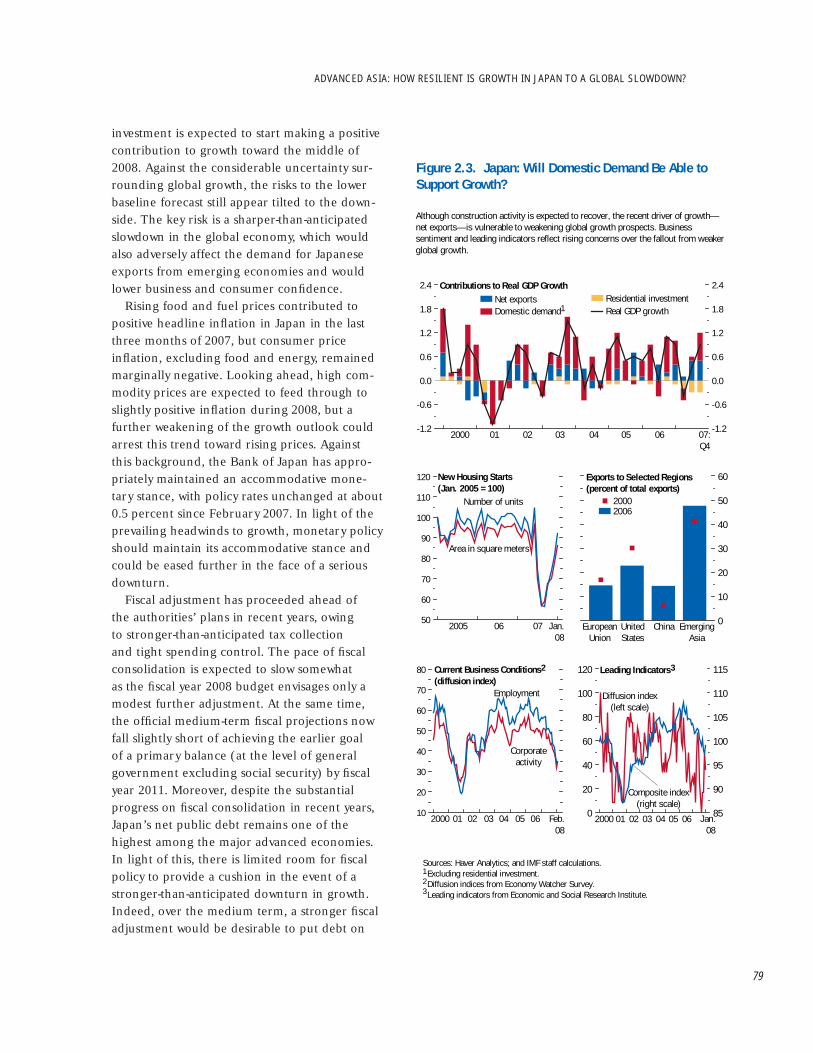
79
investment is expected to start making a positive contribution to growth toward the middle of 2008. Against the considerable uncertainty sur-rounding global growth, the risks to the lower baseline forecast still appear tilted to the down-side. The key risk is a sharper-than-anticipated slowdown in the global economy, which would also adversely affect the demand for Japanese exports from emerging economies and would lower business and consumer confi dence.
Rising food and fuel prices contributed to positive headline infl ation in Japan in the last three months of 2007, but consumer price infl ation, excluding food and energy, remained marginally negative. Looking ahead, high com-modity prices are expected to feed through to slightly positive infl ation during 2008, but a further weakening of the growth outlook could arrest this trend toward rising prices. Against this background, the Bank of Japan has appro-priately maintained an accommodative mone-tary stance, with policy rates unchanged at about 0.5 percent since February 2007. In light of the prevailing headwinds to growth, monetary policy should maintain its accommodative stance and could be eased further in the face of a serious downturn.
Fiscal adjustment has proceeded ahead of the authorities’ plans in recent years, owing to stronger-than-anticipated tax collection and tight spending control. The pace of fi scal consolidation is expected to slow somewhat as the fi scal year 2008 budget envisages only a modest further adjustment. At the same time, the offi cial medium-term fi scal projections now fall slightly short of achieving the earlier goal of a primary balance (at the level of general government excluding social security) by fi scal year 2011. Moreover, despite the substantial progress on fi scal consolidation in recent years, Japan’s net public debt remains one of the highest among the major advanced economies. In light of this, there is limited room for fi scal policy to provide a cushion in the event of a stronger-than-anticipated downturn in growth. Indeed, over the medium term, a stronger fi scal adjustment would be desirable to put debt on
-1.2
-0.6
0.0
0.6
1.2
1.8
2.4
-1.2
-0.6
0.0
0.6
1.2
1.8
2.4
Figure 2.3. Japan: Will Domestic Demand Be Able to Support Growth?
0
10
20
30
40
50
60Exports to Selected Regions(percent of total exports)
Contributions to Real GDP Growth
Domestic demandNet exports
Sources: Haver Analytics; and IMF staff calculations. Excluding residential investment. Diffusion indices from Economy Watcher Survey. Leading indicators from Economic and Social Research Institute.
1
Although construction activity is expected to recover, the recent driver of growth— net exports—is vulnerable to weakening global growth prospects. Business sentiment and leading indicators reflect rising concerns over the fallout from weaker global growth.
Real GDP growth
50
60
70
80
90
100
110
120 New Housing Starts(Jan. 2005 = 100)
20062000
Residential investment1
2005 06 Jan.08
Area in square meters
Number of units
EuropeanUnion
UnitedStates
China EmergingAsia
2000 01 02 03 04 05 06 07:Q4
0
20
40
60
80
100
120
85
90
95
100
105
110
115Leading Indicators
10
20
30
40
50
60
70
80 Current Business Conditions(diffusion index)
Diffusion index(left scale)
Composite index(right scale)
2000 Feb.08
Corporateactivity
Employment
02 04 05 060301 2000 Jan.08
02 04 05 060301
2 3
23
07
ADVANCED ASIA: HOW RESILIENT IS GROWTH IN JAPAN TO A GLOBAL SLOWDOWN?

CHAPTER 2 COUNTRY AND REGIONAL PERSPECTIVES
80
a fi rmly declining path. Although there is still some room for further expenditure cuts, consid-eration needs to be given to revenue measures in the context of a broad reform of the tax system, elements of which could include raising the consumption tax, reforming the corporate tax system, widening the income tax base, and strengthening tax administration.
The growth momentum in Australia and New Zealand remains robust, and the turbulence in global fi nancial markets has thus far had only a limited impact. Although direct exposure to the U.S. subprime market appears to be small, banks have passed on some of the elevated costs of funding in the interbank market in the form of higher lending rates. Despite the implied tightening of fi nancial conditions, the main short-term policy challenge is to keep infl ation pressures in check in the face of strong domes-tic demand, high capacity utilization, and tight labor market conditions. In Australia, the cash rate was appropriately raised in early February. In New Zealand, the offi cial cash rate may need to be maintained at the level in place since July until infl ation pressures ease. Prudent fi scal policies and fl exible exchange rates continue to provide both Australia and New Zealand with important buffers against any substantial weak-ening in the external environment.
Emerging Asia: Strong Internal Momentum, but Rising Risks from Spillovers
Growth in emerging Asia remained strong in the second half of 2007, although with some emerging signs of softness. Growth was led by China, where output expanded by 11.4 percent (year over year) in the second half of 2007, driven by strong investment growth and net exports, although the pace of growth moderated somewhat toward the end of the year. Growth in India slowed modestly to 8½ percent (year over year) in the second half of last year as consump-tion cooled in response to tighter monetary policy, although investment continued at a brisk pace. Robust domestic demand, led by consump-
tion, supported activity in Indonesia, Malaysia, Hong Kong SAR, the Philippines, and Singapore, even while export growth began to show some signs of moderation. Export growth remained strong in Korea and Thailand, but high fuel prices and political uncertainty weighed on domestic demand in Thailand. In Korea, domes-tic demand was supported by an acceleration in construction and investment activity.
The strength of domestic demand in the region, combined with rising food and energy prices, has contributed to a buildup of infl ation pressures in a number of countries. In China, infl ation rose to 8.7 percent in February. Infl a-tion largely refl ects rising food prices, boosted by a swine epidemic, but there is rising concern that persistent food price increases could spill over into wages and spark a broader pickup in infl ation. Infl ation pressures have also begun to emerge in Indonesia, Thailand, and the Philip-pines. In India, monetary tightening earlier in the year led to an easing of infl ation by the end of 2007; however, infl ation started to pick up in 2008 owing to rising commodity prices.
Growth prospects remain dependent on how resilient the region’s fi nancial systems and economies are to the ongoing fi nancial mar-ket dislocation and the associated slowdown in the advanced economies. Overall net private capital fl ows into the region reached record levels in 2007, led by sharp increases in port-folio infl ows into China, Hong Kong SAR, and India and by continued very strong foreign direct investment (FDI) fl ows. Capital infl ows are projected to slow this year as a consequence of the tightening of global fi nancial conditions. Thus far, however, the direct impact on regional fi nancial systems has been limited, although in early 2008, regional equity markets gave up an average of 40 percent of their 2007 gains.
A second channel of spillovers is through slow-ing demand for the region’s exports. Exports to the United States and western Europe will likely be most affected, although the impact should be less severe than during previous downturns, because the relative share of exports to these advanced economies has been steadily declining

81
while intra-Asia exports have been rising (Fig-ure 2.4). The overall effect on regional growth of slowing exports is further mitigated by the strength of domestic demand in most countries of the region, which continue to experience strong consumption and investment growth. Exports to China from elsewhere in Asia con-tinue to grow rapidly as Chinese fi xed asset investment and consumption both continue to grow vigorously. In India, however, weaker export demand and higher fi nancing costs are expected to dampen growth in private investment.
Against this background, growth in emerg-ing Asia is expected to decelerate but remain robust at about 7.5 percent in 2008 and 7.8 percent in 2009, compared with 9.1 per-cent in 2007 (Table 2.3). Growth in China is projected to moderate to 9.3 percent in 2008, with rising consumption and continuing strong investment helping to balance slowing export growth. India’s economy is expected to expand by 7.9 percent in 2008. Growth in the newly industrialized economies of Asia is expected to slow by about 1½ percentage points to 4 per-cent in 2008 and then pick up in 2009. Among the ASEAN-5 economies, growth is projected to soften by ½ percentage point in 2008, with activity strengthening in Thailand as domestic demand recovers from recent sluggishness.
Risks to the outlook remain broadly balanced. Given the region’s high degree of openness, a sharper-than-anticipated slowdown in the advanced economies could be expected to have a pronounced adverse impact on the region’s growth prospects, cooling investment as well as export growth. On the upside, domestic demand could be more resilient than projected in the face of tightening measures and a weaker exter-nal environment. In particular, the projected easing of growth in China may be more moder-ate if consumption continues to gather speed and policy measures aimed at slowing invest-ment growth fail to have the intended effect.
In light of the greater uncertainties associated with the outlook, policymakers face a diffi cult task in balancing the trade-offs between growth and infl ation. In a number of countries, the chal-
Taiw
an
Prov
ince
of C
hina
0
2
4
6
8
10
12
14
16
0
2
4
6
8
10
12
0
2
4
6
8
10
12
Figure 2.4. Emerging Asia: Trade Patterns and Growth Developments
0
20
40
60
80
100
120
140Exports to Selected Regions(percent of total exports)
Contributions to Real GDP Growth(percent)
Domestic demandReal growth
Sources: IMF, Direction of Trade Statistics; and IMF staff calculations. Includes Korea, Hong Kong SAR, Singapore, and Taiwan Province of China. Includes Indonesia, Malaysia, the Philippines, Thailand, and Vietnam. Includes Bangladesh, India, Maldives, Nepal, Pakistan, and Sri Lanka. Includes the NIEs, ASEAN-5, south Asia, Bhutan, Cambodia, China, Fiji, Kiribati, Lao PDR, Mongolia, Myanmar, Papua New Guinea, Samoa, Solomon Islands, Tonga, and Vanuatu.
1
The increase in intra-Asian trade and the strength of domestic demand suggest diminishing vulnerability to a global slowdown. The room for countercyclical fiscal and monetary policies varies across countries. Net exports continue to be an important source of growth for the region.
Growth and Domestic Demand(percent)
European Union
United States
04 07
1999 01 02 03 04 05 06 07
0
2
4
6
8
10
12
14 Policy Interest Rates(percent)
Chin
a
23
2000
04 07
Emerging Asiaexcluding China
90 07SouthAsia
90 07ASEAN-5
1990 07NIEs1 2
3
4
4
Hong
Kon
g SA
RIn
done
sia
Indi
a
Kore
aM
alays
iaPh
ilippi
nes
Sing
apor
eTh
ailan
d
Taiw
an
Prov
ince
of C
hina
Chin
aHo
ng K
ong
SAR
Indo
nesia
Indi
a
Kore
aM
alays
iaPh
ilippi
nes
Sing
apor
eTh
ailan
d -9
-6
-3
0
3
6
9
12Fiscal Balances(percent of GDP)
1
NIEs 2
ASEAN-5
04 07
China04 07
3South
Asia
04 07
Emerging
Asia4
China
Domestic demandGrowth
Feb. 2008Dec. 2004
20072005
EMERGING ASIA: STRONG INTERNAL MOMENTUM, BUT RISING RISKS FROM SPILLOVERS

CHAPTER 2 COUNTRY AND REGIONAL PERSPECTIVES
82
lenge remains to avoid overheating, which may require tighter monetary policy, supported by greater exchange rate fl exibility in some coun-tries, including China. Policymakers will need to respond fl exibly, however, to evolving devel-opments, with some scope for monetary policy easing in the event of a sharper-than- anticipated slowdown in countries where infl ation expec-tations continue to remain well anchored. In a more adverse global growth environment, countries with strong fi scal positions, such as the newly industrialized economies and China, also have some room for fi scal policy to cushion the impact on activity. However, in other countries, such as India, Pakistan, and the Philippines, continued efforts at fi scal consolidation remain an important priority, despite recent progress, limiting room for countercyclical fi scal policy.
Latin America and the Caribbean: Facing a Cold North Wind
Economic activity in Latin America and the Caribbean grew by a robust 5.6 percent in 2007,
slightly stronger than in 2006 (Table 2.4). This capped the region’s best four-year performance since the 1970s. The U.S. slowdown took some toll on growth in neighboring Mexico, while activity in the Caribbean slowed as a construc-tion boom wound down. By contrast, growth remained high in Central America and in com-modity-exporting countries in South America such as Argentina, Colombia, Peru, and the República Bolivariana de Venezuela. Moreover, growth accelerated markedly in Brazil, amid sustained declines in real interest rates and strong employment. Domestic demand has been the main driver of growth in the region. Current account surpluses have declined, and infl ation has accelerated, driven by high capac-ity utilization in some countries and by rising food and energy prices. This has encouraged a tightening of monetary policy stances in Chile, Colombia, and Peru, and to a lesser extent in Mexico, and an end to easing in Brazil. Capi-tal infl ows have generally been maintained, despite some softening in regional equity prices and a widening in risk spreads on bond issues,
Table 2.3. Selected Asian Economies: Real GDP, Consumer Prices, and Current Account Balance(Annual percent change unless noted otherwise)
Real GDP Consumer Prices1 Current Account Balance2
2006 2007 2008 2009 2006 2007 2008 2009 2006 2007 2008 2009
Emerging Asia3 8.9 9.1 7.5 7.8 3.7 4.8 5.5 3.9 5.7 6.5 5.3 5.2China 11.1 11.4 9.3 9.5 1.5 4.8 5.9 3.6 9.4 11.1 9.8 10.0
South Asia4 9.1 8.6 7.5 7.7 6.5 6.9 5.9 4.7 –1.4 –2.1 –3.4 –3.6India 9.7 9.2 7.9 8.0 6.2 6.4 5.2 4.0 –1.1 –1.8 –3.1 –3.4Pakistan 6.9 6.4 6.0 6.7 7.9 7.8 8.5 7.5 –3.9 –4.9 –6.9 –6.1Bangladesh 6.4 5.6 5.5 6.5 6.5 8.4 9.3 8.1 1.2 0.5 –0.5 –0.7
ASEAN-5 5.7 6.3 5.8 6.0 8.1 4.5 6.1 4.7 4.8 4.8 2.9 1.9Indonesia 5.5 6.3 6.1 6.3 13.1 6.4 7.1 5.9 3.0 2.5 1.8 1.2Thailand 5.1 4.8 5.3 5.6 4.6 2.2 3.5 2.5 1.1 6.1 3.4 1.3Philippines 5.4 7.3 5.8 5.8 6.2 2.8 4.4 3.8 4.5 4.4 2.1 1.0Malaysia 5.9 6.3 5.0 5.2 3.6 2.1 2.4 2.5 16.2 14.0 11.7 11.1Vietnam 8.2 8.5 7.3 7.3 7.5 8.3 16.0 10.0 –0.4 –9.6 –13.6 –11.9
Newly industrialized Asian economies 5.6 5.6 4.0 4.4 1.6 2.2 3.0 2.7 5.2 6.0 4.5 4.3Korea 5.1 5.0 4.2 4.4 2.2 2.5 3.4 2.9 0.6 0.6 –1.0 –0.9Taiwan Province of China 4.9 5.7 3.4 4.1 0.6 1.8 1.5 1.5 6.7 8.3 7.8 8.1Hong Kong SAR 7.0 6.3 4.3 4.8 2.0 2.0 3.6 4.5 12.1 12.3 9.9 8.3Singapore 8.2 7.7 4.0 4.5 1.0 2.1 4.7 2.5 21.8 24.3 20.6 18.91Movements in consumer prices are shown as annual averages. December/December changes can be found in Table A7 in the Statistical
Appendix.2Percent of GDP. 3Consists of developing Asia, the newly industrialized Asian economies, and Mongolia.4Includes Maldives, Nepal, and Sri Lanka.

83
helping to keep exchange rates buoyant and contributing to a continued buildup in interna-tional reserves.
Growth in the region is projected to moder-ate to 4.4 percent in 2008 and to slow further to 3.6 percent in 2009. In some countries, growth will suffer appreciably as capacity constraints are expected to bite. Elsewhere, growth is projected to ease more modestly, responding to the tightening of monetary conditions and to less-favorable external fi nancial conditions, but high commodity prices should help sustain domestic demand across South America. Against this background, infl ation rates are expected to rise in a number of countries in 2008 before easing in 2009. In Argentina, although mea-sured infl ation has fallen, most private sector analysts believe that actual infl ation is consider-ably higher than refl ected in offi cial data. Cur-rent account positions are expected to weaken further, and private capital infl ows are likely to moderate from the very high rates observed in 2007.
The overall prognosis is that resilient econo-mies will be dampened but not overwhelmed by the slowdown in the United States and other
advanced economies and by the dislocations in international fi nancial markets. This would be a very different outcome from past periods of external stress. As shown in Figure 2.5, going back to 1970, Latin America has invariably been hit hard by slowdowns in the United States, its largest trading partner. Many of these episodes were exacerbated by a sharp deterioration of access to external fi nancing in the context of rising risk aversion.
More formal econometric analysis has confi rmed the close relationship between the business cycle in Latin America and the external environment. Recent work has found that about one-half of variations in economic activity in Latin America can be explained by a combination of global /U.S. activity, commod-ity prices, and external fi nancial conditions.3 Indeed, the spillover from U.S. growth to Latin American growth is as high as 1:1 and even higher for Mexico, while a rise in the U.S. high-yield bond rate has also been found to have a
3See for example, Österholm and Zettelmeyer (2007); Izquierdo, Romero, and Talvi (2007); Bayoumi and Swis-ton (2007); Roache (2007); and Sosa (2007).
Table 2.4. Selected Western Hemisphere Economies: Real GDP, Consumer Prices, and Current Account Balance (Annual percent change unless noted otherwise)
Real GDP Consumer Prices1 Current Account Balance2
2006 2007 2008 2009 2006 2007 2008 2009 2006 2007 2008 2009
Western Hemisphere 5.5 5.6 4.4 3.6 5.3 5.4 6.6 6.1 1.5 0.5 –0.3 –0.9
South America and Mexico3 5.3 5.6 4.3 3.6 5.2 5.3 6.5 6.1 1.8 0.8 — –0.6Argentina 8.5 8.7 7.0 4.5 10.9 8.8 9.2 9.1 2.5 1.1 0.4 –0.5Brazil 3.8 5.4 4.8 3.7 4.2 3.6 4.8 4.3 1.3 0.3 –0.7 –0.9Chile 4.0 5.0 4.5 4.5 3.4 4.4 6.6 3.6 3.6 3.7 –0.5 –1.3Colombia 6.8 7.0 4.6 4.5 4.3 5.5 5.5 4.6 –2.1 –3.8 –4.9 –4.3Ecuador 3.9 1.9 2.9 4.1 3.3 2.2 3.3 3.3 3.6 3.3 5.2 3.9Mexico 4.8 3.3 2.0 2.3 3.6 4.0 3.8 3.2 –0.3 –0.8 –1.0 –1.6Peru 7.6 9.0 7.0 6.0 2.0 1.8 4.2 2.5 2.8 1.6 –0.2 –0.3Uruguay 7.0 7.0 6.0 4.0 6.4 8.1 7.4 5.7 –2.4 –0.8 –1.7 –0.8Venezuela, Rep. Boliv. de 10.3 8.4 5.8 3.5 13.7 18.7 25.7 31.0 14.7 9.8 7.2 5.0
Central America4 6.3 6.5 4.7 4.6 6.5 6.7 8.3 6.1 –4.9 –6.8 –7.6 –7.6
The Caribbean4 7.8 5.7 4.4 3.8 7.8 6.7 7.9 5.7 –0.8 –2.5 –2.6 –2.31Movements in consumer prices are shown as annual averages. December/December changes can be found in Table A7 in the Statistical
Appendix.2Percent of GDP.3Includes Bolivia and Paraguay.4The country composition of these regional groups is set out in Table F in the Statistical Appendix.
LATIN AMERICA AND THE CARIBBEAN: FACING A COLD NORTH WIND

CHAPTER 2 COUNTRY AND REGIONAL PERSPECTIVES
84
high impact.4 Recent studies also present evi-dence that the relevance of external factors has increased over time, as economies have become more open to both trade and capital fl ows and as domestic shocks have become less intense.5
These studies generally do not take account, however, of changes in domestic fundamentals and the global environment that are likely to make Latin America more resilient in the face of external shocks. On the domestic front, generally improved policy performance in the region has helped bring down external debt, build international reserves, and strengthen government and corporate balance sheets (see Figure 2.5). Thus, Latin America has become less vulnerable to increasing risk aversion and fi nancial disruptions. There are also reasons related to the character of the current global business cycle. First, the easing of monetary conditions by the Federal Reserve and the decline in long-term, risk-free interest rates have helped to offset the impact of some widening in risk spreads. Second, sustained strong growth in other emerging economies has kept commodity prices at high levels despite the slowdown in the advanced economies.
Nevertheless, an increasingly open Latin American economy would not be unscathed by a deeper global downturn, and the risks to the outlook are clearly weighted to the downside. The combination of falling commodity prices, weaker growth of external markets, intensifying fi nancial diffi culties among U.S. and European banks that are active in Latin America, and a drop in commodity export prices would impose a signifi cant toll on the momentum of growth in Latin America. Even so, the region’s external position should be suffi ciently robust to avoid the more severe disruptions that occurred in the past. Thus, in the context of a downside sce-nario such as the one presented in Chapter 1, growth in Latin America would likely be lowered
4See Chapter 4 of the April 2007 World Economic Outlook.
5See also Kose, Meredith, and Towe (2004).
1970 75 80 85 90 95 2000 050
10
20
30
40
50
60
70
-3
0
3
6
9
12
0
1
2
3
4
5
6
-6
-4
-2
0
2
4
50
75
100
125
150
1970 75 80 85 90 95 2000 0514
16
18
20
22
24
26
28
30
-12
-10
-8
-6
-4
-2
0
2
4
-4
-2
0
2
4
6
8
10
0
5
10
15
20
25
1970 75 80 85 90 95 2000 050
5
10
15
20
25
30
35
Figure 2.5. Latin America: Long Road to Stronger Performance(Percent of GDP unless otherwise stated)
Sources: Haver Analytics; and IMF staff estimates. Index, 2000 = 100. ROW = rest of world.
Latin America’s economy grew steadily in recent years in contrast to the volatility in the region beginning in the 1970s. More disciplined macroeconomic policies—together with improved terms of trade—have helped reduce external vulnerabilities and foster rising investment and improving performance.
Net Private Capital Flows
External Debt and ReservesCurrent Account Balance and Terms of Trade
Real GDP Growth(percent)
1
09 09
Exports Fixed Investment and Fiscal Balance
Current account(left scale)
Terms of trade(right scale)
External debt Reserves
ServicesGoods exported to ROWGoods exported to U.S.
Other flowsPortfolioForeign direct investment
Fiscal balance(right scale)
Fixed investment(left scale)
Net capital flows
1
1970 75 80 85 90 95 2000 05 1970 75 80 85 90 95 2000 0505
1970 75 80 85 90 95 200005
U.S. recessions
2
2

85
by a further 1–2 percentage points, depending on the extent of fi nancial spillovers.
How should policymakers respond to signs that Latin American economies are weaken-ing in the face of a strong downdraft in global demand? To some degree, sustained good per-formance has brought room to maneuver, but within limits. The fi rst line of defense against weaker outcomes should be monetary policy, particularly in countries (such as Brazil, Chile, Colombia, and Mexico) where infl ation target-ing has gained credibility and has succeeded in anchoring infl ation expectations more securely than in the past. However, the scope for eas-ing could be hampered by the need to bring infl ation back down to within target ranges in a number of countries, especially given the pos-sibility of continued rapid increases in food and energy prices, which weigh heavily in consump-tion baskets. Flexible exchange rate manage-ment should play a supportive role. On the fi scal front, countries that have brought public debt down to more sustainable levels would have some room to let automatic stabilizers work, often for the fi rst time in recent history, mostly by allowing some widening in defi cits as revenue performance softens. Chile has a suffi ciently robust fi scal framework and low enough public debt to allow this process to work in full. Other countries will need to proceed cautiously, and some could face serious declines in revenues from a turn in commodity prices and in corpo-rate profi ts, which could require tight control of spending in order to maintain fi scal perfor-mance on a sustainable path.
Against this background, there is a continu-ing need to consolidate and strengthen policy frameworks and lay foundations for higher growth in the medium term in a region that has continued to underperform relative to its peers even in recent years. Even though eco-nomic activity remains strong, macroeconomic policymakers should remain cautious. Monetary policymakers should seek to contain infl ation, and fi nancial supervisors must ensure that rapid credit growth is not associated with deteriorat-ing credit quality or weakening fi nancial balance
sheets. Moreover, more stringent control over government budgets should be combined with reforms to improve the effi ciency of government spending, enhance the sustainability of social security systems, and strengthen the foundations of revenue systems. Mexico has made welcome progress toward fi scal reform over the past year, and serious reform efforts are being made else-where (for example, in Brazil, Peru, and Uru-guay), but to date reform remains very much a “work in progress.” Finally, more must be done to establish an environment for sustained growth, including establishing viable frameworks for investment in energy and infrastructure and developing more fl exible labor and product markets.
Emerging Europe: Adjusting to a Rougher External Environment
Growth in Emerging Europe moderated by almost a full percentage point to 5.8 percent in 2007 (Table 2.5). The deceleration was most pronounced in Hungary, Turkey, Estonia, and Latvia. In Turkey, slower growth is attributable in part to the strength of the currency and delayed effects of monetary tightening in mid-2006, but also to a drought-related drop in agricultural output. In Hungary, fi scal consolidation to put public fi nances on a more sustainable path squeezed private consumption and investment. In Estonia and Latvia, a cyclical deceleration was exacerbated by a tightening in fi nancing conditions, after years of exceptionally strong growth. Nonetheless, 2007 marked the sixth consecutive year during which emerging Europe grew substantially faster than western Europe, contributing to a further narrowing of wealth and productivity differentials (Figure 2.6).
In most countries, growth continued to be driven by buoyant domestic demand, which again substantially outpaced production in 2007. As a consequence, the region’s overall current account defi cit widened to 6.6 percent of GDP, with double-digit external defi cits in the Baltic countries, Bulgaria, and Romania. Demand continued to be supported by strong
EMERGING EUROPE: ADJUSTING TO A ROUGHER EXTERNAL ENVIRONMENT

CHAPTER 2 COUNTRY AND REGIONAL PERSPECTIVES
86
credit growth fueled by capital infl ows and, in many countries, by vigorous wage growth as labor market conditions tightened further. Infl ation pressures increased, especially toward year-end, refl ecting in part rising food and energy prices but also increasing labor costs. In the Baltic countries, rising infl ation signifi -cantly reduced the prospects for adoption of the euro in the near term.6 In several countries, many of them in the Baltics and in southeastern Europe, an accommodative fi scal policy stance added to demand pressures, which were often reinforced by substantial increases in public wages and pensions.
6Estonia, Lithuania, Latvia, and the Slovak Republic are currently members of the transitional European exchange rate mechanism (ERM II). Full euro area membership requires that exchange rates be stable over two years and that the four “Maastricht criteria” be met. The fi scal criteria would be met by all countries, but the requirements of the Maastricht reference rate for infl ation have turned out to be the main stumbling block: average infl ation over the past 12 months must not exceed the average of the three best performers among the EU member countries by more than 1.5 percentage points on a sustainable basis.
The region’s strong performance has been supported by large capital infl ows but could be jeopardized by tightening conditions ahead. FDI accounted for about 40 percent of net private capital infl ows in 2007, but the remainder was largely in the form of potentially more volatile bank fl ows, typically from affi liated banks in western Europe.7 By mid-2007, western Euro-pean banks held assets of about $1 trillion in the region.8 These bank infl ows, in turn, contrib-uted to fuel rapid domestic credit growth, with loans often denominated in foreign curren-cies and at variable interest rates. Outstanding claims held by western European banks are
7Emerging Europe differs markedly from other emerg-ing market regions that have received primarily FDI in recent years (Latin America, Africa) or a mix of FDI and portfolio infl ows (emerging Asia; see also Box 2.2). Historically, bank fl ows have been more volatile than FDI or portfolio fl ows and have sometimes been subject to sharp reversals, such as during 1997–98 in emerging Asia or during the early 1980s in Latin America. See Box 1.1 of the September 2006 World Economic Outlook.
8For comparison, the exposure of western European banks to the U.S. subprime mortgage sector is estimated at about $250 billion.
Table 2.5. Selected Emerging European Economies: Real GDP, Consumer Prices, and Current Account Balance(Annual percent change unless noted otherwise)
Real GDP Consumer Prices1 Current Account Balance2
2006 2007 2008 2009 2006 2007 2008 2009 2006 2007 2008 2009
Emerging Europe 6.7 5.8 4.4 4.3 5.4 5.7 6.4 4.3 –6.3 –6.6 –7.2 –6.9Turkey 6.9 5.0 4.0 4.3 9.6 8.8 7.5 4.5 –6.1 –5.7 –6.7 –6.3Excluding Turkey 6.6 6.2 4.7 4.3 3.3 4.1 5.8 4.2 –6.3 –7.1 –7.5 –7.2
Baltics 9.8 8.9 4.8 3.5 4.8 7.3 10.8 6.7 –15.5 –17.0 –12.1 –9.9Estonia 11.2 7.1 3.0 3.7 4.4 6.6 9.8 4.7 –15.5 –16.0 –11.2 –11.2Latvia 11.9 10.2 3.6 0.5 6.5 10.1 15.3 9.2 –22.3 –23.3 –15.0 –10.5Lithuania 7.7 8.8 6.5 5.5 3.8 5.8 8.3 6.1 –10.8 –13.0 –10.5 –8.8
Central Europe 6.1 6.0 4.4 4.3 2.1 3.5 4.8 3.7 –4.1 –3.9 –4.6 –4.8Czech Republic 6.4 6.5 4.2 4.6 2.5 2.8 6.0 3.5 –3.1 –2.5 –3.0 –2.8Hungary 3.9 1.3 1.8 2.5 3.9 7.9 5.9 3.5 –6.5 –5.6 –5.5 –5.1Poland 6.2 6.5 4.9 4.5 1.0 2.5 4.1 3.8 –3.2 –3.7 –5.0 –5.7Slovak Republic 8.5 10.4 6.6 5.6 4.4 2.8 3.6 3.8 –7.1 –5.3 –5.0 –4.7
Southern and south-eastern Europe 7.0 6.0 5.2 4.6 6.2 5.1 7.3 5.0 –10.7 –14.0 –14.6 –13.1
Bulgaria 6.3 6.2 5.5 4.8 7.4 7.6 9.7 6.0 –15.6 –21.4 –21.9 –18.9Croatia 4.8 5.8 4.3 4.0 3.2 2.9 5.5 3.5 –7.9 –8.5 –9.0 –8.7Romania 7.9 6.0 5.4 4.7 6.6 4.8 7.0 5.1 –10.4 –13.9 –14.5 –13.01Movements in consumer prices are shown as annual averages. December/December changes can be found in Table A7 in the Statistical
Appendix.2Percent of GDP.

87
highest for countries whose banking systems are largely foreign-owned (see Figure 2.6). Although local bank lending is funded mainly with local deposits, these countries would be vulnerable in case of problems in parent banks. Since 2002, the ratio of domestic credit to GDP has more than doubled in Latvia, Lithuania, Bulgaria, and Romania and has almost doubled in Estonia. Although patterns differ across countries, for-eign credit has often fi nanced activities in the nontradables sector, such as investment in real estate and household consumption. Widespread housing booms have been one consequence. Real house prices have more than tripled since end-2003 in Latvia and have more than doubled in Bulgaria, Estonia, and Lithuania.
The outlook for 2008 is for a further slowing of GDP growth in the region to 4.4 percent. Growth in most economies would ease closer to potential, refl ecting a slowing both of domestic demand and of export growth in the face of lower demand from western Europe.
This baseline projection assumes that capi-tal fl ows to emerging Europe moderate in an orderly manner—with a modest reduction in private capital infl ows matched by a slower accu-mulation of foreign currency reserves. A critical issue for the region’s outlook is the degree to which external bank fl ows could be disrupted by fi nancial turbulence in mature fi nancial mar-kets, especially by losses sustained by western European banks. A sudden capital fl ow reversal could trigger a credit crunch as well as asset price defl ation. The likely consequence would be an undesirably sharp slowdown in domestic absorption, combined with a painful deleverag-ing of corporate and household balance sheets.
To date, signs of slowing capital infl ows have been largely confi ned to the Baltic countries, notably Latvia and Estonia, where tighter condi-tions imposed by parent banks have slowed lending—a process that started well before the onset of fi nancial turbulence in August 2007. In addition, spreads on credit default swaps have widened sharply, refl ecting these countries’ dependence on foreign capital. There are at least three risk factors:
Strong GDP growth, driven primarily by domestic demand, has supported a substantial narrowing of income differentials with the euro area. At the same time, increasing inflationary pressures, losses in competitiveness, and dependence on external financing flows—especially from western European banks—have given rise to substantial macroeconomic and financial vulnerabilities.
EstoniaCroatia
LatviaHungary
LithuaniaSlovak Rep.
Czech Rep.Bulgaria
RomaniaSlovenia
PolandSerbia
Turkey0
40
80
120
160
200
0
40
80
120
160
200
-3
0
3
6
9
12
1993 95 97 99 2001 03 05 0720
30
40
50
60
Pola
ndTu
rkey
Slov
enia
Hung
ary
Slov
ak R
ep.
Czec
h Re
p.Es
toni
aBu
lgar
iaLi
thua
nia
Latv
iaRo
man
ia
-120
-90
-60
-30
0
30
60
1993 95 97 99 2001 03 05 07-20
-15
-10
-5
0
5
10
Figure 2.6. Emerging Europe: Macroeconomic Vulnerabilities on the Rise
Sources: Bank for International Settlements, Consolidated Banking Statistics; European Commission; IMF, International Financial Statistics; and IMF staff calculations. Emerging Europe includes Baltics, central Europe, southeastern Europe, and Turkey. Central Europe includes Czech Republic, Hungary, Poland, Slovak Republic, and Slovenia.Baltics includes Estonia, Latvia, and Lithuania. Southeastern Europe includes Albania; Bosnia and Herzegovina; Bulgaria; Croatia; Macedonia, FYR; Romania; and Serbia. Purchasing-power-parity-based per capita GDP relative to the euro area. Twelve-month rolling average of year-over-year inflation. Vertical lines represent assessment dates for Estonia, Lithuania, Latvia, and Slovak Republic. UWC based. A positive value represents a depreciation. Differential in the growth of UWC in the manufacturing sector relative to trade partners. Total financial claims net of interoffice accounts.
GDP Convergence(percent)
External Competitiveness(2002–07 percent change, inverted scale)
Current Account Balance(percent of GDP)
Liabilities to Foreign Banks(percent of GDP as of 2007:Q2)
1
Maastricht Inflation Criterion for Euro Adoption
Emerging Europe Central Europe Baltics
Southeastern Europe Turkey
Scandinavian banksGerman banksAustrian banks
Italian banksOther banks
Real effectiveexchange rateUnit wage cost(UWC) componentNominal effectiveexchange rate
1
5
2
2
4
3
4
Latvia
Slovak Republic
Lithuania
Estonia
Feb.08
Maastricht limit
3
5
6
6
2004 05 06 07
EMERGING EUROPE: ADJUSTING TO A ROUGHER EXTERNAL ENVIRONMENT

CHAPTER 2 COUNTRY AND REGIONAL PERSPECTIVES
88
• Contagion: Contagion could occur either directly, if banks cut back lending to cover losses from the subprime fallout, or indirectly, if a higher cost of capital and wider risk spreads induce banks to extend fewer loans to emerging Europe and/or to offer less-favor-able terms. The potential for direct contagion appears limited, as few banks have (known) exposures both to the U.S. subprime sector and to emerging Europe. Banks affected by the subprime crisis are located primarily in the United Kingdom, Germany, Switzerland, and (to a lesser extent) France, and lending to emerging Europe has been carried out mainly by Scandinavian banks (especially to the Baltic countries) and by banks in Austria and Italy (especially to countries in southeast-ern Europe). Indirect contagion seems more plausible, however, as lending standards in the euro area have tightened markedly since the outbreak of financial turbulence.
• Concerns about profitability and asset quality: Wage increases in excess of productivity gains have triggered sharp losses of external com-petitiveness in recent years, especially in the Baltic countries and in southeastern Europe. In most cases, this has occurred in the context of accommodative fiscal policies and fixed exchange rate regimes.9 This trend threatens to undermine a core motivation for foreign investors’ presence in the region. In countries where much of the lending has been in the form of mortgages—such as the Baltic coun-tries and Hungary—slowing housing markets could also trigger a reassessment of credit risk.
• A slowing of petrodollar flows: As discussed in Box 2.2, there is evidence that many funds lent to emerging Europe through banks origi-nated in oil-producing countries and other commodity exporters. These funding sources could dry up if the global economy were to
9By contrast, infl ation pressures and competitiveness losses have been less pronounced in central Europe, where less-constrained central banks have kept a tighter lid on demand pressures.
slow sufficiently to reverse the surge in com-modity prices, eroding commodity exporters’ surpluses in the process.The challenge for macroeconomic policymak-
ers is twofold. As long as the current constel-lation persists—which is still characterized by overheating pressures in most countries—poli-cymakers should steer their economies toward a soft landing. Fiscal policy should take the lead role in the adjustment: in countries with fl exible exchange rate regimes, this would lower the bur-den on monetary policy, and in countries with fi xed or tightly managed exchange rates (the Baltic countries, Bulgaria, and Croatia), fi scal tightening is the main tool available to dampen domestic demand and preserve competitiveness. Restraining the growth of public sector wages and pensions also has a role to play (including in Bulgaria, Estonia, and Romania), as do labor market reforms to boost employment (includ-ing in the Czech Republic, the Slovak Republic, and Poland). Credit risks should be monitored closely, and prudential and regulatory policies should seek to ensure that banks have sound capital bases to absorb potential losses.
If the external environment deteriorates sub-stantially, some countries would have room for fi scal stimulus, given low levels of public debt, although there would be less room in countries with fi scal sustainability concerns, such as Hun-gary or Poland. Monetary and exchange rate policies could help in countries with fl exible exchange rate regimes, even though balance sheet euroization would limit the scope for depreciation in some countries, including Hun-gary. Finally, fl exible adjustment of wages would be crucial to limit the real impact of a fi nancial contraction.
Commonwealth of Independent States: Containing Infl ation Remains the Central Challenge
Real GDP growth was sustained at 8.5 per-cent in the Commonwealth of Independent States (CIS) during 2007, with high commodity prices, expansionary macroeconomic policies,

89
“Petrodollar recycling” is a phenomenon familiar from the 1970s. When oil prices rose sharply in fall 1973, oil-exporting countries were faced with a windfall in export receipts. A large portion of those receipts was saved and deposited with banks in industrial countries, which, in turn, onlent a large part of the funds to emerging economies, especially in Latin America. When the oil boom subsided in the early 1980s, bank fl ows to emerging markets reversed sharply, triggering the Latin American debt crisis.
How Important Are Bank Deposits Today for Investing Oil Surpluses?
Bank onlending of petrodollars is rarely con-sidered to be a feature of the current oil price boom.1 Two factors may contribute to this. First, in contrast to the 1970s, emerging economies as a group have built up sizable current account surpluses in recent years, making a debt buildup comparable to that of the 1970s seem unlikely. Second, bank deposits are widely believed to have lost importance as an instrument for investing oil (and other) surpluses. Recently, much attention has focused instead on vehicles used to invest emerging economy surpluses in global securities markets, including sovereign wealth funds.
Neither point holds up to scrutiny, however. First, not all emerging economies have been running external surpluses. In particular, emerging Europe had an average current account defi cit of almost 6 percent of GDP during the past four years—fully comparable to external defi cits prevailing in the 1970s. Second, the fl ow of bank deposits from oil-exporting countries—although less important than in the 1970s—has not become negligible: between 2001 and 2006, deposit outfl ows from oil exporters to banks in countries reporting to the Bank for International Settlements (BIS) accounted for 27 percent of their total gross
Note: The main author of this box is Johannes Wiegand.
1An important exception is Boorman (2006).
fi nancial outfl ows. This compares with 44 per-cent for the period 1973–79 (see Box 2.2 of the April 2006 World Economic Outlook).
The degree to which oil exporters use bank deposits to invest surpluses varies across coun-tries, however. As the table shows, between 2001 and 2007, the average correlation coeffi cient between oil exporters’ deposit outfl ows and the IMF average petroleum spot price (APSP) was 0.29, only slightly higher than the overall
Box 2.2. Petrodollars and Bank Lending to Emerging Markets
Correlation of Quarterly Deposit Outfl ows with the IMF Average Petroleum Spot Price
CorrelationCoefficient
Total DepositOutflows, 2001–07
(billions of U.S. dollars)
Country groups (#) Average1
All countries (210) 0.21 (.02) 10,483Oil exporters (27) 0.29 (.05) 671Offshore centers (19) 0.39 (.06) 1,818Other (164) 0.17 (.02) 7,995
Ten highest correlationsLibya (oe) 0.90 55Panama (oc) 0.85 34Jersey (oc) 0.68 251Macao SAR (oc) 0.68 14Samoa (oc) 0.68 3Nigeria (oe) 0.66 27Philippines 0.66 8West Indies, U.K. (oc) 0.61 97Lao PDR 0.60 1Russia (oe) 0.60 255
Other major oil exportersUnited Arab Emirates 0.46 35Kuwait 0.43 29Iran, I.R. of 0.41 12Saudi Arabia 0.37 41Norway 0.25 135Venezuela, Rep. Boliv. de 0.12 15
Other major offshore centersGuernsey 0.50 67Hong Kong SAR 0.50 58Cayman Islands 0.31 899Singapore 0.30 82Bahamas 0.25 120Bermuda –0.04 63
Sources: Bank for International Settlements; and IMF staff calculations.
Note: oe: oil exporter; oc: offshore center.1Standard error in parentheses.
COMMONWEALTH OF INDEPENDENT STATES: CONTAINING INFLATION REMAINS THE CENTRAL CHALLENGE

CHAPTER 2 COUNTRY AND REGIONAL PERSPECTIVES
90
cross-country average (0.21). At the same time, deposit outfl ows from some exporters—notably Libya, Nigeria, and Russia—displayed some of the highest correlations, while for others— including Saudi Arabia and other Middle Eastern oil exporters—the correlations were only modest. Libya, Nigeria, and Russia also accounted for one-half of all deposit outfl ows from oil-exporting countries, and in each of these countries deposit outfl ows accounted for one-half or more of total gross capital outfl ows. This suggests that some but not all oil- exporting countries deposited oil surpluses regularly with banks in BIS-reporting coun-tries, while other exporters pursued different investment strategies. The table also shows high correlations between outfl ows from several offshore centers and oil prices. One possible explanation is that some oil surpluses may have fi rst been invested with offshore centers and then deposited with banks in BIS-reporting countries.2
Are Petrodollars Onlent to Emerging Markets?
To analyze the extent to which oil surpluses are channeled to emerging economies, quar-terly loans to them by banks in BIS-report-ing countries were regressed on the various sources of bank funding, including deposit infl ows differentiated by country or region of origin and nondeposit infl ows (such as debt securities and equity participations), using BIS locational banking statistics. Comovement of loans to emerging economies with specifi c types of funding is interpreted as an indica-tion of onlending.3 For the period 2001–07, the results suggest that a large part of bank loans to emerging economies originated from only two sources:• Oil surpluses: According to the regressions’
central estimate, banks in BIS-reporting coun-tries onlent about half of deposits received
2The correlations for the deposit outfl ows of Lao PDR and the Philippines with the oil price may be spurious.
3See Wiegand (2008) for details.
from oil exporters to emerging economies. Onlending from Russia, Nigeria, and Libya was as much as 80 percent. Overall, oil surpluses accounted for more than half of emerging economies’ bank loans.
• Deposits from emerging economies that are not oil exporters: Again, banks in BIS-report-ing countries seem to have onlent about half of these funds to other emerging economies. Many countries in this group are non-oil-com-modity exporters.By contrast, deposits from industrial coun-
tries and offshore centers displayed little or no statistical relationship with loans to emerging economies. This suggests that funds channeled through offshore centers—including oil sur-pluses—were largely put to other uses.
Is This Relationship Stable?
Changes in bank loans to emerging econo-mies are determined by two factors: variations in sources of funding and shifts in banks’ investment strategies. Shifts in banks’ invest-ment strategies would lead to an unstable relationship between sources of funding and bank loans. As the first figure shows, the relationship was indeed unstable between 1996 and 2001. From 1996 until 1998, banks in BIS-reporting countries sharply cut exposure to emerging economies, before reengaging cautiously thereafter. This pattern mirrors the standard narrative of bank lending dur-ing and after the Asian and Russian crises. A stable relationship is observed from 2001 until end-2006, a period without major emerging market turbulence. In the fi rst half of 2007, however, loans to emerging economies picked up substantially more than predicted by a model based on unchanged investment strategies. It is quite possible that this signals another structural break, in this case a shift of lending by banks in BIS-reporting countries into loans to emerging economies, perhaps in reaction to fi nancial turbulence in advanced economies. However, there are too few data points after the potential breakpoint to estab-lish this fi rmly.
Box 2.2 (continued)

91
Who Has Benefi ted from the Onlending of Petrodollars?
Results from region-specifi c regressions sug-gest that almost half the petrodollar surpluses invested in bank deposits were onlent to emerg-ing Europe. This is consistent with the more general pattern of bank lending to emerging economies in recent years, which has evolved quite differently across regions (second figure). Since 2001, about one-half of emerging market loans has gone to emerging Europe, one-third to emerging Asia, and one-sixth to the Middle East and Africa. Latin America did not join the global emerging markets lending boom until very recently. In emerging Europe, bank infl ows account also for a much larger share of both GDP and total capital infl ows than in other regions, where portfolio infl ows are relatively more prevalent.
Some Implications
The current environment of high commodity prices that give rise to large external surpluses, especially in low- and middle-income countries, seems particularly conducive for bank lending to emerging economies. As a consequence, a sharp drop in commodity prices—or higher domes-tic absorption by commodity-exporting coun-tries—could create substantial risks for emerging economies that depend heavily on bank infl ows
1996 98 2000 02 04 06-50
-25
0
25
50
75
100
125
150
Bank Recycling of Deposits from Commodity Exporters to Emerging Economies(Billions of U.S. dollars)
Sources: Bank for International Settlements; and IMF staff calculations.
Predictedloans
Actual loans to emerging economies
No relationship during period of turbulence
Close relationshipsince 2001
07:Q1
-4
-2
0
2
4
6
8
2001 02 03 04 05 06 07:Q1
-100
-50
0
50
100
150
200
250
300
Bank Loans to Emerging Economies
Sources: Bank for International Settlements (BIS); and IMF staff calculations. Following BIS classifications, emerging Europe includes Belarus, Moldova, Russia, and Ukraine; emerging Asia includesthe remaining Commonwealth of Independent States countries.
Loans by Recipient Region(billions U.S. dollars, cumulative since 2001:Q2)
Emerging Europe
Emerging Asia
Middle East and Africa
Latin America
1980 85 90 95 2000 05
Emerging Europe and Central Asia
Structure of Capital Inflows(percent of GDP)
Foreign direct investmentBank and other flows Portfolio flows
1
1
-4
-2
0
2
4
6
8
1980 85 90 95 2000 05
Other Emerging Economies
COMMONWEALTH OF INDEPENDENT STATES: CONTAINING INFLATION REMAINS THE CENTRAL CHALLENGE

CHAPTER 2 COUNTRY AND REGIONAL PERSPECTIVES
92
strong capital infl ows during most of the year, rapid credit growth, and rising asset prices fueling very strong domestic demand growth (Table 2.6). With imports surging, the growth contribution from the external sector was substantially negative, however, and current account balances weakened (smaller surpluses in energy exporters and larger defi cits in energy importers). The strong growth of recent years has largely eliminated spare capacity in most economies, and wage growth has picked up. Together with rising food prices—which have particularly affected Kazakhstan, the Kyrgyz Republic, and Tajikistan—this has resulted in a sharp acceleration in infl ation across the region in recent months (Figure 2.7). In Russia, infl ation rose to almost 12 percent in December 2007, substantially exceeding the central bank’s 6.5–8.0 percent year-end target, and was running at nearly 13 percent by Febru-ary. Infl ation is running at about 20 percent in Azerbaijan, Kazakhstan, the Kyrgyz Republic, Tajikistan, and Ukraine.
The turmoil in global fi nancial markets has begun to affect most countries in the region, particularly because bank and portfolio infl ows have recently become the dominant source of external fi nancing. In Russia and Ukraine, where banks have borrowed heavily in international markets to fi nance rapid growth in domestic lending, spreads on external debt have widened. In Kazakhstan, the impact of the fi nancial turmoil has been more severe,
with external fi nancing drying up, credit growth slowing sharply, and reserves initially declining as the central bank intervened in the foreign exchange market to support the exchange rate.
High oil and commodity prices should con-tinue to provide support, but a weaker global economy and slower credit growth would slow the pace of the expansion. Consequently, real GDP growth is expected to ease to 7 percent this year and 6.5 percent in 2009. In Russia, although consumption is expected to moderate, it should remain the main source of demand, spurred by still-strong gains in real incomes, and investment should also rise strongly, led by construction and public capital spending. In Ukraine, growth is projected to slow as wage growth moderates, export demand softens, and the rise in the terms of trade levels off. In Kazakhstan, the construction and real estate sectors are expected to be signifi cantly affected by the sharp slowing in credit growth, and real GDP growth is projected to ease to 5 percent in 2008, from 8.5 percent in 2007. Elsewhere, strong growth is expected to continue in Azerbaijan (as oil output increases further) and Armenia (where the construction and services sectors remain buoyant) and to remain stable in Moldova, Tajikistan, and Uzbekistan.
Risks to the outlook are tilted to the down-side. A sharper-than-expected slowdown in the global economy would likely lead to a decline in oil and commodity prices, a key driver of
to fi nance external defi cits by drying up sources of funding. In contrast to the 1970s and 1980s, the bulk of countries most at risk are not in Latin America but in emerging Europe. This goes at least in part against the conventional view that falling oil prices would help non-oil-exporting emerging economies by improving their trade balances and reducing fi nancing needs.
Even if commodity exporters’ surpluses persist, however, bank lending could still reverse
if banks reassess the viability of lending to emerging economies, as they did during the Asian and Russian crises. Such a reassessment could in principle go either way, however. There are indeed indications that banks in BIS-report-ing countries shifted their lending portfolios in favor of emerging economies in early 2007, a move that coincided with increasing credit- quality issues in advanced economies, notably the United States.
Box 2.2 (concluded)

93
regional growth, and could adversely affect external fi nancing conditions. All countries in the region would be negatively affected, although the impact would be largest on those where portfolio and bank infl ows are most signifi cant (Kazakhstan, Russia, and Ukraine). Further, links between fi nancial systems in the region would mean that diffi culties in the bank-ing systems in larger economies could affect credit availability and growth in other coun-tries (for example, Kazakhstani banks have an important presence in Tajikistan and the Kyrgyz Republic).
The most immediate challenge for policymak-ers in the region is to rein in rising infl ation pressures. Although the anticipated slowdown in growth and some easing of food price increases should help reduce infl ation over the course of 2008, it is likely to remain uncomfortably high unless macroeconomic and incomes policies are also tightened. The failure to act swiftly to contain infl ation pressures could result in wage and price expectations ratcheting upward,
putting at risk the hard-won gains from earlier disinfl ation policies.
Fiscal policy has added to demand pressures in a number of countries (including Azerbaijan, Georgia, Russia, and Ukraine), and a tighter budgetary stance will be necessary to cool domestic demand. Income policies should be geared toward achieving wage outcomes consis-tent with single-digit infl ation, given underlying trends in productivity. This will require contain-ing the growth of public sector wages—large increases have taken place in many countries in recent years—and limiting increases in mini-mum wages. Tighter monetary policy combined with greater exchange rate appreciation will also be necessary in many countries, including Georgia and Russia. In Ukraine, monetary con-ditions were tightened beginning in the second half of 2007 in response to rising infl ation. In Kazakhstan, monetary policy was tightened in December as infl ation increased and the exchange rate came under downward pressure, and it can now remain on hold until the impli-
Table 2.6. Commonwealth of Independent States (CIS): Real GDP, Consumer Prices, and Current Account Balance(Annual percent change unless noted otherwise)
Real GDP Consumer Prices1 Current Account Balance2
2006 2007 2008 2009 2006 2007 2008 2009 2006 2007 2008 2009
Commonwealth of Independent States 8.2 8.5 7.0 6.5 9.5 9.7 13.1 9.5 7.5 4.5 4.8 2.4
Russia 7.4 8.1 6.8 6.3 9.7 9.0 11.4 8.4 9.5 5.9 5.8 2.9Ukraine 7.1 7.3 5.6 4.2 9.0 12.8 21.9 15.7 –1.5 –4.2 –7.6 –9.7Kazakhstan 10.7 8.5 5.0 7.0 8.6 10.8 17.1 8.3 –2.2 –6.6 –1.7 –1.0Belarus 10.0 8.2 7.1 6.8 7.0 8.4 11.2 8.8 –4.1 –6.6 –7.5 –7.7Turkmenistan 11.1 11.6 9.5 10.0 8.2 6.4 12.0 12.0 15.3 16.8 23.6 28.1
Low-income CIS countries 14.7 14.5 11.9 10.8 10.1 12.7 14.7 13.3 8.0 12.9 19.3 19.6Armenia 13.3 13.8 10.0 8.0 2.9 4.4 6.8 4.5 –1.8 –6.5 –6.8 –5.0Azerbaijan 30.5 23.4 18.6 15.6 8.4 16.6 19.6 20.5 17.7 28.8 39.5 39.2Georgia 9.4 12.4 9.0 9.0 9.2 9.2 9.6 6.4 –15.9 –19.7 –16.6 –13.2Kyrgyz Republic 3.1 8.2 7.0 6.5 5.6 10.2 18.8 10.2 –6.6 –6.5 –8.3 –7.4Moldova 4.0 5.0 7.0 8.0 12.7 12.6 11.4 7.9 –12.0 –9.7 –10.3 –10.6Tajikistan 7.0 7.8 4.1 7.0 10.0 13.2 18.5 10.5 –3.0 –9.5 –8.3 –7.1Uzbekistan 7.3 9.5 8.0 7.5 14.2 12.3 11.8 10.9 18.8 23.8 24.6 20.8
MemorandumNet energy exporters3 8.2 8.6 7.1 6.8 9.7 9.4 12.1 8.9 9.1 6.0 6.7 4.1Net energy importers4 7.9 7.9 6.2 5.3 8.4 11.4 18.1 12.9 –3.1 –5.8 –8.1 –9.3
1Movements in consumer prices are shown as annual averages. December/December changes can be found in Table A7 in the Statistical Appendix.
2Percent of GDP. 3Includes Azerbaijan, Kazakhstan, Russia, Turkmenistan, and Uzbekistan.4Includes Armenia, Belarus, Georgia, Kyrgyz Republic, Moldova, Tajikistan, and Ukraine.
COMMONWEALTH OF INDEPENDENT STATES: CONTAINING INFLATION REMAINS THE CENTRAL CHALLENGE

CHAPTER 2 COUNTRY AND REGIONAL PERSPECTIVES
94
cations of the sharp slowing in credit growth become clearer.
With credit-to-GDP ratios in the region still relatively low, fi nancial deepening is very wel-come, but the pace of credit growth has raised concerns about whether a number of countries are experiencing unsustainable credit booms. Rapid credit expansion may be undermining credit quality, particularly if the capacity of banks to assess the creditworthiness of borrowers is failing to keep pace with the expansion of their lending activities, and the potential for sharp reversals of asset prices raises questions about the value of the collateral backing the loans in the event of a downturn. A further concern is that, in many cases, the credit expansion is being fi nanced by bank borrowing in foreign currency, opening exposure to exchange rate movements. To minimize the risks from rapid credit growth, it is important that the authorities upgrade their monitoring and supervisory practices, that banks themselves improve their credit-assessment and risk-management systems, and that borrowers are better educated about the exchange rate and interest rate risks they face.
Over the longer term, the region continues to face the challenge of diversifying its production base away from the current heavy reliance on commodities. Investment in the region remains low—only 22 percent of GDP in 2007—and is concentrated in extractive industries and construction. Efforts to strengthen institutions, improve the business climate, continue trade reforms, and develop more diversifi ed domestic fi nancial systems will be essential to encourage greater private sector investment.
Sub-Saharan Africa: Strong Growth Prospects, but Risks Remain
Building on the best period of sustained economic growth since independence, the pace of economic activity in sub-Saharan Africa (SSA) accelerated to 6.8 percent in 2007, led by very strong growth in oil-exporting countries and supported by robust expansions in the region’s other economies. The region’s strongest growth
Spurred by rising earnings from commodity exports and rapid credit expansion, domestic demand in the CIS region is growing very strongly. This strong growth, together with rising food prices, has led to a sharp pickup in inflation in recent months.
-25
-20
-15
-10
-5
0
5
10
0
5
10
15
20
Figure 2.7. Commonwealth of Independent States (CIS): Inflation Pressures Remain the Central Concern
4
6
8
10
12
14
70
80
90
100
110
120
4
8
12
16
20
24
0
20
40
60
80
100
Real Effective Exchange Rate(index, 2006 = 100)
Net Foreign Assets of Banking System(percent of GDP)
Private Credit Growth (12-month percent change)
Policy Interest Rates(percent)
Consumer Price Inflation(percent)
Sources: IMF, International Financial Statistics; and IMF staff calculations. 2006–07 average.
GDP and Domestic Demand Growth (percent)
1
Overall
Ukraine
Russia
KazakhstanKazakhstan
Russia
Ukraine
1
1
20052007
GDPDomestic demand
Jan.08
060504
07060504Dec.07
060504
2003
Excluding food
CIS Russia Ukraine Kazakhstan
CIS Russia Ukraine Kazakhstan CIS Russia Ukraine Kazakhstan
2003 2003 Feb.08

95
was recorded by Angola, where oil and diamond production have both risen sharply. In Nigeria, robust non-oil sector growth offset the drag from a decline in oil production in the Niger Delta. The pace of activity elsewhere in SSA has been supported by domestic demand (invest-ment in particular), the payoff from improve-ments in macroeconomic stability, and the reforms undertaken in most countries. In South Africa, the region’s largest economy, the pace of activity has eased modestly as tighter monetary policy, aimed at containing rising infl ation pres-sures from food and fuel prices, has applied a brake to household spending, but investment continues to grow at a brisk pace in preparation for the 2010 FIFA World Cup. Elsewhere, infl a-tion pressures remain generally well contained, refl ecting a variety of factors, including stabili-zation gains in some countries, improved food supplies, appropriately restrictive monetary poli-cies—with, in some cases, exchange rate appre-ciation in response to capital infl ows—and lower bank fi nancing of fi scal defi cits.
The favorable environment has made some countries in SSA increasingly attractive as des-tinations for private capital infl ows. Net private capital infl ows reached record levels in 2007, led by strong FDI infl ows. However, the bulk of FDI is still focused on a few countries and targeted mainly at extractive industries, particu-larly the petroleum sector, based on evidence from cross-border mergers-and-acquisition-related infl ows—an important fraction of gross FDI infl ows.
As discussed in Chapter 5, the current cycle differs in many important ways for commod-ity exporters, including in Africa. Although commodity export values have risen as a share of regional GDP, the increase in the volume of commodity exports has been much more limited. On the other hand, rising investment—which has benefi ted from improved policies and a strengthened institutional environment—has provided the basis for a growing manufactur-ing sector in several countries. Volumes of manufacturing exports now represent a much larger share of regional GDP than commod-
1998 2000 02 04 06 08-30
-20
-10
0
10
20
30
40
1998 2000 02 04 06 08-4
-2
0
2
4
6
8
10
2005 20060
3
6
9
12
15
0
20
40
60
80
100
Figure 2.8. Sub-Saharan Africa: Vulnerability of Commodity Exports to Global Demand
Commodity Export Destinations(percent of total exports)
0
4
8
12
16
20Export Volumes by Type(percent of regional GDP)
Sub-Saharan Africa
Domestic demandNet exports
Sources: UNCTAD World Investment Report; and IMF staff estimates. Angola, Republic of Congo, Equatorial Guinea, Gabon, and Nigeria. Benin, Botswana, Burkina Faso, Burundi, Cameroon, Cape Verde, Central African Republic, Chad, Comoros, Dem. Rep. of Congo, Côte d’Ivoire, Djibouti, Ethiopia, Gambia, Ghana, Guinea, Guinea-Bissau, Kenya, Lesotho, Madagascar, Malawi, Mali, Mauritania, Mauritius, Mozambique, Namibia, Niger, Rwanda, Senegal, Seychelles, Sierra Leone, South Africa, Swaziland, Tanzania, Togo, Uganda, and Zambia.
1
Despite strong domestic demand, the region’s dependence on commodities underscores continued vulnerability to terms-of-trade shocks. Foreign direct investment is still targeted mainly toward primary sectors, especially oil.
Contributions to Growth(percent)
Terms-of-trade gain
Sub-Saharan Fuel Exporters
Sub-Saharan Nonfuel Exporters Inward Mergers and Acquisitions by Sector(billions of U.S. dollars)
Services
PrimarySecondary
Nonfuel-based commoditiesFuel-based commoditiesManufactures
Advanced economies
China
Developing Asiaexcluding China
Other developingeconomies
1990 94 98 02 06
1984 88 92 96 2000 04
92 96 2000 04
1
2
2
1998 2000 02 04 06 08-10
-5
0
5
10
15
SUB-SAHARAN AFRICA: STRONG GROWTH PROSPECTS, BUT RISKS REMAIN

CHAPTER 2 COUNTRY AND REGIONAL PERSPECTIVES
96
ity exports (Figure 2.8). Among commodity exporters, manufacturing activity is often in commodity-related sectors, but the rising role of manufacturing exports nevertheless presents an opportunity for a move up the value chain and greater diversifi cation of the economy away from primary exports. As a result of the broad-ening base of regional economies, terms-of-trade gains now play a smaller role than in the past in explaining the contributions to overall growth of both domestic demand and net exports. Export destinations have also become more diversi-fi ed, with a greater share of exports now going
to other emerging and developing economies, although advanced economies still account for three-quarters of all exports.
Against this background, growth in SSA during 2008–09 is projected to slow only modestly from the pace recorded in 2007 (Table 2.7). Growth will continue to be led by oil exporters, refl ecting the coming onstream of new production facilities in oil-exporting countries. In view of the strength of nonfuel commodity exports and strong investment growth, growth in non-fuel-exporting countries is expected to continue at about the same pace
Table 2.7. Selected African Economies: Real GDP, Consumer Prices, and Current Account Balance (Annual percent change unless noted otherwise)
Real GDP Consumer Prices1 Current Account Balance2
2006 2007 2008 2009 2006 2007 2008 2009 2006 2007 2008 2009
Africa 5.9 6.2 6.3 6.4 6.4 6.3 7.5 5.9 3.1 0.1 1.7 0.9
Maghreb 4.4 4.2 5.5 5.3 3.1 3.1 3.7 3.3 14.3 12.4 13.9 10.7Algeria 2.0 4.6 4.9 4.9 2.5 3.7 4.3 4.1 25.2 23.2 26.0 20.6Morocco 8.0 2.2 6.5 5.7 3.3 2.0 2.0 2.0 2.8 –0.1 –1.1 –0.9Tunisia 5.5 6.3 5.5 5.9 4.5 3.1 4.7 3.5 –2.0 –2.5 –2.7 –2.7
Sub-Sahara 6.4 6.8 6.6 6.7 7.3 7.2 8.5 6.6 –0.1 –3.3 –1.8 –1.7
Horn of Africa3 11.3 10.8 7.9 10.5 9.1 11.4 12.6 8.6 –13.3 –9.8 –8.3 –5.9Ethiopia 11.6 11.4 8.4 7.1 12.3 17.0 20.1 12.9 –9.1 –4.5 –4.3 –6.1Sudan 11.3 10.5 7.6 12.7 7.2 8.0 8.0 6.0 –15.1 –11.8 –9.8 –5.6
Great Lakes3 6.0 6.8 5.7 6.4 10.4 9.2 9.2 6.6 –4.4 –4.8 –8.0 –10.0Congo, Dem. Rep. of 5.6 6.3 8.8 11.6 13.2 16.7 10.1 11.4 –2.4 –4.0 –10.7 –24.6Kenya 6.1 7.0 2.5 3.4 14.5 9.8 12.3 7.0 –2.5 –3.5 –5.5 –3.8Tanzania 6.7 7.3 7.8 8.0 7.3 7.0 7.1 5.2 –7.8 –9.2 –9.7 –10.1Uganda 5.1 6.5 7.1 7.0 6.6 6.8 5.9 5.0 –4.0 –2.0 –7.7 –9.3
Southern Africa3 10.8 12.8 11.1 9.4 11.2 10.1 9.8 7.8 15.2 6.7 5.8 6.4Angola 18.6 21.1 16.0 13.2 13.3 12.2 11.4 8.9 23.3 11.0 12.0 11.8Zimbabwe4 –5.4 –6.1 –6.6 –6.8 1,016.7 10,452.6 . . . . . . –6.0 –1.0 — . . .
West and Central Africa3 4.6 5.1 7.0 6.9 7.0 4.6 6.7 6.1 4.2 –1.6 2.4 2.1Ghana 6.4 6.4 6.9 7.5 10.9 9.6 8.9 7.9 –10.9 –12.8 –9.8 –7.9Nigeria 6.2 6.4 9.1 8.3 8.3 5.5 8.6 8.5 9.5 0.7 6.5 5.7
CFA franc zone3 2.2 3.6 4.8 5.2 3.6 1.6 3.9 2.9 –0.3 –2.3 –0.6 –1.0Cameroon 3.2 3.3 4.5 4.6 5.1 0.9 3.0 2.3 0.7 0.4 — –0.4Côte d’Ivoire –0.3 1.6 2.9 5.1 5.0 2.1 4.7 3.2 3.1 1.4 0.6 –0.5
South Africa 5.4 5.1 3.8 3.9 4.7 7.1 8.7 5.9 –6.5 –7.3 –7.7 –7.9
MemorandumOil importers 5.7 5.2 5.1 5.2 6.3 6.7 7.6 5.5 –3.5 –4.8 –5.9 –6.1Oil exporters5 6.3 8.0 8.4 8.3 6.4 5.6 7.2 6.5 13.1 7.4 11.1 9.3
1Movements in consumer prices are shown as annual averages. December/December changes can be found in Table A7 in the Statistical Appendix.
2Percent of GDP. 3The country composition of these regional groups is set out in Table F in the Statistical Appendix. 4The inflation figure for 2007 represents an estimate. No inflation projection for 2008 and beyond is shown. No forecast for the current
account in percent of GDP is shown for 2009. 5Includes Chad and Mauritania.

97
as in 2007. However, in South Africa, rising electricity shortages are expected to weigh on activity during 2008–09.
The balance of risks to the outlook is tilted to the downside. As discussed, regional economies are becoming more diversifi ed and benefi ting from improved policies and structural reforms that are under way in many countries. This should strengthen the resilience of the region to a slowdown in the advanced economies. Nonetheless, the region remains sensitive to developments in advanced economy trading partners, especially western Europe. A shar-per-than-expected slowdown in the advanced economies that reduces the demand for the region’s principal exports is still the key source of risk for the region’s commodity exporters, along with the related risk of weaker commodity prices. Tighter global fi nancial market condi-tions could also slow the pace of capital infl ows and investment into the region. In a number of countries, political and security risks remain important.
The main policy challenges for the region are to maintain progress toward increasing integration with the global economy and to reduce poverty in the context of a less-friendly global environment. Globalization is positively associated with a reduction in inequality in developing countries (see Chapter 4 of the October 2007 World Economic Outlook), but more needs to be done to allow all segments of the population to benefi t from the region’s strong growth performance. At the same time, it is important to reduce the region’s vulnerabilities to commodity-market-led downturns, which disproportionately affect the poor. Macroeco-nomic policy frameworks need to be further strengthened and supported by reforms to build on recent progress in improving the business environment and institutions. Further progress in trade integration needs to be complemented with fi nancial sector reform to broaden the private sector’s access to fi nancial and bank-ing services and to tools for managing risk, in order to allow economies to take fuller advan-tage of the increasing opportunities offered by
globalization. Resource-rich countries need to ensure that fi scal policy is carefully calibrated to keep buildups in spending from export earnings in line with the economy’s absorptive capacity and consistent with fi scal sustainability. Fiscal policy should be supported by appropri-ate monetary policies and targeted at improv-ing the economic prospects of the poor and of future generations. Similar strictures apply more broadly to the management of scaled-up aid infl ows. In countries where exports remain less diversifi ed, fi scal policy also needs to guard against competitiveness pressures in non-resource-exporting sectors caused by Dutch disease effects.
Middle East: Infl ation Is a Growing Concern
Global fi nancial market turmoil has had little direct effect on the Middle East, although the depreciation of the U.S. dollar is complicat-ing policymaking in some countries. Regional growth remains strong, reaching 5.8 percent in 2007 (Table 2.8). In oil-exporting countries, increases in oil production have been limited, but high oil prices are supporting increased government spending, including on infrastruc-ture and social projects, and strong expansion of credit to the private sector. Despite the increase in domestic spending and imports, the large current account surpluses in these countries have narrowed only slightly—to about 22¾ per-cent of GDP—as higher oil prices have further boosted export revenues. Elsewhere, growth has been even stronger, spurred by trade and fi nancial spillovers from oil-exporting countries as well as domestic reforms. Egypt has been leading the way, with the economy expanding by more than 7 percent in 2007.
Infl ation pressures in the region have risen considerably in recent months, owing to strong domestic demand, rising food prices, and higher rents in the Gulf Cooperation Coun-cil (GCC) countries, where a large infl ux of expatriate workers and the growing prosperity of local residents have caused a housing short-
MIDDLE EAST: INFLATION IS A GROWING CONCERN

CHAPTER 2 COUNTRY AND REGIONAL PERSPECTIVES
98
age (Figure 2.9). Consumer price index (CPI) infl ation is running at close to 20 percent (year over year) in the Islamic Republic of Iran, is near 14 percent in Qatar, and is above 9 percent in the United Arab Emirates (a 19-year high). Even in Saudi Arabia, where infl ation has tra-ditionally been in the 1–2 percent range, prices increased by 6.5 percent in 2007.
The short-term outlook for the region gener-ally remains positive. Growth is projected to rise to over 6 percent in both 2008 and 2009, the current account surplus is expected to remain very large, and infl ation pressures should moderate as rents ease with the completion of a large number of new housing units (Qatar and the United Arab Emirates) and limited price controls take effect (caps on rents in the United Arab Emirates and Oman, and subsidies on some food items in Saudi Arabia). Risks to the outlook at this stage appear broadly balanced. Continued high oil prices and/or the large cut in U.S. interest rates could stimulate a stronger-than-expected expansion of domestic demand, although this would likely come at the cost of higher infl ation and would create risks of a pos-sible asset price bubble. A broad-based global slowdown that resulted in a substantial drop in
oil prices and regional geopolitical uncertainties are the main near-term downside risks to the outlook.
The key macroeconomic policy challenge is to contain rising infl ation pressures. Although the baseline forecast envisages some reduction in infl ation over the next year, infl ation will still remain uncomfortably high, and risks are on the upside, given strong money and credit growth. The exchange rates of most GCC coun-tries are pegged to the U.S. dollar (Kuwait is the exception, pegging to an undisclosed basket of currencies since May 2007). This constrains the fl exibility of monetary policy, given that capital accounts are essentially open.10 In this context, the recent monetary policy easing in the United States has not been helpful for the GCC countries, leading to increasingly negative real interest rates at a time when the regional economic cycle is moving ahead strongly. Moreover, the weakness of the U.S. dollar has implied real effective depreciation for many Middle Eastern country currencies, while fi scal
10The Syrian Arab Republic has also moved away from a peg to the U.S. dollar and now pegs its currency to the SDR.
Table 2.8. Selected Middle Eastern Economies: Real GDP, Consumer Prices, and Current Account Balance(Annual percent change unless noted otherwise)
Real GDP Consumer Prices1 Current Account Balance2
2006 2007 2008 2009 2006 2007 2008 2009 2006 2007 2008 2009
Middle East 5.8 5.8 6.1 6.1 7.0 10.4 11.5 10.0 20.9 19.8 23.0 19.4
Oil exporters3 5.8 5.6 6.0 5.9 7.6 10.5 12.2 10.4 24.0 22.8 26.3 22.4Iran, I.R. of 5.8 5.8 5.8 4.7 11.9 17.5 20.7 17.4 9.3 10.4 11.2 8.4Saudi Arabia 4.3 4.1 4.8 5.6 2.3 4.1 6.2 5.6 27.4 26.8 31.3 24.0United Arab Emirates 9.4 7.4 6.3 6.4 9.3 11.0 9.0 5.3 22.0 21.6 27.5 26.0Kuwait 6.3 4.6 6.0 6.2 3.1 5.0 6.5 5.5 51.7 47.4 45.2 42.3
Mashreq 5.9 6.3 6.2 6.5 5.4 9.5 8.4 8.2 –2.4 –2.8 –3.0 –3.4Egypt 6.8 7.1 7.0 7.1 4.2 11.0 8.8 8.8 0.8 1.5 0.8 –0.5Syrian Arab Republic 4.4 3.9 4.0 4.8 10.6 7.0 7.0 7.0 –6.1 –5.8 –6.6 –5.5Jordan 6.3 5.7 5.5 5.8 6.3 5.4 10.9 6.5 –11.3 –17.3 –15.5 –13.4Lebanon — 4.0 3.0 4.5 5.6 4.1 5.5 5.3 –6.0 –10.7 –9.8 –10.2
MemorandumIsrael 5.2 5.3 3.0 3.4 2.1 0.5 2.6 2.0 6.0 3.1 1.8 1.7
1Movements in consumer prices are shown as annual averages. December/December changes can be found in Table A7 in the Statistical Appendix.
2Percent of GDP. 3Includes Bahrain, Islamic Republic of Iran, Kuwait, Libya, Oman, Qatar, Saudi Arabia, Syrian Arab Republic, United Arab Emirates, and
Republic of Yemen.
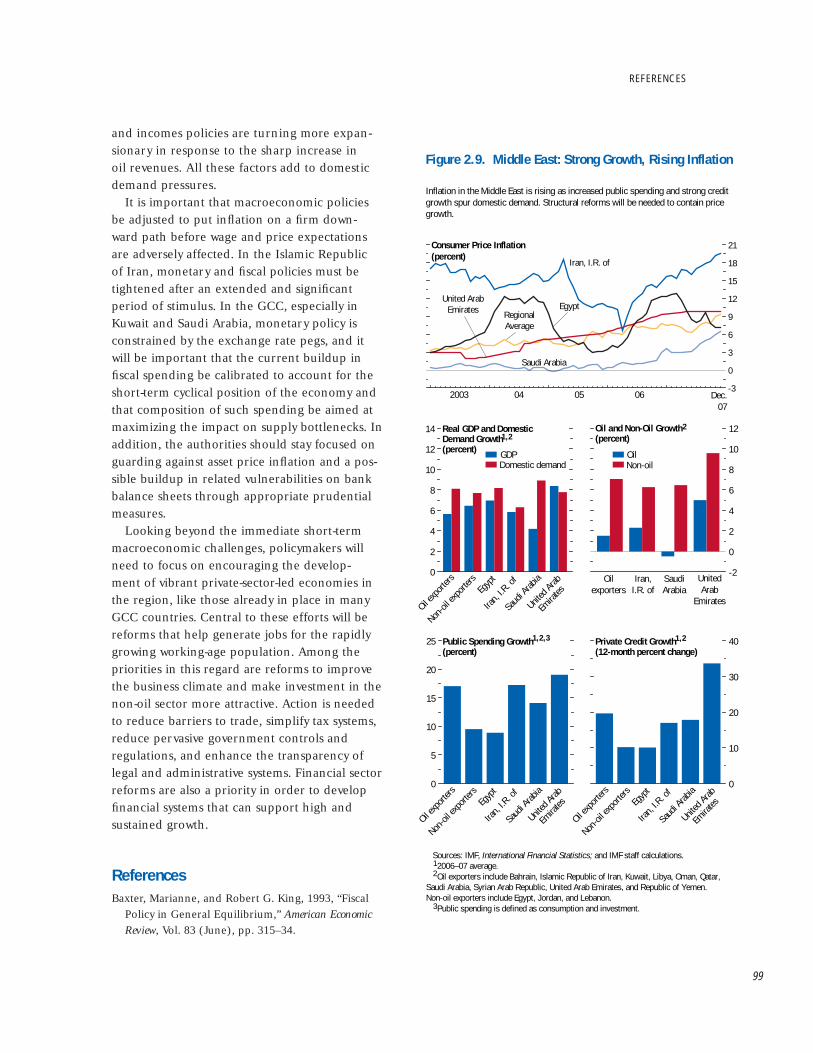
99
and incomes policies are turning more expan-sionary in response to the sharp increase in oil revenues. All these factors add to domestic demand pressures.
It is important that macroeconomic policies be adjusted to put infl ation on a fi rm down-ward path before wage and price expectations are adversely affected. In the Islamic Republic of Iran, monetary and fi scal policies must be tightened after an extended and signifi cant period of stimulus. In the GCC, especially in Kuwait and Saudi Arabia, monetary policy is constrained by the exchange rate pegs, and it will be important that the current buildup in fi scal spending be calibrated to account for the short-term cyclical position of the economy and that composition of such spending be aimed at maximizing the impact on supply bottlenecks. In addition, the authorities should stay focused on guarding against asset price infl ation and a pos-sible buildup in related vulnerabilities on bank balance sheets through appropriate prudential measures.
Looking beyond the immediate short-term macroeconomic challenges, policymakers will need to focus on encouraging the develop-ment of vibrant private-sector-led economies in the region, like those already in place in many GCC countries. Central to these efforts will be reforms that help generate jobs for the rapidly growing working-age population. Among the priorities in this regard are reforms to improve the business climate and make investment in the non-oil sector more attractive. Action is needed to reduce barriers to trade, simplify tax systems, reduce pervasive government controls and regulations, and enhance the transparency of legal and administrative systems. Financial sector reforms are also a priority in order to develop fi nancial systems that can support high and sustained growth.
ReferencesBaxter, Marianne, and Robert G. King, 1993, “Fiscal
Policy in General Equilibrium,” American Economic Review, Vol. 83 (June), pp. 315–34.
-2
0
2
4
6
8
10
12
0
10
20
30
40
0
5
10
15
20
25
0
2
4
6
8
10
12
14
-3
0
3
6
9
12
15
18
21
Figure 2.9. Middle East: Strong Growth, Rising Inflation
Sources: IMF, International Financial Statistics; and IMF staff calculations. 2006–07 average. Oil exporters include Bahrain, Islamic Republic of Iran, Kuwait, Libya, Oman, Qatar, Saudi Arabia, Syrian Arab Republic, United Arab Emirates, and Republic of Yemen. Non-oil exporters include Egypt, Jordan, and Lebanon. Public spending is defined as consumption and investment.
Inflation in the Middle East is rising as increased public spending and strong credit growth spur domestic demand. Structural reforms will be needed to contain price growth.
Real GDP and Domestic Demand Growth(percent)
Public Spending Growth(percent)
Oil and Non-Oil Growth(percent)
Consumer Price Inflation(percent)
1
United Arab Emirates
Iran, I.R. of
Private Credit Growth(12-month percent change)
Saudi Arabia
1,2
2
RegionalAverage
Egypt
1,2,3
OilNon-oil
GDPDomestic demand
Oilexporters
Iran,I.R. of
SaudiArabia
UnitedArab
Emirates
1,2
2003 04 05 06 Dec.07
Oil exp
orters
Non-oi
l exp
orters
Egyp
t
Iran,
I.R. o
f
Saudi
Arabia
3
United
Arab
Emira
tes
Oil exp
orters
Non-oi
l exp
orters
Egyp
t
Iran,
I.R. o
f
Saudi
Arabia
United
Arab
Emira
tes
Oil exp
orters
Non-oi
l exp
orters
Egyp
t
Iran,
I.R. o
f
Saudi
Arabia
United
Arab
Emira
tes
2
REFERENCES

CHAPTER 2 COUNTRY AND REGIONAL PERSPECTIVES
100
Bayoumi, Tamim, 2001, “The Morning After: Explain-ing the Slowdown in Japanese Growth,” in Post-Bub-ble Blues—How Japan Responded to Asset Price Collapse, ed. by Tamim Bayoumi and Charles Collyns (Wash-ington: International Monetary Fund).
Bayoumi, Tamim, and Andrew Swiston, 2007, “Foreign Entanglements: Estimating the Source and Size of Spillovers Across Industrial Countries,” IMF Working Paper 07/182 (Washington: International Monetary Fund).
Bernanke, Ben, 2007, “Housing, Housing Finance and Monetary Policy,” opening speech at the Federal Reserve Bank of Kansas City 31st Economic Policy Symposium, “Housing, Housing Finance and Monetary Policy,” Jackson Hole, Wyoming, August 31–September 1.
Blinder, Alan, 2004, “The Case Against Discretionary Fiscal Policy,” CEPS Working Paper No. 100 (Princ-eton, New Jersey: Princeton University Center for Economic Policy Studies). Available via the Inter-net: www.princeton.edu/~ceps/workingpapers/100blinder.pdf.
Boorman, Jack, 2006, “Global Imbalances and Capital Flows to Emerging Market Countries,” paper presented at the Emerging Markets Forum 2006 Global Meeting, “International Capital Flows, Domestic Capital Markets Growth and Develop-ment in Emerging Market Countries,” Jakarta, September 20–22.
Botman, Dennis, 2006, “Effi ciency Gains from Reduc-ing the GST Versus Personal Income Taxation in Canada,” in Canada: Selected Issues, IMF Country Report 06/229 (Washington: International Mon-etary Fund).
Botman, Dennis, Philippe Karam, Douglas Laxton, and David Rose, 2007, “DSGE Modeling at the Fund: Applications and Further Developments,” IMF Working Paper 07/200 (Washington: Interna-tional Monetary Fund).
Catalán, Mario, and Ruy Lama, 2006, “Fiscal Policy and the External Balance in Spain,” in Spain: Selected Issues, IMF Country Report No. 06/213 (Washington: International Monetary Fund).
Corsetti, Giancarlo, and Nouriel Roubini, 1996, “Budget Defi cits, Public Sector Solvency and Political Biases in Fiscal Policy: A Case Study of Finland,” Finnish Economic Papers, Vol. 9 (Spring), pp. 18–36.
Davis, Morris A., Andreas Lehnert, and Robert F. Mar-tin, 2007, “The Rent-Price Ratio for the Aggregate Stock of Owner-Occupied Housing” (unpublished,
December). Available via the Internet: morris.marginalq.com/DLM_fullpaper.pdf.
de Castro Fernández, Francisco, and Pablo Hernández de Cos, 2006, “The Economic Effects of Exogenous Fiscal Shocks in Spain: A SVAR Approach,” ECB Working Paper No. 647 (Frankfurt am Main: Euro-pean Central Bank).
Ford, Robert, and Douglas Laxton, 1999, “World Public Debt and Real Interest Rates,” Oxford Review of Economic Policy, Vol. 15 (Summer), pp. 77–94.
Galí, Jordi, J. David López-Salido, and Javier Vallés, 2007, “Understanding the Effects of Govern-ment Spending on Consumption,” Journal of the Euro pean Economic Association, Vol. 5 (March), pp. 227–70.
Giavazzi, Francesco, and Marco Pagano, 1990, “Can Severe Fiscal Contractions Be Expansionary? Tales of Two Small European Countries,” NBER Macro-economics Annual 1990 (Cambridge, Massachusetts: MIT Press), pp. 75–111.
Giordano, Raffaela, Sandro Momigliano, Stefano Neri, and Roberto Perotti, 2007, “The Effects of Fiscal Policy in Italy: Evidence from a VAR Model,” Euro-pean Journal of Political Economy, Vol. 23 (Septem-ber), pp. 707–33.
Girouard, Nathalie, and Christophe André, 2005, “Measuring Cyclically-Adjusted Budget Balances for OECD Countries,” OECD Economics Department Working Paper No. 434 (Paris: Organization for Economic Cooperation and Development).
Hemming, Richard, Michael Kell, and Selma Mah-fouz, 2002, “The Effectiveness of Fiscal Policy in Stimulating Economic Activity—A Review of the Literature,” IMF Working Paper 02/208 (Washing-ton: International Monetary Fund).
Heppke-Falk, Kirsten H., Jörn Tenhofen, and Gun-tram B. Wolff, 2006, “The Macroeconomic Effects of Exogenous Fiscal Policy Shocks in Germany: A Disaggregated SVAR Analysis,” Deutsche Bundes-bank Discussion Paper, Series 1: Economic Studies No. 41/2006 (Frankfurt am Main: Deutsche Bundesbank).
Izquierdo, Alejandro, Randall Romero, Ernesto Talvi, 2008, “Booms and Busts in Latin America: The Role of External Factors,” IADB Research Depart-ment Working Paper No. 631 (Washington: Inter-American Development Bank).
Johnson, David S., Jonathan A. Parker, and Nicholas S. Souleles, 2004, “The Response of Consumer Spending to the Randomized Income Tax Rebates

101
of 2001,” The Wharton School Working Paper (February).
Kose, M. Ayhan, Guy Meredith, and Christopher Towe, 2004, “How Has NAFTA Affected the Mexi-can Economy? Review and Evidence,” IMF Working Paper 04/59 (Washington: International Monetary Fund).
Kumhof, Michael, and Douglas Laxton, 2007, “A Party Without a Hangover? On the Effects of U.S. Fiscal Defi cits,” IMF Working Paper 07/202 (Washington: International Monetary Fund).
Kuttner, Kenneth N., and Adam S. Posen, 2002, “Fiscal Policy Effectiveness in Japan,” Journal of the Japanese and International Economies, Vol. 16 (December), pp. 536–58.
Leamer, Edward, 2007, “Housing and the Business Cycle,” paper presented at the Federal Reserve Bank of Kansas City 31st Economic Policy Symposium, “Housing, Housing Finance and Monetary Policy,” Jackson Hole, Wyoming, August 31–September 1.
Linnemann, Ludger, and Andreas Schabert, 2003, “Fiscal Policy in the New Neoclassical Synthe-sis,” Journal of Money, Credit and Banking, Vol. 35 (December), pp. 911–29.
Mühleisen, M., 2000, “Too Much of a Good Thing? The Effectiveness of Fiscal Stimulus,” in Post-Bubble Blues—How Japan Responded to Asset Price Collapse, ed. by Tamim Bayoumi and Charles Collyns (Washing-ton: International Monetary Fund).
Österholm, Pär, and Jeromin Zettelmeyer, 2007, “The Effect of External Conditions on Growth in Latin America,” IMF Working Paper 07/176 (Washing-ton: International Monetary Fund).
Perotti, Roberto, 2005, “Estimating the Effects of Fis-cal Policy in OECD Countries,” CEPR Discussion Paper No. 4842 (London: Centre for Economic Policy Research).
———, 2007, “In Search of the Transmission Mecha-nism of Fiscal Policy,” NBER Working Paper No. 13143 (Cambridge, Massachusetts: National Bureau of Economic Research).
Posen, Adam, 1998, Restoring Japan’s Economic Growth (Washington: Institute for International Economics).
Ravn, Morten, Stephanie Schmitt-Grohé, and Martín Uribe, 2006, “Deep Habits,” Review of Economic Stud-ies, Vol. 73 (January), pp. 195–218.
Roache, Shaun, 2007, “Central America’s Regional Trends and U.S. Cycles,” paper presented at the Economic and Financial Linkages in the Western Hemisphere Seminar organized by the Interna-tional Monetary Fund Western Hemisphere Depart-ment, Washington, November 26. Available via the Internet: www.imf.org/external/np/seminars/eng/2007/whd/pdf/session2-1a.pdf.
Sgherri, Silvia, 2006, “How Expansionary Are Tax Cuts in Italy?” in Italy: Selected Issues, IMF Country Report No. 06/59 (Washington: International Monetary Fund).
Shapiro, Matthew D., and Joel Slemrod, 2003, “Consumer Response to Tax Rebates,” American Economic Review, Vol. 93 (March), pp. 381–96.
Swiston, Andrew, and Tamim Bayoumi, 2008, “Spillovers Across NAFTA,” IMF Working Paper 08/3 (Washington: International Monetary Fund).
Sosa, Sebastian, 2007, “External Shocks and Busi-ness Cycle Fluctuations in Mexico: How Important Are U.S. Factors?” IMF Country Report 07/378 (Washington: International Monetary Fund).
Wiegand, Johannes, 2008, “Petrodollars and Bank Lending to Emerging Market Economies dur-ing the Current Oil Price Boom,” IMF Working Paper (Washington: International Monetary Fund, forthcoming).
REFERENCES

Related Documents