of www. pans.co.id www. post.co.id 1 14 Coal Mining & Contracting Sector FAJAR INDRA [email protected] +62215153055 Prepared by December 2014

Panin Sekuritas Coal Sector Outlook 2015-edited
Aug 14, 2015
Welcome message from author
This document is posted to help you gain knowledge. Please leave a comment to let me know what you think about it! Share it to your friends and learn new things together.
Transcript

ofwww. pans.co.id www. post.co.id 1 14
Coal Mining & Contracting Sector
FAJAR [email protected]
+62215153055
Prepared by
December 2014

ofwww. pans.co.id www. post.co.id 2 31
Global Economic Outlook 2015 – Recoveries
Viany Indah
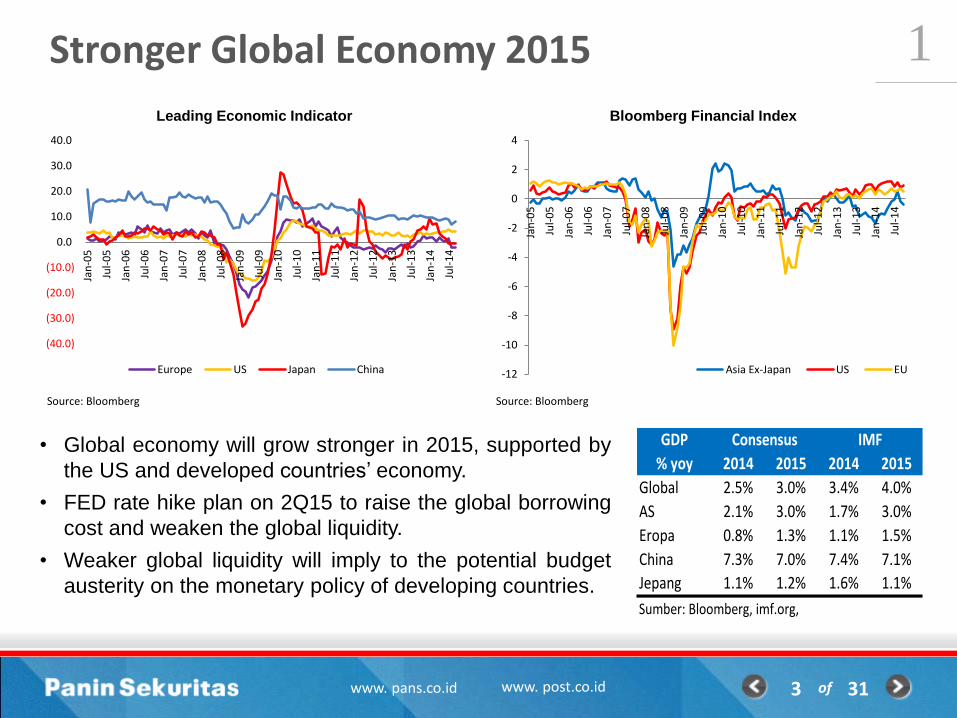
Stronger Global Economy 2015
ofwww. pans.co.id www. post.co.id
1
3 31
Source: Bloomberg
• Global economy will grow stronger in 2015, supported by
the US and developed countries’ economy.
• FED rate hike plan on 2Q15 to raise the global borrowing
cost and weaken the global liquidity.
• Weaker global liquidity will imply to the potential budget
austerity on the monetary policy of developing countries.
Source: Bloomberg
GDP
% yoy 2014 2015 2014 2015
Global 2.5% 3.0% 3.4% 4.0%
AS 2.1% 3.0% 1.7% 3.0%
Eropa 0.8% 1.3% 1.1% 1.5%
China 7.3% 7.0% 7.4% 7.1%
Jepang 1.1% 1.2% 1.6% 1.1%
Sumber: Bloomberg, imf.org,
Consensus IMF
-12
-10
-8
-6
-4
-2
0
2
4
Jan
-05
Jul-
05
Jan
-06
Jul-
06
Jan
-07
Jul-
07
Jan
-08
Jul-
08
Jan
-09
Jul-
09
Jan
-10
Jul-
10
Jan
-11
Jul-
11
Jan
-12
Jul-
12
Jan
-13
Jul-
13
Jan
-14
Jul-
14
Bloomberg Financial Index
Asia Ex-Japan US EU
(40.0)
(30.0)
(20.0)
(10.0)
0.0
10.0
20.0
30.0
40.0
Jan
-05
Jul-
05
Jan
-06
Jul-
06
Jan
-07
Jul-
07
Jan
-08
Jul-
08
Jan
-09
Jul-
09
Jan
-10
Jul-
10
Jan
-11
Jul-
11
Jan
-12
Jul-
12
Jan
-13
Jul-
13
Jan
-14
Jul-
14
Leading Economic Indicator
Europe US Japan China
-4.0%
-2.0%
0.0%
2.0%
4.0%
6.0%
8.0%
10.0%
0.0%
2.0%
4.0%
6.0%
8.0%
10.0%
12.0%
14.0%
Mar
-05
Oct
-05
May
-06
Dec
-06
Jul-
07
Feb
-08
Sep
-08
Ap
r-0
9
No
v-0
9
Jun
-10
Jan
-11
Au
g-1
1
Mar
-12
Oct
-12
May
-13
Dec
-13
Jul-
14
Chinese GDP Growth & Inflation
GDP Growth (yoy) Inflation
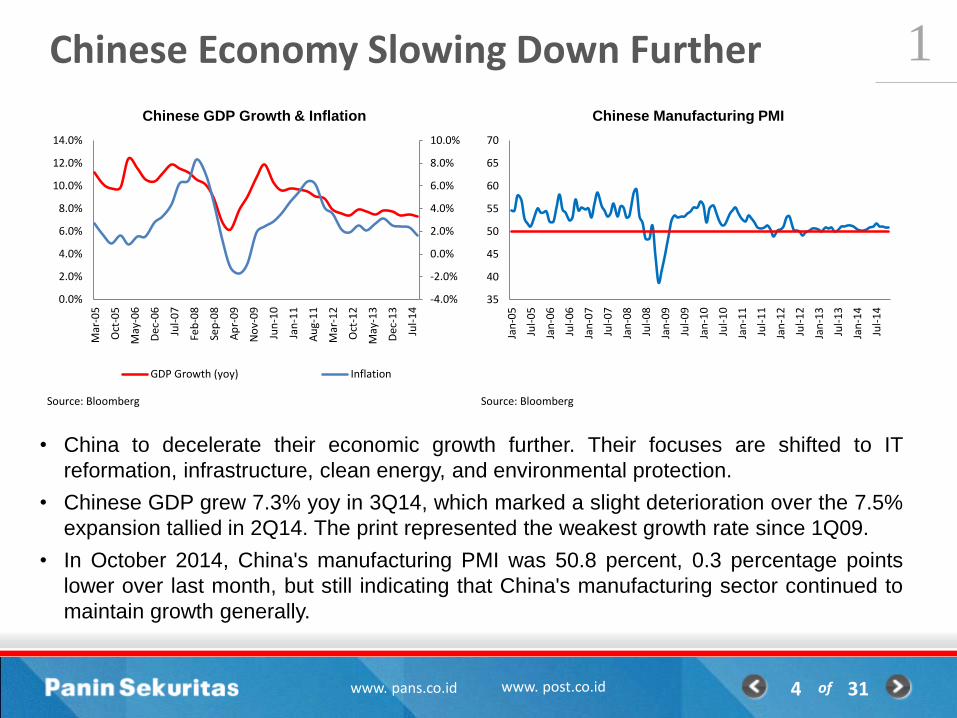
Chinese Economy Slowing Down Further
ofwww. pans.co.id www. post.co.id
1
4 31
Source: Bloomberg
• China to decelerate their economic growth further. Their focuses are shifted to IT
reformation, infrastructure, clean energy, and environmental protection.
• Chinese GDP grew 7.3% yoy in 3Q14, which marked a slight deterioration over the 7.5%
expansion tallied in 2Q14. The print represented the weakest growth rate since 1Q09.
• In October 2014, China's manufacturing PMI was 50.8 percent, 0.3 percentage points
lower over last month, but still indicating that China's manufacturing sector continued to
maintain growth generally.
Source: Bloomberg
35
40
45
50
55
60
65
70
Jan
-05
Jul-
05
Jan
-06
Jul-
06
Jan
-07
Jul-
07
Jan
-08
Jul-
08
Jan
-09
Jul-
09
Jan
-10
Jul-
10
Jan
-11
Jul-
11
Jan
-12
Jul-
12
Jan
-13
Jul-
13
Jan
-14
Jul-
14
Chinese Manufacturing PMI
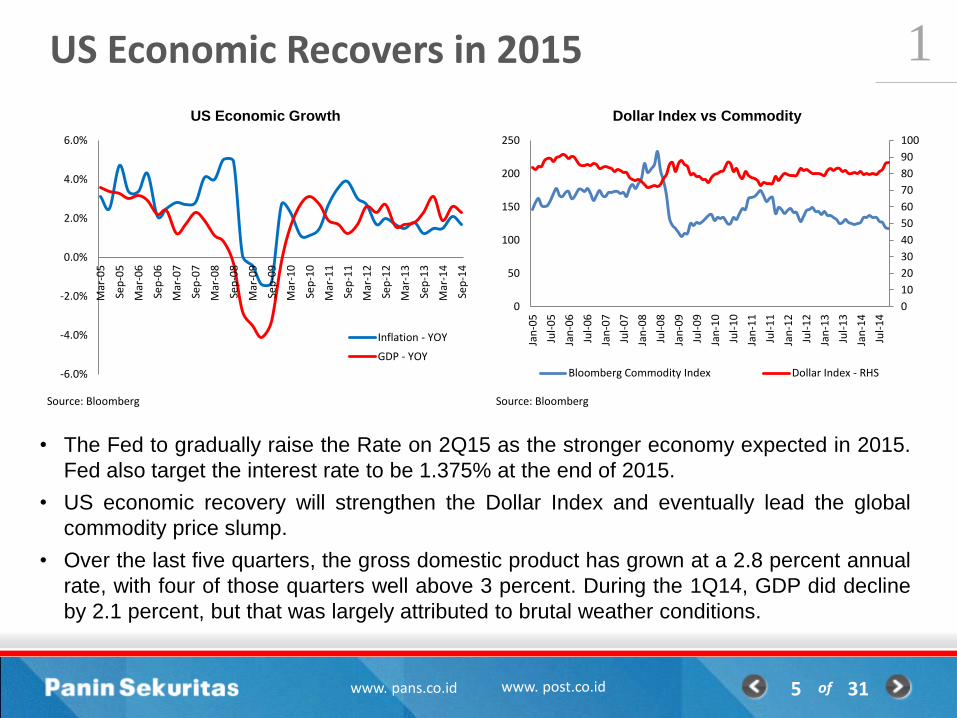
US Economic Recovers in 2015
ofwww. pans.co.id www. post.co.id
1
5 31
Source: Bloomberg
• The Fed to gradually raise the Rate on 2Q15 as the stronger economy expected in 2015.
Fed also target the interest rate to be 1.375% at the end of 2015.
• US economic recovery will strengthen the Dollar Index and eventually lead the global
commodity price slump.
• Over the last five quarters, the gross domestic product has grown at a 2.8 percent annual
rate, with four of those quarters well above 3 percent. During the 1Q14, GDP did decline
by 2.1 percent, but that was largely attributed to brutal weather conditions.
Source: Bloomberg
-6.0%
-4.0%
-2.0%
0.0%
2.0%
4.0%
6.0%
Mar
-05
Sep
-05
Mar
-06
Sep
-06
Mar
-07
Sep
-07
Mar
-08
Sep
-08
Mar
-09
Sep
-09
Mar
-10
Sep
-10
Mar
-11
Sep
-11
Mar
-12
Sep
-12
Mar
-13
Sep
-13
Mar
-14
Sep
-14
US Economic Growth
Inflation - YOY
GDP - YOY
0
10
20
30
40
50
60
70
80
90
100
0
50
100
150
200
250
Jan
-05
Jul-
05
Jan
-06
Jul-
06
Jan
-07
Jul-
07
Jan
-08
Jul-
08
Jan
-09
Jul-
09
Jan
-10
Jul-
10
Jan
-11
Jul-
11
Jan
-12
Jul-
12
Jan
-13
Jul-
13
Jan
-14
Jul-
14
Dollar Index vs Commodity
Bloomberg Commodity Index Dollar Index - RHS

ofwww. pans.co.id www. post.co.id 6 31
Coal Market Outlook 2015 - No Turnaround Story
Fajar IndraTechnical Perspective by Purwoko Sartono

Thermal Coal Global Balance: Oversupply
ofwww. pans.co.id www. post.co.id
2
7 31
Source: BREE, McKloskey, SXCoal, Peabody, Bloomberg, ITMG, ADRO, PANS Estimates
(mio tonnes) Additional
Input/OutputRemarks
Supply
Indonesia +10.0 Production Cap, Stronger Domestic Demand, DMO, Tax Levels
Australia +10.0 Chinese Import Tax, AUD Depreciation, Diminishing Exploration
Russia +4.5 Divert Coal To Export Due To Lower Domestic Demand
Columbia +5.0 Production Target Lifting, Cerrejon & Drummond Expansions
South Africa +1.5 Limited Rail Capacity, Uncertain Expansion
US -5.0 Arbitrage for Exports Closing, Continued Domestic Retraction
Others -2.0 Small Coal Producers Witn Higher Cash Cost
Global +28.0
Demand
China -15.0 Weaker Economic Growth, Protectionism Policy
Japan +2.0 High Reliance on Thermal Generator, Some Nuclear Reactors Are Reactivated
Europe -5.0 High Inventory, Power Plants Retirement Continues
India +20.0 Facing Coal Shortage, Increased Power Demand
Others +5.0 Other Asian & South Americas Drive Demand Growth
Global +7.0
• The market is still plagued by oversupply. The supply glut that’s driven coal to the lowest
since 2009 will more than double next year.
• Demand will increase at a modest rate and prices will remain near the level of marginal
production costs.
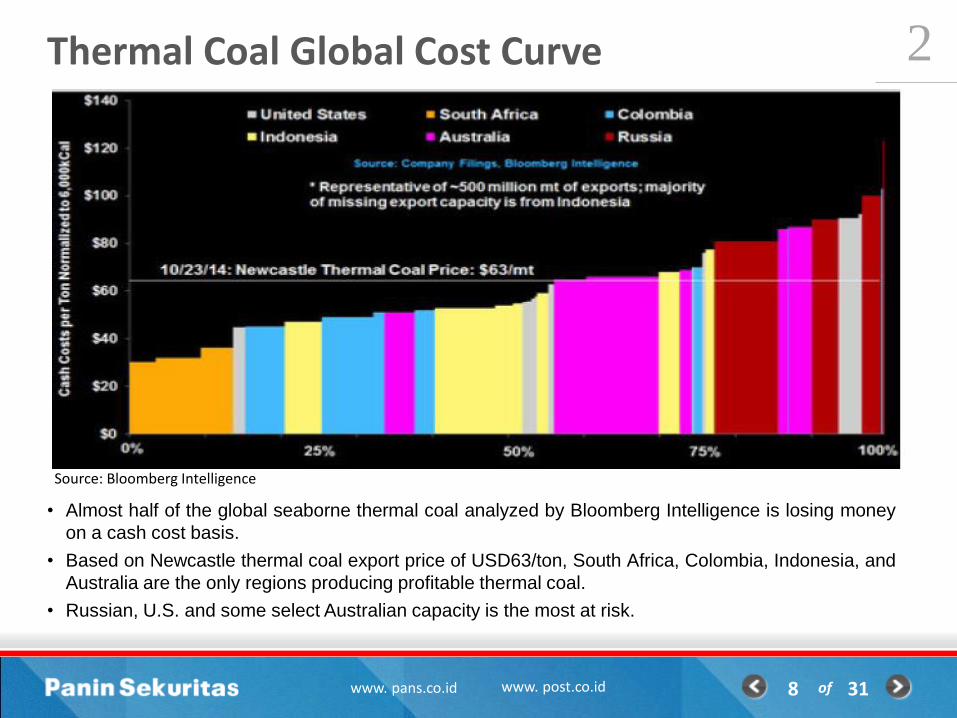
Thermal Coal Global Cost Curve
ofwww. pans.co.id www. post.co.id
2
8 31
Source: Bloomberg Intelligence
• Almost half of the global seaborne thermal coal analyzed by Bloomberg Intelligence is losing money
on a cash cost basis.
• Based on Newcastle thermal coal export price of USD63/ton, South Africa, Colombia, Indonesia, and
Australia are the only regions producing profitable thermal coal.
• Russian, U.S. and some select Australian capacity is the most at risk.

0.0
5.0
10.0
15.0
20.0
25.0
30.0
35.0
40.0
Jan
-10
Ap
r-1
0
Jul-
10
Oct
-10
Jan
-11
Ap
r-1
1
Jul-
11
Oct
-11
Jan
-12
Ap
r-1
2
Jul-
12
Oct
-12
Jan
-13
Ap
r-1
3
Jul-
13
Oct
-13
Jan
-14
Ap
r-1
4
Jul-
14
Oct
-14
Chinese Coal Import, Including Brown Coal (miotonnes)
0.0
100.0
200.0
300.0
400.0
500.0
600.0
Chinese Electricity Output (bio KWh)
Hydro Nuclear Thermal
China: Weak Demand Continues in 2015
ofwww. pans.co.id www. post.co.id
2
9 31
Source: Bloomberg Source: Bloomberg
• Chinese seaborne coal demand until 10M14 is not living up the expectation. Coal imports fall 4.8%
yoy to 243.8 mio tonnes, supported by the significant import decline from Indonesia (27.7% yoy).
• Growth in imports has been moderated by slower economic activity, increased utilisation of
hydropower and relatively low domestic prices which reduced the competitiveness of imports.
• The thermal electricity output growth until 10M14 is steady by growing 0.4% yoy to 3160 bio KWh.
• The coal import will likely weaken further in 2015 as China to set higher standards on coal quality.
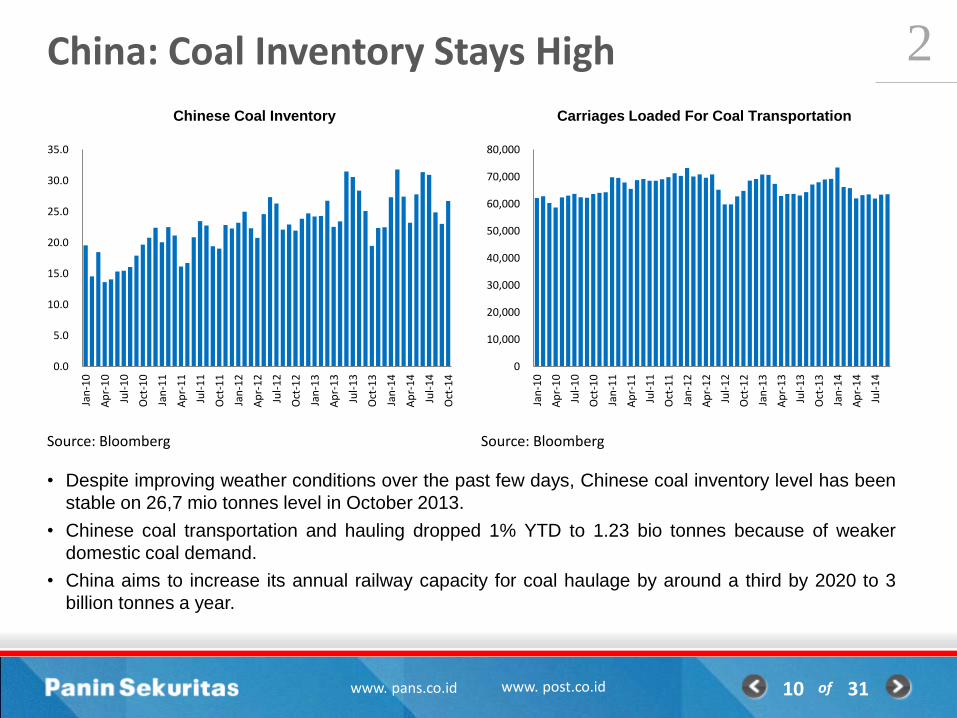
China: Coal Inventory Stays High
ofwww. pans.co.id www. post.co.id
2
10 31
Source: Bloomberg Source: Bloomberg
• Despite improving weather conditions over the past few days, Chinese coal inventory level has been
stable on 26,7 mio tonnes level in October 2013.
• Chinese coal transportation and hauling dropped 1% YTD to 1.23 bio tonnes because of weaker
domestic coal demand.
• China aims to increase its annual railway capacity for coal haulage by around a third by 2020 to 3
billion tonnes a year.
0.0
5.0
10.0
15.0
20.0
25.0
30.0
35.0
Jan
-10
Ap
r-1
0
Jul-
10
Oct
-10
Jan
-11
Ap
r-1
1
Jul-
11
Oct
-11
Jan
-12
Ap
r-1
2
Jul-
12
Oct
-12
Jan
-13
Ap
r-1
3
Jul-
13
Oct
-13
Jan
-14
Ap
r-1
4
Jul-
14
Oct
-14
Chinese Coal Inventory
0
10,000
20,000
30,000
40,000
50,000
60,000
70,000
80,000
Jan
-10
Ap
r-1
0
Jul-
10
Oct
-10
Jan
-11
Ap
r-1
1
Jul-
11
Oct
-11
Jan
-12
Ap
r-1
2
Jul-
12
Oct
-12
Jan
-13
Ap
r-1
3
Jul-
13
Oct
-13
Jan
-14
Ap
r-1
4
Jul-
14
Carriages Loaded For Coal Transportation

Development in Chinese Energy Policy
ofwww. pans.co.id www. post.co.id
2
11 31
• China has announced that it will restrict
consumption of thermal coal with high ash and
sulphur content from 1 January 2015.
• China has introduced a 3% import tax for both
anthracite and coking coal and 6% for
bituminous imports starting 15 October 2014 to
protect its domestic coal producers.
• China has announced that it will replace its tax
on coal production with a tax on coal sales
from 1 December 2014.
• China has mandated that power utilities reduce
their coal imports by a combined 50 mio
tonnes in 2014.
• China has announced an action plan to
improve the operating efficiency of coal-fired
power plants between 2014 and 2020. It is
targeted that plants will reduce their thermal
coal use to between 300–310g/kWh by 2020.
• China to punish coal mines operating above
approved capacity. Companies that exceed
production limits will be fined and have their
license suspended.
Australia31%
Indonesia17%Russia
9%Mongolia
6%
North Korea5%
Others32%
Chinese Seaborne Coal Import
0.0
50.0
100.0
150.0
200.0
250.0
300.0
350.0
400.0
Jan
-12
Mar
-12
May
-12
Jul-
12
Sep
-12
No
v-1
2
Jan
-13
Mar
-13
May
-13
Jul-
13
Sep
-13
No
v-1
3
Jan
-14
Mar
-14
May
-14
Jul-
14
Sep
-14
Chinese Domestic Coal Production
Source: Bloomberg
Source: Bloomberg

India: Facing Coal Shortages
ofwww. pans.co.id www. post.co.id
2
12 31
Source: BREE, Coal Ministry of India Source: Central Electricity Authority of India
• India’s electricity demand is expected to rise substantially over the projection period as household
income increases, the middle class expands and the government improves electrification. India is
halfway though building another 65 GW Powerplant until 2017.
• The coal producers are projected to be unable to fulfill the whole Indian coal consumption because of
the infrastructure bottleneck.
• Coal-fired power is a major component of India’s existing electricity generation capacity and this role
is expected to expand with more than 100 GW of new coal-fired capacity under construction.
118 124 132 143 148
159 174
200
223
246 260
272 288
2005 2006 2007 2008 2009 2010 2011 2012 2013 2014F2015F2016F2017F
Indian Power Plant Capacity
21.7 25.2 33.3
40.8
58.3
71.8
98.2
123.0 130.0
145.0 155.0
160.0
2005 2006 2007 2008 2009 2010 2011 2012 2013 2014E 2015F 2016F
Indian Coal Import Volume

Japan: Still Relies On Thermal Power, But May Decline
ofwww. pans.co.id www. post.co.id
2
13 31
Source: BREE, ABARES Source: Federal Electrical Companies of Japan
• Japan has relied heavily on thermal power (oil, gas and coal) since the end of 2013 when all of its
nuclear capacity was closed.
• Japanese coal demand may decline if authorities move forward with the reactivation of nuclear
reactors in a bid to reduce reliance on foreign energy sources.
• As older coal-fired capacity is closed, Japan’s coal imports are projected to decline at an average
annual rate of 2.2% from 142 mio tonnes in 2014 to 127 mio tonnes in 2019.
128.8 126.7
111.4
127.7 121.5
131.6
141.8 142.0 140.0
-
20.0
40.0
60.0
80.0
100.0
120.0
140.0
160.0
2007 2008 2009 2010 2011 2012 2013 2014E 2015F
Japanese Coal Import
8%
78%
13%
1%
Japanese Power Generator 2013
Hydroelectric Thermal Nuclear Others
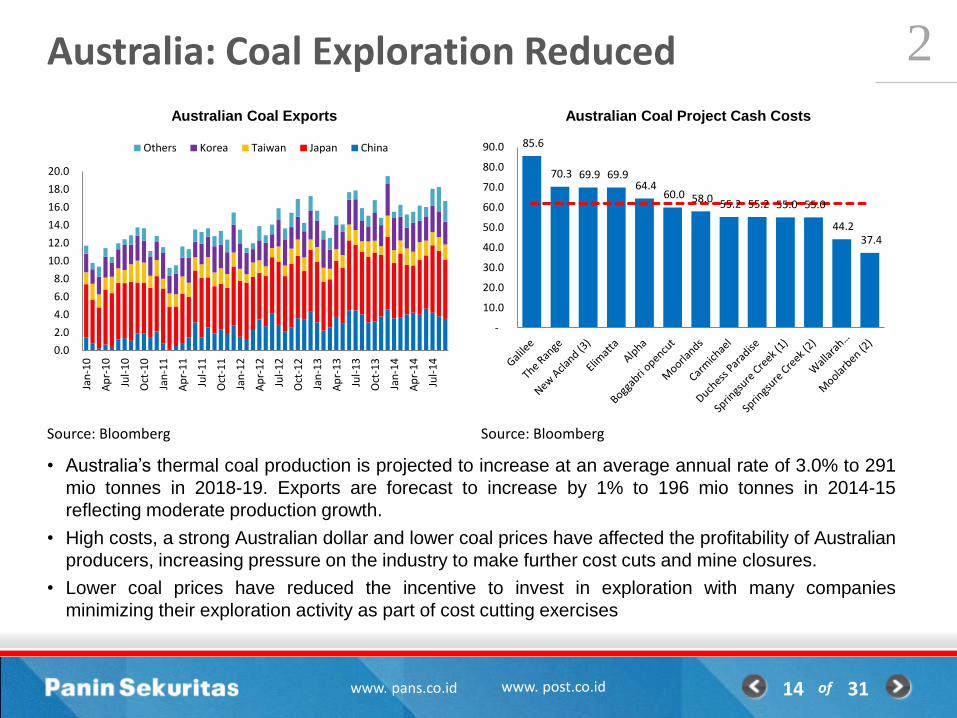
Australia: Coal Exploration Reduced
ofwww. pans.co.id www. post.co.id
2
14 31
Source: Bloomberg Source: Bloomberg
• Australia’s thermal coal production is projected to increase at an average annual rate of 3.0% to 291
mio tonnes in 2018-19. Exports are forecast to increase by 1% to 196 mio tonnes in 2014-15
reflecting moderate production growth.
• High costs, a strong Australian dollar and lower coal prices have affected the profitability of Australian
producers, increasing pressure on the industry to make further cost cuts and mine closures.
• Lower coal prices have reduced the incentive to invest in exploration with many companies
minimizing their exploration activity as part of cost cutting exercises
0.0
2.0
4.0
6.0
8.0
10.0
12.0
14.0
16.0
18.0
20.0
Jan
-10
Ap
r-1
0
Jul-
10
Oct
-10
Jan
-11
Ap
r-1
1
Jul-
11
Oct
-11
Jan
-12
Ap
r-1
2
Jul-
12
Oct
-12
Jan
-13
Ap
r-1
3
Jul-
13
Oct
-13
Jan
-14
Ap
r-1
4
Jul-
14
Australian Coal Exports
Others Korea Taiwan Japan China 85.6
70.3 69.9 69.9 64.4
60.0 58.0 55.2 55.2 55.0 55.0
44.2 37.4
-
10.0
20.0
30.0
40.0
50.0
60.0
70.0
80.0
90.0
Australian Coal Project Cash Costs
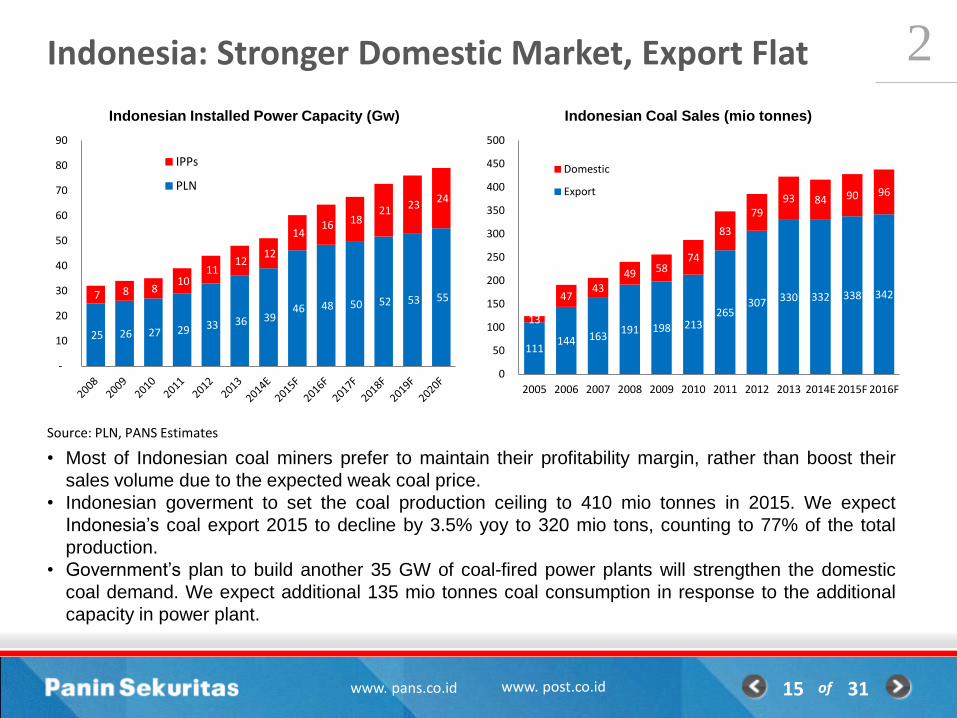
Indonesia: Stronger Domestic Market, Export Flat
ofwww. pans.co.id www. post.co.id
2
15 31
Source: PLN, PANS Estimates
• Most of Indonesian coal miners prefer to maintain their profitability margin, rather than boost their
sales volume due to the expected weak coal price.
• Indonesian goverment to set the coal production ceiling to 410 mio tonnes in 2015. We expect
Indonesia’s coal export 2015 to decline by 3.5% yoy to 320 mio tons, counting to 77% of the total
production.
• Government’s plan to build another 35 GW of coal-fired power plants will strengthen the domestic
coal demand. We expect additional 135 mio tonnes coal consumption in response to the additional
capacity in power plant.
111 144 163
191 198 213 265
307 330 332 338 342
13
47 43
49 58 74
83
79 93 84 90 96
0
50
100
150
200
250
300
350
400
450
500
2005 2006 2007 2008 2009 2010 2011 2012 2013 2014E 2015F 2016F
Indonesian Coal Sales (mio tonnes)
Domestic
Export
25 26 27 29 33 36 39 46 48 50 52 53 55 7 8 8
10 11
12 12
14 16 18
21 23 24
-
10
20
30
40
50
60
70
80
90
Indonesian Installed Power Capacity (Gw)
IPPs
PLN
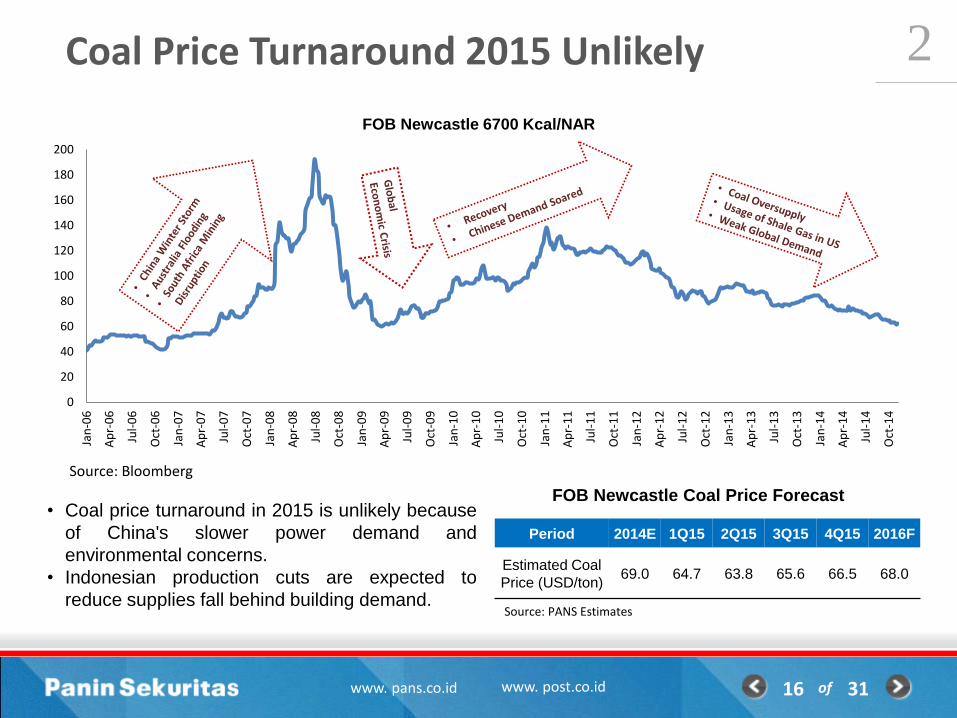
Coal Price Turnaround 2015 Unlikely
ofwww. pans.co.id www. post.co.id
2
16 31
Source: Bloomberg
• Coal price turnaround in 2015 is unlikely because
of China's slower power demand and
environmental concerns.
• Indonesian production cuts are expected to
reduce supplies fall behind building demand.
FOB Newcastle Coal Price Forecast
Period 2014E 1Q15 2Q15 3Q15 4Q15 2016F
Estimated Coal
Price (USD/ton)69.0 64.7 63.8 65.6 66.5 68.0
Source: PANS Estimates
0
20
40
60
80
100
120
140
160
180
200
Jan
-06
Ap
r-0
6
Jul-
06
Oct
-06
Jan
-07
Ap
r-0
7
Jul-
07
Oct
-07
Jan
-08
Ap
r-0
8
Jul-
08
Oct
-08
Jan
-09
Ap
r-0
9
Jul-
09
Oct
-09
Jan
-10
Ap
r-1
0
Jul-
10
Oct
-10
Jan
-11
Ap
r-1
1
Jul-
11
Oct
-11
Jan
-12
Ap
r-1
2
Jul-
12
Oct
-12
Jan
-13
Ap
r-1
3
Jul-
13
Oct
-13
Jan
-14
Ap
r-1
4
Jul-
14
Oct
-14
FOB Newcastle 6700 Kcal/NAR
Coal Price vs Oil Price: No Strong Correlation
ofwww. pans.co.id www. post.co.id
2
17 31
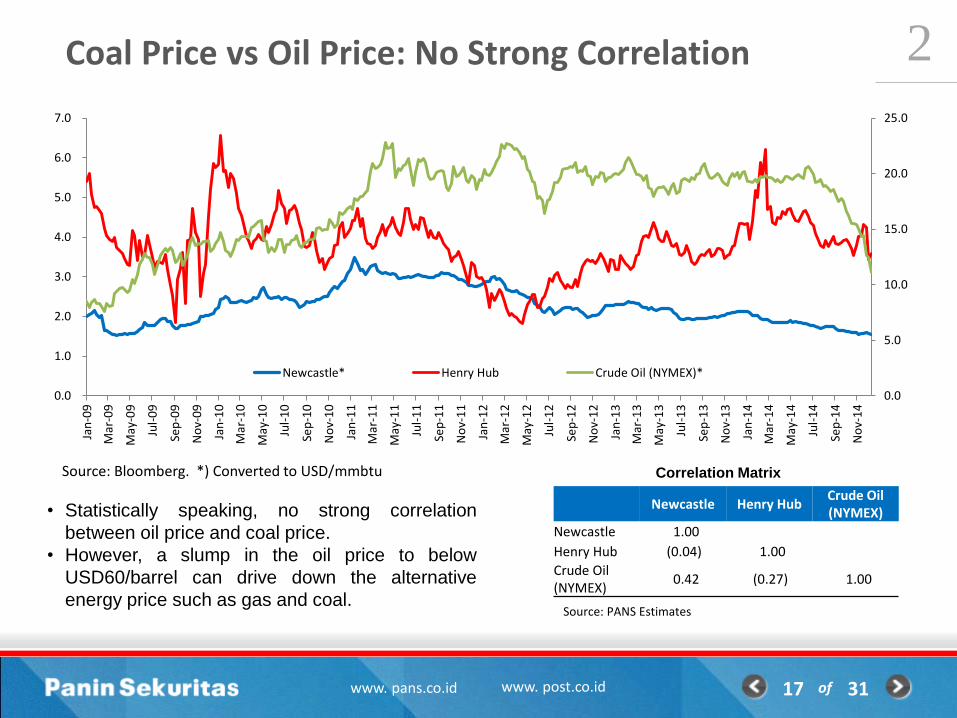
• Statistically speaking, no strong correlation
between oil price and coal price.
• However, a slump in the oil price to below
USD60/barrel can drive down the alternative
energy price such as gas and coal.
0.0
5.0
10.0
15.0
20.0
25.0
0.0
1.0
2.0
3.0
4.0
5.0
6.0
7.0
Jan
-09
Mar
-09
May
-09
Jul-
09
Sep
-09
No
v-0
9
Jan
-10
Mar
-10
May
-10
Jul-
10
Sep
-10
No
v-1
0
Jan
-11
Mar
-11
May
-11
Jul-
11
Sep
-11
No
v-1
1
Jan
-12
Mar
-12
May
-12
Jul-
12
Sep
-12
No
v-1
2
Jan
-13
Mar
-13
May
-13
Jul-
13
Sep
-13
No
v-1
3
Jan
-14
Mar
-14
May
-14
Jul-
14
Sep
-14
No
v-1
4
Newcastle* Henry Hub Crude Oil (NYMEX)*
Source: Bloomberg. *) Converted to USD/mmbtu
Newcastle Henry HubCrude Oil (NYMEX)
Newcastle 1.00
Henry Hub (0.04) 1.00
Crude Oil (NYMEX)
0.42 (0.27) 1.00
Correlation Matrix
Source: PANS Estimates

Coal Price: Technical Perspective
ofwww. pans.co.id www. post.co.id
2
18 31
The Newcastle coal price is still running on the bearish region as depicted on the chart above. The
coal price is forming the wave 5 with the Fibonacci Projection target150% to USD58,2/ton, implied
to 9,9% downside. However, that Elliot Wave scenario can be denied if the coal price rebounds to
wave 4 in USD69,5/ton.
ofwww. pans.co.id www. post.co.id 19 31
Indonesian Coal 2015 – Entering The Downstream
Fajar Indra
Indonesian Energy – Upside From Low Electrification Ratio
ofwww. pans.co.id www. post.co.id
3
20 31
Source: PLN, PANS Estimate
Source: PLN
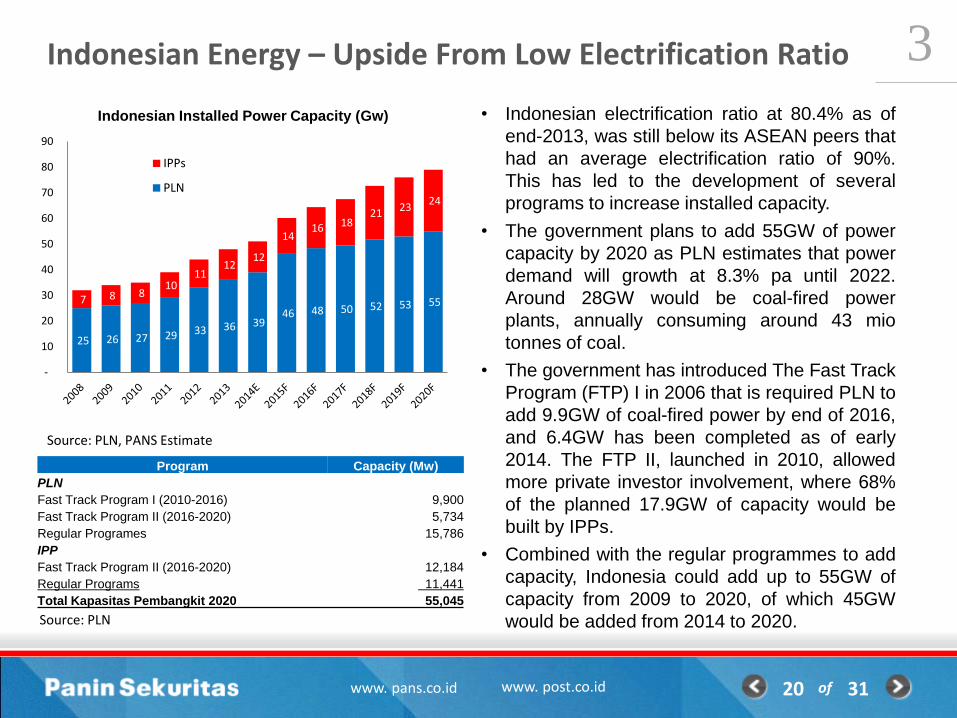
• Indonesian electrification ratio at 80.4% as of
end-2013, was still below its ASEAN peers that
had an average electrification ratio of 90%.
This has led to the development of several
programs to increase installed capacity.
• The government plans to add 55GW of power
capacity by 2020 as PLN estimates that power
demand will growth at 8.3% pa until 2022.
Around 28GW would be coal-fired power
plants, annually consuming around 43 mio
tonnes of coal.
• The government has introduced The Fast Track
Program (FTP) I in 2006 that is required PLN to
add 9.9GW of coal-fired power by end of 2016,
and 6.4GW has been completed as of early
2014. The FTP II, launched in 2010, allowed
more private investor involvement, where 68%
of the planned 17.9GW of capacity would be
built by IPPs.
• Combined with the regular programmes to add
capacity, Indonesia could add up to 55GW of
capacity from 2009 to 2020, of which 45GW
would be added from 2014 to 2020.
25 26 27 29 33 36 39 46 48 50 52 53 55 7 8 8
10 11
12 12
14 16 18
21 23 24
-
10
20
30
40
50
60
70
80
90
Indonesian Installed Power Capacity (Gw)
IPPs
PLN
Program Capacity (Mw)
PLN
Fast Track Program I (2010-2016) 9,900
Fast Track Program II (2016-2020) 5,734
Regular Programes 15,786
IPP
Fast Track Program II (2016-2020) 12,184
Regular Programs 11,441
Total Kapasitas Pembangkit 2020 55,045

Indonesian Energy – Replacing Diesel to Coal
ofwww. pans.co.id www. post.co.id
3
21 31
Source: PLN, PANS Estimate Source: PLN
0%
10%
20%
30%
40%
50%
60%
70%
80%
90%
100%
2009 2010 2011 2012 2013 2014E 2015F
Indonesian Power Generation
Others Diesel Hydro Natural Gas Coal
• Indonesia has 46GW of installed power generation capacity as of end-2013. Around 45% is fuelled
by coal, while 30% is either gas powered or coal fired power plants.
• Diesel’s share of overall power generation has declined over the past 5 years and been replaced by
coal and natural gas power generation. The fuel cost for diesel power generation is almost 8x higher
than that of coal and 3x higher than that of natural gas power generation.
• Around 18GW of coal power capacity has already been assigned in the FTP II and IPP programmes,
while geothermal would add 7.3GW.
66%
26%
8%
PLN’s Fast Track Program II
Coal Geothermal Others
Higher Expectation on Domestic Coal Demand
ofwww. pans.co.id www. post.co.id
3
22 31
Source: ESDM, PANS Estimate Source: PLN, PANS Estimates
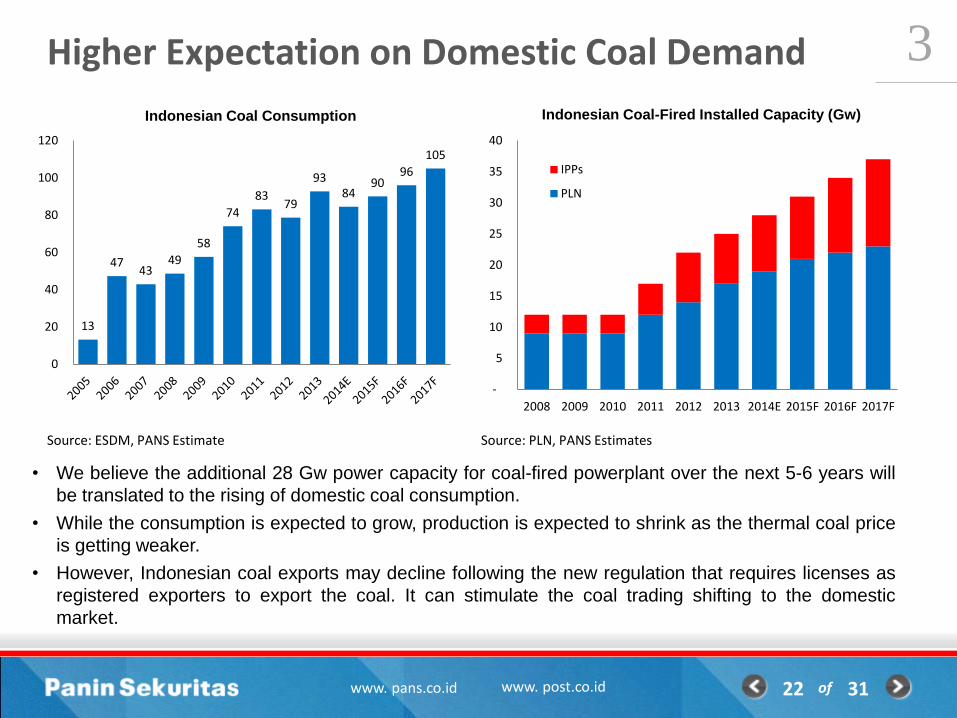
• We believe the additional 28 Gw power capacity for coal-fired powerplant over the next 5-6 years will
be translated to the rising of domestic coal consumption.
• While the consumption is expected to grow, production is expected to shrink as the thermal coal price
is getting weaker.
• However, Indonesian coal exports may decline following the new regulation that requires licenses as
registered exporters to export the coal. It can stimulate the coal trading shifting to the domestic
market.
-
5
10
15
20
25
30
35
40
2008 2009 2010 2011 2012 2013 2014E 2015F 2016F 2017F
Indonesian Coal-Fired Installed Capacity (Gw)
IPPs
PLN
13
47 43
49
58
74
83 79
93 84
90 96
105
0
20
40
60
80
100
120
Indonesian Coal Consumption

Production Flat as The Coal Price Weaker
ofwww. pans.co.id www. post.co.id
3
23 31
Source: ESDM, PANS Estimate Source: PLN, PANS Estimates
• Indonesian government has imposed the annual coal production ceiling at 420 mio tonnes in 2014 as
the coal price getting weaker.
• Most of Indonesian mining companies focus on maintaining the operational cost rather than ramping up
the production. Some of them have even suspended the mining operation.
• Most of mining companies strip ratios will be flat in 2015, indicated their initiatives to reduce the cost
and hold the expansion.
114 153 157 167
198 219 244 255 271 275 276 275
10
38 49 73
58 68
104 130
151 141 152 155
0
50
100
150
200
250
300
350
400
450
500
2005 2006 2007 2008 2009 2010 2011 2012 2013 2014E 2015F 2016F
Indonesian Coal Production
Mining Licenses CCOW
0.0
2.0
4.0
6.0
8.0
10.0
12.0
Kideco BUMI ADRO PTBA ITMG HRUM
Strip Ratio of Major Coal Companies
2013 2014E 2015F

Indonesian Coal Miners – The Best Among The Worst
ofwww. pans.co.id www. post.co.id
3
24 31
• We prefer PTBA & ADRO to be our “best among the worst” for the coal sector. PTBA has the highest
exposure to domestic coal sales within our coverage universe. Besides, PTBA also promises potential
growth, driven by its volume growth.
• In the long run, ADRO will also be attractive if its downstream projects such as 2x1000 Mw Batang
powerplant and 2x300 Mw mine-mouth powerplant are completed. ADRO also promises highers
potential earning growth on small number basis.
• ITMG has its own reputation as a high dividend payer. With lower capex, we believe ITMG will
maintain its dividend on 80-90% of their annual earnings, implied to 7-9% dividend yield.
• UNTR will face a difficult period over the next few years as many coal producers will maintain their
production on the low strip ratio level. Besides, lower capex will hit the heavy equipment sales on the
mining sectors.
• We do not prefer on HRUM due to its lack coal reserves and no significant cost efficiency initiatives.
• IDR depreciation will benefit UNTR and PTBA as they state their financial statements in IDR. UNTR
and PTBA are the USD earners with around half IDR cash cost.
Stock RatingTarget
PricePE-15 PBV-15 ROE-15
Dividend
Yield
EPS Growth
- 15
PTBA NEUTRAL 11.600 13.5x 1.2x 20.4% 3.6% -2.2%
ADRO NEUTRAL 1.100 13.0x 1.0x 6.3% 1.5% 28.1%
UNTR NEUTRAL 19.750 13.5x 1.9x 13.2% 3.0% -6.8%
ITMG NEUTRAL 18.200 9.6x 1.8x 18.8% 9.0% -16.6%
HRUM SELL 1.000 15.0x 0.7x 6.2% 5.5% -16.2%

Head Office :Indonesia Stock Exchange Tower II Suite 1705
Jl. Jend Sudirman kav. 52-53, Jakarta Selatan - 12190Telp: (021) 515 3055, Faks: (021) 515 3061
Email: [email protected] Website: www.pans.co.id
Online Trading: www.post.co.id
PT PANIN SEKURITAS Tbk
Branch Offices :Kelapa Gading - North Jakarta : (021) 2938 5767Pluit Village - North Jakarta : (021) 6667 0268Pluit Sakti - North Jakarta : (021) 666 00302 Pondok Indah - South Jakarta : (021) 722 4420Puri Kencana - West Jakarta : (021) 582 3868Tanah Abang - Central Jakarta : (021) 2357 1177Tangerang - Alam Sutera : (021) 2921 1518
Denpasar-Bali : (0361) 7152 999Medan-Dipenogoro : (061) 451 9267Medan-Iskandar Muda : (061) 453 0123Medan-Pemuda : (061) 457 6996Padang : (0751) 811 322Palembang : (0711) 370 235Pekanbaru : (0761) 27827Pontianak : (0561) 748 888Semarang : (024) 850 2300Solo : (0271) 727888Surabaya : (031) 561 3388
ofwww. pans.co.id www. post.co.id 25 31
Bandung – Batununggal : (022) 87301954Bandung – Sunda : (022) 732 1434Bandung – Dago : (022) 426 8127, 426 8129Batam : (0778) 459 222Bukit Tinggi : (0752) 33998
Related Documents