Aurizon Network Debt Investor Update Pam Bains – EVP & Group Chief Financial Officer David Collins – VP Finance & Group Treasurer March 2017

Welcome message from author
This document is posted to help you gain knowledge. Please leave a comment to let me know what you think about it! Share it to your friends and learn new things together.
Transcript

Aurizon Network
Debt Investor Update
Pam Bains – EVP & Group Chief Financial Officer
David Collins – VP Finance & Group Treasurer
March 2017

2
No Reliance on this document
This document was prepared by Aurizon Holdings Limited (ACN 146 335 622) (referred to as
“Aurizon” which includes its related bodies corporate (including Aurizon Operations Limited).
Whilst Aurizon has endeavoured to ensure the accuracy of the information contained in this
document at the date of publication, it may contain information that has not been
independently verified. Aurizon makes no representation or warranty as to the accuracy,
completeness or reliability of any of the information contained in this document. Aurizon owes
you no duty, whether in contract or tort or under statute or otherwise, with respect to or in
connection with this document, or any part thereof, including any implied representations or
otherwise that may arise from this document. Any reliance is entirely at your own risk.
Document is a summary only
This document contains information in a summary form only and does not purport to be
complete and is qualified in its entirety by, and should be read in conjunction with, all of the
information which Aurizon files with the Australian Securities Exchange. Any information or
opinions expressed in this document are subject to change without notice. Aurizon is not under
any obligation to update or keep current the information contained within this document.
Information contained in this document may have changed since its date of publication.
No investment advice
This document is not intended to be, and should not be considered to be, investment advice
by Aurizon nor a recommendation to invest in Aurizon. The information provided in this
document has been prepared for general informational purposes only without taking into
account the recipient’s investment objectives, financial circumstances, taxation position or
particular needs. Each recipient to whom this document is made available must make its own
independent assessment of Aurizon after making such investigations and taking such advice
as it deems necessary. If the recipient is in any doubts about any of the information contained
in this document, the recipient should obtain independent professional advice.
No offer of securities
Nothing in this presentation should be construed as a recommendation of or an offer to sell or a
solicitation of or subscription or invitation of an offer to buy or sell securities in Aurizon in any
jurisdiction (including in the United States), nor shall it or any part of it form the basis of or be
relied on in connection with any contract or commitment whatsoever. This document is not a
prospectus and it has not been reviewed or authorised by any regulatory authority in any
jurisdiction. This document does not constitute an advertisement, invitation or document which
contains an invitation to the public in any jurisdiction to enter into or offer to enter into an
agreement to acquire, dispose of, subscribe for or underwrite securities in Aurizon.
Forward-looking statements
This document may include forward-looking statements which are not historical facts. Forward-
looking statements are based on the current beliefs, assumptions, expectations, estimates and
projections of Aurizon. These statements are not guarantees or predictions of future
performance, and involve both known and unknown risks, uncertainties and other factors, many
of which are beyond Aurizon’s control. As a result, actual results or developments may differ
materially from those expressed in the forward-looking statements contained in this document.
Aurizon is not under any obligation to update these forward-looking statements to reflect events
or circumstances that arise after publication. Past performance is not an indication of future
performance.
No liability
To the maximum extent permitted by law in each relevant jurisdiction, Aurizon and its directors,
officers, employees, agents, contractors, advisers and any other person associated with the
preparation of this document, each expressly disclaims any liability, including without limitation
any liability arising from fault or negligence, for any errors or misstatements in, or omissions
from, this document or any direct, indirect or consequential loss howsoever arising from the use
or reliance upon the whole or any part of this document or otherwise arising in connection with it.
Important notice

3
Introduction
Aurizon Network Financials
Funding and Capital Management
Regulation
Coal Market Update
Agenda

Introduction

5
Aurizon (ASX: AZJ) is Australia’s largest rail freight operator and atop 50 ASX company. Aurizon has four major product lines forcustomers: Coal, Iron Ore, Freight and Network.
•ABOVE RAIL
› Aurizon transports more than 250 million tonnes of Australian
commodities, connecting miners, primary producers, and
industry with international and domestic markets.
•BELOW RAIL (NETWORK)› Aurizon Network controls, manages, operates and maintains the
fixed rail infrastructure "below rail" assets of the Central Queensland Coal Network (CQCN)
› Regulated Asset Base (RAB) of A$5.8 billion¹
› Rated Baa1 (stable) / BBB+ (stable)
› The CQCN is Australia’s largest export coal rail network and is the vital rail link between Queensland’s coal mines and the various ports used to export coal
› The CQCN is a natural monopoly infrastructure asset regulated
by the Queensland Competition Authority (QCA)
› Aurizon Network’s regulated revenue is protected through a
combination of contractual and regulatory mechanisms which
limit counterparty and volume risk
1. Estimate as at 30 June 2017 – includes deferred capital but excludes $0.4bn in assets operating under an Access Facilitation Deed
(AFD). Estimate subject to QCA Approval of RAB roll‐forward and approval of the FY2016 and FY2017 Capital Claims
2. As at 8 February 2017
Aurizon
Holdings Limited
Other members of
Aurizon Holdings Group
Aurizon Finance Pty
Ltd
Market cap of A$10.2bn2
Baa1 (stable) / BBB+
(stable)
› “Above-rail” freight
haulage
› Construction, engineering
and project management
› Specialised track
maintenance
•AURIZON HOLDINGS LEGAL STRUCTURE
Aurizon Operations
Limited
Aurizon
Network Pty Ltd
› “Below-rail” operations
› RAB of A$5.8bn1
› Baa1 (stable) / BBB+
(stable)
Issuer under the A$ MTN Debt Issuance Programme dated October 4, 2013 and
the EMTN Issuance Programme dated September 2, 2014 and May 13, 2016
About Aurizon

6
•GROUP FINANCIAL
RESULTS
› Revenue up 1% to $1.8bn - increase in Below Rail partly offset by volume driven decrease in
Above Rail
› Underlying EBIT up 21% to $488m, driven by transformation benefits in Above Rail and impact of
finalisation of UT4 in Below Rail
› Statutory NPAT of $54m reflects the impact of impairments and transformation costs
› ROIC 9.6%
•REGULATION › UT4 Final Decision 11th October 2016 (2013-2017 – MAR $3.9bn)
› UT5 Draft lodged 30th November 2016 (2018-2021 – MAR $4.9bn)
•MANAGEMENT
CHANGES
› Andrew Harding appointed as Group CEO, effective 1st December 2016
› Pam Bains appointed as Group CFO, effective 15th December 2016
•CUSTOMERS › All coal and iron ore customers estimated to be profitable due to stronger prices, improving
industry health
› Current coal price and time to market pressures presenting opportunities
•FUNDING AND CAPITAL
MANAGEMENT
› Moody’s lifted Outlook to Baa1 (Stable) for Aurizon Group and Network on February 15th 2017
› Board supports current credit ratings (Moody’s Baa1 (Stable), S&P BBB+ (stable))
› Debt maturity tenor stable at 5.3 years
Recent Developments

7
CENTRAL QLD COAL NETWORK (CQCN)
Dalrymple Bay Coal Terminal (DBCT)
Hay Point Coal Terminal (HPCT)
Abbot Point Coal Terminal (APCT)
Gladstone
Moura
CoppabellaMoranbah
Dysart
Emerald
Bluff
Stanwell
Alpha
Springsure
Collinsville
Bowen
Townsville
Rockhampton
Mackay
LEGEND
City/town
Power Station
Coal Export Terminal
Rail Systems
Goonyella Coal Rail System
Newlands Coal Rail System
Blackwater Coal Rail System
Moura Coal Rail System
KEY NETWORK FACTS
40 + operating coal mines serviced
Open access network with 3 above rail
coal operators – Aurizon Operations,
Pacific National and BMA Rail
70 services per day
+225mt coal moved each year
The CQCN comprises 4 major coal
systems and 1 connecting system link
serving Queensland’s Bowen Basin coal
region: Newlands, Goonyella, Blackwater
and Moura with GAPE the connecting
system link
5 export terminals at 3 ports
1 control centre
Track 2,670 km
Electrified track 2,000 km
It is estimated the value of the regulated
Asset Base (RAB) will be $5.8bn1 as at 30
June 2017
Clermont
BlackwaterWiggins Island Coal Export Terminal (WICET)
Blair Athol
R.G. Tanna Coal Terminal
PORT OF ABBOT POINT
PORT OF HAY POINT
PORT OF GLADSTONE
Network Snapshot
1. Estimate as at 30 June 2017 - excludes $0.4bn in assets operating under an Access Facilitation Deed (AFD). Estimate subject to
QCA Approval of RAB roll‐forward and approval of the FY2016 and FY2017 Capital Claims.

8
Highly regulated revenues within a stable and well established regulatory regime1
Long term lease arrangements supported by the central QLD coal mining sector2
Infrastructure network servicing well-established haulage customers and high
quality mines predominantly operated by investment grade coal miners 3
Strong financial position and ratings stability5
Revenue protection mechanisms limit exposure to patronage and volume risk4
Experienced board and management team6
Network - Summary of Key Credit Highlights

Aurizon Network Financials
Half Year Ended 31 December 2016

10
REVENUE › Increased 15% to $671m due to true-up from under recovery of UT4 revenue from prior years
UNDERLYING EBIT › Increased $50m (20%) to $295m due to higher revenue
OPERATIONAL
PERFORMANCE
› Improving asset management leads to 20% reduction in system closure hours (planning and
scheduling maintenance programs)
› Performance to plan down 1.2ppts to 91.5% from previous record high (17% increase in
services cancelled, mainly mine related)
RAB › Estimated $5.8bn1 value start of UT5
REGULATION › UT4 finished October 2016, $89m true-up in FY2017
› UT5 draft submitted November 2016, industry comments extended to 17 March 2017
› Key issue remains appropriate return given level of risk
Below Rail Benefits From UT4 Finalisation
1. Estimate as at 30 June 2017 – includes deferred capital but excludes $0.4bn in assets operating under Access Facilitation Deeds
(AFD). Estimate subject to QCA Approval of RAB roll‐forward and approval of the FY2016 and FY2017 Capital Claims

11
$m
1HVariance
fav / (adv)
2H
FY2017 FY2016 FY2016
Tonnes (million) 112.9 114.0 (1%) 111.9
Revenue - Access 629 560 12% 576
- Services/Other 42 21 100% 22
Total Revenue 671 581 15% 598
Operating costs (234) (211) (11%) (204)
EBITDA 437 370 18% 394
EBITDA margin 65.1% 63.7% 1.4ppt 65.9%
Depreciation and amortisation (142) (125) (14%) (133)
EBIT 295 245 20% 261
Operating Ratio 56.0% 57.8% 1.8ppt 56.4%
› Revenue Access increase primarily
attributable to UT4 True-up ~$45m
› Revenue Other includes the
recognition of Bandanna Group’s
bank guarantee held as security for
their WIRP Deed that was terminated
due to insolvency ~$15m
› Operating Costs increase driven by
Energy Costs +$10m and UT4
Corporate Cost True-up $13m
› Depreciation increase from WIRP and
Asset Renewals
COMMENTARY
Below Rail Profit & Loss (Underlying)

12
As at ($m) 31 Dec 2016 30 June 2016
Total current assets 272 289
Property, plant & equipment 5,417 5,432
Other non-current assets 153 157
Total assets 5,842 5,878
Other current liabilities (243) (305)
Total borrowings (2,790) (3,003)
Other non-current liabilities (855) (778)
Total liabilities (3,888) (4,086)
Net assets 1,954 1,792
Gearing
(net debt/net debt + equity)58.6% 62.6%
Below Rail Balance Sheet
› Decrease primarily attributable to a
reduction in Trade and Other
Receivables from lower accruals for
FY16 adjustments and GAPE Fees
› Increase in Other current liabilities
primarily due to interest rate swaps
maturing in FY17 from non-current
liabilities
› Borrowings decreased due to the
revaluation of the Eurobonds and
payment made to the revolving loan
facility
› Non current Liabilities increased due
to increased deferred tax liability and
increases associated with the mark-
to-market valuation of Cross Currency
Swaps Interest Rate Swaps
associated with the Eurobonds
COMMENTARY

Funding and Capital
Management

14
300
300
200
FY2026FY2021FY2020
$m
Undrawn bank debt
Drawn bank debt
778711
525
225
490
300
$m
FY2026FY2025FY2022FY2021FY2019
Undrawn bank debt
Drawn bank debt
EMTN
A$MTN
ABOVE RAIL $0.6BN MATURITY PROFILE
BELOW RAIL $2.8BN1 DEBT MATURITY PROFILE
CURRENT RATINGS ARE APPROPRIATE
› Moody’s outlook lifted to Baa1 (stable) on February 15, 2017
› Board supports current credit ratings in light of market
outlook (Moody’s Baa1 (negative), S&P BBB+ (stable))
› Strategy remains to diversify funding sources & extend tenor
› Debt maturity tenor stable at 5.3 years
› Interest cost on drawn debt increased 40bps to 5.1% due to
impact from longer term debt
› Approximately 76% of interest rate exposure is fixed or
hedged.
› Group gearing now 37.1% (37.4% at 30 June 2016)
› Network gearing 51.4% Debt/RAB (56.6% at 30 June 2016)
› Improved coal industry pricing and outlook has lowered
counterparty credit risk – all customers are now estimated to
be cash positive.
Funding Update
1. Excludes working capital facility.

15
› Network 1H17 capex $125m (1H16 $198m)
› FY2017 capex forecast down $50m
› Growth capital in 1HFY2017 fully committed
› Transformation capital for 1HFY2017 has focussed on
operational technology programs including:
› Wayside condition monitoring (WCM) and On Train
Repair (OTR)
› Driver Advisory System (DAS)
› Network Asset Management System (NAMS)
› Advanced Planning and Execution (APEX) software
CAPITAL EXPENDITURE FORECAST(F) FY2017 – FY2019 ($M)1
26
50
68
62
130
164
206
370
24
FY2019(f)
~500
~10
~160
~330
FY2018(f)
~525
~20
~150
~355
FY2017(f)
~550
2HFY2017(f)
294
1HFY2017(a)
256
Sustaining GrowthTransformational and productivity
Group Capital Spend Continues to Reduce
1. Includes capitalised interest but excludes strategic projects.

16
1H
$m FY2017 FY2016
EBITDA - statutory 432.3 362.5
Working capital & other movements (1.7) 7.7
Non-cash adjustments - impairment 1.4 7.7
Cash from operations 432.0 377.9
Interest received 0.7 0.9
Income taxes paid (73.0) (40.9)
Net cash inflows from operating activities 359.7 337.9
Net cash outflow from investing activities (129.5) (235.6)
Net (repayments) / proceeds from borrowings (131.2) (4.5)
Capital distribution to Parent (0.6) (0.4)
Loans from/(to) related parties 27.0 (33.0)
Finance lease payments (9.6) (1.0)
Dividends paid to company shareholders (14.5) (113.7)
Interest paid (77.5) (62.4)
Net cash outflow from financing activities (206.4) (215.0)
Net increase / (decrease) in cash 23.8 (112.7)
Free Cash Flow (FCF)1 152.7 39.9
› Strong growth in FCF due to
stronger earnings and lower
capex due to ceasation of
growth capex
› FCF exceeded dividend
payments
Below Rail Cashflow Statement
1. Defined as net cash inflow from operating activities less net cash outflow from investing activities less interest paid.

Regulation

18
MAXIMUM ALLOWABLE
REVENUE (MAR)
› Overall maximum revenue of $3.933 billion over the period of the Undertaking
› Weighted Average Cost of Capital (WACC) - 7.17%
TRUE-UP RECOVERY
PROCESS
› The Final UT4 Decision highlighted a net under recovery of Regulatory Revenue in FY14 and FY15
(representing the difference between transitional revenues and the final Allowable revenue)
› In FY17, Aurizon Network will recover $89m of True-up Revenue relating to FY14 and FY15, net of
Revenue Cap
WIGGINS ISLAND RAIL
PROJECT (WIRP)
› The QCA has continued to apply a revenue deferral for WIRP customers who are not expected to rail
during the FY14 - FY17 regulatory period
› The QCA has recognised the ability for Aurizon Network to seek QCA approval to reduce the scope of
the revenue deferral as WIRP volumes increase
› The deferral amount is Net Present Value (NPV) neutral
› WIRP revenues remain socialised within the two existing System Allowable Revenues – the Blackwater
and Moura systems
ASSET STRANDING › The QCA believes each situation should be considered on a case by case basis
› The QCA believes Aurizon Network is best placed to mitigate stranding risk
› As in UT3, QCA can optimise however under UT4 they must first consider any alternate proposal and
consult with Aurizon Network
› Optimisation is a last resort and socialisation is an alternative
› Optimisation reversed where conditions improve
› Security under standard access agreement increased to six months (from three months under UT3)
Aurizon Network – UT41 Final Decision
1. Access Undertaking 4 (UT4) applies for the period 1 July 2013 to 30 June 2017.

19
CONTEXT
› Aurizon Network submitted to the Queensland Competition
Authority (QCA) its Draft Access Undertaking (UT5 Draft).
› The UT5 Draft covers the period 1 July 2017 – 30 June 2021.
› It largely reflects the policy positions of the previous undertaking
(UT4), approved by the QCA on 11 October 2016 and due for
expiry on 30 June 2017.
OBJECTIVES
› UT5 recognises the significant investment by many stakeholders
in the development of UT4.
› Aurizon Network considers that the inherent risks of the network
business are higher than what the QCA has previously
considered.
› If Aurizon Network is required to accept a lower return than
proposed in the UT5 Draft, then the risk associated with
ownership and management of the asset should reduce
accordingly.
› Aurizon Network is working with customers to explore ways to
improve utilisation of the existing network without the need for
large-scale capital investment.
UT5 – Submitted November 2016
1. Estimated UT5 opening RAB including $0.4 billion of mine specific infrastructure
2. Estimated subject to QCA approval. Blackwater capital expenditure is included whilst Moura remains deferred.
REVENUE PROPOSAL
› Significantly larger Regulated Asset Base (RAB) of ~$6.2 billion1
as a result of customer requested expansions.
› The roll-forward RAB now includes the majority of capital
expenditure relating to Wiggins Island Rail Project (WIRP)2.
› Proposes a Maximum Allowable Revenue (MAR) of $4,892
million over the four year regulatory period.
› Reduces WACC to 6.78% (from 7.17% in UT4).
› Includes a change in the inflation application and methodology
that reflects a reduction in the inflation expectations for the
period.
› The methodology for operating expenditure, maintenance and
depreciation allowance is broadly unchanged.
› Results in an 11% increase in average CQCN tariffs.
POLICY PROPOSAL
› Policy changes limited to matters addressing:
› Issues with UT4 practicality, workability or efficiency;
› Specific customer requests; and
› The removal of UT4 positions that Aurizon Network
considers are not within the QCA’s powers and materially
impact on Aurizon Network’s legitimate business
interests.

Coal Market Update

21
10497
10498
10698
111104
0
20
40
60
80
100
120 $100
$80
$60
$40
$20
$0
US
$/t
Mill
ion T
onnes
1H172H161H162H151H152H141H142H13
100
1H13
METALLURGICAL COAL: CONTRACT, SPOT AND REALISED PRICE (USD)MONTH AVERAGE (JANUARY 2015 TO DECEMBER 2016)
THERMAL COAL: CONTRACT, SPOT AND REALISED PRICE (USD)MONTH AVERAGE (JANUARY 2015 TO DECEMBER 2016)
$300
$200
$100
$0
Oct-16Jul-16Apr-16Jan-16Oct-15Jul-15Apr-15Jan-15
Price [
US
D]
per
tonne +242%
ABS Realised Price*
Spot Price (Peak Downs Region HCC)
Contract Price (Peak Downs Region HCC)
$100
$90
$80
$70
$60
$50
$40
Oct-16Jul-16Apr-16Jan-16Oct-15Jul-15Apr-15Jan-15
Price [
US
D]
per
tonne +71%
ABS Realised Price*
Spot Price, Newcastle benchmark
Japan Financial Year Contract Price
96949592969089
7973
0
25
50
75
100
$50
$0
$250
$200
$150
$100
Mill
ion T
onnes
1H172H161H162H151H152H141H142H131H13
US
$/t
Average Thermal Coal Spot Price - Newcastle benchmark (USD) [RHS]
Thermal Coal Export Volume (mt) [LHS]
METALLURGICAL COAL: SPOT PRICE AND AUSTRALIA EXPORT VOLUME
THERMAL COAL: SPOT PRICE RELATIVE TO AUSTRALIA EXPORT VOLUME
Average Spot Price (Peak Downs Region HCC) [RHS]
Metallurgical Coal Export Volume (mt) [LHS]
Coal Market Update: Market Fundamentals
* Based on Australian Bureau of Statistics data reported in AUD and converted to USD using monthly average exchange rate.
Source: Australia Bureau of Statistics, Platts.

22
THERMAL COAL SEABORNE EXPORTS
VOLUME AND MARKET SHARE, CALENDAR YEARS
AUSTRALIA METALLURGICAL COAL EXPORTS BY DESTINATION
CALENDAR YEARS (MILLION TONNES)
AUSTRALIA THERMAL COAL EXPORTS BY DESTINATION
CALENDAR YEARS (MILLION TONNES)
METALLURGICAL COAL SEABORNE EXPORTS
VOLUME AND MARKET SHARE, CALENDAR YEARS
0
100
200
300
400
50%
55%
60%
65%
70%
20112010
Mill
ion t
onnes
Mark
et S
hare
+7pts
20162015201420132012
Australia Share [RHS]
Australia
United States
Russia
Canada
Rest of World
18%
20%
22%
24%1.000
800
600
400
200
0
Mill
ion t
onnes
Mark
et S
hare
+2pts
2016201520142013201220112010
Australia Share [RHS]
Indonesia
Australia
Russia
Colombia
South Africa
Rest of World
2016
190.0
2015
186.2
2014
186.5
2013
170.0
2012
145.0
2011
132.2
2010
158.5
India ChinaJapanSouth KoreaTaiwanOther
200.9 202.1
2014
200.3
2015 2016
188.2
2011 2013
141.3 147.5
2010 2012
171.1
Other TaiwanIndia China JapanSouth Korea
Coal Market Update: Australia
Source: Wood Mackenzie Coal Markets Tool (2H 2016), Australia Bureau of Statistics

Questions & Answers

Appendices
Appendix 1: UT5 Draft Revenue and WACC
Appendix 2: Regulatory Revenue Protection
Appendix 3: Aurizon Group Financial Information
Appendix 4: Aurizon Company History
Appendix 5: Network Management Team

Appendix 1
UT5 Draft Revenue & WACC

26
MAR
$m
UT4 UT5
Total FY2017 FY2018 FY2019 FY2020 FY2021 Total
Return on capital 1,526 420 409 402 395 386 1,592
Depreciation (less inflation) 771 218 284 281 289 287 1,141
Maintenance costs 805 207 221 225 235 240 921
Operating costs 815 223 206 211 217 221 855
Tax net imputation credits 144 41 78 81 85 85 328
Total MAR 4,062 1,109 1,198 1,201 1,220 1,219 4,838
Capital carryover (129) (34) 13 13 14 14 54
Total Adjusted MAR 3,933 1,074 1,211 1,214 1,233 1,233 4,892
Forecast Volumes 221.4 225.7 228.4 228.4 228.4
UT5 Draft: MAR1 and Forecast Volumes
1. Maximum Allowable Revenue that Aurizon Network is entitled to earn from the provision of coal carrying train services on the CQCN.

27
FINANCIAL OUTCOMES UT4 FINAL UT5 SUBMISSION
Decision Date 28 Apr 2016 n/a
Risk-free Rate 3.21% 2.13%
Averaging Period 20-Day to 31 Oct 2013 20-Day to 30 Jun 2016
Term of Risk-free Rate 4-year 10-year
Gearing Ratio 55% 55%
Benchmark Credit Rating BBB+ BBB+
Asset Beta 0.45 0.55
Equity Beta 0.8 1.0
Market Risk Premium 6.5% 7.0%
Debt Margin1 2.94% 2.732%
Gamma 0.47 0.25
Return on Equity 8.41% 9.13%
Return on Debt 6.15% 4.86%
WACC (post tax nominal vanilla) 7.17% 6.78%
Inflation 2.50% 1.22%
UT5 Draft: Allowable Return on Capital
1. Debt margin includes debt transaction costs.

Appendix 2
Regulatory Revenue Protection

29
› The provision of transportation
services by rail on the CQCN is
regulated by the Queensland
Competition Authority
› The CQCN is a vital part of the
Central Queensland coal supply
chain
› The form of regulation is a
conventional revenue cap
› Over 90% of Aurizon Network
revenue is from track access
payments
› Access revenue growth and
contribution have remained stable
over time
WELL ESTABLISHED REGULATORY
REGIME1
STABLE REGULATED REVENUE BASE2
WELL DEVELOPED BUILDING BLOCK APPROACH
TO REVENUE DETERMINATION3
BU
ILD
ING
BL
OC
KS
WACC (return
on capital)
Depreciation
net of inflation
(return of
capital)
Opex
Maintenance
Gamma
adjusted tax
Aurizon
Network’s
maximum
allowable
revenue
+
=
› RAB is approved by the QCA
on a Depreciated Optimal
Replacement Cost basis
1
› “Building block” approach
adopted to determine the
CQCN’s maximum allowable
revenue
› Reference tariffs determined,
taking into consideration
forecast volumes and under
and over recovery in prior
periods
+
+
+
(A$ in million / % of revenue)1
Regulated Revenues Within a Stable and Well-Established Regulatory Regime
90.0%
94.0% 94.0%94.6%
96.4%
10.0%
5.9%6.0%
5.4%
3.6%
$827
$980$1,012
$1,108
$1,179
Track access Other
FY12 FY13 FY14 FY15 FY16
2
3
1. ASX market announcement, Aurizon Network – Segment note reinstatement January 13, 2014.

30
AT1
AT2
AT3
AT4
AT5
Revenue for each year determined by individual
system, based on regulatory approved forecasted
volumes
These five different reference tariffs reflecting
different recovery categories
RETURN ON CAPITAL(Weighted Average Cost of Capital – WACC)
RETURN OF CAPITAL
(Depreciation)
OPEX
TAX
MAINTENANCE
These building blocks represent Capital and operational
costs that Aurizon Network can recover for CQCN access
The QCA approves the Maximum Allowable Revenue
(MAR) that can be earned by Aurizon Network.
MAR
MAXIMUM ALLOWABLE
REVENUE
AT2-5
billings
REGULATORY REVENUE
(FORECASTED) FOR EACH YEAR
OF UNDERTAKING PERIOD
TOTAL ACTUAL REVENUE
Total Actual Revenue (TAR)
Total Actual Revenue for revenue protection
calculation purposes = System Allowable
Revenue (SAR) (including ToP if triggered)
adjusted for rebates, cross system traffic
and transfer/relinquishment fees
ToP
PROTECTION
TESTS
Rev
Cap
Outside the revenue protection scope
› Aurizon Network’s regulated revenue is protected through a combination of contractual and regulatory mechanisms that are included in the
Access Undertaking and access agreements
› These mechanisms come into effect when revenue shortfalls occur due to actual tonnage railed being less than regulatory approved
tonnage forecasts
The CQCN Regulatory Framework Provides Revenue Protection Through a Building Block Approach

31
AT2
AT3
AT4
AT5
Reven
ue c
ap
Take o
r
pay
Train Paths
Net Train Kilometres (NTK)
Net Tonnes (NT)
Rev
Cap
Rev
Cap
FY0 FY2
Revenue Cap Adjustment
(received 2 years later)
ToP
Access R
even
ue C
harg
e Y
ear
0
Syste
m A
llo
wab
le R
even
ue (
SA
R)
Year
2
Ad
juste
d S
yste
m A
llo
wab
le R
even
ue Y
ear
2
Syste
m A
llo
wab
le R
even
ue (
SA
R)
Year
0
ToP
Rev
Cap
Take-or-pay
mechanisms
Revenue cap
mechanism
Socialisation of
counterparty
risk
› Primary revenue protection mechanism available to
Aurizon Network
› Allows Aurizon Network to recover revenue shortfall
directly from the access holder
› Comes into effect in the event take or pay mechanisms
do not recover a revenue shortfall
› Revenue cap mechanism allows for remaining shortfall
to be recovered two years later through a WACC
adjusted tariff
› In the event that total allowable revenue collected
exceeds the Maximum Allowable Revenue (MAR), the
revenue cap mechanism will return the surplus revenue
two years later through an adjusted tariff
› Counterparty risk occurs when certain mines are no
longer in operation
› If a counterparty fails, the total allowable revenue will
be shared among the remaining users and so Aurizon
Network will continue to earn its aggregate regulated
revenue
… with Take-or-Pay Protection Should Revenues Fall Short (With a Revenue Cap)

Appendix 3
Aurizon Group
Financial Information

33
$m 1HFY2017 1HFY2016 Variance
› Revenue growth includes timing differences in
Network to reflect UT4 finalisation and bank
guarantee for Bandanna
› Operating costs decrease reflects $64m in
transformation benefits and $36m reduction in
access charges
› Depreciation increase reflects Below Rail increase
due to rail renewals and ballast undercutting
partially offset by a decrease in Above Rail
depreciation
› Pre-tax statutory results include $321m in
redundancy costs and impairments
Revenue 1,781 1,758 1%
Operating costs (1,006) (1,075) 6%
Depreciation & amortisation (287) (280) (3%)
EBIT – underlying1 488 403 21%
EBIT – statutory 167 (23) -
Operating Ratio (%) 72.6 77.1 4.5ppt
NPAT – underlying1 279 237 18%
NPAT – statutory 54 (108) -
EPS (cps) – underlying 13.6 11.2 21%
EPS (cps) – statutory 2.6 (5.1) -
DPS (cps) 13.6 11.3 20% › Dividend based on 100% payout ratio
Group Financial Highlights
1. Refer following slide for details of underlying adjustments.

34
$m
1H
FY2016FY2017 FY2016
Underlying EBIT 488 403 871
Significant items
Impairments (257) (426) (528)
Redundancy costs (64)
Statutory EBIT 167 (23) 343
Net finance costs (92) (70) (150)
Statutory profit before tax 75 (93) 193
Income tax expense (21) (15) (121)
Statutory NPAT 54 (108) 72
EARNINGS RECONCILIATION SIGNIFICANT ITEMS – IMPAIRMENTS
$m
Intermodal (162)
FMT1 project (64)
Freight review contract costs (10)
Other assets (21)
(257)
Earnings Reconciliation and Significant Items
1. Freight Management Transformation.

35
1H
$m FY2017 FY2016
EBITDA - statutory 454 257
Working capital & other movements 33 (47)
Non-cash adjustments - impairment 266 426
Cash from operations 753 636
Interest received 2 1
Income taxes paid (130) (115)
Net cash inflows from operating activities 625 522
Net cash outflow from investing activities (182) (396)
Net (repayments) / proceeds from borrowings (31) 388
Payment for share buyback and share based payments (7) (168)
Interest paid (87) (63)
Dividends paid to company shareholders (273) (295)
Net cash outflow from financing activities (398) (138)
Net increase / (decrease) in cash 45 (12)
Free Cash Flow (FCF)1 356 63
› Strong growth in FCF due to stronger
earnings and lower capex
› FCF exceeded dividend payments
› Result includes $98m proceeds from disposal
of Moorebank investment
Strong FCF Generation Helped by Moorebank
1. Defined as net cash inflow from operating activities less net cash outflow from investing activities less interest paid.
36
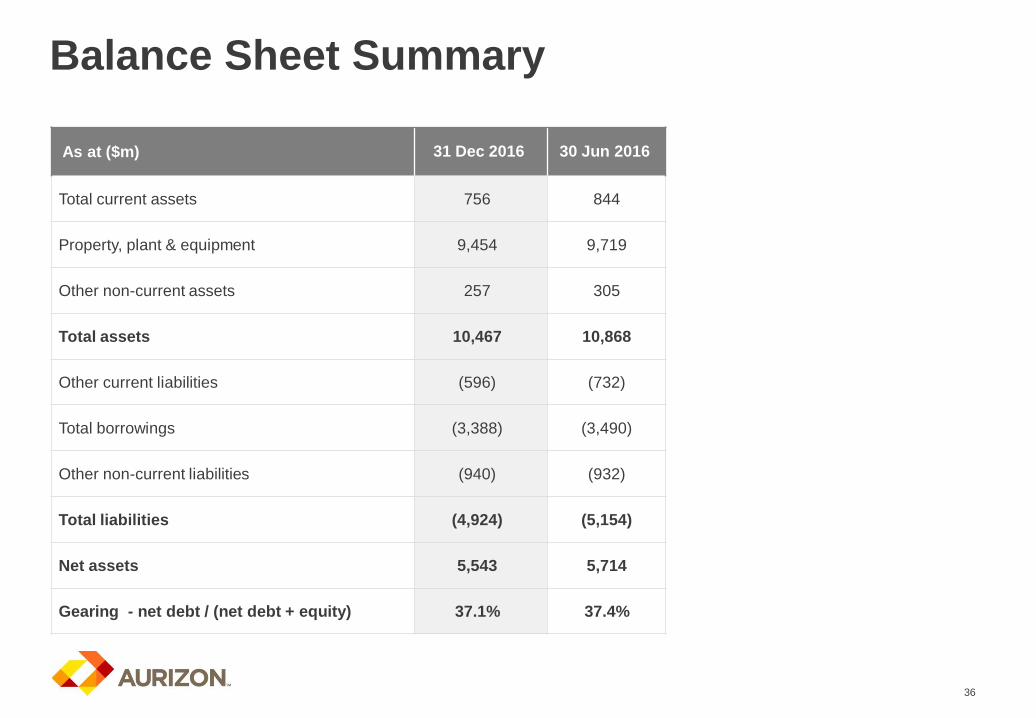
As at ($m) 31 Dec 2016 30 Jun 2016
Total current assets 756 844
Property, plant & equipment 9,454 9,719
Other non-current assets 257 305
Total assets 10,467 10,868
Other current liabilities (596) (732)
Total borrowings (3,388) (3,490)
Other non-current liabilities (940) (932)
Total liabilities (4,924) (5,154)
Net assets 5,543 5,714
Gearing - net debt / (net debt + equity) 37.1% 37.4%
Balance Sheet Summary

37
COAL IRON ORE
MARKETS › Strong prices driven by supply restricting policy in
China
› Near term volume upside more apparent with
mines operating at low utilisation
› Met coal – Australian exports increased to 67%
market share in 2016
› Thermal coal – share dropped marginally to 22%
due to expected increase in Indonesian exports
› Price support driven by:
› Increase in Chinese crude steel production
› Demand for higher grade ores
› Additional future supply likely to put some pressure
on prices long term
CUSTOMERS › All customers estimated at positive cash margins
› New form contracts now 96% of volumes
› Weighted average contract life 10.1 years
› Recent moves include AGL win and Whitehaven
increase
› Sustained elevated coal prices may present future
volume and growth opportunities
› All customers estimated at positive cash margins
› Weighted average contract life 8.1 years after
executing an extension with Karara
› Mt Gibson production expected to be extended to
align with December 2018 contract end following
announcement of approval for Iron Hill mine
Improvements in Key Operating Markets, Too Early to Call Volume Impact

38
› Revenue $3.35 - $3.55bn
› Underlying EBIT $900 - 950m, assumptions:
› Above Rail
› Moderate growth from prior year – transformation and
stronger coal offset weaker Freight
› Volumes of 255 – 275mt, including Coal 200 - 212mt
› Below Rail
› EBIT expectations increased – UT4 true-up at higher
end of range, additional $10m energy recovery (year
earlier than expected) and GAPE and AFD true-up
› Group
› 1H results include benefit of non-recurring items from
prior year
› Excludes transformation related restructuring and
redundancy costs (at least $100m)
› No major weather impacts
FY2018FY2017
› Achievement of 70% OR target remains dependent on:
› Delivery of $380m transformation target
› Above rail volume growth
› UT5
› Outcome of freight review
FY17 AZJ Group Guidance Range Unchanged

Appendix 4
Aurizon Company History

40
Baa1 / BBB+ (stable / stable)
Market cap: A$10.8bn1
Baa1 / BBB+ (stable/ stable)
RAB: A$5.8bn2
Aurizon Holdings
Aurizon Network
QR National
2010 2011 2012 2013 2014 2015 2016 2017
Restructure
Separation of Queensland Rail
from QR Limited (State of QLD
interest of 100%)
IPO
QR National listed on ASX
(State of QLD interest of 34%)
Completion of
A$1.1bn
Goonyella to
Abbot Point
Expansion
(GAPE) project
Name change
“QR National"
renamed
"Aurizon“
State of QLD
commences
reduction of
ownership
New Capital Structure and
Reorganisation
New long term capital structure
implemented, with standalone
debt facilities put in place for
both Aurizon Holdings and
Aurizon Network
A$ Medium Term Note issue
(MTN) in October 2013
State of Queensland reduces its
ownership below 5%
Debut Euro MTN issue
in September 2014
UT4 Final Decision announced
(total UT4 MAR $3.922bn)
AZJ lodges UT5 submission
proposing MAR of $4.892bn
Euro MTN issue in June 2016
Tim Poole
appointed to
Aurizon Board
as Chairman
Completion of
$800m Wiggins
Island Rail
Project (WIRP)
Andrew Harding appointed
CEO of Aurizon
Pam Bains appointed CFO of
Aurizon
Company History
1. As at 2nd March 2017.
2. Estimate as at 30 June 2017 -excludes $0.4bn in assets operating under an Access Facilitation Deed (AFD). Estimate subject to
QCA Approval of RAB roll‐forward and approval of the FY2016 and FY2017 Capital Claims.

Appendix 5
Network Management Team

42
PRUE MACKENZIE
VICE PRESIDENT –
REGULATION
SEAN BURTON
ACTING VICE PRESIDENT –
NETWORK FINANCE
CLAY MCDONALD
VICE PRESIDENT – NETWORK
COMMERCIAL
SCOTT RIEDEL
VICE PRESIDENT – NETWORK
OPERATIONS
ALEX KUMMANT
DIRECTOR,
EXECUTIVE VICE PRESIDENT
Mr Kummant has more than 25 years’ experience in the North
American industrial sector, including various executive roles in
the rail industry. Mr Kummant was appointed Executive Vice
President Network in November 2013 having joined the
Company as Executive Vice President Strategy in October
2012. Prior to joining Aurizon Mr Kummant was Chief
Executive Officer of Amtrak and Vice President in several
executive roles at Union Pacific, the world’s largest freight
railroad. Prior to joining Union Pacific, Mr Kummant held
various executive roles at Emerson Electric Co. and SPX
Corporation. Mr Kummant holds a Bachelors Degree in
Science (Mechanical Engineering), a Masters of Engineering
(Manufacturing) and a MBA (Stanford).
Ms Mackenzie has 15 years’ experience in corporate finance,
M&A, capital markets and marketing in Australia, Asia, the UK
and USA. As Vice President Regulation, Ms Mckenzie is
responsible for managing Aurizon Network’s regulatory
compliance, policy, processes and framework for access to the
CQCN. Prior to her current role, Ms Mackenzie was Vice
President Commercial & Marketing and Vice President Mergers
and Acquisitions. During this time Ms Mackenzie was
accountable for over $1 billion of annual revenue from coal
customers; led the $3.6 billion restructuring of Aurizon’s Network
business and led the transaction with the Queensland
Government to buy back $1 billion of equity with a simultaneous
$500 million placement to key new investors. Ms Mackenzie is
an alumni of Harvard Business School and the University of
Queensland and is an Industry Fellow within the Business,
Economic and Law Faculty at the University of Queensland.
Mr Riedel has more than 25 years’ experience in the rail and
petrochemical industries in Australia, Asia and the UK. This
experience includes managing all phases of rail projects from
concept to renewal, including project execution and operational
requirements. As VP Network Operations, Mr Riedel is
responsible for safely and sustainably delivering maximum
system throughput at the lowest cost of operation, while ensuring
the integrity of the CQCN for the coal industry. Mr Riedel’s direct
responsibilities include asset maintenance, scheduling access
paths, operational train control, minor maintenance execution
and emergency and incident management and response. Mr
Riedel holds an Honours Degree in Electrical Engineering, a
Graduate Diploma in Business, and is a Registered Professional
Engineer of Queensland.
Mr McDonald has 15 years’ experience in the transport and
logistics sector in Queensland and New South Wales. As Vice
President Commercial Development, Mr McDonald is
responsible for the planning and development of the CQCN
and for managing the commercial arrangements for access to
the network. Prior to his current role, he was VP Network
Operations for over four years and Group General Manager of
Above Rail Operations responsible for Blackwater, Moura and
West Morton coal corridors for three years. Mr McDonald has a
Bachelor of Science from University NSW and a Masters
Degree in Operations from Macquarie Graduate School of
Management (MGSM). In 2016 Mr McDonald completed an
Advanced Management Program at Harvard University.
Mr Burton has 20 years’ experience in finance roles across
Public Practice, Public Service and Commerce in Australia and
the UK. As Acting Vice President Network Finance, Mr
Burton’s responsibilities include providing insight through
business partnering, strategic and financial planning and
external stakeholder engagement. Mr Burton is also
Chairperson of the Aurizon Network Investment Committee.
Prior to his current role, Mr Burton spent four years as a
Finance Manager in Aurizon’s Network business and worked in
a number of key finance and strategic project roles. These
include the privatisation and ASX listing of QR National
(Aurizon) in 2010 as well as the $3.6 billion restructuring of
Aurizon’s Network business. Mr Burton holds a Bachelors
Degree in Accounting and a Masters Degree in Commerce
and is a Fellow of CPA Australia.
Aurizon Network: Experienced Management

43
Mr Fraser has more than 30 years’ experience in the Australian
energy industry. He has held various executive positions at
AGL Energy culminating in his role as Managing Director and
Chief Executive Officer for the period of seven years until
February 2015. Mr Fraser is currently a Non-Executive Director
of the ASX listed APA Group. Mr Fraser is a former Chairman
of the Clean Energy Council, Elgas Limited, ActewAGL and the
NEMMCo Participants Advisory Committee, as well as a former
Director of Queensland Gas Company Limited, the Australian
Gas Association and the Energy Retailers Association of
Australia.
SAM LEWIS
NON-EXECUTIVE DIRECTOR
Ms Lewis has extensive financial experience, including as a lead
auditor of a number of major Australian listed entities. Ms Lewis
has significant experience working with clients in the
manufacturing, consumer business and energy sectors, and in
addition to external audits, has provided accounting and
transactional advisory services to other major organisations in
Australia. Ms Lewis's expertise includes accounting, finance,
auditing, risk management, corporate governance, capital
markets and due diligence. Ms Lewis is currently a non-
executive director and chair of the Audit & Compliance
Committee of Orora Limited and also holds a Non-Executive
Directorship with Greenstone Limited. Previously, Ms Lewis was
an Assurance & Advisory partner from 2000 to 2014 with
Deloitte Australia.
MICHAEL FRASER
NON-EXECUTIVE CHAIRMAN
Mr Kummant has more than 25 years’ experience in the North
American industrial sector, including various executive roles in
the rail industry. Mr Kummant was appointed Executive Vice
President Network in November 2013 having joined the
Company as Executive Vice President Strategy in October 2012.
Prior to joining Aurizon Mr Kummant was Chief Executive Officer
of Amtrak and Vice President in several executive roles at Union
Pacific, the world’s largest freight railroad. Prior to joining Union
Pacific, Mr Kummant held various executive roles at Emerson
Electric Co. and SPX Corporation. Mr Kummant holds a
Bachelors Degree in Science (Mechanical Engineering), a
Masters of Engineering (Manufacturing) and a MBA (Stanford).
ALEX KUMMANT
DIRECTOR,
EXECUTIVE VICE PRESIDENT
JOHN COOPER
NON-EXECUTIVE DIRECTOR
Mr Cooper has more than 35 years’ experience in the
construction and engineering sector in Australia and overseas.
Currently, Mr Cooper is Chairman and Non-Executive Director
of Southern Cross Electrical Engineering Limited and also
holds a Non-Executive Directorship with NRW Holdings
Limited. During his career as an executive Mr Cooper’s roles
have encompassed large civil, commercial and infrastructure
projects and complex engineering and project management
activities in the mining, oil and gas, engineering and property
sectors.
ANDREW HARDING
DIRECTOR
Mr Harding has more than 24 years’ experience as an
executive in the resources industry. He was appointed
Managing Director & CEO of Aurizon in December 2016 to
lead the Company into the next phase of its transformation
program. Prior to joining Aurizon, Mr Harding was Global Chief
Executive for Rio Tinto’s Iron Ore business. He brings
extensive operational experience in the resource industry and
in managing supply chains for the world’s largest integrated
portfolio of iron ore assets. He is focused on leading
performance improvement initiatives, and has championed a
number of workplace initiatives including improvements in
safety, a commitment to diversity, and the strengthening of
indigenous and community relationships.
KATE VIDGEN
NON-EXECUTIVE DIRECTOR
Ms Vidgen began her career as a banking, finance and energy
lawyer at Malleson Stephen Jacques and in 1998 started in the
Infrastructure advisory team within the Macquarie Group.
During her time at Macquarie, Kate has traversed a number of
sectors with a focus on infrastructure, energy and resources.
Kate has also held a number of roles including heading up
Macquarie Capital’s coal advisory team in Australia and being
Global Co-Head of Resources Infrastructure. Ms Vidgen
remains an Executive Director at Macquarie Capital and is
currently the Global Head of Principal in Resources. Kate is
also the Founding Chair of Quadrant Energy, a privately held
oil and gas producer and explorer which is the single largest
domestic gas supplier in the Western Australian market.
Aurizon Network: Experienced Board

44
Related Documents


