Dynamic Relationship and Volatility Spillover between the Stock Market and the Foreign Exchange Market in Pakistan: Evidence from VAR-EGARCH Modelling PIDE WORKING PAPERS No. 103 P A K I S T A N I N S T I T U T E O F D E V E L O P M E N T E C O N O M I C S Junr 2014 Abdul Qayyum Muhammad Arshad Khan

Welcome message from author
This document is posted to help you gain knowledge. Please leave a comment to let me know what you think about it! Share it to your friends and learn new things together.
Transcript
Dynamic Relationship and Volatility Spillover between the Stock Market and the Foreign Exchange Market
in Pakistan: Evidence from VAR-EGARCH Modelling
PID
E W
OR
KIN
G P
AP
ER
S
No
. 1
03
PA K I S TA N I N S T I T U T E O F D E V E L O P M E N T E C O N O M I C S
Junr 2014
Abdul QayyumMuhammad Arshad Khan

PIDE Working Papers 2014: 103
Dynamic Relationship and Volatility Spillover between the Stock Market and the Foreign Exchange Market
in Pakistan: Evidence from VAR-EGARCH Modelling
Abdul Qayyum Pakistan Institute of Development Economics, Islamabad
and
Muhammad Arshad Khan
COMSATS Institute of Information Technology, Islamabad
PAKISTAN INSTITUTE OF DEVELOPMENT ECONOMICS ISLAMABAD

All rights reserved. No part of this publication may be reproduced, stored in a retrieval system or transmitted in any form or by any means—electronic, mechanical, photocopying, recording or otherwise—without prior permission of the Publications Division, Pakistan Institute of Development Economics, P. O. Box 1091, Islamabad 44000.
© Pakistan Institute of Development Economics, 2014.
Pakistan Institute of Development Economics Islamabad, Pakistan E-mail: [email protected] Website: http://www.pide.org.pk Fax: +92-51-9248065
Designed, composed, and finished at the Publications Division, PIDE.
C O N T E N T S
Page
Abstract v
1. Introduction 1
2. Overview of the Stock Market and the Foreign Exchange Market 3
2.1. The Stock Market 3
2.2. The Foreign Exchange Market 5
3. Data and Methodology 6
4. Empirical Analysis 9
4.1. Descriptive Statistics 9
4.2. Cointegration Analysis 11
4.3. Results from the Multivariate EGARCH Model 12
5. Conclusions and Policy Implications 14
References 15
List of Tables Table 1. Description of Parameters Equation 2a-3b 9
Table 2. Summary of Descriptive Statistics 10
Table 3. Johansen Cointegration Test (Stock Market Index and Exchange Rate) 12
Table 4. Results of the Multivariate EGARCH Model 13
List of Figure Figure 1. Volatility Clustering of Weekly Stock Market Returns and
Exchange Rate Returns (July 02, 1997 to July 04, 2012) 11
ABSTRACT
The paper examines the dynamic relationship and volatility spillovers between the stock market and the foreign exchange market in Pakistan using weekly data from 02 July, 1997 to 04 July 2012. We have used Johansen cointegration test to determine long run relationship between stock price index and exchange rate. The result lends no support for the presence of long-run relationship between the stock price index and exchange rate. Furthermore, volatility spillover is modelled through bivariate EGARCH framework. The result from the EGARCH models reveals two-way volatility spillovers. The returns of one market are affected by the volatility of other market. Particularly, the returns of the stock market are more sensitive to the exchange rate returns as well as the volatility of foreign exchange market. Furthermore, the returns in the foreign exchange market are also affected by the stock market returns and the volatility of stock market returns. Overall, the results suggest that there is strong link between the volatility of foreign exchange market and the volatility of returns in stock market in Pakistan.
JEL Classification: C32, F31, G15; R10 Keywords: Stock Market, Foreign Exchange Market, EGARCH,
Volatility Spillover, Stock Market Return, Foreign Exchange Return, Pakistan
1. INTRODUCTION
The economy of Pakistan has gone through various institutional and financial reforms during the past two and a half decades. The main objectives of these reforms were to reduce domestic financial imbalances, and enhance the efficiency and depth of the financial markets. Opening of stock markets and adoption of a free flexible exchange rates regime makes stock and foreign exchange markets interdependent. The opening of stock markets resulted in sharp increase in the inflows of portfolio investment. On the one hand, increase in investment helps in raising investable funds, and on the other, it produces wild swings in the stock market indices. For example, the Karachi Stock Exchange (KSE)-100 index increased to 2600 in 1995 but declined sharply to just 879 in 1998. The reason of this sharp decline could be that most of the institutional foreign investors had withdrawn from the market due to financial crisis.1 From this low level it crossed 10 thousand marks in early 2005 but by May 2005 it again declined to around 7 thousand marks. Since then the stock market has shown tremendous growth and the KSE-100 index has risen to 15676.3 points in 2008. However, from 2008 the index has been showing a declining trend falling to 10677.5 points in 2010. This could be due to the high volatility of the bullish market. The other reason could be the outflows of foreign direct and portfolio investments due to the weak performance of the economy during the past two years.
Similarly, the foreign exchange market has also shown high volatility since 1998. For example, Pak-rupee exchange rate depreciated against U.S. dollar from Rs 43.19 per dollar in 1998 to Rs 61.41 per dollar in 2001-02. However, it started appreciation against the US dollar and touched Rs 57.5 per dollar in July-August 2004. From 2004 to 2007, the exchange rate varied between Rs 57.6 to Rs 60.63 band, but after 2007 it drastically depreciated and falling to Rs 85.5 per dollar in July 2011.
After the 1990s financial sector reforms, the stock market and foreign exchange market have become more integrated and interdependent. The rapid expansion of trading activities at Karachi Stock Exchange (KSE) since then and the adoption of free flexible exchange rate in July 2000 have increased exchange rate uncertainty and volatility. Zapatero (1995) shows that in perfect integrated financial markets, there is an explicit linkage between the volatility of stock prices and the volatility of the exchange rate. Yang and Doong (2004) note that
1The Karachi stock exchange has been influenced by sanctioned imposed by world community after the nuclear tests in May 1998.

2
the exchange rate has become more sensitive to stock market innovations and portfolio investment because of the rapid integration and deregulation of financial markets since 1990s. The exchange rate uncertainty is likely to transmit shocks to the stock markets. For example, the exchange rate uncertainty during the Asian financial crisis of 1997-1998 beginning with the devaluation of the Thai Baht, transmitted shocks to equity markets throughout the region. As the uncertainty rose, investors withdrew capital and the economies successively collapsed. Therefore, in countries like Pakistan an understanding of inter-market volatility is important for the pricing of securities within and across markets for trading, hedging strategies, formulation of regulatory policies and portfolio management. [Mishra, et al. (2007)].
The theoretical link between foreign exchange markets and stock markets can be traced back in the writings of Dornbusch and Fisher (1980), Branson (1983) and Frankel (1983). According to Dornbusch and Fischer’s (1980) flow-oriented models of exchange rate determination, movements in exchange rates affect the international competitiveness of firms and trade balance which, in turn, affects real income and output and, eventually, the stock prices. Stock prices react to exchange rate changes and affect aggregate demand through wealth and liquidity effects, thereby influencing demand for money and the exchange rate [Gavin (1989) and Yang and Doong (2004)]. This is because many companies borrow in foreign currency to fund their operations. However, the impact depends on whether the firm is an exporting industry or a heavy user of imported inputs [Mishra (2004)]. Alternatively, the asset market models of exchange rate determination due to Branson (1983) and Frankel (1983) suggest that causality runs from stock prices to exchange rate changes as expectations of financial price movements affect the dynamics of exchange rates [Morales (2008)]. It can be argued that exchange rate volatility may affect stock prices which, in turn, affect domestic and foreign investor’s investment decisions. For example, depreciation in exchange rate not only affects the demand and supply of financial assets but the returns on stocks and bonds are also affected. This implies that changes in returns on financial assets could occur due to exchange rate movements. The financial position of an economy is largely determined by the depth and strength of the capital market which is susceptible to foreign exchange volatility. Foreign exchange volatility influences the value of the firm since the future cash flows of the firm change with the fluctuations in the foreign exchange rate [Agrawal and Srivastava (2011)]. The depreciation of exchange rate has both positive and negative effects on the domestic stock prices for export and import-dominated country [Ma and Kao (1990)]. Exchange rate changes can affect stock prices for multinational firms as well as domestic firms [Agrawal and Srivastava (2011)]. Developments in the foreign exchange market have important implications for all economic and financial agents. Therefore, it is necessary to understand the origin and nature of stock prices and exchange rate volatility with its spillover effects.
3
A number of empirical studies inter alia, by Yang and Doong (2004); Apte (2001) and Kanas (2000, 2002); Meghrabi, et al. (2006); Leeves (2007); Morales (2008) and Agrawal and Srivastava (2011) have examined the extent of volatility spillover between stock markets and foreign exchange markets. However, only one study is available [i.e. Qayyum and Kemal (2006)] that investigated volatility spillovers between stock market and foreign exchange market with reference to Pakistan.
Given the role of the stocks and foreign exchange markets in evaluating the economic conditions of a country, the main focus of the present study is to explore the dynamic interaction between the stocks and foreign exchange markets in Pakistan using weekly data over the period July 1997-July 2012. The present study in particular addresses the nature of volatility spillovers between the stock market and foreign exchange market in Pakistan.
The study is organised as follows: Section 2 overviews the stock market and the foreign exchange market in Pakistan. Section 3 elaborates the data and the methodological framework. Empirical results are presented in Section 4. This section also undertakes preliminary data analysis, cointegration analysis and discusses the results of the EGARCH model. Concluding remarks are given in the final section.
2. OVERVIEW OF THE STOCK MARKET AND THE
FOREIGN EXCHANGE MARKET 2.1. The Stock Market
The stock market in Pakistan consists of three stock exchanges, namely the Karachi Stock Exchange (KSE), the Lahore Stock Exchange (LSE) and the Islamabad Stock Exchange (ISE) which were established in 1947, 1971 and 1997 respectively. The capital market is regulated by the Security and Exchange Commission of Pakistan (SECP) which was established in 1997 by succeeding the Corporate Law Authority established in 1947.
Out of these stock exchanges, the Karachi Stock Exchange (KSE) dominates all the trading activities, while the Lahore Stock Exchange (LSE) and Islamabad Stock Exchange (ISE) account for very small share in the trading volume. The KSE started its functioning with 90 members and 13 listed companies in 1949. The number of listed companies rose to 318 in 1971. The growth of equity market during the decade of 1960s was due to the industrialisation policies pursued by the Government of Pakistan [Qayyum and Kemal (2006)].
The decade of the 1970’s started with political turmoil and unrest in the Eastern part of the country. The worsening domestic situation in East Pakistan resulted in the break up of the country. After separation of East Pakistan in 1971, 60 companies that belonged to East Pakistan (Bangladesh) were de-listed

4
from the KSE. During 1973-74 the Government nationalised all types of private sector industrial and financial institutions. This wholesale nationalisation of industries completely eliminated the private sector from the country [Qayyum and Kemal (2006)].
The nationalisation policy adopted in the 1970s was reversed by the next government during 1985-86 due to the losses and inefficiency of the public sector enterprises. To minimise losses and improve the efficiency of industrial and financial institutions, the government launched a policy of denationalisation of the earlier nationalised industries and privatisation of public sector industries and financial institutions. Furthermore, the 1990s decade started with a number of reforms in the financial sector under the guidance of World Bank and Asian Development Bank [Khan, et al. (2005)]. These reforms included the opening of the stock markets to international investors; removal of constraints to repatriation of investment proceeds, capital gains and transfer of dividend; allowing foreign companies to engage in export sector; liberalisation of foreign exchange restrictions, allowing private sector to set-up commercial and investment banks and allowing Pakistanis to open foreign currency accounts, etc. [Khan and Khan (2007)].2 These measures served as catalyst in reviving the confidence in the stock markets. The KSE responded positively to the liberalisation measures resulting in unprecedented increase in all market indicators, such as listing of companies, KSE-100 index, turnover of shares and market capitalisation, that was observed in the first year of its opening. The Karachi stock market was ranked third after Argentina and Columbia in 1991 in terms of its performance [Husain and Qayyum (2006)]. But the Pakistani equities markets collapsed in 1995 due to domestic political crisis and a discouraging macroeconomic outlook. The average monthly turnover remained very low and reached US $266.2 million, while the total market capitalisation dropped from 24.3 percent to US $9.3 billion at the end of the year. The KSE showed improvement during 1997-98 when the listed capital increased and the turnover of shares more than doubled from 5,707 million shares during 1996-97 to 11,438 million in 1998. Further, KSE established a `Defaulting Companies Counter’ in August 1997. By the end of March 1998, the number of companies were reduced to 126 on removing the defaulters or offering to buy-back the shares by the sponsors. The KSE introduced a computerised trading system i.e. KATS (Karachi Automated Trading System) in order to provide a fair, transparent, efficient and cost effective market place for the investors. The KSE-100 Index reached to 2600 points in 1995 but declined sharply to just 879 points in 1998. The reason of this sharp decline could be that most of the institutional foreign investors had withdrawn from the market due to the sanctions against Pakistan over the issue of nuclear tests. From this low level, it again crossed to 10 thousand points mark in the early 2005. But by May 2005 it again declined to
2Detailed review of reforms can be seen in Khan and Khan (2007).
5
around 7 thousand points mark. Since then the stock market has shown tremendous growth and the KSE-100 Index rose to 15676.3 points in 2008. After 2008, the index again depicted a declining trend touching 12496.03 points in June 2011. This could be due to the high volatility in the bullish market rather than the bearish market. The other reason could be the outflows of foreign direct and portfolio investment due to the weak performance of the economy on account of escalating political unrest, depreciation of Pak-rupee and increasing fiscal deficit during the past two years.3 However, KSE-100 index resumed its momentum during the third quarter of 2011-12 and stood at 14744 points on August 09, 2012 registering a growth of 15.33 percent compared to July 10, 2011 when the index stood at 12484.17 points. This could be due to encouraging measures, such as reduction in discount rate by State Bank of Pakistan and increase in foreign exchange reserves.4 After two decades of reforms, a total of 591 companies were listed at the KSE with listed capital of Rs 1059.087 billion as on May 04, 2012. The total market capitalisation stood at Rs 3755 billion as on August 09, 2012. Despite ongoing political issues and ratings downgrade by Moody’s, Pakistan stood out as the best performing Asian Market in the outgoing month of July 2012 as measured by the Morgan Stanley Capital International (MSCI) index. The MSCI of Pakistan increased 6.1 percent and KSE-100 index increased by 5.6 percent (US$ 5.6 percent). 2.2. The Foreign Exchange Market
The State Bank of Pakistan (SBP), under the Foreign Exchange Regulation Act 1947, is responsible for formulating and conducting the exchange rate policy and regulating the foreign exchange market. All commercial banks have been declared as Authorised Dealers (ADs) of foreign exchange. The SPB fixes dollar rate at which it buys and sells US dollars from the ADs. All transactions of foreign exchange are processed through ADs and authorised money changers at the given rate.
Pakistan’s foreign exchange system has gone through a number changes during the last four decades. Pakistani Rupee was linked with British Pound Sterling before 1970. In 1971 the Pak-Rupee was de-linked from the Pound and pegged with the US dollar at the official rate of Rs 4.76 per dollar [Qayyum and Kemal (2006)]. In 1972 Pak-rupee was devalued by 56.7 percent in terms of gold and allowed to fluctuate at about 4.5 percent. The Rupee was again devalued in 1974 to Rs 11.00 a dollar. Pakistan opted for a managed float system by replacing the fixed exchange rate system in February 1982. Under the managed floating system, rupee was linked to a trade-weighted currency basket
3The UAE and Chile based investors withdrew their investment from the equity market due
to economic recession over the last couple of years [SBP (2010)]. 4Other measures that help to boost market sentiment include promulgation of Capital Gain
Tax Ordinance, in 14th April 2012.

6
of Pakistan’s trade partners. The SBP announced a comprehensive package of exchange and payments reforms in 1991 that allowed resident Pakistanis to open foreign currency accounts (FCA) with Pakistani banks. Further, non-resident Pakistanis were also allowed to invest in the stock market by opening a Special Convertible Rupee Account with authorised dealers (ADs) in Pakistan. Moreover, the Rupee was made convertible to international currency. Pakistani nationals and firms were given license to act as money changers subject to the payment of prescribed fee [Qayyum and Kemal (2006)]. In 1994, Pakistan government signed and accepted the obligation of Article VIII, Section 2, 3 and 4 of the IMF Articles of Agreement. This step made Pak-rupee convertible on current international transactions.
Pakistan adopted a multiple exchange rate system in 1998 which consists of three types of exchange rates—official exchange rate that is pegged to the US dollar by SBP, a Floating Inter Bank Exchange Rate (FIBR) and composite rate that combines the official and FIBR rates. Further, the banks were allowed to quote their own exchange rates for currencies other than the US dollar and the rates for the US dollar within the State Bank of Pakistan’s buying and selling band. The multiple exchange rate system was converted into a unified exchange rate in 1999 and the rupee was again pegged to the US dollar and was allowed to fluctuate within a specified band—Rs 52.10 to 52.30 per dollar. Another step towards liberalisation of foreign exchange market was the removal of fluctuation band from the exchange rate in July 2000 when the Rupee became free floating and the exchange rate was determined by the market forces. The exchange rate varied between Rs 57.6 to Rs 60.63 per US dollar during 2004-2007. After 2007 it gradually depreciated and reaching to Rs 94.10 per dollar as on August 08, 2012.
The above liberalisation and deregulation measures call for inquiring into the dynamics of interaction between the stock and foreign exchange markets of Pakistan. Traditionally both markets have been regarded as sensitive to any policy change which gets quickly reflected in these two markets. The analysis of their behaviour is necessary because it is considered to be the barometer which readily registers the economy’s response to external factors [Mishra (2004)].
3. DATA AND METHODOLOGY
The present study aims at examining the dynamics of volatility spillovers between stock and foreign exchange markets using stock price index and Pak-rupee -US dollar exchange rate. For empirical analysis we use weekly data from 02 July 1997 to 04 July 2012. The data on stock price index proxied by Karachi Stock Exchange 100 index (KSE-100 Index) are taken from the http://finance.yahoo.com/q/hp?s=%5EKSE+Historical+Prices, while the data on bilateral exchange rate (Pak rupee-US dollar) are obtained from http://www.oanda.com/currency/historical-rates/. The weekly stock returns have

7
been calculated by taking natural logarithm of weekly closing stock price index relatives, i.e., St = Ln(SPIt / SPIt–1). Where SPI(t) is the closing stock price index of the tth day. Similarly natural logarithms of weekly bilateral nominal exchange rate relatives have been calculated as Et = Ln = (EXRt / EXRt–1). The volatility measure of the stock price index and exchange rate is calculated by employing AR(2) – GARCH(1,1) model.5
Following the empirical literature, we started our investigation by examining the time series properties of the data to determine the nature of distribution and stationarity. It can be argued that financial time series, particularly stock market returns, are not distributed normally but are generally assumed to be Leptokurtic. Due to this it is necessary to test the skewness, Kurtosis and normality of the series. The Jarque-Bera test is used to test the normality of the series and the Augmented Dickey Fuller (ADF) unit root test is used to test stationarity of the data [Dickey and Fuller (1981)]. The volatility of stock returns and exchange rate returns is judged by plotting the data.
For the existence of the cointegrating relationship between the stock price index and the exchange rate, Johansen multivariate cointegration test is employed. The test hypothesis is formulated as the restriction of the reduced rank of ∏:H0(r): ∏=αβ′ for the reduced form error-correction model (ECM):
1 1 1 ( 1) 1.........t t k t k t t tZ Z Z Z D U− − − − −∆ = Γ ∆ + + Γ ∆ + Π + Ψ + … (1)
Where Z = [LSPI, LEXRT], LSPIt, is the logarithm of stock price index, LEXRt is
the logarithm of nominal exchange rate and Ut is the white noise residual. α and β represent the speed of the adjustment parameter and cointegrating vector respectively. D stands for the deterministic term including the dummy variables.
Since the volatility in the stock prices is negatively correlated with volatility in the exchange rate [Qayyum and Kemal (2006) and Apte (2001)], therefore the volatility spillovers effect between the stock market and foreign exchange market is estimated using the Autoregressive Conditional Heteroscedasticity Generalised Autoregressive Conditional Heteroscedasticity (ARCH – GARCH) models proposed by Engle (1982). Though in most of the cases the ARCH – GARCH (p,q) models are apparently successful in estimating and forecasting the volatility on financial time series, but they cannot capture the “leverage effect”, where the conditional variance tends to respond asymmetrically to positive and negative shocks in errors [Karmarker (2007)]. Keeping the importance of leverage effect in stock returns, Bollerslev (1986) and Nelson (1991), among others, proposed an Exponential GARCH (EGRACH) model based on a logarithmic expression of the conditional variability in the variables under analysis. The main advantage of EGRACH model is that the parameters are not restricted to be non-negative. Later on,
5Results of volatility measures of stock price index and exchange rate are available to the authors and can be obtained upon request.
8
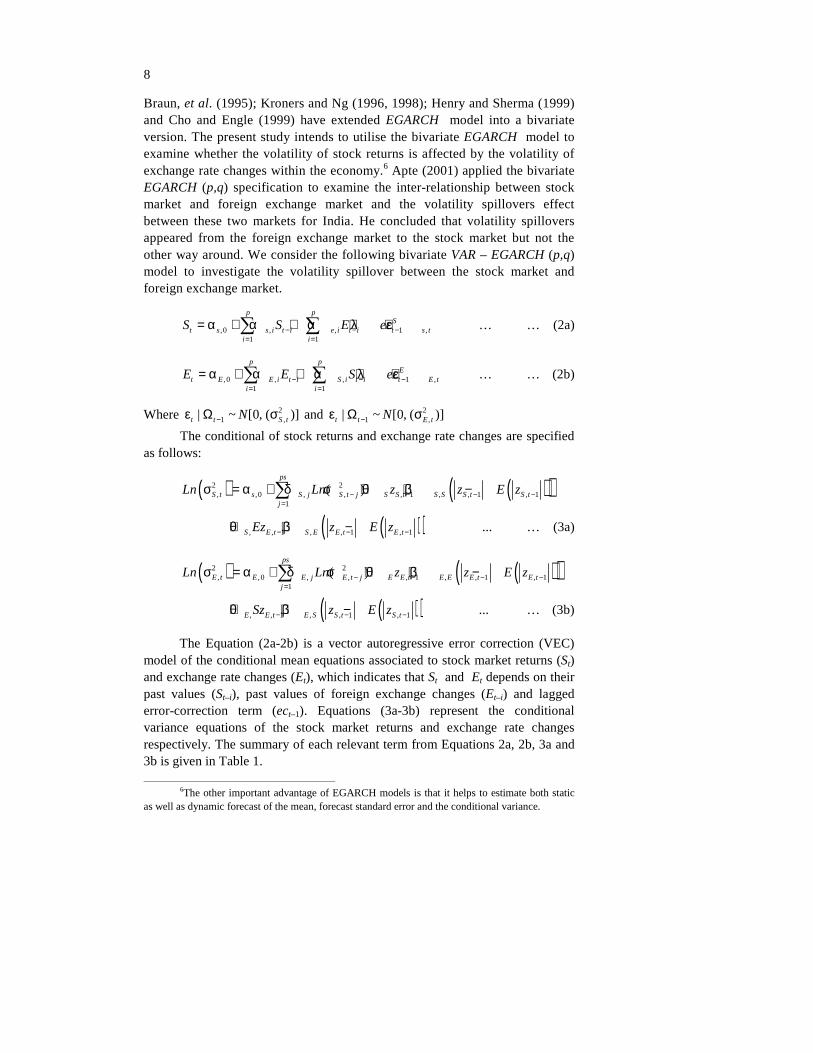
Braun, et al. (1995); Kroners and Ng (1996, 1998); Henry and Sherma (1999) and Cho and Engle (1999) have extended EGARCH model into a bivariate version. The present study intends to utilise the bivariate EGARCH model to examine whether the volatility of stock returns is affected by the volatility of exchange rate changes within the economy.6 Apte (2001) applied the bivariate EGARCH (p,q) specification to examine the inter-relationship between stock market and foreign exchange market and the volatility spillovers effect between these two markets for India. He concluded that volatility spillovers appeared from the foreign exchange market to the stock market but not the other way around. We consider the following bivariate VAR – EGARCH (p,q) model to investigate the volatility spillover between the stock market and foreign exchange market.
,0 , , 1 ,1 1
p pS
t s s i t i e i t i t s ti i
S S E ec− − −= =
= α + α + α + λ + ε∑ ∑ … … (2a)
,0 , , 1 ,1 1
p pE
t E E i t i S i t i t E ti i
E E S ec− − −= =
= α + α + α + λ + ε∑ ∑ … … (2b)
Where 21 ,| ~ [0, ( )]t t S tN−ε Ω σ and 2
1 ,| ~ [0, ( )]t t E tN−ε Ω σ
The conditional of stock returns and exchange rate changes are specified as follows:
( ) ( )( )2 2, ,0 , , , 1 , , 1 , 1
1
( )ps
S t s S j S t j S S t S S S t S tj
Ln Ln z z E z− − − −=
σ = α + δ σ + θ + β −∑
( )( ), , 1 , , 1 , 1S E t S E E t E tEz z E z− − −+θ + β −
... … (3a)
( ) ( )( )2 2, ,0 , , , 1 , , 1 , 1
1
( )ps
E t E E j E t j E E t E E E t E tj
Ln Ln z z E z− − − −=
σ = α + δ σ + θ + β −∑
( )( ), , 1 , , 1 , 1E E t E S S t S tSz z E z− − −+θ + β − ... … (3b)
The Equation (2a-2b) is a vector autoregressive error correction (VEC) model of the conditional mean equations associated to stock market returns (St) and exchange rate changes (Et), which indicates that St and Et depends on their past values (St–i), past values of foreign exchange changes (Et–i) and lagged error-correction term (ect–1). Equations (3a-3b) represent the conditional variance equations of the stock market returns and exchange rate changes respectively. The summary of each relevant term from Equations 2a, 2b, 3a and 3b is given in Table 1.
6The other important advantage of EGARCH models is that it helps to estimate both static
as well as dynamic forecast of the mean, forecast standard error and the conditional variance.

9
Table 1
Description of Parameters Equation 2a-3b Stock Returns Exchange Rate Returns Stochastic error terms.
,S tε ,E tε
Error Correction Terms 1
Stec− 1
Etec−
Information Set at t-1. 1t −Ω 1t −Ω
Conditional time varying parameters.
2,S tσ 2
,E tσ
Standardised residuals assumed to normally distributed with
zero mean and variance of 2,S tσ
and 2,E tσ
.
, , ,/S t S t S tz = ε σ
2, 1 ,/ ~ (0, )S t t S tN−ε Ω σ
, , ,/E t E t E tz = ε σ 2
, 1 ,/ ~ (0, )e t t e tN−ε Ω σ
Persistence of Volatility. ,
1
ps
S jj =
δ∑ ,1
ps
E jj =
δ∑
ARCH effect where the parameters ,S Sθ and ,E Eθ
allow
this effect to be symmetric.
,, , , S tS t S t S Szz E z − + θ
,, , , E tE t E t E Ezz E z − + θ
Volatility Spillovers. , , 1 , 1 ,S E E t E t S Ezz E z− − β − + θ
, , 1 , 1 ,E S S t S t E Szz E z− − β − + θ
Measures of spillovers.
,S Eσ ,E Sσ
Asymmetry of Spillovers. ,S Eθ ,E Sθ
Source: Morales (2008, p. 191). Note: θS,E < 0
implies that negative exchange rate shocks increase the volatility of stock returns
more than positive shocks.
We select the number of lags for our conditional mean Equations (2a-2b)
using Schewaz Bayesian Criteria (SBC), because SBC is preferable over Akaike’s Information Criteria (AIC) as the latter tends to over parameterise the model.
4. EMPIRICAL ANALYSIS 4.1. Descriptive Statistics
We begin with the analysis of descriptive statistics. The summary statistics are reported in Table 2. The mean of the stock price index, exchange rate, stock market returns and exchange rate returns is positive implying that these series have increased over time. The stock market returns are negatively

10
skewed although the skewness statistics are not much large. The negative skewness implies that the return distribution of the shares traded in the market in the given period have a large probability of earning returns greater than the mean. The values of the Kurtosis for the stock market returns and exchange rate changes is greater than 3, which implies a heavier tail than the standard normal distribution, as confirmed by the Jarque-Bera normality test. The standard deviation of stock returns is larger than that of exchange rate changes which suggest that stock returns are highly volatile compared to exchange rate changes. The same result is true for stock price index and exchange rate.
Table 2
Summary of Descriptive Statistics Statistic LSPIt
LEXRt
Et
St
Mean 8.40 4.13 0.0011 0.003 Maximum 9.65 4.54 0.07 0.11 Minimum 6.70 3.70 –0.05 –0.18 Std. Dev. 0.94 0.20 0.008 0.03 Skewness –0.30 0.35 1.79 –1.00 Kurtosis –1.53 –0.62 20.75 3.28 Jarque-Bera 88.37 [0.000]** 28.76 [0.000]** 14466 [0.000]** 480.95 [0.000]** ARCH 1-10 test: F(10, 762) 63752 [0.000]** 60433 [0.000]** 9.32 [0.000]** 14.97 [0.000]** Q-statistic (50) 34809.6 [0.000]** 28539.8 [0.000]** 152.96 [0.000]** 134.27 [0.000]** Q2-statistic (50) 34766.2 [0.000]** 28846.1 [0.000]** 235.15 [0.000]** 273.84 [0.000]** ADF Test (constant) –0.43 –0.97 –11.68** –19.96** ADF Test (Constant and Trend) –1.75 –2.11 –11.67** –19.96** Observations 784 784 784 784
** Indicates significant at the one percent level of significance.
The unit root test is also presented in Table 2 where the ADF statistics
indicate that the stock market price index (LSPIt) and foreign exchange rate (LEXRt) are nonstationary at their levels (i.e. I(1)). However, stock market returns (St) and foreign exchange returns (Et) are stationary (i. e. I (0)). Moreover, the ARCH test confirms the presence of the ARCH effect in the stock returns as well as exchange rate returns. Therefore, we can directly perform volatility analysis using the EGARCH (p,q) approach.
To examine the volatility clustering, the data on stock market returns and foreign exchange returns is depicted in Figure 1. It appears from Figure 1 that there are stretches of time where the volatility is relatively high and stretches of time where the volatility is relatively low, suggesting an apparent volatility clustering in the stock market returns and exchange rate returns over the period 02 July 1997 to 04 July 2012. However, volatility clustering is strong in the stock market returns as compared to exchange rate returns. The presence of volatility clustering implies a strong autocorrelation in squared residuals. To

11
detect volatility clustering, we use Box-Pierce Q-statistic assuming the null hypothesis of no serial correlation. The value of Q2(50) statistic rejects the joint hypothesis that all serial correlations of the squared returns from lag 1 to 50 are simultaneously equal to zero, and hence suggest the presence of volatility clustering in the stock returns and exchange rate returns. Engle, et al. (1990) noted that the nominal interest rate, dividend yield, oil price, margin requirement, business cycle and information patterns are the key sources of volatility clustering. Furthermore, differences in the participant’s expectations and market dynamics can also lead to volatility clustering [Karmakar (2007)].
Fig. 1. Volatility Clustering of Weekly Stock Market Returns and Exchange Rate Returns (July 02, 1997 to July 04, 2012)
4.2. Cointegration Analysis
Before estimating the EGARCH model, we first examine the possibility of cointegration between the stock price indices and exchange rate using the Johansen cointegration test, which is robust in the presence of ARCH effect. The vector autoregressive (VAR) model includes the restricted intercept but no trend. Furthermore, two dummy variables are entered unrestrictedly in the VAR model based on the careful examination of stock prices and exchange rate data. The first dummy variable (D553) represents high spikes in the stock price index; it takes value one for 2007:39-2008:52 and zero otherwise. The second dummy variable (D576) is introduced to capture the after-shocks of global financial crisis on Pakistan’s stock and foreign exchange markets. This variable takes value one for 2008:10-2010:25 and zero otherwise. On the basis of Schewaz Bayesian Criteria (SBC) three lags were selected for our VAR model.7 Table 3 reports the
7Since SB Criteria is preferable over Akaike’s Information Criteria (AIC) because the later tends to over parameterised the model and the former is considered to be more parsimonious.
12
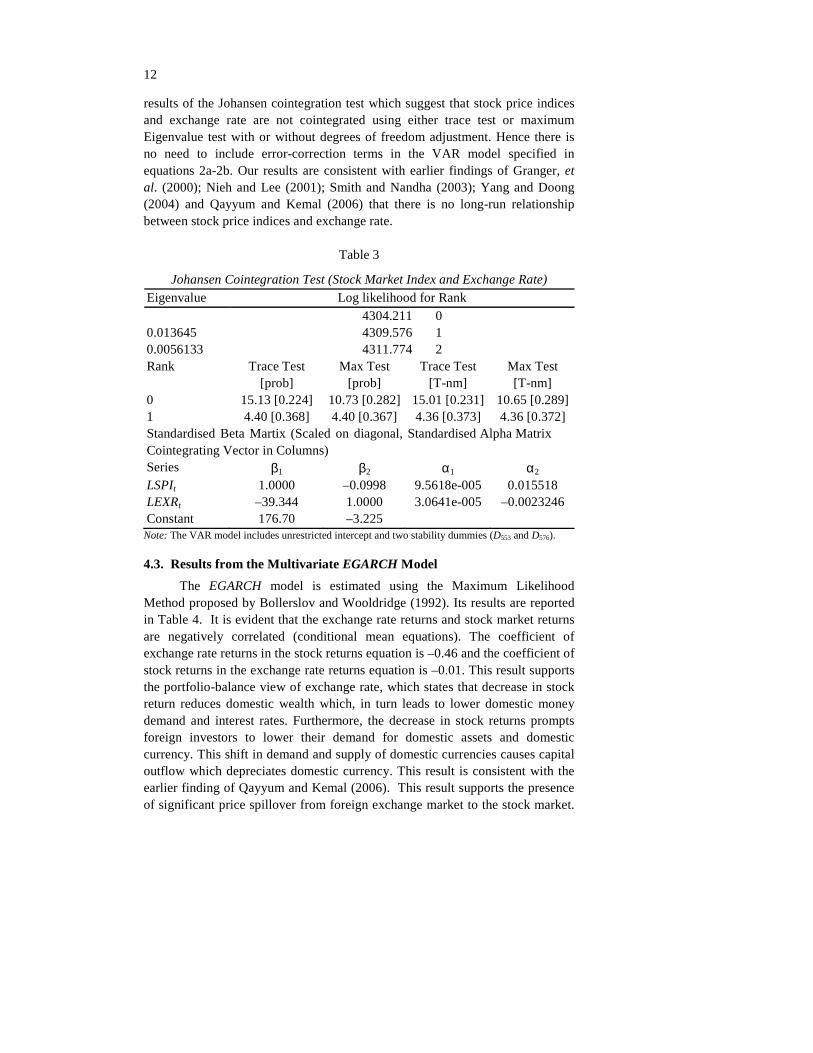
results of the Johansen cointegration test which suggest that stock price indices and exchange rate are not cointegrated using either trace test or maximum Eigenvalue test with or without degrees of freedom adjustment. Hence there is no need to include error-correction terms in the VAR model specified in equations 2a-2b. Our results are consistent with earlier findings of Granger, et al. (2000); Nieh and Lee (2001); Smith and Nandha (2003); Yang and Doong (2004) and Qayyum and Kemal (2006) that there is no long-run relationship between stock price indices and exchange rate.
Table 3
Johansen Cointegration Test (Stock Market Index and Exchange Rate)
Eigenvalue Log likelihood for Rank 0.013645 0.0056133
4304.211 0 4309.576 1 4311.774 2
Rank Trace Test [prob]
Max Test [prob]
Trace Test [T-nm]
Max Test [T-nm]
0 15.13 [0.224] 10.73 [0.282] 15.01 [0.231] 10.65 [0.289] 1 4.40 [0.368] 4.40 [0.367] 4.36 [0.373] 4.36 [0.372] Standardised Beta Martix (Scaled on diagonal, Cointegrating Vector in Columns)
Standardised Alpha Matrix
Series β1 β2 α1 α2 LSPIt 1.0000 –0.0998 9.5618e-005 0.015518 LEXRt –39.344 1.0000 3.0641e-005 –0.0023246 Constant 176.70 –3.225
Note: The VAR model includes unrestricted intercept and two stability dummies (D553 and D576).
4.3. Results from the Multivariate EGARCH Model
The EGARCH model is estimated using the Maximum Likelihood Method proposed by Bollerslov and Wooldridge (1992). Its results are reported in Table 4. It is evident that the exchange rate returns and stock market returns are negatively correlated (conditional mean equations). The coefficient of exchange rate returns in the stock returns equation is –0.46 and the coefficient of stock returns in the exchange rate returns equation is –0.01. This result supports the portfolio-balance view of exchange rate, which states that decrease in stock return reduces domestic wealth which, in turn leads to lower domestic money demand and interest rates. Furthermore, the decrease in stock returns prompts foreign investors to lower their demand for domestic assets and domestic currency. This shift in demand and supply of domestic currencies causes capital outflow which depreciates domestic currency. This result is consistent with the earlier finding of Qayyum and Kemal (2006). This result supports the presence of significant price spillover from foreign exchange market to the stock market.

13
It implies that depreciation of Pak-rupee exchange rate drags down stock prices. The reason could be that in Pakistan the external trade sector is dominated by imports and exchange rate depreciation produces unfavourable effects on imports which may induce a bearish stock market [Yang and Doong (2004)]. However, in the short-run, currency depreciation may have a negative effect on the stock market because domestic currency depreciation results in inflation, which may exert a dampening effect on the stock market. The inflationary effects of depreciation of domestic currency may encourage foreign investors to decrease their portfolio assets, depressing the stock market in the long-run [Yang and Doong (2004)]. The evidence of price spillovers from stock market to the foreign exchange market is also available. This implies that movements in stock returns produce changes in exchange rate returns which tends to fuel inflationary fears. Rising inflationary expectations exert downward pressure on the value of domestic currency in the short-run. However, in the long-run the negative effect of increase in stock prices on exchange rate is found to be consistent with the portfolio-balance view of exchange rate. The presence of significant price spillovers indicates that changes in exchange rate return and movements in stock market returns signal important information about the future stock prices and exchange rate trends. Our results support the existence of two-way price spillovers which suggest that both markets are non-dichotomous.
Table 4
Results of the Multivariate EGARCH Model Conditional Mean Equation Variables St
z-statistics Et
z-statistics
C 0.39 4.16 0.12 4.90 St–1
0.28 7.40 –0.01 –2.64
Et–1
– 0.46 –3.32 0.10 2.90 Conditional Variance Equation C -0.05 –0.99 -0.39 -8.46
2, 1( )S tLn −σ 0.87 35.14 – –
zS, t–1
–0.6 –2.34 –0.11 –5.53
, 1 , 1S t S tz E z− − −
0.36 8.80 –0.19 –4.07
2, 1( )E tLn −σ – – 0.76 43.87
ZE, t–1
–0.07 –2.51 0.21 7.29
, 1 , 1E t E tz E z− − −
0.13 2.78 0.52 13.57
Q-stat (36) 28.46 0.811 34.67 0.532
Q2-stat (36) 26.16 0.886 1.502 1.000
Jarque-Bera 575.58 0.000 71105.15 0.000
The estimated conditional variance equation(s) indicate that there are
volatility spillovers from foreign exchange market to stock market and from foreign exchange market to stock market. However, the magnitude of volatility spillover from foreign exchange market to stock market is (0.13) which is larger

14
than that of volatility spillover from stock market to foreign exchange market (–0.19). The volatility of exchange rate returns is positively related to volatility of stock returns which implies that the movement in exchange rate returns causes movement in stock returns. Furthermore, the volatility persistence terms are positive and significant for both stock and exchange rate returns. However, the size of these coefficients is less than unity.
It can be further argued that the news about the volatility of foreign exchange market has an asymmetric impact on the volatility of stock returns. The significance of the ARCH term from stock market returns indicates that news impact on the volatility of foreign exchange return is asymmetric.
The parameters θ measure the asymmetric impact of innovation. We find negative value of θ which suggests that negative innovation tends to reinforce the size effect. The negative θ provides evidence of asymmetry. The relative importance of negative to positive innovation in the volatility process is measured by the ratio –1+θ/(1+θ). The significance of asymmetry
coefficients justifies the use of EGARCH model to capture the asymmetry in the impact of good and bad news.
The Jarque-Bera test for normality applied on the standardised residuals for the stock and exchange rate returns equations suggest that residuals are non-normal. The Q-stat and Q2-stat suggest no residual linear or non-linear dependencies.
5. CONCLUSIONS AND POLICY IMPLICATIONS
This study explores the dynamic linkage between the stock market and the foreign exchange market of Pakistan using weekly data for the period 02 July 1997 to 04 July 2012. The Johansen cointegration test is employed to determine the cointegration between stock prices and exchange rate. The volatility analysis of returns is modelled using the VAR – EGARCH method. The cointegration analysis suggests lack of cointegration between the stock market and foreign exchange market.
The results with respect to volatility transmission mechanism suggest that the behaviour of the stock and foreign exchange markets are interlinked. The return of one market is affected by the volatility of the other market. Particularly, the stock market returns are more sensitive to the returns as well as the volatility of the foreign exchange market. On the other hand, the returns in the foreign exchange market are also affected by the volatility of the stock market returns. This means that there is significant interaction between the foreign exchange market and the stock market volatilities in the case of Pakistan. Furthermore, the movements of stock prices affect future exchange rate movements, but changes in the exchange rate have less impact on future changes in stock prices. The results also point out significant volatility spillover and asymmetric effects from the foreign exchange market

15
to stock market and from stock market to foreign exchange market. Overall, there is information flow between the two markets that helps them integrate. The stock market plays a relatively less dominant role than the foreign exchange market.
The most important policy implications derived from these results is that the State Bank of Pakistan may monitor the impact of exchange rate and stock price fluctuations and its impact on both markets because the behaviour of international portfolios is affected by the behaviour of the two markets. Furthermore, if the policymakers want to stabilise the stock and foreign exchange markets and minimise the adverse effects of exchange rate and stock price volatilities on investment decisions, they should design a policy that helps minimise the adverse impact of volatility. It is well known that the stability in the stock and foreign exchange markets is important to guarantee foreign direct and portfolio investments, which exert a positive impact on economic growth and enhance macroeconomic stability of the country.
REFERENCES
Agrawal, G. and A. Srivastava (2011) Stock Market Returns and Exchange Rates Volatility: A GARCH Application. Research Journal of International Studies 20, 12–23.
Apte, P. J. (2001) The Inter-relationship between Stock Markets and the Foreign Exchange Market. Prajnan 30:1, 17–29.
Bollerslev, T. (1986) Generalised Autoregressive Conditional Heteroscedasticity. Journal of Econometrics 31, 307-–327.
Bollerslov, T. and J. M. Wooldridge (1992) Quasi-Maximum Likelihood Estimation and Inference in Dynamic Models with Time-varying Covariances. Econometric Reviews 11, 143-–172.
Branson, W. H. (1983) Macroeconomic Determinants of Real Exchange Rate Risk. In R. J. Herring (ed.) Managing Foreign Exchange Risk. Cambridge University Press.
Braun, P. A., D. B. Nelson, and A. M. Sunier (1995) Good News, Bad News, Volatility and Betas. Journal of Finance, 50, 1575-–1603.
Cho, Y. H. and R. F. Engle (1999) Time Varying Betas and Asymmetric Effects of News: Empirical Analysis of Blue Chip Stocks. (NBER Working Paper No. 7330).
Dickey, D. A. and A. W. Fuller (1981) Likelihood Ratio Statistics for Autoregressive Time Series with a Unit Root. Econometrica 49:4, 1057–1072.
Dornbusch, R. and S. Fisher (1980) Exchange Rates and the Current Account. American Economic Review 70, 960–971.
Engle, R. F. (1982) Autoregressive Conditional Heteroskedasticity and Estimates of the Variance of UK Inflation. Econometrica 50, 987–1008.

16
Frankel, J. A. (1983) Monetary and Portfolio Balance Models of Exchange Rate Determination. In J. Bhandari and B. Putman (eds.) Economic Inter-dependence and Flexible Exchange Rates. MA. MIT Press.
Gavin, M. (1989) The Stock Market and Exchange Rate Dynamics. Journal of International Money and Finance 8, 181–200.
Granger, C. W. J., B. N. Huang, and C. W. Yang (2000) A Bivariate Causality between Stock Prices and Exchange Rates: Evidence from Recent Asian Flu. Quarterly Review of Economics and Finance 40, 337–3354.
Henry, Ó. T. and J. S. Sharma (1999) Asymmetric Conditional Volatility and Firm Size: Evidence from Australian Equity Portfolios. Australian Economic Papers 38, 393–407.
Hussain, F. and A. Qayyum (2006) Stock Market Liberalisation in the South Asian Region. Pakistan Institute of Development Economics, Islamabad. (PIDE Working Papers 2006:6).
Kanas, A. (2000) Volatility Spillover between Stock Returns and Exchange Rate Changes: International Evidence. Journal of Business Finance and Accounting 27, 447–467.
Kanas, A. (2002) Is Exchange Rate Volatility Influenced by Stock Returns Volatility? Evidence from the US, the UK and Japan. Applied Economics Letters 9, 501–503.
Karmaker, M. (2007) Asymmetric Volatility and Risk-Return Relationship in the Indian Stock Market. South Asia Economic Journal 8:1, 99–116.
Khan, M. A. and S. Khan (2007) Financial Restructuring in Pakistan. The Lahore Journal of Economics (Special Edition), 97–125.
Khan, M. A., A. Qayyum, and S. A. Sheikh (2007) Financial Development and Economic Growth: The Case of Pakistan. The Pakistan Development Review 44:4, 819–838.
Kroner, K. F. and K. V. Ng (1996) Multivariate GARCH Modelling of Asset Returns, Papers and Proceedings of the American Statistical Association, Business and Economics Section, 31–46.
Kroner, K. F. and K. V. Ng (1998) Modeling Asymmetric Co-movements of Asset Returns. Review of Financial Studies 11, 817–44.
Leeves, G. (2007) Asymmetric Volatility of Stock Returns During the Asian Crisis: Evidence from Indonesia. International Review of Economics and Finance 16, 272–286.
Meghbari, N., M. J. Homles, and E. J. Pentecost (2006) Are There Asymmetries between Exchange Rate Fluctuations and Stock Market Volatility in Pacific Basin Countries? Review of Pacific Basin Financial Markets and Policies 9:2, 229–256.
Mishra, A. K. (2004) Stock Market and Foreign Exchange Market in India: Are they Related? South Asia Economic Journal 5:2, 209–232.

17
Mishra, A. K., N. Swain, and D. K. Malhotra (2007) Volatility Spillover between Stock and Foreign Exchange Markets: Indian Evidence. International Journal of Business 12:3, 343–359.
Morales, L. De L. N. (2008) Volatility Spillovers between Equity and Currency Markets: Evidence from Major Latin American Countries. Caudernos De Economia 45, 185–215.
Nelson, D. B. (1991) Conditional Heteroscedasticity in Asset Returns: A New Approach. Econometrica 59, 347–370.
Nieh, C. C. and C. F. Lee (2001) Dynamic Relationship between Stock Prices and Exchange Rates for G7 Countries. Quarterly Review of Economics and Finance 41, 477–90.
Qayyum, A. and A. R. Kemal (2006) Volatility Spillover Between the Stock Market and the Foreign Exchange Market in Pakistan. Pakistan Institute of Development Economics, Islamabad. (PIDE Working Papers 2006:7).
Smith, R., and M. Nandha (2003) Bivariate Causality between Exchange Rates and Stock Prices in South Asia. Applied Economics Letter 10, 699–704.
State Bank of Pakistan (2010) Annual Report. Karachi: State Bank of Pakistan. Yang, S-Y. and S-C. Doong (2004) Price and Volatility Spillover Between
Stock Prices and Exchange Rates: Empirical Evidence from the G-7 Countries. International Journal of Business and Economics 3, 139–153.
Zapatero, F. (1995) Equilibrium Asset Prices and Exchange Rates. Journal of Economic Dynamics and Control 19, 787–811.
Related Documents