1 Impact of CPEC on Social Welfare in Pakistan: A District Level Analysis Rashida Haq PhD Candidate (Economics) Senior Research Economist ® Pakistan Institute of Development Economics Islamabad Nadia Farooq PhD Candidate (Economics) FUUAST School of Economic Sciences, Islamabad Pakistan Institute of Development Economics Pakistan Society of Development Economists 32 nd Annual General Meeting and Conference 2016

Welcome message from author
This document is posted to help you gain knowledge. Please leave a comment to let me know what you think about it! Share it to your friends and learn new things together.
Transcript

1
Impact of CPEC on Social Welfare in Pakistan: A District Level Analysis
Rashida Haq PhD Candidate (Economics)
Senior Research Economist ® Pakistan Institute of Development Economics
Islamabad
Nadia Farooq PhD Candidate (Economics)
FUUAST School of Economic Sciences, Islamabad
Pakistan Institute of Development Economics
Pakistan Society of Development Economists
32nd Annual General Meeting and Conference 2016

2
Impact of CPEC on Social Welfare in Pakistan: A District Level Analysis
Abstracts
The main objective of this study is to forecast the short run net impact of CPEC projects on social welfare for all provinces and districts of Pakistan related to its three dimensions of welfare; education, health and housing. The development vitality of this mega project indicates that there will be 5.21 percent growth in social welfare in Pakistan, up till 2020. At provincial level highest growth in social welfare impact can be ranked as; in Balochistan (6.4 percent), Sindh (6.31 percent), KP (5.19 percent), and Punjab (3.5 percent), respectively. The net impact can also be depicted by its three dimensions of social welfare; education 3.85 percent, health 4.74 percent and housing 8.6 percent, also indicating high growth in terms of living standards. Districts which have high level of poverty and unemployment will significantly improve quality of life relative to other districts. Furthermore, districts which are located on its three routes also depict substantial growth in its welfare dimensions. Finally, the realization of CPEC is a manifestation of the shared dream of unprecedented prosperity for the region.
Keywords: CPEC, Social welfare, Education, Health, Living standards
I. Introduction
The effect of recent economic and financial crises provides a number of reasons to develop
national and regional infrastructure in Asia as it enhances competiveness and productivity.
Regional infrastructure also help to increase the standard of living and reduce poverty by
connecting isolated places and people with major economic centers and markets, narrowing the
development gap among a region (Bhattacharyay, 2012). In this scenario China Pakistan
Economic Corridor (CPEC) is critically important for both countries. Pakistan needs it to
overcome its economic development, social and energy problems while China needs it to
expand its periphery of influence, consolidate its global presence and securing future supply
routes of energy and trade (Small,2015).
Pakistan enjoys a unique geographical landscape situated at the cross-roads in south Asia but
it is considered as one of the least integrated region of the world. The CPEC projects with

3
investment of $46 billion, is being developed as part of strategic partnership between the two
countries Pakistan and China in 2013 which is a long term plan having a time frame of 2014 –
2030, with its two necessary conditions of the Corridor – development of the port at Gwadar
and creating surface transport connectivity between the city of Gwadar in southwestern
Pakistan to China's northwestern autonomous region of Xinjiang. The short-term programs will
be completed by 2020 including the early harvest projects till 2017. The medium-term
programs to be completed by 2025 while the long-term projects will be completed by 2030.
Pakistan signs 43-years lease for Gwadar port with China and rented 2,300 acres of land to
China for developing the first Special Economic Zone (SEZ) in the deep sea port of Gwadar. It
was estimated that shipping cost will drop drastically if proposed route of CPEC is used by
China and transit time will decrease more than ten days for its trade (Aqeel, 2016).
In developing countries like Pakistan, the phenomena of unemployment and disguised
unemployment occur simultaneously as the population of poor stratum continues to rise. To
promote inclusive and sustainable economic growth, employment and decent work for all is
considered to be the key to eradicate extreme poverty and hunger, which is recognized as one of
the ‘Sustainable Development Goals’. Employment and decent work can enhance social welfare
when policies are taken to expand productive, remunerative and satisfying work opportunities;
enhance workers’ skills and potentials. According UNDP (2015) Pakistan ranked at 147 out of
188 countries in term of Human Development Index and placed in low human development
country. Given the present scenario, the CPEC project related investment in Pakistan for
development of various sectors mainly; energy and infrastructure would predict in the creation of
700,000 direct jobs between 2015 to 2030 and add 2 to 2.5 percentage points to the country's
annual economic growth. Furthermore, transport and infrastructure projects would allow easier

4
and low cost access to domestic and overseas markets, promoting inter-regional and international
merchandise trade that would further surge private business investment and enhance productivity.
This investment would also influence the stock market. The revenue and share prices will increase
for the cement and steel sectors due to heavy construction. Productivity of manufacturers can also
increase due to high demand and availability of energy. Consumer stock will also get benefits
from the higher level of demand and income levels (Aqeel, 2016).
The main objective of this paper is to forecast the net impact of CPEC; early harvest
projects and medium term projects in the short run on social welfare for all provinces and
districts of Pakistan, specifically in three dimensions of welfare education, health and housing.
The study is more focused on districts which are under the zone of influence of its three
routes1; the western, central and eastern (Bengali, 2015). It is expected that this pioneer work
will have an important contribution for public policy makers for designing appropriate policies,
by keeping in mind the public welfare, especially for the vulnerable districts of Pakistan.
Limitation of the study; CPEC project is under construction so it is difficult to collect the exact
data for enrollment rates, access to health care utilization and housing conditions, so the
predicted outcomes are all based on the forecast and projections through the help of different
tools and parameters.
1 There are three routes of the CPEC.
1. The Eastern route is stipulated to pass through Gwadar-Turbat-Panjgur-Khuzdar-Ratodero-Kashmore-Rajanpur-Dera Ghazi Khan-Multan-Faisalabad-PindiBhatian-Rawalpindi-Hasanabdal- and onwards.
2. The Central Route is stipulated to pass through: Gwadar-Turbat-Panjgur-Khuzdar-Ratodero-Kashmore-Rajanpur-Dera Ghazi Khan-Dera Ismail Khan-Bannu-Kohat-Peshawar-Hasanabdal-and onwards.
3. The Western route is proposed to pass through: Gwadar-Turbat-Panjgur-Khuzdar-Kalat-Quetta-Zhob-Dera Ismail KhanBannu-Kohat-Peshawar-Hasanabdal-and onwards.

5
II. Review of Literature
In this section some literature related to CPEC projects and its socio-economic impact for
Pakistan is discussed.
Education and health are closely related to travel time and mobility. Howard and Masset
(2004) argue that reduced time and convenient mobility improved enrolment rates in developing
countries. Mattson (2011) investigated that reduced time and convenient mobility increases
access to the community for utilization of health care and education facilities. Keeping in mind
the CPEC scenario, Habib, et al (2016) explored the impact of reduced travel time after the
development of CPEC on school enrollment and maternal health care utilization for eleven
districts that are situated within western route. He found a significance increase in school
enrollment and attendance due to reduce travel time while a significant increase in utilization of
lady health workers is also observed.
Hussain and Ali (2015) argued that CPEC will increase social connectivity among
people. It is significant for Pakistan as well as China as it will increase economic activity in
Pakistan. In this regard it was decided to prepare a Master Plan of CPEC by 2015 in four main
areas of cooperation, i.e., transport, infrastructure, energy and industrial cooperation. In addition
to it, China’s strategic initiatives to build the Silk Road Economic Belt and the 21st-Century
Maritime Silk Road will accelerate prospective regional as well as global development (Xudong,
2015).
Haris (2015) contended that industrialization in ‘Special Economic Zone’ along the CPEC will
help in rehabilitation of Pakistan’s deteriorated industrial units while, Tong (2015) expected that
employment generation will take place mostly from the local community rather from China or

6
from any specific province of the country. It is also analyzed that because of so many projects
via CPEC, the employment generation will also take place in a massive amount. Since Pakistan
is a small economy compared to China, it will have to seek special protections for its local
industries, (Hamid and Sarah, 2012).
While discussing three routes controversy of CPEC projects, Bengali (2015) investigated that
lack of access to markets and to employment, educational, health and socialization
opportunities in some areas defined as regional inequality, constitutes the basis of disaffection
and insurgency; creating conditions for higher security costs. He computed a comparative
opportunity cost of the three routes, in terms of three variables: population density, total area
under cultivation, and total production of four major crops and concluded that the western
route is likely to be the shortest and least cost bearing in terms of opportunity cost and
dislocation compensation cost.
Using a newly updated measure of economic complexity to forecast annual growth rates
over the next decade, it was believed that the higher growth rates will come because of gains in
productive capabilities. Pakistan’s predicted annual growth rate for the next 10 years is 5.07
percent, set to grow by 4.28 percent. It was also believed that the countries with the greatest
potential for growth are located mainly in South Asia and East Africa. (CID, 2016).
Gilbert and Nilanjan (2012) analyze that for all south Asian economies, the efficient
transport infrastructure would boost GDP. The highest rate of increase would be 14.8 percent
as a percentage of current GDP in Nepal, followed by 4.10 percent in Bangladesh and 4.6
percent in Sri Lanka. In absolute terms, India would gain the most, by over $ 4.3 billion,
followed by Pakistan at $ 2.6 billion. It would have an impact on household welfare through a
reduction in regional transportation cost, with clear pro-poor outcomes in the region. The

7
household impacts were found to be positive for Pakistan including the south Asian countries,
suggesting an expected drop in the absolute poverty level.
Hussain and Ali (2015) observed that CPEC is not only a road rather it will bring vast
level of connectivity through road, railway, pipelines, fiber optics special economic zones etc.
It was also elaborated that South Asian region is considered as one of the least integrated
region of the world. So, this project is a big hope for Pakistan to connect with the region as
well as, good for China to integrate its Western part with Pakistan and its nearby routes
through oil imports (Xie et al, 2015).
CPEC is a game changer project which will lift millions of Pakistanis out of poverty trap
and misery. The project embraces the construction of textile and apparel industry, industrial
park projects, construction of dams, the installation of nuclear reactors and creating networks
of road, railway line which will generate employment and people will also take ownership of
these projects. Fully equipped hospitals, technical and vocational training institutes, water
supply and distribution in undeveloped areas will also improve the quality of life of the masses
(Abid and Ashfaq, 2015).
From the above discussion, it can be concluded that CPEC projects would have substantial
impact on social welfare of Pakistan, through employment generation, gains in productive
capabilities, reduced travel time and convenient mobility, etc.

8
III. Data and Methodology
To examine the socio-economic welfare impact of CPEC projects in different regions of
Pakistan, a district level analysis is conducted by employing data from the tenth round of the
Pakistan Social and Living Standards Measurement (PSLM) Survey 2014-15 (Pakistan, 2015).
The survey consists of 5428 sample blocks (Primary Sampling Units) and 81992 households
(Secondary Sampling Units), which is expected to produce reliable results at the district level. In
this survey, 78,635 households were covered in the entire country and information was collected
from households on a range of social sector issues. The survey primarily focused on the main
sectors i.e. education, health, including child and maternal health and housing conditions in the
overall context of Sustainable Development Goals (SDGs). The study covered 115 districts of
Pakistan, 36 districts from Punjab, 24 districts from Sindh, 25 districts from KP and 30 districts
from Baluchistan. Two districts of Balochistan, namely Panjgur and Khuzdar were not covered in
PSLM, 2014-15 due to security reasons so the values were imputed by using growth rates of
previous years. The study consists of objective indicators of social welfare with its three
dimensions namely, access to education, access to child and maternal health and living standard
measured as housing conditions.
Indicators Used for Composite Social Welfare Index for Pakistan
Indicators are the backbone of measurement and their quality, accuracy, and reach
determine the informational content of welfare measures. The selection of indicators should be
transparently justified, interpretable and reflect the direction of change (Midgley,2013). In this
regard following are the indicators to measure social welfare across districts of Pakistan.
A) Education indicators by districts;

9
i) Primary net enrolment ratio:- Number of children attending primary level (classes 1-5)
aged 6-10 years divided by children aged 6-10 years multiplied by 100. Enrolment in
Katchi is excluded.
ii) Middle net enrolment ratio:- Number of children attending middle level (classes 6-8)
aged 11-13 years divided by number of children aged 11-13 years multiplied by 100.
iii) Matric/Secondary net enrolment ratio:- Number of children aged 14-15 years attending
matric level (classes 9-10) divided by number of children aged 14-15 years multiplied by
100.
B) Child and Maternal Health indicators by districts;
i) Children aged 12-23 months who had reported to receive full immunization based
on record, expressed as a percentage of all children aged 12-23 months. To be classified
as fully immunized; a child must have received: ’BCG’, DPT1, DPT2, DPT3, Polio1,
Polio2, Polio3 and Measles.
ii) Pre-natal:- Ever married women aged 15 – 49 years who had given birth in the
last three years and who had attended at least one pre-natal consultation during the last
pregnancy, expressed as a percentage of all ever married women aged 15 – 49 years who
had given birth in the last three years.
iii) Safe childbirth at facility
iv) Post-natal:- Post-natal is the period beginning immediately after childbirth and
extending for about six weeks. Ever married women aged 15-49 years who had received
post-natal check-up expressed as a percentage of all ever married women aged 15-49
years who had a birth in the last three years.
C) Housing indicators by districts taken as living standard;

10
i) Percentage distribution of households by material used for roof (RBC/RCC).
ii) Main source of safe drinking water (tap water or motor pump).
iii) Percentage distribution of households by gas as fuel used for cooking.
In Table 1 some mean values related to social welfare indicators at provincial
levels are presented to evaluate disparity in quality of life in Pakistan.
Table. 1 Statistics of Social Welfare Indictors in Provinces of Pakistan (%)
Indicators Punjab Sindh KPK Balochistan Pakistan
Net enrolment rate at the primary level 70 61 71 56 67
Net enrolment rate at the middle level 38 31 41 26 37
Net enrolment rate at the matric level 29 25 27 15 27 Children fully immunized- Based on record 70 45 58 27 60
Pre – natal consultations 78 72 64 47 73
Safe childbirth at facility 57 57 54 36 55
Post- natal consultations 29 33 25 21 29
Material used for roof (RBC/RCC) 24.5 34.5 35 7 30
Main source of safe drinking water 63 52 61 51 60
Gas as fuel used for cooking 39 56 26 25 41 Source: Based on ‘The Pakistan Social and Living Standards Measurement Survey 2014-15’
Methodology
Statistical techniques are widely used in the design of poverty measures as well as in
measures of well-being (Maggino and Zumbo 2012). Key techniques include principle component
analysis, multiple correspondence analysis, cluster analysis, latent class analysis, and factor
analysis. In this study two indices are constructed. Firstly, principle component analysis (Murtagh
and Heck, 1987) is used for ranking districts of Pakistan in terms of social welfare. Principal
Components Analysis (PCA) generates components in descending order of importance,
that is, the first component explains the maximum amount of variation in the data, and the last
component the minimum (Haq and Zia, 2013) . On the bases of these factors an index of weighted
factor score is constructed for ranking social welfare across districts of Pakistan. Secondly,

11
nested weighted social welfare indices similar to Human Development Index UNDP (2014) and
Alkire, et al (2015) are constructed to measure the impact of CPEC projects in growth of quality
of life, across districts of Pakistan. Like Human Development Index, these indices also measure
average achievement in three basic dimensions of human development— education, health, and a
decent standard of living. The importance of social welfare index can be declared by first Human
Development Report (UNDP, 1990) that the means of development have obscured its ends
because of two primary factors:
“First, national income figures, useful though they are for many purposes, do not reveal
the composition of income or the real beneficiaries. Second, people often value achievements that
do not show up at all, or not immediately, in higher measured income or growth figures: better
nutrition and health services, greater access to knowledge, more secure livelihoods, better
working conditions, security against crime and physical violence, satisfying leisure hours, and a
sense of participating in the economic, cultural and political activities of their communities. Of
course, people also want higher incomes as one of their options. But income is not the sum total
of human life”.
To represent a new global development compact, the 2030 Agenda for Sustainable
Development comprising the 17 Sustainable Development Goals (SDGs) and 169 targets
encompassing three core dimensions of economic, social and environmental development was
adopted at the United Nations by the 193 Member States in 2015. Although a number of
Millennium Development Goals (MDGs) have been achieved including the poverty reduction
goal but the progress has been uneven across goals, and across and within countries, especially in
south Asia which represents the largest concentration of poverty and hunger in the world. Hence,
the SDGs provide to the region a transformative opportunity for a life of dignity and sustainable
prosperity to all, (ESCAP,2016).
Keeping in mind the importance of Sustainable Development Goals and Human
Development Index, this study had constructed two welfare indices (UNDP, 2014) for districts of
12
Pakistan; one for present scenario of social welfare and second one to depict the impact of CEPC
projects on wellbeing by using the standard deviation method which is based on the concept of
simplest forecasting model (Nau, 2014). Using the two series, an index of growth rates are
computed for social welfare using its three dimensions; education, health and housing for ith
district in jth province.
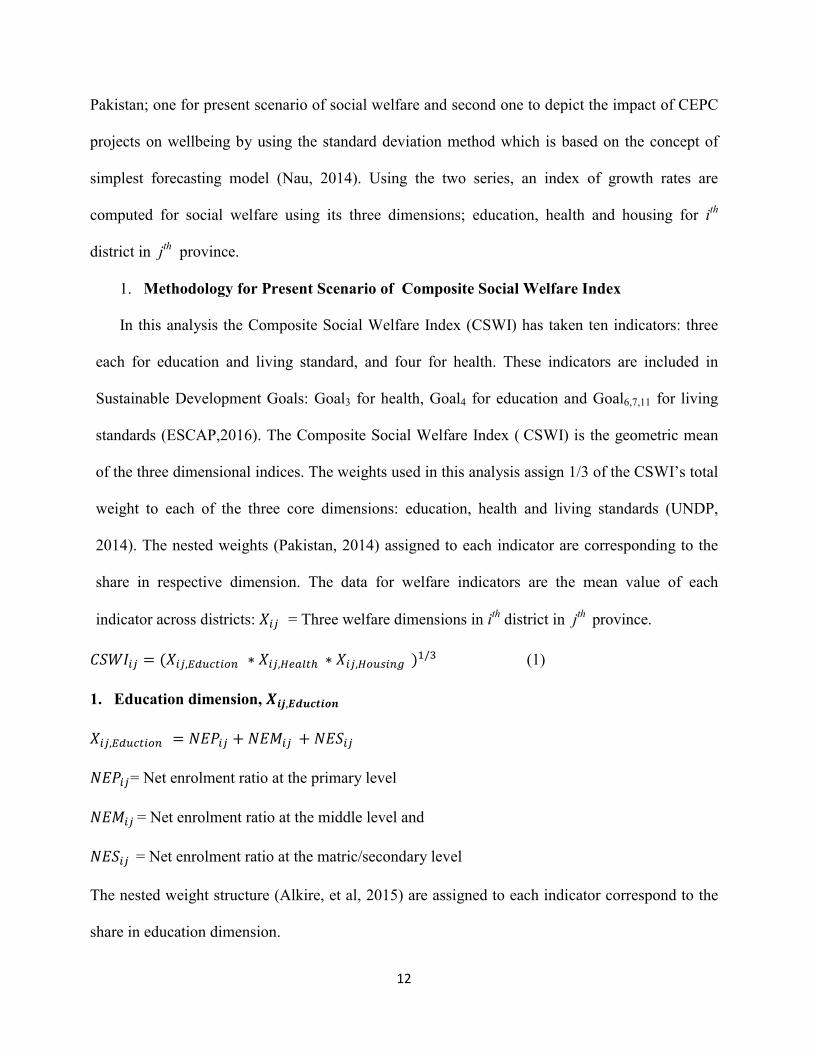
1. Methodology for Present Scenario of Composite Social Welfare Index
In this analysis the Composite Social Welfare Index (CSWI) has taken ten indicators: three
each for education and living standard, and four for health. These indicators are included in
Sustainable Development Goals: Goal3 for health, Goal4 for education and Goal6,7,11 for living
standards (ESCAP,2016). The Composite Social Welfare Index ( CSWI) is the geometric mean
of the three dimensional indices. The weights used in this analysis assign 1/3 of the CSWI’s total
weight to each of the three core dimensions: education, health and living standards (UNDP,
2014). The nested weights (Pakistan, 2014) assigned to each indicator are corresponding to the
share in respective dimension. The data for welfare indicators are the mean value of each
indicator across districts: ��� = Three welfare dimensions in ith district in jth province.
������ = (���,�������� ∗ ���,������ ∗ ���,�������)�/� (1)
1. Education dimension, ���,��������
���,�������� = ����� + ����� + �����
�����= Net enrolment ratio at the primary level
�����= Net enrolment ratio at the middle level and
����� = Net enrolment ratio at the matric/secondary level
The nested weight structure (Alkire, et al, 2015) are assigned to each indicator correspond to the
share in education dimension.

13
2. Health dimension, ���,������
���,������ = 0.5���� + 0.5���� or ���,������ = 0.5���� + 0.5(������ + ����� + +�����)
0.5����= Children fully immunized- Based on record
0.5���� = Maternal health care utilization
0.5���� = ������ + �����+�����
������ = Pre – natal consultations, ����� = Safe childbirth at facility
������Post- natal consultations
The weights assigned to each index of child and maternal health is 50 percent while weights
assigned to each indicator of maternal health care utilization correspond to the share in overall
maternal health care utilization for its respective indicators.
3. Housing dimension, ���,�������
���,������� = ���� + ����� + ����
���� = Quality of household by material used for roof (RBC/RCC)
�����= Safe drinking water (tap water or motor pump)
���� = Quality of fuel (gas) used for cooking
The nested weights assigned to each indicator are corresponding to the share in respective
dimension.
2. Methodology of CPEC Scenario for Composite Social Welfare Index: The Simplest
Forecasting Model
Forecasting is an important aid in effective and efficient planning for the given circumstances
or for any time horizon involved. Some of general principles for forecasting are to use methods
that are structured, quantitative, causal, and simple. One of the most enduring and useful

14
conclusions from research on forecasting is that simple methods are generally as accurate as
complex methods (Armstrong, 1985). In this regard, to forecast the net impact of CPEC projects
on social welfare, a methodology is employed, based on the concept of simplest forecasting
model, the mean model (Nau, 2014). This simplest forecasting model assumes that the data
consists of independently and identically distributed values, as if each observation is randomly
drawn from the same population. So the most natural forecast to use is the sample mean of the
historical data because by definition it is an unbiased predictor and also it minimizes the mean
squared forecasting error regardless of the shape of the probability distribution. The sample mean
has the property that it is the value around which the sum of squared deviations of the sample data
is minimized.
To forecast the net impact of CPEC projects on social welfare, mean and standard deviation
are computed for each welfare indicator across districts. It is expected that there will be
improved geographic connectivity, employment generation due to increase in business activities
and improvement in households income which will improve the social welfare indicators,
especially in those districts which are located in three zones of influence / route of CPEC.
Now for forecasting with the mean model:
Let ���,�������� denote a forecast of Xij based on observed data. In the special case of the
mean model, the sample standard deviation (s) is what is called the standard error of the model,
i.e., the estimated standard deviation of the intrinsic risk. Now, the standard deviation of the error
term is used as to forecast for��� . This is called the standard error of the forecast����������, and
it depends on both the standard error of the model and the standard error of the mean.
Specifically, it is the square root of the sum of the squares of those two numbers calculated for ith
indicator in jth province:

15
����,�������� = √�� + �������
=�1 + 1/��
����,��������,the standard error, measures the forecasting, assuming the model is correct.
��,the standard error (for ith indicator in jth
province) of the model measures the intrinsic risk
(estimated ‘noise’ in the data); for the mean model, the standard error of the model is just the
sample standard deviation.
������� , the standard error of the mean for ith indicator in jth province in the model measures the
parameter risk (error in estimating the ‘signal’ in the data)
For the mean model (Nau, 2014), the result is that the forecast standard error is slightly
larger than the sample standard deviation. As the study is based on cross section data for different
indicators at one point in time, so naive forecasting technique is also incorporated in which last
period actuals are used as the this period forecast (Armstrong, 2001). So in this analysis mean
value of all welfare indicators, X ij are used as the base period for forecasting instead of taking the
sample mean.
A point forecast should always be accompanied by a confidence interval to indicate the
accuracy range of the forecast values (Hyndman, 2014). In this analysis appropriate confidence
interval with critical t-values had been adopted to give a forecast time horizon.
Confidence interval for ���,�������� = X ij ± (critical t-value) × (����,��������,standard
error of forecast)
Here, ‘confidence’ means a sort of like ‘probability’ but not exactly. Rather, there is a
probability that the future data will fall in the calculated confidence interval for the forecast. A ‘t-
table’ showing the critical values of the t distribution for some representative values of the
confidence level ( one-sided, for an upper bound) and the number of degrees of freedom are used
with a forecast horizon ranging from one to fifteen years that is 2016-2030. Here the weight for

16
forecast time horizon is α with value 0 ≥ α ≤ 1. To measure the short run impact of the project, the
value for α is taken as 0.2 while for rest of the period it is (1- α ). A smaller weight is given to
recent period to measure the short run impact of the project because the flow of investment has
not taken its full momentum. Finally, two measures of confidence intervals are taken to forecast
the net impact of social welfare for the short run of the projects with α=0.2. For district located on
CPEC rout / zone of influence regions, a 68% confidence interval is taken because these regions
will get the direct benefit of this mega project.
���,�������� (68% confidence interval) = X ij + α *[(critical t-value) × (����������)]
���,�������� (50% confidence interval) = X ij + α *[(critical t-value) × (����������)]
For all other districts of Pakistan, 50% confidence interval is used as these regions will
have indirect or multiplier impact of huge employment generation, growth in income and
geographic connectivity. The nice thing about a 50% confidence interval is that it is a ‘coin flip’
as to whether the true value will fall inside or outside of it, which is extremely easy to think about.
Also, confidence intervals for forecasts at high levels of confidence tend to be so wide as to not be
very informative while the 50% intervals are often more helpful as visual reference points,
particularly when comparing the degree of overlap between forecasts produced by different
models. In general, the consequences of error in the decision problem at hand, as well as the
expectations of the audience, should be taken into account when choosing a confidence level to
emphasize (Nau, 2014).
������,�������� = (����,��������,�������� ∗ ����,��������,������ ∗ ����,���������������)�
�(2)
����,��������,�������� = �����,�������� + �����,�������� + �����,��������
����,��������,������ = 0.5����,�������� + 0.5����,��������
����,��������,������� = ����,�������� + �����,�������� + ����,��������

17
The descriptions of predicted welfare indicators ����,��������are same as given for present
scenario of social welfare indicators in the first model.
By employing the two indices, present scenario and CPEC scenario, the growth rates are
constructed for each indicator of education, health and housing to demonstrate the net impact on
these three dimensions of social welfare. Finally, a composite social welfare index is constructed
for each district to forecast the net impact of CPEC projects in the short-run for which more than
half ($28 billion) is allocated.
Following is the growth rates for the three dimensions which are incorporated to construct growth
in social welfare as given in equation in 6.
�����ℎ����������������(����,���������) = ����,��������,�������������,���������
���,���������∗ 100 (3)
�����ℎ�������ℎ�����(����,������) = ����,��������,����������,������
���,������∗ 100 (4)
�����ℎ��������������(����,�������) = ����,��������,�����������,�������
���,�������∗ 100 (5)
�����ℎ���������������(������) = (����,�������� ∗ ����,������ ∗ ����,�������)�/� (6)

18
IV. Analysis
In Pakistan the capital and main cities are the largest agglomerations of economic activity
and the main generator of regional flows. In this regard, the colossal projects of CPEC have a
profound impact not only on economic growth but also on social welfare because its route touches
the major cities of Pakistan. It has also a multiplier effect on remote regions in terms of
employment and other social indicators which facilitates concise, comprehensive and balanced
judgments about the condition of major aspects of society. These are in all cases a direct measure
of welfare and if it changes in the 'right' direction, while other things remain equal, people are
'better off'’ as these indicators measure individual and household well-being. The social indicators
have two main purposes to serve in development planning: first, they help to crystallize the goals
of development planning in terms of targets; second, they help to measure the progress made
towards the goals in relation to the targets set.
The CPEC scenario, is predicted to create more or less 700,000 direct jobs between 2015
and 2030, and is eventually going to add 2 to 2.5 percentage points to the country's annual
economic growth. The aim of this analysis is to investigate the impact of social welfare in terms
of education, health and housing across districts of its four provinces. In this regard to observe the
social ranking of 115 districts of Pakistan, a weighted composite welfare index is constructed
using the principal component analysis which also gives the implicit weights to its welfare
indicators. A high value of this index gives high welfare ranking while a low value depicts
deprivation in social welfare (Appendix. A). It is analyzed that there is huge disparity across the
districts of Pakistan as seen in Figure 1. Most of the districts of Balochistan are placed in low
ranking, i.e Chagai, Kila Abdullah, Dera Bugti and Kohistan. In terms of wellbeing Balochistan

19
ranked as the most deprived province where 62 percent population is placed in the category of
bad quality of life (Haq and Zia, 2012). Some of the other districts of Pakistan are also vulnerable
in terms of wellbeing, i.e, Ranjan pur, Thatta, D.G Khan and Umerkot, etc. It is predicted that the
CPEC investment has a significant direct and indirect impact on the economy of Pakistan. Direct
impact of investment can lift the GDP growth beyond 6 percent for the fiscal years 2016-18 while
the indirect impact is long term impact for the economy of Pakistan and much higher than the
direct impact due to the bulk of the investment in energy sector that has the potential to give a
boost to current industry of Pakistan and attract the private investors. The World Bank and IMF
have also linked their future growth rate with the success of CPEC projects, predicting that
Pakistan needs seven percent plus growth rate to ensure real improvements in the economy.
-14
-11
-8
-5
-2
1
4
7
10
13
16
wei
gh
ted
Fa
ctor
sco
res
Districts
Figure 1. Ranking of Composit Social Welfare Index Across Districts

20
Table. 2 Net Impact of CPEC on Social Welfare Indices in Districts of Punjab up till 2020 (%).
Districts Education
Index Health Index
Housing Index
Composite Index of Social Welfare
Attock 2.28 1.86 3.35 2.42 Bahawalnagar 3.64 2.23 6.50 3.75 Bahawalpur 4.32 2.56 5.73 3.98 Bhakar 3.22 2.22 10.45 4.21 Chakwal 2.19 1.78 3.75 2.44 Chiniot 3.18 2.14 5.68 3.38 D.G.Khan* 5.01 4.23 11.31 6.20 Faisalabad* 3.52 3.46 6.61 4.31 Gujranwala 2.63 1.92 2.94 2.45 Gujrat 2.30 1.69 2.99 2.27 Hafizabad 2.90 2.20 4.71 3.11 Jehlum 2.32 1.65 3.28 2.32 Jhang 3.14 2.77 6.99 3.93 Kasur 3.00 1.94 6.98 3.43 Khanewal 3.10 2.37 4.55 3.22 Khushab 3.02 2.19 6.30 3.46 Lahore* 3.43 2.72 3.69 3.25 Layya 2.39 2.11 8.37 3.48 Lodharan 3.51 2.55 4.87 3.51 Mandi Bahauddin* 3.47 2.87 8.16 4.33 Mianwali 2.91 2.09 7.39 3.55 Multan* 4.53 3.28 5.56 4.35 MuzafarGarh 3.83 2.69 11.96 4.97 Nankana Sahib 2.68 1.71 5.18 2.87 Narowal 2.36 2.12 4.66 2.85 Okara 2.72 2.12 3.77 2.79 Pakpattan 3.09 2.24 4.17 3.07 Rahim Yar Khan 4.51 2.87 9.45 4.96 RajanPur* 5.39 3.30 15.28 6.30 Rawalpindi* 3.15 2.64 4.36 3.31 Sahiwaal 2.97 1.83 4.19 2.83 Sargodha 2.81 2.08 6.44 3.35 Sheikhupura 2.77 1.94 3.35 2.62 Sialkot 2.34 1.80 3.02 2.33 Toba Tek Singh 2.57 2.07 4.60 2.90 Vehari 3.14 2.11 4.43 3.08 Average 3.18 2.34 5.90 3.50
Source: Estimates are based on ‘The Pakistan Social and Living Standards Measurement Survey 2014-15’
Districts located on three routes of CPEC.
To analyze the net social welfare impact of CPEC across four provinces and its respective
districts, a social welfare index, similar to UNDP human development index (1990) is constructed
with its three dimensions; education, health and housing. As it is earlier mentioned that this

21
project would have great significance in enhancing bilateral connectivity, improving people’s
livelihood and fostering pragmatic economic and trade cooperation. It works on the principle of
“one corridor with multiple passages” aiming at directly benefitting the socio-economic
development of Pakistan, especially the western and north-western regions and providing
significant importance to Gwadar port. The break-up of CPEC projects are listed as; Punjab 12,
Sindh 13, KPK 8 and Balochistan 16.
Punjab is the most populous of the four provinces of Pakistan with 55 percent of
population share, 25.8 percent landmass and 21 percent poor population. BISP (2016) reported a
high youth unemployment for male; Rahim Yar Khan 65, Jhang 55.7, Khanewal 58.6 and
Nankana Sahib 53.5 percent, etc. Given the provincial profile, it is predicted that the present
CPEC projects have considerable impact on quality of life at all level. Following are the 12
projects related to Punjab are: Optical Fiber Cable from Rawalpindi to Khunjrab, Haier & Ruba
Economic Zone II, Karach-Lahore Motorway (Sukkur-Multan), Joint Feasibility Study for
upgradation of ML1, Upgradation of ML-1, Sahiwal Coal Fired Power Plant, Rahimyar Khan
Coal Power Plant, Karot Hydro-Power Plant, Lahore Orange Line Metro Train, Matiari-Lahore
Transmission Line, Matiari-Faisalabad Transmission Line, Quaid-i-Azam Solar Park in
Bahawalpur. These projects will create not only millions of employments opportunities but also
enhance the living standard of local community.
Table 2, present the net impact of the short-term programs including ‘early harvest’
projects of CPEC on social welfare in districts of Punjab up till year 2020. It is observed that
average impact of social welfare is 3.5 percent in Punjab while its three dimensions education,
health and housing had 3.18 percent, 2.34 percent and 5.9 percent, respectively. Housing index
which includes three indicators of wellbeing are quality of roof, access to safe water and gas as

22
cooking fuel are used as a proxy for household income. It had a high growth in quality of life as
compare to other human capital indices, education and health. The districts located on zone of
influence (districts located on routes) have relatively higher impact as compared to other districts.
Some other districts which have high incidence of poverty such as Rahim Yar Khan 44 percent,
Bahawalpur 29.5 percent and Kasur 30 percent also depict significant welfare impact of CPEC
projects up till 2020.
Table. 3 Net Impact of CPEC on Social Welfare in Districts of Sindh up till 2020 (%).
Districts Education
Index Health Index
Housing Index
Composite Index of Social Welfare
Badin 4.42 4.42 15.17 6.65 Dadu 2.27 3.35 6.33 3.63 Ghotki 3.61 9.24 12.24 7.41 Haiderabad 2.80 3.36 3.73 3.27 Jacobabad 3.77 8.64 20.75 8.75 Jamshoro 3.08 3.86 6.42 4.24 Karachi* 3.48 4.26 3.62 3.77 Kashmor* 6.56 13.38 23.75 12.74 Khairpur 2.74 6.37 13.78 6.21 Larkana* 4.15 6.08 9.33 6.16 Matiari 3.63 3.72 10.12 5.14 Mirpur Khaas 3.59 4.43 10.87 5.56 Naushehro Feroz 2.76 3.89 9.39 4.65 S. Benazirabad 4.66 4.79 23.97 8.10 Sajwal 2.70 4.50 5.27 4.00 Sakhur 3.67 5.60 11.34 6.14 Sanghar 3.45 4.92 15.09 6.34 Shahdatkot 2.97 5.36 10.47 5.50 Shikarpur 3.62 6.47 12.36 6.60 Tadu Alayaar 3.99 4.32 8.65 5.29 TandoM. Khan 5.77 4.87 17.03 7.81 Tharparkar 3.82 7.23 25.14 8.89 Thatta 6.10 5.07 12.74 7.32 Umerkot 3.77 4.24 24.62 7.32 Average 3.81 5.52 13.0 6.31
Source: Estimates are based on ‘The Pakistan Social and Living Standards Measurement Survey 2014-15’
Districts located on three routes of CPEC.

23
The province of Sindh is the second in terms of population with 24.3 percent share and
44.65 percent poverty rates. Sindh contains two commercial seaports - Port Bin Qasim and the
Port of Karachi.
The 13 CPEC projects related to Sindh are: Matiari-Lahore Transmission Line, Matiari-
Faisalabad Transmission Line, Port Qasim Power Plant, Engro Thar Power Plant & Surface Mine
in Block II of Thar Coal Field , Dawood Wind Farm, Jhimpir wind Farm, Sachal Wind Farm,
China-Sunec Wind Farm, Upgradation of ML-1. Thar Coal Block I & Mine Mouth Power Plant,
Gwadar-Nawabshah LNG Terminal & Pipeline, Karachi-Lahore Motorway (Sukkur- Multan) and
Joint Feasibility Study for Upgradation of ML-1. The impact of these multimillion projects would
have significant impact on quality of life in the respective districts of Sindh. The net impact of
CPEC projects on social welfare and its dimensions can be depicted in Table 3. It is examined
that a 6.31 percent of significant growth in social welfare index can be observed in Province of
Sindh with its three components as education 3.81 percent, access to child and maternal health
care services 5.52 percent and improved quality of housing 13.0 percent. The districts which are
placed in lower ranking of social wellbeing as depicted in Appendix A, also exhibited substantial
growth in social welfare.
For provincial disaggregation, at least eight projects under CPEC are related to KPK.
These projects include: Joint Feasibility Study for Upgradation of ML-1, Establishment of
Havelian Dry Port, KKH II (Havelian-Thakot), Upgradation of ML-1, KKH III (Raikot-Thakot),
D.I Khan-Quetta highway (N-50), Suki Kinari Hydropower Project and Optical Fiber Cable from
Rawalpindi to Khanjrab.

24
Khyber Pakhtunkhwa (KPK) is the smallest province by size, located in northwestern
region of Pakistan with 11.9 percent share in total population. The province had 36.9 percent poor
population and 23.8 percent unemployed youth, BISP (2016).
Table.4 Net Impact of CPEC on Social Welfare in Districts of KPK up till 2020 (%).
Districts Education
Index Health Index Housing
Index Composite Index of
Social Welfare Abbotabad 2.74 3.12 3.90 3.21 Bannu* 4.11 10.64 7.46 6.87 Batagram 4.23 5.67 5.56 5.10 Buner 3.03 4.13 5.53 4.10 Charsadda 3.00 3.68 5.01 3.80 Chitral 2.75 3.69 6.06 3.94 D.I Khan** 6.55 7.42 15.74 9.12 Haripur 2.57 3.30 4.02 3.24 Hungo 3.29 4.06 5.05 4.07 Karak 3.57 6.16 7.25 5.41 Kohat* 4.41 5.53 8.55 5.92 Kohistan 7.47 10.18 15.34 10.46 Lakki Marwat 3.15 8.66 7.19 5.80 Lower Dir 3.07 3.20 5.90 3.86 Malakand PA 2.59 3.75 5.20 3.69 Mansehra 2.96 4.09 5.93 4.15 Mardan 2.61 3.32 4.50 3.39 Noshehra 2.67 3.46 4.44 3.45 Peshawar* 4.32 4.79 5.59 4.87 Shangla 5.45 6.58 8.88 6.82 Swabi 2.64 3.90 4.38 3.55 Swat 2.98 3.56 4.88 3.72 Tank 4.58 5.61 6.76 5.57 Tor Ghar 5.65 13.15 6.23 7.60 Upper Dir 4.32 4.90 11.53 6.23 Average 3.79 5.94 7.03 5.19
Source: Estimates are based on ‘The Pakistan Social and Living Standards Measurement Survey 2014-15’
Districts located on three routes of CPEC.
The profile of social welfare across districts of KPK is exhibited in Table 4. The
composite index of social welfare revealed a 5.19 percent growth while its three dimension
education, health and housing had growth of 3.79 percent, 5.94 percent and 7.03 percent,

25
respectively. The quality of life in terms of housing had highest impact of welfare, then comes
health and education at all districts level. The districts located on CPEC routes such as Peshawar,
Kohat, Bannu, and D.I.Khan had significant impact of social welfare.
Table.5 Net Impact of CPEC on Social Welfare in Districts of Balochistan up till 2020 (%).
Districts
Education Index (%)
Health Index (%)
Housing Index (%)
Composite Index of Social Welfare (%)
Awaran 3.89 4.05 9.71 5.34
Barkhan 4.00 3.86 14.65 6.08
Chagai 5.43 6.46 14.17 7.91
Dera Bugti 7.26 16.72 9.39 10.42
Gawadar** 4.05 5.72 7.82 5.65
Harnai 6.89 6.03 8.68 7.11
Jaffar Abad 4.50 6.59 10.34 6.73
Jhal Magssi 4.32 5.37 11.78 6.47
Kachi (Bolan) 4.92 5.05 8.93 6.04
Kalat** 5.18 6.24 6.64 5.98
Ketch* 4.58 7.82 10.40 7.18
Kharan 3.90 4.31 6.19 4.70
Khuzdar** 5.19 9.37 9.64 7.75
Kila Abdullah 6.24 8.45 9.58 7.95
Killa Saif Ullah 4.19 5.17 4.30 4.52
Kohlu 4.86 6.20 10.55 6.81
Lasbela 4.68 3.83 8.13 5.25
Loralai 3.28 7.73 9.14 6.13
Mastung 2.78 4.75 4.12 3.79
Musa Khel 4.13 6.28 11.23 6.61
Nasir abad 5.58 7.38 16.00 8.68
Noshki 3.78 5.69 4.13 4.45
Pishin 5.08 5.38 4.67 5.03
Punjgur* 4.92 7.52 12.88 7.79
Quetta** 4.54 4.92 5.84 5.06
Sheerani 5.19 5.13 10.59 6.54
Sibbi 4.47 3.73 5.44 4.48
Washuk 3.98 8.72 12.46 7.55
Zhob** 6.57 6.04 16.37 8.64
Ziarat 3.84 5.31 10.63 5.99
Average 4.74 6.33 9.48 6.42
Pakistan 3.85 4.74 8.60 5.21
Source: Estimates are based on ‘The Pakistan Social and Living Standards Measurement Survey 2014-15’
Districts located on three routes of CPEC.

26
Giving the break-up of CPEC projects at provincial level, 16 are related to Balochistan.
These mega-development initiatives consist of, Khunzdar-Basima Highway (N-30), D. I. Khan-
Quetta Highway (N-50), Hubco Coal Power Plant, Gwadar Power Plant, Gwadar-Nawabshah
LNG Terminal and Pipeline, Gwadar Eastbay Expressway, Gwadar New International Airport,
Gwadar Smart Port City Master Plan, Expansion of multipurpose terminal including Breakwater
& Dredging Wastewater, Treatment Plants for Gwadar city, Gwadar Primary School, Gwadar
Hospital Upgradation, Gwadar Technical & Vocational College, Gwadar Eastbay Expressway II,
Freshwater Supply and Gwadar Free Zone. These investment and construction of energy and
infrastructure projects under CPEC have a significant long term impact both for Pakistan and
China in social, economic, culture and natural resources.
Balochistan is the one of the fourth province of Pakistan located in the southwestern region. It is
by far the largest in size (44% of land area) and the smallest share in (5%) population with 44
percent of poor population. The economy of the province is largely based upon livestock,
agriculture, fisheries and production of natural gas, coal, and minerals but still lags far behind
other parts of Pakistan. Although rich in mineral resources, but its share is lowest as compare to
other provinces. All the indicators of welfare have the lowest values as compare to other
provinces as perceived in Table 1. In this scenario, the projects of CPEC have tremendous
importance for socio economic development of this vulnerable region. In Table 5 a composite
index of social welfare is presented indicating a 6.42 percent growth due to hefty investment in
this region while for growth rates for its three dimensions are: growth in education index 4.74
percent, health index 6.33 percent and housing index 9.4 percent. As it is earlier mentioned that
most of its districts are placed in low ranking in terms of social welfare, this project will have

27
significant impact in all dimensions of wellbeing and contribute in poverty alleviation of this
neglected region.
V. Conclusions
The China-Pakistan Economic Corridor will take along a massive socio-economic impact
and it will play a significant role in economic development of both the countries through one belt.
The aim of this study is to forecast the net impact of CPEC projects on social welfare across four
provinces and all districts of Pakistan, particularly focusing on its three routes. It is based on data
from ‘The Pakistan Social and Living Standards Measurement (PSLM) Survey 2014-15’ and
methodology is based on the simplest forecasting model. For measuring social welfare index
three dimensions related to access to education (net enrolment in primary, middle and matric),
health (child and maternal health) and housing (quality of roof, safe water delivery system and
gas as cooking fuel) are taken. To further see the multiplier impact of CPEC projects across
Pakistan, two composite indices are constructed depicting present scenario and CPEC scenario.
The results related to net impact of CPEC projects is expected to be a win-win initiative,
as this enormous project will increase geographical connectivity and create millions of
employment opportunities for the local people, resulting an increase in household income. The
development vitality of this project indicates that there will be 5.21 percent growth in social
wellbeing in Pakistan, up till 2020. At provincial level the impact of highest growth in social
welfare can be ranked as; in Balochistan (6.4 percent), Sindh (6.31 percent), KP (5.19 percent),
and Punjab (3.5 percent), respectively. The net impact can also be depicted by its three
dimensions of social welfare as; education 3.85 percent, health 4.74 percent and housing 8.6
percent, also indicating high growth in terms of housing conditions. While discussing the social
welfare impact at districts level, it is important to note that those districts which have high level of
28
poverty or low ranking in wellbeing will significantly improve quality of life relative to other
districts. In addition, districts which are located on its three routes also depict significant growth
in its welfare dimensions.
Finally, it can be concluded that China had already invested $14 billion in 30 early harvest
projects, 16 have been completed or are under construction. The realization of CPEC is a
manifestation of the shared dream of unprecedented prosperity for the region.
References
Abid, M., and Ashfaq, A. (2015). CPEC: Challenges and Opportunities for Pakistan. Pakistan Vision, 16(2).
Aqeel, M. (2016). Impact of China Pakistan Economic Corridor. Unpublished degree
thesis, BBA International Business. ARCADA. Alkire,S., Foster, J., Seth,S., Santos, M.E. Roche, J.M. and Ballon,P.(2015).
Multidimensional Poverty Measurement and Analysis. Oxford University Press. Armstrong, J. Scott, ed. (2001). Principles of Forecasting: A Handbook for Researchers
and Practitioners. Norwell, Massachusetts: Kluwer Academic Publishers. Bengali, K (2015) China-Pakistan Economic Corridor? The Route Controversy, Chief
Minister’s Policy Reform Unit, Government of Balochistan. Bhattacharyay. B.N; Masahiro. K and Raiat. N.(2012) Infrastructure for Asian
Connectivity. Asian Development Bank Institute. BISP (2016) Poverty Profile. Population of Pakistan: An Analysis of NSER 2010-11.
Benazir Income Support Programme (BISP). BISP (2016) Youth and Employment Participation. Population of Pakistan: An Analysis
of NSER 2010-11. Benazir Income Support Programme (BISP). CID (2016) Center for International Development at Harvard University (CID) Hussain, E and Ali,G (2015) China-Pakistan Economic‖, Daily Times, accessed February
28, 2015, http://www.dailytimes.com.pk/opinion/28-Feb-2015/pakistan-China-economic-relations.

29
Gilbert, J and Nilanjan, B .(2012) Socio-economic Impact of Regional Transportation Infrastructure in South Asia. Edited, Infrastructure for Asian Connectivity. Asian Development Bank Institute.
Goldstein, A. (2005). Rising to the Challenge: China's Grand Strategy and International
Security. Stanford University Press. Habib, S, Fazal, R. Farkhanda, J. and Adeel, K. (2015) Assessing Ex-ante Socioeconomic
Impact of China Pakistan Economic Corridor (CPEC) Across the Zone of
Influence. Proceedings of International Conference on CPEC,GC University,
Lahore. December 09-10.
Hamid, N.and Sarah, H (2012) The Opportunities and Pitfalls of Pakistan’s Trade with
China and Other Neighbors, The Lahore Journal of Economics, (September, 2012).
Haq, R and Zia, U. (2013) Multidimensional Wellbeing: An Index of Quality of Life in a
Developing Economy. Social Indicator Research. Volume 114, No.3. Haris, M (2015). Identifying investment sectors along Pak China economic corridor,
Memoir of International Academic Symposium on China Pakistan Economic Corridor, (May 2015):39-45.
Hyndman, R.J. (2014). Forecasting: Principles and Practice. University of Western
Australia. Maggino, F. and Zumbo, B.D. (2012). Measuring the quality of life and the construction
of social indicators. In K. C. Land, A. C. Michalos, & M. J.Sirgy, eds. Handbook of social indicators and quality of life research Springer, pp. 201– 238.
Mattson, J. (2011). Transportation, distance, and health care utilization for older adults in
rural and small urban areas. Transportation Research Record: Journal of the
Transportation Research Board.(2011): 192-199.
Midgley, J. (2013). Social Development: Theory and Practice. London: SAGE.
Murtagh, F., and Heck, A. (1987). Multivariate Data Analysis. D. Reidel, Netherlands.
Nau, R. (2014). Review of Basic Statistics and the Simplest Forecasting Model: The
Sample Mean. Fuqua School of Business, Duke University.
Pakistan, Government of. (2015). The Pakistan Social and Living Standards Measurement
(PSLM) Survey 2014-15. Pakistan Bureau of Statistics, Islambad.

30
Pakistan, Government of. (2016). Multidimensional Poverty in Pakistan. Ministry of Planning, Development and Reforms. Pakistan.
Shakeel A. Ramay,(2015). China Pakistan Economic Corridor-A Chinese Dream Being
materialized through Pakistan, SDPI.
Small, A. (2015). The China Pakistan Axis: Asia’ New Geopolitics. Oxford University
Press.
Tong, L. (2015). CPEC Industrial Zones and China Pakistan Capacity
Cooperation.http://issi.org.pk/wp-content/uploads/2015/12/Liang-
Tong_3435_SS_41_20142015.pdf
UNDP (1990). Human Development Report 1990. The United Nations Development
Programme (UNDP).
UNDP (2014) Sustaining Human Progress Reducing Vulnerabilities and Building
Resilience; Technical notes. Human Development Report 2014. The United
Nations Development Programme (UNDP), One United Nation Palaza, New York.
UNDP (2015) Work for Human Development, Human Development Report 2015. The
United Nations Development Programme (UNDP), One United Nation Palaza,
New York, NY 10017.
Howard,W. and Edoardo, M.(2004) Books, buildings, and learning outcomes: An impact
evaluation of World Bank support to basic education in Ghana (Washington DC:
World Bank, 2004).
Xudong, Z (2015) China Today (February 2015):41-43.

31
Appendix A. Social Welfare Rankinga, Poverty and Unemployment in Districts of Pakistan
Districts Social
welfare Ranking
Poverty Level (%)
Unemployment Rates
(Male) Karachi 1 11.01 28.1
Lahore 2 10.19 23.7
Rawalpindi 3 7.34 22.3
Haiderabad 4 36.62 40.7
Jehlum 5 6.34 26.7
Gujrat 6 8.83 27.2
Gujranwala 7 13.28 22.2
Attock 8 6.77 23
Chakwal 9 9.87 18.7
Peshawar 10 32.15 27.6
Abbotabad 11 7.32 29.9
Sargodha 12 14.07 46
Sialkot 13 5.63 27.1
Faisalabad 14 12.86 34.4
Sahiwal 15 NA 46.5
Noshehra 16 NA NA
Multan 17 39.41 36.4
Mandi 18 9.85 46.2
Haripur 19 10.55 27.3
Dadu 20 50.20 24.3
Mardan 21 36.41 27.3
Sheikhupura 22 15.54 33
Lower Dir 23 44.41 37.4
Charsadda 24 37.53 29.6
Nankana 25 21.13 53.5
TobaTek 26 12.19 34.3
Malakand PA 27 33.72 18
Sakhur 28 NA 39.4
Jamshoro 29 NA 39.1
Naushehro 30 57.26 52.8
Okara 31 21.03 48.1
Swabi 32 46.05 21.9
Swat 33 42.24 48.3
Khanewal 34 20.20 58.6
Layya 35 36.37 19.1
Gawadar 36 50.30 71
Khushab 37 NA 34.3
Districts Social
welfare Ranking
Poverty Level (%)
Unemployment Rates
(Male) Kohat 38 32.97 33.8
Matiari 39 61.45 52.9
Hafizabad 40 15.6 48.3
Chitral 41 28.77 41.6
Mianwali 42 22.83 3.2
Hungo 43 NA 35.1
Mastung 44 24.98 68.6
Larkana 45 55.04 29.8
Kalat 46 41.45 76.1
Mansehra 47 33.08 27.1
Chiniot 48 20.07 45.2
Quetta 49 20.34 38.4
Pakpattan 50 28.81 40.6
Narowal 51 11.49 51.5
Vehari 52 20.17 51
Kasur 53 20.35 22.7
Jhang 54 21.37 55.7
Karak 55 30.42 30.7
Lodharan 56 29.24 47.2
Buner 57 39.15 26.4
Mirpur Khaas 58 47.93 2.8
Tandu 59 NA 16.4
Bannu 60 38.17 35.9
Khairpur 61 53.81 34.6
MuzafarGarh 62 49.18 40.7
BahawalNaga 63 15.30 34.7
Rahim 64 44.15 65
Badin 65 67.15 38.7
Bhakar 66 21.56 28.6
Sanghar 67 NA 22.1
D.I Khan 68 44.82 37.6
Tank 69 51.28 35.7
S.Benaziraba 70 NA 50.4
Lakki Marwat 71 54.36 49.9
BahawalPur 72 29.52 34.7
Shahdatkot 73 NA NA
Sibbi 74 48.22 53.1

32
Districts Social
welfare Ranking
Poverty Level (%)
Unemployment Rates
(Male) Umerkot 75 66.00 43.4
Khuzdar 76 47.29 65.2
Shikarpur 77 65.93 33
TandoMuham 78 70.43 44.3
Ketch 79 46.95 51.6
D.G.Khan 80 NA 40.2
Barkhan 81 46.06 37.9
Noshki 82 NA 68.3
Zhob 83 46 56.7
Upper Dir 84 57.14 58
Batagram 85 21.7 33.9
Ghotki 86 54.07 48.1
Punjgur 87 38.16 91
Jaffar Abad 88 58.63 52.1
Jacobabad 89 59.75 28.8
Ziarat 90 37.66 60.9
Lasbela 91 61.39 49
Killa Saif 92 14.04 1.8
Kharan 93 38.95 87.3
RajanPur 94 60.05 40.7
Loralai 95 38.56 56.7
Musa Khel 96 50.77 44
Kashmor 97 44.49 30.3
Pishin 98 38.51 66.2
Tharparkar 99 54.16 22
Kachi (Bolan) 100 55.25 78.5
Nasir abad 101 60.97 NA
Awaran 102 42.90 88.8
Shangla 103 53.13 61.4
Sheerani 104 NA 80
Kohlu 105 45.13 73.6
Sajwal 106 NA NA
Jhal Magssi 107 57.99 71.4
Thatta 108 72.97 57.8
Washuk 109 58.22 88.6
Hamai 110 44.65 73
Chagai 111 58.67 79.3
Kila Abdullah 112 40.53 55.1
Districts Social
welfare Ranking
Poverty Level (%)
Unemployment Rates
(Male) Tor Ghar 113 NA NA
Dera Bugti 114 55.56 82.7
Kohistan 115 50.84 66.1
Source: BISP (2016) for Poverty and unemployment estimates.
a. ‘The Pakistan Social and Living Standards Measurement (PSLM) Survey 2014-15’

33
Related Documents