A group of Wakhi women comes back from their daily trek across the Hunza riverbed to gather fodder and wood for their cooking fires – Photo by Matthieu Paley Pakistan Development Update April 2015 Public Disclosure Authorized Public Disclosure Authorized Public Disclosure Authorized Public Disclosure Authorized Public Disclosure Authorized Public Disclosure Authorized Public Disclosure Authorized Public Disclosure Authorized

Welcome message from author
This document is posted to help you gain knowledge. Please leave a comment to let me know what you think about it! Share it to your friends and learn new things together.
Transcript

A group of Wakhi women comes back from their daily trek across the Hunza riverbed to gather fodder and wood for
their cooking fires – Photo by Matthieu Paley
Pakistan Development Update April 2015
Pub
lic D
iscl
osur
e A
utho
rized
Pub
lic D
iscl
osur
e A
utho
rized
Pub
lic D
iscl
osur
e A
utho
rized
Pub
lic D
iscl
osur
e A
utho
rized
Pub
lic D
iscl
osur
e A
utho
rized
Pub
lic D
iscl
osur
e A
utho
rized
Pub
lic D
iscl
osur
e A
utho
rized
Pub
lic D
iscl
osur
e A
utho
rized
WB406484
Typewritten Text
95751
WB406484
Typewritten Text

Pakistan Development Update 2015
ii

Pakistan Development Update 2015
iii
Table of Contents
List of Acronyms .......................................................................................................................................... 1
Executive Summary ...................................................................................................................................... 2
Real Sector Developments ............................................................................................................................ 5
Monetary Aggregates and Inflation .............................................................................................................. 7
Fiscal Policy and Public Debt ..................................................................................................................... 11
External Sector ............................................................................................................................................ 16
Financial Sector Developments .................................................................................................................. 20
Poverty in Pakistan ..................................................................................................................................... 22
Progress with Structural Reforms ............................................................................................................... 24
Medium-Term Outlook ............................................................................................................................... 26
External Environment ............................................................................................................................. 26
Macroeconomic Outlook ........................................................................................................................ 28
Annex I: Impact of Lower Oil Prices on Economy..................................................................................... 30
Annex II: One Stop Shop for Business Registration-Progress so far .......................................................... 31
Annex III: Paying Taxes in Pakistan-Status and Challenges ...................................................................... 32
Annex IV: Pakistan International Sukuks: Foot-printing the Shariah-compliant Capital Markets after
almost a Decade .......................................................................................................................................... 33
Annex V: World Bank Support to Pakistan ................................................................................................ 35
Annex VI: Pakistan Data Sheet ................................................................................................................... 36
This brief is prepared by Saadia Refaqat (Economist, MFM) under the guidance of Jose R.
Lopez-Calix (Lead Economist, MFM).
Sector analysis: Executive summary and progress with structural reforms (Jose R. Lopez-
Calix), external sector and macroeconomic outlook (Muhammad Waheed), public debt
(Mehwish Ashraf), inflation (Syedah Mohsina Atiq), monetary aggregates (Mohammad Omar
Joya), financial sector developments (Sarmad Shaikh and Rafay Khan), poverty (David Locke
Newhouse), World Bank support to Pakistan (Sana Shahid Ahmed) and real sector
developments, fiscal, and external environment (Saadia Refaqat).

Pakistan Development Update 2015
1
List of Acronyms
3G Third Generation
4G Fourth Generation
BISP Benazir Income Support Programme
BOP Balance of Payments
CAR Capital Adequacy Ratio
CY Calendar Year
CCTs Conditional Cash Transfers
CPI Consumer Price Index
CSF Coalition Support Fund
DB Doing Business
DFID Department for International
Development
DPC Development Policy Credit
EFF Extended Fund Facility
EMBI Emerging Market Bond Index
ERU Economic Reform Unit
EU European Union
FATA Federally Administered Tribal Areas
FBR Federal Board of Revenue
FDI Foreign Direct Investment
FY Fiscal Year
GCC Gulf Cooperation Council
GDP Gross Domestic Product
GIDC Gas Infrastructure Development-Cess
GSP Generalized System of Preferences
GST General Sales Tax
H1 First half (of the fiscal year)
H2 Second half (of the fiscal year)
HIES Household Integrated Economic
Survey
HOBC High Octane Blending Component
IBRA Indicator Based Reform Advisory
IBRD International Bank for Reconstruction
and Development
IMF International Monetary Fund
IT Information Technology
KESC Karachi Electricity Supply
Corporation
KIBOR Karachi Interbank Offered Rate
KSE Karachi Stock Exchange
LSM Large-scale Manufacturing
M2 Broad Money
MENAP Middle-East, North Africa, Afghanistan
and Pakistan
MFN Most Favored Nation
MRTBs Market Related Treasury Bills
MTBs Market Treasury Bills
NATO North Atlantic Treaty Organization
NDA Net Domestic Asset
NFA Net Foreign Asset
NFNE Non-food, non-energy
NPLs Non-performing Loans
OECD Organization for Economic
Co-operation and Development
OGDCL Oil and Gas Development Company
Limited
OSS One Stop Shop
PBS Pakistan Bureau of Statistics
PIB Pakistan Investment Bond
PKR Pakistani Rupee
PSDP Public Sector Development
Programme
PSLM Pakistan Social and Living Standards
Measurement
Q1 First Quarter (of the fiscal year)
Q2 Second Quarter (of the fiscal year)
Q3 Third Quarter (of the fiscal year)
Q4 Fourth Quarter (of the fiscal year)
REER Real Effective Exchange Rate
SBP State Bank of Pakistan
SOEs State Owned Enterprises
SROs Statutory Regulatory Orders
UAE United Arab Emirates
UK United Kingdom
UNDP United Nations Development
Programme
US United States
USD United States Dollar
Y-o-Y Year-on-Year

Pakistan Development Update 2015
2
Executive Summary
The Pakistani economy faced four major domestic shocks: (i) a political sit-in by
opposition parties in Islamabad that lasted between August and December and
raised significant political uncertainty; (ii) the September floods in Punjab that
affected agricultural crops; (iii) the postponed sale of Oil and Gas Development
Company Limited (OGDCL) equity shares in November that reduced its expected
privatization proceeds and foreign direct inflows (FDI); and (iv) the terrorist attack
in a school in Peshawar that heightened security concerns. However, supported by
a favorable slump in international oil prices, and steady implementation of
structural reforms by the government, the economy is improving. Gross domestic
product (GDP) growth is projected to pick up from 4.1 percent in FY14 to 4.3-4.6
percent this year, mainly driven by dynamic agriculture and service sectors on the
supply side, and slightly better energy availability, continuous revival of credit and
to a lesser extent, growing investor confidence on the demand side. Low oil prices
have also had a marked disinflationary effect. Headline inflation rate, Year-on-Year
(Y-o-Y), achieved a 13-year low last November at 4 percent and the average
inflation rate for FY15 is now projected at around 5.5 percent. The fiscal deficit
remains contained at around 5 percent of GDP, but slightly below target due to
legal challenges and lower than expected revenue from taxes on oil imports.
Improved tax collection, restricted current (especially power subsidies) and
development expenditures, and small provincial surpluses account for sustained
fiscal consolidation. And on the external front, strong remittances and oil prices
also favor to keep the current account deficit modest at around 0.6 percent of GDP.
The external position has markedly improved since monetary and exchange rate
policies converged toward rebuilding reserves, which reached 2.5 months of next
year’s imports last December. Coupled with decreasing public debt ratios, this
result has allowed Pakistan to qualify again for International Bank for
Reconstruction and Development (IBRD) financing. Performance under the
International Monetary Fund (IMF) program remains on track, with the Sixth
Review satisfactorily concluded on March 27th 2015. Although they are easing,
domestic and external risks remain high.
Preliminary data for the first half of FY15 show growth picking up, driven mainly
by strong performance in the agriculture and services sectors. Despite the floods
last year, growth improved in the cotton, wheat, and rice crops. The services sector
was boosted by transport, storage, communications, finance, and insurance.
Arising from strong performance of pharmaceuticals, electronics, automobiles,
iron and steel, growth of large-scale manufacturing was positive but below that of
last year’s. The manufacturing sector continues to be constrained by gas shortages,
the security situation and weak external demand of cotton yarn.
On the demand side, growth continues to be driven by private consumption partly
fuelled by high remittance inflows. Credit to the private sector continued to grow,
but slightly less rapidly than last year: as a percentage of GDP, it fell to 13.4
percent in January 2015 compared with 14.1 percent in January 2014. Credit
growth to the manufacturing sector was the lowest among all sectors. Much of this
outcome is inherited from the persistent crowding out of private-sector credit by
government borrowing, which, for the first time, was kept below the quantitative
ceiling agreed under the IMF’s Extended Fund Facility (EFF) program.
Helped by cheap oil
prices and steady
implementation of its
reforms program,
Pakistan’s
Government has
weathered well four
severe domestic
shocks during the
first half of FY15
Economic activity is
improving
persistently but
slowly….
…growth continues
to be driven by
private consumption
fuelled by high
remittances

Pakistan Development Update 2015
3
Pakistan is on track to meet a fiscal deficit target of 4.8 percent of GDP in FY15.
The newly elected government appears to be committed to fiscal discipline and has
made fiscal consolidation the cornerstone of its economic program supported by
the IMF, the World Bank and other donors. Collection by the Federal Board of
Revenue (FBR) is positive relative to last year but slightly below target, which has
prompted two minor official revisions. Last February, the government approved a
series of tax contingency measures equivalent to about 0.3 percent of GDP. On the
expenditure side, energy-related budgeted subsidies keep being reduced with power
tariff adjustments and surcharges, favored by the oil price windfall that has
provided room for their adjustment with very little negative impact on the final tariff
for consumers. However, the circular debt is re-emerging. And public investment–
constrained by lack of fiscal space and the commitment to reduce the fiscal deficit–
remains contained as well. Public debt is above the 60 percent of GDP allowed by
the Fiscal Responsibility Law, but on a decreasing trend. As past large fiscal
deficits were financed increasingly through domestic borrowing, such trend is
reversing. Previously scarce access to external financing available to the
government, has significantly improved in the first two quarters, which includes a
placement of USD 1 billion in Sukuks in international markets under very favorable
conditions last November.
Favored by cheap oil prices, the current account deficit remains small and on track
to achieve about 1.2 percent of GDP by end-FY15. Gross official foreign exchange
reserves reached about 2.5 months of imports at the end of December 2015 and
should approach a minimum cushion of 3 months of next year’s import in the second
half of FY15. This is due not only to successful bond placements and external aid,
but to the fact that since the second quarter of FY15, the State Bank of Pakistan
(SBP) has started to purchase dollars on the spot market, turning decisively toward
rapid rebuilding the reserves to a minimum cushion level.
At present, Pakistan is facing three sources of risk: First is the prospect of an early
reversal of the fall in oil prices. Second is the repeat of political events of the first
half that keep FDI flows and private investment low; and also affects foreign reserves,
privatization program and growth prospects. An uncertain political environment
undermines investor confidence and depresses economic activity. Third is the
continuation of a troubled domestic energy sector that continues to endure a long-
due complex inheritance on its circular debt. Its accumulation might affect the
magnitude of the fiscal deficit. In the meantime, markets seem to underplay such risks.
Pakistan’s Emerging Markets Bonds Index Plus (EMBI+) risk spread keeps declining
from the high levels shown at the start of the new administration. And confidence in
the government’s program is bearing fruit, as the EMBI+ has almost halved from
1,011 basis points in March 2013 to around 525 basis points as of December 31,
2014. The government intends to benefit from it and reinvigorate the speed of its
reform program in the current fiscal year.
Given past trends and the current growth rate, poverty is expected to continue to
fall and shared prosperity to improve in this and the next fiscal year. However, a
large mass of the population is clustered around the official poverty line, so that
small improvements in household real consumption can translate into substantial
movement in poverty in either direction. This makes the precise number in any year
less informative than looking at the overall trend over time. The trend has shown a
steadily declining level of poverty but the pace of decline is likely to be a good bit
smaller than previously estimated due to a range of issues, principally those related
…and fiscal
consolidation keeps
taking place, leading
to a decline in public
debt
While the current
account deficit
remains contained
and foreign
exchange reserves
build-up continues...
...reversal of
international oil
price decline,
uncertain political
situation and
underperforming
energy sector, all
pose risks to the
economy
Poverty trends keep
declining

Pakistan Development Update 2015
4
to prices and inflation. These are being reviewed for correction. The Government
has recently decided to hold sixth population census which is a positive
development given that the last population census took place in 1998.

Pakistan Development Update 2015
5
Real Sector Developments1
Economic growth continues to be supported by strong performance of agriculture and services sectors
despite sluggish growth of manufacturing
Pakistan’s economic growth is showing gradual signs of recovery. Economic
growth during FY15 is expected to be around 4.3-4.6 percent of GDP, marginally
above 4.1 percent of GDP reached in FY14 but significantly better than 3.7 percent
of GDP growth during FY13. Growth impetus in FY15 appears to come from
agriculture (which accounts for one fifth of GDP) and services sector (which
accounts for 60 percent of GDP) despite weaker than expected performance by
manufacturing sector (almost 14 percent share of GDP). Growth would have been
higher had it not been for difficult domestic environment that prevailed during the
first half of FY15.2
Agriculture sector growth will be supported by a bumper wheat crop, resilient
livestock sector and strong growth of minor crops despite weak performance of
major kharif crops (cotton, rice, sugarcane). Kharif crops, accounting for almost
one fourth of the agricultural value added, have already been harvested and
preliminary estimates show weak results (Table 1). Cotton production remained
below the targeted level while sugarcane production failed to reach last year’s
production levels. The area under sugarcane declined as a result of a price dispute
between cane growers and mill owners as well as stagnant prices last year.3 Cotton
production was better than last year,4 but remained below the target of 15.1 million
bales for the fiscal year. Low international prices translated into low domestic price
and, 5 as a result farmers did not wait for third and fourth cotton picking.
For the second consecutive year, preliminary estimates for production of wheat, the
key rabi crop,6 predict a bumper crop of around 25.8 million tons. This prediction
is based on sowing patterns across the country. This news is positive for overall
growth of the agriculture sector as wheat contributes 13 percent of the total value
added of the agricultural sector, and is cultivated over 37 percent of the country’s
cropped area. A major policy incentive this year for the wheat crop has been the
increase in the support price to PKR 1,300 per 40 kilograms from PKR 1,200 per
40 kilograms last year. Moreover, this year’s wheat crop is expected to benefit from
moderate temperatures and timely availability of key inputs, including water and
fertilizers.7 Minor crops are expected to grow close to their targeted growth of 4.5
percent due to improved water availability. Livestock, with the highest share in
agriculture, is expected to meet the targeted growth of 3.8 percent.
1Due to paucity of data on demand side, discussion on real sector developments focuses on the supply side. 2First six months of FY15 have been marked by several domestic shocks. Firstly, floods hit the country, particularly central Punjab. Secondly, domestic
political situation remained uncertain as a result of protest rallies and sit-in by one of the opposition parties. 3The government announced the sugarcane support price at PKR 182 per 40 kilograms. This price did not satisfy either the growers or millers. Growers
believe they are unable to breakeven at a price below PKR 200 per 40 kilograms while millers complained of maintaining high inventories (as a result
of bumper crop last year) and regulatory hurdles. 4The cotton arrivals were higher by 12.1 percent in Punjab and 5.3 percent in Sindh compared to last year. 5Chinese government’s policy to stockpile cotton reserves has created a surplus of around 11 million bales in the international market, leading to
downward pressure on prices. 6Rabi season: October to March 7Punjab has two irrigation zones namely Jhelum-Chenab Zone and Indus Zone. Water availability for the rabi season (October-December 2014)
remained 7 percent above same time last year. Irrigation water supply in Jhelum–Chenab zone and Indus zone was 2.6 percent and 15.8 percent higher than last year respectively. In Sindh, irrigation water supply was also up by 4.4 percent.
Pakistan’s economic
growth is showing
signs of sustained
recovery
Bumper wheat crop
and resilient livestock
sector will support
agriculture sector
growth despite weak
performance by kharif
crops
Wheat crop is expected
to be a bumper crop
for second consecutive
year

Pakistan Development Update 2015
6
Table 1: Performance of Major Crops
Production in millions of tons Percent
FY13 FY14 FY15T FY15P FY15P/FY14 FY15p/FY15T
Cotton* 13.0 12.8 15.1 13.5 5.7 -10.6
Sugarcane 62.5 66.5 65.5 63.9 -3.9 -2.4
Rice 5.5 6.8 6.8 6.9 1.5 1.4
Wheat 24.2 25.3 25.8 26.0 2.8 0.8
T: Target, P: Provisional *Millions of bales
Source: Targets based on Annual Plan, FY15, Government Planning Commission. Provisional estimates based on World Bank Staff
estimates
Growth in the large-scale manufacturing (LSM) continues to remain constrained by
numerous factors such as domestic security situation, gas shortages, and continued
weakening of demand of cotton yarn export.8 During the first half of FY15 (H1-
FY15), LSM 9 exhibited a
growth rate of only 2.7
percent, compared to 6.6
percent growth achieved in
the same period last year
(Figure 1). A closer look
reveals that almost 40
percent of sectors with 50
percent share in LSM
exhibited single or double
digit contraction. This
included agro-based
industries (sugar, edible oil,
and fertilizers).10 Growth in other key sectors (with 20 percent share in LSM)
including textiles, coke and petroleum products, rubber, and paper and board
appears to be tapering off. Only select sectors such as pharmaceuticals, 11
electronics, automobiles, iron and steel products,12 registered strong growth but not
enough to maintain resilience of LSM sector at the same level as last year.
Performance of the services sector, which contributes to around 60 percent of
domestic output, is expected to remain strong.13 This is on account of the transport,
storage, communication, finance and insurance and general government services
sub-sectors (with almost 40 percent share in services). 14
Transport, storage and communication: Within this category “road transport”
enjoys the largest share (70 percent share), followed by “communication” (22
percent share). Growth in “road transport” during H1-FY15 proxied by sale of
commercial vehicles remained strong while in “communication” category 3G/4G
8On demand side, cotton exports remained low as a result of China’s supply policies while gas shortages proved to be a severe constraint for textile mills
on the supply side. 9 LSM (with a share of 52 percent in the overall industry) is integral for the industrial growth of Pakistan. 10As a result of base effect as well as reduced gas supply to industries such as paper, glass, leather, and fertilizers. 11This industry is heavily dependent on imported raw material and benefited from strengthening of local currency. 12Steel demand rose as a result of number of mega construction projects including Rawalpindi-Islamabad Metro bus, construction at Port Qasim, and Multan-Faisalabad motorway. 13Despite its growing share, timely availability of detailed and reliable information on this sector poses a major constraint in meaningful analysis.
Currently, Pakistan Bureau of Statistics (PBS) releases information only on annual basis. 14General government includes federal, provincial and district governments; local bodies; cantonment boards; and social security funds.
-15.0
-10.0
-5.0
0.0
5.0
10.0
15.0
20.0
Jul-
11
Sep
-11
Nov
-11
Jan-1
2
Mar
-12
May
-12
Jul-
12
Sep
-12
Nov
-12
Jan-1
3
Mar
-13
May
-13
Jul-
13
Sep
-13
Nov
-13
Jan-1
4
Mar
-14
May
-14
Jul-
14
Sep
-14
Nov
-14
Source: Pakistan Bureau of Statistics
Figure 1: Growth (m-o-m) in Quantum Index of LSM
Large-scale
Manufacturing
sector continues to
exhibit weak
performance
Services sector is
boosted by road
transport and
telecom industry as
well as by recovering
profits of scheduled
banks

Pakistan Development Update 2015
7
licenses auction last year will continue to have a positive impact on revenues thus
creating positive momentum for value addition from this sub-sector.
Finance & insurance: Recent available information suggests that scheduled banks
recorded a recovery in their profitability on account of higher investment in
government papers (see Box-1: Banks still remain the prime lender to the
government) and an expansion in their deposit base.15 Moreover, commercial banks
benefited from the slowdown in the incremental stock of nonperforming loans.
Strong growth in SBP’s profits will also support the value addition in this sub-
sector.
Wholesale and retail trade: This category, the largest within services, captures the
value of margins on commercial trading activities. A closer look reveals decreased
trading activity for manufactured goods (reflecting large-scale manufacturing’s
sluggish performance) and decreased trading in agriculture products (following the
losses in cotton and sugarcane crops). Still, services sector growth is projected to
be better than last year and close to the targeted level.
Monetary Aggregates and Inflation
Budgetary
borrowing
shifted from
SBP to the
scheduled
banks leading
to deceleration
in broad
money growth
but crowding-
out of private sector credit to some extent.
15According to SBP’s Monetary Policy Statement for January 2015, financial analysis of the banking sector as of Q1-FY15, reveals that the sector
remains profitable, capital adequacy is above minimum regulatory requirements, and there is sizeable growth in investments and advances as compared
to Q1-FY14.
Box-1: Banks are still the prime lenders to the government
During the H1-FY15, banks held 70 percent of the outstanding Pakistan Investment Bonds
(PIBs) as opposed to a 54 percent share in July-December 2014. The buildup of long-term
assets on the banking sector’s financial statements against the short-term nature of their
liabilities (bank deposits) point to a maturity risk underlying the domestic banking
industry. However, encouragingly, PIBs holding by the non-banks have increased
significantly, by about 80 percent during July-December 2014 as compared to the same
period last year, in terms of volume.

Pakistan Development Update 2015
8
Broad money (M2) growth remained sluggish in H1-FY15 as a result of reduced
government borrowing from the SBP. The year-on-year growth of broad money
was 12 percent on February 27th 2015; 1.6 percentage points lower than that in the
same period previous year. While the external inflows helped in boosting Net
Foreign Assets (NFA), Net Domestic Assets (NDA) decelerated (Table 2) mainly
due to lower private sector credit off-take.
Credit to private sector grew less rapidly in the first half of FY15 compared to the
same period of last year. The banking sector extended PKR 224.5 billion more in
total credit to private sector in the first half of the year. However, this amount was
lower than the credit growth recorded in the same period previous year (i.e. PKR
325.8 billion). One of the major reasons for this has been increased demand for bank
financing from the government. During the first eight months of the current fiscal
year, borrowing from the banking sector stood at almost PKR 1 trillion as compared
to only PKR 292 billion in the same period in the previous year. As a result of this
shift, government has been able to retire PKR 570 billion to the central bank during
this period compared to PKR 186 billion borrowed in the same period last year.
This general trend in government borrowing shift towards scheduled banks, is
expected to continue in the coming months owing to SBP (Amendment) Act 2012,
under which the government has to bring net borrowing from the SBP down to zero
at the end of each quarter. Other factors such as challenging security situation,
falling commodity prices, and continued energy/gas shortages for the industry16
also led to slowdown in credit growth.
Table 2: Selected monetary indicators
(percent growth since end June unless otherwise indicated)
Feb 28th 2014 Feb 27th 2015
Net foreign assets -57.3 23.71
Net domestic assets 6.8 2.8
o/w: Government borrowings 8.4 -4.2
o/w: Private sector borrowings 4.9 1.0
M2 5.0 4.0
M2 to GDP ratio 34.9 35.5
Private sector credit to GDP ratio 13.2 13.3
Source: Monetary Policy Information Compendium, SBP, Jan 2015
16Credit growth to manufacturing sector, particularly to the textiles industry, was the lowest.
Monetary expansion
remained sluggish
despite better
external inflows
Credit to private
sector continues to
slow down as a result
of multiple factors
including
unprecedented
government
borrowing from
scheduled banks

Pakistan Development Update 2015
9
Inflationary pressures have considerably reduced owing to falling global commodity prices, especially oil,
and a combination of better supply side factors
The SBP lowered the policy rate (called SBP reverse repo rate) from 10 percent to
9.5 percent on November 17th 2014 and further to 8.5 percent on January 26th 2015
and then another 50 basis point cut to 8 percent on March 24th 2015. Real weighted
average lending rates remained positive since December 2013. The Karachi
Interbank Offer Rate (KIBOR) remained marginally above policy rate and only fell
below the discount rate in the last two months under analysis –January and February
2015.
Subdued inflationary expectations were the main driving force behind the sharp
policy rate cut by the central bank (≊ 200 basis points) in a period of only five
months. These expectations were led by food, non-food factors (including falling
oil prices that have a second round effect for example, on transport services), lagged
impact of previous conservative policy rate and moderating aggregate demand. The
Institute of Business Administration-State Bank of Pakistan (IBA-SBP) Consumer
Confidence Survey of January 2015 also proposed passive inflation, an idea
supported by the inclination
of banks towards long-term
government securities. Overall inflationary
pressures eased in FY14 and
the trend of single-digit Y-o-
Y Consumer Price Index
(CPI) continued well into
H1-FY15 and beyond,
despite witnessing some
volatility in Y-o-Y headline
inflation (Figure 2). The
average headline inflation in
Q1-FY15 was recorded at
7.5 percent, markedly lower compared to previous quarter’s figure of 8.6 percent.
In Q2-FY15, average headline inflation stood at 4.7 percent, a fall of almost 52
percent from corresponding quarter of FY14 (Table 3). At the end of February 2015,
CPI inflation recorded a further shrinkage to 3.2 percent as compared to 3.9 percent
in January 2015 and 7.9 percent in February 2014. A number of broad-based
domestic and international factors are responsible for this downward trend in
inflation in FY15 so far.
Less than expected severity of floods in Punjab, timely imports of certain food items
like fresh vegetables, depressed exports of rice and improved supply management
of onion and tomato crops all contributed to low food inflation. Food inflation (Y-
o-Y) fell from 6.6 percent in Q1-FY15 to 3.6 percent in Q2-FY15, a reduction of
45 percent and further declined to 2.1 percent in February 2015. The weighted
contribution of Food group towards Y-o-Y inflation fell dramatically as well in Q2-
FY15 by almost 40 percent specifically in November 2014 (Figure 3) attributable
to the above mentioned factors.
2.03.04.05.06.07.08.09.010.011.012.0
3.04.05.06.07.08.09.0
10.011.012.0
Jul-
13
Aug
-13
Sep
-13
Oct
-13
Nov
-13
Dec
-13
Jan-1
4
Feb
-14
Mar
-14
Apri
l-14
May
-14
Jun
-14
Jul-
14
Aug
-14
Sep
-14
Oct
-14
Nov
-14
Dec
-14
Jan-1
5
Feb
-15
Core (NFNE) CPI Headline (RHS)
Source: State Bank of Pakistan
Policy rate has been
cut several times
Headline inflation
continues to remain
in single digit
Domestic factors
contributed towards
food disinflation
Figure 2: Trend in Inflation (Y-o-Y, percent)

Pakistan Development Update 2015
10
The government
considerably cut retail oil
prices in Q2-FY15,
inducing a negative
contribution of transport
group to Y-o-Y inflation
in this quarter and
extending well into
January 2015 (Figure 3).
An upward move was
owed to increases in
electricity tariffs on
different consumption
slabs,17 and a revision of
federal excise duties on cigarettes, 18 which pushed up the retail price of this
commodity. 19 However, these rising price pressures were more than offset by
domestic food and international crude oil factors as a result of which Q2-FY15
witnessed a 13-year low CPI inflation of 4.0 percent in November 2014,20 and food,
non-food and core (NFNE) inflation fell by 46 percent, 33 percent and 11 percent
respectively from Q1-FY15 (Table 3).
The prime reason for decline in core NFNE inflation was a drop in the price index
of transport services of 2.0 percent from Q1-FY15 to Q2-FY15 and a further fall of
7.8 percent from Q2-FY15 to February 2015. 21 Core trimmed inflation also
exhibited a downward trend, registering at 7.3 percent in Q1-FY15, 5.5 percent in
Q2-FY15 and 4.2 percent in February 2015.
17Price index of electricity increased by almost 16 percent in October 2013 and almost 2 percent in November 2014 (Source: SBP First Quarterly
Report FY15 and Inflation Monitor January 2015). 18An increase of 13.5-27.6 percent for different brands (Source: SBP First Quarterly Report FY15). 19During Q1-FY15, this commodity contributed 0.4 percentage points to overall CPI inflation (Source: SBP First Quarterly Report). The weight
assigned to this commodity is 1.39 but its weighted contribution in January 2015 was 8.6 percent with a Y-o-Y change of 16.2 percent in January 2014
and 20.4 percent in January 2015 (Source: PBS and SBP). 20Last record low inflation was documented in FY03 (Source: Pakistan Economic Survey 2006). 21Sources: Pakistan Bureau of Statistics Monthly Price Indices and SBP Inflation Monitor.
Table 3: Quarterly Averages of Y-o-Y Inflation (percent)
General %
change* Food
%
change*
Non-
Food
%
change* NFNE
%
change* Trimmed
%
change*
FY2014
Q1 8.1 - 9.1 - 7.3 - 8.5 - 7.8 -
Q2 9.7 19.8 10.7 17.6 9.0 23.3 8.4 -1.2 8.9 14.1
Feb 7.9 - 7.6 - 8.2 - 7.8 - 8.1 -
Q3 8.1 -20.2 8.0 -25.2 8.2 -8.9 7.8 -7.1 8.1 -8.9
Q4 8.6 6.2 8.2 2.5 8.9 8.5 8.6 10.3 8.4 3.7
FY2015
Q1 7.5 -12.8 6.6 -19.5 8.2 -7.9 8.0 -6.9 7.3 -13.1
Q2 4.7 -37.3 3.6 -45.5 5.5 -32.9 7.1 -11.3 5.5 -24.7
Jan 3.9 - 3.0 - 4.5 - 6.4 - 4.8 -
Feb 3.2 - 2.1 - 4.0 - 6.2 - 4.2 -
*Percent change from previous quarter.
Source: State Bank of Pakistan and Pakistan Bureau of Statistics
-0.20
0.00
0.20
0.40
0.60
0.80
1.00
1.20
Jan-1
4
Feb
-14
Mar
-14
Apri
l-14
May
-14
Jun
-14
Jul-
14
Aug
-14
Sep
-14
Oct
-14
Nov
-14
Dec
-14
Jan-1
5
Food Clothing & Footwear
Elec,Gas & Other Fuel Transport
Education Others
Source: State Bank of Pakistan
Figure 3: Weighted Contribution to CPI Lowering oil prices
led to lower
transportation cost
There were some
upward pressures on
inflation but not
enough to offset the
decline coming from
food and lower
transportation cost

Pakistan Development Update 2015
11
Fiscal Policy and Public Debt
Containment of fiscal deficit is encouraging but much more needs to be done during the remainder of the
year. Continued consolidation effort has put public debt to GDP ratio firmly on a downward trajectory
Pakistan’s fiscal position has undergone significant consolidation over the last two
years. Two factors explain this apparent departure from the past. First, the newly
elected government appears to be committed to fiscal discipline. Second, the
government prepared an economic reform program with fiscal consolidation as its
cornerstone supported by the IMF. In the first half, the consolidated fiscal deficit
increased slightly to 2.2 percent of GDP compared to 2.1 percent over the same
period last year (Table 4). Total expenditures registered a growth of 4.8 percent,
just below 5 percent growth in total revenues allowing deficit to be contained.
However, primary balance which remained in surplus (0.2 percent of GDP) in the
first quarter turned to a deficit of 0.3 percent during H1-FY15, reflecting underlying
pressures such as increased defense expenditures,22 weak revenue mobilization, and
higher development spending.
Table 4: Summary of Pakistan Fiscal Operations (First Half)
Billions of PKR unless mentioned otherwise Growth (percent)
FY15* H1-FY13 H1-FY14 H1-FY15 H1-FY14 H1-FY15
Total Revenue 4,248 1,462 1,665 1,749 13.9 5.0
Tax Revenue 3,361 1,013 1,172 1,361 15.7 16.1
Federal 3,129 942 1,084 1,266 15.1 16.8
Provincial 232 71 88 95 23.9 8.4
Non-Tax 887 449 493 388 9.9 -21.4
Federal 803 415 468 363 12.9 -22.4
Provincial 84 34 25 25 -26.4 -2.8
Expenditures 5,681 2,000 2,214 2,320 10.7 4.8
Current of which: 4,339 1,722 1,888 1,989 9.6 5.4
Interest 1,325 553 598 573 8.2 -4.2
Subsidy 203 157 136 117 -13.4 -14.0
Defense 700 257 295 330 15.1 11.6
Development
Expenditure 1,342 268 228 286 -14.8 25.1
Net lending 5 10 98 45
Statistical
Discrepancy 87 -8 81
Fiscal Balance (excl.
grants) -1,432 -625 -540 -652 -13.5 20.7
% of GDP -4.9 -2.8 -2.1 -2.2
Memorandum items:
GDP (nominal) 29,078 22,489 25,402 29,078
*Budgeted whole year Source: Pakistan Fiscal Operations, Ministry of Finance.
FBR revenue collection (with the major share in total tax collection)23 continues to
experience shortfall–resultantly revenue target has been revised downward several
times. At the time of budget, target was set at PKR 2,810 billion envisaging 24
percent growth in its tax collection over last year. However, floods and major
political turbulence (as discussed earlier) during the first half of the fiscal year
created significant headwinds and FBR’s tax collection during H1-FY15 grew only
by 13.6 percent leading to a downward initial revision of the target by almost PKR
22On June 15th, the Government of Pakistan launched operation “Zarb-e-Azb,” a full-fledged military operation in North Waziristan. 23FBR revenue collection has almost 85 percent share in total tax collection of the consolidated government.
Fiscal consolidation
during H1-FY15
appears to be on
track
FBR tax collection
continues to be a
major challenge

Pakistan Development Update 2015
12
55 billion (requiring 22 percent growth).24 Government remained cognizant of weak
performance and took several mid-year course correction measures including
increase in the General Sales Tax (GST) rate on petroleum products, 25 and
imposition of regulatory duty on several items.26 The overall impact of these two
measures is projected to be around 0.3 percent of GDP. This anticipated gain
however may be eroded as a result of two tax measures introduced at the time of
the budget which presently stand challenged in the court of law. 27 Consequently,
FBR’s target was revised downward to PKR 2,691 billion, requiring 19 percent
growth over last year. At present, meeting this revised target appears challenging.28
Table 5: FBR Tax Collection
Billions of PKR unless mentioned otherwise Growth (percent)
FY15* H1-FY13 H1-FY14 H1-FY15 H1-FY14 H1-FY15
Direct 1,149 331.3 382.0 459 15.3 20.1
Indirect 1,661 551.9 649.4 713 17.7 9.8
Customs 284 108.0 110.1 135 2.0 22.9
Sales Tax 1,206 392.2 481.7 514 22.8 6.7
Federal
Excises 171 51.7 57.7 64 11.5 10.8
Total Taxes 4,471 1,435 1,031 1,172 -28.1 13.6
*Budgeted
Source: Federal Board of Revenue
Non-tax revenues during H1-FY15 stood at PKR 388 billion compared to PKR 493
billion during the same period last year (Table 6). Some support came on account
of dividends from OGDCL (PKR 24 billion), Pakistan Petroleum Limited (PKR 10
billion) and Pakistan Arab Refinery Limited (PKR 4.5 billion) and the Coalition
Support Fund (CSF, PKR 75 billion). 29 Collections last year, however, were
abnormally high, due to one-off inflows (i.e., universal service fund)30 and the
mark-up received from state owned enterprises (SOEs) against the circular debt
settlement.
Current expenditures of the federal government have risen by 5 percent. Recurrent
spending appears to be high compared to last year as a result of additional defense
related expenditures and federal grants to SOEs.31 Domestic interest payments
during H1-FY15 declined by almost 6 percent compared to last year, despite
registering a growth of 31 percent during Q1-FY15. This decline in interest
payments remains surprising because the maturity profile of domestic debt has been
shifting towards costlier long-term government bonds. Additional fiscal space was
created as subsidies registered a decline for the third consecutive year – from 0.7
percent of GDP in H1-FY14 to 0.4 percent of GDP during H1-FY15.
24FBR’s revised target was initially set at PKR 2,756 billion (see IMF Country Report 14/357: December 2014) 25Effective January 1, 2015, GST on import and supply of petroleum products has been increased to 22 percent. The additional 5 percent tax will be
charged on petroleum products including high-octane blended component (HOBC), motor sprit, kerosene oil, light diesel oil and high speed diesel oil. 26The Federal Board of Revenue has imposed regulatory duty of 10 percent on almost 314 items. 27These measures include 5 percent income tax on bonus shares and Gas Infrastructure Development Cess (GIDC). Revenue impact from the former is
around PKR 12 billion while from the latter is PKR 18 billion. 28On February 28, in a bid to maintain oil prices following an upward revision in price of petroleum products in the international market, the government
reduced tax rates on four oil products–petrol, light diesel, kerosene, and HOBC from 27 percent to 18 percent. However, sales tax rate on high speed
diesel was increased to an unprecedented 37 percent. 29CSF is reimbursement for logistic support provided by Pakistan to North Atlantic Treaty Organization (NATO) troops in Afghanistan. 30This is mainly on account of monies from Universal Access Fund of the Telecommunication Ministry which were brought into the budget as non-tax
revenue. 31This head includes the federal grant to Pakistan Railways (PKR. 18 billion), Pakistan Bait-ul-Mal (PKR 1.0 billion), contingent liabilities (PKR 58
billion), outstanding liabilities (PKR 25 billion), and misc. items (PKR 39 billion).
Non-tax revenues
registered a sharp
decline primarily due
to absence of one-off
items
Security related
expenditures and
injections in public
sector entities kept
current spending at
an elevated level.

Pakistan Development Update 2015
13
Table 6: Non-Tax Revenues
Billions of PKR unless mentioned otherwise Growth (percent)
H1-FY14 H1-FY15 H1-FY14 H1-FY15
Interest (PSEs & Others) 58 4 1235 -93
Dividends 28 40 30 40
SBP Profits 145 138 45 -5
Defense 38 80 -78 110
Passport Fee 7 7 21 -2
Development Surcharges on Natural Gas 29 0 281 -100
Discount retained on local crude price 8 5 11 -35
Royalties on Oil/Gas 37 41 23 11
Others 117 49 93 -59
Provincial 25 25 -26 -3
Total 493 388 10 -21
Source: Pakistan Fiscal Operations, Ministry of Finance
Development spending of the consolidated government registered a marginal
increase of 1.5 percent compared to last year. This almost static growth was
surprising, given that the provincial Public Sector Development Programme
(PSDP) grew by almost 53 percent compared to last year. Thus, it appears decline
in net lending and stagnant growth in federal PSDP spending almost offset the
increase in provincial development.32 At the current spending rate, reaching the
budgeted target of PKR 525 billion for federal PSDP appears challenging.
During H1-FY15 the provincial combined surplus stood at PKR 143 billion or 0.5
percent of GDP, in line with the historical trend. Provincial PSDP spending
however typically picks up during the third and final quarters of the fiscal year.
Moreover, provincial tax revenue collection during the first half of the year
remained dismal, showing a decline of almost 30 percent. These two factors during
the remaining half of fiscal year make further increase in provincial surpluses
unlikely.
During H2-FY15 much more effort is required if the government is to meet the
budget deficit target of 4.9 percent of GDP for FY15. Lowering recurrent spending
further may not be possible as a result of increased security related spending and
higher interest payments on domestic debt due to change in domestic debt profile.
Lackluster FBR revenue collection during H2-FY15 needs to shift gears if
consolidation effort is to remain on track (see Annex III). Moreover, government
needs to ensure provinces continue to support the consolidation effort and the
present trend continues during H2-FY15.
32The apparent fall in overall development expenditure is an outcome of accounting protocols which include all lending (net of repayments) of the federal
government to SOEs as development expenditure.
Development
spending continued
to be curtailed but
only at the federal
level
Fiscal consolidation
effort continued to
be supported by
provinces
Achieving fiscal
deficit target require
much more effort in
H2-FY15
Pakistan Development Update 2015
14
Table 7: Analysis of Consolidated Spending
Billions of PKR unless mentioned otherwise Growth (percent)
H1-FY14 H1-FY15 FY14 FY15
Total expenditures 2,214 2,320 10.7 4.8
Current 1,888 1,989 9.6 5.4
Federal 1,376 1,402 7.5 1.9
Interest payments 598 573 8.2 -4.2
Domestic 559 524 10.1 -6.2
External 38 48 -14.0 25.6
Pensions 85 73 14.3 -13.8
Grant 116 156 22.8 34.3
Defense 295 330 15.1 11.6
Public Order and Safety 39 44 15.6 12.9
Health & education 32 33 23.3 2.8
Subsidies 136 117 -18.1 -14.0
Others 76 77 -2.2 1.6
Provincial 541 610 13.7 12.6
Development 243 321 -10.5 32.0
PSDP 215 271 -18.7 26.4
Federal 121 127 -14.7 5.5
Provincial 94 144 -23.3 53.2
Other dev. Expenditures 31 52 49.9 68.3
Net-lending 83 10 1360.0 -88.4
Source: Pakistan Fiscal Operations, Ministry of Finance
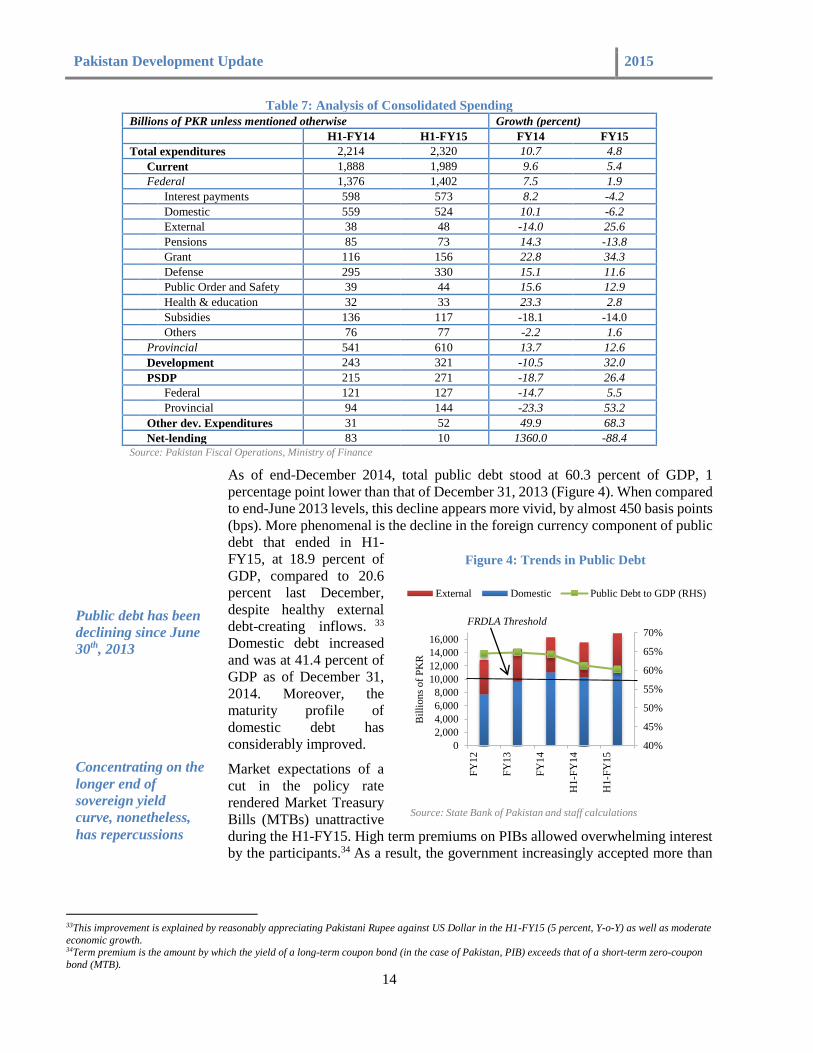
As of end-December 2014, total public debt stood at 60.3 percent of GDP, 1
percentage point lower than that of December 31, 2013 (Figure 4). When compared
to end-June 2013 levels, this decline appears more vivid, by almost 450 basis points
(bps). More phenomenal is the decline in the foreign currency component of public
debt that ended in H1-
FY15, at 18.9 percent of
GDP, compared to 20.6
percent last December,
despite healthy external
debt-creating inflows. 33
Domestic debt increased
and was at 41.4 percent of
GDP as of December 31,
2014. Moreover, the
maturity profile of
domestic debt has
considerably improved.
Market expectations of a
cut in the policy rate
rendered Market Treasury
Bills (MTBs) unattractive
during the H1-FY15. High term premiums on PIBs allowed overwhelming interest
by the participants.34 As a result, the government increasingly accepted more than
33This improvement is explained by reasonably appreciating Pakistani Rupee against US Dollar in the H1-FY15 (5 percent, Y-o-Y) as well as moderate
economic growth. 34Term premium is the amount by which the yield of a long-term coupon bond (in the case of Pakistan, PIB) exceeds that of a short-term zero-coupon
bond (MTB).
Public debt has been
declining since June
30th, 2013
Concentrating on the
longer end of
sovereign yield
curve, nonetheless,
has repercussions
40%
45%
50%
55%
60%
65%
70%
0
2,000
4,000
6,000
8,000
10,000
12,000
14,000
16,000
FY
12
FY
13
FY
14
H1-F
Y14
H1-F
Y15
Bil
lion
s of
PK
R
External Domestic Public Debt to GDP (RHS)
FRDLA Threshold
Source: State Bank of Pakistan and staff calculations
Figure 4: Trends in Public Debt

Pakistan Development Update 2015
15
the targeted amounts in primary auctions,35 leading to elevated yields on PIBs.36
Moreover, half of the issuance in the domestic capital market is in 3-year PIBs.37
While this re-profiling has helped the government shift away from issuing a bulk of
short-term maturities and retire its stock of central bank borrowings,38 the debt
servicing cost on permanent debt has almost doubled in just a year (Table 8).39,40
Particularly, interest paid on PIBs constituted 34 percent of domestic debt service
in July-December 2014 from a 14 percent share in July-December 2013 interest
payments. Going forward, in order to curtail the fiscal burden as well as alleviate
pressures on liquidity management, the government needs to adhere to its pre-
auction targets.
Table 8: Interest Payments on Government Domestic Debt
Billions of PKR FY13 FY14 H1-FY13 H1-FY14 H1-FY15
A. Permanent Debt (> 1 year) 193.2 228.6 93.2 111.4 219.4
Govt. Ijarah Sukuks 42.8 37.3 22.9 20.0 15.7
Pakistan Investment Bonds
(PIBs) 117.8 153.6 55.7 73.5 183.6
Prize Bonds 32.6 37.6 14.5 17.9 20.0
B. Floating Debt (≤ 1 year) 477.7 561.9 293.6 300.5 193.8
Market Treasury Bills
(MTBs) 303.0 343.6 196.1 194.1 54.2
Market Related Treasury Bills
(MRTBs)* 174.7 218.2 97.6 106.4 139.5
C. Unfunded Debt (National
Saving Schemes) 236.2 252.3 121.0 112.4 121.3
Total (A+B+C) 907.2 1,042.8 507.8 524.3 534.4 *Since FY13, actual MRTBs interest payments are used. Previously it was on accrual basis.
Source: State Bank of Pakistan
35Against an aggregate target of PKR 450 billion for H1-FY15 in PIB, the government accepted PKR 642 billion that constituted 54 percent of the
offered amount. 36The cut-off yield on 3-year PIBs stood at 10.6 percent, 112 bps above the 6-month Treasury bill cut-off as of end-December 2014. Secondary market
yield (Pakistan Revaluation rate) for the 3-year paper was at 10.06 percent. Nevertheless, these have come down since the latest monetary policy
decision. 37No auction was held for Ijarah Sukuks during the first half of FY15, leaving a potential segment of market-Islamic banks-untapped (see Annex IV). 38Evidenced by a 26 percent increase in interest payments on Market Related Treasury Bills (MRTBs) during July-December 2014. 39Medium-to long term category of domestic debt and primarily includes Prize Bonds, PIBs and Ijarah Sukuks. 40At the end of December 2014 (H1-FY15), the interest payments on permanent debt rose to PKR 219 billion from a payment of PKR 111 billion at the
end of December 2013 (H1-FY14).

Pakistan Development Update 2015
16
External Sector
External position improved, despite widening of trade deficit, on the back of robust remittance inflow,
successful completion of fourth and fifth IMF review, and issuance of Sukuks in international market
Despite a mildly higher current account deficit of USD 2.2 billion (0.8 percent of
GDP), Pakistan’s overall external balance turns out positive USD 0.49 billion in
H1-FY15 from a deficit of USD 1.9 billion in H1-FY14 (Table 9). This was due to
resilient growth in workers’ remittances which offset a chronically negative trade
balance, sustained decline in international prices, improved inflows in terms of CSF
from USA for military assistance, an increase in the capital and financial account
supported by receipts from the issuance of Sukuk bonds (see Annex IV). In addition,
the successful continuation of the IMF’s EFF program further strengthened the
market expectations as well as the reserve position, which reached at USD 10.6
billion at end December 2014 compared with USD 9.2 billion at June 30, 2014. Pak
rupee also remained relatively stable in nominal terms during H1-FY15.
Table 9: Balance of Payment Summary
Billions of USD H1-FY14 H1-FY15
i. Current account (A+B+C+D) -2 -2.21
A. Trade balance -8.70 -9.79
Export 12.46 12.19
Import 21.16 21.99
B. Services net -1.45 -1.14
of which: CSF 0.32 0.74
C. Income net -2.0 -2.31
D. Current transfers net 10.15 11.04
of which Remittances 7.79 8.98
ii. Capital and Financial A/c 0.41 2.57
of which:
Direct investment 0.38 0.48
Portfolio investment 0.10 1.18
Other Investment Assets 0.06 0.23
Other Investment Liabilities -0.30 0.57
iii. Errors and omissions -0.30 0.13
Overall balance -1.90 0.49
SBP reserves (excl. Cash Reserve Requirements,
sinking fund) 3.63 10.59
Memorandum Items
Current A/c Balance (% of GDP) -0.81 -0.80
Trade Account (% of GDP) -3.51 -3.56
Financial & Capital A/c (% of GDP) 0.16 0.93
Export growth % 2.60 -2.15
Import growth % 5.30 3.10
Remittance growth % 9.50 15.3
Source: State Bank of Pakistan
Notwithstanding a
widening trade
deficit, Pakistan’s
Balance of Payment
(BOP) position has
improved

Pakistan Development Update 2015
17
The slowing global economy and decline in international prices hit the major chunk
of total exports. The negative exports growth was mainly driven by declining
exports of textile,41 food items (wheat and tobacco), petroleum (Naptha, petroleum
products), chemicals and pharmaceuticals. These declines reflected the impact of
the domestic energy crisis as well as drop in international prices. Decline in cotton
prices in international markets and saturation of the textile input market in China,
and weaker activity in Bangladesh’s garment industry, were mainly responsible for
low exports of textile raw material, which contributed 0.43 percent in overall
decline in exports earning. This decline in textile exports is particularly challenging
when the European Union has granted Generalized System of Preferences plus
(GSP plus) to Pakistan and continued to be the largest markets for Pakistan’s
exports.42 Although Pakistan exported larger quantity of rice during H1-FY15, a
substantial drop in the international price of rice has resulted in neutralizing any
positive impact on value of rice exports.
Imports witnessed significant growth on the back of higher demand of food items
(wheat, milk products, spices, pulses, etc), machinery (particularly power
generation and electrical machinery), chemicals, transport, and industrial raw
material, fertilizers, iron, steel, textiles (synthetic fiber and artificial silk yarn),
paper, and rubber products etc. The higher value of imports is basically because of
higher quantity imported (Figure 6). In contrast, with increased demand of
petroleum products the drop in international oil price was mildly reflected in import
bill of petroleum43, contained by around USD 753 million. Hence, with sharp 51
percent fall in international oil prices – lowest in last six years during H1-FY15 –
the biggest chunk in Pakistan’s import bill has become less of a concern and likely
to shrink in remaining of FY15 (see Annex 1).
41Textile contributed 57 percent in total exports, showed negative growth of 0.8 percent in H1-FY15 against a positive growth of 7.8 percent in
comparable period last year (Figure 5). 42Pakistani exports to EU mainly comprise textile and clothing, accounting for 75 percent of total exports to EU. 43The petroleum import bill was USD 6.8 percent in H1-FY15 mildly below USD 7.5 billion in comparable period last year, which could be higher
without favorable price effect.
Figure 5: Trend of textile exports
-60%-40%-20%
0%20%40%60%80%
100%
Whea
t
Mil
k a
nd
Cre
am e
tc.
Pet
role
um
Pro
duct
s
Pet
role
um
Cru
de
Raw
Co
tton
Syn
thet
ic F
iber
Art
ific
ial
Sli
k Y
arn
Fer
tili
zer
Man
ufa
cture
d
Iro
n a
nd s
teel
scr
ap
Iro
n a
nd S
teel
Ru
bber
Pro
duct
s
Pap
er p
rod
uct
s
% change in Quantity % change in Price
Source: Pakistan Bureau of Statistics
Figure 6: Price and Quantum effect on import in H1-
FY15
Trade deficit
widened as export
registered a decline
Import growth was
mainly driven by
improved economic
activity
-2.0%
0.0%
2.0%
4.0%
6.0%
8.0%
10.0%
0
2
4
6
8
10
12
14
H1-F
Y13
H1-F
Y14
H1-F
Y15
Bil
lion
s of
US
D
Other Manufactures Petroleum Group
Textile Group Food Group
Textile Export Growth
Source: Pakistan Bureau of Statistics

Pakistan Development Update 2015
18
During H1-FY15, current transfers stood at USD 10.9 billion against USD 10
billion in the comparable period of last year on the back of impressive growth by
15.3 percent in workers’ remittances,44 against 9.3 percent in comparable period of
last year. Country wise data show that remittances from all major countries
increased, except from the EU countries,45 which contributed only 2 percent in total
remittance and thus had a negligible impact on overall volume and growth of
remittances. The share of Saudi Arabia in overall remittances was the largest (29
percent); with the United Arab Emirates (21 percent), the United States (14 percent)
and United Kingdom (13 percent) together contributing 79 percent in total
remittances. 46 Member countries of the Gulf Cooperation Council (GCC)
contributed about 11 percent. However, because the oil exporting countries
represent 61 percent of total remittances, the recent decline in the price of oil will
likely have a negative impact on the growth in remittances.47
After the continuous slack
performance since FY11,
the capital and financial
account registered sizable
net inflows of 1 percent of
GDP in H1-FY15 (Figure
7). This is mainly
supported by sizeable
growth in portfolio
investment after successful
issuance of Sukuk bond
worth USD 1.0 billion48 in
the international bond
market to augment foreign
exchange reserves. It was
further strengthened by the
successful completion of
fourth and fifth review of
the IMF’s EFF which guaranteed some of multilateral debt inflows. However,
foreign direct investment was around USD 488 million in H1-FY15, which is low
by any standard thus putting a serious constraint on the country’s future productive
capacity together with low domestic investment (see Annex II).
Overall, official reserves increased to USD 10.6 billion by end December, 2014
compared to USD 9.2 billion at end of FY14. Import coverage of reserves has
improved recently to 2.6 months of import of goods and services by end-February,
2015.
44The significant growth can be largely explained by the initiative of channelizing international remittances through banks and other money transfer service under Pakistan Remittance Initiative. 45Growth rate turned negative in H1-FY15 from 15 percent in H1-FY14. 46Remittances from Saudi Arabia, UAE, USA and UK grew by 20 percent, 26 percent, 5 percent and 3 percent respectively in H1-FY15. 47The expected decline in remittance may reduce the overall welfare by hitting income levels of individuals. Nevertheless, it may somewhat be offset by
decreased cost of transports and travelling as percent share of transport and travel expenses in total expenditure is increasing overtime (HIES 2012) –
which translates into an increase in their real income. 48Against the budgeted amount of USD 500 million, government has raised USD 1.0 billion through the issuance of 5-year dollar denominated Sukuk bonds
at a profit rate 6.75 percent. There were total offers of USD 2.3 billion.
Figure 7: Capital and financial account (percent of
GDP
2.72%
1.84%1.72%
0.47%
0.16%
-0.20%
0.16%
0.96%
-0.50%
0.00%
0.50%
1.00%
1.50%
2.00%
2.50%
3.00%
H1-F
Y08
H1-F
Y09
H1-F
Y10
H1-F
Y11
H1-F
Y12
H1-F
Y13
H1-F
Y14
H1-F
Y15
Source: State Bank of Pakistan
Current transfers
(mainly remittances)
continue to bring
support to external
current account
Capital and
Financial account
registered a sizeable
surplus
Reserves gradual
buildup has
strengthened the
foreign exchange
market position

Pakistan Development Update 2015
19
Until October 2014, the Pakistani rupee remained under stress and depreciated
sharply, by 4.2 percent, due to political uncertainty, non-completion of the fourth
review under the IMF’s EFF during mid-August 2014, and unsuccessful bid to issue
OGDCL Global Depository Receipts in the international market by the end of
November 2014. However, positive inflows in the foreign exchange market started
emerging in the beginning of November 2014 with the receipt of USD 1.0 billion
from the issuance of Sukuk bond, USD 735 million under CSF and continuation of
the IMF program. In addition, falling international oil price was also instrumental
in reducing earlier pressure on exchange rate.49 Rupee slightly depreciated by 2
percent during H1-FY15 in nominal terms while the Real Effective Exchange Rate
(REER) appreciated by 3.8 percent (Figure 8).
49As oil imports account for approximately one third of total imports, overall import payments could fall significantly. This would help in narrowing the
trade gap and reducing the pressures on exchange rate.
Pakistani Rupee
remained stable
80
85
90
95
100
105
110
115
NEER REER
Source: IMF International Financial Statistics
Figure 8: Movement in Exchange Rate

Pakistan Development Update 2015
20
Financial Sector Developments
Pakistan’s banking sector remains profitable and well-capitalized with some signs of recovery in
private sector credit, while the microfinance sector and equity markets continue to sustain positive
growth momentum
The banking sector remains profitable, capital adequacy is above the minimum
regulatory requirements, and there is sizeable growth in investments and advances,
despite the reduction of SBP’s key policy rate by 200 basis points, which was due
to favorable trends in commodity prices and lower inflation. The structure of the
banks’ investments remained tilted towards risk-free government securities,
supported by increased budgetary borrowing from scheduled banks (as discussed
above). The banking sector’s solvency position remained steady and strong. The
accumulation of profits and slow growing Risk Weighted Assets helped maintain
the high Capital Adequacy Ratio, at 17.1 percent in December 2014, compared to
15.1 percent in June 2014. This was well-above the minimum requirement of 10
percent (Table 10). Given adequate provisioning, the net non-performing loans
(NPLs) ratio 50 has declined from 2.9 percent in June 2014 to 2.7 percent in
December 2014. The microfinance sector continued to grow substantially in
calendar year 2014. The sector registered a 10.9 percent increase in active
borrowers, 28.2 percent growth in gross loan portfolio, 42.5 percent increase in
savers and 25 percent in value of savings.
Table 10: Selected Key Indicators of the Banking Sector
Jun 2014 Dec 2014
Profit Before Tax (Billion PKR) 113 247
Credit to Private Sector 4,001 4,242
Return On Assets Before Tax (%) 2.1 2.2
Return On Equity Before Tax (%) 23.5 24.3
Advances to Deposits Ratio (%) 47.7 48.2
Liquid Assets/Total Deposits (%) 60.6 64.5
Capital Adequacy Ratio (%) 15.1 17.1
Gross NPLs to Loans (%) 12.8 12.3
Net NPLs to Loans (%) 2.9 2.7
6 month KIBOR (%) 10.2 9.47
Source: State Bank of Pakistan Quarterly Banking System Compendium,
December 2014
The Karachi Stock Exchange 100 (KSE-100) Index51 registered a growth of 16.9
percent between August 2014 and January 2015 on the back of strong
macroeconomic fundamentals and general investor confidence. However, despite
strong performance overall, the six months between August 2014 and January 2015
were marred by high volatility as a result of drawn out political protests. The KSE-
100 index set a number of positive records in the second half of 2014. It broke the
31,000 and 32,000 ceilings in November and December, respectively. This upward
trend in turnover volumes and the KSE-100 index was primarily driven by foreign
portfolio investment (FPI), resilient corporate profitability, record foreign exchange
50 Defined as net-non performing loans/total loans. 51 The KSE-100 index is a capitalization weighted index in that its level is determined by aggregating the market value of outstanding shares. Market
value in turn is determined by volume of transactions amongst other factors.
Banking sector
remains profitable,
solvent and tilted
towards investing in
government
securities
Equity market has
shown some volatility

Pakistan Development Update 2015
21
reserve levels, increased confidence shown by international agencies, and the
government’s energy sector related initiatives.

Pakistan Development Update 2015
22
Poverty in Pakistan
Poverty in Pakistan has fallen significantly during the decade of 2000’s
As shown in Figure 9, headcount poverty, according to World Bank staff
calculations, fell nationally from 35 percent in 2002 to an estimated 13.6 percent in
2011. This figure is based on the 2001 poverty line, inflated by the CPI, which is
equal to PKR 1,777 per adult equivalent in 2011, or USD 1.59 in Purchasing Power
Parity terms. The 13.6 percent headcount poverty rate generated by applying this
line to the Pakistan Social and Living Standards Measurement (PSLM) data is
similar to the 12.4 percent rate found by the United Nations Development
Programme (UNDP, 2014). Reductions in poverty have been strong in both urban
and rural areas, and the fall in rural poverty from 40 to 16 percentage points between
2002 and 2011 is particularly striking. This decline in poverty is confirmed when
examining the poverty headcount according to the international poverty line of USD
1.25 per capita. According to this metric, poverty in Pakistan declined from 36
percent in 2002 to 11 percent in 2011. 52 Pakistan now has the second lowest
headcount poverty rate in the South Asia region, after Sri Lanka (4 percent).
The sharp decline given by the official statistics has been largely dismissed as
unlikely by a range of poverty experts, academics and policy makers, who have
raised concerns regarding the quality of the household survey data (HIES/PSLM)
and the official consumer price index as a measure of inflation faced by the poor,
especially in rural areas. This longstanding controversy over poverty measurement
has prevented the Planning Commission from publishing recent estimates.
A large mass of the population is clustered around the official poverty line, so that
small improvements in household real consumption can translate into substantial
movement in poverty in either direction. This makes the precise number in any year
less informative than looking at the overall trend over time. Figure 10 shows the
52Although the international line of USD 1.25 per day is lower than the national line, it based on per capita rather than per adult-equivalent
consumption, and therefore generates a similar estimated headcount rate.
According to official
statistics, Pakistan
has made substantial
progress in reducing
poverty
…large numbers of
households remain
close to the poverty
line
Figure 9: Official Statistics show great progress in reducing headcount
poverty
30.4% 34.7%
24.1%21.9%
17.2%13.6%
0%
5%
10%
15%
20%
25%
30%
35%
40%
45%
19
99
20
00
20
01
20
02
20
03
20
04
20
05
20
06
20
07
20
08
20
09
20
10
20
11
Per
cen
t of
pop
ula
tion
Poverty Headcount Rate
Urban Rural Total
Notes: Based on national poverty line of $1.59 in PPP terms. Year indicates final year
of data collection. Rates differ slightly from official numbers due to differences in data
cleaning procedures. Source: World Bank staff calculations based on Pakistan Socialand Living Standards Measurement surveys.
According to official
statistics, Pakistan
has made substantial
progress in reducing
poverty

Pakistan Development Update 2015
23
full distribution of household adult-equivalent consumption, which is the indicator
used to measure poverty. In 2002, the consumption of nearly 21 percent of the
population was PKR 400 below the poverty line (in 2010 prices), which is almost
exactly the poverty reduction observed in 2002-2011. By 2011, the highest
concentration of people are right above the poverty line and small income
reductions can bring them back into poverty. For example, a reduction of PKR 325
per month would lead the poverty rate to double from 13.6 percent to 27.2 percent.
Since 1998-1999, poverty has been estimated using a simple food energy intake
approach with a caloric threshold of 2,350. The initial estimates used the 1998-99
Household Integrated Economic Survey data. This was slightly modified using data
from 2001-2002, when the Planning Commission re-estimated the poverty line and
simplified the adult-equivalence scale.53 Since then, the official poverty line has
been updated using the 2002 official poverty line and inflation rates from the CPI.
For each round, only the national poverty line is updated and spatial price
adjustments are carried out using food unit values from the HIES/PSLM, following
the recommendation of Deaton and Zaidi (1998). 54
Since price increases in food have considerably outpaced those for non-food items
during the past decade, a key issue with the construction of the CPI is the weight
given to food. The weights applied to food in the CPI do not represent the share of
food consumed by the poor, for two reasons. First, the weight given to food is taken
from a survey of urban households. Second, the CPI is based on the food share of a
typical household rather than a poor household. Since rural and poor households
tend to spend a larger share of their budget on food, the official CPI underestimates
inflation for the poor.
53The household adult-equivalence scale adopted since 2002 gives children aged fifteen and below a weight of 0.7. 54The HIES was incorporated into the PSLM in 2004, with minor changes in the questionnaire.
2002
2011
0%
2%
4%
6%
8%
10%
12%
14%
20
0
400
600
800
1,0
00
1,2
00
1,4
00
1,6
00
1,8
00
2,0
00
2,2
00
2,4
00
2,6
00
2,8
00
3,0
00
3,2
00
3,4
00
3,6
00
3,8
00
4,0
00
Per
cen
tage
of
the
pop
ula
tion
Monthly consumption per adult equivalent in 2010 prices
Poverty Line = Rs.1,777/month ($48 in ppp terms)
Source: World Bank staff calculations based on 2002 and 2011 Pakistan Social and Living Standards
Measurement surveys
Figure 10: A large share of households are clustered near the poverty line
The official poverty
line has not been
updated in many
years
As a result, the
poverty measure is
sensitive to how the
poverty line is
adjusted for inflation

Pakistan Development Update 2015
24
Progress with Structural Reforms
The agenda of key structural reforms is now regaining momentum
Political protests slowed down the pace of structural reforms, especially those in the
privatization program, which requires some degree of political certainty. The
protest also called for expanding reforms to tackle pro-inclusion and pro-
governance policies. In such regards, the status of the main areas of reform is as
follows:
The first and top sector priority of reforming the power sector remains, as lack of
adequate power inhibits business, and subsidies contribute to the massive deficit.
As a part of effective load-management, the government is prioritizing the industrial
consumers for supply of electricity.55 The measures adopted are part of a new
energy policy approved last July 2013. They have committed the government to go
further, including: (i) adoption of a new tariff pricing formula; (ii) an improved
operating efficiency and reduced losses within power distribution companies; and
(iii) incentives for investments, including stronger efforts to develop gas
production. All combined, these reforms will result in a decrease in the budgeted
power subsidies to an estimated 0.5-0.7 percent of GDP in FY15.
A second priority is to raise revenue from below 10 percent of GDP to 14 percent
over five years. Measures adopted in the FY15 budget are projected to raise the tax
ratio by about 0.7 percent of GDP. Their goal is to increase revenue mainly by
broadening the tax base, while strengthening compliance with a solid set of tax
administration reforms and a reinvigorated and performance-based tax
administration. The government also approved a series of contingency tax measures
to fill the gap with respect to its end-of-year target. Key measures expected to be
adopted in next budget FY16 will also be part of the tax reform strategy approved
in February 2014. These include: (i) the second stage of the 3-year program of
elimination of tax exemptions and concession supported by Statutory Regulatory
Orders (SROs); (ii) transfer of legal power to approve concessionary tax
exemptions, based on SROs from FBR to Parliament; (iii) the second stage of the
tariff rationalization plan to move towards a trade regime based on four slabs; (iv)
continuity of the new income and sales tax registration schemes; and (v) upgrading
of the enforcement and auditing coverage targets supported by an upgraded and tax
integrated information technology (IT) system at the FBR.
A third critical reform is the implementation of an ambitious privatization process,
especially dealing with the sale of loss-making SOEs. This remains essential to
improve service delivery, and reduce fiscal losses. A list of 31 loss-making
enterprises has been approved by the Cabinet Committee on Privatization. After the
government completed the capital market transactions scheduled for the first year,
the second year plans include additional equity sales and the startup of the strategic
sales, including several electricity generation and distribution companies.
A fourth critical reform is to enhance the business environment, as part of a
comprehensive ongoing effort at improving Pakistan’s ranking in doing business
indicators. This is needed to foster private investment and attract investors, and
requires federal and provincial measures. Last December, they launched the virtual
55According to Ministry of Water and Power load-shedding for industrial consumers from May 2014 to November 2014 (on dedicated feeders) virtually declined to zero from 8-10 hours load-shedding last year.
New energy policy to
cut-down power
outage
Reformed tax
administration to
increase revenues
Continuation of a
rigorous and
comprehensive
privatization process
Fostering a healthy
business
environment

Pakistan Development Update 2015
25
One Stop Shop (OSS) for business registration and expect to open the first physical
OSS in Lahore. The government also submitted the credit bureau law to Parliament,
launched a National Financial Inclusion Strategy, applied for admission at the
global better than Cash Alliance Initiative and approved a plan to improve Doing
Business Indicators mainly centered on federal indicators: getting electricity,
paying taxes, enforcing contracts, starting businesses, trading across borders, and
getting credit.
Finally, a fifth critical reform is the strengthening of the Benazir Income Support
Programme (BISP) as part of the support of the poor and vulnerable and, through
its conditional cash transfer program, increase enrolment in primary school. As part
of the FY15 budget, the government increased BISP’s allocation to PKR 97.2
billion, which allowed for a raise in individual family allocations to PKR 1,500 per
month, a 25 percent increase, well above inflation. BISP also started activities to
expand Conditional Cash Transfers (CCTs) in 27 districts and approved an increase
in the benefit per child from PKR 200 to PKR 250. BISP has also strengthened its
internal governance by completing its Board appointments and issuing new
regulations to prevent overlap on management affairs between Chairperson,
Secretary, and rest of the administration.
Strengthening of
Benazir Income
Support Program
and its use to
increase primary
school enrolment
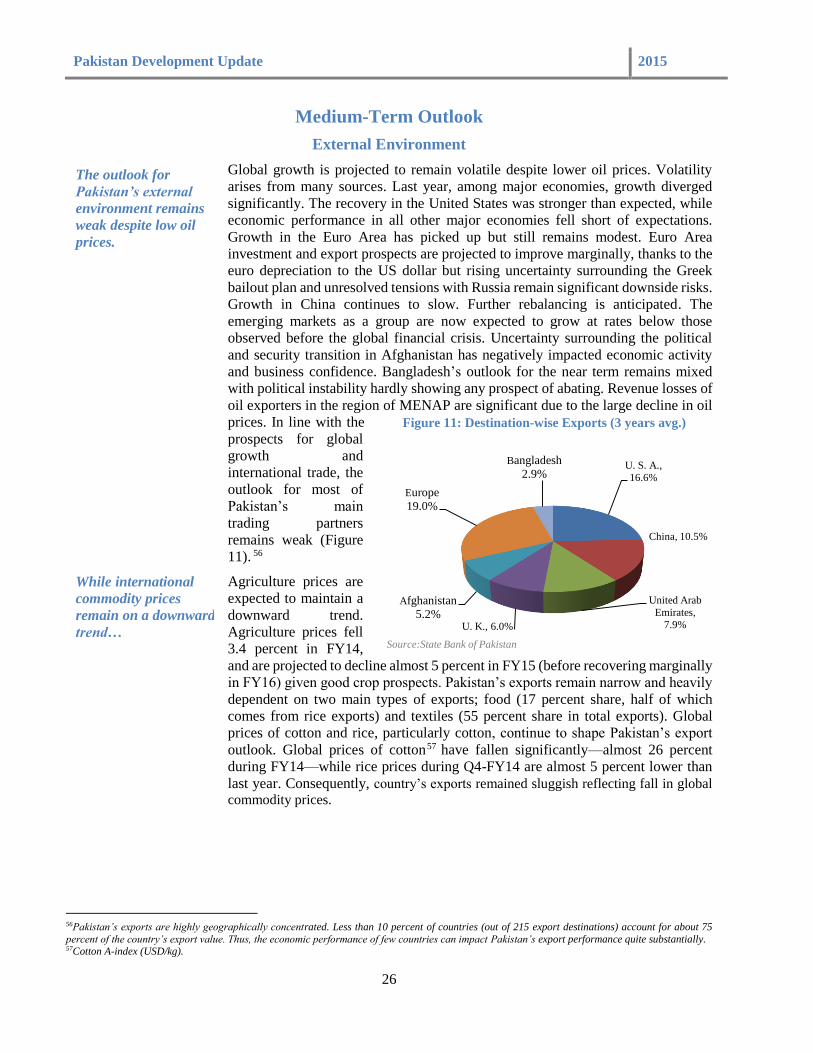
Pakistan Development Update 2015
26
Medium-Term Outlook
External Environment
Global growth is projected to remain volatile despite lower oil prices. Volatility
arises from many sources. Last year, among major economies, growth diverged
significantly. The recovery in the United States was stronger than expected, while
economic performance in all other major economies fell short of expectations.
Growth in the Euro Area has picked up but still remains modest. Euro Area
investment and export prospects are projected to improve marginally, thanks to the
euro depreciation to the US dollar but rising uncertainty surrounding the Greek
bailout plan and unresolved tensions with Russia remain significant downside risks.
Growth in China continues to slow. Further rebalancing is anticipated. The
emerging markets as a group are now expected to grow at rates below those
observed before the global financial crisis. Uncertainty surrounding the political
and security transition in Afghanistan has negatively impacted economic activity
and business confidence. Bangladesh’s outlook for the near term remains mixed
with political instability hardly showing any prospect of abating. Revenue losses of
oil exporters in the region of MENAP are significant due to the large decline in oil
prices. In line with the
prospects for global
growth and
international trade, the
outlook for most of
Pakistan’s main
trading partners
remains weak (Figure
11). 56
Agriculture prices are
expected to maintain a
downward trend.
Agriculture prices fell
3.4 percent in FY14,
and are projected to decline almost 5 percent in FY15 (before recovering marginally
in FY16) given good crop prospects. Pakistan’s exports remain narrow and heavily
dependent on two main types of exports; food (17 percent share, half of which
comes from rice exports) and textiles (55 percent share in total exports). Global
prices of cotton and rice, particularly cotton, continue to shape Pakistan’s export
outlook. Global prices of cotton57 have fallen significantly—almost 26 percent
during FY14—while rice prices during Q4-FY14 are almost 5 percent lower than
last year. Consequently, country’s exports remained sluggish reflecting fall in global
commodity prices.
56Pakistan’s exports are highly geographically concentrated. Less than 10 percent of countries (out of 215 export destinations) account for about 75
percent of the country’s export value. Thus, the economic performance of few countries can impact Pakistan’s export performance quite substantially. 57Cotton A-index (USD/kg).
U. S. A.,
16.6%
China, 10.5%
United Arab
Emirates,
7.9%U. K., 6.0%
Afghanistan
5.2%
Europe
19.0%
Bangladesh
2.9%
Source:State Bank of Pakistan
Figure 11: Destination-wise Exports (3 years avg.)
The outlook for
Pakistan’s external
environment remains
weak despite low oil
prices.
While international
commodity prices
remain on a downward
trend…

Pakistan Development Update 2015
27
However, over the past six months, crude oil prices have fallen sharply, with the
Brent crude benchmark down by 55 percent. And as a net oil importer, Pakistan
benefited from a reduced oil import bill (see Annex I), but this benefit to some
extent, continues to be offset by declines in the export values of agriculture
commodities and lower trade related revenues. Low oil prices nevertheless have
created an opportunity to step up the structural reform particularly on the energy
side. Moreover, there is an opportunity to boost domestic demand through
additional exchange rate flexibility or by reducing domestic interest rates.
Figure 12: Global Commodity Prices-Rice Figure 13: Global Commodity Prices-Cotton
…low oil prices offer
important opportunities
to do structural
reforms
40
50
60
70
80
90
100
110
120
130
Jul-
11
Oct
-11
Jan-1
2
Apr-
12
Jul-
12
Oct
-12
Jan-1
3
Apr-
13
Jul-
13
Oct
-13
Jan-1
4
Apr-
14
Jul-
14
Oct
-14
Jan-1
5
Crude oil, Brent ($/bbl) Crude oil, Dubai ($/bbl)
Source: DECPG, The World Bank
1.0
1.2
1.4
1.6
1.8
2.0
2.2
2.4
2.6
2.8
Jul-
11
Oct
-11
Jan-1
2
Apr-
12
Jul-
12
Oct
-12
Jan-1
3
Apr-
13
Jul-
13
Oct
-13
Jan-1
4
Apr-
14
Jul-
14
Oct
-14
Jan-1
5
Cotton, A Index ($/kg)
Source: DECPG, The World Bank

Pakistan Development Update 2015
28
Macroeconomic Outlook
Preliminary outlook for FY15 remains cautiously optimistic
The medium-term macroeconomic framework FY15-FY18 projects gradual growth
recovery with low inflation, supported by fiscal consolidation and rebuilding of the
economy’s external position (Table 11). This path assumes tackling the key growth
constraints: (i) power load-shedding, (ii) a cumbersome business environment, and
(iii) limited access to finance and stable commodity prices. GDP growth is expected
to be 4.4-4.6 percent in the current fiscal year and recover to 4.8 percent in FY17
and onwards. On the supply side, growth is expected to be driven by the services
and large-scale manufacturing sectors, which will benefit from decreased power
load-shedding, an improved business climate, and improved availability of credit
ensuing from fiscal consolidation. On the demand side, growth will be supported
by strong remittances, with strengthened private investment, and renewed export
dynamism, and to an increase in public investment. Inflation, which has been below
double digits for the last two fiscal years, is expected to settle around 5 percent by
FY16, owing to continued fiscal prudence. Relatively stable or declining
international commodity prices and a stable exchange rate are expected to help
contain imported inflationary pressures.
Table 11: Medium Term Framework
Percent of GDP unless mentioned otherwise FY13 FY14 FY15 FY16 FY17
Real GDP Growth at factor cost 3.7 4.1 4.3-4.6 4.6 4.8
Consumer Prices Inflation (period average) 7.4 8.7 5.0-6.0 5.0 5.0
Current Account Balance -1.1 -1.2 -1.2 -1.2 -1.6
Exports of goods & services 13.6 12.3 11.3 10.8 10.6
Imports of goods & services 20.9 20 18.7 17.9 18.1
Remittances 6.0 6.4 6.3 6.3 6.3
Gross official reserves (in months of imports of
G&S) 1/ 1.5 2.1 3.6 4.2 4.1
Revenues 13.1 14.3 14.6 15.0 15.4
Expenditures 21.4 19.8 19.6 19.5 19.6
of which: Current 16.6 16.2 16.3 16.2 16.1
Overall Fiscal Balance 2/ -8.3 -5.5 -5.0 -4.5 -4.2
Memorandum: 22,489 25,402 28,081 30,566 33,536
Notes:
1/ Excluding gold and foreign currency deposits of commercial banks held with the State Bank of
Pakistan.
2/ Excluding grants
Source: The World Bank staff
Fiscal consolidation is expected to continue in the medium-term because of the
efforts to raise tax revenue, curtail federal government grants and subsidies, and
increase development spending for key public infrastructure and human resource
development. Revenues are projected to increase from 14.3 percent of GDP in FY14
to 15.4 percent in FY17 as a result of a sound tax reform strategy. On the
expenditure side, energy-related budgeted subsidies continue to decline with power
tariff adjustments. This is a result of the oil price windfall, which has provided room
for their adjustment with very little negative impact on the consumers. The overall
fiscal deficit will therefore decline from 5.5 percent of GDP in FY14 to 4.2 percent
of GDP in FY17.
GDP growth is
expected to be
between 4.3-4.6
percent in the
current fiscal year
while inflation is
expected to follow its
single-digit trend….
….and fiscal
consolidation is
expected to continue

Pakistan Development Update 2015
29
Faster growth will require higher imports (including oil) of raw materials. Thus, the
current account deficit is expected to increase to 1.6 percent of GDP in FY17-up
from a modest 1.2 percent of GDP in FY15. Export recovery and the strong
dynamism of remittances will finance the current account deficit in the medium
term—despite some negative spillovers from lower oil prices. Official foreign
exchange reserves are expected to continue rising from USD 9.2 billion at the end
of FY14 and will reach USD 15.4 billion by FY15 (about 3.6 months of import
coverage). This expected reserve build-up will continue in the medium-term based
on the expected strong financial inflows.
Current account
deficit and foreign
exchange reserves
are expected to rise
in the medium term

Pakistan Development Update 2015
30
Annex I: Impact of Lower Oil Prices on Economy58
The recent steep oil price decline is driven by a global oil glut and exacerbated by an economic slowdown in Europe and
Asia. Prices fell by more than 40 percent from about USD 109 per barrel in H1-FY14 to below USD 60 per barrel in
December 2014. Pakistan being a net importer of energy is expected to benefit from this. This decline may have the
following impacts on key indicators of Pakistan economy.
Lower oil prices are positive for BOP. During the last few years, about one-third of Pakistan’s import payments were for
crude oil and petroleum products. During FY14, Pakistan spent USD 14.7 billion on oil related imports. Assuming similar
quantum, a 25-30 percent average decline in prices would reduce the import bill by about USD 3.0-4.0 billion.59 In addition,
prices of key inputs such as fertilizers and chemicals are also declining. This may have a positive effect on exports as well,
provided that external demand for textiles is not affected by slowdowns in Europe and Asia. This bodes well for the trade
balance and will help the central bank build up its foreign exchange reserves. Nevertheless, the downside risk from any
decline in remittances from oil exporting countries remains in the medium run. Improvements in current account balance
and resultant buildup of foreign exchange reserves will help reduce the exchange rate volatility.
Declining oil prices may have neutral to negative impact on fiscal deficit. With a pass through of lower international oil
prices to domestic market, the government is likely to collect lower ad valorem sales taxes.60 This is likely to put a drag
on the government’s effort to meet its tax revenue targets. In addition, government is expected to receive lower royalties
from domestic oil and natural gas producers. Also as discussed in the next section, lower expected inflation may decrease
the overall tax buoyancy. On the positive side, Pakistan is expected to benefit from lower electricity generation costs, as
more than half of electricity is generated from imported fuel oil. This may reduce the amount of the power differential
subsidy (difference of cost of electricity generation and domestic electricity prices) that the government pays to power
producers. But the exact magnitude of these benefits would depend on the government’s decision to adjust domestic
electricity prices downwards or not. If government decides to lower the price of electricity, these benefits may not accrue.
Better supply conditions, reduced external vulnerability and fiscal consolidation contributed to the softening of underlying
inflationary pressures for the last 12 months. Nevertheless, lower oil prices have contributed significantly to this trend in
recent months. The Y-o-Y CPI inflation eased to a record low of 3.9 percent in January 2015 compared to 8.2 percent in
June 2014. Both food and non-food segments contributed to this decline. Food inflation (Y-o-Y) declined from 7.4 percent
in June 2014 to 3.0 percent in January 2015. Similarly, non-food inflation (Y-o-Y) declined from 8.9 percent in June 2014
to 4.5 percent in January 2015. Moreover, core inflation (NFNE–Y-o-Y) decreased from 7.8 percent in October 2014 to
6.4 percent in January 2015. It is expected that falling domestic oil prices will not only contribute directly to lowering of
inflation, but will also dampen inflation through a second round impact. In addition to better harvest, lower transport cost,
and cheaper diesel and fertilizer inputs contributed to lowering of domestic food prices.
Although it is too early to quantify, lower fuel and electricity cost coupled with lower industrial input prices are expected
to have positive impact on domestic economic activity. The impact of lower oil prices is expected to vary from neutral to
positive. Agriculture is expected to benefit from lower diesel and fertilizer prices. However, lower cotton and rice prices
in domestic market may negatively impact the demand of durables from these farmers. Similarly, industrial sector will
benefit from lower fuel cost and decline in prices of key industrial raw materials. The downside risk is the lower external
demand and shrinking domestic consumption which may result from falling remittances from oil producing countries.
58Contributed by Muhammad Waheed. 59Historically, price elasticity of demand for petroleum products (with 60 percent share in petroleum group) is quite inelastic. But there is a chance that government may import more crude oil at lower prices to increase domestic production of electricity. 60There is an automatic adjustment mechanism for domestic fuel prices vis a vis international prices.

Pakistan Development Update 2015
31
Annex II: One Stop Shop for Business Registration-Progress so far61
Pakistan has struggled to keep pace with investment climate reforms being implemented across the world. The country
currently ranks 128th out of 189 economies in the Doing Business (DB) Ease of Doing Business Rankings 2015. Five years
ago, it ranked 75th out of 131 economies. The largest decline in rankings in the past five years has been in the Starting a
Business indicator, down from 63rd in DB2010 (South Asia median
was 72nd) to 116th in DB2015, which is lower than the South Asia
median rank of 104th. It currently takes 10 procedures and 19 days to
register a limited liability company in the country.
In March 2013, the Economic Reform Unit (ERU) of the Ministry of
Finance initiated a dialogue with the World Bank team to request
support for developing a one stop shop (OSS) business registration
platform which would simultaneously register businesses with
multiple government institutions. During the course of diagnostic
assessment exercise and implementation, there has been an
unprecedented level of collaboration reached particularly between the
Securities and Exchange Commission of Pakistan, FBR and the
Employees Old Age Benefits Institution (EOBI), with strong
leadership and commitment from ERU. The three institutions
formalized their partnership through a Memorandum of Understanding
which created a Joint Management Committee and a Technical
Working Group to guide the process.
This positive energy was highlighted during discussions under the IMF program on reform actions as well as in a
Development Policy Credit (DPC) series on Growth and Competitiveness. Once the initial one-stop-shop reform actions
were included in these discussions, this paved the way for identifying technical requirements and preparing the feasibility
of setting up a virtual one-stop-shop.
In December 2014, the government successfully developed and launched the online OSS (http://voss.secp.gov.pk/). In the
initial phase, the virtual/online OSS reduced to two procedures and two days for business registration, and eliminated
transaction costs related to interacting separately with three government institutions on company registration, tax
registration, and employee social security/benefits registration. Further work is underway to (i) create a physical OSS in
Lahore and Karachi, (ii) include one other provincial government institution in the virtual OSS, and (iii) further simplify
procedures and requirements for business registration.
61Contributed by Sarmad Shaikh and Rafay Khan.

Pakistan Development Update 2015
32
Annex III: Paying Taxes in Pakistan-Status and Challenges62
The Doing Business (DB) reports highlight difficulties for a medium-sized firm in Pakistan in paying taxes, as the country’s
international ranking on this indicator has been slipping over time–from 168 (out of 189 economies) in 2013 to 172 in
2014.63 The total tax rate has reduced overtime (from 39.1 percent of profit in 2012 to 32.6 percent in 2014), while the
number of tax payments (47) has remained constant for last nine years. However, the time to prepare, file and pay taxes
has increased from 560 hours during 2006-2013 to 594 hours in 2014—about 6 percent increase, despite the introduction
of mandatory electronic filing & payment facility and tax payer facilitation services. This administrative burden is higher
than other South Asian and the member countries of the Organization for Economic Co-operation and Development
(OECD) countries.
Among different taxes paid by the firms in a year, payment of GST takes most of the time (514 hours), followed by
corporate tax and social security contributions (40 hours each). The firms reported highest compliance time taken at the
preparation stage, as with the new systems more details are required to be provided while filing monthly GST returns. The
filing of income tax returns by companies is also declining.64 This reflects on different internal and external issues related
with existing processes, systems, and
capacity (human resource and IT
infrastructure) of the tax authority and
education and morale of taxpayers.
To improve the situation, the FBR, with the
support from the Indicator-Based Reforms
Advisory (IBRA) team of the World Bank,
has prepared a short-to-medium-term
reform action plan. 65 It is based on
following measures focusing on
modernizing tax administration and
streamlining processes to reduce discretion
and make it simpler, easier and quicker for
both taxpayer and the administrator:
- Measures to directly benefit taxpayers: (i) update and simplify legal texts; (ii) review, simplify and streamline existing
processes and forms (for both income tax and sales tax); (iii) strengthen IT infrastructure by enhancing network
connectivity of IT systems for customs (WeBOC) and income and sales tax (IRIS), and increasing tax portal capacity
(to take additional load on tax filing due dates); (iv) upgrade taxpayer services by improving helpline and facilitation
centers, and updating information/guidance material; and (e) provide training to tax consultants.
- Other measures for tax authority: (i) implement performance-based reporting and monitoring system for a results-
oriented administration; (ii) developing protocols and Standard Operating Procedures to share data with different
departments and at different levels of the organization; (iii) improving tax audit and business intelligence related
interventions; (iv) training of field staff to improve business knowledge and usage of tax/IT systems; and (v) conduct
taxpayer perception and compliance survey to assess improvement.
The above legal, administrative, and capacity building measures are part of current tax strategy of FBR. For its
implementation, the Bank is providing support through a Department for International Development (DFID) Task Force,
to facilitate tax compliance and increase tax revenue. During the ongoing first year of the program, the team will conduct
mapping of taxpayer register and tax collection processes (both income and sales tax), including electronic systems review,
to identify specific bottlenecks and make recommendations. Streamlining core processes is part of the functional review
of FBR, which is also planned to be conducted in FY15.
62Contributed by Irum Touqeer 63As reported in Doing Business reports 2014 and 2015. 64Per available data from Federal Board of Revenue, about 50 percent of registered companies filed taxes in FY11 which has reduced to 48 percent in
FY13. The total tax filing data for FY14 is not available as it is currently being compiled. 65The Board of Investment is tasked to lead the preparation of a consolidated action plan (with inputs from relevant agencies) for different DB indicators, including paying taxes, starting a business, dealing with construction permits, getting credit, trading across borders, and enforcing
contracts.
Table 12: Pakistan’s performance on paying taxes indicator 2014
Indicator Pakistan South
Asia OECD
Overall Karachi Lahore
Payments (number per
year) 47.0 47.0 47.0 31.4 11.8
Time (hours per year) 594.0 594.0 594.0 325.3 175.4
Profit tax (%) 18.7 18.7 18.6 17.9 16.4
Labor tax and
contributions (%) 12.8 12.7 13.0 8.7 23.0
Other taxes (%) 1.1 1.1 1.1 13.1 1.9
Total tax rate (% profit) 32.6 32.5 32.8 39.7 41.3
Source: Doing Business database 2015

Pakistan Development Update 2015
33
Annex IV: Pakistan International Sukuks: Foot-printing the Shariah-compliant
Capital Markets after almost a Decade66
Pakistan has made two successful ventures in the international capital markets in 2014, refreshing its footprint after almost a decade. This is
occurring at a time when international markets have an increased appetite for highly lucrative sovereign papers issued by developing economies
and when interest rates are at historical lows, in anticipation of a global economic slowdown, First, on April 9th, the country raised USD
denominated dual tranche Eurobond aggregating USD 2.0 billion, USD 1.0 billion each in 5 and 10 years tenors-5 year bonds at a fixed rate of
7.25 percent (5-year US Treasury rate+558 basis points) and 10 year bonds at a fixed rate of 8.25 percent (10-yr UST+556 bps). This transaction
represents the largest ever international bond offering by Pakistan. Second, on November 26th, Pakistan issued international Sukuk67 under Reg-
S/144A format by accepting bids of USD 1.0 billion at a profit rate of 6.75 percent (5-yr UST+517 bps), priced lower than the (1) 5-year
Eurobond issue in April 2014 by 50 bps and (2) initial guidelines of 6.9 percent. The international Sukuk is backed by the Islamabad-Lahore
Motorway (M2).
Both the issues were highly oversubscribed and thus allowed the government to issue more than the initially targeted placement of USD 500
million for both of these. Moreover, geographic distribution of investors was encouraging, with 47 percent subscriptions coming from the United
States, 32 percent from Europe, and 20 percent from Middle East and Asia, on aggregate. The substantial dollar proceeds helped shore up the
country’s foreign exchange reserves while the rupee counterpart was utilized in retiring the expensive domestic debt.
However, when compared to regional peers,
these issues appear costly. For instance, Sri
Lanka issued a 5-year Eurobond a day before
Pakistan at a yield of 5.125 percent. Similarly,
Ethiopia raised a 10-year USD 1.0 billion debut
international bond on December 4 priced to
yield 6.625 percent. Despite declining country
risk spreads since the smooth transition to the
new democratic set-up (Figure 14), Pakistan
was highly priced primarily on account of
perceived risks that still mar the country.
Furthermore, this mega issuance by Pakistan
needs to be looked at in the perspective of its
amortization schedule which entails an in-built
bullet repayment feature. Given Pakistan’s
history of volatile external imbalances,
managing these outflows in the future may turn
out to be challenging.
It may be worthwhile for Pakistan then to turn
to unwinding the hidden potential of local
markets. A promising-still untapped–segment
of the domestic capital market is the Islamic banking industry. Nonetheless, government started issuing 3-year Ijarah Sukuks in September 2008
and this initiative was very well received by the Islamic market,68 as no Shariah-compliant avenue was available for them to place their idle cash
with. Moreover, the Islamic financial market was able to prudently manage its Statutory Liquidity Requirements (SLRs) stipulated by the SBP.69
This tapping continued for a period of three years against M-3 Motorway till June 2014. Islamic banks have, yet again, become investment
hungry,70 and are maintaining high levels of deposits on their balance sheets.71 On top of re-invigorating the 3-year Islamic bonds, there are also
proposals to introduce short-term Shariah-compliant securities on the lines of Treasury bills in order to create a parallel investment option for
the Islamic segment to manage their asset-liability composition. But securing a (real) underlying asset for the Shariah-compliant papers appears
to be the major challenge to keep the ball rolling or to launch new innovations under this concept.
66Contributed by Mehwish Ashraf 67Sukuk is the Arabic name for financial certificates, but commonly refers to the Islamic equivalent of bonds. Since fixed income, interest bearing bonds
are not permissible in Islam, Sukuk securities are structured to comply with the Islamic law and its investment principles, which prohibits the charging, or paying of interest. This is generally done by involving a tangible asset in the investment, such as by giving partial ownership of a property built by
the investment company to the bond owner. The bond owner is then able to collect his profit as a rent, which is allowed under Islamic law. (Source:
Wikipedia) 68As of end-June 2014, the market had offered on aggregate PKR 858 billion against a cumulative target of about PKR 498 billion since the first
issuance in September 2008 69The SLR for Islamic Banks/Islamic Banking Branches with effect from June 03, 2011, is (1) 19 percent (excluding Cash Reserve Requirement) of Total Demand Liabilities (including Time deposits with tenors of less than 1 year); and (2) Time Liabilities (including Time deposits with tenor of 1
year and above) will not require any SLR. 70The Financing to Deposits ratio (Liquidity indicator of Islamic banking) went down from 54.3 percent in CY09 to 38.2 percent in CY14, exhibiting a build-up of liquidity in the Islamic banking institutions in recent years. 71As of December 2014, the Islamic banks underwent a huge growth of 23 percent in their deposit base (Y-o-Y).
200
400
600
800
1,000
1,200
1,400
Jul-
11
Aug
-11
Sep
-11
Oct
-11
Nov
-11
Dec
-11
Jan-1
2F
eb-1
2M
ar-1
2A
pr-
12
May
-12
Jun
-12
Jul-
12
Aug
-12
Sep
-12
Oct
-12
Nov
-12
Dec
-12
Jan-1
3F
eb-1
3M
ar-1
3A
pr-
13
May
-13
Jun
-13
Jul-
13
Aug
-13
Sep
-13
Oct
-13
Nov
-13
Dec
-13
Jan-1
4F
eb-1
4M
ar-1
4A
pr-
14
May
-14
Jun
-14
Jul-
14
Aug
-14
Sep
-14
Oct
-14
Nov
-14
Dec
-14
Sover
eign
bon
d i
nte
rest
rat
e sp
read
s
(bp
s over
US
T-b
ills
)
Pakistan Pakistan 8.25% due 2024
Pakistan 7.25% due 2019 Pakistan 6.75% due 2019
Source: Global Economic Monitor
General Elections 2013
Figure 14: Falling recent country risk spreads and Eurobonds/Sukuks
Pricing
Figure 13: Falling recent country risk spreads and Eurobonds/Sukuks Pricing

Pakistan Development Update 2015
34
Going forward, there is an immediate need to streamline as well as expand the horizon of domestic Islamic bond issuance–most probably linked
to infrastructure financing that intrinsically takes care of the ‘tangible asset’ feature–so as to facilitate the Islamic banking sector. This will also
help diversify the financing mix and funding base for the Government of Pakistan.
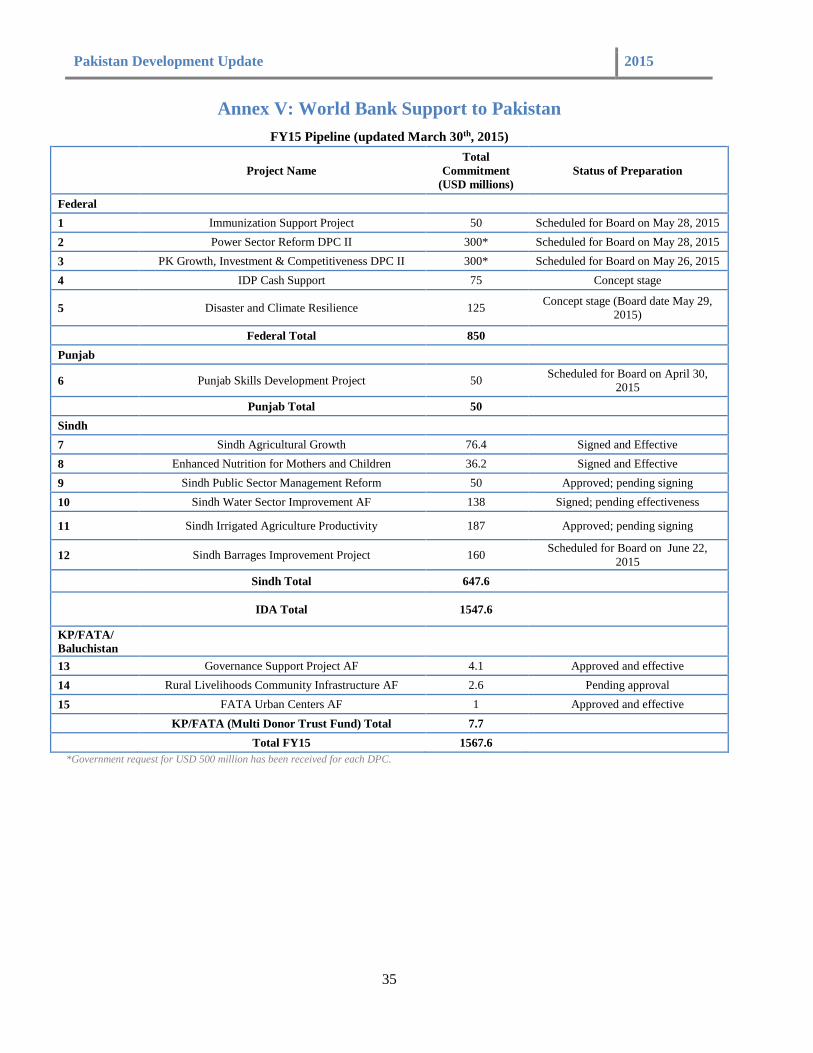
Pakistan Development Update 2015
35
Annex V: World Bank Support to Pakistan
FY15 Pipeline (updated March 30th, 2015)
Project Name
Total
Commitment
(USD millions)
Status of Preparation
Federal
1 Immunization Support Project 50 Scheduled for Board on May 28, 2015
2 Power Sector Reform DPC II 300* Scheduled for Board on May 28, 2015
3 PK Growth, Investment & Competitiveness DPC II 300* Scheduled for Board on May 26, 2015
4 IDP Cash Support 75 Concept stage
5 Disaster and Climate Resilience 125 Concept stage (Board date May 29,
2015)
Federal Total 850
Punjab
6 Punjab Skills Development Project 50 Scheduled for Board on April 30,
2015
Punjab Total 50
Sindh
7 Sindh Agricultural Growth 76.4 Signed and Effective
8 Enhanced Nutrition for Mothers and Children 36.2 Signed and Effective
9 Sindh Public Sector Management Reform 50 Approved; pending signing
10 Sindh Water Sector Improvement AF 138 Signed; pending effectiveness
11 Sindh Irrigated Agriculture Productivity 187 Approved; pending signing
12 Sindh Barrages Improvement Project 160 Scheduled for Board on June 22,
2015
Sindh Total 647.6
IDA Total 1547.6
KP/FATA/
Baluchistan
13 Governance Support Project AF 4.1 Approved and effective
14 Rural Livelihoods Community Infrastructure AF 2.6 Pending approval
15 FATA Urban Centers AF 1 Approved and effective
KP/FATA (Multi Donor Trust Fund) Total 7.7
Total FY15 1567.6
*Government request for USD 500 million has been received for each DPC.
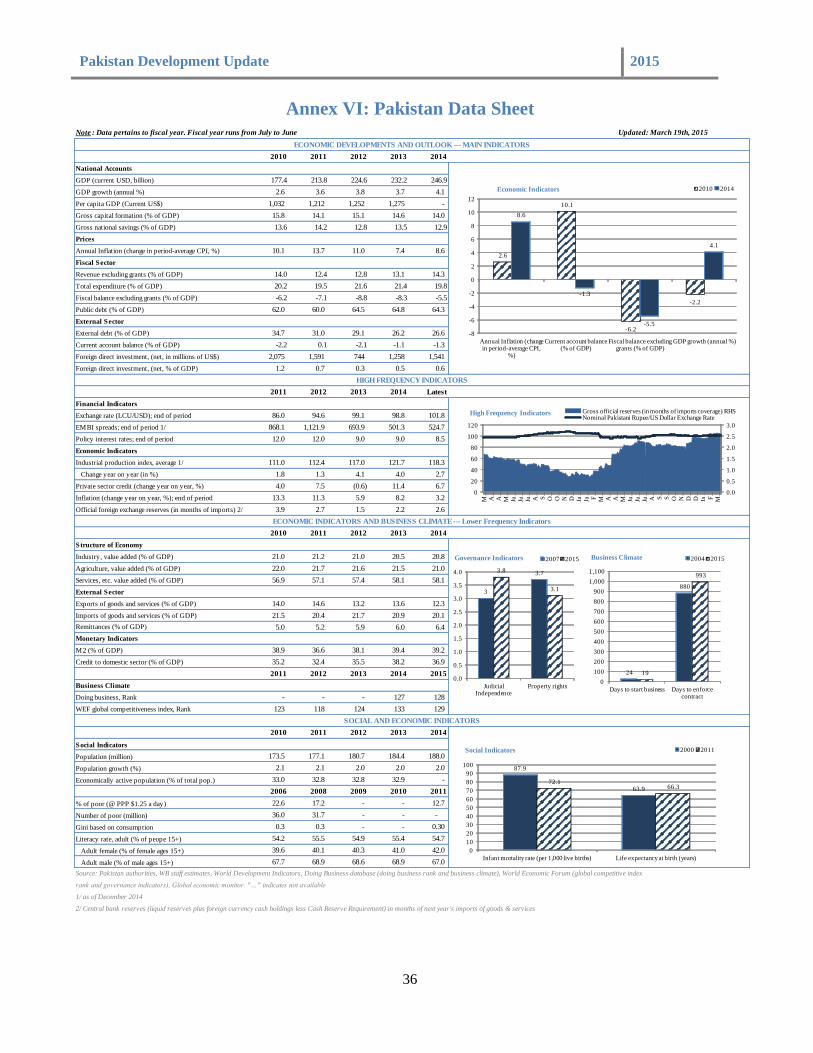
Pakistan Development Update 2015
36
Annex VI: Pakistan Data Sheet
2010 2011 2012 2013 2014
National Accounts
GDP (current USD, billion) 177.4 213.8 224.6 232.2 246.9
GDP growth (annual %) 2.6 3.6 3.8 3.7 4.1
Per capita GDP (Current US$) 1,032 1,212 1,252 1,275 -
Gross capital formation (% of GDP) 15.8 14.1 15.1 14.6 14.0
Gross national savings (% of GDP) 13.6 14.2 12.8 13.5 12.9
Prices
Annual Inflation (change in period-average CPI, %) 10.1 13.7 11.0 7.4 8.6
Fiscal Sector
Revenue excluding grants (% of GDP) 14.0 12.4 12.8 13.1 14.3
Total expenditure (% of GDP) 20.2 19.5 21.6 21.4 19.8
Fiscal balance excluding grants (% of GDP) -6.2 -7.1 -8.8 -8.3 -5.5
Public debt (% of GDP) 62.0 60.0 64.5 64.8 64.3
External Sector
External debt (% of GDP) 34.7 31.0 29.1 26.2 26.6
Current account balance (% of GDP) -2.2 0.1 -2.1 -1.1 -1.3
Foreign direct investment, (net, in millions of US$) 2,075 1,591 744 1,258 1,541
Foreign direct investment, (net, % of GDP) 1.2 0.7 0.3 0.5 0.6
2011 2012 2013 2014 Latest
Financial Indicators
Exchange rate (LCU/USD); end of period 86.0 94.6 99.1 98.8 101.8
EMBI spreads; end of period 1/ 868.1 1,121.9 693.9 501.3 524.7
Policy interest rates; end of period 12.0 12.0 9.0 9.0 8.5
Economic Indicators
Industrial production index, average 1/ 111.0 112.4 117.0 121.7 118.3
Change year on year (in %) 1.8 1.3 4.1 4.0 2.7
Private sector credit (change year on year, %) 4.0 7.5 (0.6) 11.4 6.7
Inflation (change year on year, %); end of period 13.3 11.3 5.9 8.2 3.2
Official foreign exchange reserves (in months of imports) 2/ 3.9 2.7 1.5 2.2 2.6
2010 2011 2012 2013 2014
Structure of Economy
Industry, value added (% of GDP) 21.0 21.2 21.0 20.5 20.8
Agriculture, value added (% of GDP) 22.0 21.7 21.6 21.5 21.0
Services, etc. value added (% of GDP) 56.9 57.1 57.4 58.1 58.1
External Sector
Exports of goods and services (% of GDP) 14.0 14.6 13.2 13.6 12.3
Imports of goods and services (% of GDP) 21.5 20.4 21.7 20.9 20.1
Remittances (% of GDP) 5.0 5.2 5.9 6.0 6.4
Monetary Indicators
M2 (% of GDP) 38.9 36.6 38.1 39.4 39.2
Credit to domestic sector (% of GDP) 35.2 32.4 35.5 38.2 36.9
2011 2012 2013 2014 2015
Business Climate
Doing business, Rank - - - 127 128
WEF global competitiveness index, Rank 123 118 124 133 129
2010 2011 2012 2013 2014
Social Indicators
Population (million) 173.5 177.1 180.7 184.4 188.0
Population growth (%) 2.1 2.1 2.0 2.0 2.0
Economically active population (% of total pop.) 33.0 32.8 32.8 32.9 -
2006 2008 2009 2010 2011
% of poor (@ PPP $1.25 a day) 22.6 17.2 - - 12.7
Number of poor (million) 36.0 31.7 - - -
Gini based on consumption 0.3 0.3 - - 0.30
Literacy rate, adult (% of peope 15+) 54.2 55.5 54.9 55.4 54.7
Adult female (% of female ages 15+) 39.6 40.1 40.3 41.0 42.0
Adult male (% of male ages 15+) 67.7 68.9 68.6 68.9 67.0
2/ Central bank reserves (liquid reserves plus foreign currency cash holdings less Cash Reserve Requirement) in months of next year's imports of goods & services
rank and governance indicators), Global economic monitor. "…" indicates not available
SOCIAL AND ECONOMIC INDICATORS
Source: Pakistan authorities, WB staff estimates, World Development Indicators, Doing Business database (doing business rank and business climate), World Economic Forum (global competitive index
1/ as of December 2014
Note : Data pertains to fiscal year. Fiscal year runs from July to June Updated: March 19th, 2015
ECONOMIC DEVELOPMENTS AND OUTLOOK --- MAIN INDICATORS
HIGH FREQUENCY INDICATORS
ECONOMIC INDICATORS AND BUSINESS CLIMATE --- Lower Frequency Indicators
2.6
10.1
-6.2
-2.2
8.6
-1.3
-5.5
4.1
-8
-6
-4
-2
0
2
4
6
8
10
12
Annual Inflation (change in period-average CPI,
%)
Current account balance (% of GDP)
Fiscal balance excluding grants (% of GDP)
GDP growth (annual %)
2010 2014Economic Indicators
87.9
63.972.1
66.3
0
10
20
30
40
50
60
70
80
90
100
Infant mortality rate (per 1,000 live births) Life expectancy at birth (years)
2000 2011Social Indicators
24
880
19
993
0
100
200
300
400
500
600
700
800
900
1,000
1,100
Days to start business Days to enforce contract
2004 2015Business Climate
3
3.73.8
3.1
0.0
0.5
1.0
1.5
2.0
2.5
3.0
3.5
4.0
Judicial Independence
Property rights
2007 2015Governance Indicators
0.0
0.5
1.0
1.5
2.0
2.5
3.0
0
20
40
60
80
100
120
M…
A…
A…
M…
Ju…
Ju…
Ju…
A…
S…
O…
O…
N…
D…
Ja…
Ja…
F…
M…
A…
A…
M…
Ju…
Ju…
Ju…
A…
S…
S…
O…
N…
D…
D…
Ja…
F…
M…
Gross official reserves (in months of imports coverage) RHSNominal Pakistani Rupee/US Dollar Exchange Rate
High Frequency Indicators
Related Documents