Welcome message from author
This document is posted to help you gain knowledge. Please leave a comment to let me know what you think about it! Share it to your friends and learn new things together.
Transcript


PAKISTAN DEVELOPMENT UPDATE N a vig a ti ng i n Uncerta in T im es
April 2021

Preface
The World Bank Pakistan Development Update (PDU) provides an update on the Pakistani economy, its economic outlook, together with the development challenges it faces and the structural reforms that should be considered. The report begins with a chapter on recent economic developments, with sections on the real sector and economic growth, monetary and financial sector developments, the external sector, and fiscal policy and public debt. The second chapter provides the medium-term macroeconomic outlook, describes risks and challenges, and structural reform needs. This is followed by the focus topic section on the impact of the COVID-19 Crisis on the Private Sector. This edition of the Pakistan Development Update (PDU) was prepared by the Macroeconomics, Trade and Investment Global Practice under the guidance of Najy Benhassine (Country Director, SACPK), Zoubida Allaoua (Regional Director, ESADR), Manuela Francisco (Practice Manager, ESAMU) and Shabih Ali Mohib (Lead Country Economist, ESADR). The core PDU team was led by Derek H. C. Chen (Task Team Leader, Senior Economist, ESAMU) and Adnan Ashraf Ghumman (Co-Task Team Leader, Economist, ESAMU), and includes Zehra Aslam (Economist, ESAMU), Nyda Hanid Mukhtar (Economist, ESAMU), Rafay Khan (Economist, ESAF1), Aroub Farooq (Research Analyst, ESAMU), Arsianti (Consultant, ESAMU), and Abid Hussain Chaudhry (Program Assistant, SACPK). Section 1 of the report was contributed by Derek Chen, Adnan Ashraf Ghumman and Zehra Aslam. Section 2 was contributed by Adnan Ashraf Ghumman (Real Sector-Growth), Aroub Farooq (Real Sector-Inflation), Silvia Redaelli (Real Sector-Poverty), Zehra Aslam and Sarmad Shaik (Monetary and Financial Sector), Zehra Aslam (External Sector), Nyda Mukhtar, Adnan Ashraf Ghumman and Zehra Aslam (Fiscal Policy and Debt Sustainability). Section 3 was contributed by Derek Chen and Zehra Aslam (Medium-term Outlook), Adnan Ashraf Ghumman (Risks and Priorities), and Gonzalo Varela and Alen Mulabdic (Box 3.1). Rafay Khan contributed Section 4. The report benefitted from comments provided by Aurelien Kruse (Lead Country Economist, EAWDR) and Mustapha Kamel Nabli (Consultant, ESADR). The report was edited by Janani Kandhadai. The findings, interpretations, and conclusions expressed in this report do not necessarily reflect the views of the Executive Directors of the World Bank or the governments they represent. The World Bank does not guarantee the accuracy of the data included in this work. The data cut-off date for this report was March 22, 2021. The boundaries, colors, denominations, and other information shown on any map in this work do not imply any judgment on the part of the World Bank concerning the legal status of any territory or the endorsement or acceptance of such boundaries. The photograph for the front cover and section 3 is by AMSyed/shutterstock.com, for section 2 by NovikovAlexey/shutterstock.com and section 3 by SAKhan/shutterstock.com. All rights reserved. To receive the PDU and related publications by email, please email [email protected]. For questions and comments, please email [email protected] and [email protected]
Table of Contents
PREFACE ............................................................................................................................. V
LIST OF FIGURES, TABLES AND BOXES .................................................................... VII
LISTS OF ABBREVIATIONS AND ACRONYMS .............................................................IX
1. EXECUTIVE SUMMARY.................................................................................................. 1
2. RECENT ECONOMIC DEVELOPMENTS .................................................................... 3
a. Context ............................................................................................................................ 3 b. Real Sector ....................................................................................................................... 4 c. Monetary and financial sector........................................................................................... 12 d. External sector ............................................................................................................... 17 e. Fiscal and Debt Sustainability .......................................................................................... 23
3. OUTLOOK AND MEDIUM-TERM PROSPECTS ........................................................ 29
a. Medium-Term Outlook ................................................................................................... 29 b. Risks and Priorities ......................................................................................................... 31
4. IMPACT OF THE COVID-19 CRISIS ON THE PRIVATE SECTOR IN PAKISTAN.................................................................................................................... 34
a. Introduction ................................................................................................................... 34 b. Operational Impact and Recovery .................................................................................... 35 c. Expectations and Economic Activity ................................................................................ 37 d. Impact on Sales .............................................................................................................. 38 e. Resilience of Firms.......................................................................................................... 39 f. Digitization ..................................................................................................................... 39 g. Government Policies and Support Measures...................................................................... 41 h. Policy Responses to Support Private Sector Recovery ......................................................... 42
REFERENCES .................................................................................................................. 44
ANNEXES .......................................................................................................................... 46
List of Figures, Tables and Boxes
FIGURES
Figure 2.1: Community Mobility Trends ................................................................................. 6 Figure 2.2: Commercial Bank Loans to Private Businesses for Fixed Investment (H1 Flow) ........ 6 Figure 2.3: Large Scale Manufacturing Index .......................................................................... 7 Figure 2.4: Pakistan Business Confidence Survey (BCS)........................................................... 7 Figure 2.5: Headline inflation y-o-y ........................................................................................ 8 Figure 2.6: Inflation by group y-o-y ........................................................................................ 8 Figure 2.7: Inflation in urban areas y-o-y................................................................................. 9 Figure 2.8: Inflation in rural areas y-o-y .................................................................................. 9 Figure 2.9: Share of employed workforce affected by COVID-19, by sector............................... 10 Figure 2.10: Pre- and post-COVID-19 poverty rate in FY20, by area of residence........................11 Figure 2.11: Nominal and Real Policy Rate............................................................................ 12 Figure 2.12: Share of financing sources in government domestic debt...................................... 15 Figure 2.13: Growth in credit to private sector and gross NPLs ............................................... 15 Figure 2.14: Stock Market Performance................................................................................. 16 Figure 2.15: PKR Sovereign Debt Yield Curve ....................................................................... 16 Figure 2.16: H1 Current Account Balances (Jul–Dec) ............................................................. 17 Figure 2.17: Exports of goods and services (Jul–Dec) ............................................................. 17 Figure 2.18: Imports of goods and services (Jul–Dec) ............................................................. 17 Figure 2.19: Sectoral trends in Exports (Goods) ..................................................................... 19 Figure 2.20: Sectoral trends in Imports (Goods) .................................................................... 19 Figure 2.21: Sectoral changes in Exports (Services) ................................................................ 20 Figure 2.22: Sectoral changes in Imports (Services)................................................................ 20 Figure 2.23: Remittance inflows by country (Jul–Dec)............................................................ 21 Figure 2.24: Financial Account (Jul–Dec).............................................................................. 21 Figure 2.25: Net Incurrence of Liabilities (Jul–Dec)............................................................... 22 Figure 2.26: Foreign Exchange Reserves and PKR/US$ Exchange Rate ................................. 22 Figure 2.27: Contributions to H1 Revenue Growth ................................................................. 24 Figure 2.28: Contributions to H1 Expenditure Growth ........................................................... 24 Figure 2.29: H1 Budgetary Finance: External and Internal Inflows (PKR billions) .................... 26 Figure 2.30: Public and Publicly Guaranteed Debt ................................................................. 28 Figure 3.1: Index of Missing Exports, Pakistan (red) and other countries ................................ 32 Figure 3.2: Export potential & Eligibility for Drawback of Local Taxes and Levies (DLTL) and
Duty Drawback of Taxes Premium for Non-Traditional Destinations................................. 33 Figure 4.1: Operational Status – Waves 1 and 2 ...................................................................... 36 Figure 4.2: Operational Status by Firm Age – Wave 2 ............................................................. 36 Figure 4.3: Operational Status by Firm Size – Wave 2............................................................. 36 Figure 4.4: Sales Expectations Over Coming 6 Months – Waves 1 and 2................................... 37 Figure 4.5: Percent of Firms Reporting Change in Sales Compared to Same Period in 2020 – Wave
2 ................................................................................................................................... 38 Figure 4.6: Percent of Firms Reporting Change in Sales – By Sector – Wave 2 (percent)............ 38 Figure 4.7: Percent of Firms Reporting Change in Sales – By Exporting Status – Wave 2 .......... 38 Figure 4.8: Use of Digital Platforms by Exporting Status (Wave 2) .......................................... 40 Figure 4.9: Use of Digital Platforms by Firm Size (Wave 2)..................................................... 40 Figure 4.10: Constraints to Adopting Digital Technologies (Wave 2) ....................................... 40 Figure 4.11: Most needed policies to support firms during the COVID-19 crisis – Wave 2 .......... 42
TABLES
Table 1: Projections of Key Economic Indicators..................................................................... 2 Table 2.1: Fiscal Stimulus Package Support the Economy amid the COVID Crisis ..................... 5 Table 2.2: Monetary Measures to Support the Economy amid the COVID Crisis........................ 6 Table 2.3: Percentage point contribution to headline inflation by main product groups............... 9
Table 2.4: Monetary Aggregates ........................................................................................... 12 Table 2.5: Credit to Private Sector—Flow.............................................................................. 14 Table 2.6: Selected Key Indicators of the Banking Sector ....................................................... 15 Table 2.7: Selected Key Indicators in SME Finance and Microfinance..................................... 16 Table 2.8: Balance of payments summary1 ............................................................................ 17 Table 2.9: Summary of Pakistan Fiscal Operations ................................................................ 23 Table 2.10: Revenue Collection ............................................................................................ 24 Table 2.11: Analysis of consolidated spending ....................................................................... 26 Table 2.12: Half-year Provincial Finances ............................................................................. 27 Table 3.1: Pakistan Macroeconomic Outlook (FY21-23) (Annual percent change unless indicated
otherwise) ..................................................................................................................... 29
BOXES
Box 2.1: Pandemic Fiscal and Monetary Mitigation Measures in FY20 ...................................... 5 Box 2.2: Methodological approach in simulating the poverty impact of COVID-19 ....................11 Box 3.1:.............................................................................................................................. 32 Box 4.1: Sample Selection and Stratification .......................................................................... 35 Box 4.2: Moving from Relief to Recovery and Resilience ........................................................ 42
Lists of Abbreviations and Acronyms
ADB Asian Development Bank BCS Business Confidence Survey BPM6 Balance of Payments Manual 6 BPS Business Pulse Survey CAD Current Account Deficit CPEC China Pakistan Economic Corridor CRR Cash Reserve Requirement DDT Duty Drawback of Taxes DHS Demographic and Health Survey DLTL Drawback of Local Taxes and
Levies DSSI Debt Service Suspension Initiative EF External Finance EFF Extended Fund Facility EMDEs Emerging Market and Developing
Economies ETF Exchange-Traded Funds FATF Financial Action Task Force FDI Foreign Direct Investment FRDLA Fiscal Responsibility and Debt
Limitation Act FY Fiscal Year GDP Gross Domestic Product GIDC Gas Infrastructure Development
Cess GST General Sales Tax GTAP Global Trade Analysis Project HIES Household Income and
Expenditure Survey HIICS Household Integrated Income and
Consumption Survey IMF International Monetary Fund IT Information Technology JOCEX Jobs Content of Exports KIBOR Karachi Interbank Offer Rate KSA Kingdom of Saudi Arabia LSM Large Scale Manufacturing LTFF Long-Term Financing Facility MMT Million Metric Tons MSME Micro, Small & Medium Enterprise NAPHDA Naya Pakistan Housing Scheme
Authority NDA Net Domestic Assets NFA Net Foreign Assets
NFNE Non-Food Non-Energy NPL Non-Performing Loans NRDO National Regulatory Delivery
Office PBS Pakistan Bureau of Statistics PDU Pakistan Development Update PFM Public Financial Management PHPL Power Holding Power Limited PKR Pakistani Rupee POL Pakistan Oilfields Limited PPGD Pakistan’s Public and Publicly
Guaranteed Debt PSDP Public Sector Development
Program PSE Public Sector Enterprise PSLM Pakistan Social and Living
Standards Measurement REER Real Effective Exchange Rate RFCC Refinance Facility for Combating
COVID-19 SBP State Bank of Pakistan SCRR Special Cash Reserve Requirement SECP Security and Exchange Commission
of Pakistan SOEs State Owned-Enterprises SME Small and Medium Enterprise SRO Statutory Regulatory Order SMEDA Small and Medium Enterprises
Development Authority STG Sales Tax on Goods STS Sales Tax on Services TERF Temporary Economic Refinance
Facility UAE United Arab Emirates UK United Kingdom UN United Nations UNESCO The United Nations Educational,
Scientific and Cultural Organization US$ United States Dollar WBG World Bank Group WHO World Health Organization y-o-y Year-on-Year
N a v i g a t i n g i n U n c e r t a i n T i m e s P a k i s t a n D e v e l o p m e n t U p d a t e
A p r i l 2 0 2 1 T h e W o r l d B a n k
1
1. Executive Summary Pakistan has been showing signs of a fragile economic recovery
Over July to December 2020 (H1 FY21), Pakistan has been showing signs of a fragile economic recovery, with the lifting of lockdown measures and a resumption of economic activity. Private consumption is estimated to have picked up, in part due to the record increase in remittances inflows, social assistance support from the Ehsaas program,1 and a return to pre-COVID community mobility levels from September 2020. Investment is also estimated to have recovered marginally, as machinery imports and cement sales both recorded double-digit growth rates during this period.
Leading indicators on the production side are also signaling a nascent recovery
On the production side, crop production was relatively weak in H1 FY21, as cotton production was adversely affected by heavy monsoon floods. Following the phased lifting of lockdown measures from May 2020 onwards, indicators of industrial and services activity have recovered, with Large-scale Manufacturing (LSM) and business confidence indexes exceeding pre-COVID levels in December 2020.
Monetary policy has remained accommodative in H1 FY21
Although headline inflation fell over H1 FY21 (y-o-y), it remained elevated at an average of 8.6 percent during this period, mostly on account of high food inflation. Since July 2020, the State Bank of Pakistan (SBP) has maintained the policy rate at 7.0 percent to support the economy. The capital adequacy ratio at end-December 2020 remained well above the minimum regulatory requirement, indicating banking sector resilience over the first half of the fiscal year.
The current account recorded a surplus in H1 FY21, the first half-year surplus in a decade
Supported by record remittance inflows, Pakistan registered a current account surplus of US$ 1.1 billion in H1 FY21, the first half-year surplus in a decade. With the phased lifting of COVID-19-related generalized lockdown measures and the ensuing recovery in domestic economic activity, imports grew y-o-y over the first six months of FY21. However, exports declined amidst difficult external conditions, leading to a wider trade deficit. Meanwhile, remittances grew by 24.9 percent to reach a record US$14.2 billion over the same period. Despite lower direct investment and portfolio flows, financing from bilateral, multilateral, and commercial sources supported the financial account, which recorded an overall net inflow during this period. The financial account surplus, coupled with the positive developments in the current account, resulted in an overall balance-of-payments surplus during the first six months of the fiscal year. This led to an increase in SBP’s gross foreign exchange reserves to US$14.9 billion, equivalent to 3.3 months of imports2 by end-December 2020. Aided by the improvement in the external sector, the Pakistani rupee appreciated by 5.4 percent against the U.S. dollar, from end-June 2020 to end-December 2020.
The fiscal deficit widened over the first six months of the year, in part due to higher interest payments
Pakistan’s consolidated fiscal deficit (excluding grants) for H1 FY21 reached PKR 1,137.9 billion, 14.4 percent higher than the H1 FY20 deficit of PKR 994.7 billion. The primary surplus for H1 FY21 was recorded at PKR 337.2 billion, higher than the PKR 286.5 billion surplus in H1 FY20. This was the second consecutive half-year primary surplus, indicating the government’s commitments to fiscal consolidation efforts. Despite lower non-tax revenues, total consolidated revenues increased by 3.7 percent, as tax revenues registered double-digit growth, in line with the recovering economic activity. Total expenditures rose by 6.2 percent, with interest payments and provincial spending being the largest contributors. Public debt (including guaranteed debt) reached 87.9 percent of GDP at the end of December 2020, an increase from 86.7 percent in December 2019.
GDP growth is projected to gradually recover but
Economic growth is expected to recover slowly, given heightened uncertainty surrounding the COVID-19 pandemic, including the emergence of new strains and the availability of mass vaccinations. At the same time, economic activity is projected to be
1 Based on data from the Special Survey on Evaluating the Impact of COVID-19 conducted by the Pakistan Bureau of Statistics, increased social assistance spending from public and private sources is also expected to help stabilize poverty levels. 2 Based on next 12 months' projected imports of goods & services. Import coverage ratio may change with the change in import projections.

N a v i g a t i n g i n U n c e r t a i n T i m e s P a k i s t a n D e v e l o p m e n t U p d a t e
A p r i l 2 0 2 1 T h e W o r l d B a n k
2
will remain below potential over the forecast horizon
dampened in the short-term by fiscal consolidation measures associated with the resumption of the IMF stabilization program. The outlook entails a gradual post-COVID recovery during which economic growth is expected to remain below potential, reaching 1.3 percent in FY21 and strengthening to 3.4 percent in FY23 (Table 1). This baseline projection is highly uncertain, especially with the third and more contagious wave of the pandemic currently infecting the country.
Table 1: Projections of Key Economic Indicators
FY18 FY19 FY20 FY21 FY22 FY23 Real GDP growth, at constant factor prices 5.8 1.0 -1.5 1.3 2.0 3.4 Current Account Balance (% of GDP) -6.1 -4.8 -1.1 -0.8 -1.3 -1.7 Fiscal Balance (% of GDP), excluding grants -6.5 -9.1 -8.2 -8.4 -7.8 -7.0 Public Debt, including govt. guaranteed debt (% of GDP) 75.9 89.9 93.6 93.9 94.4 94.1
Sources: Data from the official sources, World Bank staff estimates. Note: This macroeconomic outlook was prepared by World Bank staff and differs from that of the government.
The current account deficit is expected to slowly increase with the recovery in domestic activity
The current account deficit is projected to narrow to 0.8 percent of GDP in FY21, as a wider trade deficit is more than offset by stronger remittances inflows. However, the current account deficit is expected to increase over the medium term. Exports are projected to grow from FY22 onwards, as external conditions become more conducive and tariff reforms gain traction, but imports are also expected to increase in line with stronger domestic activity and higher oil prices.
The fiscal deficit is expected to be high in FY21 but gradually decline with continued fiscal consolidation efforts
While fiscal consolidation efforts are expected to resume, the deficit (excluding grants) is projected to remain elevated at 8.4 percent of GDP in FY21, partly due to the settlement of arrears in the power sector. As critical revenue-enhancing reforms gain pace, the fiscal deficit is projected to gradually narrow over the medium-term. Nevertheless, public debt will remain elevated in the medium term, as will Pakistan’s exposure to debt-related shocks.
Increasing the competitiveness of Pakistan’s economy will contribute to a rapid and full economic recovery
Enhancing the competitiveness of Pakistan’s economy is key to unleashing the growth potential of the private sector, especially as the country recovers from the pandemic. Increasing competitiveness and stimulating private investment will require continued macroeconomic stability and maintenance of a market-determined exchange rate, improving the business environment, and supporting competition to promote exports.
Despite some recovery in the private sector, many firms remain vulnerable and require support to prevent closures and further job losses
Findings from two Business Pulse Surveys (BPS) administered across Pakistan suggest that a nascent recovery is underway in the private sector. Businesses that had highlighted the steep impact of the COVID-19 crisis and a dismal outlook in the first survey, administered over June-July 2020, reported improving conditions in the second survey, administered in January 2021. While the general trend is reassuring, many businesses are still vulnerable. Sales performance also remains muted, having not recovered to pre-pandemic levels. Moreover, uncertainty remains high amid the current third wave of the infection with the reimposition of some social restrictions. Consequently, economic conditions facing businesses can quickly become adverse with significant implications. There is therefore a case for further policy support to buttress the nascent recovery. Policy measures that prevent permanent firm closures and the consequent layoff of workers will contribute significantly to sustaining the recovery.

N a v i g a t i n g i n U n c e r t a i n T i m e s P a k i s t a n D e v e l o p m e n t U p d a t e
A p r i l 2 0 2 1 T h e W o r l d B a n k
3
2. Recent Economic Developments
a. Context Targeted lockdowns helped to contain the second wave, while partially permitting economic activity
Using targeted lockdowns, Pakistan successfully contained the second wave of the COVID-19 pandemic, which lasted from November 2020 through early February 2021. These localized mobility restrictions measures, while effective at containing the infection, still permitted the partial resumption of economic activity and supported the ongoing recovery.
Domestic COVID-19 cases are spiking with an on-going third wave of the pandemic, posing risks to the economic outlook
However, a third and more contagious wave of the pandemic has begun spreading in the country. As of April 1, the number of daily new infection cases had risen to 5,234, more than five times the low of 958 on February 15.3 Similarly, the three-day rolling average positivity rate has tripled to 9.8 percent from a trough of 3.2 percent on February 25. In response, the government has temporarily re-imposed some containment measures: suspending in-person attendance at educational institutions, restricting commercial business hours, and a 50 percent work-from-home policy for offices.4 The government has also implemented localized lockdowns in virus hotspots, including in Islamabad and some areas of the Punjab province. Although these social restrictions contain the infection and save lives, they may also stifle the fragile economic recovery and therefore pose significant downside risks to the economic outlook.
The vaccination program is still in the initial stages
Meanwhile, the authorities have expanded the vaccination program, with citizens over the age of 50 eligible to register to receive their first dose of a two-dose vaccine. As of end-March, it was reported that more than 2.5 million doses are or would be soon available domestically5 and that 0.8 million doses had been administered.6 The government has also permitted the private import of vaccines to further boost domestic supplies. The country is due to receive another 14 million vaccine doses through the global COVAX initiative in the coming months. Nonetheless, given that Pakistan’s population of around 220 million people, the vaccination program needs to be vastly expanded before the country can achieve herd immunity via vaccinations.
3 https://covid.gov.pk/ 4 https://www.aljazeera.com/news/2021/3/15/pakistan-increases-coronavirus-restrictions-amid-third-wave 5 https://www.aljazeera.com/news/2021/4/1/pakistan-receives-another-large-covid-vaccine-shipment-from-china 6 https://www.dawn.com/news/1615662
N a v i g a t i n g i n U n c e r t a i n T i m e s P a k i s t a n D e v e l o p m e n t U p d a t e
A p r i l 2 0 2 1 T h e W o r l d B a n k
4
b. Real Sector Growth Global growth is projected to recover in 2021, with global output remaining below pre-pandemic projections
Global economic output is projected to expand by 4.0 percent in 2021, albeit remaining more than 5.0 percent below pre-pandemic projections.7 The pandemic has had a significant impact on private consumption, investment, and human capital accumulation in emerging markets and developing economies (EMDEs). Despite the lingering effects of the pandemic, EMDE growth is projected to recover to 5.0 percent in 2021, largely reflecting an expected economic rebound in China. Downside risks to the global growth outlook include a possible resurgence of the virus, delays in vaccine procurement, distribution, and inoculation, and financial stress from high debt levels exacerbated by the pandemic.
In South Asia, economic growth is expected to remain weak with the long-lasting effects of the pandemic
The South Asian economy is projected to grow at 3.3 percent in 2021, after an estimated contraction of 6.7 percent in 2020. The hospitality, retail, and transport sectors have been severely affected and the economic contraction due to the COVID-19 pandemic has led to a sharp rise in poverty and unemployment in the region. After stringent lockdowns were eased, industrial production has improved, and the region’s goods exports are gradually returning to pre-pandemic levels. However, the tourism industry remains at a stand-still, with continued impediments to international travel. The pandemic is expected to curtail the region’s long-term growth prospects by depressing investment, eroding human capital, undermining productivity, and depleting policy buffers.
Pakistan’s GDP contracted sharply in FY20 in part due to the COVID-19 social restrictions and lockdowns
Real GDP growth at factor cost is estimated to have declined from 1.9 percent y-o-y in FY19 to -1.5 percent in FY20 8, the first contraction in decades. This reflected the effects of the COVID-19 pandemic-related containment measures that followed the monetary and fiscal tightening associated with the IMF Extended Fund Facility (IMF-EFF). To curtail the spread of the infection, a partial lockdown was imposed in March, which included the suspension of air travel and inner-city public transport, a ban on religious/social gatherings, and closure of all non-essential businesses and schools, and was gradually eased from May 2020 onwards9. This disrupted domestic supply and demand, as businesses were unable to operate and consumers curbed spending, and affected both services and industry. The services sector is estimated to have contracted by over 1.0 percent, while industrial production is expected to have contracted by 5.0 percent, due to the high policy rates prior to the pandemic and plunging domestic and global demand thereafter. The agriculture sector, partially insulated from the effects of the containment measures, expanded modestly over the year.
Private consumption and investment are estimated to have declined with the pandemic
Private consumption is estimated to have contracted by 1.0 percent y-o-y in FY20 as households reduced consumption amid the lockdown and dimmer employment prospects. Similarly, with heightened uncertainty, disrupted supply chains, and a global slowdown, investment is estimated to have fallen drastically by nearly 18 percent. Exports and imports also shrank, by an estimated 8.6 percent and 10.5 percent, respectively, given weaknesses in global trade and domestic demand. In contrast, government consumption is projected to have risen by 5.6 percent, reflecting the rollout of the fiscal stimulus package to cushion the effects of the pandemic. Complementing the fiscal measures, an array of monetary policy measures was also implemented to mitigate the adverse economic effects induced by the pandemic (Box 2.1).
7 World Bank (2021). Global Economic Prospects. January 2021, Washington DC: World Bank 8 As per the latest official data released, real GDP growth (at factor cost) for FY20 is provisionally estimated at -0.4 percent. World Bank estimates the real GDP growth (at factor cost) for FY20 to be -1.5 percent. 9 The economy opened in phases with the construction industry, tourism sector and restaurants and transport sectors opening in August, while restrictions on educational institutions and marriage halls were lifted in September.
N a v i g a t i n g i n U n c e r t a i n T i m e s P a k i s t a n D e v e l o p m e n t U p d a t e
A p r i l 2 0 2 1 T h e W o r l d B a n k
5
Box 2.1: Pandemic Fiscal and Monetary Mitigation Measures in FY20
Prior to the onset of COVID-19 pandemic in March 2020, Pakistan was emerging from a macroeconomic crisis. In conjunction with the IMF-EFF program, the government had made considerable progress towards macroeconomic stabilization over July 2019-March 2020. The key measures initiated included a shift to a market-based exchange rate regime, fiscal consolidation, strengthening of coordination between federating units, an upward adjustment in energy prices, and tightening monetary policy, all of which helped to reduce domestic and external imbalances. As the country looked to implement other key structural reforms, the COVID-19 pandemic forced global and domestic economies into lockdowns and severely disrupted economic activity. With the economy facing a sharp contraction and the livelihood of millions at risk, the government refocused from structural reforms towards mitigating the impact of economic losses and protecting the social and economic well-being of the affected and vulnerable population. Fiscal Measures The Federal Government on 24th March 2020 announced a fiscal stimulus package of approximately PKR 1.27 trillion (approximately 2.9 percent of GDP) aimed at achieving three core objectives: (a) to enhance the capacity of the healthcare sector to combat the spread of the virus and provide support to affected workers; (b) to provide targeted financial support to the poor and vulnerable, whose livelihoods have been impacted by the economic slowdown; and (c) to provide relief to the businesses and industries to mitigate losses from the lockdown and shun a larger economic downturn (Table 2.1). The majority of the fiscal package was financed through reappropriation of funds. It is estimated that only around PKR 300 billion (or approximately 24 percent of the total announced fiscal package) of new expenditures were authorized during Q4 FY20, which helped keep the total fiscal deficit for FY20 lower than initially anticipated.
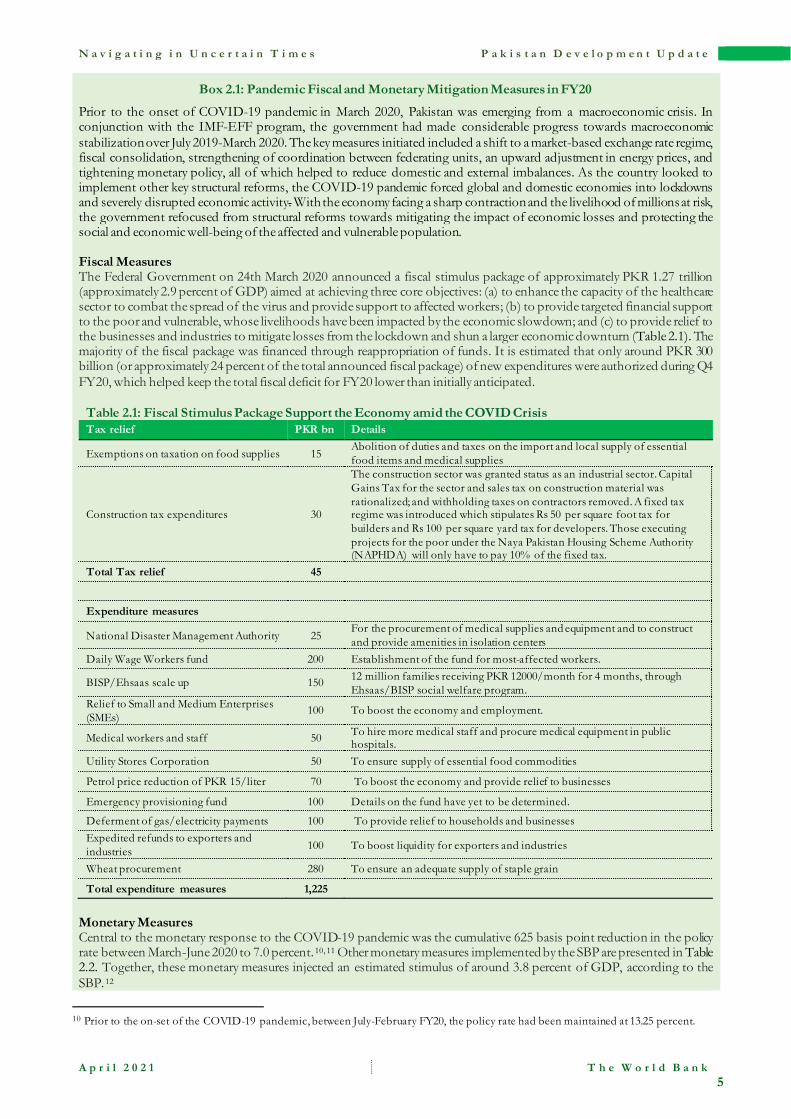
Table 2.1: Fiscal Stimulus Package Support the Economy amid the COVID Crisis Tax relief PKR bn Details
Exemptions on taxation on food supplies 15 Abolition of duties and taxes on the import and local supply of essential food items and medical supplies
Construction tax expenditures 30
The construction sector was granted status as an industrial sector. Capital Gains Tax for the sector and sales tax on construction material was rationalized; and withholding taxes on contractors removed. A fixed tax regime was introduced which stipulates Rs 50 per square foot tax for builders and Rs 100 per square yard tax for developers. Those executing projects for the poor under the Naya Pakistan Housing Scheme Authority (NAPHDA) will only have to pay 10% of the fixed tax.
Total Tax relief 45
Expenditure measures
National Disaster Management Authority 25 For the procurement of medical supplies and equipment and to construct and provide amenities in isolation centers
Daily Wage Workers fund 200 Establishment of the fund for most-affected workers.
BISP/Ehsaas scale up 150 12 million families receiving PKR 12000/month for 4 months, through Ehsaas/BISP social welfare program.
Relief to Small and Medium Enterprises (SMEs)
100 To boost the economy and employment.
Medical workers and staff 50 To hire more medical staff and procure medical equipment in public hospitals.
Utility Stores Corporation 50 To ensure supply of essential food commodities
Petrol price reduction of PKR 15/liter 70 To boost the economy and provide relief to businesses
Emergency provisioning fund 100 Details on the fund have yet to be determined.
Deferment of gas/electricity payments 100 To provide relief to households and businesses Expedited refunds to exporters and industries 100 To boost liquidity for exporters and industries
Wheat procurement 280 To ensure an adequate supply of staple grain
Total expenditure measures 1,225
Monetary Measures Central to the monetary response to the COVID-19 pandemic was the cumulative 625 basis point reduction in the policy rate between March-June 2020 to 7.0 percent.10, 11 Other monetary measures implemented by the SBP are presented in Table 2.2. Together, these monetary measures injected an estimated stimulus of around 3.8 percent of GDP, according to the SBP.12
10 Prior to the on-set of the COVID-19 pandemic, between July-February FY20, the policy rate had been maintained at 13.25 percent.
N a v i g a t i n g i n U n c e r t a i n T i m e s P a k i s t a n D e v e l o p m e n t U p d a t e
A p r i l 2 0 2 1 T h e W o r l d B a n k
6
Table 2.2: Monetary Measures to Support the Economy amid the COVID Crisis Tax relief Details
Deferment of payments Banks were instructed to defer the payment of principal on loans and advances by one year.13
Restructuring of loans
For more financially distressed borrowers, the SBP relaxed the regulatory criteria for restructuring/rescheduling of loans. The loans that would be re-scheduled/restructured within 180 days from the due date of payment will not be treated as defaults. These measures are expected to allow the private sector to preserve cash flows for their ongoing activities, provide incentives for banks to maintain committed credit flows or provide additional credit, and offer immediate relief and additional time to borrowers to service and remain current on their debts.
Temporary Economic Refinance Facility (TERF)14
Concessional financing scheme to promote manufacturing
Refinance Facility for Combating COVID-19 (RFCC)15
Concessional financing scheme to enhance the capacity of the health sector
SBP Rozgar Scheme 16 Provides concessional loans and other incentives for businesses that commit to not lay off workers for six months
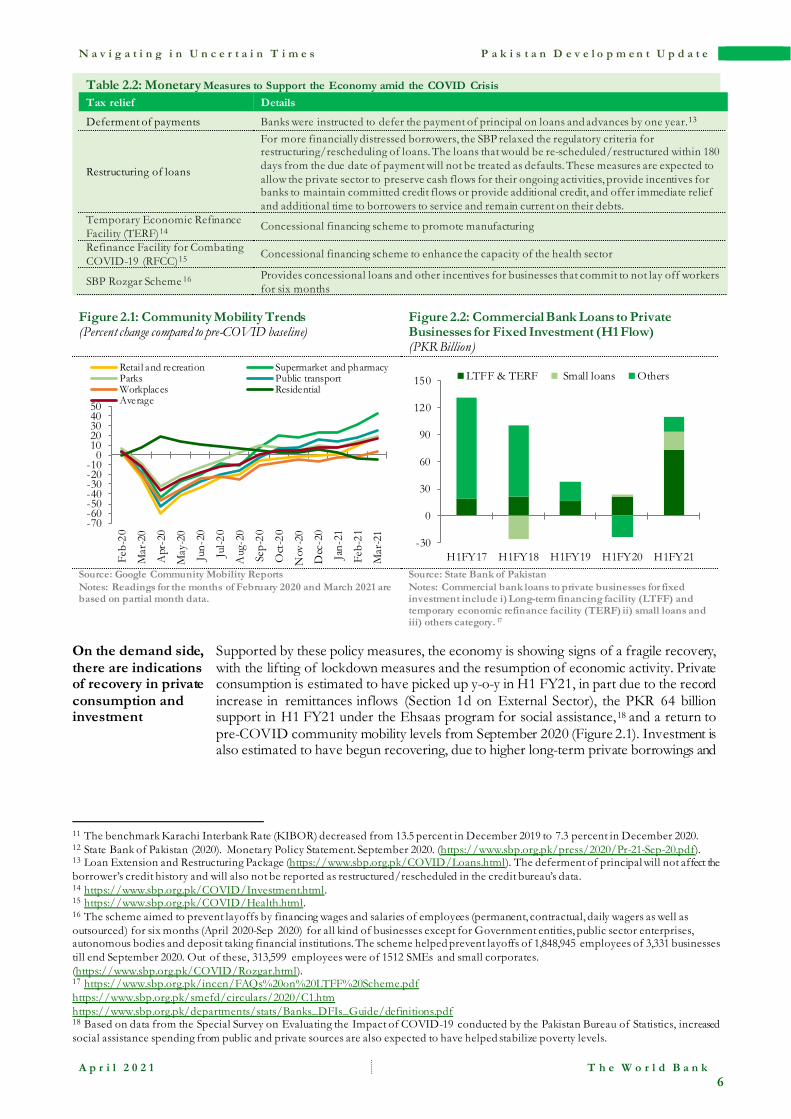
Figure 2.1: Community Mobility Trends (Percent change compared to pre-COVID baseline)
Figure 2.2: Commercial Bank Loans to Private Businesses for Fixed Investment (H1 Flow) (PKR Billion)
Source: Google Community Mobility Reports Notes: Readings for the months of February 2020 and March 2021 are based on partial month data.
Source: State Bank of Pakistan Notes: Commercial bank loans to private businesses for fixed investment include i) Long-term financing facility (LTFF) and temporary economic refinance facility (TERF) ii) small loans and iii) others category. 17
On the demand side, there are indications of recovery in private consumption and investment
Supported by these policy measures, the economy is showing signs of a fragile recovery, with the lifting of lockdown measures and the resumption of economic activity. Private consumption is estimated to have picked up y-o-y in H1 FY21, in part due to the record increase in remittances inflows (Section 1d on External Sector), the PKR 64 billion support in H1 FY21 under the Ehsaas program for social assistance,18 and a return to pre-COVID community mobility levels from September 2020 (Figure 2.1). Investment is also estimated to have begun recovering, due to higher long-term private borrowings and
11 The benchmark Karachi Interbank Rate (KIBOR) decreased from 13.5 percent in December 2019 to 7.3 percent in December 2020. 12 State Bank of Pakistan (2020). Monetary Policy Statement. September 2020. (https://www.sbp.org.pk/press/2020/Pr-21-Sep-20.pdf). 13 Loan Extension and Restructuring Package (https://www.sbp.org.pk/COVID/Loans.html). The deferment of principal will not affect the borrower’s credit history and will also not be reported as restructured/rescheduled in the credit bureau’s data. 14 https://www.sbp.org.pk/COVID/Investment.html. 15 https://www.sbp.org.pk/COVID/Health.html. 16 The scheme aimed to prevent layoffs by financing wages and salaries of employees (permanent, contractual, daily wagers as well as outsourced) for six months (April 2020-Sep 2020) for all kind of businesses except for Government entities, public sector enterprises, autonomous bodies and deposit taking financial institutions. The scheme helped prevent layoffs of 1,848,945 employees of 3,331 businesses till end September 2020. Out of these, 313,599 employees were of 1512 SMEs and small corporates. (https://www.sbp.org.pk/COVID/Rozgar.html). 17 https://www.sbp.org.pk/incen/FAQs%20on%20LTFF%20Scheme.pdf https://www.sbp.org.pk/smefd/circulars/2020/C1.htm https://www.sbp.org.pk/departments/stats/Banks_DFIs_Guide/definitions.pdf 18 Based on data from the Special Survey on Evaluating the Impact of COVID-19 conducted by the Pakistan Bureau of Statistics, increased social assistance spending from public and private sources are also expected to have helped stabilize poverty levels.
-70-60-50-40-30-20-10
01020304050
Feb-
20
Mar
-20
Apr
-20
May
-20
Jun-
20
Jul-2
0
Aug
-20
Sep-
20
Oct
-20
Nov
-20
Dec
-20
Jan-
21
Feb-
21
Mar
-21
Retail and recreation Supermarket and pharmacyParks Public transportWorkplaces ResidentialAverage
-30
0
30
60
90
120
150
H1FY17 H1FY18 H1FY19 H1FY20 H1FY21
LTFF & TERF Small loans Others
N a v i g a t i n g i n U n c e r t a i n T i m e s P a k i s t a n D e v e l o p m e n t U p d a t e
A p r i l 2 0 2 1 T h e W o r l d B a n k
7
the increase in capital goods imports19 (Figure 2.2). While also showing signs of recovery, export growth has on average remained in the negative territory in H1 FY21. In contrast, government consumption and investment are expected to remain muted, in line with fiscal consolidation efforts.
Leading indicators on the production side are also signaling a fragile recovery
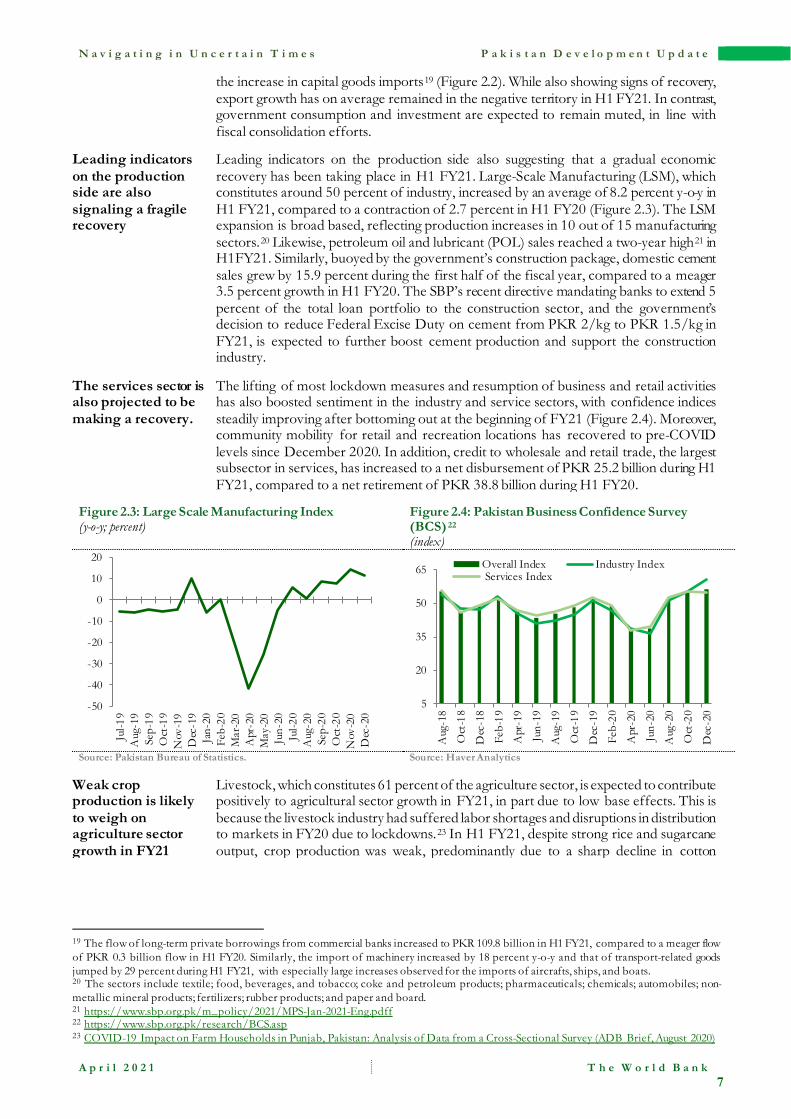
Leading indicators on the production side also suggesting that a gradual economic recovery has been taking place in H1 FY21. Large-Scale Manufacturing (LSM), which constitutes around 50 percent of industry, increased by an average of 8.2 percent y-o-y in H1 FY21, compared to a contraction of 2.7 percent in H1 FY20 (Figure 2.3). The LSM expansion is broad based, reflecting production increases in 10 out of 15 manufacturing sectors.20 Likewise, petroleum oil and lubricant (POL) sales reached a two-year high21 in H1FY21. Similarly, buoyed by the government’s construction package, domestic cement sales grew by 15.9 percent during the first half of the fiscal year, compared to a meager 3.5 percent growth in H1 FY20. The SBP’s recent directive mandating banks to extend 5 percent of the total loan portfolio to the construction sector, and the government’s decision to reduce Federal Excise Duty on cement from PKR 2/kg to PKR 1.5/kg in FY21, is expected to further boost cement production and support the construction industry.
The services sector is also projected to be making a recovery.
The lifting of most lockdown measures and resumption of business and retail activities has also boosted sentiment in the industry and service sectors, with confidence indices steadily improving after bottoming out at the beginning of FY21 (Figure 2.4). Moreover, community mobility for retail and recreation locations has recovered to pre-COVID levels since December 2020. In addition, credit to wholesale and retail trade, the largest subsector in services, has increased to a net disbursement of PKR 25.2 billion during H1 FY21, compared to a net retirement of PKR 38.8 billion during H1 FY20.
Figure 2.3: Large Scale Manufacturing Index (y-o-y; percent)
Figure 2.4: Pakistan Business Confidence Survey (BCS) 22 (index)
Source: Pakistan Bureau of Statistics. Source: Haver Analytics
Weak crop production is likely to weigh on agriculture sector growth in FY21
Livestock, which constitutes 61 percent of the agriculture sector, is expected to contribute positively to agricultural sector growth in FY21, in part due to low base effects. This is because the livestock industry had suffered labor shortages and disruptions in distribution to markets in FY20 due to lockdowns.23 In H1 FY21, despite strong rice and sugarcane output, crop production was weak, predominantly due to a sharp decline in cotton
19 The flow of long-term private borrowings from commercial banks increased to PKR 109.8 billion in H1 FY21, compared to a meager flow of PKR 0.3 billion flow in H1 FY20. Similarly, the import of machinery increased by 18 percent y-o-y and that of transport-related goods jumped by 29 percent during H1 FY21, with especially large increases observed for the imports of aircrafts, ships, and boats. 20 The sectors include textile; food, beverages, and tobacco; coke and petroleum products; pharmaceuticals; chemicals; automobiles; non-metallic mineral products; fertilizers; rubber products; and paper and board. 21 https://www.sbp.org.pk/m_policy/2021/MPS-Jan-2021-Eng.pdff 22 https://www.sbp.org.pk/research/BCS.asp 23 COVID-19 Impact on Farm Households in Punjab, Pakistan: Analysis of Data from a Cross-Sectional Survey (ADB Brief, August 2020)
-50
-40
-30
-20
-10
0
10
20
Jul-1
9A
ug-1
9Se
p-19
Oct
-19
Nov
-19
Dec
-19
Jan-
20Fe
b-20
Mar
-20
Apr
-20
May
-20
Jun-
20Ju
l-20
Aug
-20
Sep-
20O
ct-2
0N
ov-2
0D
ec-2
0
5
20
35
50
65
Aug
-18
Oct
-18
Dec
-18
Feb-
19
Apr
-19
Jun-
19
Aug
-19
Oct
-19
Dec
-19
Feb-
20
Apr
-20
Jun-
20
Aug
-20
Oct
-20
Dec
-20
Overall Index Industry Index Services Index
N a v i g a t i n g i n U n c e r t a i n T i m e s P a k i s t a n D e v e l o p m e n t U p d a t e
A p r i l 2 0 2 1 T h e W o r l d B a n k
8
production, estimated to have fallen by 34.4 percent y-o-y during H1 FY21 as the cotton crop suffered due to exceptionally heavy monsoon rains and locust attacks.24
Inflation Headline inflation decreased during H1 FY21 as inflationary pressures from energy price hikes in FY20 continue to dissipate
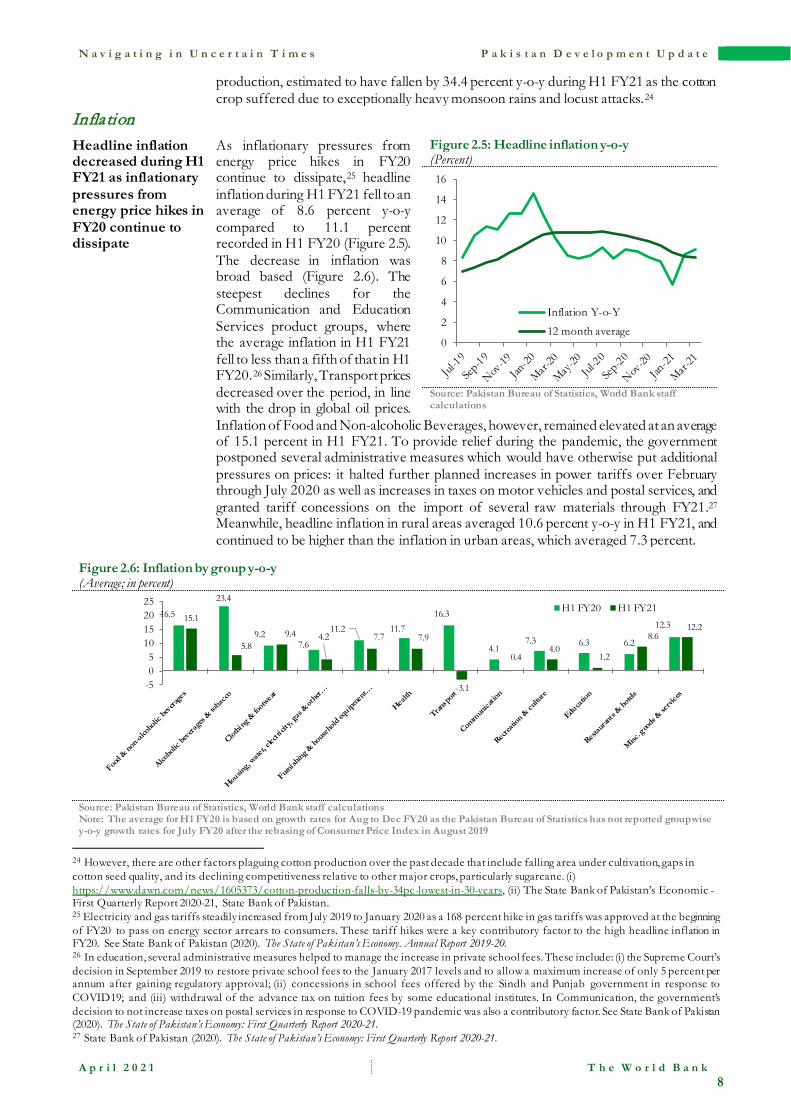
As inflationary pressures from energy price hikes in FY20 continue to dissipate,25 headline inflation during H1 FY21 fell to an average of 8.6 percent y-o-y compared to 11.1 percent recorded in H1 FY20 (Figure 2.5). The decrease in inflation was broad based (Figure 2.6). The steepest declines for the Communication and Education Services product groups, where the average inflation in H1 FY21 fell to less than a fifth of that in H1 FY20.26 Similarly, Transport prices decreased over the period, in line with the drop in global oil prices. Inflation of Food and Non-alcoholic Beverages, however, remained elevated at an average of 15.1 percent in H1 FY21. To provide relief during the pandemic, the government postponed several administrative measures which would have otherwise put additional pressures on prices: it halted further planned increases in power tariffs over February through July 2020 as well as increases in taxes on motor vehicles and postal services, and granted tariff concessions on the import of several raw materials through FY21.27 Meanwhile, headline inflation in rural areas averaged 10.6 percent y-o-y in H1 FY21, and continued to be higher than the inflation in urban areas, which averaged 7.3 percent.
Figure 2.5: Headline inflation y-o-y (Percent)
Source: Pakistan Bureau of Statistics, World Bank staff calculations
Figure 2.6: Inflation by group y-o-y (Average; in percent)
Source: Pakistan Bureau of Statistics, World Bank staff calculations Note: The average for H1 FY20 is based on growth rates for Aug to Dec FY20 as the Pakistan Bureau of Statistics has not reported groupwise y-o-y growth rates for July FY20 after the rebasing of Consumer Price Index in August 2019
24 However, there are other factors plaguing cotton production over the past decade that include falling area under cultivation, gaps in cotton seed quality, and its declining competitiveness relative to other major crops, particularly sugarcane. (i) https://www.dawn.com/news/1605373/cotton-production-falls-by-34pc-lowest-in-30-years, (ii) The State Bank of Pakistan’s Economic - First Quarterly Report 2020-21, State Bank of Pakistan. 25 Electricity and gas tariffs steadily increased from July 2019 to January 2020 as a 168 percent hike in gas tariffs was approved at the beginning of FY20 to pass on energy sector arrears to consumers. These tariff hikes were a key contributory factor to the high headline inflation in FY20. See State Bank of Pakistan (2020). The State of Pakistan’s Economy. Annual Report 2019-20. 26 In education, several administrative measures helped to manage the increase in private school fees. These include: (i) the Supreme Court’s decision in September 2019 to restore private school fees to the January 2017 levels and to allow a maximum increase of only 5 percent per annum after gaining regulatory approval; (ii) concessions in school fees offered by the Sindh and Punjab government in response to COVID19; and (iii) withdrawal of the advance tax on tuition fees by some educational institutes. In Communication, the government’s decision to not increase taxes on postal services in response to COVID-19 pandemic was also a contributory factor. See State Bank of Pakistan (2020). The State of Pakistan’s Economy: First Quarterly Report 2020-21. 27 State Bank of Pakistan (2020). The State of Pakistan’s Economy: First Quarterly Report 2020-21.
16.5
23.4
9.27.6
11.2 11.716.3
4.17.3 6.3 6.2
12.315.1
5.89.4 4.2 7.7 7.9
-3.1
0.44.0
1.2
8.612.2
-505
10152025 H1 FY20 H1 FY21
0
2
4
6
8
10
12
14
16
Inflation Y-o-Y
12 month average
N a v i g a t i n g i n U n c e r t a i n T i m e s P a k i s t a n D e v e l o p m e n t U p d a t e
A p r i l 2 0 2 1 T h e W o r l d B a n k
9
Food price inflation remained elevated, contributing more than 60 percent to headline inflation
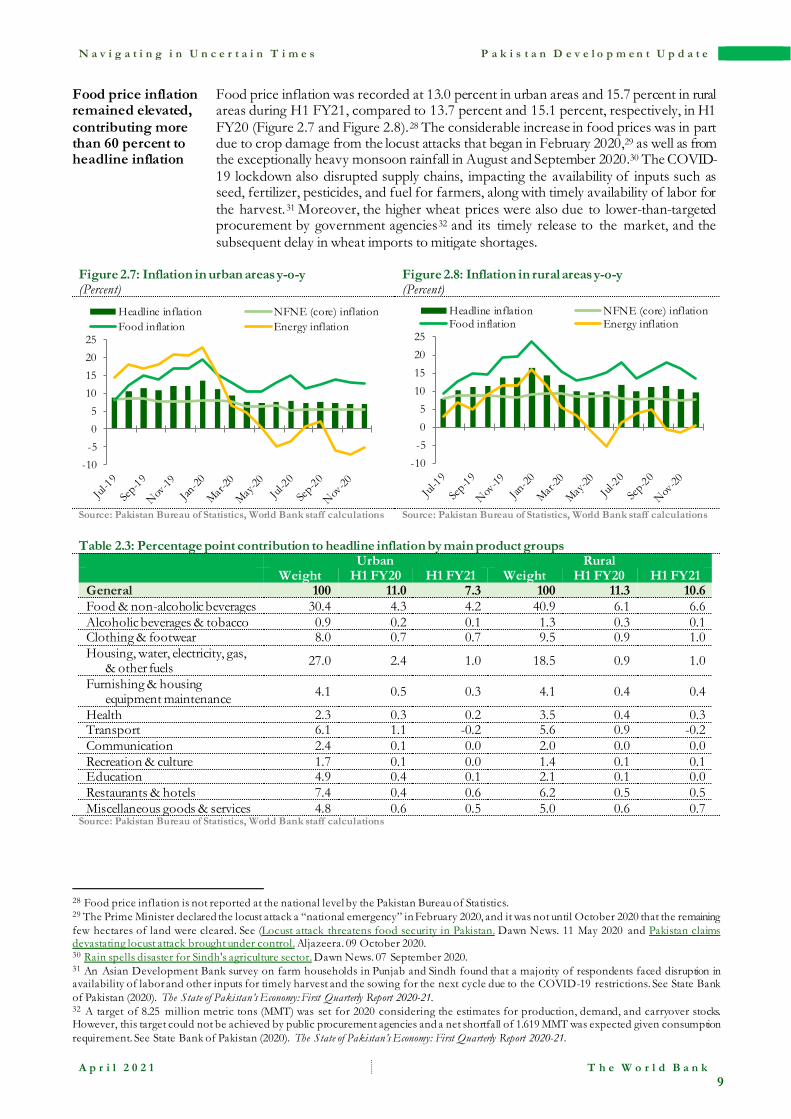
Food price inflation was recorded at 13.0 percent in urban areas and 15.7 percent in rural areas during H1 FY21, compared to 13.7 percent and 15.1 percent, respectively, in H1 FY20 (Figure 2.7 and Figure 2.8).28 The considerable increase in food prices was in part due to crop damage from the locust attacks that began in February 2020,29 as well as from the exceptionally heavy monsoon rainfall in August and September 2020.30 The COVID-19 lockdown also disrupted supply chains, impacting the availability of inputs such as seed, fertilizer, pesticides, and fuel for farmers, along with timely availability of labor for the harvest.31 Moreover, the higher wheat prices were also due to lower-than-targeted procurement by government agencies32 and its timely release to the market, and the subsequent delay in wheat imports to mitigate shortages.
Figure 2.7: Inflation in urban areas y-o-y (Percent)
Figure 2.8: Inflation in rural areas y-o-y (Percent)
Source: Pakistan Bureau of Statistics, World Bank staff calculations Source: Pakistan Bureau of Statistics, World Bank staff calculations
Table 2.3: Percentage point contribution to headline inflation by main product groups
Urban Rural Weight H1 FY20 H1 FY21 Weight H1 FY20 H1 FY21 General 100 11.0 7.3 100 11.3 10.6 Food & non-alcoholic beverages 30.4 4.3 4.2 40.9 6.1 6.6 Alcoholic beverages & tobacco 0.9 0.2 0.1 1.3 0.3 0.1 Clothing & footwear 8.0 0.7 0.7 9.5 0.9 1.0 Housing, water, electricity, gas,
& other fuels 27.0 2.4 1.0 18.5 0.9 1.0
Furnishing & housing equipment maintenance 4.1 0.5 0.3 4.1 0.4 0.4
Health 2.3 0.3 0.2 3.5 0.4 0.3 Transport 6.1 1.1 -0.2 5.6 0.9 -0.2 Communication 2.4 0.1 0.0 2.0 0.0 0.0 Recreation & culture 1.7 0.1 0.0 1.4 0.1 0.1 Education 4.9 0.4 0.1 2.1 0.1 0.0 Restaurants & hotels 7.4 0.4 0.6 6.2 0.5 0.5 Miscellaneous goods & services 4.8 0.6 0.5 5.0 0.6 0.7
Source: Pakistan Bureau of Statistics, World Bank staff calculations
28 Food price inflation is not reported at the national level by the Pakistan Bureau of Statistics. 29 The Prime Minister declared the locust attack a “national emergency” in February 2020, and it was not until October 2020 that the remaining few hectares of land were cleared. See (Locust attack threatens food security in Pakistan. Dawn News. 11 May 2020 and Pakistan claims devastating locust attack brought under control. Aljazeera. 09 October 2020. 30 Rain spells disaster for Sindh's agriculture sector. Dawn News. 07 September 2020. 31 An Asian Development Bank survey on farm households in Punjab and Sindh found that a majority of respondents faced disruption in availability of labor and other inputs for timely harvest and the sowing for the next cycle due to the COVID-19 restrictions. See State Bank of Pakistan (2020). The State of Pakistan’s Economy: First Quarterly Report 2020-21. 32 A target of 8.25 million metric tons (MMT) was set for 2020 considering the estimates for production, demand, and carryover stocks. However, this target could not be achieved by public procurement agencies and a net shortfall of 1.619 MMT was expected given consumption requirement. See State Bank of Pakistan (2020). The State of Pakistan’s Economy: First Quarterly Report 2020-21.
-10-505
10152025
Headline inflation NFNE (core) inflationFood inflation Energy inflation
-10-505
10152025
Headline inflation NFNE (core) inflationFood inflation Energy inflation
N a v i g a t i n g i n U n c e r t a i n T i m e s P a k i s t a n D e v e l o p m e n t U p d a t e
A p r i l 2 0 2 1 T h e W o r l d B a n k
10
Core inflation declined during H1 FY21
Both rural and urban core inflation declined in H1 FY21. Urban core inflation fell to 5.5 percent from 8.0 percent in H1 FY20, whereas rural core inflation declined to 7.7 percent from 8.4 percent a year earlier. The lower core inflation was partly due to lower inflation rates for services such as education, health, and transport (Table 2.3). There was a smaller decline in rural core inflation in H1 FY21, partly because of higher inflation for clothing and footwear, non-energy housing-related services, and miscellaneous goods and services in rural areas.
Headline inflation rose in February 2021 partly due to higher power tariffs
After a few months of declining inflation, monthly headline inflation jumped to 8.7 percent in February 2021, from 5.7 percent in January 2021, on account of an increase in energy prices33 and continued pressures from food inflation.
Poverty COVID-19 is likely to push between 119 and 124 million people into extreme poverty globally
The COVID-19 pandemic brought about the worst reversal of global poverty reduction in three decades. According to most recent estimates, the socio-economic consequences of the pandemic are likely to have pushed between 119 and 124 million people into extreme poverty in 2020, setting back poverty reduction by around three years.34 The pandemic is also likely to exacerbate pre-existing inequalities within countries. Early data indicate that labor market impacts of the pandemic are strikingly unequal, with workers in the informal sector being hit the hardest, as services, which are largely informal, were affected most by the lockdowns.
South Asia region has the largest increase in poverty incidence due to the pandemic
The adverse economic effects of the COVID-19 pandemic have been particularly strong in South Asia, where more than 80 percent of its workers are engaged in informal activities without any form of job security and social insurance. While the poor have suffered severely during the crisis, many informal workers in the middle of the income distribution have experienced a substantial drop in earnings. It is estimated that South Asia accounts for the largest share (approximately 60 percent) of the COVID-19-induced new poor.35
Nearly half of the labor force saw job or income losses due to the lockdown in 2020
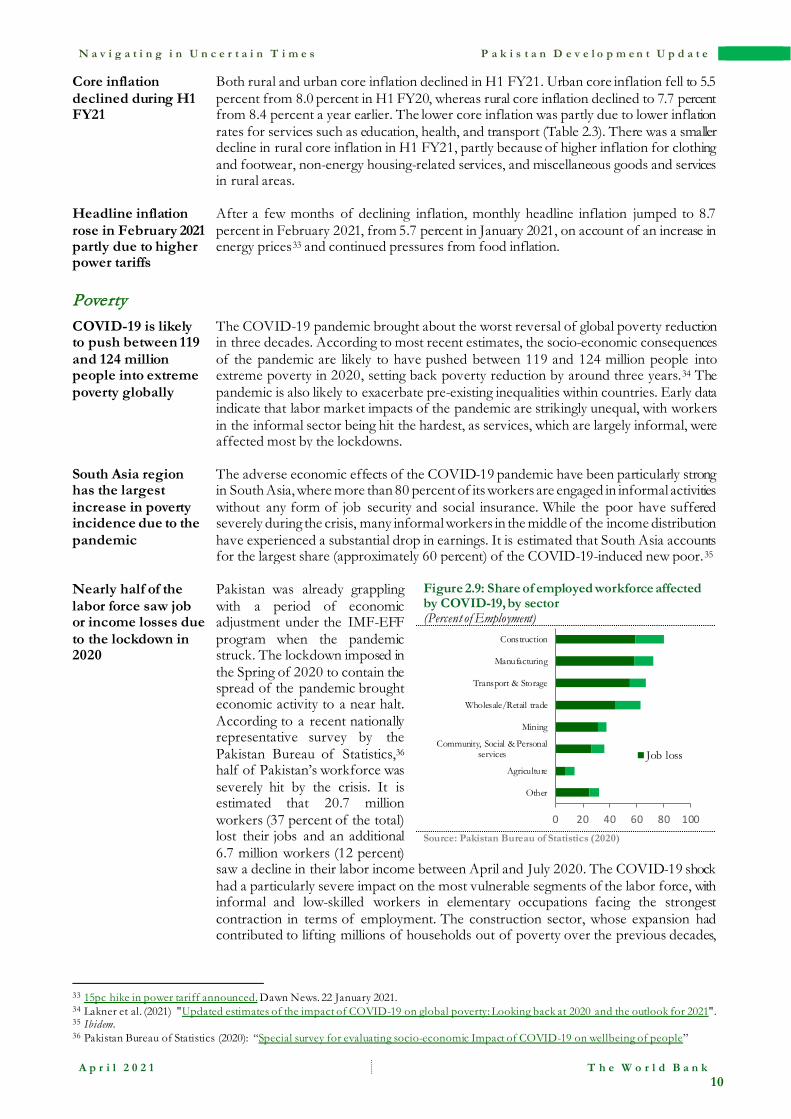
Pakistan was already grappling with a period of economic adjustment under the IMF-EFF program when the pandemic struck. The lockdown imposed in the Spring of 2020 to contain the spread of the pandemic brought economic activity to a near halt. According to a recent nationally representative survey by the Pakistan Bureau of Statistics,36 half of Pakistan’s workforce was severely hit by the crisis. It is estimated that 20.7 million workers (37 percent of the total) lost their jobs and an additional 6.7 million workers (12 percent) saw a decline in their labor income between April and July 2020. The COVID-19 shock had a particularly severe impact on the most vulnerable segments of the labor force, with informal and low-skilled workers in elementary occupations facing the strongest contraction in terms of employment. The construction sector, whose expansion had contributed to lifting millions of households out of poverty over the previous decades,
Figure 2.9: Share of employed workforce affected by COVID-19, by sector (Percent of Employment)
Source: Pakistan Bureau of Statistics (2020)
33 15pc hike in power tariff announced. Dawn News. 22 January 2021. 34 Lakner et al. (2021) "Updated estimates of the impact of COVID-19 on global poverty: Looking back at 2020 and the outlook for 2021". 35 Ibidem. 36 Pakistan Bureau of Statistics (2020): “Special survey for evaluating socio-economic Impact of COVID-19 on wellbeing of people”
0 20 40 60 80 100
Other
Agriculture
Community, Social & Personalservices
Mining
Wholesale/Retail trade
Transport & Storage
Manufacturing
Construction
Job loss
N a v i g a t i n g i n U n c e r t a i n T i m e s P a k i s t a n D e v e l o p m e n t U p d a t e
A p r i l 2 0 2 1 T h e W o r l d B a n k
11
suffered the heaviest toll. Some 80 percent of its workers lost their jobs or had reductions in income (Figure 2.9).
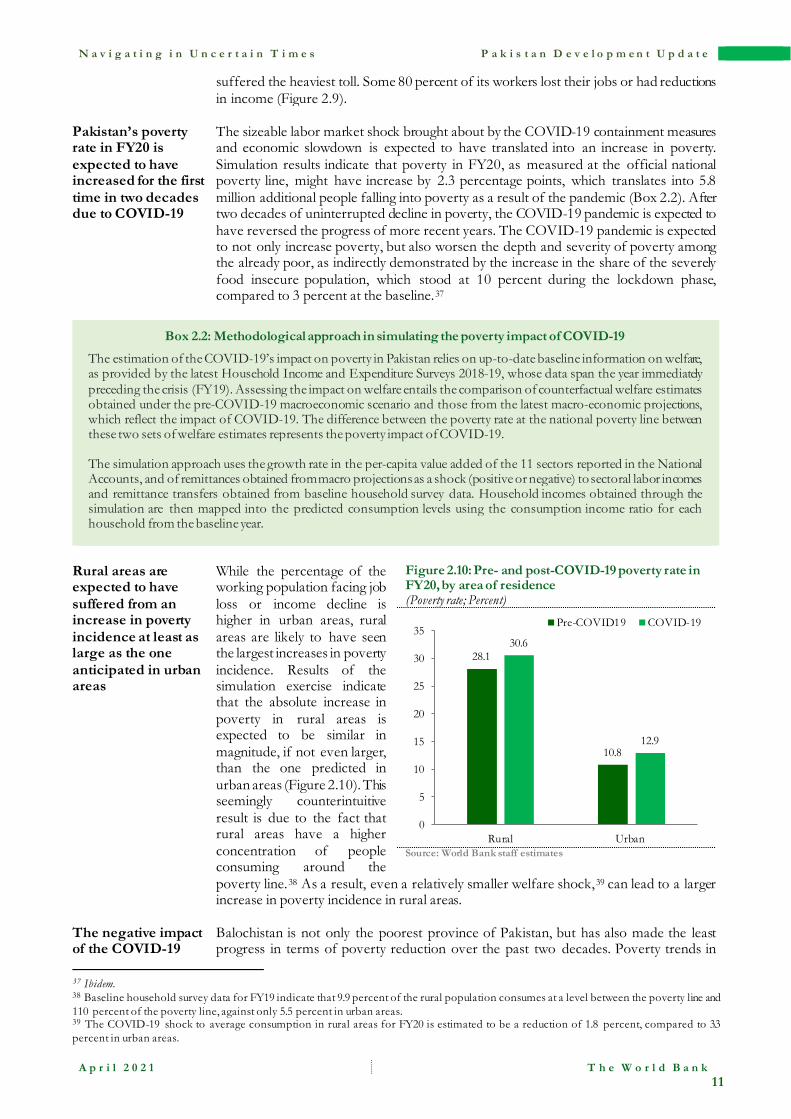
Pakistan’s poverty rate in FY20 is expected to have increased for the first time in two decades due to COVID-19
The sizeable labor market shock brought about by the COVID-19 containment measures and economic slowdown is expected to have translated into an increase in poverty. Simulation results indicate that poverty in FY20, as measured at the official national poverty line, might have increase by 2.3 percentage points, which translates into 5.8 million additional people falling into poverty as a result of the pandemic (Box 2.2). After two decades of uninterrupted decline in poverty, the COVID-19 pandemic is expected to have reversed the progress of more recent years. The COVID-19 pandemic is expected to not only increase poverty, but also worsen the depth and severity of poverty among the already poor, as indirectly demonstrated by the increase in the share of the severely food insecure population, which stood at 10 percent during the lockdown phase, compared to 3 percent at the baseline.37
Box 2.2: Methodological approach in simulating the poverty impact of COVID-19
The estimation of the COVID-19’s impact on poverty in Pakistan relies on up-to-date baseline information on welfare, as provided by the latest Household Income and Expenditure Surveys 2018-19, whose data span the year immediately preceding the crisis (FY19). Assessing the impact on welfare entails the comparison of counterfactual welfare estimates obtained under the pre-COVID-19 macroeconomic scenario and those from the latest macro-economic projections, which reflect the impact of COVID-19. The difference between the poverty rate at the national poverty line between these two sets of welfare estimates represents the poverty impact of COVID-19. The simulation approach uses the growth rate in the per-capita value added of the 11 sectors reported in the National Accounts, and of remittances obtained from macro projections as a shock (positive or negative) to sectoral labor incomes and remittance transfers obtained from baseline household survey data. Household incomes obtained through the simulation are then mapped into the predicted consumption levels using the consumption income ratio for each household from the baseline year.
Rural areas are expected to have suffered from an increase in poverty incidence at least as large as the one anticipated in urban areas
While the percentage of the working population facing job loss or income decline is higher in urban areas, rural areas are likely to have seen the largest increases in poverty incidence. Results of the simulation exercise indicate that the absolute increase in poverty in rural areas is expected to be similar in magnitude, if not even larger, than the one predicted in urban areas (Figure 2.10). This seemingly counterintuitive result is due to the fact that rural areas have a higher concentration of people consuming around the poverty line.38 As a result, even a relatively smaller welfare shock,39 can lead to a larger increase in poverty incidence in rural areas.
Figure 2.10: Pre- and post-COVID-19 poverty rate in FY20, by area of residence (Poverty rate; Percent)
Source: World Bank staff estimates
The negative impact of the COVID-19
Balochistan is not only the poorest province of Pakistan, but has also made the least progress in terms of poverty reduction over the past two decades. Poverty trends in
37 Ibidem. 38 Baseline household survey data for FY19 indicate that 9.9 percent of the rural population consumes at a level between the poverty line and 110 percent of the poverty line, against only 5.5 percent in urban areas. 39 The COVID-19 shock to average consumption in rural areas for FY20 is estimated to be a reduction of 1.8 percent, compared to 3.3 percent in urban areas.
28.1
10.8
30.6
12.9
0
5
10
15
20
25
30
35
Rural Urban
Pre-COVID19 COVID-19

N a v i g a t i n g i n U n c e r t a i n T i m e s P a k i s t a n D e v e l o p m e n t U p d a t e
A p r i l 2 0 2 1 T h e W o r l d B a n k
12
shock is expected to be particularly severe in Balochistan.
Balochistan have been traditionally characterized by a high degree of volatility, which indicates a relatively higher vulnerability to welfare shocks. Given Balochistan’s relatively higher concentration of population just above the poverty line40, the COVID-19 shock is expected to have the largest increase in poverty incidence in this province.
The pandemic poses significant risks to long-term prospects of poverty reduction, equity and social mobility.
The long-run poverty impact of the COVID-19 crisis remains unclear. Recent estimates indicate that Pakistan’s labor market has almost fully returned to its pre-lockdown levels (PBS, 2020). Nevertheless, the severity of the crisis amongst the poorest and most vulnerable segments of the population might have long-lasting consequences. The majority of households at the lower end of the welfare distribution coped with the crisis by adopting strategies such as reducing non-food expenditure, consuming lower quality or quantity of food, and selling productive assets that might affect their capacity to recover in the long run (PBS, 2020). Moreover, with disruptions to schooling and the associated learning losses, the pandemic poses significant risks to long-term prospects of poverty reduction, equity, and social mobility.
c. Monetary and financial sector
Monetary In H1 FY21, the SBP maintained the policy rate at 7.0 percent to support the fragile economic recovery
To preserve financial stability and support economic activity amid the COVID-19 crisis (Box 2.2), the SBP has maintained the policy rate at 7.0 percent, implying a negative real interest rate throughout the first six months of this fiscal year41 (Figure 2.11). Moreover, in line with the SBP’s forward guidance,42 the monetary policy is expected to remain accommodative in the near term, with future adjustments in the policy rate to be measured and gradual to achieve mildly positive real interest rates.
Figure 2.11: Nominal and Real Policy Rate (Percent)
Source: Data from State Bank of Pakistan and Pakistan Bureau of Statistics, World Bank staff calculations. Note: Real policy rate is calculated using y-o-y headline inflation on 2015/18 base year.
Table 2.4: Monetary Aggregates (PKR billion unless mentioned otherwise)
Stock Flow*
30-Jun-18 30-Jun-19 30-Jun-20 H1 FY20 H1 FY21
Net Foreign Assets -208.0 -1,507.1 -516.2 878.0 578.8 of which: SBP 12.5 -1,127.2 -181.3 805.1 345.5
Net Domestic Assets 16,205.6 19,305.6 21,424.2 39.3 584.3 Government borrowing: 10,199.7 12,336.7 14,547.2 159.3 359.4
Budgetary borrowing 9,393.0 11,596.5 13,748.3 186.6 437.6 from SBP 3,613.4 6,691.9 6,538.8 -740.5 -585.9 from Scheduled banks 5,779.6 4,904.6 7,209.5 927.1 1,023.5
Commodity operations 819.7 756.4 813.4 -28.5 -79.3
40 In Balochistan, the share of population within a 10 percent negative shock to the poverty line is 15 percent, against a corresponding figure of 10 percent in Khyber Pakhtunkhwa province and 7 percent in Punjab and Sindh. 41 Headline inflation averaged 8.6 percent in H1 FY21 (Section 2b on Inflation). 42 See SPB Monetary Policy Statement January 2021 https://www.sbp.org.pk/m_policy/2021/MPS-Jan-2021-Eng.pdf
-4-202468
10121416
Policy Rate Real Policy Rate
N a v i g a t i n g i n U n c e r t a i n T i m e s P a k i s t a n D e v e l o p m e n t U p d a t e
A p r i l 2 0 2 1 T h e W o r l d B a n k
13
Non-govt. sector borrowing: 7,033.6 8,072.8 8,372.4 214.0 317.8 Private sector 5,973.0 6,666.5 6,862.9 215.6 343.5 Public Sector Enterprises 1,068.2 1,394.2 1,490.5 -2.4 -29.3
Other Items (net) -1,027.7 -1,103.9 -1,495.5 -334.0 -92.9 Broad Money (M2) 15,997.2 17,798.5 20,908.0 917.3 1,163.1 Reserve Money (RM) 5,485 6,573 7,680 165.3 11.7 Memorandum item
Currency in circulation 4,387.8 4,950.0 6,142.0 330.0 64.5 Total Deposits with Banks 11,582.4 12,814.8 14,724.8 587.4 1,082.1 CIC/Deposit ratio (end-period) 0.38 0.39 0.42 0.39 0.39
(Average Growth Y-o-Y) M2 12.2 10.1 13.6 11.9 17.5 RM 15.6 15.5 17.4 17.2 16.2 Currency in circulation 15.6 15.5 18.9 17.9 17.3 Total Deposits with Banks 10.9 8.0 11.4 9.4 17.5 * Based on weekly monetary survey data.
Source: State Bank of Pakistan
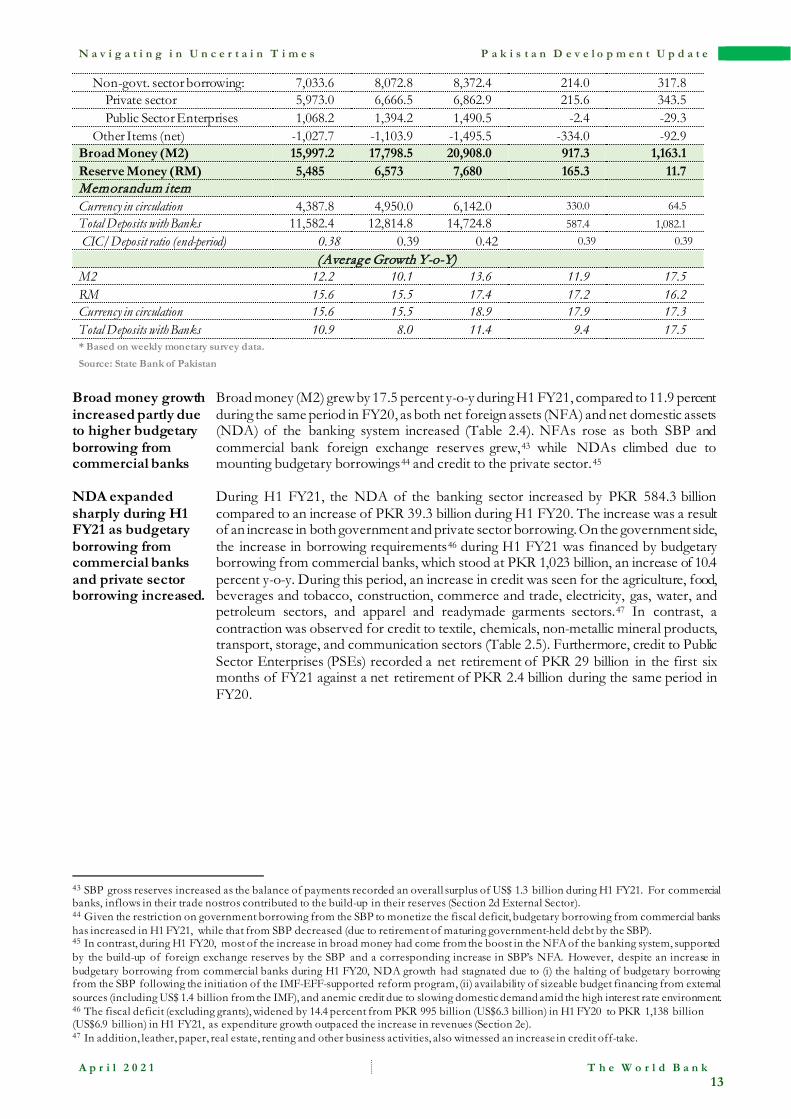
Broad money growth increased partly due to higher budgetary borrowing from commercial banks
Broad money (M2) grew by 17.5 percent y-o-y during H1 FY21, compared to 11.9 percent during the same period in FY20, as both net foreign assets (NFA) and net domestic assets (NDA) of the banking system increased (Table 2.4). NFAs rose as both SBP and commercial bank foreign exchange reserves grew,43 while NDAs climbed due to mounting budgetary borrowings44 and credit to the private sector.45
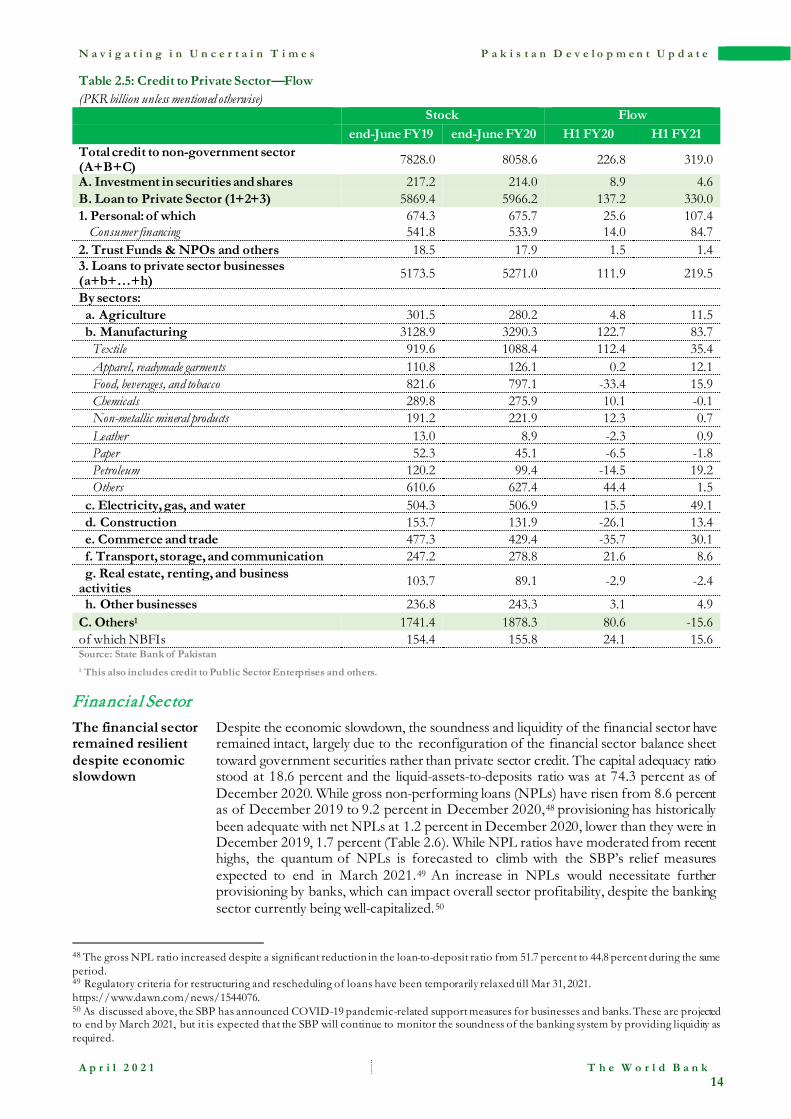
NDA expanded sharply during H1 FY21 as budgetary borrowing from commercial banks and private sector borrowing increased.
During H1 FY21, the NDA of the banking sector increased by PKR 584.3 billion compared to an increase of PKR 39.3 billion during H1 FY20. The increase was a result of an increase in both government and private sector borrowing. On the government side, the increase in borrowing requirements46 during H1 FY21 was financed by budgetary borrowing from commercial banks, which stood at PKR 1,023 billion, an increase of 10.4 percent y-o-y. During this period, an increase in credit was seen for the agriculture, food, beverages and tobacco, construction, commerce and trade, electricity, gas, water, and petroleum sectors, and apparel and readymade garments sectors.47 In contrast, a contraction was observed for credit to textile, chemicals, non-metallic mineral products, transport, storage, and communication sectors (Table 2.5). Furthermore, credit to Public Sector Enterprises (PSEs) recorded a net retirement of PKR 29 billion in the first six months of FY21 against a net retirement of PKR 2.4 billion during the same period in FY20.
43 SBP gross reserves increased as the balance of payments recorded an overall surplus of US$ 1.3 billion during H1 FY21. For commercial banks, inflows in their trade nostros contributed to the build-up in their reserves (Section 2d External Sector). 44 Given the restriction on government borrowing from the SBP to monetize the fiscal deficit, budgetary borrowing from commercial banks has increased in H1 FY21, while that from SBP decreased (due to retirement of maturing government-held debt by the SBP). 45 In contrast, during H1 FY20, most of the increase in broad money had come from the boost in the NFA of the banking system, supported by the build-up of foreign exchange reserves by the SBP and a corresponding increase in SBP’s NFA. However, despite an increase in budgetary borrowing from commercial banks during H1 FY20, NDA growth had stagnated due to (i) the halting of budgetary borrowing from the SBP following the initiation of the IMF-EFF-supported reform program, (ii) availability of sizeable budget financing from external sources (including US$ 1.4 billion from the IMF), and anemic credit due to slowing domestic demand amid the high interest rate environment. 46 The fiscal deficit (excluding grants), widened by 14.4 percent from PKR 995 billion (US$6.3 billion) in H1 FY20 to PKR 1,138 billion (US$6.9 billion) in H1 FY21, as expenditure growth outpaced the increase in revenues (Section 2e). 47 In addition, leather, paper, real estate, renting and other business activities, also witnessed an increase in credit off-take.
N a v i g a t i n g i n U n c e r t a i n T i m e s P a k i s t a n D e v e l o p m e n t U p d a t e
A p r i l 2 0 2 1 T h e W o r l d B a n k
14
Table 2.5: Credit to Private Sector—Flow (PKR billion unless mentioned otherwise) Stock Flow end-June FY19 end-June FY20 H1 FY20 H1 FY21 Total credit to non-government sector (A+B+C) 7828.0 8058.6 226.8 319.0
A. Investment in securities and shares 217.2 214.0 8.9 4.6 B. Loan to Private Sector (1+2+3) 5869.4 5966.2 137.2 330.0 1. Personal: of which 674.3 675.7 25.6 107.4
Consumer financing 541.8 533.9 14.0 84.7 2. Trust Funds & NPOs and others 18.5 17.9 1.5 1.4 3. Loans to private sector businesses (a+b+…+h) 5173.5 5271.0 111.9 219.5
By sectors: a. Agriculture 301.5 280.2 4.8 11.5 b. Manufacturing 3128.9 3290.3 122.7 83.7 Textile 919.6 1088.4 112.4 35.4 Apparel, readymade garments 110.8 126.1 0.2 12.1 Food, beverages, and tobacco 821.6 797.1 -33.4 15.9 Chemicals 289.8 275.9 10.1 -0.1 Non-metallic mineral products 191.2 221.9 12.3 0.7 Leather 13.0 8.9 -2.3 0.9 Paper 52.3 45.1 -6.5 -1.8 Petroleum 120.2 99.4 -14.5 19.2 Others 610.6 627.4 44.4 1.5 c. Electricity, gas, and water 504.3 506.9 15.5 49.1 d. Construction 153.7 131.9 -26.1 13.4 e. Commerce and trade 477.3 429.4 -35.7 30.1 f. Transport, storage, and communication 247.2 278.8 21.6 8.6 g. Real estate, renting, and business activities 103.7 89.1 -2.9 -2.4
h. Other businesses 236.8 243.3 3.1 4.9 C. Others1 1741.4 1878.3 80.6 -15.6 of which NBFIs 154.4 155.8 24.1 15.6 Source: State Bank of Pakistan 1 This also includes credit to Public Sector Enterprises and others.
Financia l Sector The financial sector remained resilient despite economic slowdown
Despite the economic slowdown, the soundness and liquidity of the financial sector have remained intact, largely due to the reconfiguration of the financial sector balance sheet toward government securities rather than private sector credit. The capital adequacy ratio stood at 18.6 percent and the liquid-assets-to-deposits ratio was at 74.3 percent as of December 2020. While gross non-performing loans (NPLs) have risen from 8.6 percent as of December 2019 to 9.2 percent in December 2020,48 provisioning has historically been adequate with net NPLs at 1.2 percent in December 2020, lower than they were in December 2019, 1.7 percent (Table 2.6). While NPL ratios have moderated from recent highs, the quantum of NPLs is forecasted to climb with the SBP’s relief measures expected to end in March 2021.49 An increase in NPLs would necessitate further provisioning by banks, which can impact overall sector profitability, despite the banking sector currently being well-capitalized.50
48 The gross NPL ratio increased despite a significant reduction in the loan-to-deposit ratio from 51.7 percent to 44.8 percent during the same period. 49 Regulatory criteria for restructuring and rescheduling of loans have been temporarily relaxed till Mar 31, 2021. https://www.dawn.com/news/1544076. 50 As discussed above, the SBP has announced COVID-19 pandemic-related support measures for businesses and banks. These are projected to end by March 2021, but it is expected that the SBP will continue to monitor the soundness of the banking system by providing liquidity as required.
N a v i g a t i n g i n U n c e r t a i n T i m e s P a k i s t a n D e v e l o p m e n t U p d a t e
A p r i l 2 0 2 1 T h e W o r l d B a n k
15
Table 2.6: Selected Key Indicators of the Banking Sector (PKR billion unless mentioned otherwise)
Jun-18 Dec-18 Jun-19 Dec-19 Jun-20 Dec-20 Profit Before Tax year to date (PKR bn) 129 243 155 304 217 411
Credit to Private Sector (PKR bn) 5,796 6,366 6,667 6,841 6,863 6,865 ROA Before Tax (%) 1.4% 1.3% 1.6% 1.5% 1.9% 180.0%
ROE Before Tax (%) 18.5% 17.4% 21.3% 20.1% 25.2% 23.3% Advances to Deposits Ratio (%) 53.1% 55.8% 53.2% 51.7% 46.3% 44.8%
Liquid Assets/Deposits (%) 71.3% 67.2% 65.3% 68.4% 72.6% 74.3%
Capital Adequacy Ratio (%) 15.9% 16.2% 16.1% 17.0% 18.7% 18.6%
Gross NPLs to Loans (%) 7.9% 8.0% 8.8% 8.6% 9.7% 9.2%
Net NPLs to Loans (%) 1.1% 1.4% 2.1% 1.7% 1.9% 1.2%
Source: State Bank of Pakistan
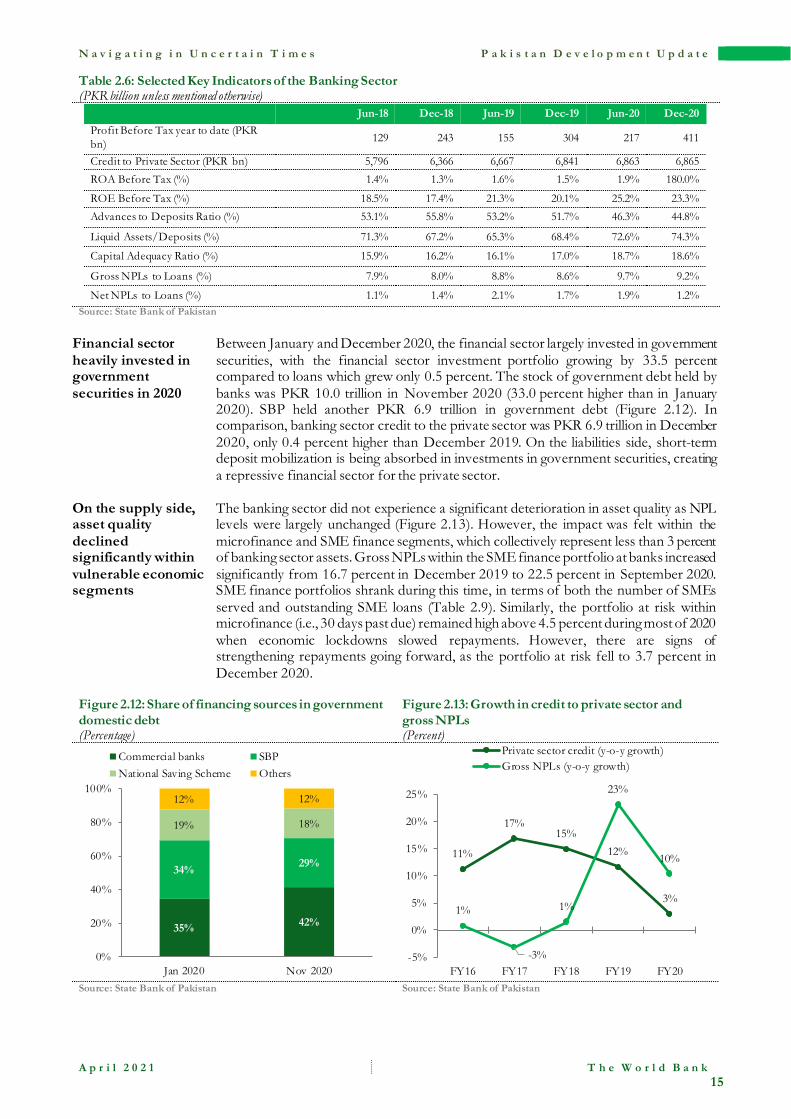
Financial sector heavily invested in government securities in 2020
Between January and December 2020, the financial sector largely invested in government securities, with the financial sector investment portfolio growing by 33.5 percent compared to loans which grew only 0.5 percent. The stock of government debt held by banks was PKR 10.0 trillion in November 2020 (33.0 percent higher than in January 2020). SBP held another PKR 6.9 trillion in government debt (Figure 2.12). In comparison, banking sector credit to the private sector was PKR 6.9 trillion in December 2020, only 0.4 percent higher than December 2019. On the liabilities side, short-term deposit mobilization is being absorbed in investments in government securities, creating a repressive financial sector for the private sector.
On the supply side, asset quality declined significantly within vulnerable economic segments
The banking sector did not experience a significant deterioration in asset quality as NPL levels were largely unchanged (Figure 2.13). However, the impact was felt within the microfinance and SME finance segments, which collectively represent less than 3 percent of banking sector assets. Gross NPLs within the SME finance portfolio at banks increased significantly from 16.7 percent in December 2019 to 22.5 percent in September 2020. SME finance portfolios shrank during this time, in terms of both the number of SMEs served and outstanding SME loans (Table 2.9). Similarly, the portfolio at risk within microfinance (i.e., 30 days past due) remained high above 4.5 percent during most of 2020 when economic lockdowns slowed repayments. However, there are signs of strengthening repayments going forward, as the portfolio at risk fell to 3.7 percent in December 2020.
Figure 2.12: Share of financing sources in government domestic debt (Percentage)
Figure 2.13: Growth in credit to private sector and gross NPLs (Percent)
Source: State Bank of Pakistan Source: State Bank of Pakistan
35% 42%
34% 29%
19% 18%
12% 12%
0%
20%
40%
60%
80%
100%
Jan 2020 Nov 2020
Commercial banks SBPNational Saving Scheme Others
11%
17%15%
12%
3%1%
-3%
1%
23%
10%
-5%
0%
5%
10%
15%
20%
25%
FY16 FY17 FY18 FY19 FY20
Private sector credit (y-o-y growth)Gross NPLs (y-o-y growth)
N a v i g a t i n g i n U n c e r t a i n T i m e s P a k i s t a n D e v e l o p m e n t U p d a t e
A p r i l 2 0 2 1 T h e W o r l d B a n k
16
Table 2.7: Selected Key Indicators in SME Finance and Microfinance (PKR billion unless mentioned otherwise)
Jun-19 Dec-19 Jun-20 Dec-20* SME finance loan portfolio 465 477 401 386 SME finance (percent of bank private sector finance) 7.5 7.5 6.4 6.2 No. of SME borrowers 183,606 185,010 188,804 178,827 Microfinance loan portfolio 294 306 300 324
No. of microfinance borrowers 7,142,247 7,249,943 6,885,117 7,005,885
*SME finance data is as of Sep 2020. Source: State Bank of Pakistan
Macro Financia l Capital markets remain shallow and volatile
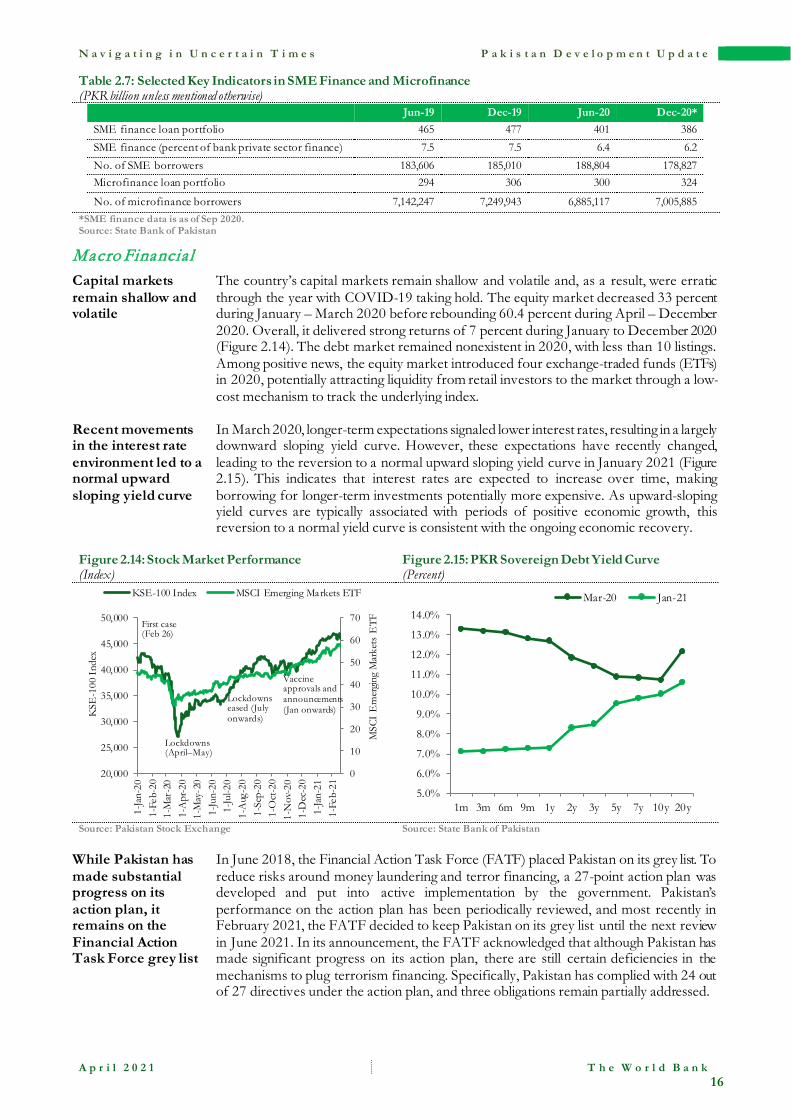
The country’s capital markets remain shallow and volatile and, as a result, were erratic through the year with COVID-19 taking hold. The equity market decreased 33 percent during January – March 2020 before rebounding 60.4 percent during April – December 2020. Overall, it delivered strong returns of 7 percent during January to December 2020 (Figure 2.14). The debt market remained nonexistent in 2020, with less than 10 listings. Among positive news, the equity market introduced four exchange-traded funds (ETFs) in 2020, potentially attracting liquidity from retail investors to the market through a low-cost mechanism to track the underlying index.
Recent movements in the interest rate environment led to a normal upward sloping yield curve
In March 2020, longer-term expectations signaled lower interest rates, resulting in a largely downward sloping yield curve. However, these expectations have recently changed, leading to the reversion to a normal upward sloping yield curve in January 2021 (Figure 2.15). This indicates that interest rates are expected to increase over time, making borrowing for longer-term investments potentially more expensive. As upward-sloping yield curves are typically associated with periods of positive economic growth, this reversion to a normal yield curve is consistent with the ongoing economic recovery.
Figure 2.14: Stock Market Performance (Index)
Figure 2.15: PKR Sovereign Debt Yield Curve (Percent)
Source: Pakistan Stock Exchange Source: State Bank of Pakistan
While Pakistan has made substantial progress on its action plan, it remains on the Financial Action Task Force grey list
In June 2018, the Financial Action Task Force (FATF) placed Pakistan on its grey list. To reduce risks around money laundering and terror financing, a 27-point action plan was developed and put into active implementation by the government. Pakistan’s performance on the action plan has been periodically reviewed, and most recently in February 2021, the FATF decided to keep Pakistan on its grey list until the next review in June 2021. In its announcement, the FATF acknowledged that although Pakistan has made significant progress on its action plan, there are still certain deficiencies in the mechanisms to plug terrorism financing. Specifically, Pakistan has complied with 24 out of 27 directives under the action plan, and three obligations remain partially addressed.
0
10
20
30
40
50
60
70
20,000
25,000
30,000
35,000
40,000
45,000
50,000
1-Ja
n-20
1-Fe
b-20
1-M
ar-2
01-
Apr
-20
1-M
ay-2
01-
Jun-
201-
Jul-2
01-
Aug
-20
1-Se
p-20
1-O
ct-2
01-
Nov
-20
1-D
ec-2
01-
Jan-
211-
Feb-
21
MSC
I E
mer
ging
Mar
kets
ETF
KSE
-100
Inde
x
KSE-100 Index MSCI Emerging Markets ETF
First case (Feb 26)
Lockdowns (April–May)
Lockdowns eased (July onwards)
Vaccineapprovals and announcements (Jan onwards)
5.0%
6.0%
7.0%
8.0%
9.0%
10.0%
11.0%
12.0%
13.0%
14.0%
1m 3m 6m 9m 1y 2y 3y 5y 7y 10y 20y
Mar-20 Jan-21

N a v i g a t i n g i n U n c e r t a i n T i m e s P a k i s t a n D e v e l o p m e n t U p d a t e
A p r i l 2 0 2 1 T h e W o r l d B a n k
17
d. External sector
Pakistan recorded a current account surplus in H1 FY21, the first half-yearly surplus in a decade
During H1 FY21, the current account recorded a surplus of US$ 1.1 billion, compared to a deficit of US$ 2.0 billion during H1 FY20 – the first half-yearly surplus since FY11 (Figure 2.16, Table 2.6). Despite a wider (goods and services) trade deficit, record remittance inflows swung the current account to a surplus during this period.
Figure 2.16: H1 Current Account Balances (Jul–Dec) (US$ Billion)
Source: State Bank of Pakistan, World Bank staff calculations
The (goods and services) trade deficit widened in H1 FY21, as a larger goods trade deficit more than offset a narrower services trade deficit
The overall trade deficit grew to US$ 12.4 billion in H1 FY21 from US$ 11.4 billion in H1 FY21. This reflects the widening of the goods trade deficit to US$ 11.4 billion in H1 FY21 from US$ 9.7 billion in H1 FY20, as goods imports recovered amidst improving domestic economic activity. In contrast, the services trade deficit shrank to US$ 1.0 billion in H1 FY21 from US$ 1.7 billion a year earlier, as imports of key services, including tourism and transport, continued to be adversely impacted by the pandemic. During H1 FY21, exports of goods and services contracted by 3.8 percent y-o-y, while total imports saw a mild recovery, increasing 1.4 percent (Figure 2.17 and Figure 2.18).
Figure 2.17: Exports of goods and services (Jul–Dec) (US$ million)
Figure 2.18: Imports of goods and services (Jul–Dec) (US$ million)
Source: State Bank of Pakistan, World Bank staff calculations Source: State Bank of Pakistan, World Bank staff calculations
Table 2.8: Balance of payments summary1 US$ million unless mentioned otherwise
FY19 FY20 H1 FY20 H1 FY21 i. Current account (A+B+C+D) -13,434 -2,970 -2,032 1,141
A. Good trade balance -27,612 -19,910 -9,743 -11,398 Goods Exports 24,257 22,507 12,393 11,804 Goods Imports 51,869 42,417 22,136 23,202
B. Services Trade Balance -4,970 -2,827 -1,697 -989 C. Balance on primary income2 -5,610 -5,682 -3,151 -2,721 D. Balance on secondary income2 24,758 25,449 12,559 16,249
of which, remittances 21,740 23,127 11,371 14,203 ii. Capital account 229 290 198 132
12,393 11,804
2,835 2,844
0
5,000
10,000
15,000
20,000
25,000
30,000
FY20 FY21
Exports of goods FOB Exports of services
-3.8 percent
22,136 23,202
4,532 3,833
0
5,000
10,000
15,000
20,000
25,000
30,000
FY20 FY21
Imports of goods FOB Imports of services
1.4 percent
-20
-10
0
10
FY13 FY14 FY15 FY16 FY17 FY18 FY19 FY20 FY21
Secondary Income BalancePrimary Income BalanceServices Trade BalanceGoods Trade BalanceCurrent account Balance
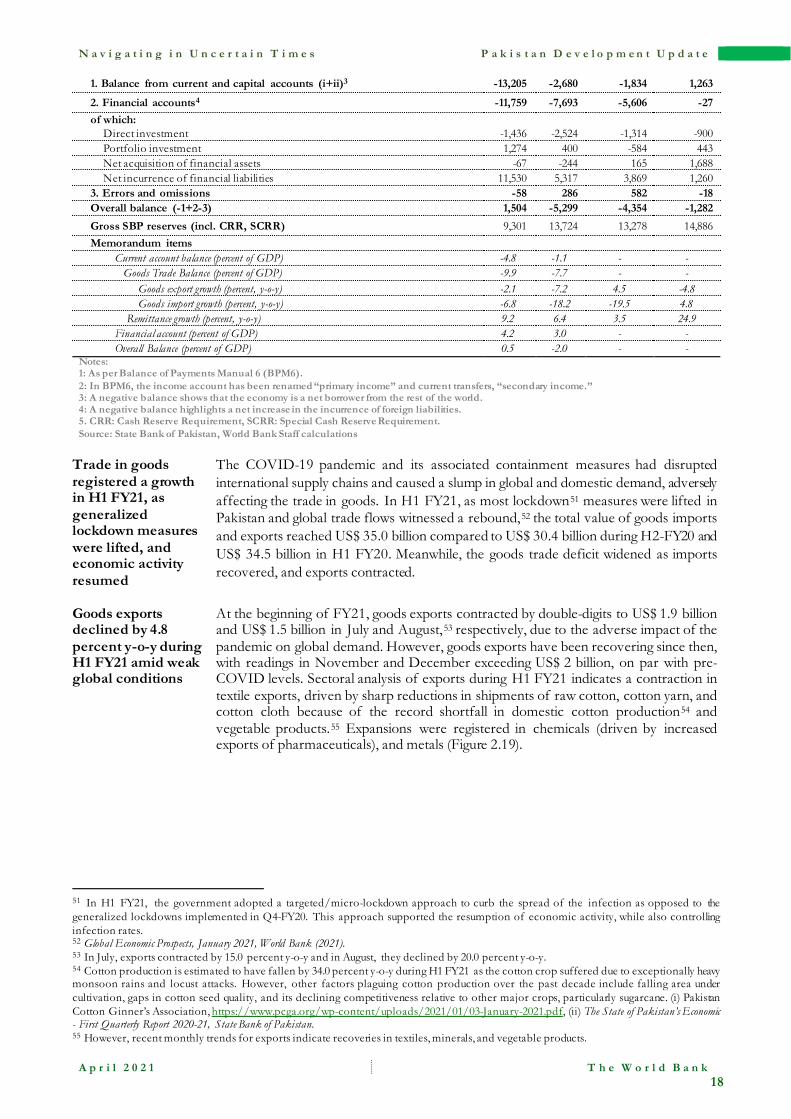
N a v i g a t i n g i n U n c e r t a i n T i m e s P a k i s t a n D e v e l o p m e n t U p d a t e
A p r i l 2 0 2 1 T h e W o r l d B a n k
18
1. Balance from current and capital accounts (i+ii)3 -13,205 -2,680 -1,834 1,263
2. Financial accounts4 -11,759 -7,693 -5,606 -27 of which:
Direct investment -1,436 -2,524 -1,314 -900 Portfolio investment 1,274 400 -584 443 Net acquisition of financial assets -67 -244 165 1,688 Net incurrence of financial liabilities 11,530 5,317 3,869 1,260
3. Errors and omissions -58 286 582 -18 Overall balance (-1+2-3) 1,504 -5,299 -4,354 -1,282 Gross SBP reserves (incl. CRR, SCRR) 9,301 13,724 13,278 14,886 Memorandum items
Current account balance (percent of GDP) -4.8 -1.1 - - Goods Trade Balance (percent of GDP) -9.9 -7.7 - -
Goods export growth (percent, y-o-y) -2.1 -7.2 4.5 -4.8 Goods import growth (percent, y-o-y) -6.8 -18.2 -19.5 4.8
Remittance growth (percent, y-o-y) 9.2 6.4 3.5 24.9 Financial account (percent of GDP) 4.2 3.0 - - Overall Balance (percent of GDP) 0.5 -2.0 - -
Notes: 1: As per Balance of Payments Manual 6 (BPM6). 2: In BPM6, the income account has been renamed “primary income” and current transfers, “secondary income.” 3: A negative balance shows that the economy is a net borrower from the rest of the world. 4: A negative balance highlights a net increase in the incurrence of foreign liabilities. 5. CRR: Cash Reserve Requirement, SCRR: Special Cash Reserve Requirement. Source: State Bank of Pakistan, World Bank Staff calculations
Trade in goods registered a growth in H1 FY21, as generalized lockdown measures were lifted, and economic activity resumed
The COVID-19 pandemic and its associated containment measures had disrupted international supply chains and caused a slump in global and domestic demand, adversely affecting the trade in goods. In H1 FY21, as most lockdown51 measures were lifted in Pakistan and global trade flows witnessed a rebound,52 the total value of goods imports and exports reached US$ 35.0 billion compared to US$ 30.4 billion during H2-FY20 and US$ 34.5 billion in H1 FY20. Meanwhile, the goods trade deficit widened as imports recovered, and exports contracted.
Goods exports declined by 4.8 percent y-o-y during H1 FY21 amid weak global conditions
At the beginning of FY21, goods exports contracted by double-digits to US$ 1.9 billion and US$ 1.5 billion in July and August,53 respectively, due to the adverse impact of the pandemic on global demand. However, goods exports have been recovering since then, with readings in November and December exceeding US$ 2 billion, on par with pre-COVID levels. Sectoral analysis of exports during H1 FY21 indicates a contraction in textile exports, driven by sharp reductions in shipments of raw cotton, cotton yarn, and cotton cloth because of the record shortfall in domestic cotton production54 and vegetable products.55 Expansions were registered in chemicals (driven by increased exports of pharmaceuticals), and metals (Figure 2.19).
51 In H1 FY21, the government adopted a targeted/micro-lockdown approach to curb the spread of the infection as opposed to the generalized lockdowns implemented in Q4-FY20. This approach supported the resumption of economic activity, while also controlling infection rates. 52 Global Economic Prospects, January 2021, World Bank (2021). 53 In July, exports contracted by 15.0 percent y-o-y and in August, they declined by 20.0 percent y-o-y. 54 Cotton production is estimated to have fallen by 34.0 percent y-o-y during H1 FY21 as the cotton crop suffered due to exceptionally heavy monsoon rains and locust attacks. However, other factors plaguing cotton production over the past decade include falling area under cultivation, gaps in cotton seed quality, and its declining competitiveness relative to other major crops, particularly sugarcane. (i) Pakistan Cotton Ginner’s Association, https://www.pcga.org/wp-content/uploads/2021/01/03-January-2021.pdf, (ii) The State of Pakistan’s Economic - First Quarterly Report 2020-21, State Bank of Pakistan. 55 However, recent monthly trends for exports indicate recoveries in textiles, minerals, and vegetable products.
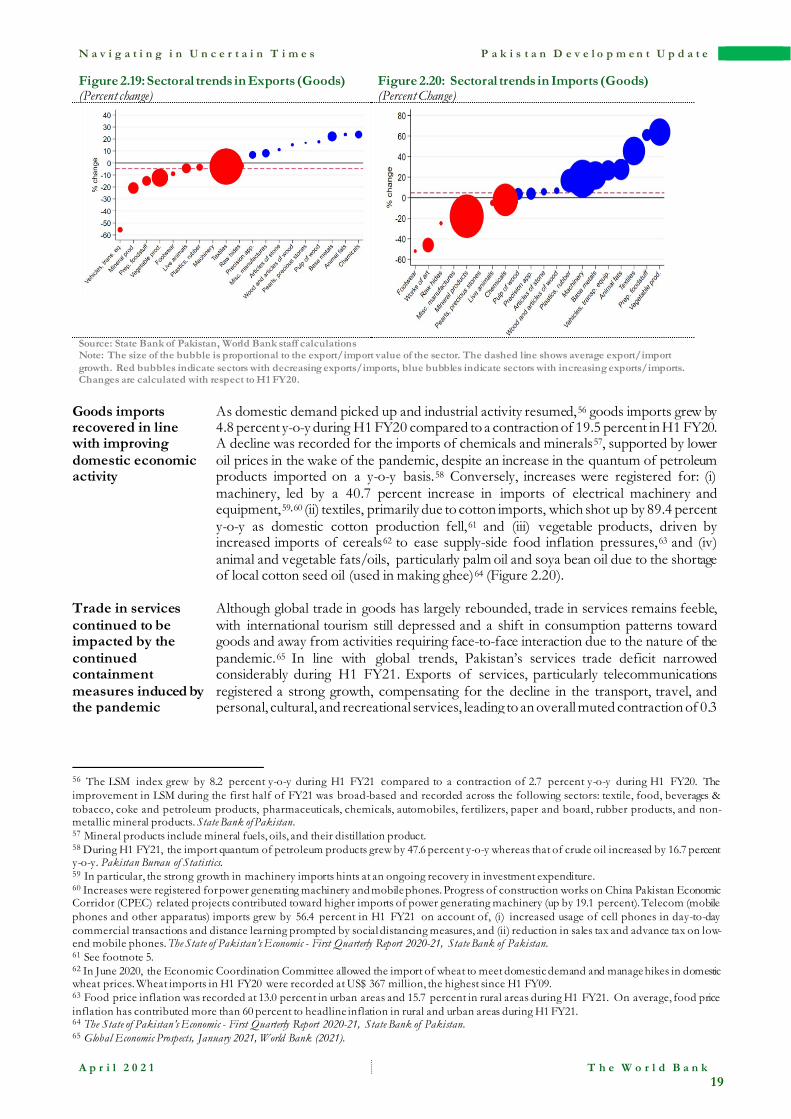
N a v i g a t i n g i n U n c e r t a i n T i m e s P a k i s t a n D e v e l o p m e n t U p d a t e
A p r i l 2 0 2 1 T h e W o r l d B a n k
19
Figure 2.19: Sectoral trends in Exports (Goods) (Percent change)
Figure 2.20: Sectoral trends in Imports (Goods) (Percent Change)
Source: State Bank of Pakistan, World Bank staff calculations Note: The size of the bubble is proportional to the export/import value of the sector. The dashed line shows average export/import growth. Red bubbles indicate sectors with decreasing exports/imports, blue bubbles indicate sectors with increasing exports/imports. Changes are calculated with respect to H1 FY20.
Goods imports recovered in line with improving domestic economic activity
As domestic demand picked up and industrial activity resumed,56 goods imports grew by 4.8 percent y-o-y during H1 FY20 compared to a contraction of 19.5 percent in H1 FY20. A decline was recorded for the imports of chemicals and minerals57, supported by lower oil prices in the wake of the pandemic, despite an increase in the quantum of petroleum products imported on a y-o-y basis.58 Conversely, increases were registered for: (i) machinery, led by a 40.7 percent increase in imports of electrical machinery and equipment,59,60 (ii) textiles, primarily due to cotton imports, which shot up by 89.4 percent y-o-y as domestic cotton production fell,61 and (iii) vegetable products, driven by increased imports of cereals62 to ease supply-side food inflation pressures,63 and (iv) animal and vegetable fats/oils, particularly palm oil and soya bean oil due to the shortage of local cotton seed oil (used in making ghee)64 (Figure 2.20).
Trade in services continued to be impacted by the continued containment measures induced by the pandemic
Although global trade in goods has largely rebounded, trade in services remains feeble, with international tourism still depressed and a shift in consumption patterns toward goods and away from activities requiring face-to-face interaction due to the nature of the pandemic.65 In line with global trends, Pakistan’s services trade deficit narrowed considerably during H1 FY21. Exports of services, particularly telecommunications registered a strong growth, compensating for the decline in the transport, travel, and personal, cultural, and recreational services, leading to an overall muted contraction of 0.3
56 The LSM index grew by 8.2 percent y-o-y during H1 FY21 compared to a contraction of 2.7 percent y-o-y during H1 FY20. The improvement in LSM during the first half of FY21 was broad-based and recorded across the following sectors: textile, food, beverages & tobacco, coke and petroleum products, pharmaceuticals, chemicals, automobiles, fertilizers, paper and board, rubber products, and non-metallic mineral products. State Bank of Pakistan. 57 Mineral products include mineral fuels, oils, and their distillation product. 58 During H1 FY21, the import quantum of petroleum products grew by 47.6 percent y-o-y whereas that of crude oil increased by 16.7 percent y-o-y. Pakistan Bureau of Statistics. 59 In particular, the strong growth in machinery imports hints at an ongoing recovery in investment expenditure. 60 Increases were registered for power generating machinery and mobile phones. Progress of construction works on China Pakistan Economic Corridor (CPEC) related projects contributed toward higher imports of power generating machinery (up by 19.1 percent). Telecom (mobile phones and other apparatus) imports grew by 56.4 percent in H1 FY21 on account of, (i) increased usage of cell phones in day-to-day commercial transactions and distance learning prompted by social distancing measures, and (ii) reduction in sales tax and advance tax on low-end mobile phones. The State of Pakistan’s Economic - First Quarterly Report 2020-21, State Bank of Pakistan. 61 See footnote 5. 62 In June 2020, the Economic Coordination Committee allowed the import of wheat to meet domestic demand and manage hikes in domestic wheat prices. Wheat imports in H1 FY20 were recorded at US$ 367 million, the highest since H1 FY09. 63 Food price inflation was recorded at 13.0 percent in urban areas and 15.7 percent in rural areas during H1 FY21. On average, food price inflation has contributed more than 60 percent to headline inflation in rural and urban areas during H1 FY21. 64 The State of Pakistan’s Economic - First Quarterly Report 2020-21, State Bank of Pakistan. 65 Global Economic Prospects, January 2021, World Bank (2021).
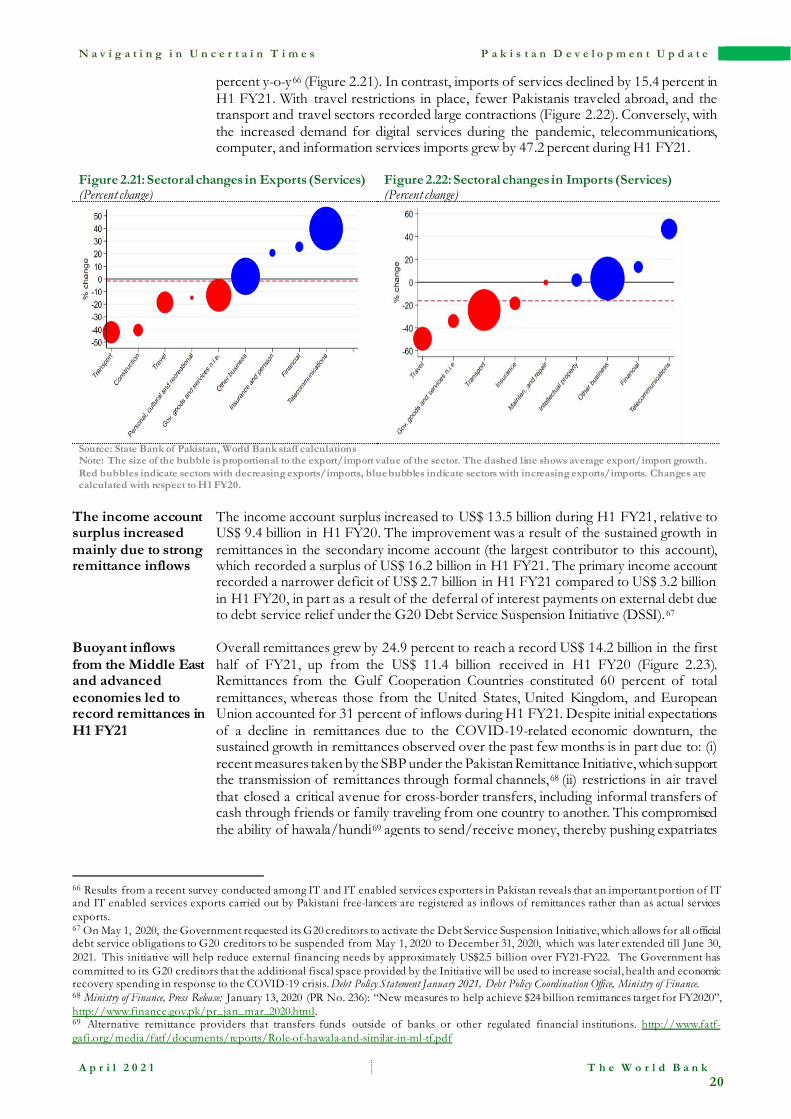
N a v i g a t i n g i n U n c e r t a i n T i m e s P a k i s t a n D e v e l o p m e n t U p d a t e
A p r i l 2 0 2 1 T h e W o r l d B a n k
20
percent y-o-y66 (Figure 2.21). In contrast, imports of services declined by 15.4 percent in H1 FY21. With travel restrictions in place, fewer Pakistanis traveled abroad, and the transport and travel sectors recorded large contractions (Figure 2.22). Conversely, with the increased demand for digital services during the pandemic, telecommunications, computer, and information services imports grew by 47.2 percent during H1 FY21.
Figure 2.21: Sectoral changes in Exports (Services) (Percent change)
Figure 2.22: Sectoral changes in Imports (Services) (Percent change)
Source: State Bank of Pakistan, World Bank staff calculations Note: The size of the bubble is proportional to the export/import value of the sector. The dashed line shows average export/import growth. Red bubbles indicate sectors with decreasing exports/imports, blue bubbles indicate sectors with increasing exports/imports. Changes are calculated with respect to H1 FY20.
The income account surplus increased mainly due to strong remittance inflows
The income account surplus increased to US$ 13.5 billion during H1 FY21, relative to US$ 9.4 billion in H1 FY20. The improvement was a result of the sustained growth in remittances in the secondary income account (the largest contributor to this account), which recorded a surplus of US$ 16.2 billion in H1 FY21. The primary income account recorded a narrower deficit of US$ 2.7 billion in H1 FY21 compared to US$ 3.2 billion in H1 FY20, in part as a result of the deferral of interest payments on external debt due to debt service relief under the G20 Debt Service Suspension Initiative (DSSI).67
Buoyant inflows from the Middle East and advanced economies led to record remittances in H1 FY21
Overall remittances grew by 24.9 percent to reach a record US$ 14.2 billion in the first half of FY21, up from the US$ 11.4 billion received in H1 FY20 (Figure 2.23). Remittances from the Gulf Cooperation Countries constituted 60 percent of total remittances, whereas those from the United States, United Kingdom, and European Union accounted for 31 percent of inflows during H1 FY21. Despite initial expectations of a decline in remittances due to the COVID-19-related economic downturn, the sustained growth in remittances observed over the past few months is in part due to: (i) recent measures taken by the SBP under the Pakistan Remittance Initiative, which support the transmission of remittances through formal channels,68 (ii) restrictions in air travel that closed a critical avenue for cross-border transfers, including informal transfers of cash through friends or family traveling from one country to another. This compromised the ability of hawala/hundi69 agents to send/receive money, thereby pushing expatriates
66 Results from a recent survey conducted among IT and IT enabled services exporters in Pakistan reveals that an important portion of IT and IT enabled services exports carried out by Pakistani free-lancers are registered as inflows of remittances rather than as actual services exports. 67 On May 1, 2020, the Government requested its G20 creditors to activate the Debt Service Suspension Initiative, which allows for all official debt service obligations to G20 creditors to be suspended from May 1, 2020 to December 31, 2020, which was later extended till June 30, 2021. This initiative will help reduce external financing needs by approximately US$2.5 billion over FY21-FY22. The Government has committed to its G20 creditors that the additional fiscal space provided by the Initiative will be used to increase social, health and economic recovery spending in response to the COVID-19 crisis. Debt Policy Statement January 2021, Debt Policy Coordination Office, Ministry of Finance. 68 Ministry of Finance, Press Release: January 13, 2020 (PR No. 236): “New measures to help achieve $24 billion remittances target for FY2020”, http://www.finance.gov.pk/pr_jan_mar_2020.html. 69 Alternative remittance providers that transfers funds outside of banks or other regulated financial institutions. http://www.fatf-gafi.org/media/fatf/documents/reports/Role-of-hawala-and-similar-in-ml-tf.pdf
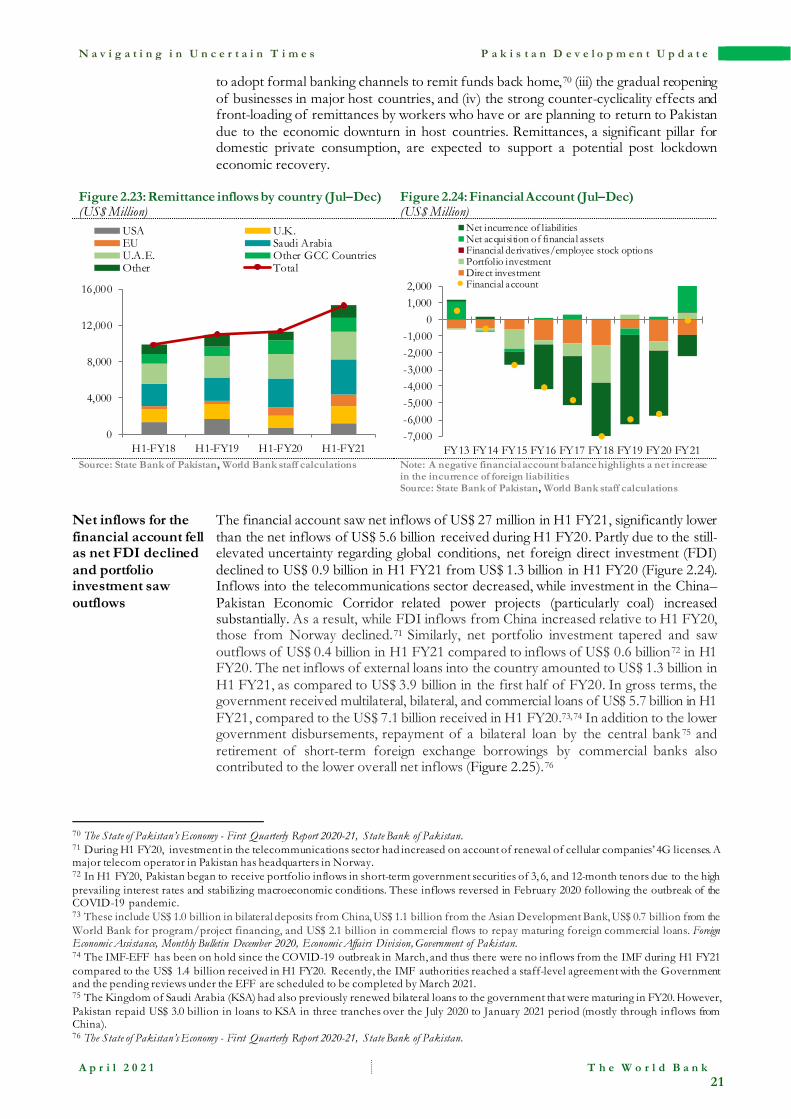
N a v i g a t i n g i n U n c e r t a i n T i m e s P a k i s t a n D e v e l o p m e n t U p d a t e
A p r i l 2 0 2 1 T h e W o r l d B a n k
21
to adopt formal banking channels to remit funds back home,70 (iii) the gradual reopening of businesses in major host countries, and (iv) the strong counter-cyclicality effects and front-loading of remittances by workers who have or are planning to return to Pakistan due to the economic downturn in host countries. Remittances, a significant pillar for domestic private consumption, are expected to support a potential post lockdown economic recovery.
Figure 2.23: Remittance inflows by country (Jul–Dec) (US$ Million)
Figure 2.24: Financial Account (Jul–Dec) (US$ Million)
Source: State Bank of Pakistan, World Bank staff calculations Note: A negative financial account balance highlights a net increase
in the incurrence of foreign liabilities Source: State Bank of Pakistan, World Bank staff calculations
Net inflows for the financial account fell as net FDI declined and portfolio investment saw outflows
The financial account saw net inflows of US$ 27 million in H1 FY21, significantly lower than the net inflows of US$ 5.6 billion received during H1 FY20. Partly due to the still-elevated uncertainty regarding global conditions, net foreign direct investment (FDI) declined to US$ 0.9 billion in H1 FY21 from US$ 1.3 billion in H1 FY20 (Figure 2.24). Inflows into the telecommunications sector decreased, while investment in the China–Pakistan Economic Corridor related power projects (particularly coal) increased substantially. As a result, while FDI inflows from China increased relative to H1 FY20, those from Norway declined.71 Similarly, net portfolio investment tapered and saw outflows of US$ 0.4 billion in H1 FY21 compared to inflows of US$ 0.6 billion72 in H1 FY20. The net inflows of external loans into the country amounted to US$ 1.3 billion in H1 FY21, as compared to US$ 3.9 billion in the first half of FY20. In gross terms, the government received multilateral, bilateral, and commercial loans of US$ 5.7 billion in H1 FY21, compared to the US$ 7.1 billion received in H1 FY20.73,74 In addition to the lower government disbursements, repayment of a bilateral loan by the central bank75 and retirement of short-term foreign exchange borrowings by commercial banks also contributed to the lower overall net inflows (Figure 2.25).76
70 The State of Pakistan’s Economy - First Quarterly Report 2020-21, State Bank of Pakistan. 71 During H1 FY20, investment in the telecommunications sector had increased on account of renewal of cellular companies’ 4G licenses. A major telecom operator in Pakistan has headquarters in Norway. 72 In H1 FY20, Pakistan began to receive portfolio inflows in short-term government securities of 3, 6, and 12-month tenors due to the high prevailing interest rates and stabilizing macroeconomic conditions. These inflows reversed in February 2020 following the outbreak of the COVID-19 pandemic. 73 These include US$ 1.0 billion in bilateral deposits from China, US$ 1.1 billion from the Asian Development Bank, US$ 0.7 billion from the World Bank for program/project financing, and US$ 2.1 billion in commercial flows to repay maturing foreign commercial loans. Foreign Economic Assistance, Monthly Bulletin December 2020, Economic Affairs Division, Government of Pakistan. 74 The IMF-EFF has been on hold since the COVID-19 outbreak in March, and thus there were no inflows from the IMF during H1 FY21 compared to the US$ 1.4 billion received in H1 FY20. Recently, the IMF authorities reached a staff-level agreement with the Government and the pending reviews under the EFF are scheduled to be completed by March 2021. 75 The Kingdom of Saudi Arabia (KSA) had also previously renewed bilateral loans to the government that were maturing in FY20. However, Pakistan repaid US$ 3.0 billion in loans to KSA in three tranches over the July 2020 to January 2021 period (mostly through inflows from China). 76 The State of Pakistan’s Economy - First Quarterly Report 2020-21, State Bank of Pakistan.
0
4,000
8,000
12,000
16,000
H1-FY18 H1-FY19 H1-FY20 H1-FY21
USA U.K.EU Saudi ArabiaU.A.E. Other GCC CountriesOther Total
-7,000-6,000-5,000-4,000-3,000-2,000-1,000
01,0002,000
FY13 FY14 FY15 FY16 FY17 FY18 FY19 FY20 FY21
Net incurrence of liabilitiesNet acquisition of financia l assetsFinancial derivatives/employee stock optionsPortfolio investmentDirect investmentFinancial account
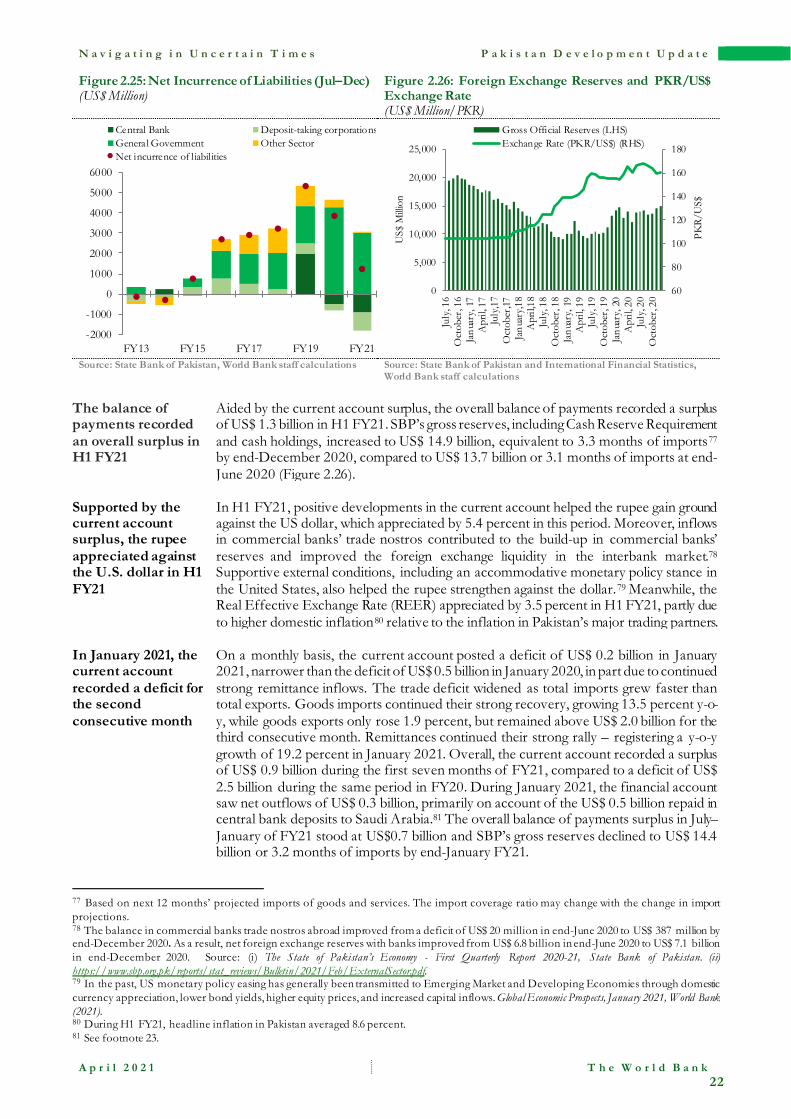
N a v i g a t i n g i n U n c e r t a i n T i m e s P a k i s t a n D e v e l o p m e n t U p d a t e
A p r i l 2 0 2 1 T h e W o r l d B a n k
22
Figure 2.25: Net Incurrence of Liabilities (Jul–Dec) (US$ Million)
Figure 2.26: Foreign Exchange Reserves and PKR/US$ Exchange Rate (US$ Million/PKR)
Source: State Bank of Pakistan, World Bank staff calculations Source: State Bank of Pakistan and International Financial Statistics,
World Bank staff calculations The balance of payments recorded an overall surplus in H1 FY21
Aided by the current account surplus, the overall balance of payments recorded a surplus of US$ 1.3 billion in H1 FY21. SBP’s gross reserves, including Cash Reserve Requirement and cash holdings, increased to US$ 14.9 billion, equivalent to 3.3 months of imports77 by end-December 2020, compared to US$ 13.7 billion or 3.1 months of imports at end-June 2020 (Figure 2.26).
Supported by the current account surplus, the rupee appreciated against the U.S. dollar in H1 FY21
In H1 FY21, positive developments in the current account helped the rupee gain ground against the US dollar, which appreciated by 5.4 percent in this period. Moreover, inflows in commercial banks’ trade nostros contributed to the build-up in commercial banks’ reserves and improved the foreign exchange liquidity in the interbank market.78 Supportive external conditions, including an accommodative monetary policy stance in the United States, also helped the rupee strengthen against the dollar.79 Meanwhile, the Real Effective Exchange Rate (REER) appreciated by 3.5 percent in H1 FY21, partly due to higher domestic inflation80 relative to the inflation in Pakistan’s major trading partners.
In January 2021, the current account recorded a deficit for the second consecutive month
On a monthly basis, the current account posted a deficit of US$ 0.2 billion in January 2021, narrower than the deficit of US$ 0.5 billion in January 2020, in part due to continued strong remittance inflows. The trade deficit widened as total imports grew faster than total exports. Goods imports continued their strong recovery, growing 13.5 percent y-o-y, while goods exports only rose 1.9 percent, but remained above US$ 2.0 billion for the third consecutive month. Remittances continued their strong rally – registering a y-o-y growth of 19.2 percent in January 2021. Overall, the current account recorded a surplus of US$ 0.9 billion during the first seven months of FY21, compared to a deficit of US$ 2.5 billion during the same period in FY20. During January 2021, the financial account saw net outflows of US$ 0.3 billion, primarily on account of the US$ 0.5 billion repaid in central bank deposits to Saudi Arabia.81 The overall balance of payments surplus in July–January of FY21 stood at US$0.7 billion and SBP’s gross reserves declined to US$ 14.4 billion or 3.2 months of imports by end-January FY21.
77 Based on next 12 months’ projected imports of goods and services. The import coverage ratio may change with the change in import projections. 78 The balance in commercial banks trade nostros abroad improved from a deficit of US$ 20 million in end-June 2020 to US$ 387 million by end-December 2020. As a result, net foreign exchange reserves with banks improved from US$ 6.8 billion in end-June 2020 to US$ 7.1 billion in end-December 2020. Source: (i) The State of Pakistan’s Economy - First Quarterly Report 2020-21, State Bank of Pakistan. (ii) https://www.sbp.org.pk/reports/stat_reviews/Bulletin/2021/Feb/ExternalSector.pdf. 79 In the past, US monetary policy easing has generally been transmitted to Emerging Market and Developing Economies through domestic currency appreciation, lower bond yields, higher equity prices, and increased capital inflows. Global Economic Prospects, January 2021, World Bank (2021). 80 During H1 FY21, headline inflation in Pakistan averaged 8.6 percent. 81 See footnote 23.
-2000
-1000
0
1000
2000
3000
4000
5000
6000
FY13 FY15 FY17 FY19 FY21
Central Bank Deposit-taking corporationsGeneral Government Other SectorNet incurrence of liabilities
60
80
100
120
140
160
180
0
5,000
10,000
15,000
20,000
25,000
July
, 16
Oct
ober
, 16
Janu
ary,
17A
pril,
17
July
,17
Oct
ober
,17Ja
nuar
y,18
Apr
il,18
July
, 18
Oct
ober
, 18
Janu
ary,
19A
pril,
19
July
, 19
Oct
ober
, 19
Janu
ary,
20A
pril,
20
July
, 20
Oct
ober
, 20
PKR/
US$
US$
Milli
on
Gross Official Reserves (LHS)Exchange Rate (PKR/US$) (RHS)
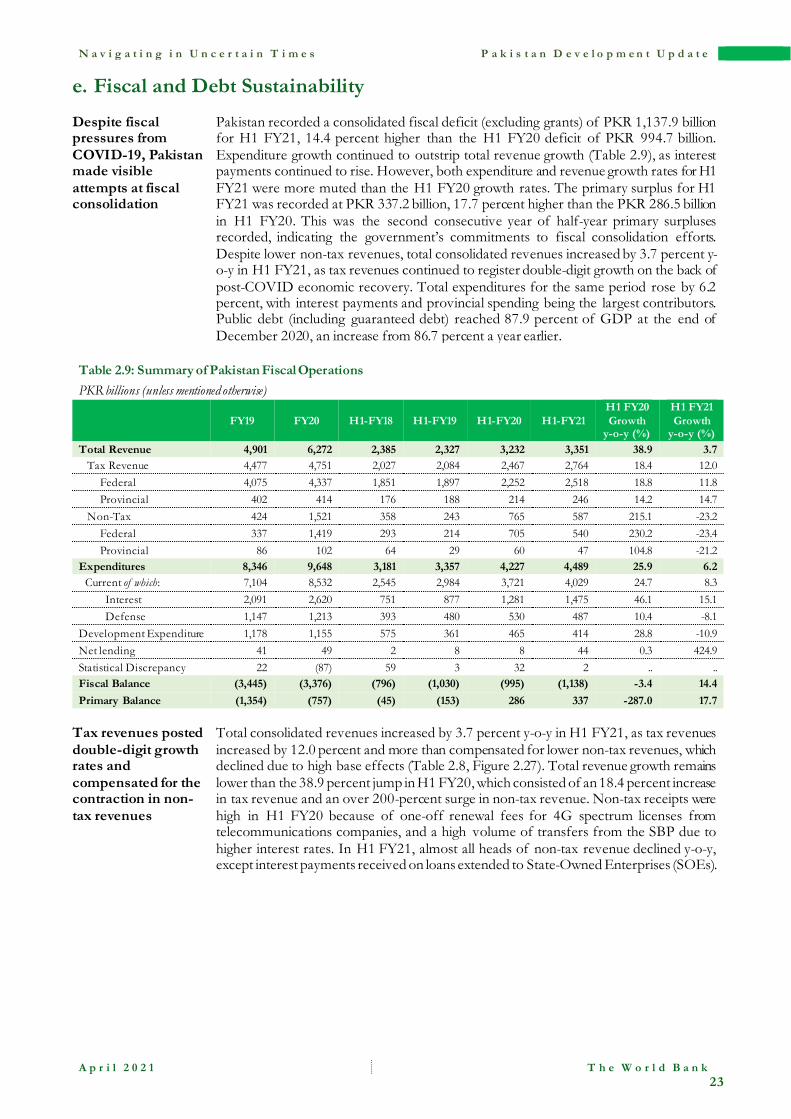
N a v i g a t i n g i n U n c e r t a i n T i m e s P a k i s t a n D e v e l o p m e n t U p d a t e
A p r i l 2 0 2 1 T h e W o r l d B a n k
23
e. Fiscal and Debt Sustainability
Despite fiscal pressures from COVID-19, Pakistan made visible attempts at fiscal consolidation
Pakistan recorded a consolidated fiscal deficit (excluding grants) of PKR 1,137.9 billion for H1 FY21, 14.4 percent higher than the H1 FY20 deficit of PKR 994.7 billion. Expenditure growth continued to outstrip total revenue growth (Table 2.9), as interest payments continued to rise. However, both expenditure and revenue growth rates for H1 FY21 were more muted than the H1 FY20 growth rates. The primary surplus for H1 FY21 was recorded at PKR 337.2 billion, 17.7 percent higher than the PKR 286.5 billion in H1 FY20. This was the second consecutive year of half-year primary surpluses recorded, indicating the government’s commitments to fiscal consolidation efforts. Despite lower non-tax revenues, total consolidated revenues increased by 3.7 percent y-o-y in H1 FY21, as tax revenues continued to register double-digit growth on the back of post-COVID economic recovery. Total expenditures for the same period rose by 6.2 percent, with interest payments and provincial spending being the largest contributors. Public debt (including guaranteed debt) reached 87.9 percent of GDP at the end of December 2020, an increase from 86.7 percent a year earlier.
Table 2.9: Summary of Pakistan Fiscal Operations PKR billions (unless mentioned otherwise)
FY19 FY20 H1-FY18 H1-FY19 H1-FY20 H1-FY21 H1 FY20 Growth
y-o-y (%)
H1 FY21 Growth
y-o-y (%) Total Revenue 4,901 6,272 2,385 2,327 3,232 3,351 38.9 3.7 Tax Revenue 4,477 4,751 2,027 2,084 2,467 2,764 18.4 12.0 Federal 4,075 4,337 1,851 1,897 2,252 2,518 18.8 11.8 Provincial 402 414 176 188 214 246 14.2 14.7 Non-Tax 424 1,521 358 243 765 587 215.1 -23.2 Federal 337 1,419 293 214 705 540 230.2 -23.4 Provincial 86 102 64 29 60 47 104.8 -21.2 Expenditures 8,346 9,648 3,181 3,357 4,227 4,489 25.9 6.2 Current of which: 7,104 8,532 2,545 2,984 3,721 4,029 24.7 8.3 Interest 2,091 2,620 751 877 1,281 1,475 46.1 15.1 Defense 1,147 1,213 393 480 530 487 10.4 -8.1 Development Expenditure 1,178 1,155 575 361 465 414 28.8 -10.9 Net lending 41 49 2 8 8 44 0.3 424.9 Statistical Discrepancy 22 (87) 59 3 32 2 .. .. Fiscal Balance (3,445) (3,376) (796) (1,030) (995) (1,138) -3.4 14.4 Primary Balance (1,354) (757) (45) (153) 286 337 -287.0 17.7
Tax revenues posted double-digit growth rates and compensated for the contraction in non-tax revenues
Total consolidated revenues increased by 3.7 percent y-o-y in H1 FY21, as tax revenues increased by 12.0 percent and more than compensated for lower non-tax revenues, which declined due to high base effects (Table 2.8, Figure 2.27). Total revenue growth remains lower than the 38.9 percent jump in H1 FY20, which consisted of an 18.4 percent increase in tax revenue and an over 200-percent surge in non-tax revenue. Non-tax receipts were high in H1 FY20 because of one-off renewal fees for 4G spectrum licenses from telecommunications companies, and a high volume of transfers from the SBP due to higher interest rates. In H1 FY21, almost all heads of non-tax revenue declined y-o-y, except interest payments received on loans extended to State-Owned Enterprises (SOEs).
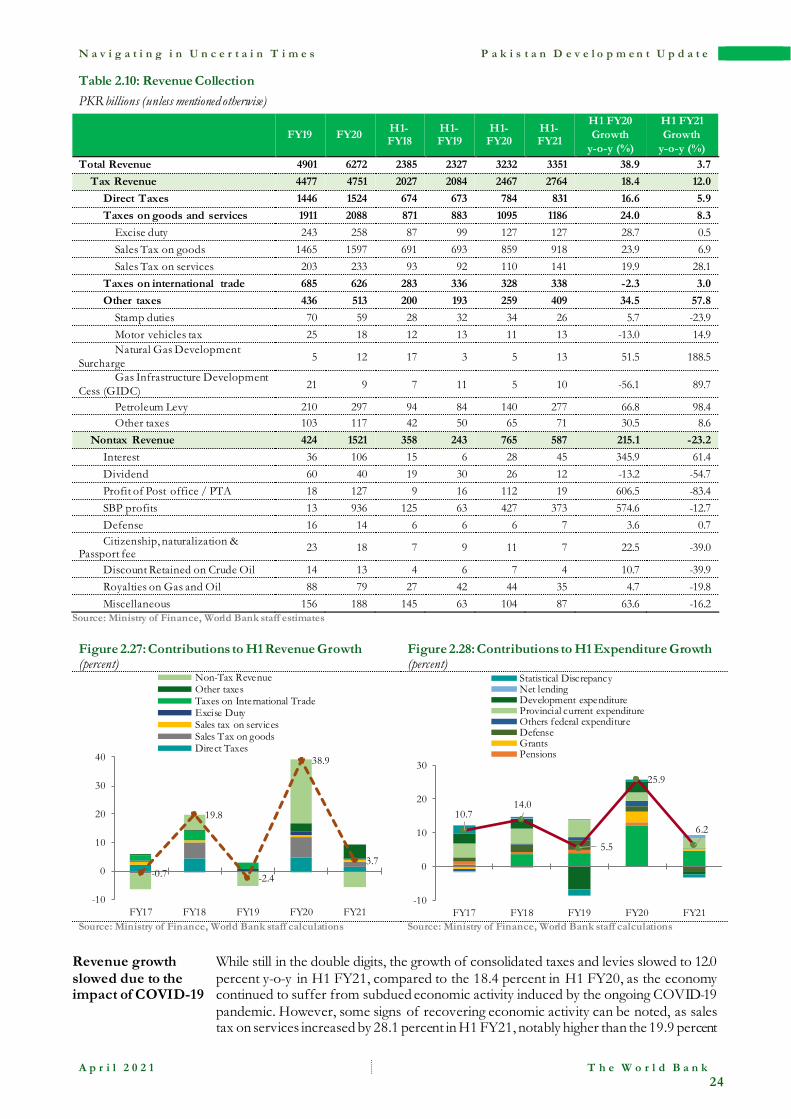
N a v i g a t i n g i n U n c e r t a i n T i m e s P a k i s t a n D e v e l o p m e n t U p d a t e
A p r i l 2 0 2 1 T h e W o r l d B a n k
24
Table 2.10: Revenue Collection PKR billions (unless mentioned otherwise)
FY19 FY20 H1-FY18
H1-FY19
H1-FY20
H1-FY21
H1 FY20 Growth
y-o-y (%)
H1 FY21 Growth
y-o-y (%) Total Revenue 4901 6272 2385 2327 3232 3351 38.9 3.7
Tax Revenue 4477 4751 2027 2084 2467 2764 18.4 12.0 Direct Taxes 1446 1524 674 673 784 831 16.6 5.9 Taxes on goods and services 1911 2088 871 883 1095 1186 24.0 8.3
Excise duty 243 258 87 99 127 127 28.7 0.5 Sales Tax on goods 1465 1597 691 693 859 918 23.9 6.9 Sales Tax on services 203 233 93 92 110 141 19.9 28.1
Taxes on international trade 685 626 283 336 328 338 -2.3 3.0 Other taxes 436 513 200 193 259 409 34.5 57.8
Stamp duties 70 59 28 32 34 26 5.7 -23.9 Motor vehicles tax 25 18 12 13 11 13 -13.0 14.9 Natural Gas Development
Surcharge 5 12 17 3 5 13 51.5 188.5
Gas Infrastructure Development Cess (GIDC) 21 9 7 11 5 10 -56.1 89.7
Petroleum Levy 210 297 94 84 140 277 66.8 98.4 Other taxes 103 117 42 50 65 71 30.5 8.6
Nontax Revenue 424 1521 358 243 765 587 215.1 -23.2 Interest 36 106 15 6 28 45 345.9 61.4 Dividend 60 40 19 30 26 12 -13.2 -54.7 Profit of Post office / PTA 18 127 9 16 112 19 606.5 -83.4 SBP profits 13 936 125 63 427 373 574.6 -12.7 Defense 16 14 6 6 6 7 3.6 0.7 Citizenship, naturalization &
Passport fee 23 18 7 9 11 7 22.5 -39.0
Discount Retained on Crude Oil 14 13 4 6 7 4 10.7 -39.9 Royalties on Gas and Oil 88 79 27 42 44 35 4.7 -19.8 Miscellaneous 156 188 145 63 104 87 63.6 -16.2
Source: Ministry of Finance, World Bank staff estimates Figure 2.27: Contributions to H1 Revenue Growth (percent)
Figure 2.28: Contributions to H1 Expenditure Growth (percent)
Source: Ministry of Finance, World Bank staff calculations Source: Ministry of Finance, World Bank staff calculations
Revenue growth slowed due to the impact of COVID-19
While still in the double digits, the growth of consolidated taxes and levies slowed to 12.0 percent y-o-y in H1 FY21, compared to the 18.4 percent in H1 FY20, as the economy continued to suffer from subdued economic activity induced by the ongoing COVID-19 pandemic. However, some signs of recovering economic activity can be noted, as sales tax on services increased by 28.1 percent in H1 FY21, notably higher than the 19.9 percent
-0.7
19.8
-2.4
38.9
3.7
-10
0
10
20
30
40
FY17 FY18 FY19 FY20 FY21
Non-Tax RevenueOther taxesTaxes on International TradeExcise DutySales tax on servicesSales Tax on goodsDirect Taxes
10.714.0
5.5
25.9
6.2
-10
0
10
20
30
FY17 FY18 FY19 FY20 FY21
Statistical DiscrepancyNet lendingDevelopment expenditureProvincial current expenditureOthers federal expenditureDefenseGrantsPensions
N a v i g a t i n g i n U n c e r t a i n T i m e s P a k i s t a n D e v e l o p m e n t U p d a t e
A p r i l 2 0 2 1 T h e W o r l d B a n k
25
rise in H1 FY20. Similarly, taxes on international trade saw a growth of 3.0 percent, compared to a contraction of 2.3 percent for the same period in 2020, as imports of goods and services recovered to a certain extent in H1 FY21.82 However, sales tax on goods, constituting around a third of total tax collections, saw a significantly lower growth in H1 FY21 at 6.9 percent, compared to almost 24.0 percent for the same period in 2020, as domestic production and demand are in the early stages of recovery.83 Similarly, growth in direct taxes saw a more muted growth in H1 FY21 at 5.9 percent, compared to 16.6 percent in H1 FY20. In contrast, “Other taxes” 84 saw a large increase of 57.8 percent due to higher collections from the petroleum levy, National Gas Development Surcharge, and the Gas Infrastructure Development Cess (GIDC).85 While global oil prices were lower in H1 FY21 than in H1 FY20, the government increased the petroleum levy and kept retail petroleum prices relatively stable, resulting in higher revenue collection.86
Expenditure growth was curtailed in H1 FY21, despite rising domestic interest payments
Consolidated expenditures grew by 6.2 percent y-o-y in H1 FY21, as compared with the almost 26 percent growth in H1 FY20 (Figure 2.28, Table 2.11), primarily due to rising interest payments. Current expenditure rose by 8.3 percent in H1 FY21 on the back of higher federal interest payments, which increased by 15.1 percent. Domestic interest payments saw a 21.1 percent growth.87 Meanwhile, Pakistan’s participation in the Debt Servicing Suspension Initiative (DSSI) and the appreciation of the rupee both contributed to a temporary reduction in external interest payments of 26.4 percent. Total consolidated non-interest current expenditure increased by only 4.7 percent in H1 FY21, primarily because the federal non-interest current expenditure declined by almost 2 percent, as the federal government continued to exercise fiscal prudence to meet its fiscal consolidation targets. This is despite increased federal government expenditure on the continued post-COVID emergency cash transfers under the Ehsaas program.88 In contrast, provincial expenditures increased mainly because of higher current expenditure, registering a 12.3 percent growth, higher than the H1 FY20 growth of 7.6 percent.89
Development expenditure contracted in H1 FY 21, bearing the brunt of fiscal consolidation measures
Development expenditure contracted in H1 FY21 by almost 11.0 percent, compared to the 28.8 percent growth in H1 FY20. Federal PSDP development expenditure declined by 26.1 percent y-o-y, while provincial development expenditure saw a modest growth of 3.8 percent. The decline was in part due to changes in the Classification of Public Sector Development Program (PSDP) as certain expenditures were reclassified from federal PSDP to “other development expenditures”, e.g. Prime Minister Youth Loan scheme, some security expenditure, and rehabilitation of Internally Displaced Persons. Federal net lending90 rose to PKR 44 billion in H1 FY21 from PKR 8 billion in HY FY20 - an almost 425 percent increase.91
82 Import values of goods and services increased 1.4 percent in H1 FY21, compared to a contraction of 19.5 percent in H1 FY20. 83 While LSM growth significantly picked up in November and December, recording an H1 FY21 average growth of 8.1 percent, the full revenue impact of the production growth is expected to be felt in the second half of the year. 84 From Q1-FY21 onwards, the federal government is reporting property taxes as part of provincial “Other taxes”. For consistency of analysis, we have incorporated the property tax from previous years and quarters into “Other taxes” 85 GIDC receipts are expected to increase further in the upcoming years, as the judicial rulings on GIDC arrears have favored the government, and they are expected to receive GIDC arrears of approximately PKR 457 billion over the next 24 months from the fertilizer industries https://www.dawn.com/news/1579172 86 The government availed the benefit of the lower global oil prices and raised the petroleum levy to boost revenues and to create a cushion against future global oil price fluctuations. See https://tribune.com.pk/story/2257305/ecc-okays-petroleum-levy-cushion-plan 87 Domestic interest payments are high as the policy rate was high last year and part of the increase in interest payments is fueled by payments against domestic debt contracted on those rates. 88 In FY20, expenditure on Ehsaas/BISP increased by 112 percent as the government expanded the cash transfer program in the last quarter in response to COVID-19. The expanded program is expected to have some impact on federal grants expenditure in FY21 as the government continued its COVID response measures in the first quarter of the fiscal year. However, the emergency transfers under Ehsaas were discontinued for the second quarter, to allow the expenditure policy focus to be on fiscal consolidation. 89 Average H1 growth of provincial current expenditure between FY15 and FY19 was 14.3 percent. In FY19, this decreased to 7.6 percent as both federal and provincial governments attempted to curtail expenditures to meet fiscal consolidation measures, as stipulated by the IMF-EFF program. 90 Federal net lending includes federal lending for development projects to State-owned Enterprises (SOEs) but also includes payments to Power Holding Power Limited (PHPL), a special-purpose vehicle that holds a portion of the government’s power sector circular debt. Payments to PHPL are often recorded as net lending in the public finances of the federal government. 91 Net lending for FY21 is expected to increase to capture federal payments to Power Holding Power Limited (PHPL) to discharge its debt and settlement of arrears in the power sector.
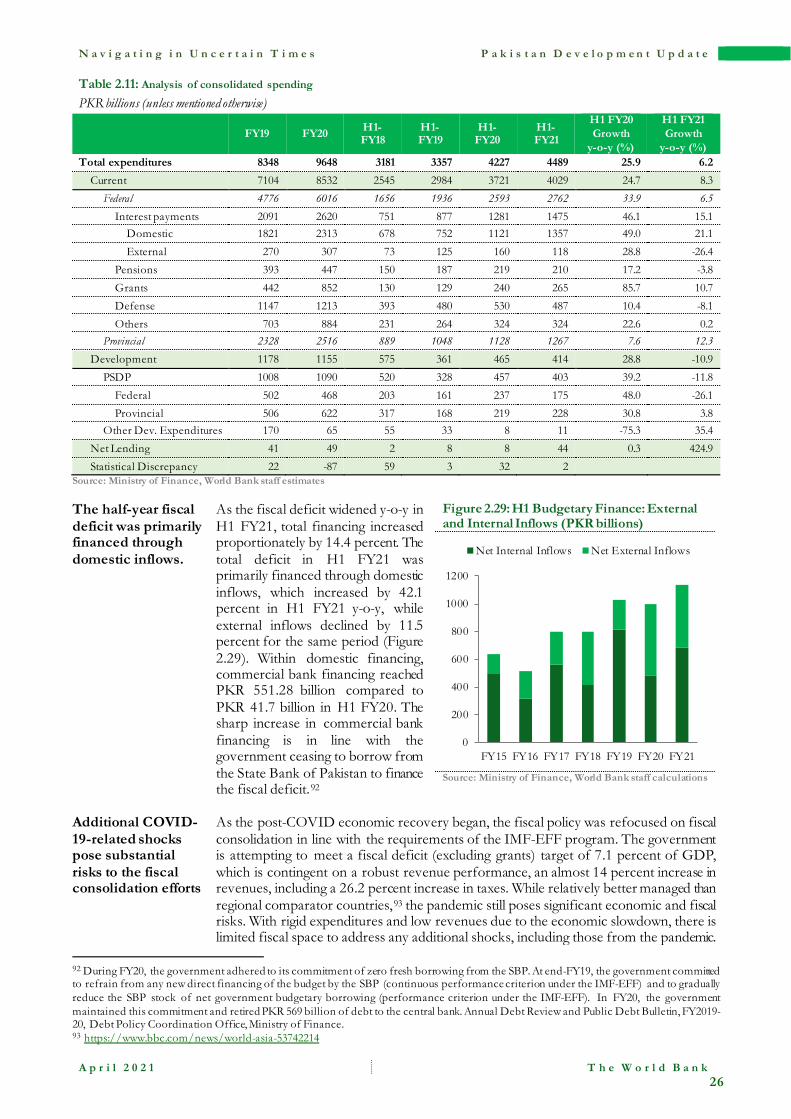
N a v i g a t i n g i n U n c e r t a i n T i m e s P a k i s t a n D e v e l o p m e n t U p d a t e
A p r i l 2 0 2 1 T h e W o r l d B a n k
26
Table 2.11: Analysis of consolidated spending
PKR billions (unless mentioned otherwise)
FY19 FY20 H1-FY18
H1-FY19
H1-FY20
H1-FY21
H1 FY20 Growth
y-o-y (%)
H1 FY21 Growth
y-o-y (%) Total expenditures 8348 9648 3181 3357 4227 4489 25.9 6.2
Current 7104 8532 2545 2984 3721 4029 24.7 8.3 Federal 4776 6016 1656 1936 2593 2762 33.9 6.5
Interest payments 2091 2620 751 877 1281 1475 46.1 15.1 Domestic 1821 2313 678 752 1121 1357 49.0 21.1 External 270 307 73 125 160 118 28.8 -26.4
Pensions 393 447 150 187 219 210 17.2 -3.8 Grants 442 852 130 129 240 265 85.7 10.7 Defense 1147 1213 393 480 530 487 10.4 -8.1 Others 703 884 231 264 324 324 22.6 0.2
Provincial 2328 2516 889 1048 1128 1267 7.6 12.3 Development 1178 1155 575 361 465 414 28.8 -10.9
PSDP 1008 1090 520 328 457 403 39.2 -11.8 Federal 502 468 203 161 237 175 48.0 -26.1 Provincial 506 622 317 168 219 228 30.8 3.8
Other Dev. Expenditures 170 65 55 33 8 11 -75.3 35.4 Net Lending 41 49 2 8 8 44 0.3 424.9 Statistical Discrepancy 22 -87 59 3 32 2
Source: Ministry of Finance, World Bank staff estimates The half-year fiscal deficit was primarily financed through domestic inflows.
As the fiscal deficit widened y-o-y in H1 FY21, total financing increased proportionately by 14.4 percent. The total deficit in H1 FY21 was primarily financed through domestic inflows, which increased by 42.1 percent in H1 FY21 y-o-y, while external inflows declined by 11.5 percent for the same period (Figure 2.29). Within domestic financing, commercial bank financing reached PKR 551.28 billion compared to PKR 41.7 billion in H1 FY20. The sharp increase in commercial bank financing is in line with the government ceasing to borrow from the State Bank of Pakistan to finance the fiscal deficit.92
Figure 2.29: H1 Budgetary Finance: External and Internal Inflows (PKR billions)
Source: Ministry of Finance, World Bank staff calculations
Additional COVID-19-related shocks pose substantial risks to the fiscal consolidation efforts
As the post-COVID economic recovery began, the fiscal policy was refocused on fiscal consolidation in line with the requirements of the IMF-EFF program. The government is attempting to meet a fiscal deficit (excluding grants) target of 7.1 percent of GDP, which is contingent on a robust revenue performance, an almost 14 percent increase in revenues, including a 26.2 percent increase in taxes. While relatively better managed than regional comparator countries,93 the pandemic still poses significant economic and fiscal risks. With rigid expenditures and low revenues due to the economic slowdown, there is limited fiscal space to address any additional shocks, including those from the pandemic.
92 During FY20, the government adhered to its commitment of zero fresh borrowing from the SBP. At end-FY19, the government committed to refrain from any new direct financing of the budget by the SBP (continuous performance criterion under the IMF-EFF) and to gradually reduce the SBP stock of net government budgetary borrowing (performance criterion under the IMF-EFF). In FY20, the government maintained this commitment and retired PKR 569 billion of debt to the central bank. Annual Debt Review and Public Debt Bulletin, FY2019-20, Debt Policy Coordination Office, Ministry of Finance. 93 https://www.bbc.com/news/world-asia-53742214
0
200
400
600
800
1000
1200
FY15 FY16 FY17 FY18 FY19 FY20 FY21
Net Internal Inflows Net External Inflows
N a v i g a t i n g i n U n c e r t a i n T i m e s P a k i s t a n D e v e l o p m e n t U p d a t e
A p r i l 2 0 2 1 T h e W o r l d B a n k
27
An additional COVID-related expenditure, at either the federal or provincial government levels, including any expenditure on purchasing vaccines, can derail efforts to meet the fiscal deficit target.
Additional fiscal risks stem from possible expenditure overruns, especially on subsidies; SOEs; and civil service compensation and pension expenditures
The fiscal deficit targets in the FY21 budget were also planned to be achieved by having lower federal subsidy payments, as the government had plans to undertake significant reforms to manage the ballooning circular debt and its fiscal implications. By end-December 2020, the government had already incurred 61.7 percent of the budgeted subsidies expenditure, and any delay in the reforms could result in the government overshooting its budgeted target for subsidies. Over the medium term, fiscal risks from SOEs and the civil service compensation and pensions continue to be significant. The federal government is in the process of implementing an SOE reform plan, including preparing an SOE law, an SOE policy, as well as undertake possible divestments and restructuring of certain SOEs. However, these reforms have not been finalized, and have considerable political economy implications, which must first be addressed. SOEs therefore continue to be a source of fiscal risk, especially as they account for significant extrabudgetary transactions of the federal government. In addition, civil service and pensions continue to be a growing source of fiscal risk for the government. Federal and provincial employee compensation accounted for at least 23 percent of national expenditures in FY19, while pensions in FY19 were an additional 10 percent of the total national expenditure. Reforms are being planned for civil service at the federal government, while all governments are planning pensions reforms, with an aim to have partially funded pension programs in place to ease the fiscal burden off the budget in medium-long term.
National fiscal consolidation efforts also depend on positive provincial balances, which continue to be at risk
The federal budget estimates a provincial surplus of PKR 242 billion (0.5 percent of estimated GDP) for FY21 to reach the national fiscal deficit (excluding grants) of 7.1 percent of GDP. Thus far during the year, despite lower levels of federal transfers and higher provincial current expenditure, provincial governments have still managed to post a consolidated fiscal surplus of PKR 170 billion (Table 2.12).94 However, the surplus is 29.3 percent narrower than in H1 FY20. Given the provincial budgetary projections, it is estimated that provincial expenditure will accelerate in the second half of FY21, putting pressure on the consolidated provincial balance, and possibly affecting the efforts to achieve the national fiscal deficit target.
Table 2.12: Half-year Provincial Finances
PKR billions (unless mentioned otherwise)
H1 FY20 H1 FY21 H1 Revenue Growth Rate
(percent)
H1 Expenditure Growth Rate
(percent)
Total Revenues
95
Total Expenditures
Fiscal Balance
Total Revenues
Total Expenditures
Fiscal Balance
Punjab 781 652 129 780 621 159 -0.1 -4.7 Sindh 435 370 65 436 394 42 0.3 6.5
Khyber Pakhtunkhwa 299 228 70 308 282 25 3.0 23.7
Balochistan 167 110 56 152 106 46 -8.8 -3.7 Total 1681 1360 321 1675 1403 272 -0.3 3.2 Federal grants (to be deducted) -81 -102
Federal interest payments (to be
-12 -14
Consolidated provincial
1600 1360 240 1573 1403 170 -1.7 3.2
94 Consolidated provincial balance do not include federal grants and interest payments made to the federal government. 95 Total revenues are reported excluding impact of federal loans.
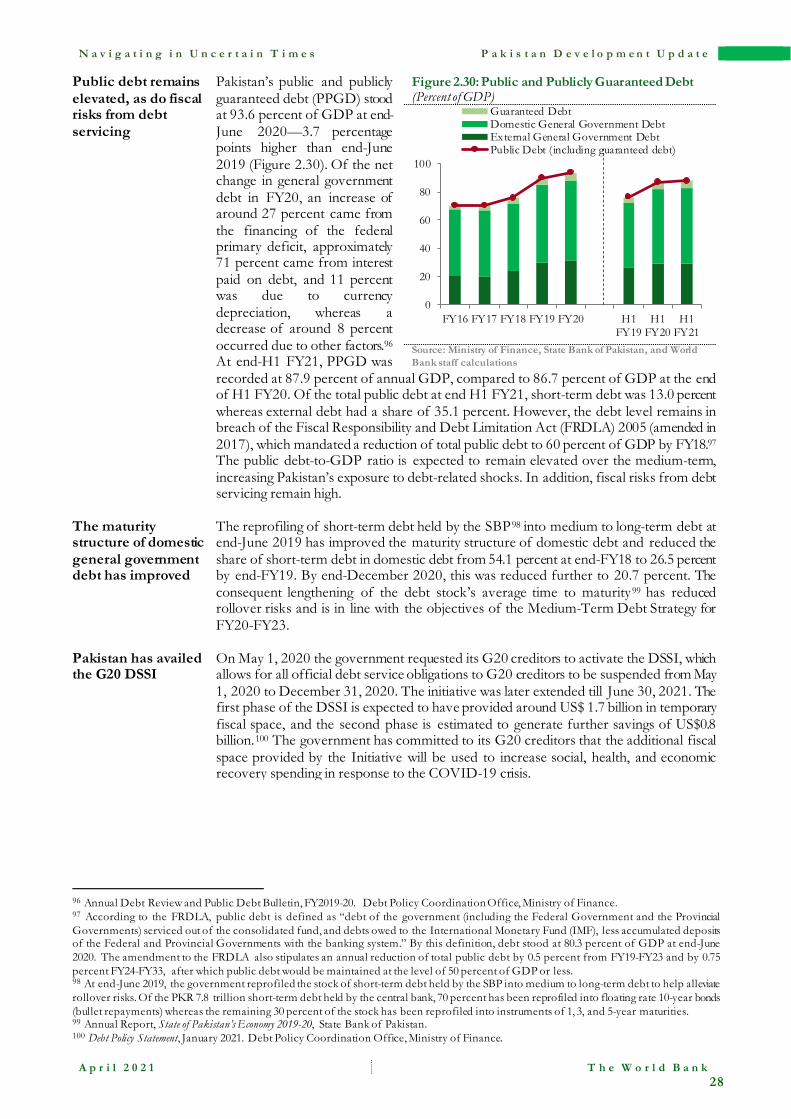
N a v i g a t i n g i n U n c e r t a i n T i m e s P a k i s t a n D e v e l o p m e n t U p d a t e
A p r i l 2 0 2 1 T h e W o r l d B a n k
28
Public debt remains elevated, as do fiscal risks from debt servicing
Pakistan’s public and publicly guaranteed debt (PPGD) stood at 93.6 percent of GDP at end-June 2020—3.7 percentage points higher than end-June 2019 (Figure 2.30). Of the net change in general government debt in FY20, an increase of around 27 percent came from the financing of the federal primary deficit, approximately 71 percent came from interest paid on debt, and 11 percent was due to currency depreciation, whereas a decrease of around 8 percent occurred due to other factors.96 At end-H1 FY21, PPGD was recorded at 87.9 percent of annual GDP, compared to 86.7 percent of GDP at the end of H1 FY20. Of the total public debt at end H1 FY21, short-term debt was 13.0 percent whereas external debt had a share of 35.1 percent. However, the debt level remains in breach of the Fiscal Responsibility and Debt Limitation Act (FRDLA) 2005 (amended in 2017), which mandated a reduction of total public debt to 60 percent of GDP by FY18.97 The public debt-to-GDP ratio is expected to remain elevated over the medium-term, increasing Pakistan’s exposure to debt-related shocks. In addition, fiscal risks from debt servicing remain high.
Figure 2.30: Public and Publicly Guaranteed Debt (Percent of GDP)
Source: Ministry of Finance, State Bank of Pakistan, and World Bank staff calculations
The maturity structure of domestic general government debt has improved
The reprofiling of short-term debt held by the SBP98 into medium to long-term debt at end-June 2019 has improved the maturity structure of domestic debt and reduced the share of short-term debt in domestic debt from 54.1 percent at end-FY18 to 26.5 percent by end-FY19. By end-December 2020, this was reduced further to 20.7 percent. The consequent lengthening of the debt stock’s average time to maturity99 has reduced rollover risks and is in line with the objectives of the Medium-Term Debt Strategy for FY20-FY23.
Pakistan has availed the G20 DSSI
On May 1, 2020 the government requested its G20 creditors to activate the DSSI, which allows for all official debt service obligations to G20 creditors to be suspended from May 1, 2020 to December 31, 2020. The initiative was later extended till June 30, 2021. The first phase of the DSSI is expected to have provided around US$ 1.7 billion in temporary fiscal space, and the second phase is estimated to generate further savings of US$0.8 billion.100 The government has committed to its G20 creditors that the additional fiscal space provided by the Initiative will be used to increase social, health, and economic recovery spending in response to the COVID-19 crisis.
96 Annual Debt Review and Public Debt Bulletin, FY2019-20. Debt Policy Coordination Office, Ministry of Finance. 97 According to the FRDLA, public debt is defined as “debt of the government (including the Federal Government and the Provincial Governments) serviced out of the consolidated fund, and debts owed to the International Monetary Fund (IMF), less accumulated deposits of the Federal and Provincial Governments with the banking system.” By this definition, debt stood at 80.3 percent of GDP at end-June 2020. The amendment to the FRDLA also stipulates an annual reduction of total public debt by 0.5 percent from FY19-FY23 and by 0.75 percent FY24-FY33, after which public debt would be maintained at the level of 50 percent of GDP or less. 98 At end-June 2019, the government reprofiled the stock of short-term debt held by the SBP into medium to long-term debt to help alleviate rollover risks. Of the PKR 7.8 trillion short-term debt held by the central bank, 70 percent has been reprofiled into floating rate 10-year bonds (bullet repayments) whereas the remaining 30 percent of the stock has been reprofiled into instruments of 1, 3, and 5-year maturities. 99 Annual Report, State of Pakistan’s Economy 2019-20, State Bank of Pakistan. 100 Debt Policy Statement, January 2021. Debt Policy Coordination Office, Ministry of Finance.
0
20
40
60
80
100
FY16 FY17 FY18 FY19 FY20 H1FY19
H1FY20
H1FY21
Guaranteed DebtDomestic General Government DebtExternal General Government DebtPublic Debt (including guaranteed debt)

N a v i g a t i n g i n U n c e r t a i n T i m e s P a k i s t a n D e v e l o p m e n t U p d a t e
A p r i l 2 0 2 1 T h e W o r l d B a n k
29
3. Outlook and Medium-Term Prospects
a. Medium-Term Outlook
GDP growth is projected to gradually recover but remain below potential over the forecast horizon
Economic growth is expected to recover slowly, given heightened uncertainty surrounding the COVID-19 pandemic, including the emergence of new strains and the availability of mass vaccinations.101 At the same time, economic activity is projected to be dampened in the short-term by fiscal consolidation measures associated with the IMF stabilization program, which is expected to resume as the economy regains its footing. The outlook entails a gradual post-COVID recovery, during which economic growth is expected to remain below potential, reaching 1.3 percent in FY21 and strengthening to 3.4 percent in FY23 (Table 3.1). This baseline projection is predicated on the absence of significant infection flare-ups or vaccine resistant strains that would require more protracted and extensive lockdowns.
Table 3.1: Pakistan Macroeconomic Outlook (FY21-23) (Annual percent change unless indicated otherwise) 2017/18 2018/19 2019/20 2020/21 2021/22 2022/23 Real GDP growth, at constant factor prices 5.8 1.0 -1.5 1.3 2.0 3.4
Private Consumption 6.2 2.9 -1.0 2.5 2.5 3.4 Government Consumption 8.6 0.8 5.6 0.1 2.2 3.0 Gross Fixed Capital Investment 11.2 -12.8 -17.9 -4.2 1.1 3.7 Exports, Goods and Services 12.7 14.5 -8.6 -1.7 3.0 5.5 Imports, Goods and Services 17.6 4.3 -10.5 0.9 4.3 4.8 Agriculture 4.0 0.6 1.5 0.5 2.3 2.6 Industry 4.6 -2.3 -5.0 1.5 1.7 3.5 Services 6.3 3.8 -1.3 1.4 2.1 3.6
Inflation (Consumer Price Index) 4.7 6.8 10.7 9.0 7.0 6.0 Current Account Balance (% of GDP) -6.1 -4.8 -1.1 -0.8 -1.3 -1.7
Net Foreign Direct Investment (% of GDP) 0.9 0.5 1.0 0.7 0.8 1.0 Fiscal Balance (% of GDP), excluding grants -6.5 -9.1 -8.2 -8.4 -7.8 -7.0
Public Debt (% of GDP) 75.9 89.9 93.6 93.9 94.4 94.1 Primary Balance (% of GDP) -2.1 -3.5 -1.8 -2.1 -1.7 -1.1 Sources: Pakistan Bureau of Statistics, State Bank of Pakistan, World Bank staff estimates Notes: e = estimate, f = forecast.
101 This macroeconomic outlook was prepared by World Bank staff and differs from that of the government.

N a v i g a t i n g i n U n c e r t a i n T i m e s P a k i s t a n D e v e l o p m e n t U p d a t e
A p r i l 2 0 2 1 T h e W o r l d B a n k
30
Private consumption is expected to be the main driver of growth in the immediate term
Domestic demand is expected to recover as social restrictions associated with the pandemic are increasingly scaled down and vaccinations gradually become widespread. As the infection rate continues to stabilize, private consumption, especially for transportation, food and beverages, and entertainment, are all expected to slowly improve.102 Remittance inflows, a significant pillar for domestic private consumption, have been robust and are also expected to support the near-term post-lockdown economic recovery. In contrast, government consumption growth is expected to initially weaken as fiscal consolidation resumes after COVID-19 mitigation measures wind down and the government attempts to rein in the fiscal deficit. Gross fixed capital formation is also expected to be weak and continue shrinking for the third consecutive year in FY21, amid the uncertainty regarding the medium-term impact of the COVID-19 crisis and tepid global growth. Net exports are expected to decline this fiscal year as export volumes are projected to contract, while import volumes grow in line with the domestic demand recovery.
Inflation is projected to decline given spare capacity in the economy
Headline consumer price inflation is expected to average 9.0 percent in FY21, as the recent hike in energy prices is likely to maintain an upward pressure on prices for the remainder of the year. Inflation is expected to decline over the forecast horizon given the persistence of spare capacity in the economy, and as food price inflation continues to moderate with the gradual resolutions of supply chains disruptions.
Monetary policy is expected to remain accommodative in the near term to support the recovery
Since the beginning of the fiscal year, SBP has maintained a supportive monetary stance keeping the policy rate at 7.0 percent, and therefore real interest rates negative. In line with SBP forward guidance, monetary policy is expected to remain accommodative in the near term, with future adjustments in the policy rate targeting a gradual return of mildly positive real interest rates. Despite the economic slowdown, the soundness and liquidity of the financial sector have remained intact, largely due to the redirection of financial sector balance sheets toward government securities rather than private sector credit. While NPL ratios have moderated from recent highs, the quantum of NPLs is forecasted to climb with the expected expiration of SBP relief measures in March 2021.103 An increase in NPLs would necessitate further provisioning by banks, which could impact overall sector profitability, despite the banking sector currently being well-capitalized.
The current account deficit is expected to slowly increase with the domestic demand-driven recovery
The current account deficit is projected to gradually widen as domestic demand picks up and international trade recovers. Export values are projected to decline in FY21 amid weak global demand, whereas import values are projected to grow in line with the recovery in domestic economic activity. However, the current account deficit is projected to narrow to 0.8 percent of GDP, as a wider trade deficit is more than offset by stronger remittance inflows. Over the projection horizon, the current account deficit is projected to gradually widen to 1.7 percent of GDP in FY23, with import values growing alongside domestic demand and higher projected oil prices. Meanwhile, exports are projected to resume growing from FY22, as external conditions become more conducive and tariff reforms gain traction. The growth of worker remittances is expected to normalize from recent highs over the medium-term.
The overall fiscal deficit is expected to be elevated in FY21 but projected to gradually decline on continued fiscal consolidation efforts
The fiscal deficit (excluding grants) is projected to reach 8.4 percent of GDP in FY21, partly due to subdued economic activity and the settlement of arrears in the power sector. As critical revenue-enhancing reforms gain pace, the fiscal deficit (excluding grants) is projected to gradually narrow to 7.0 percent of GDP by FY23. Under the baseline scenario, revenue collection is expected to increase over the medium term as growth recovers and the government implements structural reforms related to GST harmonization, rolls back tax expenditures, streamlines tax rates, and improves the
102 However, elevated inflation and the substantial pandemic-related job losses will take time to reverse and therefore will temporarily drag on household consumption. 103 As discussed in Section 2c, the SBP has announced COVID-19 pandemic related support measures for businesses and banks. These are projected to end by March 2021, but it is expected that the SBP will continue to monitor the soundness of the banking system by providing liquidity as required.
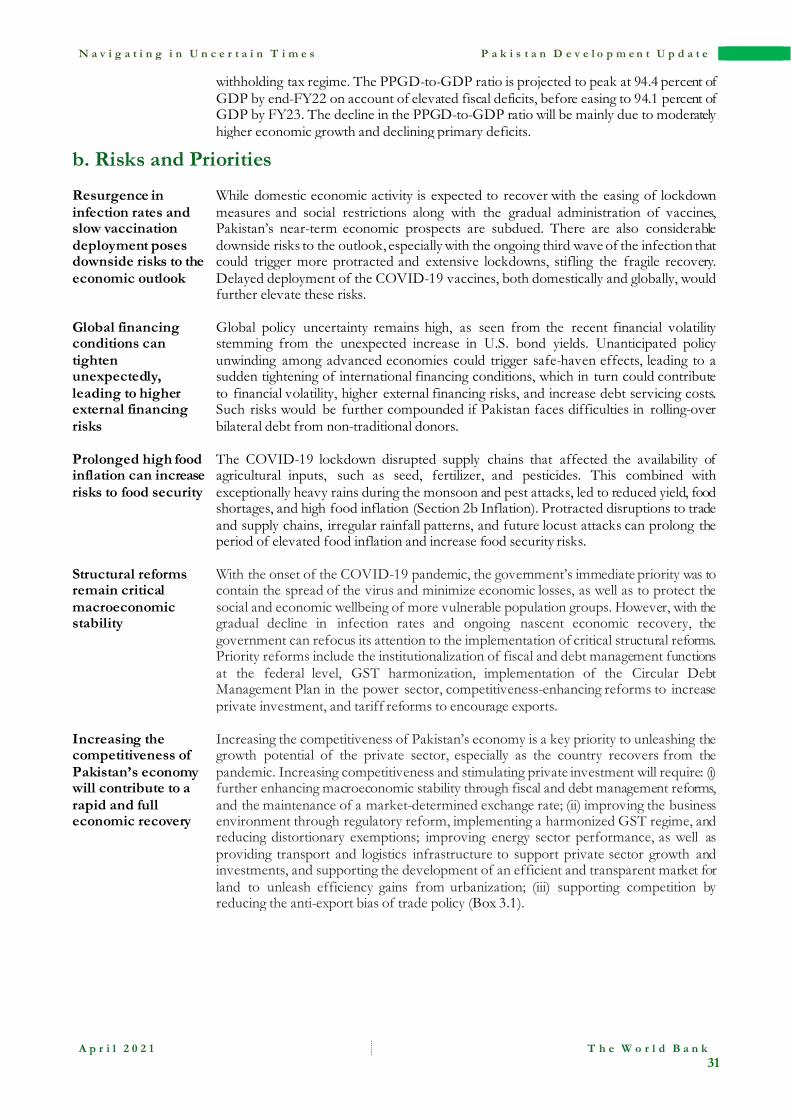
N a v i g a t i n g i n U n c e r t a i n T i m e s P a k i s t a n D e v e l o p m e n t U p d a t e
A p r i l 2 0 2 1 T h e W o r l d B a n k
31
withholding tax regime. The PPGD-to-GDP ratio is projected to peak at 94.4 percent of GDP by end-FY22 on account of elevated fiscal deficits, before easing to 94.1 percent of GDP by FY23. The decline in the PPGD-to-GDP ratio will be mainly due to moderately higher economic growth and declining primary deficits.
b. Risks and Priorities
Resurgence in infection rates and slow vaccination deployment poses downside risks to the economic outlook
While domestic economic activity is expected to recover with the easing of lockdown measures and social restrictions along with the gradual administration of vaccines, Pakistan’s near-term economic prospects are subdued. There are also considerable downside risks to the outlook, especially with the ongoing third wave of the infection that could trigger more protracted and extensive lockdowns, stifling the fragile recovery. Delayed deployment of the COVID-19 vaccines, both domestically and globally, would further elevate these risks.
Global financing conditions can tighten unexpectedly, leading to higher external financing risks
Global policy uncertainty remains high, as seen from the recent financial volatility stemming from the unexpected increase in U.S. bond yields. Unanticipated policy unwinding among advanced economies could trigger safe-haven effects, leading to a sudden tightening of international financing conditions, which in turn could contribute to financial volatility, higher external financing risks, and increase debt servicing costs. Such risks would be further compounded if Pakistan faces difficulties in rolling-over bilateral debt from non-traditional donors.
Prolonged high food inflation can increase risks to food security
The COVID-19 lockdown disrupted supply chains that affected the availability of agricultural inputs, such as seed, fertilizer, and pesticides. This combined with exceptionally heavy rains during the monsoon and pest attacks, led to reduced yield, food shortages, and high food inflation (Section 2b Inflation). Protracted disruptions to trade and supply chains, irregular rainfall patterns, and future locust attacks can prolong the period of elevated food inflation and increase food security risks.
Structural reforms remain critical macroeconomic stability
With the onset of the COVID-19 pandemic, the government’s immediate priority was to contain the spread of the virus and minimize economic losses, as well as to protect the social and economic wellbeing of more vulnerable population groups. However, with the gradual decline in infection rates and ongoing nascent economic recovery, the government can refocus its attention to the implementation of critical structural reforms. Priority reforms include the institutionalization of fiscal and debt management functions at the federal level, GST harmonization, implementation of the Circular Debt Management Plan in the power sector, competitiveness-enhancing reforms to increase private investment, and tariff reforms to encourage exports.
Increasing the competitiveness of Pakistan’s economy will contribute to a rapid and full economic recovery
Increasing the competitiveness of Pakistan’s economy is a key priority to unleashing the growth potential of the private sector, especially as the country recovers from the pandemic. Increasing competitiveness and stimulating private investment will require: (i) further enhancing macroeconomic stability through fiscal and debt management reforms, and the maintenance of a market-determined exchange rate; (ii) improving the business environment through regulatory reform, implementing a harmonized GST regime, and reducing distortionary exemptions; improving energy sector performance, as well as providing transport and logistics infrastructure to support private sector growth and investments, and supporting the development of an efficient and transparent market for land to unleash efficiency gains from urbanization; (iii) supporting competition by reducing the anti-export bias of trade policy (Box 3.1).
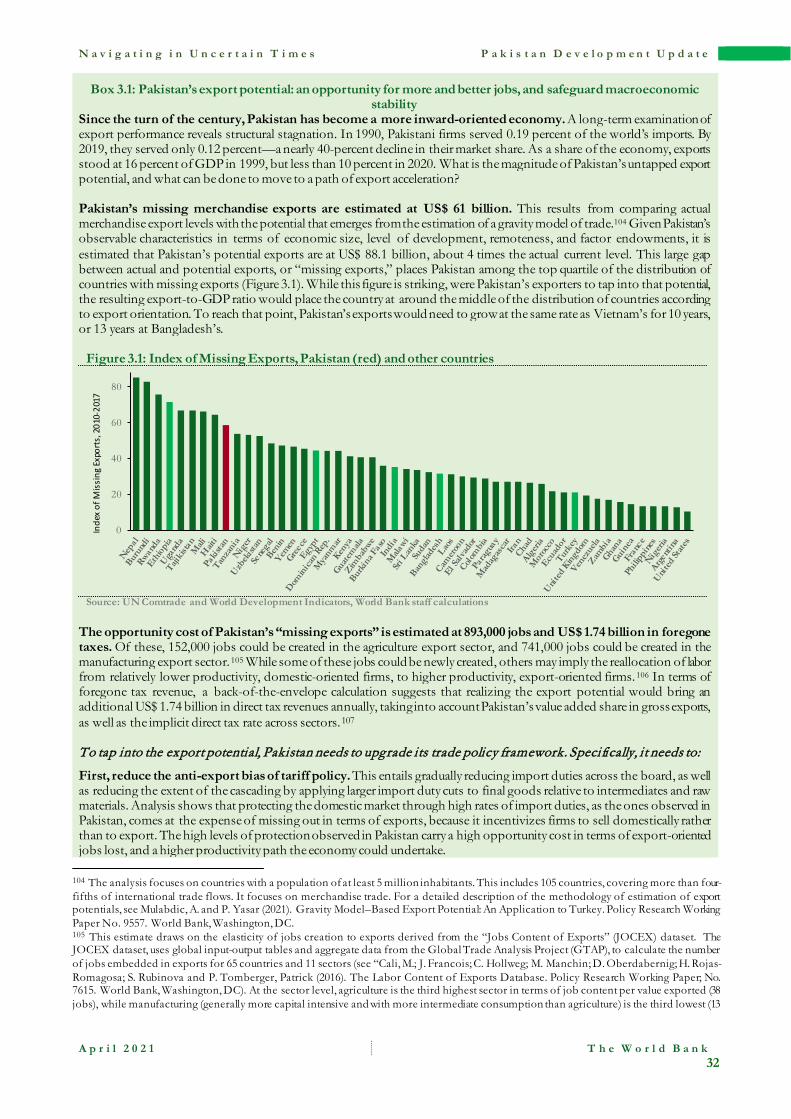
N a v i g a t i n g i n U n c e r t a i n T i m e s P a k i s t a n D e v e l o p m e n t U p d a t e
A p r i l 2 0 2 1 T h e W o r l d B a n k
32
Box 3.1: Pakistan’s export potential: an opportunity for more and better jobs, and safeguard macroeconomic stability
Since the turn of the century, Pakistan has become a more inward-oriented economy. A long-term examination of export performance reveals structural stagnation. In 1990, Pakistani firms served 0.19 percent of the world’s imports. By 2019, they served only 0.12 percent—a nearly 40-percent decline in their market share. As a share of the economy, exports stood at 16 percent of GDP in 1999, but less than 10 percent in 2020. What is the magnitude of Pakistan’s untapped export potential, and what can be done to move to a path of export acceleration? Pakistan’s missing merchandise exports are estimated at US$ 61 billion. This results from comparing actual merchandise export levels with the potential that emerges from the estimation of a gravity model of trade.104 Given Pakistan’s observable characteristics in terms of economic size, level of development, remoteness, and factor endowments, it is estimated that Pakistan’s potential exports are at US$ 88.1 billion, about 4 times the actual current level. This large gap between actual and potential exports, or “missing exports,” places Pakistan among the top quartile of the distribution of countries with missing exports (Figure 3.1). While this figure is striking, were Pakistan’s exporters to tap into that potential, the resulting export-to-GDP ratio would place the country at around the middle of the distribution of countries according to export orientation. To reach that point, Pakistan’s exports would need to grow at the same rate as Vietnam’s for 10 years, or 13 years at Bangladesh’s.
Figure 3.1: Index of Missing Exports, Pakistan (red) and other countries
Source: UN Comtrade and World Development Indicators, World Bank staff calculations
The opportunity cost of Pakistan’s “missing exports” is estimated at 893,000 jobs and US$ 1.74 billion in foregone taxes. Of these, 152,000 jobs could be created in the agriculture export sector, and 741,000 jobs could be created in the manufacturing export sector. 105 While some of these jobs could be newly created, others may imply the reallocation of labor from relatively lower productivity, domestic-oriented firms, to higher productivity, export-oriented firms.106 In terms of foregone tax revenue, a back-of-the-envelope calculation suggests that realizing the export potential would bring an additional US$ 1.74 billion in direct tax revenues annually, taking into account Pakistan’s value added share in gross exports, as well as the implicit direct tax rate across sectors.107 To tap into the export potential, Pakistan needs to upgrade its trade policy framework. Specifically, it needs to:
First, reduce the anti-export bias of tariff policy. This entails gradually reducing import duties across the board, as well as reducing the extent of the cascading by applying larger import duty cuts to final goods relative to intermediates and raw materials. Analysis shows that protecting the domestic market through high rates of import duties, as the ones observed in Pakistan, comes at the expense of missing out in terms of exports, because it incentivizes firms to sell domestically rather than to export. The high levels of protection observed in Pakistan carry a high opportunity cost in terms of export-oriented jobs lost, and a higher productivity path the economy could undertake.
104 The analysis focuses on countries with a population of at least 5 million inhabitants. This includes 105 countries, covering more than four-fifths of international trade flows. It focuses on merchandise trade. For a detailed description of the methodology of estimation of export potentials, see Mulabdic, A. and P. Yasar (2021). Gravity Model–Based Export Potential: An Application to Turkey. Policy Research Working Paper No. 9557. World Bank, Washington, DC. 105 This estimate draws on the elasticity of jobs creation to exports derived from the “Jobs Content of Exports” (JOCEX) dataset. The JOCEX dataset, uses global input-output tables and aggregate data from the Global Trade Analysis Project (GTAP), to calculate the number of jobs embedded in exports for 65 countries and 11 sectors (see “Cali, M.; J. Francois; C. Hollweg; M. Manchin; D. Oberdabernig; H. Rojas-Romagosa; S. Rubinova and P. Tomberger, Patrick (2016). The Labor Content of Exports Database. Policy Research Working Paper; No. 7615. World Bank, Washington, DC). At the sector level, agriculture is the third highest sector in terms of job content per value exported (38 jobs), while manufacturing (generally more capital intensive and with more intermediate consumption than agriculture) is the third lowest (13
0
20
40
60
80
Inde
x of
Mis
sing
Exp
orts
, 201
0-20
17

N a v i g a t i n g i n U n c e r t a i n T i m e s P a k i s t a n D e v e l o p m e n t U p d a t e
A p r i l 2 0 2 1 T h e W o r l d B a n k
33
Second, reorient trade enhancement schemes. Currently, schemes such as those put forward in Statutory Regulatory Order (SRO) 711(I) 2018, provide support to exporters that reach destinations with low export potential and low dynamism, thus not leading to an effective and efficient allocation of scarce public funds (Figure 3.2). High-potential Asian destinations should be targeted rather than low-potential African, Latin American, or Pacific Islands ones. Further, the sectoral targeting of these schemes should be revised. From a sectoral perspective, these schemes have a strong anti-diversification focus, as they target support f well-established products, but virtually ignore potentially new products. 108 Third, negotiate market access with high potential destinations. Central Asian republics are a high potential for Pakistan, because of high missing exports to those countries, and because of their import dynamism. Preferential trade agreements with Uzbekistan or Kazakhstan should be priorities, along with the negotiation of agreements on transit trade with Afghanistan to facilitate physical access to those markets.
Figure 3.2: Export potential & Eligibility for Drawback of Local Taxes and Levies (DLTL) and Duty Drawback of Taxes Premium for Non-Traditional Destinations
Source: UN Comtrade and World Development Indicators, World Bank staff calculations
jobs). In the case of Pakistan, to estimate “missing” jobs associated with “missing exports” the median jobs-to-exports elasticity is assumed (38 additional jobs per US$ 1 million of agricultural exports and 13 additional jobs per US$ 1 million of manufacturing exports) across comparable countries. 106 Export-oriented firms in Pakistan are estimated to be 25 percent more productive than domestic-oriented ones with similar characteristics (see “Lovo, S. and G. Varela (2020). Internationally Linked Firms, Integration Reforms and Productivity: Evidence from Pakistan. Policy Research Working Paper; No. 9349. World Bank, Washington, DC). 107 This back-of-the-envelope calculation of foregone tax revenues assumes that there is idle capacity in Pakistan’s manufacturing and agriculture, so that the increase in exports will be driven by new economic activity rather than by the reallocation of resources away from other sectors. If instead, the realization of the export potential implies reallocating resources from other activities into exporting, then the foregone tax revenues due to missing exports are likely lower. 108 The anti-diversification bias of the DDT and DLTL schemes is evidenced by the fact that well-established export products are 18 times more likely to be targeted than potentially new export products. Also, within the group of products classified by the Engineering Development Board as “locally manufactured,” those that are already being exported are 1.45 times more likely to be targeted to receive support under the DDT and DLTL than those that are locally manufactured but are not exported.
SWECHE ESP
JPN
CAN
TUN
GBR
SAU ISRPOL
KOR
VNM
IDNFRA
IRQ
SVK
THA
BEL
AUTFINMYS NLD GRC
HKG
DEU
ROM DNK
ITA
CZE
IND
HUN
TURPHL
CHN
MMR
IRN
BGR
USA
NPLPRT
LAO
ETH
MAR
HND
RUS
UKREGY
UZB
AGO
BRA
ZMBPRY
BFA
SLV
AUS
MEX
SDN
DZA
BLR
GTM DOM
CMR
CHLAZE
BDI
KAZ
NIC
BOL
PER
ECU
SEN
ZAF
GHA
COL
TZA
NGAARG
MWI8
10
12
14
16
-10 -5 0 5 10 15
Destinations not eligible for additional rebateDestinations eligible for aditional rebate
Import growth of Pakistan's trading partner (%)
Paki
stan
'sM
issin
g E
xpor
ts (l
ogs)
N a v i g a t i n g i n U n c e r t a i n T i m e s P a k i s t a n D e v e l o p m e n t U p d a t e
A p r i l 2 0 2 1 T h e W o r l d B a n k
34
4. Impact of the COVID-19 Crisis on the Private Sector in Pakistan
a. Introduction
Findings from two waves of the Business Pulse Surveys (BPS) administered across Pakistan suggest that a nascent recovery is underway in the private sector. Businesses that had highlighted the steep impact of the COVID-19 crisis and a dismal outlook in the first-wave of the survey, administered over June-July 2020, reported improving conditions in the second-wave of the survey, administered in January 2021. While the general trend is reassuring, there is a case for cautious optimism, as many businesses are still in a vulnerable state and have low cash buffers to navigate further shocks. Moreover, sales performance remains muted, having not recovered to pre-pandemic levels. The case for caution is given impetus by the fact that the country is now firmly in the midst of a third COVID wave. While the outlook was favorable at the time of survey administration, uncertainty remains high and the economic conditions facing businesses can quickly become adverse with significant implications, particularly for vulnerable firms. This uncertainty and choppy economic conditions have manifested themselves in recent weeks with the government re-imposing some of the restrictions it had lifted earlier. There is a case for further policy support to buttress the nascent recovery. Policy measures that prevent permanent firm closures and the consequent layoff of workers will contribute significantly to sustaining the recovery. The COVID-19 crisis exacerbated prevailing challenges facing the private sector while also introducing new ones.
The COVID-19 crisis, which manifested itself through a confluence of demand, supply, and financial shocks, all of which were heightened by uncertainty in the economy, aggravated the already adverse economic climate that prevailed before the pandemic (Section 2b). The impact of the crisis was large, as it was wide-ranging. Given the magnitude and scope of the adverse economic impact, there is a need for a more comprehensive understanding of the impact of the crisis on the private sector to inform the design of new policy measures and/or refine existing ones to prevent widespread long-term firm closures and job losses that may result in a substantive permanent loss of national output.
Two waves of BPS were undertaken to study the different facets of the impact
This section presents the findings of two waves of the BPS that were undertaken to: 1. quantify the impact of the COVID-19 crisis on the private sector, and 2. to study the evolution of its impact over two periods. The first survey was administered in June-July 2020, while the second was administered in January 2021. The survey covered a sample of 1,515 firms in the first wave and 602 firms in the second wave, with the same set of
N a v i g a t i n g i n U n c e r t a i n T i m e s P a k i s t a n D e v e l o p m e n t U p d a t e
A p r i l 2 0 2 1 T h e W o r l d B a n k
35
and its evolution over time.
602 firms being tracked over time.109 The results presented in this special section are limited to the panel of 602 firms that were interviewed in both waves of the survey. 110 The sample included firms of all sizes (i.e., micro, small, medium, and large), operating in all provinces in all the major sectors and comprising different organizational structures, including, but not limited, to sole proprietorships, partnerships, and limited liability companies (Box 4.1).
Box 4.1: Sample Selection and Stratification
The survey sample was selected employing stratified sampling with proportional allocation. Stratified sampling is a technique that uses auxiliary information, referred to as stratification variables, to increase the efficiency of a sample design and accuracy of point estimates. Stratification also permits separate analyses on each stratum and allows for different interests to be analyzed for different groups.
Two levels of stratification were employed in selecting the sample from the sample frame for the business pulse survey: 1. sector and 2. geographical location/province. At the sectoral level, enterprises in the frame were allocated to three main sectors: a) agriculture, b) manufacturing, and c) services. At the regional level, enterprises were allocated to 5 regions: a) Punjab, b) Sindh, c) Baluchistan, d) KP, and e) Other Regions/Territories. Once the frame had been stratified, a simple random sample was taken from each stratum to establish the total sample.
Enterprises were selected from the individual strata in proportion to the weight of these strata (that is, proportional distribution) in the Economic Census, which served as the stratification source. In proportional allocation, the sample allocated to each stratum is proportional to the number of units in the strata. For instance, if we were sampling 10 percent of the population, we would then sample 10 percent of each stratum. This method thus takes into account the size of each stratum, and larger strata will have larger samples taken from them.
b. Operational Impact and Recovery
The COVID-19 crisis took a substantial toll on Pakistan’s private sector.
The substantial impact of the COVID-19 crisis on the private sector was evident in the findings of the first wave of the BPS. Most firms were operating under reduced hours (51 percent), were temporarily closed (13 percent), or had closed permanently (9 percent). The fact that less than a third of the firms were fully operational at the time of administration of the survey, when the lockdown had been lifted and most of the restrictions had been eased, indicates the severity of the crisis and its lingering impact on the private sector. A majority of the firms reported not having significant financial buffers, highlighting the fragility of the recovery process. While 60 percent of the firms reported only having cash buffers for 30 days, a significant 18 percent had no cash buffers.111 The breadth of the impact on the labor force is also indicated by the large share of workers employed in vulnerable firms, that is, firms that were still either operating under reduced operations or temporarily closed at the time of survey administration. Of the 54,433 employees covered under the first wave, 41 percent were working in vulnerable firms. The impact of the crisis on the private sector was not only deep and broad, but also differentiated, with smaller firms and those operating in the services sector most impacted by the crisis, while larger firms and exporters fared better, even when controlling for other core characteristics. For example, 10 percent of micro-sized firms had closed down permanently as a result of the crisis, as opposed to only 2 percent of large firms.
109 The core characteristics of the sample did not change significantly between the two waves. Out of the 1,515 firms interviewed in the first wave, 65.9 percent were classified as micro-sized firms, 73 percent were located in Punjab, and 66.9 percent were operating as sole proprietorships. The numbers are remarkably similar for the smaller sample in the second wave. Of the 602 firms surveyed, 67.3 percent were classified as micro, 74.9 percent were operating in Punjab, and 66 percent were operating as sole proprietorships. 110 602 firms, equivalent to 40 percent of firms surveyed in the first wave, were successfully interviewed in the second wave. The attrition in the sample stemmed from firms indicating during the first wave that they did not want to be contacted again (12 percent of firms), appointment being given but no response on follow-up despite five call attempts (13 percent of firms), refusal before the beginning of or during interview (14 percent of firms), number busy/number powered off/no response despite five call attempts (13 percent of firms). The results presented in this special section therefore suffer from a degree of attrition bias, attributable primarily to the firms which couldn’t be contacted (number busy/powered off/no-response). Attrition bias implies that firms in the panel may have been systematically more resilient than firms that dropped from the sample. The results presented in the special section, as such, may present a more favorable picture of the recovery than the ground realities. 111 The results presented in this paragraph are for the full sample of firms surveyed in the first wave of the BPS.
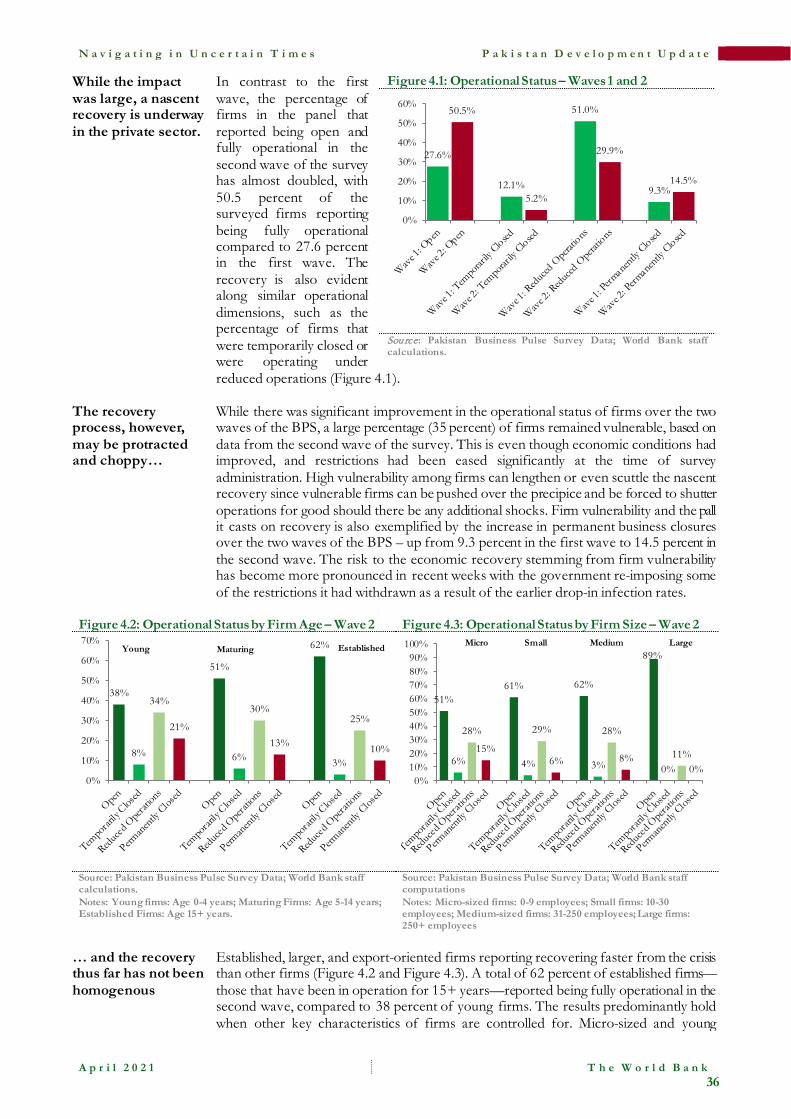
N a v i g a t i n g i n U n c e r t a i n T i m e s P a k i s t a n D e v e l o p m e n t U p d a t e
A p r i l 2 0 2 1 T h e W o r l d B a n k
36
While the impact was large, a nascent recovery is underway in the private sector.
In contrast to the first wave, the percentage of firms in the panel that reported being open and fully operational in the second wave of the survey has almost doubled, with 50.5 percent of the surveyed firms reporting being fully operational compared to 27.6 percent in the first wave. The recovery is also evident along similar operational dimensions, such as the percentage of firms that were temporarily closed or were operating under reduced operations (Figure 4.1).
Figure 4.1: Operational Status – Waves 1 and 2
Source : Pakistan Business Pulse Survey Data; World Bank staff calculations.
The recovery process, however, may be protracted and choppy…
While there was significant improvement in the operational status of firms over the two waves of the BPS, a large percentage (35 percent) of firms remained vulnerable, based on data from the second wave of the survey. This is even though economic conditions had improved, and restrictions had been eased significantly at the time of survey administration. High vulnerability among firms can lengthen or even scuttle the nascent recovery since vulnerable firms can be pushed over the precipice and be forced to shutter operations for good should there be any additional shocks. Firm vulnerability and the pall it casts on recovery is also exemplified by the increase in permanent business closures over the two waves of the BPS – up from 9.3 percent in the first wave to 14.5 percent in the second wave. The risk to the economic recovery stemming from firm vulnerability has become more pronounced in recent weeks with the government re-imposing some of the restrictions it had withdrawn as a result of the earlier drop-in infection rates.
Figure 4.2: Operational Status by Firm Age – Wave 2 Figure 4.3: Operational Status by Firm Size – Wave 2
Source: Pakistan Business Pulse Survey Data; World Bank staff calculations. Notes: Young firms: Age 0-4 years; Maturing Firms: Age 5-14 years; Established Firms: Age 15+ years.
Source: Pakistan Business Pulse Survey Data; World Bank staff computations Notes: Micro-sized firms: 0-9 employees; Small firms: 10-30 employees; Medium-sized firms: 31-250 employees; Large firms: 250+ employees
… and the recovery thus far has not been homogenous
Established, larger, and export-oriented firms reporting recovering faster from the crisis than other firms (Figure 4.2 and Figure 4.3). A total of 62 percent of established firms—those that have been in operation for 15+ years—reported being fully operational in the second wave, compared to 38 percent of young firms. The results predominantly hold when other key characteristics of firms are controlled for. Micro-sized and young
38%
8%
34%
21%
51%
6%
30%
13%
62%
3%
25%
10%
0%
10%
20%
30%
40%
50%
60%
70%EstablishedYoung Maturing
51%
6%
28%
15%
61%
4%
29%
6%
62%
3%
28%
8%
89%
0%11%
0%0%
10%20%30%40%50%60%70%80%90%
100% Micro Small Medium Large
27.6%
50.5%
12.1%5.2%
51.0%
29.9%
9.3%14.5%
0%
10%
20%
30%
40%
50%
60%

N a v i g a t i n g i n U n c e r t a i n T i m e s P a k i s t a n D e v e l o p m e n t U p d a t e
A p r i l 2 0 2 1 T h e W o r l d B a n k
37
exporters, for example, reported being fully operational at much higher rates than peers that are not exporters. The heterogeneity witnessed in the recovery is closely associated with the heterogeneity in the resilience of firms. Larger, more established, and export-oriented firms on average have easier access to finance and greater cash buffers, and so were not only able to weather through the crisis, but also restart operations faster. Smaller and young firms, in contrast, tend to be more informally organized, have fewer financial buffers, and have limited access to finance. Therefore, these firms, albeit nimbler than large firms, may have had difficulty restarting operations at scale owing to the depletion of working capital and/or productive assets during the peak of the crisis.
c. Expectations and Economic Activity
Operational recovery was reflected in resurgent business confidence at the time of survey administration.
Firms’ expectations about the future, at the time of survey administration had improved considerably, in line with the recovery in the broader economy (Section 2b). This was most immediately captured by the Business Confidence Survey (BCS) administered by the State Bank of Pakistan and used to compute the Business Confidence Index.112 As of December 2020, the Business Confidence Index was at its highest level of 56 since survey administration began in August 2018, after collapsing to its lowest point in April–June 2020. Findings of the WBG’s BPS echoed the findings of the BCS. Approximately 50 percent of the firms in the panel in the first wave expected sales to decline in the following 3 months. In contrast, less than a fourth (23 percent) of the firms surveyed in the second wave expected a decline in sales in the following 6 months (Figure 4.4). This turnaround was also reflected in employment and investment expectations, with a significant decrease in the percentage of firms that expected a decrease in employment and investment in the following months. In the second wave, only 9.7 and 6.6 percent of firms expected a decrease in employment and capital investment plans, respectively, in contrast to the first wave of the survey, where a sizable 51.6 and 22 percent of firms reported expecting a decrease in employment and investment plans, respectively.
Figure 4.4: Sales Expectations Over Coming 6 Months – Waves 1 and 2
Source: Pakistan Business Pulse Survey Data; World Bank staff calculations.
112 The business confidence survey is a bi-monthly telephonic survey conducted in the second half of even-numbered months. This survey targets large firms in manufacturing, services, construction, wholesale and retail trade, and financial services sectors from across the country to seek their opinions on factors such as production, employment, demand for credit, and economic conditions. The sample is based on around 1000 large firms registered with Security and Exchange Commission of Pakistan (SECP).
13%
34%
48%
23%
39%43%
0%
10%
20%
30%
40%
50%
60%
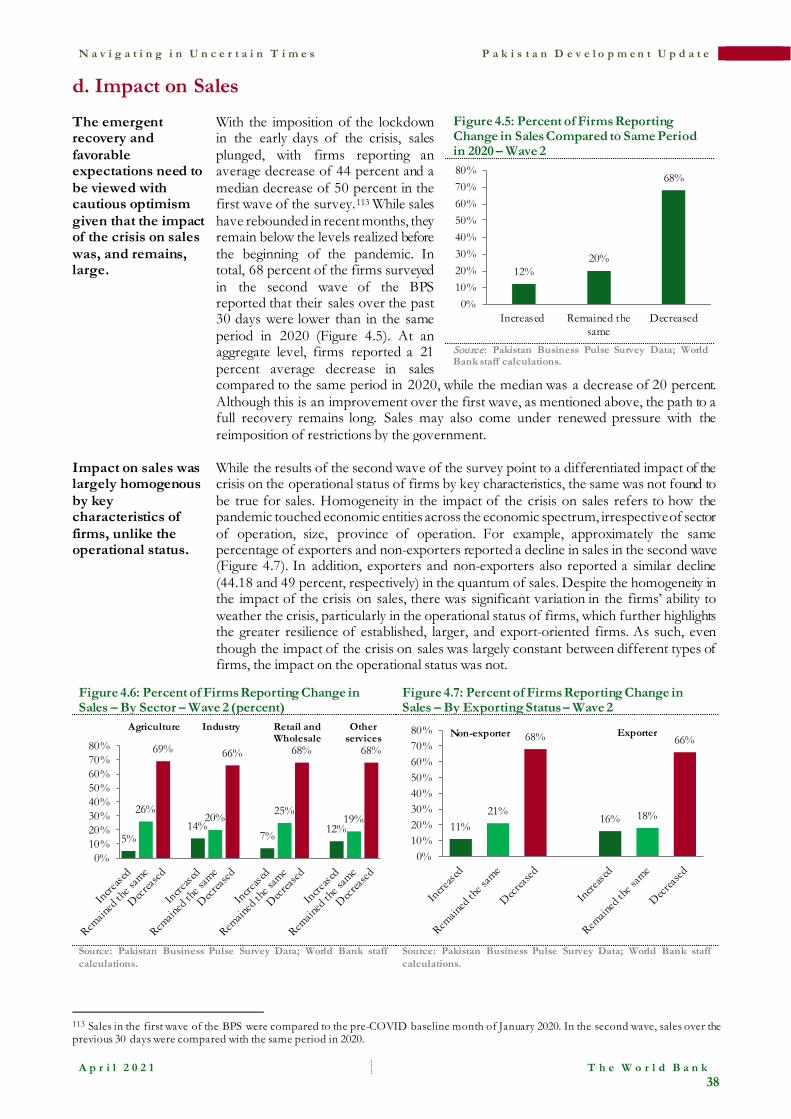
N a v i g a t i n g i n U n c e r t a i n T i m e s P a k i s t a n D e v e l o p m e n t U p d a t e
A p r i l 2 0 2 1 T h e W o r l d B a n k
38
d. Impact on Sales
The emergent recovery and favorable expectations need to be viewed with cautious optimism given that the impact of the crisis on sales was, and remains, large.
With the imposition of the lockdown in the early days of the crisis, sales plunged, with firms reporting an average decrease of 44 percent and a median decrease of 50 percent in the first wave of the survey.113 While sales have rebounded in recent months, they remain below the levels realized before the beginning of the pandemic. In total, 68 percent of the firms surveyed in the second wave of the BPS reported that their sales over the past 30 days were lower than in the same period in 2020 (Figure 4.5). At an aggregate level, firms reported a 21 percent average decrease in sales compared to the same period in 2020, while the median was a decrease of 20 percent. Although this is an improvement over the first wave, as mentioned above, the path to a full recovery remains long. Sales may also come under renewed pressure with the reimposition of restrictions by the government.
Figure 4.5: Percent of Firms Reporting Change in Sales Compared to Same Period in 2020 – Wave 2
Source : Pakistan Business Pulse Survey Data; World Bank staff calculations.
Impact on sales was largely homogenous by key characteristics of firms, unlike the operational status.
While the results of the second wave of the survey point to a differentiated impact of the crisis on the operational status of firms by key characteristics, the same was not found to be true for sales. Homogeneity in the impact of the crisis on sales refers to how the pandemic touched economic entities across the economic spectrum, irrespective of sector of operation, size, province of operation. For example, approximately the same percentage of exporters and non-exporters reported a decline in sales in the second wave (Figure 4.7). In addition, exporters and non-exporters also reported a similar decline (44.18 and 49 percent, respectively) in the quantum of sales. Despite the homogeneity in the impact of the crisis on sales, there was significant variation in the firms’ ability to weather the crisis, particularly in the operational status of firms, which further highlights the greater resilience of established, larger, and export-oriented firms. As such, even though the impact of the crisis on sales was largely constant between different types of firms, the impact on the operational status was not.
Figure 4.6: Percent of Firms Reporting Change in Sales – By Sector – Wave 2 (percent)
Figure 4.7: Percent of Firms Reporting Change in Sales – By Exporting Status – Wave 2
Source: Pakistan Business Pulse Survey Data; World Bank staff calculations.
Source: Pakistan Business Pulse Survey Data; World Bank staff calculations.
113 Sales in the first wave of the BPS were compared to the pre-COVID baseline month of January 2020. In the second wave, sales over the previous 30 days were compared with the same period in 2020.
5%
26%
69%
14%20%
66%
7%
25%
68%
12%19%
68%
0%10%20%30%40%50%60%70%80%
Agriculture Industry Retail and Wholesale
Other services
11%21%
68%
16% 18%
66%
0%10%20%30%40%50%60%70%80% Non-exporter Exporter
12%20%
68%
0%10%20%30%40%50%60%70%80%
Increased Remained thesame
Decreased
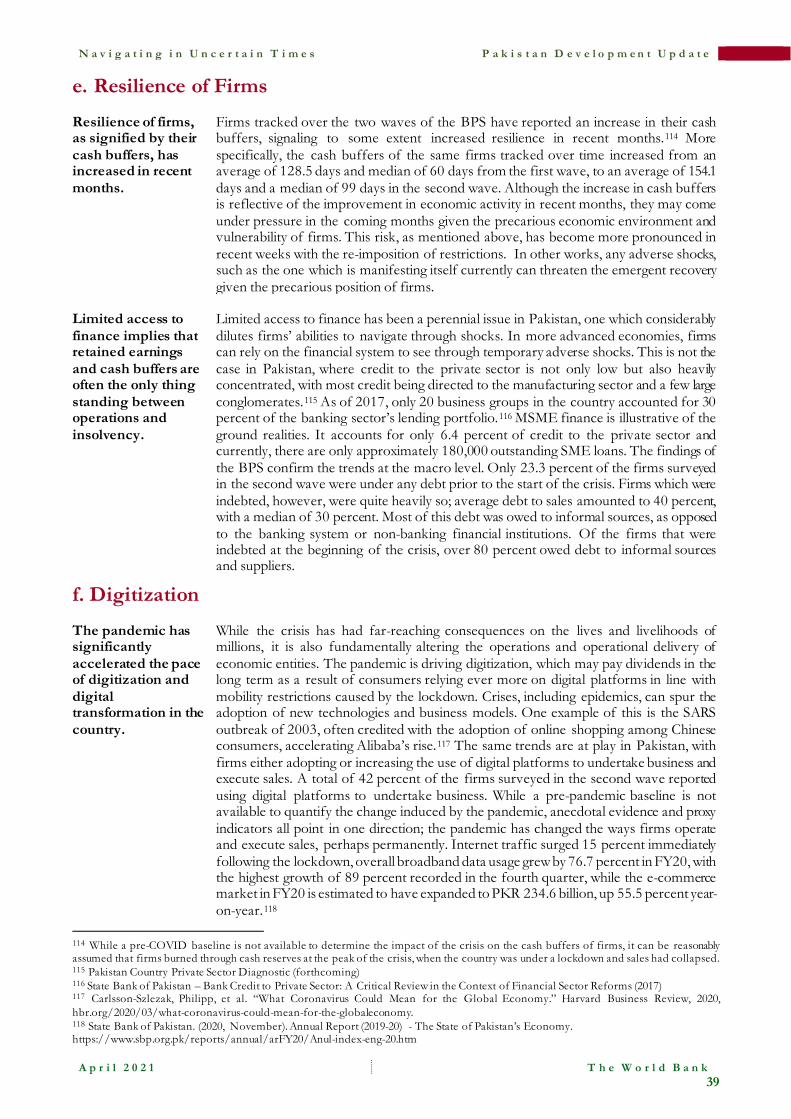
N a v i g a t i n g i n U n c e r t a i n T i m e s P a k i s t a n D e v e l o p m e n t U p d a t e
A p r i l 2 0 2 1 T h e W o r l d B a n k
39
e. Resilience of Firms
Resilience of firms, as signified by their cash buffers, has increased in recent months.
Firms tracked over the two waves of the BPS have reported an increase in their cash buffers, signaling to some extent increased resilience in recent months.114 More specifically, the cash buffers of the same firms tracked over time increased from an average of 128.5 days and median of 60 days from the first wave, to an average of 154.1 days and a median of 99 days in the second wave. Although the increase in cash buffers is reflective of the improvement in economic activity in recent months, they may come under pressure in the coming months given the precarious economic environment and vulnerability of firms. This risk, as mentioned above, has become more pronounced in recent weeks with the re-imposition of restrictions. In other works, any adverse shocks, such as the one which is manifesting itself currently can threaten the emergent recovery given the precarious position of firms.
Limited access to finance implies that retained earnings and cash buffers are often the only thing standing between operations and insolvency.
Limited access to finance has been a perennial issue in Pakistan, one which considerably dilutes firms’ abilities to navigate through shocks. In more advanced economies, firms can rely on the financial system to see through temporary adverse shocks. This is not the case in Pakistan, where credit to the private sector is not only low but also heavily concentrated, with most credit being directed to the manufacturing sector and a few large conglomerates.115 As of 2017, only 20 business groups in the country accounted for 30 percent of the banking sector’s lending portfolio.116 MSME finance is illustrative of the ground realities. It accounts for only 6.4 percent of credit to the private sector and currently, there are only approximately 180,000 outstanding SME loans. The findings of the BPS confirm the trends at the macro level. Only 23.3 percent of the firms surveyed in the second wave were under any debt prior to the start of the crisis. Firms which were indebted, however, were quite heavily so; average debt to sales amounted to 40 percent, with a median of 30 percent. Most of this debt was owed to informal sources, as opposed to the banking system or non-banking financial institutions. Of the firms that were indebted at the beginning of the crisis, over 80 percent owed debt to informal sources and suppliers.
f. Digitization
The pandemic has significantly accelerated the pace of digitization and digital transformation in the country.
While the crisis has had far-reaching consequences on the lives and livelihoods of millions, it is also fundamentally altering the operations and operational delivery of economic entities. The pandemic is driving digitization, which may pay dividends in the long term as a result of consumers relying ever more on digital platforms in line with mobility restrictions caused by the lockdown. Crises, including epidemics, can spur the adoption of new technologies and business models. One example of this is the SARS outbreak of 2003, often credited with the adoption of online shopping among Chinese consumers, accelerating Alibaba’s rise.117 The same trends are at play in Pakistan, with firms either adopting or increasing the use of digital platforms to undertake business and execute sales. A total of 42 percent of the firms surveyed in the second wave reported using digital platforms to undertake business. While a pre-pandemic baseline is not available to quantify the change induced by the pandemic, anecdotal evidence and proxy indicators all point in one direction; the pandemic has changed the ways firms operate and execute sales, perhaps permanently. Internet traffic surged 15 percent immediately following the lockdown, overall broadband data usage grew by 76.7 percent in FY20, with the highest growth of 89 percent recorded in the fourth quarter, while the e-commerce market in FY20 is estimated to have expanded to PKR 234.6 billion, up 55.5 percent year-on-year.118
114 While a pre-COVID baseline is not available to determine the impact of the crisis on the cash buffers of firms, it can be reasonably assumed that firms burned through cash reserves at the peak of the crisis, when the country was under a lockdown and sales had collapsed. 115 Pakistan Country Private Sector Diagnostic (forthcoming) 116 State Bank of Pakistan – Bank Credit to Private Sector: A Critical Review in the Context of Financial Sector Reforms (2017) 117 Carlsson-Szlezak, Philipp, et al. “What Coronavirus Could Mean for the Global Economy.” Harvard Business Review, 2020, hbr.org/2020/03/what-coronavirus-could-mean-for-the-globaleconomy. 118 State Bank of Pakistan. (2020, November). Annual Report (2019-20) - The State of Pakistan’s Economy. https://www.sbp.org.pk/reports/annual/arFY20/Anul-index-eng-20.htm
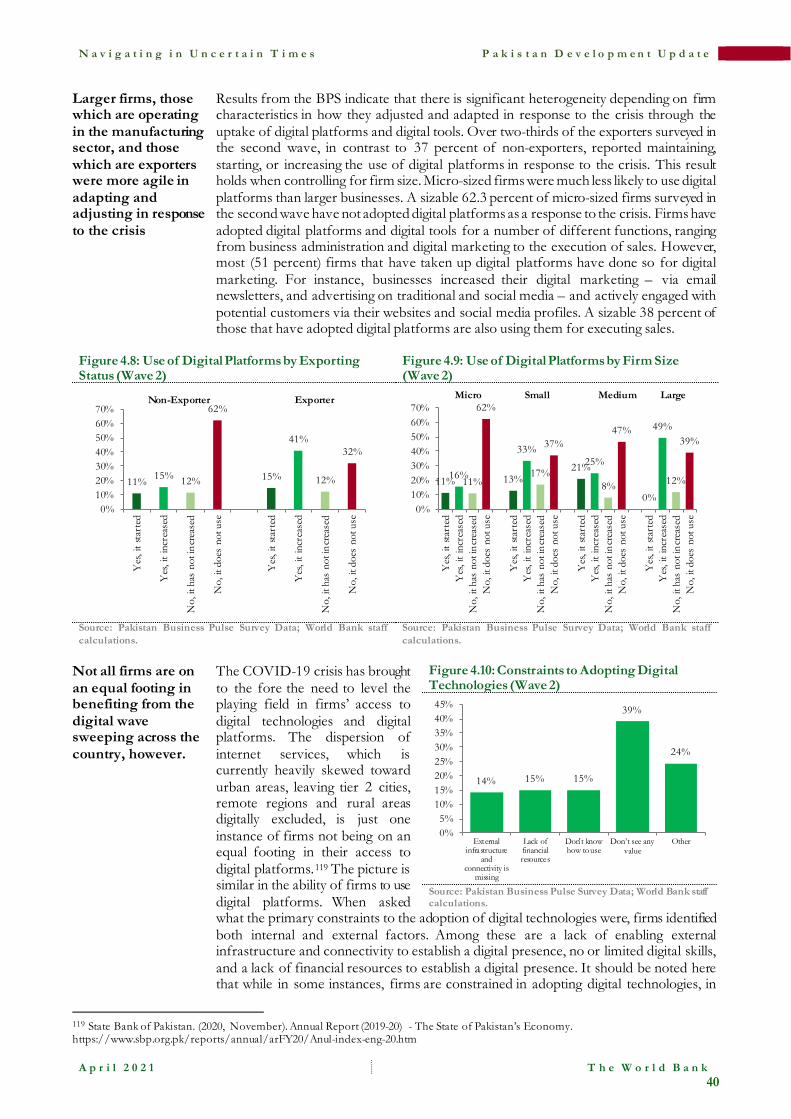
N a v i g a t i n g i n U n c e r t a i n T i m e s P a k i s t a n D e v e l o p m e n t U p d a t e
A p r i l 2 0 2 1 T h e W o r l d B a n k
40
Larger firms, those which are operating in the manufacturing sector, and those which are exporters were more agile in adapting and adjusting in response to the crisis
Results from the BPS indicate that there is significant heterogeneity depending on firm characteristics in how they adjusted and adapted in response to the crisis through the uptake of digital platforms and digital tools. Over two-thirds of the exporters surveyed in the second wave, in contrast to 37 percent of non-exporters, reported maintaining, starting, or increasing the use of digital platforms in response to the crisis. This result holds when controlling for firm size. Micro-sized firms were much less likely to use digital platforms than larger businesses. A sizable 62.3 percent of micro-sized firms surveyed in the second wave have not adopted digital platforms as a response to the crisis. Firms have adopted digital platforms and digital tools for a number of different functions, ranging from business administration and digital marketing to the execution of sales. However, most (51 percent) firms that have taken up digital platforms have done so for digital marketing. For instance, businesses increased their digital marketing – via email newsletters, and advertising on traditional and social media – and actively engaged with potential customers via their websites and social media profiles. A sizable 38 percent of those that have adopted digital platforms are also using them for executing sales.
Figure 4.8: Use of Digital Platforms by Exporting Status (Wave 2)
Figure 4.9: Use of Digital Platforms by Firm Size (Wave 2)
Source: Pakistan Business Pulse Survey Data; World Bank staff calculations.
Source: Pakistan Business Pulse Survey Data; World Bank staff calculations.
Not all firms are on an equal footing in benefiting from the digital wave sweeping across the country, however.
The COVID-19 crisis has brought to the fore the need to level the playing field in firms’ access to digital technologies and digital platforms. The dispersion of internet services, which is currently heavily skewed toward urban areas, leaving tier 2 cities, remote regions and rural areas digitally excluded, is just one instance of firms not being on an equal footing in their access to digital platforms.119 The picture is similar in the ability of firms to use digital platforms. When asked what the primary constraints to the adoption of digital technologies were, firms identified both internal and external factors. Among these are a lack of enabling external infrastructure and connectivity to establish a digital presence, no or limited digital skills, and a lack of financial resources to establish a digital presence. It should be noted here that while in some instances, firms are constrained in adopting digital technologies, in
Figure 4.10: Constraints to Adopting Digital Technologies (Wave 2)
Source: Pakistan Business Pulse Survey Data; World Bank staff calculations.
119 State Bank of Pakistan. (2020, November). Annual Report (2019-20) - The State of Pakistan’s Economy. https://www.sbp.org.pk/reports/annual/arFY20/Anul-index-eng-20.htm
11% 15% 12%
62%
15%
41%
12%
32%
0%10%20%30%40%50%60%70%
Yes
, it s
tart
ed
Yes
, it i
ncre
ased
No,
it h
as n
ot in
crea
sed
No,
it d
oes
not u
se
Yes
, it s
tart
ed
Yes
, it i
ncre
ased
No,
it h
as n
ot in
crea
sed
No,
it d
oes
not u
se
ExporterNon-Exporter
11%16%11%
62%
13%
33%
17%
37%
21%25%
8%
47%
0%
49%
12%
39%
0%10%20%30%40%50%60%70%
Yes
, it s
tart
edY
es, i
t inc
reas
edN
o, it
has
not
incr
ease
dN
o, it
doe
s no
t use
Yes
, it s
tart
edY
es, i
t inc
reas
edN
o, it
has
not
incr
ease
dN
o, it
doe
s no
t use
Yes
, it s
tart
edY
es, i
t inc
reas
edN
o, it
has
not
incr
ease
dN
o, it
doe
s no
t use
Yes
, it s
tart
edY
es, i
t inc
reas
edN
o, it
has
not
incr
ease
dN
o, it
doe
s no
t use
Small Medium LargeMicro
14% 15% 15%
39%
24%
0%5%
10%15%20%25%30%35%40%45%
Externalinfrastructure
andconnectivity is
missing
Lack offinancialresources
Don't knowhow to use
Don’t see any value
Other
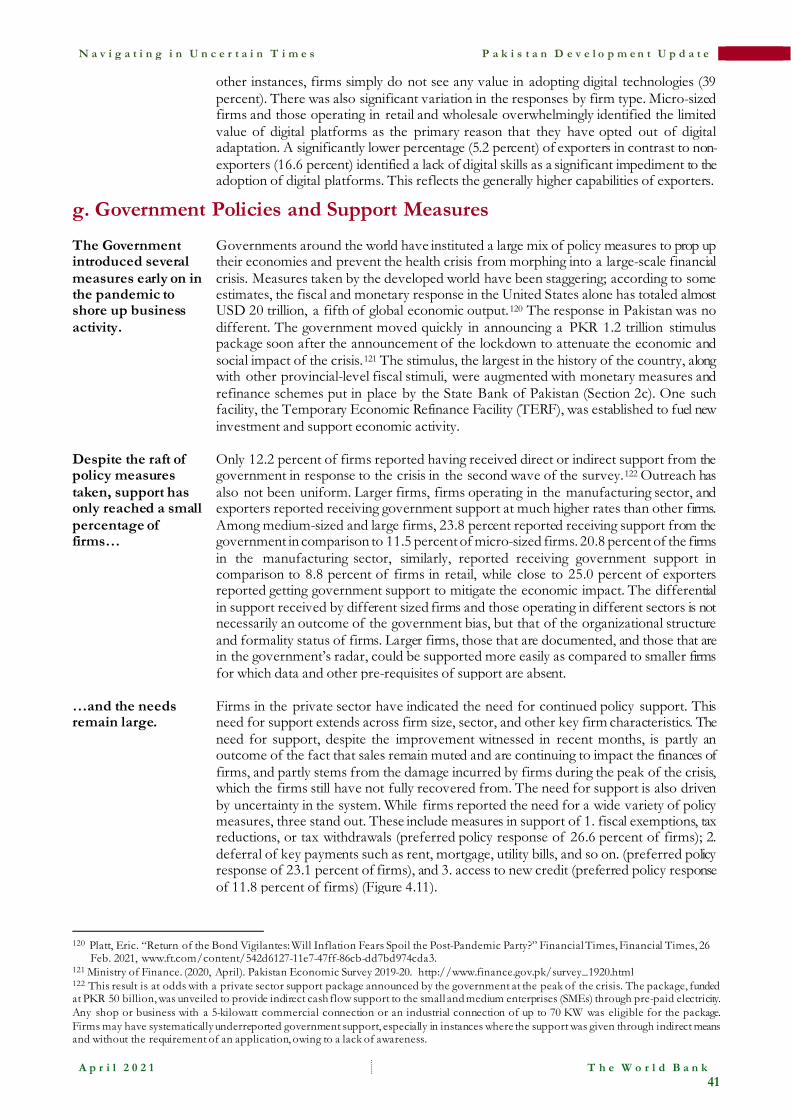
N a v i g a t i n g i n U n c e r t a i n T i m e s P a k i s t a n D e v e l o p m e n t U p d a t e
A p r i l 2 0 2 1 T h e W o r l d B a n k
41
other instances, firms simply do not see any value in adopting digital technologies (39 percent). There was also significant variation in the responses by firm type. Micro-sized firms and those operating in retail and wholesale overwhelmingly identified the limited value of digital platforms as the primary reason that they have opted out of digital adaptation. A significantly lower percentage (5.2 percent) of exporters in contrast to non-exporters (16.6 percent) identified a lack of digital skills as a significant impediment to the adoption of digital platforms. This reflects the generally higher capabilities of exporters.
g. Government Policies and Support Measures
The Government introduced several measures early on in the pandemic to shore up business activity.
Governments around the world have instituted a large mix of policy measures to prop up their economies and prevent the health crisis from morphing into a large-scale financial crisis. Measures taken by the developed world have been staggering; according to some estimates, the fiscal and monetary response in the United States alone has totaled almost USD 20 trillion, a fifth of global economic output.120 The response in Pakistan was no different. The government moved quickly in announcing a PKR 1.2 trillion stimulus package soon after the announcement of the lockdown to attenuate the economic and social impact of the crisis.121 The stimulus, the largest in the history of the country, along with other provincial-level fiscal stimuli, were augmented with monetary measures and refinance schemes put in place by the State Bank of Pakistan (Section 2c). One such facility, the Temporary Economic Refinance Facility (TERF), was established to fuel new investment and support economic activity.
Despite the raft of policy measures taken, support has only reached a small percentage of firms…
Only 12.2 percent of firms reported having received direct or indirect support from the government in response to the crisis in the second wave of the survey.122 Outreach has also not been uniform. Larger firms, firms operating in the manufacturing sector, and exporters reported receiving government support at much higher rates than other firms. Among medium-sized and large firms, 23.8 percent reported receiving support from the government in comparison to 11.5 percent of micro-sized firms. 20.8 percent of the firms in the manufacturing sector, similarly, reported receiving government support in comparison to 8.8 percent of firms in retail, while close to 25.0 percent of exporters reported getting government support to mitigate the economic impact. The differential in support received by different sized firms and those operating in different sectors is not necessarily an outcome of the government bias, but that of the organizational structure and formality status of firms. Larger firms, those that are documented, and those that are in the government’s radar, could be supported more easily as compared to smaller firms for which data and other pre-requisites of support are absent.
…and the needs remain large.
Firms in the private sector have indicated the need for continued policy support. This need for support extends across firm size, sector, and other key firm characteristics. The need for support, despite the improvement witnessed in recent months, is partly an outcome of the fact that sales remain muted and are continuing to impact the finances of firms, and partly stems from the damage incurred by firms during the peak of the crisis, which the firms still have not fully recovered from. The need for support is also driven by uncertainty in the system. While firms reported the need for a wide variety of policy measures, three stand out. These include measures in support of 1. fiscal exemptions, tax reductions, or tax withdrawals (preferred policy response of 26.6 percent of firms); 2. deferral of key payments such as rent, mortgage, utility bills, and so on. (preferred policy response of 23.1 percent of firms), and 3. access to new credit (preferred policy response of 11.8 percent of firms) (Figure 4.11).
120 Platt, Eric. “Return of the Bond Vigilantes: Will Inflation Fears Spoil the Post-Pandemic Party?” Financial Times, Financial Times, 26
Feb. 2021, www.ft.com/content/542d6127-11e7-47ff-86cb-dd7bd974cda3. 121 Ministry of Finance. (2020, April). Pakistan Economic Survey 2019-20. http://www.finance.gov.pk/survey_1920.html 122 This result is at odds with a private sector support package announced by the government at the peak of the crisis. The package, funded at PKR 50 billion, was unveiled to provide indirect cash flow support to the small and medium enterprises (SMEs) through pre-paid electricity. Any shop or business with a 5-kilowatt commercial connection or an industrial connection of up to 70 KW was eligible for the package. Firms may have systematically underreported government support, especially in instances where the support was given through indirect means and without the requirement of an application, owing to a lack of awareness.
N a v i g a t i n g i n U n c e r t a i n T i m e s P a k i s t a n D e v e l o p m e n t U p d a t e
A p r i l 2 0 2 1 T h e W o r l d B a n k
42
Figure 4.11: Most needed policies to support firms during the COVID-19 crisis – Wave 2
Source: Pakistan Business Pulse Survey Data; World Bank staff calculations.
Box 4.2: Moving from Relief to Recovery and Resilience
As the crisis has evolved, so have the restrictions associated with it. Extreme measures implemented at the start of the crisis such as the nationwide lockdown have in recent months given way to more targeted restrictions which have been applied surgically to locations with high contagion.
The evolving nature of the crisis, associated restrictions and their impact on the private sector has implied that policy priorities need to evolve. During the first phase of the crisis – relief, there was an urgent need to adopt emergency measures to address immediate liquidity challenges, reduce layoffs, and avoid firm closures and bankruptcies. A key consideration in this phase was providing support that is rapid, broad-based, transparent, and time bound. The government delivered on this objective through the mobilization of the fiscal support package, as mentioned above, regulatory forbearance measures, refinance schemes, in addition to other direct and indirect measures to preserve the liquidity of firms and prevent widespread closures and bankruptcies.
Pakistan is now in second phase of the crisis – recovery and resilience. In this phase, the policy objective needs to shift to helping firms return to their pre-crisis production and employment levels and set the foundations for longer-term productivity driven growth. During this phase, opportunities to address pre-crisis constraints on firm development may also arise. Credit and tax support measures should be focused on promoting investment and reactivating supply chains. Fiscal measures should be geared toward temporary job creation programs, as well as establishing government programs that aim to promote firm and productivity growth.
h. Policy Responses to Support Private Sector Recovery
Policy measures that prevent permanent firm closures and the consequent layoff of workers will significantly contribute to sustaining recovery.
There is a case for policy support to buttress the nascent recovery. This case is given credence by the fact that the private sector is still being impacted by the crisis, more so in recent weeks with a surge in infection rates, and a sizable percentage of firms remain vulnerable. Policy measures that prevent underlying vulnerabilities and temporary closures from evolving into permanent closures, and which prevent the dissolution of the bond between firms and their employees, especially those with firm-specific human capital, will significantly contribute to sustaining the recovery. There is also a case for policy support given the more permanent changes introduced by the pandemic, that is, digitization and the changing spending patterns of consumers. Lastly, there is a case for policy support given the structural issues plaguing the private sector. These issues, such as low access to finance and a poor investment climate, have always needed a policy push. The need for this push, however, is ever greater now given the toll exacted by the crisis on the private sector. The process of recovery can be given a boost if the government, in collaboration with the private sector, can make tangible progress on the issues stifling growth in the private sector more generally.
To induce stronger recovery, the government needs to: Enhance access to formal finance, in particular for
The State Bank of Pakistan, taking stock of the dire situation, announced a Loan Extension and Restructuring Package to facilitate the restructuring and deferment of loans for borrowers from the financial system. The debt relief scheme aimed to preserve the solvency of the borrowers and enable them to combat the economic disruptions. The scheme, while commendable, was limited to the narrow borrower pool of the formal financial system, which predominantly comprises larger firms operating in the
6%
23%
12%
27%
1%4% 4%
6%4%
13%
0%5%
10%15%20%25%30%
Gra
nts
Def
erra
l of p
aym
ent
Acc
ess t
o ne
w cr
edit
Fisc
al ex
cmpt
ions
Wag
e su
bsid
ies
Supp
ort f
or d
igita
lte
chno
logy
Supp
or fo
r hea
lthpr
otoc
ols
Supp
ort f
orm
arke
ting
Supp
ort f
orm
anag
emen
t ski
lls
Oth
er
N a v i g a t i n g i n U n c e r t a i n T i m e s P a k i s t a n D e v e l o p m e n t U p d a t e
A p r i l 2 0 2 1 T h e W o r l d B a n k
43
MSMEs, through the banking system and non-banking financial institutions.
manufacturing sector. The vast majority of the firms operating in Pakistan do not have access to the formal financial system, even if these firms are formal themselves. The BPS validated this fact: of the firms surveyed that were indebted at the beginning of the crisis, the vast majority were indebted to informal sources. This fact, coupled with the low cash buffer position of the surveyed firms, is indicative of the need to enhance access to formal finance for firms, and in particular, MSMEs. As a starting point, the government can operationalize the SME Credit Guarantee Company and develop alternative financing methods to substitute traditional collateralized lending for MSMEs.
Ease the explicit and implicit burden on the private sector through regulatory and administrative streamlining.
Pakistan has made significant progress in streamlining its regulatory environment. This is most notably reflected in the WBG’s Ease of Doing Business Index. More needs to be done, in particular given the COVID-19 context, to spur the nascent recovery. Although regulatory and administrative streamlining, translating into lower implicit and explicit costs, were required even before the onset of the crisis, they are even more important in the current context with many firms operating on thin margins. As a starting point, the government can establish a National Regulatory Delivery Office (NRDO) under the Prime Minister’s Office as part of the Pakistan Regulatory Modernization Initiative for a coordinated approach to business regulation. It can also formulate a Regulators’ Code as a framework of principles for new regulation that is proportionate, risk based, targeted and cost effective.
Support firms in establishing an online presence and digitizing.
Any lingering doubts about the need for digital transformation in an increasingly digitally connected world have been silenced by COVID-19 crisis. While Pakistan and the rest of the world may be seeing the light at the end of the tunnel insofar as the COVID-19 crisis is concerned, the need for digital transformation and digitization will remain. It is “go digital” or “go dark” in the post-COVID-19 world. Consumers’ shopping patterns have changed, with an ever-increasing number of consumers preferring to shop online through digital platforms. Firms in Pakistan have adapted to the new reality with gusto, but the take-up has not been consistent across the board. This heterogeneity is driven by both firm-internal (i.e., lack of skills or perceived lack of value) and firm-external (i.e., lack of connectivity and infrastructure) factors. The government can, to begin with, ensure that external infrastructure and connectivity is available, in particular in second- and third-tier cities, to ensure that firms are at an equal footing in adapting and adjusting to the changes unleashed by the crisis.
Undertake a new economic census.
The last economic census was conducted over the April 2001–December 2003 period and covered 3.2 million establishments. The lack of an up-to-date economic census, along with other comprehensive databases, has implied not only that policy formulation in Pakistan related to the private sector has often taken place in a vacuum from the ground realities, but also that the government is often unable to support enterprises that are most in need of this support, due to a lack of data. This was particularly evident during the COVID-19 crisis. While the government was able to mobilize support for larger, more established and formal firms on which data was readily available, it could not muster the same response for smaller, more unorganized, and informal firms owing to a lack of data. A new economic census, even beyond the COVID-19 crisis, would help in the design of policies more attuned to the needs of and reflective of the makeup of the private sector.
N a v i g a t i n g i n U n c e r t a i n T i m e s P a k i s t a n D e v e l o p m e n t U p d a t e
A p r i l 2 0 2 1 T h e W o r l d B a n k
44
References
Executive Summary, Section 2 and 3 ADB. August 2020. COVID-19 Impact on Farm Households in Punjab, Pakistan: Analysis of Data from a Cross-Sectional
Survey. ADB Brief, August 2020.
Aljazeera. October 9, 2020. “Pakistan claims devastating locust attack brought under control.” https://www.aljazeera.com/news/2020/10/9/pakistan-claims-devastating-locust-swarm-brought-under-control
_________. March 15, 2021. “Pakistan Increases Coronavirus Restrictions Amid Third Wave.” https://www.aljazeera.com/news/2021/3/15/pakistan-increases-coronavirus-restrictions-amid-third-wave
BBC. August 21, 2020. “Coronavirus: Youthful Pakistan appears to avoid worst of pandemic” https://www.bbc.com/news/world-asia-53742214
Cali, M.; J. Francois; C. Hollweg; M. Manchin; D. Oberdabernig; H. Rojas-Romagosa; S. Rubinova and P. Tomberger, Patrick. 2016. “The Labor Content of Exports Database.” Policy Research Working Paper; No. 7615. World Bank, Washington, DC
Dawn News. March 27, 2020. “SBP unveils debt relief measures for individuals, businesses.” https://www.dawn.com/news/1544076.
_________. May 2020. “Locust attack threatens food security in Pakistan.” https://www.dawn.com/news/1555487
_________. September 07, 2020. “Rain spells disaster for Sindh's agriculture sector.” https://www.dawn.com/news/1578307
_________. September 12, 2020. “Govt declines relaxation in GIDC recovery.” https://www.dawn.com/news/1579172
_________. January 22, 2021. “15pc hike in power tariff announced.” https://www.dawn.com/news/1602828
_________. February 04, 2021. “Cotton production falls by 34 pc, lowest in 30 years.” https://www.dawn.com/news/1605373/cotton-production-falls-by-34pc-lowest-in-30-years
Debt Policy Coordination Office, Ministry of Finance. 2021. Debt Policy Statement January 2021.
Economic Affairs Division, Government of Pakistan. 2020. Foreign Economic Assistance, Monthly Bulletin December 2020.
Financial Action Task Force (FATF). 2013. The role of hawala and other similar service providers in money laundering and terrorist financing. http://www.fatf-gafi.org/media/fatf/documents/reports/Role-of-hawala-and-similar-in-ml-tf.pdf
Finance. 2019-20. Pakistan Economic Survey 2019-20. Growth and Investment. http://finance.gov.pk/survey/chapter_20/01_Growth_and_Investment.pdf
Lakner et al. 2021. Updated estimates of the impact of COVID-19 on global poverty: Looking back at 2020 and the outlook for 2021.
Lovo, S. and G. Varela. 2020. “Internationally Linked Firms, Integration Reforms and Productivity: Evidence from Pakistan.” Policy Research Working Paper; No. 9349. World Bank, Washington, DC).
Ministry of Finance. Press Release: January 13, 2020 (PR No. 236): “New measures to help achieve $24 billion remittances target for FY2020.” http://www.finance.gov.pk/pr_jan_mar_2020.html.
Ministry of Finance. 2020. Annual Debt Review and Public Debt Bulletin, FY2019-20. Debt Policy Coordination Office,
Mulabdic, A. and P. Yasar. 2021. “Gravity Model–Based Export Potential: An Application to Turkey.” Policy Research Working Paper; No. 9557. World Bank, Washington, DC.
https://www.aljazeera.com/news/2021/3/15/pakistan-increases-coronavirus-restrictions-amid-third-wave
N a v i g a t i n g i n U n c e r t a i n T i m e s P a k i s t a n D e v e l o p m e n t U p d a t e
A p r i l 2 0 2 1 T h e W o r l d B a n k
45
Pakistan Bureau of Statistics. 2020. “Special survey for evaluating socio-economic Impact of COVID-19 on wellbeing of people”
Pakistan Cotton Ginner’s Association. 2021. https://www.pcga.org/wp-content/uploads/2021/01/03-January-2021.pdf,
Reuters. March 17, 2021. “Pakistan receives 500,000 vaccine doses from China, doubling available supply.” https://www.reuters.com/article/us-health-coronavirus-pakistan-vaccine/pakistan-receives-500000-vaccine-doses-from-china-doubling-available-supply-idUSKBN2B925F
State Bank of Pakistan. April 2016. “FAQs - Long Term Financing Facility (LTFF) for Plant & Machinery.” https://www.sbp.org.pk/incen/FAQs%20on%20LTFF%20Scheme.pdf
_________. 2020. “Daily Foreign Exchange Rates.” https://www.sbp.org.pk/reports/stat_reviews/Bulletin/2021/Feb/ExternalSector.pdf.
_________. 2020-2021. “Extension and Restructuring Package.” https://www.sbp.org.pk/COVID/Loans.html
_________. 2020. “Monetary Policy Statement.” September 2020. (https://www.sbp.org.pk/press/2020/Pr-21-Sep-20.pdf)
_________. “Business Confidence Survey.” https://www.sbp.org.pk/research/BCS.asp
_________. March 17, 2020. “Circulars/Notifications/Infrastructure, Housing & SME Finance Department.” https://www.sbp.org.pk/smefd/circulars/2020/C1.htm
_________. “Definitions and Terminologies.” https://www.sbp.org.pk/departments/stats/Banks_DFIs_Guide/definitions.pdf
_________. Countering Covid-19: Measures by State Bank of Pakistan. https://www.sbp.org.pk/COVID/index.html
_________. 2020. The State of Pakistan’s Economy. Annual Report 2019-20.
_________. 2020. The State of Pakistan’s Economy: First Quarterly Report 2020-21.
_________. 2021. “Monetary Policy Committee.” https://www.sbp.org.pk/m_policy/2021/MPS-Jan-2021-Eng.pdf
Tribune. July 30, 2020. “ECC okays petroleum levy cushion plan.” https://tribune.com.pk/story/2257305/ecc-okays-petroleum-levy-cushion-plan
World Bank. 2021. Global Economic Prospects. January 2021, Washington DC: World Bank
Section 4 - Focus Topic Carlsson-Szlezak, Philipp, et al. 2020. “What Coronavirus Could Mean for the Global Economy.” Harvard Business
Review. March 3, 2020. https://hbr.org/2020/03/what-coronavirus-could-mean-for-the-global-economy
Ministry of Finance. April 2020. Pakistan Economic Survey 2019-20. http://www.finance.gov.pk/survey_1920.html
Platt, Eric. 2021. “Return of the Bond Vigilantes: Will Inflation Fears Spoil the Post-Pandemic Party?” Financial Times, 26 Feb. 2021. www.ft.com/content/542d6127-11e7-47ff-86cb-dd7bd974cda3
State Bank of Pakistan. November 2020. The State of Pakistan’s Economy. Annual Report 2019-20. https://www.sbp.org.pk/reports/annual/arFY20/Anul-index-eng-20.htm
_________. 2017. Bank Credit to Private Sector: A Critical Review in the Context of Financial Sector Reforms.
World Bank. Pakistan Country Private Sector Diagnostic (forthcoming).

N a v i g a t i n g i n U n c e r t a i n T i m e s P a k i s t a n D e v e l o p m e n t U p d a t e
A p r i l 2 0 2 1 T h e W o r l d B a n k
46
Statistical Annex
No. Indicator EDUCATION AND SKILLS PSLM 2010-11 HIES 2015-16* HIES 2018-19 1 Overall pre-primary participation rate ages 4-5 (%) 36.5 43.4 44.9
Male 38.4 45.4 46.0 Female 34.5 41.3 43.7
Balochistan 21.7 18.0 12.5 Khyber Pakhtunkhwa 27 29.3 29.0
Punjab 45.2 54.3 61.8 Sindh 27 34.5 30.9
2 School Participation Rate Ages 6-10 (%) 74.3 74.6 77.1 Male 79.5 79.6 80.8
Female 68.6 69.2 73.2 Q 1 (poorest) 47.9 61.1 55.9 Q 5 (richest) 94.6 90.5 94.5 Balochistan 57.6 49.9 43.9
Khyber Pakhtunkhwa 74.1 75.9 76.1 Punjab 80.2 82.1 87.8 Sindh 66.1 63.0 64.2
3 School Participation Rate Ages 11-15 (%) 66.5 65.6 68.9 Male 73.3 73.3 76.5
Female 58.6 57.3 61.0 Q 1 (poorest) 34.7 46.1 43.6 Q 5 (richest) 90.4 87.9 90.0 Balochistan 49.7 45.5 45.9
Khyber Pakhtunkhwa 68.2 70.7 71.0 Punjab 69.6 70.6 75.1 Sindh 61.2 55.3 59.6
4 Percentage of 18-24 year olds enrolled in higher education or skills training (%)
8.1 13.7 10.1
Male 9.4 15.8 11.8 Female 6.9 11.8 8.7
Q 1 (poorest) 0.7 2.8 0.9 Q 5 (richest) 19.9 32.3 26.7 Balochistan 5.3 8.1 3.8
Khyber Pakhtunkhwa 7.7 14.6 9.9 Punjab 8.0 14.2 11.9 Sindh 8.7 13.3 8.2
5 Expenditure on education (% of GDP) 2.3 (2010) 2.7 (2015) 2.9 (2017) HEALTH AND NUTRITION DHS 2006-07 DHS 2012-13 DHS 2017-18
6 Percentage of births attended by a skilled health personnel
38.8 52.1 69.3
National - urban 60.1 71.0 83.8 National - rural 29.8 44.4 62.6
Balochistan 23.0 17.8 38.2 Khyber Pakhtunkhwa 37.9 48.3 67.4
Punjab including Islamabad (ICT) 37.7
Punjab excluding Islamabad (ICT)
52.5 71.3
ICT
88.1 86.6 Sindh 44.4 60.5 74.8
Q 1 (poorest) 16.1 29.8 46.0 Q 5 (richest) 77.3 85.2 93.2
7 Child immunization rate (full immunization based on recall and records) for children ages 12-23
months
47.3 53.8 65.6
Male 49.8 56.0 68.0
Female 44.3 51.5 63.1 Q 1 (poorest) 25.9 23.4 38.2 Q 5 (richest) 63.7 75.4 80.0
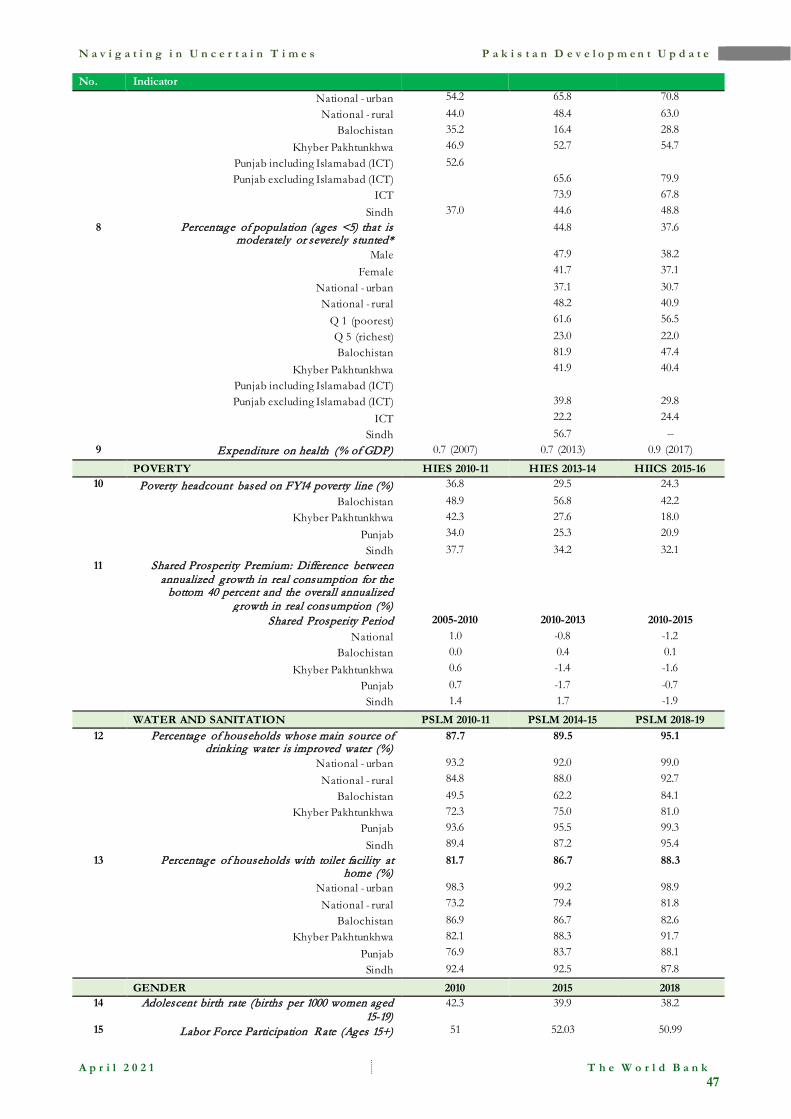
N a v i g a t i n g i n U n c e r t a i n T i m e s P a k i s t a n D e v e l o p m e n t U p d a t e
A p r i l 2 0 2 1 T h e W o r l d B a n k
47
No. Indicator National - urban 54.2 65.8 70.8 National - rural 44.0 48.4 63.0
Balochistan 35.2 16.4 28.8 Khyber Pakhtunkhwa 46.9 52.7 54.7
Punjab including Islamabad (ICT) 52.6
Punjab excluding Islamabad (ICT)
65.6 79.9
ICT
73.9 67.8 Sindh 37.0 44.6 48.8
8 Percentage of population (ages <5) that is moderately or severely stunted*
44.8 37.6
Male
47.9 38.2
Female
41.7 37.1 National - urban
37.1 30.7
National - rural
48.2 40.9 Q 1 (poorest)
61.6 56.5
Q 5 (richest)
23.0 22.0 Balochistan
81.9 47.4
Khyber Pakhtunkhwa
41.9 40.4 Punjab including Islamabad (ICT)
Punjab excluding Islamabad (ICT)
39.8 29.8 ICT
22.2 24.4
Sindh
56.7 -- 9 Expenditure on health (% of GDP) 0.7 (2007) 0.7 (2013) 0.9 (2017)
POVERTY HIES 2010-11 HIES 2013-14 HIICS 2015-16 10 Poverty headcount based on FY14 poverty line (%) 36.8 29.5 24.3
Balochistan 48.9 56.8 42.2 Khyber Pakhtunkhwa 42.3 27.6 18.0
Punjab 34.0 25.3 20.9 Sindh 37.7 34.2 32.1
11 Shared Prosperity Premium: Difference between annualized growth in real consumption for the
bottom 40 percent and the overall annualized growth in real consumption (%)
Shared Prosperity Period 2005-2010 2010-2013 2010-2015
National 1.0 -0.8 -1.2 Balochistan 0.0 0.4 0.1
Khyber Pakhtunkhwa 0.6 -1.4 -1.6 Punjab 0.7 -1.7 -0.7 Sindh 1.4 1.7 -1.9
WATER AND SANITATION PSLM 2010-11 PSLM 2014-15 PSLM 2018-19 12 Percentage of households whose main source of
drinking water is improved water (%) 87.7 89.5 95.1
National - urban 93.2 92.0 99.0 National - rural 84.8 88.0 92.7
Balochistan 49.5 62.2 84.1 Khyber Pakhtunkhwa 72.3 75.0 81.0
Punjab 93.6 95.5 99.3 Sindh 89.4 87.2 95.4
13 Percentage of households with toilet facility at home (%)
81.7 86.7 88.3
National - urban 98.3 99.2 98.9 National - rural 73.2 79.4 81.8
Balochistan 86.9 86.7 82.6 Khyber Pakhtunkhwa 82.1 88.3 91.7
Punjab 76.9 83.7 88.1 Sindh 92.4 92.5 87.8
GENDER 2010 2015 2018 14 Adolescent birth rate (births per 1000 women aged
15-19) 42.3 39.9 38.2
15 Labor Force Participation Rate (Ages 15+) 51 52.03 50.99
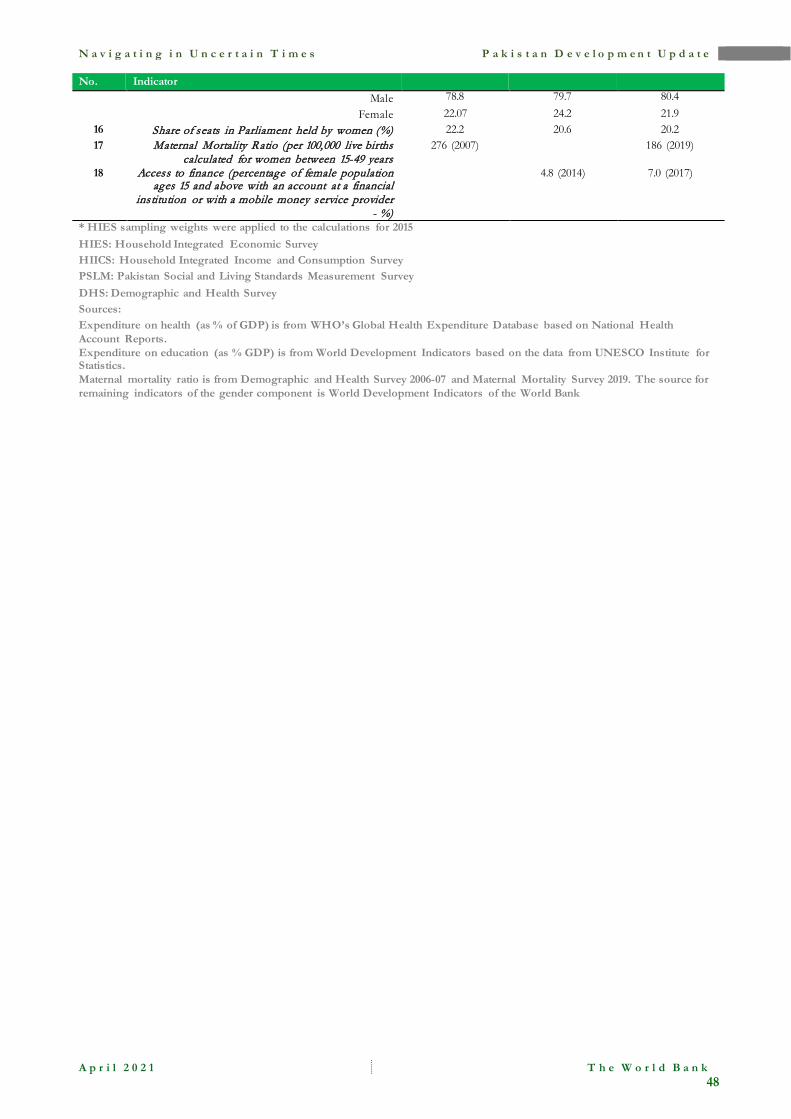
N a v i g a t i n g i n U n c e r t a i n T i m e s P a k i s t a n D e v e l o p m e n t U p d a t e
A p r i l 2 0 2 1 T h e W o r l d B a n k
48
No. Indicator Male 78.8 79.7 80.4
Female 22.07 24.2 21.9 16 Share of seats in Parliament held by women (%) 22.2 20.6 20.2 17 Maternal Mortality Ratio (per 100,000 live births
calculated for women between 15-49 years 276 (2007)
186 (2019)
18 Access to finance (percentage of female population ages 15 and above with an account at a financial
institution or with a mobile money service provider - %)
4.8 (2014) 7.0 (2017)
* HIES sampling weights were applied to the calculations for 2015 HIES: Household Integrated Economic Survey HIICS: Household Integrated Income and Consumption Survey PSLM: Pakistan Social and Living Standards Measurement Survey DHS: Demographic and Health Survey Sources: Expenditure on health (as % of GDP) is from WHO’s Global Health Expenditure Database based on National Health Account Reports. Expenditure on education (as % GDP) is from World Development Indicators based on the data from UNESCO Institute for Statistics. Maternal mortality ratio is from Demographic and Health Survey 2006-07 and Maternal Mortality Survey 2019. The source for remaining indicators of the gender component is World Development Indicators of the World Bank

N a v i g a t i n g i n U n c e r t a i n T i m e s P a k i s t a n D e v e l o p m e n t U p d a t e
A p r i l 2 0 2 1 T h e W o r l d B a n k
49
Related Documents