Pairwise Global Alignment of Protein Interaction Networks by Matching Neighborhood Topology Rohit Singh 1 , Jinbo Xu 2 , and Bonnie Berger 1, 1 Computer Science and AI Lab., Massachusetts Institute of Technology [email protected], [email protected] 2 Toyota Technological Institute, Chicago, USA [email protected] Abstract. We describe an algorithm, IsoRank, for global alignment of two protein-protein interaction (PPI) networks. IsoRank aims to max- imize the overall match between the two networks; in contrast, much of previous work has focused on the local alignment problem— identify- ing many possible alignments, each corresponding to a local region of similarity. IsoRank is guided by the intuition that a protein should be matched with a protein in the other network if and only if the neighbors of the two proteins can also be well matched. We encode this intuition as an eigenvalue problem, in a manner analogous to Google’s PageRank method. We use IsoRank to compute the first known global alignment between the S. cerevisiae and D. melanogaster PPI networks. The com- mon subgraph has 1420 edges and describes conserved functional compo- nents between the two species. Comparisons of our results with those of a well-known algorithm for local network alignment indicate that the glob- ally optimized alignment resolves ambiguity introduced by multiple local alignments. Finally, we interpret the results of global alignment to iden- tify functional orthologs between yeast and fly; our functional ortholog prediction method is much simpler than a recently proposed approach and yet provides results that are more comprehensive. 1 Introduction A fundamental goal of biology is to understand the cell as a system of interact- ing components and, in particular, how proteins in the cell interact with each other. Towards this goal, high-throughput experimental techniques (e.g., yeast two-hybrid [12,14] and co-immunoprecipitation [11]) to discover protein-protein interactions (PPIs) are being used. These techniques have also been supple- mented by promising new computational approaches [27,24,23,26,17,29,9] to PPI prediction, resulting in an explosive growth in available PPI data. A powerful way of representing and analyzing all this data is the PPI network: a network where each node corresponds to a protein and an edge indicates a direct physical Corresponding author. Also with the Department of Mathematics, MIT. T. Speed and H. Huang (Eds.): RECOMB 2007, LNBI 4453, pp. 16–31, 2007. c Springer-Verlag Berlin Heidelberg 2007

Welcome message from author
This document is posted to help you gain knowledge. Please leave a comment to let me know what you think about it! Share it to your friends and learn new things together.
Transcript
Pairwise Global Alignment of ProteinInteraction Networks by Matching
Neighborhood Topology
Rohit Singh1, Jinbo Xu2, and Bonnie Berger1,�
1 Computer Science and AI Lab., Massachusetts Institute of [email protected], [email protected]
2 Toyota Technological Institute, Chicago, [email protected]
Abstract. We describe an algorithm, IsoRank, for global alignment oftwo protein-protein interaction (PPI) networks. IsoRank aims to max-imize the overall match between the two networks; in contrast, much ofprevious work has focused on the local alignment problem— identify-ing many possible alignments, each corresponding to a local region ofsimilarity. IsoRank is guided by the intuition that a protein should bematched with a protein in the other network if and only if the neighborsof the two proteins can also be well matched. We encode this intuitionas an eigenvalue problem, in a manner analogous to Google’s PageRankmethod. We use IsoRank to compute the first known global alignmentbetween the S. cerevisiae and D. melanogaster PPI networks. The com-mon subgraph has 1420 edges and describes conserved functional compo-nents between the two species. Comparisons of our results with those of awell-known algorithm for local network alignment indicate that the glob-ally optimized alignment resolves ambiguity introduced by multiple localalignments. Finally, we interpret the results of global alignment to iden-tify functional orthologs between yeast and fly; our functional orthologprediction method is much simpler than a recently proposed approachand yet provides results that are more comprehensive.
1 Introduction
A fundamental goal of biology is to understand the cell as a system of interact-ing components and, in particular, how proteins in the cell interact with eachother. Towards this goal, high-throughput experimental techniques (e.g., yeasttwo-hybrid [12,14] and co-immunoprecipitation [11]) to discover protein-proteininteractions (PPIs) are being used. These techniques have also been supple-mented by promising new computational approaches [27,24,23,26,17,29,9] to PPIprediction, resulting in an explosive growth in available PPI data. A powerfulway of representing and analyzing all this data is the PPI network: a networkwhere each node corresponds to a protein and an edge indicates a direct physical
� Corresponding author. Also with the Department of Mathematics, MIT.
T. Speed and H. Huang (Eds.): RECOMB 2007, LNBI 4453, pp. 16–31, 2007.c© Springer-Verlag Berlin Heidelberg 2007
Pairwise Global Alignment of Protein Interaction Networks 17
interaction between the proteins. Computational analyses of these networks hasalready yielded valuable insights: the scale-free character of these networks andthe disproportionate importance of “hub” proteins [30]; the combination of thesenetworks with gene expression data to discern some of the dynamic character ofthe cell [8]; the use of PPI networks for inferring biological function [20], etc.
As more PPI data becomes available, comparative analysis of PPI networks(across species) is proving to be a valuable tool. Such analysis is similar in spiritto traditional sequence-based comparative genomic analyses; it also promisescommensurate insights. Such an analysis can identify conserved functional com-ponents across species [15]. As a phylogenetic tool, it offers a function-orientedperspective that complements traditional sequence-based methods. It also facili-tates annotation transfer between species. Indeed, Bandyopadhyay et al. [3] havedemonstrated that the use of PPI networks in computing orthologs produces or-thology mappings that better conserve protein function across species.
In this paper, we explore a new approach to comparative analysis of PPInetworks. Specifically, we consider the problem of finding the optimal globalalignment between two PPI networks, aiming to find a correspondence betweennodes and edges of the input networks that maximizes the overall match betweenthe two networks. For this problem, we propose a novel pairwise global alignmentalgorithm, IsoRank.
1.1 Contributions
In this paper, we draw attention to the global network alignment problem andits biological importance (as distinct from local network alignment, see Sec. 1.2).We propose IsoRank— an algorithm for pairwise global network alignment ofPPI networks; to the best of our knowledge, it is the first such algorithm of itskind. It simultaneously uses both PPI network data and sequence similarity datato compute the alignment, the relative weights of the two data sources beinga free parameter (existing local network alignment algorithms have typicallynot provided such direct control over the relative weights). The algorithm isintuitive: a node i in G1 is mapped to a node j in G2 if the neighborhoodtopologies of i and j are similar, i.e., the neighbors of i can be well-mapped tothe neighbors of j. This approach has parallels to Google’s PageRank technique;like the latter, we formalize our intuition as an eigenvalue problem (see Sec. 3).IsoRank is, by design, tolerant to errors in the input (e.g., missing or spuriousedges) and takes advantage of edge confidence scores as well as other biologicalsignals (e.g. sequence similarity scores), when available. We use the algorithmto compute a global alignment of the S. cerevisiae and D. melanogaster PPInetworks and describe the conserved subgraph (possibly disconnected) betweenthem. The conserved subgraph immediately suggests functions for some hithertounannotated proteins. It also suggests sets of functional orthologs between thetwo species; these predictions are consistent with those of Bandyopadhyay et al.[3], and, in some cases, are more precise and accurate.
18 R. Singh, J. Xu, and B. Berger
X
XX
G1
G2
G1
G2
Local Network AlignmentGlobal Network Alignment
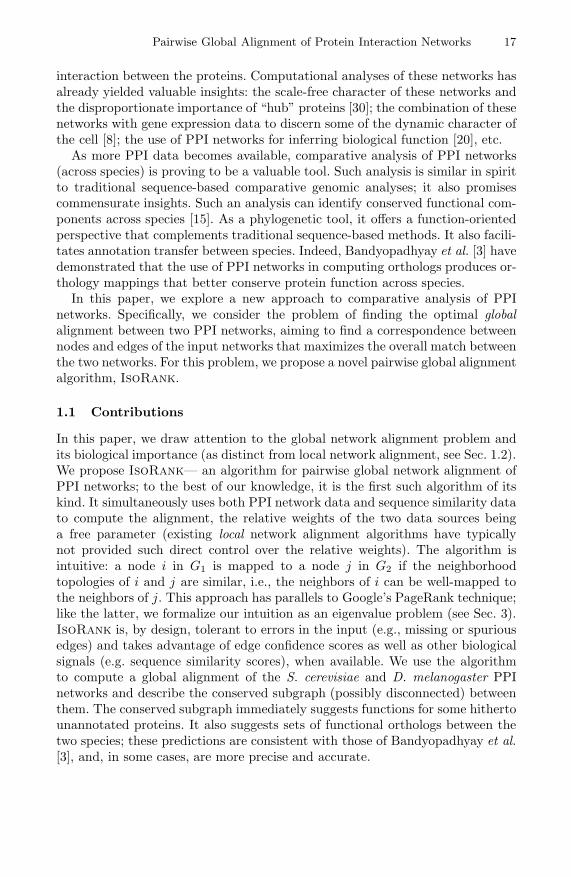
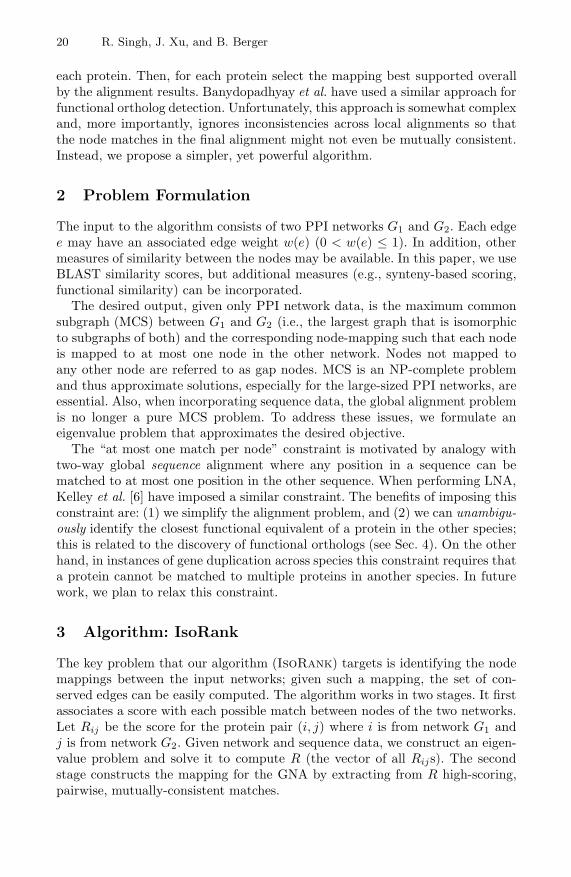
Fig. 1. Cartoon comparing global and local network alignments: The local net-work alignment between G1 and G2 specifies three different alignments; the mappingsfor each are marked by a different kind of line (solid, dashed, dotted). Each alignmentdescribes a small common subgraph. Local alignments need not be consistent in theirmapping— the points marked with ‘X’ each have ambiguous/inconsistent mappingsunder different alignments. In global network alignment, the maximum common sub-graph is desired and it is required that the mapping for a node be unambiguous. Inboth cases, there are ‘gap’ nodes for which no mappings could be predicted (here, thenodes with no incident black edges are such nodes).
1.2 Related Work: The Distinction Between Local and GlobalAlignment
The network alignment problem has been formulated previously [6,18,15], withsome variations. To place our work in that context, we first distinguish betweenglobal and local network alignment.
Each input network can be represented as an undirected graph G = (V, E)where V is the set of nodes and E is the set of edges. Furthermore, G maybe a weighted graph, i.e., a confidence measure w(e) may be associated witheach edge e in E. In this paper, we consider graphs of arbitrary structure; whengraphs have specific structures (e.g., trees) other efficient methods are available[13,28]. The goal in network alignment is to identify one or multiple possiblemappings between the nodes of the input networks and, for each mapping, thecorresponding set of conserved edges. Mappings may be partial, i.e., they neednot be defined for all the nodes in the networks. Each mapping implies a com-mon subgraph between the two networks: when protein a1 from network G1 ismapped to protein a2 from network G2, then a1 and a2 refer to the same nodein the common subgraph; the edges in the common subgraph correspond to theconserved edges. Based on the kind of mapping(s) sought, we distinguish betweenthe local and global network alignment (in analogy with sequence alignment).
Local Network Alignment (LNA): The goal in LNA is to find local regions of iso-morphism (i.e. same graph structure) between the input networks, each regionimplying a mapping independently of others. Many independent, high-scoring lo-cal alignments are usually possible between two input networks; in fact, the cor-responding local alignments need not even be mutually consistent (i.e., a protein
Pairwise Global Alignment of Protein Interaction Networks 19
might be mapped differently under each, see Fig 1). This may not be undesirable(e.g., it may indicate gene duplication); however, in some cases LNA algorithmsoffer implausibly numerous matches for a single protein. The motivations be-hind local sequence alignment and local network alignment are analogous— theformer is often used to find conserved sequence motifs; the latter for findingconserved functional components (e.g., pathways, complexes, etc.).
Previous work on PPI network alignment has almost exclusively focused onthis problem: the pioneering work of Kelley et al. [6] described how BLAST sim-ilarity scores and PPI network information could be used to identify conservedfunctional motifs. Koyuturk et al. [18] proposed another method, motivated bybiological models of duplication and deletion. Recently, Flannick et al. [15] pro-posed a new approach, using modules of proteins to infer the alignment. Theapproach is efficient and is the first LNA method to align multiple species si-multaneously. In contrast to these methods, our work targets the global networkalignment problem (see Footnote 1).
Global Network Alignment (GNA): The aim in GNA is to find the best overallalignment between the input networks. A GNA algorithm must define a singlemapping across all parts of the input (see Fig 1), even if it were locally sub-optimal in some regions of the networks. In contrast, an LNA algorithm has thefreedom to choose the locally optimal mapping for each local region of similarity,even if this results in overlapping — and mutually inconsistent — local align-ment. We avoid this in GNA by requiring that for any global alignment to bevalid the corresponding mapping be comprehensive: each node in an input net-work is either matched to some node in the other network or explicitly markedas a gap node (i.e., with no match in the other network). Our goal in GNAthen is to find a comprehensive mapping such that the size of the correspond-ing common subgraph is maximized. The motivations behind global sequencealignment and GNA are again analogous: the former is often used for compar-ing genomic sequences to understand variations between species; the latter maybe used to compare interactomes, and to understand cross-species variations.Also, the GNA problem is related to the detection of functional orthologs, as wediscuss in Sec. 4.
The GNA problem, as we describe it here, is the focus of this paper. It haspreviously received little attention in the literature; much of existing work hasfocused on the LNA problem1. One can imagine using results of an LNA toestimate a global alignment: use LNA methods to compute possible matches for
1 We note that in some previous works on network alignment, the distinction between“global” and “local” network alignment has centered on the relative input sizes foreach. There, the term “global network alignment” is used when the input consists ofroughly equal-sized networks (e.g., two species-wide networks) while “local networkalignment” is used when one input is a small query network and the other is a largespecies-wide network. In both instances, however, the output consists of multiplelocal subgraphs (and corresponding local alignments). As such, we believe that boththese instances are best characterized as local network alignments, regardless of inputsizes.
20 R. Singh, J. Xu, and B. Berger
each protein. Then, for each protein select the mapping best supported overallby the alignment results. Banydopadhyay et al. have used a similar approach forfunctional ortholog detection. Unfortunately, this approach is somewhat complexand, more importantly, ignores inconsistencies across local alignments so thatthe node matches in the final alignment might not even be mutually consistent.Instead, we propose a simpler, yet powerful algorithm.
2 Problem Formulation
The input to the algorithm consists of two PPI networks G1 and G2. Each edgee may have an associated edge weight w(e) (0 < w(e) ≤ 1). In addition, othermeasures of similarity between the nodes may be available. In this paper, we useBLAST similarity scores, but additional measures (e.g., synteny-based scoring,functional similarity) can be incorporated.
The desired output, given only PPI network data, is the maximum commonsubgraph (MCS) between G1 and G2 (i.e., the largest graph that is isomorphicto subgraphs of both) and the corresponding node-mapping such that each nodeis mapped to at most one node in the other network. Nodes not mapped toany other node are referred to as gap nodes. MCS is an NP-complete problemand thus approximate solutions, especially for the large-sized PPI networks, areessential. Also, when incorporating sequence data, the global alignment problemis no longer a pure MCS problem. To address these issues, we formulate aneigenvalue problem that approximates the desired objective.
The “at most one match per node” constraint is motivated by analogy withtwo-way global sequence alignment where any position in a sequence can bematched to at most one position in the other sequence. When performing LNA,Kelley et al. [6] have imposed a similar constraint. The benefits of imposing thisconstraint are: (1) we simplify the alignment problem, and (2) we can unambigu-ously identify the closest functional equivalent of a protein in the other species;this is related to the discovery of functional orthologs (see Sec. 4). On the otherhand, in instances of gene duplication across species this constraint requires thata protein cannot be matched to multiple proteins in another species. In futurework, we plan to relax this constraint.
3 Algorithm: IsoRank
The key problem that our algorithm (IsoRank) targets is identifying the nodemappings between the input networks; given such a mapping, the set of con-served edges can be easily computed. The algorithm works in two stages. It firstassociates a score with each possible match between nodes of the two networks.Let Rij be the score for the protein pair (i, j) where i is from network G1 andj is from network G2. Given network and sequence data, we construct an eigen-value problem and solve it to compute R (the vector of all Rijs). The secondstage constructs the mapping for the GNA by extracting from R high-scoring,pairwise, mutually-consistent matches.
Pairwise Global Alignment of Protein Interaction Networks 21
a
ed
c
b
e'
b'c'
a'd'
Raa'14 Rbb'= Rbb'
13 Rac'= 1
3 Ra'c Raa'19 Rcc'+ + + Rdd'
19 Rcc'=
Rcc'14 Rbb'= 1
2 Rbe'+ + 12 Rbd'
+ 12 Reb'
12 Rdb'+ + Ree'
+ Red'+ Rde'
+ Rdd'
a
b
c
d
e
a' b' c' d' e'
0.0625
0.0312
0.0312
0.0312
0.0312
0.0312
0.0937
0.0937
0.0625
0.0625 0.0625
0.2812
0.1250
R
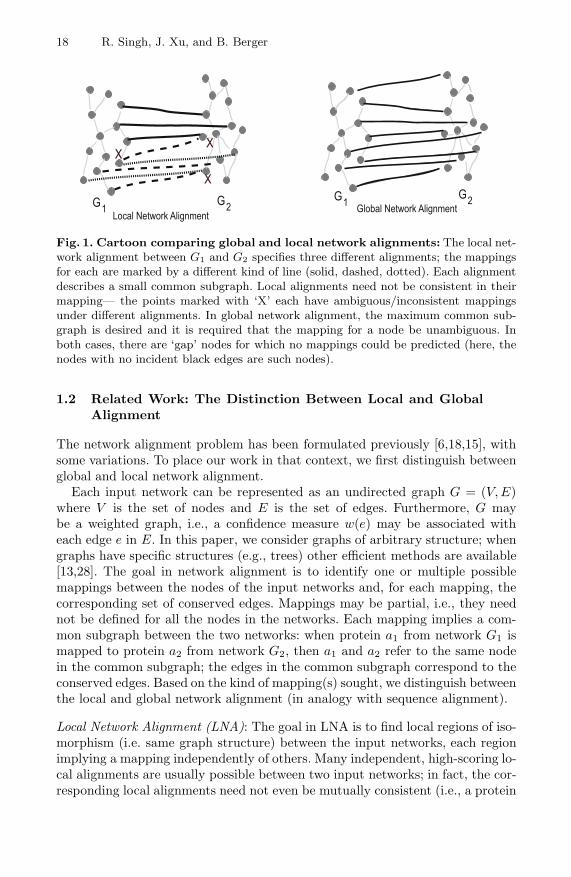
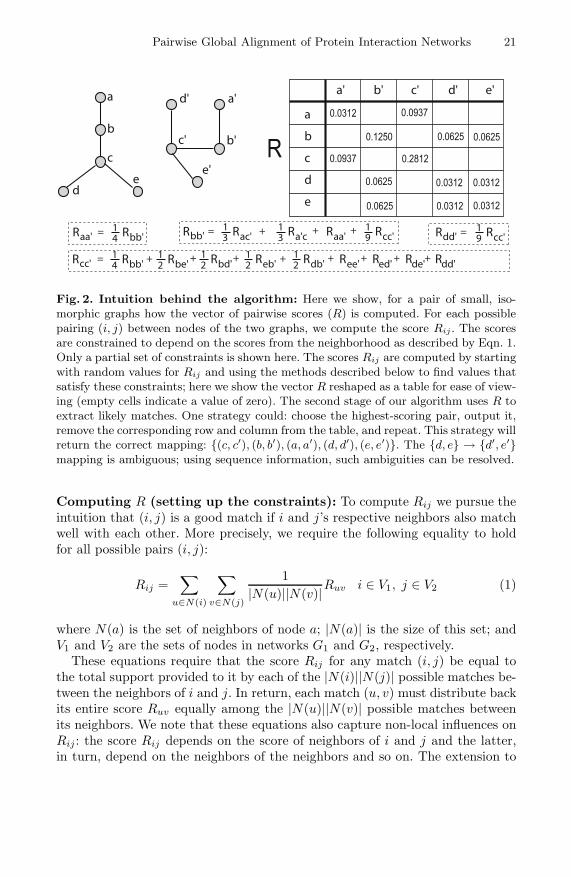
Fig. 2. Intuition behind the algorithm: Here we show, for a pair of small, iso-morphic graphs how the vector of pairwise scores (R) is computed. For each possiblepairing (i, j) between nodes of the two graphs, we compute the score Rij . The scoresare constrained to depend on the scores from the neighborhood as described by Eqn. 1.Only a partial set of constraints is shown here. The scores Rij are computed by startingwith random values for Rij and using the methods described below to find values thatsatisfy these constraints; here we show the vector R reshaped as a table for ease of view-ing (empty cells indicate a value of zero). The second stage of our algorithm uses R toextract likely matches. One strategy could: choose the highest-scoring pair, output it,remove the corresponding row and column from the table, and repeat. This strategy willreturn the correct mapping: {(c, c′), (b, b′), (a, a′), (d, d′), (e, e′)}. The {d, e} → {d′, e′}mapping is ambiguous; using sequence information, such ambiguities can be resolved.
Computing R (setting up the constraints): To compute Rij we pursue theintuition that (i, j) is a good match if i and j’s respective neighbors also matchwell with each other. More precisely, we require the following equality to holdfor all possible pairs (i, j):
Rij =∑
u∈N(i)
∑
v∈N(j)
1|N(u)||N(v)|Ruv i ∈ V1, j ∈ V2 (1)
where N(a) is the set of neighbors of node a; |N(a)| is the size of this set; andV1 and V2 are the sets of nodes in networks G1 and G2, respectively.
These equations require that the score Rij for any match (i, j) be equal tothe total support provided to it by each of the |N(i)||N(j)| possible matches be-tween the neighbors of i and j. In return, each match (u, v) must distribute backits entire score Ruv equally among the |N(u)||N(v)| possible matches betweenits neighbors. We note that these equations also capture non-local influences onRij : the score Rij depends on the score of neighbors of i and j and the latter,in turn, depend on the neighbors of the neighbors and so on. The extension to
22 R. Singh, J. Xu, and B. Berger
the weighted-graph case is intuitive: the support offered to neighbors is now inproportion to the edge weights:
Rij =∑
u∈N(i)
∑
v∈N(j)
w(i, u)w(j, v)∑r∈N(u) w(r, u)
∑q∈N(v) w(q, v)
Ruv i ∈ V1, j ∈ V2 (2)
Clearly, Eqn. 1 is a special case of Eqn. 2 when all the edge weights are 1. Wecan rewrite Eqn. 1 in matrix form (Eqn. 2 can be similarly rewritten):
R = AR
A[i, j][u, v] ={ 1
|N(u)||N(v)| if (i, u) ∈ E1 and (j, v) ∈ E2
0 otherwise(3)
where A is a |V1||V2| × |V1||V2| matrix and A[i, j][u, v] refers to the entry at therow (i, j) and column (u, v) (the row and column are doubly-indexed).
Another interpretation of the above equations is that they describe a randomwalk on the product graph of G1 = (V1, E1) and G2 = (V2, E2). We define G∗ =(V ∗, E∗) where V ∗ = V1×V2 and E∗ = {( (i, j), (u, v) ) | (i, u) ∈ E1, (j, v) ∈ E2}.Also, if G1 and G2 are weighted, so is G∗: w( (i, j), (u, v) ) = w(i, u)w(j, v). Wenow specify a random walk among the nodes of G∗: from any node we can moveto one of its neighbors, with a probability proportional to the edge weight:
P (st = (i, j) | st−1 = (u, v)) =w(i, u)w(j, v)∑
r∈N(u) w(r, u)∑
q∈N(v) w(q, v)(4)
where st is the node occupied at time t. Eqns. 1, 2 and 3 can now be interpreted asdefining R to be the stationary distribution of this random walk (its transitionmatrix is A). Thus, a high Rij implies that the node (i, j) of G∗ has a highprobability of being occupied in the stationary distribution.
The vector R is determined by finding a non-trivial solution to these equations(a trivial solution is to set all Rijs to zero). In Fig 2, we illustrate, on a pair ofsmall graphs, how the equations capture the graph topology; their solution alsoconfirms our intuition: node pairs that match well have higher Rij scores.
Computing R (solving the constraints): In general, to solve the above equa-tions, we observe that these equations describe an eigenvalue problem (see Eqn. 3).The value of R we are interested in is the principal eigenvector of A. Note that A isa stochastic matrix (i.e., each of its columns sums to 1) so that the principal eigen-value is 1. Also, for numerical stability purposes we require that R be normalized,i.e., |R|1 = 1. In the case of biological networks, A is typically a very large matrix(about 108 × 108 for fly-vs.-yeast GNA); however, A and R are both very sparse,so R can be efficiently computed by iterative techniques. We use the power method[16], an iterative technique often used for large eigenvalue problems. The powermethod repeatedly updates R as per the update rule: R(k+1) ← AR(k)/|AR(k)|,where R(k) is the value of the vector R in the k-th iteration and has unit norm.In case of a stochastic matrix (like A), the power method will provably convergeto the principal eigenvector; the convergence can be sped up significantly by a
Pairwise Global Alignment of Protein Interaction Networks 23
judicious choice of the initial value R(0) [16]. As we describe shortly, a good ini-tial value R(0) is often available in our case.
The incorporation of other information, e.g. BLAST scores, into this model isstraightforward. Let Bij denote the score between i and j; for instance, Bij canbe the Bit-Score of the BLAST alignment between sequences i and j. Bijs neednot even be numeric— they can be binary. Let B be the vector of Bijs. We firstnormalize B: E = B/|B|. The eigenvalue equation is then modified to
R = αAR + (1 − α)E where 0 ≤ α ≤ 1. (5)
Eqn. 5 is solved by similar techniques as Eqn. 3. Also, node matches basedpurely on sequence similarity are an approximation to the node mappings de-sired; hence, the vector E is a good choice for the initial value R(0) in the powermethod. We emphasize that this choice of starting value does not change thefinal value of R— it just speeds up the computation.
In this computation, α controls the weight of the network data (relative tosequence data), e.g., α = 0 implies no network data will be used, while α = 1indicates only network data will be used. Tuning α allows us to analyze therelative importance of PPI data in finding the optimal alignment.
Extracting the mapping from R: Once R has been computed, we extract thenode mappings from it. An appealing approach is to extract the set of mutually-consistent, pairwise matches (p, q) such that the sum of their scores is maximized.The optimal solution can thus be found efficiently by interpreting R as encoding abipartite graph and finding the maximum-weight bipartite matching [22] for thisgraph. Each side of the bipartite graph contains all the nodes from one network.The weight of the edge (i, j) is then set to Rij . We compute the maximum-weightmatching in this bipartite graph and output the paired nodes. Any remainingunpaired nodes are designated as gap nodes. This algorithm guarantees the setof matches that satisfy our criterion.
While this principled algorithm does give good results, in practice we foundthat the following greedy algorithm sometimes performs even better: identify thehighest score Rpq and output the pairing (p, q). Then, remove all scores involvingp or q. We then repeat this process until the list is empty. In the bipartite graph,this strategy corresponds to removing, at each step, the maximum weight edgeand the incident nodes. In future work, we plan to investigate whether thisheuristic’s better performance is related to the structure of R.
Once a comprehensive alignment has been computed, the corresponding sub-graph in the GNA can be identified relatively easily. For example, if a1 is alignedto a2, and b1 is aligned to b2, the output subgraph should contain an edge between(a1, a2) and (b1, b2) if and only if both the input networks contain supportingedges (i.e., (a1, b1) in G1 and (a2, b2) in G2). When edges also have associatedweights, formalizing the intuition depends on how the edge weights are beinginterpreted; for example, we could require that the combined weight be higherthan a threshold or that the minimum of the two be greater than a threshold.
24 R. Singh, J. Xu, and B. Berger
4 Results: GNA of Yeast and Fly PPI Networks
We now describe the results of two-way global alignment of the S. cerevisiae andD. melanogaster PPI networks, the two species with the most available networkdata. The PPI network data for the species was retrieved from the GRID [4] andDIP [7] databases, and the sequence data was retrieved from Ensembl [2]. Theedges in the PPI networks did not have associated weights. We applied IsoRank
to this pair of networks, using it to identify the common subgraph.The common subgraph corresponding to the global alignment between the
yeast and fly PPI networks has 1420 edges (where α = 0.6; the criterion forchoosing α is described later in this section). While this indicates a relativelylow overlap between the yeast and fly networks (both the networks have morethan 25000 edges each), it is not surprising: firstly, currently available PPI data isknown to contain many false-positives, and the number of true interactions in thecurrent networks is expected to be significantly lower [27,25]. Secondly, currentPPI data is far from comprehensive; e.g., the fly network has no known PPIs forabout 6500 proteins (almost 50% of the genome). As these issues get resolved,we expect the size of the global alignment to grow substantially. Nevertheless,the current global alignment already provides many valuable insights.
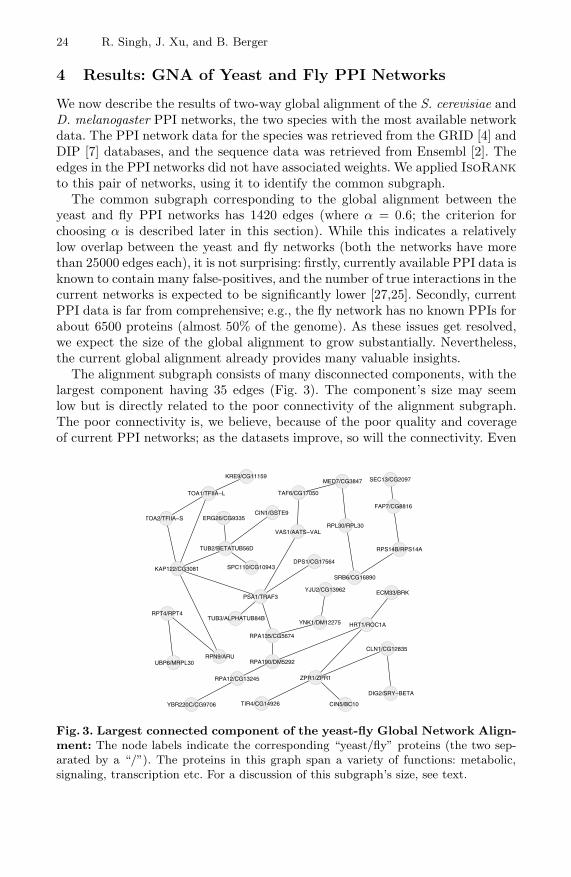
The alignment subgraph consists of many disconnected components, with thelargest component having 35 edges (Fig. 3). The component’s size may seemlow but is directly related to the poor connectivity of the alignment subgraph.The poor connectivity is, we believe, because of the poor quality and coverageof current PPI networks; as the datasets improve, so will the connectivity. Even
PSA1/TRAF3
KAP122/CG3081
YJU2/CG13962
ERG26/CG9335
RPT4/RPT4
RPN9/ARUCLN1/CG12835
RPS14B/RPS14A
SPC110/CG10943
SRB6/CG16890
YNK1/DM12275
RPA12/CG13245
TUB3/ALPHATUB84B
SEC13/CG2097
VAS1/AATS−VAL
YBR220C/CG9706
TOA2/TFIIA−S
RPA135/CG5674
TAF6/CG17050TOA1/TFIIA−L
KRE9/CG11159
UBP6/MRPL30
TUB2/BETATUB56D
RPL30/RPL30
TIR4/CG14926
DIG2/SRY−BETA
RPA190/DM5292
MED7/CG3847
FAP7/CG8816
HRT1/ROC1A
CIN5/BC10
CIN1/GSTE9
ECM33/BRK
DPS1/CG17564
ZPR1/ZPR1
Fig. 3. Largest connected component of the yeast-fly Global Network Align-ment: The node labels indicate the corresponding “yeast/fly” proteins (the two sep-arated by a “/”). The proteins in this graph span a variety of functions: metabolic,signaling, transcription etc. For a discussion of this subgraph’s size, see text.
Pairwise Global Alignment of Protein Interaction Networks 25
CSE1/CAS
SSN2/CG17826
SRP1/KAP−ALPHA1
YER010C/KEL
SIN4/CG32542
(a) Pathway
SSN8/CYCC
YLR358C/CG9072
PHO85/CDK5
SSN3/EIP63E
RIM15/CG31679AGX1/CG6191
STH1/NEJ
MMR1/CG6488
(b) Kinases
MAK21/CG2116
GUS1/CYP12A4
NEW1/CG5346
RPL31B/RPL31
RPL2A/RPL8
NUG1/CG17666
NOP4/CG3056
RPL43A/RPL37A
RPL3/RPL3
SKI3/CG6621
(c) Ribosome Complex
FAF1/CG15782
SKP1/SKPA
YJL149W/CG7148
UFO1/CG9461
MFB1/CG13213 GRR1/PPA
YMR258C/CG10855
CTF13/CG14937SC1375/CG4643
MET30/SLMB
YLR224W/CG2010
CDC4/AGO
YLR352W/CG14317
YGL149W/CG5003CSN9/CG9316
(d) Ubiquitin Ligase
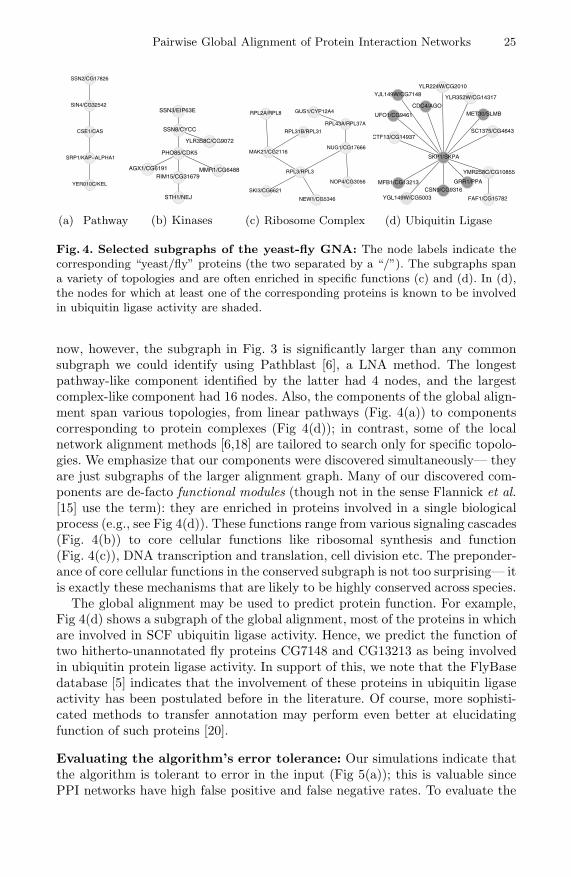
Fig. 4. Selected subgraphs of the yeast-fly GNA: The node labels indicate thecorresponding “yeast/fly” proteins (the two separated by a “/”). The subgraphs spana variety of topologies and are often enriched in specific functions (c) and (d). In (d),the nodes for which at least one of the corresponding proteins is known to be involvedin ubiquitin ligase activity are shaded.
now, however, the subgraph in Fig. 3 is significantly larger than any commonsubgraph we could identify using Pathblast [6], a LNA method. The longestpathway-like component identified by the latter had 4 nodes, and the largestcomplex-like component had 16 nodes. Also, the components of the global align-ment span various topologies, from linear pathways (Fig. 4(a)) to componentscorresponding to protein complexes (Fig 4(d)); in contrast, some of the localnetwork alignment methods [6,18] are tailored to search only for specific topolo-gies. We emphasize that our components were discovered simultaneously— theyare just subgraphs of the larger alignment graph. Many of our discovered com-ponents are de-facto functional modules (though not in the sense Flannick et al.[15] use the term): they are enriched in proteins involved in a single biologicalprocess (e.g., see Fig 4(d)). These functions range from various signaling cascades(Fig. 4(b)) to core cellular functions like ribosomal synthesis and function(Fig. 4(c)), DNA transcription and translation, cell division etc. The preponder-ance of core cellular functions in the conserved subgraph is not too surprising— itis exactly these mechanisms that are likely to be highly conserved across species.
The global alignment may be used to predict protein function. For example,Fig 4(d) shows a subgraph of the global alignment, most of the proteins in whichare involved in SCF ubiquitin ligase activity. Hence, we predict the function oftwo hitherto-unannotated fly proteins CG7148 and CG13213 as being involvedin ubiquitin protein ligase activity. In support of this, we note that the FlyBasedatabase [5] indicates that the involvement of these proteins in ubiquitin ligaseactivity has been postulated before in the literature. Of course, more sophisti-cated methods to transfer annotation may perform even better at elucidatingfunction of such proteins [20].
Evaluating the algorithm’s error tolerance: Our simulations indicate thatthe algorithm is tolerant to error in the input (Fig 5(a)); this is valuable sincePPI networks have high false positive and false negative rates. To evaluate the
26 R. Singh, J. Xu, and B. Berger
5 10 15 20 25 30 35 40 45 50
0.1
0.3
0.5
0.7
0.9
Percent of randomized edges
Fra
ctio
n of
nod
es m
appe
d co
rrec
tlyα=1-10
-6
α=1
(a) Error-Tolerance
0 0.1 0.2 0.3 0.4 0.5 0.6 0.7 0.8 0.9 1
200
400
600
800
1000
1200
1400
1600
Maxweight bipartite matching
Greedy strategy
α (= weight of network data)
Size of alignm
ent graph after G
NA
(b) α
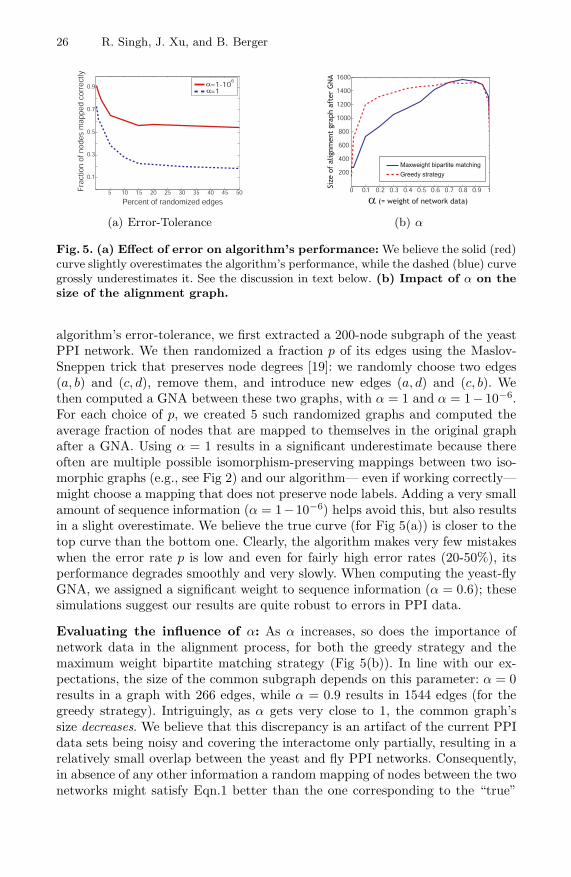
Fig. 5. (a) Effect of error on algorithm’s performance: We believe the solid (red)curve slightly overestimates the algorithm’s performance, while the dashed (blue) curvegrossly underestimates it. See the discussion in text below. (b) Impact of α on thesize of the alignment graph.
algorithm’s error-tolerance, we first extracted a 200-node subgraph of the yeastPPI network. We then randomized a fraction p of its edges using the Maslov-Sneppen trick that preserves node degrees [19]: we randomly choose two edges(a, b) and (c, d), remove them, and introduce new edges (a, d) and (c, b). Wethen computed a GNA between these two graphs, with α = 1 and α = 1− 10−6.For each choice of p, we created 5 such randomized graphs and computed theaverage fraction of nodes that are mapped to themselves in the original graphafter a GNA. Using α = 1 results in a significant underestimate because thereoften are multiple possible isomorphism-preserving mappings between two iso-morphic graphs (e.g., see Fig 2) and our algorithm— even if working correctly—might choose a mapping that does not preserve node labels. Adding a very smallamount of sequence information (α = 1−10−6) helps avoid this, but also resultsin a slight overestimate. We believe the true curve (for Fig 5(a)) is closer to thetop curve than the bottom one. Clearly, the algorithm makes very few mistakeswhen the error rate p is low and even for fairly high error rates (20-50%), itsperformance degrades smoothly and very slowly. When computing the yeast-flyGNA, we assigned a significant weight to sequence information (α = 0.6); thesesimulations suggest our results are quite robust to errors in PPI data.
Evaluating the influence of α: As α increases, so does the importance ofnetwork data in the alignment process, for both the greedy strategy and themaximum weight bipartite matching strategy (Fig 5(b)). In line with our ex-pectations, the size of the common subgraph depends on this parameter: α = 0results in a graph with 266 edges, while α = 0.9 results in 1544 edges (for thegreedy strategy). Intriguingly, as α gets very close to 1, the common graph’ssize decreases. We believe that this discrepancy is an artifact of the current PPIdata sets being noisy and covering the interactome only partially, resulting in arelatively small overlap between the yeast and fly PPI networks. Consequently,in absence of any other information a random mapping of nodes between the twonetworks might satisfy Eqn.1 better than the one corresponding to the “true”
Pairwise Global Alignment of Protein Interaction Networks 27
alignment. The use of sequence-based scores helps mitigate this, by directing thealgorithm towards the true alignment.
When choosing the most appropriate value of the free parameter α, we re-jected the choice corresponding to the largest common subgraph size— the inputnetworks are noisy and conserved edges may be simply due to noise; thus, theα leading to the largest-size subgraph may not be a biologically appropriatechoice. Instead, for each choice of α, we compared the resulting node mappingsto sequence-based ortholog predictions from the Inparanoid database [21] andchose the α (= 0.6) that resulted in the greatest overlap with these. While thisapproach is conservative and might undervalue the network component duringthe alignment, it also lowers the adverse impact of noise in the PPI data.
The differences between the node pairings found by our algorithm and thosefrom Inparanoid broadly fall into two categories: (1) those corresponding to lowRij values indicating low confidence of our approach in that mapping, and (2)functional orthologs where the use of network data genuinely changes the nodemapping. We discuss the latter in more detail later in this section.
Comparing global and local alignment results: Our global alignment re-sults compare favorably to the those of NetworkBlast [1] (an implementationof PathBlast) and sequence-only approaches. We compared the aggregate set oflocal alignments from NetworkBlast with our global alignment. Each local align-ment defines one-to-one matches between some yeast and fly proteins. Many ofthe matches from our global alignment are seen in these local alignments: of the701 matched protein-pairs in the former that consist of proteins seen in at leastone local alignment, 83% (582) of the pairs are also observed in one or more localalignments. However, there are many overlapping local alignments, resulting inambiguity and inconsistency: averaged across the entire set of local alignments, ayeast protein is aligned to 5.36 different fly proteins. Sometimes, such ambiguitymay be biologically meaningful, e.g., in instances of gene duplication. However,the degree of ambiguity in some of the PathBlast results is clearly implausi-ble. For example, the yeast protein SNF1, a Serine-Threonine Kinase (STK), ismatched to 71 different fly proteins. In fact, PathBlast results for many of theyeast STKs are very ambiguous– over the set of 72 yeast proteins annotatedas STKs, the average number of matching fly proteins per yeast STK is 29.3.STKs are part of many important signaling pathways, e.g, the MAPK, JNK andAKT cascades. Sequence-only approaches. (e.g. Inparanoid) too have performedpoorly at ascertaining the correspondence between yeast and fly STKs: Inpara-noid does not predict any fly orthologs for 58 of the 72 yeast STKs. Thus theuse of GNA to resolve this ambiguity in correspondence is particularly valuable.
GNA and functional orthologs: In analogy with sequence-based compara-tive genomics methods [10], we apply IsoRank to the detection of functionalorthologs (i.e., sets of proteins that perform the same function in two or morespecies) by exploiting the strong connection between these two problems: pro-teins that are aligned together in the global alignment should have similar in-teraction patterns in their respective species and are thus likely to be functional
28 R. Singh, J. Xu, and B. Berger
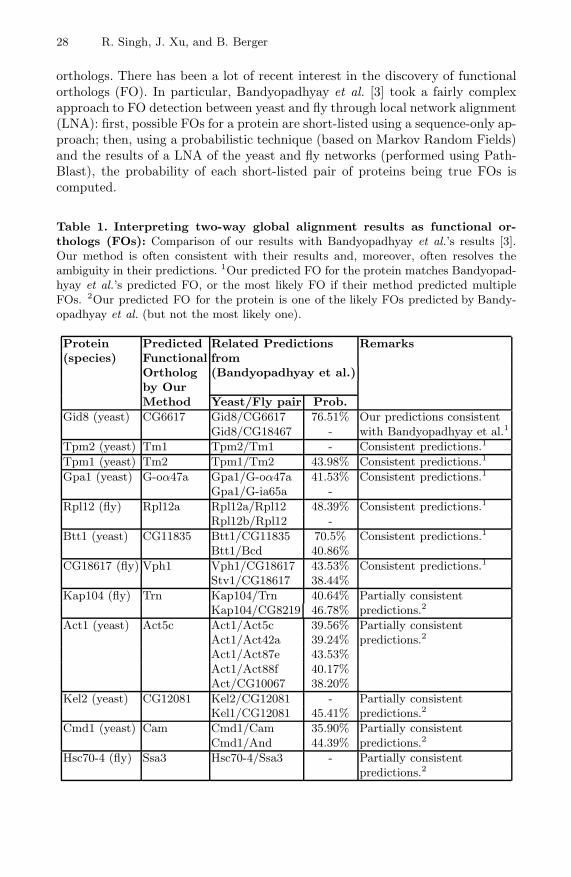
orthologs. There has been a lot of recent interest in the discovery of functionalorthologs (FO). In particular, Bandyopadhyay et al. [3] took a fairly complexapproach to FO detection between yeast and fly through local network alignment(LNA): first, possible FOs for a protein are short-listed using a sequence-only ap-proach; then, using a probabilistic technique (based on Markov Random Fields)and the results of a LNA of the yeast and fly networks (performed using Path-Blast), the probability of each short-listed pair of proteins being true FOs iscomputed.
Table 1. Interpreting two-way global alignment results as functional or-thologs (FOs): Comparison of our results with Bandyopadhyay et al.’s results [3].Our method is often consistent with their results and, moreover, often resolves theambiguity in their predictions. 1Our predicted FO for the protein matches Bandyopad-hyay et al.’s predicted FO, or the most likely FO if their method predicted multipleFOs. 2Our predicted FO for the protein is one of the likely FOs predicted by Bandy-opadhyay et al. (but not the most likely one).
Protein Predicted Related Predictions Remarks(species) Functional from
Ortholog (Bandyopadhyay et al.)by OurMethod Yeast/Fly pair Prob.
Gid8 (yeast) CG6617 Gid8/CG6617 76.51% Our predictions consistentGid8/CG18467 - with Bandyopadhyay et al.1
Tpm2 (yeast) Tm1 Tpm2/Tm1 - Consistent predictions.1
Tpm1 (yeast) Tm2 Tpm1/Tm2 43.98% Consistent predictions.1
Gpa1 (yeast) G-oα47a Gpa1/G-oα47a 41.53% Consistent predictions.1
Gpa1/G-ia65a -Rpl12 (fly) Rpl12a Rpl12a/Rpl12 48.39% Consistent predictions.1
Rpl12b/Rpl12 -Btt1 (yeast) CG11835 Btt1/CG11835 70.5% Consistent predictions.1
Btt1/Bcd 40.86%CG18617 (fly) Vph1 Vph1/CG18617 43.53% Consistent predictions.1
Stv1/CG18617 38.44%Kap104 (fly) Trn Kap104/Trn 40.64% Partially consistent
Kap104/CG8219 46.78% predictions.2
Act1 (yeast) Act5c Act1/Act5c 39.56% Partially consistentAct1/Act42a 39.24% predictions.2
Act1/Act87e 43.53%Act1/Act88f 40.17%Act/CG10067 38.20%
Kel2 (yeast) CG12081 Kel2/CG12081 - Partially consistentKel1/CG12081 45.41% predictions.2
Cmd1 (yeast) Cam Cmd1/Cam 35.90% Partially consistentCmd1/And 44.39% predictions.2
Hsc70-4 (fly) Ssa3 Hsc70-4/Ssa3 - Partially consistentpredictions.2
Pairwise Global Alignment of Protein Interaction Networks 29
The results of IsoRank compare favorably with Bandyopadhyay et al.’s. Ourmethod has the advantage that it guarantees the predicted sets of FOs will bemutually consistent and achieves higher genome coverage— PathBlast’s yeast-vs.-fly local alignments cover only 20.56% of the genes covered by our globalalignment. In many cases the FO predictions between the two methods are par-tially or fully consistent (see Table 1), i.e, FOs predicted by our method are alsothe likely FOs predicted by their method. Furthermore, their method often pro-poses multiple FOs for a protein, and our method resolves the ambiguity in theirresults. In a few other cases, predictions of the two methods differ. At least insome such cases, our method’s predictions are better supported by evidence. Forexample, our method predicts Bic (in fly) as the FO of Egd (in yeast). Bandy-opadhyay et al.’s method is ambiguous here as Bcd, its predicted FO of Egd,is also predicted as a FO of Btt1. Furthermore, there is experimental evidencethat both Egd and Bic are components of the Nascent Polypeptide-AssociatedComplex (NAC) in their respective species, lending support to our prediction;in contrast, Bcd does not seem to be involved in NAC.
5 Conclusion
In this paper, we focus on the global network alignment problem, and describe anintuitive yet powerful algorithm for computing the global alignment of two PPInetworks; in contrast, much of the previous work has been focused on the localalignment problem. Our algorithm, IsoRank, simultaneously uses network andsequence information and is tolerant of noise in the inputs; furthermore, it is easyto control the relative weights of the network and sequence information in thealignment. We use IsoRank to compute a global alignment of the S. cerevisiaeand D. melanogaster PPI networks. The results provide valuable insights aboutthe conserved functional components between the two species. They also allowus to predict functional orthologs between the fly and yeast; the quality of ourpredictions compare favorably with previous work.
Our algorithm is similar— in spirit— to Google’s PageRank algorithm, whichranks web-pages in the order of their “authoritativeness”. The intuition be-hind the two algorithms has a similar flavor: in PageRank, a page has a highscore if many pages with high scores link to it. The intuitions are also formal-ized similarly– by constructing an eigenvalue problem. Our actual algorithm isquite distinct from PageRank: in our case the input is a pair of undirected,weighted graphs and the output is an alignment; PageRank’s input is a directed,unweighted graph (where the nodes indicate web-pages and directed edges, hy-pertext links), and it outputs node rankings.
We have already extended IsoRank to perform global alignment of multi-ple networks, but this is beyond the scope of this paper. In future work, weplan to improve the algorithm, better characterize its theoretical behavior, andidentify other applications for it. Since PPI data is noisy, it might be useful togenerate multiple near-optimal alignments and rank them by their significance.Also, the algorithm can be applied to other biological and non-biological data.
30 R. Singh, J. Xu, and B. Berger
It might also be possible to extend such an eigenvalue approach to perform localnetwork alignment; as noted before, the use of an eigenvalue approach removesthe restriction of being able to find subgraphs with only certain topologies– alimitation of some of the existing local network alignment methods.
References
1. http://chianti.ucsd.edu/NetworkBlast.2. http://www.ensembl.org.3. S. Bandyopadhyay, R. Sharan, and T. Ideker. Systematic identification of func-
tional orthologs based on protein network comparison. Genome Res, 16(3):428–35,2006.
4. B.J. Breitkreutz, C. Stark, and M. Tyers. The GRID: the general repository forinteraction datasets. Genome Biology, 4(3):R23, 2003.
5. FlyBase Consortium. The FlyBase database of the drosophila genome projects andcommunity literature. Nucleic Acids Res, 31(1):172–175, 2003.
6. B.P. Kelley et al. Pathblast: a tool for alignment of protein interaction networks.Nucleic Acids Res, 32(Web Server issue):W83–8, 2004.
7. I. Xenarios et al. DIP, the database of interacting proteins: a research toolfor studying cellular networks of protein interactions. Nucleic Acids Res, 30(1):303–305, 2002.
8. J.D. Han et al. Evidence for dynamically organized modularity in the yeast protein-protein interaction network. Nature, 430(6995):88–93, 2004.
9. J.P. Miller et al. Large-scale identification of yeast integral membrane proteininteractions. Proc Natl Acad Sci USA, 102(34):12123–12128, 2005.
10. M. Kellis et al. Methods in comparative genomics: genome correspondence,gene identification and regulatory motif discovery. J of Computational Biology,11(2-3):319–355, 2004.
11. N.J. Krogan et al. Global landscape of protein complexes in the yeast saccha-romyces cerevisiae. Nature, 440(7084):637–43, 2006.
12. P. Uetz et al. A comprehensive analysis of protein-protein interactions in saccha-romyces cerevisiae. Nature, 403(6770):623–7, 2000.
13. R.Y. Pinter et al. Alignment of metabolic pathways. Bioinformatics, 21(16):3401–3408, 2005.
14. T. Ito et al. A comprehensive two-hybrid analysis to explore the yeast proteininteractome. Proc Natl Acad Sci USA, 98(8):4569–74, 2001.
15. J. Flannick, A. Novak, B.S. Srinivasan, H.H. McAdams, and S. Batzoglou. Graem-lin: general and robust alignment of multiple large interaction networks. GenomeRes, 16(9):1169–81, 2006.
16. G.H. Golub and C. Van Loan. Matrix computations. Johns Hopkins UniversityPress), 2006.
17. I. Gat-Viks, A. Tanay, D. Raijman, and R. Shamir. A probabilistic methodology forintegrating knowledge and experiments on biological networks. J of ComputationalBiology, 13(2):165–181, 2006.
18. M. Koyuturk, A. Grama, and W. Szpankowski. Pairwise local alignment of proteininteraction networks guided by models of evolution. Proc of the 9th InternationalConference on Research in Computational Molecular Biology (RECOMB), 2005.
19. S. Maslov and K. Sneppen. Specificity and stability in topology of protein networks.Science, 296(5569):910–913, 2002.
Pairwise Global Alignment of Protein Interaction Networks 31
20. E. Nabieva, K. Jim, A. Agarwal, B. Chazelle, and M. Singh. Whole-proteomeprediction of protein function via graph-theoretic analysis of interaction maps.Bioinformatics, 21 Suppl 1:i302–10, 2005.
21. K.P. O’Brien, M. Remm, and E.L. Sonnhammer. Inparanoid: a comprehensivedatabase of eukaryotic orthologs. Nucleic Acids Res, 33(Database issue):D476–80,2005.
22. C. Papadimitriou and K. Steiglitz. Combinatorial optimization: algorithms andcomplexity. Dover), 1998.
23. Y. Qi, J. Klein-Seetharaman, and Z. Bar-Joseph. Random forest similarity forprotein-protein interaction prediction from multiple sources. Proc of the PacificSymposium on Biocomputation, 2005.
24. R. Singh, J. Xu, and B. Berger. Struct2net: Integrating structure into protein-protein interaction prediction. Proceedings of the Pacific Symposium on Biocom-putation, 2006.
25. D. Sontag, R. Singh, and B. Berger. Probabilistic modeling of systematic errors inyeast two-hybrid experiments. To Appear. Proceedings of the Pacific Symposiumon Biocomputation, 2007.
26. B.S. Srinivasan, A. Novak, J. Flannick, S. Batzoglou, and H. McAdams. Inte-grated protein interaction networks for 11 microbes. Proc of the 10th InternationalConference on Research in Computational Molecular Biology(RECOMB), 2006.
27. C. von Mering et al. Comparative assessment of large-scale data sets of protein-protein interactions. Nature, 417(6887):399–403, 2002.
28. M.Y. Yao, T.W. Lam, and H.F. Ting. An even faster and more unifying algorithmfor comparing trees via unbalanced bipartite matchings. J of Algorithms, 40:212,2006.
29. C.H. Yeang and M. Vingron. A joint model of regulatory and metabolic networks.BMC Bioinformatics, 7:332, 2006.
30. S.H. Yook, Z.N. Oltvai, and A.L. Barabasi. Functional and topological character-ization of protein interaction networks. Proteomics, 4(4):928–42, 2004.
Related Documents


![Collaborative Translational Metric Learning · •Pointwise methods: eALS[SIGIR 2016], NeuMF[WWW 2017] •Pairwise methods: BPR [UAI 2009], AoBPR[WSDM 2014] 2.Neighborhood-based baselines](https://static.cupdf.com/doc/110x72/5ede2951ad6a402d666975b4/collaborative-translational-metric-learning-apointwise-methods-ealssigir-2016.jpg)