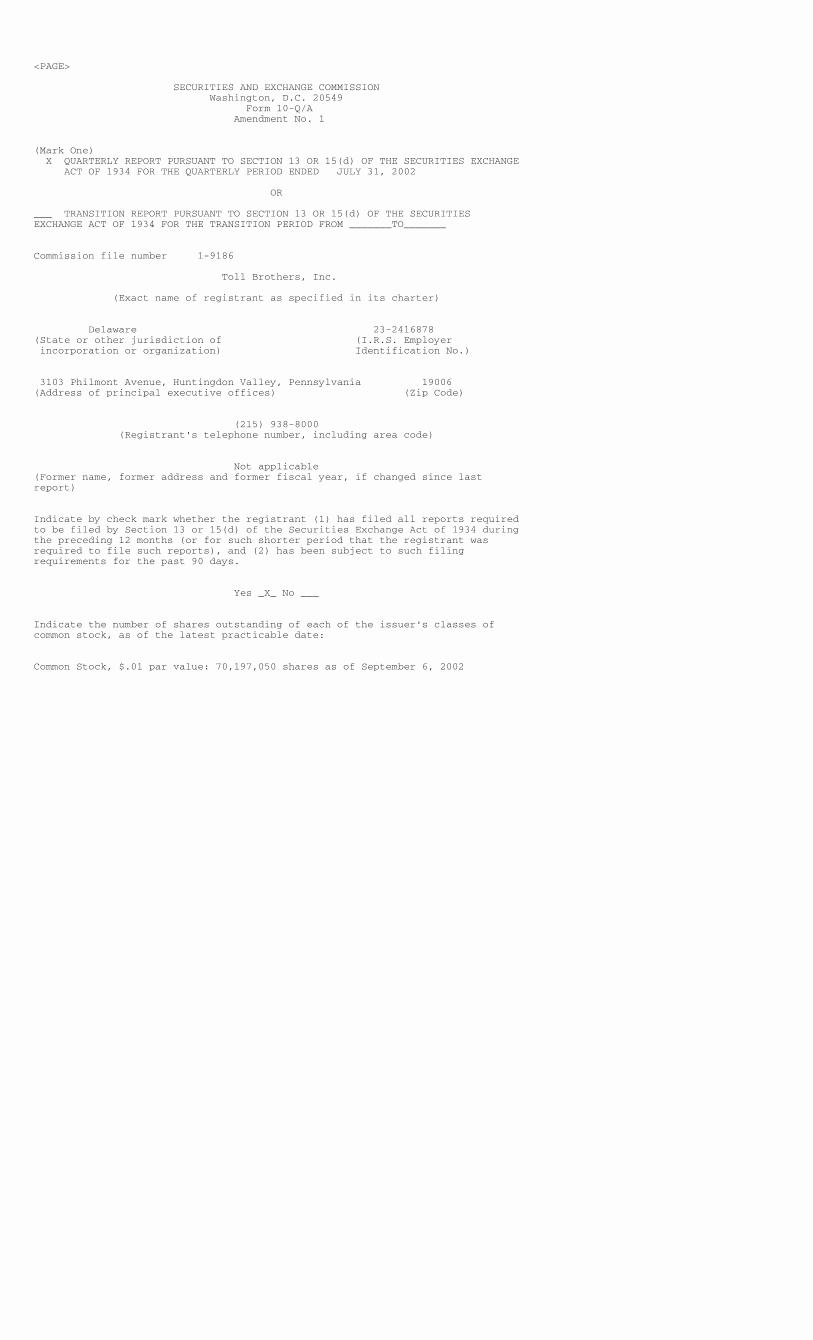
<PAGE> SECURITIES AND EXCHANGE COMMISSION Washington, D.C. 20549 Form 10-Q/A Amendment No. 1 (Mark One) X QUARTERLY REPORT PURSUANT TO SECTION 13 OR 15(d) OF THE SECURITIES EXCHANGE ACT OF 1934 FOR THE QUARTERLY PERIOD ENDED JULY 31, 2002 OR ___ TRANSITION REPORT PURSUANT TO SECTION 13 OR 15(d) OF THE SECURITIES EXCHANGE ACT OF 1934 FOR THE TRANSITION PERIOD FROM _______TO_______ Commission file number 1-9186 Toll Brothers, Inc. (Exact name of registrant as specified in its charter) Delaware 23-2416878 (State or other jurisdiction of (I.R.S. Employer incorporation or organization) Identification No.) 3103 Philmont Avenue, Huntingdon Valley, Pennsylvania 19006 (Address of principal executive offices) (Zip Code) (215) 938-8000 (Registrant's telephone number, including area code) Not applicable (Former name, former address and former fiscal year, if changed since last report) Indicate by check mark whether the registrant (1) has filed all reports required to be filed by Section 13 or 15(d) of the Securities Exchange Act of 1934 during the preceding 12 months (or for such shorter period that the registrant was required to file such reports), and (2) has been subject to such filing requirements for the past 90 days. Yes _X_ No ___ Indicate the number of shares outstanding of each of the issuer's classes of common stock, as of the latest practicable date: Common Stock, $.01 par value: 70,197,050 shares as of September 6, 2002

Welcome message from author
This document is posted to help you gain knowledge. Please leave a comment to let me know what you think about it! Share it to your friends and learn new things together.
Transcript
<PAGE>
SECURITIES AND EXCHANGE COMMISSION Washington, D.C. 20549 Form 10-Q/A Amendment No. 1
(Mark One) X QUARTERLY REPORT PURSUANT TO SECTION 13 OR 15(d) OF THE SECURITIES EXCHANGE ACT OF 1934 FOR THE QUARTERLY PERIOD ENDED JULY 31, 2002
OR
___ TRANSITION REPORT PURSUANT TO SECTION 13 OR 15(d) OF THE SECURITIESEXCHANGE ACT OF 1934 FOR THE TRANSITION PERIOD FROM _______TO_______
Commission file number 1-9186
Toll Brothers, Inc.
(Exact name of registrant as specified in its charter)
Delaware 23-2416878(State or other jurisdiction of (I.R.S. Employer incorporation or organization) Identification No.)
3103 Philmont Avenue, Huntingdon Valley, Pennsylvania 19006(Address of principal executive offices) (Zip Code)
(215) 938-8000 (Registrant's telephone number, including area code)
Not applicable(Former name, former address and former fiscal year, if changed since lastreport)
Indicate by check mark whether the registrant (1) has filed all reports requiredto be filed by Section 13 or 15(d) of the Securities Exchange Act of 1934 duringthe preceding 12 months (or for such shorter period that the registrant wasrequired to file such reports), and (2) has been subject to such filingrequirements for the past 90 days.
Yes _X_ No ___
Indicate the number of shares outstanding of each of the issuer's classes ofcommon stock, as of the latest practicable date:
Common Stock, $.01 par value: 70,197,050 shares as of September 6, 2002

<PAGE>
TOLL BROTHERS, INC. AND SUBSIDIARIES INDEX
Page No.
Statement of Forward-Looking Information 1
PART I. Financial Information ITEM 1. Financial Statements
Condensed Consolidated Balance Sheets (Unaudited) as of July 31, 2002 and October 31, 2001 2
Condensed Consolidated Statements of Income (Unaudited) For the Nine Months and Three Months Ended July 31, 2002 and 2001 3
Condensed Consolidated Statements of Cash Flows (Unaudited) For the Nine Months Ended July 31, 2002 and 2001 4
Notes to Condensed Consolidated Financial Statements (Unaudited) 5
ITEM 2. Management's Discussion and Analysis of Financial Condition and Results of Operations 8
ITEM 3. Quantitative and Qualitative Disclosures About Market Risk 16
ITEM 4. Controls and Procedures 16
PART II. Other Information 16
SIGNATURES 17

<PAGE>
STATEMENT ON FORWARD-LOOKING INFORMATION
Certain information included herein and in our other reports, SEC filings,statements and presentations is forward-looking within the meaning of thePrivate Securities Litigation Reform Act of 1995, including, but not limited to,statements concerning our anticipated operating results, financial resources,changes in revenues, changes in profitability, interest expense, growth andexpansion, ability to acquire land, ability to sell homes and properties,ability to deliver homes from backlog, ability to open new communities, abilityto secure materials and subcontractors and stock market valuations. In somecases you can identify those so called forward-looking statements by words suchas "may," "should," "expects," "plans," "anticipates," "believes," "estimates,""predicts," "potential," or "continue" or the negative of those words or othercomparable words. Such forward-looking information involves important risks anduncertainties that could significantly affect actual results and cause them todiffer materially from expectations expressed herein and in our other reports,SEC filings, statements and presentations. These risks and uncertainties includelocal, regional and national economic and political conditions, the consequencesof any future terrorist attacks such as those that occurred on September 11,2001, the effects of governmental regulation, the competitive environment inwhich we operate, fluctuations in interest rates, changes in home prices, theavailability and cost of land for future growth, the availability of capital,fluctuations in capital and securities markets, the availability and cost oflabor and materials, and weather conditions.
Additional information concerning potential factors that we believe could causeour actual results to differ materially from expected and historical results isincluded under the caption "Factors That May Affect Our Future Results" in Item1 of our Annual Report on Form 10-K for the fiscal year ended October 31, 2001.If one or more of the assumptions underlying our forward-looking statementsproves incorrect, then our actual results, performance or achievements coulddiffer materially from those expressed in, or implied by the forward-lookingstatements contained in this report. Therefore, we caution you not to placeundue reliance on our forward-looking statements. This statement is provided aspermitted by the Private Securities Litigation Reform Act of 1995.
When this report uses the word "we," "us," and "our," they refer to TollBrothers, Inc. and its subsidiaries, unless the context otherwise requires.
1
<PAGE>
PART 1. FINANCIAL INFORMATION
ITEM 1. FINANCIAL STATEMENTS
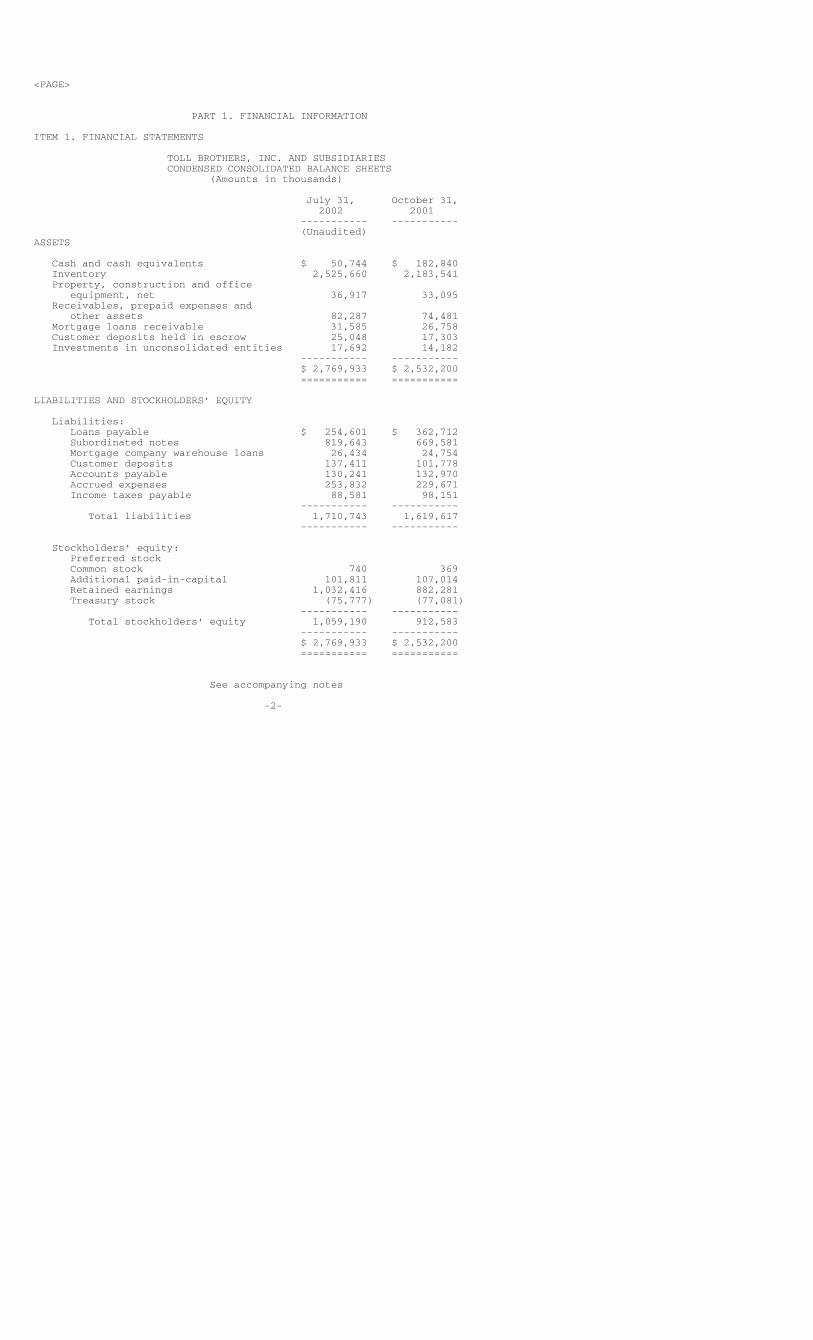
TOLL BROTHERS, INC. AND SUBSIDIARIES CONDENSED CONSOLIDATED BALANCE SHEETS (Amounts in thousands)
July 31, October 31, 2002 2001 ----------- ----------- (Unaudited)ASSETS
Cash and cash equivalents $ 50,744 $ 182,840 Inventory 2,525,660 2,183,541 Property, construction and office equipment, net 36,917 33,095 Receivables, prepaid expenses and other assets 82,287 74,481 Mortgage loans receivable 31,585 26,758 Customer deposits held in escrow 25,048 17,303 Investments in unconsolidated entities 17,692 14,182 ----------- ----------- $ 2,769,933 $ 2,532,200 =========== ===========
LIABILITIES AND STOCKHOLDERS' EQUITY
Liabilities: Loans payable $ 254,601 $ 362,712 Subordinated notes 819,643 669,581 Mortgage company warehouse loans 26,434 24,754 Customer deposits 137,411 101,778 Accounts payable 130,241 132,970 Accrued expenses 253,832 229,671 Income taxes payable 88,581 98,151 ----------- ----------- Total liabilities 1,710,743 1,619,617 ----------- -----------
Stockholders' equity: Preferred stock Common stock 740 369 Additional paid-in-capital 101,811 107,014 Retained earnings 1,032,416 882,281 Treasury stock (75,777) (77,081) ----------- ----------- Total stockholders' equity 1,059,190 912,583 ----------- ----------- $ 2,769,933 $ 2,532,200 =========== ===========
See accompanying notes
-2-
<PAGE>
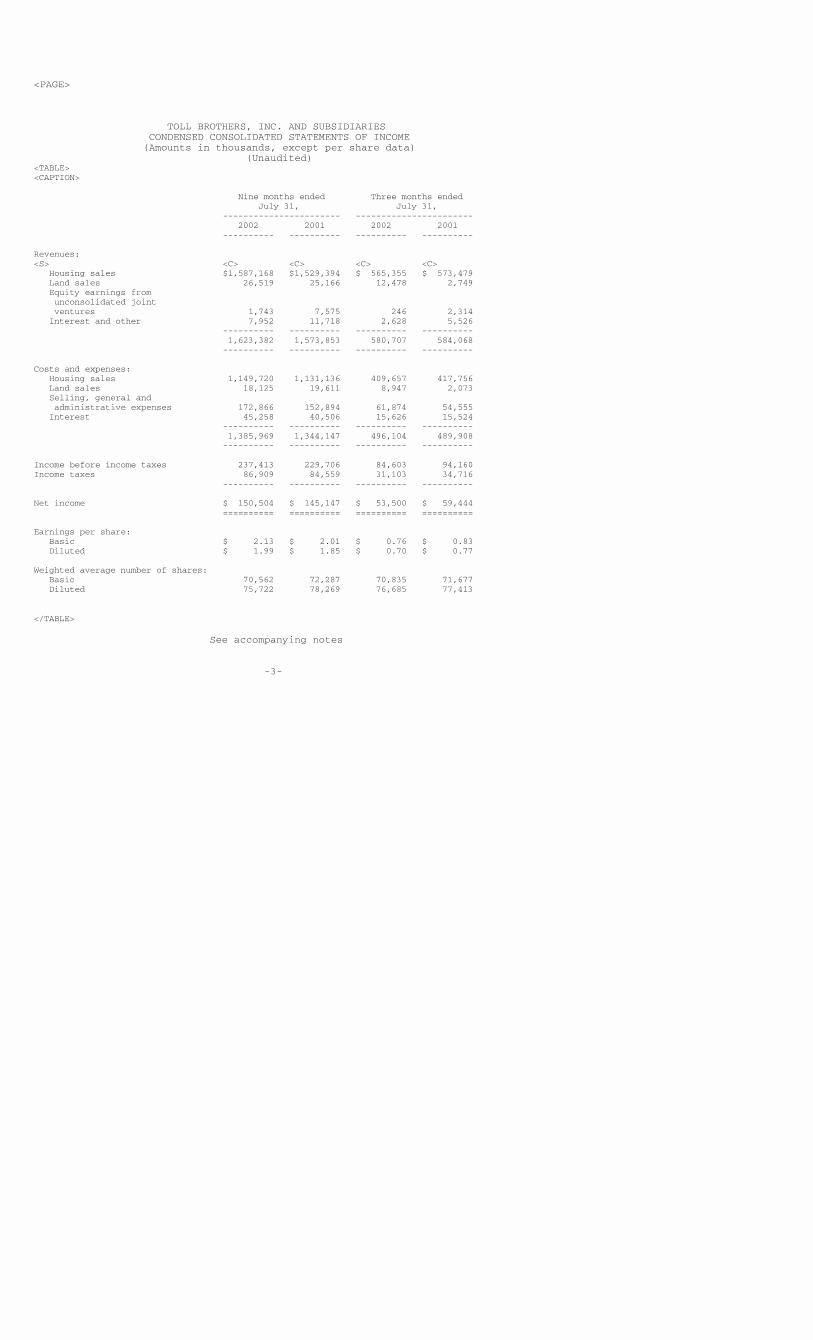
TOLL BROTHERS, INC. AND SUBSIDIARIES CONDENSED CONSOLIDATED STATEMENTS OF INCOME (Amounts in thousands, except per share data) (Unaudited)<TABLE><CAPTION>
Nine months ended Three months ended July 31, July 31, ----------------------- ----------------------- 2002 2001 2002 2001 ---------- ---------- ---------- ----------
Revenues:<S> <C> <C> <C> <C> Housing sales $1,587,168 $1,529,394 $ 565,355 $ 573,479 Land sales 26,519 25,166 12,478 2,749 Equity earnings from unconsolidated joint ventures 1,743 7,575 246 2,314 Interest and other 7,952 11,718 2,628 5,526 ---------- ---------- ---------- ---------- 1,623,382 1,573,853 580,707 584,068 ---------- ---------- ---------- ----------
Costs and expenses: Housing sales 1,149,720 1,131,136 409,657 417,756 Land sales 18,125 19,611 8,947 2,073 Selling, general and administrative expenses 172,866 152,894 61,874 54,555 Interest 45,258 40,506 15,626 15,524 ---------- ---------- ---------- ---------- 1,385,969 1,344,147 496,104 489,908 ---------- ---------- ---------- ----------
Income before income taxes 237,413 229,706 84,603 94,160Income taxes 86,909 84,559 31,103 34,716 ---------- ---------- ---------- ----------
Net income $ 150,504 $ 145,147 $ 53,500 $ 59,444 ========== ========== ========== ==========
Earnings per share: Basic $ 2.13 $ 2.01 $ 0.76 $ 0.83 Diluted $ 1.99 $ 1.85 $ 0.70 $ 0.77
Weighted average number of shares: Basic 70,562 72,287 70,835 71,677 Diluted 75,722 78,269 76,685 77,413
</TABLE>
See accompanying notes
-3-
<PAGE>
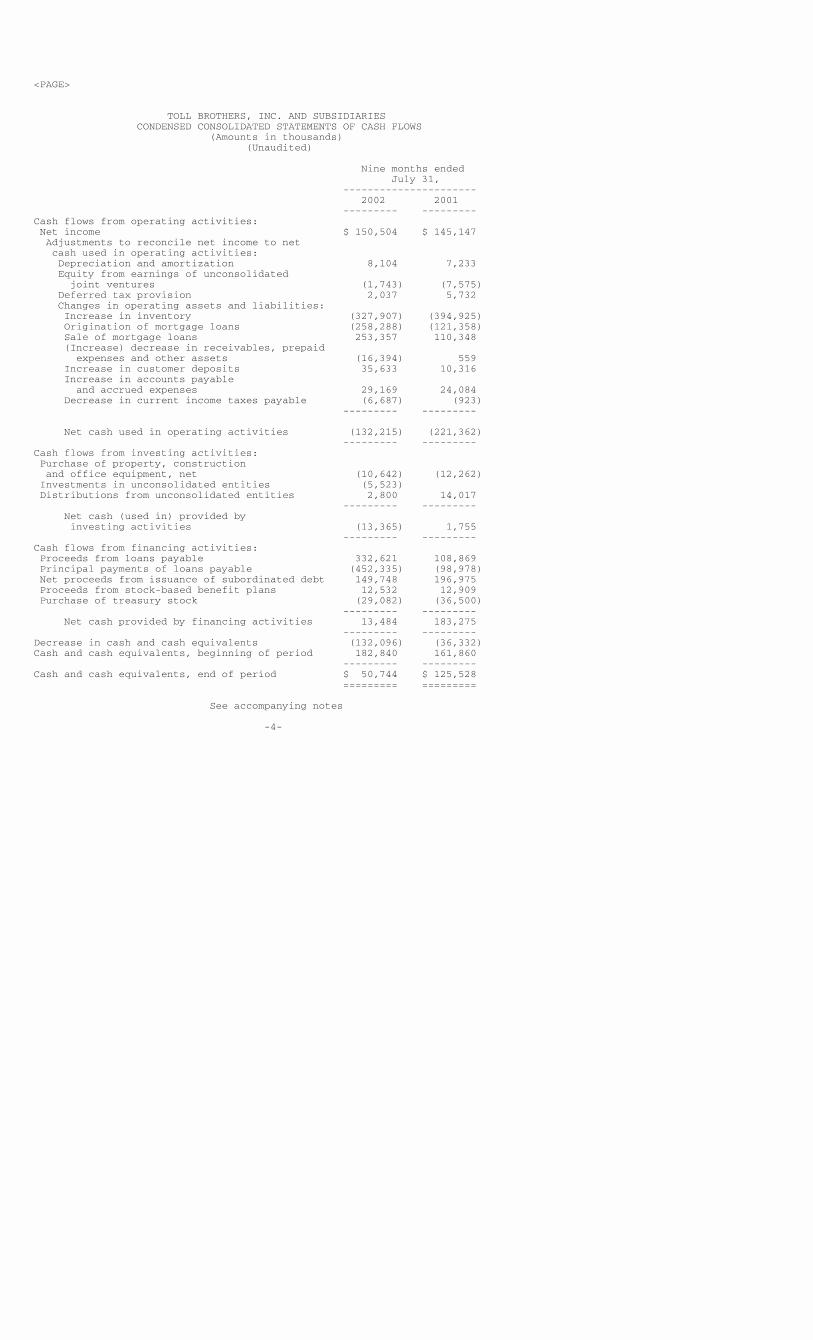
TOLL BROTHERS, INC. AND SUBSIDIARIES CONDENSED CONSOLIDATED STATEMENTS OF CASH FLOWS (Amounts in thousands) (Unaudited)
Nine months ended July 31, ---------------------- 2002 2001 --------- ---------Cash flows from operating activities: Net income $ 150,504 $ 145,147 Adjustments to reconcile net income to net cash used in operating activities: Depreciation and amortization 8,104 7,233 Equity from earnings of unconsolidated joint ventures (1,743) (7,575) Deferred tax provision 2,037 5,732 Changes in operating assets and liabilities: Increase in inventory (327,907) (394,925) Origination of mortgage loans (258,288) (121,358) Sale of mortgage loans 253,357 110,348 (Increase) decrease in receivables, prepaid expenses and other assets (16,394) 559 Increase in customer deposits 35,633 10,316 Increase in accounts payable and accrued expenses 29,169 24,084 Decrease in current income taxes payable (6,687) (923) --------- ---------
Net cash used in operating activities (132,215) (221,362) --------- ---------Cash flows from investing activities: Purchase of property, construction and office equipment, net (10,642) (12,262) Investments in unconsolidated entities (5,523) Distributions from unconsolidated entities 2,800 14,017 --------- --------- Net cash (used in) provided by investing activities (13,365) 1,755 --------- ---------Cash flows from financing activities: Proceeds from loans payable 332,621 108,869 Principal payments of loans payable (452,335) (98,978) Net proceeds from issuance of subordinated debt 149,748 196,975 Proceeds from stock-based benefit plans 12,532 12,909 Purchase of treasury stock (29,082) (36,500) --------- --------- Net cash provided by financing activities 13,484 183,275 --------- ---------Decrease in cash and cash equivalents (132,096) (36,332)Cash and cash equivalents, beginning of period 182,840 161,860 --------- ---------Cash and cash equivalents, end of period $ 50,744 $ 125,528 ========= =========
See accompanying notes
-4-
<PAGE>
TOLL BROTHERS, INC. AND SUBSIDIARIES NOTES TO CONDENSED CONSOLIDATED FINANCIAL STATEMENTS (Amounts in thousands, except per share amounts) (Unaudited)
1. Basis of Presentation
The accompanying unaudited condensed consolidated financial statements have beenprepared in accordance with the rules and regulations of the Securities andExchange Commission for interim financial information. The October 31, 2001balance sheet amounts and disclosures included herein have been derived from ourOctober 31, 2001 audited financial statements. Since the accompanying condensedconsolidated financial statements do not include all the information andfootnotes required by accounting principles generally accepted in the UnitedStates for complete financial statements, we suggest that they be read inconjunction with the financial statements and notes thereto included in ourOctober 31, 2001 Annual Report on Form 10-K. In the opinion of management, theaccompanying unaudited condensed consolidated financial statements include alladjustments, which are of a normal recurring nature, necessary to present fairlyour financial position as of July 31, 2002, the results of our operations forthe nine months and three months ended July 31, 2002 and 2001 and our cash flowsfor the nine months ended July 31, 2002 and 2001. The results of operations forsuch interim periods are not necessarily indicative of the results to beexpected for the full year.
On March 4, 2002, our Board of Directors declared a two-for-one split of ourcommon stock in the form of a stock dividend to stockholders of record on March14, 2002. The additional shares were distributed on March 28, 2002. All shareand per share information has been restated to reflect this split.
Statement of Financial Accounting Standards ("SFAS") No.142, "Goodwill andOther Intangible Asset" provides guidance on accounting for certain intangiblesand eliminates the amortization of goodwill and certain intangible assets.Intangible assets, including goodwill, that are not subject to amortization arerequired to be tested for impairment and possible write-down on an annual basis.We adopted SFAS 142 on November 1, 2001, the first day of our 2002 fiscal year.We had $8.9 million of goodwill at November 1, 2001. The adoption of SFAS 142did not have a material impact on our financial statements. For the nine-monthand three-month periods ended July 31, 2001, we amortized $795 (net of $466 ofincome taxes) and $265 (net of $156 of income taxes) of goodwill, respectively.Had we not amortized goodwill during the nine-month and three-month periodsended July 31, 2001, we would have reported net income, diluted earnings pershare and basic earnings per share of $145,942, $1.86 and $2.02, respectively,for the nine-month period and $59,709, $.77 and $.83, respectively, for thethree-month period.
Certain amounts reported in prior periods have been reclassified for comparativepurposes.
-5-
<PAGE>
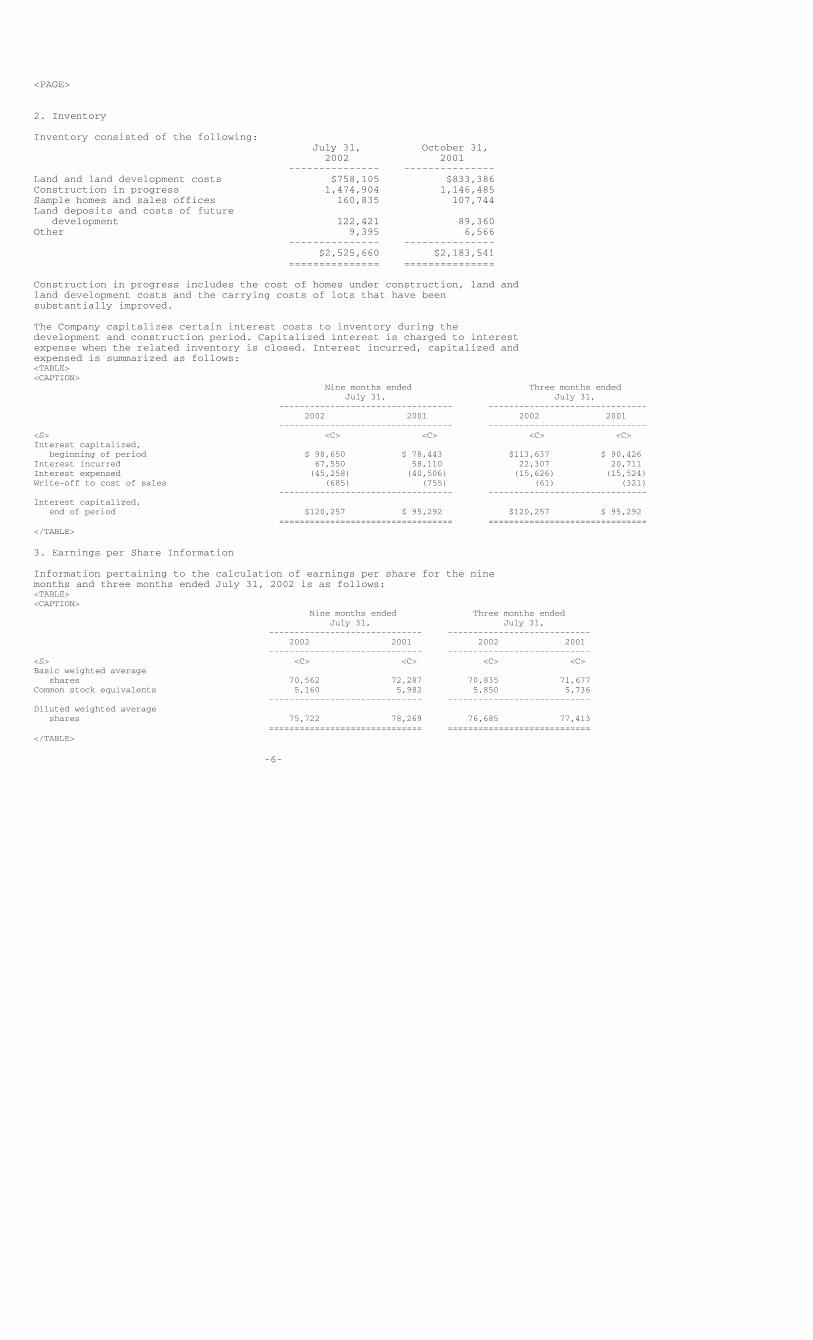
2. Inventory
Inventory consisted of the following: July 31, October 31, 2002 2001 --------------- ---------------Land and land development costs $758,105 $833,386Construction in progress 1,474,904 1,146,485Sample homes and sales offices 160,835 107,744Land deposits and costs of future development 122,421 89,360Other 9,395 6,566 --------------- --------------- $2,525,660 $2,183,541 =============== ===============
Construction in progress includes the cost of homes under construction, land andland development costs and the carrying costs of lots that have beensubstantially improved.
The Company capitalizes certain interest costs to inventory during thedevelopment and construction period. Capitalized interest is charged to interestexpense when the related inventory is closed. Interest incurred, capitalized andexpensed is summarized as follows:<TABLE><CAPTION> Nine months ended Three months ended July 31, July 31, ---------------------------------- ------------------------------- 2002 2001 2002 2001 ---------------------------------- -------------------------------<S> <C> <C> <C> <C>Interest capitalized, beginning of period $ 98,650 $ 78,443 $113,637 $ 90,426Interest incurred 67,550 58,110 22,307 20,711Interest expensed (45,258) (40,506) (15,626) (15,524)Write-off to cost of sales (685) (755) (61) (321) ---------------------------------- -------------------------------Interest capitalized, end of period $120,257 $ 95,292 $120,257 $ 95,292 ================================== ===============================</TABLE>
3. Earnings per Share Information
Information pertaining to the calculation of earnings per share for the ninemonths and three months ended July 31, 2002 is as follows:<TABLE><CAPTION> Nine months ended Three months ended July 31, July 31, ------------------------------ ---------------------------- 2002 2001 2002 2001 ------------------------------ ----------------------------<S> <C> <C> <C> <C>Basic weighted average shares 70,562 72,287 70,835 71,677Common stock equivalents 5,160 5,982 5,850 5,736 ------------------------------ ----------------------------Diluted weighted average shares 75,722 78,269 76,685 77,413 ============================== ============================</TABLE>
-6-
<PAGE>
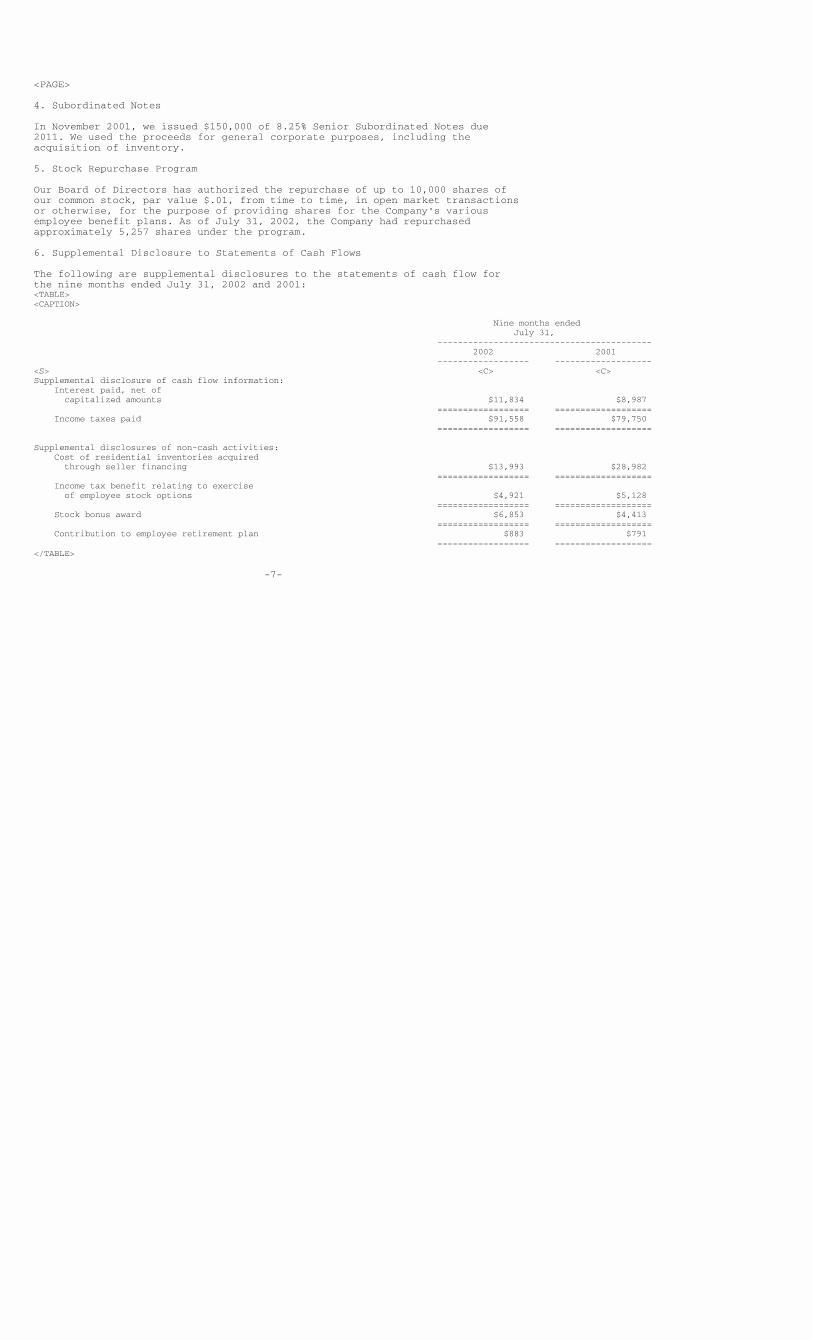
4. Subordinated Notes
In November 2001, we issued $150,000 of 8.25% Senior Subordinated Notes due2011. We used the proceeds for general corporate purposes, including theacquisition of inventory.
5. Stock Repurchase Program
Our Board of Directors has authorized the repurchase of up to 10,000 shares ofour common stock, par value $.01, from time to time, in open market transactionsor otherwise, for the purpose of providing shares for the Company's variousemployee benefit plans. As of July 31, 2002, the Company had repurchasedapproximately 5,257 shares under the program.
6. Supplemental Disclosure to Statements of Cash Flows
The following are supplemental disclosures to the statements of cash flow forthe nine months ended July 31, 2002 and 2001:<TABLE><CAPTION>
Nine months ended July 31, ------------------------------------------ 2002 2001 ------------------ -------------------<S> <C> <C>Supplemental disclosure of cash flow information: Interest paid, net of capitalized amounts $11,834 $8,987 ================== =================== Income taxes paid $91,558 $79,750 ================== ===================
Supplemental disclosures of non-cash activities: Cost of residential inventories acquired through seller financing $13,993 $28,982 ================== =================== Income tax benefit relating to exercise of employee stock options $4,921 $5,128 ================== =================== Stock bonus award $6,853 $4,413 ================== =================== Contribution to employee retirement plan $883 $791 ================== ===================</TABLE>
-7-
<PAGE>
ITEM 2. MANAGEMENT'S DISCUSSION AND ANALYSIS OF FINANCIAL CONDITION AND RESULTS OF OPERATIONS
CRITICAL ACCOUNTING POLICIES
Basis of PresentationOur financial statements include the accounts of Toll Brothers, Inc. and itsmajority owned subsidiaries. All significant intercompany accounts andtransactions have been eliminated. Investments in 20% to 50% owned partnershipsand affiliates are accounted for on the equity method.
InventoryInventory is stated at the lower of cost or fair value in accordance withStatement of Financial Accounting Standards ("SFAS") No. 121. In addition todirect acquisition, land development and home construction costs, costs includeinterest, real estate taxes and direct overhead costs related to development andconstruction, which are capitalized to inventories during the period beginningwith the commencement of development and ending with the completion ofconstruction.
It takes approximately four to five years to fully develop, sell and deliver allthe homes in one of our typical communities. Longer or shorter lengths of timeare possible depending on the number of home sites in a community. Since ourinventory is considered a long lived asset under accounting principles generallyaccepted in the United States, we are required to review the carrying value ofthe communities and write-down the value of those communities for which webelieve the values are not recoverable. When the profitability of a currentcommunity deteriorates or the sales pace declines significantly or some otherfactor indicates a possible impairment in the recoverability of the asset, weevaluate the property in accordance with the guidelines of SFAS No. 121. If thisevaluation indicates an impairment loss should be recognized, we charge cost ofsales for the estimated impairment loss in that quarter.
In addition, we review all the land held for future communities or futuresections of current communities, whether owned or under contract, to determinewhether or not we expect to proceed with the development of the land. Based uponthis review, we decide: (a) as to land that is under a purchase contract but notowned, whether the contract will be terminated or renegotiated; and (b) as toland we own, whether the land can be developed as contemplated or in analternative manner or should be sold. Based upon this review, we furtherdetermine what costs that have been capitalized to the property are recoverableand what costs should be written-off.
Land, land development and related costs (both incurred and estimated to beincurred) are amortized to the cost of homes closed based upon the total numberof homes to be constructed in each community. Home construction and relatedcosts are charged to the cost of homes closed under the specific identificationmethod. Any changes to the estimated costs subsequent to the commencement ofdelivery of homes are allocated to the remaining homes in the community.
The estimated land, common area development and related costs of master plannedcommunities (including the cost of golf courses, net of its estimated residualvalue) are allocated to individual communities within the master plannedcommunity on a relative sales value basis. Any change in the estimated costs areallocated to the remaining lots in each of the communities of the master plannedcommunity.
-8-

<PAGE>
Income RecognitionRevenue and cost of sales are recorded at the time each home, or lot, is closedand title and possession is transferred to the buyer.
Joint Venture AccountingWe have entered into three joint ventures with independent third parties todevelop and sell land that was owned or is currently owned by our venturepartners. We recognize our share of earnings from the sale of lots to otherbuilders. We do not recognize earnings from lots we purchase, but reduce ourcost basis in the lots by our share of the earnings on those lots. We haveagreed to purchase 180 lots from one of the ventures and 46 lots from another,and we have the right to purchase up to 385 lots from the third. We also willparticipate in the profits earned from the lots sold to other builders abovecertain agreed upon levels. At July 31, 2002 we had approximately $9 millioninvested in these joint ventures and were committed to contribute additionalcapital of approximately $31 million if the joint ventures require it.
In addition, we effectively own one-third of Toll Brothers Realty Trust Group(the "Trust"), which was formed with a number of our senior executives anddirectors and with the Pennsylvania State Employees Retirement System to takeadvantage of commercial real estate opportunities that may present themselvesfrom time to time. We provide development, finance and management services tothe Trust and receive fees under various agreements. At July 31, 2002, ourinvestment in the Trust was $7.5 million. We also entered into a subscriptionagreement whereby each group of investors agreed to invest an additional $9.3million if required by the Trust. The original subscription agreement was toexpire in June 2002 but was extended to August 2003. The Trust currently ownsand operates several office buildings and an apartment complex, a portion ofwhich is still under construction.
We also own 50% of a joint venture with an unrelated third party that iscurrently selling and building an active adult, age-qualified community. At July31, 2002, our investment was $1.2 million in this joint venture.
We do not currently guarantee any indebtedness of the joint ventures or theTrust. Our total commitment to these entities is not material to our financialcondition. These investments are accounted for on the equity method.
-9-
<PAGE>
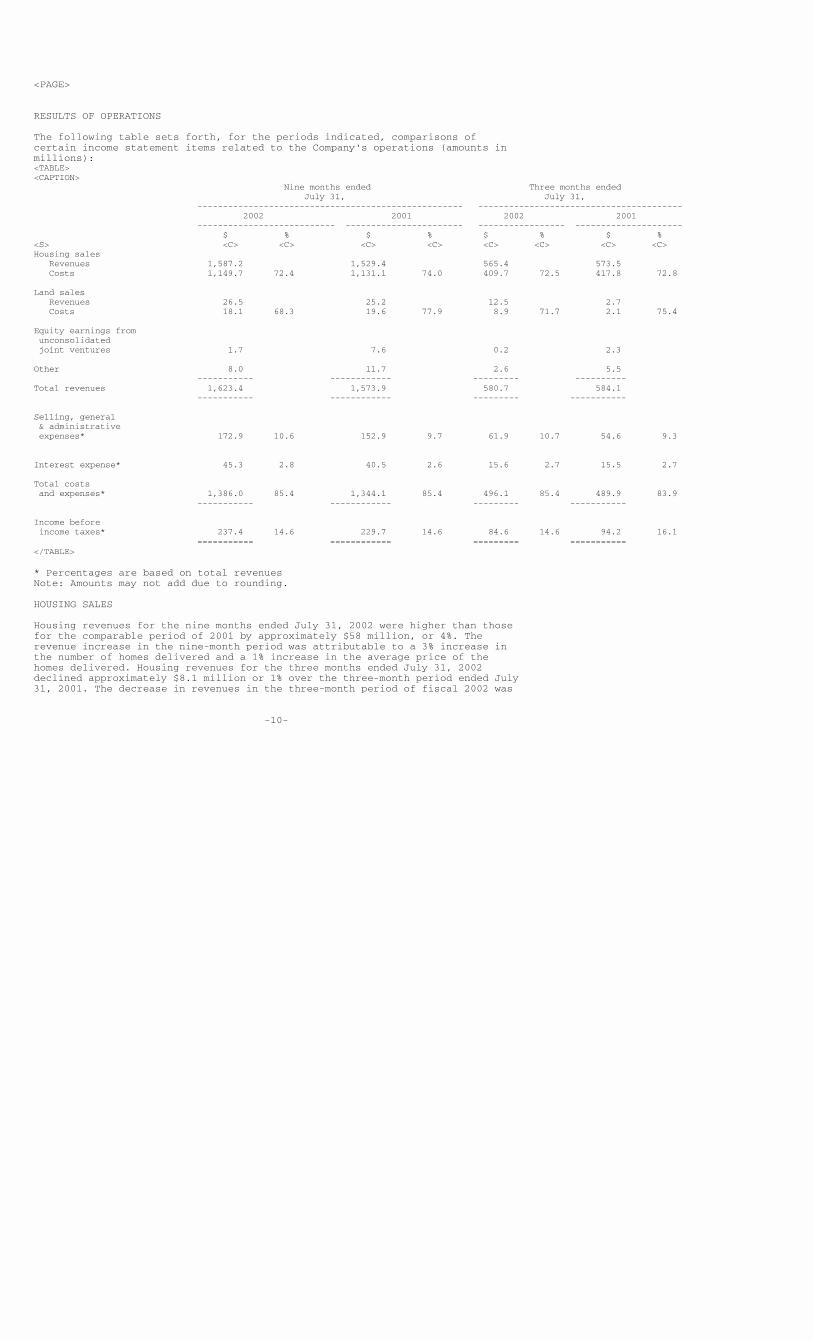
RESULTS OF OPERATIONS
The following table sets forth, for the periods indicated, comparisons ofcertain income statement items related to the Company's operations (amounts inmillions):<TABLE><CAPTION> Nine months ended Three months ended July 31, July 31, ---------------------------------------------------- ---------------------------------------- 2002 2001 2002 2001 --------------------------- ----------------------- ----------------- --------------------- $ % $ % $ % $ %<S> <C> <C> <C> <C> <C> <C> <C> <C>Housing sales Revenues 1,587.2 1,529.4 565.4 573.5 Costs 1,149.7 72.4 1,131.1 74.0 409.7 72.5 417.8 72.8
Land sales Revenues 26.5 25.2 12.5 2.7 Costs 18.1 68.3 19.6 77.9 8.9 71.7 2.1 75.4
Equity earnings from unconsolidated joint ventures 1.7 7.6 0.2 2.3
Other 8.0 11.7 2.6 5.5 ----------- ------------ --------- ----------Total revenues 1,623.4 1,573.9 580.7 584.1 ----------- ------------ --------- -----------
Selling, general & administrative expenses* 172.9 10.6 152.9 9.7 61.9 10.7 54.6 9.3
Interest expense* 45.3 2.8 40.5 2.6 15.6 2.7 15.5 2.7
Total costs and expenses* 1,386.0 85.4 1,344.1 85.4 496.1 85.4 489.9 83.9 ----------- ------------ --------- -----------
Income before income taxes* 237.4 14.6 229.7 14.6 84.6 14.6 94.2 16.1 =========== ============ ========= ===========</TABLE>
* Percentages are based on total revenuesNote: Amounts may not add due to rounding.
HOUSING SALES
Housing revenues for the nine months ended July 31, 2002 were higher than thosefor the comparable period of 2001 by approximately $58 million, or 4%. Therevenue increase in the nine-month period was attributable to a 3% increase inthe number of homes delivered and a 1% increase in the average price of thehomes delivered. Housing revenues for the three months ended July 31, 2002declined approximately $8.1 million or 1% over the three-month period ended July31, 2001. The decrease in revenues in the three-month period of fiscal 2002 was
-10-
<PAGE>
attributable to a 3% decrease in the number of homes delivered offset in part bya 2% increase in the average price of the homes delivered. The increase in theaverage price of the homes delivered in both periods of fiscal 2002 was theresult of increased selling prices and a shift in the location of homesdelivered to more expensive areas. Homes delivered in the nine-month period aregenerally those homes that were in backlog at the beginning of the period andthe homes contracted for during the first three months of the period. Theincrease in the number of homes delivered in the nine month period of fiscal2002 is primarily due to our delivering a higher percentage of homes that werein backlog at October 31, 2001 and homes contracted for in the first quarter offiscal 2002 compared to the percentage of homes we delivered in the fiscal 2001period from the October 31, 2000 backlog and homes contracted for in the firstquarter of fiscal 2001.
Homes delivered in our fiscal third quarter are generally homes that would havebeen contracted for in the fourth quarter of the prior fiscal year and the firstquarter of the current fiscal year. The decrease in the number of homesdelivered in the three-month period ended July 31, 2002 compared to the three-month period ended July 31, 2001 was due primarily to the decline in newcontracts signed in our fourth quarter of fiscal 2001 compared to the fourthquarter of fiscal 2000 and the continued softness in new contract signing thatwe encountered in the first portion of the first quarter of fiscal 2002. Thedecline in new contracts in the fourth quarter of fiscal 2001 and the softnessin the first part of the first quarter of fiscal 2002 was due primarily to theslowing economy exacerbated by the tragic events of September 11, 2001 and thedelays in the opening of new communities due to increased governmentalregulation. We believe that the decline in contracts in the fourth quarter offiscal 2001 and the softness in new contract signing that we encountered in thefirst part of the first quarter of fiscal 2002 will also have a negative impacton the number of homes delivered in the fourth quarter of fiscal 2002. We expectthat the negative impact of the aforementioned slowdown on unit deliveries inthe fourth quarter of fiscal 2002 will be significantly reduced by an increasein the delivered price of the homes. For fiscal 2002, we expect to deliverbetween 4,275 and 4,425 homes, compared to 4,358 homes in fiscal 2001, andrealize revenues from housing sales of between $2.17 billion and $2.27 billionas compared to $2.18 billion in fiscal 2001.
The value of new sales contracts signed amounted to $2.09 billion (3,908 homes)in the nine months ended July 31, 2002, a 24% increase over the value ofcontracts signed in the comparable period of fiscal 2001 of $1.69 billion (3,396homes). This increase is attributable to a 15% increase in the number of unitssold and an 8% increase in the average selling price of the homes (due primarilyto the location and size of homes sold and increases in base selling prices).For the three months ended July 31, 2002, the value of contracts signedincreased 30% over the comparable period of fiscal 2001. This increase wasprimarily attributable to a 17% increase in the number of units sold and an 11%increase in the average selling price of the homes. The increase in the numberof units sold is attributable to an increase in the number of communities fromwhich we are selling and the continued demand for our product. At July 31, 2002,we were selling from 167 communities compared to 142 communities at July 31,2001 and 155 communities at October 31, 2001.
We believe that the demand for our product is attributable to an increase in thenumber of affluent households, the maturation of the baby boom generation, aconstricted supply of available new home sites, attractive mortgage rates andthe appeal on the part of potential customers that the purchase of a home is astable investment in the current period of economic uncertainty. At July 31,2002, we had over 42,000 home sites under our control nationwide in markets weconsider as affluent.
-11-
<PAGE>
At July 31, 2002, our backlog of homes under contract was $1.90 billion(3,441 homes), 21% higher than the $1.58 billion (3,055 homes) backlog at July31, 2001 and 35% higher than the $1.41 billion (2,727 homes) backlog at October31, 2001. The increase in backlog at July 31, 2002 is primarily attributable tothe increase in the number of new contracts signed and the increased prices ofthe homes sold during fiscal 2002 as previously discussed. Based on the size ofour current backlog, the continued demand for our product and the increasednumber of selling communities from which we are operating and the additionalcommunities we expect to open in the coming months, we believe that we willdeliver approximately 5,000 homes in fiscal 2003 and the average delivered priceof those homes will be approximately $525,000 to $530,000.
Housing costs as a percentage of housing sales decreased in both periods offiscal 2002 as compared to the comparable periods of fiscal 2001. The decreaseswere largely the result of selling prices increasing at a greater rate thancosts, lower land and improvement costs, improved operating efficiencies andlower inventory write-offs, offset in part by sales incentives provided tocustomers in the later part of the fourth quarter of fiscal 2001 and thebeginning of the first quarter of fiscal 2002 to help reduce the effect on neworders from the economic slowdown in the later part of fiscal 2001 and thetragedy of September 11th. The Company incurred $3.4 million and $1.6 million inwrite-offs in the nine-month and three-month periods ended July 31, 2002,respectively, as compared to $6.6 million and $2.3 million in the comparableperiods of fiscal 2001.
LAND SALES
We are developing several master planned communities in which we sell land toother builders. The amount of land sales will vary from quarter to quarterdepending upon the scheduled timing of the delivery of the land parcels. Landsales amounted to $26.5 million and $12.5 million for the nine months and threemonths ended July 31, 2002, respectively, as compared to $25.2 million and $2.7million for the comparable periods of 2001.
EQUITY EARNINGS IN UNCONSOLIDATED JOINT VENTURES
We have entered into three joint ventures to develop and sell lots to otherbuilders. We also acquire or will acquire lots from these ventures for our ownuse. We recognize our share of earnings from the sale of lots to other buildersbut do not recognize earnings from lots we purchase. We reduce our cost basis inthe lots we purchase from the joint ventures by our share of the earnings onthose lots. Earnings from the joint ventures will vary significantly fromquarter to quarter.
INTEREST AND OTHER INCOME
Interest and other income decreased $3.8 million in the nine-month period endedJuly 31, 2002 as compared to the comparable period of fiscal 2001. The decreasewas principally due to a decrease in interest income, the gain from the sale ofan office building constructed by the Company recognized in the 2001 period, adecrease in earnings from the Company's ancillary businesses, offset in part byincreased income from retained customer deposits.
-12-
<PAGE>
For the three months ended July 31, 2002, interest and other income decreased$2.9 million as compared to the three months ended July 31, 2001. This decreasewas primarily the result of a gain realized in the 2001 period on the sale of anoffice building constructed by the Company, a decrease in interest income and adecrease in earnings from the Company's ancillary businesses.
SELLING, GENERAL AND ADMINISTRATIVE EXPENSES ("SG&A")
SG&A spending increased by $20.0 million or 13% and $7.3 million or 13% in thenine-month and three-month periods ended July 31, 2002 as compared to thecomparable periods of fiscal 2001. This increased spending was principally dueto the greater number of selling communities that we had during both periods offiscal 2002 as compared to the comparable periods of fiscal 2001.
INTEREST EXPENSE
We determine interest expense on a specific lot-by-lot basis for ourhomebuilding operations and on a parcel-by-parcel basis for land sales. As apercentage of total revenues, interest expense varies depending on many factorsincluding the period of time that we owned the land, the length of time that thehomes delivered during the period were under construction, and the interestrates and the amount of debt carried by us in proportion to the amount of ourinventory during those periods. Interest expense as a percentage of revenues wasslightly higher in the nine-month period ending July 31, 2002 as compared to thecomparable period of 2001, and approximately the same for the three-month periodending July 31, 2002 as compared to the three-month period of fiscal 2001.
INCOME BEFORE INCOME TAXES
Income before taxes increased 3% in the nine-month period ended July 31, 2002over the comparable period of fiscal 2001 and declined 10% in the three-monthperiod ended July 31, 2002 as compared to the comparable period of fiscal 2001.
INCOME TAXES
Income taxes were provided at an effective rate of 36.6% and 36.8% for the nine-month periods ended July 31, 2002 and 2001, respectively. For the three-monthperiods ended July 31, 2002 and 2001, income taxes were provided at 36.8% and36.9%, respectively. The difference in rates in the nine-month periods andthree-month periods of fiscal 2002 as compared to comparable periods of fiscal2001 was due primarily to higher tax-free income in fiscal 2002 as compared tofiscal 2001.
CAPITAL RESOURCES AND LIQUIDITY
Funding for our operations has been provided principally by cash flows fromoperations, unsecured bank borrowings and the public debt markets.
Cash flow from operations, before inventory additions, has improved as operatingresults have improved. One of the main factors that determines cash flow fromoperations, before inventory additions, is the level of revenues from thedelivery of homes and land sales. We anticipate that cash flow from operations,before inventory additions, will continue to be strong. We have used our cashflow from operations, before inventory additions, bank borrowings and publicdebt to: acquire additional land for new communities; fund additionalexpenditures for land development; fund construction costs needed to meet the
-13-
<PAGE>
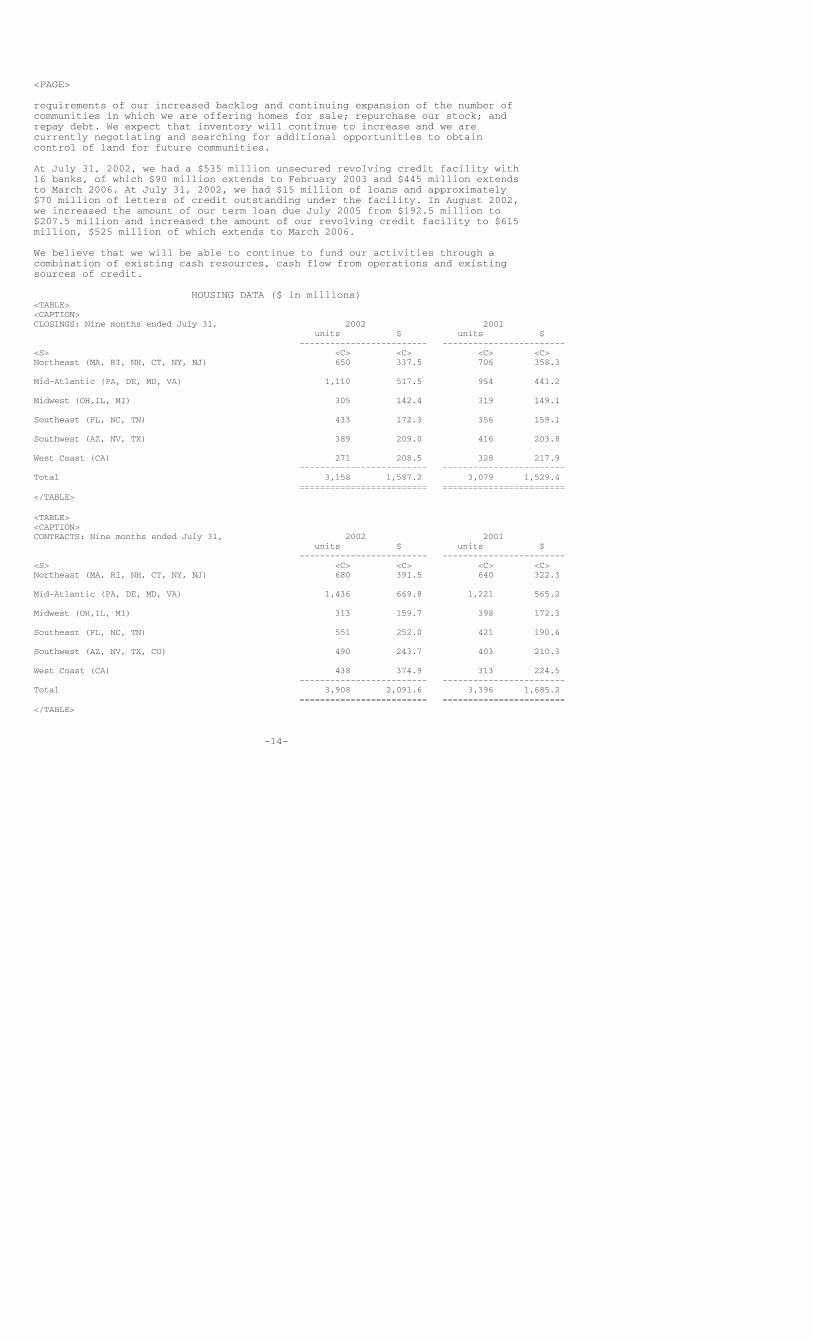
requirements of our increased backlog and continuing expansion of the number ofcommunities in which we are offering homes for sale; repurchase our stock; andrepay debt. We expect that inventory will continue to increase and we arecurrently negotiating and searching for additional opportunities to obtaincontrol of land for future communities.
At July 31, 2002, we had a $535 million unsecured revolving credit facility with16 banks, of which $90 million extends to February 2003 and $445 million extendsto March 2006. At July 31, 2002, we had $15 million of loans and approximately$70 million of letters of credit outstanding under the facility. In August 2002,we increased the amount of our term loan due July 2005 from $192.5 million to$207.5 million and increased the amount of our revolving credit facility to $615million, $525 million of which extends to March 2006.
We believe that we will be able to continue to fund our activities through acombination of existing cash resources, cash flow from operations and existingsources of credit.
HOUSING DATA ($ in millions)<TABLE><CAPTION>CLOSINGS: Nine months ended July 31, 2002 2001 units $ units $ ------------------------- ------------------------<S> <C> <C> <C> <C>Northeast (MA, RI, NH, CT, NY, NJ) 650 337.5 706 358.3
Mid-Atlantic (PA, DE, MD, VA) 1,110 517.5 954 441.2
Midwest (OH,IL, MI) 305 142.4 319 149.1
Southeast (FL, NC, TN) 433 172.3 356 159.1
Southwest (AZ, NV, TX) 389 209.0 416 203.8
West Coast (CA) 271 208.5 328 217.9 ------------------------- ------------------------Total 3,158 1,587.2 3,079 1,529.4 ========================= ========================</TABLE>
<TABLE><CAPTION>CONTRACTS: Nine months ended July 31, 2002 2001 units $ units $ ------------------------- ------------------------<S> <C> <C> <C> <C>Northeast (MA, RI, NH, CT, NY, NJ) 680 391.5 640 322.3
Mid-Atlantic (PA, DE, MD, VA) 1,436 669.8 1,221 565.2
Midwest (OH,IL, MI) 313 159.7 398 172.3
Southeast (FL, NC, TN) 551 252.0 421 190.6
Southwest (AZ, NV, TX, CO) 490 243.7 403 210.3
West Coast (CA) 438 374.9 313 224.5 ------------------------- ------------------------Total 3,908 2,091.6 3,396 1,685.2 ========================= ========================</TABLE>
-14-
<PAGE>
<TABLE><CAPTION>
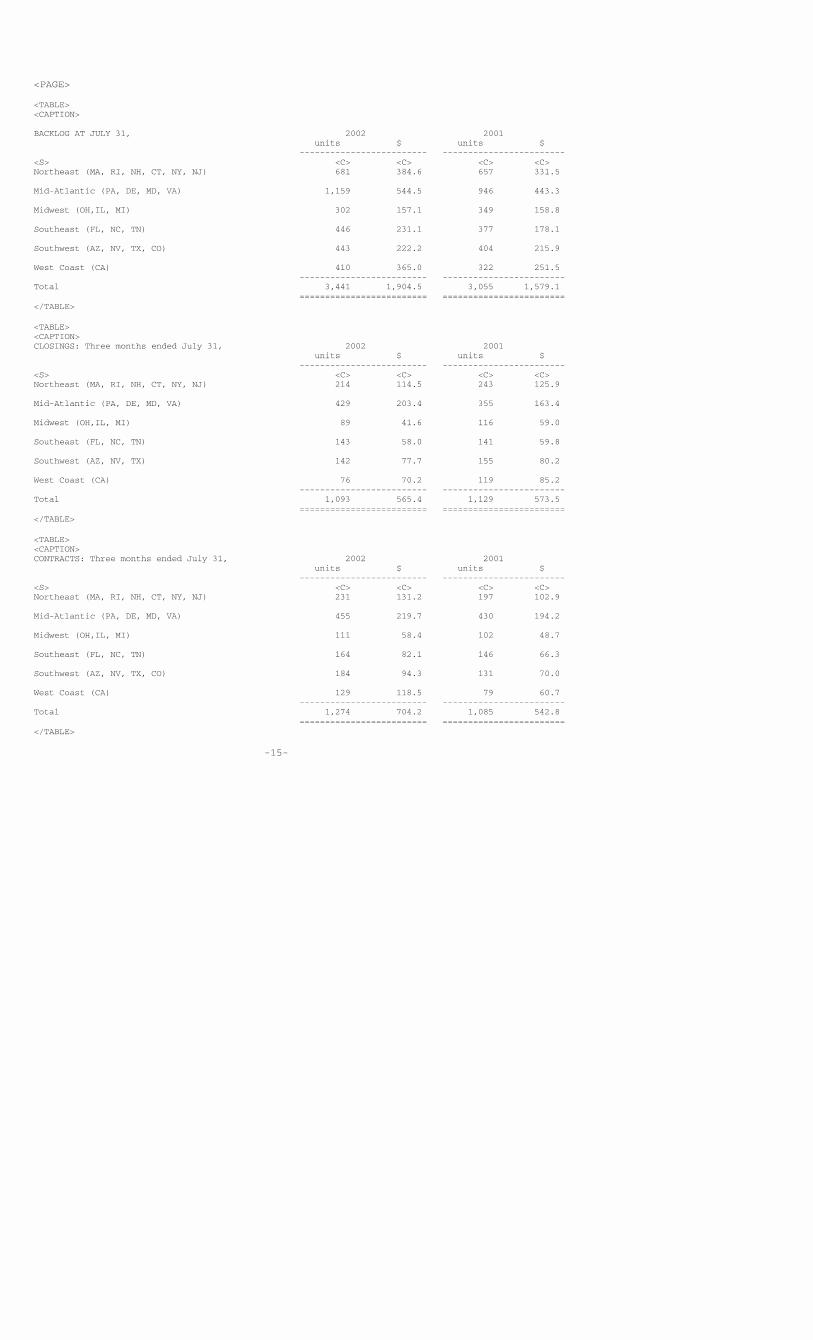
BACKLOG AT JULY 31, 2002 2001 units $ units $ ------------------------- ------------------------<S> <C> <C> <C> <C>Northeast (MA, RI, NH, CT, NY, NJ) 681 384.6 657 331.5
Mid-Atlantic (PA, DE, MD, VA) 1,159 544.5 946 443.3
Midwest (OH,IL, MI) 302 157.1 349 158.8
Southeast (FL, NC, TN) 446 231.1 377 178.1
Southwest (AZ, NV, TX, CO) 443 222.2 404 215.9
West Coast (CA) 410 365.0 322 251.5 ------------------------- ------------------------Total 3,441 1,904.5 3,055 1,579.1 ========================= ========================</TABLE>
<TABLE><CAPTION>CLOSINGS: Three months ended July 31, 2002 2001 units $ units $ ------------------------- ------------------------<S> <C> <C> <C> <C>Northeast (MA, RI, NH, CT, NY, NJ) 214 114.5 243 125.9
Mid-Atlantic (PA, DE, MD, VA) 429 203.4 355 163.4
Midwest (OH,IL, MI) 89 41.6 116 59.0
Southeast (FL, NC, TN) 143 58.0 141 59.8
Southwest (AZ, NV, TX) 142 77.7 155 80.2
West Coast (CA) 76 70.2 119 85.2 ------------------------- ------------------------Total 1,093 565.4 1,129 573.5 ========================= ========================</TABLE>
<TABLE><CAPTION>CONTRACTS: Three months ended July 31, 2002 2001 units $ units $ ------------------------- ------------------------<S> <C> <C> <C> <C>Northeast (MA, RI, NH, CT, NY, NJ) 231 131.2 197 102.9
Mid-Atlantic (PA, DE, MD, VA) 455 219.7 430 194.2
Midwest (OH,IL, MI) 111 58.4 102 48.7
Southeast (FL, NC, TN) 164 82.1 146 66.3
Southwest (AZ, NV, TX, CO) 184 94.3 131 70.0
West Coast (CA) 129 118.5 79 60.7 ------------------------- ------------------------Total 1,274 704.2 1,085 542.8 ========================= ========================</TABLE>
-15-
<PAGE>
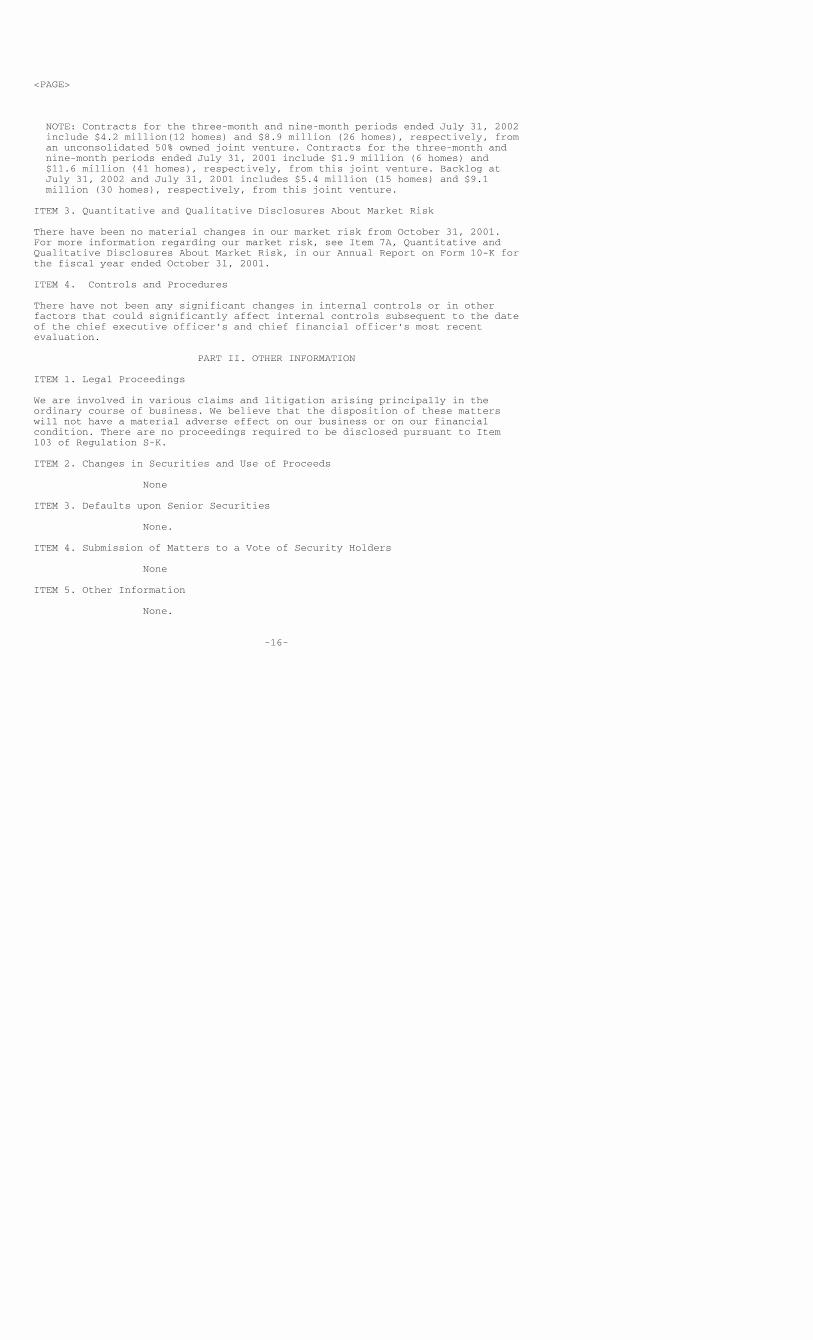
NOTE: Contracts for the three-month and nine-month periods ended July 31, 2002 include $4.2 million(12 homes) and $8.9 million (26 homes), respectively, from an unconsolidated 50% owned joint venture. Contracts for the three-month and nine-month periods ended July 31, 2001 include $1.9 million (6 homes) and $11.6 million (41 homes), respectively, from this joint venture. Backlog at July 31, 2002 and July 31, 2001 includes $5.4 million (15 homes) and $9.1 million (30 homes), respectively, from this joint venture.
ITEM 3. Quantitative and Qualitative Disclosures About Market Risk
There have been no material changes in our market risk from October 31, 2001.For more information regarding our market risk, see Item 7A, Quantitative andQualitative Disclosures About Market Risk, in our Annual Report on Form 10-K forthe fiscal year ended October 31, 2001.
ITEM 4. Controls and Procedures
There have not been any significant changes in internal controls or in otherfactors that could significantly affect internal controls subsequent to the dateof the chief executive officer's and chief financial officer's most recentevaluation.
PART II. OTHER INFORMATION
ITEM 1. Legal Proceedings
We are involved in various claims and litigation arising principally in theordinary course of business. We believe that the disposition of these matterswill not have a material adverse effect on our business or on our financialcondition. There are no proceedings required to be disclosed pursuant to Item103 of Regulation S-K.
ITEM 2. Changes in Securities and Use of Proceeds
None
ITEM 3. Defaults upon Senior Securities
None.
ITEM 4. Submission of Matters to a Vote of Security Holders
None
ITEM 5. Other Information
None.
-16-
<PAGE>
ITEM 6. Exhibits and Reports on Form 8-K
(a) Exhibits
Exhibit 99.1* Certification of Robert I. Toll pursuant to Section 906 of the Sarbanes-Oxley Act of 2002.
Exhibit 99.2* Certification of Joel H. Rassman pursuant to Section 906 of the Sarbanes-Oxley Act of 2002.
*Filed electronically herewith.
(b) Reports on Form 8-K
During the quarter ended July 31, 2002, we filed a Current Report on Form 8-K on July 2, 2002 for the purpose of filing Exhibit 11, "Statement re: computation of per share earnings" reflecting the restated earnings per share for our two-for-one stock split, and filing Exhibit 99.1 reflecting the transitional disclosure required by Statement of Financial Accounting Standards No.142.
SIGNATURES
Pursuant to the requirements of the Securities Exchange Act of 1934, theregistrant has duly caused this report to be signed on its behalf by theundersigned thereunto duly authorized.
TOLL BROTHERS, INC. (Registrant)
Date: September 12, 2002 By: /s/ Joel H. Rassman -------------------- Joel H. Rassman Executive Vice President, Treasurer and Chief Financial Officer
Date: September 12, 2002 By: /s/ Joseph R. Sicree --------------------- Joseph R. Sicree Vice President - Chief Accounting Officer (Principal Accounting Officer)
-17-
<PAGE>
CERTIFICATION
I, Robert I. Toll, Chief Executive Officer of Toll Brothers, Inc., certify that:
1. I have reviewed this quarterly report on Form 10-Q/A of Toll Brothers, Inc.;
2. Based on my knowledge, this quarterly report does not contain any untrue statement of a material fact or omit to state a material fact necessary to make the statements made, in light of the circumstances under which such statements were made, not misleading with respect to the period covered by this quarterly report;
3. Based on my knowledge, the financial statements, and other financial information included in this quarterly report, fairly present in all material respects the financial condition, results of operations and cash flows of the registrant as of, and for, the periods presented in this quarterly report;
Date: September 12, 2002 By: /s/ Robert I. Toll ------------------ Robert I. Toll Chief Executive Officer
CERTIFICATION
I, Joel H. Rassman, Chief Financial Officer of Toll Brothers, Inc., certifythat:
1. I have reviewed this quarterly report on Form 10-Q/A of Toll Brothers, Inc.;
2. Based on my knowledge, this quarterly report does not contain any untrue statement of a material fact or omit to state a material fact necessary to make the statements made, in light of the circumstances under which such statements were made, not misleading with respect to the period covered by this quarterly report;
3. Based on my knowledge, the financial statements, and other financial information included in this quarterly report, fairly present in all material respects the financial condition, results of operations and cash flows of the registrant as of, and for, the periods presented in this quarterly report;
Date: September 12, 2002 By: /s/ Joel H. Rassman ------------------- Joel H. Rassman Chief Financial Officer
-18-

Filename: ex99-1.txt
Type: EX-99
Comment/Description: ex99-1.txt(this header is not part of the document)

<PAGE>
Exhibit 99.1
CERTIFICATION PURSUANT TO 18 U.S.C. SECTION 1350, AS ADOPTED PURSUANT TO SECTION 906 OF THE SARBANES-OXLEY ACT OF 2002
In connection with the Quarterly Report of Toll Brothers, Inc. (the"Company") on Form 10-Q/A for the period ending July 31, 2002 as filed with theSecurities and Exchange Commission on the date hereof (the "Report"), I, RobertI. Toll, Chief Executive Officer of the Company, certify, pursuant to 18 U.S.C.Section 1350, as adopted pursuant to Section 906 of the Sarbanes-Oxley Act of2002, that:
(1) The Report fully complies with the requirements of Section 13(a) or15(d) of the Securities Exchange Act of 1934; and
(2) The information contained in the Report fairly presents, in allmaterial respects, the financial condition and results of operations of theCompany.
/s/ Robert I. Toll---------------------Robert I. TollChief Executive OfficerSeptember 12, 2002

Filename: ex99-2.txt
Type: EX-99
Comment/Description: ex99-2.txt(this header is not part of the document)

<PAGE>
Exhibit 99.2
CERTIFICATION PURSUANT TO 18 U.S.C. SECTION 1350, AS ADOPTED PURSUANT TO SECTION 906 OF THE SARBANES-OXLEY ACT OF 2002
In connection with the Quarterly Report of Toll Brothers, Inc. (the"Company") on Form 10-Q/A for the period ending July 31, 2002 as filed with theSecurities and Exchange Commission on the date hereof (the "Report"), I, Joel H.Rassman, Chief Financial Officer of the Company, certify, pursuant to 18 U.S.C.Section 1350, as adopted pursuant to Section 906 of the Sarbanes-Oxley Act of2002, that:
(1) The Report fully complies with the requirements of Section 13(a) or15(d) of the Securities Exchange Act of 1934; and
(2) The information contained in the Report fairly presents, in allmaterial respects, the financial condition and results of operations of theCompany.
/s/ Joel H. Rassman---------------------Joel H. RassmanChief Financial OfficerSeptember 12, 2002
Related Documents


