Packing density effects on the fluctuations of the emission lines in laser-induced breakdown spectroscopy ☆ P. Sivakumar, L. Taleh, Y. Markushin, N. Melikechi ⁎ Optical Science Center for Applied Research and Applications, Department of Physics and Engineering, Delaware State University, Dover, DE 19901, USA abstract article info Article history: Received 6 June 2013 Accepted 25 October 2013 Available online xxxx Keywords: Laser-induced breakdown spectroscopy Packing density Random close packing Relative standard deviation In an earlier publication, we reported the results of a nanosecond-laser-induced breakdown spectroscopy (LIBS) analysis of pellets of Iron and Carbon and have shown that the shot-to-shot variations of the inten- sities of iron emission lines measured in iron to be much stronger than those measured in carbon. Here, we present a numerical model based on two-dimensional random close packing of disks in a confined geom- etry that shows that the fluctuation effects observed in C and Fe are essentially due to the packing density of the samples interrogated. © 2013 Elsevier B.V. All rights reserved. 1. Introduction Over the past few years, laser induced breakdown spectroscopy (LIBS) has experienced a rich and a relatively strong growth in many and diverse areas of research and to some extent in industrial applica- tions. This growth is in part due to the fact that LIBS is an all-optical, rel- atively rapid spectrochemical analytical technique that can be used essentially without any sample preparation. Another important feature of LIBS is that the samples of interest can not only be of any type but also may be interrogated even in challenging environments [1,2]. As a result, LIBS has been used in fields as diverse as protein characterization [3] and remote sensing of the planet Mars [4] to name a few. In addition, LIBS has been the subject of intense theoretical studies focused on better understanding the various fundamental and complex processes that take place before, during and immediately following laser ablation [5–7]. Often the accuracy of the analysis is limited by shot-to-shot spec- tral fluctuations of the intensities of the various emission lines. These fluctuations, which vary tremendously depending on the type of target and laser used limit the domain of applications of LIBS. This drawback has been addressed by few researchers who have investigated the source of the intensity fluctuations in LIBS spectra [8,9] and proposed methods to correct for them [8,10–12]. Thus, the sources of fluctuations are sometimes attributed to the characteristics of the laser pulses used to induce breakdown in targets that are not necessarily spatially uniform on the scale of the laser beam. Furthermore, the environment in which the laser–target interaction takes place is not always reproducible from one pulse to the next. Typically, these effects as well as instrument used for the detection of LIBS signals contribute to the generation of non-uniform and thus fluctuating LIBS plasmas. Some researchers have focused their work on overcoming the extensive spectral fluctuations observed on a laser shot-to-shot basis through the use of classical ensemble averaging of spectra or statistical analysis of single-shot spectral data [13,14]. Others have investigated the effects of sample properties such as micro-hardness or particle size on the fluc- tuations of LIBS spectra [15,16]. In a recent publication, using a binary carbon–iron mixture as a test sample, we reported stronger shot-to- shot variations of the intensities of iron emission lines than those from carbon [17]. In addition, we suggested that the morphology, and more specifically the packing density of the binary carbon–iron mixture greatly affect the relative standard deviation (RSD) of the laser- induced plasma emission lines. In this letter, we provide the theoret- ical framework for this suggestion by simulating the laser–target in- teraction using a two dimensional (2D) random close packing (rcp) model of disks distributed in a confined geometry. Packing density of powder mixtures is an empirical parameter that describes the density of solid particles obtained when they are packed closely. In powder processing operations and especially in powder com- paction by dry pressing [18], this effect has been the subject of theoret- ical and experimental investigations which led to the calculation of the packing density from known characteristics of particulate mixture [19–22]. Often the proposed approaches resort to simplified or semi- empirical models of the experimental packing situations [23]. Yet, the theoretical approaches used often fail to identify the mechanisms in- volved in the distortion of the packing of individual components when they interact in the mixture, and fail to account for the effect of mixture inhomogeneity. However, these models can provide insights into the surface and volume structures of binary compacted powder mixtures. Spectrochimica Acta Part B xxx (2013) xxx–xxx ☆ This paper is dedicated to the memory of our colleague Mr. Tahar Kerdja, Allah Yerahmou, who passed away recently. ⁎ Corresponding author. E-mail address: [email protected] (N. Melikechi). SAB-04634; No of Pages 6 0584-8547/$ – see front matter © 2013 Elsevier B.V. All rights reserved. http://dx.doi.org/10.1016/j.sab.2013.10.007 Contents lists available at ScienceDirect Spectrochimica Acta Part B journal homepage: www.elsevier.com/locate/sab Please cite this article as: P. Sivakumar, et al., Packing density effects on the fluctuations of the emission lines in laser-induced breakdown spectroscopy, Spectrochim. Acta Part B (2013), http://dx.doi.org/10.1016/j.sab.2013.10.007

Welcome message from author
This document is posted to help you gain knowledge. Please leave a comment to let me know what you think about it! Share it to your friends and learn new things together.
Transcript
Spectrochimica Acta Part B xxx (2013) xxx–xxx
SAB-04634; No of Pages 6
Contents lists available at ScienceDirect
Spectrochimica Acta Part B
j ourna l homepage: www.e lsev ie r .com/ locate /sab
Packing density effects on the fluctuations of the emission lines inlaser-induced breakdown spectroscopy☆
P. Sivakumar, L. Taleh, Y. Markushin, N. Melikechi ⁎Optical Science Center for Applied Research and Applications, Department of Physics and Engineering, Delaware State University, Dover, DE 19901, USA
☆ This paper is dedicated to the memory of our colYerahmou, who passed away recently.⁎ Corresponding author.
E-mail address: [email protected] (N. Melikechi).
0584-8547/$ – see front matter © 2013 Elsevier B.V. All rihttp://dx.doi.org/10.1016/j.sab.2013.10.007
Please cite this article as: P. Sivakumar, etspectroscopy, Spectrochim. Acta Part B (201
a b s t r a c t
a r t i c l e i n f oArticle history:Received 6 June 2013Accepted 25 October 2013Available online xxxx
Keywords:Laser-induced breakdown spectroscopyPacking densityRandom close packingRelative standard deviation
In an earlier publication, we reported the results of a nanosecond-laser-induced breakdown spectroscopy(LIBS) analysis of pellets of Iron and Carbon and have shown that the shot-to-shot variations of the inten-sities of iron emission lines measured in iron to be much stronger than those measured in carbon. Here, wepresent a numerical model based on two-dimensional random close packing of disks in a confined geom-etry that shows that the fluctuation effects observed in C and Fe are essentially due to the packing densityof the samples interrogated.
© 2013 Elsevier B.V. All rights reserved.
1. Introduction
Over the past few years, laser induced breakdown spectroscopy(LIBS) has experienced a rich and a relatively strong growth in manyand diverse areas of research and to some extent in industrial applica-tions. This growth is in part due to the fact that LIBS is an all-optical, rel-atively rapid spectrochemical analytical technique that can be usedessentially without any sample preparation. Another important featureof LIBS is that the samples of interest can not only be of any type but alsomay be interrogated even in challenging environments [1,2]. As a result,LIBS has been used in fields as diverse as protein characterization [3]and remote sensing of the planet Mars [4] to name a few. In addition,LIBS has been the subject of intense theoretical studies focused on betterunderstanding the various fundamental and complex processes thattake place before, during and immediately following laser ablation[5–7]. Often the accuracy of the analysis is limited by shot-to-shot spec-tral fluctuations of the intensities of the various emission lines. Thesefluctuations, which vary tremendously depending on the type of targetand laser used limit the domain of applications of LIBS. This drawbackhas been addressed by few researchers who have investigated thesource of the intensity fluctuations in LIBS spectra [8,9] and proposedmethods to correct for them [8,10–12]. Thus, the sources of fluctuationsare sometimes attributed to the characteristics of the laser pulses usedto induce breakdown in targets that are not necessarily spatiallyuniform on the scale of the laser beam. Furthermore, the environmentin which the laser–target interaction takes place is not always
league Mr. Tahar Kerdja, Allah
ghts reserved.
al., Packing density effects on3), http://dx.doi.org/10.1016/
reproducible from one pulse to the next. Typically, these effects aswell as instrument used for the detection of LIBS signals contribute tothe generation of non-uniform and thus fluctuating LIBS plasmas.Some researchers have focused their work on overcoming the extensivespectral fluctuations observed on a laser shot-to-shot basis through theuse of classical ensemble averaging of spectra or statistical analysis ofsingle-shot spectral data [13,14]. Others have investigated the effectsof sample properties such asmicro-hardness or particle size on the fluc-tuations of LIBS spectra [15,16]. In a recent publication, using a binarycarbon–iron mixture as a test sample, we reported stronger shot-to-shot variations of the intensities of iron emission lines than those fromcarbon [17]. In addition, we suggested that the morphology, and morespecifically the packing density of the binary carbon–iron mixturegreatly affect the relative standard deviation (RSD) of the laser-induced plasma emission lines. In this letter, we provide the theoret-ical framework for this suggestion by simulating the laser–target in-teraction using a two dimensional (2D) random close packing (rcp)model of disks distributed in a confined geometry.
Packing density of powder mixtures is an empirical parameter thatdescribes the density of solid particles obtained when they are packedclosely. In powder processing operations and especially in powder com-paction by dry pressing [18], this effect has been the subject of theoret-ical and experimental investigations which led to the calculation of thepacking density from known characteristics of particulate mixture[19–22]. Often the proposed approaches resort to simplified or semi-empirical models of the experimental packing situations [23]. Yet, thetheoretical approaches used often fail to identify the mechanisms in-volved in the distortion of the packing of individual components whenthey interact in themixture, and fail to account for the effect of mixtureinhomogeneity. However, these models can provide insights into thesurface and volume structures of binary compacted powder mixtures.
the fluctuations of the emission lines in laser-induced breakdownj.sab.2013.10.007
2 P. Sivakumar et al. / Spectrochimica Acta Part B xxx (2013) xxx–xxx
2. Experimental
In Ref. [17], we described the experimental setup as well as themethod of preparation of the C1 − xFex composites using powderedgraphite (Spectrum, USA) and iron (99% Powder, 325 Mesh, AcrosOrganics) as sources. These were hand ground in an Agate mortar forapproximately 6 min then fitted in a 15 mm bore non magnetic stain-less steel (300 series) and pressed at (4500 ± 500) psi (BenchtopShop Press, Big Red). A laser-induced micro plasma was generated byfocusing laser pulse on the surface of the target material via a 60 mmfocal length fused silica Bi-Convex lens, from a 10 ns Q-switched Nd:YAG laser (B.M. Industries Thomson-CSF Series 5000) operating at the1064 nm. The focused laser spot diameter at the sample surface wasmeasured using a knife-edge approach and estimated using a knife-edge technique to be (450 ± 45) μm, which yields an irradiance of(5 ± 1) GW/cm2. An energy meter (FieldMaxII-TOP, Coherent Inc.)was employed tomeasure shot-to-shot laser energy pulses and fluctua-tions were estimated to be less than 3%. A fiber collimation lens placedat 45° with respect to the laser beam and focused onto an optical fiberwas used to collect the optical emissions from the plasma. The fiberwas coupled to an Echelle spectrograph (Andor Technology, ME 5000)with an iStar Intensified Charge Coupled Device (ICCD) camera (AndorTechnology, DH734-18F O3). The LIBS spectra were collected 300 nsafter the Q-switch pulse, with an integration time of 700 μs. Theseparameters were chosen by finding a balance between optimum re-duction of the continuum background and the signal to noise ratio ofdominant emission lines. To reduce effects from the surroundingatmosphere, the measurements were performed in a chamber filledand kept at a constant pressure of (760 ± 5) Torr of Helium. Theintensity of each emission line generated by a laser shot was deter-mined as such: First, the continuum background was estimated forevery laser shot by fitting to a second or higher order polynomialin the wavelength range of interest. Then the fitted backgroundcurve was subtracted from the original spectra. Second, the intensityof the emission line was determined by curve fitting of the spectrallines with Gaussian functions.
3. Description of the model
Tomodel the influence of the surfacemorphology on LIBS emissions,the local packing density of a random close packed system in a confinedgeometrywas computed numerically. Random close packing is general-ly referred to as a collection of particles randomly packed into the dens-est possible configurationwhich corresponds to the lowest free space inthe system. To determine if there is a relationship between the fluctua-tions of the LIBS emission lines and the atomic number density and forthe sake of simplicity, we consider a 2-D model where the focusedlaser beam is assumed to interact with the sample only at its surface.In other words, the penetration depth of the laser beam at the samplesurface is assumed to be less than the particle sizes. The fundamentalprocedure and geometrical algorithms of random close packing areestablished following the work of Desmond and Weeks [20].
For a binary mixture of hard-disks with size ratio σ = dl/ds,where dl is the diameter of large disks and ds diameter ofsmall disks in a box with fixed boundary conditions in all direc-tions, the packing assembly can be constructed using the ap-proach proposed by Desmond and Weeks [20]. This is done byusing a minimum energy criteria combined with frictionless parti-cles that interact via a short-range repulsive potential model as a lin-ear spring potential [24,25]. The potential energy between the disksis given by:
V rij� �
¼ ε2
1−rijdij
!2
Θ 1−rijdij
!ð1Þ
Please cite this article as: P. Sivakumar, et al., Packing density effects onspectroscopy, Spectrochim. Acta Part B (2013), http://dx.doi.org/10.1016/
Where rij is the center-to-center distance between disks i and j, ε isthe characteristic energy scale of the interaction (ε = 1 for simulation),Θ(x) is the Heaviside step function, dij = (di + dj)/2 = di(1 + σij)/2,where di is the diameter of particle, and σij is the particle size ratio.
To randomly pack a collection of particles into the densest possibleconfiguration, infinitesimal particles (disks) are placed first randomlyin a box of known dimensions and boundary conditions. At the initialstate, the particles do not overlap i.e. the total potential energy is zero.Then, the sizes of disks are gradually expanded while keeping the sizeratio fixed. Succeeding each expansion, the overlap between disks ischecked and if any particles overlapped, the conjugate gradient methodwasused to decrease the total potential energy by adjusting the positionof particles. Finally, after successive expansion and contraction of parti-cles followed by conjugate gradient, the random close packing (rcp)state was achieved in which all the particles collectively jammed andno longer expand. Similarly, rcp state was attained for uniform size par-ticles in confined geometry. In addition, the average packing density aswell as the particles' coordinates and sizes were computed from theabove-mentioned simulations. First, the computational studies of rcpsystemare classifiedwith the particular case ofσ = 1.4 and binarymix-ture of 5000 particles with an equal number of large and small particles,and we found an average packing density of φrcp ~ (0.843 ± 0.005).The latter result appears to be in good agreement with previous studies[20,25,26].
The local packing density for the single-type rcp system is de-fined as, the packing density of the area enclosed by the laserfocus spot size at different locations of the sample's surface, andgiven by,
φl ¼X
iAi
π D2
� �2 ð2Þ
Where, Ai is the covering area between the ith single type particleand laser spot, and D is the laser spot diameter.
To establish a relationship between the simulated values of packingdensity and the atomic number density of an element in the pellet, weassume that the atoms are hard spheres with a fixed radius and are uni-formly distributed. Furthermore, we consider that a single type of parti-cle is composed by one type of atoms with similar atomic bonds insidethe pellet. With these assumptions, the number of atoms in a particle isproportional to the size of the particle [27]. Therefore, the total numberof atoms in a spot area is proportional to the covering area between asingle type of particles and the laser focus spot size. The local surfaceatomic number density for a single type of particles can then beexpressed as,
Nl ¼ σ c1φl ð3Þ
Where, ϕl denotes the local packing density of a single type ofparticles, and σc1 is a constant representative of the surface atomicnumber density for a single type of particles. The surface atomicnumber densities of carbon and iron particles were determinedfrom the geometry of the pure carbon and pure iron pellets sampleswith the assumptions of uniform particle distribution in the pellets.Numerical values of the RSD of the local surface atomic number den-sity were obtained using the following procedure. First, two rcpstates were generated for each concentration of large and small par-ticles. For each rcp state, the local surface atomic number densitiesfor 50 laser spot locations on the rcp system and the correspondingRSD were obtained using Monte-Carlo simulations. This procedurewas repeated 3 times for each rcp state. Finally, the uncertainty inRSD for various concentrations of binary particles is determined.The similar procedure is also used for uniform disks in rcp state.
the fluctuations of the emission lines in laser-induced breakdownj.sab.2013.10.007
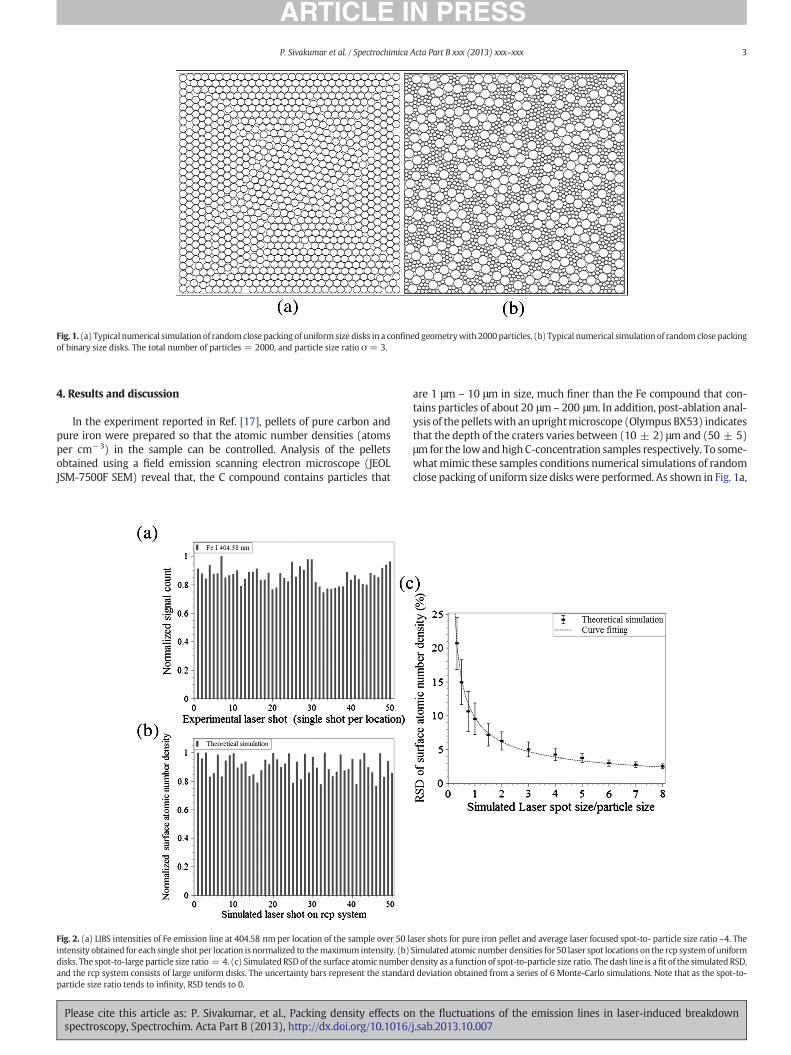
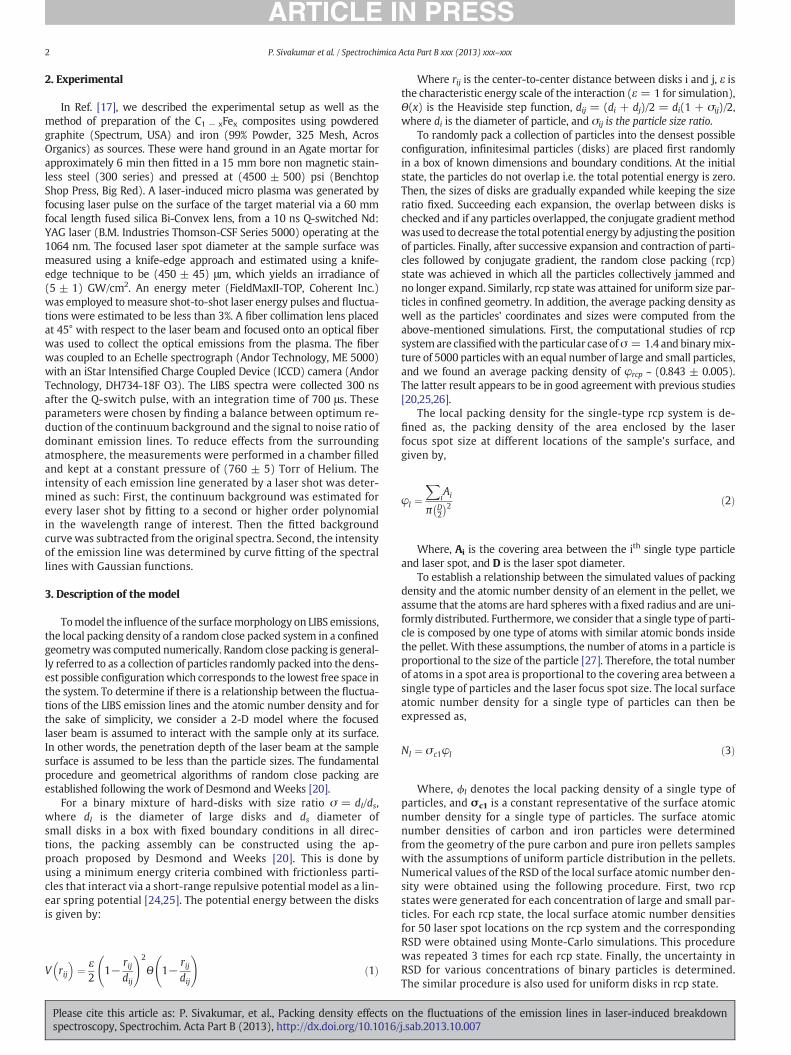
Fig. 1. (a) Typical numerical simulation of randomclose packing of uniform size disks in a confined geometrywith 2000particles. (b) Typical numerical simulation of randomclose packingof binary size disks. The total number of particles = 2000, and particle size ratio σ = 3.
3P. Sivakumar et al. / Spectrochimica Acta Part B xxx (2013) xxx–xxx
4. Results and discussion
In the experiment reported in Ref. [17], pellets of pure carbon andpure iron were prepared so that the atomic number densities (atomsper cm−3) in the sample can be controlled. Analysis of the pelletsobtained using a field emission scanning electron microscope (JEOLJSM-7500F SEM) reveal that, the C compound contains particles that
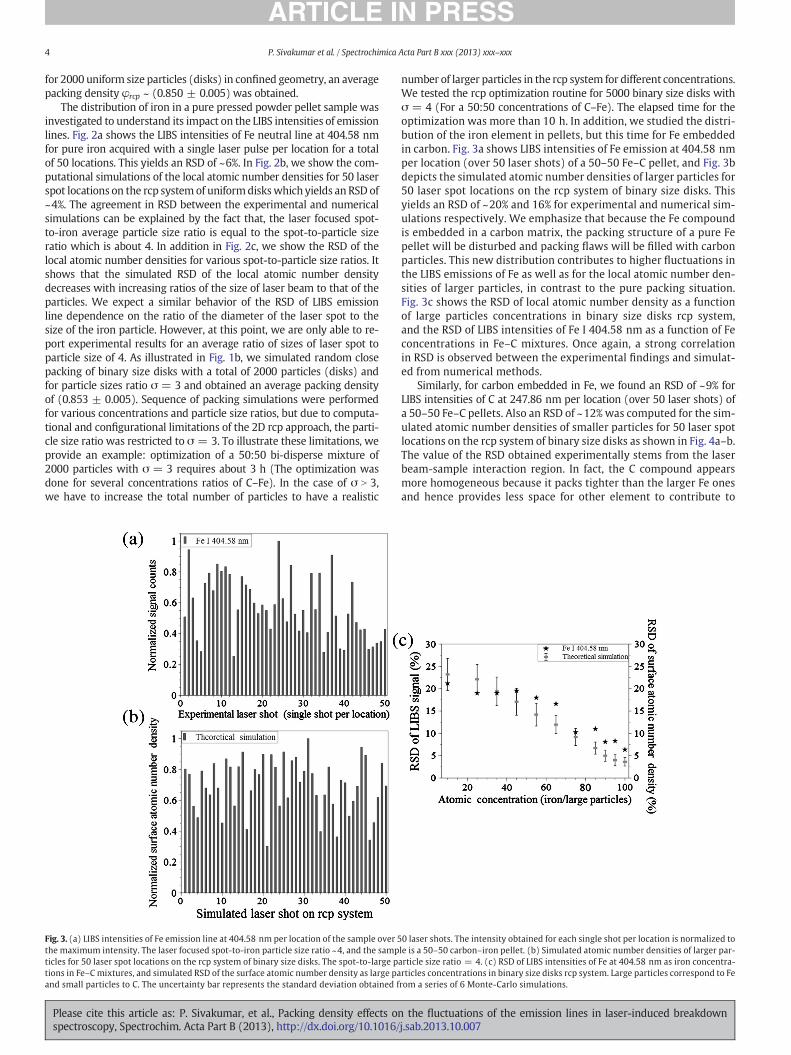
Fig. 2. (a) LIBS intensities of Fe emission line at 404.58 nm per location of the sample over 50 lintensity obtained for each single shot per location is normalized to themaximum intensity. (b)disks. The spot-to-large particle size ratio = 4. (c) Simulated RSDof the surface atomic numberand the rcp system consists of large uniform disks. The uncertainty bars represent the standardparticle size ratio tends to infinity, RSD tends to 0.
Please cite this article as: P. Sivakumar, et al., Packing density effects onspectroscopy, Spectrochim. Acta Part B (2013), http://dx.doi.org/10.1016/
are 1 μm – 10 μm in size, much finer than the Fe compound that con-tains particles of about 20 μm – 200 μm. In addition, post-ablation anal-ysis of thepelletswith anuprightmicroscope (Olympus BX53) indicatesthat the depth of the craters varies between (10 ± 2) μm and (50 ± 5)μmfor the low and high C-concentration samples respectively. To some-whatmimic these samples conditions numerical simulations of randomclose packing of uniform size diskswere performed. As shown in Fig. 1a,
aser shots for pure iron pellet and average laser focused spot-to- particle size ratio ~4. TheSimulated atomic number densities for 50 laser spot locations on the rcp systemof uniformdensity as a function of spot-to-particle size ratio. The dash line is afit of the simulated RSD,deviation obtained from a series of 6 Monte-Carlo simulations. Note that as the spot-to-
the fluctuations of the emission lines in laser-induced breakdownj.sab.2013.10.007
4 P. Sivakumar et al. / Spectrochimica Acta Part B xxx (2013) xxx–xxx
for 2000 uniform size particles (disks) in confined geometry, an averagepacking density φrcp ~ (0.850 ± 0.005) was obtained.
The distribution of iron in a pure pressed powder pellet sample wasinvestigated to understand its impact on the LIBS intensities of emissionlines. Fig. 2a shows the LIBS intensities of Fe neutral line at 404.58 nmfor pure iron acquired with a single laser pulse per location for a totalof 50 locations. This yields an RSD of ~6%. In Fig. 2b, we show the com-putational simulations of the local atomic number densities for 50 laserspot locations on the rcp system of uniformdiskswhich yields an RSD of~4%. The agreement in RSD between the experimental and numericalsimulations can be explained by the fact that, the laser focused spot-to-iron average particle size ratio is equal to the spot-to-particle sizeratio which is about 4. In addition in Fig. 2c, we show the RSD of thelocal atomic number densities for various spot-to-particle size ratios. Itshows that the simulated RSD of the local atomic number densitydecreases with increasing ratios of the size of laser beam to that of theparticles. We expect a similar behavior of the RSD of LIBS emissionline dependence on the ratio of the diameter of the laser spot to thesize of the iron particle. However, at this point, we are only able to re-port experimental results for an average ratio of sizes of laser spot toparticle size of 4. As illustrated in Fig. 1b, we simulated random closepacking of binary size disks with a total of 2000 particles (disks) andfor particle sizes ratio σ = 3 and obtained an average packing densityof (0.853 ± 0.005). Sequence of packing simulations were performedfor various concentrations and particle size ratios, but due to computa-tional and configurational limitations of the 2D rcp approach, the parti-cle size ratio was restricted to σ = 3. To illustrate these limitations, weprovide an example: optimization of a 50:50 bi-disperse mixture of2000 particles with σ = 3 requires about 3 h (The optimization wasdone for several concentrations ratios of C–Fe). In the case of σ N 3,we have to increase the total number of particles to have a realistic
Fig. 3. (a) LIBS intensities of Fe emission line at 404.58 nm per location of the sample over 5the maximum intensity. The laser focused spot-to-iron particle size ratio ~4, and the sampticles for 50 laser spot locations on the rcp system of binary size disks. The spot-to-large ptions in Fe–Cmixtures, and simulated RSD of the surface atomic number density as large paand small particles to C. The uncertainty bar represents the standard deviation obtained f
Please cite this article as: P. Sivakumar, et al., Packing density effects onspectroscopy, Spectrochim. Acta Part B (2013), http://dx.doi.org/10.1016/
number of larger particles in the rcp system for different concentrations.We tested the rcp optimization routine for 5000 binary size disks withσ = 4 (For a 50:50 concentrations of C–Fe). The elapsed time for theoptimization was more than 10 h. In addition, we studied the distri-bution of the iron element in pellets, but this time for Fe embeddedin carbon. Fig. 3a shows LIBS intensities of Fe emission at 404.58 nmper location (over 50 laser shots) of a 50–50 Fe–C pellet, and Fig. 3bdepicts the simulated atomic number densities of larger particles for50 laser spot locations on the rcp system of binary size disks. Thisyields an RSD of ~20% and 16% for experimental and numerical sim-ulations respectively. We emphasize that because the Fe compoundis embedded in a carbon matrix, the packing structure of a pure Fepellet will be disturbed and packing flaws will be filled with carbonparticles. This new distribution contributes to higher fluctuations inthe LIBS emissions of Fe as well as for the local atomic number den-sities of larger particles, in contrast to the pure packing situation.Fig. 3c shows the RSD of local atomic number density as a functionof large particles concentrations in binary size disks rcp system,and the RSD of LIBS intensities of Fe I 404.58 nm as a function of Feconcentrations in Fe–C mixtures. Once again, a strong correlationin RSD is observed between the experimental findings and simulat-ed from numerical methods.
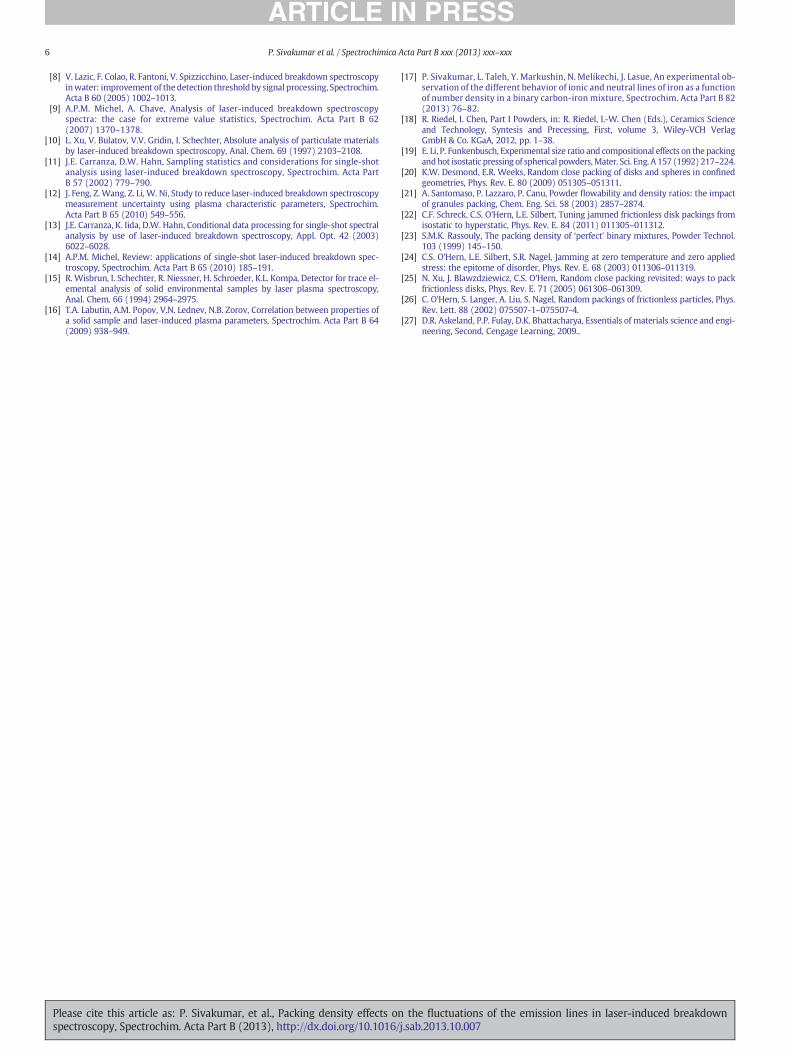
Similarly, for carbon embedded in Fe, we found an RSD of ~9% forLIBS intensities of C at 247.86 nm per location (over 50 laser shots) ofa 50–50 Fe–C pellets. Also an RSD of ~12% was computed for the sim-ulated atomic number densities of smaller particles for 50 laser spotlocations on the rcp system of binary size disks as shown in Fig. 4a–b.The value of the RSD obtained experimentally stems from the laserbeam-sample interaction region. In fact, the C compound appearsmore homogeneous because it packs tighter than the larger Fe onesand hence provides less space for other element to contribute to
0 laser shots. The intensity obtained for each single shot per location is normalized tole is a 50–50 carbon–iron pellet. (b) Simulated atomic number densities of larger par-article size ratio = 4. (c) RSD of LIBS intensities of Fe at 404.58 nm as iron concentra-rticles concentrations in binary size disks rcp system. Large particles correspond to Ferom a series of 6 Monte-Carlo simulations.
the fluctuations of the emission lines in laser-induced breakdownj.sab.2013.10.007
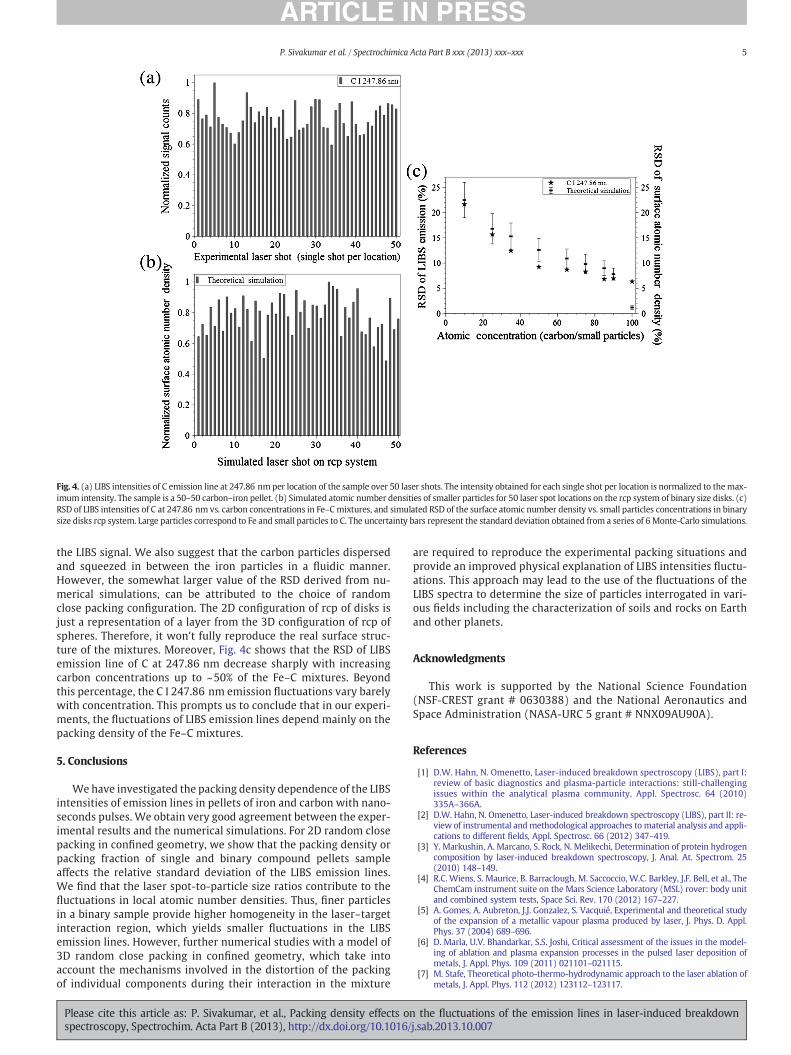
Fig. 4. (a) LIBS intensities of C emission line at 247.86 nm per location of the sample over 50 laser shots. The intensity obtained for each single shot per location is normalized to themax-imum intensity. The sample is a 50–50 carbon–iron pellet. (b) Simulated atomic number densities of smaller particles for 50 laser spot locations on the rcp system of binary size disks. (c)RSD of LIBS intensities of C at 247.86 nm vs. carbon concentrations in Fe–Cmixtures, and simulated RSD of the surface atomic number density vs. small particles concentrations in binarysize disks rcp system. Large particles correspond to Fe and small particles to C. The uncertainty bars represent the standard deviation obtained from a series of 6 Monte-Carlo simulations.
5P. Sivakumar et al. / Spectrochimica Acta Part B xxx (2013) xxx–xxx
the LIBS signal. We also suggest that the carbon particles dispersedand squeezed in between the iron particles in a fluidic manner.However, the somewhat larger value of the RSD derived from nu-merical simulations, can be attributed to the choice of randomclose packing configuration. The 2D configuration of rcp of disks isjust a representation of a layer from the 3D configuration of rcp ofspheres. Therefore, it won't fully reproduce the real surface struc-ture of the mixtures. Moreover, Fig. 4c shows that the RSD of LIBSemission line of C at 247.86 nm decrease sharply with increasingcarbon concentrations up to ~50% of the Fe–C mixtures. Beyondthis percentage, the C I 247.86 nm emission fluctuations vary barelywith concentration. This prompts us to conclude that in our experi-ments, the fluctuations of LIBS emission lines depend mainly on thepacking density of the Fe–C mixtures.
5. Conclusions
Wehave investigated the packing density dependence of the LIBSintensities of emission lines in pellets of iron and carbon with nano-seconds pulses. We obtain very good agreement between the exper-imental results and the numerical simulations. For 2D random closepacking in confined geometry, we show that the packing density orpacking fraction of single and binary compound pellets sampleaffects the relative standard deviation of the LIBS emission lines.We find that the laser spot-to-particle size ratios contribute to thefluctuations in local atomic number densities. Thus, finer particlesin a binary sample provide higher homogeneity in the laser–targetinteraction region, which yields smaller fluctuations in the LIBSemission lines. However, further numerical studies with a model of3D random close packing in confined geometry, which take intoaccount the mechanisms involved in the distortion of the packingof individual components during their interaction in the mixture
Please cite this article as: P. Sivakumar, et al., Packing density effects onspectroscopy, Spectrochim. Acta Part B (2013), http://dx.doi.org/10.1016/
are required to reproduce the experimental packing situations andprovide an improved physical explanation of LIBS intensities fluctu-ations. This approach may lead to the use of the fluctuations of theLIBS spectra to determine the size of particles interrogated in vari-ous fields including the characterization of soils and rocks on Earthand other planets.
Acknowledgments
This work is supported by the National Science Foundation(NSF-CREST grant # 0630388) and the National Aeronautics andSpace Administration (NASA-URC 5 grant # NNX09AU90A).
References
[1] D.W. Hahn, N. Omenetto, Laser-induced breakdown spectroscopy (LIBS), part I:review of basic diagnostics and plasma-particle interactions: still-challengingissues within the analytical plasma community, Appl. Spectrosc. 64 (2010)335A–366A.
[2] D.W. Hahn, N. Omenetto, Laser-induced breakdown spectroscopy (LIBS), part II: re-view of instrumental andmethodological approaches to material analysis and appli-cations to different fields, Appl. Spectrosc. 66 (2012) 347–419.
[3] Y. Markushin, A. Marcano, S. Rock, N. Melikechi, Determination of protein hydrogencomposition by laser-induced breakdown spectroscopy, J. Anal. At. Spectrom. 25(2010) 148–149.
[4] R.C. Wiens, S. Maurice, B. Barraclough, M. Saccoccio, W.C. Barkley, J.F. Bell, et al., TheChemCam instrument suite on the Mars Science Laboratory (MSL) rover: body unitand combined system tests, Space Sci. Rev. 170 (2012) 167–227.
[5] A. Gomes, A. Aubreton, J.J. Gonzalez, S. Vacquié, Experimental and theoretical studyof the expansion of a metallic vapour plasma produced by laser, J. Phys. D. Appl.Phys. 37 (2004) 689–696.
[6] D. Marla, U.V. Bhandarkar, S.S. Joshi, Critical assessment of the issues in the model-ing of ablation and plasma expansion processes in the pulsed laser deposition ofmetals, J. Appl. Phys. 109 (2011) 021101–021115.
[7] M. Stafe, Theoretical photo-thermo-hydrodynamic approach to the laser ablation ofmetals, J. Appl. Phys. 112 (2012) 123112–123117.
the fluctuations of the emission lines in laser-induced breakdownj.sab.2013.10.007
6 P. Sivakumar et al. / Spectrochimica Acta Part B xxx (2013) xxx–xxx
[8] V. Lazic, F. Colao, R. Fantoni, V. Spizzicchino, Laser-induced breakdown spectroscopyinwater: improvement of thedetection threshold by signal processing, Spectrochim.Acta B 60 (2005) 1002–1013.
[9] A.P.M. Michel, A. Chave, Analysis of laser-induced breakdown spectroscopyspectra: the case for extreme value statistics, Spectrochim. Acta Part B 62(2007) 1370–1378.
[10] L. Xu, V. Bulatov, V.V. Gridin, I. Schechter, Absolute analysis of particulate materialsby laser-induced breakdown spectroscopy, Anal. Chem. 69 (1997) 2103–2108.
[11] J.E. Carranza, D.W. Hahn, Sampling statistics and considerations for single-shotanalysis using laser-induced breakdown spectroscopy, Spectrochim. Acta PartB 57 (2002) 779–790.
[12] J. Feng, Z. Wang, Z. Li, W. Ni, Study to reduce laser-induced breakdown spectroscopymeasurement uncertainty using plasma characteristic parameters, Spectrochim.Acta Part B 65 (2010) 549–556.
[13] J.E. Carranza, K. Iida, D.W. Hahn, Conditional data processing for single-shot spectralanalysis by use of laser-induced breakdown spectroscopy, Appl. Opt. 42 (2003)6022–6028.
[14] A.P.M. Michel, Review: applications of single-shot laser-induced breakdown spec-troscopy, Spectrochim. Acta Part B 65 (2010) 185–191.
[15] R. Wisbrun, I. Schechter, R. Niessner, H. Schroeder, K.L. Kompa, Detector for trace el-emental analysis of solid environmental samples by laser plasma spectroscopy,Anal. Chem. 66 (1994) 2964–2975.
[16] T.A. Labutin, A.M. Popov, V.N. Lednev, N.B. Zorov, Correlation between properties ofa solid sample and laser-induced plasma parameters, Spectrochim. Acta Part B 64(2009) 938–949.
Please cite this article as: P. Sivakumar, et al., Packing density effects onspectroscopy, Spectrochim. Acta Part B (2013), http://dx.doi.org/10.1016/
[17] P. Sivakumar, L. Taleh, Y. Markushin, N. Melikechi, J. Lasue, An experimental ob-servation of the different behavior of ionic and neutral lines of iron as a functionof number density in a binary carbon-iron mixture, Spectrochim. Acta Part B 82(2013) 76–82.
[18] R. Riedel, I. Chen, Part I Powders, in: R. Riedel, I.-W. Chen (Eds.), Ceramics Scienceand Technology, Syntesis and Precessing, First, volume 3, Wiley-VCH VerlagGmbH & Co. KGaA, 2012, pp. 1–38.
[19] E. Li, P. Funkenbusch, Experimental size ratio and compositional effects on the packingandhot isostatic pressing of spherical powders,Mater. Sci. Eng. A 157 (1992) 217–224.
[20] K.W. Desmond, E.R. Weeks, Random close packing of disks and spheres in confinedgeometries, Phys. Rev. E. 80 (2009) 051305–051311.
[21] A. Santomaso, P. Lazzaro, P. Canu, Powder flowability and density ratios: the impactof granules packing, Chem. Eng. Sci. 58 (2003) 2857–2874.
[22] C.F. Schreck, C.S. O'Hern, L.E. Silbert, Tuning jammed frictionless disk packings fromisostatic to hyperstatic, Phys. Rev. E. 84 (2011) 011305–011312.
[23] S.M.K. Rassouly, The packing density of ‘perfect’ binary mixtures, Powder Technol.103 (1999) 145–150.
[24] C.S. O'Hern, L.E. Silbert, S.R. Nagel, Jamming at zero temperature and zero appliedstress: the epitome of disorder, Phys. Rev. E. 68 (2003) 011306–011319.
[25] N. Xu, J. Blawzdziewicz, C.S. O'Hern, Random close packing revisited: ways to packfrictionless disks, Phys. Rev. E. 71 (2005) 061306–061309.
[26] C. O'Hern, S. Langer, A. Liu, S. Nagel, Random packings of frictionless particles, Phys.Rev. Lett. 88 (2002) 075507-1–075507-4.
[27] D.R. Askeland, P.P. Fulay, D.K. Bhattacharya, Essentials of materials science and engi-neering, Second, Cengage Learning, 2009..
the fluctuations of the emission lines in laser-induced breakdownj.sab.2013.10.007
Related Documents