41 CHAPTER CONTENTS Light, the Retinal Image, and Photoreceptors Orin Packer 1 and David R.Williams 2 1 Department of Biological Structure G514 Health Sciences Building, Box 357420, University of Washington, Seattle WA 98195, USA 2 Center for Visual Science University of Rochester, Rochester, NY 14627, USA 2 2.1 Introduction 42 2.2 The light stimulus 42 2.2.1 Radiometry 43 2.2.2 Photometry 44 2.2.3 Actinometry of the retinal image 44 2.2.4 Examples of retinal photon flux 45 2.3 Sources of light loss in the eye 46 2.3.1 Light loss due to reflection 46 2.3.2 Light loss due to absorption 46 2.3.2.1 The cornea 47 2.3.2.2 The aqueous and vitreous humors 47 2.3.2.3 The lens 47 2.3.2.4 The retinal vasculature 48 2.3.2.5 The macular pigment 49 2.3.2.6 Total filtering by prereceptoral factors 50 2.3.3 Effects of prereceptoral filtering on color matching 50 2.3.4 Effects of prereceptoral filtering on color appearance 51 2.3.5 Protective effects of prereceptoral filtering 51 2.4 Sources of blur in the retinal image 52 2.4.1 The generalized pupil function and image formation 52 2.4.2 Diffraction 53 2.4.3 Monochromatic aberrations 53 2.4.3.1 Computing retinal image quality 55 2.4.4 Chromatic aberrations 58 2.4.4.1 Axial chromatic aberration 58 2.4.4.2 What wavelength does the eye focus on? 59 2.4.4.3 Why isn’t axial chromatic aberration very deleterious? 59 2.4.4.4 Transverse chromatic aberration 60 2.4.4.5 Techniques to avoid chromatic aberration 61 2.4.5 Scatter 61 2.5 Photoreceptor optics 62 2.5.1 The photoreceptor aperture 63 2.5.1.1 Anatomical and psychophysical measurements 63 2.5.1.2 Spatial filtering 63 2.5.1.3 Contrast detection 64 2.5.2 Axial photopigment density 64 2.5.3 Self-screening and color matching 65 2.5.4 Directional sensitivity 66 2.5.4.1 The Stiles–Crawford effect of the first kind 66 2.5.4.2 Fundus reflectometry 67 2.5.4.3 The photoreceptor as an optical waveguide 68 2.5.4.4 What purpose does directional sensitivity serve? 69 2.5.4.5 The Stiles–Crawford effect of the second kind 70 2.6 Photoreceptor topography and sampling 71 2.6.1 Photoreceptor topography of the mosaic as a whole 72 2.6.1.1 Cone topography 72 2.6.1.2 Rod topography 73 2.6.2 Photometric quantum efficiency 74 2.6.3 Sampling theory 75 2.6.4 Off-axis image quality and retinal sampling 77 2.6.5 S cone topography 78 2.6.6 Implications of S cone sampling 79 The Science of Color Copyright © 2003 Elsevier Ltd ISBN 0–444–512–519 All rights of reproduction in any form reserved Packer O, Williams DR. Light, the Retinal Image, and Photoreceptors. In: Shevell S, ed. The Science of Color. Boston; Elsevier, 2003, pp. 41-102.

Welcome message from author
This document is posted to help you gain knowledge. Please leave a comment to let me know what you think about it! Share it to your friends and learn new things together.
Transcript
41
CHAPTER CONTENTS
Light, the Retinal Image,and Photoreceptors
Orin Packer1 and David R.Williams2
1 Department of Biological StructureG514 Health Sciences Building, Box 357420, University of Washington,Seattle WA 98195, USA2 Center for Visual ScienceUniversity of Rochester, Rochester, NY 14627, USA
2
2.1 Introduction 42
2.2 The light stimulus 422.2.1 Radiometry 432.2.2 Photometry 442.2.3 Actinometry of the retinal image 442.2.4 Examples of retinal photon flux 452.3 Sources of light loss in the eye 462.3.1 Light loss due to reflection 462.3.2 Light loss due to absorption 46
2.3.2.1 The cornea 472.3.2.2 The aqueous and vitreous humors 472.3.2.3 The lens 472.3.2.4 The retinal vasculature 482.3.2.5 The macular pigment 492.3.2.6 Total filtering by prereceptoral
factors 502.3.3 Effects of prereceptoral filtering on color
matching 502.3.4 Effects of prereceptoral filtering on color
appearance 512.3.5 Protective effects of prereceptoral filtering 512.4 Sources of blur in the retinal image 522.4.1 The generalized pupil function and image
formation 522.4.2 Diffraction 532.4.3 Monochromatic aberrations 53
2.4.3.1 Computing retinal image quality 552.4.4 Chromatic aberrations 58
2.4.4.1 Axial chromatic aberration 582.4.4.2 What wavelength does the eye
focus on? 592.4.4.3 Why isn’t axial chromatic aberration
very deleterious? 59
2.4.4.4 Transverse chromatic aberration 602.4.4.5 Techniques to avoid chromatic
aberration 612.4.5 Scatter 61
2.5 Photoreceptor optics 622.5.1 The photoreceptor aperture 63
2.5.1.1 Anatomical and psychophysicalmeasurements 63
2.5.1.2 Spatial filtering 632.5.1.3 Contrast detection 64
2.5.2 Axial photopigment density 642.5.3 Self-screening and color matching 652.5.4 Directional sensitivity 66
2.5.4.1 The Stiles–Crawford effect of thefirst kind 66
2.5.4.2 Fundus reflectometry 672.5.4.3 The photoreceptor as an optical
waveguide 682.5.4.4 What purpose does directional
sensitivity serve? 692.5.4.5 The Stiles–Crawford effect of the
second kind 70
2.6 Photoreceptor topography andsampling 71
2.6.1 Photoreceptor topography of the mosaicas a whole 722.6.1.1 Cone topography 722.6.1.2 Rod topography 73
2.6.2 Photometric quantum efficiency 742.6.3 Sampling theory 752.6.4 Off-axis image quality and retinal sampling 772.6.5 S cone topography 782.6.6 Implications of S cone sampling 79
The Science of Color Copyright © 2003 Elsevier LtdISBN 0–444–512–519 All rights of reproduction in any form reserved
Packer O, Williams DR. Light, the Retinal Image, and Photoreceptors.In: Shevell S, ed. The Science of Color. Boston; Elsevier, 2003, pp. 41-102.

2.1 INTRODUCTION
This chapter discusses the sequence of events,beginning with the stimulus, that ultimatelyleads to the generation of signals in photorecep-tors. We will first describe the physical attributesof the light emanating from the object that areimportant for human vision. Next, we willexamine the transmittance of light through theoptics of the eye and the formation of the retinalimage. Finally, we will discuss the sampling ofthe light distribution in the retinal image by themosaic of photoreceptors.
2.2 THE LIGHT STIMULUS
All quantitative analyses of human visual per-formance, whether in the domain of color visionor otherwise, require meaningful ways todescribe the light stimulus. The number ofdescriptions from which to choose is large,sometimes bewilderingly so. The appropriatedescription to use in a given situation dependson such factors as the spatial, temporal, andspectral properties of the stimulus. It alsodepends on whether you want to provide apurely physical description of the stimulus ortake into account known properties of humanvision to estimate the visual effect of the
stimulus. Here we provide a brief conceptual dis-cussion of the specification of light stimuli. Morecomplete descriptions can be found in AppendixA and in Wyszecki and Stiles (1982).
Light stimuli can be described with any of fourclasses of measurement: actinometry, radiome-try, photometry, and colorimetry. Actinometryand radiometry characterize light in physicalterms that are completely independent of theproperties of the human visual system.Actinometry measures light in units of photons.Radiometry measures light in energy units.Photometry and colorimetry quantify light stim-uli in terms of the effect they have on vision.Colorimetry reduces the many-valued spectrumof a light stimulus, usually defined in radiomet-ric terms, to three numbers that describe itseffect on the three types of cone photoreceptors.Photometry reduces the many-valued spectrumof a light stimulus to a single number that esti-mates its visual effectiveness. Both colorimetryand photometry are based on a standardobserver whose response to light of differentwavelengths is representative of the normal pop-ulation of observers. Here we confine our dis-cussion to the standard observer’s response toluminance since colorimetry is discussed in alater chapter.
For many applications in visual science, suchas specifying the light level of a CRT display in a
■ THE SCIENCE OF COLOR
42
2.6.7 L and M cone topography 792.6.8 Implications of L and M cone sampling 82
2.6.8.1 Photopic luminosity and colorappearance 82
2.6.8.2 L and M cone resolution 832.6.8.3 Chromatic aliasing 83
2.7 Summary 85
2.8 Appendix A: Quantifying the lightstimulus 87
2.8.1 Radiometry 882.8.1.1 Radiant energy 882.8.1.2 Radiant power 882.8.1.3 Exitance and irradiance 882.8.1.4 Radiant intensity 892.8.1.5 Radiance 892.8.1.6 Spectral radiance 902.8.1.7 Wavelength, frequency, and
wavenumber 902.8.2 Photometry 90
2.8.2.1 Converting radiometric units tophotometric units 91
2.8.2.2 The troland 922.8.2.3 More obscure photometric units 932.8.2.4 Light meters 93
2.8.3 Actinometry 942.8.3.1 Converting radiometric units to
actinometric units 942.8.4 Actinometry of the retinal image 94
2.8.4.1 The reduced eye 942.8.4.2 Computing retinal photon flux
irradiance 96
2.9 Appendix B: Generalized pupil functionand image formation 96
2.9.1 Quantitative description of the generalizedpupil function 96
2.9.2 Computing retinal images for arbitrary objects 97
2.10 Acknowledgments 98
2.11 References 98

psychophysical experiment, photometric meas-urements alone are adequate. In color science,radiometry or actinometry are used when it isimportant to preserve spectral information, as inthe case of characterizing light absorption by theocular media or photopigment, or when thespectral response of an observer is expected todiffer from that of the photometric standardobserver. Most light-measuring devices displaymeasurements in radiometric rather than actin-ometric units. Actinometry is often used in thecontext of light absorption by the retina sincethe minimum amount of light required to iso-merize a photopigment molecule is a singlephoton.
2.2.1 RADIOMETRY
In addition to choosing whether to use actinom-etry, radiometry, or photometry, you mustdecide how best to describe light in space andtime. For example, as illustrated in Table 2.1, ifyou use radiometry, you must also decide amongenergy, power, intensity, exitance, irradiance, orradiance, each of which is appropriate in a dif-ferent situation. Radiant energy, expressed injoules (J) is simply the total energy emitted by astimulus. This specification is used relativelyinfrequently because it provides no informationabout how that energy is distributed in space ortime. Radiant power or flux, specified in joules
s�1 or watts, specifies how the energy is distrib-uted in time. Figure 2.1 shows that radiantintensity, specified in watts steradian�1, specifiesthe direction and the angular density withwhich power is emitted from a source. It is oftenused to describe point sources. Irradiance, spec-ified in watts m�2, specifies how much powerfalls on each location of a surface. It is oftenused to describe the spatial density of powerfalling on a surface when direction and angulardensity does not need to be taken into account.Exitance is identical to irradiance except that itrefers to power being emitted from rather thanfalling on a surface. Lastly, radiance, specified inwatts per steradian per meter squared, combinesthe properties of both radiant intensity andirradiance to specify the direction and angulardensity of the power falling on each point of asurface.
Each of these radiometric terms has a parallelterm in actinometry and photometry. The equiv-alent terms for each class of measurement corre-spond to rows of Table 2.1. The actinometric andphotometric equivalent values can be convertedfrom radiometric units using rules described inAppendix A below. Lastly, since most lights arebroadband, it will often be necessary to describetheir wavelength composition. This can be doneby adding the word spectral and the subscript kto any of the actinometric or radiometric units,such as spectral photon flux irradiance, E
pk.
LIGHT, THE RETINAL IMAGE,AND PHOTORECEPTORS ■
43
Table 2.1 Descriptions of light stimuli in three systems of measurement, actinometry, radiometry, and photometry.Thename of the measurement, its units and the symbol by which it will be referred to in this paper are listed in each cell
Actinometry Radiometry Photometry
Amount of light Photon dose Radiant energy Luminous energyphotons joules (J) lumens·sQp Qe Qv
Amount per unit time Photon flux Radiant power or flux Luminous power or fluxphotons·s�1 J·s�1 = watts (W) lumens (lm)Pp Pe Pv
Amount per unit time Photon flux intensity Radiant intensity Luminous intensityper unit solid angle photons·s�1·sr�1 W·sr�1 lm·sr�1 = candelas (cd)
Ip Ie IvAmount per unit time Photon flux irradiance Irradiance Illuminanceper unit area photons·s�1·m�2 W·m�2 lm·m�2 = lux (lx)
Ep Ee EvAmount per unit time Photon flux radiance Radiance Luminanceper unit solid angle photons·s�1·sr�1·m�2 W·sr�1·m�2 lm·sr�1·m�2 = cd·m�2
per unit area Lp Le Lv

2.2.2 PHOTOMETRY
Radiometry and actinometry provide usefulphysical descriptions of light stimuli that arecompletely independent of the properties of thehuman visual system. However, when specifyingstimuli seen by the eye, we often need todescribe how visually effective a stimulus is. Theradiance of a light stimulus is often a poor pre-dictor of its brightness. Photometry was devel-oped to provide quantitative descriptions of lightstimuli that are visually meaningful.
The photometric system is based on the stan-dard observer, an imaginary individual whosevisual system has an agreed upon and preciselydefined spectral sensitivity, chosen to mimic thespectral sensitivity of the average human visualsystem. Specific individuals measured under spe-cific conditions may have significantly differentspectral sensitivities than the standard observer.Moreover, the perception of brightness byhuman observers is affected by other factors,such as saturation, which means that thephotometric system should not be construed asproviding a highly accurate measure of the sub-jective sensation of brightness in an individual.Though these differences have been the basis formore than one career in visual science, the pho-tometric system is an approximate method topredict how bright a wide variety of stimuli areto individual human observers.
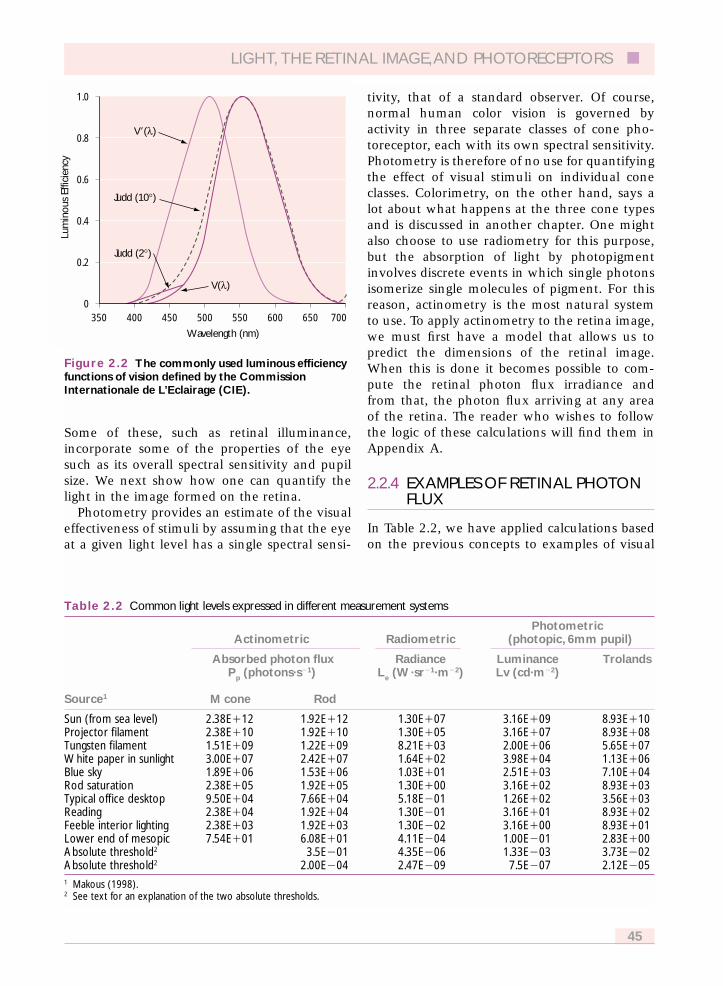
At high light levels where cones normallyoperate, the standard observer’s spectral sensitiv-ity is given by the photopic luminous efficiencyfunction, V(k) and was derived from psy-chophysical measurements of heterochromaticphotometry (Wyszecki and Stiles, 1982). At lowlight levels where rods normally operate, thestandard observer takes on a different spectralsensitivity, the scotopic luminous efficiencyfunction, V�(k) that was derived from brightnessmatches of stimuli viewed in rod vision andmeasurements of threshold under dark-adaptedconditions as a function of wavelength. Severalvariants of these functions are useful for colorscientists and they are explained in Appendix A.All of these luminous efficiency functions areplotted here in Figure 2.2, and tabulated in Table2.3 which is found in Appendix A.
The photometric system also takes into accountanother property of the eye, pupil size. Whenluminance (measured in candelas m�2 ) is multi-plied by the area of the pupil in mm2, the productis the troland value. The troland is widely used incolor science because it reflects, better than lumi-nance alone, the visual effectiveness of a stimulusseen through a pupil of a particular size.
2.2.3 ACTINOMETRY OF THE RETINALIMAGE
The previous sections have described methodsfor defining the stimulus external to the eye.
■ THE SCIENCE OF COLOR
44
Figure 2.1 The geometry of the basic radiometricquantities: (A) exitance and irradiance; (B) radiantintensity; (C) radiance; dA is a patch of surface ofinfinitesimal size. dAproj is the patch of surface visiblefrom the direction of observation. dx is a solid angleof infinitesimal size. r is the radius of a sphere. Asp isthe area of the sphere cut off by the solid angle dx.h is the angle between a surface normal and thedirection in which the radiance measurement is made.
Exitance or Irradiance
Radiant Intensity
Sphere
Radiance
dA
dA
dAθdAproj
dAproj
dω
dω
Asp
r
(A)
(B)
(C)
Some of these, such as retinal illuminance,incorporate some of the properties of the eyesuch as its overall spectral sensitivity and pupilsize. We next show how one can quantify thelight in the image formed on the retina.
Photometry provides an estimate of the visualeffectiveness of stimuli by assuming that the eyeat a given light level has a single spectral sensi-
tivity, that of a standard observer. Of course,normal human color vision is governed byactivity in three separate classes of cone pho-toreceptor, each with its own spectral sensitivity.Photometry is therefore of no use for quantifyingthe effect of visual stimuli on individual coneclasses. Colorimetry, on the other hand, says alot about what happens at the three cone typesand is discussed in another chapter. One mightalso choose to use radiometry for this purpose,but the absorption of light by photopigmentinvolves discrete events in which single photonsisomerize single molecules of pigment. For thisreason, actinometry is the most natural systemto use. To apply actinometry to the retina image,we must first have a model that allows us topredict the dimensions of the retinal image.When this is done it becomes possible to com-pute the retinal photon flux irradiance andfrom that, the photon flux arriving at any areaof the retina. The reader who wishes to followthe logic of these calculations will find them inAppendix A.
2.2.4 EXAMPLES OF RETINAL PHOTONFLUX
In Table 2.2, we have applied calculations basedon the previous concepts to examples of visual
LIGHT, THE RETINAL IMAGE,AND PHOTORECEPTORS ■
45
Figure 2.2 The commonly used luminous efficiencyfunctions of vision defined by the CommissionInternationale de L’Eclairage (CIE).
Lum
inou
s Ef
ficie
ncy
Wavelength (nm)
0.8
0.6
0.4
0.2
0350 400 500 550 600 650 700450
1.0
V�(l)
V(l)
Judd (10°)
Judd (2°)
Table 2.2 Common light levels expressed in different measurement systems
PhotometricActinometric Radiometric (photopic, 6mm pupil)
Absorbed photon flux Radiance Luminance TrolandsPp (photons·s�1) Le (W·sr�1·m�2) Lv (cd·m�2)
Source1 M cone Rod
Sun (from sea level) 2.38E�12 1.92E�12 1.30E�07 3.16E�09 8.93E�10Projector filament 2.38E�10 1.92E�10 1.30E�05 3.16E�07 8.93E�08Tungsten filament 1.51E�09 1.22E�09 8.21E�03 2.00E�06 5.65E�07White paper in sunlight 3.00E�07 2.42E�07 1.64E�02 3.98E�04 1.13E�06Blue sky 1.89E�06 1.53E�06 1.03E�01 2.51E�03 7.10E�04Rod saturation 2.38E�05 1.92E�05 1.30E�00 3.16E�02 8.93E�03Typical office desktop 9.50E�04 7.66E�04 5.18E�01 1.26E�02 3.56E�03Reading 2.38E�04 1.92E�04 1.30E�01 3.16E�01 8.93E�02Feeble interior lighting 2.38E�03 1.92E�03 1.30E�02 3.16E�00 8.93E�01Lower end of mesopic 7.54E�01 6.08E�01 4.11E�04 1.00E�01 2.83E�00Absolute threshold2 3.5E�01 4.35E�06 1.33E�03 3.73E�02Absolute threshold2 2.00E�04 2.47E�09 7.5E�07 2.12E�051 Makous (1998).2 See text for an explanation of the two absolute thresholds.
stimuli and important light levels that span theintensity range of human vision. Each light levelis expressed in terms of radiance, luminance,troland value, and absorbed photon flux. Sincemost interesting stimuli are broadband, we cal-culated spectral photon flux irradiance, E
pk, andspectral photon flux, P
pk, by applying the calcu-lations to each wavelength in the stimulus andsumming the results. We made the assumptionthat the stimuli have equal energy at all wave-lengths and that the diameter of the pupil of theeye is 6 mm. Lastly, we took into account theefficiency with which the retina actually usesphotons by correcting for the Stiles–Crawfordeffect (q � 0.05), absorption of photons by theoptical media (Table I(2.4.6) from Wyszecki andStiles, 1982), absorption of photons in the pho-topigment (Baylor et al., 1987) and the efficiencywith which absorbed photons actually isomerizephotopigment (0.67; Dartnall, 1968). We willcome back to these topics in more detail later.For the moment the important point is that theactinometric numbers represent the number ofphotons that actually isomerize photopigmentmolecules, not just those that are incident on thecornea.
The absolute thresholds at the bottom of thetable require some additional explanation. Thefirst absolute threshold was calculated for the caseof a small (22» diameter), short (10 ms), mono-chromatic (507 nm) stimulus imaged at theeccentricity of maximum rod density (Hallett,1987). It would deliver about 100 quanta to thecornea and ten or fifteen of those would actuallybe absorbed by the 1600 rods illuminated by thestimulus. The vast majority of rods will not absorbany photons at all during the short stimulus pres-entation. We calculated what stimulus luminancewould deliver 10 absorbed quanta to this field in10 ms as well as the absorbed photon flux foreach rod. This particular example represents thestimulus conditions that require the fewest pho-ton absorptions to reach threshold. The secondabsolute threshold is for a large, long stimulusthat exceeded both the spatial summation areaand the temporal integration time of the visualsystem. In this case, luminance threshold is aslow as 7.5 � 10–7 candelas/m2 (Pirenne, 1962).However, the number of absorbed photonsrequired to reach threshold would be muchhigher than for the small, short stimulus.
2.3 SOURCES OF LIGHT LOSSIN THE EYE
Light is lost to reflection and absorption as itpasses through the optics of the eye to the retina.These losses need to be accounted for when thespectral properties of the light reaching the pho-topigment are important, such as for designingstimuli for psychophysical experiments. Formost purposes, light losses due to reflection fromthe surfaces of the ocular media are minimal.However, the media preferentially absorb a sub-stantial proportion of the short wavelength light.This gives the lens, for example, a distinctlyyellow appearance.
2.3.1 LIGHT LOSS DUE TO REFLECTION
Light losses due to reflection from the surfacesof the optical media are small and largely wave-length-independent. The largest reflectance fornormally incident illumination occurs at thefront surface of the cornea, where about 3 per-cent of the light is reflected. This reflection islarge because of the substantial difference inthe refractive indices of air and cornea.Reflections from other optical surfaces total lessthan 0.3 percent of the incident light (Boettnerand Wolter, 1962). Although small, the specu-lar reflections or Purkinje images from thefront and back surfaces of the cornea and lenscan be used to noninvasively track the direc-tion of gaze (Cornsweet and Crane, 1973) andto measure the spectral transmittance of theocular media in situ (van Norren and Vos,1974).
2.3.2 LIGHT LOSS DUE TO ABSORPTION
The ocular media (Figure 2.3), comprised of thecornea, aqueous humor, lens, vitreous humor,retinal vasculature, and macular pigment, are acascaded series of color filters. Their transmissionspectra have been measured both in excised tis-sue and in situ. The data presented in Figure2.4(A) are based on measurements of freshlyenucleated eyes.
■ THE SCIENCE OF COLOR
46
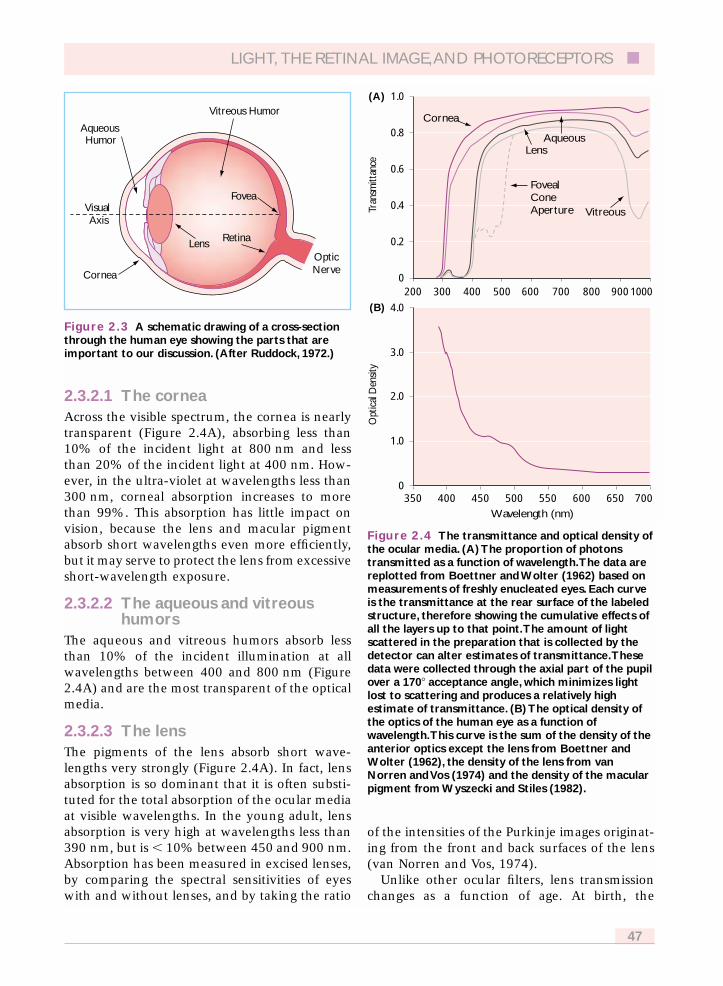
2.3.2.1 The corneaAcross the visible spectrum, the cornea is nearlytransparent (Figure 2.4A), absorbing less than10% of the incident light at 800 nm and lessthan 20% of the incident light at 400 nm. How-ever, in the ultra-violet at wavelengths less than300 nm, corneal absorption increases to morethan 99%. This absorption has little impact onvision, because the lens and macular pigmentabsorb short wavelengths even more efficiently,but it may serve to protect the lens from excessiveshort-wavelength exposure.
2.3.2.2 The aqueous and vitreoushumors
The aqueous and vitreous humors absorb lessthan 10% of the incident illumination at allwavelengths between 400 and 800 nm (Figure2.4A) and are the most transparent of the opticalmedia.
2.3.2.3 The lensThe pigments of the lens absorb short wave-lengths very strongly (Figure 2.4A). In fact, lensabsorption is so dominant that it is often substi-tuted for the total absorption of the ocular mediaat visible wavelengths. In the young adult, lensabsorption is very high at wavelengths less than390 nm, but is � 10% between 450 and 900 nm.Absorption has been measured in excised lenses,by comparing the spectral sensitivities of eyeswith and without lenses, and by taking the ratio
of the intensities of the Purkinje images originat-ing from the front and back surfaces of the lens(van Norren and Vos, 1974).
Unlike other ocular filters, lens transmissionchanges as a function of age. At birth, the
LIGHT, THE RETINAL IMAGE,AND PHOTORECEPTORS ■
47
Figure 2.3 A schematic drawing of a cross-sectionthrough the human eye showing the parts that areimportant to our discussion. (After Ruddock, 1972.)
Vitreous Humor
Aqueous Humor
Cornea
Fovea
Lens Retina
OpticNerve
Visual Axis
Figure 2.4 The transmittance and optical density ofthe ocular media. (A) The proportion of photonstransmitted as a function of wavelength.The data arereplotted from Boettner and Wolter (1962) based onmeasurements of freshly enucleated eyes. Each curveis the transmittance at the rear surface of the labeledstructure, therefore showing the cumulative effects ofall the layers up to that point.The amount of lightscattered in the preparation that is collected by thedetector can alter estimates of transmittance.Thesedata were collected through the axial part of the pupilover a 170� acceptance angle, which minimizes lightlost to scattering and produces a relatively highestimate of transmittance. (B) The optical density ofthe optics of the human eye as a function ofwavelength.This curve is the sum of the density of theanterior optics except the lens from Boettner andWolter (1962), the density of the lens from vanNorren and Vos (1974) and the density of the macularpigment from Wyszecki and Stiles (1982).
Tran
smitt
ance
0.8
0.6
0.4
0.2
0200 300 500 600 800700 9001000400
1.0
Opt
ical
Den
sity
Wavelength (nm)
3.0
2.0
1.0
0350 400 500 550 650600 700450
4.0
FovealConeAperture
Cornea
(A)
(B)
AqueousLens
Vitreous
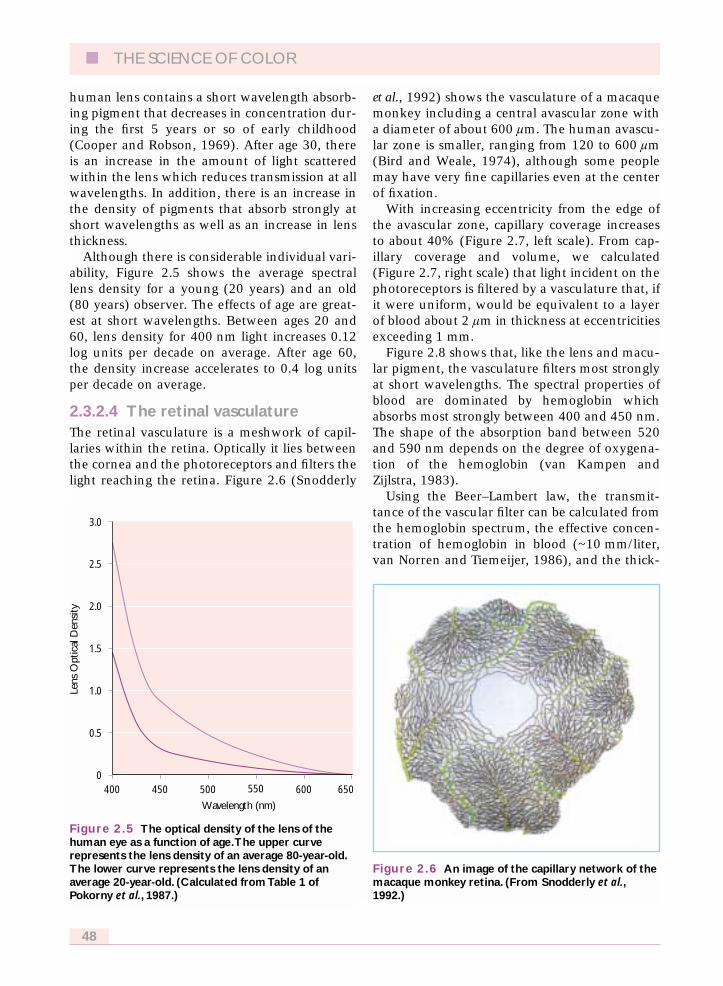
human lens contains a short wavelength absorb-ing pigment that decreases in concentration dur-ing the first 5 years or so of early childhood(Cooper and Robson, 1969). After age 30, thereis an increase in the amount of light scatteredwithin the lens which reduces transmission at allwavelengths. In addition, there is an increase inthe density of pigments that absorb strongly atshort wavelengths as well as an increase in lensthickness.
Although there is considerable individual vari-ability, Figure 2.5 shows the average spectrallens density for a young (20 years) and an old(80 years) observer. The effects of age are great-est at short wavelengths. Between ages 20 and60, lens density for 400 nm light increases 0.12log units per decade on average. After age 60,the density increase accelerates to 0.4 log unitsper decade on average.
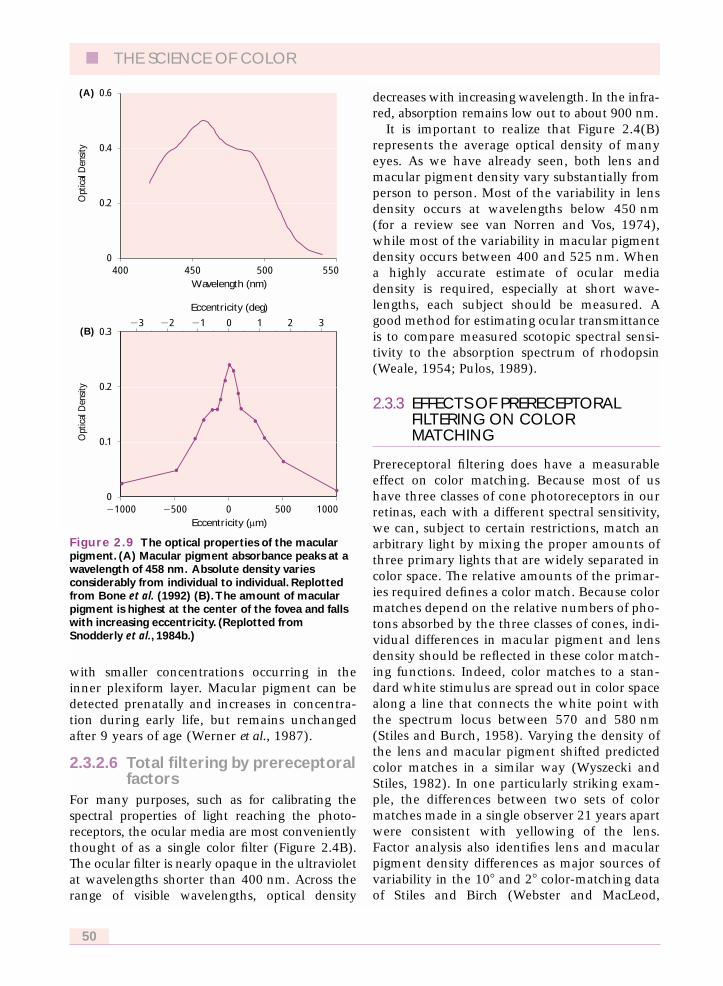
2.3.2.4 The retinal vasculatureThe retinal vasculature is a meshwork of capil-laries within the retina. Optically it lies betweenthe cornea and the photoreceptors and filters thelight reaching the retina. Figure 2.6 (Snodderly
et al., 1992) shows the vasculature of a macaquemonkey including a central avascular zone witha diameter of about 600 lm. The human avascu-lar zone is smaller, ranging from 120 to 600 lm(Bird and Weale, 1974), although some peoplemay have very fine capillaries even at the centerof fixation.
With increasing eccentricity from the edge ofthe avascular zone, capillary coverage increasesto about 40% (Figure 2.7, left scale). From cap-illary coverage and volume, we calculated(Figure 2.7, right scale) that light incident on thephotoreceptors is filtered by a vasculature that, ifit were uniform, would be equivalent to a layerof blood about 2 lm in thickness at eccentricitiesexceeding 1 mm.
Figure 2.8 shows that, like the lens and macu-lar pigment, the vasculature filters most stronglyat short wavelengths. The spectral properties ofblood are dominated by hemoglobin whichabsorbs most strongly between 400 and 450 nm.The shape of the absorption band between 520and 590 nm depends on the degree of oxygena-tion of the hemoglobin (van Kampen andZijlstra, 1983).
Using the Beer–Lambert law, the transmit-tance of the vascular filter can be calculated fromthe hemoglobin spectrum, the effective concen-tration of hemoglobin in blood (~10 mm/liter,van Norren and Tiemeijer, 1986), and the thick-
■ THE SCIENCE OF COLOR
48
Figure 2.5 The optical density of the lens of thehuman eye as a function of age.The upper curverepresents the lens density of an average 80-year-old.The lower curve represents the lens density of anaverage 20-year-old. (Calculated from Table 1 ofPokorny et al., 1987.)
Lens
Opt
ical
Den
sity
Wavelength (nm)
2.0
1.5
1.0
0.5
0400 450 550 600 650500
2.5
3.0
Figure 2.6 An image of the capillary network of themacaque monkey retina. (From Snodderly et al.,1992.)

ness of the blood layer. In Figure 2.8, the trans-mittances of a 2 lm thick blood layer at severalkey wavelengths are shown on the oxyhemoglo-bin spectrum. Transmittance would be signifi-cantly reduced only at wavelengths between 400and 450 nm.
Of course, the retinal vasculature is not a singlelayer of uniform thickness. The capillaries liebetween the pupil and the photoreceptors and castshadows whose widths are larger than the capil-laries themselves. If the distance of the capillaryfrom the photoreceptor is 50 lm and the pupildiameter is 6 mm, the shadow would be 2 or 3times the width of the capillary. This is roughlyequivalent to multiplying capillary coverage bytwo or three. At eccentricities greater than 1 mm,this would imply complete retinal coverage, whileat eccentricities less than 1 mm, some photo-receptors would be shaded while others wouldnot. To take an extreme example, a photoreceptordirectly under two overlapping 8 lm capillarieswould receive only 57% of the 555 nm light(Figure 2.8, transmittances in parentheses)received by a neighbor lying under a gap betweencapillaries. At short wavelengths this differencewould be larger. The invisibility of the vasculaturein normal viewing is due to presumably, localretinal gain changes, cortical adaptation and thefailure to represent retinal regions beneath thedenser vessles (Adams and Horton, 2002).
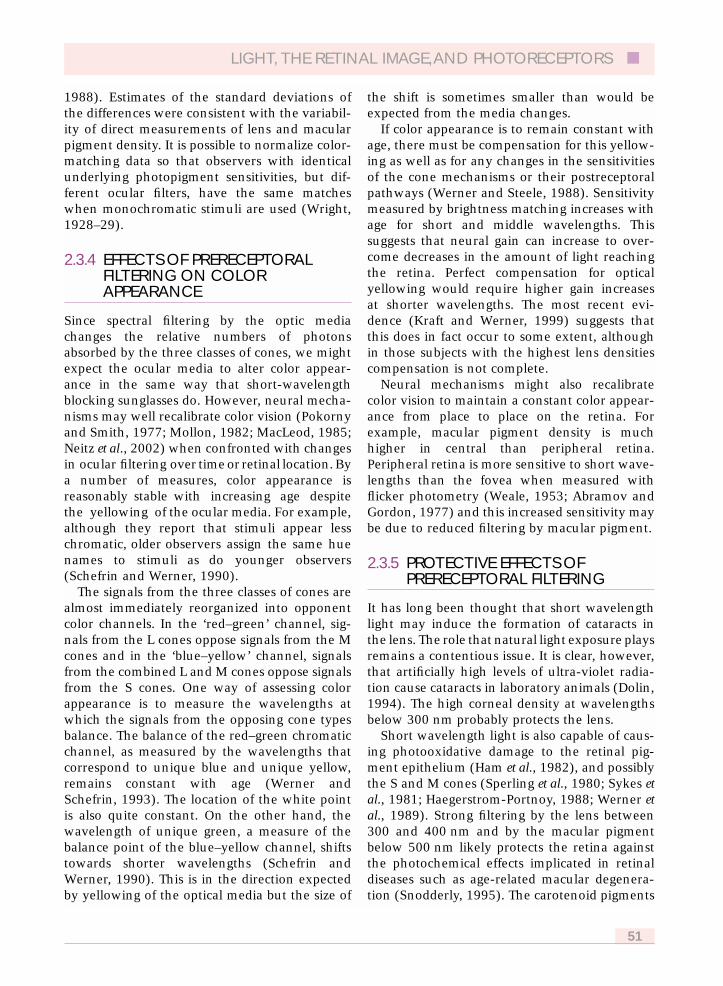
2.3.2.5 The macular pigmentThe final filter, the macular pigment, is also inte-gral to the retina, absorbing most strongly from400 to 550 nm with a peak near 458 nm (Figure2.9A). Macular pigment is a combination of theisomeric carotenoids zeaxanthin and lutein(Bone et al., 1985) which are closely related tothe xanthophyll pigments found in leaves.These pigments are obtained from the diet andtransported to the retina.
Macular pigment concentration falls withincreasing eccentricity from a peak at the center ofthe fovea, to an asymptotic level at 3� (~1 mm) ofeccentricity (Figure 2.9B). Although not visuallyimportant, a measurable concentration of pig-ment can be found even in far peripheral retina.Macular pigment concentration also shows a highdegree of individual variability. Although a spec-tral absorbance function with a peak density of0.5 log units is plotted in Figure 2.9(A), individualpeak densities range from 0 in some albinos(Abadi and Cox, 1992) to over 1.2 log units.
Macular pigment density also varies fromlayer to layer within the retina. The highest con-centrations are found in the fibers of Henle(photoreceptor axons) (Snodderly et al., 1984a),
LIGHT, THE RETINAL IMAGE,AND PHOTORECEPTORS ■
49
Figure 2.7 The distribution of retinal capillaries.The left axis shows the percentage of retinal areacovered by capillaries as a function of eccentricity inmillimeters.The right axis shows the thickness of theblood layer that would result if the capillary volume ateach eccentricity were reformed into a single layer.T represents the far temporal periphery. (Retinalcoverage and capillary volume are from Snodderlyet al., 1992.)
% R
etin
al A
rea
Mea
n Bl
ood
Thi
ckne
ss (
lm
)
Eccentricity (mm)
0 1.0 2.0 3.0 T
70
50
30
10 0
1.0
2.0
3.0
Figure 2.8 The absorption spectrum ofoxyhemoglobin, the primary absorbing element of theblood.The curve is replotted from van Kampen andZijlstra (1983). For our purposes the absorptivity scaleis arbitrary.The numbers not enclosed in parenthesesrepresent the transmittance of a 2 lm thick layer ofblood.The numbers in parentheses represent thetransmittance of two overlapping 8 lm capillaries.
Abs
orpt
ivity
Wavelength (nm)
70
0350 400 500 550 600 650 700450
1400.55 (0.01)
0.98 (0.84)0.99 (0.92)
0.93 (0.57)
Transmittance of2 lm blood layer
Transmittance of2 8 lm capillaries
with smaller concentrations occurring in theinner plexiform layer. Macular pigment can bedetected prenatally and increases in concentra-tion during early life, but remains unchangedafter 9 years of age (Werner et al., 1987).
2.3.2.6 Total filtering by prereceptoralfactors
For many purposes, such as for calibrating thespectral properties of light reaching the photo-receptors, the ocular media are most convenientlythought of as a single color filter (Figure 2.4B).The ocular filter is nearly opaque in the ultravioletat wavelengths shorter than 400 nm. Across therange of visible wavelengths, optical density
decreases with increasing wavelength. In the infra-red, absorption remains low out to about 900 nm.
It is important to realize that Figure 2.4(B)represents the average optical density of manyeyes. As we have already seen, both lens andmacular pigment density vary substantially fromperson to person. Most of the variability in lensdensity occurs at wavelengths below 450 nm(for a review see van Norren and Vos, 1974),while most of the variability in macular pigmentdensity occurs between 400 and 525 nm. Whena highly accurate estimate of ocular mediadensity is required, especially at short wave-lengths, each subject should be measured. Agood method for estimating ocular transmittanceis to compare measured scotopic spectral sensi-tivity to the absorption spectrum of rhodopsin(Weale, 1954; Pulos, 1989).
2.3.3 EFFECTS OF PRERECEPTORALFILTERING ON COLORMATCHING
Prereceptoral filtering does have a measurableeffect on color matching. Because most of ushave three classes of cone photoreceptors in ourretinas, each with a different spectral sensitivity,we can, subject to certain restrictions, match anarbitrary light by mixing the proper amounts ofthree primary lights that are widely separated incolor space. The relative amounts of the primar-ies required defines a color match. Because colormatches depend on the relative numbers of pho-tons absorbed by the three classes of cones, indi-vidual differences in macular pigment and lensdensity should be reflected in these color match-ing functions. Indeed, color matches to a stan-dard white stimulus are spread out in color spacealong a line that connects the white point withthe spectrum locus between 570 and 580 nm(Stiles and Burch, 1958). Varying the density ofthe lens and macular pigment shifted predictedcolor matches in a similar way (Wyszecki andStiles, 1982). In one particularly striking exam-ple, the differences between two sets of colormatches made in a single observer 21 years apartwere consistent with yellowing of the lens.Factor analysis also identifies lens and macularpigment density differences as major sources ofvariability in the 10� and 2� color-matching dataof Stiles and Birch (Webster and MacLeod,
■ THE SCIENCE OF COLOR
50
Figure 2.9 The optical properties of the macularpigment. (A) Macular pigment absorbance peaks at awavelength of 458 nm. Absolute density variesconsiderably from individual to individual. Replottedfrom Bone et al. (1992) (B).The amount of macularpigment is highest at the center of the fovea and fallswith increasing eccentricity. (Replotted fromSnodderly et al., 1984b.)
Opt
ical
Den
sity
Wavelength (nm)
Eccentricity (deg)
0.4
0.2
0400 500 550450
0.6(A)
(B)
Opt
ical
Den
sity
Eccentricity (lm)
0.2
0.1
0�1000 �500 500 10000
0.3�3 �2 �1 0 1 2 3
••
•
•• •
•
•
••
•
••
•
•
•
1988). Estimates of the standard deviations ofthe differences were consistent with the variabil-ity of direct measurements of lens and macularpigment density. It is possible to normalize color-matching data so that observers with identicalunderlying photopigment sensitivities, but dif-ferent ocular filters, have the same matcheswhen monochromatic stimuli are used (Wright,1928–29).
2.3.4 EFFECTS OF PRERECEPTORALFILTERING ON COLORAPPEARANCE
Since spectral filtering by the optic mediachanges the relative numbers of photonsabsorbed by the three classes of cones, we mightexpect the ocular media to alter color appear-ance in the same way that short-wavelengthblocking sunglasses do. However, neural mecha-nisms may well recalibrate color vision (Pokornyand Smith, 1977; Mollon, 1982; MacLeod, 1985;Neitz et al., 2002) when confronted with changesin ocular filtering over time or retinal location. Bya number of measures, color appearance isreasonably stable with increasing age despitethe yellowing of the ocular media. For example,although they report that stimuli appear lesschromatic, older observers assign the same huenames to stimuli as do younger observers(Schefrin and Werner, 1990).
The signals from the three classes of cones arealmost immediately reorganized into opponentcolor channels. In the ‘red–green’ channel, sig-nals from the L cones oppose signals from the Mcones and in the ‘blue–yellow’ channel, signalsfrom the combined L and M cones oppose signalsfrom the S cones. One way of assessing colorappearance is to measure the wavelengths atwhich the signals from the opposing cone typesbalance. The balance of the red–green chromaticchannel, as measured by the wavelengths thatcorrespond to unique blue and unique yellow,remains constant with age (Werner andSchefrin, 1993). The location of the white pointis also quite constant. On the other hand, thewavelength of unique green, a measure of thebalance point of the blue–yellow channel, shiftstowards shorter wavelengths (Schefrin andWerner, 1990). This is in the direction expectedby yellowing of the optical media but the size of
the shift is sometimes smaller than would beexpected from the media changes.
If color appearance is to remain constant withage, there must be compensation for this yellow-ing as well as for any changes in the sensitivitiesof the cone mechanisms or their postreceptoralpathways (Werner and Steele, 1988). Sensitivitymeasured by brightness matching increases withage for short and middle wavelengths. Thissuggests that neural gain can increase to over-come decreases in the amount of light reachingthe retina. Perfect compensation for opticalyellowing would require higher gain increasesat shorter wavelengths. The most recent evi-dence (Kraft and Werner, 1999) suggests thatthis does in fact occur to some extent, althoughin those subjects with the highest lens densitiescompensation is not complete.
Neural mechanisms might also recalibratecolor vision to maintain a constant color appear-ance from place to place on the retina. Forexample, macular pigment density is muchhigher in central than peripheral retina.Peripheral retina is more sensitive to short wave-lengths than the fovea when measured withflicker photometry (Weale, 1953; Abramov andGordon, 1977) and this increased sensitivity maybe due to reduced filtering by macular pigment.
2.3.5 PROTECTIVE EFFECTS OFPRERECEPTORAL FILTERING
It has long been thought that short wavelengthlight may induce the formation of cataracts inthe lens. The role that natural light exposure playsremains a contentious issue. It is clear, however,that artificially high levels of ultra-violet radia-tion cause cataracts in laboratory animals (Dolin,1994). The high corneal density at wavelengthsbelow 300 nm probably protects the lens.
Short wavelength light is also capable of caus-ing photooxidative damage to the retinal pig-ment epithelium (Ham et al., 1982), and possiblythe S and M cones (Sperling et al., 1980; Sykes etal., 1981; Haegerstrom-Portnoy, 1988; Werner etal., 1989). Strong filtering by the lens between300 and 400 nm and by the macular pigmentbelow 500 nm likely protects the retina againstthe photochemical effects implicated in retinaldiseases such as age-related macular degenera-tion (Snodderly, 1995). The carotenoid pigments
LIGHT, THE RETINAL IMAGE,AND PHOTORECEPTORS ■
51
of the retina are also thought to chemically blockphotooxidative reactions that are damaging tothe retina (Burton and Ingold, 1984).
2.4 SOURCES OF BLUR IN THE RETINAL IMAGE
In addition to reducing the intensity of the lightreaching the retina, the optics of the eye blur theretinal image. The quality of this image dependson diffraction at the pupil, aberrations in thecornea and lens, light scatter in the opticalmedia, and the optical properties of the retinaitself. We first describe the effects of diffractionand aberrations in the eye, ignoring for themoment the effects of light scatter and opticalproperties of the retina. Diffraction and aberra-tions are well-characterized with Fourier optics.For an excellent treatment of Fourier optics inimaging systems, see Goodman (1996).
2.4.1 THE GENERALIZED PUPILFUNCTION AND IMAGEFORMATION
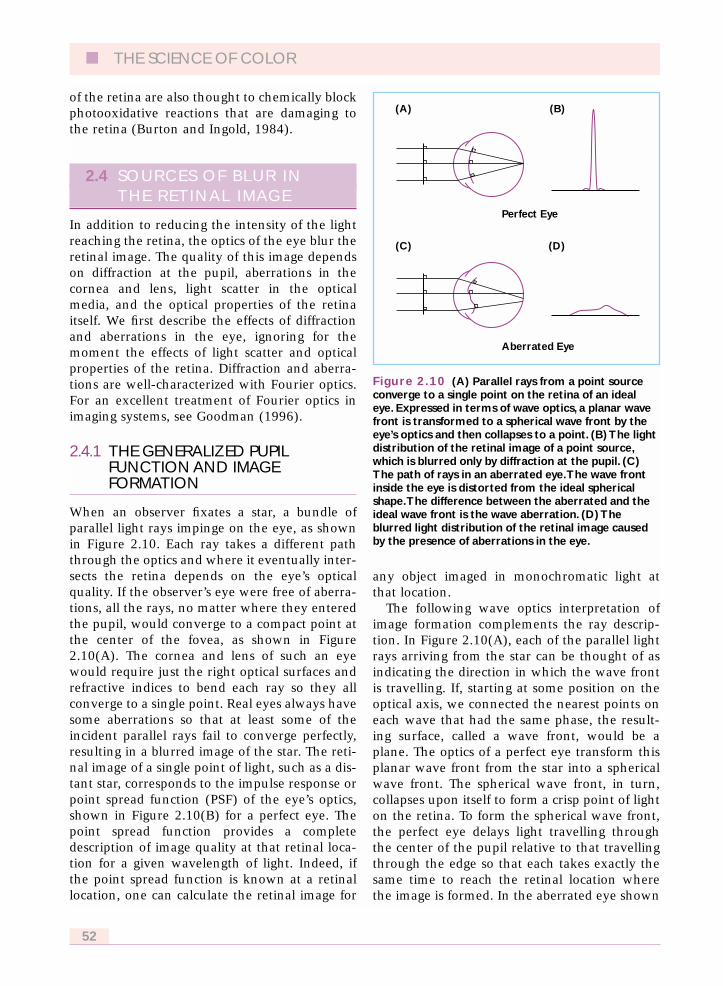
When an observer fixates a star, a bundle ofparallel light rays impinge on the eye, as shownin Figure 2.10. Each ray takes a different paththrough the optics and where it eventually inter-sects the retina depends on the eye’s opticalquality. If the observer’s eye were free of aberra-tions, all the rays, no matter where they enteredthe pupil, would converge to a compact point atthe center of the fovea, as shown in Figure2.10(A). The cornea and lens of such an eyewould require just the right optical surfaces andrefractive indices to bend each ray so they allconverge to a single point. Real eyes always havesome aberrations so that at least some of theincident parallel rays fail to converge perfectly,resulting in a blurred image of the star. The reti-nal image of a single point of light, such as a dis-tant star, corresponds to the impulse response orpoint spread function (PSF) of the eye’s optics,shown in Figure 2.10(B) for a perfect eye. Thepoint spread function provides a completedescription of image quality at that retinal loca-tion for a given wavelength of light. Indeed, ifthe point spread function is known at a retinallocation, one can calculate the retinal image for
any object imaged in monochromatic light atthat location.
The following wave optics interpretation ofimage formation complements the ray descrip-tion. In Figure 2.10(A), each of the parallel lightrays arriving from the star can be thought of asindicating the direction in which the wave frontis travelling. If, starting at some position on theoptical axis, we connected the nearest points oneach wave that had the same phase, the result-ing surface, called a wave front, would be aplane. The optics of a perfect eye transform thisplanar wave front from the star into a sphericalwave front. The spherical wave front, in turn,collapses upon itself to form a crisp point of lighton the retina. To form the spherical wave front,the perfect eye delays light travelling throughthe center of the pupil relative to that travellingthrough the edge so that each takes exactly thesame time to reach the retinal location wherethe image is formed. In the aberrated eye shown
■ THE SCIENCE OF COLOR
52
Figure 2.10 (A) Parallel rays from a point sourceconverge to a single point on the retina of an idealeye. Expressed in terms of wave optics, a planar wavefront is transformed to a spherical wave front by theeye’s optics and then collapses to a point. (B) The lightdistribution of the retinal image of a point source,which is blurred only by diffraction at the pupil. (C)The path of rays in an aberrated eye.The wave frontinside the eye is distorted from the ideal sphericalshape.The difference between the aberrated and theideal wave front is the wave aberration. (D) Theblurred light distribution of the retinal image causedby the presence of aberrations in the eye.
Perfect Eye
Aberrated Eye
(A)
(C)
(B)
(D)

in Figure 2.10(C), the wave front is not delayedby the proper amounts as it passes through theoptics and the actual wave front inside the eyedeparts from the ideal spherical wave front.Because it is misshapen, it fails to collapse to acrisp point at the retina as shown in Figure2.10(D). The errors in the delays could arisefrom several sources, such as a misshapencornea or lens. For our purposes, it is sufficientto sum all the errors experienced by a photonpassing through the cornea and lens and assignthe sum to the point in the entrance pupil of theeye through which the photon passed. Theerrors could be expressed in units of time, but itis more convenient to express them in a unit ofdistance, such as micrometers, indicating howfar the distorted wave front departs at each pointin the entrance pupil from the ideal wave front.A map of the eye’s entrance pupil that plots theerror at each entry point is called the eye’s waveaberration. The wave aberration describes all theeye’s aberrations at a particular wavelength oflight that ultimately influence image quality at aparticular location on the retina.
The eye’s optics not only influence the time ittakes photons to reach the retina from differentdirections, they also influence the number ofphotons arriving at the retina from differentdirections. For example, the iris absorbs practi-cally all the light that strikes it, precluding anylight from arriving from directions outside thepupil. The generalized pupil function is anextension of the wave aberration that capturesboth the delay properties of the eye’s optics andtheir transmittance. The power of the general-ized pupil function is that, if it is known, it ispossible to calculate the point spread function,which as we said before is a complete descrip-tion of image quality. This allows us to deter-mine directly the impact of the wave aberrationand pupil diameter on retinal image quality. Aquantitative description of the generalized pupilfunction can be found in Appendix B.
2.4.2 DIFFRACTION
We can illustrate the power of the generalizedpupil function by first considering the case of anaberration-free eye which blurs the retinalimage only because of diffraction by the pupil.We already saw in Figure 2.10(B) that even in an
eye with perfect optics, the light from the star isnot imaged as a single point. Rather the image isa bright central point surrounded by dimmerrings. This occurs because light spreads or dif-fracts whenever it passes through a circular aper-ture such as the pupil. Thus, diffraction is theultimate limit on image quality in any opticalsystem. The degree of spreading is greater forsmaller pupils and shorter wavelengths of light.
Figure 2.11(A) shows the wave aberration foran aberration-free eye. Figure 2.11(E) againshows that the image of an infinitely small pointof light (PSF) has the form of a central point sur-rounded by rings. This is called an Airy disk andcan be described quantitatively by
I(r) � [2J1(pr) /pr]2
where I(r) is normalized intensity as a functionof distance r from the peak and J
1is a Bessel
function of the first kind. The radius of the PSF,r
o, expressed in radians and measured from the
peak to the first point at which the intensity iszero, is given by
ro
� 1.22k/a
where k is the wavelength of light and a is thediameter of the circular pupil. Because the widthof the diffraction-limited PSF is proportional towavelength and inversely proportional to pupildiameter, the retinal image quality of this idealeye is optimum at large pupil sizes and shortwavelengths. Converting radians to degrees, wefind that for a 3 mm pupil, the radius of the PSFis 0.62» of arc at 440 nm and 0.98» of arc at700 nm. At 555 nm, the radius is 1.2» of arc for a2 mm pupil and 0.29 for an 8 mm pupil. Thewidth of this function is sometimes characterizedby the full width at half height, which happensto have almost the same value as the radius.
2.4.3 MONOCHROMATIC ABERRATIONS
In any real eye, optical performance is worsethan predicted by diffraction because of imper-fections in the optics. Figure 2.11(B), (C), and(D) are wave aberrations for three typicalhuman eyes. The wave aberration is different foreach eye. The corresponding PSFs (Figure 2.11F,
LIGHT, THE RETINAL IMAGE,AND PHOTORECEPTORS ■
53
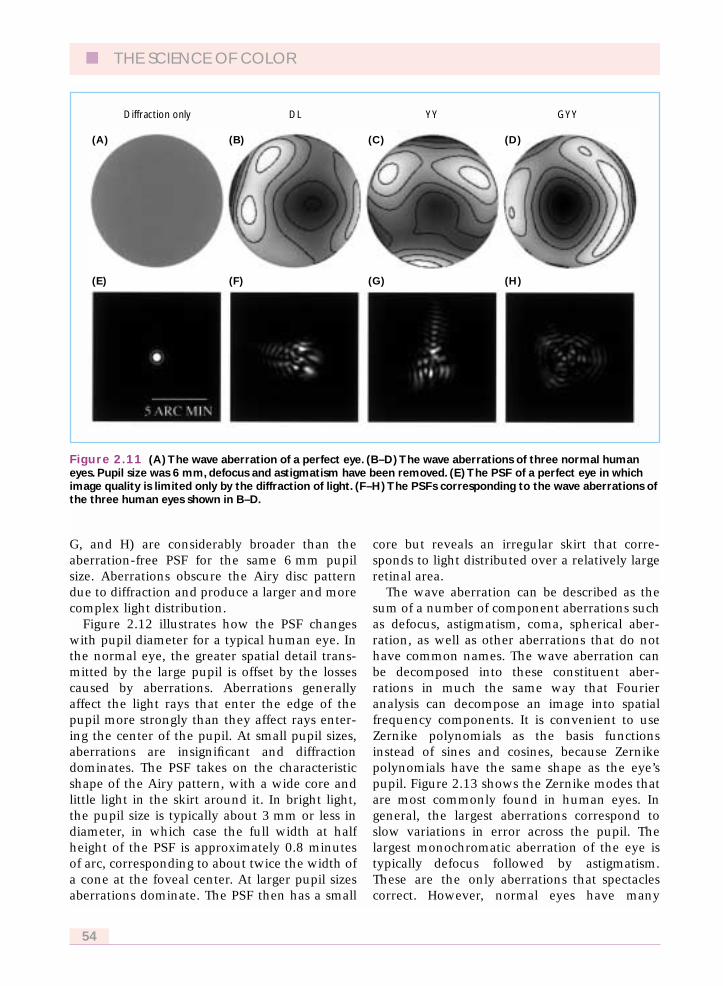
G, and H) are considerably broader than theaberration-free PSF for the same 6 mm pupilsize. Aberrations obscure the Airy disc patterndue to diffraction and produce a larger and morecomplex light distribution.
Figure 2.12 illustrates how the PSF changeswith pupil diameter for a typical human eye. Inthe normal eye, the greater spatial detail trans-mitted by the large pupil is offset by the lossescaused by aberrations. Aberrations generallyaffect the light rays that enter the edge of thepupil more strongly than they affect rays enter-ing the center of the pupil. At small pupil sizes,aberrations are insignificant and diffractiondominates. The PSF takes on the characteristicshape of the Airy pattern, with a wide core andlittle light in the skirt around it. In bright light,the pupil size is typically about 3 mm or less indiameter, in which case the full width at halfheight of the PSF is approximately 0.8 minutesof arc, corresponding to about twice the width ofa cone at the foveal center. At larger pupil sizesaberrations dominate. The PSF then has a small
core but reveals an irregular skirt that corre-sponds to light distributed over a relatively largeretinal area.
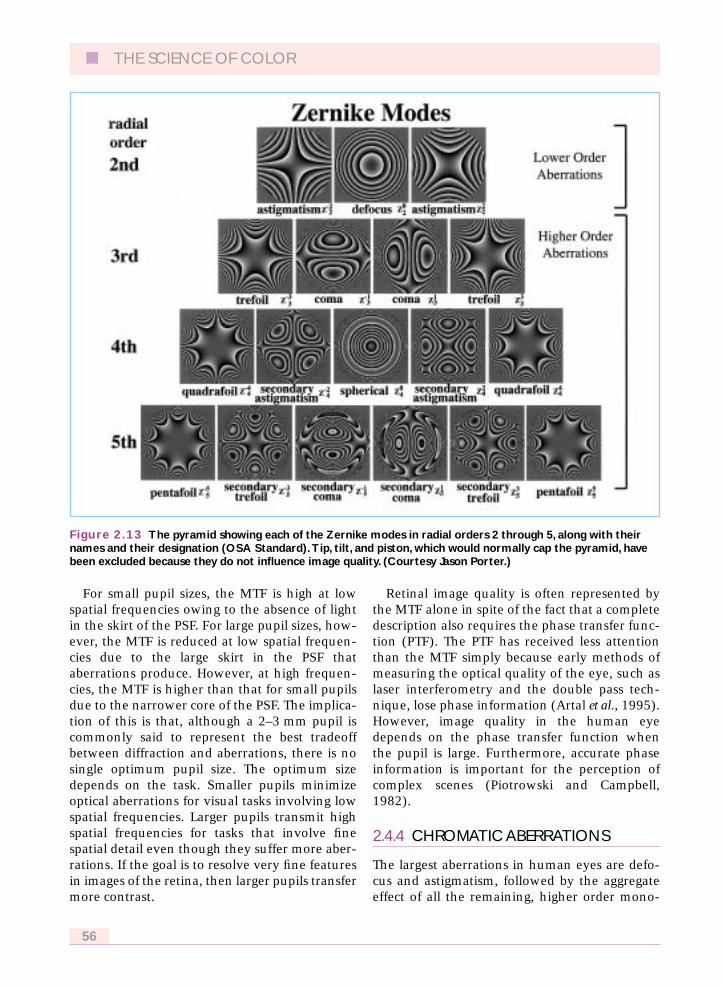
The wave aberration can be described as thesum of a number of component aberrations suchas defocus, astigmatism, coma, spherical aber-ration, as well as other aberrations that do nothave common names. The wave aberration canbe decomposed into these constituent aber-rations in much the same way that Fourieranalysis can decompose an image into spatialfrequency components. It is convenient to useZernike polynomials as the basis functionsinstead of sines and cosines, because Zernikepolynomials have the same shape as the eye’spupil. Figure 2.13 shows the Zernike modes thatare most commonly found in human eyes. Ingeneral, the largest aberrations correspond toslow variations in error across the pupil. Thelargest monochromatic aberration of the eye istypically defocus followed by astigmatism.These are the only aberrations that spectaclescorrect. However, normal eyes have many
■ THE SCIENCE OF COLOR
54
Figure 2.11 (A) The wave aberration of a perfect eye. (B–D) The wave aberrations of three normal humaneyes. Pupil size was 6 mm, defocus and astigmatism have been removed. (E) The PSF of a perfect eye in whichimage quality is limited only by the diffraction of light. (F–H) The PSFs corresponding to the wave aberrations ofthe three human eyes shown in B–D.
Diffraction only DL YY GYY
(A)
(E)
(B)
(F)
(C)
(G)
(D)
(H)

monochromatic aberrations besides defocus andastigmatism. Generally speaking, aberrations thatcorrespond to more rapidly varying errorsacross the pupil have smaller amplitudes andmake a smaller contribution to the total waveaberration.
Defocus is often expressed in diopters, whichcorrespond to the reciprocal of the focal lengthin meters of the lens necessary to restore goodfocus.
2.4.3.1 Computing retinal imagequality
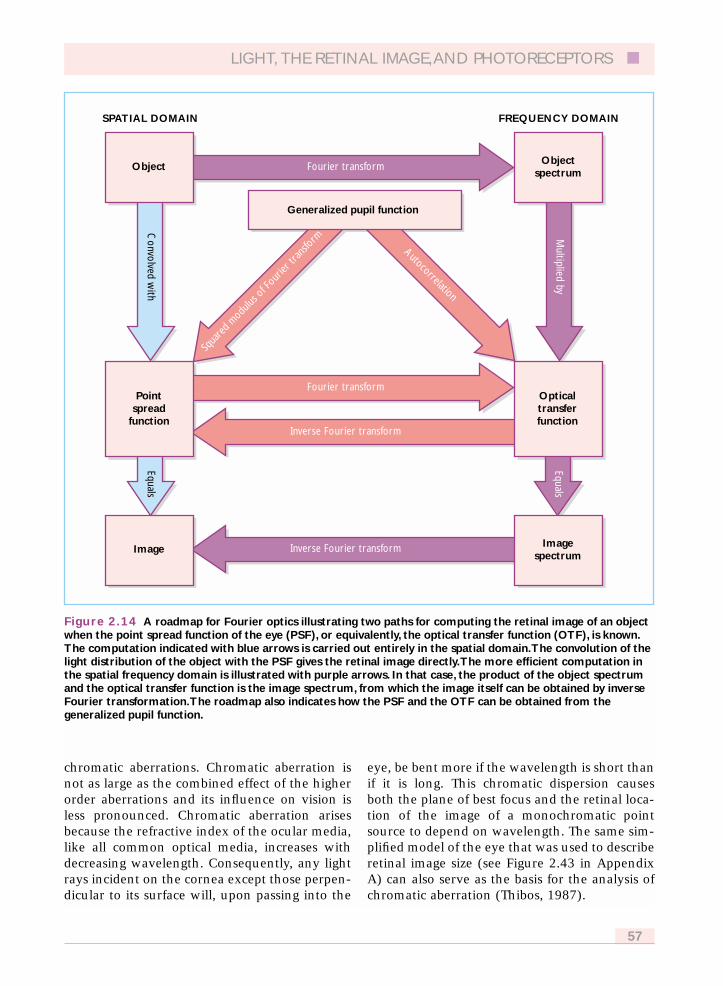
Figure 2.14 shows that a retinal image can becalculated for some arbitrary object either in thespatial domain by convolving the light distribu-tion of the object with the point spread functionof the eye, or in the spatial frequency domain bymultiplying the object spectrum by the opticaltransfer function. In practice, this calculation isusually more efficient in the frequency domain.The optical transfer function required for this
calculation can itself be calculated from eitherthe point spread function or the generalizedpupil function. A more quantitative descriptionof these calculations is found in Appendix B.
When these calculations are applied to an eyewith perfect diffraction-limited optics and a 3 mmpupil illuminated with 632.8 nm light, the inco-herent optical cutoff is 82.7 cycles/degree. Thesolid curves in Figure 2.15 show modulationtransfer functions (MTFs) for a diffraction-limitedeye with pupil diameters ranging from 2 through7 mm calculated for a wavelength of 555 nm.
Figure 2.15 also shows the mean mono-chromatic MTFs (long dashed lines) computedfrom the wave aberration measurements for 14eyes made with a Hartmann-Shack wavefrontsensor (Liang and Williams, 1997). With increas-ing pupil diameter, the difference between thediffraction-limited and real MTFs grows, due tothe decrease in the contribution of diffraction toretinal blur and the increase in the role ofaberrations.
LIGHT, THE RETINAL IMAGE,AND PHOTORECEPTORS ■
55
Figure 2.12 The dependence of the PSF on pupil diameter for a typical human eye. At small pupil sizes,diffraction dominates. For large pupils aberrations are the primary cause of retinal image blur. (Courtesy ofAustin Roorda.)
For small pupil sizes, the MTF is high at lowspatial frequencies owing to the absence of lightin the skirt of the PSF. For large pupil sizes, how-ever, the MTF is reduced at low spatial frequen-cies due to the large skirt in the PSF thataberrations produce. However, at high frequen-cies, the MTF is higher than that for small pupilsdue to the narrower core of the PSF. The implica-tion of this is that, although a 2–3 mm pupil iscommonly said to represent the best tradeoffbetween diffraction and aberrations, there is nosingle optimum pupil size. The optimum sizedepends on the task. Smaller pupils minimizeoptical aberrations for visual tasks involving lowspatial frequencies. Larger pupils transmit highspatial frequencies for tasks that involve finespatial detail even though they suffer more aber-rations. If the goal is to resolve very fine featuresin images of the retina, then larger pupils transfermore contrast.
Retinal image quality is often represented bythe MTF alone in spite of the fact that a completedescription also requires the phase transfer func-tion (PTF). The PTF has received less attentionthan the MTF simply because early methods ofmeasuring the optical quality of the eye, such aslaser interferometry and the double pass tech-nique, lose phase information (Artal et al., 1995).However, image quality in the human eyedepends on the phase transfer function whenthe pupil is large. Furthermore, accurate phaseinformation is important for the perception ofcomplex scenes (Piotrowski and Campbell,1982).
2.4.4 CHROMATIC ABERRATIONS
The largest aberrations in human eyes are defo-cus and astigmatism, followed by the aggregateeffect of all the remaining, higher order mono-
■ THE SCIENCE OF COLOR
56
Figure 2.13 The pyramid showing each of the Zernike modes in radial orders 2 through 5, along with theirnames and their designation (OSA Standard).Tip, tilt, and piston, which would normally cap the pyramid, havebeen excluded because they do not influence image quality. (Courtesy Jason Porter.)
chromatic aberrations. Chromatic aberration isnot as large as the combined effect of the higherorder aberrations and its influence on vision isless pronounced. Chromatic aberration arisesbecause the refractive index of the ocular media,like all common optical media, increases withdecreasing wavelength. Consequently, any lightrays incident on the cornea except those perpen-dicular to its surface will, upon passing into the
eye, be bent more if the wavelength is short thanif it is long. This chromatic dispersion causesboth the plane of best focus and the retinal loca-tion of the image of a monochromatic pointsource to depend on wavelength. The same sim-plified model of the eye that was used to describeretinal image size (see Figure 2.43 in AppendixA) can also serve as the basis for the analysis ofchromatic aberration (Thibos, 1987).
LIGHT, THE RETINAL IMAGE,AND PHOTORECEPTORS ■
57
Figure 2.14 A roadmap for Fourier optics illustrating two paths for computing the retinal image of an objectwhen the point spread function of the eye (PSF), or equivalently, the optical transfer function (OTF), is known.The computation indicated with blue arrows is carried out entirely in the spatial domain.The convolution of thelight distribution of the object with the PSF gives the retinal image directly.The more efficient computation inthe spatial frequency domain is illustrated with purple arrows. In that case, the product of the object spectrumand the optical transfer function is the image spectrum, from which the image itself can be obtained by inverseFourier transformation.The roadmap also indicates how the PSF and the OTF can be obtained from thegeneralized pupil function.
SPATIAL DOMAIN FREQUENCY DOMAIN
Object Fourier transform Objectspectrum
Generalized pupil function
Pointspread
function
Fourier transform
Inverse Fourier transform
Inverse Fourier transform
Multiplied by
Autocorrelation
Squa
red m
odulu
s of F
ourie
r tra
nsfor
m
Convolved w
ithEquals
Equals
Opticaltransferfunction
Image Imagespectrum

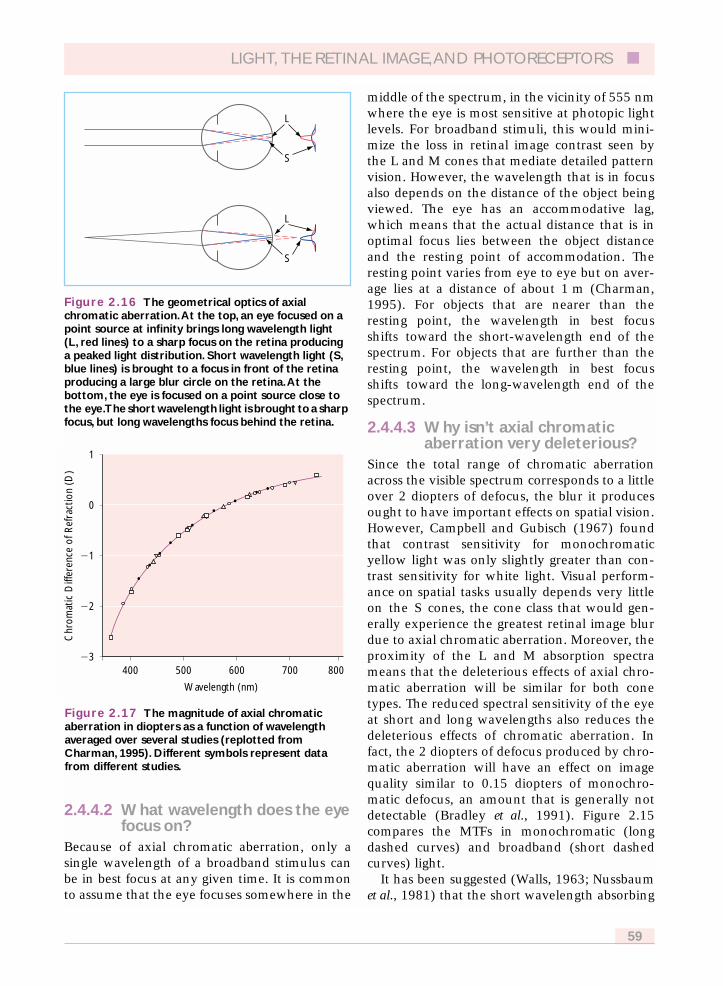
2.4.4.1 Axial chromatic aberrationFigure 2.16 shows how a point source lying onthe optic axis of the eye is imaged on the retina.If the point source consists of two wavelengths,the short wavelength light is brought to a focusnearer to the lens than the long wavelengthlight. When the point source is effectively atinfinity and the eye is in focus for long wave-lengths, the short wavelength light will bebroadly distributed in a blur circle. If the pointis moved nearer the eye such that the shortwavelength light is well focused, then the longwavelength light will be blurred. This wave-length-dependent displacement in the axial posi-tion of best focus is called axial or longitudinalchromatic aberration.
Figure 2.17 shows the chromatic difference offocus of the eye, which has been measuredextensively. There is almost no variation fromobserver to observer because all eyes are made ofessentially the same materials with the samechromatic dispersion. From 400 to 700 nm thetotal chromatic difference of focus is ~2.25diopters.
Axial chromatic aberration causes the waveaberration of the eye to depend on the wave-length of light. To a first approximation, the onlyZernike polynomial that depends strongly onwavelength is the defocus term, with all theother aberrations retaining similar amplitudeswhen expressed in micrometers.
■ THE SCIENCE OF COLOR
58
Figure 2.15 Modulation transfer functions calculated for eyes with pupils ranging from 2 through 7 mm. Ineach panel, the solid line shows the MTF for an eye whose optics suffer only from diffraction, k � 555 nm.Thelong dashed lines show the mean monochromatic MTFs of 14 normal human eyes. MTFs were computed fromwave aberration measurements obtained with a Hartmann–Shack wavefront sensor and a 7.3 mm pupil (Liangand Williams, 1997).The short dashed lines show the MTFs expected in white light taking into account the axialbut not the transverse chromatic aberration of the eye.The eye was assumed to be accommodated to 555 nmand its spectral sensitivity was assumed to correspond to the photopic luminosity function.
The MTFs were calculated without defocus and astigmatism by setting the appropriate Zernike terms in thewave aberration to zero.This is not quite the same as finding the values of defocus and astigmatism thatoptimize image quality as one does in a conventional clinical refraction. Had such an optimization beenperformed, the white light and monochromatic MTFs would have been more similar.
Mod
ulat
ion
Tran
sfer
Spatial Frequency (cycles/deg)
2 mm 3 mm
5 mm 6 mm
4 mm
7 mm
0.10
0.01
1.00
0.10
0.010 10 30 40 50 6020 0 10 30 40 50 6020 0 10 30 40 50 6020
1.00
2.4.4.2 What wavelength does the eyefocus on?
Because of axial chromatic aberration, only asingle wavelength of a broadband stimulus canbe in best focus at any given time. It is commonto assume that the eye focuses somewhere in the
middle of the spectrum, in the vicinity of 555 nmwhere the eye is most sensitive at photopic lightlevels. For broadband stimuli, this would mini-mize the loss in retinal image contrast seen bythe L and M cones that mediate detailed patternvision. However, the wavelength that is in focusalso depends on the distance of the object beingviewed. The eye has an accommodative lag,which means that the actual distance that is inoptimal focus lies between the object distanceand the resting point of accommodation. Theresting point varies from eye to eye but on aver-age lies at a distance of about 1 m (Charman,1995). For objects that are nearer than theresting point, the wavelength in best focusshifts toward the short-wavelength end of thespectrum. For objects that are further than theresting point, the wavelength in best focusshifts toward the long-wavelength end of thespectrum.
2.4.4.3 Why isn’t axial chromaticaberration very deleterious?
Since the total range of chromatic aberrationacross the visible spectrum corresponds to a littleover 2 diopters of defocus, the blur it producesought to have important effects on spatial vision.However, Campbell and Gubisch (1967) foundthat contrast sensitivity for monochromaticyellow light was only slightly greater than con-trast sensitivity for white light. Visual perform-ance on spatial tasks usually depends very littleon the S cones, the cone class that would gen-erally experience the greatest retinal image blurdue to axial chromatic aberration. Moreover, theproximity of the L and M absorption spectrameans that the deleterious effects of axial chro-matic aberration will be similar for both conetypes. The reduced spectral sensitivity of the eyeat short and long wavelengths also reduces thedeleterious effects of chromatic aberration. Infact, the 2 diopters of defocus produced by chro-matic aberration will have an effect on imagequality similar to 0.15 diopters of monochro-matic defocus, an amount that is generally notdetectable (Bradley et al., 1991). Figure 2.15compares the MTFs in monochromatic (longdashed curves) and broadband (short dashedcurves) light.
It has been suggested (Walls, 1963; Nussbaumet al., 1981) that the short wavelength absorbing
LIGHT, THE RETINAL IMAGE,AND PHOTORECEPTORS ■
59
Figure 2.16 The geometrical optics of axialchromatic aberration.At the top, an eye focused on apoint source at infinity brings long wavelength light (L, red lines) to a sharp focus on the retina producinga peaked light distribution. Short wavelength light (S,blue lines) is brought to a focus in front of the retinaproducing a large blur circle on the retina.At thebottom, the eye is focused on a point source close tothe eye.The short wavelength light is brought to a sharpfocus, but long wavelengths focus behind the retina.
L
S
L
S
Figure 2.17 The magnitude of axial chromaticaberration in diopters as a function of wavelengthaveraged over several studies (replotted fromCharman, 1995). Different symbols represent datafrom different studies.
Chr
omat
ic D
iffer
ence
of R
efra
ctio
n (D
)
Wavelength (nm)
0
1
�1
�2
�3400 600 700 800500
•••
••
••
••
pigments of the ocular media play an importantrole in limiting blur from chromatic aberration.Reading and Weale (1974) modeled chromaticaberration in the eye and found that the opti-mum filter for reducing the deleterious effects ofchromatic aberration on spatial vision in daylightwould have spectral characteristics very similarto those of the macular pigment. However, theeffect of spectral filtering in the ocular media onthe modulation transfer function is relativelysmall. A less widely recognized reason thatchromatic aberration is not more deleterious isthat it is overwhelmed by the numerous mono-chromatic aberrations. These aberrations, mostof which spectacles fail to correct, dilute theimpact of axial chromatic aberration (Marcos et al.,1999; Yoon and Williams, 2002).
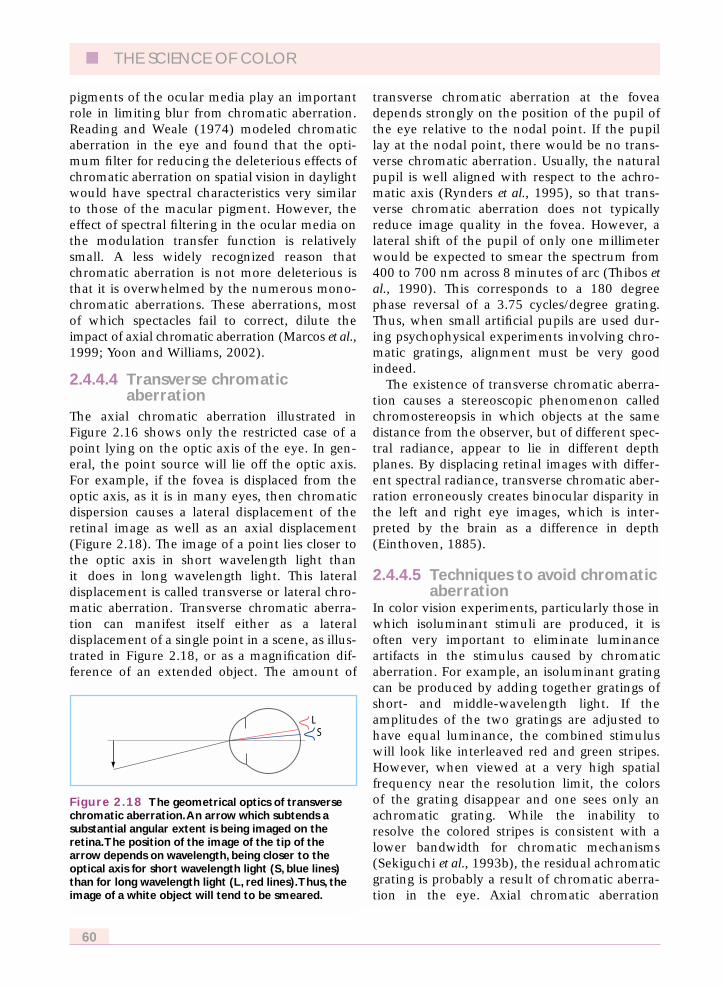
2.4.4.4 Transverse chromaticaberration
The axial chromatic aberration illustrated inFigure 2.16 shows only the restricted case of apoint lying on the optic axis of the eye. In gen-eral, the point source will lie off the optic axis.For example, if the fovea is displaced from theoptic axis, as it is in many eyes, then chromaticdispersion causes a lateral displacement of theretinal image as well as an axial displacement(Figure 2.18). The image of a point lies closer tothe optic axis in short wavelength light thanit does in long wavelength light. This lateraldisplacement is called transverse or lateral chro-matic aberration. Transverse chromatic aberra-tion can manifest itself either as a lateraldisplacement of a single point in a scene, as illus-trated in Figure 2.18, or as a magnification dif-ference of an extended object. The amount of
transverse chromatic aberration at the foveadepends strongly on the position of the pupil ofthe eye relative to the nodal point. If the pupillay at the nodal point, there would be no trans-verse chromatic aberration. Usually, the naturalpupil is well aligned with respect to the achro-matic axis (Rynders et al., 1995), so that trans-verse chromatic aberration does not typicallyreduce image quality in the fovea. However, alateral shift of the pupil of only one millimeterwould be expected to smear the spectrum from400 to 700 nm across 8 minutes of arc (Thibos etal., 1990). This corresponds to a 180 degreephase reversal of a 3.75 cycles/degree grating.Thus, when small artificial pupils are used dur-ing psychophysical experiments involving chro-matic gratings, alignment must be very goodindeed.
The existence of transverse chromatic aberra-tion causes a stereoscopic phenomenon calledchromostereopsis in which objects at the samedistance from the observer, but of different spec-tral radiance, appear to lie in different depthplanes. By displacing retinal images with differ-ent spectral radiance, transverse chromatic aber-ration erroneously creates binocular disparity inthe left and right eye images, which is inter-preted by the brain as a difference in depth(Einthoven, 1885).
2.4.4.5 Techniques to avoid chromaticaberration
In color vision experiments, particularly those inwhich isoluminant stimuli are produced, it isoften very important to eliminate luminanceartifacts in the stimulus caused by chromaticaberration. For example, an isoluminant gratingcan be produced by adding together gratings ofshort- and middle-wavelength light. If theamplitudes of the two gratings are adjusted tohave equal luminance, the combined stimuluswill look like interleaved red and green stripes.However, when viewed at a very high spatialfrequency near the resolution limit, the colorsof the grating disappear and one sees only anachromatic grating. While the inability toresolve the colored stripes is consistent with alower bandwidth for chromatic mechanisms(Sekiguchi et al., 1993b), the residual achromaticgrating is probably a result of chromatic aberra-tion in the eye. Axial chromatic aberration
■ THE SCIENCE OF COLOR
60
Figure 2.18 The geometrical optics of transversechromatic aberration.An arrow which subtends asubstantial angular extent is being imaged on theretina.The position of the image of the tip of thearrow depends on wavelength, being closer to theoptical axis for short wavelength light (S, blue lines)than for long wavelength light (L, red lines).Thus, theimage of a white object will tend to be smeared.
LS
ensures that at least one grating will be out offocus and will therefore have reduced contrast,which can result in a luminance modulation asspatial frequency is increased. At the same time,transverse chromatic aberration can shift onegrating relative to the other on the retina, whichalso creates a luminance modulation in theretinal image.
There are several ways to avoid or reducechromatic aberration. If stimuli are produced inmultiple channels of a Maxwellian view system,axial chromatic aberration can be corrected byadjusting the optical distances so that stimuli ofdifferent wavelengths are in focus simultane-ously. Another approach is to use an achroma-tizing lens specifically designed to correct axialchromatic aberration of the eye (Bradley et al.,1991). Small pupils can also be used to increasethe depth of focus of the eye, reducing axialchromatic aberration. It is worth noting thoughthat unless the achromatizing lens or small pupilis perfectly aligned it may make matters worse.
The use of interference fringes is an extremeexample of using a small pupil to increasethe depth of focus (Sekiguchi et al., 1993a).Interference fringes are high contrast sinusoidalgratings formed on the retina by shining two laserbeams through the pupil of the eye and allowingthem to interfere with each other. Since all thelight enters the eye through two tiny separatedpupils, depth of focus is very high. The use ofstimuli confined to low spatial frequencies mini-mizes the visual consequences of transversechromatic aberration. At moderate spatial fre-quencies, the magnification and phase of theshort- and long-wavelength gratings can be inde-pendently adjusted to compensate for transversechromatic aberration, although this becomes pro-gressively more difficult with increasing spatialfrequency (Sekiguchi et al., 1993a).
2.4.5 SCATTER
In addition to losses due to diffraction and opti-cal aberrations, retinal image contrast is reducedby light scatter in the anterior optics and retina(Vos, 1963). The sources of scattered light in theeye that contribute to the contrast reduction ofthe retinal image are (1) forward scatter fromthe cornea, (2) forward scatter from the lens, (3)forward scatter from the retina, and (4) back
scatter from the fundus. Roughly a quarter of thescatter comes from the cornea, another quarterfrom the retina, and the remaining half from thelens. Since most of the forward scattering is byrelatively large particles, the scattered light inthe eye does not show a strong wavelengthdependence (Wooten and Geri, 1987).
Scatter reduces contrast principally by addinga veiling illumination to the retinal image thatreduces the ratio of the intensities of the lightestand darkest regions. In the normal eye at highlight levels, scatter is not a major source of imageblur. It becomes important primarily in situa-tions where the observer is detecting a relativelydim object in the presence of a glare source. Agood example from daily life is the driver whofails to detect a pedestrian in the roadway as aresult of glare from oncoming headlights.Scattering tends to increase with age and cansometimes make it difficult for older people todrive at night even though by many measures,such as acuity, their vision remains quite good(Westheimer and Liang, 1995). Performance oncertain psychophysical experiments can also bemeasurably degraded by scatter, although theamount is quite dependent on stimulus condi-tions. For example, the detection threshold of asmall spot of light is noticeably raised by sur-rounding it with a bright annulus. The amountof scatter can be estimated by measuring theilluminance of a superimposed backgroundrequired to degrade detection of the small spot tothe same level caused by the annulus. Undersimilar conditions, the scattered illuminanceranges from 1 to 28% of the illuminance of theretinal image (Shevell and Burroughs, 1988).The smaller values are for conditions in whichthe annulus is farther away from the spot beingdetected and thus scatters less light over it. Ingeneral, it is important to consider whether scat-ter is likely to be a problem for some particularexperiment. For a given stimulus configuration,the amount of scattering can often be measured.
2.5 PHOTORECEPTOR OPTICS
Once light passes through the anterior optics ofthe eye and forms a retinal image, photo-receptors transduce it into a neural signal. The
LIGHT, THE RETINAL IMAGE,AND PHOTORECEPTORS ■
61

morphology of photoreceptors gives them prop-erties similar to fiber optic waveguides. Figures2.19(A) and (C) are vertical sections through thehuman retina (Curcio et al., 1990) that reveal themorphology of foveal and peripheral photo-receptors. The normally transparent layers havebeen stained to make the structure visible. In theliving eye, light would have passed throughthese sections of retina from the bottom to thetop. After passing through the cell layers of theinner retina, light is funneled through the photo-receptor inner segments, the large tapered pro-files in the middle of each image, and into thephotopigment filled outer segments, the thread-like profiles at the top of each image. In thefovea (Figure 2.19A), all of the photoreceptorsare cones, while in peripheral retina (Figure2.19C), narrow cylindrical rods fill in around thelarge tapered cones. We will now examine theindividual photoreceptor as an optical elementin order to see how its aperture affects sensitiv-ity and spatial resolution, how self-screeningwithin the photopigment-filled outer segment
affects spectral sensitivity, and how the morpho-logical properties of individual photoreceptorsconfer directional sensitivity.
2.5.1 THE PHOTORECEPTOR APERTURE
Light first interacts with rods and cones at thephotoreceptor apertures, which are shown faceon (Figures 2.19B and D) with the aid of aNomarski microscope. The aperture is located atthe level of the inner segments where the indicesof refraction inside and outside of the photore-ceptors diverge enough that the rods and conesbegin to capture light (arrows in Figures 2.19Aand C). Evidence for this comes from obser-vations of the retina using Nomarski opticswhich show that the photoreceptors first becomedistinct from their matrix at this level. Addition-ally, the psychophysically measured aperturecovaries with inner segment diameter and notouter segment diameter as a function of retinaleccentricity (Chen et al., 1993). The size of the
■ THE SCIENCE OF COLOR
62
Figure 2.19 The human retina viewed in histological vertical sections and face on using a Nomarskimicroscope (from Curcio et al., 1990). (A) Vertical section through the fovea.The large funnel-shaped profiles arecone inner segments.The thin fibers at the top are the pigment-filled outer segments.The shearing in the outersegments is a tissue-processing artifact. In the intact retina, light would pass through from bottom to top. (B)Nomarski image of the foveal center.All of the profiles are cone inner segments. (C) Vertical section of mid-peripheral retina. Filling in between the cones are the thinner more cylindrical rods. (D) Nomarski image ofmid-peripheral retina.The large profiles are cones and the smaller profiles are rods.The scale bars are 10 lm.The white arrows indicate the level at which the inner segments become optically distinct.
(A)
(C)
(B)
(D)

photoreceptor aperture is important becausecones need to reliably detect small differences inretinal image contrast while at the same timepreserving important spatial detail. These attrib-utes are not easy to accommodate in a singledetector. Spatial resolution is lower for a largeaperture because the aperture pools all of thephotons that fall on it, and in the process, aver-ages away spatial detail. Sensitivity, on the otherhand, is higher for a large aperture that can col-lect more photons. We will now examine thistradeoff between high spatial resolution andhigh sensitivity.
2.5.1.1 Anatomical and psychophysicalmeasurements
Figure 2.20 shows that in the macaque monkey,cone inner segments are about 2.5 lm in diame-ter at the center of the fovea, about 8 lm at 20�of eccentricity, and over 11 lm at the edge oftemporal retina. Rod inner segments (notshown) also increase in diameter from about1.5 lm at their eccentricity of first appearancejust outside the foveola to over 4 lm near thetemporal edge of the retina.
The size of the foveal cone aperture has alsobeen estimated psychophysically. MacLeod et al.(1992) formed interference fringes on the retinaand estimated foveal cone aperture size from thedemodulation of a distortion product as a func-tion of spatial frequency. Measured in this way,the cone aperture was about half the anatomicaldiameter. This measurement probably representsa lower bound on the true size of the cone aper-ture. This difference between the anatomical andfunctional measurements suggests that theanatomical aperture is larger than the functionalaperture.
2.5.1.2 Spatial filteringFor the purposes of evaluating spatial filteringand photon capture, the photoreceptor is oftenmodeled as a circular aperture. The diffractionlimit of the largest aperture estimate, the 2.5 lmanatomical aperture, of a foveal cone is ~150cycles/degree at midspectral wavelengths. Thus,the cone aperture is capable of preserving muchfiner detail than exists in the retinal imagebecause the optics of the eye filter out spatialfrequencies above about 60 cycles/degree.Therefore, under normal viewing conditions, the
spatial resolution of the eye is not limited byfiltering at the cone aperture (Williams, 1985).
Peripheral cone apertures are larger and thusfilter high spatial frequencies more strongly.Even so, aperture filtering does not match opti-cal filtering until cone inner segment diameterreaches 6 lm, which occurs in macaque retina atan eccentricity of about 4�. Even at the edge ofthe retina, spatial frequencies up to 20 cycles/degree would be preserved. However, the aper-ture does reduce the contrast of spatial frequen-cies that alias (see below) (Miller and Bernard,1983) and the close match between the spatialfrequencies that alias and filtering by the aper-ture suggests that detection and resolution ofgratings in peripheral retina is limited byaperture filtering (Thibos et al., 1987).
2.5.1.3 Contrast detectionThe ability to detect contrast is a fundamentalproperty of the visual system and depends on thestrength of the visual signal relative to any noisethat contaminates it. The main source of noise inthe visual optics is due to the quantum nature oflight. The result of this quantum nature is thatthe number of photons that isomerize the pho-topigment molecules in a photoreceptor outersegment will vary from interval to interval. This
LIGHT, THE RETINAL IMAGE,AND PHOTORECEPTORS ■
63
Figure 2.20 Inner segment diameter of macaquemonkey cones as a function of retinal eccentricity indegrees along the horizontal meridian.The filledsymbols represent nasal retina.The open symbolsrepresent temporal retina. Inner segment diameter inmacaque and human does not differ substantially.(After Packer et al., 1989.)
Con
e In
ner
Segm
ent
Dia
met
er (
lm
)
Eccentricity (degrees)
10.0
12.0
8.0
6.0
4.0
2.00 20 30 40 50 60 7010
TemporalNasal
•
••
••
••••••••
••••••••••
variability makes it difficult to distinguishbetween two stimuli of only slightly differentlight output. The probability that a particularnumber of photons will isomerize photopigmentmolecules during a given interval is described bya Poisson distribution,
p(n) � an/exn!
where p is the probability of counting exactly nphotoisomerizations given that, over many rep-etitions of the measurement, an average of xphotoisomerizations occur. The standard devia-tion of the distribution of photoisomerizationsabout x is the square root of x. For example, toreliably detect an intensity difference betweentwo lights 84% of the time, there should be aseparation of 1 standard deviation in the meannumber of photoisomerizations produced. Usingthis criterion, the smallest contrast that can bereliably distinguished, c, will be
c � �x/x
In the case of a single foveal cone, a 100troland stimulus produces approximately 1100photoisomerizations/s(Makous,1997).Assumingonly photon noise, a 50 ms stimulus (approxi-mately equal to the temporal integration time),would produce ~55 photoisomerizations, whichis sufficient to detect contrasts of ~14%. Thus,individual foveal cones are not highly reliablecontrast detectors at low photopic luminances.The visual system is capable of detecting 0.5%contrast or less under ideal circumstances, andthat requires at least 40 000 photoisomeriza-tions. This could be accomplished by increasingretinal light levels to 8 � 105 trolands during that50 ms interval or by combining the signals ofmultiple photoreceptors. The visual system relieson spatial pooling of signals from many photore-ceptors to achieve high contrast sensitivity at lowspatial frequencies.
In summary, individual foveal cones supportexcellent spatial resolution but are good detec-tors of contrast only at higher light levels.Although the cone aperture is much smallerthan required for good spatial resolution, we willsee later that cone sampling also benefits fromsmall, tightly packed cone apertures. Thus theresolution-sensitivity tradeoff has been resolvedin favor of high spatial resolution. At lower light
levels, where spatial resolution is limited by pho-ton scarcity anyway, signals from many photo-receptors need to be combined to improvesensitivity.
2.5.2 AXIAL PHOTOPIGMENT DENSITY
Good visual sensitivity requires that the photonscaptured by the cone apertures isomerize asmuch photopigment as possible. Efficient photonusage is promoted by the ability of photorecep-tors to funnel light through long photopigmentfilled outer segments. This ability is a result ofwaveguide properties. Figure 2.21 is a transmis-sion image of peripheral macaque retina. Theretina was illuminated from the normal direc-tion and the photoreceptors funnelled the lightthrough the inner and outer segments. Eachbright spot is an image of the outer segment tipof a photoreceptor. The image on the left isfocused on the tips of the cones, while theimage on the right is focused on the tips of therods. The intensity of the light emerging fromthe rod outer segment tips averages 1.7 timesthe intensity of the light incident on the rodaperture. This is direct evidence that even therods, which are less funnel shaped than thecones, have the ability to trap and even con-centrate light within their outer segments.
Once the light is confined, long outer seg-ments give a photon a better chance of interact-ing with a pigment molecule. Outer segmentlength varies as a function of retinal location(Polyak, 1957; Hendrickson and Yuodelis, 1984),being longest (45 lm) at the center of the foveaand shortest in the far periphery. The simplestgeometrical calculation predicts that outer seg-ment axial density is the product of outer seg-ment length and the specific density ofphotopigment (0.16/lm, Baylor et al., 1984). Inthe fovea, measurements made with retinal den-sitometers, which collect light that has passedthrough the photopigment twice, are never thishigh (0.72), seldom exceed 0.4 and are com-monly as low as 0.05. This is probably becauseretinal densitometry doesn’t take into accountstray light such as reflection from the membranesurfaces of the outer segments disks (van deKraats et al., 1996) or from the junctions betweenthe inner and outer segments. In peripheral
■ THE SCIENCE OF COLOR
64

retina, on the other hand, photopigment trans-mittance imaging (Packer et al., 1996) hasmeasured axial photopigment densities that areconsistent with the simple calculation.
2.5.3 SELF-SCREENING AND COLORMATCHING
In addition to improving the efficiency withwhich the retina absorbs photons, high axialphotopigment density also broadens the spectralabsorptance of photopigment. This, in turn,broadens the underlying spectral sensitivities ofthe photoreceptors and slightly changes ourcolor vision as assessed by such measurements ascolor matching.
The dependence of the photopigment spectrumon optical density is known as self-screening.Self-screening results because the fraction oflight absorbed depends on wavelength andbecause absorption can never exceed 100% ofthe illuminating light. Assume, for example, thata column of pigment is illuminated axially by abroadband light and that the column of pigmentabsorbs all of the light at 560 nm but only asmall fraction at 450 nm and 650 nm. If morepigment is added, the column still absorbs 100%of the light at 560 nm. However, it absorbs alarger proportion of the light at long and shortwavelengths causing the absorption curve toflatten. The spectrum of the photopigment con-
tained in an outer segment of a particular lengthcan be calculated from the Beer–Lambert law,where
t(k) � 10 �dce(k)
and t is the proportion of incident light transmit-ted (transmittance) as a function of wavelength(k), d is the path length through the pigment, cis pigment concentration and e is the absorptivityof the pigment as a function of wavelength.
This equation shows that the changes in spec-tral sensitivity due to self-screening can be dueeither to changes in the length of the path thatlight takes through the pigment or to changes inthe concentration of the pigment. Outer segmentlength remains constant at any particular retinallocation, but light level can substantially affect theconcentration of unbleached pigment molecules.Figure 2.22 shows that the spectral absorptancefunction of an L cone (spectra from Baylor et al.,1987) narrows when its optical density changesfrom 0.4 log units following dark adaptation to0.01 log units following exposure to a very highlight level. This change in the shape of the absorp-tance spectrum is reflected in the color matchingfunctions which are not the same for a moderatelight level like 1000 trolands as they are for a veryhigh light level like 100 000 trolands (Wyszeckiand Stiles, 1980).
Conversely, photopigment density and absorp-tion spectra have been estimated from color
LIGHT, THE RETINAL IMAGE,AND PHOTORECEPTORS ■
65
Figure 2.21 Transmittance image of an excised patch of macaque monkey retina.The retina is beingilluminated from the normal direction and viewed under a light microscope that is focused in the plane of theouter segment tips.The image on the left is focused on the cones.The image on the right is focused on the rods.(From Packer et al., 1996.)
Cone focus Rod focus
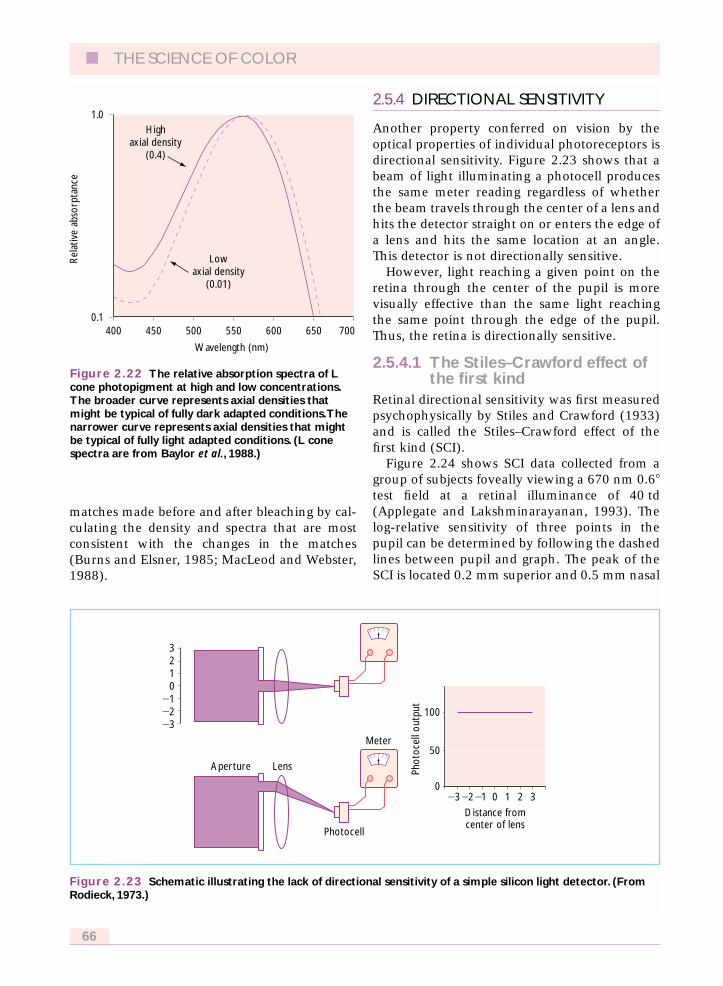
matches made before and after bleaching by cal-culating the density and spectra that are mostconsistent with the changes in the matches(Burns and Elsner, 1985; MacLeod and Webster,1988).
2.5.4 DIRECTIONAL SENSITIVITY
Another property conferred on vision by theoptical properties of individual photoreceptors isdirectional sensitivity. Figure 2.23 shows that abeam of light illuminating a photocell producesthe same meter reading regardless of whetherthe beam travels through the center of a lens andhits the detector straight on or enters the edge ofa lens and hits the same location at an angle.This detector is not directionally sensitive.
However, light reaching a given point on theretina through the center of the pupil is morevisually effective than the same light reachingthe same point through the edge of the pupil.Thus, the retina is directionally sensitive.
2.5.4.1 The Stiles–Crawford effect ofthe first kind
Retinal directional sensitivity was first measuredpsychophysically by Stiles and Crawford (1933)and is called the Stiles–Crawford effect of thefirst kind (SCI).
Figure 2.24 shows SCI data collected from agroup of subjects foveally viewing a 670 nm 0.6�test field at a retinal illuminance of 40 td(Applegate and Lakshminarayanan, 1993). Thelog-relative sensitivity of three points in thepupil can be determined by following the dashedlines between pupil and graph. The peak of theSCI is located 0.2 mm superior and 0.5 mm nasal
■ THE SCIENCE OF COLOR
66
Figure 2.22 The relative absorption spectra of Lcone photopigment at high and low concentrations.The broader curve represents axial densities thatmight be typical of fully dark adapted conditions.Thenarrower curve represents axial densities that mightbe typical of fully light adapted conditions. (L conespectra are from Baylor et al., 1988.)
Rel
ativ
e ab
sorp
tanc
e
Wavelength (nm)
1.0
0.1400 500 550 600 650 700450
Highaxial density
(0.4)
Lowaxial density
(0.01)
Figure 2.23 Schematic illustrating the lack of directional sensitivity of a simple silicon light detector. (FromRodieck, 1973.)
Phot
ocel
l out
put
Distance fromcenter of lens
Aperture Lens
Photocell
Meter
�3
�3�2�1
0123
�2�1 0 1 2 3
100
50
0
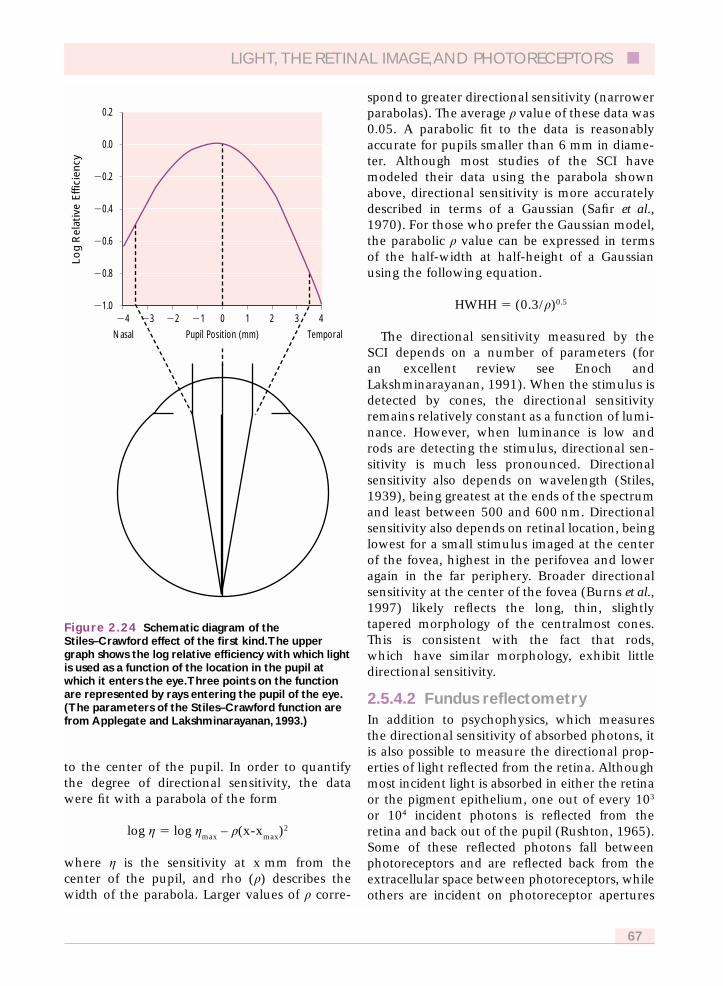
to the center of the pupil. In order to quantifythe degree of directional sensitivity, the datawere fit with a parabola of the form
log g � log gmax
– q(x-xmax
)2
where g is the sensitivity at x mm from thecenter of the pupil, and rho (q) describes thewidth of the parabola. Larger values of q corre-
spond to greater directional sensitivity (narrowerparabolas). The average q value of these data was0.05. A parabolic fit to the data is reasonablyaccurate for pupils smaller than 6 mm in diame-ter. Although most studies of the SCI havemodeled their data using the parabola shownabove, directional sensitivity is more accuratelydescribed in terms of a Gaussian (Safir et al.,1970). For those who prefer the Gaussian model,the parabolic q value can be expressed in termsof the half-width at half-height of a Gaussianusing the following equation.
HWHH � (0.3/q)0.5
The directional sensitivity measured by theSCI depends on a number of parameters (foran excellent review see Enoch andLakshminarayanan, 1991). When the stimulus isdetected by cones, the directional sensitivityremains relatively constant as a function of lumi-nance. However, when luminance is low androds are detecting the stimulus, directional sen-sitivity is much less pronounced. Directionalsensitivity also depends on wavelength (Stiles,1939), being greatest at the ends of the spectrumand least between 500 and 600 nm. Directionalsensitivity also depends on retinal location, beinglowest for a small stimulus imaged at the centerof the fovea, highest in the perifovea and loweragain in the far periphery. Broader directionalsensitivity at the center of the fovea (Burns et al.,1997) likely reflects the long, thin, slightlytapered morphology of the centralmost cones.This is consistent with the fact that rods,which have similar morphology, exhibit littledirectional sensitivity.
2.5.4.2 Fundus reflectometryIn addition to psychophysics, which measuresthe directional sensitivity of absorbed photons, itis also possible to measure the directional prop-erties of light reflected from the retina. Althoughmost incident light is absorbed in either the retinaor the pigment epithelium, one out of every 103
or 104 incident photons is reflected from theretina and back out of the pupil (Rushton, 1965).Some of these reflected photons fall betweenphotoreceptors and are reflected back from theextracellular space between photoreceptors, whileothers are incident on photoreceptor apertures
LIGHT, THE RETINAL IMAGE,AND PHOTORECEPTORS ■
67
Figure 2.24 Schematic diagram of theStiles–Crawford effect of the first kind.The uppergraph shows the log relative efficiency with which lightis used as a function of the location in the pupil atwhich it enters the eye.Three points on the functionare represented by rays entering the pupil of the eye.(The parameters of the Stiles–Crawford function arefrom Applegate and Lakshminarayanan, 1993.)
Log
Rel
ativ
e Ef
ficie
ncy
Pupil Position (mm)Nasal Temporal
0.2
0.0
�1.0
�0.8
�0.6
�0.4
�0.2
�4 �2 �1 0 1 2 3 4�3
and are reflected back down the axis of the pho-toreceptor. Those reflected photons that missedthe photoreceptors have little directional charac-ter and uniformly fill the pupil, while those pho-tons reflected back down the axes of thephotoreceptors leave the eye near the center ofthe pupil (van Blockland and van Norren, 1986).Each photoreceptor thus acts like a tiny flash-light, emitting light in a cone whose widthdepends on its optical properties (Snyder, 1969).Furthermore, all of the flashlights are pointedtowards the center of the pupil (Laties andEnoch, 1971; Roorda and Williams, 2002). Thus,the directional sensitivity of the retina can beestimated by measuring the width of the inten-sity profile of the light leaving the eye throughthe center of the pupil.
Directional sensitivity measurements madewith fundus reflectometry have foveal q valuesthat are on average about twice those measuredpsychophysically. The Stiles–Crawford effect is apsychophysical measurement of the directionalityof photons incident on the photoreceptors andabsorbed by photopigment, while fundus reflec-tometry measures the directionality of photonsreflected from the retina. Two factors explain alarge fraction of the differences in directionalsensitivity measured with the two techniques (Heet al., 1999). First, part of the light captured bycone inner segments leaks out of the outer seg-ments and is not waveguided back out of thephotoreceptor that captured it. This reflected lighthas less power contained in higher order modes(see next section) and as a result is emitted in anarrower cone. Second, individual cones are sosmall that the light reflected back from them iscoherent. Slight differences in cone length intro-duce phase differences in the light from neighbor-ing cones. The resulting interference narrows theangular extent of the light in the pupil. Thusalthough both the behavioral and optical methodsof measuring the directional sensitivity of theretina tap into the waveguide behavior of photo-receptors, the property responsible for retinaldirectional sensitivity, they do so in slightlydifferent ways.
2.5.4.3 The photoreceptor as anoptical waveguide
The SCI is known to be retinal in origin andmediated by the waveguide properties of pho-
toreceptors (Enoch and Lakshminarayanan,1991). An optical waveguide has a core of highrefractive index surrounded by a cladding oflower refractive index. In a photoreceptor, thecytoplasm of the inner and outer segmentsserves as the high index core and the cell mem-brane and surrounding fluid serve as thecladding. Because photoreceptors have diame-ters near the wavelength of light, their opticalbehavior is better explained using wave opticsrather than geometrical optics (Toraldo diFrancia, 1949).
Light waves incident on a photoreceptor aper-ture propagate along the length of the inner andouter segments. These waves constructively anddestructively reflect from the cell membrane,setting up stationary energy patterns or modes inand around the photoreceptor. These modes areanalogous to the standing waves set up in avibrating string. The parameter
V � pd/k (n12 – n
22)0.5
indicates which modes can be supported by acylindrical waveguide, where d is diameter, k iswavelength, and n
1and n
2are the indices of
refraction of the core and cladding respectively.When V is large, several modes may exist simul-taneously. Images of modal patterns observed invertebrate photoreceptors can be found in Enochand Lakshminarayanan (1991). The energy of amode exists both inside and outside of the pho-toreceptor, but only the energy within the pho-toreceptor interacts with photopigment. As Vincreases, the proportion of energy within thephotoreceptor increases relative to that outside.
Each mode is associated with a particular pat-tern of directional sensitivity. As the angle ofincidence of the illuminating light increases, lessenergy is coupled into a mode. If the photore-ceptor supports multiple modes, increasing theangle of incidence causes the higher order modesto be more efficiently stimulated. For any givenV, the higher order modes also have a smallerpercentage of their energy within the photopig-ment. Therefore, since the directional sensitivityof the photoreceptor is the sum of the sensitivi-ties of the individual modes, increasing the angleof incidence reduces the amount of light that caninteract with the photopigment.
Models which incorporate these features and
■ THE SCIENCE OF COLOR
68
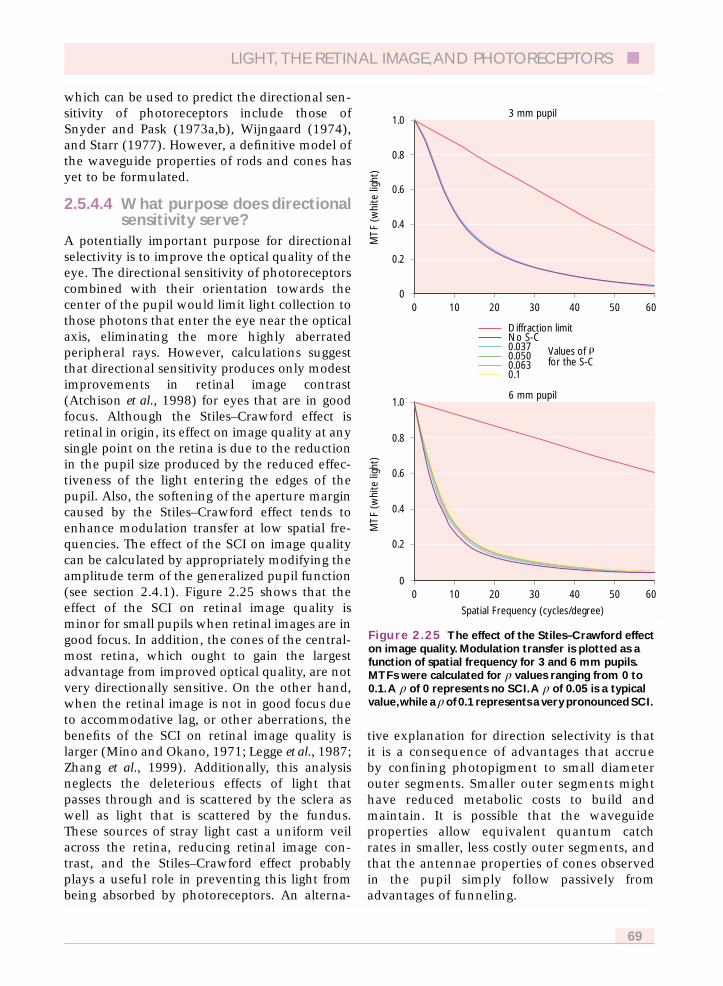
which can be used to predict the directional sen-sitivity of photoreceptors include those ofSnyder and Pask (1973a,b), Wijngaard (1974),and Starr (1977). However, a definitive model ofthe waveguide properties of rods and cones hasyet to be formulated.
2.5.4.4 What purpose does directionalsensitivity serve?
A potentially important purpose for directionalselectivity is to improve the optical quality of theeye. The directional sensitivity of photoreceptorscombined with their orientation towards thecenter of the pupil would limit light collection tothose photons that enter the eye near the opticalaxis, eliminating the more highly aberratedperipheral rays. However, calculations suggestthat directional sensitivity produces only modestimprovements in retinal image contrast(Atchison et al., 1998) for eyes that are in goodfocus. Although the Stiles–Crawford effect isretinal in origin, its effect on image quality at anysingle point on the retina is due to the reductionin the pupil size produced by the reduced effec-tiveness of the light entering the edges of thepupil. Also, the softening of the aperture margincaused by the Stiles–Crawford effect tends toenhance modulation transfer at low spatial fre-quencies. The effect of the SCI on image qualitycan be calculated by appropriately modifying theamplitude term of the generalized pupil function(see section 2.4.1). Figure 2.25 shows that theeffect of the SCI on retinal image quality isminor for small pupils when retinal images are ingood focus. In addition, the cones of the central-most retina, which ought to gain the largestadvantage from improved optical quality, are notvery directionally sensitive. On the other hand,when the retinal image is not in good focus dueto accommodative lag, or other aberrations, thebenefits of the SCI on retinal image quality islarger (Mino and Okano, 1971; Legge et al., 1987;Zhang et al., 1999). Additionally, this analysisneglects the deleterious effects of light thatpasses through and is scattered by the sclera aswell as light that is scattered by the fundus.These sources of stray light cast a uniform veilacross the retina, reducing retinal image con-trast, and the Stiles–Crawford effect probablyplays a useful role in preventing this light frombeing absorbed by photoreceptors. An alterna-
tive explanation for direction selectivity is thatit is a consequence of advantages that accrueby confining photopigment to small diameterouter segments. Smaller outer segments mighthave reduced metabolic costs to build andmaintain. It is possible that the waveguideproperties allow equivalent quantum catchrates in smaller, less costly outer segments, andthat the antennae properties of cones observedin the pupil simply follow passively fromadvantages of funneling.
LIGHT, THE RETINAL IMAGE,AND PHOTORECEPTORS ■
69
Figure 2.25 The effect of the Stiles–Crawford effecton image quality. Modulation transfer is plotted as afunction of spatial frequency for 3 and 6 mm pupils.MTFs were calculated for q values ranging from 0 to0.1.A q of 0 represents no SCI.A q of 0.05 is a typicalvalue,while a q of 0.1 represents a very pronounced SCI.
MT
F (w
hite
ligh
t)
3 mm pupil
0.8
1.0
0.6
0.2
0.4
00 10 30 40 50 6020
Diffraction limitNo S-C0.0370.0500.063
Values of for the S-C
0.1
Spatial Frequency (cycles/degree)
MT
F (w
hite
ligh
t)
6 mm pupil
0.8
1.0
0.6
0.2
0.4
00 10 30 40 50 6020
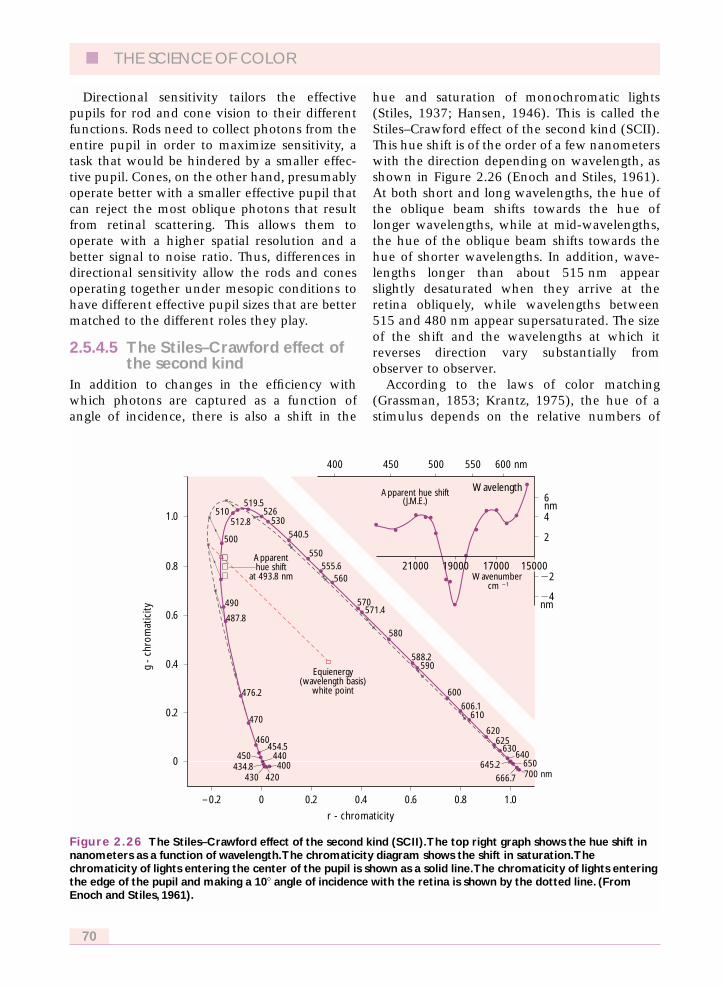
Directional sensitivity tailors the effectivepupils for rod and cone vision to their differentfunctions. Rods need to collect photons from theentire pupil in order to maximize sensitivity, atask that would be hindered by a smaller effec-tive pupil. Cones, on the other hand, presumablyoperate better with a smaller effective pupil thatcan reject the most oblique photons that resultfrom retinal scattering. This allows them tooperate with a higher spatial resolution and abetter signal to noise ratio. Thus, differences indirectional sensitivity allow the rods and conesoperating together under mesopic conditions tohave different effective pupil sizes that are bettermatched to the different roles they play.
2.5.4.5 The Stiles–Crawford effect ofthe second kind
In addition to changes in the efficiency withwhich photons are captured as a function ofangle of incidence, there is also a shift in the
hue and saturation of monochromatic lights(Stiles, 1937; Hansen, 1946). This is called theStiles–Crawford effect of the second kind (SCII).This hue shift is of the order of a few nanometerswith the direction depending on wavelength, asshown in Figure 2.26 (Enoch and Stiles, 1961).At both short and long wavelengths, the hue ofthe oblique beam shifts towards the hue oflonger wavelengths, while at mid-wavelengths,the hue of the oblique beam shifts towards thehue of shorter wavelengths. In addition, wave-lengths longer than about 515 nm appearslightly desaturated when they arrive at theretina obliquely, while wavelengths between515 and 480 nm appear supersaturated. The sizeof the shift and the wavelengths at which itreverses direction vary substantially fromobserver to observer.
According to the laws of color matching(Grassman, 1853; Krantz, 1975), the hue of astimulus depends on the relative numbers of
■ THE SCIENCE OF COLOR
70
Figure 2.26 The Stiles–Crawford effect of the second kind (SCII).The top right graph shows the hue shift innanometers as a function of wavelength.The chromaticity diagram shows the shift in saturation.Thechromaticity of lights entering the center of the pupil is shown as a solid line.The chromaticity of lights enteringthe edge of the pupil and making a 10� angle of incidence with the retina is shown by the dotted line. (FromEnoch and Stiles, 1961).
g -
chro
mat
icity
r - chromaticity
0.4
0.6
Equienergy(wavelength basis)
white point
Wavenumber cm �1
460454.5
450434.8
430 420
440400
470
476.2
487.8
490
500
510512.8
519.5526
530
540.5
550555.6
560
570571.4
580
Apparent hue shift(J.M.E.)
Wavelength
588.2590
600
606.1610
620625
630640
645.2 650
666.7 700 nm
Apparenthue shift
at 493.8 nm0.8
1.0
6nm4
2
�2
�4nm
0.2
0
–0.2 0.2 1.0
600 nm550500450400
0.8
21000 17000 15000
0.60.40
19000
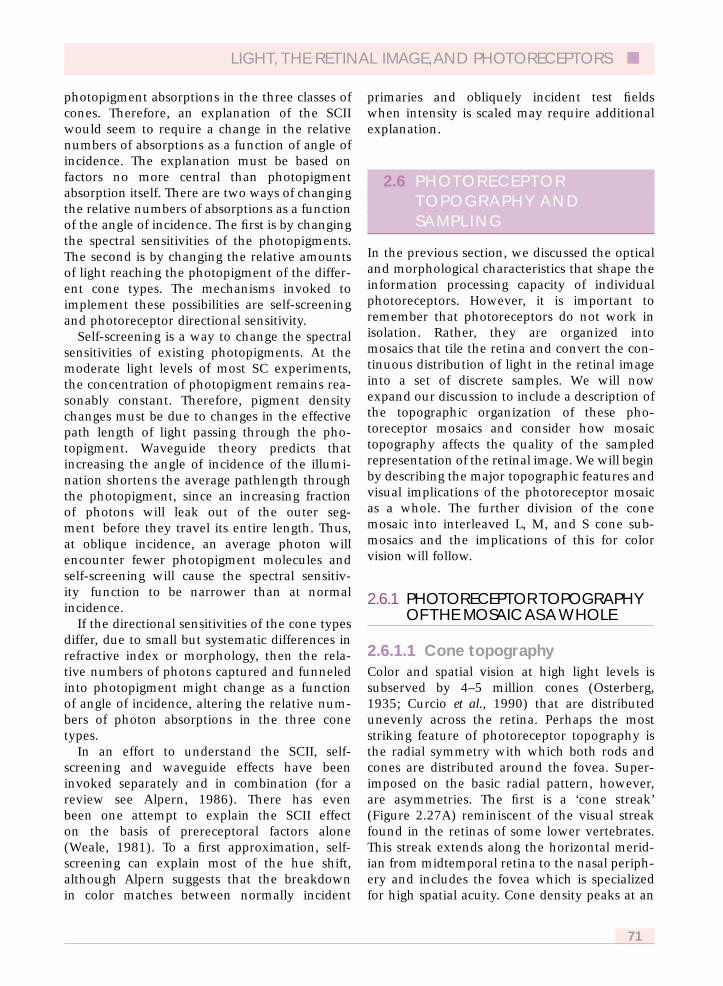
photopigment absorptions in the three classes ofcones. Therefore, an explanation of the SCIIwould seem to require a change in the relativenumbers of absorptions as a function of angle ofincidence. The explanation must be based onfactors no more central than photopigmentabsorption itself. There are two ways of changingthe relative numbers of absorptions as a functionof the angle of incidence. The first is by changingthe spectral sensitivities of the photopigments.The second is by changing the relative amountsof light reaching the photopigment of the differ-ent cone types. The mechanisms invoked toimplement these possibilities are self-screeningand photoreceptor directional sensitivity.
Self-screening is a way to change the spectralsensitivities of existing photopigments. At themoderate light levels of most SC experiments,the concentration of photopigment remains rea-sonably constant. Therefore, pigment densitychanges must be due to changes in the effectivepath length of light passing through the pho-topigment. Waveguide theory predicts thatincreasing the angle of incidence of the illumi-nation shortens the average pathlength throughthe photopigment, since an increasing fractionof photons will leak out of the outer seg-ment before they travel its entire length. Thus,at oblique incidence, an average photon willencounter fewer photopigment molecules andself-screening will cause the spectral sensitiv-ity function to be narrower than at normalincidence.
If the directional sensitivities of the cone typesdiffer, due to small but systematic differences inrefractive index or morphology, then the rela-tive numbers of photons captured and funneledinto photopigment might change as a functionof angle of incidence, altering the relative num-bers of photon absorptions in the three conetypes.
In an effort to understand the SCII, self-screening and waveguide effects have beeninvoked separately and in combination (for areview see Alpern, 1986). There has evenbeen one attempt to explain the SCII effecton the basis of prereceptoral factors alone(Weale, 1981). To a first approximation, self-screening can explain most of the hue shift,although Alpern suggests that the breakdownin color matches between normally incident
primaries and obliquely incident test fieldswhen intensity is scaled may require additionalexplanation.
2.6 PHOTORECEPTOR TOPOGRAPHY ANDSAMPLING
In the previous section, we discussed the opticaland morphological characteristics that shape theinformation processing capacity of individualphotoreceptors. However, it is important toremember that photoreceptors do not work inisolation. Rather, they are organized intomosaics that tile the retina and convert the con-tinuous distribution of light in the retinal imageinto a set of discrete samples. We will nowexpand our discussion to include a description ofthe topographic organization of these pho-toreceptor mosaics and consider how mosaictopography affects the quality of the sampledrepresentation of the retinal image. We will beginby describing the major topographic features andvisual implications of the photoreceptor mosaicas a whole. The further division of the conemosaic into interleaved L, M, and S cone sub-mosaics and the implications of this for colorvision will follow.
2.6.1 PHOTORECEPTOR TOPOGRAPHYOF THE MOSAIC AS A WHOLE
2.6.1.1 Cone topographyColor and spatial vision at high light levels issubserved by 4–5 million cones (Osterberg,1935; Curcio et al., 1990) that are distributedunevenly across the retina. Perhaps the moststriking feature of photoreceptor topography isthe radial symmetry with which both rods andcones are distributed around the fovea. Super-imposed on the basic radial pattern, however,are asymmetries. The first is a ‘cone streak’(Figure 2.27A) reminiscent of the visual streakfound in the retinas of some lower vertebrates.This streak extends along the horizontal merid-ian from midtemporal retina to the nasal periph-ery and includes the fovea which is specializedfor high spatial acuity. Cone density peaks at an
LIGHT, THE RETINAL IMAGE,AND PHOTORECEPTORS ■
71

average of 200 000 cones/mm2 at the center ofthe fovea, then falls sharply to one half maximumat �0.2� of eccentricity, to one-tenth maximumat 1� of eccentricity and to 5000 cones/mm2 orless near the edge of the retina (Figure 2.28).Cone distribution is also nasotemporallyasymmetric. Overall, there are about 25% morecones in nasal than temporal retina. This asym-metry is not apparent near the fovea, butbecomes more pronounced with increasingeccentricity.
Foveal cones are set in a lattice which has anapproximately triangular packing arrangement(see Figure 2.19B). The mean center to centerspacing of the central-most cones has beenmeasured anatomically at 2.24 lm (27» of arc)and interferometrically (see below) in the livinghuman eye at 2.7 lm (32» of arc) (Williams,1988). The 60� symmetry of the triangular latticewas apparent in both types of measurements.Triangular packing allows the foveal cones tomaximize the proportion of retinal surface cov-ered with photoreceptor apertures while retain-ing their round shape. Even so, in the macaquemonkey, anatomical measurements indicate that~15% of the retinal surface is space betweencone inner segments (Packer et al., 1989). In fact,the resulting 15% loss of photons between conesis probably a lower limit since the cone aperture
measured psychophysically is smaller yet, pre-dicting larger spaces between cones. Further evi-dence that photons do, in fact, fall betweencones comes from images of the cone mosaicmade after neutralizing the optical aberrations ofthe eye (see below, Figure 2.36). In the originalimages, cones are bright spots separated by darkregions. Even in the presence of residual opticalblurring that redistributes photons from thebright spots into the dark areas, photons still dis-appear into the spaces between cones. Not all ofthe photons that fall between photoreceptors arelost to vision, however, since some pass throughthe walls of neighboring outer segments intophotopigment or pass through the walls ofneighboring inner segments at an angle shallowenough to be recaptured (Chen and Makous,1989).
2.6.1.2 Rod topographyInterspersed around the cones of the humanretina are about 90 million rods (Osterberg,1935; Curcio et al., 1990) which subserve visionat low light levels (see Figure 2.19D). The regionof highest rod density is in a ‘rod ring’ aroundthe fovea at an eccentricity of about 12�(3.6 mm) (Figure 2.27B). In the average eye, thepeak rod density of 180 000 rods/mm2 occurs onthe rod ring in superior retina just to the nasal
■ THE SCIENCE OF COLOR
72
Figure 2.27 Color topographic maps of cone (A) and rod (B) numerical density.The density scale, shownunder each map, is photoreceptors/mm2 � 1000. Blue represents low densities and red represents high densities.In A, areas in white exceed 16 000 photoreceptors/mm2.The rings are spaced at intervals of about 20�.The foveais at the center of the inner ring. Nasal and temporal retina are to the left and right of the fovea respectively.(From Curcio et al., 1990.)
0 4 16 200 0 100 200
(A) (B)

side of the fovea. Rods are absent at the center ofthe human fovea and sparse at the center of themonkey fovea (Packer et al., 1989). The absenceof foveal rods can be demonstrated by notingthat a dim spot of light in a dark room is moreeasily detected a few degrees away from the cen-ter of fixation where rod density is high. In thehuman retina, the diameter of the rod-free zone,defined to be the region with fewer than 1000rods/mm2 averages 1.25� (0.375 mm). At theedge of the retina, rod density declines to 40–60thousand rods/mm2. Rod density along the hor-izontal meridians as a function of eccentricity isplotted in Figure 2.28(C) below.
Because the rod sampling rate is so high, espe-cially in peripheral vision, and their signals areimmediately pooled, the discrete nature of therod mosaic is not very important for spatialvision. However, the rod system operates at lowlight levels where every photon counts.Therefore, the tight packing of the rods mini-mizes the intervening spaces into which photonscould be lost. We have estimated the proportionof photons lost by measuring the proportion oflight absorbed in a patch of rod-dominatedperipheral monkey retina similar to that shownin Figure 2.21. The proportion of light absorbedacross the whole patch was calculated by takingthe ratio of the light transmitted before and afterbleaching the photopigment and averagingacross all of the pixels in the image. The axialabsorptance of individual rods was estimated byaveraging only the pixels corresponding to rodouter segment tips. The ratio of the proportion ofincident photons absorbed by a patch of retinaand the axial absorptance of the individual rodsin that patch suggests that at least 30% of thephotons incident on peripheral retina are lostbetween the rods.
LIGHT, THE RETINAL IMAGE,AND PHOTORECEPTORS ■
73
(A)
(B)
(C)
Con
e D
ensi
ty (
cone
s/m
m2 �
100
0)C
one
Den
sity
(co
nes/
mm
2 � 1
000)
Rod
Den
sity
(ro
ds/m
m2 �
100
0)
Eccentricity (mm)
150
100
50
00 0.2 0.6 0.8 10.4
200
20
15
10
5
05 15 20 2510
25
140
120
100
60
80
400 5 10
Eccentricity (mm)
Eccentricity (mm)
15 20
160
•
•
••
•• • • • • • •
•••••••••••••••••••
••
••
•
•
•••
••
••
••
••
••
••
Figure 2.28 Photoreceptor density along thehorizontal meridian of the human retina. Filledsymbols are nasal retina. Open symbols are temporalretina. (A) Cone density (cones � 1000/mm2) from thefoveal center to 1 mm of eccentricity. (B) Conedensity (cones � 1000/mm2) from 1 to 22 mm ofeccentricity. (C) Rod density (rods � 1000/mm2). Incentral retina, the conversion factor 0.29 mm/degreewill convert retinal eccentricity in millimeters toretinal eccentricity in visual degrees. (From Curcio etal., 1990.)

2.6.2 PHOTOMETRIC QUANTUMEFFICIENCY
Ideally, all of the photons incident on the corneawould be transduced into visual signals. In fact,however, only a small proportion of the incidentphotons are visually effective. There are severalsources of photon loss in the ocular media. Somephotons are absorbed by pigments in the anterioroptics of the eye, others fall uselessly between thephotoreceptors, and yet others pass through thephotopigment without isomerizing a pigmentmolecule. In order to estimate the combinedeffects of all the sources of light loss, it is possibleto calculate the proportion of quanta incident onthe cornea that actually isomerizes a photopig-ment molecule and is transduced into a neuralsignal. This proportion represents the opticalefficiency of the visual system and is called photo-metric quantum efficiency (Pelli, 1990).
Photometric quantum efficiency has tradition-ally been estimated from the product of (1) thefraction of photons incident on the cornea thatare transmitted by the ocular media, (2) the frac-tion of photons arriving at the retina that arecaptured by photoreceptors, (3) the fraction ofcaptured photons that are absorbed by photopig-ment, and (4) the fraction of absorbed photonsthat isomerize photopigment molecules (0.67;Dartnall, 1968). Estimates of photometric quan-tum efficiency at absolute threshold based on theproduct of the above factors range between 11%and 48% in rod-dominated peripheral retina(Sharpe, 1990). We made a more direct meas-urement of the proportion of incident light actu-ally absorbed by the retina in an attempt toeliminate some of the uncertainties inherent inestimating the optical properties of individualphotoreceptors. Photometric quantum efficiencywas ~12%, near the lower end of the range ofthe earlier estimates. Thus, the combined lossesin the anterior optics and photoreceptor mosaicare no less than 50% and probably closer to 90%.
If photometric quantum efficiency at absolutethreshold were the same as the overall quantumefficiency of vision at absolute threshold, then allof the information loss in the visual system couldbe attributed to the anterior optics and the pho-toreceptor mosaic. However, all measurementsof the overall quantum efficiency of vision atabsolute threshold are less than 10% (Barlow,
1977; Hallett, 1987; Pelli, 1990). Therefore, pho-tometric quantum efficiency is higher than theoverall quantum efficiency of vision whichshows that neural processing further degradesthe visual signal over and above the lossesincurred in the anterior optics and the retina.Assuming an overall quantum efficiency of 10%at absolute threshold and a photometric quan-tum efficiency of 12%, the efficiency with whichthe neural visual system can process the visualinformation and detect the stimulus can be ashigh as 80%. In other words, the physical limitto performance is dominated by the quantalnature of light. However, if the stimulus is madelarger or of longer duration or presented on abackground, overall quantum efficiency maydrop by several orders of magnitude while pho-tometric quantum efficiency remains about thesame, implying that neural efficiency must alsodrop by several orders of magnitude. In short,under most conditions, the physical limit to per-formance is dominated not by the quantumnature of light but by inefficiency in neuralprocessing.
2.6.3 SAMPLING THEORY
The fidelity with which the nervous system canrepresent the retinal image depends critically onthe sampling characteristics of the photoreceptormosaic. According to the sampling theorem(Shannon, 1949), to reconstruct a one-dimen-sional signal from a set of samples, the samplingrate must be equal to or greater than twice thehighest frequency in the signal. Applying thistheorem to the cone mosaic, with a given spac-ing between receptors, the highest spatial fre-quency that is adequately sampled, known asthe Nyquist limit, is half the sampling frequencyof the mosaic. Of course the cone mosaic is atwo-dimensional sampling array, for which thereis a corresponding two-dimensional samplingtheorem (Pettersen and Middleton, 1962). Infact, it is not straightforward to extrapolate fromthe one-dimensional case illustrated here to thetwo-dimensional sampling performed by thecone mosaic because of the many ways in whichthe spatial frequency response plane can be tiledby frequency domains. Nevertheless, in theinterests of brevity, we will adopt the basic intu-itions derived from the one-dimensional case.
■ THE SCIENCE OF COLOR
74
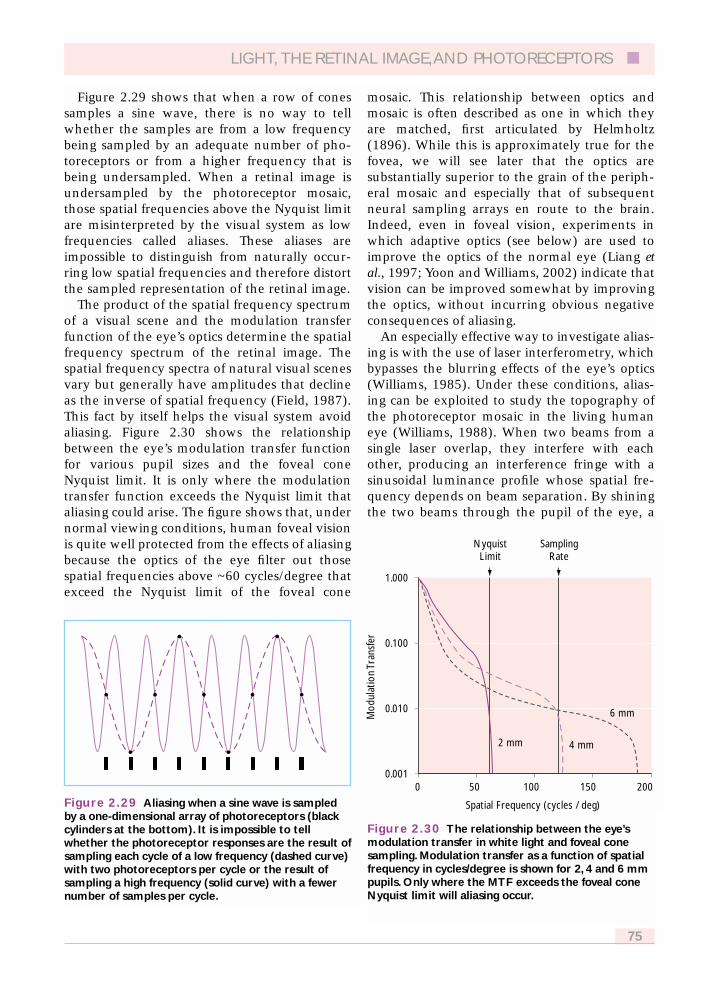
Figure 2.29 shows that when a row of conessamples a sine wave, there is no way to tellwhether the samples are from a low frequencybeing sampled by an adequate number of pho-toreceptors or from a higher frequency that isbeing undersampled. When a retinal image isundersampled by the photoreceptor mosaic,those spatial frequencies above the Nyquist limitare misinterpreted by the visual system as lowfrequencies called aliases. These aliases areimpossible to distinguish from naturally occur-ring low spatial frequencies and therefore distortthe sampled representation of the retinal image.
The product of the spatial frequency spectrumof a visual scene and the modulation transferfunction of the eye’s optics determine the spatialfrequency spectrum of the retinal image. Thespatial frequency spectra of natural visual scenesvary but generally have amplitudes that declineas the inverse of spatial frequency (Field, 1987).This fact by itself helps the visual system avoidaliasing. Figure 2.30 shows the relationshipbetween the eye’s modulation transfer functionfor various pupil sizes and the foveal coneNyquist limit. It is only where the modulationtransfer function exceeds the Nyquist limit thataliasing could arise. The figure shows that, undernormal viewing conditions, human foveal visionis quite well protected from the effects of aliasingbecause the optics of the eye filter out thosespatial frequencies above ~60 cycles/degree thatexceed the Nyquist limit of the foveal cone
mosaic. This relationship between optics andmosaic is often described as one in which theyare matched, first articulated by Helmholtz(1896). While this is approximately true for thefovea, we will see later that the optics aresubstantially superior to the grain of the periph-eral mosaic and especially that of subsequentneural sampling arrays en route to the brain.Indeed, even in foveal vision, experiments inwhich adaptive optics (see below) are used toimprove the optics of the normal eye (Liang etal., 1997; Yoon and Williams, 2002) indicate thatvision can be improved somewhat by improvingthe optics, without incurring obvious negativeconsequences of aliasing.
An especially effective way to investigate alias-ing is with the use of laser interferometry, whichbypasses the blurring effects of the eye’s optics(Williams, 1985). Under these conditions, alias-ing can be exploited to study the topography ofthe photoreceptor mosaic in the living humaneye (Williams, 1988). When two beams from asingle laser overlap, they interfere with eachother, producing an interference fringe with asinusoidal luminance profile whose spatial fre-quency depends on beam separation. By shiningthe two beams through the pupil of the eye, a
LIGHT, THE RETINAL IMAGE,AND PHOTORECEPTORS ■
75
Figure 2.29 Aliasing when a sine wave is sampledby a one-dimensional array of photoreceptors (blackcylinders at the bottom). It is impossible to tellwhether the photoreceptor responses are the result ofsampling each cycle of a low frequency (dashed curve)with two photoreceptors per cycle or the result ofsampling a high frequency (solid curve) with a fewernumber of samples per cycle.
•
• •
• • • •
••
Figure 2.30 The relationship between the eye’smodulation transfer in white light and foveal conesampling. Modulation transfer as a function of spatialfrequency in cycles/degree is shown for 2, 4 and 6 mmpupils. Only where the MTF exceeds the foveal coneNyquist limit will aliasing occur.
Mod
ulat
ion
Tran
sfer
Spatial Frequency (cycles / deg)
0.100
0.010
0.0010 50 150 200100
1.000
NyquistLimit
SamplingRate
6 mm
4 mm2 mm

sinusoidal grating is formed on the retina.Because the beams are largely unaffected by theoptics, the spatial frequency of the high contrastinterference fringe is limited only by the size ofthe pupil. In the case of an 8 mm pupil, the cut-off exceeds 200 cycles/degree. Under these con-ditions, many observers report seeing a lowfrequency moiré pattern not present in the orig-inal image (Byram, 1944, Campbell and Green,1965; Williams, 1985). These studies supportearlier observations by Bergmann (1858), whoreported seeing aliasing-like effects when view-ing gratings normally, without the benefit ofinterferometry.
A highly regular array of sampling elementsproduces aliases that are also highly regular,while aliasing by a disordered array takes theform of noise. In the case of the foveal cones,the packing geometry is regular enough to pro-duce moiré patterns that look like zebra stripes.In some observers, the zebra stripes are clearenough to be sketched (Figure 2.31). The spac-ing of the photoreceptors can then be measuredby noting the spatial frequency at which thezebra stripes have the coarsest appearance. Thisoccurs when fringe spacing is matched to thespacing of the rows of the cone mosaic. In thehuman fovea, the spatial frequency at whichthe zebra stripes appear coarsest corresponds totwice the cone Nyquist frequency or about 120cycles/degree. In a few observers, the fovealcone mosaic has enough regularity to exhibitthe rotational symmetry inherent in a triangu-lar lattice. In these observers, zebra stripecoarseness varies as a function of the orienta-tion of the interference fringe relative to thecone mosaic, being greatest every 60� when thebars of the fringe align with the rows ofphotoreceptors.
2.6.4 OFF-AXIS IMAGE QUALITY ANDRETINAL SAMPLING
Under normal viewing conditions, foveal visionis protected from aliasing by optical filtering.However, Figure 2.32 shows that the same is nottrue for peripheral vision because optical band-width declines only slowly with increasingeccentricity (Jennings and Charman, 1981;Navarro et al., 1993; Williams et al., 1996) whilethe center to center spacing of the cones
increases rapidly. At just a few degrees of retinaleccentricity, the Nyquist limit of the cone mosaic(dashed line) drops below the optical cutoff(filled symbols). We have used as an estimate ofthe optical cutoff, the spatial frequency at whichthe modulation transfer function drops to 0.10,using the data of Williams et al. (1996) for a3 mm pupil. Energy at spatial frequencies abovethe Nyquist limit but below the optical cutoff canthen produce detectable aliasing under normalviewing conditions (Smith and Cass, 1987;Thibos et al., 1987; Anderson and Hess, 1990;Galvin and Williams, 1992; Artal et al., 1995;Thibos et al., 1996).
The parvocellular ganglion cell mosaic, whichsubserves our detailed spatial vision, also samples
■ THE SCIENCE OF COLOR
76
Figure 2.31 A sketch of the moiré patterns seen bytwo observers while viewing a high contrast 120cycles/degree interference fringe.The scale barrepresents 1 degree of visual angle. (From Williams,1985.)
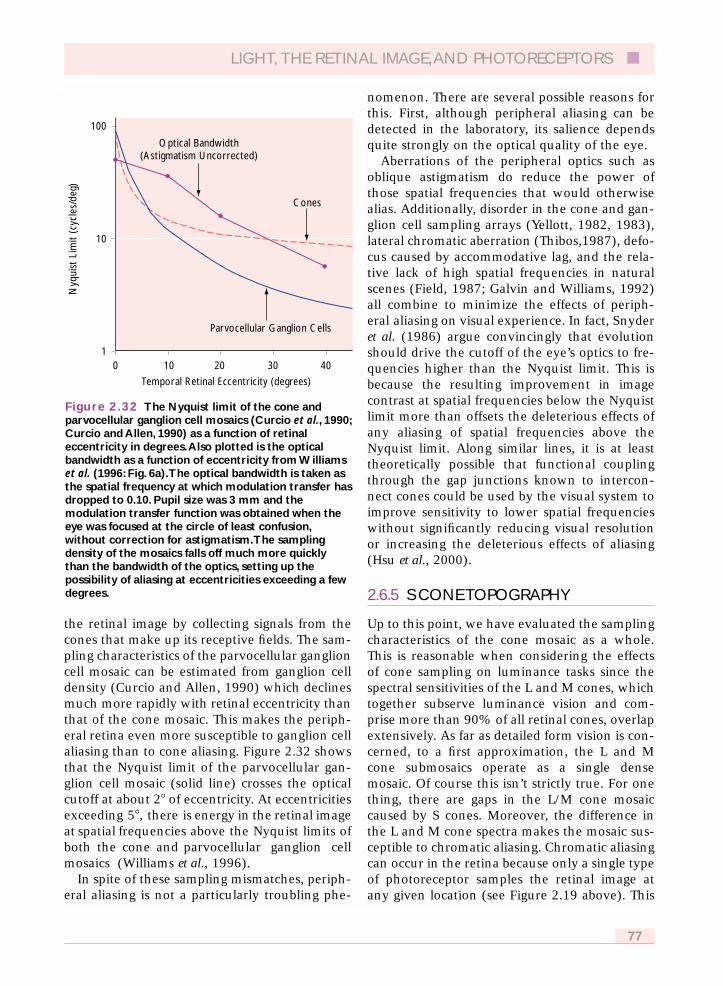
the retinal image by collecting signals from thecones that make up its receptive fields. The sam-pling characteristics of the parvocellular ganglioncell mosaic can be estimated from ganglion celldensity (Curcio and Allen, 1990) which declinesmuch more rapidly with retinal eccentricity thanthat of the cone mosaic. This makes the periph-eral retina even more susceptible to ganglion cellaliasing than to cone aliasing. Figure 2.32 showsthat the Nyquist limit of the parvocellular gan-glion cell mosaic (solid line) crosses the opticalcutoff at about 2� of eccentricity. At eccentricitiesexceeding 5�, there is energy in the retinal imageat spatial frequencies above the Nyquist limits ofboth the cone and parvocellular ganglion cellmosaics (Williams et al., 1996).
In spite of these sampling mismatches, periph-eral aliasing is not a particularly troubling phe-
nomenon. There are several possible reasons forthis. First, although peripheral aliasing can bedetected in the laboratory, its salience dependsquite strongly on the optical quality of the eye.
Aberrations of the peripheral optics such asoblique astigmatism do reduce the power ofthose spatial frequencies that would otherwisealias. Additionally, disorder in the cone and gan-glion cell sampling arrays (Yellott, 1982, 1983),lateral chromatic aberration (Thibos,1987), defo-cus caused by accommodative lag, and the rela-tive lack of high spatial frequencies in naturalscenes (Field, 1987; Galvin and Williams, 1992)all combine to minimize the effects of periph-eral aliasing on visual experience. In fact, Snyderet al. (1986) argue convincingly that evolutionshould drive the cutoff of the eye’s optics to fre-quencies higher than the Nyquist limit. This isbecause the resulting improvement in imagecontrast at spatial frequencies below the Nyquistlimit more than offsets the deleterious effects ofany aliasing of spatial frequencies above theNyquist limit. Along similar lines, it is at leasttheoretically possible that functional couplingthrough the gap junctions known to intercon-nect cones could be used by the visual system toimprove sensitivity to lower spatial frequencieswithout significantly reducing visual resolutionor increasing the deleterious effects of aliasing(Hsu et al., 2000).
2.6.5 S CONE TOPOGRAPHY
Up to this point, we have evaluated the samplingcharacteristics of the cone mosaic as a whole.This is reasonable when considering the effectsof cone sampling on luminance tasks since thespectral sensitivities of the L and M cones, whichtogether subserve luminance vision and com-prise more than 90% of all retinal cones, overlapextensively. As far as detailed form vision is con-cerned, to a first approximation, the L and Mcone submosaics operate as a single densemosaic. Of course this isn’t strictly true. For onething, there are gaps in the L/M cone mosaiccaused by S cones. Moreover, the difference inthe L and M cone spectra makes the mosaic sus-ceptible to chromatic aliasing. Chromatic aliasingcan occur in the retina because only a single typeof photoreceptor samples the retinal image atany given location (see Figure 2.19 above). This
LIGHT, THE RETINAL IMAGE,AND PHOTORECEPTORS ■
77
Figure 2.32 The Nyquist limit of the cone andparvocellular ganglion cell mosaics (Curcio et al., 1990;Curcio and Allen, 1990) as a function of retinaleccentricity in degrees.Also plotted is the opticalbandwidth as a function of eccentricity from Williamset al. (1996: Fig. 6a).The optical bandwidth is taken asthe spatial frequency at which modulation transfer hasdropped to 0.10. Pupil size was 3 mm and themodulation transfer function was obtained when theeye was focused at the circle of least confusion,without correction for astigmatism.The samplingdensity of the mosaics falls off much more quicklythan the bandwidth of the optics, setting up thepossibility of aliasing at eccentricities exceeding a fewdegrees.
Nyq
uist
Lim
it (c
ycle
s/de
g)
Temporal Retinal Eccentricity (degrees)
Optical Bandwidth(Astigmatism Uncorrected)
Cones
Parvocellular Ganglion Cells
1
10
100
0 10 403020

means that at a local spatial scale, the retina iscolor blind. This is unlike color film which sam-ples each location in the image with three emul-sions, each of which is sensitive to a differentpart of the visible spectrum. The L, M, and Scones submosaics are interleaved with eachother so that the sampling density of each sub-mosaic is necessarily lower than the samplingdensity of the mosaic as a whole. Chromaticaliasing, therefore, can arise at lower spatial fre-quencies than the Nyquist limit for the mosaicas a whole.
The sampling characteristics of the S cone sub-mosaic provide a useful way to introduce theproblem of chromatic aliasing because S conessample the retinal image so sparsely. S coneshave morphological, histological and immuno-cytochemical differences that allow them to bedistinguished from L and M cones and labeled insitu (deMonasterio et al., 1981, 1985; Ahnelt etal., 1987; Wikler and Rakic, 1990; Curcio et al.,1991). Figure 2.33(A) shows a patch of macaquemonkey retina stained with a Procion dye thatselectively labels S cones. The S cone distributionhas also been studied psychophysically in theliving human eye (Williams et al., 1981; Williamsand Collier, 1983).
S cones are absent at the center of the foveaat eccentricities less than 50 lm (10» of arc),reach a peak numerical density of about 2000cones/mm2 at an eccentricity of 100–300 lm(20–60») and then gradually decline in densitywith increasing eccentricity (Figure 2.33B). Atthe eccentricity of peak S cone density, centerto center spacing averages about 22 lm (4»),increasing in the periphery to 40 lm (8») ormore. Measured anatomically (Curcio et al.,1991), the S cones account for about 7% of allcones and are sparsely distributed in peripheralretina. Individual S cones tend to be more evenlyspaced across the retina than would be expectedfrom a random distribution in the macaquemonkey, though they are packed in a less orderlyfashion in human retina (Bumsted et al., 1996;Roorda and Williams, 1999). There also isapparently a species difference in the S conedistribution at the foveal center, with thehuman usually showing a region on the order of20» of arc in diameter that is devoid of S cones.This S cone-free area is not so apparent in themonkey.
2.6.6 IMPLICATIONS OF S CONESAMPLING
Because the sampling density of the S cone sub-mosaic is lower than the density of the mosaic asa whole, spatial resolution under conditions inwhich it operates independently must be lowerthan the spatial resolution of the compositemosaic. It is possible to create such isolating con-ditions by superimposing a violet grating on abright, long wavelength background that sup-presses the sensitivity of the L and M cones tothe grating. Under these conditions, most psy-
■ THE SCIENCE OF COLOR
78
Figure 2.33 The S cone mosaic of the macaquemonkey retina. (A) The S cones (dark profiles) havebeen stained with a Procion dye (from deMonasterioet al., 1981). (B) The S cone numerical density profileas a function of eccentricity along the horizontalmeridian. Filled symbols are nasal retina. Opensymbols are temporal retina. In central retina, theconversion factor 0.29 mm/degree will convert retinaleccentricity in millimeters to retinal eccentricity invisual degrees. (From Curcio et al., 1991).
(A)
(B)
S C
one
Den
sity
(co
nes/
mm
2 � 1
000)
Eccentricity (mm)
2.0
1.5
1.0
0.5
00 0.5 1.5 2.0 2.5 3.0 3.51.0
2.5
•
••• • •
••
•
• • •
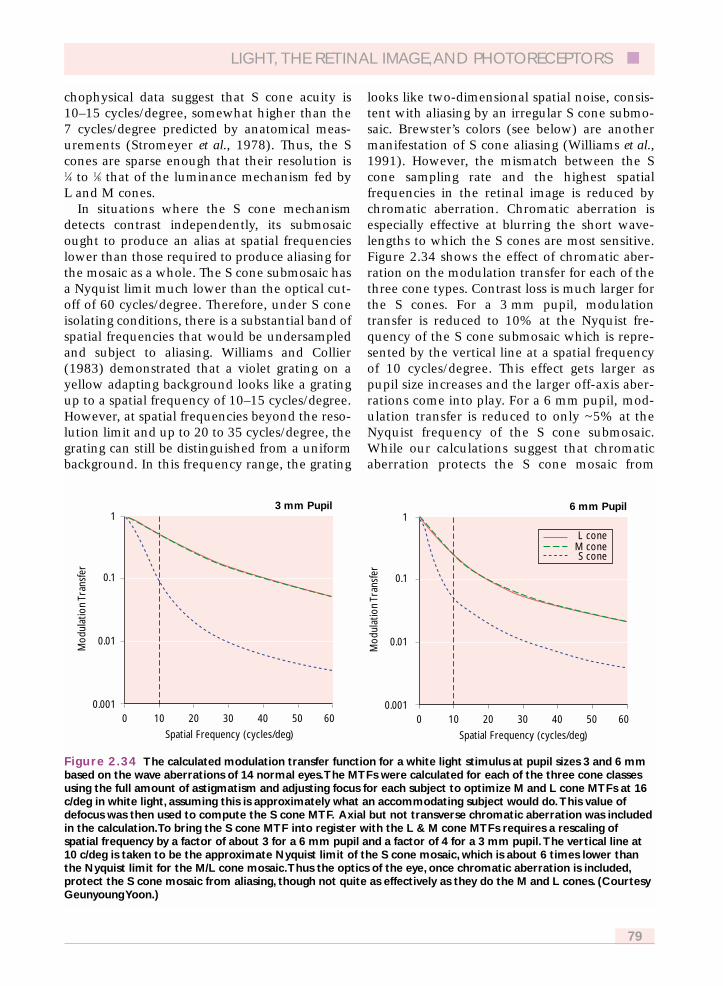
chophysical data suggest that S cone acuity is10–15 cycles/degree, somewhat higher than the7 cycles/degree predicted by anatomical meas-urements (Stromeyer et al., 1978). Thus, the Scones are sparse enough that their resolution is1⁄4 to 1⁄6 that of the luminance mechanism fed byL and M cones.
In situations where the S cone mechanismdetects contrast independently, its submosaicought to produce an alias at spatial frequencieslower than those required to produce aliasing forthe mosaic as a whole. The S cone submosaic hasa Nyquist limit much lower than the optical cut-off of 60 cycles/degree. Therefore, under S coneisolating conditions, there is a substantial band ofspatial frequencies that would be undersampledand subject to aliasing. Williams and Collier(1983) demonstrated that a violet grating on ayellow adapting background looks like a gratingup to a spatial frequency of 10–15 cycles/degree.However, at spatial frequencies beyond the reso-lution limit and up to 20 to 35 cycles/degree, thegrating can still be distinguished from a uniformbackground. In this frequency range, the grating
looks like two-dimensional spatial noise, consis-tent with aliasing by an irregular S cone submo-saic. Brewster’s colors (see below) are anothermanifestation of S cone aliasing (Williams et al.,1991). However, the mismatch between the Scone sampling rate and the highest spatialfrequencies in the retinal image is reduced bychromatic aberration. Chromatic aberration isespecially effective at blurring the short wave-lengths to which the S cones are most sensitive.Figure 2.34 shows the effect of chromatic aber-ration on the modulation transfer for each of thethree cone types. Contrast loss is much larger forthe S cones. For a 3 mm pupil, modulationtransfer is reduced to 10% at the Nyquist fre-quency of the S cone submosaic which is repre-sented by the vertical line at a spatial frequencyof 10 cycles/degree. This effect gets larger aspupil size increases and the larger off-axis aber-rations come into play. For a 6 mm pupil, mod-ulation transfer is reduced to only ~5% at theNyquist frequency of the S cone submosaic.While our calculations suggest that chromaticaberration protects the S cone mosaic from
LIGHT, THE RETINAL IMAGE,AND PHOTORECEPTORS ■
79
Figure 2.34 The calculated modulation transfer function for a white light stimulus at pupil sizes 3 and 6 mmbased on the wave aberrations of 14 normal eyes.The MTFs were calculated for each of the three cone classesusing the full amount of astigmatism and adjusting focus for each subject to optimize M and L cone MTFs at 16c/deg in white light, assuming this is approximately what an accommodating subject would do.This value ofdefocus was then used to compute the S cone MTF. Axial but not transverse chromatic aberration was includedin the calculation.To bring the S cone MTF into register with the L & M cone MTFs requires a rescaling ofspatial frequency by a factor of about 3 for a 6 mm pupil and a factor of 4 for a 3 mm pupil.The vertical line at10 c/deg is taken to be the approximate Nyquist limit of the S cone mosaic, which is about 6 times lower thanthe Nyquist limit for the M/L cone mosaic.Thus the optics of the eye, once chromatic aberration is included,protect the S cone mosaic from aliasing, though not quite as effectively as they do the M and L cones. (CourtesyGeunyoung Yoon.)
Mod
ulat
ion
Tran
sfer
Spatial Frequency (cycles/deg) Spatial Frequency (cycles/deg)
3 mm Pupil
0.001
0.01
0.1
1
Mod
ulat
ion
Tran
sfer
0.001
0.01
0.1
1
0 10 40 50 603020
6 mm Pupil
0 10 40 50 603020
L coneM coneS cone

aliasing, the issue is not without controversy(McLellan et al., 2002).
Chromatic aberration and the properties ofnatural scenes are apparently sufficient to pre-vent S cone submosaic aliasing from intruding inour daily visual experience. It is especially strik-ing that the absence of S cones from the central20» of arc of the fovea in most humans is not sub-jectively obvious to us since it renders us tri-tanopic within the most acute portion of ourvisual field (Williams et al., 1981). The brainmust be equipped with sophisticated interpola-tion circuitry capable of hiding this gaping chro-matic blind spot from us (Brainard and Williams,1993).
2.6.7 L AND M CONE TOPOGRAPHY
For the photoreceptor mosaic as a whole, rodsand cones are easily localized and can be distin-guished on the basis of their morphology. In thecase of the S cone submosaic, there are sufficienthistological and immunocytochemical differ-ences to allow differential staining. However,there are no known morphological differencesbetween the L and M cones on which to base adiscrimination. It is only recently that theirtopography has been revealed.
Several methods have provided informationabout the relative numbers of L and M cones inthe mosaic, including microspectrophotometry(MSP), photopigment transmittance imaging,suction electrode recording, genetic analysis, andpsychophysics (see Packer et al., 1996 for impor-tant references). Analysis of the mRNA contentof the retina has been quite useful in determin-ing the relative numbers of L and M cones inpatches of retina as well as classifying individualcones (Hagstrom et al., 2000). The cones containthe L and M photopigment genes on their Xchromosomes. When photopigment is manufac-tured by the cone, messenger RNA (mRNA) car-ries the instructions from the genes in thenucleus to the site where the photopigment isassembled. Each cone expresses only a singletype of photopigment. In addition, each coneapparently makes about the same amount ofmRNA. Therefore, a measurement of the relativeamounts of L and M mRNA gives an estimate ofthe relative numbers of L and M cones. Very sen-sitive techniques have been developed for meas-
uring the type of mRNA produced in a singlecone or the relative amounts of mRNA producedin a patch of retina. Results using this techniqueshow that there are differences in the L/M ratioas a function of retinal location. L cones aremore numerous near the edge of the retina thanthey are near the fovea in humans (Hagstrom etal., 1997). There is also a tendency for higherratios in temporal retina in the macaque monkey(Deeb et al., 2000).
Even without identifying individual conetypes in the mosaic, it is obvious that the L andM cone submosaics cannot be crystalline in theirpacking geometry. Figures 2.19(B) and (D) showthat the composite lattice is not perfectly regular.Therefore, the L and M submosaics must exhibitat least as much spatial disorder as the compos-ite lattice. This disorder is especially large outsidethe fovea where rods and S cones begin tointrude. In addition to disorder in the physicalpositions of the cones, the interleaving of the Land M submosaics is far from regular. Mollonand Bowmaker (1992) used axial MSP to distin-guish the L and M cones in several small patchesof monkey fovea and found that the L and Mcone assignment could not be distinguished fromthat of a random distribution. Packer et al.(1996) examined the L and M cone topographyof larger patches of peripheral monkey retinausing photopigment transmittance imaging, atechnique that can classify the L and M cones onthe basis of the photopigment they contain.Figure 2.35 is a composite image that shows apatch of peripheral retina. Color has beenassigned to the image based on measurements ofthe photopigment transmittance in the patch.The color was assigned to indicate the appear-ance of the retina were it possible to view itunder the microscope without bleaching all ofthe photopigment in the process. Viewed underthese conditions, the L, M, and S cones havebluish, purplish, and yellowish hues respectively,while rods are reddish. Examples of L cones, Mcones, and rods are indicated with arrows. It isobvious even from this small image that the Land M cones are not assigned in a highly orderedway. Analysis of a larger patch of peripheralretina showed a tendency for like-type cones toclump though the sample size was small.
Recently, noninvasive measurements of thepositions of L and M cones in the central retina
■ THE SCIENCE OF COLOR
80

of the living human eye have been made byusing adaptive optics to neutralize the aberra-tions of the ocular media (Roorda and Williams,1999). This allows individual foveal cones to beresolved and, with retinal densitometry, classi-fied on the basis of their photopigment type.Figure 2.36 shows images of the foveal conemosaic of two human eyes and one macaque eyein which identified cones have been overlaidwith a colored dot that represents its photopig-ment type. The relative number of L and Mcones differs greatly between the two eyes. Intwo patches of retina, one from the nasal andone from the temporal fovea, subject JW had amean ratio of L to M cones of 3.79 whereas ANhad a ratio of 1.15. Subject JW was not selectedfor this experiment based on any prior knowl-edge of his color vision. However, AN wasselected because previous measurements of hisspectral electroretinogram (ERG), a techniquefor measuring the electrical activity of the retinausing external electrodes, had suggested that hewas unusually middle-wavelength sensitive,which was confirmed by our imaging observa-
tions (Brainard et al., 2000). Though the selec-tion of subjects was not random, the large indi-vidual difference between the two is consistentwith the variability found using psychophysicalmethods (Rushton and Baker, 1964; Vimal et al.,1989), spectral ERG (Jacobs and Neitz, 1993;Jacobs and Deegan, 1997; Carrol et al., 2002),microspectrophotometry (Bowmaker and Dartnall,1980; Dartnall et al. 1983), and mRNA analysis(Hagstrom et al., 1997; Yamaguchi et al., 1997).
In short, we now have complete descriptionsof the L and M cone topography for a smallnumber of locations in the retinas of a smallnumber of individuals. We do not yet know theextent of individual variability or the extent towhich topography may depend on retinal loca-tion. The available data suggest that the L to Mratio is quite variable from individual to individ-ual. L and M cones are arranged in a highlydisordered manner which is either perfectly ran-dom or very close to it. There is no evidence thatthe L and M submosaics are interleaved in a waythat would distribute each cone type evenlyacross the retina in a regular pattern.
LIGHT, THE RETINAL IMAGE,AND PHOTORECEPTORS ■
81
Figure 2.35 A color composite image of a patch of retina rendered to reveal its true colors.The larger sparsecells are cones and the small reddish profiles filling in around them are the rods. Purple colored cells are Mcones. Blue colored cells are L cones.Yellowish colored cells are likely to be S cones.This image was created inour laboratory from photopigment transmittance images of a patch of peripheral macaque retina.
M Cone
L Cone
Rods
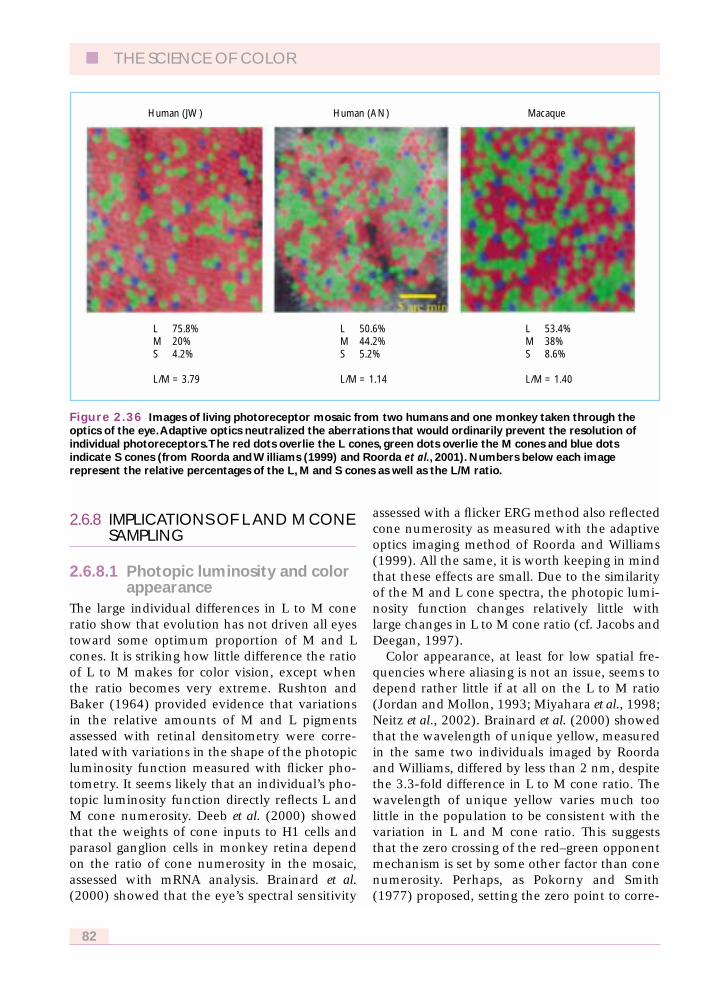
2.6.8 IMPLICATIONS OF L AND M CONESAMPLING
2.6.8.1 Photopic luminosity and colorappearance
The large individual differences in L to M coneratio show that evolution has not driven all eyestoward some optimum proportion of M and Lcones. It is striking how little difference the ratioof L to M makes for color vision, except whenthe ratio becomes very extreme. Rushton andBaker (1964) provided evidence that variationsin the relative amounts of M and L pigmentsassessed with retinal densitometry were corre-lated with variations in the shape of the photopicluminosity function measured with flicker pho-tometry. It seems likely that an individual’s pho-topic luminosity function directly reflects L andM cone numerosity. Deeb et al. (2000) showedthat the weights of cone inputs to H1 cells andparasol ganglion cells in monkey retina dependon the ratio of cone numerosity in the mosaic,assessed with mRNA analysis. Brainard et al.(2000) showed that the eye’s spectral sensitivity
assessed with a flicker ERG method also reflectedcone numerosity as measured with the adaptiveoptics imaging method of Roorda and Williams(1999). All the same, it is worth keeping in mindthat these effects are small. Due to the similarityof the M and L cone spectra, the photopic lumi-nosity function changes relatively little withlarge changes in L to M cone ratio (cf. Jacobs andDeegan, 1997).
Color appearance, at least for low spatial fre-quencies where aliasing is not an issue, seems todepend rather little if at all on the L to M ratio(Jordan and Mollon, 1993; Miyahara et al., 1998;Neitz et al., 2002). Brainard et al. (2000) showedthat the wavelength of unique yellow, measuredin the same two individuals imaged by Roordaand Williams, differed by less than 2 nm, despitethe 3.3-fold difference in L to M cone ratio. Thewavelength of unique yellow varies much toolittle in the population to be consistent with thevariation in L and M cone ratio. This suggeststhat the zero crossing of the red–green opponentmechanism is set by some other factor than conenumerosity. Perhaps, as Pokorny and Smith(1977) proposed, setting the zero point to corre-
■ THE SCIENCE OF COLOR
82
Figure 2.36 Images of living photoreceptor mosaic from two humans and one monkey taken through theoptics of the eye.Adaptive optics neutralized the aberrations that would ordinarily prevent the resolution ofindividual photoreceptors.The red dots overlie the L cones, green dots overlie the M cones and blue dotsindicate S cones (from Roorda and Williams (1999) and Roorda et al., 2001). Numbers below each imagerepresent the relative percentages of the L, M and S cones as well as the L/M ratio.
Human (JW) Human (AN) Macaque
LMS
L/M = 3.79
75.8%20%4.2%
LMS
L/M = 1.14
50.6%44.2%5.2%
LMS
L/M = 1.40
53.4%38%8.6%
spond to the ambient chromaticity of naturalscenes would be a more efficient choice for thevisual system, since it would minimize the meta-bolic cost of transmitting variations in rednessand greenness.
Neitz et al., 2002 have provided compellingevidence for the plasticity of color vision, show-ing that experience can modify the boundarybetween red and green.
2.6.8.2 L and M cone resolutionBecause the sampling densities of the L and Mcone submosaics are lower than the density ofthe mosaic as a whole, one might expect to findboth a reduction in the acuity of the separate Land M cone submosaics as well as evidence forchromatic aliasing, just as we did for the S conesubmosaic. However, there is apparently no sub-stantial reduction in acuity observed in studies inwhich chromatic adaptation was used to isolateeither the L or M cone submosaic. There is nomeasurable difference in contrast sensitivity oracuity when the L and M cones are isolated com-pared to conditions in which they operatetogether (cf. Brindley, 1953; Williams, 1991).This is true even when using laser interferencefringes to exclude blurring by the optics of theeye. To be sure, resolution will decline when thedensity of cones in the submosaic becomessparse enough. The S cone submosaic is a case inpoint. Nonetheless, relatively large density losseshave no obvious effects on grating acuity (Gelleret al., 1992). This is almost certainly due to thedisordered arrangement of L and M cones whichcreates small clumps of like-type cones whosespacing is much less than the average spacing ofthat submosaic. These clumps may be suffi-ciently large and common to subserve betterthan expected acuity, especially with extendedstimuli such as large patches of grating. Onlywhen one cone class is greatly underrepre-sented, as in some heterozygous carriers for con-genital x-linked protanopia, is resolution clearlyaffected in cone isolating conditions (Miyahara etal., 1998). Presumably, visual stimuli that aremore localized, such as vernier targets, would bebetter suited to reveal a deficit due to the coarsergrain of the separate L and M cone submosaics.
Just as resolution is not much affected whenthe L and M cone mosaics are isolated, neitherare the foveal aliasing effects seen at very high
frequencies with interference fringes. Subjectsreport that the zebra stripe patterns lookessentially the same under all conditions ofchromatic adaptation, except for changes inapparent contrast. Also, the spatial frequency atwhich the foveal moiré pattern is coarsest showslittle or no change even under the most extremeconditions of chromatic adaptation that can bearranged while still keeping the perceptsuprathreshold (Williams et al., 1991). In fact,simulations show that the invariant appearanceof zebra stripes is actually what you wouldexpect, even if chromatic adaptation is successfulat completely desensitizing one submosaic andsparing the other.
Consider a regular lattice, and the same latticewith two thirds of the receptors randomlydeleted (Figure 2.37). The complete mosaic cor-responds to the condition where the L and Mcones both see equal contrasts and can worktogether. The mosaic with random deletions ismeant to simulate the situation when the fringecontrast exceeds threshold for the M conemosaic alone. When these two lattices sample agrating stimulus whose bars have a spacing nearthat of the rows of receptors, the moiré patternsare quite similar. Therefore, the similarity offoveal zebra stripe patterns under conditions ofextreme chromatic adaptation is consistentwith the sampling properties of the separatesubmosaics.
2.6.8.3 Chromatic aliasingNonetheless, the existence of independent L andM submosaics does predict another form of alias-ing, similar to that described for the S conemosaic. Submosaic or chromatic aliasing is acommon artifact in imaging systems. Thebrightly colored moiré patterns that result whena color CCD camera images the fine groovesmachined in the gears of Figure 2.38 are a goodexample. Because the three classes of light sen-sors in the camera are arranged in regular arraythe moiré pattern is vividly chromatic.
The visual system, on the other hand, isremarkably resistant to the effects of chromaticaliasing. In those cases in which it can be detectedat all, it is subtle and fleeting. One of the earliestreports of chromatic percepts related to the topo-graphic organization of the cone mosaic comesfrom Holmgren (1884), who noticed that the hue
LIGHT, THE RETINAL IMAGE,AND PHOTORECEPTORS ■
83

of stars varied from instant to instant, a fact heattributed to selective excitation of different coneclasses as the point of light moved across themosaic. Psychophysicists have since exploitedthis observation by using small spots (cf.Krauskopf, 1978; Cicerone and Nerger, 1989;Vimal et al., 1989) to map the organization of theL and M cone submosaics. However, this colorpercept is never very salient because the optics ofthe eye blur the point of light across severalcones. It has recently become possible to use
adaptive optics (Liang, Williams and Miller,1997) to reduce the diameter of the spots of lightto less than the diameter of an individual cone.Under these conditions, the chromatic percept isgreatly strengthened.
Many observers report seeing a splotchy pat-tern of desaturated colors while viewing highcontrast patterns such as black and white lineswith spatial frequencies between 10 and 40cycles/degree (Brewster, 1832; Skinner, 1932;Luckiesh and Moss, 1933; Erb and Dallenbach,1939). Williams et al. (1991) have named thiseffect, Brewster’s colors, after the first to havedescribed them.
When subjects are asked to match Brewster’scolors with a computer screen displaying a pat-tern of spatially similar chromatic splotches(Williams et al., 1991), they choose a direction incolor space along which only L and M cones aremodulated when the eye is in good focus (Figure2.39A, right). When the eye is defocused by �1to �1.5 diopters, observers choose a directionalong which only the S cones are modulated(Figure 2.39A, left). Apparently, at best subjec-tive focus, short wavelengths are stronglyblurred by the optics (Figure 2.39B). Therefore,the L and M cones are strongly modulated whilethe S cones see a nearly uniform field. When theeye is defocused by �1 to �1.5 diopters, the oppo-site is true. Therefore, the hue of the Brewster’scolors is consistent with the cone types beingmodulated.
■ THE SCIENCE OF COLOR
84
Figure 2.37 A simulation showing the invariantappearance of zebra stripes in the face of random andregular receptor loss. On the left side of each panel aregular lattice is undersampling a horizontal grating.Because of sampling regularity, the alias is a stripedpattern. On the right side of each panel, two thirds ofthe sampling elements have been deleted. In the toppanel the deletions were done in a regular pattern. Inthe bottom panel, the deletions were random.Thealiases look similar in all cases. (After Williams, 1991.)
Figure 2.38 Chromatic aliasing produced by a colorcamera imaging fine spatial detail in the machinedgears that is above the Nyquist limit of its threesensor arrays. Because the sensors in each array arehighly ordered, the alias takes the form of a highlychromatic moiré pattern. (From Williams et al., 1993.)
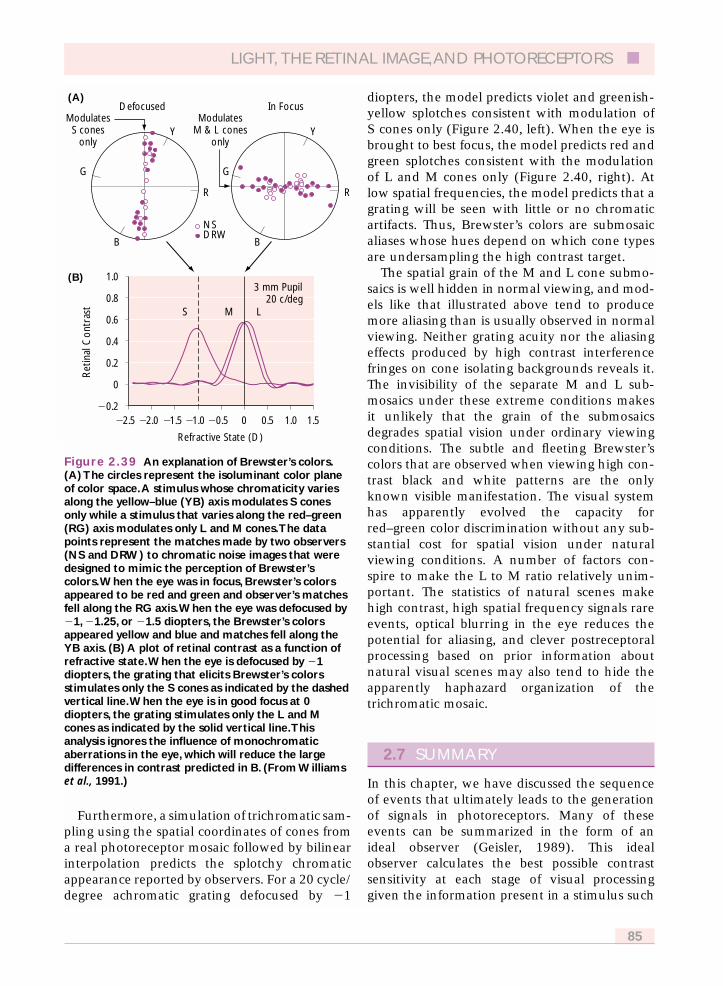
Furthermore, a simulation of trichromatic sam-pling using the spatial coordinates of cones froma real photoreceptor mosaic followed by bilinearinterpolation predicts the splotchy chromaticappearance reported by observers. For a 20 cycle/degree achromatic grating defocused by �1
diopters, the model predicts violet and greenish-yellow splotches consistent with modulation ofS cones only (Figure 2.40, left). When the eye isbrought to best focus, the model predicts red andgreen splotches consistent with the modulationof L and M cones only (Figure 2.40, right). Atlow spatial frequencies, the model predicts that agrating will be seen with little or no chromaticartifacts. Thus, Brewster’s colors are submosaicaliases whose hues depend on which cone typesare undersampling the high contrast target.
The spatial grain of the M and L cone submo-saics is well hidden in normal viewing, and mod-els like that illustrated above tend to producemore aliasing than is usually observed in normalviewing. Neither grating acuity nor the aliasingeffects produced by high contrast interferencefringes on cone isolating backgrounds reveals it.The invisibility of the separate M and L sub-mosaics under these extreme conditions makesit unlikely that the grain of the submosaicsdegrades spatial vision under ordinary viewingconditions. The subtle and fleeting Brewster’scolors that are observed when viewing high con-trast black and white patterns are the onlyknown visible manifestation. The visual systemhas apparently evolved the capacity forred–green color discrimination without any sub-stantial cost for spatial vision under naturalviewing conditions. A number of factors con-spire to make the L to M ratio relatively unim-portant. The statistics of natural scenes makehigh contrast, high spatial frequency signals rareevents, optical blurring in the eye reduces thepotential for aliasing, and clever postreceptoralprocessing based on prior information aboutnatural visual scenes may also tend to hide theapparently haphazard organization of thetrichromatic mosaic.
2.7 SUMMARY
In this chapter, we have discussed the sequenceof events that ultimately leads to the generationof signals in photoreceptors. Many of theseevents can be summarized in the form of anideal observer (Geisler, 1989). This idealobserver calculates the best possible contrastsensitivity at each stage of visual processinggiven the information present in a stimulus such
LIGHT, THE RETINAL IMAGE,AND PHOTORECEPTORS ■
85
Figure 2.39 An explanation of Brewster’s colors.(A) The circles represent the isoluminant color planeof color space.A stimulus whose chromaticity variesalong the yellow–blue (YB) axis modulates S conesonly while a stimulus that varies along the red–green(RG) axis modulates only L and M cones.The datapoints represent the matches made by two observers(NS and DRW) to chromatic noise images that weredesigned to mimic the perception of Brewster’scolors.When the eye was in focus, Brewster’s colorsappeared to be red and green and observer’s matchesfell along the RG axis.When the eye was defocused by�1, �1.25, or �1.5 diopters, the Brewster’s colorsappeared yellow and blue and matches fell along theYB axis. (B) A plot of retinal contrast as a function ofrefractive state.When the eye is defocused by �1diopters, the grating that elicits Brewster’s colorsstimulates only the S cones as indicated by the dashedvertical line.When the eye is in good focus at 0diopters, the grating stimulates only the L and Mcones as indicated by the solid vertical line.Thisanalysis ignores the influence of monochromaticaberrations in the eye, which will reduce the largedifferences in contrast predicted in B. (From Williamset al., 1991.)
Ret
inal
Con
tras
t
Refractive State (D)
S
G G
Y
R
NSDRW
R
BB
Y
M L
3 mm Pupil20 c/deg
Defocused In FocusModulatesS cones
only
ModulatesM & L cones
only
1.0
0.8
0.6
0.4
0.2
0
�0.2�2.0�2.5 �1.0 �0.5 0 0.5 1.0 1.5�1.5
(A)
(B)

as a sinusoidal grating. Although contrast sensi-tivity does not account for all of the factors thatwe have talked about, such as the perceived pat-terns of aliases, it summarizes many of theimportant steps. Figure 2.41 shows that the firstfactor that limits the performance of the idealobserver is the quantum nature of light. Thefield size required to present a fixed number ofcycles of a visual stimulus decreases linearly withincreasing spatial frequency. Stimulus area aswell as the number of stimulus photons thusdecreases as the square root of spatial frequency.Since the variance of photon noise equals themean number of photons, the resulting decreasein the signal to noise ratio also follows a squareroot relationship which gives the contrast sensi-tivity function a slope of �1. A second major fac-tor that limits visual performance is light loss,whose signature is a simple downward shift inthe contrast sensitivity function. Light lossoccurs in the optical media, between photore-ceptors, as a result of the finite axial density ofthe photopigment, and as a result of photoiso-
merization inefficiency following absorption. Athird major factor that limits visual performanceis spatial frequency-dependent filtering, whosesignature is a change in the shape of the contrastsensitivity function. Filtering occurs in theoptics, at the pupil, and at the cone aperture. Inthis schematic, we have assumed that the opticsof the eye were bypassed by the use of interfer-ence fringes. As a result, optical filtering is notexplicitly shown although it would have a simi-lar but greater effect than cone blurring. Evenafter taking all of the optical factors into account,however, there remains a substantial gapbetween the best possible performance of theideal observer and the actual performance of ahuman subject. These additional losses must beattributed to neural processing.
We can get some clues as to where these lossesoccur by representing the response of the visualsystem at each stage of visual processing by apoint spread function (Sekiguchi et al., 1993b).Wider point spread functions indicate moreinformation loss. Due to optical blurring, the
■ THE SCIENCE OF COLOR
86
Figure 2.40 A simulation of Brewster’s colors.A high contrast black and white grating of 20 cycles/deg issampled by a mosaic whose cone positions are taken from an image of a real photoreceptor mosaic. Bilinearinterpolation was used as a simple method to reconstruct an image from the cone signals.The L to M cone ratiowas set to 2 and 10% of the cones were randomly assigned to be S cones. (Left) Result of sampling with �1diopter of defocus and a random assignment of L and M cones. (Right) Result with the eye at best focus. (FromWilliams et al., 1991.)
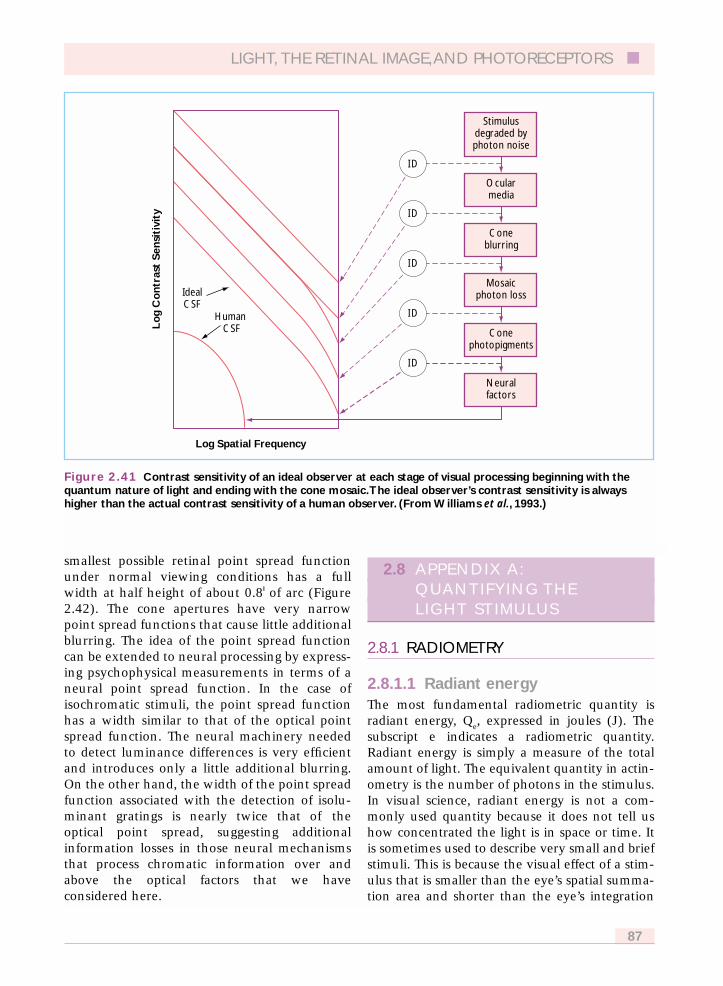
smallest possible retinal point spread functionunder normal viewing conditions has a fullwidth at half height of about 0.8» of arc (Figure2.42). The cone apertures have very narrowpoint spread functions that cause little additionalblurring. The idea of the point spread functioncan be extended to neural processing by express-ing psychophysical measurements in terms of aneural point spread function. In the case ofisochromatic stimuli, the point spread functionhas a width similar to that of the optical pointspread function. The neural machinery neededto detect luminance differences is very efficientand introduces only a little additional blurring.On the other hand, the width of the point spreadfunction associated with the detection of isolu-minant gratings is nearly twice that of theoptical point spread, suggesting additionalinformation losses in those neural mechanismsthat process chromatic information over andabove the optical factors that we haveconsidered here.
2.8 APPENDIX A:QUANTIFYING THE LIGHT STIMULUS
2.8.1 RADIOMETRY
2.8.1.1 Radiant energyThe most fundamental radiometric quantity isradiant energy, Q
e, expressed in joules (J). The
subscript e indicates a radiometric quantity.Radiant energy is simply a measure of the totalamount of light. The equivalent quantity in actin-ometry is the number of photons in the stimulus.In visual science, radiant energy is not a com-monly used quantity because it does not tell ushow concentrated the light is in space or time. Itis sometimes used to describe very small and briefstimuli. This is because the visual effect of a stim-ulus that is smaller than the eye’s spatial summa-tion area and shorter than the eye’s integration
LIGHT, THE RETINAL IMAGE,AND PHOTORECEPTORS ■
87
Figure 2.41 Contrast sensitivity of an ideal observer at each stage of visual processing beginning with thequantum nature of light and ending with the cone mosaic.The ideal observer’s contrast sensitivity is alwayshigher than the actual contrast sensitivity of a human observer. (From Williams et al., 1993.)
Log
Co
ntra
st S
ensi
tivi
ty
Stimulusdegraded byphoton noise
Ocularmedia
Coneblurring
Mosaicphoton loss
Conephotopigments
IdealCSF
Human CSF
Log Spatial Frequency
Neuralfactors
ID
ID
ID
ID
ID
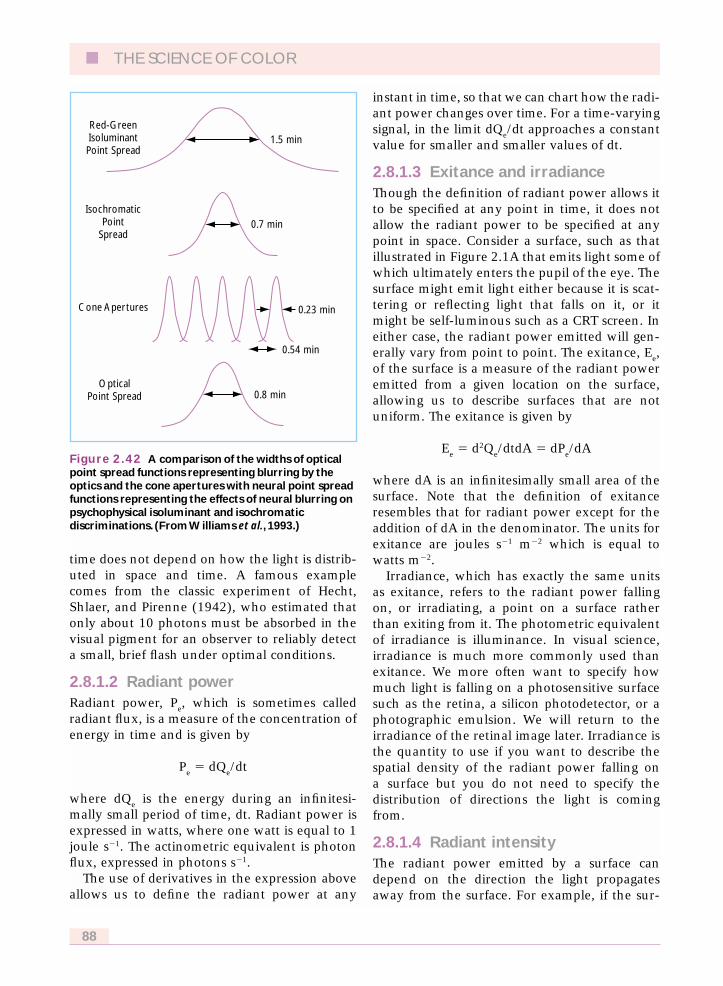
time does not depend on how the light is distrib-uted in space and time. A famous examplecomes from the classic experiment of Hecht,Shlaer, and Pirenne (1942), who estimated thatonly about 10 photons must be absorbed in thevisual pigment for an observer to reliably detecta small, brief flash under optimal conditions.
2.8.1.2 Radiant powerRadiant power, P
e, which is sometimes called
radiant flux, is a measure of the concentration ofenergy in time and is given by
Pe
� dQe/dt
where dQe
is the energy during an infinitesi-mally small period of time, dt. Radiant power isexpressed in watts, where one watt is equal to 1joule s�1. The actinometric equivalent is photonflux, expressed in photons s�1.
The use of derivatives in the expression aboveallows us to define the radiant power at any
instant in time, so that we can chart how the radi-ant power changes over time. For a time-varyingsignal, in the limit dQ
e/dt approaches a constant
value for smaller and smaller values of dt.
2.8.1.3 Exitance and irradianceThough the definition of radiant power allows itto be specified at any point in time, it does notallow the radiant power to be specified at anypoint in space. Consider a surface, such as thatillustrated in Figure 2.1A that emits light some ofwhich ultimately enters the pupil of the eye. Thesurface might emit light either because it is scat-tering or reflecting light that falls on it, or itmight be self-luminous such as a CRT screen. Ineither case, the radiant power emitted will gen-erally vary from point to point. The exitance, E
e,
of the surface is a measure of the radiant poweremitted from a given location on the surface,allowing us to describe surfaces that are notuniform. The exitance is given by
Ee
� d2Qe/dtdA � dP
e/dA
where dA is an infinitesimally small area of thesurface. Note that the definition of exitanceresembles that for radiant power except for theaddition of dA in the denominator. The units forexitance are joules s�1 m�2 which is equal towatts m�2.
Irradiance, which has exactly the same unitsas exitance, refers to the radiant power fallingon, or irradiating, a point on a surface ratherthan exiting from it. The photometric equivalentof irradiance is illuminance. In visual science,irradiance is much more commonly used thanexitance. We more often want to specify howmuch light is falling on a photosensitive surfacesuch as the retina, a silicon photodetector, or aphotographic emulsion. We will return to theirradiance of the retinal image later. Irradiance isthe quantity to use if you want to describe thespatial density of the radiant power falling ona surface but you do not need to specify thedistribution of directions the light is comingfrom.
2.8.1.4 Radiant intensityThe radiant power emitted by a surface candepend on the direction the light propagatesaway from the surface. For example, if the sur-
■ THE SCIENCE OF COLOR
88
Figure 2.42 A comparison of the widths of opticalpoint spread functions representing blurring by theoptics and the cone apertures with neural point spreadfunctions representing the effects of neural blurring onpsychophysical isoluminant and isochromaticdiscriminations. (FromWilliams et al.,1993.)
Red-GreenIsoluminantPoint Spread
IsochromaticPoint
Spread
Cone Apertures 0.23 min
0.7 min
1.5 min
0.54 min
0.8 minOptical
Point Spread

face were a mirror illuminated by a laser, the radi-ant power emitted from the mirror would dependstrongly on direction. Virtually all the photonswould stream off in a single direction and the eyewould see nothing unless the pupil were posi-tioned to intercept the reflected beam. The radiantintensity, I
e, is the radiant power emitted in a par-
ticular direction into the infinitesimally small solidangle, dx, and is given by
Ie
� d2Qe/dtdx � dP
e/dx
Radiant intensity is expressed in units of wattsper steradian. Note that the definition of radiantintensity resembles that for radiant power withthe addition of dx in the denominator.
Figure 2.1(B) shows the geometry under-lying the concept of solid angle. The solidangle, x, expressed in steradians, sr, is the three-dimensional analog of angles defined in twodimensions and expressed in radians. Imagine apoint on a surface that is radiating light into ahemisphere with radius, r. A cone with its vertexat the point on the surface intersects the hemi-sphere, defining an area, A
sp. Solid angle is given
by the expression
x � Asp
/r2
Very often in light measurement, we need tocalculate the solid angle subtended by planarobjects. If r is greater than 1.75 times the radiusof the object, the area of the planar object can besubstituted for the area of the surface of a spherewith an error of less than 10%. In describing thesolid angle of visual stimuli, we usually expressvisual angle in degrees. To convert from deg�2 tosteradians, it is useful to know that one squaredegree equals 3.05 � 10–4 steradians.
In the expression for radiant intensity above,dx is an infinitesimally small solid angle arounda specific direction in which radiant power prop-agates. Just as irradiance allows you to describethe spatial density of radiant power, radiantintensity allows you to describe the angular den-sity of radiant power. Radiant intensity, or itsphotometric equivalent, luminous intensity, isusually used to describe small stimuli such aspoint sources though it is defined for extendedsources as well.
2.8.1.5 RadianceExitance and irradiance both incorporate loca-tion but not direction; radiant intensity incorpo-rates direction but not location. Radiance is aparticularly useful quantity that allows us todescribe the radiant power in a particular loca-tion and propagating in a particular direction.Radiance, L
e, is given by
Le
� d3Qe/dtdxdAcosh
� d2Pe/dxdAcosh
� dIe/dAcosh
where d2Pe
is the radiant power emitted intosolid angle dx by an infinitesimal area on thesurface dA. The units of radiance are watts persteradian per meter squared. The equivalentphotometric quantity is luminance, which willbe defined later.
The cosh in the denominator, when multipliedby dA, defines the area of the surface visiblefrom the direction of observation rather than theactual area of the surface, as shown in Figure2.1(C). h is the angle formed between the surfacenormal and the direction in which the radiancemeasurement is made. To understand the signif-icance of this, consider a good diffuse reflectorsuch as a white piece of paper. If we measure theradiant intensity of the paper in units of wattssr�1 as a function of h, it will decline as a cosinefunction of increasing angle simply because theprojected area of the paper declines in this way.This is known as Lambert’s law and diffusers thatobey this law, which are common in nature, aresaid to be Lambertian. However, the radiance ofthe paper will remain unchanged because theprojected area appears in the denominator of thedefinition of radiance. The radiant intensity,which is in the numerator, declines in exactlythe same way as the projected area withincreasing angle, leaving radiance constant.Other properties of radiance that make it a par-ticularly valuable quantity will be discussedlater.
2.8.1.6 Spectral radianceMost visual stimuli in color science have radiantpower distributed across a broad range of wave-lengths. The definition of radiance, or any otherradiometric quantity for that matter, can be
LIGHT, THE RETINAL IMAGE,AND PHOTORECEPTORS ■
89
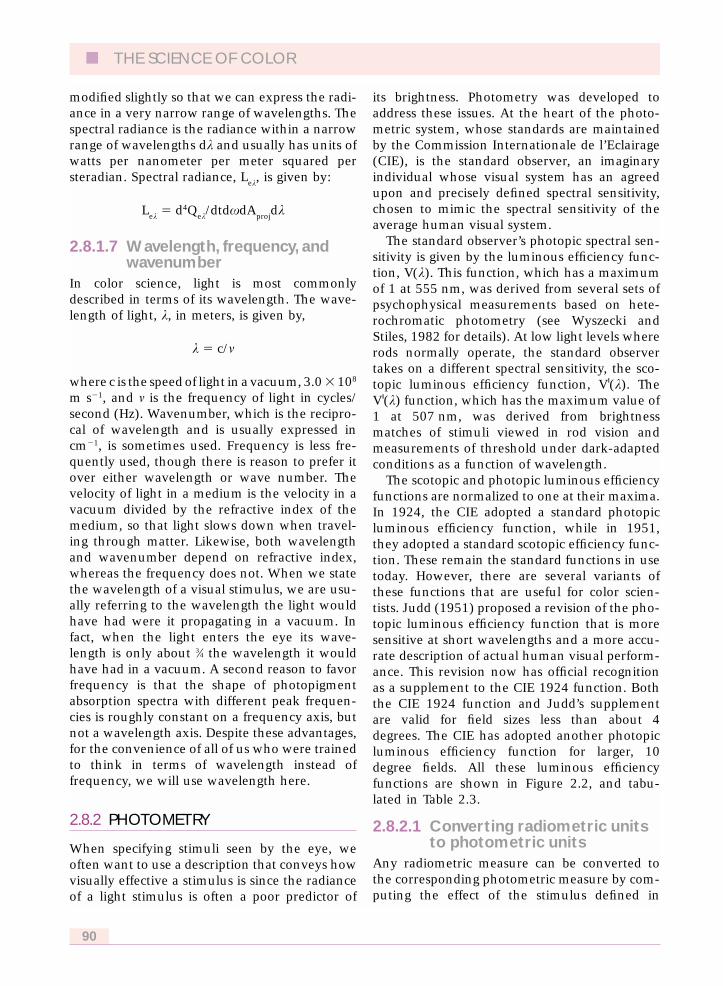
modified slightly so that we can express the radi-ance in a very narrow range of wavelengths. Thespectral radiance is the radiance within a narrowrange of wavelengths dk and usually has units ofwatts per nanometer per meter squared persteradian. Spectral radiance, L
ek, is given by:
Lek � d4Q
ek/dtdxdAproj
dk
2.8.1.7 Wavelength, frequency, andwavenumber
In color science, light is most commonlydescribed in terms of its wavelength. The wave-length of light, k, in meters, is given by,
k � c/m
where c is the speed of light in a vacuum, 3.0 � 108
m s�1, and m is the frequency of light in cycles/second (Hz). Wavenumber, which is the recipro-cal of wavelength and is usually expressed incm�1, is sometimes used. Frequency is less fre-quently used, though there is reason to prefer itover either wavelength or wave number. Thevelocity of light in a medium is the velocity in avacuum divided by the refractive index of themedium, so that light slows down when travel-ing through matter. Likewise, both wavelengthand wavenumber depend on refractive index,whereas the frequency does not. When we statethe wavelength of a visual stimulus, we are usu-ally referring to the wavelength the light wouldhave had were it propagating in a vacuum. Infact, when the light enters the eye its wave-length is only about 3⁄4 the wavelength it wouldhave had in a vacuum. A second reason to favorfrequency is that the shape of photopigmentabsorption spectra with different peak frequen-cies is roughly constant on a frequency axis, butnot a wavelength axis. Despite these advantages,for the convenience of all of us who were trainedto think in terms of wavelength instead offrequency, we will use wavelength here.
2.8.2 PHOTOMETRY
When specifying stimuli seen by the eye, weoften want to use a description that conveys howvisually effective a stimulus is since the radianceof a light stimulus is often a poor predictor of
its brightness. Photometry was developed toaddress these issues. At the heart of the photo-metric system, whose standards are maintainedby the Commission Internationale de l’Eclairage(CIE), is the standard observer, an imaginaryindividual whose visual system has an agreedupon and precisely defined spectral sensitivity,chosen to mimic the spectral sensitivity of theaverage human visual system.
The standard observer’s photopic spectral sen-sitivity is given by the luminous efficiency func-tion, V(k). This function, which has a maximumof 1 at 555 nm, was derived from several sets ofpsychophysical measurements based on hete-rochromatic photometry (see Wyszecki andStiles, 1982 for details). At low light levels whererods normally operate, the standard observertakes on a different spectral sensitivity, the sco-topic luminous efficiency function, V »(k). TheV »(k) function, which has the maximum value of1 at 507 nm, was derived from brightnessmatches of stimuli viewed in rod vision andmeasurements of threshold under dark-adaptedconditions as a function of wavelength.
The scotopic and photopic luminous efficiencyfunctions are normalized to one at their maxima.In 1924, the CIE adopted a standard photopicluminous efficiency function, while in 1951,they adopted a standard scotopic efficiency func-tion. These remain the standard functions in usetoday. However, there are several variants ofthese functions that are useful for color scien-tists. Judd (1951) proposed a revision of the pho-topic luminous efficiency function that is moresensitive at short wavelengths and a more accu-rate description of actual human visual perform-ance. This revision now has official recognitionas a supplement to the CIE 1924 function. Boththe CIE 1924 function and Judd’s supplementare valid for field sizes less than about 4degrees. The CIE has adopted another photopicluminous efficiency function for larger, 10degree fields. All these luminous efficiencyfunctions are shown in Figure 2.2, and tabu-lated in Table 2.3.
2.8.2.1 Converting radiometric unitsto photometric units
Any radiometric measure can be converted tothe corresponding photometric measure by com-puting the effect of the stimulus defined in
■ THE SCIENCE OF COLOR
90
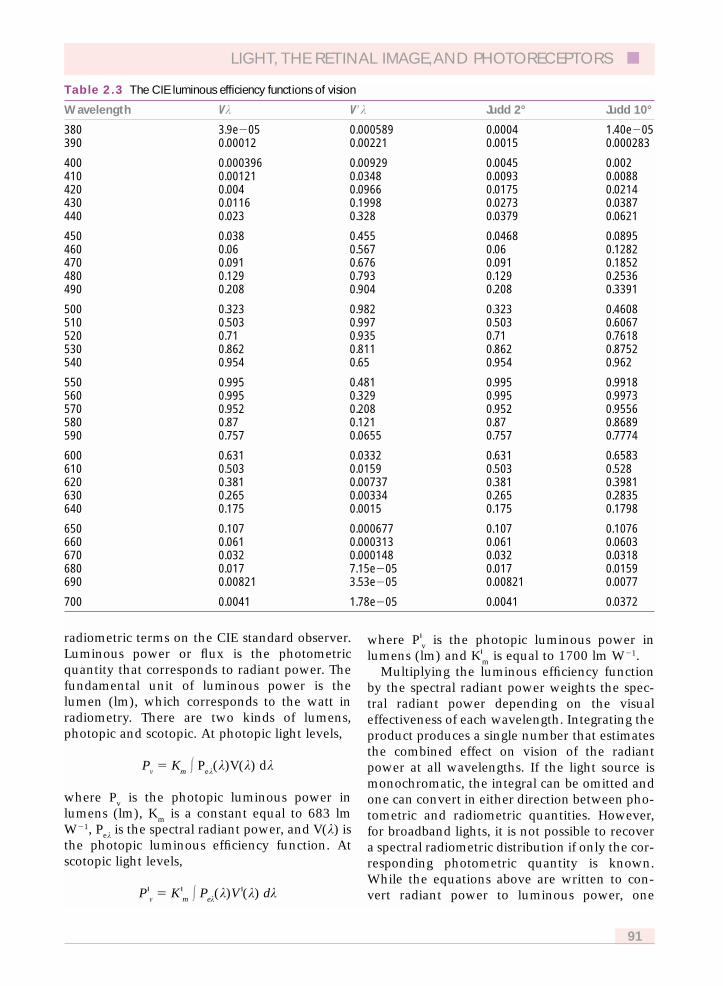
radiometric terms on the CIE standard observer.Luminous power or flux is the photometricquantity that corresponds to radiant power. Thefundamental unit of luminous power is thelumen (lm), which corresponds to the watt inradiometry. There are two kinds of lumens,photopic and scotopic. At photopic light levels,
Pm � Km
� Pek(k)V(k) dk
where Pv
is the photopic luminous power inlumens (lm), K
mis a constant equal to 683 lm
W�1, Pek is the spectral radiant power, and V(k) is
the photopic luminous efficiency function. Atscotopic light levels,
P »m � K »m
� Pek(k)V »(k) dk
where P »v
is the photopic luminous power inlumens (lm) and K»
mis equal to 1700 lm W�1.
Multiplying the luminous efficiency functionby the spectral radiant power weights the spec-tral radiant power depending on the visualeffectiveness of each wavelength. Integrating theproduct produces a single number that estimatesthe combined effect on vision of the radiantpower at all wavelengths. If the light source ismonochromatic, the integral can be omitted andone can convert in either direction between pho-tometric and radiometric quantities. However,for broadband lights, it is not possible to recovera spectral radiometric distribution if only the cor-responding photometric quantity is known.While the equations above are written to con-vert radiant power to luminous power, one
LIGHT, THE RETINAL IMAGE,AND PHOTORECEPTORS ■
91
Table 2.3 The CIE luminous efficiency functions of vision
Wavelength Vk V�k Judd 2° Judd 10°
380 3.9e�05 0.000589 0.0004 1.40e�05390 0.00012 0.00221 0.0015 0.000283
400 0.000396 0.00929 0.0045 0.002410 0.00121 0.0348 0.0093 0.0088420 0.004 0.0966 0.0175 0.0214430 0.0116 0.1998 0.0273 0.0387440 0.023 0.328 0.0379 0.0621
450 0.038 0.455 0.0468 0.0895460 0.06 0.567 0.06 0.1282470 0.091 0.676 0.091 0.1852480 0.129 0.793 0.129 0.2536490 0.208 0.904 0.208 0.3391
500 0.323 0.982 0.323 0.4608510 0.503 0.997 0.503 0.6067520 0.71 0.935 0.71 0.7618530 0.862 0.811 0.862 0.8752540 0.954 0.65 0.954 0.962
550 0.995 0.481 0.995 0.9918560 0.995 0.329 0.995 0.9973570 0.952 0.208 0.952 0.9556580 0.87 0.121 0.87 0.8689590 0.757 0.0655 0.757 0.7774
600 0.631 0.0332 0.631 0.6583610 0.503 0.0159 0.503 0.528620 0.381 0.00737 0.381 0.3981630 0.265 0.00334 0.265 0.2835640 0.175 0.0015 0.175 0.1798
650 0.107 0.000677 0.107 0.1076660 0.061 0.000313 0.061 0.0603670 0.032 0.000148 0.032 0.0318680 0.017 7.15e�05 0.017 0.0159690 0.00821 3.53e�05 0.00821 0.0077
700 0.0041 1.78e�05 0.0041 0.0372
could convert any radiometric quantity, such asradiance to its photometric equivalent, which isluminance, simply by substituting the appropriatequantity for P
ek in the equations above.
2.8.2.2 The trolandThe goal of the photometric system is to takeinto account a property of the eye, namely itsspectral sensitivity, when quantifying stimuliseen by the visual system. In that same spirit, thetroland was invented to take into account theeffect of the eye’s pupil. For a stimulus of fixedluminance, the illuminance of the retinal image,expressed in lumens per square meter of retina,will increase in proportion to the area of thepupil. If you have measured the luminance of avisual stimulus and you know the area of theobserver’s pupil while viewing the stimulus, thephotopic troland value, T, expressed in trolands,is given by
T � Lv
p
where Lv
is the luminance in cd m�2 and p isthe area of the pupil in mm2. Scotopic trolandsare similarly computed but using luminancevalues based on the scotopic luminous efficiencyfunction.
The above definition of the troland is conven-ient when you use a light meter that reads theluminance of a surface such as a CRT screen.Some light meters are not equipped with lenses.These also can also be used to calculate trolandvalues. In that case, the photodetector surface isplaced in the plane where the observer’s pupilwould normally lie. In Maxwellian view sys-tems, where this technique is frequently used,the photodetector surface is placed conjugate tothe artificial pupil so that all the light that wouldordinarily pass into the eye is collected by thedetector. The illuminance measurement pro-vided by the detector can be converted to lumi-nous power simply by multiplying by the area ofthe detector, being careful to express the area inthe same units as those incorporated in thereadout units. (In many devices, the size of thephotodetector is exactly 1 cm2 and the readoutunits are expressed in luminous power cm�2 sothat the displayed number gives the luminouspower directly.) Then, the troland value, T, isgiven by
T � Pv
x�1 106
where Pv
is the luminous power in lumens andx is the solid angle subtended by the stimulus atthe eye’s nodal point (which will be definedbelow). If the light is monochromatic, and youmade your measurement of the light enteringthe pupil in irradiance units instead of illumi-nance units, then the troland value, T, is givenby
T � 683 Pe
Vk x�1 106
where Pe is radiant power in watts.
The troland value is often referred to as retinalilluminance, but this usage is technically incor-rect. As we will see later, the actual retinal illu-minance depends not just on the luminance ofthe stimulus and the area of the pupil as the def-inition of troland value suggests, but also on thefocal length of the eye and the transmittance ofthe ocular media.
Neither the troland value nor the actual reti-nal illuminance take into account the directionalsensitivity of the retina, or the Stiles–Crawfordeffect. This effect, described in section 2.5.4,means that the visual effectiveness of a stimulusdepends on the distribution of luminous powerin the pupil and not simply on the total amount.Nonetheless, the troland value is a useful quantityand is widely used in color science today.
2.8.2.3 More obscure photometricunits
There are a large number of terms for describinglight that can be found in the literature and arenot discussed here. These include luxons, nits,footcandles, apostilbs, blondels, and talbots.Should you encounter these terms and need toconvert them into the quantities that are com-monly accepted by vision scientists, their defini-tions can be found in Wyszecki and Stiles (1982).They are not repeated here in the hope that thismight help to discourage their use.
2.8.2.4 Light metersCommercial devices for measuring light have abewildering number of names, and these namesare often used without a great deal of consis-tency. For our purposes, there are basically fourtypes of instruments: radiometers, spectroradio-
■ THE SCIENCE OF COLOR
92

meters, photometers, and colorimeters. Thecapabilities of these four instruments are oftencombined into a single device.
Radiometers measure light in terms of radio-metric units. An example of a simple radiometeris a silicon photodiode with a filter in front of itto make the overall energy-based sensitivity ofthe device flat across the visible spectrum. Thedevice spatially integrates all the light falling onthe photosensitive surface of the photodiode.Such devices essentially measure the irradianceof the light falling on them with typical units ofmicrowatts cm�2. More sophisticated versions ofthese devices can integrate irradiance over auser-specified time interval, so that radiantenergy in a flash of light can be measured.Photometers measure light in photometric units.The simple photodiode discussed above can beconverted from a radiometer to a photometer byreplacing the filter in front of it with a specificyellow–green appearing filter that gives thedetector a spectral sensitivity similar to the pho-topic luminous efficiency function. Such a devicemeasures illuminance, usually in lux (lx), whichis the photometric equivalent of irradiance. Onelux is equivalent to one lumen m�2.
Both radiometers and photometers of thiskind can be used to measure other quantitiesbesides irradiance and illuminance. For exam-ple, suppose you want to measure the luminousintensity of a light source such as an LED withthe photometer. If the light falls uniformlyacross the photodetector, you could multiplythe measured illuminance by the area of thedetector to compute the total luminous power itis receiving. The luminous intensity is then theluminous power divided by the solid angle sub-tended by the detector at the source. (This isequivalent to dividing the measured illumi-nance of the source by the square of the dis-tance of the photodetector from the source.)The units of luminous intensity are candelas(cd) where one candela is equal to one lumensr�1. Alternatively, you can compute the lumi-nance of a source such as a CRT from the meas-ured illuminance. You would place a mask overall areas of the CRT except a small uniformpatch whose luminance you would like tomeasure. The luminance of the patch can becalculated by dividing the luminous intensity,calculated as described above, by the projected
area of the patch in square meters. The units ofluminance are candelas m�2.
Some radiometers and photometers areequipped with a lens and a viewfinder. Theregion of the scene in the viewfinder over whichthe light measurement is made is indicated, usu-ally by a black dot. These devices make radi-ance/luminance measurements as simple aspressing a button because they image the objectonto the photodetector. Ignoring transmissionlosses in the lens, the radiance (and luminance)of the image of a surface within the solid anglesubtended by the lens, is the same as that of thesurface itself (see Boyd, 1983 for a proof). Thismeans that such devices can read out radiance(and luminance in the photometric versions)directly without the user having to measure anydistances or projected areas.
Whereas the devices described above integratelight at different wavelengths, arriving at singlenumber, spectroradiometers measure radiantpower at multiple wavelengths. This is usuallyaccomplished by using a diffraction grating tospread the light from the region of interest into aspectrum that is sampled by a one-dimensionalarray of detectors. The spectral radiance distribu-tion can be computed from the distribution ofradiant power across the detectors. These devicesare quite useful in color science because theyprovide the basic data from which all radianceand luminance computations can be performed.In addition, these devices, when equipped withthe appropriate software, can behave as color-imeters, calculating the chromaticity coordinatesof surfaces.
2.8.3 ACTINOMETRY
2.8.3.1 Converting radiometric unitsto actinometric units
Any radiometric quantity, such as radiant power,irradiance, or spectral radiance, can be convertedto the corresponding actinometric quantity byapplying Planck’s Law, which states that theenergy in a single photon, Q, is
Q � hm
where m is the frequency of the light and h isPlanck’s constant, 6.6262 �10–34 J s. The numberof photons, Q
p, is given by
LIGHT, THE RETINAL IMAGE,AND PHOTORECEPTORS ■
93

Qp
� 5.0341 � 1015 k Qe
where Qe
is radiant energy expressed in joulesand k is the wavelength of light measured innanometers. The subscript p stands for photonand indicates an actinometric quantity. Thisequation would hold not only for radiant energyand photons but also for any corresponding pairof radiometric and actinometric quantities, suchas radiance and photon flux radiance.
In color science, spectral sensitivity curvesfrom psychophysical experiments are some-times plotted using an energy basis on theordinate and at other times using a quantumbasis. The shapes of the curves depend onwhich basis is used, with the quantum basisversion always higher at the short wavelengthend of the spectrum. If you want to convert aquantum-based spectral sensitivity curveexpressed in photons s�1 deg�2 to an energy-based curve expressed in watts deg�2, divide by5.0341 � 1015 k, if you want to convert froman energy to a quantum basis, multiply by5.0341 � 1015 k.
2.8.4 ACTINOMETRY OF THE RETINALIMAGE
2.8.4.1 The reduced eyeTo apply actinometry to the retinal image, wemust first have a model of the eye that allows usto predict with reasonable accuracy the dimen-sions of the retinal image. Figure 2.3 shows across-section through the human eye, indicatingthe most important features for our purposes.The passage of rays through this structure iscomplex, in part because of the gradient indexproperties of the human lens, which have notbeen completely characterized. Numerousschematic eyes have been designed to capturethe imaging properties of real eyes (see Wyszeckiand Stiles, 1982 for details). We will use a sim-plified model of the eye, called the reduced eye(Elmsley, 1952), which does an adequate job ofpredicting the dimensions of the retinal imagedespite its inaccuracies in some other respects.
The reduced eye, shown in Figure 2.43, con-sists of a single convex surface which does therefracting work of the cornea and lens in the real
eye. This is not quite as gross a violation of real-ity as it might first appear. In the real eye, thefirst surface of the cornea accounts for about80% of the refracting power of the total eye,with the lens mainly responsible for focusing theeye on objects at different distances. This spheri-cal surface has a radius of curvature, PN, of5.56 mm. The reduced eye has a pupil, which islocated, for simplicity in a plane containing theprincipal point, P.
In the real eye, the retinal image is formed ina medium with a higher refractive index than thatoutside the eye. Correspondingly, the reducedeye has a refractive index, n», inside of 4⁄3 and arefractive index, n, outside of 1. This influencesthe posterior focal length of the eye which influ-ences the size, and therefore, the actinometry ofthe retinal image. The distance between therefractive surface at P and the retina at R is theposterior focal length of the eye, f », which has avalue of 22.22 mm.
Suppose the reduced eye is viewing an objectthat is very distant from the eye. We can locatethe position of the retinal image of a point on theobject by considering two rays from the objectpoint. Since the object is very far away these rayswill be effectively parallel as they impinge on theeye, as shown in Figure 2.43. Consider first theray that intersects the optic axis at P, where itmakes an angle h with respect to the optic axisoutside the eye. The law of refraction, alsoknown as Snell’s Law, states that the angle theray makes inside the eye, h », will be given by
sinh » � (n/n») sinh
For small values of h and substituting the refrac-tive indices assumed for the reduced eye, thiscan be rewritten
h » � h/n» � 0.75h
Again for small angles, the size of the retinalimage, S
r, is given by
tan h » � tan (0.75h) � Sr/f »
Substituting the reduced eye value for f » solvingfor S
r, we have, approximately
Sr
� 0.291h
■ THE SCIENCE OF COLOR
94

which implies that 1� of visual angle correspondsto about 0.291 mm on the retina, or that oneminute of arc corresponds to 4.85 lm.
Consider the second ray from the objectpoint that is coincident with a normal to therefracting surface. This ray will not be bent atall and will intersect the optic axis at point N.Point N is called the nodal point of the eye.The ray continues through N, intersecting theretina at the same point as the first ray. Raysthat pass through N have the valuable prop-erty that angles inside and outside the eye areequal. This allows us an alternative and sim-pler way to compute the size of the retinalimage, by using similar right triangles. In thereduced eye, the distance between N and theretina, which is sometimes called the poste-rior nodal distance, D
r, is 16.67 mm. The pos-
terior nodal distance, incidentally, is theposterior focal length of a schematic eye thatconsists of a thin lens and equal refractiveindices inside and outside the eye. In thiscase,
Ss/D
s� S
r/D
r
In terms of area, if we let As
be the area of thesurface, S
s2 and Ar be the area of the retinal
image, Sr2, we can write
As/D
s2 � A
r/D
r2
This expression simply says that the solid angleswith respect to the nodal point outside andinside the eye are equal.
2.8.4.2 Computing retinal photon fluxirradiance
We are now in a position to compute the retinalphoton flux irradiance for a monochromaticstimulus. Typically we might be given the lumi-nance or radiance of the stimulus. If we aregiven luminance, then we must first convert toradiometric units which we can do by
Le
� Lv/K
mV(k)
LIGHT, THE RETINAL IMAGE,AND PHOTORECEPTORS ■
95
Figure 2.43 The geometry of the reduced schematic eye (Elmsley, 1952) used to predict the dimensions ofthe retinal image.The upper figure shows the object space including the area, As, height, Ss, and distance, Ds, ofthe object being viewed.The lower half of the figure is an expanded view of the image space showing the area,Ar, height, Sr, and distance, Dr, of the image being formed. P is the point at which the optical axis intersects thecornea, the only refracting element in the reduced eye. Rays incident on P at an angle h with respect to theoptical axis will be bent towards the optical axis making a reduced angle h » that can be calculated from Snell’sLaw and the refractive indices n and n». N is the nodal point through which a ray passes unbent. f » is the focallength of the model eye.
DS
SS
AS
DS
n�1 n»�4/3
DrAr
SrPN R
Pupil
f »�
θ»�θ (
)

If we are given the radiance of the stimulus orafter we have converted luminance to radiance,the next step is to convert to photon flux radianceby
Lp
� 5.0341 � 1015 kLe
Given the photon flux radiance of the surface,we can compute the photon flux in the pupil by
Pp
� LpA
sA
p/D
s2
This expression tells us the number of photons/sarriving at the pupil from the source. Next, weneed to compute how these photons will be dis-tributed on the retina. We can calculate the areaof the retinal image using a rearranged versionof one of the equations developed above for thesimplified schematic eye.
Ar
� Dr2A
s/D
s2
Knowing both the photon flux radiance and thearea of the retinal image we can then calculatephoton flux irradiance from
Ep
� TPp/A
r� TL
pA
p/D
r2
The expression for photon flux irradiance on theright is calculated by substituting for P
pand A
r
and taking into account light losses in the opticalmedia by including its transmittance, T.
We can now calculate the photon flux arrivingat any area of the retina by
Pp
� EpA
r
where Ar is the area of interest. For example,photon flux for a particular stimulus could becalculated by setting A
requal to the stimulus
area. The number of photons/s arriving at a singlephotoreceptor can be estimated by setting A
r
equal to the area of the photoreceptor aperture.Examples, which are explained in section 2.2.4can be found in Table 2.2.
2.9 APPENDIX B:GENERALIZED PUPILFUNCTION AND IMAGEFORMATION
2.9.1 QUANTITATIVE DESCRIPTION OFTHE GENERALIZED PUPILFUNCTION
The optics of the eye can be evaluated by deter-mining what happens to a planar wave front asit passes through the optics to the retina. In anaberrated eye, the light waves passing throughdifferent parts of the pupil will be delayed by dif-ferent amounts resulting in an imperfect retinalimage. A map of the amount that light is delayedas it passes through the pupil is known as thewave aberration. The generalized pupil functionis an extension of the wave aberration that takesinto account not only the delays introduced bythe eye’s optics but also their transmittance. Ifthe generalized pupil function is known, itbecomes possible to calculate the point spreadfunction, which is a complete description ofimage quality.
The generalized pupil function is:
P(g,n) � P0(g,n) · exp(i2pW(g,n))
k
where (g,n) are 2-d spatial coordinates in the entrance pupil and W(g,n) is the eye’s waveaberration, which describes errors in the delay oflight at each location in the pupil. P
0(g,n) is the
amplitude transmittance across the eye’s optics,the truncating effect of the iris being the mostimportant. The variation in the absorption of thecornea and lens across the pupil is small enoughin the normal eye that it can usually beignored. However, because of the antennaproperties of cones, the quantum efficiency ofthe retina depends on the entry point of light inthe pupil. Though this effect, known as theStiles–Crawford effect (see section 2.5.4.1), iscaused by the optics of the retina, it is equivalentto reducing the amplitude transmittance towardsthe perimeter of the entrance pupil. Therefore,the generalized pupil function for the eyeincludes the directional sensitivity of the retinain P
0(g,n).
■ THE SCIENCE OF COLOR
96

The PSF is the squared modulus of the Fouriertransform of the generalized pupil function. Thatis,
PSF(x, y) � |�(P(kdg, kdn))|2
where the Fourier transform is given by
�(f(g, n)) � ��f(g, n)·EXP[�i2p(xm � yn)]dgdn
2.9.2 COMPUTING RETINAL IMAGES FOR ARBITRARY OBJECTS
The retinal image for an arbitrary object, as illus-trated in Figure 2.14, can be computed either inthe spatial domain or the frequency domain. Inthe spatial domain, the intensity distribution ofthe image, I(x,y), is the convolution of the PSFwith the intensity distribution of the object,O(x,y). That is,
I(x,y) � PSF(x, y) � O(x/M, y/M)
where M is the magnification between the objectand image planes.
The convolution of two functions f(x,y) andg(x,y) is
f(x, y) � g(x, y) � �� f(x, y) · g(r � x, s � y)dxdy.
Inpractice, thecomputationof the retinal imageis more efficient in the spatial frequency domain.In that case, the intensity distribution of theobject. O(x, y), is Fourier transformed to providethe object Fourier spectrum, o( f
x, f
y). That is,
o( fx, f
y) � �(O(x, y))
The object Fourier spectrum is then multipliedby the optical transfer function (OTF) of the eyeto give the image Fourier spectrum:
i(fx, f
y) � OTF( f
x, f
y) · o(Mf
x, Mf
y)
By taking the inverse Fourier transform of theimage spectrum, one obtains the retinal image.
I(x, y) � ��1(i( fx, f
y))
The OTF is the autocorrelation of the general-ized pupil function. Alternatively, the OTF canbe computed by Fourier transforming the PSF.The OTF is complex, consisting of two parts, amodulation transfer function (MTF) and a phasetransfer function (PTF). The MTF indicates howfaithfully the contrast of individual spatial fre-quency components of the object is transferredto the image. The PTF indicates how individualspatial frequency components of the object havebeen translated in the retinal image.
For the diffraction-limited eye, optical per-formance can be characterized by the modula-tion transfer function (MTF) alone sincediffraction produces no phase error. In this case,the MTF is
2 s s sD(s,s
0) � �cos�1� � � � � �1� � �
2
�p s0
s0
s0
for s � s0
where s is spatial frequency in cycles/degree, ands
0is the incoherent cut-off frequency for a dif-
fraction-limited imaging system with a circularpupil. The incoherent cut-off frequency is thespatial frequency above which the optical trans-fer function is zero. In radians, the incoherentoptical cutoff is
s0
� a/k
where a is the diameter of the pupil and k is thewavelength of light.
2.10 ACKNOWLEDGMENTS
The authors wish to thank Joe Carroll, DavidBrainard, Larry Thibos, and Walt Makous fortheir comments on the manuscript and AntonioGuirao, Heidi Hofer, and Geun-Young Yoon fortheir assistance. We acknowledge financial sup-port from the National Eye Institute.
2.11 REFERENCES
Abadi, R.V. and Cox, M.J. (1992) The distributionof macular pigment in human albinos. InvestOphthalmol Vis Sci, 33, 494–7.
LIGHT, THE RETINAL IMAGE,AND PHOTORECEPTORS ■
97

Abramov, I. and Gordon, J. (1977) Color vision in theperipheral retina. I. Spectral sensitivity. J Opt Soc Am,67, 195–202.
Adams, D.L., Horton, J.C. (2002) Shadows cast byretinal blood vessels mapped in primary visualcortex. Science, 298(5593): 572–6.
Ahnelt, P.K., Kolb, H., and Pflug, R. (1987)Identification of a subtype of cone photoreceptor,likely to be blue sensitive, in the human retina.J Comp Neurol, 255, 18–34.
Alpern, M. (1986) The Stiles–Crawford effect of thesecond kind (SCII): a review. Perception, 15, 785–99.
Anderson, S.J. and Hess, R.F. (1990) Post-receptoralundersampling in normal human peripheral vision.Vision Res, 30, 1507–15.
Applegate, R.A. and Lakshminarayanan, V. (1993)Parametric representation of Stiles–Crawford func-tions: normal variation of peak location and direc-tionality. J Opt Soc Am A, 10, 1611–23.
Artal, P., Derrington, A.M., and Colombo, E. (1995)Refraction, aliasing, and the absence of motionreversals in peripheral vision. Vision Res, 35, 939–47.
Artal, P., Marcos, S., Navarro, R., and Williams, D.R.(1995) Odd aberrations and double-pass measure-ments of retinal image quality. J Opt Soc Am A, 12,195–201.
Atchison, D.A., Joblin, A., and Smith, G. (1998)Influence of Stiles–Crawford effect apodization onspatial visual performance. J Opt Soc Am A, 15,2545–51.
Barlow, H.N. (1977) Retinal factors in human visionlimited by noise. In H.N. Barlow and P. (eds),Photoreception in Vertebrates. London: AcademicPress.
Baylor, D.A., Nunn, B.J., and Schnapf, J.L. (1984) Thephotocurrent, noise, and spectral sensitivity of rodsof the monkey Macaca fascicularis. J Physiol (Lond),357, 575–607.
Baylor, D.A., Nunn, B.J., and Schnapf, J.L. (1987)Spectral sensitivity of cones of the monkey Macacafascicularis. J Physiol (Lond), 390, 145–60.
Bergmann, C. (1858) Anatomisches und Physiologischesuber die Netzhaut des Auges. Zeitschrift fur ration.Medicin, 2, 83–108. [Translated by D’Zmura, M.(1996) Bergmann on visual resolution. Perception,25, 1223–34.]
Bird, A.C. and Weale, R.A. (1974) On the retinalvasculature of the human fovea. Exp Eye Res, 19,409–17.
Boettner, E.A. and Wolter, J.R. (1962) Transmission ofthe ocular media. Invest Ophthalmol Vis Sci, 1,776–83.
Bone, R.A., Landrum, J.T., and Tarsis, S.L. (1985)Preliminary identification of the human macularpigment. Vision Res, 25, 1531–5.
Bowmaker, J.K. and Dartnall, H.J. (1980) Visual pig-ments of rods and cones in a human retina. J Physiol(Lond), 298, 501–11.
Boyd, R.W. (1983) Radiometry and the Detection ofOptical Radiation. New York: John Wiley.
Bradley, A., Zhang, X.X., and Thibos, L.N. (1991)Achromatizing the human eye. Optom Vis Sci, 68,608–16.
Brainard, D.H. and Williams, D.R. (1993) Spatialreconstruction of signals from short-wavelengthcones. Vision Res, 33, 105–16.
Brainard, D.H., Roorda, A., Yamauchi, Y., Calderone,J.B., Metha, A., Neitz, M., Neitz. J., Williams, D.R.,and Jacobs, G.H. (2000) Functional consequences ofthe relative numbers of L and M cones. J Opt Soc AmA, 17, 607–14.
Brewster, D. (1832) On the undulations excited in theretina by the action of luminous points and lines,London and Edinburgh Philosoph Mag and J Sci, pp.1–169.
Brindley, G.S. (1953) The effects on colour vision ofadaptation to very bright lights. J Physiol (Lond),122, 332–50.
Bumsted, K.M., Jasoni, C.L., and Hendrickson, A.E.(1996) Developmental appearance of the monkeycone mosaic detected by opsin mRNA and proteinexpression. Invest Ophthalmol Vis Sci, 37, S149.
Burns, S.A. and Elsner, A.E. (1985) Color matching athigh illuminances: the color-match-area effect andphotopigment bleaching. J Opt Soc Am A, 2, 698–704.
Burns, S.A., Wu, S., He. J.C., and Elsner, A.E. (1997)Variations in photoreceptor directionally across thecentral retina. J Opt Soc Am A, 14, 2033–40.
Burton, G.W. and Ingold, K.U. (1984) Beta-carotene:an unusual type of lipid antioxidant. Science, 224,569–73.
Byram, G.M. (1944) The physical and photochemicalbasis of visual resolving power. Part II. Visual acuityand the photochemistry of the retina. J Opt Soc Am,34, 718–38.
Campbell, F.W. and Green, D.G. (1965) Optical andretinal factors affecting visual resolution. J Physiol(Lond), 181, 576–93.
Campbell, F.W. and Gubisch, R.W. (1967) The effect ofchromatic aberration on visual acuity. J Physiol(Lond), 192, 345–58.
Carroll, J., Neitz, J., and Neitz, M. (2002) Estimates ofL:M cone ratio from ERG flicker photometry andgenetics. J Vision, 2, 531–42.
Charman, W.N. (1995) Optics of the eye. In MichaelBass (ed.), Handbook of Optics. New York: McGraw-Hill, pp. 24.3–24.54.
Chen, B. and Makous, W. (1989) Light capture byhuman cones. J Physiol (Lond), 414, 89–109.
Chen, B., Makous, W., and Williams, D.R. (1993)Serial spatial filters in vision. Vision Res, 33, 413–27.
Cicerone, C.M. and Nerger, J.L. (1989) The relativenumbers of long-wavelength-sensitive to middle-wavelength-sensitive cones in the human foveacentralis. Vision Res, 29, 115–28.
Cooper, G.F. and Robson, J.G. (1969) The yellowcolour of the lens of man and other primates. JPhysiol (Lond), 203, 411–17.
Cornsweet, T.N. and Crane, H.D. (1973) Accuratetwo-dimensional eye tracker using first and fourthPurkinje images. J Opt Soc Am, 63, 921–8.
■ THE SCIENCE OF COLOR
98
Curcio, C.A. and Allen, K.A. (1990) Topography ofganglion cells in human retina. J Comp Neurol, 300,5–25.
Curcio, C.A., Allen, K.A., Sloan, K.R., Lerea, C.L.,Hurley, J.B., Klock, I.B., and Milam, A.H. (1991)Distribution and morphology of human cone pho-toreceptors stained with anti-blue opsin. J CompNeurol, 312, 610–24.
Curcio, C.A., Sloan, K.R., Kalina, R.E., andHendrickson, A.E. (1990) Human photoreceptortopography. J Comp Neurol, 292, 497–523.
Dartnall, H.J. (1968) Quantum efficiency of rhodopsinbleaching. Vision Res, 8, 339–58.
Dartnall, H.J., Bowmaker, J.K., and Mollon, J.D.(1983) Human visual pigments: microspectrophoto-metric results from the eyes of seven persons. Proc RSoc Lond B Biol Sci, 220, 115–30.
Deeb, S.S., Diller, L.C., Williams, D.R., and Dacey,D.M. (2000) Interindividual and topographical vari-ation of L:M cone rations in monkey retinas. J OptSoc Am A, 17, 538–44.
de Monasterio, F.M., Schein, S.J., and McCrane, E.P.(1981) Staining of blue-sensitive cones of themacaque retina by a fluorescent dye. Science, 213,1278–81.
de Monasterio, F.M., McCrane, E.P., Newlander, J.K.,and Schein, S.J. (1985) Density profile of blue-sensitive cones along the horizontal meridian ofmacaqueretina. InvestOphthalmolVisSci, 26,289–302.
Dolin, P.J. (1994) Ultraviolet radiation and cataract: areview of the epidemiological evidence. Br JOphthalmol, 78, 478–82.
Einthoven, W. (1885) Stereoskopie durch farbendif-ferenz. Albrecht von Graefes Archiv fur Ophthalmologie,31, 211–38.
Elmsley, H.H. (1952) Visual Optics, 5th edn, Vol. 1.London: Butterworths.
Enoch, J.M. and Lakshminarayanan, V. (1991) Retinalfibre optics. In J. Cronly-Dillon (ed.), Vision andVisual Dysfunction, Vol. I. Boca Raton: CRC Press,pp. 280–309.
Enoch, J.M. and Stiles, W.S. (1961) The colour changeof monochromatic light with retinal angle of inci-dence. Optica Acta, 8, 329–58.
Erb, M.B. and Dallenbach, K.M. (1939) ‘Subjective’colors from line patterns. Am J Psych, 52, 227.
Field, D.J. (1987) Relations between the statistics ofnatural images and the response properties of corti-cal cells. J Opt Soc Am A, 4, 2379–94.
Galvin, S.J. and Williams, D.R. (1992) No aliasing atedges in normal viewing. Vision Res, 32, 2251–9.
Geisler, W.S. (1989) Sequential ideal-observer analysisof visual discriminations. Psychol Rev, 96, 267–314.
Geller, A.M., Sieving, P.A., and Green, D.G. (1992)Effect on grating identification of sampling withdegenerate arrays. J Opt Soc Am A, 9, 472–7.
Goodman, J.W. (1996) Introduction to Fourier Optics.New York: McGraw-Hill.
Grassman, H.G. (1853) Zur theorie der farbenmis-chung. Annalen der Physik und Chemie, 89, 69–84.
Haegerstrom-Portnoy, G. (1988) Short-wavelength-sensitive-cone sensitivity loss with aging: a protec-tive role for macular pigment? J Opt Soc Am A, 5,2140–4.
Hagstrom, S.A., Neitz, J., and Neitz, M. (1997) Ratio ofM/L pigment gene expression decreases with retinaleccentricity. In C.R. Cavonious (ed.), Colour VisionDeficiencies XIII. Dordrecht: Kluwer Academic, pp.59–66.
Hagstrom, S.A., Neitz, J., and Neitz, M. (2000) Conepigment gene expression in individual photorecep-tors and the chromatic topography of the retina.J Opt Soc Am A, 17, 527–37.
Hallett, P.E. (1987) Quantum efficiency ofdark–adapted human vision. J Opt Soc Am A, 4,2330–5.
Ham, W.T., Jr, Mueller H.A., Ruffolo, J.J., Jr, Guerry,D. 3d, and Guerry, R.K. (1982) Action spectrum forretinal injury from near-ultraviolet radiation in theaphakic monkey. Am J Ophthalmol, 93, 299–306.
Hansen, G. (1946) The influence of theStiles–Crawford effect on measurements with thePulfrich photometer. J Opt Soc Am, 36, 321–5.
He, J.C., Marcos, S., and Burns, S.A. (1999)Comparison of cone directionality determined bypsychophysical and reflectometric techniques. J OptSoc Am A, 16, 2363–9.
Hecht, S., Shlaer, S., and Pirenne, M.H. (1942)Energy, quanta, and vision. J Gen Physiol, 25:819–40.
Helmholtz, H. (1896) Helmholtz’s Treatise onPhysiological Optics (translated from the 3rd Germanedn, edited by J.P.C. Southall), 3rd edn (1962). NewYork: Dover.
Hendrickson, A.E. and Yuodelis, C. (1984) The mor-phological development of the human fovea.Ophthalmology, 91, 603–12.
Holmgren, F. (1884) Uber den Farbensinn. Compterendu du congrès international de science et medecine (Vol1: Physiology). Copenhagen, pp. 80–98.
Hsu, A., Smith, R.G., Buchsbaum, G., and Sterling, P.(2000) Cost of cone coupling to trichromacy inprimate fovea. J Opt Soc Am A, 17, 635–40.
Jacobs, G.H. and Deegan, J.F. 2nd (1997) Spectral sen-sitivity of macaque monkeys measured with ERGflicker photometry. Vis Neurosci, 14, 921–8.
Jacobs, G.H. and Neitz, J. (1993) Electrophysiologicalestimates of individual variation in the L/M coneratio. In B. Drum (ed.), Colour Vision DeficienciesXI. Dordrecht: Kluwer Academic, pp. 107–112.
Jennings, J.A. and Charman, W.N. (1981) Off-axisimage quality in the human eye. Vision Res 21,445–55.
Jordan, G., Mollon, J.D. (1993) The Nagel anomalo-scope and seasonal variation of colour vision.Nature. J363(6429): 546–9.
Judd, D.B. (1951) Report of the U.S. SecretariatCommittee on Colorimetry and Artificial Daylight,CIE Proceedings, Vol. 1, Part 7, p. 11 (Stockholm1951). Paris, Bureau Central de la CIE.
LIGHT, THE RETINAL IMAGE,AND PHOTORECEPTORS ■
99

Kraft, J.M. and Werner, J.S. (1999) Aging and thesaturation of colors. 2. Scaling of color appearance.J Opt Soc Am A, 16, 231–5.
Krantz, D.H. (1975) Color measurement and colortheory: I. Representation theorem for Grassmanstructures. J Math Psychol, 12, 283–303.
Krauskopf, J. (1978) On identifying detectors. In J.C.Armington, J. Krauskopf, and B.R. Wooten (eds),Visual Psychophysics and Physiology. New York:Academic Press pp. 283–95.
Laties, A.M. and Enoch, J.M. (1971) An analysis ofretinal receptor orientation. I. Angular relationshipof neighboring photoreceptors. Invest Ophthalmol,10, 69–77.
Legge, G.E., Mullen, K.T., Woo G.C., and Campbell,F.W. (1987) Tolerance to visual defocus. J Opt Soc AmA, 4, 851–63.
Liang, J. and Williams, D.R. (1997) Aberrations andretinal image quality of the normal human eye.J Opt Soc Am A, 14, 2873–83.
Liang, J., Williams, D.R., and Miller, D.T. (1997)Supernormal vision and high resolution imagingthrough adaptive optics. J Opt Soc Am A, 14,2884–92.
Luckiesh, M. and Moss, F.K. (1933) A demonstra-tional test of vision. Am J Psych, 45, 135.
McLellan, J.S., Marcos, S., Prieto, P.M., Burns, S.A.(2002) Imperfect optics may be the eye’s defenceagainst chromatic blur. Nature, 417(6885): 174–6.
MacLeod, D.I.A. (1985) Receptoral restraints on colorvision. In D. Ottoson and S. Zeki (eds), Central andPeripheral Mechanisms of Colour Vision. London:Macmillan, pp. 103–16.
MacLeod, D.I. and Webster, M.A. (1988) Direct psy-chophysical estimates of the cone-pigment absorp-tion spectra. J Opt Soc Am A, 5, 1736–43.
MacLeod, D.I.A., Williams, D.R., and Makous, W.(1992) A visual nonlinearity fed by single cones.Vision Res, 32, 347–63.
Makous, W. (1997) Fourier models and loci of adapta-tion. J Opt Soc Am A, 14, 2323–45.
Makous, W. (1998) Optics. In R.H.S. Carpenter andJ.G. Robson (eds), Vision Research: a Practical Guide toLaboratory Methods. Oxford: Oxford University Press,pp. 1–49.
Marcos, S., Burns, S.A., Moreno-Barriusop, E.,Navarro, R. (1999) A new approach to the study ofocular chromatic aberrations. Vision Res. 39(26):4309–23.
Miller, W.H. and Bernard, G.D. (1983) Averaging overthe foveal receptor aperture curtails aliasing. VisionRes, 23, 1365–9.
Mino, M. and Okano, Y. (1971) Improvement in theOTF of a defocussed optical system through the useof shaded apertures. Applied Optics, 10, 2219–25.
Miyahara, E., Pokorny, J., Smith, V.C., Baron, R., andBaron, E. (1998) Color vision in two observers withhighly biased LWS/MWS cone ratios. Vision Res, 38,601–12.
Mollon, J.D. (1982) Color vision. Ann Rev Psychol, 33,41–85.
Mollon, J.D. and Bowmaker, J.K. (1992) The spatialarrangement of cones in the primate fovea. Nature,360, 677–9.
Navarro, R., Artal, P., and Williams, D.R. (1993)Modulation transfer of the human eye as a functionof retinal eccentricity. J Opt Soc Am A, 10, 201–12.
Neitz, J., Carroll, J., Yamauchi, Y., Neitz, M., Williams,D.R. (2002) Color Perception is Mediated by aPlastic Neural Mechanism that Remains Adjustablein Adults. Neuron, 35, 738–92.
Nussbaum, J.J., Pruett, R.C., and Delori, F.C. (1981)Historic perspectives. Macular yellow pigment. Thefirst 200 years. Retina, 1, 296–310.
Osterberg, G.A. (1935) Topography of the layer of rodsand cones in the human retina. Acta Ophthalmol, 6(Suppl. 13), 1–102.
Packer, O., Hendrickson, A.E., and Curcio, C.A. (1989)Photoreceptor topography of the retina in the adultpigtail macaque (Macaca nemestrina). J Comp Neurol,288, 165–83.
Packer, O.S., Williams, D.R., and Bensinger, D.G.(1996) Photopigment transmittance imaging of theprimate photoreceptor mosaic. J Neurosci, 16,2251–60.
Pelli, D.G. (1990) The quantum efficiency of vision. InC. Blakemore (ed.), Vision: Coding and Efficiency.Cambridge: Cambridge University Press, pp. 3–24.
Pettersen, D.P. and Middleton, D. (1962) Samplingand reconstruction of wave number limited func-tions in N-dimensional euclidean space. Informationand Control, 5, 279–323.
Piotrowski, L.N. and Campbell, F.W. (1982) A demon-stration of the visual importance and flexibility ofspatial-frequency amplitude and phase. Perception,11, 337–46.
Pirenne, M.H. (1962) Absolute thresholds and quan-tum effects. In H. Davson (ed.), The Eye, Vol. 2. NewYork: Academic Press, pp. 123–40.
Pokorny, J. and Smith, V.C. (1977) Evaluation of sin-gle pigment shift model of anomalous trichromacy.J Opt Soc Am, 67, 1196–209.
Pokorny, J., Smith, V.C., and Lutze, M. (1987) Agingof the human lens. Applied Optics, 26, 1437–1440.
Polyak, S.L. (1957) The Vertebrate Visual System.Chicago: University of Chicago Press.
Pulos, E. (1989) Changes in rod sensitivity throughadulthood. Invest Ophthalmol Vis Sci, 30, 1738–42.
Reading, V.M. and Weale, R.A. (1974) Macular pig-ment and chromatic aberration. J Opt Soc Am, 64,231–4.
Rodieck, R.W. (1973) The Vertebrate Retina; Principles ofStructure and Function. San Francisco, Freeman.
Roorda, A., Metha, A.B., Lennie, P., and Williams,D.R. (2001) Packing arrangement of the three coneclasses in primate retina. Vision Res, 41, 1291–306.
Roorda, A. and Williams, D.R. (1999) The arrange-ment of the three cone classes in the living humaneye. Nature, 397, 520–2.
Roorda, A., Williams, D.R. (2002) Optical fiberproperties of individual human cones. Journal ofVision, 2, 404–12.
■ THE SCIENCE OF COLOR
100
Ruddock, K.H. (1972) Light transmission through theocular media and its significance for psychophysicalinvestigation. In D. Jameson and L.M. Hurvich(eds), Handbook of Sensory Physiology, Vol. VII/4. NewYork: Springer-Verlag, pp. 455–69.
Rushton, W.A.H. and Baker, H.D. (1964) Red/greensensitivity in normal vision. Vision Res, 4, 75–85.
Rushton, W.A.H. (1965) Stray light and the measure-ment of mixed pigments in the retina. J Physiol(Lond), 176, 46–55.
Rynders, M.C., Lidkea, B.A., Chisholm, W.J., andThibos, L.N. (1995) Statistical distribution of fovealtransverse chromatic aberration, pupil centration,and angle psi in a population of young adult eyes.J Opt Soc Am A, 12, 2348–57.
Safir, A., Hyams, L., and Philpot, J. (1970) Movementof the Stiles–Crawford effect. Invest Ophthalmol, 9,820–5.
Schefrin, B.E. and Werner, J.S. (1990) Loci of spectralunique hues throughout the life span. J Opt Soc AmA, 7, 305–11.
Sekiguchi, N., Williams, D.R., and Brainard, D.H.(1993a) Aberration-free measurements of the visi-bility of isoluminant gratings. J Opt Soc Am A, 10,2105–17.
Sekiguchi, N., Williams, D.R., and Brainard, D.H.(1993b) Efficiency in detection of isoluminant andisochromatic interference fringes. J Opt Soc Am A,10, 2118–33.
Shannon, C.E. (1949) Communication in the pres-ence of noise. Proc IRE, 37, 10.
Sharpe, L.T. (1990) The light-adaptation of the humanrod visual system. In R.F. Hess, L.T. Sharpe andK. Nordby (eds), Night Vision: Basic, Clinical andApplied Aspects. Cambridge: Cambridge UniversityPress, p. 9.
Shevell, S.K. and Burroughs, T.J. (1988) Light spreadand scatter from some common adapting stimuli:computations based on the point-source light pro-file. Vision Res, 28, 605–9.
Skinner, B.F. (1932) A paradoxical color effect. J GenPsychol, 7, 481.
Smith, R.A. and Cass, P.F. (1987) Aliasing in parafoveawith incoherent light. J Opt Soc Am A, 4, 1530–4.
Snodderly, D.M., Brown, P.K., Delori, F.C., and Auran,J.D. (1984a) The macular pigment. I. Absorbancespectra, localization, and discrimination from otheryellow pigments in primate retinas. InvestOphthalmol Vis Sci, 25, 660–73.
Snodderly, D.M., Auran, J.D., and Delori, F.C. (1984b)The macular pigment. II. Spatial distribution in pri-mate retinas. Invest Ophthalmol Vis Sci, 25, 674–85.
Snodderly, D.M., Weinhaus, R.S., and Choi, J.C. (1992)Neural-vascular relationships in central retina ofmacaque monkeys (Macaca fascicularis). J Neurosci,12, 1169–93.
Snodderly, D.M. (1995) Evidence for protectionagainst age-related macular degeneration bycarotenoids and antioxidant vitamins. Am J ClinNutr, 62(6 Suppl), 1448S–61S.
Snyder, A.W. and Hall, P.A. (1969) Unification of elec-tromagnetic effects in human retinal receptors withthree pigment colour vision. Nature, 223, 526–8.
Snyder, A.W. and Pask, C. (1973a) TheStiles–Crawford effect – explanation and conse-quences. Vision Res, 13, 1115–37.
Snyder, A.W. and Pask, C. (1973b) Letter: Waveguidemodes and light absorption in photoreceptors. VisionRes, 13, 2605–8.
Snyder, A.W., Bossomaier, T.R., and Hughes, A. (1986)Optical image quality and the cone mosaic. Science,231, 499–501.
Sperling, H.G., Johnson, C., and Harwerth, R.S. (1980)Differential spectral photic damage to primatecones. Vision Res, 20, 1117–25.
Stromeyer, C.F. 3rd, Kronauer, R.E., and Madsen, J.C.(1978) Apparent saturation of blue-sensitive conesoccurs at a color-opponent stage. Science, 202,217–19.
Starr, S.J. (1977) Effect of wavelength and luminanceon the Stiles–Crawford effect in dichromats. PhDdissertation, University of Chicago, Chicago, IL.
Stiles, W.S. (1937) The luminous efficiency of mono-chromatic rays entering the eye pupil at differentpoints and a new colour effect. Proc R Soc Lond B BiolSci, 123, 90–118.
Stiles, W.S. (1939) The directional sensitivity of theretina and the spectral sensitivities of the rods andcones. Proc R Soc Lond B Biol Sci, 127, 64–105.
Stiles, W.S. and Burch, J.M. (1959) National PhysicalLaboratory colour-matching investigation: finalreport. Optica Acta, 6, 1–26.
Stiles, W.S. and Crawford, B.H. (1933) The luminousefficiency of rays entering the eye pupil at differentpoints. Proc R Soc Lond B Biol Sci, 112, 428–50.
Sykes, S.M., Robison, W.G. Jr, Waxler, M., andKuwabara, T. (1981) Damage to the monkey retinaby broad-spectrum fluorescent light. InvestOphthalmol Vis Sci, 20, 425–34.
Thibos, L.N. (1987) Calculation of the influence of lat-eral chromatic aberration on image quality acrossthe visual field. J Opt Soc Am A, 4, 1673–80.
Thibos, L.N., Bradley, A., Still, D.L., Zhang, X., andHowarth, P.A. (1990) Theory and measurement ofocular chromatic aberration. Vision Res, 30, 33–49.
Thibos, L.N., Still, D.L., and Bradley, A. (1996)Characterization of spatial aliasing and contrast sen-sitivity in peripheral vision. Vision Res, 36, 249–58.
Thibos, L.N., Walsh, D.J., and Cheney, F.E. (1987)Vision beyond the resolution limit: aliasing in theperiphery. Vision Res, 27, 2193–7.
Toraldo di Francia, G. (1949) The radiation pattern ofretinal receptors. Proc R Soc (Lond) Ser B, 62, 461–2.
van Blokland, G.J. and van Norren, D. (1986)Intensity and polarization of light scattered at smallangles from the human fovea. Vision Res, 26, 485–94.
van de Kraats, J., Berendschot, T.T., and van Norren,D. (1996) The pathways of light measured in fundusreflectometry. Vision Res, 36, 2229–47.
van Kampen, E.J. and Zijlstra, W.G. (1983)Spectrophotometry of hemoglobin and hemoglobinderivatives. Adv Clin Chem, 23, 199–257.
LIGHT, THE RETINAL IMAGE,AND PHOTORECEPTORS ■
101
van Norren, D. and Vos, J.J. (1974) Spectral trans-mission of the human ocular media. Vision Res, 14,1237–44.
van Norren, D. and Tiemeijer, L.F. (1986) Spectralreflectance of the human eye. Vision Res, 26,313–20.
Vimal, R.L., Pokorny, J., Smith, V.C., and Shevell, S.K.(1989) Foveal cone thresholds. Vision Res, 29,61–78.
Vos, J.J. (1963) Contribution of the fundus oculi toentoptic scatter. J Opt Soc Am, 53, 1449.
Walls, G.L. (1963) The Vertebrate Eye and Its AdaptiveRadiation. New York: Hafner.
Weale, R.A. (1953) Spectral sensitivity and wavelengthdiscrimination of the peripheral retina. J Physiol(Lond), 121, 170–90.
Weale, R.A. (1954) Light absorption by the lens of thehuman eye. Optica Acta, 1, 107–10.
Weale, R.A. (1981) On the problem of retinal direc-tional sensitivity. Proc R Soc Lond B Biol Sci, 212,113–30.
Webster, M.A. and MacLeod, D.I. (1988) Factors under-lying individual differences in the color matches ofnormal observers. J Opt Soc Am A, 5, 1722–35.
Werner, J.S., Donnelly, S.K., and Kliegl, R. (1987)Aging and human macular pigment density. VisionRes, 27, 257–68.
Werner, J.S. and Schefrin, B.E. (1993) Loci of achro-matic points throughout the life span. J Opt Soc AmA, 10, 1509–16.
Werner, J.S. and Steele, V.G. (1988) Sensitivity ofhuman foveal color mechanisms throughout the lifespan. J Opt Soc Am A, 5, 2122–30.
Werner, J.S., Steele, V.G., and Pfoff, D.S. (1989) Lossof human photoreceptor sensitivity associated withchronic exposure to ultraviolet radiation.Ophthalmology, 96, 1552–8.
Westheimer, G. and Liang, J. (1995) Influence ofocular light scatter on the eye’s optical performance.J Opt Soc Am A, 12, 1417–24.
Wikler, K.C. and Rakic, P. (1990) Distribution of pho-toreceptor subtypes in the retina of diurnal andnocturnal primates. J Neurosci, 10, 3390–401.
Wijngaard, W. (1974) Some normal modes of an infi-nite hexagonal array of identical circular dielectricrods. J Opt Soc Am, 64, 1136–44.
Williams, D.R. (1985) Aliasing in human fovealvision. Vision Res, 25, 195–205.
Williams, D.R. (1988) Topography of the foveal conemosaic in the living human eye. Vision Res, 28,433–54.
Williams, D.R. (1990) The invisible cone mosaic. In:Advances in Photoreception: Proceedings of a Symposiumon Frontiers of Visual Science. Washington, DC:National Academy Press, pp. 135–48.
Williams, D.R. and Collier, R. (1983) Consequences ofspatial sampling by a human photoreceptor mosaic.Science, 221, 385–7.
Williams, D.R., MacLeod, D.I., and Hayhoe, M.M.(1981) Punctate sensitivity of the blue-sensitivemechanism. Vision Res, 21, 1357–75.
Williams, D.R., Sekiguchi, N., and Brainard, D. (1993)Color, contrast sensitivity, and the cone mosaic. ProcNatl Acad Sci U S A, 90, 9770–7.
Williams, D.R., Sekiguchi, N., Haake, W., Brainard, D.,and Packer, O. (1991) The cost of trichromacy forspatial vision. In A. Valberg and B.B. Lee (eds),From Pigments to Perception. New York: Plenum, pp. 11–22.
Williams, D.R., Artal, P., Navarro, R., McMahon, M.J.,and Brainard, D.H. (1996) Off-axis optical qualityand retinal sampling in the human eye. Vision Res36, 1103–4.
Wooten, B.R. and Geri, G.A. (1987) Psychophysicaldetermination of intraocular light scatter as a func-tion of wavelength. Vision Res, 27 (8), 1291–8.
Wright, W.D. (1928–29) A re-determination of themixture curves of the spectrum. Trans Opt Soc, 31,201.
Wyszecki, G. and Stiles, W.S. (1980) High-leveltrichromatic color matching and the pigment-bleaching hypothesis. Vision Res, 20, 23–37.
Wyszecki, G. and Stiles, W.S. (1982) Color Science:Concepts and Methods, Quantitative Data and Formulae,2nd edn. Wiley: New York.
Yamaguchi, T., Motulsky, A.G., and Deeb, S.S. (1997)Visual pigment gene structure and expression in thehuman retinae. Hum Mol Genet, 6, 981–90.
Yellott, J.I. (1982) Spectral analysis of spatial samplingby photoreceptors: topological disorder preventsaliasing. Vision Res, 22, 1205–10.
Yellott, J.I. (1983) Spectral consequences of photore-ceptor sampling in the rhesus retina. Science, 221,382–5.
Yoon, G.Y. and Williams, D.R. (2002) Visual perform-ance after correcting the monochromatic andchromatic aberrations of the eye. J Opt Soc Am A, 19,266–75.
Zhang, X.X., Ye, M., Bradley, A., and Thibos, L.N.(1999) Apodization by the Stiles–Crawford effectmoderates the visual impact of retinal image defocus.J Opt Soc Am A, 16, 812–20.
■ THE SCIENCE OF COLOR
102
Related Documents