Package ‘gRain’ October 17, 2016 Version 1.3-0 Title Graphical Independence Networks Author Søren Højsgaard <[email protected]> Maintainer Søren Højsgaard <[email protected]> Description Probability propagation in graphical independence networks, also known as Bayesian networks or probabilistic expert systems. License GPL (>= 2) Depends R (>= 3.0.2), methods, gRbase (>= 1.7-2) Imports igraph, graph, magrittr, functional, Rcpp (>= 0.11.1) URL http://people.math.aau.dk/~sorenh/software/gR/ Encoding UTF-8 Suggests Rgraphviz, microbenchmark LinkingTo Rcpp (>= 0.11.1), RcppArmadillo, RcppEigen, gRbase (>= 1.8-0) ByteCompile Yes RoxygenNote 5.0.1 NeedsCompilation yes Repository CRAN Date/Publication 2016-10-17 11:09:28 R topics documented: compile-cpt ......................................... 2 cptable ............................................ 3 evidence-object ....................................... 4 extract-cpt .......................................... 6 finding ............................................ 8 grain-compile ........................................ 10 grain-evi ........................................... 11 grain-evidence ........................................ 14 1

Welcome message from author
This document is posted to help you gain knowledge. Please leave a comment to let me know what you think about it! Share it to your friends and learn new things together.
Transcript

Package ‘gRain’October 17, 2016
Version 1.3-0
Title Graphical Independence Networks
Author Søren Højsgaard <[email protected]>
Maintainer Søren Højsgaard <[email protected]>
Description Probability propagation in graphical independence networks, alsoknown as Bayesian networks or probabilistic expert systems.
License GPL (>= 2)
Depends R (>= 3.0.2), methods, gRbase (>= 1.7-2)
Imports igraph, graph, magrittr, functional, Rcpp (>= 0.11.1)
URL http://people.math.aau.dk/~sorenh/software/gR/
Encoding UTF-8
Suggests Rgraphviz, microbenchmark
LinkingTo Rcpp (>= 0.11.1), RcppArmadillo, RcppEigen, gRbase (>=1.8-0)
ByteCompile Yes
RoxygenNote 5.0.1
NeedsCompilation yes
Repository CRAN
Date/Publication 2016-10-17 11:09:28
R topics documented:compile-cpt . . . . . . . . . . . . . . . . . . . . . . . . . . . . . . . . . . . . . . . . . 2cptable . . . . . . . . . . . . . . . . . . . . . . . . . . . . . . . . . . . . . . . . . . . . 3evidence-object . . . . . . . . . . . . . . . . . . . . . . . . . . . . . . . . . . . . . . . 4extract-cpt . . . . . . . . . . . . . . . . . . . . . . . . . . . . . . . . . . . . . . . . . . 6finding . . . . . . . . . . . . . . . . . . . . . . . . . . . . . . . . . . . . . . . . . . . . 8grain-compile . . . . . . . . . . . . . . . . . . . . . . . . . . . . . . . . . . . . . . . . 10grain-evi . . . . . . . . . . . . . . . . . . . . . . . . . . . . . . . . . . . . . . . . . . . 11grain-evidence . . . . . . . . . . . . . . . . . . . . . . . . . . . . . . . . . . . . . . . . 14
1

2 compile-cpt
grain-generics . . . . . . . . . . . . . . . . . . . . . . . . . . . . . . . . . . . . . . . . 16grain-main . . . . . . . . . . . . . . . . . . . . . . . . . . . . . . . . . . . . . . . . . . 17grain-predict . . . . . . . . . . . . . . . . . . . . . . . . . . . . . . . . . . . . . . . . . 19grain-propagate . . . . . . . . . . . . . . . . . . . . . . . . . . . . . . . . . . . . . . . 20grain-simulate . . . . . . . . . . . . . . . . . . . . . . . . . . . . . . . . . . . . . . . . 22load-save-hugin . . . . . . . . . . . . . . . . . . . . . . . . . . . . . . . . . . . . . . . 23logical . . . . . . . . . . . . . . . . . . . . . . . . . . . . . . . . . . . . . . . . . . . . 24mendel . . . . . . . . . . . . . . . . . . . . . . . . . . . . . . . . . . . . . . . . . . . . 26querygrain . . . . . . . . . . . . . . . . . . . . . . . . . . . . . . . . . . . . . . . . . . 26repeatPattern . . . . . . . . . . . . . . . . . . . . . . . . . . . . . . . . . . . . . . . . 28set-jevidence . . . . . . . . . . . . . . . . . . . . . . . . . . . . . . . . . . . . . . . . 30update.CPTgrain . . . . . . . . . . . . . . . . . . . . . . . . . . . . . . . . . . . . . . 32
Index 34
compile-cpt Compile conditional probability tables / cliques potentials.
Description
Compile conditional probability tables / cliques potentials as a preprocessing step for creating agraphical independence network
Usage
compileCPT(x, forceCheck = TRUE, details = 0)
compilePOT(x)
Arguments
x To compileCPT x is a list of conditional probability tables; to compilePOT, x isa list of clique potentials
forceCheck Controls if consistency checks of the probability tables should be made.
details Controls amount of print out. Mainly for debugging purposes
Value
compileCPT returns a list of class ’cptspec’ compilePOT returns a list of class ’potspec’
Author(s)
Søren Højsgaard, <[email protected]>
References
Søren Højsgaard (2012). Graphical Independence Networks with the gRain Package for R. Journalof Statistical Software, 46(10), 1-26. http://www.jstatsoft.org/v46/i10/.

cptable 3
See Also
extractCPT, extractPOT
cptable Create conditional probability tables (CPTs)
Description
Creates conditional probability tables of the form p(v|pa(v)).
Usage
cptable(vpar, levels = NULL, values = NULL, normalize = TRUE,smooth = 0)
Arguments
vpar Specifications of the names in P(v|pa1,...pak). See section ’details’ for informa-tion about the form of the argument.
levels See ’details’ below.
values Probabilities; recycled if necessary. Regarding the order, please see section ’de-tails’ and the examples.
normalize See ’details’ below.
smooth See ’details’ below.
Details
If normalize=TRUE then for each configuration of the parents the probabilities are normalized tosum to one.
If smooth is non–zero then zero entries of values are replaced with smooth before normalizationtakes place.
Regarding the form of the argument vpar: To specify P (a|b, c) one may write ~a|b:c, ~a:b:c,~a|b+c, ~a+b+c or c("a","b","c"). Internally, the last form is used. Notice that the + and :operator is used as a separator only. The order of the variables is important so the operators do notcommute.
If a has levels a1,a2 and likewise for b and c then the order of values corresponds to the config-urations (a1,b1,c1), (a2,b1,c1) (a1,b2,c1), (a2,b2,c1) etc. That is, the first variable variesfastest. Hence the first two elements in values will be the conditional probabilities of a givenb=b1, c=c1.
Value
A cptable object (a list).

4 evidence-object
Author(s)
Søren Højsgaard, <[email protected]>
References
Søren Højsgaard (2012). Graphical Independence Networks with the gRain Package for R. Journalof Statistical Software, 46(10), 1-26. http://www.jstatsoft.org/v46/i10/.
See Also
andtable, ortable, extractCPT, compileCPT, extractPOT, compilePOT, grain
Examples
yn <- c("yes","no")ynm <- c("yes","no","maybe")a <- cptable( ~ asia, values=c(1,99), levels=yn)t.a <- cptable( ~ tub : asia, values=c(5,95,1,99,1,999), levels=ynm)d.a <- cptable( ~ dia : asia, values=c(5,5,1,99,100,999), levels=ynm)cptlist <- compileCPT(list(a,t.a,d.a))grain(cptlist)
## Example: Specifying conditional probabilities as a matrixbayes.levels <- c('Enzyme', 'Keratine', 'unknown')root.node <- cptable( ~R, values=c( 1, 1, 1 ), levels=bayes.levels)cond.prob.tbl <- t(matrix( c( 1, 0, 0, 0, 1, 0, 0.5, 0.5, 0 ),
nrow=3, ncol=3, byrow=TRUE, dimnames=list(bayes.levels, bayes.levels)))cond.prob.tbl## Notice above: Columns represent parent states; rows represent child statesquery.node <- cptable( ~ Q | R, values=cond.prob.tbl, levels=bayes.levels )sister.node <- cptable( ~ S | R, values=cond.prob.tbl, levels=bayes.levels )## Testingcompile(grain(compileCPT(list( root.node, query.node, sister.node ))), propagate=TRUE)
evidence-object Evidence objects
Description
Functions for defining and manipulating evidence.

evidence-object 5
Usage
new_ev(evi.list = NULL, levels)
is.null_ev(object)
## S3 method for class 'grain_ev'print(x, ...)
## S3 method for class 'grain_ev'varNames(x)
## S3 method for class 'grain_ev'as.data.frame(x, row.names = NULL, optional = FALSE, ...)
setdiff_ev(ev1, ev2)
union_ev(ev1, ev2)
Arguments
evi.list A named list with evidence; see ’examples’ below.
levels A named list with the levels of all variables.
object Some R object.
x Evidence object
... Not used.
row.names Not used.
optional Not used.
ev1, ev2 Evidence.
Details
Evidence is specified as a list. Internally, evidence is represented as a grain evidence object whichis a list with 4 elements.
Author(s)
Søren Højsgaard, <[email protected]>
Examples
## Define the universe
uni <- list(asia = c("yes", "no"), tub = c("yes", "no"), smoke = c("yes", "no"),lung = c("yes", "no"), bronc = c("yes", "no"), either = c("yes", "no"),xray = c("yes", "no"), dysp = c("yes", "no"))

6 extract-cpt
e1 <- list(dysp="no", xray="no")eo1 <- new_ev( e1, levels=uni )eo1as.data.frame( eo1 )eo1 %>% str
e1.2 <- list(dysp="no", xray=c(0, 1))eo1.2 <- new_ev( e1.2, levels=uni )eo1.2
# Notice that in \code{eo1.2}, \code{xray} is not regarded as hard# evidence but as a weight on each level. Other than that \code{eo1.2}# and \code{eo1} are equivalent here. This is used in connection# with specifying likelihood evidence.
e2 <- list(dysp="yes", asia="yes")eo2 <- new_ev(e2, uni)
# If evidence 'e1' is already set in the network and new evidence# 'e2' emerges, the evidence in the network must be updated. But# there is a conflict in that \code{dysp="yes"} in 'e1' and# \code{dysp="no"} in 'e2'. The (arbitrary) convention is that# existsting evidence overrides new evidence so that the only new# evidence in 'e2' is really \code{asia="yes"}.
# To subtract existing evidence from new evidence we can do:setdiff_ev( eo2, eo1 )
# Likewise the 'union' isunion_ev( eo2, eo1 )
extract-cpt Extract conditional probabilities and clique potentials from data.
Description
Extract list of conditional probability tables and list of clique potentials from data.
Usage
extractCPT(x, graph, smooth = 0)
extractPOT(x, graph, smooth = 0)
Arguments
x An array or a dataframe.
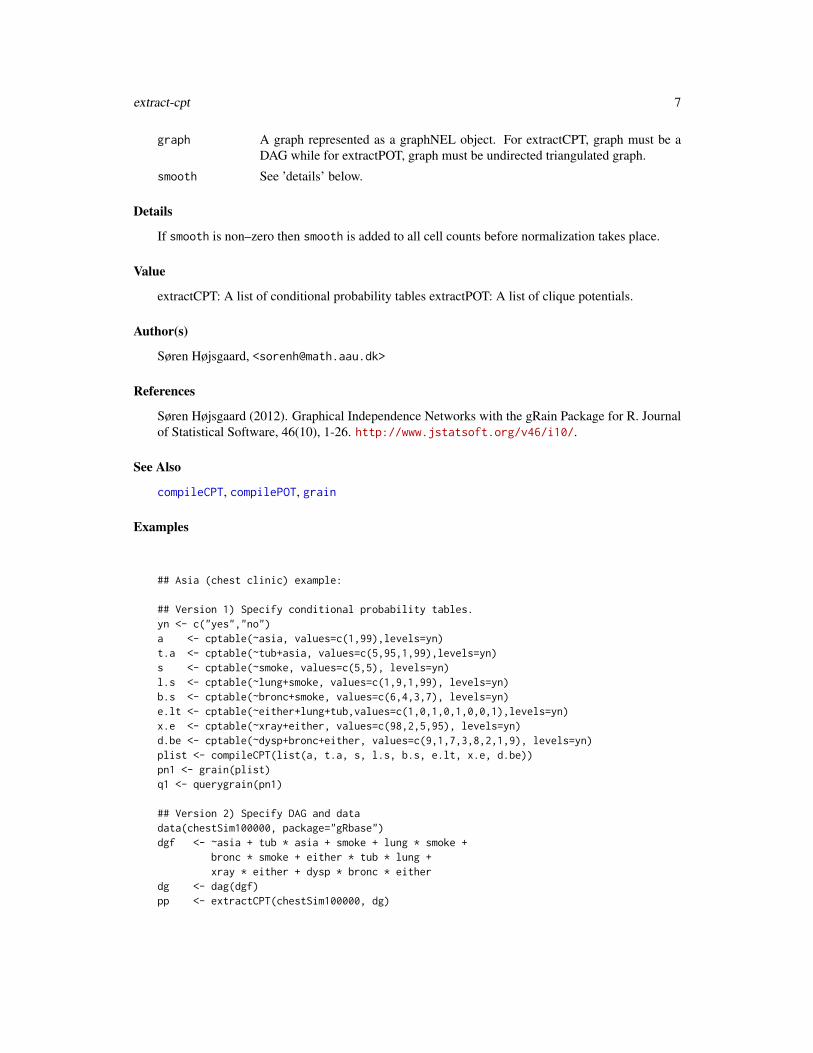
extract-cpt 7
graph A graph represented as a graphNEL object. For extractCPT, graph must be aDAG while for extractPOT, graph must be undirected triangulated graph.
smooth See ’details’ below.
Details
If smooth is non–zero then smooth is added to all cell counts before normalization takes place.
Value
extractCPT: A list of conditional probability tables extractPOT: A list of clique potentials.
Author(s)
Søren Højsgaard, <[email protected]>
References
Søren Højsgaard (2012). Graphical Independence Networks with the gRain Package for R. Journalof Statistical Software, 46(10), 1-26. http://www.jstatsoft.org/v46/i10/.
See Also
compileCPT, compilePOT, grain
Examples
## Asia (chest clinic) example:
## Version 1) Specify conditional probability tables.yn <- c("yes","no")a <- cptable(~asia, values=c(1,99),levels=yn)t.a <- cptable(~tub+asia, values=c(5,95,1,99),levels=yn)s <- cptable(~smoke, values=c(5,5), levels=yn)l.s <- cptable(~lung+smoke, values=c(1,9,1,99), levels=yn)b.s <- cptable(~bronc+smoke, values=c(6,4,3,7), levels=yn)e.lt <- cptable(~either+lung+tub,values=c(1,0,1,0,1,0,0,1),levels=yn)x.e <- cptable(~xray+either, values=c(98,2,5,95), levels=yn)d.be <- cptable(~dysp+bronc+either, values=c(9,1,7,3,8,2,1,9), levels=yn)plist <- compileCPT(list(a, t.a, s, l.s, b.s, e.lt, x.e, d.be))pn1 <- grain(plist)q1 <- querygrain(pn1)
## Version 2) Specify DAG and datadata(chestSim100000, package="gRbase")dgf <- ~asia + tub * asia + smoke + lung * smoke +
bronc * smoke + either * tub * lung +xray * either + dysp * bronc * either
dg <- dag(dgf)pp <- extractCPT(chestSim100000, dg)

8 finding
cpp2 <- compileCPT(pp)pn2 <- grain(cpp2)q2 <- querygrain(pn2)
## Version 2) Specify triangulated undirected graph and dataugf <- list(c("either", "lung", "tub"), c("either", "lung", "bronc"),
c("either", "xray"), c("either", "dysp", "bronc"), c("smoke","lung", "bronc"), c("asia", "tub"))
gg <- ugList(ugf)pp <- extractPOT(chestSim100000, gg)cpp3 <- compilePOT(pp)pn3 <- grain(cpp3)q3 <- querygrain(pn3)
## Compare results:str(q1)str(q2[names(q1)])str(q3[names(q1)])
finding Set, retrieve, and retract finding in Bayesian network.
Description
Set, retrieve, and retract finding in Bayesian network. NOTICE: The functions described here arekept only for backward compatibility; please use the corresponding evidence-functions in the future.
Usage
setFinding(object, nodes = NULL, states = NULL, flist = NULL,propagate = TRUE)
Arguments
object A "grain" object
nodes A vector of nodes
states A vector of states (of the nodes given by ’nodes’)
flist An alternative way of specifying findings, see examples below.
propagate Should the network be propagated?
Note
NOTICE: The functions described here are kept only for backward compatibility; please use thecorresponding evidence-functions in the future:
setEvidence() is an improvement of setFinding() (and as such setFinding is obsolete). Usersare recommended to use setEvidence() in the future.

finding 9
setEvidence() allows to specification of "hard evidence" (specific values for variables) and likeli-hood evidence (also known as virtual evidence) for variables.
The syntax of setEvidence() may change in the future.
Author(s)
Søren Højsgaard, <[email protected]>
References
Søren Højsgaard (2012). Graphical Independence Networks with the gRain Package for R. Journalof Statistical Software, 46(10), 1-26. http://www.jstatsoft.org/v46/i10/.
See Also
setEvidence getEvidence retractEvidence pEvidence querygrain
Examples
## setFindingsyn <- c("yes","no")a <- cptable(~asia, values=c(1,99),levels=yn)t.a <- cptable(~tub+asia, values=c(5,95,1,99),levels=yn)s <- cptable(~smoke, values=c(5,5), levels=yn)l.s <- cptable(~lung+smoke, values=c(1,9,1,99), levels=yn)b.s <- cptable(~bronc+smoke, values=c(6,4,3,7), levels=yn)e.lt <- cptable(~either+lung+tub,values=c(1,0,1,0,1,0,0,1),levels=yn)x.e <- cptable(~xray+either, values=c(98,2,5,95), levels=yn)d.be <- cptable(~dysp+bronc+either, values=c(9,1,7,3,8,2,1,9), levels=yn)plist <- compileCPT(list(a, t.a, s, l.s, b.s, e.lt, x.e, d.be))chest <- grain(plist)
## These two forms are equivalentbn1 <- setFinding(chest, nodes=c("asia","xray"), states=c("yes", "yes"))bn2 <- setFinding(chest, flist=list(c("asia","yes"), c("xray", "yes")))
getFinding(bn1)getFinding(bn2)
pFinding(bn1)pFinding(bn2)
bn1 <- retractFinding(bn1, nodes="asia")bn2 <- retractFinding(bn2, nodes="asia")
getFinding(bn1)getFinding(bn2)
pFinding(bn1)pFinding(bn2)

10 grain-compile
grain-compile Compile a graphical independence network (a Bayesian network)
Description
Compiles a Bayesian network. This means creating a junction tree and establishing clique poten-tials.
Usage
## S3 method for class 'grain'compile(object, propagate = FALSE, root = NULL,control = object$control, details = 0, ...)
## S3 method for class 'CPTgrain'compile(object, propagate = FALSE, root = NULL,control = object$control, details = 0, ...)
## S3 method for class 'POTgrain'compile(object, propagate = FALSE, root = NULL,control = object$control, details = 0, ...)
Arguments
object A grain object.
propagate If TRUE the network is also propagated meaning that the cliques of the junctiontree are calibrated to each other.
root A set of variables which must be in the root of the junction tree
control Controlling the compilation process.
details For debugging info. Do not use.
... Currently not used.
Value
A compiled Bayesian network; an object of class grain.
Author(s)
Søren Højsgaard, <[email protected]>
References
Søren Højsgaard (2012). Graphical Independence Networks with the gRain Package for R. Journalof Statistical Software, 46(10), 1-26. http://www.jstatsoft.org/v46/i10/.

grain-evi 11
See Also
grain, propagate, triangulate, rip, junctionTree
grain-evi Set evidence in grain objects
Description
Setting and removing evidence in grain objects.
Usage
setEvi(object, nodes = NULL, states = NULL, evidence = NULL,propagate = TRUE, details = 0)
setEvi_(object, evidence = NULL, propagate = TRUE, details = 0)
retractEvi(object, items = NULL, propagate = TRUE)
retractEvi_(object, items = NULL, propagate = TRUE)
absorbEvi(object, propagate = TRUE)
absorbEvi_(object, propagate = TRUE)
pEvidence(object)
getEvidence(object)
dropEvi(object) <- value
addEvi(object) <- value
evidence(object)
## S3 method for class 'grain'evidence(object)
evidence(object) <- value
## S3 replacement method for class 'grain'evidence(object) <- value
addEvi(object, nodes = NULL, states = NULL, evidence = NULL,propagate = TRUE, details = 0)

12 grain-evi
dropEvi(object, items = NULL, propagate = TRUE)
getEvi(object)
insertEvi(evi.list, pot, hostclique)
getHostClique(set.list, cliques)
Arguments
object A "grain" object
nodes A vector of nodes; those nodes for which the (conditional) distribution is re-quested.
states A vector of states (of the nodes given by ’nodes’)
evidence An alternative way of specifying findings (evidence), see examples below.
propagate Should the network be propagated?
details Debugging information
items Items in the evidence list to be removed. Here, NULL means remove everything.If items is a character vector (of nodes) then evidence on these nodes is re-moved. If items is a numeric vector then those items in the evidence list isremoved. Notice that 0 means nothing is removed.
value The evidence in the form of a named list or an evidence-object.
evi.list A "grain_ev" object.
pot A list of clique potentials (a potential is an array).
hostclique A numerical vector indicating in which element of ’pot’ each eviendence itemin ’evi.list’ should be inserted in.
set.list A list of sets (a set is a character vector).
cliques A list of sets (a set is a character vector).
Author(s)
Søren Højsgaard, <[email protected]>
References
Søren Højsgaard (2012). Graphical Independence Networks with the gRain Package for R. Journalof Statistical Software, 46(10), 1-26. http://www.jstatsoft.org/v46/i10/.
See Also
setEvidence getEvidence retractEvidence pEvidence setFinding getFinding retractFindingpFinding

grain-evi 13
Examples
## setFinding / setEvidence
yn <- c("yes","no")a <- cptable(~asia, values=c(1,99),levels=yn)t.a <- cptable(~tub+asia, values=c(5,95,1,99),levels=yn)s <- cptable(~smoke, values=c(5,5), levels=yn)l.s <- cptable(~lung+smoke, values=c(1,9,1,99), levels=yn)b.s <- cptable(~bronc+smoke, values=c(6,4,3,7), levels=yn)e.lt <- cptable(~either+lung+tub,values=c(1,0,1,0,1,0,0,1),levels=yn)x.e <- cptable(~xray+either, values=c(98,2,5,95), levels=yn)d.be <- cptable(~dysp+bronc+either, values=c(9,1,7,3,8,2,1,9), levels=yn)plist <- compileCPT(list(a, t.a, s, l.s, b.s, e.lt, x.e, d.be))bn <- grain(plist)
## 1) These forms are identical
e1 <- list(dysp="no", xray="no")
setEvi(bn, evidence=e1)setEvi(bn, nodes=c("dysp","xray"), states=c("no", "no"))setEvidence(bn, nodes=c("dysp","xray"), states=c("no", "no"))
# Notice: setFinding is old school but it was used in the# "Graphical Models with R" book.setFinding(bn, nodes=c("dysp","xray"), states=c("no", "no"))
## 2) Updating evidence# Notice that only 'asia' is set because 'dysp' was set earlier
e2 <- list(dysp="yes", asia="yes")bn1 <- setEvi(bn, evidence=e1)bn1bn2 <- setEvi(bn1, evidence=e2)bn2
## 3) Shorter forms
bn2 <- bnevidence(bn2)evidence(bn2) <- e1evidence(bn2)evidence(bn2) <- e2evidence(bn2)evidence(bn2) <- NULLevidence(bn2)
## 4) Alternative forms:
setEvi(bn, evidence=list("asia"=c(1, 0), "xray"="yes"))

14 grain-evidence
## 5) Suppose we do not know with certainty whether a patient has## recently been to Asia. We can then introduce a new variable## "guess.asia" with "asia" as its only parent. Suppose## p(guess.asia=yes|asia=yes)=.8 and p(guess.asia=yes|asia=no)=.1## If the patient is e.g. unusually tanned we may set## guess.asia=yes and propagate. This corresponds to modifying the## model by the likelihood (0.8, 0.1) as
b =setEvi(bn, nodes=c("asia","xray"), states=list(c(0.8,0.1), "yes"))as.data.frame( evidence( b ) )
grain-evidence Set evidence.
Description
Set, update and remove evidence..
Usage
setEvidence(object, nodes = NULL, states = NULL, evidence = NULL,nslist = NULL, propagate = TRUE, details = 0)
retractEvidence(object, nodes = NULL, propagate = TRUE)
absorbEvidence(object, propagate = TRUE)
Arguments
object A "grain" object
nodes A vector of nodes; those nodes for which the (conditional) distribution is re-quested.
states A vector of states (of the nodes given by ’nodes’)
evidence An alternative way of specifying findings (evidence), see examples below.
nslist deprecated
propagate Should the network be propagated?
details Debugging information
Value
A list of tables with potentials.

grain-evidence 15
Note
setEvidence() is an improvement of setFinding() (and as such setFinding is obsolete). Usersare recommended to use setEvidence() in the future.
setEvidence() allows to specification of "hard evidence" (specific values for variables) and likeli-hood evidence (also known as virtual evidence) for variables.
The syntax of setEvidence() may change in the future.
Author(s)
Søren Højsgaard, <[email protected]>
References
Søren Højsgaard (2012). Graphical Independence Networks with the gRain Package for R. Journalof Statistical Software, 46(10), 1-26. http://www.jstatsoft.org/v46/i10/.
See Also
setFinding getFinding retractFinding pFinding
Examples
testfile <- system.file("huginex", "chest_clinic.net", package = "gRain")chest <- loadHuginNet(testfile, details=0)qb <- querygrain(chest)qb
lapply(qb, as.numeric) # Safesapply(qb, as.numeric) # Risky
## setFinding / setEvidence
yn <- c("yes","no")a <- cptable(~asia, values=c(1,99),levels=yn)t.a <- cptable(~tub+asia, values=c(5,95,1,99),levels=yn)s <- cptable(~smoke, values=c(5,5), levels=yn)l.s <- cptable(~lung+smoke, values=c(1,9,1,99), levels=yn)b.s <- cptable(~bronc+smoke, values=c(6,4,3,7), levels=yn)e.lt <- cptable(~either+lung+tub,values=c(1,0,1,0,1,0,0,1),levels=yn)x.e <- cptable(~xray+either, values=c(98,2,5,95), levels=yn)d.be <- cptable(~dysp+bronc+either, values=c(9,1,7,3,8,2,1,9), levels=yn)plist <- compileCPT(list(a, t.a, s, l.s, b.s, e.lt, x.e, d.be))chest <- grain(plist)
## 1) These two forms are identicalsetEvidence(chest, c("asia","xray"), c("yes", "yes"))setFinding(chest, c("asia","xray"), c("yes", "yes"))
## 2) Suppose we do not know with certainty whether a patient has

16 grain-generics
## recently been to Asia. We can then introduce a new variable## "guess.asia" with "asia" as its only parent. Suppose## p(guess.asia=yes|asia=yes)=.8 and p(guess.asia=yes|asia=no)=.1## If the patient is e.g. unusually tanned we may set## guess.asia=yes and propagate. This corresponds to modifying the## model by the likelihood (0.8, 0.1) assetEvidence(chest, c("asia","xray"), list(c(0.8,0.1), "yes"))
## 3) Hence, the same result as in 1) can be obtained withsetEvidence(chest, c("asia","xray"), list(c(1, 0), "yes"))
## 4) An alternative specification using evidence issetEvidence(chest, evidence=list("asia"=c(1, 0), "xray"="yes"))
grain-generics gRain generics
Description
Generic functions etc for the gRain package
Usage
nodeNames(x)
## S3 method for class 'grain'nodeNames(x)
nodeStates(x, nodes = nodeNames(x))
## S3 method for class 'grain'nodeStates(x, nodes = nodeNames(x))
universe(object, ...)
## S3 method for class 'grain'universe(object, ...)
## S3 method for class 'grainEvidence_'varNames(x)
Arguments
x, object A relevant object.
nodes Some nodes of the object.
... Additional arguments; currently not used.

grain-main 17
grain-main Graphical Independence Network
Description
The ’grain’ builds a graphical independence network.
Usage
grain(x, data = NULL, control = list(), smooth = 0, details = 0, ...)
## S3 method for class 'CPTspec'grain(x, data = NULL, control = list(), smooth = 0,details = 0, ...)
## S3 method for class 'POTspec'grain(x, data = NULL, control = list(), smooth = 0,details = 0, ...)
## S3 method for class 'graphNEL'grain(x, data = NULL, control = list(), smooth = 0,details = 0, ...)
## S3 method for class 'dModel'grain(x, data = NULL, control = list(), smooth = 0,details = 0, ...)
is.grain(object)
Arguments
x An argument to build an independence network from. Typically a list of condi-tional probability tables, a DAG or an undirected graph. In the two latter cases,data must also be provided.
data An optional data set (currently must be an array/table)
control A list defining controls, see ’details’ below.
smooth A (usually small) number to add to the counts of a table if the grain is built froma graph plus a dataset.
details Debugging information.
... Additional arguments, currently not used.
object Any R object.
Details
If ’smooth’ is non-zero then entries of ’values’ which a zero are replaced by the value of ’smooth’ -BEFORE any normalization takes place.

18 grain-main
Value
An object of class "grain"
Author(s)
Søren Højsgaard, <[email protected]>
References
S<f8>ren H<f8>jsgaard (2012). Graphical Independence Networks with the gRain Package for R.Journal of Statistical Software, 46(10), 1-26. http://www.jstatsoft.org/v46/i10/.
See Also
cptable, compile.grain, propagate.grain, setFinding, setEvidence, getFinding, pFinding,retractFinding
Examples
## Asia (chest clinic) example:yn <- c("yes","no")a <- cptable(~asia, values=c(1,99), levels=yn)t.a <- cptable(~tub+asia, values=c(5,95,1,99), levels=yn)s <- cptable(~smoke, values=c(5,5), levels=yn)l.s <- cptable(~lung+smoke, values=c(1,9,1,99), levels=yn)b.s <- cptable(~bronc+smoke, values=c(6,4,3,7), levels=yn)e.lt <- cptable(~either+lung+tub, values=c(1,0,1,0,1,0,0,1), levels=yn)x.e <- cptable(~xray+either, values=c(98,2,5,95), levels=yn)d.be <- cptable(~dysp+bronc+either, values=c(9,1,7,3,8,2,1,9), levels=yn)plist <- compileCPT(list(a, t.a, s, l.s, b.s, e.lt, x.e, d.be))bn <- grain(plist)bnsummary(bn)plot(bn)bnc <- compile(bn, propagate=TRUE)
## If we want to query the joint distribution of the disease nodes,## computations can be speeded up by forcing these nodes to be in## the same clique of the junction tree:
bnc2 <- compile(bn, root=c("lung", "bronc", "tub"), propagate=TRUE)
system.time({for (i in 1:200)querygrain(bnc, nodes=c("lung","bronc", "tub"), type="joint")})
system.time({for (i in 1:200)querygrain(bnc2, nodes=c("lung","bronc", "tub"), type="joint")})
## Simple example - one clique only in triangulated graph:

grain-predict 19
plist.s <- compileCPT( list(a, t.a) )bn.s <- grain( plist.s )querygrain( bn.s )
## Simple example - disconnected network:plist.d <- compileCPT( list(a, t.a, s) )bn.d <- grain( plist.d )querygrain( bn.d )
## Create network from data and graph specification.## There are different ways:data(HairEyeColor)hec <- HairEyeColordaG <- dag( ~Hair + Eye:Hair + Sex:Hair )class( daG )uG <- ug( ~Eye:Hair + Sex:Hair )class( uG )
## Create directly from dag:b1 <- grain( daG, hec )class( b1 )
## Build model from undirected (decomposable) graphb3 <- grain( uG, hec )class( b3 )
grain-predict Make predictions from a probabilistic network
Description
Makes predictions (either as the most likely state or as the conditional distributions) of variablesconditional on finding (evidence) on other variables in an independence network.
Usage
## S3 method for class 'grain'predict(object, response, predictors = setdiff(names(newdata),response), newdata, type = "class", ...)
Arguments
object A grain object
response A vector of response variables to make predictions on
predictors A vector of predictor variables to make predictions from. Defaults to all vari-ables that are note responses.
newdata A data frame

20 grain-propagate
type If "class", the most probable class is returned; if "distribution" the conditionaldistrubtion is returned.
... Not used
Value
A list with components
pred A list with the predictions
pFinding A vector with the probability of the finding (evidence) on which the predictionis based
Author(s)
Søren Højsgaard, <[email protected]>
References
Søren Højsgaard (2012). Graphical Independence Networks with the gRain Package for R. Journalof Statistical Software, 46(10), 1-26. http://www.jstatsoft.org/v46/i10/.
See Also
grain
grain-propagate Propagate a graphical independence network (a Bayesian network)
Description
Propagation refers to calibrating the cliques of the junction tree so that the clique potentials areconsistent on their intersections
Usage
## S3 method for class 'grain'propagate(object, details = object$details, ...)
propagate__(object, details = object$details, ...)
propagateLS(cqpotList, rip, initialize = TRUE, details = 0)

grain-propagate 21
Arguments
object A grain object
details For debugging info
... Currently not used
cqpotList Clique potential list
rip A rip ordering
initialize Always true
Details
The propagate method invokes propagateLS which is a pure R implementation of the Lauritzen-Spiegelhalter algorithm.
The function propagate__ invokes propagateLS__ which is a c++ implementation of the Lauritzen-Spiegelhalter algorithm.
The c++ based version is several times faster than the purely R based version, and after someadditional testing the c++ based version will become the default.
Value
A compiled and propagated grain object.
Author(s)
Søren Højsgaard, <[email protected]>
References
Søren Højsgaard (2012). Graphical Independence Networks with the gRain Package for R. Journalof Statistical Software, 46(10), 1-26. http://www.jstatsoft.org/v46/i10/.
See Also
grain, compile
Examples
yn <- c("yes","no")a <- cptable(~asia, values=c(1,99), levels=yn)t.a <- cptable(~tub+asia, values=c(5,95,1,99), levels=yn)s <- cptable(~smoke, values=c(5,5), levels=yn)l.s <- cptable(~lung+smoke, values=c(1,9,1,99), levels=yn)b.s <- cptable(~bronc+smoke, values=c(6,4,3,7), levels=yn)e.lt <- cptable(~either+lung+tub, values=c(1,0,1,0,1,0,0,1), levels=yn)x.e <- cptable(~xray+either, values=c(98,2,5,95), levels=yn)d.be <- cptable(~dysp+bronc+either, values=c(9,1,7,3,8,2,1,9), levels=yn)plist <- compileCPT(list(a, t.a, s, l.s, b.s, e.lt, x.e, d.be))

22 grain-simulate
pn <- grain(plist)pnc <- compile(pn, propagate=FALSE)
if (require(microbenchmark))microbenchmark(
propagate(pnc),propagate__(pnc) )
grain-simulate Simulate from an independence network
Description
Simulate data from an independence network.
Usage
## S3 method for class 'grain'simulate(object, nsim = 1, seed = NULL, ...)
Arguments
object An inpendence network
nsim Number of cases to simulate
seed An optional integer controlling the random number generatation
... Not used...
Value
A data frame
Author(s)
Søren Højsgaard, <[email protected]>
References
Søren Højsgaard (2012). Graphical Independence Networks with the gRain Package for R. Journalof Statistical Software, 46(10), 1-26. http://www.jstatsoft.org/v46/i10/.

load-save-hugin 23
Examples
## Not run:
tf <- system.file("huginex", "chest_clinic.net", package = "gRain")chest <- loadHuginNet(tf, details=1)
simulate(chest,n=10)
chest2 <- setFinding(chest, c("VisitToAsia", "Dyspnoea"),c("yes","yes"))
simulate(chest2, n=10)
## End(Not run)
load-save-hugin Load and save Hugin net files
Description
These functions can load a net file saved in the ’Hugin format’ into R and save a network in R as afile in the ’Hugin format’.
Usage
loadHuginNet(file, description = rev(unlist(strsplit(file, "/")))[1],details = 0)
saveHuginNet(gin, file, details = 0)
Arguments
file Name of HUGIN net file. Convenient to give the file the extension ’.net’
description A text describing the network, defaults to file
details Debugging information
gin An independence network
Value
An object (a list) of class "huginNet".
Author(s)
S<f8>ren H<f8>jsgaard, <[email protected]>

24 logical
References
S<f8>ren H<f8>jsgaard (2012). Graphical Independence Networks with the gRain Package for R.Journal of Statistical Software, 46(10), 1-26. http://www.jstatsoft.org/v46/i10/.
See Also
grain
Examples
## Load HUGIN net filetf <- system.file("huginex", "chest_clinic.net", package = "gRain")chest <- loadHuginNet(tf, details=1)chest
## Save a copytd <- tempdir()saveHuginNet(chest, paste(td,"/chest.net",sep=''))
## Load the copychest2 <- loadHuginNet(paste(td,"/chest.net",sep=''))
tf <- system.file("huginex", "golf.net", package = "gRain")golf <- loadHuginNet(tf, details=1)
saveHuginNet(golf, paste(td,"/golf.net",sep=''))golf2 <- loadHuginNet(paste(td,"/golf.net",sep=''))
logical Conditional probability tables based on logical dependencies
Description
Generate conditional probability tables based on the logical expressions AND and OR.
Usage
booltab(vpa, levels = c(TRUE, FALSE), op = `&`)
andtab(vpa, levels = c(TRUE, FALSE))
ortab(vpa, levels = c(TRUE, FALSE))
andtable(vpa, levels = c(TRUE, FALSE))
ortable(vpa, levels = c(TRUE, FALSE))

logical 25
Arguments
vpa Node and two parents; as a formula or a character vector.
levels The levels (or rather labels) of v, see ’examples’ below.
op A logical operator.
Details
Regarding the form of the argument vpa: To specify P (a|b, c) one may write ~a|b+c or ~a+b+c or~a|b:c or ~a:b:c or c("a","b","c"). Internally, the last form is used. Notice that the + and :operator are used as separators only. The order of the variables is important so + does not commute.
Value
An array.
Note
andtable and ortable are aliases for andtab and ortab and are kept for backward compatibility.
Author(s)
Søren Højsgaard, <[email protected]>
References
Søren Højsgaard (2012). Graphical Independence Networks with the gRain Package for R. Journalof Statistical Software, 46(10), 1-26. http://www.jstatsoft.org/v46/i10/.
See Also
cptable
Examples
## Logical OR:
## A variable v is TRUE if either of its parents pa1 and pa2 are TRUE:ortab( c("v", "pa1", "pa2") ) %>% ftable(row.vars="v")## TRUE and FALSE can be recoded to e.g. yes and no:ortab( c("v", "pa1", "pa2"), levels=c("yes", "no") ) %>% ftable(row.vars="v")
## Logical AND:
## Same story here:andtab( c("v", "pa1", "pa2") ) %>% ftable(row.vars="v")andtab( c("v", "pa1", "pa2"), levels=c("yes", "no") ) %>% ftable(row.vars="v")
## Combined approach

26 querygrain
booltab(c("v", "pa1", "pa2"), op=`&`) %>% ftable(row.vars="v") ## ANDbooltab(c("v", "pa1", "pa2"), op=`|`) %>% ftable(row.vars="v") ## OR
booltab(~v+pa1+pa2, op=`&`) %>% ftable(row.vars="v") ## ANDbooltab(~v+pa1+pa2, op=`|`) %>% ftable(row.vars="v") ## OR
mendel Mendelian segregation
Description
Generate conditional probability table for mendelian segregation.
Usage
mendel(allele, names = c("child", "father", "mother"))
Arguments
allele A character vector.names Names of columns in dataframe.
Examples
## Inheritance of the alleles "y" and "g"
men <- mendel( c("y","g"), names = c("ch", "fa", "mo") )men
querygrain Query a network
Description
Query an independence network, i.e. obtain the conditional distribution of a set of variables -possibly (and typically) given finding (evidence) on other variables.
Usage
querygrain(object, nodes = nodeNames(object), type = "marginal",evidence = NULL, exclude = TRUE, normalize = TRUE, result = "array",details = 0)
## S3 method for class 'grain'querygrain(object, nodes = nodeNames(object),type = "marginal", evidence = NULL, exclude = TRUE, normalize = TRUE,result = "array", details = 0)

querygrain 27
Arguments
object A "grain" object
nodes A vector of nodes; those nodes for which the (conditional) distribution is re-quested.
type Valid choices are "marginal" which gives the marginal distribution for eachnode in nodes; "joint" which gives the joint distribution for nodes and "conditional"which gives the conditional distribution for the first variable in nodes given theother variables in nodes.
evidence An alternative way of specifying findings (evidence), see examples below.
exclude If TRUE then nodes on which evidence is given will be excluded from nodes (seeabove).
normalize Should the results be normalized to sum to one.
result If "data.frame" the result is returned as a data frame (or possibly as a list ofdataframes).
details Debugging information
Value
A list of tables with potentials.
Note
setEvidence() is an improvement of setFinding() (and as such setFinding is obsolete). Usersare recommended to use setEvidence() in the future.
setEvidence() allows to specification of "hard evidence" (specific values for variables) and likeli-hood evidence (also known as virtual evidence) for variables.
The syntax of setEvidence() may change in the future.
Author(s)
Søren Højsgaard, <[email protected]>
References
Søren Højsgaard (2012). Graphical Independence Networks with the gRain Package for R. Journalof Statistical Software, 46(10), 1-26. http://www.jstatsoft.org/v46/i10/.
See Also
setEvidence, getEvidence, retractEvidence, pEvidence

28 repeatPattern
Examples
testfile <- system.file("huginex", "chest_clinic.net", package = "gRain")chest <- loadHuginNet(testfile, details=0)qb <- querygrain(chest)qb
lapply(qb, as.numeric) # Safesapply(qb, as.numeric) # Risky
## setFinding / setEvidence
yn <- c("yes","no")a <- cptable(~asia, values=c(1,99),levels=yn)t.a <- cptable(~tub+asia, values=c(5,95,1,99),levels=yn)s <- cptable(~smoke, values=c(5,5), levels=yn)l.s <- cptable(~lung+smoke, values=c(1,9,1,99), levels=yn)b.s <- cptable(~bronc+smoke, values=c(6,4,3,7), levels=yn)e.lt <- cptable(~either+lung+tub,values=c(1,0,1,0,1,0,0,1),levels=yn)x.e <- cptable(~xray+either, values=c(98,2,5,95), levels=yn)d.be <- cptable(~dysp+bronc+either, values=c(9,1,7,3,8,2,1,9), levels=yn)plist <- compileCPT(list(a, t.a, s, l.s, b.s, e.lt, x.e, d.be))chest <- grain(plist)
## 1) These two forms are identicalsetEvidence(chest, c("asia","xray"), c("yes", "yes"))setFinding(chest, c("asia","xray"), c("yes", "yes"))
## 2) Suppose we do not know with certainty whether a patient has## recently been to Asia. We can then introduce a new variable## "guess.asia" with "asia" as its only parent. Suppose## p(guess.asia=yes|asia=yes)=.8 and p(guess.asia=yes|asia=no)=.1## If the patient is e.g. unusually tanned we may set## guess.asia=yes and propagate. This corresponds to modifying the## model by the likelihood (0.8, 0.1) assetEvidence(chest, c("asia","xray"), list(c(0.8,0.1), "yes"))
## 3) Hence, the same result as in 1) can be obtained withsetEvidence(chest, c("asia","xray"), list(c(1, 0), "yes"))
## 4) An alternative specification using evidence issetEvidence(chest, evidence=list("asia"=c(1, 0), "xray"="yes"))
repeatPattern Create repeated patterns in Bayesian networks
Description
Repeated patterns is a useful model specification short cut for Bayesian networks

repeatPattern 29
Usage
repeatPattern(plist, instances, unlist = TRUE)
Arguments
plist A list of conditional probability tables. The variable names must have the formname[i] and the i will be substituted by the values given in instances below.
instances A vector of distinct integersunlist If FALSE the result is a list in which each element is a copy of plist in which
name[i] are substituted. If TRUE the result is the result of applying unlist().
Author(s)
Søren Højsgaard, <[email protected]>
References
Søren Højsgaard (2012). Graphical Independence Networks with the gRain Package for R. Journalof Statistical Software, 46(10), 1-26. http://www.jstatsoft.org/v46/i10/.
See Also
grain, compileCPT
Examples
## Specify hidden markov models. The x[i]'s are unobserved, the## y[i]'s can be observed.
yn <- c("yes","no")
## Specify p(x0)x.0 <- cptable(~x0, values=c(1,1), levels=yn)
## Specify transition densityx.x <- cptable(~x[i]|x[i-1], values=c(1,99,2,98),levels=yn)
## Specify emissiob densityy.x <- cptable(~y[i]|x[i], values=c(1,99,2,98),levels=yn)
## The pattern to be repeatedpp <- list(x.x, y.x)
## Repeat pattern and create networkppp <- repeatPattern(pp, instances=1:10)qqq <- compileCPT(c(list(x.0),ppp))rrr <- grain(qqq)

30 set-jevidence
set-jevidence Set joint evidence in grain objects
Description
Setting and removing joint evidence in grain objects.
Usage
setJEvi(object, evidence = NULL, propagate = TRUE, details = 0)
insertJEvi(evi.list, pot, hostclique)
retractJEvi(object, items = NULL, propagate = TRUE, details = 0)
new_jev(ev, levels)
## S3 method for class 'grain_jev'print(x, ...)
Arguments
object A "grain" object
evidence A list of evidence. Each element is a named array.
propagate Should the network be propagated?
details Debugging information
evi.list A "grain_jev" object.
pot A list of clique potentials (a potential is an array).
hostclique A numerical vector indicating in which element of ’pot’ each eviendence itemin ’evi.list’ should be inserted in.
items Items in the evidence list to be removed. Here, NULL means remove everything,0 means nothing is removed. Otherwise items is a numeric vector.
ev A named list.
levels A named list.
x A "grain_jev" object.
... Additional arguments; currently not used.
Note
All the joint evidence functionality should be used *with great care*.
Author(s)
Søren Højsgaard, <[email protected]>

set-jevidence 31
References
Søren Højsgaard (2012). Graphical Independence Networks with the gRain Package for R. Journalof Statistical Software, 46(10), 1-26. http://www.jstatsoft.org/v46/i10/.
See Also
setFinding getFinding retractFinding pFinding
Examples
example("grain")
uni <- list(asia = c("yes", "no"), tub = c("yes", "no"),smoke = c("yes", "no"), lung = c("yes", "no"),bronc = c("yes", "no"), either = c("yes", "no"),xray = c("yes", "no"), dysp = c("yes", "no"))
ev <- list(tab("asia", levels=uni, values=c(1,0)),tab("dysp", levels=uni, values=c(1,0)),tab(c("dysp","bronc"), levels=uni, values=c(.1, .2, .9, .8)) )
bn2 <- setJEvi(bn, evidence=ev)bn2
## Notice: The evidence is defined on (subsets of) cliques of the junction tree# and therefore evidence can readily be absorbed:getgrain(bn, "rip")$cliques %>% str
## On the other hand, below evidence is not defined cliques of the# junction tree and therefore evidence can not easily be absorbed.# Hence this will fail:
## Not run:ev.fail <- list(tab(c("dysp","smoke"), levels=uni, values=c(.1, .2, .9, .8)) )setJEvi(bn, evidence=ev.fail)
## End(Not run)
## Evidence can be removed with
retractJEvi(bn2) ## All evidence removed.retractJEvi(bn2, 0) ## No evidence removed.retractJEvi(bn2, 1:2) ## Evidence items 1 and 2 are removed.
## Setting additional joint evidence to an object where joint# evidence already is set will cause an error. Hence this will fail:## Not run:
ev2 <- list(smoke="yes")setJEvi(bn2, evidence=ev2)
## End(Not run)

32 update.CPTgrain
## Instead we can donew.ev <- c( getEvidence(bn2), list(smoke="yes") )setJEvi( bn, evidence=new.ev )
## Create joint evidence object:
db <- parray(c("dysp","bronc"), list(yn,yn), values=c(.1,.2,.9,.8))dbev <- list(asia=c(1,0), dysp="yes", db)
uni <- list(asia = c("yes", "no"), tub = c("yes", "no"),smoke = c("yes", "no"), lung = c("yes", "no"),bronc = c("yes", "no"), either = c("yes", "no"),xray = c("yes", "no"), dysp = c("yes", "no"))
jevi <- new_jev( ev, levels=uni )jevi
bn3 <- setJEvi( bn, evidence=jevi)evidence( bn3 )
update.CPTgrain Update a Bayesian network
Description
Update a Bayesian network
Usage
## S3 method for class 'CPTgrain'update(object, ...)
Arguments
object A Bayesian network of class CPTgrain
... If CPTlist is a name in the dotted list, then the object will be update with thisvalue (which is assumed to be a list of conditional probabilities). ... here~~
Value
A new Bayesian network. If it is a LIST, use
Note
There is NO checking that the input matches the settings in the Bayesian network.

update.CPTgrain 33
Author(s)
Søren Højsgaard, <[email protected]>
References
Søren Højsgaard (2012). Graphical Independence Networks with the gRain Package for R. Journalof Statistical Software, 46(10), 1-26. http://www.jstatsoft.org/v46/i10/.
Examples
## Network for Bernulli experiment; two nodes: X and thetaXyn <- c("yes", "no") # Values for XthX.val <- c(.3, .5, .7) # Values for thetaXprX.val <- rep(1, length(thX.val)) # Probabilities for thetaX values
thX <- cptable(~thetaX, values=prX.val, levels=thX.val)X <- cptable(~X|thetaX, values=rbind(thX.val,1-thX.val), levels=yn)
cptlist <- compileCPT( list(thX, X) )bn <- compile( grain( cptlist ) )querygrain( setEvidence(bn, nodes="X", states="yes") )
## To insert a new prior distribution we may do as follows## (where we can omit the process of recompiling the network)prX.val2 <- c(.2,.3,.5)thX2 <- cptable(~thetaX, values=prX.val2, levels=thX.val)bn2 <- update(bn, CPTlist=compileCPT( list(thX2, X)))querygrain( setEvidence(bn2, nodes="X", states="yes") )

Index
∗Topic modelscptable, 3finding, 8grain-compile, 10grain-evi, 11grain-evidence, 14grain-main, 17grain-predict, 19grain-propagate, 20grain-simulate, 22querygrain, 26set-jevidence, 30
∗Topic utilitiescompile-cpt, 2extract-cpt, 6finding, 8grain-compile, 10grain-evi, 11grain-evidence, 14grain-propagate, 20load-save-hugin, 23logical, 24querygrain, 26set-jevidence, 30update.CPTgrain, 32
∗Topic utilsrepeatPattern, 28
absorbEvi (grain-evi), 11absorbEvi_ (grain-evi), 11absorbEvidence (grain-evidence), 14addEvi (grain-evi), 11addEvi<- (grain-evi), 11andtab (logical), 24andtable, 4andtable (logical), 24as.data.frame.grain_ev
(evidence-object), 4
booltab (logical), 24
compile, 21compile-cpt, 2compile.CPTgrain (grain-compile), 10compile.grain, 18compile.grain (grain-compile), 10compile.POTgrain (grain-compile), 10compileCPT, 4, 7, 29compileCPT (compile-cpt), 2compilePOT, 4, 7compilePOT (compile-cpt), 2cptable, 3, 18, 25
dropEvi (grain-evi), 11dropEvi<- (grain-evi), 11
evidence (grain-evi), 11evidence-object, 4evidence<- (grain-evi), 11extract-cpt, 6extractCPT, 3, 4extractCPT (extract-cpt), 6extractPOT, 3, 4extractPOT (extract-cpt), 6
finding, 8
getEvi (grain-evi), 11getEvidence, 9, 12, 27getEvidence (grain-evi), 11getFinding, 12, 15, 18, 31getFinding (finding), 8getHostClique (grain-evi), 11grain, 4, 7, 11, 20, 21, 24, 29grain (grain-main), 17grain-compile, 10grain-evi, 11grain-evidence, 14grain-generics, 16grain-main, 17grain-predict, 19
34

INDEX 35
grain-propagate, 20grain-simulate, 22grain.CPTspec (grain-main), 17grain.dModel (grain-main), 17grain.graphNEL (grain-main), 17grain.POTspec (grain-main), 17
insertEvi (grain-evi), 11insertJEvi (set-jevidence), 30iplot.grain (grain-main), 17is.grain (grain-main), 17is.null_ev (evidence-object), 4
junctionTree, 11
load-save-hugin, 23loadHuginNet (load-save-hugin), 23logical, 24
mendel, 26
new_ev (evidence-object), 4new_jev (set-jevidence), 30nodeNames (grain-generics), 16nodeStates (grain-generics), 16
ortab (logical), 24ortable, 4ortable (logical), 24
pEvidence, 9, 12, 27pEvidence (grain-evi), 11pFinding, 12, 15, 18, 31pFinding (finding), 8plot.grain (grain-main), 17predict.grain (grain-predict), 19print.CPTspec (compile-cpt), 2print.grain_ev (evidence-object), 4print.grain_jev (set-jevidence), 30propagate, 11propagate.grain, 18propagate.grain (grain-propagate), 20propagate__ (grain-propagate), 20propagateLS (grain-propagate), 20propagateLS__ (grain-propagate), 20
qgrain (querygrain), 26querygrain, 9, 26
repeatPattern, 28
retractEvi (grain-evi), 11retractEvi_ (grain-evi), 11retractEvidence, 9, 12, 27retractEvidence (grain-evidence), 14retractFinding, 12, 15, 18, 31retractFinding (finding), 8retractJEvi (set-jevidence), 30rip, 11
saveHuginNet (load-save-hugin), 23set-jevidence, 30setdiff_ev (evidence-object), 4setEvi (grain-evi), 11setEvi_ (grain-evi), 11setEvidence, 9, 12, 18, 27setEvidence (grain-evidence), 14setFinding, 12, 15, 18, 31setFinding (finding), 8setJEvi (set-jevidence), 30setJEvi_ (set-jevidence), 30simulate.grain (grain-simulate), 22subset.grain_ev (evidence-object), 4summary.CPTspec (compile-cpt), 2
triangulate, 11
union_ev (evidence-object), 4universe (grain-generics), 16update.CPTgrain, 32
varNames.grain_ev (evidence-object), 4varNames.grainEvidence_
(grain-generics), 16
Related Documents