G. Beers (ed.) K.J. Poppe H.C. Pruis Mededeling 536 PACIOLI 3 Need for change Workshop report June 1996 PACIOLI Agricultural Economics Research Institute (LEI-DLO)

Welcome message from author
This document is posted to help you gain knowledge. Please leave a comment to let me know what you think about it! Share it to your friends and learn new things together.
Transcript

G. Beers (ed.) K.J. Poppe H.C. Pruis
Mededeling 536
PACIOLI 3 Need for change
Workshop report
June 1996
PACIOLI
Agricultural Economics Research Institute (LEI-DLO)

ABSTRACT
PACIOLI 3; NEED FOR CHANGE; WORKSHOP REPORT Beers, G. (ed.). K.J. Poppe, H.C. Pruis The Hague, Agricultural Economics Research Institute (LEI-DLO) Mededeling 536 ISBN 90-5242-353-9 342 p., tab., fig., annexes
The PACIOLI project is a concerted action for the EC consisting of four workshops; the first workshop. Farm accounting and information management, was held in March 1995, the second workshop. Accounting and managing innovation, was held in September 1995 and the third workshop. Need for change, was held in March 1996. The objective of PACIOLI is to explore the needs for and feasibility of projects on the innovation in farm accounting and its consequences for the data-gathering with Farm Accountancy Data Networks (FADN).
The third step towards innovation was to gather a lot of ideas, discuss them and structure them into project indications. During the fourth, and last, step these project indications will be worked out to project proposals. In this way the platform of PACIOLI is really getting prepared for actual innovation.
Innovation/Farm Accountancy Data Networks/Stakeholder analysis
The contents of this report may be quoted or reproduced without further permission. Due acknowledgement is requested.

CONTENTS
Page
PREFACE 7
SUMMARY 9
HOW TO READ THIS BOOK 11
1. INTRODUCTION PACIOLI 3 - GENERATING PROJECT IDEAS 13 (George Beers)
STAKEHOLDER INVOLVEMENT 18
WORKING GROUP SESSION 1 The influence of the CAP reform on RICA and the national FADNs 21
2. EXTERNAL ORGANIZATION 27 INTRODUCTION 27 2.1 STRATEGIC MANAGEMENT FOR A FADN - THE CASE OF
THE NETHERLANDS (Krijn J. Poppe) 28
2.2 THE COMMERCIAL EXPLOITATION OF THE FADN IN ENGLAND OPPORTUNITIES AND CONSTRAINTS (David Hughes and Nigel Williams) 38
2.3 DETERMINANTS AND CONSTRAINTS FOR ADMINISTRATIVE CHANGE IN SPAIN (Miguel Merino Pacheco) 41
2.4 FARM ACCOUNTANCY DATA NETWORK, REQUESTS FOR ADDITIONAL DATA FROM RESEARCHERS (Alastair Bailey) 49
2.5 THE NEEDS AND EXPECTATIONS OF THE FINNISH MINISTRY OF AGRICULTURE AND FORESTRY WITH RESPECT TO THE FADN (Markku Himanen) 56
3. INTERNAL ORGANIZATION 59 INTRODUCTION 59 3.1 INNOVATIONS IN FADNs - SWITZERLAND
(Beat Meier) 60 3.2 QUICK STATISTICS FOR FADN
(Arne Bolin) 63 3.3 TECHNICAL ACTION PLANS FOR FADNs
(Simo Tiainen) 66

Page
3.4 REVISION OF FARM TYPOLOGY IN ORDER TO OBTAIN MORE CONTINUE ACCOUNTANCY DATA SERIES (Nicole Taragola and Dirk van Lierde) 67
3.5 THE PERSPECTIVES ON THE ITALIAN AGRICULTURAL ACCOUNTANCY NETWORK: NEEDS OF INNOVATION The reorganization project of the Italian RICA (Part I) (Carla Abitabile) 76
3.6 POSSIBLE CHANGES / INNOVATIONS IN THE SPANISH FADN (Inmaculada Astorkiza) 82
4. DOMAIN 85 INTRODUCTION 85 4.1 CAP 2000, ENLARGEMENT AND FOLLOW-UP OF AGRICULTURAL
DEVELOPMENTS AND POLICY-MAKING IN CENTRAL EASTERN EUROPE ('PECO') (Louis Florez-Robles) 86
4.2 ANALYSIS AND CONTROL OF MINERAL BALANCES AT THE FARM LEVEL .(Bo Öhlmér) 95
4.3.1 GLOBAL ENVIRONMENTAL PRODUCTIVITY MEASURES USING MICRO DATA 99
4.3.2 PROBLEMS PRESENTED BY THE CALCULATION OF EXTERNALITIES 103 4.3.3 PROBLEMS PRESENTED BY AMORTIZATION AND NATURAL
CAPITAL (Carlos San Juan) 104
4.4 FRANCE - IDEAS FOR INNOVATION (Bernard Del'Homme and Jérôme Steffe) 107
4.5 IMPORTANT QUESTIONS FOR FADN IN SHORT AND LONG RUN FROM A SWEDISH ANGLE (PerPersson) 110
4.6 RECOMMENDATIONS FOR THE FUTURE DEVELOPMENT OF INDICATORS WITHIN FADN: PROSPECT AND RETROSPECT (Berkeley Hill) 116
4.7 POSSIBLE CHANGES / INNOVATIONS IN THE SPANISH FADN (Inmaculada Astorkiza) 120
WORKING GROUP SESSION 2 Discussion on selection criteria 122
5. QUALITY MANAGEMENT 127 INTRODUCTION 127 5.1 INCREASE FLEXIBILITY BY GIVING UP THE 'ONE SOFTWARE
APPROACH'; DEFINING A FARM RETURN (Beat Meier) 128
5.2 INNOVATION IN THE FADN AND STOCKHOLDERS (Carlos San Juan) 130
5.3 INTEGRATED QUALITY PROGRAM FOR FADN (Gunnar Larsson) 134

Page
5.4 A POSITIVE MATHEMATICAL PROGRAMMING MODEL FOR REGIONAL ANALYSIS OF AGRICULTURAL POLICIES (Quirino Paris and Filippo Arfini) 139
5.5 THE REORGANIZATION PROJECT OF THE ITALIAN RICA (Part II) (Carla Abitabile) 162
5.6 POSSIBLE CHANGES / INNOVATIONS IN THE SPANISH FADN (Inmaculada Astorkiza) 167
INFORMATION TECHNOLOGY 169 INTRODUCTION 169 6.1 USE ACCOUNTS WITH DIFFERENT LEVELS OF DETAIL
(Beat Meier) 170 6.2 SYSTEM SPECIALISTS MEETINGS
(Lars-Eric Gustafson) 173 6.3 CREATING A DATABANK OF FARMS AND RURAL ENTERPRISES IN
FINLAND - A PILOT PROJECT (Jouko Siren) 177
6.4 MAKING RICA INFORMATION AND DATABASES ACCESSIBLE ON .THE INTERNET (Guido Bonati) 181
6.5 INNOVATION IN THE BELGIAN FARM ACCOUNTANCY DATA NETWORK: DEVELOPMENT OF A COMPUTERIZED INFORMATION MODEL (Dirk van Lierde and Nicole Taragola) 183
6.6 POSSIBLE CHANGES / INNOVATIONS IN THE SPANISH FADN (Inmaculada Astorkiza) 189
FARM MANAGEMENT ACCOUNTING 191 INTRODUCTION 191 7.1 FINANCIAL ACCOUNTING, GAAP AND AGRICULTURE
(Krijn J. Poppe) 192 7.2 MONITORING THE PERFORMANCE OF AGRI-ECOLOGICAL
PRODUCTION CHAINS BY LCA AND FADN (Marieke J.G. Meeusen-van Onna and Krijn J. Poppe) 213
7.3 THE UTILIZATION OF FISCAL INCENTIVES FOR THE INTRODUCTION OF THE ACCOUNTING IN THE SPANISH AGRARIAN FIRMS (Gomez-Limon Rodriguez) 231
7.4 THE REORGANIZATION PROJECT OF THE ITALIAN RICA (Part III) (Carla Abitabile) 245
7.5 AGRICULTURE - POINT OUTLINE (Ian Kirton) 247
7.6 POSSIBLE CHANGES / INNOVATIONS IN THE SPANISH FADN (Inmaculada Astorkiza) 268
WORKING GROUP SESSION 3 Clustering of ideas 271
WORKING GROUP SESSION 4 Generating project indications 275

Page
WORKING GROUP SESSION 5
A step up to the next workshop 296
CONCLUDING REMARKS 311
ANNEXES 313
1. Farm Business Survey; Collection and Processing of Farm Accounts Data in the UK 314
2. Process models 317 3. Curricula vitae participants PACIOLI 3 329 4. Addresses participants PACIOLI 3 336

PREFACE
The changing conditions in agriculture during the last years have brought fundamental changes in agricultural decision making on farm level but certainly also in agricultural policy making. Since decision making processes determine the information requirements, it is clear that the activities that supply the necessary information should be adapted to a new situation too.
LEI-DLO as an institute that tries to fulfi l l the information needs of (Dutch) agricultural policy makers, is also confronted wi th this changing environment. During the last five years serious changes in types of data that are gathered and in the data gathering process have taken place. In this respect we are very pleased to be able to discuss wi th our colleagues throughout the EU, our process of change, the things we are concerned about and the ideas for future directions in the further development of our farm accountancy data network.
We hope that by sharing ideas and extensive collaboration the FADNs will be able to generate the information that is required by our clients; in the near future as well as in the long run. We are very much aware that this ambition will confront us with the need for major changes in our activities. We hope that the PACIOLI project will help us and our FADN colleagues to make a major step in the good direction.
The Hague, June 1996 achariasse
SUMMARY
The PACIOLI project is a concerted action for the EC consisting of four workshops; the first workshop farm accounting and information management was held March 1995. The second workshop accounting and managing innovation is held September 1995. The third workshop need for change was held March 1996. The objective of PACIOLI is to explore the needs for and feasibility of projects on the innovation in farm accounting and its consequences for the data-gathering with Farm Accountancy Data Networks (FADN). In line with the discussion about the impact of the CAP reform, the main objective of PACIOLI is to come up with proposals for reforming the RICA FADN.
In the first workshop the objectives of the project were discussed and it was concluded that the main objectives for innovation in the FADNs are im-provementof the quality of FADN data, the use of data and the cost effectiveness of FADNs. A mature level of strategic information management is a prerequisite for more flexible FADNs that are supplying data with high quality in a cost effective way.
In the second workshop the national FADNs were the main subject. Both the organization around the FADN and within the FADN were discussed. The stakeholder analysis was a very important part of the discussion; as the objective of PACIOLI is to innovate the FADN, we have to know to whom we should listen and pick up ideas for change. The participants that were present at the second PACIOLI workshop agreed that the next step in the process was to make lists of potential innovations and to order these topics on importancy and preference.
Thus the objective of the third workshop was to come up with a lot of ideas, to structure them and to design project indications. During the workshop all ideas were presented, after which they were assigned to one of the following categories: 1. external organization; 2. internal organization; 3. domain of FADN data; 4. quality management; 5. information technology; 6. farm management accounting.
The ideas vary from gathering of new data (quantitative) to meetings with specialists (qualitative), all meant to help to innovate the FADNs. Also the stakeholders have had an important role; either they were present at the third workshop, or they had been interviewed before the third workshop.

Within a category the ideas were clustered, after which they were worked out to project indications. Among other things these project indications consist of a description of the project, the stakeholders to be involved and the potential funders. The potential funders are very important of course, therefore one working group session was about the criteria that will be used in assessment of project proposals.
Finally each participating country was asked to point out which project indications interests them; what specific contribution they can offer and if they would like to be initiator. This resulted in an overview of who will work out what project indications before the fourth and last PACIOLI workshop which will be held September 30 - October 2, 1996.
Last but not least it was obvious that the enthusiastic network of accounting experts, information scientists and FADN experts of 7 EU countries become to know each other. This might be very important in some of the proposals that will be of a networking kind. Experts from Belgium, Germany and Switzerland joined the group. For the last workshop the other EU memberstates are still invited, in order to get a broad platform for ideas about innovation of FADNs.
10

HOW TO READ THIS BOOK
This book is the result of the third PACIOLI workshop. The workshop was organized around three days of presenting papers, discussing them and discuss related subjects. This book follows the order of the performances in the workshop.
After the introduction to PACIOLI 3 (chapter 1), the participating countries were asked to describe their experiences with their stakeholders. The results of this plenary discussion is presented after chapter 1.
Before the main subject was started, the participants were asked to discuss external changes that influences the (national) FADNs. The results of this first working group session are presented before chapter 2.
The main subject of the third workshop was to bring forward a lot of innovative ideas. Therefore all participants presented papers with ideas. To order all ideas six categories were distinguished: 1. external organization; 2. internal organization; 3. domain; 4. quality management; 5. information technology; 6. farm management accounting.
The topics of a presented paper were identified and each topic was assigned to one of the categories. Chapter two to chapter seven give the result of this ordening. Each chapter describes all ideas that were pointed to the concerning category.
After chapter four the results of working group session 2 on 'discussion on selection criteria' are presented.
The last three working group sessions are presented after each other after chapter seven, because they give the logical order from clustering the ideas, to project indications, to who is interested in which project.
Finally the conclusions of the third PACIOLI workshop are presented. In annex 1 the report is given of the lecture given at Wye College on 'The Farm Business Survey'. In the following annexes the process models of the participating countries are presented, together with the curricula vitae of the participants of the third workshop and their addresses.
11
1. INTRODUCTION PACIOLI 3 - GENERATING PROJECT IDEAS
George Beers
1.1 The PACIOLI project
This paper gives an introduction and some backgrounds of the third workshop in the PACIOLI project. PACIOLI is a concerted action for the EC in collaboration with the RICA/FADN unit. The objective of the concerted action is to explore the needs for and feasibility of projects on the innovation in farm accounting and its consequences for data-gathering on a European level through Farm Accountancy Data Network (FADN). This may also be considered as a first step in disseminating Dutch experiences with the information modelling approach in agriculture. The long term objective of PACIOLI is to come to an infrastructure for innovation of FADNs. More specific, the concerted action is a step in preparation and development of projects in which information models wil l be developed that support the development of information systems to improve and extend the RICA/FADN network with various types of data in order to support EC-policy making and evaluation.
1.2 Workplan
The concerted action is organized around four workshops:
Workshop 1 (March 95); 'Introduction and Information Analysis' In the first workshop the concerted action has been introduced and the
objectives have been discussed. The need for Strategic Information Management (SIM) in agriculture has been identified and some experiences wi th this in various memberstates were presented. A special focus was on the Dutch experiences with the Information Modelling Program.
Workshop 2 (September 95); 'Accounting and managing innovation' The workshop in Maastricht was focused on the FADNs; the national
FADNs as well as the RICA FADN of the EU. They were described in information models and analyses were done on the organizations and persons that are influencing the FADNs one way or another (the stakeholders analysis). Examples of some recent innovations in the FADNs were discussed in order to learn from the past. It was concluded that in the process of processing ideas for reforming the FADNs it is important that all stakeholders are involved. It was clearly stated the discussion should be broader than just the person directly involved in the FADNs but also funders, users of FADN data and suppliers of data should be consulted for bringing up ideas for change.
13
Workshop 3 (March 96); 'Need for change' The third workshop can be considered as a brainstorming to bring up
ideas for reform and innovation. Special attention wil l be given to the policy making processes since policy can be considered to be the primary users (and financiers) of information obtained by FADNs. Attention will be given to the information requirements related to policy making processes and the way these information requirements are influencing the FADNs. Representatives of the users of FADN will be participating in this workshop, explicitly to give directions for innovation of FADNs on national and EU level. The consequences of the suggestions f rom policy makers wil l be discussed as a first assessment.
Workshop 4 (September 96); 'Suggestions for continuation' In the last PACIOLI workshop ideas from the previous workshop wil l be
worked out to proposals for follow-up. The discussion wil l be on priorities of topics and identification of projects. Using the material brought up in the other three PACIOLI workshops innovation projects will be developed for the FADNs, including the information models to be used, organizations to be involved and the main threads and benefits of the proposals.
1.3 Conclusions of the first t w o workshops
In the first workshop it was concluded that the main objectives for innovation in the FADNs are improvement of FADN data, the use of data and the cost effectiveness of FADNs. A mature level of strategic information management is a prerequisite for more flexible FADNs that wil l be able to supply data w i th high quality in a cost effective way.
Within the group that was present in Ameland there was on remarkable consensus about 'the need for action'. For all participants it was beyond any doubt that new development of FADNs is necessary to survive. It was clearly stated that improvement of FADNs will not be enough, we should strive for INNOVATION of FADN. Suggestions were generated that should help to make some steps in the direction of this innovation process.
In further development of FADN it is stressed that more attention for the users of the FADN data is an absolute prerequisite. Another aspect in the thinking about innovating FADNs and farm accounting is to take explicitly into consideration the developments and trend in the information and communication technology (ICT). In this respect one can think of e.g. the farmer as a supplier of data. It is also important not to forget to involve the financiers of FADN in the further development of plans for innovation of FADNs. To combine the various aspects there is a clear need for a structured approach like the informat ion modelling approach.
In the PACIOLI context strategic information management is aimed at effective and efficient gathering and distribution of information. The Informat ion Modelling (IM) approach and the Dutch experiences wi th IM have been introduced. Information models are essential tools in information management activities.
14

In the second workshop the process models of the various FADNs are presented and discussed. Comparing these models shows that there are a lot of processes in common, but there are also differences in the activities involved in a FADN. For thinking about further development and cooperation between FADNs these process models can help as a guide in the management of the changes.
Discussing recent innovations in the FADN environment showed the importance of 'stakeholders' for the PACIOLI project. As the objective is to innovate the FADN, we have to know to whom we should listen and pick up ideas for change. Especially the relation between the FADN and the policy makers is discussed extensively. Their need for up-to-date data was expressed, because policy making is 'future making'. At the same time researchers ask for data similarity between the countries in the RICA data set.
On the way to innovation, the gathering of data on issues like environment and forestry is discussed. The conservation of the environment and forestry management are examples of these topics. In the software field the use of data with 'client' software (a client-server approach using an interface based on Windows) was presented by Italy.
The participants that were present at this second PACIOLI workshop agreed that the next step in the process is to make lists of potential innovations and to order these topics on importancy and preference. To contact and maybe involve the most important stakeholders is another task. During PACIOLI 3 the topics will be described and the need for change will be pointed out. The effect of the changes on the information model wil l be discussed and a stakeholder analysis will make clear how to deal with the most important stakeholders. This should result in a list of subjects which can be worked out to make actual project proposals. By preparing innovations in this structured and 'stakeholder oriented' way, the chances on success of our efforts wil l improve.
Last but not least this second workshop made the enthusiastic network of accounting experts, information scientists and FADN experts of 7 EU countries even more enthusiastic. Experts from Belgium and Germany joined this group already. For the remaining two workshops the other EU memberstates are still invited, in order to get a broad platform for ideas about innovation of FADNs.
1.4 Reflection papers
The papers presented and the results of the various working group sessions during the workshop are published in an extensive workshop report and a management summary. In addition to the workshop report a synthesis of the papers, discussions during the workshop and afterwards and a good doses of reflection, the workshops also result in so-called reflection papers. The first reflection paper, that contains an analysis of the RICA 'Farm Return' sheet, provides suggestions for decision making on the further development of the European FADN and is submitted to the management committee of the RICA.
15

The reflection paper of the second workshop was about innovation and integration in the various levels of accountancy. In the second reflection paper the principles of management of innovation processes as used in the PACIOLI project are described. Because PACIOLI is also looking at innovation of farm accounting, the development of the information function at the farm level and the implications for farm accounting are reflected. In respect to the reform of FADNs the information model for RICA is given and worked out for the different ways in which FADNs can be managed.
1.5 Innovation management in PACIOLI
The objective of innovation management is the innovation process that results in an ' innovation'. Innovations can be considered as a drastic change wi th in a particular system; it needs to be distinguished from an evolutionary adaption of the system and from a revolutionary change of the system (figure 1.1). In a certain sense this is comparable with changes in the Common Agricultural Policy that also can be labelled as 'status quo', 'reform' and 'radical reform'.
Adaption Innovation (reform) Revolution
Small change Large change
Figure 1.1 Innovation positioned between evolution and revolution
The impact of an innovation (a reform) is more drastic than adaption of the system, it deals with more or less fundamental changes in the system. In the PACIOLI context innovation stands for more than the adaption of e.g. data definitions or harmonizing the samples. One could assume that creating an environment in which these type of adaptions can be rather easily established, might need organizational changes that can be considered as reform. On the other side of the spectrum of change revolution is identified. This differs f rom innovation in the sense that revolution implies something like 'throw away' the old system and create a new one. Innovation in this perspective exploits the strong points of an existing system and is an attempt to improve it on the weak
16

points. In the PACIOLI context the starting point is that policy makers at national and EU level need information that is based on farm level data and that FADN-like institutions are required to supply this information.
Where revolutions are often prepared by a small group of key-persons, and adaptions demand only a small amount of energy from all the persons involved, a reform or innovation asks for an important group that carries out change management. The concerted action PACIOLI is a breeding place for such change management.
1.6 Issues in the third workshop
In the preparation of the third workshop all participants have had discussions with the stakeholders involved in their FADN. In this discussion ideas for reforming the FADN haven been generated. These ideas wil l be input for the workshop and they wil l be structured, combined. This wil l result in clusters of ideas that are very much related and these ideas for reforming the FADN wil l be transformed to action oriented proposals; so-called 'project ideas'.
It is useful to think and discuss about the reason why FADNs have to change so drastically at the moment. One of the reasons for this might be an external one; the reform of the Common Agricultural Policy. The effects of the new CAP on the information requirements of the policy makers wil l be discussed in the workshop and also matters like extending the EU. After generating the project ideas, this wil l be helpful in a first assessment of the need and feasibility of the project ideas.
Thus the third workshop wil l be organized in four steps:
Step 1 : developments around the FADNs: effects CAP reform; effects of extending the EU (PECO countries); developments in accounting practice (IASC).
Step 2: classification of the ideas in one of the categories for innovation: 1. external organization (of national/EU FADN); 2. internal organization (of national/EU FADN); 3. domain of the data (type of farms and types of data in FADN); 4. quality management (in FADN); 5. information technology (in FADN); 6. farm accounting (at the farm and accountancy office).
Step 3: generating project ideas. Step 4: first assessment of project ideas:
establishing criteria; assessment of the project ideas.
The workshop wil l end in a list of selected project ideas for which the participants are convinced that it would be worth the effort to work them out to real project proposals. In the last PACIOLI workshop these proposals wil l be worked out and discussed.
17

STAKEHOLDER INVOLVEMENT
During the second PACIOLI workshop, the participating countries agreed that they all would contact their stakeholders between the second and the th ird workshop. At the beginning of the third workshop each country was given the opportunity to tell something about the involvement of their stakeholders.
The Netherlands
LEI-DLO had three interviews with their most important stakeholder: the Ministry of Agriculture, Nature Management and Fisheries. They spoke about strategic management of the FADN and the internal organization. The performance and quality indicators of the FADN were topics that wi l l be discussed in the near future. The learning experience of these interviews is: 'We thought we know each other, but we must speak more like this'. The ministry is acquainted wi th the PACIOLI project, because during the second and third PACIOLI workshop one person of the ministry joined the Dutch delegation.
Sweden
For the Swedish delegation it was rather easy: the most important stakeholders are in the PACIOLI group. The only stakeholder they miss in their delegation is the Farmers' Union, but they know about the PACIOLI project. Their only remark is that there must not be too much burden on the collection of data (now Sweden has a 70% response rate), so it wi l l be difficult in Sweden to increase the amount of data collected.
United Kingdom
In the UK there is systematic contact between the UK delegation and the major stakeholder, the Ministry of Agriculture. There has been a major investment in innovation for the more efficient collection and analysis of FADN data during the past year. The main UK stakeholders (the Ministry of Agriculture and the National Farmers Union) attended the workshop.
18

Finland
Provision of data
Provision of finance
Content determination
1. Farmers - personal information letter - questionnaire on investments etc. (75% have
answered!!) - willingness to continue questionnaire: 85%
2. Farmers' organization - 'lets answer if requested'
1. Ministry of Agriculture - result agreement discussions - pi lot project (description in PACIOLI 3) f i
nancing 2. Farmers' organization
- support for targets
1. Research (pilot project) 2. Ministry of Agriculture
- interested but difficult to identify, research has to foresee what is needed and asked
3. Farmers - economic result of own farm - comparison to other farms
4. Farmers' organization - quite the same as ministry
- Importance for users 1. Research - data content needs 'unlimited'
2. Ministry of Agriculture - farm and agricultural policy
3. Farmers - mainly for own use
4. Farmers' organization - tool to affect farms and agricultural policy
Definition more exactly in the 'pilot project'.
RICA (EU /DG VI)
A questionnaire was send out, which nobody answered! DG VI is busy with a new concept and the evaluation of the agricultural policy. In an internal document the same things are brought up which are discussed many times already. There was no contact on 'environmental policy'. Slowly some comments are coming on the widening of the EU (PECO countries). But: PACIOLI 3 wil l be discussed wi th DG VI in Brussels.
19

Italy
In Italy there was no specific 'PACIOLI' contact with the stakeholders, because there is systematic contact. Besides that, some stakeholders are involved in the PACIOLI project. Unlike the ministry, the most regions in Italy know very well what they want wi th the data of the FADN. But the methodology is getting too difficult; this must change otherwise the continuation of the collection of data is in danger.
France
The few people who are involved in RICA are hard to f ind! But they learned at the ministry, the attitude in France is: NO innovation !! Perhaps some improvements, because the RICA must exist. Innovation on specific issues wil l not happen in the field of RICA.
Spain
The responsibles of the Spanish FADN (RECAN) at the Ministry of Agriculture, Fishery and Food (MAPA) in Madrid were sceptical about PACIOLI and the incorporation of some innovations. Despite many things are still improvable in the Spanish FADN and other national FADNs at the European level (i.e.: there is not homogeneity in criteria, definition of variables, etc. among EU countries). They think that the changes, improvements and/or innovations wil l not come up from an 'academic forum' like PACIOLI but from needs and decisions agreed in the political arena of the EU.
Regional ministries of agriculture received a questionnaire on 'how they think about RECAN' (Spanish FADN). The two different kind of regions (regions with Collaboration Agreements with the RECAN/MAPA that have the regional FADNs on their responsibility, and regions without Collaboration Agreements and no responsibilities on FADN) reacted very different on the questionnaire: in the regions with experience the answer rate was 100%, in the regions wi thout experience the answer rate was around 60%.
Switzerland
A working group of all stakeholders will report this summer on the FADN. The importance of the discussion is very clear, noticing that there is an enormous switch between extreme ideas.
20

WORKING GROUP SESSION 1 The influence of the CAP reform on RICA and the national FADNs
In the first working group session the participants were asked to discuss the influence of external changes on the FADNs.
Group division: random
The changing European policy (the CAP reform) can be seen as the most important external change, especially for RICA. Mr Fischler of DG VI has written a paper on the CAP reform, called 'Study on alternative strategies for the development of relations in the field of agriculture between the EU and the associated countries with a view to future accession of these countries' (Agricultural Strategy Paper, communication by mr. Fischler, in agreement with mr. Van den Broek). In this paper three future orientations for the CAP are described.
The participants were asked to discuss the implications of the CAP reform on the FADNs, national as well as RICA. During the discussion a distinction was made between reform because of the changing policy and reform because of the enlargement of the EU.
The most important policy directions of the CAP reform can be summarized as follows: a. status quo (Fischler scenario 1) b. radical reform (Fischler scenario 2) c. higher competitiveness d. integrated rural policy (Fischler scenario 3) e. simplification f. being realistic (own expectations)
The results of the group discussions are presented below.
A. Status q u o
No change - continued monitoring of '92 reform. Steady decrease in resources. Set up CEEC network. Reduced funds improve cost effectiveness and standardisation:
* resource reduction * reduced quality * data availability problems
Improve quality control.
21

Projection of yields. Data on quota, data on set aside. Cost prices of products.
Short term: no radical change small improvements
Long term: impossible (a new reform will happen ! !)
Problems of finance. Need simplification to enable new management system to comply.
B. Radical reform
Redundancy, or radical simplification. Other information tool.
Data on direct payments and for direct payments (tax?). No cost prices? Who can survive on world market prices? Data on non-farm income. Assessment of viability of farms; how many wi l l survive? Swedens' experience: smaller sample, fewer data -*• farmer needs more info.
Two options: * important simplification * new developments (new data, i.e. environmental)
(both could happen)
No need for data on agricultural income. Possible need for regional information other than agriculture:
* environmental issues * regional development * total (and other) incomes (which may impact on regional aspects)
It is not clear that the FADN is the best way to collect this information.
C. Higher competitiveness
Comparability: in and out of EU. Manage standardisation. Establishing costs of production tools. Sample orientated to products and to cover maximum production (competitive farms). Input / output quantities. Information technology needed for rapid results !!
More product information: quality, services, value added in chain. Cost prices for l imitation subsidies experience. Data on compensations.
22

Integration wi th market (cooperations) ->• transformation on farm / cooperations.
Short term: no radical change small improvements
Long term: RICA will go on * cost productions * competitiveness of agriculture
Lower costs of collection to reduce budget costs. Better analysis to meet needs of users / customers. Less political pressure.
D. In tegra l rura l policy
Widen interest bodies: * type * regions
Widen data scope. Links to and integration wi th other data sources. More use of regional results. Non-agricultural activity (including labour force). Environmental information. Detailed information on direct payment. Sample quality. Standardisation very important !!
Data on multifunctional role e.g. agri-tourisme, state of natural resources. Abandon FADN -> rural area data network: regional informations (pollution points).
Two options: * radical changes: substitution between economic information and environmental and non-farm data
* add new information: environmental data non-farm incomes income in rural areas indicators rural development
Need for integration with other data on e.g. * transport * research (?) * sectoral / regional policy
Is FADN suitable survey ?
23

E. Simplification
FADN as an extension tool . Information on market versus structural measures. Better information on grants and subsidies; better sample. Complete information releive to policy measures. Get information more rapidly! !
Simplification IS NOT simplification for RICA !! More diversity between regions. More complex to gather data at national / EU level. Need for EU-comparison because effect on common market 'put in green box'. Every five year a changed 'Farm Bill'.
Simplification of RICA possible (subsidies, quotas, compensatory payments,...) (if simplification means régionalisation: complexification of RICA) Improvement of national FADNs.
Simplification is not possible !!! Better data processing etc. More administration needs more information.
C. Higher competitiveness, D. Integral rural policy and E. Simplification
Reduction in support via commodity regimes. More market orientation -less intervention. Implies reduced need to monitor farm businesses.
Separation of production support and income support. Income support wi l l probably be a matter of subsidiarily and subject to 'normal' poverty net. Income measurement a national response? Diversification of economic activity (more than at present)
* of farms * of rural economy Expansion of explicit payments for environmental services. This may need
monitoring (but is FADN necessary for this?). Possible polarisation of agricultural production (more % in large units).
Abandon coverage if small producers? Possible greater regional disparity. Conflict between single market (and
regional comparative advantage) and support to disadvantaged areas. Underlines regional development policy.
Less need for detailed economic variables - simpler and less data collected. Extend coverage to non-farming activity + (maybe) other rural businesses. Common accounting framework for agricultural and non-agricultural businesses.
24
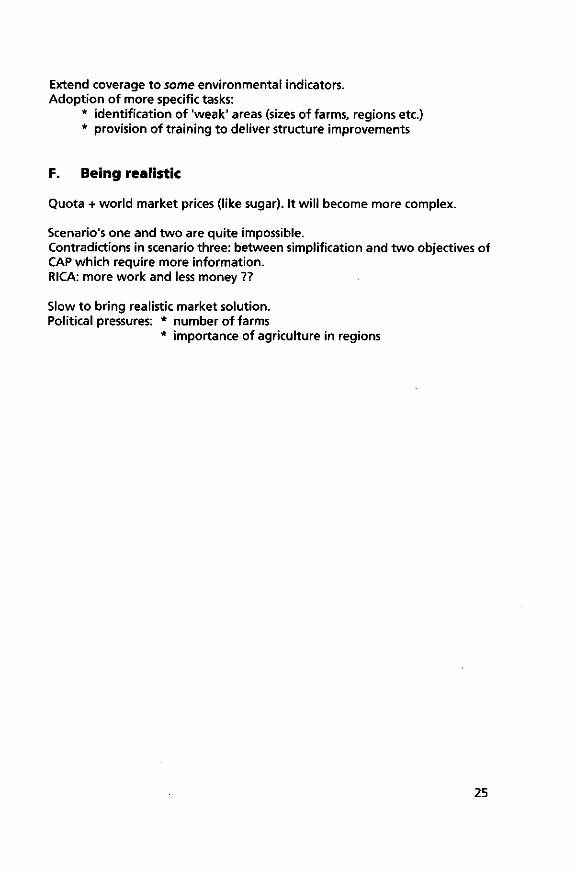
Extend coverage to some environmental indicators. Adoption of more specific tasks:
* identification of 'weak' areas (sizes of farms, regions etc.) * provision of training to deliver structure improvements
F. Being realistic
Quota + world market prices (like sugar). It wil l become more complex.
Scenario's one and two are quite impossible. Contradictions in scenario three: between simplification and two objectives of CAP which require more information. RICA: more work and less money ??
Slow to bring realistic market solution. Political pressures: * number of farms
* importance of agriculture in regions
25

2. EXTERNAL ORGANIZATION
INTRODUCTION
During the plenary session in which the participants presented their ideas, the following keywords were noted to the subject external organization. These keywords can be find again in the papers which are presented in this chapter.
Better involvement stakeholders Information model Commercial exploitation FADN Administrative change Research Requirements (demand for information) Needs and expectation of Ministry CAP subsidies
27

2.1 STRATEGIC MANAGEMENT FOR A FADN - THE CASE OF THE NETHERLANDS
Krijn J. Poppe and George Beers 1)
2.1.1 Introduction
This paper reports the interviews held wi th stakeholders of the Dutch Farm Accountancy Data Network (FADN) on the issue of the innovation of strategic management. In the second workshop of the concerted action PACIOLI (Beers, 1996) it was decided that in each member state stakeholders (persons having an interest in the operation like farmers, data suppliers, financing organizations, users) should be contacted on the innovations needed in the FADNs and RICA. The Dutch volunteered to focus on strategic management, as this topic seems an important but also a difficult one (as concluded in the first workshop of PACIOLI - reported in Beers, 1995).
The national interest in this topic origins from the current project 'Accounting 2000' that renews and revitalizes the Dutch FADN. In this project the strategic management is also an issue under review.
2.1.2 Method: stakeholders involved
The involvement of the stakeholders has been arranged in three separate interviews of about 1.5 hours. Interviews were mostly on an individual basis. To prepare the interviews we reviewed the current thinking on the management of agricultural research programs in the Netherlands. We also brainstormed on some extreme positions for strategic management, t o be used as propositions to invoke clear comments from the interviewed. In the interviews extensive reference was made to PACIOLI and Accounting-2000, in order to separate the discussion from current debates on the 1996-budget for the FADN. We used a copy of the process model, and especially the function strategic planning as a framework in the interviews.
1) The authors work with the Dutch Agricultural Economics Research Institute LEI-DLO. Beers coordinates PACIOLI and Poppe the Dutch FADN. The authors would like to express their severe thanks to messrs. Gijs van Leeuwen, Marc Scha-kenraad. Foppe de Haan and Wouter Gerstel, who kindly helped to clarify the line of thinking on this topic within the Ministry of Agriculture, Nature Management and Fisheries.
28

2.1.3 Background of the Dutch situation
To understand the Dutch case correctly, it is necessary to provide some background information, especially on the past and current situation in strategic management.
History for the Dutch FADN starts in the 1940's and 1950's when the Agricultural Economics Research Institute LEI-DLO was created to provide Dutch agricultural policy wi th data and analysis based on farm level data. The institute supported yearly negotiations between the farmers' organizations and the Ministry of Agriculture by providing authoritative, unbiased information. For this reason the institute was organized as an independent foundation, f i nanced 50/50 by farmers' organizations and the government.
This situation provided the LEI a task-oriented organization and internal culture as well as an external image of independency, authority and unbiased science. This situation is not uncommon in the Netherlands. Where other countries sometimes reserve such a position for their Statistical Office and their National Bank, in Dutch politics some institutes that carry out applied (economic) science to improve public decision making have such a 'planning bureau' funct ion. Their statute allows them to bypass their Minister to give advice to the Houses of Parliament, even if nobody asks for the advice. Examples are the CPB (the Central Planning Bureau that was founded by Nobel laureate Tinbergen to make economic forecasts), the RIVM (the National Institute of Public Health and Environmental Protection) and the SCP (Social-Cultural Planning Office).
With the introduction of the Common Agricultural Policy and decision making moving to Brussels, the Dutch farmers' organizations abandoned their financial support of the LEI. In 1971 the institute was more or less turned into a government agency. Employees were put on the payroll of the Ministry of Agriculture. But formally the Foundation LEI was not abolished and the institute is (still) governed by a Board in which representatives of the Ministry as well as representatives of the farmers organizations and other stakeholders take the important decisions. This constellation fits (or at least f itted) well into the Dutch consensus oriented way of policy making. The chairman of the Board is by tradition an independent professor in agricultural economics. In addition each department of LEI-DLO has its own Advisory Committee with a line-up comparable to that of the Board. In LEI-DLO the FADN is carried out by the different departments. However the Advisory Committees often focus in their discussions on the research activities and usually not on the FADN.
An important change in the management of the LEI occurred in the beginning of the 1990's, when the financial incentive system was turned upside down. The budget/input method of finance (in which the Advisory Committees sanctioned the spending of the budget) was de facto replaced by output f i nance. In 1992 the so called 'Statutory and Service Tasks (SST)' ('Wettelijke en Dienstverlenende Taken') were defined. That is to say that the tasks (often not research but data collection and periodic reports on the state of agriculture) carried out by LEI-DLO on the basis of (EU-)Regulations or as a service to the Ministry were identified. For each task the amount of t ime needed (per type of employee) was also agreed on. This deal can be interpreted as one big con-
29

tract for the SST. From 1996 on the SST-tasks will not be measured anymore in the time needed (on 1992-data), as this measure is converted into money. For all the other (research-)projects the Ministry and LEI-DLO choose the method of output finance, on a project basis or on a program (that is a cluster of coherent projects) basis. This choice was made by LEI-DLO as it was not wi l l ing to accept the alternative: a reduction of the institute due to lower financial support f rom the Ministry.
At the same time plans were published to make the group of agricultural research institutes (DLO - more or less comparable to e.g. the INRA in France) more independent f rom the Ministry of Agriculture. This could be in the form of an Agency or a Limited Company (with the government as shareholder). The DLO-organization created its own management structure. This involves program-financing by the Ministry of Agriculture and negotiations between the policy-making Ministry and the operation-oriented DLO will take place on this level. The FADN (including periodic reports on the state of agriculture) is one of the programs. For the policy-sensitive research programs of LEI-DLO it is not yet clear how, in line w i th output financing of all research activities, policymakers in their role of major client should be taken on board in the management of the different programs, especially not in those cases where most of the money in a program comes from contract work for other clients. It should be noted that ail the programs are evaluated from time to t ime, and the Ministry of Agriculture evaluated the FADN-program in 1992.
The RICA-regulations state that the FADN in each country should install a National Committee. Although no rules are given for the composition of such a committee, representatives from stakeholders (like agricultural accounting organizations, banks, farmers etc.)could be member of such a forum. The Committee has an official role in the approval of the selection plan and the select ion report. Probably the founding fathers of the RICA found it attractive to increase the support for the national FADNs by officially bringing the stakeholders and the FADN together.
In the 1960's and 1970's the Ministry of Agriculture had a special committee on farm accounting ('Cie. Bedrijfsadministratie'). This committee worked on standardisation and the promotion of accounting by farmers. One of its smaller tasks was to act as the official Dutch RICA-Committee. In the early 1980's this committee faded away (committees never seem to be dissolved off icially): work on the other tasks was not necessary anymore or taken over by projects on the promotion of informatics. As the attitude towards the RICA-task of the Committee had always been low-profile by leaving the decisions to the experts at the LEI, there was not much reason to keep the committee alive for that reason.
A last remark on the current situation concerns the steering of statistical activities in the Netherlands. The Ministry of Agriculture has an active standing committee that takes decisions on the annual census (the Farm Structure Survey) and that advises the Central Statistical Office (CBS) on its agricultural statistics. As the FADN is a tool to create an integrated database for research and policy analysis, it has always been neglected in discussions on statistics. The Central Statistical Office (CBS) tends to see this as unfair: they tend to regard
30

the publications with descriptive statistics from the FADN as a heavy competitor - although from the point of view of the FADN it is a - not unimportant - cheap byproduct of its database. At the moment LEI-DLO and CBS are exploring the possibilities to clear up their relationship and to see if a strategic alliance would make sense. Probably this would define the FADN as an important input for statistics. It would then be thinkable to give the CBS a better defined role in the strategic management of the FADN and LEI-DLO a better access to other statistics (e.g. on the food industry).
2.1.4 Different views
Changes in the market The interviewed stakeholders made clear that today's governments are
quickly becoming more market oriented, even in the area of infrastructure. Money becomes scarcer which gives an incentive to cut down expenses. Data networks have more and more users and (potential) uses. It is in such a situat ion not clear why one user (the Ministry) should pay the whole bill. On the other hand there is a large debate in Dutch agricultural politics on the 'knowledge infrastructure', and the FADN could be seen as being part of such an infrastructure (especially on monitoring). So views of the FADN differ between 'infrastructure' and 'data for actual problem solving'.
The policy makers are nowadays able to choose their statistics f rom several sources: besides the Farm Structure Survey (Annual Census) and the FADN, also the Mac Sharry-payments have become an information source, and more and more commercial accounting organizations and organizations that carry out telephone surveys are entering the market. Especially in the preparation of policy it is not a big problem that data definitions differ.
An advantage of the FADN however is that different types of data can be integrated at farm level. This makes it for instance easy to calculate the effects of a levy on energy for the income and the viability of the holdings; w i th normal statistics on e.g. energy-consumption this is impossible. These results can also easily be aggregated from the micro to the macro level. In addition the infrastructure of the FADN makes it possible to conduct additional questionnaires in the same framework. Our interviewed stakeholders recognized these advantages, but also had the impression that they are not very well known within the Ministry. It are mainly persons who in the past worked with LEI-DLO and then joined the Ministry, who are aware of these advantages in day to day policy making. As LEI-DLO has not a clear human resource management to outplace persons to the Ministry, this is a small basis. More public relations is seen as necessary.
Due to the changes in the market, the ties between the Ministry and LEI-DLO (and its FADN) becomes detached. Although some persons in the Ministry have a warm feeling towards the FADN the interviewed stakeholders warned us not to count on old privileges: things are changing fast nowadays and this trend will go on. It is especially in the interest of LEI-DLO to carry out its strategic planning in cooperation with its main stakeholders like the Ministry. In gen-
31

eral it was thought that stakeholders would be interested to participate in such a planning process, as long as it would also be useful for them (by helping them in their own struggle w i th the future) and if they had a real influence. The current experience on the Advisory Committees was referred to as a bad example.
Not all the persons interviewed were very happy wi th the current developments around LEI-DLO becoming more market oriented due to its output finance. The fact that part of LEI-DLO (especially the SST) is a task-organization where the other part is a market organization is seen as a source of conflicts of interest. Especially if other clients ask LEI-DLO to carry out policy research that intervenes the decision making process between the Minister of Agriculture and Parliament, these problems seems to arise. This has not so much to do wi th the fact that everybody uses FADN-data to support its work, but wi th research for more than one client in the same case or branch. This type of research for other participants in the actual policy debate is in the view of some of our interviewed stakeholders not invoked by the 'planning bureau' function of LEI-DLO but mainly by money from research contracts. They think that the results of such research contracts is mainly demanded to improve the lobbying process of these participants. The function of this type of research is thus more comparable wi th consultancy, and some of the persons interviewed wondered if such a consultancy activity should be a mission of LEI-DLO. This of course is clearly an area of (current) debate.
Economics of the FADN Our interviews revealed that there is a common understanding of the
peculiar economics of the FADN: relatively high fixed costs for running the panel (the infrastructure) and very low marginal costs for gathering an additional data-item or making an additional table w i th results. In addition the elapse t ime of a change in the FADN is until now rather long: it takes a few years between a decision to change the panel or the data gathered, and the moment the data are available for research and policy makers. This asks for good long term planning (strategic management).
Another problem is the fact that the FADN has several products: main products are the tape for the EU, the database for policy-research and some reports on the state of agriculture. By-products are a number of statistical reports (perhaps not much used in the Ministry, but more by other institutes, the extension service, banks and other users of statistics), copies of the (part of the) database for Ph.D /fundamental research, the publication of norms and standards (like sgm's or valuation methods) for accounting offices, and using the network to gather additional data by questionnaires (like the use of ground water or the monitoring of energy) or on special non-FADN-farms for specific research (e.g. compare the economic and environmental aspects of organic farming and traditional methods). Allocating the fixed costs to the different products seems to be rather arbitrary and does not take place at the moment. In addition, some of these by-products tend to become a main product (e.g. monitoring energy in glasshouse horticulture, or demonstration farms per region on mineral management).
32

Calculating costs per FADN-product could however be attractive, seen from the point of view of the Ministry. Especially in cases were there are important other users of the database (e.g. research projects for other ministries or for private organizations) a product pricing policy seems to be needed as the Ministry doesn't feel the need to pay all the costs of the infrastructure.
FADN: back office in a commercial environment? As an extreme proposition to create reactions we suggested that, as this
process of cost management is rather difficult to evaluate by outsiders like the Ministry, it would be better to leave all the strategic management and its risks to LEI-DLO. In this opinion the FADN is rather similar to a laboratory at a technical institute. Indeed it plays the same role of 'observing the reality of the agricultural system'. In the current situation of output-related finance it is the risk of the technical institute to run the laboratory or the experimental farm. Costs of the laboratory are expressed in the price of its service, which is specified as material costs in the project proposals for a research project or program. Any differences in price or volume are the risk of the institute.
Running the FADN along those lines would increase the costs of projects carried out by LEI-DLO, but for the Ministry that could be attractive. Costs of economic projects (mainly labour, nearly no material costs) are relatively low compared to more technical projects financed by the Ministry and it also means that part of the FADN-costs will be paid by other users (that in the current situation get the use of FADN-data free of charge).
However, the idea has some important drawbacks. The first one is that such a pricing method would turn the low marginal costs of the FADN into distorted high marginal costs. This is unattractive for all parties involved as it leads to a use of the FADN-data that is less than might be expected on the basis of the real costs and benefits.
Second, most of the fixed costs in such a pricing strategy will be allocated to the main product, the EU-sample of 1,500 farms and its tape. Costs for additional national data (viability of farms based on non-farm income, environmental data) is relatively cheap, once the panel exists. This would probably even be true if the value of the main product (the EU-tape) would be estimated on a totally different architecture of the network (e.g. the costs of a Type-X panel (see Poppe and Beers, 1996) that buys data from the accounting offices like in Germany). It is not likely that the Ministry of Agriculture wil l accept the outcome of this calculation without being involved in the process of calculation and the strategic choices that lay behind it.
Third, if the strategic management would totally be in hands of LEI-DLO, this institute would feel the need to interact wi th its main customers like the Ministry of Agriculture. So, if this idea would be chosen, the risks in the management of the FADN and the pricing policy would be on the account of LEI-DLO, but there would still be a need for involvement of the Ministry.
Suggestions for interaction The interviews revealed that stakeholders in the Ministry approved the
idea that long-term agreements are necessary. At the moment strategic discus-
33

sions are focused on finance only and are triggered by a desire in the Ministry to cut costs. In such a situation persons indicate that the FADN-budget should be cut, but these indications are not based on a clear view of costs and benefits of the different FADN-products. This situation seems to work against the interests of the FADN and tends to lead to high-level lobbying processes that cost a lot of energy and to negotiations mainly based on financial considerations.
One of the interviewed persons cited the example of the Farm Structure Survey, that is guided by a similar process, and where the Ministry is very much dependant on external reviews and trial projects on alternative methods to keep costs down. He had the feeling that these trial projects were carried out half- hardly - to avoid the word sabotage. If such a situation would develop around the FADN, that would be negative for its image and that of LEI-DLO and for the future of the FADN in the long term. This example is another evidence that stakeholders at the Ministry of Agriculture should be taken on board in the process of strategic management.
As a result of the project Accounting 2000, the FADN will become more flexible and wi th a quicker reaction time to new demands. Our interviews made clear that this is an attractive idea for the stakeholders in the Ministry. They suggested that this demands a closer cooperation in planning. They also expressed the opinion that e.g. once every 3 year about 10% of the capacity should be made available for re-allocation to new topics. Proposals should be made by the FADN-management as a kind of menu of which stakeholders than could pick their choice.
The discussions stressed that the roles of the participants in the (strategic) planning process should however be clear. In our process model the strategic planning differs f rom specifying products in detail (data management) and servicing clients. Thus, stakeholders should not attend a meeting on strategic planning in the FADN with the idea to receive a table or analysis on income of cereal farmers within two weeks time. This asks for clear role descriptions and well designed objectives of a program-committee involved in strategic planning. A set of indicators on the performance of the FADN and its support for the policy makers would also help.
We suggested a table used yearly by the RIVM (National Institute of Public Health and Environmental Protection) to guide its planning process. In discussions with stakeholders from their Ministry for the Environment they yearly create a simple table, that includes long-term topics (like policy products to be delivered in the coming 5 years):
Policy Policy Research Models Data products a) questions questions needed needed
a) e.g. White paper on .
34

Such a table would support the stakeholders in the Ministry to guide the FADN and to justify its costs. However it was noted that the Ministry of Agriculture itself has not a clear agenda on policy products, especially for the longer term. At best the departments work with a yearly agenda and with some policy agenda's for specific sectors. Planning is not always seen as necessary, because the agenda is seen as dominated by the political debate of the day and the demands of the Minister. This focus on day-to-day issues and the lack of an internal information strategy (as somebody remarked: 'the demand for information is not clearly articulated') hampers the strategic planning of the FADN.
However, it was suggested that an experiment within the Ministry w i th a new Concern Control System that will be installed to improve its internal economic management, could provide clues. This control system will include policy indicators on costs as well as on the benefits of the policy projects (e.g. the improvement of the environment, an increase in the number of instalments in agriculture etc.). The FADN could perhaps provide some of those indicators.
Another suggestion was to carry out an analysis on necessary changes in the FADN after the publication of an strategic policy document or after the arrival of a new Minister.
In general the interviewed stakeholders agreed that strategic planning is a necessary activity and that the Ministry should be involved. However they stressed more than once that LEI-DLO itself remains responsible for this process, as well as for ex-ante and ex-post evaluations and audits. This includes also larger audits (like a 5-yearly examination by an external inspection team of -foreign - experts). Only by exception one might lean on the Ministry as the big financier: beware that they wil l very often have a cost reduction programme as a starting point for their evaluation.
2.1.5 Lessons for the Netherlands
First lesson of our interviews is that the contact wi th the stakeholders must be improved. This in perhaps not a new or unknown fact (it has also been advised in an audit of LEI-DLO by foreign experts in 1993). However, in times of budget problems and big and quick changes in the agricultural sector, it seems more true than ever. As this is mainly a problem of LEI-DLO, the FADN should install a clear public relation policy and should policy makers involve in the current renewal of the FADN (the project Boekhouding 2000). This should lead to more understanding of the FADN in the Ministry and to more support for its activities. The FADN should also become more user-oriented. The framework used in the second PACIOLI workshop (Beers et al., 1996) and its Reflection paper (Poppe and Beers, 1996) in which friends, enemies, opponents and potential allies were identified, could be of help in this process. It seems that the FADN has only contacts wi th 'friends'.
Second it seems to make sense to support a joint process of strategic decision making on the FADN between the Ministry and LEI-DLO. This could be organized in a very informal attitude, by inviting important stakeholders twice a year for a brainstorming meeting. Typical points for discussion at such meet-
35

ings are: the impact on the FADN of strategic policy documents, the annual work plans of the stakeholders, the selection plan of the FADN, the type of data to be gathered, results from user-surveys by the FADN (measuring satisfaction of its clients and farmers) and other performance indicators for the FADN. Performance indicators could include allocated costs for the different products (perhaps using Activity Based Costing) and indicators for efficiency and renewal of data (perhaps using the Balanced Score Card approach).
Such an advisory club could create more support for the FADN and an improved use of this instrument for monitoring. It could make suggestions to the director of LEI-DLO and the financing authorities at the Ministry on the content and future development of the FADN for their negotiations on the financing of the Statutory and Service Tasks ('the management contract').
However such meetings only make sense if the people in the Ministry are prepared to provide information (not necessary in written form) on the policy-agenda for this and the coming years. If they cannot express their ideas on this agenda (even if it changes a few times a year), in a form comparable as the Ministry for the Environment does, than this institution could easily lead to more confusion: actors from the Ministry join the meeting wi th demands for receiving a table tomorrow, where the FADN is trying to steer the collection of data in the coming years.
It has to been if i t is attractive to invite other stakeholders (like the Rabobank, the EUs RICA, the central DLO-organization, the IKC and the Farmers' organization LTO-NL as a representative of farmers providing the data) for these meetings, or if separate meetings should be held with them. As the FADN is nearly 90% of the SST, and some tasks in the other 10% are closely related to the SST (like price statistics, reports on the state of agriculture and on the environment), the discussions could also be broadened to the total SST.
2.1.6 Lessons for RICA
Although this paper focuses on the case of the Netherlands, there are perhaps a few lessons in it for the RICA at EU-level (and for the other member states?).
First it could be attractive for the RICA-network if the RICA also participates in National Committees of stakeholders in the member states. Currently only people from the member state show up in Brussels at meetings of the management committee. In the future it could be attractive to stress the network-function by inviting persons from Brussels (and experts from other countries, like they do in Portugal) for such discussions. More bilateral visits could also help.
Second, our experiences wi th PACIOLI in Brussels and the problems to involve stakeholders from DGVI in this concerted action, suggests that the 'stakeholder-problem' could be quite alive in the case of the RICA too. One of the interviewed persons (in the Dutch Ministry) remarked that there are international fora where PACIOLI-like discussions (or at least the results of these actions) should be discussed. At the moment this is restricted to a one in every
36

10 year discussion of a progress report on the FADN in the CSA (Comité Special Agricole). The working group on statistics of the Council could be such a place; a problem could be that discussions at council level are not value-free: a suggestion to gather data to non-farm income is seen as having clear policy implications. EUROSTATs committee for agricultural statistics as well as OECD meetings could also be attractive places for these discussions.
Third, the management committee of the RICA had in the past some meetings with users of the data ('user-forums'). It is striking (and indicative for the stakeholder-problem) that we did not have meetings with users in DGVI on strategic management. We could e.g. imagine a two hour informal meeting with discussions on the effect of mister Fischler's Agricultural Strategy Paper for the future of the RICA. If this would lead to some strategic management, fo l lowed up by measures from the commission to change the farm return and the procedures for data collection, stakeholders would perhaps be more happy and prepared to provide extra finance or personnel.
At least for the Netherlands, and perhaps also for RICA, we learned from this exercise that probably more money can be made from 'external management' than from internal directed actions.
References
Beers, G., K.J. Poppe, D.F. Spiering and H.C. Pruis (eds.) (1995a) PACIOLI 1 Farm accountancy data networks and information analysis; Workshop report; The Hague, LEI-DLO; Mededeling 532
Beers, G., K.J. Poppe and H.C. Pruis (1996b) PACIOLI 2 Accounting and managing innovation; Workshop report; The Hague, LEI-DLO; Mededeling 534
Poppe, K.J. and G. Beers (1996) PACIOLI 2 On innovation management in farm accountancy data networks; Reflection paper; The Hague, LEI-DLO; Mededeling 535
37

2.2 THE COMMERCIAL EXPLOITATION OF THE FADN IN ENGLAND OPPORTUNITIES AND CONSTRAINTS
David Hughes and Nigel Williams
The funding constraints that face all public sector operations demand that the possibilities for the commercial exploitation of such work is explored. While the Ministry of Agriculture, as funding agency, is keen to see the results of the English Farm Accountancy Data Network (FADN) used widely, there are constraints on the use of the data collected and on the ability to collect additional data that would be of commercial value.
In the first instance, the FADN has to satisfy the requirements of the EU, the Government Statistical Service, the Ministry of Agriculture and the universities. This is inevitable and understandable, given that MAFF fund the operation to inform policy making, but it does limit the flexibility of the FADN to respond to and exploit commercial opportunities. The manner in which the FADN is carried out also has implications for the way in which it might be developed to generate data of commercial value.
The collection of data for the FADN in England is carried out by a number of regional universities. The data are typically collected from farmers and growers by staff with degrees or diplomas in agriculture or related subjects. Participating farms are normally visited once a year at some point after their financial year ends, but before the national and EU deadlines for data submission. The basic data collected from farms varies in its degree of completeness, and can range from boxes of unsorted invoices, bank statements, etc. to fully reconciled management accounts. The latter make up only a minority of cases.
The great complexity of the physical and financial data required for the completion of the farm return means that the farm visit can be lengthy and involves intensive questioning of the farmer. At the same time, the enumerator has to develop a rapport w i th the farmer as many of the questions asked are sensitive, in particular those relating to cash sales of produce, non-farming income and private drawings. The essence of the relationship is that the farmer must trust the enumerator and his/her professionalism. This is essential to the successful operation of the survey as it means that the data collected wil l be complete, that the farmer wil l not try t o influence the enumerator in his/her interpretation of the data and that the farmer wil l remain in the survey. This latter point is important as it increases the size of the year by year identical sample, reduces the inevitable measurement error when a new farm is first recruited and helps to contain recruitment costs.
Farmers are motivated to cooperate with the FADN for a number of reasons. These include the provision of comprehensive management accounts (as opposed to financial accounts prepared for him by his accountant), access to
38

comparative data on farms of similar size and type in the region and the satisfaction of helping the local university or college in its work of education and research.
The data collected from farms are used in a number of ways in addition to servicing the needs of the national and EU administrations. Data may be used for research purposes within the collecting universities, provided that the anonymity of the farmers is preserved. Data may be published in aggregate form, again providing that no single farm can be identified either by default or inference. The data are stored in a national data base which can be accessed for research purposes. Currently, commercial exploitation of the English FADN data is very limited. The Ministry of Agriculture occasionally carries out analyses of data for other organizations and charges for this service. The issue of who, when and how much to charge for using the data has not, as yet, been fully resolved.
One of the big stumbling blocks to commercial exploitation of the FADN is the long lead time between an event happening on the farm and it being recorded in the FADN data base. This is an inevitable consequence of spreading the workload of the enumerators over as much of the year as possible, and wherever possible obtaining actual data rather than estimates. Cost (and time) constraints also limit the ability of staff to collect data on physical measures of variable resource use such as kg of fertilizer or of active ingredient of pesticides used.
Within the UK, several private firms are active in surveying the farming sector, largely with a view to collecting information that can be packaged for sale t o companies in the agricultural input supply industry. Produce Studies Limited is a case in point: PSL elicit information on farm input purchases (e.g. fertilizer, herbicides, manufactured feed) f rom a panel of farmers, produce estimates of, inter alia, market size by farm input product category (e.g. broad leaf weed products), and market share. The surveys are of a syndicated nature and may have an 'omnibus' element; i.e. individual companies commit in advance of the survey to purchase the results, and may commission questions for which the responses wil l be exclusively reported to the commissioning company. Surveys may be undertaken more than once per year; for example, summer surveys to capture data on arable input purchases, and winter surveys for livestock input purchases.
Companies purchasing farm survey market research data do so as integral strategic elements in developing their marketing plans. They seek: accuracy -the degree depending on the company and the market in which it is active, but, +/- 2 percent would be the extreme range; and quick turn-around - they wish to use the information for commercial purposes, and its value declines sharply as time elapses. Generally, but not always, farmers receive some recompense for participating in such surveys, particularly, if the farmers are part of a panel involving providing information on more than a one off basis.
The FADN is not a suitable vehicle for providing market research data as outlined above, for two principal reasons: first, the FADN turn-around t ime is too long to meet with prospective client requirements; secondly, the relationship that FADN surveyors build up with their farmer sample would be compro-
39

mised if information was collected from farmers and, subsequently, sold to private companies - companies that many farmers perceive as the rapacious 'enemy'! There are, however, question areas that could be canvassed to both the benefit of the farmer, FADN, and the organization interested in the answers. For example, such customers as government (national and European), commodity organizations, political parties, lobby groups may wish to monitor farmer opinions on such matters as agricultural and rural policy changes - questions that are of interest to farmers, as well as the sponsoring client, whereby the answers could be tabulated and communicated to survey respondents. The trusting relationship built up between farmers and enumerators within the FADN should lead to more honest and thoughtful answers to controversial questions than could be obtained from a conventional market research 'cold call' approach.
It has to be noted that the commercial potential for such activities is not large. The opportunity is more to use information gathered and analysed as a public relations tool; for example, providing an opportunity for regional universities to show farmers, politicians and others that they have their fingers on the pulse of rural opinion.
The conclusion must be that the opportunities for making increased use of the FADN for commercial purposes are strictly l imited. Emphasis should instead be placed on making better use of the data that are already available by improving and enhancing interrogation and analysis procedures of databases. There is, though, some scope for using the FADN for gaining insights into farmers views and attitudes to 'current issues'.
40

2.3 DETERMINANTS AND CONSTRAINTS FOR ADMINISTRATIVE CHANGE IN SPAIN INSTITUTIONAL ANALYSIS OF POSSIBLE REFORMS OF THE SPANISH FARM ACCOUNTANCY NETWORK
Miguel Merino-Pacheco
2.3.1 Introduction
A reform, even a modest one, implies rearrangement of resources. Somebody wins, somebody loses and many persons or institutions not directly involved are nevertheless affected. The introduction of changes in the system of agricultural accountancy of the European Union is an example of a modest reform in which a considerable amount of persons will be affected. These persons are defined as stakeholders; they have something at stake in the system and can win or lose wi th the proposed changes according to their respective positions and interests.
Institutions, defined in a broad sense, are rules or dispositions within a society or organization, which lead to the coordination among its members. In the economic area, institutions help the economic agents to predict the actions of other agents under a certain set of circumstances, diminishing the unsecurity which normally surrounds economic transactions. In a narrow sense, institution is a synonym for organization and in the daily usage this concept has been imposed. According to this view, the changes to the European accountancy network being presently considered are an institutional reform, which must be achieved within the frame and with the active participation or acquiesence of existing organizations. These existing organizations have to be motivated to collaborate with the proposed changes or at least not to oppose them. In the present contribution the workings of a resource allocation process implied in an institutional reform will be studied and the different interests at stake described.
2.3.2 Institutions and their role in the allocation process
The process of institutional change or institution building can be considered within the frame of a market analysis. According to HAYAMI and RUTTAN, technological change, factor supply and product demand are the main sources of institutional change, a process that has to be considered as generated endogenously by the economic system. Basic institutional changes; like alteration of property rights, for instance, are normally accompanied by an accumulation of 'secondary' or 'marginal' institutional changes.
41
Considering the determination of property rights for environmental goods used, among others, by farmers - an aspect that has already being discussed in relationship wi th possible changes of the European accountancy network -, following model can be conceived: the growth of society's demand for environmental goods and the growing conscience of the limits of the environment creates the need for a basic new institution: property rights for the environment; and for a reliable measuring system for its use. The introduction of environmental variables in the accountancy network - a marginal institutional change - could support and make possible the formerly described institutional development. On the other hand, the introduction of institutional changes implies a confrontation among vested interests which carries a cost. It is the cost of arriving to a consensus in a democracy - or subduing opposition in a dictatorship. Identifying the sources of opposition and support among more or less directly and openly interested groups - stakeholders - wil l help in keeping those costs low.
2.3.3 Behaviour of stakeholders in the institutional process
The neoclassical economic theory considers the economic subjects as individuals acting as maximizers of their utility - measured through their private profits subject to some kind of constraint. Political decision makers, on the contrary, are seen as individuals oriented towards the maximization of a social welfare function. This welfare function originates through the political process and contains generally such elements like achieving continued growth wi thin a frame of stability and just income distribution. The analytical frame originating in this conception boils down to the so called 'rational choice models', which describe Government officials as centralizing decision making like good wi l led dictators wi th perfect knowledge of their economic environment - including the welfare function - and of the consequences of their actions. These models supposes also a division of labor between the decision makers, in charge of interpreting the welfare function and setting the economic policy objectives and the scientists acting as counsellors, which are charged wi th the job of designing a fast and efficient way of achieving those policy objectives. Institutions are considered as given and not relevant for the outcome of the resource allocation.
On the other hand, the institutional interpretation considers also the institutions as relevant elements of the allocation process. In that way it is hoped to f ind a better understanding of the allocation of resources and to improve the political acceptability of reforms. The analysis wi thin this frame uses also neoclassical instruments. The most important are:
the methodological individualism: its main idea is that a society, a state, the political parties and other organizations cannot be considered as independent beings, behaving like persons, but like aggregations of individuals acting as utility maximizers within the frame and constraints of the organization. The resultant of the interaction of a great number of individual wills determines the policy outcome;
42

the existence of consistent, stable and individual preferences (utility functions); economically rational behaviour of the individuals in the sense of utility maximization subject to constraints (moral, psychological, etc).
According to this interpretation, rationality and utility maximization stay circumscribed to the individuals and commercial organizations, but are not valid for the society as a whole who seldom appears to be working somewhere near a Paretian optimum. Therefore, in order to obtain an accurate picture of the workings of society, we have to dispose of the idea of politicians and bureaucrats acting as good willed dictators ordering the World for the welfare of the whole community, and consider what really makes public officials and politicians tick: the maximization of a personal utility function, which varies according with the institutional frame where each one of them develops his/her activity.
A quick review of the objectives and constraints of different economic and institutional agents according to the principle of methodological individualism can be sketched as follows:
private entrepreneurs: as in the neoclassical theory, they act rationally to maximize the profits and the survival of their firms in the long run; elected politicians: their main concern is the reelection. They use the patronage possibilities of their office to offer their voters an acceptable mix. They are prone, however, to approve short term measures to improve the lot of a clearly defined group of voters, in spite that those measures could damage the economic system as a whole in the long run; political officials: those are administrative officials which owe their positions, however, to a political appointment. Their tenancy is l imited in t ime and usually lapses if the political fortune of the elected patrons is under threat. The attitudes of political officials are then closely linked to the ones of the elected politicians;
unelected bureaucrats: this kind of officials are not worried about being displaced of their jobs due to a sudden political change. But being embedded in an administrative frame, where authority flows from top to bottom, makes these official worry about their careers. If they are placed close to the top of the pyramid, they are interested in the size and influence of their organizations, which depends on political decisions. They wil l close tactical alliances wi th their politically appointed colleagues, sometimes fol lowing their instructions, sometimes acting as a counterweight. The stage of their professional development influences also their attitudes. Normally they love to control more resources, but are reticent to start new activities who could overstretch their available capacity. Middle and low level management is prone to indulge in superior-pleasing conduct;
trade union officials, elected and unelected: their basic attitudes are very similar of their counterparts elected in the non-corporative system. With the difference that they have a very well delimited clientele to satisfy and as a consequence they are subject to closer scrutiny from the side of their
43

represented. In spite of that, big sindical bureaucracies develop also their own interests, which do not have to coincide necessarily wi th the ones of the electors.
Wi th this fast review of the behaviour trends of main actors in an institutional-economic process are the main lines for a stakeholder analysis drawn. It has to be developed according to the nature of the problem, to the local structures and to the situation in different countries in a given moment. The central idea has been heavily criticized because it seems not to leave room for any kind of unselfish actions. But setting aside a first repulsion feeling, it has to be recognized that is exactly the same supposition we use to understand private enterprise according to the principle of profit maximization. And altruist attitudes can also be convenient to achieve political relevance anyway.
2.3.4 Role of the institutions in the Spanish agricultural sector
The Spanish agricultural sector has some important characteristics which determine the way it works:
it is regionally strong differentiated. This includes climatic conditions and agricultural structures. Politically, this is reflected in the decision making capabilities of the regional governments, which are specially broad for the agricultural sector; rural vote is still very important in regional and national politics. This was shown again in the recent national elections (March 3, 1996), when a strong showing of the Government party in the rural regions of Andalusia was one of the main factors which prevented the former opposition to win an outright majority at national level; strong but uncomplete process of structural change in the last years; the agricultural administration understands itself as defender of sectoral interests; weak and divided agricultural unions.
All this aspects boil down to a very strong interest (and interference) of politicians and political officials in the problems of agriculture and its backward and forward linkages.
According to this general description, we can expect that a reform of the organization and contents of the farm accountancy network 1), which does not offer immediate patronage possibilities but can increase budgetary costs and/or the workload of officials and farmers will not be popular with neither of them.
Of course researchers, both from Universities or f rom official research institutes would love it. They always love it when they have a chance for number crunching. But they are not in a position to do much more than express their positive feelings about the proposed changes. And the professional firms
1) The national branch is called RECAN in Spain.
44

which are in charge of collecting and processing the information for the accountancy network in some areas will welcome the extra work, if they are paid for it. But again, they do not sit where decisions are taken. Decisive wil l be the attitudes of the farmers, of the politicians - specially local ones - and of the regional bureaucracies. So much for the general frame.
2.3.5 Reform possibilities
According to ASTORKIZA 1) the Spanish farm accountancy network is efficiently organized in the regions Cataluna, Navarra and Pais Vasco, where data is collected through accountancy centers which operate the whole year round offering management counselling to the farmers. This centers are partially financed by the farmers themselves and data collection for the accountancy network is only an activity among others. In other Spanish regions data collection is made 'ad hoc' for the 'RECAN' and normally not before September or October each year. The reliability of the information suffers under the second system. Some agricultural extension services offer also management guidance to farmers, but most are not integrated to the RECAN.
An obvious first step of reform is then to extend the above mentioned system of management counselling into other Spanish regions in a systematic way and to integrate it in the data collection system of the farm accountancy network. This implies, however, a mayor shift in the organization of data collection wi th some obvious advantages and some drawbacks, which can be quickly described:
it is an already proven system, which is working efficiently in some areas; the use of the data is not limited to the RECAN, but has also immediate returns for the farmers under the form of useful informations. It is not another bothersome survey; creation of a group of professionally engaged stakeholders; the operators of the management extension services. Farm unions have also an stake at those centers and wil l support the initiative; support from the side of regional politicians, which could be interested in introducing an useful service in their districts. It is also to be noticed that, after the last national elections on March 3rd., 1996, the devolution of responsibilities to the regions is likely to be continued. The formation of the national Government in Madrid wil l not be possible without the support of powerful regional parties, interested in extending that devolution process; interest from the central authorities at the Agricultural Ministry because of improved data quality; regional differences, however, could be eventually an obstacle for the extension of the Catalan and Basque systems to other Spanish regions. Both a more backward agriculture like the one to be found in Castile or
1) ASTORKIZA, I.: Personal communication, March 1996.
45

Extremadura or a highly commercial one like the growth of fruits and vegetables at the Mediterranean cost could be difficult to integrate in such a system;
Further reforms of the farm accountancy network, like introducing some new variables in the farm returns could only be developed wi th very clearly defined objectives related to new or existing programs of the Common Agricultural Policy. Obviously a redefinition of property rights will be welcomed by all involved if those rights are to be kept at home. Information that could lead to increased taxation or limitations to farm support wil l be divisive.
It is to be mentioned that the European Union contributed wi th 761,000 million Pesetas (some 4,816 million ECU) to the Spanish agricultural and fisheries sectors in 1994. If we relate that number to the total value of the Spanish agricultural production (3,524,000 million Pesetas; 22,304 million ECU), we see that 21.6% of the value of the agricultural produce is covered by subsidies of the European Union.
This is a fact which is likely to be taken into account by the people who matters at the moment to take a decision, specially if it is an impopular one. But in order to movilize that muscle it is necessary to have clearly defined objectives; related also to concrete policy goals. No need to be fooling around at the edges wi thout a clear idea of what is wanted.
46

Annex Classification of innovative ideas for spain
Innovative idea: Extend existing regional data collection organization and structures (Cataluna, Navarra, Pais Vasco) to all Spain.
Essential aspects: In the Northern regions of Spain, RECAN data is collected by semi-private management extension services. This information is a by-product of the counselling activity of these centers, which help the farmers in management and organizational aspects. The centers are partially financed by the farmers themselves and have the support of the regional governments and local farmer's unions. The activity takes place all year round and its primary aim is not to feed data into the accountancy network. In other regions of Spain, the data is collected with the specific aim of fulfilling the needs of the RECAN and does not happen until late in the year (September or October). Data quality suffers under such circumstances.
Stakeholders involved
a) Regional governments, including elected politicians, politically appointed bureaucrats, career officials.
b) Central government c) Private consultancies involved in data collection and processing d) Farmer's unions e) Farmers themselves f) Information users, including researchers and decision makers at national and
supranational level
Stakeholder moving principle: methodological individualism
Each individual participating in the system maximizes a private utility function which depends on individual circumstances and is independent of any welfare maximization for the whole society. The interaction of those individuals within the frame of their organizations and their relative power determines the outcome.
Probable attitudes of identified stakeholders
a) Regional governments
Positive, because of increased influence for local bureaucrats and improving of a service for rural areas, which can be presented as a political success. On the wake of a continuing process of devolution of responsibilities to local level, the funding for the extension of this services could be made available.
47

b) Central government
Divided. Lost of some influence could generate resistance. On the other hand, improved data quality is quite interesting for policy making.
c) Private consultancies involved in data collection and evaluation
Positive because of improved business opportunities.
d) Farmer's unions
Positive. Good possibilities of extending their influence. Attitudes similar to regional politicians on this issue.
e) Farmers themselves
Divided from positive to indifferent according to professionality (full time, part time), holding size, etc.
f) Information users
Positive
Possible outcome
A coalition of regional authorities, farmer's unions and dynamic full time farmers and private entrepreneurs could bring forward enough muscle to push this reform.
Classification of the idea
The idea belongs to the category of external organization.
48

2.4 FARM ACCOUNTANCY DATA NETWORK, REQUESTS FOR ADDITIONAL DATA FROM RESEARCHERS THE DEMAND FOR INFORMATION
Alastair Bailey 1)
Abstract
This forum has provided all interested parties in the FADN wi th the opportunity to assess both the value of a continuing and evolving network and to discuss the strengths and weaknesses of the FADN as it stands from the point of view of 'stakeholders'. This paper discusses the downstream demands placed by those groups who wish to utilize the network to provide answers to many diverse questions with regard to farming in the European Union. In this discussion, the emphasis is that of the commonality of data requests, I actively pursue the minimum additional information requirement to satisfy all of the major research demands. Without this concerted approach the FADN will be unable to satisfy all additional needs, due to financial and computational constraints. It could be argued that without such an approach FADN also forgoes additional political and financial revenue earning potential.
Introduction
In this forum, 'PACIOLI - Panel in Accounting for Innovation, Offering a Lead-up to the use of Information Modelling, a concerted action' we have been presented with a variety of claims for data which are as yet, either not collected or not recorded within the FADN return. These requests come from downstream stakeholders who are engaged upon the task of conducting research using what is clearly a 'second hand' data source. This research is carried out on behalf of government bodies, for companies and charitable institutions and not least in the name of academia. These researchers are at work in many diverse agricultural related disciplines, from ecology through to economics, yet they all share a common cry more information please. The FADN data set is undoubtedly large, and has a relatively comprehensive coverage. Nevertheless the large amount of public money which is expended upon it's collection does not prevent it f rom suffering from some major omissions of information, see Williams, Bailey and Dedman (1995). Thus while the FADN does satisfy, to a
1) Is a Research Officer at the Department of Agricultural Economics, FBU. Wye College, University of London, Ashford, Kent. TN25 5AH. UK.
49

greater extent, the primary purpose for its inception there is clearly some lost opportunity in not taking account of the additional data requirements of secondary research users.
2.4.1 Main type of question asked of the data
a. Economists - use the data to build models in order to uncover the behaviour of producers. These models can then be used to predict change, for example in input demand and output supply i.e. for price changes, taxes on fertilizer, returns to unconventional inputs or the effect of the heterogeneity of land etc. etc. Economists often wish to assess the degree of any differential impact of policy changes, i.e., by commodities or for different farm types, regions or countries etc. etc.
b. Environmental researchers are primarily interested in the rate of use of potentially harmful inputs and chemical balances on farms. These researchers are also interested in how use of inputs and chemical balances differ form region to region. The spatial dimension to research of this type is highly important because of climatic, topographic and ecological differences are found which science suggests will alter the relationship between inputs and outputs and the reactions between chemicals and the environment.
c. Agricultural systems scientists wish to discover the rate and distribution of the adoption of different or novel farming practices.
2.4.2 What data do these projects need?
a. Economists are interested in testing their theories of the behaviour of economic agents. For this they primarily need the prices of both inputs and outputs, with some additional information such as the level of inputs and outputs that yields the levels of Costs, Revenues or Profits of the firm. In it's present incarnation the FADN can supply output levels and implied output prices; input expenditures from which, by assuming that all firms face common cross section prices, we can recover constant quality input quantities; and prices. The levels of Costs, Revenues and Profits are easily computed directly from the data.
This is fine should the researcher only be interested in overall farm production. However, this requires the researcher to assume that the production of M farm commodities, where M = 1,..m, m>1, are produced by some single, joint, technical function. This means that we can build models of production which optimise only the levels of output for each commodity and the levels of farm inputs, given prices.
50

Without access to information upon the way farmers allocate inputs to the M outputs we cannot test the validity of our assumptions of the level of output cross dependency and jointness in the technical process. In this way we must treat production of multiple outputs as a 'black box' in that we cannot satisfactorily discover the allocations of inputs to outputs.
b. Environmental research is based upon the purely technical information in the FADN data. Natural scientists wish to assess the importance of some observed scientific process, for example nitrate leaching into water courses. From experimental observation of natural processes and of the relationships between, say, nitrate application rates, cropping and soil types, the researcher wishes to utilize large cross section surveys to assess the possible prevalence and distribution of such a problem. See San Juan (1995).
So, what data do environmental researchers need. The researcher is primarily interested in physical, chemical and biochemical relationships as they impact upon the environment. In order to assess the level of impact they require data upon the physical quantities of inputs, physical outputs, areas planted, stocking densities and some level of geographic information. The FADN, in its current form supplies information on output quantities, areas planted and the numbers of animals carried.
The information which is required to spatially identify each farm in the sample is, due to the confidentiality required of surveys of this nature, not generally available. We can locate each holding within some regional identity, in the case of the UK we might use Counties as geographic variables. However, this level of data is rarely accurate enough to characterise the specific nature of each farm in that region. FADN does record each holding's grid reference to a resolution of a 10 km grid square (consistent wi th soil mapping at 1:50,000) in which all or the majority of the holding resides. For the purposes of confidentiality, however, this information is suppressed when the FADN is accessed by the researcher. Some studies have overcome this problem by requesting that the FADN agency replace the grid reference with correlated soil type and land class code before releasing the data for analysis. This approach was taken by the MAFF when they supplied national FBS data for use on the 'Land Use Allocation Model' (see Jones, Rehman, Harvey, Tranter, Marsh, Bunce and Howard (1995) which, incidentally, they sponsored).
The availability of data on inputs is clearly unsatisfactory from the point of view of environmental research. These types of studies tend, by nature of the scientific processes which spawned them, to be related to very specific inputs or technical practice. For example, scientists might be interested in the use of nitrates, phosphates or some specific pesticide. Because the input categories within the FADN data are not presented in detail but as aggregate groups, this information is hidden. Researchers must then place some prior assumption upon the composition of the FADN aggregate inputs in order to proceed.
In most cases researchers wil l be interested in exposing the relationship between output commodities and the level of use of each chemical or process.
51

For this task the researcher requires input allocations to output commodity groups.
c. Agriculturists who are interested in investigating the rate and distribution of the adoption of some specific technology may wish to interrogate the FADN. Firstly, these researchers would need to identify adoption. To achieve this requires that the technology be transparent. Thus when the researcher consults successive data sets, through t ime, technology adoption patterns can be discovered. For this to be possible would require that the data contain input quantities and allocations, output quantities and some qualitative information upon each output, for example differentiat ion between 9 and 18 month beef or milling and feed quality wheat.
2.4.3 Assumptions needed to circumvent deficiencies in the data
In this section we consider some of the possible assumptions which the researcher might employ to allow he or she to make use of the FADN data for research. Clearly, any assumption imposed upon the data wil l be restrictive, yet the researcher may consider that some mix of assumptions are justifiable in order to make use of this large data set. This section wil l consider each data problem in turn.
i. Input quantities: Some measure of input quantity can be gained by dividing input expenditures by constant cross section prices derived from external sources for example 'Eurostat, Agricultural Prices'. This approach does ignore discounts, market power or any differences in prices resulting from non-competitive behaviour on the part of farmers or input suppliers. However, this approach does take account of qualitative differences between the input quantities used on different farms. For example, ferti lizer is supplied in various presentations and concentrations which are reflected in the price charged to farmers. To illustrate, assume that 2 farmers buy different fertilizer's, fertilizer a. and fertilizer b. Assume that fertilizer a. contains 1.2 times the concentration of plant nutrient than does fertilizer b. As long as the actual price of fertilizer b. is 0.8 times the price of fertilizer a. then this difference wil l be reflected in each farm's expenditure on fertilizer. In this case a more accurate, quality adjusted, measure of fertilizer quantity is gained by imposing constant prices across the section than would be the case if we simply recorded the actual quantity applied.
i i. Allocations of the proportion of input /' used in the production of output n are difficult to discover from data which does not explicitly record them. This problem is perhaps the most damaging deficiency in the data and affects all research groups alike. Any assumptions based upon external data, such as gross margin data, applied to this problem wi l l impose a structure of production for each of the enterprises of each farm. In most
52

cases, the structure of production assumed from gross margin data wil l conform to the Leontief production function.
The Leontief production function implies that output is equal to the minimum of all inputs and that output increases in direct proportion to the increase in strictly all inputs, therefore no substitution of inputs are allowed and all inputs are strictly essential. Additionally the Leontief production function implies that the production of multiple outputs is incidental only for one unique output price combination, all other output price ratios should yield stand alone production given zero risk and the homogeneity of all inputs. The lack of input allocation information also has major implications for the FADN agencies themselves, for example MAFF are currently commissioning a study entitled 'The Estimating Gross and Net Margin Data' which uses national FADN data to derive allocations from the data via statistical means. Although this method does not rely upon externally generated data it still assumes that the production function is Leontief.
iii. Beef/Dairy complex: For 'livestock products', primarily dairy milk product ion, data is available on output quantities (milk and animals) revenues and herd numbers all of which are recorded in a consistent manner. However, for 'livestock' themselves there exists some ambiguity. There is l ittle or no possibility of disentangling the 'Other Cattle' section into animals for meat and those for future breeding without the imposition of some very heroic assumptions. We might consider that these assumptions would require, not only frequent updating, but would place far too heavy a restriction upon the underlying technology. This latter point stems from the fact that to extract the information required the researcher would have to a priori impose some arbitrary production funct ion to the data.
The researcher can circumvent this problem, rather than address it head on, by suggesting that the data conform to the 'commodity technology' assumptions of Stone (1963 and 1984), see also Midmore (1990). By these means the researcher must assume that the technology required to grow cattle, from calves to fat cattle is identical to that required to grow calves into breeding stock. To do this we would estimate for 'All Other Cattle Output' as one enterprise. This again is a somewhat heroic assumption. However, by partitioning our data sample into groups (on robust farm types) the researcher is able to side-step some of the potential criticisms of this approach and allow for the heterogeneity of these two output groups. Thus splitting the sample will result in the fol lowing assumptions: a. commodity technology assumptions imposed within grouped data; b. industry technology assumptions allowed for between grouped sets of
observations.
iv. To decompose aggregate input groups into their specific inputs requires the researcher to make strong assumptions about the way in which these
53

sub-inputs make up the whole. Economists call the assumption required 'separability'. This states that the elasticity of substitution between any two members of the group are independent of what happens outside of the group. This concept can be used to justify the use of results of other surveys, such as 'The Survey of Fertilizer Practice' for the UK, to decompose fertilizer into various plant nutrients, dependant upon the cropping pattern on any particular holding. This procedure has been adopted by Hadley (Ph.D. thesis in progress) to investigate the shadow value of farmer nitrate pollution of water courses in the UK.
2.4.4 Commonality of requests
All three research groups regularly request data for: i. Input quantity i i . Allocations iii. Disaggregation of dairy/beef complex iv. All researchers would like to make use of heterogeneity of land i.e. soil
type data
Only agricultural systems scientists specifically ask for additional qualitative information, although all could make use of this additional information in the modelling exercise.
2.4.5 Minimum data additions
i. On inputs input quantity, or input prices, sufficient to derive implied quantity.
i i. On input allocations,.... input shares, fraction of input / used to produce output n, only need to be farmers best guess. Some allocation information is already recorded for 'Concentrate Foodstuffs', although a full audit process is currently used to record this item.
ii i. On output qualitative disaggregation,.... a full audit is done by FADN collection agencies on 'other cattle', no additional data is therefore required to split the return into dairy followers, beef from grass and intensive beef.
2.4.6 Conclusions
With the addition of information upon the fol lowing: allocations of inputs, input quantities and the beef/dairy complex the potential number of requests for FADN data f rom researchers is enormous. Since, in a large number of cases the product of these researchers efforts is requested and in some cases utilized by government bodies to aid their decision making, the potential benef i t to society could be greater than the additional costs incurred by DG VI. In
54

addition, private companies also commission work which could be significantly enhanced by the inclusion of these variables. The willingness to pay of these private companies has not been measured, yet we might expect that they are will ing to pay the expected value of the benefit they gain from possessing and acting upon the results of such studies. FADN, as has been discussed in this forum, has many 'stakeholders', both up and down stream. The down stream sector, both DG VI, researchers and commissioning bodies represent a potentially effective demand for good quality data in a form which can yield believable results. If it can be exploited, this demand for data could relieve some of the financial burden on the commission itself.
References
Jones, P.J., T. Rehman, D.R. Harvey, R.B. Tranter, J.S. Marsh, R.G.H. Bunce and D.C. Howard (1995)
Developing LUAM (Land Use Allocation Model) and modelling CAP reforms; CAS paper No 32. CAS, The University of Reading
Midmore, P. (1990) Estimating Input - Output Coefficients From Regional Farm Data-A Comment; Journal of Agricultural Economics, p.108
San Juan, C. (1995) Spanish FADN and the Environment; Paper presented to PACIOLI 2 Workshop: Accounting and Innovation, Valkenburg The Netherlands
Stone, R. (1984) Accounting Matrices in Economics and Demography; in Pleog, F.v.d., Mathematical Methods in Economics, Wiley
Williams, N.T., A.S. Bailey and S. Dedman (1995) Information Disparities in the FADN/RICA - Causes and Consequences; PACIOLI 1, Workshop Report, LEI-DLO, p. 45
55

2.5 THE NEEDS AND EXPECTATIONS OF THE FINNISH MINISTRY OF AGRICULTURE AND FORESTRY WITH RESPECT TO THE FADN
Markku Himanen 1)
Background
Finland has a long history of voluntary profitability bookkeeping activity in agriculture. Bookkeeping data have been utilized in the national Farm Income Act system for calculating the development of returns and costs in agriculture as well as for making decisions on the prices of agricultural products. The agricultural income of farmers used to be determined by means of the above-mentioned mechanism.
Expectations of the Ministry of Agriculture and Forestry
The Ministry has very clear and straightforward expectations with respect to the FADN system. It can be noted, in general, that commensurate data measured by means of economic key ratios are needed in making decisions on agricultural policy issues. The system should be a practicable means of supporting decision-making in agricultural policy both nationally and internationally. It is hoped that the results would also be more representative than in the case of the national profitability bookkeeping in Finland.
Practical needs and problem areas
The Ministry of Agriculture and Forestry provides financing for agricultural research and advisory services (extension). The aim has been to enforce the economic research and extension services of agriculture. The possibility of efficient utilization of the FADN data in the research and extension serving agriculture is considered very important at the Ministry. This leads to the central point that the FADN data should meet the needs of the research in order to provide the advisory services with the necessary means for guiding farmers to operate in an economically optimal way. This is vital in Finland today when we have to be able to lower the cost level of agriculture.
One potential problem is how the FADN sample can be made representative enough with respect to the different production lines and regions. At this stage the Ministry does not wish to expand the FADN system to cover other
1) Ministry of Agriculture and Forestry; Department of Agriculture; Kaisaniemenkatu 4 A; P.O. Box 232; SF-00101 HELSINKI FINLAND; Tel. int. +358 0 160 4238; Telefax +358 0 160 2443
56

forms of small-scale entrepreneurial activity on farms and sources of additional incomes, but the expectations are centered to the representativeness of the economic key ratios of agriculture.
Another question is whether it is possible to include an adequate number of farms in the system, in terms of both the production lines and regions. In this connection the regional study refers to the different support areas in Finland. This is extremely important for Finland right now as the negotiations on the so-called support in the case of serious difficulties (Article 141) to Southern Finland are being started with the EU. In these negotiations precise regional figures on the development of the economic situation of farmers after the accession into the EU are needed.
This is one practical example of the needs of the Ministry that could be met by this kind of a calculation system. But such needs also involve the question of the time it takes to obtain the necessary data, and I think that the FADN system alone is not capable of providing the results for this kind of needs, but special arrangements are necessary in cases where the data must be available in a relatively short t ime.
The recruitment of an adequate number of FADN farms seems to be one of the most difficult practical problems in Finland, but the other Finnish representatives wil l be concerned wi th this, so that I shall not discuss it any further in this connection. I do wish, however, that the solutions to this problem could be discussed in this meeting, because in the present situation it is very difficult to get farmers involved in this kind of voluntary systems that require additional efforts in terms of the 'office work'. Farmers have one year as members of the EU behind them, and it has required a great deal of extra work in f i l l ing out various kinds forms and other paper work, so that there is not very much wi l l ingness to join such a bookkeeping system at this stage.
Solution to the problems
In general, there seem to be two ways in which we might get a representative and adequate number of farms to join the FADN. One is to give practicable feedback from the FADN to farms in terms of individual farms, different production lines and regions, as well as the whole country. Another means might be the introduction of a form of support to be granted to farmers. I do not think, however, that there would be any willingness in Finland to pay national support to farms joining the FADN system. The possibilities for support that could be used to get farmers to join the FADN will probably be discussed in the other address by a Finnish representative. The Ministry is also very interested in these possibilities (e.g. the possibility to link the FADN farms to the bookkeeping support according to the Regulation on improving the efficiency of agricultural structures (2328/91)).
The possibility to utilize the FADN data at the farm level is central for inducing farmers to join the system. The Finnish national profitability bookkeeping system has managed to satisfy the needs of research and advisory services quite well (with the exception of representativeness), and thus it has also served the needs of farmers.
57

In addition, we should direct attention to obtaining the data more rapidly. Quite many Finnish farmers already have a computer, and the information and communications technology is highly developed in Finland. There is also an advisory organization with relatively good regional coverage. When considering the needs for improvement, the primary objective should be the data fed to the computers of farmers or advisors, which are then transmitted to the central computer of the person collecting the data via data communication lines. This kind of system would speed up the collection of data considerable, and thus it would also serve the users much better.
All possibilities for linkages to other sources of data (e.g. possibilities t o combine data) should also be mapped out in developing the FADN system. One of the most obvious possibilities is the IACS-(integrated administration and control) system, which includes certain basic data on all farms that filed support applications in 1995.
58

3. INTERNAL ORGANIZATION
INTRODUCTION
During the plenary session in which the participants presented their ideas, the following keywords were noted to the subject internal organization. These keywords can be find again in the papers which are presented in this chapter.
Splitting the sample Harmonize classification of forms Quick statistics TAPAS Public tender system Decentralise Weighted accountancy data Regional accountancy networks New Farm Return
59
3.1 INNOVATIONS IN FADNs - SWITZERLAND
Beat Meier 1)
Introduction
The Swiss Federal Research Station for Agricultural Economics and Engineering (FAT) is in charge of the so-called Central Analysis, the Swiss Farm Accountancy Data Network (FADN).
The accounts of more than 4,000 Swiss farms are collected every year. 30 accounting offices, most of them private, gather the data f rom the farms.
The used accounts are very detailed, gross margins are calculated for all production branches. The whole agricultural enterprise is covered, including non-farm income and household expenditure. In the past, the accounts for the FADN were designed as a management tool on the one hand (good intra- and interfarm comparisons) and as a basis for statistical purposes on the other hand (time series, interfarm comparisons, income statistics).
Since 1993, accounting for taxation is compulsory for all the farms. A t the same time, budget constraints lead to a decreasing public support for the accounting business. The Swiss FADN is confronted wi th a decreasing readiness of the farmers and/or accountants to keep detailed accounts w i th a high level of standardisation for the FADN.
To have an up to date network, accelerated changes in agricultural policy and information needs must be integrated in the accounting systems and the evaluation of the data. The present, historically grown system is not flexible enough.
A task force is elaborating a new concept for the Swiss FADN. The raised questions are very similar to the PACIOLI subjects. A core question is; how to change the FADN from impeding to promoting innovations.
Beat Meier (FAT, department of agricultural economics), has studied the European FADN to calculate comparable results of Swiss farms. (A report is published in German wi th French and English summaries: FAT Schriftenreihe 41, Vergleich landwirtschaftlicher Buchhaltungsdaten der Schweiz und der EU -Methodische Grundlagen. Tänikon 1996, p. 162)
1 ) Swiss Federal Research Station for Agricultural Economics and Engineering (FAT), CH-83S6 Taenikon/Switzerland E-Mail: [email protected] Fax: +41 52 61 11 90 / Phone: +41 52 62 32 36 (after 23 March 1996: SMTP:[email protected] X.400: G=Beat; S=Meier; =fat; A=admin; C=ch Fax: +41 52 365 11 90 / Phone: +41 52 368 32 36).
60
Structure of presentation of each innovation: 1. Innovation
1.1 Status Quo, problem definition 1.2 Proposed innovation
2. Involved stakeholders 3. Expected benefits
Proposed innovations: A use accounts wi th different levels of detail; B Better representativity by splitting the sample for different purposes; C increase flexibility by giving up the 'one software approach'; defining a
farm return, other, not elaborated subjects; D institutional aspects and innovation; E integration of non-monetary data and accountancy data; F farm accounts and socio-economic analysis (pluriactivity etc.).
3.1.1 Better representativity by splitting the sample for different purposes
3.1.2 Innovation
3.1.2.1 Status Quo, problem definition
For policy purposes (intersectoral income comparison), the unweighed income of so called 'test farms' has been in the centre of interest. According to the law, 'Test farms' should be (economically) positively selected. Representativity has therefore not been a main goal of the Swiss FADN.
Nevertheless, representativity is of increasing importance, for policy as well as for research purposes.
The Swiss FADN uses accounts with highly disaggregated data (gross margins). Trying to make a random sample, a very high non-response rate is to be expected, due to the high requirements (assuming the compensation stays the same as today). Tax accounts are kept on all farms, but are not used for statistics so far.
3.1.2.2 Proposed innovation
The sample is divided into: 1. representative, random sample with simple accounts (highly aggregated
data), concentration on income indicators and balance sheets; the use of tax accounts and of data provided by tax-authorities is to be discussed;
2. non-representative sample of farms wi th data of special interest (gross margins, physical flows, special production branches; long term analysis etc.). Further (sub)division for different statistical (market prices) or research
purposes possible.
61

3.1.3 Involved stakeholders
Farmer/accountant: decreasing interest in providing detailed data with present low compensation.
Extension/research: increasing interest in receiving representative data.
Policy makers/administration: ?
3.1.4 Expected benefits
High flexibility to recruit interesting farms. Aggregated income indicators at low costs. High representativity at low costs. Decoupling the samples for political and research/extension purposes allows more flexible approaches on both sides.
62

3.2 QUICK STATISTICS FOR FADN
Arne Bolin
3.2.1 Background
The financial and political problems in relation to the Common Agricultural Policy, intensify the need for a change in the information structure of FADN in the meaning of data contents, organization of data and accessibility of data for the users. A 'new' FADN must be characterised by flexibility according to the assessment of data and the supply of analytical tools. But first of all data must be up-to-date.
3.2.2 Revised time-table for the Farm Return
A very serious threat today against the usefulness of FADN is the time lag of almost 2 years. According to Commission Regulation No 1915/83 the member states are today obliged to deliver data for their national Farm Return to DG VI at the latest 9 months after the closing date of the accounting year. The closing data can vary up to 6 months, between December 31 and June 30. It is obvious that there are great differences between the member states, concerning the ability and conditions to satisfy this time-table. Therefore it can be useful to have different time-tables for separate parts of the Farm Return, in order to satisfy the most important demands of 'quick statistics'.
3.2.3 Proposal
Split-up the time-table of Farm Return into two parts
The proposal means, that the member states shall deliver a l imited (but accurate) amount of variables very short after the end of the accounting year -quick statistics - and at a future date, the rest of the data. It is understood tacitly, that 'quick statistics' wil l be a part of a reorganized and renewed FADN. In this paper a 'two-step' time-table for Farm Return is suggested. Certain data are pointed out in terms of a 'new' FADN to be included in the 'quick statistics' and be delivered in the first step of the time-table.
Concerning 'quick statistics' it is important to emphasise that this does not make the FADN Forecasting System (RFS) unnecessary. The RFS will rather be more accurate if the forecasting figures are based on more up-to-date data f rom 'quick statistics'.
63

3.2.4 The 'new' FADN
FADN of today have, and will even in the future have the fol lowing purposes:
describing the structure and evolution of the agricultural sector; short-term and long-term forecasting of production and income in the agricultural sector; simulations of the consequences of changes in agricultural policies for the agricultural sector, other sectors, employment etc.
It is urgent that the 'new' FADN is based on data f rom an accounting process, using standard charts of accounts to record the farm transactions systematically and regularly throughout the accounting year. If these conditions are satisfied it wil l simplify the realization of 'quick statistics'.
A comprehensive 'new' FADN can in a condensed picture be described in the fol lowing way:
cesammcAMULrsB
SB MAVOM
' FORECAST»»
... _j
L S 1 T A * R S B
C Ê L T T ' U I T R ° 1 E E
S
•LJ J 1 PLOTACIMIES
avMMMomu. 1 1 '
- 1. p R 0 D U
• f * T " U
c R
0 s T S
••:_!• i " • " " " '
HKBML BALANCES
mooucnofuet
Figure 3.2.1 The 'new' FADN
64

In f igure 3.2.1 the contents of FADN are symbolised by vertical blocks, while horizontal blocks symbolise different applications. Especially data for forecasting and simulation must be of great interest. Current data must be of great value for RFS. For the 'new' FADN the collection of quantities and costs for different production lines must have a high priority in 'quick statistics'.
3.2.5 Stakeholders
Presumptive users of 'quick statistics' are especially agricultural political institutions, in EU and at a national level. In Sweden imaginable users are The Joint Council for Economic Studies in the Food Sector (LES), The Ministry of Agriculture, The National Board of Agriculture and The University of Agricultural Sciences.
3.2.6 The contents
In order to satisfy demands of up-to-date data, different alternatives are possible. Useful criteria for the determination of the contents can be:
the accounting year - only farms with book keeping per calendar year wil l be covered in the data delivered; specific production lines of political interest, e.g. dairy, pigs, etc.; certain farm sizes according to production value; certain regions, etc.
3.2.7 Time-table for 'quick statistics'
'Quick statistics' must be delivered very soon, at the latest 5-6 months after the closing date for the collecting of data. The date must be adjusted to the stakeholders demands, e.g. the point of time for an important yearly recurrent decision. The rest of the variables in Farm Return can instead be delivered at a later date than today.
65

3.3 TECHNICAL ACTION PLANS FOR FADNs D
Simo Tiainen
Creating a new management process for improving the efficiency of the Community FADN - A stoled idea f rom Eurostat
For improving the Community agricultural statistics Eurostat has prepared the legal instrument which sets down the statistical areas where economies are to be sought and where strengthening is needed. It also provides a management framework for implementing changes and sets out the principles governing these changes. To encourage member states to do the necessary changes the decision allows Commission to provide some financial assistance to them.
The target of the TAPAS is that Member States shall adapt their national systems to serve better the new information needs resulting f rom the reform of the CAP. The Commission has prepared a list of those statistical areas which can be decreased or which have to be expanded. This list wi l l be updated when necessary. Member States submit annually a report concerning the actions they have done and what they are planning to do in above mentioned areas. In the Community level there is the Standing Commitee of Agricultural Statistics which discuss annually about the Member States actions and plans and the Community finance for them. The decisions wil l be done in accordance wi th certain procedure.
Could something paraller new management process be an innovation for Community FADN? Having a look for a few last agendas of the Community Commitee for the FADN one can notice that many important issues, even fundamental ones, have been raised (e.g. pluriactivity and non-farm incomes, giving the individual data to member states, forestry, environmental indicators). The conclusion is that the Community FADN seems all the time to be under pressure of change. Could it be easier to put the changes into effect if there would be a special management process for implementing new things ? In other words - Could it be an improvement to reorganize the role and tasks of the Community Committee for the FADN? Could it be possible to prepare the paraller frame plan about the future needs of the Community FADN? Could it be an efficient way to implement new things in member states by providing some Community finance to them?
1 ) Adapted from the Technical Action Plan for Agricultural Statistics (TAPAS); Council Decision of on improving Community Agricultural Statistics.
66

3.4 REVISION OF FARM TYPOLOGY IN ORDER TO OBTAIN MORE CONTINUE ACCOUNTANCY DATA SERIES
Nicole Taragola and Dirk van Lierde
3.4.1 Introduction
Innovating in farm accountancy systems demands a lot of efforts. New relevant data are collected in the accountancy data network; the number of financial and technical criteria and data concerning environmental indicators is always growing. The accountancy data network evolved to an information data network on agricultural and horticultural activities. There is a constant need to improve the quality of the collected data in order to obtain reliable results when the data are used for different research purposes.
One o.f the most important applications is the establishment of average data (especially economic data on profitability) for the population of farms in the f ield of observation. As we know that a lot of economic parameters are highly depending on farm type, economic farm size and region, a stratification of the sample and the population in combination wi th a weighting system seems to be an appropriate method. Stratification is only possible if the farms in the population and in the sample can be classified in different types of farms and in different classes of economic dimension. For this purpose the community typology for agricultural holdings as described in the Official Journal of the European Communities (N° L 220) can be used. The type of holding is determined by the relative contribution of the standard gross margins (SGM) of different enterprises (crops and livestock) to the total SGM of the holding. The standard gross margin is the balance between the standard value of production and the standard value of certain specific costs. For every enterprise of the farm (crops and livestock) an SGM is determined. As SGM's are economic criteria they should be regularly updated to take account of economic trends; actually they are renewed every two years. As SGM's are calculated as the balance between values of productions and values of certain specific costs they depend highly on prices and yields. In agriculture variation of prices can be very important, and weather conditions do have a great influence on yields. To avoid these problems SGM's are calculated as averages of gross margins of three successive accountancy years. Nevertheless, there can be a lot of variability between successive sets of SGM's; especially for products wi th a cyclic price development the differences can be important.
Researchers are aware of this problem since the community typology was established, and different solutions to resolve this problem are in use. The aim of this paper is neither to explain these different solutions, nor to develop in detail a new theory about this. Only some reflections are made before intro-
67

ducing a new weighting system for the Belgian FADN. Before starting to work on this innovation, we thought the PACIOLI-project could offer us an opportunity to present our ideas to a forum of specialists for further discussion.
3.4.2 Actual situation of typology
3.4.2.1 Defining farm types
The community typology permits to define in an unequivocal way the type of a farm, defining the farm type based on the surface of the crops and the number of animals at the farm. By using a set of SGM's the importance of the different crops and cattle can be compared and according to the definitions of the types the farm type and its economic dimension can be determined in an unequivocal way. The rules to define the different farm types are very objective; on the other hand the definition of these rules are rather subjective. In the present schedule of the farm typology the specialized farms (types 1 to 5) are defined as farms where the SGM of the crops or cattle in which they are specialized are greater than 2/3 of the total SGM of the farm (for example at general cropping farms, type 1, the SGM of the general crops should be greater than 2/3 of the total SGM of the farm). This definition is rather subjective, one could have decided to develop another schedule where the total SGM of enterprises in which the farms are specialized (crops or cattle) should be greater than 70 p.c. or 75 p.c...of the total SGM of the farm. But once the definition is fixed, it is a very objective criterion for determining the farm type. For the mixed farm types the definitions are more complex, but they also offer a very objective criterion for determining the farm type.
The type of a farm should tell us something about the structure of the farm and its production capacity. This is related to availability of land, presence of cattle, specific investments for the different crops and cattle. Structures of farms can change, but they normally change over a longer period as most of the investments are made for a long period. So one should expect the units of measure in order to determine the importance of different crops and different kinds of cattle, to be rather stable in t ime. Especially there could be expected that the ratio between different enterprise SGM's would not vary from one set to another. As in the community typology SGM's are based on a period of three years, and as SGM's depend in a rather important way on prices and yields they are very variable in t ime.
3.4.2.2 Stability of farm type
The definition of a farm type in the typology schedule is stable but is the type of a farm with the same structure stable over the years? We should expect that a farm wi th the same structure over some years (same surfaces of crops, same number of animals) would keep its farm type over the years, independent of the set of SGM's we use. This is not always the case, especially for farms belonging to a mixed farm type. For example a farm wi th various crops and live-
68

stock combined (type 82) is a farm where the SGM of general cropping and of granivores is greater than 1/3 of the total SGM. As the SGM of granivores (pigs for example) is very variable in time it is possible that a farm of this type, maintaining the same structure for some years, is belonging one year to the type 82 and another year to another type because the actual SGM of fattening pigs is lower than in the last set of SGM's. By using a new set of SGM's the farm can become once again a type 82, and so on. So the farm type is not only depending on the structure of the farm but is also influenced by yearly price and yield fluctuations. If we use this typology in a stratified sample and then weight the accountancy data and compare the weighted results for some successive years there can be doubt about what actually we are comparing. Part of the difference wil l originate from differences in profitability during the accountancy years we are comparing; but part of the difference will originate from the difference in composition of the strata in the sample and the field of observation due to price and yields variability during the years for which we calculated the sets of SGM's.
Suppose there is a price cycle of 5 years for pig meat. Inevitable there will be a set of SGM's based on three years including the top of the cycle. This set of SGM's can only be used for stratification of the farms in the field of observation and in the sample some years after SGM's are established; at that moment the bottom of the price cycle can already be reached. The consequences are that as SGM's for fattening pigs become more important the importance of pig fattening wil l be greater, and the number of farm types wi th pig fattening (types 5, 72, 82) will be greater. So in the weighted results the influence of the farms with fattening pigs will also be greater. As profitability of pig fattening is low in the accountancy year we are weighting this wil l result in average results for the whole agricultural sector that are worse than they should be.
To illustrate that the effect of the selected set of SGM's is very important a little exercise was done. By using the data of the 1992 census, the farm types were first established on the basis of the set of SGM's centred on '1988' and afterwards the set centred on '1990' was used. In the second set the SGM for fattening pigs was much greater than in the first one. This resulted in an increase of more than 20 p.c. of the number of farms belonging to the types 5, 72 or 82 (and this based on the same census!).
In the long run of course the ratio between SGM's of different productions wil l change. Agriculture is changing during the years; a certain crop or cattle production can become more or less intensive so the gross margin can change and become more or less important than other gross margins. So what we need for typology are standard gross margins reflecting tendencies in the long term but avoiding variability due to short-term price and yield fluctuations.
3.4.2.3 Defining the field of observation
In the farm structure census all holdings with agricultural activities are recorded. Applying the community typology on the farm data recorded in the census the type of every farm in the census can be established. Normally the
69

field of observation that is covered by the FADN is smaller than the population of the census. There are a lot of very little farms in the structure census that are not represented in the field of observation of the FADN. Consequently the field of observation of the FADN had to be delimited to farms of a certain economic size, the economic size of a holding being determined on the basis of the total standard gross margin of the holding. The economic size of a holding is expressed in terms of European Size Units (ESU); at the start of the system one ESU represented a SGM of 1,000 ECU. As SGM's were renewed regularly it was planned that the value of 1,000 ECU would be multiplied by a coefficient to take account of global agro-economic trends in the Community.
Every member state had to fix the lower limit of the field of observation of its FADN. For Belgium this limit was fixed at 12 ESU, corresponding to the average economic dimension of a farm that could give a full employment to one labour unit (this value was fixed using regression technique). For some other countries this limit was fixed at 2 ESU, for other countries at 4 ESU, and so on. For the other member states there were probably other rules to fix the lower limit of their field of observation, the farms should be great enough to belong to the field of observation.
As new sets of SGM's are used the size of the ESU should be adapted in order to follow SGM's evolution. Even if this would be done systematically there would grow after some time some discordance between the new adapted limits and the original aim of limiting the field of observation, originating from a different evolution of the SGM's of different enterprises. Besides there can be noticed that the size of the ESU was not systematically adapted during the years as was intended at the moment of introduction of the system. The only adaptation came in 1984 when a coefficient of 1.2 was introduced to adapt the ESU. As a consequence of this and supposing that the actual SGM's are greater than in the past due to inflation, the actual field of observation may include more farms than when the ESU-system was introduced (although it is not sure that all SGM's are now greater than in the past!).
3.4.2.4 Defining limits of the strata
The limits of the actual economic size classes used in the Community and expressed in ESU are 2; 4; 6; 8; 12; 16; 40 and 100 ESU. Defining the limits of the strata (consisting of economic size classes) deals with the same problems as defining the lower limit of the field of observation. Although we are inclined to think that in a sample that is representative for all dimensions of farms this influence will be smaller than the influence of the changing lower limit of the field of observation.
3.4.3 Actual solutions
Researchers are aware of this problem and tried to solve it by using different systems, all having certain advantages and disadvantages. In the official system used by the Community the set of SGM's is changed every time a new
70

set is available. The advantage of this method is first of all that it is the official method used by the Commission and secondly that the evolution of SGM's, and consequently the evolution in agriculture, is always fol lowed. A disadvantage of the system is that one has to fixe regularly the lower l imit of the f ield of observation, and the limits of the strata to adapt them to the changing SGM's (coefficients for ESU adaptation). As mentioned before this is not always done because there is probably not a clear and undisputed method to apply. As the calculation of the average SGM's is based on a rather short period of three years, the observed changes are often originating from variations of SGM's and not f rom changes in structure.
Another method that is used in some countries to avoid the above ment ioned problems is the use of the same set of SGM's for a longer period. This is the case in the Belgian FADN (for national use!) where the same set of SGM's is used for a period o f ten years. By using this method we try t o avoid variability of farm types due to short-term changes in SGM's. In this system a farm wi th an unchanged structure will belong to the same type and economic size during the years. Limits of the field of observation and the strata also remain unchanged resulting in comparable data series over a period of some years. According to this method the observed variation in the averages of parameters wi l l be due" to differences of the observed parameters and there wil l be no influence of changes in the composition of the strata originating from variability of SGM's.
Of course this method also has disadvantages. The most important disadvantage is that after every period (in the case of Belgian FADN after a period of 10 years) the set of SGM's should be actualized. At this occasion the limits of the f ield of observation and the strata should also be adapted. If we want to compare the coming years wi th the past period we should have to establish a new series of averages using the new set of SGM's for the past period. So it would be rather difficult to explain to the stakeholders that changing the method would imply that former published data (on income for example) now have changed! Faced with this problem it is not surprising that the decision to change the set of SGM's is postponed until a better system is found (postponing the problem makes it more difficult to solve, this situation is comparable with the official method where adapting the limits is also postponed to a later occasion).
Another, and often neglected, disadvantage of the method is that the set of SGM's that is used for a longer period is also based on only three years. This means that this set, that is also variable compared to the previous and next sets, influences the composition of the field of observation for a long period. So it is possible that if we used another set of SGM's for this period the composition of the field of observation would have been different f rom the one we actually use, and as a consequence the weighting system would produce other figures. If for example we use a set of SGM's based on three years where pig prices are on the top of the price cycle this would imply a greater importance of pig production than in the case that we should use the next set of SGM's w i th pig prices situated at the bottom of the price cycle. And this influence would last for the whole period of ten, or even more, years.
71

3.4.4 Innovation
It is a fact that the use of SGM's for defining farm types and limits of the field of observation and strata deals with a lot of problems. We do not intend to solve these problems all by ourselves, we just try to f ind a valuable alternative in the hope that this would interest people involved in FADNs and lead to discussions wi th colleagues throughout the EU.
As typology does not depend on the authority of the community FADN the proposed innovation could only be applied to the Belgian FADN, and only for national use. In this way the project could be considered as a pilot-project. The Belgian FADN has some characteristics which make it very suitable to do this kind of experiments. The Belgian national FADN is embedded in the Agricultural Economics Research Institute (LEI - IEA), besides the Institute establishes the farm types of the farms in the national census and it also establishes the standard gross margins. So the Institute has a lot of possibilities to do experiments in this domain. Another point in favour is that the Belgian community FADN consists of only one region, so there is only one set of SGM's.
3.4.4.1 Adapting period to calculate SGM
By considering all the above mentioned problems the question arises if it would not be more logical to work with a set of SGM based on a longer period than 3 years (eventually with a deflation of the yearly data, or even giving the most recent gross margins a higher weight or not deflating the data having an equivalent effect as giving greater weights to the most recent years).
Every year the set of SGM's could be adapted by adding on the one hand the gross margins for the new accountancy year, and dropping on the other hand the gross margins of the first year in the series. This period should be long enough to avoid price cycles, and not too long in such a way that the new set of SGM's is still close to actual developments. As a matter of fact we should prefer to work w i th a moving average of SGM's.
Suppose the period we chose is seven years, and the most recent set of gross margins available would be that of the last accountancy year. The calculat ion of the new set of SGM's could be presented as follows:
Accountancy year SGM of enterprise A
1992 --> SGMA92=(gma86+gma87+gma88+gma89+gma90+gma91+gma92)/7
1993 --> SGMA93=(gma87+gma88+gma89+gma90+gma91+gma92+gma93)/7
1994 --> SGMA94=(gma88+gma89+gma90+gma91+gma92+gma93+gma94)/7
1995 --> SGMA95=(gma89+gma90+gma91+gma92+gma93+gma94+gma95)/7
72

SGMAT = moving average of the gross margin of enterprise A used for year T.
gma t = gross margin of enterprise A for a year in the period of 7 years (in this example).
A set of SGM's calculated over a longer period eliminates a lot of variation due to temporary effects (changes in prices and yields), and it reflects tendencies over longer periods. And that is what is needed when we are studying structural changes in the field of observation. In the actual system a farm that maintains the same structure over the years can change easily from one type to another due to changing the sets of SGM's (several times over a period of some years).
Another more practical advantage would be that we shall have to do the exercise every year, so we shall be obliged to include this task in our annual planning. This wil l guarantee that the work wil l be done regularly.
3.4.4.2 Limiting the f ield of observation and defining the limits of the strata
The field of observation of the Belgian FADN is not covering all farms in the country. The smallest farms are not represented in the sample because the field of observation is limited to farms with a certain economic size, actually in Belgium the farms in the field of observation are greater than 12 ESU.
When changing to a new set of SGM's this limit should be revised. Indexing these limits is a possibility, but this should be done regularly and a basis is required to determine the appropriate coefficients. This is not always evident, and we can see that in practice this is not regularly done. It would be better if limits were no longer expressed as an absolute number (for example 12,000 ECU) but that there would be another definition of the lower limit of the field of observation.
If we say that a farm should be great enough to belong to the field of observation then what do we mean by that? Being great enough includes the idea that we compare the dimension of the farm wi th other farms, and then according to some fixed rules we decide if the farm meets our definition. This can be clarified in the next example. Suppose we consider a person who is 180 cm tal l . In the sixties we should have considered this person to be tall, nowadays however although he would still measure 180 cm, we should no longer expect this person to be tall. This is because the idea of being tall is related to a comparison to other persons living in the same region. In the sixties most of the people were smaller than 180 cm, so the person in the example was considered to be tall. Nowadays however we see a lot of persons being taller than 180 cm, so our person is no longer considered to be tall. So we could also define a person being tall if, for example, he belongs to the 10 p.c. of people being taller than the rest.
In the same way the field of observation (and the sample) could be limited for example to all the farms belonging to the group of farms in the census of which the total SGM represents 90 p.c. (or 95 p.c. or 85 p.c..) of the total SGM of all the farms in the census. This definition gives objective rules to de-
73

fine the lower limit of the field of observation every t ime one changes the set of SGM's. This limit is no longer a quantity of ECU's, so the set of SGM's used to determine the typology is no longer of any importance to define the lower l imit of the field of observation.
To fix the limits of the strata one could act in the same way; for example different strata could be defined as strata containing a certain part of the total number of farms in the f ield of observation. This does not mean that in every stratum of the field of observation there should be the same number of farms because this seems not to be a good solution in order to obtain optimal results in a weighting system. To define the conditions to determine the limits of the strata some research and experiments with the census data wil l be needed. The result could be that limits of strata are no longer expressed as quantities of ECU'S, consequently the set of SGM's used would no longer be of any importance.
Another difficulty is that the units in which we measure are changing during the years. In the example of the length of the person the units rested unchanged (centimetres), in typology the units change. If we compare the SGM of a milk cow wi th this of fattening pigs for different sets of SGM's (3 years averages), we can see that for the '1982' set of SGM's the SGM of one milk cow had the same value as these of 12.4 fattening pigs, for the '1986' set this was 22.0 fattening pigs and for '1990' it was 13.5 fattening pigs. On the other hand as SGM's are expressed in ECU's they are also influenced by monetary fluctuations making comparisons over a period of years difficult.
It is clear that the above mentioned definitions are not valuable for eternity, and that regularly new research wil l be needed to actualize the definitions if necessary.
3.4.5 Attitude of the stakeholders to the problem
As a matter of fact no particular stakeholder proposed a change of the weighting system, but this innovating idea is the answer of the Belgian FADN management to the growing number of remarks made by most of our stakeholders concerning continuity and comprehensibility of the figures FADN calculates for the farms in the field of observation. It is rather difficult to explain t o the users of our data network that we, even in 1995, still use the set of SGM's centred on '1980'. It would even be more difficult t o explain to our stakeholders that after replacing the '1980' set by the '1992' set the results of the preceding years change because we calculate them again on the basis of the set of SGM's of '1992'. In our opinion the proposed change wil l make the f igures of the Belgian FADN more comprehensible for our stakeholders, also more continue accountancy data series can be obtained.
74

Conclusions
As we demonstrated using community typology for stratification of the field of observation and the sample is a good tool, but it also has a lot of disadvantages. This is well known to researchers and different solutions to resolve this problem are in use. However none of these solutions can be considered as the ideal solution, and we doubt if there actually is an ideal solution. We hope that this paper can contribute to draw attention to the problem and can be a step up to further discussion on typology.
75

3.5 THE PERSPECTIVES ON THE ITALIAN AGRICULTURAL ACCOUNTANCY NETWORK: NEEDS OF INNOVATION
Carla Abitabile 1)
The context
The recent study of INEA (Italian Institute of Agricultural Economy) about the reorganization of the Italian FADN starts firstly from the conviction that it is necessary to involve the FADN stakeholders in a real structured Informative System of Agricultural Accountancy. Only in such a way wil l it be possible to overcome the present limits of the Italian RICA.
In fact these arise bear from the complexity and rigidity of the system that run the network and that have a double negative impact. Firstly it is at a 'micro' level: the long delay in the delivery of farm results undermines the RICA use for the farm management goals. Secondly it is at a 'macro' level, as the impossibility of a casual selection of the farms means an inadequate representativeness of the sample and therefore poor utilization at aggregated level (e.g. for the political programming).
In the past, the large number of the surveyed farms (that reached 28 thousands units in 1989, a sampling fraction greater than 2%) led to the belief that it was sufficient to solve possible bias problems of the sample (and in some cases this could be true), but more recently budget problems caused the surveyed farm numbers to decrease.
This happened contemporaneously with an increase of the data requests related to the recent changes in the CAP with interventions that demand expressly ex-ante and ex-post valuations and the monitoring of the effects of the policies.
The growing use of FADN data had led to requests for more and more innovative and detailed kinds of information, in the misguided conviction that the network could satisfy all needs. Nevertheless this cannot be considered negatively, as first of all it has increased the familiarity with RICA and, secondly, it has revealed a well defined demand of information, qualitatively and quantitatively.
In short we have to face a twofold problem: in the first place how to increase the use of accountancy at farm level, by demonstrating its utility for
1 ) The author works as senior researcher at the Italian Institute of agricultural economy where she is responsible of the management of FADN. The paper is an updated and revisited version of a paper presented during a 1995 Seminar (Abitabile, 1995).
76

farm management, and in the second place how to improve the efficiency of the whole network, by assuring a high representativeness of the sample and the high quality of the data.
The answer of INEA to the new needs of the users and to solve the present problems of the RICA system is a Reorganization Project (INEA, 1996) in which objectives, methodologies and the structure of the survey are tackled in detail and new solutions are proposed.
This is the basis on which a technical committee is working and where all the Italian RICA stakeholders are involved. Their main task is to prepare a final version of the project (by June 1996), which is adapted to the different regional situations, and whose applicability will be evaluated later by the political decision makers.
This brief paper aims to introduce the Project of reorganization of Italian RICA following the suggested scheme of the third PACIOLI workshop. For this purpose the paper is articulated in three parts where the organizational model, the sample of farms and quality management, and the accountancy methodology are described briefly in the present situation and how they are proposed in the Project.
3.5.1 The reorganization project of the Italian RICA Part I: The organizational model
Introduction
The revision of the RICA organizational model constitutes the core of the INEAs Reorganization Project to which most of the RICAs problems are strictly connected.
The technical solutions for it do exist as the recent (information) technology give all the required tools. The reorganization of RICA in Italy depends mainly from the political will in that direction and anyway this last one constitutes the first step of a global revision of the survey.
An improved and better involvement in the RICA of all its stakeholders is necessary to carry out a networks able to satisfy its very objectives, before all, and to get the desirable synergies inside the SIAN (National agricultural informative system).
The new model proposed by INEA will be fully operative in the near future but only in some of the Regions, where properly conditions exist. In the others, 'modular' solutions will have to apply which adapt to the different contexts.
77

The present situation
Gathering accountancy data is quite complex for the Italian RICA organization. The situation varies in the different Regions 1) which since 1972 have had this competence by law. Some of them have their own network and methodology, while some others do not do accountancy at all (INEA does it for them), but the majority of them gather data through the farm associations on the basis of the INEA methodology and give them to the liaison agency (INEA) for processing (see figure 3.5.1).
INEA runs the control programs (at central level) and corrects the data with the help of the technicians (at regional level). Finally it produces the Italian and EC farm returns.
So, a wide variety of contracts regulates the relationships between INEA, the Regions and their structures, the Farms Associations and the other institutions involved, defining the tasks of each in the complex system of selection of farms, gathering of data, control of the technician activities and on the congruence of data, and their processing until their delivery to the EC.
Such differentiated organization creates problems for good management of the whole network carried out by INEA, primarily because of the impossibility of direct control over the different phases. Consequently it is an easy source of bias and mistakes.
The future organizational model
The main objective of the Reorganization Project is to create autonomous regional networks that run the accountancy data of representative regional samples.
Their tasks are not only to gather accountancy data using pc software (made by INEA) through acknowledged institutions (farms associations, accountancy centres, etc.), but also to run the control programs and to correct the data at a regional level.
The gathering structure is the crux of the problem because of the negative effects that it can have on the quality of data. Moreover there exists the necessity to rationalize the data gathering for needs which are quite apart from the accountancy (e.g. structural surveys). Thus the most appropriate solution appears to institute a permanent gathering structure of agricultural data, which is able to answer all the requests.
The regional networks produce a double output. The first is a quick farm return, utilized directly by the technicians for the farm management goals. The second is an accountancy file transmitted, via telematic network, to INEA. In this way the regional networks satisfy both the needs of the networks' farms (farm balance, analysis of productive sectors), through the agricultural development services, and the central networks that they feed.
1) Remember that in Italy there are 21 administrative regions.
78
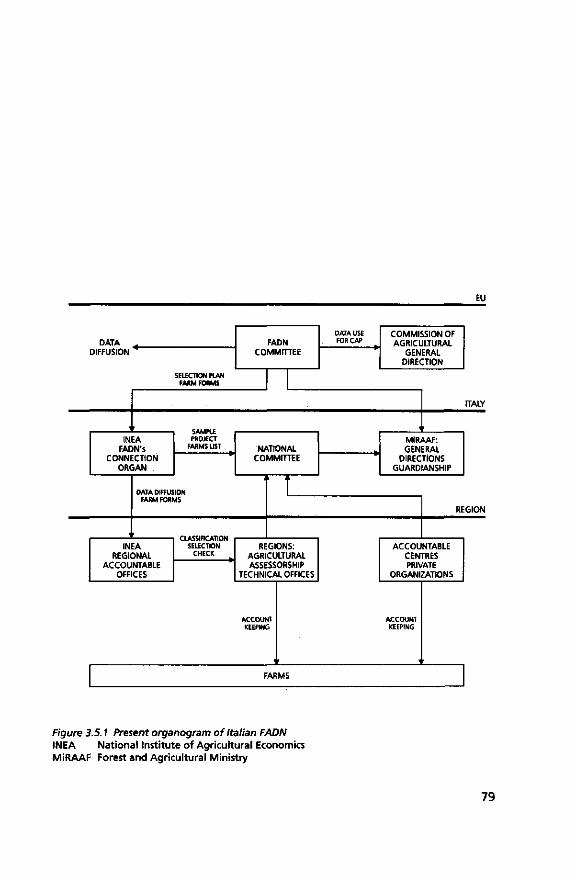
EU
DATA DIFFUSION
•
SELECTION PLAN FARM FORMS
' INEA
FADN'S CONNECTION
ORGAN
*
DATA DIFFUS
SAMPLE PROJECT
FARMS LIST
ION FARM FORMS
' INEA
REGIONAL ACCOUNTABLE
OFFICES
CLASSIFICATION SELECTION
CHECK
FADN COMMITTEE
DATA USE FOR CAP
COMMISSION OF AGRICULTURAL
GENERAL DIRECTION
NATIONAL COMMITTEE
j , L
ITALY
< ' MiRAAF: GENERAL
DIRECTIONS GUARDIANSHIP
REGIONS: AGRICULTURAL ASSESSORSHIP
TECHNICAL OFFICES
ACCOUNT
KEEPING
'
REGION
ACCOUNTABLE CENTRES PRIVATE
ORGANIZATIONS
ACCOUNT
KEEPING
' FARMS
Figure 3.5.1 Present organogram of Italian FADN INEA National Institute of Agricultural Economics MiRAAF Forest and Agricultural Ministry
79

INEA FADN's
CONNECTION ORGAN
FADN NATIONAL
COMMITTEE
DATA DIFFUSION FARM FORMS
REGION
INEA REGIONAL
ACCOUNTABLE OFFICES
REGIONAL COORDINATION
CENTRE
CONSULTATIVE COMMITTEE
OF REGIONAL NETWORK
PROVINCIAL COORDINATION
CENTRE
PERMANENT STRUCTURE OF
DATA GATHERING
ACCOUNT KEEPING
FARMS
Figure 3.5.2 Hypothesis of new organogram of Italian FADN
80

INEA manages the national network, applies a multivariate control program at national/multiregional level to guarantee better quality of the data, supplies the methodologies and technical assistance in all the phases and assures the connections wi th the other stakeholders (EU, the Ministry, the National Institute of Statistics, etc.).
Furthermore INEA produces and runs the national RICA data bank. Hence it assures the spread of information through telematic connections to its data bank, which is differentiated for its users according to their degree of informatie knowledge, and produces periodic publications on the aggregated data, at both regional and national level (figure 3.5.2).
In such a network the information f low is structured in a standard way. Moreover it is regulated in relation to the different information needs: farms can utilize the accountancy results in real time, while aggregated data fol low a longer item, needing more time to be processed.
References
Abitabile, C. (1995) Present situation and perspectives of the RICA in Italy (in Italian); Paper presented at the National Seminar on: Problems and perspectives of the utilization of the RICA data in Italy: an users comparison; Rome, February 28th
INEA (1991) The farm accountancy in Italy. Vol.1: INEA (in Italian); Rome, National Institute of Agricultural Economy
INEA (1996) The reorganization project of the Italian RICA (in Italian); Rome; Draft version
Filippucci, C. (1995) The statistical utilization of the RICA data and the perspectives of a reorganization of the survey (in Italian); Rome, National Institute of Agricultural Economy; Draft version
Filippucci, C, F. Alboni and A. Fabbiani (1993) A statistical investigation on farm accountancy data network; Paper presented at the ASA congress
81

3.6 POSSIBLE CHANGES / INNOVATIONS IN THE SPANISH FADN
Inmaculada Astorkiza
Introduction
The Spanish Farm Accountancy Data Network (RECAN) is the responsibility of the Ministry of Agriculture, Fisheries, and Food (MAPA) of the Central Government. The regional governments, therefore, don't have responsibility over these areas with the exception of the three Autonomous Regions of Catalonia, The Basque Country and Navarra (the last as of this year only) which have signed Agreements of Collaboration with MAPA for the purposes of gathering agri-food statistics of interest to the local governments.
These three autonomous regions have their own Farm Accounting Data Network, which is integrated in RECAN and which has the responsibility over the selection and contracting of Accounting Offices as well as the collection and processing of the data, following the procedures established by RECAN, RICA, and those set by the Regional Governments (R.G.'s) themselves. The governments of these three regions have instigated the creation of institutes and centres of technical and economic management (their name, structure and financing varies from one region to another) under the control of the farmers and professional associations. These centres, apart from providing the above-mentioned services for their associates, act as Accounting Offices (A.O.'s).There is a strong basis of trust between the farmers and the A.O., so the data which is provided is very reliable.
The other fourteen autonomous regions don't have their own Farm Accounting Data Network and the regional agricultural authorities do not participate directly in RECAN which is under the direct control of MAPA. The reason behind this absence of participation by these regions is that the local and central governments have not signed Collaboration Agreements usually because of a lack of initiative towards this end. On the other hand, the development of the techno-economic management services is very uneven in these regions - the majority of these regions have Agricultural Extension Services - although the type of assessments which these services provide are usually more orientated towards technical rather than economic aspects. However, even in those regions which have developed techno-economic management services from a regional level, the centres and groups which carry out this work do not form part of the RECAN.
However, the A.O's work independently of these management services. They have to comply with a series of requirements imposed by the RECAN and this work is contracted out by public tender. As a consequence it is often given to private accounting companies, external to the agricultural sector, whose only contact with the agriculturalists themselves is usually only in relation to
82

obtaining data, with no kind of feedback whatsoever between the parties concerned. This obviously creates serious limitations in the functioning of the sector : professionalism is diminished, the quality of the data is doubtful, etc., etc.
The need to improve the functioning of the RECAN, using all the currently existing management services at the regional level is considered by the author to be essential for the incorporation of future innovations in the agricultural accounting network of our country. This situation has led to the carrying out of a survey by mail of Agricultural Advisers to the regional governments to f ind out their opinions on the situation despite their having no direct authority in the matter. Another survey is being carried out of Agrarian organizations which are acting as Accounting Offices in regions which have Collaborat ion Agreements on the fol lowing four questions :
the functioning of the RECAN in the regions; the functioning of the Accounting Offices in the regions; possible ways to extend the use of accounting in the agricultural sector; the incorporation of additional data (innovations).
The level of replies to the survey from the Regional Agricultural Advisers was 64% of the total (100% from those wi th collaboration agreements and 54% from those without). The percentage of replies from the Agricultural Organizations was 100%.
The reasons for six Regional Agricultural Advisers not replying to the survey are probably bureaucratic, but more worrying is the possibility of a lack of interest in the matter.
Functioning of the Spanish FADN (RECAN)
Autonomous Regions without Collaboration Agreements
(A) Classification of innovative ideas: Internal Organization 1. Description of the proposed change
Change the system and the bases of the public tender system for A.O.'s There should be a greater interaction between the A.O.'s and the farmers : the current tender system favours the big accounting firms which are unrelated to the agricultural sector and which hardly given any advice to the farmers in making business decisions.
2. Description of the benefits If there were better forms of communication between the parties the number of participating agriculturalists in the system of collecting data would increase, as would mutual confidence between the different groups, the business capacity of the farmers, the quality of the data and the use of system.
83

(B) Classification of innovative ideas: Internal Organization 1. Description of the proposed change
To carry out the assessing and contracting of A.O.'s a year in advance or impose multi-year contracts.
2. Description of the benefits Avoid the delay between the beginning of the accounting year and the beginning of work in the Accounting Offices (after the signing of the annual contracts) - important in a country such as ours where only a minority of farmers keep accounts and at the same t ime only a minority of the A.O.'s are in the hands of Agrarian Associations which carry out a stable job wi th their agricultural associates.
(C) Classification of innovative ideas: Quality Organization + Internal Organization
1. Description of the proposed change Strengthen the techno-economic management through the RECAN. The RECAN should make contact wi th those centres or services (i.e. Extension Services) which offer this type of service to the different regions.
2. Description of the benefits The RECAN currently meets an administrative necessity of the Spanish Government to meet its obligations with the RICA without considering whether this serves the needs of the farmers and the agricultural sector. If the farmers received more feedback from their participation their interest in management would increase and hence their increased participat ion would lead to better data for the system, etc. The collaboration wi th the regional services which provide techno-economic management services would enable the RECAN to obtain better data and thereby improve its functioning.
(D) Classification of innovative ideas: Domain + Internal Organization 1. Description of the proposed change
Bring about an increased participation of the regional governments in the RECAN. Decentralise its operation, maintaining the general coordination and functioning in the hands of MAPA which, for its part must respect the over-all control of the RICA to safeguard the homogeneity of the statistics at a European level. The majority of the Regional Governments without Collaboration Agreements which have responded to the survey would like to sign some type of agreement which would permit them to assume more responsibility within the system in their regions. (It is not known what the level of interest i s in those governments which did not respond to the survey; but it is presumed not to be very high).
2. Description of the benefits As above (to make use of those techno-economic management centres which the local governments have been able to develop in their respective regions and to bring about their creation in the areas where they don't as yet exist).
84

4. DOMAIN
INTRODUCTION
During the plenary session in which the participants presented their ideas, the following keywords were noted to the subject domain. These keywords can be f ind again in the papers which are presented in this chapter.
Mineral balance Environmental productivity 'Sondes' Effects quota system Variables for direct support Scenario: Environment and landscape Scenario: Sparsely populated Development of indicators Last page of Inma's paper Situational accounting
85

4.1 CAP 2000# ENLARGEMENT AND FOLLOW-UP OF AGRICULTURAL DEVELOPMENTS AND POLICY-MAKING IN CENTRAL-EASTERN EUROPE ('PECO') WITH ESPECIAL ATTENTION TO MICRO-ECONOMIC INDICATORS
Louis Florez-Robles
Subject: Annual Report on PECO agriculture with a special coverage of farm income indicators by type of farming.
Objective: the objective of this document is to present a project description about how to meet regular essential information requirements for PECO agriculture to formulate the European Union agricultural pre-enlargement policies (1996-2000) and to prepare the CAP of the year 2000.
Introduction
This is a proposal of creating an Annual Report on PECO agriculture w i th a special coverage of farm income indicators by type of farming through the use of internal and external resources in the context of CAP 2000.
In this first step data coming from national sources would be used. Coverage by collecting harmonized base data would come in a second step.
4.1.1 Objectives in the CAP 2000 environment
The objective of this document is to present a project description about how to meet regular essential information requirements for PECO agriculture to formulate the European Union agricultural pre-enlargement policies (1996-2000) and to prepare the CAP of the year 2000.
CAP 2000 is a horizontal reflection action of DG VI having two working groups, an internal one (officials of DG VI) and an external one (external experts). It is one of the two central issues of agricultural policy work for the year 1996, the other one being the European Conference on Rural Development.
The continuation of the CAP reform and the negotiations for the enlargement of the PECO countries require having more precise and more up to date information about Central-Eastern European Agriculture.
86

This action meets the decision that 'the Union must prepare the way for enlargement in all branches of its activity' (The Commission work program for 1996).
'Agriculture has been identified as an important issue for future accession because of its relative size in some of the Central European Countries (CECs), and because of the difficulties there might be in extending the Common Agricultural Policy (CAP) in its current form to these countries' (Agricultural Strategy Paper, 29.11.95).
4.1.2 Problem statement
The country reports prepared by DG VI/01 (in collaboration with DG VI/A2, DG II and DG IA) constitute a huge step forward to monitoring agricultural developments in the 10 PECO countries. They provide an analysis of the current situation of agriculture and an assessment of the developments expected.
The evolution of PECO-10 shows that changes proceed incredibly fast, that assessments and forecasts have to be reviewed frequently in a context of a changing national and international economic environment, and that policy formulation and evaluation in the perspective of the CAP of the year 2000 has to be made w i th a close eye on the most recent level of the main economic indicators for agriculture.
Given the fact that micro-economic indicators are especially appreciated by agricultural policy makers, because they provide farm income by type of farming and by other criteria, particular attention should be paid to these indicators, a task that DG VI/A3 can organize with the help of individual and institutional expertise of the PECO countries.
DG VI/A3 has the expertise and the required and desired experience to meet agricultural information requirements on PECO countries by extending the RICA network EUR-15 to PECO-10. The process of creating or extending a network is, however, very slow since many agents and means are required and a detailed planning of responsibilities has to be made well in advance.
The traditional approach of DG VI/A3 to the need for extending the network on the occasion of the successive enlargements was to give priority to gather only harmonized data. Some time later these data would be used to produce analyses and reports. The result of this approach is important delays on information delivery about the new Member States farm income from DG VI/A3. For example, during the first year of accession of Austria, Sweden and Finland, RICA did not provide any type of information on farm income indicators for these Member States. This situation of important delays on information delivery implies that a change of approach is necessary. Priority should be given to have a minimum of information for use in pre-enlargement negotiations and immediately after accession.
The key question is then how to have information as soon as possible for defining pre-enlargement policies. The answer is simple, collecting information regularly in a systematic and harmonized way and putting them in an organized and didactical Annual Report.
87

The central element of RICA is 'network', this is, an organization wi th the capacity to bring data together and this experience would be an asset to bring information from national sources together. Even some experiences in this line of gathering information exist in a limited scale, like the recent experience of gathering information on costs of production for Slovenia that was very successful.
In conclusion, DG VI/A3 can provide the relevant information on the most recent agricultural developments in the PECO countries in a regular (annual) basis. This can be done through a small project to produce the Annual Report on the situation of agriculture in PECO-10, with particular attention to the evolution of income micro-economic indicators. Discussions wi th policy-makers in DG VI would help to bring the report as close as possible to the needs of the pre-enlargement policies for agriculture. Policy-makers are expected to say what type of information they need for policy formulation and evaluation.
4.1.3 Guidelines for the Annual Report
The content of the Annual Report would be one chapter per PECO member plus a summary chapter for PECO-10, plus a chapter of comparison of PECO-10 and EUR-15.
The proposed title is: 'The Annual Report on the situation of agriculture in PECO-10 with particular attention to the evolution of income micro-economic indicators'.
The proposed content for the index of the chapter (one per PECO country) is presented afterwards.
Period: the description of the situation of agriculture and of the farm incomes corresponds (example for the report 1996) to the evolution of the two last agricultural years (1995 and 1996), related to the corresponding previous ones (1994 and 1995 respectively) and on real terms (real percentage change and/or real monetary value). If possible, tables providing information on the income results and factors evolution of the last 5 years should be provided.
4.1.3.1 Introduction
A brief presentation of the content of the chapter.
4.1.3.2 General overview
The country reports for PECO presented recently contain information on this section, but an annual updating seems necessary to make a fol low up of the situation. This kind of information becomes 'old' very soon.
88

Role of agriculture in the national economy, main figures. Support system and structural policy. Agricultural output. Agricultural trade, EU and GATT.
4.1.3.3 Income factors
General economic conditions affecting agricultural developments: * economic growth and internal demand; * GDP deflator; * exchange rate; * interest rates; * export and import markets; * other (ex. GATT, ...). Weather conditions during the agricultural year/s. Output: * yields of crops; * livestock conditions and developments; * changes in areas; * changes in physical production (quantities); * changes in prices; Input: * input consumption, crops; * feed use; * changes in prices of inputs; * depreciation; * labour and labour costs; * interest rates. National agricultural policy changes, general effects on income factors.
4.1.3.4 Income and productivity estimates and/or forecasts
Overall level of results and changes. Results by main (national) types of farming and changes. The role of direct subsidies on income. Estimated changes of the reform the national agricultural policy. Income distribution (if available, optional): * small versus large farms; * part-time versus full-time farming; * total income; * succinct regional description (multi-regional countries); * other criteria.
4.1.3.5 Costs of production for the main agricultural products
Costs per quintal for the cereals, oilseed and protein crops, other arable crops, milk, beef and pigs.
89

When facing problems of lack of information the PECO expert has to do his/her best to meet information requirements for policy formulation and evaluation. The use of farm models or models produced by research institutes may be an example of alternatives. The report wil l help also DG VI/A3 to know the status of agricultural information systems in PECO countries.
4.1.3.6 Conclusions
The key elements of the results in a short description.
To make the chapters between the PECO countries comparable, and to write a concluding chapter on PECO-10, it is suggested to include a harmonized table. This table could have the fol lowing form:
Table 4.1.1 Net value added (ECU in real, 1994, terms) per farm
Type of farming Year
1993 1994 1995 1996 a)
Arable farms 20.000 15.000 50.000 40.000 (-20%) Horticulture
Dairy farms
All farms
a) Between brackets: the percentage change over 1995.
4.1.3.7 Annex: ful l tables of estimates and/or forecasts
Results (and estimates/forecasts) for the accounting years 1993, 1994 and 1995. Real terms and real percentage change. By (national) type of farming:
basic variables total output; specific costs; overhead expenses; depreciation; net value added including subsidies; current grants and subsidies; total input (intermediate consumption + depreciation + external factors).
extended variables net value added per Annual work unit-productivity (total output/total input); current grants and subsidies/net value added; agricultural income/total income (if available).
90

Data should be presented as complete as possible according to the availability of information.
4.1.3.8 Methodological explanations
The particularities of the national methodology should be described here. The assumption of this statement is that a harmonized methodology does not exist and then, for comparison, it is convenient to have a description of the methodologies used.
Note: Sections 2, 3 and 4 can be splited into several ones, especially for the pur
pose of avoiding too long sections.
4.1.4 Some organizational aspects and action plan
Title: 'The Annual Report on the situation of agriculture in PECO-10 wi th particular attention to the evolution of income micro-economic indicators.'
By: one/two coordinator/s of DG VI and one national (sub)coordinator per PECO country, w i th the collaboration of some national institutions (the national RICAs, the macro-economic services and research institutes particularly).
Coordinator of DG VI: one/two analyst/s of DG VI/01 (direction and formulation) in close collaboration with an analyst of DG VI/A3 (execution) and one analyst of DG VI/A2 (ad hoc contributions).
Subcoordination: the possibility of using Hungarian (or other local PECO) expertise wi th international experience should be evaluated. Hungary is a country with relevant experience on organizing international events w i th the participation of agricultural economists of all over the world and especially from PECO countries. This may be an important help to overcome organizational problems and to get the right expertise. A compensation for this work is naturally expected.
National coordinators from PECO-10: to be selected from professionals with experience in the subject. The national RICA should participate in any case.
Content. 1 chapter per Member State + 1 chapter for PECO-10+1 chapter of comparison between PECO-10 and EUR-15.
91

The report wi l l not be released to press, it wil l be provided to the decision-makers of DG VI - European Commission (classified as internal and confidential document) during the confidentiality period.
Calendar of actions
Discussion in the context of the project PACIOLI: February-March '96 and July-October '96.
Interaction with the members of the PECO consultation team (feed-back wi th the assistant of the project leader) in the context of CAP 2000: once a month.
Permanent follow up by the project leader (part time) and by the assistant to the project leader (full-time).
The Annual Forum on PECO agriculture (November). Organizing a RICA-Committee type meeting at the end of November wi th presentations on the 'situation of agriculture during the last year and on the work being carried out for the Annual Report'. It might be possible to have one day for EUR-15 and the following day for PECO agriculture (to facilitate interaction on methodological issues between European Union and PECO members). This action implies supervising and propitiating reports of quality and giving a kind of 'official' recognition to the PECO national coordinators.
First edition: 15 January 97. Confidentiality deadline: 30 April 1997 Second edition: 30 April 97. Confidentiality deadline: 15 June 1997
4.1.5 Rough evaluation of resources
Internal resources (European officials): top managers of DG VI; the consultation team (about 10 officials of DG VI), ad hoc collaboration; the direction team (two officials of DG VI/01, one official of DG VI/A3 and one official of DG VI/A2), part-time work; one coordinator -project leader- from DG VI/A3: one official (analyst), part-time.
External resources (independent experts): * assistant to the project leader: one junior consultant assisting the DG offi
cial, full-time (Brussels), responsible for: routinary tasks of keeping in touch with all the participants; building up the network of national coordinators; editing the report and preparing the chapters summary and comparison PECO-10to EUR-15 budget: xxxxxx ECU;
* local PECO subcoordinator (Budapest or other PECO capital): part-time, helping the consultant to establish the network of contacts, xxxx ECU;
* 10 PECO national coordinators, part t ime, responsible for their national chapter in the report, xxxx ECU.
92

Total cost xxxxx ECU
Unit providing the budget for this project: DG VI/A3 (and/or any other volunteering).
93

Annex
A4.1.1 Involvement and interaction within DG VI
Apart of the top managers of this topic, a working consultation team can provide some feed-back on agricultural policy information needs and on methods of information gathering.
The consultation team on PECO-10:
Mr. Thierry Vard, DG VI/A3; Ms. Jette de Gier, DG VI/A3; Mr. Luis Florez, DG VI/A3; Other DG VI/A3, DG VI/01 and DG VI/A2 members; DG VI/H3; DG VI/H4; DGIA.
A4.1.2 Questions to be answered by each one of the members of the PECO consultation team
1. General suggestions to the proposal. 2. Particular comments for micro-economic aspects. 3. Description of practical changes to modify the proposal. 4. Description of the benefits of question 3). 5. Other comments, principally to the action plan.
Further steps for updating this draft (stakeholders, -agents and decision-makers related to this work-identification, selection, interaction and involvement, benefits of the innovation, integration with the workshops 3 and 4 of PACIOLI).
A4.1.3 List of expertise on PECO agriculture (including addresses and events) and literature
In preparation
94

4.2 ANALYSIS AND CONTROL OF MINERAL BALANCES AT THE FARM LEVEL
Bo Öhlmér
4.2.1 Problem and aim
Natural resources and environmental issues have a high priority when deciding political strategies in Sweden. As is mentioned by Per Persson (1996) in his paper to this meeting, around 4,000 farms participate in a separate environmental survey, which produces statistics on external effects on natural resources in different counties and regions of Sweden. One issue studied is mineral balances of the farms.
In PACIOLI 2, on-going research about how to collect data on mineral balances as a part of RICA-FADN was presented (Merino-Pacheco, 1996, and Pirttijärvi, 1996).
In this paper, the aim is to discuss the benefits of collecting data on mineral balances as a part of RICA-FADN. How may these data be used by farmers and policy makers?
4.2.2 Potential use by farmers
Improved mineral balances means decreased losses of nitrogen, i.e. that more of the applied amount of nitrogen is used by the crops. This means a better economy if the costs for improving the mineral balance are less than the costs of the saved nitrogen.
Losses of nitrogen are in the form of ammonia emission and nitrate leakage. A farmer can affect the losses by, e.g.:
decreasing the amount of nitrogen applied on the fields (see figure 4.2.1); the technology in spreading fertilizer, especially manure; the technology in storing manure; the choice of crops; the technology in preparing the fields and growing the crops; nitrogen fixating technology.
A small decrease in the applied amount of nitrogen has only limited effects on the crop yield if the application rate is close to optimum (or above). Some of the other factors may also be easy to change. The FADN data on mineral balances will give feedback about the effect of such changes. This feedback may be more important for the motivation to change than governmental regulations.
95

Content in products kgN
200
100
100 N from the nature
200 N from fertilizer or manure
Surplus of N (losses)
Organic rest products
Harvested products
Total amount of N.kg
Figure 4.2.1 Utilization and losses of nitrogen at increasing application rate Source: Johnsson (1991).
4.2.3 Potential use by policy makers
The society wants to control the nitrogen losses from agriculture. The main motive to conduct statistical surveys on such nitrogen losses is to evaluate society measures to control the nitrogen losses. The measures to control this can be divided in the following categories:
information to farmers; payment (for e.g. improved mineral balances); price of nitrogen; buying licences of nitrogen; quotas on nitrogen use.
The policy makers and the researchers want to estimate the relationship between such measures and the effect on the mineral balances and farms' profitability and financial situation (Merino-Pacheco, 1996, p. 10).
96

4.2.4 Method
A project is proposed in which: 1. farmers are encouraged to improve the mineral balances by themselves; 2. the relationships between governmental measures to control the nitro
gen losses and the effects on farms (including the mineral balances) are estimated.
The first part is an advisory project that can be conducted in limited areas. The benefits of decreasing a farm's nitrogen losses are explained, and a service of calculating a farm's mineral balance is offered. This service is based on the farm's accounting system and uses the same method as in the RICA-FADN system.
The second part may demand that control measures are implemented. If such measures are planned, the relationships should be estimated before and after the implementation. It may also be possible to test some measures in limited areas. The effects of price changes may be estimated based on normal price variations.
4.2.5 Stakeholders involved
Farmers' interest to participate in the data collecting for the mineral balance calculation and the whole FADN is crucial. The Swedish farmers' book keeping organization is presently evaluating a service on calculating mineral balances. A market study indicates that some farmers are willing to pay for this calculation but they are rather sensitive to the price level of the service. They need to learn more about what they earn on decreased nitrogen losses. In addition, the agribusiness is paying more for products produced in an environmental friendly way, because of the consumer interest in such food. However, if farmers learn that the data wil l be used to force them to improve the mineral balances, they may be less will ing to provide the data.
The policy makers have decided to include the calculation of mineral balances in FADN, which indicates that they are interested in the analysis according to part 2 of the proposed project.
References
Johnsson, Bertil (1991) Bättre kväveanvändning; Ingâr i Ekonomidagen 1991, Ett miljövänligt jordbruk - Företags- och samhällskonsekvenser, Konsulentavdelningens rapporter, Allmänt 175, sid 53-64; Uppsala, Sveriges lantbruksuniversitet, Konsulentavdelningen
97

Merino-Pacheco, M. (1996) Institutional questions and environmental assets in European agriculture -how and when RICA will go green; The Hague, LEI-DLO; Paper at PACIOLI 2
Persson, P. (1996) Important questions for FADN in the short and long run from à Swedish angle; The Hague, LEI-DLO; Paper at PACIOLI 3
Pirttijärvi, R. (1996) Control of agricultural pollution through mineral balances; The Hague, LEI-DLO; Paper at PACIOLI 2
98

4.3.1 GLOBAL ENVIRONMENTAL PRODUCTIVITY MEASURES USING MICRO DATA
Carlos San Juan
The measure of capital stock is one of the main problems that arises when carrying out global productivity measures for inputs. In fact, the FADN data are one of the basic and most reliable sources for carrying out agrarian productivity measures, since farm balances are a reliable source for measuring capital stock.
Furthermore, they have the advantage of enabling the comparison of inter-regional productivities, according to OTE's and size (Decimavilla, 1996).
Alternatives should be based on the objectives of the research, data requirements and availability, and the assumptions made. In research using FADN, the econometric approach was frequently rejected because the l imited set of data, together wi th problems derived from the estimate, could hinder the accuracy of the approach and its own conclusions. In addition, in spite of some objections 1), the European Commission claims that the index number approach has played a key role in the analysis of the farm sector and should be maintained because of its simplicity and usefulness.
Consequently, total productivity measures wil l be calculated w i th the Translog index 2), also called Tornquist-Theil index or Tornquist-Divisa index, which is both a discrete approximation to the Divisa index and a superlative quantity index 3). The analysis of total productivity wi th index numbers must start from a determined aggregate production function, notwithstanding that some theoretical problems are expected. Starting f rom a translog function in region i at t ime t :
Ln Yit = Fit [Ln Llt, Ln Klt, Ln Xit, Tt, DJ
where: Yit = aggregate of outputs at t ime t in region i; Lit = work force inputs at t ime t in region i; Kit = capital inputs at t ime t in region i; Xjt = intermediate inputs at t ime t in region i;
1) Cf. European Commission Report, 1991. With data from RICA, two basic objections were made to the index number approach: (i) the ratios are based on private costs and income without considering that these prices might be distorted because of subsidies; (ii) rations are calculated totally. This does not allow researchers to analyse individually, something which will be useful for upgrading policies related to subsidies.
2) Cf. Gandoy, R. and R. Myro (1982); Denny, M. and M. Fuss (1983a); Denny, M. and M. Fuss (1983b); Myro, R. (1983) and San Juan, C. (1986).
3) An index that is exact for linear homogeneous flexible functional form for the aggregator function was termed superlative by Diewert (1976, 1978).
99
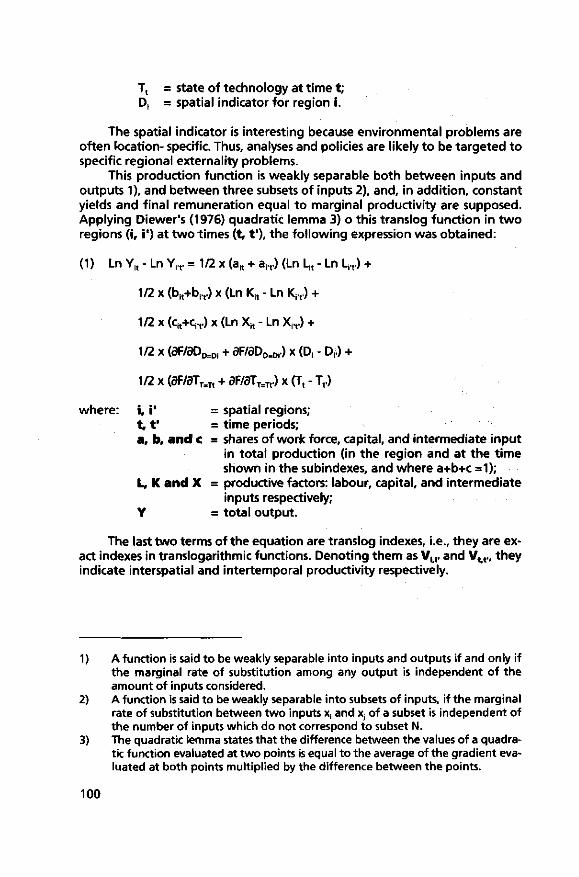
Tt = state of technology at t ime t ; D, = spatial indicator for region i.
The spatial indicator is interesting because environmental problems are often location- specific. Thus, analyses and policies are likely to be targeted to specific regional externality problems.
This production function is weakly separable both between inputs and outputs 1), and between three subsets of inputs 2), and, in addition, constant yields and final remuneration equal to marginal productivity are supposed. Applying Diewer's (1976) quadratic lemma 3) o this translog function in two regions ( i , i') at two times (t, t"), the fol lowing expression was obtained:
(1 ) Ln Yit - Ln Y,.t. = 1/2 x (ait + a,t.) (Ln Lit - Ln LiT) +
1/2 x (b^+b;.,.) x (Ln Kit - Ln Krt.) +
1/2 x (cit+Cj.t.) x (Ln Xit - Ln X iT) +
1/2 x (öF/8D0=Di + ÔF/3DD=Di.) x (Di - D,.) +
1/2 x (öF/3TT=Tt + dF/3TT=Tt.) x (T, - Tt.)
where: i, i ' = spatial regions; 1 .1 ' = t ime periods; a, b, and c = shares of work force, capital, and intermediate input
in total production (in the region and at the t ime shown in the subindexes, and where a+b+c =1);
L, K and X = productive factors: labour, capital, and intermediate inputs respectively;
Y = total output.
The last two terms of the equation are translog indexes, i.e., they are exact indexes in translogarithmic functions. Denoting them as V,,. and V t t., they indicate interspatial and intertemporal productivity respectively.
1) A function is said to be weakly separable into inputs and outputs if and only if the marginal rate of substitution among any output is independent of the amount of inputs considered.
2) A function is said to be weakly separable into subsets of inputs, if the marginal rate of substitution between two inputs x, and Xj of a subset is independent of the number of inputs which do not correspond to subset N.
3) The quadratic lemma states that the difference between the values of a quadratic function evaluated at two points is equal to the average of the gradient evaluated at both points multiplied by the difference between the points.
100

From equation (1), these conclusions can be drawn:
a) assuming that D;=Dj., V t t. compares intertemporal productivity. In other words, we can check productivity for different t ime periods in mostly dry or mostly irrigated farming:
(2) V t t. = (Ln Yt - Ln Yt.) - [1/2 x (at+at') x (Ln L, - Ln L,.)]
- [1/2 x (bt+bt.) x (Ln Kt - Ln Kt.)]
- [1/2 x (q+c,.) x (Ln X, - Ln X,.)]
Hence, V u > 0 denotes productivity increases against last year's yields. The opposite holds when V t t. < 0.
b) when Tt= Tt., V;,. compares interspatial productivity. In other words, we can check productivity in two types of forms (OTE, or OTE2), considering that i=r(OTE,) and that i'=s (OTE2):
(3) VM. = (Ln Y, - Ln Yr) - [1/2 x (a^a,.) x (Ln L, - Ln L,.)]
- [1/2 x (bi+b,.) x (Ln Ki - Ln Kr)]
- [1/2 x (Cj+Cj.) x (Ln Xi - Ln X^)]
Hence, V;i.=Vrs > 0 indicates lower productivity in OTE2 The opposite holds when V,i=Vrs < 0.
Assuming that OTE1 has less consumption of a natural resource (or produces less polluting residues), a clear contradiction would arise between 'economic' productivity and adaptation to the natural environment.
An interesting innovation is to present data which not only allow a traditional perspective of global productivity as a measure of input productive effectiveness (primary and intermediary), but also enable the creation of a global environmental productivity indicator.
(4) Ytr = Ft (L, K, I, R, E, t)
Global environmental productivity would be defined as the relationship between the variation in the amount of net output (not including polluting residues), and the variation in the amounts of inputs used, chosen according to their role in the output production process.
y ' - r ' (5) EGP =
aL'+bK'+cl'+dR'+eE'
101

where: y' = dy/dt r' = ar/öt L' = dUdt K' = aK/at i' = ei/at R' = dR/dt E' = dE/at
where: y = real output; r = residues connected to output; L = work in A W U or by the hour; K = services of capital stock used; I = inputs purchased at constant prices; R = inputs reused at constant prices; E = net externalities at constant prices; t = t ime.
Externalities, for practical calculating reasons, are taken to be net: E = net externalities = E positive - E negative.
being: a = input participation L in the obtention of output-fa = input participation K in the obtention of output; c = input participation I in the obtention of output; d = input participation R in the obtention of output; e = input participation E in the obtention of output.
These refer to positive or negative externalities connected to the use of natural or manufactured inputs.
102

4.3.2 PROBLEMS PRESENTED BY THE CALCULATION OF EXTERNALITIES
Carlos San Juan
Calculating the externalities generated by agrarian production is a perspective where available experiences are limited (Capalabo, S.M. and J.M. Antle, 1988).
Firstly is the problem of listing the possible externalities and, secondly, of quantifying them. Most externalities should be quantified differently according to the geographical point where the activity is developed. Many environmental and resource externalities that result from agricultural production also involve complex biological and physical processes. To provide essential information on long-run agricultural productivity, economic models need to integrate these physical and biological processes.
Therefore, the coefficients ofeXv externalities could vary according to each region or area r. Nevertheless, once calculated, they could maintain a reasonable stability in the course of t ime for each of the i inputs and j outputs for each OTE.
The second problem consists of evaluating the externalities, since notwithstanding assistance from existing defined standards, it must not be forgotten that the externalities must reflect the loss of social welfare caused by the use of a certain technology f or each input.
For some inputs, such as the case of minerals, this calculation would be made easier by recently developed techniques, e.g. mineral balance (Brouwer, F.M., F.E. Godeschalk, P.J.G.J. Hellegersand H.J. Kelholdt, 1995).
However, in other cases, such as pesticides, it is necessary to construct data bases which allow us to study commercial brands purchased as inputs by farms in connection wi th the residues generated. This task would appear to entail a certain complexity due to the high number of brands, of active principles in each pesticide and constant innovation. It is a pending task in this f ield.
On the other hand, in most cases, little attention has been paid to the task of listing and evaluating positive externalities generated by agrarian farms.
In principle, it seems that these externalities would mainly depend on the OTE and this would allow the construction of technical coefficients w i th easily identifiable regional variations.
103

4.3.3 PROBLEMS PRESENTED BY AMORTIZATIONS AND NATURAL CAPITAL
Carlos San Juan
The amount of capital services reflected by K depends on the quality of capital, evaluated at constant prices. This presents two types of problems:
I. calculating the value of artificial capital services (manufactured by man), at constant pricing: A. in the case of cultivated land, the improvements introduced should
be separated from the 'original potentialities for production', which many turn out to be complicated in practice;
B. the evaluation should always be made at current market prices, but whilst calculating capital services one should deflect these values with indexes which gather price variation in improvements on cultivated lands, which are difficult to separate f rom the market value for the lands. In fact, as is well known, the land plays the role of a save value. It may alter its price as a consequence of changes in the costs of opportunity of investment in land, as opposed to other financial or real assets, or simply because of changes in the profitability expectations of agrarian activity.
In any case, I will not develop this point any further, since there is ample literature available. However, I would like to point out the new problems presented by regarding capital as the sum of artificial plus natural capital KH + KN.
II. calculating the services of natural capital stock in the farm and its surroundings. Obviously, a pragmatic solution requires the definit ion of natural capital as that not 'conventionally' taken into account by the farmsn accounting; A. therefore, it is necessary to define the surroundings where the farm
has positive or negative effects (externalities), as relevant for accounting purposes;
B. it is necessary to evaluate, or translate into artificial capital equivalences, the benefit (contribution to the preservation of the farmns natural capital) or environmental damage. Within the damage, one must distinguish two aspects:
1. the consumption of natural capital assimilated by the surroundings or the sustainable amortization for natural capital KN;
104

2. the deterioration of natural capital, of a reversible nature, which may be evaluated by the cost of compensations or the necessary measures for restoring the surroundings (equivalent to replacement cost);
3. activities which deteriorate natural capital, but of an irreversible nature, which may not be evaluated according to the cost of compensations or necessary measures for restoring the surroundings. Fortunately, in agrarian activity, this situation is not too frequent, but if an evaluation were carried out, it would greatly depend on the criteria (social preferences) in force at that moment; C. one must distinguish between deterioration of natural capital by
agrarian activity, f rom negative externalities in strict terms, such as: fires caused, pesticide pollution of an accidental nature, dumping of residues, etc. This kind of damage would be included amongst the externalities.
III. f rom the point of view of reevaluating KN, one must distinguish: A. what constitutes preservation of the natural capital by the agrarian
activity, from positive externalities in strict terms, such as: the recovery of forestry areas, the cleansing of rivers, fire prevention, etc. These kinds of beneficial activities would be included amongst positive externalities.
References
Brouwer, F.M., F.E. Godeschalk, P.J.G.J. Hellegers and H.J. Kelholt (1995) Mineral Balances at Farm Level in the European Union; Agricultural Economics Research Institute (LEI-DLO); The Hague
Capalbo, S.M. and J.M. Antle (eds.) (1988) Agricultural Productivity; Measurement and Explanation; Washington D.C., Resources for the Future
Capalbo, S.M. and J.M. Antle (1988) An Introduction to recent developments in production theory and productivity measurement, In: Capalbo, S.M. and J.M. Antle (eds.); pp. 17-95
European Commission (1991) The calculation of economic indicators; Making use of RICA accountancy data; Brussels Report
Decimavilla, E. (forthcoming) Productivity of Irrigated Framing in Spain and Castilla-León; In: C. San Juan and A. Montalvo (eds.); Madrid, Mundi Prensa, Universidad Carlos III de Madrid
105

Denny, M. and M. Fuss (1983a) A general approach to intertemporal and interspatial productivity comparisons; Journal of Econometrics, Vol. 23, no. 3, pp. 315-330
Denny, M. and M. Fuss (1983b) The use of discrete variables in superlative index number comparisons; International Economic Review, Vol. 24, No. 2, June, pp. 419-421
Diewert,W.E. (1976) Exact and superlative index numbers; Journal of Econometrics, Vol. 4, no. 2, pp. 115-145
Diewert, W.E. (1978) Superlative index number and consistency in aggregation; Econometrica, Vol. 46. no. 4. July, pp. 883-900
Gandoy, R. and R. Myro (1982) Medida y anâlisis de la productividad global; Revista de Economia de ICE, pp. 29-38; November
Myro, R. (1983) La evolución de la productividad global de la economia espanola en el periodo 1965-1981; Información Comercial Espanlano. 594, pp. 115-127
San Juan, C (1986) Eficacia y rentabilidad de la agricultura espanola; Serie Estudios; Madrid, Ministerio de Agricultura, Pesca y Alimentation
106

4.4 FRANCE - IDEAS FOR INNOVATION
Bernard Del'Homme and Jérôme Steffe
In this paper, we will discuss ideas for innovation in RICA and we wil l expose the point of view of the French stakeholders concerning the two main innovations that appeared in PACIOLI 2: forestry and environmental data.
In France, we contacted the main stakeholders involved in RICA: farmers, advisory centers, the Ministry of Agriculture and researchers and nobody proposed something truly innovative for RICA. In fact, only small and precise improvements were advanced. However, we will present for each stakeholder the point of view toward innovation.
4.4.1 The point of v iew of farmers and advisory centers
These stakeholders are, above all, involved in the collect of data and they aren't really users of RICA.
Thus, they seem to be quite disconnected from the utilization of RICA. In their opinion, RICA is a macro-economic tool which provides aggregated results which are of no interest to them. Indeed, they estimate the results to be too general to be useful at their micro-economic level. Moreover, there is another problem which stems from the delay of publication of the results. The latter are all the more current for advisory centers in so far as they have their own network of collect which provides them much more precise data wi th a shorter delay.
However, some of the advisory centers are sometimes interested in having some results at the European level but they don't really use them. They wish only to have a general idea of agriculture in Europe and a way of comparing their area to another one.
Concerning farmers, they don't have any feedback from RICA except for money (for farmers, RICA, most often, synonymous wi th money).
Therefore, these stakeholders have not a precise position towards innovations in RICA. The data collected in RICA is not the crucial point: money collected through RICA is more interesting for them.
4.4.2 The point of v iew of researchers and of the Ministry o Agriculture
Researchers and people working at the Ministry of Agriculture are certainly the most involved stakeholders in the use of RICA. Therefore, they play a great rule in the debate concerning innovations in RICA. The general idea which prevails is that innovation has no place in RICA: RICA must be improved but not re-structured.
107

a) RICA quite correctly meets requirements First of all, the richness of RICA must be underlined. It is indeed quite rare
that a sector such Agriculture be described in such detail on the level of the individual unit of production (for example, in the area of business, it is more difficult to gather the same data). The reliability of RICA depends above all on its accountancy logic. The accountancy rules actually ensure the coherence and the comparability of data. Thus, thanks to its accountancy rigour, has RICA provided the basis for a great number of studies for econometric models and has also been used for some fine simulations on agricultural policy tools.
Thus, for people from the Ministry of Agriculture and researchers, RICA is a good tool which meets their requirements. Some of them even think that RICA database is under-used: a lot of studies or a lot of student works could be strengthened by the use of more representative data.
b) Att i tude towards innovations Researchers and people from the Ministry of Agriculture are not against
innovation but are persuaded that innovation does not really have its place in RICA. According to them, RICA database is rich enough and it would be dangerous to enlarge it. The growth of RICA may be fatal.
These stakeholders underline the fact that RICA is an accountancy network and that it seems, therefore, very difficult to enlarge the field of data collected to non-book-keeping data. The main reasons this attitude are:
the mode of collect; in France, the existence of RICA depends on the collaboration of advisory centers. Thus, independent of the overcost, there is the problem of the acceptance of the advisory centers in collecting new data. On the one hand, RICA must not be perceived as a tool which could be used to exert an administrative control. And the other hand, since inception of the CAP reform, farmers have been in a great statistical and administrative pressure. So it does not appear very relevant to increase this pressure;
the rule of the statistical tool; another problem is that RICA is an official statistical tool which can't anticipate social and political evolution. If it were otherwise, there would be risk in loosing the status of objective reference. At the present t ime, the agriculture support is based on agricultural production activity and the extension of RICA to data which does not belong to the field of production activity does not seem very relevant. This is the case, for example, for non-farm income but also for environmental data. The statistical tool must evolve at the same rhythm as the social and political context but not faster;
the reliability of data; it is sure that it is tempting to introduce into RICA new qualitative data but it increases costs, of course, it makes the collect harder and it raises the problem of representatitvity. It would be illusive to have a sample
108

which would answer to all questions in agriculture. One must not sacrifice the accountancy rigour to the seek of an illusory exhaustivity. In France, collecting non-book-keeping data wil l raise problems not only for advisory centers (it's difficult for them to provide reliable data in this field) but also for farmers who are not really ready to give such information. Thus, to stay reliable, RICA must not do everything: its target must stay well-specified around accountancy data.
c) Conclusion and solutions The position of these stakeholders in France can also appeared quite
conservatrice, but they all sustain the idea that RICA can not do everything. RICA is an accountancy network, data are collected by accountants and are used by people who need accountancy information to answer their questions. New data are interesting but their collect must not be led at the expense of accountancy data. That's why these stakeholders are not really in favour of collecting environmental or forestry data in RICA. They rather propose an improvement of the actual database. They propose for example a more precise description of animals, an analytic accountancy approach concerning two or three products ... They are not against innovation but they think that innovations that are proposed have not their place in RICA. To treat these innovations, they think it would be better to work at another level. Thus, they propose to use some ad hoc studies to answer these new questions. We already have this case in France: these studies are called sondes and collect detailed data on a precise question. There are led with the collaboration of organisms specialized in the problem, which allows a better treatment of results. Thus, they are in favour of the creation of such sondes to study the cases of agri-environmental data, biological agriculture ... At last, to improve some questions at a local level, it would be possible to use RICA database as a start of a more detailed study. RICA will be used in this way to complete ad hoc studies.
109

4.5 IMPORTANT QUESTIONS FOR FADN IN SHORT AND LONG RUN FROM A SWEDISH ANGLE
Per Persson
4.5.1 Important questions in the short run
4.5.1.1 Subjects of vital importance from a Swedish angle
One conclusion from the previous two PACIOLI seminars is that the future design of FADN should be closely linked to what kind of future questions one expect to be able to answer wi th help of information from the survey. When discussing future needs of FADN- data the simple question is therefore 'to what purpose do we carry through the survey'. In the first two PACIOLI-seminars papers from Sweden have partly focused upon this question. The rather obvious conclusion was made that the need of information is a function of the present and future agriculture policy. In the short run three different issues were pointed out in the Swedish paper to PACIOLI 2 1), namely:
how does EUs quota system influence the farmers incomes and agriculture structure; how does the direct support-system (general, LFA, environmental) influence the farmers incomes and the agriculture structure; how does the support for landscape-care effect the agriculture structure. Before going on I will give a short following up remark on each of these
points f rom a Swedish point of view. A quick view on the preliminary structure statistics that recently have
been published in Sweden indicate that there is a good ground for assuming that the impact of quotas on the agriculture structure has been great. At least f rom a national point of view there is therefore of interest to fol low up the economic consequences of quotas for different types of farms. To be able to do that from book-keeping data there is a need for increasing the number of variables in the surveys. Figures on values must here be combined wi th figures on quantities.
Looking upon the two other questions pointed out many analyses have recently been made on the impact on farmers income of different type of direct support. Such supports have been introduced in 1995 when Sweden became member of the community. The forecasting -model earlier presented in the Swedish paper to PACIOLI 2 has been used to throw light upon these questions and also other calculations based on more synthetic material. One prob-
1) The use of statistics for book-keeping surveys from a Swedish angle: past and future.
110

lern when using book-keeping data is that the account system used in Sweden does not permit detailed extraction of different direct supports. When analysing the material this information is important. In the future one could perhaps use lACS-data 1) to come round the problems. In other case there has to be an expanded data-collection in the book-keeping survey.
Questions concerning effects of landscape-care supports have not yet been dealt w i th.
Apart from the listed three points a lot was discussed on the second PACIOLI meeting on the subject Mineral balances. It was pointed out that the question of how to get a good picture of the leakage from farms is important for most countries. One point that was not so clarified was the importance of connecting the book-keeping survey with environmental information. In Sweden a lot of efforts are spent upon a separate environmental study. Around 4,000 farms participate in this survey and the output is, among other things, statistics on mineral balances for different counties and other regions in Sweden. This statistics is the most important tool for evaluating different political steps when dealing with environmental problems connected wi th agriculture.
What has been said above initiates the fol lowing two questions 'is the book-keeping survey a mean to be able to catch data for environmental statistics' or 'is information on mineral-balances etc. a mean to get a better knowledge on the economic impact of environmental restrictions for different farms'. As shall be discussed in another paper in Sweden we have focused upon the last question. Compared with the situation today there is a need of extra data collection in order to be able to throw light upon these environmental-economic questions.
4.5.1.2 Questions concerning quality and technique in the base study
Besides the 'new' questions that could be of interest to deal w i th in a FADN-perspective one should also have the technical and quality problems in mind when talking about reforming the FADN. The first two PACIOLI-seminars have shown that there is a need for getting a better harmonization in the design etc. of the book-keeping studies between different countries. This could concern the way of choosing participating farms and also to get a better harmonization when classifying different types of farms. The experience from Sweden indicate that the basic classification wi th SGM-figures 2) used are vague and not consistent between countries. To make it easier to compare data between countries there is a need for reforming this system that in many respect is out of date.
1 ) IACS stands for Integrated Administrative and Control System. This system is built up for handling the payment of milk-quotas and different direct-supports.
2) SGM stands for Standard Gross Margin which is in economic measure that is used for classifying structure statistics and FADN-farms.
111

4.5.1.3 Projects that could be of interest in the short run
It is hard to evaluate the common interest in EU of the questions mentioned in the first part of point 4.5.1.1. To be able to do that one must have a very good knowledge about the discussions that are going on in EU in the agriculture-political f ield. On this background no proposals of projects are given from Sweden concerning these items. At least for the time being we regard it as internal Swedish questions.
As for mineral balances project-proposals are given in the paper sent out to PACIOLI 3 'Analyses and control of mineral balances' (Bo Öhlmér). Projects concerning quality and system-improvements are dealt wi th in paper 'Integrated quality program for FADN' (Gunnar Larsson) and paper 'System specialists meeting' (Lars-Eric Gustafson). A special aspect of quality, namely quick statistics is discussed in paper 'Quick statistics for FADN' (Arne Bolin).
As have been indicated above there is a need of looking over the classification system built on SGM-figures. To the projects taken up in other papers Sweden wi l l therefore also add a projects that focus upon this problem. The form for this work has not yet clear.
4.5.2 Important questions in the long run
In the long run the situation in EU could be quite different f rom now as far as concerns the agriculture policy. FADN has so far been dealing with issues concerning the classic question of how high the absolute profitability is for different types of farms and different production-lines and what changes in profitability that has occurred during a certain period. Even general profitability forecasts and effects of planned political actions such as introduction of direct payments have been visualised and analysed wi th help of FADN. The now mentioned questions wil l perhaps no longer be of interest in view of a possible change in the common agriculture policy. The basic concept of FADN must in this case be more or less changed. In the following I will give you some 'extreme' scenarios that perhaps look far off today but in my opinion is in line w i th the signals that has been given through either the political decisions taken during the last years or the present debate in the field of agriculture policy. All the scenarios contain elements of deregulation of the agriculture sector. In some cases other interests than food production are placed in focus.
The environmental-landscape scenario
The agriculture policy turns in this scenario into an environmental-landscape policy. The key-point is no longer to protect farmers income from producing goods for the food-industry but to use the resources in the agriculture sector to keep up an open landscape in a way that satisfy the need of recreation etc. for people in general. Agriculture products are in this scenario not regarded as a scarce utility. Instead a nice landscape and a clean air are scarce utilities. Farm-products such as cereals and meat are regarded as being by-prod-
112

ucts and the motive for producing them is as a mean for keeping the landscape open. The new 'environmental-landscape farmer' gets compensation for his efforts through different direct payments from the society. These payments are not connected to the alternative value of agriculture production given up.
Of course effective farms in a traditional sense still exist in this scenario but only in the best regions. These farms are few, big and wi th a high production per unit of capital and labour. The border protection for agriculture products is low after intensive GATT-negotiations.
How big is the interest in this scenario to look on the profitability for different holdings. I would say almost zero. Payments to farmers are determined individually through local agencies. The horizontal payments are neglect able. There could be of some interest to look upon the high effective farms that still produce for the market. But not to a larger extent than for comparable enterprises in other sectors.
There will still be of a great interest to study structural changes but now in an environmental perspective. Statistics in the environmental field wil l of course also be of big interest.
The Laissez-faire scenario
In this scenario the important thing that has happened is that EU has taken in 5-7 new member states, each wi th a big agriculture production. The old member states are no longer will ing to keep up the now existing system with general support for different crops, different regions etc. Instead a deregulation of the agriculture sector starts and by t ime each country handles its own agriculture direct support-systems within certain limits set up by EU. A common market and a common border protection wil l still prevail.
In this situation the common interest to follow the profitability for different farmers will be lower than today. This question becomes a national matter to a greater extent. There could still be some motives for keeping FADN but in a more extensive form. Perhaps the Norwegian system wi th a few model-farm could be of some interest in this situation.
The sparsely-populated scenario
In this scenario the border between farmers and other socio-economic groups permanently living in the country-side is wiped out from a political point of view. The main political interest is to give people in sparsely-populated areas a decent income. This is done by direct support to all kind of enterprises in these areas. Even some other type of direct support to individuals could be introduced.
The regions that would become subject to support are defined from a political angle. From a statistical point of view there are needs of information of total incomes for different households in these regions. This information gives in the same way as the now measured income from agriculture in FADN grounds for determining the level of support needed. There are a lot of prob-
113

lems with defining the household income. For example how shall you compare income from wages wi th income from enterprises.
Programs are already in force in EU for less favoured areas. Some of these programs give support to all kinds of investments that creates jobs in the regions. Compared wi th the situation in the scenario the basic difference is not so big. One could say that the only change is that the present supports are widened and that agriculture no longer is a priority sector.
A remark to what has been said above concerning statistics of households is that production of such statistics is already under discussion within the frame of the TIAH 1). During a seminar in January 1996 a lot was discussed of how to define different types of households. The discussion made it clear that in many regions there are a diffuse border between agriculture households and other households. A guideline is that a certain percentage of the total income should come from agriculture when defining the household as an agriculture household. This criteria is though vague. One reason is that incomes from different income-sources are to a great extent incomparable.
The problem with classifying households by sectors is also getting bigger by time which gives the indication that it in the future wil l be meaningless to make a to detailed classification of households.
One general problem with using book-keeping data is what is regarded as being income from agriculture in the survey in fact is an income from another source. In Sweden many farmers use machines and other agriculture facilities for jobs in other sectors. The registered income is a mixture of agriculture incomes and other incomes. The main problems concern the cost side where there sometimes is very hard to clearly extract the cost for agriculture product ion from other costs.
Conclusions
The main question that comes up when thinking about what needs of microeconomic statistics that will occur in the future is if the frame that FADN works wi thin today wil l be valid in the future. Is it in line wi th the new demands of statistics that is coming up. At present FADN is ruled by rather old regulations from times long before the reformed CAP was settled. In the perspective of what has been said above one could ask if: 1. the population is wide enough; 2. there is need to fol low the changes in profitability so much in detail as
now. The number of variables could perhaps be cut down.
Looking upon the last scenario above there is perhaps a need for a more overall statistics covering a bigger population and covering all activities represented both inside and outside the farm. The unit that could be of interest to study is the household and not just the farm. There seems here to be a clear connection to the work done within TIAH.
1) Total Income of Agriculture Households.
114

To study pure profitability-questions for different production lines within the agriculture sector could perhaps more easily been done by combining material from other existing statistical sources. The big cost for collecting detailed book-keeping data could then be avoided.. In Sweden calculations for special production-lines have been set up. These are built on a mix of price-statistics, production statistics, structure statistics and pure technical coefficient. The time-lag for such calculations is short 1) and it is easy to isolate different effects such as price effects, effects of dry weather, differences from a normative or an earlier projected situation etc in these calculations. The two main problems with book-keeping data could here be avoided, namely the long t ime lag before data are available and the difficulties to extract data for different production-lines from other data. A growing problem that is that there are a lot of miscellaneous incomes and costs in the book-keeping systems. What is hidden behind these incomes and costs is sometimes hard to get to. It could be different types of direct-supports, products f rom agriculture of minor importance and also services and products that belongs to other sectors but are produced w i th own labour and machines etc. from the farm. The trend towards production outside the sector gives an indication that the traditional farmer is disappearing and that there is a general entrepreneur coming in. The border between agriculture and other sectors is becoming more and more diffuse.
4.5.2.1 Projects that could be of interest in the long run
To suggest huge projects for dealing wi th questions connected wi th the long run is of cause to go to far. Discussions of what wil l actually happen in the future can only be speculations which are hard to concrete. There are though a lot of indications that say that there will be a lot of changes in EU agriculture policy within a few years time. To have some sort of 'emergency planning' for such changes is of some importance. I see two steps that could be taken to meet this need. The first is to fol low the TIAH-work monitoring upon the possibilities to combine the surveys connected with TIAH with corresponding surveys inside the frame of FADN. The second is to discuss alternative and cheaper ways of catching profitability-figures for different production-lines for the traditional agriculture production. The objective is not to reach a detailed plan how to carry through a combined TIAH/FADN-study or to make alternative calculations but just to take up the questions in a working group or other proper forum.
1) In February there is definitive figures for the last year.
115

4.6 RECOMMENDATIONS FOR THE FUTURE DEVELOPMENT OF INDICATORS WITHIN FADN: PROSPECT AND RETROSPECT
Berkeley Hill
Background
In 1990/91 the author undertook for the European Commission a review of the economic indicators used by FADN. This was published in 1991 as The Calculation of Economic Indicators: Making use of RICA (FADN) accountancy data. Document series. The Commission (ISBN 92-826-3037-4) and, in summary form, as Green Europe 3/91 Measuring farmers' income and business performance: farm-level (FADN) data analysis, present and future. The broad aim was, by identifying apparent shortcomings and suggesting changes, to assist FADN in meeting its requirement to provide objective and relevant information on incomes in the various categories of agricultural holdings and on the business operation of holdings coming within categories which call for special attention at Community level. The utility of FADN as part of the EU's information system was thereby to be enhanced.
Flowing from the review, a number of recommendations were made. PACIOLI 3 provides in 1996 an opportunity to revisit these recommendations and to re-examine their validity in the light of changes that have taken place in the five years since they were made, a period that has included, inter alia, the CAP reforms that followed the Mac Sharry proposals of 1991.
Recommendations of 1991
The recommendations listed in the two publications of 1991 are reproduced below. In view of the general rule that the selection of indicators for particular policy situations must reflect the objectives of the policy the indicators are required to serve, the first recommendation is perhaps the most fundamental and necessary of all: Clarification of policy objectives a. Consideration should be given by the Commission, as user of FADN, of
the information which is needed to serve present and future policies, predominantly the CAP but also extending to others for which farm-level data could form an input (for example, spending under regional, social or environmental policies).
Coverage of non-farm income and assets b. Consideration should be given to the collection of additional income
information from off-farm sources (from independent activity, dependent
116

activity, property, pensions and other transfers). This should be available for the farmer and spouse, and for other household members where possible, whether or not they work on the holding.
c. Consideration should be given to the collection of data on taxation and other outgoings which would result in the calculation of disposable income along the lines of family budget surveys and similar in definition to that being employed by Eurostat for its aggregate indicator of disposable income of agricultural households.
d. Consideration should be given to identifying and, where possible, valuing assets held by agricultural households outside the farm business.
Coverage e. Without necessarily reducing the ability of FADN to represent the great
majority of production, thought should given to expanding or modifying the FADN field of observation so that it can be used as a means for representing the incomes of the great majority of people who are involved in agricultural production.
f. Support should be given to (then) current work to establish an identical sample of farms covering a number of years, so that their economic performance over this period can be examined. For the purpose of examining income movements, FADN should average (real) incomes over periods of three years.
A wider range of indicators g. Family Farm Income (FFI) should become the main concept used in des
cribing the income situation of farms. There is a preference for expressing this on a per holding basis; the desirability of also making estimates per FWU is accepted, assuming that the labour units are reliable.
h. A range of alternative economic indicators should be considered for regular calculation, together with some selected business ratios (FNVA/Total output (%); FFIflotal output (%); Cash Indicator 1/FFI (%)).
i. FADN should calculate a Total Factor Product (TFP) ratio, the preferred formulation being the value of total enterprise output divided by the cost of a bundle of inputs comprised of intermediate consumption plus depreciation plus actual labour costs and imputed charges for the labour inputs of the farmer and other unpaid workers. FADN should investigate the alternative methodologies for imputation and should review the sensitivity of the patterns of relative performance to the assumptions built into them.
j . A range of partial productivity measures are recommended for regular calculation and a range of indicators of financial status (see original).
Classification of farms k. FADN should consider analysing farms according to their family status,
based on labour input composition, as part of its regular breakdown of results. The relative incomes and business performances of family and
117

other types of farm should be explored within each type and within each ESU size group at Member State level.
I. FADN should conduct regular analyses by level of performance, as shown by FFI/FWU and FFI per business, in order to concentrate attention on those holdings where incomes are particularly low.
m. FADN should experiment with different formulations of the margin available for reinvestment, including a range of estimates of minimum living expenditures for the farmer and his family. The sizes of these margins should be compared wi th actual changes at the farm level over a prescribed period, including the complete disappearance of businesses.
n. Before any comparisons of FADN economic indicators between Member States are undertaken, attention should be given to the objective of the comparison, since this will affect the choice both of the indicator and the means of conversion to a common monetary base. Where the intention is to indicate the relative command over consumer goods and services that an income gives, the conversions from national currencies are most appropriately made using Purchasing Power Standards.
Enterprise performance o. In view of the strength of demand for information of profitability at the
enterprise level, the feasibility of allocating variable costs between enterprises in order to estimate gross margins should be explored, at least for a subsample of holdings.
Making FADN more easily accessible p. FADN should consider giving wider access to the results of analysis by
making available tabulations in electronic spreadsheet form, usable by standard commercial packages and broken down by Member State and type of farming, wi th size groupings based on at least two measures of size (ESU and UAA).
Retrospect f rom 1996
In large part these recommendations have a familiar ring to them in 1996 when the future development of FADN is discussed in PACIOLI. No formal assessment of progress along the suggested lines in the period 1991-96 has been made for PACIOLI 3, so a retrospect can only be a personal impression, based on observation. Additional change may have been considered but not made public.
The unit of DG VI responsible for FADN has indicated that some progress has been made on the use of a constant sample, though income averaging has not yet assumed the prominence in the published results that was hoped for in 1991. The use of FADN for longitudinal time series studies remains an important issue, and it is widely agreed that farm performance in single years is not necessarily a satisfactory guide to the longer-term situation. However, l inking accounts of individual farms across years seems to present technical difficulties at both the EU and national levels.
118

There is a continuing general need for policy-makers to make more explicit their objectives, and hence provide statisticians (including those engaged with FADN) with better guidance on what to plan by way of data. The growth of Eurostat's aggregate Total Income of Agricultural Households (TIAH) statistics and their extension to all Member States has exposed the need for equivalent microeconomic data by which variations around the averages can be explored, in particular the numbers of cases where household disposable income is unacceptably low. The frustrated attempts by FADN to move in this direction are common knowledge.
The fact that some national farm surveys can allocate disposable income between consumption spending and savings has awakened interest in seeking this possibility more widely; it might be argued that consumption spending is a key variable in monitoring the CAP objective of a 'fair' standard of living for the agricultural community, as given in the Treaty of Rome. On the matter of further ways of grouping farms, the economic situation of 'family farms', in contrast to other types of operation, remains an issue that is little explored empirically.
Among the 1991 recommendations on the use of indicators, FFI appears to be generally accepted as the preferred income concept. There is now a wide recognition that the choice of indicator must reflect the particular circumstances, and that no single indicator can suit all situations. However, requests to FADN for results still seem to be dominated by those concerned with the costs, margins and profitability of individual enterprises (rather than whole-farm matters). Statisticians do not appear to have satisfactorily met this demand within the microeconomic framework.
Only the 1991 suggestion ((e) - that the coverage of FADN should be modified so that the sample becomes more representative of the people engaged in agriculture) appears to have been significantly diminished in validity by the passage of time. It has been undermined by the launching of new data sources (such as the European Community Household Panel) and information from elsewhere that shows the low dependency of many (mainly small and non-commercial) holdings on agriculture for their livelihoods and the relatively small amounts of aggregate farming income they generate.
Finally, though a number of FADN publications containing results have appeared since 1991, these do not yet constitute a regular and predictable series of publications that are available to analysts outside the Commission (unlike, for example, Eurostat's annual aggregate Agricultural Income reports). Though FADN results are always likely to suffer from a handicap of poor timeliness (survey data being quite historic under present systems of collection and handling), their potential to answer many key policy questions and to describe farm-level behaviour is very substantial. Thus changes to FADN that are designed to enhance its performance in an evolving environment and to facilitate the more widespread dissemination of its results should be examined with great seriousness.
119

4.7 POSSIBLE CHANGES / INNOVATIONS IN THE SPANISH FADN
Inmaculada Astorkiza
Innovations: gathering of additional data
All the Stakeholders
Feasibility of the proposed innovations: Most RG's surveyed coincide in pointing out that this type of innovation
could only be applied on a state-wide level if the techno-economic management services also operate state-wide. The way RECAN currently operates is not adequate enough to think about incorporating data innovations.
Still in the case that the above-mentioned management system does extend, it would be more feasible to work with a more restricted sample of farms for certain concrete innovations (refer to A, C, D as follows).
Also it should be mentioned that there is a need to increase the economic incentives to motivate the participation of the farmer.
(A) Classification of innovative ideas: Quality Management 1. Description of the proposed change
Incorporation of amounts of minerals and pesticides, etc. applied to each crop/production.
2. Description of the benefits Realization of analyses of the environmental impact of agricultural practices and the implementation of environmental policies to counter these.
(B) Classification of innovative ideas: Quality Management + Domain (?) 1. Description of the proposed change
Incorporation of tree production. 2. Description of the benefits
Greater knowledge of the reality of these types of farms. The possibility of implementing more appropriate policies.
(C) Classification of innovative ideas: Quality Management 1. Description of the proposed change
Incorporation of gross margins obtained per crop/production. 2. Description of the benefits
Greater knowledge of the reality of the farms. The possibility of implementing more appropriate policies.
120

(D) Classification of innovative ideas: Quality Management 1. Description of the proposed change
Incorporation of income unrelated to farming. 2. Description of the benefits
Greater knowledge of the reality of the farms. The possibility of implementing more appropriate policies.
(E) Classification of innovative ideas: Quality Management 1. Description of the proposed change
Incorporation of more detail about the use of labour in each activity (wage-earner, family member).
2. Description of the benefits Greater knowledge of the reality of the farms. The possibility of implementing more appropriate policies.
(F) Classification of innovative ideas: Quality Management 1. Description of the proposed change
Incorporation of more detail about hours of work dedicated to each activity whether or not of an agrarian nature (in case of multi-activity farming operation).
2. Description of the benefits Greater knowledge of the reality of the farms. The possibility of implementing more appropriate policies.
121

WORKING GROUP SESSION 2 Discussion on selection criteria
The project proposals which will result from the PACIOLI project, will be judged by the potential funders. While making these project proposals it is very wise to think of how the project proposals will be judged. Therefore we asked the participants to discuss some selection criteria.
Group division: random
Nine selection criteria were given, of which four are based on innovation management principles (see figure 1) and five are based on project management basics (SMART). These criteria are:
Changing process: 1. Pressure to change 2. Shared vision 3. Fulfilled conditions for change 4. Feasible first steps
SMART: 5. Specific 6. Measurable 7. Acceptable 8. Realistic 9. Traceable
The participants were asked to discuss these selection criteria and to try to give the order of importance. The results of these discussions are given below.
Comment on the selection criteria
1. Pressure is important 2. Shared vision: important for success
if missing: project can still be good 3. & 4. Enough institutional flexibility 5. & 6. Better: well defined 7. a 2 ? » 3? 8. Realistic: * finance
* time * farmers' willingness
9. Monitoring possible?
Remark: The importance of the selection criteria differs per project.
122

Important remarks on the selection criteria
* There must be common interest (shared vision) * Add: cost / benefit ratio: investment versus results * Estimated users satisfaction * Pressure for change (REactive!) AND need for change (PROactive!) * Realistic -• resource constraints * Specific: well defined, clear and non-conflicting goals * Traceable = possible to make a time-table
The following selection criteria should be thought of (in order of importance)
1. Fulfilled conditions for change 2. SMART (take proposed criteria 6 till 9 together) 3. Pressure to change 4. Benefits: * scientific quality
* money * environmental
5. Priority on research agenda (EU) 6. Quality of partnership 7. Feasible first steps 8. Breadth of application (usable for many countries?) 9. Shared vision 10. Involvement of small / medium sized enterprises 11. International cooperation
123

3
ai
o 3 UI
O) C ID
- C u
E'S IQ "> E"S
c . 2« ti ai .2 c 3 (U
.15 « te o £ c
VI (1) u u 3
01 -O "üi ID
UI
O.
3 « «•-
« '3ï (D ai
«t-
l/l
a. ai
+i C
H -
ai ja "ui ID 01
ui
a ai
E H -
ai
'vi <0
UI
a. 01
£ H -
wi ai •o c o> « o c
~ V* (D £=5-5 a E •-"•" 8 o w »£
ui 01 T J C O I ai o c ^Z & ID EH5-5 => £ i -"" 8 o u «j:
wi ai •o c o> a> o e ^ +5 ID
£=5-5 3 E «-*" 8 o w »£
\ / \ / \ / V A / \ / \
/ \
ui 01 "o E o> v o c » "j3 (D £=5 "5 3 E i-
• • O o u .$:
• o 01
«o UI
C O UI
>
"O ai (0
.c UI
C O UI
>
• o 01 ID
.C UI
C O UI
>
ai 3 UI UI
01 O»
c ID
a. o *-•
ai
3 £ ui ID UI f a» u
a. o *•>
p& 3 £ ui (D ui r-a j u Q . O
•>-•
!"8> 3 £ ui ID UI f a » u Q . O
•M
,c 5> c m
5
3 Dl •E
124

The story of the frog who wanted to become as big as an ox (Adapted from Jean de la Fontaine)
Once there was a frog who looked very enviously at an ox.
Because he was a bit thoughtless, he bet that he could become as fat as the ox. Therefore, he tries to inflate.
What should happen arrives.... he explodes and dies.
Morality 1. If you are a frog, don't try to become as fat as an ox 2. Try to know your limits 3. Don't be thoughtless 4. If you still want to become an ox, give great subsidies to biological research cen
tres, in order they give you a solution
A C T U A L
^
125

5. QUALITY MANAGEMENT
INTRODUCTION
During the plenary session in which the participants presented their ideas, the following keywords were noted to the subject quality management. These keywords can be find again in the papers which are presented in this chapter.
Integration of accounting methods Accounts with different levels of detail Splitting the sample No one-software-approach Information model Integrated quality programme Scenario: Extensive version Quick statistics Positive mathematical programming Feedback to farmers Regional samples Periodical technical Reunions Paying farmers for quality Decentralised selection and control
127

5.1 INCREASE FLEXIBILITY BY GIVING UP THE 'ONE SOFTWARE APPROACH'; DEFINING A FARM RETURN
Beat Meier 1)
5.1.1 Innovation
5.1.1.1 Status Quo, problem definition
The Swiss FADN evaluates about 5,000 accounts yearly. All of them are established with one PC-programme 'LBH'. Gross margins are calculated for all production branches. The codes for cost units, sectors of the farm, output types etc. are predetermined. The data transfer to the Swiss FADN and the created database is based on this codes as well. This code framework is now over 20 years old and close to collapsing. The data system is open (non-finite), over 100,000 code combinations are possible. The introduction of a new cost unit (e.g. cannabis for fibre production) or a new cost type is very difficult and must be carried out on all levels of a data lifecycle. An adaption must be fol lowed by all farmers and accountants.
There is an increasing demand of accounting software offices to be allowed to create a FADN-output.
The advantage of having one software is, that quality control can concentrate on the accountants use of the one, predetermined system.
5.1.1.2 Proposed innovation
The FADN gives up defining codes for the accounts; the FADN defines the required data in a farm return; any software programme can be used to provide the data in the farm return; the codes in the farm return are independent from codification in the accounts and only relevant for data storing and analysis; quality control can be restricted to approve software (?).
5.1.2 Involved stakeholders
Farmer/accountant/extension/research: the monopolistic position of the FADN software 'LBH' is criticized; farmers, extension services, consulting and software offices want more flexibility: 'say what you want (in a f inite farm return), we wil l provide it'.
1) See paragraph 3.1; Introduction.
128

It is important for the development of a new software, whether the accounts can be used for the FADN or not (FADN compensation).
Policy makers/administration:
5.1.3 Expected benefits
More flexibility for farmers and software providers: innovation promoted Farm return and codification can be defined according to the needs of the analysis, independent from the accounts.
Problems: control (many of the definitions/rules are implemented in the 'LBH' software now); level of standardisation (valuation, depreciation, internal consumption etc.) will be lower than now; restrictions for horizontal farm comparisons.
129

5.2 INNOVATION IN THE FADN AND STOCKHOLDERS
Carlos San Juan
Introduction
Innovation in the FADN must include, amongst its objectives, the fulfilment of its users' future information needs.
This implies attaining a greater level of utilization and development of primary information, and increasing the gamut of fields on which information is available.
At first sight this increased information could seem overly costly, but it must be pointed out that if new fields of information are covered, where there exist detected needs (detailed statistical information for decision-making), the final balance could prove to be greatly cost saving in new statistics, and an important additional benefit, since it collects coherent information originating from the same source.
Information model
Consequently, the tasks this new information model would have to cover, would be the following (amongst others): A. detecting the information needs that could be covered by the FADN, e.g.
environmental and financial information, the effectiveness of investments in structures, control over the effectiveness of certain economic policies (structural funds, price maintenance, set a side), etc.
To provide essential information on long-run agricultural activity, economic models need to integrate physical and biological processes.
B. determining the necessary alterations in the data obtention process, which implies: 1. altering the questionnaire to include new information (e.g. physical
amounts of inputs and outputs, the brand and type of products purchased, the residues produced, etc.);
2. measures to avoid the loss of information which causes the rupture of historical series. This point is particularly important since, to a great extent, restrictions to the use of FADN data originate from the non-existence of long and homogenous series;
3. changes in information systems which allow: a. the recovery of data collected in the questionnaire but which are
later lost in the process of aggregation and presentation of results.
130
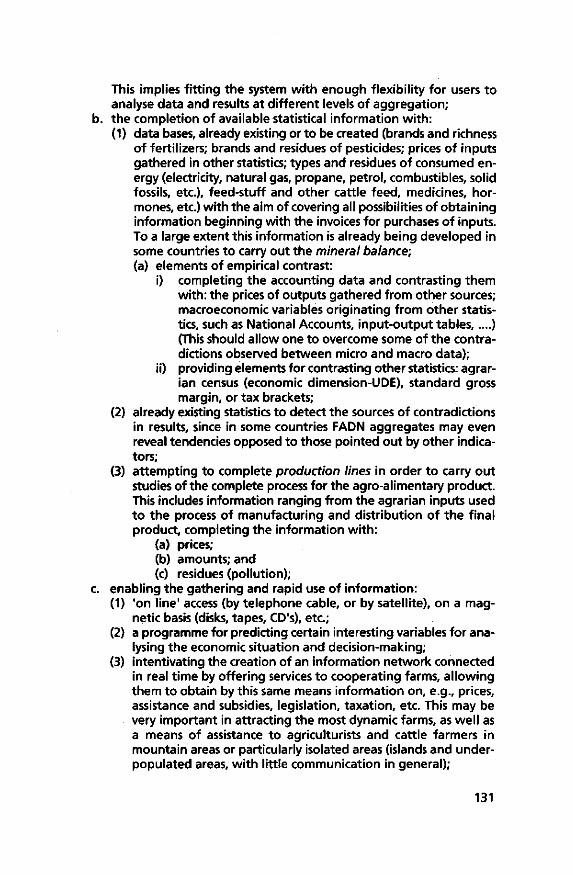
This implies f i t t ing the system wi th enough flexibility for users to analyse data and results at different levels of aggregation;
b. the completion of available statistical information wi th: (1) data bases, already existing or to be created (brands and richness
of fertilizers; brands and residues of pesticides; prices of inputs gathered in other statistics; types and residues of consumed energy (electricity, natural gas, propane, petrol, combustibles, solid fossils, etc.), feed-stuff and other cattle feed, medicines, hormones, etc.) with the aim of covering all possibilities of obtaining information beginning with the invoices for purchases of inputs. To a large extent this information is already being developed in some countries to carry out the mineral balance; (a) elements of empirical contrast:
i) completing the accounting data and contrasting them with: the prices of outputs gathered from other sources; macroeconomic variables originating from other statistics, such as National Accounts, input-output tables,....) (This should allow one to overcome some of the contradictions observed between micro and macro data);
ii) providing elements for contrasting other statistics: agrarian census (economic dimension-UDE), standard gross margin, or tax brackets;
(2) already existing statistics to detect the sources of contradictions in results, since in some countries FADN aggregates may even reveal tendencies opposed to those pointed out by other indicators;
(3) attempting to complete production lines in order to carry out studies of the complete process for the agro-alimentary product. This includes information ranging from the agrarian inputs used to the process of manufacturing and distribution of the f inal product, completing the information wi th:
(a) prices; (b) amounts; and (c) residues (pollution);
c. enabling the gathering and rapid use of information: (1) 'on line' access (by telephone cable, or by satellite), on a mag
netic basis (disks, tapes, CD's), etc.; (2) a programme for predicting certain interesting variables for ana
lysing the economic situation and decision-making; (3) intentivating the creation of an information network connected
in real t ime by offering services to cooperating farms, allowing them to obtain by this same means information on, e.g., prices, assistance and subsidies, legislation, taxation, etc. This may be very important in attracting the most dynamic farms, as well as a means of assistance to agriculturists and cattle farmers in mountain areas or particularly isolated areas (islands and underpopulated areas, wi th little communication in general);
131

(4) exchanging information on the partial experience of some countries, w i th pilot experiences already in operation, in order to determine to what extent they may be extended to the FADN as a whole;
C. improving the presentation of results: 1. pointing out which aggregated data should be presented as preferential
historical series; 2. pointing out at which level of disaggregation should aggregates pub
lished as historical series be presented; 3. defining the deflators to be created for inputs and outputs of preferen
tial OTE's, the size of the farm, regions, ...; 4. defining the most important environmental variables in each case pre
sented as historical series (mineral balance, the use of pesticides, polluting residues, recycled materials, packaging, watering, technologies ).
The adequate carrying out of these alterations, avoiding losses in informat ion, the rupture of historical series, and the duplication of efforts by using partially existing resources to cover information needs which would be covered at greater expense by the elaboration of new statistics, are strategic elements to increase the effectiveness of the FADN and the number of users.
It is also important for users that the information used may be used in a flexible manner. This mainly affects the design of software for access to the data base where the information is stored.
References
Brouwer, F.M., F.E. Godeschalk, P.J.G.J. Hellegers and HJ. Kelholt (1995) Mineral Balances at Farm Level in the European Union; Agricultural Economics Research Institute (LEI-DLO); The Hague
Capalbo, S.M. and J.M. Antle (eds.) (1988) Agricultural Productivity; Measurement and Explanation; Washington D.C., Resources for the Future
Capalbo, S.M. and J.M. Antle (1988) An Introduction to recent developments in production theory and productivity measurement, In: Capalbo, S.M. and J.M. Antle (eds.); pp. 17-95
European Commission (1991) The calculation of economic indicators; Making use of RICA accountancy data; Brussels Report
Decimavilla, E. (forthcoming) Productivity of Irrigated Framing in Spain and Castilla-León; In: C. San Juan and A. Montalvo (eds.); Madrid, Mundi Prensa, Universidad Carlos III de Madrid
132

Denny, M. and M. Fuss (1983a) A general approach to intertemporal and interspatial productivity comparisons; Journal of Econometrics, Vol. 23, no. 3, pp. 315-330
Denny, M. and M. Fuss (1983b) The use of discrete variables in superlative index number comparisons; International Economic Review, Vol. 24, No. 2, June, pp. 419-421
Diewert, W.E. (1976) Exact and superlative index numbers; Journal of Econometrics, Vol. 4, no. 2, pp. 115-145
Diewert, W.E. (1978) Superlative index number and consistency in aggregation; Econometrica, Vol. 46. no. 4. July, pp. 883-900
Gandoy, R. and R. Myro (1982) Medida y anâlisis de la productividad global; Revista de Economia de ICE, pp. 29-38; November
Myro, R. (1983) La evolución de la productividad global de la economia espanola en el perfodo 1965-1981; Information Comercial Espanlano. 594, pp. 115-127
San Juan, C. (1986) Eficacia y rentabilidad de la agricultura espanola; Serie Estudios; Madrid, Ministerio de Agricultura, Pesca y Alimentación
133

5.3 INTEGRATED QUALITY PROGRAM FOR FADN
Gunnar Larsson
5.3.1 Background
At the first PACIOLI work shop the individual objectives of the participants regarding PACIOLI were discussed. The participants were asked to give priorities to various objectives. A great many objectives were identified. To facilitate the analyses they were grouped into the following four objectives:
Score
improvement of quality of FADN data 37% stimulate the use of FADN data. 22% improvement of cost effectiveness 17% need for and feasibility of follow-up projects 13%
As can be seen, improvements in quality were given the highest priorities. But what is included in the concept 'quality'? If you study the individual answers you will find a wide range of objectives. The quality of statistical design and reliability are central areas. Other quality aspects have connections with techniques and methods (data systems, production routines, punctuality etc.). Several of the quality objectives are related to the use of FADN data.
At Statistics Sweden the quality concept covers not only accuracy, but even more important, the satisfaction of the user demands for relevant, timely and readily available information. During the last few years there has been an intensified effort towards quality in a broader sense. The current definition of quality is:
all aspects of the statistics sen/ice which influence the use of the statistics and to which users pay attention.
In this paper the need for an Integrated Quality Program for FADN is discussed. The covering of such a program is outlined and a number of innovations are proposed.
5.3.2 Structure of an Integrated Quality Program for FADN
The starting point for a quality program for FADN must be an objective, mainly based on users priorities. Cost effectiveness is important due to financial restrictions in the future. To realize this, a good documentation is essential.
134

Statistics Sweden's guiding principles for statistical work state that statistics should be objective, reliable and accessible. The fol lowing strategic issues have been pointed out:
monitoring of statistics; the customer in focus; relationships w i th stakeholders; providers of basic data (respondents and suppliers of administrative data); techniques and methods (statistics, EDP, production routines); quality of presented statistics; process control; development and strengthening of competence.
These issues have been broken down into operational and measurable objectives taken into account the fol lowing main ideas:
customer focus; process orientation; consistent leadership and systematic improvement work; standardization of procedures and production processes.
In the case of FADN most of the issues mentioned above may be applied. Customer focus is really important to FADN. The big size of the FADN sample also calls for a process orientation in improvement work. With 15 member states cooperating in FADN standardization is necessary.
5.3.3 Some proposals on innovations
Before you start to discuss improvements in quality you must know the starting point. Therefore documentation is a key word in this work. The following pages cover some proposals on activities in an Integrated Quality Program for FADN. The proposals fol low experiences in quality work at Statistics Sweden.
Quality guidelines
A broad quality concept ought to be defined for FADN based on actual user validation. In principle all aspects/components of quality are to be valued by the user. In the case of Sweden the quality guidelines includes the following four quality domains.
contents; accuracy; timeliness;
availability; sampling, non-response.
135

The development of quality guidelines for FADN could be coordinated with the corresponding work which is now going on in Eurostat.
Documentation system
The quality of FADN data has been directed by instructions on how to manage the sampling procedure, detailed variable definitions, time-tables for data delivery etc. However member states have only met the requirements to a varying degree. This is shown in different studies initiated by DG VI, such as:
'Harmonization of the FADN Farm Return', 1991 and 'The calculation of economic indicators. Making use of RICA/FADN accountancy data', 1991.
As a suggestion a computerized documentation system, FADN DOC, could be created. This system could be updated either annually or when major changes have taken place It is important that the users easily can get hold of the documentation. Therefore it may well be made available both on paper and in a database.
Annual Quality Survey
An Annual Quality Survey should aim at monitoring the changes in quality as they are considered by the users. Major deficiencies and problems calling for attention are documented together with ongoing improvements.
Probably the national FADN surveys continuously strive to improve quality. This is made more difficult when a survey is exposed to major shocks and budget cuts and other external influences on an ad hoc basis. The following issues can be pointed out as important in a quality study of FADN. Some of the issues mentioned (punctuality in reports etc.) can be applied also on the FADN-work in DG VI.
Comparability over time Frame and coverage of observations Speed of production Punctuality in reports Documentation Typology
As a proposal an Annual Quality Survey in FADN could be carried out by DG VI at the end of the production process. Thus the 1994 FADN ought to be realized during 1996.
Customer Satisfaction Studies
Customer focus is essential for FADN. The need and demand for micro economic data on agriculture can be mapped in different ways. One example is the PACIOLI project, where great attention is paid to policy making and fu-
136

ture need for data. In different ways DG VI has worked for enlargement of the contacts between FADN and users of data. Thus researchers have been invited to FADN Committee meetings to present studies based on FADN.
Up to now the use of FADN is concentrated to the policy makers wi th in DG VI. Now the objective to expand the use of FADN is expressed. Perhaps traditional feed back from main users is not enough in this situation.
As a proposal Costumer Satisfaction Studies could be carried out for FADN. A key group are the policymakers in the memberstate, but also many researchers and institutions belong to the target group.
An important aspect on a customer study is that there is a need for understanding the demands from the customers of tomorrow. This must be taken into account when the target group is defined. As a proposal a Customer Satisfaction Study on FADN could be carried out and evaluated as a tool for mapping consumer needs.
5.3.4 Tools in the quality work
Process Focused Studies
Statistics Sweden has started to systematically document and review a number of crucial processes. This is a process quality management effort within the TQM-program (Total Quality Management). It has shown considerable potentials for improvements. Some of these have been implemented and already delivered anticipated benefits. However, this activity is still in an initial stage.
Apart from which technique is chosen for the quality work on FADN process documentation and reviewing can be one of the main instruments. This is in line wi th the work in PACIOLI 2, where Farm Information Systems and Process models of national FADNs were discussed.
5.3.5 The involvement of the stakeholders and their benefits of the proposed innovations
The stakeholders will benefit from the improved quality, if this definition can be realized:
all aspects of the statistics service which influence the use of the statistics and to which users pay attention.
The involvement of the stakeholders is an essential part of the proposed Integrated Quality Program for FADN. A quality survey is one way to get into contact w i th the users.
The reader of this paper may react on 'improved quality', wi thout any references to the costs. However, cost efficiency is here an implied condition. 'Improved quality' could as well be read as 'Right quality' or 'Demanded quality'.
137

5.3.6 Conclusions
A feasibility study is proposed including the following parts: quality guidelines; documentation system; annual Quality Survey; customer Satisfaction Studies.
138

5.4 A POSITIVE MATHEMATICAL PROGRAMMING MODEL FOR REGIONAL ANALYSIS OF AGRICULTURAL POLICIES
Quirino Paris 1) and Filippo Arfini2)
Abstract
A crucial aspect of policy analysis regards the collection of microinformation related to farm activities. Even when this information is available, it has been difficult to produce credible evaluations of agricultural policies that describe relevant economic and technical relations among different type of farms. This papers presents a mathematical programming model suitable for policy analysis that utilizes the FADN farms data. The model is called 'Positive Mathematical Programming' (PMP) because its distinguishing feature consists in the exploitation of the 'positive' information represented by the FADN data. The analysis is limitated to farms of the Emilia Romagna region.
5.4.1 Mathematical Programming and Agricultural Policy Analysis
5.4.1.1 Foreword
One of the main goals of economic analysis is to determine how market equilibrium conditions can possibly be reached while changing some of the parameters affecting the operators' decision-making process. In theory this is done through a 'comparative statics' analysis, whereas in practice, as long as adequate information is available, econometrics is used. In the latter case, the appropriate methodological approach requires that the economic analysis issue be dealt with in two separate phases: estimate and forecasting. The former entails the econometric model calibration, including verification tests. Forecasting, on the contrary, is designed to analyse the model behaviour in other conditions than the initial ones, thus providing a measure of the changes resulting from the newly introduced parameters.
It should be noted that econometric analysis, powerful as it may be, is impractical in dealing with agricultural development issues, since adequate data are extremely difficult to obtain. In most cases the agricultural scenario is indeed quite fragmentary, being made up of a multilayer productive and orga-
1) Department of Agricultural Economics, University of California, 95616 Davis, Ca, USA.
2) Istituto di Economia Agraria e Forestale, Univesità di Parma - Via F.J. Kennedy, 6-43100 Parma, Italy.
139

nizational pattern that is typical of and heavily affects the farmers' environment, in addition to leading to oversimplifications that make it virtually impossible for the models to thoroughly and comprehensively interpret the existing phenomena.
A sound alternative to econometric procedures is provided by mathematical programming (MP) which, while requiring a limited amount of information, can nevertheless handle economic analysis issues through a two-stage approach: estimate (or calibration) and forecasting.
Mathematical programming has often been criticized for the normative character of its models, which is in sharp contrast to the positive nature of econometric models. In reply to this criticism, one could say that, if the degree of specification associated with the optimization of a goal does make LP models normative in character, it is equally true that MP is not solely designed to solve maximization or minimization problems. For instance, no normative qualificat ion can be applied to models intended to identify equilibrium conditions. Moreover, the normative character of any MP model can be mitigated if all the available information is used.
5.4.1.2 Positive Quadratic Programming
The philosophy and procedures associated with the positive character of these models form the basis of a mathematical programming method commonly referred to as Positive Quadratic Programming (PQP).
The PQP underlying concept is rather straightforward and its components have been known for some time. Since the earliest application of LP models to the solution of business and industry problems, back in the '50s, investigators have realized that the most desirable solutions were too specialized and, generally speaking, unsuitable for the large number and level of activities carried out and monitored in the companies and in the areas investigated. For this reason, many early researchers augmented the usual set of structural constrains in a linear programming model (Ax <. b) with a set of constrains on the possible levels of activities defined by using the realized (observed) levels, say x„. The structure of these constraints varied lightly from study to study, but they can be represented conveniently as x <. XR.
By combining information on the level of resources b to technology A, and the net revenue coefficients c wi th the existing information about the production levels seen for each activity ( ^R ) , investigators were confronted w i th the need to render mathematical programming models more 'positive', that is to make such models capable to produce solutions not too different from realized decision taken by the entrepreneur under investigation. The evolution of this theoretical approach is widely documented in the literature and, in particular, in Heady and Egbert papers (Heady and Egbert, Econometrica, 1964; Howitt, 1990).
The concept of PQP was developed in the late '70s, essentially as an outgrowth of the observation that it is easier to collect information about the output levels produced on a farm (or an agricultural sector's) x „ , than infor-
140

mation about the cost^f producing them. No doubt, when deciding to produce a given amount X R, entrepreneurs are well aware of all costs they wil l incur (such as costs associated wi th technologies, environmental conditions, possible hazards and so on), therefore the selected production portfolio is the result of a decision-making process whereby farmers or their families make decisions (about production, organization and the market) that may vary between individual farms. In sum, the observed output levels are the result of complex decisions, the costs of which are known to (or perceived by) the entrepreneurs, but can hardly be measured by outside observers.
This scenario does not differ considerably from the instance of a consumer, whose utility function cannot be observed, but who is nevertheless considered able to make rational decisions. The 'revealed preference' theory was developed precisely in order to evaluate the consumers' behaviour based on their decision-making patterns, i.e. on the purchased goods. Likewise a 'revealed efficiency' theory can be developed, based on the parameters and the decisions made by entrepreneurs, and that can be directly observed.
The PQP method involves all the characteristic components of a well-made empirical analysis, consisting of two discrete phases of estimate (or calibration) and prediction. In particular, the PQP calibration phase is designed to 'estimate' a 'pseudo- cost' function, that replaces the hidden and unobservable cost function used (either explicity or implicity) by the entrepreneurs. In this particular stage the PQP methodology calibrates the model in such a way that is capable of reproducing the base-period results. It is analogous to the model specification and selection of econometric studies. The prediction phase of PQP uses the calibrated model to generate responses in the endogenous variables induced by the variation of some relevant parameters, assimilated to the exogenous variables of econometric models. Let's consider the fol lowing LP model concerning an individual f irm or economic sector:
max TR = c'x dual variables subject to: Ax s_b y (1)
x * 0
where TR is the total revenue, A the technical matrix, c' the output price vector, x the unknown quantity vector, x
R the observed output vector, y the vector of input shadow prices and A the vector of Lagrange multipliers.
The specification of the model, as described in (1), is often the best possible given the available information. In this case the model objective function is simply the total revenue of the firm. The absence of a cost function is clearly noticeable. It is important to realize that we refer here to the absence of a variable-cost function and not of fixed cost.
When variable costs are not a linear function of outputs (as in the case of perceived risk in the enterprise), the only source of information about them resides in the vector of realized activity levels (X
H). In order to make this point clear, the dual specification of model (1) can be stated as:
141

minimizing TC = b'y + A' x*. subject to A'y +A * c A * 0 , y z 0 (2)
where TC are the total costs and A the Lagrange multiplier vector associated with the primal constrains x ^ ^ R . The first component of the total cost represents the familiar costs of l imiting inputs. The second component A' X R represents the variable costs of the enterprise.
Let us now consider a dual pair of quadratic programming problems stated as fol low: Primal
max TNR= c 'x-Vix'Qx subject to Ax <. b (3)
x * 0
where TNR is the total net revenue and Q is a positive semidefinite matrix: Dual
min TC = b'y + Vi x'Qx subject to A'y + Qx * c (4)
x ï O . y ï O .
The comparison of the dual constraints in (2) and in (4) reveals that, for A = Qx, the LP model (1 ) is equivalent to the QP model (3). The main innovation about PQP is in establishing such an equivalence explicitly. Under this assumpt ion, the variable cost functions of both models are:
53} 53!
ƒ A*. ƒ W* 0 0
KXR = V2X-RQXR
which explains the equivalence between the two models. To render the equivalence empirically feasible it is necessary to obtain a
proper estimate of the matrix Q. This objective is achieved by solving first the LP problem (1) and, secondly, by defining the Q matrix using the optimal vector of Lagrange multipliers * and the vector of the realized activity levels x
R. With a single observation of this last vector it is possible to define only the diagonal elements of the matrix Q:
**i (6) j = 1,2 n
142

The quadratic programming model (3) (solved after replacing the matrix Q wi th the estimated Q) reproduces the base-period information within a desiderate level of precision.
5.4.1.3 Positive Mathematical Programming
PQP can be further refined to obtain a more general description of the 'implicit' function of variable costs. Although quadratic programming in the model calibration stage is a crucial step in the PQP development, it should be pointed out that this is not absolutely vital to the development of the model. The empirical analysis of problems characterized by the availability of l imited information admits any family of variable cost functions. For this reason the more general version of PQP can be referred to as Positive Mathematical Programming (PMP).
In particular, let us assume that, once the necessary LP procedure is completed, the marginal cost related to the production levels reached as part of the j-th activity is set at:
Aj = q, + qj log {x). (7)
The total variable cost function is therefore the integral of (7) for all activity levels xjf where j = 1,2,.... n, that is
E ƒ W E ƒ ty'qiogtyty-> 1 0 > ' 0
(8)
E ƒ WÊçVs r fV >1 0 >1
The qj parameters defining the cost function in (8) are estimated, as was noted above, based on the dual information Aj generated in the LP phase of the procedure:
i*iogO^) ( 9 )
Therefore, the primal model of the calibrating phase is
maxRN - E 99 - E S/ ogty >i >i ( 1 0 )
143

subject to
X j ^ e > 0 , j = 1,2,...,n
When a logarithmic formula is used, great care should be taken to prevent that any primal variables assume a zero value at any time. For this reason, the parameter e is taken to be an arbitrary small but positive real number.
Model (10) is no longer a quadratic programming specification because the quadratic form of (9) representing the variable cost function has been replaced by an alternative formulation which is equally plausible. The dual formulation of the primal model (10) is easily obtained as an application of Karush-Kuhn-Tucker theory and corresponds to the fol lowing specification:
m n
AI j.1 ( 1 1 )
subject to m
Xj 2: e, y, £ 0, i=1,2,...,m j=1,2,...,n.
Unlike (10) the objective function of (11) is linear and its constraints are nonlinear. The pair of models (10) and (11), constructed by using the information on the parameters developed using qj's as stated in (9), is capable of reproducing the base -period results in the sense that the optimal primal solution approximates the base-period vector of realized activities within the desider-able level of precision, that is x*= ^ R
The above process can be viewed as a tautology and, indeed, the solutions produced by the LP and QP models are exactly the same because the process is tautological. This degree of precision is, in fact, the ideal goal of any empirical study, including econometric analyses: the specification of a model that is capable of reproducing the sample information with the maximum level of precision. In econometrics, the degree of precision is often measured in terms of a coefficient of multiple determination which assumes more respectability the closer it is to one. Econometricians, it seems, do not disdain the potentially tautological process which underlies the estimation phase. Important as it is, the calibration (estimation) phase cannot be justified without a prediction phase. In PQP, the prediction phase reveals the entire merit of the methodology.
In this connection, LP models are known to typically develop demand and supply functions having the classical staircase pattern; on the contrary, PQP can break this bottleneck thanks to the quadratic formulation of the problem that can produce continuous demand and supply functions.
144

5.4.2 Implementation of Positive Quadratic Programming (PQP)
In order to assess the implementation potential of the PQP model, information on how farms are run is needed that can reflect the behaviour and choices of individual operators. At the moment the only source of sufficiently discrete economic and structural information is the Farm Accountancy Data Network (FADN) or Reseau d'Information Comptable Agricole (RICA). While specifically set up to meet the EC Commission's requirements for more information, the network at the same time provides an invaluable source of information to shed light on the ex ante and ex post effects of the different agricultural policies. The empirical development of the PQP model thus includes the fol lowing steps:
model building; model implementation in a number of sample farms that are members of the Emilia Romagna FADN; check of the model conformity wi th the observed reality; determination of the new equilibrium conditions with changing parameters of the model.
5.4.2.1 Model building
The most distinctive feature of the PQP model is its ability to make use of the so-called 'positive' information, reflecting the farm management capabilities and the choices of entrepreneurs which depend on their technological expertise, their family pattern or their bargaining power wi th regard to the market.
In practice the 'positive' information employed in the model concerns such elements - that are immediately visible on the farm and are closely related to such production activities as prices output, quantities and technical coefficients, which in this particular case are solely obtained from the accounts, wi thout recourse to subjective evaluations or the technologies used. Using positive information the model is able to assess variable costs and the company's total revenues.
As was outlined at in the previous chapter, positive mathematical programming requires that the model be divided into two stages: calibration (or estimate) and forecasting. The goal of calibration is to 'estimate' the 'cost' function that is not measurable directly as well as to 'calibrate' the model so that it can reproduce the results seen in a given basic period. In the forecast stage the model is then used to f ind out how endogenous variables (production level and production costs) vary as some significant parameters change. In its calibration phase the model is further divided into two sub-units: (1) linear programming (LP) that allows to estimate shadow prices, these being dependent on the factors required to evaluate the cost function and (2) quadratic programming that can reproduce information about the basic period.
145

5.4.2.1.1 Basic data and variable sets
As was mentioned above, the basic data used in the model are the 'positive' information on how entrepreneurs react to the technical, structural and organizational problems they are confronted with. More precisely, the type of information required by the model is the fol lowing:
Total surface area (in Ha) and number of livestock heads (in AUB) on the farm. Both the total area and number of heads may refer to the whole farm or to sub-units of matched crops (or herds) depending on the level of model resolution; Amount produced in each activity (in hundreds of kilos). This summarily reflects the farm production capacity in each area. It depends on the role played by each individual process as part of the farm organization, on the weight attributed to them by farmers as income-producing factors and on the farmer's technical skills. Output assessment is done both for productions that are entirely marketed and for those that are partially or totally ploughed back. Sale prices for each process (in Lire). This price is a function of the farmer's bargaining power as well as of how close his relations w i th the market are. Needless to say, prices are given only for goods that were actually sold, whereas the price of reinvested goods is equal to zero. Process technical coefficients. This reflects the production, or better, processing capacity of limiting factors with respect to the individual activities performed on the farm. Here the availability of land and the number of heads raised were assumed as a limiting factor. In this particular instance the coefficients show the ratio of the constraining factor (land or number of heads) to the quantity of products obtained in each process. All data employed in the model as parameters, including the re-used
quantities and technical coefficients, can be retrieved from the FADN data bank, w i th not need for arbitrary evaluations.
In this case the variable 'sets' included in the model are confined to just the processes (J) actually performed on the farm, including re-uses, and constraints (I). The latter wil l vary depending on the l imiting factors (such land, water, cattle heads etc.) and on the level of model decomposition for each activity (for instance total arable land can be broken down into corn and other crops, or grassland and woodland). Constraints associated with the process linkups also fall wi thin this set.
Each variable set is related to some observed parameters, namely: b is the vector of constraints denoting the total surface area (in hectare) and the number of heads (in UGB); X is the vector of the processes showing the total output obtained; A is the technical matrix containing the above-mentioned technical coefficients that denote the production relations between the j - th process and the i-th l imiting factor. The matrix has I and J dimensions; C is the vector of the recorded prices for each j - th process. The model unknown (referred to as X) is provided by the output obtained
in each j - th process, while the economic goal to be promoted is different in the
146

two sub-models making up the PQP model. In particular, in the LP model the saleable gross production is maximized, while in the PQ model gross revenues are.
5.4.2.1.2 PL model
This step is characterized by a constraint set that gives the model its 'positive' character, in that it reflects an actual occurrence, resulting f rom the farmer's decisions concerning his production plans. In particular, it is assumed that the output to be obtained (X) never exceeds the actual one (X). This makes it possible to highlight the shadow prices (A) for each process. The shadow prices thus obtained are indicative of the 'opportunity cost' suffered by farmers for giving up additional output and allow to estimate total variable costs in the second phase of the model.
Hence this first model only maximizes the saleable gross output that is subject to technical constraints (matrix A) and to the actually observed outputs (-*"). More precisely the specification of this first sub-model is the fol lowing:
MAXPLV= » X(J,.C(J) (12)
Subject to: n
E " A(U) * X(J)_ * b w
x ( j ) * x r i
5.4.2.1.3 QP model
Building a quadratic programming sub-model requires that an additional parameter be defined, which is referred to as qg ) . This denotes the ratio of the shadow price (A) of each constrained production to the corresponding actual output {x). This parameter enters the model in a diagonal matrix having n x n dimensions, called matrix QW), namely:
Q u » . * » / *«> ( 1 3 )
The construction of a Q(JJ) matrix takes on special significance, since, as was shown above, a close correlation exists between the LP and QP models, this being expressed by the condition X = Qx. This allows to estimate the total variable costs 1). Once matrix Q0j) has been defined, the model, using either qua-
1) The expression given in (13) to obtain matrix Q(JJ) and estimate total variable costs can be replaced by other expressions, that are equally able to evaluate a cost function. In particular, the logarithmic function given in (9) can be employed.
147

dratic or logarithmic functions, aims at maximizing gross revenues, calculated as the difference between gross saleable output and estimated variable total costs, subject to the only constraint of total availability of the identified limiting factor (b). More precisely, the sub-model specification is as follows:
n n
Ë E MAX ML = >i X(J)*C(J, -% » X'(J) *Q ( J J )*X ( J ) (14)
Subject to:
> 1 A(l.J) * X(J) * b m
The distinguishing element of this sub-model is the assessment of variable total costs through the expression 1/2 X'(J) * Q(JJ) * X(J), this being the integral
of the farm variable costs ( V x ) . Moreover, it is apparent that 'positive' constraints are lacking, thus leaving the model free to choose the best production combination, albeit subject to the only constraint assumed, i.e. the total availability of the limiting factor 'b ' (farm arable land or number of herds), in accordance to economic convenience criteria only.
If the findings reflect the actual production scenario, the model is said to be 'calibrated' and can be used for the purpose of agricultural policy analysis to 'simulate' farmers' behaviours when faced with new events.
5.4.2.2 Model implementation in a number of sample farms belonging to Emilia Romagna FADN
Given the study goals, i.e. to assess the PQP potential for enhancement of FADN data and as a means of ex-ante analysis in the framework of agricultural policy actions, the model was not implemented in the myriad of FADN member farms in Emilia Romagna, but limited to a stratified sample selected according to OTE and the farm size.
In particular, in 1993, i.e. the year the research findings refer to, in Emilia Romagna 817 farms joined FADN; thus, the actual number of farms investigated in the empirical stage of the study was a small fragment of the multitude of FADN members. More specifically one farm was picked for each class identified in the 'OTE-farm size' stratification.
As far as large classes are concerned (with more than a unit) the farm wi th the lowest deviation from the group average gross saleable output was chosen. This procedure, as was pointed out earlier on, is not designed to identify farms that are statistically 'representative' of the subpopulation, but rather a collection of farms adequately disaggregated and representative of the existing classes.
Based on the above criteria and the actual number of farms, 72 farms were selected, accounting for about 9% of all local FADN members. For every single farm the 'positive' information, previously examined for each production
148

activity (farming or livestock breeding) carried on the farm, had to be obtained from the accounting books.
As soon as all necessary information for model building were collected, the actual empirical phase could start. 72 models were developed, each for every farm. Obviously the model structure differed between farms depending on whether or not animal husbandry activities were performed or tree crops were cultivated as well as on how finely annual crops were classified (for instance distinguishing between cereals and industrial crops) or on what processes were re-used.
A tricky step in the model development is the 'total variable cost evaluation', for this requires that the type of function be sought, whether quadratic or logarithmic 1), that can best reflect the total variable costs actually incurred by farmers. The requirement of different functions results from the very fact that not all farms use the same function of production and, consequently, of cost. The PQP model, similar to the econometric ones, strives to identify the function that best suits the actual reality. Obviously function selection is possible only if corporate data is available, whereby the costs revealed by the different functions can be compared with the actual ones.
5.4.2.3 Check of the model conformity with actual reality
As was noted above, the PQP model method closely resembles the econometric one, in that, before the model can be used for forecasting purposes, its ability to represent a given occurrence is to be assessed. To this end the 'estimated' data is compared with the 'actual' one, as is reported in the books, concerning sold and reused productions, gross saleable output and total variable costs. It goes wi thout saying that the model performance is better the closer the estimated values are to the actual ones.
The calibrated models (table 5.4.1) gave encouraging results as to the PQP model ability to represent actual reality, since the average difference between actual and estimated data is 4.5% for gross saleable output and 1.2% for TVC. The model accuracy in estimating total variable costs is further proved by the comparison of the sets of data about actual and estimated costs in increasing order (figure 5.4.1).
Any sources of error are likely to reside in the model inability to provide an accurate TVC estimate, especially when a limited number of processes and, therefore, of shadow prices is available, as well as in the fact that the FADN records do not contain all the necessary information. By way of example, as far as livestock farms go, no meat sale prices are recorded. Furthermore, the value of grapes, when used again for other purposes, is not known, which compels the guessing of sale prices that cannot but add to the model inaccuracy in the estimate phase.
1) In addition to quadratic and logarithmic functions, a third one was used. This was referred to as 'average', this being the arithmetical mean of the two cost functions (quadratic and logarithmic).
149

eoo Million Lire
Farm
Obaarved TVC ° Eatlmated TVC
Figure 5.4.1 Discrepancy between observed TVC and estimated TVC
5.4.2.4 Determination of new equilibrium conditions wi th changing parameters
Any model that has proven capable of reflecting the economic-productive characteristics of a farm with a tolerable degree of inaccuracy can be used as part of agricultural policy analyses. They wil l simulate the effects brought about by any changes in the basic parameters originally assumed, such as sale prices, or ascertain the impact of some EC policies, such as set aside policies for arable lands.
In mathematical programming this corresponds to 'parametric programming' or 'post-optimal analysis', that allows to identity the company's new equilibrium conditions as one (or more) parameter changes.
In this study post-optimal analysis is conducted assuming two different scenarios that may occur as a result of changes in the present agricultural policies or in the market conditions. More precisely the following two assumptions were investigated: 1) Changing sale prices of soft wheat in all OTE of the sample. In particular,
increases and decreases by 5, 15, 25 and -5%, -15 and -25% respectively were assumed;
2) compulsory introduction of set aside policies and their settlement.
150

These are of course just some of the possible scenarios that may come about, against which the model potential can be evaluated in post-optimal analyses. Clearly other assumptions may be made depending on the specific goals of the investigation.
5.4.2.3.1 Effects produced by changes in the soft wheat sale prices
The goal of this initial simulation is to determine how any changes in the soft wheat price impact on the company's gross revenues depending on its production strategy and its degree of specialization (table 5.4.2).
The results of this simulation exercise must be interpreted while bearing in mind that the model has no possibility to expand the variety of production processes that can, partially or totally, replace the accomplished processes and that production yields, as represented by technical coefficients, remain constant.
Having said that, the model behaves differently f rom the 'classic' LP model, since, rather than showing the best productive combination (while revealing any output changes), it gives economic clues, in that it determines the total variable costs resulting f rom the new shadow prices and, consequently, the 'new' gross revenues.
Any strictly economic information on the costs that farms should bear in order to keep pace with the newly developed market conditions is an addit ional consideration in the analysis of possible scenarios by farmers or public decision- makers. It indeed enables us to determine a priori what is the price limit required for a farm to stay in business as well as the degree of elasticity of the relation between price variations and gross revenues. It should be emphasized that the assumption made in the model, i.e. that production volumes remain unaltered, is particularly relevant to modern agriculture. As a matter of fact the newly proposed agricultural policies introduce a system of production quotas that drastically restrains farms and keeps them from increasing their total output and is in line wi th the latest environmental policies promoting extensive crops, thereby preventing any increase in yields.
Assuming that farmers wish to keep their output unchanged, as is often the case (farmers do not decrease their production with decreasing prices), they will upgrade their production technologies with the aim of cutting down costs in a long-term vision (Zamagni, 1984). In a long-term cost curve farms can lie on the left or on the right of the point of inflection: in the former case any price decrease involves a cost reduction, in the latter an increase in total costs results in a further reduction of total revenues.
5.4.2.3.2 Introduction of a compulsory set aside policy and its settlement
The goal of this second simulation is to evaluate the impact of compulsory set aside on crops and the farm revenues in a group of 8 farms that were either very large in size or fell nevertheless within the 'large producer' category on account of their significant corn output. In these farms it was assumed that 15% of the arable land would be set aside against payment of a compensation.
151

In this regard, for a better understanding of the repercussions of such measure, several levels of indemnity were considered (Lit. 350,000, 400,000, 450,000, 500,000, 550,000 and 600,000).
With a view to simulating the farmers' reactions to a set-aside policy, the model was changed as far as the objective functions of the two sub-models (linear and quadratic) were concerned, assuming compensation to be a component of gross saleable production.
The results of the simulation of a scenario, where set aside policies are introduced (table 5.4.3), while limited to a few production units, nonetheless allow to determine how accurate the model is in predicting the new policy effects on the farms under examination. The model shows, in particular, that the crops yielding the lowest production, such as barley, durum and soft wheat, are preferably set aside. Besides, it shows that set-aside is a profitable measure for farms and that farms do not lower their production costs, which actually remain constant. This appears to be a rather strange scenario, suggesting a 'slippage' effect that was actually seen in the set-aside implementation stage.
5.4.3 Conclusions
On completion of the empirical stage of PQP implementation some final conclusions can be drawn.
A first remark is about one of the vulnerable points where most models, wi th special regard to the so-called 'territorial' ones, fail. As you may recall, one of the weaknesses in the construction of LP models is the inability to pinpoint relevant technical coefficients that can reliably reflect the varying degree of technological progress of farms. Using a matrix f rom one technique, based on geographical or farm size distribution, does not allow to take into account the production course undertaken by farmers and, even more importantly, to evaluate the degree of specialization reached by them. PQP makes it possible to overcome this obstacle using a matrix that can be obtained directly f rom the account books, w i th no need for subjective evaluations and estimates. In this connection PQP is a very powerful analytical tool, in that it makes the most of all information that can be directly inferred from the books, wi th no impairment to the model development.
A second implication is that, thanks to the PQP method, simulation and planning models lose much of their 'normative' character, that sometimes made their findings somewhat unpalatable. The very development of useful tools to predict the effects of agricultural policy measures compels us to take account of some typical elements of a farm medium-term strategy, such as its production course. In this respect, the more models have a 'positive' content, the better they are to reflect the real strategies pursued by farmers.
On account of their ability to estimate total variable costs, these models are more innovative in character than 'classic' linear programming. This feature of theirs is particularly significant, for it allows to determine the new variable costs farms will have to bear as their product prices vary, thus providing individual farmers and decision makers wi th extremely useful information.
152

The results of some agricultural policy simulations revealed that the model can adapt to any production circumstances, and, even more so, it can be adjusted to cater for any special requirements according to the individual production courses and degree of specialization.
Despite the small sample investigated, PQP as a whole seems to show a remarkable potential in its ability to maximize the information contained in basic accountancy data and as a policy analysis tool that can provide invaluable information to predict the effects of measures having a direct impact on local economies.
References
Abitabile, C. (1995) Situazione e prospettive delta RICA in Italia, Atti del convegno 'Problemi e prospettive dell'utilizzazione dei dati RICA in Italia: un confronto tra utenti'; Roma, 28 febbraio
Agrawal, R.C. and E.O. Heady (1972) Operations Research Methods for Agricultural Decisions; Ames, The Iowa State University Press
De Benedictis, M. and V. Cosentino (1979) Economia dell'azienda agraria; Il Mulino, Bologna
Giacomini, C, L. Cesaro and F. Arfini (1992) Possibili conseguenze délie proposte Mac Sharry sull'agricoltura dell' Emilia Romagna; Roma, INEA
Giacomini, C. and F. Arfini (1993) Presupposti metodologici e applicativi delta programmazione lineare; in Metodologie per la programmazione in agricoltura (edited by Giacomini C), pp. 63-111, INEA, II Mulino, Bologna
Hazell, P.B. and R.D. Norton (1986) Mathematical Programming for Economic Analysis in Agriculture; New York, McMillian Publishing Company
Heady, E.O. and, A.C. Egbert (1964) Regional Programming of Efficient Agricultural Production Patterns; Eco-nometrica, pp. 374-386, Vol.32, n.3
Howit, R.E. (1990) Positive Mathematical Programming; University of California, Davis, Working Paper
153

Intriligator, M.D. (1971) Mathematical Optimization and Economic Theory; New York, Prentice-Hall
Meister, A.D., C.C. Chen and E. Heady (1978) Quadratic Programming Models Applied to Agricultural Policies; Iowa State University Press, Ames
Paris, Q. (1991) Programmazione lineare, un'interpretazione economica; II Mulino, Bologna
Paris, Q. (1993) PQP, PMP, Parametric Programming and Comparative Statics; University of California, Davis, Lecture Notes
Paris, Q. and CD. Easter (1985) A Programming Model with Stochastic Technology and Prices: The Case of Australian Agriculture; American Journal of Agricultural Economics, pp. 120-129, February
Zamagni, S. (1989) Economia politica: teoria dei prezzi dei mercati e della distribuzione, NIS, Roma.
154

Table 5.4.1 Comparison between real and estimated data as to oteand farm size
ITEM NUMBER
1 2 3 4 5 6 7 8 9
10 11 12 13 14 15 16 17 18 19 20 21 22 23 24 25 26 27 28 29 30 31 32 33 34 35 36 37 38 39 40 41 42 43 44 45 46 47 48 49 50 51 52 53 54
OTE
1110 1110 1110 1120 1220 1220 1220 1220 1220 1230 1230 1230 1230 1230 3120 3120 3120 3120 3210 3210 3210 3210 3210 3240 3240 3240 3240 3240 4110 4110 4110 4110 4120 4120 4120 4120 4120 4310 5130 6220 6220 6220 6230 6230 6230 6230 6230 6240 6240 6250 6250 6250 7110 7110
CLASS OF FARM
2 3 4 3 1 2 3 4 5 1 2 3 4 5 1 2 3 4 1 2 3 4 5 1 2 3 4 5 2 3 4 5 1 2 3 4 5 4 3 2 3 5 1 2 3 4 5 3 4 1 3 4 3 4
TOTAL UAA (HA)
6.5 15.1 23.8 10.5 2.5 9.6
10.5 35.4 93.9 3.0 7.2
13.6 44.4 67.0 4.7 8.0
13.2 23.8 4.9 8.1
10.2 20.7 63.2 3.8 8.2
10.2 47.6 60.5 6.2
17.0 38.8 75.0 5.3
10.8 15.9 30.0 59.8 27.4 15.7 5.9
11.7 50.4 3.6 8.7
14.4 21.6 63.9 19.0 21.2 4.2
17.0 26.9 17.0 21.0
TOTAL AUB
_ -------
27.7
-------------------
33.6 32.1 45.4 81.7 28.8 30.5 55.2 74.2
128.2 75.4
--------
5.7 --
8.2 12.9 59.0 42.2
REAL GSP (.000 di £)
20,749 47,352 52,662 43,615
7,810 35,880 38,376
125,350 279,747
37,926 23,014 94,528
218,640 680,417
81,500 78,720 66,255 26,550 81,382 56,691 79,066
139,085 252,818
24,650 85,335 91,089
295,383 281.262 149,639 140,173 139,153 361,745 129,550 121,015 313,453 238,076 605,919 386,477
1,031.774 37,407 64,250
157,754 14,567 96,410
106,556 138,097 234,035
93.748 150,645
16,791 29,485
155,146 169,369 198,931
REAL TVC (.000 di £)
7,080 15,802 21,571 17,947 2,748
13,835 16,588 34,863
182,164 15,511
5,356 37,345
126,201 300,361
18,057 4,728 6,839 5,424
21,662 12,420 28,015 55,206
104,143 11,524 10,657 13,939
122,467 164,641
53,199 77,460 93,389
227,926 60,158 79,297
120,610 99,436
263,992 118,476 528,198
14,969 13,507 75,012
4,727 19,005 33,462 45,272 84,159 36,702 72,714
5,255 13,052 43,995 68,285 66,895
ESTIMAT. GSP (.000 di £)
17,662 41,321 47,834 43,615
7,811 35,996 37,853
125,098 274,889
37,048 23,423 94,635
231,335 680,909
36,600 8,077
66,216 27,537 76,086 56,617 71,208
134,284 249,310
24,650 81,603 89,427
293,940 305,438 156,821 139,226 140,149 375,040 129,232 118.638 306,718 238,264 605,092 330,565
1,109,344 38,780 64,213 87,439 15,844 96,227
102,226 134,530 218,164
81,918 150,613
16,769 30,877
155,058 149,456 205,326
ESTIMAT. TVC (.000 d £)
7,235 16,738 23,056 18.029 2,876
12,834 16,680 34,121
190.520 16,510
5,710 35,580
129,090 272,019
18,297 4,631 7,324 5,199
21,264 12,582 28,641 57,369
101,876 12,325 10,251 14,571
121,990 163,562
54,053 79,294 91,523
226,696 63,021 79,708
121,948 94,634
279,487 112,654 541,484
14,279 14,169 76,454
4,873 20,228 33,375 48,416 88,484 35,734 71,173
5,583 12,504 47,727 66.451 65,407
GSP % ERR
-14.9 -12.7
-9.2 0.0 0.0 0.3
-1.4 -0.2 -1.7 -2.3 1.8 0.1 5.8 0.1
-55.1 -89.7
-0.1 3.7
-6.5 -0.1 -9.9 -3.5 -1.4 0.0
-4.4 -1.8 -0.5 8.6 4.8
-0.7 0.7 3.7
-0.2 -2.0 -2.1 0.1
-0.1 -14.5
7.5 3.7
-0.1 -44.6
8.8 -0.2 -4.1 -2.6 -6.8
-12.6 0.0
-0.1 4.7
-0.1 -11.8
3.2
TVC% ERR
2.2 5.9 6.9 0.5 4.7
-7.2 0.6
-2.1 4.6 6.4 6.6
-4.7 2.3
-9.4 1.3
-2.1 7.1
-4.1 -1.8 1.3 2.2 3.9
-2.2 7.0
-3.8 4.5
-0.4 -0.7 1.6 2.4
-2.0 -0.5 4.8 0.5 1.1
-4.8 5.9
-4.9 2.5
-4.6 4.9 1.9 3.1 6.4
-0.3 6.9 5.1
-2.6 -2.1 6.2
-4.2 8.5
-2.7 -2.2
155

Table 5.4.1 (continue)
ITEM NUMBER
55 56 57 58 59 60 61 62 63 64 65 66 67 68 69 70 71 72
OTE
7110 8110 8110 8110 8120 8120 8120 8130 8130 8140 8140 8140 8210 8210 8220 8220 8220 8220
CLASS OF FARM
5 3 4 5 3 4 5 4 5 2 3 4 1 4 1 2 3 4
TOTAL UAA (HA)
51.3 16.5 20.0
108.5 15.5 48.7
145.4 23.4 60.2 8.5
19.0 27.0 4.8
21.2 3.0 9.3
15.3 40.0
TOTAL AUB
75.9 20.1 10.1 69.7 13.7 71.8
REAL GSP (.000 di £)
249,442 9,261
31,355 252,593 108,357 354,998
200.41,070,436 6.3
57.7 9.5
10.4 15.4
---
8.1
-35.5
49,603 291,054
25,464 37,085 66,612 39,195
185,521 147,251
50,580 320.384
96,565
REAL TVC (.000 di £)
152,778 52,497 13,608
142,360 52,674
143,973 452,812
23,828 120,067
13,591 17,575 30,279 18,708
103,108 84,639 34,960
174,612 46,151
ESTIMAT. GSP (.000 di £)
249,342 89,256 29,563
236,847 102,236 328,751
1,063,804 45,188
281,940 26,096 35,857 46,349 39,986
186,058 148,075
50,123 318,366
96,466
ESTIMAT. TVC (.000 d £)
156,212 54,105 14,758
147,824 51,093
155,051 476,517
22,603 133,000
13,038 17,921 31,919 16,878
107,260 72,241 35,906
176,027 48,690
GSP % ERR
0.0 -3.6 -5.7 -6.2 -5.6 -7.4 -0.6 -8.9 -3.1 2.5
-3.3 -30.4
2.0 0.3 0.6
-0.9 -0.6 -0.1
T V C % ERR
2,2 3.1 8.5 3.8
-3.0 7.7 5.2
-5.1 10.8 -4.1 2.0 5.4
-9.8 4.0
-14.6 2.7 0.8 5.5
156

Table 5.4.2 Results of soft wheat price variations In LP model
MODEL N.3-OTE1110
%Var
25 15 5 0
-5 -15 -25
Soft wheat prices (£)
41,250 37,950 34,650 33,000 31,350 28,050 24,750
-CL.4
Estim. GSP (.000 £)
55,323 53,077 50,830 47,835 48,584 46,337 44,091
Estim. TVC (.000 £)
28,169 26.635 25,101 23,056 23,568 22,034 20,500
Estim. GM (.000 £)
27,154 26,441 25,728 24,778 25,016 24,303 23,591
GSP% Var.
15.65 10.96 6.26 0.00 1.57
-3.13 -7.83
TVC% Var.
22.18 15.52 8.87 0.00 2.22
-4.43 -11.09
G M % Var.
9.59 6.71 3.83 0.00 0.96
-1.92 -4.79
MODEL N.46 - OTE 6230 - CL.4
% Var
25 15 5 0 -5
-15 -25
Soft wheat prices (£)
37,500 34,500 30,000 30,000 28,500 25,500 22,500
Estim. GSP (.000 £)
137,154 136,104 135,054 134,530 134,005 132,956 131,906
Estim. TVC (.000 f )
45,015 46,375 47,735 48,416 49.096 50,456 51,816
Estim. GM (.000 £)
92,138 89,729 87,319 86,114 84,909 82,500 80,090
GSP % Var.
1.95 1.17 0.39 0.00
-0.39 -1.17 -1.95
TVC% Var.
-7.02 -4.22 -1.41 0.00 1.40 4.21 7.02
G M % Var.
7.00 4.20 1.40 0.00
-1.40 -4.20 -7.00
MODELL N .9 - OTE 1220 - CL.5
%Var
25 15 5 0
-5 -15 -25
Soft wheat prices (£)
43,996 40,477 35,197 35,197 33,437 29,917 26,398
Estim. GSP (.000 £)
277,010 276.161 275.313 274,889 274,464 273,615 272,767
Estim. TVC (.000 £)
191,947 191,376 190,805 190,519 190,234 189,662 189,092
Estim. GM (.000 £)
85,063 84,786 84,508 84,369 84,230 83,953 83,675
GSP% Var.
0.77 0.46 0.15 0.00
-0.15 -0.46 -0.77
TVC% Var.
0.75 0.45 0.15 0.00
-0.15 -0.45 -0.75
G M % Var.
0.82 0.49 0.16 0.00
-0.16 -0.49 -0.82
MODELL N.51 - OTE 6250 - CL.3
% Var
25 15 5 0
-5 -15 -25
Soft wheat prices (£)
42,500 39,100 34,000 34,000 32,300 28,900 25,500
Estim. GSP (.000 £)
32,151 31,641 31,131 30,877 30,621 30,111 29,601
Estim. TVC (.000 £)
13,566 13,141 12,716 12,504 12,291 11,866 11,441
Estim. GM (.000 £)
18,585 18,500 18,415 18,373 18,330 18,245 18,161
GSP % Var.
4.13 2.47 0.82 0.00
-0.83 -2.48 -4.13
TVC% Var.
8.49 5.09 1.70 0.00
-1.70 -5.10 -8.50
G M % Var.
1.15 0.69 0.23 0.00
-0.23 -0.70 -1.15
157

MODELL N.27 - OTE 3240 - CL.4
%Var
25 15 5 0
-5 -15 -25
Soft wheat prices (£)
41,403 38.090 33,122 33.122 31,466 28,154 24,842
Estim. GSP (.000 £)
300,461 297,949 295,277 293,940 292,604 289,932 287,259
Estim. TVC (.000 £)
111,876 115,772 119,917 121,990 124,062 128,207 132,352
Estim. GM (.000 £)
188,585 182,177 175,359 171,950 168,542 161,724 154,907
GSP% Var.
2.22 1.36 0.45 0.00
-0.45 -1.36 -2.27
TVC% Var.
-8.29 -5.10 -1.70 0.00 1.70 5.10 8.49
G M % Var.
9.67 5.95 1.98 0.00
-1.98 -5.95 -9.91
MODELLO .55 - OTE 7110 - CL.5
%Var
25 15 5 0
-5 -15 -25
Soft wheat prices (£)
37,500 34,500 30,000 30,000 28,500 25,500 22,500
Estim. GSP (.000 £)
253,542 251,862 250,182 249.342 248.502 246,822 245,142
Estim. TVC (.000 £)
159,075 157,930 156,784 156,212 155,639 154,494 153,348
Estim. GM (.000 £)
94,466 93,932 93,397 93,130 92,862 92,328 91,793
GSP% Var.
1.68 1.01 0.34 0.00
-0.34 -1.01 -1.68
TVC% Var.
1.83 1.10 0.37 0.00
-0.37 -1.10 -1.83
G M % Var.
1.43 0.86 0.29 0.00
-0.29 -0.86 -1.44
MODELL N.34 - OTE 4120 - CL.3
%Var
25 15 5 0
-5 -15 -25
Soft wheat prices (£)
39,883 36,692 31,906 31,906 30,311 27,120 23,930
Estim. GSP (.000 £)
309,416 308,336 307,257 306,718 306.178 305.099 304,020
Estim. TVC (.000 £)
123.774 123.043 122,313 121,948 121,583 120.853 120.122
Estim. GM (.000 £)
185,642 185,293 184,944 184,770 184,595 184,246 183,898
GSP% Var.
0.88 0.53 0.18 0.00
-0.18 -0.53 -0.88
TVC% Var.
1.50 0.90 0.30 0.00
-0.30 -0.90 -1.50
G M % Var.
0.47 0.28 0.09 0.00
-0.09 -0.28 -0.47
MODELL N.58 - OTE 8110 - CL.5
%Var
25 15 5 0
-5 -15 -25
Soft wheat prices (£)
39.096 35.969 31,277 31,277 29,713 26,585 23,458
Estim. GSP (.000 £)
239,661 238,536 237.280 236,847 236,284 235,157 234,032
Estim. TVC (.000 £)
149,730 148.968 148,117 147,824 147,442 146,679 145,917
Estim. GM (.000 £)
89,931 89,568 89.163 89,023 88,841 88,478 88.115
GSP% Var.
1.19 0.71 0.18 0.00
-0.24 -0.71 -1.19
TVC% Var.
1.29 0.77 0.20 0.00
-0.26 -0.77 -1.29
G M % Var.
1.02 0.61 0.16 0.00
-0.20 -0.61 -1.02
158

Table 5.4.3 Results of simulation of set-aside introduction
MODELL N
Compensation payment (.000 £)
0 350 400 450 500 550 600
1.3-OTE 1110-'
Soft wheat (Q.li)
623 490 490 490 490 490 490
Corn (Q.li)
383 383 383 383 383 383 383
CL.4
Estim. GSP (.000 £)
47,834 43,422 43.422 43,422 43,422 43,422 43,422
Estim. TVC (.000 £)
23,056 23,056 23,056 23,056 23,056 23,056 23,056
GM without comp. payments (.000 £)
24,778 20,366 20,366 20,366 20,366 20,366 20,366
Level of comp. payments (.000 £)
0 5,250 6,000 6,750 7,500 8,250 9.000
GM with comp. payments (.000 £)
24,778 25,616 26,366 27,116 27,866 28,616 29,366
GM % Var.
0.00 3.38 6.41 9.44
12.46 15.49 18.52
MODELL N. 31. - OTE 4110 - CL.4
Compensation
Soft wheat
payment (Q.li) (.000 £)
0 350 400 450 500 550 600
130 130 130 130 130 130 130
Selled Barley (Q.li)
19.6 19.6 19.6 19.6 19.6 19.6 19.6
Reinvested burley (Q.H)
125 73 73 73 73 73 73
Feed corn (Q.li)
350 350 350 350 350 350 350
Estim. GSP (.000 £)
140,149 140,148 140,148 140,148 140,148 140,148 140,148
Estim. TVC
GM without comp.
(.000 £) payments
91,533 91,533 91,533 91,533 91,533 91,533 91,533
(.000 £)
48,616 48,615 48,615 48,615 48,615 48,615 48,615
Level of comp.
GM with comp.
payments payments (.000 £)
0 2,100 2,400 2,700 3,000 3,300 3.600
(.000 £)
48,616 50,715 51,015 51,315 51,615 51,915 52,215
GM% Var.
0.00 4.32 4.93 5.55 6.17 6.79 7.40
MODELL N.46. - OTE 6230 - CL.4
Compensation payment (.000 £)
0 350 400 450 500 550 600
Durum wheat (Q.li)
349.9 232.8 232.8 232.8 232.8 232.8 232.8
Corn (Q.li)
790 790 790 790 790 790 790
Estim. GSP (.000 £)
134,520 131,007 131,007 131,007 131,007 131,007 131,007
Estim. TVC (.000 £)
36,374 36,374 36,374 36,374 36,374 36,374 36,374
GM without comp. payments (.000 £)
98.146 94.633 94,633 94,633 94,633 94,633 94,633
Level comp. payments (.000 £)
0 3,717 4,248 4.779 5.310 5,841 6,372
GM with comp. payments (.000 £)
98,146 98,350 98,881 99,412 99,943
100,474 101,005
GM % Var.
0.00 0.21 0.75 1.29 1.83 2.37 2.91
159

MODELL N. 61. - OTE 8120 - CL.5
Compensation payment (.000 £)
0 350 400 450 500 550 600
Soft wheat (Q.H)
541.4 541.4 541.4 541.4 541.4 541.4 541.4
Corn (Q.N)
376.8 376.8 376.8 376.8 376.8 376.8 376.8
Barley Estim. GSF (Q.li) (.000 £)
390 1,063,805 220.8 1,059,079 220.8 1.059,079 220.8 1,059,079 220.8 1,059,079 220.8 1,059,079 220.8 1,059,079
' Estim. TVC (.000 £)
461,182 461,182 461,182 461,182 461,182 461,182 461,182
GM without comp. payments (.000 £)
602,623 597,897 597,897 597,897 597,897 597,897 597,897
Level of comp. payments (.000 £)
0 6,895 7,988 8,986 9,985
10,983 11,982
GM with comp. payments (.000 £)
602,623 604,792 605,885 606,883 607,882 608,880 609.879
GM % Var.
0.00 0.36 0.54 0.71 0.87 1.04 1.20
160

Table 5.4.4 Results of soft wheat price variations in P.O. Sub-model
MODELLO .7 - OTE 1220 - CL.3
Var.% Soft Estim. wheat GSP price (.000 £)
Estim. TVC (.000 di
£)
Estim. GSP GM % (.000 di
£)
TVC %
GM %
Soft Sorghum Sugar-Wheat (q.li) beet (q.li) (q.li)
Potatoes Alfa-(q.li) alfa
(q.li)
25 37,245 36,914 14,265 22,649 -2.48 -14.48 6.97 213 12 1,344 38 105 15 34,265 37,231 15,198 22,033 -1.64 -8.88 4.06 201 14 1,453 39 113 5 29,796 37,626 16,175 21,451 -0.60 -3.03 1.31 190 17 1,563 39 122 0 29,796 37,853 16,680 21,173 0.00 0.00 0.00 183 18 1,619 40 126
-5 28,306 38,099 17,195 20,904 0.65 3.09 -1.27 178 19 1,674 40 130 -15 25,327 38,650 18,258 20,392 2.11 9.46 -3.69 166 22 1,786 41 139 -25 22,347 39,279 19,364 19,915 3.77 16.09 -5.94 154 25 1,898 42 147
MODELLO .27 - OTE 3240 - CL.4
Var.%
25 15 5 0
-5 -15 -25
Soft wheat price (£)
41,403 38,090 33.122 33,122 31,466 28,154 24,842
Estim. GSP (.000 £)
263,136 267,623 281,248 293,940 312,872 326,396 326,396
Estim. TVC (.000 di £)
79,566 89,412
107,660 121,990 141,883 155,556 155,556
Estim. GM (.000 di £)
183,570 178,211 173,588 171,950 170,989 170,840 170,840
GSP %
-10.48 -8.95 -4.32 0.00 6.44
11.04 11.04
TVC %
-34.78 -26.71 -11.75
0.00 16.31 27.52 27.52
GM %
6.76 3.64 0.95 0.00
-0.56 -0.65 -0.65
Soft Wheat
(q.li)
1,829 1,593 1,153 806.9
327 0 0
Pisum (q.li)
107 220 476 700
1.028 1,261 1,261
Potatoes (q.li)
83 112 152 178 207 225 225
MODELLO .46 - OTE 6230 - CL.4
Var.% Soft Estim. Estim. Estim. GSP TVC wheat GSP TVC GM % % price (£) (.000 £) (.000 di £) (.000 di £)
GM Durum Corn Sugar- Potatoes % Wheat (q.li) beet (q.li)
(q.li) (q.li)
25 15 5 0
-5 -15 -25
37,500 34,725 31,500 30,000 28.500 25,500 22,500
131,802 132,545 133,752 134,529 135,423 137,558 140,157
42,340 44,596 47,085 48,415 49,805 52,757 55,942
89,462 87,949 86,667 86,114 85.618 84,801 84,215
-2.03 -1.47 -0.58 0.00 0.66 2.25 4.18
-12.55 -7.89 -2.75 0.00 2.87 8.97
15.55
3.89 2.13 0.64 0.00
-0.58 -1.52 -2.21
543 465 388 349 311 233 156
553 647 742 790 837 932
1,027
3,030 3,241 3,452 3,558 3,663 3,874 4,085
527 547 567 577 586 606 626
161

5.5 THE REORGANIZATION PROJECT OF THE ITALIAN RICA
Carla Abitabile 1)
5.5.1 Part II: The sample of farms and the quality of data
Introduction
The definition of the RICA sample is seen in the context of the new organization in regional networks. Each of these has specific characteristics (part I). The national sample is the result of the aggregation of the regional samples that may vary in the first phase of application of the Project. In any case, to get a good national sample, the regional samples must guarantee the representativeness at least at regional level, a homogeneous processing of data in relation to control and validation, and the use of a methodology that assures the production of the data requested by UE (part III).
The present situation
According to the tasks of RICA liaison agency, INEA draws the theoretical sample by starting from the RICA field of observations, in its turn derived f rom the last available agricultural census. Farms are classified on the basis of Sgm in strata defined by type of activity (EC typology 1985) and classes of Esu (starting f rom 2 Esu) for each region. In Italy the altimetric level is also considered as a further stratification parameter for its importance in influencing farm production.
The sampling procedure draws a stratified sample with optimal allocation (Neyman) and uses Sgm as pilot variable so that the number of farms in each stratum of the sample depends on the variability of Sgm inside the respective strata of the population.
At this point there should be a random selection of farms f rom the universe, as a starting point to assure the representativeness of the sample. But problems due to the unavailability of the census list, on the one hand, and to the above mentioned organizational defects, on the other, makes this impractical.
Generally, therefore, the selection of sample farms is made by technicians themselves from a sub-universe made up of farms that have requested the EC contribution for their accountancy (Reg. 2328/91/EEC) and/or associated farms and/or farms entering in a network of technical assistance 2). The farms are
1) See paragraph 3.5; The context. 2) Then the sample configures itself better as a quota sample.
162

chosen on the basis of various (subjective) considerations, nevertheless technicians do try to respond to the theoretical sample.
As far as the gathering activity of technicians is concerned, general systematic control procedure does not exist. However the local structures, in collaboration wi th the INEAs regional offices, make random controls on the farms and on the technicians themselves.
The quality of data is assured by automatic procedures that run about 300 univariate controls. A quota of them are processed at regional level, during the gathering data activity or immediately afterwards. This contrasts w i th the EC programs which are run at central level by INEA.
5.5.2 The future sample and quality management of data
The RICA field of observation
The definition of the field of observation is necessary to get the sample. In the RICA context the Eu is interested in knowing the economic situation of commercial farms, that is farms exceeding a minimum economic size. There is however another need which has arisen recently and that is to get sufficient cognitive elements about those units that are not very important from an economic point of view but that have rural and environmental functions. Hence it is necessary to define a double field of observation. The first is related to commercial farms, the second to all the others.
The RICA sample
The RICA sample must be representative of the regional agricultural situations. This implies first of all that the selection of the units f rom the universe must be random inside the strata defined by the classification.
The sample size depends on the territorial level 1) which it is referred to, on the precision desired, and not least, on the budget available.
As far as the sampling technique is concerned, the present technique of stratified sampling is maintained. Nevertheless, it is inserted in a panel survey. Such a system unables us to answer some interesting questions such as the estimation of individual variation across time and the estimation of behavioural models (evaluation of the impact of economic politics).
1) For example, some Regions could decide to have a representative sample at provincial level.
163

The universe and the selection of farms
This phase is strategic for the utilization of the data. As we said previously, it is the kind of selection of farms that influence the capacity of the sample to represent the real agricultural situation.
To get a random selection it is necessary, first of all, to have access to the census lists of the farms. It is here that the collaboration with the National Institute of Statistics is indispensable. Unfortunately, at present, they are unwil l ing to give these lists to us.
A possible alternative could be to explore the use of administrative files of farms as universe from which the farms of the RICA sample could be drawn out 1).
The application of statistical techniques to improve the representativeness of the RICA sample
Several problems can introduce bias elements in the sample itself. These include: problems due to the choice of universe and to the relative methodological and definition differences, difficulties which arise in the collection of data and problems inherent to the adopted statistical technique. Thus it is necessary to use specific statistical techniques of data treatment to improve the significancy of estimations.
A recent study done by INEA (Filippucci, 1995) has demonstrated, on three RICA regional samples, that the problems of the sample bias can be reduced by linking the survey wi th external parameters (such as structural surveys).
In short it suggests working on the data 'a posteriori', first of all by a procedure that identifies outliers and then corrects the weight of the sample units in the estimation process. The experimented methods (radio estimator, post-stratification technique) produce an improvement in our estimations.
An example of this can be seen in table 5.5.1, where the estimations of total output and intermediate consumptions are reported, corrected and not corrected. The same variables calculated by the National Institute of Statistics (ISTAT) are shown for comparison.
As we can see, the average difference is about 10%. This means that the impact of correction is relevant. In five out of six cases, not-corrected estimations differ from ISTAT values more than the corrected ones. Without entering in further details, we can say that the results obtained suggest the need to extend the method to all the sample systematically. However, a preliminary study on the representativeness of the regional samples would first be necessary.
1) An experiment of this kind has been done in one Region (Valle d'Aosta) for the 1996 regional sample (Seroglia, 1996). The first results obtained in terms of distribution of farms in the typological strata seem to give a good respondence to the reality. Of course the future availability of accountancy data will permit to check better the goodness of the method.
164

Table 5.5.1 Estimations of total output and intermediate consumptions with (corr. est.) and without (not corr. est.) correction of data and comparison with ISTAT(1990 data, values in billions of lire)
Regions Parameters IST AT corr. est. not corr.est.
Toscana Total output 2,362 2,657 3,184 Toscana Interm. cons. 651 1,228 1,449 Marche Total output 1,618 1,612 1,503 Marche Interm. cons. 493 787 781 Campania Total output 4,358 3,298 3,459 Campania Interm. cons. 799 1,064 1,103
The controls of the data
The present procedure of controls on data has evolved through a continuous adjustment process over a long period of t ime. It is t ime now for its revision, starting from a theoretical modelization of the system with an entity-relationship approach. In such a way it would be possible to rationalize the present controls, to eliminate the possible redundancy and the controls which are no longer useful.
On the basis of this model, univariate control P.C. procedure can be made. This is run in a local (regional) context as well as the relative corrections. So the data that arrive at the central network have already been checked and can be processed by a multivariate control program, as further warranty of quality.
References
Abitabile, C. (1995) Present situation and perspectives of the RICA in Italy (in Italian); Paper presented at the National Seminar on: Problems and perspectives of the utilization of the RICA data in Italy: an users comparison; Rome; February 28th
INEA(1991) The farm accountancy in Italy. Vol. 1: INEA (in Italian); Rome, National Institute of Agricultural Economy
INEA (1996) The reorganization project of the Italian RICA (in Italian); Rome; Draft version
165

Filippucci, C. (1995) The Statistical utilization of the RICA data and the perspectives of a reorganization of the survey (in Italian); Rome, National Institute of Agricultural Economy; Draft version
Filippucci, C, F. Alboni, A. Fabbiani (1993) A statistical investigation on farm accountancy data network; Paper presented at the ASA congress
Seroglia, G. (1996) The representative sample of Valle d'Aosta farms on the base of regional administrative files (in Italian); INEA; Draft version
166

5.6 POSSIBLE CHANGES / INNOVATIONS IN THE SPANISH FADN
Inmaculada Astorkiza
Functioning of the Spanish FADN (RECAN)
(E) Classification of innovative ideas: Quality Management 1. Description of the proposed change
Revise the representativeness of the sample because according to some of those surveyed the current sample does not reflect well the reality in the regions.
2. Description of the benefits Greater quality in the statistics. Greater benefit for the policy makers. The survey indicates that some regional governments are not habitual users of the RECAN for all these reasons
Autonomous Regions with Collaboration Agreements
(A) Classification of innovative ideas: Quality Management 1. Description of the proposed change
To increase the communication and exchange of information with the heads of RECAN (periodical technical reunions) as between the RICA and the users of the system (network).
2. Description of the benefits The benefits which normally arise from closer cooperation between the heads of different Administrations.
(B) Classification of innovative ideas: Quality Management 1. Description of the proposed change
Augment the representativeness of the sample in some types of farming and European Size Units (ESU), as some are over-represented and others under-represented depending on the farms associated with the centres/groups/institutes of management.
2. Description of the benefits Greater quality of statistics provided. Greater benefit to the policy makers.
167

Functioning of the accounting offices
(B) Classification of innovative ideas : Quality Management 1. Description of the proposed change
Greater economic incentives for the participating farmers and the AO's (especially if they are both urged to provide more functions) and a greater level of professionalism. Payment would depend on the difficulty of the accounting.
2. Description of the benefits Greater disposition of these to participate and to provide more data, etc.
168

6. INFORMATION TECHNOLOGY
INTRODUCTION
During the plenary session in which the participants presented their ideas, the following keywords were noted to the subject information technology. These keywords can be find again in the papers which are presented in this chapter.
Accounts with different levels of detail Systems specialist meeting Rural enterprises Standard data files RICA on the Internet Computerised information model New farm return
169

6.1 USE ACCOUNTS WITH DIFFERENT LEVELS OF DETAIL
Beat Meier 1)
6.1.1 Innovation
6.1.1.1 Status Quo, problem definition
The Swiss FADN uses accounts with a highly disaggregated data. For all production branches (enterprises) of a farm, data for the calculation of gross margins must be provided. The distribution of all inputs and outputs takes a lot of time. The willingness of the farmers to provide so detailed data is decreasing.
These accounts allow a profound economic analysis (intra-farm and inter-farm comparisons). For the establishment of income indicators, less detailed (and cheaper) data are sufficient. For specific economical or ecological questions, even more details are required (attribution of fixed costs, physical inputs per animal/hectare).
With the present request for a uniform, high level of data disaggregation, it is: a) very difficult to ask for more details if all farms must fulfill it; b) very difficult to enlarge the sample; c) very difficult to obtain a random sample (high non-response rate).
6.1.1.2 Proposed innovation
Accounts with different levels of detail are accepted for the FADN. The range is open from simple financial accounts to complex gross margin accounts, with a minimum of technical data or detailed lists of physical inputs (intermediate consumption, labour etc.). For these different accounts, there must (?) be one common concept, as for the definition of sectors (farm/household delimitation) or the valuation and depreciation. A compromise must be made on how much a farmer can adapt the accounts to the farm reality and how uniform the data must be to allow statistical evaluation.
The compensation for the accounts can easily be adapted to the value of the different levels of detail. Example: Costs in Wheat and Barley (simplified).
1) See paragraph 3.1; Introduction.
170

Present Fixed System 410 Wheat
470 Barley
01 Seeds
07 Plant protection
10 Fertilizer
01 Seeds
07 Plant protection
10 Fertilizer
Proposed flexible system:
Possibility A
410 wheat
470 Barley
01 Seeds
07 Plant protection
10 Fertilizer
99 Variable Inputs
10.1 N-Fertilizer
10.2 P-Fertilizer
10.3 K-Fertilizer
Possibility B
499 Cereals
01 Seeds
07 Plant protection
10 Fertilizer
07.1 Herbicides
07.9 Other Plant prot.
171

6.1.2 Involved stakeholders
Farmer/accountant: a survey shows: the innovation is an answer to the increasing demand for flexibility. In general, farmers want to provide less detailed data, w i th more flexibility for one or a few key sectors per farm. The farmer mainly provides detailed data where he has a personal interest. Less important production branches can be summarized.
Extension/research: a survey shows: more details on certain (e.g. new) production branches are demanded.
Policy makers/administration: more information at lower costs required; demand for disaggregated data on farm type/ region level (not on farm level).
6.1.3 Expected benefits
Available data is not anymore determined by the lowest common denominator. Aggregated data provided at lower costs. Random sampling easier: improved representativity for highly aggregated indicators (e.g. income). New production branches can easily be introduced(?). Higher compensation only for detailed data necessary.
172

6.2 SYSTEM SPECIALISTS MEETINGS
Lars-Eric Gustafson
6.2.1 Background
It is common knowledge that: the number of countries in FADN has increased since the system was developed; the need of FADN data has changed and the methodology has not been adjusted to the needs of today; the information technology has developed considerably since the system was built.
In discussions in the PACIOLI seminars we have heard about plans regarding a major revision of the total FADN from a technological point of view. We have also observed and are expecting major changes in policy makers' and researchers' need of information based on FADN data because of the changes in agricultural policy and the increased internationalization.
There is also work going on concerning system development of national FADNs. Newly arrived member countries are adjusting their national farm accounting systems to the principles of FADN. Other member countries are revising their existing systems. In addition we are expecting further more countries to join EU in the near future, that may take benefit of experiences from implementation and revision of various national FADNs.
Against this background we f ind it motivated to arrange regular meetings for system specialists from each member country, in order to discuss strategic issues concerning the revision of the total FADN and the implementation and revision of the national FADNs.
6.2.2 Issues concerning FADN
There is (at least) six major issues that concern FADN system development, that should be given priority: 1. since new member countries have arrived lately and other countries are
expected to join in the near future, there are urgent needs for establishing standards when developing systems according to the principles of FADN. Also for other member countries who are planning for major revisions of their existing systems, standards are needed. This issue should be discussed in the frame of system specialists meetings;
2. the establishment of standards is a datalogical issue. Before reaching that stage we have to have a principle agreement on possible changes in FADN contents. PACIOLI should be the starting point for such discussions.
173

Hopefully the PACIOLI meetings will lead to continued and deepened discussions on FADN contents, among subject specialists from the member countries;
3. we should also have a principle agreement on data quality issues. In a broad sense this is about how to prevent false interpretation and use of FADN data. This issue should also be discussed among subject specialists;
4. there is also a need to discuss data accessibility and data confidentiality. This issue has to be discussed among those in charge of FADN data register management in each member country;
5. we should also have in mind that a major revision of the total FADN, containing all data from the community, have been discussed, and probably is required. The principles for such a modernised system could be discussed in the frame of system specialists meetings;
6. there is also an obvious need to discuss issues concerning the connection between all national FADNs and the total FADN. This could also be done in the frame of system specialists meetings.
6.2.3 What should be discussed in system specialists meetings?
Concerning issue 1 and 5, system specialists meetings could deal with the following discussion points:
choice of software and hardware technique; general principles for arranging data in the database; how to technically gain control of data confidentiality?; how to technically gain control of data quality?
Concerning issue 6, the following discussion points could be raised: data communication arrangements; a common format for delivery of data.
6.2.4 Comments and reflections on the discussion points
Choice of hardware and software technique
FADN 1) should be based on what is modern technology today. This means that FADN could be located in a PC/Windows environment. Another alternative is to base FADN on the operating system UNIX.
1) With FADN we mean a revised total FADN, as well as all revised or newly implemented national FADNs.
174

FADN should be database oriented. Technically this means that FADN data would be stored and processed in the frame of a so-called database management system (for instance Oracle or Sybase SQL server). Database orientat ion is in line w i th the ambition to facilitate planned, as well as unplanned extraction of FADN data for various use.
FADN should be based on the client/server technique. The client/server technique implies dataprocesses to be both logically and physically divided into two different parts, where one part is executed close to the database (in a database server) and another part is executed close to the user (in a workstation). Today, database orientation in most cases implies use of the client/server technique.
General principles for arranging data in a database
As far as we know FADN will continue to be microdata oriented, where data are stored about single holdings. Thus the starting point for storage of data in FADN is the holding. Another possible object around which we could store data is all products related to activities in farms. If there are plenty of variables to handle in FADN (which it is in fact today), and a lot of them are not applicable for each holding (for instance o//Ve production in Swedish holdings) there is a possibility to store data in the format object-variable-value. In that case data would not be object-row oriented but object-row-column oriented, using terminology from the relational database theory. This implies data that are not applicable to be physically skipped and not stored.
How to technically gain control of data confidentiality?
If we in a technical sense want to gain control of in what extent different users may access different data there are two major possibilities:
each user is put in one from a number of various user groups wi th different access rights to FADN data; data that are marked sensitive have to be aggregated to a level where no one may backwards identify microdata, before accessing data.
The first point may be solved by implementing so-called table views in the FADN database. In other words, each user group has its own view of what data there is in the database. What he or she is not allowed to access is left out of the view.
The other point may be solved by implementing confidentiality f lags and confidentiality algorithms. A confidentiality f lag is a data-item associated to each value. This flag indicates whether the value is considered to be confidential or not.
Principles for what data that should be considered as confidential, could preferably be established by the member countries together.
175

How to technically gain control of data quality?
This could technically be done by implementing quality flags and footnotes in FADN. A quality flag is a data-item associated to each single value or group of values, and indicates the level of quality. For instance a single value or a group of values could be marked uncertain or certain. A footnote gives more extensive textual information about quality that may be of use when interpreting data. Footnotes could include information about for instance methods used when accounting FADN data. Footnotes could also contain remarks and explanations on FADN data.
To guarantee quality in FADN data, each member country should be obliged to integrate appropriate quality related information with data delivered to the total FADN.
Data communication arrangements
To make the total FADN a more open system, users outside DG VI should get access to it. Especially main partners in the member countries should get telecommunication services opened, in order to at least be able to look at FADN data. If the member countries want to deliver data to the total FADN via electronic data interchange (EDI), another main task will be how to arrange the telecommunication services.
A common format for delivery of data
If the member countries want to deliver FADN data via electronic data interchange, we have to decide in which messageformat. We should have a look at what standards there are on the market. There is for example the GESMES format. GESMES is an acronym for Generic Statistical Message. It is an electronic message which has been designed to support the exchange of multidimensional statistical arrays and time series data.
6.2.5 Summary
We suggest that there will be held system specialists meetings every half a year, wi th an initial meeting in June 1996. Participants should preferably be one or two persons from each member country, in charge of technical tasks concerning the national FADNs. These meetings should mainly deal wi th the fol lowing three issues:
technical principles for national FADNs; technical principles for a revised total FADN; communication arrangements between all national FADNs and the total FADN.
176

6.3 CREATING A DATABANK OF FARMS AND RURAL ENTERPRISES IN FINLAND - A PILOT PROJECT
Jouko Siren
Backround
Farm Accountancy Data Network (FADN) was established in Finland in 1912. At the moment, about 1,100 farms or 1 % of all active farms deliver their data for the Finnish FADN.
Special legislation for regulating the FADN didn't exist before the EU-membership. So, there has not been strict rules on the data content or its scope. Until 1995 two factors in particular, have formulated the FADN-system and its content in Finland.
First of all, agricultural research, extension services and education needed many-sided farm level data. To fulfill those needs the data content of the farm economy, labour and capital use has been developed frequently.
The second factor has been the Finnish national agricultural policy, which before the membership in the EU, aimed at keeping the farm income level and its development balanced with income of other similar worker groups. Economic results of book-keeping farms have been the most important tool in fol lowing up the farmers income development stratified by production lines, farm size and regions.
The basic interest in the Finnish FADN has focused on the agriculture. The data on agricultural activities are very detailed when compared to the FADN in the Union. The Finnish data include also other farm activities, such as forestry, small scale industries and private economy, but that data are not very detailed.
Need for change
Data requirements for research and agricultural policy still exist. Over the last years, however, numerous other needs for enlargening the data base have emerged. The data base should include not only farms but also other rural enterprises. Developments in logistics and data processing offer now more and increasingly better possibilities for wider and faster data collocation.
Mainly the fol lowing aspects affect the process: the FADN in the EU is based on legislation, including minimum data requirements; access to investment programs require that farms are keeping books;
177

it is possible to give financial support for farms starting the book-keeping. In that case, the minimum data content is determined by the legislat ion; systematical book-keeping and follow-up system has not been applied to horticulture farms in Finland; especially, forestry and some other enterprises are common in Finnish farms. From national point of view, more accurate and wide data on those activities are needed. Under the EU-member ship, the livelihood of the countryside wil l bee more and more integrated to other economic activities than to the basic agricultural production; multifunctional farming wi th many activities, including small scale processing and marketing, wil l be more common in the near future; logistics in data transfer and processing is growing up all the t ime. At the end of 1995, 3 1 % of Finnish farms owned a computer, and the estimate is 40% at the end of 1996. Possibilities to collect more data at lower costs are increasing.
Pilot project for the databank
Agricultural Economics Research Institute is starting a project w i th its main stakeholders. The project has fol lowing goals:
to fulf i l l the increasing needs for data mentioned above; to speed up and improve the data transfer from enterprises to data analysis and use; to lower unit costs of data collection.
Starting point is that majority of farms and farm enterprises use computer Data can be transferred also f rom other sources, as banks and book-keeping offices.
The databank project wil l be created as follows (see figure 6.3.1):
1. Definition of data needs who are users of the data (stakeholders); what data they need (needs for data wil l be pinned down later).
2. Systems that are steering the data content needs and content of FADN in the EU; aid to start book-keeping (content of data); investment aid requirements for farms' book-keeping; taxation; special national needs.
3. Sources of data farms wi th agricultural production; multifunctional farms(agriculture, forestry, small scale enterprises);
178

horticultural farms; rural enterprises (not agricultural farming); banks, book-keeping offices etc.
4. Organizing the data collection creating the basic data on farms etc.; computer programs and technology in collecting the data (including the organization in the field); county extension services.
5. Final products the databank; services and products for the needs of stakeholders.
The project starts in 1996 and is financed partly by the Ministry of Agriculture and Forestry.
179

c o
o u ra +•» ra O ai
c
c ra 01
U
0 LU
C7>
<
r
vi
œ t
X! ra
(/) o
l/l E 01 +•» 1/1
wo
• 0 c
ra 01 iü c ra '? Q
% IS •H'
c 0) c 0
01 •o
Z u i i
èr r 3 0
u
c 0
"Ci C
+••
LU
0)
5= 0
(ü
!° S's t 01 ç Ç X ui
01 u
> (V l/>
c 0
'trt
> ai
cc • 0 r
ra .* u
ra J2 "O 01 01
_* c
ra m
ra •4-»
Û
k-V
c (D
1— (Q +•» (ü
t; 3 "O 0 i e -0 s ui —' •0 0 ra O
, 0 1 -
r — "
s
O) I . c v> 1
_ i •« * I • * Q . u l O U l f I 00 . * -°l
v»
F (0
t --1
<
ta
3 ai
3 a
0 c X ui
VI VI e 01 t . 2 « n
<J S J l i j
II
" P c • -01 3 E ST •Ó DC 01 _
> 2 .£<
+•» c ai
E
.*
Aid
to
star
t Bo
o
keep
ing
z 0 < u.
ra
Oth
er
(nat
io
Nee
ds
•
ra
arch
at
ion
ns
ion
inis
tr
"» 3 & -s I I T J S ^ se ui ui <
u
S 3
O 3 •w Q-
c 0 'c _)
1
01 +•»
c UI
VI w 3 01 c ai Q .
ra XI ra + j ra O ai +: 01 01 ra
.E 5 ™£ ai o 1- i n U 1
ra +•» ra O
. 01
VI — 01 01 3 c
f« E 01
t a>
s" Q. 4-»
'5.
c S r a c i .2 § S 5 8 „ • t i J o ï - ¥ E
01 ra _ o O > , û Q .E l ï œ vi
c o SS "8 . E ™ - o i - O o 01 14. 01 a o c
TD c ra
-Q
s ra Q
10
£ 3 Ol iE
180

6.4 MAKING RICA INFORMATION AND DATABASES ACCESSIBLE ON THE INTERNET Innovative idea for the development of the FADN-RICA network
Guido Bonati
Background
The Internet has become a widely used service to access remote computers. The success on the Internet depends on various factors, among which the most are:
the great number of protocols and services available wi th the same connection (e-mail, archie, FTP, discussion lists, gopher, telnet, WWW etc.); the limited costs to develop and distribute services; the low cost to access services; the ease of use of the hypertext interface based on the World Wide Web; the increasing number of providers of information and, consequently, of documents and databases. According to several sources, the number of Internet users should be be
tween 10 and 50 million people worldwide (about 150,000 in Italy). On the Internet there are already several sites f rom important organiza
tions (UN, World Bank, FAO, USDA, OCDE, EU), research centre, universities etc.
Description
The idea presented is based on the possibility of distributing information on the RICA through the Internet in the World Wide Web standard.
Several types of information could be made available: general information on the RICA-FADN network (participating countries and organizations, basic statistics etc.); texts of the regulation upon which the RICA network is based; various tables containing preformatted data on the RICA, i.e. in Lotus 123 format; access to a global databases of aggregate data (i.e. data on SGMs), though a form to exactly select the query; access to single national databases to get aggregate data (with an interface similar to the one developed for the Italian national RICA system); documents, books, handbooks etc. concerning the RICA, possibly in HTML or PDF (i.e. the proceedings of PACIOLI).
181

Classification of the idea
The idea should belong in the category of 'Information technology'.
Stakeholders involved
The stakeholders involved should be the European Union and the national partners of the RICA network. It should be possible to identify one or more sites in which to start a prototype of the system.
182

6.5 INNOVATION IN THE BELGIAN FARM ACCOUNTANCY DATA NETWORK: DEVELOPMENT OF A COMPUTERIZED INFORMATION MODEL
Dirk van Lierde and Nicole Taragola
6.5.1 Introduction
In the Belgian FADN a lot of data are collected at agricultural and horticultural holdings. The associated farmers are not only gathering economic but also technical data which are periodically registrated by the accountants of the provincial offices of the institute. A t the end of each financial year the accounts are closed and the different figures needed for establishing the individual results of the farm are written down on file sheets and sent to the central office in Brussels for encoding and data processing. After running a control program the final data are recorded on magnetic tapes.
A great disadvantage of the actual system is that a lot of detailed information is only available in the documents of the accountants but not in the central office, which makes it impossible for the different users of the FADN to have access to the data.
At the moment the accounts of the Belgian FADN are global accounts, only allowing to calculate a global financial result of the farm. At agricultural farms the gross margins of the different products are calculated, in horticulture however this is not the case. However more and more farmers prefer to have more detailed results and there is a growing demand for cost price calculation.
During last years environmental problems have become a topical matter in Belgium. The growth in regulatory measures will increase the need of information on this subject. This will require additional record keeping and the development of environmental accounting.
6.5.2 Objectives of the innovation project
In order to meet the growing need of accurate and up-to-date information an important innovation project of the Belgian FADN has been started up. The idea is to develop a global computerized information model integrating financial, technical and environmental data. Important objectives of the new system are improvement of the data (high quality and up-to-date) and an increase of the use of the data. An important requirement of the new system is that there can be worked in a cost effective way.
183

6.5.3 Occurrence o f the innovation in the process-model
In the information model two important stages can be distinguished. The first stage is the data-entry phase, which includes the input and control of the data supplied by the farmers. The next stage consists of data processing and calculation of the f inal results.
In the process-model of the Belgian FADN these activities are classified under the item 'Accounting'.
6.5.4 Stakeholders involved
Ministry of Agriculture As the Agricultural Economics Institute is depending of the Ministry of
Agriculture, this ministry is responsible for the finance of the project.
Farmers The data of the FADN are coming from the farmers; if we want to collect
more data (mineral balances, energy consumption, use of pesticides,...) the collaboration of the farmers is required. Indeed the farmers must agree to put their data at the disposal of the accountants of the institute.
Researchers In principle the researchers of the section 'Accountancy and Financial
Analysis' of the Agricultural Economics Institute are responsible for the analysis of the system (content, methodology,...). The development of the software is executed in collaboration with a software company specialized in the development of farm accounting software. However in practice there is no clear dividing line in the working fields what makes it possible to exchange mutual experiences and ideas.
The researchers of the other sections of the institute or researchers and students at universities and schools need data for their research. Their data requests can be integrated into the information model.
European Commission The future data requests of the European Commission wil l also be inte
grated into the information model.
6.5.5 Development of the information model
6.5.5.1 Data-entry
The accounting software used in the data-entry phase is developed in collaboration wi th the software company CercoSoft, specialized in the development of farm accounting software. In principle the Agricultural Economics Institute is responsible for the analysis of the system and the softwareprograms are
184

written by the private f irm. However in practice mutual experience and ideas can be exchanged.
The final users of the software package are the bookkeepers of the institute. Consequently the development and testing of the software is executed in consultation w i th the bookkeepers.
In developing the software the option was taken to make a uniform and user-friendly system which is not so evident as there is a big diversity in farm types. The data-entry software is composed of a limited number of modules, namely:
a 'general' module: basic inputs; module 'purchases and sales'; module 'investments': buildings, machinery, loans, registration of parcels, inventories,...; module 'livestock';
The 'general' module includes the basic inputs by the central office in Brussels allowing a homogeneous treatment of the data.
In the module 'purchases and sales' all kinds of purchases and sales can be registrated in a uniform way. The main principle is that the types of purchases or sales are indicated by a code. Depending on the code specific information is asked. The information that is asked for each code is completely defined by the central office of the institute. The link between the code and the asked information can be changed without modifying the computer program. An important advantage of this system is that the module is very flexible and that it can easily be adapted to future information needs.
For registration of investments a separate module 'investments' is created. This module includes the calculation of depreciations, interests, replacement values,...
The module 'livestock' is the only module which is already operational at the moment. During the accounting year 1994-95 the module was used in about 40% of the accounts. In analogy to the module 'purchases and sales' only one module is needed for treatment of data of any animal species present at the farm. A list of codes of the different animal species (e.g. cattle, horses, sheeps, pigs,...) is established by the central office. In the module a choice is possible between the individual follow-up of the animals or the follow-up of the animals as a group (e.g. pigs). This possibility is linked to the code of the animal and is consequently determined by the central office.
It is clear that the softwareprograms of the data-entry phase must be as flexible as possible allowing a lot of adaptations and making easier the introduction of innovations in the FADN.
6.5.5.2 Data processing
Another important stage is the development of the softwareprograms needed for data processing and calculation of the results. These programs will mainly be developed by the Agricultural Economics Institute itself what wil l make it easier to introduce modifications into the programs. Now already the
185

need of yearly modifications of the programs can be foreseen. The modifications are principally determined by the demand of the users of the FADN, namely researchers, European Commission, farmers, Ministry of Agriculture,...
6.5.5.3 Conclusion
The development of the information model can be considered as the basic instrument allowing the introduction of innovations. At the moment three innovations are proposed, partially related to environmental problems. The first innovation is the setting up of a mineral record system allowing to make 'mineral balances'. The other items are the registration of pesticides and the monitoring of energy consumption.
6.5.6 Mineral balances
In the new information system the possibility of calculating mineral balances will be included. The mineral record system is a set of accounts to register the supply (inflow) and removal (outflow) of minerals. The inflow can exist of fertilizers, compound feed, roughage, ... Examples of outflows are livestock, products and manure removed from the farm. At the moment some data are already available in the FADN such as the yields of the crops, the amounts of animal products like milk, eggs (but not the amounts of meat) and the mineral content of the fertilizers. Other necessary data are not yet available in the FADN and will be introduced in the system.
6.5.6.1 Introduced innovations
The introduced innovations are concerning the following topics:
Livestock The weight of every individual animal or group of animals is registrated
at the moment of entering (purchase) and leaving (sale or death) the farm. Also at the beginning and at the end of each accounting year the weights are recorded. On the basis of coefficients related to the mineral composition of the animals (according to species, age, breed,...) the input and output of minerals concerning meat production can be calculated.
Feed The different kinds of feed are recorded; in addition there is a possibility
to registrate the most important components of each feed in order to determine the supply of minerals at the farm. Also the follow-up of feed consumption per category of animal will be possible.
186
Fertilizers The different fertilizers used at the farm are registrated; for every kind
of fertilizer the mineral content will be recorded allowing to calculate the supply of minerals.
Concerning organis manure the supply as well as the removal at the farm wi l l be recorded. There will be a distinction between the different kinds of organic manure allowing to use the appropriate mineral coefficients.
The application of fertilizers can be recorded separately for each type of cultivation in order to make separate calculations for each crop.
6.5.6.2 Problems
Farmers The biggest problem related to the calculation of mineral balances is the
collection of the data at the farm. Experiences from the first year of application of the module 'livestock' show that it is not evident that all farmers can return the weights of the animals w i th the required precision. A certain period of transition wil l be needed to familiarize the farmer as well as the accountant wi th the new system and to make them realize that collection of these data is also useful for the farmer himself.
Concerning the registration of the different kinds of feed used at each farm an additional effort will be needed. In general there can be no problem for the composed feed formulated by specialized firms; in most of the cases the composition of the feed can be found at the packing material. If this is not the case the only possibility is to work with fixed values resulting however in a lower precision.
As a consequence of the great diversity of fertilizers (especially composed fertilizers) and feed, it is impossible to the central office to make a uniform code list for every accountant. For this reason a system is worked out al lowing the bookkeeper to make the codes himself for each individual farm. In this system every farm has its own codes for fertilizers and feed. For each code, representing a certain fertilizer or kind of feed, the mineral composition is recorded. So each fertilizer or kind of feed is characterized and can be recognized by the mineral composition. On the basis of the amounts used of each product and its mineral composition the supply of minerals can be calculated.
6.5.7 Pesticides
As environmental problems have become a topical matter in Belgium there is an increasing need for data concerning the use of pesticides in agriculture. In the new system these needs can be satisfied.
On the analogy of fertilizers and feed there is a great variation in pesticides. A difference with fertilizers is that the pesticides used in agriculture have to be recognized by the government; as a consequence of this regulation the composition of each pesticide coming at the market is known. The list of recog-
187

nized pesticides is integrated in the information model, allowing the accountants to use uniform codes. As a result of the registration of the amounts used of each kind of pesticide and the composition of each pesticide the amount of active components can be determined.
In the new system there wil l be a possibility to allocate the pesticides to the different crops.
6.5.8 Energy
During last forty years an important development of Belgian horticulture was taking place. A considerable amount of energy is needed for heating the glasshouses. The entry into the European Community of some southern countries w i th a developing horticulture and non-existing fuel costs can be an important threat to the Belgian glasshouse sector. Moreover, the environmental pollution caused by the use of fuel oil has become an actual subject in Belgium. In the near future, environmental legislation in Belgium will impose some restraints on the heating systems and the use of fuel oil in glasshouses.
At the moment only few information on energy consumption in the horticultural sector is available. In the context of the above mentioned problems, a growing need of information on this subject can be expected. In order to make a contribution to this need the objective of the innovation is to gain a better insight into the consumption of energy and the different sources of energy used in Belgian horticulture.
The FADN can be considered as a useful source of information for this purpose. In the accounts of the institute not only the values but also the amounts of used energy must be registrated by source of energy. By means of conversion coefficients the amounts used of the different sources of energy, measured in different units (e.g. kilogrammes of heavy fuel oil, m3 of natural gas,...) can be converted into the same unit of energetic value, namely Joules, allowing to calculate the total energy consumption.
6.5.9 Classification of the innovation
There can be doubt about the classification of the innovation. As mentioned before the information model that will be developed can be considered as a basic instrument allowing the introduction of other innovations. The idea of developing an information model can belong to the categories 'information technology' as well as 'farm accounting'. One of the objectives if improvement of the quality, so the project could also be classified under the item 'quality management'. The innovations proposed at the moment, namely the setting up of mineral balances, the registration of pesticides and the monitoring of energy consumption are related to environmental problems and can consequently be classified under the item 'domain'.
188

6.6 POSSIBLE CHANGES / INNOVATIONS IN THE SPANISH FADN
Inmaculada Astorkiza
Functioning of the Spanish FADN (RECAN)
(C) Classification of innovative ideas: Information Technology 1. Place of the process model where the change will occur 2. Description of the proposed change
Eliminate the obligatory nature of using the IDUS program with the only obligation that of using standard data files.
3. Description of the benefits The Accounting Offices which carry out techno-economic management use other programs. The obligation to use this program implies double entry book-keeping and hence more work.
Agrarian Associations which act as Accounting Offices
The answers of this group have already been mentioned.
189

7. FARM MANAGEMENT ACCOUNTING
INTRODUCTION
During the plenary session in which the participants presented their ideas, the following keywords were noted to the subject farm management accounting. These keywords can be f ind again in the papers which are presented in this chapter.
Integration of accounting methods Agri-ecological production chains Accounting office as advisor CAP subsidies Extension and promotion of accounting Fiscal incentives Situational accounting
191

7.1 FINANCIAL ACCOUNTING, GAAP AND AGRICULTURE
Krijn J. Poppe 1)
7.1.1 I ntroduction
Agricultural enterprises produce goods by controlling the development of plants and animals through the use of means of production. That dependence on nature often means that there is great degree of uncontrollability of the production process. This results in a number of specific characteristics to be discussed further.
In this paper attention is devoted above all to Dutch arable farming, horticulture and livestock farming. These activities and numerous combinations of them are practised in the Netherlands by some 120,000 holdings, and usually these are known for short as 'the agricultural sector' or ' farming'. Agricultural contracting businesses, which make machinery and labour available for specific seasonal activities, are sometimes considered to form part of the sector. As reporting for those businesses does not differ from what is usual for other agricultural enterprises or as part of the prevailing reporting outside agriculture, no special further attention is devoted to them. Another specific category is formed by the breeding establishments, which engage in developing and multiplying new varieties and strains of plants. Characteristic of these establishments is not only their industrial size - in proportion to ordinary agricultural enterprises - but also the nature of the operating process (Starreveld et al., 1989). In the reporting that is reflected in the great importance of the costs of research and development and the possession of rights to the varieties developed (including plant breeder's right). These are to be treated intangible assets. Another specific category is formed by forestry activities, to which attention is briefly devoted in Section 7.1.10. Fisheries, partly in view of their extractive character, are as a rule not regarded as belonging to the agricultural sector and therefore not taken into consideration here (see for this Poppe, 1992). Nor is attention devoted in this paper to the specific consequences of environmental pollution and environmental control.
The author works at the Agricultural Economics Research Institute LEI-DLO in the Hague (NL) and coordinates the Dutch Farm Accountancy Data Network. This paper is a translation (with some minor adaptions) of chapter 45 'Agrarische Bedrijven' from M.N. Hoogendoorn, J. Klaassen en F. Krens (eds.): Externe verslaggeving in theorie en praktijk. The Hague (Deiwel Uitgeverij B.V. 1995). The permission of the publisher (mr. P. van den Berg) for the publication of this translation is gratefully acknowledged. The Dutch version benefited from comments by A. Boers, A.G.M. Broeks, J. van Dijk en M.N. Hoogendoorn.
192

Dependence on nature and the relatively uncontrollable production process have led in Western Europe to a sector organized on a small scale wi th family businesses. On those farms labour, management and capital are largely in one hand (for an economic explanation of this, see among others Poppe, 1988, and the literature cited there).
The nature of the agricultural enterprises entailed from of old little need for information: controlling information for business management was of limited value through the uncontrollable nature of the process, certainly when corrective intervention during the production process (as in vegetable production) is practically impossible. The purse was the best measure of the farming family's income, and systematic registration of primary basic data was absent (Broeks and Van Loon, 1987).
It is above all through the requirements of the tax authorities that Dutch agriculture has been confronted with external reporting. The reporting was and is also used for obtaining credit. To an increasing extent the reporting has also come to be used and adapted for management purposes. Developments of a more recent date, which may be encapsulated by the terms 'socialization' and 'scientization', are leading to the role of reporting in and around the agricultural enterprise becoming steadily greater (Zachariasse and Poppe, 1994a and 1994b).
As a result of the above, the influence of legislation and regulations with respect to annual reporting in the agricultural sector is chiefly of an indirect nature. There are relatively few businesses of such a size that they have a duty to publish. That means also that jurisprudence and formulation of theories have less great an influence than elsewhere. The accountants and business economists working in the sector, however, regard Title 9 of the Civil Law (that contains rules for external reporting by businesses) and the Guidelines for annual reporting (the General Accepted Accountancy Principles-GAAP) as a guide to their activities. Both general business economic training and confrontation within their working environment with non-agricultural enterprises contribute to that. With the GRAS accounting system usual in this branch of industry (see Section 7.1.3), the legislation and regulations applicable to other sectors are therefore as much as possible the point of departure. However, for a proper understanding of the models advocated in GRAS some knowledge of the characteristics of the agricultural enterprises and their effect on the annual accounts is important. That is the subject of Section 7.1.2. Then there are a number of specific agricultural subjects for which the theory of external reporting gives chiefly broad indications. The solutions chosen in practice are discussed in Sections 7.1.4 to 7.1.9.
7.1.2 Business economic and fiscal reporting
The present financial reporting in the agricultural sector is characterized by a mix of two goals: the reporting for the tax authorities and that for the business economic management of the enterprise. In the latter case external inter-business comparison has long played a major role: through the structure
193

of the small, closely comparable enterprises that produce for an anonymous market and through the absence of assessment processes within the enterprise, inter-business comparison (possibly supported by study clubs) is an important management instrument. It supplies a measure of the entrepreneur's own activities. Because the entrepreneurs in many case have their books kept by an accountants' office, the actual exchange of data (after authorization by the entrepreneurs concerned) is no great obstacle to the inter-business comparison.
In this inter-business comparison accountants' offices concentrate above all on financial analysis and less on direct costs and technical results. Internal management systems on personal computers and production records (registration of returns and direct costs) in service processing of for instance feed suppliers have a strong market position in the latter fields.
This inter-business comparison calls for standardization, notably of the bases of valuation and accounting systems. In the forties valuation bases were developed by Horring (1948) who in his thesis designed a costing system for farming on the basis of the ideas of the so called Amsterdam school in Dutch cost accounting, which in essence promoted a form of current cost accounting. This method of costing and the calculated cost prices were for years the basis for Dutch agricultural policy. The replacement value was selected as the starting point, not only as a basis for the valuation of the fixed assets, but also as a normative point of departure for seeking a valuation of the means of product ion contributed by the family-members. When the enterprise utilizes unpaid labour of the entrepreneur and his family-members, the costs of this labour are calculated on the strength of the costs that the enterprise would incur in replacement of the family-members by calling on the services of an employee via the market (i.e. the gross contract wage plus employer's costs). For all the capital too (irrespective whether of it is net worth or borrowed capital) interest charges are calculated, albeit that land costs are often calculated on a tenancy basis. Supplies of the one production process (e.g. piglet production) to the other (e.g. fattening of pigs) are valued at market prices (inter-farm trade).
This method of costing and profit calculation is excellently suited to external inter-business comparison: not only is there less trouble wi th developments in the prices of fixed assets than in the fiscal system of the historical expenditure price, but in addition businesses of equal size with differences in financing sources and in the hiring of personnel via the market or not can be compared: two exactly identical businesses, whereby the labour is supplied in one case by the entrepreneur and his son and in the other by the entrepreneur and a paid worker, are closely comparable in this way, for they have the same labour costs, cost price and profit. However, the income of the entrepreneur's family f rom the business differs. The inclusion of inter-farm trade also makes it easier to compare branches of production between businesses.
It is this form of reporting that Kuperus (1970) in his thesis called 'business economic reporting', which incidentally does not mean that fiscal reporting is not based on business economic points of departure. He argued that a profit and loss account based on the fundamentals of Horring and in the debit and credit form, w i th comparison of all cost and return categories, would be the
194

most informative for all concerned. This form of reporting is also used by the advisory organizations as a model for budgets in farm planning.
This form of reporting, which is still used by a number of administrative and accountants' offices, the Agricultural Economic Research Institute (LEI-DLO) and the advisory services active in the sector, contains a specific profit concept: the net operating result. In the sense of GAAP this is a specific concept because it proceeds from costs included in the calculation for family labour and net wor th. In other words, a strict and special separation is prescribed between business and family.
In addition a number of income indicators are distinguished. The net operating result is a criterion of the profitability (also known in the sector as rent-ability) and thus indicate the remuneration for management and risk. On many farms these net operating results are structurally negative: the cost price is higher than the selling price. This is connected with the valuation bases chosen in relation to the high market value of the assets in the sector: the selling prices are too low to remunerate one's own work and net worth invested in expensive land and quotas valued in line with the market. Conversely, many agricultural entrepreneurs prove to be prepared to employ their means of production in their own business for a remuneration lower than the valuation standards derived from the labour and capital markets. In practice their own opportunity cost is lower than the market-derived values.
If the amounts charged as costs of family labour and net worth are added to the net operating result (i.e. not regarded as costs), a picture is obtained of the income acquired by the family wi th the business (table 7.1.1). It should be borne in mind here that on many farms a number of entrepreneurs are active (partnerships between father and son or husband and wife), who sometimes form part of a family and sometimes do not. In partnerships some of the assets may moreover be the property of one of the partners, whereby leasing to the partnership occurs (from a personal enterprise). That therefore leads to separate annual accounts for the various components of such a 'financial administrative unit'.
These income indicators are not in themselves a measure of the possibilities of continuity (viability). The latter depend on the cash f low (short-term) and the increment of net worth (longer-term), which are also influenced by among other things the income earned outside the farm business, the private taxes and the private withdrawals. This distinction between indicators for profitability, income and continuity for the agricultural sector is also usual in a number of other countries (Hill, 1991).
The tax authorities (and thus fiscal reporting) do not accept the valuation bases of business economic reporting: there the valuation takes place on the basis of the historical costs and the goal is income determination, denoted as 'fiscal profit 'or, in terms of the tax return, 'profit from enterprises'. Figure 7.1.1 illustrates the differences in points of departure between the two forms of reporting.
195

Table 7.1.1 Connection between indicators of profitability and income (assuming one entrepreneur per business)
Returns (output) Paid and calculated costs
Net operating result Calculated wage of entrepreneur
Entrepreneur's labour income Extraordinary items Calculated remuneration for net worth
Entrepreneur's income Calculated wage of family-members
Family farm income ƒ 60,000
ƒ
'-ƒ ƒ
ƒ
ƒ
330,000 368,000
38,000 69,000
31,000 -1,000
-10,000
42,000 -18,000
Fiscal Business economic
Valuation of fixed assets Calculated costs of family work Valuation of livestock and
liquid assets
historical cost no
fiscal value
current cost yes
current value
Figure 7.1.1 Comparison of business economic and fiscal reporting
The differences in valuation between the two forms of reporting are reflected not only in the current value for fixed assets and the calculated costs of own work and net worth, but also make their effect felt in standards for the valuation of inter-farm trade (including changes in stocks as a result of for instance seed or cattle feed that is produced in the one financial year for use in the following financial year), the value of closing stocks and the value of rearing livestock. In both forms of reporting these items are valued at cost price or lower market value. From the business economic point of view the market value is in many cases lower than the business economic costs (including labour and interest on net worth). Moreover, valuing the stock of the products at market value supports inter-business comparison. In fiscal reporting, conversely, the cost price (excluding labour and costs of net worth) is as a rule lower than the market value. Incidentally, in some regions, partly on the strength of agreements with the tax authorities, it is usual not to account on the balance sheet for stocks and stock changes in self-produced stocks (such as roughage) but to incorporate them directly as costs. This is not, of course, conducive to the desired insight.
196

7.1.3 GRAS reporting models
In the mid eighties a renewed standardization took place of the accounting systems and publication models used in farming. This led to GRAS - an acronym in Dutch for the Uniformed Accounting System for the Agricultural Sector (VLB, various years). GRAS has no legal status. Partly because a large number of parties (including proffesional bodies NOVAA, VLB and LEI-DLO) have been involved in the creation and maintenance of GRAS, it has a broad basis and is used or supported by various accountants' offices and software suppliers.
GRAS takes as its starting point on the one hand the history and the need for information of the entrepreneur and his advisers and on the other the legislation and regulations relating to annual reporting (GAAP) and the tax return. This has led to the compilation of models that give a standard set-up for business economic and fiscal reporting. The terminology is as much as possible identical in the two types of models. Concepts that are characteristic of one of the forms of reporting (such as net operating result) occur in only one of the two models. In compilation of the models and the guidelines for dealing w i th specific subjects the non-agricultural Guidelines for annual reporting (GAAP) have been followed as closely as possible.
On the basis of the developments in practice the GRAS accounting system was modified in 1994. Besides the introduction of 'mineral bookkeeping' (a form of environmental accountancy), this was inspired by the need for a sharper distinction between cost categories and cost centres. The modification has also been used to eliminate a number of discrepancies with the GAAP Guidelines (for instance, with regard to subsidies).
Figure 7.1.2 presents the model for the business economic profit and loss account included in GRAS. A division by category has been opted for, wi th explicit balancing of returns and allocated (directly variable) costs. A functional model is not (yet) usual in the agricultural sector.
Under the non-allocated costs labour, work by contractors and the costs of machinery and equipment have been placed together; jointly these cost categories are termed operating costs. The difference between the balance and the non-allocated costs is the net operating result.
In the fiscal profit and loss account this difference is termed production result. The non-allocated costs do not then include interest charges. As a result, this indicator lends itself to some extent to inter-business comparison between the financial years, provided that there are only slight differences in the source of the labour and the valuation of the fixed assets. The production result is supplemented by the financing result and the extraordinary items to arrive at the fiscal profit.
The model for the balance sheet (figure 7.1.3) is closely based on the current models outside farming. Some specific items, such as the distinction between breeding livestock and fattening cattle, are discussed in the fol lowing sections. The items included on the credit side for share capital and the revaluation reserve are used only incidentally, namely by the businesses that are run in the form of private limited companies. Incidentally, the model for the fiscal balance sheet does not differ from figure 7.1.3 as regards terminology.
197
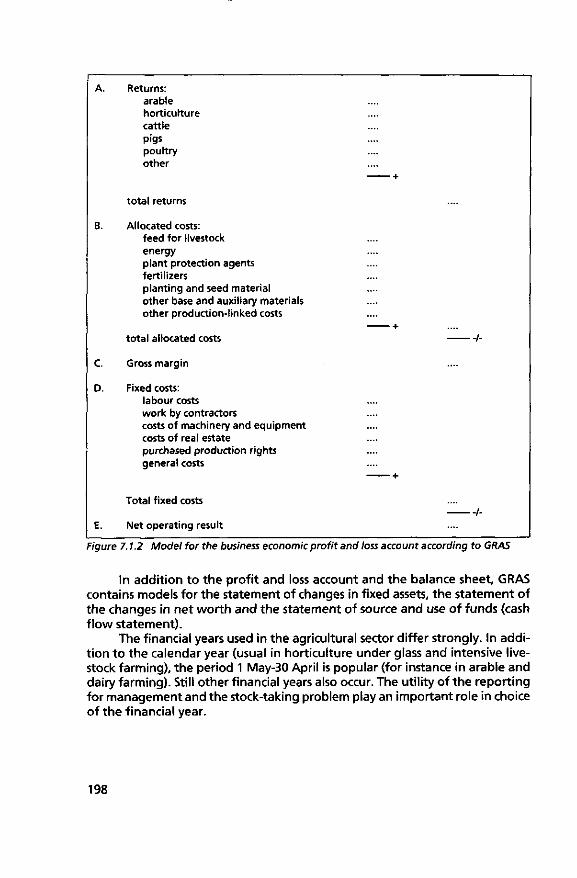
A.
B.
C.
D.
E.
Returns: arable horticulture cattle pigs poultry other
total returns
Allocated costs: feed for livestock energy plant protection agents fertilizers planting and seed material other base and auxiliary materials other production-linked costs
total allocated costs
Gross margin
Fixed costs: labour costs work by contractors costs of machinery and equipment costs of real estate purchased production rights general costs
Total fixed costs
Net operating result
-/-
/-
Figure 7.1.2 Model for the business economic profit and loss account according to GRAS
In addition to the profit and loss account and the balance sheet, GRAS contains models for the statement of changes in fixed assets, the statement of the changes in net worth and the statement of source and use of funds (cash f low statement).
The financial years used in the agricultural sector differ strongly. In addit ion to the calendar year (usual in horticulture under glass and intensive livestock farming), the period 1 May-30 April is popular (for instance in arable and dairy farming). Still other financial years also occur. The utility of the reporting for management and the stock-taking problem play an important role in choice of the financial year.
198

Assets A.
1 II
III
:ixed assets intangible fixed assets tangible fixed assets 1 land 2 buildings and glass houses 3 plant 4 machinery and equipment 5 permanent + crops 6 breeding livestock 7 permanent rights
(e.g. long lease tenure) 8 other tangible fixed assets Financial fixed assets 1 participations 2 surety deposits 3 loans given
B. Current assets 1
II
III IV
stocks and work in progress 1 field stock 2 fattening and traded live
stock 3 feed 4 base and auxiliary materials 5 products for sale amounts receivable 1 trade debtors 2 repayments to be received in
coming financial year 3 amounts receivable from
participations 4 investment contributions,
Investment Account Act 5 shareholder current account 6 other amounts receivable securities liquid assets 1 savings account(s) 2 current account with bank(s) 3 cash
Liabilities A.
B.
C.
D.
E.
Equity I net worth
ordinary shares II share premium account III revaluation reserve IV statutory reserves V other reserves VI undistributed profit
Equalization account for investment premiums
Provisions 1 for pensions 2 for taxes 3 various provisions
Long-termliabilities 1 banks and finance companies 2 government 3 family 4 private persons 5 institutional investors 6 other long-term debts
Short-term liabilities 1 shareholder current account 2 debts to participations 3 current account with bank(s) 4 loans 5 repayment obligations in the
coming financial year 6 trade creditors 7 taxes and social security con
tributions 8 other debts
Figure 7.1.3 Model for the business economic balance sheet according to GRAS
7 AA Livestock
The yields of livestock farming consist not only of products such as milk and eggs, but also of returns obtained from the sale of stock. Traditionally these returns are designated in the profit and loss account and accompanying accounting systems as 'turnover and increment'. This item consists of two com-
199

ponents. The first is the net return made on the sale of stock, less the purchase of stock. The second is the difference between the initial and the final value of the herd. This differential item comes about through breeding and growth, corrected for death. This increment means that the size of the herd has increased. It is included in the profit and loss account because costs have been incurred that have not led to returns being made in the period in question, but wil l do so in subsequent periods.
Turnover and increment have from of old been taken together because the distinction is an arbitrary one. Because they are not calculated on the basis of the individual transactions, but in one go over the total herd, a proper distinction is impossible. An example of the calculation of turnover and increment may clarify that (table 7.1.2).
Table 7.1.2 Example calculation of turnover and increment a)
Calves Yearlings Dairy cows Total
Number on opening balance sheet 20 Value of opening balance sheet 400
(//animal) Book value (ƒ) 8,000
Sales in financial year Selling price (//animal) Purchases in financial year Purchase price (//animal) Turnover (ƒ)
44 350
0
5,400
Number on closing balance sheet 18 Final value (ƒ) 7,200 Increment (ƒ) - 800 Growth (animals) before deduction
of sales 56
Turnover and increment (ƒ) 14,600
Value on closing balance sheet ( //animal)
Revaluation (//animal) Revaluation (ƒ) Book value (ƒ)
375 -25
-450 6,750
17 1,250
21,250
3 1,100
2 1,300
700
16 20,000 - 1,250
550
1,250 0 0
20,000
65 2,200
143,000
15 1,900
0 0
28,500
64 140,800 - 2,200
14
26,300
2,250 50
3,200 144,000
102
172,250
62
2
44,600
98 168,000 -4,250
40,350
2,750 170,750
a) Based on Van den Tempel en Giessen (1992).
The example shows that the turnover per category of animal is determined by balancing sales and purchases. We thus have here a specific net turnover concept. The increment then shows the differences between the opening and the closing balance sheet and is determined in guilders: if a number of animals on the opening balance sheet are sold or the average selling price lies
200

below the book value, the increment is negative. At least in guilders, because the example shows that there may have been growth in numbers of animals, but these animals have meanwhile been sold or have through increasing age moved into a following category. Thus in the example 14 yearlings have moved into the dairy cows category (viz 64 + 15 - 0 - 65). Also, 14 calves have moved into the yearlings category (viz 16 + 3 - 2 - 1 7 + 14; the last 14 are the 14 yearlings that moved into the dairy cows category). Furthermore, it can be calculated that 56 calves have been born (14 moved to yearlings plus 44 sales plus 18 on the closing balance sheet minus 20 on the initial balance sheet). It is clear that turnover and increment are not determined only in combination, but that the distinction is also rather arbitrary. If one of the calves had been sold just before instead of after the balancing date, the turnover would have been higher and the increment almost proportionately lower.
The valuations used at the balancing date are based on the rearing costs, i.e. the replacement value. In practice market values are often used, because, here too the market value is often lower than the cost price on a business economic basis (including labour costs). By leaving any price changes out of consideration in calculation of the increment, only the composition of the herd (i.e. the rearing) is accounted for as output. By starting from the rearing costs, no unrealized returns are recorded. In the current value system the calculation is supplemented by a revaluation on the closing balance sheet so as to allow for the price changes (Van den Tempel en Giessen, 1992, p. 160).
This traditional presentation of the returns in livestock farming (figure 7.1.2) is unnecessarily complicated for farms that engage principally in the fattening of stock for slaughter (among others pigs, broilers, bulls, turkeys). In such cases the expenditure on the starting material (the young animals) is sometimes also accounted for under the costs, whereas sales of the fattened animals and the increment in value are presented under the returns. Even then insight into the link between costs and returns may be too limited when the matching principle is disregarded (because purchases are directly written off as costs and thus are confronted in the profit and loss account wi th the sales of other animals). To deal wi th these problems Broeks et al. (1991) have made proposals for improvement. For this purpose use has been made of the distinction applied in GRAS between breeding livestock as against fattening livestock (including animals purely held for trading). The breeding livestock have been termed in the balance sheet (figure 7.1.3) 'breeding livestock' and fattening cattle as 'fattening and traded livestock'. The first category, which includes dairy cows, heifers, horses, ewes, breeding sows, service boars and laying hens, consists of investment goods. They are comparable with other fixed assets that in the course of time generate a f low of returns. Fattening and traded livestock are work in progress, in fact therefore incomplete finished products.
The distinction may also be found in the decisions of the entrepreneur: in the case of breeding animals it is in the first case a matter of maintenance and optimal use of the herd; in the case of fattening cattle it is a question of adding as much value as possible to the product at the lowest possible cost. In the balance sheet the distinction is important for assessing the financing structure. From the point of view of liquidity there is little difference between the
201
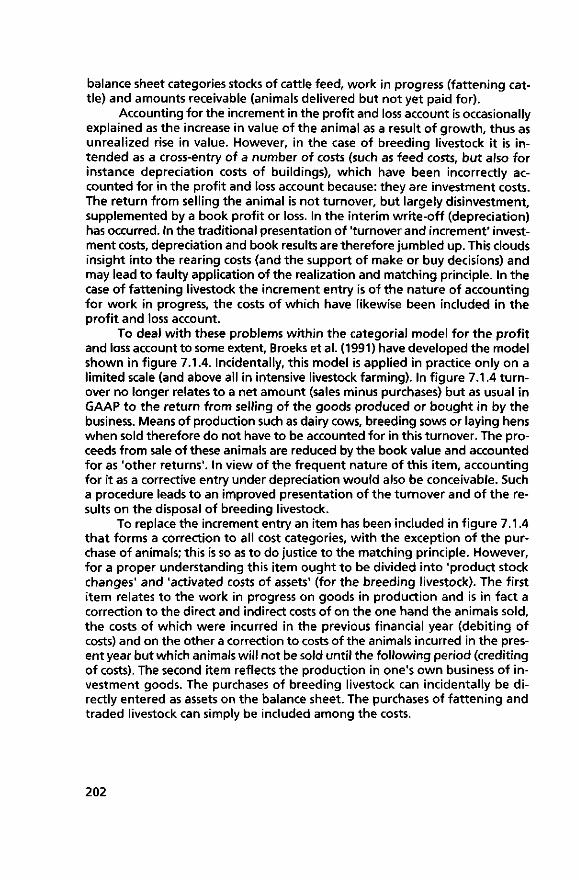
balance sheet categories stocks of cattle feed, work in progress (fattening cattle) and amounts receivable (animals delivered but not yet paid for).
Accounting for the increment in the profit and loss account is occasionally explained as the increase in value of the animal as a result of growth, thus as unrealized rise in value. However, in the case of breeding livestock it is intended as a cross-entry of a number of costs (such as feed costs, but also for instance depreciation costs of buildings), which have been incorrectly accounted for in the profit and loss account because: they are investment costs. The return from selling the animal is not turnover, but largely disinvestment, supplemented by a book profit or loss. In the interim write-off (depreciation) has occurred. In the traditional presentation of 'turnover and increment' investment costs, depreciation and book results are therefore jumbled up. This clouds insight into the rearing costs (and the support of make or buy decisions) and may lead to faulty application of the realization and matching principle. In the case of fattening livestock the increment entry is of the nature of accounting for work in progress, the costs of which have likewise been included in the profit and loss account.
To deal w i th these problems within the categorial model for the prof i t and loss account to some extent, Broeks et al. (1991) have developed the model shown in f igure 7.1.4. Incidentally, this model is applied in practice only on a limited scale (and above all in intensive livestock farming). In f igure 7.1.4 turnover no longer relates to a net amount (sales minus purchases) but as usual in GAAP to the return f rom selling of the goods produced or bought in by the business. Means of production such as dairy cows, breeding sows or laying hens when sold therefore do not have to be accounted for in this turnover. The proceeds from sale of these animals are reduced by the book value and accounted for as 'other returns'. In view of the frequent nature of this item, accounting for it as a corrective entry under depreciation would also be conceivable. Such a procedure leads to an improved presentation of the turnover and of the results on the disposal of breeding livestock.
To replace the increment entry an item has been included in f igure 7.1.4 that forms a correction to all cost categories, wi th the exception of the purchase of animals; this is so as to do justice to the matching principle. However, for a proper understanding this item ought to be divided into 'product stock changes' and 'activated costs of assets' (for the breeding livestock). The first item relates to the work in progress on goods in production and is in fact a correction to the direct and indirect costs of on the one hand the animals sold, the costs of which were incurred in the previous financial year (debiting of costs) and on the other a correction to costs of the animals incurred in the present year but which animals wil l not be sold until the following period (crediting of costs). The second item reflects the production in one's own business of investment goods. The purchases of breeding livestock can incidentally be directly entered as assets on the balance sheet. The purchases of fattening and traded livestock can simply be included among the costs.
202

A. Returns: turnover product stock changes (ready and in progress) activated costs of assets other returns
Total returns
B. Allocated cost: purchases of fattening and traded livestock feed for livestock other allocated costs a)
Total allocated costs
C. Gross margin
D. Fixed costs labour costs work by contractors depreciation of breeding livestock other non-allocated costs a)
Total fixed costs
Net operating result
Figure 7.1.4 Model for profit and loss account with improved presentation for the results of livestock farming
a) For a list see figure 7.1.2.
5. Quotas
The government's involvement with market planning in agriculture has led to the production per farm being limited by quotas for a number of products. This applies at farm level notably to milk, sheep (ewe premium) and sugarbeet. As part of manure legislation manure quotas have been set, which lay down the maximum quantity of manure to be produced per farm.
First of all, it must be remarked that from the legal point of view there is not always a right of production involved. Thus the milk quota is in fact a prohibitive charge ('super levy'), which has to be paid on production above a granted charge-free quantity. Materially, however, a quota system has been introduced in which the individual production rights are transferable. That can be done by leasing and by purchase and sale. In the latter case there may (legally) be a question of a link with the land, which, however, can be circumvented via repurchase of the land on a long-term basis. In a fiscal respect the Dutch Supreme Court has determined that the milk quota must be regarded as an independent asset.
203

Quotas that are transferable acquire value in economic transactions, even if that is in some cases (e.g. sugar quota) difficult to separate from the value of the transferred land. In the annual accounts quotas are regarded as intangible assets, in view of the close resemblance to concessions and licences. The consequence is that only purchased quotas are carried as assets, and that depreciation is applied in proportion to use. This is incidentally a good example of the greater influence that GAAP has acquired within the agricultural sector: in the ideas of the business economic annual report and the replacement value applied in it the quotas acquired for nothing ought also to be valued (Kievit, 1993), but GAAP does not permit this.
Depreciation in proportion to use is incidentally not easy to perform, because the duration of the quota regulations is often unclear. In some cases the legislator determines for how long the promulgated regulation will continue to be maintained (e.g. manure quotas, milk quotas), but that does not mean to say that in the meantime quotas cannot be curtailed (quota reduction or suspension). Purchased quota are as a rule valid for an unlimited time. Incidentally, quota regulations that have been instituted to control production and thus to make high selling prices possible are difficult to abolish from a political point of view. The milk and sugar quota systems have therefore been extended several times. All in all the moment at which purchased quotas become valueless is unclear. These political risks make depreciation desirable (the caution principle), even if extension of the quota regulation is attractive from the viewpoint of the farmer's income. Now in fiscal reporting depreciation of milk quotas over eight years and of sugar quotas over five years is usual. Manure quotas are written off up to 1 January 2000. In business economic reporting 7% of the purchase value is rather arbitrarily written off per year. An alternative to depreciation could be accounting for the reduction in value in the profit and loss account only in the case of a permanent fall in value.
7.1.6 Long lease of land
A long lease is an incorporeal right to the use of land. Although the duration of the right can be indefinite from the legal point of view, in practice it is often limited. A contract of long lease is concluded ('bought') for a certain sum of money and every year a certain amount in land-rent is paid. Leasing occurs chiefly in arable farming, in two forms: as an instrument for granting land by the government in the new reclaimed Usselmeer polders and as a financing instrument (sale and lease back) with an institutional investor (such as AMEV or FAGOED). In the Usselmeer polders the government also uses long leaseholds to dispose of the real estate that has been built on farms that have been let via ordinary leasehold law. For this purpose the land located under and round the buildings is granted in long leasehold and the buildings are sold to the leaseholder ('new-style long lease'), while the land under cultivation is let in the normal way.
When the government grants land for cultivation on a long lease, this right is often acquired for nothing. However, in some cases a link is established
204

wi th the transfer to the government of land on the 'old land' (i.e. as distinct from the newly reclaimed land) below the market value (for instance for land consolidation or urban expansion). In that case there is a loss of capital that may be regarded as an extraordinary expense or that can be written off via entry as an asset. The latter is to be preferred from a business economic point of view. A long leasehold can be transferred. In the case of transfer within the family f rom one generation to another that may take place for nothing, but in free transactions leasehold has a value approaching that of land.
If a long leasehold is purchased, entry as an asset and depreciation are self-evident. Entry as an asset takes place as a permanent right in the real estate category. This is thus a tangible fixed asset. Depreciation can take place over the duration of the contract. In view of the trend in value of leaseholds in practice and the absence of complementary maintenance costs, arguments may be adduced for depreciation on the basis of annuities.
Whereas long leasehold in the Usselmeer polders is applied not only as financing in the granting of land but also (by the government) as an instrument of land management, the sale and lease back device wi th institutional investors is directed entirely towards business financing. To finance a desired increase in farm size newly acquired land is sold on by the business to an institutional investor at for instance 70% of the value in free dealings with simultaneous restitution in leasehold. Sale with retention of operating rights therefore takes place. Incidentally, owned land can also be introduced into this device. Upon transfer a capital loss is therefore suffered to the extent of the difference between the purchase price and the transfer price obtained from the investor. Then every year a land-rent is paid and at the end of the duration of the contract (a minimum of 27 years) one has an option to repurchase the land.
Cases are conceivable in which this device is above all a form of financial reorganization to keep a business going that is contending wi th a structurally unfavourable ratio between costs and returns. The capital loss could then be written off in one go as an extraordinary charge. As a rule the long leasehold device is, however, applied to finance business expansion with the intention to profit in the future from advantages of scale. In that case it is from the material point of view a matter of financing costs, the current value of which is equivalent w i th the capital loss suffered. The capital loss can then be entered as an asset to be matched against future income. Here too that could be a tangible fixed asset, but by analogy with the costs of issuing shares, classification as intangible fixed assets also seems defensible. GRAS has opted for the former option. From the business economic point of view one could also imagine that in certain situations entry as a land asset continues to take place (for instance depending on the content of the buy back option), comparable to the incorporation of financial lease in the annual accounts. In entry of the capital loss as an asset depreciation is required. Incidentally, there are procedures for this in the fiscal sphere.
205

7.1.7 Permanent crops, perennial crops and f ield stock
When compiling a balance sheet arable farms and horticultural holdings often have not only stocks of seed and planting material and stocks of harvested products, but also growing crops. These can be divided into f ield stock, perennial crops (growing crops) and permanent crops. Field stock comes about because in the financial year means of production (seed, fertilizer and the like) have been committed to the soil, but the harvest occurs after the closing balancing date. The flower bulb stock (see below) is a special example of this. With these crops the production process covers about one growing year, but the balancing date is unfortunately not the separation between the two growing years. With perennials the production process is considerably longer than one year, but harvesting does take place in one go (e.g. pot plants, arboriculture, quick-growing timber). Sometimes the length of the production process is variable f rom the point of view of cultivation: the entrepreneur determines the moment at which cultivation is terminated by sale on the basis of market expectations and his business situation. Until the harvest perennials are of the nature of work in progress. With permanent crops there are several harvests after each other, often once a year (for instance fruit crops, asparagus): the plant endures and is actually a means of production. Incidentally, in fiscal jurisprudence (Gerbera judgment and Carnation judgment) the requirement is made that the yield period (i.e. not the longer production period) of certain crops must be longer than 24 months (animals: 10 months), before one can speak of a means of production. In other cases a stock is involved, the costs of which wil l have to be assigned to the returns, more or less comparable to writeoffs.
A special asset is the f lower bulb stock in bulb growing. This stock of planting material is maintained every year, whereby the technical performance need not deteriorate in efficient management. However, economic ageing of the cultivar in question may occur, which is strongly dependent on the type of bulb. In that case writing-off is called for. On account of the absence of an obvious planting material market for many bulb types, and the differences in quality of the batches of planting material, valuation of the f lower bulb stock is incidentally not simple. Moreover, great price differences may occur f rom year to year. Return registration per cultivar still offers the best starting points. In many cases there wil l be a considerable temptation to perform valuation in accordance with the method of a fixed amount (Section 385/2, subsection 3, of the Civil Code), but the requirements made for that (minor importance, l ittle change in composition, value and quantity) wil l by no means always be met.
For the annual accounts a problem comparable to that wi th livestock (section 7.1.4) applies to the permanent crops, perennials and f ield stocks. Perennials and field stocks are work in progress. Permanent crops are of the nature of an investment good.
Although in the legal sense all three kinds of production units are as a rule immovable by nature, the field stock should be included in the balance sheet under current assets. That is also recommended for perennials, certainly when the time of harvesting can be flexibly determined by the entrepreneur,
206

with a view to the market. In practice, however, classification under tangible fixed assets also takes place. Permanent crops should be included among the fixed assets. For these plants the total lifetime can be divided into two periods, viz the development period and the productive period. During the development period the means of production supplies insufficient or no yields, but the value of the asset increases annually as a result of the investments made ('increment') and possible revaluation. If in that period there are also (small) yields, the latter reduce the investment costs. The productive (or rather output generating) period begins in the business economic sense once the maximum investment has been reached. That is not necessarily the moment at which production begins or reaches its maximum level. The productive period is the period in which depreciation is applied. Allowance should be made thereby for the trend of production: for fruit crops the amounts written off increase in the first years, then remain constant for a number of years and after that fall. Sometimes allowance must also be made for the occurrence of costs (such as l i ft ing costs) at the termination of cultivation. Building up a provision for disinvestment may then be appropriate.
In the current categorial model of the profit and loss account the amounts included in the costs for investment goods (permanent crops) or work in progress (field stock and perennial crops) have to be corrected by entering increment under returns. Broeks et al. (1991) have proposed in this case too to make a distinction between costs of means of production activated as assets (for the permanent crops) and a product stock change (for perennial crops and field stock). Above all wi th field stock the method is occasionally encountered in practice that the direct costs (seed, fertilizer) are directly incorporated in the profit and loss account and are not included in the balance sheet as f ield stock at the balancing date. With a varying cropping plan this may lead to an incorrect insight because the costs of machinery and labour are not allocated to the right period.
7.1.8 Participations in and payments by cooperatives
The relationship between agricultural enterprises and their cooperatives is complex. As a member of a cooperative a farmer or market gardener can participate in various ways in the capital resources of the cooperative. For the annual accounts of the members it is of great importance thereby whether he himself may if desired have the disposal of the balance on his members' account. In that case (one then often speaks of a 'free members' account') the situation is the facto one of a short-term loan made or an account that is comparable to a deposit account. In the balance sheet such credit balances are incorporated under amounts receivable. As a rule the member cannot directly have the disposal of the balance on his members' account. Sometimes participations of a certain duration are involved and in many cases the capital cannot be withdrawn during the entire membership. In these cases the balances are included as 'members' capital' under fixed financial assets. The members' capital is included at the nominal paid-up amounts, even in the - common
207

- Situation that no interest is paid on that capital, unless specific agreements have been made for this between the cooperative and the tax authorities (see below). Valuation at the nominal amounts is also applied if there are claims on the reserves, and the participations have a higher value than the nominal paid-up amount.
More problematic than the classification of the members' accounts in the balance sheet is accounting for the payments by the cooperatives. Apart from remuneration for the farmer-administrators (attendance money, salaries), the payments involved are payments for products, allowances and (bulk) discounts, distribution of profits, interest payments on members' accounts and restitution of members' capital. Payments for products are naturally entered as returns on the products concerned. Allowances and discounts are allocated to the products or deducted from the means of production involved that have been purchased f rom the cooperative. Because product prices in the transactions between the members and the cooperative may be of an arbitrary nature and payment of the surplus on the operating account is of the nature of a f inal settlement as a correction to those prices, any distribution of profits is also allocated to the products and means of production traded in via the cooperative. Because these payments are in many cases percentages of the turnover involved, that is quite feasible. Incidentally, distributions of profits per share are also included in the returns on the product concerned, since there is a close link between the number of shares and the amount of product 'sold' to the cooperative.
These distributions from the operating surplus are not only concerned wi th pay-outs. Credits to members' accounts or certificates made available often occur, in order to strengthen the cooperative's capital resources. In all cases the payments are fully incorporated as profits. Because these members' accounts and certificates are not (directly) withdrawable, and the balances credited to them by the cooperative are subject to tax on the members, this crediting implies a deterioration in the member's cash flow. In a number of cases, in particular when these accounts do not bear interest, cooperatives have therefore arranged wi th the tax authorities that these members' accounts can be incorporated in the fiscal annual accounts of the members at current (discounted) value and that every year only the current value of the credit to the members' account plus the increment on the credits of previous years is taxed. For that purpose the cooperative furnishes its members wi th an annual survey showing the status of the members' account concerned, the increment over the old years and the sums credited (with the corresponding lower fiscal valuation) in the current year. Sometimes arrangements wi th the tax authorities do not exist, and certificates are not entered in the accounts, or entered at an estimated low value. In the annual accounts of the member GRAS has opted in this special situation for the following treatment: the members' account concerned is entered under the members' capital (fixed financial assets) at discounted value. Every year this value is increased by the increment (because the number of years to be discounted decreases until the money becomes available). This increment is entered under interest received. In the case of an addition to this account from the cooperative's profit the current value of the amount credited
208

is accounted for on the members' capital. However, in the profit and loss account the nominal value of the amount credited is accounted for under the returns on the product (in many cases milk). As a result inter-business comparison between the members of the cooperative (blocking of the members' account depends among other things on the expected length of membership and new, young members can sometimes withdraw the amounts) and non-members remains possible. The difference between the current and the nominal value is entered under the financing costs, so that on balance the (fiscal) profit and loss account contains only the increment and the current value of the amounts credited.
Interest payments on members' accounts, which occur in particular on free members' accounts and on participation certificates, are entered as interest received. It incidentally occurs that a cooperative gets into financial difficulties and is l iquidated. Members' liability and the participation in the capital resources of the cooperative then lead to an extraordinary item in the annual accounts of the member.
7.1.9 Government payments
The fact that the government follows an extensive policy in the agricultural sector is also reflected in numerous subsidies, payments and reimbursements for which agricultural enterprises can qualify. These may be divided into:
operating subsidies for the reduction of certain costs (e.g. wage costs, certain advice) or remuneration for damage suffered (e.g. frost or drought damage schemes); investment subsidies connected with certain specific investment expenditure or the financing relating to this (e.g. subsidy for energy-saving, structural improvement scheme, contribution schemes for manure storage); financing facilities (e.g. remission as a result of suretyship, general income support for the self-employed); development credits, which in fact are a special financing facility; tax facilities (e.g. accelerated depreciation on environmental investments). In the frequently occurring legal forms of the one-man business and partnership, these are not incorporated in the annual accounts of the business, but in private accounts (and thus indirectly in the change of net worth).
Incorporation of these items in the annual accounts takes place as recommended in the Guidelines for Annual Accounting (GAAP). The measures of agricultural policy, often proceeding from market management or structural policy, can as a rule be placed in one of those categories. As a rule these reimbursements are in fact return-increasing operating subsidies. Examples are the compensation amounts per hectare for cereals, flax, grass seed and set-aside ('Mac Sharry-premiums'), extensification premiums, premiums for nursing cows and ewes. Reimbursements for nature management, which are obtained via an agreement in which, with a view to the development of nature, management
209

restrictions on the use of land are accepted, are to be regarded as normal returns from nature production or service. Contributions towards the planting of quick-growing timber are investment subsidies. A number of contributions are directed above all towards the income of the self-employed, and thus are more difficult to interpret as operating subsidy. This relates among others to the incentive scheme for farm termination in arable farming (under which an entrepreneur receives a financial contribution after selling his land - and thus his business - to colleagues), and the arable farming income support that was granted for five years to growers of cereals, pulses, oilseed rape and industrial potatoes whose income (including that f rom non-farm activities and that of their partner) was very low or negative. The income contributions are therefore not incorporated in the annual accounts of the farm, but in the income sphere (and therefore as a change in the entrepreneur's net worth).
Contributions from measures of agricultural policy of the nature of an operating subsidy should be incorporated in the categorial profit and loss account under 'other returns' wi th the definition 'income allowances and reimbursements', in the year in which growing of the crop in question takes place. Because in specifications per cost centre (crop) these reimbursements are allocated to the cultivated crop, it is also frequently encountered in practice that the reimbursements are entered in the annual accounts under the returns from the crop in question. From the business economic point of view insight into the source of the returns is desirable, and this should therefore be advised against.
7.1.10 Forestry
Further to the arable farming and horticulture discussed in the preceding sections, a number of remarks should also be made concerning forestry. First of all, there is the fact that management of a forest is in the Netherlands exempt from income tax. That means that, of the some 1,450 private businesses, if desired books are kept only for management purposes (often by land agencies or by LEI-DLO for research purposes). External accounting via the annual accounts hardly plays a role. Incidentally, more than 60% of Dutch woodland is publicly owned and is therefore accounted for by the authorities.
Next it must be stated that, as a result of the extremely long production cycle (many decades) and realization of part of the return via interim thinning and via other returns than those on timber (e.g. subsidies), application of the matching principle is practically impossible and is regarded as rather pointless. Cash flows are therefore entered at the moment of use of the means of production, and income is entered when sales are made. Unlike the situation with tree nurseries, increment is not entered to correct the expenditure on planting and upkeep for the moment when the returns are realized. Returns from thinning and subsidies are not written off f rom the costs of the work in progress, but recorded as returns. Nor is any unrealized return made on account of the growth of the standing timber. On the balance sheet the stock of standing timber is not valued. For more information on annual accounts in Dutch forestry reference may be made to Berger (1993) and Van Boven en Tänzer (1986).
210

7.1.11 Concluding remarks
The agricultural sector is characterized by family businesses. Reporting is thereby above all in use for internal management purposes and for the tax authorities. The influence of GAAP (including legislation and regulations on reporting) is therefore of an indirect nature. Historically, the reporting in the agricultural sector is determined above all by the business economic reporting (current cost accounting and a specific separation between business and family via valuation of family input in conformity with market principles) and by fiscal practice. This has led to reporting models in GRAS.
GAAP (title 9 and the accompanying literature) are also well applicable in agricultural reporting. Typically agricultural subjects such as livestock, permanent and perennial crops, quotas, leaseholds, payments from cooperatives and government payments do, however, call for a specific application of the general guidelines. Because the legislation and regulations relating to reporting in the sector have from of old received little attention, in practice one wil l sometimes (still) come across procedures that are debatable f rom the point of view of GAAP. It is expected that that will be the case less and less in the years to come, having regard to the training of accountants and the ongoing integration of the agricultural sector into the rest of the economy.
References
Berger, E.P. (1993) Bedrijfsuitkomsten in de Nederlandse particuliere bosbouw; Den Haag, LEI-DLO, p. 74
Boven, B. van and L.B. Tänzer (1986) Bedrijfsadministraties in de bosbouw - verslag van een studiereis naar West-Duitsland; Den Haag, LEI, p. 62
Broeks, A.G.M, and C.J. van Loon (1987) Bestuurlijke informatieverzorging en het agrarische bedrijf; Accountant Adviseur, oktober, pp. 28-35
Broeks, A.G.M., K.J. Poppe and P.C.M, van Beek (1991) Omzet en aanwas: het einde; Den Haag, LEI-DLO, p. 36
Hill, B. (1991) The calculation of economie indicators; Luxemburg, EG, p. 342
Horring, J. (1948) Methode van kostprijsberekening in de landbouw; Emmen, Ten Kate, p. 179
211

Kievit, H. (1993) De behandeling van immateriële vaste activa, in het bijzonder melkquotum, in de landbouwjaarrekening (scriptie); Wageningen, p. 66
Kuperus, J.A. (1970) Bedrijfseconomische verslaggeving voor landbouwbedrijven; Den Haag, LEI, p. 266
Poppe, K.J. (1992) Het LEI-Boekhoudnet van A tot Z; Den Haag, LEI-DLO, p. 104
Poppe, K.J. (1988) Administreren voor agrariërs - ontwikkelingen en onderzoekthema's; Den Haag, LEI, p. 99
Starreveld, R.W., H.B. de Mare and E.J. Joëls (1989) Bestuurlijke informatieverzorging, deel 2 - typologie van toepassingen (derde druk); Alphen aan de Rijn, Samson
Tempel, F.C.A. van den and G.W.J. Giessen (1992) Agrarische bedrijfseconomie: inleiding; Culemborg, Educaboek, p. 456
VLB (diverse jaren) GRAS - Geüniformeerd Rekeningschema voor de Agrarische Sector; Leiden, losbladige uitgave
Zachariasse, L.C. and K.J. Poppe (1994a) Trends in de agrarische sector, De Accountant 10; (100) juni, pp. 696-699
Zachariasse, L.C. and K.J. Poppe (1994b) Administratieve ontwikkelingen in de agrarische sector, De Accountant 7 7; (100) jul i , pp. 769-771
212

7.2 MONITORING THE PERFORMANCE OF AGRI-ECOLOGICAL PRODUCTION CHAINS BYLCAANDFADN
Marieke J. G. Meeusen-van Onna and Krijn J. Poppe 1)
7.2.1 Introduction
The environmental effects of agricultural production are one of the main topics of debate in politics and research. Not only the environmentalists and organic-oriented consumers are aware of the environmental impact of agricultural production; the sector itself, the industry, the government and the 'ordinary' consumers are also convinced that this topic is important: sustainability of the agricultural production is necessary. However, each party in the debate has its own perception of the problem 'agriculture-and-environment' and its own solutions. Consequently, each party has its own needs for information and information systems.
This paper aims to answer the question: 'Can the current information systems be beneficial and helpful to support the development of sustainable production chains in agriculture?'
To answer this question, the term 'information system' has to be split up into two aspects: the score card and the data-collection. The score card describes the measurement system: which information do the actors (consumers, government, farmers etc.) need to be able to take decisions, and how is this information defined. The data-collection system is the actual information system that makes the collection of the data possible. Of course these two aspects of the information system must be balanced: the output of the data-collection systems should be the defined score card.
So, to answer our central question, we use the fol lowing approach: 1. make an inventory of the requirements that the actors involved in the
debate 'agriculture-and-environment' have for score cards and data collection systems;
2. select a score card that meets these requirements. Here we introduce Life Cycle Assessment (LCA).
3. select a data collection system that meets the requirements. Here we suggest to use farm accounting, in connection with farm accounting data
1) The authors work at the Agricultural Economics Research Institute (LEI-DLO) in The Hague. Marieke Meeusen-van Onna leads a project on LCA for agricultural products. Krijn J. Poppe coordinates the Dutch FADN and contributes to the concerted action PACIOLI (see text). The authors would like to thank George Beers for his comments on an earlier draft. The normal disclaimer applies.
213

networks as a monitoring system and auditing to support consumer oriented brands.
This approach is visualized in figure 7.2.1.
actors requirements on scorecards
i
+
—(solution)
LCAas score card
data
requirements on data collecting
systems i i a
—(solutio
FADN as data collecting
system
Figure 7.2.1 Approach
7.2.2 Requirements for the information systems on environment-and-agriculture
In this section we select the requirements of consumers, the government and the farmers themselves for information systems that analyse the environmental effects of agricultural production.
Consumers
The consumer who cares about the environment, bases his decision to buy a product on several arguments, including quality, price and environmental effects. Therefore, he needs information about the environmental impacts of product(s). He wants to compare the environmental impacts of different products, that have the same function.
In practice it wil l be nearly impossible for him to assess all the environmental effects. A solution for this problem is to aggregate all the effects into one or two indicators. This requires a weighting method, for instance based on average consumer preferences (see e.g. Horowitz, 1994) or on abatement costs.
Another solution is to introduce a special label or 'brand'. This fits in the need for product differentiation in saturated markets. A brand guarantees that the product meets (minimum) quality standards. In the Netherlands, we have two general (green) brands specifying the environmental quality standards: the
214

Agro-Environmental Hallmark ('Agro Milieu Keur') and the EKO-hallmark. Both are based on EU regulations and in both cases the quality standards refer to all stages in the production chain and several environmental issues (for example: the use of energy, fertilizer, pesticides).
The methodology of this hallmark is based on the concept of Life Cycle Assessment (LCA, see below). In a so called 'Environmental matrix' the main environmental aspects of the product are indicated per stage ('life cycle') of the production process in the total chain. Then requirements on these aspects are formulated and published. Producers can use these requirements to adapt their production process and can apply for the award of the hallmark. In general requirements for packaging are not formulated, unless there is a clear environmental impact. Requirements on health aspects, animal welfare and product quality are in principle not different from those for uninspected products.
An important aspect of such a brand is that it is rebased from t ime to time. If negative environmental effects of agricultural production decrease over t ime, the criteria to award a green label must be revised upwards (a sliding scale). Otherwise in the end all products would qualify and the label loses its discriminating value. This requires [a] a regular comparison of the environmental impact of products under a green label with products that are not involved in such a scheme and [b] a reformulation of the criteria for the label.
Government
The government needs information. The type of information depends on the stage of the political process and on the political importance of the problem. Winsemius (1986) distinguishes four stages in the political process (see figure 7.2.2): 1. problem recognition
in this stage there is not much agreement on the importance of the problem. Need for information: Data in order to define and locate the problem is important. The information system should support this activity;
2. policy formulation the discussions focus on an acceptable sharing of the costs of the proposed policy options and not (yet) on efficiency. Need for information: additional data are often needed. The government needs representative monitoring systems and statistics. It should adapt its statistics and databases according to new realities as topics and policies change (Fletcher and Phipps, 1991);
3. solutions in this stage large costs are made, especially by farmers and agri-business. Where policies in earlier stages focused on extension and included compensations for negative income consequences of policies; in this stage the production as such is more often questioned. Economic effects on micro-level are a central issue in the discussion. The fulf i lment of policies by farmers becomes an important issue. This could demand simple taxes and auditable data. The efficiency of the policy is also more often questioned.
215

Several actors within the government (including local ones) become involved;
4. control of the policy in this stage the policy is evaluated and, if necessary, reconsidered. Need for information: in this stage monitoring plays an important role.
The environmental policy is a relatively young branch on the policy tree. In the Netherlands most parts of it are in the policy formulation stage and enter the solution stage.
Several environmental policy instruments have been developed and installed in practice. We mention the direct regulation instruments, the social regulation instruments and the financial regulation instruments. The direct regulation instruments directly influence the behaviour of the individuals: i t forces or orders the individual to handle in the way the government wants. The social regulation instruments have another character: they motivate the individuals to voluntarily change their behaviour. Education is an example of this instrument. Finally, the financial regulation instruments can be considered as 'somewhere in between'. These instruments try to influence the individual by connecting his behaviour to financial incentives. Taxes can be mentioned as an example (Brouwer, 1992).
Political importance
Recognition Policy-formulation
Solution Control Stage
Figure 7.2.2 The stages of the political process Source: Winsemius (1986).
216
One can observe that the approach of the problem 'environment' has evaluated. Initially, the environmental issue was approached in a fragmented way. The government and the scientists only considered the greenhouse-effect or the eutrophication without looking at the (related) effects on other environmental themes. Currently, the attention is moving towards an integrated approach: all the environmental themes have to be considered in assessing products, processes and activities.
Finally, its is important that the government uses information and instruments, that are accepted by the individuals who face the results of it and who have to change their behaviour - voluntarily or not.
Producers
Farmers face the requirements of the consumer to use less energy, fertilizers and pesticides. Until recently, the decision to introduce new agri-systems, techniques or products was primarily based on economic and technical considerations. However, in future, market aspects which are partially related to environmental aspects wil l be an important element in the decision making process. In new designed sustainable agri-ecological systems, it could be attractive to produce branded products with a quality premium, like products wi th an Agro-Environmental Hallmark- as mentioned above. Such a premium can be justified on a lower (or even zero) use of certain inputs like pesticides.
Furthermore, farmers face environmental legislation and regulation from various government bodies. They have to oblige laws and need to prove that they are acting legally or at least that they are not aching illegally.
So, the environmental topic wil l be more and more an issue that the farmer has to consider. For new designed agri-ecological systems, and those under development, the need for information is high. Farmers, extension service and researchers are learning rapidly and make their improvements at a high rate. This knowledgement has to be brought to the actors, who have to implement it into practice. Consequently, the farmers need a lot of technical information how to meet the requirements of the consumer and the government. In that, farmers have to deal wi th several sorts of information. Family farms, that dominate European farming, are characterised by a strong integrat ion in their technical, economic and social decisions. Farm families adopting new farm systems go through a period of severe changes. The new systems have not (yet) the place in the markets, that well established current systems have. This requires a systematic and solid basis for decision making. For farmers the reflection on their farming systems should also lead to a reflection on their management information systems.
Furthermore its important that governments and consumers are convinced of the advantages of the new systems, especially in the case that it leads to a higher cost price but lower external effects than current production systems. The consumers need the information to support their buy-decisions and the government to monitor its policies and farmers have an interest to provide this data. Thus they should include information on new developed systems in their information systems.
217

In conclusion
One can conclude that agriculture needs information systems that meet a list of requirements, of which most are derived from the demands f rom consumers and government. In a rather arbitrarily order:
acceptance of score cards there is a need for a score card that makes it possible to communicate about environmental effects in such a way that all parties involved recognize the problem and have confidence in the way solutions are selected. This instrument has to be accepted by all the parties involved in the debate; acceptance of data and information information about environmental effects of agriculture have to be acceptable for all parties involved; they have to 'rely' on those data. The consumer has to trust the image of the brand and therefore the informat ion which forms the base for the award of the brand. Acceptance of information is also essential in the communication between the farmer and the government: the farmer has to trust that policies are made after analysing the problem and selecting the best measures; he has to have confidence in the information that often serves as a base for levies or taxes. For some applications extra requirements are necessary. Policy proposals, like the extensification premiums, the intensification levies and perhaps even input levies, require detailed and auditable records on farm level for all farms concerned. Claims made by brands should also be supported by accounting and auditing; this can reduce the marketing costs of building a green image of the brand; integrated environmental assessment an integrated approach is necessary: consumers and the government consider all environmental impacts through the entire life cycle of the product. Its not acceptable that one solves e.g. the problem of the greenhouse effect, while creating a 'new' environmental problem or increasing an existing one. Neither is it acceptable that one producer in the production chain reduces his environmental impact by increasing the impact in the next stage of the production chain; integrated decision making an integration of technical and economical aspects in one instrument for decision making has a preference above the use of several instruments that each deals with only one aspect of the decision. Such an instrument makes it possible to base the decisions on different perspectives.
7.2.3 Life Cycle Assessment
We present the Life Cycle Assessment (LCA) methodology as a score card for the environmental impacts of a product during its total life cycle. LCA meets some of the requirements mentioned above:
218

1. the acceptance of the score card; 2. integrated environmental assessment: the possibility to consider all envi
ronmental impacts of the product through its entire life cycle; 3. integrated decision making: the possibility to integrate the technical and
economic aspects for decision making. This section first presents the methodology, and then discusses the data
needed.
How it works
LCA identifies and quantifies the emissions, the material and energy consumptions which affect the environment at all stages of the entire product life cycle (Bergen, 1995). Up til l now, LCA is mainly used for assessing industrial products. With the increasing acceptance of the instrument, parties involved in the 'agriculture-and-environment' debate also begin to show interest in it. This has been the driving force to make the instrument more suitable for agricultural products. The LCA has been developed primarily for comparing industrial products and therefore the instrument had some difficulties in handling items typical for agricultural production. We mention two of those items, which had our special interest.
First, there was the issue of the soil. In agriculture, the soil can be considered as an economical production factor, just like labour and capital. When we should consider soil as a part of the economical production system and not as a part of the environmental system, the environmental effect in and on the soil, should not be noticed, because LCA only takes the environmental effect in the environmental system into account. However, the consumer and the government do not agree with the statement that a farmer can do what ever he wants with 'his' soil. So, we have to choose whether we consider the soil as a part of the production system (as a reality for farmers) or as a part of the environmental system (as a reality for consumers and government). We have chosen for the option: 'the soil has to be considered as a part of the environmental system'. In the assessment afterwards one can take into account that the soil can be considered as a production factor.
A second example is how to deal with eutrophication. In the original LCA, the use of fertilizer was for 100% considered to be eutrophical. That is not the reality. In practice, a (considerable) part of the fertilizers is used by the crops; only the remaining part can be eutrophical. The 'new' LCA takes this into account.
An LCA starts with a process f low chart that maps the activities carried out in the production, distribution, marketing and use of the end product. This process f low chart covers all the processes related to the product: from the extraction of raw materials through the disposal of the waste of the end product. For each process data on all the extractions from and the emissions into the environment are collected. Emissions are split up, according to their destiny: water, air, soil. The extractions and emissions for each process are then added up to show the inputs and outputs for the entire product life cycle. This results in an inventory table. Then the inventory table is related to environmental
219

themes: What is the contribution of C02-emission to the greenhouse-effect? What is the effect of NH3-emission on acidification etc. By converting each emission and extraction into a contribution to environmental themes, one simplifies the (very, very) large inventory table to a relative small table wi th the 'scores' of the product on a limited number of environmental themes. This is the base for the next step: LCA helps to identify the areas of possible improvement. In this 'improvement-stage' one can integrate other disciplines that are necessary in decision-making.
Data needed
The methodology is data-intensive. Using LCA to determine the environmental profile of a product requires a lot of data of the processes involved. For all these processes in the process f low chart environmental data (emissions and extractions) have to be collected. This could be a problem if the product chain is rather long and without clear leadership; cooperation of all the stages in the product chain is then not guaranteed. Also if the source of the inputs is geographically far away (e.g. animal feed produced in Brazil or the U.S.A.) or diff icult t o check, data problems can arise.
A lot of the information needed can be retrieved from the Farm Accountancy Data Network (FADN). We now have some experience in using the FADN for executing LCAs. This exercise gave us an idea of the pro's and contra's and the restrictions of using the FADN. We will discuss this in the next section.
Relevance in terms of the requirements
In section 7.2.2 we have identified a number of requirements for score cards and data collection systems. LCA is an appropriate score card for a number of applications. The most important ones are:
to give information on the environmental impacts of a product; to identify the environmentally most dominant stage in the product life cycle; to select areas in existing product (systems) that could be improved; to design new product (systems); and
furthermore the data can be used for monitoring environmental performance in the product chain.
The list of applications shows that the LCA-instrument can be used as one of the tools in answering the question 'how to reduce the environmental burden of agricultural production?', regarding the chain-approach and wi th (limited) possibilities to integrate the environmental issues wi th other disciplines (economics, technology). However, this integration could be improved.
The LCA is also an accepted instrument. The Dutch government uses the instrument in his Product Policy and finances studies on developing the instrument. It's not only the government that has confidence in the instrument, consumers groups that are involved in awarding the Agro-Environmental Hallmark also rely on LCA-results.
220

7.2.4 Farm accountancy and monitoring
The previous section introduced the LCA-methodology as a score card that meets three of the four requirements defined in section 7.2.2. The missing requirement is the acceptance of data and information by all parties involved in the debate. In this section we discuss if farm accounting and FADNs (FADN) can fulf i l l this need. This requirement involves that: 1. information has to be reliable; all parties in the debate 'agriculture-and-
environment' need to have confidence in the data; 2. there is a need for data for many activities / processes and on a very de
tailed level. We start wi th farm accounting and, after a side step on auditing, then
turn to monitoring wi th an FADN.
Farm accounting
Agricultural systems should be monitored for the benefit of the farmers themselves as for the benefit of researchers and policy makers. Farmers benefit because they learn from their own data as well as from a comparison with others (benchmarks). Study clubs of farmers can be very fruitful as a platform for training, reflection, and exchange of information. As there are large differences between farms in their economic and environmental impact, extension should be fostered.
Integration of economics and environmental issues in one farm accounting information system is attractive. The gathering of data, and especially environment-related data, has been supported enormously by the developments in information systems and electronic data interchange (Poppe, 1992; Poppe et al., 1994, Breembroek et al., 1996).
Gathering environment related data for farm decision making can be done in several ways: it can be done separated from the tax accounting system (stand alone), integrated with production records or integrated with financial tax accounts (Poppe, 1992, p. 199). Gathering the data separately for each system is inefficient especially wi th respect to auditing. The major advantage of integration with production records is that it supplies the farmer with management information. A problem however is that production records are usually branch specific, i.e. separate for dairy, poultry etc. So on a mixed farm an enlargement of the production records will be needed. Auditability is also weak. The third option offers the best prospects, especially if farmers have compulsory financial accounts done by specialized accountancy agencies to make a tax-return (Poppe, 1991, p. 9). The integration of financial and environment related data will result in a considerable saving of accounting time. Data have to be entered only once and are directly available in a format that fits in the audit trail. On the other hand, the farmer's involvement will be less and the results will not be available before closing the fiscal accounting records.
221

Auditing
A rather new development is the need to audit farm accounts. This could be needed in two cases: when the government uses farm accountancy data to police the environmental behaviour of the farm and when the agri-business needs to be informed on the production methods of the farm. In that case auditing can be regarded as a process that increases the acceptance of the data for other actors (agri-business and consumers) in the agricultural-and-environ-ment debate.
Several methods can be used to check the claim of a low(er) use of certain inputs. Spot checks, laboratory inspection of the end product and remote sensing (e.g. on the density of planting) are some of them. Accounting and auditing of the accounts can be an attractive alternative, as they have several advantages compared to the other methods: a. it could be relatively cheap; b. it can be carried out by the private sector, farmers or bookkeepers,
checked by certified public accountants and on the top of the pyramid the government that organizes a compliance check on the public accountants;
c. the checks are not t ied to a certain moment, but cover the whole accounting period - normally a year;
d. accounting also provides possibilities for farmers to learn f rom feedback on their own results and those of their colleagues. Of course there are also disadvantages, especially resulting from potential
fraud due to a low market value of the product involved. Given the advantages of auditing, it makes sense to look more in detail how it works (more details can be found in Breembroek et al., 1995).
If financial flows (costs and sales) and physical inputs are accounted for in the same system, there is a direct relationship between the physical input flows (e.g. pesticides) and the financial flows on the farm. Auditing is possible by comparison of both flows. In financial accounts most entries of inputs like pesticides or nutrients are considered as costs (or benefits in the case of manure that is sold). In the environmental accounting system the same quantities are the base for assessing the pesticide use or the nutrient surplus in kg N and kg P. Between the two types of accounts a conflict of interest exists in a profit situation. An entry which is accounted for as costs results in less financial income (which is fiscally attractive); the same entry in environmental accounting results in a supply (which is not attractive).
It depends on marginal financial costs (influenced by the price of inputs and the income tax rate), marginal benefits of the physical input (net of income tax) and the levy on an input surplus wether it wil l be attractive to commit f raud. In general farmers wil l not f ind it attractive to hide income from sales on purpose to increase the application of e.g. fertilizers. Nevertheless, inputs the farmer can buy abroad and transport himself and which are relatively cheap, will be difficult to audit. Some items, like manure and dead animals, do not always have a pendant in financial figures. For the audit of some inputs a system of certificates (vouchers) of delivery could be introduced and supported
222

by the information on cost of transport, which wil l be registered in financial accounts.
Auditing becomes more and more an issue. For example, an audit-matrix for nutrients has been developed, wi th criteria to assess how auditable a specific f low of goods is. Based on that analysis additional measures can be taken and auditing protocols can be designed. In addition to the audit-matrix the fraud problems should be taken into account. That involves situations where a number of holdings in the input chain try to create profits by acting fraudulent together.
Product-chain approach
The developments in farm accounting and auditing reinforce the point made for an integrated approach in the product chain. First of all there is the question of information sharing. The data necessary to account for the f low of environment related inputs to and from the farm must be gathered from different sources. Much data is needed from the trade partners of the farm (e.g. content of nutrients in animal feed, active ingredients in pesticides etc.). Therefore a chain approach is attractive. In principle invoices should contain additional information on physical inputs, as the invoice is the basis for the accounting and auditing process. But also periodic reports could be made available that include a specification of all the deliveries.
A second type of information sharing concerns the market information that the agri-business receives from the supermarkets and other outlets. This information is translated into price and quality parameters that are passed on to the farmers. In the end quality is defined by the consumer. Quality management involves the definition of quality parameters in all levels of the chain (based on ISO 9000 or in another way) and measuring the realized quality. To realize improvements it is important that the total chain becomes a 'learning organization' and tries to optimise the processes in the chain in stead of in the separate businesses.
Monitoring in an FADN
In the Netherlands we have positive experiences with the use of monitoring systems (Poppe et al., 1995). An example is the FADN, originally created to monitor the developments in production costs and incomes at farm level for policy makers. In recent years two types of innovation have taken place: a. monitoring the use of pesticides, nutrients, water and energy to support
both farm and government decision making in an integrated framework of economic and environmental issues. This innovation is based on the possibilities to gather these data in a farm accounting system (see above);
b. monitoring new farm systems, like integrated arable farming and organic farming. If this is done in the framework of an established FADN a comparison wi th traditional farm systems is guaranteed.
223

Relevance in terms of the requirements
Farm accounting and FADN play an important role in the Dutch and EU policymaking as a monitoring system. In the Netherlands the accounting options mentioned above are used to make nutrient accounting obligatory for farmers and to introduce a levy on the excess production of minerals like nitrogen and phosphate. In its role as an environmental policy instrument such a nutrient accounting systems enables the government: 1. to measure the individual contribution of a farm to the saturation of soils
and the evaporation of ammonia; and 2. to impose a levy on surpluses - and not penalize or even subsidize the
farms that produce with less environmental burden that required by law. The current monitoring systems can be considered as very reliable, w i th
a great acceptance in the Dutch society. Farmers are for a long time obliged to keep books for tax purposes. They regard a mineral accounting system as a fair system, although they disagree wi th the government's mineral reduction targets. The FADN, based on an at random, representative sample, is viewed as an unbiased source of data. Regular reports on the quality of the sample support this image. (Silvis, 1994) It helps parties in the debate to assess the situation and the policies that are proposed.
In comparison wi th the use of normative standards the FADN has two pro's. First, it gives a coherent set of data; coherent in the way that the data 'f it together' - the aggregate per enterprise / farm is correct. This is less certain when standards are used. Furthermore, the data give an idea of real practice because it is based on a representative sample; it is not 'best-practice' or 'best-technical'or whatever.
For the previous reasons it is attractive to use FADN data in the LCA-calcu-lations. However this requires data on very detailed level. For example: for assessing the environmental effects of '1 kilogram milk' we need data on the use of every type of pesticide, fertilizer, energy, machines, buildings. The FADN helps a lot in collecting these data. However, sometimes its a problem that the FADN collects data on farm or enterprise level, and not on the level of processes or activities.
As an example: the use of machines. Ideally, we need data for every activity that involves the use of machines. Which machine is used, for how long, wi th what energy-use? The same question for the activities: fertilizing, spreading pesticides, harvesting and so on.
At this moment we have not those data on that detailed level. However, in the future this could be improved if Activity Based Costing is be introduced in farm accounting. The introduction of electronic plot records (Doluschitz, 1995) could also be useful.
Another 'contra' is that the current FADN only measures the use of environment-related inputs at farm level, whilst for LCA we need the emissions. However, it can be expected that such additional data will be collected in more detail in the future. In our Dutch FADN we had already a project were on 100 dairy farms the emissions of minerals in ground and surface water were measured and correlated with the farm management.
224
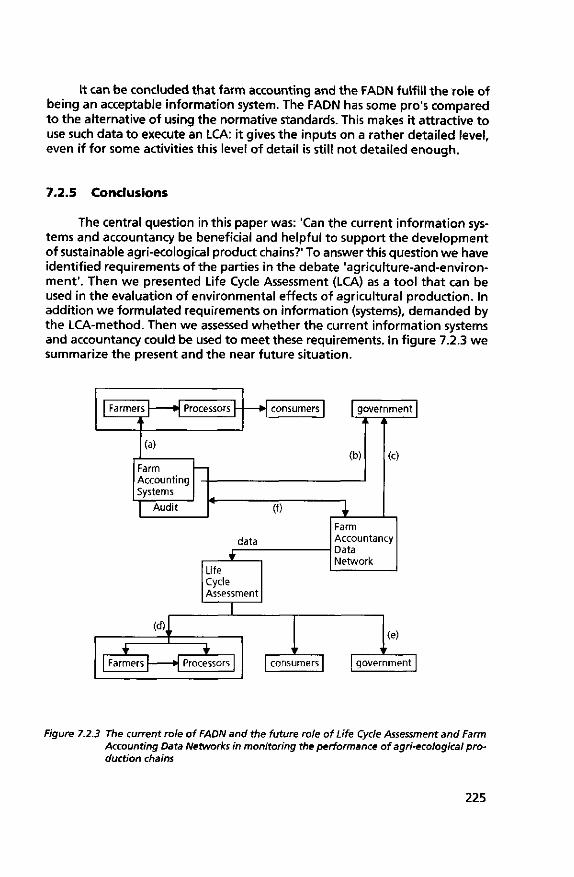
It can be concluded that farm accounting and the FADN fulfil l the role of being an acceptable information system. The FADN has some pro's compared to the alternative of using the normative standards. This makes it attractive to use such data to execute an LCA: it gives the inputs on a rather detailed level, even if for some activities this level of detail is still not detailed enough.
7.2.5 Conclusions
The central question in this paper was: 'Can the current information systems and accountancy be beneficial and helpful to support the development of sustainable agri-ecological product chains?' To answer this question we have identified requirements of the parties in the debate 'agriculture-and-environ-ment'. Then we presented Life Cycle Assessment (LCA) as a tool that can be used in the evaluation of environmental effects of agricultural production. In addition we formulated requirements on information (systems), demanded by the LCA-method. Then we assessed whether the current information systems and accountancy could be used to meet these requirements. In figure 7.2.3 we summarize the present and the near future situation.
Farmers Processors consumers government
(a)
Farm Accounting Systems
(b)
Audit (f)
data
Life Cycle Assessment
I
(c)
Farm Accountancy Data Network
(d),
+ Farmers
r
* Processors
' ' consumers
' (e)
' government
Figure 7.2.3 The current role of FADN and the future role of Life Cycle Assessment and Farm Accounting Data Networks in monitoring the performance of agri-ecological production chains
225

We distinguish the current situation (the upper layer) and the additions for the future situation (the layer below). In both situations four groups of players are involved in the debate: farmers, government, the agri-business in the production and marketing chain and the consumers. However, the influence of each party differs.
In the current situation some important f lows of information can be distinguished. We indicate them a), b) and c). a) Farm accounting systems are adapted to inform the farmers on environ
mental issues like the use of nitrogen, pesticides or energy. b) In some cases governments start to ask for environmental reports f rom
farmers. Examples are environmental taxes, cross compliance to receive income subsidies and environmental plans to get building permitments. This asks for accounts that are audited.
c) Farm accounting data networks that governments use to monitor the developments in farm income are adapted to monitor environmental effects of farming. The f igure shows that these streams of information ' f low' mainly be
tween the farmers and the government. The consumers and the other companies in the production chain do not have a dominant role in the information systems.
Furthermore, the data can be considered as reliable and accepted by all parties in the debate: producers, government and consumers. Farm accounting is an attractive information system, also because these data can be audited. This raises the acceptance of these data.
The situation for the future might be a little different. Other parties in the debate might ask for a more prominent position in the discussion and need information to meet requirements and to achieve goals. As we can see in figure 7.2.3, the layer below, the other companies in the production chain and the consumers ask for product information. The Life Cycle Assessment could fulf i l l this need - as it meets the requirements of the parties in the debate. Informat ion [d] t i l l [f] are examples of the applications for which LCA could be used. d) The agribusiness tries to make money out of the consumers care for the
environment by 'green marketing' and the introduction of specific brands that guarantee an environment-friendly production. To be able t o guarantee the product quality, in general but especially for environment-friendly products, the agribusiness increases its control over farm product ion by prescription of production methods in contracts. This includes reports on the use of pesticides etc.
e) The government tries to influence the management decisions of producers by providing information which make it easier to develop agri-ecological systems.
f) Farmers can learn how to improve their product(system) by comparising with new agri-ecological systems, that have been developed by research. The FADN might be considered as a very interesting data collecting sys
tem, that can be used in executing these LCAs. The current FADN meets the identified requirements. The Farm Data Accountancy Network - w i th some ex-
226

ceptions - provides these data. Improvements are possible with respect to data on individual processes and on emissions.
7.2.6 Future research
'The Macnamara fallacy: The first step is to measure whatever can be easily measured. This is OK as far as it goes. The second step is to disregard that which can't be easily measured or give it an arbitrary quantitative value. This is artificial and misleading. The third step is to presume that what can't be measured easily really isn't important. This is blindness. The fourth step is to say that what can't be easily measured really doesn't exist. This is suicide.' (D. Yankelovich -1972, cited in Gray, 1993)
Family farms become more and more integrated in society and the international economic system. This process has a long history and there is no sign that it wil l weaken. On the contrary: farming in Western Europe is now characterized by two important influences: science and society. Developments in science lead to more measuring and more control of the production process (e.g. computerisation, informatisation, bio-technology, precision farming). Especially in operational management this trend of f ine tuning is dominant.
The influence of the society is especially strong in strategic management: a farmer who would like to be successful in the longer term has to adjust his business to trends in the society at large (environmental policy, declining CAP-budgets, labour market policies, non-farm activities).
Both trends could lead to an increase in information management, including accounting and auditing, in the agricultural sector. The influence of science leads to more accounting for farm management purposes. The requirements f rom the society leads to more administration in order to be accountable. The trend of environmental accounting is also clear outside agriculture (U.N., 1992; Gray, 1993).
In designing sustainable agri-ecological production chains, it seems important to us that these developments are taken into account. This leads to the fol lowing research questions (and some starting points for answers): 1. could we f ind measures to compare the performance (e.g. income, envi
ronmental impact, know-how needed) of agri-ecological production chains in relation to the demand of consumers and the society at large? To us, the LCA-methodology seems to be a starting point in trying to answer this question;
2. in which cases could the labelling of products (brands) contribute to the increase the economic performance of an agri-ecological production chain and how can we ex ante estimate costs and benefits of such a scheme?
3. which information and communication systems (including accounting) are needed to monitor the performance of the systems?
227

To us the experiences in the current FADNs look a good starting point in f inding the answers. As advocated earlier in the EU's Fast programme (Fast, 1988; Tims et al., 1987) these concepts should be broadened to other businesses in the product chain; 4. to which extent do we incorporate the findings on the desired informa
t ion systems into codes of good agricultural practice (Jordan, 1993)? 5. does it make sense to develop a methodology for auditing the informa
t ion systems and their data on the performance of the agri-ecological production chains?
6. to which extent does the focus on information and auditing influence the attractiveness of the designed agri-ecological system for the individual farmer? Several studies on farm styles and on decision making (Van der Ploeg et al., 1992); for an overview see also Beers, 1995) indicated that farmers differ in their management style, as well as learning style and farm style. Some styles are heavily data-dependent, others are more outside oriented or less precision-oriented. That means that agri-ecological production chains wi th a strong emphasis on information and auditing should (at least in the introduction stage) be matched with a certain type of farmers;
7. how do we implement these methodologies in production chains, especially if there is no clear leadership by the agri-businesses in one of the stages of the product chain.
At the moment we, at LEI-DLO, have no answers to these questions. But we have research going on, especially on brands, LCA and on innovation in accounting. The last topic is the subject of a concerted action in the AIR-programme of the EU, called PACIOLI: a Panel in Accounting for Innovation, Offering a Lead-up to the use of Information modelling (Beers et al., 1995; Poppe and Beers, 1995). In four international workshops we try to improve the quality, use and cost effectiveness of farm accounting and farm accounting data networks, especially by stressing the need to improve information management.
It seems to us that in the 'agriculture-and-environment' debate explicit attention should be paid to information management. LCA and farm accounting can play a significant role in the design of sustainable agri-ecological production chains.
References
Beers, G. (eds.) (1995) Papers DOBI-Seminar, The Hague, LEI-DLO
Beers, G. et al. (ed.) (1995) PACIOLI 1: Farm accountancy data networks and information analysis; Workshop report; The Hague, LEI-DLO
228

Bergen, N.W. van den et al. (1995) Beginning LCA, a guide into environmental Life Cycle Assessment; CML, Unilever, NOVEM, RIVM
Breembroek, J.A., B. Koole, K.J. Poppe and G.A.A. Wossink (to be published in 1996)
Environmental farm accounting: the case of the Dutch nutrient bookkeeping system; Accepted by Agro-Systems
Brouwer, F.M. (1992) Een verbruiksbelasting op milieugrondslag: raming van de kosten voor land- en tuinbouw; The Hague, LEI-DLO
CEC (Commission of the European Communities) (1992) Towards sustainability: a European Community programme of policy and action in relation to the environment and sustainable development, Brussels, Commission of the European Communities
Doluschitz, R., C. Fuchs and B. Schanzenbächer (1995) Electronic plot records for environmental protecting management of crop farms; In: L.M. Albisu and C. Romero: Environmental and land use issues; Kiel
Gray, R. (1993) Accounting for the environment, London
Horowitz, J. (1994) Preferences for pesticide regulation; In: American Journal of Agricultural Economics 76 (August 1994), pp. 396-406
FAST Programme 1984 -1988 (1988) Results and recommendations; Brussels; vol 5. and vol. 6
Fletcher, J.J. and T.T. Phipps (1991) Data needs to assess environmental quality issues related to agriculture and rural areas; American Journal of Agricultural Economics; Vol. 73, no. 3, pp. 926-932
Jordan, V.W.L (ed.) (1993) Scientific basis for codes of good agricultural practice; Brussels, CEC
LCA voor Agrarische Produkten (to be published in 1995) Deel 1,2,3, and 4; CML, CLM, The Hague, LEI-DLO
Office of Technology Assessment - Congress of the U.S. (1992) Green products by design; Washington
229

Ploeg, J.D. van der, S. Miedema and D. Roep (1992) Boer bliuwe, blinder bedrijfsstijlen, ondernemerschap en toekomstperspectieven; Wageningen, Landbouwuniversiteit Wageningen, AVM, CCLB Accountants
Poppe, K.J. (1991) Information needs and accounting in agriculture; The Hague, LEI-DLO; Mededeling 444
Poppe, K.J. (1992) Accounting and the Environment, In: Schiefer, G. (ed). Integrated Systems in Agricultural Informaties; Bonn, ILB
Poppe, K.J., B. Koole, J.A. Breembroek and F. Engelbart (1994) The effects of obligatory environmental accounts on Dutch software; In: Royal Agricultural Society of England: Fifth international congress for computer technology in agriculture; Cambridge
Poppe, K.J. et al. (1995) Landbouw, Milieu en Economie, editie 1995; The Hague, LEI-DLO
Poppe, K.J. and G. Beers (1995) PACIOL11: On data management in farm accountancy data networks; The Hague, LEI-DLO; Reflection paper
Silvis, H. (1994) Landbouweconomie als beleidswetenschap; Wageningen, Landbouwuniversiteit Wageningen
Tims, W. and T. Koopmans (1987) Integrated management of economical ecological agro-ecosystems; FAST occasional paper nr. 176; Theme SYRENA-SYstèmes des REsources Naturelles; Brussels
United Nations (1992) Environmental Accounting; New York
Winsemius, P. (1986) Gast in eigen huis: beschouwingen over milieumanagement, Alphen aan de Rijn
230

7.3 THE UTILIZATION OF FISCAL INCENTIVES FOR THE INTRODUCTION OF THE ACCOUNTING IN THE SPANISH AGRARIAN FIRMS
Gomez-Limon Rodriguez
7.3.1 Introduction
The first that we would like to highlight is the interest and the utility that accounting possess for the agricultural holdings. In this way we could indicate that accounting could constitute a necessary element for:
support to decisions making; instrument of control for the manager on the operation and state of their company, for the administration that is carried out, for the financial politics, for the result of the activities..., in order to know if the holding is earning or losing money; service of information to third people been interested in the f i rm, workers, outfitters and clients, associates or owners of the company, banks. Public Administration, etc.; cover the demands of information by the Administration, for supporting the policy decision making; instrument of reference and comparison for the company wi th other carrying out their same activity (benchmarking), contributing to get greater efficiency and better operation.
In this way is also suitable to highlight that the use of the accounting presents also a series of inconvenient and difficulties:
the demand of some minimums levels of preparation for the people charged with carrying it, besides the people that are going to receive this information; the economical cost that supposes the recruiting or preparation of these people, the necessary infrastructure for the treatment and diffusion of the mentioned information.
These inconvénients has made that different incentives, in form of direct aids have been developed:
at European level the V Chapter 'Accompaniment measured in benefit of the agricultural exploitations' of the Reglament 2328/ 91; at Spanish level the Royal decree 1987/ 91 on 'Improvement of the efficacy of the agrarian structures'.
231
In spite of those encouragement for the introduction of the accounting in the agricultural holdings, these has had very scarce success.
For the agrarian companies, accounting has the same interest of for any another company. However, in practice, one of its main advantages is the possibility of election between the different fiscal schemes that the legislation permits to this sector. Indeed, the countable process permits, for the Spanish case, that the agricultural producer measure if it are worthwhile to him to continue paying the Spanish income tax (IRPF) for the objective estimate scheme for farmer (Estimation Objetiva por Modulos), or on the contrary he would be benefited opting for the subjective estimate (Estimation Directa). In same way accounting wil l facilitate the farmer evaluate the convenience of continuing in the VAT special scheme for farmer (REAGP), or opposite he would be interested in opting for the ordinary scheme of this tax.
Maybe this fiscal saving that accounting could facilitate, is one of the factors that more influences its introduction in the agricultural holdings. That is the point we are going to analyse next, studying separately both taxes: income tax and VAT, concerning the holdings that maintain an accounting and those that they don't make it.
7.3.2. The income tax and the Spanish agriculture
7.3.2.1 Introduction
The income tax (IRPF) is the most 'popular' tax in Spain, because it is a t r ibute paid by everyone who get any income. This tax is ruled for the Law 18/91 and its Reglament, approved by the Royal Decree 1.841/91.
The total income in order to compute the tax is the global sum of: a) the net incomes (revenues-expenses) from dependent personal work; b) the net incomes (revenues-expenses) from fixed capital (land, build
ings...); c) the net incomes (revenues-expenses) f rom financial capital; d) the net incomes (revenues-expenses) from managerial activities or profes
sionals; e) the increments and decreases of patrimony.
Next we are going to centre the attention only in the incomes of the managerial activities (d) due to this is the most typical and habitual income that farmers get of their agricultural activity.
7.3.2.2 Systems of determination of the agricultural incomes
He objective of whatever of the systems or existent schemes is to determine the net income of the agricultural activity. This income is defined by Law like the 'difference between the revenues (included self-consumption, grants
232

and others transfers) and the necessary expenses to obtaining this income (including the amount of depreciation)'.
Nowadays, the schemes applicable for the determination of the net income from the agricultural activity are the fol lowing two: 1.° Subjective Estimate (S.E.) 2.° Objective Estimate (O.E.)
7.3.2.3 The regimen of Subjective Estimate (S. E.)
In this regime of Subjective Estimate (S. E.) the income of the agricultural holdings it is determined by the difference between total revenues and total expenses.
A. Who can opt to it
Direct estimate is applied to: the farmer whose sales are superiors to 50 millions pesetas; that agricultural producers that give up to the Objective Estimate.
B. Revenue and expenses
In order to determine the net income from the agricultural activity in the regimen of S. E., it is compulsory to keep in mind all the revenues gotten, all the necessary expenses obtained and the increments and decreases of patrimony originate in the goods affected to the holding.
As for revenue wi l l be computed the fol lowing ones: normals revenues of the activity (sales and services); self-consumed and of the free transfer to thirds, computing these to the normal courage that have in the market; grants received from Administration; current transfers received by the farmer; increases of the patrimony produced by goods affected to the agricultural activity.
Deductible Expenses, are those necessary for the obtaining of the revenues and the amount of the deterioration suffered by the goods that composed the f irm (depreciation). They are included under this heading:
current acquisitions of goods (productive factors), like seeds, fertilizers, crop protection products, fuel, feed-stuff, vaccines, packings and, in general, all consumables products in the normal productive process of the holding; personnel expenses; financial expenses; the works, supplies and external services diverse expenses, like: office material, telephone and mail, publicity, attorneys, etc.;
233

tributes, other than personal income; annual depreciation of the goods affected to the activity; provisions endowed in the exercise in order to cover doubtful payments; the decreases of the patrimony produced by goods affected to the agricultural activity.
C. Formal liabilities
Application of the subjective estimation scheme demand the farmers' collaboration and the execution of numerous fiscal liabilities. This paperwork is an important liabilities of this regimen. In this sense, it should annotated that the agricultural activity is not considered 'commercial', and in consequence, farmers are not supposed to carry an accounting f i t to the Commerce Code. In spite of it, these managers wil l fulf i l l the fol lowing liabilities: a) carry out the fol lowing books:
- Book of registrations of sales and revenues - Book of registration of purchases and expenses - Book of registration of goods of investment
b) keep the invoices and other accrediting documents during five years; c) send and deliver invoice in the operations of sale and services.
We can conclude affirming that for the correct management of this regime of the income tax is necessary to carry out an accounting. In any other case, the farmer would be incapable of f i l l ing the previous administrative requirements.
It could be appreciated that the S.E. scheme has the accuracy like principal advantage. The main inconvenient resides, however, in the indirect fiscal pressure that it supposes for the taxpayer (and, especially, for the small manager), especially due to the cost of the countable registrations and the execution of another formal liabilities. In many cases farmer need the advice of a tax counsellor to f i l l the formal requirements.
7.3.2.4 Objective Estimate
This system takes like base for the determination of the net income of the activity, the amount obtained by applicating a percentage (called 'module') to the revenues gotten in the holdings. These percentages wi l l be variable depending upon type of cultivation, or livestock production. The tax base may be corrected in certain cases (like lease, utilization of means of irrelevant product ion, recruiting of hand of work and consumption of feedstuff).
A. Who can opt to it
This scheme is compulsory for all those farmers w i th sales below 50 millions pesetas, but the farmer can voluntarily be exempted from this spatial regime and opt for the general one.
234

B. Net income calculation
The modules system try to avoid the problems the Subjective Estimate involved, attempting simplicity and ease of administration, at the same t ime that make it acceptably accurate making the estimate. But simplicity necessary involve lack of precision.
To apply this system. Law has determined five groups of agricultural products, assigning each product to a group, and to each group one single module. This percentage can be appreciated in table 7.3.1.
In this chart it can be also seen that the average module for national agricultural sector is 31.4%, which it means that are the 68.6% of the farmer's income are deductible expenses.
Table 7.3.1 Groups of agricultural products and its modules
Group Products Net income (%)
I poultry (meat and eggs) 12 II beans
cereals 24 III wine
oil seeds dry fruits pigs 30 cattle other livestocks citrics
IV roots, potatoes and forage rice wine 35 other crops dairy sheeps and goats products
V textile crops fruits tobacco horticultural products 40 grapes dairy cows products sheeps goats
Agricultural sector average module 31.41
There also some circumstances in which we can applicate corrective multipliers. In these cases, the final net income will be estimate by applying these multipliers to the previous amount. This cases and the indexes are the fol lowing ones:
235

1. when all the means of production used do not belong to the farmer. It could be used an factor of the 0.75;
2. when the cost of the hired labour is more than the 10% of the whole expenditure, the corrective factor to apply will be 0.90. In the same way, when this cost is more than the 20%, the corrective factor is 0.85; more than the 30%, 0.80 and more than the 40%, 0.75;
3. when the farmer pay a rent for the land, the corrective multiplier applicable only to the crops gotten in leased land will be 0.90;
4. when all animal feeding in the livestock holdings is acquired to other people, wi thout no self-consumed, the appropriate factor wil l be the 0.80.
Note: Multiplier factor 1 and 2 are not simultaneously compatible.
For the year 1995 (severe draught) was also provided a reduction of the final net income calculated in 8.5%.
C. Formal requirements
This regimen of determination of the net income of the f irm is adapted to the Spanish agricultural holdings without countable infrastructure. For that circumstances, the formal obligations to make for these producers are totally minimal, wi thout necessity of making no type of registration.
So, the principal characteristics of this regimen of estimate are the following: 1) it is a simple system and easily comprehensible for the farmers; 2) it is based on variables of easy measurement and control; 3) involve formal liability easy to carry; 4) it allows to get an increment of state receipts, approaching the fiscal ef
fort of the farmer to the of other groups of taxpayers.
7.3.3 The vat in the Spanish agriculture
7.3.3.1 Introduction
The Spanish normative regulates the application of the VAT is the Law 37/92. In this rule two possible systems of manage VAT for the agricultural activities are a referred: 1°- General regime 2°- Special Flat Rate Scheme for farmers {REAGP)
Next we are going to analyse each one of it shortly.
236

7.3.3.2 The standard regime
VAT is an indirect tax that relapses on the final consumption taxing the deliver of goods and services effected by firms or professionals, as well as the imports of goods. When this system is applied to the agricultural sector, all goods and services that carries out for the farmer should be burdened.
Like more important exception of this rule general that considers all sale of goods or services taxed, we have the following exemptions in reference to the agricultural sector:
deliver of goods and services to Unions, farmers' Associations, and any other legally grateful which don't have a lucrative objectives; deliveries of agricultural lands; the lease of agricultural lands, included buildings.
A. Tax calculation
This common VAT system was, in principle, to be applied to the agricultural sector. In this regime, farmers registered as VAT payers, deduct the amount of tax paid on purchases of input (input VAT) from the amount of tax collected on sales (output VAT). We can affirm that VAT is 'neutral' because VAT does not place a fiscal burden/subsidy on farmers. Farmer must carry out the fol lowing three the operations: 1°- Calculate the collected VAT on farm sales (output tax) 2°- Calculate the paid VAT on farm purchases (input tax) 3°- Calculate the VAT to be paid to the Administration for the period, esti
mated as the difference between output VAT and input VAT
However, to implement these operations is necessary to make some further explanations:
a) Calculation of the base
Like general rule the tax base to calculate the collected tax means the global amount of the invoice charge to the buyer, including:
sold products price; accessory expenses: transports, insurances, interests, packings, etc.; grants received by reason of the price; any another tr ibute that tax the operation.
b) Application of the VAT rates
The Law of the VAT contemplated the following VAT rates: a) 16% as standard rate of the Tax; b) 7% as reduced rate, for agriculture this refers to the fol lowing
goods: - products utilized for the human or animal feeding; - purchased inputs (seeds, fertilizers, crops protection, etc.);
237

- water for irrigation; - medicines for animals and sanitary products and material in order
to prevent or cure human and animals illness. c) 4% as superreduced rate, applicated for the fol lowing goods;
- primary food: bread, milk, eggs, cheese, fruits, vegetables and potatoes.
c) Deduction of the input VAT
VAT calculation consists in the difference between collected tax on sales minus paid tax on purchases. However some of the paid input VAT is not deductible, on the contrary, the following input VAT will not able be used to reduced the amount paid to the Treasure:
- paid VAT in acquisitions of goods and services carry out outside the f irm activities;
- paid VAT in the following acquisitions: not industrial vehicles, expenses of travels, of foods or drinks, hostelry or restaurant services and the of goods destined to attentions of clients or employees.
When the paid input VAT is lesser than collected output VAT, the difference must be paid in the Treasure. On the contrary, when the paid input VAT is higher than collected output VAT, the farmer may be compensated directly be Treasure or keep the credit to be balanced wi th future tributary debts (for this VAT).
C. Formal liabilities
In order to finish the study of the general regime of VAT, it is necessary indicate the principal formal liabilities that the agricultural producers are forced to manage:
carry the following registration books: emitted invoices, received invoices and of goods of investment; deliver invoices for each operation that they carry out, and conserve a copy for five years; conserve the received invoices for five years.
It can be observed, in the same way as the S. E. system of income tax, the inclusion in this regime would implicate the obligation of managing a minimal accounting. This will be the cost that they wil l be supported to pay VAT in order to get perfect neutrality.
7.3.3.3 The Special Scheme for Farmer (REAGP)
The special f lat rate scheme for farmer {REAGP) has been regulated the Spanish legislation since 1986, fol lowing the lines offered by the European Directives. So this system has been based on two criteria: to ease administrative liabilities, and to give farmer a compensation for the input tax.
238

A. Application
This special regime is applied to all farmers unless they voluntarily opt for the general one. Also, farmers who are excluded of REAGP by law are:
Private Societies; cooperative; tax payers whose operations during the last year exceed 50 millions pesetas.
In whatever of these cases, and the voluntary option, farmer would manage VAT for the ordinary regime.
B. Compensation mechanism
The essential element of the REAGP constitutes the right for farmers to perceive a compensation, which wil l try to refund the input tax paid for them in the acquisitions of mean of production. This compensation is settled down by Law as the resulting quantity of applying the percentage of the 4% to the price of sale of the products and services.
On the other hand, the tax payers that have satisfied the compensations to the flat rate farmer (buyers of agricultural products), wi l l be able to deduce this amount like any other input tax in next declarations. In order to exercise this right, these buyers will be in possession of the receipt signed by the farmer.
C. Formal liabilities
Referred to the formal obligations, the REAGP has the objective of liberating farmers of the administrative and accountant difficulties. For this purpose, farmers will not need to calculate and pay the VAT debt. Therefore this scheme is the most adequate for that farmers that lack accounting.
7.3.4 Methodology
We may affirm that farmer carrying out an accounting practice wil l have the possibility of opting for the different systems of manage income tax and VAT. On the opposite, the agricultural producer that doesn't administer their managerial activity of this way will be obligated to pay the income tax for the O.E. system, and manage VAT for the REAGP.
In this way now we are going to analyse if the taxation of farmers w i thout accounting by the special simplified schemes supposes to them an economic damage. So we wil l check if these special schemes for the agriculture supposes a discriminative treat, and therefore in this way if the introduction of the accounting (paying taxes for ordinary systems) can improve the tax saving.
For it, now we are going to describe shortly the methodology that allow us to quantify the effects of the special schemes of the income tax and VAT for
239

the agriculture. This means that we are going to determine if these systems for farmer generate a grant for them or opposite and overtaxation.
7.3.4.1 The income tax
To reach this objective, in the case of the income tax, our work wil l consist of getting the net income of the agricultural activities for the S.E. and the O.E. systems, in order to make comparison. We for this motive will begin calculating the two fol lowing magnitudes:
- (1) S.E net income
S.E. net income = Total output - Y, inputs
(1)
- (2) O.E net income
O.E. net income - £ inputj . indexj
(2)
We wil l compute the difference (1)-(2), when this amount is negative implies penalty for the farmer if he is taxing the income tax by objective estimate regime. Conversely, if it is positive, this special scheme for agricultural producers implies an economic benefit for him.
Full detail of this methodology are available in the annex.
These calculation the we will carry out starting from the data of the Farm Account Data Network (FADN or RICA), that offer us the countable data of the average farm of nine types of farming, as they are classified in the standard results.
So, we will be only interested in the results belonged to groups of holdings with similar productive orientation. Our study will consist in analysing the 'average' holding defined by the European classification in Spain.
The types of farming that we will use in this calculation, are shown in table 7.3.2.
The study wil l be carried out for each one of the nine types of farming, during a period of study that covers from 1986 to 1992. These wil l be gotten by a spread sheet, like the one in the annex.
240

Table 7.3.2 Types of farming composition in the standard results
Standard results types of farming Principles types of farming
A. cereals B. general agriculture
C. horticulture D. wineyard E. fruit trees and other permanent crops
F. dairy cows G. cattle, sheeps and goats
H. poultry and pigs I. mixture (crops and livestock)
11. cereals 12. general crops
variety of crops horticulture wineyard fruit trees
33. olives trees 34. variety of permanent crops 41. dairy cows
cattle cattle and dairy cows sheeps and goats poultry and pigs variety of livestock (cattle, sheeps and goats)
72. variety of livestock (poultry and pigs) 81. crops and cattle, sheeps and goats 82. crops and livestock mixture
60 20 31 32
42. 43. 44. 50. 71.
Source: Commission of the European Communities (1990).
7.3.4.2 VAT
In the case of the VAT will have to keep in mind that the ordinary regimen is always neutral for the manager, which means that it doesn't suppose you neither an entrance neither a extraordinary expenses. However the REAGP, as defined as an estimated compensation to the input VAT may suppose a grant (when the balanced VAT is superior to the input VAT) or a burden (when the balanced VAT is inferior to the input VAT). We for this motive wil l begin calculating the two following magnitudes:
-(1) VAT refund
VAT refund - £ Output,. 4%
(2) Input VAT
Input VAT. Y, Inputsj - ratSj
241

Once calculated both magnitudes will be in conditions of calculating their difference (1)-(2):
when (1)-(2) is negative, this means that the REAGP is negative for farming; when it is positive, this scheme implies a grant (subvention) for this producers.
We'll analyse the same holdings a as we made for the income tax, for each one of the nine Types of farming of the standard results for the period 86-92.
More details are available in the annex.
7.3.5 Results
The results of applying the previous methodology can be observed in table 7.3.3.
Table 7.3.3 Results
Year
ALL A B C D E F G H I
1986
-138.3 -3,312.9
949.1 469.7
-1,419.2 972.3 800.9 559.0
-2,927.2 89.5
1987
-301.7 -1,971.9
-117.5 1,846.6 1,833.7
802.8 882.6
-181.4 -2,592.1 -1,119.7
1988
-1,271.2 -1,936.3 -1,385.5 1,598.5
301.9 61.5
330.6 52.4
•10,896.4 -3,540.8
1989
income 1
-1,803.1 -4,178.1 -2,566.3 -1,540.2
223.7 -128.8
1,605.2 107.3
-6,216.7 -2,797.1
1990
tax (E.O.)
-1,247.8 -3,099.0 -1,632.8 1,763.2 -357.9 -485.3
66.3 -221.3
-7,384.0 -1,827.4
1991
-1,099.4 -3,218.7 -1,756.1 1,039.4 -741.9
-1,564.5 711.5 506.5
-3,609.3 294.6
1992
1502.9 -1,041.1
118.0 3,725.7
-3,136.3 817.7
3,931.7 4,099.5 8,437.7 4,169.7
Average
-622.6 -2,679.7
-913.0 1,271.8 -470.9
68.0 1,189.8
703.2 -3,598.3
-675.9
VAT (REAGP)
ALL A B C D E F G H I
-30.8 -206.2
93.0 60.3 68.5
121.7 -111.0
-98.4 -931.2
-64.0
-79.2 -267.2
-9.4 401.5 133.9 95.2
-119.0 -126.5
-1,350.6 -233.8
-61.2 -187.0
45.0 93.0
226.7 163.9
-134.8 -65.5
-1,686.6 -287.0
-129.3 -197.3
39.1 -391.2 121.5 46.7
-154.3 -152.1
-1,959.9 -223.6
-52.0 -157.7
55.1 247.5 148.8 186.1
-181.7 -69.0
-1,848.9 -344.6
34.8 -139.9
75.3 264.7 237.2 270.9 -94.2 -63.8
-1,119.3 -72.4
127.9 6.8
130.6 349.1
62.3 312.7
53.0 128.2
-889.4 101.0
-27.1 -164.1
61.2 146.4 142.7 171.0
-106.0 -63.9
-1,398.0 -160.6
Source: Own elaboration.
242

From this information we can deduce that Special Scheme supposes a disadvantage for many types of farming (cereals, general crops, horticultural, fruit trees, herbivores and mixed) that is not noticed by those agricultural holdings wi thout accounting.
Consequently this situation, theoretically, should induce to an important number of holdings to opt for the standard income tax and VAT regimes. However this is not the situation, and we believe that this non-rational behaviour of sector could be caused by two motives:
the high fiscal fraud of the sector, A significant number of commercial transactions are not documentated (invoices.) and the Treasure tax fiscal inspection hardly acts. This facilitates of fraud make that these taxpayers do not declared the real net income they calculate applying the modules based on sales figure; the traditional rejection of farmers to the introduction of new management tools, although these guarantee them an important saving.
7.3.6 Conclusions
We start from the assumption that it is an objective of policy makers to introduce accountancy practices in the farm sector, the policy makers believe that this should be pursued as it wil l increase competitiveness of farms by increasing efficiency and profitability. Also, as a consequence of the introduction of accountability, there will be an advance in the quantity and quality of information available for policy makers. Finally, it may be a tool for the achievement of a equal and fair distribution of taxes.
Theoretically, the agricultural special regimes for income and VAT taxes put a penalty on farmers and consequently may be a tool for moving farmers to introduce the countable mechanics in the administration of their exploitations. However we believe that the use of tax incentives via the punishment of special simplified regimes would not be the most adequate for the fol lowing reasons:
higher tax pressure would not be accepted for the sector, increasing their tendency to the fraud; it may suppose a discrimination for the smallest farmers, as they would have a greater difficulty in order to adapt to the ordinary systems of taxes; it wi l l represent a competitive handicap for Spanish agriculture inside European Union.
In spite of the above mentioned shortcomings, if the agrarian special regimes are used as an incentive for the introduction of accounting mechanics in farms holdings, we suggest the fol lowing actions may help to achieve the goal of introduction of accountancy.
Accentuate the fiscal inspection in the farm sector, especially to those producers welcomed to the agricultural simplified regimes.
243

Diminish the limit of sales that obligates to the producers to opt for the standard regime. We believe that a decrease from the present level 50 mill ion pesetas to a future even of 20 million pesetas in the next five years would facilitate an acceptable transition. Disable the present system that allows voluntary option between standard and simplified tax regimes; now the minimal period of choice for the standard regimes is established in five years, but we believe that if a producer belongs to standard systems during a period, he may continue in it.
The present policy measures based upon subsidies for implementing the accounting mechanics into farms should be complementary of the above measures. We believe that it is a good investment by Public Administrations, since financial controls will increase the capacity of administration and the efficiency of the sector and will facilitate in the end a greater capacity of generating fiscal receipts.
In this sense would be convenient to make an effort of development of countable adequate instruments for this objective, like for example in development of teaching tools and special software for the necessities of each one of the types of farming orientations. Once the tools are available, it should be convenient a plan of popularization among farmers, by means of qualification courses through extension services followed by constant advice and support from the Public Authorities.
We believe that main obstacles to accountancy introduction are phycological factors and fiscal fraud, therefore increase of inspection and compulsory accountancy records for farmers are the main tools to help into this policy. The introduction of compulsory accountancy is limited by farmer qualification, therefore only greater qualification of farmers and some non-economical profits should help to create a network of farms where the introduction of accountancy and collaboration with Public Bodies should profit wi th not only a small grant but also innovative measures, (e.g. study trips, continuous educat ion, computer and farm support, etc.).
244

7.4 THE REORGANIZATION PROJECT OF THE ITALIAN RICA
Carla Abitabile 1)
7.4.1 Part III: The accountancy methodology
Introduction
The context in which INEA has developed the RICA accountancy methodology, currently in use, is conditioned by the very low diffusion of accountancy procedures on farms. Thus the data gathering must be supported by a heavy activity of assistance at both the methodological and operative level that involves the Farm Associations and the public regional organisms.
The present situations
In the present situation farms can use two accountancy methodologies (INEA, 1991).
The first is based on a pre-coded bookkeeping which is organized in four chapters and collects data on:
farm structure (anagrafic data, utilization of UAA, labour); inventories (fixed assets: land, permanent crops and buildings, machinery and equipment, credits, debts, etc.); products (of livestock, crops, others); costs (for livestock, crops, machinery, general and land costs).
This elementary data is then processed by a mainframe software that calculates the accountancy voices, makes the controls and prints the results on the farm returns, feeds the RICA data bank and prepares the EC farm returns.
The second method is a pc software, named Continea, that is the informatie version of the previous one. It allows farms to process their own accountancy data and to transmit the information to INEA on magnetic support.
At present the first system is still working, but by 1997 Continea wil l substitute it completely.
The future methodology
There are mainly two reasons that have stimulated the research into a new accountancy methodology. The first is that accountancy is not a very sim-
1) See paragraph 3.5; The context.
245
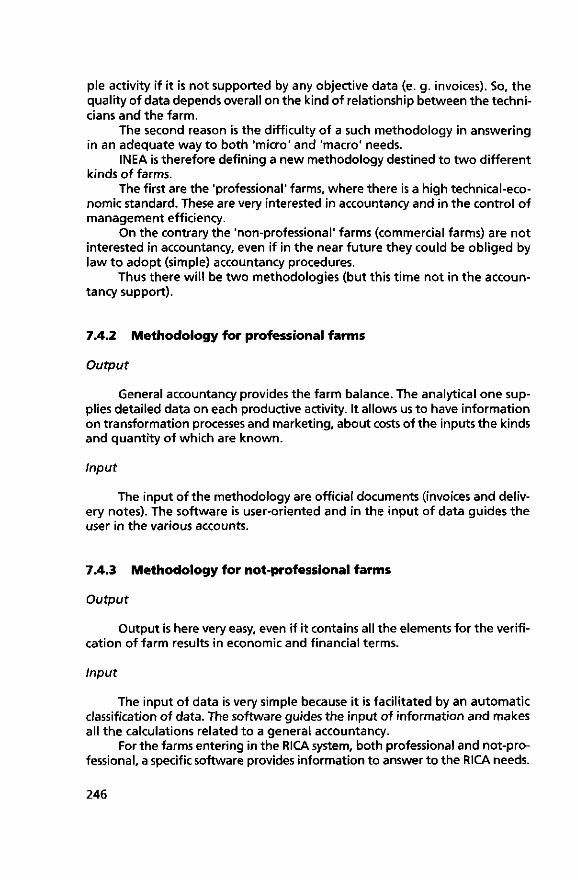
pie activity if it is not supported by any objective data (e. g. invoices). So, the quality of data depends overall on the kind of relationship between the technicians and the farm.
The second reason is the difficulty of a such methodology in answering in an adequate way to both 'micro' and 'macro' needs.
INEA is therefore defining a new methodology destined to two different kinds of farms.
The first are the 'professional' farms, where there is a high technical-economic standard. These are very interested in accountancy and in the control of management efficiency.
On the contrary the 'non-professional' farms (commercial farms) are not interested in accountancy, even if in the near future they could be obliged by law to adopt (simple) accountancy procedures.
Thus there wil l be two methodologies (but this t ime not in the accountancy support).
7.4.2 Methodology for professional farms
Output
General accountancy provides the farm balance. The analytical one supplies detailed data on each productive activity. It allows us to have information on transformation processes and marketing, about costs of the inputs the kinds and quantity of which are known.
Input
The input of the methodology are official documents (invoices and delivery notes). The software is user-oriented and in the input of data guides the user in the various accounts.
7.4.3 Methodology for not-professional farms
Output
Output is here very easy, even if it contains all the elements for the verification of farm results in economic and financial terms.
Input
The input of data is very simple because it is facilitated by an automatic classification of data. The software guides the input of information and makes all the calculations related to a general accountancy.
For the farms entering in the RICA system, both professional and not-professional, a specific software provides information to answer to the RICA needs.
246

7.5 AGRICULTURE-POINT OUTLINE
Ian Kirton
7.5.1 Introduction
1. The Board agreed in June 1994 to add to its work programme a project which wil l deal wi th the recognition, measurement and disclosure of assets, liabilities, income and expenses resulting from growing crops, plantations and forestry, and livestock.
2. The significance of agriculture, the exclusion of agricultural activities from the ambit of several existing International Accounting Standards, and the diversity of practice found in accounting for agricultural activities, combine to support the need for a Standard on Agriculture.
3. The Board approved membership of the Steering Committee at its November 1994 meeting. Membership of the Steering Committee now comprises:
Canada India New Zealand Thailand
Zimbabwe France
Mr H.D. Howarth (Chan Mr N.P. Sarda Ms B.A. Monopoli Professor K. Narongdej Dr A. Priebjrivat Mr J.A. Atkinson Mr J. Allimant
The World Bank Mr G. Russell Project Manager Mr I.F. Kirton
4. The Steering Committee has held two meetings: 18/19 May 1995, London. The main topic under discussion at this meeting was sector scope; 9/10 November, Wellington, New Zealand. The main topic under discussion was conceptual scope.
5. Research has been initiated through a questionnaire addressed to IASC member bodies designed to discern;
Current and recent activity by IASC member bodies in developing promulgations to provide guidance in the accounting and reporting for agricultural producers. Member body promulgations in existence to guide members involved in the preparation of financial information about agricultural production entities. The extent of the exclusion of activities associated wi th agricultural production entities from existing promulgations.
247

Agencies with overview responsibilities for agriculture who may have an interest in the development of an accounting standard for agriculture. Stock Exchange listed corporations or other reporting enterprises wi th significant activities in the agricultural production sector. Specific issues which the member body believes should be considered in lASC-Agriculture.
A summary of responses to date is attached as annex 1.
6. Ongoing research is being undertaken into: the diversity in accounting and reporting practice for agriculture; the degree of departure from historical cost in the financial statements of agricultural reporting entities; and the means of ensuring the involvement of preparers and users in the due process.
7.5.2 Outline of the Issues
7. The Steering Committee from the outset acknowledged the delicate balance between the lASC's objectives of improvement and harmonization, and the genesis of this Point Outline which is sector uniqueness. The Steering Committee is seeking to establish a logic which flows from special industry characteristics, through accounting model selection, to the development of an accounting standard. Where possible recommendations should be f i t ted into existing IASC Framework for the Preparation and Presentation of Financial Statements (Framework) and Standard structures.
8. The IASC Framework limits applicability to general purpose financial statements (para. 6) and therefore the common needs of users are assumed. In developing accounting policies for a specific entity or sector the special needs of users, both as a consequence of the type of entity, and also the mix of users, need to be considered. The Steering Committee is therefore looking to capture the specific needs of general purpose financial statements for agricultural activities.
9. The Steering Committee acknowledges the IASC requirement that the development of standards be guided by the Framework and therefore initially focused upon the scope offered by this Framework rather than the constraints of any particular accounting model embedded within existing standards. In this respect the development of an accounting standard for agriculture has already raised a number of questions wi th regard to the scope offered by, and interpretation of, the framework, particularly:
the criteria by which a particular model should be selected; a valid range of models; the pervasiveness or primacy of a chosen model; articulation between alternative models and existing standards; and
248

disclosure requirements particularly with reference to the logic of accounting model selection (for example, dominant activity, stakeholder and regulatory characteristics) and significance of departure from the 'benchmark' accounting model.
10. Issues which the Steering Committee has considered in developing a Standard on Agriculture and for which it seeks confirmation from the Board:
Objectives Sector Characterisation Conceptual Approach Scope Framework-Objectives Framework-Underlying Assumptions Framework-Elements Framework-Recognition
11. Consequential issues which the Steering Committee, and IASC member bodies surveyed, believe should be considered in developing a Standard on Agriculture:
Framework-Measurement Framework-Concepts of Capital and Capital Maintenance Classification Other issues of significance
7.5.3 Time-table for the Project
12. A time-table for completion of this project is set out below. The Steering Committee in adopting a conceptual approach recognised the practical con-
Timing Milestone
May 1995 Steering Committee meeting to develop initial scope November 1995 Steering Committee meeting to develop draft Point Outline March 1996 Point Outline discussed by Consultative Group and approved by Board May 1996 Steering Committee meeting to develop Draft Statement of Principles
(DSOP) October 1996 Steering Committee meeting to approve DSOP November 1996 DSOP issued for comment by 28 February 1997 April 1997 Steering Committee meeting to approve Statement of Principles (SOP) June 1997 Board to approve SOP August 1997 Steering Committee meeting to approve draft Exposure Draft for
submission to the Board October 1997 Exposure Draft discussed with Consultative Group and approved by
Board December 1997 Exposure Draft issued for comment by 30 June 1998 October 1998 Steering Committee meeting to consider comments and to approve draft
International Accounting Standard March 1999 Board to consider and approve International Accounting Standard April 1999 International Accounting Standard issued, effective January 2000
249

straints of such a time-table. The time-table has been prepared on a conservative basis but t iming could be influenced by a number of factors, for example, emergence of new issues, increased cooperation with member bodies currently active in the area, or intransigent conceptual stances.
7.5.4 Objectives
13. The objective of this project is to research and draft for the approval of the IASC Board an International Accounting Standard on agriculture which wil l improve the relevance and reliability of published financial statements of enterprises involved in agriculture.
14. To achieve this objective the Steering Committee wi l l : consider the relevance of existing International Accounting Standards to agricultural activities and, in particular, address existing exemptions; consider the need for an additional International Accounting Standard for agricultural activities; review the impact of conceptual issues discussed by the Steering Committee during the project and to recommend to the Board, if necessary, any revisions or developments to the Framework; illustrate any recommended accounting and disclosure treatments by way of specific examples designed to broaden application beyond those reporting enterprises required to prepare general purpose financial statements.
7.5.5 Sector Characterisation
15. The economic significance of the agricultural sector is well documented in both developing and developed economies. Significance alone, however, is insufficient to warrant a specific standard. The Steering Committee recognized that by excluding agriculture from the scope of a number of accounting standards (e.g. IAS, Sri Lanka, Australia), accounting standard setters were signalling a fundamental difference in the nature, and activities of agriculture.
16. In order to clarify the nature and activities of the sector the Steering Committee proposes that agriculture be defined as the 'Management of the biological transformation of animal and plant, to produce products for consumption or further processing'. The Steering Committee believes that expansion of the components of this definition further clarifies the subject of this standard.
17. Biological relating to life phenomena. The animal and plant components of an agricultural system have a life of their own capable of growth (including procreation and change in form) without human intervention. Such life is
250

generally dependent upon a combination of natural resources i.e. sunlight, water, air, soil.
18. Transformation a change in quality (e.g. genetic merit, density, ripeness, fat cover, protein content, fibre strength) and/or quantity (e.g. progeny, live weight, cubic metres, fibre length/diameter, stems, buds, suckers, deaths, losses) over a period of t ime. is monitored and measured as part of management control, such measurement is becoming increasingly objective (e.g. weighing, laboratory analysis, girth measurement).
19. Managed Process management attempts to facilitate the biological transformation by enhancing or stabilising conditions necessary for the process to take place (e.g. nutrient levels of the growing medium, soil moisture, temperature, sterility, fertility, immunity, light). control exerted over the conditions (intensive cf. extensive) determines the relationship between human intervention (with associated costs) and production. The less control, the more tenuous the relationship, differentiates agriculture from exploitation in the form of extraction (e.g. f ishing, clear felling, mining) which makes no attempt to facilitate the transformation. Extraction or harvest is an essential part of agriculture but alone does not constitute agriculture.
20. Products of agriculture are diverse and generally require further processing before ultimate consumption. management often has a choice of product from an animal or plant species (e.g. forestry-clearwood, pulp, roundwood, f irewood or any combinat ion, sheep-wool, meat, progeny for replacement), the coincidence of; a combination of product from a species; a combinat ion of species; and, a tenuous relationship between human intervention and product, create difficulties in cost attachment to product.
21. Consumption and/or further processing agricultural products serve to satisfy two of the basic needs of human beings, i.e. food and shelter. depending upon the state of maturity of an economy, agriculture assumes a developmental role brought into play by lengthening the value chain, from subsistence to self sufficiency, from self sufficiency to export significance. the importance of the products of agriculture to satisfy basic needs often give rise to government intervention to ensure adequacy of supply (production) and accessibility (pricing).
251

the agricultural producer is often one of a number of producers, not seen to be in competition, cooperating on a regional or national basis to add further value to product (Cooperatives).
22. The Steering Committee believes biological transformation, the innate ability of biological assets, is the source of sector uniqueness.
23. The Steering Committee noted that the majority of promulgations developed by member bodies were for biological assets wi th longer productions cycles (e.g. plantations, forestry, livestock). The significance of time to maturity or marketability can be significant within a transaction based accounting model as there is a greater potential for transaction based costs to deviate from market derived values. The Steering Committee considered that whilst the length of time highlighted the divergence, the potential for divergence was present in all agricultural production systems. Such a view was also sustained when considering interim reporting, or any situation where the production cycle and accounting cycle do not coincide.
24. The Steering Committee acknowledges that difficulties surrounding accounting for agriculture are compounded by a number of other significant features of agriculture, for example:
large numbers of small production units with no requirement to produce general purpose financial statements and with a basic tax or cash orientat ion; product processing and input acquisition often facilitated by cooperative membership; government intervention in production and pricing decisions; joint products and joint costs often confound cost relationships. However, the Steering Committee considered that these features individ
ually are neither unique to agriculture nor are present in all agricultural systems.
25. The Steering Committee identified a diverse range of agricultural systems, brought about by; the vast array of plant and animal species; the potential for species to generate alternate or joint products; and, the capability of combining species in mixed systems. The definition adopted by the Steering Committee embraces products as diverse as rubber, tea, sugar, timber, eggs, salmon, prawns, deer velvet, fibre, annual flowers and vegetables.
26. The Steering Committee will be striving to develop a Standard applicable to all agricultural systems and in particular all biological assets. In existing member body guidelines a number of taxonomies are used to subdivide the biological asset group (for example, maturity, life cycle, pattern of production [consumable or bearer] or, plant or animal). The Steering Committee wil l consider the significance of such taxonomies in relation to the dominant feature, that is, transformative capability and the need for specific classification or additional sub-classification.
252

27. The diversity of agricultural system is compounded when environmental, economic and regulatory conditions are overlaid. Such diversity suggests caut ion in inferring homogeneity wi th regard to risk and return for agricultural producers. The Steering Committee wil l consider the application of ED51, Reporting Financial Information by Segment, to entities undertaking agricultural production activities with significantly different risk/return characteristics.
7.5.6 Conceptual Approach
28. The IASC Framework purports to be applicable to a range of accounting models. The conceptual dilemma which confronted the Steering Committee was whether to:
seek possible solutions in terms of the most appropriate accounting model available; or seek possible solutions in terms of the most common and accepted accounting model.
29. The Steering Committee therefore a) considered sector characteristics and user needs, and tested the relevance
and reliability of alternate 'pure' accounting models for a range of agricultural activities. This approach was seen to - be consistent wi th both the Framework and the project brief ( inter
preted as developing an accounting Standard for the activities of agriculture);
- provide the preparer wi th a clear conceptual model wi th attached meanings by which a measurement system could be applied; and
- provide the user with the assurance that the financial statements are internally consistent and have a specific meaning in terms of the accounting model chosen.
Alternate models considered were: - Transaction based/Historical cost - Value basedA/alue in use - Value basedA/alue in exchange
b) considered relaxing the pure historical cost accounting model to allow revaluations for specific agricultural assets. The modified historical cost approach is consistent wi th existing Standards.
30. The Steering Committee reached the conclusion that there is an urgent need for harmonization of existing accounting practice; there is limited guidance available within the Framework for a departure from transaction based accounting models;
253

the time frame required to develop a value-based model is considerable and the repercussions such as to take this approach beyond the scope of the project; discussion should be limited to recognition and measurement of biological transformation; precedents in existing Standards provide a useful starting point; and a review of the impact of conceptual issues discussed during the course of the project should be undertaken and recommendations for further development or clarification of the Framework should be made to the Board.
31. The Steering Committee proposes that a modified historical cost approach be adopted; the assets for which modification wil l be considered are those biological assets unique to agriculture; guidance be provided for elements not falling within the biological asset classification, yet significant to agriculture, drawing upon the requirements specified in, and flexibility offered by, existing Standards.
32. The Steering Committee recognises that the proposed approach now more closely aligns this project w i th that being undertaken by the Australian Accounting Research Foundation in their project Accounting for Self-generating and Regenerating Assets. The Steering Committee wil l strive to ensure a synergy between the two projects.
7.5.7 Scope
33. The Steering Committee believes the proposed Standard should apply to general purpose external financial statements of enterprises with agricultural activities.
34. The Steering Committee observed that many of the guidelines developed by member bodies targeted user groups not required to prepare general purpose external financial statements. The Steering Committee is optimistic that use wil l extend to such groups due to the universality and clarity of the proposed standard, and the simplicity and explanatory power of the proposed accompanying illustrations.
7.5.8 Framework-Objectives
35. The Framework (para. 110) and Draft Statement of Principle 'Presentation of Financial Statements' (Principle 18) identify that choice of an accounting model or an accounting policy should be on the basis of relevance and reliability.
254

36. The Steering Committee considered the information needs of three main groups of external user.
Investors The IASC framework identifies that investors are concerned wi th the risk inherent in and return provided by, their investments. The general acknowledgement of inherent business risk in agricultural activities cautions investors to seek returns commensurate wi th the level of risk. Lenders Agriculture is an activity which; often requires considerable investment in long lived assets relative to total assets (particularly where land, development or time to maturity is involved); due to seasonality often requires short term operational finance. The large numbers of agricultural entities requiring high levels of investment, and Government encouragement to invest, have often led to levels of debt which generally would not be considered prudent given the high business risk. Lenders wil l be interested in information enabling assessment of financial risk. Whilst banks have detailed information derived from monitoring of daily cash flows, and specific information required as a condition of borrowing, periodic affirmation is required. Governments and their agencies There is a considerable history of government intervention in the production and pricing of agricultural production. Agriculture has been viewed as an essential industry in terms of the products it supplies (satisfying two basic human needs of food and shelter) and hence prompting measures to ensure adequacy of supply (production) and access to supply (pricing). Once basic needs are met agriculture is seen as a means of initiating economic development. The protections instituted for the former and the importance attached to the latter often combine to lead to a dependence upon continued intervention. Government and their agencies need information to monitor the effectiveness of interventions in delivering desired outcomes.
37. The Framework acknowledges three different but overlapping purposes for financial statements.
a) Decision usefulness By considering the needs of significant users of financial information, and the specific decisions implied by accountability and stewardship, the Steering Committee is confident the decision usefulness objective of f i nancial statements wil l be met.
b) Accountability The Steering Committee defined accountability as the reconciliation of actions taken and resultant position wi th prior statements of intent which have formed the basis of stakeholder expectation. The Steering Committee is aware of increasing enunciation of intent, for example:
255

Tasman Agriculture's focus will be to continue to increase shareholder's assets by conversion arbitrage - adding value to sheep and beef grazing land by converting it to dairying.
...to spread risk by commodity and geographical location so that realized profits may be in the order of 30% cotton, 30% horticulture, 20% wine grapes, 20% cereal, wool and eating sunflower.
The Steering Committee will therefore be considering the need to weigh such statements of organizational intent when considering the events to be recognised, and the measurement of the events in the financial statements.
c) Stewardship The Steering Committee acknowledges the need for information which wil l facilitate judgements regarding distributions made and compliance w i th legal obligations which are the primary focus of the transaction based/historical cost model. The Steering Committee is aware that any modifications to this model, particularly in terms of non-transactional events recognised, wil l need to ensure that concepts of capital and capital maintenance, and disclosures, enable such judgements to be made.
38. The Steering Committee is of the opinion that biological transformation is the unique event which distinguishes agricultural activities from other activities. Resources are marshalled toward facilitating and sustaining growth, an activity specifically entered into to change the substance of assets in a way which enhances value of the asset.
39. The Steering Committee concurs w i th the view that the essence of reliability is the degree of correspondence between what the information conveys to statement users and the underlying transactions and events that have occurred and have been measure and displayed. Existing Standards formulated in relation to a transaction based/historical cost model
often exclude from their scope specific agricultural activities; give rise to a diversity of accounting practice; and are often in conflict wi th guidelines developed by user groups. Such observations have been interpreted by the Steering Committee as
evidence that this 'pure' model does not adequately capture the events impacting upon agricultural activities.
40. In many agricultural activities, particularly the more extensive, there is an indirect relationship between transactions and biological transformation. The Steering Committee is of the opinion that transaction based recognition and measurement methods can
provide only a partial portrayal of such activities; and introduce bias by excluding a material event.
256

7.5.9 Framework-Underlying assumptions
41. Accrual assures the user that significant transactions and events are recorded and recognised in the financial statements in the periods in which they have occurred and not as cash or its equivalent is received or paid. The Steering Committee in acknowledging the significance of biological transformation within agricultural entities will need to ensure, subject to the asset meeting the definitional and recognition requirements specified in the Framework;
that the measurement system can capture the substance of entity activities to enable periodic recognition of such transactions or events; and that the measurement system has adequate gradations to sensitively portray the between period changes in this substance.
42. The Steering Committee will carefully consider the relationship of going concern to sustainability of agricultural activities. The Steering Committee has tentatively concluded that sustainability exists in the context of biological assets when output levels are maintained either through evidenced ongoing replacement programmes ( bearer systems) or existence of multiple generations (consumable systems). A limited life production system might grow to maturity one generation of animal, or tree crop. The Steering Committee believe the distinct ion may be important;
for long production cycle systems where 'foreseeable future' becomes ambiguous; and in providing, in the absence of a clear recommendation within the Framework, some guidance for preparers of financial reports for agricultural activities where going concern is clearly violated.
43. The Steering Committee wil l consider the relevance of developments in accounting for environmental assets and liabilities. The dependence of agricultural production systems upon, and the ability of such systems to deplete, natural resources, indicates that the measurement and disclosure of critical qualities could be particularly pertinent in going concern or sustainability decisions.
7.5.10 Framework-Elements
44. In the Steering Committee's opinion biological resources are tangible resources controlled by an enterprise from which future benefits are expected to f low to the enterprise and, therefore, conform to the Framework definition of an asset. The Framework specifically identifies that:
events other than transactions may generate assets (para. 58); and the absence of a related expenditure does not preclude an item from satisfying the definition of an asset (para. 59).
45. The definition of income and expense in terms of period changes in assets and liabilities (para. 70) means that there appears to be no obstacle to an event
257

resulting in a change in an item defined as an asset or liability moving to the recognition criteria.
46. In research to date the Steering Committee has found no disagreement w i th the classification of biological resources as assets.
7.5.11 Framework-Recognition
47. The Steering Committee considered whether biological assets as a whole, or a subset of such assets, should be formally recorded into the financial statements of an entity, by token of meeting the two recognition criteria;
it is probable any future economic benefit wil l f low to or from the enterprise; the item has a cost or value that can be measured w i th reliability.
48. The Steering Committee considered that the agricultural enterprise is founded on the assumption that benefits wil l f low from biological assets as they are the primary source of economic benefit. To challenge the certainty of f low is to challenge the assumption of going concern.
49. Biological assets are tangible. The characteristics which give rise to the ability to generate economic benefits are measurable and can be related to the qualities valued by the market. In the Steering Committee's opinion there generally exists both a cost and value. Whilst the Steering Committee identifies that there is generally both a cost and value they also note the Framework acknowledges the use of reasonable estimates is an essential part of the preparation of financial statements.
50. In research to date the Steering Committee has found no disagreement wi th the recognition of biological assets.
7.5.12 Framework-Measurement
51. The Steering Committee believes that to select an accounting policy for biological assets which conforms to the Framework requirements of relevance and reliability, the biological growth event must be recognised.
52. Historical cost measurement of such assets recognises the assets but not biological growth. The Steering Committee believes that other transaction based measurement methods, for example compounded historical cost or cost of replacement through normal course of business, wil l demonstrate the same deficiency.
53. In adopting a modified historical cost approach the Steering Committee wil l need to take cognizance of existing Standards and current developments
258

which allow or are considering departures from historical cost valuation, for example, IAS 16, Property, Plant and Equipment, IAS 25, Accounting for Investments, and Phase II Financial Instruments. In addition to the precedents sought for the measurement method the Steering Committee wil l need to consider guidance available for consequential issues such as income tax effects, depreciation, treatment of non-biological movements in value, presentation and disclosure.
54. The Steering Committee wil l consider identifying an overall benchmark for the measurement of all biological assets. Pertinent to such considerations are: a) identification of alternate measurement methods
- the Steering Committee is currently considering both market based (exit or entry) and expectation based (NPV.) measurement methods;
- precedent exists for fair value usually market (IAS 16); - there exists within current Standards a presumption that such measures
are available and in use, for example, periodic assessment of whether recoverable amount is below the carrying amount of fixed assets (IAS 16) or the measurement of inventories at the lower of cost and net realizable value (IAS 2).
b) the applicability to all biological assets - a proposed benchmark will need to be tested on a range of biological
assets in a range of locations giving due consideration to features such as: * maturity - mature/immature;
* species - plant/animal; * production - bearer/consumable; * life cycle - short/long; * management- sustainable/limited life;
c) in the absence of the primary benchmark are surrogates available. d) the consequential impact on revenue recognition when biological assets
are harvested.
- IAS 2 excludes producers' inventories of livestock, agricultural and forest products... to the extent that they are measured at net realizable value in accordance with well established practices.
e) the depth and sensitivity of markets for biological assets. f) the appropriate market f rom which market price should be sourced.
- IAS 16 describes fair value of land and buildings as usually its market value for existing use, and for items of plant and equipment as usually their market value determined by appraisal. Biological assets wil l often have a value based upon intended use as well as existing state, for example immature trees suitable for pulpwood but managed for clearwood.
55. The Steering Committee is aware that biological transformation is just one of several variables captured within a market valuation. In the context of a modified historical cost approach treatment of value increments attributable
259
to other factors, for example general and specific price changes, would need to be consistent wi th either application of the historical cost accounting model or precedents established within existing Standards. The Steering Committee wil l attempt to reconcile such requirements with the Framework criteria of relevance and reliability.
56. Where assets of significance to agriculture ( particularly land, possible also riparian rights, quotas) have available a benchmark and allowed alternative treatment, the Steering Committee will consider whether a preferred treatment should be expressed consistent wi th the recommended treatment for biological assets.
7.5.13 Framework-Capital and Capital Maintenance
57. The Steering Committee will review the relationship between an accounting model and the application of a concept of capital and capital maintenance. The Steering Committee is initially of the view that in adopting a modified historical cost approach concepts of capital will be sourced from the historical cost accounting model, i.e. a financial concept of capital.
58. The Framework provides insight into the concept of financial capital maintenance where capital is defined in terms of nominal monetary units by stating that whilst increases in the prices of assets held over a period are conceptually profits they may not be recognised until the assets are disposed of in an exchange transaction. This view appears consistent wi th the treatment of revaluations of property, plant and equipment described in IAS. 16.
59. The Steering Committee will test the decision usefulness of this interpretat ion in the context of agricultural systems.
7.5.14 Asset Classification
60. The Steering Committee has identified that biological assets have a unique characteristic. Pertinent to interpretation of existing Standards is the classification of such assets. The Steering Committee will be considering several alternatives, including:
a separate classification of assets ( for example, biological, or self-generating and regenerating assets) capable in itself of being sub-classified (for example, mature/immature and/or bearer/consumable); preservation of the dichotomy which exists in current Standards relating to tangible assets, and classification as either inventory and fixed assets.
61. The Steering Committee wil l consider whether by proposing that the transformative attributes of biological assets be recognised (growth as an event which confers economic benefit), it is attributing to biological assets, whether
260

mature or immature, qualities more associated with fixed assets than inventory. Such reasoning would
clearly delineate between biological assets and the product of biological assets (having the character of inventory); enable some consistency in treatment of other assets necessary for the production process, particularly land, where allowed alternative treatments are available and used; and would increase the potential for one proposed measurement method to apply to all biological assets.
Déprécia tion/Dimin ution Structure and Content of Financial Statements Notes to the Financial Statements Other Disclosures Segmental reporting Subsidies and other interventions Cooperatives Taxation
62. The Steering Committee acknowledges that the above issues are of significance but not unique to agriculture. A review of existing Standards and work in progress will be undertaken to ascertain whether specific guidelines need to be incorporated within a Standard on Agriculture or whether the implementation guidelines the Steering Committee intends to produce should be structured to illustrate an interpretation of existing Standards in relation to these issues.
261

Annex 1
Response to questionnaire
Region
Africa Asia Caribbean/South America Europe North America/Oceania Middle East
Total
total member bodies
15 17 16 41 12 14
115
Total responses
responses (number)
5 12 5
21 7 4
54
responses (%)
33 71 31 51 58 29
47
Question 1
Do you currently have (or have had in the recent past) a standing committee, working party or advisory group, set up to initiate, or develop accounting guidelines, or monitor financial reporting, for agricultural producers?
Australia Accounting for Self-Generating and Regenerating Assets Discussion Paper 23
Malaysia Accounting for pre-cropping costs Accounting for livestock
New Zealand Primary Sector Panel of Advisors Netherlands Working Party on Agriculture (Dairy farming, meat production,
arable activities, horticulture (greenhouse)) Sri Lanka Accounting for Plantations
Question 2
Have you developed promulgations specifically to guide members involved in the preparation of financial information about agricultural production entities?
Australia Accounting for self-generating and regenerating assets, Roberts, D.L., Staunton, J.J. and Hagan, L.L., Australian Accounting Research Foundation, Discussion Paper No. 23 1995. The Valuation of Livestock in the Accounts of Primary Producers, Research Study M1 (1971), Research Study M1A (1973). Institute of Chartered Accountants in Australia.
262
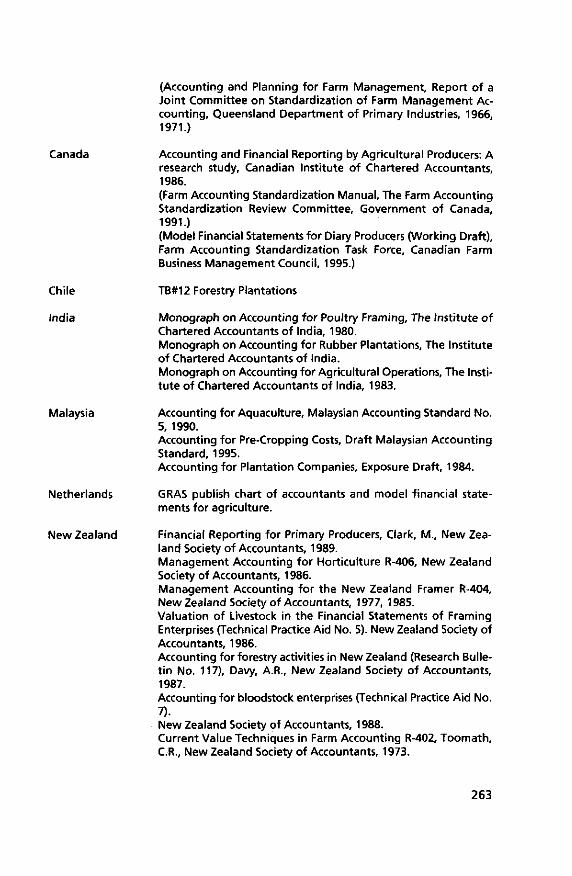
Canada
(Accounting and Planning for Farm Management, Report of a Joint Committee on Standardization of Farm Management Accounting, Queensland Department of Primary Industries, 1966, 1971.)
Accounting and Financial Reporting by Agricultural Producers: A research study, Canadian Institute of Chartered Accountants, 1986. (Farm Accounting Standardization Manual, The Farm Accounting Standardization Review Committee, Government of Canada, 1991.) (Model Financial Statements for Diary Producers (Working Draft), Farm Accounting Standardization Task Force, Canadian Farm Business Management Council, 1995.)
Chile
India
Malaysia
Netherlands
New Zealand
TB#12 Forestry Plantations
Monograph on Accounting for Poultry Framing, The Institute of Chartered Accountants of India, 1980. Monograph on Accounting for Rubber Plantations, The Institute of Chartered Accountants of India. Monograph on Accounting for Agricultural Operations, The Institute of Chartered Accountants of India, 1983.
Accounting for Aquaculture, Malaysian Accounting Standard No. 5, 1990. Accounting for Pre-Cropping Costs, Draft Malaysian Accounting Standard, 1995. Accounting for Plantation Companies, Exposure Draft, 1984.
GRAS publish chart of accountants and model financial statements for agriculture.
Financial Reporting for Primary Producers, Clark, M., New Zealand Society of Accountants, 1989. Management Accounting for Horticulture R-406, New Zealand Society of Accountants, 1986. Management Accounting for the New Zealand Framer R-404, New Zealand Society of Accountants, 1977, 1985. Valuation of Livestock in the Financial Statements of Framing Enterprises (Technical Practice Aid No. 5). New Zealand Society of Accountants, 1986. Accounting for forestry activities in New Zealand (Research Bulletin No. 117), Davy, A.R., New Zealand Society of Accountants, 1987. Accounting for bloodstock enterprises (Technical Practice Aid No. 7). New Zealand Society of Accountants, 1988. Current Value Techniques in Farm Accounting R-402, Toomath, CR., New Zealand Society of Accountants, 1973.
263

Farm Accounting in New Zealand, New Zealand Society of Accountants, 1965. (Forestry Accounting: the report of a working party, Inflation Accounting Research Project, Department Studies, University of Waikato, 1985.)
Papua New Guinea Accounting for Plantations, Proposed Statement of Accounting Standard, Papua New Guinea Association of Accountants, 1990.
South Africa Valuation of Livestock in the Financial Statements of Framing Enterprises, Accounting Guideline AC 205, The South African Institute of Chartered Accountants, 1988. Accounting for Cooperatives, Accounting Guideline AC206, The South African Institute of Chartered Accountants, 1989. Guidelines for Annual Financial Statements of Primary Agricultural Cooperatives, Circular 9/91, The South African Institute of Chartered Accountants, 1991.
Sri Lanka Accounting for Plantations, SLAS 32, The Institute of Chartered Accountants of Sri Lanka, 1993.
Thailand Guideline for recording and disclosing activities of the dairy farming business.
United Nations Accounting for Sustainable Forestry Management: A case study. United Nations Conference on Trade and Development, 1994.
United States Audit and Accounting Guide - Audits of Agricultural Producers and Agricultural Cooperatives with Conforming Changes as of May 1,1994. American Institute of Certified Public Accountants, (original issue 1987). Statement of Position 85-3 - Accounting by Agricultural Producers and Agricultural Cooperatives. American Institute of Certified Public Accountants, 1985. (Financial Guidelines for Agricultural Producers. Farm Financial Standards Task Force, 1991.)
Question 3
Do any current accounting promulgations specifically exclude from their scope activities associated with agricultural production entities?
Australia AAS 2/AASB 1019 Measurement and Presentation of Inventories in the Context of the Historical Cost System - 'does not apply to inventories that are .... forests, livestock, or similar regenerative natural resources....'. AAS 4/AASB 1021 Depreciation of Non-Current Assets - '.... does not apply to non-current assets that are .... forests, livestock, or similar regenerative natural resources....'.
264

Fiji
New Zealand
Denmark
IAS
South Africa
Sri Lanka
AAS 10/AASB 1010 Accounting for the Revaluation of Non-Current Assets - '.... does not apply to inventories ....'.
FAS 2 Valuation and Presentation of Inventories in the context of Historical Cost System specifically excludes 'forestry inventories'.
FRS 4 Accounting for Inventories does not apply to forest crops, farm produce and livestock held by the producer. SSAP 3 Accounting for Depreciation applies to all depreciable assets except .... forests and similar regenerative natural resources. SSAP28 Accounting for Fixed Assets does not deal w i th accounting for .... forests and similar regenerative assets .... livestock which are dealt w i th in TRA-5, Valuation of Livestock in the Financial Statements of Farming Enterprises, and bloodstock which are dealt wi th in TRA-7, Accounting for Bloodstock Enterprises.
DAS 10Tangible Fixed Assets- does not apply to forest and similar regenerative assets.
IAS 2 Inventories.... 'other than .... producers inventories of livestock, agricultural and forest products, and mineral ores t o the extent that they are measured at net realizable value in accordance wi th well established practices in certain industries. IAS 4 Depreciation Accounting .... except.... forests and similar regenerative natural resources. IAS 16 Property Plant and Equipment.... does not apply to forests and similar regenerative natural resources. IAS 17 Accounting for Leases .... does not deal w i th .... specialized types of leases:.... lease agreements to explore for or use natural resources. IAS 18 Revenue .... does not deal w i th revenue arising f rom .... natural increases in herds, and agricultural and forest products.
AC 108 Inventories .... excludes producers' inventories of livestock, agricultural and forest products. AC 111 Revenue .... excludes revenue arising f rom natural increases in herd, agricultural and forest products. AC 123 Property, Plant and Equipment.... does not apply to forests and similar regenerative natural resources.
SLAS 5 Inventories 1(c) excludes .... 'producers' inventories of livestock, agricultural and forest products To the extent that they are measured at net realizable value in accordance w i th established practices in certain industries. SLAS 8 Accounting for Depreciation 4(a) excludes.... forest and similar regenerative natural resources. SLAS 18 Property, Plant and Equipment 3(a) excludes.... forests and similar regenerative natural resources.
265

Question 4
Would you please identify agencies that have overview responsibilities for agriculture who would have an interest in a project to develop an international accounting standard on agriculture?
Region Identified Agencies (No.)
Africa 13 Asia 21 Caribbean/South America 8 Europe 28 North America/Oceania 9 Middle East 2
Total 81
Question 5
Would you please identify Stock Exchange listed corporations, or other reporting enterprises which have significant activities in the agricultural production sector?
Region
Africa Asia Caribbean/South America Europe North America/Oceania Middle East
Total
Identified Corporates
18 108 16 68 78 9
297
Responses
3 4 0
25 26
58
(No.) Responses (%)
17 4 0
37 33 0
20
Question 6
Are there any specific issues which you believe should be considered in the IASC project on agriculture?
a) Context Based Definitions e.g. Agriculture Environmental impact of agricultural activities Implications o f GATT
266

Risk disclosure and consequential treatment of losses from calamities/natural phenomenon Joint ventures (e.g. landowner and grazier) International comparisons, types of tax, risks, ownership, unpaid family labour, internal consumption Point of maturity
b) Model Selection Issues Valuations Inventory (crops, livestock), long term productive assets
(plantations), quota Accounting for livestock/forests/cash crops/subsistence agriculture/horticulture Valuation of standing timber Performance measurement and financial reporting criteria for plantations at different stages of maturity Derivation of costs beyond costs to date e.g. harvest, process, market Measurement of timber access rights Treatment of research and development Treatment of Foreign Exchange Taxation/Deferred Taxation Treatment of leases Treatment of stabilisation reserves/provisions in pool accounting Valuation of agricultural stock in pool accounting and the disclosure of pool commission policies Income recognition by industry Consistency of treatment home grown/purchased, livestock and produce
c) Transaction based/historical exchange interpretations Quota - Amortisation Timing of revenue recognition where produce is delivered to selling for sale at an undetermined price Matching of revenue and expenses if revenue recognition is deferred until evidence of proceeds is available Methods for capitalising and amortising interest, other financial costs, and development expenditure incurred in the establishment of plantations Recommended amortisation periods Deferring future crop expenditure Depreciation of Orchards Capitalization of growing crops until harvest Range of costs to be capitalised Valuation of plantations to ensure lower of costs and market rule applied Determination of cost of timber felled Write off to cover loss or damage caused by fire, disease, etc. Foreign Exchange - revenue recognition/accrual/treatment of differences
267

7.6 POSSIBLE CHANGES / INNOVATIONS IN THE SPANISH FADN
Inmaculada Astorkiza
Functioning of the accounting offices
All the Stakeholders
(A) Classification of innovative ideas: Quality Management + Internal Organization
1. Description of the proposed change There exists unanimity of opinion that the Accounting Offices should offer management services and give techno-economic and fiscal advise to the farmers. They should use specialized professionals in their confidence who will assess and analyse the results of the farmers. Some local governments answer that such AO should come from the agrarian associations (professional organizations. Cooperatives, Unions, etc.) although wi th the support of regional administrations. On the other hand, other RG's mention that some Services, dependent on RG's (e.g. Extension Services), could act as possible AO's if they were to incorporate some of the before-mentioned changes.
The AO's should not be businesses external to the agrarian sector or, as is often the case, people subcontracted by these, and whose only contact w i th the farmer is to collect data as mentioned above.
2. Description of the benefits Increased disposition of the farmers to participate in the whole process as well as an increase in their consideration of management in general and of the AO's and RECAN in particular. The quality of the data collected by RECAN would increase. The number of potential users would also increase. Those regions which don't have these types of services would be obliged to create them (the RG's would have to become involved in their creation, although it would later be the Agrarian Organizations which took over their running once established).
268

The increase of accounting in the agrarian sector
All the Stakeholders
(A) Classification of innovative ideas: Quality management + Farm Accounting
1. Description of the proposed change The agrarian organizations would provide a techno-economic management and assessment service to their associates and even to assume the function of an Accounting Office. In this way the data collected by RECAN would be a by-product of their daily work with the farmers. It must be the agrarian sector which instigates the accounting, although with the help of RG's. Some RG's consider it important to have an 'administrative centre' for the different initiatives of this type which could be formed.
2. Description of the benefits The f low of information (feedback) which is generated between the farmer and the management office creates a mutual confidence, and a greater professionalism of the farmers and a more business-like form of decision making (the small and medium size farmers who join this type of organization usually change their perception of their own work, and start to perceive themselves as agricultural businessmen rather than mere peasants). The consequence of this is that the data generated is more reliable and the quality of statistics and the results drawn from these are also better.
(B) Classification of innovative ideas: Farm Accounting 1. Description of the proposed change mentioned by stakeholders
To relate the access to CAP (Common Agricultural Policy) and other structural subsidies to the fact that the farmer does his accounting (or to establish positive discrimination in these subsidies).
2. Description of the benefits To give incentives to the farmers to practice accounting if they want to benefit f rom the subsidies. However, this type of action is not having much success as the Administrat ion is not fol lowing up the level of compliance with the requisites demanded to apply for subsidies. 'Protectionist Policies' of this type as well as fiscal protection for agriculture could lead in the long term to structural retardation and also impede the acquisition of a more exhaustive knowledge of farming operations.
(C) Classification of innovative ideas: Farm Accounting + Quality Management
1. Description of the proposed change The launching of programs to explain to the farmers the practice of accounting.
269
2. Description of the benefits To make them see the benefits of accounting for decision making and derivative benefits. The general fiscality which makes the practice of accounting obligatory is in many cases more favourable than the agrarian special fiscal system. The farmers which use accounting can choose the most convenient of the two systems, while the farms which do not practice accounting have to fol low the agrarian special fiscal system (The paper by Gomez-Limon and Berbel corroborates this opinion).
270

WORKING GROUP SESSION 3 Clustering of ideas
After all papers were presented and discussed, the participants were asked to divide themselves between the six categories:
1. External organization 2. Internal organization 3. Domain 4. Quality management 5. Information technology 6. Farm management accounting
Within each category, as a first step towards project indications, there had to be made clusters of ideas. The ideas within a category came f rom:
a) working group session 1 (external change, CAP reform); b) the papers handed in for the third workshop; c) ideas mentioned in the previous PACIOLI workshops, which were not
worked out in the third workshop.
The result of the first clustering is presented below. The name of a cluster is printed bold and in italics, followed by the ideas belonging to that cluster.
1. External o rganizat ion
Recouping of costs of data collection Commercial exploitation research requirements
Involvement of stakeholders Systematic questioning of policy makers and other stakeholders on information needs and use
- (all levels: European / national / regions) Strategies for administrative change Outsourcing data management at EU level / national level (?)
- (regulation / interpretation: DG VI) Needs and expectations of Ministries
271

2. Internal o rganizat ion
Data management Quick statistics Splitting sample New Farm Return
Decentralisation Regional Accounting networks Greater involvement wi th extension services
Data quality Improving sample quality Development of control programmes Incentives for participation
Development forum e.g. TAPPAS Setting goals Planning future Sparing resources / ideas
Classification I weighing Improved typology (community level)
- sampling - results
Price cycles Comparability Continuity Simplification
3. Domain
Additional data on regional development Household income (including multi-activity and off-farm income) Coordination w i th TIAH, EUROSTAT
Additional data on environment + landscape + healthy food Impact on farm structure Changes in the environment
- mineral balances - pesticides - energy balances
Product line data including farm and food industry
272

Additional details for cost of production Enterprise data - gross margin per crop / production Labour data - labour use in each activity
- labour input composition
Additional data on the effects of current policy measures Quota + direct support data Reinvestment capability - minimum family expenditure
- family composition Farmers off-farm income (household income)
Additional data on forestry production
4. Qual i ty management
Regionalization Splitting sample Regional sample Decentralization selection and control
Flexible information models Positive mathematical programming Integration of accountancy methods Accounts wi th different level of details No one-software approach Information model
Fast feedback Feaadback to farmers Quick statistics
Quality documentation Integrated quality programme
Stimulation for quality Periodical technical reunions Paying farmers for quality
Feedback for quality Control of customer satisfaction Comparison between different sources Comparison between different context Recovery of lost information (more detailed) Comparison between different networks
273

Programmes for human capital quality Training Mobility programme External expertises
5. I n fo rmat ion technology
Data collecting, processing and dissemination
System specialists meetings and all the others
RICA on the Internet
Reference information model of the European RICA New farm return Computerized information model Standards for FADN-data exchange System specialists meetings Standard data files
6. Farm account ing
Accounting and farm management Agri-ecological production chains Accounting offices as advisors Integration accounting and farm management information system Farm accounting and changes in policy
RICA and policy Policy: CAP subsidies Extension and promotion of accounting Fiscal incentives Accounting and changing policies
Improve comparability Improve understanding of accounting methods in Member States
Farm accounting and the profession GAAP / integration methods Accounting office as advisor Extension and promotion of accounting Situational accounting / double entry accounting Integration accounting and farm management information system
274

WORKING GROUP SESSION 4 Generating project indications
After the six groups had made clusters of ideas and had thought about the most important criteria project ideas will be judged on, the next step could be made: to write project indications. The format the project indications had to be writ ten in is as follows:
1.
2.
3.
Description of the project
Product
Changing process(es)
The name you gave to the cluster can be a start for the project description.
What wil l be the specific result of the project?
Which process(es) in the process model wil l be effected?
Stakeholders to be involved Who have to cooperate to realize the project?
5. Potential funder
Critical success factor
Remaining remarks
Who is interested and is willing to pay for the project?
What is the most important obstacle that has to be taken to make the project a success?
Finally there remain fifteen project indications which wil l be worked out before and during the fourth PACIOLI workshop.
275

EXTERNAL ORGANIZATION
1. Est imation o f data needs
Description of the project To establish data needs
* in general * by stakeholders * access the committee
Literature survey of users Literature review to verify
Product Better informed policy Efficient collection of data Improved response to requirements Better priority setting Measurability -* qualitative
Changing process(es) Strategic planning
* policy developments * proposals for new data * perform special studies
Stakeholders to be involved Policy makers (national and EU) Officials (national and EU) Farmers and representatives Data collectors Researchers
Potential funder Member States RICA
Critical success factor Contents Organization Cooperation of policy makers
276

EXTERNAL ORGANIZATION
2. Contract ou t data process
Description of the project Tender out data process work
* collation of data * validation * regular statistics published
Product Improved 'turn around' t ime Reduced cost Reduced policial - financial constraints
Changing process(es)
Stakeholders to be involved Data processors DGVI Accounting offices
Potential f under Switch or privatise
Critical success factor No national FADN access by national government Involves some labour saving Confidentiality * respondent concerns * political questions
277

INTERNAL ORGANIZATION
3. Changing t ypo logy t o improve results
Description of the project increased value of data and of information derived from it through improved comparability: * between countries over t ime improved coverage, simplification easier management
Product A classification system -> better results
Changing processies) Farm classification system
Stakeholders to be involved All FADNs and statistical offices Eurostat
Potential funder All administrations, especially EU
Critical success factor Cooperation between stakeholders (data producers and data users)
Remaining remarks Essential project M
278

INTERNAL ORGANIZATION
4. Rapid results
Description of the project Cost benefit analysis of methods of production of rapid results
Product Timely results for political annual review
Changing process(es) results within accounting year results immediately after accounting year subsamples -+ rapid results * commodity specific * before agricultural year ends
Stakeholders to be involved EU / national / regional / farms i.e. accounting FADN partners
Potential f under National / EU administration
Critical success factor finance new practices for data collection integrating Information Technology
Remaining remarks Role of simulation forecasts
279

INTERNAL ORGANIZATION
New EU farm return
Description of the project A new 'fiche' (farm return) and documentation base
Product Data structure to ensure
* comparability * consistency * flexibility * clarity * rapidity
Documentation for data users and managers
Changing process(es) New farm return and Member State conversion Programmes Training New data - new methods
Stakeholders to be involved FADN liaison agencies DGVI
Potential funder Commission Member States
Critical success factor Participation and number of accountants Stakeholders (Information Technology, private sector, regions)
Remaining remarks Complementary with'Rapid results' Possibly 'Two tier fiche'
280
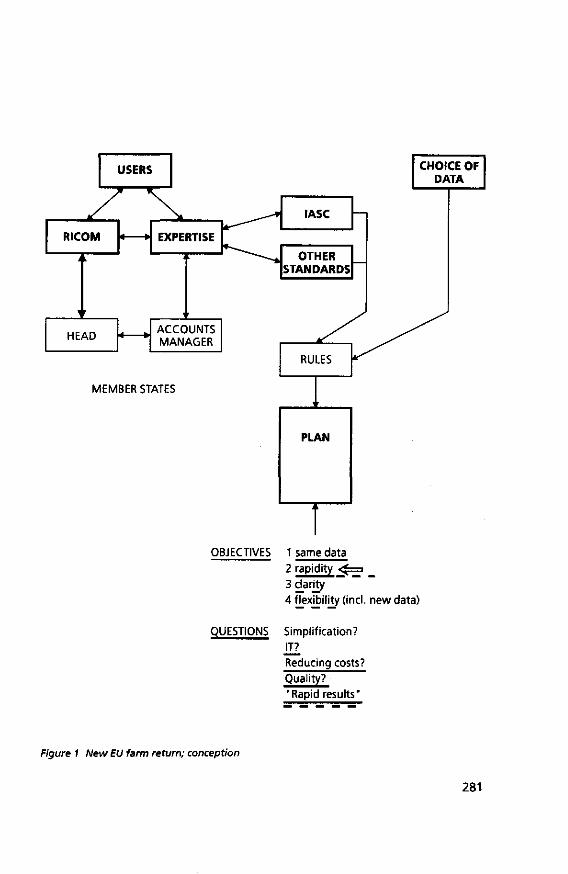
OBJECTIVES 1 same data 2 rapidity <£=i 3 clarity 4 flexibility (incl. new data)
QUESTIONS Simplification? JT? Reducing costs? Quality? "Rapid results"
Figure 1 New EU farm return; conception
281

1 f
DATA DOCUMENTATION
i i
USERS
i L
RICOM
i
RULES & DATA CHOICE
' '
PLAN
i '
,
' '
HEADS
Î ACCOUNTS MANAGERS
i i i
NATIONAL DELEGATIONS
! -) EXPERT 1 • GROUP
Figure 2 New EU farm return; implementation
282

DOMAIN
6. Management o f env i ronment , landscape and f o o d qual i ty
Description of the project Describe possible management methods at the national level as well as the farm level Identify and analyse the effects of the management methods Analyse how to measure the effects (methods and tools) Conclude on the data needs
Product Measure to manage the environment, landscape and food quality by
* the policy makers * the farmers
Changing process(es) Strategic planning
* study policy development / objectives (common environmental policy, food quality policy)
* new data requirement -*• data management
making forecasts
Stakeholders to be involved EU Commission National authorities Farmer organizations Political parties *- consumers
Potential funder EU research funds (DG VI, DG XXI) Additional funding on a national level
Critical success factor Farmer cooperation National FADN coop. (Ministry of Agriculture) Size of the project; delimit and specify it: * most important characteristics / aspects and benefits of managing them * how they could be managed and measured * analyse data need to decide about and evaluate the management
methods
283

DOMAIN
7. Management o f regional deve lopment
Description of the project Describe possible management levels at the regional and household levels Identify and analyse the effects of these management methods Analyse measurement methods and tools Conclude on the data needs
Product Measures to manage regional management by farmers (rural households) and policy makers.
Changing processies) Gathering of additional data -* processmodel EU RICA
* strategic planning (rural policy development, new data requirements) * data management (definition of new variables) * making forecast
Stakeholders to be involved EU Commission National / regional authorities Farmer + rural organizations Political parties <- consumer organizations (?)
Potential f under EU research funds Additional funding; national / regional level
Critical success factor * The political atmosphere in:
- rural household cooperation - National FADN cooperation (Ministry of Agriculture)
* The size of the project; delimit and specify it, e.g. - specify the most important aspects / characteristics and possible bene
fits of managing them - how they can be measured and managed - analyse the data needs in order to make decisions and evaluate the
management methods
284

QUALITY MANAGEMENT
8. Qual i ty ne twork sof tware
Description of the project Development of software able to check data at different levels of detail
Product High standard quality data base
Changing process(es) Using data Application management
Stakeholders to be involved RICA liaisons agency Universities Policy makers
Potential funder EU-RICA National RICA Users (?)
Critical success factor
285

QUALITY MANAGEMENT
SUPPLY/ USERS
PATH LEVELS
FARM
MANAGEMENT AID
POLICY MAKING
RESEARCHERS
USERS
MODULARE SOFTWARE
(UNIVARIATE CONTROL)
PROVISIONAL DATA BASE
MODULARE SOFTWARE (QUALITY)
MULTIFUNCTIONAL DATA BASE
METHODOLOGY SHARE x —
ANALISYS LEVELS
FARM
NETWORK
HIGH QUALITY ANALISYS
MODEL
EXTERNAL DECISION
Figure 3 Quality management
286

QUALITY MANAGEMENT
Modular flexible i n fo rmat ion technology
Description of the project Software to access to different levels of aggregation (EU, countries, region...)
Product Avoid losses of information and provide fast feedback
Changing process(es) Methodology share and flexible tools
Stakeholders to be involved RICA Delegations Farmers Data users
Potential f under EU RICA delegations Farmers unions Educational programmes
Critical success factor Money Confidentiality of data
287

QUALITY MANAGEMENT
10. Qual i ty analyses model f o r FADN
Description of the project Quality programme for FADN based on the users priorities. The steps:
* quality guidelines (rules) * documentation system * annual quality survey (progress report each year) * customer satisfaction study
Product A broad quality concept based on actual user validation is defined A standardized documentation system is created Annually the changes in quality are described
Changing process(es) Strategical management Technical management Operational management Accounting management
Stakeholders to be involved The national FADN producers and FADN users DGVI
Potential funder DGVI National FADNs
Critical success factor Too detailed Too sophisticated
288

INFORMATION TECHNOLOGY
11. Reference in format ion model and standards fo r data-exchange on a European level
Description of the project The project consists of two stages:
1. the development of a RIM for RICA 2. the development of standards for data-exchange between RICA and
Member States (FADNs) The first part of the project focuses on describing:
- actors (RICA, Member States) - information flows (technical, financial, environmental) - entity types - attributes (data dictionaries) The second part of the project focuses on the use of international stan
dards for EDI (EDIFACT etc.) for data exchange.
Product Deliverables (as a framework for development of national FADNs and EDI applications concerning RICA):
- handbook wi th information model - data dictionary / electronic version - specification of EDI messages
Changing processies) Not really changing processes; it might ceap to an improved overall RICA
information model. Changing transfer of data.
Stakeholders to be involved RICA National experts on FADNs, information modelling Participants other PACIOLI projects: RIM and EDI standards should be supporting other PACIOLI projects
Potential funder EG: DG VI RICA
Critical success factor Use already existing material: information models, EDI standards. Shared vision, general agreement of scope project, what has to be in
cluded: financial, technical, environmental aspects.
289

Remaining remarks This project contributes greatly to the development of integrated infor
mation systems concerning financial and economical information, throughout all Member States.
The project also aims at integration of data and metadata.
290

INFORMATION TECHNOLOGY
12. FADN on t he Internet (FADN and ne twork computers)
Description of the project Evaluate the need of information from end users Define standards for data and document dissemination Develop a prototype (EU + 3 countries) Evaluate the final system (users' needs, further implementations, Internet versus other tools) Develop a prototype for data input and data distribution to the farmer
Product Web service Report on users' needs Report on standard definition for an Internet service Report on evaluation of the final system Prototype of a network service for the farmers
Changing processies) Distribution, analysis and forecast
Stakeholders to be involved EU National FADNs Information Technology experts Users Farmers
Potential funder EU: DG VI (research or FADN division) National FADNs Other EU projects (TURA, INFO 2000)
Critical success factor Data availability Involvement of end users Involvement of farmers
291
FARM MANAGEMENT ACCOUNTING
13. Developing f a rm management accounting
Description of the project
Product Guidelines for developing accounting modules in farm Management In
formation Systems for data intensive farms in 2005.
Changing process(es) Accounting
Stakeholders to be involved Farmers Accountants Software developers
Potential f under FAIR programme EU + National supplement
Critical success factor Involvement farmers + SME Lateral thinking - * be creative! Kick-off position / selection of farm type / technological environment
292

PACIOLI
FADN
MACRO INTER
FARM MANAGEMENT ACCOUNTING
— • MICRO INTRA
SCENARIOS
COMPETITIVENESS REGIONAL
_ SIMPLICITY
ACCOUNTING ACCOUNTABILITY
EU PRIMARY FARMER - SELF
- PUBLIC - ENVIRONMENT - PUBLIC - POLICY - PUBLIC - REVENUE - LENDERS
INNOVATION
BENEFICIAL CHANGE TO MEANS OF ACHIEVING PURPOSE
FARM ACCOUNTING 2 HURDLES 1 IMPACT ON 2 IMPACT ON
FARM MANAGEMENT FADN
CLUSTERS - SOURCES OF INFLUENCE
Figure 4 Farm management accounting
293

FARM MANAGEMENT ACCOUNTING
14. Tacking stock of issues / satisfaction + debate
Description of the project Environmental GAAP Audit ing Simplification
Product Survey of accounting methods (Canadian study) and new + future issues (including statistics)
Changing processies) Organizing discussion between policy makers and profession
Stakeholders to be involved
accounting offices The profession: accounting associations
standard setting organizations
Survey: researchers statistics
Farmers union: simplification
Potential funder EU policy unit (?) Agricultural banks (Credit Ag. Rabobank) as users of accounts
Critical success factor Involvement profession
294

FARM MANAGEMENT ACCOUNTING
15. Farm account ing as a policy instrument
Description of the project
Product List of useful incentives for promotion of agricultural accounting Suggestions to adapt farm accounting towards tool for policy-compliance Suggestion for simplification of paperwork in agriculture
Changing process(es)
Stakeholders to be involved Policy makers AICS / subsidy organization / auditors Accountants Extension service Tax authorities
Potential funder National / EU policy units FEOGA / Court of auditors (?)
Critical success factor
295

WORKING GROUP SESSION 5 A step up to the next workshop
After the project indications were presented, the last question to the participating countries was to point out which project indications interests them.
Group division: by country
For each project indication a country was interested in, the participants were asked to formulate:
1. What specific contribution they can offer to this project
2. If they would like to be initiator
The results of this quick inventory is presented below.
296

EXTERNAL ORGANIZATION
1. Estimation of data needs
United Kingdom
Contribution Project outline (proposal / draft)
Initiator Wye College
2. Contract out data process
297

INTERNAL ORGANIZATION
3. Changing typology to improve results
Finland
Contribution Just adapted new typology Expertise Contacts
Initiator
Ok, if needed.
RICA / EU
Contribution As user, needs experience. Initiator partner
Switzerland
Contribution Problem definition Theoretical background * sampling * stratification * weighting Practical application (Swiss data)
Initiator Participation in, but not coordination of EU-research projects possible (as non-EU-member).
Belgium
Contribution Analyse of actual problems and proposals for change Evaluation of the effect of possible changes at national level
298

Italy
Contribution Italien experience in this sector
Sweden
Contribution Experience Interest
Initiator Yes, possible
299

INTERNAL ORGANIZATION
4. Rapid results
United Kingdom
Contribution Project outline
pilot study of alternative approaches: - model - interim results - early year ends - improving processing
Initiator Wye College
RICA / EU
Contribution Project (co-)management User needs
? (co-)financing
Initiator Yes (with other parties; homologues)
300
INTERNAL ORGANIZATION
New EU f a rm return
Finland
Contribution Just renewed in Finland according to EU FADN.
Initiator
No, together wi th others.
The Netherlands
Contribution
Strategic information management Pilot institute Experience in the process of renewal Organizing workshop
Initiator Available
RICA / EU
Contribution project management (user needs) financing
Initiator Yes
301

DOMAIN
6. Management of env i ronment , landscape and f ood qual i ty
Finland
Contribution Lots of research of mineral balances Interests f rom the ministry
Initiator
Together wi th others
Sweden
Contribution
Experiences from evaluation and use of policy measures to manage such issues Research in the area Policy makers are concerned Swedish consumers and political parties are concerned
Initiator Yes, possible
Italy
Contribution Previous research at INEA on environment
Spain
Contribution Productivity measurements Rural tourism programmes
Initiator
Together wi th others
Switzerland
Contribution Environment Life cycle assessment
302
DOMAIN
7. Management o f regional development
Switzerland
Contribution Non-farm income Lines of micro (FADN) and macro (national accounts) data Household approaches
Spain
Contribution Methodology of evaluation Mediterranean problems
Initiator Together wi th others
303

QUALITY MANAGEMENT
8. Quality network software
Italy
Contribution Italien approach to the problem of data quality (multivariate analysis etc.)
9. Modular flexible information technology
Italy
Contribution Italien experience Prototype of network computers
304

QUALITY MANAGEMENT
10. Qual i ty analyses model f o r FADN
Sweden
Contribution Experience in developing quality guidelines Several years of experience in the area of annual quality survey
Initiator Yes!
Italy
Contribution
Italien approach to the problem of data quality (multivariate analysis etc.)
The Netherlands
Contribution
ISO 9000 development within Dutch FADN Method 'Balanced Score Card' Quality management innovation process
305

INFORMATION TECHNOLOGY
11. Reference in format ion model and standards fo r data-exchange on a European level
Italy
Contribution
Italien information model
Sweden
Contribution
Experience wi th data modelling Experience wi th EDI Experience w i th statistical metadata
Initiator Possible
France
Contribution Expertise in information modelling Expertise in EDI
Initiator
? Need the assessment of my colleagues
The Netherlands
Contribution Experience in the area of information modelling Experience in the area of farm accounting systems Experience in the area of EDI (EDIFACT) message-development Experience in the area of international data dictionaries Information model of the Dutch FADN?
Initiator Yes
306

INFORMATION TECHNOLOGY
12. FADN on the Internet (FADN and network computers)
The Netherlands
Contribution Pilot institute Web server available Moderator Experience with FADN communication strategies
Initiator Available
Italy
Contribution Previous experience with Internet services
Initiator Guido Bonati
307

FARM MANAGEMENT ACCOUNTING
13. Developing f a rm management account ing
Finland
Contribution Good expertise Just under work in Finland
Initiator No, together wi th others
Sweden
Contribution Experience from research and development in the area Powerful stakeholder with 60% of the Swedish farmers' accounting service market and The stakeholder is interested! 40% of the Swedish farmers use on farm computers for accounting
Italy
Contribution
Italien experience in a flexible accounting methodology
Germany
Contribution
Work out project proposal Organize input from profession in Germany (discussion partners), contacts Organize / supervise specific tasks (to be identified)
Initiator
Only if no experienced volunteer could be found
The Netherlands
Contribution
Contact farmers Environmental accounting Integrated management information system
308

Expert Systems Data modelling
Initiator Available (but UK preferred !)
France
Contribution Direct contribution to the project Coordination of French stakeholders involved
309

FARM MANAGEMENT ACCOUNTING
14. Tacking stock of issues / satisfaction + debate
The Netherlands
Contribution Survey know-how Organization workshop Know-how on issues
Initiator Available
15. Farm accounting as a policy instrument
The Netherlands
Contribution Know-how on policies Workshops with extension / accountants Auditing + obliged mineral balances
Initiator Available
Spain
Contribution Experience (water policy)
310

CONCLUDING REMARKS
The third PACIOLI workshop started with a impressive collection of interesting ideas and suggestions for improving and changing the RICA FADN. A lot of these ideas are available in proposals worked out in detail, other ideas are more global indications.
During the third workshop we have been looking for a structure in these ideas. Equally spread over six domains we identified 16 clusters of ideas in which proposals will be combined in specific projects. In the preparation for the fourth (and last) PACIOLI workshop these 'project indications' as they are called, wil l be discussed with the relevant stakeholders and worked out to project proposals in the last workshop to be held f rom September 30 - October 2, 1996.
During the PACIOLI project we adopted a bottom-up approach in the sense that we started in a kind of brainstorming mode to generate ideas and we structured them later on in the process. The structure is needed to communicate with the stakeholders. In this interaction we can be, and probably need to be flexible w i th the structure to come up wi th feasible proposals. We can afford to be flexible because of the detailed 'database' of ideas that is available.
The criteria for feasibility of the proposals are largely determined external; outside the PACIOLI group. Most of the PACIOLI participants have done an interesting job in analysing their stakeholders and to discuss the ideas for improving the FADNs with them. We also held an interesting discussion about the CAP-reform and the implications for the FADNs. For all of us it is obvious that the directions for improvement of FADNs are determined by these sources.
In line with the discussion about the impact of the CAP reform, the main aim of PACIOLI is Reforming the RICA FADN.
It appeared to be that in PACIOLI a concentrate of expertise on the f ield of farm accounting is available. This resulted in proposals for further development in farm accounting; on the integration in farm processes as well as on standardisation issues.
During the third workshop it became obvious that we are making very good progress in the networking objectives of the PACIOLI project. The group is getting to know each other very well on the personal level as well as on our work and the environment in which we all operate. This might be very impor-
311

tant in some of the proposals that will be of a networking kind in which informal contacts on a personal level are a critical success factor.
The PACIOLI group can be characterized as a very heterogenous group wi th various scientific disciplines, various interests in FADNs, various cultures etc. It is interesting to see how such a heterogenous group operates together. It is obvious that this group has a clear common interest; we are all concerned about the future of the FADNs and we are all convinced that a FADN is a very useful instrument to support the agricultural policy making in an effective way.
312

ANNEXES
313
Annex 1 Farm Business Survey; Collection and Processing of Farm Accounts Data in the UK
Alison Tanton, Senior Investigational Officer, Wye College, University of London
During the third PACIOLI workshop in the United Kingdom we visited Wye College. After a conducted tour on the College Farm a lecture was given on the Farm Business Survey. In this annex a report of this lecture is given.
At Wye there is a team of nine staff engaged in the Ministry of Agriculture Fisheries and Food's (MAFF) Commissioned Work Programme. The team consists of three Investigational Officers who carry out all the field work and six clerical staff who provide an office back up for data analysis and processing. This is the present situation; as a result of cuts in funding over the next five years there will be a scaling back of the clerical team. More use will be made of available Information Technology to perform data analysis tasks.
In practise, the work of the Farm Business Survey can be broken down into seven areas. Sample selection, recruitment, data collection, data analysis and processing, farmer feedback, data submission and the production of the Farm Business Statistics for South-East England.
Sample Selection MAFF has a contract with the university to supply 200 accounts each year. This
is broken down into farm types. The university has to supply the stipulated number of each farm type to fulfill its contract. Penalty and bonus payments exist to encourage compliance. The structure of the contract by farm type varies between regions based on an analysis of the agricultural census carried out by MAFF each year. It is hoped that the sample drawn in this way is then representative of the population we are sampling but in practise this is not always the case. This matter is presently being considered by a statistical methods working party. It is possible that part of the problem lies in the incidence of 'multiple holdings' where a farm may return two or more census forms but actually operate as one business. The farm type of the combined business may be different from that of the two component parts. There is also a tendency for farms to change type from year to year as the relative importance of different enterprises changes within the business.
Recruitment Each year we replace between twenty and thirty farms in the sample. This is nec
essary for several reasons. MAFF has a rule that a farm may not remain on the survey for more than fifteen years; each year some farms reach this point and have to be discarded from the sample. Some farms may cease trading or the business may be passed on to another member of the family who may not wish to continue cooperation. Some farms have to be dropped because there are too many of their particular type. Conversely, we may not have enough of a particular type and therefore need to recruit more.
MAFF supplies the universities with a list of farms drawn at random from the population recorded in the annual census. The farmers on this random sample list are written to, inviting them to participate in the survey. If there is a positive response to
314

the letter then contact is made on the phone leading to a farm visit if it seems likely we will be able to proceed with the cooperator. Participation is on a voluntary basis and success in recruitment varies with farm type. Overall, approximately 20% of the farmers who are written to will agree to participate in the survey. A record is made of non-cooperators.
Data Collection The data is collected from the farm by the Investigational Officer at a time con
venient to the cooperator. Often the books are analysed for the Farm Business Survey before the accountant has access to them. Normally, all the records provided for the accountant plus crop records etc. are made available and they are returned to the farm within two weeks of collection. In future, where it is feasible, analysis will be carried out on the farm with the use of laptop computers thus removing the need to take the books away from the farm. This will enable records to be completed more efficiently where, for example, there is a very good record of transactions on the farm's own computer.
Data Analysis and Processing A spreadsheet based analysis package has been developed for the Farm Business
Survey and this will be used where there is no reliable analysis available from the farm. At present this method is no quicker than the manual analysis system in use but speed will come with experience and development of the package. The results of the analysis are then entered into the Farm Return that we are required to complete for MAFF. This is in the form of a spreadsheet which performs all the arithmetical functions required to construct the account. Once completed, automated credibility checks can be run on the data to ensure only 'clean' records are submitted to MAFF.
Farmer Feedback A Farm Report is constructed from the completed Farm Return spreadsheet. It
presents a summary of the farm business's performance over the year and compares the result with the previous year and the average of a group of similar farms. This is discussed with the farmer to ensure that it is a fair representation of the account. The feedback we are able to give the farmer is critical to their ongoing cooperation with the survey.
Data Submission MAFF will accept data from May to October each year. It is submitted by elec
tronic mail. Validation of the records usually takes place within a week of submission and notifications of any failures follow. When the farm record is 'clean' it is classified by type and size. It is then utilized by MAFF for their purposes and forwarded to the commission.
Farm Business Statistics When the data collection is completed and all the records are 'clean', a regional
analysis is carried out by each centre. This provides the data for inclusion in the individual Farm Reports; data are published in aggregate form by the universities for sale to consultants, students, banks, etc.
The Future? Funding to the Farm Business Survey has recently been under review. The result
is an overall reduction in income over the next few years. Clerical jobs will be lost. Fur-
315

ther development of computer software will be critical along with the necessary staff training and development. As more farmers use computers to keep their business records it will be necessary to ensure they are utilized to their full potential. More cooperation between participating universities will be important so that effort is not duplicated, for example, in the development of computer software. How will we cope with increasing demands for information? There needs to be careful monitoring of all data collected so that new areas of work replace erstwhile studies, not add to them.
316

Annex 2 Process models
Farm management accounting RICA Belgium Finland France Italy The Netherlands Spain Sweden United Kingdom
Italy: stakeholders diagram
317

«e
i
O C £
T3
con
trt
stoc
ks
serv
i
i i
- ' S Ê
1
a l l -•81
O
1
w ac
IN »5 ri c **
« o
1
IM au
1
J _
« o
1
•o 3 Ol .c +3 C 3 O
C <u S (U Ol 10 c n> E
318

A
l i l * Ç eu 2 S E
Ol u o
a l l £ 3 8 ZEZ
111 ï 8 !
.-£•*
I l l s -5 fi-o5"j 2.5 S 8 5
o > v
suis <5 E c B =
I
S.9
If
i l l
IP « ft Q
. * t3"o
£55 HI 3 §2
| . E J o 2 JS
'5 o , j c
-ESS III i l s
! " S •3! «r :e ; Î
s S c e m Ê S 1 X OC 2
I
5 SS ï
:2.sg> ? C £ j= 01 u 01 E £ 'S « 5T w O S E S **=
, 5 J B
IX: 2 s
•S 2 'î 3.= ï c e ? 2 IJ'S
I 2-8 u«
iistic c Q " C O 'm p. 9; E "P 01
E ~
2 . »
•i-8 s
2 E ° S
319

CU >, Q_ 'D E
u Lfl
vo
a i
b
c
O l
O •4: u
O l re
O
r, Ol l / ï l£> l£ï
E fO
• o
re ;>
ca
re
x : ü
> £ re S>
£ " c
T3
c
c LU
i n
Ï ?
s.| E--P 0) <D
re
LO
T3
<i; - C
O
re n
*_»
r r u n
o3
i/i
re fa
"O
a i
LD
ü
re cc
b
o o
* o
t
Q .
b
b
re
tr o ÇU
<u "O
g a . 00 i n
o
? Q-
13 c a.
tr re CL
i—
m
re o. re 3
* re O
n ^ O £
a i
re <
o i c CU
fc
p c o u
m
o
ai a i o o.
> re
VD fM
a i
re 5
C CU
F o. o-a*
rsi
a> i / i
1-
J3
F
O
-o
•* £ Ol
t— re
*"". rsi
F re
3
5
O
c re Q . a i
o fc re
a>
ÜO rsi CN
ai
o
ai
O CL
re TD O
1
Q .
5.y
Q - f a •* Si rsj
.g
3
c re c
? m r g
o o
4 *
_ E
o
£
're
2 I D r g
?>•,
o o
o>
aî
fc
O l
ai
^ ^ • re
<
u.
r 0) b o
% eu T3
3-S
Jfl
E
=3 CT
C
b
n
r
5
> T i
a>
i> D m a i
o o *
.
320

321

X
r\
\j
o c
t n
r aj
b
ro
ut
.£ o a 3
5 5.2
Ent
er in
to
agre
emen
ts
with
pa
rtici
pant
s ta tz -o
^ 4 - <U
Q. O
ÛJ
tu M 00
c u
3
E
S f
L
\
\ c
E Ol Ol
ra m t , /
e jS m
ra O-
2.1
raw
up
sam
ple
o 1
322

i l l
3 S
Q
O
. c
<u
F
3 S £2
Û* O m -ï -° Tï ™ fO "
I
SP«
St3
i l s
c O 2
i E « ) •fî Ä S
en c 7
s le
Î S S. o ï .§2
> Q .O
323

o c
LIJ
i n
<D a.
S r * j
nto
nt
s
nts
Ent
er
reem
e w
ith
rtic
ipa
ui " °-
m
T3
" 5 O
i [
*T
T3
!" to
<D S:5 o "si
I?
m
S r
Ä 1
(U
n i/ï
fi 3 •D Q.
"* tu
>
a! c a> -t
CT C o
1
m
*~
ai c E
S
a
n <L> T 3 Q
TJ
a* O k£>
3
n
>--o
m 3
C«
3
m
« c
c o CL
a
o .c
E T3 C
324

z o
z < o
5?
m c
o
eu
^
nt . 0
ra ra
ra C C <
O
Oi
co
3 £ LJ-
* < 5 "O c
o
01
"D
CL CL 3 un
c i i CU
T3
fc
TJ C f0
l / ,
3
"O
7 -
< i j L U
a:
CU
c LU
r
ï i t
<u F QJ
IT}
O)
c 3 KJ
ra
l/l
n u r CL
"O
u
c fM
TJ C
cr
• a
u
.c w
CLÏ: eu o
> o
«^ • t ; eu
tfS •j-> ra
CL • o - »
c:
»# û-çu
3
S
C
F ÇU
o CU
S o
SS
. OJ
o
r
r - i
ra
U
F
r
t
ra CL
C « o E
-^3 eg ra Cft
c-ü
- 1
5
LS
O r
ra CL
>. C
<
T l eu eu
c:
ra F o t
ra r <
* c <u t o CU
-o
ra
o LU
fB
CL
F
F
**-
(D
3
C O
u
F m
r
ra rt!
>
X I
t/>
E u
n
>. en O
T3
o (U b
eu
n
</> tf-W Î5 S =5?
3 m CT
eu r i
3 01
F
r o
325

Strategie management
'
Analyaa
changaaai
auric pclcy
1
Datarmine
OOjeCttvaawMl
theaurvay
1
Technical management
1
Draw up
' '
Draw up
1 '
Draw upa
pnjdudlonpHn
Makanacaa-
aary ohangaaai
EDP-ayatema
JEU/FADN
1
Operational management
1
Enter into agrae-
mantawth
1
EataUaha
'
Send out
'
Send out
insaucaona
1
Support
•IhniuaUufi
Accounting
Receive and
contre, forms
Encode data
Amend data
1 1
Receive
book-keeping
1 1
Receive data from
other registers
Use of data
"
EstaMsha
final register
1 '
Make pretont-
naiy calculations
Make neces
sary aggregations
Make ad-hoc
extractions
1 '
Prepare
reports
and tables
Sweden
326

b
ra
3
ra ra
TD
1
ra TJ
^ E c at
: 3 0
|
u
CL.
Û . O
T ra O.
o o>
1
ra I/I r- "O - ^ 3 m flj ™ <
-52
OJ
ra ra >
LU
• ü
D C
u
|
C n» y
E£ "J ra
M
E
ra
<v . O l
5™ ô -I O a;
E
3=
« o
Jfl c
eu ai
£ E ?* < « O)
•o
-.= ra "O c P ai
-o o <= ü ö £' a o ? " s-5
°* <" £
tt 3'5 uj Er o-
I
- a> b
5 E ai
a i
<
2 o Q .
a.
5 o
•/t
ra c o u
327

European Commission
Ministry of Agriculture
National Statistical Institute
Researchers
Users
Regions
Accountancy Centers
Farms Associations
Farms
INEA
Reglemantations Data
/ Periodic reports
Financina data \ / & analises requests \ / Data
/ Periodic reports
data requests
data reauests \ methodological suggestions
'
Data
/ Elaborations SGM
Data
yr Elaborations
data & analises \ ^ s^ requests 1 Data
Data ^ ^ " ^
RICA ITALIA
^^-^^ Elaborations
^ Software Farm returns ^ ^ ^ ^ Elaborations
data S analises J 1 Regional data banks requests ^S \ .
Data yS
Instructions request
/ Data /
Instructions request
L
y ^ Software Data
N. Farm returns
Data / \ Farm returns
\ Farm management aid
software /
co-ordination
\ Accountancy
National data bank balance
European Commission
Ministry of Agriculture
National Statistical Institute
Researchers
Users
Regions
Accountancy Centers
Farms Associations
Farms
INEA
Italy: Stakeholders diagram
328

Annex 3 Curricula vitae participants PACIOLI 3
RICA
Bernard Brookes 1983 - Administrator, European Commission, Brussels. Unit: Analysis of the
situation of agricultural holdings 1978 - 1983 Agricultural economist. Dept. of Agriculture for Northern Ireland.
Unit: Economics and Statistics 1977 - 1978 Horticultural assistant (advisory service). Ministry of Agriculture, Eng
land 1975 - 1977 Practical farming experience
1975 Graduated f rom Reading university, England (Agricultural science)
Luis Florez-Robles Business economist working as administrator/analyst for the European Commis-sion-RICA Europe. Graduated at the Polytechnic University of Madrid. Started his career as lecturer of agro-economics at the University of Leon, where he became head of academic affairs of the School of Technical Agricultural Engineering. Moved to the Polytechnic University of Madrid t o do research and teaching work on several topics of agribusiness economics and microeconomics. Also worked as general manager of the Spanish National Association of the Brown Swiss Cattle Producers and as a private consultant before joining the European Commission. His main areas of work are economic analysis, costs of production for crops, forecasts of the farm income and European projects for producing, gathering and disseminating agro-economic information.
Belgium
Nicole Taragola Current function: researcher in the Agricultural Economics Research Institute (LEI-IEA), Brussels. She is responsible for the Belgian FADN of horticulture holdings; sample plan, coordination of the collection and analysis of FADN data. She makes the calculation of the Standard Gross Margins and is also busy wi th micro-economic research in horticulture.
Dirk van Lierde Current function: head of the Department Micro Economy of LEI-IEA, Brussels. He is responsible for the Belgian FADN since 1987. He carries out micro economic research in horticulture and agriculture. He is also responsible for developing software packages for the IEA accountancy data network.
Germany
Hans-Hennig Sundermeier graduated 1976 in Agricultural Economics at the Christian-Albrecht-University, Kiel (Germany). Research and teaching at the Departments of Agricultural Eco-
329

nomicsatthe University in Kiel and at thee Michigan State University, East Lansing (USA), concentrated on farm management, management information systems, mathematical programming of agriculture and since 1988 on agricultural bookkeeping and accounting. The work in agribusiness started 1987 as head of data processing in a major private accounting and tax consulting organization in Northern Germany. Since 1991 he is responsible for the information management of the Agricultural Bookkeeping Association Schleswig-Holstein and Hamburg in Kiel.
Finland
Jouko Siren, member of the Management Board: Long term experience in agricultural economic research especially in farm management and accountancy. 15 years experience in agricultural policy planning and administration in the ministry of agriculture and forestry and national board of agriculture. Vice chairman of the agricultural research consultative national committee. Head of the Agricultural Economics Research Institute since 1992. MTTL as the 'section Finland' is tuning the Finish FADN to the RICA network.
Simo Tiainen, researcher in the Agricultural Economics Research Institute (MTTL). Mr. Tiainen is a specialist in agricultural statistics and especially FADN-network. He has worked for some months in DG VI in Brussels w i th FADN in European Union. At the moment he is working wi th problems concerning EU farm typology on Finnish bookkeeping farms and Standard Gross Margins (SGM) for different products.
Markku Hi man en, works at the Ministry of Agriculture and Forestry, at the department of Agriculture. He is chief inspector at the Research and Extension Unit. He is dealing w i th agricultural extension work since 1988.
France
Bernard Del'Homme Lecturer in Economy and Management at the ENITA de Bordeaux (a national School of Engineers in Agriculture). Specialist in farm management. He works on expert system for management diagnosis and on Information System in Agriculture, particularly around references. He participates at the ENITA to the software activities. (ENITA produces and sells several softwares in accounting and management in Agriculture).
Jerome Steffe Assistant-lecturer in Management and Computerizing eat the Enita de Bordeaux. Specialist in Information System in Agriculture. He participates at the ENITA to the software activities. At the present time, he works on a new definit ion of the management Information System of the farm, in order t o develop a new management software.
330

I taly
Guido Bonati graduated in Agricultural Sciences (Piacenza Catholic University). MBA degree at Boston university. Senior researcher at INEA. Responsible for information technologies at INEA. Main research activities in: - information technologies for agriculture; - adoption of IT by farmers; - uti l ization of IT for extension services; - development of DSS for agriculture.
Carla Abitabile graduated in Agricultural Sciences (Naples University). Senior researcher at INEA. Responsible for RICA/FADN in Italy. Main research activities in: - statistical uti l ization of RICA data; - CNR-RAISA project on agriculture of Italian disadvantaged areas; - agricultural data bases; - biological agriculture.
Filippo Arfini is researcher at the University of Parma. He has developed an application of Positive Quadratic Programming to RICA data. At present he is working on an implementation of this software in order to take into account all 20,000 Italian RICA farms.
The Netherlands
George Beers Management scientist, expertise in ISD-methodology, experience in development of farm information systems, development of agricultural information models, manager/senior scientist in research programme on fundamentals of information modelling, project leader of innovation of computer system for Dutch Farm Accountancy Data Network.
Connie Graumans works wi th the ATC. This organization develops and maintains information models for Dutch agriculture. The aim of the Agro Telematics Centre (ATC) is to optimize the use of informatics in agriculture. It is a non-profit organization, f i nanced by the government and the farmers organizations. The ATC has been active in international projects before.
Krijn Poppe Business economist wi th many years experience in research to support the agricultural policy making in the Netherlands. Dutch representative in the RICA committee. Expertise in accountancy and information modelling in agricultural bookkeeping. Project leader of projects to implement mineral bookkeeping in Dutch agriculture. Intensively involved in the management and innovation of the Dutch FADN.
331

Carlien Pruis is the organizer of research events at LEI-DLO. She supports the project leader in organizing the PACIOLI workshops.
Mare Schakenraad Marc graduated at Wageningen Agricultural University. He worked as a researcher at the Dutch Agricultural Economic Research Institute (LEI-DLO). At present he is working at the Ministry of Agriculture, Nature Management and Fisheries (MvLNV). He is involved in social and economic policy making, including the concern for an adequate infrastructure for statistics.
New Zealand
Ian Kirton Project Manager, lASC-Agriculture, developing an International Accounting Standard for agriculture. Senior Lecturer, Primary Industry Accounting, Massey University Current work: 1. Financial Analysis Tui Dairy Farmer of the Year
2. The intersection of financial and physical information in farming systems
3. The interface between accountant and farmer client.
Spain
Inmaculada Astorquiza Research experience in Spain and United States on natural resources and environmental economics related wi th agricultural production. Publications on agricultural production, supply and policy, as well as resource and environmental economics. Familiar w i th data sources in the agricultural context. At the UPNA there are research groups working on decision making, accountancy, informat ion systems, policy etc, as well as on environmental issues.
Miguel Merino-Pacheco Agricultural economist and researcher w i th extensive work done on different aspects of Spanish agriculture integration in the EU, regional economics, set aside programs, marketing of agricultural products). Based in Germany, he makes long and frequents research stays in Spain. His work has been carried out, up t o the present, through the Universities of Madrid, Hohenheim (Stuttgart, GFR) and Humboldt (Berlin (GFR), w i th private and public funding.
Carlos San Juan has a Ph.D. in Economics f rom the Complutense University of Madrid, and has a postgraduate degree in 'Time Series Analysis and Macroeconomic Dynamic Models' f rom the Central Bank of Spain. He is presently a Professor at the Carlos III University of Madrid in the Economics Department, teaching Applied Economics (Spanish Economics, Environmental Economics and E.U. Economics). His research is in the field of Agricultural and Environmental Economics and the Labour Market, and has published several books and articles.
332

Sweden
Bo Öhlmér Professor in farm management, Swedish University of Agricultural Sciences. He has carried out research in farmers' need and use of information, the managerial processes and use of information technology.
Arne Bolin and Lars-Eric Gustafson work at Statistics Sweden. Arne Bolin
is specialized in financial accounting and has experience f rom different sectors of industry. He has been in charge of the Swedish Farm Economic Survey since the administration of the survey was transferred from the National Board of Agriculture to Statistics Sweden in 1976. Bolin is responsible for the adaptation and implementation of economic methodology according to the principles of the Farm Accountancy Data Network (FADN) in the Swedish system.
Lars-Eric Gustafson is a computer scientist wi th university diploma and several years of professional experience of agricultural systems. In 1994 he worked in Eurostat w i th issues concerning development of a metadata and catalogue system for European statistics (CANDIDE). In the adaptation of the Swedish Farm Economic Survey to the principles of FADN, he is responsible for the system analysis and the programming.
Gunnar Larsson Head of the Farm Economic Surveys, Statistics Sweden (SCB). His department is producing statistics on farm economics, and the main users of these statistics are the agricultural policy makers. The department is working wi th the implementat ion of FADN in the Swedish survey.
Switzerland
Beat Meier has studied agriculture at the Swiss Federal Institute of Technology in Zürich. At present he works as an Agricultural Economist at the Swiss Federal Research Station for Agricultural Economics and Engineering, Taenikon/Switzerland (FAT). In his work he focuses on the application of the EU farm typology and the methodology of the EU FADN on Swiss data. Relation to FADN: He has applied the methodology of the EU FADN to the data of Swiss farms. This involves dealing w i th the EU Farm typology, creating the data set of the Farm Return (in a simplified form), the calculation of the essential 105 standard variables per farm and the weighed standard results. For the future development of the Swiss FADN, he is mainly involved wi th the issues farm typology, sampling and weighing.
333

United Kingdom
Nigel Williams Current function: Senior lecturer in agricultural business management. Wye College, University of London. Relation t o FADN: Chairman, UK Ministry of Agriculture Farm Business Survey Methodology Working Party. Member, UK Ministry of Agriculture Farm Business Survey Sub-committee. Actively involved in the collection and analysis of FBS/FADN data at Manchester University and London University (Wye College) f rom 1970 to 1978. Manager, Wye College FBS/FADN operation from 1977 to 1984. Author of numerous reports on FBS/FADN data. Author of several computer software packages in use at Wye College and other universities for dealing w i th current cost accounting procedures. Expertise in information science: An extensive experience of linear and other programming techniques and their data requirements for economic and behavioural modell ing. Relation t o agricultural policy makers: Carried out a number of policy evaluations for UK Ministry of Agriculture.
Alastair Bailey Current function: Research Officer in Agricultural Management and Economics. Wye College, University of London. Relation to FADN: Have extensive knowledge of building secondary data sets, using UK s national FBS and the FADN, for economic modelling purposes. Much of this work has involved the pooling of successive FBS cross sections to form Panel Data sets. This work was carried out for my PhD study and for a project funded by the EC The FADN Gross Margin Project wi th Andrew Errington and Peter Midmore (Reading and Aberystwyth). Data collection role. Have acted as a research assistant on MAFF Occasional Survey of Hardy Nursery Stock enterprise in England and Wales 1993. Expertise in information science: The above data sets have been used in conjunction to econometric techniques t o obtain production parameters f rom duality based models. In the long term it is hoped that these models will be combined wi th GIS and Meteorological data t o improve estimation performance. Relation to agricultural policy makers: No direct involvement as yet. However, most of my work does have policy implication.
Sandra Dedman Current function: Lecturer in Accountancy. Wye College, University of London. Relation to FADN: Utilizes FBS FADN derived agricultural business statistics for teaching and practising comparative statistics. Expertise in information science: A fully qualified chartered accountant trained by a top 8 UK f i rm which specializes in agriculture. As such she is well versed in the problems of extracting data on complex agricultural businesses and their analysis.
334

Relation to agricultural policy makers: Strictly f irm level business analysis.
Berkely Hill He is University of London Reader in Agricultural Economics at Wye College. The main area of his research is incomes of the agricultural industry, of farm businesses and (especially) of agricultural households. Work for FADN / RICA has involved a review of its economic indicators (Hill, B. (1991) The calculation of Economic Indicators: making use of FADN (RICA) data, Document series: The Commission) which contained a list of recommendations for RICAs future development, and a comparison of macro and micro income measures (Hill, B. and B. Brookes (1993) Farm incomes in the 1980s, Document series, The Commission). Work for Eurostat has concerned the development of methodology for its Total Income of Agricultural Households (TIAH) statistics and the interpretation of results from Member States. Income measurement has been put in context in Farm Incomes, Wealth and Agricultural Policy, Avebury (Grower Press) (First edit ion 1989, second edition 1996).
John Malcolm A graduate of Oxford and London Universities, he is the National Farmers' Union's Chief Economic Adviser. The Department is responsible for economic analysis and policy advice on all matters relating to the economic and financial wel l being of the agricultural and horticultural industries. He joined the National Farmers' Union Economics Department in 1970. He subsequently served as Head of Horticulture, the head of the Agricultural Resources Department and Head of the Crops Department. In February 1994 he returned to the Economics Department as Cief Economic Adviser. Among his spare t ime activities, he is a part-time tutor in Economics for the Open University.
Peter Muriel After graduating from Newcastle University in 1970, he joined the Economics Group in MAFF. He obtained an MSc in Economics from LSE in 1978. He has his posts in all MAFF economics divisions as well as administrative divisions dealing w i th licensing veterinary medicines and the EC agri-monetary system before taking up his current post in 1990. He currently is responsible for the conduct of the Farm Business Survey in England which provides the data for FADN. He also chairs the OECD group on cereals and oilseeds.
335

Annex 4 Addresses participants PACIOLI 3
Participants PACIOLI 3
RICA/European Commission Luis Florez Office 3.138 200, Rue de la Loi B 1049 Brussels BELGIUM Phone: +32.2-295.81.22 Fax: + 32.2-296.59.91 e-mail: 'Luis.Florez Robles'@dg6.cec.be
RICA/ European Commission Bernard Brookes Office 3.138A 200, Rue de la Loi B 1049 Brussels BELGIUM Phone: +32.2-295.90.62 Fax: + 32.2-296.59.91 e-mail: [email protected]
MTTL Dr. Jouko Siren Head of the Agricultural Economics Research Institute P.O. Box 3 SF 00411 Helsinki FINLAND Phone: + 358.0.50.44.73.00 Fax: +358.0.56.31.164 e-mail: Jouko.Siren@HKI01 .mmm.agrifin.mailnet.fi
MTTL Simo Tiainen M.Sc. Agricultural Economics P.O. Box 3 SF 00411 Helsinki FINLAND Phone: + 358.0.50.44.73.22 Fax: +358.0.56.31.164 e-mail: Simo.Tiainen@HKI01 .mmm.agrifin.mailnet.fi
336

5. Ministry of Agriculture and Forestry Markku Himanen M.Sc. Department of Agriculture Kaisaniemenkatu 4 A, 4th f loor SF 00101 Helsinki FINLAND Phone: +358.0.160.42.38 Fax: +358.0.160.24.43
6. ENITA Bernard Del'Homme Eseignant-chercheur en Economie et Gestion de l'Entreprise 1, Cours du General de Gaulle - B.P. 201 F 33175 Gradignan Cedex FRANCE Phone: +33.57.35.07.07 Fax: + 33.57.35.07.09 e-mail: [email protected]
7. ENITA Jérôme Steffe Eseignant-chercheur en Economie et Gestion de l'Entreprise 1, Cours du General de Gaulle - B.P. 201 F 33175 Gradignan Cedex FRANCE Phone: +33.57.35.07.71 Fax: + 33.57.35.07.09 e-mail: [email protected]
8. INEA, Instituto Nazionale di Economia Agraria Dr. Guido Bonati Via Barberini, 36 00187 Rome ITALY Phone: +39.6.47.44.261-2-3 Fax: +39.6.47.41.984 e-mail: [email protected]
9. INEA, Instituto Nazionale de Economia Agraria Ms. Carla Abitabile Via Barberini, 36 00187 Rome ITALY Phone: +39.6.47.44.261-2-3 Fax: +39.6.47.41.984 e-mail: [email protected]
337

10. University of Parma Filippo Arf ini Via J.F. Kennedy, 6 43100 Parma ITALY Phone: +39.521.902.414 Fax: +39.521.902.498 e-mail: [email protected]
11. Agricultural Economics Research Institute (LEI-DLO) Krijn J. Poppe M.A. Business Economist Farm Accountancy Data Network P.O. Box 29703 NL-2502 LS The Hague THE NETHERLANDS Phone: +31.70.330.8.330 Fax: +31.70.361.56.24 e-mail: [email protected]
12. Ministry of Agriculture, Nature Management and Fisheries Directorate Agriculture Ir. Marc Schakenraad P.O Box 20401 NL-2500 EK The Hague THE NETHERLANDS Phone: +31.70.379.22.37 Fax: +31.70.347.79.86
13. Agrarisch Telematica Centrum (ATC) ir Conny A.M. Graumans EDI-manager Agro Business Park 58 NL-6708 PW Wageningen THE NETHERLANDS Phone: +31.83.70.79.658 Fax: +31.83.70.21.722 e-mail: [email protected]
14. Agricultural Economics Research Institute (LEI-DLO) Dr ir George Beers Management Scientist P.O. Box 29703 NL-2502 LS The Hague THE NETHERLANDS Phone: +31.70.330.8.337/360 Fax: +31.70.361.56.24 e-mail: [email protected]
338

15. Agricultural Economics Research Institute (LEI-DLO) Ms. Carlien Pruis P.O. Box 29703 NL-2502 LS The Hague THE NETHERLANDS Phone: +31.70.330.8.338/360 Fax: +31.70.361.56.24 e-mail: [email protected]
16. Universidad del Pais Vasco Facultad de Ciencias Economicas y Empresariales Prof. Inmaculada Astorquiza Avda. Lehendakari Agirre, 83 48015 Bilbao SPAIN Phone: +34.4.447.28.00 Fax: +34.4.447.51.54 e-mail: [email protected]
17. Economist Consultant Spain Dr. Miguel Merino Pacheco Springbornstrasse 268 12487 Berlin GERMANY Phone: +49.30.636.16.57 Fax: +49.30.636.16.57
18. Universidad Carlos III de Madrid Departemento de Economia Prof. Carlos San Juan c/Madrid, 126-128 28903 Getafe, Madrid SPAIN Phone: +34.1.624.95.77 Fax: +34.1.624.98.75 e-mail: [email protected]
19. The Swedish University of Agricultural Sciences Professor Bo Öhlmér Department of Economics P.O. Box 7013 S-750 07 Uppsala SWEDEN Phone: +46.18.67.17.26 Fax: +46.18.67.35.02 e-mail: [email protected]
339

20. Statistics Sweden Environmental and Agricultural Statistics Arne Bolin Agricultural Economist S 70189 Örebro Örebro SWEDEN Phone: +46.19.17.64.66 Fax: +46.19.17.70.58 e-mail: [email protected]
21. Statistics Sweden Environmental and Agricultural Statistics Lars-Eric Gustafson System e rare S 70189 Örebro Örebro SWEDEN Phone: +46.19.17.62.99 Fax: +46.19.17.70.58 e-mail: [email protected]
22. Statistics Sweden, M/LE Gunnar Larsson S 70189 Örebro Örebro SWEDEN Phone: +46.19.17.65.06 Fax: +46.19.17.70.58 e-mail: [email protected]
23. Wye College, University of London Nigel Williams Wye Ashford Kent TN25 5AH UNITED KINGDOM Phone: +44.12.33-812.401 Fax: +44.12.33-813.498 e-mail: [email protected]
24. Wye College, University of London Alastair Baily Research Officer in Agric. Business Management and Economics Wye Ashford Kent TN25 5AH UNITED KINGDOM Phone: +44.12.33-812.401 Fax: +44.12.33-813.498 e-mail: [email protected]
340

25. Wye College, University of London Sandra Dedman Wye Ashford Kent TN25 5AH UNITED KINGDOM Phone: +44.12.33-812.401 Fax: +44.12.33-813.498 e-mail: [email protected]
26. Wye College, University of London Berkeley Hill Wye Ashford Kent TN25 5AH UNITED KINGDOM Phone: +44.12.33-812.006 Fax: +44.12.33-813.498 e-mail: [email protected]
27. National Farmers' Union John Malcolm 164 Shaftesbury Avenue London, WC2H 8HL Phone: +44.171.331.7243 Fax: +44.171.331.7313
28. MAFF Peter Muriel 3 -8Wh i teha l l Place London, SW1A 2HH Phone: +44.171.270.8629 Fax: +44.171.270.8558
29. Agricultural Economic Research Institute Nicole Taragola Manhattan Center, Office Tower, 20e verdieping Bolwerklaan 21 BE-1210 Brussels BELGIUM Phone: +32.2-206.75.84 Fax: + 32.2-206.72.02
30. Agricultural Economic Research Institute Dirk van Lierde Manhattan Center, Office Tower, 20e verdieping Bolwerklaan 21 BE-1210 Brussels BELGIUM Phone: +32.2-206.75.80 Fax: + 32.2-206.72.02
341

31. Ian Kirton 116 Hickford Road RD 13 Foxton NEW ZEALAND Phone: +64.6.363.76.37 Fax: + 64.6.363.76.37 e-mail: [email protected]
32. Agrar-Daten GMBH H.H. Sundermeier Lorentzendamm 40 24103 Kiel, GERMANY Phone: 49 431 5936 419 Fax: 49 431 5936 401
33. Swiss Research Institute for Agricultural Economics and Engineering Beat Meier CH - 8356 Taenikon, SWITZERLAND Phone: 41 52 62 32 36 Fax: 41 52 61 11 90 e-mail: [email protected]
342
Related Documents