EDITORS FILE COPY ,:~, United States ~.-~k~.2)Department of ~ I Agriculture Forest Service Pacific Northwest Research Station Research Paper PNW-RP-432 January 1991 Pacific Rim Log Trade: Determinants and Trends Donald F. Flora, Andrea L. Anderson, and Wendy J. McGinnis

Welcome message from author
This document is posted to help you gain knowledge. Please leave a comment to let me know what you think about it! Share it to your friends and learn new things together.
Transcript

EDITORS FILE COPY , : ~ , United States ~.-~k~.2) Department of
~ I Agriculture
Forest Service
Pacific Northwest Research Station
Research Paper PNW-RP-432 January 1991
Pacific Rim Log Trade: Determinants and Trends Donald F. Flora, Andrea L. Anderson, and Wendy J. McGinnis
Denney

~ ~ • , , ~ . ~ . - . ~ ~ ~ , - ~ s ~ . ~ • J . . . . ~ , ~ ~ j ~ ~ ~
Abstract Flora, Donald F.; Anderson, Andrea L.; McGinnls, Wendy J. 1991. Pacific Rim softwood log trade: determinants and trends. Res. Pap. PNW-RP-432. Portland, OR: U.S. Department of Agriculture, Forest Service, Pacific Northwest Research Station. 72 p.
Pacific Rim trade in softwood logs amounts to about $3 billion annually, of which the U.S. share is about $2 billion. Log exporting is a significant part of the forest economy in the Pacific Northwest. The 10 major Pacific Rim log-trading client and competitor countries differ widely in their roles in trade and in their policies affecting the industry.
Keywords: Markets (external), supply and demand (forest products), trade (Pacific Rim), log exports.
Summary ' Timber exports have been a regular feature of trade from western North America for 150 years. By the late 1980s, the Pacific Rim softwood log trade involved several hundred specialized ships, billions of dollars of annual transactions, and a distinctive and highly competitive industry structure.
Demand for wood products around the .Pacific Rim can be attributed to a chain of causal factors: a country's general economic health and interest rates determine homebuilding and construction activity, which draw wood products imports and manufacture. Log supplies are affected similarly by technical and economic factors.
There is tight linkage between economic changes in the United States and those in Japan: the general economies move together, within a month or two of each other. Although housing activity differs between the two countries in the short run, cyclic movements are similar. Thus demands for U.S. and Japanese wood products gen- erally move together.
During the late 1980s, the rate of increase of total Pacific Basin softwood log move- ments seems to have declined, but the trend remains upward. Average log prices have increased much faster than inflation.
Since the late 1960s, several pronounced fluctuations in economic activity in general and timber trade in particular have occurred. By the 1980s, business cycles domi- nated economic charts and largely obscured long-term market trends. This tendency is expected to continue.
Contents 1
1
1
3
4
5
5
5
5
6
,7
19
28
28
29
29
33
35
36
42
43
46
48
48
48
50
51
55
62
66
Introduction
The Report
Measurement Units
Log Grades
Prices
Data
Terminology
Part h Development of the Trade
In General
The Pacific Basin
Long-Term Timber Market Trends
Postwar Cycles in Timber Markets
Part Ih Structure of the Trade
In General
Industry Anatomy
The Export Business Process
Ocean Transport
TheOffshore Market as aSecondary Outlet
Tariffs, Quotas, and Embargoes
Other Political Factors
World-scale Economic Developments Affecting the Log Trade
Species Preferences and the Export Premium
Part IIh Determinants, Interactions, and Reaction Times in the Log Trade
In General
Log Demand
Log Supply
• Interactions Among Trade-Related Economic Elements
Reaction Times Among Log Supply and Demand Factors
Seasonality of the Log Trade
Literature Cited
I n t r o d u c t i o n
The Report
Measurement Units
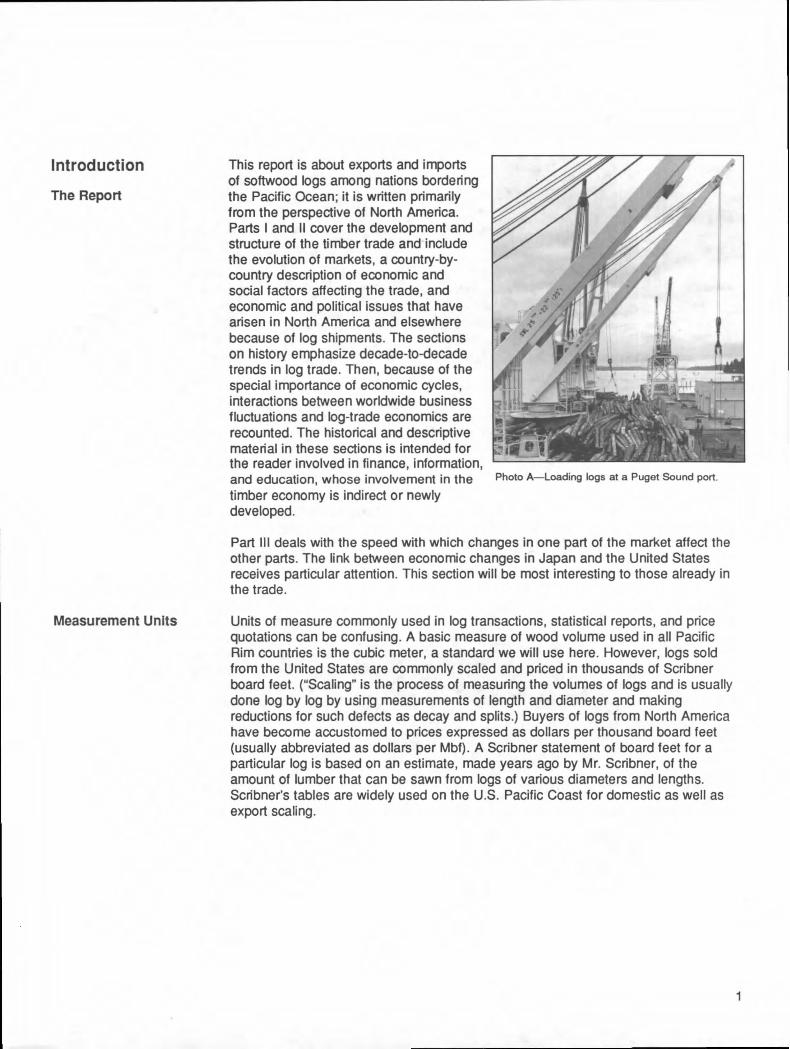
This report is about exports and imports of softwood logs among nations bordering the Pacific Ocean; it is written primarily from the perspective of North America. Parts I and II cover the development and structure of the timber trade and include the evolution of markets, a country-by- country description of economic and social factors affecting the trade, and economic and political issues that have arisen in North America and elsewhere because of log shipments. The sections on history emphasize decade-to-decade trends in log trade. Then, because of the special importance of economic cycles, interactions between worldwide business fluctuations and log-trade economics are recounted. The historical and descriptive material in these sections is intended for the reader involved in finance, information, and education, whose involvement in the timber economy is indirect or newly developed.
Photo A ~ o a d i n g logs at a Puget Sound port.
Part III deals with the speed with which changes in one part of the market affect the other parts. The link between economic changes in Japan and the United States receives particular attention. This section will be most interesting to those already in the trade.
Units of measure commonly used in log transactions, statistical reports, and price quotations can be confusing. A basic measure of wood volume used in all Pacific Rim countries is the cubic meter, a standard we will use here. However, logs sold from the United States are commonly scaled and priced in thousands of Scribner board feet. ("Scaling" is the process of measuring the volumes of logs and is usually done log by log by using measurements of length and diameter and making reductions for such defects as decay and splits.) Buyers of logs from North America have become accustomed to prices expressed as dollars per thousand board feet (usually abbreviated as dollars per Mbf). A Scribner statement of board feet for a particular log is based on an estimate, made years ago by Mr. Scribner, of the amount of lumber that can be sawn from logs of various diameters and lengths. Scribner's tables are widely used on the U.S. Pacific Coast for domestic as well as export scaling.

Photo B~Export logs rolled out for individual scaling and grading.
Photo C--Douglas-fir logs being graded and scaled. In the background is a debarking plant, providing bark-free logs for export.
Measurements in cubic meters are intended to express the total wood content of the log rather than its lumber yield. For many log users, this is a more relevant measure than Scribner scale because any estimate of lumber output requires assumptions about the thickness of saws, the degree of use of rounded portions of the log, and even the length of the log. it follows that there is not a constant relation between cubic meters and board feet for logs of all dimensions. Rather, the ratio of cubic feet to board feet ranges widely among log shipments and even among logs within a sin~lle truckload. A widely used average relation is 4.5 cubic meters (abbreviated as m" or cum) per thousand board feet (Mbf) (Darr 1984a); however, factors ranging from 3.5 to 8.0 may be appropriate to log sizes in particular shipments. We used factors from 4.0 to 6.0 in this report for various segments of the trade; these are indicated in the appropriate places.
Larger volumes of timber are expressed in millions and billions of board feet and thousands and millions of cubic meters. Thus, a highway truckload of logs might carry between 3.5 and 5.0 thousand board feet (Mbf), and a shipload of logs would be between 3.5 and 5.0 million board feet. Corresponding numbers for cubic meters are 16 to 22 cure on the truck and 16 to 22 thousand on the ship.
Export logs commonly are about 40 feet long. If the logs averaged, say, 20 inches in diameter, a shipload would be equivalent to a pile 30 feet high and about 1,000 feet long.
Photo D--At a port, a deck of 40-foot export logs.
Billions of board feet usually pertain to regional totals and periods of time of about a year. United States soft- wood log exports in 1988 were about 4 billion board feet; the total timber harvest in Washington and Oregon in 1988 was about 16 billion board feet. United States softwood log exports in 1987 were about 18 million cum, and the Northwest harvest was about 70 million cumo
2
Log Grades
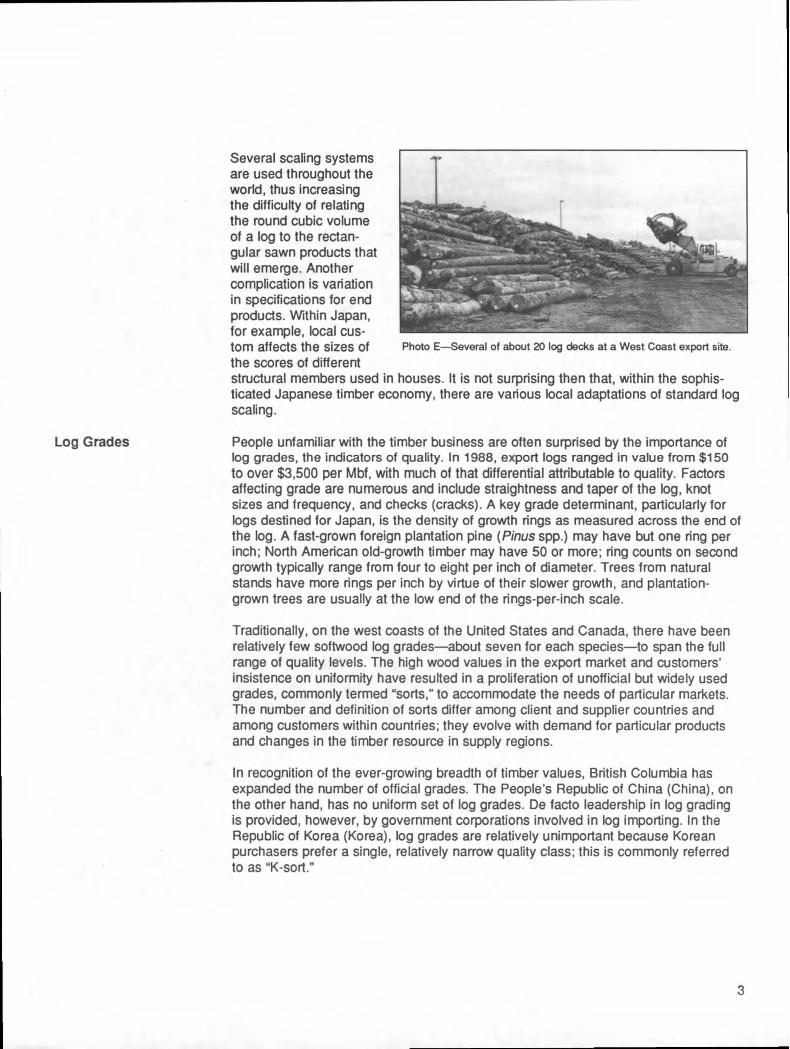
Several scaling systems are used throughout the world, thus increasing the difficulty of relating the round cubic volume of a log to the rectan- gular sawn products that will emerge. Another complication is variation in specifications for end products. Within Japan, for example, local cus- tom affects the sizes of the scores of different
T
Photo E---Several of about 20 log decks at a West Coast export site.
structural members used in houses. It is not surprising then that, within the sophis- ticated Japanese timber economy, there are various local adaptations of standard log scaling.
People unfamiliar with the timber business are often surprised by the importance of log grades, the indicators of quality. In 1988, export logs ranged in value from $150 tO over $3,500 per Mbf, with much of that differential attributable to quality. Factors affecting grade are numerous and include straightness and taper of the log, knot sizes and frequency, and checks (cracks). A key grade determinant, particularly for logs destined for Japan, is the density of growth rings as measured across the end of the log. A fast-grown foreign plantation pine (Pinus spp.) may have but one ring per inch; North American old-growth timber may have 50 or more; ring counts on second growth typically range from four to eight per inch of diameter. Trees from natural stands have more rings per inch by virtue of their slower growth, and plantation- grown trees are usually at the low end of the rings-per-inch scale.
Traditionally, on the west coasts of the United States and Canada, there have been relatively few softwood log grades--about seven for each species--to span the full range of quality levels. The high wood values in the export market and customers' insistence on uniformity have resulted in a proliferation of unofficial but widely used grades, commonly termed "sorts," to accommodate the needs of particular markets. The number and definition of sorts differ among client and supplier countries and among customers within countries; they evolve with demand for particular products and changes in the timber resource in supply regions.
In recognition of the ever-growing breadth of timber values, British Columbia has expanded the number of official grades. The People's Republic of China (China), on the other hand, has no uniform set of log grades. De facto leadership in log grading is provided, however, by government corporations involved in log importing. In the Republic of Korea (Korea), log grades are relatively unimportant because Korean purchasers prefer a single, relatively narrow quality class; this is commonly referred to as "K-sort."
3
Prlces
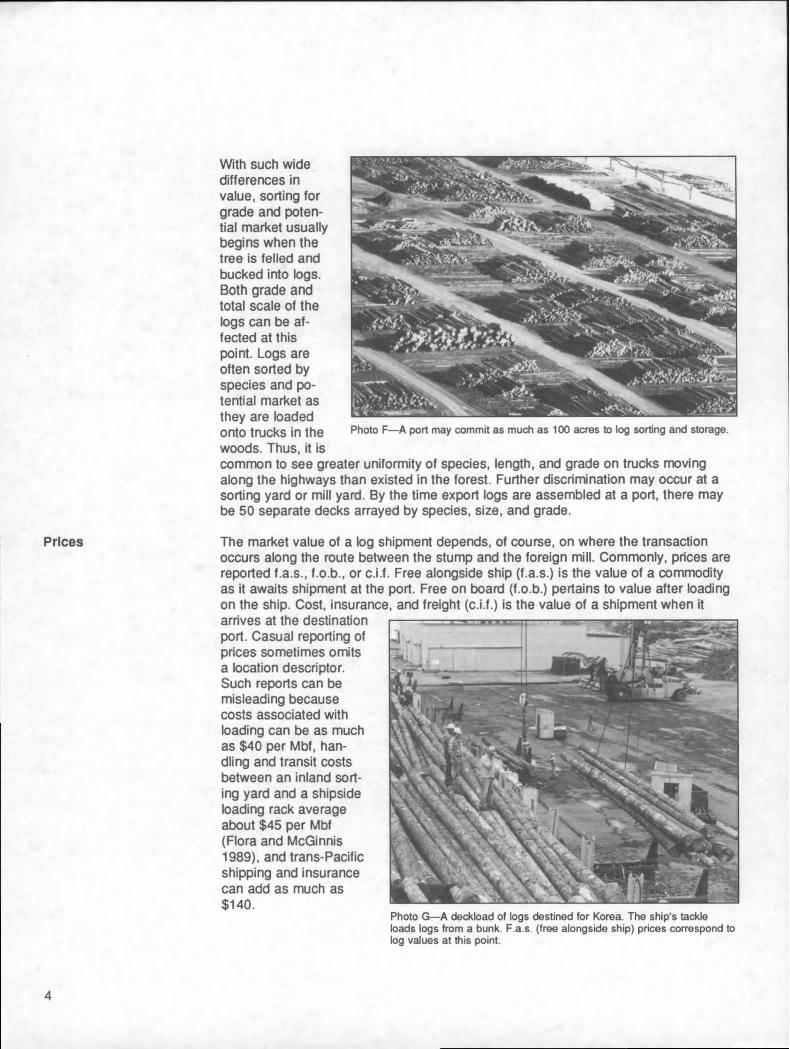
With such wide differences in value, sorting for grade and poten- tial market usually begins when the tree is felled and bucked into logs. Both grade and total scale of the logs can be af- fected at this point. Logs are often sorted by species and po- tential market as they are loaded onto trucks in the woods. Thus, it is
Photo F--A port may commit as much as 100 acres to log sorting and storage.
common to see greater uniformity of species, length, and grade on trucks moving along the highways than existed in the forest. Further discrimination may occur at a sorting yard or mill yard. By the time export logs are assembled at a port, there may be 50 separate decks arrayed by species, size, and grade.
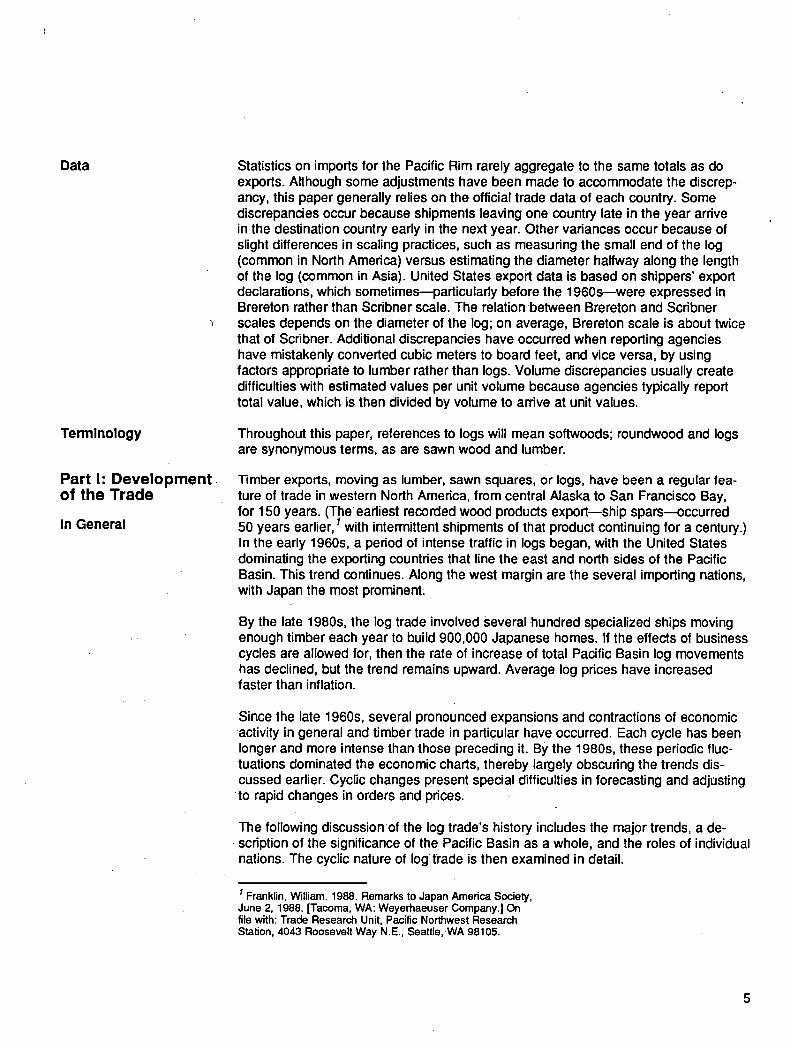
The market value of a log shipment depends, of course, on where the transaction occurs along the roJute between the stump and the foreign mill. Commonly, prices are reported f.a.s., f.o.b., or c.i.f. Free alongside ship (f.a.s.) is the value of a commodity as it awaits shipment at the port. Free on board (f.o.b.) pertains to value after loading on the ship. Cost, insurance, and freight (c.i.f.) is the value of a shipment when it arrives at the destination port. Casual reporting of prices sometimes omits a location descriptor. Such reports can be misleading because costs associated with loading can be as much as $40 per Mbf, han- dling and transit costs between an inland sort- ing yard and a shipside loading rack average about $45 per Mbf (Flora and McGinnis 1989), and trans-Pacific shipping and insurance can add as much as $140.
Photo G--A deckload of logs destined for Korea, The ship's tackle loads logs from a bunk. F.a.s. (free alongside ship) prices correspond to log values at this point.
4
Data
Terminology
Part I: Development of the Trade
In General
Statistics on imports for the Pacific Rim rarely aggregate to the same totals as do exports. Although some adjustments have been made to accommodate the discrep- ancy, this paper generally relies on the official trade data of each country. Some discrepancies occur because shipments leaving one country late in the year arrive in the destination country early in the next year. Other variances occur because of slight differences in scaling practices, such as measuring the small end of the log (common in North America) versus estimating the diameter halfway along the length of the log (common in Asia). United States expoi't data is based on shippers' export declarations, which sometimes--particularly before the 1960s--were expressed in Brereton rather than Scribner scale. The relation between Brereton and Scribner scales depends on the diameter of the log; on average, Brereton scale is about twice that of Scribner. Additional discrepancies have occurred when reporting agencies have mistakenly converted cubic meters to board feet, and vice versa, by using factors appropriate to lumber rather than logs. Volume discrepancies usually create difficulties with estimated values per unit volume because agencies typically report total value, which is then divided by volume to arrive at unit values.
Throughout this paper, references to logs will mean softwoods; roundwood and logs are synonymous terms, as are sawn wood and lumber.
Timber exports, moving as lumber, sawn squares, or logs, have been a regular fea- ture of trade in western North America, from central Alaska to San Francisco Bay, for 150 years. (The earliest recorded wood products export--ship spars--occurred 50 years earlier, 7 with intermittent shipments of that product continuing for a century.) In the early 1960s, 'a period of intense traffic in logs began, with the United States dominating the exporting countries that line the east and north sides of the Pacific Basin. This trend continues. Along the west margin are the several importing nations, with Japan the most prominent:
By the late 1980s, the log trade involved Several hundred specialized ships moving enough timber each year to build 900,000 Japanese homes. If the effects of business cycles are allowed for, then the rate of increase of total Pacific Basin log movements has declined, but the trend remains upward. Average log prices have increased faster than inflation.
Since the late 1960s, several pronounced expansions and contractions of economic activity in general and timber trade in particular have occurred. Each cycle has been longer and more intense than those preceding it. By the 1980s, these periodic fluc- tuations dominated the economic charts, thereby largely obscuring the trends dis- cussed earlier. Cyclic changes present special difficulties in forecasting and adjusting
to rapid changes in orders and pdces.
The following discussionof the log trade's history includes the major trends, a de- scription of the significance of the Pacific Basin as awhole, and the roles of individual nations. The cyclic nature of Iogtrade is then examined in detail.
t Franklin, William. 1988. Remarks to Japan America Society, Juno 2, 1988. [Tacoma, WA: Weyerhaeuser Company.] On file with: Trade Research Unit, Pacific Northwest Research Station, 4043 Roosevelt Way N.E., Seattle,-WA 98105.
The Pacific Basin
o _=
o .0 c 0
. ~
' : ' : ' I = I = I J I = I I I = I = I
67 69 7.1 73 75 77 79 81 83 85 87
Year
, / f
1
0 ' : '
63 65
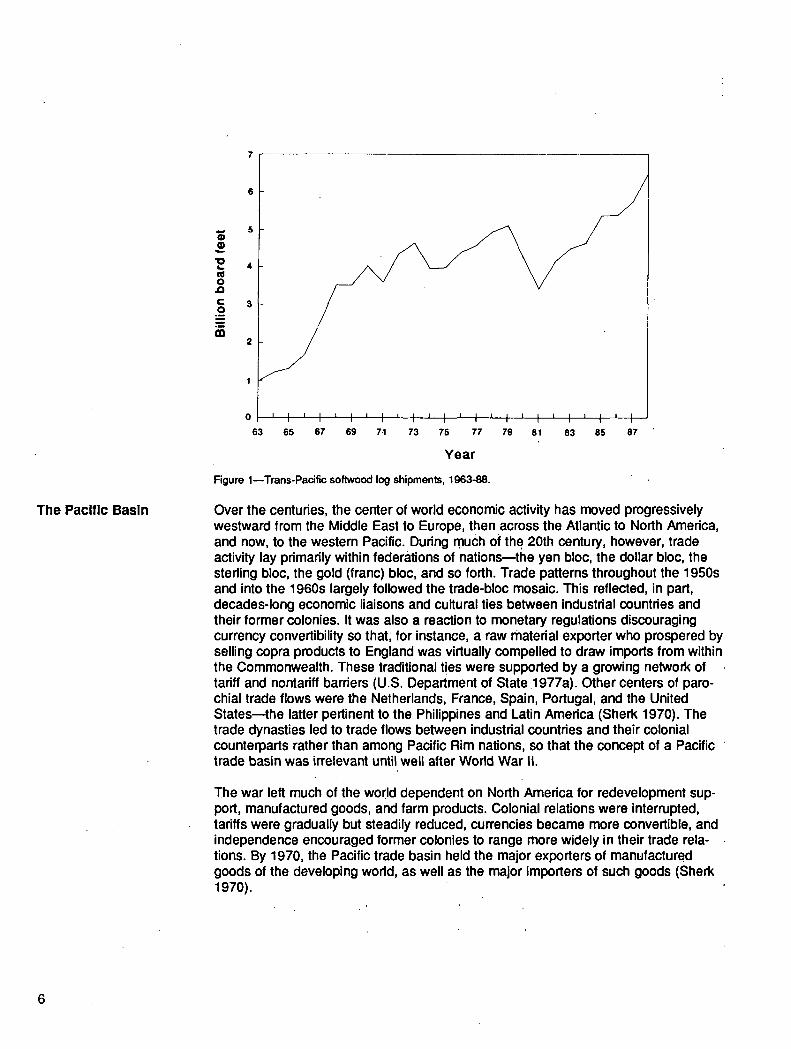
Figure 1--Trans-Pacific softwood log shipments, 1963-88.
Over the centuries, the center of world economic activity has moved progressively westward from the Middle East to Europe, then across the Atlantic to North America, and now, to the western Pacific. During much of the 20th century, however, trade activity lay primarily within federations of nations--the yen bloc, the dollar bloc, the sterling bloc, the gold (franc) bloc, and so forth. Trade patterns throughout the 1950s and into the 1960s largely followed the trade-bloc mosaic. This reflected, in part, decades-long economic liaisons and cultural ties between industrial countries and their former colonies. It was also a reaction to monetary regulations discouraging currency convertibility so that; for instance, a raw material exporter who prospered by selling copra products to England was virtually compelled to draw imports from within the Commonwealth. These traditional ties were supported by a growing network of tariff and nontariff barriers (U.So Department of State 1977a). Other centers of paro- chial trade flows were the Netherlands, France, Spain, Portugal, and the United States--the latter pertinent to the Philippines and Latin America (Sherk 1970). The trade dynasties led to trade flows between industrial countries and their colonial counterparts rather than among Pacific Rim nations, so that the concept of a Pacific trade basin was irrelevant until well after World War II.
The war left much of the world dependent on North America for redevelopment sup- port, manufactured goods, and farm products. Colonial relations were interrupted, tariffs were gradually but steadily reduced, currencies became more convertible, and independence encouraged former colonies to range more widely in their trade rela- tions. By 1970, the Pacific trade basin held the major exporters of manufactured goods of the developing world, as well as the major importers of such goods (Sherk 1970).
6
Long-Term Timber Market Trends
By 1985, Asia accounted for 25 percent of U.S. exports and one-third of U.S. imports from outside North America. Almost two-thirds of solid-wood product exports were going to Pacific Rim nations. Of total world trade in logs and lumber, the Pacific Basin accounted for about 50 percent of imports and about 57 percent of exports. Softwood 10g shipments from all Pacific Rim sources are shown in-figure 1.
By 2000, eastern Asia's economic output is expected to equal that of North America (United Kingdom-Japan 2000 Group 1988). That level of total prosperity will certainly make the Pacific Rim thedominant offshore market for North American wood prod- ucts. But key Pacific Rim countries are responding quite differently to global economic forces of the short and long run. Markets trends therefore will be discussed sepa- rately for each country.
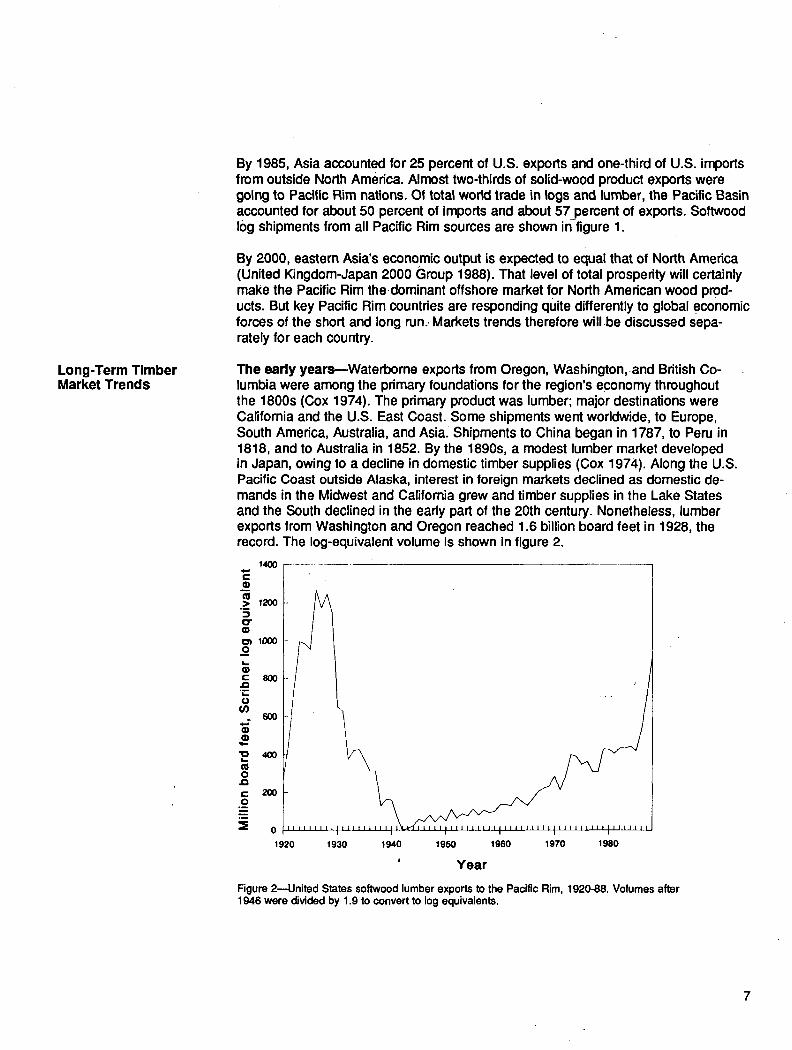
The early years--Waterborne exports from Oregon, Washington, and British Co- lumbia were among the primary foundations for the region's economy throughout the 1800s (Cox 1974). The primary product was lumber; major destinations were California and the U.S. EastCoast. Some shipments went worldwide, to Europe, South America, Australia, and Asia~ Shipments to China began in 1787, to Peru in 1818, and to Australia in 1852. By the 1890s, a modest lumber market developed in Japan, owing to a decline in domestic timber supplies (Cox 1974). Along the U.S. Pacific Coast outside Alaska, interest in foreign markets declined as domestic de- mands in the Midwest and California grew and timber supplies in the Lake States and the South declined in the early part of the 20th century. Nonetheless, lumber exports from Washington and Oregon reached 1.6 billion board feet in 1928, the record. The log-equivalent volume is shown in figure 2.
o"
c
o
o
c .fl
o
1920 1930 1940 1950 1960 1970 1980
' Year
Figure 2--United States softwood lumber exports to the Pacific Rim, 1920-88. Volumes after 1946 were divided by 1.9 to convert to log equivalents.
1400

5O0O
~) ¢1 O 4OOO U)
r -
JO
¢.) 3(X)O (n 4)
~2ooo o JO c o ~- lOOO =E
0000 1920 1930 1 9 4 0 1950 1960 1 9 7 0 . 1980
Year
Figure 3---United States softwood log exports to all destinations, 1920-88. Volumes before 1941 were divided by 1.8 to convert from Brereton to Scribner.
United States softwood log exports became significant after World War I (fig. 3), and in 1924, the Japanese received 108 million board feet (Elchibegoff 1949). It is likely that the early trade was measured in Brereton scale, in which case the 1924 volume was about 50 million board feet Scribner. The log trade rose to about 340 million board feet (160 million Scribner) in 1928, then declined during the depression years, halted in 1941 because of World War II, and resumed in 1952. Volumes remained below 100 million board feet per year through 1960 (Stanford Research Institute 1974).
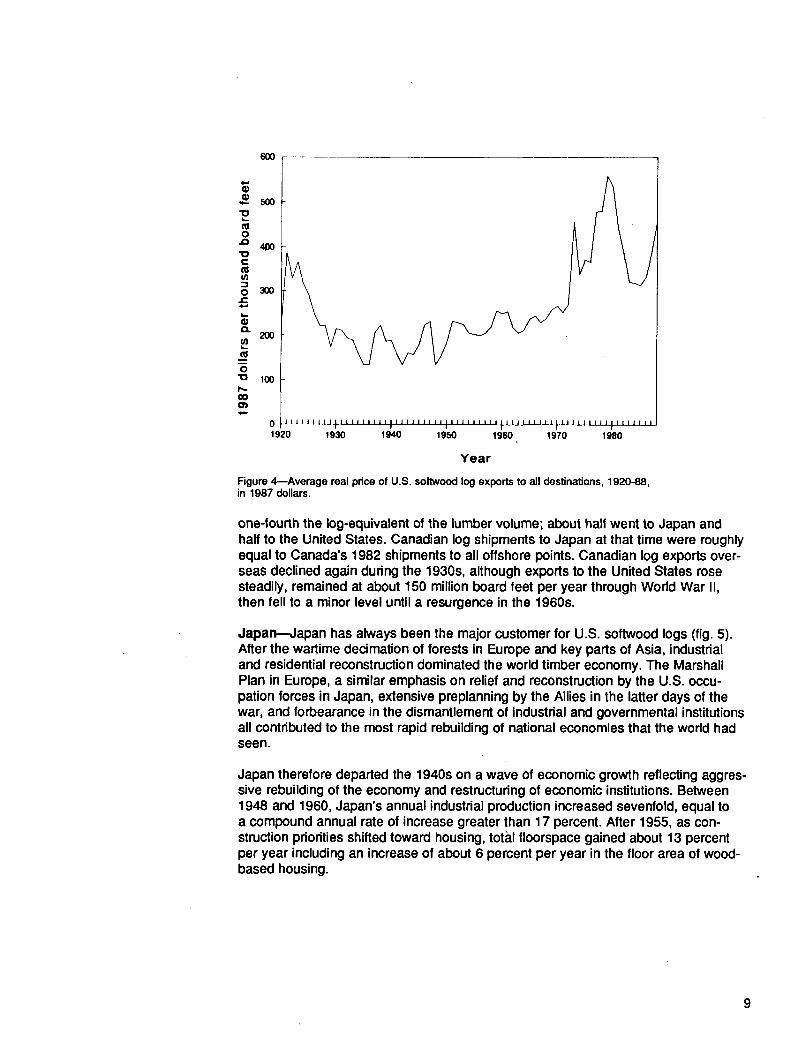
Prices of U.S. softwood export logs, adjusted for inflation, were at about the same level in 1987 as they had been in 1921 (fig. 4); about $400 per Mbf in 1987 dollars. During the interim, prices fell in the 1920s, fluctuated strongly but followed a flat trajectory during the Depression and World War II, rose gradually during the 1950s and 1960s, and soared during the 1970s. By 1979, prices were twice the 1921 level but plunged by almost half over the next 4 years. Recovering to about $400 per Mbf by 1987, they continued to climb in 1988 and 1989; by mid-1989 they were over $460 per Mbf (still in 1987 dollars).
Like the United States, Canada experienced a rush of timber exports in the 1920s. Substantial volumes of timber, averaging 280 million board feet per year during 1921-31, moved south into the United States, mostly to the Atlantic Coast. A like amount went offshore, mostly to Australia, Japan, and China (Elchibegoff 1949). Softwood log exports to all destinations were high during the same period, at about
8
(1)
¢I o f~
'ID e- ra oo
o m-
¢,1
o
50O
4IX)
3OO
200
100
o . . . . . . . . I . . . . . . . . . I . . . . . . . . . ~ ' " ' " . . . . . . . . , ' . . . . I . . . . . . . . I ' ' ' ' ' " 1920 1930 1940 1950 1960 1970 1980
Year
Figure 4--Average real price of U.S. sol twood log exports to all destinations, 1920-88, in 1987 dollars.
one-tourth the log-equivalent of the lumber volume; about halt went to Japan and half to the United States. Canadian log shipments to Japan at that time were roughly equal to Canada's 1982 shipments to all offshore points. Canadian log exports over- seas declined again during the 1930s, although exports to the United States rose steadily, remained at about 150 million board feet per year through World War II, then fell to a minor level until a resurgence in the 1960s.
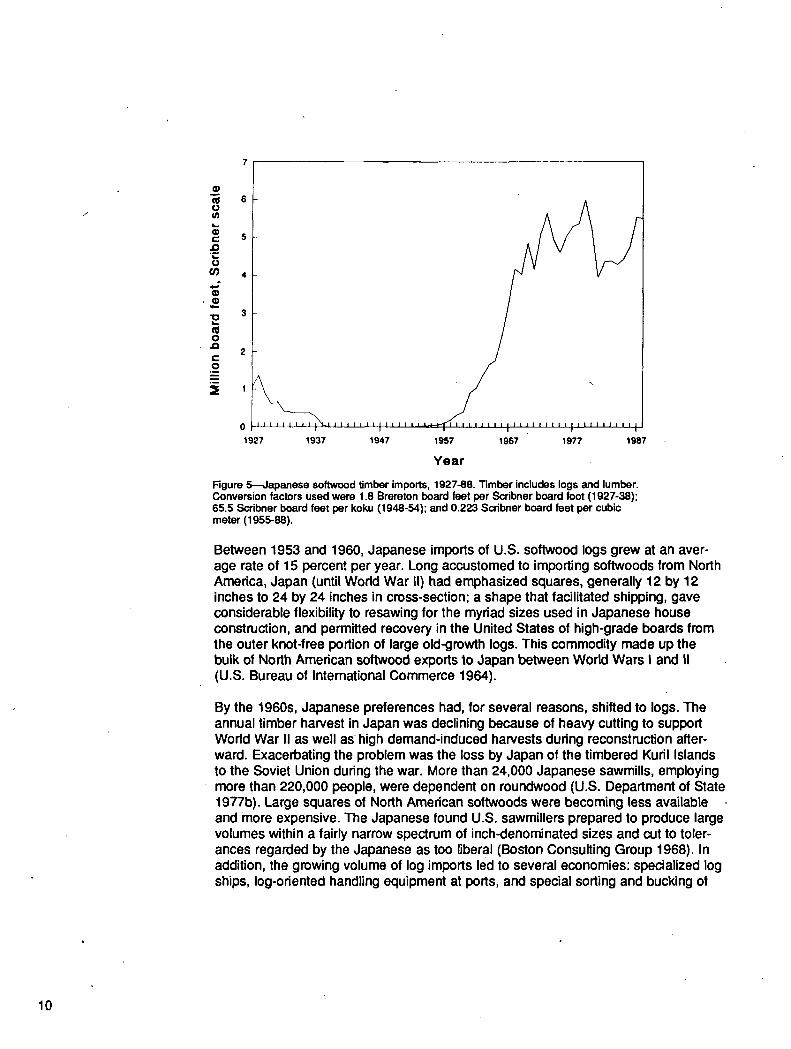
Japan--Japan has always been the major customer for U.S. softwood logs (fig. 5). After the wartime decimation of forests in Europe and key parts of Asia, industrial and residential reconstruction dominated the world timber economy. The Marshall Plan in Europe, a similar emphasis on relief and reconstruction by the U.S. occu- pation forces in Japan, extensive preplanning by the Allies in the latter days of the war, and forbearance in the dismantlement of industrial and governmental institutions all contributed to the most rapid rebuilding of national economies that the world had seen.
Japan therefore departed the 1940s on a wave of economic growth reflecting aggres- sive rebuilding of the economy and restructuring of economic institutions. Between 1948 and 1960, Japan's annual industrial production increased sevenfold, equal to a compound annual rate of increase greater than 17 percent. After 1955, as con- struction priorities shifted toward housing, total floorspace gained about 13 percent per year including an increase of about 6 percent per year in the floor area of wood- based housing.
0
=- JD . w
o O0 4 - f
¢D
o J3 c- o
2
' \ \ 1927 1937
/
I I I I I I I I I I I I I I I I I I I I I I I I I
1947 1957 1967 1977 1987
Year
Figure 5---Japanese softwood timber imports, 1927-88. Timber includes logs and lumber. Conversion factors used were 1.8 Brereton board feet per Scribner board foot (1927-38); 65.5 Scribner board feet per koku (1948-54); and 0,223 Scribner board feet per cubic meter (1955-88).
Between 1953 and 1960, Japanese imports of U.S. softwood logs grew at an aver- age rate of 15 percent per year. Long accustomed to importing softwoods from North America, Japan (until World War II) had emphasized squares, generally 12 by 12 inches to 24 by 24 inches in cross-section; a shape that facilitated shipping, gave considerable flexibility to resawing for the myriad sizes used in Japanese house construction, and permitted recovery in the United States of high-grade boards from the outer knot-free portion of large old-growth logs. This commodity made up the bulk of North American softwood exports to Japan between World Wars I and II (U.S. Bureau of International Commerce 1964).
By the 1960s, Japanese preferences had, for several reasons, shifted to logs. The annual timber harvest in Japan was declining because of heavy cutting to support World War II as well as high demand-induced harvests dudng reconstruction after- ward. Exacerbating the problem was the loss by Japan of the timbered Kuril Islands to the Soviet Union during the war. More than 24,000 Japanese sawmills, employing more than 220,000 people, were dependent on roundwood (U.S. Department of State 1977b). Large squares of North American softwoods were becoming less available and more expensive. The Japanese found U.S. sawmillers prepared to produce large volumes within a fairly narrow spectrum of inch-denominated sizes and cut to toler- ances regarded by the Japanese as too liberal (Boston Consulting Group 1968). In addition, the growing volume of log imports led to several economies: specialized log ships, log-oriented handling equipment at ports, and special sorting and bucking of
10
logs in the United States for the Japanese market. These developments increased the economic attractiveness of logs relative to sawn wood. In 1960, Japan°s log im- ports from the United States were 2-1/2 times those of lumber (in solid-wood equiv- alent), with lumber imports quadrupling during the decade and logs increasing tenfold.
Japanese economic growth remained strong through the 1960s. During the decade, their gross national product (GNP) and industrial production increased at an average rate of 12 percent per year. Annual softwood saw-log consumption by sawmills grew 40 percent to about 9 billion board feet; the share for domestic forests was 45 percent (Food and Agriculture Organization 1972). In 1970, half the imported softwood saw logs came from the United States, one-third from the Soviet Union, 1 percent from Canada, and 10 percent from New Zealand (Food and Agriculfure Organization 1971 ).
In October 1962, a hurricane-force windstorm moved through coastal portions of Oregon, Washington, and southern British Columbia. An estimated 17 billion board feet (about 75 million cum) of softwood timber was broken or blown down. The volume corresponded to 1-1/2 times the annual harvest in Washington and Oregon. Japanese timber importers were invited to help use the timber (Fisher 1964), and they did. In 1963, U.S. exporters sold to Japanese purchasers 6.9 billion board feet (31 million cure) of softwood logs, virtually all from Oregon and Washington. In the 1950s, the primary species was Douglas-fir (Pseudotsuga menziesfi (Mirb.) Franco) with Port-Orford-cedar (Chamaecyparis lawsoniana (A. Murr.) Pad.) secondary in volume; in 1963 and 1964, more than 85 percent of shipments were other species-- primarily hemlock ( Tsuga spp.) and true firs (Abies spp.).
Extensive plantations were established in the Pacific Northwest, beginning with a surge of activity in the late 1940s. It was widely assumed that plantation thinnings would be marketed to pulp mills; however, the Northwest pulp industry deemphasized facilities for handling round logs during the 1940s, because an economic source of raw material was found in sawmill residues. Thus, when salvage timber of all sizes could be sold overseas in the early 1960s, expectations reemerged for commercial thinnings. Soon, though, the Japanese were drawn toward larger, higher graded logs because of the distinctly higher handling costs and lower lumber recovery for small logs, and because of Japanese preference for knot-free, close-grained, appearance- grade lumber.
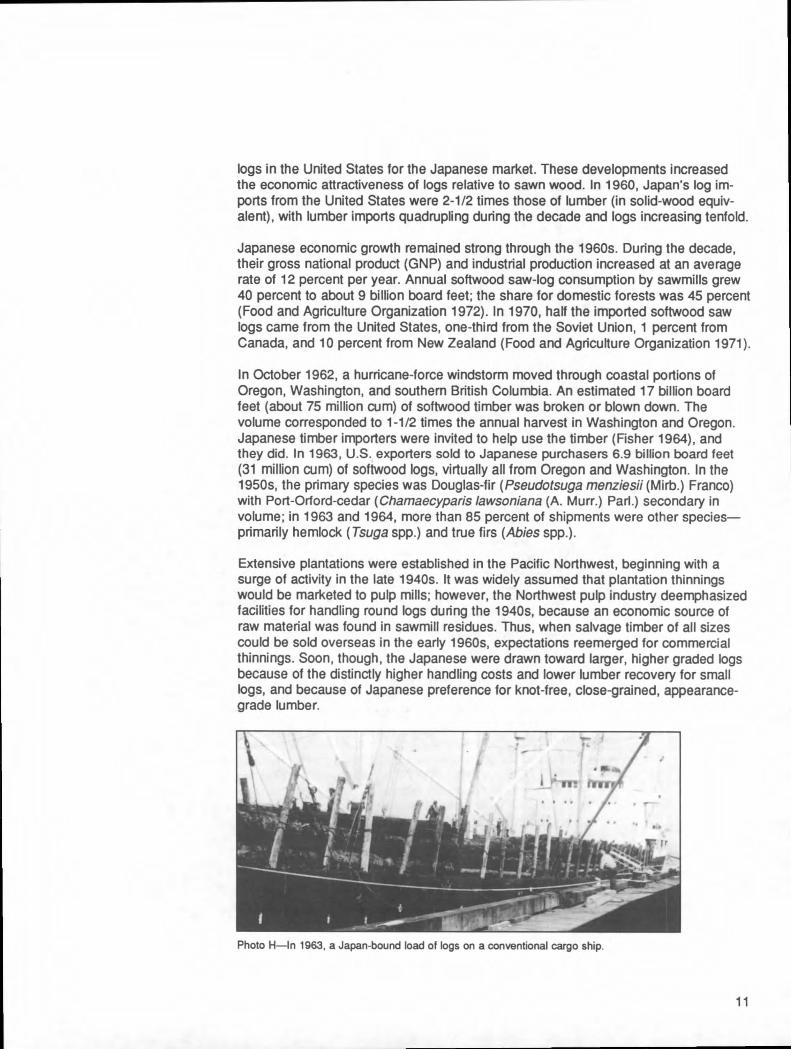
Photo H--In 1963, a Japan-bound load of logs on a conventional cargo ship.
11
G)
, oo
¢. , .
o 3 0 0 0 ¢/)
q)
~2ooo ci! o .o c .2 1 ~
0 t I ' I = I ' I = I "' I ' I = I ' I = I ' I ' 63 65 67 69 71 73 75 77 79 81 83 85 87
Year i
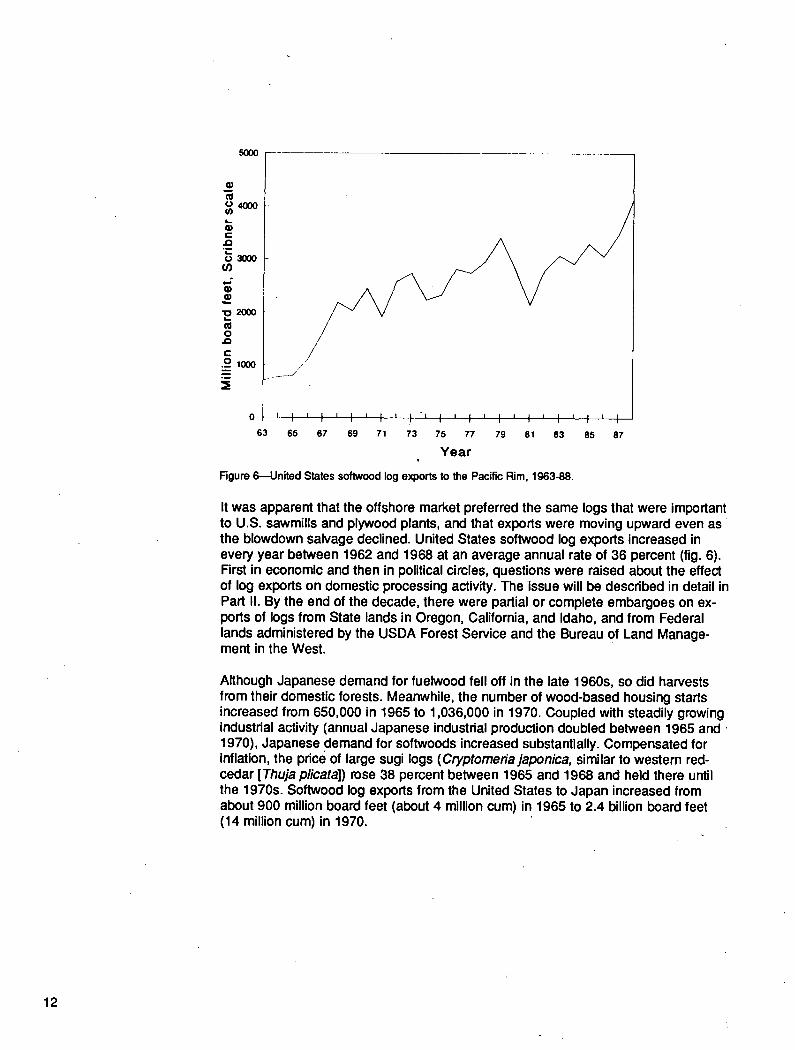
Figure ~---Uni~d States softwood log exports to the Pacific Rim, 1963-88.
It was apparent that the offshore market preferred the same logs that were important to U.S. sawmills and plywood plants, and that exports were moving upward even as the blowdown salvage declined. United States softwood log exports increased in every year between 1962 and 1968 at an average annual rate of 36 percent (fig. 6). First in economic and then in political circles, questions were raised about the effect of log exports on domestic processing activity. The issue will be described in detail in Part II. By the end of the decade, there were partial or complete embargoes on ex- ports of logs from State lands in Oregon, California, and Idaho, and from Federal lands administered by the USDA Forest Service and the Bureau of Land Manage- ment in the West.
Although Japanese demand for fuelwood fell off in the late 1960s, so did harvests from their domestic forests. Meanwhile, the number of wood-based housing starts increased from 650,000 in 1965 to 1,036,000 in 1970. Coupled with steadily growing industrial activity (annual Japanese industrial production doubled between 1965 and 1970), Japanese demand for softwoods increased substantially. Compensated for inflation, the price of larg e sugi logs (Cryptomeriajaponica, similar to western red- cedar [Thuja plicata]) rose 38 percent between 1965 and 1968 and held there until the 1970s. Softwood log exports from the United States to Japan increased from about 900 million board feet (about 4 million cum) in 1965 to 2.4 billion board feet (14 million cum) in 1970.
12
The 1970sbrought an era of worldwide monetary communion as the industrial nations agreed to float their currencies and reduce tariffs, other Pacific Rim nations made significant entry into the softwood log market as exporters, trade flows broke away from traditional arcs among former colonial partners, the Pacific Rim emerged as an autonomous trade region, and market-based economies experienced (almost concur- rently) a series of sharp economic expansions and contractions. Although less tranquil economically than in the 1960s, Japan prospered during this decade. Economic growth, in annual percentage rates, was twice as great in Japan as in the United States. Starting from a higher level of economic development than other Pacific Rim countries, Japan remained the dominant consumer of raw materials in the western Pacific.
The 1980s brought to Japan several kinds of structural change in its timber economy. The number of sawmills, although still numerous by U.S. standards, had declined by one-third since the 1960s. Lumber production remained high, reflecting a trend toward larger sawmills with many located near tidewater to receive imported logs. Expected new timber supplies from domestic plantations did not materialize despite rising log prices, so Japan's dependence on imports remained high. Constraints on hardwood log exports from Southeast Asia crippled Japan's plywood industry and increased interest in softwood logs from North America. That interest increased with the 1985-86 rise in the value of the yen compared to the U.S. dollar (discussed in detail later). Rising Japanese labor costs and the growing capacity of North American mills to produce lumber meeting Japanese requirements meanwhile led to sharp increases in lumber imports, which offset the decrease in logs to some extent.
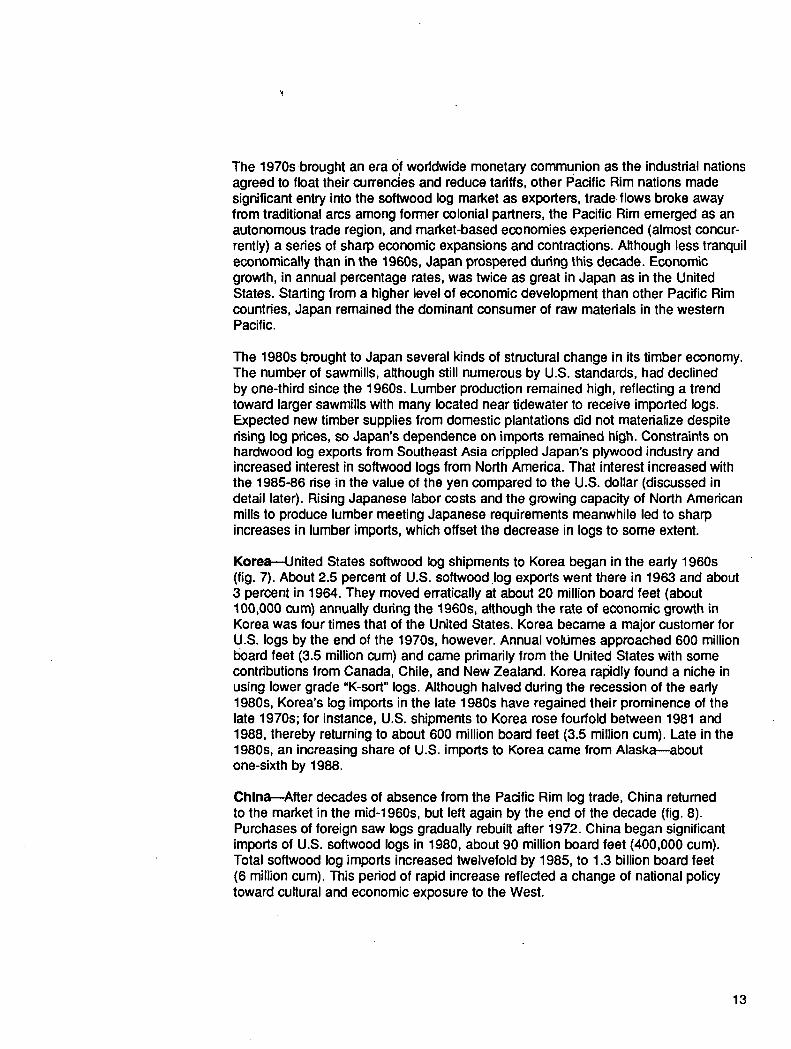
KoreamUnited States softwood log shipments to Korea began in the early 1960s (fig. 7). About 2.5 percent of U.S. softwood log exports went there in 1963 and about 3 percent in 1964. They moved erratically at about 20 million board feet (about 100,000 cure) annually during the 1960s, although the rate of economic growth in Korea was four times that of the United States. Korea became a major customer for U.S. logs by the end of the 1970s, however. Annual volumes approached 600 million I~ard feet (3.5 million cum) and came primarily from the United States with some contributions from Canada, Chile, and New Zealand. Korea rapidly found a niche in using lower grade "K-sort" logs. Although halved during the recession of the early 1980s, Korea's log imports in the late 1980s have regained their prominence of the late 1970s; for instance, U.S. shipments to Korea rose fourfold between 1981 and 1988, thereby returning to about 600 million board feet (3.5 million cum). Late in the 1980s, an increasing share of U.S. imports to Korea came from Alaska--about one-sixth by 1988.
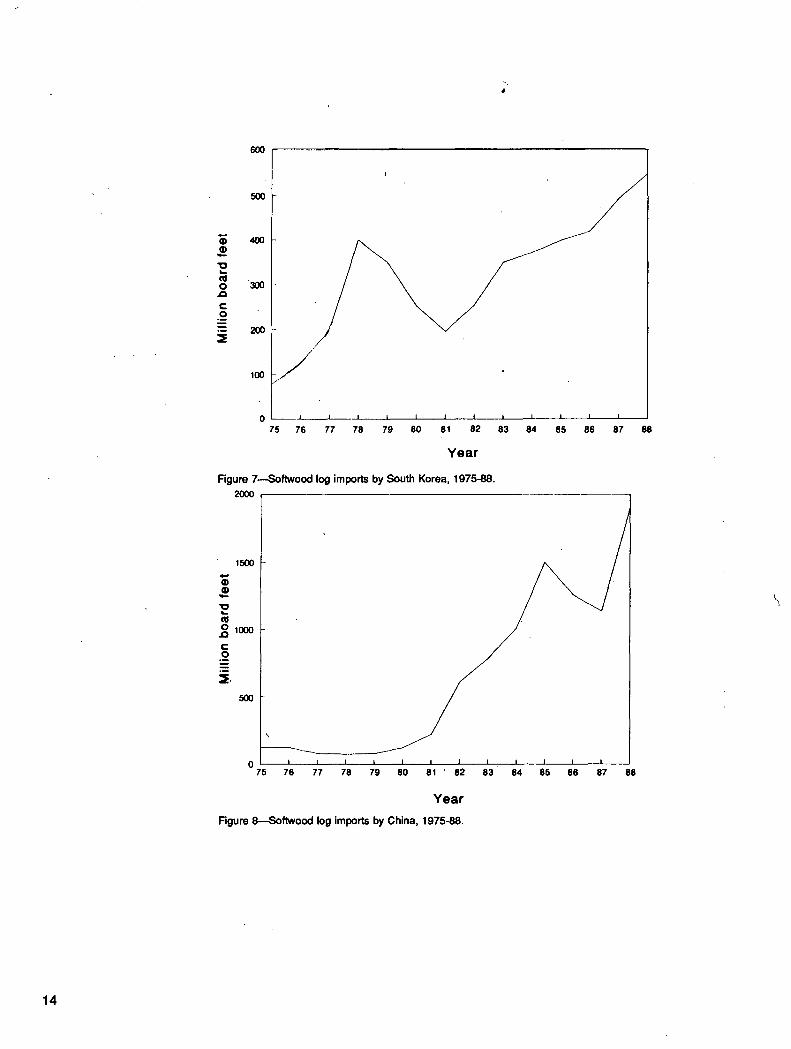
China--After decades of absence from the Pacific Rim log trade, China retumed to the market in the mid-1960s, but left again by the end of the decade (fig. 8). Purchases of foreign saw logs gradually rebuilt after 1972. China began significant imports of U.S. softwood logs in 1980, about 90 million board feet (400,000 cum). Total softwood log imports increased twelvefold by 1985, to 1.3 billion board feet (6 million cum). This period of rapid increase reflected a change of national policy toward cultural and economic exposure to the West.
13
6OO
2 m . 0 30O
¢.- ._o
- 2 o o ~-
~ ' ~ j " i I i I I I i
lO0
0 I I I I 75 76 77 78 79 80 81 82 83 84 85 86 87 88
1500
Figure 7- -Sof twood log imports by South Korea, 1975-88.
200o
500
G)
m 0 1000 rt t- O °~ =E.
0 i [ I I I I I [ , I i I I
75 76 77 78 79 80 81 " 82 83 84 85 86 87 88
Y e a r
Y e a r
Figure 8- -Sof twood log imports by China, 1975-88.
14

6OO
m O
c- O . M
. D
5O0
300
2OO
100
0 75
I I I I I I I I t I I I
76 77 78 79 80 81 82 83 84 85 86 87 88
Y e a r
Figure 9~Sof twood log exports by Alaska, 1975-88.
Scarcity of foreign exchange reduced all importing by China in 1986 and 1987; log exports to China from the United States fell by 40 percent between 1985 and 1986, but this was partly offset by increased shipments from the Soviet Union. Log prices remained roughly constant in U.S. dollars despite sharp declines in the value of the yuan (reflecting strong inflation in China). Slow but steady improvement in China's balance of payments later in the decade was reflected in imports of wood products. Purchases from the United States returned in 1988 to their 1985 level of about 1 bil- lion board feet (about 4.5 million cum). The combination of the stronger U.S. dollar and the political events of 1989 are expe~ed to reduce log imports by China.
The United States--As shown in figures 3 and 6, U.S. participation in log trade was minimal until the 1960s. The dramatic, major shift in the mid-1960s (see section on Japan, above), moved U.S. shipments from less than 200 million board feet (900,000 cum) annually to around 3 billion board feet (14 million cum). United States exports followed the general upward trend of Japanese demand until 1981, and China's im- ports have accounted for most U.S. export growth since then. Although the United States set records for log exports in 1970 and 1978, the records were modest rel- ative to the higher levels reached in the 1980s.
The 1980s have been eventful for U.S. log exporters; economic changes have been so extreme that referring to a trend is irrelevant. The cyclic variations, with record prices and volumes interrupted by an extreme economic recession, are discussed in the next section. Overall, the decade represented a plateau--the highest ever--in export activity. Significant domestic changes included emergence of an export market for Alaska logs, movement of modest quantities of softwood logs (and large volumes of hardwood logs) from the Gulf Coast to the Pacific Rim, growing success in pene- trating foreign markets for softwood lumber, and renewed controversy (discussed
15
8OO
700
6oo
"-500
O,oo t -
O
:=3o0 . m
100 / '
- _ _ _ J
o J I ' I ' I ' I L I i I i I ' I i I J I ' I ' 63 65 67 69 71 73 75 77 79 81 83 85 87
Y e a r
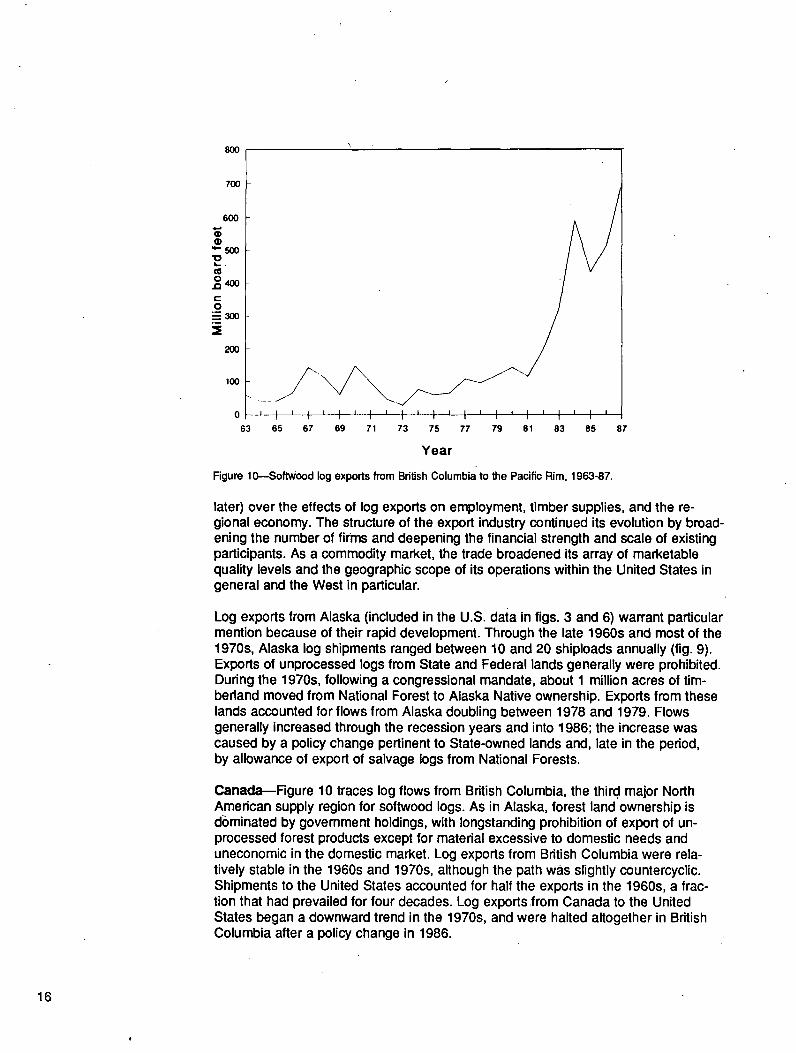
Figure 10--Softwood log exports from Bdtish Columbia to the Pacific Rim, 1963-87.
later) over the effects of log exports on employment, timber supplies, and the re- gional economy. The structure of the export industry continued its evolution by broad- ening the number of firms and deepening the financial strength and scale of existing participants. As a commodity market, the trade broadened its array of marketable quality levels and the geographic scope of its operations within the United States in general and the West in particular.
Log exports from Alaska (included in the U.S. data in figs. 3 and 6) warrant particular mention because of their rapid development. Through the late 1960s and most of the 1970s, Alaska log shipments ranged between 10 and 20 shiploads annually (fig. 9). Exports of unprocessed logs from State and Federal lands generally were prohibited. During the 1970s, following a congressional mandate, about 1 million acres of tim- berland moved from National Forest to Alaska Native ownership. Exports from these lands accounted for flows from Alaska doubling between 1978 and 1979. Flows generally increased through the recession years and into 1986; the increase was caused by a policy change pertinent to State-owned lands and, late in the period, by allowance of export of salvage logs from National Forests.
Canada--Figure 10 traces log flows from British Columbia, the third, major North American supply region for softwood logs. As in Alaska, forest land ownership is dc)minated by government holdings, with longstanding prohibition of export of un- processed forest products except for material excessive to domestic needs and uneconomic in the domestic market. Log exports from British Columbia were rela- tively stable in the 1960s and 1970s, although the path was slightly countercyclic. Shipments to the United States accounted for half the export s in the 1960s, a frac- tion that had prevailed for four decades. Log exports from Canada to the United States began a downward trend in the 1970s, and were halted altogether in British Columbia after a policy change in 1986.
16
400
0 .Jo e-. 0
300
200
100
60 62 64 66 68 70 72 74 76 78 80 82 84 86 88
Year
500
Figure 1 l ~ o f t w o o d log exports by New Zealand, 1960-88.
The average log volume exported to Pacific nations from British Columbia from 1976 to 1979 (a period of strong Canadian domestic demand) was about 150 million board feet (about 675 thousand cum) per year (fig. 10). The recession of the 1980~ ren- dered substantial volumes along the British Columbia coast uneconomic for domestic use, so the Provincial Government permitted an expansion of log exports. Exports increased to an average of about 420 million board feet (about 1.9 million cum) per year in 1980-86, with a high in 1987 of about 700 million board feet (3.2 million cum) in British Columbia Iogscale (Warren 1988). By 1987, British Columbia accounted for about one-fifth of North American softwood log exports moving westward. Log move- ments from Alaska to Canada have been modest, reaching about 80 million board feet (about 350 thousand cum) in 1988.
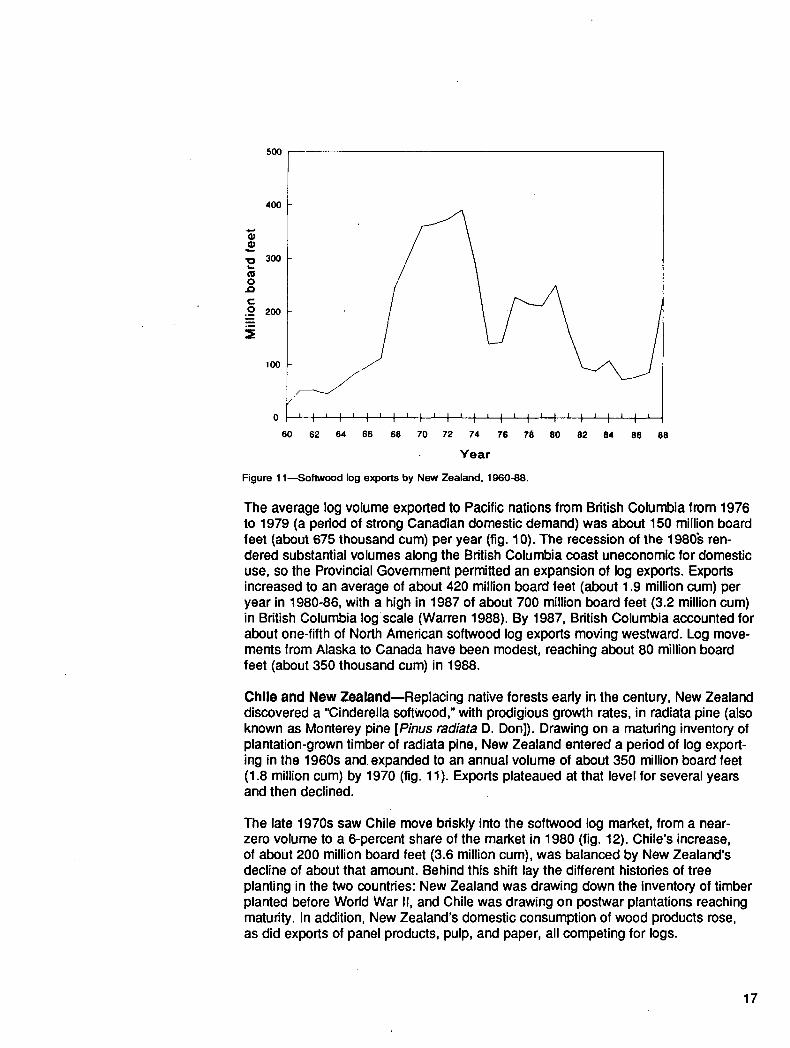
Chile and New Zealand--Replacing native forests early in the century, New Zealand discovered a "Cinderella softwood," with prodigious growth rates, in radiata pine (also known as Monterey pine [Pinus radiata D. Don]). Drawing on a maturing inventory of plantation-grown timber of radiata pine, New Zealand entered a period of log export- ing in the 1960s and. expanded to an annual volume of about 350 million board feet (1.8 million cum) by 1970 (fig. 11). Exports plateaued at that level for several years and then declined.
The late 1970s saw Chile move briskly into the softwood log market, from a near- zero volume to a 6-peroent share of the market in 1980 (fig. 12). Chile's increase, of about 200 million board feet (3.6 million cum), was balanced by New Zealand's decline of about that amount. Behind this shift lay the different histories of tree planting in the two countries: New Zealand was drawing down the inventory of timber planted before World War II, and Chile was drawing on postwar plantations reaching maturity. In addition, New Zealand's domestic consumption of wood products rose, as did exports of panel products, pulp, and paper, all competing for logs.
17

m 0
.io
c .9
I I I I I I I '1 I I I
76" 77 78 79 80 81 82 83 84 85 86 87 88
35O
30O
2 5 0
2OO
150
100 -E 0
75
-- Year
Figure 12--Softwood log exports by Chile, 1975-88.
In Chile, the 1980s continuedthe upward export trend of the 1970s. Chilean log exports to the Pacific Rim more than doubled between 1980 and 1988 and reached about 350 million board feet (about 1.6 million cum).
The trend in.the 1980s of New Zealand's export performance mainly tracked the available inventory; declining shipments in the 1980s extended the downward trend that began in the mid-1970s, from about 350 million board feet (about 1.6 million cum) to about 80 million board feet (0.4 million cum) in 1986. Resurgence late in the decade, reflecting post-Wo~ld War II reforestation, brought exports up to about 250 million board feet (about 1.1 million cum).
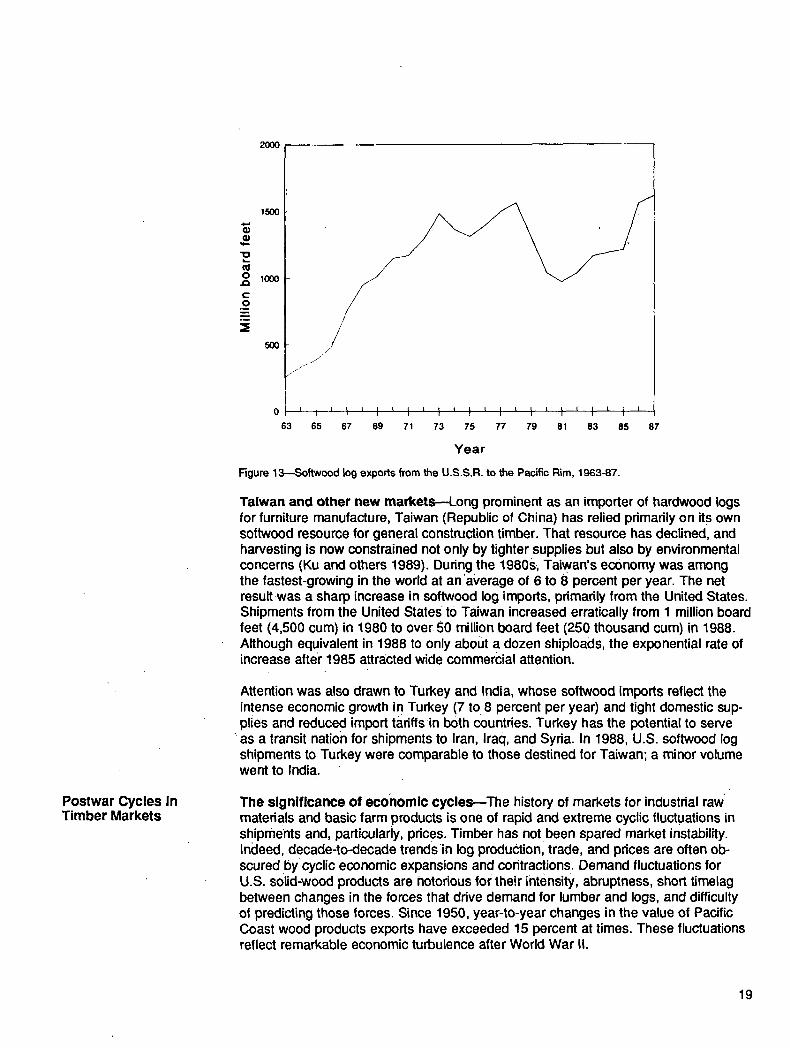
The Soviet Union~Long active in European markets, the Soviet Union moved rapidly during the 1960s to participate in meeting the burgeoning Japanese demand (fig. 13). Drawing on vast forests in eastern Siberia and the Soviet Far East, the U.S.S.R. supplied several softwood species, with larch providing the majority of the volume traded. Between 1963 and 1970, Soviet exports quadrupled to more than a billion board feet (6 million cum) per year.
During the 1970s, the Soviet Union's large and expanding log-export volume to Japan leveled at about 1.4 billion board feet (7.5 million cum) per year. Shipments were equivalent to about 40 percent of U.S. log exports to the Pacific Rim and to about 40 percent of Japan's softwood log imports.
Soviet shipments to Japan declined by a third between 1975 and 1985; at the same time', log exports from the Soviet Union to China increased fivefold to about 500 mil- lion board'feet (2.5 million cum). Total Soviet exports to the Pacific Rim thus regained their former level, although:interrupted along the way by Japan's recession and China's foreign exchange problems.
18
2000
Postwar Cycles in Timber M a r k e t s
m O t-=
t -
O
1500
1000
50O / j
j l ~"
0 ~ t L
63 65
/
I i I i t ¢ t ' I i I i I t t t I ' t L 67 69 71 73 75 77 79 81 83 85 87
Year
Figure 13--Sof twood log exports from the U.S.S.R. to the Pacific Rim, 1963-87.
T a i w a n a n d o t h e r n e w markets--Long prominent as an importer of hardwood logs for furniture manufacture, Taiwan (Republic of China) has relied primarily on its own softwood resource for general construction timber. That resource has declined, and harvesting is now constrained not only by tighter supplies but also by environmental concerns (Ku and others 1989). During the 1980S~ Taiwan's economy was among the fastest-growing in the world at an'average of 6 to 8 percent per year. The net result was a sharp increase in softwood log imports, pdmadly from the United States. Shipments from the United States to Taiwan increased erratically from 1 million board feet (4,500 cum) in 1980 tO over 50 million board feet (250 thousand cum) in 1988. Although equivalent in 1988 to only about a dozen shiploads, the exponential rate of increase after 1985 attracted wide commercial attention.
Attention was also drawn to Turkey and India, whose softwood imports reflect the intense economic growth i n Turkey (7 to 8 percent per year) and tight domestic sup- plies and reduced import tariffsin both countries. Turkey has the potential to serve as a transit nation for shipments to Iran, Iraq, and Syria. In 1988, U.S. softwood log shipments to Turkey were comparable to those destined for Taiwan; a minor volume went to India.
The s i g n i f i c a n c e o f e c 0 n o m i c cycles--The history of markets for industrial raw" materials and basic farm products is one of rapid and extreme cyclic fluctuations in shipments and, particularly, prices. Timber has not been spared market instability. Indeed, decade-to-decade trendsin log productionl trade, and prices are often ob- scured bycyclic economic expansions and contractions. Demand fluctuations for U.S. solid-wood products are notorious for their intensity, abruptness, short timelag between changes in the forces that drive demand for lumber and logs, and difficulty of predicting those forces. Since 1950, year-to-year changes in the value of Pacific Coast wood products exports have exceeded 15 percent at times. These fluctuations reflect remarkable economic turbulence after World War II.
19
2500
(n
"0 E
:3 0
..C I -
2000
1 5 0 0
1000
5 0 0
United States
: ' . . . , " , . -
• ' :
: . . "
- . , , "
• ." J a p a n . . . . . ° . . - " "
. . . . . . . . . - . . "
o '''~''''''''~''~''''~'''`'''~'''''''~'''''''''`''''''''"'''~''''''~È''''''`''~''''~'"""'''~'''''''''''''''''`''~''''''~"'''''~'''''''''''''''`~" 50 52 54 56 58 S0 62 64 66 68 70 72 74 76 78 80 82 84 86 88
Y e a r
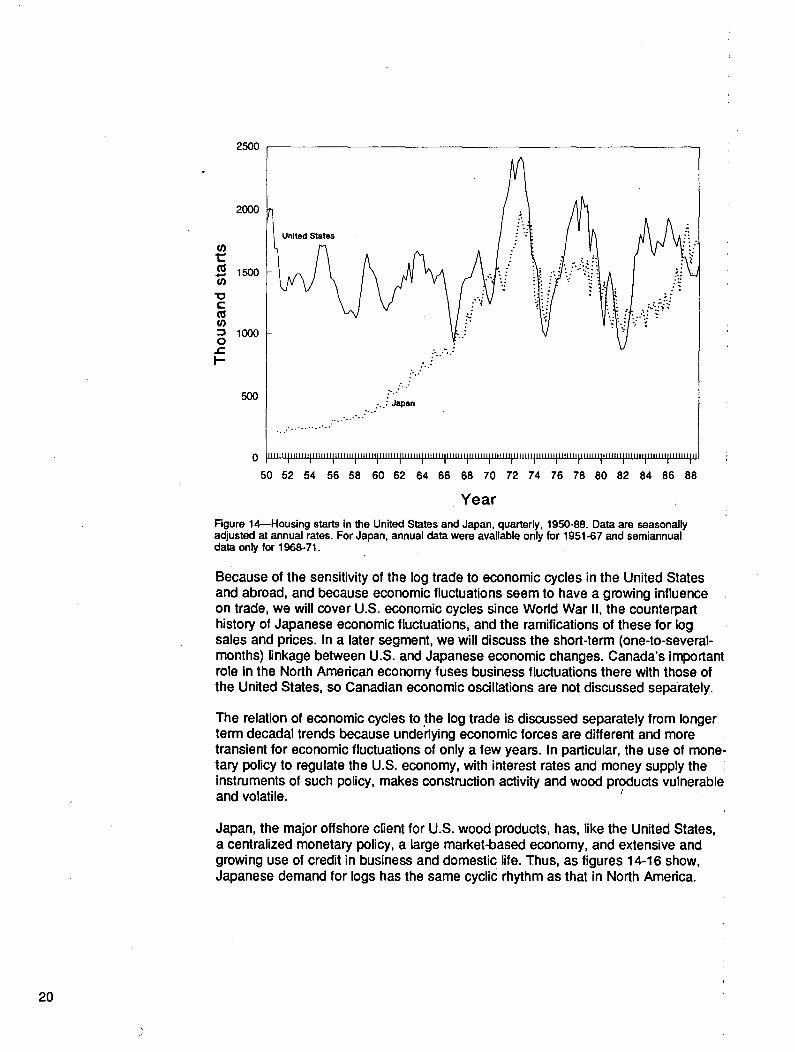
Figure 14---Housing starts in the United States and Japan, quarterly, 1950-88. Data are seasonally adjusted at annual rates. For Japan, annual data were available only for 1951-67 and semiannual data only for 1968-71.
Because of the sensitivity of the log trade to economic cycles in the United States and abroad, and because economic fluctuations seem to have a growing influence on trade, we will cover U.S. economic cycles since World War II, the counterpart history of Japanese economic fluctuations, and the ramifications of these for log sales and prices. In a later segment, we will discuss the short-term (one-to-several- months) linkage between U.S. and Japanese economic changes. Canada's important role in the North American economy fuses business fluctuations there with those of the United States, so Canadian economic oscillations are not discussed separately.
The relation of economic cycles to the log trade is discussed separately from longer term decadal trends because underlying economic forces are different and more transient for economic fluctuations of only a few years. In particular, the use of mone- tary policy to regulate the U.S. economy, with interest rates and money supply the instruments of such policy, makes construction activity and wood products vulnerable and volatile, i
Japan, the major offshore client for U.S. wood products, has, like the United States, a centralized monetary policy, a large market-based economy, and extensive and growing use of credit in business and domestic life. Thus, as figures 14-16 show, Japanese demand for logs has the same cyclic rhythm as that in North America.
20

160
r 140 .-"t
. I 0 I I i ~ w
. "o , . , , " ~ "
40
~ .- • . . . -
20 . .."" Japan
. . . . . . . . o - - - . - ' "
] I I ' t i i l ' l H I I I I I I I II I H I I I I I I I I I I I l t l l l l I I I I l l l l l l l l l l l t l l l t l l II I I I l I I I I I II I l l l l l t l l l l l l l l l II1111111 I I I I I I I I II I I ) l l l l l l I I I I I I I I I H I I I II I l t l l l t l l l l l II II I I I I I I I I I I 0 I I t I I I I I I I I I I I I I I I I I
48 50 52 54 56 58 60 62 64 66 68 70 72 74 76 78 80 82 84 86 88
Y e a r
Figure 15IQuartedy industrial production in the United States and Japan, 1948-88.
120
II 100
00 O~ " " 80 x" 03
e- 60
1600
1400
1200
03 03 ,4- 1000
0 800 .10
c 0
"-- 6 0 0
4OO
200
75 76 77 78 79 80 81 82 83 84 85 86 87 88
Y e a r
Figure 16--United States exports and Japanese imports of softwood logs by quarter, 1975-88.
21
Cycles through 1975---In the United States, rising demand for housing caused acute price increases for lumber after price controls were abolished in 1946 (Johnston 1986). Between 1946 and 1951, average real (inflation compensated) lumber prices increased 109 percent, while annual production grew about 10 percent. Domestic production was augmented by imports, which doubled during that period (U.S. De- partment of Commerce 1967). Housing starts advanced 40 percent (fig. 14). Not the least of the factors accounting for economic growth during this period was Federal emphasis on'full employment, which strongly influenced Federal fiscal and monetary policies.
A minor recession in 1949 was quickly offset by the military buildup accompanying the Korean War from 1951 to 1953, as well as a surge of house construction in 1950 to more than 1.9 million units---a record at that time.
Between 1951 and 1957, u.s. lumber prices remained roughly constant and annual production declined about 12 percent. This tendency probably reflected the economics of supply and a sharp, short recession in 1956-57 in which housing starts fell from 1.6 million to 1.2 million, lumber production dropped 15 percent, and lumber and Pacific Northwest saw-log prices declined about 8 percent. The recession was at least partly attributable to a reduction of manufacturing to eliminate the inventories that had accumulated due to scarcity expectations during the Korean War (Cooper and Lawrence 1975). In 1958, Japan's economy felt the effects of the U.S. economic contraction. Industrial production and housing activity declined, and lumber imports from the United States f611 almost to zero from 47 million board feet in 1957, although softwood log imports rose from 36 to 48 million board feet. Overall, however, the 1950s and early 1960s were characterized by relatively stable economic growth with real GNP more than doubling, fairly stable levels of housing starts, and only minor cyclic activity in lumber demand and saw-log prices.
The late 1960s introduced an epoch of major cyclic variation in the U.S. economy and U.S. timber markets (See figs. 14 and 15). Early in 1966, 8 years of negligible inflation ended with a sharp rise in prices of consumer and producer goods, attributed to Viet Nam war-related demand. The inflation triggered an increase in the Federal Reserve Bank's discount rate followed by home mortgage interest rates, which led to a 20-percent decrease in the monthly rate of housing starts. United States lumber production declined only 5 percent, probably because of orders for military construc- tion, and prices of lumber and Northwestern saw logs did not drop. Pacific Northwest timber harvests, which had risen for a decade, declined 10 percent relative to 1965. Japan's economy was largely unscathed by this recession, although log imports, which had become significant early in the decade, halted their upward trend for a year (see fig. 5), and dollar prices of export logs declined somewhat. Canadian and U.S. log exports, which had been climbing aggressively (see figs. 6 and 10), faltered in 1968-69 and returned to cyclic upward rates in early 1970.
A more serious interdiction of economic growth, home building and general construc- tion activity, lay in the recession of 1970-71. This marked the first of three recent, ever more intense downturns (see figs. 14 and 15). Unaccustomed rates of inflation in 1968-69 in the United States and abroad led to sharply higher interest rates. Hous- ing starts faltered in both Japan and the United States; log movements between the two countries fell about 10 percent in 1971. Export log prices leveled but did not fall.
22
The period of strong world economic growth in 1971-73 expressed itself in industrial production, housing starts, and commodity prices (especially those of wood products) around the Pacific Rim. In 2 years, the floor area of wooden buildings under construc- tion in Japan increased almost 50 percent. Total Japanese housing starts reached 1.9 million in 1973~a level that would be considered unusually high in the United States and was remarkable in Japan, where the population was half that of the United States. Prices of imported logs in Japan doubled, while large hemlock logs leaving the United States rose 45 percent in price (Ruderman 1975), and prices for Canadian export logs moved similarly.
Prices of construction lumber and logs became a matter of public concern in the early 1970s. Between 1967 and 1973, the price for" Douglas-fir saw logs, compen- sated for inflation, increased 60 percent, as did real prices for U.S. lumber. Annual lumber production increased only 11 percent. During this period, the annual rate of home construction grew 56 percent, and U.S. log exports grew 73 percent, to a level corresponding to about 10 percent of U.S. saw-log production.
Log exports from Canada to the Pacific Rim did not increase in response to higher prices. Shipments declined by two-thirds between 1970 and 1973 (fig. 10), presum- ably reflecting Federal and Provincial export policies that, then and now, encourage domestic manufacture of wood products. As described by Shinn 2 in detail, such pol- icies confine export activity to economically surplus timber, with the economic test more easily met when domestic demand is low.
Between 1973 and 1975, during the oil shock recession, U.S. housing starts fell by about half. United States lumber production and prices declined by 16 percent and 28 percent, respectively, and saw-log prices in the Pacific Northwest declined 25 per- cent in real terms. Japan, with limited domestic energy resources, was especially hard hit. For the first time since World War II, industrial production declined there--by 19 percent between the first quarter of 1974 and the first quarter of 1975. Japanese housing starts declined 31 percent during those 12 months. Besides a 400-percent increase in oil prices, which raised the cost of living, the decline in housing starts has also been attributed to rapidly increasing land costs after 1973 and a tightening of the supply of home loans (Nippon Mokuzai Bichiku Kiko 1983). The price of imported softwood logs dropped 14 percent. United States log exports to Japan declined 17 percent; however the average unit value of those logs in U.S. dollars rose 3 percent-- probably reflecting the rapidly declining value of the dollar relative to the yen and other currencies and the limited decline in lumber prices in Japan.
2 Shinn, Craig W. 1989. British Columbia log export policy: historical review and analysis. On file with: Pacific Northwest Research Station, Forestry ,Sciences Laboratory, 4043 Roosevelt Way N.E., Seattle, WA 98105. 63 p. Sponsored by: U.S. Department of Agriculture, Forest Service, Pacific Northwest Research Station and Center for International Trade in Forest Products, College of Forest Resources, University of Washington.
23
This economic low point was described at the time as the worst recession since the Great Depression of the 1930s. Indeed, in the United States, industrial production declined about 14 percent between 1973 and 1974, and U.S. housing starts were off 43 percent between 1973 and 1975. The effect on housing starts apparently was amplified by monetary policy; the prime rate rose from 6 percent in early 1973 to 12 percent in late 1974.
Aided by sharply lower interest rates (the prime rate was down to 7 percent by mid- 1975) and a return to a more orderly petroleum market, the U.S. economy started upward in 1975 and was followed at once by economic growth in Japan. Between 1975 and 1979, U.S. industrial production increased about 36 percent; that in Japan grew more than 45 percent (fig. 15).
The next two cycles--The 1975-to-1979 economic boom carried U.S. housing starts upward to about 2.2 million per year by mid-1978; thereafter, they were discouraged by high interest rates. Lumber prices rose until mid-1979, or about 30 percent over the 4 years. Annual lumber production increased 25 percent. Real prices of Pacific Northwest saw logs gained almost 70 percent, export log prices increased 18 per- cent, and log exports increased 50 percent.
Japan's use of wood remained quite stable during this period. Japanese lumber pro- duction grew less than 10 percent between 1975 and 1979, with wood use of all kinds for all purposes gaining about 15 percent. Housing starts in Japan increased from about 1.4 million to about 1.5 million, although wooden houses declined from about 66 percent to about 60 percent of the total; the floor area of all new wooden structures was virtually stable (Nippon Mokuzai Bichiku Kiko 1983).
Softwood supplies from non-U.S, sources meanwhile were strong. Imports from New Zealand increased about 50 percent and moved the total from that country to about 200 million board feet (1 million cum) by 1980. Imports of both logs and lumber from the Soviet Union together ranged between 1.6 and 1.8 billion board feet in log- equivalent scale (8 to 9 million cum). Log and lumber exports to Japan from British Columbia grew over 60 percent to about 700 million board feet (3 million cum) in 1979. The harvest of Japanese domestic timber declined in the first half of the decade; during the 1975-79 recovery, domestic log production remained almost constant.
A considerable increase in the value of the yen reinforced Japanese demand for North American wood products. A major episode of currency realignment occurred after an early-1970s decision by industrial countries to allow their monetary values to float. The yen nearly doubled in value relative to the dollar between 1975 and early 1979 (a two-thirds gain in real purchasing power when adjusted for the relative inflation rates of the two countries).
The net effect of these factors was to gradually depress the price of logs imported to Japan through the recovery, with inflation-compensated prices declining about 27 percent. United States softwood logs exported to Japan increased in volume about 18 percent between 1976 and 1979 to about 2.7 billion board feet (14 million cubic meters). The average price increased 26 percent after adjustment for inflation.
24
Exports of softwood logs from the United States to Korea increased 88 percent between 1976 and 1979, to about 250 million board feet (1.5 million cum). That flow had been less than 50 million board feet (0.3 million cum) in 1970, with a steady increase interrupted only by the recession.
Canadian log exports to the Pacific Rim increased during the late 1970s. The in- crease started with a pulse of volume during the 1974-75 recession (fig. 10) and presumably was encouraged by the countercyclic export policy mentioned earlier. Between 1973 and 1980, exports from British Columbia to offshore countries gained about fivefold, from about 30 to about 145 million board feet (135 to 160 thousand cum); the latter is equivalent to about 4 percent of U.S. log exports.
The U.S. forest products recession from 1979 to 1982 can be understood in terms of a halving of housing starts. United States lumber production declined 26 percent, real lumber prices declined 27 percent, and real prices of Pacific Northwest saw logs declined 36 percent. During these years, log exports slid 17 percent and their average real prices fell 27 percent.
The recession had a major effect on Japanese demand. High interest rates in the United States, seen as necessary to curtail inflation, radiated to other industrial countries. Always lower than in the United States, the Japanese equivalent of the prime rate had risen to 9 percent in 1980---a post-World War II high. Housing starts in Japan responded by falling from about 1.5 million in 1979 to about 1.1 million in 1984. The long-standing trend in Japan toward proportionately fewer wooden houses and a decline in the average size of houses reduced the floor area of new wooden houses by 35 percent between 1979 and 1983 (Ueda and Darr 1980). (By 1987, the floor area of new wooden houses was still 18 percent less than in 1979.)
O
Adjusted for inflation, the average price of Japan's imported softwood logs declined 15 percent from 1979 to 1982, and key domestic lumber prices fell 30 percent. The annual volume of U.S. softwood log shipments to Japan declined 25 percent. From Canada, log volumes rose substantially, in keeping with policy-oriented procedural guidance inside Canada that sought to maintain a strong timber economy during the weakest North American domestic markets since the 1930s. Between 1980 and 1984, annual offshore exports from British Columbia increased fourfold, to about 600 million board feet (2.7 million cum), equivalent to about 17 percent of U.S. softwood log exports to the Pacific Rim.
The recovery of 1982-83 returned housing starts in the United States to about 1.7 million from about 1.1 million, raised lumber production by about 22 percent, and elevated lumber prices about 36 percent.
Each year between 1983 and 1987, the demand for wood products in the United States increased; lumber production approached Or exceeded record levels. As it was in the United States, so it was in Japan, with rising industrial production, con- struction activity, lumber production, and log imports.
25
700
, , I , -=
"10
0 J3
0
0
600
5OO
400
300
200
: "..
! . ~ - : ........... "" / ' ~ X '; Real price, 1987 U.S. dollars
o " ' I ' " I ' " I ' " I ' ~ ' I ' " I ' " I ' " I ' " I ' " I ' " I ' " I ' " I ' ' 75 76 77 78 79 80 81 82 83 84 85 86 87 88
Year
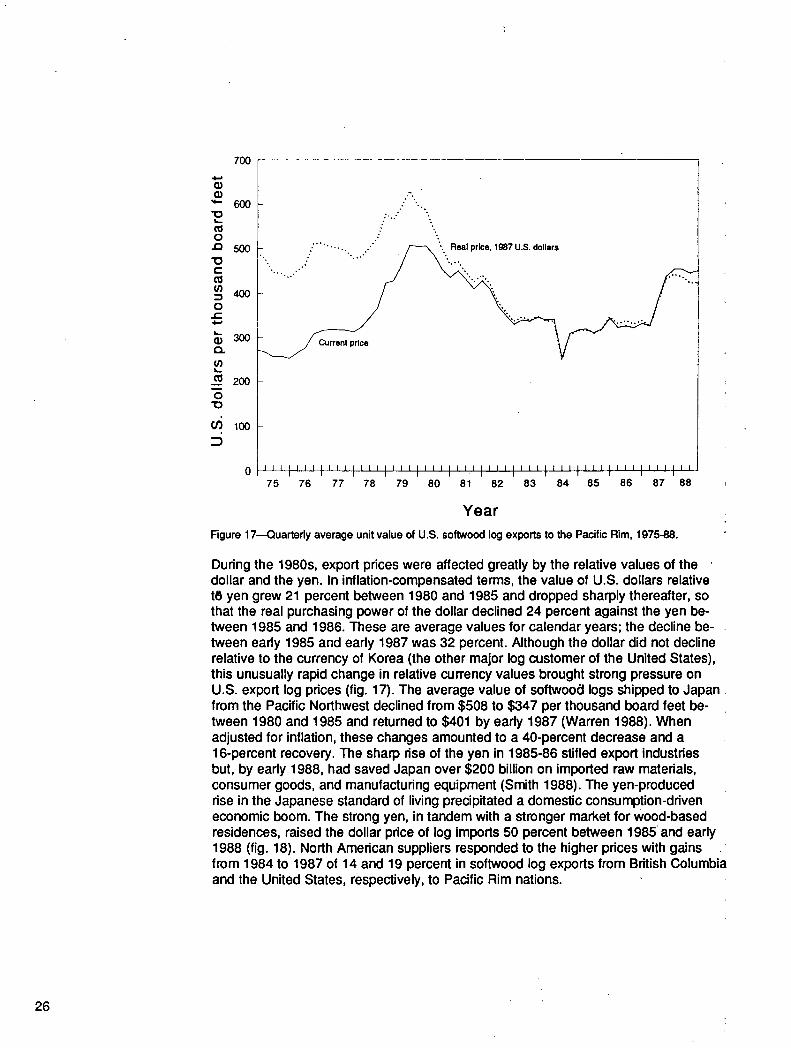
Figure 17---Quarterly average unit value of U.S. softwood log exports to the Pacific Rim, 1975-88.
During the 1980s, export prices were affected greatly by the relative values of the dollar and the yen. In inflation-compensated terms, the value of U.S. dollars relative t8 yen grew 21 percent between 1980 and 1985 and dropped sharply thereafter, so that the real purchasing power of the dollar declined 24 percent against the yen be- tween 1985 and 1986. These are average values for calendar years; the decline be- tween early 1985 and early 1987 was 32 percent. Although the dollar did not decline relative to the currency of Korea (the other major log customer of the United States), this unusually rapid change in relative currency values brought strong pressure on U.S. export log prices (fig. 17). The average value of softwoo~l logs shipped to Japan from the Pacific Northwest declined from $508 to $347 per thousand board feet be- tween 1980 and 1985 and returned to $401 by early 1987 (Warren 1988)• When adjusted for inflation, these changes amounted to a 40-percent decrease and a 16-percent recovery. The sharp rise of the yen in 1985-86 stifled export industries but, by early 1988, had saved Japan over $200 billion on imported raw materials, consumer goods, and manufacturing equipment (Smith 1988). The yen-produced rise in the Japanese standard of living precipitated a domestic consumption-driven economic boom. The strong yen, in tandem with a stronger market for wood-based residences, raised the dollar price of log imports 50 percent between 1985' and early 1988 (fig. 18). North American suppliers responded to the higher prices with gains from 1984 to 1987 of 14 and 19 percent in softwood log exports from British Columbia and the United States, respectively, to Pacific Rim nations.
26
5 0
• ~, 40
E
3 0 3 0
e~
e -
~, , 2 0
e -
3 O 10 e-
." . C.I.f. pd{'" " "" " to lg r .c" " ' " ' " ' ' ' " ' . . ' " ' " . . . . ""
." F.a.s. United State,= """ . . . . . " ' . . . . . . . . . .
. , " ' . .
~, I~ , , ~ , , , , r , l l l l l l l l , , I l l l P l l I 78 79 80 81 82 83 84 8 5 8 6 87 88
Y e a r
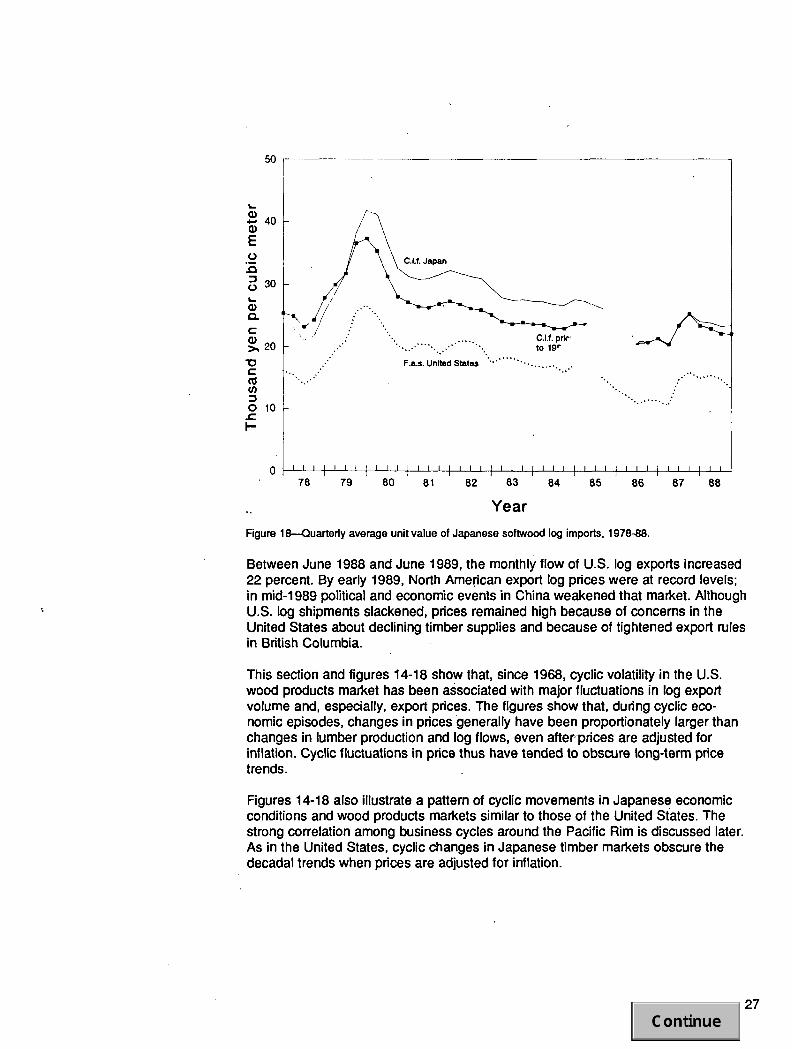
Figure 18 - -Quar te r l y average unit va lue of Japanese softwood log imports, 1978-88 .
Between June 1988 and June 1989, the monthly flow of U.S. log exports increased 22 percent. By early 1989, North Amedcan export log prices were at record levels; in mid-1989 political and economic events in China weakened that market. Although U.S. log shipments slackened, prices remained high because of concerns in the United States about declining timber supplies and because of tightened export rules in British Columbia.
This section and figures 14-18 show that, since 1968, cyclic volatility in the U.S. wood products market has been associated with major fluctuations in log export volume and, especially, export prices. The figures show that, during cyclic eco- nomic episodes, changes in prices generally have been proportionately larger than changes in lumber production and log flows, even after~prices are adjusted for inflation. Cyclic fluctuations in price thus have tended to obscure long-term price trends.
Figures 14-18 also illustrate a pattern of cyclic movements in Japanes e economic conditions and wood products markets similar to those of the United States. The strong correlation among business cycles around the Pacific Rim is discussed later. As in the United States, cyclic changes in Japanese timber markets obscure the decadal trends when prices are adjusted for inflation.
27
Prospects for dampening trade fluctuations in the future may depend on China's par- ticipation in the Pacific Rim economy and the kind of domestic economic system that may evolve there. In concept, a centrally managed economy playing a large role in wood products demand, with limited use of potentially volatile credit in the consumer, producer, and government sectors, could be a major, inertial stabilizing force. The presence of the Soviet Union on the supply side might have a similar influence. It is not clear, though, whether the economy of either country is moving toward reduced dependence on credit, and there is no evidence of any new mechanism in other parts of the Pacific Rim trade region, such as controls on credit, that could moderate eco- nomic flux. A plausible future to consider, then, is one in which economic cycles may largely obscure trends in supply and demand, like the trends projected in the last section of this report.
Part I1: Structure of t he Trade
In General
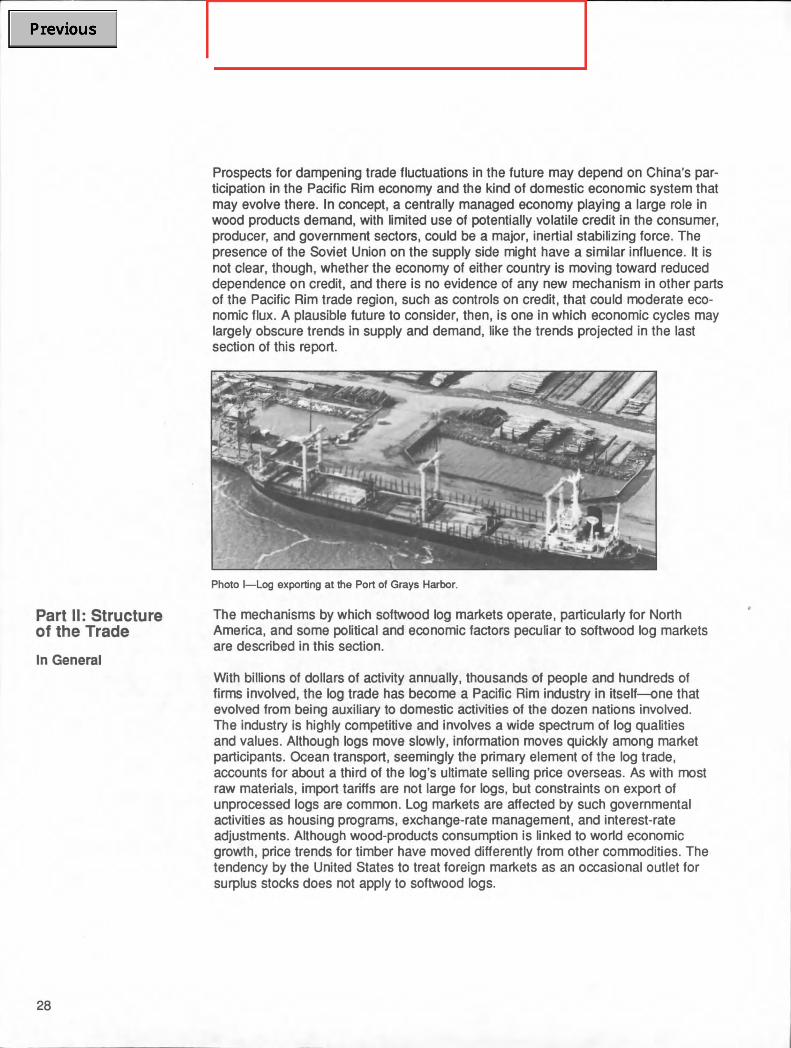
Photo I--Log exporting at the Port of Grays Harbor.
The mechanisms by which softwood log markets operate, particularly for North America, and some political and economic factors peculiar to softwood log markets are described in this section.
With billions of dollars of activity annually, thousands of people and hundreds of firms involved, the log trade has become a Pacific Rim industry in itself---one that evolved from being auxiliary to domestic activities of the dozen nations involved. The industry is highly competitive and involves a wide spectrum of log qualities and values. Although logs move slowly, information moves quickly among market participants. Ocean transport, seemingly the primary element of the log trade, accounts for about a third of the log's ultimate selling price overseas. As with most raw materials, import tariffs are not large for logs, but constraints on export of unprocessed logs are common. Log markets are affected by such governmental activities as housing programs, exchange-rate management, and interest-rate adjustments. Although wood-products consumption is linked to world economic growth, price trends for timber have moved differently from other commodities. The tendency by the United States to treat foreign markets as an occasional outlet for surplus stocks does not apply to softwood logs.
28
Denney
Industry Anatomy
The Export Business Process
As in many industries, a relatively few firms account for about 80 percent of the log trade in each participating country; many more firms account for the rest. In Chile and New Zealand, a half-dozen firms account for most log exports with only a few ports in each country used. Soviet logs are administered within a managed economy; several trade, natural resource management, planning, and industrial agencies are involved. Along the Soviet Pacific coast, two ports account for more than half of the log exports, and the balance of the trade is divided among 15 other shipping points (Fenton and Maplesden 1986). Export logs leave from several points along the Brit- ish Columbia coast. Canadian log export trade is handled by several large timber companies selling their own roundwood and some purchased logs. In addition, out- bound logs are sold by independent firms; some with partial or total foreign owner- ship (Fenton 1984). In the U.S. Pacific Northwest, logs move through a dozen ports. Besides major industrial landowners who deal directly with offshore trading com- panies, about 60 brokers, freight forwarders, and export trading and management companies deal heavily in wood products. Of these, about 50 are in Washington State (Anderson and Bagger 1989) with the majority handling logs. In 1984, there were 102 export "operations" (a single export firm handling exports through three ports would count as three operations) in Washington State. In 1986, there were 101 (Larsen and Bearden 1986 and in press). Washington ports account for about 70 percent of logs exported from the Pacific Northwest.
In Japan, the majority of imported logs are handled by major trading companies. In 1976, Japan had about 150 timber importers; 50 handled North American timber (U.S. Department of State 1977b). Assuming that log distribution is similar to that of lumber, about 15 trading companies account for three-quarters of the volume (Baskerville 1986). About 60 percent of imported logs pass through wholesalers en route to sawmills; most of the remainder bypass wholesale establishments (Nippon Mokuzai Bichiku Kiko 1984).
The recession years of the early 1980s forced consolidations and withdrawals from the export industry. The attrition was offset by entry of new brokers and trading com- panies, partly in anticipation of an expanded Chinese market. Specialization among and within firms in the timber trade is occurring as both export volumes and unit values expand.
Special features of the log trade---Softwood logs are distinct from other inter- nationally traded commodities in several ways. Roundwood is characterized by relatively low value per unit weight; relatively slow transportation; low value rela- tive to its end products; a long time frame for production to delivery; derivation from a source that is both mined and replenished; a wide range of qualities and prices in the marketplace; and a flow generally unimpeded by importing govern- ments, although often encountering political frictions as the logs leave the export- ing nation.
29
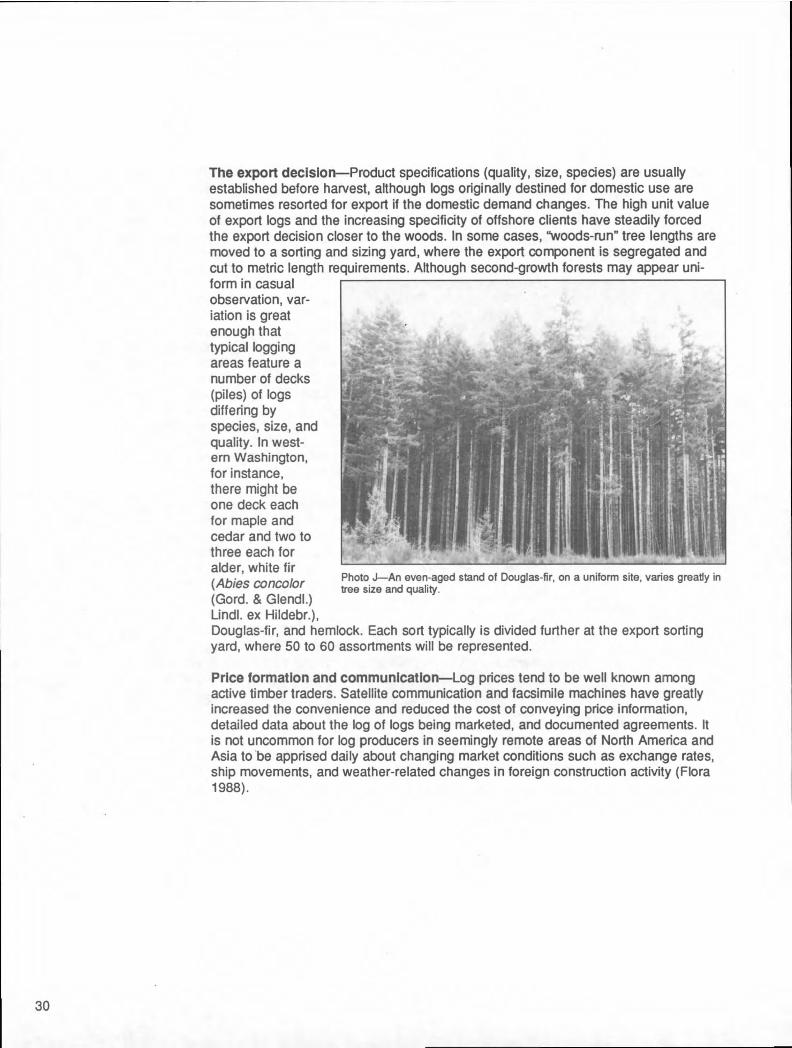
The export decision--Product specifications (quality, size, species) are usually established before harvest, although logs originally destined for domestic use are sometimes resorted for export if the domestic demand changes. The high unit value of export logs and the increasing spedficity of offshore clients have steadily forced the export decision closer to the woods. In some cases, "woods-run" tree lengths are moved to a sorting and sizing yard, where the export component is segregated and cut to metric length requirements. Although second-growth forests may appear uni- form in casual observation, var- iation is great enough that typical logging areas feature a number of decks (piles) of logs differing by species, size, and quality. In west- ern Washington, for instance, there might be one deck each for maple and cedar and two to three each for alder, white fir
} f
(Abies concolor Photo J--An even-aged stand of Douglas-fir, on a uniform site, varies greatly in tree size and quality.
(Gord. & Glendl.) Undl. ex Hildebr.), Douglas-fir, and hemlock. Each sort typically is divided further at the export sorting yard, where 50 to 60 assortments will be represented.
Price formation and communlcatlon~Log prices tend to be well known among active timber traders. Satellite communication and facsimile machines have greatly increased the convenience and reduced the cost of conveying price information, detailed data about the log of logs being marketed, and documented agreements. It is not uncommon for log producers in seemingly remote areas of North America and Asia to be apprised daily about changing market conditions such as exchange rates, ship movements, and weather-related changes in foreign construction activity (Flora 1988).
30
Because of its magnitude, trade between the United States and Japan serves as a benchmark to gauge other prices against. Average prices of domestic and imported logs are reported biweekly in Japan, based on customs declarations and surveys of sawmill operators. Around the Pacific Rim, the majority of log transactions are designated in U.S. dollars, although some transactions have been based on yen.
Export-log contracts may have escalation clauses to accommodate changing curren- cy exchange rates and product prices or (infrequently) inflation rates. Renegotiation of prices (sometimes while logs are in transit) may be called for if several months elapse during the marketing process.
"Countertrade" (barter) has had limited application in the log trade between North America and Asia. It is common though between Japan and the U.S.S.R. and be- tween China and the U.S.S.R.; less has occurred between China and Japan. Circum- stances differ widely, with items being bartered including labor, engineering services, textiles, agricultural products, manufacturing equipment, and entire installed factories. These transactions often (the authors believe usually) involve intermediate valuation of the traded goods and services in yen or dollars; for logs, this generally includes consideration of log prices prevailing in the Pacific Rim market. Thus dollar prices have a bearing even on countertrade.
Although spot markets exist in the log trade on both sides of the Pacific, much of the business is based on transactions spanning several months and in some cases years. This partly reflects the time-intensive character of moving bulk materials long distances, as discussed later. And partly, it is consistent with prevailing business practices involving raw materials and long-standing business contacts. In any case, in many arrangements agreement on the volume and timing of shipments proceeds separately from price negotiations, with 1- to 5-year volume agreements predicated on quarterly price renegotiation. Examples include certain arrangements between the U.S.S.R. and Japan that have been in place for many years (Nomura 1988). Over half the logs moved from the Soviet Union tO Japan are based on 5-year plans, negotiated 1-year volume targets, and quarterly adjustment of prices.
For economic analysis and forecasting, an important implication of separation in time of price and quantity decisions is the apparent (but not real) distortion of competitive- market operation. As discussed in a later section, there can be significant lags be- tween flow and price changes. And on average, the international log trade gives an appearance of inertia (Francescon and Nagy 1988, Nagy and Anderson 1988).
31
Ownership and Its transfermThere may be continuity of ownership of logs from forest to offshore destination, such as when a foreign firm purchases forest land in the United States. More commonlY, ownership changes one to several times as logs arrive at sorting yards, ports, holds of ships, the foreign port, or an offshore sorting yard. Log grading and scaling typically occur twice: first, within the exporting country, and second, on arrival at the foreign purchaser's log boom or dry land storage space at a port. Scaling usually is done one log at a time, with logs taken from a truck, a pile, or a hold and rolled out on the ground or floated in-a log boom for a full-length inspection. However, when logs of relatively low value are trade~! between organi- zations with long-standing relations, scaling and grading may be based on a sample or an ends-only survey in a deck. Nowhere around the Pacific Rim have uniform, enduring, multinational grading systems for export logs become embedded in the marketplace. This creates problems for buyers and sellers, because several factors affect log quality and value', and the range of values is great. The quality and value of logs of similar sizes may differ as much as tenfold depending on species, growth rate, taper, knot size and distribution, straightness, and other factors. To overcome these problems, third-party organizations have been established to provide scaling and grading services. Examples from the United States are the Puget Sound Log Scaling and Grading Bureau and its several counterparts. These organizations may need to apply different grading criteria among different shipments from an individual vendor, depending on the destination.
Because of the time between initial orders and delivery overseas--which can exceed 6 monthsDand because of the possibility of changes in the exchange rate and other payment risks, arrangements for payment are usually handled through a bank with a letter of credit, whereby the bank makes payment to the vendor after receiving proof that the shipment has arrived at its destination. The letter of credit is attractive to those participants in the exchange process who bear the risks of long time frames, direct dealings with foreign buyers, and the foibles of fluctuating currencies. Where long periods are involved, exporters may borrow against the value of the shipment. In the United States, a kind of credit oriented specifically to exports is the banker's acceptance, created by Federal law to allow banks to lend against maturities that vary with anticipated shipping times. Banker's acceptances have especially favorable interest rates (Ingram 1989).
Documentation is widely seen as a formidable burden, particularly to buyers and sellers just entering the trade: U.S. exporters confront more than a dozen forms, not counting inspection certificates and import declarations required by foreign govern- ments. Cargoes to be divided among multiple destinations, perhaps in different countries, multiply the volume of paperwork. Frequent export business generates familiarity and makes this documentation routine.
32
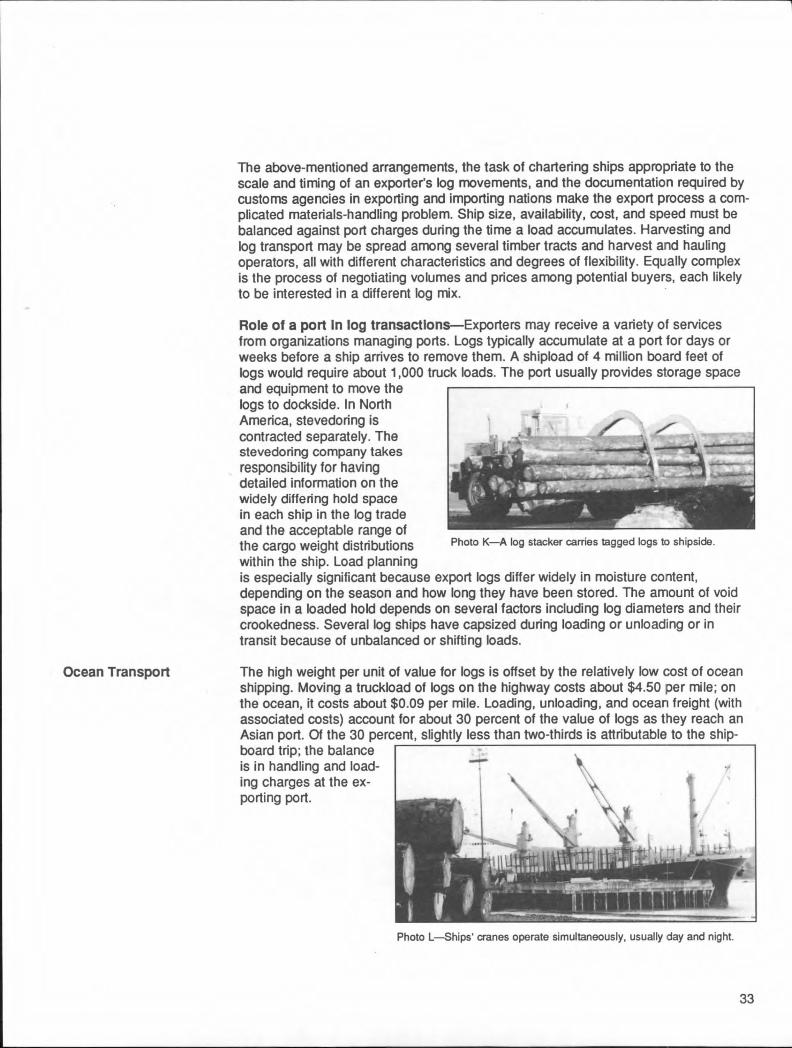
Ocean Transport
The above-mentioned arrangements, the task of chartering ships appropriate to the scale and timing of an exporter's log movements, and the documentation required by customs agencies in exporting and importing nations make the export process a com- plicated materials-handling problem. Ship size, availability, cost, and speed must be balanced against port charges during the time a load accumulates. Harvesting and log transport may be spread among several timber tracts and harvest and hauling operators, all with different characteristics and degrees of flexibility. Equally complex is the process of negotiating volumes and prices among potential buyers, each likely to be interested in a different log mix.
Role of a port In log transacUons--Exporters may receive a variety of services from organizations managing ports. Logs typically accumulate at a port for days or weeks before a ship arrives to remove them. A shipload of 4 million board feet of logs would require about 1,000 truck loads. The port usually provides storage space and equipment to move the logs to dockside. In North America, stevedoring is contracted separately. The stevedoring company takes responsibility for having detailed information on the widely differing hold space in each ship in the log trade and the acceptable range of the cargo weight distributions Photo K--A log stacker carries tagged logs to shipside.
within the ship. Load planning is especially significant because export logs differ widely in moistUre content, depending on the season and how long they have been stored. The amount of void space in a loaded hold depends on several factors including log diameters and their crookedness. Several log ships have capsized during loading or unloading or in transit because of unbalanced or shifting loads.
The high weight per unit of value for logs is offset by the relatively low cost of ocean shipping. Moving a truckload of logs on the highway costs about $4.50 per mile; on the ocean, it costs about $0.09 per mile. Loading, unloading, and ocean freight (with associated costs) account for about 30 percent of the value of logs as they reach an Asian port. Of the 30 percent, slightly less than two-thirds is attributable to the ship- board trip; the balance is in handling and load- ing charges at the ex- porting port.
Photo L--Ships' cranes operate simultaneously, usually day and night.
33
During the early and mid 1980s, there was excess capacity in the shipping industry, worldwide. Rates charged to shippers for moving softwood logs differed little among exporting countries on the eastern edge of the Pacific and only modestly among destinations; for example, chartering a ship for a cargo to China might cost 5 percent more than chartering the same vessel to go to Japan. Lower labor costs in Chilean ports have made shipments from that country slightly cheaper than those from North America, though.
Although average differences in intercountry shipping costs are small, there can be a wide range in the costs of individual shipments. Sources of the differences include the degree of mechanization at the port and its charges for equipment rental, storage space forthe logs, and berthing space for the ship; differences among ships in their capacity, cargo-handling gear, and layout of hatches and bulkheads; waiting time while other ships unload (a particular problem in regions where log activity is grow- ing); the number of destination ports and the number of log sorts to be segregated within the ship; whether logs are loaded into the hold or onto the deck; whether loads taken from rafts in the water are bundled or floating singly; whether the capacity of the ship will be filled with many small logs or fewer large ones; and whether logs are available in sufficient quantity close to the ship or must be trucked there with inter- mittent arrivals. Together, these factors can account for a $50 (per Mbf) range in shipping costs between two countries whose average figure is $150 per Mbf.
As the log trade developed in the early 1960s, port facilities had little capadty to accumulate logs, so a voyage Often involved two or more stops to accumulate a full cargo. Despite expansion of storage areas in many ports, multiple stops are still common, partly because the capacity of ships has grown. For the same reason, logs may be unloaded at more than one destination. Too, a shipper may have several clients, each wishing to buy or sell a limited total volume or a species or grade in short supply. In general, however, cargos have increased steadily in size, and port facilities have grown and become mechanized to accommodate them. By the late 1960s, special log ships were being constructed. It was reported in 1968 (Boston Consulting Group 1968) that 20 such ships were in service and 36 were being built, with features such as multiple onboard cranes to handle heavy loads quickly, un- usually wide hatches, holds long enough to accommodate prevailing log lengths, an absence of decks within the hold that would be appropriate to packaged or palletized cargo, and strong decks and structures above the deck to accommodate open deck loads of logs. As with ships for other bulk commodities, the size of log ships has steadily increased. In the 1980s, cargos range from 3 to 7 million board feet. Operating steadily and with an average roundtrip time of 30 days, a ship carrying 4 million board feet can handle the harvest from two square miles of timberland in a yearmassuming 40,000 board feet per acre.
Log sales from North America are almost always measured in board feet (elsewhere, in cubic meters). This unit of measure creates problems for shippers because the ca-. pacity of a ship to carry logs is limited by the space available on board, not by weight. Unfortunately, the relation between the board-foot measure of a log and its volume depends on its diameter, length, and taper. Thus, a shipper cannot know exactly the
34

The Offshore Market as a Secondary Outlet
total board-foot volume that will match the capacity of any particular ship. Although stevedoring companies and exporters keep records of the board-foot loads carried previously by ships they have had experience with, the ever-changing mix of log sizes invites the use of ships that are safely beyond the capacity that seems to be needed. This problem at times has caused logs in a particular order to be left behind; more often, it has caused exporters to underuse ships. It is, in general, another reason for variation in shipping costs. The problem is more tractable, of course when exporters have multiship orders or long-term arrangements with buyers.
The economies of scale that have enlarged the size of specialized log ships have had far-reaching consequences. Traders must be prepared to handle such large vol- umes, finance them, and (usually) locate multiple buyers. In the supplying countries, logging and hauling companies are usually small enough that multiple trucking firms and log sources must be engaged to service the capacity of a single berth at a port. In a cross-Pacific voyage, a log ship spends 4 to 7 days loading, a similar period unloading, and 10 to 14 days in transit each way. To feed a busy port, as many as 200 truckloads must ardve daily at the staging area. The scale of an efficient log- exporting enterprise can be expected to encourage, and even require, that large tirms manage transactions of $2 million to $4 million dollars, each several times each month. The scale of individual transactions and the number of them involved in serv- icing a $2-billion-per-year line of commerce partly explain the presence of specialized trading companies and credit sources in this business.
Ownership of log ships is almost entirely outside North America. Most exporters based in North America resort to charters and deal with owners' agents who have offices in exporting regions. Both "spot" (one-trip charters) and long-term charters are used. People in the trade estimate that about 300 specialized log ships operate in the Pacific.
Industry observers and foreign participants in wood products trade have remarked, the latter with some frustration, on the tendency of U.S. producers to favor domestic markets (Darr 1984b, Drake 1984, Elchibegoff 1949, Simpson 1973, Wadsworth 1983). Policy often favors domestic use over export; either legislated (as in Canada [mentioned earlier], Indonesia, and Malaysia) or less formally (as in Chile). United States log sellers and mill people have at hand the world's largest market for wood products of all kinds; because of a shared language, an absence of currency- exchange-rate risks, and familiar marketing customs and banking processes, they respond quickly to price signals from U.S. buyers. For producers who regularly serve domestic demand, offshore markets often mean different commodity specifications.
A similar circumstance arose in British Columbia in the first decade of this century. With a building boom in Canada in general and in the Prairie Provinces in particular, mills formerly engaged in exporting dropped their overseas accounts and concen- trated on shipments eastward (Gillis and Roach 1986).
35
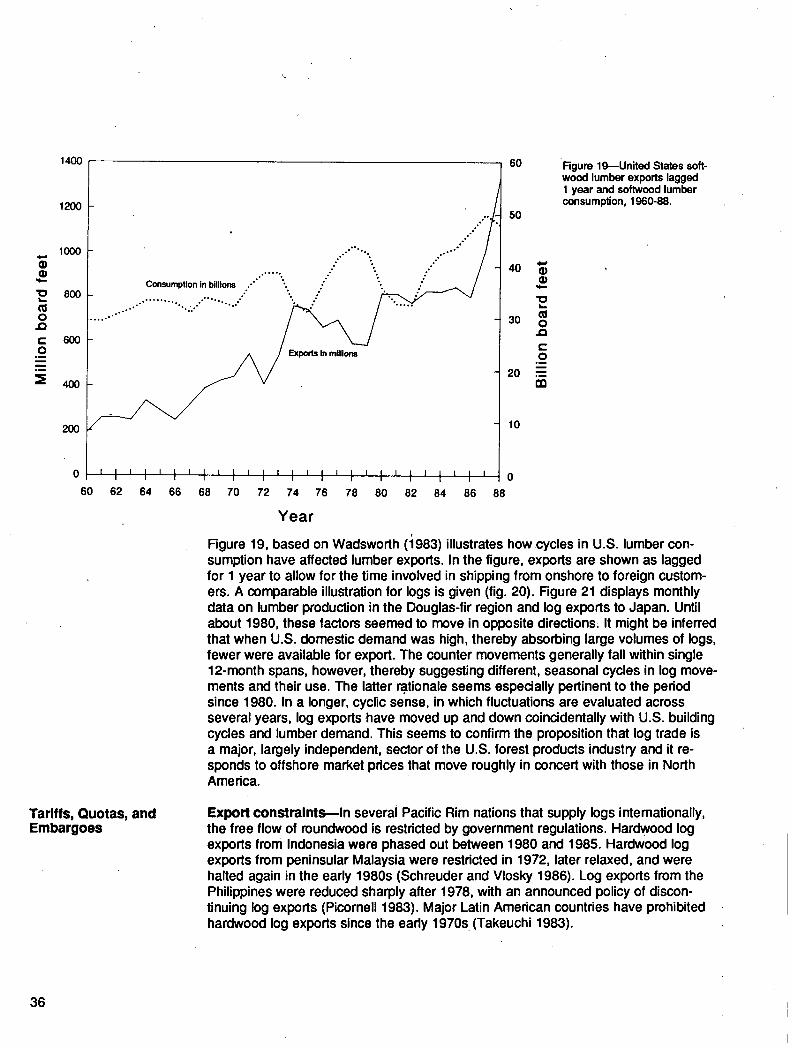
(9
2 m o
t - o
o ~
1400
1200
1000
800
6013
4130
200
, • , ° - • *
Consumption in billions .." °,
. , . - . . . . . . . . . , , , . . , . - " ' . , . . , , ,"
...•.,.-'•'"
60 62 64 66
• • ,
E x p o r t s In m i l l i o n s
60
68 70 72 74 76 78 80
Y e a r
,,o'°,
- ~ 0
82 84 86 88
50
Figure 19---Unitod States soft- wood lumber exports lagged 1 year and softwood lumber consumplJon, 1960-88.
40 " " Q) ."
"o L -
ca 30 O
JO ¢-, O , m
20 ,'= m
10
Figure 19, based on Wadsworth (1983) illustrates how cycles in U•S• lumber con- sumption have affected lumber exports. In the figure, exports are shown as lagged for 1 year to allow for the time involved in shipping from onshore to foreign custom- ers. A comparable illustration for logs is given (fig. 20). Figure 21 displays monthly data on lumber production in the Douglas-fir region and log exports to Japan. Until about 1980, these factors seemed to move in opposite directions; It might be inferred that when U.S. domestic demand was high, thereby absorbing large volumes of logs, fewer were available for export. The counter movements generally fall within single 12-month spans, however, thereby suggesting different, seasonal cycles in log move- ments and their use. The latter rationale seems especially pertinent to the period since 1980. In a longer, cyclic sense, in which fluctuations are evaluated across several years, log exports have moved up and down coinddentally with U.S. building cycles and lumber demand. This seems to confirm the proposition that log trade is a major, largely independent, sector of the U.S. forest products industry and it re- sponds to offshore market prices that move roughly in concert with those in North Amedca•
Tariffs, Quotas, and Embargoes
Export constraints--In several Pacific Rim nations that supply logs intemationally, the free flow of roundwood is restricted by government regulations• Hardwood log exports from Indonesia were phased out between 1980 and 1985. Hardwood log exports from peninsular Malaysia were restricted in 1972, later relaxed, and were halted again in the early 1980s (Schreuder and Vlosky 1986)• Log exports from the Philippines were reduced sharply after 1978, with an announced policy of discon- tinuing log exports (Picornell 1983). Major Latin American countries have prohibited hardwood log exports since the early 1970s (Takeuchi 1983).
36
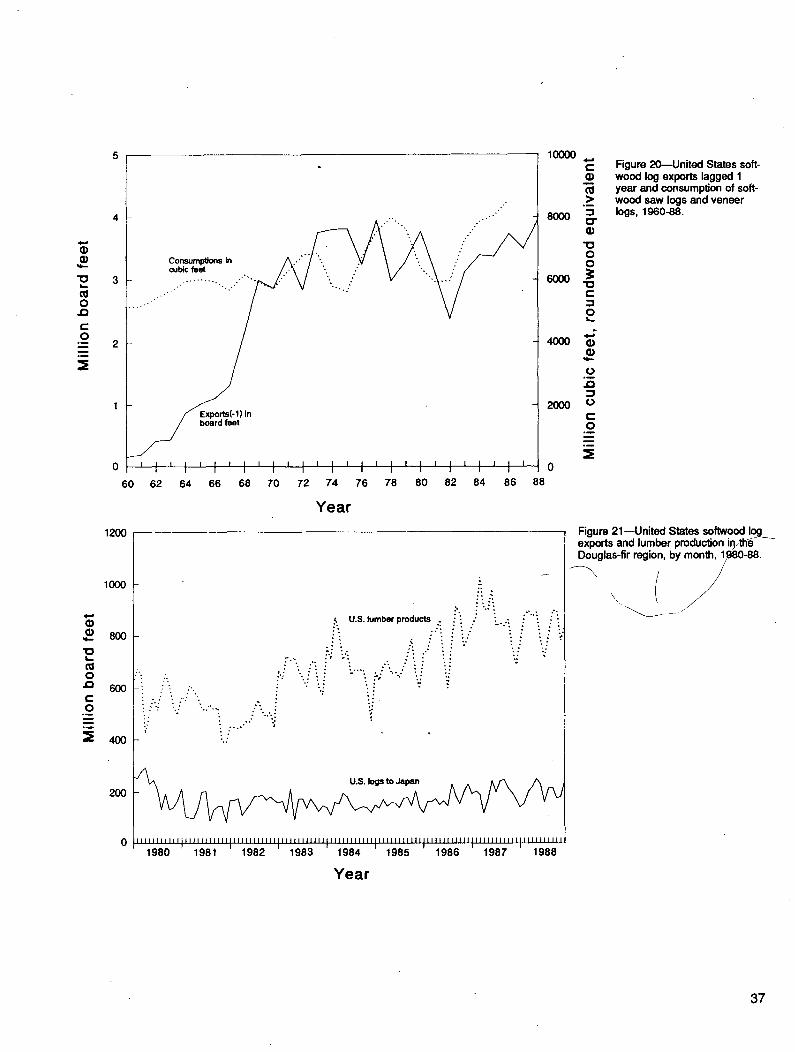
N . - .
i l l O t-J
t- O
o ~
: i
4 ..........
3 Ccl~nsumpitons In A . - " /
2
1 / i Exports(-1)in
~ board feet
0 I ' I I ' I I I I I ' I ' I ' I ' ' ' ' , j ,' ' ' ' j 0 60 62 64 66 68 70 72 74 76 78 80 82 84 86 88
Y e a r
1200
1000
80O N , . -
l o i . _
o~
o i ¢'~ 600 : e,-
.9
.'- " "-/tJ " - ! " : " : / " :".. i .: i~ :-/ '../: ':....... :" : : : .
. : . . o " " ", '.
101X~
8000 :3 ¢3"
'10 0 0
6 o o o ~ c
o
o , m
2000 0 t- O
... ! - . 4 o . - . . : : '%
~. U . S . l u m b e r p r o d u c t s . i i :: '-..". :. '. ~ : .:'.. :: . : : ' . : : - : : : : : ! ' : : . . . . o . : * - :
-:
200
I I i l l I I I I I I I I I i I I1'1 I I I I I I l l l l I l l l l I l l I I I I I I l l l I I I I I I I I I I [ I I I I l l l I 1 ( I I I I I I I I I I I I I I I I I I I I I I I I I I I ( I I I I I I I I I I I 1 I I I I I I I
1980 1981 1982 1983 1984 1985 1986 1987 1988
Y e a r
t - Figure 20--United States soft- wood log exports lagged 1
"~ year and consumption of soft- .>_. wood saw logs and veneer
logs, 1960-88.
Figure 21--United States softwood log exports and lumber production in.the- Douglas-fir region, by month, lji{10-88.
/
3 7
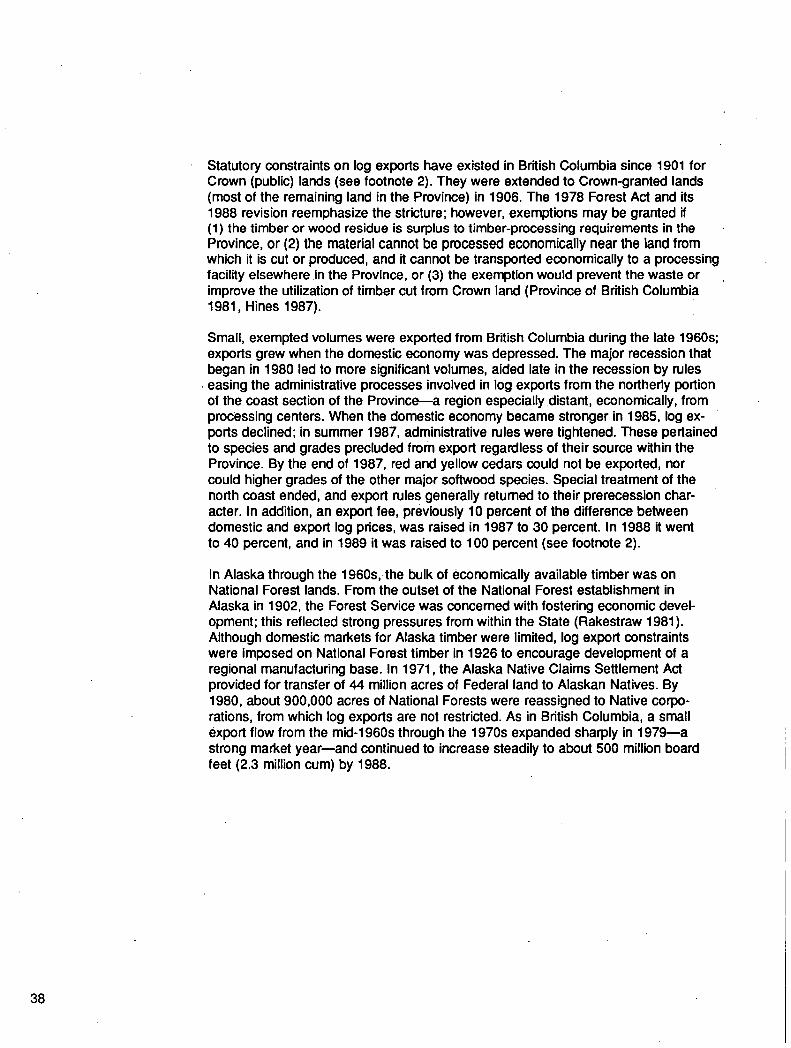
Statutory constraints on log exports have existed in British Columbia since 1901 for Crown (public) lands (see footnote 2). They were extended to Crown-granted lands (most of the remaining land in the Province) in 1906. The 1978 Forest ACt and its 1988 revision reemphasize the stricture; however, exemptions may be granted if (1) the timber or wood residue is surplus to timber-processing requirements in the Province, or (2) the material cannot be processed economically near the land from which it is cut or produced, and it cannot be transported economically to a processing facility elsewhere in the Province, or (3) the exemption would prevent the waste or improve the utilization of timber cut from Crown land (Province of British Columbia 1981, Hines 1987).
Small, exempted volumes were exported from British Columbia during the late 1960s; exports grew when the domestic economy was depressed. The major recession that began in 1980 led to more significant volumes, aided late in the recession by rules
• easing the administrative processes involved in log exports from the northerly portion of the coast section of the Province~a region especially distant, economically, from processing centers. When the domestic economy became stronger in 1985, log ex- ports declined; in summer 1987, administrative rules were tightened. These pertained to species and grades precluded from export regardless of their source within the Province. By the end of 1987, red and yellow cedars could not be exported, nor could higher grades of the other major softwood species. Special treatment of the north coast ended, and export rules generally returned to their prerecession char- acter. In addition, an export fee, previously 10 percent of the difference between domestic and export log prices, was raised in 1987 to 30 percent. In 1988 it went to 40 percent, and in 1989 it was raised to 100 percent (see footnote 2).
In Alaska through the 1960s, the bulk of economically available timber was on National Forest lands. From the outset of the National Forest establishment in Alaska in 1902, the Forest Service was concerned with fostering economic devel- opment; this reflected strong pressures from within the State (Rakestraw 1981). Although domestic markets for Alaska timber were limited, log export constraints were imposed on National Forest timber in 1926 to encourage development of a regional manufacturing base. In 1971, the Alaska Native Claims Settlement Act provided for transfer of 44 million acres of Federal land to Alaskan Natives. By 1980, about 900,000 acres of National Forests were reassigned to Native corpo- rations, from which log exports are not restricted. As in British Columbia, a small export flow from the mid-1960s through the 1970s expanded sharply in 1979--a strong market year--and continued to increase steadily to about 500 million board feet (2.3 million cum) by 1988.
38
Export limitations in other Western States followed a different historic path. Although concerns about incoming wood products led to tariffs as early as the 1850s, attention did not focus on exports until the 1930s, when relatively unprocessed squares left the West Coast for Asia. In 1964, as the pressure of unsalvaged windstorm timber abated, U.S. lumbermen noticed that Japanese log imports were continuing at a high level induced by rapid economic growth there, intensive home building, and declining harvests in Japanese forests. Prices of export logs were higher than those for logs used domestically, and export log prices were rising. Proposals emerged to halt log exports. Public attention was drawn to the issue and to studies that continued for more than 15 years (for example, Darr 1975, 1981; Darr and others 1980; Fisher 1964; Hamilton 1971; Haynes 1976; Pacific Power & Light Co. 1968; Stanford Re- search Institute 1974; U.S. Department of the Treasury 1968; U.S. Senate 1968, 1972; Washington Department of Natural Resources 1965; Wolf 1975).
Arguments for limiting and encouraging log exports were (and largely still are) as follows:
Constraining log exportsm
• Employment, especially in mills near ports, is reduced as logs are shunted away. • Limiting exports would provide more timber, at lower prices, to the U.S. market. • Keeping U.S. logs at home would reduce lumber imports from Canada or induce
lumber exports to former log customers; either would improve the U.S. trade balance.
• Exports from private lands intensify pressure on public timber supplies and, by expanding the total cut, extend environmental damage.
• By exporting timber inventories now, we foreclose future trade income and economic welfare.
Maintaining or expanding log exports m
• Log exporting has become an industry of its own, with significant employment and related local and regional economic activity.
• Overseas markets provide outlets for thinnings, salvage logs, and species lacking markets here.
• Log exports enhance stumpage prices for landowners, and if exports were permitted from Federal lands, taxpayers would benefit.
• High value of logs adds significantly to the U.S. trade balance, thereby increasing the value of the U.S. dollar.
• Free trade is demonstrably preferable economically. Restraints encourage retali- atidn and invite remedial reactions by the General Agreement on Tariffs and Trade (GATT), the European Economic Community (EEC), and other inter- national bodies.
39

It can be argued that at least some Asian purchases of logs occur only because mills there are subsidized and that, on their own, such mills could not afford to im- port logs. Absent the subsidy, such mills would close and those countries would import U.S. lumber. The matter is economically complex because of differences in labor and capital costs, product recovery, and the very different arrays of lumber products generated in the Far East and North America. To judge the economic tradeoffs, analysts must evaluate representative items from among the hundreds of lumber items used abroad (particularly in Japan) as well as from among the scores of species-size-grade combinations available from log producers. In addition, there are significant.complexities in transport economics, with a large fraction of lumber shipments using containers that would otherwise return to Asia empty; some lumber being shipped in general-cargo ships that carry freight wherever they go; and logs moving in multipurpose ships as well as specialized log carders, the latter returning to North America empty. Costs of each kind of transport change according to factors outside the log trade, including demand in North America for other goods and the changing inventory of ships in the Pacific.
From a succession of analyses and political issues have emerged a series of govern- mental decisions to restrict or continue U.S. log exports. In 1961, the State of Oregon placed an embargo on the export of timber from State-owned lands but exempted Port-Orford-cedar (Austin 1969). In April 1968, the Secretaries of the Interior and Agriculture promulgated plans developed by the Bureau of Land Management and the Forest Service to limit log exports from Federal lands in Washington and Oregon to 350 million board feet (about 1575 cum) per year, except for Port-Orford-cedar. Primary manufacture in the United States would be met by producing export cants sawn on two sides, 8 inches or less in thickness. In that year also, Congress passed the Morse Amendment to the Foreign Assistance Act of 1968 (82 Stat. 966), which superseded the agencies' policy by applying the same quantity limit to all Federal lands in the West, except Alaska. Port-Orford-cedar and western redcedar were exempted, and provision was made for exempting other species deemed surplus by the agencies. The amendment was set to expire at the end of 1971 (Austin 1973). In the same year, Washington State voters rejected an initiativethat would have required primary processing of timber from the 2 million acres Of State-owned forest land.
The Federal restriction was ultimately extended indefinitely with minor revisions, including a provision for exempting grades as well as specie s (Lindell 1978). By 1974, the thickness limitation had been expanded slightly to 8-3/4 inches (slightly over 22 Cm). In 1974, California legislated an end to export of State-owned timber.
A provision of the Export Administration Act of 1§79 (15 CFR 377.7) provided for a phased halt to export of western redcedar logs and waney cants from Federal- and State-owned lands, to become fully effective in late 1982 (Hines 1987). This action reflected concern about supplies of old-growth western redcedar for shakes, shingles, and lumber.
40
In 1984, the U,S. Supreme Court concluded that the State of Alaska, in restraining export of logs from State-owned lands, violated the commerce clause of the U.S. Constitution. Oregon's reaction was to announce that it would no longer enforce its export ban, and California decided to continue to constrain exports of State-owned timber until directed otherwise by the courts (Hines 1987). Idaho's statute prohibiting export of State-sold logs was subsequently repealed.
In 1989, a year of record log exports from the Pacific Northwest, intense public interest developed in the region about declining timber supplies, Federal forest withdrawals from timber harvest for spotted-owl protection, declining acreages of remaining old-growth timber, and recent and projected declines in employment in the forest industry. Congress considered proposals to allow States to halt exports of State-owned timber. A referendum on the subject in Oregon led to enabling legislation there, and legislative committees in Washington and California began studies of timber-supply issues.
At issue throughout the 25 years just reviewed was the substitution by exporters of timber harvested from Federal lands for privately owned timber that they sold for shipment abroad (Lawton and Gish 1969, Lindel11980, Reifenberg 1979). Federal and California laws established provisions to prevent this direct substitution. Indirect or third-party substitution, which is legal, occurs when log-exporting mills purchase Federal logs from other, third, pa/ties. The U.S. General Accounting Office (1985) estimates that about 100 million board feet (about 450,000 cum) of annual log ex- ports is related to third-party substitution. With about 3.7 billion board feet of soft- wood logs exported from the United States in 1985, the estimated third-party vol- ume was less than 3 percent.
Import tariffs--Just as most countries are reluctant to export unprocessed raw materials, so are they pleased to receive them. Indeed, tadffs~like freight rates-- generally become progressively higher with the degree of manufacture of imports. For example, in 1977 in the Philippines, the average tariff rate for wood in the rough was 10 percent, that for primary wood products was 39 percent, and the rate for sec- ondary wood products was 85 percent (United Nations 1983). Comparable figures for South Korea in 1976 were 14, 33, and 54 percent. The United States has no tariff on incoming softwood logs, but in 1986 imposed a 35-percent tariff on Canadian cedar shakes and shingles, reduced it to 20 percent in late 1988, and scheduled further annual reductions until the tariff ends in 1991. In lieu:of a tariff, the United States has induced Canada to impose a 15-percent export fee on softwood lumber bound for the United States. There is a U.S. tariff of 20 percent on inbound softwood plywood. (For imports from Canada, the bilateral free trade agreement concluded in 1987 provides that these tariffs will decline to zero within 10 years.) Canada imposes no tariff on logs or lumber, but it has a 15-percent tariff on softwood plywood. Japan's import duty structure is comparable, with a gradual but steady reduction in tariffs responding to U.S. pressure (Darr 1984b, Radcliffe 1981). Korea has no duty on log imports, and Taiwan's is small.
41
Other Political Factors Unlike international transactions in most commodities, governments play little role in managing log purchases. An exception is China, where three federal corporations account for the majority of log imports. Until 1989, importing prerogatives were being decentralized gradually, however, so that individual provinces and special economic zones could make independent purchases.
A number of political measures translate immediately or ultimately into economic elements that encourage or retard trade in softwood logs. In industrialized countries, monetary policies undertaken to manage the domestic economy or affect currency values typically include adjustment of short-term interest rates. Changes in short-term rates ripple into long-term capital markets and, thus, into mortgage rates. Interest rates have been managed centrally and closely in Canada, the United States, and Japan during the 1980s.
Around the Pacific Rim, federal and local housing programs have had various ob- jectives including housing the poor, revitalizing neighborhoods, providing high-rise housing close to metropolitan centers, and improving the quality of shelter in rural areas. Some of these programs indirectly provide improvements such as delivery of community water systems, electricity, and fire protection. Objectives of housing programs generally do not include encouraging more use of wood, and programs such as those in China, in which wood is specifically proscribed, do not benefit the trade directly. Rising economic w e l f a r e and improved conditions associated with such programs can be expected to raise the aspirations of dwellers toward " b e t t e r " :
homes, which typically include not only more wood as a consequence of larger floor space, but also a greateruse of wood in decoration. In this vein, the federal housing incentives put in place in Japan in the mid-1980s encouraged more wood use even as the average size of homes in Japan declined.
As with housing, governments intervene in the economy to encourage investment, either directly with lower interest rates or indirectly by encouraging savings, discour - aging consumption, or providing tax incentives such as investment credits and accel- erated depredation rates. In Japan, for instance, types of individual savings and certain kinds of corporate investment have been deductible. Too, interest rates to business borrowers have been lower in Japan than in most Asian countries. In Korea, investments meeting high-priority national goals have been offered various tax exemptions and double depreciation (U.S. Department of Commerce 1983).
o_
World traders confront a variety of trade laws and administrative rules governing inspection, currency movements, grades and standards, customs, credit, duty pay- ments, incorporation, and the like. In addition, maritime law covering liability for shipping losses and delays is complex. Troublesome as the considerable body of regulation can be, international trade is especially difficult in circumstances where commercial codes are nonexistent or are in flux, such as in China.
Banking laws and regulations on foreign exchange draw the detailed attention of North American exporters who retain title to shipments until they arrive at their destinations, because of the difficulty of repatriating profits in dollars from some countries. Related to this matter are changes in exchange rates that, having been freed to float since theearly 1970s, sometimes move abruptly, driven by either market forces or government interventions.
42
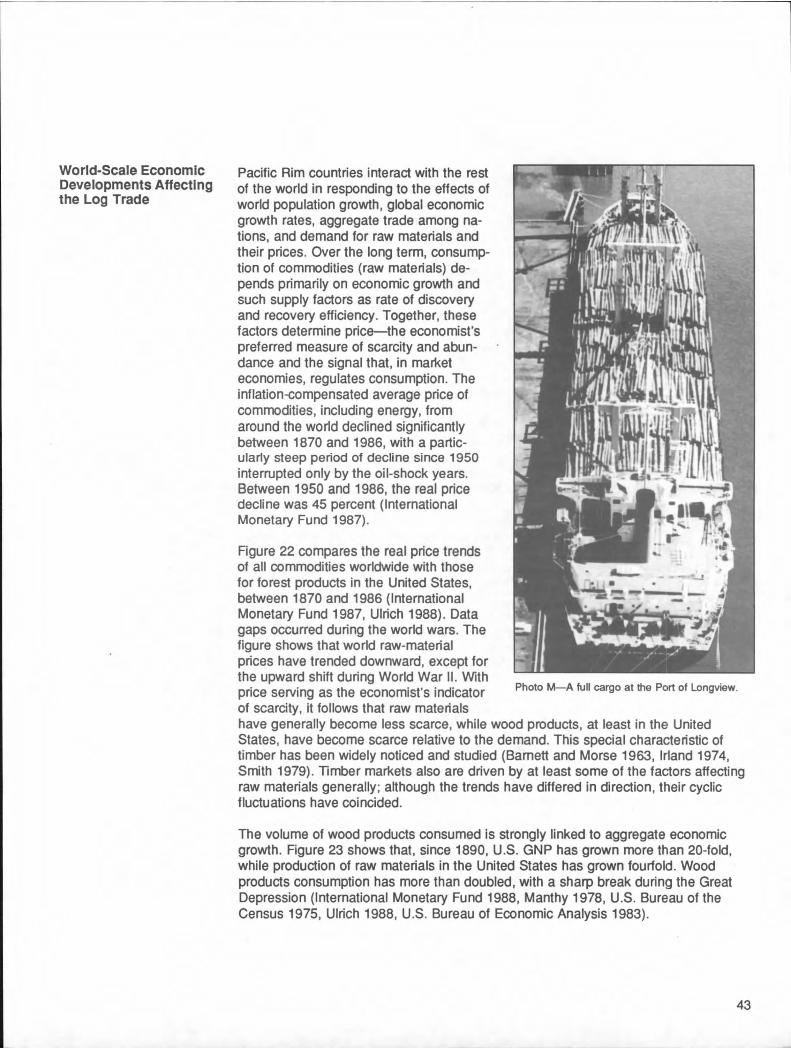
World-Scale Economic Developments Affecting the Log Trade
Pacific Rim countries interact with the rest of the world in responding to the effects of world population growth, global economic growth rates, aggregate trade among na- tions, and demand for raw materials and their prices. Over the long term, consump- tion of commodities (raw materials) de- pends primarily on economic growth and such supply factors as rate of discovery and recovery efficiency. Together, these factors determine price--the economist's preferred measure of scarcity and abun- dance and the signal that, in market economies, regulates consumption. The inflation-compensated average price of commodities, including energy, from around the world declined significantly between 1870 and 1986, with a partic- ularly steep period of decline since 1950 interrupted only by the oil-shock years. Between 1950 and 1986, the real price decline was 45 percent (International Monetary Fund 1987).
Figure 22 compares the real price trends of all commodities worldwide with those for forest products in the United States, between 1870 and 1986 (International Monetary Fund 1987, Ulrich 1988). Data gaps occurred during the world wars. The figure shows that world raw-material prices have trended downward, except for the upward shift during World War II. With price serving as the economist's indicator Photo M--A full cargo at the Port of Longview.
of scarcity, it follows that raw materials have generally become less scarce, while wood products, at least in the United States, have become scarce relative to the demand. This special characteristic of timber has been widely noticed and studied (Bamett and Morse 1963, Irland 1974, Smith 1979). Timber markets also are driven by at least some of the factors affecting raw materials generally; although the trends have differed in direction, their cyclic fluctuations have coincided.
The volume of wood products consumed is strongly linked to aggregate economic growth. Figure 23 shows that, since 1890, U.S. GNP has grown more than 20-fold, while production of raw materials in the United States has grown fourfold. Wood products consumption has more than doubled, with a sharp break during the Great Depression (International Monetary Fund 1988, Manthy 1978, U.S. Bureau of the Census 1975, Ulrich 1988, U.S. Bureau of Economic Analysis 1983).
43

160
140
120
0 0 ~ - 100 II
¢JD O~ 80
~ 6O "0 e'-
40
20
. ; i i i /
... '....." ' , '" . - " "
• . . . . . " • • .. -.:
: ' . U.S. lumber pr ices . . . - ' ° . : - . . . , . " . . . :
. . . . , . . . % . . . . . . . . . . . . . . , .
0 ~ 1 ~ 1 ~ 1 ~ i i ~ t ~ I ~ i ~ t ~ i ~ j ~ 1 ~ t ~ ~ l ~ t ~ i ~ I I 1 I I I I I I I I
1870 1880 1890 1900 1910 1920 1930 1940 1950 1960 1970 1980
Year
Figure 22--Wodd raw material prices and U.S. lumber prices, inflation adjusted, 1870-1988 Data for the r a w materials prices were interpolated for the years 1914-20 and 1939-49
800
600
I=.
0
c o n s u m p t i o n ~ . ~ i n d e x .*::"
:...°-" , .,,'..."
R a w material use, index . , . .
. . . . , - . . . . . ° . , " °,...-"
V , . ; . , . ;
. . . ° ' * ' " . . , . . * ,o
, , . . . . : ;." . . . . . . . . - "~
G N P at 1958 prices
4OO
200
120
100
80
60
40
20
0 ~ 0 1870 1880 1890 1900 1910 1920 1930 1940 1950 1960 1970
Y e a r
Figure 23~A century of gross national product, raw material use, and wood products consumption
O O
II p,. ¢O
X (9 "10 ¢.-
44
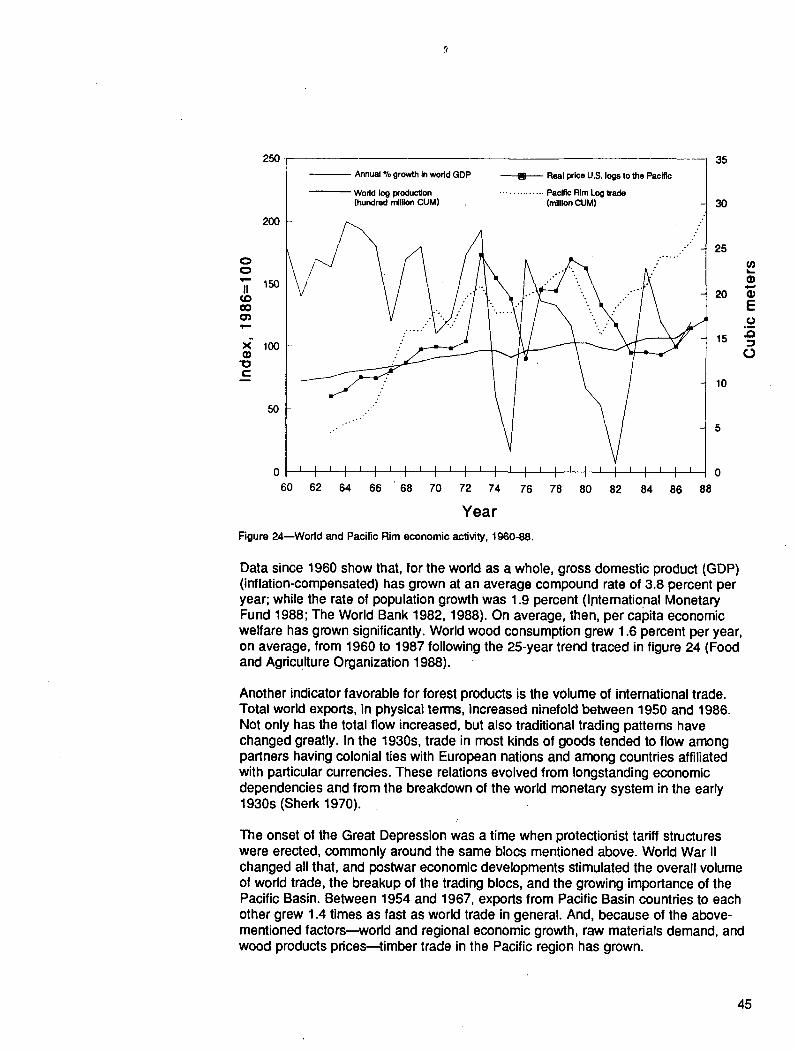
250
II ¢.D OO O3
x" 0)
"10 t -
200
150
100
50
Annual % growth In world GDP
World log production (hundred million CUM)
• .. ~ l P
rj(7•-" ... o
i I I
Real price U.S. logs to the Pacific
.............. Pacific Rim tog trade (million CUM)
o-
0
60 62 64 66 68 70 72 74 76 78 80 82 84 86 88
Year
Figure 2 4 - - W o d d and Pacific Rim economic activity, 1960-88.
35
30
25
20
15
10
Data since 1960 show that, for the world as a whole, gross domestic product (GDP) (inflation-compensated) has grown at an average compound rate of 3.8 percent per year; while the rate of population growth was 1.9 percent (Ir~tematio.nal Monetary Fund 1988; The World Bank 1982, 1988). On average, then, per capita economic welfare has grown significantly. World wood consumption grew 1.6 percent per year, on average, from 1960 to 1987 following the 25-year trend traced in figure 24 (Food and Agriculture Organization 1988).
Another indicator favorable for forest products is the volume of international trade. Total world exports, in physical terms, increased ninefold between 1950 and 1986. Not only has the total flow increased, but also traditional trading patterns have changed greatly. In the 1930s, trade in most kinds of goods tended to flow among partners having colonial ties with European nations and among countries affiliated with particular currencies. These relations evolved from longstanding economic dependencies and from the breakdown of the world monetary system in the early 1930s (Sherk 1970).
The onset of the Great Depression was a time when protectionist tariff structures were erected, commonly around the same blocs mentioned above. World War II changed all that, and postwar economic developments stimulated the overall volume of world trade, the breakup of the trading blocs, and the growing importance of the Pacific Basin. Between 1954 and 1967, exports from Pacific Basin countries to each other grew 1.4 times as fast as world trade in general. And, because of the above- mentioned factors~world and regional economic growth, raw materials demand, and wood products prices--timber trade in the Pacific region has grown.
U~ I = .
0)
E O
o u .ID
(3
45
Species Preferences and the EXPOrt Premium
A wide disparity in all these economic factors exists among nations, to the advantage of timber trade. Softwood logs are employed in commodities whose use is closely linked to the rates of economic growth of the using nations. Between 1965 and 1987, the average economic growth rates of industrial countries was 3.2 percent; for Asian nations, it was 5.4 percent (International Monetary Fund 1988). Gross national prod- uct per capita grew 2.4 percent in industrial countries; the average rate in China, Korea, and Taiwan (potential markets for softwoods) was 4.9 percent.
World economic trends more specific to softwood log consumption in the 1980s are both favorable and unfavorable for thetrade. New pulping processes permit sub- stitution of light-colored hardwoods for softwoods in production of printing papers. Several techniques permit an economic scale of production smaller than in kraft pulp plants, thereby letting firms and countries with limited capital enter the business. On the other hand, softwoods are being tried extensively and used modestly in replacing Southeast Asian hardwoods in Asian furniture production. Housing styles and archi- tectural preferences for wood are in constant evolution, exemplified by the emerging use of platform rather than post-and-beam construction in Japan, with the platform more adaptable to North American products. It is estimated that the 2-by-4 construc- tion grew from25,000 to about 50,000 units between 1986 and 1989. As per capita incomes increase in developing Asian nations, consumption of housing and housing services are expected to increa.se toward levels in industrialized countries.
Throughout the recent 25-year history of softwood log trade around the Pacific, there has been a preference for light-colored defect-free, close-grained woods, which re- flects the use of premium-grade woods in Japanese homes, where wood paneling and exposed structural members are important features of interior decor. In addition, traditional construction methods involving patient hand joinery of the framework has employed appearance-grade material as an indicator of taste and quality, even though the construction will be obscured by wall coverings and sidings. Prices, therefore, have been especially high for old-growth selects in spruce, hemlock, and true firs. Especially valuable has been piano-grade Sitka spruce from Alaska at the upper end of the range of North American softwood log values, which span $200 to $3500 per Mbf at dockside. Also at the upper end are Port-Orford-cedar, an aromatic western Oregon wood used sparingly (because of its cost) in cabinets andstorage chests, and Alaska-cedar, an aromatic gold-colored wood that is strong structurally relative to other cedars but with the excellent working properties and decay resistance of the other species.
With old-growth supplies declining steadily in North America, prices of upper grade, close-grained logs have risen relative to prices of the mid-graded and lower graded timber, which are in the majority. For instance, in Japan in 1978, Alaska prime spruce cants were worth three times as much as U.S. number 3 hemlock logs; by 1989, the multiple had increased to almost six.
46
Entry of Korea and China into the log market in the 1970s and 1980s, respectively, expanded demand for lower graded logs because appearance grades are less impor- tant in those countries. Demand for close-grained, low-defect, low-taper, straight logs nonetheless has continued to be strong enough that, on average, export logs have had higher value than logs going to domestic processing. A Puget Sound logger can expect to receive nearly the same price for a truckload of second-growth 8-inch logs destined for Korea as for the same load headed to a local mill yard, assuming uni- form, straight pieces. But an operator harvesting 18-inch old-growth logs would expect the value of that load to be determined by the offshore market, alt.hough it might move to a U.S. mill cutting for the premium U.S. finish grade market. Both on average and within the standard grades, export logs command a premium of 25 to several hundred percent.
BecatJse export logs are generally higher graded than domestic logs, the apparent export premiums of several hundred percent usually reflect quality differences as well as destination differences. The export premium within a log grade may also involve a quality differential, with offshore demand centered on logs at the upper end of the grade. It therefore is difficult to estimate from price-by-grade data the export premium for logs of identical quality. Adding to the difficulty is the fact that export logs involve slightly greater handling and (dockside) storage costs. Too, domestic log prices are typically reported from inland sorting yards or purchasing sites, and export prices are more apt to come from the docks after inland sorting and transport to the coast. We have estimated that these transport-sort-handling differences average $45 per Mbf in the Douglas-fir region. 3
After accounting for these cost differences, export logs should be the same price as domestic logs in a free market. But U.S. limitations on exports of logs from Federal lands (virtually all such logs are old-growth) create a barrier that raises offshore log prices and reduces domestic prices. We have estimated that, in early 1988, the re- sulting export price premium for old-growth logs was about $400 per Mbf, and the premium for second-growth logs, whose export is almost unrestricted, was only about $25 per Mbf. 4
3 Flora, Donald F.; McGinnis, Wendy J. 1989. The export premium. Unpublished report on file with: Trade Research Unit, Pacific Northwest Research Station, 4043 Roosevelt Way NE, Seattle, WA 98105.
4 Flora, Donald F.; McGinnis, Wendy J. 1989. Causality analysis: two approaches applied to the timber harvest-log export linkage. Seattle, WA: Pacific Northwest Research Station. 13 p. Office report on file with: Trade Research Unit, Pacific Northwest Research Station, 4043 Roosevelt Way NE, Seattle, WA 98105.
47

Part II1: Determinants, Interactions, and Reaction Times in the Log Trade
In General
Log Demand
As Part II suggests, demand for wood products around the Pacific Rim can be attributed to a chain of causal factors: a country's general economic health and interest rates determine home building and con- struction activity, which draw wood products imports and manufacture. Within this chain are a number of significant factors. Similarly, log sup-
Photo N--A rack of export logs. Tags permit accounting for each log, per- haps throughout several transactions.
plies are affected by technical and economic factors. Demand and supply, their interconnections, and their relative dynamics are discussed here.
There is a tight link between economic changes in the United States and those in Japan. The general economies move together within a month or two of each other. Although housing activity differs in the short run, cyclic movements are similar. Thus U.S. and Japanese wood products demands generally move together. Lags between lumber prices and production changes in Japanese and U.S. export-log market change are on the order of a month.
Almost universally, a country's economic growth and industrial activity account for some fraction of wood consumption, quite aside from housing. Around much of the Pacific Rim, residential construction accounts for relatively little wood consumption because of traditional use of concrete, tile, and other earth-based materials. In the econometric analysis described later, it was found that GNP has been a highly sig- nificant determinant of import log demand in Japan, China, Korea, and Taiwan, which comprise all the softwood-log-consuming countries studied. In Japan, housing is a major user of wood. Industrial production, another component of GNP, accounts for substantial fractions of wood consumption and, therefore, log imports in all four coun- tries. Changes in industrial production therefore help to account for changes in wood imports.
Within the construction sector, housing starts have been a less important indicator of log imports than has the area of wood-based construction in Korea and Japan, where such data are available. The floor area of new wooden structures (houses plus busi- ness and industrial buildings) has been a more consistent explanatory factor than the area of wood-based houses alone. It is significant, though, that during the early 1980s, the floor area per dwelling unit declined in Japan for both wood and nonwood houses, with the average size of wooden homes stabilizing in the mid-1980s and turning slightly upward when the number of housing starts rose.
48
Denney

Monetary policy adopted to regulate the economy has a strong influence on housing in the log consuming countries of the Pacific Rim, as it does in the United States. There is great variation in that sensitivity, though, depending partly on the degree to which a nation's economy is subject to cyclic fluctuations. Fluctuations generally are associated with credit-oriented, advanced market economies and with countries closely tied to such nations. Sensitivity also depends on the degree to which mon- etary policy is used to regulate the economy and to which interest rates are allowed to fluctuate with those of the world.
Currency exchange rates have several short- and long-term effects on demand for imported timber. Although the industrialized countries of the world agreed in the early 1970s to let their currencies float relative to each other, in fact, most nations (includ- ing the United States) manage the value of their currency either by directly controlling its exchange value or by such indirect methods as regulating interest rates and buy- ing and selling their own or other nations' currency.
An abrupt increase in the value of a currency, such as happened to the yen.in 1985, has four effects on log trade.
1. A windfall is created for Japanese buyers holding contracts with the price specified in U.S. dollars, as is common in log transactions. The 12-percent gain in purchasing power of the yen in late 1985 benefitted buyers to that extent without injuring sellers.
2. Sellers are able to negotiate dollar prices upward by arguing that buyers should share their unearned gain. Between late 1985 and mid-1986, the yen gained 30 per- cent relative to the dollar, which suggests that dollar prices of logs would have risen about 15 percent had buyers and sellers "split the difference." From mid-1985 to mid-1986, log prices actually rose about 12 percent in U.S. dollars.
3. A third kind of effect is indirect but nonetheless important for forest products. These consequences are changes in the national economy at large. They are especially sig- nificant in countries heavily dependent on trade or deeply involved in international movements of capital. During 1986, Japan's economy was depressed significantly by the decline in the value of the UoS. dollar, because it reduced the capacity of the United States to buy goods offshore; Japan's exports are equivalent to about one- third of that country's GNP, and about half of those exports go to the United States. Reduced demand from the United States exacerbated for Japan the flat economy of the world at large. Japan's economic growth rate, which has been twice that of the United States, declined to the U.S. level. Housing starts fell and, thus, demand for imported logs.
4. A combination of price adjustments and a recession-induced plateau in the trend in the value of the yen allowed Japan's exports to recover. This occurred 18 months after the start of the dollar's sharp decline. For several reasons including Japan's renewed interest in timber imports, log prices in U.S. dollars were at near-record highs by then.
49
Log Supply
In other log-consuming countries of the Pacific Rim, the effects of the dollar's deval- uation were negligible because, for various reasons, their currencies fell at least as much as the U.S. dollar. China's currency declined because of foreign-exchange problems; Korea's because of monetary policy and the world recession.
Exchange rates are significant for the supply of logs from competing countries. During the U.S. dollar's rapid decline (1985-86), Canada's monetary policy regulated the value of the Canadian dollar. With adjustment of interest rates and some buying and selling of currency, Canada's central bank held the value of the Canadian dollar within a percentage point or two of its former position relative to the U.S. dollar. Over the 18 months, the number of Chilean pesos per U.S. dollar doubled; however, half of this change was attributable to inflation. Only 50 percent of the change represented a real improvement in the competitive position of Chile relative to the United States in offering logs to Pacific Rim customers. A sharp increase in purchases of Chilean logs and other wood products followed. On the other hand, New Zealand (which competes with Chile in supplying radiata pine) experienced an increase in the value of its cur- rency relative to the U.S. dollar, thus reducing its capacity to compete in the log market. Purchases declined.
On the supply side, the economic availability of timber for cutting is clearly a supply determinant over the long term. Year to year, the volume of economically mature timber available on the stump represents only a ceiling on roundwood supply. In supply countries like Canada and the United States, this ceiling is very high. Along the British Columbia coast, for example, there are more than 200 billion board feet (a trillion cubic meters) of timber that is economically available during periods of strong markets (Flora 1986, Morrison and others 1985, Williams and Gasson 1986).
In Chile, New Zealand, and Japan, log supply is distinctly related to the amount of timber reaching economic maturity. For Chile, the area of plantations reaching age 23 is useful in explaining export supply; in that country, exports are based primarily on their 3 million acres of radiata pine plantations. The same is true of New Zealand, where the total plantation area is slightly less than that in Chile. In Japan, domestic forests provide only about one-third of domestic log consumption. Natural stands, heavily depleted during World War II, have been replaced by about 25 million acres of plantations, mostly softwoods. Management plans were largely frustrated by labor costs that were higher than expected, which sharply limited the amount of precom- mercial thinning done. A result has been dense, heavily stocked stands slow to reach merchantable diameters. It is not surprising, then, that Japan's use of domestic logs (and therefore its log-import demand) is strongly correlated with the acreage of plantations reaching age 40.
For various reasons, including promotion of domestic economic development and employment~ several nations have let domestic demand take precedence over export sales. Canada and New Zealand are notable among softwood suppliers, Indonesia and the Philippines among hardwood producers.
50

Interactions Among Trade-Related Economic Elements
We mentioned earlier that U.S. domestic demand does not seem to dominate export supplies. The export industry has become a sector unto itself, thereby reflecting (1) its magnitude (equal to the private harvest in Washington State, principal source of log exports); (2) the passage of time, with 25 years having passed since the export in- dustry became important in the early 1960s; (3) growing product differentiation in ex- port merchandising and movement; and (4) product specialization with distinct species preferences, use-specific grades, and special scaling and bucking practices.
Year-to-year U.S. export activity is correlated with westem Washington harvest levels (Flora and Vlosky 1986). Detailed analysis of the causality involved (see footnote 4) shows that exports apparently are not propelled by Northwest cutting levels; rather, cutting and shipments respond to export log prices.
Recent cyclic behavior of the world's economy has produced the widespread impres- sion that major perturbations are most apt to occur in the United States, the wodd's largest economy, home of the most active financial markets, and site of the largest amount of credit and debt. Increasing trade connections among industrialized nations in general, and Pacific Rim countries in particular, raise questions about the dynam- ics of trading in raw materials. Do demand changes in Japan, the principal consum- ing country follow or coincide with similar changes in the United States? Can U.S. export prices and fluctuations in export volumes be explained by Japanese demand factors? Do economic trends create an echo across the Pacific, with the demand for wood products responding weeks or months later to drive log prices along the Pacific Northwest coast? If so, how long are the lags? Are they reliable enough for market forecasting? Within Japan, are stable relations found among the basic drivers: wood- product demand, log prices, and log consumption? This section and the next will deal with these questions.
Photo O--A China-bound deck of second-growth logs.
51
The tabulation below shows the degree of correlation among major determinants of timber activity in the United States and Japan. The first entry, for example, shows that GNP in the United States has a correlation of 0.99 with GNP in Japan. The nu- merical entry is the simple correlation coefficient, known to statistidans as R or r, which ranges between 0 and 1.0. The validity of this measure depends on the amount of data represented. Twenty-four units of annual data are reflected in this table. With that number of observations, any r less than 0.40 is not significant. Also important is that the coefficient, however high, does not measure causality, just correlation. The following tabulation compares Japan with the United States:
Economic factor Correlation (r)
GNP 0 .99 Industrial production .78 Interest rates .88 Housing activity .57
The entries for annual data show strong correlation between major economic drivers in the two countries. A further reservation is in order, however: The strong correlation is attributable to the economies of Japan and the United States having moved to- gether in multiyear, cyclic waves (figs. 25-27). Shorter term fluctuations may be quite different between the two economies. Some economic factors, such as housing, are quite seasonal, as discussed later. Seasonality aside, the U.S. timber economy may experience short-term stimuli or depressants, such as regional building booms or work stoppages, not affecting Japan, and vice versa. The cross-dynamics of several- month phenomena, of intense interest to market analysts doing quarterly and annual forecasting, can be studied with monthly or quarterly data; quarterly data are used here to avoid the static that appears in monthly economic numbers. The tabulation below shows the relation of quarterly changes in the economies of Japan and the United States:
Economic factor Correlation (r)
GNP 0.26 Industrial production .42 Interest rate .28 Housing activity .68
These correlations are much smaller than in the previous tabulation; two are not significantly better than zero. Quarterly changes in housing construction are more closely related than are annual levels. The generally lower correlations mean that, while one can expect large waves to move together, ripples may differ in their timing and intensity considerably.
52
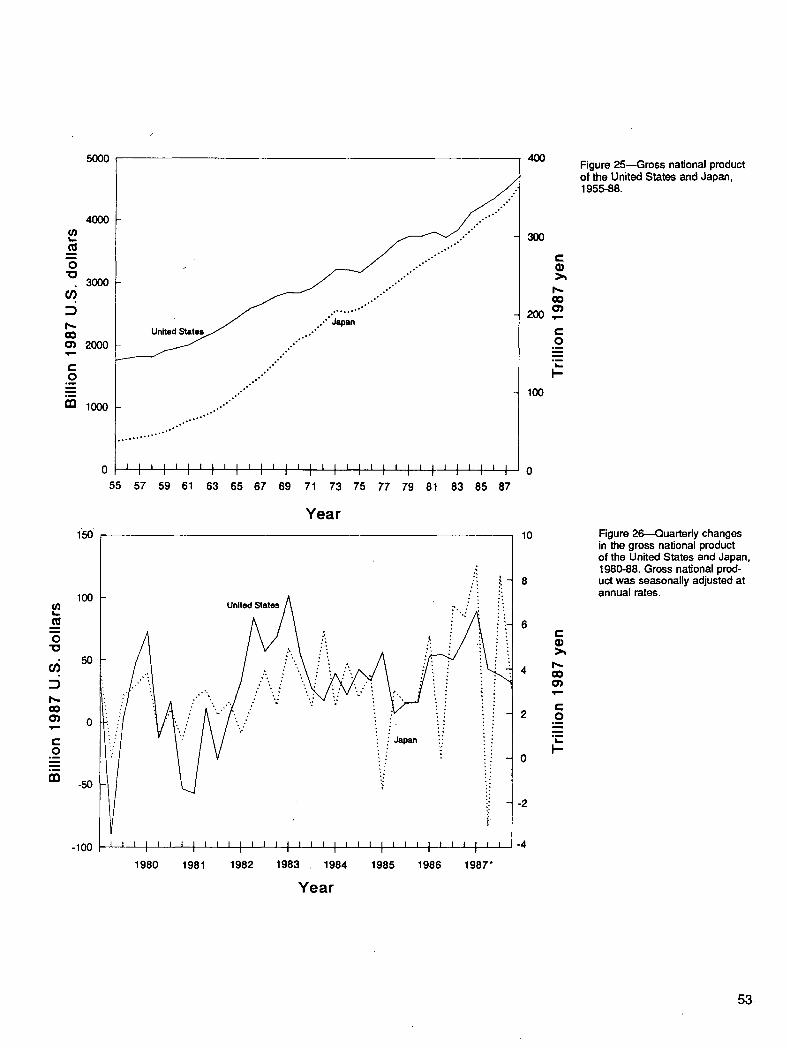
5000
4000
L _
0
• 3000
o~ 2000
c O . m
. i
I~ 1000
1so
..°'" ."
. . . . . '"" °.o......""
I I I I I I I I I I I I I I I I I I I I I I I I I I I I I I I I I I I I I I I I I I I I I I I
55 57 59 61 63 65 67 69 71 73 75 77 79 81 83 85 87
Y e a r
100(- United States A i " , ." i ~
.~ :': ~ i i i
so
o
?,
-100
1980 1981 1982 1983 . 1984 1985 1986 1987"
Y e a r
4O0
3)O
e-
200 ,,. t- O . i
, I t , .
l - 100
10
6 c 3~
4 Qo o~ V I
c 2 .2
I- 0
-2
-4
Figure 25--Gross national product of the United States and Japan, 1955-88
Figure 26--Quarterly changes in ~e gross national product of the United States and Japan, 1980-88 Gross national prod uct was seasonally adjusted at annual rates
53

O
II ¢O O~
x" "10 ¢- i
160
140
120
100
80
,.o ."'
. . , : : " , : " : :" \ .
. . . ~ Un i ted S t a t e s
I I l l I I I I I I I I I I I { t l I I I I I I I I l l I I I I I I I I I l l l l l l l l l l I I I l l t l l l I I t t l l l I I I I I I I11 I11 I I I I I l l l l I I I I f t I I I I I l J l l l l l l l I I I I I I I I I
1980 1981 1982 1983 1984 1985 1986 1987 1988
Figure 27--Industrial produc- tion in the United States and Japan, by month, 1980-88.
Year
The next tabulation deals with Japan alone. With quarterly data for 1975 through 1987, correlations were estimated between presumably closely related pairs of economic indicators; for example, GNP and industrial production, or interest rates and housing:
This Indicator: And this one: Have this
correlation:
GNP Industrial production 0.99 Yen-dollar exchange Industrial production -.72 Industrial production Interest rate , -.73 Interest rate Housing (area) -.67 Housing (area) Lumber production .89 Housing (area) Lumber price .71 Housing (area) Log price .81 Lumber production Log price .82 Lumber price Log price .87 Lumber production Log volume from
United States .61 Lumber productio n Import log price .81 Lumber price Log volume from
' United States .79 Lumber price Import price. .84 Housing (area) Log volume from
United States .69 Housing (area) Import log price .78
54
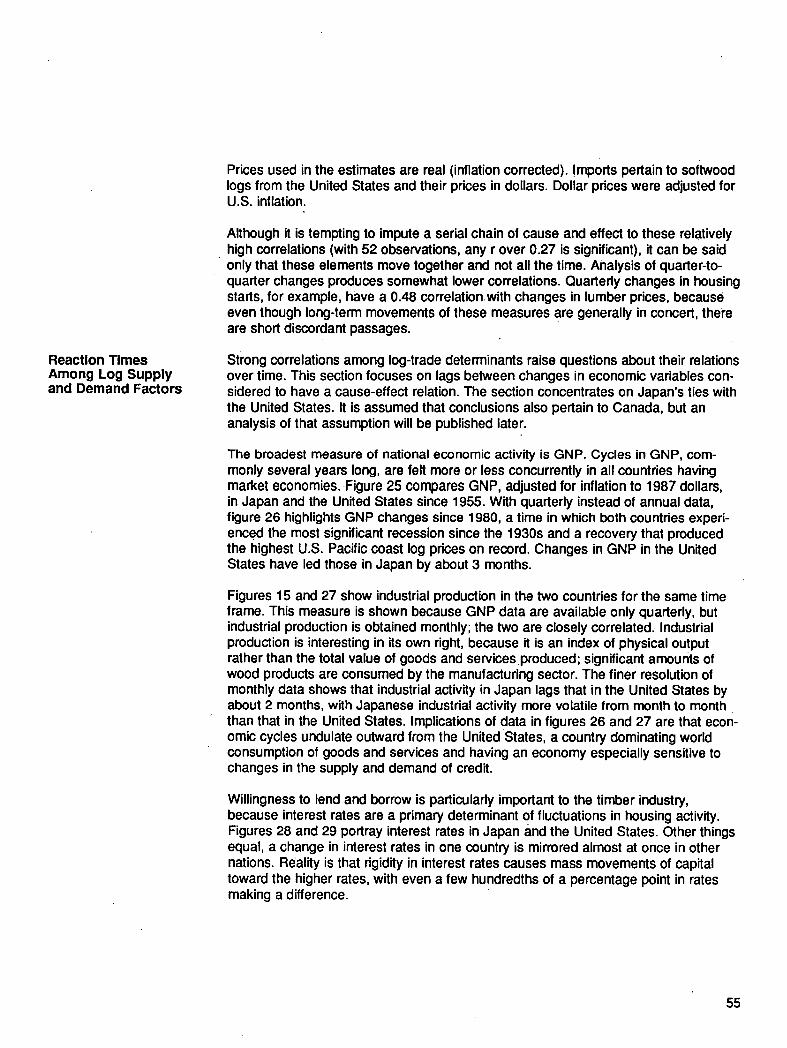
Reaction Times Among Log Supply and Demand Factors
Prices used in the estimates are real (inflation corrected). !mports pertain to softwood logs from the United States and their prices in dollars. Dollar prices were adjusted for U.S. inflation.
Although it is tempting to impute a serial chain of cause and effect to these relatively high correlations (with 52 observations, any r over 0.27 is significant), it can be said only that these elements move together and not all the time. Analysis of quarter-to- quarter changes produces somewhat lower correlations. Quarterly changes in housing starts, for example, have a 0.48 correlation with changes in lumber prices, because even though long-term movements of these measures are generally in concert, there are short discordant passages.
Strong correlations among log-trade determinants raise questions about their relations over time. This section focuses on lags between changes in economic variables con- sidered to have a cause-effect relation. The section concentrates on Japan's ties with the United States. It is assumed that conclusions also pertain to Canada, but an analysis of that assumption will be published later.
The broadest measure of national economic activity is GNP. Cycles in GNP, com- monly several years long, are felt more or less concurrently in all countries having market economies. Figure 25 compares GNP, adjusted for inflation to 1987 dollars, in Japan and the United States since 1955. With quarterly instead of annual data, figure 26 highlights GNP changes since 1980, a time in which both countries experi- enced the most significant recession since the 1930s and a recovery that produced the highest U.S. Pacific coast log prices on record. Changes in GNP in the United States have led those in Japan by about 3 months.
Figures 15 and 27 show industrial production in the two countries for the same time frame. This measure is shown because GNP data are available only quarterly, but industrial production is obtained monthly; the two are closely correlated. Industrial production is interesting in its own right, because it is an index of physical output rather than the total value of goods and services produced; significant amounts of wood products are consumed by the manufacturing sector. The finer resolution of monthly data shows that industrial activity in Japan lags that in the United States by about 2 months, with Japanese industrial activity more volatile from month to month than that in the United States. Implications of data in figures 26 and 27 are that econ- omic cycles undulate outward from the United States, a country dominating world consumption of goods and services and having an economy especially sensitive to changes in the supply and demand of credit.
Willingness to lend and borrow is particularly important to the timber industry, because interest rates are a primary determinant of fluctuations in housing activity. Figures 28 and 29 portray interest rates in Japan and the United States. Other things equal, a change in interest rates in one country is mirrored almost at once in other nations. Reality is that rigidity in interest rates causes mass movements of capital toward the higher rates, with even a few hundredths of a percentage point in rates making a difference.
55

r- O) ~J i . _
o) n
C O) 0
O) n
20
15
10
0
14
12
10
ii Housing starts, seasonally adjusted at annual rates
'"'i.' :"'"..
Federal funds Interest rate
I [ [ I t i I I I I l i l t I I I I I I I I l l I I I I I I I I I l f l l l I I I I I I I I I I I I I I I I I l l l l l l l I I I I I I I I I I l l I I I I I I I t I I I I I I I I I I I I I i i i I I I I I I I I I I I I I
1980 1981 1982 1983 1984 1985 1986 1987 1988
Year
8
6
f , . . o
\ /
i .o=no =n ==on,,~ .d~=,~ / - ; : "'", ...:'' - ,........ :: '. :..." .: ..... ...
I I t I I I i l l I I I I I I I I I I I I I I I I I t I I I I I I I I I I l l I I i I I I I I i l I I I I I I I I I I I I I I I I I I I I I I I I l l t l l I I I I l l I I I I I I I I I I I I I I I I I I I I I I I I I
1980 1981 1982 1983 1984 1985 1986 1987 1988
Y e a r
2500
2000
1500
1000
500
180
160
140
120
100
80
60
40
20
0
Figure 28--Interest rates and housing starts in the United States, by month, 1980-88.
(/) 1::
(/)
"0
u~ :3 0 t-
F-
Figure 29~ln terest rates and housing starts in Japan, by month, 1980-88.
1::
¢3)
e-
:3 0
.1£: I--
56

The levels of interest rates differ greatly among countries for several reasons; per- haps the most significant is inflation. As rising prices reduce the purchasing power of money, lenders require a premium for postponing the purchasing power of their money, because they recognize its dilution over time. Thus, long-term interest rates in otherwise stable countries tend to be 3-4 percent above the expected rate of in- flation. Another reason for international'differences in interest rates is that interest rates are used by central banks as a primary tool of monetary policy, both to regulate the domestic economy and to influence the international value of currencies. A dif- ficult tradeoff sometimes must be made between, say, lowering interest rates to stim- ulate the domestic economy and raising them to improve the value of that country's currency. Currency values are stimulated by high rates because of the resulting capital flows mentioned earlier, which increase the demand for financial instruments denominated in the appreciating currency. Finally, interest rates in any country are influenced by the government's need to borrow, the unwillingness of lenders to part with financial resources during times of stress, perceptions of credit worthiness, and political and economic risks peculiar to particular nations.
With all these factors changing from time to time, it is not surprising that considerable variance occurs between U.S. and Japanese interest rates (figs. 28 and 29). Since 1978, Japan's rates for both borrowers and lenders have been relatively low. Individ- ual savers in Japan have been accustomed to rates of about 3 percent, and business borrowers have obtained funds from banks at about 5 percent; these are comparable to rates in the United States in the 1950s. But in real (inflation-compensated) terms, Japan's rates have been comparable to those in the United States since the mid- 1960s. F!gures 28 and 29 show that interest-rate policy and flux in Japan have lagged those of the United States by about 2 months, but not consistently. In any case, Japan's interest rates have changed less month to month and year to year than have comparable U.S. rates.
Recent relations between housing activity and wood construction in the United States and Japan are shown in figure 30. Because most residential construction in Japan is not wood based, and because the average size of wood-based homes has varied greatly in Japan with business cycles, the floor area of all wood-based structures is shown for Japan rather than the number of housing starts.
The monthly housing data do not indicate any close correspondence between housing in the United States and that in Japan during the relatively stable period since 1982. Short-term reactions of housing to interest-rate changes in the United States are well known (Throop 1986). Figure 28 suggests a lag of 2 to 6 months between interest-rate changes and housing shifts in the United States, although the causal relation is more apparent in a multiyear than in a multimonth display. In Japan (fig. 29), housing responds to general economic and demographic conditions and government funding programs, with little apparent connection to interest rates.
57
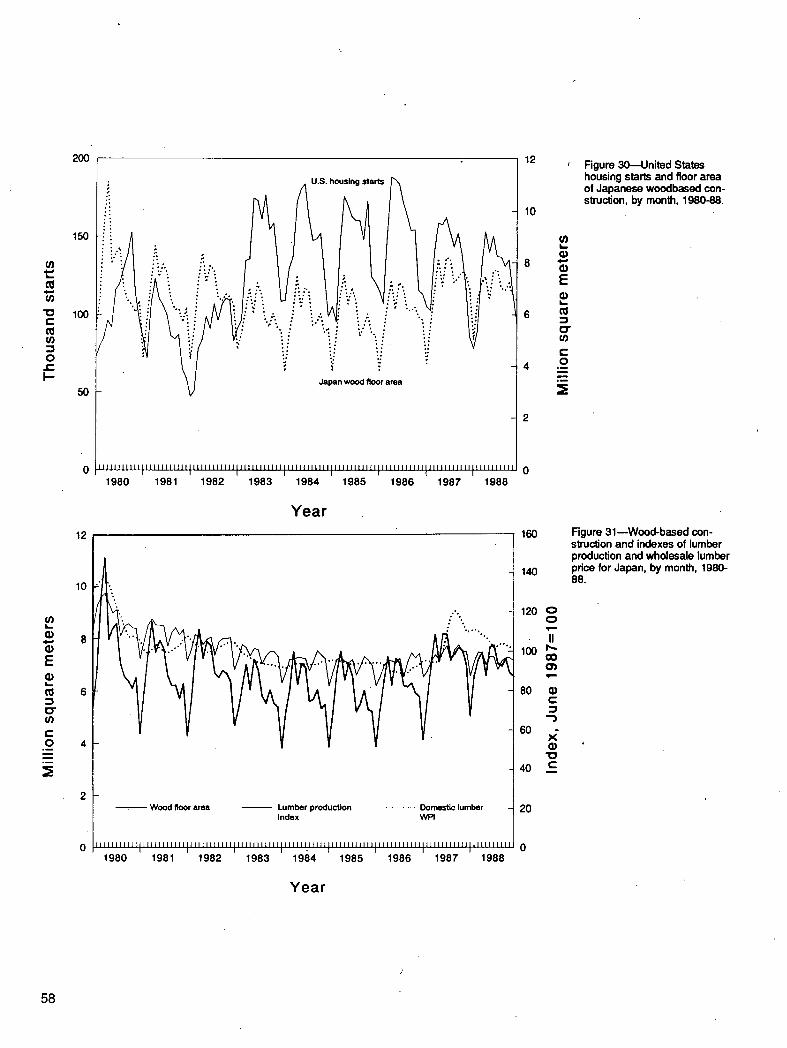
200
150
U) 1:: o~ (/)
• 1~ 100 ¢:
u)
0 ¢.- l - -
50
12
10
P
g
, m
, m
t
/ ~ U . S . h o u s i n g s t a r t s
11 I I I I I I I I t I I I I I I I I l l I I I I I I I I I I I I I I I I I I I I I I I I I I I I I I I I I I I I I I I I I I I I I I I I I I I l Z l I I I I t I I I I I I J i l l I I I I I I I I I I I I I I I I I I I I ( I
1980 1981 1982 1983 1984 1985 1986 1987 1988
Year
W o o d f l o o r a r e a L u m b e r p r o d u c t i o n . . . . . . . . . . . . . D o m e s t i c l u m b e r
i n d e x W P I
I 1 1 1 I } 1 1 [ L I 1 I I I I I L I I I I I J I I t i l l I I I l i l l I I I I I l l I l l I i I I I I I L I I I I I I I I I I ~ I I I I I I I I I I I I I I I I l l l I I I I I I I I I I ~ I I I I I I I I I I l I I I
1980 1981 1982 1983 1984 1985 1986 1987 1988
Y e a r
12
lO
6 g
P, 4 . - .
2
160
140
120
80
6o ff
40 ~
20
Figure 30---United States housing starts and floor area of Japanese woodbased con- struction, by month, 1980-88.
Figure 31--Wood-based con- sb'uction and indexes of lumber production and wholesale lumber price for Japan, by month, 1980- 88.
58

Figure 31 compares Japan's lumber production, lumber prices, and wood-based con- struction. Swings in lumber production coincide with multiyear movements in con- struction. Japan clearly did not share either the great U.S. market decline of 1978-81 or the abrupt recovery of 1982-83. Lumber prices in Japan have been much steadier than those in the United States (figs. 31 and 32) and tracked lumber production close, ly until the sharp rise in housing starts in 1987. Oscillations in lumber prices may be more common in the future as U.S. and Soviet supplies increase and contribute to a (perhaps) less orderly market. In any case, it is not apparent that construction leads lumber manufacture from month to month.
Japanese wholesale prices for North American hemlock logs and an index of prices for domestic logs are shown with monthly wood-construction activity in figure 33. Like lumber prices, log prices in Japan move with construction; changes in the latter are mirrored at once in prices. As with lumber, price movements have been modest rela- tive to price fluctuations for U.S. logs.
Figure 34 shows monthly U.S. softwood log exports to Japan. Changes in log ship- ments have lagged Japanese lumber production by about a month; this is a remark- ably tight performance considering trans-Pacific shipping time of about 2 weeks plus the additional time required to assemble cargoes in response to rising demand. Although there are seasonal drops in U.S. log exports, notably from Alaska, they do not seem as pronounced as the seasonal declines in Japanese lumber production.
120
110
100
90
80
70
60
II
oo O)
x "
l o ¢-
so '' ' '~'' ' '~'' '~'' ' ' ' ' '~'' ' ' ' '` ' ' ' '~`' ' ' ' ' ' ' ' '~'' ' ' ' ' ' ' '` '~''``' ' ' ' ' ' '~'' ' ' ' ' ' ' ' ' ' '`~'' ' i ' ' ' ' '~ ' ' ' ' ' ' ' ' ' 1980 1981 1982 1 1983 1984 1985 1986 ~ 1987 1988
'. Year Figure 32--United States wholesale lumber priqe index, by month, 1980-88.
59
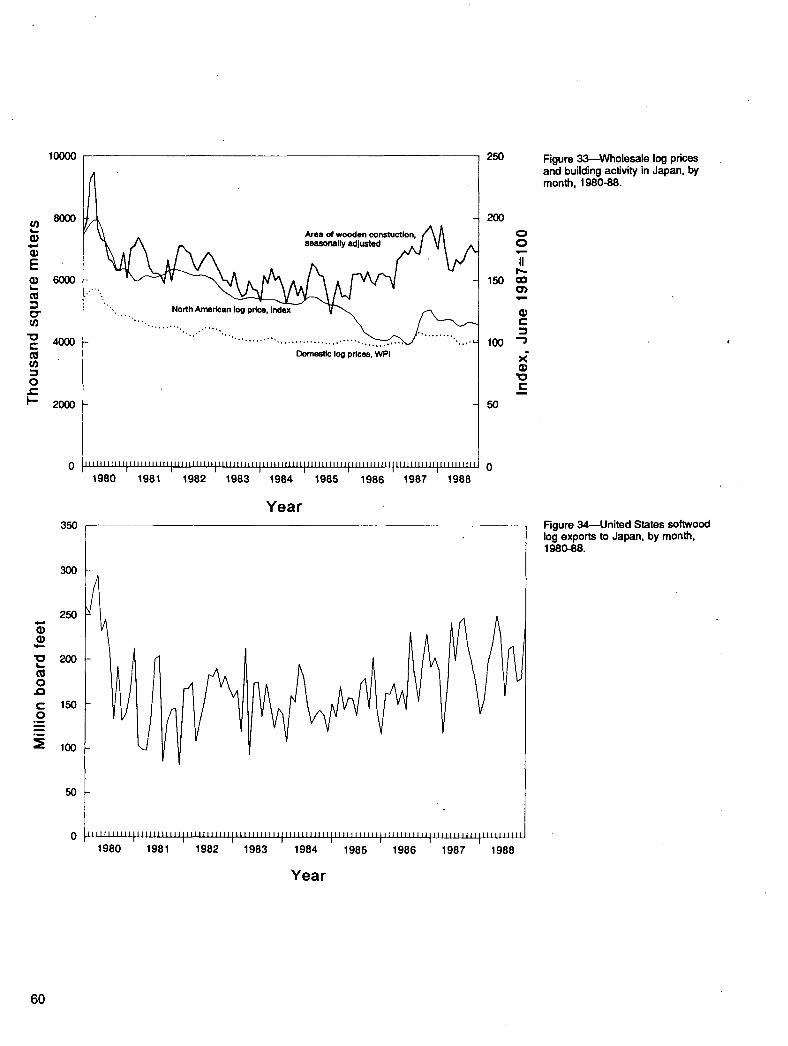
In
03 ,,k,,l o,I E 03
o" 09
10 I - ra 09
o t.- +.-
03 03
10
m O
.1:3 t - O ° ~
10000
8OO0
6000
4000
2000
350
300
250
200
150
100
50
Area of wooden constuctlon, //~ A
"", ..... , .......... ?~i.~..:~..'ii,lr.'~,.'.i~.il .......... i,.+...~.,. A, ~ ~ Domestlc log pdces, WPI
I I I I I III IIIIIIi l q l l l l l l l l t l l l l l l II l l l l l l l l f l l l i lI l l l l l i l I f l l l IIIIIIIIII I t l l l l i l i l l l l l l l l l l I I I I I I I II IIIIII II I t l
1980 1981 1982 1983 1984 1985 1986 1987 1988
Year
250
2OO
150
100
50
O O
II
¢O O>
03 t -
- . j
x" 03 10
I I I t I I I I I I I I I I I I I I I I I I I I I I I I I I I I I I I L L I I I I I I I I l l l l l l l l l l l l l l l l l l l l i l l l I t I l t l I I I I I I l l I I I Z I I I l i i I I I I I I I I l l l l I I l l I f I I
1980 198i 1982 1983 1984 1985 1986 1987 1988
Year
Figure 33--Wholesale log prices and building activity in Japan, by month, 1980-88.
t -
Figure a4--United States softwood log exports to Japan, by month, 1980-88.
60

(9
o .o '1o t -
u)
o t -
O~ Q.
¢ _
o
700
6O0
5O0
400
3O0
200
' . . ". .
" , : ....:.... . , -
-.....,.. ... " "
! I t~IIJ~[ILLL~JIJJ.Lt[.[LHLLLILI~I|LLLLLLLLLtlLIJJ.tlI.LIJtlL[LI.| tJ l_ l l } l l l l l lJ t i l l [ l lJ . l l - [HILL} l l lJ l l l i lL 1980 1981 1982 1983 1984 1985 1986 1987 1988
Figure 35~Average unit value of U.S. softwood log exports to Japan,
• F.A.S. at west coast ports, by month, 1980-88.
Y e a r Figure 35 shows the average reported value per thousand board feet of log ship- ments to Japan from the United States, as indicated on export declarations collected by the U.S. Customs Bureau and reported by the U.S. Census Bureau (U.S. Bureau of the Census 1978 through 1988). The values are adjusted for inflation to 1987 prices by using the U.S. wholesale price index. Like Japanese lumber and domestic- log prices, these have changed modestly relative to volume fluctuations and U:S. on- shore log and lumber prices. Comparison with figures 31 and 32 shows relatively greater price impulses on the east than on the west end of the log trade.
Price lags are shown in figure 36, in which Japan's overall wholesale price index for lumber is plotted with the price (average unit value, f.a.s.) of U.S. export logs. There has been a fairly consistent 1-month lag between Japan's lumber price changes and changes in prices of U.S. export logs.
Prices for U.S. export logs apparently have been more synchronous with Japanese log and lumber prices than with U.S. prices. The relation can be seen by comparing figure 35 with figures 32 and 36.
Overall, the U.S.-Japan log trade has reflected the steady economic growth trend in Japan as well as economic cycles there and in the United States. Short-term changes in economic aggregates, on the scale of several weeks to a few months, apparently have influenced Japanese lumber production immediately. After the seasonality factor" is accounted for, short-term changes in lumber activity in Japan seem to coincide with construction and lead U.S. log exports and U.S. export log prices by about a month. Japanese prices at all levels move more smoothly than their counterparts in the United States.
61
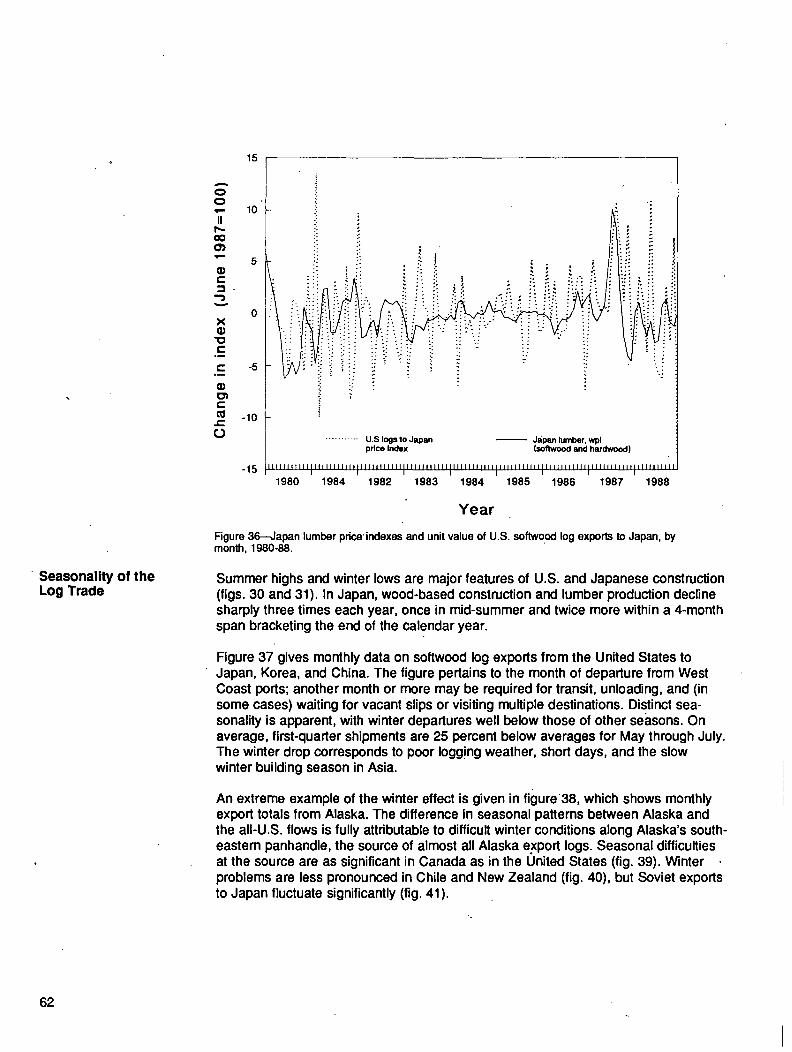
• Seasonality of the Log Trade
A
0 0
II
¢-
X
" 0 i -
l -
e-
t -
O
15
10
-5
-10
i i iJ "i
. ;:. J
:: ii , . :. : :
"2
. . . . . . . . . . . U.S logs to Japan - - Japan lumber, wpl price Index (softwood and hardwood)
- 1 5 ~ . . U I I I I I I I I I : I I I ~ t ~ [ ~ ~ ~ ~ i ~ ~ ~ I I I I I I I
1980 1984 1982 1983 1984 1985 1986 1987 1988
Year
Figure 36--Japan lumber pdce'indexes and unit value of U.S. softwood log exports to Japan, by month, 1980-88.
Summer highs and winter lows are major features of U.S. and Japanese construction (figs. 30 and 31). In Japan, wood-based construction and lumber production decline sharply three times each year, once in mid-summer and twice more within a 4-month span bracketing the end of the calendar year.
Figure 37 gives monthly data on softwood log exports from the United States to Japan, Korea, and China. The figure pertains to the month of departure from West Coast ports; another month or more may be required for transit, unloading, and (in some cases) waiting for vacant slips or visiting multiple destinations. Distinct sea- sonality is apparent, with winter departures well below those of other seasons. On average, first-quarter shipments are 25 percent below averages for May through July. The winter drop corresponds to poor Iogg!ng weather, short days, and the slow winter building season in Asia.
An extreme example of the winter effect is given in figure 38, which shows monthly export totals from Alaska. The difference in seasonal patterns between Alaska and the alI-U.S, flows is fully attributable to difficult winter conditions along Alaska's south- eastern panhandle, the source of almost all Alaska export logs. Seasonal difficulties at the source are as significant in Canada as in the United States (fig. 39). Winter problems are less pronounced in Chile and New Zealand (fig. 40), but Soviet exports to Japan fluctuate significantly (fig. 41).
62
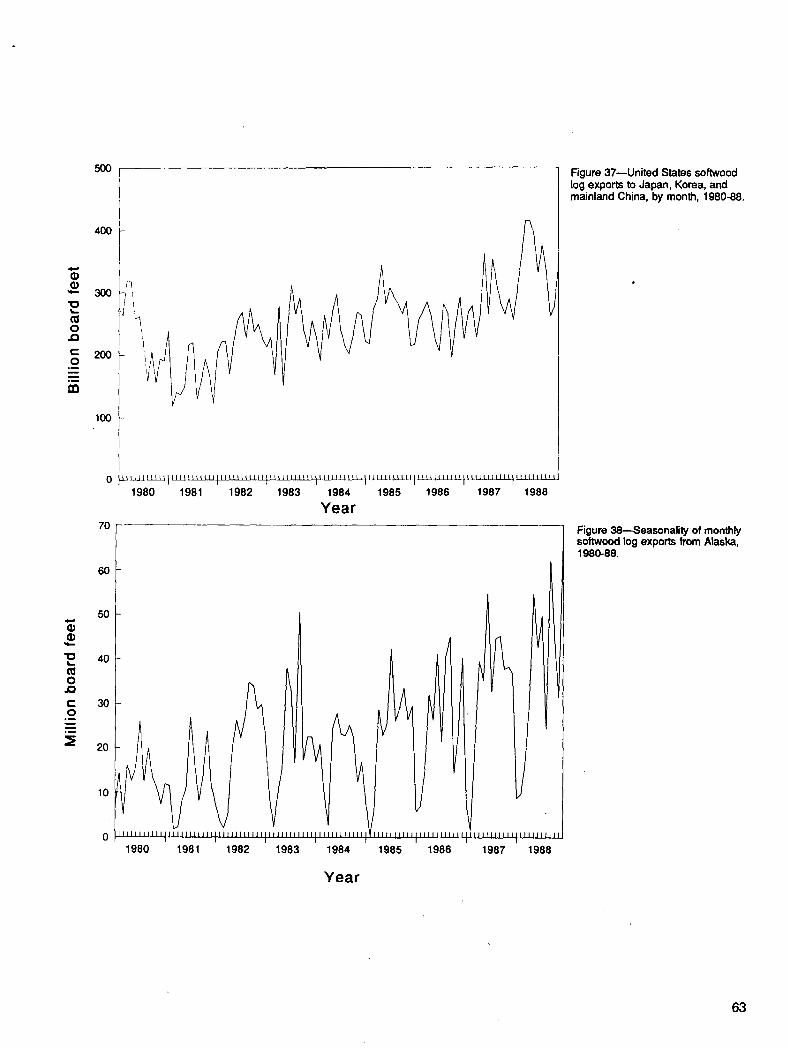
"1o 1 = -
0
t- O
° ~
, m
m
q) (9
2 0 JO t- o
o ~
° ~
=Z
5OO
4OO
3OO
200
100
70
60
50
40
30
20
10
1980 1981 1982 1983 1984 1985 1986 1987 1988
Year
l l l l l l l l l l l l l l l l i l l J l l l l l I I
I I I I I I I I I I I I I I I I I I I I I I
1980 1981 1982 1983 I I J I I I I I I V l l l l l l l l l l l l l l l l l l l l l J J l l l l l l l l l l l t l l l l l Z l l l
I I I 1984 1985 1986 1987 1988
Year
Figure 37--United States softwood log exports to Japan, Korea, and mainland China, by month, 1980-88.
Figure 38--Seasonality of monthly softwood log exports from Alaska, 1980-88.
63
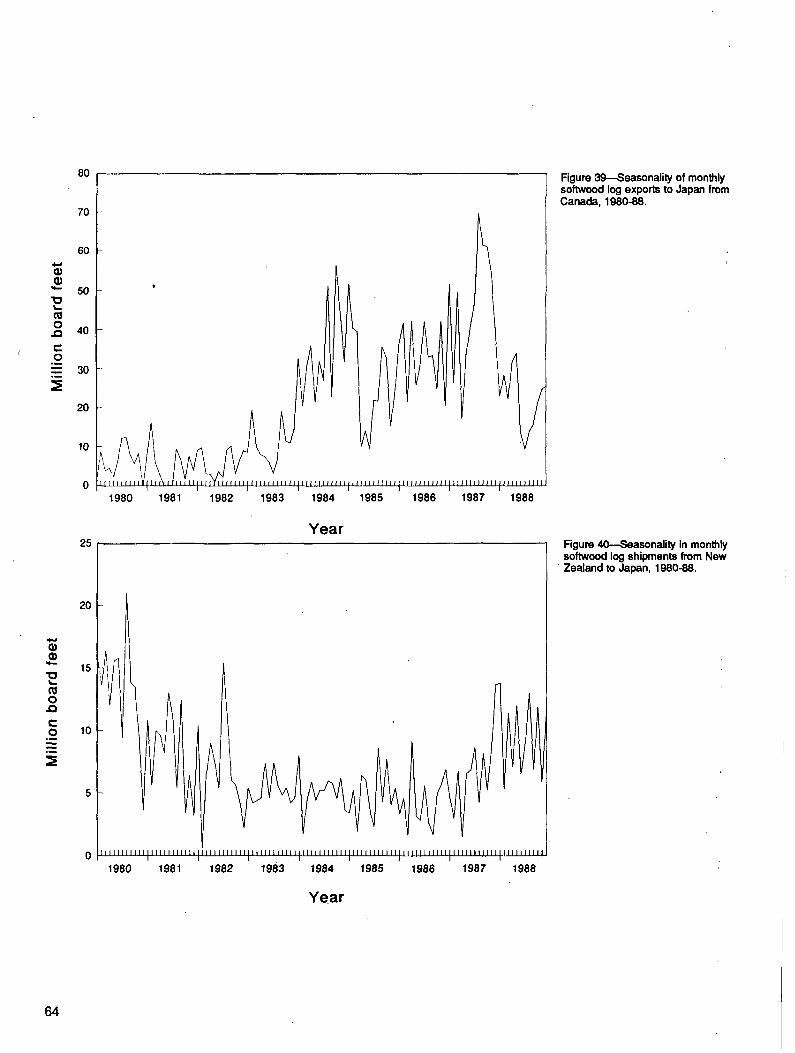
80
70
60
~- 50 "10
0 a~ 40
C 0 --- 3O , ~
20
10
25
20
15 £
o ,,Q
lO
i
J l f f l 1980
r f l ~ ' ~ ~ l l l l l l l ~ i l l l l l l l l l l i l l l l l J l l l l l l l l l l i i l l l l l l l l l l I 1981 1982 1983 1984 1985 1986 1987 1988
Year
IIIIIIII11111111111111 I 1980 1981
l l l l l l l l l l l l l l l l l l t l ] | l l l l l l l l l l l l l l l l l l l l l l l l l l l l l l l l l l l l l l l l l l l l l l l l l l l l l l I I I I I I I l l l I
1982 1983 1984 1985 1986 1987 1988
Year
Figure 39--Seasonality of monthly softwood log exports to Japan from Canada, 1980-88.
Figure 40--Seasonality in monthly softwood log shipments from New
' Zealand to Japan, 1980-88.
64
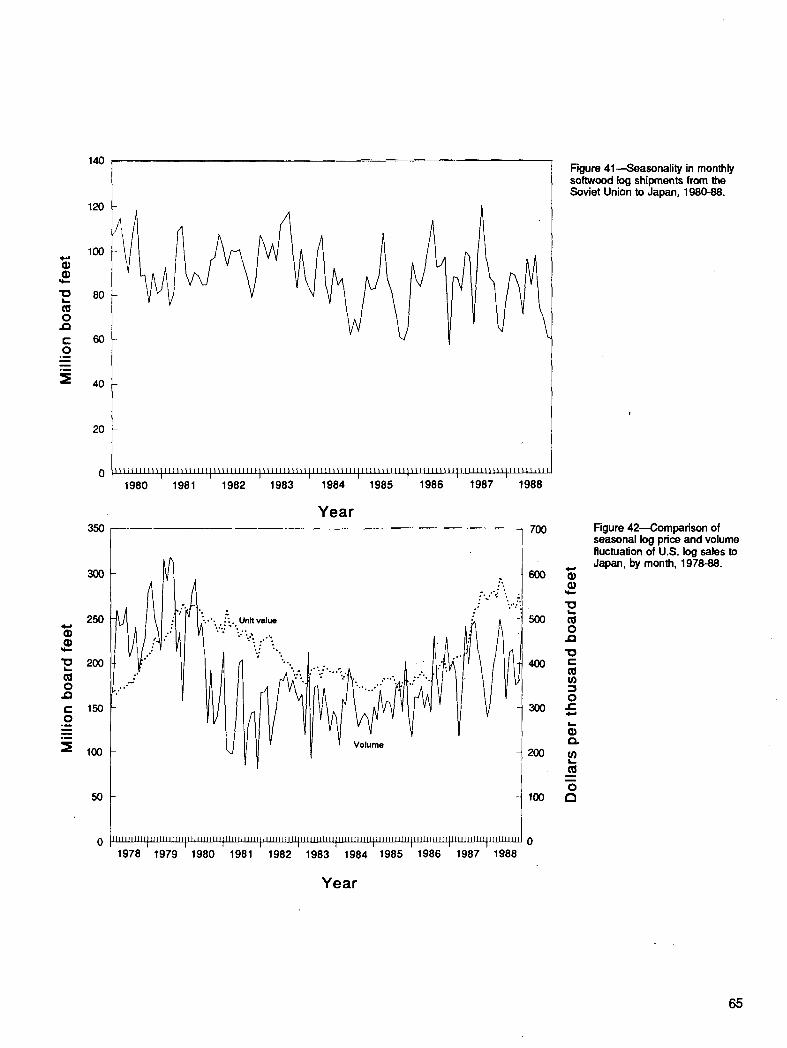
120
"10 t~ m 0 .43
c 0
o ~
~E
A
100
80
60
40
20
350
140
A
~ t~lIIII iIliltIII~ II~IIItblt If II It It If Ill t ~ ~Ittlt It ItIIIttItlI IIIttItttl it it l l IS It fill lltI~l ilIII~lIitl I I I I I T I
1980 1981 1982 1983 1984 1985 1986 1987 1988
Year
. . o.-,. ;
250 .'...: ~... Unlt va lue i
200150 lOO
50
II I r l l l l l l I H I I I I [ r l l l l i l l l l r l l l l l l l l l l l l l l l l l l I l l l J l l l l l l l l l i l + l l l l l N l l I11111 l l l l l l l l l l l l l l l l l I L L J J J J J J J J J ~ U J.l l I I I I I l I l I I I I I I I I I I I I I I I I
1978 1979 1980 1981 1982 1983 1984 1985 1986 1987 1988
Year
Figure 41---Seasonality in monthly softwood log shipments from the Soviet Union to Japan, 1980-88.
700
<.e
400
200
m
o 1oo t~
Figure 42--Comparison of seasonal log pdce and volume fluctuation of U.S. log sales to Japan, by month, 1978-88.
65
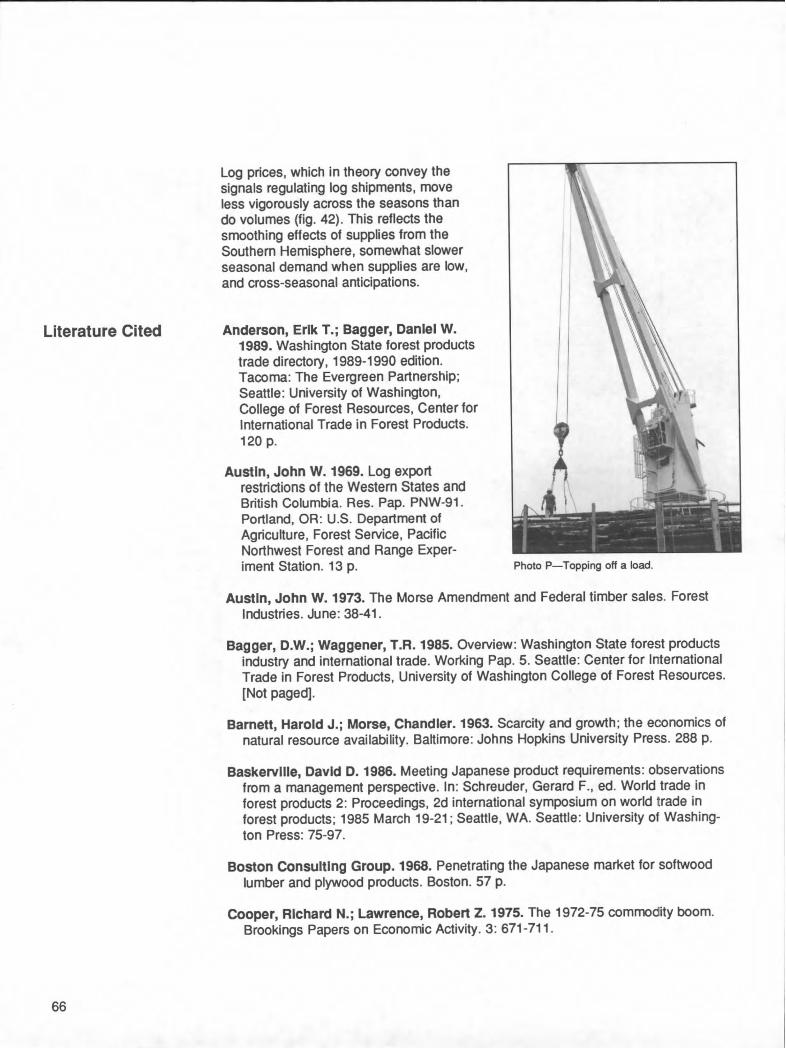
Literature Cited
Log prices, which in theory convey the signals regulating log shipments, move less vigorously across the seasons than do volumes (fig. 42). This reflects the smoothing effects of supplies from the Southern Hemisphere, somewhat slower seasonal demand when supplies are low, and cross-seasonal anticipations.
Anderson, Erlk T.; Bagger, Daniel W. 1989. Washington State forest products trade directory, 1989-1990 edition. Tacoma: The Evergreen Partnership; Seattle: University of Washington, College of Forest Resources, Center for International Trade in Forest Products. 120 p.
Austin, John W. 1969. Log export restrictions of the Western States and British Columbia. Res. Pap. PNW-91. Portland, OR: U.S. Department of Agriculture, Forest Service, Pacific Northwest Forest and Range Exper- iment Station. 13 p.
I
Photo P--Topping off a load.
Austin, John W. 1973. The Morse Amendment and Federal timber sales. Forest Industries. June: 38-41.
Bagger, D.W.; Waggener, T.R. 1985. Overview: Washington State forest products industry and international trade. Working Pap. 5. Seattle: Center for International Trade in Forest Products, University of Washington College of Forest Resources. [Not paged].
Barnett, Harold J.; Morse, Chandler. 1963. Scarcity and growth; the economics of natural resource availability. Baltimore: Johns Hopkins University Press. 288 p.
Baskervllle, David D. 1986. Meeting Japanese product requirements: observations from a management perspective. In: Schreuder, Gerard F., ed. World trade in forest products 2: Proceedings, 2d international symposium on world trade in forest products; 1985 March 19-21; Seattle, WA. Seattle: University of Washing- ton Press: 75-97.
Boston Consulting Group. 1968. Penetrating the Japanese market for softwood lumber and plywood products. Boston. 57 p.
Cooper, Richard N.; Lawrence, Robert Z. 1975. The 1972-75 commodity boom. Brookings Papers on Economic Activity. 3:671-711.
66

Cox, Thomas R. 1974. Mills and markets, a history of the Pacific coast lumber industry to 1900. Seattle: University of Washington Press. 332 p.
Darr, David R. 1975. U.S. forest products trade policies: what are the options? Gen. Tech. Rep. PNW-41. Portland, OR: U.S. Department of Agriculture, Forest Service, Pacific Northwest Forest and Range Experiment Station. 36 p.
Darr, David R. 1981. Interactions between domestic and export markets for softwood lumber and plywood: tests of six hypotheses. Res. Pap. PNW-293. Portland, OR: U.S. Department of Agriculture, Forest Service, Pacific Northwest Forest and Range Experiment Station. 22 p.
Darr, David R. 1984a. Conversion factors can affect forest products trade policies. Journal of Forestry. 82(8): 489-491.
Darr, David R. 1984b. U.S. trade in timber products: a background report. Wash- ington, DC: U.S. Department of Agriculture, Forest Service. [Not paged].
Darr, David R.; Haynes, R!chard W.; Adams, Darius M. 1980. The impact of the export and import of raw logs on domestic timber supplies-and prices. Res. Pap. PNW-277. Portland, OR: U.S. Department of Agriculture, Forest Service, Pacific Northwest Forest and Range Experiment Station. 38 p.
Drake, Peter. 1984. Prospects and problems for North American exports to Pacific Rim countries. In: International forest products trade: resources and market op- portunities: Proceedings of a conference; 1983 November 7-9; [Arlington, VA]. Madison, Wh Forest Products Research Society: 135-139.
Elchlbegoff, Ivan M. 1949. United States international timber trade in the Pacific area. Stanford, CA: Stanford University Press. 302 p.
Fenton, R.T. 1984. Sawn timber in Japan, and New Zealand prospects: progress report. Rotorua, New Zealand: New Zealand Forest Research Institute. 67 p.
Fenton, R.T.; Maplesden, F.M. 1986. The eastern USSR: forest resources and forest products exports to Japan. FRI Bull. 123. Rotorua, New Zealand: New ZealandForest Research Institute. 93 p.
Fisher, W. Halder. 1964. Report on analysis of the relationship of softwood log exports to the economy of the State of Washington. Columbus, OH: Battelle Memorial Institute; report to Washington Department of Natural Resources. 66 p.
Flora, Donald F. 1986. Markets for radiata pine as seen from that other softwood region. New Zealand Forestry. 31(1): 19-22.
• Flora Donald F. 1988. USA: trade channels for its forest products. In: Nagy, Andras, ed. International tradein forest products. Oxon, Great Britain: A B Academic Publishers: 171-182.
67

Flora, Donald F.; McGInnls, Wendy J. 1989. Embargoes on and off: some effects of ending the export ban on federal logs and halting exports of state-owned logs. Western Journal of Applied Forestry. 4(3): 77-79.
Flora, Donald F.; Vlosky, RichardP. 1986. Potential Pacific Rim demand for construction-grade softwood logs. Res. Pap. PNW-RP-364. Portland, OR: U.S. Department of Agriculture, Forest Service, Pacific Northwest Research Station; Seattle: University of Washington, College of Forest Resources, Center for International Trade in Forest Products. 29 p.
Food and Agriculture Organization. 1971-72. Yearbook of forest products. Rome: United Nations.
Food and Agriculture Organization. 1988. Yearbook of forest products. Rome: United Nations.
Francescon, A.; Nagy, A. 1988. Historical analysis: international trade in forest products. In: Nagy, Andras, ed. International trade in forest products. Oxon, Great Britain: A B Academic Publishers: 197-256.
GUlls, R. Peter; Roach, Thomas R. 1986. Lost initiatives, Canada's forest indus- tries, forest policy and forest conservation. Contributions in economics and econ- omic history 69. New York: Greenwood Press. 326 p.
Hamilton, Thomas E. 1971. Log export Policy: theory vs. reality. Journal of Forestry. 68(8): 494-497.
Haynes, Richard W. 1976. Price impacts Of log export restrictions under alternative assumptions. Res. Pap. PNW-212. Portland, OR: U.S. Department of Agriculture, Forest Service, Pacific Northwest Forest and Range Experiment Station. 25 p.
Hines, Judith A., 1987. Log export restrictions of the Western States and British Columbia. Gen. Tech. Rep. PNW-GTR-208. Portland, OR: U.S. Department of Agriculture, Forest Service, Pacific Northwest Research Station. 13 p.
Ingram, Robert M., III. 1983. Financing export sales for the small- and medium-size forest products firm. In: Bethel, James S., ed. World trade in forest products. Seattle: University of Washington Press: 425-531.
International Monetary Fund. 1987. Primary commodities; market developments and outlook. Washington, DC. 91 p.
International Monetary Fund. 1988. International financial statistics; yearbook. Eng. ed. Washington, DC. 764 p.
Irland, Lloyd C. 1974. Is timber scarce? The economics of a renewable resource. Yale University School of Forestry and Environmental Studies Bull. 83. New Haven, CT: Yale University. 97 p.
68

Johnston, Verle B. 1986. Adjusting the focus. FRBSF Weekly Letter. San Francisco: Federal Reserve Bank of San Francisco. April 25: 1-3.
Ku, Timothy T.; Guldin, James M.; Beasley, R. Scott. 1989. Management shift embraces nontimber values; contemporary forestry on the island of Taiwan: a report. Journal of Forestry. 87(6): 16-18.
Larsen, David N.; Bearden, Donald Ao 1986. 1984 Washington mill survey, wood consumption and mill characteristics. Series Rep. 9. Olympia, WA: Washington State Department of Natural Resources. 28 p.
Larsen, David N.; Bearden, Donald A. [In press]. 1986 Washington mill survey. Olympia, WA: Washington State Department of Natural Resources.
Lawton, Donald P.; Glsh, Elden M., hearing officers. 1969, Prevention of Federal timber substitution for nonfedera! log exports: Transcript of proceedings of a hearing; 1969 September 26; Portland, OR: U.S. Department of Agriculture, Forest Service; U.S. Department of the Interior, Bureau of Land Management. 94 p.
LIndell, Gary R. 1978. Log export restrictions of the Western States and British Columbia. Gen. Tech. Rep. PNW-63. Portland, OR: U.S. Department of Agriculture, Forest Service, Pacific Northwest Forest and Range Experiment Station. 14 p.
Llndell, Gary R. 1980. Substitution and the USDA Forest Service log export restrictions. Res. Note PNW-355. Portland, OR: U.S. Department of Agriculture, Forest Service, Pacific Northwest Forest and Range Experiment Station. 6 p.
Manthy, Robert S. 1978. Natural resource comrnodities--a century of statistics; prices, output, consumption, foreign trade, and employment in the United States, 1870-1973. Baltimore: Johns Hopkins University Press. 240 p.
Morrlson, Peter; Gasson, Rob; Armstrong, Glen; Williams, Douglas. 1985. The recovery cost of the merchantable timber in coastal British Columbia. Forest Economics and Policy Analysis Project Information Rep. 85-8. Vancouver, BC: [University of British Columbia], Forest Economics and Policy Analysis Project. 48p.
Nagy, A.; Anderson, A. 1988. Introduction. In: Nagy, Andras, ed. International trade in forest products. Oxon, Great Britain: A B Academic Publishers: 1-16.
Nippon Mokuzal Bichiku Klko. 1983. Wood supply and demand in ,Japan. Tokyo: Nippon Mokuzai Bichiku Kiko; supervised by Forestry Agency. 53 p.
Nomura, Isamu. 1988. Japan: the timber trade and its problems. In: Nagy, Andras, ed. International trade in forest products. Oxon, Great Britain: A B Academic Publishers: 115-134.
Pacific Power & Light Company. 1968. Log exports, their impact upon the forest products industry and the Oregon economy. Portland, OR. 10 p.
69
Plcornell, Pedro M. 1983. The market for wood-based products as seen by a Southeast Asian producer. In: Bethel, James S., ed. World trade in forest products. Seattle: University of Washington Press: 262-268.
Province of British Columbia. 1981. Forest Act, chapter 140 [Act administered by the Ministry of Forests] [Consolidated August 11, 1981]. Victoria: Queen's Printer, 69 p.
Radcliffe, Samuel J. 1981. U.S. forest products trade and the multilateral trade negotiations. In: Sedjo, Roger A., ed. Issues in U.S. international forest products trade: Proceedings of a workshop; 1980 March 6-7; Washington, DC. Washington, DC: Resources for the Future: 136-168.
Rakestraw, Lawrence W. 1981. A history of the United States Forest Service in Alaska. Anchorage: Alaska Historical Society. 221 p.
Relfenberg, Arno, hearing officer. 1979. In the matter of third party substitution: Transcript of proceedings of hearings; 1979 August 15-16. Portland, OR; Seattle, WA: U.S. Department of Agriculture. 200 p.
Ruderman, Florence K. 1975. Production, prices, employment and trade in Northwest forest industries, fourth quarter 1974. Portland, OR: U.S. Department of Agriculture, Forest Service, Pacific Northwest Forest and Range Experiment Station. 52 p.
Schreuder, Gerard F.; Vlosky, Richard P. 1986. Indonesia as an exporter and importer of forest products. In: Schreuder Gerard F., ed. World trade in forest products 2. Seattle: University of Washington Press: 168-190.
Sherk, Donald R. 1970. The United States and the Pacific trade basin. San Francisco: Federal Reserve Bank of San Francisco. 64 p.
Simpson, Thomas E. 1973. Kauri to radiata, origin and expansion of the timber industry of New Zealand. Aukland, New Zealand: Hodder and Stoughton. 442 p.
Smith, Charles. 1988. On the verge of a splurge. Far Eastern Economic Review. October 13: 47-49.
Smith, V. Kerry, ed. 1979. Scarcity and growth reconsidered. Baltimore: Johns Hopkins University Press. 298 p.
Stanford Research Institute. 1974. Benefits and costs of alternative log export policies: Phase I report. Menlo Park, CA: Stanford Research Institute; prepared for Pacific Northwest Regional Commission. 193 p.
Takeuchl, Kenji. Market prospects for tropical hardwoods from Southeast Asia. In: Bethel, James S., ed. World trade in forest products. Seattle: University of Washington press: 432-447.
70

Throop, Adrian W. 1986. Slight moderation in the housing cycle. FRBSF Weekly Letter. San Francisco: FederalReserve Bank of San Francisco. [Issue unknown]: 1-3.
Ueda, Mlchlhiko; Darr, David R. 1980. The outlook for housing in Japan to the year 2000. Res. Pap. PNW-276. Portland, OR: U.S. Department O f Agriculture, Forest Service, Pacific Northwest Forest and Range Experiment Station. 25 p.
Ulrich, Alice H. 1988. U.S. timber production, trade, consumption, and price statistics 1950-86. Misc. Publ. 1460. Washington, DC: U.S. Department of Agriculture, Forest Service, Demand, Price, and Trade Analysis Group. 81 p.
United Kingdom-Japan 2000 Group. 1988. Excerpts from papers at January, 1988 meeting. The Economist. January 23: 63.
United Nations Industrial Development Organization. 1983. Tariff and non-tariff measures in the world trade of wood and wood products (prepared by the UNCTAD secretariat). Sectoral Studies Branch, Division for Industrial Studies, Sectoral Working Paper Series, Number 6. Vienna: United Nations Industrial Development Organization. 61 p. [limited edition].
U.S. Bureau of the Census. 1978-88. U.S. exports; schedule E, commodity by country; Series FT410. Washington, DC: U.S. Government Printing Office. Monthly and annual.
U.S. Bureau of the Census. 1975. Historical statistics of the United States; colonial times to 1970. Washington, DC: U.S. Government Printing Office. 2 vol.
U.S. Bureau of Economic Analysis. 1983. Business statistics 1982; a supplement to the Survey of Current Business. Washington, DC: U.S. Government Printing Office. 221 p.
U.S. Bureau of International Commerce. 1964. The Japanese market for softwood logs and lumber. Washington, DC. 33 p.
U.S. Department of Commerce. 1967. Business statistics 1967; the biennial sup- plement to the Survey of Current Business. Washington, DC. 262 p.
U.S. Department of State. 1977a. The trade debate. Department of State Publ. 8942. Washington, DC. 32 p.
U.S. Department of State. 1977b. Update on the forest industry in Japan. Unclas- sifted airgram A-346, 15 November. Tokyo: American Embassy. 14 p.
U.S. Department of the Treasury.' 1968. Treasury Department staff report on the Pacific Northwest log export problem. Washington, DC. 20 p.
U.S. General Accounting Office. 1985. Potential impacts of tighter Forest Service log export restrictions. GAO/RCED-85-17. Washington, DC. 34 p.
71
U.S. Senate. 1968. Log-exporting problems. Hearings before the Subcommittee on Retailing, Distribution, and Marketing Practices of the Select Committee on Small Business, January 22, and 23, 1968. Washington, DC. 3 vol.
U.S. Senate. 1972. Log export controls. Hearings before the Subcommittee on Inter- national Finance of the Committee on Banking, Housing and Urban Affairs, June 1972. Washington, DC. 454 p.
Wadsworth, John. 1983. International wood markets: a European view. In: Bethel, James S., edo World trade in forest products. Seattle: University of Washington Press: 402-415.
Warren, Debra D.' 1988. Production, prices, employment and trade in northwest forest industries, fourth quarter 1987. Resour. Bull. PNW-RB-154. Portland, OR: U.S. Department of Agriculture, Forest Service, Pacific Northwest Research Station. 74 p.
Washington Department of Natural Resources. 1965. Report on log export problem. Olympia, WA. 19 p.
Williams, D.H.; Gasson, R. 1986. The economic stock of timber in the coastal region of British Columbia. Forest Economics and Policy Analysis Project Inf. Rep. 86-11. Vancouver, BC: [University of British Columbia], Forest Economics and Policy Analysis Project. 20 p.
Wolf, Robert E. 1975. The Douglas fir region timber supply situation and log export regulation as proposed by H.R. 5544. Washington, DC: The Library of Congress Congressional Research Service. 26 p.
World Bank. 1982 and 1988. Wodd development report. New York: Oxford Uni- versity Press.
72 lkU.S GOVERNMENT PRINTING OFFICE:1991-591-001~I40021

Flora, Donald F.; Anderson, Andrea L ; McGInnlm, Wendy J. 1991. Pacific Rim soft- wood log trade: determinants and trends. Res. Pap. PNW-RP-432. Portland, OR: U.S. Department of Agriculture, Forest Service, Pacific Northwest Research Station. 72 p.
Pacific Rim trade in softwood logs amounts to about $3 billion annually, of which the U.S. share is about $2 billion. Log exporting is a significant part of the forest economy in the Pacific Northwest. The 10 major Pacific Rim log-trading client and competitor countries differ widely in their roles in trade and in their policies affecting the industry.
Keywords: Markets (external), supply and demand (forest products), trade (Pacific Rim), log exports.
The Forest Service of the U.S. Department of Agriculture is dedicated to the principle of multiple use management of the Nation's forest resources for sustained yields of wood, water, forage, wildlife, and recreation. Through forestry research, cooperation with the States and private forest owners, and management of the National Forests and National Grasslands, it stdves~as directed by Congress--to provide increasingly greater service to a growing Nation.
The U.S. Department of Agriculture is an Equal Opportunity Employer. Applicants for all Department programs will be given equal consideration without regard to age, race, color, sex, religion, or national origin.
Pacific Northwest Research Station 319 S.W. Pine St. P.O. Box 3890 Portland, Oregon 97208-3890
U.S. Department of Agriculture Pacific Northwest Research Station 319 S.W. Pine Street P.O. Box 3890 Portland, Oregon 97208
BULK RATE POSTAGE + FEES PAID USDA-FS
PERMIT No. G-40
Official Business Penalty for Private Use, $300
do NOT detach label
Related Documents