? Pacific Northwest Refineries: Cheap Crude and a Captive Market Margins Helped by Advantaged Crude and Less Competition Executive Summary The five refineries in the U.S. Pacific Northwest performed better in 2016 than rivals on the East or Gulf coasts for two main reasons. First, the changing pattern of North American crude supply has worked to their advantage. Faced with the threat of dwindling mainstay crude supplies from Alaska, refiners in Washington state replaced 22% of their slate with North Dakota Bakken crude shipped in by rail. They have also enjoyed advantaged access to discounted crude supplies delivered from nearby western Canada. Second, Northwest refiners face less competition for refined product customers than rivals on the East and Gulf coasts, meaning they have a captive market that often translates to higher margins. Future opportunities for these refineries abound, due to recently approved upcoming expansion of the Trans Mountain crude pipeline that delivers Canadian crude from Edmonton, Alberta, to Vancouver, British Columbia, and the Puget Sound refineries. Although there are still hurdles for this project to overcome, if the expansion goes ahead, then owner Kinder Morgan will nearly triple the line’s capacity to 890 thousand barrels per day. This will significantly increase access to western Canadian crude supplies and could encourage Northwest refinery upgrades or expansion with a view to exporting more refined product from the region. This outlook details the changing crude supply picture for Washington state refineries as well as regional refined product demand and margin performance. We also detail operations and prospects for each refinery, concluding with a summary of winners and losers. Key Takeaways × The five refineries in the Pacific Northwest primarily serve demand in Washington state and Oregon as well as British Columbia. × The downstream market for refined products in this region is less competitive, meaning fuel prices are generally higher than in the Gulf and East coast regions, boosting refinery margins. × Refiners have adapted to several structural changes in their crude supply, the most significant being continued decline in the output of Alaskan North Slope crude. × ANS is being replaced with light sweet shale crude from the Bakken formations in North Dakota, delivered by rail. × Even as crude price differentials narrowed to make crude by rail less competitive at Gulf and East coast refineries, higher product yields for Bakken crude compared with ANS on the West Coast mean that supplies from North Dakota continue to play a significant part in the Northwest refinery slate. Morningstar Commodities Research 5 January 2017 Sandy Fielden Director, Oil and Products Research +1 512-431-8044 [email protected] Data Sources for this Publication gAlaska Dept. of Revenue gCalifornia Energy Commission gClipperData gCME Group gCrude Postings gEIA To discover more about the data sources used Click Here

Welcome message from author
This document is posted to help you gain knowledge. Please leave a comment to let me know what you think about it! Share it to your friends and learn new things together.
Transcript

? Pacific Northwest Refineries: Cheap Crude and a Captive Market Margins Helped by Advantaged Crude and Less Competition
Executive Summary
The five refineries in the U.S. Pacific Northwest performed better in 2016 than rivals on the East or Gulf
coasts for two main reasons. First, the changing pattern of North American crude supply has worked
to their advantage. Faced with the threat of dwindling mainstay crude supplies from Alaska, refiners in
Washington state replaced 22% of their slate with North Dakota Bakken crude shipped in by rail. They
have also enjoyed advantaged access to discounted crude supplies delivered from nearby western
Canada. Second, Northwest refiners face less competition for refined product customers than rivals on
the East and Gulf coasts, meaning they have a captive market that often translates to higher margins.
Future opportunities for these refineries abound, due to recently approved upcoming expansion of the
Trans Mountain crude pipeline that delivers Canadian crude from Edmonton, Alberta, to Vancouver,
British Columbia, and the Puget Sound refineries. Although there are still hurdles for this project to
overcome, if the expansion goes ahead, then owner Kinder Morgan will nearly triple the line’s capacity
to 890 thousand barrels per day. This will significantly increase access to western Canadian crude
supplies and could encourage Northwest refinery upgrades or expansion with a view to exporting more
refined product from the region.
This outlook details the changing crude supply picture for Washington state refineries as well as
regional refined product demand and margin performance. We also detail operations and prospects for
each refinery, concluding with a summary of winners and losers.
Key Takeaways
× The five refineries in the Pacific Northwest primarily serve demand in Washington state and Oregon as
well as British Columbia.
× The downstream market for refined products in this region is less competitive, meaning fuel prices are
generally higher than in the Gulf and East coast regions, boosting refinery margins.
× Refiners have adapted to several structural changes in their crude supply, the most significant being
continued decline in the output of Alaskan North Slope crude.
× ANS is being replaced with light sweet shale crude from the Bakken formations in North Dakota,
delivered by rail.
× Even as crude price differentials narrowed to make crude by rail less competitive at Gulf and East coast
refineries, higher product yields for Bakken crude compared with ANS on the West Coast mean that
supplies from North Dakota continue to play a significant part in the Northwest refinery slate.
Morningstar Commodities Research
5 January 2017
Sandy Fielden Director, Oil and Products Research +1 512-431-8044 [email protected]
Data Sources for this Publication
gAlaska Dept. of RevenuegCalifornia Energy CommissiongClipperDatagCME GroupgCrude PostingsgEIA
To discover more about the data sources used Click Here
Pacific Northwest Refineries 5 January 2017 Page 2 of 28
× Increased Canadian production in recent years caused pipeline takeaway congestion, resulting in
Northwest refiners enjoying advantaged access to discounted prices, particularly for heavy crude.
× Future expansion of Canadian crude deliveries to the West Coast offers increased opportunity for
Northwest refiners.
× Downside risks for refiners include reduced U.S. shale production in North Dakota and a lack of
investment in upgrading capacity.
U.S. Refining Overview
In our June note on refinery performance (see U.S. Refiners Lose Crude Price Advantage), we described
how U.S. refiners enjoyed record margins between 2011 and 2015 as a result of advantages bestowed
by the dramatic increase in domestic crude production during the shale boom. Domestic crude
production increased by 75% from 5.5 million barrels/day, or mmb/d, in January 2011 to a peak of 9.6
mmb/d in April 2015 before declining since by 9% (in response to lower prices) to 8.8 mmb/d in October
2016 (data according to the U.S. Energy Information Administration). Two competitive advantages
underpinned record refinery performance during the shale boom. First, access to lower-priced crude
feedstock, primarily from shale, as well as cheap natural gas fuel for processing, kept costs low. Second,
increased demand for refined products, fueled by an export boom on the Gulf Coast, provided an outlet
for refiners processing higher volumes of crude.
The first of these two advantages has now all but disappeared, as U.S. crude prices are level with
international competitors. The second—growing refined product exports—has continued and been
joined by renewed growth in domestic gasoline consumption. As a result, U.S. refining margins are
down in 2016 compared with their peak in 2012, but they continue to outperform international
competitors.
This is the second in a series of outlooks for each of the U.S. refining regions that we will publish in
coming months. The five refining regions covered are based on the Department of Energy Petroleum
Administration for Defense Districts, or PADDS, that underlie EIA data reporting and analysis. The five
PADD regions are shown in Exhibit 1.

Pacific Northwest Refineries 5 January 2017 Page 3 of 28
Exhibit 1 U.S. PADD Refining Regions
Source: EIA, Morningstar
As outlined in the first Outlook in this series (see East Coast Refining After the Shale Boom), our refinery
analysis focuses on 114 plants in the Lower 48 states and Hawaii that process crude oil to manufacture
transportation fuels. We do not include an additional 23 plants listed by EIA in its biannual refining
capacity review, either, because they are in Alaska or because they primarily produce lubricants or
asphalt rather than transport fuels. Total operating capacity for the 114 plants is a fraction under 18
million barrels per day. The regional breakdown of refining capacity is 1.2 mmb/d in PADD 1 (East Coast),
3.8 mmb/d in PADD 2 (Midwest), 9.8 mmb/d in PADD 3 (Gulf Coast) 0.8 mmb/d in PADD 4 (Rockies) and
2.4 mmb/d in PADD 5 (West Coast and Hawaii). Two thirds of capacity is in the combined Gulf Coast
(55%) and Midwest (21%) regions.
For the purpose of this analysis, we assigned refinery ownership to one of the eight categories shown in
Exhibit 2. Of these categories, 70% (by capacity) belong to large independents and major oil companies.
In order of capacity, the large independents are Valero, Phillips 66, Marathon Petroleum, Tesoro, PBF
Energy, and Holly Frontier. The major oil companies in order of capacity are ExxonMobil, Royal Dutch
Shell, Chevron, BP, and Total. There are 12 smaller independent refiners with 10% of capacity among
them, four national oil companies (Citgo, Aramco/Motiva, Pemex, and Petrobras) with 9% of capacity, 13
privately owned companies with 15 plants and 6% of capacity, five private equity firms owning six
refineries, and two cooperatives.

Pacific Northwest Refineries 5 January 2017 Page 4 of 28
These refineries vary considerably in capacity and complexity. For example, of the 114 refineries
considered, 52% have coker units that process heavy crude (for more on heavy crude processing see our
August 2016 note Gulf Coast Refiners Enjoy Higher Margins From Processing Heavy Crude). About 10%
are configured to process the ultralight crude oils known as condensate that we discussed in our July
note covering light crude capacity on the Gulf Coast (see Gulf Coast Refiners Penalized for Running the
Lights) and our September note on Kinder Morgan's condensate splitter (see Kinder Morgan Splitter
Runs at 71% Throughput).
Exhibit 2 U.S. Refiner Categories by Capacity
Source: EIA, Morningstar
Northwest Refining
This outlook concentrates on five refineries with 634 mb/d capacity located in Washington state that
serve the Pacific Northwest. BP, Shell, Tesoro, Phillips 66, and U.S. Oil own these refineries. West Coast
refining also includes 10 refineries in California, with 1,629 mb/d capacity, five refineries in Alaska with
combined capacity of 165 mb/d, and two refineries in Hawaii with 148 mb/d capacity.
The five refineries in Washington state make up 28% of Lower 48 West Coast capacity and primarily
serve the 11.2 million residents of Washington state and Oregon. Washington refineries also meet a
portion of refined product needs in the Canadian province of British Columbia that has only one refinery.
Pacific Northwest refineries are relatively isolated from competitive oil markets both in the U.S. and
overseas. The West Coast is 10 days' travel by tanker from the U.S. Gulf Coast, three weeks from Asia,
more than four weeks from Europe, and no pipelines deliver crude oil across the Rockies. Most refinery
output is consumed by local demand, and refiners face little competition from outside the region. To the
south, California refineries produce specialized gasoline and diesel blends to meet California Air
Resources Board requirements that are more expensive than Washington specifications, meaning they
can only supply the Puget Sound region competitively in the event of refinery outages or other supply
disruptions. To the north, British Columbia is underserved, with only one 55 mb/d refinery at Burnaby
and other products delivered long distance by pipeline from Edmonton.
Operating Refinery Capacity # Refineries
% of Total Capacity
Large Independent 8,136,950 49 45%Major Oil Companies 4,556,100 18 25%Small Independent 1,837,500 17.5 10%National Oil Company 1,620,000 5.5 9%Private Owner 1,110,800 15 6%Private Equity 557,000 6 3%Cooperatives 173,000 3 1%Total 17,991,350 114
Pacific Northwest Refineries 5 January 2017 Page 5 of 28
Refineries in Utah and Montana serve parts of eastern Washington and Oregon via pipeline, but the
extent of competition from these suppliers is constrained by pipeline capacity as well as the physical
barrier of the Cascade Mountains.
Washington refineries get their crude feedstock from three main sources: Alaska, Canada, and North
Dakota. Additional supplies are imported from overseas. Declining production of Alaskan North Slope, or
ANS, crude in the past 20 years led refiners to increase purchases of crude imports. During the shale
production boom from 2011 to 2015, about 25% of imported and ANS feedstock was replaced by
domestic crude from North Dakota, delivered by rail. During this time, refiners in Washington could
purchase crude from Canada and North Dakota at advantaged prices resulting from transport congestion
in the U.S. Midwest and from Canada into the U.S. As crude infrastructure has been built out since
2013, overall crude prices have fallen since 2014 and U.S. shale production has leveled off since 2015,
such advantaged crude price differentials have narrowed, but the lack of crude pipelines to the West
Coast has kept discounts wide enough to continue benefiting Washington refineries.
The lack of competition in the West Coast refined product market combined with access to advantaged
crude from Canada and North Dakota in recent years has led to robust refining margins for Washington
refineries.
Refinery Crude Supply
Most ANS crude is produced in Prudhoe Bay on the north coast of Alaska and shipped to a marine
terminal at the southern port of Valdez via the 800-mile Trans Alaska Pipeline, or TAPS. U.S. flag tankers
ship ANS crude from Valdez to refineries in Washington and California, with smaller quantities going to
Hawaii and exports. Western Canadian crude is delivered via the 300 mb/d Kinder Morgan Trans
Mountain pipeline from Edmonton, Alberta, to Burnaby, British Columbia, and via a southern lateral to
Puget Sound refineries. Williston Basin light sweet crude from the Bakken Shale formation in North
Dakota is delivered to Puget Sound refineries by rail. We look in detail at each of these sources below
and identify the volumes delivered to each Washington refinery.
Additional crude supplies are imported from Latin America, the Middle East, and Asia, including the
Russian Far East.
ANS Crude From Alaska
ANS is considered a medium sour crude with an API gravity of 31.5 and 0.96% sulfur content. The
largest ANS producers are ExxonMobil, ConocoPhillips, and BP.
ANS production began in 1977 after a spike in crude prices justified the cost of building TAPS, ramped
up during the 1980s to peak at just under 2.1 mmb/d in 1988 and has been in slow decline ever since
(Exhibit 3). According to the EIA, Alaska crude production fell to an annual average 500 mb/d during
2014 and has remained flat at about 480 mb/d since then. Lower oil prices since the second half of 2014
as well as increased restrictions on Arctic drilling discourage increased investment in new Alaska
production, meaning that supply is likely to continue to decline. If volumes eventually drop below 350

Pacific Northwest Refineries 5 January 2017 Page 6 of 28
mb/d, then the successful operation of the Trans Alaska Pipeline is at risk because of the difficulty of
maintaining critical flows in freezing weather.
Exhibit 3 ANS Production
Source: EIA
Falling production has in turn resulted in West Coast refineries reducing their overall reliance on ANS
crude. Exhibit 4 summarizes ANS shipping flows provided by ClipperData for the period between
January 2013 and November 2016. The data shows that roughly half of ANS shipments go to each of
Washington and California destinations, with a smaller quantity going to Hawaii. The purple shaded
area represents total ANS production, according to the Alaska Department of Revenue, over and above
shipments to the West Coast and Hawaii—a volume that includes about 70 mb/d consumed by
refineries in Alaska and smaller occasional export volumes. The data shows ANS deliveries to
Washington state declining relative to California in the past three years, most likely in response to
Washington refineries consuming more Bakken crude at the expense of ANS. ClipperData identifies two
ANS export cargoes to South Korea in October 2014 and May 2015 that occurred under an exception to
a federal ban on crude exports that permitted ANS to be shipped overseas in limited circumstances
before 2016. The federal export regulations were overturned in December 2015, and since then, one
cargo was shipped to Japan in June and two cargoes to China in August and September of 2016.
0.00
0.50
1.00
1.50
2.00
2.50
Jan-
1980
May
-198
1
Sep-
1982
Jan-
1984
May
-198
5
Sep-
1986
Jan-
1988
May
-198
9
Sep-
1990
Jan-
1992
May
-199
3
Sep-
1994
Jan-
1996
May
-199
7
Sep-
1998
Jan-
2000
May
-200
1
Sep-
2002
Jan-
2004
May
-200
5
Sep-
2006
Jan-
2008
May
-200
9
Sep-
2010
Jan-
2012
May
-201
3
Sep-
2014
Jan-
2016
mill
ion
barr
els/
day

Pacific Northwest Refineries 5 January 2017 Page 7 of 28
Exhibit 4 ANS Shipments to PADD 5 by State
Source: ClipperData, EIA
ANS Deliveries to the Pacific Northwest
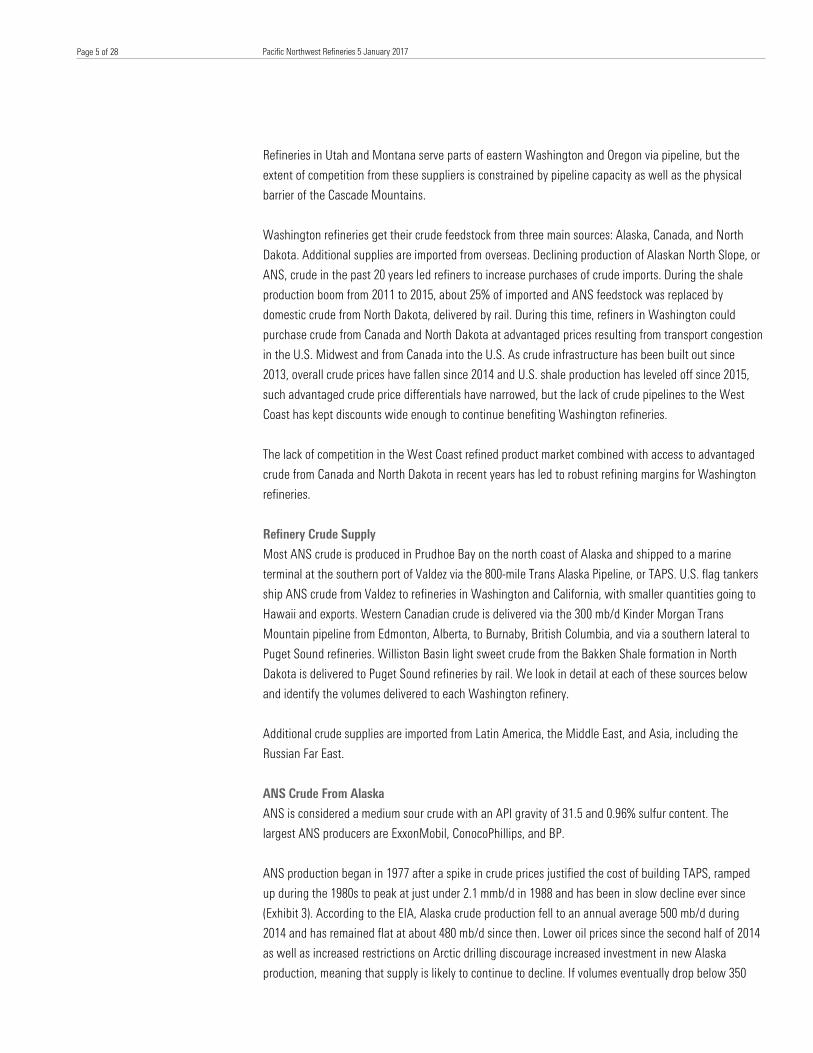
Exhibit 5, also based on ClipperData, shows that ANS deliveries to Washington state between 2013 and
2016 were mainly to BP, Shell, and Phillips 66. The data shows BP Ferndale as the largest consumer of
ANS, averaging 115 mb/d in 2013, down to 89 mb/d in 2016 through November. Phillips 66 received an
average 68 mb/d of ANS in 2013, just ahead of Shell’s 63 mb/d in that year but by 2016 (through
November) Phillips had reduced its ANS consumption to an average 41 mb/d while Shell increased to an
average 71 mb/d. In 2013 U.S. Oil received negligible quantities of ANS (3 mb/d on average) and it
abstained from Alaskan crude altogether between May 2014 and July 2016 before receiving about 10
mb/d in August, September, and November of 2016. Tesoro increased receipts of ANS slightly from an
average 3 mb/d in 2013 to 7 mb/d in 2015 but has more than doubled deliveries to 19 mb/d in 2016
through November.
0
100
200
300
400
500
600
Jan-
13
Mar
-13
May
-13
Jul-1
3
Sep-
13
Nov-
13
Jan-
14
Mar
-14
May
-14
Jul-1
4
Sep-
14
Nov-
14
Jan-
15
Mar
-15
May
-15
Jul-1
5
Sep-
15
Nov-
15
Jan-
16
Mar
-16
May
-16
Jul-1
6
Sep-
16
Nov-
16
thou
sand
bar
rels/
day
California Hawaii Washington Total ANS
Pacific Northwest Refineries 5 January 2017 Page 8 of 28
Exhibit 5 ANS Deliveries to Pacific Northwest Refineries
Source: ClipperData
Shipping ANS
Three shipping companies transport ANS crude from Valdez to Washington refineries. These are the
Alaska Tanker Company (a partnership between BP, Keystone, and OSG), the ConocoPhillips-owned
Polar Tankers, and the ExxonMobil-owned Sea River Company. These companies operate 10 tankers that
must comply with the provisions of the 1920 Merchant Marine Act. This regulation, better known as the
Jones Act, governs the waterborne movement of goods between U.S. ports and requires that they be
shipped on U.S. flag vessels, built in the U.S, manned by U.S. citizens, and subject to U.S. employment
law. Jones Act vessels cost roughly three times as much as nonflag equivalents to operate and make
shipping crude or refined products by water relatively more expensive than other modes of transport.
The overturning of the crude export regulations in December 2015 means that ANS can now be shipped
overseas on foreign vessels, making it more competitive in the Asian market. Overseas competition for
declining ANS supplies increases the incentive for Washington refiners to identify alternative feedstock.
Canadian Crude Via Trans Mountain
The U.S. imports more crude oil from Canada than from any other country (about 3.3 mmb/d, according
to EIA), and the volume is growing. Most imports enter the U.S. through the Midwest, feeding refineries
in PADD 2 and increasingly flowing as far as the Gulf Coast. A smaller volume of crude (222 mb/d on
average in 2015) is exported to PADD 5 from Canada, with most being shipped on the Trans Mountain
pipeline that has been in operation since 1953.
The Kinder Morgan Trans Mountain pipeline was built to ship western Canadian crude to the West
Coast. The pipeline currently transports up to 300 mb/d from Edmonton, Alberta, to central British
Columbia, the Greater Vancouver area, the Puget Sound area in Washington State, and south along the
0
50
100
150
200
250
300
350
Jan-
13
Mar
-13
May
-13
Jul-1
3
Sep-
13
Nov-
13
Jan-
14
Mar
-14
May
-14
Jul-1
4
Sep-
14
Nov-
14
Jan-
15
Mar
-15
May
-15
Jul-1
5
Sep-
15
Nov-
15
Jan-
16
Mar
-16
May
-16
Jul-1
6
Sep-
16
Nov-
16
thou
sand
bar
rels/
day
BP Ferndale P66 Ferndale Shell Anacortes Tesoro Anacortes U.S. Oil Tacoma

Pacific Northwest Refineries 5 January 2017 Page 9 of 28
West Coast or overseas through the Westridge marine terminal in Burnaby, British Columbia (Exhibit 6).
The pipeline is uniquely able to ship batches of both crude and refined products. Trans Mountain is
heavily utilized and regularly oversubscribed by shippers. Typically about 50 mb/d of the capacity is used
to ship gasoline and diesel and 250 mb/d for crude.
Exhibit 6 Trans Mountain Pipeline
Source: Kinder Morgan
Roughly 140 mb/d of the crude shipped is directed onto the Puget Sound lateral at Sumas, British
Columbia (Exhibit 7). The 56-mile, 180 mb/d capacity Puget Sound pipeline only carries crude and
condensate and delivers crude to the BP and Phillips 66 refineries in Ferndale and the Shell and Tesoro
refineries in Anacortes. The pipeline does not extend further south than Anacortes meaning that
Canadian crude deliveries to U.S. Oil in Tacoma must be waterborne.

Pacific Northwest Refineries 5 January 2017 Page 10 of 28
Exhibit 7 Puget Sound Pipeline
Source: Kinder Morgan
About 80 mb/d of Trans Mountain crude is delivered to the Westridge Marine terminal in Burnaby, from
where it can be shipped by tanker or barge to West Coast or export markets.
Our analysis of EIA crude import data into Washington state indicates that overall shipments from
Canada nearly doubled from an average of 110 mb/d in 2009 to 188 mb/d in 2015 and 200 mb/d
Pacific Northwest Refineries 5 January 2017 Page 11 of 28
between January and October 2016. We assume that the majority of these imports come directly via the
Puget Sound lateral of Trans Mountain to Washington refineries, but that pipeline alone is not capable
of shipping the quantities now being imported. Puget Sound volumes average only around 140 mb/d,
according to Kinder Morgan shipping notices. This is less than the full 180 mb/d capacity and results
either from operational constraints restricting pipeline flow or from inadequate space on the main Trans
Mountain to accommodate Puget Sound shipper nominated volumes. Either way, additional Canadian
imports to Washington state must either come by barge or tanker from the Westridge marine dock or via
the only other viable mode of transport: rail. A comparison of EIA monthly crude by rail shipment data for
PADD 5 with California Energy Commission numbers for rail shipments to that state indicates that no
crude was shipped to California by rail from Canada in 2015 or 2016 and that by implication an average
of only about 400 barrels/day were imported into Washington state from Canada by rail during this time.
So most, if not all, of the additional imports of Canadian crude to Washington refineries over and above
Puget Sound pipeline volumes, come from the Westridge dock. We also know from a documented tariff
dispute with Canada’s National Energy Board that both U.S. Oil and Shell are regular bidders for access
to the limited dock space at Westridge. Our conclusion is that some if not all Washington state refiners
are very keen to get their hands on Canadian crude for reasons that we explain below.
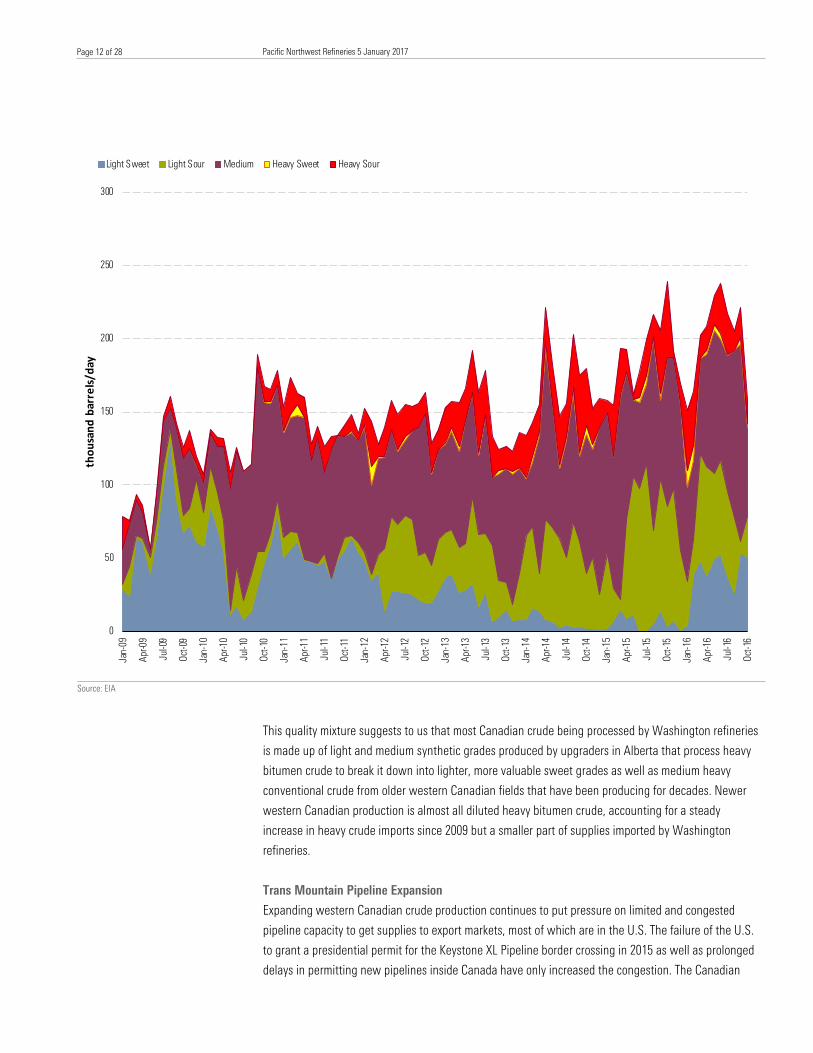
Exhibit 8 shows the monthly EIA breakdown of Canadian crude imports to Washington state by grade
since 2009. EIA categorizes heavy crude as having an API gravity of 27 or less, light crude as greater
than 35 and medium crude between 27 and 35. The agency categorizes sweet crude as having 0.5%
sulfur content or less and sour crude as having more than 0.5%. The data shows that over 80% of
Canadian crude imports since 2009 have been light or medium grades. In 2009, the annual average
mixture was 73% light, 21% medium, and 6% heavy, but medium and heavy crudes have increased their
share—to 47% and 12%, respectively, in 2015.
Exhibit 8 Canadian Crude Imports to Washington State
Pacific Northwest Refineries 5 January 2017 Page 12 of 28
Source: EIA
This quality mixture suggests to us that most Canadian crude being processed by Washington refineries
is made up of light and medium synthetic grades produced by upgraders in Alberta that process heavy
bitumen crude to break it down into lighter, more valuable sweet grades as well as medium heavy
conventional crude from older western Canadian fields that have been producing for decades. Newer
western Canadian production is almost all diluted heavy bitumen crude, accounting for a steady
increase in heavy crude imports since 2009 but a smaller part of supplies imported by Washington
refineries.
Trans Mountain Pipeline Expansion
Expanding western Canadian crude production continues to put pressure on limited and congested
pipeline capacity to get supplies to export markets, most of which are in the U.S. The failure of the U.S.
to grant a presidential permit for the Keystone XL Pipeline border crossing in 2015 as well as prolonged
delays in permitting new pipelines inside Canada have only increased the congestion. The Canadian
0
50
100
150
200
250
300
Jan-
09
Apr-0
9
Jul-0
9
Oct-0
9
Jan-
10
Apr-1
0
Jul-1
0
Oct-1
0
Jan-
11
Apr-1
1
Jul-1
1
Oct-1
1
Jan-
12
Apr-1
2
Jul-1
2
Oct-1
2
Jan-
13
Apr-1
3
Jul-1
3
Oct-1
3
Jan-
14
Apr-1
4
Jul-1
4
Oct-1
4
Jan-
15
Apr-1
5
Jul-1
5
Oct-1
5
Jan-
16
Apr-1
6
Jul-1
6
Oct-1
6
thou
sand
bar
rels/
day
Light Sweet Light Sour Medium Heavy Sweet Heavy Sour
Pacific Northwest Refineries 5 January 2017 Page 13 of 28
delays have affected Kinder Morgan’s plans—first touted in 2012—to nearly triple the capacity of the
Trans Mountain pipeline from the current 300 mb/d to 890 mb/d. The Canadian government finally
approved those expansion plans at the end of November 2016, subject to Kinder Morgan meeting 157
conditions. If the conditions are met and no other barriers emerge, Trans Mountain plans to start
construction in September 2017 with a view to commencing operation in December 2019. The expansion
will initially just expand the main pipeline from Edmonton to Burnaby—not the Puget Sound lateral,
although it will increase the power of the Sumas pumping station. The plans also include expansion of
the Westridge dock to accommodate three new berths that will handle larger vessels. The pipeline
expansion is backed by long-term shipper commitments from Canadian producers and at least two
Washington state refiners: BP and Tesoro.
If the pipeline expansion occurs as planned in 2019, it will have a significant impact on crude supply for
Washington state refiners. By removing the current congestion and providing potential access to nearly
600 mb/d of new supply, the pipeline expansion will end concerns about limited crude supply for Puget
Sound refiners. The downside will be that the current discount prices for Canadian crude that improve
refining margins will narrow as competition for space on the pipeline decreases. It is likely that the
expansion will increase flows of “newer” heavy Canadian crude, placing the three Washington refineries
without heavy crude processing capacity at a disadvantage without investing in upgrades.
Bakken Crude by Rail
Bakken crude production from shale in the Williston Basin (including North Dakota, South Dakota, and
Montana) increased more than threefold during the shale boom from 406 mb/d in January 2011 to peak
at 1,288 mb/d in June 2015, declining since to about 1,100 mb/d in October 2016, according to the
North Dakota Pipeline Authority. Since mid-2011, Bakken crude production has exceeded local refinery
consumption and pipeline takeaway capacity (see Exhibit 9). That constraint on pipeline flows out of
North Dakota will likely end in 2017 with the completion of the Dakota Access Pipeline as we outlined in
our November note (see Need for Dakota Access Reduced by Lower Bakken Production). In the
meantime, about 385 mb/d of Bakken production is still being shipped to market by rail, primarily to East
and West coast markets that are not currently served by pipeline.
Crude-by-rail transport developed in North Dakota in late 2010 as production outpaced delivery
infrastructure. As we detailed in our October Outlook (see East Coast Refining After the Shale Boom), the
differentials between prices for Bakken crude stranded inland by pipeline congestion and similar crude
grades at coastal refineries, priced at international levels, widened to over $30/barrel in 2012 and
justified the build-out of crude rail loading terminals in North Dakota and unloading terminals at East,
West, and Gulf coast refineries. Crude-by-rail freight costs were expensive but justified by the premiums
available in coastal destination markets. Refiners built out rail terminals to unload crude delivered by rail
directly at their plants or at nearby rail-to-barge marine terminals.

Pacific Northwest Refineries 5 January 2017 Page 14 of 28
Exhibit 9 Bakken Crude Production and Takeaway Capacity
Source: North Dakota Pipeline Authority
Volumes of crude delivered by rail from North Dakota declined from the end of 2014 onwards as
midstream companies built out pipeline infrastructure that allowed more Bakken crude to be shipped to
the Midwest and the Gulf Coast and narrower price differentials removed the advantage of using more
expensive rail transport. However, crude-by-rail shipments continue today. There are three reasons for
this. The first is that Bakken pipeline takeaway capacity is still not sufficient to handle all production.
The second is that refiners and shippers signed up for long-term take-or-pay contracts and invested in
rail cars and terminal infrastructure that they have sunk costs into and continue to use even though
economics do not necessarily justify these shipments. Third, there are still some routes where crude
price differentials justify sending crude by rail. These routes include shipments from North Dakota to
Washington state refineries.
The most popular route for Bakken crude delivered by rail has been to East Coast refineries, but
Washington state is the second most popular destination, and deliveries still averaged 126 mb/d in 2016
through October, according to EIA data detailing movements between PADD 2 and PADD 5 (after
removing rail shipments to California reported by the California Energy Commission). Exhibit 10 shows
the history of crude-by-rail shipments to Washington state since 2012—when they averaged just 18 b/d.
Rail shipments to Washington peaked in 2014 when they reached 171 mb/d in September and again in
December and averaged 141 mb/d over the year. Shipments to Washington fell by 50% in April 2015
after a strike at Tesoro’s Anacortes plant during February and March. In 2016, rail shipments to
Washington have fallen by about 9% on average versus 2015 but have proved more resilient than East
Coast shipments that declined by two thirds since May 2015 in response to narrower crude price
differentials.
0
500
1000
1500
2000
2500
3000
3500
1/1/
2007
6/1/
2007
11/1
/200
7
4/1/
2008
9/1/
2008
2/1/
2009
7/1/
2009
12/1
/200
9
5/1/
2010
10/1
/201
0
3/1/
2011
8/1/
2011
1/1/
2012
6/1/
2012
11/1
/201
2
4/1/
2013
9/1/
2013
2/1/
2014
7/1/
2014
12/1
/201
4
5/1/
2015
10/1
/201
5
3/1/
2016
8/1/
2016
1/1/
2017
6/1/
2017
11/1
/201
7
thou
sand
bar
rels/
day
Williston Basin Crude ProductionPipeline and Refinery CapacityCrude-by-Rail Terminal Capacity

Pacific Northwest Refineries 5 January 2017 Page 15 of 28
Exhibit 10 North Dakota Crude by Rail Shipments to Washington State
Source: EIA, California Energy Commission
Washington State Refinery Crude-by-Rail Terminals
Four of the five Washington refineries built rail terminals between 2012 and 2014 to unload crude (see
Exhibit 11). The Shell Anacortes refinery does not have an unloading facility, although the company went
through a lengthy process starting in 2014 to permit a proposed facility before giving up on the project in
October 2016.
Exhibit 11 Washington State Refinery Crude-by-Rail Terminals
Source: Company presentations
Tesoro constructed the first purposely built crude-by-rail unloading terminal at a Washington refinery,
with 50 mb/d capacity, that went into service in September 2012. Tesoro has used the facility heavily
ever since, with reported throughput for 2015 of 49 mb/d, according to company SEC filings. Tesoro and
0
50
100
150
200
250
thou
sand
bar
rels/
day
Refinery LocationRail Unload Capacity
mb/dBP West Coast Products LLC Ferndale, WA 60
Phillips 66 Ferndale, WA 30
Tesoro Anacortes, WA 50
US OIL & REFINING CO Tacoma, WA 40
Total 180

Pacific Northwest Refineries 5 January 2017 Page 16 of 28
its subsidiary logistics company (Tesoro Logistics Partners) have a crude-gathering operation in North
Dakota that allows them to source crude for their Washington refinery direct from producers.
Phillips 66 opened a 30 mb/d rail unloading terminal in November 2014. The company previously
shipped Bakken crude into Washington state to the Targa Sound rail-to-barge terminal in Tacoma and
from there to the Ferndale refinery by barge. The Phillips 66 rail terminal is owned and operated by the
company’s logistics subsidiary Phillips 66 Partners. Phillips appears to have reduced use of its facility
during 2015 when we estimate that it averaged only 10 mb/d throughput, or one third of capacity.
Trailstone expanded the railyard at its Tacoma refinery in 2013 to allow longer unit trains to unload. The
facility was expanded again during 2014 to unload up to 40 mb/d. Trailstone has also taken delivery of
heavy Canadian crude delivered by rail to an ARC logistics barge terminal in Portland. Trailstone appears
to be making heavy use of the rail facility with an estimated average throughput of 30 mb/d during
2015.
BP built the largest Washington crude-by-rail unloading terminal at its Ferndale refinery. The 60 mb/d
facility came on line in late 2013. The BP Ferndale refinery has been receiving crude-by-rail shipments as
of late December 2013 and has the capacity to unload 60 mb/d. We estimate BP usage during 2015 at
an average 50 mb/d.
A number of barge terminals in the Columbia River estuary have been used to transfer crude from rail to
barges for onward transit to Washington refineries. Tesoro and Savage have developed a joint venture
project for a large (360 mb/d) rail-to-barge and tanker terminal in Vancouver, Washington, known as the
Vancouver Energy project, that would ship crude from North Dakota as well as Canadian and other
domestic grades to refineries in California or overseas. Public sentiment in the Puget Sound region has
turned against crude-by-rail movements in the wake of several accidents and concern with growing
traffic. As a result, the Vancouver Energy project has been denied a permit, although Tesoro continues to
challenge the decision and recently agreed to reduce initial throughput by half.
Summary of Crude Supply to Washington Refineries
Exhibit 12 summarizes crude feedstock sources for Washington state refineries between January 2013
and October 2016 based on our above analysis of crude supply from Alaska, Canada, and North Dakota.
The purple shaded area represents non-Canadian crude imports that have declined from an average 72
mb/d in 2013 to 13 mb/d between January and October 2016 as refiners replaced imports with Bakken
and Canadian supplies. Most of the overseas imports are medium and light sour crude grades.

Pacific Northwest Refineries 5 January 2017 Page 17 of 28
Exhibit 12 Crude Supply to Washington State Refineries
Source: Morningstar, ClipperData, EIA, CEC
Exhibit 13 shows our estimate of average crude supply by refinery for calendar 2015. These estimates
are based on ClipperData detail of ANS shipments, monthly EIA company level import data for Canadian
and other imports, and estimates of rail deliveries based on the total shipments into Washington
discussed above, company filings, and presentations. The data shows that Alaska was the largest crude
supplier to Washington refineries in 2015, with ANS providing an average of 208 mb/d, or 37% of the
total. Canada was the second-largest supplier, with an average 189 mb/d, or 34% of the total, with rail
providing 139 mb/d, or 25% of supply, and other imports 24 mb/d, or 4%. Crude-by-rail therefore came
from nowhere to achieve a 25% market share between 2012 and 2015 even as the Shell refinery has no
direct unloading capacity.
Exhibit 13 Washington State Refinery Crude Sources in 2015 mb/d
Source: Morningstar, ClipperData, EIA, CEC
0
100
200
300
400
500
600
700
800
Jan-
13
Mar
-13
May
-13
Jul-1
3
Sep-
13
Nov-
13
Jan-
14
Mar
-14
May
-14
Jul-1
4
Sep-
14
Nov-
14
Jan-
15
Mar
-15
May
-15
Jul-1
5
Sep-
15
Nov-
15
Jan-
16
Mar
-16
May
-16
Jul-1
6
Sep-
16
thou
sand
bar
rels/
day
ANS Canada Other Imports Rail
Refinery Capacity ANS Canadian Crude Bakken Rail Other Imports Total ThroughputBP Ferndale 227 105 32 50 19 206P66 Ferndale 101 39 42 10 3 94Shell Anacortes 145 57 62 0 2 121Tesoro Anacortes 120 7 44 49 0 100Trailstone 41 0 9 30 0 39
Total 208 189 139 24

Pacific Northwest Refineries 5 January 2017 Page 18 of 28
Refined Product Demand
EIA data estimates that annual average 2015 combined refined product consumption in Oregon and
Washington was 282 mb/d gasoline, 126 mb/d diesel, and 61 mb/d of jet kerosene. During 2016 through
September, these volumes remained fairly flat, with an average 287 mb/d gasoline (61%), 123 mb/d
diesel (26%), and 58 mb/d jet (12%). Within the combined numbers, Washington demand is higher
because it has nearly double the population of Oregon, consuming about 65% of gasoline, 60% of diesel,
and 80% of jet fuel. Washington state demand for jet fuel includes a significant military and navy market
as well as regional airports, including Vancouver, British Columbia.
Most residual fuel demand is for ships bunkers in the Puget Sound area, although U.S. Oil has an
asphalt business that uses heavy residual oil for road surfacing and roofing. Fuel oil demand is the weak
link in Northwest-refined product markets. As we detail below, only two of the five regional refineries
have coking capacity to upgrade fuel oil into lighter products. The other three refineries rely on fuel oil
demand that is currently dominated by ships bunkers. As we discussed in a November note (see Marine
Bunker Deadline to Benefit Refiners and Traders) changes to international marine fuel standards in
January 2020 could radically reduce fuel oil demand. If that proves to be the case, then Pacific
Northwest refiners will need to invest in capacity to upgrade more fuel oil to lighter products.
Refined product is exported from Washington to British Columbia (mostly jet fuel and distillate by barge)
and shipped to California (gasoline). Washington state also exports refined product to other countries
such as Mexico.
Refined Product Pricing
The relative isolation of the Pacific Northwest together with the lack of nearby competition generally
results in higher prices for refined products than in the East or Gulf coasts. For example, wholesale
Portland gasoline prices were on average $0.18/gallon ($7.56/barrel) higher than similar grades at the
Gulf Coast and $0.15/gallon ($6.30/barrel) higher than New York during 2015. Portland diesel prices
were on average $0.15/gallon ($6.30/barrel) higher than the Gulf Coast and $0.07/gallon ($2.94/barrel)
higher than New York in 2015.
Because the region relies heavily on local refineries to meet demand, prices are also susceptible to
supply chain disruption. Unplanned refinery or pipeline outages typically lead to higher prices. Prices can
remain higher for longer periods after disruption compared with other regions.
Refined Product Distribution
The Puget Sound refineries supply refined products to Washington state and Oregon via a pipeline and
barge distribution system along the western side of both states (Exhibit 14). The 300 mb/d Olympic
pipeline, owned by BP, runs from Puget Sound to Portland, Oregon, and is connected to four of the five
refineries. The 300-mile pipeline transports gasoline, diesel, and jet fuel and delivers to Seattle
(including the Seattle-Tacoma airport), Tacoma, Vancouver, Washington, and Portland, Oregon. The 114-
mile 38 mb/d Kinder Morgan North products pipeline runs from Portland to Eugene, Oregon, with a
lateral connection to the Portland airport. Barges move product farther inland along the Columbia River
as far as Pasco, Washington.

Pacific Northwest Refineries 5 January 2017 Page 19 of 28
Exhibit 14 Refined Product Distribution
Source: Morningstar, EIA
Product moves into eastern Washington and Oregon from Salt Lake City, Utah, via the Northwest
Pipeline, purchased by Tesoro in June 2013 from Chevron. The 760-mile 84 mb/d pipeline connects Utah
refineries to Idaho, Oregon, and Spokane, Washington. The 725-mile 66 mb/d Yellowstone Pipeline
connects refineries in Billings, Montana, with eastern Washington. The Yellowstone Pipeline is operated
by Phillips 66, which is a joint owner with Sunoco Logistics and ExxonMobil. EIA data shows that
movements of refined product on the Yellowstone and Northwest pipelines increased by 78% from an
annual average of 32 mb/d in 2010 to 57 mb/d in 2015.
Refineries
This section provides detail on the configuration and ownership of the five Puget Sound refineries.
Exhibit 15 shows their throughput capacity.
Major oil companies, large independent refiners, and one smaller independent player own the five
Washington refineries. The two most sophisticated plants with coking units to process heavy crude
belong to major oil companies— the 145 mb/d Shell Anacortes and 227 mb/d BP Ferndale plants. Shell
is a significant West Coast refinery player, owning two additional plants in California. BP has reduced its
refining presence in the U.S. since the 2010 Gulf of Mexico Macondo disaster, but its Ferndale plant is
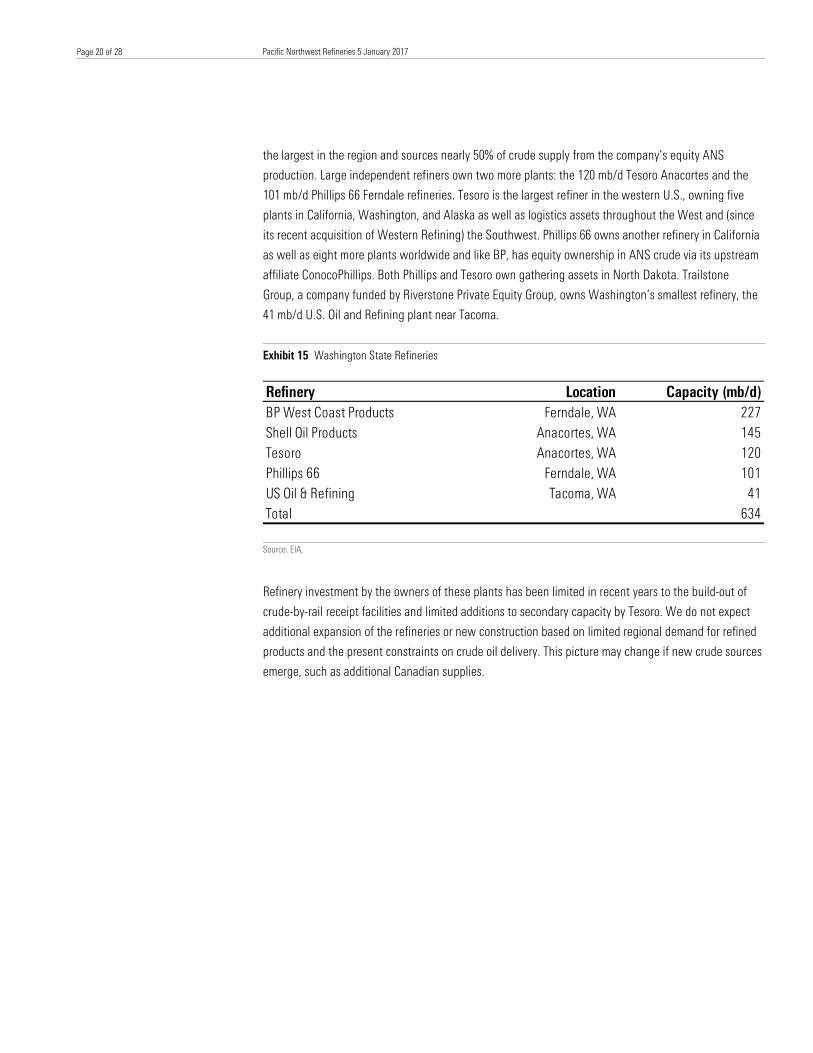
Pacific Northwest Refineries 5 January 2017 Page 20 of 28
the largest in the region and sources nearly 50% of crude supply from the company’s equity ANS
production. Large independent refiners own two more plants: the 120 mb/d Tesoro Anacortes and the
101 mb/d Phillips 66 Ferndale refineries. Tesoro is the largest refiner in the western U.S., owning five
plants in California, Washington, and Alaska as well as logistics assets throughout the West and (since
its recent acquisition of Western Refining) the Southwest. Phillips 66 owns another refinery in California
as well as eight more plants worldwide and like BP, has equity ownership in ANS crude via its upstream
affiliate ConocoPhillips. Both Phillips and Tesoro own gathering assets in North Dakota. Trailstone
Group, a company funded by Riverstone Private Equity Group, owns Washington’s smallest refinery, the
41 mb/d U.S. Oil and Refining plant near Tacoma.
Exhibit 15 Washington State Refineries
Source: EIA,
Refinery investment by the owners of these plants has been limited in recent years to the build-out of
crude-by-rail receipt facilities and limited additions to secondary capacity by Tesoro. We do not expect
additional expansion of the refineries or new construction based on limited regional demand for refined
products and the present constraints on crude oil delivery. This picture may change if new crude sources
emerge, such as additional Canadian supplies.
Refinery Location Capacity (mb/d)BP West Coast Products Ferndale, WA 227Shell Oil Products Anacortes, WA 145Tesoro Anacortes, WA 120Phillips 66 Ferndale, WA 101US Oil & Refining Tacoma, WA 41Total 634

Pacific Northwest Refineries 5 January 2017 Page 21 of 28
BP Ferndale
The 227 mb/d BP refinery is the largest in the Pacific Northwest and the third-largest on the West Coast.
This refinery is the most complex of Washington’s plants, with coker and hydro-treater units capable of
significant upgrading of residual fuel oil from primary processing. The refinery supplies calcined coke
from the coker unit to aluminum plants that are in Washington state to take advantage of cheap
hydroelectric power. The refinery meets about 20% of regional gasoline demand and is the largest
supplier of jet fuel to Vancouver, Seattle, and Portland international airports.
As an equity production owner in Alaska, BP uses ANS to meet nearly half of its crude needs but has
also taken advantage of Bakken crude delivered by rail to meet 25% of its needs. BP has retreated from
the downstream arena since the Macondo disaster in 2010, and the Ferndale refinery is its only plant in
PADD 5.
Shell Anacortes
The 145 mb/d Shell Puget Sound Refinery was built in the late 1950s by Texaco to take advantage of
Canadian crude delivered on the Trans Mountain pipeline, but now processes a roughly 50/50 mix of
ANS and Canadian crude. Like BP, this refinery is a sophisticated plant, with secondary processing
capacity that includes a 23 mb/d delayed coker and fluid cat cracker. Shell Oil Products U.S., a subsidiary
of Royal Dutch Shell, operates the refinery that it acquired as part of a merger with Texaco. At that point,
Shell owned both Anacortes refineries and was required to sell the smaller plant to Tesoro in 1998.
Shell’s failure to acquire a permit for a rail unloading terminal has prevented the company from using
significant supplies of Bakken crude, potentially putting it at a competitive disadvantage. With ANS
supply declining and Canadian crude supply limited by congestion on the Trans Mountain pipeline, Shell
is more vulnerable to supply disruption.
Tesoro Anacortes
The 120 mb/d Tesoro Anacortes plant is part of a fleet of five plants the company owns and operates in
PADD 5, including three in California and the largest refinery in Alaska. The Anacortes plant is relatively
sophisticated but does not have a coker unit to process heavy crude, although the refinery processed an
average 44 mb/d of medium and light Canadian crude in 2015. Tesoro is investing in upgrades to
increase the quantity and quality of gasoline the refinery produces with a clean product upgrade project
underway and a new isomerization unit expected on line in 2018. In part, these projects are designed to
meet tighter Tier III federal gasoline standards that come into force in January 2017.
Tesoro was the first Puget Sound refiner to build out a rail terminal in 2012 to deliver Bakken crude, and
the company has a strong presence in North Dakota, including a gathering system and the only two
refineries in that state at Mandan and Dickinson. Bakken crude has almost entirely replaced ANS at the
Anacortes Tesoro refinery (we estimated only 7 mb/d of ANS was processed on average in 2015). Tesoro
now processes a mixture of Canadian and Bakken crude, and the refinery is therefore somewhat
dependent on the economics of crude by rail from the Bakken. However, as part of a large chain of West
Coast refineries (recently expanded with the acquisition of Western Refining), Tesoro has plenty of
alternative supply options, including imports.
Pacific Northwest Refineries 5 January 2017 Page 22 of 28
Phillips 66 Ferndale
The 101 mb/d Phillips 66 Ferndale refinery is similar in complexity to the Tesoro Anacortes plant, with no
coker unit but a number of secondary units to boost gasoline, which accounts for 50% of output. The
refinery also produces distillate (28% of output) and fuel oil. Phillips is a large independent refiner with
nine U.S. refineries, two of which are in California.
Like BP, Phillips 66 has an equity interest in ANS crude (via Conoco Phillips) and the refinery ran a mix of
45% ANS, 45% Canadian crude, and 10% Bakken during 2015. Unlike Tesoro and BP, Phillips has limited
its processing of Bakken crude even though subsidiary Phillips 66 Partners operates the 100 mb/d
Palermo rail terminal in North Dakota that was completed in 2015.
Trailstone U.S. Oil Refining
The 41 mb/d U.S. Oil refinery in Tacoma is the smallest refinery in the Pacific Northwest and the least-
sophisticated, with no secondary conversion. As well as gasoline and diesel, the refinery produces jet
fuel that is delivered by pipeline to the nearby Joint Base Lewis-McChord Army and Air Force base and
the SeaTac airport. The company also has an asphalt business.
In 2015, U.S. Oil relied heavily on Bakken crude delivered by rail that accounted for 77% of its feedstock,
with Canadian crude providing the balance. U.S. Oil did not receive any ANS in 2015 but received some
shipments from Alaska during 2016. The Tacoma refinery is not connected to the Puget Sound pipeline
and therefore relies on barges to receive Canadian crude supplies from the Westridge dock. Congestion
at that dock that has a limited 80 mb/d capacity, has led U.S. Oil to query the Trans Mountain allocation
of dock space with the Canadian National Energy Board regulator.
Refining Margins
In this section, we look first at price differentials for the three main crude types processed by Puget
Sound refineries and then estimate refining margins for these crudes based on local product pricing. The
analysis is subjective given that individual refineries perform differently and incur different costs, but it
does identify broad trends. Our analysis produced two conclusions. The first is that those refineries able
to process heavy Canadian crudes (BP and Shell) have seen the best returns because of the discounted
prices available for such crude. Second, the crude costs and refining margins for crude railed in from
North Dakota have meant better returns for processing Bakken than for ANS.
Crude Prices
Exhibit 16 shows monthly average crude price premiums (discounts) versus West Texas Intermediate for
ANS, Brent, Bakken, and Western Canadian Select between January 2013 and November 2016. WTI is
used as the baseline for the differentials because it is the benchmark U.S. crude price and generally
represents inland domestic crude pricing. Brent is shown for reference because it is the international
crude benchmark that reflects the cost of imported crude. The ANS price is a delivered price to Los
Angeles that we assume is equivalent to the cost of ANS delivered to Puget Sound. The Bakken price is
a posted value that Flint Hills Resources offered to pay for North Dakota light sweet crude at the

Pacific Northwest Refineries 5 January 2017 Page 23 of 28
wellhead. WCS is a blended mix of heavy and light Canadian crude components used as a benchmark
for heavy Canadian crude. The WCS price we used is delivered at Hardisty, Alberta.
Based purely on the crude prices, the Bakken and WCS crudes are discounted versus WTI and ANS
throughout most of this period (see Exhibit 17).
Looking at Bakken first, the average price discount to WTI was $11.57/barrel in 2013, $16.43/barrel in
2014, $13.60/barrel in 2015, and $11.04/barrel in 2016 through November. But these are posted
wellhead Bakken prices, so we must factor in terminal and rail transport costs that we estimate at
roughly $10/barrel. Therefore, if Puget Sound refiners could acquire Bakken crude at the wellhead
(through gathering systems, for example) then the delivered cost compares favorably with WTI
throughout the period. Since ANS was trading at a premium to WTI during 2013-15, that meant Bakken
crude delivered by rail was consistently cheaper than ANS and the higher rail transport cost was
justified.
Exhibit 16 Crude Price Premiums to WTI
Source: CME Group, Alaska Department of Revenue, Flint Hills, Morningstar
-40
-30
-20
-10
0
10
20
30
Jan-
13
Mar
-13
May
-13
Jul-1
3
Sep-
13
Nov-
13
Jan-
14
Mar
-14
May
-14
Jul-1
4
Sep-
14
Nov-
14
Jan-
15
Mar
-15
May
-15
Jul-1
5
Sep-
15
Nov-
15
Jan-
16
Mar
-16
May
-16
Jul-1
6
Sep-
16
Nov-
16
$/ba
rrel
ANS Brent Bakken WCS WTI
Pacific Northwest Refineries 5 January 2017 Page 24 of 28
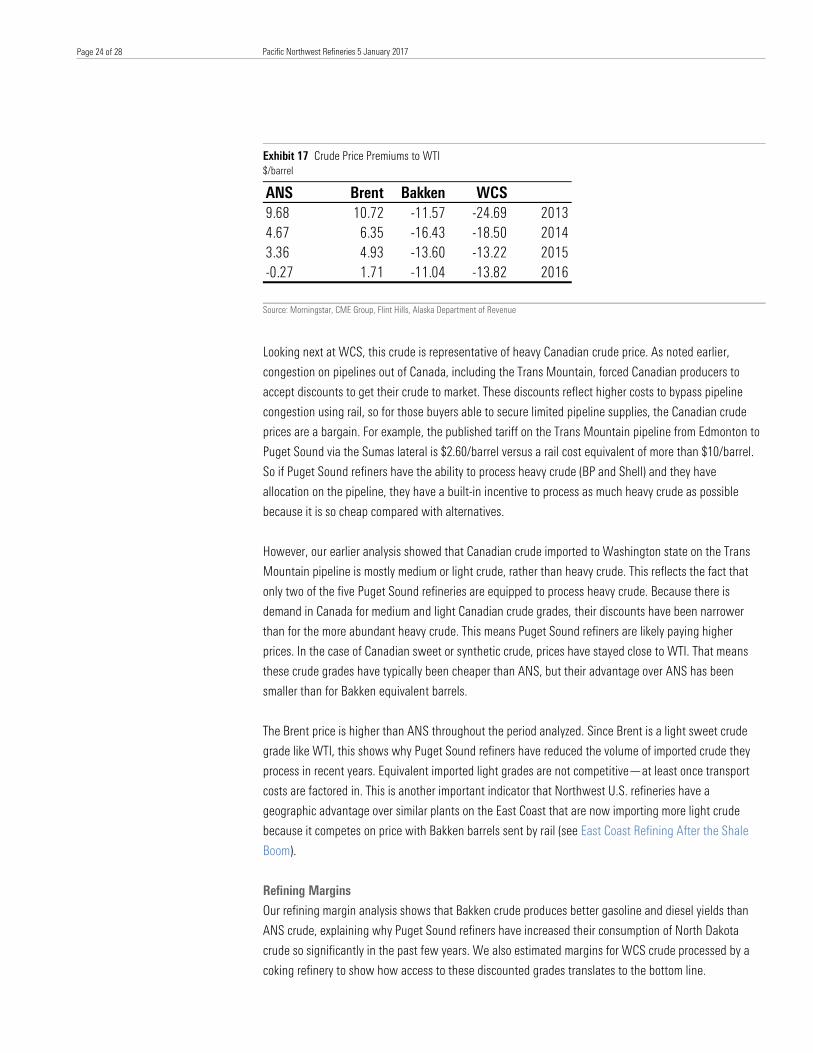
Exhibit 17 Crude Price Premiums to WTI $/barrel
Source: Morningstar, CME Group, Flint Hills, Alaska Department of Revenue
Looking next at WCS, this crude is representative of heavy Canadian crude price. As noted earlier,
congestion on pipelines out of Canada, including the Trans Mountain, forced Canadian producers to
accept discounts to get their crude to market. These discounts reflect higher costs to bypass pipeline
congestion using rail, so for those buyers able to secure limited pipeline supplies, the Canadian crude
prices are a bargain. For example, the published tariff on the Trans Mountain pipeline from Edmonton to
Puget Sound via the Sumas lateral is $2.60/barrel versus a rail cost equivalent of more than $10/barrel.
So if Puget Sound refiners have the ability to process heavy crude (BP and Shell) and they have
allocation on the pipeline, they have a built-in incentive to process as much heavy crude as possible
because it is so cheap compared with alternatives.
However, our earlier analysis showed that Canadian crude imported to Washington state on the Trans
Mountain pipeline is mostly medium or light crude, rather than heavy crude. This reflects the fact that
only two of the five Puget Sound refineries are equipped to process heavy crude. Because there is
demand in Canada for medium and light Canadian crude grades, their discounts have been narrower
than for the more abundant heavy crude. This means Puget Sound refiners are likely paying higher
prices. In the case of Canadian sweet or synthetic crude, prices have stayed close to WTI. That means
these crude grades have typically been cheaper than ANS, but their advantage over ANS has been
smaller than for Bakken equivalent barrels.
The Brent price is higher than ANS throughout the period analyzed. Since Brent is a light sweet crude
grade like WTI, this shows why Puget Sound refiners have reduced the volume of imported crude they
process in recent years. Equivalent imported light grades are not competitive—at least once transport
costs are factored in. This is another important indicator that Northwest U.S. refineries have a
geographic advantage over similar plants on the East Coast that are now importing more light crude
because it competes on price with Bakken barrels sent by rail (see East Coast Refining After the Shale
Boom).
Refining Margins
Our refining margin analysis shows that Bakken crude produces better gasoline and diesel yields than
ANS crude, explaining why Puget Sound refiners have increased their consumption of North Dakota
crude so significantly in the past few years. We also estimated margins for WCS crude processed by a
coking refinery to show how access to these discounted grades translates to the bottom line.
ANS Brent Bakken WCS9.68 10.72 -11.57 -24.69 20134.67 6.35 -16.43 -18.50 20143.36 4.93 -13.60 -13.22 2015-0.27 1.71 -11.04 -13.82 2016
Pacific Northwest Refineries 5 January 2017 Page 25 of 28
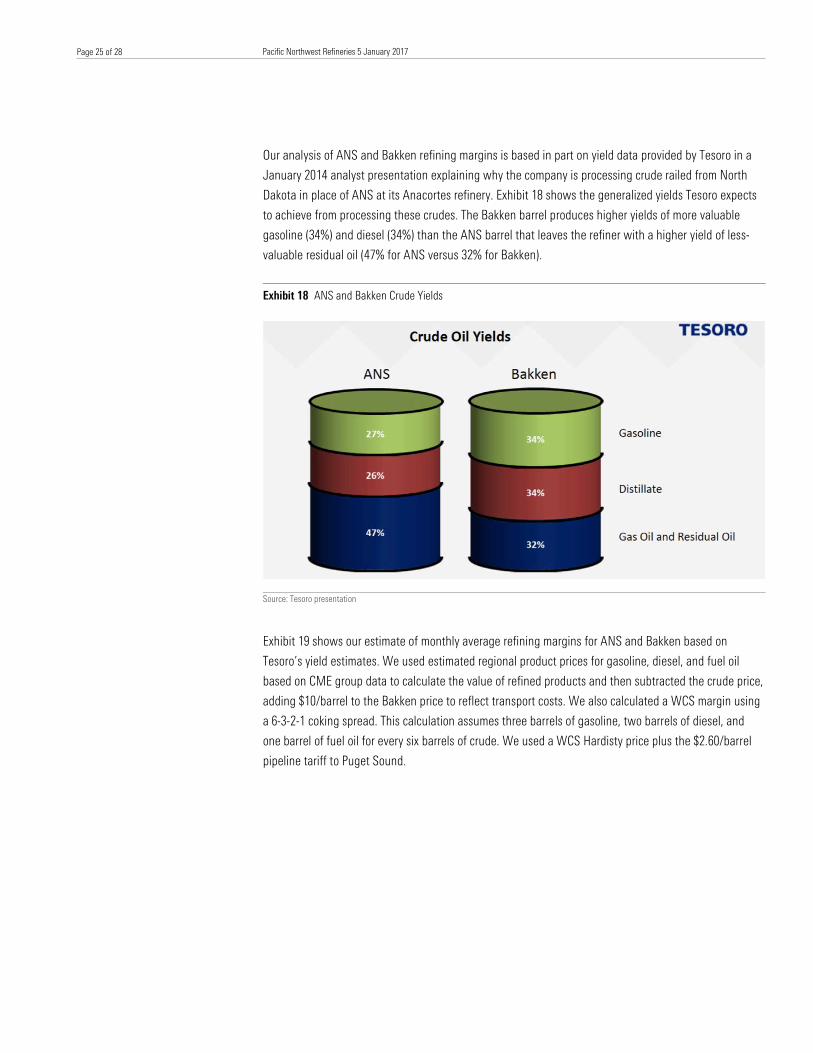
Our analysis of ANS and Bakken refining margins is based in part on yield data provided by Tesoro in a
January 2014 analyst presentation explaining why the company is processing crude railed from North
Dakota in place of ANS at its Anacortes refinery. Exhibit 18 shows the generalized yields Tesoro expects
to achieve from processing these crudes. The Bakken barrel produces higher yields of more valuable
gasoline (34%) and diesel (34%) than the ANS barrel that leaves the refiner with a higher yield of less-
valuable residual oil (47% for ANS versus 32% for Bakken).
Exhibit 18 ANS and Bakken Crude Yields
Source: Tesoro presentation
Exhibit 19 shows our estimate of monthly average refining margins for ANS and Bakken based on
Tesoro’s yield estimates. We used estimated regional product prices for gasoline, diesel, and fuel oil
based on CME group data to calculate the value of refined products and then subtracted the crude price,
adding $10/barrel to the Bakken price to reflect transport costs. We also calculated a WCS margin using
a 6-3-2-1 coking spread. This calculation assumes three barrels of gasoline, two barrels of diesel, and
one barrel of fuel oil for every six barrels of crude. We used a WCS Hardisty price plus the $2.60/barrel
pipeline tariff to Puget Sound.

Pacific Northwest Refineries 5 January 2017 Page 26 of 28
Exhibit 19 Refining Margins
Source: Morningstar, Tesoro, CME Group, Alaska Department of Revenue, Flint Hills
Exhibit 19 shows that the WCS coking margin is higher throughout the period, with Bakken crude
coming in next and ANS producing the lowest refining margin. Exhibit 20 summarizes these margin
estimates by year. In 2013, WCS produced a “windfall” $45/barrel margin for refiners that has declined
since to an average $32/barrel in 2015 and $24/barrel in 2016 through November. This narrowing
margin reflects falling crude prices in general since the end of 2014, but although Canadian crude
production has declined since then in response to lower prices, the pipeline congestion out of Canada
continues.
Exhibit 20 Refining Margins
Source: Morningstar, CME Group, Flint Hills, Alaska Department of Revenue
Like WCS, the estimated Bakken refining margins have declined by half in 2016 to $10/barrel compared
with the heady days of 2013 and 2014 when they were above $20/barrel. Note that throughout the
whole period of our analysis, ANS margins have remained flat and are still only 60% of Bakken margins
in 2016.
0
10
20
30
40
50
60
70
Jan-
13
Mar
-13
May
-13
Jul-1
3
Sep-
13
Nov-
13
Jan-
14
Mar
-14
May
-14
Jul-1
4
Sep-
14
Nov-
14
Jan-
15
Mar
-15
May
-15
Jul-1
5
Sep-
15
Nov-
15
Jan-
16
Mar
-16
May
-16
Jul-1
6
Sep-
16
Nov-
16
$/ba
rrel
ANS West Coast Bakken Delivered WCS Coking Delivered
ANS Bakken WCS2013 5.75 20.74 44.722014 6.63 20.99 33.562015 8.33 19.94 32.452016 5.81 10.15 24.09
Pacific Northwest Refineries 5 January 2017 Page 27 of 28
Winners and Losers
Our analysis indicates that Puget Sound refiners have performed well in the past three years. They have
all benefited from increased North American crude production that caused distribution congestion and
pushed feedstock prices down. Some of this benefit was due to taking early advantage of the possibility
to transport crude by rail to the region from North Dakota, and in this sense Shell has suffered by being
the last player to the table in trying to build a rail unloading terminal that failed to win approval.
However, Shell and BP have both been in a strong position to benefit from bargain-priced heavy
Canadian crude that the other refiners cannot process in significant quantities due to lack of investment
in coking units. Phillips 66 appear not to have taken full advantage of its rail terminal to increase Bakken
processing versus ANS for reasons that are unclear but may be related to its equity position in ANS
crude. Tesoro took early advantage of shipping crude to Anacortes from North Dakota and has benefited
from that decision.
Of the five Puget Sound players, the U.S. Oil refinery would appear to be the most vulnerable to market
forces in this region. As a solo player with a less-sophisticated plant, Trailstone is not able to take full
advantage of access to cheap heavy Canadian crude, but it switched away from ANS in 2013 and has
likely benefited from processing more Bakken crude since then. The “isolation” advantage of this region
(higher product prices and lower competition) has given all these refiners a cushion against market
forces after the crude price collapse in 2014.
Looking forward, the risks to these refineries are that lower margins will reduce the competitiveness of
one or more players. There is a risk that pipeline developments in North Dakota will direct more of that
crude to the Gulf Coast if the Dakota Access pipeline is built, threatening supplies to the West Coast and
increasing wellhead prices in North Dakota. This threat could be headed off by higher production in
North Dakota if crude prices stay above $50/barrel. With ANS supplies dwindling, the Puget Sound
refiners would have to import light crudes to replace Bakken barrels and such alternatives are likely to
be more expensive once shipping costs are included (meaning Brent plus transport pricing).
There are also upcoming risks in downstream-refined product markets that will affect the three
refineries that do not have coking capacity to upgrade fuel oil. Changes occurring in the ship fuel market
may dramatically reduce demand for fuel oil leaving less-sophisticated plants at a disadvantage.
Beside these risks are also great opportunities for the Puget Sound refiners. If the Trans Mountain
pipeline is expanded in 2019, the additional 600 mb/d of Canadian crude that will be available should
provide advantages. Even though only two refineries can process heavy crude, more synthetic and light
crude availability may result in more competitive prices for these grades. Increased production of light
crude in western Canada from the Duvernay basin may help counter ANS decline.
In the long run, both Tesoro and Phillips 66 would benefit from upgrading their Puget Sound refineries to
process more heavy crude since they are strategically well-placed to take advantage of greater volumes
being shipped to Vancouver. However, if these refineries increase throughput capacity, they will need to
find export markets for refined products because local demand is stagnant. Growing Latin American
demand could provide an outlet for such exports. K

Pacific Northwest Refineries 5 January 2017 Page 28 of 28
About Morningstar® Commodities Research™
Morningstar Commodities Research provides independent, fundamental research differentiated by a
consistent focus on the competitive dynamics in worldwide commodities markets. This joint effort
between Morningstar's Research and Commodities & Energy groups leverages the expertise of
Morningstar's 23 energy, utilities, basic materials, and commodities analysts as well as Morningstar's
extensive data platform. Morningstar Commodities Research initially will focus on North American
power and natural gas markets with plans to expand coverage of other markets worldwide.
Morningstar, Inc. is a leading provider of independent investment research in North America, Europe,
Australia, and Asia. The company offers an extensive line of products and services for individuals,
financial advisors, and institutions. Morningstar's Commodities & Energy group provides superior quality
market data and analytical products for energy data management systems, financial and agricultural
data management, historical analysis, trading, risk management, and forecasting.
For More Information
+1 800 546-9646 North America
+44 20 3194 1455 Europe
? 22 West Washington Street
Chicago, IL 60602 USA
©2016 Morningstar. All Rights Reserved. Unless otherwise provided in a separate agreement, you may use this report only in the
country in which its original distributor is based. The information, data, analyses, and opinions presented herein do not constitute
investment advice; are provided solely for informational purposes and therefore are not an offer to buy or sell a security; and are
not warranted to be correct, complete, or accurate. The opinions expressed are as of the date written and are subject to change
without notice. Except as otherwise required by law, Morningstar shall not be responsible for any trading decisions, damages, or
other losses resulting from, or related to, the information, data, analyses, or opinions or their use. References to “Morningstar
Credit Ratings” refer to ratings issued by Morningstar Credit Ratings, LLC, a credit rating agency registered with the Securities and
Exchange Commission as a nationally recognized statistical rating organization (“NRSRO”). Under its NRSRO registration,
Morningstar Credit Ratings issues credit ratings on financial institutions (e.g., banks), corporate issuers, and asset-backed
securities. While Morningstar Credit Ratings issues credit ratings on insurance companies, those ratings are not issued under its
NRSRO registration. All Morningstar credit ratings and related analysis are solely statements of opinion and not statements of fact
or recommendations to purchase, hold, or sell any securities or make any other investment decisions. Morningstar credit ratings
and related analysis should not be considered without an understanding and review of our methodologies, disclaimers,
disclosures, and other important information found at https://ratingagency.morningstar.com. The information contained herein is
the proprietary property of Morningstar and may not be reproduced, in whole or in part, or used in any manner, without the prior
written consent of Morningstar. To license the research, call +1 312 696-6869.
Related Documents