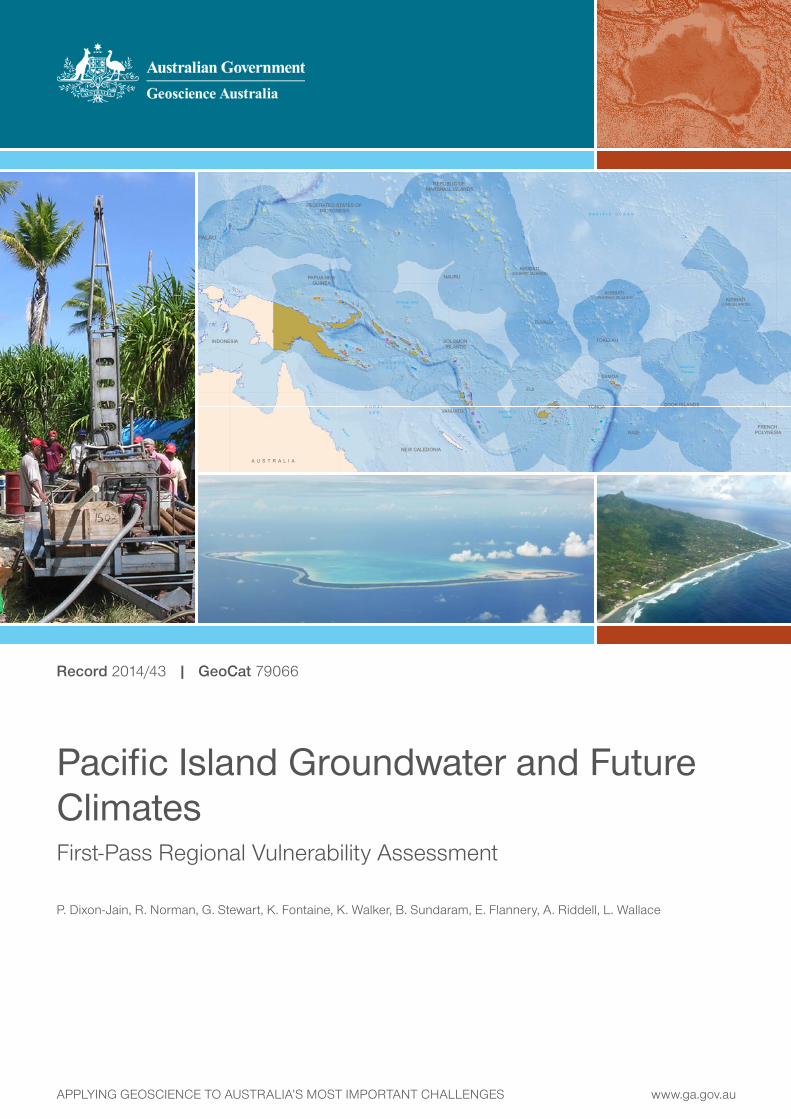
Record 2014/43 | GeoCat 79066 Pacific Island Groundwater and Future Climates First-Pass Regional Vulnerability Assessment P. Dixon-Jain, R. Norman, G. Stewart, K. Fontaine, K. Walker, B. Sundaram, E. Flannery, A. Riddell, L. Wallace APPLYING GEOSCIENCE TO AUSTRALIA’S MOST IMPORTANT CHALLENGES www.ga.gov.au

Welcome message from author
This document is posted to help you gain knowledge. Please leave a comment to let me know what you think about it! Share it to your friends and learn new things together.
Transcript
Record 2014/43 | GeoCat 79066
Pacific Island Groundwater and Future ClimatesFirst-Pass Regional Vulnerability Assessment
P. Dixon-Jain, R. Norman, G. Stewart, K. Fontaine, K. Walker, B. Sundaram, E. Flannery, A. Riddell, L. Wallace
APPLYING GEOSCIENCE TO AUSTRALIA’S MOST IMPORTANT CHALLENGES www.ga.gov.au

Pacific Island Groundwater and Future Climates First-Pass Regional Vulnerability Assessment
GEOSCIENCE AUSTRALIA RECORD 2014/43
P. Dixon-Jain, R. Norman, G. Stewart, K. Fontaine, K. Walker, B. Sundaram, E. Flannery, A. Riddell, L. Wallace
Department of Industry Minister for Industry: The Hon Ian Macfarlane MP Parliamentary Secretary: The Hon Bob Baldwin MP Secretary: Ms Glenys Beauchamp PSM
Geoscience Australia Chief Executive Officer: Dr Chris Pigram This paper is published with the permission of the CEO, Geoscience Australia
© Commonwealth of Australia (Geoscience Australia) 2014
With the exception of the Commonwealth Coat of Arms and where otherwise noted, all material in this publication is provided under a Creative Commons Attribution 3.0 Australia Licence. (http://www.creativecommons.org/licenses/by/3.0/au/deed.en)
Geoscience Australia has tried to make the information in this product as accurate as possible. However, it does not guarantee that the information is totally accurate or complete. Therefore, you should not solely rely on this information when making a commercial decision.
Geoscience Australia is committed to providing web accessible content wherever possible. If you are having difficulties with accessing this document please email [email protected].
ISSN 1448-2177 (Print) ISSN 2201-702X (PDF)
ISBN 978-1-925124-32-3 (Print) ISBN 978-1-925124-33-0 (PDF)
GeoCat 79066
Bibliographic reference: Dixon-Jain, P., Norman, R., Stewart, G., Fontaine, K., Walker, K., Sundaram, B., Flannery, E., Riddell, A., Wallace, L. 2014. Pacific Island Groundwater and Future Climates: First-Pass Regional Vulnerability Assessment. Record 2014/43. Geoscience Australia, Canberra. http://dx.doi.org/10.11636/Record.2014.043
Cover images: Tony Falkland
Pacific Island Groundwater and Future Climates: First-Pass Regional Vulnerability Assessment iii
Executive Summary
Islands in the Pacific region rely heavily on their fresh groundwater, and for a number of islands it is the only reliable source of freshwater throughout the year. Stresses on groundwater resources in many Pacific Island countries are set to escalate in the future with projected population and economic growth. In addition, there are likely to be future climate impacts on groundwater availability and quality. Although a number of studies have been undertaken at a local scale, very limited information is available to consider the impacts of future climates on groundwater systems at a regional scale.
In response, Geoscience Australia has undertaken a desktop analysis to better understand the vulnerability of fresh groundwater systems to future climates for 15 Pacific Island countries and territories1. This study has been conducted in consultation with Pacific Island groundwater hydrology experts. Where possible, this project has drawn on in-country expertise and consultation with the Applied Geoscience and Technology Division (SOPAC) of the Secretariat of the Pacific Community. This project was funded by the Pacific-Australia Climate Change Science and Adaptation Planning (PACCSAP) Program and administered by the Australian Government Department of the Environment.
This study has separately assessed the relative potential vulnerability of groundwater to: (i) low rainfall periods and (ii) mean sea-level rise, using a groundwater vulnerability framework. Potential vulnerability to future climates depends on the potential impact (sensitivity and exposure) of a particular hazard which is offset by the intrinsic ability of a groundwater system to be managed for future climate impacts.
This study has found that the majority of assessed Low Carbonate islands in the Pacific region have Higher relative potential vulnerability to low rainfall periods or mean sea-level rise by mid- and end-of-century. In response to low rainfall periods, the greatest number of most vulnerable islands are in the countries of Kiribati, Republic of Marshall Islands and Solomon Islands. In response to mean sea-level rise, Federated States of Micronesia, Republic of Marshall Islands and Solomon Islands have the greatest number of most vulnerable islands. Complex islands (>2,000 km2) are the least vulnerable to low rainfall periods or mean sea-level rise.
Despite their local diversity, there are similarities between groundwater systems on islands of similar geology, which has enabled knowledge of groundwater sensitivity to climate from well-studied islands to be applied to islands of the same geology for which there are no detailed studies. Based on their dominant geology, islands are classified into five hydrogeological island types, each with an assumed principal aquifer: Low Carbonate, Limestone, Volcanic, Composite and Complex. The majority of islands in the Pacific region are Low Carbonate islands. Although they make up the majority of islands, these are small islands that represent less than 1% of the area of all islands in the region.
1 Including: Cook Islands, Federated States of Micronesia, Fiji, Kiribati, Nauru, Niue, Palau, Papua New Guinea, Republic of
Marshall Islands, Samoa, Solomon Islands, Tonga, Tokelau, Tuvalu and Vanuatu.
iv Pacific Island Groundwater and Future Climates: First-Pass Regional Vulnerability Assessment
Islands with potential for permanent fresh groundwater were assessed for their potential vulnerability to future climates for projected 30-year periods centred on 2050 and 2085. Five relative potential vulnerability ratings were applied to each island for the two climate hazards: Lower, Moderate Low, Moderate, Moderate High or Higher. The results provide a regional, first-pass indication of relative potential groundwater vulnerability based on limited publicly-available consistent data.
Low rainfall period potential vulnerability is similar for the 2050 and 2085 projection periods. Key findings include:
• Approximately 30% of all islands assessed in the Pacific region have Higher potential vulnerability.
• Of this 30%, most are Low Carbonate islands, with a small number of Limestone and Volcanic islands.
• The most vulnerable islands are generally Low Carbonate islands with Higher potential vulnerability. This includes islands in all countries and territories except Samoa and Niue, with the majority located in Kiribati, Republic of Marshall Islands and Solomon Islands.
• Limestone, Volcanic and Composite islands mostly have Moderate High potential vulnerability.
• The least vulnerable islands are Complex islands located in Fiji, Papua New Guinea, Solomon Islands and Vanuatu.
Mean sea-level rise potential vulnerability findings for the 2050 and 2085 projection periods include:
• Approximately 60% of all islands assessed in the Pacific region have either Moderate High (2050) or Higher (2085) potential vulnerability.
• The most vulnerable islands are Low Carbonate islands. This includes islands in 12 of the countries and territories, with the majority located in Federated States of Micronesia, Republic of Marshall Islands and Solomon Islands.
• Limestone, Volcanic and Composite islands mostly have Moderate Low or Moderate potential vulnerability.
• The least vulnerable islands are located in Cook Islands, Fiji, Papua New Guinea, Samoa, Solomon Islands, Tonga and Vanuatu. These are Volcanic, Composite or Complex islands.
In addition to the rapid regional vulnerability assessment of more than 1,800 Pacific islands to future climates, key outcomes of this project include:
1. development of a hydrogeologically-based typology for the Pacific region;
2. first-time development of a regionally consistent Pacific Islands spatial database of island hydrogeological and physical characteristics;
3. identification of island type information for more than 99.9% of the study area (3,623 islands);
4. first-pass regional assessment of the potential for permanent fresh groundwater on islands in the study area.
The Pacific Islands spatial database provides important baseline data for the characterisation of island groundwater systems. The database can be used for other regional applications such as future water resource investigations and can be refined and enhanced in the future as new information becomes available.
Pacific Island Groundwater and Future Climates: First-Pass Regional Vulnerability Assessment v
This first-pass regional assessment will increase awareness and understanding of groundwater vulnerability across the Pacific Island countries and territories to future climate hazards and assist regional water managers and policy makers to develop adaptation options.
Recommendations for future work relating to management, governance, capacity building and research include:
− instigate long-term groundwater and climate monitoring at targeted locations;
− undertake integrated management of groundwater and other freshwater sources supported by regionally-consistent monitoring and management guidelines;
− increase community understanding and enhancing in-country technical knowledge of groundwater system responses to climate-related hazards;
− improve conceptual understanding of groundwater system response to climate, including the combined effects of climate hazards and extreme events;
− assess the combined impacts of future climate, population growth and urbanisation on groundwater vulnerability;
− target field studies to further investigate groundwater vulnerability at potential hotspots identified in this study and for other important freshwater aquifers across all islands types;
− undertake collection of key datasets (elevation data and baseline groundwater data).
vi Pacific Island Groundwater and Future Climates: First-Pass Regional Vulnerability Assessment
Acknowledgements
The authors wish to thank Tony Falkland and Ian White for their support and technical input to the project through numerous workshops and for their comprehensive reviews of the work. We also thank Ross Brodie for technical discussion; Peter Sinclair and other SOPAC staff for their input at various stages of the project; the Regional Coastal Susceptibility Framework for the Pacific Islands Project team for their exchange of ideas and information; and BoM and CSIRO staff for the provision of climate data. Many thanks go to Silvio Mezzomo and David Arnold for their assistance with graphics and Gail Ransom for Product Management. We also thank Lucy Lytton and Jane Coram for their valuable review of the report. This study has been commissioned by the Australian Government Department of the Environment.
Pacific Island Groundwater and Future Climates: First-Pass Regional Vulnerability Assessment vii
Contents
Executive Summary ................................................................................................................................ iii
Acknowledgements ................................................................................................................................. vi Abbreviations and Acronyms .................................................................................................................. xx
Units ..................................................................................................................................................... xxii
1 Introduction ............................................................................................................................................ 1 1.1 Background ...................................................................................................................................... 1 1.2 Project Purpose, Objectives and Scope .......................................................................................... 2 1.3 Project Approach and Methodology ................................................................................................ 3 1.4 Groundwater Vulnerability Framework ............................................................................................ 3 1.5 Key Assumptions of the Project ....................................................................................................... 5 1.6 Structure of the Report .................................................................................................................... 6
2 Hydrogeological Typology for the Pacific Region.................................................................................. 7 2.1 Classification of Islands ................................................................................................................... 7 2.2 Island Characteristics in the Pacific Region .................................................................................... 9
2.2.1 Analysis of Island Type ............................................................................................................ 10 2.2.2 Analysis of Island Area ............................................................................................................. 16 2.2.3 Analysis of Island Width ........................................................................................................... 18 2.2.4 Analysis of Island Elevation ..................................................................................................... 20 2.2.5 Combined Analysis of Island Characteristics ........................................................................... 22
2.3 Chapter Summary .......................................................................................................................... 26
3 Sensitivity of Groundwater Systems to Future Climate ....................................................................... 27 3.1 Groundwater Occurrence in Island Settings .................................................................................. 28 3.2 Groundwater Flow Systems ........................................................................................................... 30 3.3 Hydrogeological Characteristics of Island Types ........................................................................... 31
3.3.1 Low Carbonate Islands ............................................................................................................ 31 3.3.1.1 Potential effect of reduction in rainfall or sea-level rise ...................................................... 34 3.3.1.2 Thresholds for climate-related hazards .............................................................................. 36
3.3.2 Limestone Islands .................................................................................................................... 37 3.3.2.1 Potential effect of reduction in rainfall or sea-level rise ...................................................... 39
3.3.3 Volcanic Islands ....................................................................................................................... 41 3.3.3.1 Potential effect of reduction in rainfall or sea-level rise ...................................................... 44
3.3.4 Composite Islands .................................................................................................................... 46 3.3.4.1 Potential effect of reduction in rainfall or sea-level rise ...................................................... 48
3.3.5 Complex Islands ....................................................................................................................... 50 3.3.5.1 Potential effect of reduction in rainfall or sea-level rise ...................................................... 50
3.4 Aquifer Responses to Changes in Future Climate ........................................................................ 51 3.4.1 Reduction in Rainfall ................................................................................................................ 52 3.4.2 Rise in Relative Sea Level ....................................................................................................... 52
3.5 Regional Analysis of Potential for Freshwater ............................................................................... 54
viii Pacific Island Groundwater and Future Climates: First-Pass Regional Vulnerability Assessment
3.6 Rainfall Sensitivity of Aquifers ....................................................................................................... 61 3.6.1 Rainfall Thresholds .................................................................................................................. 63
3.7 Sea-Level Sensitivity of Aquifers .................................................................................................. 65 3.7.1 Sea-Level Thresholds .............................................................................................................. 68
3.8 Chapter Summary ......................................................................................................................... 69
4 Exposure to Future Rainfall and Sea Level ........................................................................................ 70 4.1 Climate Systems in the Pacific Region ......................................................................................... 70 4.2 Rainfall Exposure .......................................................................................................................... 72 4.3 Projected Low Rainfall .................................................................................................................. 75 4.4 Sea-Level Exposure ...................................................................................................................... 78 4.5 Projected Sea-Level Rise.............................................................................................................. 79 4.6 Chapter Summary ......................................................................................................................... 82
5 Potential Impact of Future Climate on Groundwater Systems ........................................................... 83 5.1 Low Rainfall ................................................................................................................................... 83 5.2 Mean Sea-Level Rise .................................................................................................................... 85 5.3 Chapter Summary ......................................................................................................................... 88
6 Groundwater System Adaptability to Future Climate ......................................................................... 89 6.1 Low Rainfall ................................................................................................................................... 91 6.2 Mean Sea-Level Rise .................................................................................................................... 91 6.2 Chapter Summary ......................................................................................................................... 92
7 Potential Vulnerability of Groundwater Systems to Future Climate ................................................... 93 7.1 Current Rainfall ............................................................................................................................. 93
7.1.1 Key Results ............................................................................................................................. 94 7.2 Future Climate: Low Rainfall ......................................................................................................... 96
7.2.1 Regional Potential Vulnerability Rating ................................................................................... 96 7.2.2 Key Results ............................................................................................................................. 98
7.2.2.1 2050 projection period ....................................................................................................... 98 7.2.2.2 2085 projection period ....................................................................................................... 99 7.2.2.3 Comparison between 2050 and 2085 results .................................................................. 100
7.3 Future Climate: Mean Sea-Level Rise ........................................................................................ 103 7.3.1 Regional Potential Vulnerability Rating ................................................................................. 103 7.3.2 Key Results ........................................................................................................................... 105
7.3.2.1 2050 projection period ..................................................................................................... 105 7.3.2.2 2085 projection period ..................................................................................................... 106 7.3.2.3 Comparison between 2050 and 2085 results .................................................................. 107
7.4 Population Density ...................................................................................................................... 110 7.5 Chapter Summary ....................................................................................................................... 114
8 Summary and Conclusions ............................................................................................................... 116 8.1 Project Summary ......................................................................................................................... 116 8.2 Key Findings ............................................................................................................................... 117 8.3 Key Outcomes ............................................................................................................................. 119
9 Knowledge Gaps and Recommendations ........................................................................................ 120 9.1 Data Limitations .......................................................................................................................... 120 9.2 Groundwater Management and Climate Adaptation Challenges ............................................... 120
Pacific Island Groundwater and Future Climates: First-Pass Regional Vulnerability Assessment ix
9.3 Recommendations for Future Work ............................................................................................. 121
References ........................................................................................................................................... 123
Personal Communications ................................................................................................................... 128
Glossary ............................................................................................................................................... 129 Map Products .................................................................................................................... 134 Appendix A
Pacific Island Hydrogeological Typology .......................................................................... 136 Appendix BB.1 Types of Aquifers ........................................................................................................................ 136
B.1.1 Small Islands .......................................................................................................................... 136 B.1.2 Large Islands ......................................................................................................................... 137
B.2 Aquifer Potential Productivity ...................................................................................................... 137 B.3 International Hydrogeological Classification ............................................................................... 137
Pacific Islands Database .................................................................................................. 139 Appendix CC.1 Island Polygons ........................................................................................................................... 139
C.1.1 Island Coastlines ................................................................................................................... 139 C.1.2 Country and Island Names .................................................................................................... 140
C.2 Island Type .................................................................................................................................. 140 C.3 Island Geometry .......................................................................................................................... 140
C.3.1 Area and Perimeter ............................................................................................................... 140 C.3.2 Island Elevation ..................................................................................................................... 140 C.3.3 Maximum Width ..................................................................................................................... 141
C.4 Hydrogeological Characteristics.................................................................................................. 141 C.4.1 Principal Aquifer..................................................................................................................... 141 C.4.2 Groundwater Flow System .................................................................................................... 141 C.4.3 Potential for Freshwater ........................................................................................................ 142
C.5 Population Density ...................................................................................................................... 142 C.6 Components of Potential Vulnerability Assessment ................................................................... 146
Reference Islands ............................................................................................................. 147 Appendix DD.1 Low Carbonate Island: Bonriki Island, South Tarawa, Kiribati .................................................... 147 D.2 Limestone Island: Tongatapu ...................................................................................................... 150 D.3 Volcanic Island: Rarotonga, Cook Islands .................................................................................. 151 D.4 Composite Island: Mangaia, Cook Islands .................................................................................. 154 D.5 Complex Island: East New Guinea, PNG ................................................................................... 157
D.5.1 Implications for Sensitivity and System Adaptability Components ........................................ 159 D.5.2 Population Density ................................................................................................................. 160
Conceptual Diagrams for Rainfall Increase ...................................................................... 162 Appendix E
Methods for Recharge Estimation ..................................................................................... 168 Appendix FF.1 Empirical Method ......................................................................................................................... 168 F.2 Water Balance Method ................................................................................................................ 169
Freshwater Potential......................................................................................................... 171 Appendix G
Climate Data ..................................................................................................................... 174 Appendix HH.1 Determining Lowest Mean Rainfall ............................................................................................. 174 H.2 Statistical Analysis of Climate Models ........................................................................................ 174 H.3 Projected Rainfall Exposure Statistics ........................................................................................ 177
x Pacific Island Groundwater and Future Climates: First-Pass Regional Vulnerability Assessment
Potential Vulnerability Results ........................................................................................... 179 Appendix II.1 Results by Country for all Islands ................................................................................................ 179
I.1.1 Lowest Mean Rainfall ............................................................................................................. 179 I.1.2 Mean Sea-Level Rise ............................................................................................................. 181
I.2 Results by Island Type and Country ............................................................................................ 183 I.2.1 Lowest Mean Rainfall ............................................................................................................. 183 I.2.2 Mean Sea-Level Rise ............................................................................................................. 188
I.3 Results for Highest Vulnerability Rating ....................................................................................... 194 I.3.1 Lowest Mean Rainfall ............................................................................................................. 194 I.3.2 Mean Sea-Level Rise ............................................................................................................. 196
I.4 Results by Island Type and Vulnerability Rating ......................................................................... 198 I.4.1 Lowest Mean Rainfall Vulnerability in 2050 and 2085 ........................................................... 199 I.4.2 Mean Sea-Level Rise Vulnerability in 2050 and 2085 ........................................................... 200
Pacific Island Groundwater and Future Climates: First-Pass Regional Vulnerability Assessment xi
List of Figures
Figure 1.1 Map of Pacific Island Countries and one territory examined in this study. Australia and Indonesia are shown for spatial reference. .............................................................................................. 2 Figure 1.2 Groundwater Vulnerability Framework adopted for the project (adapted from Schroter et al. 2004). ............................................................................................................................................... 4
Figure 1.3 Functional vulnerability framework to assess the potential vulnerability of the natural groundwater system to projected future rainfall and sea level. ................................................................ 5
Figure 2.1 Statistics of island type across the Pacific region, including islands of unknown type: a) island number and percentage out of total islands; b) percentage area out of total islands. ................. 11 Figure 2.2 Unknown types: histogram showing the relationship between island area and elevation (elevation data sources: literature values; Google Inc. 2012; METI and NASA 2011; and NGA and NASA 2000). Numbers shown in the chart are the total percentage of islands within each elevation class relative to all islands. ..................................................................................................... 11
Figure 2.3 Spatial distribution of island types across the Pacific region of interest. Tectonic plate boundary from ESRI (2011b). ................................................................................................................ 12
Figure 2.4 Number and percentage of islands (known type) in each country of the Pacific region. ...... 14
Figure 2.5 Percentage area of islands in each country of the Pacific region, including islands of unknown type. ........................................................................................................................................ 15
Figure 2.6 Spatial distribution of island area in the Pacific region. Note that for display purposes at the regional scale, outlines of polygons have been exaggerated which creates polygon overlap. ....... 17 Figure 2.7 Histogram showing the percentage of each island type in each area class. ........................ 17
Figure 2.8 Spatial distribution of maximum island width in the Pacific region. ...................................... 18
Figure 2.9 Histogram showing the percentage of each island width class in each island type. ............ 19
Figure 2.10 Spatial distribution of maximum island elevation in the Pacific region (elevation data sources: literature values; Google Inc. 2012; METI and NASA 2011; and NGA and NASA 2000). ...... 20
Figure 2.11 Histogram showing the percentage of each maximum elevation class in each island type (elevation data sources: literature values; Google Inc. 2012; METI and NASA 2011; and NGA and NASA 2000). ........................................................................................................................... 21
Figure 2.12 Relationship between island area and maximum elevation for all islands in the Pacific region. ..................................................................................................................................................... 22
Figure 2.13 Relationship between island width, elevation and area for a) Low Carbonate islands and b) Limestone islands. The total percentage of islands within each elevation class relative to all islands is shown. ................................................................................................................................ 23
Figure 2.14 Relationship between island width, elevation and area for a) Volcanic islands and b) Composite islands. The total percentage of islands within each elevation class relative to all islands is shown. .................................................................................................................................... 24
Figure 2.15 Relationship between island width, elevation and area for Complex islands. The total percentage of islands within each elevation class relative to all islands is shown. ................................ 25
Figure 3.1 Island settings for a) freshwater lenses and b) coastal aquifers. .......................................... 28
Figure 3.2 Schematic of the transition zone between freshwater and seawater in coastal aquifers (modified from Barlow 2003). ................................................................................................................. 29
xii Pacific Island Groundwater and Future Climates: First-Pass Regional Vulnerability Assessment
Figure 3.3 Photographs depicting the surface features of typical Low Carbonate islands. Left: chain of coral islands (Maiana atoll, Kiribati). Right: low relief of a Low Carbonate island (Tabiteuea and Bonriki Islands, Tarawa atoll, Kiribati). Photos courtesy of T. Falkland, 2014. ............ 31
Figure 3.4 Typology for Low Carbonate islands. The yellow box indicates the island type; the blue boxes highlight the characteristics of the assumed principal aquifer; the grey boxes indicate characteristics of other possible aquifers within the island type and the pink box highlights the GFS which has been assumed to be typical of the principal aquifer. .................................................... 32
Figure 3.5 Main features of the aquifer system on a Low Carbonate island: a) thin freshwater lens that does not reach the Thurber Discontinuity; b) thick freshwater lens truncated at the Thurber Discontinuity. ......................................................................................................................................... 33 Figure 3.6 Potential effect of b) reduction in rainfall or c) rise in sea level on the freshwater lens of a Low Carbonate island compared to the a) current situation. .............................................................. 35
Figure 3.7 Photographs depicting the surface features of typical Limestone islands. Left: whole island (Nauru). Right: karstified limestone platforms (Tongatapu, Tonga). Photos courtesy of T. Falkland, 2014. ...................................................................................................................................... 37 Figure 3.8 Typology for Limestone islands. The dark blue box indicates the island type; the blue boxes highlight the characteristics of the assumed principal aquifer; the grey boxes indicate characteristics of other possible aquifers within the island type and the pink box highlights the GFS which has been assumed to be typical of the principal aquifer. .................................................... 38
Figure 3.9 Main features of the aquifer system on a Limestone island (modified from Waterhouse 1984). ..................................................................................................................................................... 39 Figure 3.10 Potential effect of b) reduction in rainfall or c) rise in sea level on the freshwater lens of a Limestone island compared to the a) current situation (modified from Waterhouse 1984)............ 40
Figure 3.11 Photographs depicting the surface features of a typical Volcanic island. Left: rugged topography (Rarotonga, Cook Islands). Right: low-lying coastal area. Photos courtesy of T. Falkland, 2014. ...................................................................................................................................... 41
Figure 3.12 Typology for Volcanic islands. The orange box indicates the island type; the blue boxes highlight the characteristics of the assumed principal aquifer; the grey boxes indicate characteristics of other possible aquifers within the island type and the pink box highlights the GFS which has been assumed to be typical of the principal aquifer. .................................................... 43
Figure 3.13 Main features of the aquifer system on a typical young basaltic Volcanic island (modified from UNESCO 1991). ............................................................................................................ 44 Figure 3.14 Potential effect of b) reduction in rainfall or c) rise in sea level on the aquifers of a Volcanic island compared to the a) current situation (modified from UNESCO 1991). ......................... 45
Figure 3.15 Photographs depicting the surface features of typical Composite islands. Left: limestone rim and exposed volcanic core (Mangaia, Cook Islands). Right: karstified limestone rim (Mangaia, Cook Islands). Photos courtesy of T. Falkland, 2014. .......................................................... 46
Figure 3.16 Typology for Composite islands. The purple box indicates the island type; the blue boxes highlight the characteristics of the assumed principal aquifer; the grey boxes indicate characteristics of other possible aquifers within the island type and the pink box highlights the GFS which has been assumed to be typical of the principal aquifer. Note that the most productive aquifer is assumed to occur in volcanic rock (fissured fractured aquifer type)...................................... 47
Figure 3.17 Main features of the aquifer system on a Composite island (modified from Waterhouse 1984). The question marks indicate that there may be connectivity from the basal aquifer across the dikes. ........................................................................................................................ 48
Figure 3.18 Potential effect of b) reduction in rainfall or c) rise in sea level on the aquifers of a Composite island compared to the a) current situation (modified from Waterhouse 1984). The question marks indicate that there may be connectivity from the basal aquifer across the dikes. ........ 49
Pacific Island Groundwater and Future Climates: First-Pass Regional Vulnerability Assessment xiii
Figure 3.19 Typology for Complex islands. The brown box indicates the island type; the blue box highlight the characteristics of the assumed principal aquifer; the grey boxes indicate characteristics of other possible aquifers within the island type and the pink box highlights the GFS which has been assumed to be typical of the principal aquifer. .................................................... 50 Figure 3.20 Potential effect of b) reduction in rainfall or c) rise in sea level on coastal aquifers of a Complex island compared to the a) current situation. ............................................................................ 51
Figure 3.21 Number and percentage of islands of known types with and without potential for fresh groundwater and surface water across the Pacific region: a) island numbers and percentages of total islands; b) percentage of total island area. ..................................................................................... 55
Figure 3.22 Freshwater potential of islands (known types) in each country of the Pacific region as number and percentage of islands. ........................................................................................................ 57
Figure 3.23 Freshwater potential of islands (known types) in each country of the Pacific region as a percentage of island area. ................................................................................................................... 58
Figure 3.24 Regional distribution of potential freshwater sources (by % area) in each country. Refer to Figure 3.23 for an enlargement of each country pie chart. ...................................................... 59 Figure 3.25 Regional distribution of island types (by % area) in each country with potential for fresh groundwater. Refer to Appendix G for an enlargement of each pie chart. ................................... 60
Figure 3.26 Aquifer sensitivity to change in rainfall-recharge for islands in the Pacific region with potential for fresh groundwater (refer to Table 3.3)................................................................................ 62
Figure 3.27 Relationship between mean annual rainfall and mean annual recharge (for available data period) for a number of Low Carbonate, Limestone and Volcanic islands from across the globe (modified from UNESCO 1991). The red curve has been fitted to the data for Low Carbonate and Limestone islands only. The figure also shows the influence of vegetation conditions on recharge. .......................................................................................................................... 64
Figure 3.28 Aquifer sensitivity to mean SLR for islands in the Pacific region with potential for fresh groundwater (refer to Table 3.6)............................................................................................................. 68
Figure 4.1 The main climatic features of the South Pacific area in the November to April period (BoM and CSIRO 2011). ........................................................................................................................ 71
Figure 4.2 Current mean rainfall during the a) El Niño (December 1997) and b) La Niña (January 1999) phases of ENSO (GPCP rainfall dataset 1979-2013 (Adler et al. 2003)). ................................... 72
Figure 4.3 Distribution of current mean annual rainfall across the Pacific region (GPCP rainfall dataset 1979-2013 (Adler et al. 2003)). ................................................................................................. 73 Figure 4.4 Distribution of long-term annual coefficient of variation (CV) across the Pacific region (CV has been calculated from the GPCP rainfall dataset 1979-2013 (Adler et al. 2003)). .................... 74
Figure 4.5 Current rainfall stress across the Pacific region (refer to text for definitions of stress classes). ................................................................................................................................................. 74
Figure 4.6 Lowest mean annual rainfall during ENSO years for the 2050 period determined from selected climate models (three GCM and five CCAM models). ............................................................. 76 Figure 4.7 Lowest mean annual rainfall during ENSO years for the 2085 period determined from selected climate models (three GCM and five CCAM models). ............................................................. 76
Figure 4.8 Current mean sea level during the a) El Niño (December 1997) and b) La Niña (January 1999) phases of ENSO (reconstructed sea-level data for 1993-2012 (X. Zhang, pers. comm. 2013)). ........................................................................................................................................ 78
Figure 4.9 Current mean sea level across the Pacific region for the period 1993-2012 (data derived from altimeter mean sea surface, a geoid model and in-situ measurements (Rio et al. 2009)). .................................................................................................................................................... 79
Figure 4.10 Projected rise in relative mean sea level for the 30-year period centred on 2050. ............ 80
xiv Pacific Island Groundwater and Future Climates: First-Pass Regional Vulnerability Assessment
Figure 4.11 Projected rise in relative mean sea level for the 30-year period centred on 2085. ............ 80
Figure 5.1 Potential impact of lowest mean annual rainfall in 2050 on fresh groundwater availability. ............................................................................................................................................. 84
Figure 5.2 Potential impact of lowest mean annual rainfall in 2085 on fresh groundwater availability. ............................................................................................................................................. 85
Figure 5.3 Potential impact of a rise in relative mean sea level in 2050. .............................................. 87
Figure 5.4 Potential impact of a rise in relative mean sea level in 2085. .............................................. 87
Figure 6.1 Adaptability of groundwater system (principal aquifer) to periods of low rainfall or mean SLR for islands in the Pacific region with potential for fresh groundwater (refer to Table 6.1). ............ 90
Figure 7.1 Regional map of potential vulnerability of groundwater systems on islands of the Pacific region to current mean annual rainfall (GPCP rainfall dataset 1979-2013 (Adler et al. 2003))..................................................................................................................................................... 95
Figure 7.2 Regional map of potential vulnerability of groundwater systems on islands of the Pacific region to lowest mean annual rainfall in 2050. ........................................................................ 101
Figure 7.3 Regional map of potential vulnerability of groundwater systems on islands of the Pacific region to lowest mean annual rainfall in 2085. ........................................................................ 102
Figure 7.4 Regional map of relative potential vulnerability of groundwater systems on islands of the Pacific region to a rise in relative mean sea level in 2050. ........................................................... 108
Figure 7.5 Regional map of relative potential vulnerability of groundwater systems on islands of the Pacific region to a rise in relative mean sea level in 2085. ........................................................... 109
Figure 7.6 Population density for islands in the Pacific region in 2010 (data modified from AIR Worldwide 2011 and Tokelau National Statistics Office 2011)............................................................ 110
Figure 7.7 Comparison of potential vulnerability to a) lowest mean annual rainfall in 2050 and population density in 2050 and b) lowest mean annual rainfall in 2085 and population density in 2100. .................................................................................................................................................... 112
Figure 7.8 Comparison of potential vulnerability to a) mean SLR in 2050 and population density in 2050 and b) mean SLR in 2085 and population density in 2100. ....................................................... 113
Appendix Figure C.1 Island width or ‘zonal thickness’, defined as the radius of the largest circle that can be drawn within each island (ESRI 2011a). ........................................................................... 141
Appendix Figure C.2 Differences exist between the island boundaries represented in the PCRAFI dataset and the Pacific Islands database. In some cases islands are shown in the database, which do not appear in the PCRAFI boundaries. ................................................................................ 142
Appendix Figure C.3 Where PCRAFI population areas related to distinct island groups, population density was calculated as the PCRAFI population count divided by the land area of the associated islands in the Pacific Islands database. ............................................................................ 143
Appendix Figure C.4 Population density was calculated by combining the population of the three PCRAFI regions shown in the left inset (7,186 people), then dividing this value by the total land area (236.5 km2) to derive a population density of 30.4 people/km². .................................................. 144
Appendix Figure C.5 Population density of the two island groups were calculated by combining the PCRAFI population values and then dividing them by the associated land area. The two island groups were treated separately as there was no overlap of the PCRAFI population areas. .... 144
Appendix Figure C.6 The population of each PCRAFI region on the main island of PNG was only assigned to a single PNG subregion. The subregion to which the population was assigned was determined by the centre point of the PCRAFI region. ........................................................................ 145
Appendix Figure D.1 Location of Bonriki lens, Tarawa Atoll, Kiribati. ................................................. 148
Pacific Island Groundwater and Future Climates: First-Pass Regional Vulnerability Assessment xv
Appendix Figure D.2 Conceptual hydrogeological model for the freshwater lens on Bonriki island (Marshall and Jacobson 1985). ............................................................................................................ 148
Appendix Figure D.3 Location of Tongatapu, Tonga. .......................................................................... 150
Appendix Figure D.4 Distribution of groundwater salinity (electrical conductivity) in Tongatapu in August 2007 (from White et al. 2009). Seawater intrusion has been identified in the northwest of the island and is characterised by high salinity groundwater (shown in red). ...................................... 151
Appendix Figure D.5 Location of Rarotonga, Cook Islands. ................................................................ 152
Appendix Figure D.6 Main features of the aquifer system on a typical young basaltic Volcanic island (modified from UNESCO 1991). ................................................................................................ 153
Appendix Figure D.7 Topography and simplified geology of Rarotonga, Cook Islands (from Waterhouse and Petty 1986). ............................................................................................................... 153
Appendix Figure D.8 Location of Mangaia, Cook Islands. ................................................................... 155
Appendix Figure D.9 Topography and simplified geology of Mangaia, Cook Islands. ......................... 156
Appendix Figure D.10 Main features of the aquifer system on a Composite island (modified from Waterhouse 1984). The question marks indicate that there may be connectivity from the basal aquifer across the dikes. ...................................................................................................................... 156
Appendix Figure D.11 East New Guinea, PNG. ................................................................................... 157
Appendix Figure D.12 Simplified hydrogeological map for east New Guinea, PNG (derived from the potential hydrogeological map by Jacobson and Kidd 1974). ........................................................ 158
Appendix Figure D.13 Detailed hydrogeological map for east New Guinea, PNG (from Jacobson and Kidd 1974). .................................................................................................................................... 159 Appendix Figure D.14 Simplified map of population density (people/km2) for east New Guinea, PNG in 2010 (data modified from AIR Worldwide 2011). .................................................................... 160
Appendix Figure D.15 Population density (people/km2) for the PCRAFI regions in east New Guinea, PNG (data sourced from AIR Worldwide 2011). .................................................................... 161
Appendix Figure E.1 Potential effect of b) reduction in rainfall or c) increase in rainfall on the freshwater lens of a Low Carbonate island compared to the a) current situation. Red arrows indicate a reduction in the size of the lens and green arrows indicate an increase in the size of the lens. ...................................................................................................................................................... 163
Appendix Figure E.2 Potential effect of b) reduction in rainfall or c) increase in rainfall on the freshwater lens of a Limestone island compared to the a) current situation (modified from Waterhouse 1984). Red arrows indicate a reduction in the size of the lens and green arrows indicate an increase in the size of the lens. ......................................................................................... 164
Appendix Figure E.3 Potential effect of b) reduction in rainfall or c) increase in rainfall on the aquifers of a Volcanic island compared to the a) current situation (modified from UNESCO 1991). Red arrows indicate a reduction in the size of the lens and green arrows indicate an increase in the size of the lens. .............................................................................................................................. 165
Appendix Figure E.4 Potential effect of b) reduction in rainfall or c) increase in rainfall on the aquifers of a Composite island compared to the a) current situation (modified from Waterhouse 1984). The question marks indicate that there may be connectivity from the basal aquifer across the dikes. Red arrows indicate a reduction in the size of the lens and green arrows indicate an increase in the size of the lens. ............................................................................................................ 166
Appendix Figure E.5 Potential effect of b) reduction in rainfall or c) increase in rainfall on coastal aquifers of a Complex island compared to the a) current situation. Red arrows indicate a reduction in the size of the lens and green arrows indicate an increase in the size of the lens. ......... 167
xvi Pacific Island Groundwater and Future Climates: First-Pass Regional Vulnerability Assessment
Appendix Figure F.1 Relationship between mean annual rainfall and mean annual recharge (for available data period) for a number of Low Carbonate, Limestone and Volcanic islands (modified from UNESCO 1991). The red curve has been fitted to the data for Low Carbonate and Limestone islands only. The figure also shows the influence of vegetation conditions on recharge. . 168 Appendix Figure F.2 Water balance model for the surface zone (comprising a soil moisture zone and an unsaturated zone) and freshwater lens on a small Low Carbonate island with no runoff (modified from Falkland 1993). Water balance terms are described in the text. ................................. 170
Appendix Figure G.1 Number and percentage of island types across the Pacific region with potential for fresh groundwater (known island types only): a) island number and percentage of total islands; b) percentage of total island area (compare with Figure 2.1 for all islands, including those of unknown type)........................................................................................................................ 171
Appendix Figure G.2 Number and percentage of islands in each country of the Pacific region, for islands with potential for fresh groundwater (compare with Figure 2.4). ............................................. 172
Appendix Figure G.3 Percentage area of islands in each country of the Pacific region, for islands with potential for fresh groundwater (compare with Figure 2.5). ......................................................... 173 Appendix Figure H.1 Percentage of islands with minimum rainfall values sourced from each climate model for the two emissions scenarios (RCP4.5 and RCP8.5). Statistical analysis is shown for the projection periods centred on a) 2050 and b) 2085. Colours display the analysis period (El Niña, La Niña and neutral) of the climate models. .............................................................. 175
Appendix Figure H.2 Percentage of islands with minimum rainfall values sourced from models relating to each analysis period (El Niño, La Niña and neutral) during the two projection periods (2050 and 2085) for the two emissions scenarios (RCP4.5 and RCP8.5). ......................................... 176
Pacific Island Groundwater and Future Climates: First-Pass Regional Vulnerability Assessment xvii
List of Tables
Table 2.1 Summary of features in the hydrogeologically-based typology for small islands. ................... 9
Table 2.2 Percentage of island area within the island types for each country (known island types only). ....................................................................................................................................................... 16
Table 2.3 Summary of dominant trends of physical characteristics within each island type. ................ 25
Table 3.1 Occurrence of basal freshwater aquifers for different island types in the Pacific region. ...... 29
Table 3.2 Summary of potential effects of reduced rainfall-recharge or rise in relative sea level on fresh groundwater volume for freshwater lenses or coastal aquifer systems, assuming the water table is free to rise in the aquifer. ........................................................................................................... 54 Table 3.3 Aquifer sensitivity to change in rainfall-recharge on islands of the Pacific region. ................ 62
Table 3.4 Annual rainfall exposure classes based on mean annual rainfall and CV combinations. ...... 65
Table 3.5 Rainfall exposure classes for mean annual rainfall during ENSO phases. ............................ 65
Table 3.6 Aquifer sensitivity to mean SLR on islands of the Pacific region. .......................................... 67
Table 4.1 Summary of projected lowest mean annual rainfall (mm) in 2050 for the island types assessed for potential vulnerability. The total range in lowest mean rainfall, 10th percentile for each island type and percentage (count) of islands within the three rainfall exposure classes are displayed. ............................................................................................................................................... 77
Table 4.2 Summary of projected lowest mean annual rainfall (mm) in 2085 for the island types assessed for potential vulnerability. The total range in lowest mean rainfall, 10th percentile for each island type and percentage (count) of islands within the three rainfall exposure classes are displayed. ............................................................................................................................................... 77
Table 4.3 Summary of projected mean SLR (m) in 2050 (compared to the 1995 baseline) for the island types in relation to the SLR exposure classes; shown as percentage (count) of islands. ........... 81
Table 4.4 Summary of projected mean SLR (m) in 2085 (compared to the 1995 baseline) for the island types in relation to the SLR exposure classes; shown as percentage (count) of islands. ........... 81
Table 5.1 Potential impact of lowest mean annual rainfall on groundwater systems of the Pacific region. ..................................................................................................................................................... 84
Table 5.2 Relative potential impact due to a rise in relative mean sea level in 2050 or 2085 on fresh groundwater systems of the Pacific region. .................................................................................. 86
Table 6.1 Adaptability of groundwater system (principal aquifer) to periods of low rainfall or SLR. ...... 90
Table 7.1 Relative potential vulnerability of island groundwater systems to current mean rainfall (1979-2013; Adler et al. 2003), shown as percentage (count) of all islands assessed.......................... 94
Table 7.2 Rating table for the potential vulnerability of groundwater systems on islands of the Pacific region to periods of low rainfall. The combinations in this table apply to both current and future rainfall assessments. .................................................................................................................... 97
Table 7.3 Potential Vulnerability of island groundwater systems to projected lowest mean annual rainfall in 2050, shown as percentage (count) of all islands assessed. ................................................. 98 Table 7.4 Vulnerability of island groundwater systems to projected lowest mean annual rainfall in 2085, shown as percentage (count) of all islands assessed. ................................................................. 99
Table 7.5 Rating table for the potential vulnerability of groundwater systems on islands of the Pacific region to relative mean SLR. .................................................................................................... 104
xviii Pacific Island Groundwater and Future Climates: First-Pass Regional Vulnerability Assessment
Table 7.6 Percentage (count) of islands without projected mean sea-level data or elevation data in 2050 and 2085. ................................................................................................................................ 105
Table 7.7 Potential vulnerability of island groundwater systems to projected mean SLR in 2050, shown as percentage (count) of all islands assessed. ........................................................................ 106 Table 7.8 Potential vulnerability of island groundwater systems to projected mean SLR in 2085, shown as percentage (count) of all islands assessed. ........................................................................ 107
Table 7.9 Summary of projected country population and calculated population density in the Pacific region during 2010, 2050 and 2100. ........................................................................................ 111
Appendix Table A.1 Summary of A0 map products that accompany this report. ................................ 135 Appendix Table H.1 Summary statistics of projected mean annual rainfall in 2050 for each country. ................................................................................................................................................ 177
Appendix Table H.2 Summary statistics of projected mean annual rainfall in 2050 for each country. ................................................................................................................................................ 178
Appendix Table I.1 Country percentage (count) of islands in each rainfall potential vulnerability class for 2050. ..................................................................................................................................... 179
Appendix Table I.2 Country percentage (count) of islands in each rainfall potential vulnerability class for 2085. ..................................................................................................................................... 180
Appendix Table I.3: Country percentage (count) of islands in each mean SLR potential vulnerability class for 2050. ................................................................................................................. 181
Appendix Table I.4 Country percentage (count) of islands in each mean SLR potential vulnerability class for 2085. ................................................................................................................. 182
Appendix Table I.5 Low Carbonate islands: percentage (count) of islands assigned to each rainfall potential vulnerability rating in 2050......................................................................................... 183
Appendix Table I.6 Low Carbonate islands: percentage (count) of islands assigned to each rainfall potential vulnerability rating in 2085......................................................................................... 184
Appendix Table I.7 Limestone islands: percentage (count) of islands assigned to each rainfall potential vulnerability rating in 2050. ................................................................................................... 184
Appendix Table I.8 Limestone islands: percentage (count) of islands assigned to each rainfall potential vulnerability rating in 2085. ................................................................................................... 185
Appendix Table I.9 Volcanic islands: percentage (count) of islands assigned to each rainfall potential vulnerability rating in 2050. ................................................................................................... 185 Appendix Table I.10 Volcanic islands: percentage (count) of islands assigned to each rainfall potential vulnerability rating in 2085. ................................................................................................... 186
Appendix Table I.11 Composite islands: percentage (count) of islands assigned to each rainfall potential vulnerability rating in 2050. ................................................................................................... 186
Appendix Table I.12 Composite islands: percentage (count) of islands assigned to each rainfall potential vulnerability rating in 2085. ................................................................................................... 187 Appendix Table I.13 Complex islands: percentage (count) of islands assigned to each rainfall potential vulnerability rating in 2050. ................................................................................................... 187
Appendix Table I.14 Complex islands: percentage (count) of islands assigned to each rainfall potential vulnerability rating in 2085. ................................................................................................... 187
Appendix Table I.15 Low Carbonate islands: percentage (count) of islands assigned to each mean SLR potential vulnerability rating in 2050. ................................................................................. 188
Pacific Island Groundwater and Future Climates: First-Pass Regional Vulnerability Assessment xix
Appendix Table I.16 Low Carbonate islands: percentage (count) of islands assigned to each mean SLR potential vulnerability rating in 2085. .................................................................................. 189
Appendix Table I.17 Limestone islands: percentage (count) of islands assigned to each mean SLR potential vulnerability rating in 2050. ............................................................................................ 190 Appendix Table I.18 Limestone islands: percentage (count) of islands assigned to each mean SLR potential vulnerability rating in 2085. ............................................................................................ 190
Appendix Table I.19 Volcanic islands: percentage (count) of islands assigned to each mean SLR potential vulnerability rating in 2050. .................................................................................................... 191
Appendix Table I.20 Volcanic islands: percentage (count) of islands assigned to each mean SLR potential vulnerability rating in 2085. .................................................................................................... 191 Appendix Table I.21 Composite islands: percentage (count) of islands assigned to each mean SLR potential vulnerability rating in 2050. ............................................................................................ 192
Appendix Table I.22 Composite islands: percentage (count) of islands assigned to each mean SLR potential vulnerability rating in 2085. ............................................................................................ 192
Appendix Table I.23 Complex islands: percentage (count) of islands assigned to each mean SLR potential vulnerability rating in 2050. .................................................................................................... 193
Appendix Table I.24 Complex islands: percentage (count) of islands assigned to each mean SLR potential vulnerability rating in 2085. .................................................................................................... 193
Appendix Table I.25 Percentage (count) of islands (by type) with a Higher rainfall vulnerability rating in 2050 for each country as a percentage of total islands with Higher vulnerability. ................. 194
Appendix Table I.26 Percentage (count) of islands (by type) with a Higher rainfall vulnerability rating in 2085 for each country as a percentage of total islands with Higher vulnerability. ................. 195
Appendix Table I.27 Percentage (count) of islands (by type) with a Moderate High SLR vulnerability rating in 2050 for each country as a percentage of total islands with Moderate High vulnerability. .......................................................................................................................................... 196
Appendix Table I.28 Percentage (count) of islands (by type) with a Moderate High SLR vulnerability rating in 2085 for each country as a percentage of total islands with Moderate High vulnerability. .......................................................................................................................................... 197
Appendix Table I.29 Count of islands with each rainfall potential vulnerability rating as a result of the framework components. ................................................................................................................. 199
Appendix Table I.30 Count of islands with each SLR potential vulnerability rating as a result of the framework components. ....................................................................................................................... 200
xx Pacific Island Groundwater and Future Climates: First-Pass Regional Vulnerability Assessment
Abbreviations and Acronyms
AR5 Fifth Assessment Report
ASTER Advanced Spaceborne Thermal Emission and Reflection Radiometer
AusAID Australian Agency for International Development
AUSLIG Australian Surveying and Land Information Group
BoM Bureau of Meteorology
CMIP Climate Model Intercomparison Project
CSIRO Commonwealth Scientific and Industrial Research Organisation
CCAM Conformal Cubic Atmospheric Model
CMIP5 Coupled Model Intercomparison Project Phase 5
CV Coefficient of Variation
ENSO El Niño–Southern Oscillation
ESRI Environmental Systems Research Institute
FSM Federated States of Micronesia
GCM Global Climate Model
GFS Groundwater Flow System
ITCZ Intertropical Convergence Zone
IPCC Intergovernmental Panel on Climate Change
LDC Least Developed Countries
MAR Managed Aquifer Recharge
MDG Millennium Development Goal
METI Ministry of Economy, Trade and Industry of Japan
NASA National Aeronautics and Space Administration
PACCSAP Pacific-Australia Climate Change Science and Adaptation Planning
PCCSP Pacific Climate Change Science Program
PCRAFI Pacific Catastrophe Risk Assessment and Financing Initiative
PDO Pacific Decadal Oscillation
PIC Pacific Island Country
PNG Papua New Guinea
RCP Representative Concentration Pathways
RMI Republic of Marshall Islands
SLR Sea-Level Rise
SPC Secretariat of the Pacific Community
SOPAC Applied Geoscience and Technology Division of the Secretariat of the Pacific Community
Pacific Island Groundwater and Future Climates: First-Pass Regional Vulnerability Assessment xxi
SPCZ South Pacific Convergence Zone
SRTM Shuttle Radar Topography Mission
SST Sea-Surface Temperature
SWI Seawater Intrusion
UNEP United Nations Environment Programme
UNESCO United Nations Educational, Scientific and Cultural Organisation
USGS United States Geological Survey
WGS84 World Geodetic System 1984
WPM Western Pacific Monsoon
xxii Pacific Island Groundwater and Future Climates: First-Pass Regional Vulnerability Assessment
Units
km kilometre
km2 square kilometre
L/s litres per second
m metre
Pacific Island Groundwater and Future Climates: First-Pass Regional Vulnerability Assessment 1
1 Introduction
1.1 Background Many Pacific Island Countries (PICs) rely heavily on fresh groundwater in addition to harvested rainwater for drinking water, and for a number of the islands it is the only reliable source of freshwater throughout the year. Some of the larger islands in the Pacific often rely on surface water, with groundwater being a supplementary but still valuable resource. Stresses on groundwater, surface water and rainwater resources in many Pacific Islands are set to escalate in the future due to increased demand for water, related to population and economic growth and increased pollution as human settlements and activities expand (UNEP 2000). Projected changes in rainfall patterns (amount and intensity) and relative sea level are likely to put some of these groundwater resources at further risk (Mimura et al. 2007). The delivery of water supplies and sanitation services in many PICs currently falls well short of Millennium Development Goal (MDG) targets, suggesting that significant improvements are required (WHO/UNICEF 2014).
Rainfall is the most important and generally the only source of water for groundwater recharge across the Pacific Islands. The amount and variability of rainfall, which are important influences on groundwater recharge, are projected to vary in the future (White and Falkland 2010). In some cases, these variations may lead to increased pressure on already stressed groundwater resources through prolongation of drought or low annual rainfall below important recharge thresholds. Sea-level rise (SLR) can change the position of the groundwater-seawater interface and lead to a reduction in fresh groundwater reserves due to seawater intrusion into freshwater aquifers. This may temporarily or permanently affect the quality of some groundwater making it unusable for potable use.
A recent investigation by Duncan (2011) examined the threats to freshwater resources due to environmental change in seven selected PICs using a vulnerability index approach. It was concluded that the seven islands studied fell into three broad groups: (i) low-lying carbonate islands under severe resource and environmental stress, with significant development pressure and a need for improved water management and governance; (ii) larger volcanic islands with adequate water resources, but significant to severe water management and governance challenges in managing available resources, and (iii) moderate-sized volcanic islands with adequate water resources, significant water management and governance challenges in managing the available resources, but a reasonably high-level of provision of improved drinking water and sanitation. The study found that across nearly all islands studied, water resources management provides the greatest challenge regionally due to limited technical and governance capacity. Furthermore, limited availability of data across the region hinders assessment and planning.
Earlier studies have shown there is considerable diversity between and within the PICs in physiographic, geological/hydrogeological, demographic and hydrologic characteristics, all of which add to the challenges of managing water security issues in PICs. Climate is one of the many drivers impacting on water security. Although a number of studies have been undertaken at a local or country scale, very limited information is available at a regional scale to consider the impacts of future climates on groundwater systems.
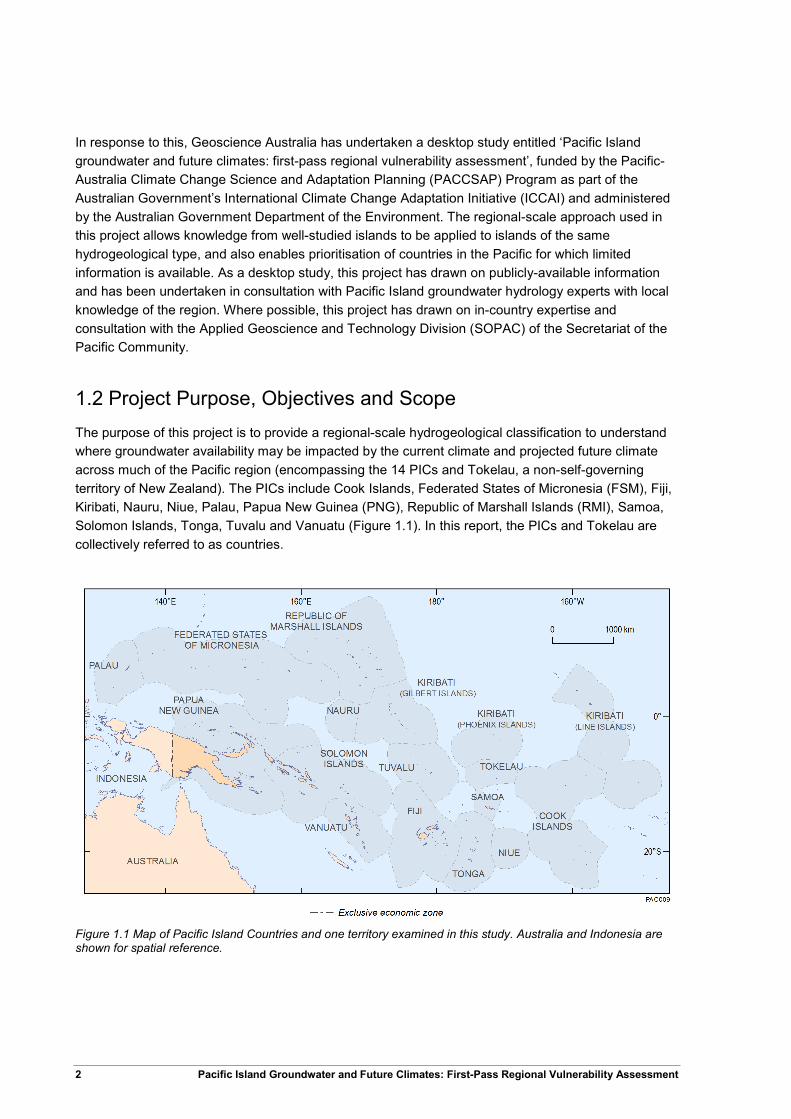
2 Pacific Island Groundwater and Future Climates: First-Pass Regional Vulnerability Assessment
In response to this, Geoscience Australia has undertaken a desktop study entitled ‘Pacific Island groundwater and future climates: first-pass regional vulnerability assessment’, funded by the Pacific-Australia Climate Change Science and Adaptation Planning (PACCSAP) Program as part of the Australian Government’s International Climate Change Adaptation Initiative (ICCAI) and administered by the Australian Government Department of the Environment. The regional-scale approach used in this project allows knowledge from well-studied islands to be applied to islands of the same hydrogeological type, and also enables prioritisation of countries in the Pacific for which limited information is available. As a desktop study, this project has drawn on publicly-available information and has been undertaken in consultation with Pacific Island groundwater hydrology experts with local knowledge of the region. Where possible, this project has drawn on in-country expertise and consultation with the Applied Geoscience and Technology Division (SOPAC) of the Secretariat of the Pacific Community.
1.2 Project Purpose, Objectives and Scope The purpose of this project is to provide a regional-scale hydrogeological classification to understand where groundwater availability may be impacted by the current climate and projected future climate across much of the Pacific region (encompassing the 14 PICs and Tokelau, a non-self-governing territory of New Zealand). The PICs include Cook Islands, Federated States of Micronesia (FSM), Fiji, Kiribati, Nauru, Niue, Palau, Papua New Guinea (PNG), Republic of Marshall Islands (RMI), Samoa, Solomon Islands, Tonga, Tuvalu and Vanuatu (Figure 1.1). In this report, the PICs and Tokelau are collectively referred to as countries.
Figure 1.1 Map of Pacific Island Countries and one territory examined in this study. Australia and Indonesia are shown for spatial reference.
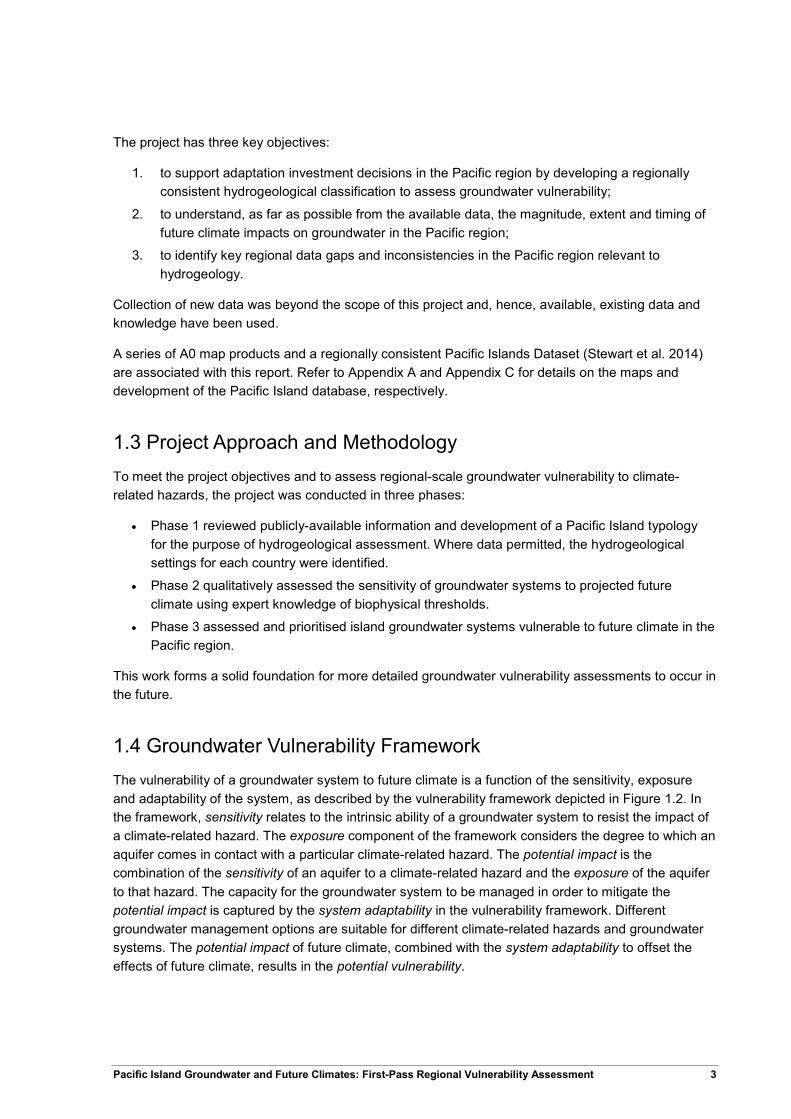
Pacific Island Groundwater and Future Climates: First-Pass Regional Vulnerability Assessment 3
The project has three key objectives:
1. to support adaptation investment decisions in the Pacific region by developing a regionally consistent hydrogeological classification to assess groundwater vulnerability;
2. to understand, as far as possible from the available data, the magnitude, extent and timing of future climate impacts on groundwater in the Pacific region;
3. to identify key regional data gaps and inconsistencies in the Pacific region relevant to hydrogeology.
Collection of new data was beyond the scope of this project and, hence, available, existing data and knowledge have been used.
A series of A0 map products and a regionally consistent Pacific Islands Dataset (Stewart et al. 2014) are associated with this report. Refer to Appendix A and Appendix C for details on the maps and development of the Pacific Island database, respectively.
1.3 Project Approach and Methodology To meet the project objectives and to assess regional-scale groundwater vulnerability to climate-related hazards, the project was conducted in three phases:
• Phase 1 reviewed publicly-available information and development of a Pacific Island typology for the purpose of hydrogeological assessment. Where data permitted, the hydrogeological settings for each country were identified.
• Phase 2 qualitatively assessed the sensitivity of groundwater systems to projected future climate using expert knowledge of biophysical thresholds.
• Phase 3 assessed and prioritised island groundwater systems vulnerable to future climate in the Pacific region.
This work forms a solid foundation for more detailed groundwater vulnerability assessments to occur in the future.
1.4 Groundwater Vulnerability Framework The vulnerability of a groundwater system to future climate is a function of the sensitivity, exposure and adaptability of the system, as described by the vulnerability framework depicted in Figure 1.2. In the framework, sensitivity relates to the intrinsic ability of a groundwater system to resist the impact of a climate-related hazard. The exposure component of the framework considers the degree to which an aquifer comes in contact with a particular climate-related hazard. The potential impact is the combination of the sensitivity of an aquifer to a climate-related hazard and the exposure of the aquifer to that hazard. The capacity for the groundwater system to be managed in order to mitigate the potential impact is captured by the system adaptability in the vulnerability framework. Different groundwater management options are suitable for different climate-related hazards and groundwater systems. The potential impact of future climate, combined with the system adaptability to offset the effects of future climate, results in the potential vulnerability.
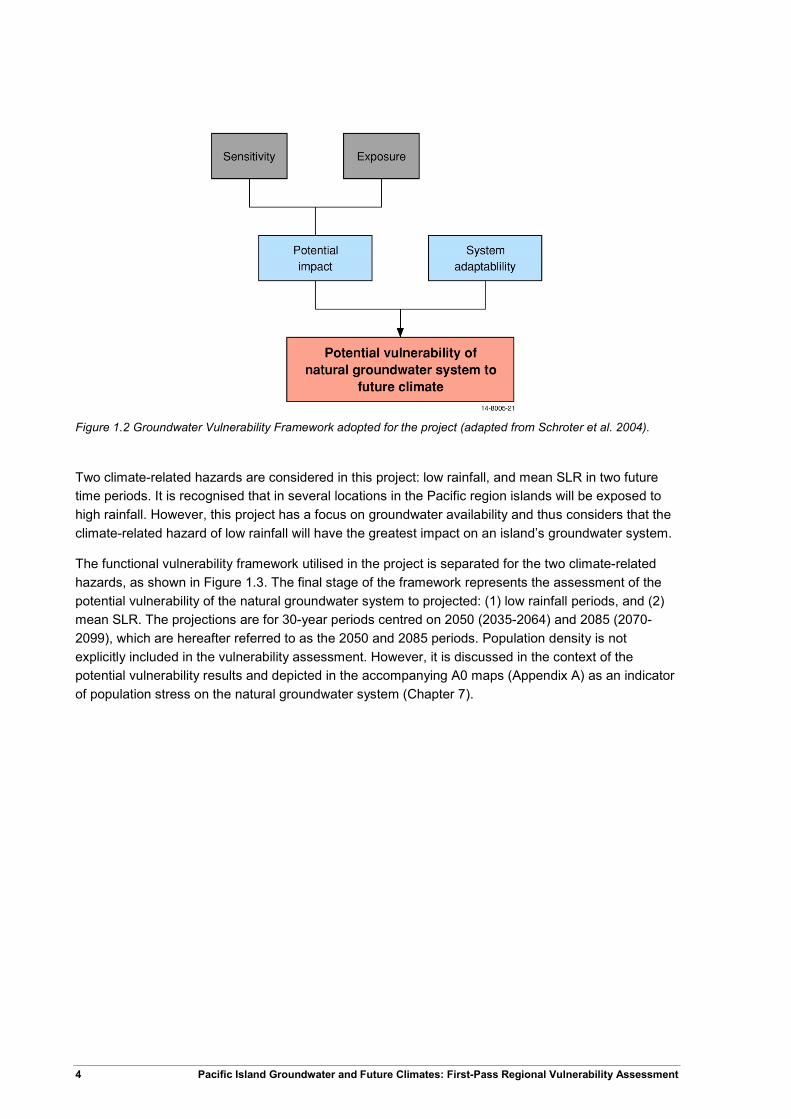
4 Pacific Island Groundwater and Future Climates: First-Pass Regional Vulnerability Assessment
Figure 1.2 Groundwater Vulnerability Framework adopted for the project (adapted from Schroter et al. 2004).
Two climate-related hazards are considered in this project: low rainfall, and mean SLR in two future time periods. It is recognised that in several locations in the Pacific region islands will be exposed to high rainfall. However, this project has a focus on groundwater availability and thus considers that the climate-related hazard of low rainfall will have the greatest impact on an island’s groundwater system.
The functional vulnerability framework utilised in the project is separated for the two climate-related hazards, as shown in Figure 1.3. The final stage of the framework represents the assessment of the potential vulnerability of the natural groundwater system to projected: (1) low rainfall periods, and (2) mean SLR. The projections are for 30-year periods centred on 2050 (2035-2064) and 2085 (2070-2099), which are hereafter referred to as the 2050 and 2085 periods. Population density is not explicitly included in the vulnerability assessment. However, it is discussed in the context of the potential vulnerability results and depicted in the accompanying A0 maps (Appendix A) as an indicator of population stress on the natural groundwater system (Chapter 7).
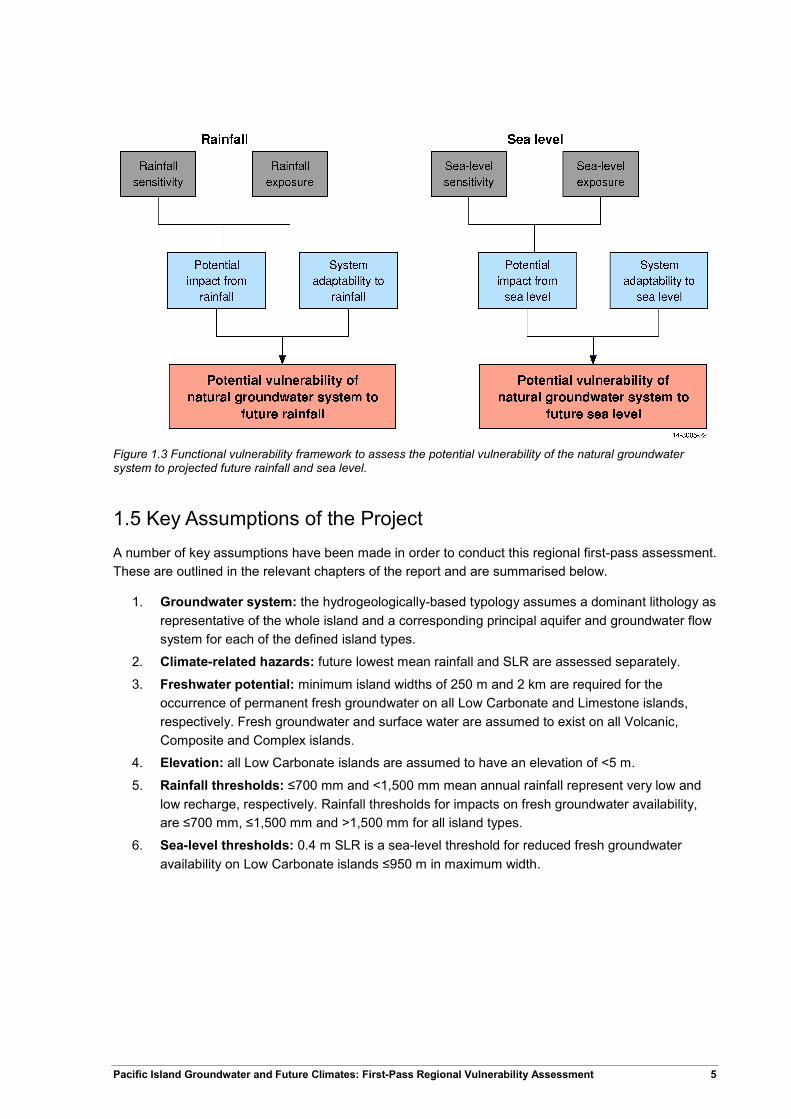
Pacific Island Groundwater and Future Climates: First-Pass Regional Vulnerability Assessment 5
Figure 1.3 Functional vulnerability framework to assess the potential vulnerability of the natural groundwater system to projected future rainfall and sea level.
1.5 Key Assumptions of the Project A number of key assumptions have been made in order to conduct this regional first-pass assessment. These are outlined in the relevant chapters of the report and are summarised below.
1. Groundwater system: the hydrogeologically-based typology assumes a dominant lithology as representative of the whole island and a corresponding principal aquifer and groundwater flow system for each of the defined island types.
2. Climate-related hazards: future lowest mean rainfall and SLR are assessed separately.
3. Freshwater potential: minimum island widths of 250 m and 2 km are required for the occurrence of permanent fresh groundwater on all Low Carbonate and Limestone islands, respectively. Fresh groundwater and surface water are assumed to exist on all Volcanic, Composite and Complex islands.
4. Elevation: all Low Carbonate islands are assumed to have an elevation of <5 m.
5. Rainfall thresholds: ≤700 mm and <1,500 mm mean annual rainfall represent very low and low recharge, respectively. Rainfall thresholds for impacts on fresh groundwater availability, are ≤700 mm, ≤1,500 mm and >1,500 mm for all island types.
6. Sea-level thresholds: 0.4 m SLR is a sea-level threshold for reduced fresh groundwater availability on Low Carbonate islands ≤950 m in maximum width.
6 Pacific Island Groundwater and Future Climates: First-Pass Regional Vulnerability Assessment
1.6 Structure of the Report This report summarises the methodology, regional analysis and assessment of the vulnerability of groundwater to projected lowest mean rainfall and mean SLR across the islands of interest within the Pacific region. The report has been structured into nine chapters.
Chapter 1 provides the background, contextual information and groundwater vulnerability framework for the project. Chapter 2 describes the Pacific Island hydrogeological typology developed for this project and presents an analysis of island physical characteristics. Chapter 3 describes the sensitivities of the fresh groundwater systems on different types of islands to a given climate-related hazard and presents a qualitative ranking of the sensitivities of these different systems. Chapter 4 describes the exposure of islands to projected lowest mean rainfall and mean SLR for the 2050 and 2085 periods. Chapter 5 presents the potential impact of the projected climate-related hazards by considering exposures and sensitivities of the fresh groundwater systems for the different types of islands. Chapter 6 describes and ranks the intrinsic system adaptability of the fresh groundwater systems associated with the different island types. Chapter 7 describes and ranks the potential vulnerability of the fresh groundwater systems on the different island types to the projected climate-related hazards by taking into account the sensitivity, exposure and the system adaptability, as presented in earlier sections of this report. Chapter 8 presents a summary of the project methodology, key findings and key outcomes of the project. Chapter 9 describes key knowledge gaps arising from this regional first-pass assessment of potential vulnerability of groundwater on islands of the Pacific region to future climates and recommendations for future work.
Pacific Island Groundwater and Future Climates: First-Pass Regional Vulnerability Assessment 7
2 Hydrogeological Typology for the Pacific Region
The Pacific region of interest, covering the 14 Pacific Island Countries (PICs) and Tokelau, encompass islands of very diverse geology. Their geological history is a fundamental control on the character of their groundwater systems. Although there is local-scale variability in the hydrogeological characteristics of any island, there are similarities between groundwater systems on islands of similar geology. These similarities are captured in the hydrogeologically-based typology developed for this project (Dixon-Jain et al. 2013, Appendix B) which provides a consistent basis for mapping and comparing aquifers across the islands of the Pacific region. The typological approach allows knowledge from well-studied islands to be applied to islands of the same type, for which little to no information is available. In particular, this approach provides a first step in a systematic regional-scale vulnerability assessment of Pacific Island groundwater to the impacts of future rainfall and relative sea level.
This chapter describes the features of the Pacific Island hydrogeological typology and presents an analysis of island physical characteristics for islands with an identified island type. Spatial analysis and statistics relating to other islands in the Pacific Islands database, for which there is insufficient information to assign an island type (unknown islands), are also presented.
2.1 Classification of Islands Typologies in the physical sciences aim to classify systems into classes based on physical, structural and functional similarities (e.g. Bokuniewicz 2001). The typology developed in this project builds on existing island classifications (UNESCO 1991, Peterson 1993, Nunn 1994), with an emphasis on the distinguishing hydrogeological characteristics of the islands in the Pacific region. Islands within each type have similar groundwater systems and are therefore expected to respond in a similar manner to changes in rainfall patterns and sea level. The hydrogeologically-based typology developed for the Pacific Islands draws on publicly-available reports and publications for individual islands/countries as well as information from experts with local knowledge of the region. Given the relatively small number of detailed groundwater studies in the Pacific region, the typology allows knowledge from well-studied islands to be applied to islands for which there is very little or no information. It is noted that although the number of studied islands is small relative to total islands in the region, islands with significant water resource problems (current or emerging) and a number of others in the Pacific region have been studied in detail or an assessment has been made at a more basic level.
Based primarily on their dominant geological makeup, islands in the Pacific region correspond to one of the following five island types: Low Carbonate, Limestone, Volcanic, Composite and Complex. The first four classes relate to small islands (area <2,000 km2) and the fifth relates to large islands (area >2,000 km2). In addition to the island type, the typology developed for small islands incorporates the variables of island composition and lithology; aquifer setting; and aquifer potential productivity (Table 2.1). The main aquifers on both small and large islands are related to an international mapping standard, the international hydrogeological classification, which categorises aquifers by their porosity (intergranular/fissured/local), extent and productivity (higher/lower). No attempt has been made to put quantitative boundaries on what constitutes lower or higher productivity, in keeping with the historical approach to groundwater mapping in the Pacific (ESCAP & RMRDC 1985; Appendix B).
8 Pacific Island Groundwater and Future Climates: First-Pass Regional Vulnerability Assessment
Intergranular aquifers are those in which the water flows through intergranular pore spaces within both consolidated rock such as porous sandstone and conglomerates, and unconsolidated sediments (clay, silt, sand, gravel and limestone formations associated with alluvial (water-formed), lacustrine (lake-formed) or aeolian (wind-formed) deposits. Fissured aquifers are those in which the water flows through fissures within both sedimentary karstic rock (solution cavities and joints), and igneous or metamorphic fractured rock (joints, bedding plains, faults and fractures). Localised aquifers are those with low degrees of connectivity, where water flow and yield tends to be localised or the groundwater resource is limited. The nature of the pore space in localised aquifers can be intergranular or fissured but the defining feature of a localised aquifer is that the water resource is small or localised/discontinuous. For instance, a karstic aquifer can be considered a fissured aquifer, or can be classed as a localised aquifer if flow rates are low, such as below yields of 1 L/s.
In a broad sense, intergranular aquifers potentially contain the greatest volume of groundwater that is relatively easy to exploit. In contrast, localised aquifers, by definition, tend to have lower yields and/or the productive areas are spatially localised. In terms of yield, fissured aquifers have the potential to store a large volume of groundwater; however, their potential yield depends on the extent and configuration of fissures.
Fissured aquifers are subdivided into karst or fractured types to reflect the dominant rock type, e.g. limestone versus volcanic, and hence the dominant style of fissure in the rock. Fissured and intergranular aquifers are further classed as ‘low’ or ‘high’, depending on the potential productivity of the main aquifers, where the terms fissured and intergranular describe the dominant lithology of the aquifer e.g. consolidated or unconsolidated rock, respectively.
The significance of the international hydrogeological classification is that it provides a consistent means for mapping and comparing aquifer types across islands of the Pacific region. Based on their international hydrogeological classification, the resulting seven main aquifer types that represent the groundwater systems of the Pacific Islands include: localised; fissured fractured low; fissured fractured high; fissured karst low; fissured karst high; intergranular low; and intergranular high. Although there are a range of potential aquifer types, for practical reasons, a principal aquifer (the most productive) is assumed for each island type. This generalisation doesn’t allow for groundwater use from different aquifer types. However, for the purposes of a regional-scale assessment, groundwater extraction from the most productive aquifer is considered a reasonable first-pass approach. The resulting principal aquifer types are associated with a groundwater flow system (GFS) (Table 2.1).The concept of a GFS is useful for informing the relative sensitivity of particular island types to changes in rainfall and sea level (Chapter 3) and the adaptability of the groundwater system to future climate (Chapter 6).
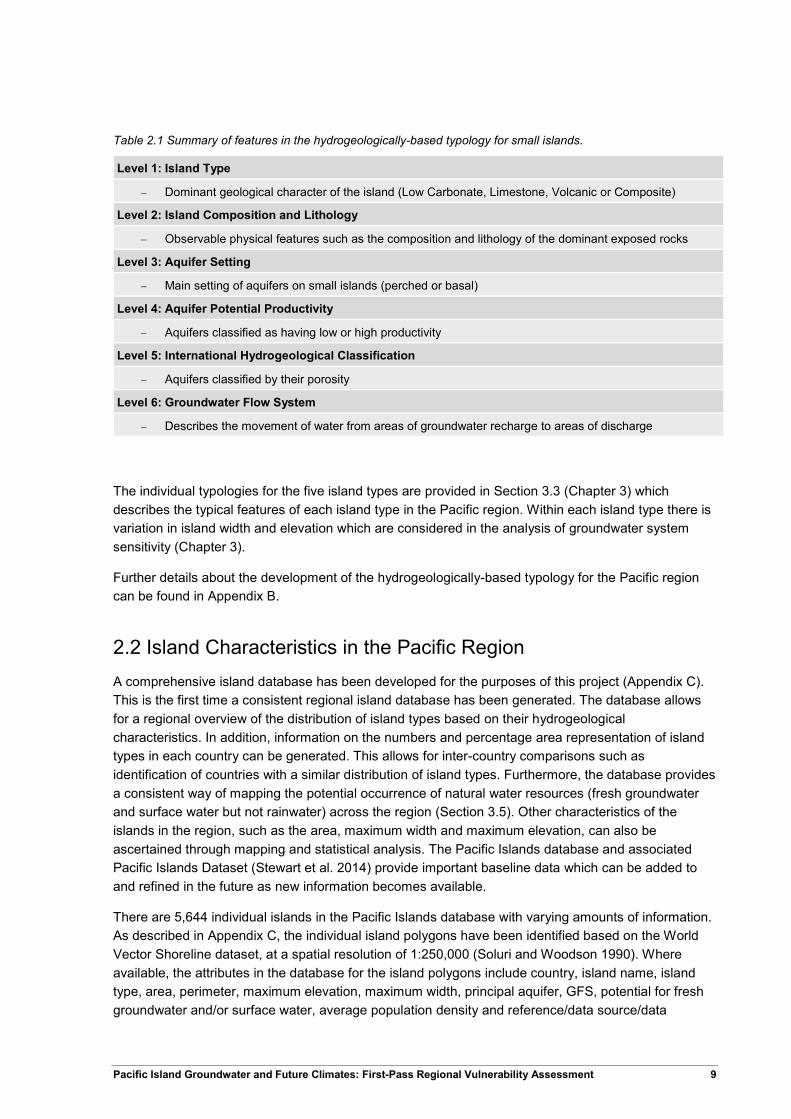
Pacific Island Groundwater and Future Climates: First-Pass Regional Vulnerability Assessment 9
Table 2.1 Summary of features in the hydrogeologically-based typology for small islands.
Level 1: Island Type
− Dominant geological character of the island (Low Carbonate, Limestone, Volcanic or Composite)
Level 2: Island Composition and Lithology
− Observable physical features such as the composition and lithology of the dominant exposed rocks
Level 3: Aquifer Setting
− Main setting of aquifers on small islands (perched or basal)
Level 4: Aquifer Potential Productivity
− Aquifers classified as having low or high productivity
Level 5: International Hydrogeological Classification
− Aquifers classified by their porosity
Level 6: Groundwater Flow System
− Describes the movement of water from areas of groundwater recharge to areas of discharge
The individual typologies for the five island types are provided in Section 3.3 (Chapter 3) which describes the typical features of each island type in the Pacific region. Within each island type there is variation in island width and elevation which are considered in the analysis of groundwater system sensitivity (Chapter 3).
Further details about the development of the hydrogeologically-based typology for the Pacific region can be found in Appendix B.
2.2 Island Characteristics in the Pacific Region A comprehensive island database has been developed for the purposes of this project (Appendix C). This is the first time a consistent regional island database has been generated. The database allows for a regional overview of the distribution of island types based on their hydrogeological characteristics. In addition, information on the numbers and percentage area representation of island types in each country can be generated. This allows for inter-country comparisons such as identification of countries with a similar distribution of island types. Furthermore, the database provides a consistent way of mapping the potential occurrence of natural water resources (fresh groundwater and surface water but not rainwater) across the region (Section 3.5). Other characteristics of the islands in the region, such as the area, maximum width and maximum elevation, can also be ascertained through mapping and statistical analysis. The Pacific Islands database and associated Pacific Islands Dataset (Stewart et al. 2014) provide important baseline data which can be added to and refined in the future as new information becomes available.
There are 5,644 individual islands in the Pacific Islands database with varying amounts of information. As described in Appendix C, the individual island polygons have been identified based on the World Vector Shoreline dataset, at a spatial resolution of 1:250,000 (Soluri and Woodson 1990). Where available, the attributes in the database for the island polygons include country, island name, island type, area, perimeter, maximum elevation, maximum width, principal aquifer, GFS, potential for fresh groundwater and/or surface water, average population density and reference/data source/data
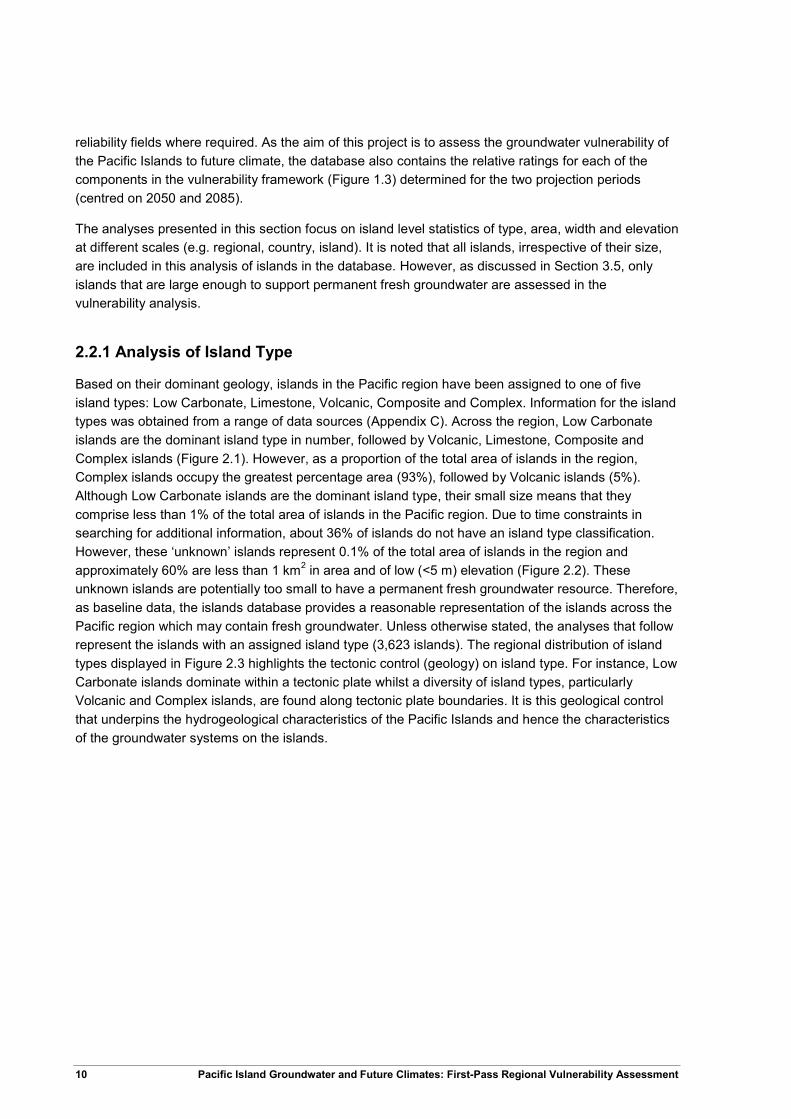
10 Pacific Island Groundwater and Future Climates: First-Pass Regional Vulnerability Assessment
reliability fields where required. As the aim of this project is to assess the groundwater vulnerability of the Pacific Islands to future climate, the database also contains the relative ratings for each of the components in the vulnerability framework (Figure 1.3) determined for the two projection periods (centred on 2050 and 2085).
The analyses presented in this section focus on island level statistics of type, area, width and elevation at different scales (e.g. regional, country, island). It is noted that all islands, irrespective of their size, are included in this analysis of islands in the database. However, as discussed in Section 3.5, only islands that are large enough to support permanent fresh groundwater are assessed in the vulnerability analysis.
2.2.1 Analysis of Island Type
Based on their dominant geology, islands in the Pacific region have been assigned to one of five island types: Low Carbonate, Limestone, Volcanic, Composite and Complex. Information for the island types was obtained from a range of data sources (Appendix C). Across the region, Low Carbonate islands are the dominant island type in number, followed by Volcanic, Limestone, Composite and Complex islands (Figure 2.1). However, as a proportion of the total area of islands in the region, Complex islands occupy the greatest percentage area (93%), followed by Volcanic islands (5%). Although Low Carbonate islands are the dominant island type, their small size means that they comprise less than 1% of the total area of islands in the Pacific region. Due to time constraints in searching for additional information, about 36% of islands do not have an island type classification. However, these ‘unknown’ islands represent 0.1% of the total area of islands in the region and approximately 60% are less than 1 km2 in area and of low (<5 m) elevation (Figure 2.2). These unknown islands are potentially too small to have a permanent fresh groundwater resource. Therefore, as baseline data, the islands database provides a reasonable representation of the islands across the Pacific region which may contain fresh groundwater. Unless otherwise stated, the analyses that follow represent the islands with an assigned island type (3,623 islands). The regional distribution of island types displayed in Figure 2.3 highlights the tectonic control (geology) on island type. For instance, Low Carbonate islands dominate within a tectonic plate whilst a diversity of island types, particularly Volcanic and Complex islands, are found along tectonic plate boundaries. It is this geological control that underpins the hydrogeological characteristics of the Pacific Islands and hence the characteristics of the groundwater systems on the islands.
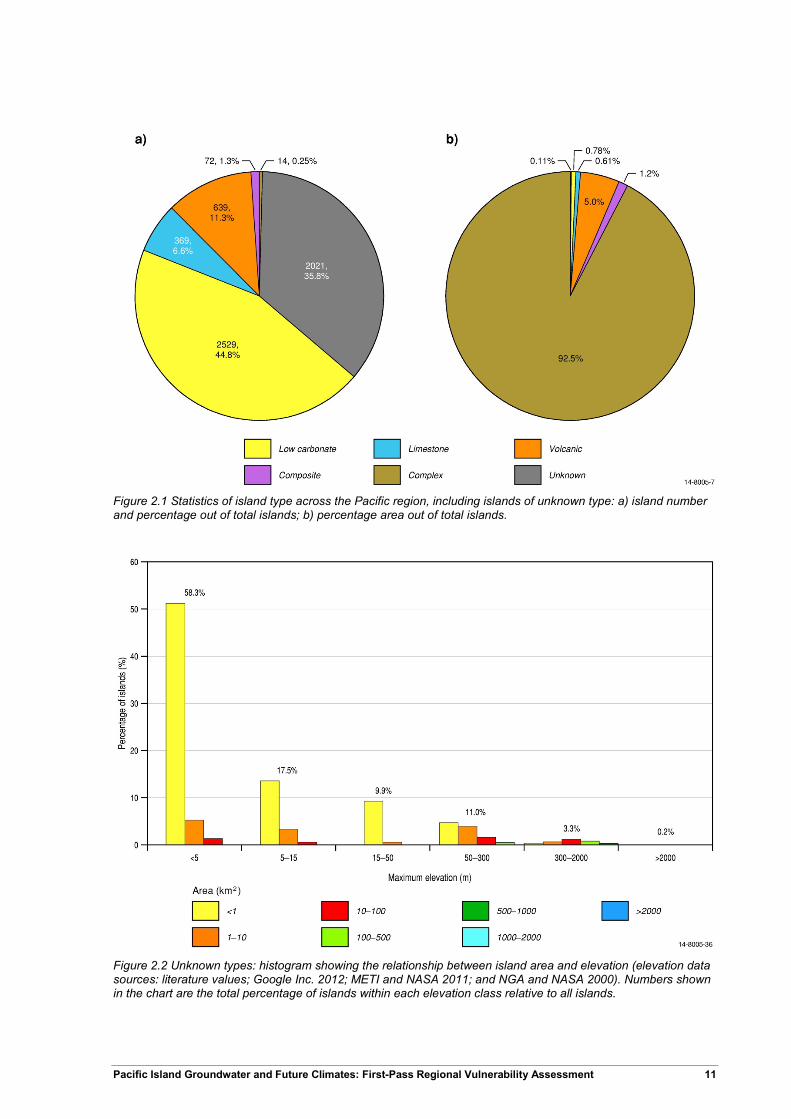
Pacific Island Groundwater and Future Climates: First-Pass Regional Vulnerability Assessment 11
Figure 2.1 Statistics of island type across the Pacific region, including islands of unknown type: a) island number and percentage out of total islands; b) percentage area out of total islands.
Figure 2.2 Unknown types: histogram showing the relationship between island area and elevation (elevation data sources: literature values; Google Inc. 2012; METI and NASA 2011; and NGA and NASA 2000). Numbers shown in the chart are the total percentage of islands within each elevation class relative to all islands.
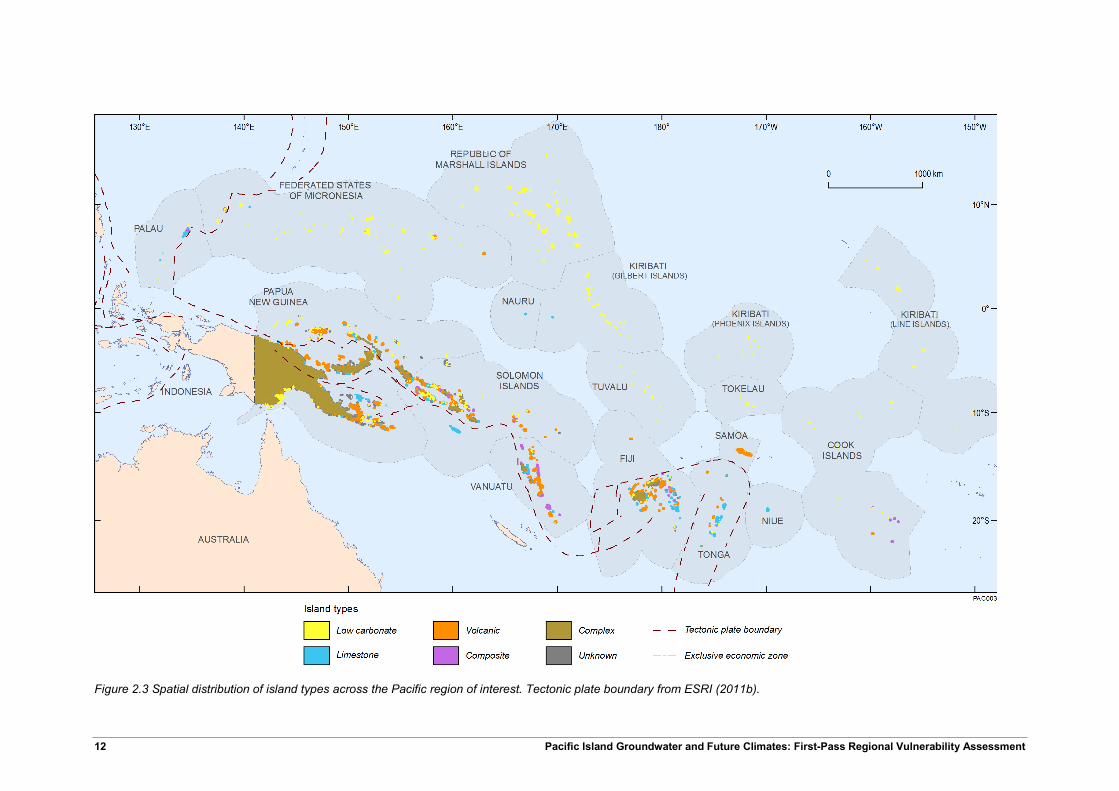
12 Pacific Island Groundwater and Future Climates: First-Pass Regional Vulnerability Assessment
Figure 2.3 Spatial distribution of island types across the Pacific region of interest. Tectonic plate boundary from ESRI (2011b).

Pacific Island Groundwater and Future Climates: First-Pass Regional Vulnerability Assessment 13
Country level statistics displayed in Figure 2.4 highlight the distribution of island types in each of the 15 countries under consideration. It can be observed that some countries are represented by a single island type, such as Nauru, Niue, RMI, Samoa, Tokelau and Tuvalu. In contrast, countries such as Fiji, Palau, PNG, Solomon Islands, Tonga and Vanuatu comprise at least 4 types of islands. Consideration of the area contribution of island types in each country, not just the number of islands, is important for delineating the dominant island type in each country (Figure 2.5). For example, although the majority of islands in FSM are Low Carbonate, the area of the country is dominated by Volcanic islands. Similarly, Volcanic and Low Carbonate islands are dominant in number in Solomon Islands, although the country area is dominated by Complex islands. The area distribution of island types in each country indicates that one island type dominates by at least 49% of the total country area.
For a given island type, the proportion of island area is highly variable across the countries (Table 2.2). Low Carbonate islands are found in 12 of the 15 countries. The greatest total area is situated in PNG. Solomon Islands contain the greatest area of Limestone islands, which are present in 9 additional countries. Volcanic islands are found in 9 of the countries, with the greatest area in PNG. Composite islands are present in 7 countries with the greatest total area of this island type in Vanuatu. Complex islands are only found in 4 of the countries, occupying the greatest area in PNG.
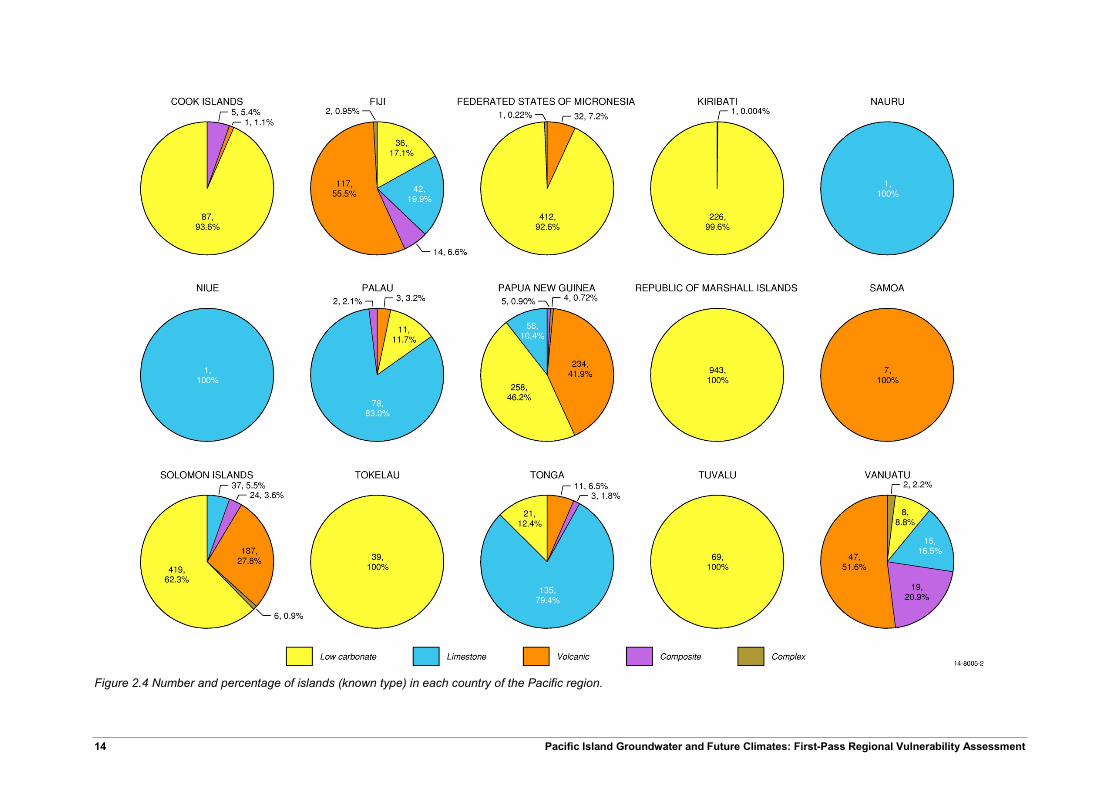
14 Pacific Island Groundwater and Future Climates: First-Pass Regional Vulnerability Assessment
Figure 2.4 Number and percentage of islands (known type) in each country of the Pacific region.
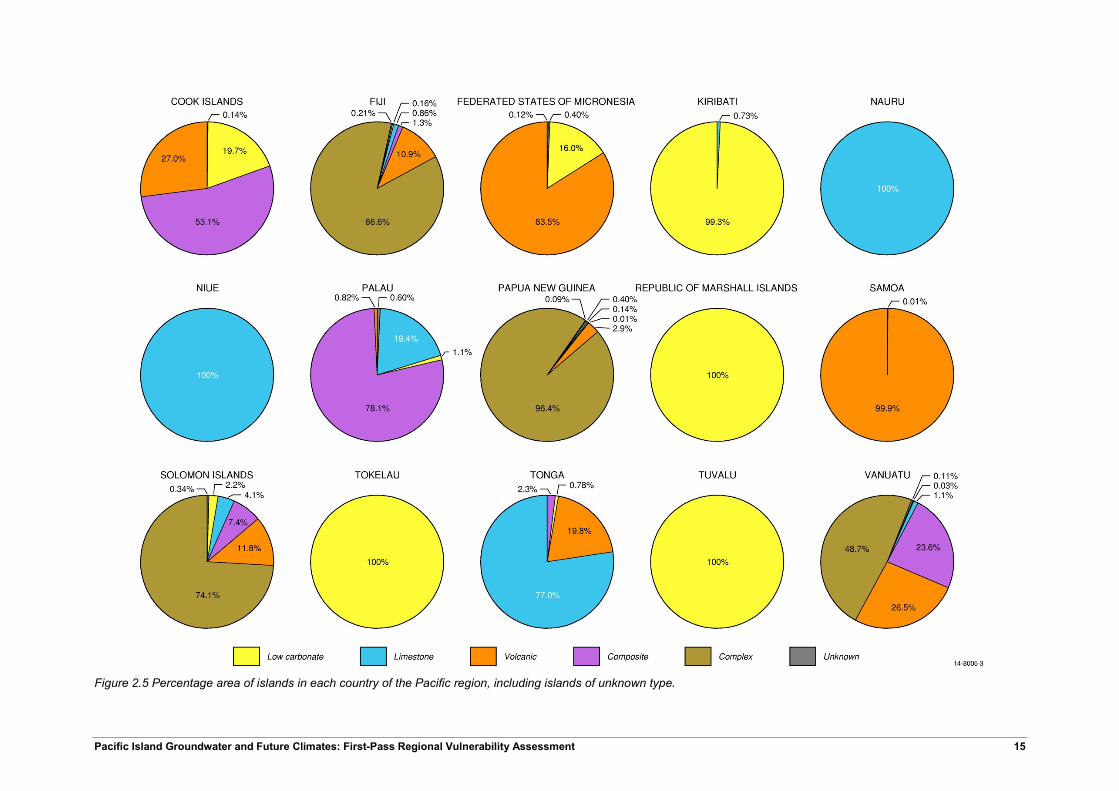
Pacific Island Groundwater and Future Climates: First-Pass Regional Vulnerability Assessment 15
Figure 2.5 Percentage area of islands in each country of the Pacific region, including islands of unknown type.
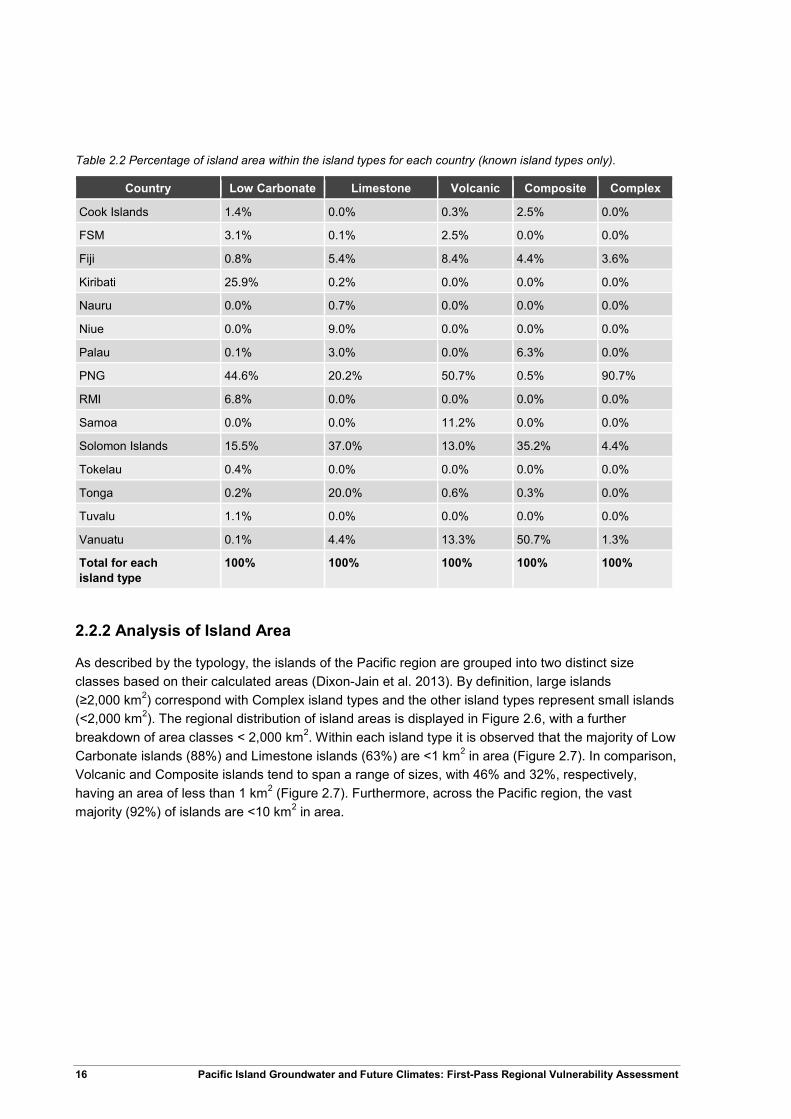
16 Pacific Island Groundwater and Future Climates: First-Pass Regional Vulnerability Assessment
Table 2.2 Percentage of island area within the island types for each country (known island types only).
Country Low Carbonate Limestone Volcanic Composite Complex
Cook Islands 1.4% 0.0% 0.3% 2.5% 0.0%
FSM 3.1% 0.1% 2.5% 0.0% 0.0%
Fiji 0.8% 5.4% 8.4% 4.4% 3.6%
Kiribati 25.9% 0.2% 0.0% 0.0% 0.0%
Nauru 0.0% 0.7% 0.0% 0.0% 0.0%
Niue 0.0% 9.0% 0.0% 0.0% 0.0%
Palau 0.1% 3.0% 0.0% 6.3% 0.0%
PNG 44.6% 20.2% 50.7% 0.5% 90.7%
RMI 6.8% 0.0% 0.0% 0.0% 0.0%
Samoa 0.0% 0.0% 11.2% 0.0% 0.0%
Solomon Islands 15.5% 37.0% 13.0% 35.2% 4.4%
Tokelau 0.4% 0.0% 0.0% 0.0% 0.0%
Tonga 0.2% 20.0% 0.6% 0.3% 0.0%
Tuvalu 1.1% 0.0% 0.0% 0.0% 0.0%
Vanuatu 0.1% 4.4% 13.3% 50.7% 1.3%
Total for each island type
100% 100% 100% 100% 100%
2.2.2 Analysis of Island Area
As described by the typology, the islands of the Pacific region are grouped into two distinct size classes based on their calculated areas (Dixon-Jain et al. 2013). By definition, large islands (≥2,000 km2) correspond with Complex island types and the other island types represent small islands (<2,000 km2). The regional distribution of island areas is displayed in Figure 2.6, with a further breakdown of area classes < 2,000 km2. Within each island type it is observed that the majority of Low Carbonate islands (88%) and Limestone islands (63%) are <1 km2 in area (Figure 2.7). In comparison, Volcanic and Composite islands tend to span a range of sizes, with 46% and 32%, respectively, having an area of less than 1 km2 (Figure 2.7). Furthermore, across the Pacific region, the vast majority (92%) of islands are <10 km2 in area.
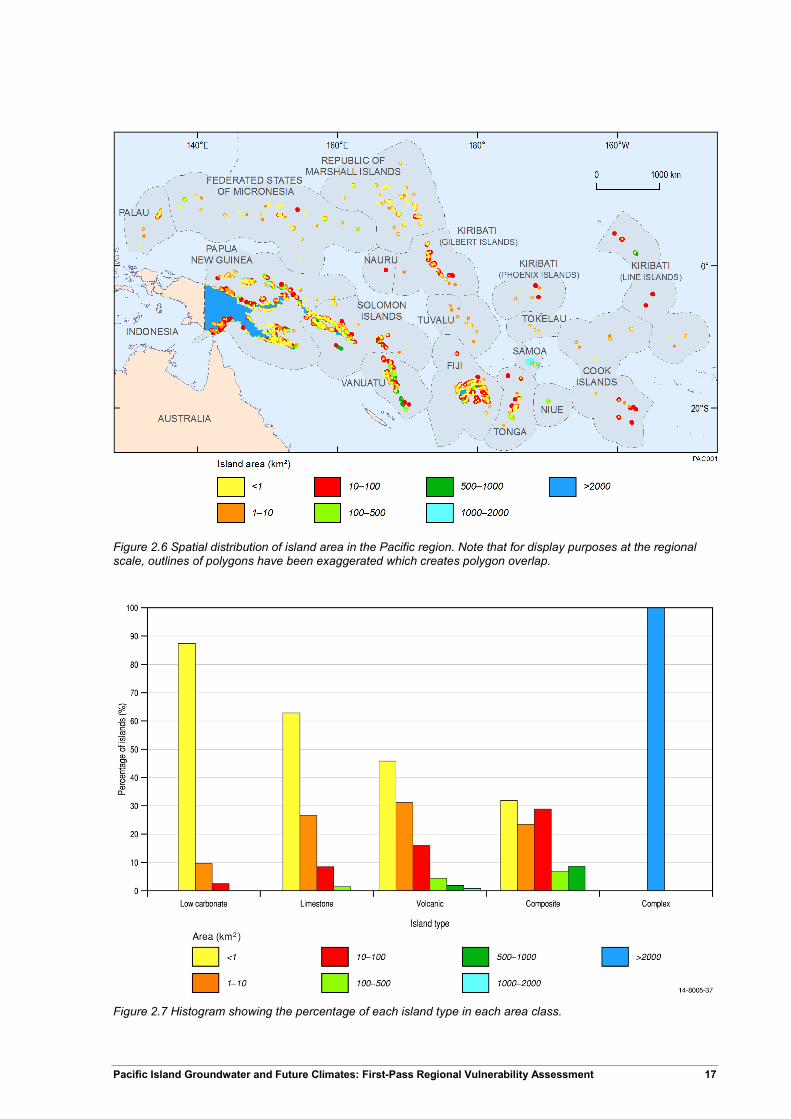
Pacific Island Groundwater and Future Climates: First-Pass Regional Vulnerability Assessment 17
Figure 2.6 Spatial distribution of island area in the Pacific region. Note that for display purposes at the regional scale, outlines of polygons have been exaggerated which creates polygon overlap.
Figure 2.7 Histogram showing the percentage of each island type in each area class.
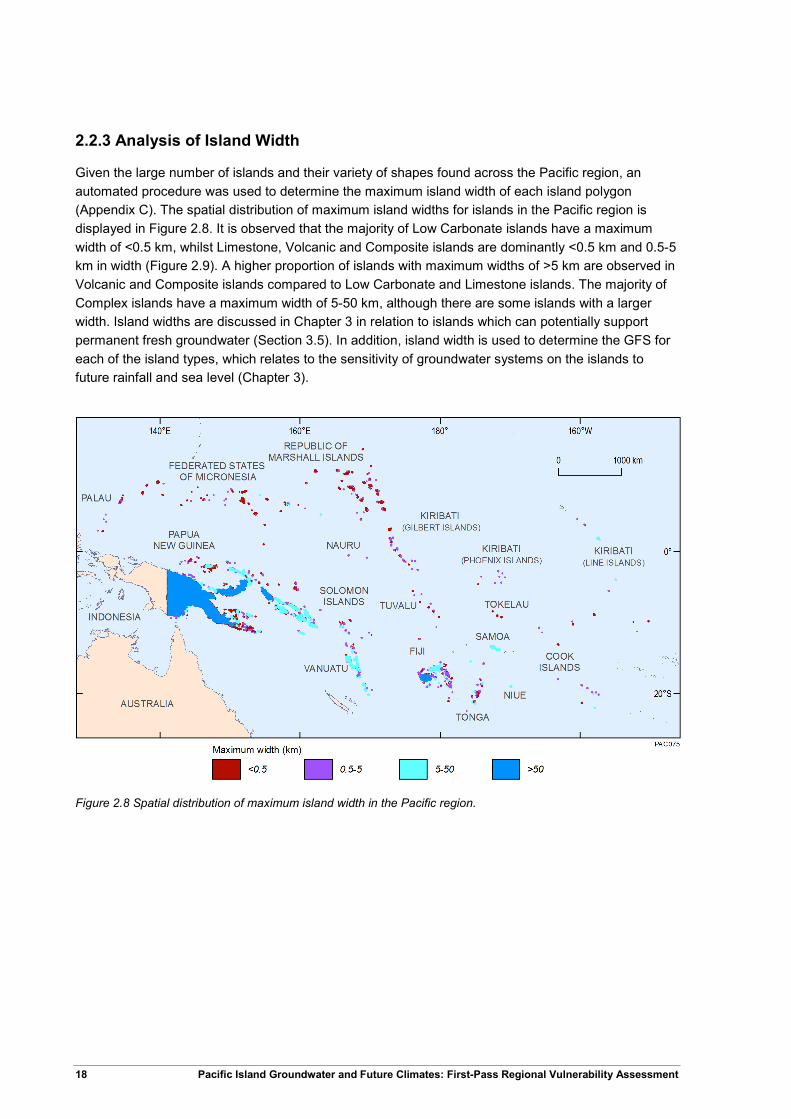
18 Pacific Island Groundwater and Future Climates: First-Pass Regional Vulnerability Assessment
2.2.3 Analysis of Island Width
Given the large number of islands and their variety of shapes found across the Pacific region, an automated procedure was used to determine the maximum island width of each island polygon (Appendix C). The spatial distribution of maximum island widths for islands in the Pacific region is displayed in Figure 2.8. It is observed that the majority of Low Carbonate islands have a maximum width of <0.5 km, whilst Limestone, Volcanic and Composite islands are dominantly <0.5 km and 0.5-5 km in width (Figure 2.9). A higher proportion of islands with maximum widths of >5 km are observed in Volcanic and Composite islands compared to Low Carbonate and Limestone islands. The majority of Complex islands have a maximum width of 5-50 km, although there are some islands with a larger width. Island widths are discussed in Chapter 3 in relation to islands which can potentially support permanent fresh groundwater (Section 3.5). In addition, island width is used to determine the GFS for each of the island types, which relates to the sensitivity of groundwater systems on the islands to future rainfall and sea level (Chapter 3).
Figure 2.8 Spatial distribution of maximum island width in the Pacific region.
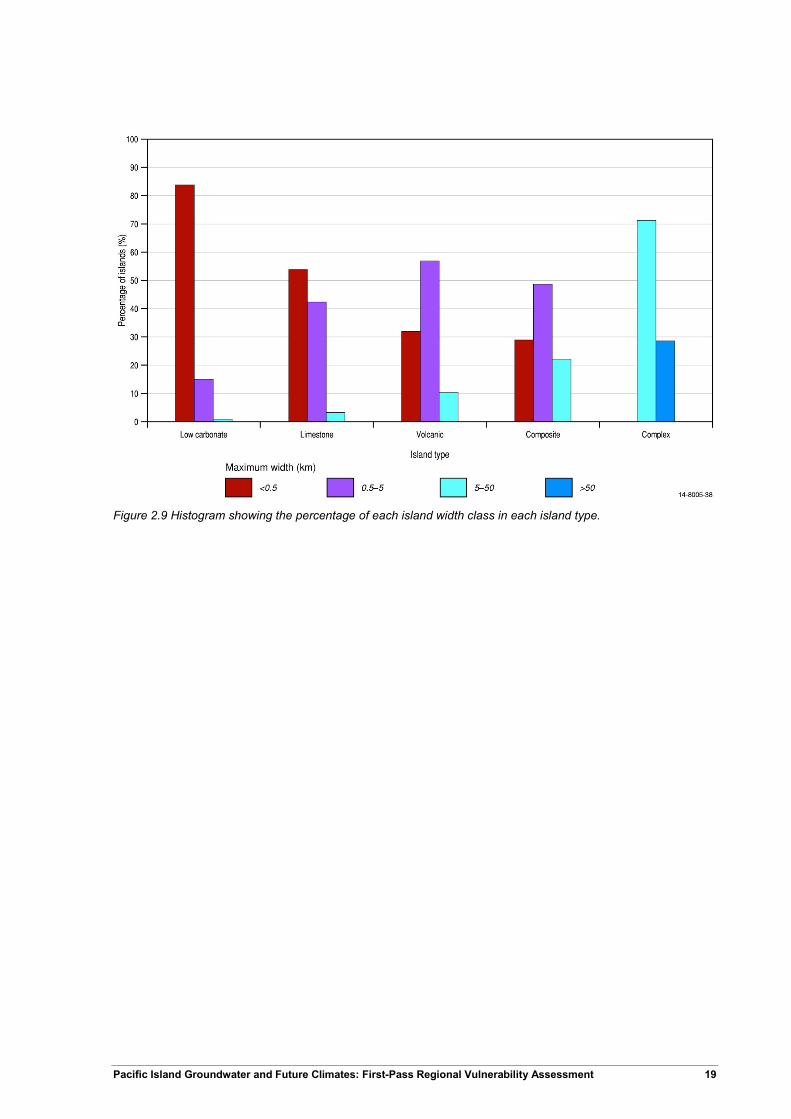
Pacific Island Groundwater and Future Climates: First-Pass Regional Vulnerability Assessment 19
Figure 2.9 Histogram showing the percentage of each island width class in each island type.
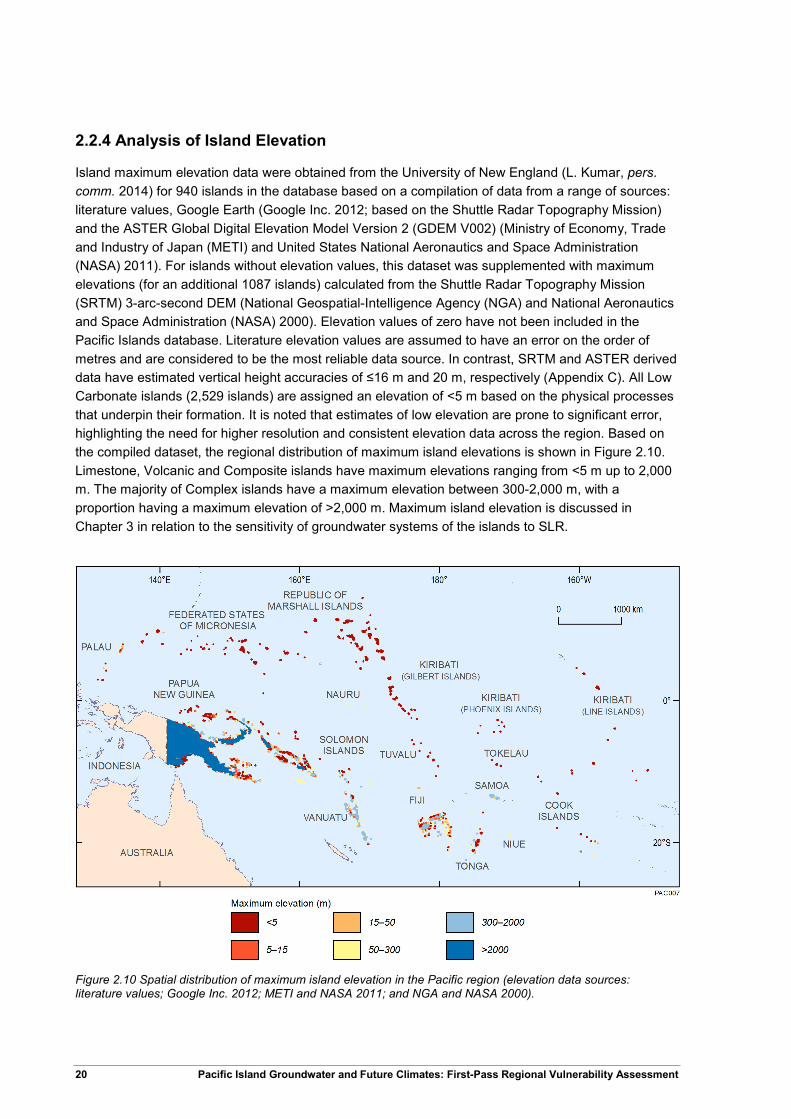
20 Pacific Island Groundwater and Future Climates: First-Pass Regional Vulnerability Assessment
2.2.4 Analysis of Island Elevation
Island maximum elevation data were obtained from the University of New England (L. Kumar, pers. comm. 2014) for 940 islands in the database based on a compilation of data from a range of sources: literature values, Google Earth (Google Inc. 2012; based on the Shuttle Radar Topography Mission) and the ASTER Global Digital Elevation Model Version 2 (GDEM V002) (Ministry of Economy, Trade and Industry of Japan (METI) and United States National Aeronautics and Space Administration (NASA) 2011). For islands without elevation values, this dataset was supplemented with maximum elevations (for an additional 1087 islands) calculated from the Shuttle Radar Topography Mission (SRTM) 3-arc-second DEM (National Geospatial-Intelligence Agency (NGA) and National Aeronautics and Space Administration (NASA) 2000). Elevation values of zero have not been included in the Pacific Islands database. Literature elevation values are assumed to have an error on the order of metres and are considered to be the most reliable data source. In contrast, SRTM and ASTER derived data have estimated vertical height accuracies of ≤16 m and 20 m, respectively (Appendix C). All Low Carbonate islands (2,529 islands) are assigned an elevation of <5 m based on the physical processes that underpin their formation. It is noted that estimates of low elevation are prone to significant error, highlighting the need for higher resolution and consistent elevation data across the region. Based on the compiled dataset, the regional distribution of maximum island elevations is shown in Figure 2.10. Limestone, Volcanic and Composite islands have maximum elevations ranging from <5 m up to 2,000 m. The majority of Complex islands have a maximum elevation between 300-2,000 m, with a proportion having a maximum elevation of >2,000 m. Maximum island elevation is discussed in Chapter 3 in relation to the sensitivity of groundwater systems of the islands to SLR.
Figure 2.10 Spatial distribution of maximum island elevation in the Pacific region (elevation data sources: literature values; Google Inc. 2012; METI and NASA 2011; and NGA and NASA 2000).
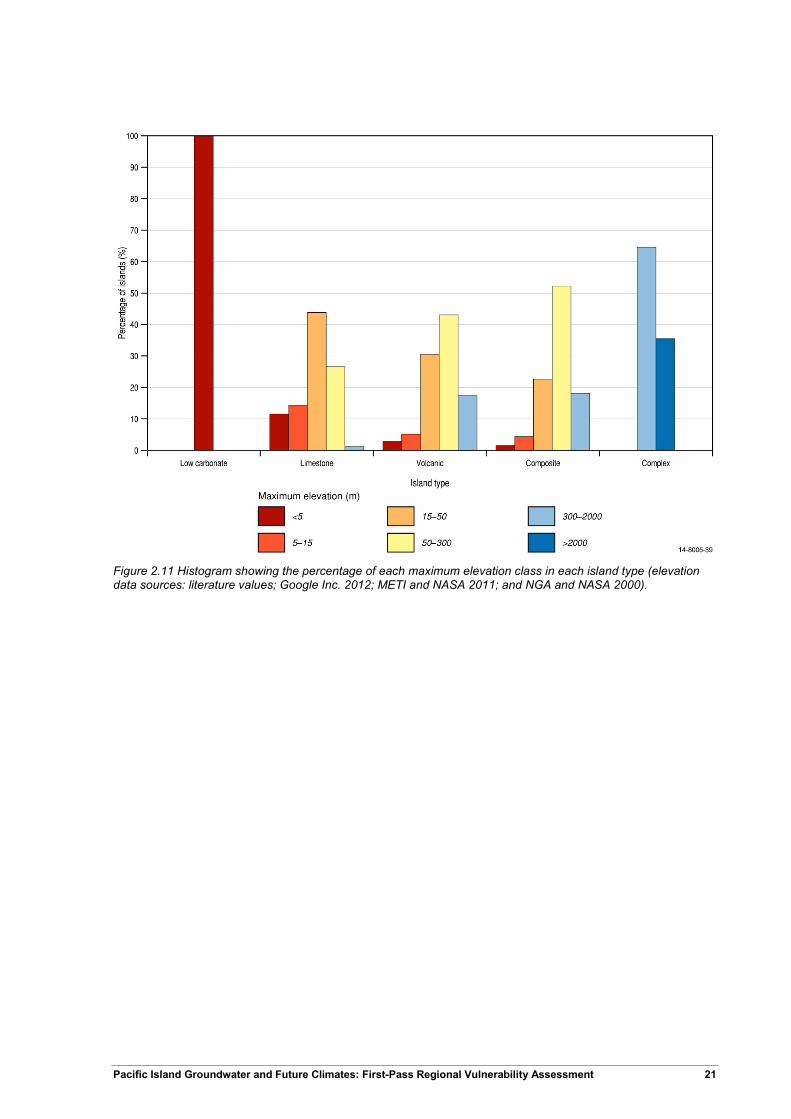
Pacific Island Groundwater and Future Climates: First-Pass Regional Vulnerability Assessment 21
Figure 2.11 Histogram showing the percentage of each maximum elevation class in each island type (elevation data sources: literature values; Google Inc. 2012; METI and NASA 2011; and NGA and NASA 2000).
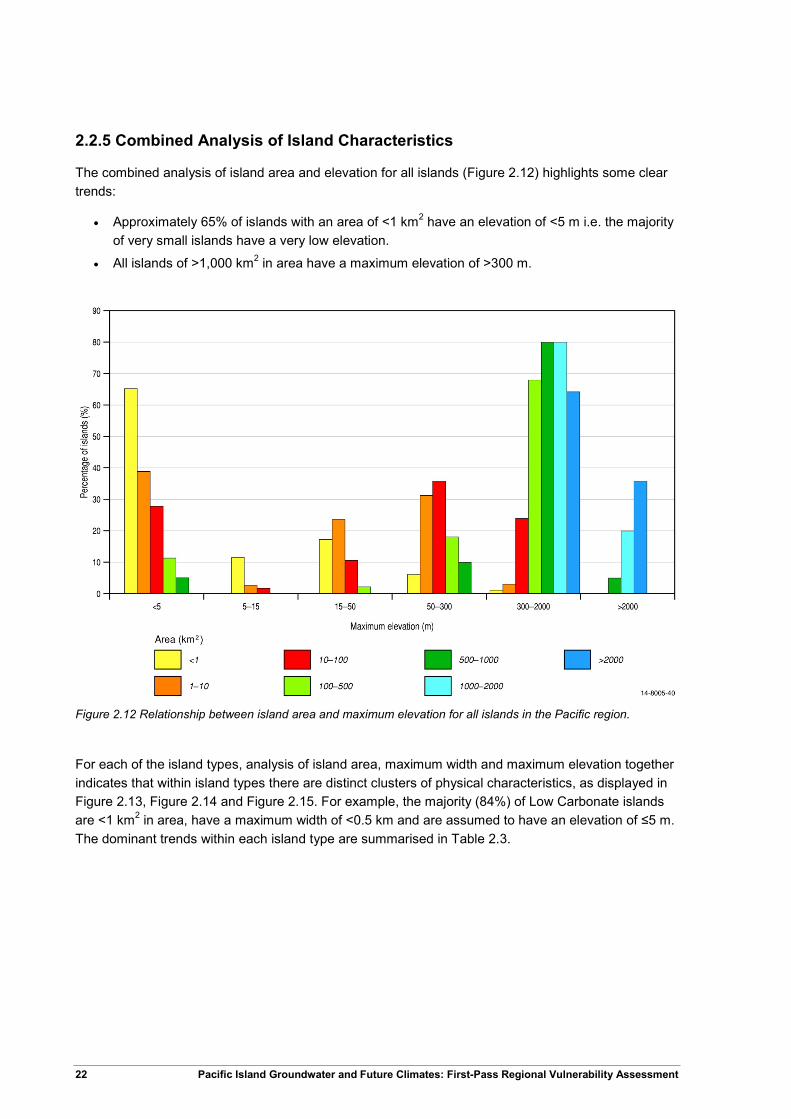
22 Pacific Island Groundwater and Future Climates: First-Pass Regional Vulnerability Assessment
2.2.5 Combined Analysis of Island Characteristics
The combined analysis of island area and elevation for all islands (Figure 2.12) highlights some clear trends:
• Approximately 65% of islands with an area of <1 km2 have an elevation of <5 m i.e. the majority of very small islands have a very low elevation.
• All islands of >1,000 km2 in area have a maximum elevation of >300 m.
Figure 2.12 Relationship between island area and maximum elevation for all islands in the Pacific region.
For each of the island types, analysis of island area, maximum width and maximum elevation together indicates that within island types there are distinct clusters of physical characteristics, as displayed in Figure 2.13, Figure 2.14 and Figure 2.15. For example, the majority (84%) of Low Carbonate islands are <1 km2 in area, have a maximum width of <0.5 km and are assumed to have an elevation of ≤5 m. The dominant trends within each island type are summarised in Table 2.3.
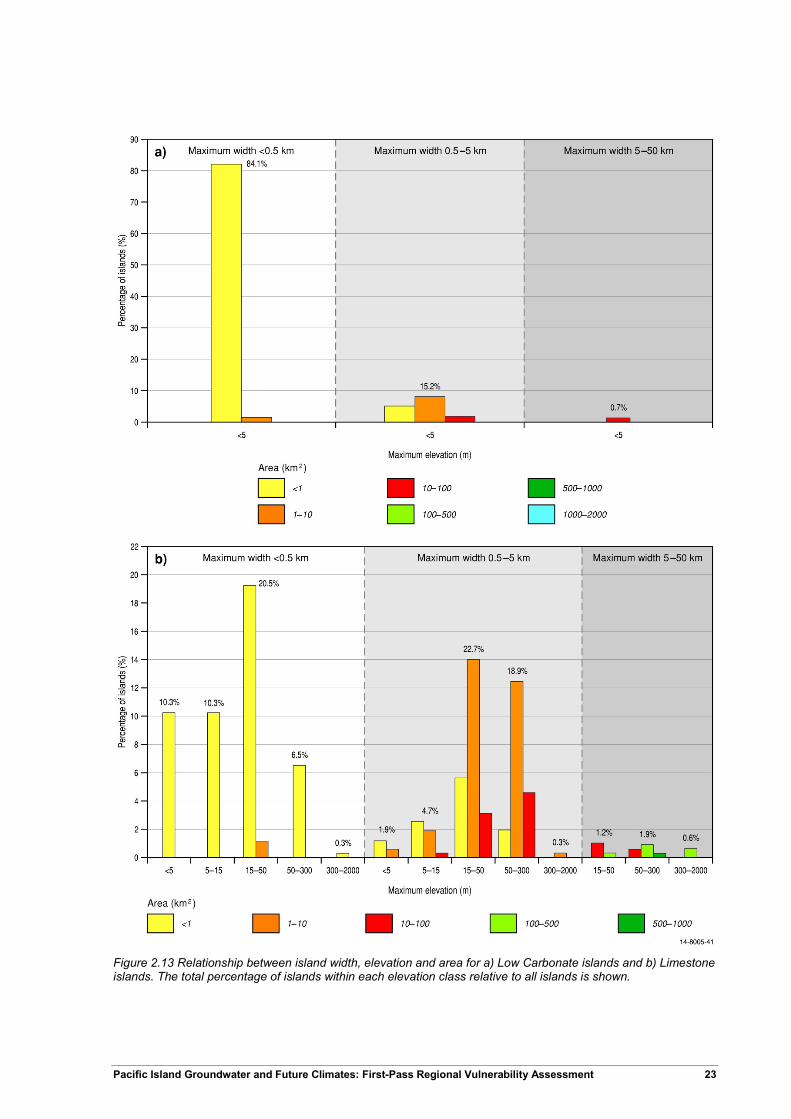
Pacific Island Groundwater and Future Climates: First-Pass Regional Vulnerability Assessment 23
Figure 2.13 Relationship between island width, elevation and area for a) Low Carbonate islands and b) Limestone islands. The total percentage of islands within each elevation class relative to all islands is shown.
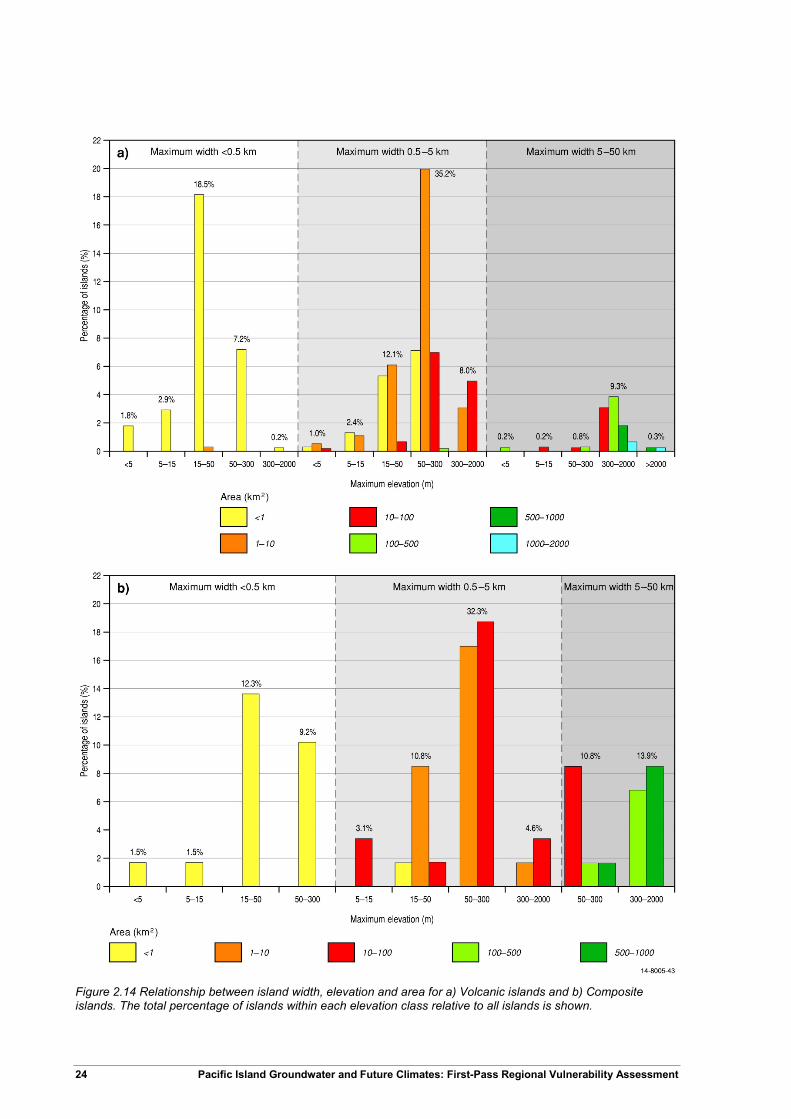
24 Pacific Island Groundwater and Future Climates: First-Pass Regional Vulnerability Assessment
Figure 2.14 Relationship between island width, elevation and area for a) Volcanic islands and b) Composite islands. The total percentage of islands within each elevation class relative to all islands is shown.
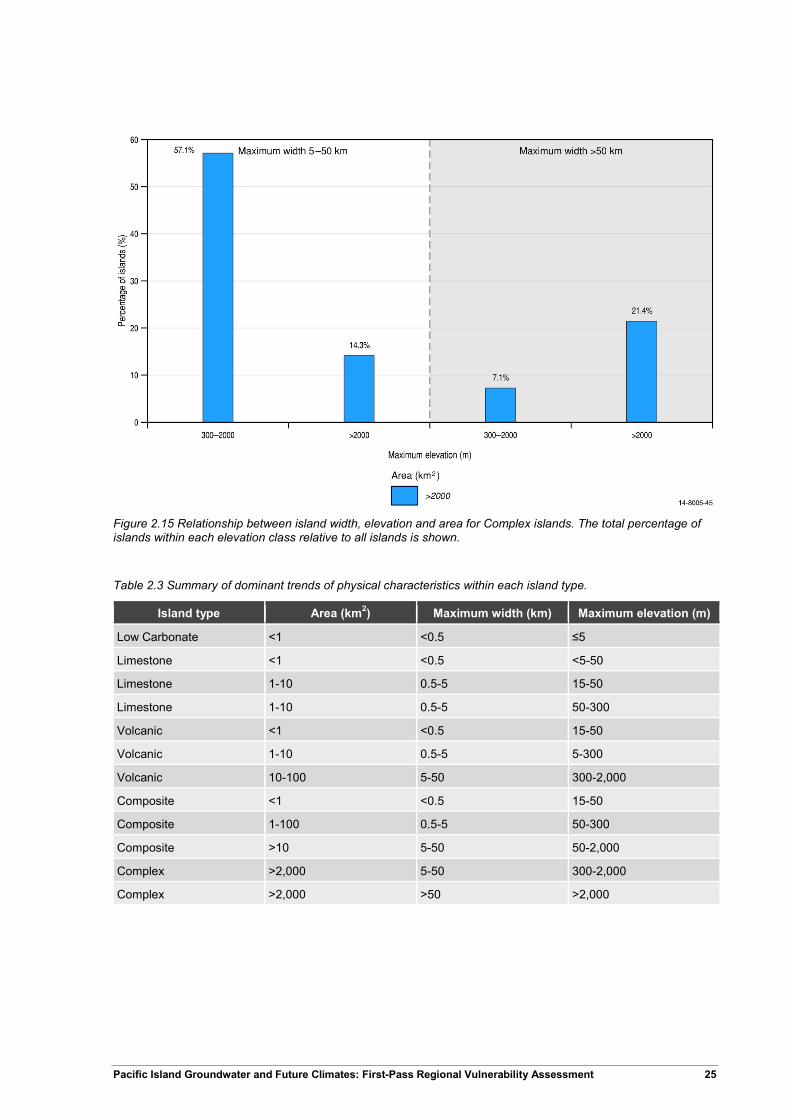
Pacific Island Groundwater and Future Climates: First-Pass Regional Vulnerability Assessment 25
Figure 2.15 Relationship between island width, elevation and area for Complex islands. The total percentage of islands within each elevation class relative to all islands is shown.
Table 2.3 Summary of dominant trends of physical characteristics within each island type.
Island type Area (km2) Maximum width (km) Maximum elevation (m)
Low Carbonate <1 <0.5 ≤5
Limestone <1 <0.5 <5-50
Limestone 1-10 0.5-5 15-50
Limestone 1-10 0.5-5 50-300
Volcanic <1 <0.5 15-50
Volcanic 1-10 0.5-5 5-300
Volcanic 10-100 5-50 300-2,000
Composite <1 <0.5 15-50
Composite 1-100 0.5-5 50-300
Composite >10 5-50 50-2,000
Complex >2,000 5-50 300-2,000
Complex >2,000 >50 >2,000
26 Pacific Island Groundwater and Future Climates: First-Pass Regional Vulnerability Assessment
2.3 Chapter Summary A hydrogeologically-based typology has been developed for the purpose of classifying islands in the Pacific region. The typology identifies five types of islands each with similar groundwater systems: Low Carbonate, Limestone, Volcanic, Composite and Complex. These types can be used for the purpose of assessing groundwater vulnerability to impacts such as those associated with climate-related hazards. Groundwater systems of small islands (area <2,000 km2) are defined by: geological island type, composition and lithology, aquifer setting, aquifer potential productivity, international hydrogeological classification and GFS. Small islands in the Pacific region have not previously been classified from a hydrogeological perspective. The hydrogeological classification of Pacific Islands relates the commonly used geomorphic island type classification to the international hydrogeological mapping standard. This allows for a cross-disciplinary approach to the study of physical processes on Pacific Islands and provides a framework for making inferences from those islands with detailed groundwater information to similar islands where detailed groundwater information is not available.
The Pacific Islands database developed for this project provides important baseline data for the region of interest. There are over 5,600 individual islands in the database with varying amounts of data depending on availability. The database includes the attributes of country, island name, island type, area, perimeter, maximum elevation, maximum width, principal aquifer, GFS, potential for fresh groundwater and/or surface water, and population density. The database also includes the relative ratings of islands for each component of the overarching vulnerability framework in the 2050 and 2085 periods.
The majority of islands in the Pacific region are Low Carbonate types (2,529, 45%). As these are small islands, the percentage area is less than 1% relative to all islands. Complex islands occupy the greatest percentage area (93%), followed by Volcanic (5%), Composite (1%), Limestone (<1%) and Low Carbonate (0.1%) islands.
Analysis of key physical characteristics of the island types highlights that there are important subgroups within the island types which are assumed to have similar sensitivities to changes in rainfall and SLR, as reflected in the sensitivity method in the following chapter.
The best available and regionally consistent datasets have been analysed in this project. Limitations in data resolution have resulted in uncertainty in island information. For example, in some areas fundamental data such as elevation information and geology of the islands is unknown. There is scope to improve the coverage of information and therefore the Pacific Islands database.
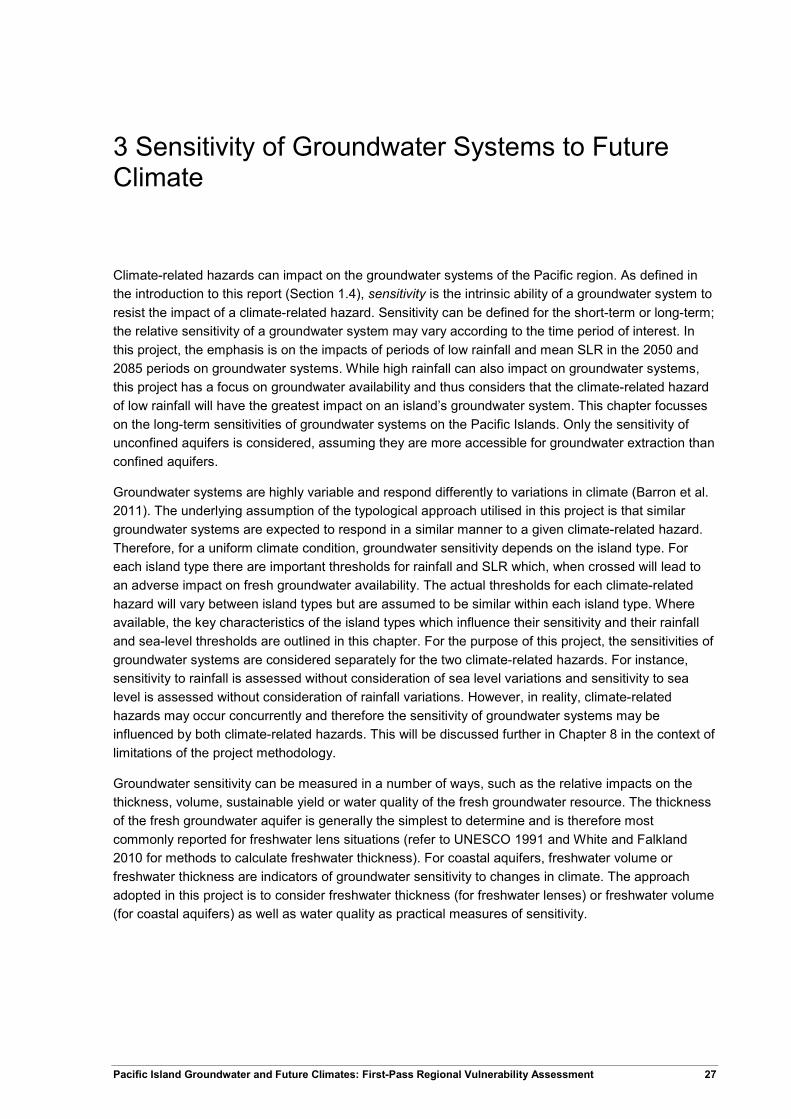
Pacific Island Groundwater and Future Climates: First-Pass Regional Vulnerability Assessment 27
3 Sensitivity of Groundwater Systems to Future Climate
Climate-related hazards can impact on the groundwater systems of the Pacific region. As defined in the introduction to this report (Section 1.4), sensitivity is the intrinsic ability of a groundwater system to resist the impact of a climate-related hazard. Sensitivity can be defined for the short-term or long-term; the relative sensitivity of a groundwater system may vary according to the time period of interest. In this project, the emphasis is on the impacts of periods of low rainfall and mean SLR in the 2050 and 2085 periods on groundwater systems. While high rainfall can also impact on groundwater systems, this project has a focus on groundwater availability and thus considers that the climate-related hazard of low rainfall will have the greatest impact on an island’s groundwater system. This chapter focusses on the long-term sensitivities of groundwater systems on the Pacific Islands. Only the sensitivity of unconfined aquifers is considered, assuming they are more accessible for groundwater extraction than confined aquifers.
Groundwater systems are highly variable and respond differently to variations in climate (Barron et al. 2011). The underlying assumption of the typological approach utilised in this project is that similar groundwater systems are expected to respond in a similar manner to a given climate-related hazard. Therefore, for a uniform climate condition, groundwater sensitivity depends on the island type. For each island type there are important thresholds for rainfall and SLR which, when crossed will lead to an adverse impact on fresh groundwater availability. The actual thresholds for each climate-related hazard will vary between island types but are assumed to be similar within each island type. Where available, the key characteristics of the island types which influence their sensitivity and their rainfall and sea-level thresholds are outlined in this chapter. For the purpose of this project, the sensitivities of groundwater systems are considered separately for the two climate-related hazards. For instance, sensitivity to rainfall is assessed without consideration of sea level variations and sensitivity to sea level is assessed without consideration of rainfall variations. However, in reality, climate-related hazards may occur concurrently and therefore the sensitivity of groundwater systems may be influenced by both climate-related hazards. This will be discussed further in Chapter 8 in the context of limitations of the project methodology.
Groundwater sensitivity can be measured in a number of ways, such as the relative impacts on the thickness, volume, sustainable yield or water quality of the fresh groundwater resource. The thickness of the fresh groundwater aquifer is generally the simplest to determine and is therefore most commonly reported for freshwater lens situations (refer to UNESCO 1991 and White and Falkland 2010 for methods to calculate freshwater thickness). For coastal aquifers, freshwater volume or freshwater thickness are indicators of groundwater sensitivity to changes in climate. The approach adopted in this project is to consider freshwater thickness (for freshwater lenses) or freshwater volume (for coastal aquifers) as well as water quality as practical measures of sensitivity.
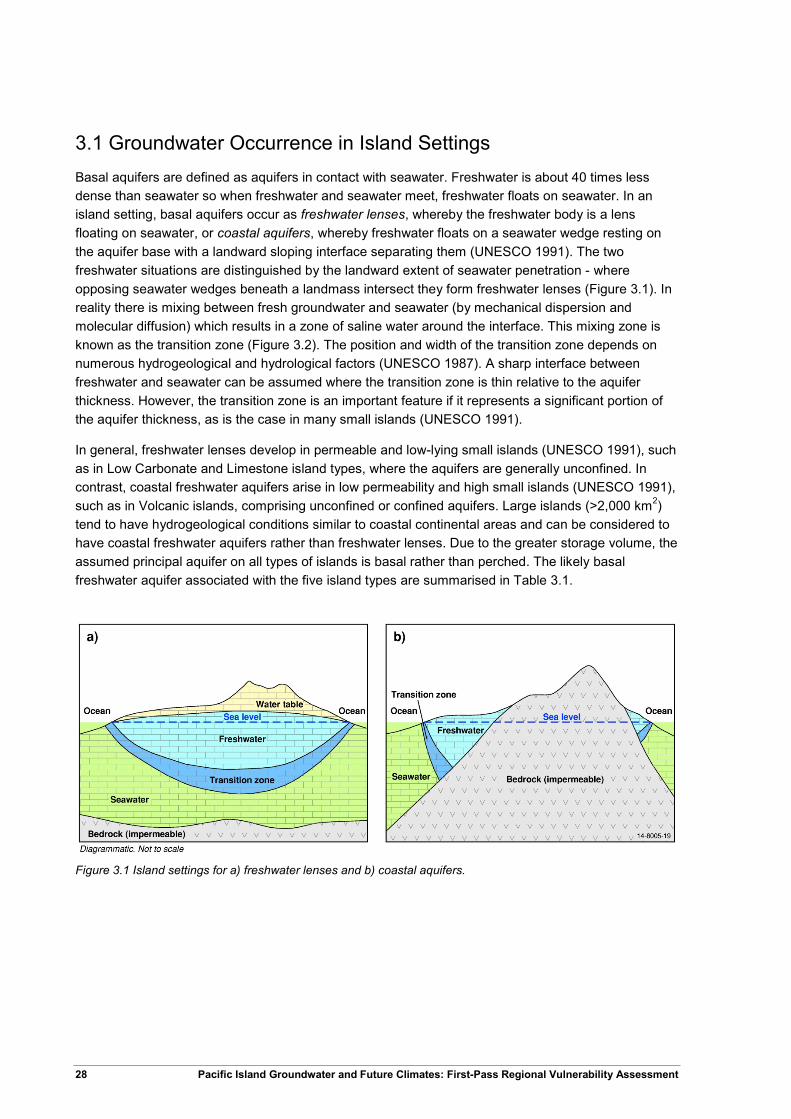
28 Pacific Island Groundwater and Future Climates: First-Pass Regional Vulnerability Assessment
3.1 Groundwater Occurrence in Island Settings Basal aquifers are defined as aquifers in contact with seawater. Freshwater is about 40 times less dense than seawater so when freshwater and seawater meet, freshwater floats on seawater. In an island setting, basal aquifers occur as freshwater lenses, whereby the freshwater body is a lens floating on seawater, or coastal aquifers, whereby freshwater floats on a seawater wedge resting on the aquifer base with a landward sloping interface separating them (UNESCO 1991). The two freshwater situations are distinguished by the landward extent of seawater penetration - where opposing seawater wedges beneath a landmass intersect they form freshwater lenses (Figure 3.1). In reality there is mixing between fresh groundwater and seawater (by mechanical dispersion and molecular diffusion) which results in a zone of saline water around the interface. This mixing zone is known as the transition zone (Figure 3.2). The position and width of the transition zone depends on numerous hydrogeological and hydrological factors (UNESCO 1987). A sharp interface between freshwater and seawater can be assumed where the transition zone is thin relative to the aquifer thickness. However, the transition zone is an important feature if it represents a significant portion of the aquifer thickness, as is the case in many small islands (UNESCO 1991).
In general, freshwater lenses develop in permeable and low-lying small islands (UNESCO 1991), such as in Low Carbonate and Limestone island types, where the aquifers are generally unconfined. In contrast, coastal freshwater aquifers arise in low permeability and high small islands (UNESCO 1991), such as in Volcanic islands, comprising unconfined or confined aquifers. Large islands (>2,000 km2) tend to have hydrogeological conditions similar to coastal continental areas and can be considered to have coastal freshwater aquifers rather than freshwater lenses. Due to the greater storage volume, the assumed principal aquifer on all types of islands is basal rather than perched. The likely basal freshwater aquifer associated with the five island types are summarised in Table 3.1.
Figure 3.1 Island settings for a) freshwater lenses and b) coastal aquifers.
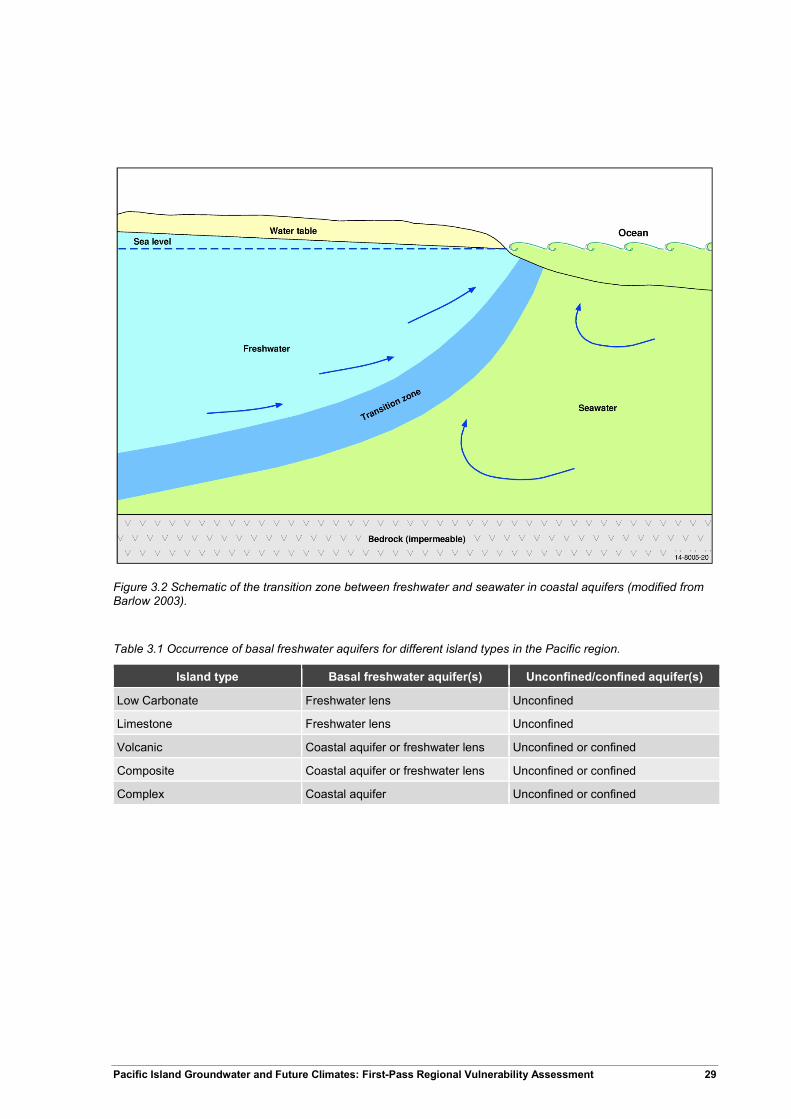
Pacific Island Groundwater and Future Climates: First-Pass Regional Vulnerability Assessment 29
Figure 3.2 Schematic of the transition zone between freshwater and seawater in coastal aquifers (modified from Barlow 2003).
Table 3.1 Occurrence of basal freshwater aquifers for different island types in the Pacific region.
Island type Basal freshwater aquifer(s) Unconfined/confined aquifer(s)
Low Carbonate Freshwater lens Unconfined
Limestone Freshwater lens Unconfined
Volcanic Coastal aquifer or freshwater lens Unconfined or confined
Composite Coastal aquifer or freshwater lens Unconfined or confined
Complex Coastal aquifer Unconfined or confined
30 Pacific Island Groundwater and Future Climates: First-Pass Regional Vulnerability Assessment
3.2 Groundwater Flow Systems The concept of a groundwater flow system (GFS) enables comparison of island types based on a range of hydrogeological and physical characteristics. The GFS of an aquifer describes the movement of water from areas of groundwater recharge to areas of discharge. Based on a combination of factors such as the scale, circulation depth, rate, storage capacity, quantity and residence time of groundwater, there are local, intermediate and regional groundwater flow systems (Toth 1963). The rate of groundwater flow depends on the hydraulic conductivity and hydraulic gradient; the greater is the hydraulic conductivity or hydraulic gradient, the more rapidly groundwater flows. In addition, groundwater movement slows down as the circulation depth increases. Compared to an intermediate and regional GFS, groundwater levels and flow in a local GFS are the most affected by variations in recharge due to the relatively large recharge and discharge areas (Toth 1963).
The concept of a GFS has many applications (e.g. Coram 1998) and can be used to inform the relative sensitivities of the principal aquifer on both small and large islands to changes in rainfall based on their relative response to changes in recharge. The following generalisations can be made (Coram 1998, Coram et al. 2000):
• Local flow systems tend to have shallow circulation depths and have recharge and discharge areas close together (1-3 km separation). They respond rapidly to increased/decreased groundwater recharge.
• Intermediate flow systems are intermediate in scale between local and regional systems (5-10 km separation of recharge and discharge areas). They have a greater storage capacity and permeability than local systems and take longer to respond to increased/decreased recharge. Intermediate flow systems may be overlain by local flow systems.
• Regional flow systems have deep circulation depths and recharge and discharge areas separated by considerable distances (>50 km). They have a higher storage capacity and high permeability and take a much longer time to develop groundwater discharge than local or intermediate flow systems (long residence times). These systems are minimally affected by seasonal variations in groundwater recharge. Regional flow systems are likely to be overlain by local and intermediate flow systems.
In summary, the typical horizontal scale of a local, intermediate and regional GFS is 1-3 km, 5-10 km and >50 km, respectively (Coram 1998). For the purposes of this study, an additional GFS, ‘very small’ is defined for Low Carbonate islands with a maximum width of ≤0.5 km (Figure 2.9). It is assumed that a local GFS has a horizontal scale (maximum island width) of up to 5 km (0.5-5 km for Low Carbonate islands) and an intermediate GFS has a horizontal scale of 5-50 km.
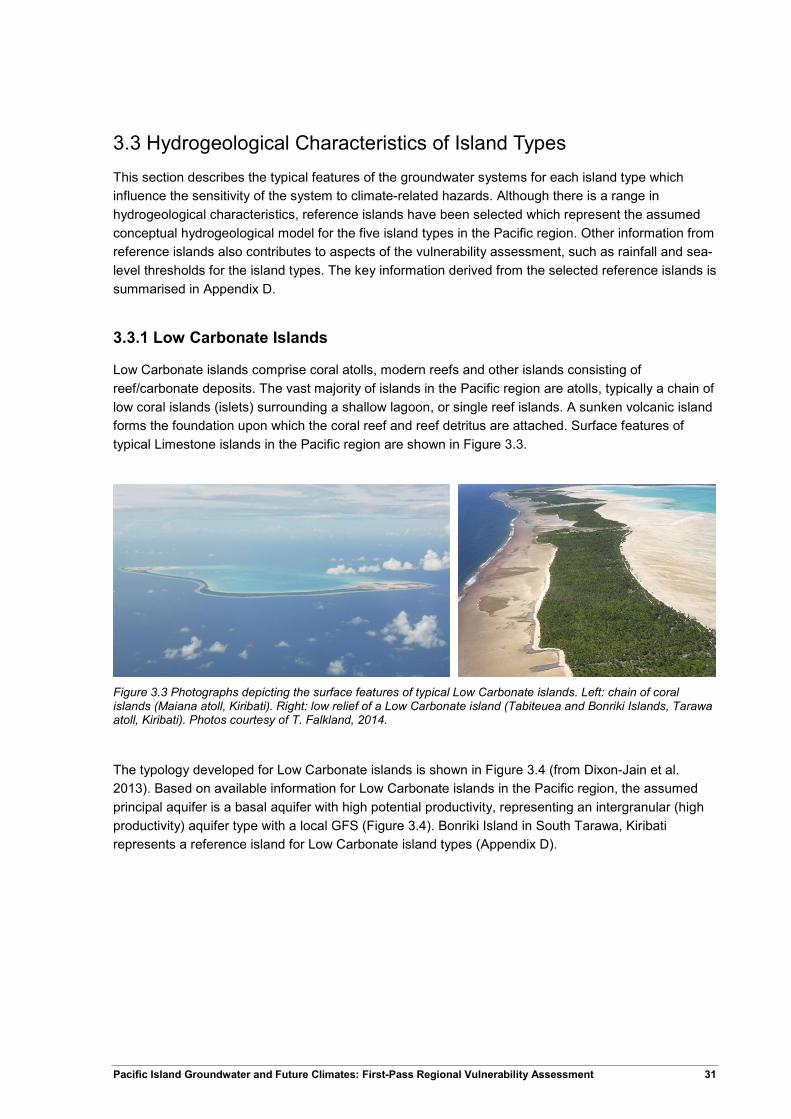
Pacific Island Groundwater and Future Climates: First-Pass Regional Vulnerability Assessment 31
3.3 Hydrogeological Characteristics of Island Types This section describes the typical features of the groundwater systems for each island type which influence the sensitivity of the system to climate-related hazards. Although there is a range in hydrogeological characteristics, reference islands have been selected which represent the assumed conceptual hydrogeological model for the five island types in the Pacific region. Other information from reference islands also contributes to aspects of the vulnerability assessment, such as rainfall and sea-level thresholds for the island types. The key information derived from the selected reference islands is summarised in Appendix D.
3.3.1 Low Carbonate Islands
Low Carbonate islands comprise coral atolls, modern reefs and other islands consisting of reef/carbonate deposits. The vast majority of islands in the Pacific region are atolls, typically a chain of low coral islands (islets) surrounding a shallow lagoon, or single reef islands. A sunken volcanic island forms the foundation upon which the coral reef and reef detritus are attached. Surface features of typical Limestone islands in the Pacific region are shown in Figure 3.3.
Figure 3.3 Photographs depicting the surface features of typical Low Carbonate islands. Left: chain of coral islands (Maiana atoll, Kiribati). Right: low relief of a Low Carbonate island (Tabiteuea and Bonriki Islands, Tarawa atoll, Kiribati). Photos courtesy of T. Falkland, 2014.
The typology developed for Low Carbonate islands is shown in Figure 3.4 (from Dixon-Jain et al. 2013). Based on available information for Low Carbonate islands in the Pacific region, the assumed principal aquifer is a basal aquifer with high potential productivity, representing an intergranular (high productivity) aquifer type with a local GFS (Figure 3.4). Bonriki Island in South Tarawa, Kiribati represents a reference island for Low Carbonate island types (Appendix D).
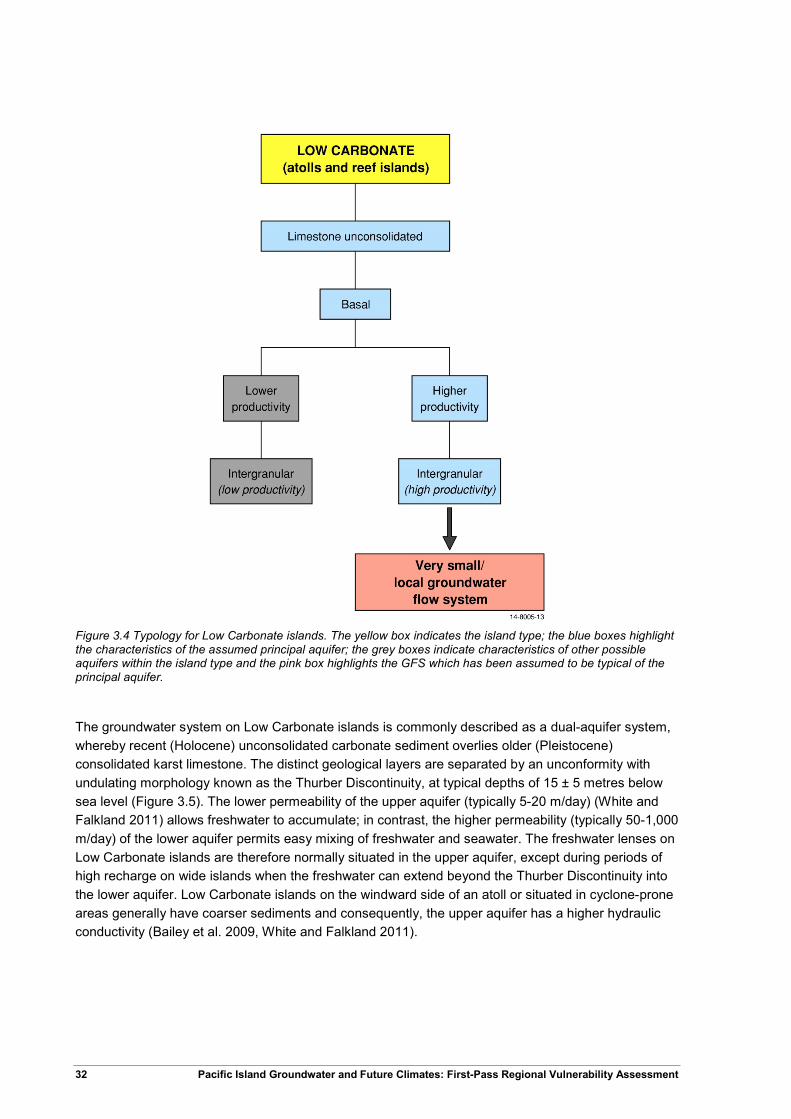
32 Pacific Island Groundwater and Future Climates: First-Pass Regional Vulnerability Assessment
Figure 3.4 Typology for Low Carbonate islands. The yellow box indicates the island type; the blue boxes highlight the characteristics of the assumed principal aquifer; the grey boxes indicate characteristics of other possible aquifers within the island type and the pink box highlights the GFS which has been assumed to be typical of the principal aquifer.
The groundwater system on Low Carbonate islands is commonly described as a dual-aquifer system, whereby recent (Holocene) unconsolidated carbonate sediment overlies older (Pleistocene) consolidated karst limestone. The distinct geological layers are separated by an unconformity with undulating morphology known as the Thurber Discontinuity, at typical depths of 15 ± 5 metres below sea level (Figure 3.5). The lower permeability of the upper aquifer (typically 5-20 m/day) (White and Falkland 2011) allows freshwater to accumulate; in contrast, the higher permeability (typically 50-1,000 m/day) of the lower aquifer permits easy mixing of freshwater and seawater. The freshwater lenses on Low Carbonate islands are therefore normally situated in the upper aquifer, except during periods of high recharge on wide islands when the freshwater can extend beyond the Thurber Discontinuity into the lower aquifer. Low Carbonate islands on the windward side of an atoll or situated in cyclone-prone areas generally have coarser sediments and consequently, the upper aquifer has a higher hydraulic conductivity (Bailey et al. 2009, White and Falkland 2011).
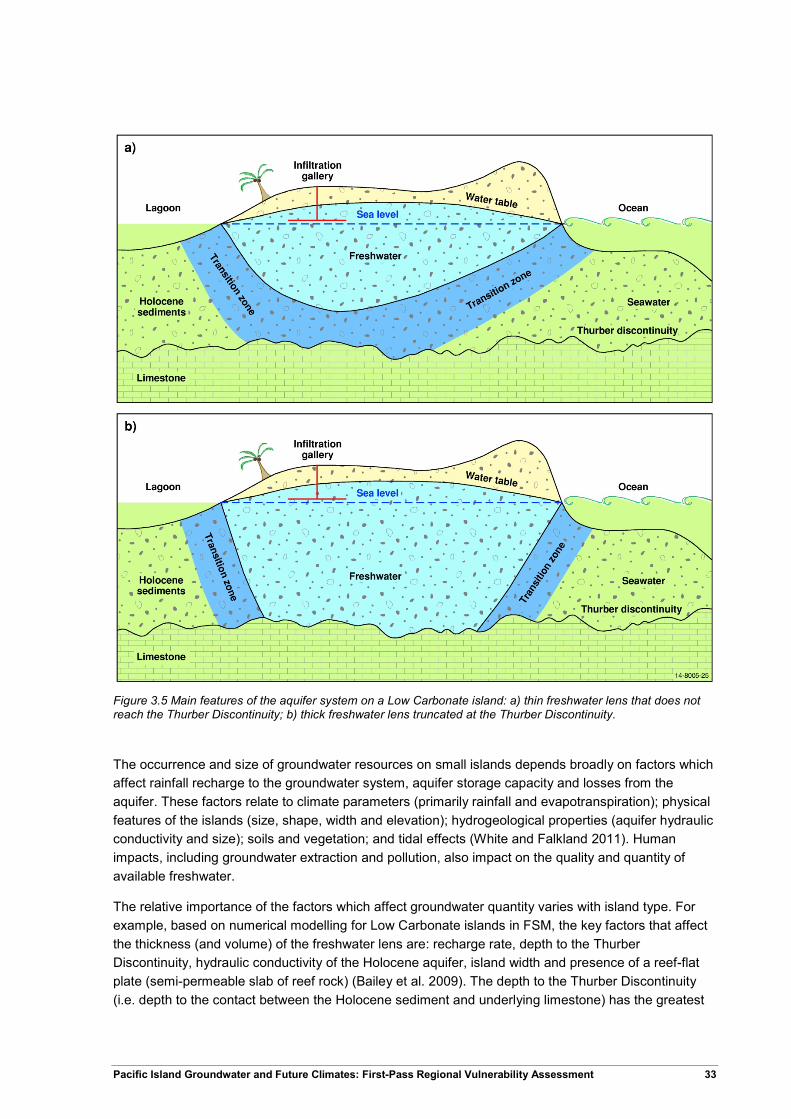
Pacific Island Groundwater and Future Climates: First-Pass Regional Vulnerability Assessment 33
Figure 3.5 Main features of the aquifer system on a Low Carbonate island: a) thin freshwater lens that does not reach the Thurber Discontinuity; b) thick freshwater lens truncated at the Thurber Discontinuity.
The occurrence and size of groundwater resources on small islands depends broadly on factors which affect rainfall recharge to the groundwater system, aquifer storage capacity and losses from the aquifer. These factors relate to climate parameters (primarily rainfall and evapotranspiration); physical features of the islands (size, shape, width and elevation); hydrogeological properties (aquifer hydraulic conductivity and size); soils and vegetation; and tidal effects (White and Falkland 2011). Human impacts, including groundwater extraction and pollution, also impact on the quality and quantity of available freshwater.
The relative importance of the factors which affect groundwater quantity varies with island type. For example, based on numerical modelling for Low Carbonate islands in FSM, the key factors that affect the thickness (and volume) of the freshwater lens are: recharge rate, depth to the Thurber Discontinuity, hydraulic conductivity of the Holocene aquifer, island width and presence of a reef-flat plate (semi-permeable slab of reef rock) (Bailey et al. 2009). The depth to the Thurber Discontinuity (i.e. depth to the contact between the Holocene sediment and underlying limestone) has the greatest
34 Pacific Island Groundwater and Future Climates: First-Pass Regional Vulnerability Assessment
influence on lens thickness, followed by the hydraulic conductivity, island width and recharge rate. In all but the deepest of freshwater lenses, where the Thurber Discontinuity is below the maximum depth of the freshwater lens, the hydraulic conductivity has the greatest influence on lens thickness.
Although the depth to the Thurber Discontinuity is an important sensitivity factor for freshwater lens size in Low Carbonate islands, there is little regional variation, ranging from 15 ± 5 m. Similarly, the hydraulic conductivity is generally fairly consistent regionally (T. Falkland and I. White, pers. comm. 2013). However, the width of Low Carbonate islands can vary significantly such that permanent freshwater lenses only occur on islands (or parts of) where the width is at least 250-300 m, i.e. as island width increases, the potential for thicker freshwater lenses increases (Falkland 2003b). For large lenses the freshwater lens is about 10-20 m thick, with a transition zone of a similar thickness. By comparison, in smaller lenses of less than 5 m in thickness, the transition zone is often thicker than the freshwater zone (Falkland 2003b). These relationships between freshwater and transition zone thickness are important for determining the practical thickness of useable freshwater, particularly in response to changes in rainfall (and hence recharge) such as during a drought. In the absence of information on aquifer thickness of all Low Carbonate islands across the Pacific region, the potential for permanent fresh groundwater can be assessed by considering the maximum width of Low Carbonate islands (Appendix C.3.3). As a conservative measure, Low Carbonate islands with a maximum width measurement of ≤250 m are assumed to be too small to support a permanent freshwater lens. Based on the maximum width measurement alone, approximately 40% of the identified Low Carbonate islands in the Pacific region have potential to support a viable fresh groundwater.
3.3.1.1 Potential effect of reduction in rainfall or sea-level rise
The most likely effect of a reduction in rainfall (and hence recharge) on the freshwater lens of a Low Carbonate island is a reduction in thickness and volume of the freshwater lens (Figure 3.6b). The potential effect of an increase in rainfall on the freshwater lens is depicted in Appendix E.
In Low Carbonate islands, the freshwater lens essentially ‘floats’ on underlying seawater and will move up or down as sea level moves up and down. Therefore, for Low Carbonate islands with a thin freshwater lens (Figure 3.5a), an increase in relative sea level would potentially lead to no change in the freshwater lens thickness or volume provided that the water table is able to rise (Figure 3.6c). Furthermore, for Low Carbonate islands with a thick freshwater lens that is truncated at the Thurber Discontinuity (Figure 3.5b), a rise in relative sea level can lead to a small increase in thickness and volume of the freshwater zone due to more of the freshwater lens sitting within the upper, lower-permeability aquifer (White and Falkland 2011). However, if relative sea level increased to an elevation where it approached the surface of the Low Carbonate island there would be a point where the freshwater lens could no longer rise. In this scenario, the amount of freshwater that could accumulate would be limited, resulting in a reduction in fresh groundwater volume due to seawater intrusion (SWI). It is noted that if coral growth and consequent sediments keep pace with SLR, there may be no impact on the volume of freshwater in the lens. Alternatively, erosion of island edges, leading to a decrease in island area, may reduce the volume of the freshwater lens under SLR.
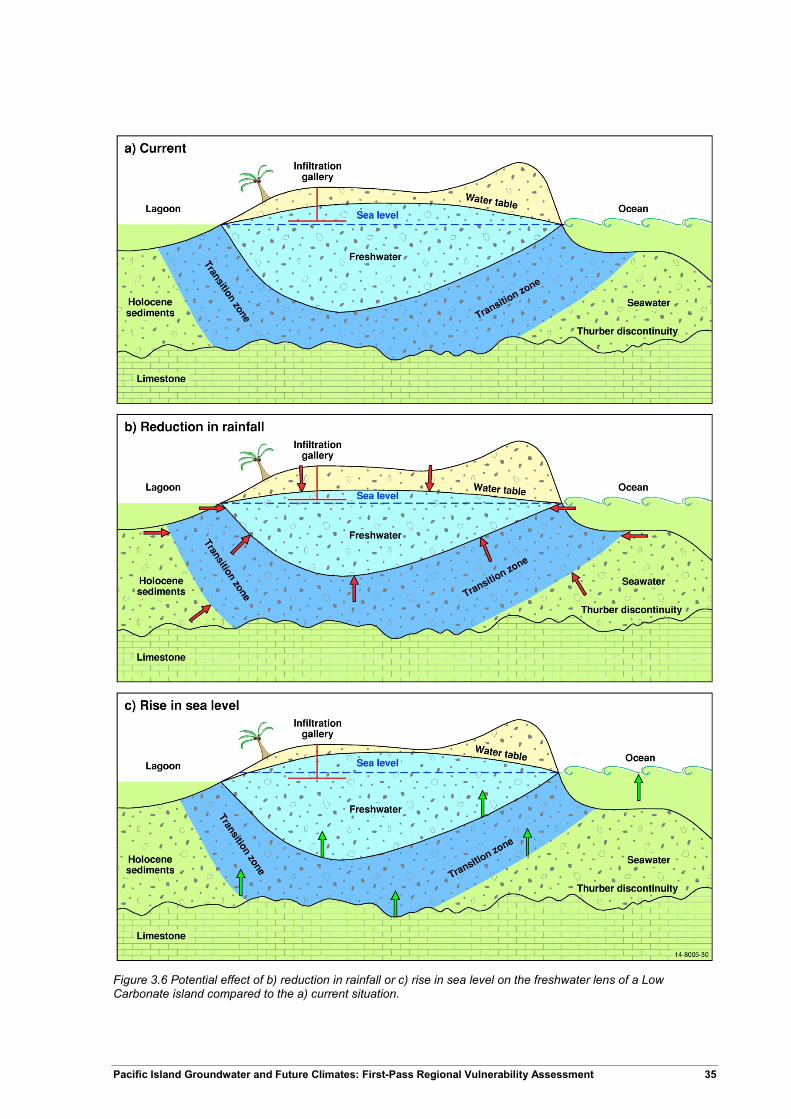
Pacific Island Groundwater and Future Climates: First-Pass Regional Vulnerability Assessment 35
Figure 3.6 Potential effect of b) reduction in rainfall or c) rise in sea level on the freshwater lens of a Low Carbonate island compared to the a) current situation.
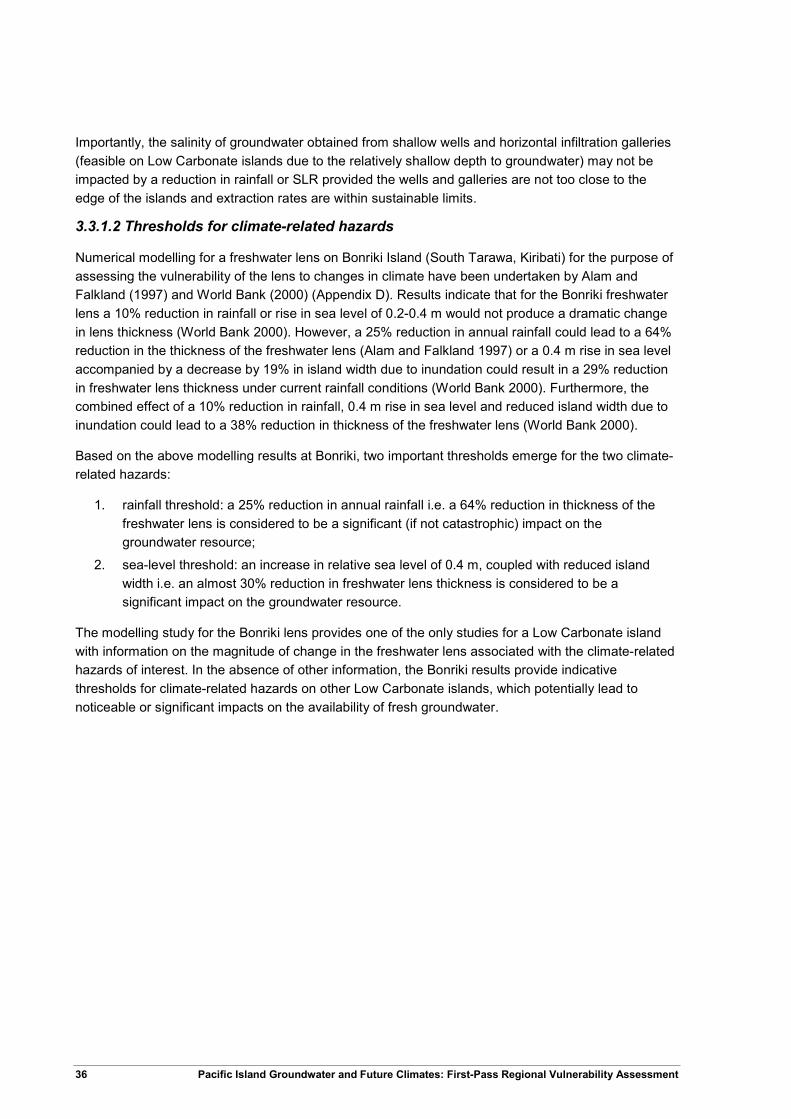
36 Pacific Island Groundwater and Future Climates: First-Pass Regional Vulnerability Assessment
Importantly, the salinity of groundwater obtained from shallow wells and horizontal infiltration galleries (feasible on Low Carbonate islands due to the relatively shallow depth to groundwater) may not be impacted by a reduction in rainfall or SLR provided the wells and galleries are not too close to the edge of the islands and extraction rates are within sustainable limits.
3.3.1.2 Thresholds for climate-related hazards
Numerical modelling for a freshwater lens on Bonriki Island (South Tarawa, Kiribati) for the purpose of assessing the vulnerability of the lens to changes in climate have been undertaken by Alam and Falkland (1997) and World Bank (2000) (Appendix D). Results indicate that for the Bonriki freshwater lens a 10% reduction in rainfall or rise in sea level of 0.2-0.4 m would not produce a dramatic change in lens thickness (World Bank 2000). However, a 25% reduction in annual rainfall could lead to a 64% reduction in the thickness of the freshwater lens (Alam and Falkland 1997) or a 0.4 m rise in sea level accompanied by a decrease by 19% in island width due to inundation could result in a 29% reduction in freshwater lens thickness under current rainfall conditions (World Bank 2000). Furthermore, the combined effect of a 10% reduction in rainfall, 0.4 m rise in sea level and reduced island width due to inundation could lead to a 38% reduction in thickness of the freshwater lens (World Bank 2000).
Based on the above modelling results at Bonriki, two important thresholds emerge for the two climate-related hazards:
1. rainfall threshold: a 25% reduction in annual rainfall i.e. a 64% reduction in thickness of the freshwater lens is considered to be a significant (if not catastrophic) impact on the groundwater resource;
2. sea-level threshold: an increase in relative sea level of 0.4 m, coupled with reduced island width i.e. an almost 30% reduction in freshwater lens thickness is considered to be a significant impact on the groundwater resource.
The modelling study for the Bonriki lens provides one of the only studies for a Low Carbonate island with information on the magnitude of change in the freshwater lens associated with the climate-related hazards of interest. In the absence of other information, the Bonriki results provide indicative thresholds for climate-related hazards on other Low Carbonate islands, which potentially lead to noticeable or significant impacts on the availability of fresh groundwater.
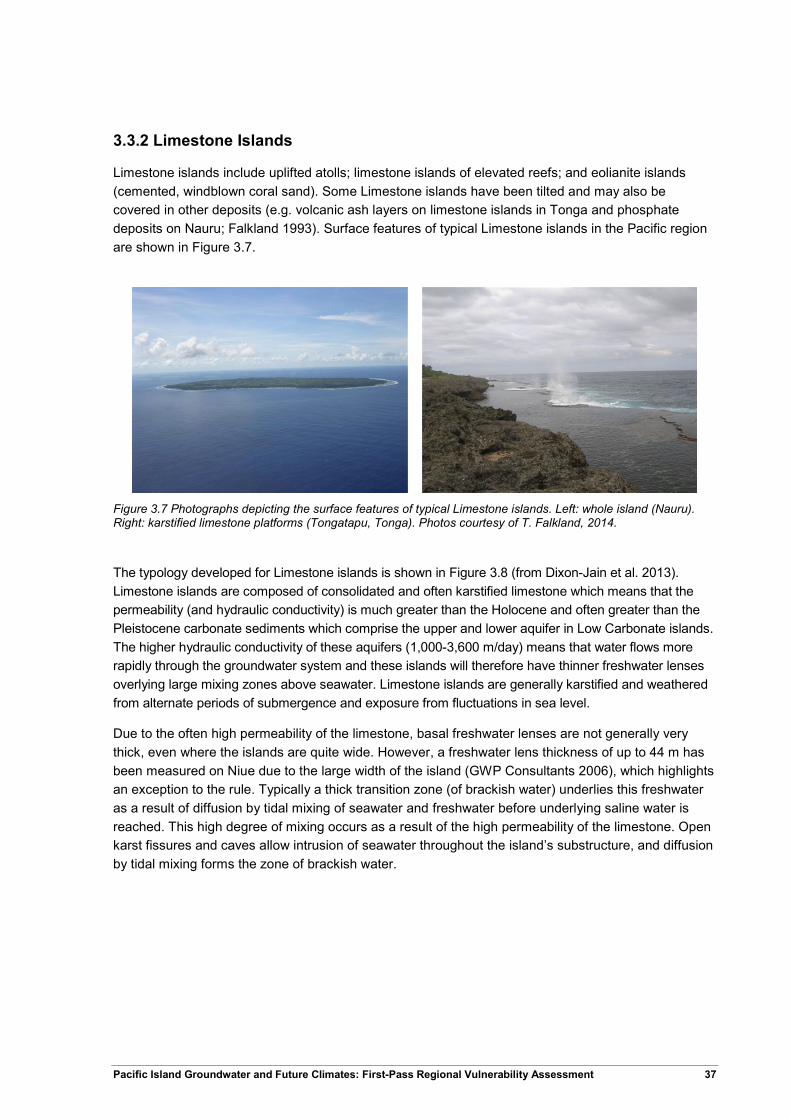
Pacific Island Groundwater and Future Climates: First-Pass Regional Vulnerability Assessment 37
3.3.2 Limestone Islands
Limestone islands include uplifted atolls; limestone islands of elevated reefs; and eolianite islands (cemented, windblown coral sand). Some Limestone islands have been tilted and may also be covered in other deposits (e.g. volcanic ash layers on limestone islands in Tonga and phosphate deposits on Nauru; Falkland 1993). Surface features of typical Limestone islands in the Pacific region are shown in Figure 3.7.
Figure 3.7 Photographs depicting the surface features of typical Limestone islands. Left: whole island (Nauru). Right: karstified limestone platforms (Tongatapu, Tonga). Photos courtesy of T. Falkland, 2014.
The typology developed for Limestone islands is shown in Figure 3.8 (from Dixon-Jain et al. 2013). Limestone islands are composed of consolidated and often karstified limestone which means that the permeability (and hydraulic conductivity) is much greater than the Holocene and often greater than the Pleistocene carbonate sediments which comprise the upper and lower aquifer in Low Carbonate islands. The higher hydraulic conductivity of these aquifers (1,000-3,600 m/day) means that water flows more rapidly through the groundwater system and these islands will therefore have thinner freshwater lenses overlying large mixing zones above seawater. Limestone islands are generally karstified and weathered from alternate periods of submergence and exposure from fluctuations in sea level.
Due to the often high permeability of the limestone, basal freshwater lenses are not generally very thick, even where the islands are quite wide. However, a freshwater lens thickness of up to 44 m has been measured on Niue due to the large width of the island (GWP Consultants 2006), which highlights an exception to the rule. Typically a thick transition zone (of brackish water) underlies this freshwater as a result of diffusion by tidal mixing of seawater and freshwater before underlying saline water is reached. This high degree of mixing occurs as a result of the high permeability of the limestone. Open karst fissures and caves allow intrusion of seawater throughout the island’s substructure, and diffusion by tidal mixing forms the zone of brackish water.

38 Pacific Island Groundwater and Future Climates: First-Pass Regional Vulnerability Assessment
Figure 3.8 Typology for Limestone islands. The dark blue box indicates the island type; the blue boxes highlight the characteristics of the assumed principal aquifer; the grey boxes indicate characteristics of other possible aquifers within the island type and the pink box highlights the GFS which has been assumed to be typical of the principal aquifer.
The main hydrogeological features of a Limestone island are depicted in Figure 3.9. Typical examples of these islands include Niue (GWP Consultants 2006), Nauru (Jacobson et al. 1997) and the Limestone islands of Tonga such as Tongatapu (Furness 1997, White et al. 2009). It is noted that on the island of Nauru (White 2012) and Lifuka Island (Tonga) (Falkland 2000, Furness and Helu 1993), coralline sand aquifers are developed on the edge of a Limestone island and the main aquifer is in the unconsolidated sand. However, for the purpose of a regional first-pass assessment, these islands are considered to be Limestone islands based on the geology of the island. In addition to basal aquifers, perched aquifers can be observed in caves at high elevations on Limestone islands. However, perched limestone aquifers in dominantly Limestone islands are generally a minor occurrence across the Pacific region (I. White and T. Falkland, pers. comm. 2013). Based on available information for Limestone islands in the Pacific region, the assumed principal aquifer is a basal aquifer with high potential productivity, representing a fissured karst (high) aquifer type with a local GFS (Figure 3.8). The island of Tongatapu, Tonga represents a reference island for Limestone island types (Appendix D).
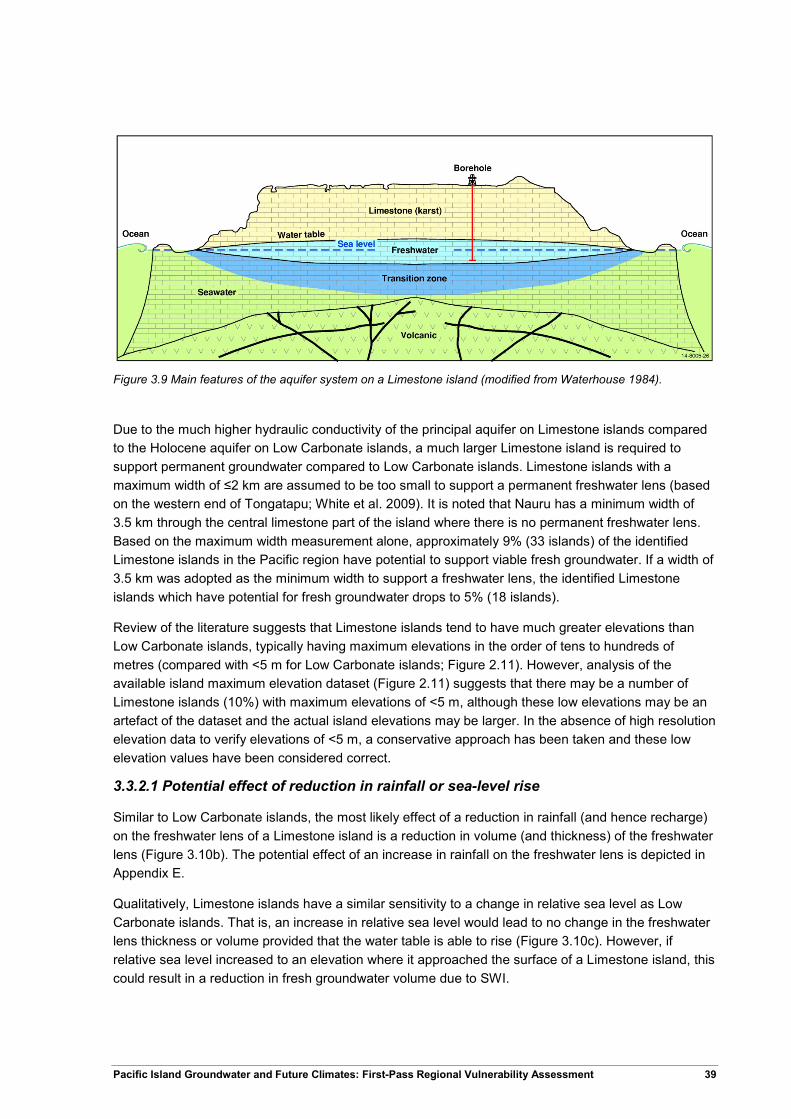
Pacific Island Groundwater and Future Climates: First-Pass Regional Vulnerability Assessment 39
Figure 3.9 Main features of the aquifer system on a Limestone island (modified from Waterhouse 1984).
Due to the much higher hydraulic conductivity of the principal aquifer on Limestone islands compared to the Holocene aquifer on Low Carbonate islands, a much larger Limestone island is required to support permanent groundwater compared to Low Carbonate islands. Limestone islands with a maximum width of ≤2 km are assumed to be too small to support a permanent freshwater lens (based on the western end of Tongatapu; White et al. 2009). It is noted that Nauru has a minimum width of 3.5 km through the central limestone part of the island where there is no permanent freshwater lens. Based on the maximum width measurement alone, approximately 9% (33 islands) of the identified Limestone islands in the Pacific region have potential to support viable fresh groundwater. If a width of 3.5 km was adopted as the minimum width to support a freshwater lens, the identified Limestone islands which have potential for fresh groundwater drops to 5% (18 islands).
Review of the literature suggests that Limestone islands tend to have much greater elevations than Low Carbonate islands, typically having maximum elevations in the order of tens to hundreds of metres (compared with <5 m for Low Carbonate islands; Figure 2.11). However, analysis of the available island maximum elevation dataset (Figure 2.11) suggests that there may be a number of Limestone islands (10%) with maximum elevations of <5 m, although these low elevations may be an artefact of the dataset and the actual island elevations may be larger. In the absence of high resolution elevation data to verify elevations of <5 m, a conservative approach has been taken and these low elevation values have been considered correct.
3.3.2.1 Potential effect of reduction in rainfall or sea-level rise
Similar to Low Carbonate islands, the most likely effect of a reduction in rainfall (and hence recharge) on the freshwater lens of a Limestone island is a reduction in volume (and thickness) of the freshwater lens (Figure 3.10b). The potential effect of an increase in rainfall on the freshwater lens is depicted in Appendix E.
Qualitatively, Limestone islands have a similar sensitivity to a change in relative sea level as Low Carbonate islands. That is, an increase in relative sea level would lead to no change in the freshwater lens thickness or volume provided that the water table is able to rise (Figure 3.10c). However, if relative sea level increased to an elevation where it approached the surface of a Limestone island, this could result in a reduction in fresh groundwater volume due to SWI.
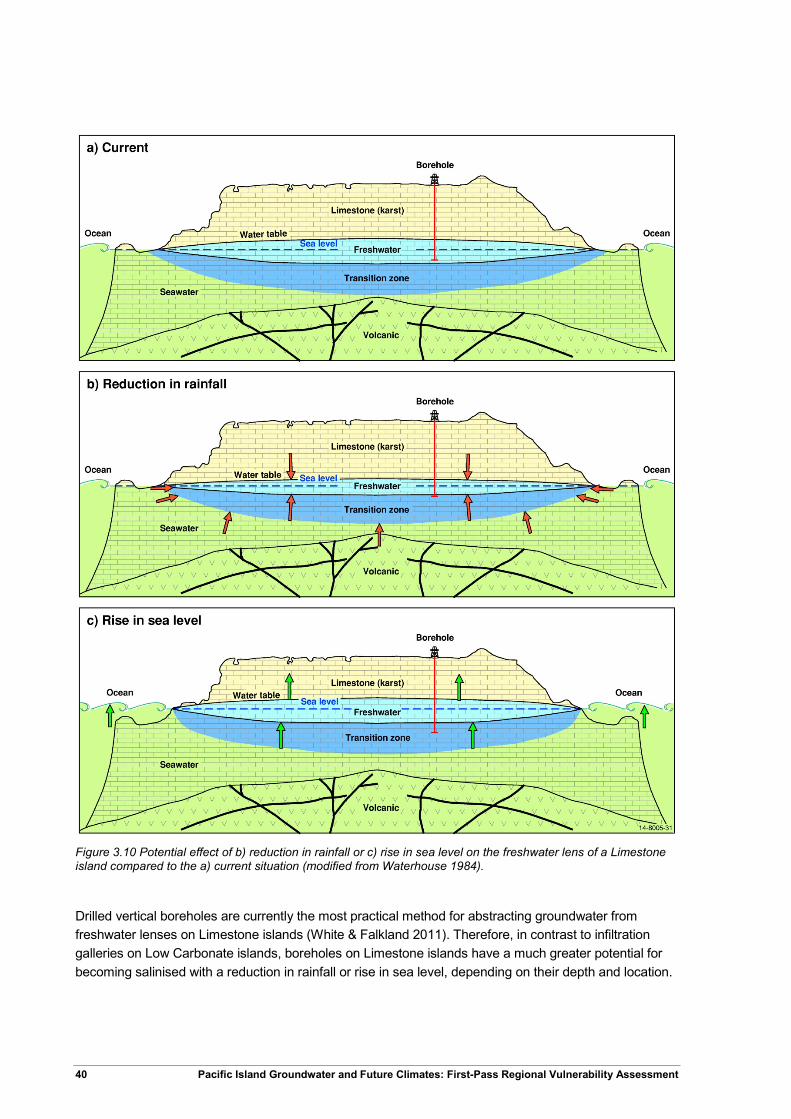
40 Pacific Island Groundwater and Future Climates: First-Pass Regional Vulnerability Assessment
Figure 3.10 Potential effect of b) reduction in rainfall or c) rise in sea level on the freshwater lens of a Limestone island compared to the a) current situation (modified from Waterhouse 1984).
Drilled vertical boreholes are currently the most practical method for abstracting groundwater from freshwater lenses on Limestone islands (White & Falkland 2011). Therefore, in contrast to infiltration galleries on Low Carbonate islands, boreholes on Limestone islands have a much greater potential for becoming salinised with a reduction in rainfall or rise in sea level, depending on their depth and location.
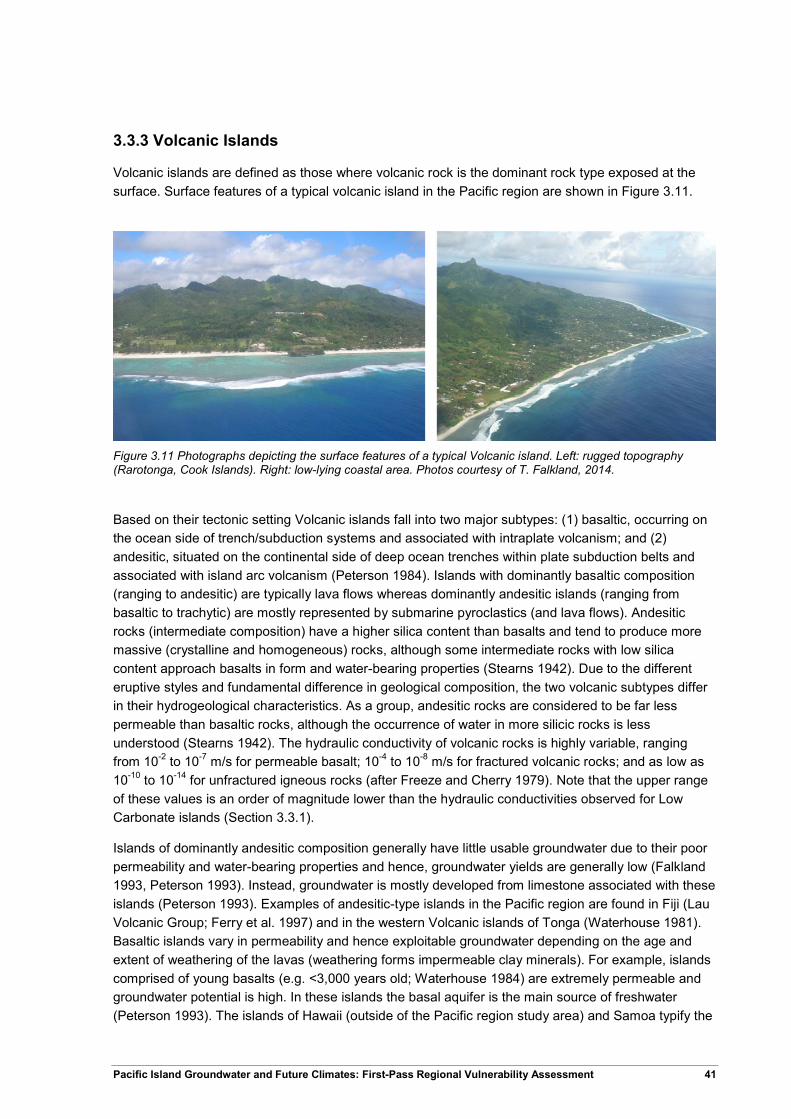
Pacific Island Groundwater and Future Climates: First-Pass Regional Vulnerability Assessment 41
3.3.3 Volcanic Islands
Volcanic islands are defined as those where volcanic rock is the dominant rock type exposed at the surface. Surface features of a typical volcanic island in the Pacific region are shown in Figure 3.11.
Figure 3.11 Photographs depicting the surface features of a typical Volcanic island. Left: rugged topography (Rarotonga, Cook Islands). Right: low-lying coastal area. Photos courtesy of T. Falkland, 2014.
Based on their tectonic setting Volcanic islands fall into two major subtypes: (1) basaltic, occurring on the ocean side of trench/subduction systems and associated with intraplate volcanism; and (2) andesitic, situated on the continental side of deep ocean trenches within plate subduction belts and associated with island arc volcanism (Peterson 1984). Islands with dominantly basaltic composition (ranging to andesitic) are typically lava flows whereas dominantly andesitic islands (ranging from basaltic to trachytic) are mostly represented by submarine pyroclastics (and lava flows). Andesitic rocks (intermediate composition) have a higher silica content than basalts and tend to produce more massive (crystalline and homogeneous) rocks, although some intermediate rocks with low silica content approach basalts in form and water-bearing properties (Stearns 1942). Due to the different eruptive styles and fundamental difference in geological composition, the two volcanic subtypes differ in their hydrogeological characteristics. As a group, andesitic rocks are considered to be far less permeable than basaltic rocks, although the occurrence of water in more silicic rocks is less understood (Stearns 1942). The hydraulic conductivity of volcanic rocks is highly variable, ranging from 10-2 to 10-7 m/s for permeable basalt; 10-4 to 10-8 m/s for fractured volcanic rocks; and as low as 10-10 to 10-14 for unfractured igneous rocks (after Freeze and Cherry 1979). Note that the upper range of these values is an order of magnitude lower than the hydraulic conductivities observed for Low Carbonate islands (Section 3.3.1).
Islands of dominantly andesitic composition generally have little usable groundwater due to their poor permeability and water-bearing properties and hence, groundwater yields are generally low (Falkland 1993, Peterson 1993). Instead, groundwater is mostly developed from limestone associated with these islands (Peterson 1993). Examples of andesitic-type islands in the Pacific region are found in Fiji (Lau Volcanic Group; Ferry et al. 1997) and in the western Volcanic islands of Tonga (Waterhouse 1981). Basaltic islands vary in permeability and hence exploitable groundwater depending on the age and extent of weathering of the lavas (weathering forms impermeable clay minerals). For example, islands comprised of young basalts (e.g. <3,000 years old; Waterhouse 1984) are extremely permeable and groundwater potential is high. In these islands the basal aquifer is the main source of freshwater (Peterson 1993). The islands of Hawaii (outside of the Pacific region study area) and Samoa typify the
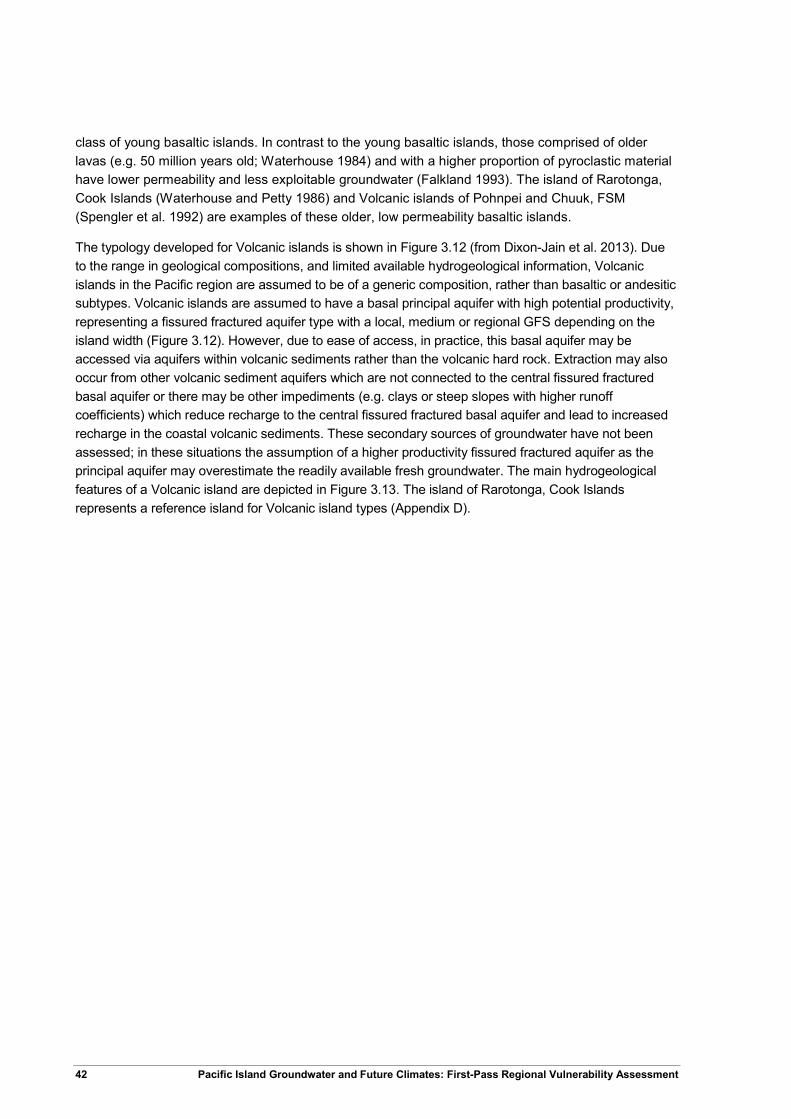
42 Pacific Island Groundwater and Future Climates: First-Pass Regional Vulnerability Assessment
class of young basaltic islands. In contrast to the young basaltic islands, those comprised of older lavas (e.g. 50 million years old; Waterhouse 1984) and with a higher proportion of pyroclastic material have lower permeability and less exploitable groundwater (Falkland 1993). The island of Rarotonga, Cook Islands (Waterhouse and Petty 1986) and Volcanic islands of Pohnpei and Chuuk, FSM (Spengler et al. 1992) are examples of these older, low permeability basaltic islands.
The typology developed for Volcanic islands is shown in Figure 3.12 (from Dixon-Jain et al. 2013). Due to the range in geological compositions, and limited available hydrogeological information, Volcanic islands in the Pacific region are assumed to be of a generic composition, rather than basaltic or andesitic subtypes. Volcanic islands are assumed to have a basal principal aquifer with high potential productivity, representing a fissured fractured aquifer type with a local, medium or regional GFS depending on the island width (Figure 3.12). However, due to ease of access, in practice, this basal aquifer may be accessed via aquifers within volcanic sediments rather than the volcanic hard rock. Extraction may also occur from other volcanic sediment aquifers which are not connected to the central fissured fractured basal aquifer or there may be other impediments (e.g. clays or steep slopes with higher runoff coefficients) which reduce recharge to the central fissured fractured basal aquifer and lead to increased recharge in the coastal volcanic sediments. These secondary sources of groundwater have not been assessed; in these situations the assumption of a higher productivity fissured fractured aquifer as the principal aquifer may overestimate the readily available fresh groundwater. The main hydrogeological features of a Volcanic island are depicted in Figure 3.13. The island of Rarotonga, Cook Islands represents a reference island for Volcanic island types (Appendix D).
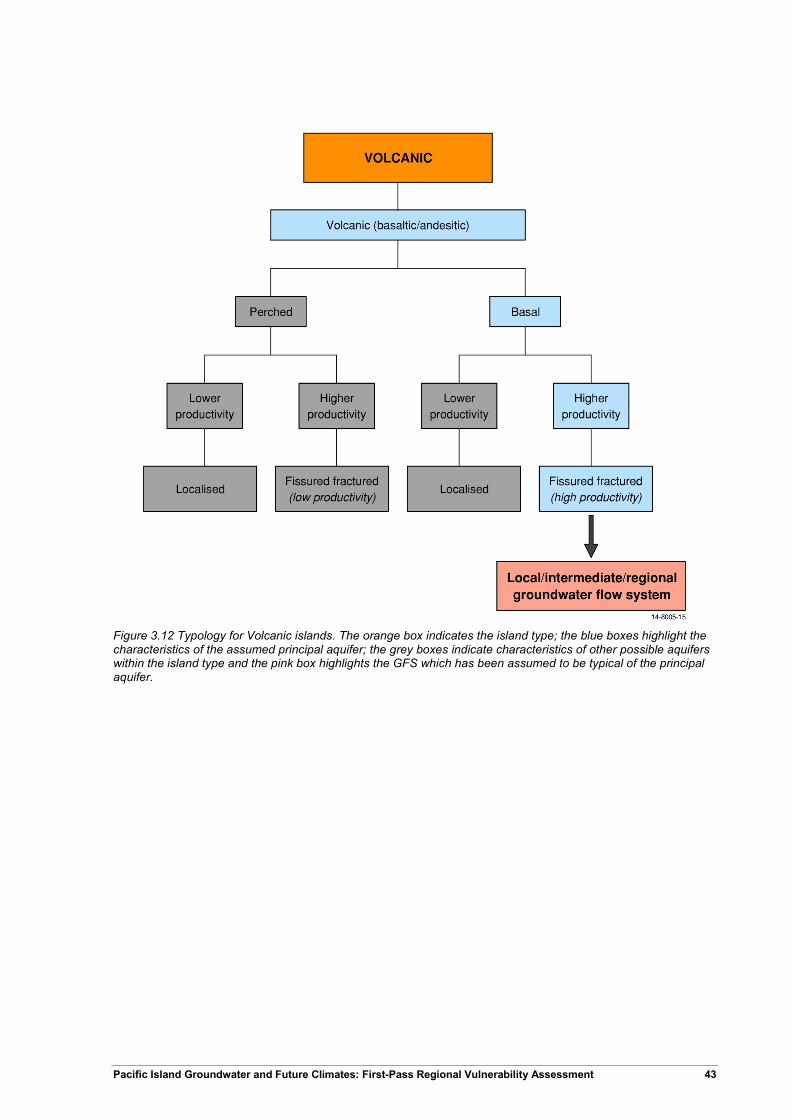
Pacific Island Groundwater and Future Climates: First-Pass Regional Vulnerability Assessment 43
Figure 3.12 Typology for Volcanic islands. The orange box indicates the island type; the blue boxes highlight the characteristics of the assumed principal aquifer; the grey boxes indicate characteristics of other possible aquifers within the island type and the pink box highlights the GFS which has been assumed to be typical of the principal aquifer.
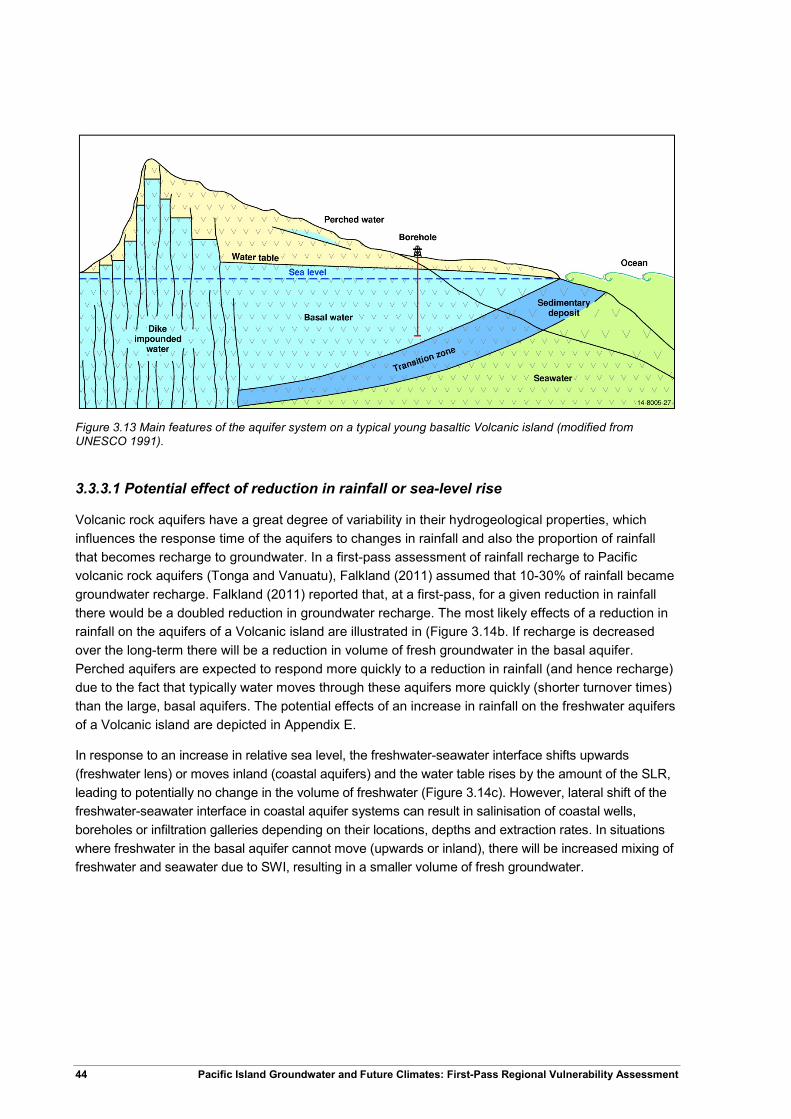
44 Pacific Island Groundwater and Future Climates: First-Pass Regional Vulnerability Assessment
Figure 3.13 Main features of the aquifer system on a typical young basaltic Volcanic island (modified from UNESCO 1991).
3.3.3.1 Potential effect of reduction in rainfall or sea-level rise
Volcanic rock aquifers have a great degree of variability in their hydrogeological properties, which influences the response time of the aquifers to changes in rainfall and also the proportion of rainfall that becomes recharge to groundwater. In a first-pass assessment of rainfall recharge to Pacific volcanic rock aquifers (Tonga and Vanuatu), Falkland (2011) assumed that 10-30% of rainfall became groundwater recharge. Falkland (2011) reported that, at a first-pass, for a given reduction in rainfall there would be a doubled reduction in groundwater recharge. The most likely effects of a reduction in rainfall on the aquifers of a Volcanic island are illustrated in (Figure 3.14b. If recharge is decreased over the long-term there will be a reduction in volume of fresh groundwater in the basal aquifer. Perched aquifers are expected to respond more quickly to a reduction in rainfall (and hence recharge) due to the fact that typically water moves through these aquifers more quickly (shorter turnover times) than the large, basal aquifers. The potential effects of an increase in rainfall on the freshwater aquifers of a Volcanic island are depicted in Appendix E.
In response to an increase in relative sea level, the freshwater-seawater interface shifts upwards (freshwater lens) or moves inland (coastal aquifers) and the water table rises by the amount of the SLR, leading to potentially no change in the volume of freshwater (Figure 3.14c). However, lateral shift of the freshwater-seawater interface in coastal aquifer systems can result in salinisation of coastal wells, boreholes or infiltration galleries depending on their locations, depths and extraction rates. In situations where freshwater in the basal aquifer cannot move (upwards or inland), there will be increased mixing of freshwater and seawater due to SWI, resulting in a smaller volume of fresh groundwater.
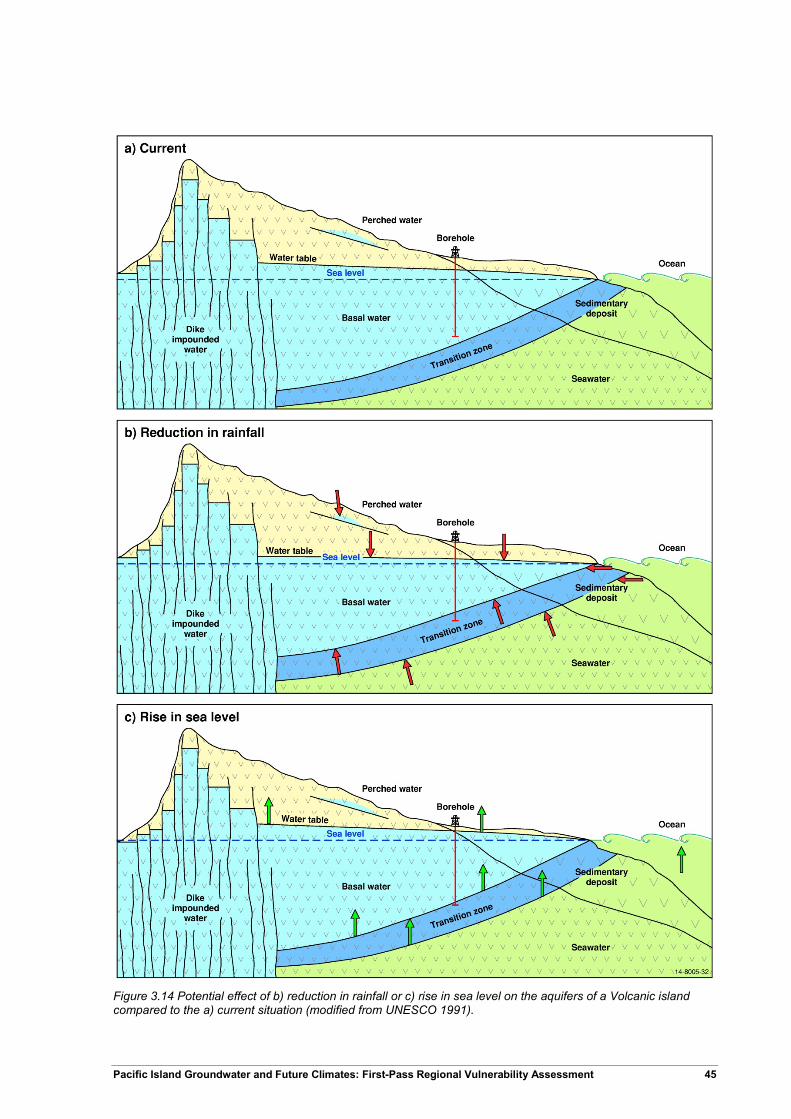
Pacific Island Groundwater and Future Climates: First-Pass Regional Vulnerability Assessment 45
Figure 3.14 Potential effect of b) reduction in rainfall or c) rise in sea level on the aquifers of a Volcanic island compared to the a) current situation (modified from UNESCO 1991).
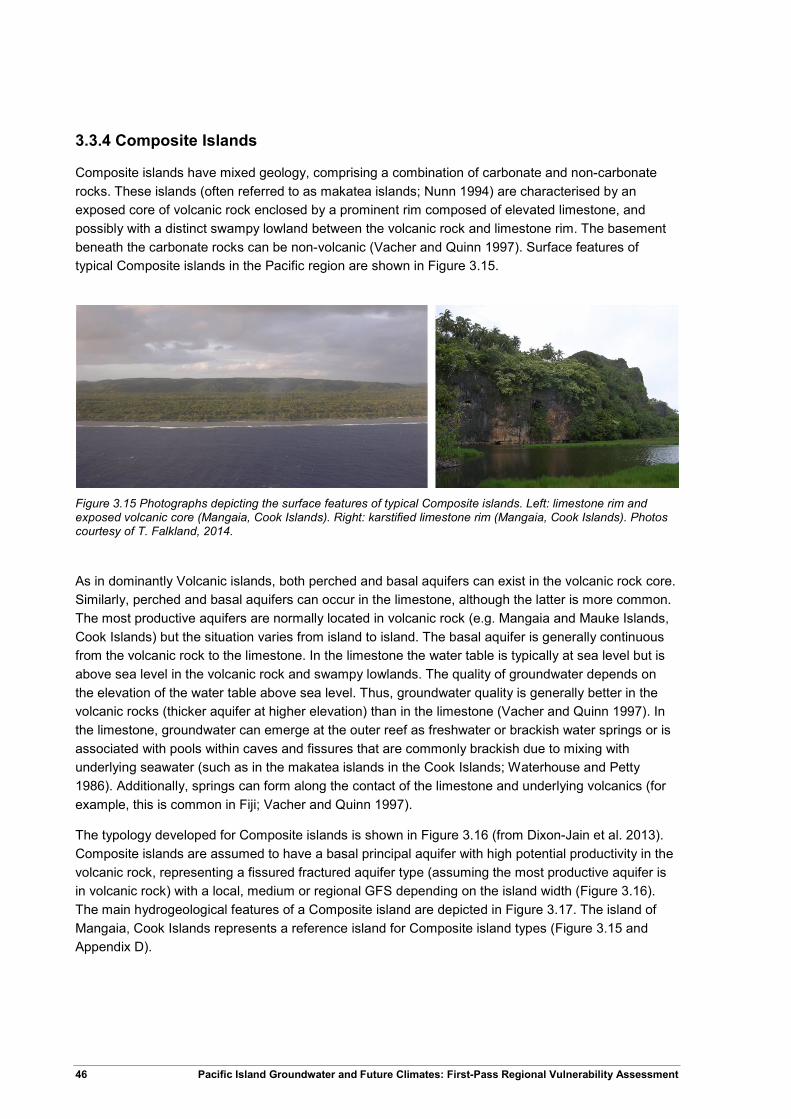
46 Pacific Island Groundwater and Future Climates: First-Pass Regional Vulnerability Assessment
3.3.4 Composite Islands
Composite islands have mixed geology, comprising a combination of carbonate and non-carbonate rocks. These islands (often referred to as makatea islands; Nunn 1994) are characterised by an exposed core of volcanic rock enclosed by a prominent rim composed of elevated limestone, and possibly with a distinct swampy lowland between the volcanic rock and limestone rim. The basement beneath the carbonate rocks can be non-volcanic (Vacher and Quinn 1997). Surface features of typical Composite islands in the Pacific region are shown in Figure 3.15.
Figure 3.15 Photographs depicting the surface features of typical Composite islands. Left: limestone rim and exposed volcanic core (Mangaia, Cook Islands). Right: karstified limestone rim (Mangaia, Cook Islands). Photos courtesy of T. Falkland, 2014.
As in dominantly Volcanic islands, both perched and basal aquifers can exist in the volcanic rock core. Similarly, perched and basal aquifers can occur in the limestone, although the latter is more common. The most productive aquifers are normally located in volcanic rock (e.g. Mangaia and Mauke Islands, Cook Islands) but the situation varies from island to island. The basal aquifer is generally continuous from the volcanic rock to the limestone. In the limestone the water table is typically at sea level but is above sea level in the volcanic rock and swampy lowlands. The quality of groundwater depends on the elevation of the water table above sea level. Thus, groundwater quality is generally better in the volcanic rocks (thicker aquifer at higher elevation) than in the limestone (Vacher and Quinn 1997). In the limestone, groundwater can emerge at the outer reef as freshwater or brackish water springs or is associated with pools within caves and fissures that are commonly brackish due to mixing with underlying seawater (such as in the makatea islands in the Cook Islands; Waterhouse and Petty 1986). Additionally, springs can form along the contact of the limestone and underlying volcanics (for example, this is common in Fiji; Vacher and Quinn 1997).
The typology developed for Composite islands is shown in Figure 3.16 (from Dixon-Jain et al. 2013). Composite islands are assumed to have a basal principal aquifer with high potential productivity in the volcanic rock, representing a fissured fractured aquifer type (assuming the most productive aquifer is in volcanic rock) with a local, medium or regional GFS depending on the island width (Figure 3.16). The main hydrogeological features of a Composite island are depicted in Figure 3.17. The island of Mangaia, Cook Islands represents a reference island for Composite island types (Figure 3.15 and Appendix D).
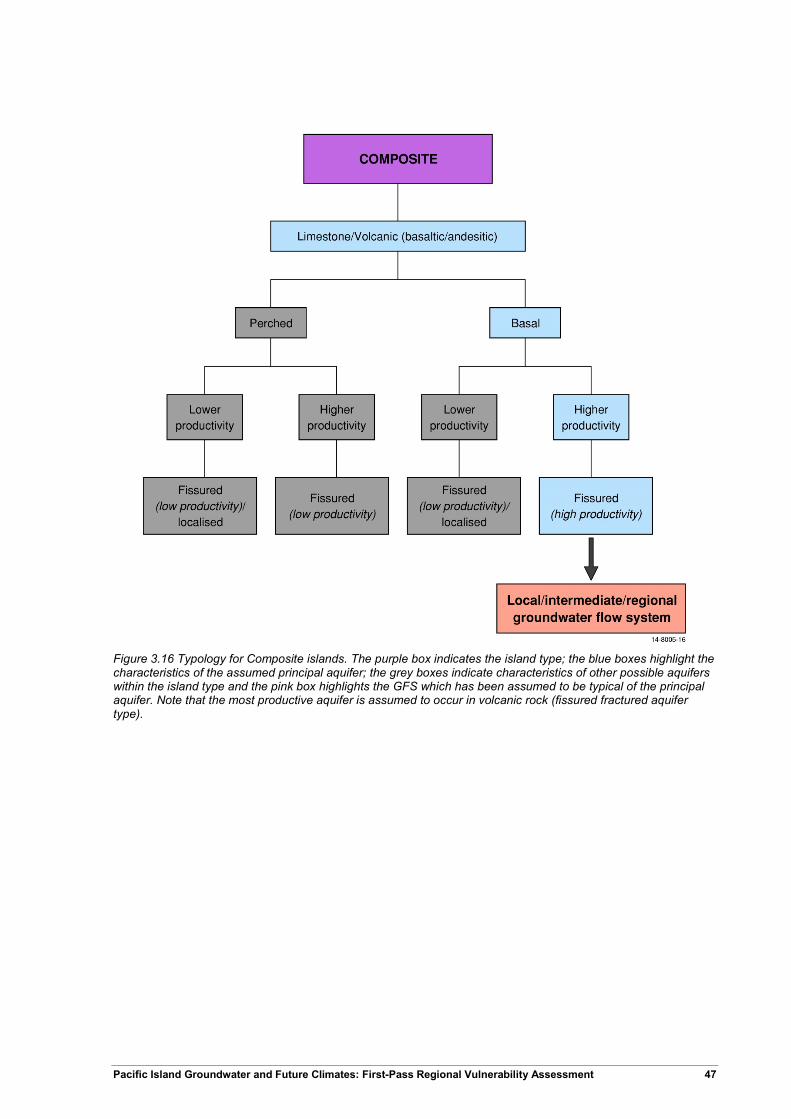
Pacific Island Groundwater and Future Climates: First-Pass Regional Vulnerability Assessment 47
Figure 3.16 Typology for Composite islands. The purple box indicates the island type; the blue boxes highlight the characteristics of the assumed principal aquifer; the grey boxes indicate characteristics of other possible aquifers within the island type and the pink box highlights the GFS which has been assumed to be typical of the principal aquifer. Note that the most productive aquifer is assumed to occur in volcanic rock (fissured fractured aquifer type).
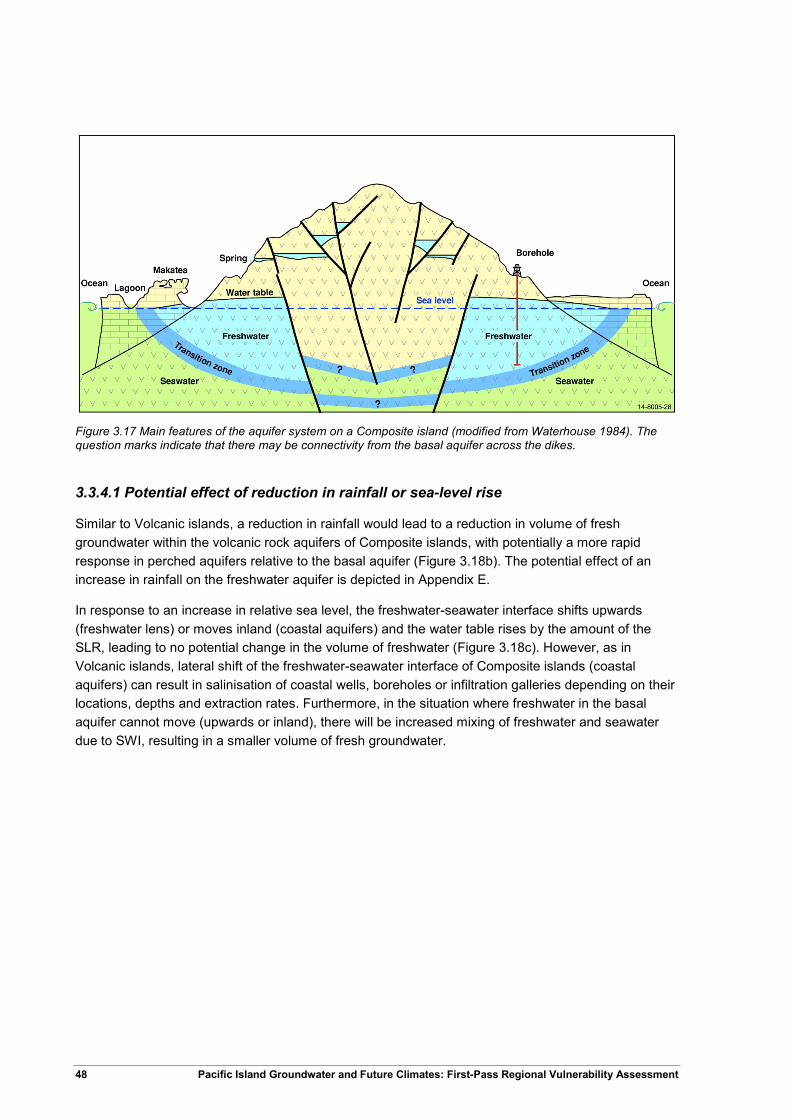
48 Pacific Island Groundwater and Future Climates: First-Pass Regional Vulnerability Assessment
Figure 3.17 Main features of the aquifer system on a Composite island (modified from Waterhouse 1984). The question marks indicate that there may be connectivity from the basal aquifer across the dikes.
3.3.4.1 Potential effect of reduction in rainfall or sea-level rise
Similar to Volcanic islands, a reduction in rainfall would lead to a reduction in volume of fresh groundwater within the volcanic rock aquifers of Composite islands, with potentially a more rapid response in perched aquifers relative to the basal aquifer (Figure 3.18b). The potential effect of an increase in rainfall on the freshwater aquifer is depicted in Appendix E.
In response to an increase in relative sea level, the freshwater-seawater interface shifts upwards (freshwater lens) or moves inland (coastal aquifers) and the water table rises by the amount of the SLR, leading to no potential change in the volume of freshwater (Figure 3.18c). However, as in Volcanic islands, lateral shift of the freshwater-seawater interface of Composite islands (coastal aquifers) can result in salinisation of coastal wells, boreholes or infiltration galleries depending on their locations, depths and extraction rates. Furthermore, in the situation where freshwater in the basal aquifer cannot move (upwards or inland), there will be increased mixing of freshwater and seawater due to SWI, resulting in a smaller volume of fresh groundwater.
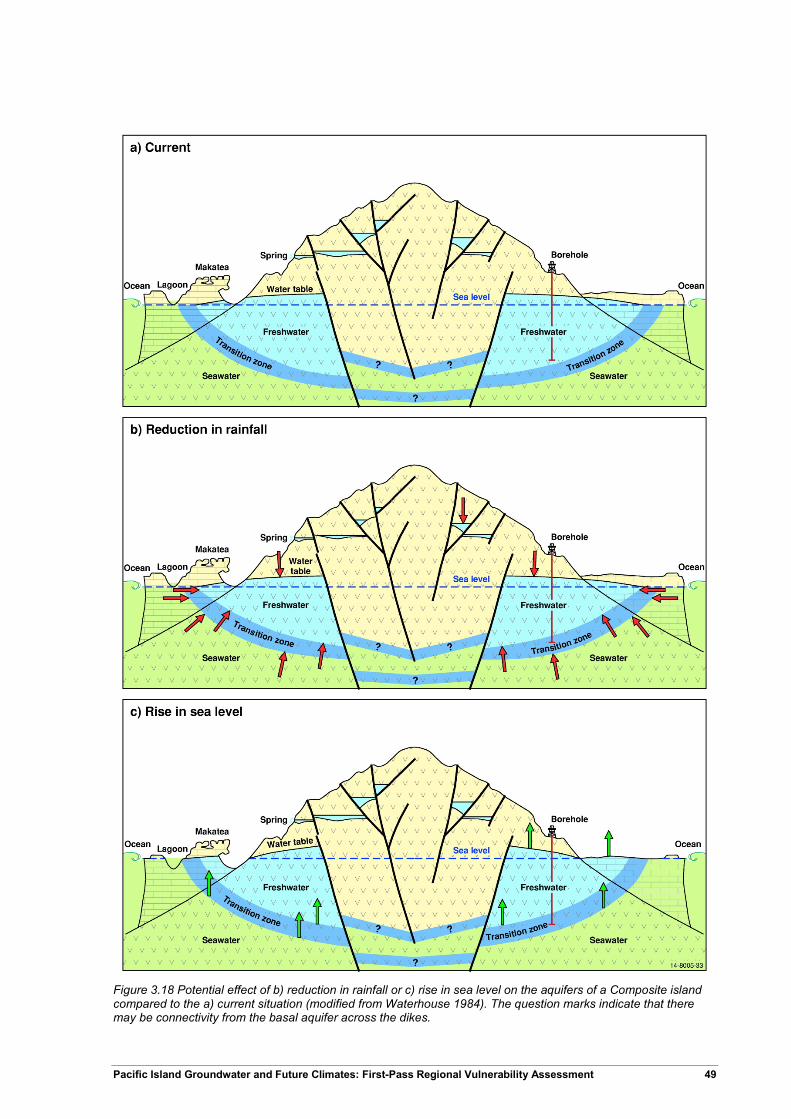
Pacific Island Groundwater and Future Climates: First-Pass Regional Vulnerability Assessment 49
Figure 3.18 Potential effect of b) reduction in rainfall or c) rise in sea level on the aquifers of a Composite island compared to the a) current situation (modified from Waterhouse 1984). The question marks indicate that there may be connectivity from the basal aquifer across the dikes.
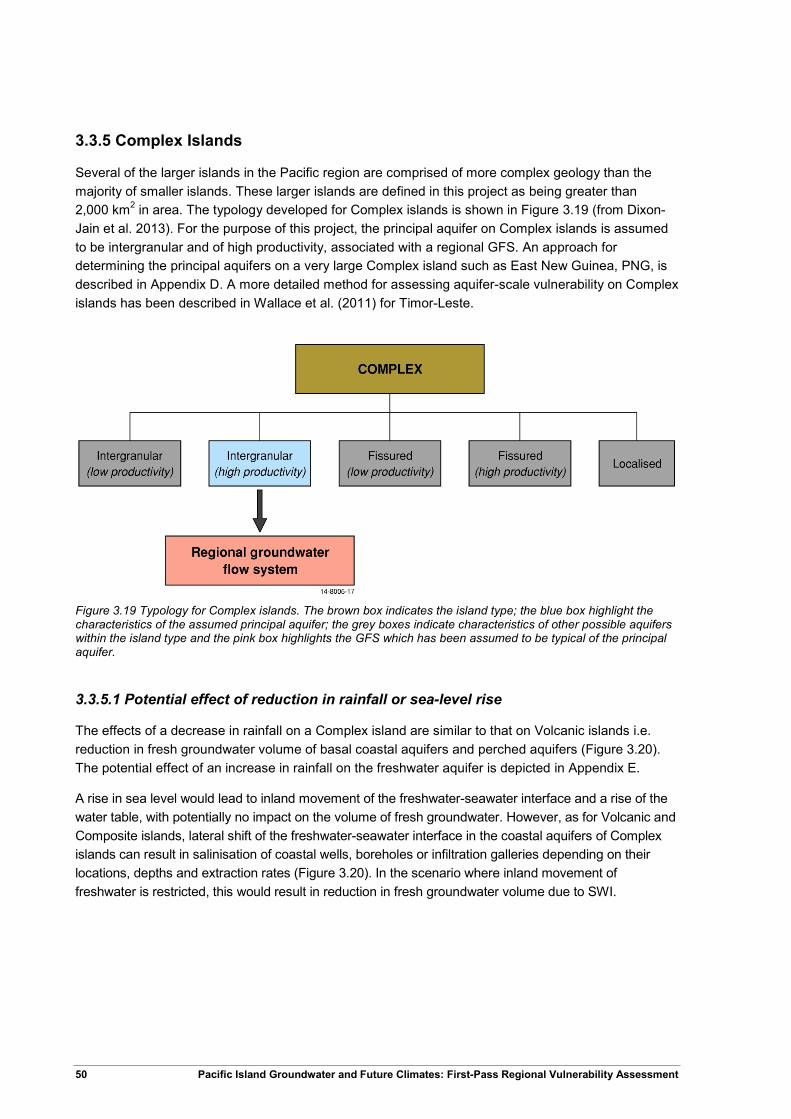
50 Pacific Island Groundwater and Future Climates: First-Pass Regional Vulnerability Assessment
3.3.5 Complex Islands
Several of the larger islands in the Pacific region are comprised of more complex geology than the majority of smaller islands. These larger islands are defined in this project as being greater than 2,000 km2 in area. The typology developed for Complex islands is shown in Figure 3.19 (from Dixon-Jain et al. 2013). For the purpose of this project, the principal aquifer on Complex islands is assumed to be intergranular and of high productivity, associated with a regional GFS. An approach for determining the principal aquifers on a very large Complex island such as East New Guinea, PNG, is described in Appendix D. A more detailed method for assessing aquifer-scale vulnerability on Complex islands has been described in Wallace et al. (2011) for Timor-Leste.
Figure 3.19 Typology for Complex islands. The brown box indicates the island type; the blue box highlight the characteristics of the assumed principal aquifer; the grey boxes indicate characteristics of other possible aquifers within the island type and the pink box highlights the GFS which has been assumed to be typical of the principal aquifer.
3.3.5.1 Potential effect of reduction in rainfall or sea-level rise
The effects of a decrease in rainfall on a Complex island are similar to that on Volcanic islands i.e. reduction in fresh groundwater volume of basal coastal aquifers and perched aquifers (Figure 3.20). The potential effect of an increase in rainfall on the freshwater aquifer is depicted in Appendix E.
A rise in sea level would lead to inland movement of the freshwater-seawater interface and a rise of the water table, with potentially no impact on the volume of fresh groundwater. However, as for Volcanic and Composite islands, lateral shift of the freshwater-seawater interface in the coastal aquifers of Complex islands can result in salinisation of coastal wells, boreholes or infiltration galleries depending on their locations, depths and extraction rates (Figure 3.20). In the scenario where inland movement of freshwater is restricted, this would result in reduction in fresh groundwater volume due to SWI.
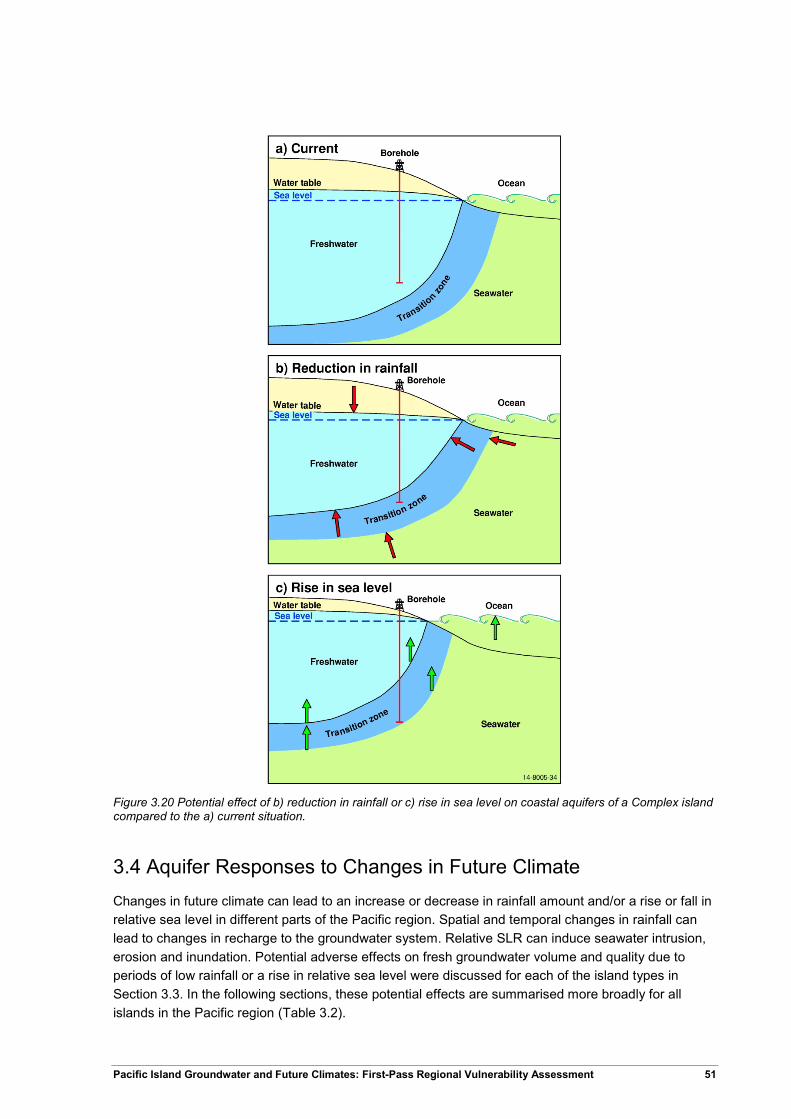
Pacific Island Groundwater and Future Climates: First-Pass Regional Vulnerability Assessment 51
Figure 3.20 Potential effect of b) reduction in rainfall or c) rise in sea level on coastal aquifers of a Complex island compared to the a) current situation.
3.4 Aquifer Responses to Changes in Future Climate Changes in future climate can lead to an increase or decrease in rainfall amount and/or a rise or fall in relative sea level in different parts of the Pacific region. Spatial and temporal changes in rainfall can lead to changes in recharge to the groundwater system. Relative SLR can induce seawater intrusion, erosion and inundation. Potential adverse effects on fresh groundwater volume and quality due to periods of low rainfall or a rise in relative sea level were discussed for each of the island types in Section 3.3. In the following sections, these potential effects are summarised more broadly for all islands in the Pacific region (Table 3.2).
52 Pacific Island Groundwater and Future Climates: First-Pass Regional Vulnerability Assessment
Seawater intrusion (SWI), defined as the landward encroachment of seawater into fresh groundwater in freshwater lenses or coastal aquifers, is induced by a lateral shift in the freshwater-seawater boundary. SWI results in salinisation of freshwater aquifers. Due to the direction of movement of the freshwater-seawater interface in freshwater lenses (upwards) compared with coastal aquifers (upwards and laterally), a rise in the interface of freshwater lenses due to a change in rainfall-recharge or relative mean sea level may have no water salinity impact on shallow wells, boreholes or infiltration galleries (provided there is no loss of land). However, in a coastal aquifer, inland migration of the interface may result in salinisation of wells, boreholes or infiltration galleries located on the coastal side of the interface.
3.4.1 Reduction in Rainfall
Rainfall volume is the most important climate parameter influencing recharge, followed by rainfall intensity and temperature (McCallum 2010). On small islands, rainfall is the main input to the groundwater system and therefore, the volume of groundwater on small islands is particularly sensitive to a reduction in rainfall amount due to its effect on recharge. There are a number of methods for estimating recharge to the groundwater system, ranging from relatively simple empirical methods that determine a relationship between annual rainfall and annual recharge based on individual water balance studies, to more detailed modelling procedures that consider all the components of the water balance (UNESCO 1991) (Appendix E). Groundwater recharge, groundwater extraction and daily tidal cycles are primary controls on the movement and position of the freshwater-seawater mixing zone (transition zone). Therefore, changes in recharge can result in a shift in position of the mixing zone, which influences the thickness and hence volume of freshwater in an aquifer. The impacts of droughts on groundwater resources are temporary, particularly on freshwater lenses that can recover over months or years after drought provided there is sufficient rainfall to recharge the groundwater system (White and Falkland 2011). However, this study is concerned with long-term changes in rainfall patterns which can lead to more permanent impacts on the availability of groundwater.
• In freshwater lens situations (unconfined aquifers), a reduction in rainfall -recharge can lead to the upwards shift and widening of the freshwater-seawater mixing zone and a decrease in thickness and volume of fresh groundwater. SWI occurs, with potential salinisation of wells, boreholes or infiltration galleries.
• In unconfined coastal aquifer situations, a reduction in rainfall-recharge can lead to the upwards and inland shift and widening of the freshwater-seawater mixing zone and a decrease in volume of fresh groundwater. SWI occurs, with potential salinisation of coastal wells, boreholes or infiltration galleries.
3.4.2 Rise in Relative Sea Level
The position of the freshwater-seawater interface and water table are influenced by relative sea level. Therefore, changes in relative sea level can result in a change in the position of the freshwater-seawater mixing zone, which influences the thickness and volume of freshwater in an aquifer. A rise in relative sea level can lead to SWI, erosion of island edges or inundation of low-lying areas. In addition, sea overtopping due to cyclone-generated waves and storm surges (a temporary rise in sea level that often accompanies tropical cyclones), or permanent surface inundation of low-lying areas, can lead to vertical infiltration of seawater into freshwater. Provided there is recharge from significant rainfall, the impacts of overwash and seawater inundation are temporary compared to more permanent changes
Pacific Island Groundwater and Future Climates: First-Pass Regional Vulnerability Assessment 53
that occur with rising sea level (White and Falkland 2011); however, temporary impacts may become more permanent if the frequency increases such that the system has insufficient time to recover between events. The impact of downward seepage of seawater into groundwater in freshwater lenses or coastal aquifers is beyond the scope of the project and will not be discussed further.
Island erosion and inundation of low-lying areas lead to loss of land and therefore a reduction in size of the freshwater aquifer and volume of freshwater. In this scenario, there is also potential for salinisation of boreholes drawing groundwater from parts of the aquifer that have become intruded by seawater. If the mixing zone rises in freshwater lenses, wells, boreholes and infiltration galleries are potentially salinised depending on their locations, depths and extraction rates. However, in coastal aquifers, lateral shift of the interface means that salinisation of coastal wells, boreholes and infiltration galleries is possible.
In freshwater lens situations (unconfined aquifers), islands can be impacted by a rise in sea level in one of the following ways:
1. the freshwater-seawater mixing zone shifts upwards and the water tables rises by the amount of the SLR. There is no change in fresh groundwater thickness or volume, with the exception of Low Carbonate islands with a thick freshwater lens, which may experience an increase in freshwater volume (Section 3.3.1). Salinisation of coastal wells, boreholes or infiltration galleries is possible; or,
2. the water table is unable to rise due to topographic constraints such as surface water bodies (drains, wetlands, streams/rivers) or low ground levels (flat topography) that control the groundwater level (head) through evapotranspiration; the mixing zone shifts inland. The freshwater volume is reduced due to SWI and there is potential salinisation of coastal wells, boreholes or infiltration galleries; or,
3. the rise in sea level is accompanied by loss of low-lying land due to inundation and/or erosion at the edges of the island. The fresh groundwater volume decreases and there is potential salinisation of coastal wells, boreholes or infiltration galleries; or,
4. total island inundation i.e. loss of freshwater aquifer.
In unconfined coastal aquifer situations, islands can be impacted by a rise in sea level in one of the following ways:
1. the freshwater-seawater mixing zone shifts upwards and moves inland and the water table rises by the amount of the SLR. There is no change in the fresh groundwater volume. However, there is potential salinisation of coastal wells, boreholes or infiltration galleries; or,
2. the water table is unable to rise due to a topographic control and the mixing zone shifts inland (by hundreds of metres to several kilometres for up to 1.5 m SLR; Werner & Simmons 2009). The fresh groundwater volume is reduced due to SWI and there is potential salinisation of coastal wells, boreholes or infiltration galleries; or,
3. the rise in sea level is accompanied by loss of low-lying land due to inundation and/or erosion at the edges of the island and the mixing zone shifts inland. The fresh groundwater volume decreases due to SWI and there is potential salinisation of coastal wells, boreholes or infiltration galleries; or,
4. total island inundation i.e. loss of freshwater aquifer.
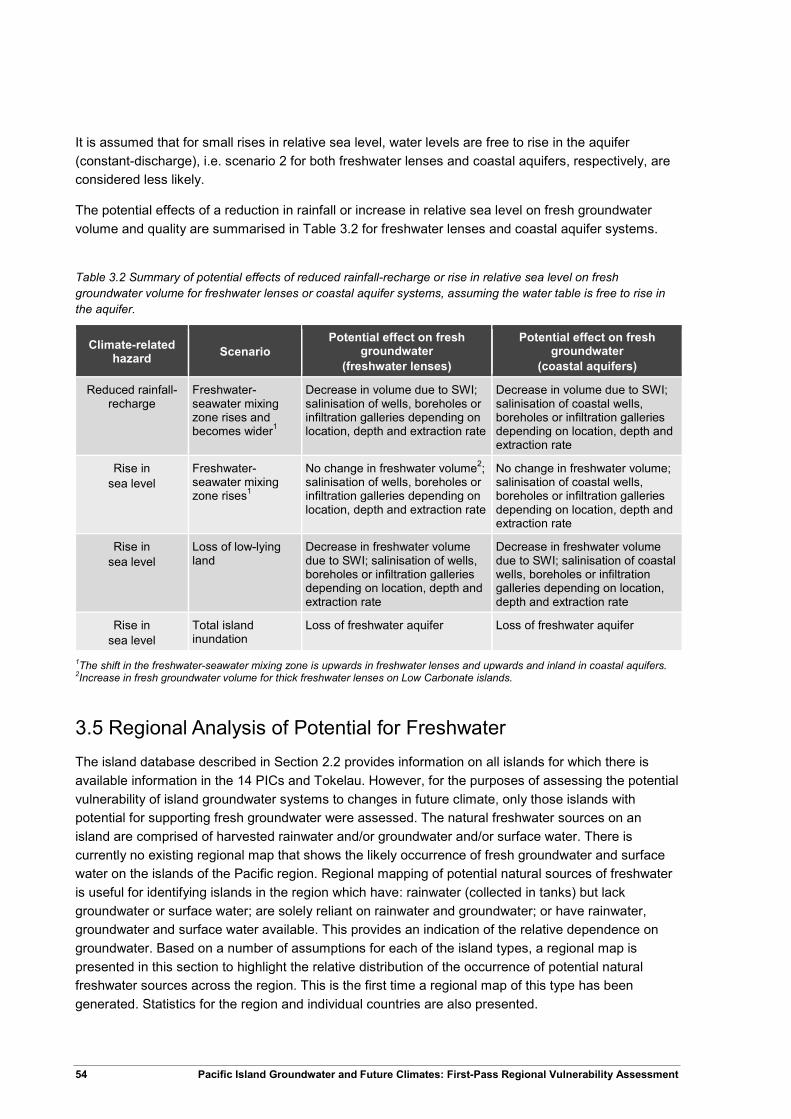
54 Pacific Island Groundwater and Future Climates: First-Pass Regional Vulnerability Assessment
It is assumed that for small rises in relative sea level, water levels are free to rise in the aquifer (constant-discharge), i.e. scenario 2 for both freshwater lenses and coastal aquifers, respectively, are considered less likely.
The potential effects of a reduction in rainfall or increase in relative sea level on fresh groundwater volume and quality are summarised in Table 3.2 for freshwater lenses and coastal aquifer systems.
Table 3.2 Summary of potential effects of reduced rainfall-recharge or rise in relative sea level on fresh groundwater volume for freshwater lenses or coastal aquifer systems, assuming the water table is free to rise in the aquifer.
Climate-related hazard Scenario
Potential effect on fresh groundwater
(freshwater lenses)
Potential effect on fresh groundwater
(coastal aquifers)
Reduced rainfall-recharge
Freshwater-seawater mixing zone rises and becomes wider1
Decrease in volume due to SWI; salinisation of wells, boreholes or infiltration galleries depending on location, depth and extraction rate
Decrease in volume due to SWI; salinisation of coastal wells, boreholes or infiltration galleries depending on location, depth and extraction rate
Rise in sea level
Freshwater-seawater mixing zone rises1
No change in freshwater volume2; salinisation of wells, boreholes or infiltration galleries depending on location, depth and extraction rate
No change in freshwater volume; salinisation of coastal wells, boreholes or infiltration galleries depending on location, depth and extraction rate
Rise in sea level
Loss of low-lying land
Decrease in freshwater volume due to SWI; salinisation of wells, boreholes or infiltration galleries depending on location, depth and extraction rate
Decrease in freshwater volume due to SWI; salinisation of coastal wells, boreholes or infiltration galleries depending on location, depth and extraction rate
Rise in sea level
Total island inundation
Loss of freshwater aquifer Loss of freshwater aquifer
1The shift in the freshwater-seawater mixing zone is upwards in freshwater lenses and upwards and inland in coastal aquifers. 2Increase in fresh groundwater volume for thick freshwater lenses on Low Carbonate islands.
3.5 Regional Analysis of Potential for Freshwater The island database described in Section 2.2 provides information on all islands for which there is available information in the 14 PICs and Tokelau. However, for the purposes of assessing the potential vulnerability of island groundwater systems to changes in future climate, only those islands with potential for supporting fresh groundwater were assessed. The natural freshwater sources on an island are comprised of harvested rainwater and/or groundwater and/or surface water. There is currently no existing regional map that shows the likely occurrence of fresh groundwater and surface water on the islands of the Pacific region. Regional mapping of potential natural sources of freshwater is useful for identifying islands in the region which have: rainwater (collected in tanks) but lack groundwater or surface water; are solely reliant on rainwater and groundwater; or have rainwater, groundwater and surface water available. This provides an indication of the relative dependence on groundwater. Based on a number of assumptions for each of the island types, a regional map is presented in this section to highlight the relative distribution of the occurrence of potential natural freshwater sources across the region. This is the first time a regional map of this type has been generated. Statistics for the region and individual countries are also presented.
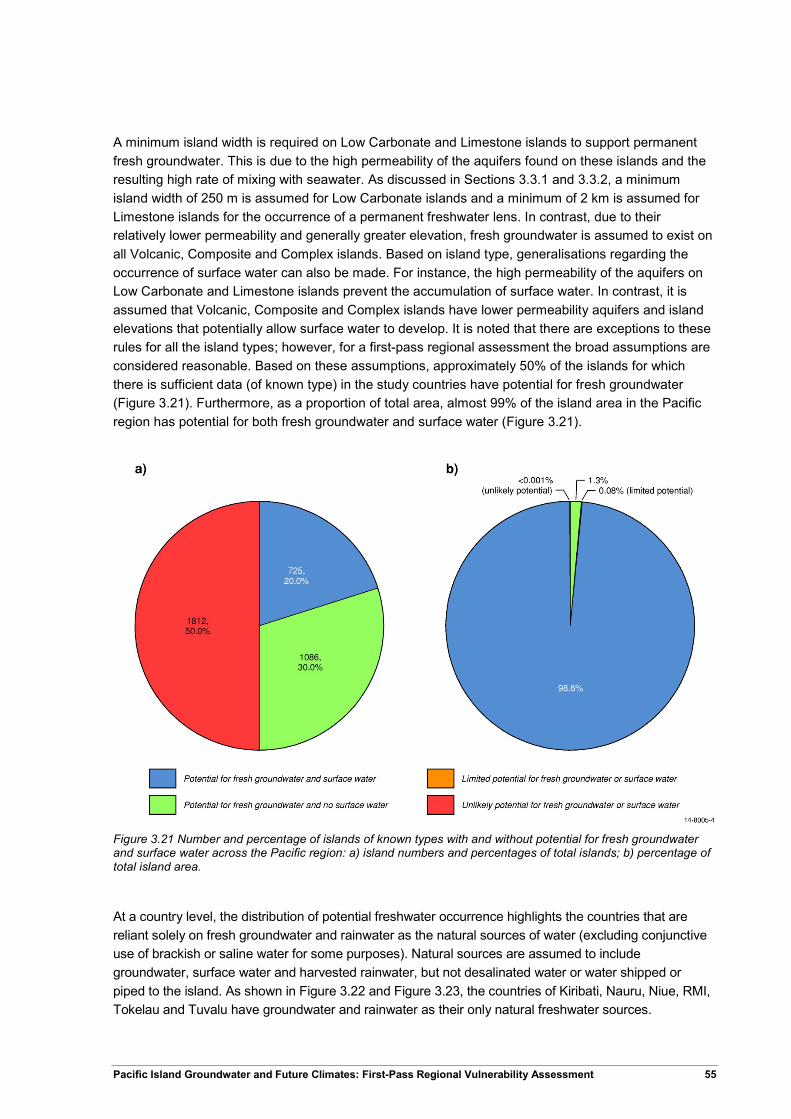
Pacific Island Groundwater and Future Climates: First-Pass Regional Vulnerability Assessment 55
A minimum island width is required on Low Carbonate and Limestone islands to support permanent fresh groundwater. This is due to the high permeability of the aquifers found on these islands and the resulting high rate of mixing with seawater. As discussed in Sections 3.3.1 and 3.3.2, a minimum island width of 250 m is assumed for Low Carbonate islands and a minimum of 2 km is assumed for Limestone islands for the occurrence of a permanent freshwater lens. In contrast, due to their relatively lower permeability and generally greater elevation, fresh groundwater is assumed to exist on all Volcanic, Composite and Complex islands. Based on island type, generalisations regarding the occurrence of surface water can also be made. For instance, the high permeability of the aquifers on Low Carbonate and Limestone islands prevent the accumulation of surface water. In contrast, it is assumed that Volcanic, Composite and Complex islands have lower permeability aquifers and island elevations that potentially allow surface water to develop. It is noted that there are exceptions to these rules for all the island types; however, for a first-pass regional assessment the broad assumptions are considered reasonable. Based on these assumptions, approximately 50% of the islands for which there is sufficient data (of known type) in the study countries have potential for fresh groundwater (Figure 3.21). Furthermore, as a proportion of total area, almost 99% of the island area in the Pacific region has potential for both fresh groundwater and surface water (Figure 3.21).
Figure 3.21 Number and percentage of islands of known types with and without potential for fresh groundwater and surface water across the Pacific region: a) island numbers and percentages of total islands; b) percentage of total island area.
At a country level, the distribution of potential freshwater occurrence highlights the countries that are reliant solely on fresh groundwater and rainwater as the natural sources of water (excluding conjunctive use of brackish or saline water for some purposes). Natural sources are assumed to include groundwater, surface water and harvested rainwater, but not desalinated water or water shipped or piped to the island. As shown in Figure 3.22 and Figure 3.23, the countries of Kiribati, Nauru, Niue, RMI, Tokelau and Tuvalu have groundwater and rainwater as their only natural freshwater sources.
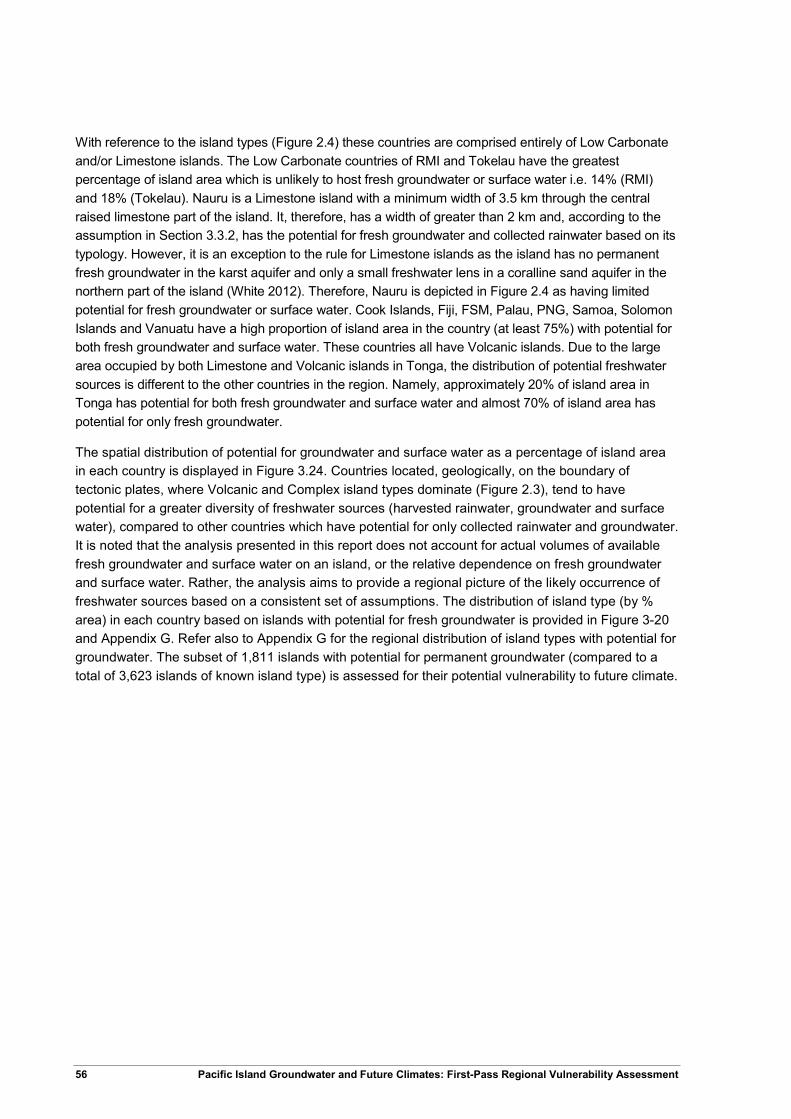
56 Pacific Island Groundwater and Future Climates: First-Pass Regional Vulnerability Assessment
With reference to the island types (Figure 2.4) these countries are comprised entirely of Low Carbonate and/or Limestone islands. The Low Carbonate countries of RMI and Tokelau have the greatest percentage of island area which is unlikely to host fresh groundwater or surface water i.e. 14% (RMI) and 18% (Tokelau). Nauru is a Limestone island with a minimum width of 3.5 km through the central raised limestone part of the island. It, therefore, has a width of greater than 2 km and, according to the assumption in Section 3.3.2, has the potential for fresh groundwater and collected rainwater based on its typology. However, it is an exception to the rule for Limestone islands as the island has no permanent fresh groundwater in the karst aquifer and only a small freshwater lens in a coralline sand aquifer in the northern part of the island (White 2012). Therefore, Nauru is depicted in Figure 2.4 as having limited potential for fresh groundwater or surface water. Cook Islands, Fiji, FSM, Palau, PNG, Samoa, Solomon Islands and Vanuatu have a high proportion of island area in the country (at least 75%) with potential for both fresh groundwater and surface water. These countries all have Volcanic islands. Due to the large area occupied by both Limestone and Volcanic islands in Tonga, the distribution of potential freshwater sources is different to the other countries in the region. Namely, approximately 20% of island area in Tonga has potential for both fresh groundwater and surface water and almost 70% of island area has potential for only fresh groundwater.
The spatial distribution of potential for groundwater and surface water as a percentage of island area in each country is displayed in Figure 3.24. Countries located, geologically, on the boundary of tectonic plates, where Volcanic and Complex island types dominate (Figure 2.3), tend to have potential for a greater diversity of freshwater sources (harvested rainwater, groundwater and surface water), compared to other countries which have potential for only collected rainwater and groundwater. It is noted that the analysis presented in this report does not account for actual volumes of available fresh groundwater and surface water on an island, or the relative dependence on fresh groundwater and surface water. Rather, the analysis aims to provide a regional picture of the likely occurrence of freshwater sources based on a consistent set of assumptions. The distribution of island type (by % area) in each country based on islands with potential for fresh groundwater is provided in Figure 3-20 and Appendix G. Refer also to Appendix G for the regional distribution of island types with potential for groundwater. The subset of 1,811 islands with potential for permanent groundwater (compared to a total of 3,623 islands of known island type) is assessed for their potential vulnerability to future climate.
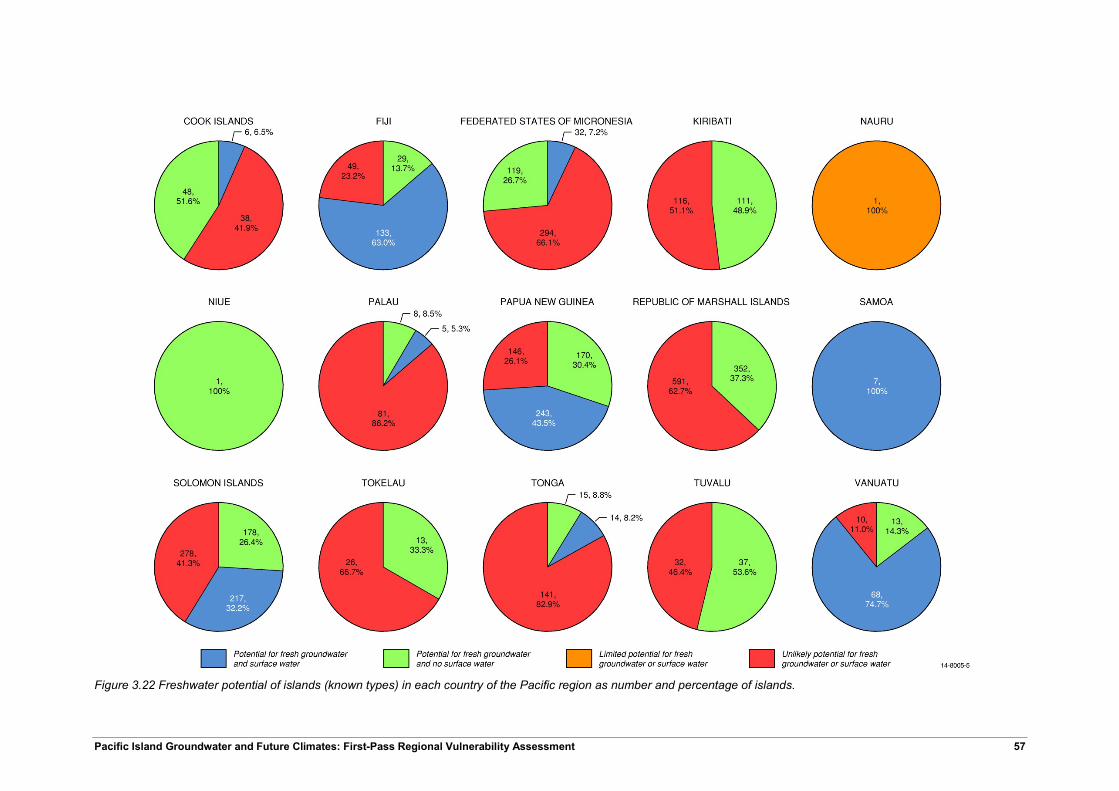
Pacific Island Groundwater and Future Climates: First-Pass Regional Vulnerability Assessment 57
Figure 3.22 Freshwater potential of islands (known types) in each country of the Pacific region as number and percentage of islands.
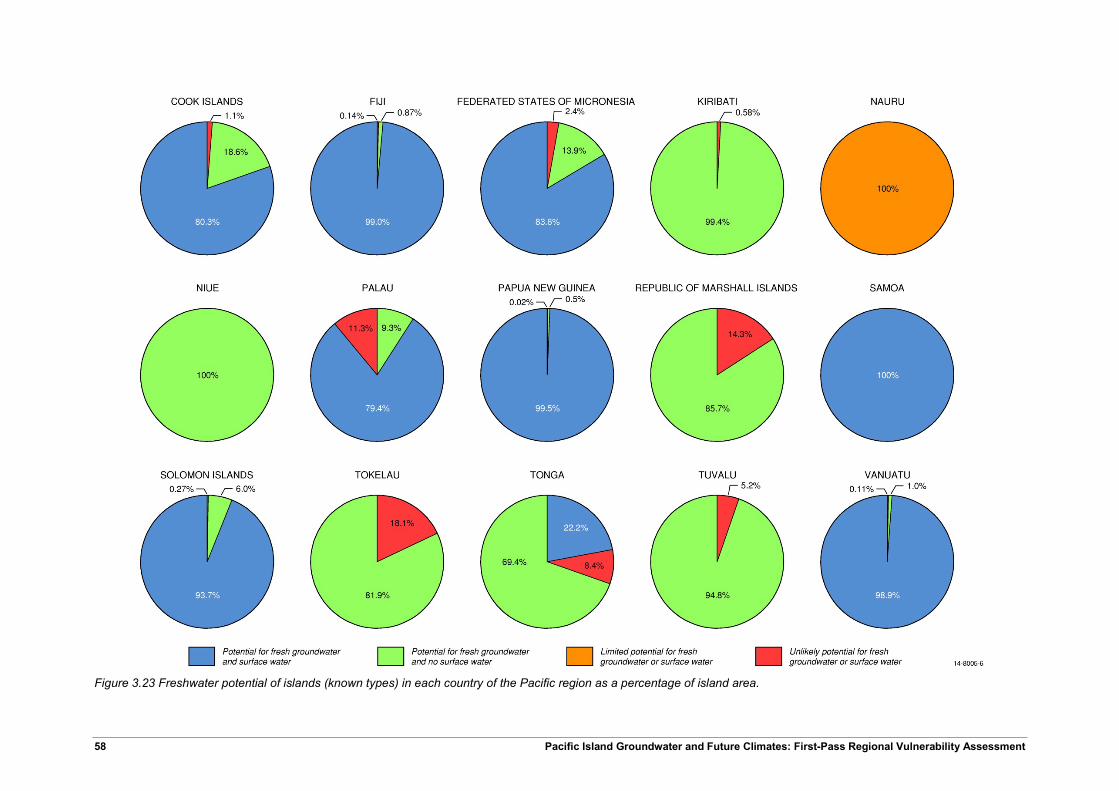
58 Pacific Island Groundwater and Future Climates: First-Pass Regional Vulnerability Assessment
Figure 3.23 Freshwater potential of islands (known types) in each country of the Pacific region as a percentage of island area.

Pacific Island Groundwater and Future Climates: First-Pass Regional Vulnerability Assessment 59
Figure 3.24 Regional distribution of potential freshwater sources (by % area) in each country. Refer to Figure 3.23 for an enlargement of each country pie chart.
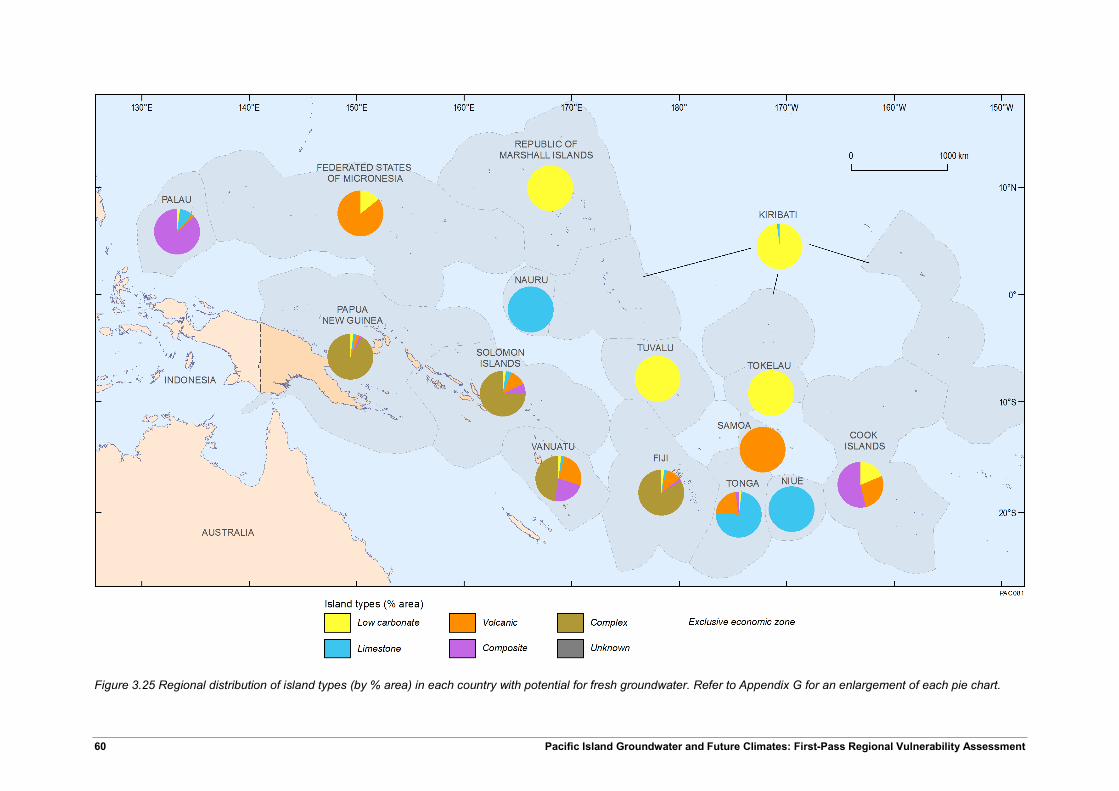
60 Pacific Island Groundwater and Future Climates: First-Pass Regional Vulnerability Assessment
Figure 3.25 Regional distribution of island types (by % area) in each country with potential for fresh groundwater. Refer to Appendix G for an enlargement of each pie chart.
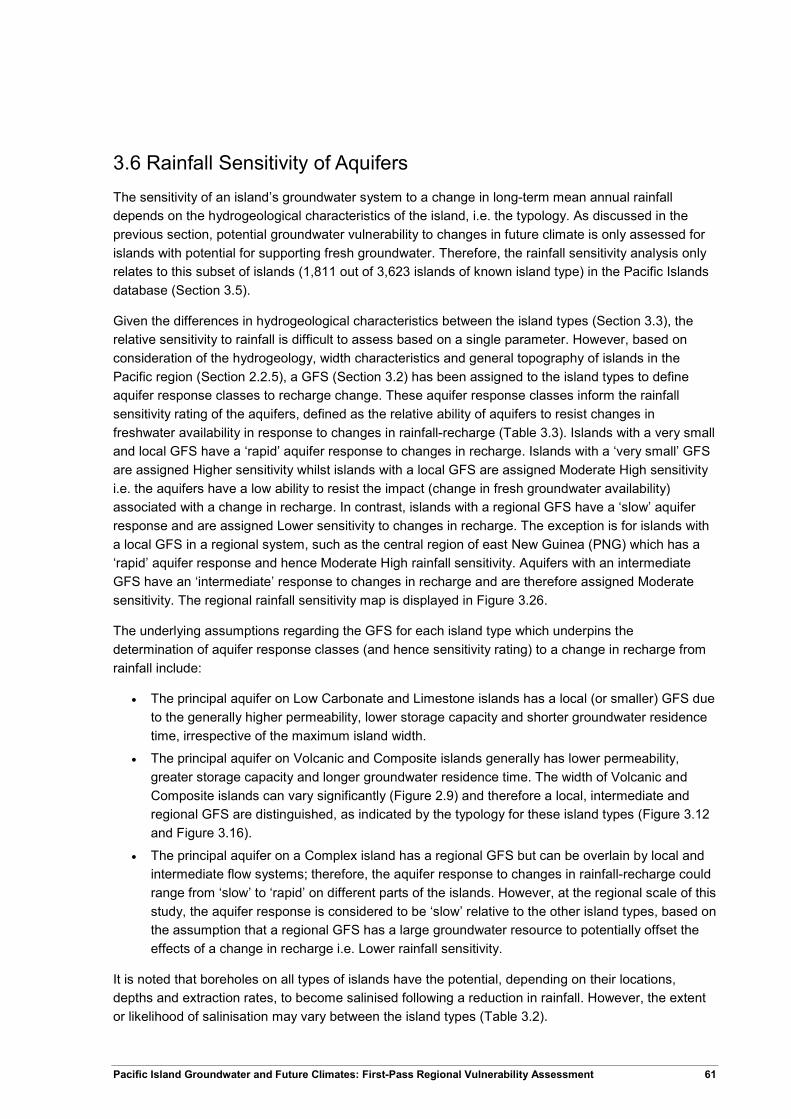
Pacific Island Groundwater and Future Climates: First-Pass Regional Vulnerability Assessment 61
3.6 Rainfall Sensitivity of Aquifers The sensitivity of an island’s groundwater system to a change in long-term mean annual rainfall depends on the hydrogeological characteristics of the island, i.e. the typology. As discussed in the previous section, potential groundwater vulnerability to changes in future climate is only assessed for islands with potential for supporting fresh groundwater. Therefore, the rainfall sensitivity analysis only relates to this subset of islands (1,811 out of 3,623 islands of known island type) in the Pacific Islands database (Section 3.5).
Given the differences in hydrogeological characteristics between the island types (Section 3.3), the relative sensitivity to rainfall is difficult to assess based on a single parameter. However, based on consideration of the hydrogeology, width characteristics and general topography of islands in the Pacific region (Section 2.2.5), a GFS (Section 3.2) has been assigned to the island types to define aquifer response classes to recharge change. These aquifer response classes inform the rainfall sensitivity rating of the aquifers, defined as the relative ability of aquifers to resist changes in freshwater availability in response to changes in rainfall-recharge (Table 3.3). Islands with a very small and local GFS have a ‘rapid’ aquifer response to changes in recharge. Islands with a ‘very small’ GFS are assigned Higher sensitivity whilst islands with a local GFS are assigned Moderate High sensitivity i.e. the aquifers have a low ability to resist the impact (change in fresh groundwater availability) associated with a change in recharge. In contrast, islands with a regional GFS have a ‘slow’ aquifer response and are assigned Lower sensitivity to changes in recharge. The exception is for islands with a local GFS in a regional system, such as the central region of east New Guinea (PNG) which has a ‘rapid’ aquifer response and hence Moderate High rainfall sensitivity. Aquifers with an intermediate GFS have an ‘intermediate’ response to changes in recharge and are therefore assigned Moderate sensitivity. The regional rainfall sensitivity map is displayed in Figure 3.26.
The underlying assumptions regarding the GFS for each island type which underpins the determination of aquifer response classes (and hence sensitivity rating) to a change in recharge from rainfall include:
• The principal aquifer on Low Carbonate and Limestone islands has a local (or smaller) GFS due to the generally higher permeability, lower storage capacity and shorter groundwater residence time, irrespective of the maximum island width.
• The principal aquifer on Volcanic and Composite islands generally has lower permeability, greater storage capacity and longer groundwater residence time. The width of Volcanic and Composite islands can vary significantly (Figure 2.9) and therefore a local, intermediate and regional GFS are distinguished, as indicated by the typology for these island types (Figure 3.12 and Figure 3.16).
• The principal aquifer on a Complex island has a regional GFS but can be overlain by local and intermediate flow systems; therefore, the aquifer response to changes in rainfall-recharge could range from ‘slow’ to ‘rapid’ on different parts of the islands. However, at the regional scale of this study, the aquifer response is considered to be ‘slow’ relative to the other island types, based on the assumption that a regional GFS has a large groundwater resource to potentially offset the effects of a change in recharge i.e. Lower rainfall sensitivity.
It is noted that boreholes on all types of islands have the potential, depending on their locations, depths and extraction rates, to become salinised following a reduction in rainfall. However, the extent or likelihood of salinisation may vary between the island types (Table 3.2).
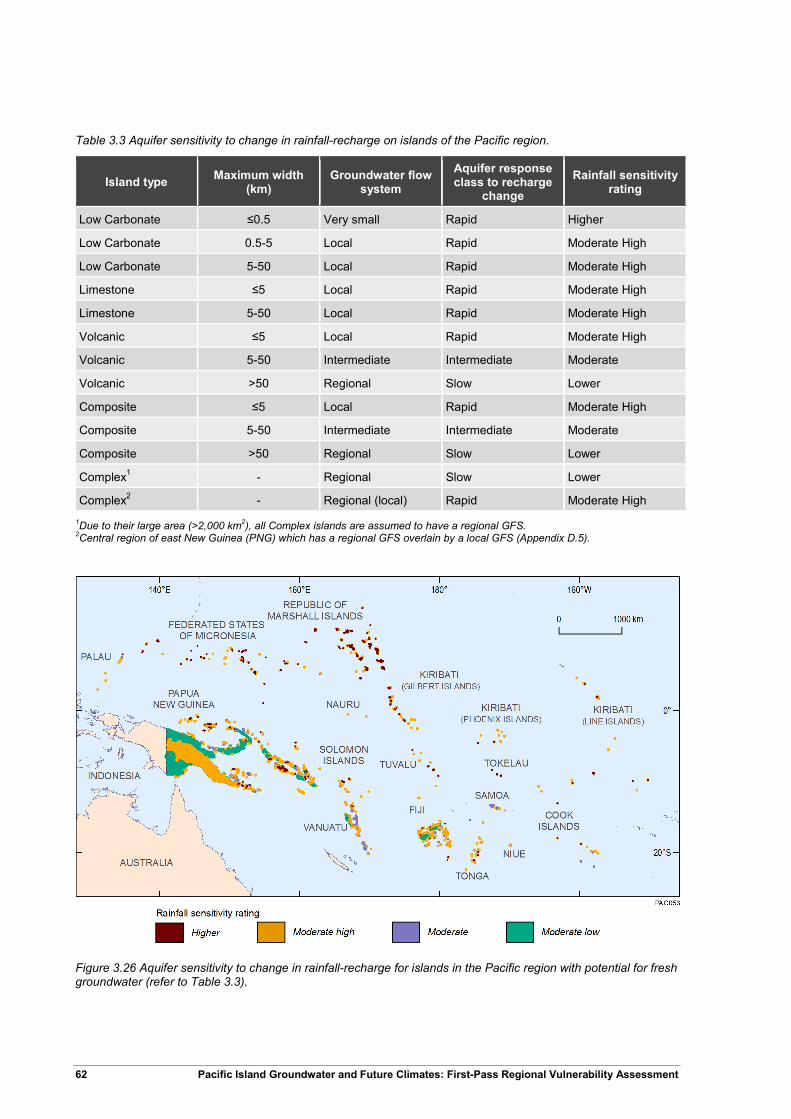
62 Pacific Island Groundwater and Future Climates: First-Pass Regional Vulnerability Assessment
Table 3.3 Aquifer sensitivity to change in rainfall-recharge on islands of the Pacific region.
Island type Maximum width (km)
Groundwater flow system
Aquifer response class to recharge
change Rainfall sensitivity
rating
Low Carbonate ≤0.5 Very small Rapid Higher
Low Carbonate 0.5-5 Local Rapid Moderate High
Low Carbonate 5-50 Local Rapid Moderate High
Limestone ≤5 Local Rapid Moderate High
Limestone 5-50 Local Rapid Moderate High
Volcanic ≤5 Local Rapid Moderate High
Volcanic 5-50 Intermediate Intermediate Moderate
Volcanic >50 Regional Slow Lower
Composite ≤5 Local Rapid Moderate High
Composite 5-50 Intermediate Intermediate Moderate
Composite >50 Regional Slow Lower
Complex1 - Regional Slow Lower
Complex2 - Regional (local) Rapid Moderate High 1Due to their large area (>2,000 km2), all Complex islands are assumed to have a regional GFS. 2Central region of east New Guinea (PNG) which has a regional GFS overlain by a local GFS (Appendix D.5).
Figure 3.26 Aquifer sensitivity to change in rainfall-recharge for islands in the Pacific region with potential for fresh groundwater (refer to Table 3.3).
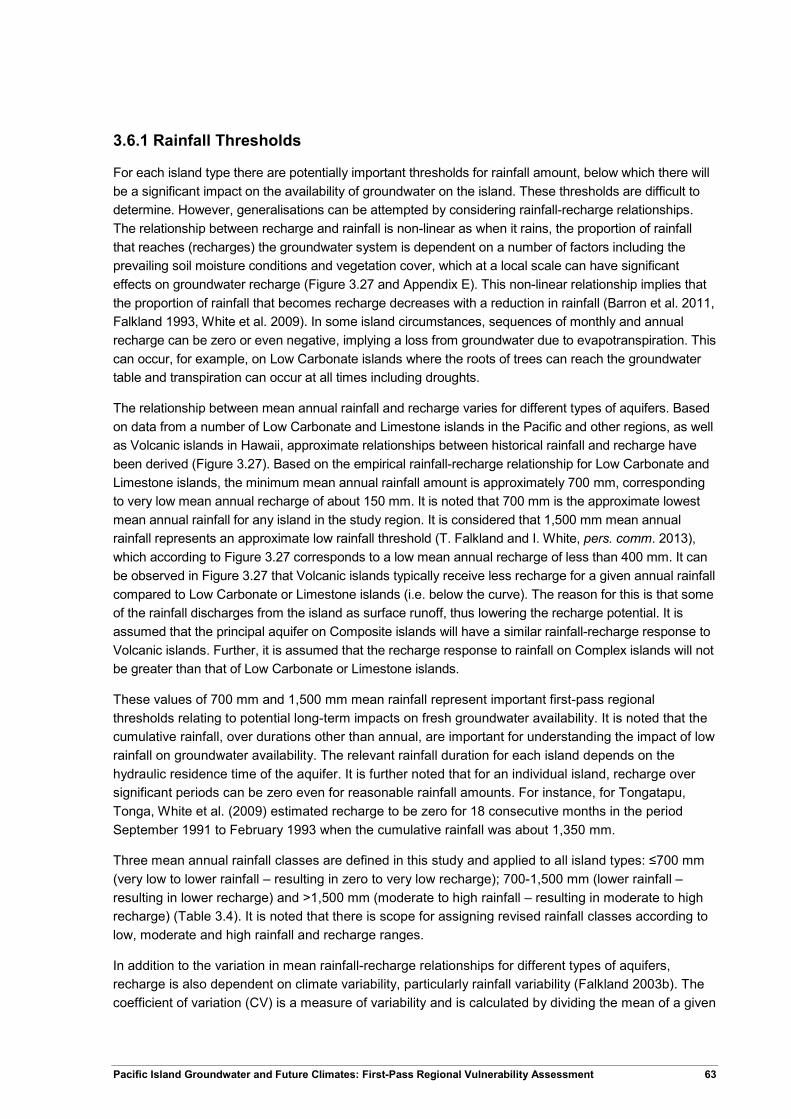
Pacific Island Groundwater and Future Climates: First-Pass Regional Vulnerability Assessment 63
3.6.1 Rainfall Thresholds
For each island type there are potentially important thresholds for rainfall amount, below which there will be a significant impact on the availability of groundwater on the island. These thresholds are difficult to determine. However, generalisations can be attempted by considering rainfall-recharge relationships. The relationship between recharge and rainfall is non-linear as when it rains, the proportion of rainfall that reaches (recharges) the groundwater system is dependent on a number of factors including the prevailing soil moisture conditions and vegetation cover, which at a local scale can have significant effects on groundwater recharge (Figure 3.27 and Appendix E). This non-linear relationship implies that the proportion of rainfall that becomes recharge decreases with a reduction in rainfall (Barron et al. 2011, Falkland 1993, White et al. 2009). In some island circumstances, sequences of monthly and annual recharge can be zero or even negative, implying a loss from groundwater due to evapotranspiration. This can occur, for example, on Low Carbonate islands where the roots of trees can reach the groundwater table and transpiration can occur at all times including droughts.
The relationship between mean annual rainfall and recharge varies for different types of aquifers. Based on data from a number of Low Carbonate and Limestone islands in the Pacific and other regions, as well as Volcanic islands in Hawaii, approximate relationships between historical rainfall and recharge have been derived (Figure 3.27). Based on the empirical rainfall-recharge relationship for Low Carbonate and Limestone islands, the minimum mean annual rainfall amount is approximately 700 mm, corresponding to very low mean annual recharge of about 150 mm. It is noted that 700 mm is the approximate lowest mean annual rainfall for any island in the study region. It is considered that 1,500 mm mean annual rainfall represents an approximate low rainfall threshold (T. Falkland and I. White, pers. comm. 2013), which according to Figure 3.27 corresponds to a low mean annual recharge of less than 400 mm. It can be observed in Figure 3.27 that Volcanic islands typically receive less recharge for a given annual rainfall compared to Low Carbonate or Limestone islands (i.e. below the curve). The reason for this is that some of the rainfall discharges from the island as surface runoff, thus lowering the recharge potential. It is assumed that the principal aquifer on Composite islands will have a similar rainfall-recharge response to Volcanic islands. Further, it is assumed that the recharge response to rainfall on Complex islands will not be greater than that of Low Carbonate or Limestone islands.
These values of 700 mm and 1,500 mm mean rainfall represent important first-pass regional thresholds relating to potential long-term impacts on fresh groundwater availability. It is noted that the cumulative rainfall, over durations other than annual, are important for understanding the impact of low rainfall on groundwater availability. The relevant rainfall duration for each island depends on the hydraulic residence time of the aquifer. It is further noted that for an individual island, recharge over significant periods can be zero even for reasonable rainfall amounts. For instance, for Tongatapu, Tonga, White et al. (2009) estimated recharge to be zero for 18 consecutive months in the period September 1991 to February 1993 when the cumulative rainfall was about 1,350 mm.
Three mean annual rainfall classes are defined in this study and applied to all island types: ≤700 mm (very low to lower rainfall – resulting in zero to very low recharge); 700-1,500 mm (lower rainfall – resulting in lower recharge) and >1,500 mm (moderate to high rainfall – resulting in moderate to high recharge) (Table 3.4). It is noted that there is scope for assigning revised rainfall classes according to low, moderate and high rainfall and recharge ranges.
In addition to the variation in mean rainfall-recharge relationships for different types of aquifers, recharge is also dependent on climate variability, particularly rainfall variability (Falkland 2003b). The coefficient of variation (CV) is a measure of variability and is calculated by dividing the mean of a given
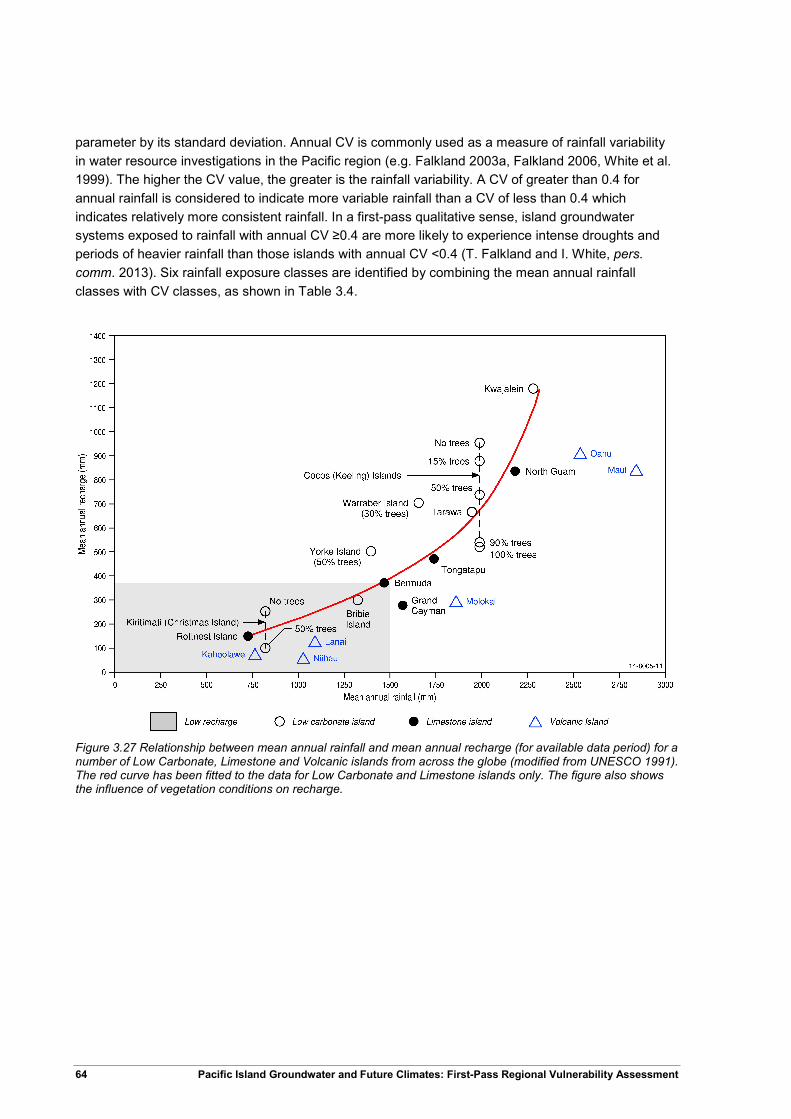
64 Pacific Island Groundwater and Future Climates: First-Pass Regional Vulnerability Assessment
parameter by its standard deviation. Annual CV is commonly used as a measure of rainfall variability in water resource investigations in the Pacific region (e.g. Falkland 2003a, Falkland 2006, White et al. 1999). The higher the CV value, the greater is the rainfall variability. A CV of greater than 0.4 for annual rainfall is considered to indicate more variable rainfall than a CV of less than 0.4 which indicates relatively more consistent rainfall. In a first-pass qualitative sense, island groundwater systems exposed to rainfall with annual CV ≥0.4 are more likely to experience intense droughts and periods of heavier rainfall than those islands with annual CV <0.4 (T. Falkland and I. White, pers. comm. 2013). Six rainfall exposure classes are identified by combining the mean annual rainfall classes with CV classes, as shown in Table 3.4.
Figure 3.27 Relationship between mean annual rainfall and mean annual recharge (for available data period) for a number of Low Carbonate, Limestone and Volcanic islands from across the globe (modified from UNESCO 1991). The red curve has been fitted to the data for Low Carbonate and Limestone islands only. The figure also shows the influence of vegetation conditions on recharge.
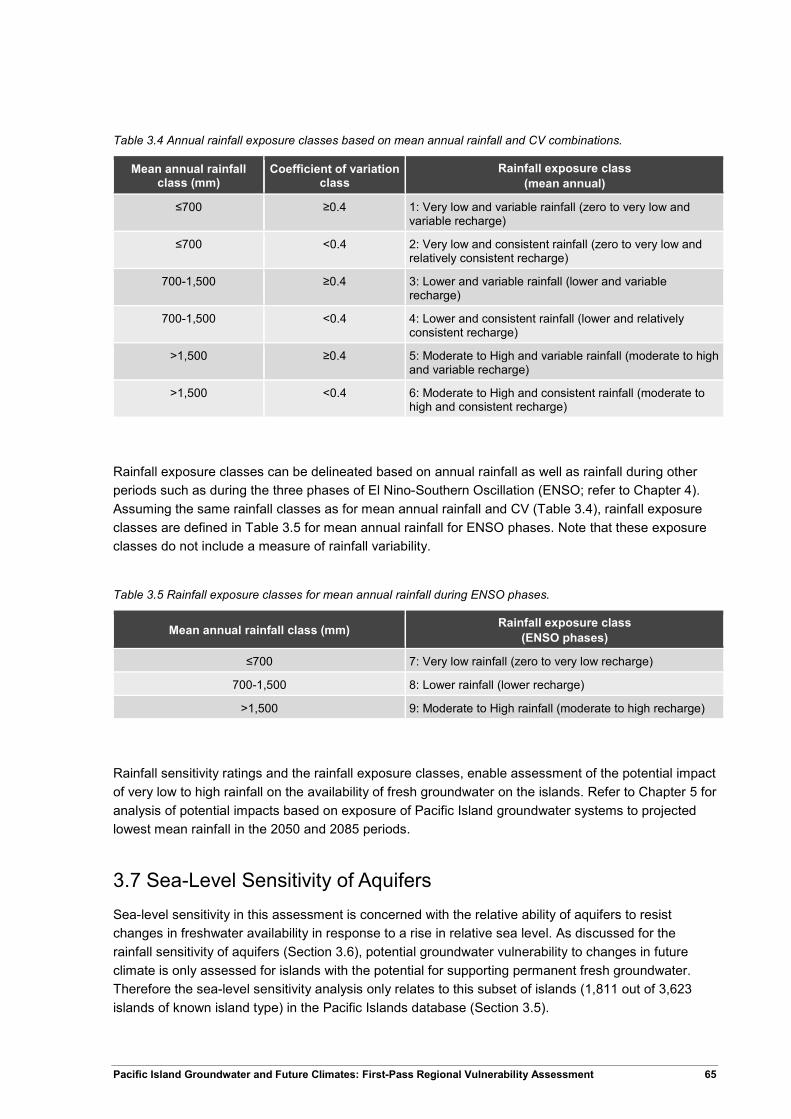
Pacific Island Groundwater and Future Climates: First-Pass Regional Vulnerability Assessment 65
Table 3.4 Annual rainfall exposure classes based on mean annual rainfall and CV combinations.
Mean annual rainfall class (mm)
Coefficient of variation class
Rainfall exposure class (mean annual)
≤700 ≥0.4 1: Very low and variable rainfall (zero to very low and variable recharge)
≤700 <0.4 2: Very low and consistent rainfall (zero to very low and relatively consistent recharge)
700-1,500 ≥0.4 3: Lower and variable rainfall (lower and variable recharge)
700-1,500 <0.4 4: Lower and consistent rainfall (lower and relatively consistent recharge)
>1,500 ≥0.4 5: Moderate to High and variable rainfall (moderate to high and variable recharge)
>1,500 <0.4 6: Moderate to High and consistent rainfall (moderate to high and consistent recharge)
Rainfall exposure classes can be delineated based on annual rainfall as well as rainfall during other periods such as during the three phases of El Nino-Southern Oscillation (ENSO; refer to Chapter 4). Assuming the same rainfall classes as for mean annual rainfall and CV (Table 3.4), rainfall exposure classes are defined in Table 3.5 for mean annual rainfall for ENSO phases. Note that these exposure classes do not include a measure of rainfall variability.
Table 3.5 Rainfall exposure classes for mean annual rainfall during ENSO phases.
Mean annual rainfall class (mm) Rainfall exposure class (ENSO phases)
≤700 7: Very low rainfall (zero to very low recharge)
700-1,500 8: Lower rainfall (lower recharge)
>1,500 9: Moderate to High rainfall (moderate to high recharge)
Rainfall sensitivity ratings and the rainfall exposure classes, enable assessment of the potential impact of very low to high rainfall on the availability of fresh groundwater on the islands. Refer to Chapter 5 for analysis of potential impacts based on exposure of Pacific Island groundwater systems to projected lowest mean rainfall in the 2050 and 2085 periods.
3.7 Sea-Level Sensitivity of Aquifers Sea-level sensitivity in this assessment is concerned with the relative ability of aquifers to resist changes in freshwater availability in response to a rise in relative sea level. As discussed for the rainfall sensitivity of aquifers (Section 3.6), potential groundwater vulnerability to changes in future climate is only assessed for islands with the potential for supporting permanent fresh groundwater. Therefore the sea-level sensitivity analysis only relates to this subset of islands (1,811 out of 3,623 islands of known island type) in the Pacific Islands database (Section 3.5).
66 Pacific Island Groundwater and Future Climates: First-Pass Regional Vulnerability Assessment
Islands are dynamic. They are continually changing in terms of size and structure due to both tectonic processes, and at an island level, coral growth and death and local hydrodynamic processes, (especially on Low Carbonate islands), with consequent sedimentation and erosion depending on the individual island characteristics. Therefore, depending on the rate of island growth and the rate of SLR, islands are capable of changing in conjunction with changes in sea level. Hence, relative sea- level change, i.e. the sea-level change experienced by an island, depends not only on the change in absolute sea level but also on the location of the island and the degree of island growth and subsidence. It was beyond the scope of this project to assess potential variations in island elevation over the projection periods due to changes in tectonics. To be conservative, it has been assumed in this project that all islands are potentially exposed to an increase in relative sea level, in order to account for those islands in which coral growth may not keep pace with projected SLR.
As summarised in Table 3.2, there is potentially no change in fresh groundwater volume in freshwater lenses or coastal aquifers due to a rise in relative sea level, assuming that the water table is able to freely rise and there is no loss of land. However, if the water table is unable to rise due to physical controls such as drains, wetlands, streams/rivers and groundwater evapotranspiration (Morgan and Werner 2014, Werner and Simmons 2009), the availability of fresh groundwater is reduced due to SWI. In this scenario, islands with a regional GFS have the potential for a large recharge area to moderate the effects of SWI (i.e. lower sensitivity) compared to islands with a local (or very small) GFS. A decrease in fresh groundwater availability can also arise if there is a reduction in island area due to inundation and hence a reduction or loss of the freshwater aquifer (Table 3.2). All islands potentially have low-lying areas that are sensitive to inundation; however, in the absence of high resolution elevation data, it is not possible to assess these low-lying areas at the regional scale. However, for a given rise in sea level, the proportion of island area that can be inundated is greatest for smaller, low-lying islands and the least for larger, higher islands. This is captured in the relative sea-level sensitivities of the island types.
The typology developed for islands in the Pacific region includes both perched and basal aquifers (Section 2.1). Perched aquifers tend to be situated high in the landscape and not in contact with seawater. In contrast, basal aquifers overlie seawater. Due to their greater storage volume, the assumed principal aquifer on all types of islands is basal rather than perched, and is therefore potentially vulnerable to SWI. The impact of a rise in long-term relative sea level on an island’s groundwater system is strongly influenced by the width and elevation of the island. A simple steady-state analytical modeling study of freshwater lenses on small, Low Carbonate islands by Morgan and Werner (2014) also found that propensity for SWI to occur was inversely proportional to island width. The GFS also influences the response of an aquifer to a change in relative sea level. Based on the availability of consistent regional data, these island characteristics are assessed in combination to inform the relative sensitivities of different groundwater systems to changes in relative mean sea level.
As summarised in Table 3.6, islands ≤0.5 km in maximum width with a local GFS and maximum elevation ≤5 m are assigned Higher sensitivity to a rise in sea level. In contrast, islands >50 km in maximum width with a regional GFS and maximum elevation >5 m are assigned Lower sensitivity to SLR. Islands with a local GFS are assigned Moderate High or Moderate sensitivity based on their maximum elevation of ≤5 m or >5 m, respectively. Due to their larger GFS, islands with an intermediate flow system are given a Lower sensitivity rating to SLR for any maximum elevation. These generalisations are considered reasonable for a first-pass regional assessment of groundwater sensitivity to a rise in sea level. The regional mean SLR sensitivity map is displayed in Figure 3.28.
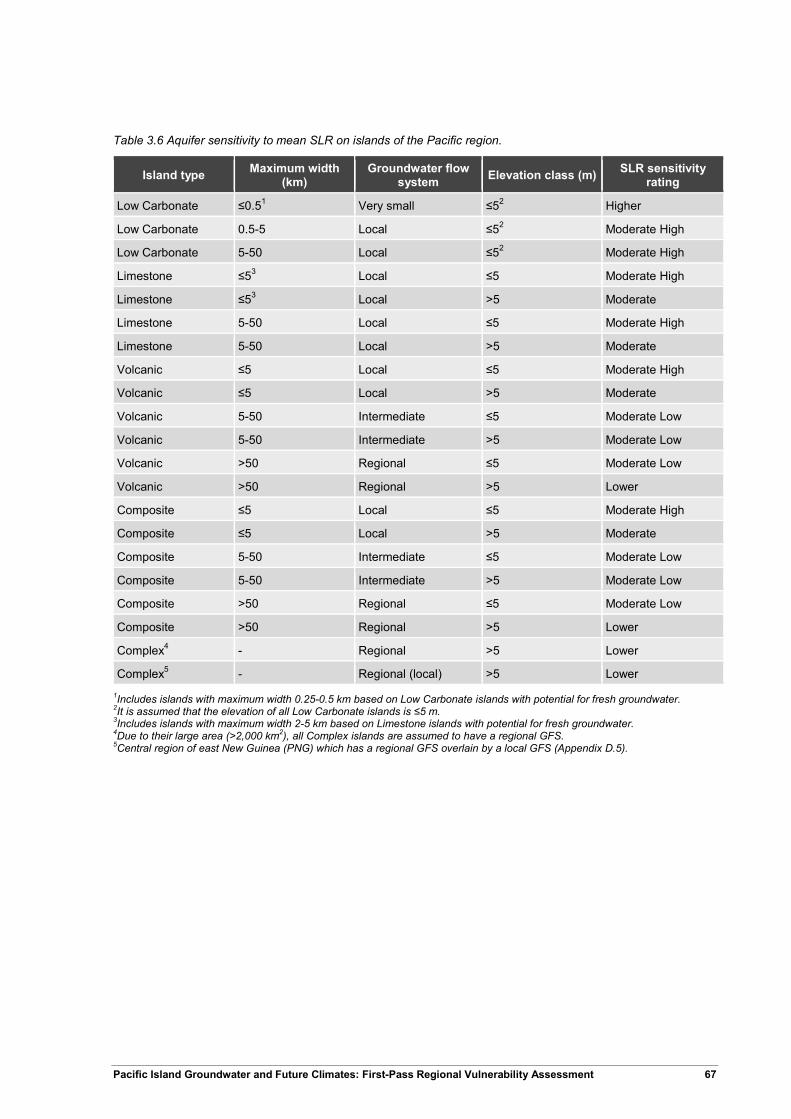
Pacific Island Groundwater and Future Climates: First-Pass Regional Vulnerability Assessment 67
Table 3.6 Aquifer sensitivity to mean SLR on islands of the Pacific region.
Island type Maximum width (km)
Groundwater flow system Elevation class (m) SLR sensitivity
rating
Low Carbonate ≤0.51 Very small ≤52 Higher
Low Carbonate 0.5-5 Local ≤52 Moderate High
Low Carbonate 5-50 Local ≤52 Moderate High
Limestone ≤53 Local ≤5 Moderate High
Limestone ≤53 Local >5 Moderate
Limestone 5-50 Local ≤5 Moderate High
Limestone 5-50 Local >5 Moderate
Volcanic ≤5 Local ≤5 Moderate High
Volcanic ≤5 Local >5 Moderate
Volcanic 5-50 Intermediate ≤5 Moderate Low
Volcanic 5-50 Intermediate >5 Moderate Low
Volcanic >50 Regional ≤5 Moderate Low
Volcanic >50 Regional >5 Lower
Composite ≤5 Local ≤5 Moderate High
Composite ≤5 Local >5 Moderate
Composite 5-50 Intermediate ≤5 Moderate Low
Composite 5-50 Intermediate >5 Moderate Low
Composite >50 Regional ≤5 Moderate Low
Composite >50 Regional >5 Lower
Complex4 - Regional >5 Lower
Complex5 - Regional (local) >5 Lower 1Includes islands with maximum width 0.25-0.5 km based on Low Carbonate islands with potential for fresh groundwater. 2It is assumed that the elevation of all Low Carbonate islands is ≤5 m. 3Includes islands with maximum width 2-5 km based on Limestone islands with potential for fresh groundwater. 4Due to their large area (>2,000 km2), all Complex islands are assumed to have a regional GFS. 5Central region of east New Guinea (PNG) which has a regional GFS overlain by a local GFS (Appendix D.5).
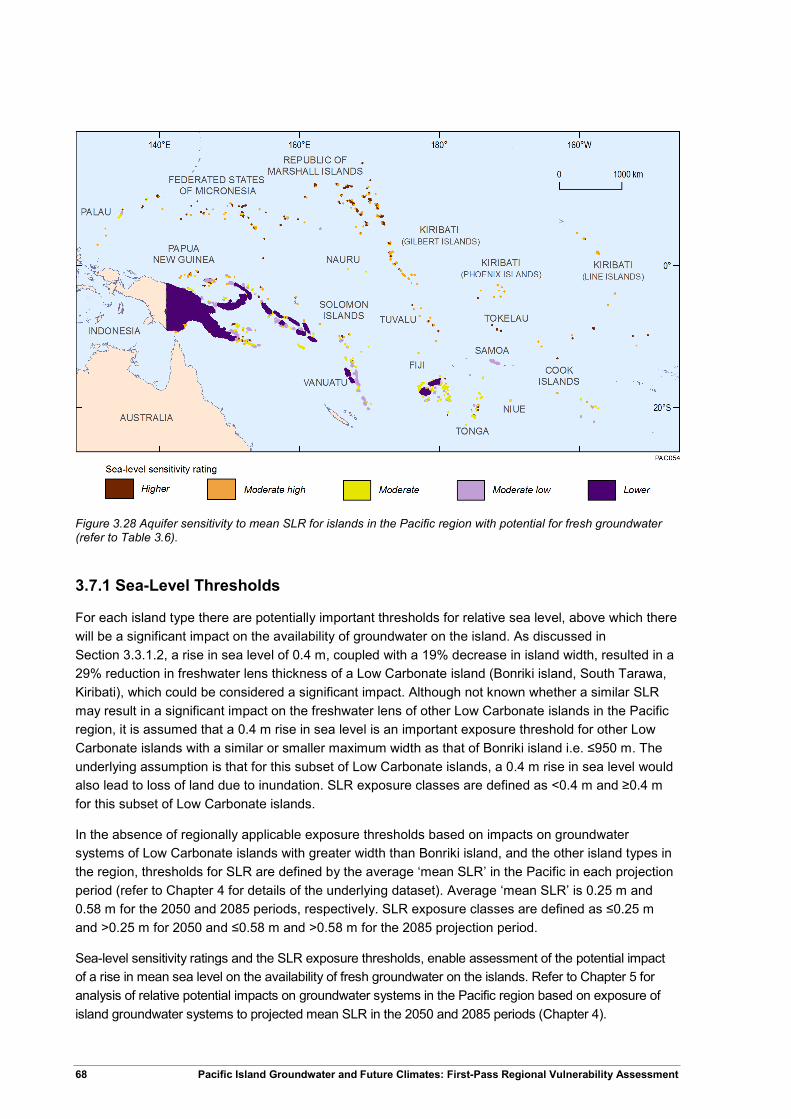
68 Pacific Island Groundwater and Future Climates: First-Pass Regional Vulnerability Assessment
Figure 3.28 Aquifer sensitivity to mean SLR for islands in the Pacific region with potential for fresh groundwater (refer to Table 3.6).
3.7.1 Sea-Level Thresholds
For each island type there are potentially important thresholds for relative sea level, above which there will be a significant impact on the availability of groundwater on the island. As discussed in Section 3.3.1.2, a rise in sea level of 0.4 m, coupled with a 19% decrease in island width, resulted in a 29% reduction in freshwater lens thickness of a Low Carbonate island (Bonriki island, South Tarawa, Kiribati), which could be considered a significant impact. Although not known whether a similar SLR may result in a significant impact on the freshwater lens of other Low Carbonate islands in the Pacific region, it is assumed that a 0.4 m rise in sea level is an important exposure threshold for other Low Carbonate islands with a similar or smaller maximum width as that of Bonriki island i.e. ≤950 m. The underlying assumption is that for this subset of Low Carbonate islands, a 0.4 m rise in sea level would also lead to loss of land due to inundation. SLR exposure classes are defined as <0.4 m and ≥0.4 m for this subset of Low Carbonate islands.
In the absence of regionally applicable exposure thresholds based on impacts on groundwater systems of Low Carbonate islands with greater width than Bonriki island, and the other island types in the region, thresholds for SLR are defined by the average ‘mean SLR’ in the Pacific in each projection period (refer to Chapter 4 for details of the underlying dataset). Average ‘mean SLR’ is 0.25 m and 0.58 m for the 2050 and 2085 periods, respectively. SLR exposure classes are defined as ≤0.25 m and >0.25 m for 2050 and ≤0.58 m and >0.58 m for the 2085 projection period.
Sea-level sensitivity ratings and the SLR exposure thresholds, enable assessment of the potential impact of a rise in mean sea level on the availability of fresh groundwater on the islands. Refer to Chapter 5 for analysis of relative potential impacts on groundwater systems in the Pacific region based on exposure of island groundwater systems to projected mean SLR in the 2050 and 2085 periods (Chapter 4).
Pacific Island Groundwater and Future Climates: First-Pass Regional Vulnerability Assessment 69
3.8 Chapter Summary Sensitivity is the intrinsic ability of a groundwater system to resist the impact of a hazard. This project has examined the relative sensitivities of groundwater systems to a change in rainfall-recharge and mean SLR. Sensitivity has been assessed for fresh groundwater availability in freshwater lenses and coastal aquifers.
Islands of a given type have similar groundwater systems. Similar groundwater systems are assumed to respond in a similar manner to a given climate-related hazard. Therefore, islands of a given type are expected to have similar sensitivities to climate-related hazards. Whilst Volcanic, Composite and Complex islands typically have multiple aquifers, Low Carbonate and Limestone islands typically have a single aquifer. The aquifer with the highest productivity potential for each island type i.e. the principal aquifer has been used for the sensitivity assessment.
The island type and GFS of the principal aquifer, as well as maximum elevation in the case of SLR, are important factors contributing to island groundwater sensitivity to a change in rainfall-recharge and a rise in mean sea level. The sensitivities of the different island types to the climate-related hazards are listed below.
• Very small Low Carbonate islands (≤500 m maximum width) have Higher sensitivity to both changes in recharge and increases in mean sea level;
• Low Carbonate islands (>500 m maximum width) have Moderate High sensitivity to changes in recharge and increases in mean sea level;
• Limestone islands have Moderate High sensitivity to changes in recharge and Moderate to Moderate High sensitivity to increases in mean sea level;
• Volcanic islands have Lower to Moderate High sensitivity to changes in recharge and Lower to Moderate High sensitivity to increases in mean sea level;
• Composite islands have lower to Moderate High sensitivity to changes in recharge and Lower to Moderate High sensitivity to increases in mean sea level;
• Complex islands generally have Lower sensitivity to both changes in recharge and increases in mean sea level.
Rainfall and SLR thresholds, which when crossed lead to an adverse impact on the availability of fresh groundwater, have been determined for the island types in the Pacific region. Sea-level sensitivity ratings and the SLR exposure thresholds enable assessment of the potential impact of a rise in sea level on the availability of fresh groundwater on the islands.
70 Pacific Island Groundwater and Future Climates: First-Pass Regional Vulnerability Assessment
4 Exposure to Future Rainfall and Sea Level
Exposure in this study is defined as the degree to which an aquifer comes in contact with a climate-related hazard. This project assesses two climate-related hazards that the Pacific Islands and their aquifers are potentially exposed to: low rainfall and a rise in sea level. While either too much or too little rainfall can cause problems for Pacific island groundwater systems, this project has a focus on groundwater availability and thus considers that the climate-related hazard of low rainfall will have the greatest adverse impact on groundwater availability.
4.1 Climate Systems in the Pacific Region Climate patterns vary across the Pacific region and are influenced on annual and interannual timescales by a number of climate features. The main climate features of the Pacific region are shown in Figure 4.1. The Intertropical Convergence Zone (ITCZ) is where the north and southeast trade winds meet. It is an area of higher rainfall. The wettest months occur during northern-hemisphere summer. The South Pacific Convergence Zone (SPCZ) is a southern sub-section of the ITCZ. The wettest months occur during southern-hemisphere summer. In the west, the influence of the Western Pacific Monsoon (WPM) results in a very strong seasonal contrast in rainfall (a very wet wet-season and a very dry dry-season). Further details of these climate features can be found in BoM and CSIRO (2011):
• Palau, FSM and RMIs’ rainfall amount and intensity are strongly influenced by the ITCZ.
• PNG and the Solomon Islands’ rainfall is strongly influenced by the WPM.
• Nauru, Kiribati, northern Tuvalu and northern Cook Islands are located away from the influences of the ITCZ, SPCZ and WPM. There are no convergence zones in this region and so this region tends to have lower relative rainfall than the other three regions of the Pacific.
• Vanuatu, Fiji, southern Tuvalu, Samoa, Tonga, Niue and southern Cook Islands’ rainfall is influenced by the South Pacific Convergence Zone (SPCZ), which is a sub-section of the ITCZ. Wettest months occur during the southern hemisphere summer.
The main climate features of the Pacific region are depicted in Figure 4.1.
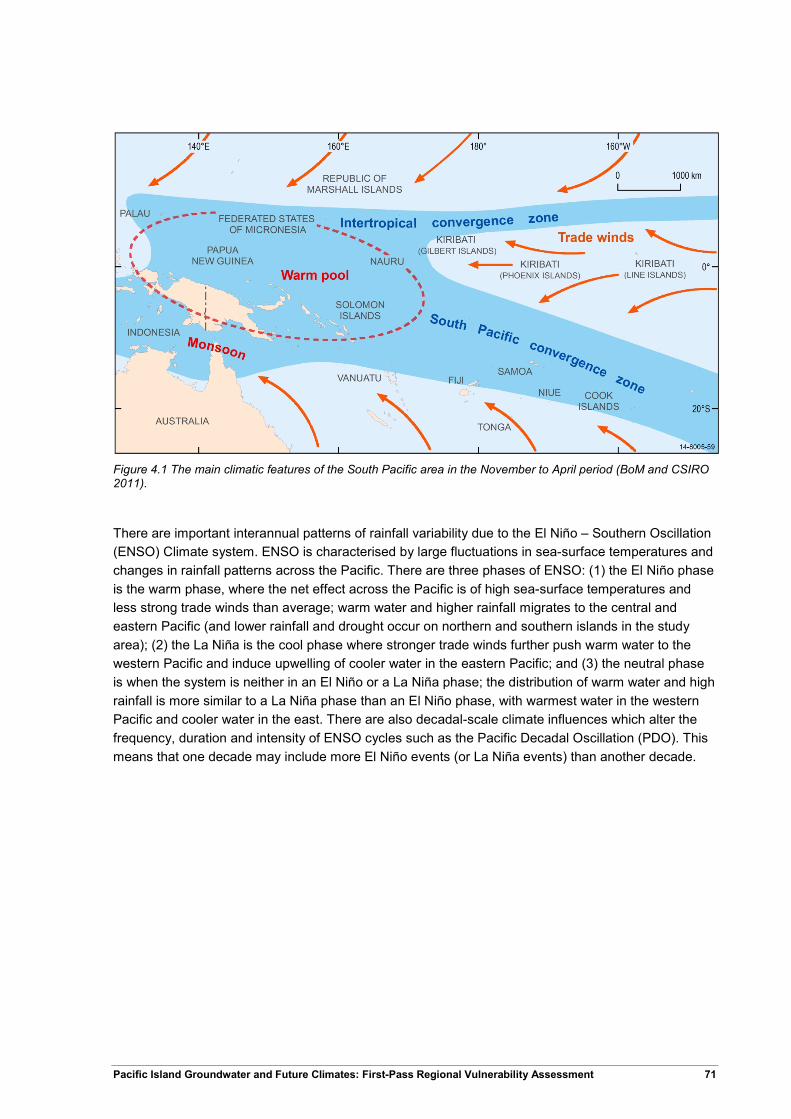
Pacific Island Groundwater and Future Climates: First-Pass Regional Vulnerability Assessment 71
Figure 4.1 The main climatic features of the South Pacific area in the November to April period (BoM and CSIRO 2011).
There are important interannual patterns of rainfall variability due to the El Niño – Southern Oscillation (ENSO) Climate system. ENSO is characterised by large fluctuations in sea-surface temperatures and changes in rainfall patterns across the Pacific. There are three phases of ENSO: (1) the El Niño phase is the warm phase, where the net effect across the Pacific is of high sea-surface temperatures and less strong trade winds than average; warm water and higher rainfall migrates to the central and eastern Pacific (and lower rainfall and drought occur on northern and southern islands in the study area); (2) the La Niña is the cool phase where stronger trade winds further push warm water to the western Pacific and induce upwelling of cooler water in the eastern Pacific; and (3) the neutral phase is when the system is neither in an El Niño or a La Niña phase; the distribution of warm water and high rainfall is more similar to a La Niña phase than an El Niño phase, with warmest water in the western Pacific and cooler water in the east. There are also decadal-scale climate influences which alter the frequency, duration and intensity of ENSO cycles such as the Pacific Decadal Oscillation (PDO). This means that one decade may include more El Niño events (or La Niña events) than another decade.
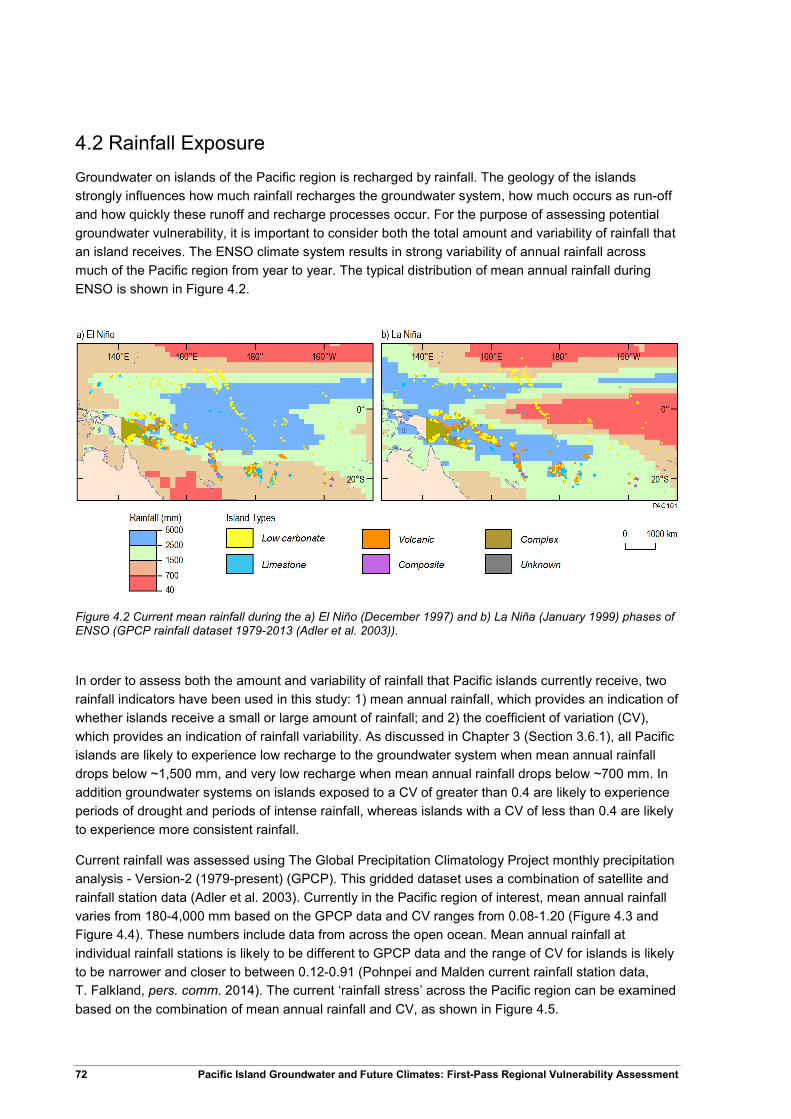
72 Pacific Island Groundwater and Future Climates: First-Pass Regional Vulnerability Assessment
4.2 Rainfall Exposure Groundwater on islands of the Pacific region is recharged by rainfall. The geology of the islands strongly influences how much rainfall recharges the groundwater system, how much occurs as run-off and how quickly these runoff and recharge processes occur. For the purpose of assessing potential groundwater vulnerability, it is important to consider both the total amount and variability of rainfall that an island receives. The ENSO climate system results in strong variability of annual rainfall across much of the Pacific region from year to year. The typical distribution of mean annual rainfall during ENSO is shown in Figure 4.2.
Figure 4.2 Current mean rainfall during the a) El Niño (December 1997) and b) La Niña (January 1999) phases of ENSO (GPCP rainfall dataset 1979-2013 (Adler et al. 2003)).
In order to assess both the amount and variability of rainfall that Pacific islands currently receive, two rainfall indicators have been used in this study: 1) mean annual rainfall, which provides an indication of whether islands receive a small or large amount of rainfall; and 2) the coefficient of variation (CV), which provides an indication of rainfall variability. As discussed in Chapter 3 (Section 3.6.1), all Pacific islands are likely to experience low recharge to the groundwater system when mean annual rainfall drops below ~1,500 mm, and very low recharge when mean annual rainfall drops below ~700 mm. In addition groundwater systems on islands exposed to a CV of greater than 0.4 are likely to experience periods of drought and periods of intense rainfall, whereas islands with a CV of less than 0.4 are likely to experience more consistent rainfall.
Current rainfall was assessed using The Global Precipitation Climatology Project monthly precipitation analysis - Version-2 (1979-present) (GPCP). This gridded dataset uses a combination of satellite and rainfall station data (Adler et al. 2003). Currently in the Pacific region of interest, mean annual rainfall varies from 180-4,000 mm based on the GPCP data and CV ranges from 0.08-1.20 (Figure 4.3 and Figure 4.4). These numbers include data from across the open ocean. Mean annual rainfall at individual rainfall stations is likely to be different to GPCP data and the range of CV for islands is likely to be narrower and closer to between 0.12-0.91 (Pohnpei and Malden current rainfall station data, T. Falkland, pers. comm. 2014). The current ‘rainfall stress’ across the Pacific region can be examined based on the combination of mean annual rainfall and CV, as shown in Figure 4.5.
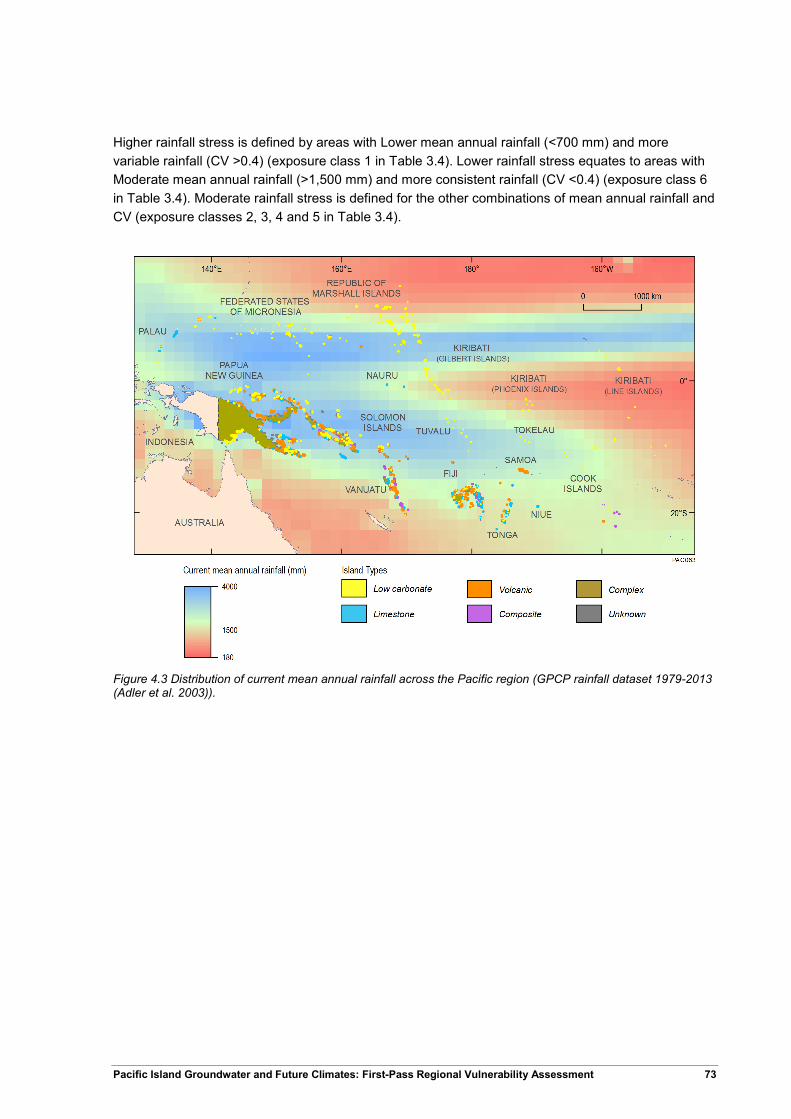
Pacific Island Groundwater and Future Climates: First-Pass Regional Vulnerability Assessment 73
Higher rainfall stress is defined by areas with Lower mean annual rainfall (<700 mm) and more variable rainfall (CV >0.4) (exposure class 1 in Table 3.4). Lower rainfall stress equates to areas with Moderate mean annual rainfall (>1,500 mm) and more consistent rainfall (CV <0.4) (exposure class 6 in Table 3.4). Moderate rainfall stress is defined for the other combinations of mean annual rainfall and CV (exposure classes 2, 3, 4 and 5 in Table 3.4).
Figure 4.3 Distribution of current mean annual rainfall across the Pacific region (GPCP rainfall dataset 1979-2013 (Adler et al. 2003)).
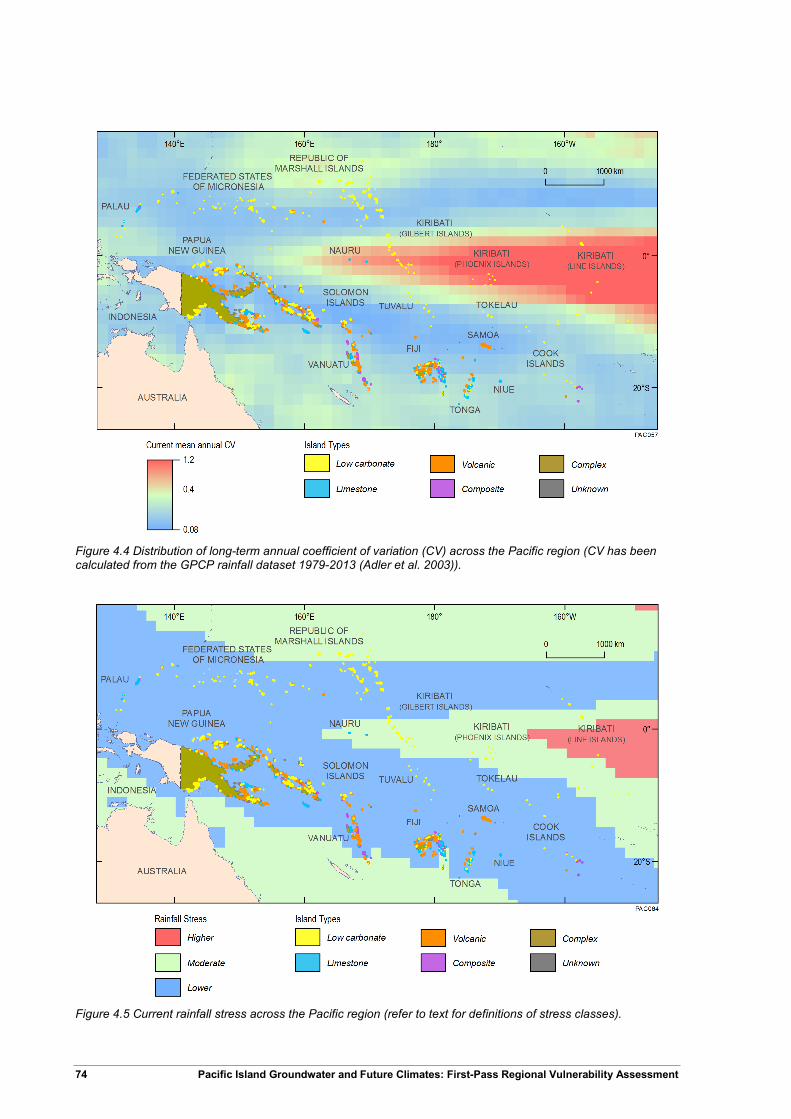
74 Pacific Island Groundwater and Future Climates: First-Pass Regional Vulnerability Assessment
Figure 4.4 Distribution of long-term annual coefficient of variation (CV) across the Pacific region (CV has been calculated from the GPCP rainfall dataset 1979-2013 (Adler et al. 2003)).
Figure 4.5 Current rainfall stress across the Pacific region (refer to text for definitions of stress classes).
Pacific Island Groundwater and Future Climates: First-Pass Regional Vulnerability Assessment 75
4.3 Projected Low Rainfall As mentioned earlier in this chapter, periods of low rainfall reduce groundwater availability and ENSO exerts an important influence on regional rainfall patterns on sub-annual to multi-year time scales. An analysis of projected lowest mean annual rainfall during ENSO phases for two future periods (2050 and 2085) under two emissions scenarios is presented. Results are summarised by island type.
There are currently a number of plausible rainfall projections for the Pacific region, as assessed by the Fifth Climate Model Intercomparison Project (CMIP5). A selection of the better performing models were used in this analysis for the two emissions scenarios, referred to as Representative Concentration Pathways (RCPs) (M. Grose, pers. comm. 2013). The RCPs include both a moderate (RCP 4.5) and a higher emissions scenario (RCP 8.5) (IPCC 2013).
Outputs from two types of models were assessed; Global Climate Models (GCMs) and higher resolution dynamically downscaled Conformal Cubic Atmospheric Models (CCAMs). Three GCM models and five CCAM models were chosen. The representative set of GCM projections were selected based on their acceptable simulation of the current mean climate, including the key climate features (SPCZ, ITCZ, WPM) and ENSO (Grose and Bedin 2013, Grose et al. 2014). The CCAMs (five CMIP5 GCMs) were selected for their performance over Australia, Southeast Asia and the Pacific (Hoffmann and Katzfey 2013). In addition, the selected GCM models represent: (1) the majority of the spread of models in terms of mean annual rainfall change at several key locations, and (2) certain model types in relation to their regional patterns (Grose and Bedin 2013).
Projected mean annual rainfall during ENSO phases (El Niño, La Niña and neutral phases) from both the GCM and CCAM models were analysed to identify the lowest mean rainfall amount for each island in the two projection periods. Projection outputs are for 30-year periods centred on 2050 and 2085, referred to as the 2050 and 2085 periods, relative to a 30-year baseline period centred on 1995. Thirty-year periods were selected for their increased ability to represent ENSO phases (M. Grose, pers. comm. 2013). The lowest mean annual rainfall values for each island are displayed by rainfall exposure class in Figure 4.6 and Figure 4.7. The ranges of lowest mean annual rainfall amounts to which each of the island types are projected to be exposed are summarised in Table 4.1 and Table 4.2. Additionally, statistical analyses of models used to determine lowest mean rainfall values and summary statistics of projected mean annual rainfall by country are provided in Appendix H.
In both 2050 and 2085, Low Carbonate and Limestone islands are exposed to the lowest projected mean rainfall values compared to Volcanic, Composite and Complex islands. With the exception of Composite and Complex islands, there are islands within the other island types that are exposed to ‘very low to lower’ rainfall (≤700 mm) in each of the projection periods. In addition, there are islands of all types exposed to ‘lower’ rainfall (700-1,500 mm) and ‘moderate to high’ rainfall (>1,500 mm) in both 2050 and 2085 (Section 3.6.1).
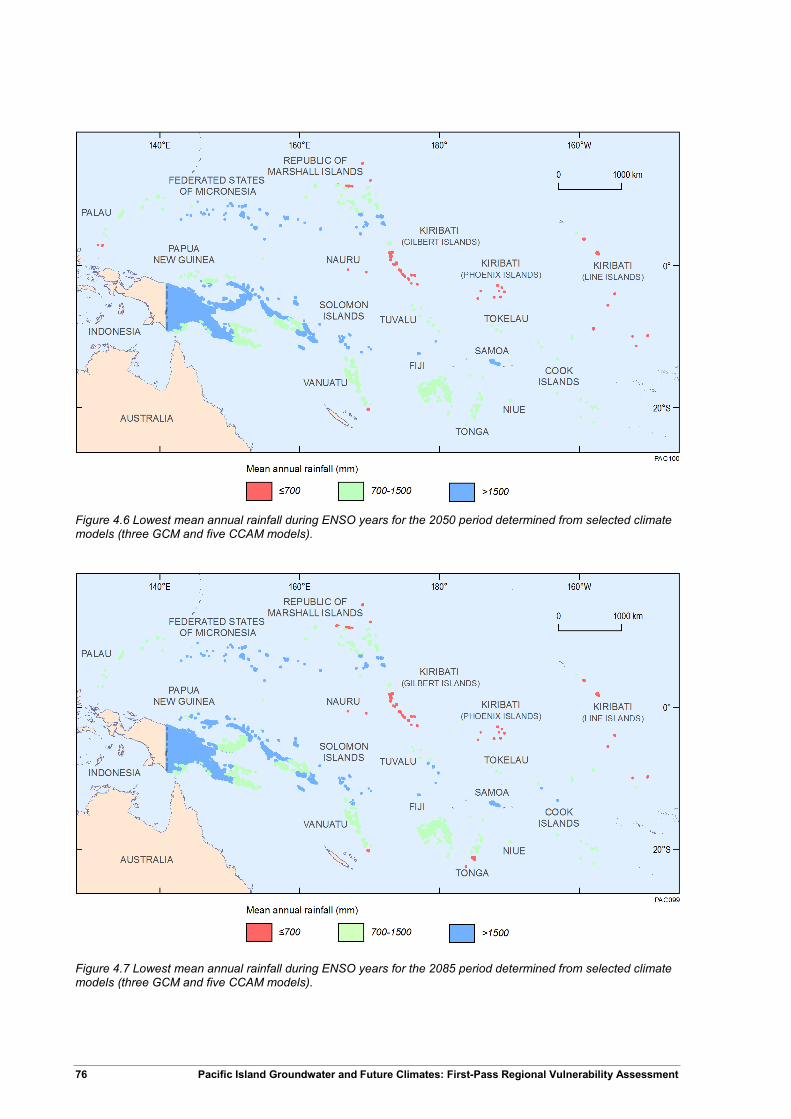
76 Pacific Island Groundwater and Future Climates: First-Pass Regional Vulnerability Assessment
Figure 4.6 Lowest mean annual rainfall during ENSO years for the 2050 period determined from selected climate models (three GCM and five CCAM models).
Figure 4.7 Lowest mean annual rainfall during ENSO years for the 2085 period determined from selected climate models (three GCM and five CCAM models).
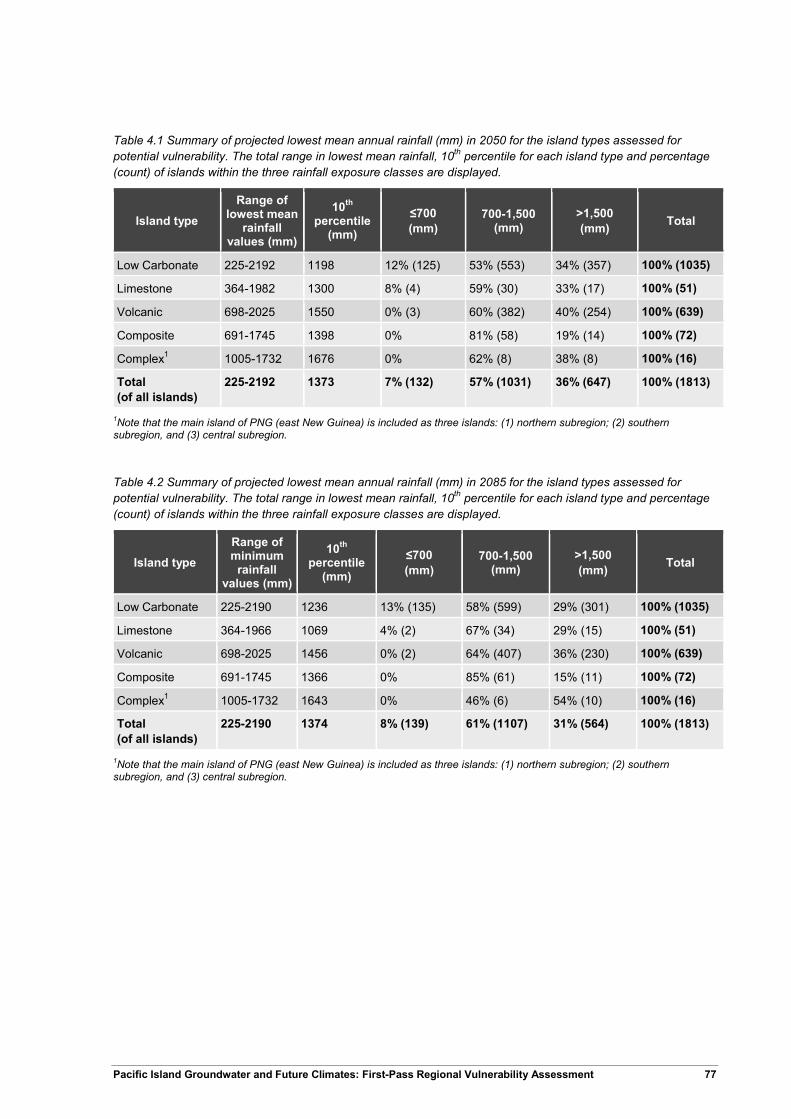
Pacific Island Groundwater and Future Climates: First-Pass Regional Vulnerability Assessment 77
Table 4.1 Summary of projected lowest mean annual rainfall (mm) in 2050 for the island types assessed for potential vulnerability. The total range in lowest mean rainfall, 10th percentile for each island type and percentage (count) of islands within the three rainfall exposure classes are displayed.
Island type Range of
lowest mean rainfall
values (mm)
10th percentile
(mm)
≤700 (mm)
700-1,500 (mm)
>1,500 (mm) Total
Low Carbonate 225-2192 1198 12% (125) 53% (553) 34% (357) 100% (1035)
Limestone 364-1982 1300 8% (4) 59% (30) 33% (17) 100% (51)
Volcanic 698-2025 1550 0% (3) 60% (382) 40% (254) 100% (639)
Composite 691-1745 1398 0% 81% (58) 19% (14) 100% (72)
Complex1 1005-1732 1676 0% 62% (8) 38% (8) 100% (16)
Total (of all islands)
225-2192 1373 7% (132) 57% (1031) 36% (647) 100% (1813)
1Note that the main island of PNG (east New Guinea) is included as three islands: (1) northern subregion; (2) southern subregion, and (3) central subregion.
Table 4.2 Summary of projected lowest mean annual rainfall (mm) in 2085 for the island types assessed for potential vulnerability. The total range in lowest mean rainfall, 10th percentile for each island type and percentage (count) of islands within the three rainfall exposure classes are displayed.
Island type Range of minimum
rainfall values (mm)
10th percentile
(mm)
≤700 (mm)
700-1,500 (mm)
>1,500 (mm) Total
Low Carbonate 225-2190 1236 13% (135) 58% (599) 29% (301) 100% (1035)
Limestone 364-1966 1069 4% (2) 67% (34) 29% (15) 100% (51)
Volcanic 698-2025 1456 0% (2) 64% (407) 36% (230) 100% (639)
Composite 691-1745 1366 0% 85% (61) 15% (11) 100% (72)
Complex1 1005-1732 1643 0% 46% (6) 54% (10) 100% (16)
Total (of all islands)
225-2190 1374
8% (139) 61% (1107) 31% (564) 100% (1813)
1Note that the main island of PNG (east New Guinea) is included as three islands: (1) northern subregion; (2) southern subregion, and (3) central subregion.
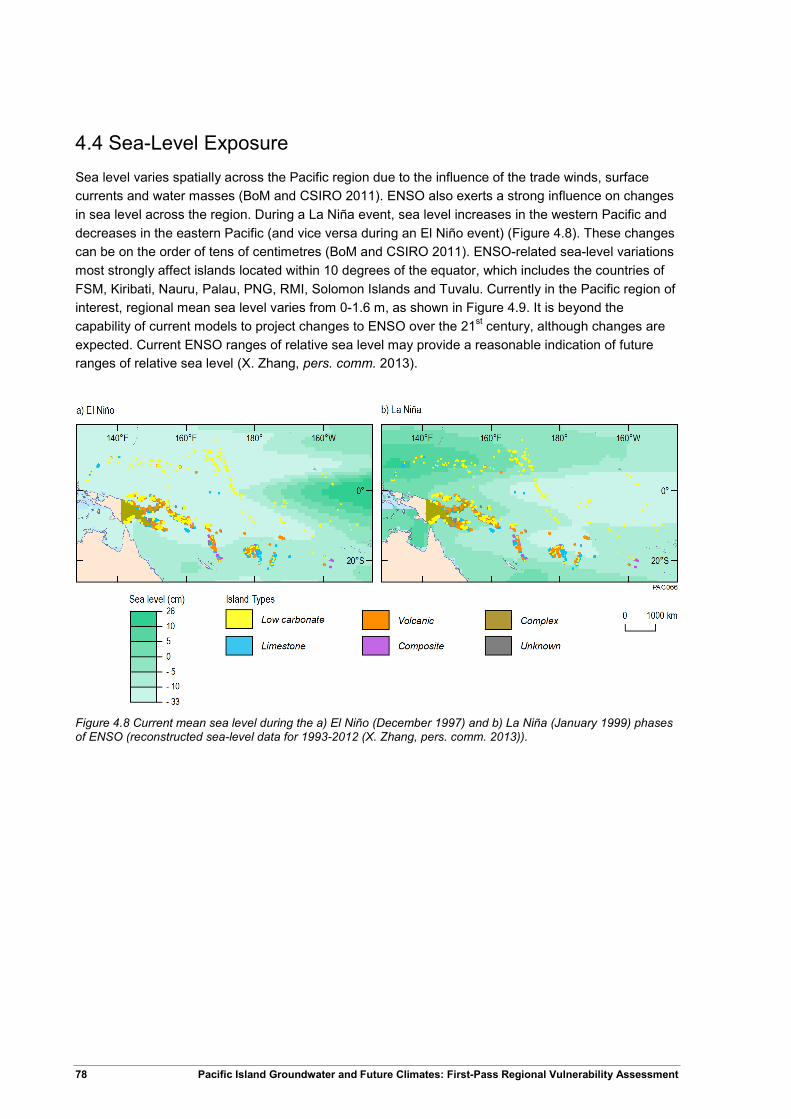
78 Pacific Island Groundwater and Future Climates: First-Pass Regional Vulnerability Assessment
4.4 Sea-Level Exposure Sea level varies spatially across the Pacific region due to the influence of the trade winds, surface currents and water masses (BoM and CSIRO 2011). ENSO also exerts a strong influence on changes in sea level across the region. During a La Niña event, sea level increases in the western Pacific and decreases in the eastern Pacific (and vice versa during an El Niño event) (Figure 4.8). These changes can be on the order of tens of centimetres (BoM and CSIRO 2011). ENSO-related sea-level variations most strongly affect islands located within 10 degrees of the equator, which includes the countries of FSM, Kiribati, Nauru, Palau, PNG, RMI, Solomon Islands and Tuvalu. Currently in the Pacific region of interest, regional mean sea level varies from 0-1.6 m, as shown in Figure 4.9. It is beyond the capability of current models to project changes to ENSO over the 21st century, although changes are expected. Current ENSO ranges of relative sea level may provide a reasonable indication of future ranges of relative sea level (X. Zhang, pers. comm. 2013).
Figure 4.8 Current mean sea level during the a) El Niño (December 1997) and b) La Niña (January 1999) phases of ENSO (reconstructed sea-level data for 1993-2012 (X. Zhang, pers. comm. 2013)).
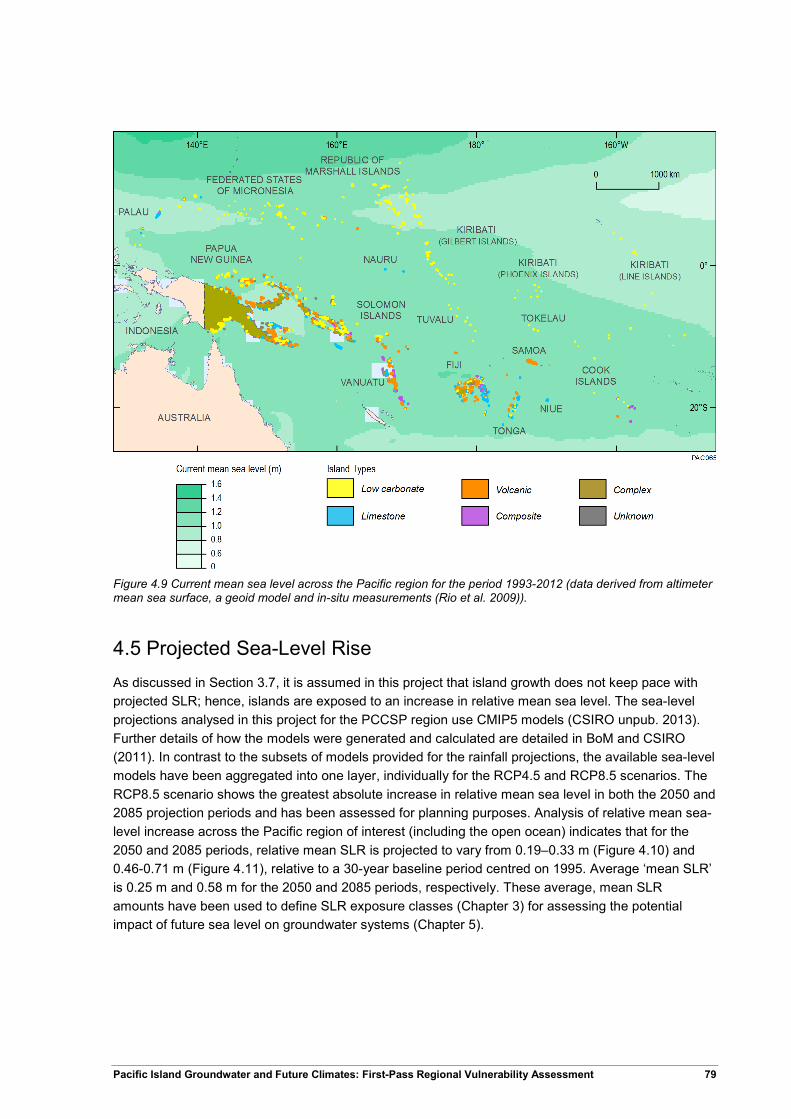
Pacific Island Groundwater and Future Climates: First-Pass Regional Vulnerability Assessment 79
Figure 4.9 Current mean sea level across the Pacific region for the period 1993-2012 (data derived from altimeter mean sea surface, a geoid model and in-situ measurements (Rio et al. 2009)).
4.5 Projected Sea-Level Rise As discussed in Section 3.7, it is assumed in this project that island growth does not keep pace with projected SLR; hence, islands are exposed to an increase in relative mean sea level. The sea-level projections analysed in this project for the PCCSP region use CMIP5 models (CSIRO unpub. 2013). Further details of how the models were generated and calculated are detailed in BoM and CSIRO (2011). In contrast to the subsets of models provided for the rainfall projections, the available sea-level models have been aggregated into one layer, individually for the RCP4.5 and RCP8.5 scenarios. The RCP8.5 scenario shows the greatest absolute increase in relative mean sea level in both the 2050 and 2085 projection periods and has been assessed for planning purposes. Analysis of relative mean sea-level increase across the Pacific region of interest (including the open ocean) indicates that for the 2050 and 2085 periods, relative mean SLR is projected to vary from 0.19–0.33 m (Figure 4.10) and 0.46-0.71 m (Figure 4.11), relative to a 30-year baseline period centred on 1995. Average ‘mean SLR’ is 0.25 m and 0.58 m for the 2050 and 2085 periods, respectively. These average, mean SLR amounts have been used to define SLR exposure classes (Chapter 3) for assessing the potential impact of future sea level on groundwater systems (Chapter 5).

80 Pacific Island Groundwater and Future Climates: First-Pass Regional Vulnerability Assessment
Figure 4.10 Projected rise in relative mean sea level for the 30-year period centred on 2050.
Figure 4.11 Projected rise in relative mean sea level for the 30-year period centred on 2085.
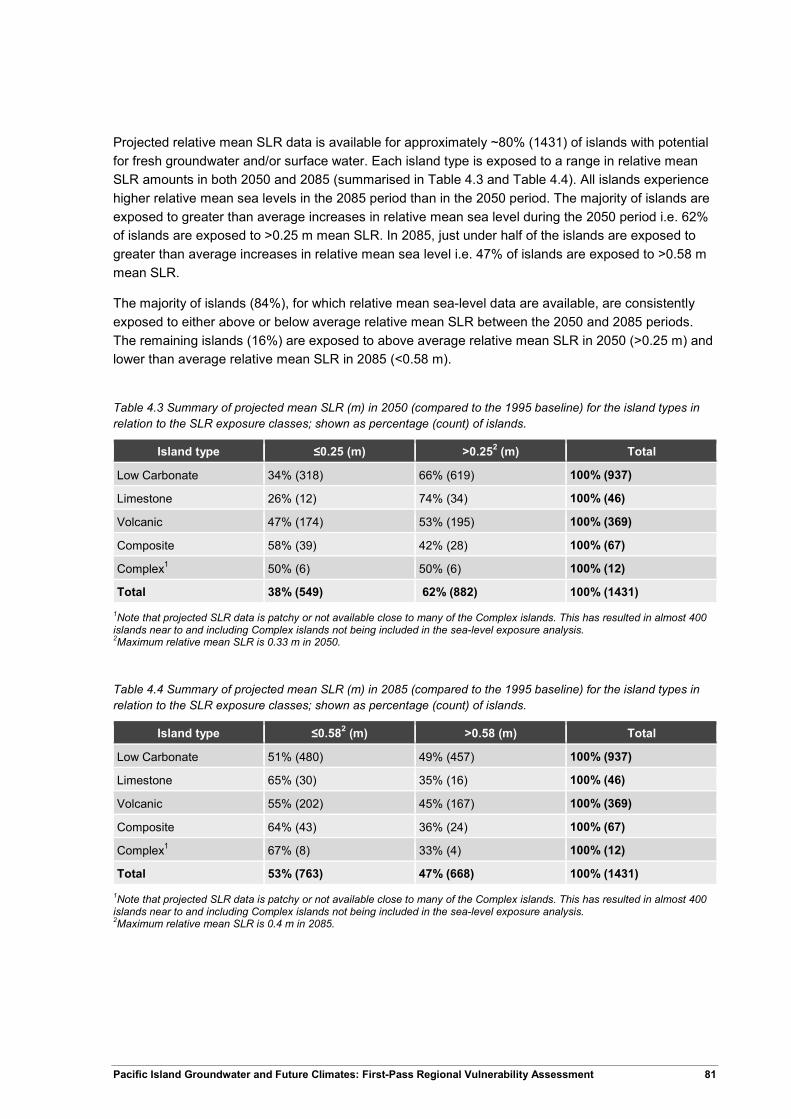
Pacific Island Groundwater and Future Climates: First-Pass Regional Vulnerability Assessment 81
Projected relative mean SLR data is available for approximately ~80% (1431) of islands with potential for fresh groundwater and/or surface water. Each island type is exposed to a range in relative mean SLR amounts in both 2050 and 2085 (summarised in Table 4.3 and Table 4.4). All islands experience higher relative mean sea levels in the 2085 period than in the 2050 period. The majority of islands are exposed to greater than average increases in relative mean sea level during the 2050 period i.e. 62% of islands are exposed to >0.25 m mean SLR. In 2085, just under half of the islands are exposed to greater than average increases in relative mean sea level i.e. 47% of islands are exposed to >0.58 m mean SLR.
The majority of islands (84%), for which relative mean sea-level data are available, are consistently exposed to either above or below average relative mean SLR between the 2050 and 2085 periods. The remaining islands (16%) are exposed to above average relative mean SLR in 2050 (>0.25 m) and lower than average relative mean SLR in 2085 (<0.58 m).
Table 4.3 Summary of projected mean SLR (m) in 2050 (compared to the 1995 baseline) for the island types in relation to the SLR exposure classes; shown as percentage (count) of islands.
Island type ≤0.25 (m) >0.252 (m) Total
Low Carbonate 34% (318) 66% (619) 100% (937)
Limestone 26% (12) 74% (34) 100% (46)
Volcanic 47% (174) 53% (195) 100% (369)
Composite 58% (39) 42% (28) 100% (67)
Complex1 50% (6) 50% (6) 100% (12)
Total 38% (549) 62% (882) 100% (1431) 1Note that projected SLR data is patchy or not available close to many of the Complex islands. This has resulted in almost 400 islands near to and including Complex islands not being included in the sea-level exposure analysis. 2Maximum relative mean SLR is 0.33 m in 2050.
Table 4.4 Summary of projected mean SLR (m) in 2085 (compared to the 1995 baseline) for the island types in relation to the SLR exposure classes; shown as percentage (count) of islands.
Island type ≤0.582 (m) >0.58 (m) Total
Low Carbonate 51% (480) 49% (457) 100% (937)
Limestone 65% (30) 35% (16) 100% (46)
Volcanic 55% (202) 45% (167) 100% (369)
Composite 64% (43) 36% (24) 100% (67)
Complex1 67% (8) 33% (4) 100% (12)
Total 53% (763) 47% (668) 100% (1431) 1Note that projected SLR data is patchy or not available close to many of the Complex islands. This has resulted in almost 400 islands near to and including Complex islands not being included in the sea-level exposure analysis. 2Maximum relative mean SLR is 0.4 m in 2085.
82 Pacific Island Groundwater and Future Climates: First-Pass Regional Vulnerability Assessment
4.6 Chapter Summary Pacific island exposure to both future periods of low rainfall and future mean SLR have been assessed by examining projections of lowest mean annual rainfall during ENSO phases and increases in relative mean SLR for the 30-year periods centred on 2050 and 2085 (relative to a 30-year baseline period centred on 1995).
While either too much or too little rainfall can cause problems for Pacific island groundwater systems, this project has a focus on groundwater availability and thus considers that the hazard of low rainfall will have the greatest adverse impact on groundwater availability.
Rainfall projections from eight better performing climate models (three GCMs and five CCAMs) were analysed for the lowest mean annual rainfall during El Niño phases from either the RCP4.5 or RCP8.5 emissions scenarios. Key rainfall exposure conclusions include:
• In both 2050 and 2085, Low Carbonate and Limestone islands are exposed to the lowest projected mean annual rainfall values compared to Volcanic, Composite and Complex islands.
• With the exception of Composite and Complex islands, there are islands within the other island types that are exposed to ‘very low to lower’ rainfall (≤700 mm) in each of the projection periods.
• Islands of all types are exposed to ‘lower’ rainfall (700-1,500 mm) and ‘moderate to high’ rainfall (>1,500 mm) in both 2050 and 2085.
Exposure of the islands to projected relative mean SLR was assessed. Key sea-level exposure conclusions include:
• In 2050, 62% of islands are exposed to a relative mean SLR of greater than 0.25 m (this includes islands of all types).
• In 2085, 47% of islands are exposed to a relative mean SLR of greater than 0.58 m (this includes islands of all types).
Pacific Island Groundwater and Future Climates: First-Pass Regional Vulnerability Assessment 83
5 Potential Impact of Future Climate on Groundwater Systems
The potential impacts of future climate on fresh groundwater availability is a combination of the sensitivity and exposure of Pacific Island aquifers to periods of low rainfall or mean SLR in the 2050 and 2085 periods.
5.1 Low Rainfall Based on lowest mean annual rainfall during ENSO phases, groundwater systems on the islands of the Pacific region are assigned a potential impact rating derived from their rainfall sensitivity rating (Table 3.3) coupled with a rainfall exposure class (Table 3.4 or Table 3.5). A Higher or Moderate High potential impact rating means that the groundwater system on the island will experience a greater long-term impact on freshwater availability than a groundwater system that has a Moderate rating. Groundwater systems with Lower or Moderate Low potential impact will experience the least long-term impact on fresh groundwater availability in response to lowest mean annual rainfall.
Potential impact ratings are assigned based on the assumption that ≤700 mm mean annual rainfall constitutes zero to very low recharge, ≤1,500 mm mean annual rainfall represents lower recharge and >1,500 mm mean annual rainfall indicates moderate to high recharge. The greatest potential impact is assigned to islands with the greatest rainfall sensitivity that are exposed to the least (and most variable) mean annual rainfall. In contrast, the least potential impact is assigned to islands with the least rainfall sensitivity that are exposed to the greatest (and least variable) mean annual rainfall (Table 5.1).
Based on exposure of the islands to lowest mean annual rainfall in the 2050 and 2085 periods (Chapter 4), the potential impact on the availability of fresh groundwater in the two future periods are represented in Figure 5.1 and Figure 5.2 for islands with potential for fresh groundwater. It can be observed that the regional trends of potential impact are similar during the two projection periods. In general, it is observed that most countries have islands with Higher potential impact in 2050 and 2085, with the majority of islands in Kiribati, Nauru, RMI and Tokelau having a Higher rating. In contrast, islands in Fiji, FSM, PNG, Samoa, Solomon Islands and Vanuatu have Moderate Low or Lower potential impact in both projection periods.
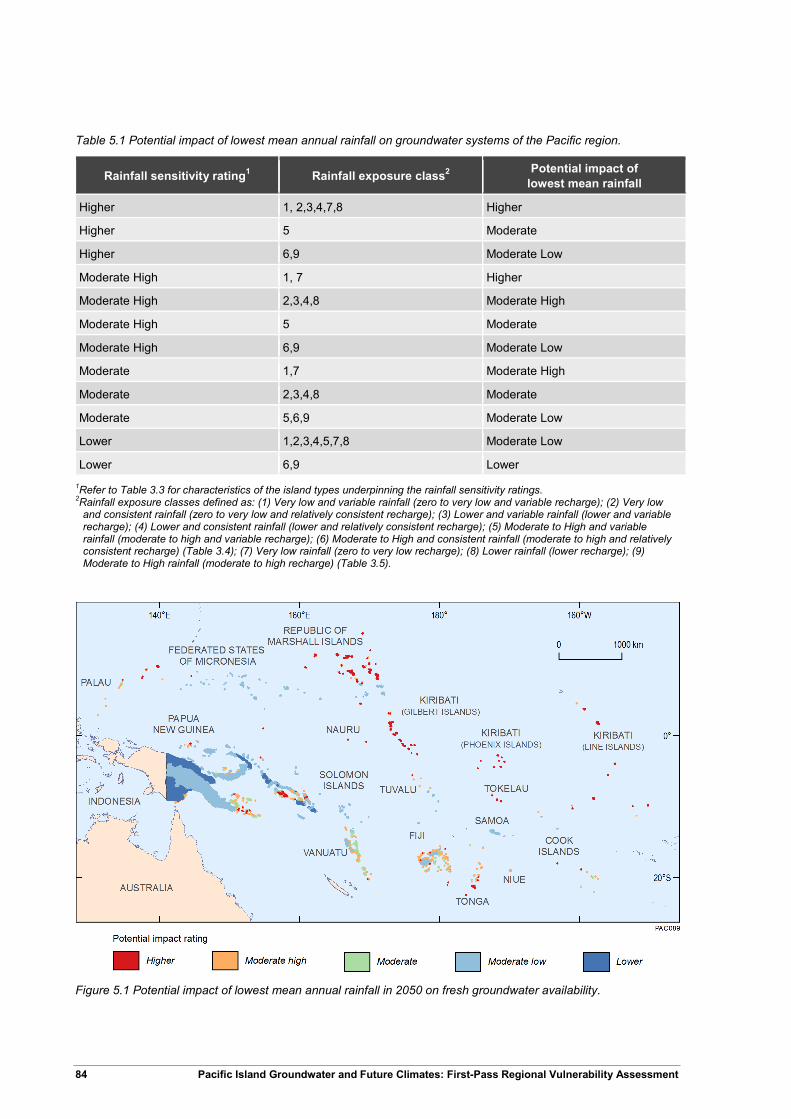
84 Pacific Island Groundwater and Future Climates: First-Pass Regional Vulnerability Assessment
Table 5.1 Potential impact of lowest mean annual rainfall on groundwater systems of the Pacific region.
Rainfall sensitivity rating1 Rainfall exposure class2 Potential impact of lowest mean rainfall
Higher 1, 2,3,4,7,8 Higher
Higher 5 Moderate
Higher 6,9 Moderate Low
Moderate High 1, 7 Higher
Moderate High 2,3,4,8 Moderate High
Moderate High 5 Moderate
Moderate High 6,9 Moderate Low
Moderate 1,7 Moderate High
Moderate 2,3,4,8 Moderate
Moderate 5,6,9 Moderate Low
Lower 1,2,3,4,5,7,8 Moderate Low
Lower 6,9 Lower 1Refer to Table 3.3 for characteristics of the island types underpinning the rainfall sensitivity ratings. 2Rainfall exposure classes defined as: (1) Very low and variable rainfall (zero to very low and variable recharge); (2) Very low
and consistent rainfall (zero to very low and relatively consistent recharge); (3) Lower and variable rainfall (lower and variable recharge); (4) Lower and consistent rainfall (lower and relatively consistent recharge); (5) Moderate to High and variable rainfall (moderate to high and variable recharge); (6) Moderate to High and consistent rainfall (moderate to high and relatively consistent recharge) (Table 3.4); (7) Very low rainfall (zero to very low recharge); (8) Lower rainfall (lower recharge); (9) Moderate to High rainfall (moderate to high recharge) (Table 3.5).
Figure 5.1 Potential impact of lowest mean annual rainfall in 2050 on fresh groundwater availability.
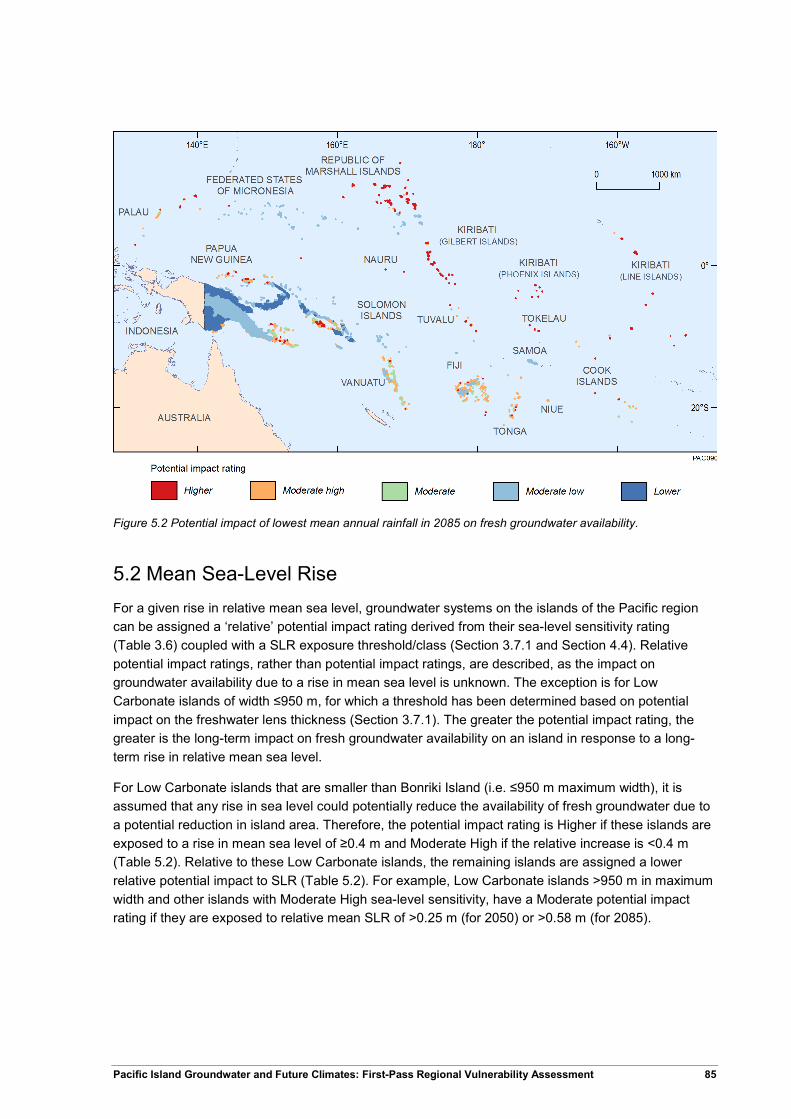
Pacific Island Groundwater and Future Climates: First-Pass Regional Vulnerability Assessment 85
Figure 5.2 Potential impact of lowest mean annual rainfall in 2085 on fresh groundwater availability.
5.2 Mean Sea-Level Rise For a given rise in relative mean sea level, groundwater systems on the islands of the Pacific region can be assigned a ‘relative’ potential impact rating derived from their sea-level sensitivity rating (Table 3.6) coupled with a SLR exposure threshold/class (Section 3.7.1 and Section 4.4). Relative potential impact ratings, rather than potential impact ratings, are described, as the impact on groundwater availability due to a rise in mean sea level is unknown. The exception is for Low Carbonate islands of width ≤950 m, for which a threshold has been determined based on potential impact on the freshwater lens thickness (Section 3.7.1). The greater the potential impact rating, the greater is the long-term impact on fresh groundwater availability on an island in response to a long-term rise in relative mean sea level.
For Low Carbonate islands that are smaller than Bonriki Island (i.e. ≤950 m maximum width), it is assumed that any rise in sea level could potentially reduce the availability of fresh groundwater due to a potential reduction in island area. Therefore, the potential impact rating is Higher if these islands are exposed to a rise in mean sea level of ≥0.4 m and Moderate High if the relative increase is <0.4 m (Table 5.2). Relative to these Low Carbonate islands, the remaining islands are assigned a lower relative potential impact to SLR (Table 5.2). For example, Low Carbonate islands >950 m in maximum width and other islands with Moderate High sea-level sensitivity, have a Moderate potential impact rating if they are exposed to relative mean SLR of >0.25 m (for 2050) or >0.58 m (for 2085).
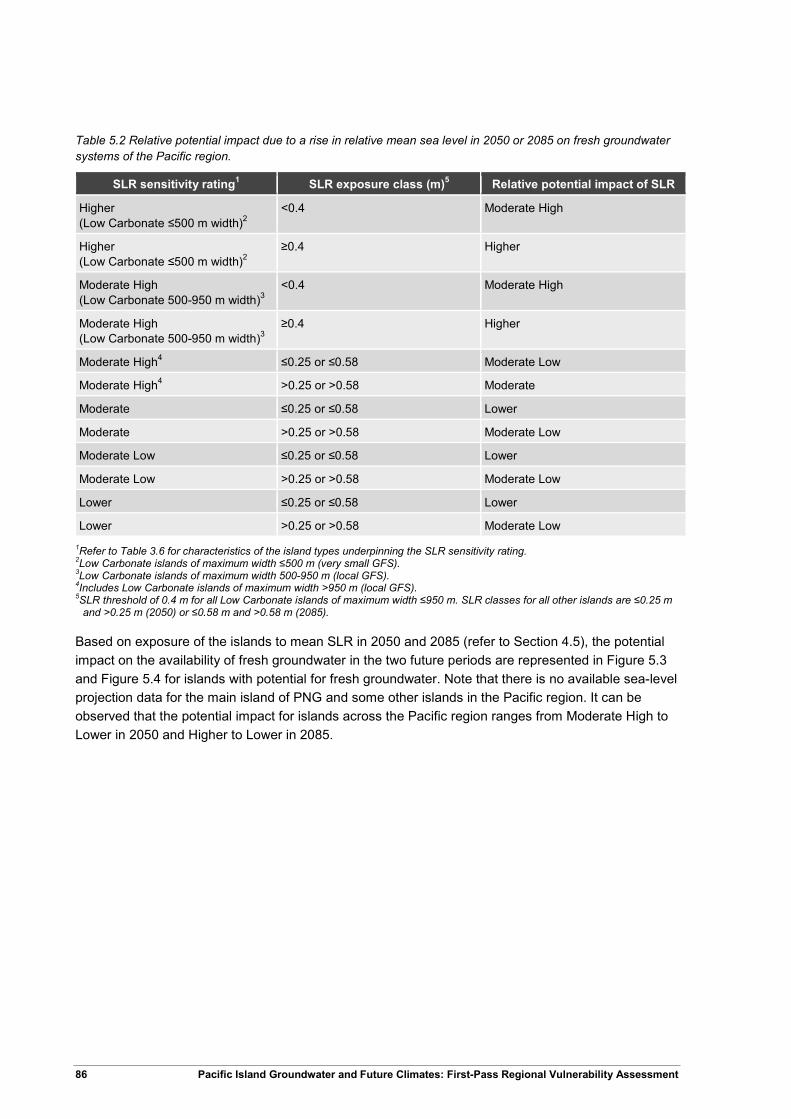
86 Pacific Island Groundwater and Future Climates: First-Pass Regional Vulnerability Assessment
Table 5.2 Relative potential impact due to a rise in relative mean sea level in 2050 or 2085 on fresh groundwater systems of the Pacific region.
SLR sensitivity rating1 SLR exposure class (m)5 Relative potential impact of SLR
Higher (Low Carbonate ≤500 m width)2
<0.4 Moderate High
Higher (Low Carbonate ≤500 m width)2
≥0.4 Higher
Moderate High (Low Carbonate 500-950 m width)3
<0.4 Moderate High
Moderate High (Low Carbonate 500-950 m width)3
≥0.4 Higher
Moderate High4 ≤0.25 or ≤0.58 Moderate Low
Moderate High4 >0.25 or >0.58 Moderate
Moderate ≤0.25 or ≤0.58 Lower
Moderate >0.25 or >0.58 Moderate Low
Moderate Low ≤0.25 or ≤0.58 Lower
Moderate Low >0.25 or >0.58 Moderate Low
Lower ≤0.25 or ≤0.58 Lower
Lower >0.25 or >0.58 Moderate Low 1Refer to Table 3.6 for characteristics of the island types underpinning the SLR sensitivity rating. 2Low Carbonate islands of maximum width ≤500 m (very small GFS). 3Low Carbonate islands of maximum width 500-950 m (local GFS). 4Includes Low Carbonate islands of maximum width >950 m (local GFS). 5SLR threshold of 0.4 m for all Low Carbonate islands of maximum width ≤950 m. SLR classes for all other islands are ≤0.25 m
and >0.25 m (2050) or ≤0.58 m and >0.58 m (2085).
Based on exposure of the islands to mean SLR in 2050 and 2085 (refer to Section 4.5), the potential impact on the availability of fresh groundwater in the two future periods are represented in Figure 5.3 and Figure 5.4 for islands with potential for fresh groundwater. Note that there is no available sea-level projection data for the main island of PNG and some other islands in the Pacific region. It can be observed that the potential impact for islands across the Pacific region ranges from Moderate High to Lower in 2050 and Higher to Lower in 2085.
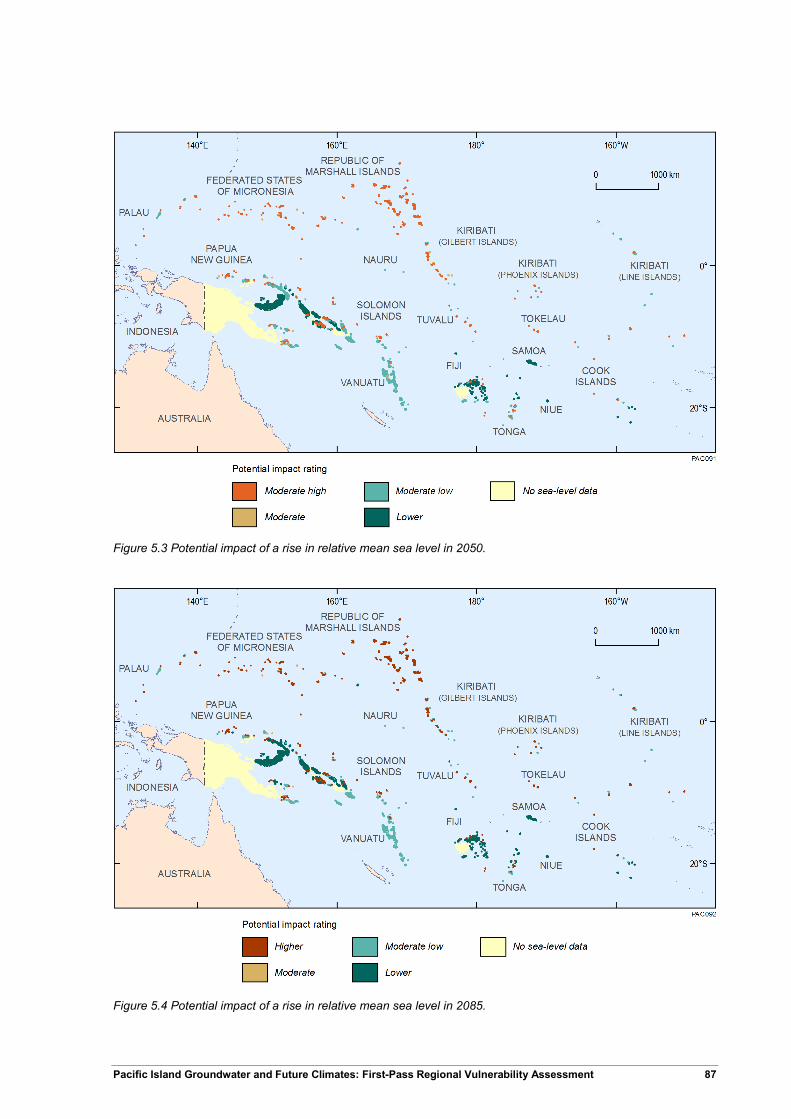
Pacific Island Groundwater and Future Climates: First-Pass Regional Vulnerability Assessment 87
Figure 5.3 Potential impact of a rise in relative mean sea level in 2050.
Figure 5.4 Potential impact of a rise in relative mean sea level in 2085.
88 Pacific Island Groundwater and Future Climates: First-Pass Regional Vulnerability Assessment
5.3 Chapter Summary The potential impact of a given climate-related hazard on an island depends both on the characteristics of the hazard and the sensitivity of the island to that hazard. The potential impacts of lowest mean annual rainfall during ENSO phases and mean SLR for 2050 and 2085 have been assessed.
The potential impacts of lowest mean annual rainfall and mean SLR on groundwater systems of the Pacific Islands have been grouped into five classes: Lower, Moderate Low, Moderate, Moderate High, or Higher. The classes are not equivalent between hazards and the results for the two analyses should be treated separately. For both climate-related hazards, islands which have the greatest potential impact will experience a greater long-term impact on fresh groundwater availability than islands which have the least potential impact.
In response to lowest mean annual rainfall during ENSO phases, the potential impact rating of a groundwater system is derived from the rainfall sensitivity rating coupled with a rainfall exposure class. The greatest potential impact rating is assigned to islands with the greatest rainfall sensitivity (islands with a very small GFS) that are exposed to the least (and most variable) mean annual rainfall (≤700 mm rainfall and CV ≥0.4). The least potential impact is assigned to islands with the least rainfall sensitivity (islands with a regional GFS) that are exposed to the greatest (and least variable) mean annual rainfall (>1,500 mm rainfall and CV <0.4).
In response to mean SLR, the potential impact rating is derived from the sea-level sensitivity rating coupled with the sea-level exposure class. The greatest potential impact rating is assigned to islands with the greatest sea-level sensitivity (islands less than 950 m in width and exposed to ≥0.4 m SLR). The least potential impact is assigned to islands with a Lower SLR sensitivity rating (islands with a regional GFS and elevation >5m) and exposed to below average relative mean SLR.
Pacific Island Groundwater and Future Climates: First-Pass Regional Vulnerability Assessment 89
6 Groundwater System Adaptability to Future Climate
Groundwater is an important, if not the main, source of freshwater for many islands in the Pacific region. Where groundwater is used, it is extracted in different ways. For example, bailing or pumping from hand-dug wells or pumping from horizontal infiltration galleries are the most common methods for obtaining groundwater from intergranular aquifers on Low Carbonate islands. In contrast, vertically drilled boreholes are the most practical method for extracting water from the fissured karst aquifer of a Limestone island (White and Falkland 2011), or large intergranular aquifers of Complex islands. Groundwater can also be obtained from natural spring flows or vertical drilled boreholes in fissured fractured aquifers of Volcanic and Composite islands. The dominant extraction methods for the assumed principal aquifers on the islands of the Pacific region (refer to typology figures in Chapter 3) are summarised in Table 6.1.
Adaptations are adjustments made in natural or human systems in response to experienced or projected climatic conditions in order to moderate or avoid adverse effects or exploit beneficial opportunities (IPCC 2014). In the context of this report, adaptations are concerned with reducing the vulnerability of groundwater systems to climatic impacts and promoting sustainable groundwater resource management. Adaptation activities for the Pacific region can be considered to fall into two groups: (i) those relating to capacity building and (ii) those relating to improved integrity of ‘ecosystems’ (Barnett 2005). For the purpose of this vulnerability assessment, the natural system adaptability of principal aquifers of islands in the Pacific region has been assessed. System adaptability falls within Barnett’s (2005) category of adaptations aimed at improving ecosystem integrity. It is beyond the scope of this project to explore the full range of adaptation options; however, more detailed discussions can be found in the following references (White and Falkland 2012, Duncan 2011, Barnett 2005).
The system adaptability component of the groundwater vulnerability assessment relates to the intrinsic capacity of hydrogeological systems to be managed, in order to mitigate potential impacts due to periods of low rainfall or mean SLR. Different groundwater management options are suitable for different types of aquifers exposed to different climate-related hazards.
Based on the potential for groundwater systems to be managed for low rainfall periods or mean SLR, a system adaptability rating is assigned to the island types in the Pacific region. Due to lack of data, a number of assumptions have been made including that the system adaptability of principal aquifers is similar for both the hazards of periods of low rainfall and mean SLR. The rating is based on the assumed principal aquifer, GFS and extraction methods (Table 6.1 and Figure 6.1). In general, there are limited options for changing the management of groundwater systems on islands with a local GFS. However, a groundwater manager has more options in larger, intergranular groundwater systems.
Table 6.1 below summarises the system adaptability for each of the principal aquifers on the different island types. Also shown are the assumed dominant extraction methods and the GFS. Islands with a local GFS have Lower system adaptability. Volcanic and Composite islands with either an intermediate or regional GFS have Moderate system adaptability. Regional intergranular aquifers on Complex islands have Higher system adaptability.
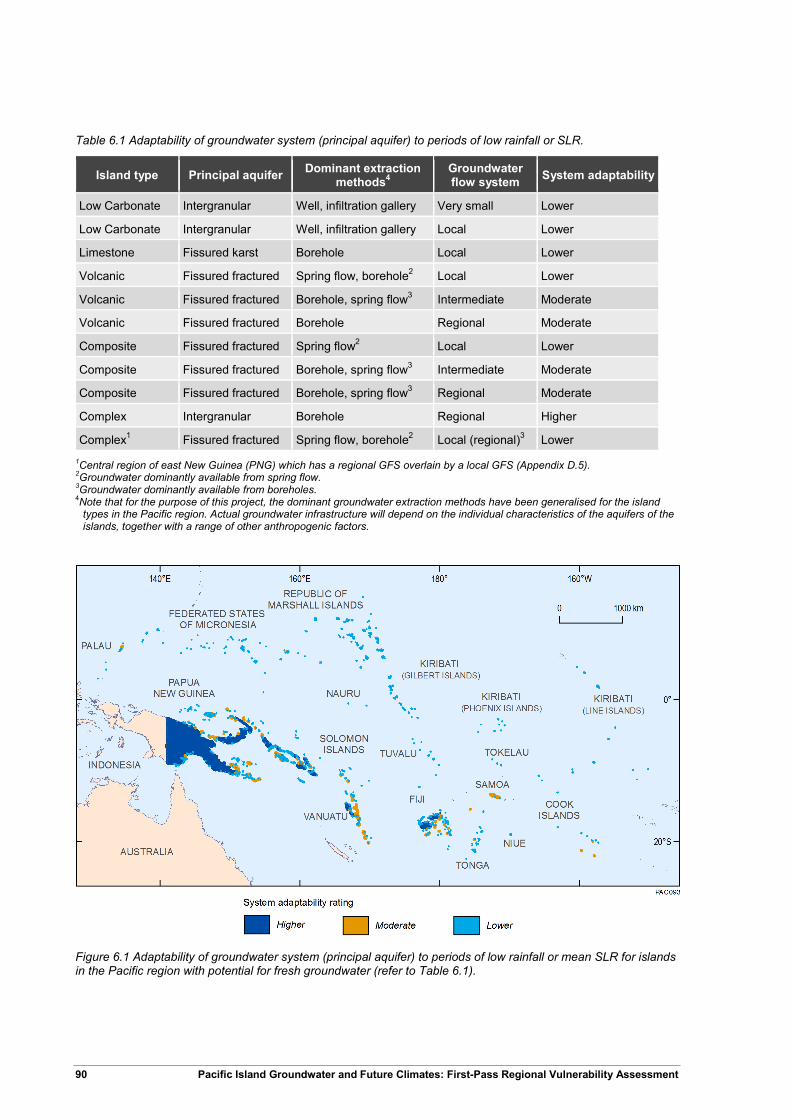
90 Pacific Island Groundwater and Future Climates: First-Pass Regional Vulnerability Assessment
Table 6.1 Adaptability of groundwater system (principal aquifer) to periods of low rainfall or SLR.
Island type Principal aquifer Dominant extraction methods4
Groundwater flow system System adaptability
Low Carbonate Intergranular Well, infiltration gallery Very small Lower
Low Carbonate Intergranular Well, infiltration gallery Local Lower
Limestone Fissured karst Borehole Local Lower
Volcanic Fissured fractured Spring flow, borehole2 Local Lower
Volcanic Fissured fractured Borehole, spring flow3 Intermediate Moderate
Volcanic Fissured fractured Borehole Regional Moderate
Composite Fissured fractured Spring flow2 Local Lower
Composite Fissured fractured Borehole, spring flow3 Intermediate Moderate
Composite Fissured fractured Borehole, spring flow3 Regional Moderate
Complex Intergranular Borehole Regional Higher
Complex1 Fissured fractured Spring flow, borehole2 Local (regional)3 Lower 1Central region of east New Guinea (PNG) which has a regional GFS overlain by a local GFS (Appendix D.5). 2Groundwater dominantly available from spring flow. 3Groundwater dominantly available from boreholes. 4Note that for the purpose of this project, the dominant groundwater extraction methods have been generalised for the island
types in the Pacific region. Actual groundwater infrastructure will depend on the individual characteristics of the aquifers of the islands, together with a range of other anthropogenic factors.
Figure 6.1 Adaptability of groundwater system (principal aquifer) to periods of low rainfall or mean SLR for islands in the Pacific region with potential for fresh groundwater (refer to Table 6.1).
Pacific Island Groundwater and Future Climates: First-Pass Regional Vulnerability Assessment 91
6.1 Low Rainfall In response to periods of low rainfall, practical groundwater management options include: reducing groundwater extraction in areas where groundwater is being extracted; integrated groundwater-surface water management, including conjunctive use of fresh groundwater and other freshwater sources; or managed aquifer recharge (MAR), whereby recharge is artificially enhanced by other freshwater sources. MAR is most applicable to larger islands which have surface water sources. Conjunctive use of brackish groundwater and saline water for non-potable uses is an effective management strategy on some Pacific Islands (D. Hebblethwaite, pers. comm. 2013). The feasibility and effectiveness of a groundwater management option, and hence the system adaptability, depends on the characteristics of the aquifer.
It is assumed that for freshwater aquifers with a relatively small fresh groundwater resource, such as intergranular and fissured karst aquifers of Low Carbonate and Limestone islands, respectively, management of (already low) extraction rates will have a limited impact on the total fresh groundwater volume. Therefore, the system adaptability of these island types is considered Lower.
Spring flows from fissured fractured aquifers rely on rainfall as the main form of recharge, particularly where they occur in topographic highs which may seasonally dry up (such as in the central region of east New Guinea, PNG). The relatively low storage capacity and fractured nature of the aquifers means that available management options such as MAR are very limited. Therefore, where spring flow dominates, these aquifers are assigned Lower system adaptability. However, in fissured fractured aquifers, where the principal aquifer is assumed to host a relatively large fresh groundwater resource that can support extraction from boreholes, management of extraction rates or integrated water resource management can be more readily instigated, particularly as Volcanic and Composite islands have the potential for surface water resources to supplement/substitute for groundwater. Therefore, the system adaptability of these islands is considered Moderate. Intergranular aquifers are the assumed principal aquifer on Complex islands. Following the approach of Wallace et al. (2011), extensive intergranular aquifers have Higher system adaptability due to the number of viable groundwater management options. These include: active management of extraction rates; integrated groundwater-surface water management; MAR during the wet season by capturing rainfall and surface waters; or passive management such as increasing surface water recharge through infiltration pits. These recharge management options are only possible if there is freshwater available.
6.2 Mean Sea-Level Rise SLR can result in a decrease in fresh groundwater volume due to SWI for aquifers that are connected to the ocean. In order to manage for the effects of SWI, groundwater extraction can be reduced in coastal areas, or freshwater can be artificially pumped into the aquifer (MAR).
On Low Carbonate and Limestone islands, as discussed in the previous section, management of (already low) extraction rates will have a limited impact. Therefore, the system adaptability of these island types is considered Lower. In addition, on Volcanic and Composite islands dominated by natural spring flows available management options are very limited. These islands have Lower system adaptability. However, management of extraction rates or integrated water resource management can be more readily instigated on Volcanic and Composite islands with fissured fractured aquifers, where the principal aquifer is assumed to host a relatively large fresh groundwater resource that can support extraction from boreholes. Therefore, the system adaptability of these islands is considered Moderate.
92 Pacific Island Groundwater and Future Climates: First-Pass Regional Vulnerability Assessment
Complex islands which are assumed to have extensive intergranular aquifers have Higher system adaptability due to the number of viable groundwater management options to manage for SWI, as discussed in the previous section (Table 6.1).
6.2 Chapter Summary The system adaptability component of the vulnerability assessment relates to the capacity of groundwater systems on Pacific islands to be managed, in order to mitigate potential impacts due to low rainfall or mean SLR.
Different management options are available for different groundwater systems, depending on their inherent physical properties. The principal aquifer type and GFS are important controls on the groundwater system adaptability. The relative ranking of system adaptability for the island types is:
• Low Carbonate islands (intergranular aquifer with a very small or local GFS) have Lower system adaptability;
• Limestone islands (fissured karst aquifer with a local GFS) have a Lower system adaptability;
• Volcanic islands (fissured fractured aquifer with local to regional GFS) have Lower to Moderate system adaptability;
• Composite islands (fissured fractured aquifer with local to regional GFS ) have Lower to Moderate system adaptability;
• Complex islands (intergranular aquifer with a regional GFS) have Higher system adaptability.
Pacific Island Groundwater and Future Climates: First-Pass Regional Vulnerability Assessment 93
7 Potential Vulnerability of Groundwater Systems to Future Climate
The potential vulnerability of groundwater systems in the Pacific region to a particular climate-related hazard is a function of the potential impact of the hazard, coupled with the system adaptability to offset the effects of the hazard, as described in the vulnerability framework in Chapter 1 (Figure 1.3). Islands have been assessed based on their principal aquifer, noting that for each island there may be other aquifers which have not been assessed.
The relative potential vulnerability has been assessed independently for the two climate-related hazards and therefore the results should be interpreted separately and are not comparable. Potential vulnerability to lowest mean annual rainfall is assessed without consideration of variations in sea-level and potential vulnerability to sea level is assessed without consideration of variations in rainfall. The method for determining potential vulnerabilities to current mean annual rainfall (Section 7.1) and future climates (Sections 7.2 and 7.3) for each combination of island type, sensitivity class, exposure class and system adaptability are summarised in Table 7.2 and Table 7.5. Although all combinations of island type, sensitivity class, exposure class and system adaptability are given a potential vulnerability rating, some combinations are not represented in the potential vulnerability results. Based on the potential vulnerability results in the 2050 and 2085 periods, the number of islands that receive each potential vulnerability rating from each combination are summarised in Appendix I.4.
7.1 Current Rainfall Based on current mean annual rainfall and mean annual rainfall variability, the potential vulnerability of groundwater systems on the islands of the Pacific region has been determined (Table 7.2). All islands which have Higher potential vulnerability are Low Carbonate islands. Many of the islands which have the highest current rainfall vulnerability results occur in regions where current mean annual rainfall is lowest, annual rainfall variability is highest and rainfall stress is highest across the Pacific region (Chapter 4). It can be observed that islands in Cook Islands, Fiji, Kiribati, RMI and Vanuatu have Moderate High to Higher potential vulnerability and are situated in the areas of Moderate to Higher rainfall stress (Figure 4.5). All islands which have Lower potential vulnerability are Complex islands. Lower and Moderate Low potential vulnerability is observed for islands in the southwest of the Pacific region, including the countries of Fiji, Palau, PNG, Samoa, Solomon Islands and Vanuatu. Islands in these countries correspond with areas of Lower rainfall stress, i.e. >1,500 mm mean annual rainfall and more consistent rainfall (Figure 4.5).
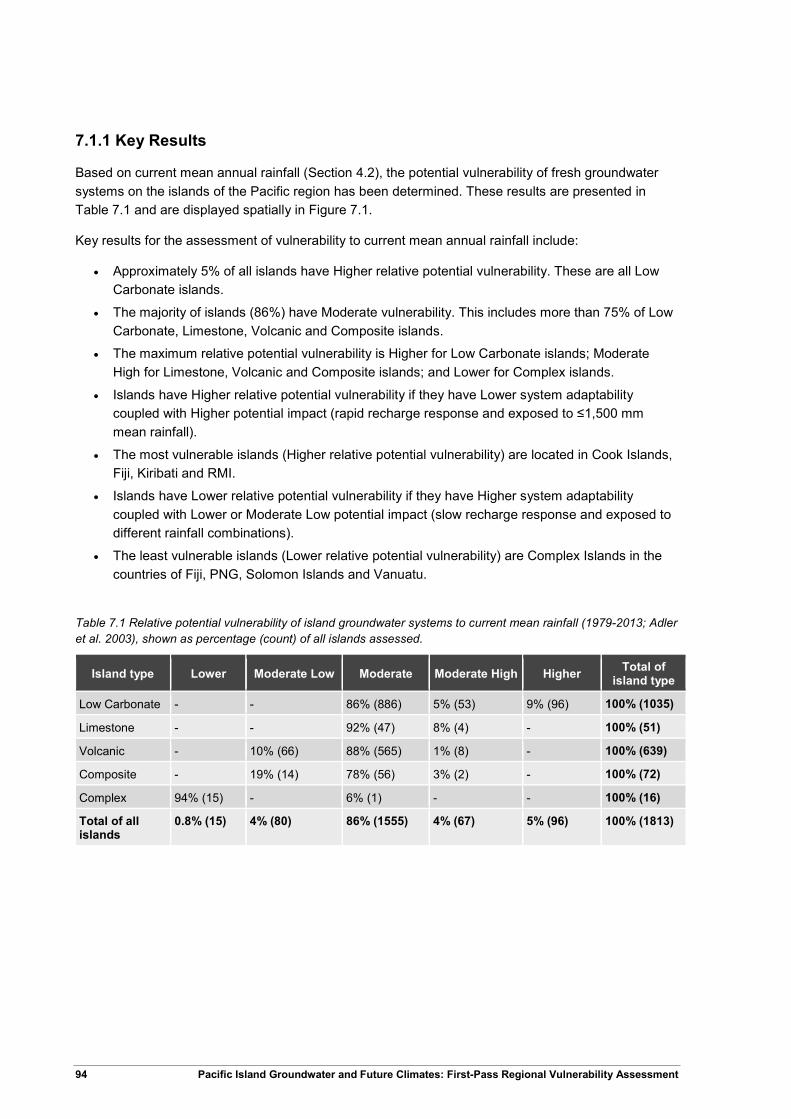
94 Pacific Island Groundwater and Future Climates: First-Pass Regional Vulnerability Assessment
7.1.1 Key Results
Based on current mean annual rainfall (Section 4.2), the potential vulnerability of fresh groundwater systems on the islands of the Pacific region has been determined. These results are presented in Table 7.1 and are displayed spatially in Figure 7.1.
Key results for the assessment of vulnerability to current mean annual rainfall include:
• Approximately 5% of all islands have Higher relative potential vulnerability. These are all Low Carbonate islands.
• The majority of islands (86%) have Moderate vulnerability. This includes more than 75% of Low Carbonate, Limestone, Volcanic and Composite islands.
• The maximum relative potential vulnerability is Higher for Low Carbonate islands; Moderate High for Limestone, Volcanic and Composite islands; and Lower for Complex islands.
• Islands have Higher relative potential vulnerability if they have Lower system adaptability coupled with Higher potential impact (rapid recharge response and exposed to ≤1,500 mm mean rainfall).
• The most vulnerable islands (Higher relative potential vulnerability) are located in Cook Islands, Fiji, Kiribati and RMI.
• Islands have Lower relative potential vulnerability if they have Higher system adaptability coupled with Lower or Moderate Low potential impact (slow recharge response and exposed to different rainfall combinations).
• The least vulnerable islands (Lower relative potential vulnerability) are Complex Islands in the countries of Fiji, PNG, Solomon Islands and Vanuatu.
Table 7.1 Relative potential vulnerability of island groundwater systems to current mean rainfall (1979-2013; Adler et al. 2003), shown as percentage (count) of all islands assessed.
Island type Lower Moderate Low Moderate Moderate High Higher Total of island type
Low Carbonate - - 86% (886) 5% (53) 9% (96) 100% (1035)
Limestone - - 92% (47) 8% (4) - 100% (51)
Volcanic - 10% (66) 88% (565) 1% (8) - 100% (639)
Composite - 19% (14) 78% (56) 3% (2) - 100% (72)
Complex 94% (15) - 6% (1) - - 100% (16)
Total of all islands
0.8% (15) 4% (80) 86% (1555) 4% (67) 5% (96) 100% (1813)
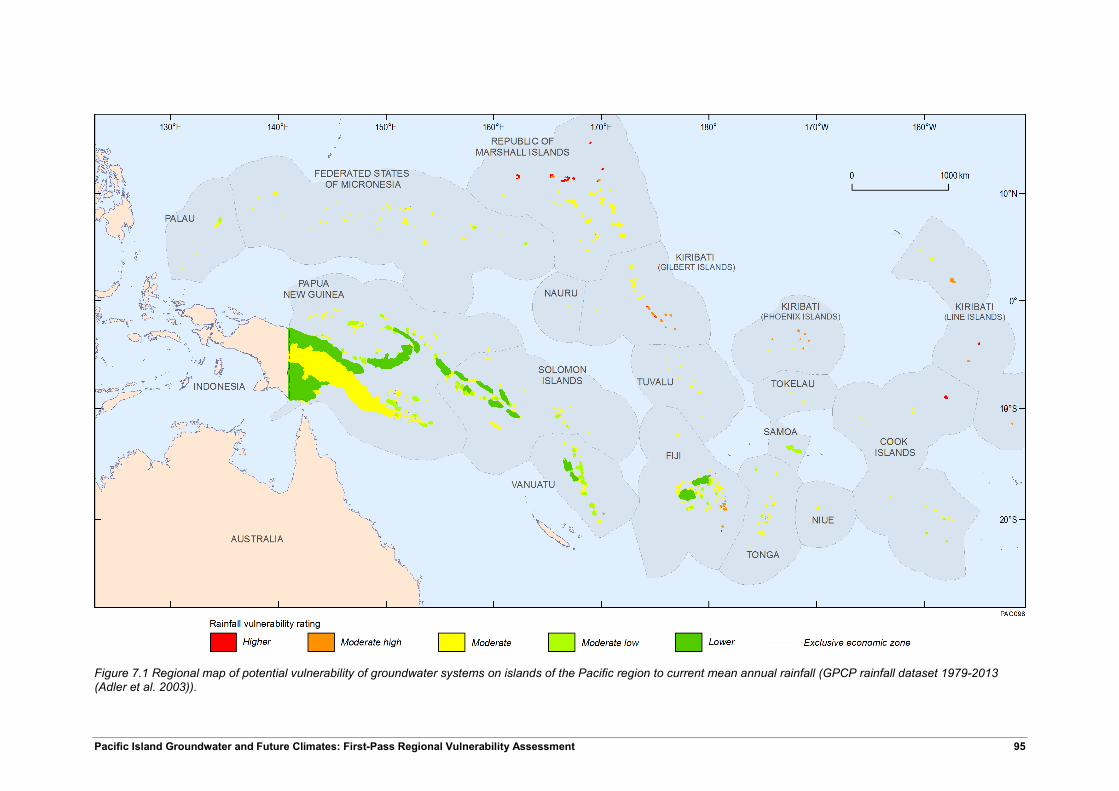
Pacific Island Groundwater and Future Climates: First-Pass Regional Vulnerability Assessment 95
Figure 7.1 Regional map of potential vulnerability of groundwater systems on islands of the Pacific region to current mean annual rainfall (GPCP rainfall dataset 1979-2013 (Adler et al. 2003)).
96 Pacific Island Groundwater and Future Climates: First-Pass Regional Vulnerability Assessment
7.2 Future Climate: Low Rainfall
7.2.1 Regional Potential Vulnerability Rating
Based on all combinations of island type, sensitivity class, exposure class and system adaptability, the highest potential vulnerability to lowest mean rainfall is assigned to islands with Higher potential impact, coupled with limited options to manage these impacts (Lower system adaptability). This includes Low Carbonate islands with a very small GFS that are exposed to ≤1,500 mm mean annual rainfall as well as Low Carbonate, Limestone, Volcanic and Composite islands with a local GFS that are exposed to ≤700 mm mean annual rainfall (Table 7.2). The lowest potential vulnerability is assigned to islands with Lower potential impact combined with Moderate or Higher system adaptability, or Moderate Low potential impact combined with Higher system adaptability. The lowest potential vulnerability is assigned to islands with Lower potential impact combined with a high ability to manage the groundwater system to offset the potential impacts (Higher system adaptability). This includes all Complex islands exposed to any amount of mean rainfall and Volcanic and Composite islands with a regional GFS, exposed to >1,500 mm of rainfall (Table 7.2).
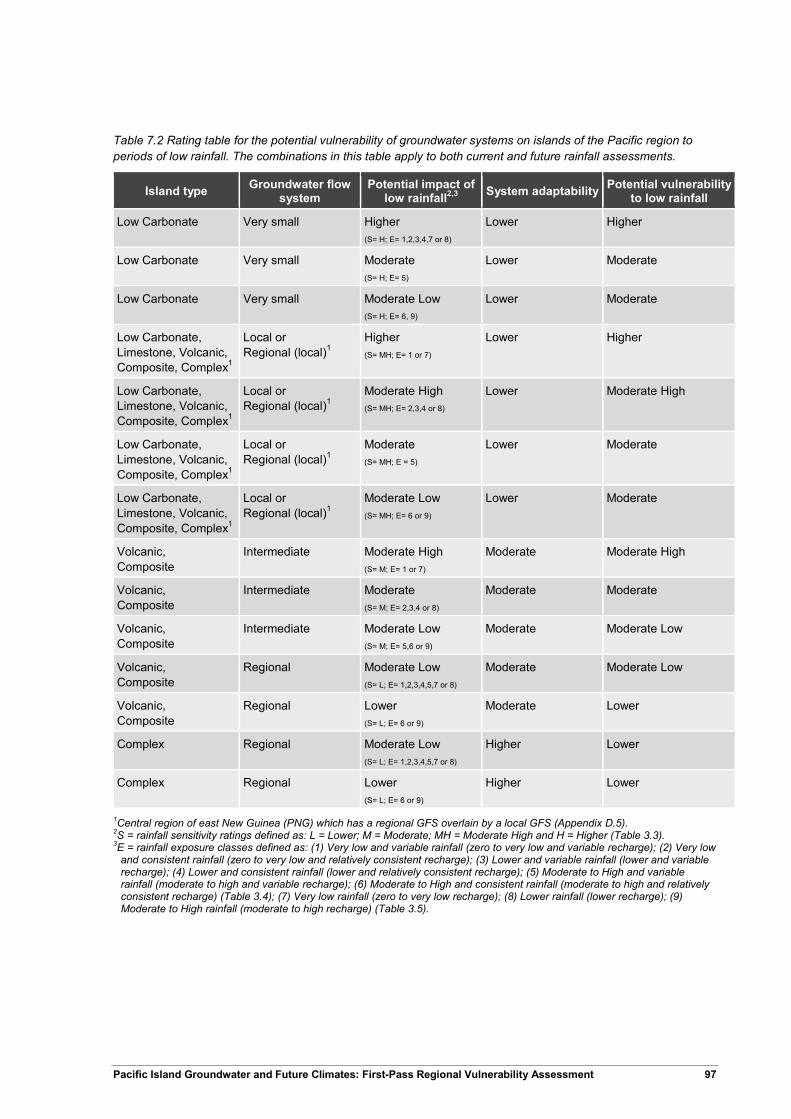
Pacific Island Groundwater and Future Climates: First-Pass Regional Vulnerability Assessment 97
Table 7.2 Rating table for the potential vulnerability of groundwater systems on islands of the Pacific region to periods of low rainfall. The combinations in this table apply to both current and future rainfall assessments.
Island type Groundwater flow system
Potential impact of low rainfall2,3 System adaptability Potential vulnerability
to low rainfall
Low Carbonate Very small Higher (S= H; E= 1,2,3,4,7 or 8)
Lower Higher
Low Carbonate Very small Moderate (S= H; E= 5)
Lower Moderate
Low Carbonate Very small Moderate Low (S= H; E= 6, 9)
Lower Moderate
Low Carbonate, Limestone, Volcanic, Composite, Complex1
Local or Regional (local)1
Higher (S= MH; E= 1 or 7)
Lower Higher
Low Carbonate, Limestone, Volcanic, Composite, Complex1
Local or Regional (local)1
Moderate High (S= MH; E= 2,3,4 or 8)
Lower Moderate High
Low Carbonate, Limestone, Volcanic, Composite, Complex1
Local or Regional (local)1
Moderate (S= MH; E = 5)
Lower Moderate
Low Carbonate, Limestone, Volcanic, Composite, Complex1
Local or Regional (local)1
Moderate Low (S= MH; E= 6 or 9)
Lower Moderate
Volcanic, Composite
Intermediate Moderate High (S= M; E= 1 or 7)
Moderate Moderate High
Volcanic, Composite
Intermediate Moderate (S= M; E= 2,3,4 or 8)
Moderate Moderate
Volcanic, Composite
Intermediate Moderate Low (S= M; E= 5,6 or 9)
Moderate Moderate Low
Volcanic, Composite
Regional Moderate Low (S= L; E= 1,2,3,4,5,7 or 8)
Moderate Moderate Low
Volcanic, Composite
Regional Lower (S= L; E= 6 or 9)
Moderate Lower
Complex Regional Moderate Low (S= L; E= 1,2,3,4,5,7 or 8)
Higher Lower
Complex Regional Lower (S= L; E= 6 or 9)
Higher Lower
1Central region of east New Guinea (PNG) which has a regional GFS overlain by a local GFS (Appendix D.5). 2S = rainfall sensitivity ratings defined as: L = Lower; M = Moderate; MH = Moderate High and H = Higher (Table 3.3). 3E = rainfall exposure classes defined as: (1) Very low and variable rainfall (zero to very low and variable recharge); (2) Very low
and consistent rainfall (zero to very low and relatively consistent recharge); (3) Lower and variable rainfall (lower and variable recharge); (4) Lower and consistent rainfall (lower and relatively consistent recharge); (5) Moderate to High and variable rainfall (moderate to high and variable recharge); (6) Moderate to High and consistent rainfall (moderate to high and relatively consistent recharge) (Table 3.4); (7) Very low rainfall (zero to very low recharge); (8) Lower rainfall (lower recharge); (9) Moderate to High rainfall (moderate to high recharge) (Table 3.5).
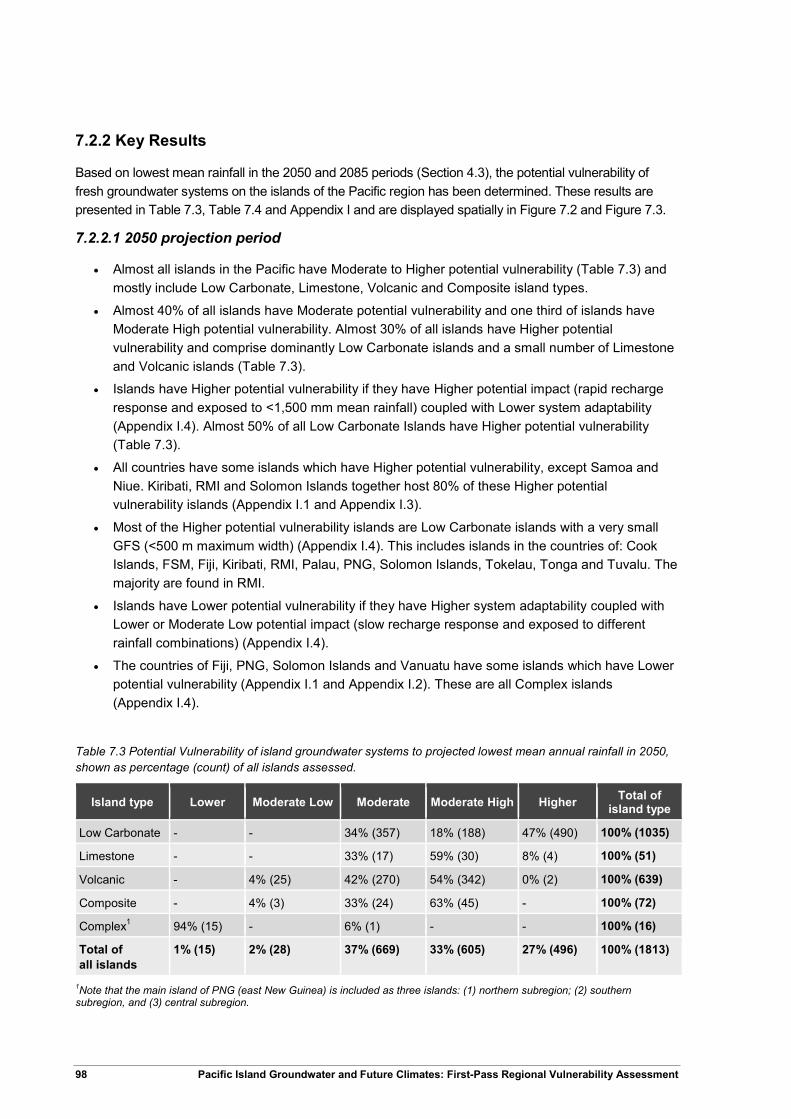
98 Pacific Island Groundwater and Future Climates: First-Pass Regional Vulnerability Assessment
7.2.2 Key Results
Based on lowest mean rainfall in the 2050 and 2085 periods (Section 4.3), the potential vulnerability of fresh groundwater systems on the islands of the Pacific region has been determined. These results are presented in Table 7.3, Table 7.4 and Appendix I and are displayed spatially in Figure 7.2 and Figure 7.3.
7.2.2.1 2050 projection period
• Almost all islands in the Pacific have Moderate to Higher potential vulnerability (Table 7.3) and mostly include Low Carbonate, Limestone, Volcanic and Composite island types.
• Almost 40% of all islands have Moderate potential vulnerability and one third of islands have Moderate High potential vulnerability. Almost 30% of all islands have Higher potential vulnerability and comprise dominantly Low Carbonate islands and a small number of Limestone and Volcanic islands (Table 7.3).
• Islands have Higher potential vulnerability if they have Higher potential impact (rapid recharge response and exposed to <1,500 mm mean rainfall) coupled with Lower system adaptability (Appendix I.4). Almost 50% of all Low Carbonate Islands have Higher potential vulnerability (Table 7.3).
• All countries have some islands which have Higher potential vulnerability, except Samoa and Niue. Kiribati, RMI and Solomon Islands together host 80% of these Higher potential vulnerability islands (Appendix I.1 and Appendix I.3).
• Most of the Higher potential vulnerability islands are Low Carbonate islands with a very small GFS (<500 m maximum width) (Appendix I.4). This includes islands in the countries of: Cook Islands, FSM, Fiji, Kiribati, RMI, Palau, PNG, Solomon Islands, Tokelau, Tonga and Tuvalu. The majority are found in RMI.
• Islands have Lower potential vulnerability if they have Higher system adaptability coupled with Lower or Moderate Low potential impact (slow recharge response and exposed to different rainfall combinations) (Appendix I.4).
• The countries of Fiji, PNG, Solomon Islands and Vanuatu have some islands which have Lower potential vulnerability (Appendix I.1 and Appendix I.2). These are all Complex islands (Appendix I.4).
Table 7.3 Potential Vulnerability of island groundwater systems to projected lowest mean annual rainfall in 2050, shown as percentage (count) of all islands assessed.
Island type Lower Moderate Low Moderate Moderate High Higher Total of island type
Low Carbonate - - 34% (357) 18% (188) 47% (490) 100% (1035)
Limestone - - 33% (17) 59% (30) 8% (4) 100% (51)
Volcanic - 4% (25) 42% (270) 54% (342) 0% (2) 100% (639)
Composite - 4% (3) 33% (24) 63% (45) - 100% (72)
Complex1 94% (15) - 6% (1) - - 100% (16)
Total of all islands
1% (15) 2% (28) 37% (669) 33% (605) 27% (496) 100% (1813)
1Note that the main island of PNG (east New Guinea) is included as three islands: (1) northern subregion; (2) southern subregion, and (3) central subregion.
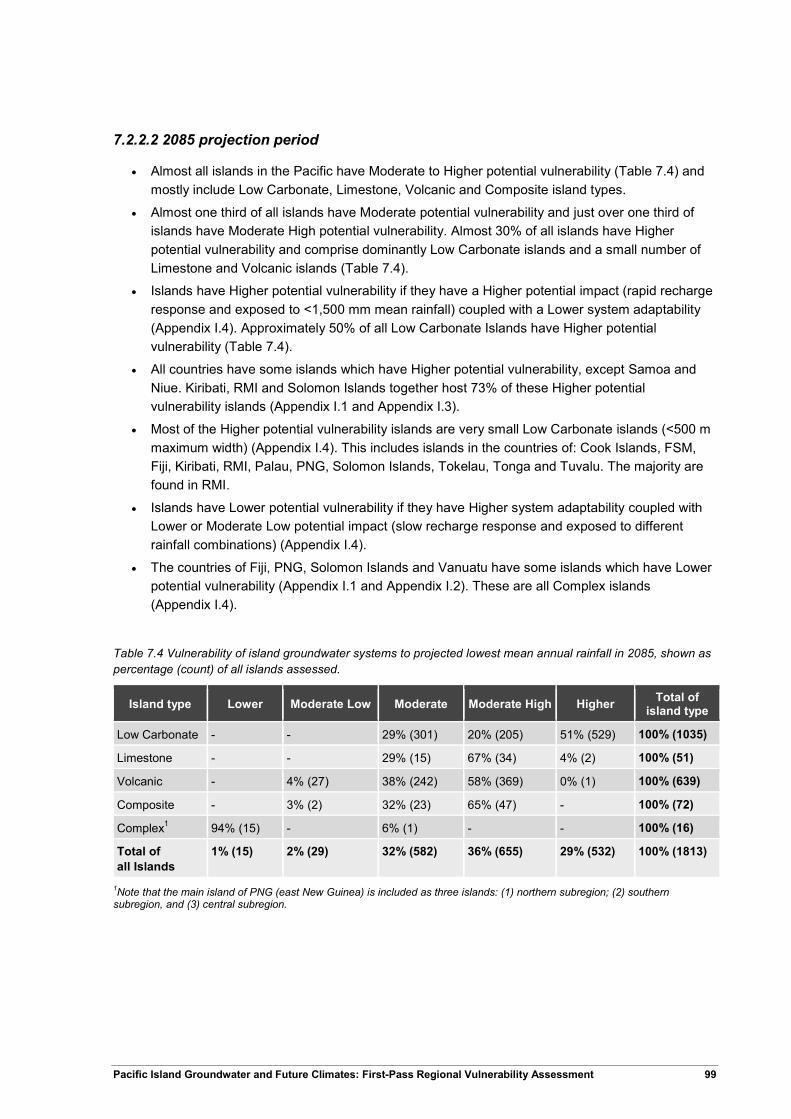
Pacific Island Groundwater and Future Climates: First-Pass Regional Vulnerability Assessment 99
7.2.2.2 2085 projection period
• Almost all islands in the Pacific have Moderate to Higher potential vulnerability (Table 7.4) and mostly include Low Carbonate, Limestone, Volcanic and Composite island types.
• Almost one third of all islands have Moderate potential vulnerability and just over one third of islands have Moderate High potential vulnerability. Almost 30% of all islands have Higher potential vulnerability and comprise dominantly Low Carbonate islands and a small number of Limestone and Volcanic islands (Table 7.4).
• Islands have Higher potential vulnerability if they have a Higher potential impact (rapid recharge response and exposed to <1,500 mm mean rainfall) coupled with a Lower system adaptability (Appendix I.4). Approximately 50% of all Low Carbonate Islands have Higher potential vulnerability (Table 7.4).
• All countries have some islands which have Higher potential vulnerability, except Samoa and Niue. Kiribati, RMI and Solomon Islands together host 73% of these Higher potential vulnerability islands (Appendix I.1 and Appendix I.3).
• Most of the Higher potential vulnerability islands are very small Low Carbonate islands (<500 m maximum width) (Appendix I.4). This includes islands in the countries of: Cook Islands, FSM, Fiji, Kiribati, RMI, Palau, PNG, Solomon Islands, Tokelau, Tonga and Tuvalu. The majority are found in RMI.
• Islands have Lower potential vulnerability if they have Higher system adaptability coupled with Lower or Moderate Low potential impact (slow recharge response and exposed to different rainfall combinations) (Appendix I.4).
• The countries of Fiji, PNG, Solomon Islands and Vanuatu have some islands which have Lower potential vulnerability (Appendix I.1 and Appendix I.2). These are all Complex islands (Appendix I.4).
Table 7.4 Vulnerability of island groundwater systems to projected lowest mean annual rainfall in 2085, shown as percentage (count) of all islands assessed.
Island type Lower Moderate Low Moderate Moderate High Higher Total of island type
Low Carbonate - - 29% (301) 20% (205) 51% (529) 100% (1035)
Limestone - - 29% (15) 67% (34) 4% (2) 100% (51)
Volcanic - 4% (27) 38% (242) 58% (369) 0% (1) 100% (639)
Composite - 3% (2) 32% (23) 65% (47) - 100% (72)
Complex1 94% (15) - 6% (1) - - 100% (16)
Total of all Islands
1% (15) 2% (29) 32% (582) 36% (655) 29% (532) 100% (1813)
1Note that the main island of PNG (east New Guinea) is included as three islands: (1) northern subregion; (2) southern subregion, and (3) central subregion.
100 Pacific Island Groundwater and Future Climates: First-Pass Regional Vulnerability Assessment
7.2.2.3 Comparison between 2050 and 2085 results
In general the potential vulnerability results due to lowest mean annual rainfall are similar between the 2050 and 2085 periods. For example, the same vulnerability classes are represented in each country between 2050 and 2085, even though the numbers of islands within each class changes between projection periods. The greatest changes between the 2050 and 2085 periods include: (i) the number of islands in PNG and Tuvalu with Higher potential vulnerability increases; (ii) the number of islands in PNG with Moderate High potential vulnerability decreases; and (iii) the number of islands in PNG and Tuvalu with Moderate potential vulnerability decreases.
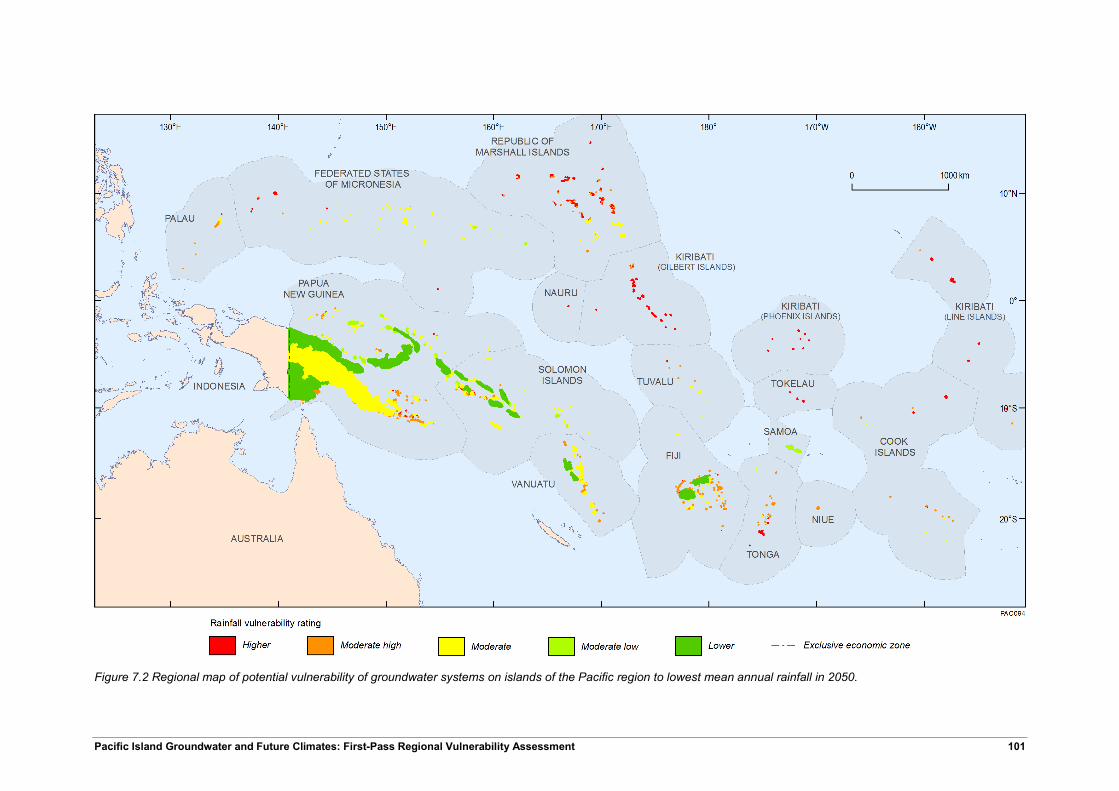
Pacific Island Groundwater and Future Climates: First-Pass Regional Vulnerability Assessment 101
Figure 7.2 Regional map of potential vulnerability of groundwater systems on islands of the Pacific region to lowest mean annual rainfall in 2050.
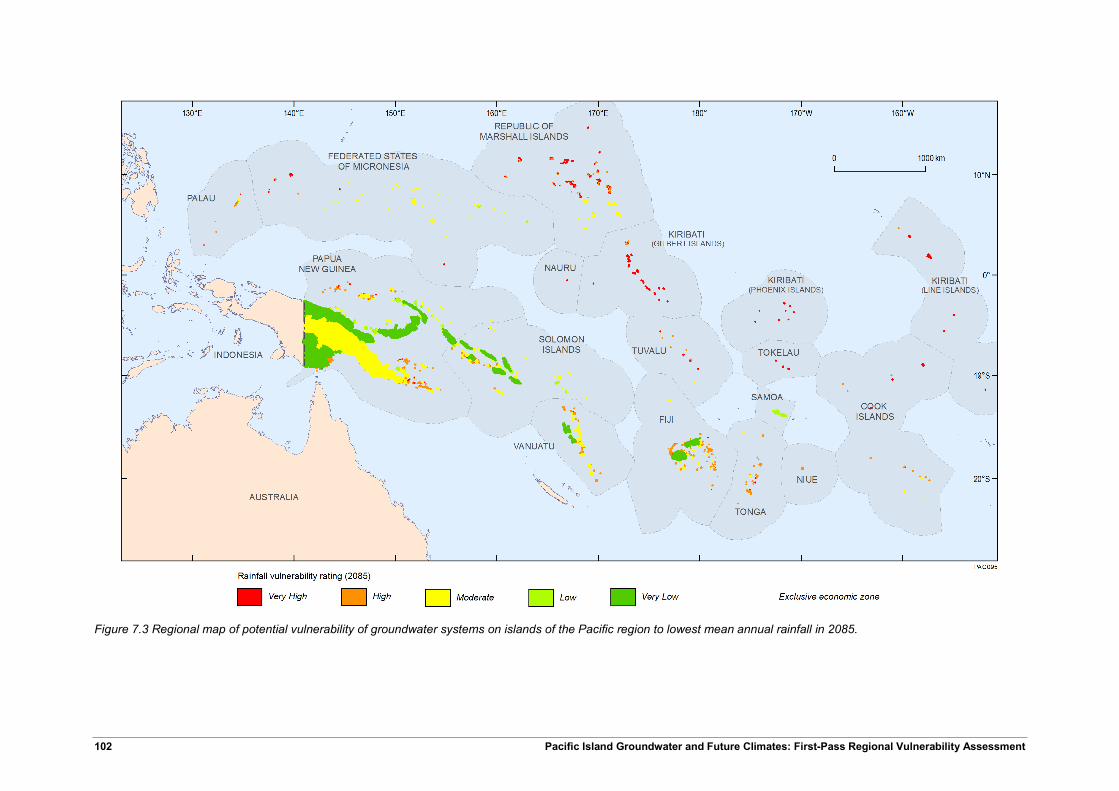
102 Pacific Island Groundwater and Future Climates: First-Pass Regional Vulnerability Assessment
Figure 7.3 Regional map of potential vulnerability of groundwater systems on islands of the Pacific region to lowest mean annual rainfall in 2085.
Pacific Island Groundwater and Future Climates: First-Pass Regional Vulnerability Assessment
7.3 Future Climate: Mean Sea-Level Rise As discussed in Chapter 3, it has been assumed in this study that all islands are potentially exposed to an increase in relative sea level, in order to account for those islands in which coral growth may not keep pace with projected SLR. It was beyond the scope of this project to assess any potential changes to island elevations due to tectonic movements over the projection periods In addition, although all islands potentially have low-lying areas that are vulnerable to SLR, the potential vulnerability of these areas has not been assessed
There is high degree of uncertainty in the SLR potential vulnerability results due to the low resolution and uncertainty in available elevation data, uniform assumption about coral growth rate relative to SLR and absence of impact-driven SLR thresholds for most island types.
7.3.1 Regional Potential Vulnerability Rating
Based on all combinations of island type, sensitivity class, exposure class and system adaptability, the highest potential vulnerability to relative mean SLR is assigned to islands with Higher potential impact, coupled with limited options to manage these impacts (Lower system adaptability). This includes Low Carbonate islands with a very small or local GFS that are exposed to ≥0.4 m mean SLR in 2050 or 2085 (Table 7.5). The lowest potential vulnerability is assigned to islands with Lower potential impact combined with Moderate or Higher system adaptability, or Moderate Low potential impact combined with Higher system adaptability. This includes all Complex islands exposed to different SLR amounts, and Volcanic and Composite islands with an intermediate or regional GFS exposed to ≤0.25 m (2050) or ≤0.58 m (2085) mean SLR (Table 7.5).
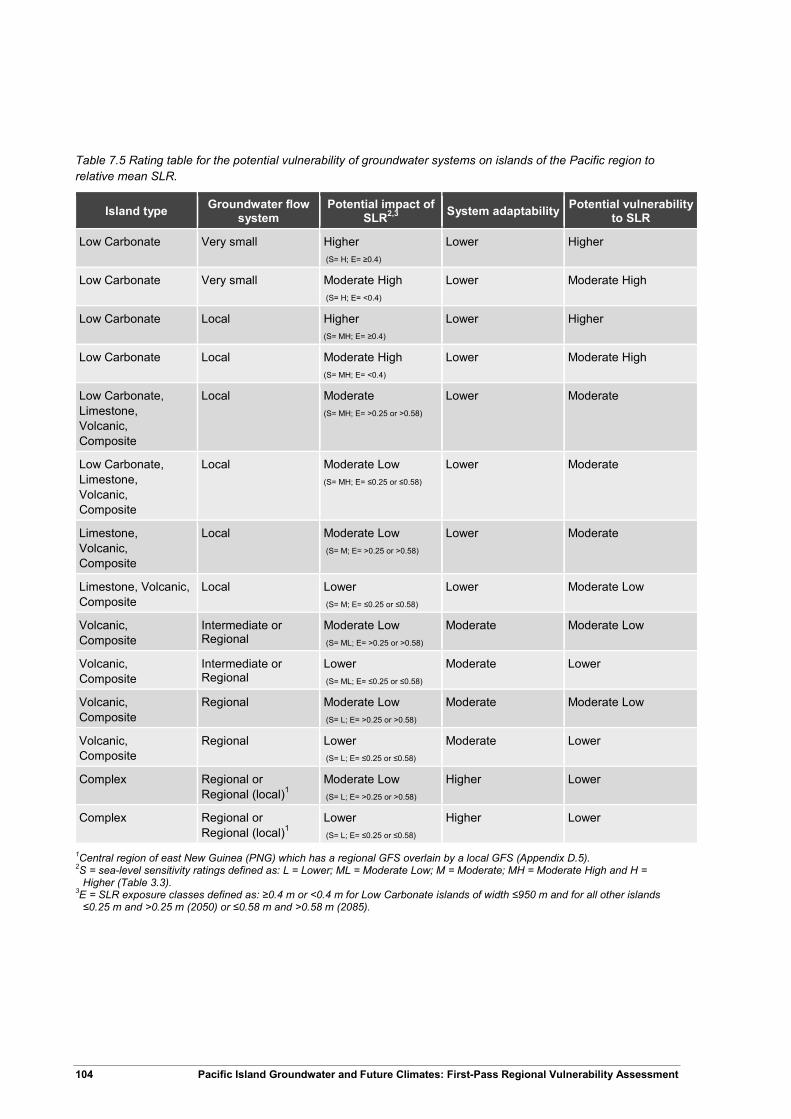
104 Pacific Island Groundwater and Future Climates: First-Pass Regional Vulnerability Assessment
Table 7.5 Rating table for the potential vulnerability of groundwater systems on islands of the Pacific region to relative mean SLR.
Island type Groundwater flow system
Potential impact of SLR2,3 System adaptability Potential vulnerability
to SLR
Low Carbonate Very small Higher (S= H; E= ≥0.4)
Lower Higher
Low Carbonate Very small Moderate High (S= H; E= <0.4)
Lower Moderate High
Low Carbonate Local Higher (S= MH; E= ≥0.4)
Lower Higher
Low Carbonate Local Moderate High (S= MH; E= <0.4)
Lower Moderate High
Low Carbonate, Limestone, Volcanic, Composite
Local Moderate (S= MH; E= >0.25 or >0.58)
Lower Moderate
Low Carbonate, Limestone, Volcanic, Composite
Local Moderate Low (S= MH; E= ≤0.25 or ≤0.58)
Lower Moderate
Limestone, Volcanic, Composite
Local Moderate Low (S= M; E= >0.25 or >0.58)
Lower Moderate
Limestone, Volcanic, Composite
Local Lower (S= M; E= ≤0.25 or ≤0.58)
Lower Moderate Low
Volcanic, Composite
Intermediate or Regional
Moderate Low (S= ML; E= >0.25 or >0.58)
Moderate Moderate Low
Volcanic, Composite
Intermediate or Regional
Lower (S= ML; E= ≤0.25 or ≤0.58)
Moderate Lower
Volcanic, Composite
Regional Moderate Low (S= L; E= >0.25 or >0.58)
Moderate Moderate Low
Volcanic, Composite
Regional Lower (S= L; E= ≤0.25 or ≤0.58)
Moderate Lower
Complex Regional or Regional (local)1
Moderate Low (S= L; E= >0.25 or >0.58)
Higher Lower
Complex Regional or Regional (local)1
Lower (S= L; E= ≤0.25 or ≤0.58)
Higher Lower
1Central region of east New Guinea (PNG) which has a regional GFS overlain by a local GFS (Appendix D.5). 2S = sea-level sensitivity ratings defined as: L = Lower; ML = Moderate Low; M = Moderate; MH = Moderate High and H =
Higher (Table 3.3). 3E = SLR exposure classes defined as: ≥0.4 m or <0.4 m for Low Carbonate islands of width ≤950 m and for all other islands
≤0.25 m and >0.25 m (2050) or ≤0.58 m and >0.58 m (2085).
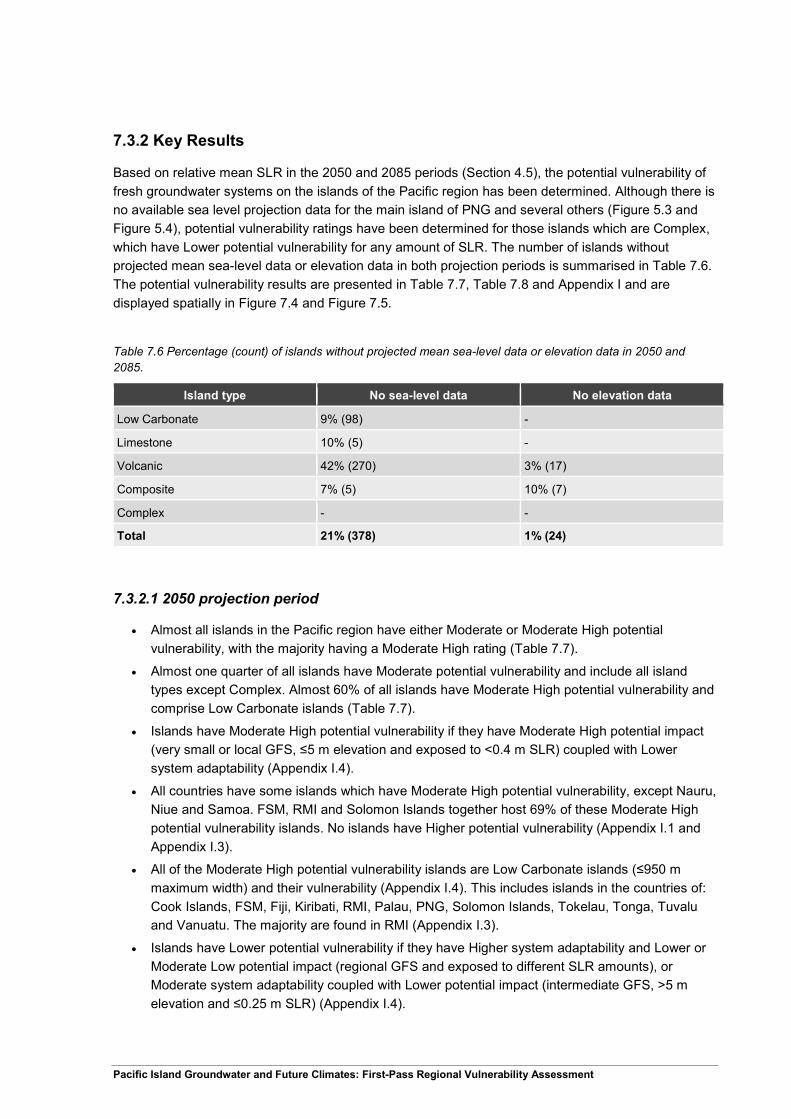
Pacific Island Groundwater and Future Climates: First-Pass Regional Vulnerability Assessment
7.3.2 Key Results
Based on relative mean SLR in the 2050 and 2085 periods (Section 4.5), the potential vulnerability of fresh groundwater systems on the islands of the Pacific region has been determined. Although there is no available sea level projection data for the main island of PNG and several others (Figure 5.3 and Figure 5.4), potential vulnerability ratings have been determined for those islands which are Complex, which have Lower potential vulnerability for any amount of SLR. The number of islands without projected mean sea-level data or elevation data in both projection periods is summarised in Table 7.6. The potential vulnerability results are presented in Table 7.7, Table 7.8 and Appendix I and are displayed spatially in Figure 7.4 and Figure 7.5.
Table 7.6 Percentage (count) of islands without projected mean sea-level data or elevation data in 2050 and 2085.
Island type No sea-level data No elevation data
Low Carbonate 9% (98) -
Limestone 10% (5) -
Volcanic 42% (270) 3% (17)
Composite 7% (5) 10% (7)
Complex - -
Total 21% (378) 1% (24)
7.3.2.1 2050 projection period
• Almost all islands in the Pacific region have either Moderate or Moderate High potential vulnerability, with the majority having a Moderate High rating (Table 7.7).
• Almost one quarter of all islands have Moderate potential vulnerability and include all island types except Complex. Almost 60% of all islands have Moderate High potential vulnerability and comprise Low Carbonate islands (Table 7.7).
• Islands have Moderate High potential vulnerability if they have Moderate High potential impact (very small or local GFS, ≤5 m elevation and exposed to <0.4 m SLR) coupled with Lower system adaptability (Appendix I.4).
• All countries have some islands which have Moderate High potential vulnerability, except Nauru, Niue and Samoa. FSM, RMI and Solomon Islands together host 69% of these Moderate High potential vulnerability islands. No islands have Higher potential vulnerability (Appendix I.1 and Appendix I.3).
• All of the Moderate High potential vulnerability islands are Low Carbonate islands (≤950 m maximum width) and their vulnerability (Appendix I.4). This includes islands in the countries of: Cook Islands, FSM, Fiji, Kiribati, RMI, Palau, PNG, Solomon Islands, Tokelau, Tonga, Tuvalu and Vanuatu. The majority are found in RMI (Appendix I.3).
• Islands have Lower potential vulnerability if they have Higher system adaptability and Lower or Moderate Low potential impact (regional GFS and exposed to different SLR amounts), or Moderate system adaptability coupled with Lower potential impact (intermediate GFS, >5 m elevation and ≤0.25 m SLR) (Appendix I.4).
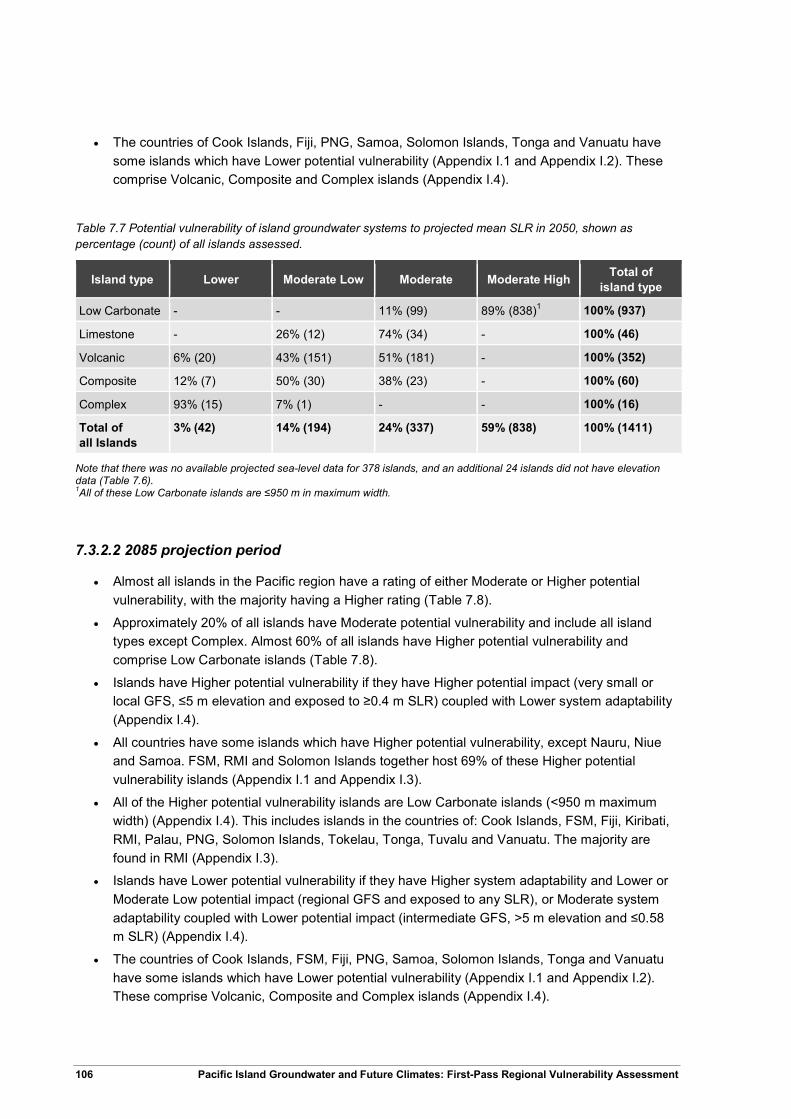
106 Pacific Island Groundwater and Future Climates: First-Pass Regional Vulnerability Assessment
• The countries of Cook Islands, Fiji, PNG, Samoa, Solomon Islands, Tonga and Vanuatu have some islands which have Lower potential vulnerability (Appendix I.1 and Appendix I.2). These comprise Volcanic, Composite and Complex islands (Appendix I.4).
Table 7.7 Potential vulnerability of island groundwater systems to projected mean SLR in 2050, shown as percentage (count) of all islands assessed.
Island type Lower Moderate Low Moderate Moderate High Total of island type
Low Carbonate - - 11% (99) 89% (838)1 100% (937)
Limestone - 26% (12) 74% (34) - 100% (46)
Volcanic 6% (20) 43% (151) 51% (181) - 100% (352)
Composite 12% (7) 50% (30) 38% (23) - 100% (60)
Complex 93% (15) 7% (1) - - 100% (16)
Total of all Islands
3% (42) 14% (194) 24% (337) 59% (838) 100% (1411)
Note that there was no available projected sea-level data for 378 islands, and an additional 24 islands did not have elevation data (Table 7.6). 1All of these Low Carbonate islands are ≤950 m in maximum width.
7.3.2.2 2085 projection period
• Almost all islands in the Pacific region have a rating of either Moderate or Higher potential vulnerability, with the majority having a Higher rating (Table 7.8).
• Approximately 20% of all islands have Moderate potential vulnerability and include all island types except Complex. Almost 60% of all islands have Higher potential vulnerability and comprise Low Carbonate islands (Table 7.8).
• Islands have Higher potential vulnerability if they have Higher potential impact (very small or local GFS, ≤5 m elevation and exposed to ≥0.4 m SLR) coupled with Lower system adaptability (Appendix I.4).
• All countries have some islands which have Higher potential vulnerability, except Nauru, Niue and Samoa. FSM, RMI and Solomon Islands together host 69% of these Higher potential vulnerability islands (Appendix I.1 and Appendix I.3).
• All of the Higher potential vulnerability islands are Low Carbonate islands (<950 m maximum width) (Appendix I.4). This includes islands in the countries of: Cook Islands, FSM, Fiji, Kiribati, RMI, Palau, PNG, Solomon Islands, Tokelau, Tonga, Tuvalu and Vanuatu. The majority are found in RMI (Appendix I.3).
• Islands have Lower potential vulnerability if they have Higher system adaptability and Lower or Moderate Low potential impact (regional GFS and exposed to any SLR), or Moderate system adaptability coupled with Lower potential impact (intermediate GFS, >5 m elevation and ≤0.58 m SLR) (Appendix I.4).
• The countries of Cook Islands, FSM, Fiji, PNG, Samoa, Solomon Islands, Tonga and Vanuatu have some islands which have Lower potential vulnerability (Appendix I.1 and Appendix I.2). These comprise Volcanic, Composite and Complex islands (Appendix I.4).
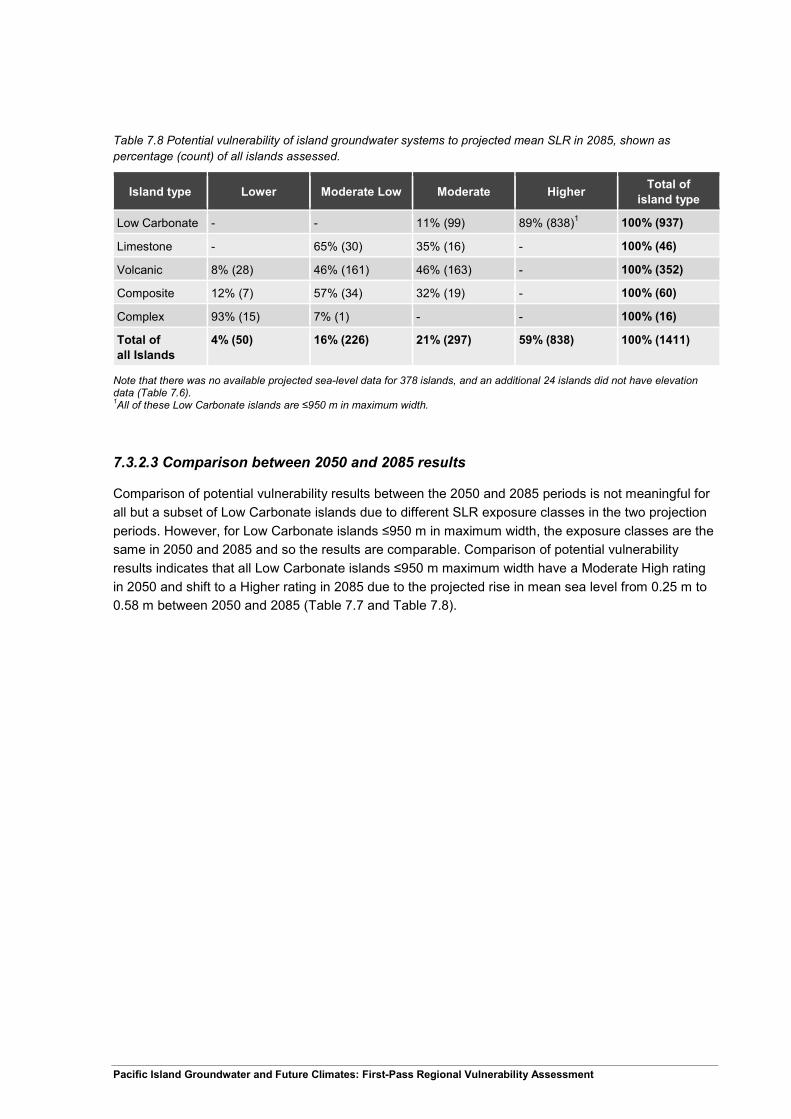
Pacific Island Groundwater and Future Climates: First-Pass Regional Vulnerability Assessment
Table 7.8 Potential vulnerability of island groundwater systems to projected mean SLR in 2085, shown as percentage (count) of all islands assessed.
Island type Lower Moderate Low Moderate Higher Total of island type
Low Carbonate - - 11% (99) 89% (838)1 100% (937)
Limestone - 65% (30) 35% (16) - 100% (46)
Volcanic 8% (28) 46% (161) 46% (163) - 100% (352)
Composite 12% (7) 57% (34) 32% (19) - 100% (60)
Complex 93% (15) 7% (1) - - 100% (16)
Total of all Islands
4% (50) 16% (226) 21% (297) 59% (838) 100% (1411)
Note that there was no available projected sea-level data for 378 islands, and an additional 24 islands did not have elevation data (Table 7.6). 1All of these Low Carbonate islands are ≤950 m in maximum width.
7.3.2.3 Comparison between 2050 and 2085 results
Comparison of potential vulnerability results between the 2050 and 2085 periods is not meaningful for all but a subset of Low Carbonate islands due to different SLR exposure classes in the two projection periods. However, for Low Carbonate islands ≤950 m in maximum width, the exposure classes are the same in 2050 and 2085 and so the results are comparable. Comparison of potential vulnerability results indicates that all Low Carbonate islands ≤950 m maximum width have a Moderate High rating in 2050 and shift to a Higher rating in 2085 due to the projected rise in mean sea level from 0.25 m to 0.58 m between 2050 and 2085 (Table 7.7 and Table 7.8).
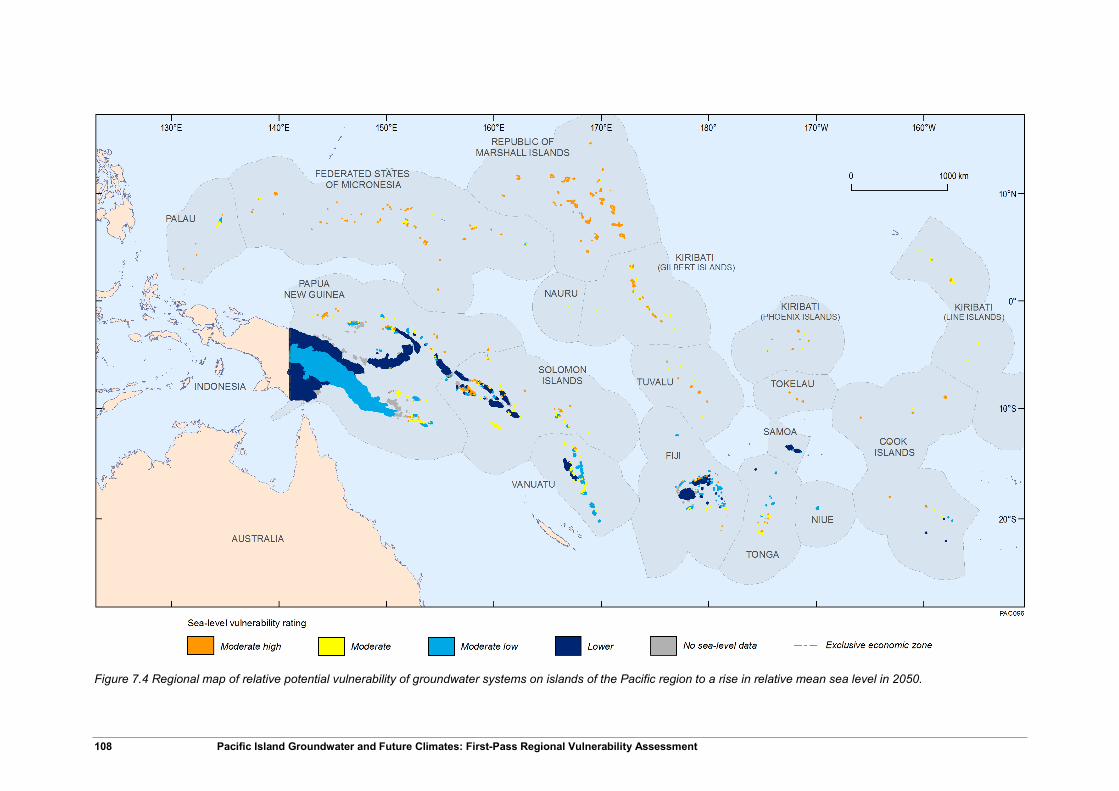
108 Pacific Island Groundwater and Future Climates: First-Pass Regional Vulnerability Assessment
Figure 7.4 Regional map of relative potential vulnerability of groundwater systems on islands of the Pacific region to a rise in relative mean sea level in 2050.
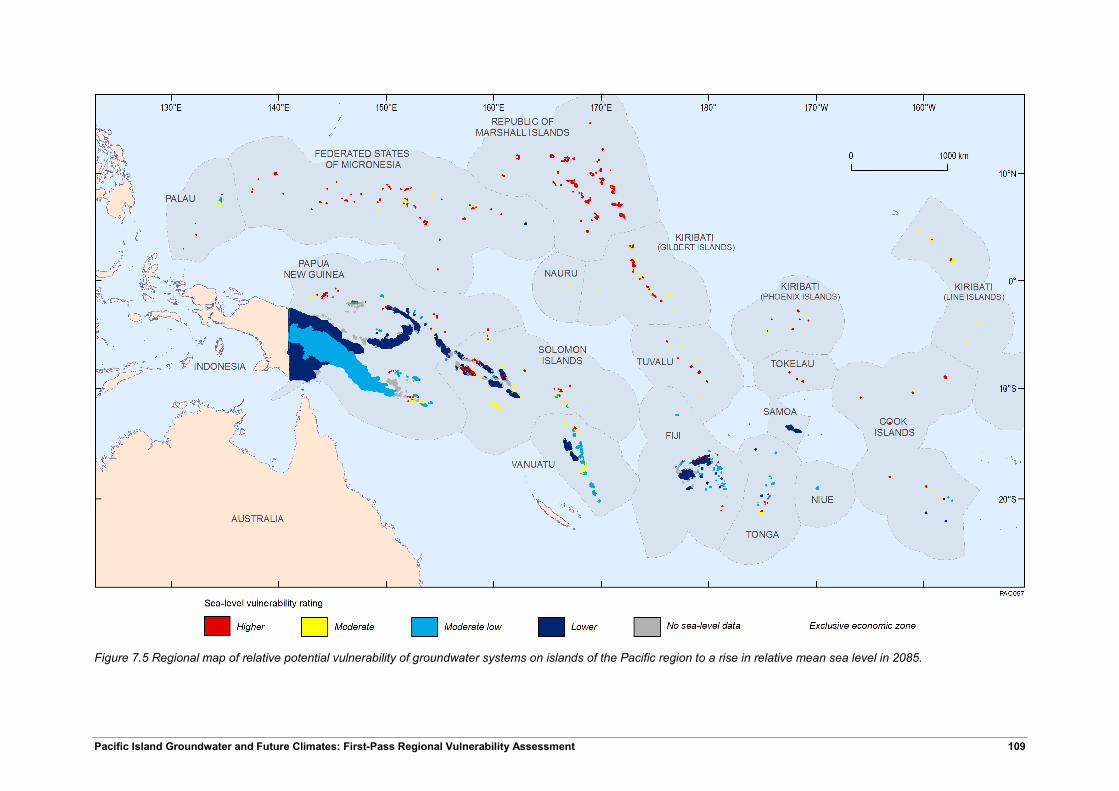
Pacific Island Groundwater and Future Climates: First-Pass Regional Vulnerability Assessment 109
Figure 7.5 Regional map of relative potential vulnerability of groundwater systems on islands of the Pacific region to a rise in relative mean sea level in 2085.
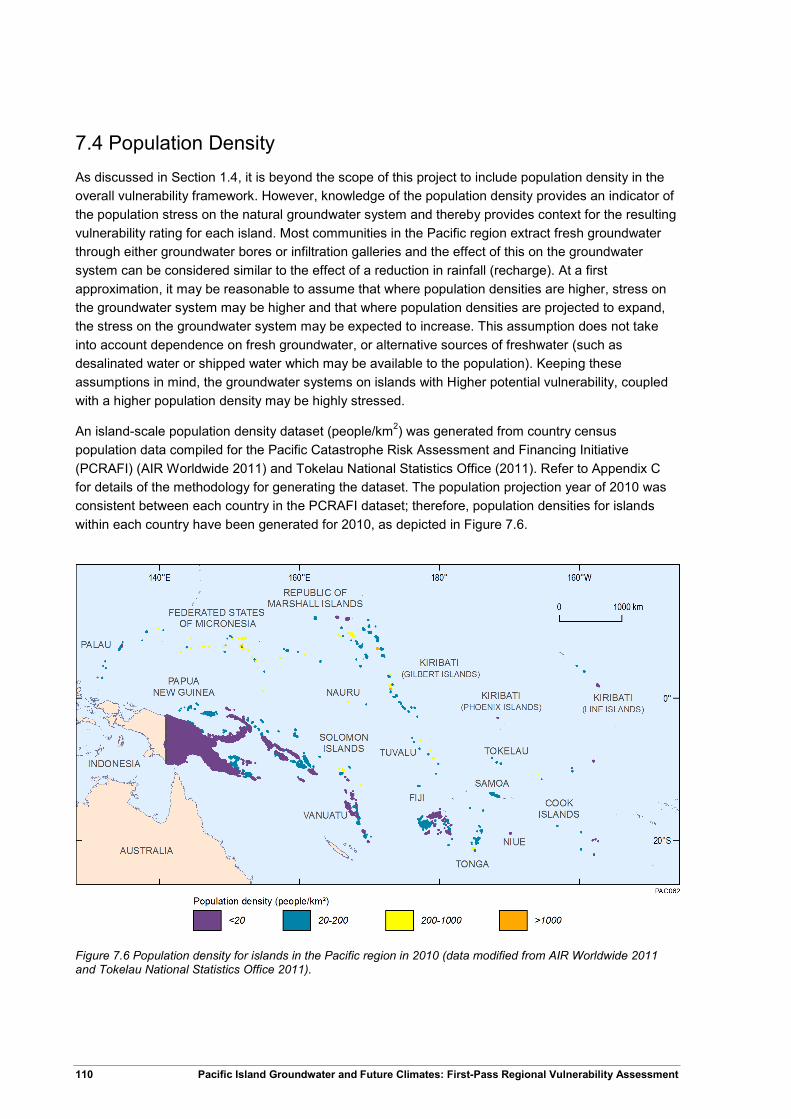
110 Pacific Island Groundwater and Future Climates: First-Pass Regional Vulnerability Assessment
7.4 Population Density As discussed in Section 1.4, it is beyond the scope of this project to include population density in the overall vulnerability framework. However, knowledge of the population density provides an indicator of the population stress on the natural groundwater system and thereby provides context for the resulting vulnerability rating for each island. Most communities in the Pacific region extract fresh groundwater through either groundwater bores or infiltration galleries and the effect of this on the groundwater system can be considered similar to the effect of a reduction in rainfall (recharge). At a first approximation, it may be reasonable to assume that where population densities are higher, stress on the groundwater system may be higher and that where population densities are projected to expand, the stress on the groundwater system may be expected to increase. This assumption does not take into account dependence on fresh groundwater, or alternative sources of freshwater (such as desalinated water or shipped water which may be available to the population). Keeping these assumptions in mind, the groundwater systems on islands with Higher potential vulnerability, coupled with a higher population density may be highly stressed.
An island-scale population density dataset (people/km2) was generated from country census population data compiled for the Pacific Catastrophe Risk Assessment and Financing Initiative (PCRAFI) (AIR Worldwide 2011) and Tokelau National Statistics Office (2011). Refer to Appendix C for details of the methodology for generating the dataset. The population projection year of 2010 was consistent between each country in the PCRAFI dataset; therefore, population densities for islands within each country have been generated for 2010, as depicted in Figure 7.6.
Figure 7.6 Population density for islands in the Pacific region in 2010 (data modified from AIR Worldwide 2011 and Tokelau National Statistics Office 2011).
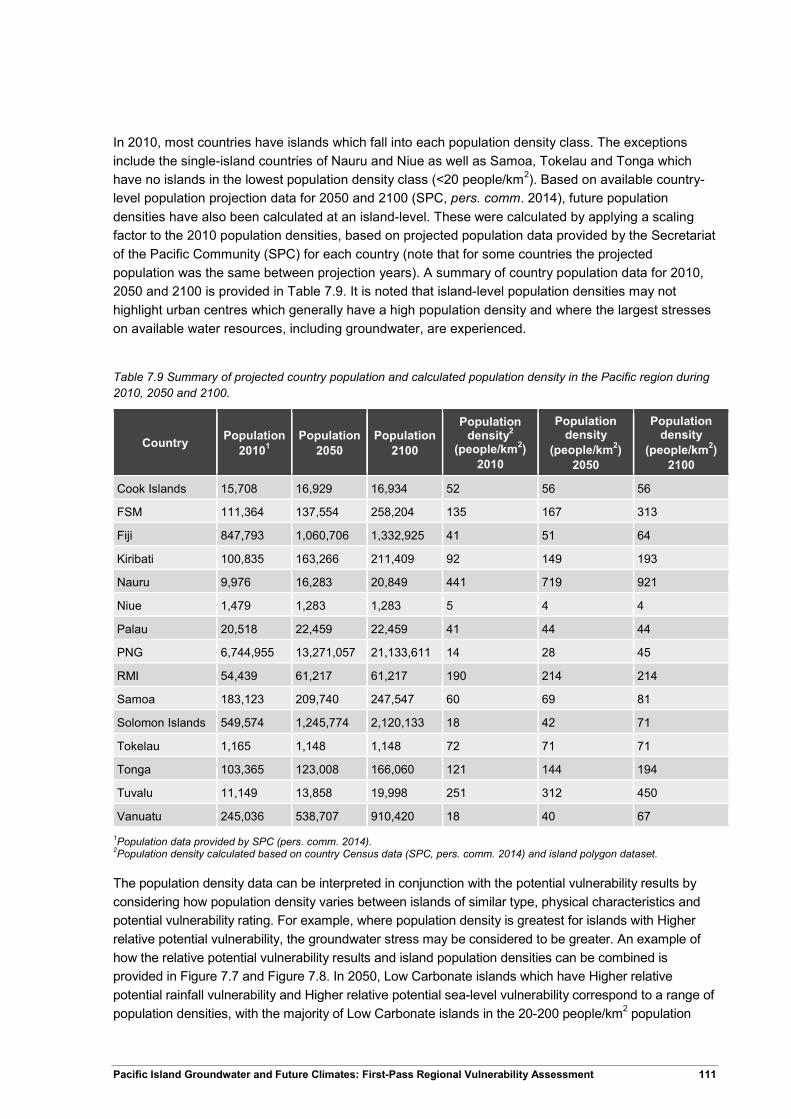
Pacific Island Groundwater and Future Climates: First-Pass Regional Vulnerability Assessment 111
In 2010, most countries have islands which fall into each population density class. The exceptions include the single-island countries of Nauru and Niue as well as Samoa, Tokelau and Tonga which have no islands in the lowest population density class (<20 people/km2). Based on available country-level population projection data for 2050 and 2100 (SPC, pers. comm. 2014), future population densities have also been calculated at an island-level. These were calculated by applying a scaling factor to the 2010 population densities, based on projected population data provided by the Secretariat of the Pacific Community (SPC) for each country (note that for some countries the projected population was the same between projection years). A summary of country population data for 2010, 2050 and 2100 is provided in Table 7.9. It is noted that island-level population densities may not highlight urban centres which generally have a high population density and where the largest stresses on available water resources, including groundwater, are experienced.
Table 7.9 Summary of projected country population and calculated population density in the Pacific region during 2010, 2050 and 2100.
Country Population 20101
Population 2050
Population 2100
Population density2
(people/km2) 2010
Population density
(people/km2) 2050
Population density
(people/km2) 2100
Cook Islands 15,708 16,929 16,934 52 56 56
FSM 111,364 137,554 258,204 135 167 313
Fiji 847,793 1,060,706 1,332,925 41 51 64
Kiribati 100,835 163,266 211,409 92 149 193
Nauru 9,976 16,283 20,849 441 719 921
Niue 1,479 1,283 1,283 5 4 4
Palau 20,518 22,459 22,459 41 44 44
PNG 6,744,955 13,271,057 21,133,611 14 28 45
RMI 54,439 61,217 61,217 190 214 214
Samoa 183,123 209,740 247,547 60 69 81
Solomon Islands 549,574 1,245,774 2,120,133 18 42 71
Tokelau 1,165 1,148 1,148 72 71 71
Tonga 103,365 123,008 166,060 121 144 194
Tuvalu 11,149 13,858 19,998 251 312 450
Vanuatu 245,036 538,707 910,420 18 40 67 1Population data provided by SPC (pers. comm. 2014). 2Population density calculated based on country Census data (SPC, pers. comm. 2014) and island polygon dataset.
The population density data can be interpreted in conjunction with the potential vulnerability results by considering how population density varies between islands of similar type, physical characteristics and potential vulnerability rating. For example, where population density is greatest for islands with Higher relative potential vulnerability, the groundwater stress may be considered to be greater. An example of how the relative potential vulnerability results and island population densities can be combined is provided in Figure 7.7 and Figure 7.8. In 2050, Low Carbonate islands which have Higher relative potential rainfall vulnerability and Higher relative potential sea-level vulnerability correspond to a range of population densities, with the majority of Low Carbonate islands in the 20-200 people/km2 population
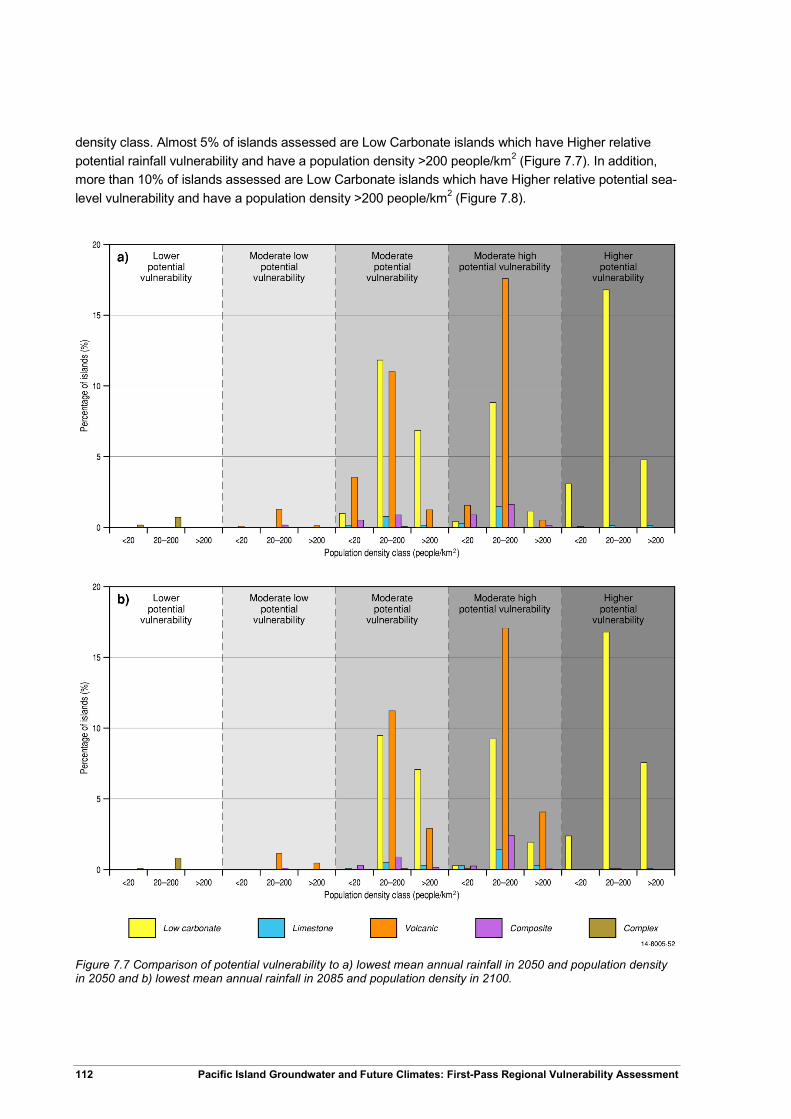
112 Pacific Island Groundwater and Future Climates: First-Pass Regional Vulnerability Assessment
density class. Almost 5% of islands assessed are Low Carbonate islands which have Higher relative potential rainfall vulnerability and have a population density >200 people/km2 (Figure 7.7). In addition, more than 10% of islands assessed are Low Carbonate islands which have Higher relative potential sea-level vulnerability and have a population density >200 people/km2 (Figure 7.8).
Figure 7.7 Comparison of potential vulnerability to a) lowest mean annual rainfall in 2050 and population density in 2050 and b) lowest mean annual rainfall in 2085 and population density in 2100.
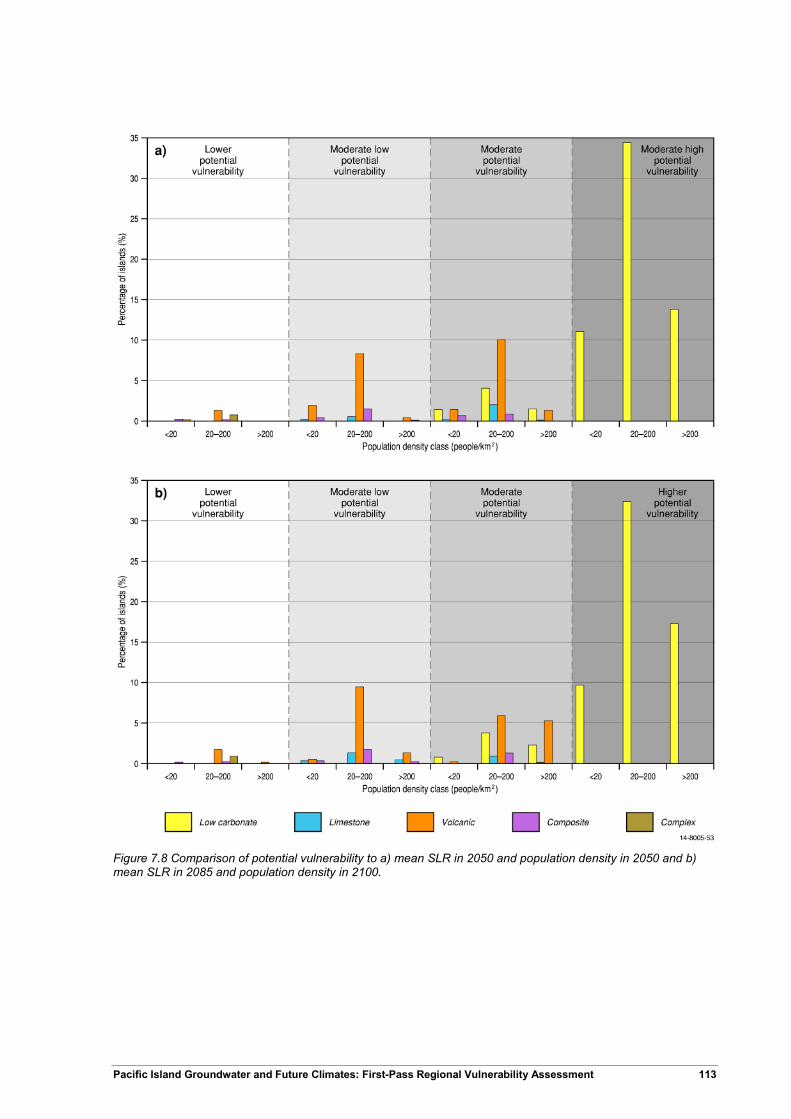
Pacific Island Groundwater and Future Climates: First-Pass Regional Vulnerability Assessment 113
Figure 7.8 Comparison of potential vulnerability to a) mean SLR in 2050 and population density in 2050 and b) mean SLR in 2085 and population density in 2100.
114 Pacific Island Groundwater and Future Climates: First-Pass Regional Vulnerability Assessment
7.5 Chapter Summary Two separate methods have been used to assess relative potential vulnerability fresh groundwater to: 1) lowest mean annual rainfall during ENSO phases and 2) mean SLR and therefore the maps and results should be interpreted separately and are not comparable.
• Ratings of relative potential vulnerability to projected low rainfall periods or mean SLR depend on the combination of potential impact (sensitivity and exposure) and system adaptability of a groundwater system. There are five possible ratings: Lower, Moderate Low, Moderate, Moderate High and Higher. The ratings for islands assessed are shown below.
• Projected lowest mean annual rainfall:
− In both 2050 and 2085, islands have Higher relative potential vulnerability if they have Lower system adaptability coupled with Higher potential impact (rapid recharge response and exposed to <1,500 mm mean rainfall).
− In both 2050 and 2085, islands have Lower relative potential vulnerability if they have Higher system adaptability coupled with Lower or Moderate Low potential impact (slow recharge response and exposed to various rainfall combinations).
• Projected mean SLR:
− In 2050, islands have Moderate High relative potential vulnerability if they have Lower system adaptability coupled with Moderate High potential impact (very small or local GFS, ≤5 m elevation and exposed to <0.4 m mean SLR).
− In 2085, islands have Higher relative potential vulnerability if they have Lower system adaptability coupled with Higher potential impact (very small or local GFS, ≤5 m elevation and exposed to ≥0.4 m mean SLR).
− In both 2050 and 2085, islands have Lower relative potential vulnerability if they have Higher system adaptability coupled with Lower or Moderate Low potential impact (regional GFS and exposed to any SLR), or Moderate system adaptability coupled with Lower potential impact (intermediate GFS, >5 m elevation and ≤0.25 m SLR).
Key conclusions for the assessment of relative potential vulnerability to current mean annual rainfall include:
• The maximum relative potential vulnerability is Higher for Low Carbonate islands; Moderate High for Limestone, Volcanic and Composite islands; and Moderate or Lower for Complex islands.
• Islands which have the highest current rainfall relative potential vulnerability occur in regions where current mean annual rainfall is Lower and annual rainfall variability is higher. Islands in the countries of Cook Islands, Fiji, Kiribati, RMI and Vanuatu have Moderate High or Higher relative potential vulnerability.
• Islands in the countries of Fiji, Palau, PNG, Samoa, Solomon Islands and Vanuatu have Lower or Moderate Low relative potential vulnerability. These islands correspond to areas of Moderate mean annual rainfall and more consistent rainfall.
Pacific Island Groundwater and Future Climates: First-Pass Regional Vulnerability Assessment 115
Key conclusions for both 2050 and 2085 for the lowest mean annual rainfall relative potential vulnerability assessment include:
• Approximately 30% of all islands in the Pacific region have Higher relative potential vulnerability.
• The most vulnerable islands (Higher relative potential vulnerability) include a proportion of Low Carbonate (~50%, 490 islands), Limestone (<10%, 4 islands) and Volcanic islands (<1%, 2 islands). This includes islands in 13 of the countries; the majority are located in Kiribati, RMI and Solomon Islands.
• Limestone, Volcanic or Composite islands mostly have Moderate High relative potential vulnerability.
• The least vulnerable islands (Lower relative potential vulnerability) are Complex islands.
Key conclusions for both 2050 and 2085 for the mean SLR relative potential vulnerability assessment include:
• Approximately 60% of all islands in the Pacific region have either Moderate High (2050) or Higher (2085) relative potential vulnerability.
• The most vulnerable islands (Moderate High relative potential vulnerability in 2050 or Higher in 2085) are Low Carbonate (~90%, 838 islands). This includes islands in 12 of the countries; the majority are located in FSM, RMI and Solomon Islands.
• The majority of Limestone, Volcanic and Composite islands have Moderate Low or Moderate relative potential vulnerability.
• The least vulnerable islands (Lower relative potential vulnerability) are Complex islands.
Knowledge of the population density for each island can provide an indicator of the population stress on the natural groundwater system and can provide context for the potential vulnerability ratings of groundwater systems to future climate. Population density data can be assessed in conjunction with the potential vulnerability results by considering how population density varies between islands of similar type, physical characteristics and potential vulnerability rating. This is an area for future work.
116 Pacific Island Groundwater and Future Climates: First-Pass Regional Vulnerability Assessment
8 Summary and Conclusions
8.1 Project Summary This project has undertaken a first-pass regional assessment of relative potential vulnerability of groundwater on islands of the Pacific region (covering 15 Pacific Island countries and territories2) to the impacts of (i) lowest mean annual rainfall during ENSO phases and (ii) mean sea-level rise (SLR) in two projection periods (30-year periods centred on 2050 and 2085). Potential vulnerability was assessed for approximately 1,800 islands with potential for permanent fresh groundwater.
The relative potential vulnerability of the assumed principal aquifer on each island to current and future climate has been assessed through a groundwater vulnerability framework, which considers the components of sensitivity, exposure, and adaptability of the groundwater system. The potential vulnerability of a given climate-related hazard depends on the potential impact (sensitivity and exposure) of a particular hazard which is offset by the intrinsic ability of a groundwater system to be managed for future climate impacts. Relative potential vulnerability has been assessed separately for the two climate-related hazards. The impacts of low rainfall periods, rather than high rainfall, were assessed as it was considered to have the greatest impact on an island’s groundwater availability.
A hydrogeologically-based typology was developed for the project due to the regional scale of the study and limited availability of detailed hydrogeological information for many of the islands in the Pacific region. Despite their local diversity, there are similarities between groundwater systems on islands of similar geology, which are captured in the typology. It is assumed that the principal aquifer occurs within the dominant geology. For the purpose of a regional-scale assessment, information about the width and elevation of the island, as well as the principal aquifer were used. The typological approach has been fundamental to the regional assessment by enabling knowledge from well-studied islands to be applied to other islands of the same geology for which there are currently no detailed studies.
Based on the typology, islands in the Pacific region of interest have been classified as belonging to one of five island types: Low Carbonate, Limestone, Volcanic, Composite and Complex (islands >2,000 km2 in area). For each of the island types, analysis of island area, maximum width and maximum elevation together indicates that there are distinct hydrogeological and physical characteristics. Low Carbonate and Limestone islands typically have a single freshwater aquifer and all Low Carbonate islands were assumed to have an elevation of <5 m. Volcanic, Composite and Complex islands typically have multiple freshwater aquifers. The aquifer with the highest potential productivity is the assumed principal aquifer for each island type. Principal aquifers fall into three groups: intergranular (Low Carbonate and Complex islands); fissured karst (Limestone islands); and fissured fractured (Volcanic and Composite islands) aquifers.
2 Including: Cook Islands, Federated States of Micronesia, Fiji, Kiribati, Nauru, Niue, Palau, Papua New Guinea, Republic of
Marshall Islands, Samoa, Solomon Islands, Tonga, Tokelau, Tuvalu and Vanuatu.
Pacific Island Groundwater and Future Climates: First-Pass Regional Vulnerability Assessment 117
Each principal aquifer has a dominant GFS which influences the rainfall sensitivity of the islands. Mean annual rainfall thresholds of ≤700 mm (very low to lower rainfall; zero to very low recharge), ≤700-1,500 mm (lower rainfall; lower recharge) and >1,500 mm (moderate to high rainfall; moderate to high recharge) were assumed to apply to all island types. The principal aquifer and GFS influence the adaptability of the groundwater system to the impacts of low rainfall periods.
The GFS and maximum island elevation influence the sensitivity of the islands to mean SLR. For Low Carbonate islands ≤950 m in maximum width, 0.4 m SLR is an important sea-level threshold. Mean SLR thresholds for all other islands were assumed to be 0.25 m (2050 period) and 0.58 m (2085 period) based on average mean SLR in each projection period. It was assumed that islands are static and coral growth will not keep up with projected SLR. The principal aquifer and GFS influence the adaptability of the groundwater system to the impacts of mean SLR.
Separate methods have been used to assess relative potential groundwater vulnerability to: (i) lowest mean annual rainfall during ENSO phases, and (ii) mean SLR and therefore the results should be interpreted separately and are not comparable. Relative potential vulnerability to low rainfall periods was assessed without consideration of variations in sea level and potential vulnerability to SLR was assessed without consideration of variations in rainfall. Five relative potential vulnerability ratings to the two climate hazards were applied to each assessed island: Lower, Moderate Low, Moderate, Moderate High or Higher.
8.2 Key Findings The vulnerability results are intended to be used as a first-pass indicator of the relative potential vulnerability of island groundwater systems across the Pacific region, based on the assumed principal aquifer within a hydrogeological island type and using limited publicly-available consistent data.
This study has found that the majority of assessed Low Carbonate islands in the Pacific region have Higher relative potential vulnerability to low rainfall periods or mean SLR by mid- and end-of-century. In response to low rainfall periods, the greatest number of most vulnerable islands are in the countries of Kiribati, Republic of Marshall Islands and Solomon Islands. In response to mean SLR, Federated States of Micronesia, Republic of Marshall Islands and Solomon Islands have the greatest number of most vulnerable islands. Complex islands are the least vulnerable to low rainfall periods or mean SLR.
The key relative potential vulnerability results for islands assessed are shown below.
Current mean annual rainfall (1979-2013):
− Approximately 5% of islands assessed have Higher relative potential vulnerability. These are all Low Carbonate islands.
− The majority of islands (86%) have Moderate relative potential vulnerability. This includes more than 75% of Low Carbonate, Limestone, Volcanic and Composite islands.
− The maximum relative potential vulnerability is Higher for Low Carbonate islands; Moderate High for Limestone, Volcanic and Composite islands; and Lower for Complex islands.
− The most vulnerable islands (Higher relative potential vulnerability) are located in Cook Islands, Fiji, Kiribati and Republic of Marshall Islands.
− The least vulnerable islands (Lower relative potential vulnerability) are Complex Islands in the countries of Fiji, Papua New Guinea, Solomon Islands and Vanuatu.
118 Pacific Island Groundwater and Future Climates: First-Pass Regional Vulnerability Assessment
Projected lowest mean annual rainfall (2050 and 2085):
− The relative potential vulnerability results for low rainfall are similar between the 2050 and 2085 projection periods.
− Approximately 30% of all islands assessed in the Pacific region have Higher relative potential vulnerability.
− The most vulnerable islands (Higher relative potential vulnerability) include a proportion of Low Carbonate (~50%, 490 islands), Limestone (<10%, 4 islands) and Volcanic islands (<1%, 2 islands). This includes islands in 13 of the countries, with the majority located in Kiribati, Republic of Marshall Islands and Solomon Islands.
− The least vulnerable islands are Complex islands located in Fiji, Papua New Guinea, Solomon Islands and Vanuatu.
For both current mean annual rainfall and projected lowest mean annual rainfall, islands have Higher relative potential vulnerability if they have Lower system adaptability coupled with Higher potential impact (rapid recharge response and exposed to ≤1,500 mm mean annual rainfall). Islands have Lower relative potential vulnerability if they have Higher system adaptability coupled with Lower or Moderate Low potential impact (slow recharge response and exposed to different rainfall combinations).
Projected mean SLR (2050 and 2085):
− Approximately 60% of all islands assessed in the Pacific region have either Moderate High (2050) or Higher (2085) relative potential vulnerability.
− The most vulnerable islands (Moderate High relative potential vulnerability in 2050 or Higher in 2085) are Low Carbonate islands (~90%, 838 islands). This includes islands in 12 of the countries; the majority are located in Federated States of Micronesia, Republic of Marshall Islands and Solomon Islands.
− The majority of Limestone, Volcanic and Composite islands have Moderate Low or Moderate relative potential vulnerability.
− The least vulnerable islands are located in Cook Islands, Fiji, Papua New Guinea, Samoa, Solomon Islands, Tonga and Vanuatu. These comprise Volcanic, Composite and Complex islands.
For projected mean SLR, islands have Moderate High relative potential vulnerability in 2050 if they have Lower system adaptability coupled with Moderate High potential impact (very small or local GFS, ≤5 m elevation and exposed to <0.4 m mean SLR). In 2085, islands have Higher relative potential vulnerability if they have Lower system adaptability coupled with Higher potential impact (very small or local GFS, ≤5 m elevation and exposed to ≥0.4 m mean SLR).
In both 2050 and 2085, islands have Lower relative potential vulnerability to mean SLR if they have Higher system adaptability coupled with Lower or Moderate Low potential impact (regional GFS and exposed to any SLR), or Moderate system adaptability coupled with Lower potential impact (intermediate GFS, >5 m elevation and exposed to ≤0.25 m mean SLR).
Pacific Island Groundwater and Future Climates: First-Pass Regional Vulnerability Assessment 119
8.3 Key Outcomes In addition to the rapid regional vulnerability assessment of more than 1,800 Pacific islands to future climates, key outcomes of this project include:
1. development of a hydrogeologically-based typology for the Pacific region;
2. first-time development of a regionally consistent Pacific Islands spatial database of island hydrogeological and physical characteristics;
3. identification of island type information for more than 99.9% of the study area (3,623 islands);
4. first-pass regional assessment of the potential for permanent fresh groundwater on islands in the study area.
120 Pacific Island Groundwater and Future Climates: First-Pass Regional Vulnerability Assessment
9 Knowledge Gaps and Recommendations
This project has collated publicly-available information relating to the geology, hydrogeology and physical characteristics of islands in the Pacific region as well as climate projection data to regionally assess the first-pass potential vulnerability of groundwater systems to future climate. Data and knowledge gaps have been identified during the project, which have led to a number of assumptions being made about island groundwater systems and their response to climate impacts (Section 1.5). These data gaps add to the groundwater management and climate adaptation challenges for the Pacific region. The key data limitations; groundwater management and climate adaptation challenges; and suggested recommendations for future work are summarised below.
9.1 Data Limitations In order to conduct the rapid regional assessment of potential groundwater vulnerability to future climate a number of assumptions were made, principally due to the limited availability of regionally consistent data.
Regional assessments of groundwater vulnerability to climate hazards could be enhanced by improvements in key datasets and knowledge, particularly: improved elevation data for low-lying areas on all island types; improved understanding of key SLR thresholds; improved climate projections; improved hydrogeological characterisation of islands.
Groundwater level and quality monitoring at targeted sites would both improve understanding of typical groundwater system responses to climate hazards and also guide management responses in the shorter and longer-term.
9.2 Groundwater Management and Climate Adaptation Challenges This project has conducted a first-pass analysis of the intrinsic ability of different groundwater systems to be managed (system adaptability) and found that smaller islands, such as Low Carbonate types, have a Lower system adaptability to periods of low rainfall or mean SLR and fewer adaptation options. In contrast, larger islands, such as Complex types, have relatively more adaptation options.
Key climate adaptation challenges for the Pacific region relate to the themes of: (i) improving groundwater system integrity and (ii) increasing the capacity of communities and institutions.
Groundwater management is an essential component of overall water management in a number of PICs. Many of the key management and adaptation actions available also contribute to general best-practice sustainable management of groundwater. Effective management of groundwater requires a monitoring framework and action plans for management scenarios. Informed groundwater management guidelines that capture and communicate groundwater knowledge from communities, NGOs, planners, policy-makers and groundwater projects are desirable. Given the current limited knowledge of groundwater, as well as imminent climate variability and future climate impacts, these guidelines will need to be updated regularly, as new information is made available. The challenge will be to build in-country capacity and resources for efficient groundwater management in a changing climate.
Pacific Island Groundwater and Future Climates: First-Pass Regional Vulnerability Assessment 121
Strategies to enhance groundwater system integrity in areas of greater relative potential vulnerability include:
• developing informed, targeted and ongoing groundwater monitoring networks;
• developing sub-regional groundwater management strategies for countries with similar island type distributions;
• ensuring sustainable extraction strategies;
• developing coordinated best-practice guidelines, policies and programs to underpin the above activities.
There are several constraints to adaptation in PICs that are inherent in the very nature of many small islands: limited natural resources, and relative isolation. A common constraint confronting most PICs is the lack of in-country adaptive capacity, or the ease with which they are able to cope with climate variability and change. In most small islands the cost of adopting and implementing adaptation options is likely to be unaffordable, and a significant proportion of a country’s economic wealth. Financial resources that are generally not available to island governments’ would need to come from donor countries.
Capacity to cope and adapt to change in the Pacific region can be increased by:
• improving in-country technical knowledge of groundwater systems;
• ensuring sufficient resources are available to carry out the adaptation activities;
• mentoring of water management agencies;
• increasing community participation in water resources management, including sustainable groundwater management.
9.3 Recommendations for Future Work A number of recommendations for future work have been identified during this project. They are summarised in four categories below, relating to: (1) management; (2) governance; (3) capacity building; and (4) research.
1. Management
− Continue to support or instigate long-term groundwater monitoring programs at targeted locations as well as long-term rainfall and SLR monitoring to assist in early identification of vulnerable groundwater systems and inform groundwater management.
− Integrated groundwater and surface water management on Volcanic, Composite and Complex islands using an adaptive management approach.
− Integrated management of groundwater and other freshwater sources on Low Carbonate and Limestone islands using an adaptive management approach.
2. Governance
− Develop monitoring and management guidelines for island groundwater and surface water systems to assist managers in collecting and using regionally-comparable information.
− Develop national policies and programs for each country in the region to address climate impacts on groundwater resources.
122 Pacific Island Groundwater and Future Climates: First-Pass Regional Vulnerability Assessment
3. Capacity building
− Increase community understanding and build in-country technical knowledge of groundwater system responses to climate-related hazards. This capacity building is essential to develop effective groundwater management strategies.
4. Research
− Continue research into the response of groundwater systems to likely future climate impacts, including improved understanding of key SLR thresholds and interactions between groundwater and other freshwater sources.
− Undertake investigations into the combined effect of climate hazards, including extreme events, on groundwater systems.
− Assess the combined impacts of future climate, population growth and urbanisation on groundwater availability and quality to inform long-term management, monitoring and planning.
− Continue to refine and enhance the hydrogeological typology.
− Undertake targeted local-scale studies to further investigate groundwater system vulnerability at potential hotspots identified in this study and for other important freshwater aquifers across all islands types.
− Investigate the movement of seawater in freshwater lenses and coastal aquifers, including studies into coral reef growth relative to SLR.
− Undertake collection of key datasets, particularly relating to high resolution elevation data (e.g. LiDAR); baseline groundwater data (e.g. aquifer properties, freshwater resource size and sustainable yields); and long-term groundwater monitoring data. This would reduce the number of assumptions and uncertainty in future regional assessments of potential vulnerability to future climates.
Pacific Island Groundwater and Future Climates: First-Pass Regional Vulnerability Assessment 123
References
ADLER, R. F., HUFFMAN, G. J., CHANG, A., FERRARO, R., XIE, P.-P., JANOWIAK, J., RUDOLF, B., SCHNEIDER, U., CURTIS, S., BOLVIN, D., GRUBER, A., SUSSKIND, J., ARKIN, P. & NELKIN, E. 2003. The Version-2 Global Precipitation Climatology Project (GPCP) Monthly Precipitation Analysis (1979–Present). Journal of Hydrometeorology, 4, 1147-1167.
AIR WORLDWIDE 2011. Pacific Catastrophe Risk Assessment and Financing Initiative (PCRAFI), Component 2: Exposure Data Collection and Management, Technical Report Submitted to the World Bank.
ALAM, K. & FALKLAND, A. 1997. Vulnerability to climate change of the Bonriki freshwater lens, Tarawa. Ministry of Environment and Social Development Republic of Kiribati.
AUSLIG. 1996. AUSAID: The Pacific Islands. Canberra: Commonwealth of Australia. BAILEY, R. T., JENSON, J. W. & OLSEN, A. E. 2009. Numerical Modeling of Atoll Island
Hydrogeology. Groundwater, 47, 184-196. BARLOW, P. M. 2003. Ground water in freshwater-saltwater environments of the Atlantic Coast.
Circular 1262. Reston, Virginia: U.S. Geological Survey. BARNETT, J. 2005. Titanic states? Impacts and responses to climate change in the Pacific islands.
JOURNAL OF INTERNATIONAL AFFAIRS-COLUMBIA UNIVERSITY, 59, 203. BARRON, O. et al. 2011. Climate change impact on groundwater resources in Australia. Waterlines
report, National Water Commission, Canberra. BELL, J. D., REID, C., BATTY, M. J., ALLISON, E. H., LEHODEY, P., RODWELL, L., PICKERING, T.
D., GILLETT, R., JOHNSON, J. E., HOBDAY, A. J. & DEMMKE, A. 2011. Implications of climate change for contributions by fisheries and aquaculture to Pacific Island economies and communities - Appendix 12.3. In: BELL, J. D., JOHNSON, J. E. & HOBDAY, A. J. (eds.) Vulnerability of Tropical Pacific Fisheries and Aquaculture to Climate Change. Noumea, New Caledonia: Secretariat of the Pacific Community.
BOKUNIEWICZ, H. 2001. Toward a coastal ground-water typology. Journal of Sea Research, 46, 99-108.
BUREAU OF METEOROLOGY (BoM) & COMMONWEALTH SCIENTIFIC & INDUSTRIAL RESEARCH ORGANISATION (CSIRO) 2011. Climate change in the Pacific: scientific assessment and new research. Volume 1. Regional Overview.
CORAM, J. (ed.) 1998. National classification of catchments for land and river salinity control, RIRDC publication 98/78: Rural Industries Research and Development Corporation, Canberra.
CORAM, J. E., DYSON, P. R., HOULDER, P. A. & EVANS, W. R. 2000. Australian Groundwater Flow Systems contributing to Dryland Salinity. Report by Bureau of Rural Sciences for National Land and Water Resources Audit, Canberra.
CSIRO (unpublished data) 2013. Projected Sea-Level Rise 2050 to 2085 (using the CMIP5 model), [Available in the future from http://www.cmar.csiro.au/sealevel].
DAHL, A. L. 1998-2006. Island Directory [Online]. Geneva, Switzerland. Available: http://islands.unep.ch [Accessed March 2013].
DIXON-JAIN, P., NORMAN, R., FONTAINE, K., HILL, A., STEWART, G. & WALLACE, L. 2013. Assessment of Groundwater Vulnerability to Climate Change in the Pacific Islands: Phase 1: Exposure/Impact analysis - Milestone 2 report (unpublished). Canberra: Geoscience Australia.
DUNCAN, D. 2011. Freshwater under threat: Pacific Islands vulnerability assessment of freshwater resources to environmental change. In: SPC-SOPAC (ed.) prepared for Regional Office for Asia and Pacific. Bangkok, Thailand: United Nations Environment Programme.
124 Pacific Island Groundwater and Future Climates: First-Pass Regional Vulnerability Assessment
ESRI. 2011a. How Zonal Geometry Works [Online]. Available: http://help.arcgis.com/en/arcgisdesktop/10.0/help/index.html#/How_Zonal_Geometry_works/009z000000ws000000/ [Accessed 29/10/2013].
ESRI. 2011b. Tectonic plate boundaries of the world [Online]. Available: http://www.arcgis.com/home/item.html?id=f155b76c13c84f62864446847f1ae652.
ESRI. 2012. National Geographic World Map - Basemap. USA: ESRI. FALKLAND, A. 2000. An outline of recent water supply improvements for Pangai-Hihifo, Lifuka,
Kingdom of Tonga. Tonga Water Board. FALKLAND, A. C. 1993. Hydrology and water management on small tropical islands. Proceedings of
the Symposium on Hydrology of Warm Humid Regions. International Association of Hydrological Sciences, Publication no. 216.
FALKLAND, A. C. & WOODROFFE, C. D. 1997. Chapter 19 Geology and hydrogeology of Tarawa and Christmas Island, Kiribati. In: VACHER, H. L. & QUINN, T. M. (eds.) Developments in Sedimentology, 54. Elsevier.
FALKLAND, T. 2003a. Mangaia, Cook Islands. Report on Water Investigations July-August 2003. Australian Agency for International Development.
FALKLAND, T. 2003b. Promotion of effective water management policies and practices, Kiribati Water Resources Assessment Report. Asian Development Bank.
FALKLAND, T. 2006. Rakahanga, Cook Islands Report on Water Investigations. Australian Agency for International Development.
FALKLAND, T. 2011. Water Security and Vulnerability to Climate Change and Other Impacts in Pacific Island Countries and East Timor: A report to the Australian Government Department of Climate Change and Energy Efficiency. Pacific Adaptation Strategy Assistance Program.
FERRY, J., KUMAR, P. B., BRONDERS, J. & LEWIS, J. 1997. Chapter 26 Hydrogeology of carbonate islands of Fiji. In: VACHER, H. L. & QUINN, T. M. (eds.) Developments in Sedimentology, 54. Elsevier.
FREEZE, R. A. & CHERRY, J. A. 1979. Groundwater, Upper Saddle River, NJ, Prentice Hall, Inc. FURNESS, L. J. 1997. Chapter 18 Hydrogeology of carbonate islands of the Kingdom of Tonga. In:
VACHER, H. L. & QUINN, T. M. (eds.) Developments in Sedimentology, 54. Elsevier. FURNESS, L. J. & HELU, S. P. 1993. The hydrogeology and water supply of the Kingdom of Tonga.
Ministry of Lands, Survey and Natural Resources. GOOGLE INC. 2012. Google Earth (Version 6.2.2.6613) [Online]. Available: http://earth.google.com. GROSE, M. & BEDIN, T. 2013. Projections of mean rainfall in different phases of ENSO:
Representative Global Climate Model projections, DoE request - GCM and CCAM mean rainfall - 29 November 2013. CSIRO.
GROSE, M. R., BROWN, J. N., NARSEY, S., BROWN, J. R., MURPHY, B. F., LANGLAIS, C., GUPTA, A. S., MOISE, A. F. & IRVING, D. B. 2014. Assessment of the CMIP5 global climate model simulations of the western tropical Pacific climate system and comparison to CMIP3. Int. J. Climatol.
GWP CONSULTANTS 2006. Groundwater Resources Investigations on Niue Island. Government of Niue and South Pacific Applied Geoscience Commission.
HOFFMANN, P. & KATZFEY, J. 2013. Projections of mean rainfall in different phases of ENSO: CCAM dynamic downscaling, DoE request - GCM and CCAM mean rainfall - 29 November 2013. CSIRO.
IPCC 2013. Climate Change 2013: The Physical Science Basis. Contribution of Working Group 1 to the Fifth Assessment Report of the Intergovernmental Panel on Climate Change. In: STOCKER, T. F., QIN, D., PLATTNER, G.-K., TIGNOR, M., ALLEN, S. K., J., B., A., N., XIA, Y., BEX, V. & MIDGLEY, P. M. (eds.). Cambridge, United Kingdom., New York, NY, USA: Cambridge University Press.
Pacific Island Groundwater and Future Climates: First-Pass Regional Vulnerability Assessment 125
IPCC 2014. Summary for policymakers. In: Climate Change 2014: Impacts, Adaptation, and Vulnerability. Part A: Global and Sectoral Aspects. Contribution of Working Group II to the Fifth Assessment Report of the Intergovernmental Panel on Climate Change. In: C.B. FIELD, V.R. BARROS, D.J. DOKKEN, K.J. MACH, M.D. MASTRANDREA, T.E. BILIR, M. CHATTERJEE, K.L. EBI, Y.O. ESTRADA, R.C. GENOVA, B. GIRMA, E.S. KISSEL, A.N. LEVY, S. MACCRACKEN, P.R MASTRANDREA & WHITE, L. L. (eds.). Cambridge, United Kingdom; New York, NY, USA.
JACOBSON, G., HILL, P. J. & GHASSEMI, F. 1997. Chapter 24 Geology and hydrogeology of Nauru Island. In: VACHER, H. L. & QUINN, T. M. (eds.) Developments in Sedimentology, 54. Elsevier.
JACOBSON, G. & KIDD, C. H. 1974. Groundwater in Papua New Guinea. Geological Survey of Papua New Guinea.
LOWE D.J. & GUNN J. 1986. Tonga '86, Expedition Report. MARSHALL, J. F. & JACOBSON, G. 1985. Holocene growth of a mid-Pacific atoll: Tarawa, Kiribati.
Coral Reefs, 4, 11-17. MCCALLUM, J., CROSBIE, RS, WALKER, GR & DAWES, WR , 2010. Impacts of climate change on
groundwater: A sensitivity analysis of recharge. Hydrogeol. J., 18(7), 1625-1638. MIMURA, N., NURSE, L., MCLEAN, R. F., AGARD, J., BRIGUGLIO, L., LEFALE, P., PAYET, R. &
SEM, G. 2007. Small Islands. In: PARRY, M. L., CANZIANI, O. F., PALUTIKOF, J. P., VAN DER LINDEN, P. J. & HANSON, C. E. (eds.) Climate Change 2007: Impacts, Adaptation and Vulnerability. Contribution of Working Group II to the Fourth Assessment Report of the Intergovernmental Panel on Climate Change. Cambridge, U.K.: Cambridge University Press.
MINISTRY OF ECONOMY, TRADE AND INDUSTRY OF JAPAN (METI) & UNITED STATES NATIONAL AERONAUTICS AND SPACE ADMINISTRATION (NASA). 2011. Advanced Spaceborne Thermal Emission and Reflection Radiometer (ASTER), Global Digital Elevation Model Version 2 (GDEM V002) [Online]. Available: http://reverb.echo.nasa.gov/reverb/#utf8=%E2%9C%93&spatial_map=satellite&spatial_type=rectangle.
MINK, J. F. 1976. Groundwater resources of Guam: occurrence and development. Technical Report no. 1. Water Resources Research Centre, University of Guam.
MORGAN, L. K. & WERNER, A. D. 2014. Seawater intrusion vulnerability indicators for freshwater lenses in strip islands. Journal of Hydrology, 508, 322-327.
MOTTELER, L. S. 2006. Pacific Island Names: A Map and Name Guide to the New Pacific, Second Edition, Honolulu, USA, Bishop Museum Press.
NATIONAL GEOSPATIAL-INTELLIGENCE AGENCY (NGA) & NATIONAL AERONAUTICS AND SPACE ADMINISTRATION (NASA). 2000. Shuttle Radar Topography Mission 3-arc-second Digital Elevation Model. United States Geological Survey. Available: at http://earthexplorer.usgs.gov [Accessed March 2013].
NEW ZEALAND HYDROGRAPHIC AUTHORITY. 2012a. Chart NZ 82 Tonga. New Zealand: Land Information New Zealand (LINZ).
NEW ZEALAND HYDROGRAPHIC AUTHORITY. 2012b. Chart NZ 86 Samoa Islands. New Zealand: Land Information New Zealand (LINZ).
NEW ZEALAND HYDROGRAPHIC AUTHORITY. 2012c. Chart NZ 822 Vava'u Group. New Zealand: Land Information New Zealand (LINZ).
NEW ZEALAND HYDROGRAPHIC AUTHORITY. 2012d. Chart NZ 14629 Samoa Islands to Northern Cook Islands and Tokelau. New Zealand: Land Information New Zealand (LINZ).
NEW ZEALAND HYDROGRAPHIC AUTHORITY. 2012e. Chart NZ 14630 Samoa Islands to Southern Cook Islands. New Zealand: Land Information New Zealand (LINZ).
NUNN, P. D. 1994. Oceanic Islands, Oxford, Blackwell. PETERSON, F. L. 1984. Hydrogeology of high oceanic islands. Regional workshop on water
resources of small islands. Commonwealth Science Council, London, United Kingdom. PETERSON, F. L. 1993. Hydrogeology of volcanic oceanic islands. 29th International Geological
Congress (I.G.C.). Kyoto, Japan: Verlag Heinz Heise, Hanover, Federal Republic of Germany.
126 Pacific Island Groundwater and Future Climates: First-Pass Regional Vulnerability Assessment
RIO, M-H., SCHAEFFER, P., MOREAUX, G., LEMOINE, J-M. & BRONNER, E. 2009: A new Mean Dynamic Topography computed over the global ocean from GRACE data, altimetry and in-situ measurements. Poster communication at OceanObs09 symposium, 21-25 September 2009, Venice.
SCHROTER, D., METZGER, M. J., CRAMER, W. & LEEMANS, R. 2004. Vulnerability assessment - analysising the human-environment system in the face of global environmental change. ESS Bulletin, 2, 11-17.
SOLURI, E. A. & WOODSON, V. A. 1990. World Vector Shoreline. International Hydrographic Review, LXVII(1).
SPENGLER, S. R., PETERSON, F. L. & MINK, J. F. 1992. Geology and Hydrogeology of the Island of Pohnpei, Federated States of Micronesia, Technical report 89. Water Resources Research Centre, Honolulu, Hawaii.
STEARNS, H. T. 1942. Hydrology of volcanic terranes. In: MEINZER, O. E. (ed.) Hydrology. New York: McGraw-Hill Book Company.
STEWART, G., WALKER, K., FONTAINE, K., DIXON-JAIN, P. & NORMAN, R. 2014. Pacific Island Groundwater Vulnerability to Future Climates Dataset. Geoscience Australia, Canberra. Available: http://www.ga.gov.au/metadata-gateway/metadata/record/gcat_81575
TOKELAU NATIONAL STATISTICS OFFICE. 2011. Tokelau 2011 Census of Population and Dwellings [Online]. Available: http://www.tokelaunso.tk [Accessed 29 July 2013].
TOTH, J. 1963. A theoretical anlaysis of groundwater flow in small drainage basins. Journal of Geophysical Research, 68.
TRIBBLE, G. 2008. Ground water on tropical Pacific Islands - understanding a vital resource. U.S. Geological Survey Circular 1312, 35.
UNEP 2000. Overview on Land-Based Pollutant Sources and Activities Affecting the Marine, Coastal, and Freshwater Environment in the Pacific Islands Region. Regional Seas Reports and Studies No. 174, 48 pp.
UNESCO 1983. International legend for hydrogeological maps. UNESCO Technical Document 51. UNESCO (ed.) 1987. Groundwater problems in coastal areas: a contribution to the International
Hydrological Programme/ prepared by E. Custodio with the collaboration of G.A. Bruggeman and case histories contributed by other experts, Paris, France: UNESCO.
UNESCO (ed.) 1991. Hydrology and water resources of small islands: a practical guide: a contribution to the International Hydrological Programme, IHP-III, Project 4.6 / prepared by A. Falkland and E. Custodio with contributions from A. Diaz Arenas and L. Simler and case studies contributed by others, Paris, France: UNESCO.
UNITED NATIONS ECONOMIC AND SOCIAL COMMISSION FOR ASIA AND THE PACIFIC (ESCAP) & REGIONAL MINERAL RESOURCES DEVELOPMENT CENTRE (RMRDC) 1985. Hydrogeological Mapping in Asia and the Pacific Region. Proceedings of the ESCAP-RMDC Workshop Bandung, 1983. In: GRIMMELMANN, W. F., KRAMPE, K. D. & STUCKMEIER, W. (eds.).
VACHER, H. L. & QUINN, T. M. (eds.) 1997. Geology and Hydrogeology of Carbonate Islands: Elsevier.
WALLACE, L., SUNDARAM, B., BRODIE, R. S., MARSHALL, S., DAWSON, S., JAYCOCK, J., STEWART, G. & FURNESS, L. 2011. Assessment of Climate Change Impacts of Groundwater in Timor-Leste- Summary Report. Record 2012/55. Geoscience Australia: Canberra.
WATERHOUSE, B. C. 1981. Hydrogeology of the Southern Cook Islands, Niue, and Tonga. In: DALE, W. R. (ed.) Pacific Island Water Resources, South Pacific Technical Inventory 2. Wellington, New Zealand: Department of Scientific and Industrial Research.
WATERHOUSE, B. C. 1984. Geological and geomorphological evolution of small islands, Pacific region. Regional workshop on water resources of small islands. Commonwealth Science Council, London, United Kingdom.
Pacific Island Groundwater and Future Climates: First-Pass Regional Vulnerability Assessment 127
WATERHOUSE, B. C. & PETTY, D. R. 1986. Hydrogeology of the Southern Cook Islands, South Pacific, New Zealand Geological Survey Bulletin 98.
WERNER, A. D. & SIMMONS, C. T. 2009. Impact of sea-level rise on seawater intrusion in coastal aquifers. Ground Water, 47, 197-204.
WHITE, I. 2012. Development of a National Water, Sanitation and Hygiene Policy Framework and Implementation Plan for the Republic of Nauru, Mission Report. Pacific Integrated Water Resources Management (IWRM) National Planning Programme.
WHITE, I., FALKLAND, A. & FATAI, T. 2009. Vulnerability of groundwater in Tongatapu, Kingdom of Tonga: groundwater evaluation and monitoring assessment. SOPAC/EU EDF 8 Reducing the vulnerability of Pacific APC States. Canberra: The Australian National University.
WHITE, I. & FALKLAND, T. 2010. Management of freshwater lenses on small Pacific islands. Hydrogeology Journal, 18, 227-246.
WHITE, I. & FALKLAND, T. 2011. Reducing groundwater vulnerability in Carbonate Island countries in the Pacific. Climate Change Effects on Groundwater Resources. CRC Press.
WHITE, I. & FALKLAND, T. 2012. Practical responses to climate change: developing national water policy and implementation plans for Pacific small island countries. Water and Climate: Policy Implementation Challenges, Practical Responses to Climate Change, National Conference. Canberra, Australia.
WHITE, I., FALKLAND, T. & SCOTT, D. 1999. Droughts in small coral islands: case study, South Tarawa, Kiribati. Technical Documents in Hydrology No. 26, IHP-V. Paris: UNESCO.
WHO/UNICEF 2014. Progress on Sanitation and Drinking water: 2014 Update. WHO, Geneva. WORLD BANK 2000. Cities, Seas, and Storms: Managing Change in Pacific Island Economies.
Adapting to Climate Change.
128 Pacific Island Groundwater and Future Climates: First-Pass Regional Vulnerability Assessment
Personal Communications
I. Eliot Coastal Geomorphologist, Damara WA Pty Ltd
T. Falkland Consultant, Island Hydrology Services
M. Grose Climate Scientist, Commonwealth Scientific and Industrial Research Organisation (CSIRO)
D. Hebblethwaite Applied Geoscience and Technology Division of Secretariat of the Pacific Community (SOPAC), Fiji, Suva
L. Kumar Associate Professor - GIS, Remote Sensing & Spatial Modelling, University of New England
R. McLean Physical Geographer, Professor Emeritus and Visiting Fellow, University of New South Wales
P. Nunn Professor of Geography, University of New England
SPC staff Secretariat of the Pacific Community, Fiji, Suva
I. White Professor of Water Resources, Australian National University
X. Zhang Physical Oceanographer, Commonwealth Scientific and Industrial Research Organisation (CSIRO)
Pacific Island Groundwater and Future Climates: First-Pass Regional Vulnerability Assessment 129
Glossary
Aquifer: A geological formation, group of formations or part of a formation which is sufficiently porous and permeable to store, and allow the movement of, groundwater. Aquifers may yield quantities of groundwater for consumptive use.
Basin: A large depression in the Earth’s crust filled by sedimentary or volcanic rocks.
Bedrock: Loose term given to any geological material that underlies the stratum of interest. Bedrock is commonly composed of crystalline rocks such as granite or metasediments.
Borehole: Generalized term for any narrow shaft bored in the ground, either vertically or horizontally
Bounding surface: A surface within a sedimentary succession that marks the upper or lower limits of a major mappable unit.
Carbonate: Refers to CO3 ions, can be carried in solution in surface water or groundwater and precipitated with Ca, Mg, or Fe ions to form carbonate minerals and rocks.
Catchment: The area of land from which rainwater drains into a river, stream or lake. Catchments are separated from each other by divides or watersheds.
Cemented: The cementation of sedimentary grains by later minerals precipitated from groundwater. Sometimes consolidated is used as an approximate synonym.
Clay: Refers to either grain size or mineralogy (a) an earthy sediment composed of rock or mineral fragments or detrital particles smaller than a very fine silt grain; (b) clay minerals are hydrous aluminium silicates derived largely from feldspars, micas and carbonate by weathering.
Cobbles: River-rocks between 64 and 256 mm across.
Composite: It’s a mixed geological system comprising a combination of carbonate and non-carbonate rocks.
Conceptual model: See model.
Conductivity (σ): How the earth or a geological formation conducts electricity. Conductivity is usually measured in milli-Siemens per metre (mS/m). It is the reciprocal of resistivity.
Confined Aquifer: An aquifer that is overlain and underlain by impervious layers (aquitards) and is not associated with the water table.
Consolidated: See cemented.
Discharge (Groundwater): The flow of groundwater to surface water, bores, between aquifers or the sea.
Discharge (Stream): Amount of water flowing in the stream.
130 Pacific Island Groundwater and Future Climates: First-Pass Regional Vulnerability Assessment
Drawdown: Change in hydraulic head relative to a background condition, indicating the difference in head which has occurred at a given location relative to an initial time at the same location.
Electrical conductivity (EC): The ability of electrical current to pass through a substance. EC is commonly used to estimate the amount of soluble salt in solution. EC measurements can be made with a range of devices on ground and stream water, soils, and soil-paste extracts. Units of electrical conductivity are commonly given in mS/m, dS/m or μS/cm; 100 mS/m = 1 dS/m = 1000 μS/cm. Here, S is the symbol for Siemens, and the prefixes d is deci (10-1), c is centi (10-2), m is milli (10-3) and μ is micro (10-6).
Evapotranspiration: The total water loss from the soil through the combined effects of evaporation and transpiration.
Exposure: It is the degree to which an aquifer comes in contact with a particular climate change hazard.
Fault: Fracture in a rock body along which displacement has occurred. A normal fault is an inclined fault in which the hanging wall (rock above the fault plane) appears to have slipped downward relative to the footwall (rock below the fault plane), usually the result of extension, or separation of geological blocks. A reverse fault is a fault in which the hanging wall side appears to have been pushed upward relative to the footwall, by compression.
Fracture: Cracks in indurated rocks formed by stress and strain. Fractures along which significant movement has occurred are called faults.
Fractured Rock Aquifer: Aquifers which store groundwater in the fractures, joints, bedding planes and cavities of the rock mass.
Geomorphology: The study of landforms.
GFS: see groundwater flow system
Granules: Gravel-sized sediment between 2 – 4 mm in diameter.
Gravel: All loose, coarse-grained sediments with grains greater than 2 mm diameter (e.g., granules and cobbles).
Groundwater: Water stored below ground within the pore spaces or fractures of a rock mass.
Groundwater flow system (GFS): The 3-D saturated geological volume that is identified by groundwater flow paths that extend from areas of recharge to areas of discharge.
Head: A measurement of water pressure representing the total energy at the entrance of a piezometer. Usually measured as a water surface elevation. Differences in head between two or more points can be used to determine hydraulic gradient and direction of groundwater flow. Synonymous with Hydraulic Head.
Hydraulic conductivity (K): Hydraulic conductivity is the volume of water flowing through a 1 m2 cross-sectional area of an aquifer under a hydraulic gradient of 1 m/1 m (100%) in a given time (usually 1 day). Horizontal hydraulic conductivity is designate Kh, vertical Kv.
Hydraulic gradient: With regard to an aquifer, the rate of change of hydraulic head per unit of distance of flow at a given point and in a given direction.
Pacific Island Groundwater and Future Climates: First-Pass Regional Vulnerability Assessment 131
Hydraulic head: The hydraulic head (or potentiometric head) is the height of the watertable above a given datum in an unconfined aquifer (representing the zone of saturated aquifer), and is the potential energy in a confined aquifer above a given datum.
Hydrogeology: The study of geological properties of rocks, soils, and sediments as they relate to groundwater movement and storage.
Hydrograph (Stream): Graphical representation showing the variation in time in the water level and/or flow in a surface water body.
Hydrograph (Bore): Graphical representation showing the variation in time in the groundwater level within a bore.
Infiltration gallery: A structure including horizontal slotted pipes in gravel buried a short distance below the water table which skim fresh groundwater from the surface of a freshwater lens and thus distribute the drawdown over a wide area.
Intergranular: A term applied to an igneous texture, especially well developed in basalts, in which the wedge-shaped spaces between a meshwork of lath-shaped crystals, such as plagioclase, are filled with granules of other minerals.
Karst: A landscape formed by the dissolution of soluble rocks, such as dolostones. Karst features include caves and dolines.
Light detection and ranging (LiDAR): A technology that uses high-speed laser to generate three dimensional structural data about the terrain and landscape features.
Limestone: Sedimentary rock composed of calcium carbonate (CaCO3) of organic, chemical or detrital origin.
Lithology: Physical characteristics of a rock or sediment.
Low carbonate: Unconsolidated limestone (sand) is the dominant rock type associated with this system
Metadata: Information about the source and accuracy of information used in a GIS.
Model: Used in two senses in this report hydrological models are based on mathematical equations that allow the behaviour of a hydrologic system to be quantitatively predicted; conceptual models are qualitative descriptions of features such as aquifers or coastal landforms.
Perched aquifer: It is an unconfined groundwater body supported by a small impermeable or slowly permeable unit.
Permeability: The ability of a material, such as rock or sediment, to allow the passage of a liquid, such as water Permeable gravel and sand, allow free movement, whereas impermeable clays are barriers.
Piezometer: A borehole or pipe (in an excavated hole) used specifically to monitor water levels or hydraulic head within an aquifer.
132 Pacific Island Groundwater and Future Climates: First-Pass Regional Vulnerability Assessment
Porosity: Open spaces in rocks and sediments that can hold water. Primary porosity formed when the sediments were laid down; these spaces may be variably infilled by cement, leaving remnant primary porosity. Secondary porosity forms through modification of rocks, such as by dissolution of soluble grains, formation of fractures, or solution-forming karst.
Potentiometric surface: A surface which represents the hypothetical level that water under pressure, within a confined aquifer, would rise to if tapped by a bore.
Rainwater: rainfall collected in a tank for domestic freshwater supply.
Recharge: The entry into the saturated zone of water made available to the water table surface, together with associated flow away from the water table within the saturated zone.
Reef-flat plate: semi-permeable slab of reef rock.
Risk: The likelihood that harm will occur from exposure to a hazard. For example, salinity risk is a measure of the chance that a salt hazard will cause harm to an asset at some time in the future.
Runoff: Overland flow and steam flow of rainfall not absorbed by the soil.
Salinity: See surface salinity.
Salinity ranges: The following ranges are typically used when discussing groundwater salinity. <1000 mg/L TDS = fresh water, 1001 to 10 000 mg/L = brackish water, 10 001 to 35 000 mg/L = saline water, >35 000 mg/L = hypersaline water.
Seawater intrusion (SWI): The landward movement of seawater into coastal aquifers, due to natural or human-related changes in groundwater dynamics.
Sedimentary: Pertaining to deposition of sediments and sedimentary process, for example, a sedimentary rock is a rock once composed of sediments such as sand, gravel, silt, etc.
Sensitivity: Relates to the intrinsic properties of an aquifer to resist the effects of climate related hazard.
Silt: Granular material of a size somewhere between sand and clay
Spring: A naturally occurring groundwater discharge feature.
SRTM: Digital Elevation Model data collected during the 2,000 STS-99 Shuttle Radar Topography Mission by the Space Shuttle Endeavour. SRTM data is widely available at 3-arc second (~90 m) horizontal resolution and on a restricted basis at 1-arc second (~30 m) horizontal resolution.
Surface salinity: Areas where salt is being deposited in the near-surface environment. Salinity is a natural phenomenon but can be increased through land use practices involving inappropriate types of soil management, vegetation clearing, cropping, and irrigation. Often abbreviated to salinity.
Sustainable yield: The level of groundwater extraction measured over a specified planning timeframe that would, if exceeded, compromise key environmental assets, ecosystem functions or the productive base of the resource associated with the aquifer. Also referred to as the environmentally sustainable level of extraction.
SWI: see seawater intrusion.
Total Dissolved Solids (TDS): The amount of material dissolved in water (mostly inorganic salts).
Pacific Island Groundwater and Future Climates: First-Pass Regional Vulnerability Assessment 133
Transpiration: Water given off by plants via pores in the surface tissues. See also evapotranspiration.
Transmissivity (T): A measure of the ability of groundwater to pass through soil, sediment or rock. The capacity of a rock to transmit water under pressure. Expressed as the volume of water flowing through a cross-sectional area of an aquifer that is 1 m x the aquifer thickness under a hydraulic gradient of 100% in a given amount of time (usually 1 day). Transmissivity is equal to the hydraulic conductivity (K) times the aquifer thickness.
Typology: The systemic classification of types that have characteristics or traits in common.
Unconfined aquifer: A type of aquifer in which the upper boundary is defined by the water table Unconfined aquifers are recharged directly from the ground surface.
Unconformity: A bounding surface where the rocks below rest at a different angle to those above, for example, where alluvial gravels rest on bedrock.
Unconsolidated: See uncemented.
Vertical infiltration: Downward movement of water from the surface into soil or sediment.
Volcanic: Processes and materials (such as ash and lava) produced by volcanic activity.
Vulnerability: The characteristics and circumstances of a community, system or asset that make it susceptible to the damaging effects of a hazard.
Water table: The surface below which an unconfined aquifer is saturated with water. See also potentiometric surface.
134 Pacific Island Groundwater and Future Climates: First-Pass Regional Vulnerability Assessment
Map Products Appendix A
A series of A0 maps accompany this report. In addition to the primary map, other figures (maps/charts) are presented on the various map sheets. The list of maps and their descriptions is provided in Appendix Table A.1.
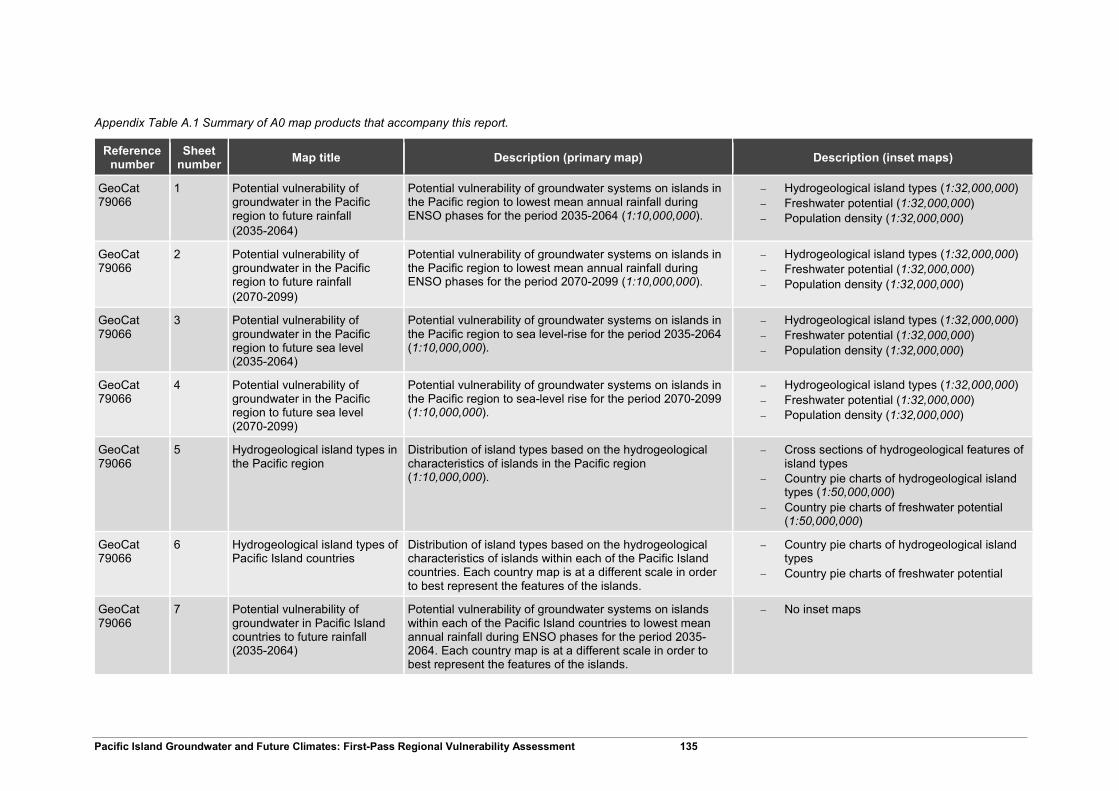
Pacific Island Groundwater and Future Climates: First-Pass Regional Vulnerability Assessment 135
Appendix Table A.1 Summary of A0 map products that accompany this report.
Reference number
Sheet number Map title Description (primary map) Description (inset maps)
GeoCat 79066
1 Potential vulnerability of groundwater in the Pacific region to future rainfall (2035-2064)
Potential vulnerability of groundwater systems on islands in the Pacific region to lowest mean annual rainfall during ENSO phases for the period 2035-2064 (1:10,000,000).
− Hydrogeological island types (1:32,000,000) − Freshwater potential (1:32,000,000) − Population density (1:32,000,000)
GeoCat 79066
2 Potential vulnerability of groundwater in the Pacific region to future rainfall (2070-2099)
Potential vulnerability of groundwater systems on islands in the Pacific region to lowest mean annual rainfall during ENSO phases for the period 2070-2099 (1:10,000,000).
− Hydrogeological island types (1:32,000,000) − Freshwater potential (1:32,000,000) − Population density (1:32,000,000)
GeoCat 79066
3 Potential vulnerability of groundwater in the Pacific region to future sea level (2035-2064)
Potential vulnerability of groundwater systems on islands in the Pacific region to sea level-rise for the period 2035-2064 (1:10,000,000).
− Hydrogeological island types (1:32,000,000) − Freshwater potential (1:32,000,000) − Population density (1:32,000,000)
GeoCat 79066
4 Potential vulnerability of groundwater in the Pacific region to future sea level (2070-2099)
Potential vulnerability of groundwater systems on islands in the Pacific region to sea-level rise for the period 2070-2099 (1:10,000,000).
− Hydrogeological island types (1:32,000,000) − Freshwater potential (1:32,000,000) − Population density (1:32,000,000)
GeoCat 79066
5 Hydrogeological island types in the Pacific region
Distribution of island types based on the hydrogeological characteristics of islands in the Pacific region (1:10,000,000).
− Cross sections of hydrogeological features of island types
− Country pie charts of hydrogeological island types (1:50,000,000)
− Country pie charts of freshwater potential (1:50,000,000)
GeoCat 79066
6 Hydrogeological island types of Pacific Island countries
Distribution of island types based on the hydrogeological characteristics of islands within each of the Pacific Island countries. Each country map is at a different scale in order to best represent the features of the islands.
− Country pie charts of hydrogeological island types
− Country pie charts of freshwater potential
GeoCat 79066
7 Potential vulnerability of groundwater in Pacific Island countries to future rainfall (2035-2064)
Potential vulnerability of groundwater systems on islands within each of the Pacific Island countries to lowest mean annual rainfall during ENSO phases for the period 2035-2064. Each country map is at a different scale in order to best represent the features of the islands.
− No inset maps
136 Pacific Island Groundwater and Future Climates: First-Pass Regional Vulnerability Assessment
Pacific Island Hydrogeological Appendix BTypology
A hydrogeologically-based typology for the Pacific region has been developed as part of this project, and is summarised in Section 2.1. Further details are provided below (from Dixon-Jain et al. 2013).
B.1 Types of Aquifers The following section describes the types of aquifers found on small and large islands.
B.1.1 Small Islands
Underpinning the third level of the typology for small islands (aquifer setting) is the notion that on small islands, groundwater occurs in two main settings: perched (high level) or basal (low level) (UNESCO 1991). Perched aquifers arise where low-permeability/confining geological features or structures block or slow the movement of groundwater, either vertically downward or horizontally toward the shoreline (Tribble 2008). The latter is a less common type of perched aquifer where water is retained in compartments by volcanic dikes (dike-confined aquifers). The water table of a perched aquifer lies above the regional or ‘true’ water table (Freeze and Cherry 1979). In the Pacific Islands perched aquifers may occur at elevations high above sea level and hence are not typically subject to contamination by seawater (Tribble 2008). Basal freshwater aquifers include unconfined, partially confined or confined freshwater bodies that form at or below sea level. With the exception of low permeability aquifers (as in some Volcanic/Complex islands) basal aquifers are in contact with seawater (UNESCO 1991). Mink (1976) additionally defines parabasal water as that part of the freshwater wedge that rests directly on impermeable basement and is thus not in direct contact with seawater. On many small carbonate islands the basal aquifer takes the form of a lens which underlies the whole island. Basal aquifers are generally more common and have a greater storage volume than perched aquifers; however, due to the freshwater/seawater connection basal aquifers are more vulnerable to saline intrusion (UNESCO 1991).
Due to their density contrast, the less dense basal freshwater occurs above and displaces the greater density seawater. The boundary between basal freshwater aquifers and seawater is transitional rather than distinct. The thickness of the transition zone depends on both natural and human-induced conditions. Additionally, the transition and freshwater zones are not of constant thickness and vary spatially (across islands) and temporally (due to climatic influences) (UNESCO 1991). Where the freshwater zone is less than about five metres in thickness, the transition zone is often thicker than the freshwater zone. For thicker freshwater lenses the transition zone is generally thinner than the freshwater zone (Falkland 1993). The base of the freshwater zone can be defined on the basis of salinity.
Pacific Island Groundwater and Future Climates: First-Pass Regional Vulnerability Assessment 137
B.1.2 Large Islands
Large islands typically have more varied aquifer types than smaller islands due the occurrence of groundwater in a variety of rock types. These aquifers can be classified according to their porosity, extent and productivity. Following the international hydrogeological classification for aquifer types, aquifers are thus classified as intergranular, fissured, or localised (UNESCO 1983) (refer to Section B.3 below).
B.2 Aquifer Potential Productivity Productivity describes an aquifer’s ability to yield water. It depends on intrinsic characteristics of the aquifer (e.g. geological composition, size, structures) as well as external influences (e.g. rainfall recharge, groundwater extraction, climate change). In this project, aquifer potential productivity (P) describes the maximum amount of water that an aquifer can yield based on its intrinsic characteristics alone. P does not explicitly take into account the quality of the water e.g. freshwater or brackish. Aquifers fall into the relative classes of low or high P. No attempt has been made to put quantitative boundaries on what is low or high productivity in keeping with the historical approach to groundwater mapping in the Pacific which recognised that the map authors should have the freedom to highlight the most important/productive aquifers for each island and that these would not fit into prescriptive quantitative classes (ESCAP and RMRDC 1985).
B.3 International Hydrogeological Classification The international legend for hydrogeological maps (UNESCO 1983) is an internationally accepted way of classifying aquifers based on their porosity (intergranular/fissured/localised), extent and productivity (higher/lower). These variables capture the ability of an aquifer to transmit, store and yield water. The classification has the advantage of being broad enough to encompass all the different aquifer types that occur on large (Complex) islands. The variables of the small island typology can also be combined and described in the context of the international hydrogeological classification system used for classifying aquifers on large islands. This provides a consistent means for comparing aquifer types across small and large islands.
Intergranular aquifers are those in which the water flows through intergranular pore spaces within both consolidated rock such as porous sandstone and conglomerates, and unconsolidated sediments (clay, silt, sand, gravel and limestone formations associated with alluvial (water-formed), lacustrine (lake-formed) or aeolian (wind-formed) deposits). Fissured aquifers are those in which the water flows through fissures within both sedimentary karstic rock (solution cavities and joints), and igneous or metamorphic fractured rock (joints, bedding plains, faults and fractures). Localised aquifers are those with low degrees of connectivity, where water flow and yield tends to be localised or the groundwater resource is limited. The nature of the pore space in localised aquifers can be intergranular or fissured but the defining feature of a localised aquifer is that the water resource is small or localised/discontinuous. For instance, a karstic aquifer can be considered a fissured aquifer, or can be classed as a localised aquifer if flow rates are low, such as below yields of 1 L/s.
138 Pacific Island Groundwater and Future Climates: First-Pass Regional Vulnerability Assessment
In a broad sense, intergranular aquifers potentially contain the greatest volume of groundwater that is relatively easy to exploit. In contrast, localised aquifers, by definition, tend to have lower yields and/or the productive areas are spatially localised. In terms of yield, fissured aquifers have the potential to store a large volume of groundwater; however, their potential yield depends on the extent and configuration of fissures.
Fissured aquifers are subdivided into karst or fractured types to reflect the dominant rock type, e.g. limestone versus volcanic, and hence the dominant style of fissure in the rock. Fissured and intergranular aquifers are further classed as ‘low’ or ‘high’, depending on the potential productivity of the main aquifers, where the terms fissured and intergranular describe the dominant lithology of the aquifer e.g. consolidated or unconsolidated rock, respectively.
Pacific Island Groundwater and Future Climates: First-Pass Regional Vulnerability Assessment 139
Pacific Islands Database Appendix C
Scale is a major consideration for data obtained for the purposes of this project. Ideally, spatial data needs to be at an appropriate scale to determine accurate island information; however, it will generally be displayed only at the regional scale. Due to the small size of the majority of islands, a single point value is assigned to each individual island in order to represent its characteristics at a regional scale.
Data for this project has been collected from a wide range of sources, with the majority of preliminary contextual data coming from freely available sources online. Existing datasets were reviewed and modifications were made based on expert opinion. These modifications are documented below, with relevant references included in the main report. The following sections describe the collection and processing of spatially-attributed data for development of the Pacific Islands database3.
C.1 Island Polygons
C.1.1 Island Coastlines
Island polygon coverage for the Pacific region was originally derived from the World Vector Shoreline dataset (Soluri and Woodson 1990), at a spatial resolution of 1:250,000 in the World Geodetic System 1984 (WGS84) coordinate system. This dataset was quality checked and verified against ESRI National Geographic base maps (ESRI 2012), Google Earth aerial photography as well as Google international borders and coastlines (Google Inc. 2012). This dataset was further checked and some areas re-digitised against a number of larger and smaller-scale (ranging from 1:10,000 to 1:1.5 million) hydrographic charts, specifically for the countries of Niue, Tonga, Tokelau, Western Samoa and parts of the Cook Islands (New Zealand Hydrographic Authority 2012a to 2012e). Other parts of the region were re-digitised or spatially shifted in order to align with the SRTM 3-arc-second DEM (NGA and NASA 2000), which was also verified against Google Earth aerial photography (Google Inc. 2012). This data verification was necessary for SRTM processing, which required direct alignment with island outlines. The resulting polygon dataset was projected into the World Mercator projection in order to generate island areas and for consistency with other datasets. The number of islands represented in the Pacific Islands database is 5,644.
The main island of PNG (east New Guinea) has been sub-divided into three areas based on its hydrogeology. For the analysis of potential vulnerability, and the components of the vulnerability framework, east New Guinea was treated as three separate regions. A single polygon of the entire island has been included in the database for assigning an island type, maximum elevation and maximum width.
3 Used to generate the Pacific Island Groundwater Vulnerability to Future Climates Dataset (Stewart et al. 2014)
140 Pacific Island Groundwater and Future Climates: First-Pass Regional Vulnerability Assessment
C.1.2 Country and Island Names
As part of island verification processes, the island polygon data were compared against a number of sources to ensure that island names were correct for the majority of significant islands. In addition, spatial locations were compared and names were verified or updated. Island names were sourced primarily from Motteler (2006), with Soluri and Woodson (1990), the AusAID map of the Pacific Islands (AUSLIG 1996), Vacher and Quinn (1997) and Google Earth/Maps (Google Inc. 2012) used for clarification where required.
C.2 Island Type A large volume of island type data were derived from the United Nations Environment Programme (UNEP) Island Directory (Dahl 1998-2006) as well as from a range of literature sources and expert opinion (I. Eliot, L. Kumar, R. McLean, P. Nunn4, pers. comm. 2014). Island type has not been assigned where there is no information from external sources.
C.3 Island Geometry
C.3.1 Area and Perimeter
Island area and perimeter have been calculated for each island in the verified polygon dataset using the ‘calculate geometry’ tool within ESRI ArcMap. Based on these areas, small (<2,000 km2) and large (≥2,000 km2) island classes have been defined.
C.3.2 Island Elevation
Maximum elevation values were acquired from various sources (Section 2.2.4). All Low Carbonate islands (2,529 islands) were assigned an elevation of <5 m based on the physical processes that underpin their formation. For all other island types, elevation information was based on literature values, Google Earth (based on the SRTM), ASTER and SRTM digital elevation models. For SRTM derived elevation values, relevant tiles covering the Pacific region of interest were downloaded individually and compiled into a single raster for analysis. A number of island areas/pixels were visually identified as having missing or incorrect values (e.g. elevation precision across very low-lying islands). To derive the maximum island elevation, the island polygons were overlayed on the SRTM elevation data and the zonal statistics tool (in ArcGIS) was used to extract the maximum elevation value for each island. The various elevation data sources have differing levels of accuracy. It is assumed that literature values have high vertical accuracy compared to the other data sources; elevations from literature are assumed to be correct. However, elevation data from the other sources are considered to have an error of between 16 m and 20 m, based on the maximum vertical accuracy of SRTM and ASTER derived data, respectively. Therefore, for all but literature data sources, maximum elevations of ≤5 m are assigned a value of ≤21 m (SRTM derived data) or ≤25 m (ASTER derived data), whilst maximum elevations of >5 m represent values of >21 m (SRTM derived data) or >25 m (ASTER derived data).
4 Regional Coastal Susceptibility Framework for the Pacific Islands Project
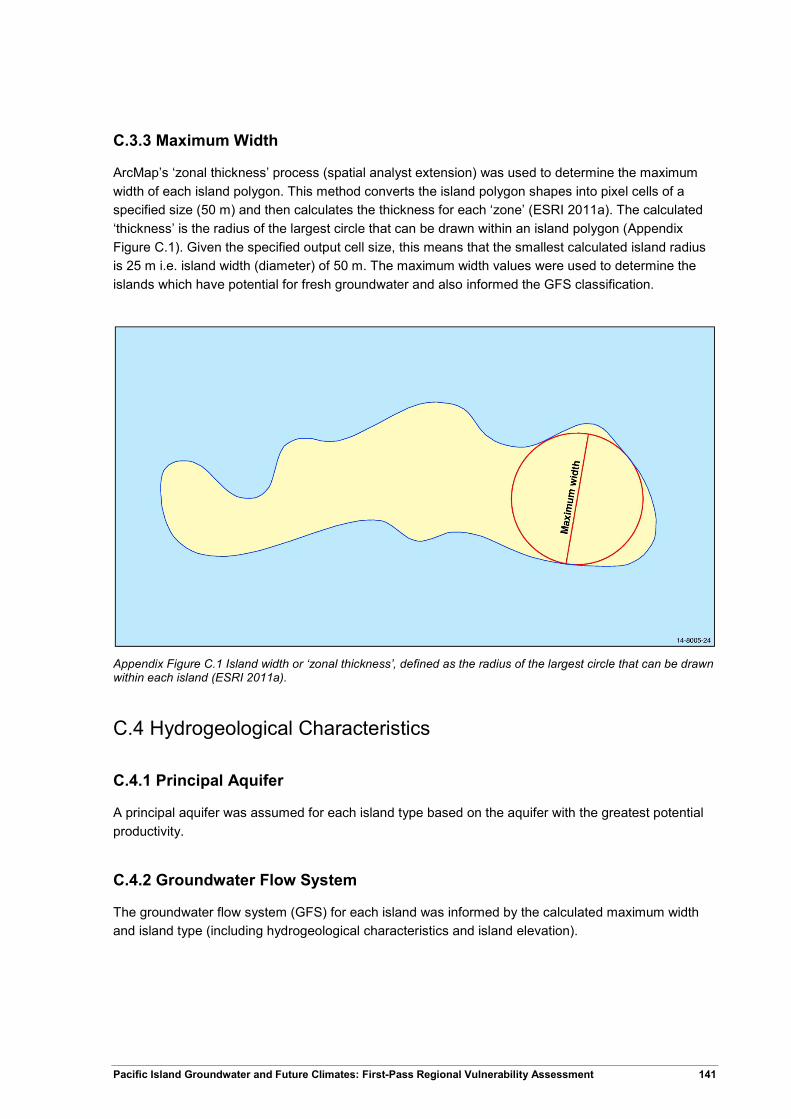
Pacific Island Groundwater and Future Climates: First-Pass Regional Vulnerability Assessment 141
C.3.3 Maximum Width
ArcMap’s ‘zonal thickness’ process (spatial analyst extension) was used to determine the maximum width of each island polygon. This method converts the island polygon shapes into pixel cells of a specified size (50 m) and then calculates the thickness for each ‘zone’ (ESRI 2011a). The calculated ‘thickness’ is the radius of the largest circle that can be drawn within an island polygon (Appendix Figure C.1). Given the specified output cell size, this means that the smallest calculated island radius is 25 m i.e. island width (diameter) of 50 m. The maximum width values were used to determine the islands which have potential for fresh groundwater and also informed the GFS classification.
Appendix Figure C.1 Island width or ‘zonal thickness’, defined as the radius of the largest circle that can be drawn within each island (ESRI 2011a).
C.4 Hydrogeological Characteristics
C.4.1 Principal Aquifer
A principal aquifer was assumed for each island type based on the aquifer with the greatest potential productivity.
C.4.2 Groundwater Flow System
The groundwater flow system (GFS) for each island was informed by the calculated maximum width and island type (including hydrogeological characteristics and island elevation).
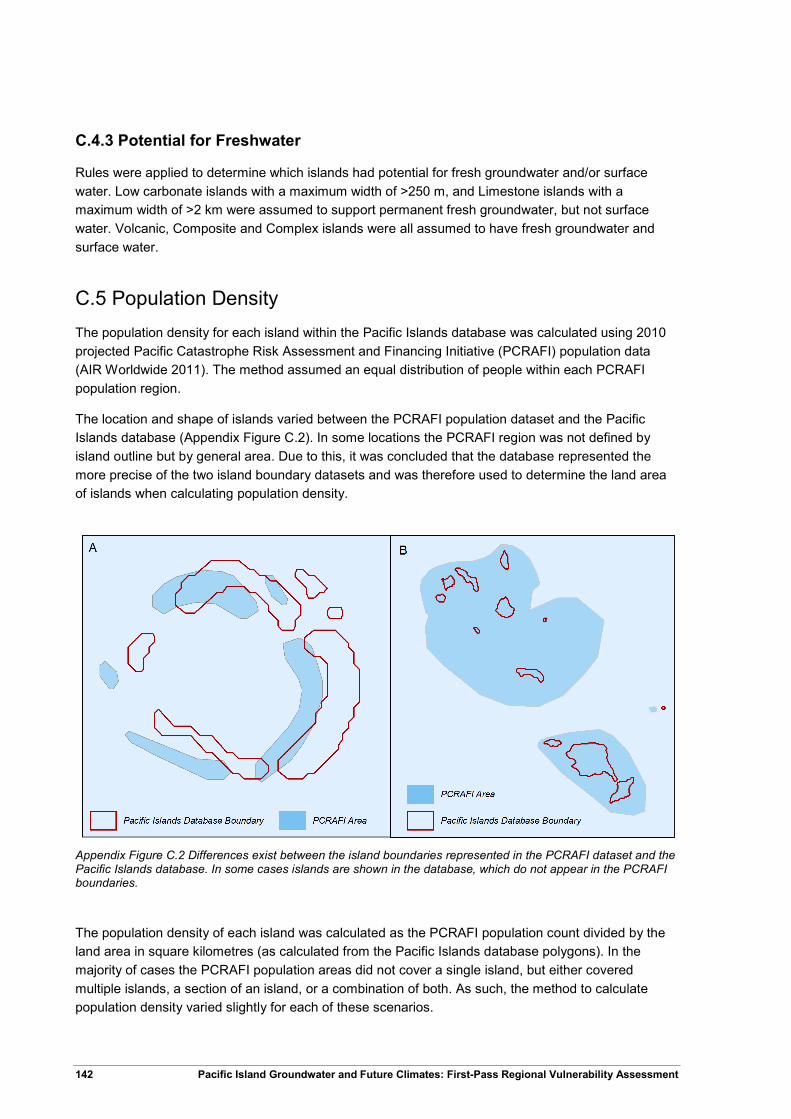
142 Pacific Island Groundwater and Future Climates: First-Pass Regional Vulnerability Assessment
C.4.3 Potential for Freshwater
Rules were applied to determine which islands had potential for fresh groundwater and/or surface water. Low carbonate islands with a maximum width of >250 m, and Limestone islands with a maximum width of >2 km were assumed to support permanent fresh groundwater, but not surface water. Volcanic, Composite and Complex islands were all assumed to have fresh groundwater and surface water.
C.5 Population Density The population density for each island within the Pacific Islands database was calculated using 2010 projected Pacific Catastrophe Risk Assessment and Financing Initiative (PCRAFI) population data (AIR Worldwide 2011). The method assumed an equal distribution of people within each PCRAFI population region.
The location and shape of islands varied between the PCRAFI population dataset and the Pacific Islands database (Appendix Figure C.2). In some locations the PCRAFI region was not defined by island outline but by general area. Due to this, it was concluded that the database represented the more precise of the two island boundary datasets and was therefore used to determine the land area of islands when calculating population density.
Appendix Figure C.2 Differences exist between the island boundaries represented in the PCRAFI dataset and the Pacific Islands database. In some cases islands are shown in the database, which do not appear in the PCRAFI boundaries.
The population density of each island was calculated as the PCRAFI population count divided by the land area in square kilometres (as calculated from the Pacific Islands database polygons). In the majority of cases the PCRAFI population areas did not cover a single island, but either covered multiple islands, a section of an island, or a combination of both. As such, the method to calculate population density varied slightly for each of these scenarios.
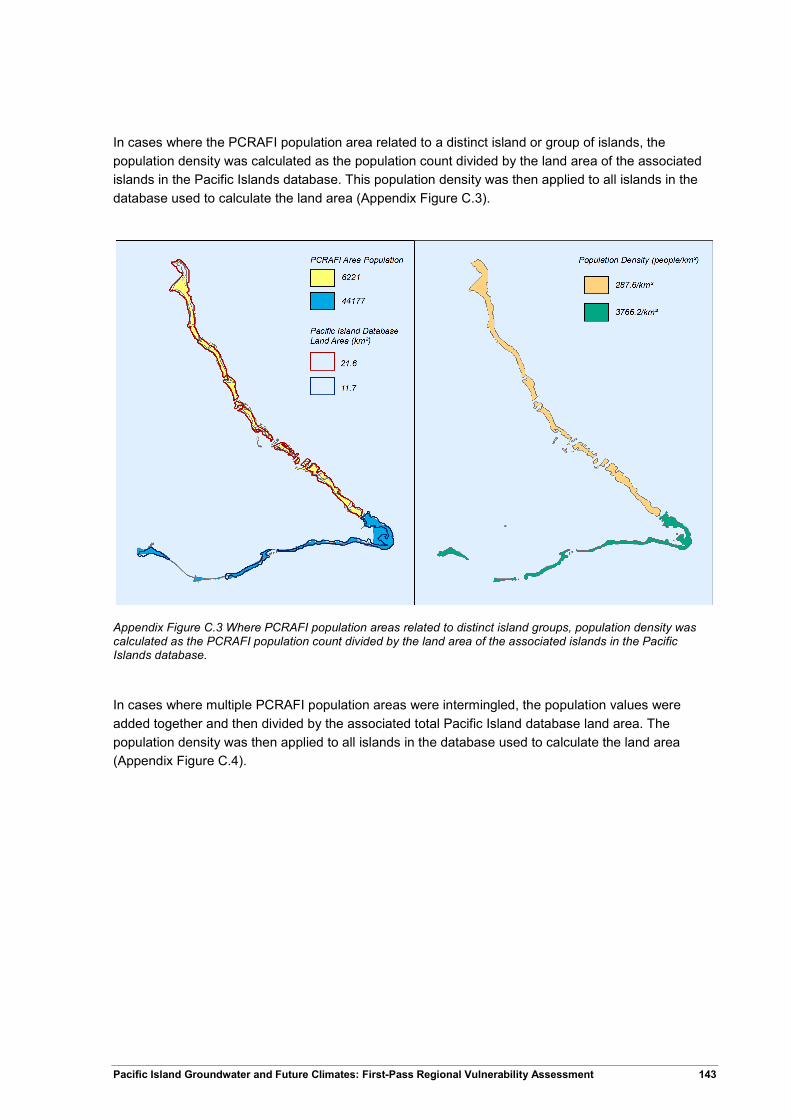
Pacific Island Groundwater and Future Climates: First-Pass Regional Vulnerability Assessment 143
In cases where the PCRAFI population area related to a distinct island or group of islands, the population density was calculated as the population count divided by the land area of the associated islands in the Pacific Islands database. This population density was then applied to all islands in the database used to calculate the land area (Appendix Figure C.3).
Appendix Figure C.3 Where PCRAFI population areas related to distinct island groups, population density was calculated as the PCRAFI population count divided by the land area of the associated islands in the Pacific Islands database.
In cases where multiple PCRAFI population areas were intermingled, the population values were added together and then divided by the associated total Pacific Island database land area. The population density was then applied to all islands in the database used to calculate the land area (Appendix Figure C.4).
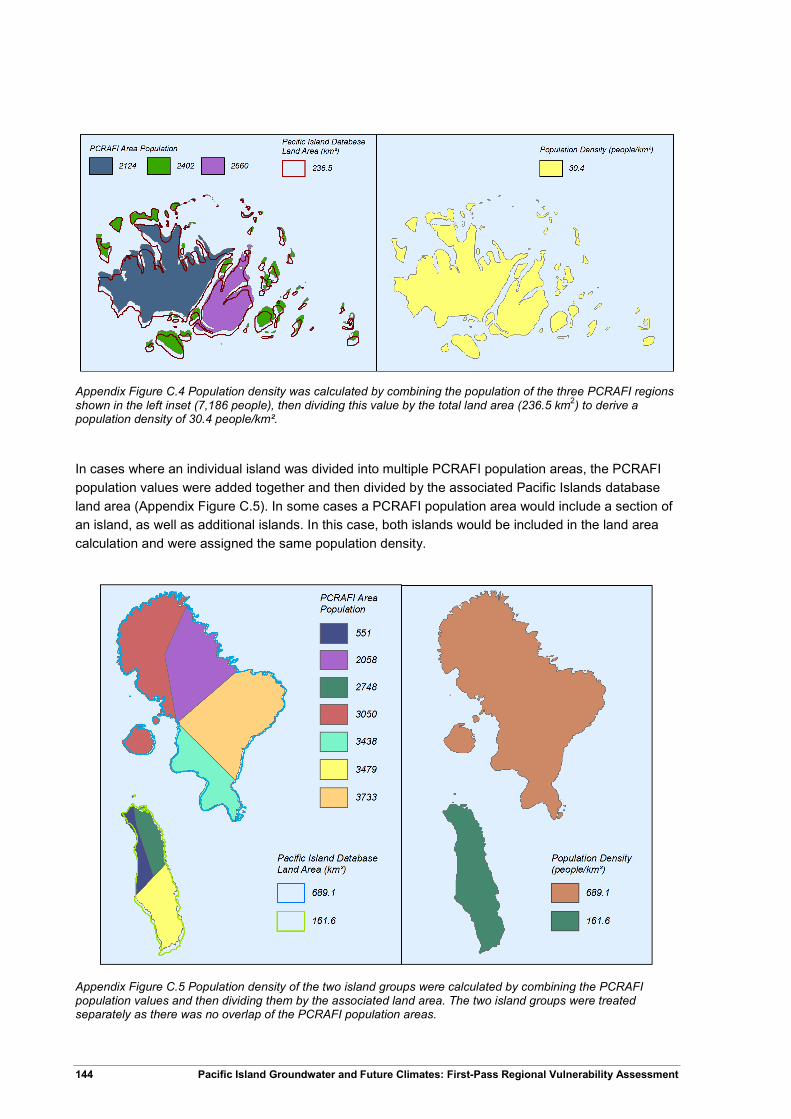
144 Pacific Island Groundwater and Future Climates: First-Pass Regional Vulnerability Assessment
Appendix Figure C.4 Population density was calculated by combining the population of the three PCRAFI regions shown in the left inset (7,186 people), then dividing this value by the total land area (236.5 km2) to derive a population density of 30.4 people/km².
In cases where an individual island was divided into multiple PCRAFI population areas, the PCRAFI population values were added together and then divided by the associated Pacific Islands database land area (Appendix Figure C.5). In some cases a PCRAFI population area would include a section of an island, as well as additional islands. In this case, both islands would be included in the land area calculation and were assigned the same population density.
Appendix Figure C.5 Population density of the two island groups were calculated by combining the PCRAFI population values and then dividing them by the associated land area. The two island groups were treated separately as there was no overlap of the PCRAFI population areas.
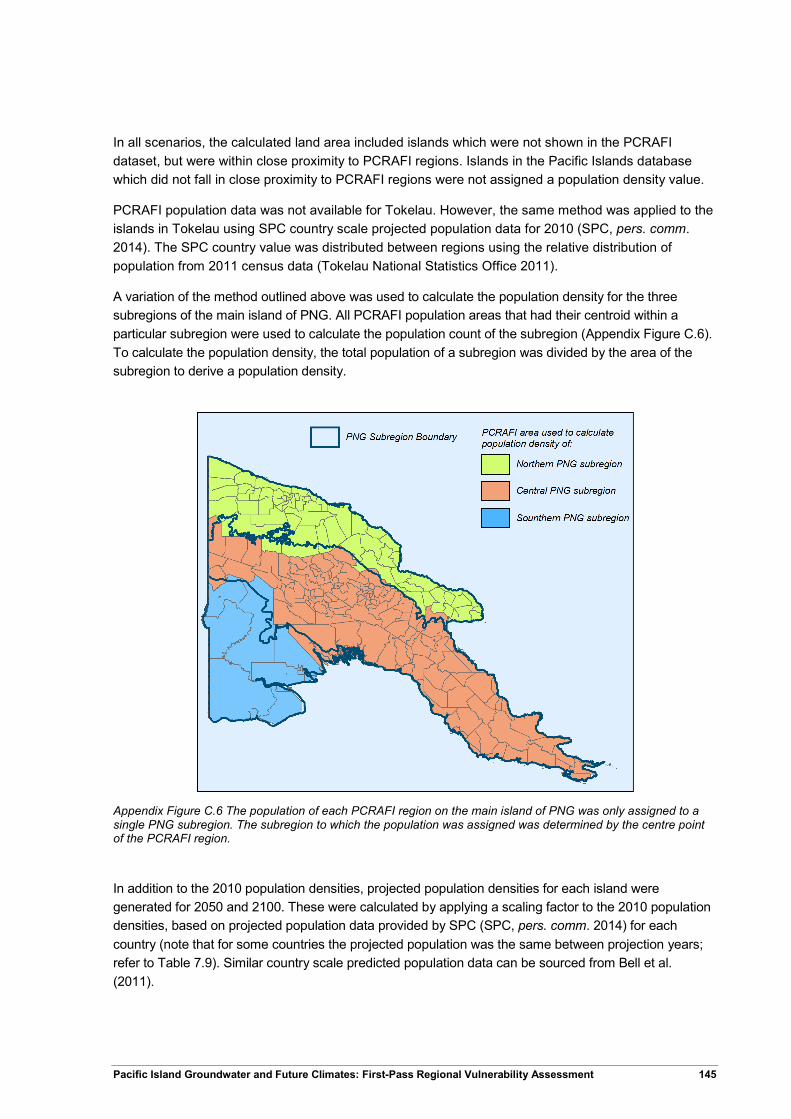
Pacific Island Groundwater and Future Climates: First-Pass Regional Vulnerability Assessment 145
In all scenarios, the calculated land area included islands which were not shown in the PCRAFI dataset, but were within close proximity to PCRAFI regions. Islands in the Pacific Islands database which did not fall in close proximity to PCRAFI regions were not assigned a population density value.
PCRAFI population data was not available for Tokelau. However, the same method was applied to the islands in Tokelau using SPC country scale projected population data for 2010 (SPC, pers. comm. 2014). The SPC country value was distributed between regions using the relative distribution of population from 2011 census data (Tokelau National Statistics Office 2011).
A variation of the method outlined above was used to calculate the population density for the three subregions of the main island of PNG. All PCRAFI population areas that had their centroid within a particular subregion were used to calculate the population count of the subregion (Appendix Figure C.6). To calculate the population density, the total population of a subregion was divided by the area of the subregion to derive a population density.
Appendix Figure C.6 The population of each PCRAFI region on the main island of PNG was only assigned to a single PNG subregion. The subregion to which the population was assigned was determined by the centre point of the PCRAFI region.
In addition to the 2010 population densities, projected population densities for each island were generated for 2050 and 2100. These were calculated by applying a scaling factor to the 2010 population densities, based on projected population data provided by SPC (SPC, pers. comm. 2014) for each country (note that for some countries the projected population was the same between projection years; refer to Table 7.9). Similar country scale predicted population data can be sourced from Bell et al. (2011).
146 Pacific Island Groundwater and Future Climates: First-Pass Regional Vulnerability Assessment
C.6 Components of Potential Vulnerability Assessment The Pacific Islands database also contains the relative ratings for each of the components in the vulnerability framework: sensitivity, exposure, potential impact, adaptability, and vulnerability. Ratings are included for the 2050 and 2085 periods, for each climate-related hazard.
Pacific Island Groundwater and Future Climates: First-Pass Regional Vulnerability Assessment 147
Reference Islands Appendix D
Information has been utilised from a number of key reference islands in the Pacific region to undertake the assessment of potential vulnerability of island groundwater systems to future climate. The five reference islands represent the hydrogeological model for each island type, including the dominant geology, principal aquifer type and GFS. In addition, information from some of the reference islands has been utilised to inform other aspects of the vulnerability assessment, such as the rainfall and sea-level thresholds used to determine the potential impact of climate-related hazards on groundwater systems. The key information derived from the reference islands is summarised in the following sections.
D.1 Low Carbonate Island: Bonriki Island, South Tarawa, Kiribati Bonriki Island has been selected as representative of the Low Carbonate island type and is situated in South Tarawa, Kiribati (Appendix Figure D.1). As with other Low Carbonate islands, the freshwater lens on the island of Bonriki is characterised by an upper unconsolidated carbonate aquifer of low permeability overlying a consolidated karst limestone aquifer of high permeability (Section 3.3.1). The conceptual hydrogeological model for the freshwater lens is depicted in Appendix Figure D.2. The freshwater lens on Bonriki Island is relatively large compared to many other Low Carbonate islands; however, the main hydrogeological features, including dominant lithology of the freshwater aquifer, principal aquifer type and GFS are the same for all Low Carbonate islands. As the freshwater lens is situated in unconsolidated carbonate sediments, the principal aquifer is an intergranular aquifer of high productivity. The corresponding GFS is very small-local, as discussed in Section 3.2.
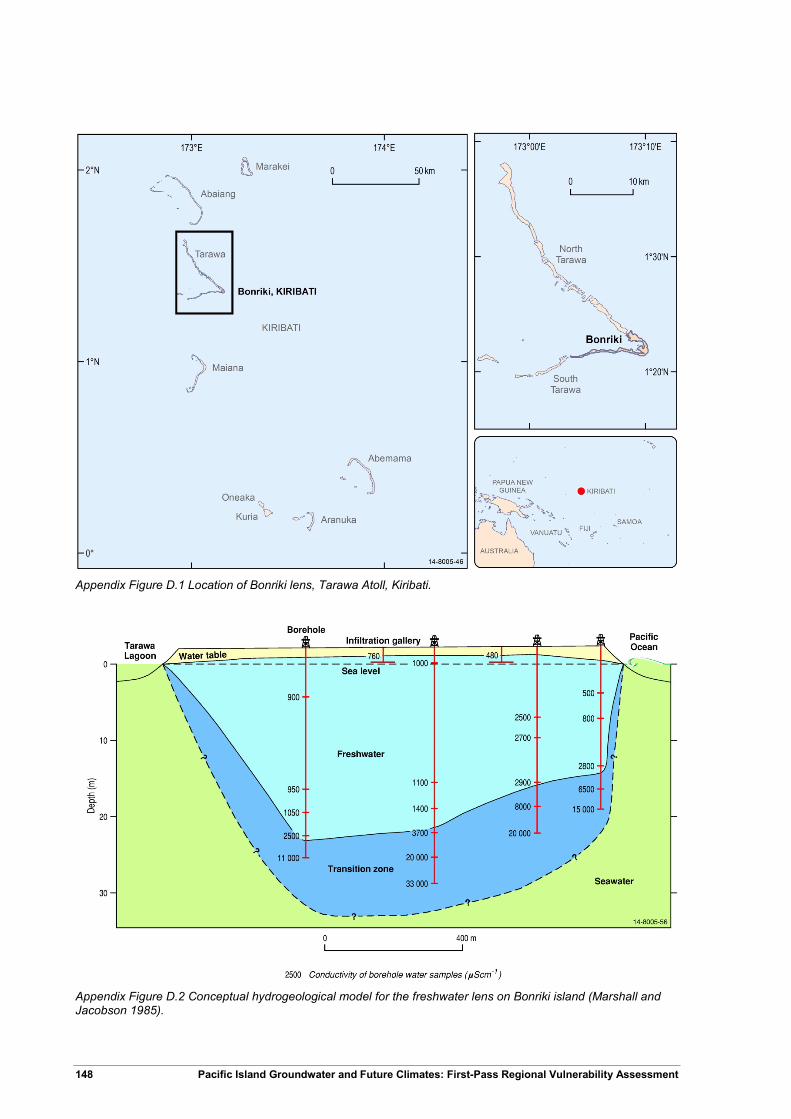
148 Pacific Island Groundwater and Future Climates: First-Pass Regional Vulnerability Assessment
Appendix Figure D.1 Location of Bonriki lens, Tarawa Atoll, Kiribati.
Appendix Figure D.2 Conceptual hydrogeological model for the freshwater lens on Bonriki island (Marshall and Jacobson 1985).
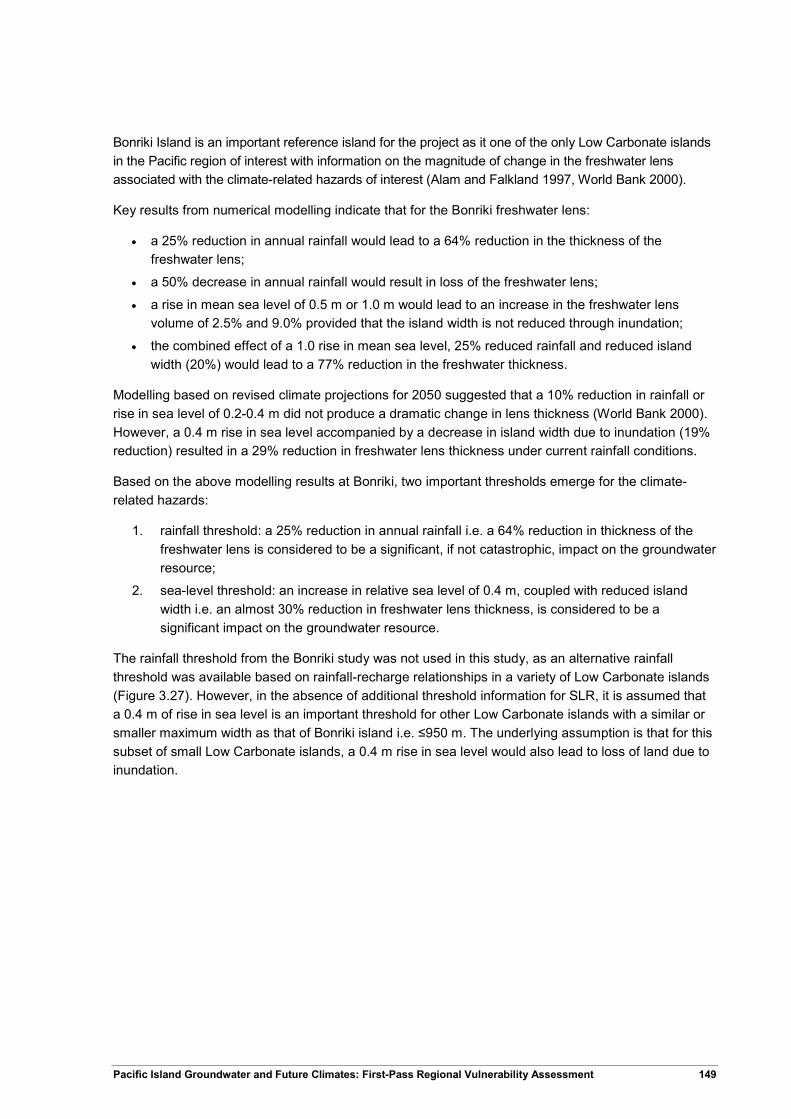
Pacific Island Groundwater and Future Climates: First-Pass Regional Vulnerability Assessment 149
Bonriki Island is an important reference island for the project as it one of the only Low Carbonate islands in the Pacific region of interest with information on the magnitude of change in the freshwater lens associated with the climate-related hazards of interest (Alam and Falkland 1997, World Bank 2000).
Key results from numerical modelling indicate that for the Bonriki freshwater lens:
• a 25% reduction in annual rainfall would lead to a 64% reduction in the thickness of the freshwater lens;
• a 50% decrease in annual rainfall would result in loss of the freshwater lens;
• a rise in mean sea level of 0.5 m or 1.0 m would lead to an increase in the freshwater lens volume of 2.5% and 9.0% provided that the island width is not reduced through inundation;
• the combined effect of a 1.0 rise in mean sea level, 25% reduced rainfall and reduced island width (20%) would lead to a 77% reduction in the freshwater thickness.
Modelling based on revised climate projections for 2050 suggested that a 10% reduction in rainfall or rise in sea level of 0.2-0.4 m did not produce a dramatic change in lens thickness (World Bank 2000). However, a 0.4 m rise in sea level accompanied by a decrease in island width due to inundation (19% reduction) resulted in a 29% reduction in freshwater lens thickness under current rainfall conditions.
Based on the above modelling results at Bonriki, two important thresholds emerge for the climate-related hazards:
1. rainfall threshold: a 25% reduction in annual rainfall i.e. a 64% reduction in thickness of the freshwater lens is considered to be a significant, if not catastrophic, impact on the groundwater resource;
2. sea-level threshold: an increase in relative sea level of 0.4 m, coupled with reduced island width i.e. an almost 30% reduction in freshwater lens thickness, is considered to be a significant impact on the groundwater resource.
The rainfall threshold from the Bonriki study was not used in this study, as an alternative rainfall threshold was available based on rainfall-recharge relationships in a variety of Low Carbonate islands (Figure 3.27). However, in the absence of additional threshold information for SLR, it is assumed that a 0.4 m of rise in sea level is an important threshold for other Low Carbonate islands with a similar or smaller maximum width as that of Bonriki island i.e. ≤950 m. The underlying assumption is that for this subset of small Low Carbonate islands, a 0.4 m rise in sea level would also lead to loss of land due to inundation.
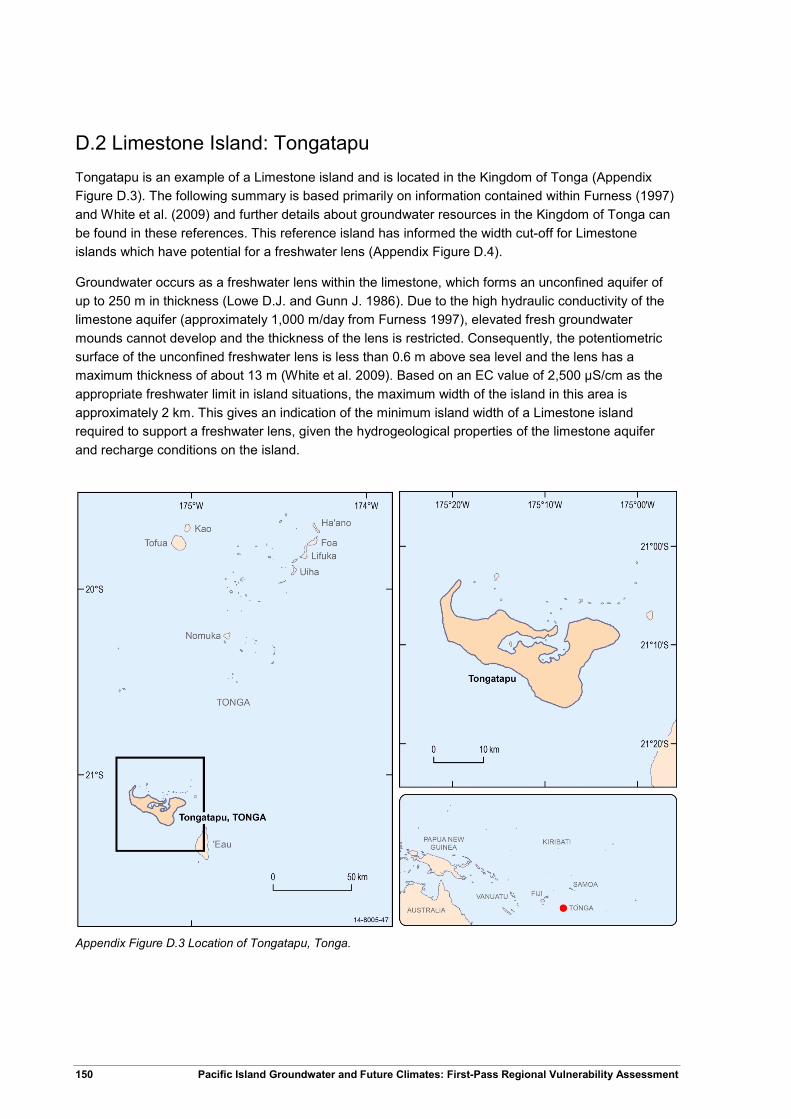
150 Pacific Island Groundwater and Future Climates: First-Pass Regional Vulnerability Assessment
D.2 Limestone Island: Tongatapu Tongatapu is an example of a Limestone island and is located in the Kingdom of Tonga (Appendix Figure D.3). The following summary is based primarily on information contained within Furness (1997) and White et al. (2009) and further details about groundwater resources in the Kingdom of Tonga can be found in these references. This reference island has informed the width cut-off for Limestone islands which have potential for a freshwater lens (Appendix Figure D.4).
Groundwater occurs as a freshwater lens within the limestone, which forms an unconfined aquifer of up to 250 m in thickness (Lowe D.J. and Gunn J. 1986). Due to the high hydraulic conductivity of the limestone aquifer (approximately 1,000 m/day from Furness 1997), elevated fresh groundwater mounds cannot develop and the thickness of the lens is restricted. Consequently, the potentiometric surface of the unconfined freshwater lens is less than 0.6 m above sea level and the lens has a maximum thickness of about 13 m (White et al. 2009). Based on an EC value of 2,500 µS/cm as the appropriate freshwater limit in island situations, the maximum width of the island in this area is approximately 2 km. This gives an indication of the minimum island width of a Limestone island required to support a freshwater lens, given the hydrogeological properties of the limestone aquifer and recharge conditions on the island.
Appendix Figure D.3 Location of Tongatapu, Tonga.
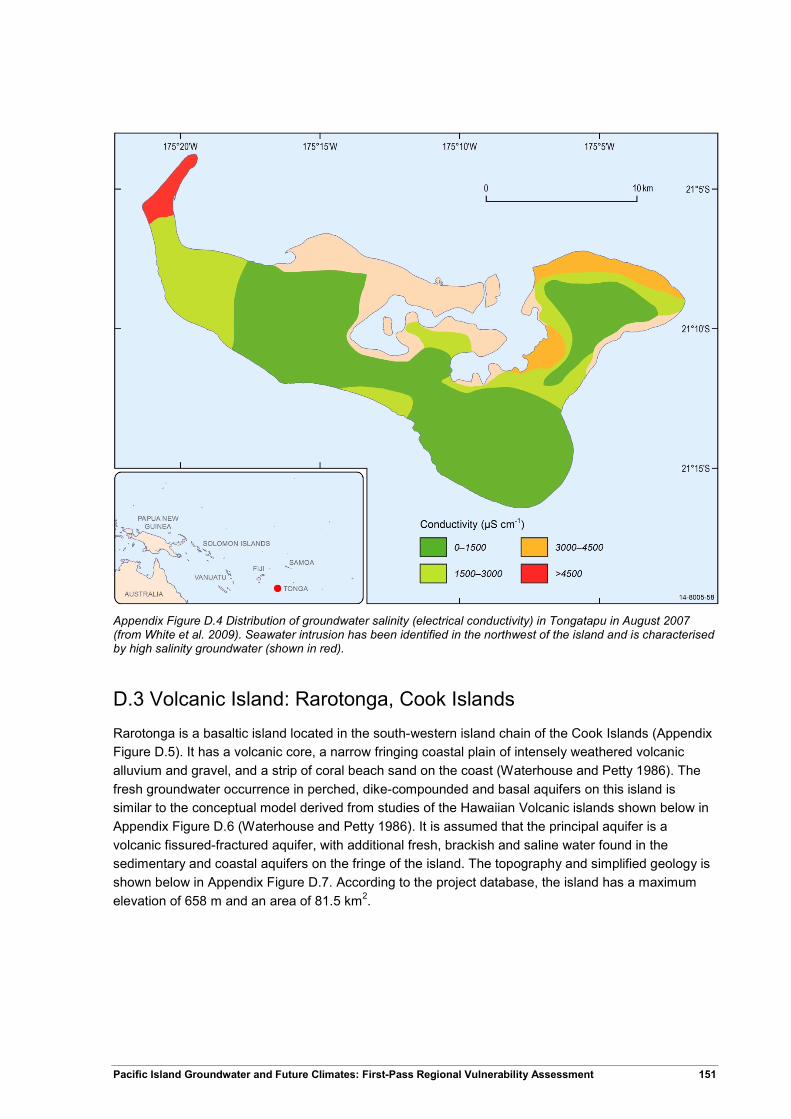
Pacific Island Groundwater and Future Climates: First-Pass Regional Vulnerability Assessment 151
Appendix Figure D.4 Distribution of groundwater salinity (electrical conductivity) in Tongatapu in August 2007 (from White et al. 2009). Seawater intrusion has been identified in the northwest of the island and is characterised by high salinity groundwater (shown in red).
D.3 Volcanic Island: Rarotonga, Cook Islands Rarotonga is a basaltic island located in the south-western island chain of the Cook Islands (Appendix Figure D.5). It has a volcanic core, a narrow fringing coastal plain of intensely weathered volcanic alluvium and gravel, and a strip of coral beach sand on the coast (Waterhouse and Petty 1986). The fresh groundwater occurrence in perched, dike-compounded and basal aquifers on this island is similar to the conceptual model derived from studies of the Hawaiian Volcanic islands shown below in Appendix Figure D.6 (Waterhouse and Petty 1986). It is assumed that the principal aquifer is a volcanic fissured-fractured aquifer, with additional fresh, brackish and saline water found in the sedimentary and coastal aquifers on the fringe of the island. The topography and simplified geology is shown below in Appendix Figure D.7. According to the project database, the island has a maximum elevation of 658 m and an area of 81.5 km2.
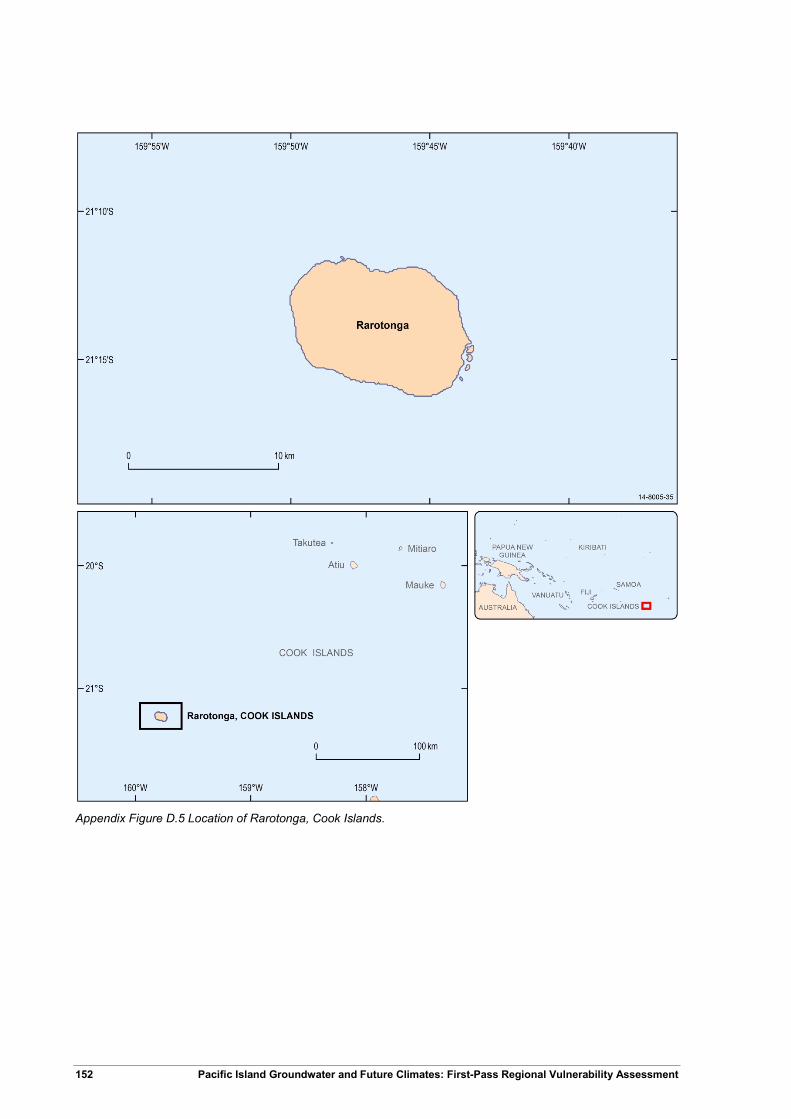
152 Pacific Island Groundwater and Future Climates: First-Pass Regional Vulnerability Assessment
Appendix Figure D.5 Location of Rarotonga, Cook Islands.
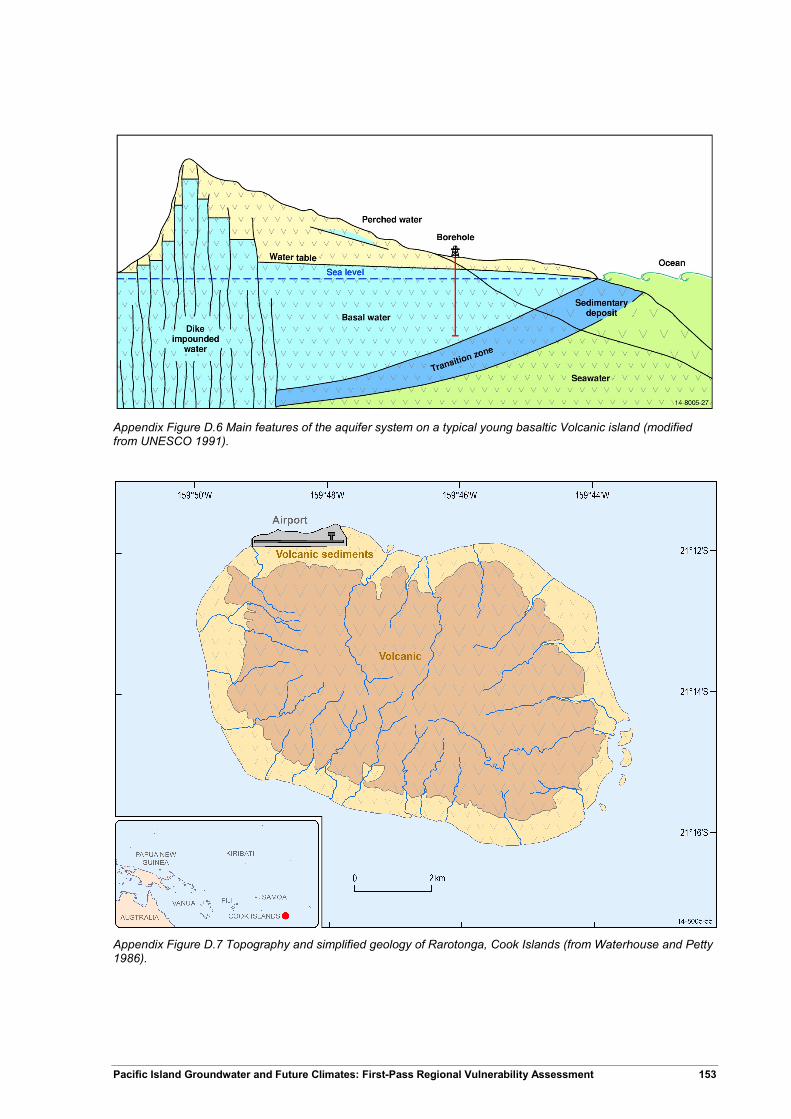
Pacific Island Groundwater and Future Climates: First-Pass Regional Vulnerability Assessment 153
Appendix Figure D.6 Main features of the aquifer system on a typical young basaltic Volcanic island (modified from UNESCO 1991).
Appendix Figure D.7 Topography and simplified geology of Rarotonga, Cook Islands (from Waterhouse and Petty 1986).
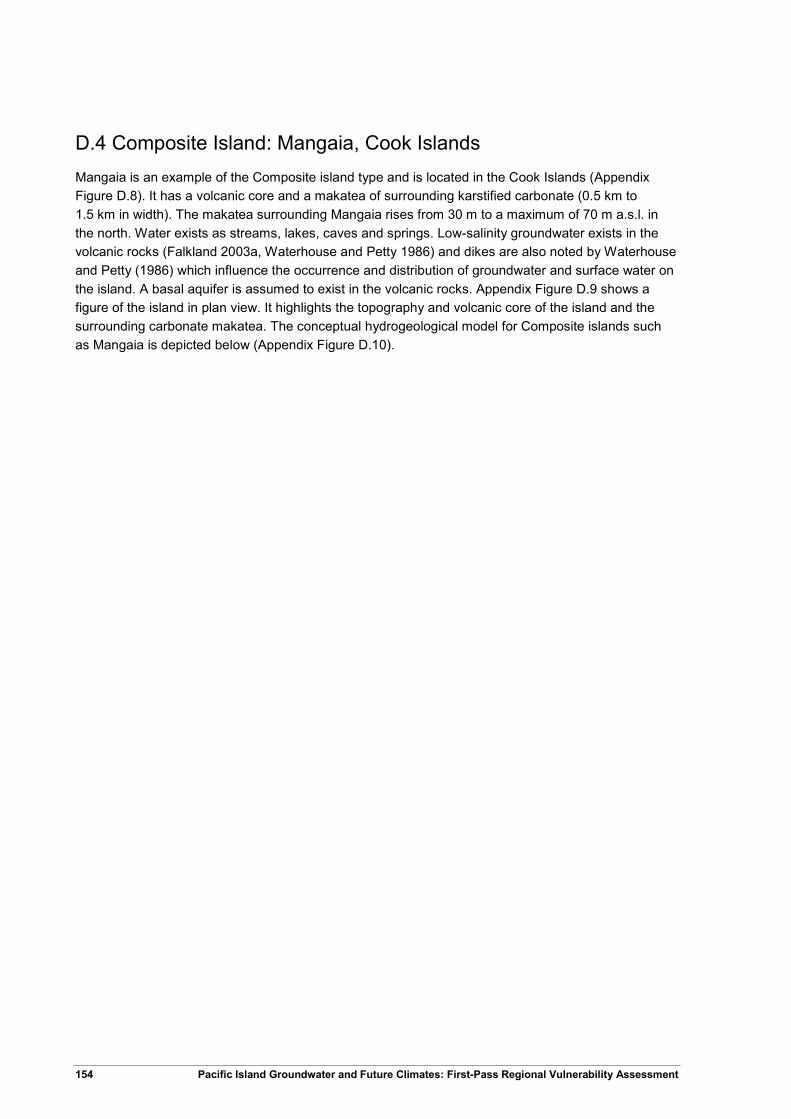
154 Pacific Island Groundwater and Future Climates: First-Pass Regional Vulnerability Assessment
D.4 Composite Island: Mangaia, Cook Islands Mangaia is an example of the Composite island type and is located in the Cook Islands (Appendix Figure D.8). It has a volcanic core and a makatea of surrounding karstified carbonate (0.5 km to 1.5 km in width). The makatea surrounding Mangaia rises from 30 m to a maximum of 70 m a.s.l. in the north. Water exists as streams, lakes, caves and springs. Low-salinity groundwater exists in the volcanic rocks (Falkland 2003a, Waterhouse and Petty 1986) and dikes are also noted by Waterhouse and Petty (1986) which influence the occurrence and distribution of groundwater and surface water on the island. A basal aquifer is assumed to exist in the volcanic rocks. Appendix Figure D.9 shows a figure of the island in plan view. It highlights the topography and volcanic core of the island and the surrounding carbonate makatea. The conceptual hydrogeological model for Composite islands such as Mangaia is depicted below (Appendix Figure D.10).
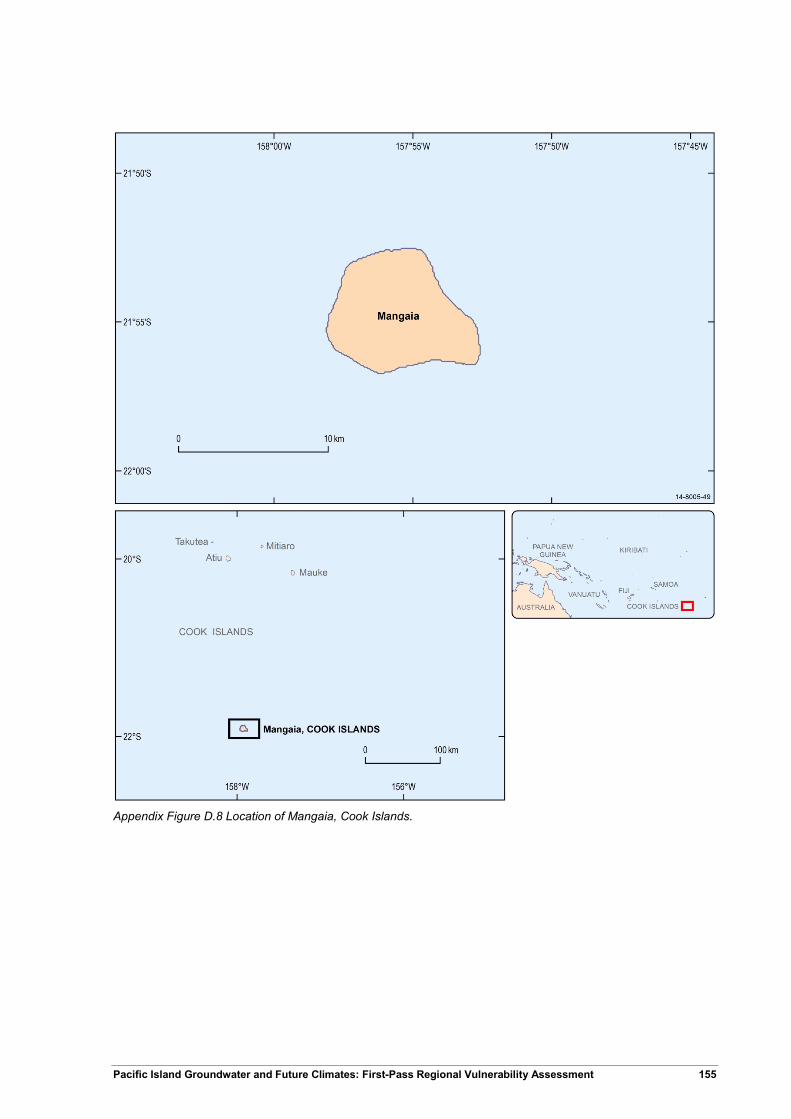
Pacific Island Groundwater and Future Climates: First-Pass Regional Vulnerability Assessment 155
Appendix Figure D.8 Location of Mangaia, Cook Islands.
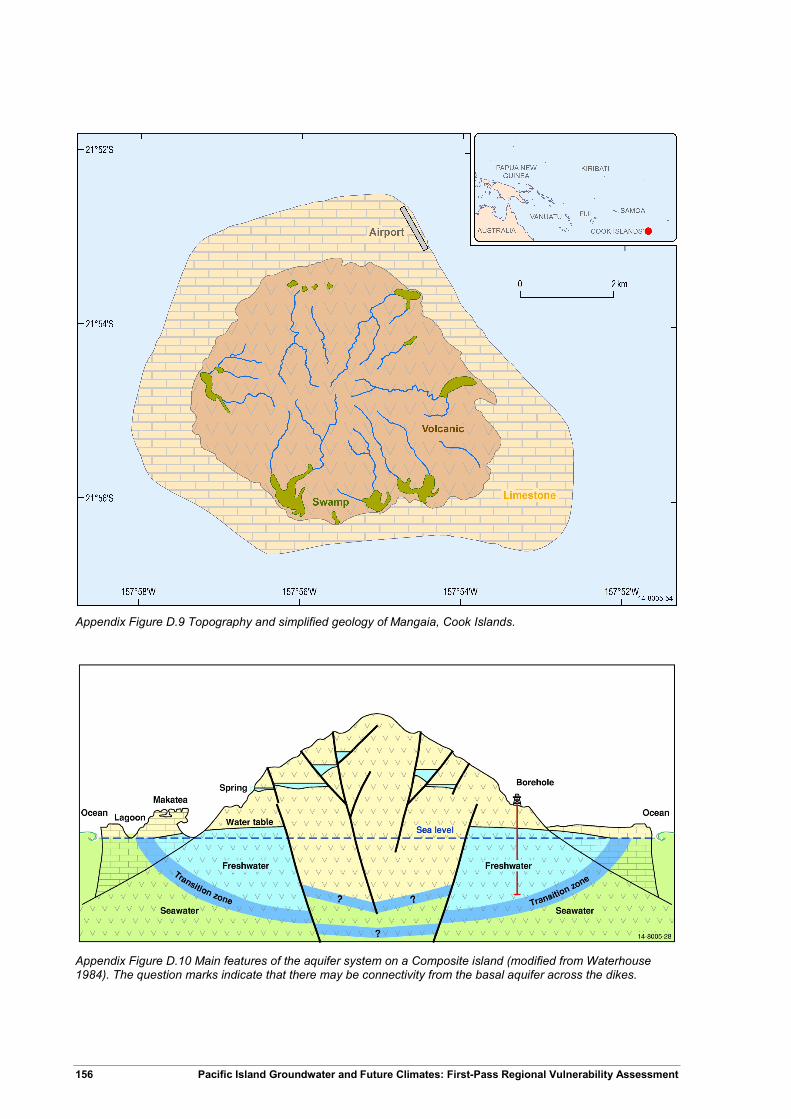
156 Pacific Island Groundwater and Future Climates: First-Pass Regional Vulnerability Assessment
Appendix Figure D.9 Topography and simplified geology of Mangaia, Cook Islands.
Appendix Figure D.10 Main features of the aquifer system on a Composite island (modified from Waterhouse 1984). The question marks indicate that there may be connectivity from the basal aquifer across the dikes.
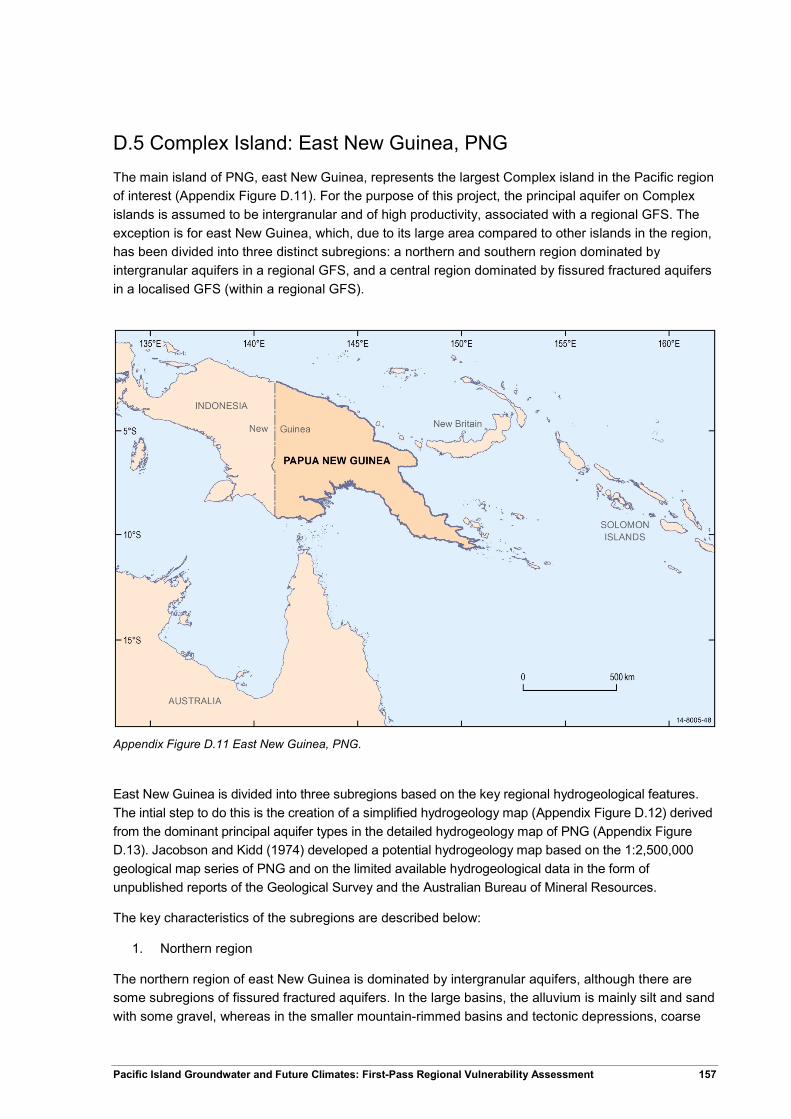
Pacific Island Groundwater and Future Climates: First-Pass Regional Vulnerability Assessment 157
D.5 Complex Island: East New Guinea, PNG The main island of PNG, east New Guinea, represents the largest Complex island in the Pacific region of interest (Appendix Figure D.11). For the purpose of this project, the principal aquifer on Complex islands is assumed to be intergranular and of high productivity, associated with a regional GFS. The exception is for east New Guinea, which, due to its large area compared to other islands in the region, has been divided into three distinct subregions: a northern and southern region dominated by intergranular aquifers in a regional GFS, and a central region dominated by fissured fractured aquifers in a localised GFS (within a regional GFS).
Appendix Figure D.11 East New Guinea, PNG.
East New Guinea is divided into three subregions based on the key regional hydrogeological features. The intial step to do this is the creation of a simplified hydrogeology map (Appendix Figure D.12) derived from the dominant principal aquifer types in the detailed hydrogeology map of PNG (Appendix Figure D.13). Jacobson and Kidd (1974) developed a potential hydrogeology map based on the 1:2,500,000 geological map series of PNG and on the limited available hydrogeological data in the form of unpublished reports of the Geological Survey and the Australian Bureau of Mineral Resources.
The key characteristics of the subregions are described below:
1. Northern region
The northern region of east New Guinea is dominated by intergranular aquifers, although there are some subregions of fissured fractured aquifers. In the large basins, the alluvium is mainly silt and sand with some gravel, whereas in the smaller mountain-rimmed basins and tectonic depressions, coarse
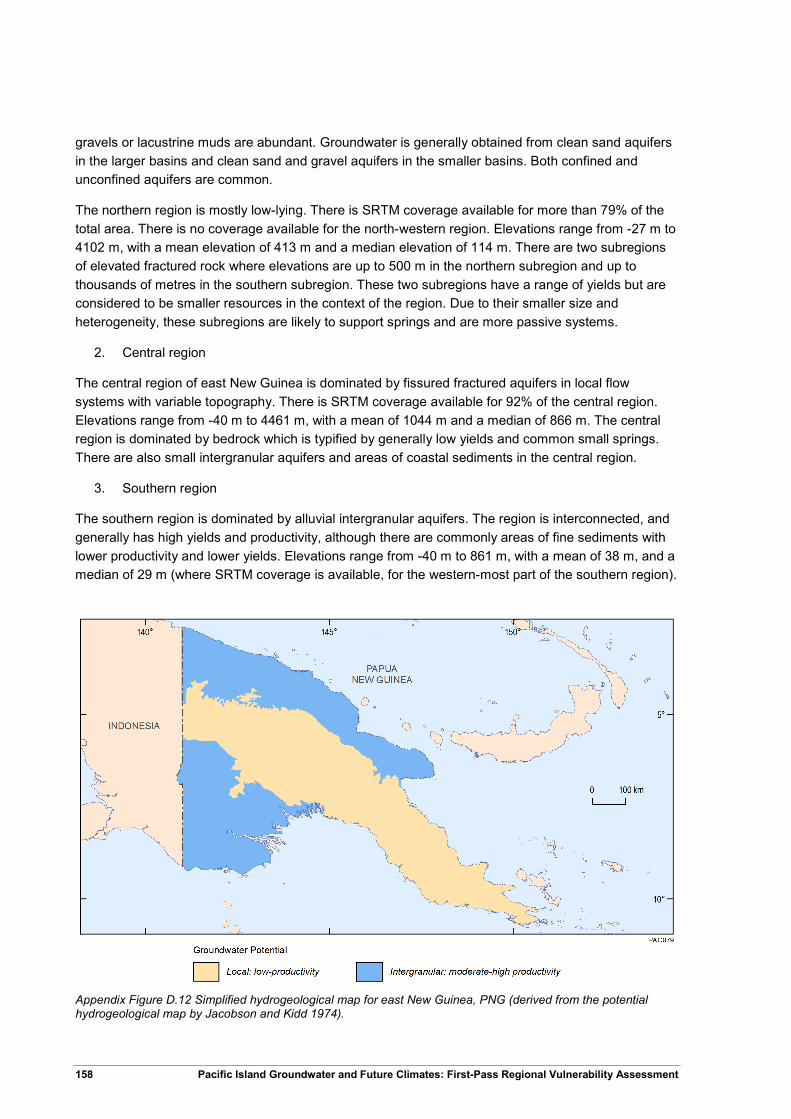
158 Pacific Island Groundwater and Future Climates: First-Pass Regional Vulnerability Assessment
gravels or lacustrine muds are abundant. Groundwater is generally obtained from clean sand aquifers in the larger basins and clean sand and gravel aquifers in the smaller basins. Both confined and unconfined aquifers are common.
The northern region is mostly low-lying. There is SRTM coverage available for more than 79% of the total area. There is no coverage available for the north-western region. Elevations range from -27 m to 4102 m, with a mean elevation of 413 m and a median elevation of 114 m. There are two subregions of elevated fractured rock where elevations are up to 500 m in the northern subregion and up to thousands of metres in the southern subregion. These two subregions have a range of yields but are considered to be smaller resources in the context of the region. Due to their smaller size and heterogeneity, these subregions are likely to support springs and are more passive systems.
2. Central region
The central region of east New Guinea is dominated by fissured fractured aquifers in local flow systems with variable topography. There is SRTM coverage available for 92% of the central region. Elevations range from -40 m to 4461 m, with a mean of 1044 m and a median of 866 m. The central region is dominated by bedrock which is typified by generally low yields and common small springs. There are also small intergranular aquifers and areas of coastal sediments in the central region.
3. Southern region
The southern region is dominated by alluvial intergranular aquifers. The region is interconnected, and generally has high yields and productivity, although there are commonly areas of fine sediments with lower productivity and lower yields. Elevations range from -40 m to 861 m, with a mean of 38 m, and a median of 29 m (where SRTM coverage is available, for the western-most part of the southern region).
Appendix Figure D.12 Simplified hydrogeological map for east New Guinea, PNG (derived from the potential hydrogeological map by Jacobson and Kidd 1974).
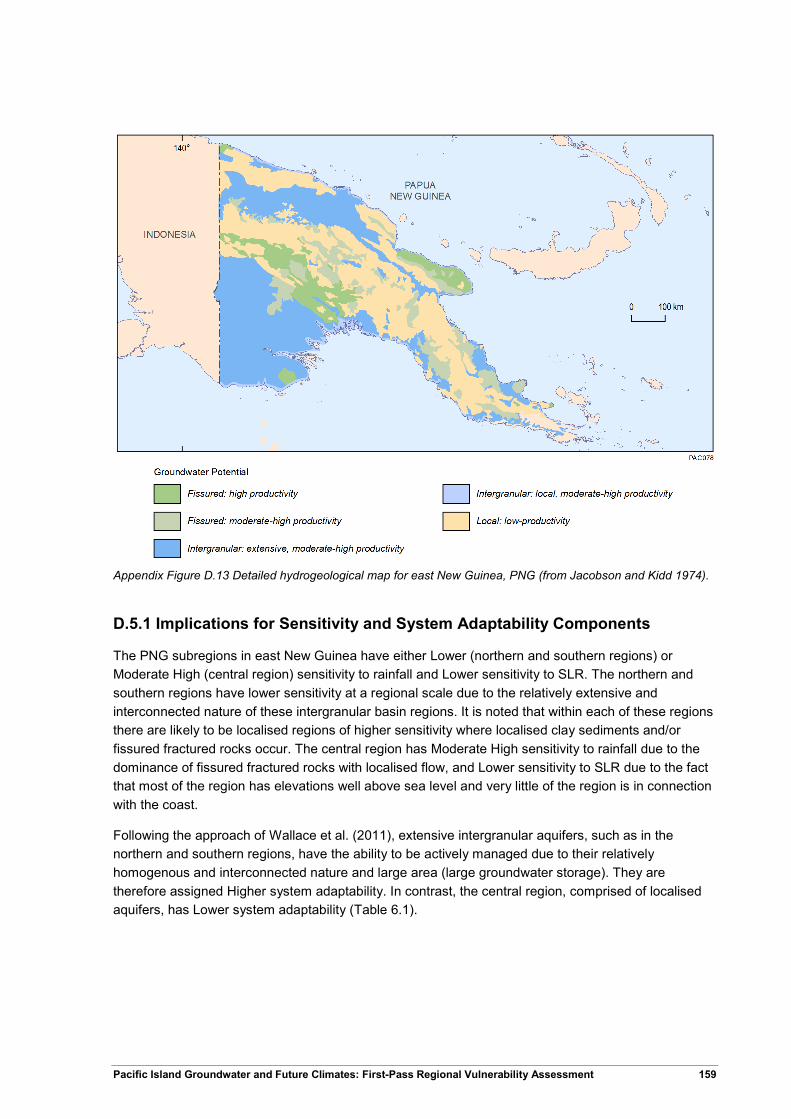
Pacific Island Groundwater and Future Climates: First-Pass Regional Vulnerability Assessment 159
Appendix Figure D.13 Detailed hydrogeological map for east New Guinea, PNG (from Jacobson and Kidd 1974).
D.5.1 Implications for Sensitivity and System Adaptability Components
The PNG subregions in east New Guinea have either Lower (northern and southern regions) or Moderate High (central region) sensitivity to rainfall and Lower sensitivity to SLR. The northern and southern regions have lower sensitivity at a regional scale due to the relatively extensive and interconnected nature of these intergranular basin regions. It is noted that within each of these regions there are likely to be localised regions of higher sensitivity where localised clay sediments and/or fissured fractured rocks occur. The central region has Moderate High sensitivity to rainfall due to the dominance of fissured fractured rocks with localised flow, and Lower sensitivity to SLR due to the fact that most of the region has elevations well above sea level and very little of the region is in connection with the coast.
Following the approach of Wallace et al. (2011), extensive intergranular aquifers, such as in the northern and southern regions, have the ability to be actively managed due to their relatively homogenous and interconnected nature and large area (large groundwater storage). They are therefore assigned Higher system adaptability. In contrast, the central region, comprised of localised aquifers, has Lower system adaptability (Table 6.1).
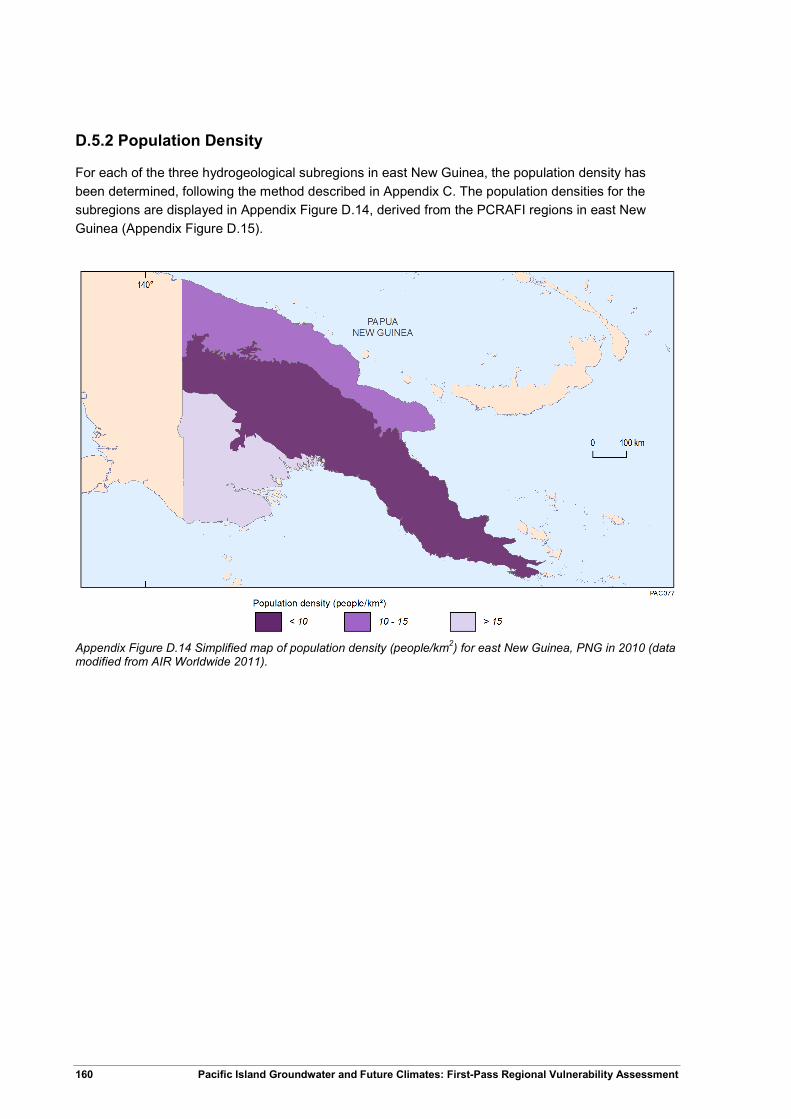
160 Pacific Island Groundwater and Future Climates: First-Pass Regional Vulnerability Assessment
D.5.2 Population Density
For each of the three hydrogeological subregions in east New Guinea, the population density has been determined, following the method described in Appendix C. The population densities for the subregions are displayed in Appendix Figure D.14, derived from the PCRAFI regions in east New Guinea (Appendix Figure D.15).
Appendix Figure D.14 Simplified map of population density (people/km2) for east New Guinea, PNG in 2010 (data modified from AIR Worldwide 2011).
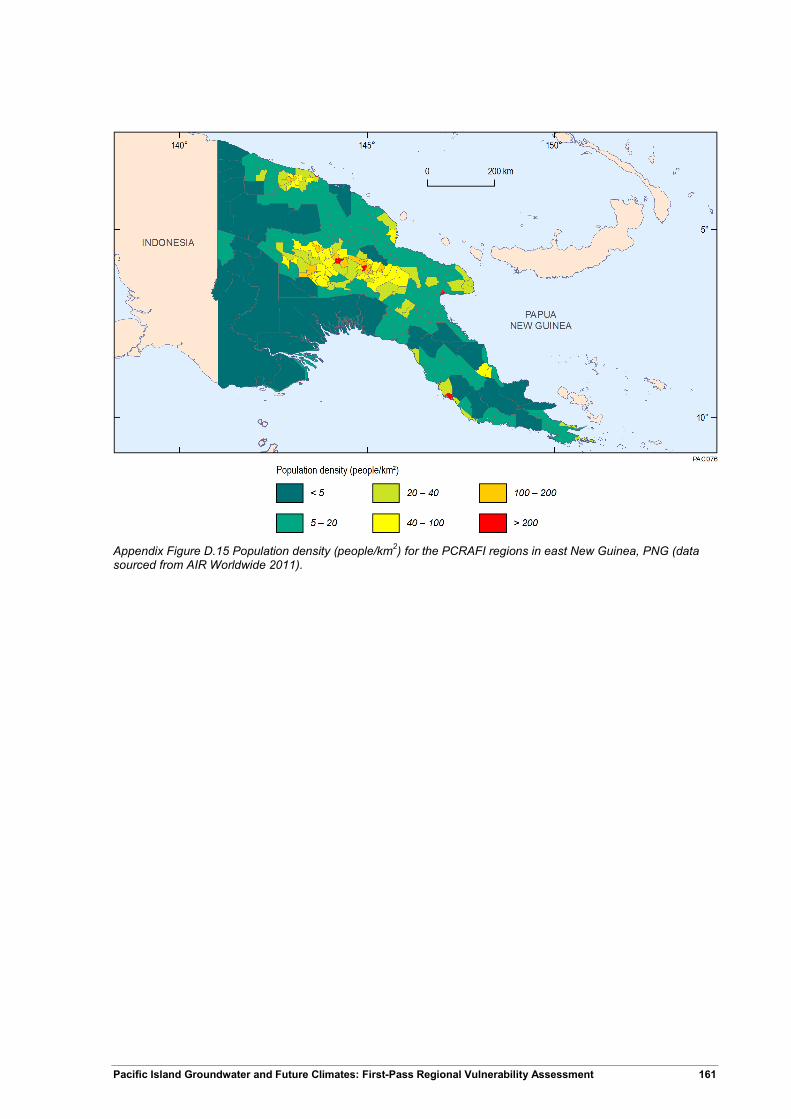
Pacific Island Groundwater and Future Climates: First-Pass Regional Vulnerability Assessment 161
Appendix Figure D.15 Population density (people/km2) for the PCRAFI regions in east New Guinea, PNG (data sourced from AIR Worldwide 2011).
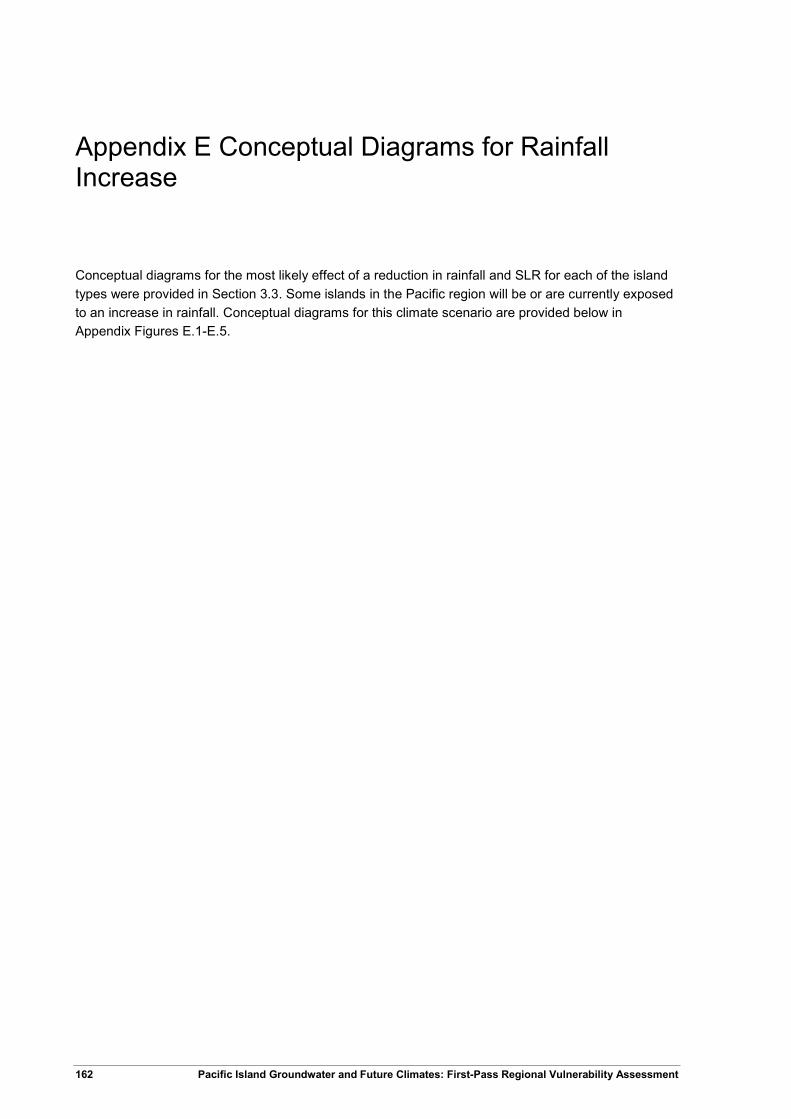
162 Pacific Island Groundwater and Future Climates: First-Pass Regional Vulnerability Assessment
Conceptual Diagrams for Rainfall Appendix EIncrease
Conceptual diagrams for the most likely effect of a reduction in rainfall and SLR for each of the island types were provided in Section 3.3. Some islands in the Pacific region will be or are currently exposed to an increase in rainfall. Conceptual diagrams for this climate scenario are provided below in Appendix Figures E.1-E.5.

Pacific Island Groundwater and Future Climates: First-Pass Regional Vulnerability Assessment 163
Appendix Figure E.1 Potential effect of b) reduction in rainfall or c) increase in rainfall on the freshwater lens of a Low Carbonate island compared to the a) current situation. Red arrows indicate a reduction in the size of the lens and green arrows indicate an increase in the size of the lens.
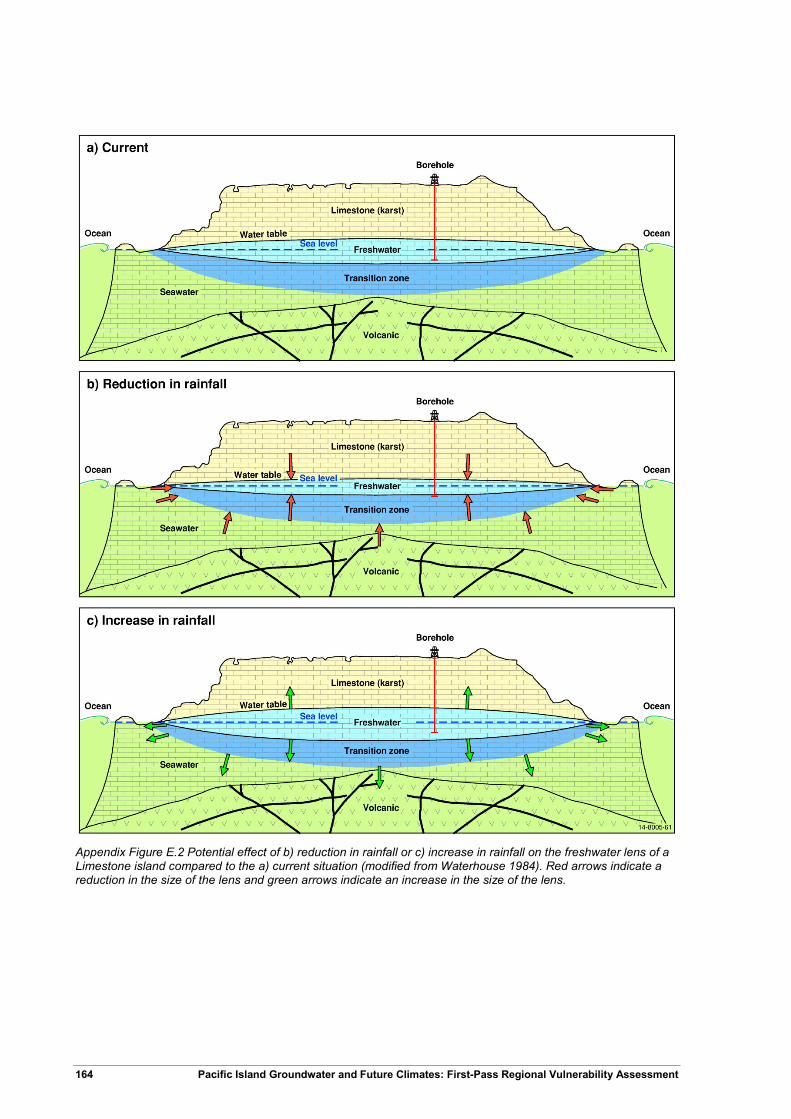
164 Pacific Island Groundwater and Future Climates: First-Pass Regional Vulnerability Assessment
Appendix Figure E.2 Potential effect of b) reduction in rainfall or c) increase in rainfall on the freshwater lens of a Limestone island compared to the a) current situation (modified from Waterhouse 1984). Red arrows indicate a reduction in the size of the lens and green arrows indicate an increase in the size of the lens.
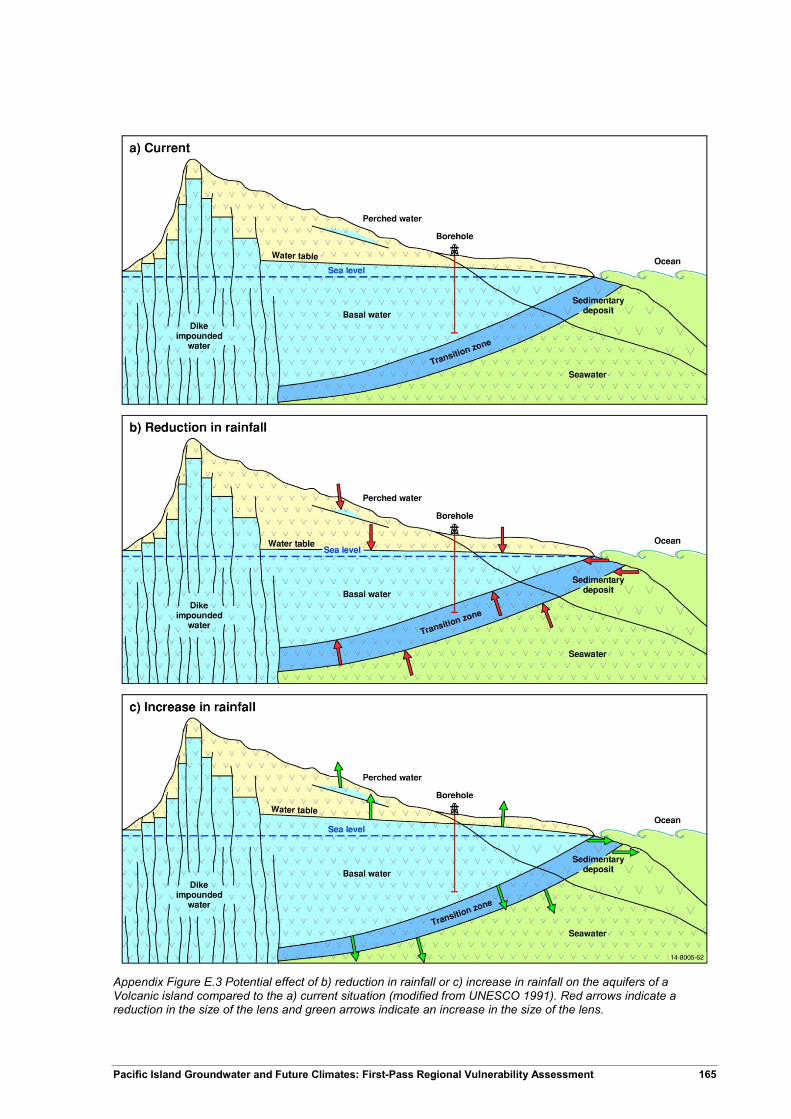
Pacific Island Groundwater and Future Climates: First-Pass Regional Vulnerability Assessment 165
Appendix Figure E.3 Potential effect of b) reduction in rainfall or c) increase in rainfall on the aquifers of a Volcanic island compared to the a) current situation (modified from UNESCO 1991). Red arrows indicate a reduction in the size of the lens and green arrows indicate an increase in the size of the lens.
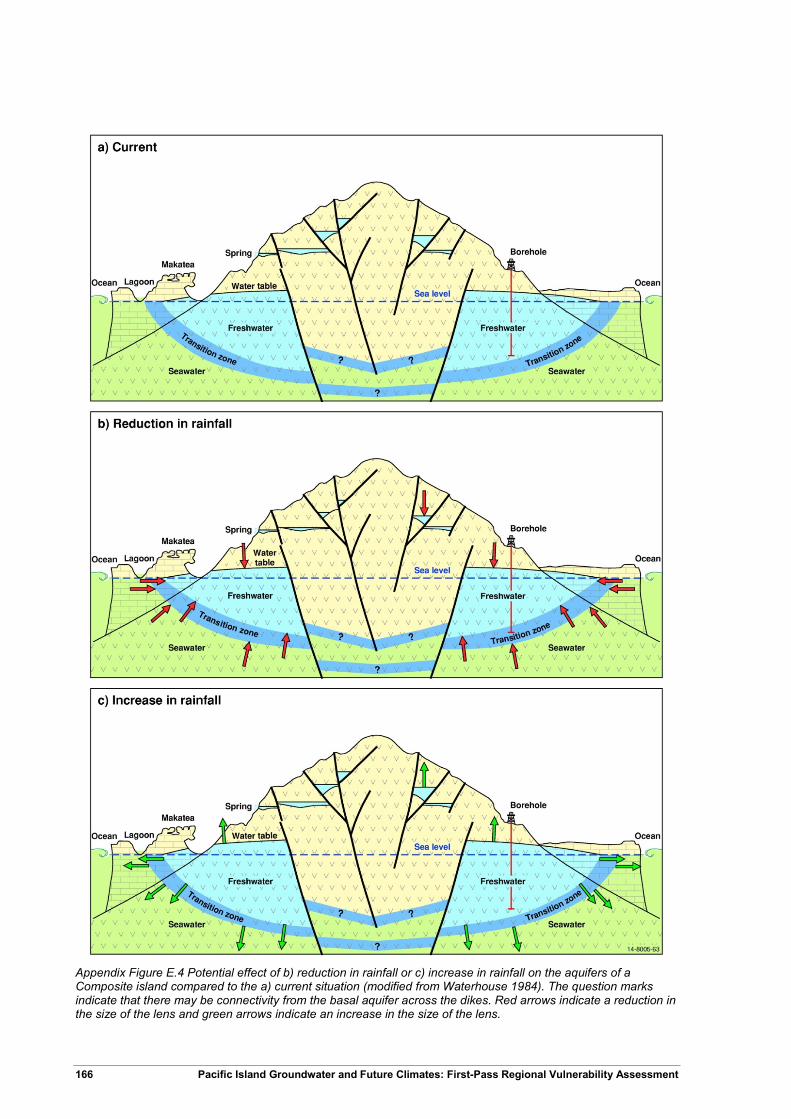
166 Pacific Island Groundwater and Future Climates: First-Pass Regional Vulnerability Assessment
Appendix Figure E.4 Potential effect of b) reduction in rainfall or c) increase in rainfall on the aquifers of a Composite island compared to the a) current situation (modified from Waterhouse 1984). The question marks indicate that there may be connectivity from the basal aquifer across the dikes. Red arrows indicate a reduction in the size of the lens and green arrows indicate an increase in the size of the lens.

Pacific Island Groundwater and Future Climates: First-Pass Regional Vulnerability Assessment 167
Appendix Figure E.5 Potential effect of b) reduction in rainfall or c) increase in rainfall on coastal aquifers of a Complex island compared to the a) current situation. Red arrows indicate a reduction in the size of the lens and green arrows indicate an increase in the size of the lens.
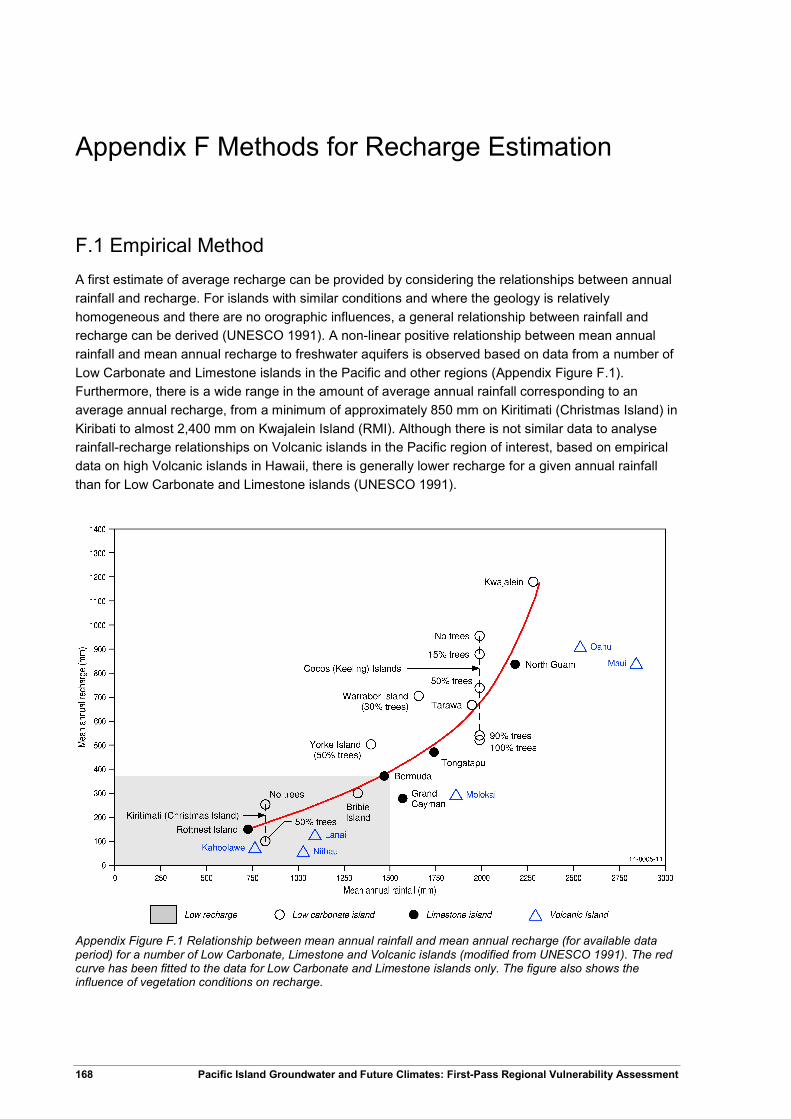
168 Pacific Island Groundwater and Future Climates: First-Pass Regional Vulnerability Assessment
Methods for Recharge Estimation Appendix F
F.1 Empirical Method A first estimate of average recharge can be provided by considering the relationships between annual rainfall and recharge. For islands with similar conditions and where the geology is relatively homogeneous and there are no orographic influences, a general relationship between rainfall and recharge can be derived (UNESCO 1991). A non-linear positive relationship between mean annual rainfall and mean annual recharge to freshwater aquifers is observed based on data from a number of Low Carbonate and Limestone islands in the Pacific and other regions (Appendix Figure F.1). Furthermore, there is a wide range in the amount of average annual rainfall corresponding to an average annual recharge, from a minimum of approximately 850 mm on Kiritimati (Christmas Island) in Kiribati to almost 2,400 mm on Kwajalein Island (RMI). Although there is not similar data to analyse rainfall-recharge relationships on Volcanic islands in the Pacific region of interest, based on empirical data on high Volcanic islands in Hawaii, there is generally lower recharge for a given annual rainfall than for Low Carbonate and Limestone islands (UNESCO 1991).
Appendix Figure F.1 Relationship between mean annual rainfall and mean annual recharge (for available data period) for a number of Low Carbonate, Limestone and Volcanic islands (modified from UNESCO 1991). The red curve has been fitted to the data for Low Carbonate and Limestone islands only. The figure also shows the influence of vegetation conditions on recharge.

Pacific Island Groundwater and Future Climates: First-Pass Regional Vulnerability Assessment 169
F.2 Water Balance Method In comparison to empirical methods, a water balance approach provides a more accurate estimate of groundwater recharge. In its simplest form, recharge to the groundwater system on a small low-lying island is a function of rainfall, evapotranspiration, and soil-moisture storage. The percentage of rainfall that becomes groundwater recharge and hence adds to available groundwater depends on the inputs and outputs of the water balance. Assuming no surface runoff (i.e. thin, permeable soils and highly permeable subsurface geology), the water balance at the surface (recharge model) can be expressed as (Falkland and Woodroffe 1997):
R = P - AET ± dV where
R = recharge to groundwater
P = rainfall
AET = actual evapotranspiration
dV = change in soil moisture store
Actual evapotranspiration includes the components of: evapotranspiration from intercepted water on trees and other surfaces (EI); evaporation and transpiration from the soil zone (ES); and, where the groundwater table is shallow as found on Low Carbonate islands, transpiration by deep-rooted vegetation directly from groundwater (TL) i.e. AET = EI + ES + TL. Excess water from the soil moisture zone drains to the water table, some of which is taken up by the roots of trees that penetrate the water table. Net recharge is the excess water remaining in the freshwater lens. On Low Carbonate islands, transpiration losses from deep-rooted vegetation such as coconut trees can significantly reduce the amount of groundwater available for use. In contrast, the roots of deep-rooted trees in Limestone islands are unable to reach the water table and, hence, unable to transpire water directly from the freshwater lens (White and Falkland 2010). Appendix Figure F.2 depicts the terms of the surface water balance for a small, low-lying island comprised of permeable material. Losses to surface water would need to be included for islands comprised of less permeable material, such as some weathered volcanic material (clays) or sealed and/or compacted surfaces. Note that the surface water balance is distinct from the groundwater balance in which recharge is the input and losses occur to seawater and groundwater extraction. There are no general water balance models for Volcanic or Composite islands and each island needs to be considered on a site-specific basis (UNESCO 1991). Further details relating to water balance calculations in different settings can be found in UNESCO (1991), Falkland (1993) and Falkland and Woodroffe (1997).
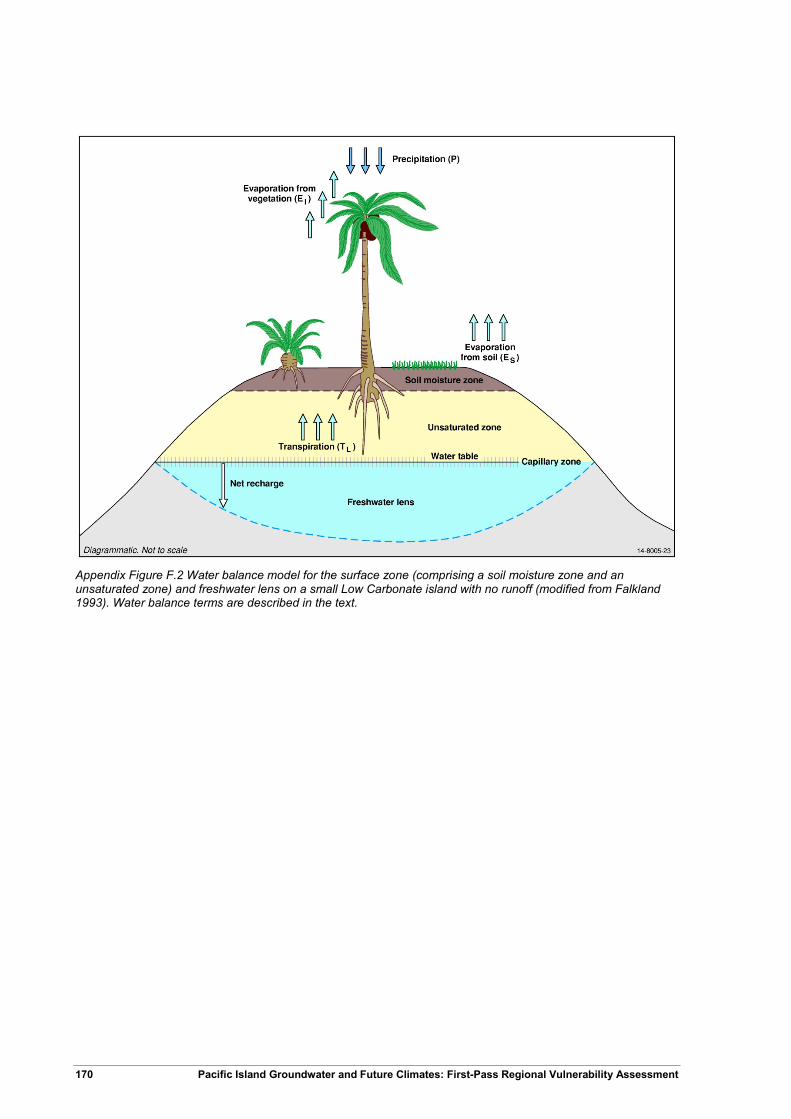
170 Pacific Island Groundwater and Future Climates: First-Pass Regional Vulnerability Assessment
Appendix Figure F.2 Water balance model for the surface zone (comprising a soil moisture zone and an unsaturated zone) and freshwater lens on a small Low Carbonate island with no runoff (modified from Falkland 1993). Water balance terms are described in the text.

Pacific Island Groundwater and Future Climates: First-Pass Regional Vulnerability Assessment 171
Freshwater Potential Appendix G
Based on islands of known type and with the potential for hosting fresh groundwater (discussed in Section 3.5), the regional and country distribution of island types (by number and percentage area) are presented in Appendix Figures G.1, G.2 and G.3 below.
Appendix Figure G.1 Number and percentage of island types across the Pacific region with potential for fresh groundwater (known island types only): a) island number and percentage of total islands; b) percentage of total island area (compare with Figure 2.1 for all islands, including those of unknown type).
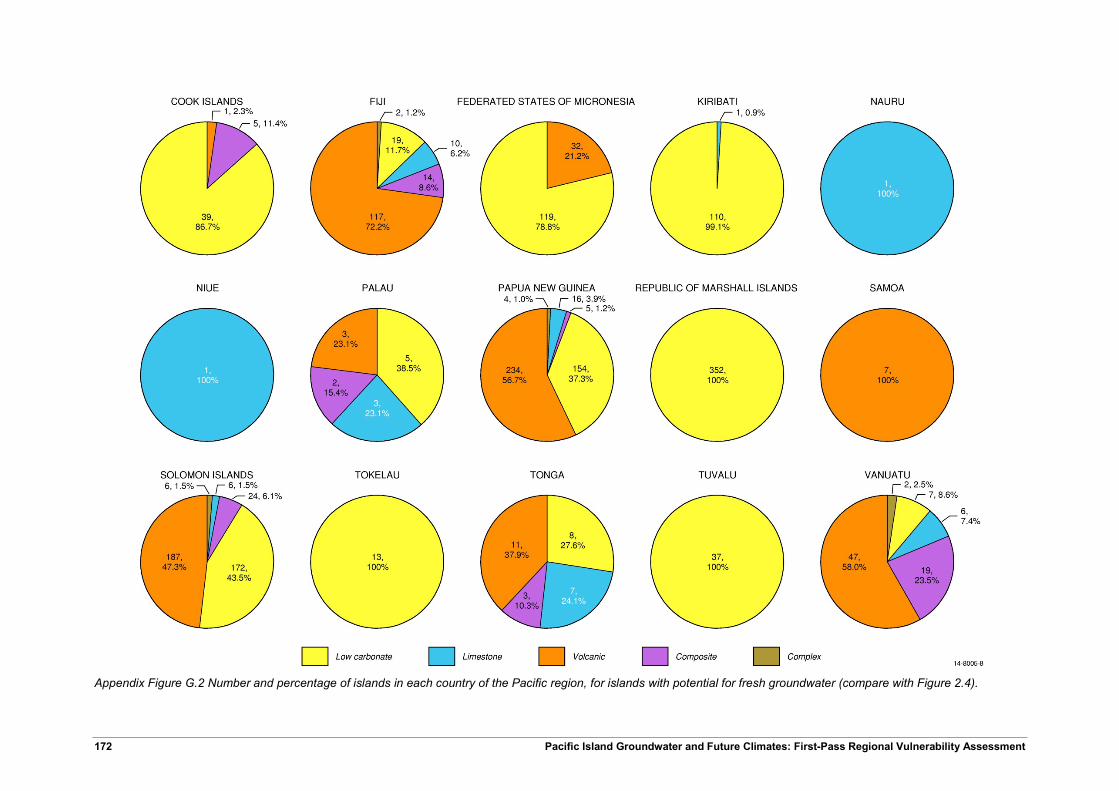
172 Pacific Island Groundwater and Future Climates: First-Pass Regional Vulnerability Assessment
Appendix Figure G.2 Number and percentage of islands in each country of the Pacific region, for islands with potential for fresh groundwater (compare with Figure 2.4).
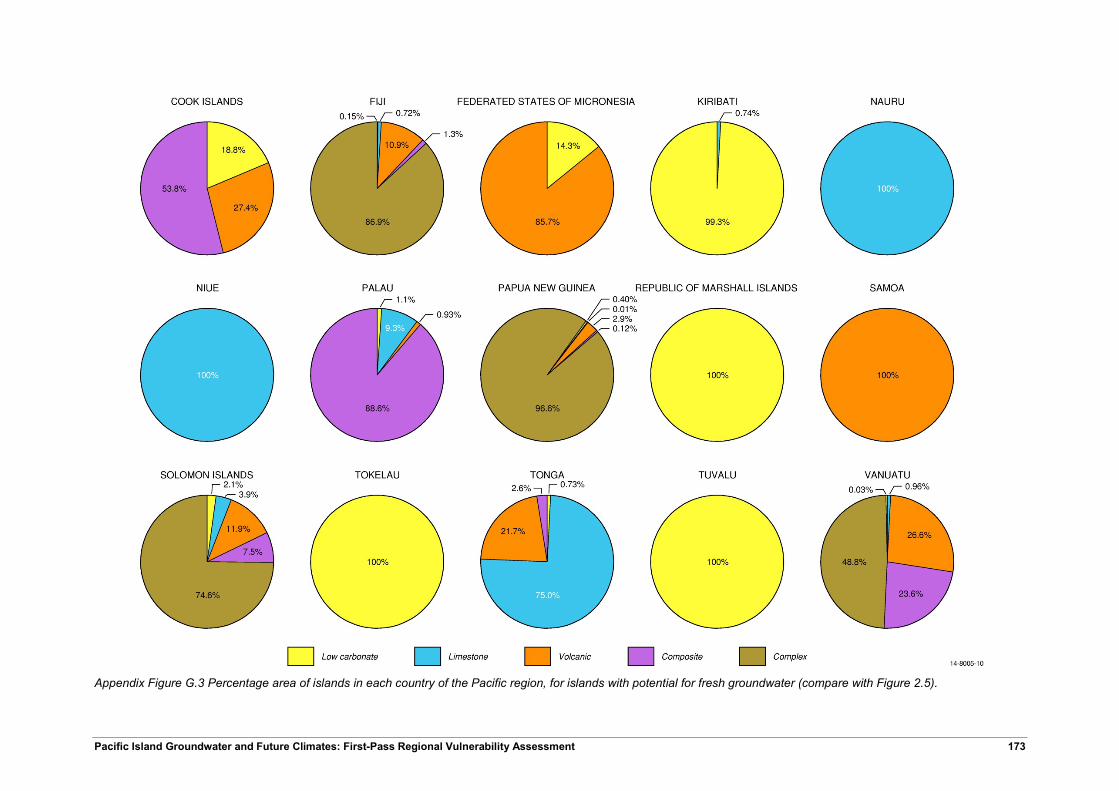
Pacific Island Groundwater and Future Climates: First-Pass Regional Vulnerability Assessment 173
Appendix Figure G.3 Percentage area of islands in each country of the Pacific region, for islands with potential for fresh groundwater (compare with Figure 2.5).
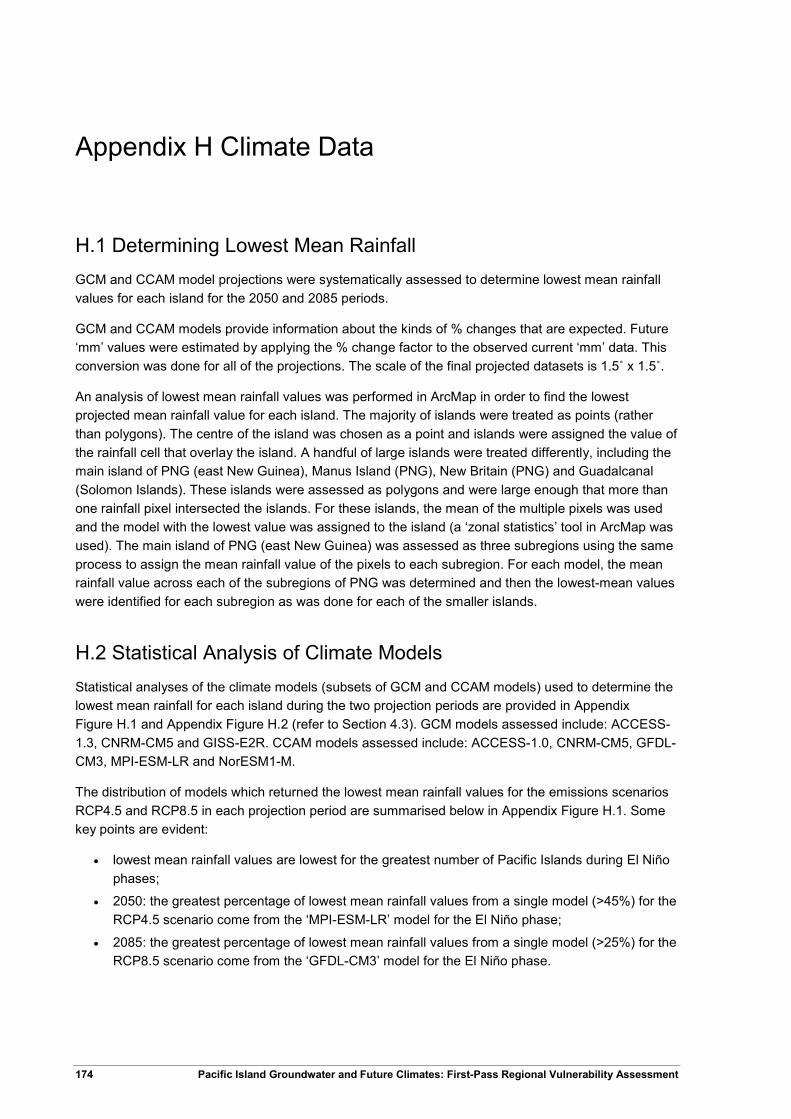
174 Pacific Island Groundwater and Future Climates: First-Pass Regional Vulnerability Assessment
Climate Data Appendix H
H.1 Determining Lowest Mean Rainfall GCM and CCAM model projections were systematically assessed to determine lowest mean rainfall values for each island for the 2050 and 2085 periods.
GCM and CCAM models provide information about the kinds of % changes that are expected. Future ‘mm’ values were estimated by applying the % change factor to the observed current ‘mm’ data. This conversion was done for all of the projections. The scale of the final projected datasets is 1.5˚ x 1.5˚.
An analysis of lowest mean rainfall values was performed in ArcMap in order to find the lowest projected mean rainfall value for each island. The majority of islands were treated as points (rather than polygons). The centre of the island was chosen as a point and islands were assigned the value of the rainfall cell that overlay the island. A handful of large islands were treated differently, including the main island of PNG (east New Guinea), Manus Island (PNG), New Britain (PNG) and Guadalcanal (Solomon Islands). These islands were assessed as polygons and were large enough that more than one rainfall pixel intersected the islands. For these islands, the mean of the multiple pixels was used and the model with the lowest value was assigned to the island (a ‘zonal statistics’ tool in ArcMap was used). The main island of PNG (east New Guinea) was assessed as three subregions using the same process to assign the mean rainfall value of the pixels to each subregion. For each model, the mean rainfall value across each of the subregions of PNG was determined and then the lowest-mean values were identified for each subregion as was done for each of the smaller islands.
H.2 Statistical Analysis of Climate Models Statistical analyses of the climate models (subsets of GCM and CCAM models) used to determine the lowest mean rainfall for each island during the two projection periods are provided in Appendix Figure H.1 and Appendix Figure H.2 (refer to Section 4.3). GCM models assessed include: ACCESS-1.3, CNRM-CM5 and GISS-E2R. CCAM models assessed include: ACCESS-1.0, CNRM-CM5, GFDL-CM3, MPI-ESM-LR and NorESM1-M.
The distribution of models which returned the lowest mean rainfall values for the emissions scenarios RCP4.5 and RCP8.5 in each projection period are summarised below in Appendix Figure H.1. Some key points are evident:
• lowest mean rainfall values are lowest for the greatest number of Pacific Islands during El Niño phases;
• 2050: the greatest percentage of lowest mean rainfall values from a single model (>45%) for the RCP4.5 scenario come from the ‘MPI-ESM-LR’ model for the El Niño phase;
• 2085: the greatest percentage of lowest mean rainfall values from a single model (>25%) for the RCP8.5 scenario come from the ‘GFDL-CM3’ model for the El Niño phase.
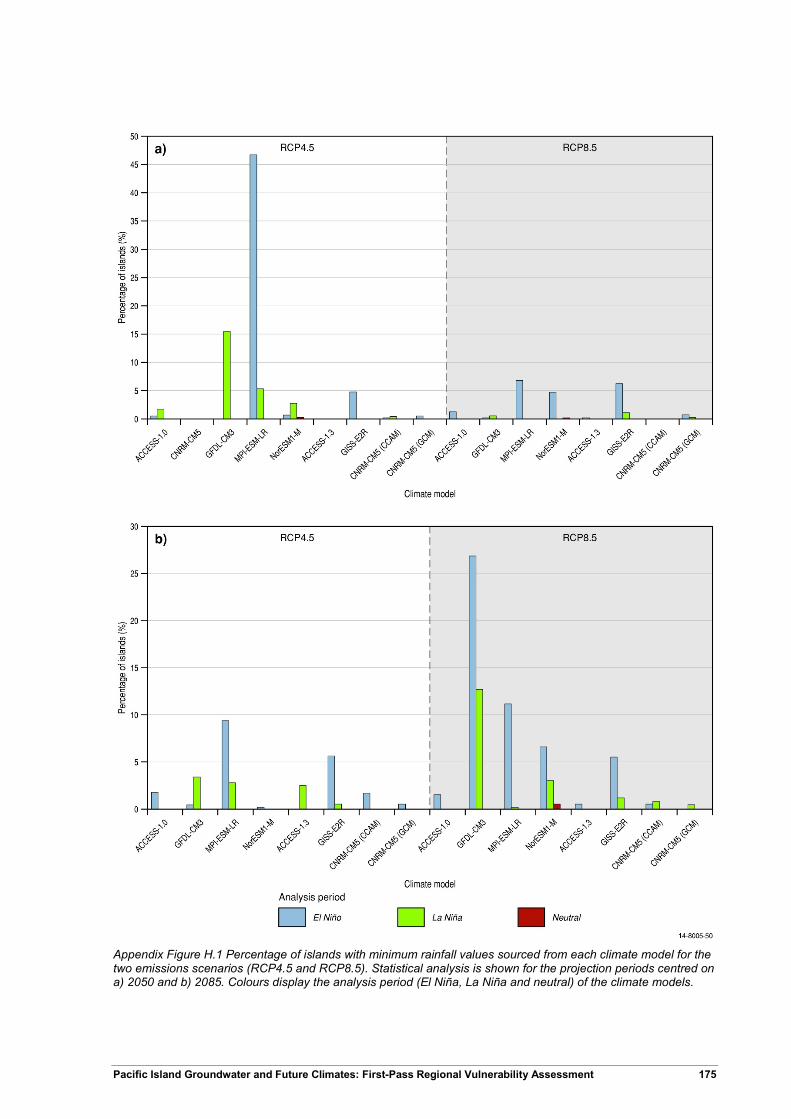
Pacific Island Groundwater and Future Climates: First-Pass Regional Vulnerability Assessment 175
Appendix Figure H.1 Percentage of islands with minimum rainfall values sourced from each climate model for the two emissions scenarios (RCP4.5 and RCP8.5). Statistical analysis is shown for the projection periods centred on a) 2050 and b) 2085. Colours display the analysis period (El Niña, La Niña and neutral) of the climate models.
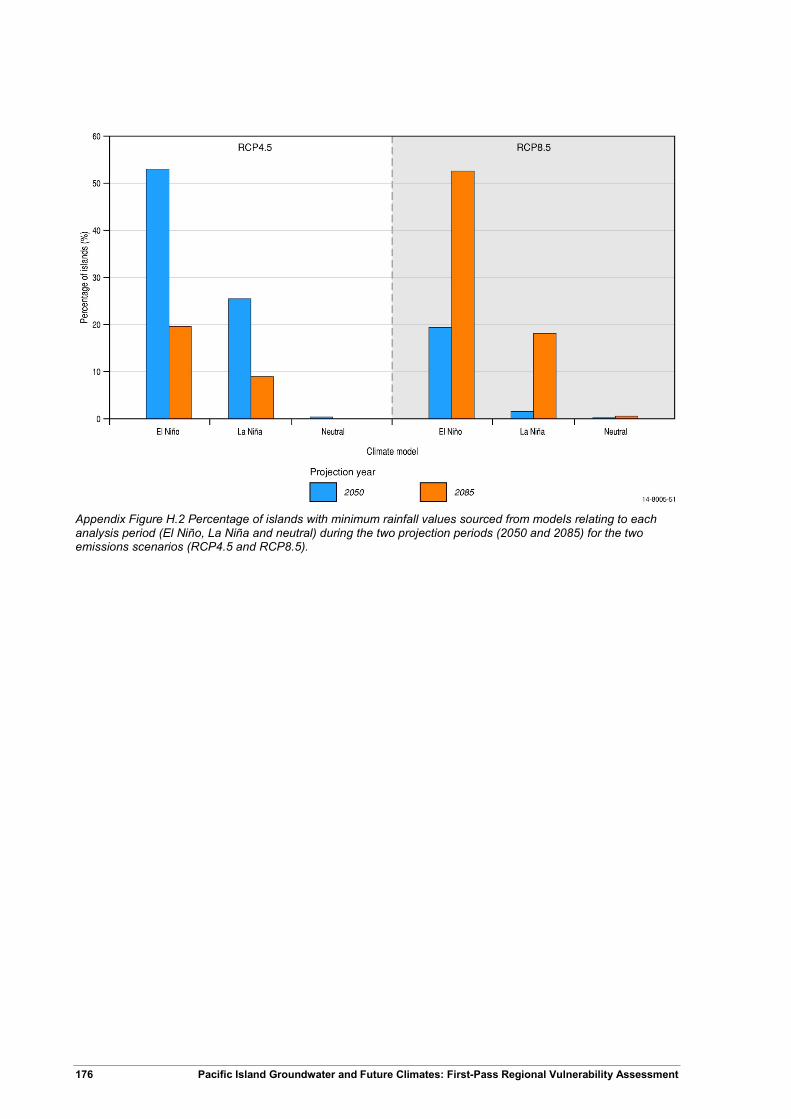
176 Pacific Island Groundwater and Future Climates: First-Pass Regional Vulnerability Assessment
Appendix Figure H.2 Percentage of islands with minimum rainfall values sourced from models relating to each analysis period (El Niño, La Niña and neutral) during the two projection periods (2050 and 2085) for the two emissions scenarios (RCP4.5 and RCP8.5).
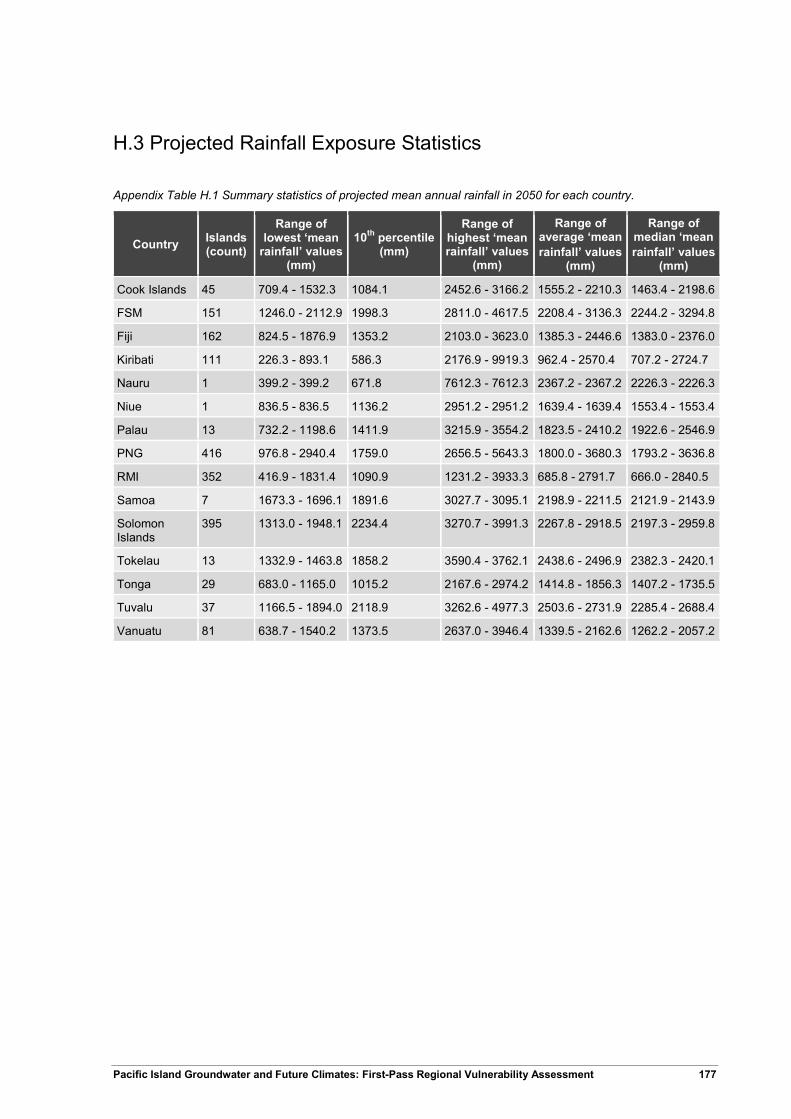
Pacific Island Groundwater and Future Climates: First-Pass Regional Vulnerability Assessment 177
H.3 Projected Rainfall Exposure Statistics
Appendix Table H.1 Summary statistics of projected mean annual rainfall in 2050 for each country.
Country Islands (count)
Range of lowest ‘mean
rainfall’ values (mm)
10th percentile (mm)
Range of highest ‘mean rainfall’ values
(mm)
Range of average ‘mean rainfall’ values
(mm)
Range of median ‘mean rainfall’ values
(mm)
Cook Islands 45 709.4 - 1532.3 1084.1 2452.6 - 3166.2 1555.2 - 2210.3 1463.4 - 2198.6
FSM 151 1246.0 - 2112.9 1998.3 2811.0 - 4617.5 2208.4 - 3136.3 2244.2 - 3294.8
Fiji 162 824.5 - 1876.9 1353.2 2103.0 - 3623.0 1385.3 - 2446.6 1383.0 - 2376.0
Kiribati 111 226.3 - 893.1 586.3 2176.9 - 9919.3 962.4 - 2570.4 707.2 - 2724.7
Nauru 1 399.2 - 399.2 671.8 7612.3 - 7612.3 2367.2 - 2367.2 2226.3 - 2226.3
Niue 1 836.5 - 836.5 1136.2 2951.2 - 2951.2 1639.4 - 1639.4 1553.4 - 1553.4
Palau 13 732.2 - 1198.6 1411.9 3215.9 - 3554.2 1823.5 - 2410.2 1922.6 - 2546.9
PNG 416 976.8 - 2940.4 1759.0 2656.5 - 5643.3 1800.0 - 3680.3 1793.2 - 3636.8
RMI 352 416.9 - 1831.4 1090.9 1231.2 - 3933.3 685.8 - 2791.7 666.0 - 2840.5
Samoa 7 1673.3 - 1696.1 1891.6 3027.7 - 3095.1 2198.9 - 2211.5 2121.9 - 2143.9
Solomon Islands
395 1313.0 - 1948.1 2234.4 3270.7 - 3991.3 2267.8 - 2918.5 2197.3 - 2959.8
Tokelau 13 1332.9 - 1463.8 1858.2 3590.4 - 3762.1 2438.6 - 2496.9 2382.3 - 2420.1
Tonga 29 683.0 - 1165.0 1015.2 2167.6 - 2974.2 1414.8 - 1856.3 1407.2 - 1735.5
Tuvalu 37 1166.5 - 1894.0 2118.9 3262.6 - 4977.3 2503.6 - 2731.9 2285.4 - 2688.4
Vanuatu 81 638.7 - 1540.2 1373.5 2637.0 - 3946.4 1339.5 - 2162.6 1262.2 - 2057.2
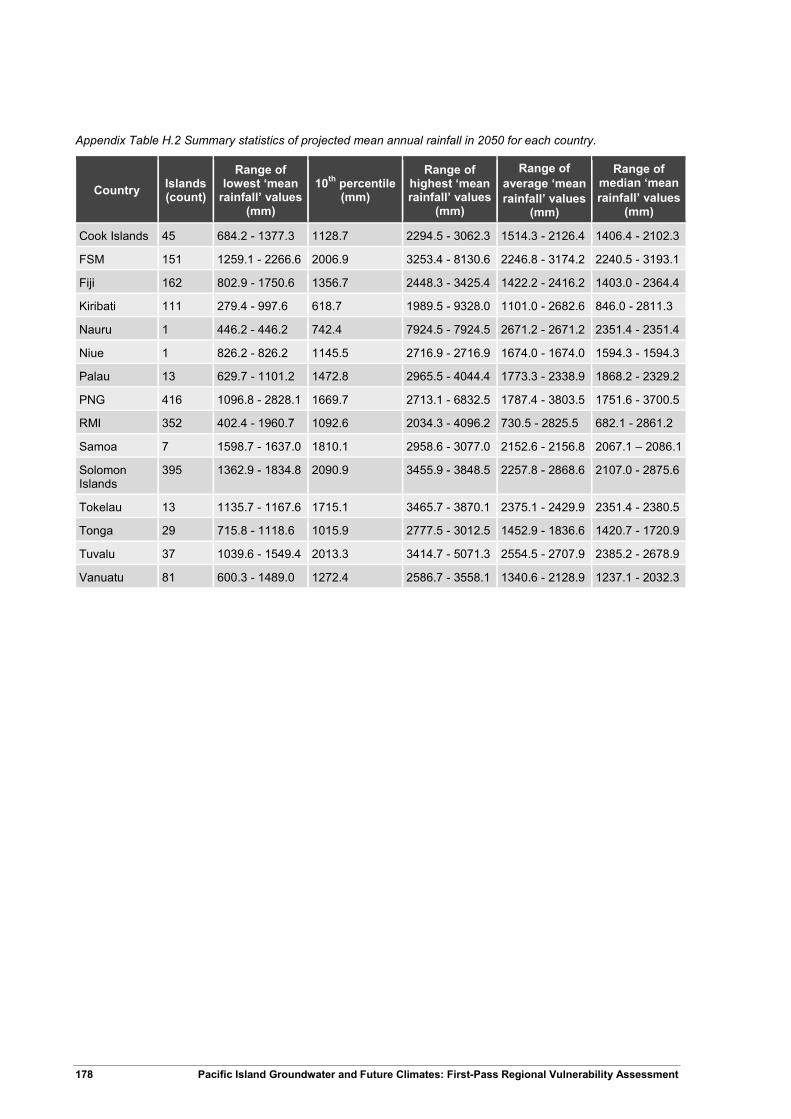
178 Pacific Island Groundwater and Future Climates: First-Pass Regional Vulnerability Assessment
Appendix Table H.2 Summary statistics of projected mean annual rainfall in 2050 for each country.
Country Islands (count)
Range of lowest ‘mean
rainfall’ values (mm)
10th percentile (mm)
Range of highest ‘mean rainfall’ values
(mm)
Range of average ‘mean rainfall’ values
(mm)
Range of median ‘mean rainfall’ values
(mm)
Cook Islands 45 684.2 - 1377.3 1128.7 2294.5 - 3062.3 1514.3 - 2126.4 1406.4 - 2102.3
FSM 151 1259.1 - 2266.6 2006.9 3253.4 - 8130.6 2246.8 - 3174.2 2240.5 - 3193.1
Fiji 162 802.9 - 1750.6 1356.7 2448.3 - 3425.4 1422.2 - 2416.2 1403.0 - 2364.4
Kiribati 111 279.4 - 997.6 618.7 1989.5 - 9328.0 1101.0 - 2682.6 846.0 - 2811.3
Nauru 1 446.2 - 446.2 742.4 7924.5 - 7924.5 2671.2 - 2671.2 2351.4 - 2351.4
Niue 1 826.2 - 826.2 1145.5 2716.9 - 2716.9 1674.0 - 1674.0 1594.3 - 1594.3
Palau 13 629.7 - 1101.2 1472.8 2965.5 - 4044.4 1773.3 - 2338.9 1868.2 - 2329.2
PNG 416 1096.8 - 2828.1 1669.7 2713.1 - 6832.5 1787.4 - 3803.5 1751.6 - 3700.5
RMI 352 402.4 - 1960.7 1092.6 2034.3 - 4096.2 730.5 - 2825.5 682.1 - 2861.2
Samoa 7 1598.7 - 1637.0 1810.1 2958.6 - 3077.0 2152.6 - 2156.8 2067.1 – 2086.1
Solomon Islands
395 1362.9 - 1834.8 2090.9 3455.9 - 3848.5 2257.8 - 2868.6 2107.0 - 2875.6
Tokelau 13 1135.7 - 1167.6 1715.1 3465.7 - 3870.1 2375.1 - 2429.9 2351.4 - 2380.5
Tonga 29 715.8 - 1118.6 1015.9 2777.5 - 3012.5 1452.9 - 1836.6 1420.7 - 1720.9
Tuvalu 37 1039.6 - 1549.4 2013.3 3414.7 - 5071.3 2554.5 - 2707.9 2385.2 - 2678.9
Vanuatu 81 600.3 - 1489.0 1272.4 2586.7 - 3558.1 1340.6 - 2128.9 1237.1 - 2032.3
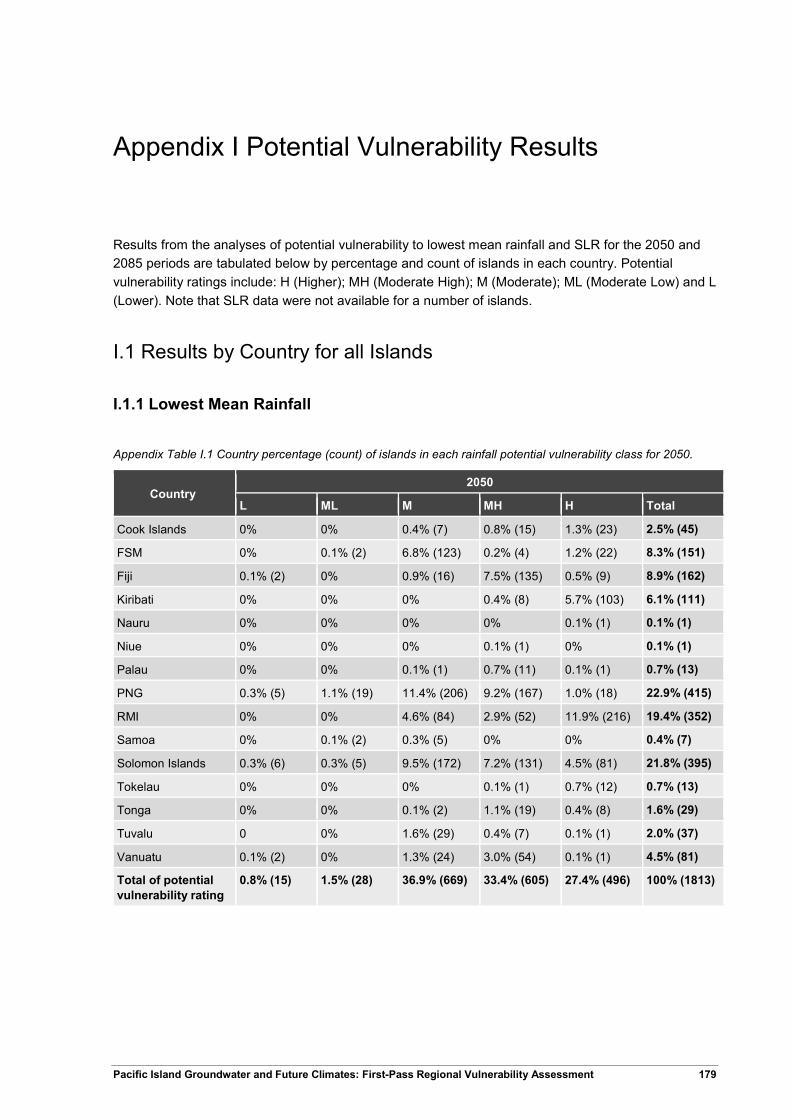
Pacific Island Groundwater and Future Climates: First-Pass Regional Vulnerability Assessment 179
Potential Vulnerability Results Appendix I
Results from the analyses of potential vulnerability to lowest mean rainfall and SLR for the 2050 and 2085 periods are tabulated below by percentage and count of islands in each country. Potential vulnerability ratings include: H (Higher); MH (Moderate High); M (Moderate); ML (Moderate Low) and L (Lower). Note that SLR data were not available for a number of islands.
I.1 Results by Country for all Islands
I.1.1 Lowest Mean Rainfall
Appendix Table I.1 Country percentage (count) of islands in each rainfall potential vulnerability class for 2050.
Country 2050
L ML M MH H Total
Cook Islands 0% 0% 0.4% (7) 0.8% (15) 1.3% (23) 2.5% (45)
FSM 0% 0.1% (2) 6.8% (123) 0.2% (4) 1.2% (22) 8.3% (151)
Fiji 0.1% (2) 0% 0.9% (16) 7.5% (135) 0.5% (9) 8.9% (162)
Kiribati 0% 0% 0% 0.4% (8) 5.7% (103) 6.1% (111)
Nauru 0% 0% 0% 0% 0.1% (1) 0.1% (1)
Niue 0% 0% 0% 0.1% (1) 0% 0.1% (1)
Palau 0% 0% 0.1% (1) 0.7% (11) 0.1% (1) 0.7% (13)
PNG 0.3% (5) 1.1% (19) 11.4% (206) 9.2% (167) 1.0% (18) 22.9% (415)
RMI 0% 0% 4.6% (84) 2.9% (52) 11.9% (216) 19.4% (352)
Samoa 0% 0.1% (2) 0.3% (5) 0% 0% 0.4% (7)
Solomon Islands 0.3% (6) 0.3% (5) 9.5% (172) 7.2% (131) 4.5% (81) 21.8% (395)
Tokelau 0% 0% 0% 0.1% (1) 0.7% (12) 0.7% (13)
Tonga 0% 0% 0.1% (2) 1.1% (19) 0.4% (8) 1.6% (29)
Tuvalu 0 0% 1.6% (29) 0.4% (7) 0.1% (1) 2.0% (37)
Vanuatu 0.1% (2) 0% 1.3% (24) 3.0% (54) 0.1% (1) 4.5% (81)
Total of potential vulnerability rating
0.8% (15) 1.5% (28) 36.9% (669) 33.4% (605) 27.4% (496) 100% (1813)
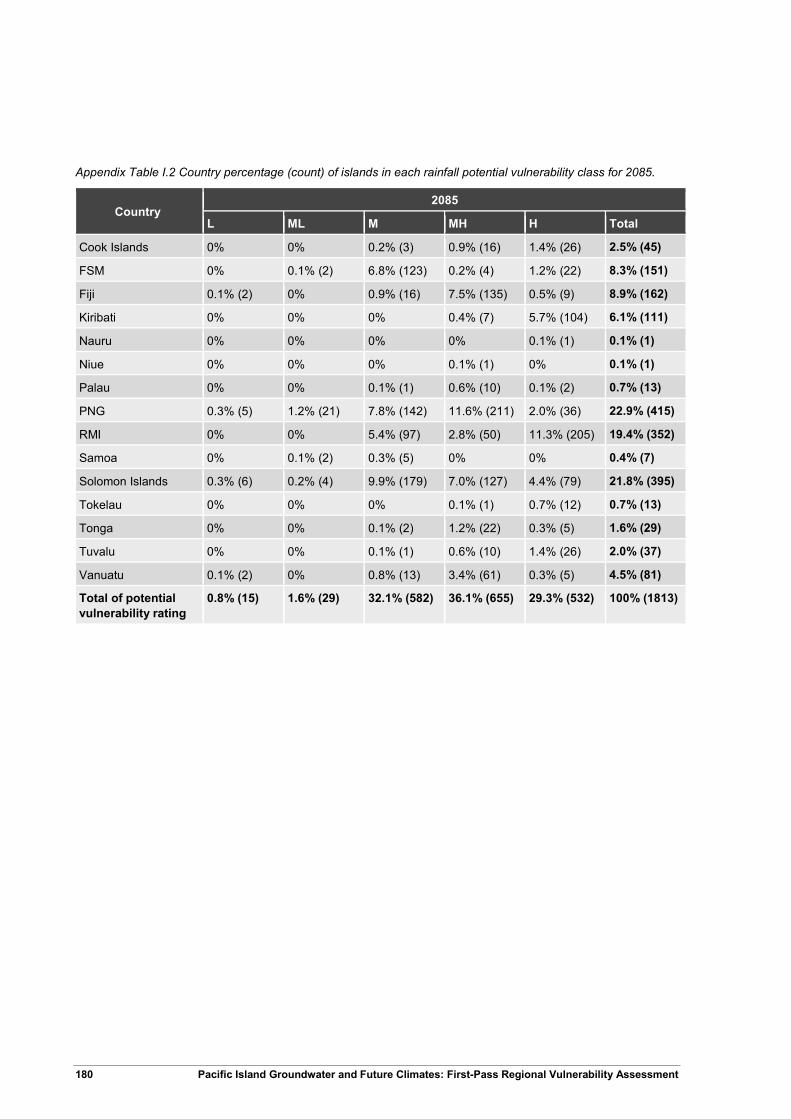
180 Pacific Island Groundwater and Future Climates: First-Pass Regional Vulnerability Assessment
Appendix Table I.2 Country percentage (count) of islands in each rainfall potential vulnerability class for 2085.
Country 2085
L ML M MH H Total
Cook Islands 0% 0% 0.2% (3) 0.9% (16) 1.4% (26) 2.5% (45)
FSM 0% 0.1% (2) 6.8% (123) 0.2% (4) 1.2% (22) 8.3% (151)
Fiji 0.1% (2) 0% 0.9% (16) 7.5% (135) 0.5% (9) 8.9% (162)
Kiribati 0% 0% 0% 0.4% (7) 5.7% (104) 6.1% (111)
Nauru 0% 0% 0% 0% 0.1% (1) 0.1% (1)
Niue 0% 0% 0% 0.1% (1) 0% 0.1% (1)
Palau 0% 0% 0.1% (1) 0.6% (10) 0.1% (2) 0.7% (13)
PNG 0.3% (5) 1.2% (21) 7.8% (142) 11.6% (211) 2.0% (36) 22.9% (415)
RMI 0% 0% 5.4% (97) 2.8% (50) 11.3% (205) 19.4% (352)
Samoa 0% 0.1% (2) 0.3% (5) 0% 0% 0.4% (7)
Solomon Islands 0.3% (6) 0.2% (4) 9.9% (179) 7.0% (127) 4.4% (79) 21.8% (395)
Tokelau 0% 0% 0% 0.1% (1) 0.7% (12) 0.7% (13)
Tonga 0% 0% 0.1% (2) 1.2% (22) 0.3% (5) 1.6% (29)
Tuvalu 0% 0% 0.1% (1) 0.6% (10) 1.4% (26) 2.0% (37)
Vanuatu 0.1% (2) 0% 0.8% (13) 3.4% (61) 0.3% (5) 4.5% (81)
Total of potential vulnerability rating
0.8% (15) 1.6% (29) 32.1% (582) 36.1% (655) 29.3% (532) 100% (1813)
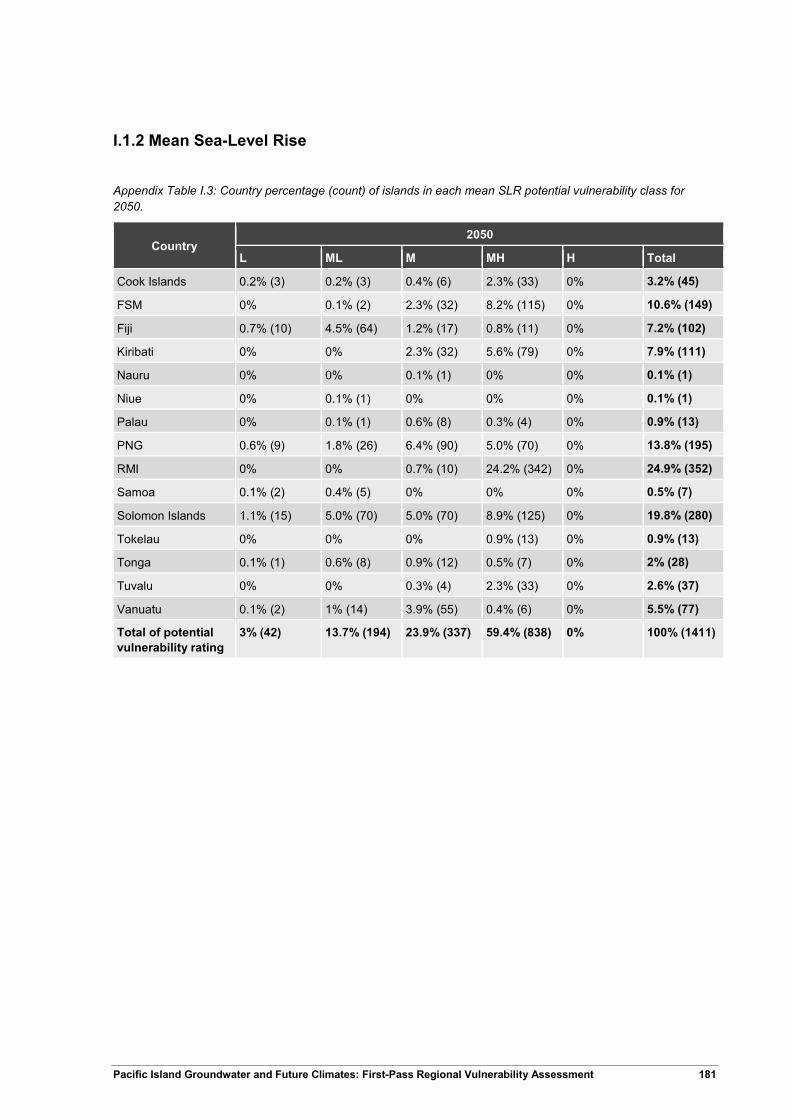
Pacific Island Groundwater and Future Climates: First-Pass Regional Vulnerability Assessment 181
I.1.2 Mean Sea-Level Rise
Appendix Table I.3: Country percentage (count) of islands in each mean SLR potential vulnerability class for 2050.
Country 2050
L ML M MH H Total
Cook Islands 0.2% (3) 0.2% (3) 0.4% (6) 2.3% (33) 0% 3.2% (45)
FSM 0% 0.1% (2) 2.3% (32) 8.2% (115) 0% 10.6% (149)
Fiji 0.7% (10) 4.5% (64) 1.2% (17) 0.8% (11) 0% 7.2% (102)
Kiribati 0% 0% 2.3% (32) 5.6% (79) 0% 7.9% (111)
Nauru 0% 0% 0.1% (1) 0% 0% 0.1% (1)
Niue 0% 0.1% (1) 0% 0% 0% 0.1% (1)
Palau 0% 0.1% (1) 0.6% (8) 0.3% (4) 0% 0.9% (13)
PNG 0.6% (9) 1.8% (26) 6.4% (90) 5.0% (70) 0% 13.8% (195)
RMI 0% 0% 0.7% (10) 24.2% (342) 0% 24.9% (352)
Samoa 0.1% (2) 0.4% (5) 0% 0% 0% 0.5% (7)
Solomon Islands 1.1% (15) 5.0% (70) 5.0% (70) 8.9% (125) 0% 19.8% (280)
Tokelau 0% 0% 0% 0.9% (13) 0% 0.9% (13)
Tonga 0.1% (1) 0.6% (8) 0.9% (12) 0.5% (7) 0% 2% (28)
Tuvalu 0% 0% 0.3% (4) 2.3% (33) 0% 2.6% (37)
Vanuatu 0.1% (2) 1% (14) 3.9% (55) 0.4% (6) 0% 5.5% (77)
Total of potential vulnerability rating
3% (42) 13.7% (194) 23.9% (337) 59.4% (838) 0% 100% (1411)
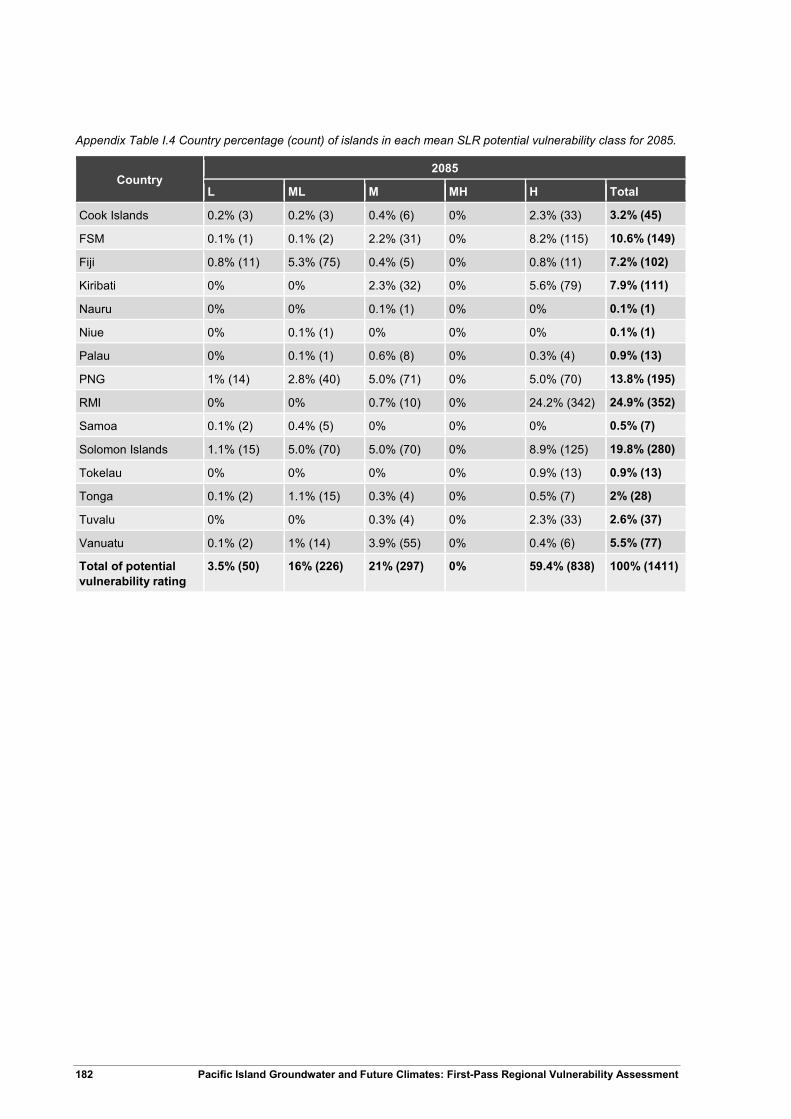
182 Pacific Island Groundwater and Future Climates: First-Pass Regional Vulnerability Assessment
Appendix Table I.4 Country percentage (count) of islands in each mean SLR potential vulnerability class for 2085.
Country 2085
L ML M MH H Total
Cook Islands 0.2% (3) 0.2% (3) 0.4% (6) 0% 2.3% (33) 3.2% (45)
FSM 0.1% (1) 0.1% (2) 2.2% (31) 0% 8.2% (115) 10.6% (149)
Fiji 0.8% (11) 5.3% (75) 0.4% (5) 0% 0.8% (11) 7.2% (102)
Kiribati 0% 0% 2.3% (32) 0% 5.6% (79) 7.9% (111)
Nauru 0% 0% 0.1% (1) 0% 0% 0.1% (1)
Niue 0% 0.1% (1) 0% 0% 0% 0.1% (1)
Palau 0% 0.1% (1) 0.6% (8) 0% 0.3% (4) 0.9% (13)
PNG 1% (14) 2.8% (40) 5.0% (71) 0% 5.0% (70) 13.8% (195)
RMI 0% 0% 0.7% (10) 0% 24.2% (342) 24.9% (352)
Samoa 0.1% (2) 0.4% (5) 0% 0% 0% 0.5% (7)
Solomon Islands 1.1% (15) 5.0% (70) 5.0% (70) 0% 8.9% (125) 19.8% (280)
Tokelau 0% 0% 0% 0% 0.9% (13) 0.9% (13)
Tonga 0.1% (2) 1.1% (15) 0.3% (4) 0% 0.5% (7) 2% (28)
Tuvalu 0% 0% 0.3% (4) 0% 2.3% (33) 2.6% (37)
Vanuatu 0.1% (2) 1% (14) 3.9% (55) 0% 0.4% (6) 5.5% (77)
Total of potential vulnerability rating
3.5% (50) 16% (226) 21% (297) 0% 59.4% (838) 100% (1411)
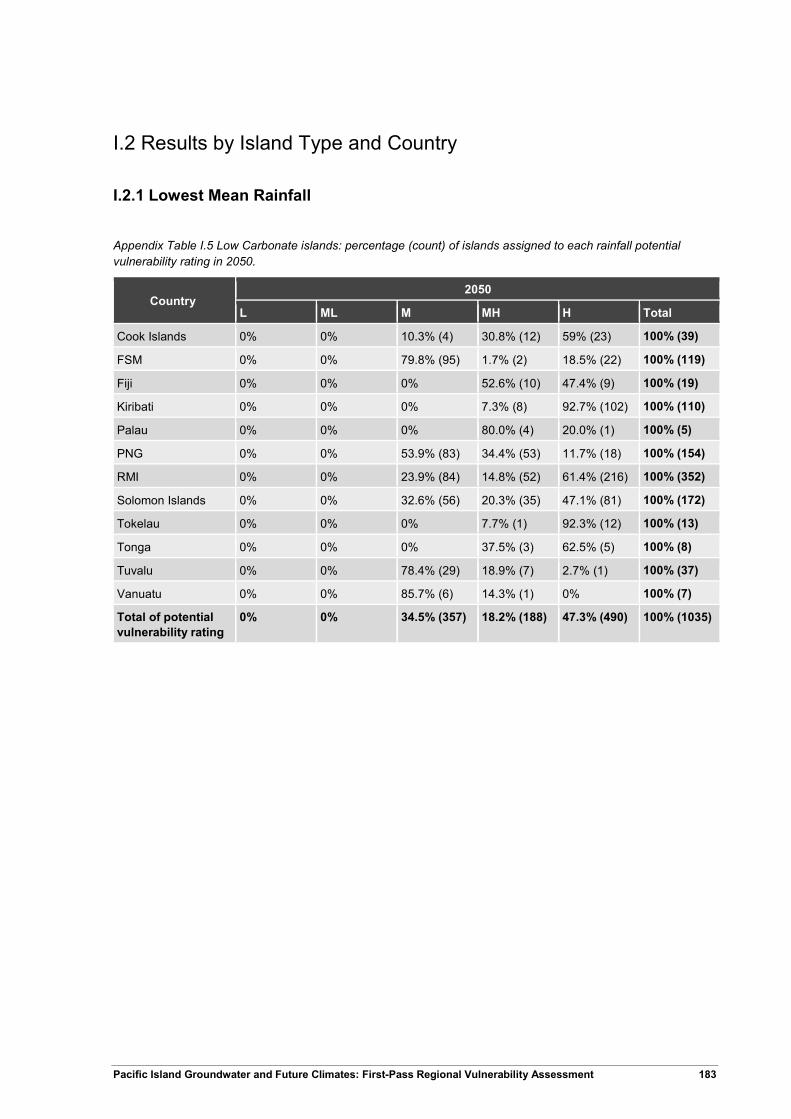
Pacific Island Groundwater and Future Climates: First-Pass Regional Vulnerability Assessment 183
I.2 Results by Island Type and Country
I.2.1 Lowest Mean Rainfall
Appendix Table I.5 Low Carbonate islands: percentage (count) of islands assigned to each rainfall potential vulnerability rating in 2050.
Country 2050
L ML M MH H Total
Cook Islands 0% 0% 10.3% (4) 30.8% (12) 59% (23) 100% (39)
FSM 0% 0% 79.8% (95) 1.7% (2) 18.5% (22) 100% (119)
Fiji 0% 0% 0% 52.6% (10) 47.4% (9) 100% (19)
Kiribati 0% 0% 0% 7.3% (8) 92.7% (102) 100% (110)
Palau 0% 0% 0% 80.0% (4) 20.0% (1) 100% (5)
PNG 0% 0% 53.9% (83) 34.4% (53) 11.7% (18) 100% (154)
RMI 0% 0% 23.9% (84) 14.8% (52) 61.4% (216) 100% (352)
Solomon Islands 0% 0% 32.6% (56) 20.3% (35) 47.1% (81) 100% (172)
Tokelau 0% 0% 0% 7.7% (1) 92.3% (12) 100% (13)
Tonga 0% 0% 0% 37.5% (3) 62.5% (5) 100% (8)
Tuvalu 0% 0% 78.4% (29) 18.9% (7) 2.7% (1) 100% (37)
Vanuatu 0% 0% 85.7% (6) 14.3% (1) 0% 100% (7)
Total of potential vulnerability rating
0% 0% 34.5% (357) 18.2% (188) 47.3% (490) 100% (1035)
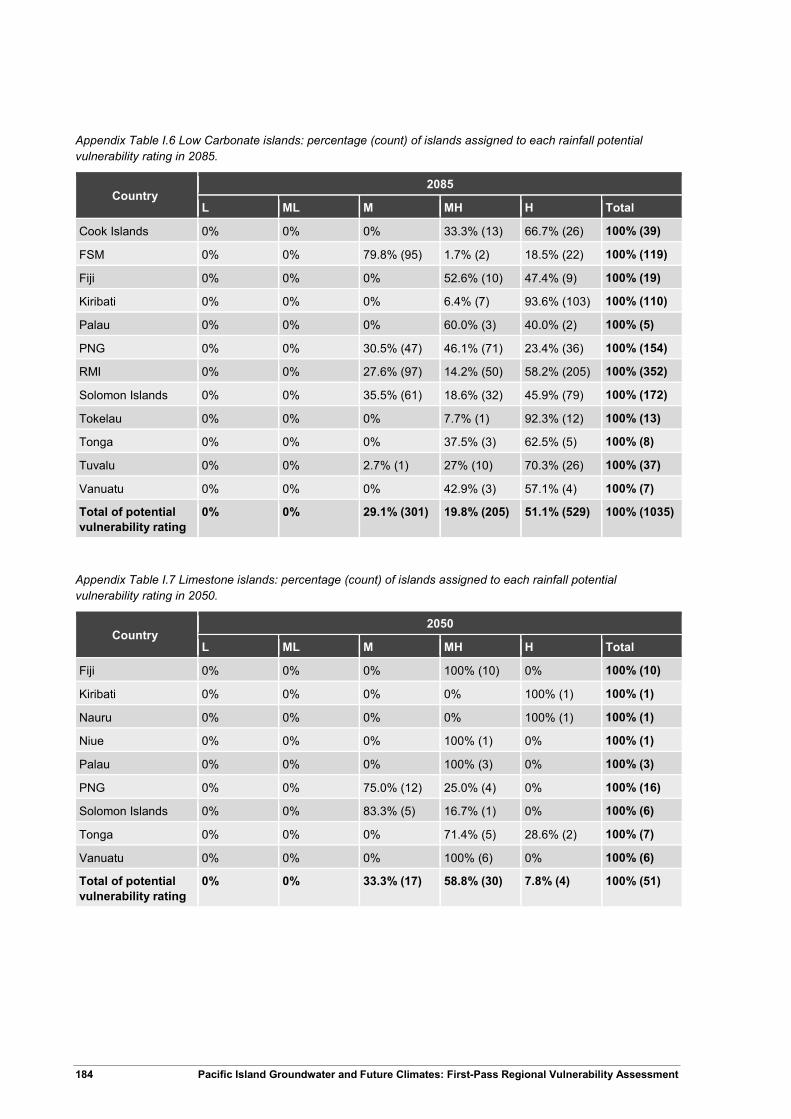
184 Pacific Island Groundwater and Future Climates: First-Pass Regional Vulnerability Assessment
Appendix Table I.6 Low Carbonate islands: percentage (count) of islands assigned to each rainfall potential vulnerability rating in 2085.
Country 2085
L ML M MH H Total
Cook Islands 0% 0% 0% 33.3% (13) 66.7% (26) 100% (39)
FSM 0% 0% 79.8% (95) 1.7% (2) 18.5% (22) 100% (119)
Fiji 0% 0% 0% 52.6% (10) 47.4% (9) 100% (19)
Kiribati 0% 0% 0% 6.4% (7) 93.6% (103) 100% (110)
Palau 0% 0% 0% 60.0% (3) 40.0% (2) 100% (5)
PNG 0% 0% 30.5% (47) 46.1% (71) 23.4% (36) 100% (154)
RMI 0% 0% 27.6% (97) 14.2% (50) 58.2% (205) 100% (352)
Solomon Islands 0% 0% 35.5% (61) 18.6% (32) 45.9% (79) 100% (172)
Tokelau 0% 0% 0% 7.7% (1) 92.3% (12) 100% (13)
Tonga 0% 0% 0% 37.5% (3) 62.5% (5) 100% (8)
Tuvalu 0% 0% 2.7% (1) 27% (10) 70.3% (26) 100% (37)
Vanuatu 0% 0% 0% 42.9% (3) 57.1% (4) 100% (7)
Total of potential vulnerability rating
0% 0% 29.1% (301) 19.8% (205) 51.1% (529) 100% (1035)
Appendix Table I.7 Limestone islands: percentage (count) of islands assigned to each rainfall potential vulnerability rating in 2050.
Country 2050
L ML M MH H Total
Fiji 0% 0% 0% 100% (10) 0% 100% (10)
Kiribati 0% 0% 0% 0% 100% (1) 100% (1)
Nauru 0% 0% 0% 0% 100% (1) 100% (1)
Niue 0% 0% 0% 100% (1) 0% 100% (1)
Palau 0% 0% 0% 100% (3) 0% 100% (3)
PNG 0% 0% 75.0% (12) 25.0% (4) 0% 100% (16)
Solomon Islands 0% 0% 83.3% (5) 16.7% (1) 0% 100% (6)
Tonga 0% 0% 0% 71.4% (5) 28.6% (2) 100% (7)
Vanuatu 0% 0% 0% 100% (6) 0% 100% (6)
Total of potential vulnerability rating
0% 0% 33.3% (17) 58.8% (30) 7.8% (4) 100% (51)
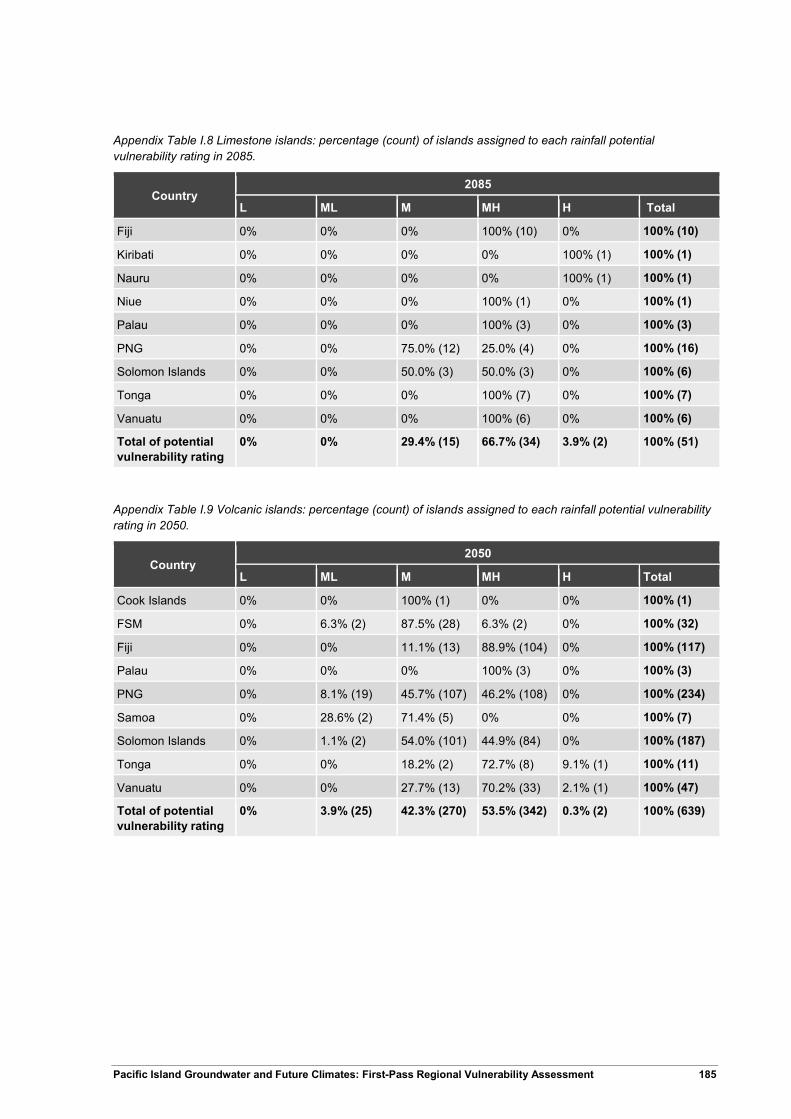
Pacific Island Groundwater and Future Climates: First-Pass Regional Vulnerability Assessment 185
Appendix Table I.8 Limestone islands: percentage (count) of islands assigned to each rainfall potential vulnerability rating in 2085.
Country 2085
L ML M MH H Total
Fiji 0% 0% 0% 100% (10) 0% 100% (10)
Kiribati 0% 0% 0% 0% 100% (1) 100% (1)
Nauru 0% 0% 0% 0% 100% (1) 100% (1)
Niue 0% 0% 0% 100% (1) 0% 100% (1)
Palau 0% 0% 0% 100% (3) 0% 100% (3)
PNG 0% 0% 75.0% (12) 25.0% (4) 0% 100% (16)
Solomon Islands 0% 0% 50.0% (3) 50.0% (3) 0% 100% (6)
Tonga 0% 0% 0% 100% (7) 0% 100% (7)
Vanuatu 0% 0% 0% 100% (6) 0% 100% (6)
Total of potential vulnerability rating
0% 0% 29.4% (15) 66.7% (34) 3.9% (2) 100% (51)
Appendix Table I.9 Volcanic islands: percentage (count) of islands assigned to each rainfall potential vulnerability rating in 2050.
Country 2050
L ML M MH H Total
Cook Islands 0% 0% 100% (1) 0% 0% 100% (1)
FSM 0% 6.3% (2) 87.5% (28) 6.3% (2) 0% 100% (32)
Fiji 0% 0% 11.1% (13) 88.9% (104) 0% 100% (117)
Palau 0% 0% 0% 100% (3) 0% 100% (3)
PNG 0% 8.1% (19) 45.7% (107) 46.2% (108) 0% 100% (234)
Samoa 0% 28.6% (2) 71.4% (5) 0% 0% 100% (7)
Solomon Islands 0% 1.1% (2) 54.0% (101) 44.9% (84) 0% 100% (187)
Tonga 0% 0% 18.2% (2) 72.7% (8) 9.1% (1) 100% (11)
Vanuatu 0% 0% 27.7% (13) 70.2% (33) 2.1% (1) 100% (47)
Total of potential vulnerability rating
0% 3.9% (25) 42.3% (270) 53.5% (342) 0.3% (2) 100% (639)
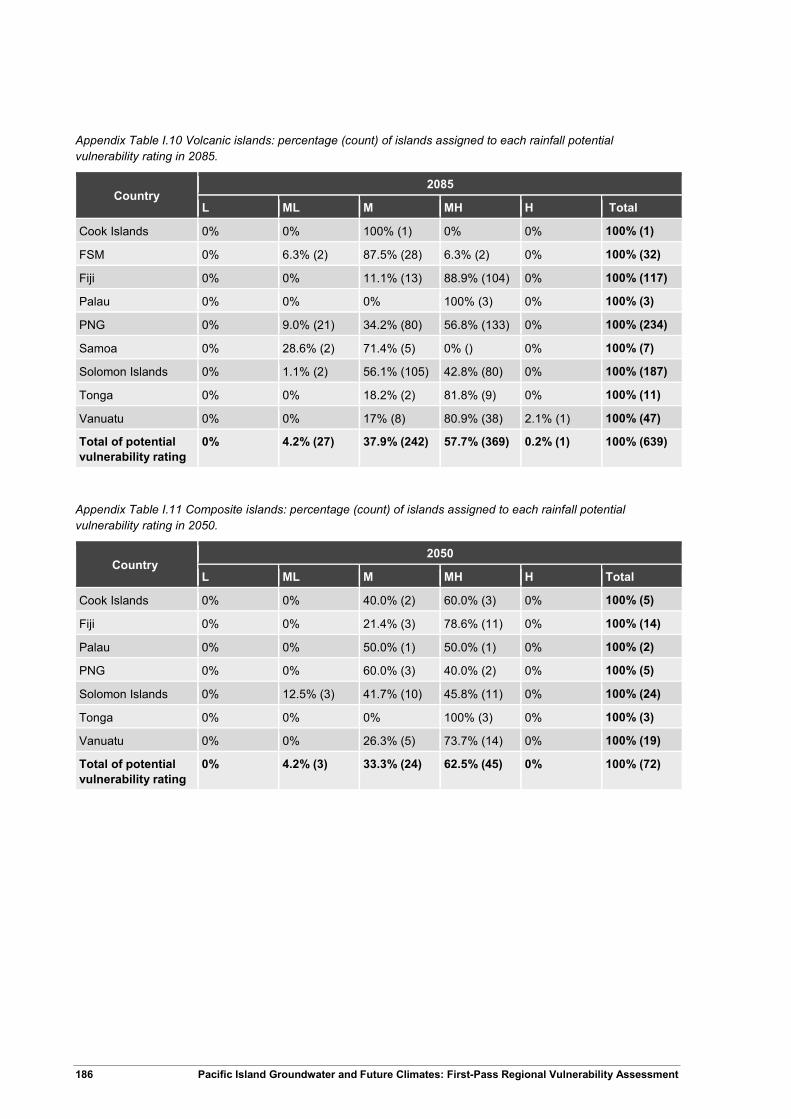
186 Pacific Island Groundwater and Future Climates: First-Pass Regional Vulnerability Assessment
Appendix Table I.10 Volcanic islands: percentage (count) of islands assigned to each rainfall potential vulnerability rating in 2085.
Country 2085
L ML M MH H Total
Cook Islands 0% 0% 100% (1) 0% 0% 100% (1)
FSM 0% 6.3% (2) 87.5% (28) 6.3% (2) 0% 100% (32)
Fiji 0% 0% 11.1% (13) 88.9% (104) 0% 100% (117)
Palau 0% 0% 0% 100% (3) 0% 100% (3)
PNG 0% 9.0% (21) 34.2% (80) 56.8% (133) 0% 100% (234)
Samoa 0% 28.6% (2) 71.4% (5) 0% () 0% 100% (7)
Solomon Islands 0% 1.1% (2) 56.1% (105) 42.8% (80) 0% 100% (187)
Tonga 0% 0% 18.2% (2) 81.8% (9) 0% 100% (11)
Vanuatu 0% 0% 17% (8) 80.9% (38) 2.1% (1) 100% (47)
Total of potential vulnerability rating
0% 4.2% (27) 37.9% (242) 57.7% (369) 0.2% (1) 100% (639)
Appendix Table I.11 Composite islands: percentage (count) of islands assigned to each rainfall potential vulnerability rating in 2050.
Country 2050
L ML M MH H Total
Cook Islands 0% 0% 40.0% (2) 60.0% (3) 0% 100% (5)
Fiji 0% 0% 21.4% (3) 78.6% (11) 0% 100% (14)
Palau 0% 0% 50.0% (1) 50.0% (1) 0% 100% (2)
PNG 0% 0% 60.0% (3) 40.0% (2) 0% 100% (5)
Solomon Islands 0% 12.5% (3) 41.7% (10) 45.8% (11) 0% 100% (24)
Tonga 0% 0% 0% 100% (3) 0% 100% (3)
Vanuatu 0% 0% 26.3% (5) 73.7% (14) 0% 100% (19)
Total of potential vulnerability rating
0% 4.2% (3) 33.3% (24) 62.5% (45) 0% 100% (72)
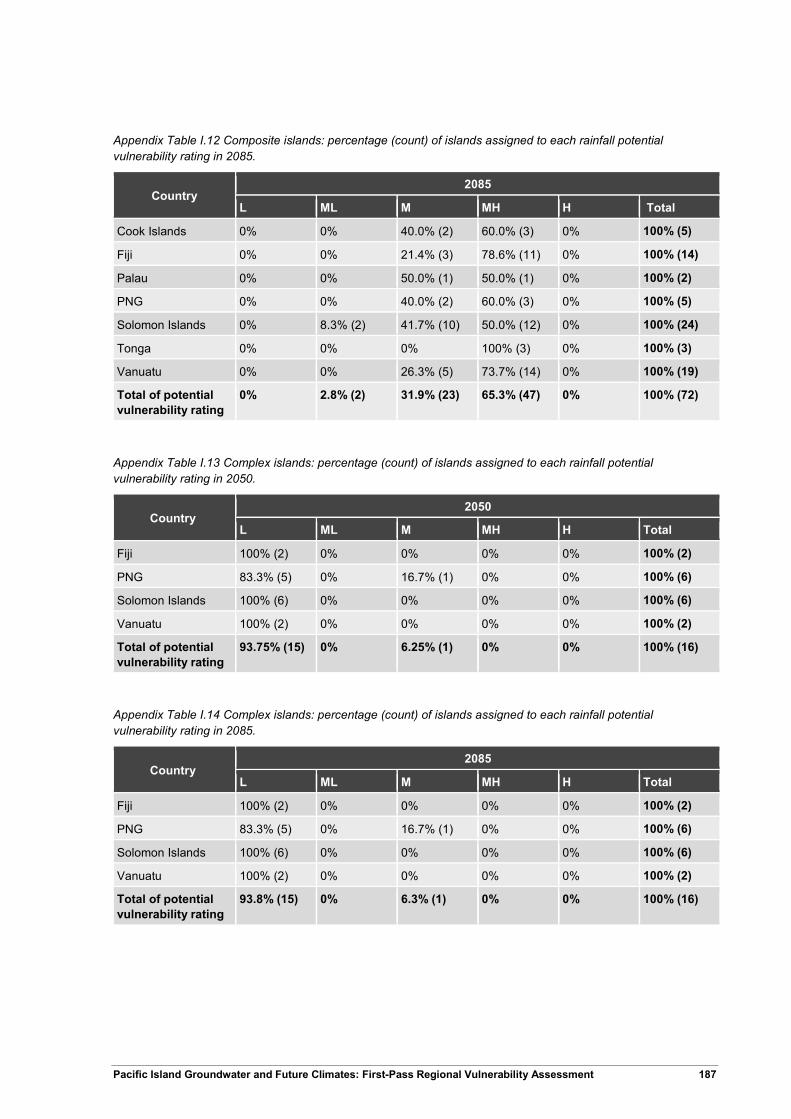
Pacific Island Groundwater and Future Climates: First-Pass Regional Vulnerability Assessment 187
Appendix Table I.12 Composite islands: percentage (count) of islands assigned to each rainfall potential vulnerability rating in 2085.
Country 2085
L ML M MH H Total
Cook Islands 0% 0% 40.0% (2) 60.0% (3) 0% 100% (5)
Fiji 0% 0% 21.4% (3) 78.6% (11) 0% 100% (14)
Palau 0% 0% 50.0% (1) 50.0% (1) 0% 100% (2)
PNG 0% 0% 40.0% (2) 60.0% (3) 0% 100% (5)
Solomon Islands 0% 8.3% (2) 41.7% (10) 50.0% (12) 0% 100% (24)
Tonga 0% 0% 0% 100% (3) 0% 100% (3)
Vanuatu 0% 0% 26.3% (5) 73.7% (14) 0% 100% (19)
Total of potential vulnerability rating
0% 2.8% (2) 31.9% (23) 65.3% (47) 0% 100% (72)
Appendix Table I.13 Complex islands: percentage (count) of islands assigned to each rainfall potential vulnerability rating in 2050.
Country 2050
L ML M MH H Total
Fiji 100% (2) 0% 0% 0% 0% 100% (2)
PNG 83.3% (5) 0% 16.7% (1) 0% 0% 100% (6)
Solomon Islands 100% (6) 0% 0% 0% 0% 100% (6)
Vanuatu 100% (2) 0% 0% 0% 0% 100% (2)
Total of potential vulnerability rating
93.75% (15) 0% 6.25% (1) 0% 0% 100% (16)
Appendix Table I.14 Complex islands: percentage (count) of islands assigned to each rainfall potential vulnerability rating in 2085.
Country 2085
L ML M MH H Total
Fiji 100% (2) 0% 0% 0% 0% 100% (2)
PNG 83.3% (5) 0% 16.7% (1) 0% 0% 100% (6)
Solomon Islands 100% (6) 0% 0% 0% 0% 100% (6)
Vanuatu 100% (2) 0% 0% 0% 0% 100% (2)
Total of potential vulnerability rating
93.8% (15) 0% 6.3% (1) 0% 0% 100% (16)
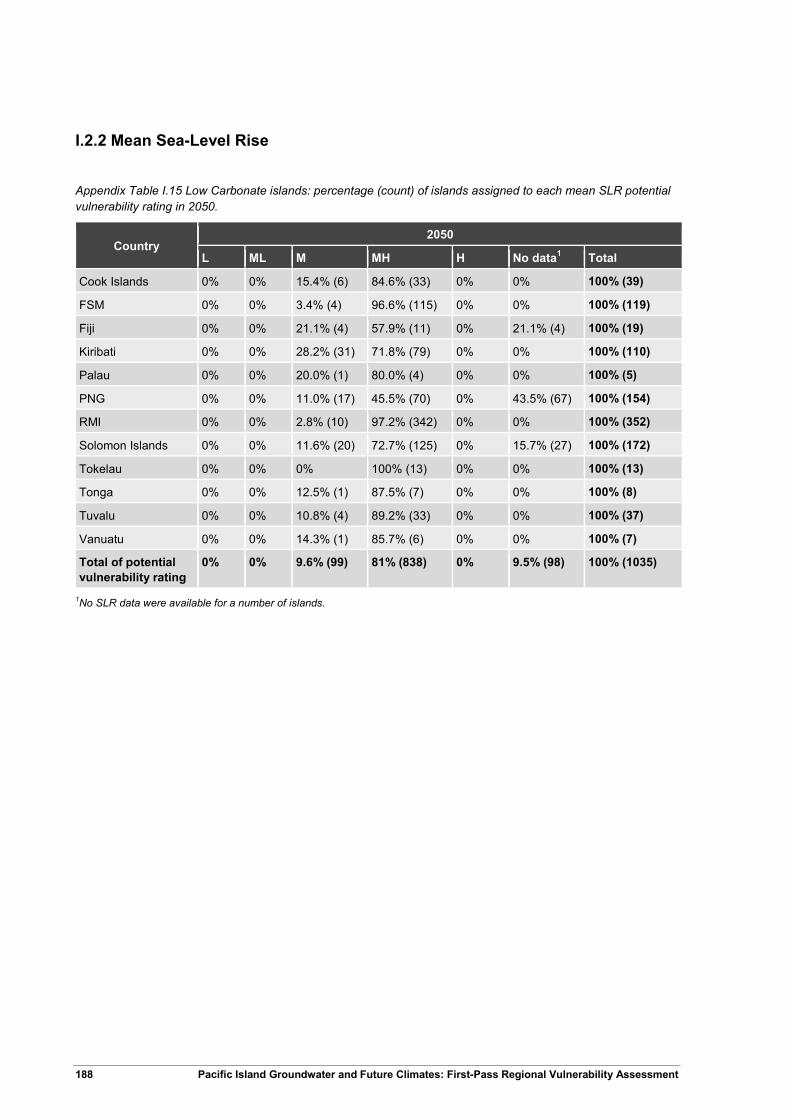
188 Pacific Island Groundwater and Future Climates: First-Pass Regional Vulnerability Assessment
I.2.2 Mean Sea-Level Rise
Appendix Table I.15 Low Carbonate islands: percentage (count) of islands assigned to each mean SLR potential vulnerability rating in 2050.
Country 2050
L ML M MH H No data1 Total
Cook Islands 0% 0% 15.4% (6) 84.6% (33) 0% 0% 100% (39)
FSM 0% 0% 3.4% (4) 96.6% (115) 0% 0% 100% (119)
Fiji 0% 0% 21.1% (4) 57.9% (11) 0% 21.1% (4) 100% (19)
Kiribati 0% 0% 28.2% (31) 71.8% (79) 0% 0% 100% (110)
Palau 0% 0% 20.0% (1) 80.0% (4) 0% 0% 100% (5)
PNG 0% 0% 11.0% (17) 45.5% (70) 0% 43.5% (67) 100% (154)
RMI 0% 0% 2.8% (10) 97.2% (342) 0% 0% 100% (352)
Solomon Islands 0% 0% 11.6% (20) 72.7% (125) 0% 15.7% (27) 100% (172)
Tokelau 0% 0% 0% 100% (13) 0% 0% 100% (13)
Tonga 0% 0% 12.5% (1) 87.5% (7) 0% 0% 100% (8)
Tuvalu 0% 0% 10.8% (4) 89.2% (33) 0% 0% 100% (37)
Vanuatu 0% 0% 14.3% (1) 85.7% (6) 0% 0% 100% (7)
Total of potential vulnerability rating
0% 0% 9.6% (99) 81% (838) 0% 9.5% (98) 100% (1035)
1No SLR data were available for a number of islands.
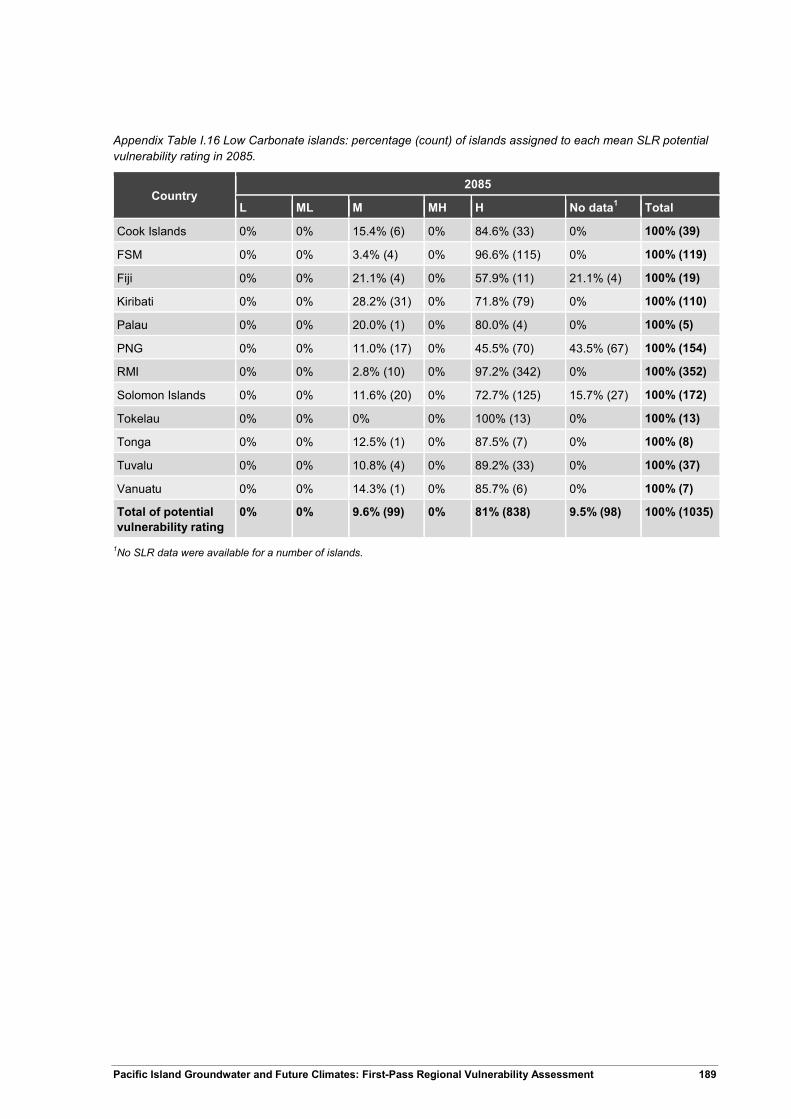
Pacific Island Groundwater and Future Climates: First-Pass Regional Vulnerability Assessment 189
Appendix Table I.16 Low Carbonate islands: percentage (count) of islands assigned to each mean SLR potential vulnerability rating in 2085.
Country 2085
L ML M MH H No data1 Total
Cook Islands 0% 0% 15.4% (6) 0% 84.6% (33) 0% 100% (39)
FSM 0% 0% 3.4% (4) 0% 96.6% (115) 0% 100% (119)
Fiji 0% 0% 21.1% (4) 0% 57.9% (11) 21.1% (4) 100% (19)
Kiribati 0% 0% 28.2% (31) 0% 71.8% (79) 0% 100% (110)
Palau 0% 0% 20.0% (1) 0% 80.0% (4) 0% 100% (5)
PNG 0% 0% 11.0% (17) 0% 45.5% (70) 43.5% (67) 100% (154)
RMI 0% 0% 2.8% (10) 0% 97.2% (342) 0% 100% (352)
Solomon Islands 0% 0% 11.6% (20) 0% 72.7% (125) 15.7% (27) 100% (172)
Tokelau 0% 0% 0% 0% 100% (13) 0% 100% (13)
Tonga 0% 0% 12.5% (1) 0% 87.5% (7) 0% 100% (8)
Tuvalu 0% 0% 10.8% (4) 0% 89.2% (33) 0% 100% (37)
Vanuatu 0% 0% 14.3% (1) 0% 85.7% (6) 0% 100% (7)
Total of potential vulnerability rating
0% 0% 9.6% (99) 0% 81% (838) 9.5% (98) 100% (1035)
1No SLR data were available for a number of islands.

190 Pacific Island Groundwater and Future Climates: First-Pass Regional Vulnerability Assessment
Appendix Table I.17 Limestone islands: percentage (count) of islands assigned to each mean SLR potential vulnerability rating in 2050.
Country 2050
L ML M MH H No data1 Total
Fiji 0% 70.0% (7) 20.0% (2) 0% 0% 10.0% (1) 100% (10)
Kiribati 0% 0% 100% (1) 0% 0% 0% 100% (1)
Nauru 0% 0% 100% (1) 0% 0% 0% 100% (1)
Niue 0% 100% (1) 0% 0% 0% 0% 100% (1)
Palau 0% 0% 100% (3) 0% 0% 0% 100% (3)
PNG 0% 0% 81.3% (13) 0% 0% 18.8% (3) 100% (16)
Solomon Islands 0% 33.3% (2) 50.0% (3) 0% 0% 16.7% (1) 100% (6)
Tonga 0% 28.6% (2) 71.4% (5) 0% 0% 0% 100% (7)
Vanuatu 0% 0% 100% (6) 0% 0% 0% 100% (6)
Total of potential vulnerability rating
0% 23.5% (12) 66.7% (34) 0% 0% 9.8% (5) 100% (51)
1No SLR data were available for a number of islands.
Appendix Table I.18 Limestone islands: percentage (count) of islands assigned to each mean SLR potential vulnerability rating in 2085.
Country 2085
L ML M MH H No data1 Total
Fiji 0% 90.0% (9) 0% 0% 0% 10.0% (1) 100% (10)
Kiribati 0% 0% 100% (1) 0% 0% 0% 100% (1)
Nauru 0% 0% 100% (1) 0% 0% 0% 100% (1)
Niue 0% 100% (1) 0% 0% 0% 0% 100% (1)
Palau 0% 0% 100% (3) 0% 0% 0% 100% (3)
PNG 0% 81.3% (13) 0% 0% 0% 18.8% (3) 100% (16)
Solomon Islands 0% 33.3% (2) 50.0% (3) 0% 0% 16.7% (1) 100% (6)
Tonga 0% 71.4% (5) 28.6% (2) 0% 0% 0% 100% (7)
Vanuatu 0% 0% 100% (6) 0% 0% 0% 100% (6)
Total of potential vulnerability rating
0% 58.8% (30) 31.4% (16) 0% 0% 9.8% (5) 100% (51)
1No SLR data were available for a number of islands.
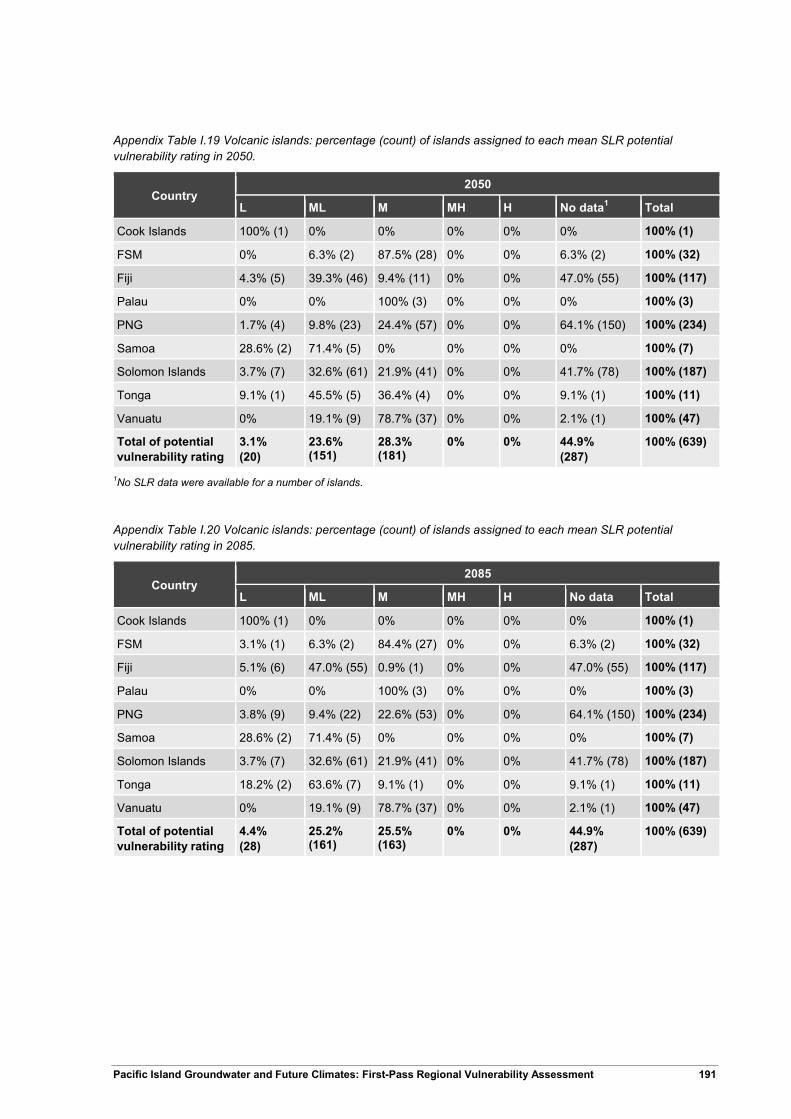
Pacific Island Groundwater and Future Climates: First-Pass Regional Vulnerability Assessment 191
Appendix Table I.19 Volcanic islands: percentage (count) of islands assigned to each mean SLR potential vulnerability rating in 2050.
Country 2050
L ML M MH H No data1 Total
Cook Islands 100% (1) 0% 0% 0% 0% 0% 100% (1)
FSM 0% 6.3% (2) 87.5% (28) 0% 0% 6.3% (2) 100% (32)
Fiji 4.3% (5) 39.3% (46) 9.4% (11) 0% 0% 47.0% (55) 100% (117)
Palau 0% 0% 100% (3) 0% 0% 0% 100% (3)
PNG 1.7% (4) 9.8% (23) 24.4% (57) 0% 0% 64.1% (150) 100% (234)
Samoa 28.6% (2) 71.4% (5) 0% 0% 0% 0% 100% (7)
Solomon Islands 3.7% (7) 32.6% (61) 21.9% (41) 0% 0% 41.7% (78) 100% (187)
Tonga 9.1% (1) 45.5% (5) 36.4% (4) 0% 0% 9.1% (1) 100% (11)
Vanuatu 0% 19.1% (9) 78.7% (37) 0% 0% 2.1% (1) 100% (47)
Total of potential vulnerability rating
3.1% (20)
23.6% (151)
28.3% (181)
0% 0% 44.9% (287)
100% (639)
1No SLR data were available for a number of islands.
Appendix Table I.20 Volcanic islands: percentage (count) of islands assigned to each mean SLR potential vulnerability rating in 2085.
Country 2085
L ML M MH H No data Total
Cook Islands 100% (1) 0% 0% 0% 0% 0% 100% (1)
FSM 3.1% (1) 6.3% (2) 84.4% (27) 0% 0% 6.3% (2) 100% (32)
Fiji 5.1% (6) 47.0% (55) 0.9% (1) 0% 0% 47.0% (55) 100% (117)
Palau 0% 0% 100% (3) 0% 0% 0% 100% (3)
PNG 3.8% (9) 9.4% (22) 22.6% (53) 0% 0% 64.1% (150) 100% (234)
Samoa 28.6% (2) 71.4% (5) 0% 0% 0% 0% 100% (7)
Solomon Islands 3.7% (7) 32.6% (61) 21.9% (41) 0% 0% 41.7% (78) 100% (187)
Tonga 18.2% (2) 63.6% (7) 9.1% (1) 0% 0% 9.1% (1) 100% (11)
Vanuatu 0% 19.1% (9) 78.7% (37) 0% 0% 2.1% (1) 100% (47)
Total of potential vulnerability rating
4.4% (28)
25.2% (161)
25.5% (163)
0% 0% 44.9% (287)
100% (639)
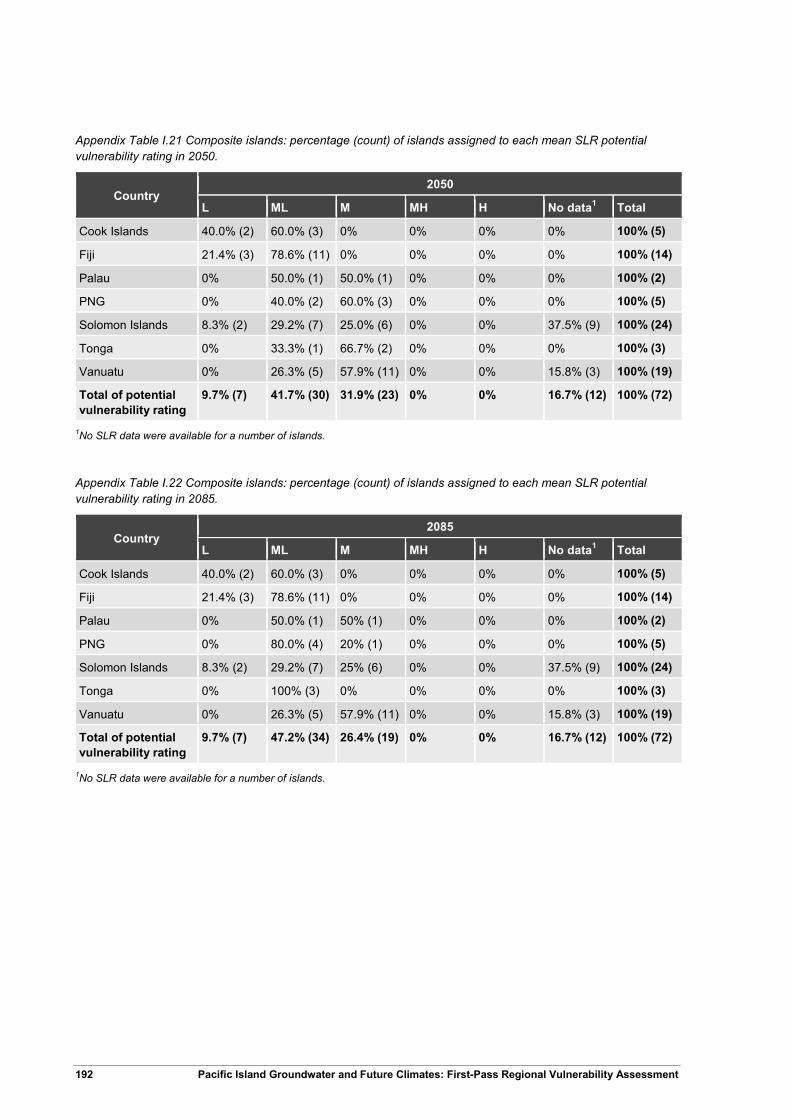
192 Pacific Island Groundwater and Future Climates: First-Pass Regional Vulnerability Assessment
Appendix Table I.21 Composite islands: percentage (count) of islands assigned to each mean SLR potential vulnerability rating in 2050.
Country 2050
L ML M MH H No data1 Total
Cook Islands 40.0% (2) 60.0% (3) 0% 0% 0% 0% 100% (5)
Fiji 21.4% (3) 78.6% (11) 0% 0% 0% 0% 100% (14)
Palau 0% 50.0% (1) 50.0% (1) 0% 0% 0% 100% (2)
PNG 0% 40.0% (2) 60.0% (3) 0% 0% 0% 100% (5)
Solomon Islands 8.3% (2) 29.2% (7) 25.0% (6) 0% 0% 37.5% (9) 100% (24)
Tonga 0% 33.3% (1) 66.7% (2) 0% 0% 0% 100% (3)
Vanuatu 0% 26.3% (5) 57.9% (11) 0% 0% 15.8% (3) 100% (19)
Total of potential vulnerability rating
9.7% (7) 41.7% (30) 31.9% (23) 0% 0% 16.7% (12) 100% (72)
1No SLR data were available for a number of islands.
Appendix Table I.22 Composite islands: percentage (count) of islands assigned to each mean SLR potential vulnerability rating in 2085.
Country 2085
L ML M MH H No data1 Total
Cook Islands 40.0% (2) 60.0% (3) 0% 0% 0% 0% 100% (5)
Fiji 21.4% (3) 78.6% (11) 0% 0% 0% 0% 100% (14)
Palau 0% 50.0% (1) 50% (1) 0% 0% 0% 100% (2)
PNG 0% 80.0% (4) 20% (1) 0% 0% 0% 100% (5)
Solomon Islands 8.3% (2) 29.2% (7) 25% (6) 0% 0% 37.5% (9) 100% (24)
Tonga 0% 100% (3) 0% 0% 0% 0% 100% (3)
Vanuatu 0% 26.3% (5) 57.9% (11) 0% 0% 15.8% (3) 100% (19)
Total of potential vulnerability rating
9.7% (7) 47.2% (34) 26.4% (19) 0% 0% 16.7% (12) 100% (72)
1No SLR data were available for a number of islands.
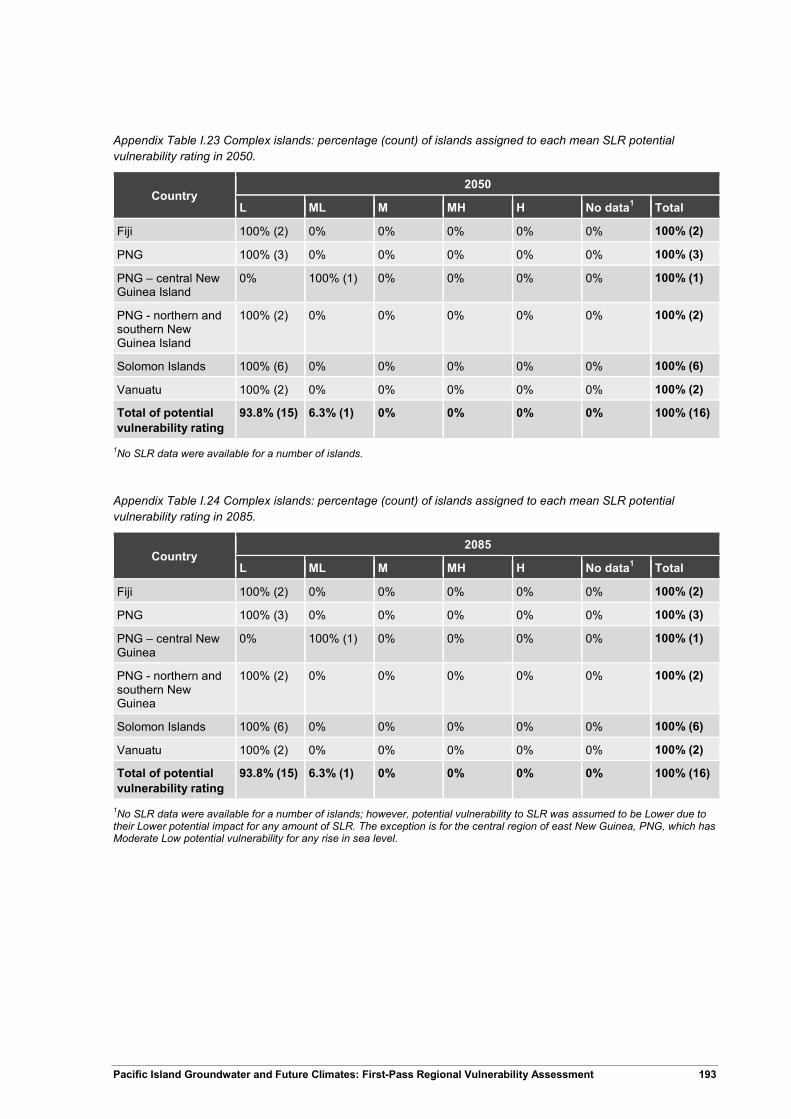
Pacific Island Groundwater and Future Climates: First-Pass Regional Vulnerability Assessment 193
Appendix Table I.23 Complex islands: percentage (count) of islands assigned to each mean SLR potential vulnerability rating in 2050.
Country 2050
L ML M MH H No data1 Total
Fiji 100% (2) 0% 0% 0% 0% 0% 100% (2)
PNG 100% (3) 0% 0% 0% 0% 0% 100% (3)
PNG – central New Guinea Island
0% 100% (1) 0% 0% 0% 0% 100% (1)
PNG - northern and southern New Guinea Island
100% (2) 0% 0% 0% 0% 0% 100% (2)
Solomon Islands 100% (6) 0% 0% 0% 0% 0% 100% (6)
Vanuatu 100% (2) 0% 0% 0% 0% 0% 100% (2)
Total of potential vulnerability rating
93.8% (15) 6.3% (1) 0% 0% 0% 0% 100% (16)
1No SLR data were available for a number of islands.
Appendix Table I.24 Complex islands: percentage (count) of islands assigned to each mean SLR potential vulnerability rating in 2085.
Country 2085
L ML M MH H No data1 Total
Fiji 100% (2) 0% 0% 0% 0% 0% 100% (2)
PNG 100% (3) 0% 0% 0% 0% 0% 100% (3)
PNG – central New Guinea
0% 100% (1) 0% 0% 0% 0% 100% (1)
PNG - northern and southern New Guinea
100% (2) 0% 0% 0% 0% 0% 100% (2)
Solomon Islands 100% (6) 0% 0% 0% 0% 0% 100% (6)
Vanuatu 100% (2) 0% 0% 0% 0% 0% 100% (2)
Total of potential vulnerability rating
93.8% (15) 6.3% (1) 0% 0% 0% 0% 100% (16)
1No SLR data were available for a number of islands; however, potential vulnerability to SLR was assumed to be Lower due to their Lower potential impact for any amount of SLR. The exception is for the central region of east New Guinea, PNG, which has Moderate Low potential vulnerability for any rise in sea level.
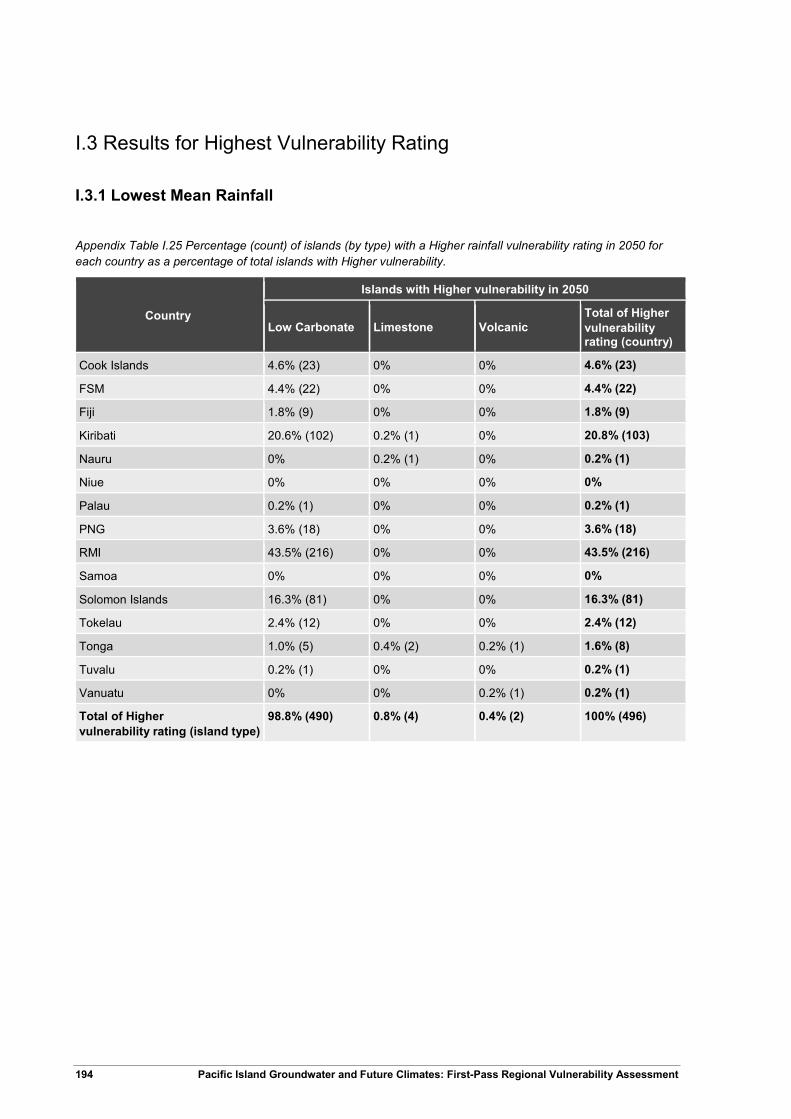
194 Pacific Island Groundwater and Future Climates: First-Pass Regional Vulnerability Assessment
I.3 Results for Highest Vulnerability Rating
I.3.1 Lowest Mean Rainfall
Appendix Table I.25 Percentage (count) of islands (by type) with a Higher rainfall vulnerability rating in 2050 for each country as a percentage of total islands with Higher vulnerability.
Country
Islands with Higher vulnerability in 2050
Low Carbonate Limestone Volcanic Total of Higher vulnerability rating (country)
Cook Islands 4.6% (23) 0% 0% 4.6% (23)
FSM 4.4% (22) 0% 0% 4.4% (22)
Fiji 1.8% (9) 0% 0% 1.8% (9)
Kiribati 20.6% (102) 0.2% (1) 0% 20.8% (103)
Nauru 0% 0.2% (1) 0% 0.2% (1)
Niue 0% 0% 0% 0%
Palau 0.2% (1) 0% 0% 0.2% (1)
PNG 3.6% (18) 0% 0% 3.6% (18)
RMI 43.5% (216) 0% 0% 43.5% (216)
Samoa 0% 0% 0% 0%
Solomon Islands 16.3% (81) 0% 0% 16.3% (81)
Tokelau 2.4% (12) 0% 0% 2.4% (12)
Tonga 1.0% (5) 0.4% (2) 0.2% (1) 1.6% (8)
Tuvalu 0.2% (1) 0% 0% 0.2% (1)
Vanuatu 0% 0% 0.2% (1) 0.2% (1)
Total of Higher vulnerability rating (island type)
98.8% (490) 0.8% (4) 0.4% (2) 100% (496)
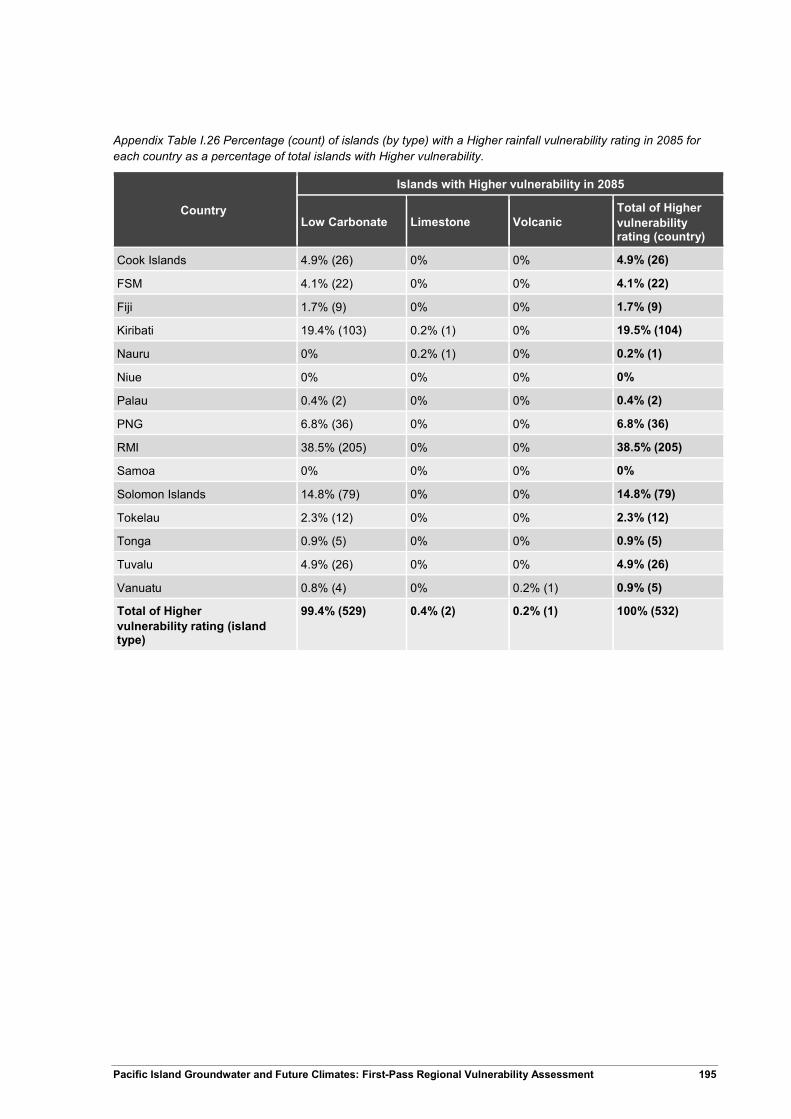
Pacific Island Groundwater and Future Climates: First-Pass Regional Vulnerability Assessment 195
Appendix Table I.26 Percentage (count) of islands (by type) with a Higher rainfall vulnerability rating in 2085 for each country as a percentage of total islands with Higher vulnerability.
Country
Islands with Higher vulnerability in 2085
Low Carbonate Limestone Volcanic Total of Higher vulnerability rating (country)
Cook Islands 4.9% (26) 0% 0% 4.9% (26)
FSM 4.1% (22) 0% 0% 4.1% (22)
Fiji 1.7% (9) 0% 0% 1.7% (9)
Kiribati 19.4% (103) 0.2% (1) 0% 19.5% (104)
Nauru 0% 0.2% (1) 0% 0.2% (1)
Niue 0% 0% 0% 0%
Palau 0.4% (2) 0% 0% 0.4% (2)
PNG 6.8% (36) 0% 0% 6.8% (36)
RMI 38.5% (205) 0% 0% 38.5% (205)
Samoa 0% 0% 0% 0%
Solomon Islands 14.8% (79) 0% 0% 14.8% (79)
Tokelau 2.3% (12) 0% 0% 2.3% (12)
Tonga 0.9% (5) 0% 0% 0.9% (5)
Tuvalu 4.9% (26) 0% 0% 4.9% (26)
Vanuatu 0.8% (4) 0% 0.2% (1) 0.9% (5)
Total of Higher vulnerability rating (island type)
99.4% (529) 0.4% (2) 0.2% (1) 100% (532)
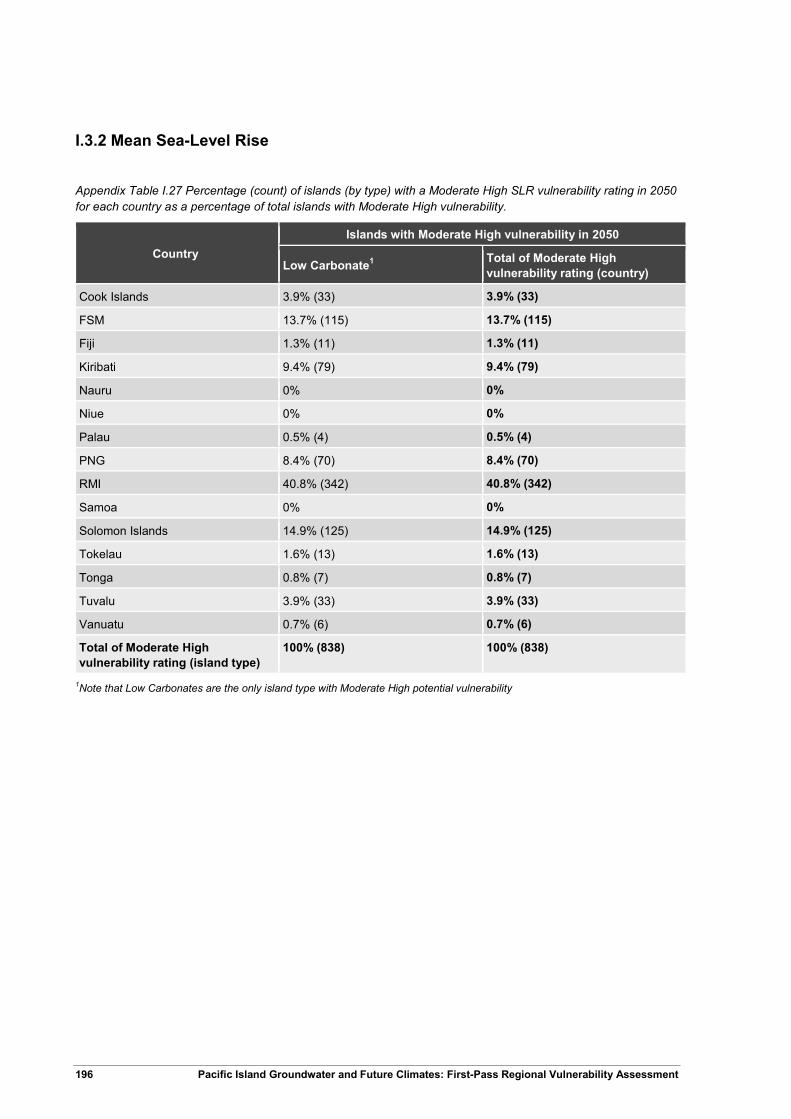
196 Pacific Island Groundwater and Future Climates: First-Pass Regional Vulnerability Assessment
I.3.2 Mean Sea-Level Rise
Appendix Table I.27 Percentage (count) of islands (by type) with a Moderate High SLR vulnerability rating in 2050 for each country as a percentage of total islands with Moderate High vulnerability.
Country Islands with Moderate High vulnerability in 2050
Low Carbonate1 Total of Moderate High vulnerability rating (country)
Cook Islands 3.9% (33) 3.9% (33)
FSM 13.7% (115) 13.7% (115)
Fiji 1.3% (11) 1.3% (11)
Kiribati 9.4% (79) 9.4% (79)
Nauru 0% 0%
Niue 0% 0%
Palau 0.5% (4) 0.5% (4)
PNG 8.4% (70) 8.4% (70)
RMI 40.8% (342) 40.8% (342)
Samoa 0% 0%
Solomon Islands 14.9% (125) 14.9% (125)
Tokelau 1.6% (13) 1.6% (13)
Tonga 0.8% (7) 0.8% (7)
Tuvalu 3.9% (33) 3.9% (33)
Vanuatu 0.7% (6) 0.7% (6)
Total of Moderate High vulnerability rating (island type)
100% (838) 100% (838)
1Note that Low Carbonates are the only island type with Moderate High potential vulnerability
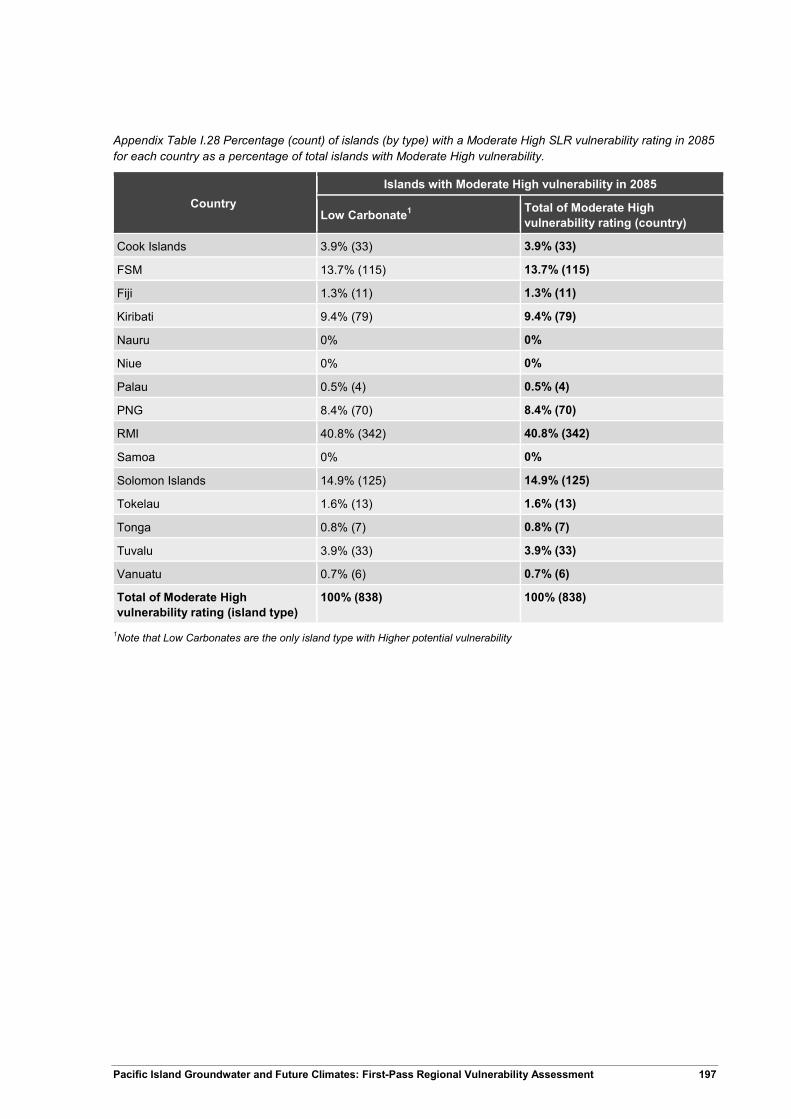
Pacific Island Groundwater and Future Climates: First-Pass Regional Vulnerability Assessment 197
Appendix Table I.28 Percentage (count) of islands (by type) with a Moderate High SLR vulnerability rating in 2085 for each country as a percentage of total islands with Moderate High vulnerability.
Country Islands with Moderate High vulnerability in 2085
Low Carbonate1 Total of Moderate High vulnerability rating (country)
Cook Islands 3.9% (33) 3.9% (33)
FSM 13.7% (115) 13.7% (115)
Fiji 1.3% (11) 1.3% (11)
Kiribati 9.4% (79) 9.4% (79)
Nauru 0% 0%
Niue 0% 0%
Palau 0.5% (4) 0.5% (4)
PNG 8.4% (70) 8.4% (70)
RMI 40.8% (342) 40.8% (342)
Samoa 0% 0%
Solomon Islands 14.9% (125) 14.9% (125)
Tokelau 1.6% (13) 1.6% (13)
Tonga 0.8% (7) 0.8% (7)
Tuvalu 3.9% (33) 3.9% (33)
Vanuatu 0.7% (6) 0.7% (6)
Total of Moderate High vulnerability rating (island type)
100% (838) 100% (838)
1Note that Low Carbonates are the only island type with Higher potential vulnerability
198 Pacific Island Groundwater and Future Climates: First-Pass Regional Vulnerability Assessment
I.4 Results by Island Type and Vulnerability Rating The following tables show the contribution of framework components to the vulnerability result and the number of islands that receive each vulnerability rating.
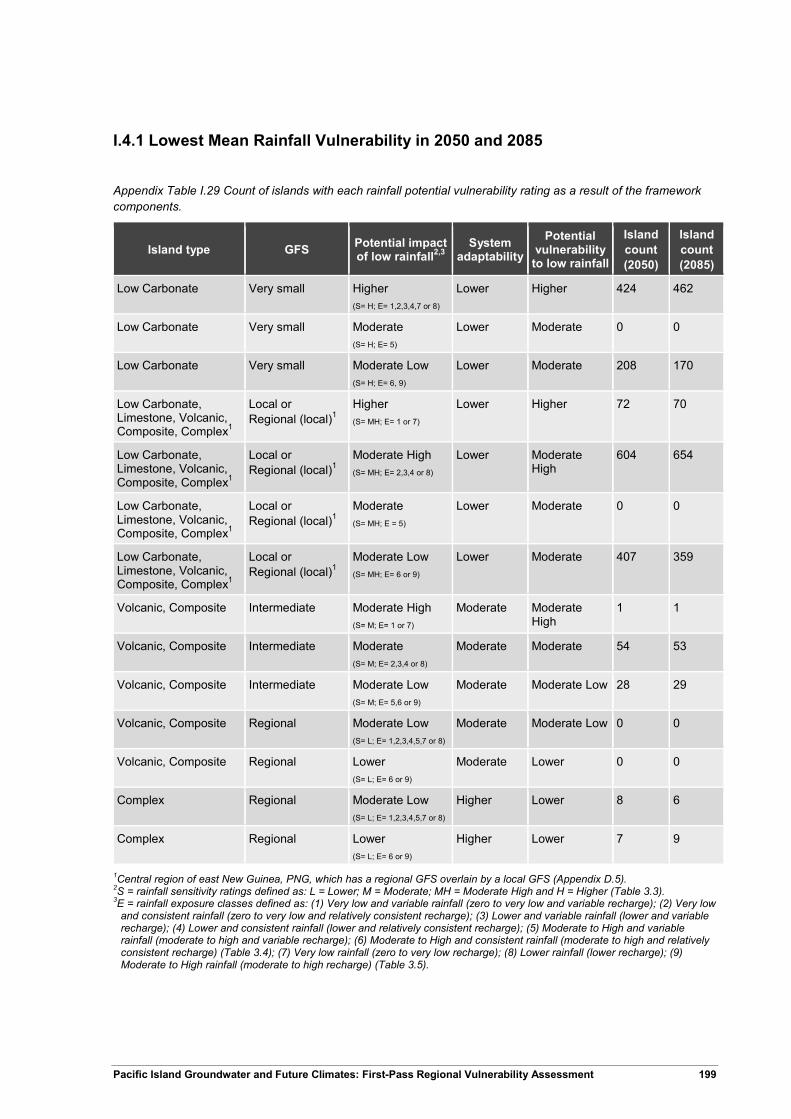
Pacific Island Groundwater and Future Climates: First-Pass Regional Vulnerability Assessment 199
I.4.1 Lowest Mean Rainfall Vulnerability in 2050 and 2085
Appendix Table I.29 Count of islands with each rainfall potential vulnerability rating as a result of the framework components.
Island type GFS Potential impact of low rainfall2,3
System adaptability
Potential vulnerability
to low rainfall
Island count (2050)
Island count (2085)
Low Carbonate Very small Higher (S= H; E= 1,2,3,4,7 or 8)
Lower Higher 424 462
Low Carbonate Very small Moderate (S= H; E= 5)
Lower Moderate 0 0
Low Carbonate Very small Moderate Low (S= H; E= 6, 9)
Lower Moderate 208 170
Low Carbonate, Limestone, Volcanic, Composite, Complex1
Local or Regional (local)1
Higher (S= MH; E= 1 or 7)
Lower Higher 72 70
Low Carbonate, Limestone, Volcanic, Composite, Complex1
Local or Regional (local)1
Moderate High (S= MH; E= 2,3,4 or 8)
Lower Moderate High
604 654
Low Carbonate, Limestone, Volcanic, Composite, Complex1
Local or Regional (local)1
Moderate (S= MH; E = 5)
Lower Moderate 0 0
Low Carbonate, Limestone, Volcanic, Composite, Complex1
Local or Regional (local)1
Moderate Low (S= MH; E= 6 or 9)
Lower Moderate 407 359
Volcanic, Composite Intermediate Moderate High (S= M; E= 1 or 7)
Moderate Moderate High
1 1
Volcanic, Composite Intermediate Moderate (S= M; E= 2,3,4 or 8)
Moderate Moderate 54 53
Volcanic, Composite Intermediate Moderate Low (S= M; E= 5,6 or 9)
Moderate Moderate Low 28 29
Volcanic, Composite Regional Moderate Low (S= L; E= 1,2,3,4,5,7 or 8)
Moderate Moderate Low 0 0
Volcanic, Composite Regional Lower (S= L; E= 6 or 9)
Moderate Lower 0 0
Complex Regional Moderate Low (S= L; E= 1,2,3,4,5,7 or 8)
Higher Lower 8 6
Complex Regional Lower (S= L; E= 6 or 9)
Higher Lower 7 9
1Central region of east New Guinea, PNG, which has a regional GFS overlain by a local GFS (Appendix D.5). 2S = rainfall sensitivity ratings defined as: L = Lower; M = Moderate; MH = Moderate High and H = Higher (Table 3.3). 3E = rainfall exposure classes defined as: (1) Very low and variable rainfall (zero to very low and variable recharge); (2) Very low
and consistent rainfall (zero to very low and relatively consistent recharge); (3) Lower and variable rainfall (lower and variable recharge); (4) Lower and consistent rainfall (lower and relatively consistent recharge); (5) Moderate to High and variable rainfall (moderate to high and variable recharge); (6) Moderate to High and consistent rainfall (moderate to high and relatively consistent recharge) (Table 3.4); (7) Very low rainfall (zero to very low recharge); (8) Lower rainfall (lower recharge); (9) Moderate to High rainfall (moderate to high recharge) (Table 3.5).
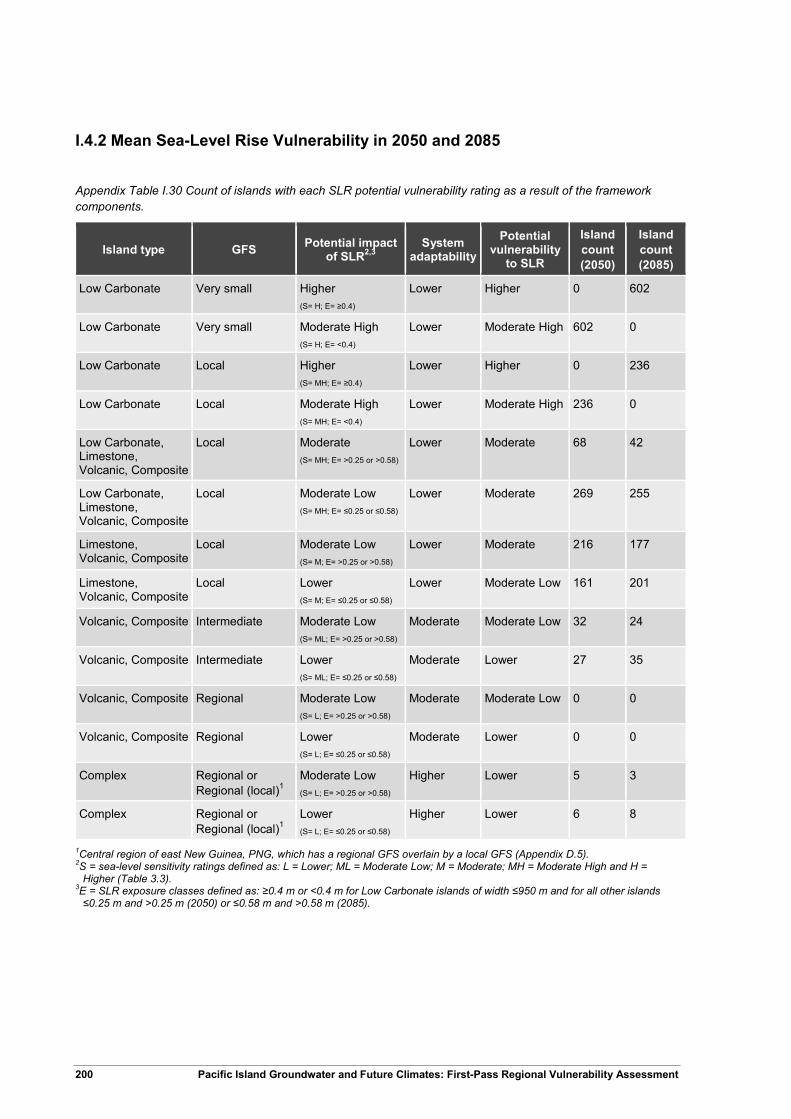
200 Pacific Island Groundwater and Future Climates: First-Pass Regional Vulnerability Assessment
I.4.2 Mean Sea-Level Rise Vulnerability in 2050 and 2085
Appendix Table I.30 Count of islands with each SLR potential vulnerability rating as a result of the framework components.
Island type GFS Potential impact of SLR2,3
System adaptability
Potential vulnerability
to SLR
Island count (2050)
Island count (2085)
Low Carbonate Very small Higher (S= H; E= ≥0.4)
Lower Higher 0 602
Low Carbonate Very small Moderate High (S= H; E= <0.4)
Lower Moderate High 602 0
Low Carbonate Local Higher (S= MH; E= ≥0.4)
Lower Higher 0 236
Low Carbonate Local Moderate High (S= MH; E= <0.4)
Lower Moderate High 236 0
Low Carbonate, Limestone, Volcanic, Composite
Local Moderate (S= MH; E= >0.25 or >0.58)
Lower Moderate 68 42
Low Carbonate, Limestone, Volcanic, Composite
Local Moderate Low (S= MH; E= ≤0.25 or ≤0.58)
Lower Moderate 269 255
Limestone, Volcanic, Composite
Local Moderate Low (S= M; E= >0.25 or >0.58)
Lower Moderate 216 177
Limestone, Volcanic, Composite
Local Lower (S= M; E= ≤0.25 or ≤0.58)
Lower Moderate Low 161 201
Volcanic, Composite Intermediate Moderate Low (S= ML; E= >0.25 or >0.58)
Moderate Moderate Low 32 24
Volcanic, Composite Intermediate Lower (S= ML; E= ≤0.25 or ≤0.58)
Moderate Lower 27 35
Volcanic, Composite Regional Moderate Low (S= L; E= >0.25 or >0.58)
Moderate Moderate Low 0 0
Volcanic, Composite Regional Lower (S= L; E= ≤0.25 or ≤0.58)
Moderate Lower 0 0
Complex Regional or Regional (local)1
Moderate Low (S= L; E= >0.25 or >0.58)
Higher Lower 5 3
Complex Regional or Regional (local)1
Lower (S= L; E= ≤0.25 or ≤0.58)
Higher Lower 6 8
1Central region of east New Guinea, PNG, which has a regional GFS overlain by a local GFS (Appendix D.5). 2S = sea-level sensitivity ratings defined as: L = Lower; ML = Moderate Low; M = Moderate; MH = Moderate High and H =
Higher (Table 3.3). 3E = SLR exposure classes defined as: ≥0.4 m or <0.4 m for Low Carbonate islands of width ≤950 m and for all other islands
≤0.25 m and >0.25 m (2050) or ≤0.58 m and >0.58 m (2085).
Related Documents