PTC® Creo® Mold Analysis Report Tuesday, December 02, 2014 CPS – CAD Professional systems

P2
Dec 03, 2015
second PTC presentation
Welcome message from author
This document is posted to help you gain knowledge. Please leave a comment to let me know what you think about it! Share it to your friends and learn new things together.
Transcript

PTC® Creo® Mold Analysis Report
Tuesday, December 02, 2014
CPS – CAD Professional systems

22
Table of Contents
• General Information
• Analysis Summary
• Result Advisor
• Analysis Conclusions and Recommendations

3
General Information
4
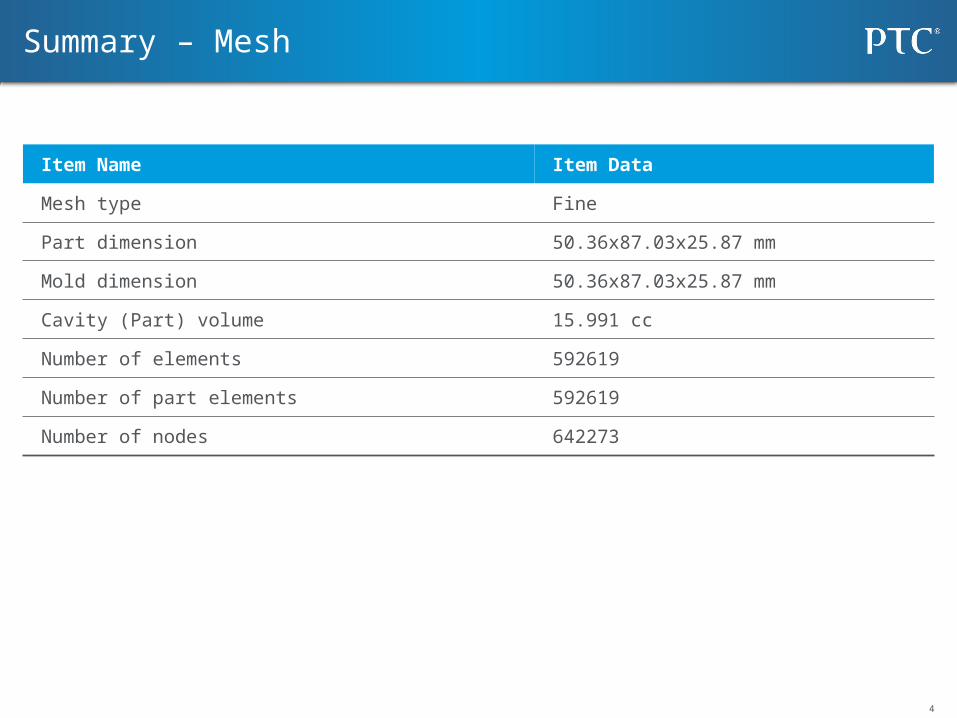
Item Name Item Data
Mesh type Fine
Part dimension 50.36x87.03x25.87 mm
Mold dimension 50.36x87.03x25.87 mm
Cavity (Part) volume 15.991 cc
Number of elements 592619
Number of part elements 592619
Number of nodes 642273
Summary – Mesh
5
Item Name Item Data
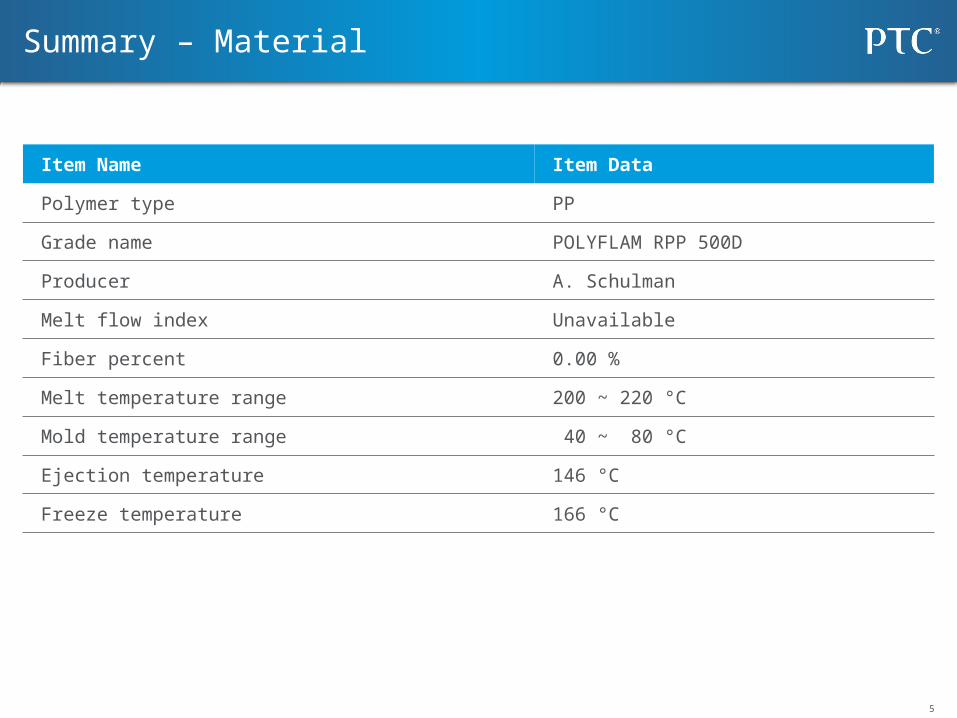
Polymer type PP
Grade name POLYFLAM RPP 500D
Producer A. Schulman
Melt flow index Unavailable
Fiber percent 0.00 %
Melt temperature range 200 ~ 220 °C
Mold temperature range 40 ~ 80 °C
Ejection temperature 146 °C
Freeze temperature 166 °C
Summary – Material

6
Item Name Item Data
Filling time 3.000 sec
Melt temperature 210.000 °C
Mold temperature 60.000 °C
Maximum injection pressure 140.000 MPa
Packing time 8.620 sec
Maximum packing pressure 140.000 MPa
VP switch by filled volume (%) 98.000 %
Summary – Process

7
Analysis Summary

8
Melt front advancement is a position indicator as melt front boundary movement in different time duration in the filling process. From the melt front advancement one can:• Examine imbalances in the filling pattern of the molding. • Check for incomplete filling of cavity or short shot problem.• Identify the weld line locations.• Identify the air trap locations.• Check the flow contribution of each gate for a balanced runner.• Check if the gate location is correct to balance the flow and eliminate
weld line.
Melt Front Time

9
The Yellow or Red regions show the areas where the melt filled with difficulty, which could result in quality related problems.
Moldability

10
Air Trap result shows the possible locations where air trap can occur.
Air Trap
11
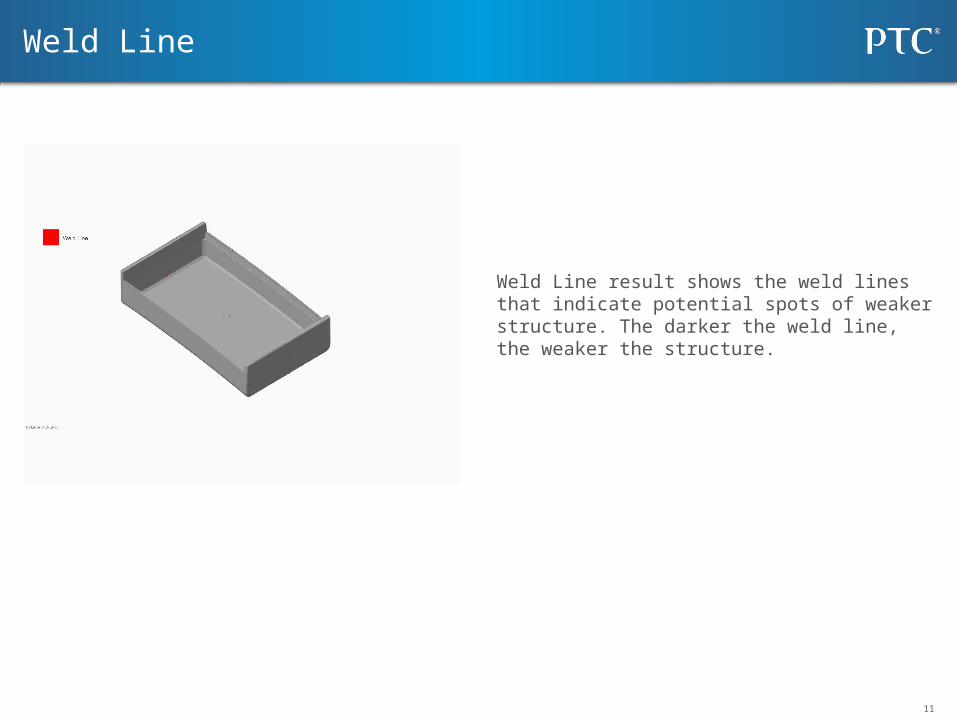
Weld Line result shows the weld lines that indicate potential spots of weaker structure. The darker the weld line, the weaker the structure.
Weld Line

12
Sink Mark is an index to evaluate the packing effect. • Positive value—shows insufficient packing. This may cause depression
or sink marks on the surface of the molded part.• Negative value—shows over packing• Value close to zero—shows correct packing
Sink Mark Indicator

13
Pressure result shows the pressure distribution of the plastic at the end of filling. Use the pressure result to analyze the following:• Check the pressure transmission conditions.• Check for drop in pressure in the runner system.• Check the mold design for a balanced flow.• Check for overpacking and flashing of the melt.• Examine the extent of packing or holding.
Pressure
14
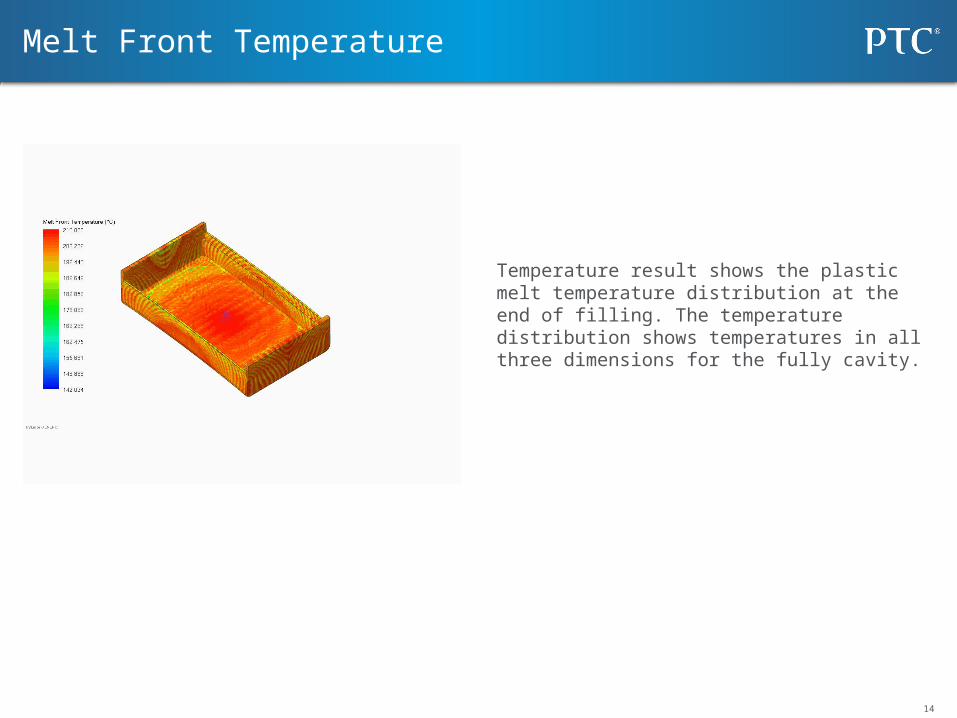
Temperature result shows the plastic melt temperature distribution at the end of filling. The temperature distribution shows temperatures in all three dimensions for the fully cavity.
Melt Front Temperature
15
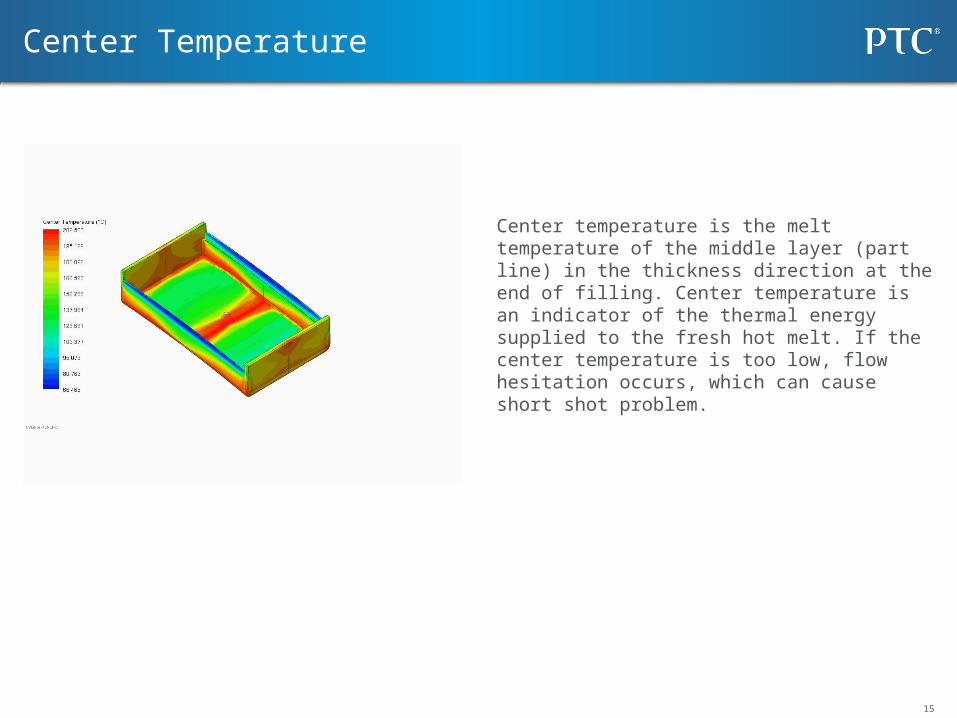
Center temperature is the melt temperature of the middle layer (part line) in the thickness direction at the end of filling. Center temperature is an indicator of the thermal energy supplied to the fresh hot melt. If the center temperature is too low, flow hesitation occurs, which can cause short shot problem.
Center Temperature
16
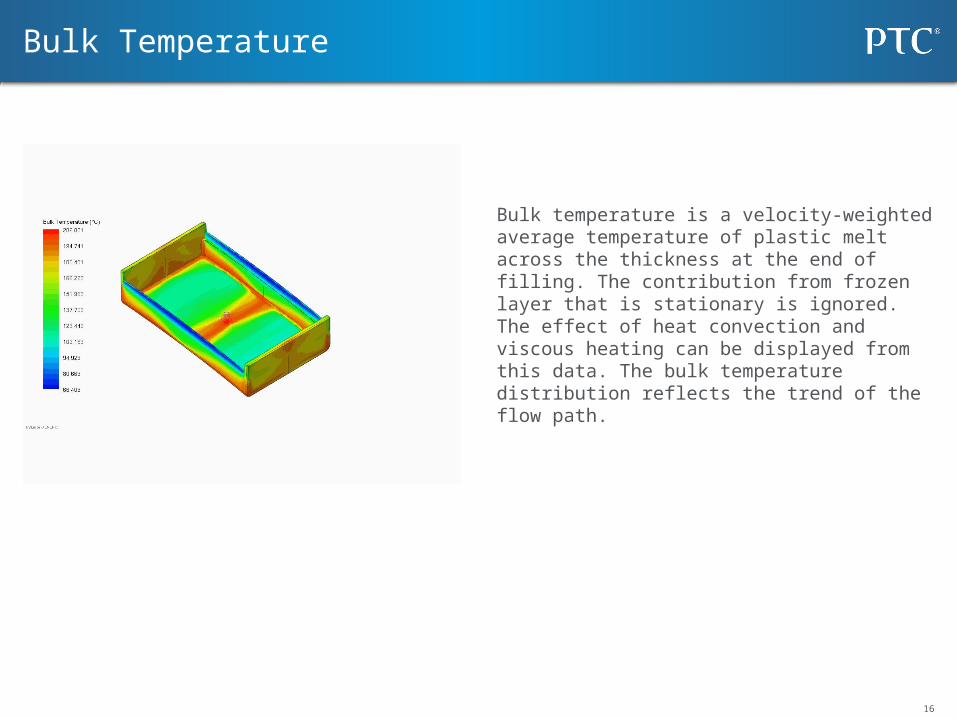
Bulk temperature is a velocity-weighted average temperature of plastic melt across the thickness at the end of filling. The contribution from frozen layer that is stationary is ignored. The effect of heat convection and viscous heating can be displayed from this data. The bulk temperature distribution reflects the trend of the flow path.
Bulk Temperature

17
Maximum shear rate result shows the peak value of shear rate at each element during the filling stage.
Max. Shear Rate

18
Maximum shear stress result shows the peak value of shear stress at each element during the filling stage.
Max. Shear Stress

19
A frozen layer is formed near the cavity surface because of solidification, which is caused by cooling. The frozen ratio gradually increases with time. An increase in frozen layer ratio reduces the cross-section along the flow path and thus increases the flow resistance and sprue pressure. The frozen layer ratio also affects the residual stress and the flow-induced orientation.
Frozen Layer Ratio
20
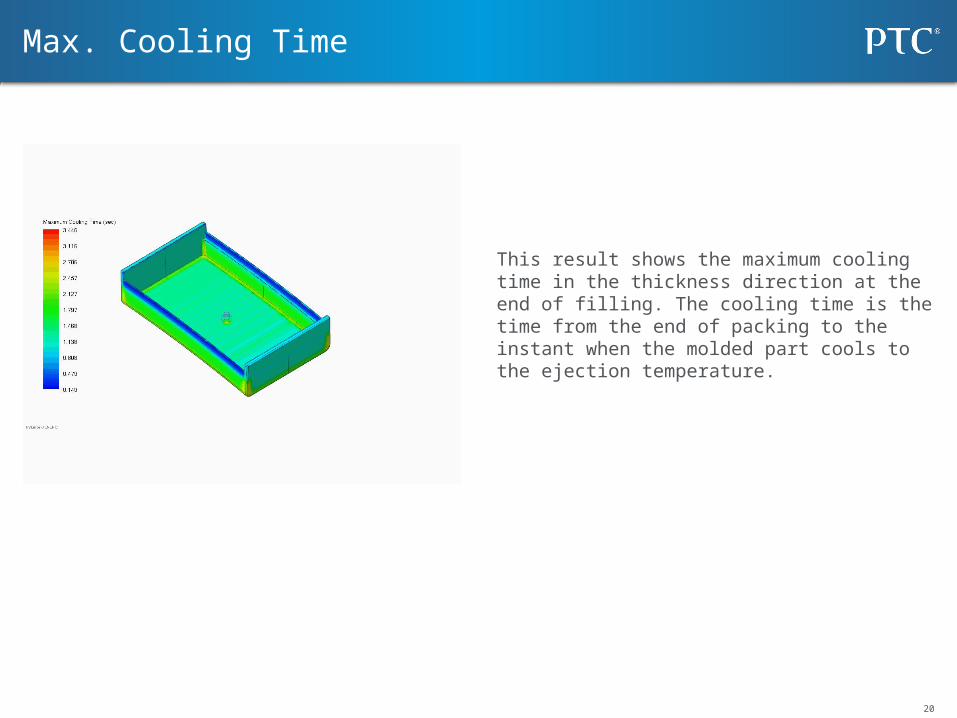
This result shows the maximum cooling time in the thickness direction at the end of filling. The cooling time is the time from the end of packing to the instant when the molded part cools to the ejection temperature.
Max. Cooling Time

21
Velocity vector is the vector plot of the velocity vector at the end of filling.
Velocity Vector

22
This result shows the maximum volume shrinkage across the part thickness at the end of filling.A high positive value represents high volume shrinkage, which may cause sink mark or void.
Volumetric Shrinkage

23
This result shows the contribution of each gate. The region in the same color represents that it was filled by the plastic from the same gate. The percentage of each color indicates its percentage of volume compared with the cavity. This result help determine whether the model was filled by balanced flow pattern.
Gate Contribution
24
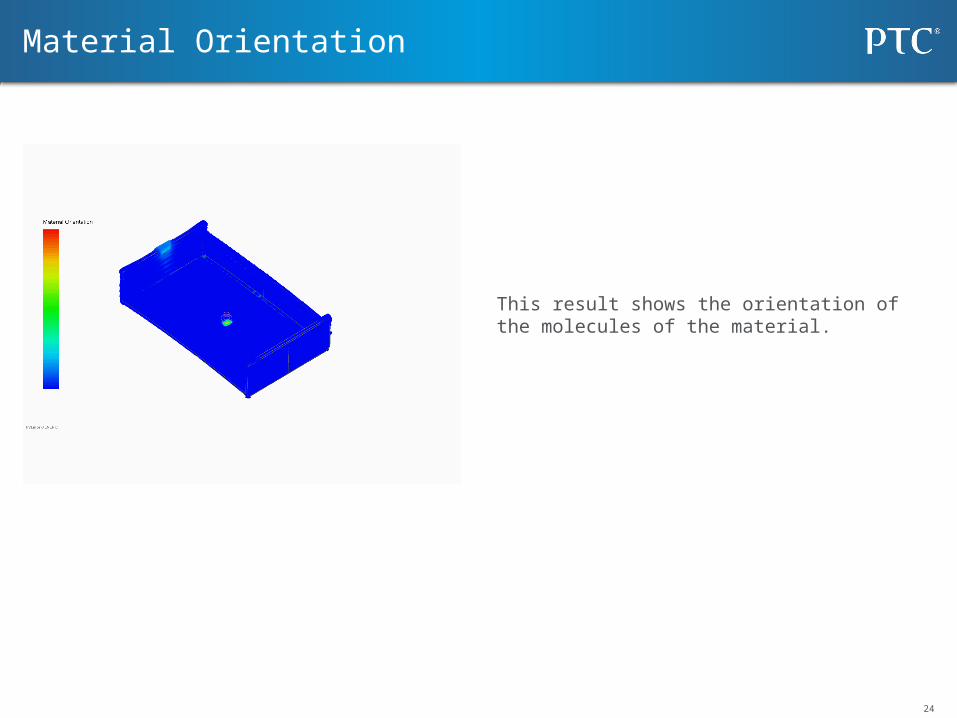
This result shows the orientation of the molecules of the material.
Material Orientation

25
This result shows the plot of sprue pressure versus filling time.You can use this result to look for any unusual sprue pressure rise during filling. If the resulting sprue pressure curve stays at the maximum allowed injection pressure, hesitation or even short shot might occur.
Sprue Pressure

26
This result shows a plot of the clamping force versus the filling time. The value is the required clamping force during the molding process instead of the force that molding machine outputs. You can use this result to identify the flash problem. If the calculated clamping force is larger than 70 percent of the machine maximum clamping force, there is a chance of plastic melt being squeezed outside the cavity and causing flash.
Clamping Force

27
This result shows the plot of flow rate at the sprue versus filling time.In most cases, the first stage of filling is controlled by the flow rate set by the machine operator. Therefore, in this result, the flow rate usually stays at the value set in the process condition. If the resulting flow rate appears otherwise, check if the maximum allowed injection pressure is too low.
Flow Rate

28
Result Advisor

29
• Result Advisor – Air trap
Result Advisor
Possible issues found in Analysis

30
Result Advisor – Air trap
Problem Description:• Air traps found inside the cavity. This may cause
voids or surface defect.
Solution:• Increase the filling time.• Change the gate location.• Reduce the injection speed.• Modify the size or location of the vents.

31
This part can be completed by the report author
Analysis Conclusions and Recommendations

Related Documents