U.S. Department of Commerce Economics and Statistics Administration U.S. CENSUS BUREAU THE NEXT FOUR DECADES The Older Population in the United States: 2010 to 2050 Population Estimates and Projections Issued May 2010 P25-1138 Current Population Reports By Grayson K. Vincent and Victoria A. Velkoff INTRODUCTION The purpose of this report is to present information on how the age structure of the overall population and the composi- tion of the older population in terms of age, sex, race, and Hispanic origin are expected to change over the next four decades. 1 Between 2010 and 2050, the United States is projected to experience rapid growth in its older population. 2 In 2050, the number of Americans aged 65 and older is projected to be 88.5 million, more than double its projected popula- tion of 40.2 million in 2010. The baby boomers are largely responsible for this increase in the older population, as they will begin crossing into this category in 2011. 3 The aging of the population will have wide-ranging implications for the coun- try. As the United States ages over the next several decades, its older popu- lation will become more racially and ethnically diverse. Projecting the size and structure, in terms of age, sex, race, and Hispanic origin, of the older population is important to public and private interests, both socially and economically. The pro- jected growth of the older population in the United States will present challenges to policy makers and programs, such as Social Security and Medicare. It will also affect families, businesses, and health care providers. 1 In this report, the “older population” refers to those aged 65 and older. 2 This report discusses data for the United States, including the 50 states and the District of Columbia; it does not include data for Puerto Rico. 3 The baby boomer generation consists of people born between 1946 and 1964. 2008 NATIONAL POPULATION PROJECTIONS Released in August of 2008, the national population projections are of the resi- dent population, as well as demographic components of change (births, deaths, and net international migration), by age, sex, race, and Hispanic origin. The pro- jections are based on Census 2000 and were produced using a cohort-component method. The components of change were projected into the future based on past trends. The projections cover the period 2000–2050. Between 2010 and 2050, the U.S. popula- tion is projected to grow from 310 million to 439 million, an increase of 42 percent. The nation will also become more racially and ethnically diverse, with the aggregate minority population projected to become the majority in 2042.* The population is also expected to become much older, with nearly one in five U.S. residents aged 65 and older in 2030. The 2008 National Population Projections, including summary tables, downloadable files, methodology and assumptions, and the press release, can be found at <www.census.gov/population/www /projections/2008projections.html>. * In this report, the minority population is consid- ered to be everyone other than the non-Hispanic White alone population.

Welcome message from author
This document is posted to help you gain knowledge. Please leave a comment to let me know what you think about it! Share it to your friends and learn new things together.
Transcript

1U.S. Census Bureau
U.S. Department of CommerceEconomics and Statistics AdministrationU.S. CENSUS BUREAU
THE NEXT FOUR DECADESThe Older Population in the United States: 2010 to 2050Population Estimates and Projections
Issued May 2010
P25-1138
Current Population Reports
By
Grayson K. Vincent
and
Victoria A. Velkoff
INTRODUCTION
The purpose of this report is to present information on how the age structure of the overall population and the composi-tion of the older population in terms of age, sex, race, and Hispanic origin are expected to change over the next four decades.1
Between 2010 and 2050, the United States is projected to experience rapid growth in its older population.2 In 2050, the number of Americans aged 65 and older is projected to be 88.5 million, more than double its projected popula-tion of 40.2 million in 2010. The baby boomers are largely responsible for this increase in the older population, as they will begin crossing into this category in 2011.3
The aging of the population will have wide-ranging implications for the coun-try. As the United States ages over the next several decades, its older popu-lation will become more racially and ethnically diverse. Projecting the size andstructure, in terms of age, sex, race, and Hispanic origin, of the older population isimportant to public and private interests, both socially and economically. The pro-jected growth of the older population in the United States will present challenges to policy makers and programs, such as
Social Security and Medicare. It will also affect families, businesses, and health care providers.
1 In this report, the “older population” refers to those aged 65 and older.
2 This report discusses data for the United States, including the 50 states and the District of Columbia; it does not include data for Puerto Rico.
3 The baby boomer generation consists of people born between 1946 and 1964.
2008 NATIONAL POPULATION PROJECTIONS
Released in August of 2008, the national population projections are of the resi-dent population, as well as demographic components of change (births, deaths, and net international migration), by age, sex, race, and Hispanic origin. The pro-jections are based on Census 2000 and were produced using a cohort-component method. The components of change were projected into the future based on past trends. The projections cover the period 2000–2050.
Between 2010 and 2050, the U.S. popula-tion is projected to grow from 310 million to 439 million, an increase of 42 percent. The nation will also become more racially and ethnically diverse, with the aggregate minority population projected to become the majority in 2042.* The population is also expected to become much older, with nearly one in five U.S. residents aged 65 and older in 2030.
The 2008 National Population Projections, including summary tables, downloadable files, methodology and assumptions, and the press release, can be found at <www.census.gov/population/www /projections/2008projections.html>.
* In this report, the minority population is consid-ered to be everyone other than the non-Hispanic White alone population.

2 U.S. Census Bureau
Figure 1.Age and Sex Structure of the Population for the United States: 2010, 2030, and 2050
Source: U.S. Census Bureau, 2008.
Male Female 2010
2030
2050
3 2 1 0 0 1 2 30
5
10
15
20
25
30
35
40
45
50
55
60
65
70
75
80
85
90
95
100+
MillionsMillions
Age

3U.S. Census Bureau
CHANGING AGE STRUCTURE
The age structure of the overall population is projected to change greatly over the next four decades (Figure 1). Much of this change is driven by the aging baby boomers and trends in immigration.
Figure 1 illustrates the importance of the baby boom generation in shaping the overall population. In 2010, the baby boom generation will be 46 to 64 years old.4 The echo of the baby boom is also evident in the 2010 population pyramid for the age groups near 20.5 By 2030, all of the baby boomers will have moved into the ranks of the older popula-tion. This will result in a shift in the age structure, from 13 percent of the population aged 65 and older in 2010 to 19 percent in 2030.
In 2010, 60 percent of the U.S. population will be aged 20–64. By 2030, as the baby boomers age, the proportion in these working ages will drop to 55 percent.
Immigration is expected to play an important role in how the age struc-ture of the United States changes over the next four decades. The aging of the baby boom increases the proportion in the older age groups, but projected immigra-tion into the working age groups tends to mitigate the impact. In other words, the country’s aging is slowed somewhat by immigration of younger people.
In 2050, every age group is pro-jected to be larger than it was in 2010. This is not the case between 2010 and 2030 or between 2030 and 2050. For instance, the number
of men aged 50–56 and the number of women aged 46–56 in 2030 are projected to be smaller than those in the same age groups in 2010 (Figure 1). This is because large cohorts of baby boomers will be in these age groups in 2010 and by 2030, younger and smaller cohorts will have replaced them. Similarly, the number of women aged 72–75 is projected to be smaller in 2050 than it was in 2030 as the smaller than average birth cohort born in the late 1970s moves into these age groups.
The number of people in the oldest-old age group is projected to grow from 5.8 million in 2010 to 8.7 mil-lion in 2030.6 In 2050, this group is projected to reach 19 million. Even
as they approach the oldest old, the baby boomers will continue to have an impact on the age structure of the U.S. population. In 2050, those aged 85 and over are projected to account for 4.3 percent of the U.S. population, up from 2.3 percent in 2030.
Another way to examine the chang-ing age structure of the population is to look at dependency ratios. Dependency ratios are an indicator of the potential burden on those in the working-age population. The total dependency ratio is projected to increase from 67 to 85 between 2010 and 2050, the result of a large increase in the old-age dependency ratio (Figure 2). The old-age depen-dency ratio sees a rapid increase between 2010 and 2030, from 22 to 35, as all of the baby boomers move into the 65 years and over category.
4 The data shown in Figure 1 represent a July 1 population, and because the baby boom began roughly in July 1946, the start of the baby boom is seen for age 63 rather than age 64, as would be suggested by the difference in the years 1946–2010 (Hogan, Perez, and Bell, 2008, Who (Really) Are the First Baby Boomers?, In JSM Proceedings, Social Statistics Section, Alexandria, VA: American Statistical Association, pp. 1009–1016).
5 The echo of the baby boomers refers to the children born to baby boomers.
6 In this report, the term “oldest old” refers to those aged 85 and older.
Figure 2.Dependency Ratios for the United States: 2010 to 2050
Note: Total dependency = ((Population under age 20 + Population aged 65 years and over) / (Population aged 20 to 64 years )) * 100.
Old-age dependency = (Population aged 65 years and over / Population aged 20 to 64 years) * 100.
Youth dependency = (Population under age 20 / Population aged 20 to 64 years) * 100.
Source: U.S. Census Bureau, 2008.
Youth dependency
Old-age dependency
8.3
8.9
20502040203020202010
2228
35 37 3767
74
83 85 85
45 46 48 48 48

4 U.S. Census Bureau
After 2030, the old-age dependency ratio continues to increase slightly to 37 by 2050. The youth depen-dency ratio increases minimally between 2010 and 2030, from 45 to 48, and remains stable until 2050.
CHANGING AGE STRUCTURE WITHIN THE OLDER POPULATION
The age composition within the older ages is projected to change between 2010 and 2050. As the baby boomers move into the older age groups, beginning in 2011, the proportion aged 65–74 is projected to increase (Figure 3). The majority of the country’s older population is projected to be relatively young, aged 65–74, until around 2034, when all of the baby boomers will be over 70. As the baby boomers move into the oldest-old age category, the age composition of the older popula-tion shifts upward. In 2010, slightly more than 14 percent of the older population will be 85 and older. By 2050, that proportion is expected to increase to more than 21 percent.
The aging of the older population is noteworthy, as those in the oldest ages often require additional care giving and support (see Table A-1 for more detailed data on the age distribution).
RACE AND HISPANIC ORIGIN7
While the older population is not as racially and ethnically diverse as the younger population, it is projected to substantially increase its racial and ethnic diversity over the next
four decades. Additionally, while all of the race and ethnic groups will become older, the degree of aging that is projected to occur within each group varies greatly.
In terms of race, the share of the population that is White alone is projected to decrease by about 10 percentage points among those 65 years and over and by about 9 percentage points among those 85 years and over between 2010 and 2050. Meanwhile, all other race groups are projected to see an increase in their shares of these populations. The 85 years and over population is less racially diverse than the 65 years and older popu-lation, but it is projected to see a similar increase in diversity between 2010 and 2050.
Although the older population is not expected to become majority-minority in the next four decades, it is projected to be 42 percent minority in 2050, up from 20 per-cent in 2010. Among the 85 years
7 Race and Hispanic origin are collected ac-cording to the Office of Management and Budget (OMB) 1997 guidelines. For further information, see Revisions to the Standards for the Classifica-tion of Federal Data on Race and Ethnicity at <www.whitehouse.gov/omb/fedreg /1997standards.html>. Race and Hispanic origin are treated as two separate and distinct con-cepts in the federal statistical system. People in each race group may be either Hispanic or non-Hispanic, and people of Hispanic origin may be any race. This report contains projections data for each of five racial categories (White, Black, American Indian and Alaska Native, Asian, and Native Hawaiian and Other Pacific Islander) for the population in the race alone categories and the population that is a race group alone or in combination with other races. Data for the alone or in combination groups appear in Table A-2. All other sections of the report refer to each of the races alone and use the Two or More Races category to represent the population reporting more than one race.
0
10
20
30
40
50
60
70
80
90
100
20502040203020202010
Figure 3.Distribution of the Projected Older Population by Age for the United States: 2010 to 2050
Note: Line indicates the year that each age group is the largest proportion of the older population.
Source: U.S. Census Bureau, 2008.
Percent
65 to 69 years
70 to 74 years
75 to 79 years
80 to 84 years
85 years and over

5U.S. Census Bureau
and over population, 33 percent are projected to be minority in 2050, up from 15 percent in 2010.
Among those aged 65 and over in 2050, 77 percent are projected to be White alone, down from 87 per-cent in 2010. Within the same age group, 12 percent are projected to be Black alone and 9 percent are projected to be Asian alone in 2050, up from 9 percent and 3 percent, respectively, in 2010 (Figure 4).
The smallest race groups are pro-jected to see large growth relative to their populations. Among the population aged 65 and older in 2050, the American Indian and Alaska Native alone population is projected to be 918,000, up from
235,000 in 2010, and the Native Hawaiian and Other Pacific Islander alone population is projected to be 219,000, up from 39,000 in 2010. The Two or More Races population is also projected to see relatively large growth among people in this age group, increasing from 278,000 in 2010 to 1.3 million in 2050.
Among those aged 85 and over in 2050, 81 percent are projected to be White alone, down from 90 percent in 2010. Within the same age group, 10 percent are projected to be Black alone and 6 percent are projected to be Asian alone in 2050, up from 7 percent and 2 percent, respectively, in 2010 (Table 1).
As with the 65 years and older group, the smallest race groups are projected to see large relative
increases in the 85 years and older age group. Among those 85 years and older in 2050, the American Indian and Alaska Native alone population is projected to reach 180,000, up from 20,000 in 2010, and the Native Hawaiian and Other Pacific Islander alone population is projected to be 35,000, up from 3,000 in 2010. The Two or More Races oldest-old population is also projected to see a relatively large increase, from 29,000 in 2010 to 208,000 in 2050.
The proportion of the older popula-tion that is Hispanic is projected to increase quickly over the next four decades. In 2050, 20 percent of the population aged 65 and over is projected to be Hispanic, up from 7 percent in 2010 (Figure 5). The
Figure 4.Projected Population Aged 65 and Over by Race for the United States: 2010 to 2050
Note: Unless otherwise specified, data refer to the population who reported a race alone. Populations for each race group include both Hispanics and non-Hispanics, as Hispanics may be of any race.
Source: U.S. Census Bureau, 2008.
Millions
Two or More Races
Native Hawaiianand OtherPacific Islander
AsianAmerican Indian and AlaskaNative
BlackWhite
0
10
20
30
40
50
60
70
80
90
100
205020452040203520302025202020152010

6 U.S. Census Bureau
proportion of the oldest-old popula-tion that is Hispanic is also projected to increase by about 10 percentage points between 2010 and 2050.
In 2050, the non-Hispanic popula-tion aged 65 and older is projected to reach 71 million, up from 37.4 million in 2010, almost doubling. In comparison, the Hispanic popu-lation aged 65 years and older is projected to grow from 2.9 million
to 17.5 million, a more than sixfold increase.
The 85 years and over population is projected to be 15 percent Hispanic in 2050, up from 5 percent in 2010 (Figure 5). The non-Hispanic popula-tion aged 85 and older is projected to nearly triple, from 5.5 million in 2010 to 16.2 million in 2050. In contrast, during this time period, the Hispanic population in this age
group is projected to increase more than ninefold, from 305,000 to 2.9 million (see Table A-2 for more detailed data on race and Hispanic origin).
Although each race and ethnic group is projected to increase in the proportion aged 65 and over between 2010 and 2050, the percent 65 and over varies by race and Hispanic origin. Some groups
Table 1. Projections and Distribution of the Population Aged 85 and Over by Race for the United States: 2010, 2030, and 2050(Numbers in thousands)
Race2010 2030 2050
Number Percent Number Percent Number Percent
85 years and over . . . . . . . . . . . . . . . . . . . . . . . . 5,751 100 .0 8,745 100 .0 19,041 100 .0
White alone . . . . . . . . . . . . . . . . . . . . . . . . . . . . . . . . . . 5,189 90 .2 7,542 86 .2 15,491 81 .4
Black alone . . . . . . . . . . . . . . . . . . . . . . . . . . . . . . . . . . 397 6 .9 701 8 .0 1,982 10 .4
American Indian and Alaska Native alone . . . . . . . . . . . 20 0 .4 62 0 .7 180 0 .9
Asian alone . . . . . . . . . . . . . . . . . . . . . . . . . . . . . . . . . . 113 2 .0 356 4 .1 1,145 6 .0
Native Hawaiian and Other Pacific Islander alone . . . . . 3 0 .1 11 0 .1 35 0 .2
Two or More Races . . . . . . . . . . . . . . . . . . . . . . . . . . . . 29 0 .5 74 0 .8 208 1 .1
Source: U .S . Census Bureau, 2008 .
Figure 5.Percent Hispanic for the Older Population by Selected Age Groups for the United States: 2010 to 2050
Source: U.S. Census Bureau, 2008.
85 years and over
2010 2020 2030 2040 2050 2010 2020 2030 20502040
7.1
9.2
12.0
16.2
19.8
5.3
8.1
9.9
11.6
15.1
65 years and over 85 years and over

7U.S. Census Bureau
will see increases of nearly 13 per-centage points, while others will see increases of less than 3 percentage points.
The non-Hispanic White alone population is the oldest with 16 percent of its population aged 65 and over in 2010. By 2030, nearly one quarter of non-Hispanic Whites
are projected to be aged 65 and over (Figure 6). At the opposite end of the spectrum, the Two or More Races population will continue to be the youngest population, with only
Figure 6.Percent Aged 65 and Over by Race and Hispanic Origin for the United States: 2010, 2030, and 2050
Note: Unless otherwise specified, data refer to the population who reported a race alone. Populations for each race group include both Hispanics and non-Hispanics, unless otherwise specified. Hispanics may be of any race.
Source: U.S. Census Bureau, 2008.
Hispanic
2010
2030
2050
13.0
19.3
20.2
14.2
20.7
21.0
16.1
24.8
25.5
8.6
15.2
18.5
7.4
14.5
16.8
9.3
16.5
21.9
5.7
10.0
13.2
6.5
13.2
17.9
5.1
7.2
7.8
Total
White
Non-Hispanic White
Black
American Indian andAlaska Native
Asian
Native Hawaiian andOther Pacific Islander
Two or More Races

8 U.S. Census Bureau
a slight increase in the percentage of its population aged 65 and older, from 5.1 percent in 2010 to 7.8 percent in 2050. While the percent aged 65 and over will more than double for the Hispanic population between 2010 and 2050, it will con-tinue to be a relatively young popu-lation with 13 percent aged 65 and older in 2050. This is comparable to the percent aged 65 and over for the total population in 2010. Two groups that see large increases in the proportion older in their popula-tions are the Asian alone and the Native Hawaiian and Other Pacific Islander alone groups. By 2050, 22 percent of the Asian alone popula-tion is projected to be aged 65 and over making it the second oldest category. The Native Hawaiian and Other Pacific Islander alone popula-tion is expected to jump from 6.5 percent aged 65 and over in 2010 to 18 percent in 2050.
SEX RATIOS
Female life expectancy has long exceeded male life expectancy, resulting in women outnumbering men in the older age groups. While that trend is projected to continue over the next four decades, the gap between the number of women and men is expected to narrow. This narrowing is due to the more rapid increase in life expectancy for men that is projected over the next several decades. Among those 65 years and over in 2050, 55 percent are projected to be female, down from 57 percent in 2010 (Figure 7). This decline in the female share, or increase in male share, of the population is even more dramatic among the oldest old. Among those 85 years and over, 61 percent are
projected to be female in 2050, down 6 percentage points from 67 in 2010 (see Table A-3 for more detailed data on the sex distribu-tion). The changing sex ratios at the older ages may have implications on the social and economic well-being of the older population. One implication would be on marital sta-tus and living arrangements of the older population. The changing sex ratios could also have an impact on the types of care that are available to the older population.
CONCLUSION
The population in the United States is projected to grow older over the next several decades. Much of this aging is due to the baby boom generation moving into the ranks of the 65 and older population. As the U.S. population grows older, the racial and ethnic composition of the older population is also expected to change. We expect to see an increase in the proportion of the older population that is Hispanic and an increase in the proportion that is a race other than White. As
Figure 7.Percent Female for the Older Population by Age for the United States: 2010, 2030, and 2050
Source: U.S. Census Bureau, 2008.
5755 55 54 53 52
5856 55
67
62 61
65 years and over 65 to 74 years 75 to 84 years 85 years and over
20502010 2030

9U.S. Census Bureau
we near 2050, we expect that the oldest age categories will grow in terms of numbers and proportions. This changing age structure of the population will have an impact on both families and society.
DATA SOURCE AND METHODOLOGY
This report uses projections of the total U.S. population as of July 1 for the years 2000–2050. The universe is the resident population of the United States (50 states and the District of Columbia). The projec-tions are based on Census 2000 and were produced using a cohort-component method, which uses the components of population change (births, deaths, and net interna-tional migration) to project forward. The assumptions for the compo-nents of change are based on time series analysis. Historical mortality trends were calculated using the National Center for Health Statistics’ data on deaths and the U.S. Census Bureau’s population estimates for 1984–2003. Fertility trends were calculated using the National Center for Health Statistics’ births data and Census Bureau estimates of the female population. The time series included data from 1980 to 2003. Trends in net international migra-tion were primarily based on data from the Immigration and
Naturalization Service and the Department of Homeland Security on persons obtaining legal perma-nent residence, as well as Census Bureau population estimates for 1972–2002.
The methodology used to produce the projections used in this report is available at <www.census.gov /population/www/projections /methodstatement.html#_ftn1>.
All derived values were computed using unrounded data. In the text, figures, and tables, most whole numbers were rounded to the near-est thousand or million and most decimal numbers were rounded to the nearest tenth or whole number.
DATA ACCURACY
These projections are based on Census 2000 and may, therefore, contain nonsampling error due to potential enumeration errors such as differential undercoverage or overcoverage by demographic char-acteristics. Technical documenta-tion for Census 2000 is available at <www.census.gov/prod/cen2000 /doc/sf1.pdf>. Nonsampling error also exists as the assumptions for the components of change were based on time series analysis. Future changes in policy or other factors that might influence levels of the population components and
their directions cannot be predicted. Thus if actual trends or levels in fertility, mortality, or international migration differ radically from the assumed trends and levels, the projected population will be less accurate.
SUGGESTED CITATION
Vincent, Grayson K. and Victoria A. Velkoff, 2010, THE NEXT FOUR DECADES, The Older Population in the United States: 2010 to 2050, Current Population Reports, P25-1138, U.S. Census Bureau, Washington, DC.
CONTACTS
U.S. Census Bureau Demographic Call Center Staff 301-763-2422 or 1-866-758-1060 (toll-free) or visit <ask.census.gov> for further information.
Population Projections Branch 301-763-2428
USER COMMENTS
The Census Bureau welcomes the comments and advice of users of our data and reports. Please send suggestions or comments to:
Chief, Population Division U.S. Census Bureau Washington, DC 20233-8800

10 U.S. Census Bureau
Appendix Table A-1. Projections and Distribution of the Total Population by Age for the United States: 2010 to 2050(Numbers in thousands)
Age 2010 2020 2030 2040 2050
NUMBER
Total . . . . . . . . . . . . . . . . . . . . . . . . . 310,233 341,387 373,504 405,655 439,010Under 20 years . . . . . . . . . . . . . . . . . . . . . 84,150 90,703 97,682 104,616 112,940
20 to 64 years . . . . . . . . . . . . . . . . . . . . . . 185,854 195,880 203,729 219,801 237,523
65 years and over . . . . . . . . . . . . . . . . . . . 40,229 54,804 72,092 81,238 88,547
65 to 69 years . . . . . . . . . . . . . . . . . . . . . 12,261 17,861 20,381 18,989 21,543
70 to 74 years . . . . . . . . . . . . . . . . . . . . . 9,202 14,452 18,404 17,906 18,570
75 to 79 years . . . . . . . . . . . . . . . . . . . . . 7,282 9,656 14,390 16,771 15,964
80 to 84 years . . . . . . . . . . . . . . . . . . . . . 5,733 6,239 10,173 13,375 13,429
85 to 89 years . . . . . . . . . . . . . . . . . . . . . 3,650 3,817 5,383 8,450 10,303
90 years and over . . . . . . . . . . . . . . . . . . 2,101 2,780 3,362 5,748 8,738
PERCENT
Total . . . . . . . . . . . . . . . . . . . . . . . . . 100 .0 100 .0 100 .0 100 .0 100 .0Under 20 years . . . . . . . . . . . . . . . . . . . . . 27 .1 26 .6 26 .2 25 .8 25 .7
20 to 64 years . . . . . . . . . . . . . . . . . . . . . . 59 .9 57 .4 54 .5 54 .2 54 .1
65 years and over . . . . . . . . . . . . . . . . . . . 13 .0 16 .1 19 .3 20 .0 20 .2
65 to 69 years . . . . . . . . . . . . . . . . . . . . . 4 .0 5 .2 5 .5 4 .7 4 .9
70 to 74 years . . . . . . . . . . . . . . . . . . . . . 3 .0 4 .2 4 .9 4 .4 4 .2
75 to 79 years . . . . . . . . . . . . . . . . . . . . . 2 .3 2 .8 3 .9 4 .1 3 .6
80 to 84 years . . . . . . . . . . . . . . . . . . . . . 1 .8 1 .8 2 .7 3 .3 3 .1
85 to 89 years . . . . . . . . . . . . . . . . . . . . . 1 .2 1 .1 1 .4 2 .1 2 .3
90 years and over . . . . . . . . . . . . . . . . . . 0 .7 0 .8 0 .9 1 .4 2 .0
Source: U .S . Census Bureau, 2008 .
11U.S. Census Bureau
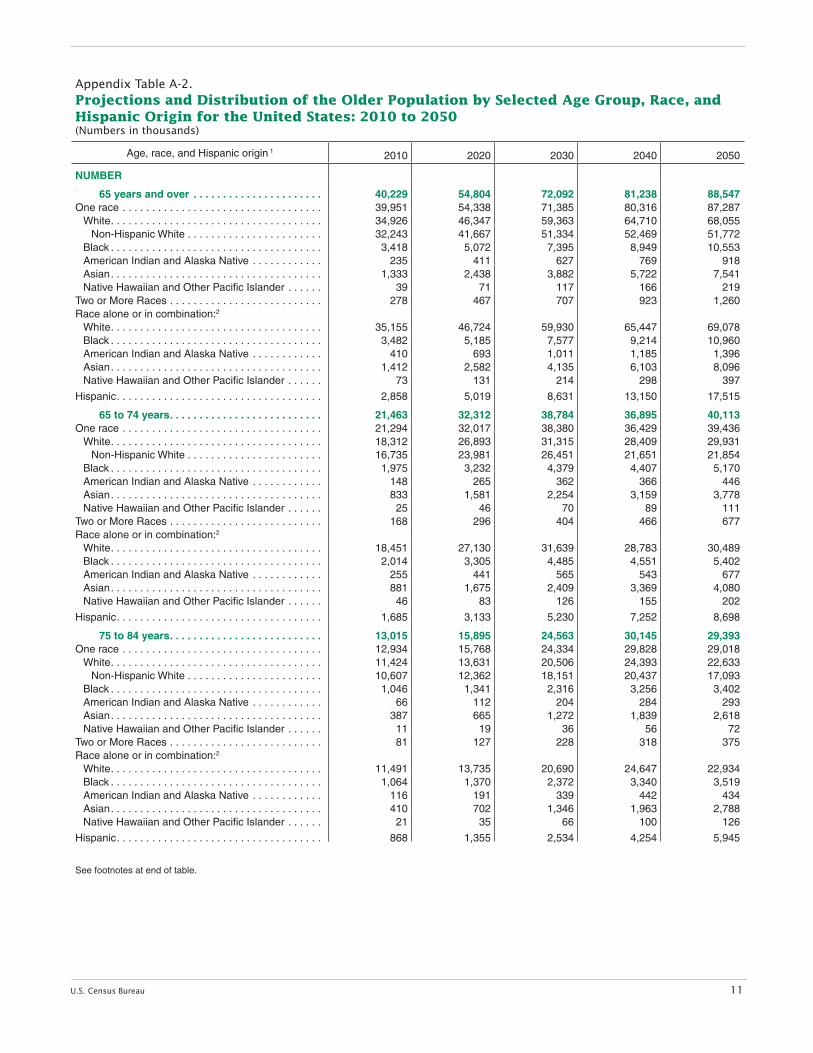
Appendix Table A-2. Projections and Distribution of the Older Population by Selected Age Group, Race, and Hispanic Origin for the United States: 2010 to 2050—Con.(Numbers in thousands)
Age, race, and Hispanic origin 1 2010 2020 2030 2040 2050
NUMBER
65 years and over . . . . . . . . . . . . . . . . . . . . . . 40,229 54,804 72,092 81,238 88,547One race . . . . . . . . . . . . . . . . . . . . . . . . . . . . . . . . . . 39,951 54,338 71,385 80,316 87,287 White . . . . . . . . . . . . . . . . . . . . . . . . . . . . . . . . . . . . 34,926 46,347 59,363 64,710 68,055 Non-Hispanic White . . . . . . . . . . . . . . . . . . . . . . . 32,243 41,667 51,334 52,469 51,772 Black . . . . . . . . . . . . . . . . . . . . . . . . . . . . . . . . . . . . 3,418 5,072 7,395 8,949 10,553 American Indian and Alaska Native . . . . . . . . . . . . 235 411 627 769 918 Asian . . . . . . . . . . . . . . . . . . . . . . . . . . . . . . . . . . . . 1,333 2,438 3,882 5,722 7,541 Native Hawaiian and Other Pacific Islander . . . . . . 39 71 117 166 219Two or More Races . . . . . . . . . . . . . . . . . . . . . . . . . . 278 467 707 923 1,260Race alone or in combination:2
White . . . . . . . . . . . . . . . . . . . . . . . . . . . . . . . . . . . . 35,155 46,724 59,930 65,447 69,078 Black . . . . . . . . . . . . . . . . . . . . . . . . . . . . . . . . . . . . 3,482 5,185 7,577 9,214 10,960 American Indian and Alaska Native . . . . . . . . . . . . 410 693 1,011 1,185 1,396 Asian . . . . . . . . . . . . . . . . . . . . . . . . . . . . . . . . . . . . 1,412 2,582 4,135 6,103 8,096 Native Hawaiian and Other Pacific Islander . . . . . . 73 131 214 298 397
Hispanic . . . . . . . . . . . . . . . . . . . . . . . . . . . . . . . . . . . 2,858 5,019 8,631 13,150 17,515
65 to 74 years . . . . . . . . . . . . . . . . . . . . . . . . . . 21,463 32,312 38,784 36,895 40,113One race . . . . . . . . . . . . . . . . . . . . . . . . . . . . . . . . . . 21,294 32,017 38,380 36,429 39,436 White . . . . . . . . . . . . . . . . . . . . . . . . . . . . . . . . . . . . 18,312 26,893 31,315 28,409 29,931 Non-Hispanic White . . . . . . . . . . . . . . . . . . . . . . . 16,735 23,981 26,451 21,651 21,854 Black . . . . . . . . . . . . . . . . . . . . . . . . . . . . . . . . . . . . 1,975 3,232 4,379 4,407 5,170 American Indian and Alaska Native . . . . . . . . . . . . 148 265 362 366 446 Asian . . . . . . . . . . . . . . . . . . . . . . . . . . . . . . . . . . . . 833 1,581 2,254 3,159 3,778 Native Hawaiian and Other Pacific Islander . . . . . . 25 46 70 89 111Two or More Races . . . . . . . . . . . . . . . . . . . . . . . . . . 168 296 404 466 677Race alone or in combination:2
White . . . . . . . . . . . . . . . . . . . . . . . . . . . . . . . . . . . . 18,451 27,130 31,639 28,783 30,489 Black . . . . . . . . . . . . . . . . . . . . . . . . . . . . . . . . . . . . 2,014 3,305 4,485 4,551 5,402 American Indian and Alaska Native . . . . . . . . . . . . 255 441 565 543 677 Asian . . . . . . . . . . . . . . . . . . . . . . . . . . . . . . . . . . . . 881 1,675 2,409 3,369 4,080 Native Hawaiian and Other Pacific Islander . . . . . . 46 83 126 155 202
Hispanic . . . . . . . . . . . . . . . . . . . . . . . . . . . . . . . . . . . 1,685 3,133 5,230 7,252 8,698
75 to 84 years . . . . . . . . . . . . . . . . . . . . . . . . . . 13,015 15,895 24,563 30,145 29,393One race . . . . . . . . . . . . . . . . . . . . . . . . . . . . . . . . . . 12,934 15,768 24,334 29,828 29,018 White . . . . . . . . . . . . . . . . . . . . . . . . . . . . . . . . . . . . 11,424 13,631 20,506 24,393 22,633 Non-Hispanic White . . . . . . . . . . . . . . . . . . . . . . . 10,607 12,362 18,151 20,437 17,093 Black . . . . . . . . . . . . . . . . . . . . . . . . . . . . . . . . . . . . 1,046 1,341 2,316 3,256 3,402 American Indian and Alaska Native . . . . . . . . . . . . 66 112 204 284 293 Asian . . . . . . . . . . . . . . . . . . . . . . . . . . . . . . . . . . . . 387 665 1,272 1,839 2,618 Native Hawaiian and Other Pacific Islander . . . . . . 11 19 36 56 72Two or More Races . . . . . . . . . . . . . . . . . . . . . . . . . . 81 127 228 318 375Race alone or in combination:2
White . . . . . . . . . . . . . . . . . . . . . . . . . . . . . . . . . . . . 11,491 13,735 20,690 24,647 22,934 Black . . . . . . . . . . . . . . . . . . . . . . . . . . . . . . . . . . . . 1,064 1,370 2,372 3,340 3,519 American Indian and Alaska Native . . . . . . . . . . . . 116 191 339 442 434 Asian . . . . . . . . . . . . . . . . . . . . . . . . . . . . . . . . . . . . 410 702 1,346 1,963 2,788 Native Hawaiian and Other Pacific Islander . . . . . . 21 35 66 100 126
Hispanic . . . . . . . . . . . . . . . . . . . . . . . . . . . . . . . . . . . 868 1,355 2,534 4,254 5,945
See footnotes at end of table .

12 U.S. Census Bureau
Appendix Table A-2. Projections and Distribution of the Older Population by Selected Age Group, Race, and Hispanic Origin for the United States: 2010 to 2050—Con.(Numbers in thousands)
Age, race, and Hispanic origin 1 2010 2020 2030 2040 2050
85 years and over . . . . . . . . . . . . . . . . . . . . . . 5,751 6,597 8,745 14,198 19,041One race . . . . . . . . . . . . . . . . . . . . . . . . . . . . . . . . . . 5,722 6,553 8,671 14,059 18,833 White . . . . . . . . . . . . . . . . . . . . . . . . . . . . . . . . . . . . 5,189 5,823 7,542 11,908 15,491 Non-Hispanic White . . . . . . . . . . . . . . . . . . . . . . . 4,902 5,324 6,731 10,381 12,825 Black . . . . . . . . . . . . . . . . . . . . . . . . . . . . . . . . . . . . 397 499 701 1,287 1,982 American Indian and Alaska Native . . . . . . . . . . . . 20 34 62 119 180 Asian . . . . . . . . . . . . . . . . . . . . . . . . . . . . . . . . . . . . 113 191 356 724 1,145 Native Hawaiian and Other Pacific Islander . . . . . . 3 6 11 21 35Two or More Races . . . . . . . . . . . . . . . . . . . . . . . . . . 29 44 74 139 208Race alone or in combination:2
White . . . . . . . . . . . . . . . . . . . . . . . . . . . . . . . . . . . . 5,213 5,859 7,601 12,017 15,655 Black . . . . . . . . . . . . . . . . . . . . . . . . . . . . . . . . . . . . 404 510 720 1,323 2,039 American Indian and Alaska Native . . . . . . . . . . . . 39 61 108 201 285 Asian . . . . . . . . . . . . . . . . . . . . . . . . . . . . . . . . . . . . 121 205 379 772 1,228 Native Hawaiian and Other Pacific Islander . . . . . . 7 12 22 43 69
Hispanic . . . . . . . . . . . . . . . . . . . . . . . . . . . . . . . . . . . 305 531 868 1,645 2,871
PERCENT
65 years and over . . . . . . . . . . . . . . . . . . . . . . 100 .0 100 .0 100 .0 100 .0 100 .0One race . . . . . . . . . . . . . . . . . . . . . . . . . . . . . . . . . . 99 .3 99 .1 99 .0 98 .9 98 .6 White . . . . . . . . . . . . . . . . . . . . . . . . . . . . . . . . . . . . 86 .8 84 .6 82 .3 79 .7 76 .9 Non-Hispanic White . . . . . . . . . . . . . . . . . . . . . . . 80 .2 76 .0 71 .2 64 .6 58 .5 Black . . . . . . . . . . . . . . . . . . . . . . . . . . . . . . . . . . . . 8 .5 9 .3 10 .3 11 .0 11 .9 American Indian and Alaska Native . . . . . . . . . . . . 0 .6 0 .7 0 .9 0 .9 1 .0 Asian . . . . . . . . . . . . . . . . . . . . . . . . . . . . . . . . . . . . 3 .3 4 .4 5 .4 7 .0 8 .5 Native Hawaiian and Other Pacific Islander . . . . . . 0 .1 0 .1 0 .2 0 .2 0 .2Two or More Races . . . . . . . . . . . . . . . . . . . . . . . . . . 0 .7 0 .9 1 .0 1 .1 1 .4Race alone or in combination:2
White . . . . . . . . . . . . . . . . . . . . . . . . . . . . . . . . . . . . 87 .4 85 .3 83 .1 80 .6 78 .0 Black . . . . . . . . . . . . . . . . . . . . . . . . . . . . . . . . . . . . 8 .7 9 .5 10 .5 11 .3 12 .4 American Indian and Alaska Native . . . . . . . . . . . . 1 .0 1 .3 1 .4 1 .5 1 .6 Asian . . . . . . . . . . . . . . . . . . . . . . . . . . . . . . . . . . . . 3 .5 4 .7 5 .7 7 .5 9 .1 Native Hawaiian and Other Pacific Islander . . . . . . 0 .2 0 .2 0 .3 0 .4 0 .4
Hispanic . . . . . . . . . . . . . . . . . . . . . . . . . . . . . . . . . . . 7 .1 9 .2 12 .0 16 .2 19 .8
65 to 74 years . . . . . . . . . . . . . . . . . . . . . . . . . . 100 .0 100 .0 100 .0 100 .0 100 .0One race . . . . . . . . . . . . . . . . . . . . . . . . . . . . . . . . . . 99 .2 99 .1 99 .0 98 .7 98 .3 White . . . . . . . . . . . . . . . . . . . . . . . . . . . . . . . . . . . . 85 .3 83 .2 80 .7 77 .0 74 .6 Non-Hispanic White . . . . . . . . . . . . . . . . . . . . . . . 78 .0 74 .2 68 .2 58 .7 54 .5 Black . . . . . . . . . . . . . . . . . . . . . . . . . . . . . . . . . . . . 9 .2 10 .0 11 .3 11 .9 12 .9 American Indian and Alaska Native . . . . . . . . . . . . 0 .7 0 .8 0 .9 1 .0 1 .1 Asian . . . . . . . . . . . . . . . . . . . . . . . . . . . . . . . . . . . . 3 .9 4 .9 5 .8 8 .6 9 .4 Native Hawaiian and Other Pacific Islander . . . . . . 0 .1 0 .1 0 .2 0 .2 0 .3Two or More Races . . . . . . . . . . . . . . . . . . . . . . . . . . 0 .8 0 .9 1 .0 1 .3 1 .7Race alone or in combination:2
White . . . . . . . . . . . . . . . . . . . . . . . . . . . . . . . . . . . . 86 .0 84 .0 81 .6 78 .0 76 .0 Black . . . . . . . . . . . . . . . . . . . . . . . . . . . . . . . . . . . . 9 .4 10 .2 11 .6 12 .3 13 .5 American Indian and Alaska Native . . . . . . . . . . . . 1 .2 1 .4 1 .5 1 .5 1 .7 Asian . . . . . . . . . . . . . . . . . . . . . . . . . . . . . . . . . . . . 4 .1 5 .2 6 .2 9 .1 10 .2 Native Hawaiian and Other Pacific Islander . . . . . . 0 .2 0 .3 0 .3 0 .4 0 .5
Hispanic . . . . . . . . . . . . . . . . . . . . . . . . . . . . . . . . . . . 7 .9 9 .7 13 .5 19 .7 21 .7
See footnotes at end of table .

13U.S. Census Bureau
Appendix Table A-2. Projections and Distribution of the Older Population by Selected Age Group, Race, and Hispanic Origin for the United States: 2010 to 2050—Con.(Numbers in thousands)
Age, race, and Hispanic origin 1 2010 2020 2030 2040 2050
75 to 84 years . . . . . . . . . . . . . . . . . . . . . . . . . . 100 .0 100 .0 100 .0 100 .0 100 .0One race . . . . . . . . . . . . . . . . . . . . . . . . . . . . . . . . . . 99 .4 99 .2 99 .1 98 .9 98 .7 White . . . . . . . . . . . . . . . . . . . . . . . . . . . . . . . . . . . . 87 .8 85 .8 83 .5 80 .9 77 .0 Non-Hispanic White . . . . . . . . . . . . . . . . . . . . . . . 81 .5 77 .8 73 .9 67 .8 58 .2 Black . . . . . . . . . . . . . . . . . . . . . . . . . . . . . . . . . . . . 8 .0 8 .4 9 .4 10 .8 11 .6 American Indian and Alaska Native . . . . . . . . . . . . 0 .5 0 .7 0 .8 0 .9 1 .0 Asian . . . . . . . . . . . . . . . . . . . . . . . . . . . . . . . . . . . . 3 .0 4 .2 5 .2 6 .1 8 .9 Native Hawaiian and Other Pacific Islander . . . . . . 0 .1 0 .1 0 .1 0 .2 0 .2Two or More Races . . . . . . . . . . . . . . . . . . . . . . . . . . 0 .6 0 .8 0 .9 1 .1 1 .3Race alone or in combination:2
White . . . . . . . . . . . . . . . . . . . . . . . . . . . . . . . . . . . . 88 .3 86 .4 84 .2 81 .8 78 .0 Black . . . . . . . . . . . . . . . . . . . . . . . . . . . . . . . . . . . . 8 .2 8 .6 9 .7 11 .1 12 .0 American Indian and Alaska Native . . . . . . . . . . . . 0 .9 1 .2 1 .4 1 .5 1 .5 Asian . . . . . . . . . . . . . . . . . . . . . . . . . . . . . . . . . . . . 3 .2 4 .4 5 .5 6 .5 9 .5 Native Hawaiian and Other Pacific Islander . . . . . . 0 .2 0 .2 0 .3 0 .3 0 .4
Hispanic . . . . . . . . . . . . . . . . . . . . . . . . . . . . . . . . . . . 6 .7 8 .5 10 .3 14 .1 20 .2
85 years and over . . . . . . . . . . . . . . . . . . . . . . 100 .0 100 .0 100 .0 100 .0 100 .0One race . . . . . . . . . . . . . . . . . . . . . . . . . . . . . . . . . . 99 .5 99 .3 99 .2 99 .0 98 .9 White . . . . . . . . . . . . . . . . . . . . . . . . . . . . . . . . . . . . 90 .2 88 .3 86 .2 83 .9 81 .4 Non-Hispanic White . . . . . . . . . . . . . . . . . . . . . . . 85 .2 80 .7 77 .0 73 .1 67 .4 Black . . . . . . . . . . . . . . . . . . . . . . . . . . . . . . . . . . . . 6 .9 7 .6 8 .0 9 .1 10 .4 American Indian and Alaska Native . . . . . . . . . . . . 0 .4 0 .5 0 .7 0 .8 0 .9 Asian . . . . . . . . . . . . . . . . . . . . . . . . . . . . . . . . . . . . 2 .0 2 .9 4 .1 5 .1 6 .0 Native Hawaiian and Other Pacific Islander . . . . . . 0 .1 0 .1 0 .1 0 .1 0 .2Two or More Races . . . . . . . . . . . . . . . . . . . . . . . . . . 0 .5 0 .7 0 .8 1 .0 1 .1Race alone or in combination:2
White . . . . . . . . . . . . . . . . . . . . . . . . . . . . . . . . . . . . 90 .6 88 .8 86 .9 84 .6 82 .2 Black . . . . . . . . . . . . . . . . . . . . . . . . . . . . . . . . . . . . 7 .0 7 .7 8 .2 9 .3 10 .7 American Indian and Alaska Native . . . . . . . . . . . . 0 .7 0 .9 1 .2 1 .4 1 .5 Asian . . . . . . . . . . . . . . . . . . . . . . . . . . . . . . . . . . . . 2 .1 3 .1 4 .3 5 .4 6 .4 Native Hawaiian and Other Pacific Islander . . . . . . 0 .1 0 .2 0 .3 0 .3 0 .4
Hispanic . . . . . . . . . . . . . . . . . . . . . . . . . . . . . . . . . . . 5 .3 8 .1 9 .9 11 .6 15 .1
1 Hispanics may be of any race . 2 In combination means in combination with one or more other races . The sum of the five race groups adds to more than the total population, and 100 percent, because individuals may report more than one race . Note: The original race data from Census 2000 are modified to eliminate the “Some Other Race” category . This modification is used for all Census Bureau projec-tions products . For more information see <www .census .gov/popest/archives/files/MRSF-01-US1 .html> . Source: U .S . Census Bureau, 2008 .
14 U.S. Census Bureau
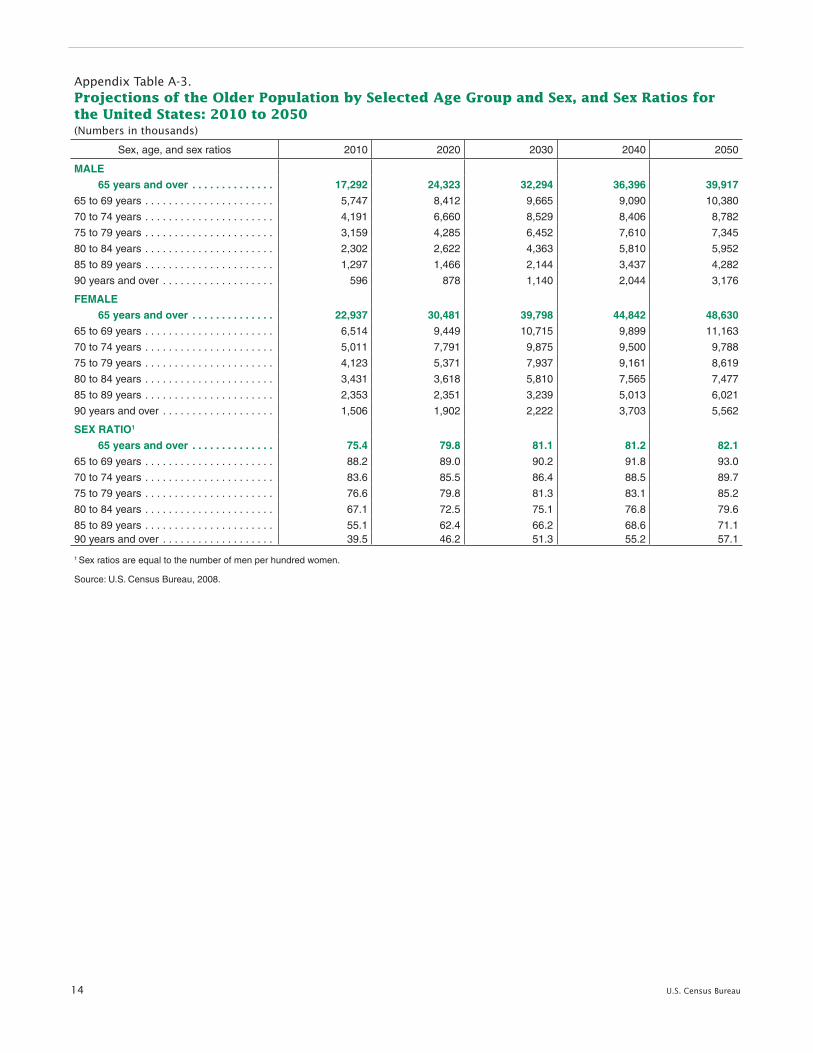
Appendix Table A-3. Projections of the Older Population by Selected Age Group and Sex, and Sex Ratios for the United States: 2010 to 2050(Numbers in thousands)
Sex, age, and sex ratios 2010 2020 2030 2040 2050
MALE
65 years and over . . . . . . . . . . . . . . 17,292 24,323 32,294 36,396 39,917
65 to 69 years . . . . . . . . . . . . . . . . . . . . . . 5,747 8,412 9,665 9,090 10,380
70 to 74 years . . . . . . . . . . . . . . . . . . . . . . 4,191 6,660 8,529 8,406 8,782
75 to 79 years . . . . . . . . . . . . . . . . . . . . . . 3,159 4,285 6,452 7,610 7,345
80 to 84 years . . . . . . . . . . . . . . . . . . . . . . 2,302 2,622 4,363 5,810 5,952
85 to 89 years . . . . . . . . . . . . . . . . . . . . . . 1,297 1,466 2,144 3,437 4,282
90 years and over . . . . . . . . . . . . . . . . . . . 596 878 1,140 2,044 3,176
FEMALE
65 years and over . . . . . . . . . . . . . . 22,937 30,481 39,798 44,842 48,630
65 to 69 years . . . . . . . . . . . . . . . . . . . . . . 6,514 9,449 10,715 9,899 11,163
70 to 74 years . . . . . . . . . . . . . . . . . . . . . . 5,011 7,791 9,875 9,500 9,788
75 to 79 years . . . . . . . . . . . . . . . . . . . . . . 4,123 5,371 7,937 9,161 8,619
80 to 84 years . . . . . . . . . . . . . . . . . . . . . . 3,431 3,618 5,810 7,565 7,477
85 to 89 years . . . . . . . . . . . . . . . . . . . . . . 2,353 2,351 3,239 5,013 6,021
90 years and over . . . . . . . . . . . . . . . . . . . 1,506 1,902 2,222 3,703 5,562
SEX RATIO1
65 years and over . . . . . . . . . . . . . . 75 .4 79 .8 81 .1 81 .2 82 .1
65 to 69 years . . . . . . . . . . . . . . . . . . . . . . 88 .2 89 .0 90 .2 91 .8 93 .0
70 to 74 years . . . . . . . . . . . . . . . . . . . . . . 83 .6 85 .5 86 .4 88 .5 89 .7
75 to 79 years . . . . . . . . . . . . . . . . . . . . . . 76 .6 79 .8 81 .3 83 .1 85 .2
80 to 84 years . . . . . . . . . . . . . . . . . . . . . . 67 .1 72 .5 75 .1 76 .8 79 .6
85 to 89 years . . . . . . . . . . . . . . . . . . . . . . 55 .1 62 .4 66 .2 68 .6 71 .190 years and over . . . . . . . . . . . . . . . . . . . 39 .5 46 .2 51 .3 55 .2 57 .1
1 Sex ratios are equal to the number of men per hundred women .
Source: U .S . Census Bureau, 2008 .


16 U.S. Census Bureau
U .S . Department of CommerceEconomics and Statistics AdministrationU .S . CENSUS BUREAUWashington, DC 20233 OFFICIAL BUSINESS Penalty for Private Use $300
FIRST-CLASS MAIL
POSTAGE & FEES PAIDU.S. Census Bureau
Permit No. G-58
Related Documents