1 2 3 4 5 6 7 8 9 10 11 12 13 14 15 16 17 18 19 20 21 22 23 24 25 26 27 28 29 30 31 32 33 34 35 36 37 38 39 40 41 42 43 44 45 46 47 48 49 50 51 52 53 54 55 56 57 58 59 60 61 62 63 64 65 1 Copper electrodeposition in a deep eutectic solvent. First stages analysis considering Cu(I) stabilization in chloride media P. Sebastián, E. Vallés, E. Gómez*, Departament de Química Física and Institut de Nanociència i Nanotecnologia (IN 2 UB), Universitat de Barcelona, Martí i Franquès 1, E-08028 Barcelona, Spain. *Author to whom correspondence should be addressed e-mail: [email protected] Phone: 34 934 021 234 Fax: 34 934 021 231 *Revised Manuscript (including Abstract) Click here to view linked References

Welcome message from author
This document is posted to help you gain knowledge. Please leave a comment to let me know what you think about it! Share it to your friends and learn new things together.
Transcript

1 2 3 4 5 6 7 8 9 10 11 12 13 14 15 16 17 18 19 20 21 22 23 24 25 26 27 28 29 30 31 32 33 34 35 36 37 38 39 40 41 42 43 44 45 46 47 48 49 50 51 52 53 54 55 56 57 58 59 60 61 62 63 64 65
1
Copper electrodeposition in a deep eutectic solvent. First stages analysis considering Cu(I) stabilization in chloride media
P. Sebastián, E. Vallés, E. Gómez*,
Departament de Química Física and Institut de Nanociència i Nanotecnologia (IN2UB),
Universitat de Barcelona, Martí i Franquès 1, E-08028 Barcelona, Spain.
*Author to whom correspondence should be addressed
e-mail: [email protected]
Phone: 34 934 021 234
Fax: 34 934 021 231
*Revised Manuscript (including Abstract)Click here to view linked References
1 2 3 4 5 6 7 8 9 10 11 12 13 14 15 16 17 18 19 20 21 22 23 24 25 26 27 28 29 30 31 32 33 34 35 36 37 38 39 40 41 42 43 44 45 46 47 48 49 50 51 52 53 54 55 56 57 58 59 60 61 62 63 64 65
2
Abstract
The aim of the present work is to study copper electrocrystallization in a Deep Eutectic
Solvent (DES) (eutectic mixture of choline chloride and urea 1:2) as electrolyte, paying
special attention to the influence of the liquid on the nucleation mechanism. Deposition
process was studied from both Cu(II) and Cu(I) solutions. As the DES solvent is chloride
rich, a parallel analysis was made in aqueous solution containing an excess of chloride to
compare medium influence on nucleation mechanism. While copper (I) can be directly
electrodeposited from chloride excess solutions, copper (II) electrodeposition takes place
via a separate step in which Cu(II) is firstly reduced to Cu(I). A methodology is proposed
for studying mechanistic aspects of the early stages of copper electrodeposition from the
Cu(II) chloride solutions. For all solutions, cyclic voltammetry was used to establish the
potential range at which copper electrodeposition occurred, while potentiostatic technique
was used to study the nucleation mechanism. In all media, deposition follows a nucleation
and three-dimensional growth controlled by diffusion. The diffusion coefficient of Cu(I)
species present in the solution has been calculated from potentiostatic curves by logarithmic
linear regression of j vs t-1/2
at long deposition times, whereas the same parameter for
copper (II) was calculated from cyclic voltammetry, taking advantage from the process
quasi -reversibility. The viability of the nucleation mechanism by Scharifker-Hills model
was demonstrated by the analysis of the rising part of the j-t transients independently of the
selected solution.
Keywords: copper electrodeposition, first stages, DES solvent, chloride effect
1. Introduction
Copper electrodeposition plays a key role in electronics, particularly in printed circuit
manufacture and especially for circuit interconnections in which copper has progressively
replaced aluminium [1]. However, while copper deposits have been widely used to form
thin and thick coatings, relatively few experiments have been conducted to study the first
deposition stages and the role of the solution chemical nature on the deposition process [2-
7]. It is well known that the characteristics of final deposits depend primarily on the plating
1 2 3 4 5 6 7 8 9 10 11 12 13 14 15 16 17 18 19 20 21 22 23 24 25 26 27 28 29 30 31 32 33 34 35 36 37 38 39 40 41 42 43 44 45 46 47 48 49 50 51 52 53 54 55 56 57 58 59 60 61 62 63 64 65
3
solution composition. In particular, the presence of free or complex cations is an important
factor, because they do strongly affect both nucleation and growth.
In the last decade, ionic liquids have been used as alternative solvents in the plating
solutions due to their low vapor pressure and because in most cases they are a less
environmentally hazardous option [8]. Recently, a novel class of liquids named Deep
eutectic solvents (DES) based on mixtures of choline chloride and hydrogen bond donors
has been developed. These liquids are able to solubilize many different metal salts or metal
oxides, so that they are being an alternative solvent for electrodeposition processes [9-12].
The DES show air and moisture stability, can be handled easily under environmental
conditions, and the fact that they offer the first economically viable liquids that can be used
in industrial scale makes them promising candidates when aqueous medium is not suitable
[13].
The copper electrodeposition has been widely investigated by some authors both in aqueous
and in ionic liquids, although most of the work was devoted to the preparation of coatings,
but few gave reliable information of the first stages of the process [14-18]. Recently Abbot
and coworkers [5] demonstrated that the use of ionic liquids based on eutectic mixtures of
choline chloride and hydrogen bond donors such as urea or ethylene glycol can be used as
convenient electrochemical solvents, in which copper reduction occurs via two well-
separated one-electron stages: Cu(II)-Cu(I)-Cu. In these conditions of intermediate
stabilization by the medium, the mechanistic analysis of the early stages of deposition
process, by means the typical single potentiostatic step, does not lead to convincing results.
The simultaneous contribution to the total current of the two reduction processes disturbs
the quantitative analysis leading to unreliable interpretations.
Aiming to deepen the study of the early stages of copper electroplating process, this work is
concerned with the copper deposit nucleation in conditions in which the intermediate Cu(I)
is stabilized, in this case due to the presence of excess chloride in solution. Copper
electrodeposition mechanism has been studied in two chemical systems that differ
substantially due to the solvent used, a choline chloride-based deep eutectic solvent and an
aqueous concentrated chloride solution, but having in common the presence of excess
chloride, placing especial interest on the first stages of the copper electrocrystallization
1 2 3 4 5 6 7 8 9 10 11 12 13 14 15 16 17 18 19 20 21 22 23 24 25 26 27 28 29 30 31 32 33 34 35 36 37 38 39 40 41 42 43 44 45 46 47 48 49 50 51 52 53 54 55 56 57 58 59 60 61 62 63 64 65
4
both from Cu(I) and Cu(II). The selected solvents present the necessary qualities to obtain
an interesting comparison.
Both Cu(I) and Cu(II) solutions were used in order to study the copper deposition process
in the selected solvents. When deposition from Cu(II) solutions was analyzed, taking into
account the stabilization of intermediate Cu(I) in the chloride media, an innovative double
potentiostatic step was proposed, in order to separate, as far as possible, currents related to
the reduction of each copper species. The purpose of the Cu deposition study from the
Cu(I) solution is to analyze the copper reduction stage leading directly to deposit. In all
media, chloride high concentration allows Cu(I) solubilisation. In order to minimize
deposition rate an amorphous substrate (vitreous carbon) has been selected and low ionic
copper concentrations were analyzed. This substrate has the advantage of presenting poor
interaction with metallic deposits and the low ionic copper concentration enables
discriminating the currents related to first stages although it does complicate obtaining
reproducible results. Previous voltammetric analysis allows defining the potential range at
which processes take place in the different media whereas potentiostatic experiments
results will provide the necessary data for the quantitative mechanistic analysis.
2. Experimental
Chemicals used were CuCl from Aesar, high purity, CuCl2 2H2O and NaCl both from
Merck, all of them of analytical grade. Aqueous solutions were prepared with water doubly
distilled and then treated with a Millipore Milli-Q system and the pH was kept at 3. The
DES solvent was prepared using choline chloride (from Across Organics) and urea (from
Merck) of analytical grade; the solids, in the molar proportion 1 choline chloride: 2 urea,
were warmed and removed constantly to achieve the liquid state. In the solution prepared
with DES no support electrolyte was added taking advantage that DES acts both as solvent
and as support electrolyte. After preparation, these solutions were placed in a desiccator in
order to avoid uptake of water by higroscopicity.
A cylindrical thermostatized three electrode cell of one single compartment was used.
Electrochemical experiments were carried out using an Autolab with PGSTAT30
1 2 3 4 5 6 7 8 9 10 11 12 13 14 15 16 17 18 19 20 21 22 23 24 25 26 27 28 29 30 31 32 33 34 35 36 37 38 39 40 41 42 43 44 45 46 47 48 49 50 51 52 53 54 55 56 57 58 59 60 61 62 63 64 65
5
equipment and GPES software. Basic electrochemical study was made using vitreous
carbon (from Metrohm) as working electrode, oxidized until the current response lower
than 10-7
A was recorded and then polished to a mirror finish using alumina of different
grades (3.75 and 1.87 m), cleaned ultrasonically for 2 min in water and immersed in the
solution. The contact with the solution was by meniscus. The counter electrode was a spiral
of platinum. The reference electrode was an Ag|AgCl/KCl 3M mounted in a Luggin
capillary containing, upon depending the solvent, either NaCl 3M in aqueous solutions or
the DES solvent when it was worked in the analogue ionic liquid medium. Stable and
reproducible potential values were obtained with these reference electrodes [19].
Voltammetric experiments were carried out at 50 mV s-1
, scanning at first to negative
potentials. Chronoamperometric experiments were performed starting from a potential
where no process took place. All electrochemical experiments were made using freshly
polished substrata. In aqueous media the working temperature was 30ºC, whereas the
temperature selected in DES solvent was 70ºC to favour low viscosity and high
conductivity of the solvent. Morphology was observed using a scanning electron
microscope JEOL model JSM-6510 and a field emission scanning electron microscope
JEOL JSM-7100F.
3. Results and discussion
3.1. Copper electrodeposition in DES. General behavior
In order to establish the potential range at which copper electrodeposition takes place in
DES, cyclic voltammetry from a solution containing 0.05M CuCl2 was recorded (Fig. 1
solid line). The voltammograms showed two groups of features sufficiently separated:
firstly, the couple whose profile fits with that corresponding to a quasi-reversible
reduction/oxidation process (C1, A1), and a second group (C2, A2) that appears at more
negative potentials. The C2 reduction peak shows a slow current increase leading to a wide
peak prior to the current decay. Reversing the scan at the beginning of C2 peak, the typical
loop associated to a nucleation and growth mechanism was recorded (Fig. 1 dashed line),
evidencing that the second group of features (C2, A2) corresponds to copper

1 2 3 4 5 6 7 8 9 10 11 12 13 14 15 16 17 18 19 20 21 22 23 24 25 26 27 28 29 30 31 32 33 34 35 36 37 38 39 40 41 42 43 44 45 46 47 48 49 50 51 52 53 54 55 56 57 58 59 60 61 62 63 64 65
6
electrodeposition, the A2 peak being related to copper deposit oxidation. Similar behavior
was observed previously [5], in two well separated steps in which firtly a single electron is
transferred, a fact that can be explained by considering copper (I) stabilization by
complexation with chloride. The fact that the overall deposition process takes place via
two widely separated processes encouraged us to analyze each one separately. At first it
was decided to analyze the stage of copper electrodeposition using a solution containing
0.05M CuCl, taking into account that 0.05M is a value close to the solubilization limit for
copper (I) chloride in the DES.
3.1.1. Copper electrodeposition from Cu(I) solution
Cyclic voltammetry from Cu(I) solution shows that the peak associated to copper
electrodeposition (Fig. 2A solid line) appears in the same potential range that that recorded
previously from copper(II) solution. Also, reversing the scan at initio of the negative
current the nucleation loop appeared (Fig. 2A dashed line). Positive scan was recorded till
the peak associated to Cu(0) to Cu(I) oxidation appeared, avoiding Cu(I) to Cu(II)
oxidation potential range.
On overlapping voltammetric curves for CuCl and CuCl2 solutions at fixed concentration
(0.05M) in DES (Fig. 2B), a good coincidence was found in the potential range associated
to copper electrodeposition, confirming that the previous Cu(II)-Cu(I) reduction step
doesn’t influence the electrodeposition mechanism.
The potentiostatic curves were recorded after applying a single-step signal from a potential
at which no process occurs to those at which they do. All current transients exhibited the
typical nucleation and three dimensional growth profile, current rising part that attains a
maximum from which the current decays on increasing time (Fig. 3A). Comparing the
curves obtained at different potentials evidences that maximum current (jm) augments as the
overpotential increases, while the time (tm) at which appears shortens. Relatively high
overpotentials were needed in order to observe relevant changes in rate of the process. It is
worth noting that, for all potentials applied, the ends of the descending part do overlap so
that applied potential does not affect the deposition process at long times. This induced us

1 2 3 4 5 6 7 8 9 10 11 12 13 14 15 16 17 18 19 20 21 22 23 24 25 26 27 28 29 30 31 32 33 34 35 36 37 38 39 40 41 42 43 44 45 46 47 48 49 50 51 52 53 54 55 56 57 58 59 60 61 62 63 64 65
7
to calculate the Cu(I) diffusion coefficient in the DES, by linear logarithmic adjustment of
the current vs time for each curve according to the well known Cotrell equation (Fig. 3A
inset). Table 1 contains the different diffusion coefficient calculated averaging to 3.2·10-
7cm
2s
-1. The values reproducibility shows that copper electrodeposition progresses via a 3D
growth mechanism diffusion controlled.
Taking this into account, the chronoamperometric results were compared with those
proposed by the model of Scharifker and Hills (S-H) [20,21]. This approach has been used
extensively to analyse metal electrodeposition in aqueous media and lately has also in ionic
liquid systems [22,23]. This model provides that, in non-dimensional form, instantaneous
(all nuclei immediately formed after the step potential) and progressive nucleation (nuclei
formed according to kinetics) follow respectively equations (1) and (2).
212
max
2564.1exp19542.1
mm t
t
t
t
j
j (1)
2212
max
3367.2exp12254.1
mm t
t
t
t
j
j
(2)
Comparison between the experimental j-t transients in the non-dimensional form and those
corresponding to S-H model limit cases (Fig. 3B) did show that, at low overpotentials, the
nucleation is nearly progressive, but upon increasing the overpotential intermediate
nucleation was observed, tending to instantaneous behavior on increasing enough the
overpotential. These results show that nucleation is activated by overpotential. The
behavior observed for copper electrodeposition is quite different from that previously found
at low temperatures from CuCl2 solutions in the same medium [5]. Then, instantaneous
nucleation followed by progressive one at long deposition times was proposed as
justification. Nevertheless in our conditions, results obtained from the Cu(I) solution are in
agreement with those usually expected, i.e. nucleation was favoured as the applied potential
was made more negative.

1 2 3 4 5 6 7 8 9 10 11 12 13 14 15 16 17 18 19 20 21 22 23 24 25 26 27 28 29 30 31 32 33 34 35 36 37 38 39 40 41 42 43 44 45 46 47 48 49 50 51 52 53 54 55 56 57 58 59 60 61 62 63 64 65
8
In a parallel way, the logarithmic analysis of the rising part of the experimental j-t
transients was made according to equations (3) and (4), derived assuming progressive and
instantaneous nucleation respectively:
23
21
21
23
)2(3
2AtNMDczFj o
(3)
21
21
21
23
)2( tNMDczFj o
(4)
and where zF is the molar charge of the depositing species, D is the diffusion coefficient, c
is the concentration, M is the molecular weight and is the density, No is the maximum
number of nuclei obtainable under the prevailing conditions and A is the steady state
nucleation rate constant per site [20].
The adjustment was made for all the transients recorded (Fig. 4), except for those obtained
at the highest overpotentials, in order to prevent the possible solvent reduction effect on the
initial recorded current, which could interfere with the response and distort the analysis
results. For the lowest overpotentials, calculated slopes were close to 1, whereas on
increasing overpotential the slope tended to 0.5 as corresponds to instantaneous nucleation.
This behaviour is in agreement with that obtained from the non-dimensional analysis via S-
H model, in which a gradual transition from progressive nucleation to instantaneous was
detected.
Since the nucleation mechanism for this kind of processes can also be derived using as
evaluation tool the product jm2tm, these products were obtained for the complete series of
experiments (Table 2). This approach requires that jm2tm be equal to 1.94 10
-6 A
2 cm
-4 s and
1.22 10-6
A2 cm
-4 s for progressive and instantaneous nucleation respectively [20]. As can
be seen in Table 2, at the lowest overpotentials the jm2tm values correspond to intermediate
behavior while at higher overpotentials the product approaches that predicted by
instantaneous nucleation.
The results obtained from all the complementary analysis performed using the Cu(I) as
electroactive species are congruent; the nucleation process evolves smoothly from

1 2 3 4 5 6 7 8 9 10 11 12 13 14 15 16 17 18 19 20 21 22 23 24 25 26 27 28 29 30 31 32 33 34 35 36 37 38 39 40 41 42 43 44 45 46 47 48 49 50 51 52 53 54 55 56 57 58 59 60 61 62 63 64 65
9
progressive to instantaneous nucleation, in turn confirming also the applicability and the
convergence of these treatments for copper deposition in the DES solutions.
3.1.2. Reduction of Cu(II) to Cu(I)
Cyclic voltammograms between 0.8 and -0.2 V were recorded at different scan rates from
the CuCl2 solution (Fig. 5A). The selected negative limit corresponds to a potential
sufficiently far from the beginning of electrodeposition process. In the same manner that
cyclic voltammetry from Figure 1 shows that the couple C1/A1 related to Cu(II)-Cu(I)
reduction/oxidation has a similar profile that the corresponding to a reversible process. The
differences |Ep,c-Ep,a| between the potential peak of the cathodic peak (C1) and the peak
potential of the anodic peak (A1) were determined (Table 3). These differences approach to
100mV at the lowest scan rates and increased as the scan rate increases. There is a
significant difference between the expected (65 mV at 70ºC) and the obtained. This
discrepancy was observed previously from experiments made at lower temperature (20ºC)
and associated to resistance of organic media [5].
As the cathodic current peak versus the square root of potential scan rate plot was linear
(Fig. 5B), the diffusion coefficient for the ion Cu(II) was calculated from the slope
according to the equation [24]:
(5)
The resulting diffusion coefficient for the Cu(II) in the DES solvent at 70ºC was 4.67·10-8
cm2s
-1, consistent with the previously reported value of 1.35·10
-8 cm
2 s
-1 at 20ºC [5], taking
into account the highest working temperature. It is remarkable that the Cu(I) diffusion
coefficient calculated in the previous section was one order of magnitude higher than that
obtained for Cu(II) species.

1 2 3 4 5 6 7 8 9 10 11 12 13 14 15 16 17 18 19 20 21 22 23 24 25 26 27 28 29 30 31 32 33 34 35 36 37 38 39 40 41 42 43 44 45 46 47 48 49 50 51 52 53 54 55 56 57 58 59 60 61 62 63 64 65
10
3.1.3 Copper electrodeposition from Cu(II) solution
In order to complete the copper electrodeposition study, the nucleation and growth process
was analyzed using the CuCl2 solution in the DES solvent.
In a first attempt, a series of j-t transients at different applied potential were recorded
applying the typical single signal step, from an starting potential at which no process
occurred to one at which Cu(II) reduction does. However, this procedure did not allow us to
obtain reproducible j-t transients, whatever of the starting potential or the applied potential.
This lack of reproducibility was attributed to the fact that Cu(II) reduction current adds to
the Cu(I) electrodeposition response, so that the profile of the recorded j-t curve was the
sum of two contributions, firstly Cu(II) reduction to Cu(I) and the subsequent Cu(I)
electrodeposition. Thus, it was considered that the single-step potentiostatic procedure was
unviable for this process, since several processes are coupled on the current vs time
response besides the copper electrodeposition. To simplify the problem new procedure was
implemented.
As copper electrodeposition from Cu(II) solution takes place via preliminary Cu(II) - Cu(I)
step, we decided to record the j-t transients by applying two consecutive steps. Starting
from a potential (E0) at which no process occurs, the potential was jumped to a potential
value (E1) in which only Cu(II) to Cu(I) can occur, such a value being maintained during a
residence time (t1). Afterwards, potential was switched to another potential value (E2) at
which copper electrodeposition takes place. The aim of this procedure is to maintain
controlled conditions during the first step, thus allowing the second step (related to Cu(I)
electrodeposition) to begin at fixed invariant conditions for all E2 values employed, so that
reproducibility is reached (Fig. 6A).
After an examination of the parameters involved in the strategy proposed, it was decided to
fix E0 at 0.6V and E1 at -0.1V. Before recording the j-t curves, a systematic study was
performed in order to evaluate how the residence time (t1) at E1 affects response. Thus, t1
was varied from 1s to 50s while keeping the E2 constant at -0.85V (Fig. 6B). The j-t profile
obtained after this procedure shows two clear zones. At first, while potential E1 is applied,
the current monotonically decays (as corresponds to Cu(II) to Cu(I) reduction). On

1 2 3 4 5 6 7 8 9 10 11 12 13 14 15 16 17 18 19 20 21 22 23 24 25 26 27 28 29 30 31 32 33 34 35 36 37 38 39 40 41 42 43 44 45 46 47 48 49 50 51 52 53 54 55 56 57 58 59 60 61 62 63 64 65
11
applying E2, a current increase was observed that reaches a clear peak, followed by current
decrease. The profile of the j-t transients during the second step is similar to that recorded
using CuCl solution. Lastly, it is observed that on increasing t1, a global decrease of the
current involved in the second feature was observed, as corresponds to a decrease in the
current associated to Cu (II) reduction. It is remarkable that, as the length pulse in E1 was
enlarged, much more decoupling between Cu(II)-Cu(I) reduction response and Cu(I)
deposition is attained, allowing to identify peak profile much more clearly associated to
Cu(I) deposition when E2 is applied, an aspect of great importance for subsequent
mechanistic analysis (Fig 6B). To confirm these observations, some series of experiments
applying different E2 were performed, in all cases, the observed behaviour being similar.
From this previous examination it can be concluded that the decreasing contribution of
Cu(II) reduction as the t1 increases allows the identification of the j-t curve related to
electrodeposition much more accurately. It should be noted however that diffusion of the
Cu(I) species towards the solution is occurring simultaneously.
In view of the influence of the residence time t1 on the profile of the transients associated to
Cu(I) electrodeposition, at first, the j-t curves were recorded applying different E2 potential
values, maintaining t1 at 5 seconds (Fig. 7A). This first t1 value was selected considering
both the contribution of Cu(II) reduction current changes and the Cu(I) diffusion to
solution. Collecting the recorded transients at different E2 potentials it was observed that
increasing the overpotential sequentially, the current maximum increases and appears at
shorter times. Comparing the descending parts of the curves recorded at E2 at long
deposition times the coincidence is not perfect but differences are not noteworthy.
Taking into account that copper electrodeposition works through a nucleation followed by
3D growth as it was demonstrated before, we aim to test if the S-H model, in the non
dimensional plot could be applied as approximation to study nucleation mechanism from
the data recorded during the second potentiostatic step from the CuCl2 solution, taking
advantage from the fact that non-dimensional equations does not contain concentration
electroactive species dependence.
Previously to the application of the S-H model, current related to Cu(II) reduction must be
subtracted from global current recorded in order to remove this additional current
1 2 3 4 5 6 7 8 9 10 11 12 13 14 15 16 17 18 19 20 21 22 23 24 25 26 27 28 29 30 31 32 33 34 35 36 37 38 39 40 41 42 43 44 45 46 47 48 49 50 51 52 53 54 55 56 57 58 59 60 61 62 63 64 65
12
contribution. Thus, it was recorded the j-t transient corresponding to Cu(II)-Cu(I) reduction
during 40s, time sufficient to cover the time range corresponding to the application of E2
studied.
The non-dimensional adjustment of the curves j-t obtained after a 5s residence time t1 is
plotted in figure 7B. It can be seen that non-dimensional curves from experimental data
obtained applying this double-step potentiostatic signal fit quite well with the S-H model
allowing, in principle, some predictions about the nucleation-growth mechanism of the
process to be made. However, from non-dimensional adjustment it is also observed that
nucleation mechanism tends to instantaneous behavior reaching it at a not really high
applied overpotential contrasting with non-dimensional analysis results electrodepositing
copper directly from Cu(I) solution (Figure 3B). This could mean that after t1=5s nucleation
is overestimated. Moreover, when an analysis of the rising part of the j-t transients is
performed, no coherent correlation is found with that obtained from Cu(I) solution.
Therefore, it is clear that not sufficiently accurate estimation of the nucleation mechanism
can be achieved by selecting a 5s residence time in potential E1, although it fit curves j-t to
S-H model.
In view of the above exposed facts, to further refine the results, it was decided, after
revising the experimental results shown in Fig 7A for the current related to Cu(II) reduction
at Cu(I) (dashed line), to record j-t curves increasing the residence time in E1, to 10s. The
objective was to minimize the change in overall recorded current along deposition time,
associated to the Cu(II) reduction to Cu(I). The current associated from Cu(II) to Cu(I)
reduction hardly changes at all after the time-range selected. These changes may distort the
extracted current of electrodeposition process especially at the low deposition times. This
selected residence time also has the risk of losing part of the Cu(I) but due to the
quantitative treatment characteristics this does not constitute a dramatic variable.
Figure 7C shows j-t curves at different applied potentials E2. The observed behavior is
analogous to that shown in figure 7A but now, comparing the descending parts of the
transients, much better overlapping of the curves was obtained, spite of the double step
signal applied, as corresponds to 3-D growth diffusion-controlled. The j-t curves profiles
are in agreement with suppositions made above.
1 2 3 4 5 6 7 8 9 10 11 12 13 14 15 16 17 18 19 20 21 22 23 24 25 26 27 28 29 30 31 32 33 34 35 36 37 38 39 40 41 42 43 44 45 46 47 48 49 50 51 52 53 54 55 56 57 58 59 60 61 62 63 64 65
13
When these new j-t curves were adjusted to the non-dimensional S-H equations (Fig. 7D) it
was observed that at the lower overpotentials analyzed the nucleation follows an
intermediate mechanism which tends to instantaneous one increasing progressively and
sufficiently the overpotential. The comparison of the results with those obtained from the
CuCl solution shows that now the behavior coincidence observed is better than the obtained
previously using lower t1.
The analysis of the corresponding rising parts of the experimental j-t curves recorded
applying the potential E2 is in agreement with the non-dimensional analysis, and congruent
with the previously obtained from the CuCl solution. The obtained slopes approach to 0.5
upon increasing the overpotential, as correspond to the evolution to an instantaneous
mechanism (Fig. 8). Comparing, at fixed potential, the slope values obtained for the rising
parts of the copper electrodeposition j-t transients recorded from the two solutions, CuCl
and CuCl2, little differences between the values are observed.
This satisfactory concordance in the obtained results from CuCl and CuCl2 solutions using
the proposed strategy provides an useful tool that may allow the accurate analysis of
electrodeposition processes in which the intermediate valences are sufficiently stabilized in
the plating solution as it is this case of Cu(I) in chloride medium. The use of a double step
procedure allows to assure that the Cu(I) presence near the electrode when the
electrodeposition process starts is similar in all conditions. Although at these conditions,
the Cu(I) concentration is unknown due to the different diffusion fluxes, it is expected that,
in all experiments, the initial conditions for the subsequent step are similar, as the first jump
conditions are fixed, procedure that facilitates the reproducibility and coherence of the
response at the different E2 applied. Moreover, in DES, the extension of the length of the
first pulse improves the results, allowing the accuracy of the analysis because the current
recorded at these conditions is less sensitive to the changes associated to the Cu(II)
reduction.
Therefore, the characteristics of the response recorded by double step procedure when the
electrodeposition process involves nucleation followed by 3D growth diffusion controlled,
permits the evaluation of the data, using as acceptable approaching the non-dimensional
equations derived from SH model and the rising part analysis. This experimental method

1 2 3 4 5 6 7 8 9 10 11 12 13 14 15 16 17 18 19 20 21 22 23 24 25 26 27 28 29 30 31 32 33 34 35 36 37 38 39 40 41 42 43 44 45 46 47 48 49 50 51 52 53 54 55 56 57 58 59 60 61 62 63 64 65
14
has been demonstrated useful when the stabilization of intermediate species by the reaction
medium takes place, as occurs for Cu(I) in chloride medium. The stabilization of species
leads to sufficient separate reduction processes, as the manner that when potentiostatic
experiments were performed by means a single step, the response is disturbed by the
contribution of outside currents to the electrodeposition process and leads to no coherent
results, when they adjust to theoretical models.
3.2. Copper electrodeposition in aqueous chloride medium
As it is well known, in chloride medium, copper reduction from Cu(II) also occurs in two
steps sufficiently separated due to the stabilization of copper (I) by formation of complexes
with chloride [25]. Now we focused our efforts in the study of the copper deposition
process in concentrated chloride aqueous medium, in order to establish the effect of
chloride presence in the overall deposition process.
The potential range at which copper reduction occurs in 0.01M CuCl2 and 0.01M CuCl
both plus 3M NaCl solutions was established by cyclic voltammetry (Fig. 9). The
concentration of 3M NaCl was needed to ensure total solubilization of the Cu(I) by
complexation [26]. As was expected, the cyclic voltammetry for Cu(II) showed two groups
of features: first one corresponding to Cu(II)-Cu(I) reduction/oxidation reversible process,
and the second group corresponding to Cu(I) electrodeposition. In aqueous medium the
potential range at which the processes occur is sited at more positive potentials than in DES
solvent, highlighting that aqueous medium favors deposition even at this concentrated
chloride presence. A good coincidence in the potential range at which electrodeposition
takes place was found overlapping the voltammetric curves recorded from CuCl and CuCl2
solutions suggesting that, as occurs in DES solvent, Cu(II) reduction does not influence the
mechanism of the electrodeposition of Cu(I). Moreover, the voltammetric peak associated
to copper electrodeposition shows a sharper current increase than the corresponding
detected on DES and a well defined maximum, features that confirms the more favored
deposition process in aqueous medium.

1 2 3 4 5 6 7 8 9 10 11 12 13 14 15 16 17 18 19 20 21 22 23 24 25 26 27 28 29 30 31 32 33 34 35 36 37 38 39 40 41 42 43 44 45 46 47 48 49 50 51 52 53 54 55 56 57 58 59 60 61 62 63 64 65
15
From the CuCl2 solution and restricting the voltammetric negative limit to potentials at
which only Cu(II)-Cu(I) reduction/oxidation occurs cyclic voltammograms were recorded
different scan rates (Fig. 10A) and the Cu(II) diffusion coefficient was calculated plotting
each recorded current versus v1/2
. Good linearity (Fig. 10B) was obtained, being the
calculated diffusion coefficient 3.67.10
-6 cm
2s
-1, value in accordance with those obtained for
Cu(II) in sulphate aqueous medium [7].
3.2.1. Copper electrodeposition from Cu(I) solution
First stages of copper electrodeposition mechanism in rich-chloride aqueous media were
analyzed, firstly, using the solution containing CuCl by means potentiostatic method. The j-
t curves from 0.01M CuCl plus 3M NaCl solution recorded applying single potential step
are shown in (Fig. 11A). The j-t transients show the typical profile of nucleation process
followed by 3D growth controlled by diffusion. It is worthy to mention that in aqueous
medium is needed a narrow potential range to observe relevant changes in the recorded j-t
transients. At longer times, the recorded curves overlap, confirming the diffusion control
for the electrodeposition process. The diffusion coefficient calculated (Table 1) by Cotrell’s
equation and using the ending of the descending curves, averages 1.5·10-5
cm2s
-1. This value
is higher than that for Cu(II) and also fifty times higher than that calculated for Cu(I) in
DES, a fact attributable to the species greater mobility in aqueous medium.
The potentiostatic curves obtained from the CuCl solution adjusted to non-dimensional S-H
model showed that, in the analyzed potential range, copper electrodeposition works through
an intermediate mechanism and tends to instantaneous one when overpotential was
increased (Fig. 11B). In this aqueous medium, the gradual change occurs in a shorter
potential range than in DES media. This approach to instantaneous behavior was also
supported by the results provided by the complementary logarithmic analysis of the rising
part of the experimental j-t transients. Linear dependence was obtained (Fig. 12A), and the
calculated slopes tend to 0.5, although is not achieved, increasing the overpotential as
predict equation (4) for instantaneous nucleation. The nucleation type derived from the jm
and tm values by means the criteria jm2 x tm confirms the intermediate behavior (Table 2),
with transition to progressive to instantaneous nucleation. The calculated products at the

1 2 3 4 5 6 7 8 9 10 11 12 13 14 15 16 17 18 19 20 21 22 23 24 25 26 27 28 29 30 31 32 33 34 35 36 37 38 39 40 41 42 43 44 45 46 47 48 49 50 51 52 53 54 55 56 57 58 59 60 61 62 63 64 65
16
higher overpotentials tested approach to the predicted for instantaneous nucleation (jm2 x tm
= 2.28*10-6
A2 cm
-4 s), whereas the lower are far of the predicted by progressive (jm
2 x tm =
3.63*10-6
A2 cm
-4 s).
Thus, from these experiments, it is confirmed the applicability of the S-H model to analyze
the nucleation mechanism from rich-chloride aqueous solution containing CuCl. Both the
non-dimensional adjustment and the logarithmic analysis of the rising part of the j-t
transients supported that copper electrodeposition tends to instantaneous mechanism
increasing the overpotential.
3.2.2. Copper electrodeposition from Cu(II) solution
As occurred in DES, it was not possible obtaining reproducible results applying single
potentiostatic step using solutions containing Cu(II) in chloride excess. In this section our
efforts addressed testing the applicability of the developed two step potential protocol to the
first stages study of copper nucleation and 3D growth mechanism in aqueous medium. For
this purpose 0.01M CuCl2 plus 3M NaCl solution was used.
After a deep analysis of the applied potential effect, it was decided to fix E0 at 0.8V and E1
at 0V, being the latter enough separated from Cu(I) electrodeposition, ensuring that only
Cu(II)-Cu(I) reduction occurs at this first step.
It was firstly evaluated as Cu(II)-Cu(I) reduction influences the electrochemical response
related to copper electrodeposition, recording j-t curves keeping E1 and E2 constant and
increasing progressively the residence time (t1) in E1, t1 was varied between 0.5 and 5s
attending the foreseeable high mobility of ion species in aqueous medium. The recorded
transient shows two clear zones, the corresponding to the reduction of Cu(II) to Cu(I) and
that of copper electrodeposition. Taking into account that these diffusion coefficients of
both Cu(II) and Cu(II) in aqueous solution are considerably higher than those obtained in
DES, it was decided to fix residence time (t1) in 1s for using the double step signal (ten
times lower than that used in the DES solvent). This residence time is a compromise value
with the purpose to minimize both the decrease of Cu(I) concentration on the electrode

1 2 3 4 5 6 7 8 9 10 11 12 13 14 15 16 17 18 19 20 21 22 23 24 25 26 27 28 29 30 31 32 33 34 35 36 37 38 39 40 41 42 43 44 45 46 47 48 49 50 51 52 53 54 55 56 57 58 59 60 61 62 63 64 65
17
surface and the contribution to overall current of Cu(II) reduction. Low residence time
implies higher contribution of Cu(II)-Cu(I) reduction process, making it difficult to extract
electrodeposition current without error. Enlarging t1 favors the Cu(I) diffusion to the
solution.
The profile for all j-t curves recorded at different E2 (Fig. 13A) shows the characteristic
profile corresponding to a nucleation followed by 3-D growth. Reproducibility was getting
very hard. Comparing the descending parts of the j-t transients overlapping at high
deposition time was found.
However contrasting with that observed when Cu(I) was directly electrodeposited, at these
conditions low E2 values were necessary to increase the deposition rate, value of 600 mV
was applied. This fact could be related to low Cu(I) concentration on the electrode surface
due to the favored diffusion towards the solution. The decrease of electroactive species on
the surface would explain the low current response compared with that obtained at fixed
potential from the Cu(I) solution in aqueous solution.-
The j-t transients obtained at different E2 potential values were fitted to the non-
dimensional equations provided by S-H model, after subtracting the corresponding Cu(II)
to Cu(I) reduction current in the overall recorded current. Non-dimensional adjustment
(Fig. 13B) shows that mechanism corresponds to intermediate behavior at the lower applied
potentials, and as occurs from the Cu(I) solution, increasing the overpotential, the curves
approach to that corresponding to instantaneous mechanism. In the same way, the analysis
of the rising part of the curves supports these results, the slope values of the linear
representation (Fig. 12B) progressively decrease, approaching to values near to 0.5, limit of
instantaneous nucleation.
The results indicate that as occurs in DES solvent, from CuCl2 aqueous solution in chloride
excess also the S-H model could be applied, as approximation, to study the nucleation
mechanism fitting the j-t transients recorded during the second stretch of the double step
procedure, decreasing the residence time t1. But spite of low residence time, attain
reproducibility is hard, the mobility of the ionic species in aqueous medium makes difficult
to keep control of the initial conditions, due to Cu(I) diffuses easily to the solution. Thus, in
1 2 3 4 5 6 7 8 9 10 11 12 13 14 15 16 17 18 19 20 21 22 23 24 25 26 27 28 29 30 31 32 33 34 35 36 37 38 39 40 41 42 43 44 45 46 47 48 49 50 51 52 53 54 55 56 57 58 59 60 61 62 63 64 65
18
aqueous medium, the diffusion rate limits the application of this procedure, forcing
applying high overpotentials to obtain a significant current response, although overcoming
the experimental drawbacks it was demonstrated that reliable information about the
nucleation process is obtained.
The general behavior is in concordance with that obtained from mechanistic analysis from
the CuCl solution using single step signal. So, the consistency of the mechanistic results
obtained from both CuCl2 and CuCl solutions supports the usefulness of the double step
signal protocol proposed, taking care that the residence time is well selected depending on
the particular characteristics of the medium.
3.3. Morphological characterization of copper deposits
In order to analyze how the nature of the solvent could affect the growth of copper
electrodeposits, a morphological analysis was performed both in DES and in aqueous
media. Figure 14 A shows that, when deposit was prepared from the DES solution, a
population of small grains with characteristic morphology appeared suggesting low
superficial diffusion and difficult nucleation at the low overpotentials. Increasing both the
overpotential and the applied charge, population of grains, that shows similar morphology,
increases (Fig. 14 B). Although coalescence is not achieved some dendritic growth was
observed at high overpotential.
On the other hand, when deposits were prepared in the aqueous solution with excess of
chloride, blocks much bigger appear (Fig. 14 C). In this medium, higher superficial
diffusion in the vitreous carbon allows the higher aggregation of the nucleus formed,
leading to crystals of high size. However, a detailed analysis of the SEM pictures indicates
that the morphology of the deposits is no affected by the medium, similar morphology was
obtained regardless of whether the deposit was formed in the DES or in the chloride
medium.

1 2 3 4 5 6 7 8 9 10 11 12 13 14 15 16 17 18 19 20 21 22 23 24 25 26 27 28 29 30 31 32 33 34 35 36 37 38 39 40 41 42 43 44 45 46 47 48 49 50 51 52 53 54 55 56 57 58 59 60 61 62 63 64 65
19
To verify if morphology is affected by the presence of chloride, copper was
electrodeposited from NaClO4 0.5M plus CuCl2 0.01M solution at different potentials.
Copper electrodeposition occurs faster in perchlorate than in chloride medium.
Figure 14 D shows that the deposit prepared in perchlorate medium at low overpotential is
formed by blocks which size is comparable to those obtained in chloride aqueous medium
at similar charge although at difference than those obtained in chloride medium, the grains
are less smoother and show more complex morphology. In this medium, when the deposits
were prepared rising slightly the overpotential, it was observed that the deposit is
constituted by crystals, all of them of similar size, suggesting that in perchlorate medium
copper electrodeposition easily takes place through an instantaneous mechanism (Fig. 14
E).
All these results suggest that copper electrodeposition takes place through a mechanism
which approach to instantaneous behavior, easily in perchlorate medium and slowly in
chloride one. The chloride presence seems to delay slightly dendrite appearance as deduced
in the comparison between the deposits obtained from perchlorate and chloride in aqueous
medium. The lower diffusion superficial in DES results in a homogenous distribution of
grains with size smaller than the observed in chloride media although morphology does not
seem affected dramatically by DES.
4. Conclusions
This work reports mechanistic analysis of the copper electrodeposition from a eutectic
mixture of choline chloride-urea. The electrochemical reduction was studied by cyclic
voltammetry and the nucleation and growth process was investigated by potentiostatic
technique. Similar analysis was made in aqueous solution with excess chloride ion.
Both chronoamperometric and voltammetric results make in evidence that the copper
deposition in all conditions studied corresponds to a nucleation and 3D growth process,
diffusion controlled.
1 2 3 4 5 6 7 8 9 10 11 12 13 14 15 16 17 18 19 20 21 22 23 24 25 26 27 28 29 30 31 32 33 34 35 36 37 38 39 40 41 42 43 44 45 46 47 48 49 50 51 52 53 54 55 56 57 58 59 60 61 62 63 64 65
20
The use of DES as solvent slows the growth process. In the DES solvent higher both
temperature and concentration are needed in order to attain current comparable with the
obtained in aqueous medium.
The applicability of the S-H model in the DES solvent was demonstrated, making in
evidence that copper deposition approaches to instantaneous nucleation applying sufficient
overpotentials.
It was designed a two step potential procedure to study the nucleation mechanism when
copper reduction takes place from Cu(II) solutions in two steps sufficiently separated,
involving each one the transference of one electron. The applicability of the S-H model has
been demonstrated for the transients obtained along the second step. The fact that S-H non-
dimensional equations do not depend on the concentration allows the use of the model. The
requirement is to keep controlled the initial conditions of second step; this is achieved by
properly selecting of residence time in the first step.
In conclusion, the double step signal proposed can be applied successfully to study the
electrodeposition process when intermediate species are stabilized by species present in the
media, being the procedure success dependent on the control of the initial conditions at
which electrodeposition takes place. In DES the low mobility of species facilitates the
application of the procedure, whereas in aqueous medium the great mobility of ionic
species makes difficult it.
This strategy does not allow to estimate Cu(I) concentration on the surface. The perspective
for the future would be focused on finding the appropriate model which could describe
accurately processes which involve more than one electroreduction step and provide the
complete mechanistic parameters to understand this kind of electrodeposition processes.
More work in this field is stell needed to be performed.
Finally, the morphological study demonstrates neither chloride presence nor DES solvent
affect significantly the morphology of final deposits although a smoothness of the grains
was observed. The small size of the grains obtained in DES by comparing them with those
obtained in aqueous medium, confirms the lower superficial diffusion in DES. The

1 2 3 4 5 6 7 8 9 10 11 12 13 14 15 16 17 18 19 20 21 22 23 24 25 26 27 28 29 30 31 32 33 34 35 36 37 38 39 40 41 42 43 44 45 46 47 48 49 50 51 52 53 54 55 56 57 58 59 60 61 62 63 64 65
21
uniformity of the grain size in perchlorate medium at moderate overpotentials confirms
copper electrodeposition mechanism tends to instantaneous condition.
Acknowledgements
Financial support from the MINECO contract CTQ2010-20726 (subprogram BQU) is
grateful acknowledged. The authors wish to thank the Centres Científics i Tecnològics de la
Universitat de Barcelona (CCiTUB) for the use of their equipment.

1 2 3 4 5 6 7 8 9 10 11 12 13 14 15 16 17 18 19 20 21 22 23 24 25 26 27 28 29 30 31 32 33 34 35 36 37 38 39 40 41 42 43 44 45 46 47 48 49 50 51 52 53 54 55 56 57 58 59 60 61 62 63 64 65
22
References
[1] C.K. Hu, J.M.E. Harper, Mater. Chem. Phys. 52 (1998) 5-16.
[2] A. Ramos, M. Miranda-Hernández, I. González, J. Electrochem. Soc. 148 (2001) C315-
C321.
[3] D. Grujicic, B. Pesic, Electrochim. Acta, 2002, 47, 2901-2912.
[4] D. Grujicic and B. Pesic. Electrochim. Acta, 2005, 50, 4426-4443.
[5] A.P. Abbott, K. E. Tabib, G. Frisch, K. J. Mckenzie, K. S. Ryder, Phys. Chem. Chem.
Phys. 11 (2009) 4269-4277.
[6] M.R. Majidi, K. Asadpour-Zeynali, B. Hafezi, Electrochim. Acta 54 (2009) 119-1126.
[7] M. Gu and Q. Zhong, J. Appl. Electrochem. 41 (2011) 765-771.
[8] Electrochemical Aspects of Ionic Liquids, Ed. Hiroyuki Ohno, John Wiley & Sons,
2005 New Jersey.
[9] A.P. Abbott, G. Capper, D.L. Davies, R.K. Rasheed, P. Shikotra, Inorg. Chem. 44
(2005) 6497-6499.
[10] S. Salomé, N.M. Pereira, E.S. Ferreira, C.M. Pereira, A.F. Silva, J. Electroanal.Chem.
703 (2013) 80-87.
[11] J.C. Malaquias, M. Steichen, M. Thomassey, P.J. Dale, Electrochim. Acta 103 (2013)
15-22.
[12] P. Guillamat, M. Cortes, E. Valles, E. Gomez, Surf. Coat. Technol. 206 (2012) 4439-
4448.
[13] K. Haerens, E. Matthijs, A. Chmielarz, B.V. Bruggen., J. Environmental.
Management 90 (2009) 3245-3252.
[14] L.A. Woolf, A. W. Hoveling, J. Phys. Chem. 74 (1970) 2046-2048.
[15] L-Bonou, M. Eyraud, J. Crousier, J. Appl. Electrochem. 24 (1994) 906-910.
[16] C. A. Gunawan, B. H. R. Suryanto, C. Zhao, J. Electrochem. Soc. 159 (2012) D611-
D615.
[17] M. A. Pasquale, L. M. Gassa, A. J. Arvia, Electrochim. Acta 53 (2008) 5891-5904.
[18] E.P. Grishina, A.M. Pimenova, N.O. Kudryakova, L.M. Ramenskaya, Russ. J.
Electrochem. 48(12) (2012) 1166-1170.
[19] E. Gomez, P. Cojocaru, L. Magagnin and E. Valles, J. Electroanal. Chem. 658 (1-2)
(2011) 18-24

1 2 3 4 5 6 7 8 9 10 11 12 13 14 15 16 17 18 19 20 21 22 23 24 25 26 27 28 29 30 31 32 33 34 35 36 37 38 39 40 41 42 43 44 45 46 47 48 49 50 51 52 53 54 55 56 57 58 59 60 61 62 63 64 65
23
[20] G. Gunawardena, G. Hills, I. Montenegro, B. Sharifker, J. Electroanal. Chem. 138
(1982) 225-239.
[21] B. Scharifker, G. Hills, Electrochim. Acta 28 (1983) 879-889.
[22] O. Mann, W. Freyland. J. Phys. Chem. C 111 (2007) 9832-9838.
[23] T. Jiang, M.J. Chollier, Brym, G. Dube, A. Lasin, G.M. Brisard, Surf. Coat. Technol.
201 (2006) 10-18.
[24] A. A. F. Bard and R. Larry. Electrochemical methods: fundamentals and applications,
page 231, 2nd ed., John Wiley & Sons Inc., New York, 1980.
[25] G. Gunawardena, G. Hills, I. Montenegro. J. Electroanal. Chem. 184 (1985) 357-369.
[26] MEDUSA-Chemical Diagrams (2.0) and HYDRA-Hydrochemical Database (2.0).
Softwares of I. Puigdomenech. http://www.kemi.kth.se/medusa/.

1 2 3 4 5 6 7 8 9 10 11 12 13 14 15 16 17 18 19 20 21 22 23 24 25 26 27 28 29 30 31 32 33 34 35 36 37 38 39 40 41 42 43 44 45 46 47 48 49 50 51 52 53 54 55 56 57 58 59 60 61 62 63 64 65
24
Captions for Figures
Fig. 1. Voltammetric curves at 50 mVs-1
from 0.05 M CuCl2 in DES solvent at different
negative limits: solid line) -1500mV and dashed line) -770mV.
Fig. 2. Voltammetric curves at 50 mVs-1
from A) 0.05 M CuCl in DES solvent at different
negative limits: solid line) -1500mV and dashed line) -847mV. B) solid line) 0.05 M CuCl2
in DES solvent and dashed line) 0.05M CuCl in DES solvent.
Fig. 3. A) Potentiostatic current transients from 0.05M CuCl in DES solution, curves a) -
750 b) -800, c) -850, d) -900, e) -965, f) -1000 and g) -1065 mV. Inset: Plots according
Cotrell equation for curves d, f and g. B) Non-dimensional plots of (j/jm)2 vs t/tm for some
of j-t transients of figure 3A.
Fig. 4. Current vs time, logarithmic plot of rising part of the current transients for the
deposition of copper from 0.05M CuCl in DES solvent, curves: a) -750, b) -800, c) -850, d)
-900, e) -965 and f) -1000 mV.
Fig. 5. A) Voltammetric curves at different scan rates from CuCl2, 0.05M in DES solvent
from 0.800V to -0.200V curves: a) 5, b) 10, c) 20, d) 50, e) 100, f) 150 and g) 200 mV/s. B)
Corresponding jp,c vs v1/2
plot.
Fig. 6. A) Scheme of the applied signal to record j-t transients. B) Potentiostatic current
transients from 0.05M CuCl2 in DES solvent using double step signal, E1= -100 mV E2= -
850 mV and different residence times (t1): a) 1 b) 5, c) 10, d) 20, e) 50 and f) 60s.
Fig. 7. A) Potentiostatic current transients for the deposition of copper from 0.05M CuCl2
in DES solvent, using double step signal, E1= -100 mV t1= 5s- and different E2: a) -800, b) -
850, c) -950, d) -1000, e) -1050, f) -1075, g) -1100 and h) 1150 mV. B) Non-dimensional
plots of (j/jm)2 vs t/tm for some of j-t transients of figure 7A. C) Same solution and
conditions and t1= 10s at different E2: a) -800, b) -850, c) -900, d) -950, e) -1000. B) Non-
dimensional plots of (j/jm)2 vs t/tm for some of j-t transients of figure 7C.
Fig. 8. Current vs time, logarithmic plot of rising part of the j-t transients of Figure 7C, at
E2: a) -850, b) -900, c) -950 and d) -1000 mV.
Fig. 9. Voltammetric curves in aqueous medium at 50 mVs-1
from: solid line) 0.01 M
CuCl2 + 3M NaCl, dashed line) 0.01M CuCl + 3M NaCl.
Fig. 10. A) Voltammetric curves in aqueous medium at different scan rates from 0.01M
CuCl2 +3M NaCl solution, scanning between 0.6V and -0.1V: a) 5, b) 10, c) 20, d) 50, e)
100, f) 150 and g) 200 mV/s. B) Corresponding j vs v1/2
plot.

1 2 3 4 5 6 7 8 9 10 11 12 13 14 15 16 17 18 19 20 21 22 23 24 25 26 27 28 29 30 31 32 33 34 35 36 37 38 39 40 41 42 43 44 45 46 47 48 49 50 51 52 53 54 55 56 57 58 59 60 61 62 63 64 65
25
Fig. 11. A) Potentiostatic current transients for the deposition of copper from 0.01M CuCl
+ 3M NaCl solution, curves: a) -345, b) -355, c) -360, d) -375, e) -390, f) -400 and g) -415
mV. B) Non-dimensional plots of (j/jm)2 vs t/tm for some of j-t transients of figure 11A.
Fig. 12. Current vs time, logarithmic plot of rising part of the j-t transients: A) from 0.01M
CuCl + 3M NaCl solution at: a) -355, b) -375, c) -400 and d) -415 mV. B) from 0.01M
CuCl2+ 3N NaCl, using double step signal at: a) -400, b) -450, c) -500 and d) -550 mV.
Fig. 13. A) Potentiostatic current transients for the deposition of copper from 0.01M
CuCl2+ 3N NaCl, using double step signal, E1= 0 mV t1= 1s and different E2: a) -400, b) -
450, c) -500, d) -520, e) -550, f) -600 and g) -650mV. B) Non-dimensional plots of (j/jm)2
vs t/tm for some of j-t transients of figure 13A.
Fig. 14. SEM images of deposits prepared potentiostaticaly from different solutions: 0.05M
de CuCl in DES solvent at: A) -850 mV, Q= -10 mC and B) -870 mV, Q=30 mC; C) 0.01M
CuCl + NaCl 3M solution at -300 mV, Q=20 mC, and 0.01M CuCl + 0.6M NaClO4
solution at: D) -100 mV, Q= 15 mC and E) -115 mV, Q= 15 mC.

1 2 3 4 5 6 7 8 9 10 11 12 13 14 15 16 17 18 19 20 21 22 23 24 25 26 27 28 29 30 31 32 33 34 35 36 37 38 39 40 41 42 43 44 45 46 47 48 49 50 51 52 53 54 55 56 57 58 59 60 61 62 63 64 65
26
Table 1.
Diffusion coefficients obtained from the descending part of the j-t transients in the analyzed
solutions
3M NaCl DES Solvent
[Cu(I)]=0.01 M [Cu(I)]=0.05 M
E/mV D/cm2s
-1 E / mV D/cm
2s
-1
-415 1.50E-05 -1065 3.27E-07
-400 1.47E-05 -1000 3.14E-07
-390 1.51E-05 -965 3.06E-07
-375 1.41E-05 -900 3.22E-07
E vs (Ag/AgCl)

1 2 3 4 5 6 7 8 9 10 11 12 13 14 15 16 17 18 19 20 21 22 23 24 25 26 27 28 29 30 31 32 33 34 35 36 37 38 39 40 41 42 43 44 45 46 47 48 49 50 51 52 53 54 55 56 57 58 59 60 61 62 63 64 65
27
Table 2.
Characteristics of the potentiostatic current maximum for the j-t transients obtained from
[Cu(I)]=0.05M in DES solvent and [Cu(I)]=0.05M + [NaCl]=0.01M in aqueous medium
DES solvent
[Cu(I)]=0.05M
E/mV tm/s jm/A cm-2
jm2 tm
-750 9.81 -0.41E-3 1.64E-06
-800 4.66 -0.57E-3 1.52E-06
-850 2.86 0.73E-3 1.51E-06
-900 2.01 -0.85E-3 1.45E-06
-965 1.56 -0.95E-3 1.42E-06
-1000 0.99 -1.20E-3 1.42E-06
Chloride 3M
[Cu(I)]=0.01M
-355 2.645 -0.98E-3 2.53E-06
-360 1.775 -1.22E-3 2.62E-06
-375 1.085 -1.54E-3 2.57E-06
-390 0.605 -2.09E-3 2.65E-06
-400 0.435 -2.45E-3 2.61E-06
E vs (Ag/AgCl)

1 2 3 4 5 6 7 8 9 10 11 12 13 14 15 16 17 18 19 20 21 22 23 24 25 26 27 28 29 30 31 32 33 34 35 36 37 38 39 40 41 42 43 44 45 46 47 48 49 50 51 52 53 54 55 56 57 58 59 60 61 62 63 64 65
28
Table 3.
Characteristic values of Ep,c and jp,c for the cathodic peak and Ep,a and jp,a for the anodic peak
at different scan rates in the analyzed solutions.
E vs (Ag/AgCl)
v / mV s-1
Epc / V Epa / V lEpc-Epal / V
200 0.239 0.434 0.185
150 0.239 0.422 0.173
DES solvent 100 0.239 0.422 0.173
[Cu(II)]=0.05M 50 0.241 0.412 0.161
20 0.272 0.389 0.117
10 0.275 0.387 0.112
5 0.278 0.383 0.105
200 0.295 0.383 0.078
150 0.295 0.388 0.073
Chloride 3M 100 0.288 0.383 0.075
[Cu(II)]=0.01M 50 0.297 0.373 0.076
20 0.307 0.378 0.071
10 0.305 0.378 0.073
5 0.305 0.375 0.071

Table 1.
Diffusion coefficients obtained from the descending part of the j-t transients in the analyzed
solutions
3M NaCl DES Solvent
[Cu(I)]=0.01 M [Cu(I)]=0.05 M
E/mV D/cm2s-1 E / mV D/cm2s-1
-415 1.50E-05 -1065 3.27E-07
-400 1.47E-05 -1000 3.14E-07
-390 1.51E-05 -965 3.06E-07
-375 1.41E-05 -900 3.22E-07
E vs (Ag/AgCl)
Table1
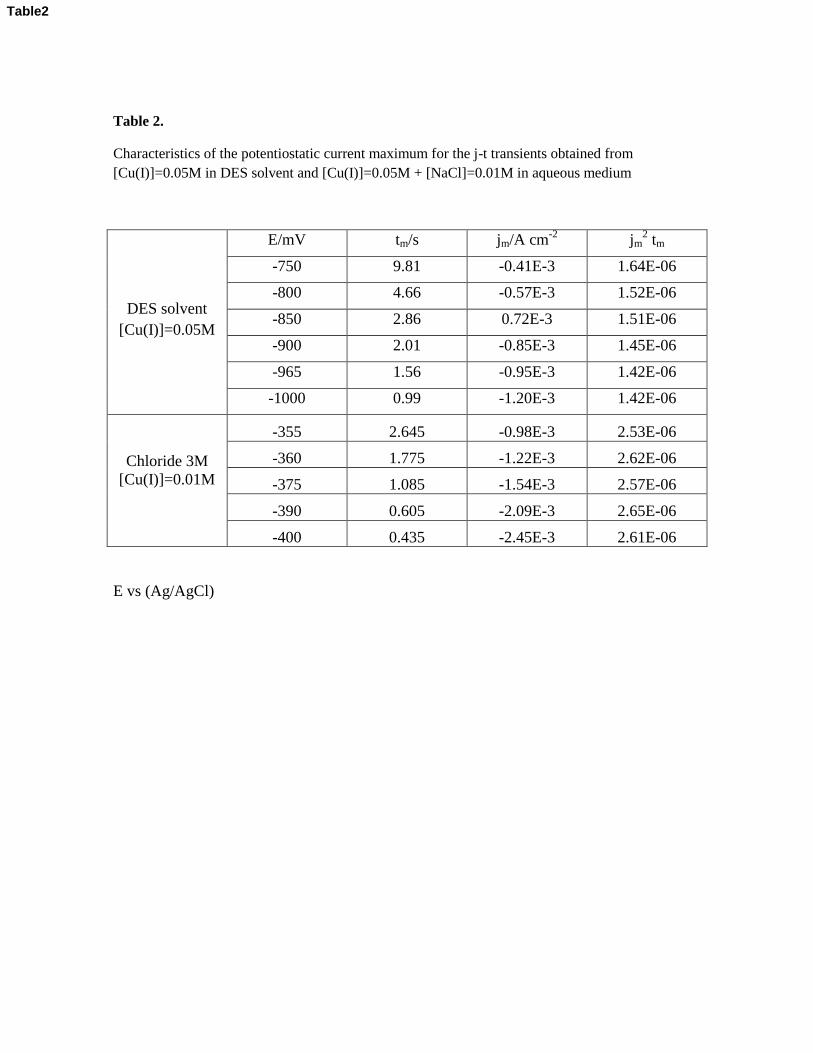
Table 2.
Characteristics of the potentiostatic current maximum for the j-t transients obtained from [Cu(I)]=0.05M in DES solvent and [Cu(I)]=0.05M + [NaCl]=0.01M in aqueous medium
DES solvent [Cu(I)]=0.05M
E/mV tm/s jm/A cm-2 jm2 tm
-750 9.81 -0.41E-3 1.64E-06
-800 4.66 -0.57E-3 1.52E-06
-850 2.86 0.72E-3 1.51E-06
-900 2.01 -0.85E-3 1.45E-06
-965 1.56 -0.95E-3 1.42E-06
-1000 0.99 -1.20E-3 1.42E-06
Chloride 3M [Cu(I)]=0.01M
-355 2.645 -0.98E-3 2.53E-06
-360 1.775 -1.22E-3 2.62E-06
-375 1.085 -1.54E-3 2.57E-06
-390 0.605 -2.09E-3 2.65E-06
-400 0.435 -2.45E-3 2.61E-06
E vs (Ag/AgCl)
Table2

Table 3.
Characteristic values of Ep,c and jp,c for the cathodic peak and Ep,a and jp,a for the anodic peak
at different scan rates in the analyzed solutions.
E vs (Ag/AgCl)
v / mV s-1 Epc / V Epa / V lEpc-Epal / V
200 0.239 0.434 0.185
150 0.239 0.422 0.173
DES solvent 100 0.239 0.422 0.173
[Cu(II)]=0.05M 50 0.241 0.412 0.161
20 0.272 0.389 0.117
10 0.275 0.387 0.112
5 0.278 0.383 0.105
200 0.295 0.383 0.078
150 0.295 0.388 0.073
Chloride 3M 100 0.288 0.383 0.075
[Cu(II)]=0.01M 50 0.297 0.373 0.076
20 0.307 0.378 0.071
10 0.305 0.378 0.073
5 0.305 0.375 0.071
Table3

Figure1Click here to download high resolution image

Figure2Click here to download high resolution image

Figure3Click here to download high resolution image

Figure4Click here to download high resolution image
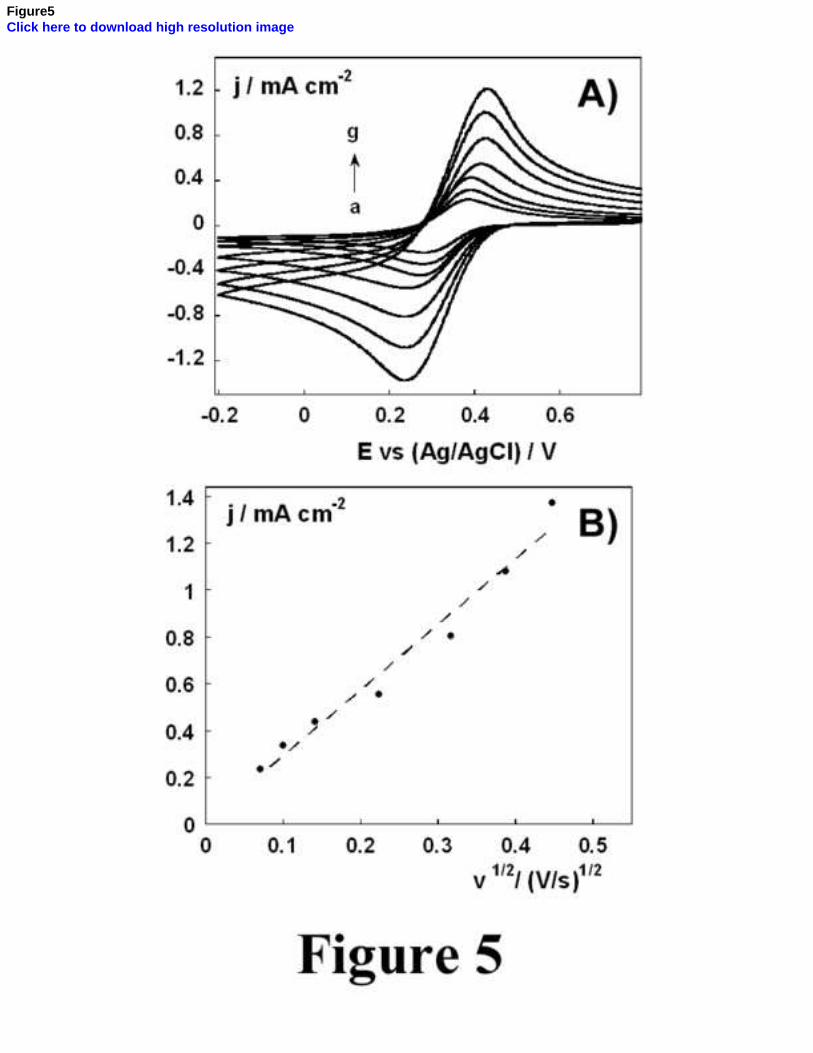
Figure5Click here to download high resolution image
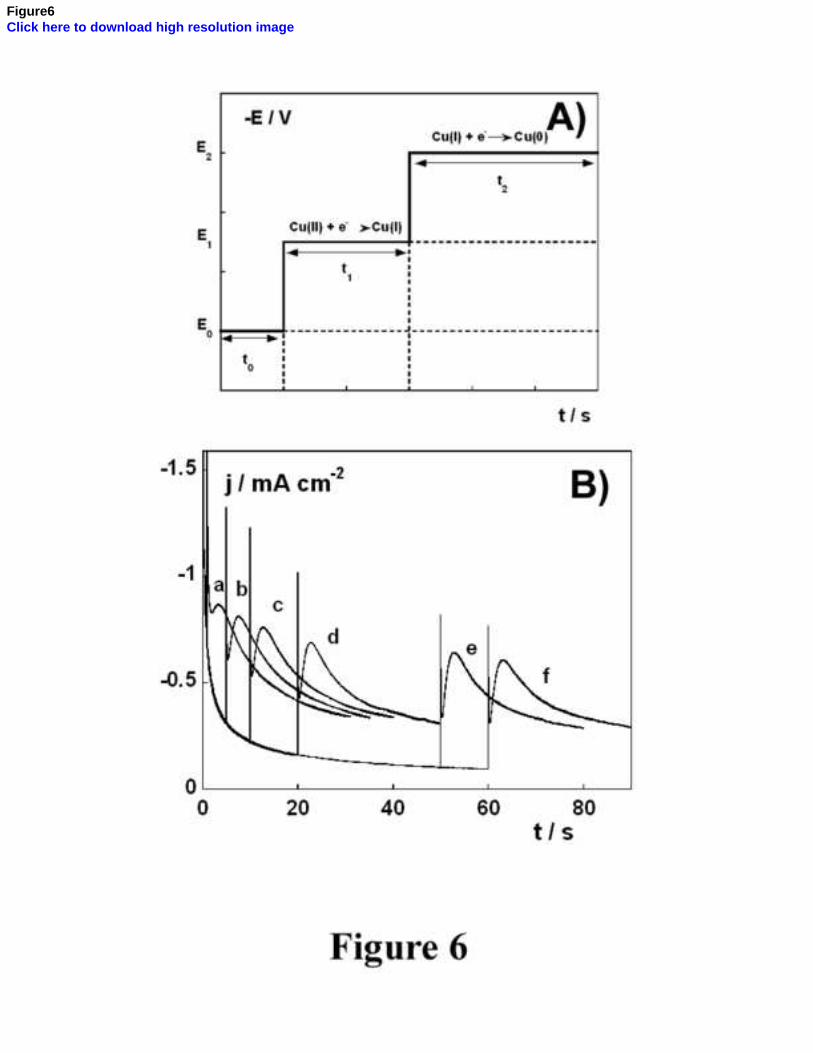
Figure6Click here to download high resolution image
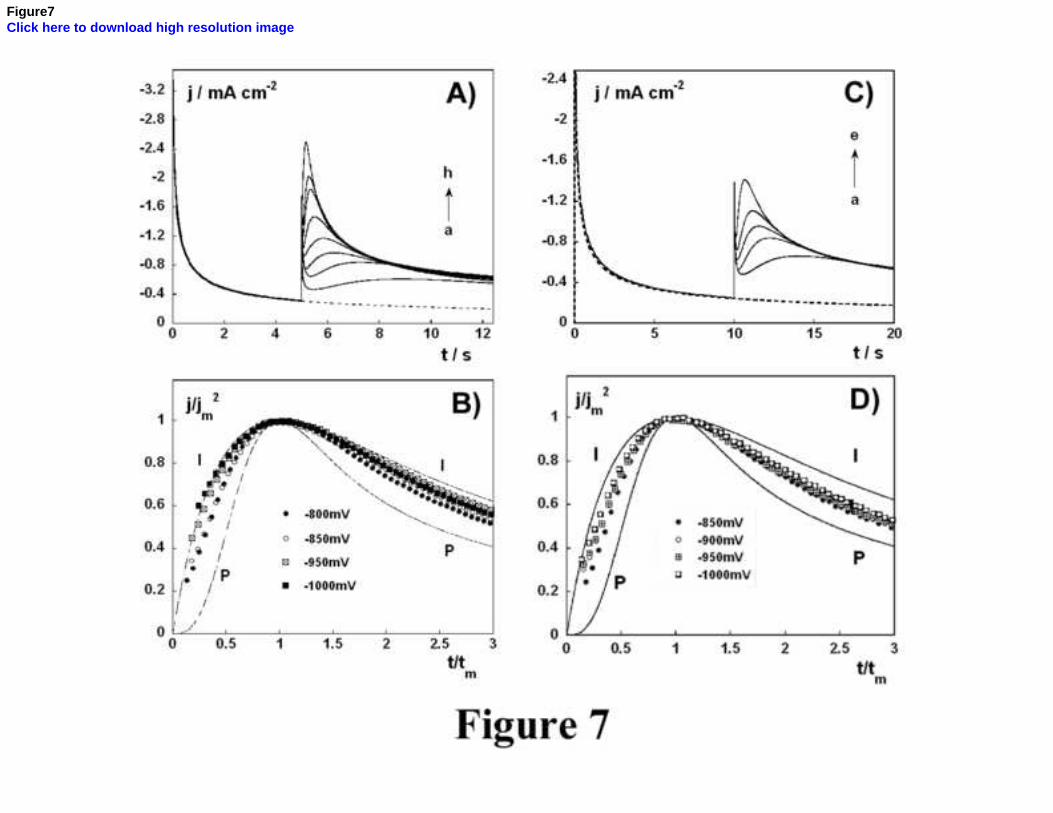
Figure7Click here to download high resolution image
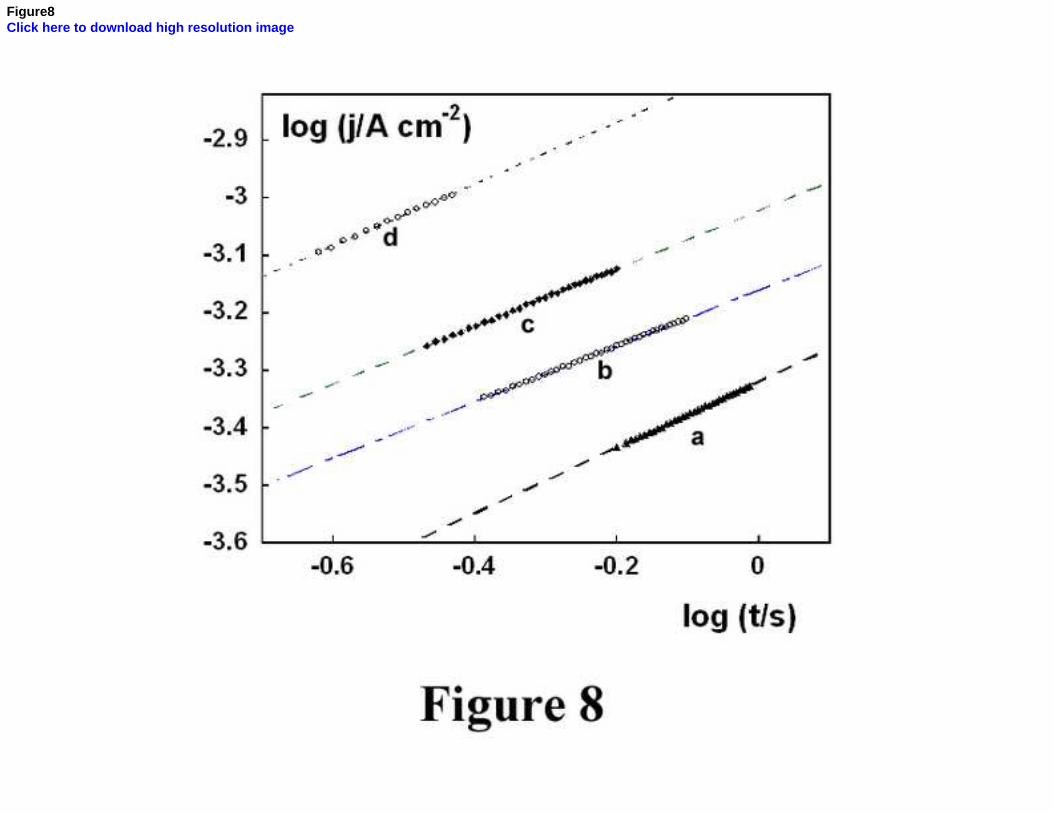
Figure8Click here to download high resolution image
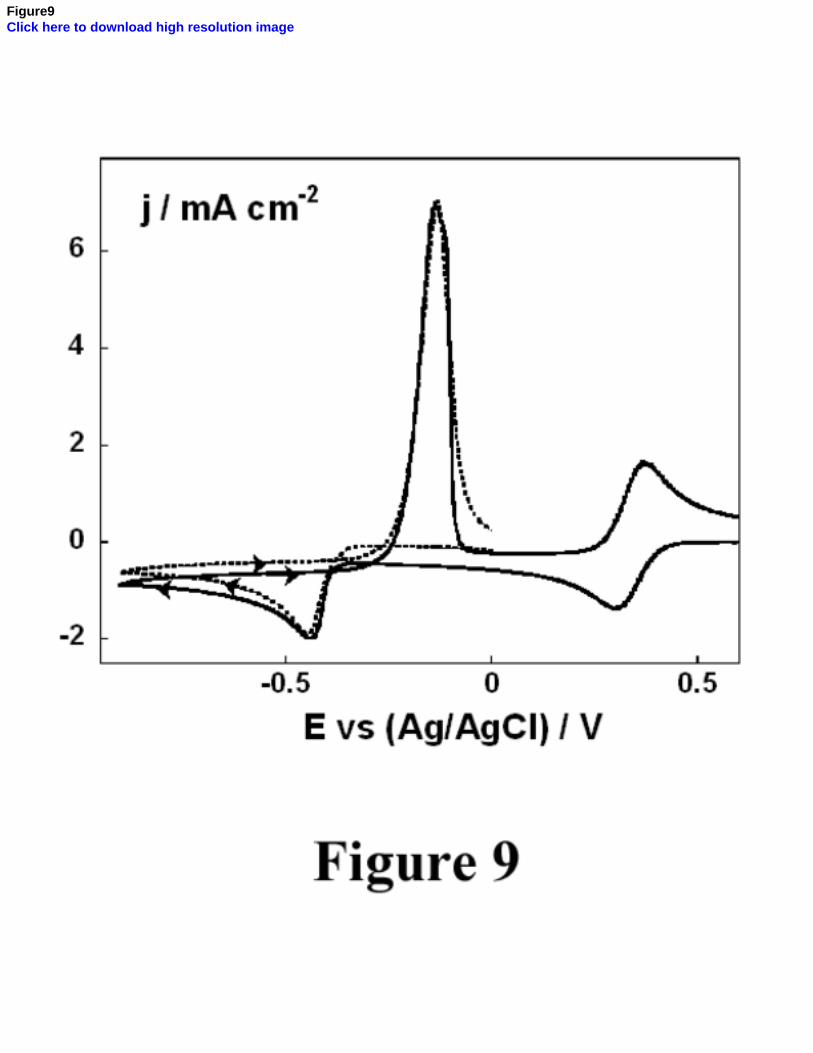
Figure9Click here to download high resolution image

Figure10Click here to download high resolution image

Figure11Click here to download high resolution image

Figure12Click here to download high resolution image

Figure13Click here to download high resolution image

Figure14ABClick here to download high resolution image
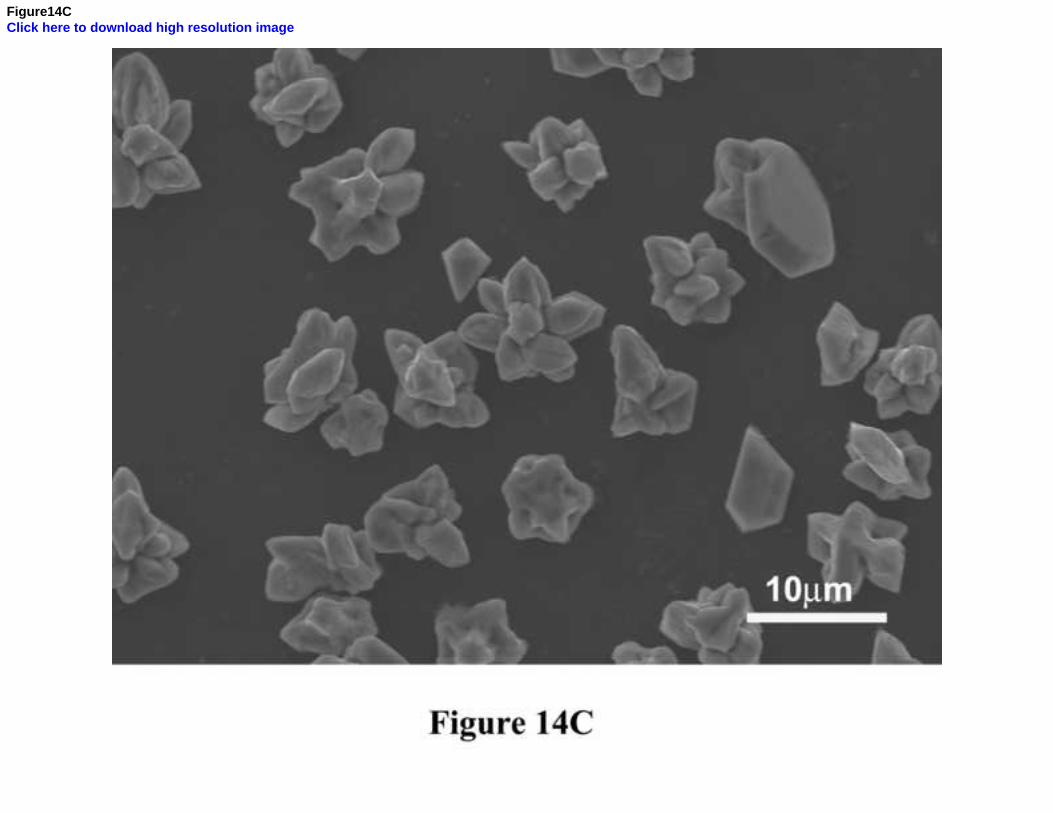
Figure14CClick here to download high resolution image

Figure14DEClick here to download high resolution image
Related Documents


