* ONGC, 6 th floor, CMDA Tower-I, Gandhi-Irwin Road, Egmore, Chennai – 600 008, India; [email protected] P-251 A feasibility study for full wave seismic imaging in Cauvery basin, India O.P.Singh*, P.L.Chamoli, S.M.Pugazhanthi & K. Ramakrishna RCC, Geophysical Services, ONGC, Chennai Summary After the introduction of high channel count systems and 3component geophones in in-house field crew and Multi component seismic processing package at Regional Processing Centre, a feasibility study for Full wave seismic imaging project was carried out. Modeling studies for acquiring PS data in Kuthalam field of Cauvery basin were done as first step. One 2D3C Seismic Line was shot in the field after designing the acquisition parameters based on the result of modeling studies. The 2D3C data shows good penetration of PS energy and it seems that a full wave seismic imaging project after the acquisition of 3D3C data in this area is feasible. Introduction Full wave seismic imaging (Multi component seismic) requires faithful recording of entire seismic signal that the earth can provide. With the introduction of high channel – count systems combined with three component (3C) digital sensors, the fully compliant full wave on-land surveys have become a practical reality (C. Jason, 2007). Shear wave information can improve both seismic imaging and reservoir characterization. Changes in reservoir quality can often be detected by combined use of P-wave and Swave recording. S-wave arrivals give useful information about fracture distribution and orientation because S-waves are much more diagnostic than P-waves of anisotropy in rocks. Another application is in imaging reservoir with gas charged over burden where the varying gas saturation play havoc with the P-wave image but has much less effect on the S-wave image. The advantage and use of S-wave data has been well documented by Stewart et al (2002). Towards preparation for 3D seismic multi-component survey in Cauvery Basin, India, one 2D3C Line data was acquired during the month of June 2009. The aim of this test line was to know about the area with respect to PS mode penetration and resolution for optimum design of field geometry. A seismic modeling study was also undertaken before the actual field work. Seismic Modeling A seismic modeling study was undertaken before the actual data acquisition to find out the feasibility for the multicomponent data acquisition in Kuthalam field and to help the designing of acquisition parameters for test survey. Seismo-geological model of the area was prepared using Geological and Geophysical data as shown in Fig. 1. Fig. 1 Seismo- geological model Shot gathers were generated for 2 no. of 2D lines (Line 01 & Line 02). The location of these lines are shown in Fig.2

Welcome message from author
This document is posted to help you gain knowledge. Please leave a comment to let me know what you think about it! Share it to your friends and learn new things together.
Transcript

* ONGC, 6th
floor, CMDA Tower-I, Gandhi-Irwin Road, Egmore, Chennai – 600 008, India; [email protected]
P-251
A feasibility study for full wave seismic imaging in Cauvery basin, India
O.P.Singh*, P.L.Chamoli, S.M.Pugazhanthi & K. Ramakrishna RCC, Geophysical Services, ONGC, Chennai
Summary
After the introduction of high channel count systems and 3component geophones in in-house field crew and Multi component
seismic processing package at Regional Processing Centre, a feasibility study for Full wave seismic imaging project was carried
out. Modeling studies for acquiring PS data in Kuthalam field of Cauvery basin were done as first step. One 2D3C Seismic Line
was shot in the field after designing the acquisition parameters based on the result of modeling studies. The 2D3C data shows
good penetration of PS energy and it seems that a full wave seismic imaging project after the acquisition of 3D3C data in this
area is feasible.
Introduction
Full wave seismic imaging (Multi component seismic) requires faithful recording of entire seismic signal that the earth can provide. With the introduction of high channel –
count systems combined with three component (3C) digital sensors, the fully compliant full wave on-land surveys have become a practical reality (C. Jason, 2007). Shear wave information can improve both seismic imaging and reservoir characterization. Changes in reservoir quality can often be detected by combined use of P-wave and Swave recording. S-wave arrivals give useful information
about fracture distribution and orientation because S-waves are much more diagnostic than P-waves of anisotropy in rocks. Another application is in imaging reservoir with gas charged over burden where the varying gas saturation play havoc with the P-wave image but has much less effect on the S-wave image. The advantage and use of S-wave data has been well documented by Stewart et al (2002). Towards preparation for 3D seismic multi-component
survey in Cauvery Basin, India, one 2D3C Line data was acquired during the month of June 2009. The aim of this test line was to know about the area with respect to PS mode penetration and resolution for optimum design of field geometry. A seismic modeling study was also undertaken before the actual field work.
Seismic Modeling
A seismic modeling study was undertaken before the actual data acquisition to find out the feasibility for the multicomponent data acquisition in Kuthalam field and to help the designing of acquisition parameters for test survey.
Seismo-geological model of the area was prepared using Geological and Geophysical data as shown in Fig. 1.
Fig. 1 Seismo- geological model
Shot gathers were generated for 2 no. of 2D lines (Line 01 & Line 02). The location of these lines are shown in Fig.2

A feasibility study for full wave seismic
imaging in Cauvery basin, India
2
Fig. 2 Location of Line 01 & Line 02
Following recording parameters were used for generating synthetic shot data.
Short group interval is required for better attenuation of ground rolls present in the field data, particularly PS component. Synthetic data generated for both the lines were processed and PP and PS sections were prepared as shown in Fig. 3 and Fig. 4.
Fig. 3a PP section for Line 01
Fig. 3b PS section for Line 01
Fig. 4a PP section for Line 02
Fig. 4b PS section for Line 02

A feasibility study for full wave seismic
imaging in Cauvery basin, India
3
It was observed that illumination of reflectors from both the lines were equally good. PP and PS signatures are clearly seen on both the lines. Thus acquisition parameters used in modeling are suitable for actual data acquisition. Synthetic PP data processed time are also compared to the time
sections of the earlier 3D data (Fig. 5) in this area and found that they are almost tallying.
Fig. 5 Corresponding PP Section from 3D Volume
Actual field data was acquired in the direction of Line 02 as this is the geological dip direction and more drilled wells are falling along the line.
Acquisition Geometry
The desired line was shot with bearing of 115 deg. Acquisition parameters were kept as in modeling. The field recording parameters can be summarized in the following table.
Table 1
Higher fold, small group interval, data record length ~ 1.6 times of P–wave data length and other acquisition parameters were given due consideration for getting good quality data as per the requirements of PS mode acquisition as described by Garotta and Granger (2003).
The perpendicular offset for most of the shots was very high as mentioned in the following table due to logistic problem.
Table 2
Processing of PP and PS data
The SPS data was merged with seismic data and QC was carried out to check the correctness of coordinates supplied
by the acquisition crew. Two horizontal components (X & Y) and one vertical component (Z) data were separated to form 03 types of datasets viz. X, Y and Z. The vertical component data was processed by adopting normal processing sequence. Residual static applied stack section and post stack migrated section were prepared as final outputs as shown in Fig. 6 & Fig. 7.
Fig. 6 PP Stack Section
A feasibility study for full wave seismic
imaging in Cauvery basin, India
4
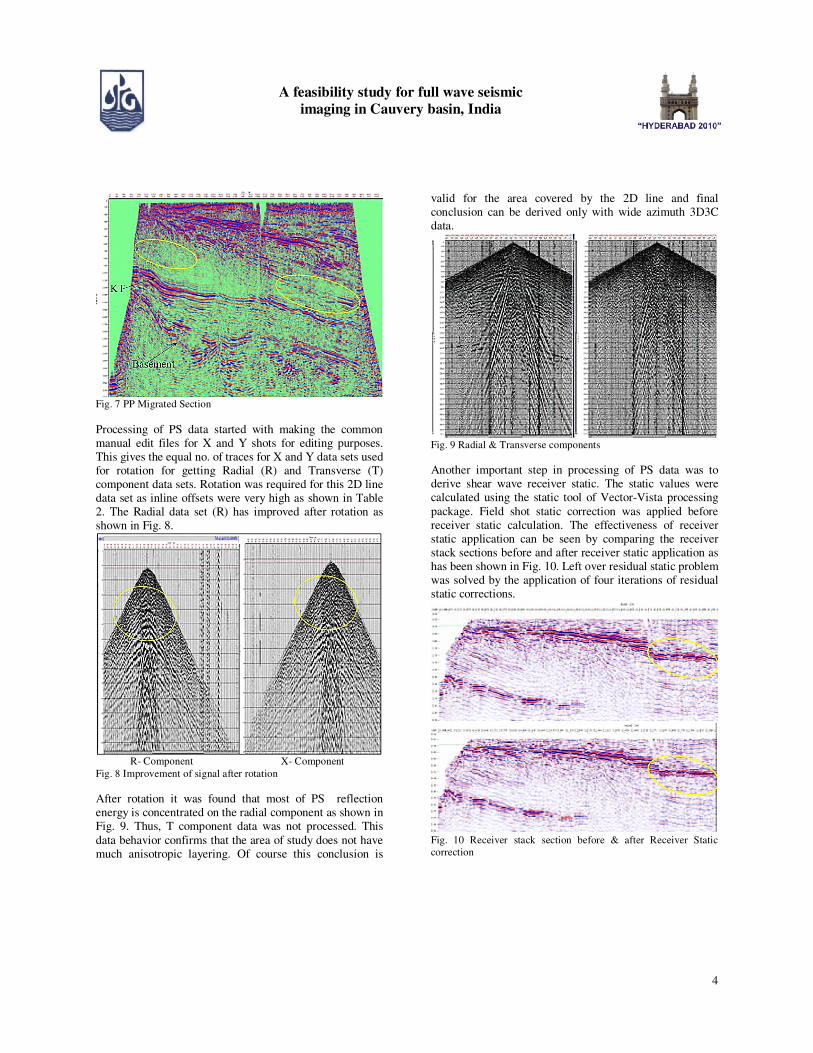
Fig. 7 PP Migrated Section
Processing of PS data started with making the common manual edit files for X and Y shots for editing purposes. This gives the equal no. of traces for X and Y data sets used for rotation for getting Radial (R) and Transverse (T) component data sets. Rotation was required for this 2D line data set as inline offsets were very high as shown in Table 2. The Radial data set (R) has improved after rotation as shown in Fig. 8.
R- Component X- Component Fig. 8 Improvement of signal after rotation
After rotation it was found that most of PS reflection energy is concentrated on the radial component as shown in Fig. 9. Thus, T component data was not processed. This
data behavior confirms that the area of study does not have much anisotropic layering. Of course this conclusion is
valid for the area covered by the 2D line and final conclusion can be derived only with wide azimuth 3D3C data.
Fig. 9 Radial & Transverse components
Another important step in processing of PS data was to derive shear wave receiver static. The static values were calculated using the static tool of Vector-Vista processing
package. Field shot static correction was applied before receiver static calculation. The effectiveness of receiver static application can be seen by comparing the receiver stack sections before and after receiver static application as has been shown in Fig. 10. Left over residual static problem was solved by the application of four iterations of residual static corrections.
Fig. 10 Receiver stack section before & after Receiver Static
correction

A feasibility study for full wave seismic
imaging in Cauvery basin, India
5
Final stack section for PS data is shown in Fig. 11. Migration module was not successful on PS data due to
poor S/N ratio of the data especially at basement level.
Fig. 11 PS Stack Section
Thus application of time and space variant gamma values was not possible and section was processed (binned) with single gamma value which was more appropriate at the
level of KT marker level (TWT of 1.8 sec) for which it was derived.
Observation on Final processed output
The marker events corresponding to PP section are seen in PS section except basement. Basement event is seen in patches. Also KT marker is very poor in the middle of the section. This may be due to very low S/N ratio of input data
as observed on raw data. PS section (Fig. 8) has better imaging at certain places as marked than PP section (Fig. 7). These better imaging areas can be attributed to hydrocarbon pay zones. PP and PS section in PP time are put together in Fig. 12 for comparison purpose.
Fig. 12 PP & PS (in PP time) sections
Conclusion
PS section can help in mapping of hydrocarbon pay zone horizons more precisely as imaging has improved in these regions. The improvement in data processing was limited due to 2D constrains and poor S/N ratio of the data as far as PS data is concerned. 3D3C data will certainly give better picture of subsurface where data will be improved at the stage of 3D migration using time and space variant gamma values. Azimuthal anisotropy studies can also be carried out with 3D3C data set.
References
Garotta R. and Granger P.Y., 2003, Some requirements for PS-mode acquisition: The Leading Edge, 25, 106-112. Stewart, R.R., Gaiser, J.E., Brown, R.J., Lawton, D.C., 2003, Converted wave seismic exploration: Applications:
Geophysics, 88, 40-57. Jason, C., 2007, Another look at full-wave seismic imaging: First Break, 25, 109-116.
Acknowledgements
The authors express their gratitude to Shri J.S. Sekhon, GGM-Basin Manager, Cauvery Basin
and Shri G. Sarvesam, GGM-Head Geophysical Services, for giving the opportunity to work on this project and constant encouragement to strive towards attainment of the best result in processing. Thanks are also due to Shri Chaman Singh, GM (GP) – the then Incharge-RCC and

A feasibility study for full wave seismic
imaging in Cauvery basin, India
6
Shri B.S.N. Murthy, GM (GP), Incharge-RCC for innovative and inspirational attitude and many valuable suggestions and encouragement during the work. Authors also thank Shri S.S. Rawat, DGM (GP) and Shri
Moloy Goswami, DGM (GP) for supervising the data processing and giving valuable suggestions. The efforts made by Party Chief, Shri G.V. Rao, CG (S)/ Shri V. Sumanbabu, CG (S) and entire crew of GP-39 in acquiring the data are duly acknowledged. Authors also thankfully acknowledge ONGC for according permission to publish this paper.
Related Documents