POWERING PROGRESS INVESTING IN AMERICA’S NEXT-GENERATION SUPPLY CHAIN July 15, 2020

Welcome message from author
This document is posted to help you gain knowledge. Please leave a comment to let me know what you think about it! Share it to your friends and learn new things together.
Transcript

P O W E R I N G P R O G R E S S I N V E S T I N G I N A M E R I C A ’ S N E X T - G E N E R A T I O N S U P P L Y C H A I N
July 15, 2020

R = 244
G = 120
B = 32
R = 42
G = 51
B = 94
R = 17
G = 152
B = 189
R = 91
G = 29
B = 42
R = 166
G = 226
B = 182
R = 51
G = 65
B = 64 2
DISCLAIMERS
This presentation is provided for informational purposes only and has been prepared to assist interested parties in making their own evaluation with respect to a potential business combination between MP Mine Operations LLC doing
business as MP Materials (“MPMO”) and Secure Natural Resources LLC (“SNR” and, together with MPMO, “MP”, “MP Materials” or the “Company”) and Fortress Value Acquisition Corp. (“FVAC”) and related transactions and for no other
purpose. No representations or warranties, express or implied are given in, or in respect of, this presentation. To the fullest extent permitted by law in no circumstances will MP, FVAC or any of their respective subsidiaries, stockholders,
affiliates, representatives, partners, directors, officers, employees, advisers or agents be responsible or liable for any di rect, indirect or consequential loss or loss of profit arising from the use of this presentation, its contents, its omissions,
reliance on the information contained within it, or on opinions communicated in relation thereto or otherwise arising in connection therewith. Industry and market data used in this presentation have been obtained from third-party
industry publications and sources as well as from research reports prepared for other purposes. Neither MP nor FVAC has independently verified the data obtained from these sources and cannot assure you of the data’s accuracy or
completeness. This data is subject to change. In addition, this presentation does not purport to be all-inclusive or to contain all of the information that may be required to make a full analysis of MP or the proposed business combination.
Viewers of this presentation should each make their own evaluation of MP and of the relevance and adequacy of the information and should make such other investigations as they deem necessary.
This presentation contains trademarks, service marks, trade names and copyrights of MP, FVAC and other companies, which are the property of their respective owners.
Forward-Looking Statements
This presentation includes “forward-looking statements” within the meaning of the “safe harbor” provisions of the United States Private Securities Litigation Reform Act of 1995. Forward-looking statements may be identified by the use of
words such as “estimate,” “plan,” “project,” “forecast,” “intend,” “expect,” “anticipate,” “believe,” “seek,” “target” or other similar expressions that predict or indicate future events or trends or that are not statements of historical
matters. These forward-looking statements include, but are not limited to, statements regarding estimates and forecasts of other financial and performance metrics and projections of market opportunity. These statements are based on
various assumptions, whether or not identified in this presentation, and on the current expectations of MP’s and FVAC’s management and are not predictions of actual performance. These forward-looking statements are provided for
illustrative purposes only and are not intended to serve as, and must not be relied on by any investor as, a guarantee, an assurance, a prediction or a definitive statement of fact or probability. Actual events and circumstances are
difficult or impossible to predict and will differ from assumptions. Many actual events and circumstances are beyond the control of MP and FVAC. These forward-looking statements are subject to a number of risks and uncertainties,
including changes in domestic and foreign business, market, financial, political and legal conditions; the inability of the parties to successfully or timely consummate the proposed business combination, including the risk that any required
regulatory approvals are not obtained, are delayed or are subject to unanticipated conditions that could adversely affect the combined company or the expected benefits of the proposed business combination or that the approval of
the shareholders of MP or stockholders of FVAC is not obtained; failure to realize the anticipated benefits of the proposed business combination; risks relating to the uncertainty of the projected financial information with respect to MP;
risks related to the rollout of MP’s business strategy and the timing of expected business milestones; risks related to MP’s arrangements with Shenghe; the effects of competition on MP’s future business; risks related to political and
macroeconomic uncertainty; the amount of redemption requests made by FVAC’s public stockholders; the ability of FVAC or the combined company to issue equity or equity-linked securities in connection with the proposed business
combination or in the future; the impact of the COVID-19 pandemic or any of the foregoing risks, and those factors discussed in FVAC’s final prospectus filed on May 1, 2020 under the heading “Risk Factors,” and other documents of
FVAC filed, or to be filed, with the Securities and Exchange Commission (“SEC”). If any of these risks materialize or our assumptions prove incorrect, actual results could differ materially from the results implied by these forward-looking
statements. There may be additional risks that neither MP nor FVAC presently know or that MP and FVAC currently believe are immaterial that could also cause actual results to differ from those contained in the forward-looking
statements. In addition, forward-looking statements reflect FVAC’s and MP’s expectations, plans or forecasts of future events and views as of the date of this presentation. FVAC and MP anticipate that subsequent events and
developments will cause FVAC’s and MP’s assessments to change. However, while FVAC and MP may elect to update these forward-looking statements at some point in the future, FVAC and MP specifically disclaim any obligation to
do so unless required by applicable law. These forward-looking statements should not be relied upon as representing FVAC’s and MP’s assessments as of any date subsequent to the date of this presentation. Accordingly, undue reliance
should not be placed upon the forward-looking statements.
Use of Projections
This presentation contains projected financial information with respect to MP, namely MP’s projected revenue, production volume, market share, certain commodity prices, Adjusted EBITDA, Adjusted EBITDA margin, capital expenditures
and free cash flow for 2020-2023. Such projected financial information constitutes forward-looking information, and is for illustrative purposes only and should not be relied upon as necessarily being indicative of future results. The
assumptions and estimates underlying such projected financial information are inherently uncertain and are subject to a wide variety of significant business, economic, competitive and other risks and uncertainties that could cause
actual results to differ materially from those contained in the prospective financial information. See “Forward-Looking Statements” above. Actual results may differ materially from the results contemplated by the projected financial
information contained in this presentation, and the inclusion of such information in this presentation should not be regarded as a representation by any person that the results reflected in such projections will be achieved. Neither the
independent auditors of FVAC nor the independent registered public accounting firm of MP, audited, reviewed, compiled, or performed any procedures with respect to the projections for the purpose of their inclusion in this
presentation, and accordingly, neither of them expressed an opinion or provided any other form of assurance with respect thereto for the purpose of this presentation.

R = 244
G = 120
B = 32
R = 42
G = 51
B = 94
R = 17
G = 152
B = 189
R = 91
G = 29
B = 42
R = 166
G = 226
B = 182
R = 51
G = 65
B = 64 3
DISCLAIMERS (CONT.)
Financial Information; Non-GAAP Financial Measures
The financial information and data contained in this presentation is unaudited and does not conform to Regulation S-X. Accordingly, such information and data may not be included in, may be adjusted in or may be presented
differently in, any proxy statement / prospectus or registration statement to be filed by FVAC with the SEC. Prior to the closing of the proposed business combination, MPMO and SNR will be combined under common ownership. Unless
otherwise noted, all references to “MP” or “MP Materials” included herein give effect to such combination of MPMO and SNR. A ll historical financial information of MP and MP Materials included herein has been presented on a
combined basis, reflecting the combined historical results of MPMO and SNR on the basis described herein, and is not necessarily indicative of the operating results of the combined entities that would have been achieved for such prior
periods. The “pro forma” financial data included herein has not been prepared in accordance with Article 11 of the SEC’s Regu lation S-X, is presented for informational purposes only and may differ materially from the Regulation S-X
compliant unaudited pro forma financial statements of MP to be included in FVAC’s proxy statement/prospectus in connection wi th the proposed business combination (when available). In addition, all MP historical financial information
included herein is preliminary and subject to change pending finalization of the audits of MPMO and SNR as of and for the years ended December 31, 2019 and December 31, 2018 in accordance with PCAOB auditing standards.
Some of the financial information and data contained in this presentation, such as Adjusted EBITDA, Adjusted EBITDA margin and free cash flow, have not been prepared in accordance with United States generally accepted
accounting principles (“GAAP”). EBITDA is defined as net earnings (loss) before interest expense, income tax expense (benefit), depreciation, amortization, accretion of asset retirement obligations and environmental liabilities. Adjusted
EBITDA is defined as EBITDA plus a deferred revenue adjustment to reflect the unrecognized portion of gross profit recoupments from Offtake Advances, and excludes other non-recurring or special items. Free Cash Flow (“FCF”) is
defined as net cash from operations minus net purchases of property, plant, and equipment. MP’s management uses these non-GAAP measures to compare MP’s performance to that of prior periods for trend analyses and for
budgeting and planning purposes. You can find the reconciliation of these measures to the nearest comparable GAAP measures on slide 49. FVAC and MP believe these non-GAAP measures of financial results provide useful
information to management and investors regarding certain financial and business trends relating to MP’s financial condition and results of operations. FVAC and MP believe that the use of these non-GAAP financial measures provides
an additional tool for investors to use in evaluating projected operating results and trends. MP's method of determining these non-GAAP measures may be different from other companies' methods and, therefore, may not be
comparable to those used by other companies and MP does not recommend the sole use of these non-GAAP measures to assess its financial performance. Management does not consider these non-GAAP measures in isolation or as
an alternative to financial measures determined in accordance with GAAP. The principal limitation of these non-GAAP financial measures is that they exclude significant expenses and income that are required by GAAP to be recorded
in MP’s financial statements. In addition, they are subject to inherent limitations as they reflect the exercise of judgments by management about which expense and income are excluded or included in determining these non-GAAP
financial measures. In order to compensate for these limitations, management presents non-GAAP financial measures in connection with GAAP results. MP is not providing a reconciliation of our projected Adjusted EBITDA for full year
2020-2023 to the most directly comparable measure prepared in accordance with GAAP, because MP is unable to provide this reconci liation without unreasonable effort due to the uncertainty and inherent difficulty of predicting the
occurrence, the financial impact, and the periods in which the adjustments may be recognized. For the same reasons, MP is unable to address the probable significance of the unavailable information, which could be material to future
results. You should review MP’s audited financial statements, which will be included in the Registration Statement (as defined below) relating to the proposed business combination (as described further below).
Additional Information About the Proposed Business Combination and Where To Find It
The proposed business combination will be submitted to stockholders of FVAC for their consideration and approval at a special meeting of stockholders. FVAC intends to file a registration statement on Form S-4 (the “Registration
Statement”) with the SEC, which will include preliminary and definitive proxy statements to be distributed to holders of FVAC’s common stock in connection with FVAC’s solicitation for proxies for the vote by FVAC’s stockholders in
connection with the proposed business combination and other matters as described in the Registration Statement, as well as the prospectus relating to the offer of the securities to be issued to MP’s shareholders in connection with the
completion of the business combination. After the Registration Statement has been filed and declared effective, FVAC will mail a definitive proxy statement and other relevant documents to its stockholders as of the record date
established for voting on the proposed business combination. FVAC's stockholders and other interested persons are advised to read, once available, the preliminary proxy statement and any amendments thereto and, once available,
the definitive proxy statement / prospectus, in connection with FVAC's solicitation of proxies for its special meeting of stockholders to be held to approve, among other things, the proposed business combination, because these
documents will contain important information about FVAC, MP and the proposed business combination. Stockholders may also obtain a copy of the preliminary or definitive proxy statement / prospectus, once available, as well as other
documents filed with the SEC regarding the proposed business combination and other documents filed with the SEC by FVAC, without charge, at the SEC's website located at www.sec.gov or by directing a request to 1345 Avenue of
the Americas, 46th Floor, New York, New York 10105, Attention: R. Edward Albert III, President ([email protected]), CC: Alexander Gillette ([email protected]). This presentation does not constitute an offer to sell or the solicitation
of an offer to buy any securities, or a solicitation of any vote or approval, nor shall there be any sale of securities in any jurisdiction in which such offer, solicitation or sale would be unlawful prior to registration or qualification under the
securities laws of any such jurisdiction. No offering of securities shall be made except by means of a prospectus meeting the requirements of Section 10 of the U.S. Securities Act of 1933, as amended.
INVESTMENT IN ANY SECURITIES DESCRIBED HEREIN HAS NOT BEEN APPROVED OR DISAPPROVED BY THE SEC OR ANY OTHER REGULATORY AUTHORITY NOR HAS ANY AUTHORITY PASSED UPON OR ENDORSED THE MERITS OF THE OFFERING OR
THE ACCURACY OR ADEQUACY OF THE INFORMATION CONTAINED HEREIN. ANY REPRESENTATION TO THE CONTRARY IS A CRIMINAL OFFENSE.
Participants in the Solicitation
FVAC, MP and certain of their respective directors, executive officers and other members of management and employees may, under SEC rules, be deemed to be participants in the solicitations of proxies from FVAC’s stockholders in
connection with the proposed business combination. Information regarding the persons who may, under SEC rules, be deemed part icipants in the solicitation of FVAC’s stockholders in connection with the proposed business
combination will be set forth in FVAC’s proxy statement / prospectus when it is filed with the SEC. You can find more information about FVAC’s directors and executive officers in FVAC’s final prospectus dated April 29, 2020 and filed with
the SEC on May 1, 2020. Additional information regarding the participants in the proxy solicitation and a description of their direct and indirect interests will be included in FVAC’s proxy statement / prospectus when it becomes available.
Stockholders, potential investors and other interested persons should read the proxy statement / prospectus carefully when it becomes available before making any voting or investment decisions. You may obtain free copies of these
documents from the sources indicated above.

R = 244
G = 120
B = 32
R = 42
G = 51
B = 94
R = 17
G = 152
B = 189
R = 91
G = 29
B = 42
R = 166
G = 226
B = 182
R = 51
G = 65
B = 64
MP MATERIALS
Our mission is to restore the full rare earth supply chain
to the United States of America.
Our success will drive the onshoring of jobs, national security and a carbon-reduced future.
4

R = 244
G = 120
B = 32
R = 42
G = 51
B = 94
R = 17
G = 152
B = 189
R = 91
G = 29
B = 42
R = 166
G = 226
B = 182
R = 51
G = 65
B = 64
INTRODUCTION
5
• MP Materials (“MP”) proposes to combine with Fortress Value Acquisition Corp. (“FVAC”) to create a combined
company with an estimated $1.5 billion post-transaction equity valuation (with $525MM of net cash)(1)(2)
• MP is at the center of the electric transportation ecosystem, serving as the only scaled source in North America for
critical rare earth materials that enable the mobility of electric vehicles, drones, defense systems, wind turbines,
robotics and many other high-growth, advanced technologies
• MP is driving the transition to fully green supply chains for electric transportation through best-in-class
environmental standards and a low impact production process located in California
• MP is cash flow positive today, and this transaction will fully fund its growth strategy, which is expected to deliver
annual estimated Adj. EBITDA of $252 million in 2023 at estimated forward pricing with the opportunity to
significantly expand earnings power as we move downstream
• Alignment of incentives between the sponsors and proposed new shareholders – FVAC has agreed to subject its
founder shares to an earn-out vesting mechanism and MP’s existing shareholders plan to roll their existing equity
into the combined company as part of the transaction
• The business combination is expected to close in Q4 2020
Notes: 1. Excluding FVAC’s out-of-the-money warrants, unvested Sponsor Promote Shares, and Seller Incentive Shares; assumes $10.00 / share market value and no redemptions; see slide 39 for additional assumptions
2. Does not include offtake advances from Shenghe
R = 244
G = 120
B = 32
R = 42
G = 51
B = 94
R = 17
G = 152
B = 189
R = 91
G = 29
B = 42
R = 166
G = 226
B = 182
R = 51
G = 65
B = 64 6
LEADERSHIP
James Litinsky – Chairman & CEO
Mr. Litinsky is the Founder, Chief Executive Officer and Chief Investment Officer of JHL Capital Group LLC. Before founding JHL in 2006, Mr. Litinsky was a member of the Drawbridge Special Opportunities Fund at Fortress Investment Group. Prior to Fortress, he was a Director of Finance at Omnicom Group, and he worked as a merchant banker at Allen & Company. Mr. Litinsky received a B.A. in Economics from Yale University, cum laude, and a J.D./M.B.A. from the Northwestern University School of Law and the Kellogg School of Management. He was admitted to the Illinois Bar. Mr. Litinsky serves on the Boards of AbilityLab and the Museum of Contemporary Art Chicago.
Ryan Corbett – Chief Financial Officer
Mr. Corbett joined the Company as Chief Financial Officer in 2019. He joined JHL Capital Group LLC as a Managing Director to focus on the firm’s investment in MP Materials. Prior to joining JHL, he was an Analyst at Brahman Capital Corp. and King Street Capital Management, both alternative asset managers based in New York, where he focused on special situations investments across the capital structure. Mr. Corbett started his career in investment banking at Morgan Stanley & Co. He graduated magna cum laude from the Wharton School of the University of Pennsylvania with a concentration in Finance.
Michael Rosenthal – Chief Operating Officer
Mr. Rosenthal will serve as the Chief Operating Officer of the Company upon closing of the business combination with FVAC. Mr. Rosenthal co-founded the Company and has been managing the Mountain Pass operation since the Company took control of the site in 2017. Before joining MP Materials, he was a Partner at QVT Financial, an investment firm. At QVT, Mr. Rosenthal concentrated on investments in the global automotive sector and in China. Prior to joining QVT, he worked as a senior high yield credit analyst for Shenkman Capital Management. Mr. Rosenthal graduated from Duke University with an A.B. degree in Economics and Comparative Area Studies.
Drew McKnight – Chief Executive Officer of FVAC
Mr. McKnight is a Managing Partner of the Credit Funds Business at Fortress based in San Francisco, CA. Mr. McKnight heads the liquid strategies and serves on the investment committee for the Credit Funds and is a member of the Management Committee of Fortress. Mr. McKnight is also the Co-CIO of the Drawbridge Special Opportunities Fund, Fortress Lending Fund and Fortress Credit Opportunities Fund V. In addition, Mr. McKnight is currently the CEO of Fortress Value Acquisition Corp.

R = 244
G = 120
B = 32
R = 42
G = 51
B = 94
R = 17
G = 152
B = 189
R = 91
G = 29
B = 42
R = 166
G = 226
B = 182
R = 51
G = 65
B = 64
EXECUTIVE SUMMARY: BUSINESS OVERVIEW
7
• MP owns and operates one of the world’s largest integrated rare earth mining and processing facilities in Mountain Pass, CA
− The only major rare earths resource in the Western Hemisphere with a proven, multi-decade reserve base
− A rich, decades-long history as the world’s leading producer of rare earth materials until the 1980s, when Chinese industrial policy prioritized market share dominance in this critical industrial input
− MP purchased the resource and state-of-the-art facilities in 2017 with the vision of incorporating proven process technologies to
recreate an integrated domestic supply chain company to power the coming Electric Vehicle (“EV”) revolution
Asset 1
• Neodymium-Praseodymium (“NdPr”) is a rare earth material used in high-strength permanent magnets that power the traction motors of EVs, robotics, wind turbines, drones and many other high-growth, advanced motion technologies
− With growing EV penetration, the market for NdPr is expected to rapidly fall into deficit without credible global resources with
economic viability at current prices
− Global industry and governments are motivated to diversify sourcing beyond China’s current dominance to ensure material availability and provide the certainty required to invest in the supply chains necessary for ex-China EV production
Market Growth
2
• MP’s current strategy consists of a three-stage plan to re-establish this critical industrial input within the United States:
− Stage I (complete): commissioning of the mining, milling, and flotation processes to produce a high-quality rare earth concentrate, an intermediate product that is currently sold into Asia. MP’s median monthly production is >2.6x that of its predecessor in a largely fixed
cost business; Adj. EBITDA and FCF positive at this stage
− Stage II (complete by 2022): retrofit of the existing processing facility workflow to make separated rare earth oxides more reliably, at significantly lower cost and with an expected smaller environmental footprint. The project is permitted, “shovel-ready,” and is expected
to accelerate near-term earnings power to $252 million of expected 2023 Adj. EBITDA at estimated forward pricing
− Stage III (2025+): leverage singular source of commercial-scale Western rare earth supply to expand downstream to magnets, easing concerns about China as a supply chain “single point of failure” as global EV penetration accelerates; flexibility to buy, bu ild, or JV with
substantial incremental EBITDA opportunity
Strategy 3
R = 244
G = 120
B = 32
R = 42
G = 51
B = 94
R = 17
G = 152
B = 189
R = 91
G = 29
B = 42
R = 166
G = 226
B = 182
R = 51
G = 65
B = 64
EXECUTIVE SUMMARY: PROPOSED TRANSACTION
8
• MP Materials and Fortress Value Acquisition Corp. have executed definitive agreements to enter into a business combination (the “Transaction”)
• It is anticipated that the post-closing public company will be a Delaware corporation, retain the MP Materials name, and be listed on the
NYSE
• The Transaction is expected to be funded by a combination of $345MM cash held in trust at FVAC (less any redemptions) and $200MM in committed PIPE proceeds
− Transaction is expected to result in $525MM of net cash(1)(2) to fully fund the MP growth strategy
− Proceeds will be utilized to complete refinery retrofit and fund downstream expansion strategy to return magnet manufacturing to the
United States
− New and existing shareholders aligned in maximizing value with FVAC’s founder shares subject to vesting pursuant to an earn-out (“Sponsor Promote Shares”) and the potential for issuance of incentive shares (“Seller Incentive Shares”) to existing target shareholders,
in each case, subject to the achievement of certain share price performance hurdles
Deal Structure
4
• Transaction implies a pre-transaction Enterprise Value (cash-free / debt-free) of ~$1,000MM and a post-transaction Equity Value of approximately ~$1,473MM(3)(4)
− Represents a material discount to public peers and retains significant valuation upside for anchor investors
• Existing MP shareholders expected to retain 62.4% of the pro forma equity(3)
− No monetization or sell-down expected by existing shareholders. MP management expected to own over 12% of the pro forma
company, and expects to remain long-term holders given their conviction in the prospects and valuation upside of the business
Valuation 5
Notes: 1. Subject to reduction to the extent cash available after the Transaction is less than $495MM
2. Does not include offtake advances from Shenghe
3. Represents economic interests, excluding public warrants, unvested Sponsor Promote Shares and Seller Incentive Shares. Including Unvested Sponsor Promote Shares, Sponsor holds a 6.1% voting interest, diluting other shareholders voting interests on a pro rata basis; assumes
$10.00/share market value, and no redemptions.
4. Equity value excludes unvested Sponsor Promote Shares and is pro forma for exchange of each Sponsor private placement warrant for 0.15 of a common share, resulting in the exchange of 5,933,333 warrants into 890,000 newly created Class F shares.

9
Asset
SECTION 1

R = 244
G = 120
B = 32
R = 42
G = 51
B = 94
R = 17
G = 152
B = 189
R = 91
G = 29
B = 42
R = 166
G = 226
B = 182
R = 51
G = 65
B = 64
Rich Rare Earths History Our Business Model
ASSET 10
MP MATERIALS AT-A-GLANCE MOUNTAIN PASS IS A UNIQUE, WORLD CLASS ASSET
8% ore grade World-Class Reserve
804k mt Recoverable tREO
Vast, High Grade Reserve
$252MM Estimated Run-rate
Adj. EBITDA (2023E)
6,075 mt Expected Run-rate NdPr
Annual Production
Sizeable and Highly Profitable Rare-Earths Operation (Stage II)
$1.7BB Total Capital Invested
~70 years Since Production Started in
Mountain Pass
Beneficiation Plant
Mine
Refining Plant
Buy, Build or JV NdPr Magnet Production
Potential Downstream Expansion (Stage III)
Magnet Making
Metallurgy
NdPr Magnets
Operationally Leveraged Earnings Power
Concentrate Oxides
Potential for fully integrated business, with lower volatility

R = 244
G = 120
B = 32
R = 42
G = 51
B = 94
R = 17
G = 152
B = 189
R = 91
G = 29
B = 42
R = 166
G = 226
B = 182
R = 51
G = 65
B = 64 ASSET 11
A RICH RARE EARTH HISTORY MP MATERIALS ACQUIRED A HISTORICALLY HIGH QUALITY ASSET AFTER A PERIOD OF CHALLENGED EXECUTION BUT SUBSTANTIAL CAPITAL INVESTMENT
1952 1960s –
80s 1997 2002 2005 2008 2010 2015 Q4 2015 Q3 2017 Q4 2017 2018 2019 2020
Molybdenum Corporation of America (“Molycorp”) begins production at Mountain Pass after
purchasing the recently discovered Sulphide Queen
carbonatite and Birthday claims
1
2
Mountain Pass is the world’s dominant
source of rare earths
UNOCAL acquires Molycorp
3
4
Chevron acquires UNOCAL
5
6
Chevron sells Mountain Pass to an investor group (“new Molycorp”)
Molycorp completes IPO and launches Project
Phoenix to rebuild processing facilities to focus on the Cerium
supply chain
7
8
Molycorp files for bankruptcy after technical
challenges with novel process, execution issues
and excessive leverage
Mountain Pass is placed into
cold-idle status
9
10
MP Materials acquires Mountain
Pass
Production is restarted at
Mountain Pass
11
12
First sales of rare earth concentrate
produced at Mountain Pass
MP Materials hits run-rate production
representing 15%(1) of global rare earth market
13
14
Stage II design and execution in process
2025E
Commence Stage III Downstream
Expansion
15
UNOCAL suspends mining
Notes: 1. Based on Company run rate estimates and the Roskill 2019 industry report

R = 244
G = 120
B = 32
R = 42
G = 51
B = 94
R = 17
G = 152
B = 189
R = 91
G = 29
B = 42
R = 166
G = 226
B = 182
R = 51
G = 65
B = 64 12
EV SUPPLY CHAIN DEMANDS A WESTERN HEMISPHERE SUPPLIER POTENTIAL TO RESTORE CRITICAL INDUSTRIAL INPUT TO THE UNITED STATES
Notes: 1. Based on Company run rate estimates and the Roskill 2019 industry report
MP represents approximately 15% of global rare earth concentrate production and 100% of the rare earth materials
produced in the Western Hemisphere (1)
ASSET
Opportunity to be the
only Integrated NdPr
Magnet Producer in the
Western Hemisphere
Scaled Rare Earth Oxide Producer
NdPr Magnet Producer
Potential Select
End Users
(Europe)
Potential Select
End Users
(APAC)
Potential Select
End Users
(Americas)

R = 244
G = 120
B = 32
R = 42
G = 51
B = 94
R = 17
G = 152
B = 189
R = 91
G = 29
B = 42
R = 166
G = 226
B = 182
R = 51
G = 65
B = 64
Sources: Roskill Rare Earth Outlook 2019; Worley report; tREO concentration of proven and probable reserves for Ucore, Texas Mineral Resources, and Rare Element Resources are estimated at 0.7%, 1.6%, and 2.7%,
respectively, versus MP Materials at 8.0%. Rare Element Resources Bear Lodge project has been suspended since 2016 ASSET 13
UNIQUE GLOBAL SUPPLY POSITION WITHOUT ALTERNATIVES HIGH BARRIERS TO ENTRY IN THE EX-CHINA RARE EARTH RESOURCES MARKET
Ucore Rare Earth Texas Mineral Resources
Rare Element Resources
Lynas
Bokan-Dodson, AK Round Top, TX Bear Lodge, WY Western Australia Mountain Pass, CA
In Pilot Testing Pre-Feasibility Study Idle Cracking / Leaching Relocation
~15% of Global Concentrate Market
30,000
Annual Production
tREO mT
COST: SEVERAL BILLION in AGGREGATE
ANNUAL PRODUCTION: 1/3RD OF MP COMBINED
TIMING: UNCERTAIN, 2023+
SIGNIFICANTLY HIGHER OPERATING COSTS
COST: ~$170MM
20,000
10,000
SEPARATED REOs EXPECTED IN 2022
GREENFIELD “STAGE II”
RETROFIT
MP believes it is the only feasible foundation for an integrated Western Hemisphere producer to compete against China
~$350MM CAPEX REQUIRED
DUPLICATIVE CAPACITY
TIMING: 2024+
GEOPOLITICAL RISK
EXISTING /
BROWNFIELD

R = 244
G = 120
B = 32
R = 42
G = 51
B = 94
R = 17
G = 152
B = 189
R = 91
G = 29
B = 42
R = 166
G = 226
B = 182
R = 51
G = 65
B = 64 ASSET 14
DIFFERENTIATED ESG THESIS VERSUS COMPETITORS MP POSITIONED AS ONLY RARE EARTHS PRODUCER THAT SATISFIES CONSUMERS’ GROWING DEMAND FOR FULLY GREEN SUPPLY CHAINS
MP can be a low cost producer while also creating significant positive externalities for the world
Produces critically important rare earths to power the new economy
Sourced primarily from bastnaesite ore with low levels of naturally-occurring radioactive elements / ×
Closed-loop flotation process water recycling ×
Single-site integrated operation enabling safe disposal of mineral byproducts at point of origin ×
Low-impact dry-stacked tailings ×
A domestic source under recent presidential determinations and DoD funding initiatives ×
Committed to rebuilding full western rare earths magnet value chain ×
Other Major
Global Peers

R = 244
G = 120
B = 32
R = 42
G = 51
B = 94
R = 17
G = 152
B = 189
R = 91
G = 29
B = 42
R = 166
G = 226
B = 182
R = 51
G = 65
B = 64 ASSET 15
SUSTAINABLY-SOURCED MATERIALS POWERING THE GREEN REVOLUTION ESG DESIGNED FROM INCEPTION WITH AN ENVIRONMENTALLY FRIENDLY “GREEN MINE”
Open Pit Mine
Mill Facility
Paste Tailings Facility Tailings Impoundment
1
2 4
3
Mine – Ore-body with low levels of thorium and
uranium
Mill – Uses reclaimed water from the paste
tailings facility
Paste Tailings – Dry tailings provides reclaimed
water for flotation
Tailings Impoundment – Dry tailings deposited in
a lined impoundment, reducing risk of seepage
issues, runout or catastrophic failure, while
minimizing waste
1
2
3
4
• Utilizes a state-of-the-art dry tailings process, eliminating the need for high-risk wet tailings ponds
• Water reclaimed from the paste tailings facility is recycled back into the production process to mitigate the environmental impact; this
process uses 1/20th of the fresh water of a comparable milling and flotation circuit
CHP and Chlor-Alkali Facility – Will utilize clean
natural gas to provide reliable, low cost power
and steam; waste water brine from the
separations process will be consumed to create
reagents on-site
5 CHP and
Chlor-Alkali Facility
5
R = 244
G = 120
B = 32
R = 42
G = 51
B = 94
R = 17
G = 152
B = 189
R = 91
G = 29
B = 42
R = 166
G = 226
B = 182
R = 51
G = 65
B = 64
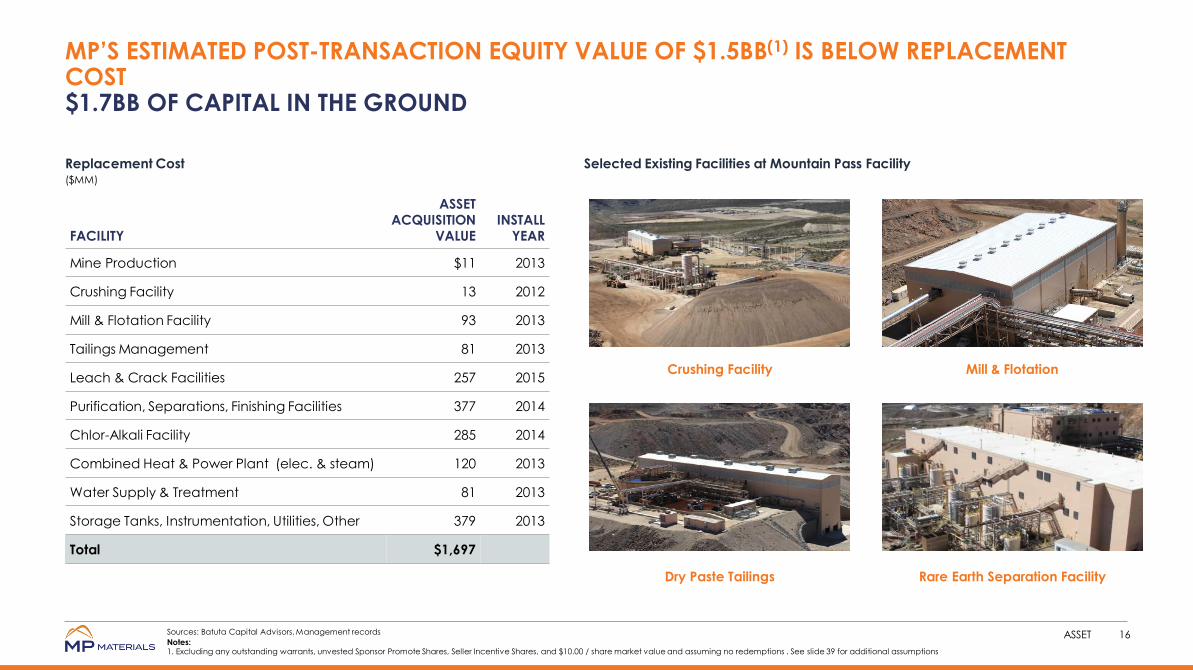
Replacement Cost ($MM)
Sources: Batuta Capital Advisors, Management records ASSET 16
MP’S ESTIMATED POST-TRANSACTION EQUITY VALUE OF $1.5BB(1) IS BELOW REPLACEMENT COST $1.7BB OF CAPITAL IN THE GROUND
FACILITY
ASSET ACQUISITION
VALUE
INSTALL YEAR
Mine Production $11 2013
Crushing Facility 13 2012
Mill & Flotation Facility 93 2013
Tailings Management 81 2013
Leach & Crack Facilities 257 2015
Purification, Separations, Finishing Facilities 377 2014
Chlor-Alkali Facility 285 2014
Combined Heat & Power Plant (elec. & steam) 120 2013
Water Supply & Treatment 81 2013
Storage Tanks, Instrumentation, Utilities, Other 379 2013
Total $1,697
Crushing Facility Mill & Flotation
Dry Paste Tailings Rare Earth Separation Facility
Selected Existing Facilities at Mountain Pass Facility
Notes: 1. Excluding any outstanding warrants, unvested Sponsor Promote Shares, Seller Incentive Shares, and $10.00 / share market value and assuming no redemptions . See slide 39 for additional assumptions

17
SECTION 2
Market Growth

R = 244
G = 120
B = 32
R = 42
G = 51
B = 94
R = 17
G = 152
B = 189
R = 91
G = 29
B = 42
R = 166
G = 226
B = 182
R = 51
G = 65
B = 64 18
THE SUSTAINABLE MOBILITY ECOSYSTEM PUBLIC INVESTORS ARE SEEKING WAYS TO GET EXPOSURE TO THE TRANSFORMATIVE CHANGES AHEAD FROM EVs AND CLIMATE CHANGE INVESTMENT
MARKET GROWTH
Semiconductors
Tech / Hardware
“Cars and Climate”
43
Metals & Mining Cap Goods
Chemicals/ Materials
Autos / Shared Mobility
Energy Machinery
Electric Utilities Batteries
MP Materials is a pure play on the cars and climate theme
48
“Cars and Climate”
48
R = 244
G = 120
B = 32
R = 42
G = 51
B = 94
R = 17
G = 152
B = 189
R = 91
G = 29
B = 42
R = 166
G = 226
B = 182
R = 51
G = 65
B = 64 MARKET GROWTH 19
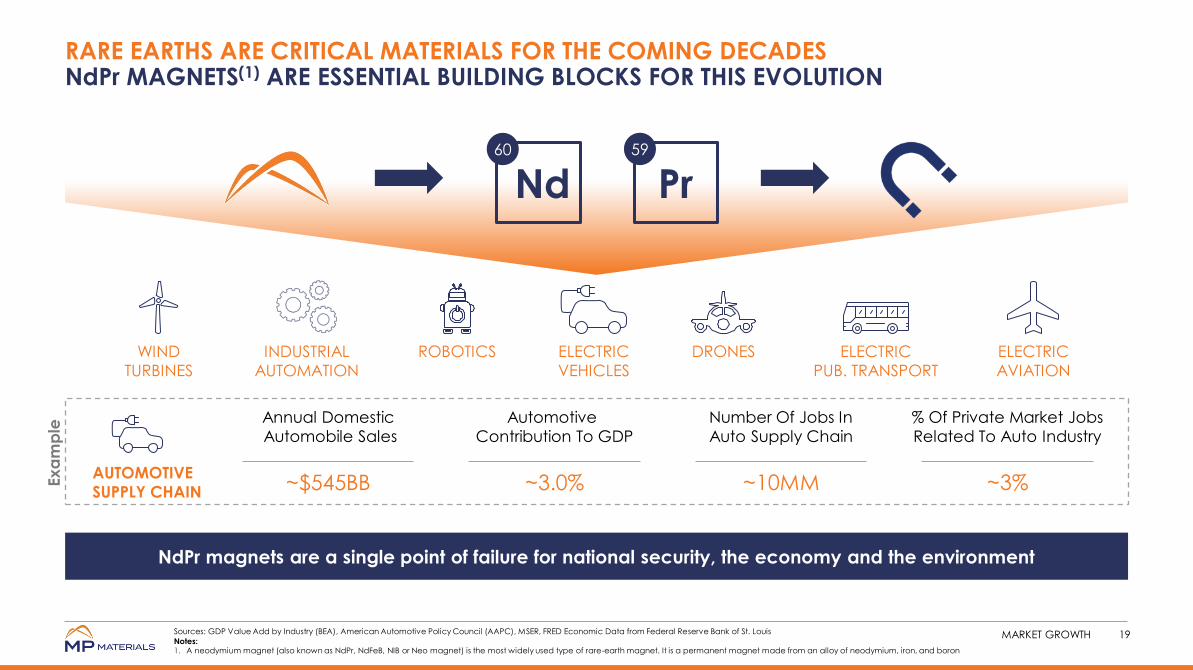
RARE EARTHS ARE CRITICAL MATERIALS FOR THE COMING DECADES NdPr MAGNETS(1) ARE ESSENTIAL BUILDING BLOCKS FOR THIS EVOLUTION
Nd Pr 60 59
Annual Domestic
Automobile Sales
~$545BB
Automotive
Contribution To GDP
~3.0%
Number Of Jobs In
Auto Supply Chain
~10MM
% Of Private Market Jobs
Related To Auto Industry
~3%
WIND
TURBINES
INDUSTRIAL
AUTOMATION
ROBOTICS ELECTRIC
VEHICLES
DRONES ELECTRIC
PUB. TRANSPORT
ELECTRIC
AVIATION
AUTOMOTIVE
SUPPLY CHAIN
NdPr magnets are a single point of failure for national security, the economy and the environment
Ex
am
ple
Sources: GDP Value Add by Industry (BEA), American Automotive Policy Council (AAPC), MSER, FRED Economic Data from Federal Reserve Bank of St. Louis
Notes: 1. A neodymium magnet (also known as NdPr, NdFeB, NIB or Neo magnet) is the most widely used type of rare-earth magnet. It is a permanent magnet made from an alloy of neodymium, iron, and boron

R = 244
G = 120
B = 32
R = 42
G = 51
B = 94
R = 17
G = 152
B = 189
R = 91
G = 29
B = 42
R = 166
G = 226
B = 182
R = 51
G = 65
B = 64 20
THE TRANSFORMATION HAS BEGUN MP IS THE BEACHHEAD OF THE NEW EV SUPPLY CHAIN
Morgan Stanley Research (October 2019)
“MS forecasts 113 million EVs globally by 2030 and 924 million by 2050. (…) To fully build out the required global infrastructure to support
electric vehicles, we forecast $11 trillion of total expenditure through 2050, or $350bn p.a.”
MARKET GROWTH
VW Aims For 100-Fold EV Production
Boost by 2028: BNEF 2020-06-12
R = 244
G = 120
B = 32
R = 42
G = 51
B = 94
R = 17
G = 152
B = 189
R = 91
G = 29
B = 42
R = 166
G = 226
B = 182
R = 51
G = 65
B = 64
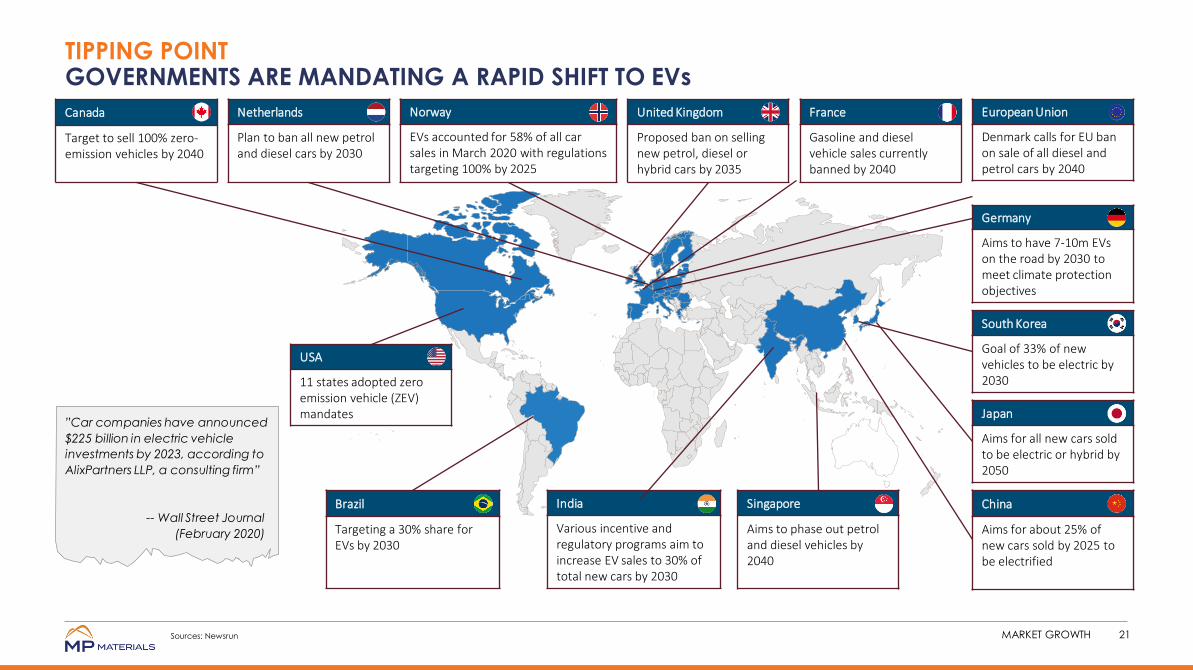
Canada
Target to sell 100% zero-emission vehicles by 2040
Netherlands
Plan to ban all new petrol and diesel cars by 2030
European Union
Denmark calls for EU ban on sale of all diesel and petrol cars by 2040
Norway
EVs accounted for 58% of all car sales in March 2020 with regulations targeting 100% by 2025
South Korea
Goal of 33% of new vehicles to be electric by 2030
USA
11 states adopted zero emission vehicle (ZEV) mandates
India
Various incentive and regulatory programs aim to increase EV sales to 30% of total new cars by 2030
China
Aims for about 25% of new cars sold by 2025 to be electrified
”Car companies have announced
$225 billion in electric vehicle
investments by 2023, according to
AlixPartners LLP, a consulting firm”
-- Wall Street Journal
(February 2020)
21 MARKET GROWTH
TIPPING POINT GOVERNMENTS ARE MANDATING A RAPID SHIFT TO EVs
Germany
Aims to have 7-10m EVs on the road by 2030 to meet climate protection objectives
Japan
Aims for all new cars sold to be electric or hybrid by 2050
Singapore
Aims to phase out petrol and diesel vehicles by 2040
United Kingdom
Proposed ban on selling new petrol, diesel or hybrid cars by 2035
France
Gasoline and diesel vehicle sales currently banned by 2040
Brazil
Targeting a 30% share for EVs by 2030
Sources: Newsrun
R = 244
G = 120
B = 32
R = 42
G = 51
B = 94
R = 17
G = 152
B = 189
R = 91
G = 29
B = 42
R = 166
G = 226
B = 182
R = 51
G = 65
B = 64
0%
25%
50%
75%
100%
-
20.0
40.0
60.0
80.0
100.0
2019 2021 2023 2025 2027 2029 2031 2033 2035 2037 2039
Unit Sales (MM) % of Total Global Unit Sales
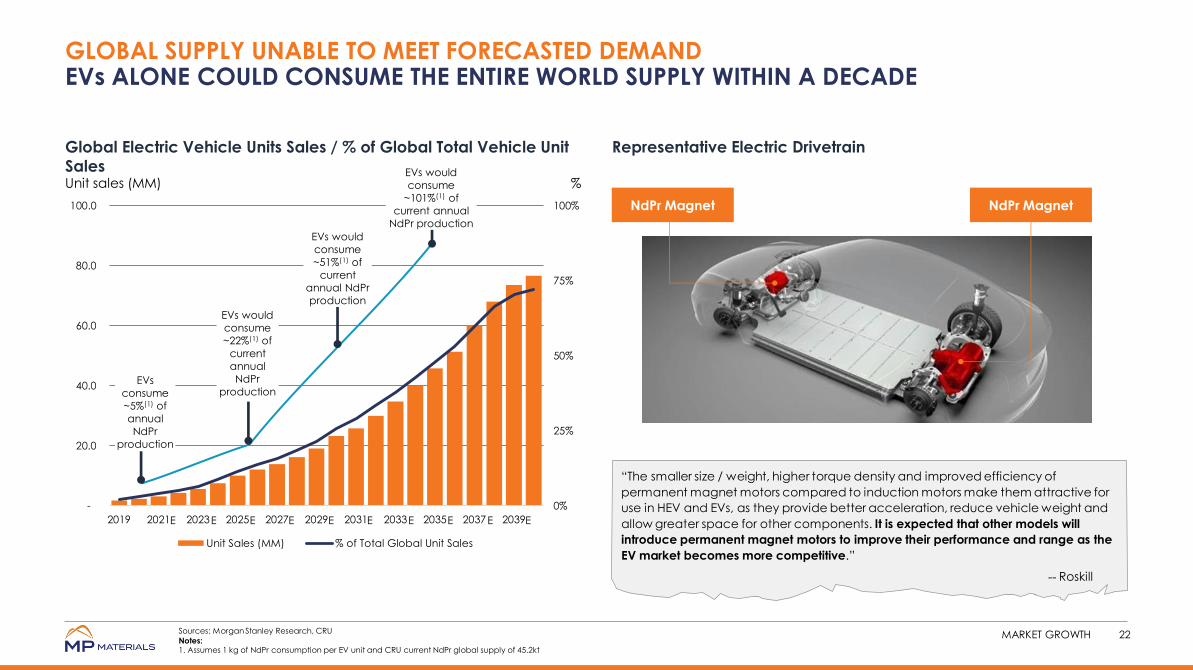
Global Electric Vehicle Units Sales / % of Global Total Vehicle Unit
Sales Unit sales (MM) %
Representative Electric Drivetrain
MARKET GROWTH 22
GLOBAL SUPPLY UNABLE TO MEET FORECASTED DEMAND EVs ALONE COULD CONSUME THE ENTIRE WORLD SUPPLY WITHIN A DECADE
NdPr Magnet
“The smaller size / weight, higher torque density and improved efficiency of
permanent magnet motors compared to induction motors make them attractive for
use in HEV and EVs, as they provide better acceleration, reduce vehicle weight and
allow greater space for other components. It is expected that other models will
introduce permanent magnet motors to improve their performance and range as the
EV market becomes more competitive.”
-- Roskill
EVs would
consume
~101%(1) of
current annual
NdPr production
NdPr Magnet
Sources: Morgan Stanley Research, CRU
Notes: 1. Assumes 1 kg of NdPr consumption per EV unit and CRU current NdPr global supply of 45.2kt
EVs would
consume
~51%(1) of
current
annual NdPr
production
EVs would
consume
~22%(1) of
current
annual
NdPr
production EVs
consume
~5%(1) of
annual
NdPr
production
E E E E E E E E E E

R = 244
G = 120
B = 32
R = 42
G = 51
B = 94
R = 17
G = 152
B = 189
R = 91
G = 29
B = 42
R = 166
G = 226
B = 182
R = 51
G = 65
B = 64 MARKET GROWTH 23
RARE EARTHS ARE ESSENTIAL EVEN TO COMPETING TECHNOLOGIES WITHIN THE ECOSYSTEM THE MOST EFFICIENT BATTERY CHEMISTRY FOR EVs IS STILL UNKNOWN, BUT MOTOR TECHNOLOGY IS WELL-SETTLED
NdPr is likely to be in high demand for EVs, regardless of which energy approach wins
Key Lithium Ion Battery Technologies Other Technologies
Battery
Chemistry LCO LMO LFP NMC NCA
Solid State
Battery
Hydrogen Fuel
Cell
Other Primary
Materials Cobalt Manganese Iron, Phosphate
Nickel, Manganese
Cobalt
Nickel, Cobalt,
Aluminum Lithium Hydrogen
Dominant Motor Technology
Permanent Magnet
Permanent Magnet
Permanent Magnet
Permanent Magnet
Permanent Magnet
Permanent Magnet
Permanent Magnet
Critical
Motor Materials
NdPr NdPr NdPr NdPr NdPr NdPr NdPr
Select OEMs Examples
Most EV OEMs
Except Tesla

R = 244
G = 120
B = 32
R = 42
G = 51
B = 94
R = 17
G = 152
B = 189
R = 91
G = 29
B = 42
R = 166
G = 226
B = 182
R = 51
G = 65
B = 64
Key NdPr Magnet Market Segments 2019
MARKET GROWTH 24
ADVANCED HIGH-GROWTH END-MARKETS NdPr MAGNETS ARE CRITICAL FOR ADVANCED TECHNOLOGIES EXPERIENCING STRONG SECULAR GROWTH
EV Powertrains
9%
E-transport
6%
Wind Turbines
9%
Robotics
1% Other
Automotive
9% Consumer
Electronics
21%
HVAC
8%
Disk Drives
4%
Speakers
5%
Other
28%
35 kt NdPr(1)
EVs and other growth areas are just 25% of the magnet market today with growth positioned to explode
Notes: 1. Considers 41.0kt of rare earths used to manufacture permanent magnets and that NdPr accounts for 85% of the rare earth consumption, per Roskill 2019 report
Sources: Roskill 2019 report

R = 244
G = 120
B = 32
R = 42
G = 51
B = 94
R = 17
G = 152
B = 189
R = 91
G = 29
B = 42
R = 166
G = 226
B = 182
R = 51
G = 65
B = 64
Global Installed Capacity GW
Representative Direct-Drive Wind Turbine
MARKET GROWTH 25
POWERING GREEN ENERGY WIND TURBINES DRIVING NdPr MAGNET DEMAND GROWTH
651
1,023
0
1,000
2,000
3,000
2019A 2025E
NdPr Magnet
“The wind turbine market is anticipated to account for ~30% of the global
growth in the use of rare earth magnets from 2015- 2025. Using rare earth metals
prevents the use of a gearbox. Rare earth magnets make the turbines lighter,
cheaper, more reliable, easier to maintain and capable of generating electricity
at lower wind speeds.”
-- UBS Research
Worldwide additions
expected to average
77GW globally
Wind turbines require up to ~232kg of NdPr / MW
62GW of wind capacity added
globally in 2019
Sources: GWEC, Wood Mackenzie; Mordor Intelligence; CRU

R = 244
G = 120
B = 32
R = 42
G = 51
B = 94
R = 17
G = 152
B = 189
R = 91
G = 29
B = 42
R = 166
G = 226
B = 182
R = 51
G = 65
B = 64 26
POWERING NATIONAL SECURITY RARE EARTHS ARE ESSENTIAL INPUTS TO THE NATIONAL DEFENSE SUPPLY CHAIN
Rare Earths Usage by Weapons Platform lbs
F-35
Arleigh Burke
DDG-51
SSN-774 Virginia-class
Submarine
920 lbs.
5,200 lbs.
9,200 lbs.
Nd, Pr,
Sm, Dy, Tb
Neodymium,
Praseodymium,
Samarium, Dysprosium,
Terbium
Compact / Powerful
Permanent Magnets
Guidance & Control Electric
Motors and Actuators
Rare Earth Technology
Function / Application
Rare Earth Elements Used
Selected Examples
Tomahawk Cruise
Missile Smart Bombs
Joint Direct Attack
Munitions
Joint Air to Ground
Fin Actuator
Predator
Unmanned Aircraft
Select Rare Earth Defense Applications
MARKET GROWTH Sources: Congressional Research Service, Rare Earth Industry and Technology Association

R = 244
G = 120
B = 32
R = 42
G = 51
B = 94
R = 17
G = 152
B = 189
R = 91
G = 29
B = 42
R = 166
G = 226
B = 182
R = 51
G = 65
B = 64 MARKET GROWTH 27
MP MATERIALS IS ANSWERING U.S. GOVERNMENT’S CALL TO ACTION THE U.S. GOVERNMENT SEES RARE EARTHS AS KEY TO OUR NATIONAL SECURITY SUPPLY CHAIN
• Executive Order 13817 “A Federal Strategy to Ensure Secure and Reliable Supplies of Critical Materials” (December 2017)
• Secretary of the Interior presents a list of 35 minerals deemed critical under the definition in the Executive Order, including the entirety of the Rare Earth Elements Group (February 2018)
• Five separate Presidential Determinations to address both the upstream and downstream deficiencies in our rare earth and magnet supply chain (July 2019)
• Department of Defense (“DoD”) Title III Funding Opportunity Announcement (“FOA”) focused on light rare earth separation capacity released; MP submitted a proposal (March 2020)
Sources: Executive Order 13817, USGS, Adamas Intelligence, DoD

28
SECTION 3
Strategy

R = 244
G = 120
B = 32
R = 42
G = 51
B = 94
R = 17
G = 152
B = 189
R = 91
G = 29
B = 42
R = 166
G = 226
B = 182
R = 51
G = 65
B = 64 STRATEGY 29
Status Complete In-Process Future
Product RE Concentrate NdPr, La, Ce, Heavy Rare Earth
Concentrate NdPr Magnets
Market China Global Global
Stage I Stage II
ROAD MAP EXECUTING ON OUR LONG TERM PLAN
Stage III

R = 244
G = 120
B = 32
R = 42
G = 51
B = 94
R = 17
G = 152
B = 189
R = 91
G = 29
B = 42
R = 166
G = 226
B = 182
R = 51
G = 65
B = 64 STRATEGY 30
ESTABLISHING A FULLY INTEGRATED VALUE CHAIN MP BRINGS DECADES OF RARE EARTH KNOW-HOW TO RESTORE DOMESTIC SUPPLY
STAGE II:
Roast, Leach,
Mill Capacity
Expansion
and Solvent
Extraction
STAGE I:
Mining,
Milling and
Flotation
Concentrate
Filter Press Flotation
Crushing
Grinding
Purification Filter Leach
Fuel
Rotary Kiln Rare Earth Solutions
Solids
Solvent Extraction
Precipitation
Fuel
Product Finishing
Separated Rare
Earth Products
STAGE III
POTENTIAL
DOWNSTREAM
OPPORTUNITY:
Production of
NdPr
Magnets(1)
Oxide to Metal
Reduction
Hydrogen
Decrepitation
Jet Milling Sinter And Heat
Treat
Pressing In
Magnetic Field
Machining Plating Magnetize Strip
Casting
Facilities to be developed
Currently being retrofitted
Filter
Notes: 1. Preliminary NdPr Magnet production flow

R = 244
G = 120
B = 32
R = 42
G = 51
B = 94
R = 17
G = 152
B = 189
R = 91
G = 29
B = 42
R = 166
G = 226
B = 182
R = 51
G = 65
B = 64 STRATEGY 31
WORLD-CLASS ORE BODY HIGH-GRADE MINE ENABLES SUPERIOR VALUE CREATION ACROSS ALL STAGES
• Uniquely high-grade mine with significant content of higher
value-added rare earth elements Nd and Pr
• ~2,200 fee simple acres with ~15,000 acres of mineral rights; 30-
year mine permit
• October 2019 NI 43-101 Resources and Reserves Study reflects
~20 years of mine life with conservative operating assumptions
• February 2020 SRK Technical Memo recognizes the potential for
15+ years of additional mine life (before pursuing an updated
exploratory drilling program) driven by the ability to sell
products outside of China
‒ Sales outside China would not be burdened by VAT or tariffs,
which should drive an increase to economically proven and
probable reserves
• Currently undertaking analysis to upgrade statement to be SEC
Guide 7 compliant; MP expects an upgrade to both total
Proven & Probable reserves as well as total mine life
Resources
Resource
Metric
Tons
Grade
(tREO %)
Contained
tREO
Tons
Recoverable
tREO
Tons (1)
Proven 214,786 9.0% 19,331 13,532
Probable 14,431,568 7.8% 1,128,549 789,984
Proven +
Probable 14,646,354 7.8% 1,147,879 803,516
Sources: NI 43-101 Technical Report Mountain Pass Rare Earth Project, San Bernardino County, California (2019), Pittuck, Wellman, Braun, Pfahl, Olin, Osborn & Rodrigues
Notes: 1. Assumes 70% mill recoveries

R = 244
G = 120
B = 32
R = 42
G = 51
B = 94
R = 17
G = 152
B = 189
R = 91
G = 29
B = 42
R = 166
G = 226
B = 182
R = 51
G = 65
B = 64
Q1 2020 Q1 2020
Annualized
Revenue $20.7 $82.9
Total Costs (16.7) (66.7)
Cost of Sales (11.8) (47.4)
Freight and Shipping (1.9) (7.5)
General and Administrative Expenses (3.0) (11.8)
EBITDA(2) $4.1 $16.3
Deferred Revenue Adjustment(3) 0.7 2.6
Adjusted EBITDA(2) $4.7 $18.9
Tariff Impact on Q1 Results (Tariff lifted Q2 2020) 4.4 17.4
2H 2020 Anticipated Cost Savings(4) 1.3 5.2
Further Adjusted EBITDA (including tariff impact and anticipated cost savings) $10.4 $41.5
Realized Price ($ / kg of concentrate) $1.33
Realized Price Ex-Tariff ($ / kg of concentrate) $1.60
Production Cost ($ / kg of concentrate) $0.92
32
Preliminary Financial Summary(1) (Unaudited, $MM)
Notes: 1. Results are unaudited and pro forma for MPMO/SNR combination 2. See slide 49 for reconciliation of Adj. EBITDA to net income 3. Assumes full recognition of gross profit recoupment from Shenghe Offtake Agreement 4. Anticipated cost savings from insourcing strip mining (starts mid-July) and the recommissioning of the NG pipeline to replace LNG (starts October)
STRATEGY
STAGE I: FULLY OPERATIONAL AND PROFITABLE BUSINESS ON TRACK TO GENERATE $40MM+ 2020 FURTHER ADJUSTED EBITDA

R = 244
G = 120
B = 32
R = 42
G = 51
B = 94
R = 17
G = 152
B = 189
R = 91
G = 29
B = 42
R = 166
G = 226
B = 182
R = 51
G = 65
B = 64 STRATEGY 33
STAGE II: PROVEN TECHNOLOGY SUCCESSFULLY EXECUTED AT MOUNTAIN PASS FOR DECADES CONTINUED EXECUTION BY NEW MANAGEMENT TEAM
• Reintroduction of concentrate drying and roasting to the Mountain Pass processing facility
• Process already performed successfully and reliably for decades - prior ownership abandoned the practice to target cerium
• Stage II investments are mainly to recreate this roasting circuit and reorient the plant process flow to accommodate the roasted concentrate
• Strong investment in product finishing circuits enable significantly higher volumes of high-purity separated oxides versus prior ownership
• Product will be separated into NdPr oxide, heavy rare earth concentrate (SEG+) and La carbonate
• Detailed capex study already concluded, high confidence in capital needed and potential to leverage existing infrastructure
Key Stage II Project Items Description
Concentrate Thickening Replacement of the existing flotation concentrate thickener underflow pumps
Concentrate Drying Addition of new filter, dryer, and storage bins
Concentrate Calcining Addition of new calciner, pneumatic conveyors and storage bins for the calcined concentrate
Leaching Addition of new scrubber system
Cerium Concentrate and Post-Precipitation
Solids Addition of new thickeners and filters
Neodymium + Praseodymium (NdPr) Finishing Addition of new NdPr oxide finishing circuit
Cerium Removal Addition of new cerium precipitation circuit
Lanthanum Carbonate Finishing Upgrade of lanthanum precipitation and finishing circuit
Salt Crystallizer Addition of new brine salt crystallizer to remove salt from process water and enable evaporation
and/or recycling of water

R = 244
G = 120
B = 32
R = 42
G = 51
B = 94
R = 17
G = 152
B = 189
R = 91
G = 29
B = 42
R = 166
G = 226
B = 182
R = 51
G = 65
B = 64
NdPr Price
$ / kg
STRATEGY 34
COMMODITY PRICE HISTORICAL AND FORECAST NdPr PRICE INCREASE EXPECTED DUE TO STRONG DEMAND / TIGHT SUPPLY DYNAMIC
0
25
50
75
100
125
150
175
200
2008 2009 2010 2011 2012 2013 2014 2015 2016 2017 2018 2019 2020 2021 2022 2023 2024 2025
HistoricalsManagement ProjectionsCRU Estimates (March 2020)
$40.00 $50.00
$65.00 $70.00
$44.20
$197.28
$60.00
$81.00 $89.00
$102.00
$127.00
$141.00
$70.35 $70.70
Sources: Bloomberg, Management, CRU
E E E E E E

R = 244
G = 120
B = 32
R = 42
G = 51
B = 94
R = 17
G = 152
B = 189
R = 91
G = 29
B = 42
R = 166
G = 226
B = 182
R = 51
G = 65
B = 64 35
STAGE II EARNINGS POWER UNDER DIFFERENT PRICE SCENARIOS LOW-COST PRODUCER PROFITABLE ACROSS DIFFERENT NdPr PRICES
STRATEGY
0%
10%
20%
30%
40%
50%
60%
70%
80%
90%
100%
Stage I Stage IIBasket Price Achieved Price
Notes: 1. Stage I figures represent 2020E estimates and Stage II figures represent 2023E estimates, each assuming the NdPr prices indicated
$133
$306
$60
$143
Stage I Stage II
$195
$415
$121
$252
Stage I Stage II
$256
$525
$183
$362
Stage I Stage II
Stages I and II Revenue and Adj. EBITDA Estimates (1)
$90 NdPr Oxide
Price: $50 $70
Revenue ($MM) Adj. EBITDA ($MM) NdPr Price ($ / kg)

R = 244
G = 120
B = 32
R = 42
G = 51
B = 94
R = 17
G = 152
B = 189
R = 91
G = 29
B = 42
R = 166
G = 226
B = 182
R = 51
G = 65
B = 64
8 29
82
172
252
0
150
300
2019 2020E 2021E 2022E 2023E
75 102
171
349
415
0
250
500
2019 2020E 2021E 2022E 2023E
Revenue(1) $MM
Adj. EBITDA (1) (2)
$MM
Capex (1) $MM
Free Cash Flow (“FCF”) (1)(3)
$MM
STRATEGY 36
STAGE II FINANCIAL OVERVIEW STRONG TOP LINE GROWTH, ALREADY ADJ. EBITDA POSITIVE AND ANTICIPATING STRONG FCF CONVERSION AT RUN-RATE
Margin: 8.0% 28.3% 47.7% 49.4% 60.8%
Maintenance
% of Sales:
5 10 12 31
139
30 2
35
149
10
42
0
100
200
2019 2020E 2021E 2022E 2023E
1.9% 34.6% 3.0%
4
(36)
(96)
102
138
(5)
43 102
168
(200)
0
200
2019 2020E 2021E 2022E 2023E
Stage II capex Chlor-Alkali capex
86.9% 10.2% 30 512 429 Cash Balance(4)($MM): 367 566
FCF (ex-growth capex) Notes: 1. All figures are pro forma for the combination of MPMO and SNR 2. Assumes (i) full recognition of gross profit recoupment from Shenghe Offtake Agreement (ii) add-back from non-cash items, and (iii) pro forma adjustments for MPMO/SNR combination. Please refer to slide 49 for detailed Adj. EBITDA reconciliation to corresponding GAAP measure 3. Free cash flow (“FCF”) is defined as net cash from operations, less net purchases of property, plant, and equipment. Please refer to slide 49 for detailed FCF reconciliation to corresponding GAAP measure 4. Includes cash and equivalents and current deposits

R = 244
G = 120
B = 32
R = 42
G = 51
B = 94
R = 17
G = 152
B = 189
R = 91
G = 29
B = 42
R = 166
G = 226
B = 182
R = 51
G = 65
B = 64 37
STAGE III: BENEFITS OF VERTICAL INTEGRATION SIGNIFICANT DOWNSTREAM EARNINGS POTENTIAL
STRATEGY
• Uniquely positioned to capture significant downstream profit
opportunity via buy, build or JV strategy as the sole
commercial-scale source of magnetic feedstock in the
Western Hemisphere
• Magnet production allows a “value upgrade” of MP’s rare
earth materials and access to a business unavailable to
potential competitors without our scarce resource
• Provides MP Materials a scalable industrial output with
profitability protection against NdPr pricing volatility
• Total profit opportunity provides a high return-on-capital
investment regardless of ultimate structure
Illustrative Permanent Magnet Motor
NdPr Magnets
Stator Rotor
Stator
Sources: Allied Market Research

38
SECTION 4
Deal Structure

R = 244
G = 120
B = 32
R = 42
G = 51
B = 94
R = 17
G = 152
B = 189
R = 91
G = 29
B = 42
R = 166
G = 226
B = 182
R = 51
G = 65
B = 64
PRO FORMA OWNERSHIP
39
$MM | Approximate Figures
Pay Down Existing Debt $21.1
Cash to Balance Sheet(1) 488.9
Equity Rollover(2) 919.4
Estimated Fees 35.0
Sponsor Warrants Converted to Common Shares 8.9
Total Transaction Uses $1,473.3
Transactions Uses
$MM | Approximate Figures
SPAC Cash in Trust(1) $345.0
Equity Rollover(2) 919.4
PIPE 200.0
Sponsor Warrants Converted to Common Shares 8.9
Total Transaction Sources $1,473.3
Transaction Sources
Estimated Pro Forma Valuation
$MM, except for share price and share count | Approximate Figures
Share Price $10.00
PF Shares Outstanding 147,332
Equity Value $1,473.3
Plus: Debt (Equipment Notes) 2.5
Plus: Offtake Advances from Shenghe 95.5
Less: Cash(3) (527.5)
Enterprise Value $1,043.9
Illustrative Pro Forma Ownership (4)
Existing MP
Materials
Shareholders
62.4%
Existing FVAC
Shareholders
23.4%
PIPE Investors
13.6% Sponsor
0.6%
DEAL STRUCTURE
Notes: 1. Subject to reduction to the extent cash available after the Transaction is less than $495MM. Actual results in connection with the business combination may differ.
2. Based on $80.6MM estimated net debt
3. Pro forma cash calculated using $38.6MM of existing cash at MP Materials plus $545MM raised via the merger with FVAC ($345MM of SPAC Cash in Trust plus $200MM of PIPE proceeds) net of $21.1MM of MP Materials debt paid down and $35MM in estimated fees
4. Represents economic interests, excluding public warrants, unvested Sponsor Promote Shares and Seller Incentive Shares. Including Unvested Sponsor Promote Shares, Sponsor holds a 6.1% voting interest, diluting other shareholders voting interests on a pro rata basis; assumes
$10.00/share market value, and no redemptions.
5. Equity value excludes unvested Sponsor Promote Shares and is pro forma for exchange of each Sponsor private placement warrant for 0.15 of a common share, resulting in the exchange of 5,933,333 warrants into 890,000 newly created Class F shares.
(5)

R = 244
G = 120
B = 32
R = 42
G = 51
B = 94
R = 17
G = 152
B = 189
R = 91
G = 29
B = 42
R = 166
G = 226
B = 182
R = 51
G = 65
B = 64
LONG-TERM PARTNERSHIP: SPAC SPONSOR “PROMOTE” RESTRUCTURED AS AN “EARN-OUT” FVAC SPONSOR HAS AGREED TO SUBJECT THEIR FOUNDER SHARES TO SHARE PRICE VESTING CONDITIONS AT A SIGNIFICANT PREMIUM TO THE TRANSACTION VALUE
40
FVAC, MP’s existing shareholders, and Management have structured a deal that demonstrates strong conviction in the business and
aligns current and prospective shareholders to create long-term value
Notes: 1. Subject to reduction to the extent cash available after the Transaction is less than $495MM
2. Subject to the common stock closing price exceeding the share price triggers specified for any 20 trading days within a 30-day consecutive trading period prior to the tenth anniversary of the closing date of the Transaction
DEAL STRUCTURE
Size Structure
Sponsor Promote Shares 8.625MM(1)
50% @ $12.00 / share(2)
25% @ $14.00 / share(2)
25% @ $16.00 / share(2)
Seller Incentive Shares 12.860MM 50% @ $18.00 / share(2)
50% @ $20.00 / share(2)
Sponsor Warrants 5.933MM To be exchanged pre-closing at 0.15
of a share per warrant

41
SECTION 5
Valuation

R = 244
G = 120
B = 32
R = 42
G = 51
B = 94
R = 17
G = 152
B = 189
R = 91
G = 29
B = 42
R = 166
G = 226
B = 182
R = 51
G = 65
B = 64
11.4%
3.5% 1.6% 1.6%
(1.1%)
13.6%
1.8% 0.1% 0.0%
17.1%
7.2% 7.0% 6.7% 4.9% 4.9%
(10.0%)
0.0%
10.0%
20.0%
30.0%
4.8x
28.7x
25.3x
18.9x
11.3x
15.0x 12.4x
8.7x 7.0x
16.2x
10.4x 8.4x
5.5x 5.1x
9.4x
0
9
18
26
35
EV / Adj. EBITDA Multiples (Run-rate 2023E for MP Materials; 2021E for Peers(1))
LFCF Yield(2) (%) (Run-rate 2023E for MP Materials; 2021E for Peers(1))
(%)
VALUATION 42
VALUATION BENCHMARKING MP MATERIALS RUN-RATE MULTIPLES AT A SIGNIFICANT DISCOUNT TO PEERS
Notes: 1. Peers data from public filings and Wall Street estimates, SEC Filings and Capital IQ; market data as of June 12, 2020 2. LFCF Yield defined as (cash flow from operations – capex) / equity value 3. Lynas multiple considers enterprise value adjusted for upcoming capex need of A$500MM (US$342MM) 4. Based on 2023E run-rate adj. EBITDA of $252MM, enterprise value of $1,214MM includes $170MM of capex spend 5. Based on 2023E LFCF excluding the impact of growth capex; post transaction equity value of $1,473MM 6. Livent and Albemarle capex figures assumed at last 2 years historical % of sales applied to 2021E sales estimates 7. Estimates unavailable
(3)
Stage II
Run-Rate(4)
Stage III
Illustrative(5)
Stage II
Run-Rate(5)
Stage III
Illustrative(7)
Electrification Peers Specialty Materials Peers
EV Revolution Peers
Implied at
Deal Price
Implied at
Deal Price
(x) Electrification Average: 21.0x Specialty Materials Average: 10.7x EV Revolution Average: 9.1x
Electrification Average: 1.4% Specialty Materials Average: 5.1% EV Revolution Average: 8.6%
(7)
(6) (6)

R = 244
G = 120
B = 32
R = 42
G = 51
B = 94
R = 17
G = 152
B = 189
R = 91
G = 29
B = 42
R = 166
G = 226
B = 182
R = 51
G = 65
B = 64
93.9% 86.5%
67.9% 63.8%
47.3%
65.8%
48.7%
N/A N/A
82.5%
67.9% 65.4% 63.8%
N/A
63.8%
0%
60%
120%
49.4%
28.4%
19.2% 17.5% 15.6%
45.6% 43.4%
28.0% 27.3% 27.4% 25.3% 19.3%
N/A N/A
45.6%
0%
30%
60%
2022E Adj. EBITDA Margin (1)
%
VALUATION 43
OPERATIONAL BENCHMARKING MP MATERIALS OUTPERFORMS PEERS IN KEY OPERATIONAL METRICS
Notes: 1. Peers data from Wall Street estimates, SEC Filings and Capital IQ; market data as of June 12, 2020 2. FCF conversion defined as (Adj. EBITDA – Maintenance Capex) / EBITDA 3. Capex based on historical average as a % of sales for last 3 years. % applied to CY2022E revenue 4. Estimates unavailable 5. Lynas maintenance capex based on CY2020E research estimates
2022E FCF Conversion (1) (2)
%
(3) (3) (3) (3)
Electrification Peers Specialty Materials Peers EV Revolution Peers
(4) (4) (4)
(4) (4)
(5)

R = 244
G = 120
B = 32
R = 42
G = 51
B = 94
R = 17
G = 152
B = 189
R = 91
G = 29
B = 42
R = 166
G = 226
B = 182
R = 51
G = 65
B = 64
Consolidated EBITDA Multiple
9.0x 10.0x 11.0x
$100$3,168 /
3.0x
$3,520 /
3.4x
$3,872 /
3.7x
$200$4,068 /
3.9x
$4,520 /
4.3x
$4,972 /
4.8x
$300$4,968 /
4.8x
$5,520 /
5.3x
$6,072 /
5.8x
Inc
rem
en
tal Sta
ge
III
EB
ITD
A P
ote
ntia
l
Run-Rate Adj. EBITDA NTM Multiple (Year 3)
8.0x 9.0x 10.0x
5%$1,795 /
72.0%
$2,020 /
93.5%
$2,244 /
115.0%
10%$1,604 /
53.7%
$1,805 /
72.9%
$2,006 /
92.1%
15%$1,441 /
38.0%
$1,621 /
55.3%
$1,801 /
72.6%
Dis
co
un
t R
ate
VALUATION 44
VALUATION SUMMARY DISCOUNTED ENTERPRISE VALUE SENSITIVITY ANALYSES
Stage II Run-Rate Discounted Enterprise Value Assuming Stage II Adj. EBITDA of $252MM and August 2020 Valuation Date $MM | % Premium to Contemplated Deal Valuation ($1,044MM)
Stage III Illustrative Future Value Sensitivity of Incremental Stage III EBITDA Scenarios, Assuming Stage II Adj. EBITDA of $252MM $MM | Multiple vs. Contemplated Deal Valuation ($1,044MM)

Supplemental Materials
45
APPENDIX A
R = 244
G = 120
B = 32
R = 42
G = 51
B = 94
R = 17
G = 152
B = 189
R = 91
G = 29
B = 42
R = 166
G = 226
B = 182
R = 51
G = 65
B = 64 46
MP MATERIALS EXECUTIVE LEADERSHIP
James Litinsky – Chairman & CEO
Mr. Litinsky is the Founder, Chief Executive Officer and Chief Investment Officer of JHL Capital Group LLC. Before founding JHL in 2006, Mr. Litinsky was a member of the Drawbridge Special Opportunities Fund at Fortress Investment Group. Prior to Fortress, he was a Director of Finance at Omnicom Group, and he worked as a merchant banker at Allen & Company. Mr. Litinsky received a B.A. in Economics from Yale University, cum laude, and a J.D./M.B.A. from the Northwestern University School of Law and the Kellogg School of Management. He was admitted to the Illinois Bar. Mr. Litinsky serves on the Boards of AbilityLab and the Museum of Contemporary Art Chicago.
Ryan Corbett – Chief Financial Officer
Mr. Corbett joined the Company as Chief Financial Officer in 2019. He joined JHL Capital Group LLC as a Managing Director to focus on the firm’s investment in MP Materials. Prior to joining JHL, he was an Analyst at Brahman Capital Corp. and King Street Capital Management, both alternative asset managers based in New York, where he focused on special situations investments across the capital structure. Mr. Corbett started his career in investment banking at Morgan Stanley & Co. He graduated magna cum laude from the Wharton School of the University of Pennsylvania with a concentration in Finance.
Michael Rosenthal – Chief Operating Officer
Mr. Rosenthal will serve as the Chief Operating Officer of the Company upon closing of the business combination with FVAC. Mr. Rosenthal co-founded the Company and has been managing the Mountain Pass operation since the Company took control of the site in 2017. Before joining MP Materials, he was a Partner at QVT Financial, an investment firm. At QVT, Mr. Rosenthal concentrated on investments in the global automotive sector and in China. Prior to joining QVT, he worked as a senior high yield credit analyst for Shenkman Capital Management. Mr. Rosenthal graduated from Duke University with an A.B. degree in Economics and Comparative Area Studies.
SUPPLEMENTAL MATERIALS
Sheila Bangalore – General Counsel and Chief Strategy Officer
Ms. Bangalore joined the Company as its General Counsel and Chief Strategy Officer in 2020. Prior to MP Materials, Ms. Bangalore was most recently Assistant General Counsel at Aristocrat Technologies (ASX: ALL), and previously held legal roles at Zappos and Bally Technologies. Ms. Bangalore began her career at Bilzin Sumberg Baena Price & Axelrod LLP. She is a former Board member and President of the Association of Corporate Counsel, Nevada Chapter. Ms. Bangalore received her B.A. in Literature from Tufts University and her J.D. from the Washington University in St. Louis. She is currently an MBA Candidate at the Wharton School of the University of Pennsylvania.

R = 244
G = 120
B = 32
R = 42
G = 51
B = 94
R = 17
G = 152
B = 189
R = 91
G = 29
B = 42
R = 166
G = 226
B = 182
R = 51
G = 65
B = 64 47
MP MATERIALS POST-TRANSACTION BOARD OF DIRECTORS(1)
SUPPLEMENTAL MATERIALS
James Litinsky – Chairman
Mr. Litinsky is the Founder, Chief Executive Officer and Chief Investment Officer of JHL Capital Group LLC. Before founding JHL in 2006, Mr. Litinsky was a member of the Drawbridge Special
Opportunities Fund at Fortress Investment Group. Prior to Fortress, he was a Director of Finance at Omnicom Group, and he worked as a merchant banker at Allen & Company. Mr. Litinsky
received a B.A. in Economics from Yale University, cum laude, and a J.D./M.B.A. from the Northwestern University School of Law and the Kellogg School of Management. He was admitted
to the Illinois Bar. Mr. Litinsky serves on the Boards of AbilityLab and the Museum of Contemporary Art Chicago.
Randall Weisenburger
Mr. Weisenburger founded Mile 26 Capital in January 2015. Previously, he was the Executive Vice President and Chief Financial Officer of Omnicom Group Inc. (NYSE: OMC) from 1998
through 2014. Before joining Omnicom, Mr. Weisenburger was a founding member of Wasserstein Perella and a former member of the First Boston Corporation. Mr. Weisenburger currently
serves on the Board of Carnival Corporation (NYSE: CCL), Valero Energy Corporation (NYSE: VLO), and Corsair Components Inc. Mr. Weisenburger holds a MBA from the Wharton School of
the University of Pennsylvania and a Bachelor’s Degree in Finance and Accounting from Virginia Tech.
Notes: 1. Michael Rosenthal will be a non-voting Board Observer. The Company anticipates naming at least two additional independent Board Directors prior to the closing of the Transaction.
Drew McKnight
Mr. McKnight is a Managing Partner of the Credit Funds Business based in San Francisco, CA. Mr. McKnight heads the liquid strategies and serves on the investment committee for the
Credit Funds and is a member of the Management Committee of Fortress. Mr. McKnight is also the Co-CIO of the Drawbridge Special Opportunities Fund, Fortress Lending Fund and
Fortress Credit Opportunities Fund V. In addition, Mr. McKnight is currently the CEO of Fortress Value Acquisition Corp.
General (Ret.) Richard Myers
Retired U.S. Air Force Gen. Richard B. Myers serves as the President of Kansas State University, where he is also a professor of mili tary history and leadership. Gen. Myers loyally served his
country for forty years and retired as a four-star general. From 2001-2005, he served as the 15th Chairman of the Joint Chiefs of Staff. As chairman, Myers was the highest-ranking uniformed
officer of U.S. military forces and served as the principal military adviser to President George W. Bush, Secretary of Defense Donald Rumsfeld, and the National Security Council. Since
retirement from the military, Myers has served on several public and non-profit boards, and also held the Colin Powell Chair for National Security Leadership, Ethics, and Character at
National Defense University.
Dan Gold
Mr. Gold is the Founder and CEO of QVT Financial LP, an alternative investment management firm, and the QVT Family Office. Prior to founding QVT he was a Managing Director at
Deutsche Bank, where he managed the proprietary trading group which became QVT via a spinout in 2003. Before Deutsche Bank he worked at Daiwa Securities and Bear Stearns. Mr.
Gold graduated from Harvard College with an A.B. in Physics.

R = 244
G = 120
B = 32
R = 42
G = 51
B = 94
R = 17
G = 152
B = 189
R = 91
G = 29
B = 42
R = 166
G = 226
B = 182
R = 51
G = 65
B = 64 48
MP MATERIALS OPERATIONAL LEADERSHIP
Peter Landi – Manager, Process Technology and Engineering
Mr. Landi has over 9 years of experience in the rare earth industry, primarily at Mountain Pass. He has served in various leadership roles supporting process engineering, plant operations, process and product development, and project engineering. He also led the development of the site-wide material and energy balances for production planning and reporting. Mr. Landi graduated from the University of Colorado, Boulder with a B.S. in Chemical Engineering. Mr. Landi will oversee Process Engineering for the Stage II project.
Robby Ruesch – Manager, Mining and Ore Delivery
Mr. Ruesch has 34 years of experience in leadership roles in open pit mining operations. Before joining MP Materials, he served as General Manager, Mine Technical Services Manager, and Mine Manager of KGHM International Ltd. Nevada Mining Company, a subsidiary or KGHM Polska Miedz, extracting copper, gold, silver and molybdenum. Mr. Ruesch also held senior mining and engineering roles at Barrick Gold. Additionally, he served on the Board of Directors for the Nevada Mining Association and is a member of Society of Mining, Metallurgy and Exploration. Mr. Ruesch received his secondary education at Great Basin Community College while working in the mining industry.
Joseph Pascoe – Principal Engineer
Mr. Pascoe leads the Process Engineering and Development group. He has worked in the rare earth industry for 13 years in various roles at Mountain Pass and as a consultant to other rare earth projects globally. Mr. Pascoe began his career in product development and holds several patents pertaining to applications of rare earths. He is a leading subject matter expert in rare earth processing and separation. Mr. Pascoe graduated from the State University of New York at Buffalo with a B.S. in Chemical Engineering and studied Physics at the University of Wales Swansea (United Kingdom). For the Stage II projects, Joe is the key subject matter expert for the drying, roasting, leaching, SX and product finishing design phases.
SUPPLEMENTAL MATERIALS
Nick Perrine – Manager, Operations and Assets
Mr. Perrine oversees approximately 150 employees in the Plant Operations, Maintenance, Maintenance Planning, Electrical, Mobi le Maintenance, and Shipping & Warehouse departments. He has led operations through MP Materials’ Stage I recommissioning efforts, resulting in record production at the Mountain Pass facilities and world-class reliability metrics. Nick has 12 years of experience in the rare earth industry, beginning his Operations career at Mountain Pass in 2008 when he lead the Commissioning and Optimization teams before his appointment as General Foreman of the rare earth Separations & Finishing facilities.

R = 244
G = 120
B = 32
R = 42
G = 51
B = 94
R = 17
G = 152
B = 189
R = 91
G = 29
B = 42
R = 166
G = 226
B = 182
R = 51
G = 65
B = 64
FY 2019 Q1 2020
Net Income (GAAP) ($5.1) $1.5
(+) Depreciation and Amortization 4.7 1.1
(+) Asset Retirement and Environmental Liability Accretion 2.1 0.4
(+) Interest Expense 3.0 0.7
(+) Income Tax Provision 0.0 0.4
EBITDA $4.7 $4.1
(+) Deferred Revenue Adjustment(2) 1.9 0.7
(+) Non-Recurring Items(3) 1.9 -
Adjusted EBITDA $8.5 $4.7
Net Cash Flow from Operations (GAAP) ($1.6) 3.6
(+) Net Purchases of Property, Plant, and Equipment 5.6 (2.0)
Free Cash Flow $4.0 $1.5
49
Reconciliations of GAAP to Non-GAAP Measures(1) ($MM)
Notes: 1. Results are pro forma unaudited combined results reflecting the combination of MP Materials and SNR 2. Assumes full recognition of 2019 deferred revenue from the Shenghe Offtake Agreement 3. Net impact of addback for one-time contract charge offset by gain on sale of asset
SUPPLEMENTAL MATERIALS
RECONCILIATIONS OF NON-GAAP MEASURES
Related Documents