Objectives P erformance Analysis = Analysis + Computer Systems Performance Analyst = Mathematician + Computer Systems Persons You will learn: • Specifying performance requirements • Evaluating design alternatives • Comparing two or more systems • Determining the optimal value of a parameter (system tuning) • Finding the performance bottleneck (bottleneck identification) c 1994 Raj Jain 1.1

Welcome message from author
This document is posted to help you gain knowledge. Please leave a comment to let me know what you think about it! Share it to your friends and learn new things together.
Transcript

Objectives
P erformance Analysis = Analysis + Computer SystemsPerformance Analyst = Mathematician + Computer SystemsPersonsYou will learn:
• Specifying performance requirements
• Evaluating design alternatives
• Comparing two or more systems
• Determining the optimal value of a parameter (systemtuning)
• Finding the performance bottleneck (bottleneckidentification)
c©1994 Raj Jain 1.1

• Characterizing the load on the system (workloadcharacterization)
• Determining the number and sizes of components(capacity planning)
• Predicting the performance at future loads (forecasting).
c©1994 Raj Jain 1.2

Basic Terms
• System: any collection of hardware, software, andfirmware
• Metrics: the criteria used to evaluate the performance ofthe system. components.
• Workloads: The requests made by the users of the system.
c©1994 Raj Jain 1.3

Part I: An Overview of Performance Evaluation
1. Introduction
2. Common Mistakes and How To Avoid Them
3. Selection of Techniques and Metrics
c©1994 Raj Jain 1.4

Example I
W hat performance metrics should be used to compare theperformance of the following systems:
1. Two disk drives?
2. Two transaction-processing systems?
3. Two packet-retransmission algorithms?
c©1994 Raj Jain 1.5

Part II: Measurement Techniques and Tools
1. Types of Workloads
2. Popular Benchmarks
3. The Art of Workload Selection
4. Workload Characterization Techniques
5. Monitors
6. Accounting Logs
7. Monitoring Distributed Systems
8. Load Drivers
9. Capacity Planning
10. The Art of Data Presentation
11. Ratio Games
c©1994 Raj Jain 1.6

Example II
W hich type of monitor (software or hardware) would bemore suitable for measuring each of the following quantities:
1. Number of Instructions executed by a processor?
2. Degree of multiprogramming on a timesharing system?
3. Response time of packets on a network?
c©1994 Raj Jain 1.7

Part III: Probability Theory and Statistics
1. Probability and Statistics Concepts
2. Four Important Distributions
3. Summarizing Measured Data By a Single Number
4. Summarizing The Variability Of Measured Data
5. Graphical Methods to Determine Distributions ofMeasured Data
6. Sample Statistics
7. Confidence Interval8. Comparing Two Alternatives
9. Measures of Relationship
10. Simple Linear Regression Models
11. Multiple Linear Regression Models
12. Other Regression Models
c©1994 Raj Jain 1.8

Example III
T he number of packets lost on two links was measured forfour file sizes as shown below:
File Size Link A Link B1000 5 101200 7 31300 3 0
50 0 1
Which link is better?
c©1994 Raj Jain 1.9

Part IV: Experimental Design and Analysis
1. Introduction to Experimental Design
2. 2k Factorial Designs
3. 2kr Factorial Designs with Replications
4. 2k−p Fractional Factorial Designs
5. One Factor Experiments
6. Two Factors Full Factorial Design without Replications
7. Two Factors Full Factorial Design with Replications
8. General Full Factorial Designs With k Factors
c©1994 Raj Jain 1.10
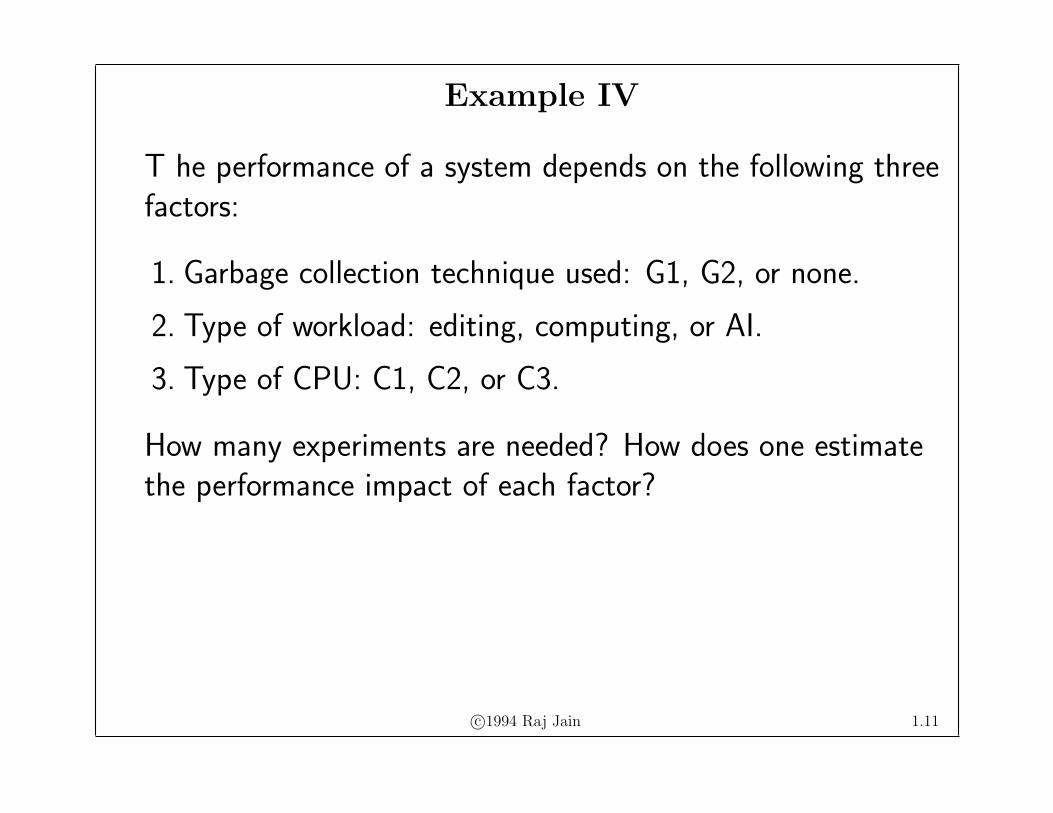
Example IV
T he performance of a system depends on the following threefactors:
1. Garbage collection technique used: G1, G2, or none.
2. Type of workload: editing, computing, or AI.
3. Type of CPU: C1, C2, or C3.
How many experiments are needed? How does one estimatethe performance impact of each factor?
c©1994 Raj Jain 1.11

Part V: Simulation
1. Introduction to Simulation
2. Types of Simulations
3. Model Verification and Validation
4. Analysis of Simulation Results
5. Random-Number Generation
6. Testing Random-Number Generators
7. Random-Variate Generation
8. Commonly Used Distributions
c©1994 Raj Jain 1.12

Example V
I n order to compare the performance of two cachereplacement algorithms:
1. What type of simulation model should be used?
2. How long should the simulation be run?
3. What can be done to get the same accuracy with ashorter run?
4. How can one decide if the random-number generator inthe simulation is a good generator?
c©1994 Raj Jain 1.13

Part VI: Queueing Theory
1. Introduction to Queueing Theory
2. Analysis of A Single Queue
3. Queueing Networks
4. Operational Laws
5. Mean Value Analysis and Related Techniques
6. Convolution Algorithm
7. Advanced Techniques
c©1994 Raj Jain 1.14

Example VI
T he average response time of a database system is threeseconds. During a one-minute observation interval, the idletime on the system was ten seconds. Using a queueing modelfor the system, determine the following:
1. System utilization
2. Average service time per query
3. Number of queries completed during the observationinterval
4. Average number of jobs in the system
5. Probability of number of jobs in the system being greaterthan 10
6. 90-percentile response time
7. 90-percentile waiting time
c©1994 Raj Jain 1.15
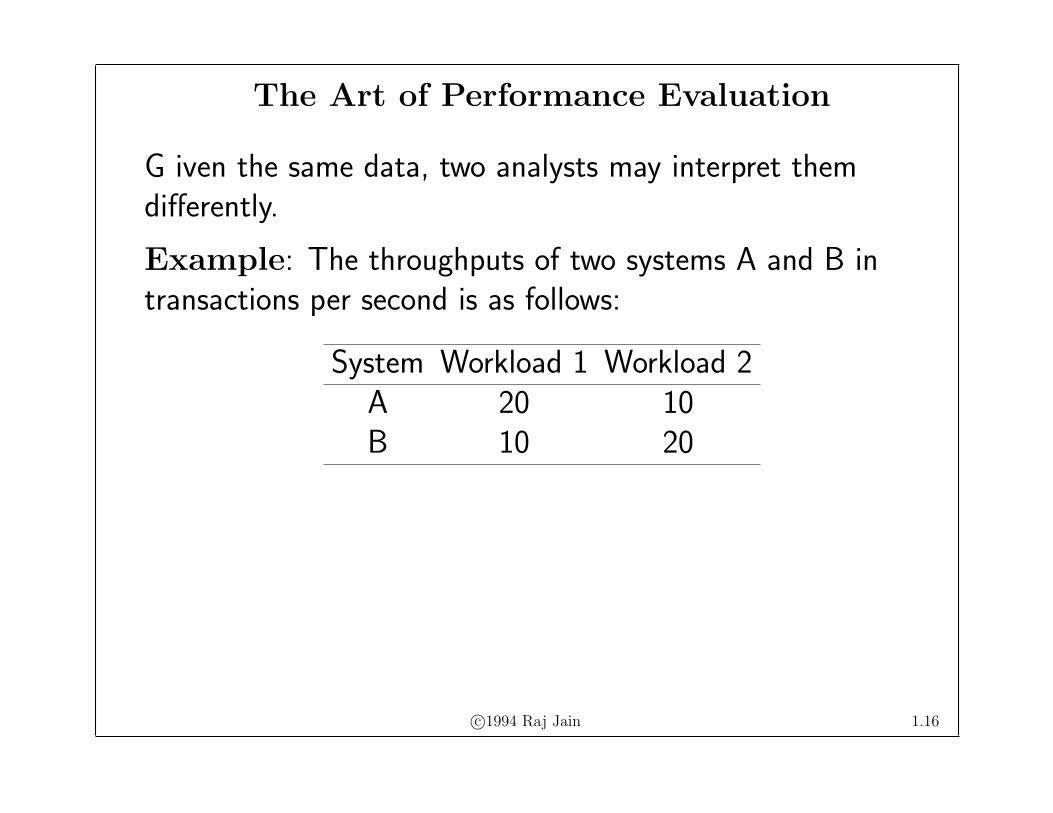
The Art of Performance Evaluation
G iven the same data, two analysts may interpret themdifferently.
Example: The throughputs of two systems A and B intransactions per second is as follows:
System Workload 1 Workload 2A 20 10B 10 20
c©1994 Raj Jain 1.16

Three Solutions
1. Compare the average:
System Workload 1 Workload 2 AverageA 20 10 15B 10 20 15
Cnclusion: The two systems are equally good.
2. Compare the ratio with system B as the base
System Workload 1 Workload 2 AverageA 2 0.5 1.25B 1 1 1
Conclusion: System A is better than B.
c©1994 Raj Jain 1.17

3. Compare the ratio with system A as the base
System Workload 1 Workload 2 AverageA 1 1 1B 0.5 2 1.25
Conclusion: System B is better than A.
Similar games in: Selection of workload, Measuring thesystems, Presenting the results.Common mistakes will also be discussed.
c©1994 Raj Jain 1.18
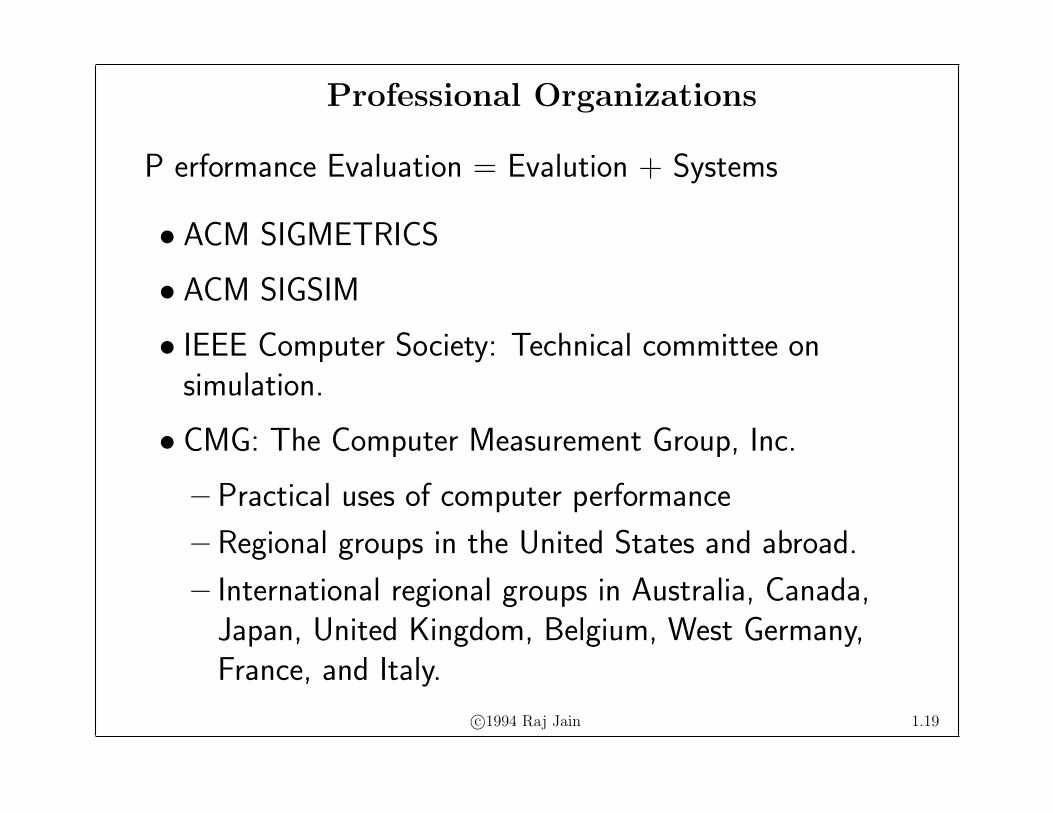
Professional Organizations
P erformance Evaluation = Evalution + Systems
• ACM SIGMETRICS
• ACM SIGSIM
• IEEE Computer Society: Technical committee onsimulation.
• CMG: The Computer Measurement Group, Inc.
– Practical uses of computer performance
– Regional groups in the United States and abroad.
– International regional groups in Australia, Canada,Japan, United Kingdom, Belgium, West Germany,France, and Italy.
c©1994 Raj Jain 1.19

• IFIP Working Group 7.3
– IFIP=International Federation for InformationProcessing
– Multinational federation of technical societies
– American Federation of Information ProcessingSocieties (AFIPS) represents the United States.
– ACM, IEEE, etc are members of AFIPS
– Several technical committees (TCs) and working groups(WGs)
– WG 7.3 is devoted to computer systems modeling
c©1994 Raj Jain 1.20

Professional Organizations (Continued)
• The Society for Computer Simulation (SCS)
– Publishes simulation books, journals
– Regional councils in the United States, Canada and theUnited Kingdom.
– Sponsors:
∗ Summer Computer Simulation Conference
∗ SCS Multiconference
∗ Eastern Simulation Conferences
∗ Winter Simulation Conference
• The Society for Industrial and Applied Mathematics(SIAM)
– Development of new mathematical techniquesc©1994 Raj Jain 1.21

– Journals:
∗ SIAM Journal on Control and Optimization
∗ SIAM Journal on Numerical Analysis
∗ SIAM Journal on Computing
∗ SIAM Journal on Scientific and Statistical Computing
∗ Theory of Probability and Its Applications.
c©1994 Raj Jain 1.22

Professional Organizations (Continued)
• The Operations Research Society of America (ORSA)
– Interests:
∗ Operation research
∗ Queueing theory
∗ Game theory
∗ Network analysis
∗ Replacement and inventory theories
∗ Scheduling
∗ Simulation
– Geographical sections, technical sections, specialinterest groups, and student sections.
– Represents the US in the International Federation ofOperational Research Societies (INFORS)
c©1994 Raj Jain 1.23
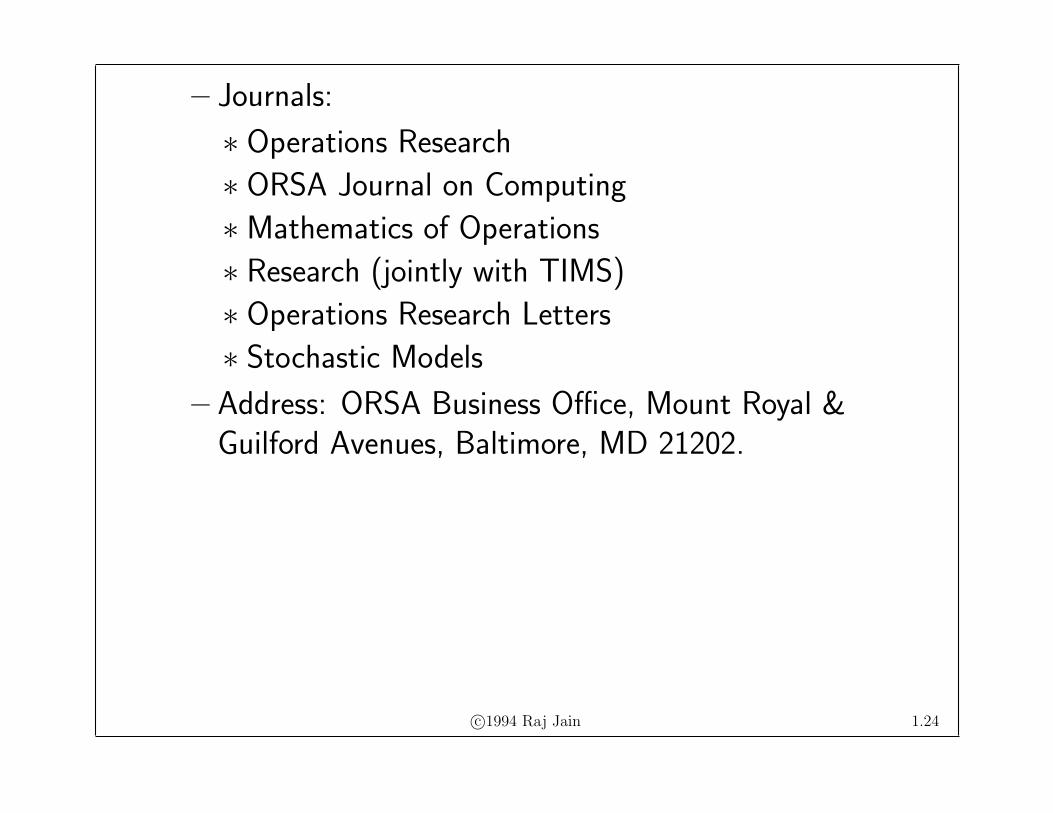
– Journals:
∗ Operations Research
∗ ORSA Journal on Computing
∗ Mathematics of Operations
∗ Research (jointly with TIMS)
∗ Operations Research Letters
∗ Stochastic Models
– Address: ORSA Business Office, Mount Royal &Guilford Avenues, Baltimore, MD 21202.
c©1994 Raj Jain 1.24

Conferences
• SIGMETRICS: Published as Performance EvaluationReview
• CMG
• PERFORMANCE (18 months)Alternately in Europe and in North America.
• EDP Performance and Capacity ManagementApplied Computer Research, Inc.
• ACM SIGSIM and IEEE Computer Society TechnicalCommittee
• Pittsburgh Conference on Modeling and Simulation:University of Pittsburgh’s School of Engineering and IEEE
c©1994 Raj Jain 1.25

Journals
1. Performance Evaluation Review: Quarterly by ACMSIGMETRICS.
2. CMG Transactions: Quarterly by CMG.
3. Performance Evaluation: Twice a year by Elsevier SciencePublishers B. V. (North-Holland)
4. EDP Performance Review: Monthly by Applied ComputerResearch, Inc. Survey in the annual reference issue.
5. Simulation: Monthly by SCS.
6. Transactions of the Society for Computer Simulation:Quarterly
7. Simulation Digest: Quarterly by ACM SIGSIM and IEEEComputer Society Technical Committee on Simulation.
c©1994 Raj Jain 1.26

8. SIAM Review: Quarterly by SIAM.
9. Operations Research: Bimonthly by ORSA.
10. See also computer systems journals.
• Communications of the ACM.
• IEEE Transactions on Software Engineering
• IEEE Transactions on Computers
• ACM Transactions on Computers
c©1994 Raj Jain 1.27

Related Courses
L ater you may consider taking courses on:
• Statistical inference operations research
• Stochastic processes
• Decision theory
• Time series analysis
• Design of experiments
• System simulation
• Queueing theory
c©1994 Raj Jain 1.28

Performance Projects
• Select a system:
– Network mail program
– Operating system
– Language compiler
– Text editor
– Processor
– Database
• Do:
– Perform measurements
– Analyze the collected data
– simulate
– analytically model the subsystem
c©1994 Raj Jain 1.29

Example of Projects
1. Measure the performance of a remote procedure callmechanism used in a distributed system.
2. Measure and compare the performance of window systemsof two artificial intelligence systems.
3. Simulate and compare the performance of two processorinterconnection networks.
4. Measure and analyze the performance of twomicroprocessors.
5. Characterize the workload of a campus timesharingsystem.
6. Compute the effects of various factors and theirinteractions on the performance of two text-formattingprograms.
7. Measure and analyze the performance of a distributedinformation system.
c©1994 Raj Jain 1.30

8. Simulate the communications controllers for an intelligentterminal system.
9. Measure and analyze the performance of acomputer-aided design tool.
10. Measure and identify the factors that affect theperformance of an experimental garbage collectionalgorithm.
11. Measure and compare the performance of remoteprocedure calls and remote pipe calls.
12. Analyze the effect of factors that impact the performanceof two RISC processor architectures.
13. Analyze the performance of a parallel compiler running ona multiprocessor system.
14. Develop a software monitor to observe the performance ofa large multiprocessor system.
15. Analyze the performance of a distributed game programrunning on a network of artificial intelligence systems.
c©1994 Raj Jain 1.31

16. Compare the performance of several robot controlalgorithms.
• Goal: Provide an insight (or information) not obviousbefore the project.
• Real Problems: Thesis work, or job
• Homeworks: Apply techniques learnt to your system.
c©1994 Raj Jain 1.32
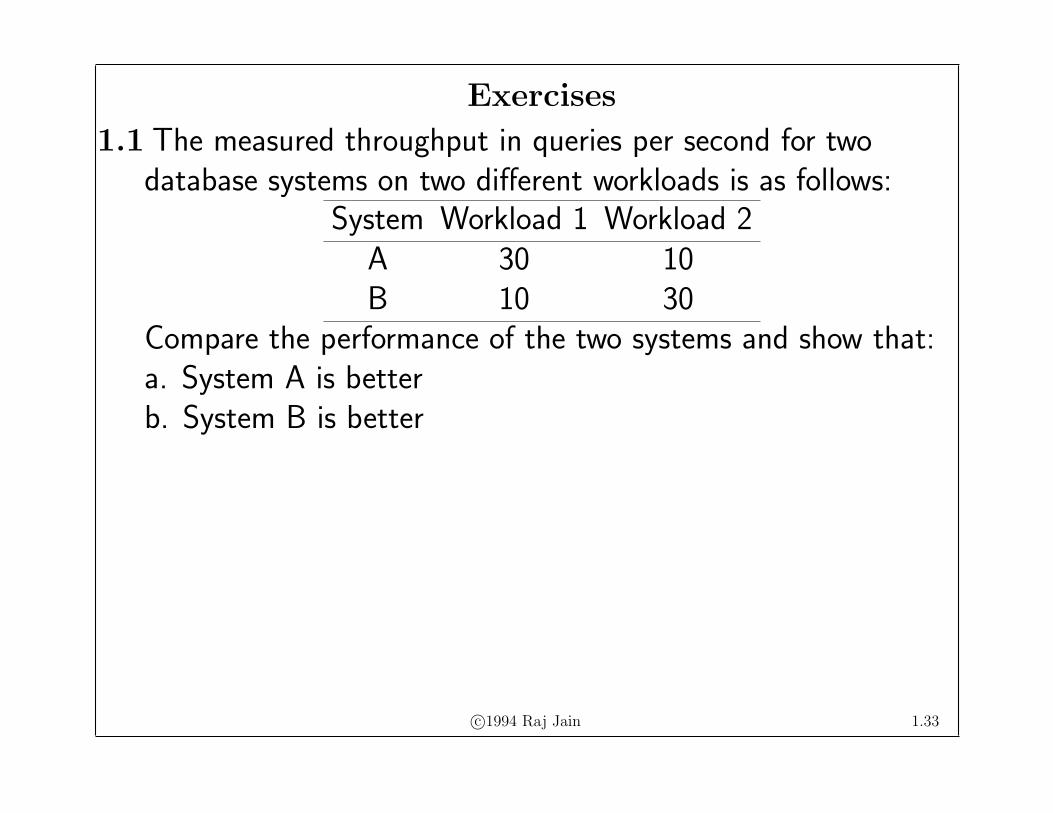
Exercises
1.1 The measured throughput in queries per second for twodatabase systems on two different workloads is as follows:
System Workload 1 Workload 2A 30 10B 10 30
Compare the performance of the two systems and show that:a. System A is betterb. System B is better
c©1994 Raj Jain 1.33
Related Documents