UNIVERSITY OF SZEGED FACULTY OF PHARMACY DEPARTMENT OF PHARMACODYNAMICS AND BIOPHARMACY DEVELOPMENT OF SMOOTH MUSCLE ELECTROMYOGRAPHIC METHOD: DETECTION AND INTERPRETATION OF SLOW WAVE ACTIVITIES IN GASTROINTESTINAL TRACT AND PREGNANT UTERUS PH.D THESIS KÁLMÁN FERENC SZŰCS SUPERVISOR: RÓBERT GÁSPÁR PH.D. 2018

Welcome message from author
This document is posted to help you gain knowledge. Please leave a comment to let me know what you think about it! Share it to your friends and learn new things together.
Transcript

UNIVERSITY OF SZEGED
FACULTY OF PHARMACY
DEPARTMENT OF PHARMACODYNAMICS AND BIOPHARMACY
DEVELOPMENT OF SMOOTH MUSCLE ELECTROMYOGRAPHIC METHOD:
DETECTION AND INTERPRETATION OF SLOW WAVE ACTIVITIES IN
GASTROINTESTINAL TRACT AND PREGNANT UTERUS
PH.D THESIS
KÁLMÁN FERENC SZŰCS
SUPERVISOR:
RÓBERT GÁSPÁR PH.D.
2018
CONTENTS
1. Introduction ....................................................................................................... 4
2. Aims .................................................................................................................. 7
3. Materials and methods....................................................................................... 8
3.1 Housing and handling of the animals ......................................................... 8
3.1.1 Mating of the animals ............................................................................. 8
3.2 Detection of gastrointestinal myoelectric activity ..................................... 8
3.2.1 Pharmacological investigations ............................................................ 11
3.3 Detection of myoelectric activity ............................................................. 11
3.3.1 Pharmacological investigations ............................................................ 13
3.4 Stress measurements ................................................................................ 14
3.4.1 EMG monitoring .................................................................................. 14
3.4.2 Collection of plasma and organ samples .............................................. 15
3.4.3 Plasma corticosterone analysis ............................................................. 15
3.4.4 HPLC analysis ...................................................................................... 16
3.4.5 Contractility studies in isolated organ bath .......................................... 16
4. Results ............................................................................................................. 18
4.1 Gastrointestinal smooth muscle myoelectric activity .............................. 18
4.2 Pregnant uterus smooth muscle myoelectric activity ............................... 24
4.3 Detection of stress in wakeful rats ........................................................... 28
5. Discussion ....................................................................................................... 36
6. References ....................................................................................................... 43
7. Ackowledgements ........................................................................................... 49

2
List of publications
This thesis is based on the following publications:
I. Szucs KF, Nagy A, Grosz G, Tiszai Z, Gaspar R: Correlation between
slow-wave myoelectric signals and mechanical contractions in the
gastrointestinal tract: Advanced electromyographic method in rats .
Journal of Pharmacological and Toxicological Methods 2016, 82:37-
44.
[IF: 2.238]
II. Szucs KF, Grosz G, Sule M, Nagy A, Tiszai Z, Samavati R, Gaspar R:
Identification of myoelectric signals of pregnant rat uterus: new
method to detect myometrial contraction. Croatian Medical Journal
2017, 58(2):141-148.
[IF: 1.619]
III. Szucs KF, Grosz G, Sule M, Sztojkov-Ivanov A, Ducza E, Marki A,
Kothencz A, Balogh L, Gaspar R: Detection of stress and the effects
of central nervous system depressants by gastrointestinal smooth
muscle electromyography in wakeful rats. Life Sciences 2018, 205:1-
8.
[IF: 2.936]
Other publication unrelated to this thesis:
I. Berko S, Szucs KF, Balazs B, Csanyi E, Varju G, Sztojkov-Ivanov A,
Budai-Szucs M, Bota J, Gaspar R: Electroporation-delivered
transdermal neostigmine in rats: equivalent action to intravenous
administration. Drug Design, Development and Therapy 2016,
10:1695-1701.
[IF: 2.822]
3
List of abbreviations
AUC: area under curve
cpm: cycles per minute
EEG: electroencephalography
EMG: electromyography
ENS: enteric nervous system
FFT: fast Fourier transformation
GI: gastrointestinal
i.p.: intraperitoneal
i.v.: intravenous
ICC: interstitial cells of Cajal
PsD: power spectrum density
SEMG: smooth muscle electromyography
SG: strain gauge

4
1. INTRODUCTION
1.1 Gastrointestinal motility disorders
The detection of motility problems of smooth muscle organs has not yet been
solved. Gastrointestinal (GI) motility disorders are among the most frequent forms of
GI motility problems, such as oesophageal reflux disease, gastroparesis, ileus, and
colon obstruction in intensive care [1], but the daily clinical practice is additionally
faced with gastric arrhythmia, heartburn, reflux, irritable bowel syndrome, chronic
constipation, etc. [2]. It is currently considered that these motility disorders are
idiopathic in origin; their diagnosis, prognosis and treatment are therefore not
satisfactory [3].
The gut-brain axis creates a two-way communication network created by the
complex system of the enteric nervous system (ENS), cerebral nerves and the humoral
system. As a part of the ENS the GI smooth muscle has its own pacemaker cells,
called the interstitial cells of Cajal (ICCs), which play a key role in the generation and
propagation of the electric signal in GI contractility. ICCs generate slow-wave electric
impulses to induce action potentials for contractions and determine the frequency of
the signals [4, 5]. Functional GI malfunctions can be the consequences of
dysregulation in the gut–brain axis. The altered gut-brain interaction can be in the
background of functional GI disorders and other motility diseases, such as
gastroesophageal reflux disease and irritable bowel syndrome. The investigation of the
gut-brain axis and the enteric plexus activity helps to promote the understanding of GI
diseases and the therapies for GI disorders and stress-induced GI malfunctions [6-8].
1.2 Uterine motility disorders
The other major unsolved problem is premature delivery, which is defined as
delivery occurring before 37 completed weeks of gestation also caused by smooth
muscle overactivity. Premature labour is the major contributor to perinatal mortality
5
and morbidity, with an average rate of 10-12% in developing and developed countries
and accounts for 75%–85% of all neonatal deaths.
The physiology of pregnant uterine contractility is very complex and not yet
fully understood. Myometrial contraction is regulated by sexual and stress hormones,
the autonomic nervous system, ion channels and transmitters. Dysregulation of the
myometrial contractility can lead to either preterm or slow-to-progress labour [9].
ICCs have been immunohistochemically detected using c-kit/CD 117
antibodies in a variety of smooth muscle tissues as well, including the myometrium.
These myometrial CD 117-positive cells could behave as sensors, controlling
myometrial contractility, depending on sexual and also the stress hormone levels.
Myometrial ICCs exhibited spontaneous electrical and pacemaker activity and
responsibility for the generation of slow myoelectric waves. It has been suspected that
CD 117-positive cells are associated with myometrial motility disorders, which may
have a role in the pathogenesis of endometriosis and the regulation of labour in the
pregnant uterus. [10, 11]
Besides, preterm delivery is related to stressful life events, anxiety, depression,
lack of psychosocial support and physical abuse. Stress triggers through three
different mechanisms: hypothalamus-pituitary-adrenal axis, activation of the
inflammatory processes, and ischemic mechanisms, all can affect the development of
premature births. In response to maternal emotional and physical stress, the endocrine
system (i.e., the hypothalamus-pituitary-adrenal axis) is activated, releasing hormones
such as adrenocorticotropin, cortisol, cytokines and prostaglandins. Patients with
anxiety and depressive disorders also have a higher incidence of functional GI
disorders that are frequently unrecognized, these organs respond to psychosocial
distress through smooth muscle contractions [12-14].
1.3 Problems of in vivo detection of smooth muscle electric
activity
Non-invasive GI electric mapping (multi-electrode method) and the
electroenterogram (ring electrode method) as new techniques have been tested to
6
characterize the GI motility, and especially the gastric activity in humans [15, 16].
Although these methods are promising, it cannot be guaranteed that the recorded
signals originate solely from the putative GI tracts. The signals can obtain the GI
slow- and fast-waves along with noises such as respiratory and motion artefact [17].
In the other hand, a sensitive method to predict the early signs of term or
preterm pregnant uterine contraction would have also a great importance in obstetric
practice. Although a few clinical studies have been published about the application of
electromyography in obstetrics [18, 19], the characterization of slow wave uterine
signals and their comparison to other smooth muscles waves have not been described
yet.
The possibility of slow-wave myoelectric signal interference, or even masking
with fast-wave signals from the brain, cardiac muscle or skeletal muscle, is very high,
and an effort is made to reduce this through the special design of the sensors [20].
Identification of the signals from the various smooth muscle organs is therefore an
essential requirement for the development of non-invasive clinical methods for the
diagnosis of motility disorders of given parts of the GI tract and for the prediction of
premature birth. On the other hand, such a model may serve as an excellent method
for smooth muscle pharmacology in vivo.
Motion artifacts are major obstacles to the various electromyographic
examinations in wakeful subjects. Studies have demonstrated that the results of
electroencephalographic (EEG) records can be modified by muscle work during the
record because the frequencies of the brain and myogenic activity are overlapping.
The electromyographic (EMG) signals can be eliminated by computerized screening
from EEG records [21]. The skeletal muscle induced motion artifacts have higher
amplitude compared to the basal activity, which may cause large distortion in the
measurement. Therefore motion artifacts have to be filtered out, however, in the case
of overlapping frequencies, filtering can result in significant data loss [22, 23].

7
2. AIMS
There are very few equipments available to follow smooth muscle functioning
and detect the effect of different drugs in vivo. Therefore, we have set the goal of
developing an in vivo measurement method to better and more specifically interpret
the information from highly complex electromyography signals in the simple
determination of the area under curve (AUC).
The first aim of our study was to identify the slow wave frequency parameter
of the gastrointestinal tract, the gastric, small intestine and the colon, and the
identification and characterization of the uterine electrical activity of the pregnant rat
and to separate these signals from each other. To attain this goal, we have developed a
method with which to follow up the changes in the myoelectric activity of
gastrointestinal tract and pregnant uterus in parallel with the mechanical contraction in
anaesthetized rats. The recording software has been equipped with effective electronic
filters to separate the slow-waves of the smooth muscle signals from the cardiac, brain
and skeletal muscle activity.
We hypothesized that our smooth muscle EMG method - accomplished with a
digital cutter for removing motion artifacts - can be applicable in wakeful rats under
normal and stress conditions. The second aim of our study was to follow up the stress
condition induced alteration in the GI tract and to measure the effects of central
nervous depressants by SEMG in wakeful rats.
To achieve these goals we initiated in vivo experiments in male and female
rats.

8
3. MATERIALS AND METHODS
3.1 Housing and handling of the animals
The animals were treated in accordance with the European Communities
Council Directives (86/609/ECC) and the Hungarian Act for the Protection of Animals
in Research (Article 32 of Act XXVIII). All experiments involving animal subjects
were carried out with the approval of the Hungarian Ethical Committee for Animal
Research (registration number: IV/198/2013 and IV/3796/2015).
Sprague-Dawley rats (Charles-River Laboratories, Budapest, Hungary) were
housed at 22 ± 3 °C and a relative humidity of 30-70%, under a 12 h light/12 h dark
cycle. Standard rodent pellet food (Charles-River Laboratories, Budapest, Hungary)
and tap water were provided ad libitum. Each animal was fasted for two hours before
the experiments.
3.1.1 Mating of the animals
The pregnant uterus study was conducted on sexually mature, pregnant, female
rats (body mass: 140–160 g, 50–60 days old). They were mated in a special mating
cage with male rats (240-260 g) in the early morning hours. An electric engine-
controlled, movable door separated the area between the male and female rats. Since
rats are usually active at night, the separating door was opened before dawn. Within 4
hours after the possibility of mating, copulation was confirmed by the presence of a
copulation plug or spermatozoa in the vaginal smears. In positive cases, the female
rats were separated and the day of copulation was considered to be the first day of
pregnancy.
3.2 Detection of gastrointestinal myoelectric activity
Male rats (10-12 weeks old, body weight: 260-300 g) were anaesthetized
intraperitoneally (i.p.) with a combination of ketamine and xylazine solution (36 and 4

9
mg/kg, respectively). The jugular vein was cannulated for later intravenous (i.v.) drug
administration.
After laparotomy, the total GI tract was resected with the exception of one
segment (stomach, small intestine or large intestine, n=6 for each group) from the
abdomen under deep anaesthesia. A bipolar thread electrode pair (SEN-15-1; MDE
GmbH, Walldorf, Germany) was inserted into the serosal surface of the target organ
(the distance between the two electrodes was 8 mm), while a bipolar disk electrode
pair (SEN-15-2; MDE GmbH, Walldorf, Germany) was placed subcutaneously above
the specific segment of the GI tract (the distance between the two electrodes was 20
mm). An implantable strain gauge (SEN-04-FSG2; MDE GmbH, Walldorf, Germany)
was sutured onto the surface of the stomach, ileum or caecum, along the long axis of
the muscle fibres, in order to detect the mechanical contractions (Fig. 1). So as to
cover the incision, the surfaces of the abdominal wall were constricted and the
abdominal skin was replaced after the positioning of the sensors.
Figure 1. Representative picture of the positioning of the electrodes and strain gauge (SG) for
recording the cecal myoelectric and mechanical signals in a rat with a resected stomach and small
intestine. The thread electrode pair and the SG were positioned on the caecum, while the disk
electrode pair were positioned on the abdomen under deep anaesthesia.
The animals were then placed immediately onto a heatable operating table
(EXP-D-TC/MA-02; MDE GmbH, Walldorf, Germany) in order to maintain the body
temperature (set to 37 °C). The basal activity was detected for 60 min. The electric
signals were recorded and analysed by an on-line computer and amplifier system by
10
the S.P.E.L. Advanced ISOSYS Data Acquisition System (MDE GmbH, Walldorf,
Germany). Electromyographic (EMG) signals were amplified by using a custom-made
amplifier designed by MDE Ltd., Budapest, Hungary. In order to reduce the artefacts
we used a double-filter system. All analogue signals were pre-filtered with a first-
order Bessel-type lowpass filter and were converted to digital signals at a sample rate
of 2 Hz with a slope of 80dB/decade. The pre-filtered myoelectric signals were then
filtered further by Bessel-type bandpass filters with a frequency of 0-30 cycles per
minute (cpm) with a slope of 140dB/decade. Each filter was a digital IIR filter. The
recorded signals were analysed by fast Fourier transformation (FFT). The frequency
of the electric activity was characterized in cpm, and the magnitude of the activity was
described as power spectrum density (PsD). When more than one peak was found in
the spectrum, only the highest peak was considered.
The mechanical contractions were evaluated by area under the curve analysis
of the primary contractility curves. Before the pharmacological studies, both the
mechanical (strain gauge) and electric (thread and disk electrodes) signals were
recorded for 30 min (n=8 for each segment).
In the case of anaesthetized, non-GI tract-resected rats (n=9), a bipolar disk
electrode was placed under the abdominal skin, 1 cm right from the midline of the
laparotomy, and 3 strain gauges were sutured one by one onto the surface of the
stomach, ileum and caecum (Fig. 2). The abdominal incision surfaces were closed by
surgical staples after the placement of the sensors.

11
Figure 2. The positioning of the disk electrode and strain gauges (1: stomach; 2: ileum; 3:
caecum) for recording of the gastrointestinal (GI) myoelectric and mechanical signals in a non-GI
tract-resected rat under deep anaesthesia.
Both the mechanical (strain gauges) and electric signals (disk electrode) were
recorded for 30 min before the administration of the investigated drugs. The
myoelectric signals were recorded with the above-mentioned equipment, but the
analysis and filtering of the signals were carried out according to our findings in the
partially GI tract-resected animals (see in the Results section).
3.2.1 Pharmacological investigations
A dose of neostigmine (20 μg/kg) was administered and after 30 min a dose of
atropine (300 μg/kg) i.v. for the GI tract-resected and intact rats. Following the
addition of each drug, the AUC and FFT of 30-min periods were evaluated. The
effects were expressed as percentages of the spontaneous activity. The AUC, cpm and
PsDmax values were determined and compared statistically (unpaired t test) by using
the computer program Prism 5.0. (GraphPad Software, USA).
3.3 Detection of myoelectric activity
Female, full term pregnant (21st and 22
nd day of pregnancy) rats were
anaesthetized intraperitoneally with a combination of ketamine and xylazine solution
12
and the jugular vein was cannulated for later intravenous drug administration as
previously done.
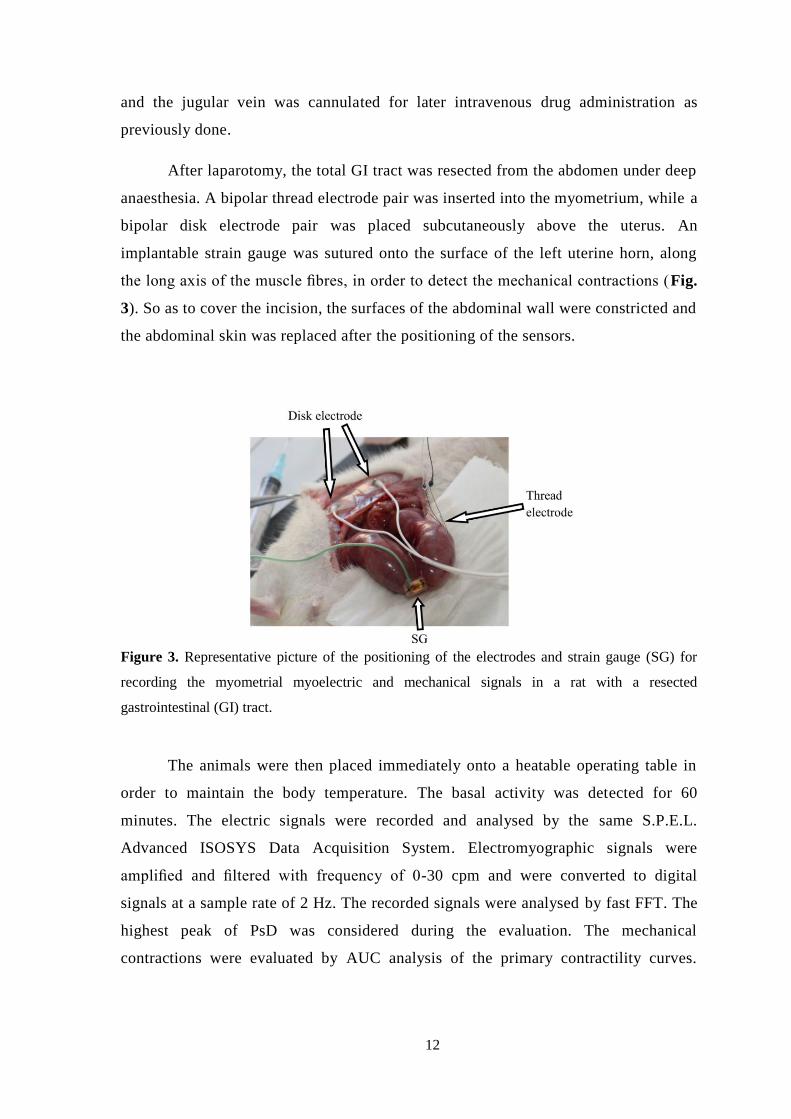
After laparotomy, the total GI tract was resected from the abdomen under deep
anaesthesia. A bipolar thread electrode pair was inserted into the myometrium, while a
bipolar disk electrode pair was placed subcutaneously above the uterus. An
implantable strain gauge was sutured onto the surface of the left uterine horn, along
the long axis of the muscle fibres, in order to detect the mechanical contractions (Fig.
3). So as to cover the incision, the surfaces of the abdominal wall were constricted and
the abdominal skin was replaced after the positioning of the sensors.
Figure 3. Representative picture of the positioning of the electrodes and strain gauge (SG) for
recording the myometrial myoelectric and mechanical signals in a rat with a resected
gastrointestinal (GI) tract.
The animals were then placed immediately onto a heatable operating table in
order to maintain the body temperature. The basal activity was detected for 60
minutes. The electric signals were recorded and analysed by the same S.P.E.L.
Advanced ISOSYS Data Acquisition System. Electromyographic signals were
amplified and filtered with frequency of 0-30 cpm and were converted to digital
signals at a sample rate of 2 Hz. The recorded signals were analysed by fast FFT. The
highest peak of PsD was considered during the evaluation. The mechanical
contractions were evaluated by AUC analysis of the primary contractility curves.

13
Before the pharmacological studies, both the mechanical and electric (thread and disk
electrodes) signals were recorded for 30 min (n=8).
In the case of anaesthetized, non-GI tract-resected rats (n=12), a bipolar disk
electrode was placed under the abdominal skin, 1 cm right from the midline of the
laparotomy, and 2 strain gauges were sutured one by one onto the surface of the uterus
and caecum (Fig. 4). The abdominal incision surfaces were closed by surgical staples
after the placement of the sensors.
Figure 4. The positioning of the disk electrode and strain gauges (uterus, caecum) for recording
of the uterine and gastrointestinal (GI) myoelectric and mechanical signals in a non-GI tract-
resected rat under deep anaesthesia.
Both the mechanical and electric signals were recorded for 30 min before the
administration of the investigated drugs. The myoelectric signals were recorded with
the above-mentioned equipment. The analysis and filtering of the signals were carried
out according to our previous findings (see in the Results section).
3.3.1 Pharmacological investigations
Two doses of oxytocin (1 μg/kg) were administered after recording the basal
activity, 15 min. apart. After 30 min, a dose of terbutaline (50 μg/kg) was injected i.v.

14
both for GI-resected (n=8 on the 21st day of pregnancy) and non-GI-resected (n=10 on
the 22nd
day of pregnancy) rats. One dose of neostigmine (20 μg/kg) and one dose of
atropine (300 μg/kg) i.v. were administered 30 min apart for non-GI-resected rats on
the 22nd
day of pregnancy. Following the administration of each drug, the AUC and
FFT of 30-min periods were evaluated. The effects were expressed as percentages of
the spontaneous activity. The AUC, cpm and PsDmax values were determined and
compared statistically (unpaired t test) by using the computer program Prism 5.0 .
3.4 Stress measurements
3.4.1 EMG monitoring
Male rats were anaesthetized with isoflurane inhalation, then a bipolar disk
electrode pair was fixed subcutaneously 1 cm right from the midline above the
gastrointestinal tract. The connecting cable of the sensor to the swivel was led
subcutaneously and the terminal was led out through the skin of the neck. After the
placement of the sensor, the abdominal and cervical incision surfaces were closed by
surgical sutures and staples, respectively.
The basal activity was detected the day after the placement of the sensors.
Food and water were withdrawn 2 hours before and during the detection. The animals
were placed one by one in cages with high-pitched walls, with a transparent wall at
the front side. The animals were not restricted in their movements for 30 min while
recording basal GI tract activity (control). Then the rats were anaesthetized with 3.5 %
isoflurane inhalation and placed and fixed onto a glass plate by strong sticky belts.
The rats were laid on the abdomen and were not able to move or turn around. After
full awakening (3-5 min), the GI activity was recorded again for 30 min under this
stress condition. When diazepam (5 mg/kg) or haloperidol (1 mg/kg) was
administered intraperitoneally for the given groups of rats, the treatments were done
after recording the basal activity. Then 30-min recording was carried out for each drug
to determine their actions before and during stress condition.

15
The myoelectric signals were recorded and analyzed by the S.P.E.L. Advanced
ISOSYS Data Acquisition System. Electromyographic signals were amplified and
filtered with a first-order bandpass Bessel-type filter with a frequency of 0-30 cpm.
The FFT of 30-min periods were evaluated. When more than one peak was found in
the spectrum, the highest peak was considered as characteristic for the given GI tract
segment. During the evaluation, the EMG spectrum of basal activity was compared to
the activities after drug treatment or during stress period. The stress-induced
alterations were expressed as percentage of the spontaneous activity. The PsDmax
values were compared statistically (one-way ANOVA) by using the computer program
Prism 5.0.
To remove the motion artifacts, a digital cutter was built into the software. The
edge values of the limiter were set by the motion artifact-free sections of the records.
Thereby, we were able to cut the artifact signals by their obviously high outlier
amplitude.
3.4.2 Collection of plasma and organ samples
At the end of each period of 30 min, samples of 0.5 ml blood were collected
from the tail veins into 1 ml tubes containing K3EDTA (0.6 mg/tube) and centrifuged
(1700 ×g, 10 min, 4° C) to separate plasma. The plasma samples were stored at -20° C
until hormone assay and HPLC analysis. The organ samples for haloperidol
determination were collected after termination by CO2 inhalation. Brain, lung and
liver tissue samples were homogenized in 0.01 M KH2PO4 (pH=4.3):methanol = 75:25
mixture (1:4 w/v) with a tissue blender. Tissue homogenates were stored at –70 ºC
until HPLC analysis.
3.4.3 Plasma corticosterone analysis
The plasma concentration of corticosterone was measured by enzyme-linked
immunosorbent assay (ELISA) from the collected samples. A Mouse/Rat
Corticosterone ELISA (BioVendor, Bio-Kasztel Ltd, Hungary) kit was used for the
quantification of corticosterone. After the preparation of microplate wells, we
16
dispensed 10 μl of each calibrator, sample and control solutions in duplicates. We
added the incubation buffer and 50 μl of enzyme conjugate into each well, and
incubated the plate for 2 hours at room temperature. After the washing procedure we
added the substrate solution to each well, and incubated for 30 min in the dark. We
stopped the reaction by adding the 50 μl of stop solution, and then we determined the
absorbance of each well at 450 nm within 15 min.
3.4.4 HPLC analysis
An aliquot of plasma or tissue homogenate sample (200 l) was combined with
20 l of 50 g/ml internal standard solution and 100 l 1 M glycine buffer (pH=10.5),
then 1.5 ml acetonitrile was added. The mixture was vortexed for 1.5 min and
centrifuged at 12,000 rpm for 10 min at 4 ºC. The supernatant was evaporated to
dryness under a stream of nitrogen at 40 ºC. The residue was reconstituted in 100 l
mobile phase and a volume of 20 l solution was injected for analysis.
The chromatographic separations were performed on a Kromasil Eternity C18
(5 m, 150 mm × 4.6 mm) analytical column at 35 ºC. The mobile phase used for the
separation consisted of acetonitrile : water : isopropyl alcohol : ammonium hydroxide
= 40 : 50 : 10 : 0,025 (v/v/v/v) pumped at a flow rate of 1 ml/min. The detection
wavelength was 245 nm.
3.4.5 Contractility studies in isolated organ bath
Before measurement, rats were fasting for 24 hours. The animals were
terminated by CO2 inhalation. The stomach, ileum and cecum were dissected, rinsed
with Tyrode solution (composition in mM: 137 NaCl, 3 KCl, 1 CaCl2, 1 MgCl2, 12
NaHCO3, 0.4 NaH2PO4, 6 glucose, pH 7.4) and cleaned from fat. Strips from the
stomach were prepared as described earlier [24]. The ileum and the cecum were cut
into 5-mm-long muscle rings. The smooth muscle samples were mounted vertically in
an organ bath containing 10 ml, 37°C Tyrode buffer and carbogen (95% O2 + 5%
CO2) was bubbled through it. The initial tension of the tissues was set to 1.5 g. The

17
samples were incubated for 60 min, the buffer solution was changed in every 15 min.
After the incubation period, the control contractions of smooth muscle were evoked
by KCl (25 mM) and a cumulative dose-response curve of 10-4
–10-9
M diazepam or
haloperidol was obtained. The activity of gastric strips, ileal and cecal rings was
measured with a gauge transducer (SG-02, MDE GmbH, Walldorf, Germany) and
recorded with a SPEL Advanced ISOSYS Data Acquisition System. The haloperidol
or diazepam effects were characterized by the percentage of the AUC values of
recorded contractions before and after adding them into the organ bath. The analyzed
periods were 5 min both for the control and the drug-altered contractions.

18
4. RESULTS
4.1 Gastrointestinal smooth muscle myoelectric activity
The separation of the primary EMG curve from the caecum obtained by serosal
thread electrodes reveals that our system detected both slow- and fast-wave (spike)
signals. In parallel, the mechanical contractions were also detectable by strain gauge
(Fig. 5).
Figure 5. Representative primary myoelectric and mechanical signals of the caecum in rat. The
signal was detected by serosal thread electrode pair. The primary signal was separated to slow-
wave and fast-wave signals. The strain gauge (SG) detected the mechanical contractions.
Representative primary EMG curves and mechanical contractions from
partially GI tract-resected rats revealed the different characteristics of the stomach
(Fig. 6A), ileum (Fig. 6B) and caecum (Fig. 6C). The thread and disk electrodes
recorded similar myoelectric signals. When the primary EMG curves were
transformed by FFT, the resulting cpm values differed for each individual GI tract
segment.
19
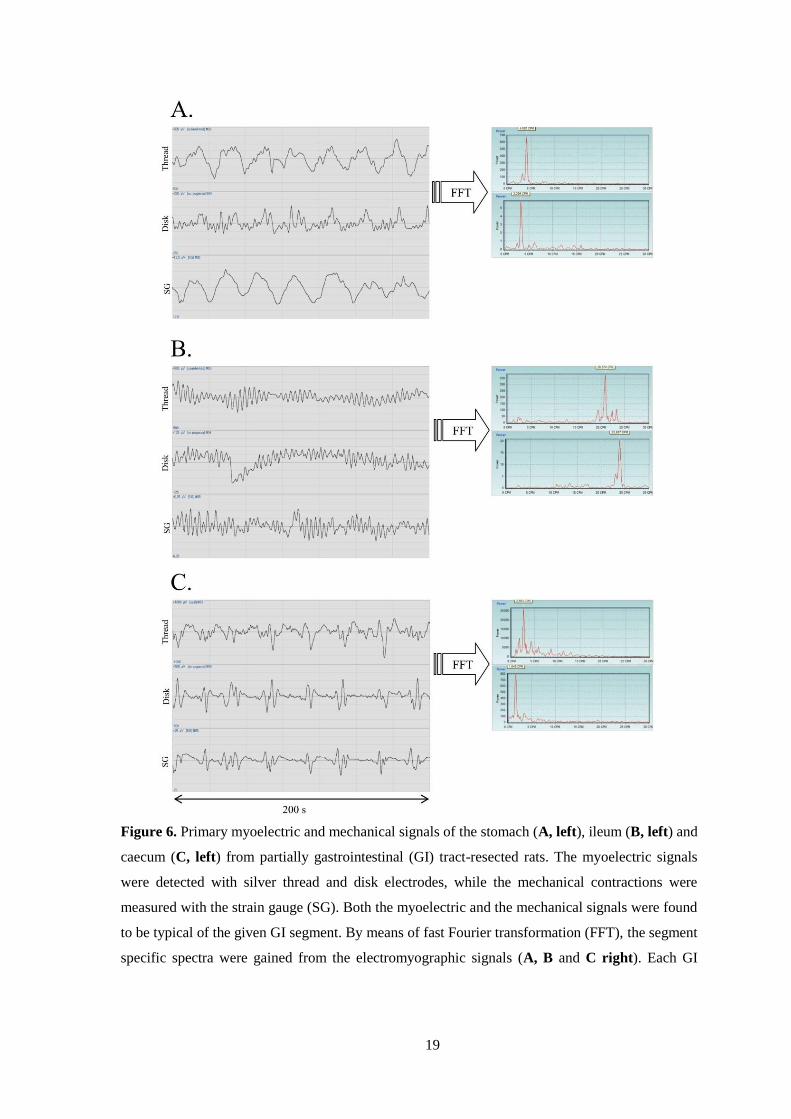
Figure 6. Primary myoelectric and mechanical signals of the stomach (A, left), ileum (B, left) and
caecum (C, left) from partially gastrointestinal (GI) tract-resected rats. The myoelectric signals
were detected with silver thread and disk electrodes, while the mechanical contractions were
measured with the strain gauge (SG). Both the myoelectric and the mechanical signals were found
to be typical of the given GI segment. By means of fast Fourier transformation (FFT), the segment
specific spectra were gained from the electromyographic signals (A, B and C right). Each GI

20
segment has the characteristic frequency expressed in cycles per minute (cpm), determined by the
highest peak in the spectrum.
The characteristic cpm values for the stomach, ileum and caecum were 3-5, 20-
25 and 1-3 cpm, respectively (Fig. 7A). The maximum intensity of the signals
(PsDmax) was higher with the thread electrodes in the given cpm ranges (Fig. 7B).
Figure 7. Cycles per minute (cpm) values of the spectra obtained by Fast Fourier transformation
for the stomach (sto), ileum (ile) and caecum (cae), measured with thread (T) and disk (D)
electrodes. The data are presented as whiskers plots (A). The intensity of the signals is expressed
as the maximum of the power spectrum density (PsDmax), which corresponds to the peak in the
spectrum. In the given cpm ranges, the PsDmax values detected with the thread electrodes were
usually higher than those with the disk electrodes (B).
Neostigmine increased, while atropine decreased both the electrical and
mechanical signals in the partially GI tract-resected rats. The FFT analysis revealed
significant changes in the PsDmax values, while the AUC analysis demonstrated
similar changes in the contractions in each investigated GI tract segment (Fig. 8A-C).

21
Figure 8. Changes in myoelectric and mechanical gastrointestinal (GI) activity after neostigmine
(Neost.) and atropine (Atr.) treatments in partially GI tract-resected rats. The electric signals were
detected with thread (T) and disk electrodes (D) and analysed by fast Fourier transformation with
GI tract segment specific filtering. The contraction was measured with a strain gauge (SG). The
intensity of electric signals was expressed as the maximum of the power spectrum density
(PsDmax), while the mechanical contraction was evaluated by area under curve (AUC) analysis. In
the stomach (sto) (A), ileum (ile) (B) and caecum (cae) (C), neostigmine increased, while atropine
reduced the electric and mechanical activities of the smooth muscles relative to the basic activity
(100%). (p<0.05: *; p<0.01: **; p<0.001: ***)
However, the pharmacological treatment did not significantly influence the
cpm values as compared with the control (Fig. 9).
Figure 9. Influence of neostigmine (Neost.) and atropine (Atr.) treatments on myoelectric
frequency values in partially gastrointestinal tract-resected rats. The electric signals were detected
with both thread and disk electrodes. Neither neostigmine nor atropine altered the characteristic
cpms of the stomach (sto), ileum (ile) or caecum (cae) significantly.

22
In the non-GI tract-resected rats, the subcutaneous abdominal disk electrode
recorded the complete electric signals from the GI tract with the basic 0-30 cpm filter
to cut out fast-wave signals from other organs. In parallel, the implanted strain gauges
in the stomach, ileum and caecum measured the real mechanical contractions of these
GI segments (Fig. 10A). FFT analysis with a 0-30 cpm filter revealed 3 main maxima
in the PsD values, corresponding to the 3 main frequency ranges determined for the
stomach, ileum and caecum in the partially GI tract-resected animals (Fig. 10B). The
individual organ-specific filtering highlighted the PsDmax values for the given GI tract
segments (Fig. 10C).
Figure 10. Primary myoelectric and mechanical signals of the gastrointestinal (GI) tract from
non-GI tract-resected rats. The myoelectric signals were detected with silver disk electrodes
positioned on the abdomen, while the mechanical contractions were measured with strain gauges
(SG) sutured onto the stomach (sto), ileum (ile) or caecum (cae) (A). Through FFT of the primary
myoelectric signals, all 3 maximum power spectrum densities (PsDmax) were revealed in the
23
characteristic cpm ranges for the stomach, ileum and caecum (B). The individual specific filters
(0-3, 3-5 and 20-25 cpm for the caecum, stomach and ileum, respectively) gave the PsDmax values
in the typical cpm ranges for each segment (C).
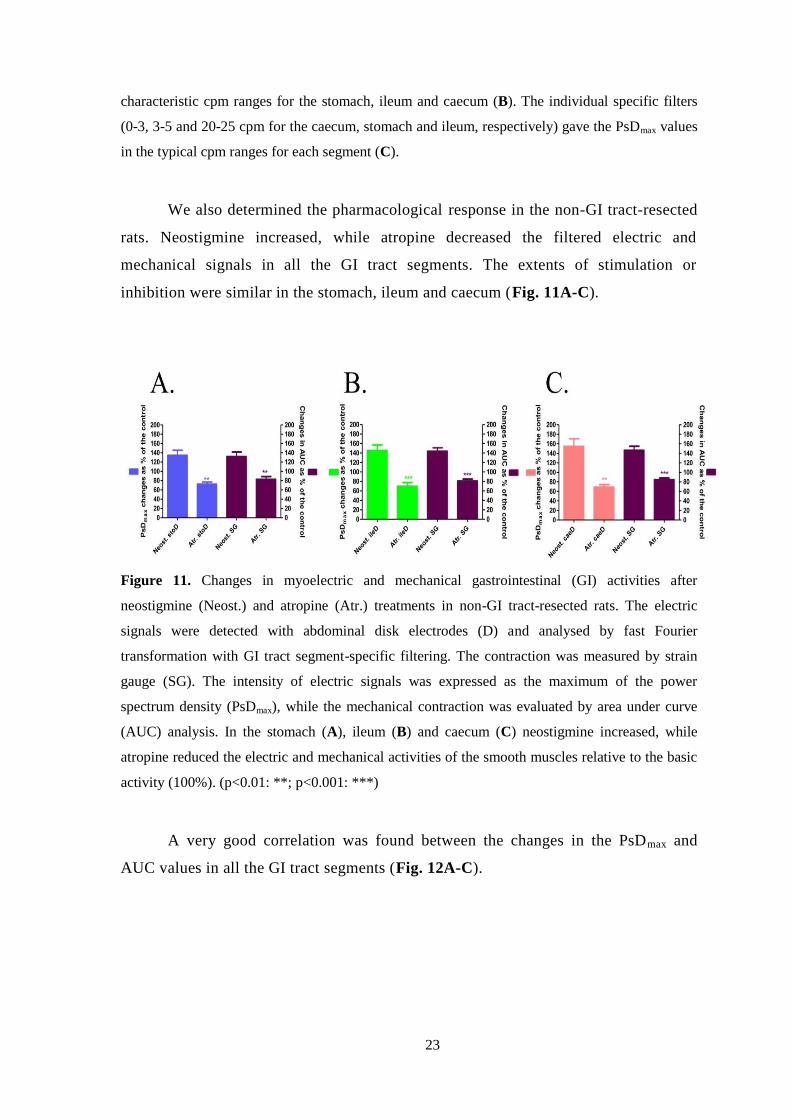
We also determined the pharmacological response in the non-GI tract-resected
rats. Neostigmine increased, while atropine decreased the filtered electric and
mechanical signals in all the GI tract segments. The extents of stimulation or
inhibition were similar in the stomach, ileum and caecum (Fig. 11A-C).
Figure 11. Changes in myoelectric and mechanical gastrointestinal (GI) activities after
neostigmine (Neost.) and atropine (Atr.) treatments in non-GI tract-resected rats. The electric
signals were detected with abdominal disk electrodes (D) and analysed by fast Fourier
transformation with GI tract segment-specific filtering. The contraction was measured by strain
gauge (SG). The intensity of electric signals was expressed as the maximum of the power
spectrum density (PsDmax), while the mechanical contraction was evaluated by area under curve
(AUC) analysis. In the stomach (A), ileum (B) and caecum (C) neostigmine increased, while
atropine reduced the electric and mechanical activities of the smooth muscles relative to the basic
activity (100%). (p<0.01: **; p<0.001: ***)
A very good correlation was found between the changes in the PsDmax and
AUC values in all the GI tract segments (Fig. 12A-C).

24
Figure 12. Correlations between myoelectric and mechanical responses induced by neostigmine
and atropine treatments in non-gastrointestinal (GI) and GI tract-resected animals. The
myoelectric response is expressed as the maximum of the power spectrum density (PsDmax), which
corresponds to the highest peak in the spectrum gained by fast Fourier transformation. The
mechanical response is expressed as the area under the curve (AUC) of the recorded smooth
muscle contractions. Linear regression analysis revealed a very good correlation between the
changes in PsDmax and AUC values in the stomach (A), ileum (B) and caecum (C).
4.2 Pregnant uterus smooth muscle myoelectric activity
Primary EMG curves from GI tract-resected rats represent characteristic
myoelectric signals recorded by thread or disk electrodes. When the primary EMG
curves were transformed by FFT, the resulting spectra had sharp and dominant peaks
(PsDmax) at low cpm values, and terbutaline reduced the PsDmax of the spectra (Fig.
13).
25
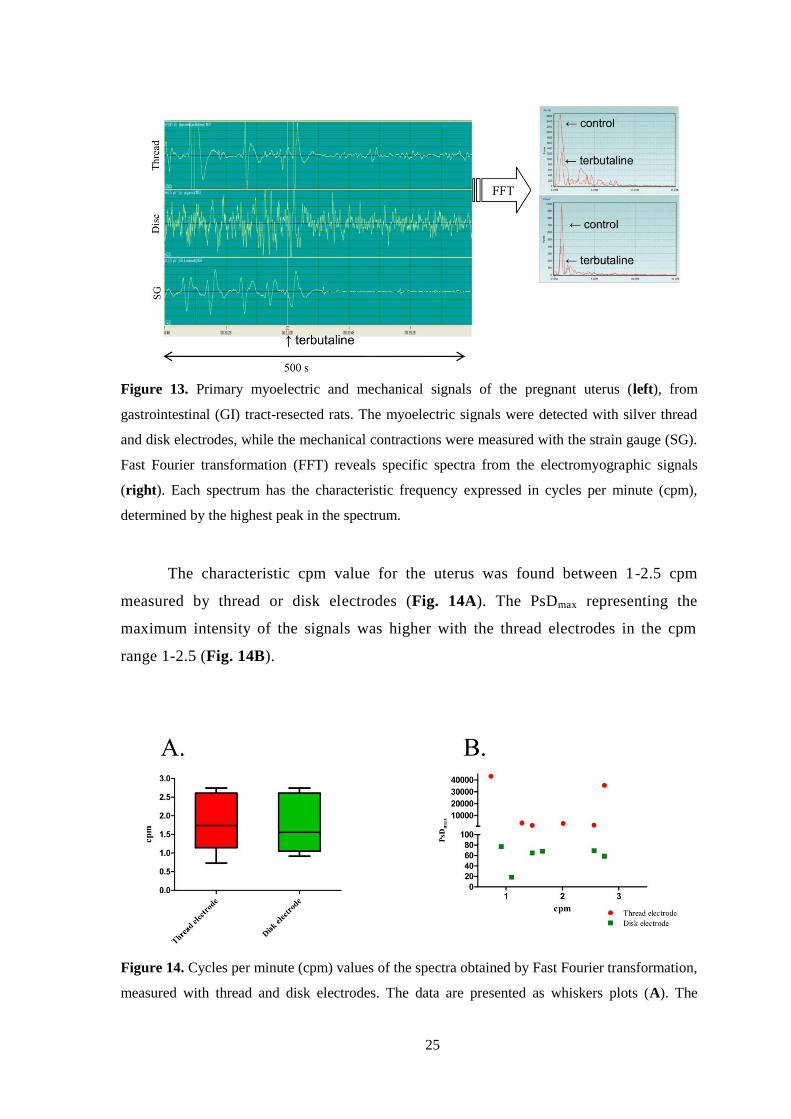
Figure 13. Primary myoelectric and mechanical signals of the pregnant uterus (left), from
gastrointestinal (GI) tract-resected rats. The myoelectric signals were detected with silver thread
and disk electrodes, while the mechanical contractions were measured with the strain gauge (SG).
Fast Fourier transformation (FFT) reveals specific spectra from the electromyographic signals
(right). Each spectrum has the characteristic frequency expressed in cycles per minute (cpm),
determined by the highest peak in the spectrum.
The characteristic cpm value for the uterus was found between 1-2.5 cpm
measured by thread or disk electrodes (Fig. 14A). The PsDmax representing the
maximum intensity of the signals was higher with the thread electrodes in the cpm
range 1-2.5 (Fig. 14B).
Figure 14. Cycles per minute (cpm) values of the spectra obtained by Fast Fourier transformation,
measured with thread and disk electrodes. The data are presented as whiskers plots (A). The
26
intensity of the signals is expressed as the maximum of the power spectrum density (PsDmax)
which corresponds to the peak in the spectrum. In the given cpm ranges, the PsDmax values
detected with the thread electrodes were usually higher than those with the disk electrodes (B).
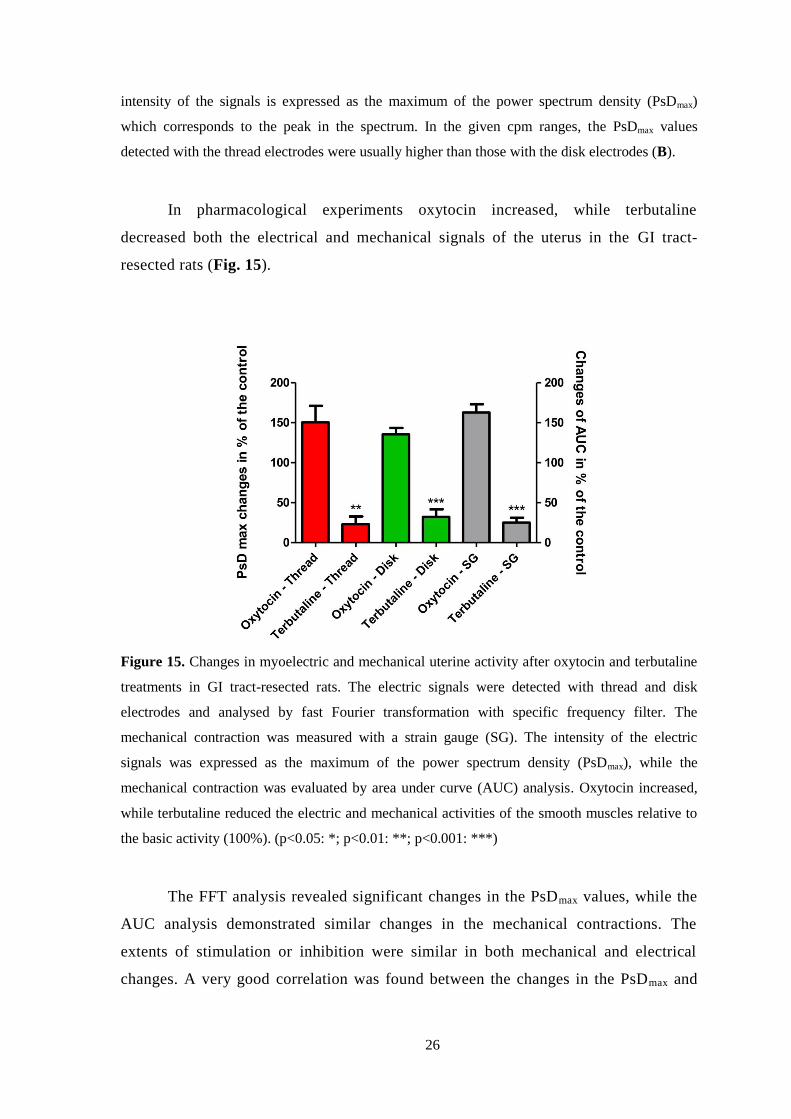
In pharmacological experiments oxytocin increased, while terbutaline
decreased both the electrical and mechanical signals of the uterus in the GI tract-
resected rats (Fig. 15).
Figure 15. Changes in myoelectric and mechanical uterine activity after oxytocin and terbutaline
treatments in GI tract-resected rats. The electric signals were detected with thread and disk
electrodes and analysed by fast Fourier transformation with specific frequency filter. The
mechanical contraction was measured with a strain gauge (SG). The intensity of the electric
signals was expressed as the maximum of the power spectrum density (PsDmax), while the
mechanical contraction was evaluated by area under curve (AUC) analysis. Oxytocin increased,
while terbutaline reduced the electric and mechanical activities of the smooth muscles relative to
the basic activity (100%). (p<0.05: *; p<0.01: **; p<0.001: ***)
The FFT analysis revealed significant changes in the PsDmax values, while the
AUC analysis demonstrated similar changes in the mechanical contractions. The
extents of stimulation or inhibition were similar in both mechanical and electrical
changes. A very good correlation was found between the changes in the PsDmax and

27
AUC values measured by thread (Fig. 16A) or disk electrode (Fig. 16B) in
comparison with SG signals.
Figure 16. Correlations between myoelectric and mechanical responses induced by oxytocin and
terbutaline treatments in GI tract-resected animals. The myoelectric response is expressed as the
maximum of the power spectrum density (PsDmax), which corresponds to the highest peak in the
spectrum gained by fast Fourier transformation. The mechanical response is expressed as the area
under the curve (AUC) of the recorded smooth muscle contractions. Linear regression analysis
revealed a very good correlation between the changes in PsDmax and AUC values in the uterine
signals recorded by thread (A), or disk electrode (B).
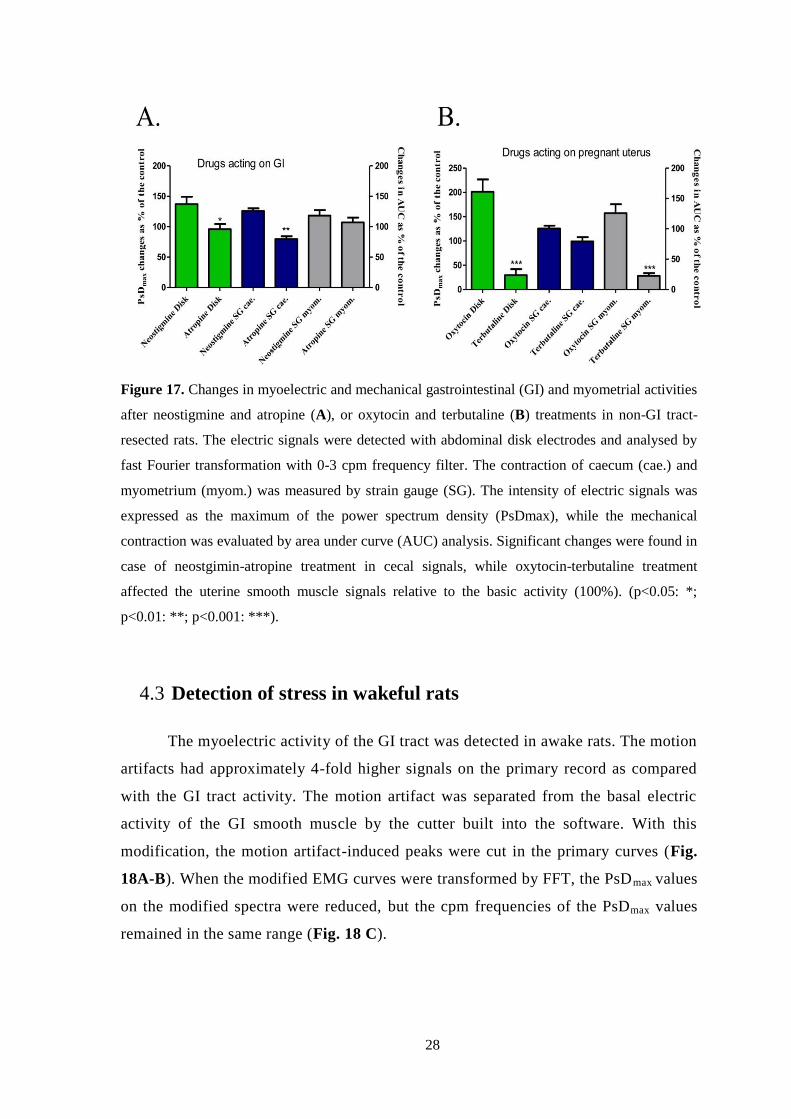
The myoelectric and contractility responses of caecum and pregnant
myometrium have been recorded for different drugs in parallel. We have administered
neostigmine and atropine, which mainly act on the GI tract, and oxytocin and
terbutaline, which have effects on the myometrium. Neostigmine and atropine
treatment caused significant changes in the myoelectric signal of the caecum (Fig.
17A), while oxytocin and terbutaline had actions both the electrical and mechanical
signals of the uterus only (Fig. 17B).
28
Figure 17. Changes in myoelectric and mechanical gastrointestinal (GI) and myometrial activities
after neostigmine and atropine (A), or oxytocin and terbutaline (B) treatments in non-GI tract-
resected rats. The electric signals were detected with abdominal disk electrodes and analysed by
fast Fourier transformation with 0-3 cpm frequency filter. The contraction of caecum (cae.) and
myometrium (myom.) was measured by strain gauge (SG). The intensity of electric signals was
expressed as the maximum of the power spectrum density (PsDmax), while the mechanical
contraction was evaluated by area under curve (AUC) analysis. Significant changes were found in
case of neostgimin-atropine treatment in cecal signals, while oxytocin-terbutaline treatment
affected the uterine smooth muscle signals relative to the basic activity (100%). (p<0.05: *;
p<0.01: **; p<0.001: ***).
4.3 Detection of stress in wakeful rats
The myoelectric activity of the GI tract was detected in awake rats. The motion
artifacts had approximately 4-fold higher signals on the primary record as compared
with the GI tract activity. The motion artifact was separated from the basal electric
activity of the GI smooth muscle by the cutter built into the software. With this
modification, the motion artifact-induced peaks were cut in the primary curves (Fig.
18A-B). When the modified EMG curves were transformed by FFT, the PsDmax values
on the modified spectra were reduced, but the cpm frequencies of the PsDmax values
remained in the same range (Fig. 18 C).

29
Figure 18. The primary myoelectric signal of the gastrointestinal tract in rat with outlier peaks of
motion artifact (A) was cut by the software in-built digital cutter to remove the motion artifacts
(B). The specific spectra were gained by fast Fourier transformation (FFT). The red curve
represents the FFT spectrum of the primary spectrum with motion artifacts, while the blue curve
shows the spectrum after the digital cut. The cycle per minute (cpm) frequencies of the peak
values remained the same after modification, but with lower power spectrum density maximum
values (C).
The digital cut reduced the motion artifact elevated PsDmax values to the range
of values in anaesthetized rats, but did not further reduce the values detected in
anesthetized rats (Fig. 19).

30
Figure 19. Changes of power spectrum density (PsDmax) values in stomach (A), small intestine
(B) and large intestine (C) in rats (n=20). The motion artifact in the conscious animal group led to
high PsDmax values, but these outliers were removed with the digital cutter. The application of the
digital cutter did not modify significantly the motion artifact-free myoelectric signals from the
anaesthetized rats, but reduced the PsDmax values of conscious rats to the anesthetized level after
the cut. (ns: not significant; p < 0.01**)
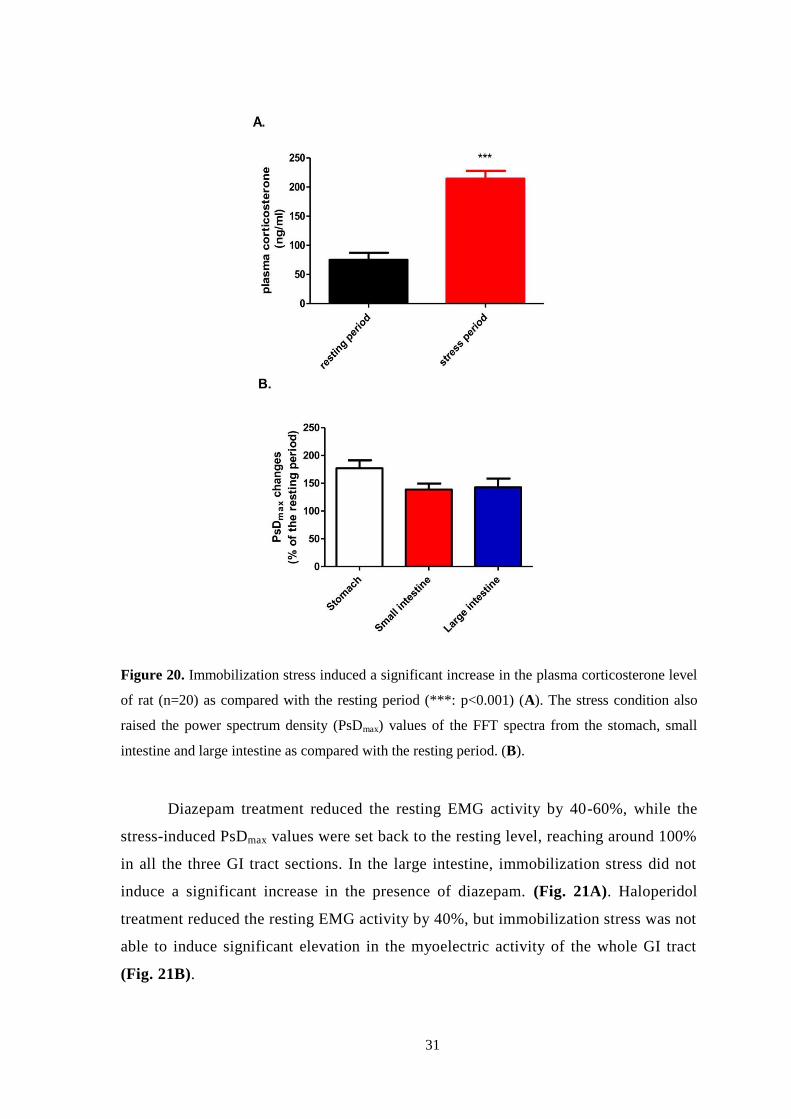
Immobilization stress significantly increased the plasma level of
corticosterone. The rate of increase was approximately 3-fold as compared with the
resting value (resting value: 75.4 ng/ml, stress value: 214.5 ng/ml) (Fig. 20A). In
parallel, the PsDmax values in the whole GI tract were elevated 1.5-2-fold during
immobilization. The greatest increase was found in the gastric values, although the
increase in the gastric PsDmax values was not significantly higher than the increase in
the small or large intestine values (Fig. 20B).
31
Figure 20. Immobilization stress induced a significant increase in the plasma corticosterone level
of rat (n=20) as compared with the resting period (***: p<0.001) (A). The stress condition also
raised the power spectrum density (PsDmax) values of the FFT spectra from the stomach, small
intestine and large intestine as compared with the resting period. (B).
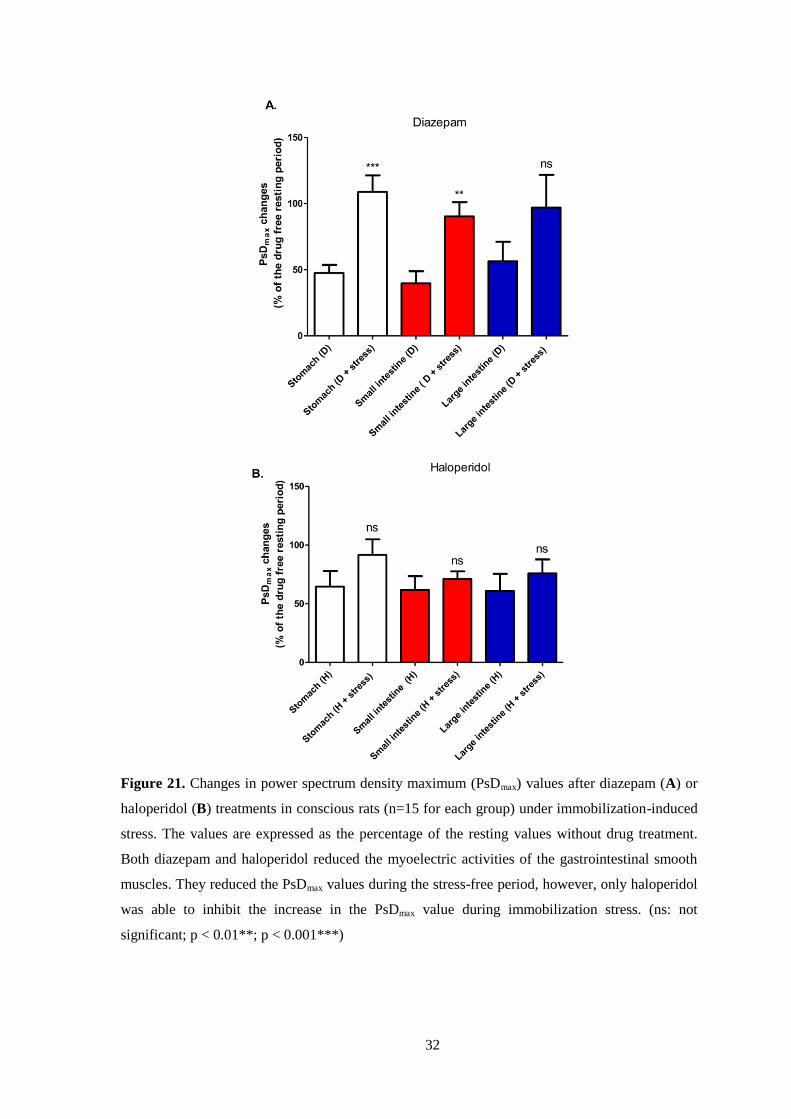
Diazepam treatment reduced the resting EMG activity by 40-60%, while the
stress-induced PsDmax values were set back to the resting level, reaching around 100%
in all the three GI tract sections. In the large intestine, immobilization stress did not
induce a significant increase in the presence of diazepam. (Fig. 21A). Haloperidol
treatment reduced the resting EMG activity by 40%, but immobilization stress was not
able to induce significant elevation in the myoelectric activity of the whole GI tract
(Fig. 21B).
32
Figure 21. Changes in power spectrum density maximum (PsDmax) values after diazepam (A) or
haloperidol (B) treatments in conscious rats (n=15 for each group) under immobilization-induced
stress. The values are expressed as the percentage of the resting values without drug treatment.
Both diazepam and haloperidol reduced the myoelectric activities of the gastrointestinal smooth
muscles. They reduced the PsDmax values during the stress-free period, however, only haloperidol
was able to inhibit the increase in the PsDmax value during immobilization stress. (ns: not
significant; p < 0.01**; p < 0.001***)

33
Both diazepam and haloperidol treatments reduced the plasma corticosterone
levels during the resting period by approximately 30 %, however, these alterations
were not significant. Only haloperidol was able to blot out the stress hormone
inducing effect of immobilization (Fig. 22).
Figure 22. Alterations of plasma corticosterone levels by drug treatments (red columns:
diazepam, blue columns: haloperidol) and immobilization stress in rats (n=15 for each group).
The hormone level was elevated significantly by stress compared to the control level. Diazepam
(5 mg/kg) or haloperidol (1 mg/kg) treatment alone reduced the plasma corticosterone values,
although the alterations were not significant. Only haloperidol was able to inhibit the increase in
the plasma corticosterone level during immobilization stress. (D. diazepam; H: haloperidol; ns:
not significant;*: p<0.05; **; p<0.01)
The plasma level of diazepam was 0.42 g/ml at the end of the resting period
(30 min after drug administration), and its level was reduced to 0.13 g/ml at the end
of the stress period (60 min after drug administration). Haloperidol was not detectable
in the plasma even at the end of the resting period, but it was found in the brain, liver
and lung in a concentration of 0.30, 1.91 and 2.23 g/g, respectively. At the end of the
stress period, the levels of haloperidol were still considerable in these organs (brain:
0.16 g/g, liver: 1.33 g/g, lung: 0.96 g/g). After statistical analysis, only the
pulmonary level of haloperidol at the end of the stress period was significantly lower
as compared with the end of the resting period (Fig. 23).

34
Figure 23. Plasma levels of diazepam (red columns) and organ levels of haloperidol (blue
columns) after 30 min (end of resting period) and 60 min (end of stress period) of intraperitoneal
administration (5 mg/kg for diazepam, 1 mg/kg for haloperidol) in rats (n=15 for each group). The
drug levels were determined by the HPLC method. (D: diazepam; H: haloperidol; ns: not
significant; *: p<0.05).
Significant correlation was found between the drug induced change in the
PsDmax values of the stomach, small intestine or large intestine and the change in
corticosterone plasma levels. The levels of correlations were the same in all the three
GI tract segments (Fig. 24).
Figure 24. Correlation between the changes of the power spectrum density maximum (PsDmax)
values in the given sections of the gastrointestinal system (A: stomach, B: small intestine, C: large

35
intestine) and the changes of corticosterone plasma levels in rats. The linear regression analysis
proved a significant correlation between PsDmax and corticosterone alteration.
Neither diazepam nor haloperidol elicited any significant relaxing effect on
gastric strip, ileal or cecal rings in isolated organ studies (Fig. 25).
Figure 25. Effects of diazepam (A) and haloperidol (B) on KCl induced stomach, ileum and
caecum contractions. The change in contraction was calculated via the area under the curve and
expressed in % ± SEM. No significant effects were observed directly on the investigated GI
samples induced by the drugs.

36
5. DISCUSSION
Several attempts have been made to record the GI tract and uterine motilities
with either implanted or surface electrodes in vivo, but the ideal method has still not
been found. Two main trends can be distinguished in the methods of recording GI
tract myoelectric signals: determination of the propagation of the GI tract electric
waves with a multi-electrode array [25-27] and investigation of the GI tract
myoelectric activity with serosal or cutaneous electrode pairs [28-31]. The latter
usually focuses on the characterization of the electric signals, searching for cycles or
periods in the spectra of the myoelectric waves. The multi-electrode array method is
also appropriate for the determination of the frequency of the contractions.
5.1 Gastrointestinal smooth muscle electromyography
The focus during the development of our research model was to create a
smooth muscle electromyographic tool for simple and reliable measurements on these
organs with pharmacological and diagnostic aims. We applied simple electrode pairs,
and we used built-in digital filters in the frequency range 0-30 cpm to separate the
noise-free, slow-wave smooth muscle signals.
The electric signals of the smooth muscles, including the GI tract or pregnant
uterus, are known to have significantly lower frequencies as compared with brain,
cardiac or skeletal muscle electric signals. FFT analysis reveals that the frequency
ranges of electroencephalograms, electrocardiograms and electromyograms for
skeletal muscles are 5-50 Hz, 3-20 Hz and 10-20 Hz, respectively [32, 33]. The slow
waves of smooth muscle electric activity are usually characterized with cpm that is the
60-fold value of Hz. The cpm for the gastric smooth muscles in humans has been
found to be 2.5-4 cpm [29, 34, 35], while that for the ileum has been described as 7.5-
12 cpm in humans [28, 36, 37] and 14-17 cpm in mice [27]. The information available
on the myoelectric cpms for the colon and uterus are very poor; an old study reported
2-9 cpm from in vitro measurements on human colon specimens [38].
The FFT calculated range for the stomach (3-5 cpm) was in harmony with
earlier findings in humans [29, 34, 35]. That for the caecum (1-3 cpm) was lower,
37
while that for the ileum (20-25 cpm) was higher than earlier findings in humans or
rodents [27, 37, 38]. The similarity only with the gastric data can be explained by the
fact that the contractility force of the stomach is usually greatest among the GI tract
segments [39, 40] and even with weaker filters and sensors, therefore these
predominant signals can be detected quite well.
5.2 Uterine smooth muscle electromyography
In order to determine the individual myoelectric signals of the pregnant uterus
and the GI tract segments, i.e. the stomach, small or large intestine, we resected non-
investigated parts. Two pairs of electrodes measured the myoelectric signals from the
left segment: one was inserted into the organ, while the other was positioned under the
skin of the abdomen. The most intensive signals were provided by the organ-inserted
electrodes, and these signals were also measured from the abdomen to allow a
comparison of the detectability of the activities between the two sites. Electrical
signals of the same character were obtained from the surface of the organ and from the
abdomen. We found that pregnant uterine smooth muscle frequency is between 1-3
cpm. The myoelectric activity was measured in parallel with the mechanical
contractions by the applied strain gauge. This triple measurement with the partial
resection and electric filters gave a clear record of the electric waves of the given
organs and their detectability through the abdominal wall in comparison with the
contractions. The detection of the myoelectric activity from the abdomen through the
disk electrodes has a special significance: the possible motion artefact caused by the
muscle contraction cannot influence the disk electrode as compared with the thread
electrodes implanted in the serosal surface of the muscle. Although both spikes and
slow wave signals can be obtained from the serosal surface, the abdominal record
reveals only slow wave because of the filtering effect of the tissues [17]. We proved
that we were able to detect the spikes (Fig.5), but those are not applicable for a non-
invasive measurement, therefore all the fast-wave signals have been filtered out
during our further experiments.
The experiments on the partially resected animals revealed that the stomach,
ileum and caecum have different mechanical and myoelectric activities, which are

38
well distinguishable from each other. However, the myoelectric signals of the
pregnant uterus and caecum overlap.
The salience peaks for the given GI tract segments and the uterus were detected
and distinguished even in non-GI tract-resected animals in the range 0-30 cpm after
FFT analysis of the primary records. This means that the smooth muscle activity can
be detected at the same time in vivo from the abdomen.
The cpm values for the given GI tract segments remained constant during the
pharmacological treatments. The PsDmax values, however, varied depending on the
intensity of the contractions. We proved this correlation via the well-known GI tract
motility increasing and decreasing effects of neostigmine and atropine, respectively.
We did not find significant differences among the GI tract segments in their response
to either neostigmine, or atropine. This is not a surprise, because there is no
information concerning any differences in sensitivity to these drugs in the main GI
tract parts. The oxytocin-induced increase and the terbutaline-induced decrease were
clearly detectable via the observation of the changes in the PsDmax intensity of the
myoelectric spectra from pregnant uterus.
The PsDmax values usually express the intensity of myoelectric signals. We
observed a very good correlation between the changes in mechanical contractile
response and the changes in electric PsDmax values. This means that the changes in
PsDmax values recorded even on the abdominal wall perfectly reflect the real changes
in the contractions of the GI tract and uterine smooth muscle.
The frequency range for the pregnant uterus and the colon myoelectric act ivity
are almost equals therefore we launched a series of experiments with non-GI-resected
pregnant animals to investigate how we can distinguish the myoelectric signals of
these two types of smooth muscles. The mechanical contractions of both organs were
detected by strain gauges applied on the surface of the caecum and pregnant
myometrium. It is known that the caecum and pregnant myometrium have different
responses to drugs. Caecum is much more sensitive to neostigmine (contraction) and
atropine (relaxation), while the pregnant uterus has a very intensive response to
oxytocin (contraction) and terbutaline (relaxation) [41, 42]. We found that drugs
acting on myometrial activity altered the PsDmax with a good correlation to

39
myometrial mechanical contractions, but they did not affect cecal activity. The drugs
acting on the caecum elicited similar action on cecal activity without influencing the
myometrial response. It means that we can follow the uterine contractions with the
evaluation of PsDmax values when the uterine activity is predominant. During
pregnancy (especially towards the end of pregnancy) the mass of the uterus is
significantly increased, and its activity is predominant over the cecal contractions. Our
method seems to be proper for the detection of the uterine activity in that late-
pregnancy period.
5.3 Smooth muscle electromyography in stress measurements
On the other hand, the non-invasive and reliable measurement of stress
condition by physiological parameters is still an unsolved clinical problem. Although
the relationships between stress condition and organ systems like cardiovascular,
dermal or GI systems are obvious, the level of stress is mostly appraised by
psychological tests [43]. A new technique and instrument measuring both
psychological and physiological parameters have been reported for stress evaluation.
Among the physiological parameters, this instrument detects cardiovascular and
dermal responses [44], however, the GI parameters are not involved in the analysis.
Although the in vivo GI motility can be assessed by the measurement of gastric
content [45] or by the detection of a coloured marker in the intestine [46], these
methods evaluate the GI responses after the termination of the experimental animals.
The consequences of the function of the brain-gut axis include the stress
induced alterations in the GI tract motility, which may lead to inflammatory bowel
disease, peptic ulcer and many other GI tract disorders [47]. Acute stress response
enhances the motility in the GI tract, which is controlled by peripheral neuropeptides
and corticosterone-releasing hormone [48]. We hypothesized that our EMG method
can be applicable to awake rats and to measuring the correlation between GI tract
motility and stress condition.
Awake EMG measurements are always disturbed by motion artifacts,
especially in experimental animals where the movements cannot be reduced by self-
40
control. Therefore, our first task was to identify the EMG signals of motion artifacts
and then develop a digital cutter to remove them from the record without significant
loss of smooth muscle data. The motion artifacts had much bigger EMG signals than
the smooth muscle did, thus their identification and removal was an easy task by the
newly developed digital cutter. The goodness of cut was proved by the FFT spectrum
analysis, in which the characteristic peaks remained at the same frequency, only their
PsDmax values were reduced, which could be anticipated before cut. After cut, the
smooth muscle EMG record showed basal activity like in anesthetized animals, where
the motion artifact is a non-significant factor. These results suggest that we have
successfully kept the smooth muscle signals with the effective removal of motion
artifact.
Acute immobilization, which increases the plasma corticosterone level, is an
accepted stress method in rats [49]. Immobilization can increase the stress factors
within quite a short period of time, 30-60 min can be enough for the significant
elevation of stress hormone levels in rodents [50, 51]. Considering this fact, we
applied immobilization to our rats for 30 minutes, which period is also suitable for the
detection of GI tract myoelectric activity. Both corticosterone and PsDmax values were
increased during the immobilization, and the correlation found between the two
parameters indicates that the severity of acute stress can be predicted by the detection
of smooth muscle EMG in awake rats. This correlation was reinforced by the results
gained after treatment with central nervous system depressants.
Diazepam is a well-known anxiolytic agent, which elicits a moderate stress
reducing effect in rats [52]. Haloperidol is a strong antipsychotic, which can cease the
whole stress response, although it can induce oxidative stress in the brain but only in
the case of chronic treatment [53]. However, in our experiments the animals were
terminated after 60 min of single drug treatment, therefore the oxidative stress-
inducing effect of haloperidol could not develop. The plasma levels of both diazepam
and haloperidol were checked 30 min (end of resting period) and 60 min (end of stress
period) after their administration. The measurement of plasma levels was important to
justify the presence of effective concentrations during our experiments. In the case of
diazepam, the lowest plasma level was around 0.1 g/ml at the end of the
experiments, which provides sufficient anxiolytic action in rats [54]. Haloperidol has
41
special pharmacokinetics with a fast distribution into different organs, thus the
concentration of haloperidol in these organs can be much higher than its plasma
concentration after 1 h of parenteral administration [55]. In our experiments, the
haloperidol plasma level was under the limit of our detection even after 30 min, but
significant amounts of drug were found in the brain, liver and lung. Since around 0.1
g/g concentration of haloperidol is considered to have therapeutic action in rats [56],
the 0.16 g/g concentration that was found after 1 h in the brain of our rats seems to
be satisfactory to provide the required neuroleptic effect.
While haloperidol blocked the rise of corticosterone during acute stress,
diazepam was only able to reduce the increase in the stress hormone level. This
difference between the effects of these two types of drug was clearly detectable in the
smooth muscle EMG response of the GI tract, especially in the gastric and the small
intestine PsDmax values. The isolated organ bath studies proved that neither diazepam
nor haloperidol had a direct smooth muscle relaxing effect on the GI tract smooth
muscles, therefore the responses found in awake rats originated from their central
nervous system effects, possibly mediated through the brain-gut axis.

42
6. CONCLUSION
Based on our results, we believe that we have successfully developed a method
for the in vivo detection of GI activity that serves a basis for non-invasive, reliable and
specific GI tract segment measurements. We have clarified the different myoelectric
activities of the stomach, ileum and caecum. Additionally, our preclinical method is
able to investigate the pregnant myometrial activity, in vivo, and already suitable for
pharmacological investigations for drugs acting on GI tract or uterine contractions.
It also can be concluded that our smooth muscle EMG instrument can measure
the level of acute stress in awake rats, which shows correlation with the stress
hormone plasma level. This finding is further evidence for the function of the brain-
gut axis. Our technique is also applicable to the investigation of different drugs
affecting the central nervous system through the GI tract myoelectric response.
The drawback of our method is that we can use the changes in PsD only as a
basis for comparison. There are huge differences in electric activity between the
individual experimental animals, and the deviations between the absolute values are
high. We are currently seeking a way to reduce these differences.
We suppose that this method serves as a good basis for the development of a
new clinical tool to investigate the pathophysiological processes in GI tract or
pregnant uterus contractility in animals and assess the stress and anxiety levels of
patients in different kinds of psychological disorders and during pharmacotherapy.
Our method is the first one that can measure the stress response via the GI tract
reactions. This kind of monitoring of smooth muscle myoelectric responses may open
a new perspective for internist to follow up the changes in GI tract or even for
obstetricians to detect early signs of premature contractions or predict initiation of
labour. Moreover, this method is useful in the diagnosis and therapy of psychosomatic
disorders.

43
7. REFERENCES
1. Aderinto-Adike, A.O. and E.M. Quigley, Gastrointestinal motility
problems in critical care: a clinical perspective. J Dig Dis, 2014. 15(7): p. 335-44.
2. Varni, J.W., et al., PedsQL gastrointestinal symptoms module:
feasibility, reliability, and validity. J Pediatr Gastroenterol Nutr, 2014. 59(3): p. 347-
55.
3. Paine, P., J. McLaughlin, and S. Lal, Review article: the assessment and
management of chronic severe gastrointestinal dysmotility in adults. Aliment
Pharmacol Ther, 2013. 38(10): p. 1209-29.
4. Lammers, W.J., Normal and abnormal electrical propagation in the
small intestine. Acta Physiol (Oxf), 2015. 213(2): p. 349-59.
5. Cryan, J.F. and S.M. O'Mahony, The microbiome-gut-brain axis: from
bowel to behavior. Neurogastroenterol Motil, 2011. 23(3): p. 187-92.
6. Chen, X., R. D'Souza, and S.T. Hong, The role of gut microbiota in the
gut-brain axis: current challenges and perspectives. Protein Cell, 2013. 4(6): p. 403-
14.
7. De Palma, G., S.M. Collins, and P. Bercik, The microbiota-gut-brain
axis in functional gastrointestinal disorders. Gut Microbes, 2014. 5(3): p. 419-29.
8. Drossman, D.A., Functional Gastrointestinal Disorders: History,
Pathophysiology, Clinical Features and Rome IV. Gastroenterology, 2016.
9. Hajagos-Toth, J., et al., The effects of progesterone on the alpha2-
adrenergic receptor subtypes in late-pregnant uterine contractions in vitro. Reprod
Biol Endocrinol, 2016. 14(1): p. 33.
10. Horn, L.C., A. Meinel, and B. Hentschel, c-kit/CD 117 positive cells in
the myometrium of pregnant women and those with uterine endometriosis. Arch
Gynecol Obstet, 2012. 286(1): p. 105-7.

44
11. Hutchings, G., et al., Myometrial interstitial cells and the coordination
of myometrial contractility. J Cell Mol Med, 2009. 13(10): p. 4268-82.
12. Van Oudenhove, L. and Q. Aziz, The role of psychosocial factors and
psychiatric disorders in functional dyspepsia. Nat Rev Gastroenterol Hepatol, 2013.
10(3): p. 158-67.
13. Dolatian, M., et al., Preterm delivery and psycho-social determinants of
health based on World Health Organization model in Iran: a narrative review. Glob J
Health Sci, 2012. 5(1): p. 52-64.
14. Facchinetti, F., E. Annessi, and F. Ottolini, The pregnant uterus as a
psycho-endocrine organ. Gynecol Endocrinol, 2012. 28 Suppl 1: p. 33-6.
15. Yassi, R., et al., The gastrointestinal electrical mapping suite (GEMS):
software for analyzing and visualizing high-resolution (multi-electrode) recordings in
spatiotemporal detail. BMC Gastroenterol, 2012. 12: p. 60.
16. Garcia-Casado, J., et al., Enhancement of non-invasive recording of
electroenterogram by means of a flexible array of concentric ring electrodes. Ann
Biomed Eng, 2014. 42(3): p. 651-60.
17. Qin, S., et al., Signal reconstruction of the slow wave and spike
potential from electrogastrogram. Biomed Mater Eng, 2015. 26 Suppl 1: p. S1515-21.
18. Qian, X., et al., Simultaneous Recording and Analysis of Uterine and
Abdominal Muscle Electromyographic Activity in Nulliparous Women During Labor.
Reprod Sci, 2016.
19. Trojner Bregar, A., et al., Uterine electromyography during active
phase compared with latent phase of labor at term. Acta Obstet Gynecol Scand, 2016.
95(2): p. 197-202.
20. Prats-Boluda, G., et al., Active concentric ring electrode for non-
invasive detection of intestinal myoelectric signals. Med Eng Phys, 2011. 33(4): p.
446-55.

45
21. Gabsteiger, F., et al., ICA-based reduction of electromyogenic artifacts
in EEG data: comparison with and without EMG data. Conf Proc IEEE Eng Med Biol
Soc, 2014. 2014: p. 3861-4.
22. De Luca, C.J., et al., Filtering the surface EMG signal: Movement
artifact and baseline noise contamination. J Biomech, 2010. 43(8): p. 1573-9.
23. Fratini, A., et al., Relevance of motion artifact in electromyography
recordings during vibration treatment. J Electromyogr Kinesiol, 2009. 19(4): p. 710-
8.
24. Vane, J.R., A sensitive method for the assay of 5-hydroxytryptamine. Br
J Pharmacol Chemother, 1957. 12(3): p. 344-9.
25. Du, P., et al., High-resolution mapping of in vivo gastrointestinal slow
wave activity using flexible printed circuit board electrodes: methodology and
validation. Ann Biomed Eng, 2009. 37(4): p. 839-46.
26. Lammers, W.J., et al., Disturbances in the propagation of the slow wave
during acute local ischaemia in the feline small intestine. Eur J Gastroenterol Hepatol,
1997. 9(4): p. 381-8.
27. Shozib, H.B., et al., Acceleration of ileal pacemaker activity in mice
lacking interleukin 10. Inflamm Bowel Dis, 2013. 19(8): p. 1577-85.
28. Chen, J.D., B.D. Schirmer, and R.W. McCallum, Measurement of
electrical activity of the human small intestine using surface electrodes. IEEE Trans
Biomed Eng, 1993. 40(6): p. 598-602.
29. Chen, J.D., B.D. Schirmer, and R.W. McCallum, Serosal and cutaneous
recordings of gastric myoelectrical activity in patients with gastroparesis. Am J
Physiol, 1994. 266(1 Pt 1): p. G90-8.
30. Zhang, J., et al., Development of gastric slow waves and effects of
feeding in pre-term and full-term infants. Neurogastroenterol Motil, 2006. 18(4): p.
284-91.
46
31. Domino, M., B. Pawlinski, and Z. Gajewski, The linear synchronization
measures of uterine EMG signals: Evidence of synchronized action potentials during
propagation. Theriogenology, 2016. 86(8): p. 1873-8.
32. Ushiyama, J., Y. Takahashi, and J. Ushiba, Muscle dependency of
corticomuscular coherence in upper and lower limb muscles and training-related
alterations in ballet dancers and weightlifters. J Appl Physiol (1985), 2010. 109(4): p.
1086-95.
33. Gil, Y., W. Wu, and J. Lee, A synchronous multi-body sensor platform
in a Wireless Body Sensor Network: design and implementation. Sensors (Basel),
2012. 12(8): p. 10381-94.
34. Obioha, C., et al., Effect of Body Mass Index on the sensitivity of
Magnetogastrogram and Electrogastrogram. Journal of Gastroenterology and
Hepatology Research, 2013. 2(4): p. 513-519.
35. Hocke, M., et al., Every slow-wave impulse is associated with motor
activity of the human stomach. Am J Physiol Gastrointest Liver Physiol, 2009. 296(4):
p. G709-16.
36. Pezzolla, F., et al., Electrical activity recorded from abdominal surface
after gastrectomy or colectomy in humans. Gastroenterology, 1989. 97(2): p. 313-20.
37. Chang, F.Y., et al., Fasting and postprandial small intestinal slow
waves non-invasively measured in subjects with total gastrectomy. J Gastroenterol
Hepatol, 2007. 22(2): p. 247-52.
38. Chambers, M.M., et al., In vitro electrical activity in human colon.
Gastroenterology, 1981. 81(3): p. 502-8.
39. Tsubouchi, T., et al., Stimulatory action of itopride hydrochloride on
colonic motor activity in vitro and in vivo. J Pharmacol Exp Ther, 2003. 306(2): p.
787-93.
40. Jeong, S.I., et al., Regulation of contractile activity by magnolol in the
rat isolated gastrointestinal tracts. Pharmacol Res, 2009. 59(3): p. 183-8.

47
41. Arias, F., Pharmacology of oxytocin and prostaglandins. Clin Obstet
Gynecol, 2000. 43(3): p. 455-68.
42. Persson, H. and T. Olsson, Some pharmacological properties of
terbutaline (INN), 1-(3,5-dihydroxyphenyl)-2-(T-butylamino)-ethanol. A new
sympathomimetic beta-receptor-stimulating agent. Acta Med Scand Suppl, 1970. 512:
p. 11-9.
43. Hinz, A., et al., Psychometric evaluation of the Generalized Anxiety
Disorder Screener GAD-7, based on a large German general population sample. J
Affect Disord, 2017. 210: p. 338-344.
44. Neureiter, E., et al., An introduction to the 'Psycho-Physiological-
Stress-Test' (PPST)-A standardized instrument for evaluating stress reactions. PLoS
One, 2017. 12(12): p. e0187859.
45. Bulbul, M., et al., Opposite effects of central oxytocin and arginine
vasopressin on changes in gastric motor function induced by chronic stress. Peptides,
2017. 87: p. 1-11.
46. Keenan, C.M., et al., AM841, a covalent cannabinoid ligand, powerfully
slows gastrointestinal motility in normal and stressed mice in a peripherally restricted
manner. Br J Pharmacol, 2015. 172(9): p. 2406-18.
47. Konturek, P.C., T. Brzozowski, and S.J. Konturek, Stress and the gut:
pathophysiology, clinical consequences, diagnostic approach and treatment options. J
Physiol Pharmacol, 2011. 62(6): p. 591-9.
48. Forbes, S.C. and H.M. Cox, Peptide YY, neuropeptide Y and
corticotrophin-releasing factor modulate gastrointestinal motility and food intake
during acute stress. Neurogastroenterol Motil, 2014. 26(11): p. 1605-14.
49. Mendez-Cuesta, L.A., et al., Early changes in oxidative stress markers
in a rat model of acute stress: effect of l-carnitine on the striatum. Basic Clin
Pharmacol Toxicol, 2011. 109(2): p. 123-9.
48
50. Uwaya, A., et al., Acute immobilization stress following contextual fear
conditioning reduces fear memory: timing is essential. Behav Brain Funct, 2016.
12(1): p. 8.
51. Bello, N.T., et al., Dietary-induced binge eating increases prefrontal
cortex neural activation to restraint stress and increases binge food consumption
following chronic guanfacine. Pharmacol Biochem Behav, 2014. 125: p. 21-8.
52. Mendez-Cuesta, L.A., et al., Diazepam blocks striatal lipid peroxidation
and improves stereotyped activity in a rat model of acute stress. Basic Clin Pharmacol
Toxicol, 2011. 109(5): p. 350-6.
53. Abdel-Salam, O.M., et al., Brain and liver oxidative stress after
sertraline and haloperidol treatment in mice. J Basic Clin Physiol Pharmacol, 2013.
24(2): p. 115-23.
54. Martin, W.R., J.W. Sloan, and E.P. Wala, Precipitated abstinence in the
diazepam-dependent rat. Pharmacol Biochem Behav, 1993. 46(3): p. 683-8.
55. Miyazaki, H., et al., Disposition and metabolism of [14C]-haloperidol
in rats. Arzneimittelforschung, 1986. 36(3): p. 443-52.
56. Ikemura, M., et al., The blood concentration and organ distribution of
haloperidol at therapeutic and toxic doses in severe fatty liver disease. Leg Med
(Tokyo), 2012. 14(3): p. 147-53.
49
8. ACKOWLEDGEMENTS
I would like to express my first thanks to my supervisor, Róbert Gáspár Ph.D.,
who has been supporting my work, and for his great guidance, useful advices and for
the opportunity to work in his team.
I also would like to thank my co-authors and colleagues in the Department of
Pharmacodynamics and Biopharmacy for the pleasant cooperation, especially to Ági
Csiszárné, who introduced me to the world of in vivo experiments.
I am also thankful to István Zupkó Ph.D., the head of the Ph.D program
Pharmacodynamics, Biopharmacy and Clinical Pharmacy for the possibility to take
part in my Ph.D studies.
Finally, my special thanks to my family and my friends for their
encouragement, patience and love throughout my studies.
Related Documents