1 P 3 Actuaries you can understand Review of Economic Assumptions November 8, 2006 P

P 3 Actuaries you can understand 1 Review of Economic Assumptions November 8, 2006 P.
Dec 14, 2015
Welcome message from author
This document is posted to help you gain knowledge. Please leave a comment to let me know what you think about it! Share it to your friends and learn new things together.
Transcript

1P3 Actuaries you can
understand
Review of Economic Assumptions
November 8, 2006
P

2P3 Actuaries you can
understand
Syllabus
• Assumptions– Economic Model– Inflation and Investment Return
• Expectations• Other 37 Act Systems• Recommendations

3P3 Actuaries you can
understand
Assumptions
• Best guess of what will happen in the future
4P3 Actuaries you can
understand
Economic Assumptions
• Describe impact on money
• InflationSalary IncreasesReturn on InvestmentsCost-of-Living Adjustments

5P3 Actuaries you can
understand
Demographic Assumptions
• Describe member movement from one category to another
• TerminationDisabilityRetirementDeath

6P3 Actuaries you can
understand
Economic Assumption Model
Inflation Inflation Inflation
Merit & Longevity
Real Investment
Return
COLA (limited to 3% )
Salary Increase
Investment Return
Across the Board

7P3 Actuaries you can
understand
Annual Inflation RateGraph 1
Annual Rates of Inflation
-4%
0%
4%
8%
12%
16%
20%
19
46
19
51
19
56
19
61
19
66
19
71
19
76
19
81
19
86
19
91
19
96
20
01
20
06
Pe
rce
nt
Ch
an
ge
in C
PI
8P3 Actuaries you can
understand
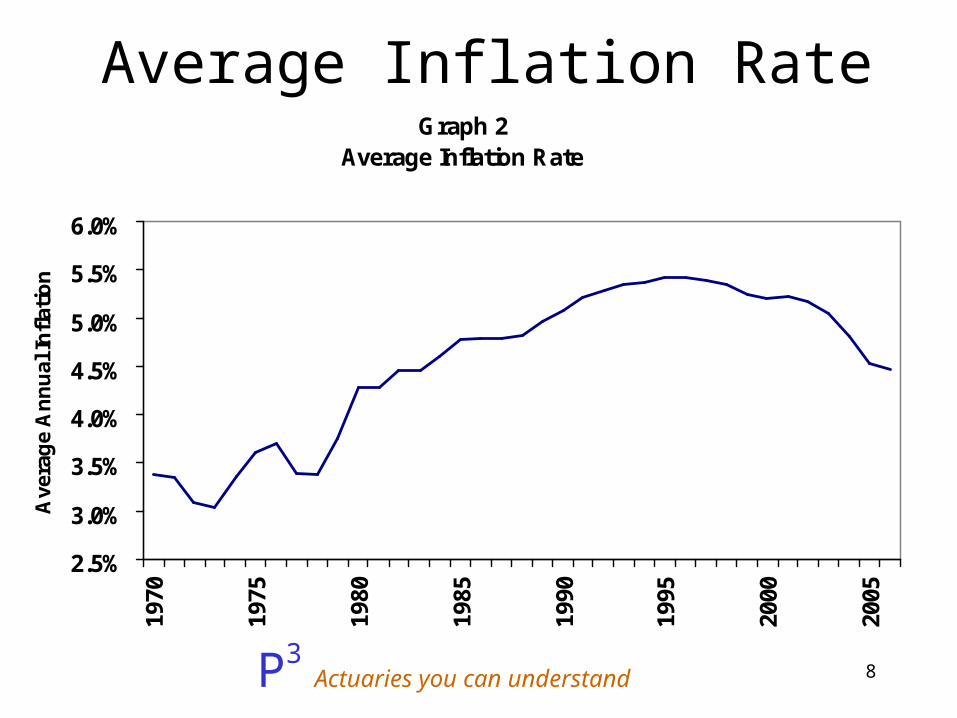
Average Inflation RateGraph 2
Average Inflation Rate
2.5%
3.0%
3.5%
4.0%
4.5%
5.0%
5.5%
6.0%
1970
1975
1980
1985
1990
1995
2000
2005
Ave
rag
e A
nn
ual
Infl
atio
n
9P3 Actuaries you can
understand
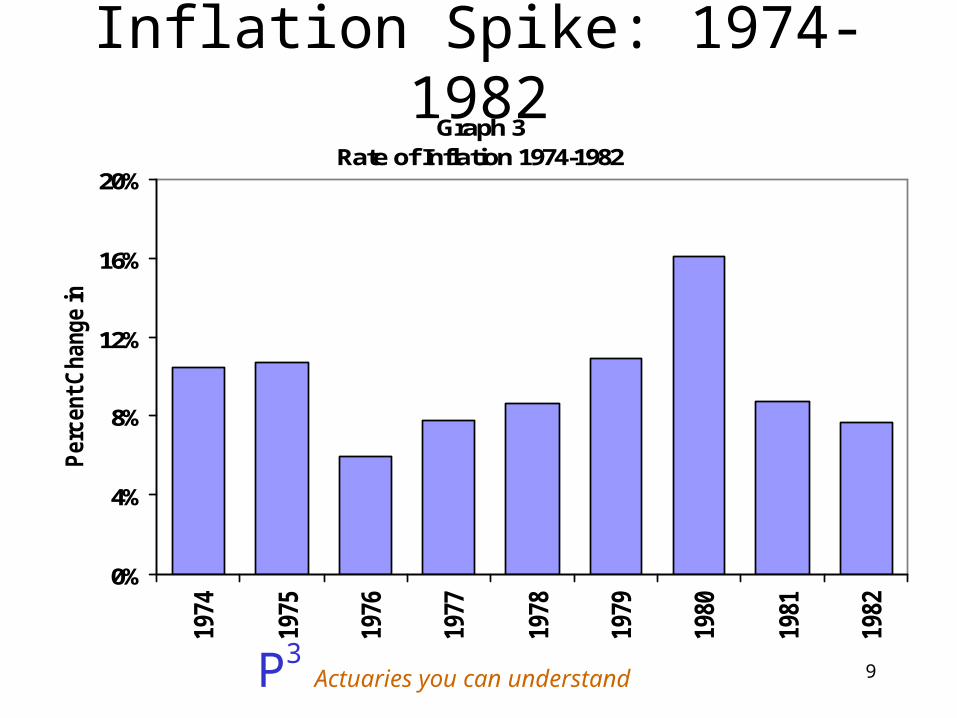
Inflation Spike: 1974-1982Graph 3
Rate of Inflation 1974-1982
0%
4%
8%
12%
16%
20%19
74
1975
1976
1977
1978
1979
1980
1981
1982
Perc
ent C
hange in
CP
I

10P3 Actuaries you can
understand
Average Inflation after Removing Spike
Graph 4Average Inflation Rate after Removing 1974-1982
2.0%
2.5%
3.0%
3.5%
4.0%
4.5%
5.0%
1970
1975
1980
1985
1990
1995
2000
2005
Avera
ge A
nnual I
nflation

11P3 Actuaries you can
understand
Inflation Assumptionsin 37 Act Systems
Graph 5Inflation Assumptions Adopted by CERL Systems
4
3
6
3 3
1
0
3
6
9
3.50% 3.75% 4.00% 4.25% 4.50% 4.75%
Inflation Assumption
Nu
mb
er o
f S
yste
ms
12P3 Actuaries you can
understand
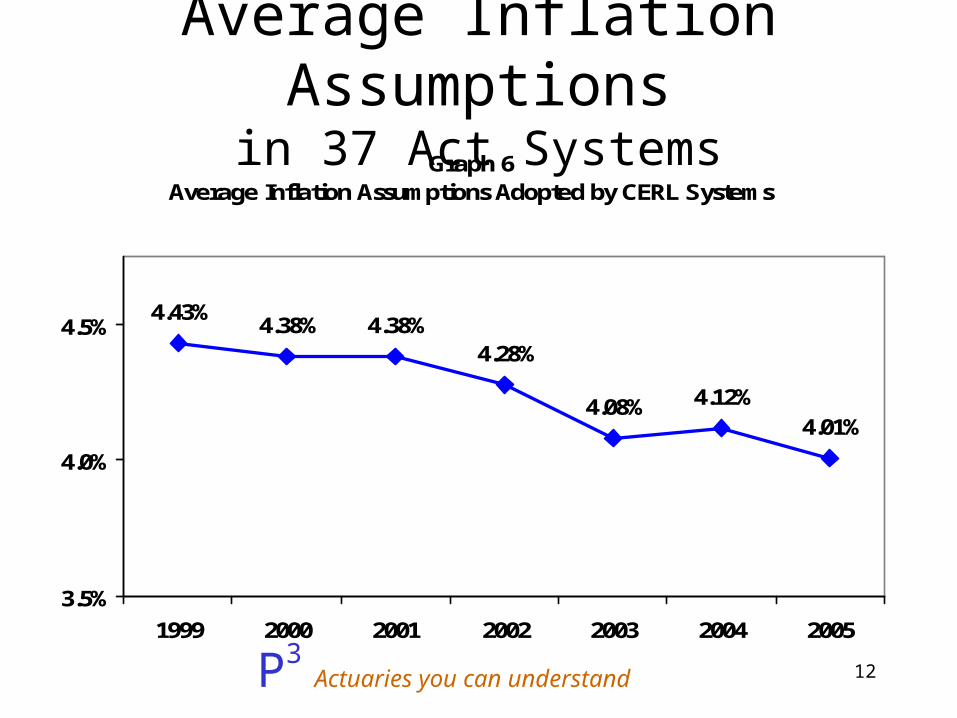
Average Inflation Assumptionsin 37 Act Systems
Graph 6Average Inflation Assumptions Adopted by CERL Systems
4.43%4.38% 4.38%
4.28%
4.08% 4.12%4.01%
3.5%
4.0%
4.5%
1999 2000 2001 2002 2003 2004 2005

13P3 Actuaries you can
understand
Inflation Assumption
• Current4.00%
• Reasonable Range 3.00% - 4.50%
• Recommendation: 4.00%

14P3 Actuaries you can
understand
Investment Return
Inflation
Real Investment
Return
15P3 Actuaries you can
understand
Real Investment Return
• Over 90% of Real Investment Return due to asset allocation

16P3 Actuaries you can
understand
FCERA Allocation Targets
Stocks – Domestic 38%
Stocks – International 18%
Bonds – Global 3%
Bonds – Core (and cash) 30%
Private Markets 11%

17P3 Actuaries you can
understand
Average Annual Real Returnsby Asset Class
(1/1/1926-6/30/2006)
Large Company Stocks 7.2%
Small Company Stocks 9.5%
Long-term Corporate Bonds 2.7%
Long-term Government Bonds 2.3%
Intermediate-term Government Bonds 2.2%
US Treasury Bills 0.6%Ibbotson Associates, Inc.

18P3 Actuaries you can
understand
Real Investment Return in 37 Act Systems
1
3
1
3
4
3
4
1
0
3
6
3.25% 3.66% 3.75% 3.90% 4.00% 4.16% 4.25% 4.50%
Real Investment Return Assumption
Num
ber
of S
yste
ms
19P3 Actuaries you can
understand
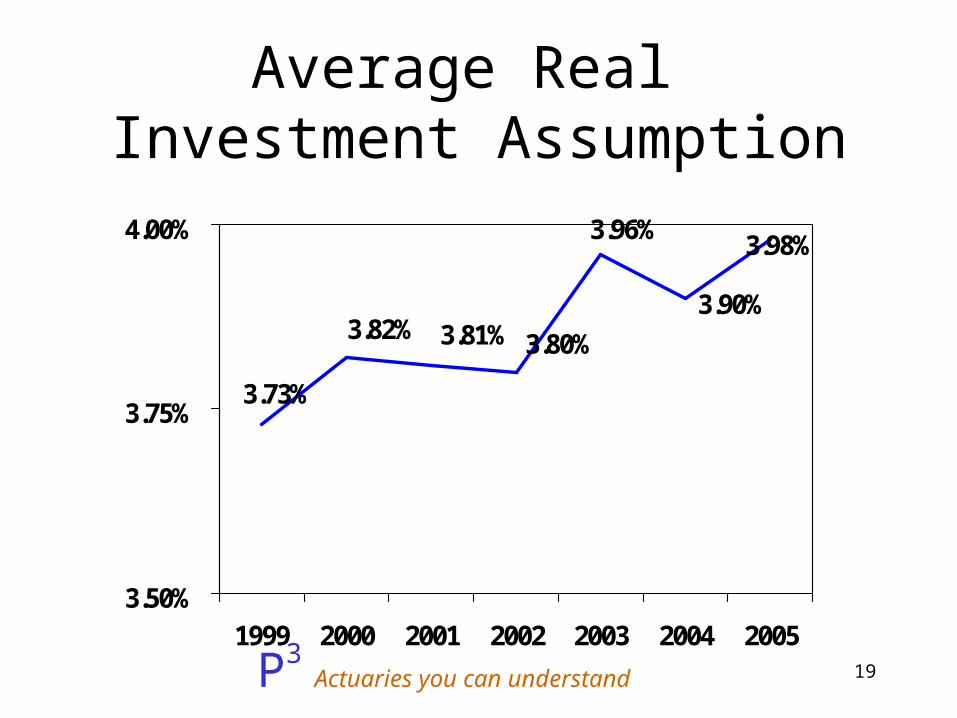
Average Real Investment Assumption
3.90%
3.98%3.96%
3.80%3.81%3.82%
3.73%
3.50%
3.75%
4.00%
1999 2000 2001 2002 2003 2004 2005
20P3 Actuaries you can
understand
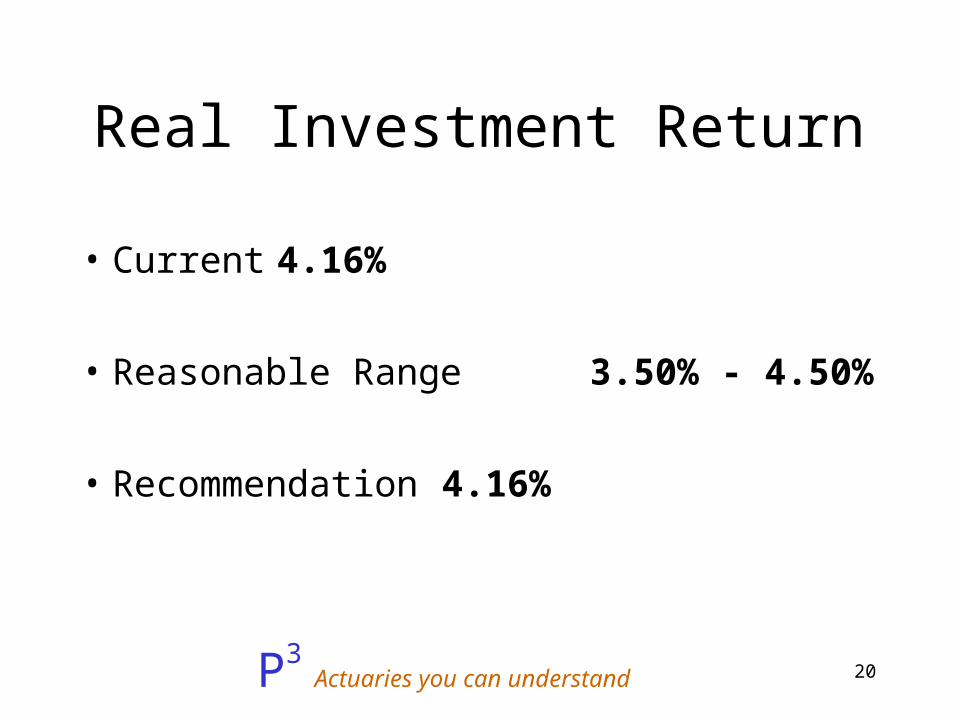
Real Investment Return
• Current 4.16%
• Reasonable Range 3.50% - 4.50%
• Recommendation 4.16%
21P3 Actuaries you can
understand
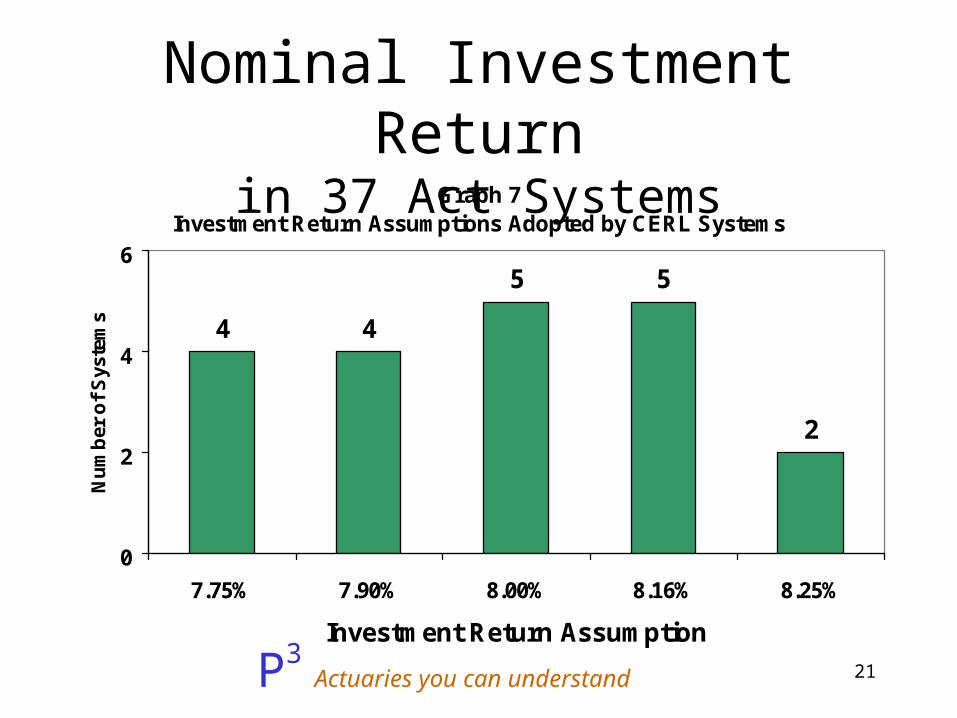
Nominal Investment Returnin 37 Act Systems
Graph 7Investment Return Assumptions Adopted by CERL Systems
4 4
5 5
2
0
2
4
6
7.75% 7.90% 8.00% 8.16% 8.25%
Investment Return Assumption
Nu
mb
er o
f S
yste
ms

22P3 Actuaries you can
understand
Average Nominal Investment Return in 37 Act Systems
Graph 8Average Investment Return Assumptions
Adopted by CERL Systems
8.15%8.20% 8.19%
8.07%8.04%
8.00% 8.00%
7.75%
8.00%
8.25%
1999 2000 2001 2002 2003 2004 2005

23P3 Actuaries you can
understand
Nominal Investment Return
• Current8.16%
• Reasonable Range 7.50% - 8.50%
• Recommendation: 8.16%(8.00% compounded semi-annually)

24P3 Actuaries you can
understand
Questions
Related Documents