Pressure Infiltration Behaviour and Properties of Aluminium Alloy - Oxide Ceramic Preform Composites by Bernd Arthur Huchler A thesis submitted to the School of Metallurgy and Materials College of Engineering and Physical Sciences of The University of Birmingham for the degree of Doctor of Philosophy University of Birmingham Birmingham B15 2TT United Kingdom July 2009

Welcome message from author
This document is posted to help you gain knowledge. Please leave a comment to let me know what you think about it! Share it to your friends and learn new things together.
Transcript
Pressure Infiltration Behaviour and Properties of
Aluminium Alloy - Oxide Ceramic Preform Composites
by
Bernd Arthur Huchler
A thesis submitted to the
School of Metallurgy and Materials College of Engineering and Physical Sciences
of
The University of Birmingham
for the degree of
Doctor of Philosophy University of Birmingham Birmingham B15 2TT United Kingdom
July 2009

University of Birmingham Research Archive
e-theses repository This unpublished thesis/dissertation is copyright of the author and/or third parties. The intellectual property rights of the author or third parties in respect of this work are as defined by The Copyright Designs and Patents Act 1988 or as modified by any successor legislation. Any use made of information contained in this thesis/dissertation must be in accordance with that legislation and must be properly acknowledged. Further distribution or reproduction in any format is prohibited without the permission of the copyright holder.

I
ABSTRACT
In the pressure infiltration processing of Metal Matrix Composites (MMCs), molten metal
is injected into a porous preform. This research investigated ways to optimize the
processing and properties of MMCs with Al alloy matrices. A ceramic volume fraction of
0.30 to 0.40 was used to keep a preponderant metallic behaviour and the reactivity of
MgO, TiO2, Al2O3-SiO2 and Al2O3-TiO2 preforms was compared to pure Al2O3.
Two stages were found during infiltration: first, flow initiation characterised by the
dynamic wetting angle θdyn and, second, the advancing flow in the preform capillaries.
Reactions were detected in the MMC but did not significantly influence the θdyn.
Unsaturated fluid flow was evaluated for the subsequent infiltration stage and good
agreement was found between a numerical model and experimental data.
The MMCs had improved properties compared to the pure alloy. Elastic moduli up to 148
GPa, bending strengths up to 456 MPa as well as reduced wear rate were found. The wear
performance of extended ceramic ligaments, found in MMCs with spherical metal
ligaments, exceeded all other materials. The improved understanding of the infiltration of
preforms and the resulting MMC properties obtained in this research should lead to the
development of tailorable composite materials.

II
ACKNOWLEDGEMENTS
I express my deepest gratitude to my supervisors at the University of Birmingham, Prof.
Stuart Blackburn and Dr. Richard Harding for their excellent supervision, advice and
guidance. This work would not have been possible without their help and support. I am
grateful to Dr. Alwin Nagel and Prof. Gerhard Schneider of the University of Aalen for
constant support and for enabling this work.
I owe my sincere thanks to the research teams at the University of Birmingham and the
University of Aalen. Especially I thank Dirk Staudenecker for his constant help. I would
not have been able to carry out the experimental work without his help. For their `open
ears` I would like to thank Timo Bernthaler, Markus Schwenger, Mr. Salzwedel and the
other team members at Aalen University and especially Marek Kremzer of Gliwice
University, Poland for his support during his sabbaticals. Further I am also grateful to Paul
Davies, Mick Wickins and John Wedderburn for their support in Birmingham.
I would like to thank Prof. Klein and his co-workers and especially Eugenius Pokora who
enabled modelling of the infiltration process. I also want to express my appreciation to the
project partners of the University of Karlsruhe, Dr. Andreas Mattern and Dr. Achim
Neubrand of the Fraunhofer Institute in Freiburg. Financial support from the
Landesstiftung Baden-Württemberg, Germany is acknowledged.
Most of all I would like to thank my wonderful and best friend Eva for her encouragement
and patience almost throughout the course of this research work.
III
CONTENTS
1. INTRODUCTION 1
2. LITERATURE REVIEW 4
2.1. Materials selection 4
2.1.1. Metal Matrix 4 2.1.2. Size and Morphology of the reinforcement 12
2.2. Static wetting in metal-ceramic systems 25
2.2.1. Non-reactive wetting 26 2.2.2. Reactive metal-ceramic systems 32
2.3. Infiltration of porous media 37
2.3.1. Dynamic wetting 38 2.3.2. Fluid flow in preform infiltration 41
2.4. Preform fabrication 46
2.4.1. Fibre preforms 46 2.4.2. Sintered particle compacts 49 2.4.3. Foamed preforms 50 2.4.4. Pore formation with pyrolysable additives 51
2.5. Pressure assisted infiltration methods 52
2.5.1. Gas pressure infiltration (GPI) 54 2.5.2. Squeeze casting infiltration 55 2.5.3. High pressure die casting infiltration 57
2.6. Aims and Objectives 61
3. EXPERIMENTAL PROCEDURE 62
3.1. Thermodynamic calculations 62
3.2. Contact angle 63
3.2.1. Sessile drop substrates 63 3.2.2. Metal alloys 64 3.2.3. Sessile drop measurement 65
3.3. MMC constituents 68
3.3.1. Preform ceramics 69 3.3.2. Pore forming agents (PFA) 70 3.3.3. Powder preparation 71 3.3.4. Sintering 73 3.3.5. Porosity fractions 74 3.3.6. Pore structure 75 3.3.7. Permeability 76 3.3.8. Compressibility 77 3.3.9. Reference preforms 79
IV
3.3.10. Microstructural investigations 80
3.4. Infiltration 80
3.4.1. Constant pressure infiltration (CPI) 81 3.4.2. Direct Squeeze-Casting (DSQC) 82 3.4.3. High pressure die casting infiltration technique 84
3.5. MMC characterisation 86
3.5.1. Differential thermal analysis 86 3.5.2. Non-destructive testing 87 3.5.3. Compression of preforms during infiltration 88 3.5.4. Microstructure and Detailed Image Analysis 88 3.5.5. Mechanical properties 88 3.5.6. Tribological test 89
4. RESULTS 91
4.1. Thermodynamic calculations 91
4.1.1. Standard free energy of formation 91 4.1.2. Most stable product phases 92
4.2. Contact angle 95
4.2.1 Influence of heating method on droplet formation 95 4.2.2 Wetting kinetics 96 4.2.3 Influence of substrate on interface formation 97
4.3. Ceramic powders 100
4.3.1 Powder particle size 100 4.3.2 Powder specific surface area 102 4.3.3 Microstructure 103
4.4. Pore forming additives (PFA) 104
4.4.1 Particle size distribution 104 4.4.2 Influence of pore former chemistry on degradation properties 105
4.5. Preform processing 107
4.5.1 Influence of PFA content 107 4.5.2 Influence of green part compaction pressure 110 4.5.3 Influence of sintering temperature 111 4.5.4 Dimensional change during sintering 113
4.6. Preform characteristics 114
4.6.1 Preform microstructure 114 4.6.2 Pore size distribution 118 4.6.3 Compressibility 126 4.6.4 Preform permeability 130
4.7. Constant pressure infiltration 133
4.8. Squeeze cast preform infiltration 137
4.8.1 Unreinforced matrix properties 138 4.8.2 Thermal properties during infiltration 139
V
4.8.3 Evaluation of infiltration behaviour 141 4.8.4 Initiation of preform infiltration with Al-Si alloy IS 143 4.8.5 Advancing infiltration with alloy Al-Si alloy IS 145 4.8.6 Homogeneity of MMC infiltrated with alloy IS 146 4.8.7 Microstructure of MMCs with Al-Si alloy matrix 148 4.8.8 Interfacial microstructure of MMC with alloy IS matrix 156 4.8.9 Differential thermal analysis on MMCs with alloy IS matrix 158 4.8.10 Infiltration behaviour with Al-Mg alloy IM 161 4.8.11 Homogeneity of MMC infiltrated with alloy IM 163 4.8.12 Microstructure of MMCs with Al-Mg alloy IM matrix 164
4.9. High pressure die casting infiltration 168
4.9.1 Homogeneity of MMC 168 4.9.2 Compression of preforms 172
4.10. MMC properties 175
4.10.1 Influence of inhomogeneities on bending strength 175 4.10.2 Influence of reinforcement type on strength and elastic modulus 177 4.10.3 Influence of reinforcement type on fracture toughness 180 4.10.4 Tribological properties 182
5. DISCUSSION 186
5.1. Tailoring properties of preform MMCs 186
5.1.1 Pure alloy properties 186 5.1.2 MMC properties in relation to the pure alloy 189 5.1.3 Influence of homogeneity 192 5.1.4 Influence of the ceramic structure 198 5.1.5 Influence of reactions 200
5.2. Preform pore formation 202 5.2.1 Foamed preforms 202 5.2.2 Pyrolised pore formers 203
5.3. Saturation of porous media 207
5.4. Modelling of fluid flow in preform infiltration 210
5.4.1. Reactivity of the metal-ceramic systems 210 5.4.2. Static wetting 213 5.4.3. Dynamic wetting 216 5.4.4. Preform permeability 223 5.4.5. Dynamic preform infiltration model 227 5.4.6. Validation of the infiltration model 229
6. CONCLUSIONS 236
7. FUTURE WORK 239
8. REFERENCES 240
VI
NOMENCLATURE
Symbol Meaning
α shape parameter of infiltration curve
a gradient in the infiltration curve
A5 fracture elongation in tension
Agate gate cross-sectional area
Apl surface area of the plunger
ciso relative isostatic compression of preform
ciso,max maximum isostatic compression
ciso,per permanent isostatic compression after pressure release
ciso,100 compression at 100 MPa isostatic pressure
cp heat capacity
CP, CF constant pressure and constant flux infiltration mode
cpf specific heat capacity of fibre preform
cpr compression of the preform due to infiltration process
CT compact tension method
CTE coefficient of thermal expansion
cv volumetric compression of preform
d50 median particle size
∆G0 free energy of formation
∆γr contribution of reduced interfacial tension due to reaction
∆Gr heat of reaction due to formation of an interfacial phase
DHg median pore size in mercury porosimetry
DSQC direct squeeze casting infiltration
E Young´s modulus
Ec, E1, E2 Young´s modulus of the composite, reinforcement phase 1 and 2
Ec,lower , Ec,upper lower and upper bound of composite Young´s modulus
Ec,ROM Young s modulus calculated using rule of mixture (ROM)
Edyn Young s modulus measured in resonance mode
Eiso volumetric modulus in isostatic compression
FN normal force in tribological testing
fPFA fraction pore forming agent in green part
FR friction force
G Gibbs energy
γHg surface tension of mercury
γlv surface tension of a liquid
GP gas pressure infiltration mode
γRl surface energy of the liquid-solid reaction product interface
VII
Symbol Meaning
γRv surface energy of the interface reaction product- atmosphere
γsv, γsl surface energies of solid-vapour, solid-liquid interfaces
η viscosity of water in permeabilty measurements
HM heat of fusion of metal phase
HPDC high pressure die casting
ISQC indirect squeeze casting
K preform permeability
k ratio of window to cell size in foamed preforms
K IC fracture toughness in mode I
KMIP permeability in mercury porosimetry
Kr relative preform permeability
Ks specific preform permeability
Ksi specific permeability in pressing direction
Ks specific permeability for flow parallel to the fibre axis
Ksp specific permeability parallel to pressing direction
Ks specific permeability for flow perpendicular to the fibre axis
λ geometrical factor of powder bed
lc length of steel cylinder
µ fluid viscosity
m Weibull modulus
m0 preform mass weighed in air
m1 preform mass saturated with fluid
m2 preform mass weighed immersed in the fluid
µi chemical potential
N1, N2 solvent mole fractions of liquid 1 and 2
νi stoichiometric coefficient
Pappl applied pressure
PC cellulose particle pore former
Pf probability of failure
PF carbon fibre pore former
PFA pore forming agent
PH initial Hertzian pressure
Piso isostatic compression pressure
Ploc local pressure
Pmet melt pressure in the direct squeeze casting tool
PMMC, PIS performance coefficient of MMC and infiltration alloy IS
pO2,calc calculated oxygen partial pressure
θ contact or wetting angle
VIII
Symbol Meaning
θ0 initial contact angle in reactive wetting
θc volume fraction of the ceramic phase
θdyn dynamic contact angle
θeq contact angle in equilibrium in reactive wetting
θHg wetting angle of mercury on ceramics
θintr intrinsic wetting angle
θl volume fraction of the intruded liquid
θmin intermediate minimum contact angle due to reactions
θst static contact angle
Ra arithmetic mean surface roughness
rc radius of steel cylinder
ρf fibre density
ρfl density of fluid
ρM metal melt density
ρp bulk density of ceramic particle
ρr raw density
rsf mean radius of fibre
S saturation of preform
σ0 characteristic stress at fracture
sc Compression strength
σc, σf, σm frailure strength of composite, fibre, matrix
SDTA simultaneous thermal differential method
SEVNB single edge V-notched bars
Si surface area per unit volume of porosity
SiHg specific surface area per unit of volume porosity
Sint integral saturation
Sloc local saturation
Sml specific area per unit preform volume of newly formed aluminium
SpHg surface area per unit volume preform from mercury porosimetry
splunger displacement of the upper punch
SsBET surface area per unit mass from gas absorption measurements
SsHg specific surface area per unit of mass - Hg intrusion method
sx, sy, sz dimensional change in the x, y and z-direction of the preform
Tm melting temperature of a solid
Tmelt,die melt temperature in the die
Tpreform, Tedge, Tcentre Local temperatures in the direct squeeze casting tool
Tref reference temperature in differential thermal analysis
Tsample sample temperature in differential thermal analysis

IX
Symbol Meaning
TYS tensile yield strength
UTS ultimate tensile strength in tension
v0 superficial fluid velocity
Vf volume fraction of fibres in a preform
Vp volume fraction of particles
vpl velocity of the plunger
Vpo pore volume fraction in foamed preforms
Vtot total intrusion volume in mercury porosimetry
Wad work of adhesion
We Weber number
Wi work of immersion
ww width of wear path after tribology test
κ geometrical factor of fibre
ΦC closed cell porosity
Φext residual filled porosity after mercury intrusion porosimetry
ΦHg total porosity intruded by mercury
Φop open cell porosity
ΦP open porosity
ΦPFA porosity formed by pore forming agent
ΦTot total porosity
1
1. INTRODUCTION
To make a lightweight material possessing high strength even at higher temperatures, it would
be desirable to take advantage of the high strength of low density ceramic materials. Ceramics
exhibit brittle behaviour, lacking the required fracture toughness for most heavy duty
applications. In contrast, low density metallic materials such as aluminium and magnesium
and their alloys, which possess the desired fracture toughness, show low strength at
temperatures above 250°C. Thus, for such applications, a composite material combining the
desirable properties of two different phases might be vastly superior. The main problem is to
effect the combination in such a manner as to exploit the desirable features of both
components and thereby maximize the material properties.
Aluminium alloys are quite attractive due to their low density, their capability to be
strengthened by precipitation, their good corrosion resistance, high thermal and electrical
conductivity, and their high damping capacity. The combination of an aluminium alloy and a
ceramic material gives a group of materials known as aluminium matrix composites and
these have been widely studied since the 1920s (1) and now are used in sporting goods,
electronic packaging and automotive industries. They offer a large variety of mechanical
properties depending on the chemical composition of the matrix alloy and the reinforcing
phase which is predominantly alumina or silicon carbide but MgO, TiO2, SiO2 and CaO may
also be considered. The aluminium matrices are in general Al-Si, Al-Cu or Al-Mg alloys. In
the 1980s, the transportation industries began to develop discontinuously-reinforced
aluminium matrix composites. These aluminium alloy matrices with dispersed ceramic
particles are very attractive due to their isotropic room temperature mechanical properties.
They are low cost due to cheap processing routes and low cost discontinuous reinforcements.
Due to the solely three dimensional connectivity of the metal phase, the main drawbacks of
2
these materials are the detrimental properties regarding creep and mechanical properties at
temperatures above 250°C.
In recent years, there has been interest in metal matrix composites with interpenetrating
networks (2). Using the Newnham taxonomy (3), which is based on phase connectivity, such
materials are designated 3-3 composites since both phases have connectivity in three
dimensions. The combination of materials means not only choosing component phases with
the right properties, but also coupling them in the best manner. Connectivity is a key feature
in property development in multiphase solids, since physical properties can change by many
orders of magnitude depending on the manner in which connections are made.
The infiltration of a porous ceramic body, called the preform, with a liquid metal represents
an attractive route to fabricate interpenetrated composite materials. The preform route offers a
wide variety of types, morphologies and metal volume contents. Thus tailored microstructures
with interpenetrated networks can be realised. The properties of the porous ceramics, the
metal melt and their interactions are most important regarding the resulting material
properties. Furthermore, the local reinforcement of cast metal components is possible.
However, industrial applications are often limited mainly by lack of precise knowledge of the
influencing factors.
Concerning the metal volume fraction, there two forms which have been well studied. One
with less than 0.50 and one with more than 0.70. For the higher content chopped fibre and
foam-based ceramic materials are used and for metal-reinforced ceramics not more than 0.50
of the metallic phase is used in order to maintain a predominant ceramic behaviour of the
resulting materials. The range between 0.50 and 0.70 has not been widely investigated up to
date. This is mainly due to the lack of commercially available preforms.
3
The present work concentrates on preforms of particulate oxide ceramics in the porosity range
of 60 to 70%. To investigate the infiltration behaviour, the preform pore structure and
chemistry were varied across this porosity range. The influence of pore structure and
reactivity on dynamic wetting angle and high velocity infiltration behaviour was investigated
and modelling this infiltration behaviour with a unsaturated flow model was validated.
An investigation of the MMC microstructures by detailed image analysis was carried out to
determine the important microstructural parameters. The mechanical properties of strength
and toughness as well as tribological characteristics were investigated and compared to the
unreinforced alloy and MMCs based on commercially available preforms.
4
2. LITERATURE REVIEW
2.1. Materials selection
The objective in research on new composite materials is to optimise a number of parameters.
Common parameters are strength to weight ratio and to cost. Conflicts arise, because the
choice that optimises one parameter will not in general do the same for the others. Then the
best choice is a compromise, optimising none but pushing all as close to their optima as their
interdependence allows. When there are two or more objectives, solutions rarely exist that
optimise all properties at once.
Metal matrix composites consist in general of a metallic matrix and a ceramic reinforcing
phase. Along with the ceramic volume content there are other parameters which determine the
properties, either of material performance or technological interest. The general properties and
the factors that influence them are presented in this Literature Review. To achieve the
maximum potential from a new material, all interacting parameters have to be taken into
account when selecting the reinforcement and the metal matrix.
2.1.1. Metal Matrix
Apart from pure aluminium, alloys of the groups of Al-Si and Al-Mg are predominantly used
in technical applications including the matrix in aluminium MMCs. Aluminium-silicon alloys
are light alloys widely used for casting components for commercial and safety critical
applications. The Al-Si alloys comprise 85% to 90% of the total weight of cast aluminium
components produced (4). Silicon is found to improve the fluidity in the molten state,
providing excellent castability to the alloy (5).
For infiltration of a porous body, the properties of the liquid metal are of interest. The rate of
oxidation of liquid Al and its alloys is orders of magnitude faster than that of the solidified
5
material (6). The oxide film is formed all along the liquid-gas interfaces when oxygen is
present. Nearly all oxygen on the surface reacts with the melt to form alumina, since the
solubility of oxygen in aluminium is extremely low, given to be 0.006 at. % (7). In Al melts
exposed to atmospheres, the oxygen consumption is the dominant reaction. As reported by
Zheng and Reddy (8), aluminium melts enclosed in a sealed container with residues of
atmosphere showed complete consumption of oxygen before the atmospheric nitrogen was
consumed to form aluminium nitride (AlN).
For pure aluminium and AlSi alloys, the oxide film is initially an amorphous film which
transforms instantaneously to crystalline γ-alumina, which is a metastable allotropic phase of
Al 2O3. After an incubation period, the crystal lattice changes to the most stable α-Al2O3
modification, usually referred to as corundum. The change in crystalline structure results in
considerable tensile stress which eventually leads to rupture of the oxide film. This rupture
enables oxidation at a faster rate. The formation of Al2O3 on liquid aluminium is prevented
from forming at an oxygen partial pressure below 10-49 bar which is lower than the oxygen
partial pressure in outer space (9).
Measurements of the rate of thickening of the film show its growth to be impressively fast and
it depends strongly on the surrounding atmosphere. For example, when water vapour is
present, the oxidation rate is increased by a factor of 4, as described by Gourmi and Joud (10).
In dry atmospheres,the oxide formation rate reaches approximately 7x10⁻⁷ kg per square meter
of melt surface per second which means formation of more than two monolayers of
aluminium oxide per second.
The oxidation behaviour of liquid Al-Mg alloys is different to that of pure Al and AlSi alloys.
Campbell (6) proposed that the addition of more than 0.05 wt.% Mg to aluminium results in
6
changes in the oxide film chemistry. A mixed oxide MgO·Al 2O3 spinel is formed. According
to Ransley and Neufeld (11), above 2 wt.% Mg, the oxide film is pure MgO.
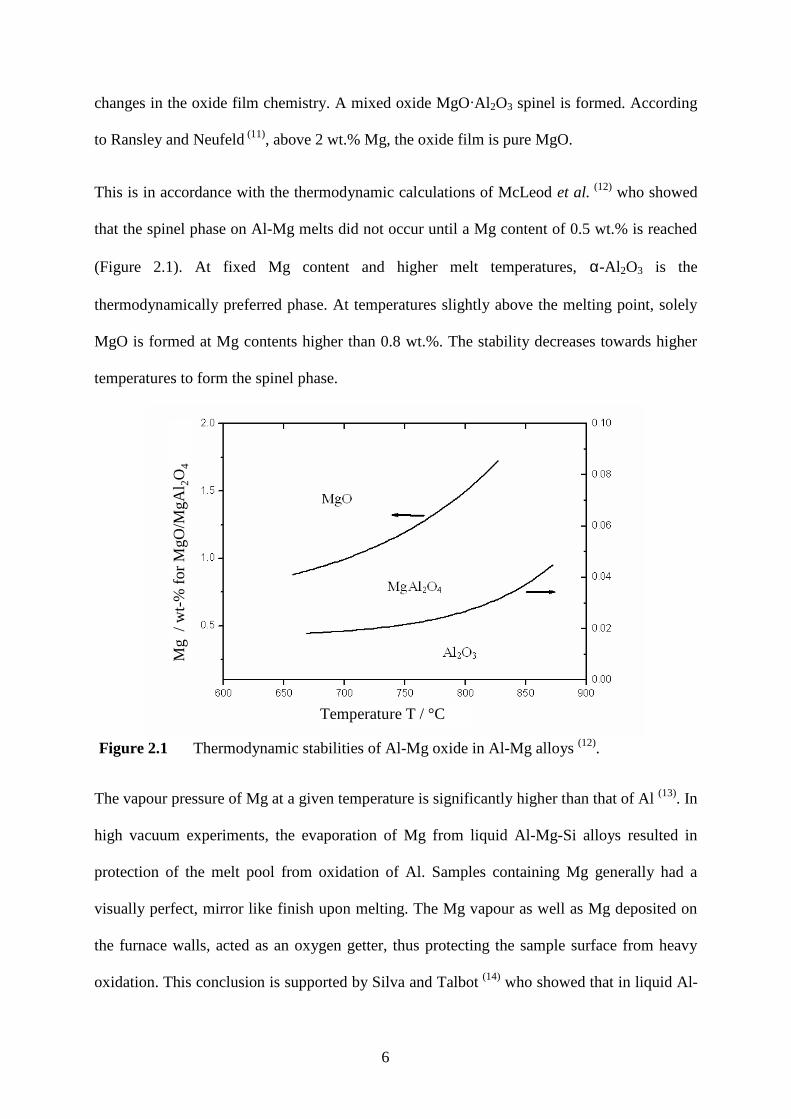
This is in accordance with the thermodynamic calculations of McLeod et al. (12) who showed
that the spinel phase on Al-Mg melts did not occur until a Mg content of 0.5 wt.% is reached
(Figure 2.1). At fixed Mg content and higher melt temperatures, α-Al 2O3 is the
thermodynamically preferred phase. At temperatures slightly above the melting point, solely
MgO is formed at Mg contents higher than 0.8 wt.%. The stability decreases towards higher
temperatures to form the spinel phase.
Temperature T / °C
Mg
/ w
t-%
for
MgO
/MgA
l 2O4
Figure 2.1 Thermodynamic stabilities of Al-Mg oxide in Al-Mg alloys (12).
The vapour pressure of Mg at a given temperature is significantly higher than that of Al (13). In
high vacuum experiments, the evaporation of Mg from liquid Al-Mg-Si alloys resulted in
protection of the melt pool from oxidation of Al. Samples containing Mg generally had a
visually perfect, mirror like finish upon melting. The Mg vapour as well as Mg deposited on
the furnace walls, acted as an oxygen getter, thus protecting the sample surface from heavy
oxidation. This conclusion is supported by Silva and Talbot (14) who showed that in liquid Al-

7
Mg alloys, Mg oxidizes preferentially to form MgO and that this is the only oxide found
during the initial stages of oxidation.
Magnesium is a powerful surfactant as well as a reactive element. The basic principles
involved in improving the wetting of ceramics by a metal melt are categorized into three
different groups as suggested by Pai et al. (15):
1. Increasing the surface energy of the solid
2. Decreasing surface tension of the liquid
3. Decreasing the solid/liquid interfacial energy at the reinforcement/matrix interface
Mg is a highly reactive element and can form a thermodynamically stable oxide by reducing
oxide-based ceramics at the synthesizing temperature of most metal-ceramic contacts.
The pressureless infiltration of preforms with aluminium alloys has been realized using the
Lanxide process (16). Here Mg addition allows wetting of the preform. Using a N2 atmosphere
and temperatures above 1000°C, magnesium nitride is formed in front of the advancing melt,
enabling wetting and capillary rise in the pores. A route for the pressureless infiltration of
Al 2O3 is enabled using the oxygen-gettering properties of Mg (17).
Commercially used Al-Mg cast alloys contain up to 10 wt.% of Mg. As shown in the binary
phase diagram of the Al-Mg system in Figure 2.2, the main phases at room temperature are
the α- and the β-phases. The equilibrium solubility of Mg is about 2 wt.% and the β-phase
consists of the stoichiometric intermetallic Al3Mg2.
Surface tension is an intrinsic property of all liquids and is due to an incomplete coordination
of the atoms at the liquid-gas interface. Atoms in the bulk of the liquid are completely
surrounded by other atoms, while those at the surface are in contact with others on the surface

8
or inside the bulk fluid only. Interatomic attractions cause an uneven pull on the surface
atoms, drawing them into the body of the liquid and resulting in a curvature of the surface as
the liquid tries to assume a shape that has the minimum surface area. Thermodynamically γlv
is defined as the surface free energy per unit area (J/m²). From a dynamic point of view, γlv
represents the work required to create one unit of additional surface area at constant
temperature. The units J/m² are equivalent to N/m.
Figure 2.2 Binary phase diagram of the system Al-Mg (27).
The γlv of liquids usually decrease with increasing temperature. Allen (18) reviewed the γlv of
liquid metals and proposed that the value for pure Al could be calculated as a function of
temperature as:
))(0036.0914.0()( mAllv TT −−=γ Equation 1
9
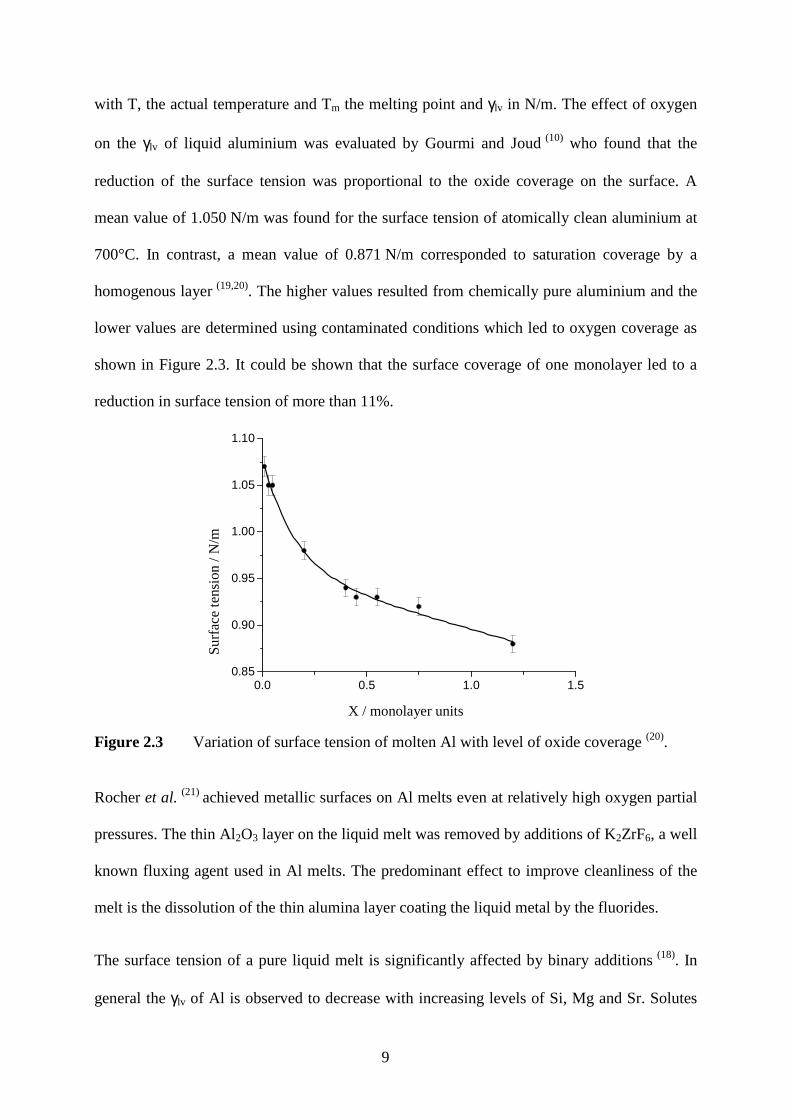
with T, the actual temperature and Tm the melting point and γlv in N/m. The effect of oxygen
on the γlv of liquid aluminium was evaluated by Gourmi and Joud (10) who found that the
reduction of the surface tension was proportional to the oxide coverage on the surface. A
mean value of 1.050 N/m was found for the surface tension of atomically clean aluminium at
700°C. In contrast, a mean value of 0.871 N/m corresponded to saturation coverage by a
homogenous layer (19,20). The higher values resulted from chemically pure aluminium and the
lower values are determined using contaminated conditions which led to oxygen coverage as
shown in Figure 2.3. It could be shown that the surface coverage of one monolayer led to a
reduction in surface tension of more than 11%.
0.0 0.5 1.0 1.50.85
0.90
0.95
1.00
1.05
1.10
Sur
face
tens
ion
(N/m
)
X (Monolayer units)X / monolayer units
Su
rfac
e te
nsio
n / N
/m
Figure 2.3 Variation of surface tension of molten Al with level of oxide coverage (20).
Rocher et al. (21) achieved metallic surfaces on Al melts even at relatively high oxygen partial
pressures. The thin Al2O3 layer on the liquid melt was removed by additions of K2ZrF6, a well
known fluxing agent used in Al melts. The predominant effect to improve cleanliness of the
melt is the dissolution of the thin alumina layer coating the liquid metal by the fluorides.
The surface tension of a pure liquid melt is significantly affected by binary additions (18). In
general the γlv of Al is observed to decrease with increasing levels of Si, Mg and Sr. Solutes
10
that are most effective in decreasing the surface tension of the solvent typically exhibit
surface tensions lower than the solvent (22). Si, Mg and Sr exhibit lower surface energies as
compared to Al and hence also decrease the surface tension (23).
The linear rule of mixture provides a first approximation for the surface tension of the
resulting solution in terms of the surface tensions γlv1 and γlv2 of the pure components 1 and 2
respectively (18). Thus
221112 lvlvlv NN γγγ += Equation 2
where N1 and N2 are the solvent mole fractions of the components 1 and 2 respectively.
Experimentally, the surface tension almost always deviates negatively from that predicted by
Equation 2. Moreover, the latter is inconsistent with thermodynamics since the liquid surface
is found to be enriched with the component with the lower γlv (24).
The addition of Si to the Al melt results in minor reductions in γlv as shown by Koerber and
Loehberg (25). The addition of 12 wt.% Si to pure Al reduces it from 0.84 N/m to 0.83 N/m
which is in the range of γlv scatter of contaminated pure Al melts. In presumably more
accurate measurements, the latter value was confirmed with an A356 alloy where γlv ranged
between 0.801 and 0.889 N/m (19). Koerber and Loehberg evaluated the effect of other
alloying elements on the surface tension of Al melts. It is interesting to note that very low
additions of Na in the range of 0.1 wt.% reduce γlv by more than 35%.
The Si in Al alloys plays an important role in the production of Al/SiC MMCs. As an alloying
element it retards the formation of the unwanted intermetallics Al4C3 and Al4SiC4 (26) which
account for the brittle character of the composite materials. Compared to pure Al in oxide
ceramic systems, no significant influence of Si additions on composite ductility could be
observed. There is a eutectic in the Al-Si system at a Si mass fraction of 11.7 % (Figure 2.4).

11
Figure 2.4 Binary phase diagram of the Al-Si system (27).
Apart from modified AlSi alloys with additions of Sr and Na (28), solidification at typical
casting cooling rates results in needle-like shaped eutectic Si precipitates. As shown by
experimental studies on Al-Si alloys, for a fixed volume content of the brittle Si precipitates,
the number of particles has a strong influence on the resulting mechanical properties. The
phenomenon was verified by Saigal and Berry (5) who showed that smaller and more
numerous particles led to improved mechanical properties. It was found empirically that, for a
given volume fraction of silicon, the tensile strength and ductility are strongly related to the
dendrite arm spacing. However, finite element analysis showed that the particle size and not
the dendrite arm spacing controls the bulk mechanical properties. A reduction in particle size
by a factor of two at a constant volume fraction resulted in a significant reduction in the crack
12
initiation stress of 25 %. Further, it was shown, that the aspect ratio of the particles has an
influence on crack initiation where larger aspect ratios of 4 showed lower crack initiation
stresses than those of perfect round particles. This important conclusion almost certainly
applies to other systems containing hard, brittle particles in a ductile matrix, such as
particulate-reinforced metal matrix composites (6).
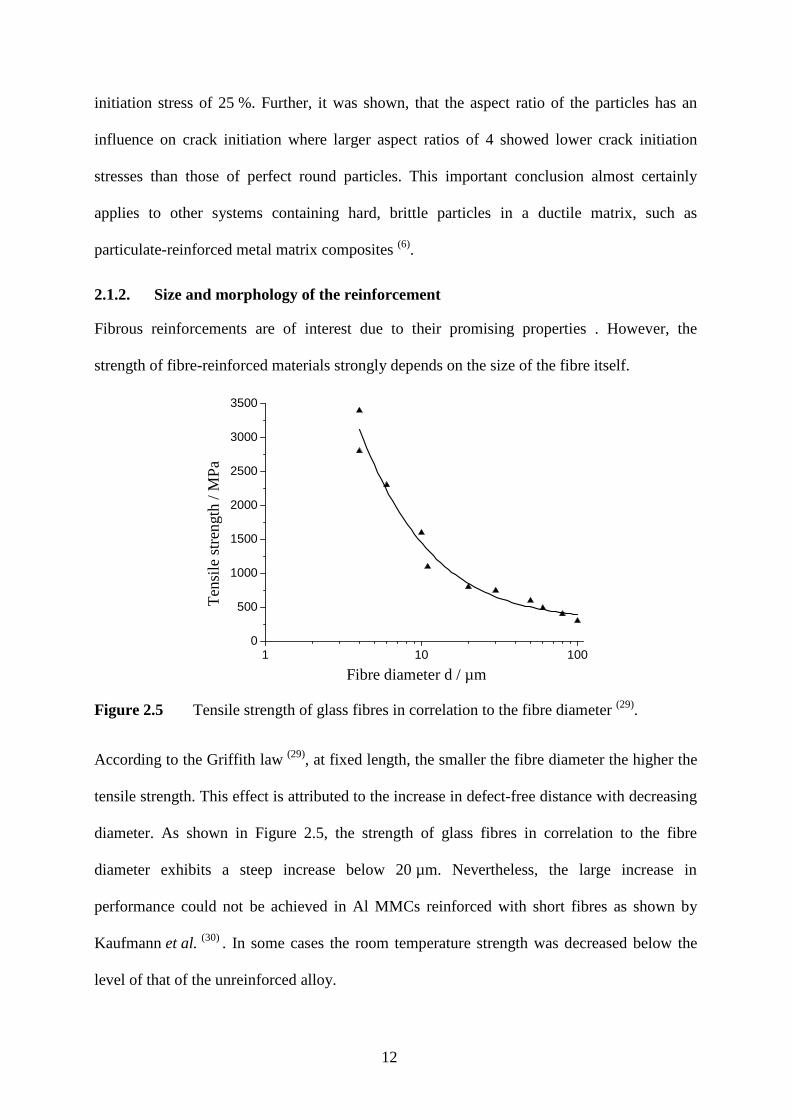
2.1.2. Size and morphology of the reinforcement
Fibrous reinforcements are of interest due to their promising properties . However, the
strength of fibre-reinforced materials strongly depends on the size of the fibre itself.
1 10 1000
500
1000
1500
2000
2500
3000
3500
Ten
sile
str
engt
h (M
Pa)
Fibre diameter d (µm]Fibre diameter d / µm
Ten
sile
stre
ngt
h/ M
Pa
Figure 2.5 Tensile strength of glass fibres in correlation to the fibre diameter (29).
According to the Griffith law (29), at fixed length, the smaller the fibre diameter the higher the
tensile strength. This effect is attributed to the increase in defect-free distance with decreasing
diameter. As shown in Figure 2.5, the strength of glass fibres in correlation to the fibre
diameter exhibits a steep increase below 20 µm. Nevertheless, the large increase in
performance could not be achieved in Al MMCs reinforced with short fibres as shown by
Kaufmann et al. (30) . In some cases the room temperature strength was decreased below the
level of that of the unreinforced alloy.
13
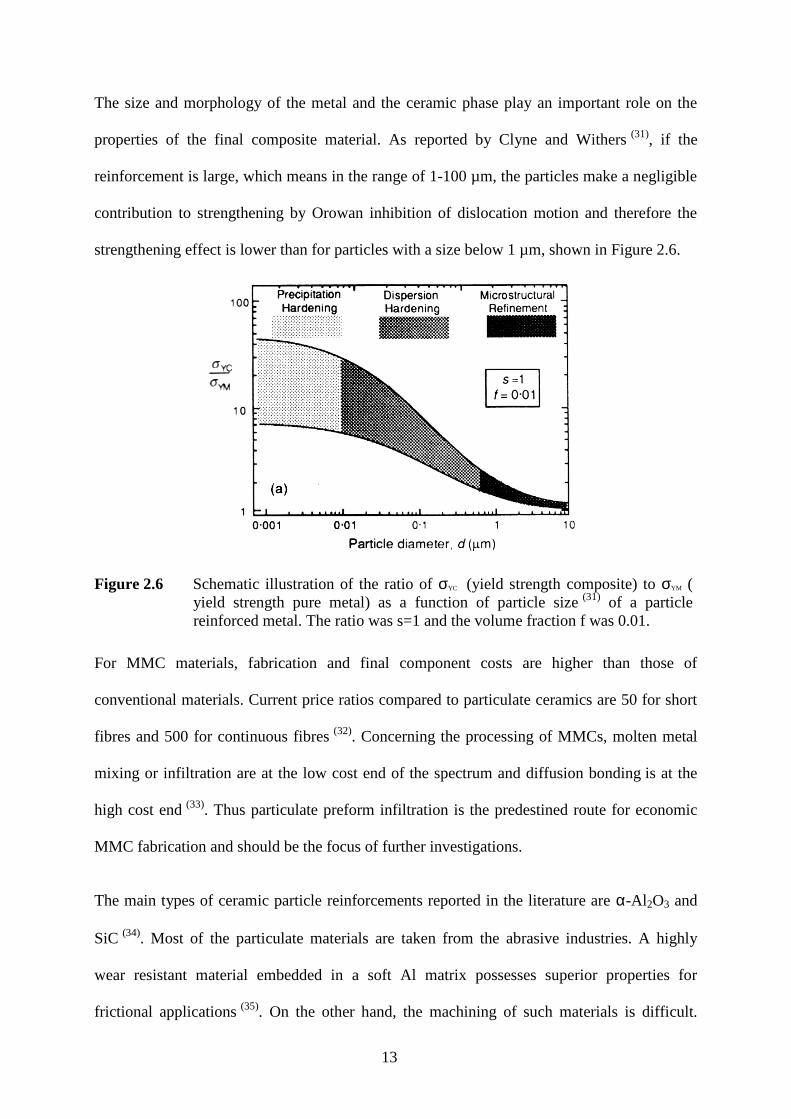
The size and morphology of the metal and the ceramic phase play an important role on the
properties of the final composite material. As reported by Clyne and Withers (31), if the
reinforcement is large, which means in the range of 1-100 µm, the particles make a negligible
contribution to strengthening by Orowan inhibition of dislocation motion and therefore the
strengthening effect is lower than for particles with a size below 1 µm, shown in Figure 2.6.
Figure 2.6 Schematic illustration of the ratio of σYC (yield strength composite) to σYM ( yield strength pure metal) as a function of particle size (31) of a particle reinforced metal. The ratio was s=1 and the volume fraction f was 0.01.
For MMC materials, fabrication and final component costs are higher than those of
conventional materials. Current price ratios compared to particulate ceramics are 50 for short
fibres and 500 for continuous fibres (32). Concerning the processing of MMCs, molten metal
mixing or infiltration are at the low cost end of the spectrum and diffusion bonding is at the
high cost end (33). Thus particulate preform infiltration is the predestined route for economic
MMC fabrication and should be the focus of further investigations.
The main types of ceramic particle reinforcements reported in the literature are α-Al 2O3 and
SiC (34). Most of the particulate materials are taken from the abrasive industries. A highly
wear resistant material embedded in a soft Al matrix possesses superior properties for
frictional applications (35). On the other hand, the machining of such materials is difficult.
14
Beffort (36) suggested that even though most of the components are fabricated using a near-net
shape route, machining cost can become the principal cost factor which makes these materials
less attractive. The higher costs are attributed to the tooling material (36).
The machinability of a MMC material depends on several factors. First of all the volume
content, Vf , of the reinforcing phase plays a major role. It has been shown that an increase in
Al 2O3 Vf from 0.10 to 0.20 reduced tool life to less than 40% (37), as well as increasing the
cutting forces and decreasing the surface finish quality (38). The ceramic type has an influence
in that, the higher the hardness of the reinforcement, the lower the tool life (37). Futhermore,
the structure of the MMC has an influence on machinability. At fixed volume content, finer
particles are much easier to machine than coarser ones (36). Brown and Klier (39) patented a
MMC with small particles, which is much more suitable to low wear machining than
materials reinforced with large particles. This was shown when comparing the machinability
of Duralcan, a cast-MMC material with 20 volume % SiC-particles of 10-15 µm average
particle size, with that of a MMC reinforced with fine Al2O3-particles of 0.2 µm mean
diameter. As shown by Ejiofor (40), the machining of hypereutectic Al-Si alloys was improved
as the silicon particles became finer and more evenly distributed. Even though the machining
properties are improved by small particles, Clyne and Withers (31) stated that, when regarding
frictional applications, the tribological properties may be diminished when using finer
particles.
As well as the tribological behaviour, the mechanical properties of MMCs are determined by
the reinforcement shape and volume fraction. Regarding the thermomechanical properties, it
was shown in the review of Legzdins et al. (41) that the reinforcement volume fractions of 0 to
0.30 and of 0.45 to 0.7 have been widely investigated whereas there is little information about
MMCs with a ceramic volume fraction in the range of 0.30 to 0.40.
15
The strengthening in MMCs is divided into two categories: direct and indirect
strengthening (42). In the direct mode, the applied load is transferred from the weaker matrix,
across the matrix-reinforcement interface, to the typically stiffer reinforcement. Due to the
lower aspect ratio of particulate materials, load transfer is not as efficient as in the case of
continuous fibre reinforcement, but is still significant in providing strengthening (43).
Upon cooling from casting temperatures, dislocations form at the reinforcement/matrix
interface due to the thermal mismatch and thermally-induced dislocation punching results in
indirect strengthening of the matrix (44). The effect of indirect strengthening is difficult to
quantify. With an increase in the reinforcement volume fraction, higher elastic moduli,
macroscopic yield and tensile strengths were observed, coupled with lower ductility.
Ductility falls off rapidly such that, at relatively low reinforcement volume fractions of about
0.20, the elongation of most MMCs is below 5%. The lower ductility at higher volume
fractions can be attributed to the earlier onset of void nucleation with increasing amount of
reinforcement. It has been found (42) that tensile ductility increases as the particle size
decreases which may be attributed to an increase in the ceramic particle strength with a
decrease in particle size. Therefore the probability of strength-limiting flaws existing in the
volume of the reinforcement decreases.
Microplasticity in the composites has been attributed to stress concentration points in the
matrix at the poles of round reinforcing particles and/or at sharp corners of irregular shaped
reinforcing particles (45). The initial micro-yielding stress decreases with increasing volume
fraction, as the number of stress concentration points increases.
The primary factors which determine the yield strength of the MMC are that of the matrix and
the reinforcement volume fraction. Significant secondary factors include the matrix/
16
reinforcement interface and reinforcement shape. Yield strength data for randomly oriented
fibre reinforced MMCs is rarely found in the published literature.
Model predictions for strength are still under development since strength is a complex
function of the composite microstructure (46). Numerous models have been developed with the
majority being the law of mixture, shear lag, Eshelby or dislocation type models (47). The
dislocation models can be further classified based on their selected contribution of Orowan
strengthening, grain and substructure strengthening, quench hardening and work
hardening (47). There is still a lack of reliable predictive capability. Since the strength depends
strongly on the matrix properties and nature of the reinforcement/matrix interface, methods
which incorporate both load sharing and matrix strengthening approaches will be needed, as
reported by Wu and Lavernia (48).
Long et al. (49) published experimental results for pure Al and Al alloy composites reinforced
with continuous and chopped alumina fibres (Saffil™ - Saffil is a trademark of ICI Americas,
Inc., Wilmington, DE). An extract of their results is listed in the mechanical properties
summary in Table 2.1. It has been shown that, when using identical processing conditions, in
general the maximum strength of continuously reinforced composites was higher than that of
chopped fibre composites, even when the strength of the matrix alloy, which was pure
aluminium for the continuous fibres and AlCu4MgAg for the chopped fibres, was lower in the
higher strength material. This higher strength was a result of the higher volume fraction of the
reinforcement in combination with the improved strengthening effect of continuous fibres.
For reasons of direct comparison, an equal reinforcement volume fraction should be aimed
for. However, in general for continuous fibres the lower limit in volume fraction was around
0.50 and the upper limit of chopped fibres was 0.30, excluding direct comparison of these two
MMC material groups.
17
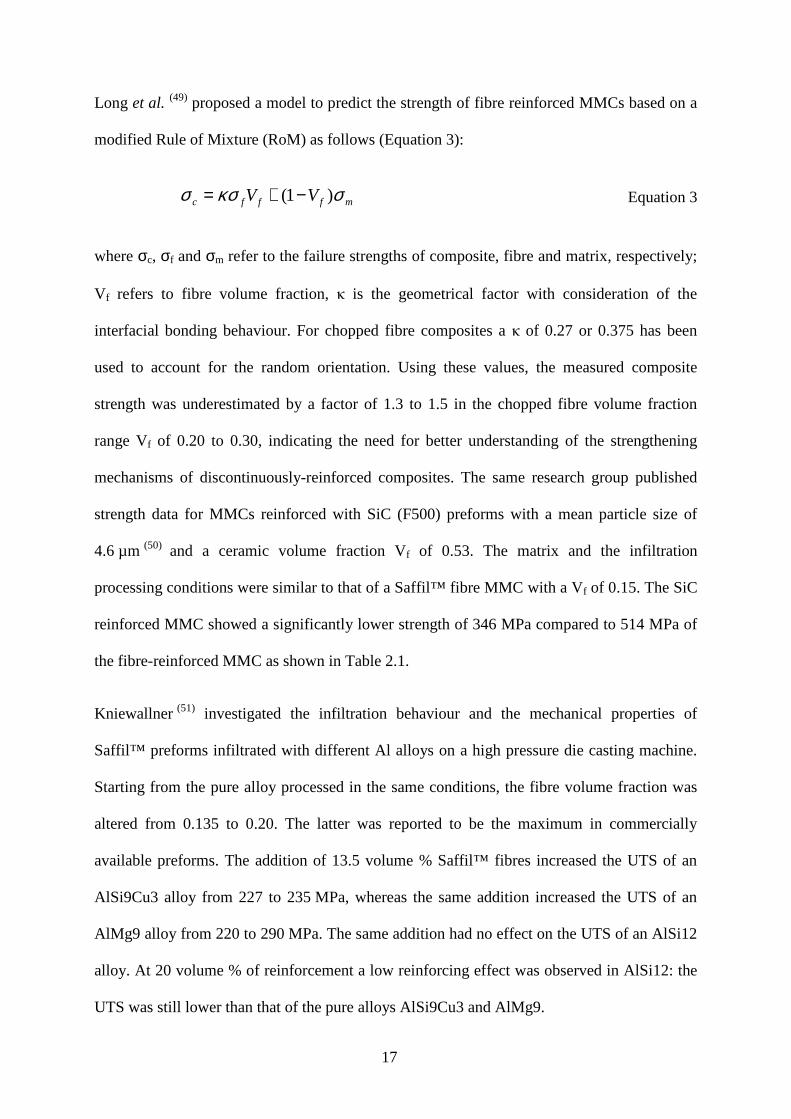
Long et al. (49) proposed a model to predict the strength of fibre reinforced MMCs based on a
modified Rule of Mixture (RoM) as follows (Equation 3):
mfffc VV σκσσ )1( −+= Equation 3
where σc, σf and σm refer to the failure strengths of composite, fibre and matrix, respectively;
Vf refers to fibre volume fraction, κ is the geometrical factor with consideration of the
interfacial bonding behaviour. For chopped fibre composites a κ of 0.27 or 0.375 has been
used to account for the random orientation. Using these values, the measured composite
strength was underestimated by a factor of 1.3 to 1.5 in the chopped fibre volume fraction
range Vf of 0.20 to 0.30, indicating the need for better understanding of the strengthening
mechanisms of discontinuously-reinforced composites. The same research group published
strength data for MMCs reinforced with SiC (F500) preforms with a mean particle size of
4.6 µm (50) and a ceramic volume fraction Vf of 0.53. The matrix and the infiltration
processing conditions were similar to that of a Saffil™ fibre MMC with a Vf of 0.15. The SiC
reinforced MMC showed a significantly lower strength of 346 MPa compared to 514 MPa of
the fibre-reinforced MMC as shown in Table 2.1.
Kniewallner (51) investigated the infiltration behaviour and the mechanical properties of
Saffil™ preforms infiltrated with different Al alloys on a high pressure die casting machine.
Starting from the pure alloy processed in the same conditions, the fibre volume fraction was
altered from 0.135 to 0.20. The latter was reported to be the maximum in commercially
available preforms. The addition of 13.5 volume % Saffil™ fibres increased the UTS of an
AlSi9Cu3 alloy from 227 to 235 MPa, whereas the same addition increased the UTS of an
AlMg9 alloy from 220 to 290 MPa. The same addition had no effect on the UTS of an AlSi12
alloy. At 20 volume % of reinforcement a low reinforcing effect was observed in AlSi12: the
UTS was still lower than that of the pure alloys AlSi9Cu3 and AlMg9.
18
It is interesting to note that, for AlMg9 and AlSi9Cu3 matrices, the tensile yield strength
(TYS), which is the important parameter for reversible loading capacity of a material, showed
the opposite behaviour to the UTS. Comparing the pure alloy and the maximum
reinforcement volume fraction, the TYS reduced from 132 MPa to 98 MPa and from 168 to
130 MPa for AlSi9Cu3 and AlMg9 respectively.
Prielipp (52) investigated Al-Al2O3 MMCs infiltrated using a gas pressure infiltration (GPI)
method. The ceramic volume fraction was 0.75. The aim was to increase the fracture
toughness of the ceramic material using a metal phase. The variation in metal ligament size,
representing the size of the metal between the ceramics, influenced the strength of the metal
toughened ceramics. The smallest ligaments showed an intermediate strength of 630 MPa
whereas the largest size resulted in the lowest bending strength of 510 MPa. The highest
strength of 710 MPa was observed for a mean ligament size of 0.25 µm.
In the work of Beyer (53), Al2O3-TiO2 hybrid preforms were infiltrated with Al. The target was
to synthesise TiAl3 - Al2O3 in a reactive heat treatment step in accordance to the reaction:
3 TiO2 + 13 Al � 3 TiAl 3 + 2 Al2O3 Equation 4
The bending strength of the initial, non-reacted material was reported to be 642 MPa and after
reaction it reduced to 398 MPa.
In comparison to the rather extensive experimental results published on mechanical properties
of chopped fibre reinforced MMCs, information on MMCs based on particulate preforms was
found to be rather scarce. For the 0.30 and 0.40 ceramic volume fraction, which was target for
the MMCs of the present work, no data could be found. For MMCs based on foamed preform
only elastic properties such as Young´s modulus or compressive properties like hardness and
compression strength have been published (54). This may be attributed to the lack of
19
appropriate specimen preparation methods or the poor mechanical properties in tensile
loading.
The experimental strength testing methods of the different research groups were derived from
their main research materials. In general, groups concentrating on ceramics rely on ceramic
material testing methods. Therefore for strength testing, bending tests were conducted as
shown in Table 2.1 by Long et al. (49,50) Prielipp et al. (52) and Beyer (53). In contrast groups
concentrating on reinforcement of light metal alloys (e.g. aluminium castings) tested the
material in pure tension, as presented by Kniewallner (51).
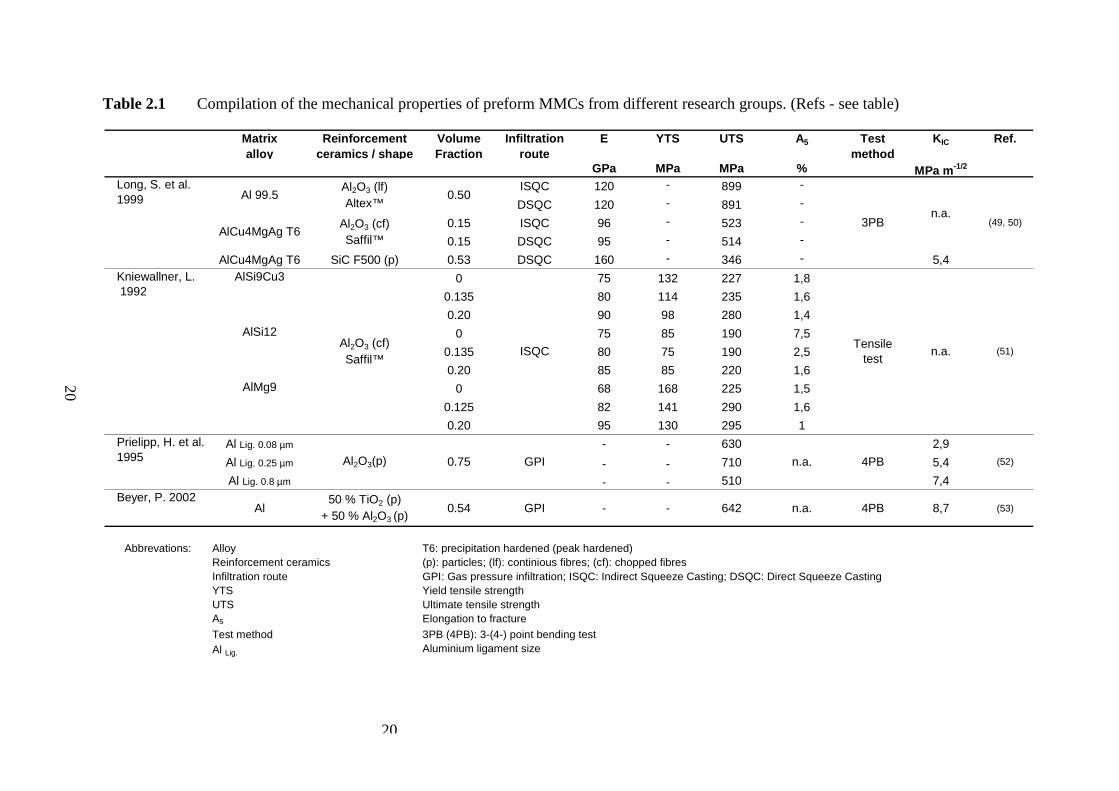
20
Table 2.1 Compilation of the mechanical properties of preform MMCs from different research groups. (Refs - see table)
Matrixalloy
Reinforcementceramics / shape
Volume Fraction
Infiltration route
E YTS UTS A5 Test method
KIC Ref.
GPa MPa MPa % MPa m-1/2
ISQC 120 - 899 -
DSQC 120 - 891 -
0.15 ISQC 96 - 523 -
0.15 DSQC 95 - 514 -
AlCu4MgAg T6 SiC F500 (p) 0.53 DSQC 160 - 346 - 5,4
0 75 132 227 1,8
0.135 80 114 235 1,6
0.20 90 98 280 1,4
0 75 85 190 7,5
0.135 80 75 190 2,5
0.20 85 85 220 1,6
0 68 168 225 1,5
0.125 82 141 290 1,6
0.20 95 130 295 1
Al Lig. 0.08 µm - - 630 2,9
Al Lig. 0.25 µm - - 710 5,4
Al Lig. 0.8 µm - - 510 7,4Beyer, P. 2002
Al50 % TiO2 (p)
+ 50 % Al2O3 (p)0.54 GPI - - 642 n.a. 4PB 8,7 (53)
Abbrevations: Alloy T6: precipitation hardened (peak hardened)Reinforcement ceramics (p): particles; (lf): continious fibres; (cf): chopped fibresInfiltration route GPI: Gas pressure infiltration; ISQC: Indirect Squeeze Casting; DSQC: Direct Squeeze CastingYTS Yield tensile strengthUTS Ultimate tensile strength A5 Elongation to fracture
Test method 3PB (4PB): 3-(4-) point bending testAl Lig. Aluminium ligament size
Prielipp, H. et al. 1995 Al2O3(p) 0.75
Kniewallner, L. 1992
(51)
n.a.
n.a.
AlSi9Cu3
AlSi12
AlMg9
ISQCTensile
test
4PB
AlCu4MgAg T6
(52)GPI
Al2O3 (cf)Saffil™
Long, S. et al.1999
(49, 50)
Al 99.5Al2O3 (lf)Altex™
0.50
n.a.3PBAl2O3 (cf)
Saffil™
20
21
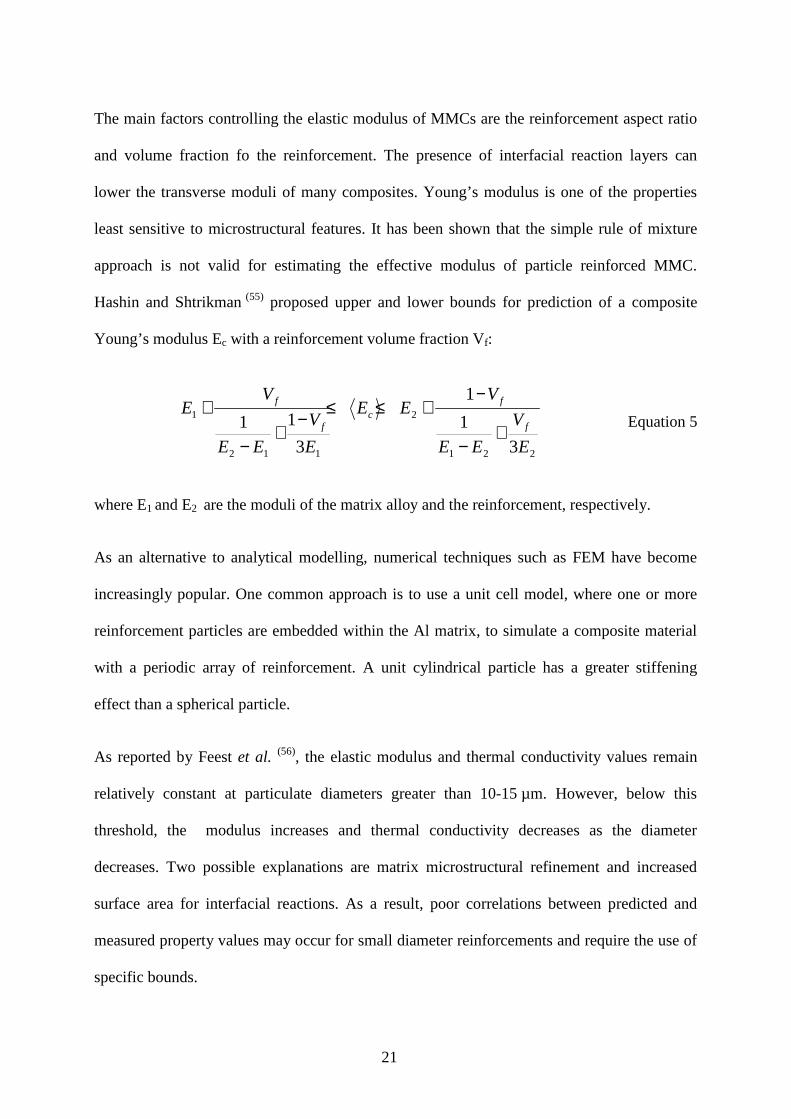
The main factors controlling the elastic modulus of MMCs are the reinforcement aspect ratio
and volume fraction fo the reinforcement. The presence of interfacial reaction layers can
lower the transverse moduli of many composites. Young’s modulus is one of the properties
least sensitive to microstructural features. It has been shown that the simple rule of mixture
approach is not valid for estimating the effective modulus of particle reinforced MMC.
Hashin and Shtrikman (55) proposed upper and lower bounds for prediction of a composite
Young’s modulus Ec with a reinforcement volume fraction Vf:
221
2
112
1
31
1
3
11E
V
EE
VEE
E
V
EE
VE
f
fc
f
f
+−
−+≤≤
−+
−
+ Equation 5
where E1 and E2 are the moduli of the matrix alloy and the reinforcement, respectively.
As an alternative to analytical modelling, numerical techniques such as FEM have become
increasingly popular. One common approach is to use a unit cell model, where one or more
reinforcement particles are embedded within the Al matrix, to simulate a composite material
with a periodic array of reinforcement. A unit cylindrical particle has a greater stiffening
effect than a spherical particle.
As reported by Feest et al. (56), the elastic modulus and thermal conductivity values remain
relatively constant at particulate diameters greater than 10-15 µm. However, below this
threshold, the modulus increases and thermal conductivity decreases as the diameter
decreases. Two possible explanations are matrix microstructural refinement and increased
surface area for interfacial reactions. As a result, poor correlations between predicted and
measured property values may occur for small diameter reinforcements and require the use of
specific bounds.

22
General models to predict fracture toughness have been shown to be inappropriate in many
MMCs (57). It is becoming recognized that, for composites, toughness is an engineering
concept and not a material property (58). Clustering of reinforcements is a typical
manufacturing problem. Studies suggest that global thermomechanical effective properties are
generally unaffected but properties such as fracture toughness, where crack initiation is a
function of the local stress, are influenced by inhomogeneous distributions (59).
Much of the driving force behind the development of MMCs has been that monolithic
lightweight alloys have inadequate fatigue resistance for many demanding applications. MMC
fatigue failure, which is governed by the growth of very small microcracks, is also not well
described by linear elastic fracture mechanics (LEFM). The single most important factor is
the reinforcement volume fraction. For particulate-reinforced composites, the matrix
properties dominate at low volume fraction, and the reinforcement properties dominate at
high (41). The shape or aspect ratio and alignment of the reinforcements are also important
factors. For random reinforcement orientations, a minor difference in the predicted property
value is seen between different reinforcement shapes, particularly at low volume fractions.
The use of high stiffness ceramic reinforcement in particulate form, such as Al2O3, can result
in a substantial increase in fatigue resistance. Several studies have shown that both, increasing
volume fraction and decreasing particle size, result in enhanced fatigue resistance. In a
composite, most of the load is carried by the high modulus, high strength reinforcement so,
for a given stress, the composite undergoes a lower average strain than the unreinforced alloy.
Thus the fatigue lives of particle-reinforced metal matrix composites are generally longer than
those of unreinforced metals (42). For a given reinforcement volume fraction, the reinforcement
interparticle spacing decreases with decreasing particle size, resulting in more barriers for the
reversible slip motion that takes place during fatigue, and a decrease in strain localization by
cyclic slip refinement. Above a critical particle size, reinforcement fracture is predominant

23
and contributes to premature fatigue life, because of the increased propensity of particle
cracking as the particle size decreases. Narrowing of the particle size range distribution also
results in a higher fatigue failure, particularly when eliminating larger particles that are more
prone to cracking (60).
Enhanced creep resistance was obtained with the higher aspect ratio whiskers than with
particles, presumably due to more effective load transfer from the matrix to the high stiffness
reinforcement (42).
The coefficient of thermal expansion (CTE) mismatch of metal and ceramic phases in the
composites leads to thermal residual stresses and induces plastic deformation in the matrix,
resulting in indirect strengthening (61). The stresses and the strengthening in these composites
were generated during the cooling after processing at a high temperature. Agrawal et al. (62)
measured residual stresses in Al-Al2O3 composites with cellular ceramic structures built up of
particles in the sub-micron size with a ceramic volume fraction of 0.29. A residual
compressive stress of up to 100 MPa in the ceramic phase and the same order of tensile stress
in the metal matrix were obtained. When regarding the ceramic phase, the compression stress
is beneficial for preventing particle cracking when a tensile stress is applied to the composite.
In contrast, the residual tension in the metal phase is detrimental to composite properties.
Yielding of the aluminium alloy matrices is already reached at tensile stress levels of about
200 MPa at room temperature (63).
Hoffmann et al. (64) synthesized alumina which was toughened by interpenetration with
aluminium. The metal ligament size was in the range of 0.12 to 1 µm. Due to their small
ligament size, dislocation movement in the ligaments is expected to be limited. The high level
of mechanical constraint induced by small ligaments tightly bonded to the ceramic is expected
to raise the flow stress in the metal well above that of the bulk material which is consistent
24
with values observed by others for highly constrained ductile particles and thin films (65,66).
This high level of residual stresses has been confirmed experimentally. At the lower ligament
size of 0.12 µm, a high residual stress of 1430 MPa were obtained whereas at a ligament size
of 1 µm a lower stress level of 760 MPa was reported. On the other hand interfacial
debonding occurred with a larger ligament size, as shown by Kohle et al. (67). In their
experiments, Al2O3 was toughened with Ni at a volume fraction of 0.20. The critical diameter
of the Ni phase in the toughened Al2O3 was in the range of 1.3 to 8.5 µm.
Knechtel et al. (68) used metal toughened ceramics to show that the interface of Al2O3-Al is
significantly stronger than the Al2O3-Cu interface. The influence of metal ligament size on
both fracture toughness and fracture strength was assessed. Different average ligament sizes
were proposed to be represented by using the median pore diameter of a mercury intrusion
porosimetry analysis which was in the range of 0.08 µm to 0.13 µm. Fracture toughness
increased with increasing metal ligament size. SEM studies of the Al2O3-Al composite
microstructure with an average ligament size below 0.10 µm clearly showed, that the small
cavities could not be infiltrated even though a gas pressure of 15 MPa and relatively high
processing temperature of 1110°C were used.
From the standpoint of infiltration behaviour, large particulates are more favourable than
smaller ones. Mitzumoto et al. (69) synthesized MMCs by a low pressure infiltration process.
The pressure required to infiltrate preforms having the same volume fraction of particles
increased from 0.05 MPa to 0.5 MPa with a decrease in the particle size from 100 µm to
20 µm. This indicates that, the infiltration is achieved with lower pressure at higher particle
diameters.
25
2.2. Static wetting in metal-ceramic systems
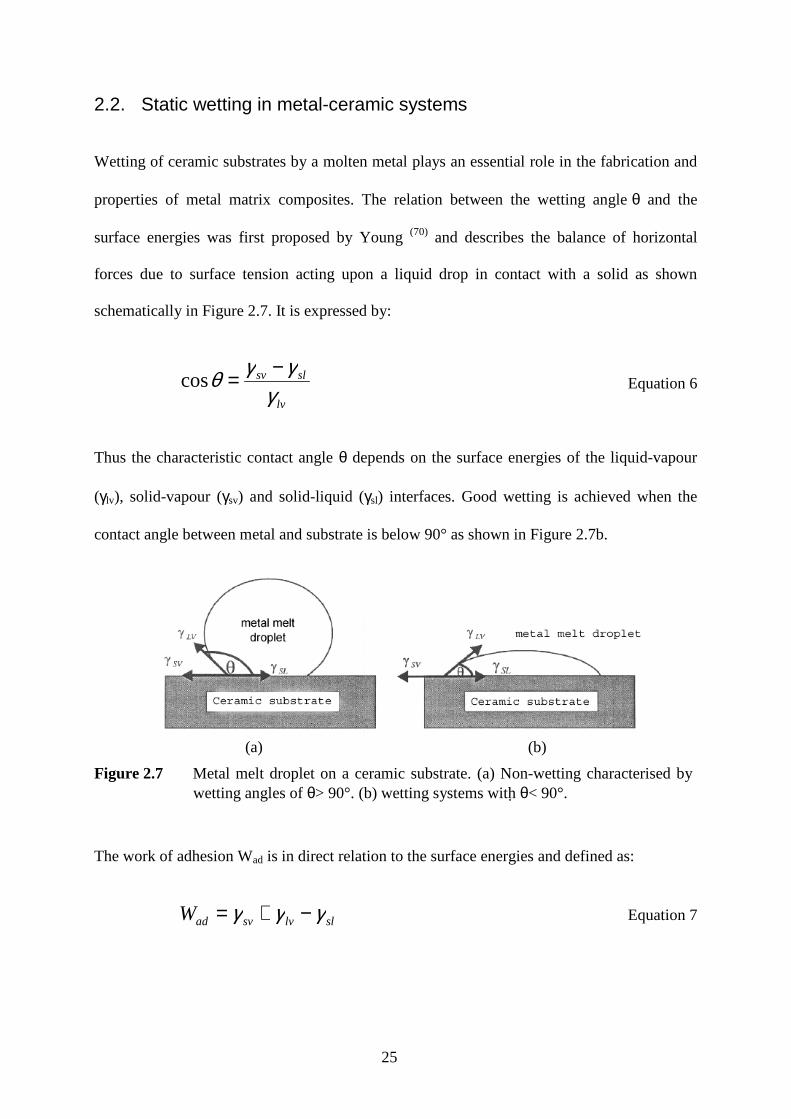
Wetting of ceramic substrates by a molten metal plays an essential role in the fabrication and
properties of metal matrix composites. The relation between the wetting angle θ and the
surface energies was first proposed by Young (70) and describes the balance of horizontal
forces due to surface tension acting upon a liquid drop in contact with a solid as shown
schematically in Figure 2.7. It is expressed by:
lv
slsv
γγγθ −=cos Equation 6
Thus the characteristic contact angle θ depends on the surface energies of the liquid-vapour
(γlv), solid-vapour (γsv) and solid-liquid (γsl) interfaces. Good wetting is achieved when the
contact angle between metal and substrate is below 90° as shown in Figure 2.7b.
(a) (b)
Figure 2.7 Metal melt droplet on a ceramic substrate. (a) Non-wetting characterised by wetting angles of θ> 90°. (b) wetting systems with θ< 90°.
The work of adhesion Wad is in direct relation to the surface energies and defined as:
sllvsvadW γγγ −+= Equation 7
26
The work of adhesion characterises the work which is necessary to separate the solid-liquid
interface. Combining Equation 6 and Equation 7 results in the following expression:
( )θγ cos1+= lvadW Equation 8
Thus the work of adhesion depends only on the surface tension of the metal melt and the
contact angle θ. It is usually measured by the sessile drop technique, which yields both the
contact angle and the surface tension of metal through analysis of the drop´s profile (13).
The work of adhesion in metal melt-ceramic systems is subdivided into two different
categories. The first one is a result of the van der Waals forces and the second is based on
chemical bonding between surface atoms of the two different phases (71). Non-reactive
systems are characterised by positive reaction enthalpies, whereas reactive systems show
negative reaction enthalpies. The pure metal-metal oxide systems (Me/MexOy), such as Al-
Al 2O3, are in general categorized as non-reactive systems.
2.2.1. Non-reactive wetting
The interfacial energies of Me/MexOy are characterized by weak van der Waals and electronic
interactions. As reported by Gallois (72), the intrinsic contact angles in these systems are
generally larger than 90°. It may be different when there are interactions between the oxide
and the metal melt or in an reactive atmosphere. Oxygen dissolved in the metal adsorbs at the
liquid metal/vapour and the liquid metal/ceramic interfaces, leading to improved wetting with
contact angles as low as 70°, as shown by Diemer et al. (73) in the Cu-Cu2O system. Among
the metal-ceramic systems, Al-Al2O3 is the most important one. As the solubility of Al2O3 in
the Al melt close to its solidus is rather low (74), less than 0.006 at-% is dissolved, there is no
influence leading to the aforementioned wetting improvement in this system.
27
The wetting behaviour of Al2O3 by liquid Al has been widely studied, as reviewed by Rocha-
Rangel et al. (75). The principal problem that appears in this system is that wetting of Al2O3 by
Al is a non-equilibrium phenomenon characterized by the continuous oxidation of Al. In fact
the contact corresponds to the Al-Al2O3/Al 2O3 system, rather than to the Al/Al2O3 couple. It
appears that the alumina layer that coats liquid aluminium is the barrier impeding the wetting
phenomenon.
The critical factors affecting the wettability of α-alumina by molten aluminium were
reviewed by Shen et al. (76). The reported contact angles are so scattered, ranging from 160° to
40°, that it is difficult to get a clear picture of the intrinsic wettability in this system. The large
scatter is primarily because of the presence of a protective surface oxide layer on the molten
aluminium, which acts as a barrier inhibiting the formation of a true Al-Al2O3 interface,
particularly below 1000°C. The ubiquitous oxide layer results in the much larger observed
contact angles. At high temperatures (>1000°C) the scatter is relatively small, which is
attributed to disappearance of the aluminium oxide film. A possible mechanism for
elimination of the oxide film could be the reaction between it and liquid aluminium involving
the formation of a gaseous suboxide according to the reaction (7,77):
(g) OAl3(s)OAl(l) 4Al 232 →+ Equation 9
The vapour pressure of Al2O over liquid Al and solid Al2O3 at 1350°C is reported to be about
3·10-4 bar (78) and that of liquid aluminium is reported to be 1·10-4 bar at the same temperature.
Thus evaporation of both Al and Al2O has to be assumed. The authors concluded that good
wetting of aluminium on alumina is possible at elevated temperatures above 1000°C.
The intrinsic wettability of α-Al 2O3 by molten Al, corresponding to situations where the Al
surface is free of oxidation and the Al2O3 substrate is not attacked by the aluminium liquid
28
and vapour, is difficult to evaluate. This is because of the viewpoint of thermodynamic
equilibrium, surface oxidation of Al can only be prevented at extremely low oxygen partial
pressures, lower than 10-44 Pa at 700°C (6,75,76).
Apart from oxidation, the surface roughness influences the wetting behaviour (79). Even
though polished samples are used in most sessile drop tests, the surface is not totally smooth.
It has been shown that when the roughness Ra is below 1 µm the influence on wettability is
rather moderate. Shen et al. (76) proposed that, in the case of a clean Al melt surface, the effect
of the substrate surface roughness is only noticeable when it exceeds 2 µm.
The effect of temperature on wettability and shear strength of Al/Al2O3 couples was assessed
by Sobczak et al. (80). They proposed the "true" contact angle at 800°C in Al/Al2O3 to be 80°.
They concluded that low contact angles correspond to high interfacial strengths. This was
indicated by comparison of the shear stresses of two different Al-Al2O3 couples where the
wetting tests were done at different test temperatures. The shear strengths were 50 MPa and
28 MPa at wetting angles of 90° and 120° respectively.
The effect of an oxide layer on the contact angle has been revealed by Ksiazek et al. (81)
through simultaneous measurement of the wetting angle θ and oxide thickness. The partial
oxide breakdown on the surface in combination with open porosity allowed the metal to
penetrate small pores even though the macroscopic wetting angle of the sessile drop was
measured to be significantly larger than the threshold angle of spreading, which is 90°.
Wetting behaviour is extremely sensitive to test conditions which are mainly atmosphere,
material purity, temperature and surface finish. In oxidation of an Al melt the submerged
oxide film is in perfect atomic contact with the Al supplying liquid (6). After solidification, the
metal-oxide bond is still strong and so the surfaces of all aluminium products are covered with
29
an intimate aluminium oxide film. In contrast to this intimate contact, the dry side of the oxide
film is not wetted by the liquid. The poor wetting behaviour is observed in similar way when
examining the results of wetting angle of Al on Al2O3 in the sessile drop test. The large scatter
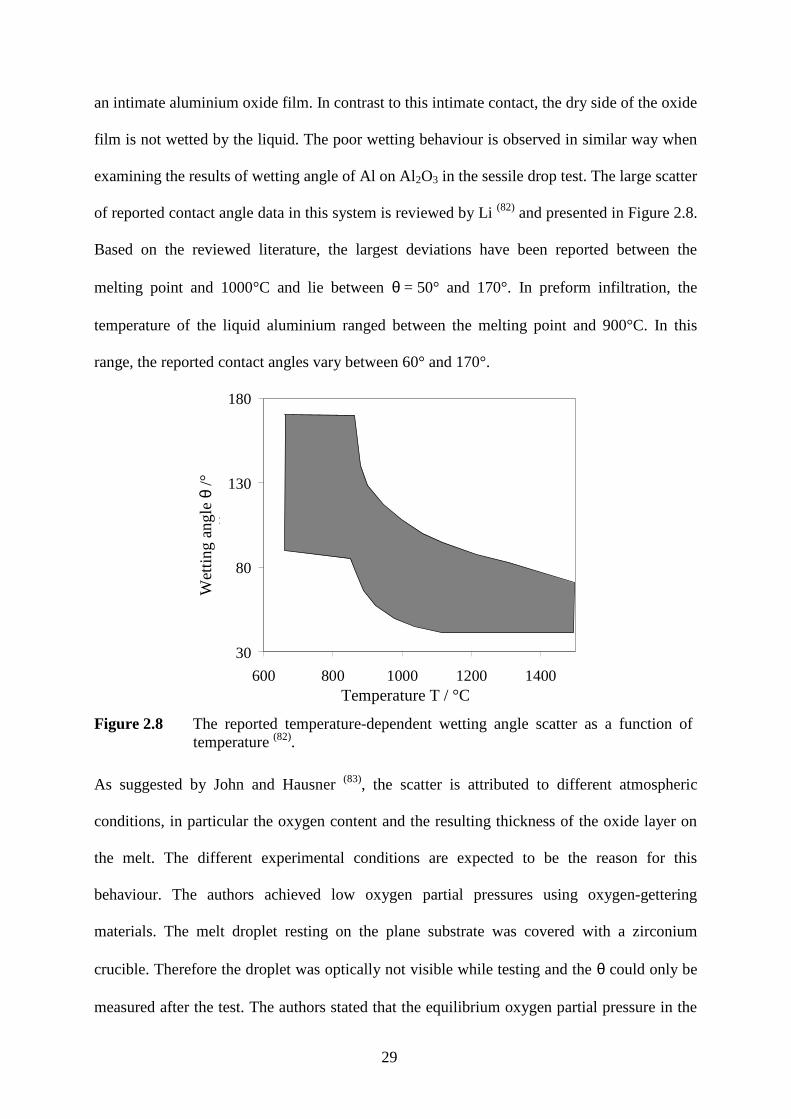
of reported contact angle data in this system is reviewed by Li (82) and presented in Figure 2.8.
Based on the reviewed literature, the largest deviations have been reported between the
melting point and 1000°C and lie between θ = 50° and 170°. In preform infiltration, the
temperature of the liquid aluminium ranged between the melting point and 900°C. In this
range, the reported contact angles vary between 60° and 170°.
30
80
130
180
600 800 1000 1200 1400
T (°C)
0 (°)
Temperature T / °C
Wet
ting
angl
e θ/°
Figure 2.8 The reported temperature-dependent wetting angle scatter as a function of temperature (82).
As suggested by John and Hausner (83), the scatter is attributed to different atmospheric
conditions, in particular the oxygen content and the resulting thickness of the oxide layer on
the melt. The different experimental conditions are expected to be the reason for this
behaviour. The authors achieved low oxygen partial pressures using oxygen-gettering
materials. The melt droplet resting on the plane substrate was covered with a zirconium
crucible. Therefore the droplet was optically not visible while testing and the θ could only be
measured after the test. The authors stated that the equilibrium oxygen partial pressure in the
30
system Al-Al2O3 is 10-49 Pa at 700°C and at the same temperature that of Zr-ZrO2 is
marginally lower. Therefore the surface of the aluminium melt droplet was assumed to be
oxygen-free. Under these conditions the wetting angle was measured to be 90° and therefore
exactly either wetting nor non-wetting.
Since the solubility of oxygen in liquid Al is extremely low (7), different oxygen partial
pressures in a sessile drop experiment will influence primarily the oxide layer thickness on the
surface of the Al. At high oxygen pressures the oxide layer will prevent the formation of the
equilibrium shape of the metal droplet, because of the mechanical strength of the oxide skin.
The results demonstrated that an oxygen partial pressure of ca. 10-13 bar is the limit for the
formation of a droplet by the liquid Al. Under the experimental conditions an oxide layer on
the surface of the Al completely prevented the formation of a spherical droplet. Very low
values for the wetting angle were obtained if a strong oxygen getter such as Zr was present in
the system. At very low oxygen partial pressures in the region of 10-44 Pa, the wetting angle at
700°C was as low as 90°.
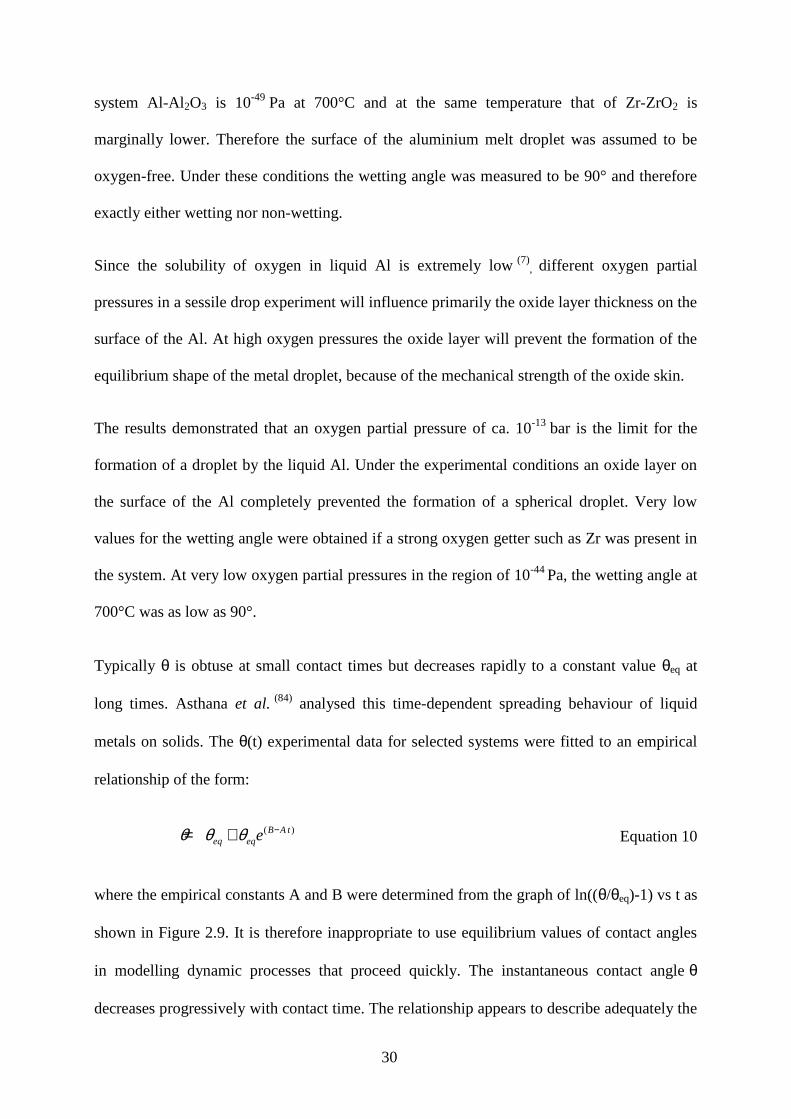
Typically θ is obtuse at small contact times but decreases rapidly to a constant value θeq at
long times. Asthana et al. (84) analysed this time-dependent spreading behaviour of liquid
metals on solids. The θ(t) experimental data for selected systems were fitted to an empirical
relationship of the form:
)( tABeqeq e −+= θθθ Equation 10
where the empirical constants A and B were determined from the graph of ln((θ/θeq)-1) vs t as
shown in Figure 2.9. It is therefore inappropriate to use equilibrium values of contact angles
in modelling dynamic processes that proceed quickly. The instantaneous contact angle θ
decreases progressively with contact time. The relationship appears to describe adequately the

31
time dependence of dynamic angles. At t=0 the droplet makes point contact with the solid
which results in a wetting angle of 180°. Thereafter the droplet begins to spread onto the solid
and the instantaneous value of θ progressively decreases with time. The progression of the
wetting perimeter is often spearheaded by a thin precursor film (85) of liquid, so that the
measured θ is an apparent rather than a true value.
Figure 2.9 Plots of ln((θ/θeq)-1) versus time of the metal – ceramic systems Al-Al2O3 and Al-SiC and the metal-metal system Al-Cu. The slope of the curve represents the parameter A and B the intercept on the t-axis (86).
According to the aforementioned work of Asthana et al. (84), liquid metal-ceramic or metal-
metal combinations exhibit different spreading behaviours. The non-reactive Al-Al2O3 system
shows an initial θ of 100° which decreases within 3000s to reach θ=50°. As shown in a later
work of Asthana (86), the equilibrium wetting angle in the Al-Al 2O3 system reaches 45°. It is
interesting to note that even though the reactive systems Al-SiC and Al-Cu exhibit a much
steeper decrease in wetting angle, the initial and the equilibrium wetting angles θeq are higher
than that of the Al-Al2O3.
32
In the Al-Cu system, although the presence of oxide film could be a problem in the
development of wettability, good wetting was achieved under carefully controlled conditions.
A partly reducible oxide film forms at the wetting front under high vacuum. The activation
energy for spreading is comparable to the activation energy for dissolution. However
interference from the oxide on Al may lead to wetting being controlled by the oxide film. The
dominant mechanism of wetting in a given system may change with test conditions but
generally the wetting behaviour in the Al-Al2O3 and Al-SiC systems is controlled by oxide
effects whereas that in Cu-Al systems is controlled by chemical reactions (86).
2.2.2. Reactive metal-ceramic systems
Although physical and mechanical properties may often limit constituent selection, it is the
chemical reactivity of the reinforcement with the matrix alloy either during service or
fabrication which will in most cases decide upon the final reinforcement/matrix
combination (41). The influence of the free energy of formation was first proposed by Aksay et
al. (87) and Naidich (71). They proposed that the enthalpy in the vicinity of the triple line
controls the spreading of the liquid on the solid material.
Naidich (71) subdivided the work of adhesion in a reactive system into two terms as:
)()( equil.nonequil. −+= adadad WWW Equation 11
and thus calculated for the interfacial region:
)(.)( equil.nonequil −−−+= adadsvlvsl WWγγγ Equation 12
It was reported that the values obtained by calculation of Wad using Equation 11 are in
accordance with experimental ones within a factor of 2. The term Wad(non-equil.) was
calculated by integration of the free enthalpy of formation between the starting conditions and
final equilibrium conditions along the interface. A rapid reaction and the formation of a
33
monolayer of the most stable reaction product on the substrate and the liquid melt was
assumed. Naidich (71) proposed that extensive chemical reactions between the constituents to
be the predominant mechanism to improve wettability.
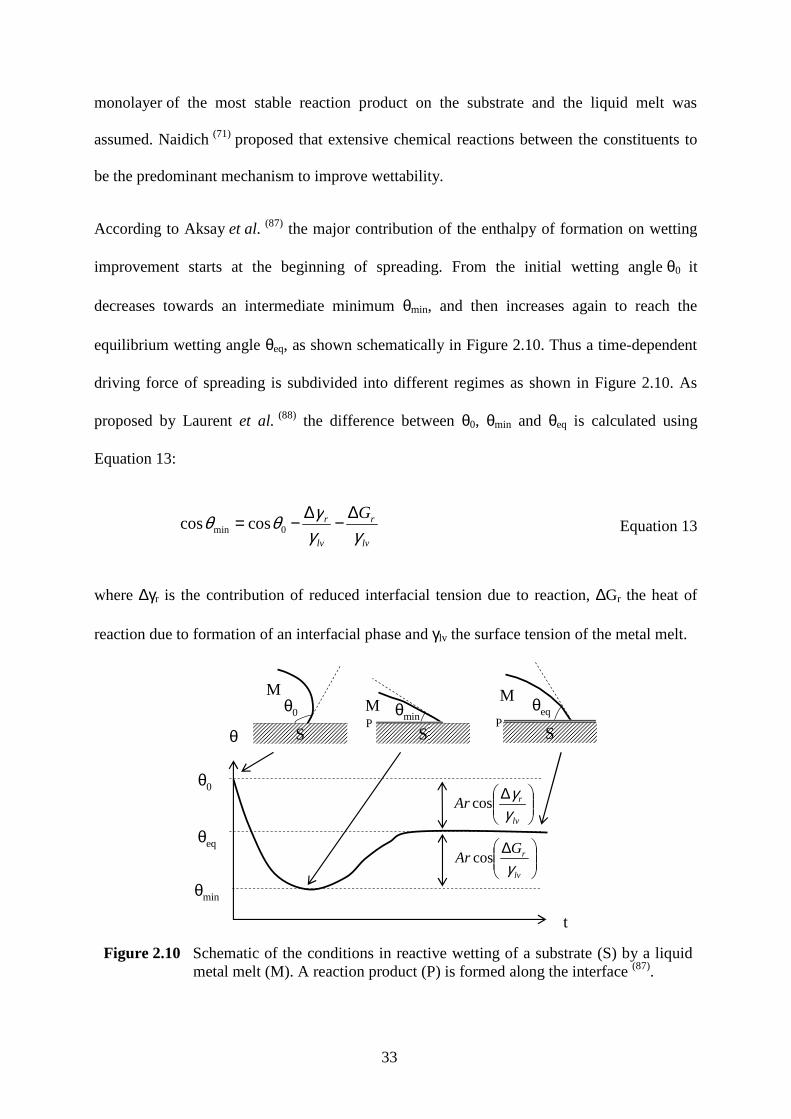
According to Aksay et al. (87) the major contribution of the enthalpy of formation on wetting
improvement starts at the beginning of spreading. From the initial wetting angle θ0 it
decreases towards an intermediate minimum θmin, and then increases again to reach the
equilibrium wetting angle θeq, as shown schematically in Figure 2.10. Thus a time-dependent
driving force of spreading is subdivided into different regimes as shown in Figure 2.10. As
proposed by Laurent et al. (88) the difference between θ0, θmin and θeq is calculated using
Equation 13:
lv
r
lv
r G
γγγθθ ∆−∆−= 0min coscos Equation 13
where ∆γr is the contribution of reduced interfacial tension due to reaction, ∆Gr the heat of
reaction due to formation of an interfacial phase and γlv the surface tension of the metal melt.
Mθ0
SS
θ0
θeq
θmin
θθmin
M
SSP
θeqM
PSS
t
∆
lv
rArγγ
cos
∆
lv
rGAr
γcos
Figure 2.10 Schematic of the conditions in reactive wetting of a substrate (S) by a liquid metal melt (M). A reaction product (P) is formed along the interface (87).
34
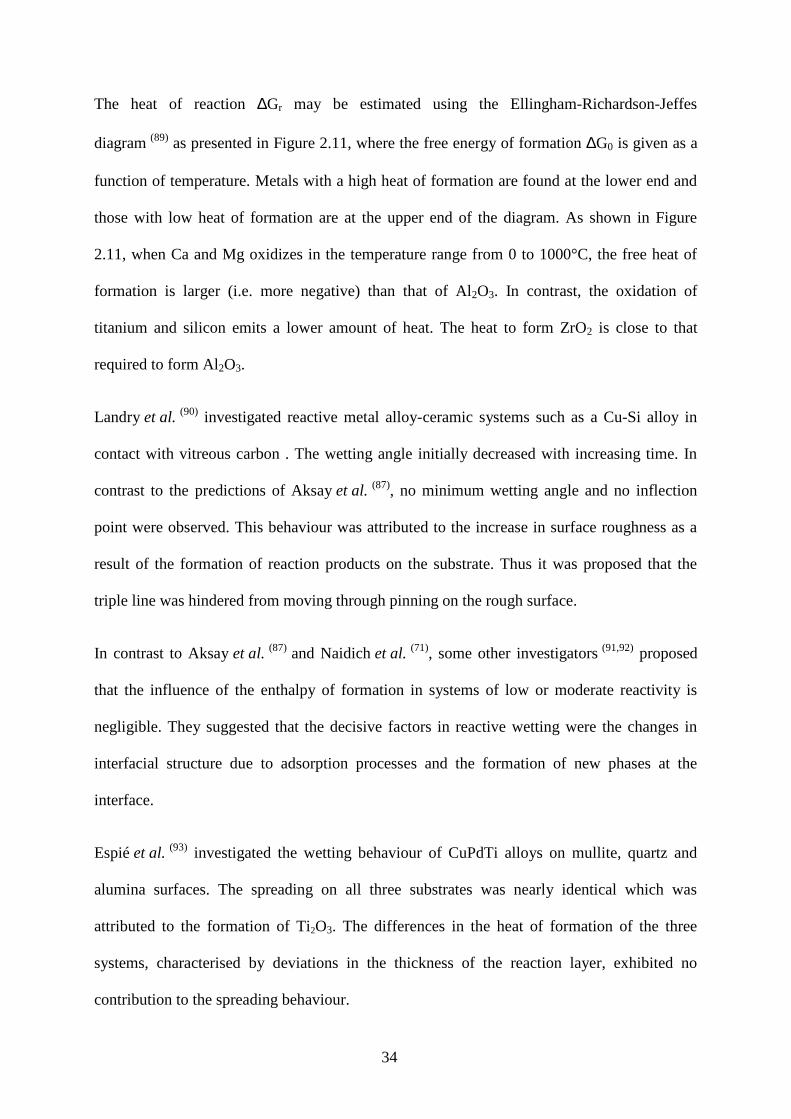
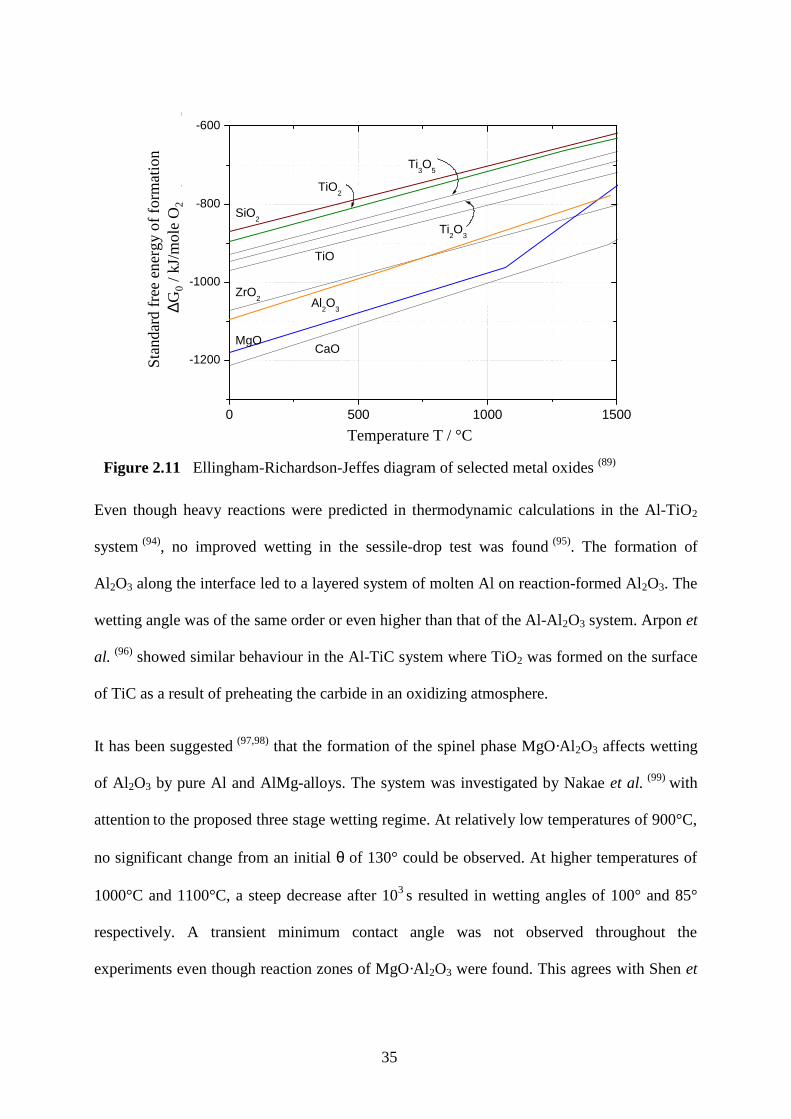
The heat of reaction ∆Gr may be estimated using the Ellingham-Richardson-Jeffes
diagram (89) as presented in Figure 2.11, where the free energy of formation ∆G0 is given as a
function of temperature. Metals with a high heat of formation are found at the lower end and
those with low heat of formation are at the upper end of the diagram. As shown in Figure
2.11, when Ca and Mg oxidizes in the temperature range from 0 to 1000°C, the free heat of
formation is larger (i.e. more negative) than that of Al2O3. In contrast, the oxidation of
titanium and silicon emits a lower amount of heat. The heat to form ZrO2 is close to that
required to form Al2O3.
Landry et al. (90) investigated reactive metal alloy-ceramic systems such as a Cu-Si alloy in
contact with vitreous carbon . The wetting angle initially decreased with increasing time. In
contrast to the predictions of Aksay et al. (87), no minimum wetting angle and no inflection
point were observed. This behaviour was attributed to the increase in surface roughness as a
result of the formation of reaction products on the substrate. Thus it was proposed that the
triple line was hindered from moving through pinning on the rough surface.
In contrast to Aksay et al. (87) and Naidich et al. (71), some other investigators (91,92) proposed
that the influence of the enthalpy of formation in systems of low or moderate reactivity is
negligible. They suggested that the decisive factors in reactive wetting were the changes in
interfacial structure due to adsorption processes and the formation of new phases at the
interface.
Espié et al. (93) investigated the wetting behaviour of CuPdTi alloys on mullite, quartz and
alumina surfaces. The spreading on all three substrates was nearly identical which was
attributed to the formation of Ti2O3. The differences in the heat of formation of the three
systems, characterised by deviations in the thickness of the reaction layer, exhibited no
contribution to the spreading behaviour.
35
0 500 1000 1500
-1200
-1000
-800
-600
CaOMgO
ZrO2
TiO
Ti2O
3
Ti3O
5
SiO2
TiO2
Al2O
3
Sta
ndar
d fr
ee e
nerg
y of
form
atio
n ∆G
0 (k
J/m
ole
O2)
Temperature (°C)
Sta
ndar
d fr
ee e
ner
gy
of f
orm
atio
n∆G
0/ k
J/m
ole
O 2
Temperature T / °C
Figure 2.11 Ellingham-Richardson-Jeffes diagram of selected metal oxides (89)
Even though heavy reactions were predicted in thermodynamic calculations in the Al-TiO2
system (94), no improved wetting in the sessile-drop test was found (95). The formation of
Al 2O3 along the interface led to a layered system of molten Al on reaction-formed Al2O3. The
wetting angle was of the same order or even higher than that of the Al-Al2O3 system. Arpon et
al. (96) showed similar behaviour in the Al-TiC system where TiO2 was formed on the surface
of TiC as a result of preheating the carbide in an oxidizing atmosphere.
It has been suggested (97,98) that the formation of the spinel phase MgO·Al2O3 affects wetting
of Al 2O3 by pure Al and AlMg-alloys. The system was investigated by Nakae et al. (99) with
attention to the proposed three stage wetting regime. At relatively low temperatures of 900°C,
no significant change from an initial θ of 130° could be observed. At higher temperatures of
1000°C and 1100°C, a steep decrease after 103 s resulted in wetting angles of 100° and 85°
respectively. A transient minimum contact angle was not observed throughout the
experiments even though reaction zones of MgO·Al2O3 were found. This agrees with Shen et
36
al. (100) who found non-wetting behaviour of aluminium melts on MgO indicated by θ of 104
to 121° in sessile drop tests.
In reactive wetting of liquid metals on ceramic substrates, Zhou and Hosson (101) proposed the
ceramic volume change as the key factor to improve wetting. They suggested that if the
volume of a ceramic substrate decreased after the reaction, wettability was not improved by
the chemical reaction. In contrast, if the volume of the ceramic substrate increased, the
wettability was improved by the chemical reaction. As an example, they pointed out the Al-
SiO2 system where a volume decrease due to formation of Al2O3 and solution of silicon in the
melt pool could be observed. In contrast, the Ti-Al2O3 system represents an example of
volume increase by the formation of TiO2 and titanium suboxides like TiO and Ti2O3.
The simple criterion of volume change proposed by the aforementioned authors was
challenged by Shen et al. (23) who investigated the Al-SiO2 system intensively. They observed
an improved wetting resulting from the chemical reaction. The authors stated that wetting is at
first a surface phenomenon.
If the change in surface energy due to reaction (∆γr) is the dominating factor in reactive
wetting, there are two possible configurations at the metal-ceramic interface as shown in
Figure 2.12.
original substrate
Reaction layerReaction layer
original substrate
Reaction layerReaction layer
Figure 2.12 Different configurations in front of the triple line in reactive wetting after equilibration.

37
In the case of a), the diffusion rates of the reacting components and thus the growth rate of the
reaction products are low relative to the flow rate of the liquid drop. The liquid at the
periphery of the drop will remain in contact with unreacted solid. In the this case, the
equilibrium wetting angle (cosθeq) is defined as:
lv
Rlsveq γ
γγθ −=cos Equation 14
where γRl is the surface energy of the liquid-solid reaction product interface.
In the second configuration b), the diffusion rates of the reacting components in the solid are
high relative to the flow rate of the liquid drop. After equilibrium is reached, the reaction
layer extends beyond the triple line. In this case the equilibrium contact angle is given by:
lv
RlRveq γ
γγθ −=cos Equation 15
where γRv is the surface energy of the interface reaction product- atmosphere.
There is up to now no definite model describing the influence of reactivity on wetting
behaviour in metal melt-ceramic systems. The enthalpy of formation and the changes in the
interface are the two factors leading to changes in the surface tension. Which of these
dominates is controversial and depends on the particular system. In dynamic infiltration
systems, where liquid metals are forced under pressure into a porous medium, the non-
reactive and the reactive wetting are even more difficult to assess.
2.3. Infiltration of porous media
The infiltration of porous preforms consists of forcing the liquid metal to infiltrate the
preform by applying pressure. The infiltration consists of an initiation step, where a certain

38
capillary or threshold pressure has to be applied to overcome the capillary backpressure. Once
the threshold pressure has been overcome, the molten metal flows into the capillaries of the
preform. Both infiltration steps will be discussed in detail below.
2.3.1. Dynamic wetting
The critical parameter that governs the wettability of a solid by liquid is the work of
immersion Wi which is given by:
svl γγ −= siW Equation 16
where γsl and γsv are the solid/liquid and solid/vapour surface energies respectively. If γsv>γsl
the metal wets the solid. If γsv<γsl work is required to generate the solid-liquid interface. In the
non-wetting case the infiltration of a liquid into a porous body will require a minimum
external pressure. This threshold or capillary pressure P0 can be written in terms of the work
of immersion:
ii0 WSP = Equation 17
where Si is the surface area per unit volume of porosity which has to be covered with the
liquid. P0 can be related to the contact angle θ at the liquid/solid interface by using the Young-
Dupré (70)equation:
θγγγ coslvslsv += Equation 18
where γlv is the liquid metal surface tension. Equation 18 can then be rewritten as:
θγ cos0 lviSP = Equation 19
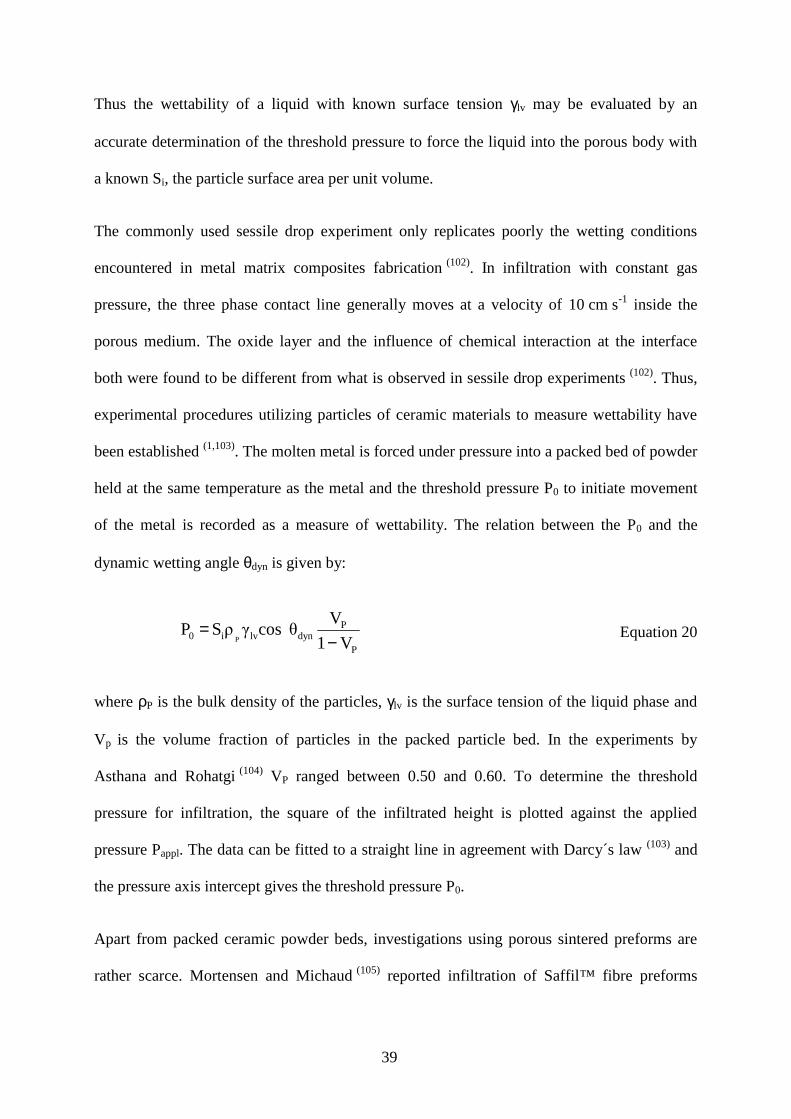
39
Thus the wettability of a liquid with known surface tension γlv may be evaluated by an
accurate determination of the threshold pressure to force the liquid into the porous body with
a known Si, the particle surface area per unit volume.
The commonly used sessile drop experiment only replicates poorly the wetting conditions
encountered in metal matrix composites fabrication (102). In infiltration with constant gas
pressure, the three phase contact line generally moves at a velocity of 10 cm s-1 inside the
porous medium. The oxide layer and the influence of chemical interaction at the interface
both were found to be different from what is observed in sessile drop experiments (102). Thus,
experimental procedures utilizing particles of ceramic materials to measure wettability have
been established (1,103). The molten metal is forced under pressure into a packed bed of powder
held at the same temperature as the metal and the threshold pressure P0 to initiate movement
of the metal is recorded as a measure of wettability. The relation between the P0 and the
dynamic wetting angle θdyn is given by:
P
Pdynlvi0 V1
Vθ cosγρSP
P −= Equation 20
where ρP is the bulk density of the particles, γlv is the surface tension of the liquid phase and
Vp is the volume fraction of particles in the packed particle bed. In the experiments by
Asthana and Rohatgi (104) VP ranged between 0.50 and 0.60. To determine the threshold
pressure for infiltration, the square of the infiltrated height is plotted against the applied
pressure Pappl. The data can be fitted to a straight line in agreement with Darcy´s law (103) and
the pressure axis intercept gives the threshold pressure P0.
Apart from packed ceramic powder beds, investigations using porous sintered preforms are
rather scarce. Mortensen and Michaud (105) reported infiltration of Saffil™ fibre preforms

40
using constant gas pressure. Infiltration with pure aluminium resulted in apparent contact
angles θ in the range of 102° to 111°. The results were much closer to sessile drop wetting
angles measured in ultra high vacuum than to those measured in air or in a lower vacuum.
Jonas et al. (106) infiltrated preforms consisting of Al2O3 particles with pure Al and Al-2% Mg
(wt.%) alloy. Even though Mg in Al was considered to improve wetting behaviour (15), the
θdyn were 106° for pure Al and 105° for the Al-Mg alloy, indicating no significant
improvement in dynamic wetting. The small effect of Mg on the wetting was attributed to the
absence of reactive wetting at the infiltration speeds used and to partial disruption of the oxide
layer on the surface of the liquid metal during infiltration.
As reported by Garcia-Cordovilla (103), two methods for determination of the surface area are
used for packed ceramic particulates. The most common is the Braunauer, Emett and Teller
(BET) nitrogen adsorption method (105).. The laser scattering method applied to the
particulates before compaction shows inaccurate results for applications where wettability is
evaluated (103). Mercury intrusion porosimetry (MIP) is an alternative method which may be
used to determine the surface areas of porous media. Most of the MIP measurements in
MMC-fabrication (53,107) have been performed solely to determine the pore size distribution of
particulate preforms with ceramic volume fraction of more than 0.50. In some cases, the
ceramic contents were much lower: Cardinal et al. (108) investigated ceramic volume fraction
of 0.35 using hybrid preforms of Al2O3 platelets and Al2O3 short fibres. The volume of
intruded mercury at a specific pressure is a result of penetration into cavities larger than a
particular size. In MIP measurements, Washburn’s equation is applied:
PD HgHg
Hg
θγ cos4−= Equation 21
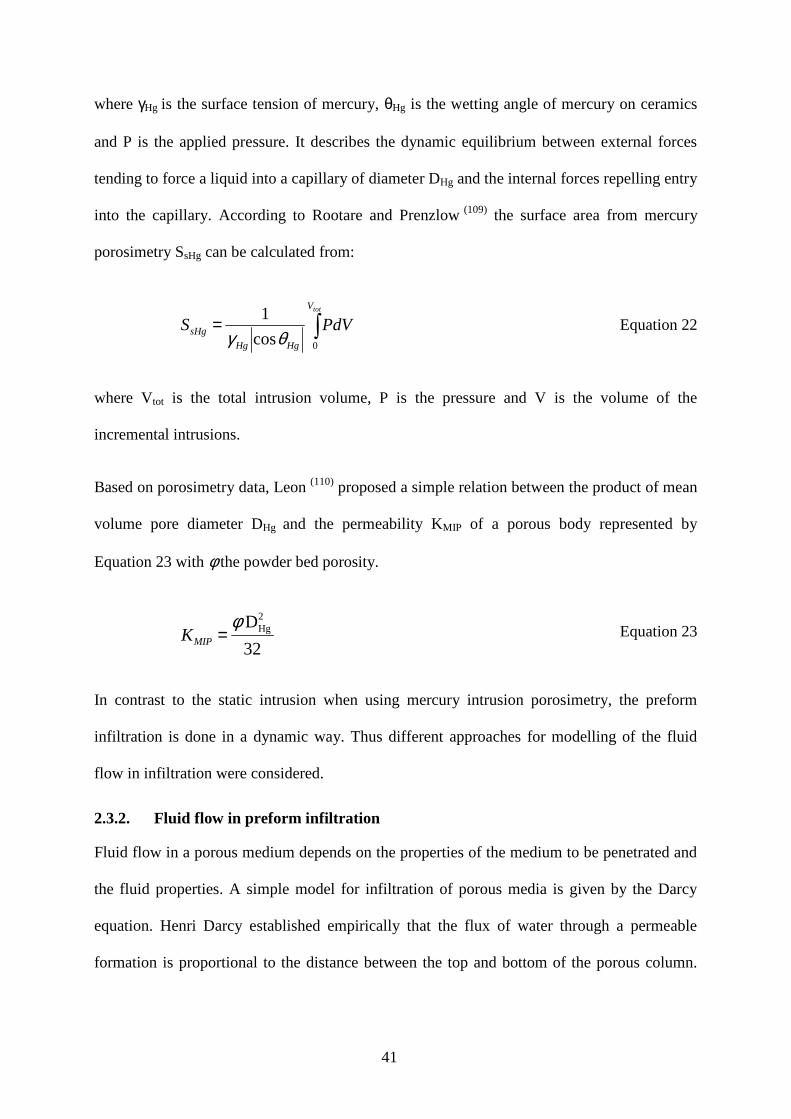
41
where γHg is the surface tension of mercury, θHg is the wetting angle of mercury on ceramics
and P is the applied pressure. It describes the dynamic equilibrium between external forces
tending to force a liquid into a capillary of diameter DHg and the internal forces repelling entry
into the capillary. According to Rootare and Prenzlow (109) the surface area from mercury
porosimetry SsHg can be calculated from:
∫=totV
HgHg
sHg PdVS0cos
1
θγ Equation 22
where Vtot is the total intrusion volume, P is the pressure and V is the volume of the
incremental intrusions.
Based on porosimetry data, Leon (110) proposed a simple relation between the product of mean
volume pore diameter DHg and the permeability KMIP of a porous body represented by
Equation 23 with φ the powder bed porosity.
32
D 2Hgφ
=MIPK Equation 23
In contrast to the static intrusion when using mercury intrusion porosimetry, the preform
infiltration is done in a dynamic way. Thus different approaches for modelling of the fluid
flow in infiltration were considered.
2.3.2. Fluid flow in preform infiltration
Fluid flow in a porous medium depends on the properties of the medium to be penetrated and
the fluid properties. A simple model for infiltration of porous media is given by the Darcy
equation. Henri Darcy established empirically that the flux of water through a permeable
formation is proportional to the distance between the top and bottom of the porous column.
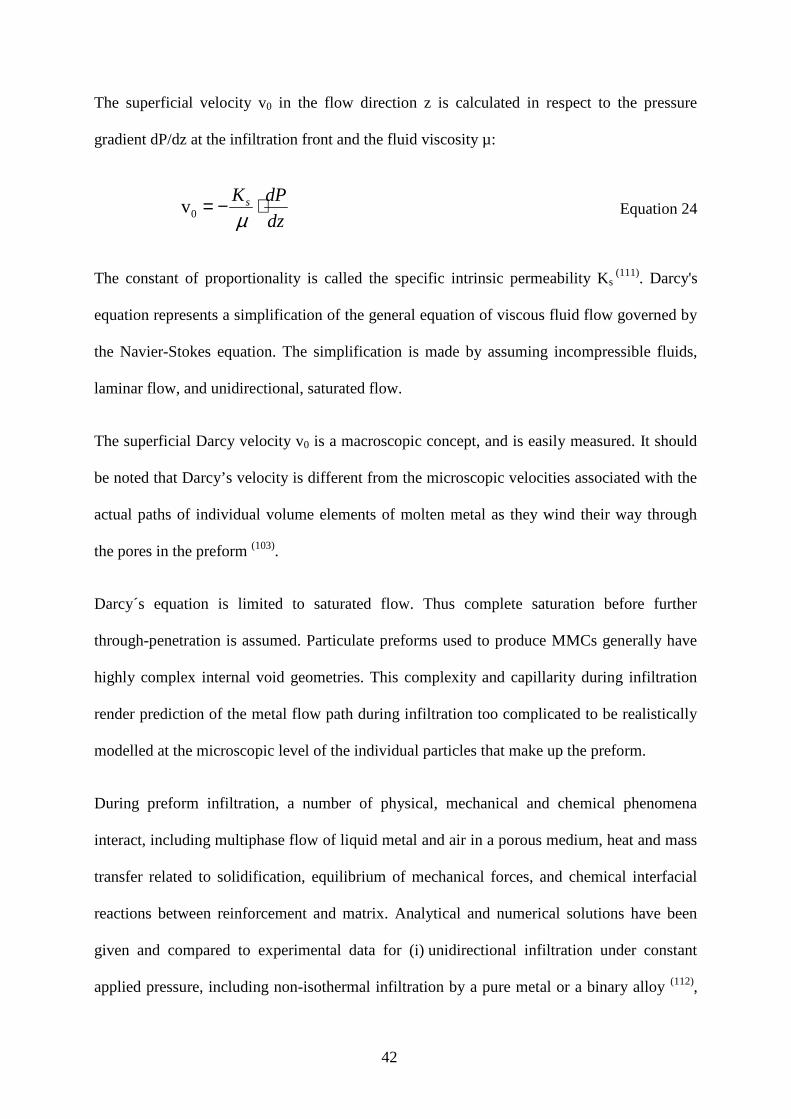
42
The superficial velocity v0 in the flow direction z is calculated in respect to the pressure
gradient dP/dz at the infiltration front and the fluid viscosity µ:
dz
dPKs ⋅−=µ0v Equation 24
The constant of proportionality is called the specific intrinsic permeability Ks (111). Darcy's
equation represents a simplification of the general equation of viscous fluid flow governed by
the Navier-Stokes equation. The simplification is made by assuming incompressible fluids,
laminar flow, and unidirectional, saturated flow.
The superficial Darcy velocity v0 is a macroscopic concept, and is easily measured. It should
be noted that Darcy’s velocity is different from the microscopic velocities associated with the
actual paths of individual volume elements of molten metal as they wind their way through
the pores in the preform (103).
Darcy´s equation is limited to saturated flow. Thus complete saturation before further
through-penetration is assumed. Particulate preforms used to produce MMCs generally have
highly complex internal void geometries. This complexity and capillarity during infiltration
render prediction of the metal flow path during infiltration too complicated to be realistically
modelled at the microscopic level of the individual particles that make up the preform.
During preform infiltration, a number of physical, mechanical and chemical phenomena
interact, including multiphase flow of liquid metal and air in a porous medium, heat and mass
transfer related to solidification, equilibrium of mechanical forces, and chemical interfacial
reactions between reinforcement and matrix. Analytical and numerical solutions have been
given and compared to experimental data for (i) unidirectional infiltration under constant
applied pressure, including non-isothermal infiltration by a pure metal or a binary alloy (112),

43
(ii) for non-isothermal infiltration by a pure metal, taking into account the influence of
preform deformability, and (iii) for isothermal infiltration, taking into account the influence of
capillary phenomena (113). Most models consider only the case of saturated flow, either by
ignoring any capillary pressure drop or using the ‘slug-flow’ assumption, which implies that
the infiltration front is abrupt. It has been shown that when the applied pressure is low or
when the preform pore structure exhibits a broad size distribution, this assumption breaks
down, as metal penetrates the preform in a gradual manner, filling the largest pores first.
This case is relevant for industrial practice, because it is desirable to maintain the applied
pressure as low as possible, to minimize preform damage and to reduce costs. In practical
cases, the applied pressure is not established instantly but follows a more or less rapidly
increasing function before the final infiltration pressure is established.
For most relevant metal/reinforcement systems, isothermal metal infiltration is similar to
drainage in soil mechanics (113). During drainage, wetting water is displaced by non-wetting
air out of a porous soil. In MMC infiltration, air generally constitutes the wetting phase and
metal the non-wetting one. Non-saturated flow through porous media and drainage
phenomena have been treated in the soil mechanics literature (111). Based on soil mechanics,
Dopler et al. (113) developed a model for isothermal infiltration of ceramic fibres based on
capillary phenomena. The relationship between local pressure and non-wetting fluid velocity
is classically described by Darcy’s law (Equation 25). When neglecting gravity it is valid for
laminar flow in a porous medium in the following form:
PKv ∇⋅−=0 Equation 25
where v0 is the superficial velocity of the non-wetting phase, defined as the volumetric flow
rate, P is the pressure and K is the permeability tensor.

44
The permeability K can be expressed as a function of three independent terms:
µrs KK
K⋅= Equation 26
where Ks is the specific preform permeability tensor, Kr is the relative permeability, varying
with saturation between 0 and 1, and µ is the dynamic fluid viscosity. The tensor of specific
permeability describes the geometrical arrangement of the porous medium. The different
components of the tensor depend on the type of preform, its volume fraction, the diameter of
the reinforcement phase, its arrangement and homogeneity. The component values of Ks can
be measured by permeability experiments, using, for example water as a fluid (114).
There is no direct way to measure the relative preform permeability Kr. It is generally back-
calculated from infiltration experiments or from calculations based on simplified porous
preform geometries such as capillary tubes. A general form with two empirical parameters A
and B can be given (113) as:
Br SAK ⋅= Equation 27
with S the saturation of the porous body. The evaluation of modelling results showed best
agreement with A and B both equal to 1. The saturation S is defined as the ratio of filled void
space to initial void space as follows:
c
lSθ
θ−
=1
Equation 28
where θl is the volume fraction of the intruded liquid and θc the volume fraction of the
ceramic phase. The saturation is expressed, in general, in soil mechanics as a function of
pressure. The functional relationship is measured by establishing a drainage curve for the
considered system, which represents the degree of saturation either of the wetting or of the
45
non-wetting fluid, as a function of the applied pressure Pappl. The curves obtained can be fitted
to phenomenological equations, introducing a threshold pressure (P0) which must be
overcome to initiate infiltration, and a shape parameter α (115,113):
20
2 )(1
11
PPS
appl −⋅+−=
α Equation 29
This equation is valid for Pappl>P0. The curve shape described by the shape parameter value
varies with the pore size distribution, the size and type of reinforcement and with the wetting
behaviour of the matrix on the reinforcement. Dopler et al. (113) proposed an equation for
modelling the infiltration behaviour of Saffil™ fibre preforms:
0)1( =
∇⋅⋅∇−
∂∂⋅⋅− P
KK
t
p
dp
dS rsf µ
θ Equation 30
In most metal melt / ceramic preform systems, only the volume fraction θf and the dynamic
viscosity µ are known. Thus the following terms need to be determined experimentally:
1. the drainage curve S(p) using the parameter P0 and α
2. the relative permeability Kr.
3. the specific permeability tensor Ks.
Dopler et al. (113) investigated fibre preform infiltration using constant pressure both
experimentally and by the aforementioned model. The system parameters 1 to 3 were
determined and the function P(x,t) could be found by solving the non-linear partial differential
equation (Equation 30) with given initial and boundary conditions. The results of the two-
dimensional numerical analysis were in good agreement with the experiments, both in terms
of infiltration kinetics and porosity distribution.
46
2.4. Preform fabrication
Composites of aluminium and its alloys with Al2O3 have the advantage of complete
thermodynamic compatibility and exhibit no solubility of one phase in the other which may
result in strong interfacial bonding (64). As a result, most of the published work on oxide
ceramic preforms used for MMC fabrication is based on alumina. Mainly fibres, like Saffil™
and others, were infiltrated with aluminium melts. Due to the multiple processing steps of
fibre fabrication, the preforms made of chopped fibres are 30 to 50 times more expensive than
particulate preforms.
2.4.1. Fibre preforms
The fibre material contains usually about 3- 4 wt.% silica which serves to stabilize a fine grain
structure with grain sizes of around 50 nm and to inhibit coarsening of the crystallites (116).
This silica is dispersed throughout the fibre section, but also tends to become slightly
concentrated at grain boundaries and free surfaces. On excessive heating, small crystallites of
mullite (3Al2O3·2SiO2) may appear.
For preform fabrication, the bulk fibre material is dispersed in a fluid, usually water,
containing an inorganic binder of the silicate type and an organic binder (e.g. starch). After
thorough mixing the fibres are allowed to settle and excess water is decanted (117). Vacuum
forming over a fine mesh followed by the application of pressure results in the required
preform density. The resulting green body is dried and fired at a temperature ranging from
800 to 1000°C. The amount of fibres in typical preforms is limited to a volume fraction of
0.08 to 0.30. At the lower level it is difficult to produce a coherent structure, whilst above
0.30 excessive fibre cracking may results in a significant reduction in aspect ratio and thus in
reinforcing properties.

47
Figure 2.13 shows an Al-Saffil™ MMC with a surface layer (S) of the binder on the Saffil™
fibre (F). The mechanical properties of the final preform depend upon the volume fraction of
fibres and the amount of inorganic binder used. Binder levels vary between 1 and 10% by
weight. The higher the binder contents the stiffer the final preform (118). In contrast, a high
binder content is detrimental to MMC properties. With increased binder content, the preform
exhibits brittle behaviour which is not favourable during infiltration. Furthermore, in the
MMC, excessive binder-metal reactions led to brittle phases (119).
M
F
P
S
Figure 2.13 SEM microstructure of Saffil™ fibre MMC: pure Al matrix (M), fibres (F) , porosity (P) and silicate binder (S) surrounding the fibres (113).
The fibres in the preforms have an average diameter below 10 µm and a length of 200-
500 µm (30,119). Due to the processing of the fibres, which is in general based on a sol-gel
process, large particles in the range of 200-800 µm with low aspect ratio are present in the
bulk material. The amount of the large ceramic particles, the so-called shot content,
determines the quality of the final MMC. The lower the shot content, the higher the MMC
quality and reliability. Large shot concentrations in loaded MMCs result in significant
lowering of the fatigue properties due to crack initiation on the surface of the particles (120).
Thus low shot contents should be the intent. Starting from an initial shot weight content of
4 %. An intensive washing procedure can lead to a reduction to less than 0.01 % (119).
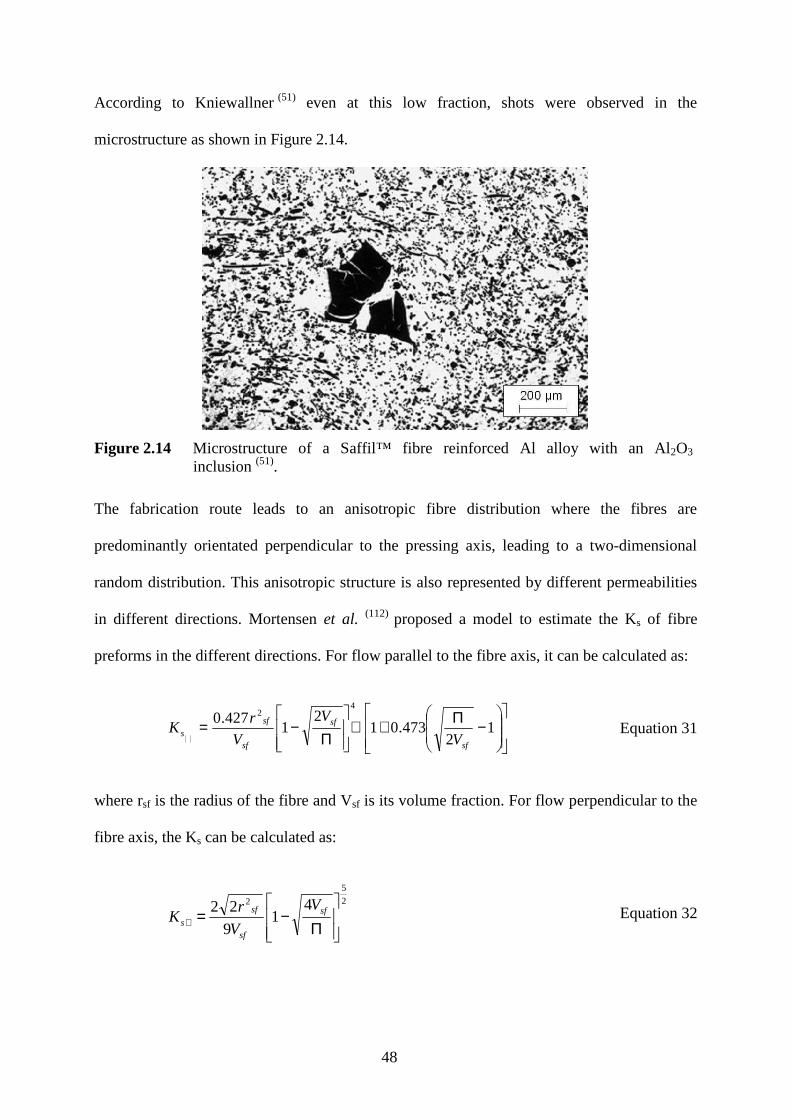
48
According to Kniewallner (51) even at this low fraction, shots were observed in the
microstructure as shown in Figure 2.14.
Figure 2.14 Microstructure of a Saffil™ fibre reinforced Al alloy with an Al2O3
inclusion (51).
The fabrication route leads to an anisotropic fibre distribution where the fibres are
predominantly orientated perpendicular to the pressing axis, leading to a two-dimensional
random distribution. This anisotropic structure is also represented by different permeabilities
in different directions. Mortensen et al. (112) proposed a model to estimate the Ks of fibre
preforms in the different directions. For flow parallel to the fibre axis, it can be calculated as:
−Π+⋅
Π−= 1
2473.01
21
427.04
2
sf
sf
sf
sf
s V
V
V
rK Equation 31
where rsf is the radius of the fibre and Vsf is its volume fraction. For flow perpendicular to the
fibre axis, the Ks can be calculated as:
2
5
2 41
9
22
Π−=⊥
sf
sf
sf
s
V
V
rK Equation 32
49
Apart from permeability, the specific surface area of a preform plays an important role in
preform infiltration. As reported by Mortensen (121),Si of Saffil™ fibre preforms, which is the
area (m²) per unit volume of porosity (m³) in the preform, is given by:
sfi VS ⋅+= 22217977800 Equation 33
In a later publication of the same author (122), the estimated value of Si was four times higher
than that obtained by using Equation 33. The differences in Si were not further discussed.
2.4.2. Sintered particle compacts
One of the most common ways to fabricate MMCs is to press ceramic particles into a cavity
and infiltrate the packed bed with a molten metal. Due to the simplicity, several research
groups have concentrated on this method (103). If the particles are assumed to have a spherical
shape with an average diameter D, Si of the packed particles is calculated as:
)1(
6
p
pi VD
VS
−=
λ Equation 34
where Vp is the particle volume fraction and λ is a geometrical factor introduced to describe
deviations from sphericity, but also takes account of surface roughness and of the actual
particle size distribution. As no binder is added, removal of the pressed compact out from the
pressing cavity can result in breakage. Thus preforms fabricated using this route are not
consistent. To achieve consistent ceramic preforms which exhibit sufficient strength to
withstand the subsequent infiltration step, the particles have to be sintered. This allows the
total porosity to be influenced to some extent by changing the powder compaction and
sintering temperature, although it is very difficult to achieve porosities above 50%. It is
possible to alter the metal ligament diameter to some small extent by changing the size of the
particles (52, 68). With this simple fabrication route it is not possible to influence the pore
structure independent of the ceramic microstructure.
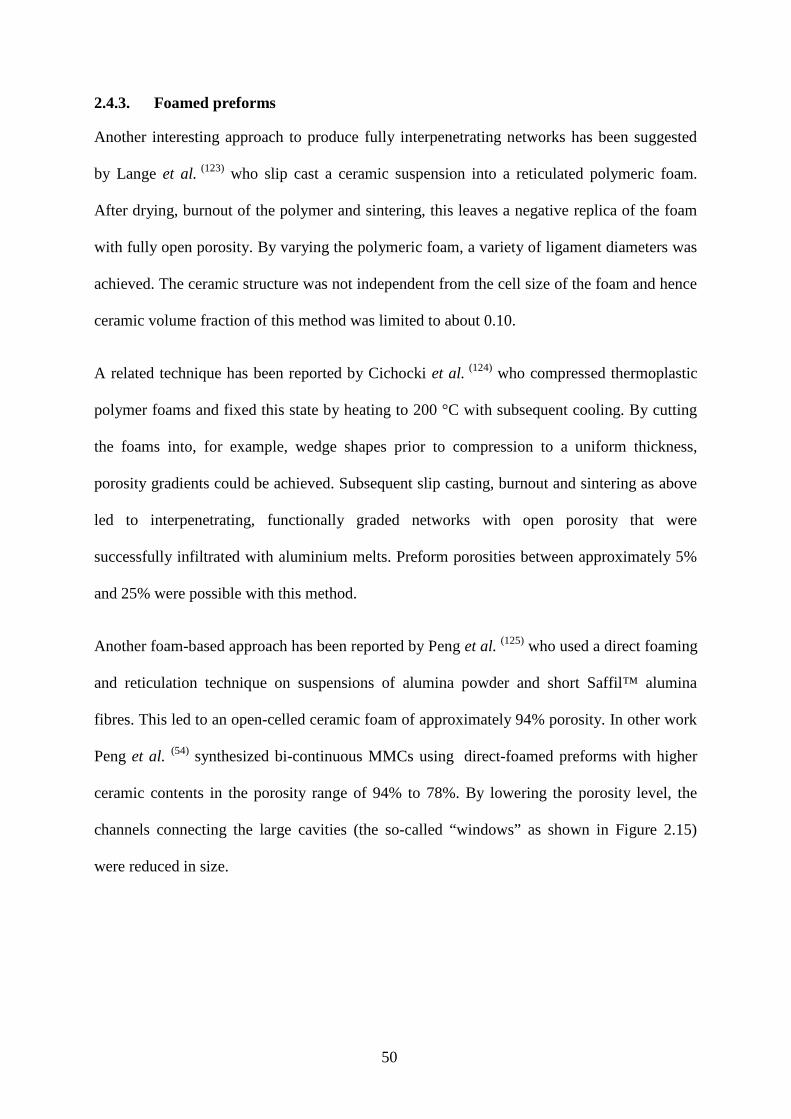
50
2.4.3. Foamed preforms
Another interesting approach to produce fully interpenetrating networks has been suggested
by Lange et al. (123) who slip cast a ceramic suspension into a reticulated polymeric foam.
Af ter drying, burnout of the polymer and sintering, this leaves a negative replica of the foam
with fully open porosity. By varying the polymeric foam, a variety of ligament diameters was
achieved. The ceramic structure was not independent from the cell size of the foam and hence
ceramic volume fraction of this method was limited to about 0.10.
A related technique has been reported by Cichocki et al. (124) who compressed thermoplastic
polymer foams and fixed this state by heating to 200 °C with subsequent cooling. By cutting
the foams into, for example, wedge shapes prior to compression to a uniform thickness,
porosity gradients could be achieved. Subsequent slip casting, burnout and sintering as above
led to interpenetrating, functionally graded networks with open porosity that were
successfully infiltrated with aluminium melts. Preform porosities between approximately 5%
and 25% were possible with this method.
Another foam-based approach has been reported by Peng et al. (125) who used a direct foaming
and reticulation technique on suspensions of alumina powder and short Saffil™ alumina
fibres. This led to an open-celled ceramic foam of approximately 94% porosity. In other work
Peng et al. (54) synthesized bi-continuous MMCs using direct-foamed preforms with higher
ceramic contents in the porosity range of 94% to 78%. By lowering the porosity level, the
channels connecting the large cavities (the so-called “windows” as shown in Figure 2.15)
were reduced in size.
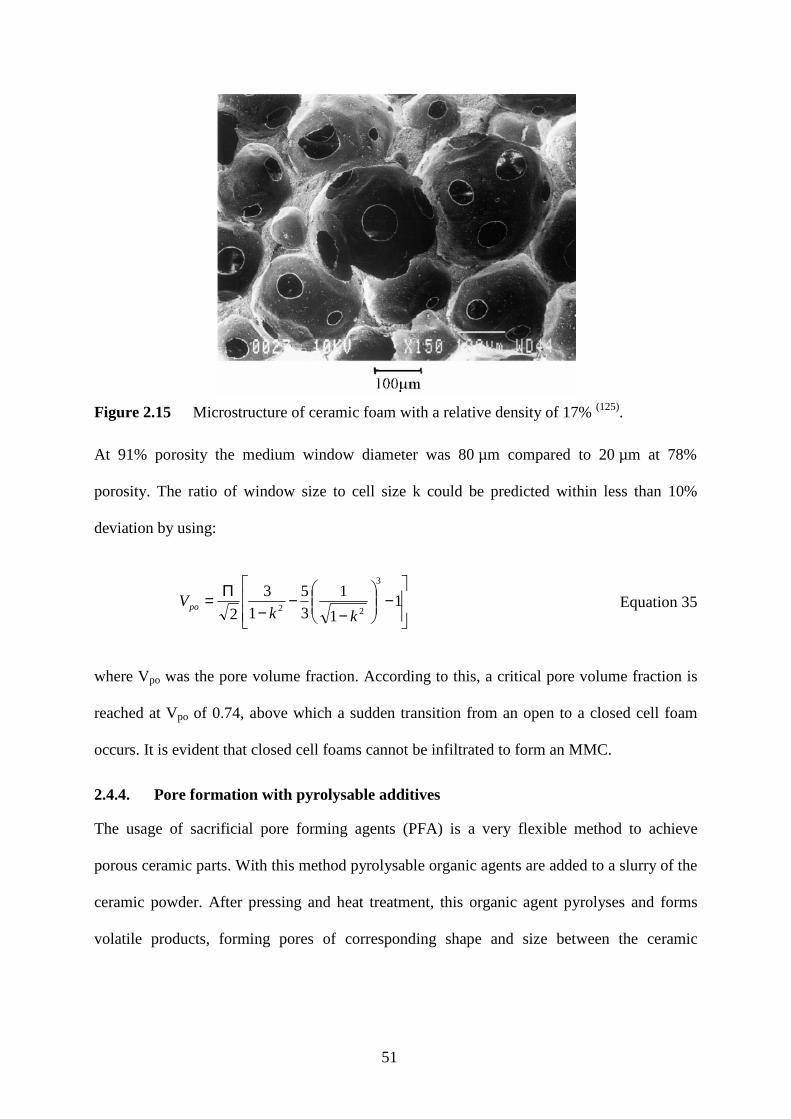
51
Figure 2.15 Microstructure of ceramic foam with a relative density of 17% (125).
At 91% porosity the medium window diameter was 80 µm compared to 20 µm at 78%
porosity. The ratio of window size to cell size k could be predicted within less than 10%
deviation by using:
−
−−
−Π= 1
1
135
13
2
3
22kk
Vpo Equation 35
where Vpo was the pore volume fraction. According to this, a critical pore volume fraction is
reached at Vpo of 0.74, above which a sudden transition from an open to a closed cell foam
occurs. It is evident that closed cell foams cannot be infiltrated to form an MMC.
2.4.4. Pore formation with pyrolysable additives
The usage of sacrificial pore forming agents (PFA) is a very flexible method to achieve
porous ceramic parts. With this method pyrolysable organic agents are added to a slurry of the
ceramic powder. After pressing and heat treatment, this organic agent pyrolyses and forms
volatile products, forming pores of corresponding shape and size between the ceramic
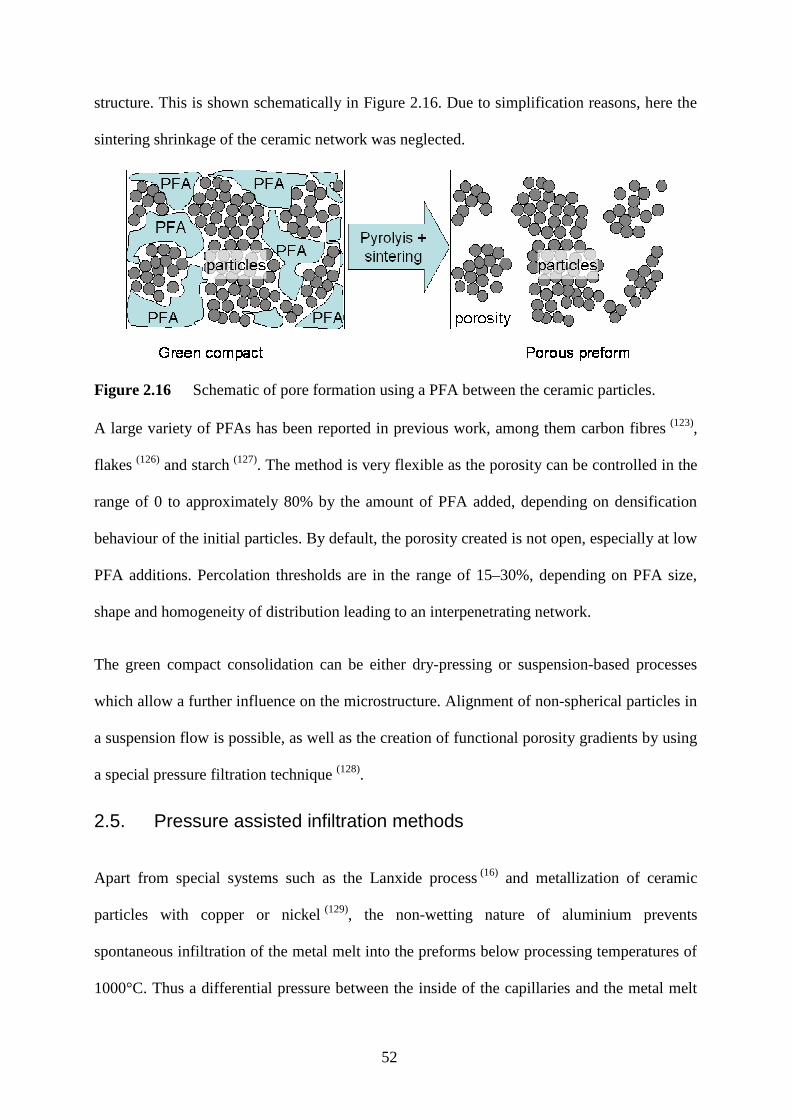
52
structure. This is shown schematically in Figure 2.16. Due to simplification reasons, here the
sintering shrinkage of the ceramic network was neglected.
Figure 2.16 Schematic of pore formation using a PFA between the ceramic particles.
A large variety of PFAs has been reported in previous work, among them carbon fibres (123),
flakes (126) and starch (127). The method is very flexible as the porosity can be controlled in the
range of 0 to approximately 80% by the amount of PFA added, depending on densification
behaviour of the initial particles. By default, the porosity created is not open, especially at low
PFA additions. Percolation thresholds are in the range of 15–30%, depending on PFA size,
shape and homogeneity of distribution leading to an interpenetrating network.
The green compact consolidation can be either dry-pressing or suspension-based processes
which allow a further influence on the microstructure. Alignment of non-spherical particles in
a suspension flow is possible, as well as the creation of functional porosity gradients by using
a special pressure filtration technique (128).
2.5. Pressure assisted infiltration methods
Apart from special systems such as the Lanxide process (16) and metallization of ceramic
particles with copper or nickel (129), the non-wetting nature of aluminium prevents
spontaneous infiltration of the metal melt into the preforms below processing temperatures of
1000°C. Thus a differential pressure between the inside of the capillaries and the metal melt
53
has to be applied. In general, infiltration methods are subdivided into the two methods of
liquid transport: the constant pressure (CP) and the constant flux (CF) methods. The former is
widely used in gas pressure infiltration of particulate compacts and is the single method
published to determine dynamic wetting angles, as reviewed by Garcia-Cordovilla et al. (103).
The infiltration times vary in the range from 30 seconds to several minutes. In the CF
infiltration mode, experimentally performed using direct squeeze casting and high pressure
die casting set-ups, the molten metal is forced into the ceramic network within relatively short
times of less than 10 seconds (130).
In all published infiltration experiments, the preforms were preheated to temperatures up to
1000°C. Nagata and Matsuda (131) suggested a critical minimum preheating temperature (Tpct)
which is independent of size, morphology of the reinforcement and melt temperature and
pressure (Equation 36).
pfff
MMmpct cV
HTT
⋅⋅⋅⋅−=
ρρ233.0
Equation 36
The influencing factors are those of the melt (liquidus temperature TM, melt density ρM and
heat of fusion of the melt HM) as well those of the fibre preform (volume fraction Vf, ρf and
its specific heat capacity cpf).
The critical preheating temperature is important in CF infiltration, where the temperature is
usually below the liquidus temperature of the infiltration alloy which is a result of the
handling of the preform and the infiltration temperatures. In contrast, in gas pressure
infiltration, the preform is heated at the same time in the same cavity as the melt, thus the
temperature of the porous media is normally the same temperature as the melt.
54
2.5.1. Gas pressure infiltration (GPI)
For continuous fibre preforms, GPI is the predominant way to produce MMCs. This is mainly
attributed to the possibility of using low pressurization rates which are necessary to prevent
fibre breakage and destruction of the preforms (103). The process is performed in an autoclave
within which the alloy and the preform is placed. To prevent gas inclusion in the preform, it
has to be evacuated prior to infiltration. The alloy and usually the preform are heated up
subsequently. After melting of the alloy, the autoclave is pressurized using an inert gas like Ar
or He up to a maximum pressure, P, of 15 MPa (132). This is the upper threshold for safety
reasons. When P reaches P0, the melt starts to infiltrate the preform. Garcia-Cordovilla et al.
(103) used a unidirectional setup to infiltrate particulate compacts which were enclosed in
tubes. The experiments were performed using relatively long contact times of the order of
minutes. In reactive systems, this period exceeds the incubation time which is in general
necessary to initiate thermodynamically preferred reactions. The reaction products sometimes
block the preform entrance, preventing further infiltration (133). To ensure that the cavities
remain saturated with metal during solidification, the shrinkage has to be directed toward the
unreinforced region. Therefore infiltration experiments were carried out using a chill in the
furnace to impose directional solidification (132,134).
Knechtel et al. (68) infiltrated Al2O3 particle beds with pure Al using 15 MPa gas pressure and
high processing temperatures of 1110°C. The fracture surface of the resulting Al2O3-Al
composites exhibited a transgranular fracture of Al2O3 and no debonding of the metal phase.
Even though the processing was done under extreme conditions, the interfacial reaction layer
was only a few monolayers thick. Apart from Al-Al2O3 systems, a few carbide systems were
also investigated (103), but no other Al-oxide ceramic systems were investigated in the
pertinent literature.
55
2.5.2. Squeeze casting infiltration
In a review of squeeze casting, Ghomashchi and Vikhrov (135) showed that the process
involves three essential steps. A specified amount of molten metal is poured into a die, the die
is closed and the liquid metal is pressurized as quickly as possible to prevent premature
solidification. Afterwards, the pressure is held on the metal until solidification is completed.
The application of pressure during solidification has an influence on the solidification
behaviour and the resulting microstructure. In accordance to the Clausius-Clapeyron equation,
the high metallostatic pressure, which can rise up to 200 MPa, leads to an increase in the
melting point of the metal (136). Further, as proposed by Epanchistov (137), the eutectic point in
the aluminium-silicon system moves to higher silicon contents.
Depending on the gating system, squeeze casting is divided into direct and indirect squeeze
casting. In the direct mode, there is no gating system at all. The metal melt is poured directly
into the die cavity, which is subsequently closed and pressurized (6,135,138). In the direct mode,
just simple geometries without undercuts are realizable. In contrast, in indirect squeeze
casting, the die is filled and pressurized through a gating system. The filling velocities in
direct and indirect mode are below the threshold of turbulent flow, preventing entrapment of
oxide films in film-forming liquid metals (6).
The pressure provides close contact of the melt with the die material, resulting in large heat
transfer to the colder die. The fast cooling rate and solidification are reflected in fine-grained
structures with a low secondary dendrite arm spacing (139). Furthermore, the pressure
application reduces gas porosity size and compensates feeding defects, thus reducing voids in
the microstructure.
Cappleman et al. (116) were the first to publish work about squeeze cast infiltration of Saffil™
fibre preforms with Al alloys. The work was concerned with the fibre/matrix interface of

56
MMCs infiltrated with an Al-9Mg or Al-11Si (wt-%). They did not observe any intermediate
phase between the fibres and the matrix, although a Mg-enriched layer about 0.17 nm thick
could be detected in the case of the AlMg alloy. The enrichment of elemental Si on the
surface of the fibre in the composite infiltrated with an AlSi alloy was probably a result of
silicon precipitates nucleating preferentially on the fibre surface. They concluded that there is
no chemical reaction in the composites due to the rapid cooling of the melt when using the
squeeze casting infiltration process and therefore bonding between matrix and reinforcement
is only the result of intimate physical contact. In contrast, observations of Levi et al. (140)
showed that there was massive formation of spinel MgAl2O4 on Al2O3 fibres which were
immersed in a Al-3Mg alloy (wt-%) for several minutes.
Another interesting aspect of the fast infiltration process is the suppression of Al2O3 formation
on the Al melt surface. As the melt have an extraordinarily high affinity for oxygen, a thin
oxide layer would be continually reforming at the infiltration front, as shown schematically in
Figure 2.17. When assuming an outlet in front of the infiltration front which is connected to
the atmosphere, the calculations by Cappleman et al. (116) showed that a monolayer oxide
formation can keep pace with rapid infiltration up to a velocity of 10-2 to 10-1 m/s.
Figure 2.17 Schematic of oxide layer formation at the infiltration front in fibre (f) preform
infiltration (116).
oxidelayer
melt fibre
v
air
oxidelayer
melt fibre
v
air
oxidelayer
melt fibre
v
air
57
On the other hand, if the outlet of the preform is closed or the preform is enveloped within the
melt pool prior to infiltration, the entrapped air determines whether an oxide film between the
matrix alloy and reinforcement is formed or not. Depending on the specific surface area of the
reinforcing phase, the calculations showed that, in preforms composed of more than about
50% by volume of fibres, oxide monolayers cannot be formed on all fibre surfaces.
2.5.3. High pressure die casting infiltration
The main benefit of high pressure die casting (HPDC) is to obtain components with accurate
near net-shape geometry due to the use of a high precision metal die. HPDC was found to
have excellent performance with regard to control of casting dimensions, making it the most
accurate casting method for light metal components (141). The filling pressures in HPDC
machines are high and commonly operate at metallic pressures of up to 100 MPa. Such
pressures will force the liquid into radii of only 10-8 m which is approaching atomic
dimensions (6). In the standard HPDC process, the high pressures are thus not needed to fill
the cavity but to reduce the volume of the entrapped air. The air originates from turbulent
filling of the die. In casting of film-forming metals, the turbulent filling process leads to
formation of double oxide films (6). These films decrease the mechanical properties, as they
act as cracks inside the castings. A parameter to evaluate the turbulence is represented by the
dimensionless Weber number We:
γrρV
We2
= Equation 37
where V is the velocity of the liquid, ρ is the density of the liquid, r is the radius of the section
thickness the liquid has to pass and γ is the surface tension of the liquid. As reported by
Campbell (6), if We ranges between 0.2 and 0.8, flow conditions free from surface turbulence
might be assumed. If the Weber number reaches 100, surface turbulence can form double
58
layer oxide films. The Weber number in high pressure die castings can rise up to 100,000
which means that conditions are closer to atomisation than to fluid flow (6).
Fine grain microstructures of HPDC components result from rapid solidification. Nevertheless
the material generally gives moderate strength and poor deformability. This is attributed to the
large amount of internal defects (142) and the presence of iron in HPDC alloys. Iron is added to
commercial HPDC alloys to prevent sticking of the metal to the uncoated die and results
therefore in increased die life (143). Iron is detrimental to material properties (144) as it forms an
increased amount of iron-rich intermetallics of the AlxFey or the AlxFeySiz(Mn) (145) type
which provoke crack initiation.
Even though HPDC is widely used for large scale manufacturing of light metal components, it
has not been used extensively for preform infiltration. The main reason is probably the lack of
suitable preforms which endure the high dynamic pressure. The plunger velocities in standard
HPDC are in the range of 1 to 5 m/s. Due to low ratios of gate area to plunger area, gate
velocities are as high as 50 m/s. The dynamic pressure often leads to intensive deformation
and cracking of the reinforcement. A measure of this deformation behaviour is the
compression which is defined as the ratio of the MMC volume after infiltration to the initial
overall preform volume, comprised of reinforcing phase plus porosity. The compression in the
published HPDC infiltration experiments reaches 30% (50,51). In compressed areas, the local
volume fraction of reinforcing phase is increased by the factor of compression.
Michaud et al. (122) investigated the preform compression behaviour when infiltrating fibre
preforms with pure Al. Fluid flow starts only above the threshold pressure P0, which leads to
compressive strain in the preform which is usually purely elastic. Assuming no premature
solidification after full infiltration of the preform, complete relaxation is possible leaving no
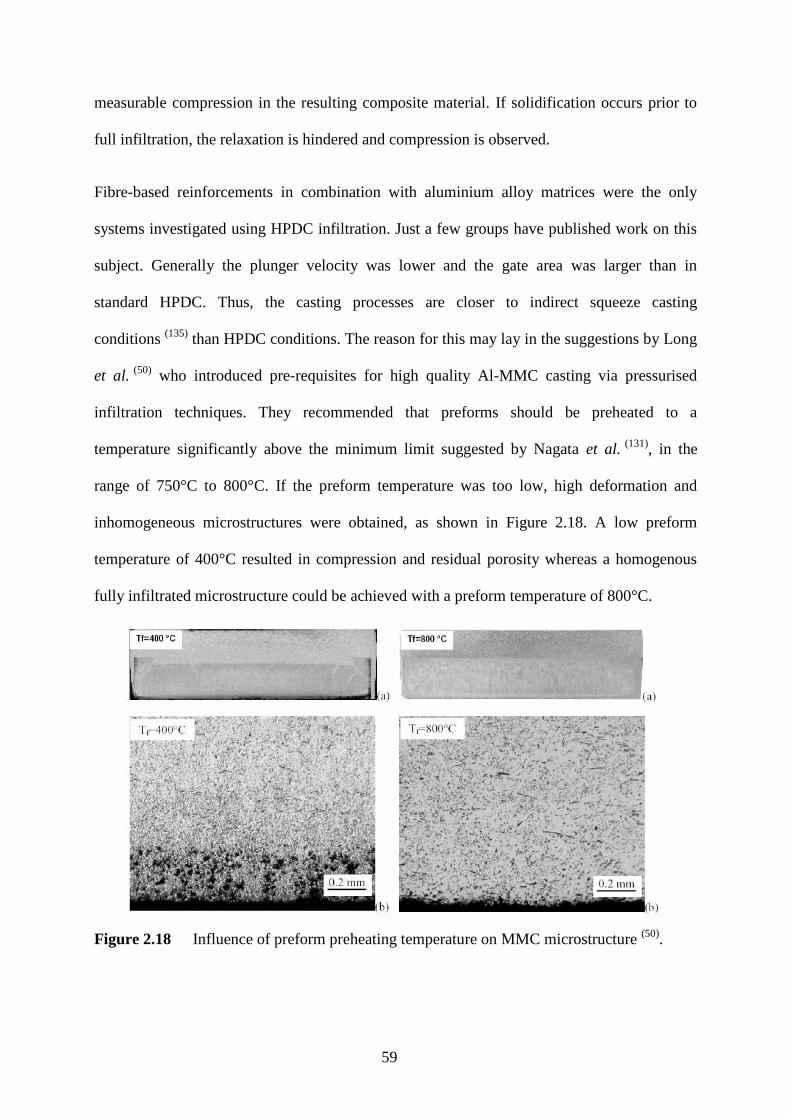
59
measurable compression in the resulting composite material. If solidification occurs prior to
full infiltration, the relaxation is hindered and compression is observed.
Fibre-based reinforcements in combination with aluminium alloy matrices were the only
systems investigated using HPDC infiltration. Just a few groups have published work on this
subject. Generally the plunger velocity was lower and the gate area was larger than in
standard HPDC. Thus, the casting processes are closer to indirect squeeze casting
conditions (135) than HPDC conditions. The reason for this may lay in the suggestions by Long
et al. (50) who introduced pre-requisites for high quality Al-MMC casting via pressurised
infiltration techniques. They recommended that preforms should be preheated to a
temperature significantly above the minimum limit suggested by Nagata et al. (131), in the
range of 750°C to 800°C. If the preform temperature was too low, high deformation and
inhomogeneous microstructures were obtained, as shown in Figure 2.18. A low preform
temperature of 400°C resulted in compression and residual porosity whereas a homogenous
fully infiltrated microstructure could be achieved with a preform temperature of 800°C.
Figure 2.18 Influence of preform preheating temperature on MMC microstructure (50).
60
Long et al. (50) suggested that v0 should be below 0.1 m/s to prevent crushing of the preform.
Another requirement to attain homogeneity in the MMC is a large cross-sectional area of the
gate to ensure feeding of the MMC to prevent solidification shrinkage.
Rasmussen et al. (146) infiltrated Al2O3 preforms with Al-Si and Al-Mg alloys using HPDC. In
contrast to Cappleman et al. (116) who could infiltrate Al2O3 fibre preforms without any visible
reactions, the infiltration with an AlMg alloy was unsuccessful due to reactions and blocking
of the capillary entrances. Due to the configuration used in the experiment, where the melt
was in extended contact with the reinforcement prior to infiltration, this behaviour may be a
result of extensive melt-matrix reactions and thus might not be a result of the HPDC
infiltration process itself.
Kang et al. (117) infiltrated fibre preforms using a broad range of plunger velocities from
0.1 m/s to 3.6 m/s. A velocity of 0.6 m/s was considered to be the optimum in terms of MMC
homogeneity. At higher velocities, massive preform deformation and cracking occurred,
making the MMC useless.
61
2.6. Aims and Objectives
Particulate preforms as a basis for preform MMCs are promising due to their advantages
regarding cost, availability and knowledge of processing routes. Nevertheless, few papers
have been published on infiltration of Al alloy melts into Al2O3 and TiO2 and none into MgO
preforms. The ceramic volume fraction range between the upper limit of chopped Al2O3 fibres
(0.25) and the lower limit of metal toughened ceramics (0.60) has not been investigated, yet it
is suggested MMCs within this range might offer improved tribological and mechanical
properties. This study is aimed at investigating the properties of MMCs with a ceramic
volume fraction between 0.30 and 0.40 in order to get sufficient strengthening and keep the
ductility as high as possible.
As it was found that there is a lack of knowledge of the influencing factors on preform
infiltration, the study of the preform infiltration behaviour was a further objective of the
present study. As reported, the infiltration process is subdivided into two steps: initiation of
the flow into the capillaries, characterised by the wetting behaviour, and further flow to fill
the pores. Below process temperatures of 1000°C, fully non-wetting conditions (θ = 180°)
were proposed for most Al-ceramic systems (53,114). A question of current interest is whether
reactions influence the infiltration performance. The data found in the literature for different
reactive melt-ceramic systems, either in static or dynamic wetting experiments, indicated that
reactions do not improve the infiltration process. Even though for further pore filling
commonly the slug-flow assumption was proposed, in recent publications some
inconsistencies of this model could be better explained using the Richards model, originating
from soil sciences, which assumes unsaturated flow. Both reactive wetting and further filling
of the preform are of interest and to be investigated in the constant pressure and the constant
flux modes.

62
3. EXPERIMENTAL PROCEDURE
The influence of reactivity between the metal melt and the ceramic reinforcement on
infiltration behaviour was investigated. Thermodynamic calculations were undertaken to
determine the equilibrium standard free energies of different aluminium alloy-oxide ceramic
systems. From this analysis, promising systems were chosen for experimental investigation of
static and dynamic wetting. The contact angles were determined using sessile drop
experiments, whereas the dynamic contact angles and the fluid flow behaviour were evaluated
during infiltration of the porous preforms with the selected aluminium alloys. The procedure
of preform preparation and characterisation and their infiltration using gas pressure (GP),
direct squeeze casting (DSQC) and high pressure die casting processes (HPDC) are presented.
The resulting MMC materials were characterised using non-destructive X-ray methods as well
as destructive metallographic methods. The Young’s modulus, strength and fracture
toughness of the MMCs and their tribological behaviour were measured. Details of these
experimental methods are given in this chapter.
3.1. Thermodynamic calculations
The standard free energies of formation for different liquid aluminium alloy-oxide ceramic
systems were calculated using the commercial thermodynamic modelling software
FACTSAGE of GTT Technologies in Herzogenrath, Germany. The calculations were
performed using the module 'Equilib' which is based on minimizing the Gibbs energy G by
the method of complex system-equilibria as introduced by Eriksson and Hack (147) and given
by the relation:
∑ == minµνG ii Equation 38
63
where νi is the stoichiometric coefficient and µi the chemical potential of a given system.
Chemical equilibrium calculations can be made for a system which has been uniquely defined
with respect to temperature, pressure and composition. The FACT database was used to
provide data for the calculations. The software was used to calculate the concentrations of
chemical species when specified elements or compounds react or partially react to reach a
state of chemical equilibrium.
3.2. Contact angle
3.2.1. Sessile drop substrates
To obtain dense substrates, fine grained powders of different oxide ceramics were used. The
properties of the initial Al2O3, TiO2, MgO powders, the sintering conditions and the
theoretical densities of the fully dense material are listed in Table 3.1. To ensure full
dispersion and de-agglomeration, the powders were milled with water using a Fritsch
Pulverisette ball mill with 12 mm diameter balls for 5 min. The container and the balls were
made of ZrO2. Subsequently 2 wt.% of the binder Mowiol 8-88, a partially hydrolysed
polyvinyl alcohol, was added to enable uniaxial pressing of the final powders. Then the slurry
was poured into aluminium alloy dishes and placed in a freezer adjusted to -24°C and stored
there for 24 h. The dishes were placed in a Christ Alpha 1-4 freeze-drying unit and the slurry
dried at 256 Pa for a minimum of 8 h. The dried powders were then passed through a 250 µm
mesh sieve to produce a granulated powder. To make the powder pressable, the binder was
activated with 2 wt.% of water dispersed into the powder. This was performed by spreading
20g of powder on a sheet of A4-size paper and atomising water above this bed until the mass
of the bed increased by the required value. It then was stored for 24 h and subsequently
pressed uniaxially to a pressure of 100 MPa to produce green compacts with a diameter of
30 mm and a height of 4 mm. The organic agents in the green compacts were pyrolysed with a
low heating rate of 20°C/h up to 500°C and subsequently heated at a rate of 300°C/h to be
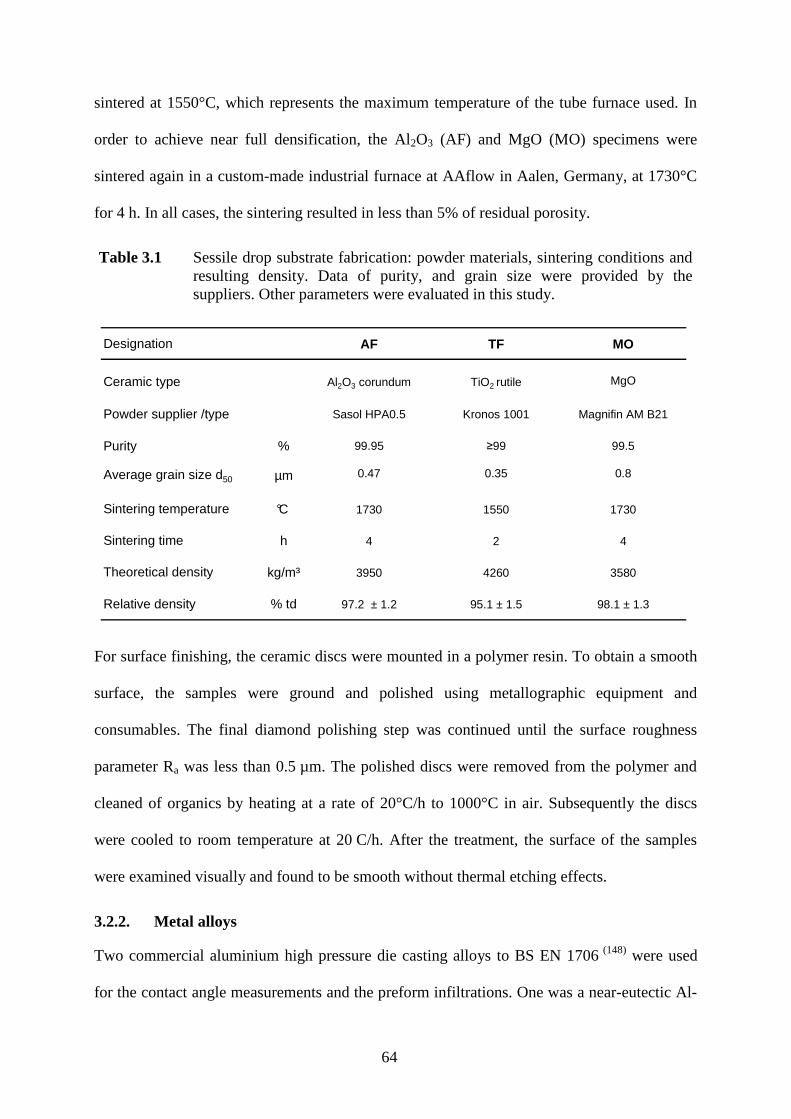
64
sintered at 1550°C, which represents the maximum temperature of the tube furnace used. In
order to achieve near full densification, the Al2O3 (AF) and MgO (MO) specimens were
sintered again in a custom-made industrial furnace at AAflow in Aalen, Germany, at 1730°C
for 4 h. In all cases, the sintering resulted in less than 5% of residual porosity.
Table 3.1 Sessile drop substrate fabrication: powder materials, sintering conditions and resulting density. Data of purity, and grain size were provided by the suppliers. Other parameters were evaluated in this study.
Designation AF TF MO
Ceramic type Al2O3 corundum TiO2 rutile MgO
Powder supplier /type Sasol HPA0.5 Kronos 1001 Magnifin AM B21
Purity % 99.95 ≥99 99.5
Average grain size d50 µm 0.47 0.35 0.8
Sintering temperature °C 1730 1550 1730
Sintering time h 4 2 4
Theoretical density kg/m³ 3950 4260 3580
Relative density % td 97.2 ± 1.2 95.1 ± 1.5 98.1 ± 1.3
For surface finishing, the ceramic discs were mounted in a polymer resin. To obtain a smooth
surface, the samples were ground and polished using metallographic equipment and
consumables. The final diamond polishing step was continued until the surface roughness
parameter Ra was less than 0.5 µm. The polished discs were removed from the polymer and
cleaned of organics by heating at a rate of 20°C/h to 1000°C in air. Subsequently the discs
were cooled to room temperature at 20 C/h. After the treatment, the surface of the samples
were examined visually and found to be smooth without thermal etching effects.
3.2.2. Metal alloys
Two commercial aluminium high pressure die casting alloys to BS EN 1706 (148) were used
for the contact angle measurements and the preform infiltrations. One was a near-eutectic Al-
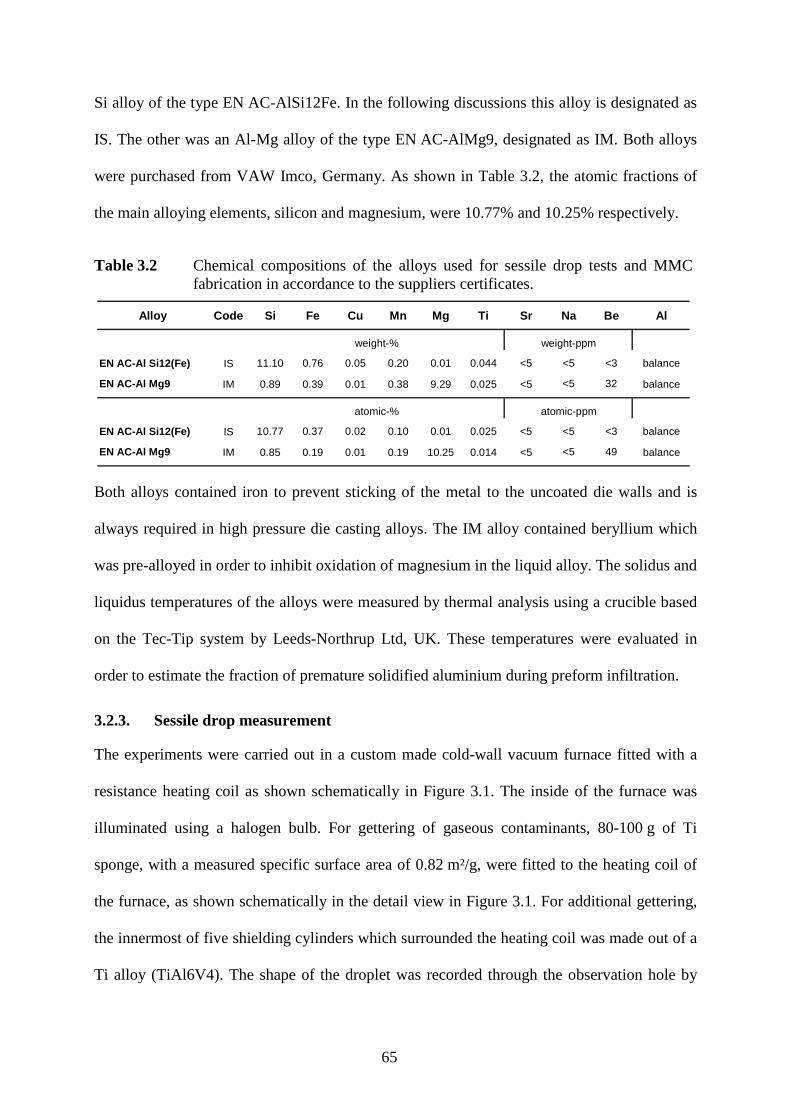
65
Si alloy of the type EN AC-AlSi12Fe. In the following discussions this alloy is designated as
IS. The other was an Al-Mg alloy of the type EN AC-AlMg9, designated as IM. Both alloys
were purchased from VAW Imco, Germany. As shown in Table 3.2, the atomic fractions of
the main alloying elements, silicon and magnesium, were 10.77% and 10.25% respectively.
Table 3.2 Chemical compositions of the alloys used for sessile drop tests and MMC fabrication in accordance to the suppliers certificates.
Alloy Code Si Fe Cu Mn Mg Ti Sr Na Be Al
EN AC-Al Si12(Fe) IS 11.10 0.76 0.05 0.20 0.01 0.044 <5 <5 <3 balance
EN AC-Al Mg9 IM 0.89 0.39 0.01 0.38 9.29 0.025 <5 <5 32 balance
EN AC-Al Si12(Fe) IS 10.77 0.37 0.02 0.10 0.01 0.025 <5 <5 <3 balance
EN AC-Al Mg9 IM 0.85 0.19 0.01 0.19 10.25 0.014 <5 <5 49 balance
weight-%
atomic-%
weight-ppm
atomic-ppm
Both alloys contained iron to prevent sticking of the metal to the uncoated die walls and is
always required in high pressure die casting alloys. The IM alloy contained beryllium which
was pre-alloyed in order to inhibit oxidation of magnesium in the liquid alloy. The solidus and
liquidus temperatures of the alloys were measured by thermal analysis using a crucible based
on the Tec-Tip system by Leeds-Northrup Ltd, UK. These temperatures were evaluated in
order to estimate the fraction of premature solidified aluminium during preform infiltration.
3.2.3. Sessile drop measurement
The experiments were carried out in a custom made cold-wall vacuum furnace fitted with a
resistance heating coil as shown schematically in Figure 3.1. The inside of the furnace was
illuminated using a halogen bulb. For gettering of gaseous contaminants, 80-100 g of Ti
sponge, with a measured specific surface area of 0.82 m²/g, were fitted to the heating coil of
the furnace, as shown schematically in the detail view in Figure 3.1. For additional gettering,
the innermost of five shielding cylinders which surrounded the heating coil was made out of a
Ti alloy (TiAl6V4). The shape of the droplet was recorded through the observation hole by

66
using a AVT-Horn (Aalen, Germany) macro-zoom objective was connected to a Nikon
Coolpix 990 digital camera. The resolution of the image of the droplet was measured to be
0.01 mm/pixel.
Water coolingsystem
Ar
PID
control
Vacuum chamber + resistance heater coil
Controlpanel
Rotarypump
Diffusion pump
Rotarypump
control
Gas control
Observation hole
Water coolingsystem
Ar
PID
control
Vacuum chamber + resistance heater coil
Controlpanel
Rotarypump
Diffusion pump
Rotarypump
control
Gas control
Observation hole to PID to PID OT
dropletsubstrate
Vacuumchamber
Oberservation hole TCout to PID
Detail: Observation hole
Observation hole
HeaterTi-sponges
Rad
ial T
iAl6
V4
-sh
ield
ing
Figure 3.1 Sketch of the vacuum furnace unit and detail view through the observation window: holder with thermocouples (TC) close to the substrate.
Prior to the test, the substrates were cleaned using high purity ethanol. Cubes of the Al alloy
with an edge length of 4 mm were ground and cleaned with ethanol. The first measurements
were performed by contact heating of the alloy sample directly on the substrate as shown
schematically in Figure 3.2 a). To enable cleaning of the liquid metal surface prior to the
sessile drop test, a more refined set-up was adapted. The cube of the Al alloy was clamped in
an Al2O3 tube, which was fixed to the substrate holder at an elevated position. At the lower
end of the tube a sharp-edged Al2O3 sheet material was introduced into the interior of the
tube. The sheet covered about 25% of the internal cross-sectional area. At 750°C the liquid
metal in the tube was forced towards the substrate by an mechanical impulse applied to the
holder as shown schematically in Figure 3.2 b).
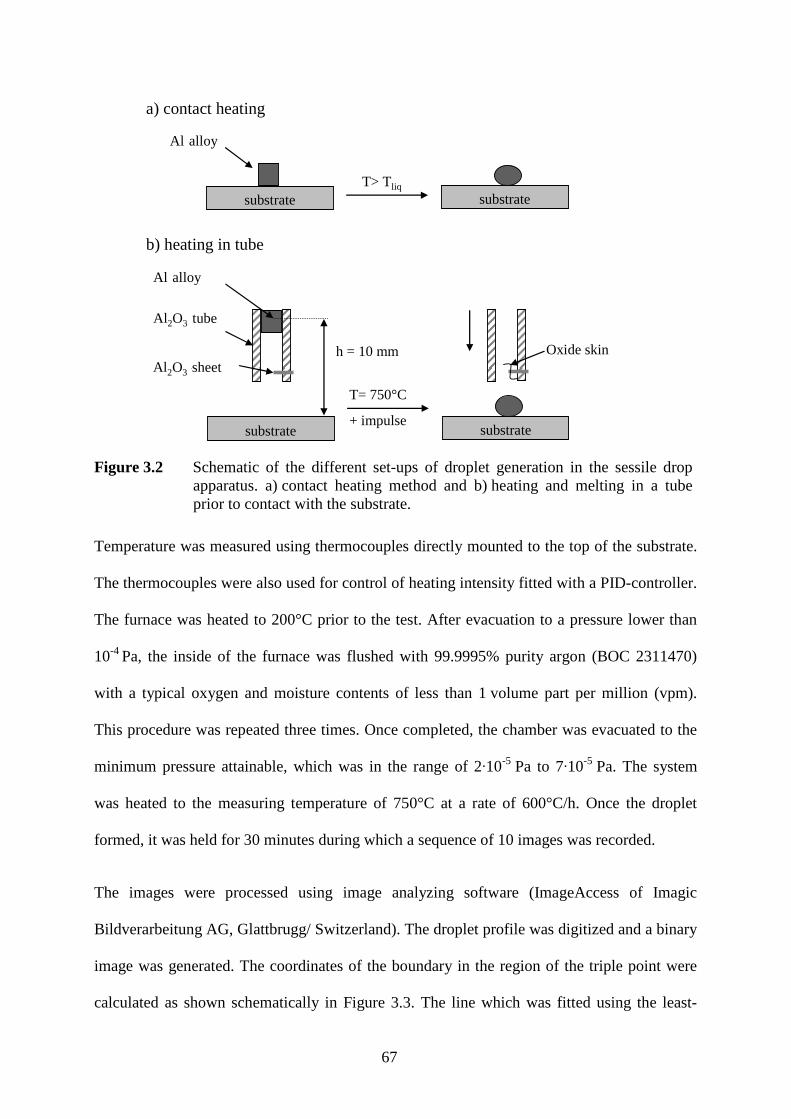
67
substrate
Al-alloy
Al 2O3-sheet
Al2O3-tube
substrate
T= 750°C
+ impulse
Oxide skin
substrate substrateT> Tliq
Al-alloy
a) contact heating
b) heating in tube
h = 10 mm
Figure 3.2 Schematic of the different set-ups of droplet generation in the sessile drop apparatus. a) contact heating method and b) heating and melting in a tube prior to contact with the substrate.
Temperature was measured using thermocouples directly mounted to the top of the substrate.
The thermocouples were also used for control of heating intensity fitted with a PID-controller.
The furnace was heated to 200°C prior to the test. After evacuation to a pressure lower than
10-4 Pa, the inside of the furnace was flushed with 99.9995% purity argon (BOC 2311470)
with a typical oxygen and moisture contents of less than 1 volume part per million (vpm).
This procedure was repeated three times. Once completed, the chamber was evacuated to the
minimum pressure attainable, which was in the range of 2·10-5 Pa to 7·10-5 Pa. The system
was heated to the measuring temperature of 750°C at a rate of 600°C/h. Once the droplet
formed, it was held for 30 minutes during which a sequence of 10 images was recorded.
The images were processed using image analyzing software (ImageAccess of Imagic
Bildverarbeitung AG, Glattbrugg/ Switzerland). The droplet profile was digitized and a binary
image was generated. The coordinates of the boundary in the region of the triple point were
calculated as shown schematically in Figure 3.3. The line which was fitted using the least-
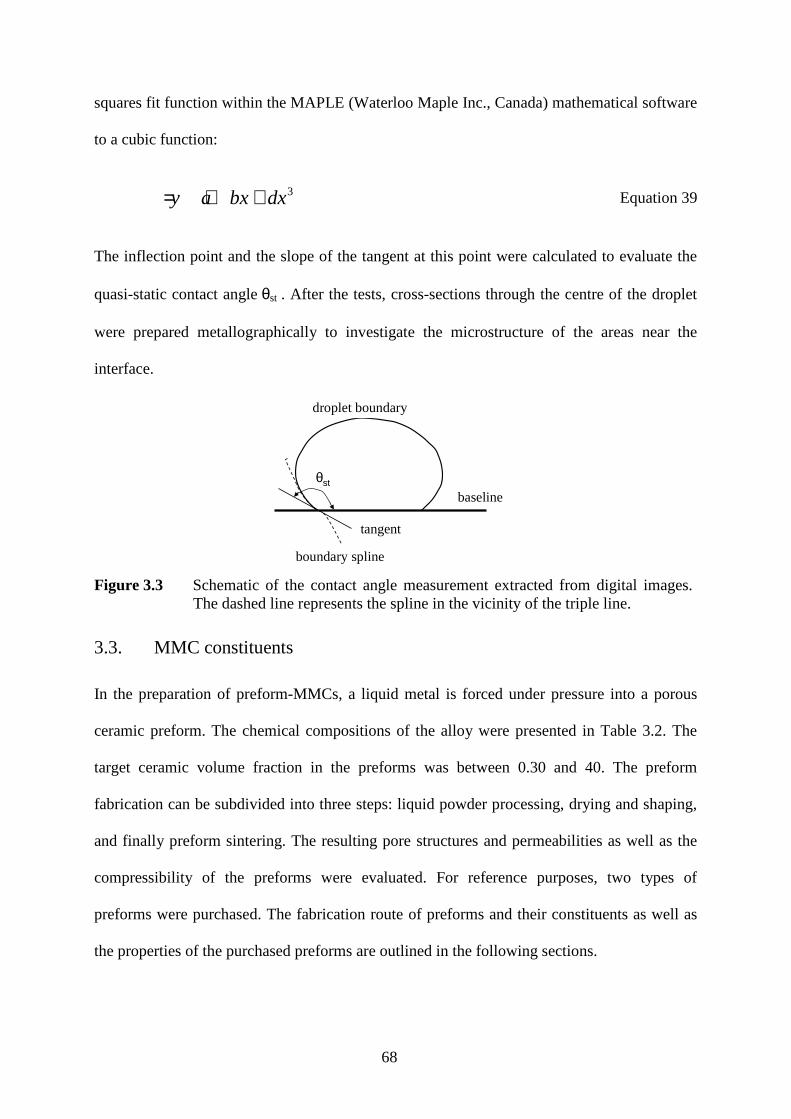
68
squares fit function within the MAPLE (Waterloo Maple Inc., Canada) mathematical software
to a cubic function:
3dxbxay ++= Equation 39
The inflection point and the slope of the tangent at this point were calculated to evaluate the
quasi-static contact angle θst . After the tests, cross-sections through the centre of the droplet
were prepared metallographically to investigate the microstructure of the areas near the
interface.
tangent
baselineθθst
droplet boundary
boundary spline
Figure 3.3 Schematic of the contact angle measurement extracted from digital images. The dashed line represents the spline in the vicinity of the triple line.
3.3. MMC constituents
In the preparation of preform-MMCs, a liquid metal is forced under pressure into a porous
ceramic preform. The chemical compositions of the alloy were presented in Table 3.2. The
target ceramic volume fraction in the preforms was between 0.30 and 40. The preform
fabrication can be subdivided into three steps: liquid powder processing, drying and shaping,
and finally preform sintering. The resulting pore structures and permeabilities as well as the
compressibility of the preforms were evaluated. For reference purposes, two types of
preforms were purchased. The fabrication route of preforms and their constituents as well as
the properties of the purchased preforms are outlined in the following sections.
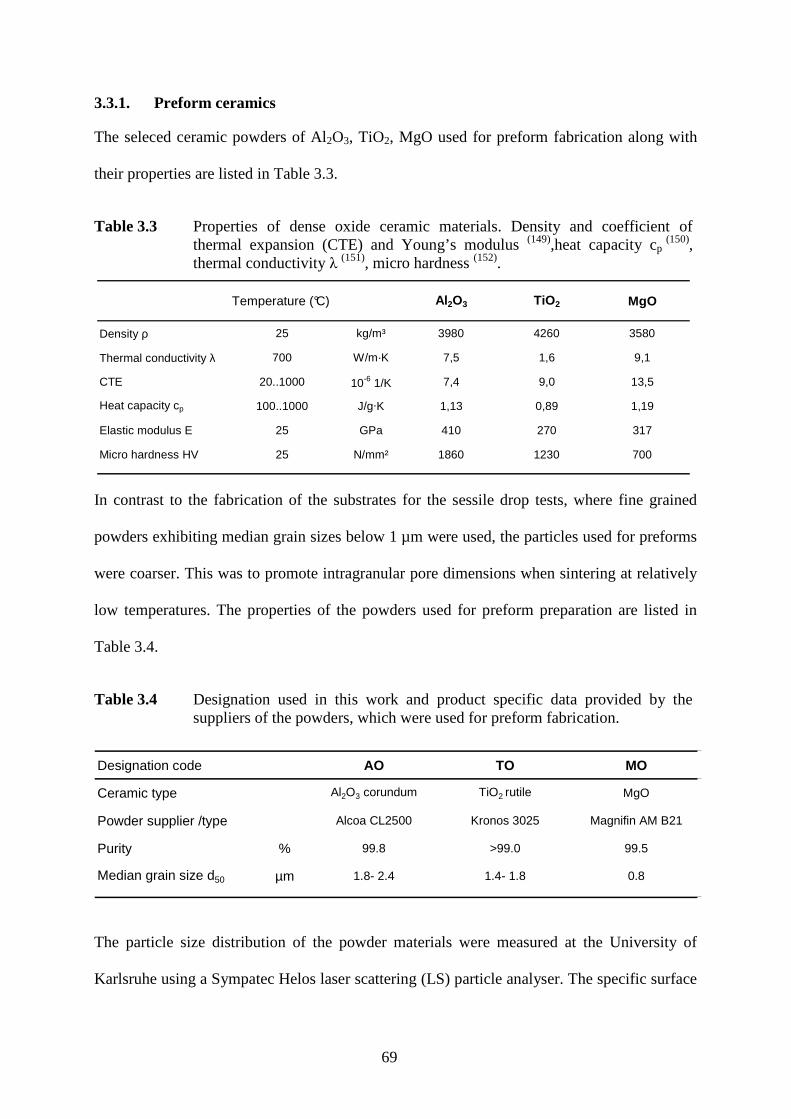
69
3.3.1. Preform ceramics
The seleced ceramic powders of Al2O3, TiO2, MgO used for preform fabrication along with
their properties are listed in Table 3.3.
Table 3.3 Properties of dense oxide ceramic materials. Density and coefficient of thermal expansion (CTE) and Young’s modulus (149),heat capacity cp
(150), thermal conductivity λ (151), micro hardness (152).
Temperature (°C) Al2O3 TiO2 MgO
Density ρ 25 kg/m³ 3980 4260 3580
Thermal conductivity λ 700 W/m·K 7,5 1,6 9,1
CTE 20..1000 10-6 1/K 7,4 9,0 13,5
Heat capacity cp 100..1000 J/g·K 1,13 0,89 1,19
Elastic modulus E 25 GPa 410 270 317
Micro hardness HV 25 N/mm² 1860 1230 700
In contrast to the fabrication of the substrates for the sessile drop tests, where fine grained
powders exhibiting median grain sizes below 1 µm were used, the particles used for preforms
were coarser. This was to promote intragranular pore dimensions when sintering at relatively
low temperatures. The properties of the powders used for preform preparation are listed in
Table 3.4.
Table 3.4 Designation used in this work and product specific data provided by the suppliers of the powders, which were used for preform fabrication.
Designation code AO TO MO
Ceramic type Al2O3 corundum TiO2 rutile MgO
Powder supplier /type Alcoa CL2500 Kronos 3025 Magnifin AM B21
Purity % 99.8 >99.0 99.5
Median grain size d50 µm 1.8- 2.4 1.4- 1.8 0.8
The particle size distribution of the powder materials were measured at the University of
Karlsruhe using a Sympatec Helos laser scattering (LS) particle analyser. The specific surface
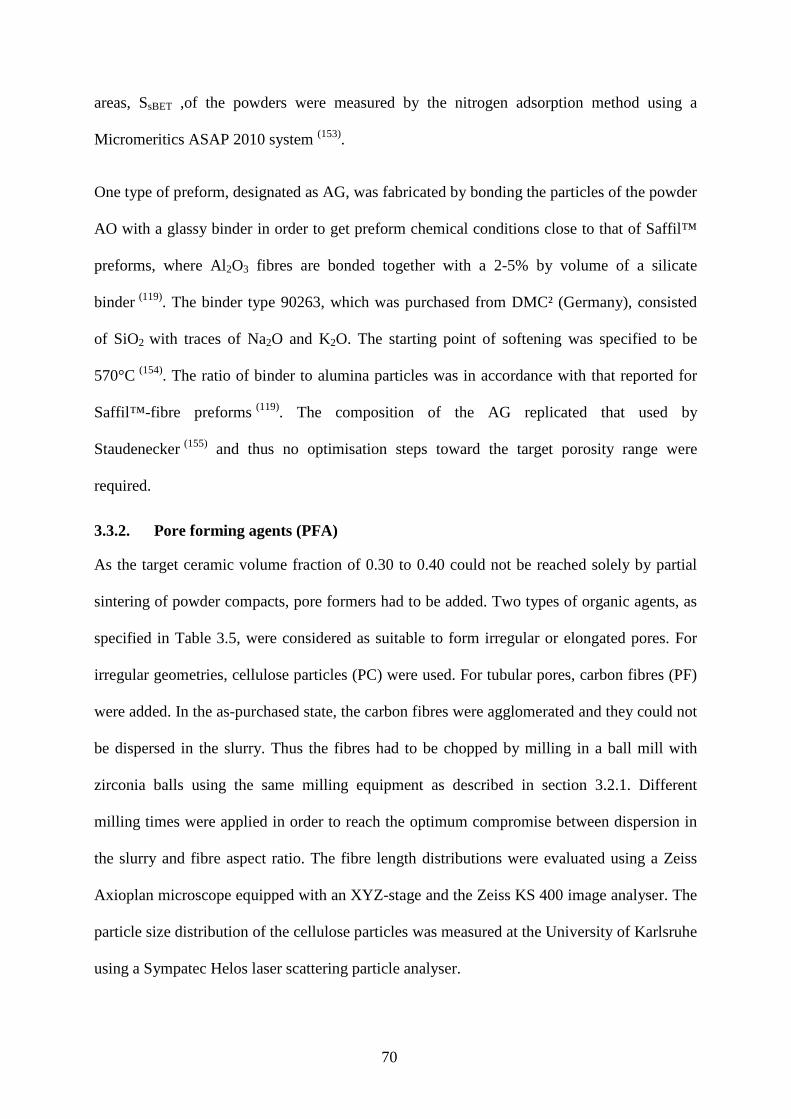
70
areas, SsBET ,of the powders were measured by the nitrogen adsorption method using a
Micromeritics ASAP 2010 system (153).
One type of preform, designated as AG, was fabricated by bonding the particles of the powder
AO with a glassy binder in order to get preform chemical conditions close to that of Saffil™
preforms, where Al2O3 fibres are bonded together with a 2-5% by volume of a silicate
binder (119). The binder type 90263, which was purchased from DMC² (Germany), consisted
of SiO2 with traces of Na2O and K2O. The starting point of softening was specified to be
570°C (154). The ratio of binder to alumina particles was in accordance with that reported for
Saffil™-fibre preforms (119). The composition of the AG replicated that used by
Staudenecker (155) and thus no optimisation steps toward the target porosity range were
required.
3.3.2. Pore forming agents (PFA)
As the target ceramic volume fraction of 0.30 to 0.40 could not be reached solely by partial
sintering of powder compacts, pore formers had to be added. Two types of organic agents, as
specified in Table 3.5, were considered as suitable to form irregular or elongated pores. For
irregular geometries, cellulose particles (PC) were used. For tubular pores, carbon fibres (PF)
were added. In the as-purchased state, the carbon fibres were agglomerated and they could not
be dispersed in the slurry. Thus the fibres had to be chopped by milling in a ball mill with
zirconia balls using the same milling equipment as described in section 3.2.1. Different
milling times were applied in order to reach the optimum compromise between dispersion in
the slurry and fibre aspect ratio. The fibre length distributions were evaluated using a Zeiss
Axioplan microscope equipped with an XYZ-stage and the Zeiss KS 400 image analyser. The
particle size distribution of the cellulose particles was measured at the University of Karlsruhe
using a Sympatec Helos laser scattering particle analyser.
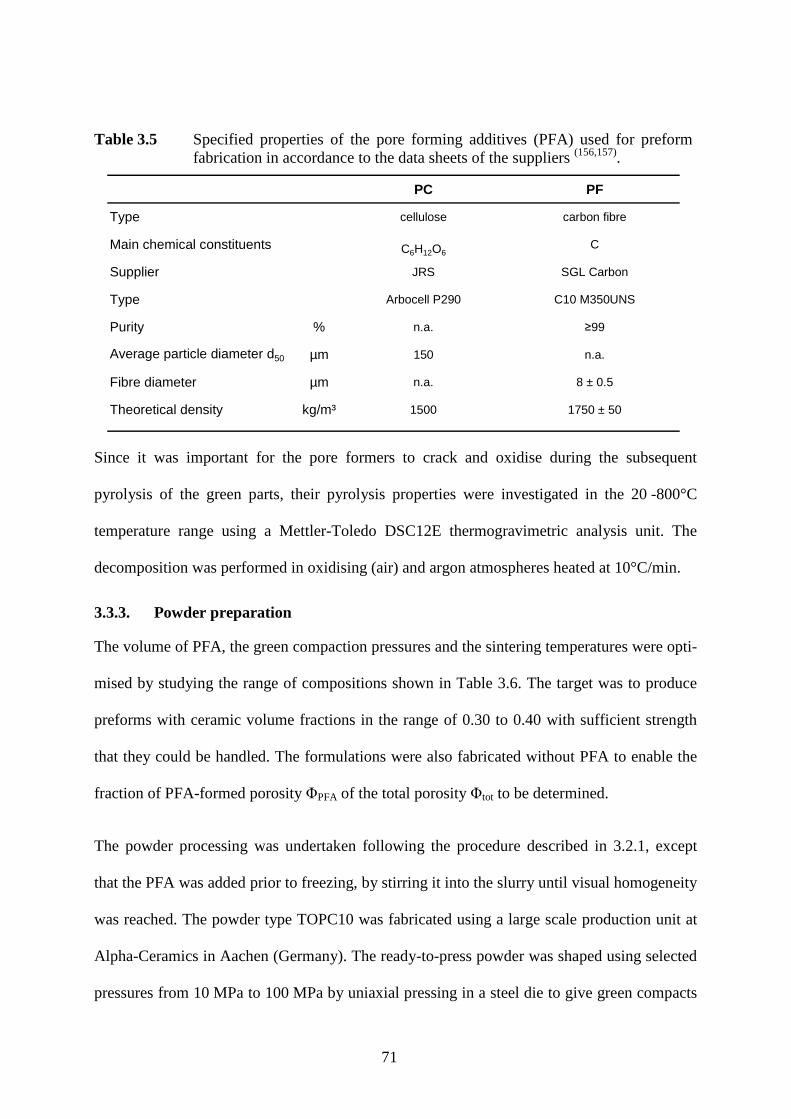
71
Table 3.5 Specified properties of the pore forming additives (PFA) used for preform fabrication in accordance to the data sheets of the suppliers (156,157).
PC PF
Type cellulose carbon fibre
Main chemical constituents C6H12O6C
Supplier JRS SGL Carbon
Type Arbocell P290 C10 M350UNS
Purity % n.a. ≥99
Average particle diameter d50 µm 150 n.a.
Fibre diameter µm n.a. 8 ± 0.5
Theoretical density kg/m³ 1500 1750 ± 50
Since it was important for the pore formers to crack and oxidise during the subsequent
pyrolysis of the green parts, their pyrolysis properties were investigated in the 20 -800°C
temperature range using a Mettler-Toledo DSC12E thermogravimetric analysis unit. The
decomposition was performed in oxidising (air) and argon atmospheres heated at 10°C/min.
3.3.3. Powder preparation
The volume of PFA, the green compaction pressures and the sintering temperatures were opti-
mised by studying the range of compositions shown in Table 3.6. The target was to produce
preforms with ceramic volume fractions in the range of 0.30 to 0.40 with sufficient strength
that they could be handled. The formulations were also fabricated without PFA to enable the
fraction of PFA-formed porosity ΦPFA of the total porosity Φtot to be determined.
The powder processing was undertaken following the procedure described in 3.2.1, except
that the PFA was added prior to freezing, by stirring it into the slurry until visual homogeneity
was reached. The powder type TOPC10 was fabricated using a large scale production unit at
Alpha-Ceramics in Aachen (Germany). The ready-to-press powder was shaped using selected
pressures from 10 MPa to 100 MPa by uniaxial pressing in a steel die to give green compacts
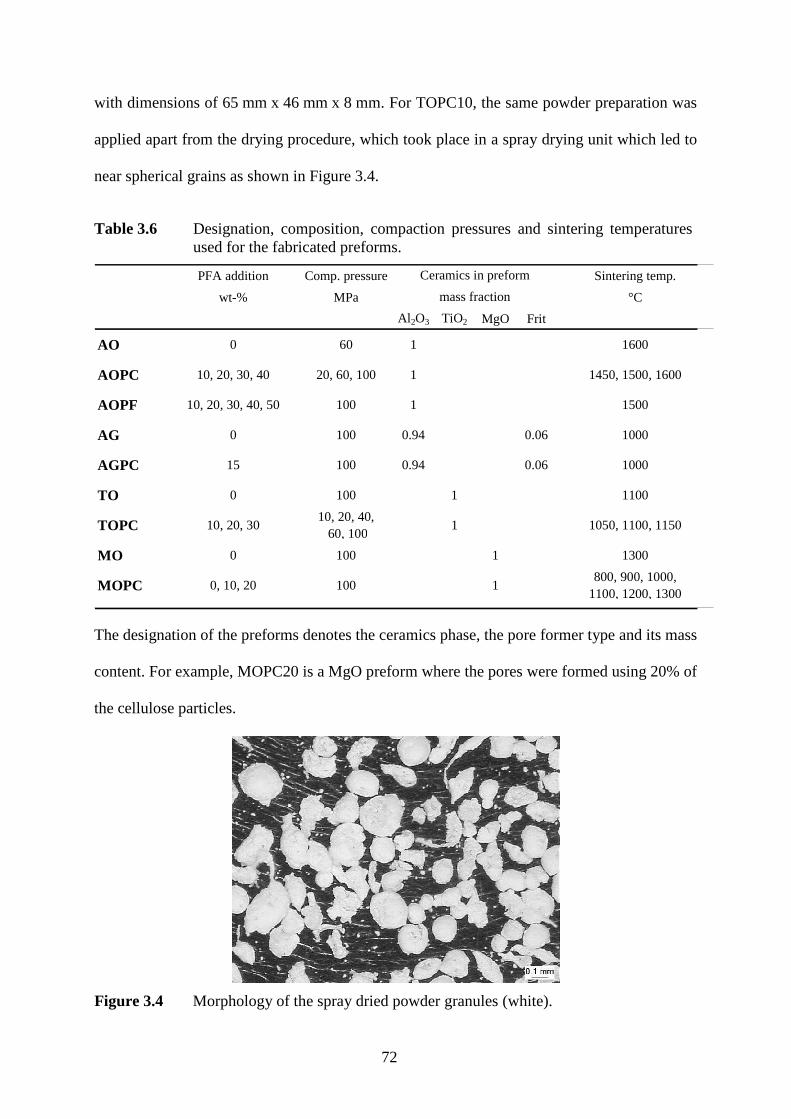
72
with dimensions of 65 mm x 46 mm x 8 mm. For TOPC10, the same powder preparation was
applied apart from the drying procedure, which took place in a spray drying unit which led to
near spherical grains as shown in Figure 3.4.
Table 3.6 Designation, composition, compaction pressures and sintering temperatures used for the fabricated preforms.
PFA addition Comp. pressure Sintering temp.
wt-% MPa °C
Al 2O3 TiO2 MgO Frit
AO 0 60 1 1600
AOPC 10, 20, 30, 40 20, 60, 100 1 1450, 1500, 1600
AOPF 10, 20, 30, 40, 50 100 1 1500
AG 0 100 0.94 0.06 1000
AGPC 15 100 0.94 0.06 1000
TO 0 100 1 1100
TOPC 10, 20, 3010, 20, 40, 60, 100
1 1050, 1100, 1150
MO 0 100 1 1300
MOPC 0, 10, 20 100 1800, 900, 1000,
1100, 1200, 1300
Ceramics in preform
mass fraction
The designation of the preforms denotes the ceramics phase, the pore former type and its mass
content. For example, MOPC20 is a MgO preform where the pores were formed using 20% of
the cellulose particles.
Figure 3.4 Morphology of the spray dried powder granules (white).

73
3.3.4. Sintering
Sintering of the green parts was performed in a Gero HTRH (Gero GmbH, Germany) alumina
lined tube furnace with an inner diameter of 60 mm. A low initial heating rate was used to
ensure that the organic compounds in the green parts were removed progressively. Thus a rate
of 5°C/h was used up to 475°C with an air flow rate of 20 l/h inside the tube. Subsequently a
rate of 300°C/h was applied under similar dynamic atmosphere. All preforms were sintered
for 2 hours at the given temperatures (Table 3.6).
Due to preform cracking during sintering in an oxidizing atmosphere, all preforms with PFA
content of 20 wt.% or more, apart from magnesia preforms and those with PF as the pore
former, had to be heat treated in an inert atmosphere prior to the oxidising sintering cycle in
order to crack the cellulose. The two stage sintering process shown in Figure 3.5 was adopted.
In the first stage heating took place at 5°C/h to 800°C with a flow of 5 l/h Ar (Figure 3.5 a).
Figure 3.5 b) shows the heating profile in air.
0 5 10 15 20 25 300
200
400
600
800
1000
1200
1400
1600
0 5 10 15 20 25 30 35 40 45
b) air flux
Tem
pera
ture
(°C
)
Process time (h)
a) argon flux
Process time t /h
Tem
per
atu
re T
/ °C
Figure 3.5 Pyrolysis and exemplary sintering cycle: a) pyrolysis in inert atmosphere. b) oxidation of organics and sintering.
74
The preform sintering process was optimised in accordance with the findings of earlier
work (158). The sintered preforms, which showed low sintering shrinkage, were ground to a
standard size of 61 mm x 42 mm x 8 mm.
3.3.5. Porosity fractions
After sintering, the specimen dimensions and weight were measured. The total porosity Φtot
was calculated using the theoretical density of the ceramics. Further, the preform types with
sufficient strength for handling and porosity were measured using Archimedes´ principle to
determine the fraction of open-cell porosity in accordance to DIN 51918 (159). The sample was
first dried in an oven at 100°C for 1 h and then weighed (m0). It was then evacuated down to
50 mbar and immersed in distilled water. Following that, atmospheric pressure was applied
for 30 min so that water fully entered the open pores of the preform and then reweighed
immersed in water (m2). Ethanol was used instead of distilled water for the measurements on
the magnesia preforms. Finally, the sample was taken out of the water, drops of the liquid
were removed from its surface and then it was reweighed (m1). The apparent density ρr and
the fraction of open porosity Φop in the preform were calculated from the following equation:
fr mm
m ρρ21
0
−= Equation 40
where ρf was the density of the fluid used at test temperature. The values were taken from
tables given by Lide (160). The open cell porosity Φop is given by:
21
01
mm
mmop −
−=Φ Equation 41
The closed cell porosity ΦC was calculated as the difference between the total porosity Φtot
and the open cell porosity Φop.
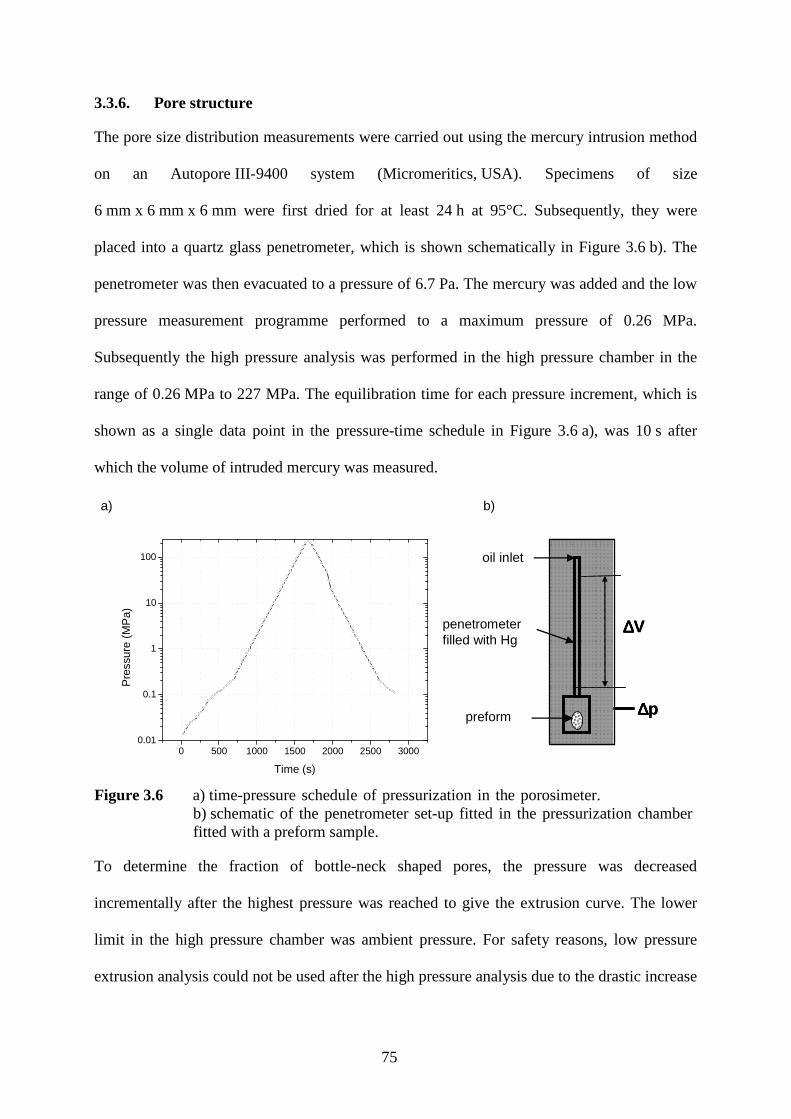
75
3.3.6. Pore structure
The pore size distribution measurements were carried out using the mercury intrusion method
on an Autopore III-9400 system (Micromeritics, USA). Specimens of size
6 mm x 6 mm x 6 mm were first dried for at least 24 h at 95°C. Subsequently, they were
placed into a quartz glass penetrometer, which is shown schematically in Figure 3.6 b). The
penetrometer was then evacuated to a pressure of 6.7 Pa. The mercury was added and the low
pressure measurement programme performed to a maximum pressure of 0.26 MPa.
Subsequently the high pressure analysis was performed in the high pressure chamber in the
range of 0.26 MPa to 227 MPa. The equilibration time for each pressure increment, which is
shown as a single data point in the pressure-time schedule in Figure 3.6 a), was 10 s after
which the volume of intruded mercury was measured.
Figure 3.6 a) time-pressure schedule of pressurization in the porosimeter. b) schematic of the penetrometer set-up fitted in the pressurization chamber fitted with a preform sample.
To determine the fraction of bottle-neck shaped pores, the pressure was decreased
incrementally after the highest pressure was reached to give the extrusion curve. The lower
limit in the high pressure chamber was ambient pressure. For safety reasons, low pressure
extrusion analysis could not be used after the high pressure analysis due to the drastic increase
0 500 1000 1500 2000 2500 30000.01
0.1
1
10
100
Pre
ssur
e (M
Pa)
Time (s)
a)
∆ ∆ ∆ ∆V
∆∆∆∆p
∆ ∆ ∆ ∆V
∆∆∆∆p
penetrometerfilled with Hg
a) b)
preform
oil inlet
76
in the evaporation of mercury at low pressure. The pore fraction still intruded after the
extrusion programme was assessed as the residual porosity after extrusion Φext. The difference
between the geometrically measured Φtot and the porosity intruded by mercury, ΦHg , at the
maximum pressure was calculated in order to determine the sum of the closed cell porosity
and the compression of the sample. The median pore diameter dHg was determined on the
basis of the intrusion curve and represents the diameter at which 50% of the total porosity was
intruded.
( )tot
totsHgiHg
SS
φφρ −
=1
Equation 42
The specific surface area per unit mass SsHg was calculated in accordance to Equation 22. The
specific surface area per unit volume of porosity SiHg was calculated using Equation 42:
3.3.7. Permeability
The permeability of the preforms was measured along and perpendicular to the uniaxial
pressing direction of the initial green compacts. This was carried out as anisotropic
permeability was expected in accordance to the work on uniaxial formed fibre preforms by
Mortensen et al. (112).
For measurements along the pressing direction, disk-shaped samples 30 mm in diameter and
7 mm high were machined from the standard preform geometries. The perpendicular direction
was measured applying a cross-sectional cut as shown in Figure 3.7 a). The samples were
bonded into aluminium rings using a high viscosity hot-melt adhesive to prevent infiltration.
Prior to testing, the samples were evacuated and immersed in water for 12 h to completely fill
the open porosity. When measuring magnesia preforms, ethanol was used instead of water to
prevent hydroxide formation. For measurement, the ring was mounted to the end of a vertical
tube. The tube was filled with the fluid and a controlled gas pressure was applied in the range
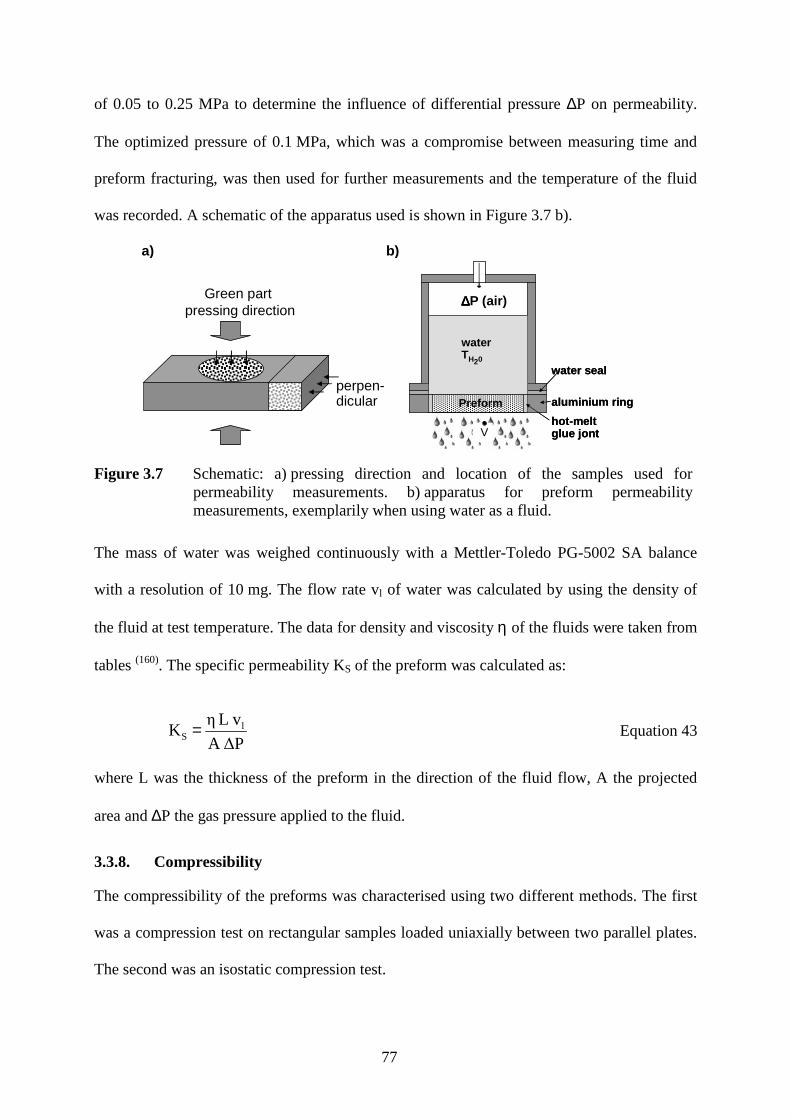
77
of 0.05 to 0.25 MPa to determine the influence of differential pressure ∆P on permeability.
The optimized pressure of 0.1 MPa, which was a compromise between measuring time and
preform fracturing, was then used for further measurements and the temperature of the fluid
was recorded. A schematic of the apparatus used is shown in Figure 3.7 b).
Green partpressing direction
perpen-dicular
∆∆∆∆p (air)
V
Preform
waterTH20
water seal
aluminium ring
hot-melt glue jont
∆∆∆∆p (air)
V
Preform
waterTH20
water seal
aluminium ring
hot-melt glue jont
a) b)
∆∆∆∆P (air)
Figure 3.7 Schematic: a) pressing direction and location of the samples used for permeability measurements. b) apparatus for preform permeability measurements, exemplarily when using water as a fluid.
The mass of water was weighed continuously with a Mettler-Toledo PG-5002 SA balance
with a resolution of 10 mg. The flow rate vl of water was calculated by using the density of
the fluid at test temperature. The data for density and viscosity η of the fluids were taken from
tables (160). The specific permeability KS of the preform was calculated as:
∆PA
vL ηK l
S = Equation 43
where L was the thickness of the preform in the direction of the fluid flow, A the projected
area and ∆P the gas pressure applied to the fluid.
3.3.8. Compressibility
The compressibility of the preforms was characterised using two different methods. The first
was a compression test on rectangular samples loaded uniaxially between two parallel plates.
The second was an isostatic compression test.
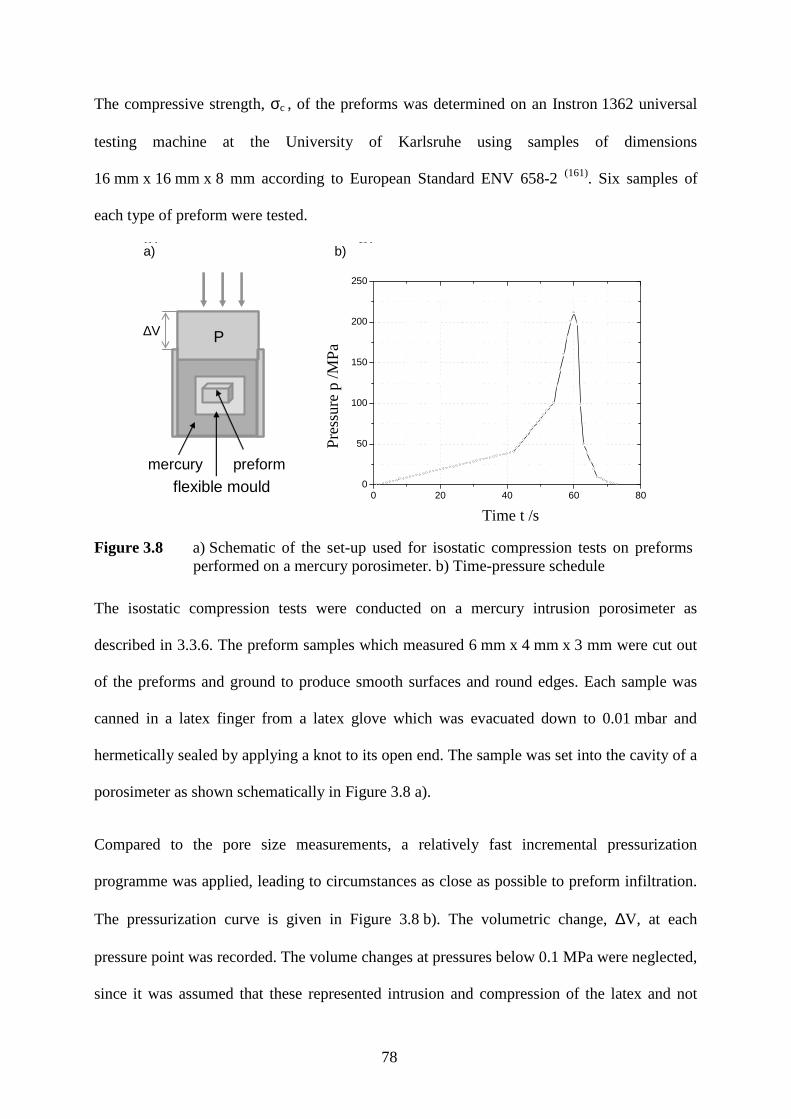
78
The compressive strength, σc , of the preforms was determined on an Instron 1362 universal
testing machine at the University of Karlsruhe using samples of dimensions
16 mm x 16 mm x 8 mm according to European Standard ENV 658-2 (161). Six samples of
each type of preform were tested.
0 20 40 60 800
50
100
150
200
250
Pre
ssur
e (M
Pa)
Time (s)
a) b)
PP
preformmercury
canning
∆V
a) b)
Time t /s
Pre
ssur
e p
/MP
a
flexible mould
Figure 3.8 a) Schematic of the set-up used for isostatic compression tests on preforms performed on a mercury porosimeter. b) Time-pressure schedule
The isostatic compression tests were conducted on a mercury intrusion porosimeter as
described in 3.3.6. The preform samples which measured 6 mm x 4 mm x 3 mm were cut out
of the preforms and ground to produce smooth surfaces and round edges. Each sample was
canned in a latex finger from a latex glove which was evacuated down to 0.01 mbar and
hermetically sealed by applying a knot to its open end. The sample was set into the cavity of a
porosimeter as shown schematically in Figure 3.8 a).
Compared to the pore size measurements, a relatively fast incremental pressurization
programme was applied, leading to circumstances as close as possible to preform infiltration.
The pressurization curve is given in Figure 3.8 b). The volumetric change, ∆V, at each
pressure point was recorded. The volume changes at pressures below 0.1 MPa were neglected,
since it was assumed that these represented intrusion and compression of the latex and not
79
preform compression. The relative volumetric compression ciso was calculated as the ratio of
volume change ∆V to the initial preform volume. The volumetric stiffness of the preform Eiso
was calculated as the slope of the linear regression of the pressure- compression curve in the
pressure range of 0.1 to 10 MPa. After reaching the maximum pressure, it was reduced
stepwise to ambient pressure while measuring volume change to evaluate the permanent
compression ciso,per after pressure release.
3.3.9. Reference preforms
Two routes were used in preparation of the reference preforms: a foaming method developed
by Dytech Corporation Ltd (Sheffield, UK) and a slurry vacuum filtration route for preforms
supplied by Saffil Japan Ltd. These preform types were chosen as they represent the most
important fabrication routes reported in the literature and because they were the only
commercial preforms within the target ceramic per cent volume content range of 0.30 to 0.40.
The processing of the foamed alumina preform was in accordance with the patent of
Sambrook (162). The target ceramic volume fraction of 0.30 could be reached by sintering the
green part at 1550°C. The preforms were cut from plates to get the preferred geometry for
infiltration which is 61 mm x 42 mm x 8 mm. The designation of this preform type was
AODY30 which represents the alumina ceramics (AO), the supplier (DY) and the volume
fraction of the ceramic phase (0.30).
As reported by Hegeler et al. (119), the ceramic volume fraction in chopped Saffil™ fibre
preforms is limited to 0.25 by volume. Thus, to reach the target volume fraction of 0.30- 0.40,
hybrid preforms made from Saffil™ RF fibres in combination with ceramic particles in a
volumetric ratio of 1:1 were purchased. Initially, a chemically inert preform consisting of δ-
alumina fibres and α-alumina particles was preferred. This type (Saffil™ designation
RFX50AX-301) contained nominally a ceramic volume fraction of 0.30 but could not be used
80
as the measured mean value 0.23. The producer confirmed problems in processing, resulting
in lower values.
As a substitute a hybrid preform type was selected with the designation RF50TD-301, in the
following designated as FATO. This consisted of Saffil™ chopped alumina fibres with titania
particles having a mean ceramic volume fraction 0.29, which was close to the target range.
The delivered preforms were 300mm x 300mm x 8mm and were then cut into standard size
samples. The properties of the reference preforms are listed in Table 3.7.
Table 3.7 Properties of purchased reference preforms, manufacturers data with exeption of density and ceramic volume fraction which were determined using procedures described in 3.3.5.
AODY30 FATO
Type α-alumina particles50% δ-alumina fibre RF + 50% TiO2 particles
Pore formation Slurry foamed Vacuum filtration
Supplier Dytech LTD UK Saffil Japan LTD
Suppliers designation POR-AL30 RF50TD-301
Theoretical density kg/m³ 3920 3830
Number of preforms 40 10
Density kg/m³ 1226 ± 59 1096 ± 22
Ceramics elastic modulus GPa 410 300
Ceramic volume fraction 0.31 ± 0.02 0.29 ± 0.01
3.3.10. Microstructural investigations
SEM examinations were carried out on powder materials by spreading the powder on an
adhesive carbon pad. The preform structures were investigated on sawn cross sections. For
increased electrical conductivity, the samples were sputter coated with a gold-palladium alloy.
3.4. Infiltration
Different infiltration modes were used to fill the pores of the preform. A constant pressure
was applied using gas pressurization. In infiltrations using squeeze casting and high pressure
81
die casting methods, a constant flow rate infiltration mode was adopted. The infiltration
experiments were performed with melts of IS and IM alloys for which the chemical
compositions are shown in Table 3.2.
3.4.1. Constant pressure infiltration (CPI)
In this method liquid metal was forced to infiltrate the preforms by means of pressurized
argon where the applied pressure, Pappl, the difference between absolute pressure Pabs and
ambient pressure, Pamb, could be adjusted in the range of 0.01 MPa to 2.5 MPa. The
pressurization was performed in a tool built up of three parts: a lower punch (LP), an upper
punch (UP) and a die (DI) as shown in Figure 3.9. All parts were made of H13 hot working
steel, with a thermal conductivity of 22 W/m K at 25°C (53). The die and the lower punch
formed a rectangular-shaped cavity of dimensions 65 mm x 46 mm x 35 mm. Prior to the
infiltration tests, the cavity and the upper punch were coated with a very thin layer of graphite
using a spray (ESD 33, Kontaktchemie, Germany) and then preheated to 450°C in a TP 400
(Fontjine Ltd, The Netherlands) laboratory platen press. The preforms were preheated in a
muffle furnace at a rate of 300 °C/h to 800°C to prevent thermally-induced cracking. The gas
pressure infiltration comprised the following:
The preform was set into the cavity. The metal melt was transferred from a crucible holding
furnace, set to a temperature of 800°C, to the die using a preheated boron nitride coated ladle
loaded with 100 ± 10 g of melt. The dross on the surface of the melt was removed and the
cleaned melt was poured directly onto the preform. The upper punch, which was fitted with a
copper sealing ring, was set onto the die cavity and the die was closed and pressed between
the platens of the press to ensure sealing between DI and UP. The gas pressure was applied
within 1 s to the chosen value. The gas in the preform which was replaced by the melt volume
could flow through the air gap between the bottom punch and the die. The pressure was held
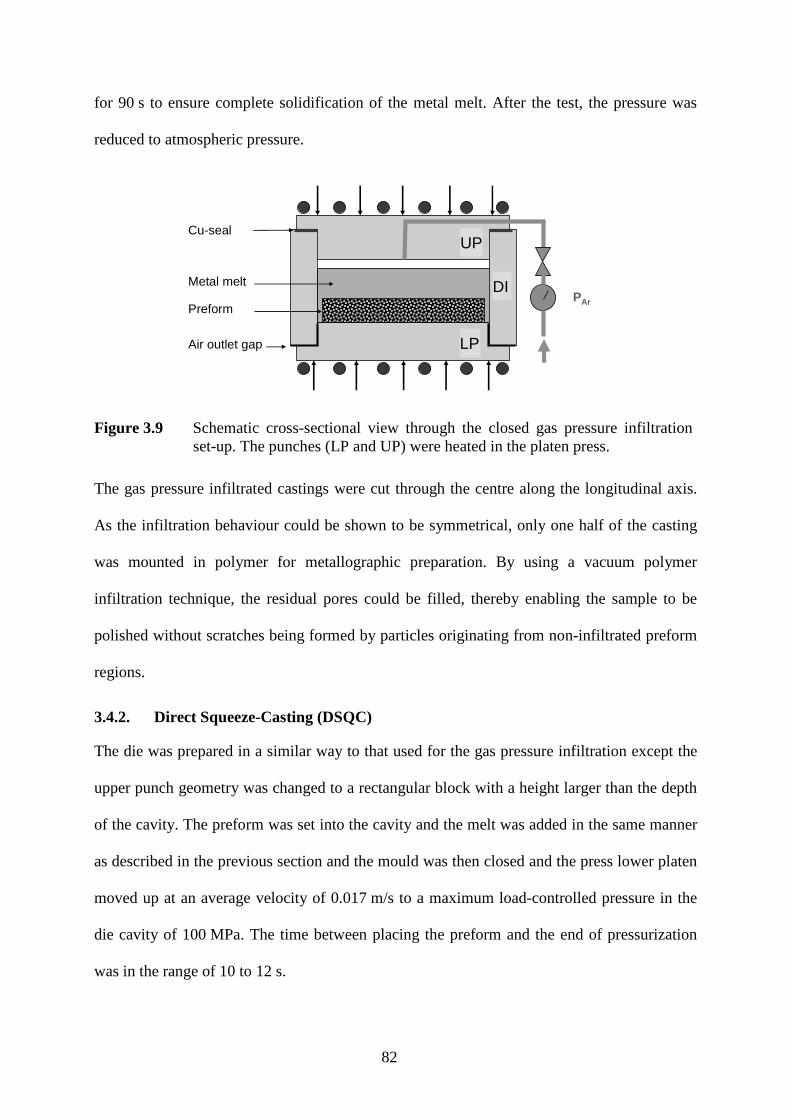
82
for 90 s to ensure complete solidification of the metal melt. After the test, the pressure was
reduced to atmospheric pressure.
PAr
Cu-seal
Preform
Metal melt
LP
UP
MA
Air outlet gap
DI
UP
LP
Figure 3.9 Schematic cross-sectional view through the closed gas pressure infiltration set-up. The punches (LP and UP) were heated in the platen press.
The gas pressure infiltrated castings were cut through the centre along the longitudinal axis.
As the infiltration behaviour could be shown to be symmetrical, only one half of the casting
was mounted in polymer for metallographic preparation. By using a vacuum polymer
infiltration technique, the residual pores could be filled, thereby enabling the sample to be
polished without scratches being formed by particles originating from non-infiltrated preform
regions.
3.4.2. Direct Squeeze-Casting (DSQC)
The die was prepared in a similar way to that used for the gas pressure infiltration except the
upper punch geometry was changed to a rectangular block with a height larger than the depth
of the cavity. The preform was set into the cavity and the melt was added in the same manner
as described in the previous section and the mould was then closed and the press lower platen
moved up at an average velocity of 0.017 m/s to a maximum load-controlled pressure in the
die cavity of 100 MPa. The time between placing the preform and the end of pressurization
was in the range of 10 to 12 s.
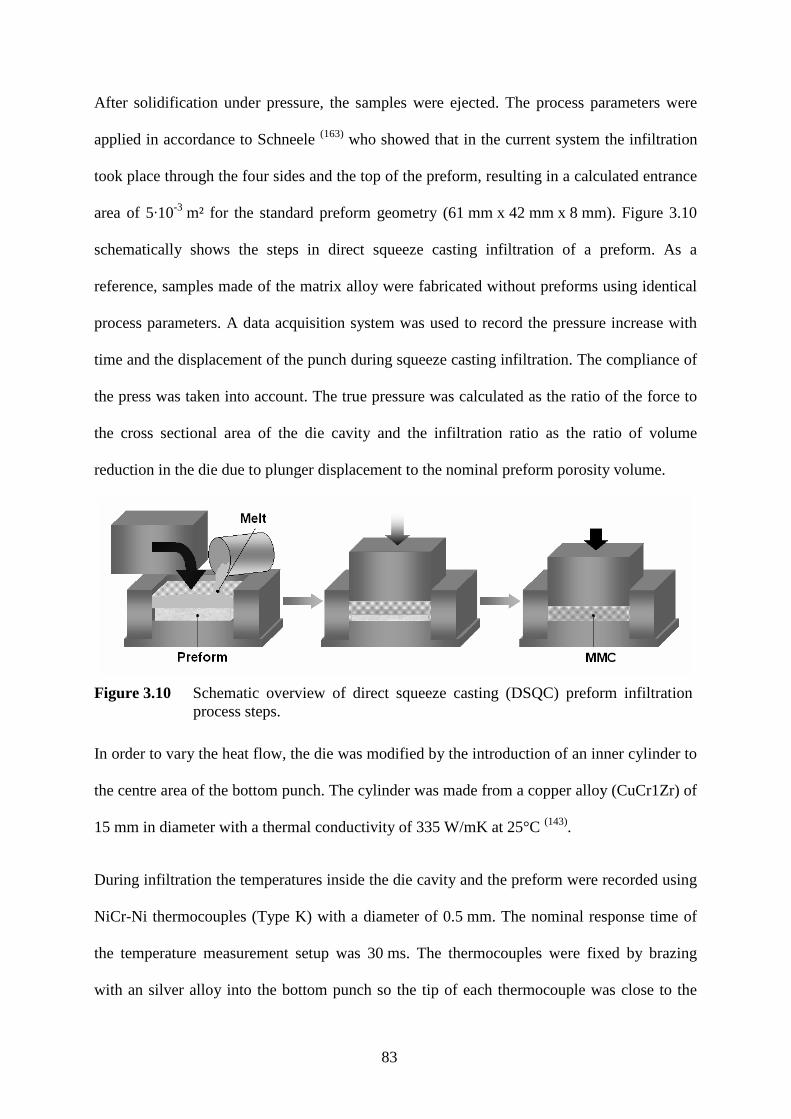
83
After solidification under pressure, the samples were ejected. The process parameters were
applied in accordance to Schneele (163) who showed that in the current system the infiltration
took place through the four sides and the top of the preform, resulting in a calculated entrance
area of 5·10-3 m² for the standard preform geometry (61 mm x 42 mm x 8 mm). Figure 3.10
schematically shows the steps in direct squeeze casting infiltration of a preform. As a
reference, samples made of the matrix alloy were fabricated without preforms using identical
process parameters. A data acquisition system was used to record the pressure increase with
time and the displacement of the punch during squeeze casting infiltration. The compliance of
the press was taken into account. The true pressure was calculated as the ratio of the force to
the cross sectional area of the die cavity and the infiltration ratio as the ratio of volume
reduction in the die due to plunger displacement to the nominal preform porosity volume.
Figure 3.10 Schematic overview of direct squeeze casting (DSQC) preform infiltration process steps.
In order to vary the heat flow, the die was modified by the introduction of an inner cylinder to
the centre area of the bottom punch. The cylinder was made from a copper alloy (CuCr1Zr) of
15 mm in diameter with a thermal conductivity of 335 W/mK at 25°C (143).
During infiltration the temperatures inside the die cavity and the preform were recorded using
NiCr-Ni thermocouples (Type K) with a diameter of 0.5 mm. The nominal response time of
the temperature measurement setup was 30 ms. The thermocouples were fixed by brazing
with an silver alloy into the bottom punch so the tip of each thermocouple was close to the

84
bottom punch surface. The temperature near the edge of a magnesia preform set into the die
cavity was recorded in order to investigate its cooling behaviour prior to infiltration.
3.4.3. High pressure die casting infiltration technique
Preform infiltrations were performed using the high pressure die casting technique. The
technique is in general characterised by high filling velocities combined with small gating
areas and low die temperatures, which were 250°C in the present experiments. The gating
areas were varied to investigate the influence of turbulence on preform infiltration behaviour.
First, a comparatively large gate area of 18 mm x 50 mm was selected to be close to the
indirect squeeze casting (ISQC) geometries described in the literature (50, 135). In contrast, a
tool with a small gate of 62 mm x 1.5 mm was also used for high pressure die casting
infiltration (HPDC). The schematic views of the infiltration geometries cast in the studies and
the gate structures are shown in Figure 3.11. The diameters of the plunger connections of the
tools were 60 mm for ISQC and 45 mm for HPDC.
6218
50
Preform cavity
a) ISQC b) HPDCY
ZX
Y
ZX
area of plungercontact
ingate
Details ingate section
Figure 3.11 Schematic of the die casting components and position of the preform. a) large gate for indirect squeeze casting infiltration (ISQC).b) small gate for high pressure die casting infiltration (HPDC).
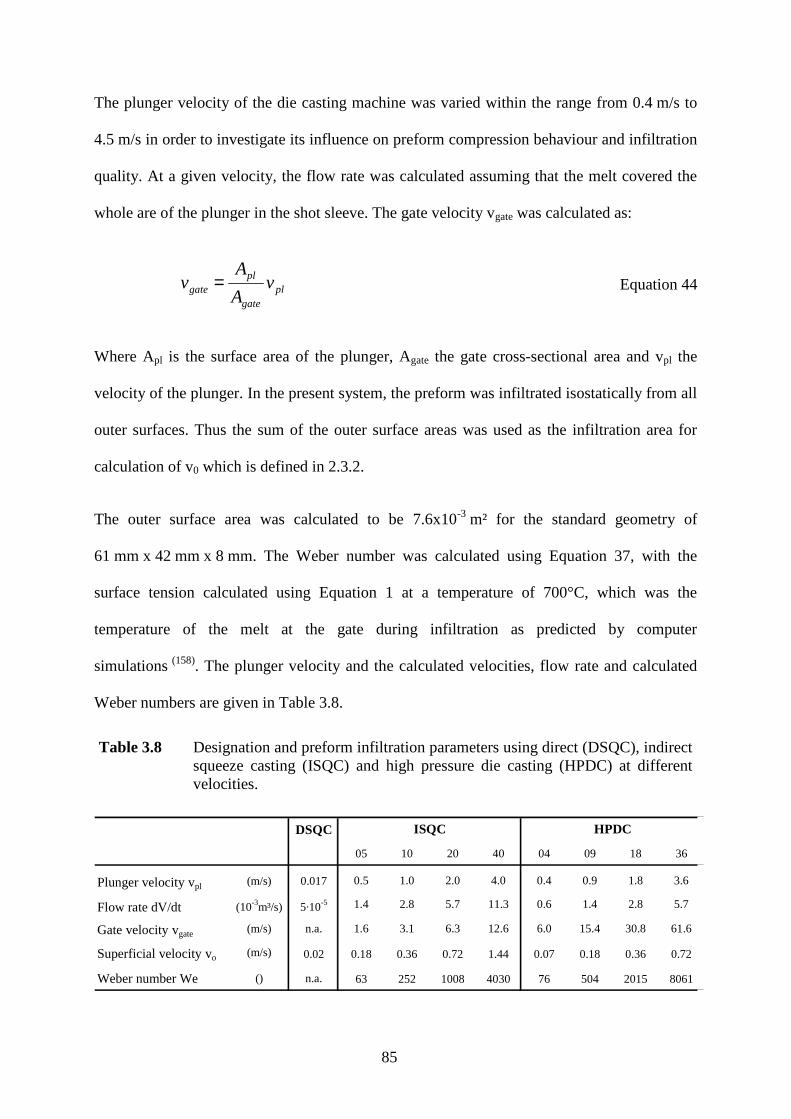
85
The plunger velocity of the die casting machine was varied within the range from 0.4 m/s to
4.5 m/s in order to investigate its influence on preform compression behaviour and infiltration
quality. At a given velocity, the flow rate was calculated assuming that the melt covered the
whole are of the plunger in the shot sleeve. The gate velocity vgate was calculated as:
plgate
plgate v
A
Av = Equation 44
Where Apl is the surface area of the plunger, Agate the gate cross-sectional area and vpl the
velocity of the plunger. In the present system, the preform was infiltrated isostatically from all
outer surfaces. Thus the sum of the outer surface areas was used as the infiltration area for
calculation of v0 which is defined in 2.3.2.
The outer surface area was calculated to be 7.6x10⁻³ m² for the standard geometry of
61 mm x 42 mm x 8 mm. The Weber number was calculated using Equation 37, with the
surface tension calculated using Equation 1 at a temperature of 700°C, which was the
temperature of the melt at the gate during infiltration as predicted by computer
simulations (158). The plunger velocity and the calculated velocities, flow rate and calculated
Weber numbers are given in Table 3.8.
Table 3.8 Designation and preform infiltration parameters using direct (DSQC), indirect squeeze casting (ISQC) and high pressure die casting (HPDC) at different velocities.
DSQC
05 10 20 40 04 09 18 36
Plunger velocity vpl (m/s) 0.017 0.5 1.0 2.0 4.0 0.4 0.9 1.8 3.6
Flow rate dV/dt (10-3m³/s) 5·10-5 1.4 2.8 5.7 11.3 0.6 1.4 2.8 5.7
Gate velocity vgate (m/s) n.a. 1.6 3.1 6.3 12.6 6.0 15.4 30.8 61.6
Superficial velocity vo (m/s) 0.02 0.18 0.36 0.72 1.44 0.07 0.18 0.36 0.72
Weber number We () n.a. 63 252 1008 4030 76 504 2015 8061
ISQC HPDC
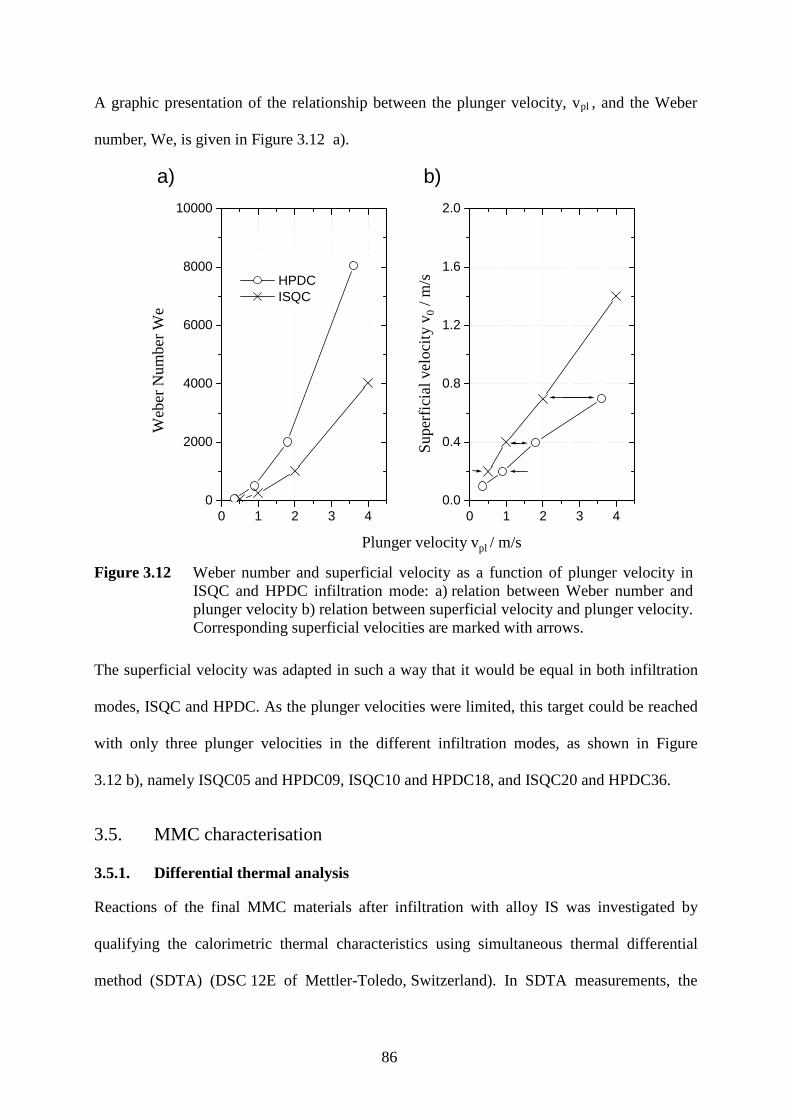
86
A graphic presentation of the relationship between the plunger velocity, vpl , and the Weber
number, We, is given in Figure 3.12 a).
0 1 2 3 40
2000
4000
6000
8000
10000
0 1 2 3 40.0
0.4
0.8
1.2
1.6
2.0
HPDC ISQC
Web
er n
umbe
r W
e ()
Plunger velocity vpl (m/s)
Sup
erfic
ial v
eloc
ity v
0 (m
/s)
a) b)
Plunger velocity vpl / m/s
Web
er
Num
ber
We
Sup
erfic
ial v
elo
city
v 0/
m/s
Figure 3.12 Weber number and superficial velocity as a function of plunger velocity in ISQC and HPDC infiltration mode: a) relation between Weber number and plunger velocity b) relation between superficial velocity and plunger velocity. Corresponding superficial velocities are marked with arrows.
The superficial velocity was adapted in such a way that it would be equal in both infiltration
modes, ISQC and HPDC. As the plunger velocities were limited, this target could be reached
with only three plunger velocities in the different infiltration modes, as shown in Figure
3.12 b), namely ISQC05 and HPDC09, ISQC10 and HPDC18, and ISQC20 and HPDC36.
3.5. MMC characterisation
3.5.1. Differential thermal analysis
Reactions of the final MMC materials after infiltration with alloy IS was investigated by
qualifying the calorimetric thermal characteristics using simultaneous thermal differential
method (SDTA) (DSC 12E of Mettler-Toledo, Switzerland). In SDTA measurements, the
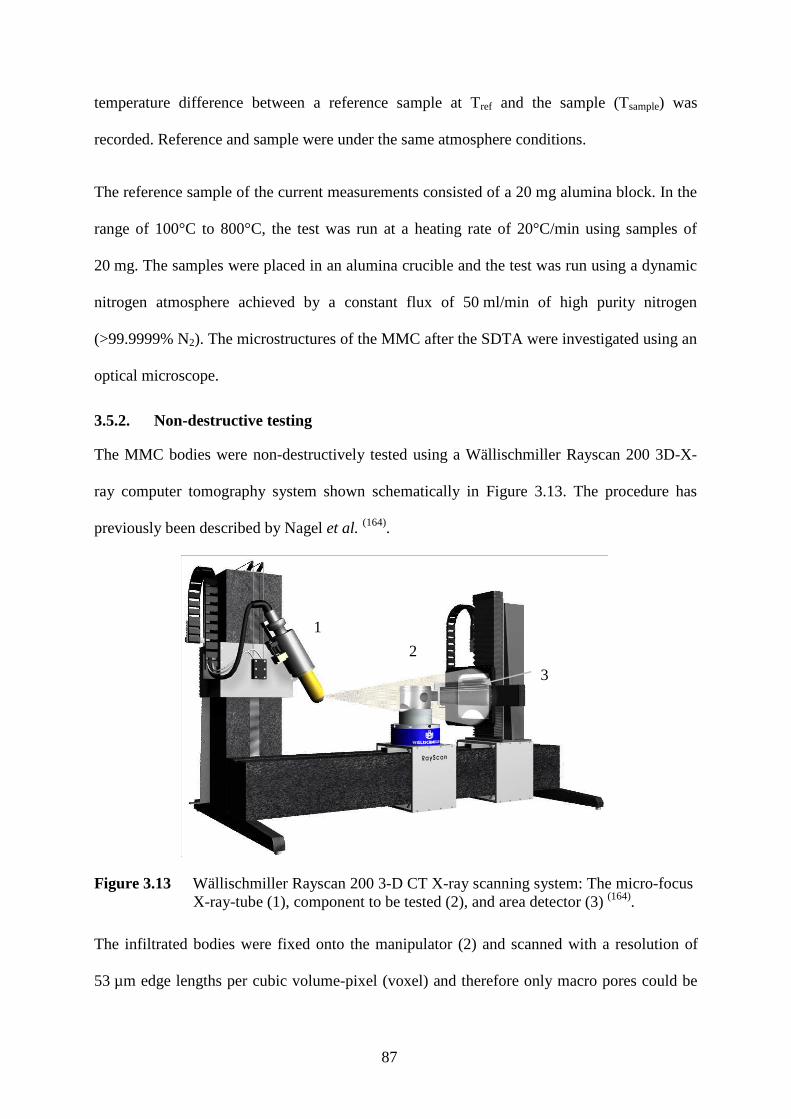
87
temperature difference between a reference sample at Tref and the sample (Tsample) was
recorded. Reference and sample were under the same atmosphere conditions.
The reference sample of the current measurements consisted of a 20 mg alumina block. In the
range of 100°C to 800°C, the test was run at a heating rate of 20°C/min using samples of
20 mg. The samples were placed in an alumina crucible and the test was run using a dynamic
nitrogen atmosphere achieved by a constant flux of 50 ml/min of high purity nitrogen
(>99.9999% N2). The microstructures of the MMC after the SDTA were investigated using an
optical microscope.
3.5.2. Non-destructive testing
The MMC bodies were non-destructively tested using a Wällischmiller Rayscan 200 3D-X-
ray computer tomography system shown schematically in Figure 3.13. The procedure has
previously been described by Nagel et al. (164).
1
2
3
1
2
3
Figure 3.13 Wällischmiller Rayscan 200 3-D CT X-ray scanning system: The micro-focus X-ray-tube (1), component to be tested (2), and area detector (3) (164).
The infiltrated bodies were fixed onto the manipulator (2) and scanned with a resolution of
53 µm edge lengths per cubic volume-pixel (voxel) and therefore only macro pores could be
88
detected. This operation took approximately 80 min using a microfocus X-ray source (1). An
area detector (3) with a 1024x1024 pixel matrix was used. The subsequent 20 minute
reconstruction step led to a 3D-database which was used for making the virtual 2D-cuts.
3.5.3. Compression of preforms during infiltration
For determination of the preform compression, MMC samples were cut along the longitudinal
axis and fine ground in several stages using graded SiC papers down to a 1200 grit size. The
cross-sectional area of the MMC was measured using digital images. The borderline of the
MMC was detected by using a grey value threshold and the area was evaluated using image
analysis software. A reproducibility test on one sample showed a scatter of 0.2 mm² for a
typical area of 400 mm². The relative preform compression, cpr , was calculated as the ratio of
the MMC cross-sectional area to the initial cross-sectional area of the preform. When using
the die casting technique for preform infiltration, a minimum of three samples per parameter
set were measured.
3.5.4. Microstructure and Detailed Image Analysis
Metallographic preparation of the composite samples was achieved by grinding and polishing
on a Struers Planopol automatic polisher. Qualitative and detailed image analyses were
performed using a Zeiss Axiophot optical microscope fitted with a computer-controlled XYZ-
stage. For determination of local saturation of the preform with metal, Zeiss KS400 image
analysis software in combination with the macro presented by Bernthaler et al. (165) were used.
High resolution microstructures were captured using a LEO Gemini 1525 SEM.
3.5.5. Mechanical properties
The elastic modulus, bending strength and fracture toughness, KIC , of the alloy IS and the
MMCS were determined using bend test bars of dimensions 42 mm x 4 mm x 3 mm. The
elastic modulus was calculated from the first resonant frequency of the bar in accordance with
ASTM-E 1876-99 (166). The bending strength was measured in the four-point mode taking into
89
account the compliance of the test system. The support distances were 20 mm and 40 mm in
accordance with EN 843-1 (167). The probability of failure, Pf , of the single fracture stresses σ
was assumed to follow the two parameter Weibull distribution as:
−−=
m
ofP
σσ
exp1 Equation 45
where σ0 is the characteristic stress at which 1/exp of specimens survived, and m the Weibull
modulus. The latter is a measure of the distribution of flaws. It is a dimensionless number
corresponding to the variability in measured strength and reflects the distribution of flaws in
the material. A high Weibull modulus indicates little variation from sample to sample. Both m
and σ0 were calculated using the maximum likelihood method in accordance with
EN 843(168) 5־. The fracture toughness was evaluated using single edge V-notched bars
(SEVNB) as described by Kübler et al. (169). The mechanical tests were conducted by the
Fraunhofer Institut für Werkstoffmechanik in Freiburg, Germany.
3.5.6. Tribological test
The model system investigated for tribological wear consisted of sliding a hardened steel
cylinder (rc=6 mm, lc=22 mm) on a polished MMC sample with a diameter of 24 mm and a
thickness of 7.9 mm. Standard motor oil (SAE 15-W40) was chosen as the tribological
medium between the two materials. The translational-reverse movement of the cylinder was
conducted on a SRV III-Optimol tribometer. A schematic of the test set-up is shown in Figure
3.14 b).
cc
NH l r
E F0.418P = Equation 46
The normal force FN was kept constant at 100 N resulting in an initial Hertzian pressure PH of
100 MPa in accordance to Equation 46 (170). The calculations were based on the elastic
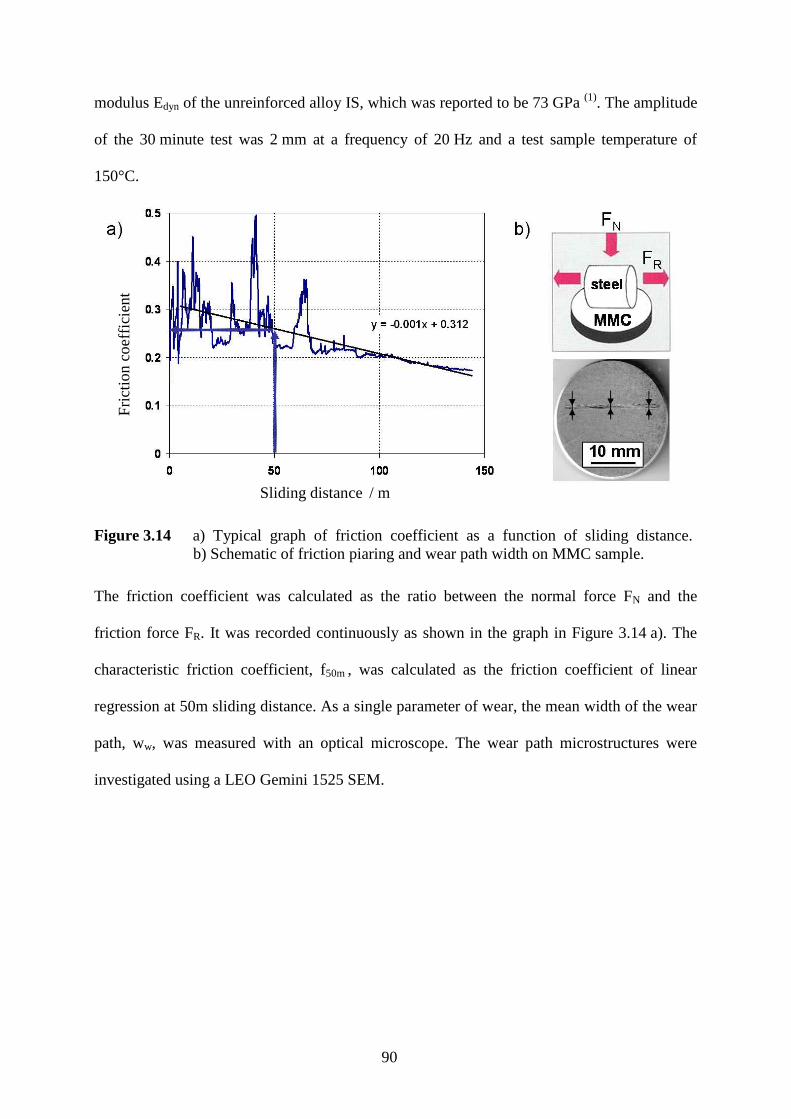
90
modulus Edyn of the unreinforced alloy IS, which was reported to be 73 GPa (1). The amplitude
of the 30 minute test was 2 mm at a frequency of 20 Hz and a test sample temperature of
150°C.
Sliding distance / m
Fric
tion
coe
ffici
ent
Figure 3.14 a) Typical graph of friction coefficient as a function of sliding distance. b) Schematic of friction piaring and wear path width on MMC sample.
The friction coefficient was calculated as the ratio between the normal force FN and the
friction force FR. It was recorded continuously as shown in the graph in Figure 3.14 a). The
characteristic friction coefficient, f50m , was calculated as the friction coefficient of linear
regression at 50m sliding distance. As a single parameter of wear, the mean width of the wear
path, ww, was measured with an optical microscope. The wear path microstructures were
investigated using a LEO Gemini 1525 SEM.
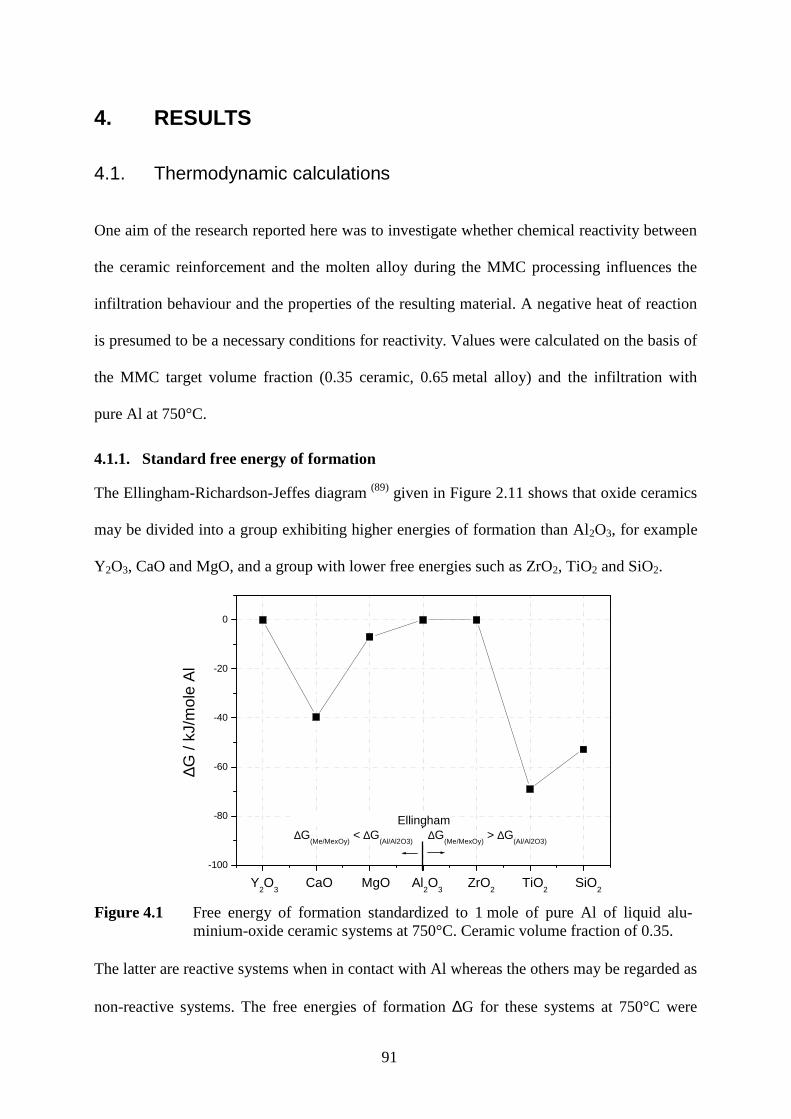
91
4. RESULTS
4.1. Thermodynamic calculations
One aim of the research reported here was to investigate whether chemical reactivity between
the ceramic reinforcement and the molten alloy during the MMC processing influences the
infiltration behaviour and the properties of the resulting material. A negative heat of reaction
is presumed to be a necessary conditions for reactivity. Values were calculated on the basis of
the MMC target volume fraction (0.35 ceramic, 0.65 metal alloy) and the infiltration with
pure Al at 750°C.
4.1.1. Standard free energy of formation
The Ellingham-Richardson-Jeffes diagram (89) given in Figure 2.11 shows that oxide ceramics
may be divided into a group exhibiting higher energies of formation than Al2O3, for example
Y2O3, CaO and MgO, and a group with lower free energies such as ZrO2, TiO2 and SiO2.
-100
-80
-60
-40
-20
0
Y2O
3 CaO MgO Al
2O
3 ZrO
2 TiO
2 SiO
2
Ellingham∆G
(Me/MexOy) < ∆G
(Al/Al2O3) ∆G
(Me/MexOy) > ∆G
(Al/Al2O3)
∆G (
kJ/m
ole
Al)
∆G /
kJ/m
ole
Al
Figure 4.1 Free energy of formation standardized to 1 mole of pure Al of liquid alu-minium-oxide ceramic systems at 750°C. Ceramic volume fraction of 0.35.
The latter are reactive systems when in contact with Al whereas the others may be regarded as
non-reactive systems. The free energies of formation ∆G for these systems at 750°C were
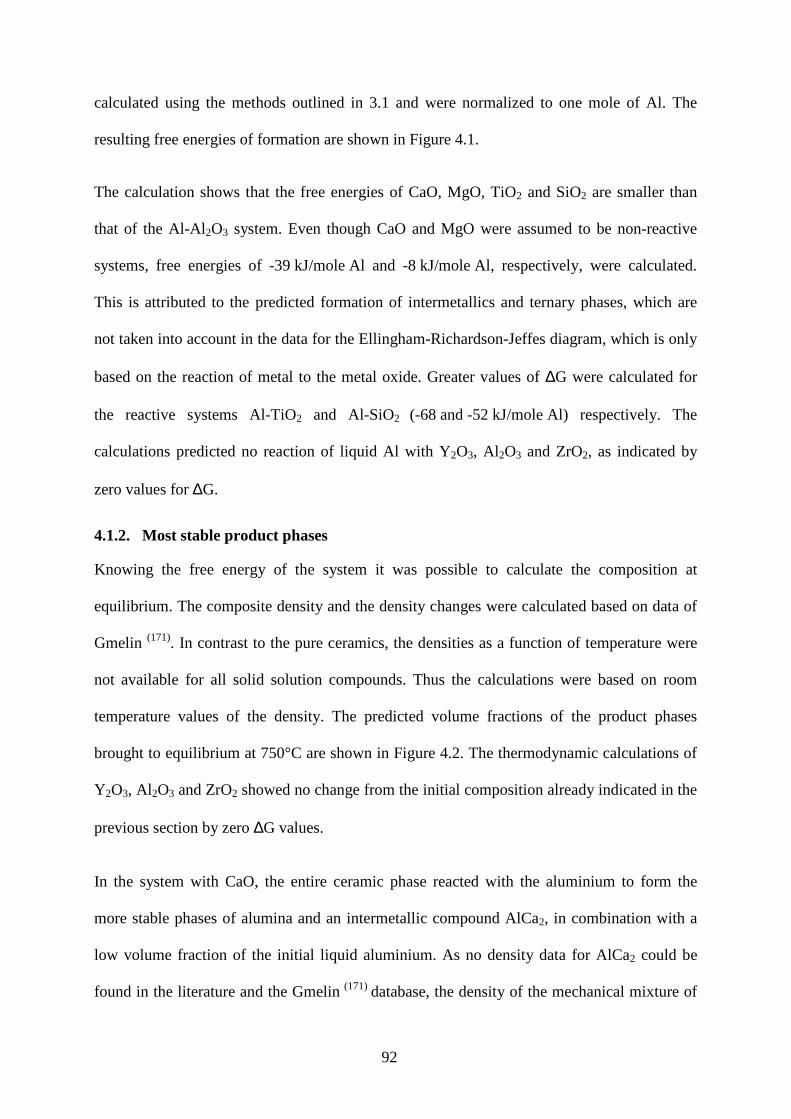
92
calculated using the methods outlined in 3.1 and were normalized to one mole of Al. The
resulting free energies of formation are shown in Figure 4.1.
The calculation shows that the free energies of CaO, MgO, TiO2 and SiO2 are smaller than
that of the Al-Al2O3 system. Even though CaO and MgO were assumed to be non-reactive
systems, free energies of -39 kJ/mole Al and -8 kJ/mole Al, respectively, were calculated.
This is attributed to the predicted formation of intermetallics and ternary phases, which are
not taken into account in the data for the Ellingham-Richardson-Jeffes diagram, which is only
based on the reaction of metal to the metal oxide. Greater values of ∆G were calculated for
the reactive systems Al-TiO2 and Al-SiO2 (-68 and -52 kJ/mole Al) respectively. The
calculations predicted no reaction of liquid Al with Y2O3, Al2O3 and ZrO2, as indicated by
zero values for ∆G.
4.1.2. Most stable product phases
Knowing the free energy of the system it was possible to calculate the composition at
equilibrium. The composite density and the density changes were calculated based on data of
Gmelin (171). In contrast to the pure ceramics, the densities as a function of temperature were
not available for all solid solution compounds. Thus the calculations were based on room
temperature values of the density. The predicted volume fractions of the product phases
brought to equilibrium at 750°C are shown in Figure 4.2. The thermodynamic calculations of
Y2O3, Al2O3 and ZrO2 showed no change from the initial composition already indicated in the
previous section by zero ∆G values.
In the system with CaO, the entire ceramic phase reacted with the aluminium to form the
more stable phases of alumina and an intermetallic compound AlCa2, in combination with a
low volume fraction of the initial liquid aluminium. As no density data for AlCa2 could be
found in the literature and the Gmelin (171) database, the density of the mechanical mixture of
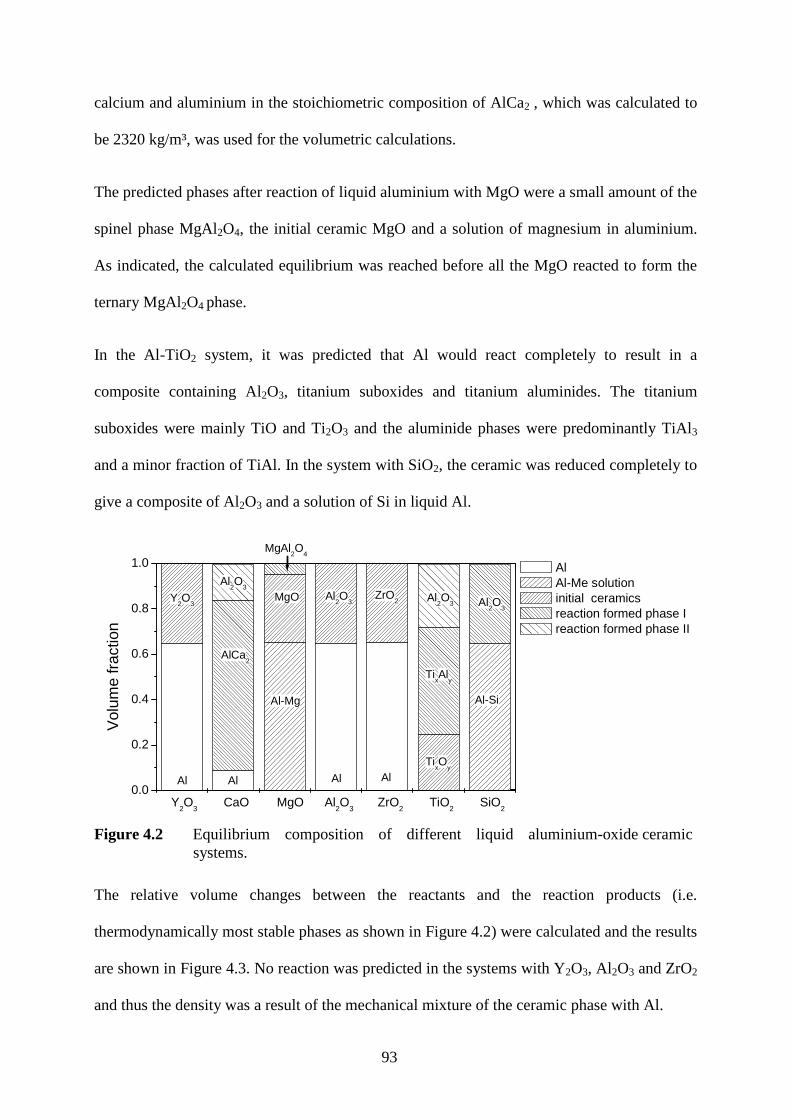
93
calcium and aluminium in the stoichiometric composition of AlCa2 , which was calculated to
be 2320 kg/m³, was used for the volumetric calculations.
The predicted phases after reaction of liquid aluminium with MgO were a small amount of the
spinel phase MgAl2O4, the initial ceramic MgO and a solution of magnesium in aluminium.
As indicated, the calculated equilibrium was reached before all the MgO reacted to form the
ternary MgAl2O4 phase.
In the Al-TiO2 system, it was predicted that Al would react completely to result in a
composite containing Al2O3, titanium suboxides and titanium aluminides. The titanium
suboxides were mainly TiO and Ti2O3 and the aluminide phases were predominantly TiAl3
and a minor fraction of TiAl. In the system with SiO2, the ceramic was reduced completely to
give a composite of Al2O3 and a solution of Si in liquid Al.
0.0
0.2
0.4
0.6
0.8
1.0
AlAlAlAl
MgOY2O
3ZrO
2Al2O
3
Y2O
3 CaO MgO Al
2O
3 ZrO
2 TiO
2 SiO
2
MgAl2O
4
Al-SiAl-Mg
TixO
y
TixAl
y
Al2O
3 Al2O
3
Al2O
3
Vol
ume
frac
tion
Al Al-Me solution initial ceramics reaction formed phase I reaction formed phase II
AlCa2
Figure 4.2 Equilibrium composition of different liquid aluminium-oxide ceramic systems.
The relative volume changes between the reactants and the reaction products (i.e.
thermodynamically most stable phases as shown in Figure 4.2) were calculated and the results
are shown in Figure 4.3. No reaction was predicted in the systems with Y2O3, Al2O3 and ZrO2
and thus the density was a result of the mechanical mixture of the ceramic phase with Al.
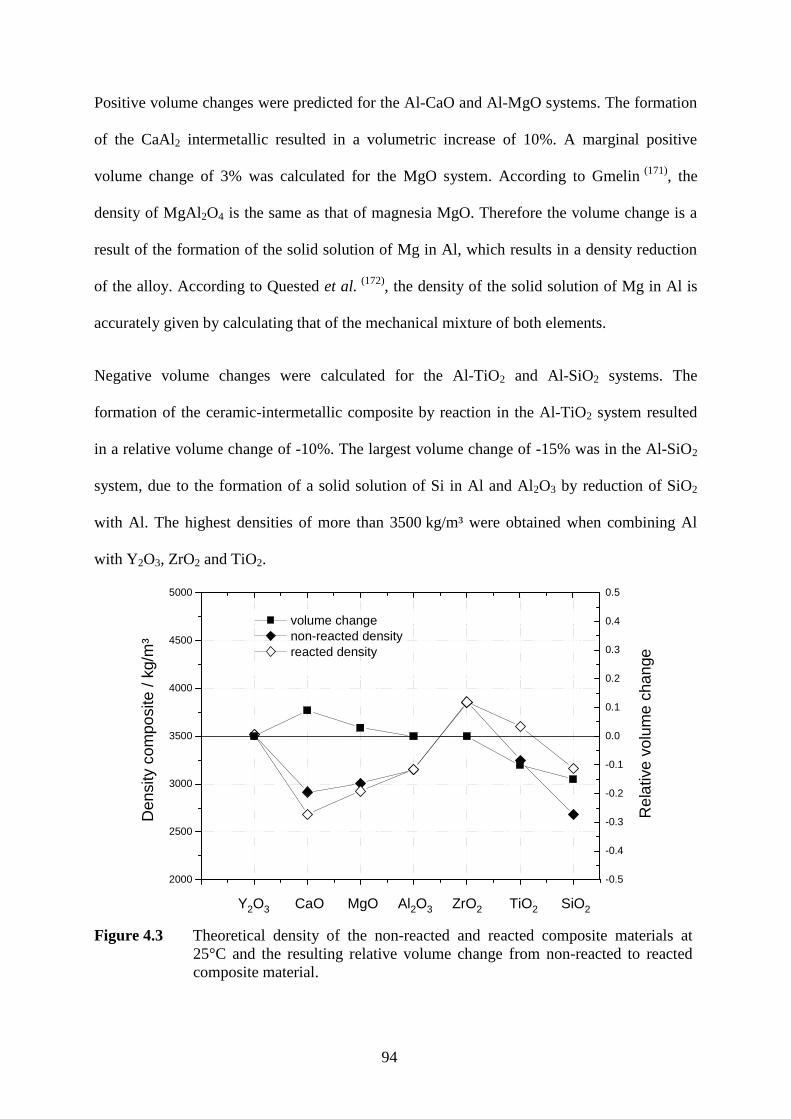
94
Positive volume changes were predicted for the Al-CaO and Al-MgO systems. The formation
of the CaAl2 intermetallic resulted in a volumetric increase of 10%. A marginal positive
volume change of 3% was calculated for the MgO system. According to Gmelin (171), the
density of MgAl 2O4 is the same as that of magnesia MgO. Therefore the volume change is a
result of the formation of the solid solution of Mg in Al, which results in a density reduction
of the alloy. According to Quested et al. (172), the density of the solid solution of Mg in Al is
accurately given by calculating that of the mechanical mixture of both elements.
Negative volume changes were calculated for the Al-TiO2 and Al-SiO2 systems. The
formation of the ceramic-intermetallic composite by reaction in the Al-TiO2 system resulted
in a relative volume change of -10%. The largest volume change of -15% was in the Al-SiO2
system, due to the formation of a solid solution of Si in Al and Al2O3 by reduction of SiO2
with Al. The highest densities of more than 3500 kg/m³ were obtained when combining Al
with Y2O3, ZrO2 and TiO2.
Figure 4.3 Theoretical density of the non-reacted and reacted composite materials at 25°C and the resulting relative volume change from non-reacted to reacted composite material.
Y2O3 CaO MgO Al2O3 ZrO2 TiO2 SiO2
2000
2500
3000
3500
4000
4500
5000
Den
sity
(kg
/m3 )
volume change non-reacted density reacted density
-0.5
-0.4
-0.3
-0.2
-0.1
0.0
0.1
0.2
0.3
0.4
0.5
Rel
ativ
e vo
lum
e ch
ange
()
Y2O3 CaO MgO Al2O3 ZrO2 TiO2 SiO2
Den
sity
com
posi
te(k
g/m
³)
Rel
ativ
e vo
lum
ech
ange
()
Den
sity
com
posi
te /
kg/m
³
Rel
ativ
e vo
lum
e ch
ange
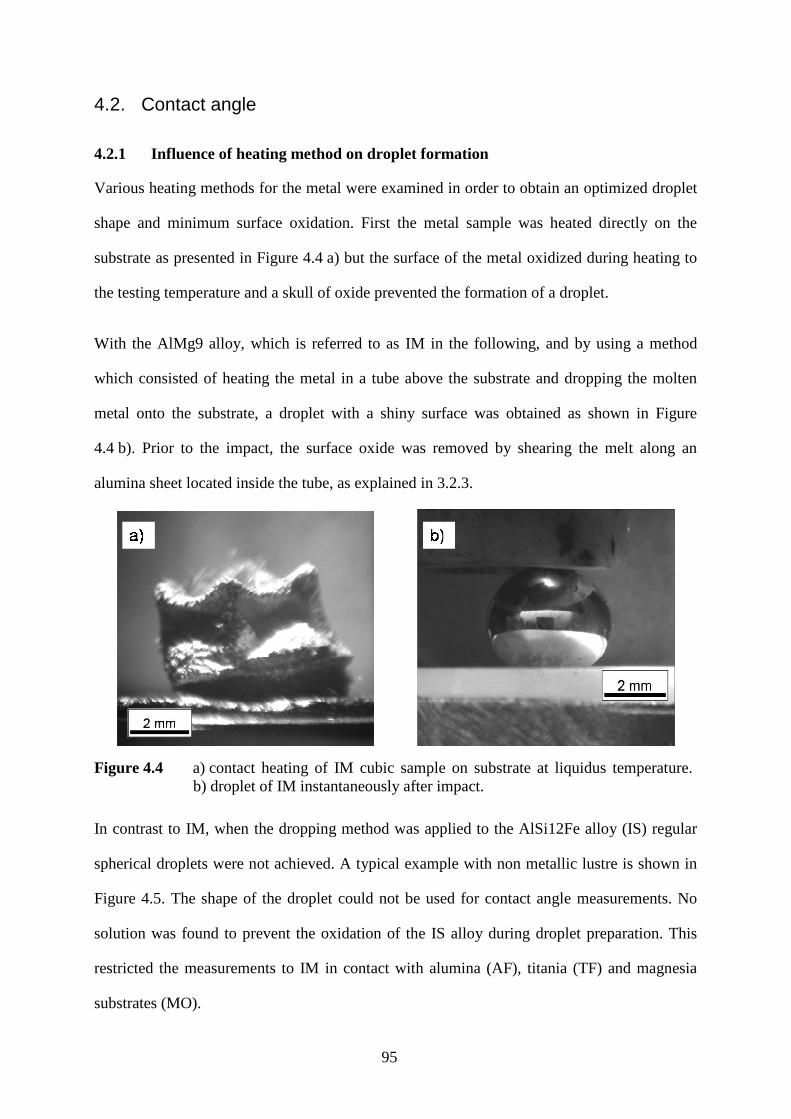
95
4.2. Contact angle
4.2.1 Influence of heating method on droplet formation
Various heating methods for the metal were examined in order to obtain an optimized droplet
shape and minimum surface oxidation. First the metal sample was heated directly on the
substrate as presented in Figure 4.4 a) but the surface of the metal oxidized during heating to
the testing temperature and a skull of oxide prevented the formation of a droplet.
With the AlMg9 alloy, which is referred to as IM in the following, and by using a method
which consisted of heating the metal in a tube above the substrate and dropping the molten
metal onto the substrate, a droplet with a shiny surface was obtained as shown in Figure
4.4 b). Prior to the impact, the surface oxide was removed by shearing the melt along an
alumina sheet located inside the tube, as explained in 3.2.3.
Figure 4.4 a) contact heating of IM cubic sample on substrate at liquidus temperature. b) droplet of IM instantaneously after impact.
In contrast to IM, when the dropping method was applied to the AlSi12Fe alloy (IS) regular
spherical droplets were not achieved. A typical example with non metallic lustre is shown in
Figure 4.5. The shape of the droplet could not be used for contact angle measurements. No
solution was found to prevent the oxidation of the IS alloy during droplet preparation. This
restricted the measurements to IM in contact with alumina (AF), titania (TF) and magnesia
substrates (MO).
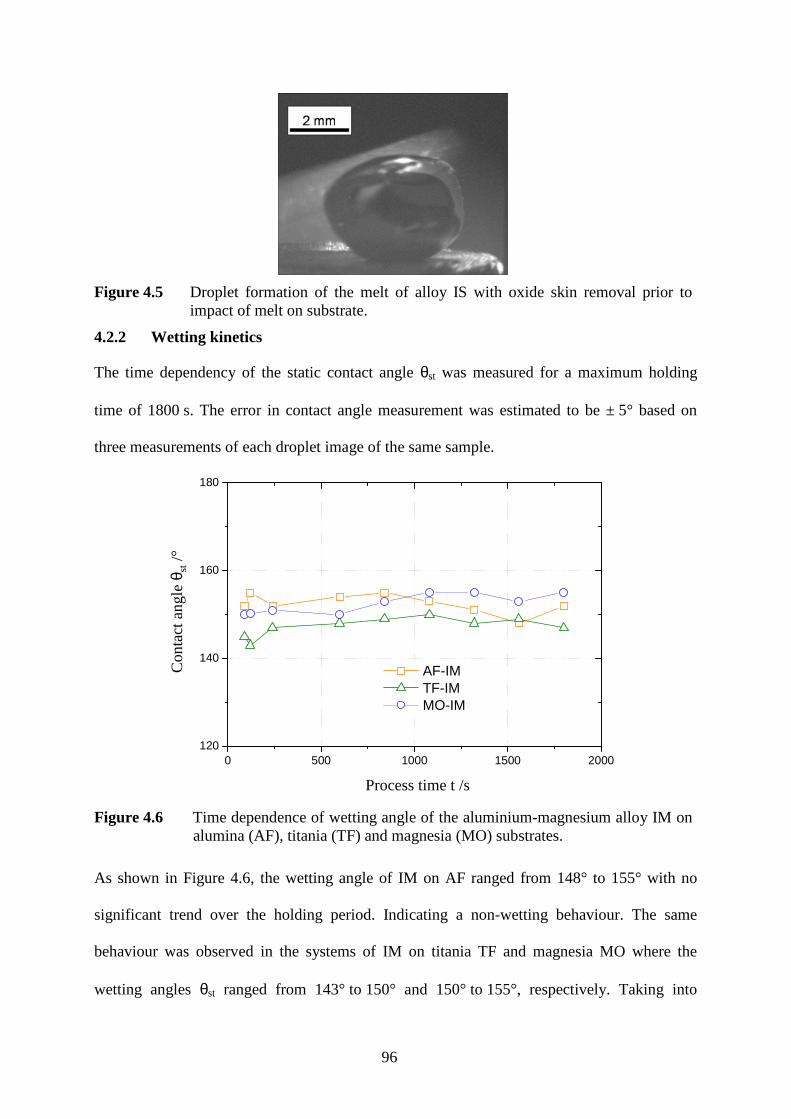
96
Figure 4.5 Droplet formation of the melt of alloy IS with oxide skin removal prior to impact of melt on substrate.
4.2.2 Wetting kinetics
The time dependency of the static contact angle θst was measured for a maximum holding
time of 1800 s. The error in contact angle measurement was estimated to be ± 5° based on
three measurements of each droplet image of the same sample.
0 500 1000 1500 2000120
140
160
180
AF-IM TF-IM MO-IM
Sta
tic w
ettin
g an
gle
θ st (
°)
Time t (s)Process time t /s
Con
tact
an
gle
θ st/°
Figure 4.6 Time dependence of wetting angle of the aluminium-magnesium alloy IM on alumina (AF), titania (TF) and magnesia (MO) substrates.
As shown in Figure 4.6, the wetting angle of IM on AF ranged from 148° to 155° with no
significant trend over the holding period. Indicating a non-wetting behaviour. The same
behaviour was observed in the systems of IM on titania TF and magnesia MO where the
wetting angles θst ranged from 143° to 150° and 150° to 155°, respectively. Taking into

97
account the error in contact angle measurements, the wetting angles in all three systems were
similar with no significant variations within the holding time.
The reliability of the measurement of the wetting angle θst during the holding time was
demonstrated when the wetting angle measured on the liquid droplet in situ was compared
with that measured on a section cut through the centre of the solidified droplet. This
measurement, as shown in Figure 4.7, was performed using the spline method similar to that
used for the in-process measurements. The wetting angle of IM on MO was 154° in both
cases, indicating good agreement between the two methods.
2 µm200 µm2 µm200 µmSubstrate MO
IM_droplet
Figure 4.7 Contact angle of IM on MO determined using a micrograph at the triple point on a cross-section through the centre of the solidified droplet.
4.2.3 Influence of substrate on interface formation
Apart from the contact angle measurements, the microstructure of the contact area between
the substrate and the metal alloy was investigated in order to detect interfacial reaction phases
and irregularities.
The ceramic substrates could not be made totally dense and contained residual closed porosity
which was opened to the surface during the substrate polishing process. In metal-ceramic
substrate couples, the bottle-neck shaped microporosity on the substrate surface was filled
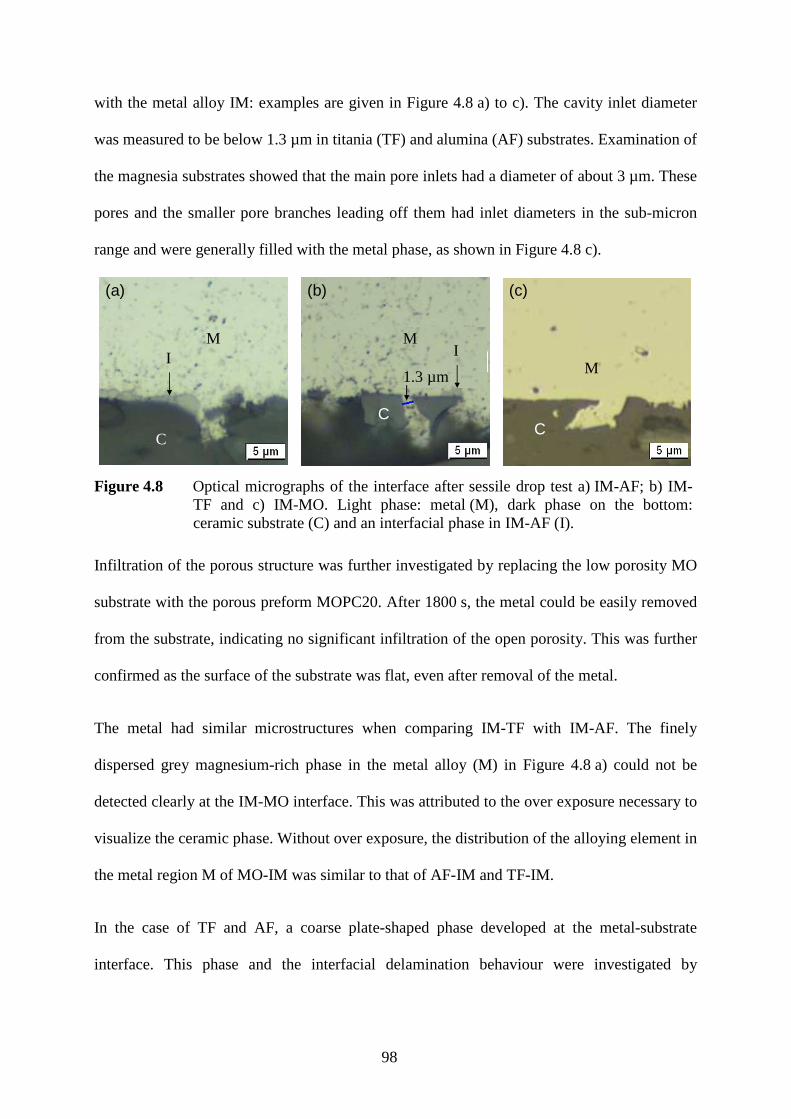
98
with the metal alloy IM: examples are given in Figure 4.8 a) to c). The cavity inlet diameter
was measured to be below 1.3 µm in titania (TF) and alumina (AF) substrates. Examination of
the magnesia substrates showed that the main pore inlets had a diameter of about 3 µm. These
pores and the smaller pore branches leading off them had inlet diameters in the sub-micron
range and were generally filled with the metal phase, as shown in Figure 4.8 c).
(a)(a) (b) (c)(c)
M
1.3 µm
C
I
C
M
C
MI
Figure 4.8 Optical micrographs of the interface after sessile drop test a) IM-AF; b) IM-TF and c) IM-MO. Light phase: metal (M), dark phase on the bottom: ceramic substrate (C) and an interfacial phase in IM-AF (I).
Infiltration of the porous structure was further investigated by replacing the low porosity MO
substrate with the porous preform MOPC20. After 1800 s, the metal could be easily removed
from the substrate, indicating no significant infiltration of the open porosity. This was further
confirmed as the surface of the substrate was flat, even after removal of the metal.
The metal had similar microstructures when comparing IM-TF with IM-AF. The finely
dispersed grey magnesium-rich phase in the metal alloy (M) in Figure 4.8 a) could not be
detected clearly at the IM-MO interface. This was attributed to the over exposure necessary to
visualize the ceramic phase. Without over exposure, the distribution of the alloying element in
the metal region M of MO-IM was similar to that of AF-IM and TF-IM.
In the case of TF and AF, a coarse plate-shaped phase developed at the metal-substrate
interface. This phase and the interfacial delamination behaviour were investigated by

99
removing the droplet of the IM-AF couple from the substrate and examining a cross-section
using SEM and EDS, as shown in Figure 4.9.
R
I
Z
M
C
Spot - I
FeFe
FeMn
Al
SiFe
(a) (b)
Figure 4.9 (a) Interface of AF-IM after droplet pull-off. M: alloy, I: Fe-rich interfacial phase, R: resin which fills the gap between ceramic substrate (C) with inclusions of zirconia (Z). (b) EDS spectrum of the spot analysis of phase I.
Bright areas in the SEM backscatter image indicate phases with higher atomic weights. These
were distributed in the substrate (C) and adjacent to the metal (M) and designated as an
interfacial phase (I) and phase Z in Figure 4.9. The phase I was found to contain mainly Al
with Fe and Mn and Si. The Fe originated from the commercial AlMg9 alloy (IM) where it
was added in order to prevent sticking to the tool steel die walls during high pressure die
casting. It accumulated on the substrate by gavity during the relatively long holding time.
The second bright phase, which was distributed in the substrate (C) and is marked with Z in
Figure 4.9, was ZrO2 which originated from the powder preparation step, where the powders
were milled in a ZrO2 container with ZrO2 balls. The abrasive properties of Al2O3 appear to be
the cause of this contamination. The comparatively lower hardness of TiO2 and MgO
prevented abrasion of ZrO2 during powder processing and therefore no zirconia debris was
found in the TF and MO substrates.

100
As shown in Figure 4.9, apart from the ZrO2 debris in the ceramic phase, there was a particle
embedded in the iron-rich phase which was covered with a small layer of the substrate AF. As
the metal droplet was pulled off prior to metallographic preparation, the weakest link in the
metal-ceramic couple appears to be the first few microns of the ceramic substrate.
4.3. Ceramic powders
4.3.1 Powder particle size
The particle size measurements of all powders were carried out in the as-purchased state. In
addition, AO was sized after a milling process used during the preform processing. The
particle size distributions of TO and MO were not specified in the data sheets of the supplier.
10-1 100 101 102
0
20
40
60
80
100
AO_as purchased AO_milled TO MO
Cum
ulat
ive
volu
me
frac
tion
(%)
Particle size (µm)Particle size /µm
Cum
ulat
ive
volu
me
/ %
Figure 4.10 Cumulative particle size distributions of the initial ceramic powders AO, TO and MO in the as-purchased state and AO after a milling step.
The characteristic median particle size d50 shown in Figure 4.10 was measured to be 1.3 µm
and 1.5 µm for TO and MO, respectively. The distribution of TO was significantly broader
than that of MO. The unmilled AO and MO powders both showed an S-shaped curve on the
log-normal plot in Figure 4.10. The unmilled TO powder was bimodal as indicated by the
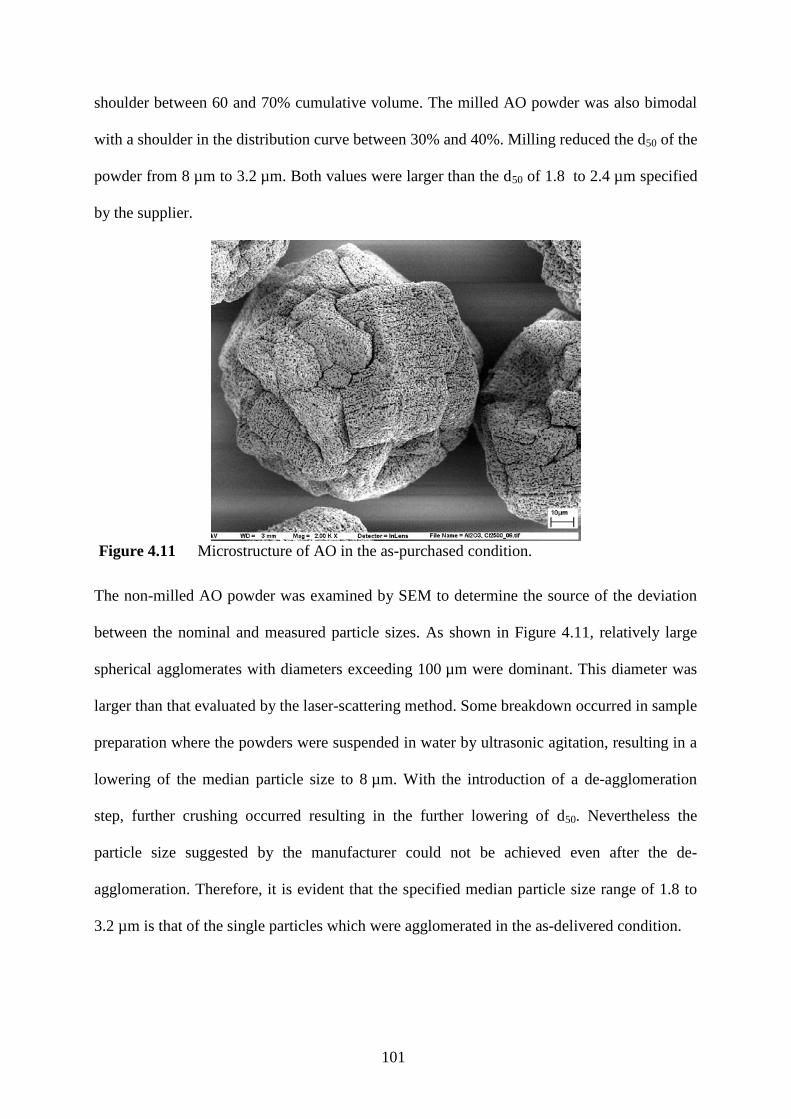
101
shoulder between 60 and 70% cumulative volume. The milled AO powder was also bimodal
with a shoulder in the distribution curve between 30% and 40%. Milling reduced the d50 of the
powder from 8 µm to 3.2 µm. Both values were larger than the d50 of 1.8 to 2.4 µm specified
by the supplier.
Figure 4.11 Microstructure of AO in the as-purchased condition.
The non-milled AO powder was examined by SEM to determine the source of the deviation
between the nominal and measured particle sizes. As shown in Figure 4.11, relatively large
spherical agglomerates with diameters exceeding 100 µm were dominant. This diameter was
larger than that evaluated by the laser-scattering method. Some breakdown occurred in sample
preparation where the powders were suspended in water by ultrasonic agitation, resulting in a
lowering of the median particle size to 8 µm. With the introduction of a de-agglomeration
step, further crushing occurred resulting in the further lowering of d50. Nevertheless the
particle size suggested by the manufacturer could not be achieved even after the de-
agglomeration. Therefore, it is evident that the specified median particle size range of 1.8 to
3.2 µm is that of the single particles which were agglomerated in the as-delivered condition.
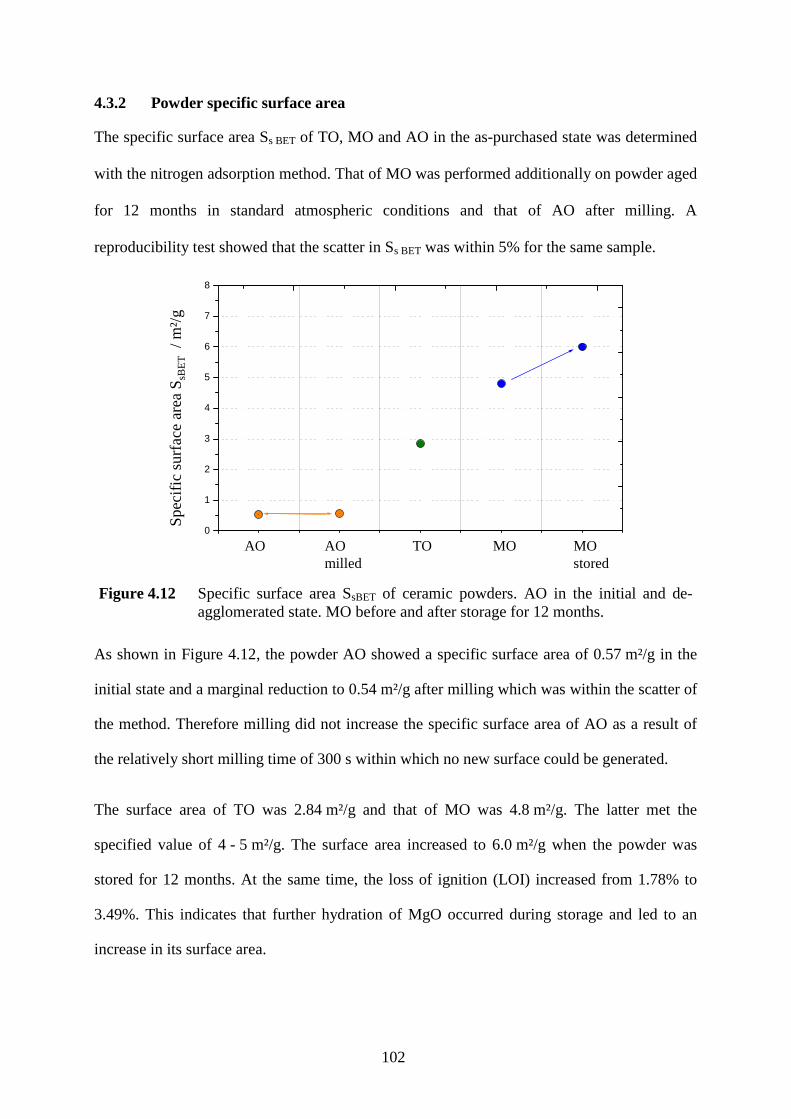
102
4.3.2 Powder specific surface area
The specific surface area Ss BET of TO, MO and AO in the as-purchased state was determined
with the nitrogen adsorption method. That of MO was performed additionally on powder aged
for 12 months in standard atmospheric conditions and that of AO after milling. A
reproducibility test showed that the scatter in Ss BET was within 5% for the same sample.
Figure 4.12 Specific surface area SsBET of ceramic powders. AO in the initial and de-agglomerated state. MO before and after storage for 12 months.
As shown in Figure 4.12, the powder AO showed a specific surface area of 0.57 m²/g in the
initial state and a marginal reduction to 0.54 m²/g after milling which was within the scatter of
the method. Therefore milling did not increase the specific surface area of AO as a result of
the relatively short milling time of 300 s within which no new surface could be generated.
The surface area of TO was 2.84 m²/g and that of MO was 4.8 m²/g. The latter met the
specified value of 4 - 5 m²/g. The surface area increased to 6.0 m²/g when the powder was
stored for 12 months. At the same time, the loss of ignition (LOI) increased from 1.78% to
3.49%. This indicates that further hydration of MgO occurred during storage and led to an
increase in its surface area.
AO AO milled TO MO MO hydr.0
1
2
3
4
5
6
7
8
Spe
cific
sur
face
are
a S
s B
ET (
m²/
g)
AO AO TO MO MOmilled stored
Spe
cific
sur
face
are
a S
sBE
T/ m
²/g
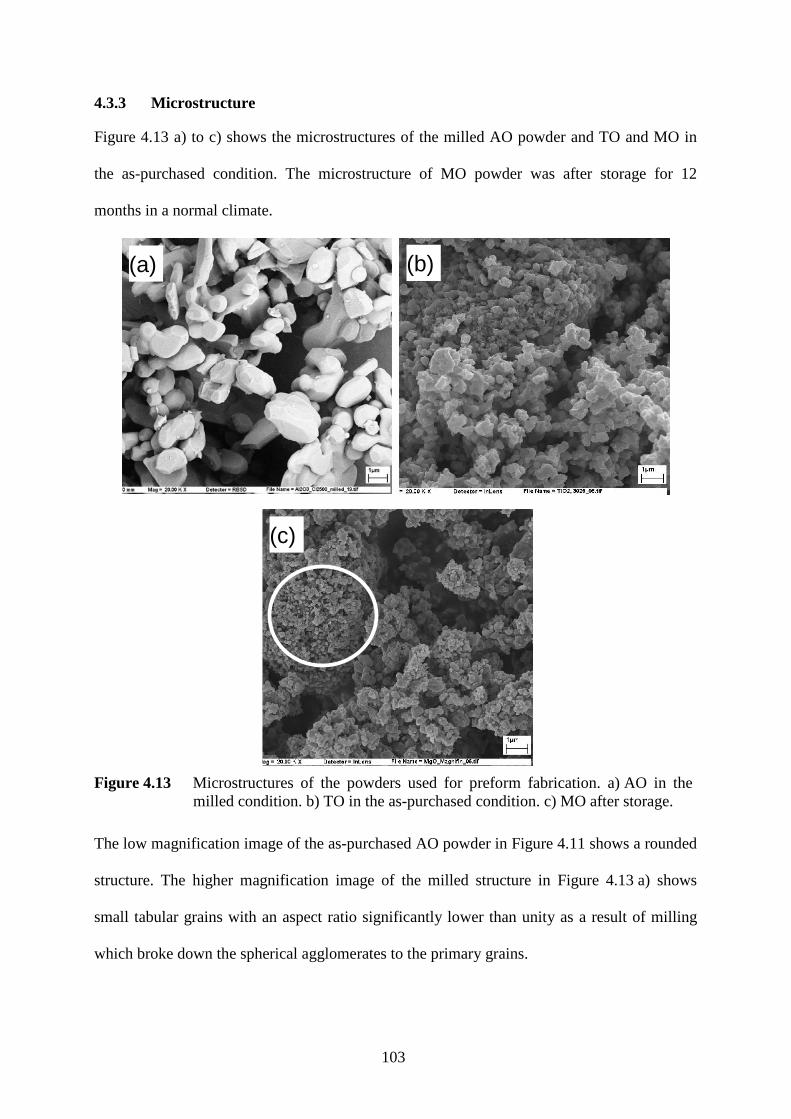
103
4.3.3 Microstructure
Figure 4.13 a) to c) shows the microstructures of the milled AO powder and TO and MO in
the as-purchased condition. The microstructure of MO powder was after storage for 12
months in a normal climate.
(b)(a)
(c)
Figure 4.13 Microstructures of the powders used for preform fabrication. a) AO in the milled condition. b) TO in the as-purchased condition. c) MO after storage.
The low magnification image of the as-purchased AO powder in Figure 4.11 shows a rounded
structure. The higher magnification image of the milled structure in Figure 4.13 a) shows
small tabular grains with an aspect ratio significantly lower than unity as a result of milling
which broke down the spherical agglomerates to the primary grains.
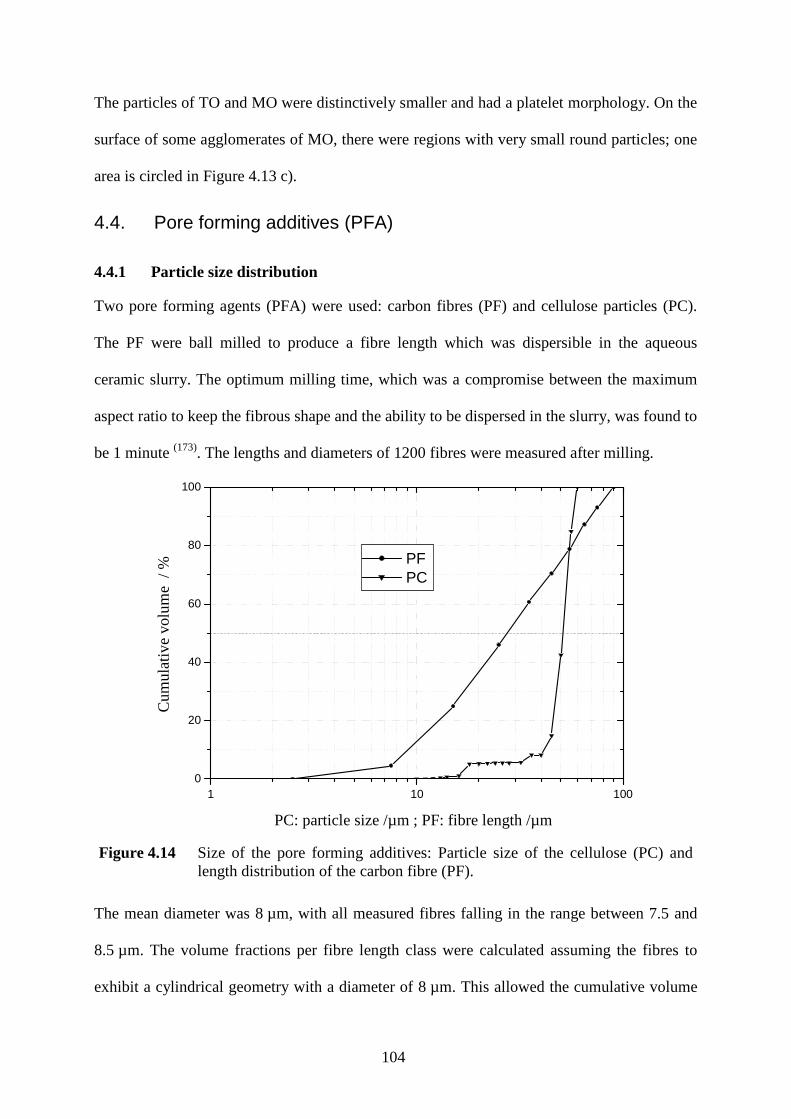
104
The particles of TO and MO were distinctively smaller and had a platelet morphology. On the
surface of some agglomerates of MO, there were regions with very small round particles; one
area is circled in Figure 4.13 c).
4.4. Pore forming additives (PFA)
4.4.1 Particle size distribution
Two pore forming agents (PFA) were used: carbon fibres (PF) and cellulose particles (PC).
The PF were ball milled to produce a fibre length which was dispersible in the aqueous
ceramic slurry. The optimum milling time, which was a compromise between the maximum
aspect ratio to keep the fibrous shape and the ability to be dispersed in the slurry, was found to
be 1 minute (173). The lengths and diameters of 1200 fibres were measured after milling.
1 10 1000
20
40
60
80
100
PF PC
Cum
ulat
ive
volu
me
frac
tion
(%)
PC: Particle size (µm) / PF: Fibre length (µm)PC: particle size /µm ; PF: fibre length /µm
Cum
ulat
ive
volu
me
/ %
Figure 4.14 Size of the pore forming additives: Particle size of the cellulose (PC) and length distribution of the carbon fibre (PF).
The mean diameter was 8 µm, with all measured fibres falling in the range between 7.5 and
8.5 µm. The volume fractions per fibre length class were calculated assuming the fibres to
exhibit a cylindrical geometry with a diameter of 8 µm. This allowed the cumulative volume
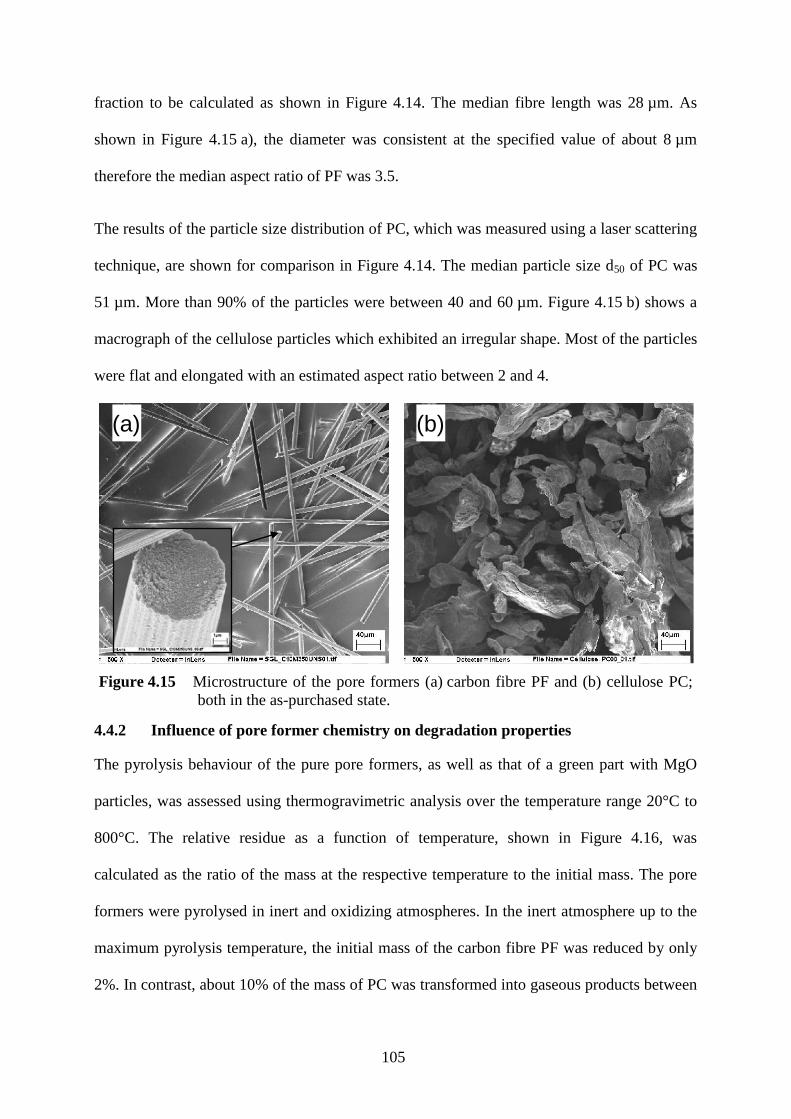
105
fraction to be calculated as shown in Figure 4.14. The median fibre length was 28 µm. As
shown in Figure 4.15 a), the diameter was consistent at the specified value of about 8 µm
therefore the median aspect ratio of PF was 3.5.
The results of the particle size distribution of PC, which was measured using a laser scattering
technique, are shown for comparison in Figure 4.14. The median particle size d50 of PC was
51 µm. More than 90% of the particles were between 40 and 60 µm. Figure 4.15 b) shows a
macrograph of the cellulose particles which exhibited an irregular shape. Most of the particles
were flat and elongated with an estimated aspect ratio between 2 and 4.
(a) (b)
Figure 4.15 Microstructure of the pore formers (a) carbon fibre PF and (b) cellulose PC; both in the as-purchased state.
4.4.2 Influence of pore former chemistry on degradation properties
The pyrolysis behaviour of the pure pore formers, as well as that of a green part with MgO
particles, was assessed using thermogravimetric analysis over the temperature range 20°C to
800°C. The relative residue as a function of temperature, shown in Figure 4.16, was
calculated as the ratio of the mass at the respective temperature to the initial mass. The pore
formers were pyrolysed in inert and oxidizing atmospheres. In the inert atmosphere up to the
maximum pyrolysis temperature, the initial mass of the carbon fibre PF was reduced by only
2%. In contrast, about 10% of the mass of PC was transformed into gaseous products between
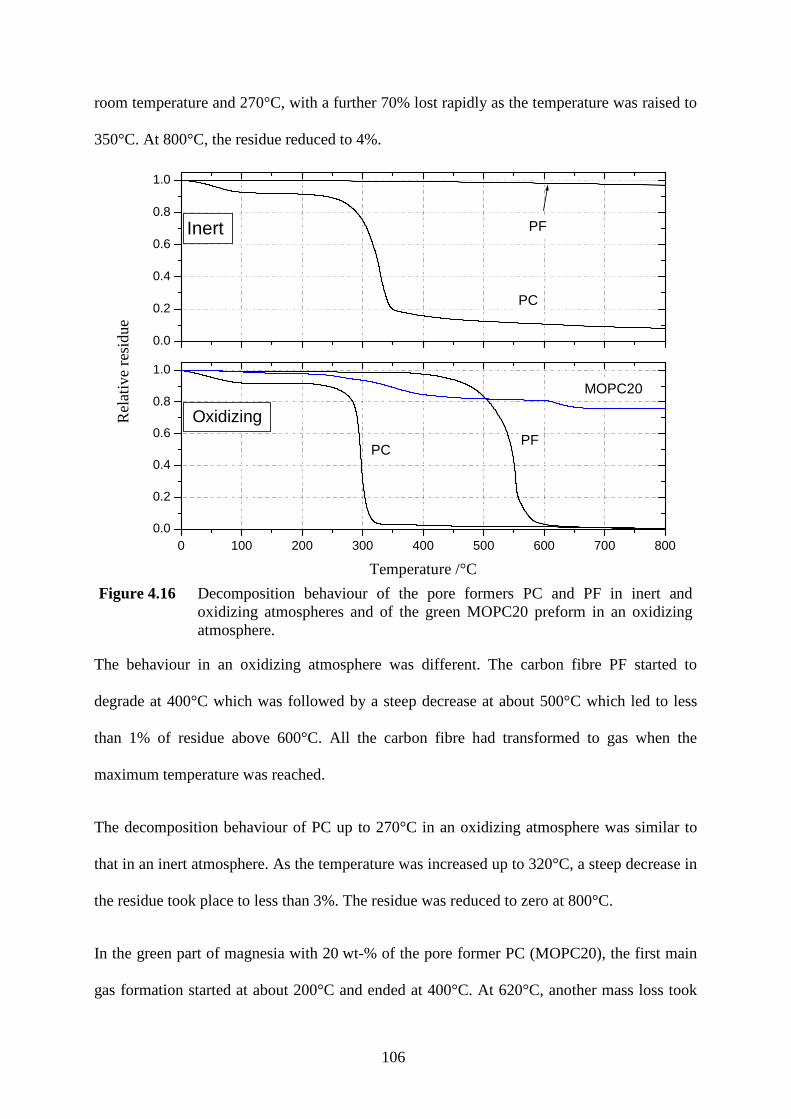
106
room temperature and 270°C, with a further 70% lost rapidly as the temperature was raised to
350°C. At 800°C, the residue reduced to 4%.
0 100 200 300 400 500 600 700 8000.0
0.2
0.4
0.6
0.8
1.0
0.0
0.2
0.4
0.6
0.8
1.0
Rel
ativ
e re
sidu
e ()
Temperature (°C)
MOPC20
PFPC
Inert
Oxidizing
PC
PF
Temperature /°C
Rel
ativ
e re
sidu
e
Figure 4.16 Decomposition behaviour of the pore formers PC and PF in inert and
oxidizing atmospheres and of the green MOPC20 preform in an oxidizing atmosphere.
The behaviour in an oxidizing atmosphere was different. The carbon fibre PF started to
degrade at 400°C which was followed by a steep decrease at about 500°C which led to less
than 1% of residue above 600°C. All the carbon fibre had transformed to gas when the
maximum temperature was reached.
The decomposition behaviour of PC up to 270°C in an oxidizing atmosphere was similar to
that in an inert atmosphere. As the temperature was increased up to 320°C, a steep decrease in
the residue took place to less than 3%. The residue was reduced to zero at 800°C.
In the green part of magnesia with 20 wt-% of the pore former PC (MOPC20), the first main
gas formation started at about 200°C and ended at 400°C. At 620°C, another mass loss took
107
place which was attributed to the calcination of Mg(OH)2, which was assumed to be the
reaction product when MgO was in contact with water during processing. A residue of 76%
was measured at the end of the test. This mass corresponded to the nominal amount of
magnesia ceramic particulates in the green as apart from 20% of PFA an organic binder and
water, each 2 % by weight, were initially added to powder.
4.5. Preform processing
The processing parameters such as the amount of pore forming agent (PFA), green sintering
temperature and green pressing pressure were varied in order to reach the target total porosity
of 60% to 70% in the final preform. As shown in the literature review, this preform volume
fraction has been rarely and incompletely investigated for preforms of particulate ceramics.
The challenge was to obtain sufficient preform strength at this relatively low ceramic volume
fraction to withstand the metal infiltration process.
4.5.1 Influence of PFA content
Figure 4.17 shows the correlations between the relative mass of pore former added to the
ceramic particles and the resulting porosity. The sintering temperature, the atmosphere (which
consisted of air throughout the whole investigation), the sintering time of 2 h and the green
compaction pressure of 100 MPa were kept constant. The sintering temperature Tsint was kept
relatively low aiming for residual porosity between the ceramic particles in order to achieve
preforms with low solid fractions. The initial sintering temperatures were taken from previous
studies, for example that of Staudenecker (155) for Al2O3 preforms with a glassy frit (type
AGPC), and Schneele (163) for TiO2 preforms. The sintering temperatures for AO and MO
preforms were based on supplier’s recommendations.
For preforms comprising pure alumina AO with the pore former PF, the minimum sintering
temperature was found to be 1500°C. When the pore former was PC it was only possible to
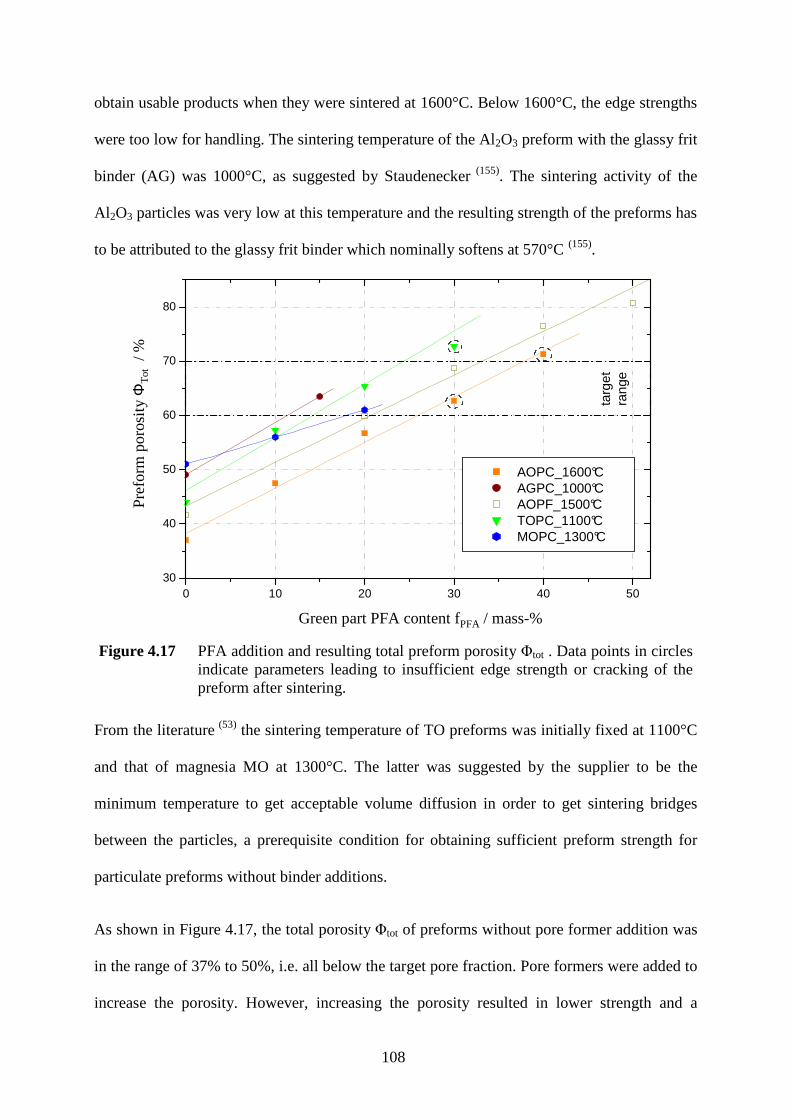
108
obtain usable products when they were sintered at 1600°C. Below 1600°C, the edge strengths
were too low for handling. The sintering temperature of the Al2O3 preform with the glassy frit
binder (AG) was 1000°C, as suggested by Staudenecker (155). The sintering activity of the
Al 2O3 particles was very low at this temperature and the resulting strength of the preforms has
to be attributed to the glassy frit binder which nominally softens at 570°C (155).
0 10 20 30 40 5030
40
50
60
70
80
targ
et
rang
e
AOPC_1600°C AGPC_1000°C AOPF_1500°C TOPC_1100°C MOPC_1300°C
Pre
form
por
osity
ΦT
ot (
%)
Green part PFA content fPFA
(mass-%)Green part PFA content fPFA / mass-%
Pre
form
poro
sity
ΦT
ot/
%
Figure 4.17 PFA addition and resulting total preform porosity Φtot . Data points in circles indicate parameters leading to insufficient edge strength or cracking of the preform after sintering.
From the literature (53) the sintering temperature of TO preforms was initially fixed at 1100°C
and that of magnesia MO at 1300°C. The latter was suggested by the supplier to be the
minimum temperature to get acceptable volume diffusion in order to get sintering bridges
between the particles, a prerequisite condition for obtaining sufficient preform strength for
particulate preforms without binder additions.
As shown in Figure 4.17, the total porosity Φtot of preforms without pore former addition was
in the range of 37% to 50%, i.e. all below the target pore fraction. Pore formers were added to
increase the porosity. However, increasing the porosity resulted in lower strength and a
109
compromise had to be found, where there was sufficient porosity (60 to 70%) and strength as
indicated by low edge fracture during handling.
The processing parameters for AG with PC were previously investigated by
Staudenecker (155). The optimum PC fraction was found to be 15% giving a final porosity of
65%. Thus AGPC15 preforms were used for further characterisation and MMC processing.
Linear regression of the data shown in Figure 4.17 indicates that AGPC, AOPC and TOPC
exhibit similar gradients. The gradient for MOPC was significantly lower, indicating a
different behaviour of the pore former PC in the MO preforms. Even though PF had a higher
density (1750 kg/m³) than PC (1500kg/m³) AOPF showed similar gradient as AOPC in Figure
4.18, which has to be attributed to higher efficiency of the pore formation with PF. More
detailed work may be performed in future to investigate the differences between PF and PC.
Cellulose (PC) or carbon fibres (PF) were used in the AO preforms in order to investigate the
influence of the pore former geometry and chemistry. For PC additions, the porosity was
raised from 35% (AO) to 72% for AOPC40. Those with the highest values (AOPC30 and
AOPC40) had low strength after sintering, making them unsuitable for further processing
(circled data points in Figure 4.17).
The AO preforms with PF could be fabricated with sufficient edge strength up to the
maximum PFA addition investigated of 50%. The resulting total porosity was 79%. The
porosity of AO in the AOPC curve was lower than that in the AOPF curve. This was due to a
lower sintering temperature of 1500°C being used for AOPF. Therefore the remaining
intragranular porosity fraction was higher.
The porosity of TO preforms was 44% and therefore higher than that of AO sintered at
1500°C and 1600°C. For TOPC with 30 wt-% of pore former the preforms had inadequate
110
strengths, whereas with 10 and 20 wt-% PC the preforms had sufficient strength and 57% and
65% porosity respectively.
The highest total porosity of 50% without PFA additions was found in the MO-preforms. The
additions of PFA showed less effect in MOPC than in the other ceramics. The addition of
20 wt-% of PC resulted in an increase of 28% total porosity in AOPC compared to 12% for
MOPC20. As TOPC did not show this behaviour, it has to be attributed to the chemistry of
the preform.
By altering the PFA content, the AOPF20 and TOPC20 preforms as well as AGPC15,
provided materials in the target porosity range and therefore were taken forward for further
characterisation and composite processing. It was wished to increase the porosity of MOPC20
from 62% to 65% (the centre of the range) by a reduction in sintering temperature which is
presented in 4.5.3. In order to reach the target range with AOPC, other process parameters
such as green compaction pressure and sintering temperature were varied, as presented in
4.5.2 and 4.5.3 respectively. The same variations were applied to the TOPC10 preforms. For
the TO preforms, the influence of the pore structure on the preform infiltration behaviour was
investigated. The pore former fractions influenced the ratio between the PFA-formed and
intragranular porosities, thus giving different ratios of coarse and fine pores with the same
total pore volume. The target was to get equal total porosity at two different pore former
fractions.
4.5.2 Influence of green part compaction pressure
The influence of the green compaction pressure on the porosity of AOPC20 and TOPC10 at
sintering temperatures of 1600 and 1100°C respectively is presented in Figure 4.18. By
reducing the compaction pressure from 100 MPa to 60 MPa, the AOPC20 preform could be
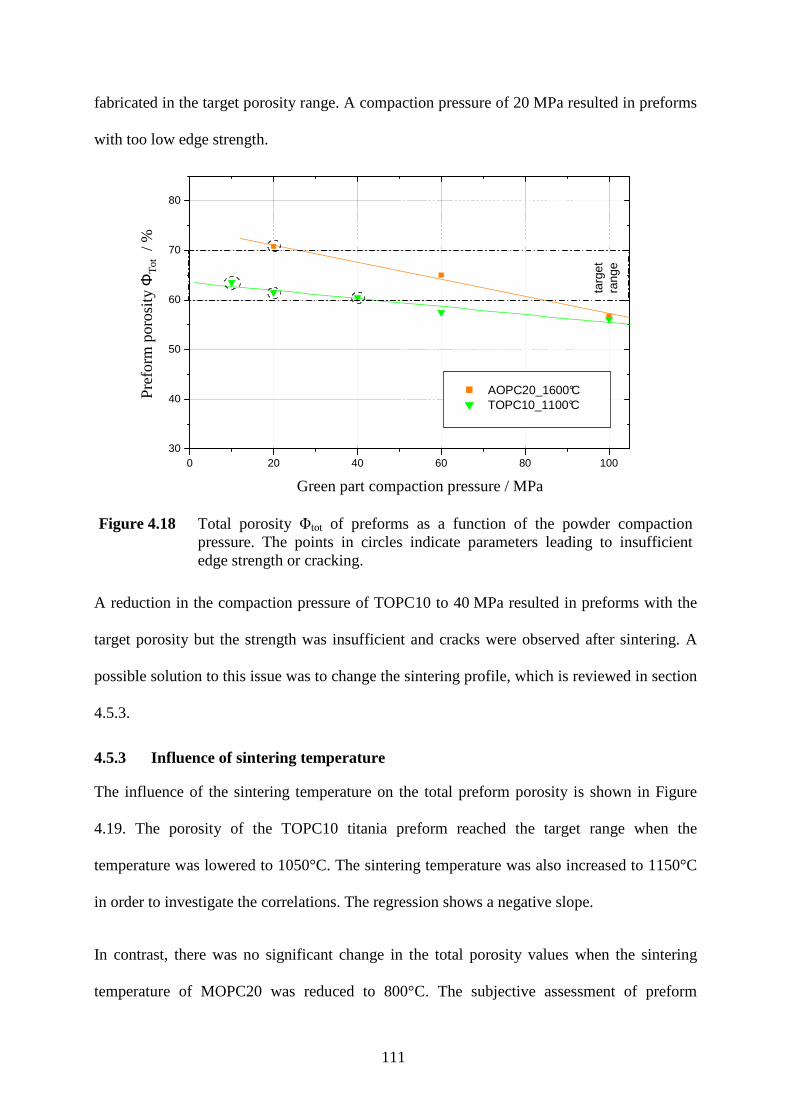
111
fabricated in the target porosity range. A compaction pressure of 20 MPa resulted in preforms
with too low edge strength.
0 20 40 60 80 10030
40
50
60
70
80
targ
et
rang
e
AOPC20_1600°C TOPC10_1100°C
Pre
form
por
osity
ΦT
ot (
%)
Green part compaction pressure (MPa)Green part compaction pressure / MPa
Pre
form
poro
sity
ΦT
ot/ %
Figure 4.18 Total porosity Φtot of preforms as a function of the powder compaction pressure. The points in circles indicate parameters leading to insufficient edge strength or cracking.
A reduction in the compaction pressure of TOPC10 to 40 MPa resulted in preforms with the
target porosity but the strength was insufficient and cracks were observed after sintering. A
possible solution to this issue was to change the sintering profile, which is reviewed in section
4.5.3.
4.5.3 Influence of sintering temperature
The influence of the sintering temperature on the total preform porosity is shown in Figure
4.19. The porosity of the TOPC10 titania preform reached the target range when the
temperature was lowered to 1050°C. The sintering temperature was also increased to 1150°C
in order to investigate the correlations. The regression shows a negative slope.
In contrast, there was no significant change in the total porosity values when the sintering
temperature of MOPC20 was reduced to 800°C. The subjective assessment of preform
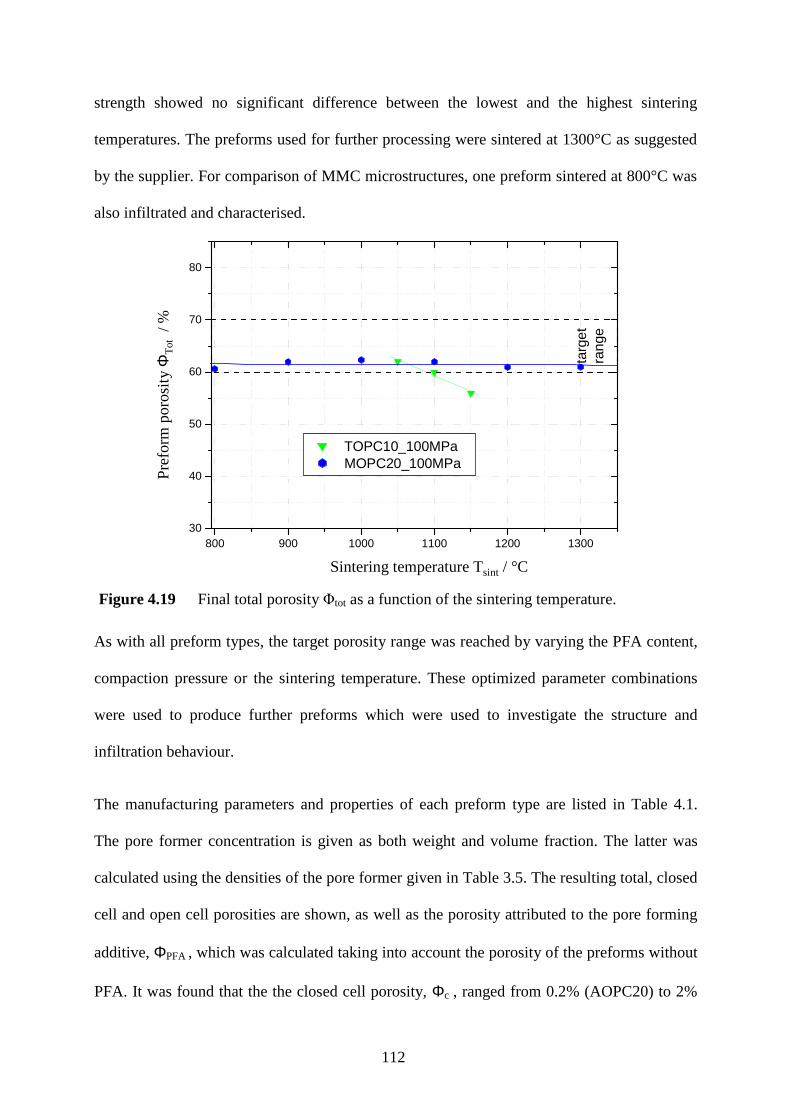
112
strength showed no significant difference between the lowest and the highest sintering
temperatures. The preforms used for further processing were sintered at 1300°C as suggested
by the supplier. For comparison of MMC microstructures, one preform sintered at 800°C was
also infiltrated and characterised.
800 900 1000 1100 1200 130030
40
50
60
70
80
targ
etra
nge
TOPC10_100MPa MOPC20_100MPaP
refo
rm p
oros
ity Φ
Tot (
%)
Sintering temperature Tsint
(°C)Sintering temperature Tsint / °C
Pre
form
poro
sity
ΦT
ot/ %
Figure 4.19 Final total porosity Φtot as a function of the sintering temperature.
As with all preform types, the target porosity range was reached by varying the PFA content,
compaction pressure or the sintering temperature. These optimized parameter combinations
were used to produce further preforms which were used to investigate the structure and
infiltration behaviour.
The manufacturing parameters and properties of each preform type are listed in Table 4.1.
The pore former concentration is given as both weight and volume fraction. The latter was
calculated using the densities of the pore former given in Table 3.5. The resulting total, closed
cell and open cell porosities are shown, as well as the porosity attributed to the pore forming
additive, ΦPFA , which was calculated taking into account the porosity of the preforms without
PFA. It was found that the the closed cell porosity, Φc , ranged from 0.2% (AOPC20) to 2%
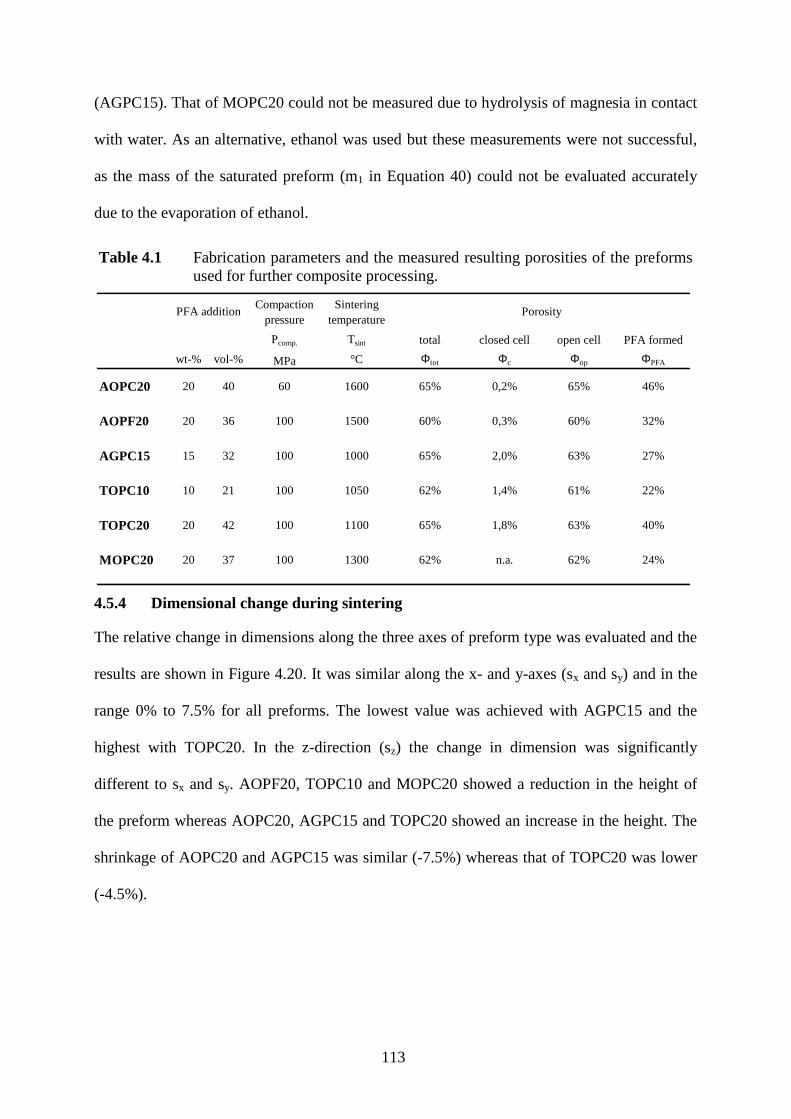
113
(AGPC15). That of MOPC20 could not be measured due to hydrolysis of magnesia in contact
with water. As an alternative, ethanol was used but these measurements were not successful,
as the mass of the saturated preform (m1 in Equation 40) could not be evaluated accurately
due to the evaporation of ethanol.
Table 4.1 Fabrication parameters and the measured resulting porosities of the preforms used for further composite processing.
Compaction pressure
Sintering temperature
Pcomp. Tsint total closed cell open cell PFA formed
wt-% vol-% MPa °C Φtot Φc Φop ΦPFA
AOPC20 20 40 60 1600 65% 0,2% 65% 46%
AOPF20 20 36 100 1500 60% 0,3% 60% 32%
AGPC15 15 32 100 1000 65% 2,0% 63% 27%
TOPC10 10 21 100 1050 62% 1,4% 61% 22%
TOPC20 20 42 100 1100 65% 1,8% 63% 40%
MOPC20 20 37 100 1300 62% n.a. 62% 24%
PFA addition Porosity
4.5.4 Dimensional change during sintering
The relative change in dimensions along the three axes of preform type was evaluated and the
results are shown in Figure 4.20. It was similar along the x- and y-axes (sx and sy) and in the
range 0% to 7.5% for all preforms. The lowest value was achieved with AGPC15 and the
highest with TOPC20. In the z-direction (sz) the change in dimension was significantly
different to sx and sy. AOPF20, TOPC10 and MOPC20 showed a reduction in the height of
the preform whereas AOPC20, AGPC15 and TOPC20 showed an increase in the height. The
shrinkage of AOPC20 and AGPC15 was similar (-7.5%) whereas that of TOPC20 was lower
(-4.5%).
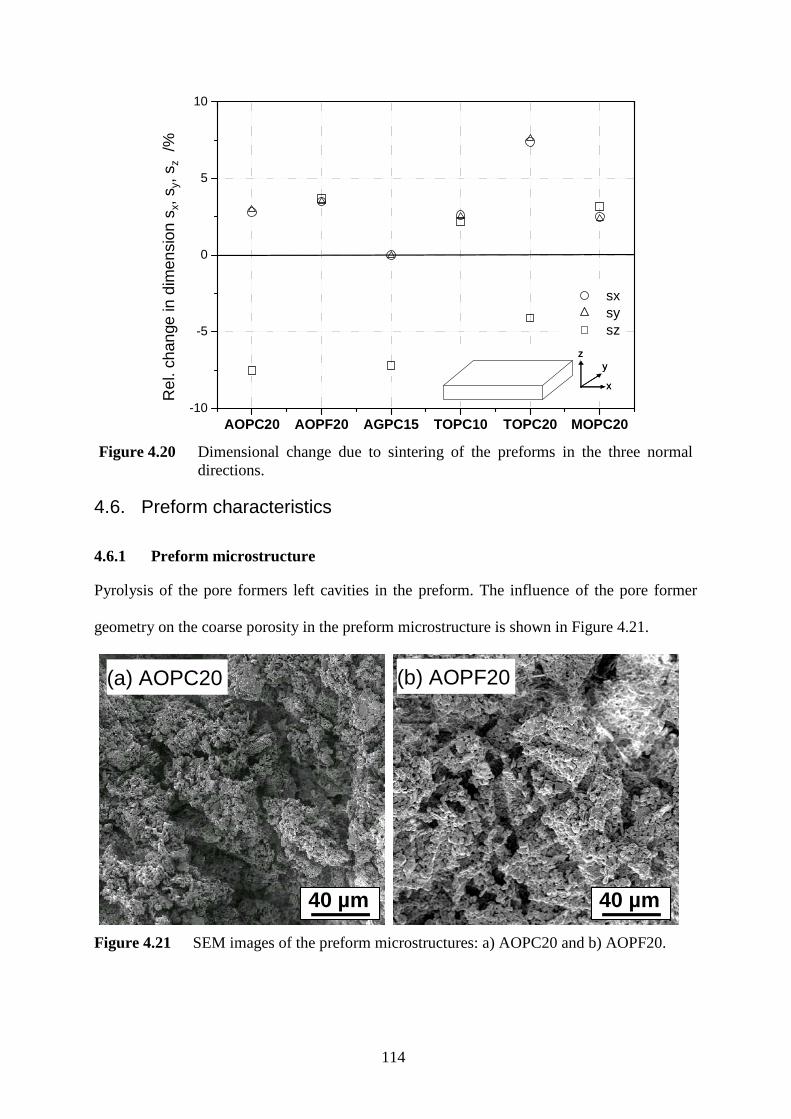
114
AOPC20 AOPF20 AGPC15 TOPC10 TOPC20 MOPC20-10
-5
0
5
10
zy
x
zy
x
sx sy sz
Rel
ativ
e ch
ange
in d
imen
sion
sx, s
y, sz (
%)
Rel
. cha
nge
in d
imen
sion
sx,
sy,
sz
/%
Figure 4.20 Dimensional change due to sintering of the preforms in the three normal directions.
4.6. Preform characteristics
4.6.1 Preform microstructure
Pyrolysis of the pore formers left cavities in the preform. The influence of the pore former
geometry on the coarse porosity in the preform microstructure is shown in Figure 4.21.
2 µm40 µm2 µm40 µm
(a) AOPC20 (b) AOPF20
2 µm40 µm2 µm40 µm
Figure 4.21 SEM images of the preform microstructures: a) AOPC20 and b) AOPF20.
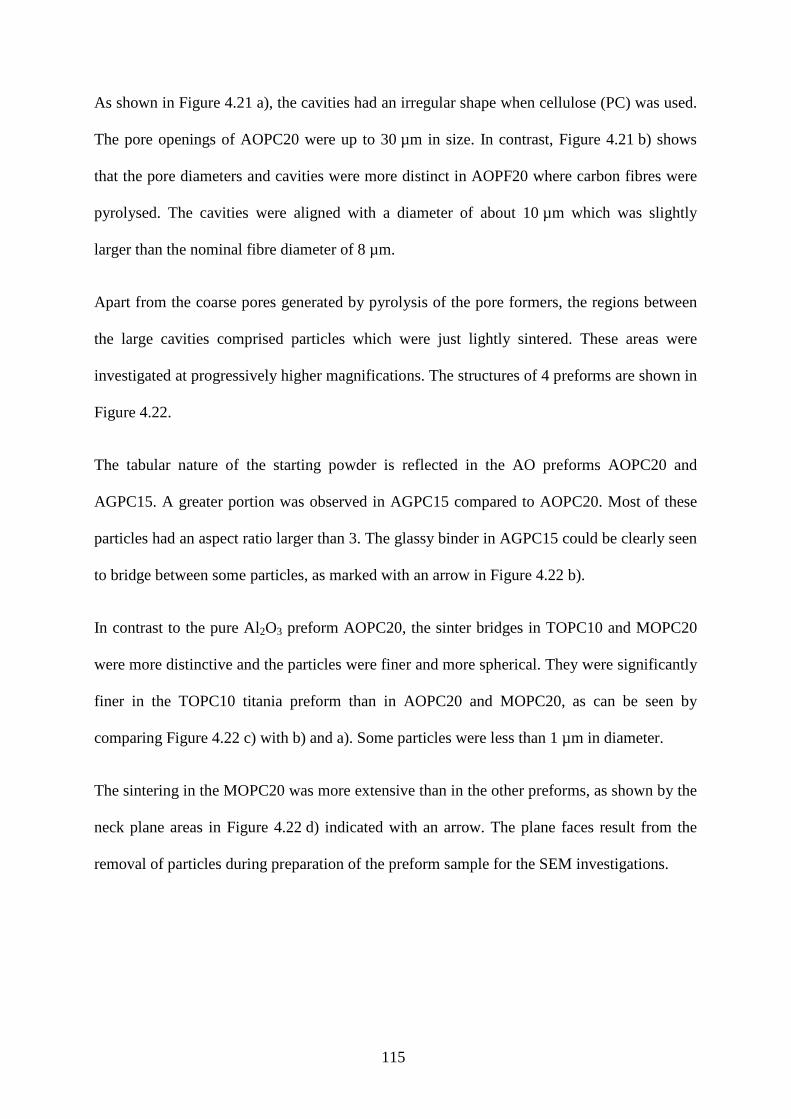
115
As shown in Figure 4.21 a), the cavities had an irregular shape when cellulose (PC) was used.
The pore openings of AOPC20 were up to 30 µm in size. In contrast, Figure 4.21 b) shows
that the pore diameters and cavities were more distinct in AOPF20 where carbon fibres were
pyrolysed. The cavities were aligned with a diameter of about 10 µm which was slightly
larger than the nominal fibre diameter of 8 µm.
Apart from the coarse pores generated by pyrolysis of the pore formers, the regions between
the large cavities comprised particles which were just lightly sintered. These areas were
investigated at progressively higher magnifications. The structures of 4 preforms are shown in
Figure 4.22.
The tabular nature of the starting powder is reflected in the AO preforms AOPC20 and
AGPC15. A greater portion was observed in AGPC15 compared to AOPC20. Most of these
particles had an aspect ratio larger than 3. The glassy binder in AGPC15 could be clearly seen
to bridge between some particles, as marked with an arrow in Figure 4.22 b).
In contrast to the pure Al2O3 preform AOPC20, the sinter bridges in TOPC10 and MOPC20
were more distinctive and the particles were finer and more spherical. They were significantly
finer in the TOPC10 titania preform than in AOPC20 and MOPC20, as can be seen by
comparing Figure 4.22 c) with b) and a). Some particles were less than 1 µm in diameter.
The sintering in the MOPC20 was more extensive than in the other preforms, as shown by the
neck plane areas in Figure 4.22 d) indicated with an arrow. The plane faces result from the
removal of particles during preparation of the preform sample for the SEM investigations.
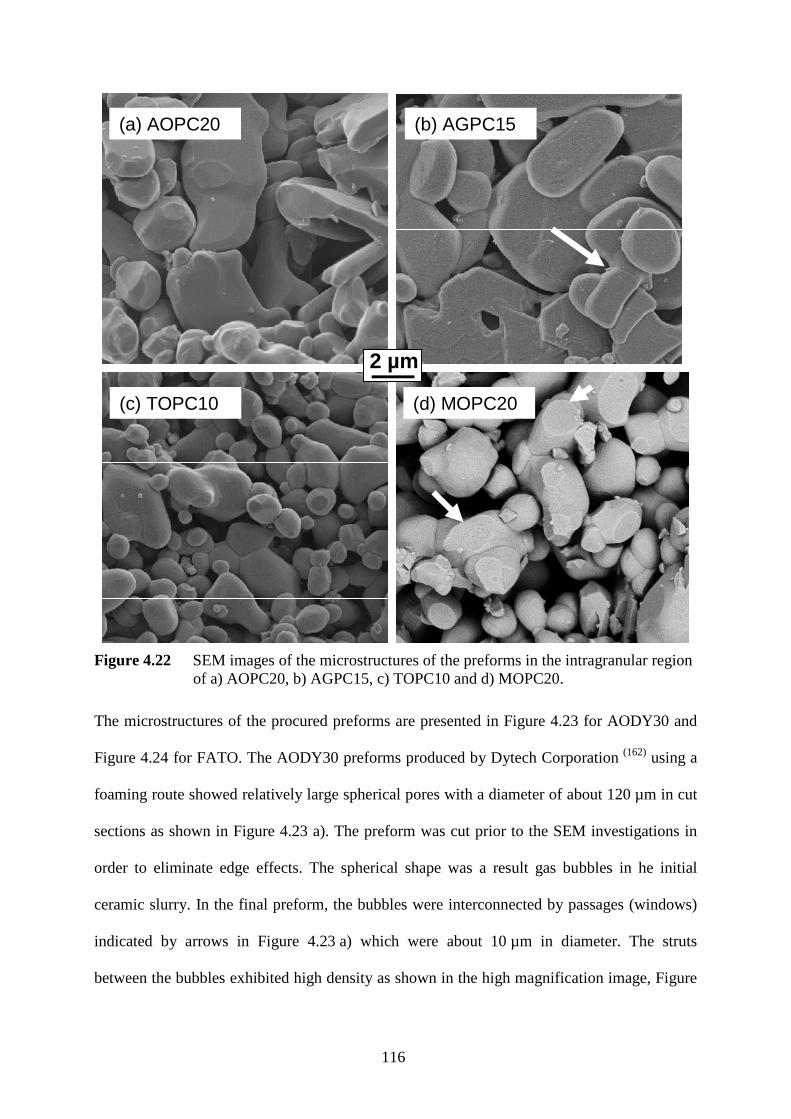
116
2 µm2 µm
(a) AOPC20 (b) AGPC15
(c) TOPC10 (d) MOPC20
Figure 4.22 SEM images of the microstructures of the preforms in the intragranular region of a) AOPC20, b) AGPC15, c) TOPC10 and d) MOPC20.
The microstructures of the procured preforms are presented in Figure 4.23 for AODY30 and
Figure 4.24 for FATO. The AODY30 preforms produced by Dytech Corporation (162) using a
foaming route showed relatively large spherical pores with a diameter of about 120 µm in cut
sections as shown in Figure 4.23 a). The preform was cut prior to the SEM investigations in
order to eliminate edge effects. The spherical shape was a result gas bubbles in he initial
ceramic slurry. In the final preform, the bubbles were interconnected by passages (windows)
indicated by arrows in Figure 4.23 a) which were about 10 µm in diameter. The struts
between the bubbles exhibited high density as shown in the high magnification image, Figure

117
4.23 b). The immediate border of the window was about 2 µm wide and had a thickness equal
to the diameter of one to three particles. Because grain growth has occurred during the
sintering process is was probable that the starting powder was smaller than one micron.
2 µm20 µm2 µm20 µm 2 µm2 µm
(b)(a)
Figure 4.23 Microstructure of the purchased AODY30 preforms: (a) overview with the single windows marked and (b) detail of a window connecting the cavities.
In the FATO preforms, built up of Saffil™ fibres and TiO2 particles, the two phases were
clearly visible, Figure 4.24 a). The fibres were embedded into the fine particles. Between the
clusters of particles and fibres, there were large pores 15-20 µm wide and more than 200 µm
long.
(b)(a)
2 µm20 µm2 µm20 µm 2 µm2 µm
Figure 4.24 Microstructure of the FATO preform. Arrows indicate an extended pore.

118
At higher magnification, Figure 4.24 b) shows the alumina fibre diameter to be about 4 µm
and the titania particles to be sub-micron. The loose particles on the fibre sections cut during
specimen preparation suggests a weak interparticle bonding.
4.6.2 Pore size distribution
The incremental and cumulative graphs of the relative pore volume of two alumina preforms,
AO and AOPC20, as a function of pore diameter are shown in Figure 4.25 a) and b)
respectively. The incremental plot is often easier to interpret in terms of fraction per pore size
diameter class and was therefore used for further presentations of the pore size distributions.
Intrusions below 0.25 µm pore diameter were not observed in any of the preforms made with
pore forming additives. Therefore the pore size distribution plots of all preforms, apart from
AODY30 and FATO, were limited to a minimum of 0.1 µm.
10-2 10-1 100 101
0.0
0.1
0.2
0.3
10-2 10-1 100 101 102
AO AOPC20
cumulativeincremental
Rel
ativ
e po
re v
olum
e ()
Pore diameter (µm)
100.0
0.1
0.2
0.3
0.4
0.5
0.6
0.7
0.8
0.9
1.0
(a) (b)
Cum
ulat
ed r
el. p
ore
volu
me
()
Pore diameter /µm
Rel
ativ
e po
re v
olum
e
Cum
ulat
ive
pore
vol
ume
Figure 4.25 Pore size distribution curves of AO and AOPC20. a) incremental and b) cumulative outline.
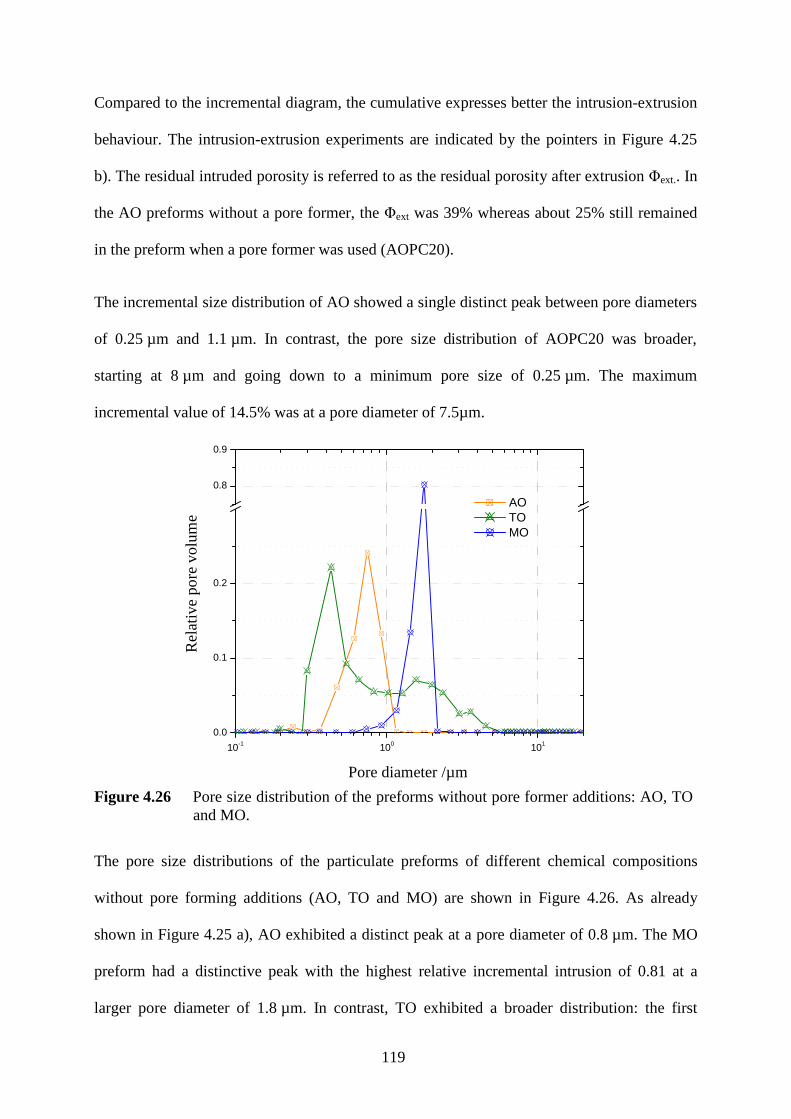
119
Compared to the incremental diagram, the cumulative expresses better the intrusion-extrusion
behaviour. The intrusion-extrusion experiments are indicated by the pointers in Figure 4.25
b). The residual intruded porosity is referred to as the residual porosity after extrusion Φext.. In
the AO preforms without a pore former, the Φext was 39% whereas about 25% still remained
in the preform when a pore former was used (AOPC20).
The incremental size distribution of AO showed a single distinct peak between pore diameters
of 0.25 µm and 1.1 µm. In contrast, the pore size distribution of AOPC20 was broader,
starting at 8 µm and going down to a minimum pore size of 0.25 µm. The maximum
incremental value of 14.5% was at a pore diameter of 7.5µm.
10-1 100 101
0.0
0.1
0.2
0.8
0.9
AO TO MO
Rel
ativ
e po
re v
olum
e ()
Pore diameter (µm)Pore diameter /µm
Rel
ativ
e po
re v
olum
e
Figure 4.26 Pore size distribution of the preforms without pore former additions: AO, TO
and MO.
The pore size distributions of the particulate preforms of different chemical compositions
without pore forming additions (AO, TO and MO) are shown in Figure 4.26. As already
shown in Figure 4.25 a), AO exhibited a distinct peak at a pore diameter of 0.8 µm. The MO
preform had a distinctive peak with the highest relative incremental intrusion of 0.81 at a
larger pore diameter of 1.8 µm. In contrast, TO exhibited a broader distribution: the first
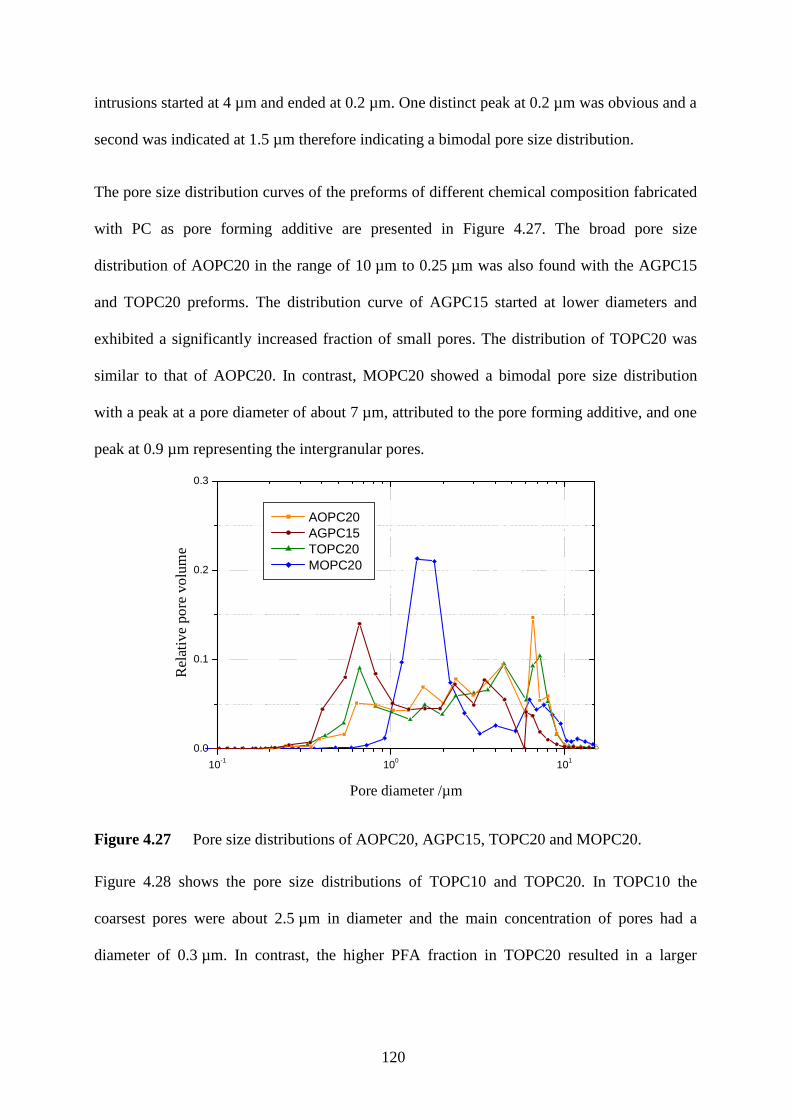
120
intrusions started at 4 µm and ended at 0.2 µm. One distinct peak at 0.2 µm was obvious and a
second was indicated at 1.5 µm therefore indicating a bimodal pore size distribution.
The pore size distribution curves of the preforms of different chemical composition fabricated
with PC as pore forming additive are presented in Figure 4.27. The broad pore size
distribution of AOPC20 in the range of 10 µm to 0.25 µm was also found with the AGPC15
and TOPC20 preforms. The distribution curve of AGPC15 started at lower diameters and
exhibited a significantly increased fraction of small pores. The distribution of TOPC20 was
similar to that of AOPC20. In contrast, MOPC20 showed a bimodal pore size distribution
with a peak at a pore diameter of about 7 µm, attributed to the pore forming additive, and one
peak at 0.9 µm representing the intergranular pores.
10-1 100 101
0.0
0.1
0.2
0.3
AOPC20 AGPC15 TOPC20 MOPC20
Rel
ativ
e po
re v
olum
e ()
Pore diameter (µm)Pore diameter /µm
Rel
ativ
e po
re v
olu
me
Figure 4.27 Pore size distributions of AOPC20, AGPC15, TOPC20 and MOPC20.
Figure 4.28 shows the pore size distributions of TOPC10 and TOPC20. In TOPC10 the
coarsest pores were about 2.5 µm in diameter and the main concentration of pores had a
diameter of 0.3 µm. In contrast, the higher PFA fraction in TOPC20 resulted in a larger
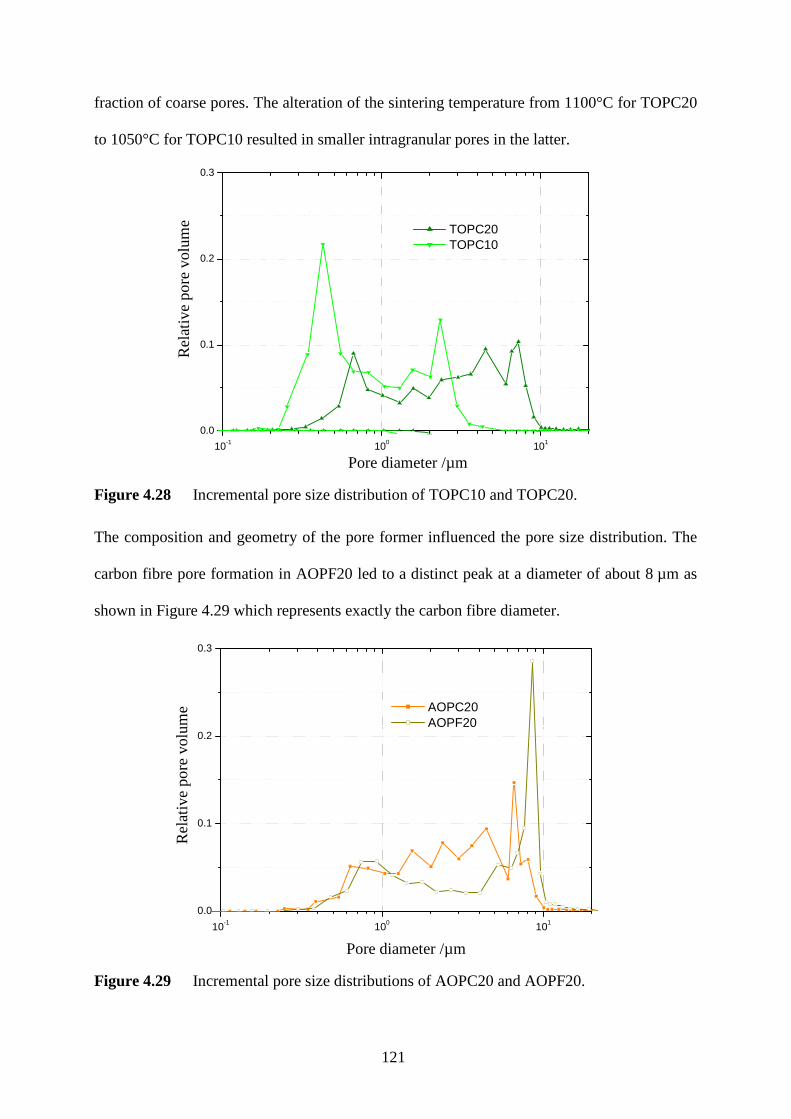
121
fraction of coarse pores. The alteration of the sintering temperature from 1100°C for TOPC20
to 1050°C for TOPC10 resulted in smaller intragranular pores in the latter.
10-1 100 101
0.0
0.1
0.2
0.3
TOPC20 TOPC10
Rel
ativ
e po
re v
olum
e ()
Pore diameter (µm)Pore diameter /µm
Rel
ativ
e po
re v
olum
e
Figure 4.28 Incremental pore size distribution of TOPC10 and TOPC20.
The composition and geometry of the pore former influenced the pore size distribution. The
carbon fibre pore formation in AOPF20 led to a distinct peak at a diameter of about 8 µm as
shown in Figure 4.29 which represents exactly the carbon fibre diameter.
10-1 100 101
0.0
0.1
0.2
0.3
AOPC20 AOPF20
Rel
ativ
e po
re v
olum
e ()
Pore diameter (µm)Pore diameter /µm
Rel
ativ
e po
re v
olum
e
Figure 4.29 Incremental pore size distributions of AOPC20 and AOPF20.

122
As shown in Figure 4.27, the pore size distribution of the magnesia preform MOPC20
sintered at 1300°C was significantly different from that of the other ceramic preforms with the
same PFA. In the metal infiltration experiments, an equal pore size distribution was targeted
in order to minimize the effect of differing pore size distributions on the comparative study.
In order to increase the fraction of finer pores in MOPC20, the sintering temperature was
reduced to 800°C with a constant holding time of 2 h. As shown in Figure 4.30, the preform
sintered at 800°C shifted the pores to finer sizes while maintaining the bimodal profile. The
coarse peak reduced from around 8 µm to about 2 µm and the fine peak reduced from 1.5 to
0.2 µm. The target to reduce the small pore size and to leave the coarse pores as they were,
could not be achieved as the coarse pores shifted to smaller sizes when the sintering
temperature was reduced.
10-1 100 101
0.0
0.1
0.2
0.3
10-1 100 101
0.0
0.1
0.2
0.3
1300°C
Rel
ativ
e po
re v
olum
e ()
Pore diameter (µm)
800°C
Rel
ativ
e po
re v
olum
e ()
Pore diameter (µm)Pore diameter /µm
Rel
ativ
e po
re v
olum
e
Figure 4.30 Influence of sintering temperature on pore size distribution of MOPC20.
The influence of the sintering temperature on the median pore diameter, dHg , and the specific
surface area, SsHg , of the MOPC20 preforms is shown in Figure 4.31. As the sintering
temperature was lowered from 1300°C to 1200°C, the median pore diameter reduced from
1.50 µm to 0.25 µm and the specific surface area increased from 0.70 m²/g to 3.78 m²/g.
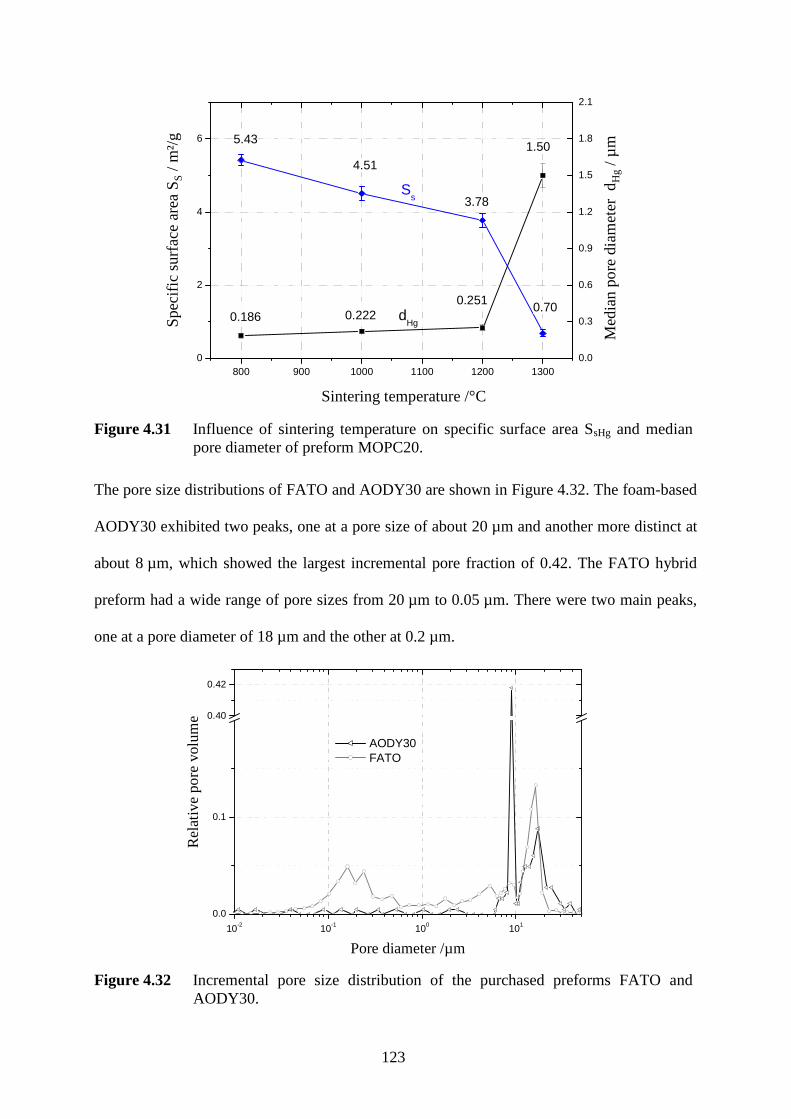
123
800 900 1000 1100 1200 13000
2
4
61.50
0.2510.2220.186
4.51
0.70
5.43
3.78
Spe
cific
sur
face
are
a S
s (m
²/g)
Sintering temperature (°C)
0.0
0.3
0.6
0.9
1.2
1.5
1.8
2.1
dHg
Ss
Med
ian
pore
dia
met
er d
Hg (µ
m)
Sintering temperature /°C
Spe
cific
sur
face
are
a S
S/
m²/
g
Med
ian
pore
dia
met
er d H
g/ µ
m
Figure 4.31 Influence of sintering temperature on specific surface area SsHg and median pore diameter of preform MOPC20.
The pore size distributions of FATO and AODY30 are shown in Figure 4.32. The foam-based
AODY30 exhibited two peaks, one at a pore size of about 20 µm and another more distinct at
about 8 µm, which showed the largest incremental pore fraction of 0.42. The FATO hybrid
preform had a wide range of pore sizes from 20 µm to 0.05 µm. There were two main peaks,
one at a pore diameter of 18 µm and the other at 0.2 µm.
10-2 10-1 100 101
0.0
0.1
0.40
0.42
AODY30 FATO
Rel
ativ
e po
re v
olum
e ()
Pore diameter (µm)Pore diameter /µm
Rel
ativ
e po
re v
olum
e
Figure 4.32 Incremental pore size distribution of the purchased preforms FATO and AODY30.
124
An overview of the specific values derived from the pore size distribution curves is shown in
Table 4.2. Most of the preforms exhibited differences between the total porosity Φtot
calculated on the basis of the measured preform volume and the theoretical density, and the
total porosity measured using the mercury intrusion method ΦHg. These differences represent
the closed cell porosity of the preform. No difference was observed with the TO and MO
preforms and small differences of 3% were found with AO, AODY30 and FATO preforms.
Larger differences were observed when cellulose (PC) was used as a pore forming agent. Here
AOPC20 showed the smallest difference of 7%, whereas TOPC10 and AGPC15 showed the
maximum differences (9%) of all the preforms investigated.
The median pore diameter dHg varied significantly over the range of 0.77 µm to 9.05 µm. The
titania and alumina preforms AO and TO exhibited the smallest diameter which was below
1 µm. In contrast MO showed a median diameter of 1.84 µm which was larger than 1.50 µm
for the MOPC20, where cellulose was used as PFA. This behaviour was unique to the
magnesia system. In all other preform types where a pore former was used, the median pore
diameters ranged between 1.06 µm (TOPC10) and 4.98 µm (TOPC20) and therefore were
larger than that of the respective preforms without PFA additions. The alumina based
preforms AGPC15 and AOPC20 showed median pore diameters of 2.77 µm and 3.48 µm
respectively. Larger values were achieved with AOPF20, where the carbon fibre was used as
a pore former. The largest values of the entire project were reached with the purchased
preforms FATO and AODY30 with 8.53 µm and 9.05 µm, respectively.
Table 4.2 shows the specific surface area per unit mass (SsHg), normalized per unit of preform
volume (SpHg), and the inner surface area per porosity volume (SiHg) which were calculated
using Equation 22 and Equation 42 respectively. The SsHg values of the preforms ranged
between 0.69 and 5.85 m²/g for AOPF20 and FATO respectively. The high value of the latter
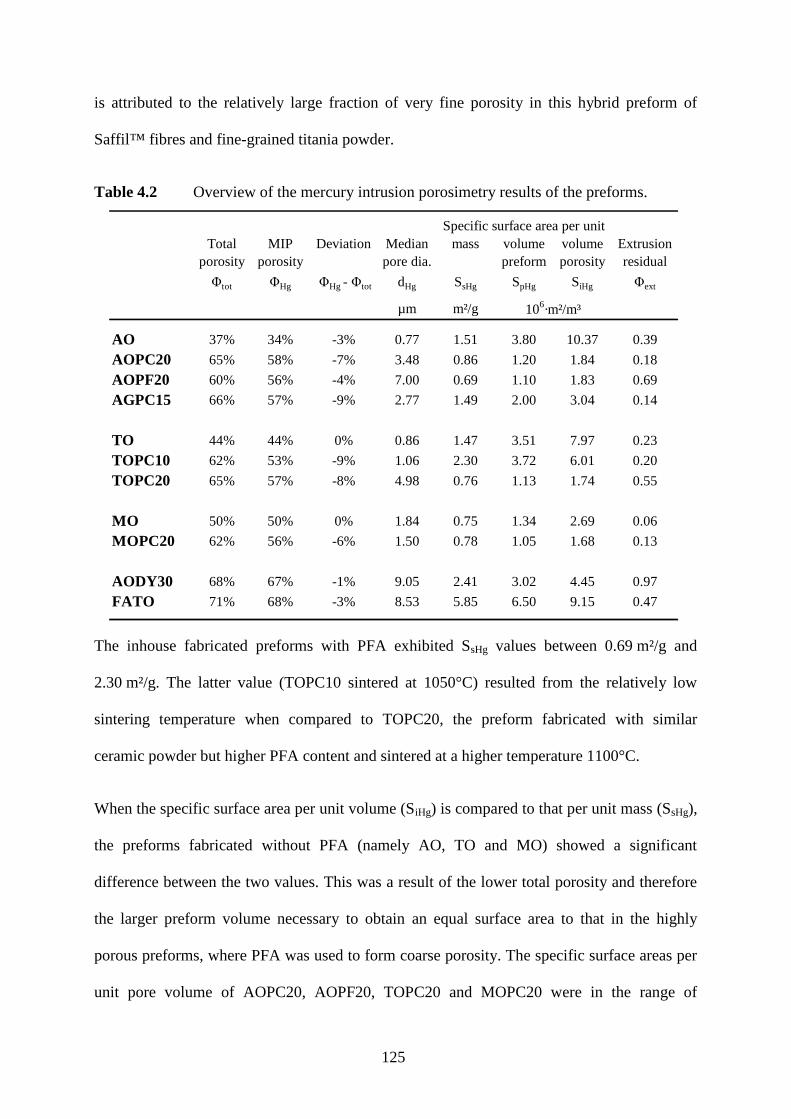
125
is attributed to the relatively large fraction of very fine porosity in this hybrid preform of
Saffil™ fibres and fine-grained titania powder.
Table 4.2 Overview of the mercury intrusion porosimetry results of the preforms.
Total porosity
MIP porosity
Deviation Median pore dia.
mass volume preform
volume porosity
Extrusion residual porosityΦtot ΦHg ΦHg - Φtot dHg SsHg SpHg SiHg Φext
µm m²/g
AO 37% 34% -3% 0.77 1.51 3.80 10.37 0.39
AOPC20 65% 58% -7% 3.48 0.86 1.20 1.84 0.18
AOPF20 60% 56% -4% 7.00 0.69 1.10 1.83 0.69
AGPC15 66% 57% -9% 2.77 1.49 2.00 3.04 0.14
TO 44% 44% 0% 0.86 1.47 3.51 7.97 0.23
TOPC10 62% 53% -9% 1.06 2.30 3.72 6.01 0.20
TOPC20 65% 57% -8% 4.98 0.76 1.13 1.74 0.55
MO 50% 50% 0% 1.84 0.75 1.34 2.69 0.06
MOPC20 62% 56% -6% 1.50 0.78 1.05 1.68 0.13
AODY30 68% 67% -1% 9.05 2.41 3.02 4.45 0.97
FATO 71% 68% -3% 8.53 5.85 6.50 9.15 0.47
Specific surface area per unit
106·m²/m³
The inhouse fabricated preforms with PFA exhibited SsHg values between 0.69 m²/g and
2.30 m²/g. The latter value (TOPC10 sintered at 1050°C) resulted from the relatively low
sintering temperature when compared to TOPC20, the preform fabricated with similar
ceramic powder but higher PFA content and sintered at a higher temperature 1100°C.
When the specific surface area per unit volume (SiHg) is compared to that per unit mass (SsHg),
the preforms fabricated without PFA (namely AO, TO and MO) showed a significant
difference between the two values. This was a result of the lower total porosity and therefore
the larger preform volume necessary to obtain an equal surface area to that in the highly
porous preforms, where PFA was used to form coarse porosity. The specific surface areas per
unit pore volume of AOPC20, AOPF20, TOPC20 and MOPC20 were in the range of
126
1.71 to 1.98·106 m²/m³. The similar values enabled direct comparison in the infiltration
experiments.
The AGPC15 preform was sintered with the aid of a glassy frit at a relatively low temperature
of 1000°C. As the Al2O3 powder showed no significant sintering activity at this temperature,
the initial grain size of the AO powder was presumably maintained. Therefore a
comparatively large surface area of 3.05 m²/m³ could be achieved compared to that of the
Al 2O3 preform without frit additions (AOPC20) sintered at significantly higher temperatures.
The reference preforms, AODY30 and FATO, exhibited larger SiHg values of 4.45 m²/m³ and
9.15 m²/m³ respectively, attributed to the comparatively high fraction of small pores.
The relative residual non-extruded porosity Φext describes the relative volume still intruded
when an ambient pressure of 0.101 MPa is reached which corresponds to a pore diameter of
11 µm using Washburn´s equation (Equation 21). It was shown that Φext ranged between 0.06
and 0.97. The lower value for the MO preform indicates that 6% of the total mercury volume
was still trapped in the preform after the extrusion procedure. In contrast, the highest value
was that of the AODY30 preform, which indicates that about 97% of the mercury remained in
pores with an entrance diameter of more than 11 µm. This indicates that the characteristic
window connections between the larger spherical cavities predominantly had diameters
smaller than 11 µm.
4.6.3 Compressibility
The quasi-static compression behaviour of the preforms was investigated using two testing
conditions. In the first, the preform samples were loaded between two platens such that the
sample could yield laterally in the x- and y-directions. The specific compression strength σc
was the ratio of the maximum load to the initial loading area. In the second, samples were
loaded isostatically and the pressure dependent volumetric compression, ciso , recorded.

127
As shown in Figure 4.33, the uniaxial compression strength of the preforms ranged between
1.1 MPa (TOPC10) and 245 MPa for the foamed preform AODY30. The compression
strength of the AGPC15 with the glassy frit binder was lower than that of the AOPC20. The
FATO hybrid reference preform had a strength of 7.0 MPa.
AOPC20 AGPC15 TOPC10 AODY30 FATO0
2
4
6
8
10
12
14
16
18
200
300
U
niax
ial c
ompr
essi
on s
tren
gth
(MP
a)U
niax
ialc
ompr
essi
on s
tren
gth
/MP
a
Figure 4.33 Uniaxial compression strength σc of the preforms.
The isostatic compression test was used in order to reproduce the conditions in the squeeze
cast infiltration experiments. As the compression strength σc of the AODY30 preform was
above the maximum pressure of the porosimeter, the isostatic testing method was omitted for
this preform.
The relative compressions ciso of the preforms made with pore forming additives as a function
of the applied mercury pressure are presented in Figure 4.34. As an incremental pressurisation
programme was used, the curves show a step-like form. The results may be categorized into
two groups. The first group consisted of the AOPC20 and TOPC20 preforms which exhibited
marginal compression up to 1 MPa and subsequently a steep increase in the degree of
compression. Up to the maximum applied pressure, the curves described a close to
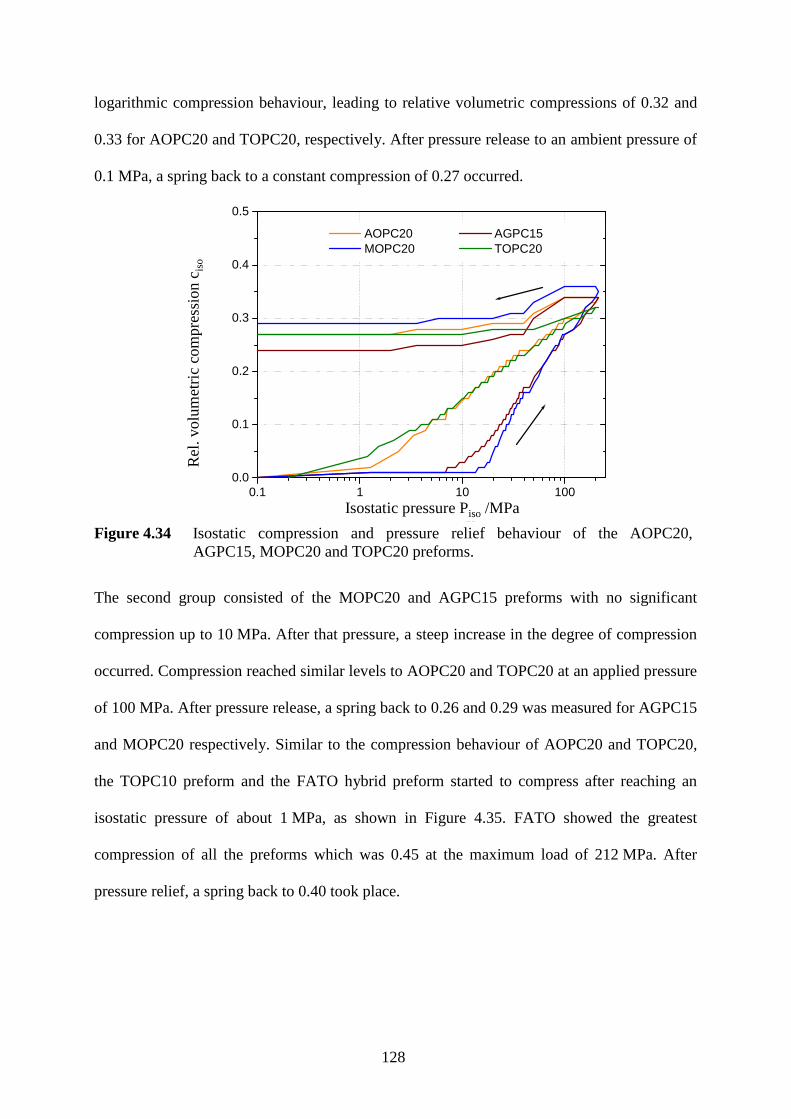
128
logarithmic compression behaviour, leading to relative volumetric compressions of 0.32 and
0.33 for AOPC20 and TOPC20, respectively. After pressure release to an ambient pressure of
0.1 MPa, a spring back to a constant compression of 0.27 occurred.
0.1 1 10 1000.0
0.1
0.2
0.3
0.4
0.5
AOPC20 AGPC15 MOPC20 TOPC20
Rel
ativ
e vo
lum
etric
com
pres
sion
cis
o (
)
Isostatic pressure Piso
(MPa)Isostatic pressure Piso /MPa
Rel
. vol
umet
ric
com
pres
sion
c iso
Figure 4.34 Isostatic compression and pressure relief behaviour of the AOPC20,
AGPC15, MOPC20 and TOPC20 preforms.
The second group consisted of the MOPC20 and AGPC15 preforms with no significant
compression up to 10 MPa. After that pressure, a steep increase in the degree of compression
occurred. Compression reached similar levels to AOPC20 and TOPC20 at an applied pressure
of 100 MPa. After pressure release, a spring back to 0.26 and 0.29 was measured for AGPC15
and MOPC20 respectively. Similar to the compression behaviour of AOPC20 and TOPC20,
the TOPC10 preform and the FATO hybrid preform started to compress after reaching an
isostatic pressure of about 1 MPa, as shown in Figure 4.35. FATO showed the greatest
compression of all the preforms which was 0.45 at the maximum load of 212 MPa. After
pressure relief, a spring back to 0.40 took place.

129
0.1 1 10 1000.0
0.1
0.2
0.3
0.4
0.5
0.6
FATO
TOPC10
Rel
ativ
e vo
lum
etric
com
pres
sion
cis
o ( )
Isostatic pressure Piso
(MPa)Isostatic pressure Piso /MPa
Rel
. vol
umet
ric
com
pres
sion
c iso
Figure 4.35 Isostatic compression of the TOPC10 and FATO preforms.
The TOPC10 preform with the lowest compression strength σc in the uniaxial test (0.7 MPa)
started to compress significantly in the isostatic test at a pressure of 1 MPa. At the maximum
load, the compression reached 0.34 and after pressure release to ambient, a constant
compression of 0.25 was measured.
0.0 0.1 0.2 0.30
2
4
6
8
10
12
AOPC20 AGPC15 TOPC10 TOPC20 MOPC20 FATO
Isos
tatic
pre
ssur
e P
iso (
MP
a)
Relative volumetric compression ciso
()
Isos
tatic
pre
ssur
e P iso
/MP
a
Rel. volumetric compression ciso
Figure 4.36 Isostatic pressure as a function of the compression in the range of 0.1 MPa to 10 MPa.
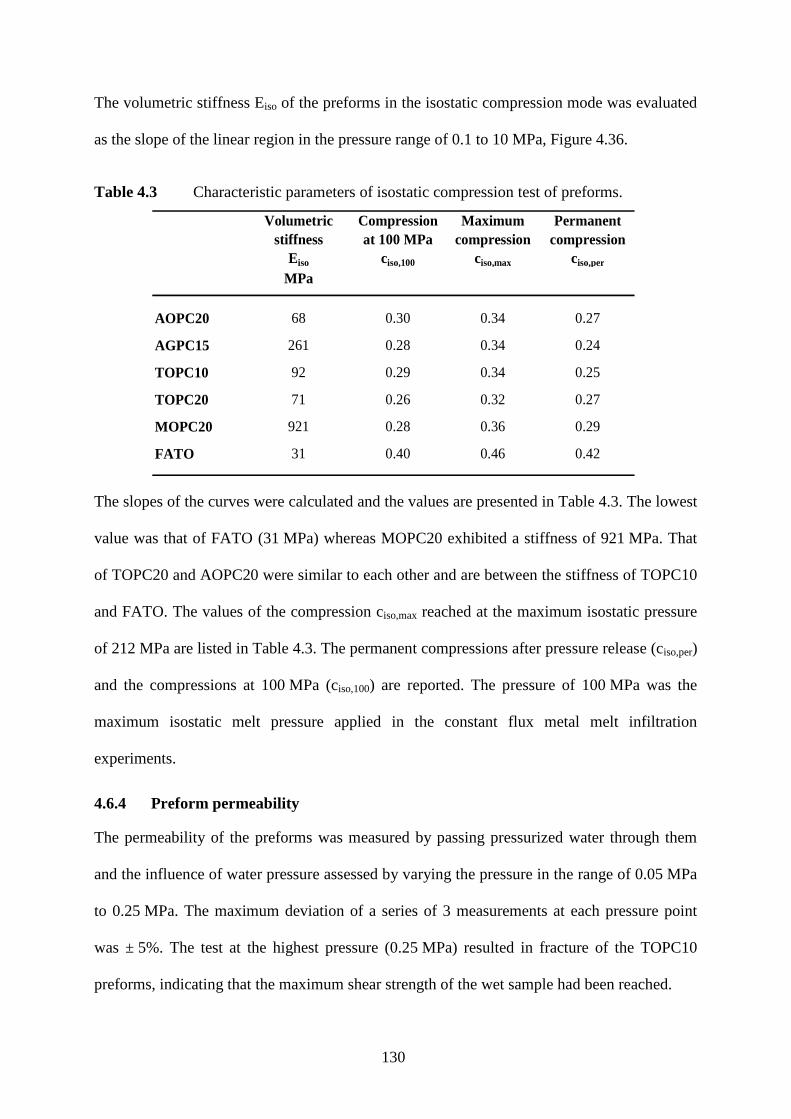
130
The volumetric stiffness Eiso of the preforms in the isostatic compression mode was evaluated
as the slope of the linear region in the pressure range of 0.1 to 10 MPa, Figure 4.36.
Table 4.3 Characteristic parameters of isostatic compression test of preforms.
Volumetric stiffness
Eiso
Compressionat 100 MPa
ciso,100
Maximum compression
ciso,max
Permanent compression
ciso,per
MPa
AOPC20 68 0.30 0.34 0.27
AGPC15 261 0.28 0.34 0.24
TOPC10 92 0.29 0.34 0.25
TOPC20 71 0.26 0.32 0.27
MOPC20 921 0.28 0.36 0.29
FATO 31 0.40 0.46 0.42
The slopes of the curves were calculated and the values are presented in Table 4.3. The lowest
value was that of FATO (31 MPa) whereas MOPC20 exhibited a stiffness of 921 MPa. That
of TOPC20 and AOPC20 were similar to each other and are between the stiffness of TOPC10
and FATO. The values of the compression ciso,max reached at the maximum isostatic pressure
of 212 MPa are listed in Table 4.3. The permanent compressions after pressure release (ciso,per)
and the compressions at 100 MPa (ciso,100) are reported. The pressure of 100 MPa was the
maximum isostatic melt pressure applied in the constant flux metal melt infiltration
experiments.
4.6.4 Preform permeability
The permeability of the preforms was measured by passing pressurized water through them
and the influence of water pressure assessed by varying the pressure in the range of 0.05 MPa
to 0.25 MPa. The maximum deviation of a series of 3 measurements at each pressure point
was ± 5%. The test at the highest pressure (0.25 MPa) resulted in fracture of the TOPC10
preforms, indicating that the maximum shear strength of the wet sample had been reached.
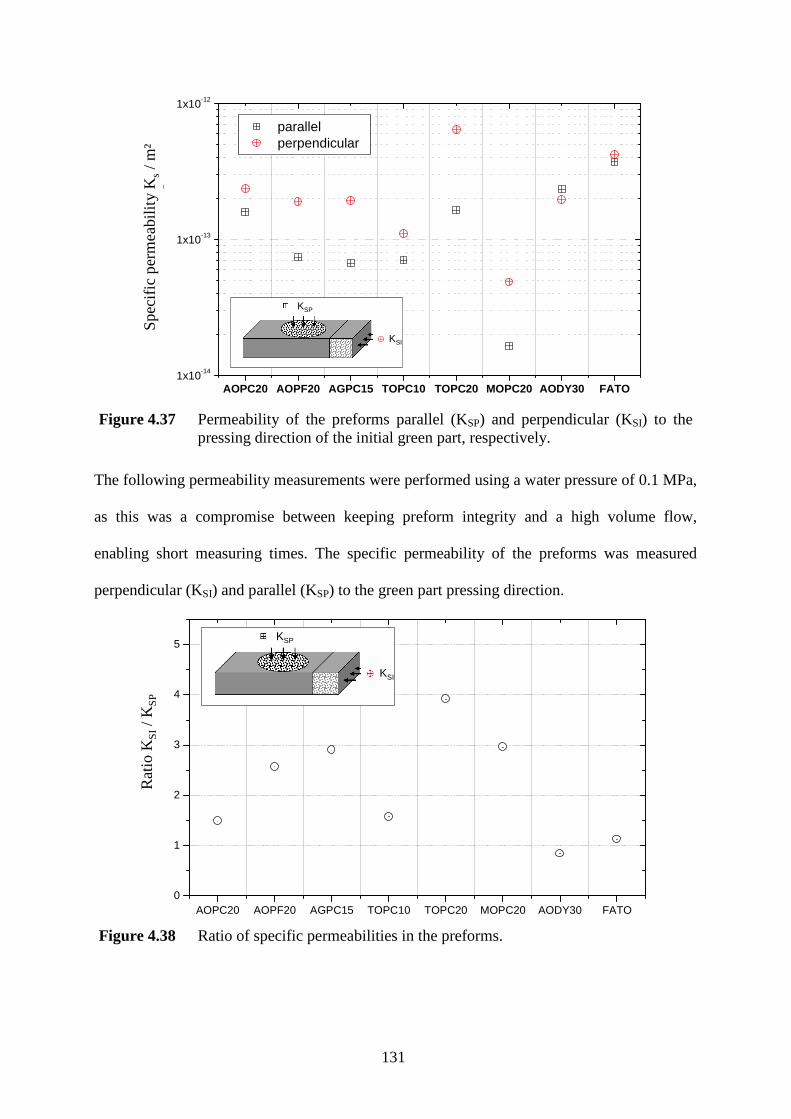
131
Figure 4.37 Permeability of the preforms parallel (KSP) and perpendicular (KSI) to the pressing direction of the initial green part, respectively.
The following permeability measurements were performed using a water pressure of 0.1 MPa,
as this was a compromise between keeping preform integrity and a high volume flow,
enabling short measuring times. The specific permeability of the preforms was measured
perpendicular (KSI) and parallel (KSP) to the green part pressing direction.
AOPC20 AOPF20 AGPC15 TOPC10 TOPC20 MOPC20 AODY30 FATO0
1
2
3
4
5
Rat
io K
SI /
KS
P (
)
KSP
KSI
Rat
io K
SI/ K
SP
Figure 4.38 Ratio of specific permeabilities in the preforms.
AOPC20 AOPF20 AGPC15 TOPC10 TOPC20 MOPC20 AODY30 FATO1x10-14
1x10-13
1x10-12
parallel perpendicular
Spe
cific
per
mea
bilit
y K
S (
m²)
KSP
KSI
Spe
cific
per
me
abili
ty K s
/ m²
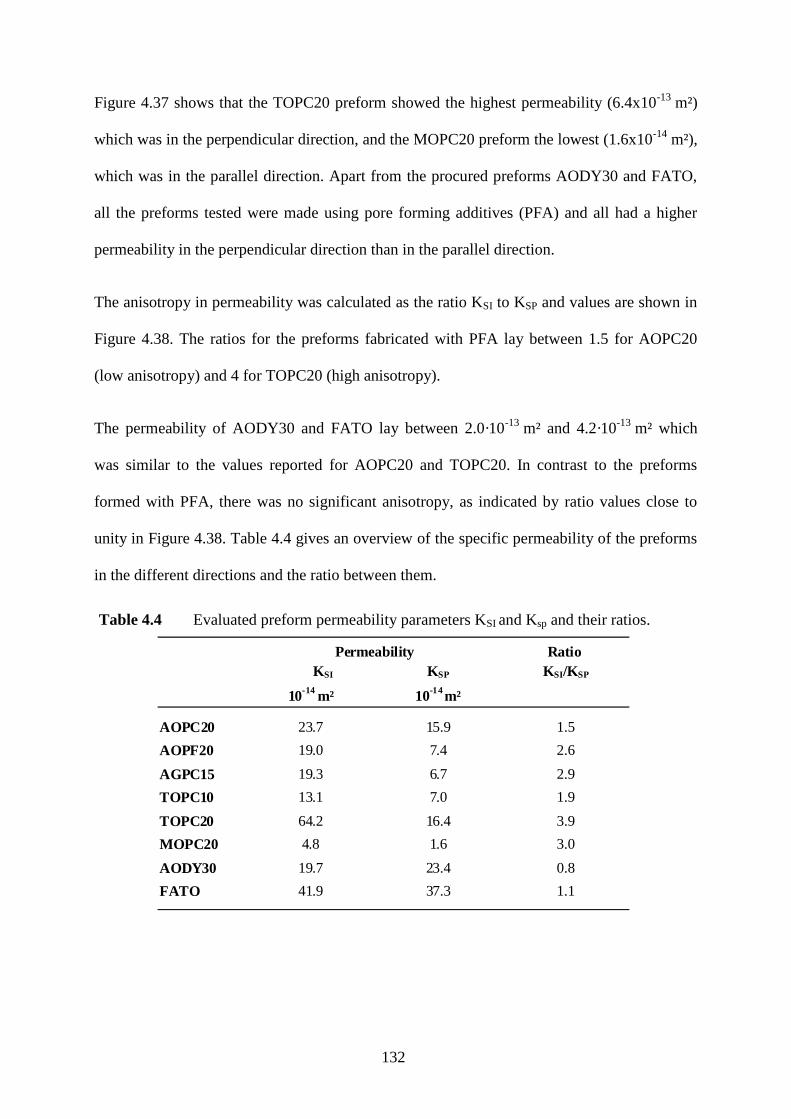
132
Figure 4.37 shows that the TOPC20 preform showed the highest permeability (6.4x10⁻¹³ m²)
which was in the perpendicular direction, and the MOPC20 preform the lowest (1.6x10⁻¹⁴ m²),
which was in the parallel direction. Apart from the procured preforms AODY30 and FATO,
all the preforms tested were made using pore forming additives (PFA) and all had a higher
permeability in the perpendicular direction than in the parallel direction.
The anisotropy in permeability was calculated as the ratio KSI to KSP and values are shown in
Figure 4.38. The ratios for the preforms fabricated with PFA lay between 1.5 for AOPC20
(low anisotropy) and 4 for TOPC20 (high anisotropy).
The permeability of AODY30 and FATO lay between 2.0·10-13 m² and 4.2·10-13 m² which
was similar to the values reported for AOPC20 and TOPC20. In contrast to the preforms
formed with PFA, there was no significant anisotropy, as indicated by ratio values close to
unity in Figure 4.38. Table 4.4 gives an overview of the specific permeability of the preforms
in the different directions and the ratio between them.
Table 4.4 Evaluated preform permeability parameters KSI and Ksp and their ratios.
Ratio KSI KSP KSI/KSP
10-14 m² 10-14 m²
AOPC20 23.7 15.9 1.5
AOPF20 19.0 7.4 2.6
AGPC15 19.3 6.7 2.9
TOPC10 13.1 7.0 1.9
TOPC20 64.2 16.4 3.9
MOPC20 4.8 1.6 3.0
AODY30 19.7 23.4 0.8
FATO 41.9 37.3 1.1
Permeability
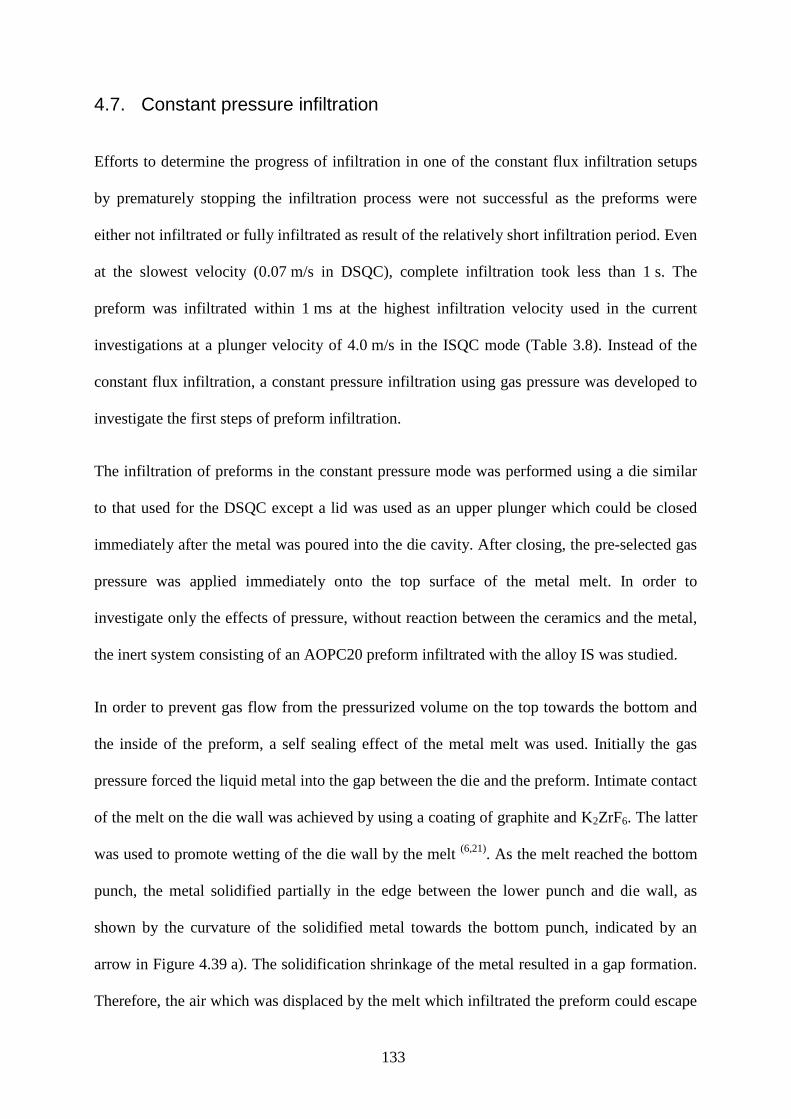
133
4.7. Constant pressure infiltration
Efforts to determine the progress of infiltration in one of the constant flux infiltration setups
by prematurely stopping the infiltration process were not successful as the preforms were
either not infiltrated or fully infiltrated as result of the relatively short infiltration period. Even
at the slowest velocity (0.07 m/s in DSQC), complete infiltration took less than 1 s. The
preform was infiltrated within 1 ms at the highest infiltration velocity used in the current
investigations at a plunger velocity of 4.0 m/s in the ISQC mode (Table 3.8). Instead of the
constant flux infiltration, a constant pressure infiltration using gas pressure was developed to
investigate the first steps of preform infiltration.
The infiltration of preforms in the constant pressure mode was performed using a die similar
to that used for the DSQC except a lid was used as an upper plunger which could be closed
immediately after the metal was poured into the die cavity. After closing, the pre-selected gas
pressure was applied immediately onto the top surface of the metal melt. In order to
investigate only the effects of pressure, without reaction between the ceramics and the metal,
the inert system consisting of an AOPC20 preform infiltrated with the alloy IS was studied.
In order to prevent gas flow from the pressurized volume on the top towards the bottom and
the inside of the preform, a self sealing effect of the metal melt was used. Initially the gas
pressure forced the liquid metal into the gap between the die and the preform. Intimate contact
of the melt on the die wall was achieved by using a coating of graphite and K2ZrF6. The latter
was used to promote wetting of the die wall by the melt (6,21). As the melt reached the bottom
punch, the metal solidified partially in the edge between the lower punch and die wall, as
shown by the curvature of the solidified metal towards the bottom punch, indicated by an
arrow in Figure 4.39 a). The solidification shrinkage of the metal resulted in a gap formation.
Therefore, the air which was displaced by the melt which infiltrated the preform could escape
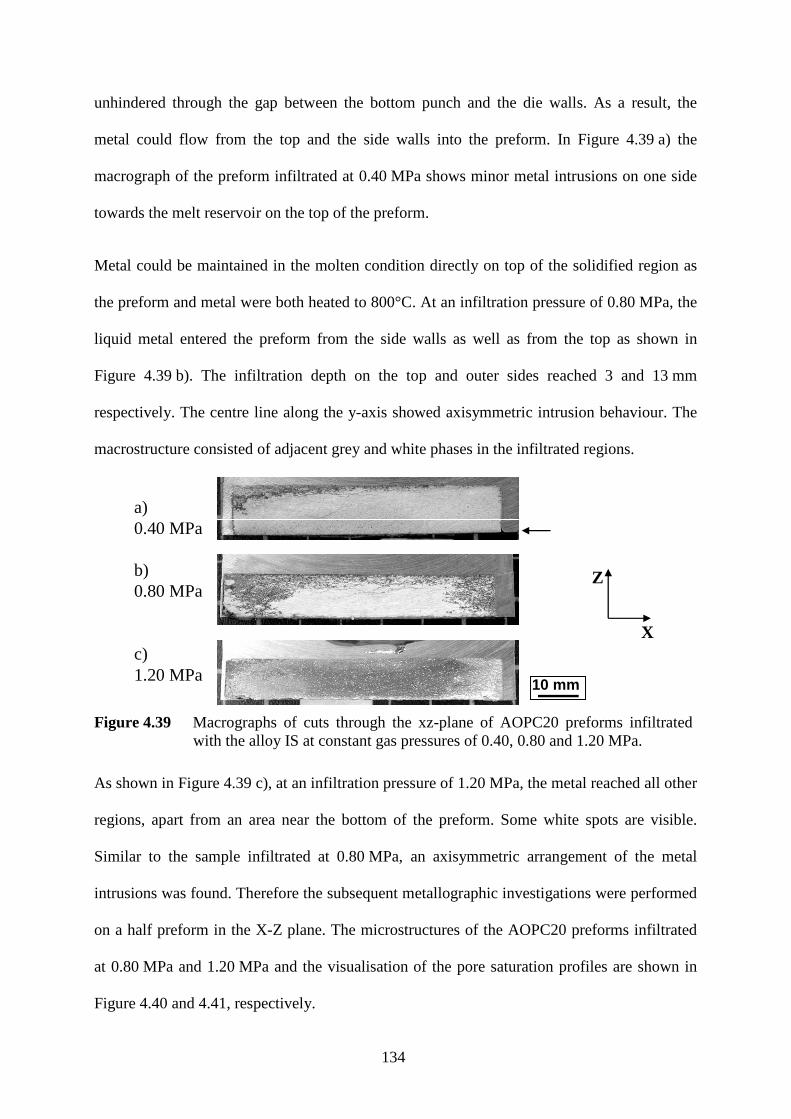
134
unhindered through the gap between the bottom punch and the die walls. As a result, the
metal could flow from the top and the side walls into the preform. In Figure 4.39 a) the
macrograph of the preform infiltrated at 0.40 MPa shows minor metal intrusions on one side
towards the melt reservoir on the top of the preform.
Metal could be maintained in the molten condition directly on top of the solidified region as
the preform and metal were both heated to 800°C. At an infiltration pressure of 0.80 MPa, the
liquid metal entered the preform from the side walls as well as from the top as shown in
Figure 4.39 b). The infiltration depth on the top and outer sides reached 3 and 13 mm
respectively. The centre line along the y-axis showed axisymmetric intrusion behaviour. The
macrostructure consisted of adjacent grey and white phases in the infiltrated regions.
2 µm10 mm2 µm10 mm
a)0.40 MPa
b)0.80 MPa
c)1.20 MPa
Z
X
Figure 4.39 Macrographs of cuts through the xz-plane of AOPC20 preforms infiltrated with the alloy IS at constant gas pressures of 0.40, 0.80 and 1.20 MPa.
As shown in Figure 4.39 c), at an infiltration pressure of 1.20 MPa, the metal reached all other
regions, apart from an area near the bottom of the preform. Some white spots are visible.
Similar to the sample infiltrated at 0.80 MPa, an axisymmetric arrangement of the metal
intrusions was found. Therefore the subsequent metallographic investigations were performed
on a half preform in the X-Z plane. The microstructures of the AOPC20 preforms infiltrated
at 0.80 MPa and 1.20 MPa and the visualisation of the pore saturation profiles are shown in
Figure 4.40 and 4.41, respectively.
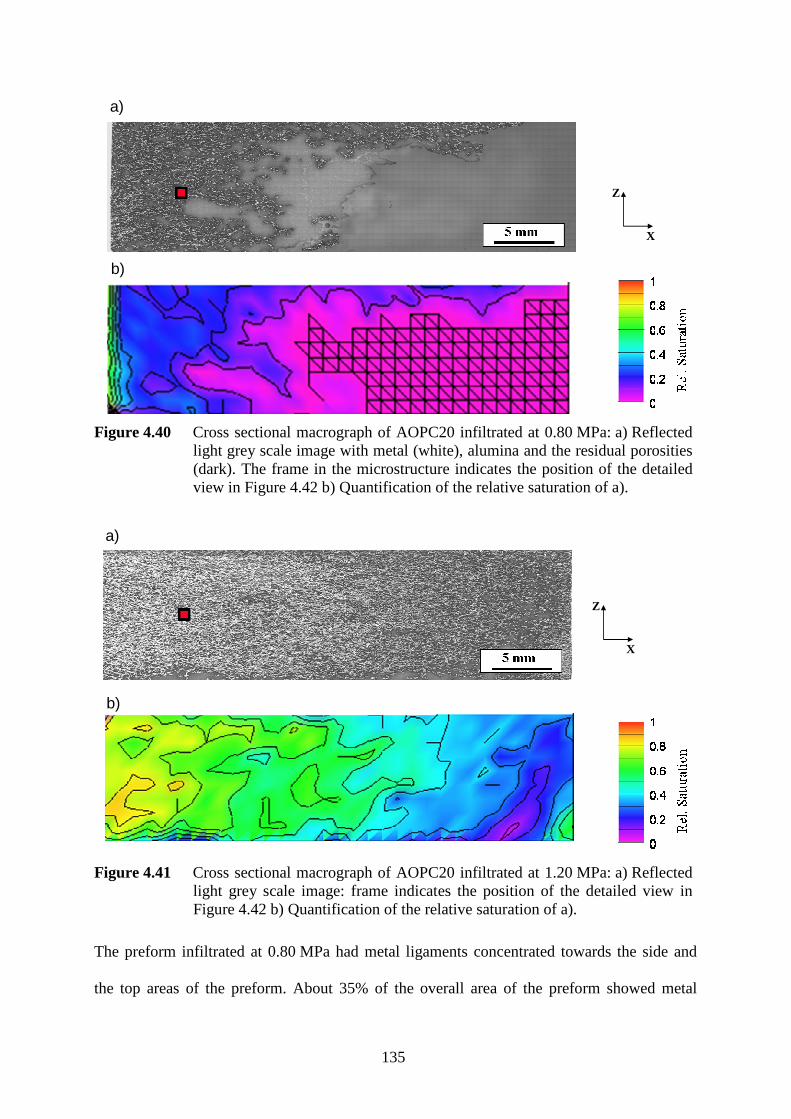
135
b)
a)
X
Z
Figure 4.40 Cross sectional macrograph of AOPC20 infiltrated at 0.80 MPa: a) Reflected light grey scale image with metal (white), alumina and the residual porosities (dark). The frame in the microstructure indicates the position of the detailed view in Figure 4.42 b) Quantification of the relative saturation of a).
b)
a)
X
Z
Figure 4.41 Cross sectional macrograph of AOPC20 infiltrated at 1.20 MPa: a) Reflected light grey scale image: frame indicates the position of the detailed view in Figure 4.42 b) Quantification of the relative saturation of a).
The preform infiltrated at 0.80 MPa had metal ligaments concentrated towards the side and
the top areas of the preform. About 35% of the overall area of the preform showed metal
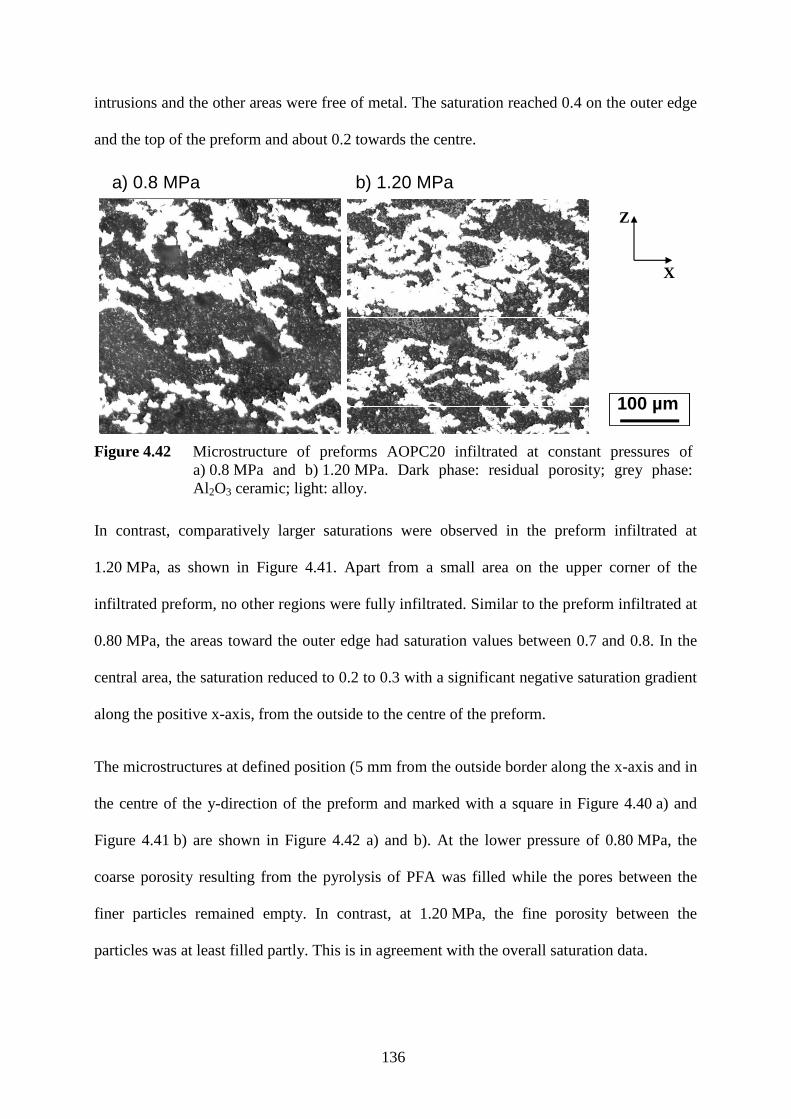
136
intrusions and the other areas were free of metal. The saturation reached 0.4 on the outer edge
and the top of the preform and about 0.2 towards the centre.
2 µm100 µm2 µm100 µm
X
a) 0.8 MPa b) 1.20 MPa
Z
Figure 4.42 Microstructure of preforms AOPC20 infiltrated at constant pressures of a) 0.8 MPa and b) 1.20 MPa. Dark phase: residual porosity; grey phase: Al 2O3 ceramic; light: alloy.
In contrast, comparatively larger saturations were observed in the preform infiltrated at
1.20 MPa, as shown in Figure 4.41. Apart from a small area on the upper corner of the
infiltrated preform, no other regions were fully infiltrated. Similar to the preform infiltrated at
0.80 MPa, the areas toward the outer edge had saturation values between 0.7 and 0.8. In the
central area, the saturation reduced to 0.2 to 0.3 with a significant negative saturation gradient
along the positive x-axis, from the outside to the centre of the preform.
The microstructures at defined position (5 mm from the outside border along the x-axis and in
the centre of the y-direction of the preform and marked with a square in Figure 4.40 a) and
Figure 4.41 b) are shown in Figure 4.42 a) and b). At the lower pressure of 0.80 MPa, the
coarse porosity resulting from the pyrolysis of PFA was filled while the pores between the
finer particles remained empty. In contrast, at 1.20 MPa, the fine porosity between the
particles was at least filled partly. This is in agreement with the overall saturation data.
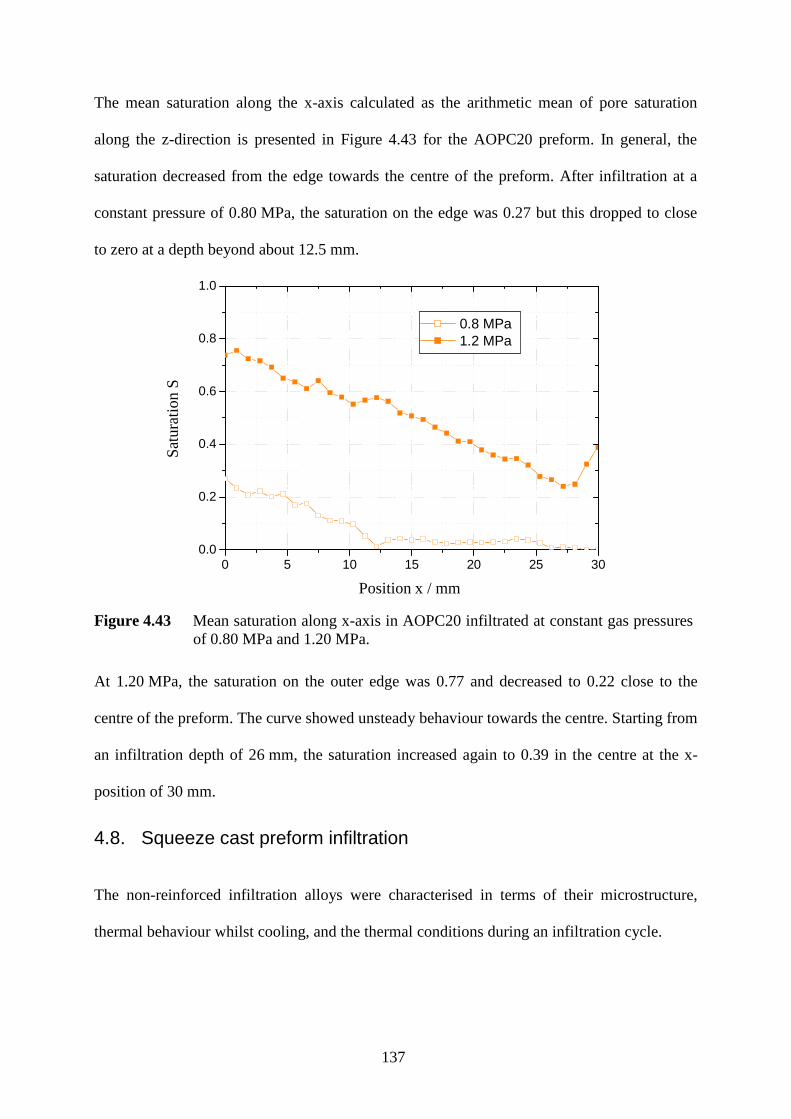
137
The mean saturation along the x-axis calculated as the arithmetic mean of pore saturation
along the z-direction is presented in Figure 4.43 for the AOPC20 preform. In general, the
saturation decreased from the edge towards the centre of the preform. After infiltration at a
constant pressure of 0.80 MPa, the saturation on the edge was 0.27 but this dropped to close
to zero at a depth beyond about 12.5 mm.
0 5 10 15 20 25 300.0
0.2
0.4
0.6
0.8
1.0
0.8 MPa 1.2 MPa
Sat
urat
ion
S (
)
x (mm)Position x / mm
Sat
urat
ion
S
Figure 4.43 Mean saturation along x-axis in AOPC20 infiltrated at constant gas pressures of 0.80 MPa and 1.20 MPa.
At 1.20 MPa, the saturation on the outer edge was 0.77 and decreased to 0.22 close to the
centre of the preform. The curve showed unsteady behaviour towards the centre. Starting from
an infiltration depth of 26 mm, the saturation increased again to 0.39 in the centre at the x-
position of 30 mm.
4.8. Squeeze cast preform infiltration
The non-reinforced infiltration alloys were characterised in terms of their microstructure,
thermal behaviour whilst cooling, and the thermal conditions during an infiltration cycle.
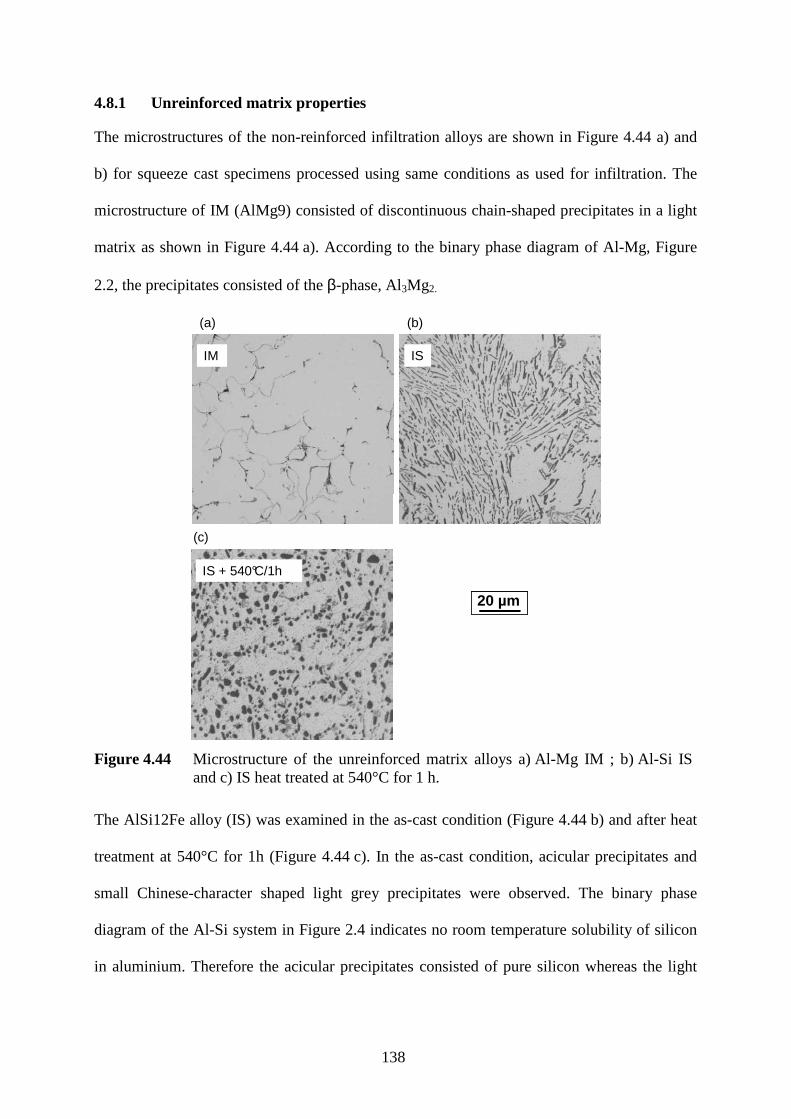
138
4.8.1 Unreinforced matrix properties
The microstructures of the non-reinforced infiltration alloys are shown in Figure 4.44 a) and
b) for squeeze cast specimens processed using same conditions as used for infiltration. The
microstructure of IM (AlMg9) consisted of discontinuous chain-shaped precipitates in a light
matrix as shown in Figure 4.44 a). According to the binary phase diagram of Al-Mg, Figure
2.2, the precipitates consisted of the β-phase, Al3Mg2.
IS
IS + 540°C/1hIS + 540°C/1h
2 µm20 µm2 µm20 µm
IM
(b)(a)
(c)
Figure 4.44 Microstructure of the unreinforced matrix alloys a) Al-Mg IM ; b) Al-Si IS and c) IS heat treated at 540°C for 1 h.
The AlSi12Fe alloy (IS) was examined in the as-cast condition (Figure 4.44 b) and after heat
treatment at 540°C for 1h (Figure 4.44 c). In the as-cast condition, acicular precipitates and
small Chinese-character shaped light grey precipitates were observed. The binary phase
diagram of the Al-Si system in Figure 2.4 indicates no room temperature solubility of silicon
in aluminium. Therefore the acicular precipitates consisted of pure silicon whereas the light

139
grey areas consisted of an intermetallic of the Al-Fe-Si type as reported by Schumann (174).
Both types of precipitates were spherodized by the heat treatment.
Time t / s
Tem
per
atu
re T
/°C
Figure 4.45 Thermal analysis of the infiltration alloys a) IM and b) IS.
The thermal analysis curves of the infiltration alloys are shown in Figure 4.45 a) and b). To
ensure infiltration in the fully molten condition, the temperatures of the melt and the preform
were maintained above the liquidus temperatures of the alloys. The liquidus temperature of
IM was measured to be 613°C and that of IS, 577°C. The solidus temperatures of both alloys
were evaluated to be 566°C.
4.8.2 Thermal properties during infiltration
The temperatures Tpreform, Tedge, Tcentre, the displacement of the upper punch splunger and the
metallic pressure Pmet were measured during the first 15 s of an infiltration cycle and are given
in Figure 4.46 for MOPC20. The Tpreform curve corresponds to the temperature in the preform
close to its edge (p. 82) whereas Tcentre and Tedge represent the temperatures close to the
bottom punch surface in the centre and the edge respectively. As the melt temperature in the
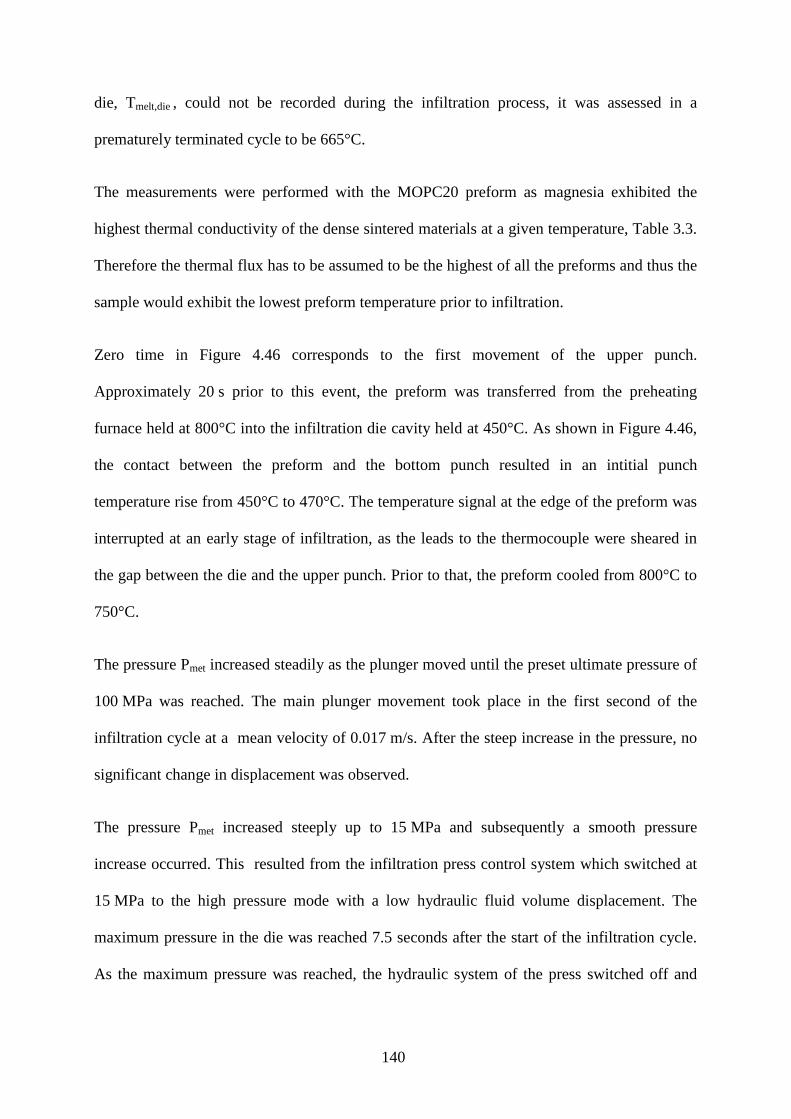
140
die, Tmelt,die , could not be recorded during the infiltration process, it was assessed in a
prematurely terminated cycle to be 665°C.
The measurements were performed with the MOPC20 preform as magnesia exhibited the
highest thermal conductivity of the dense sintered materials at a given temperature, Table 3.3.
Therefore the thermal flux has to be assumed to be the highest of all the preforms and thus the
sample would exhibit the lowest preform temperature prior to infiltration.
Zero time in Figure 4.46 corresponds to the first movement of the upper punch.
Approximately 20 s prior to this event, the preform was transferred from the preheating
furnace held at 800°C into the infiltration die cavity held at 450°C. As shown in Figure 4.46,
the contact between the preform and the bottom punch resulted in an intitial punch
temperature rise from 450°C to 470°C. The temperature signal at the edge of the preform was
interrupted at an early stage of infiltration, as the leads to the thermocouple were sheared in
the gap between the die and the upper punch. Prior to that, the preform cooled from 800°C to
750°C.
The pressure Pmet increased steadily as the plunger moved until the preset ultimate pressure of
100 MPa was reached. The main plunger movement took place in the first second of the
infiltration cycle at a mean velocity of 0.017 m/s. After the steep increase in the pressure, no
significant change in displacement was observed.
The pressure Pmet increased steeply up to 15 MPa and subsequently a smooth pressure
increase occurred. This resulted from the infiltration press control system which switched at
15 MPa to the high pressure mode with a low hydraulic fluid volume displacement. The
maximum pressure in the die was reached 7.5 seconds after the start of the infiltration cycle.
As the maximum pressure was reached, the hydraulic system of the press switched off and
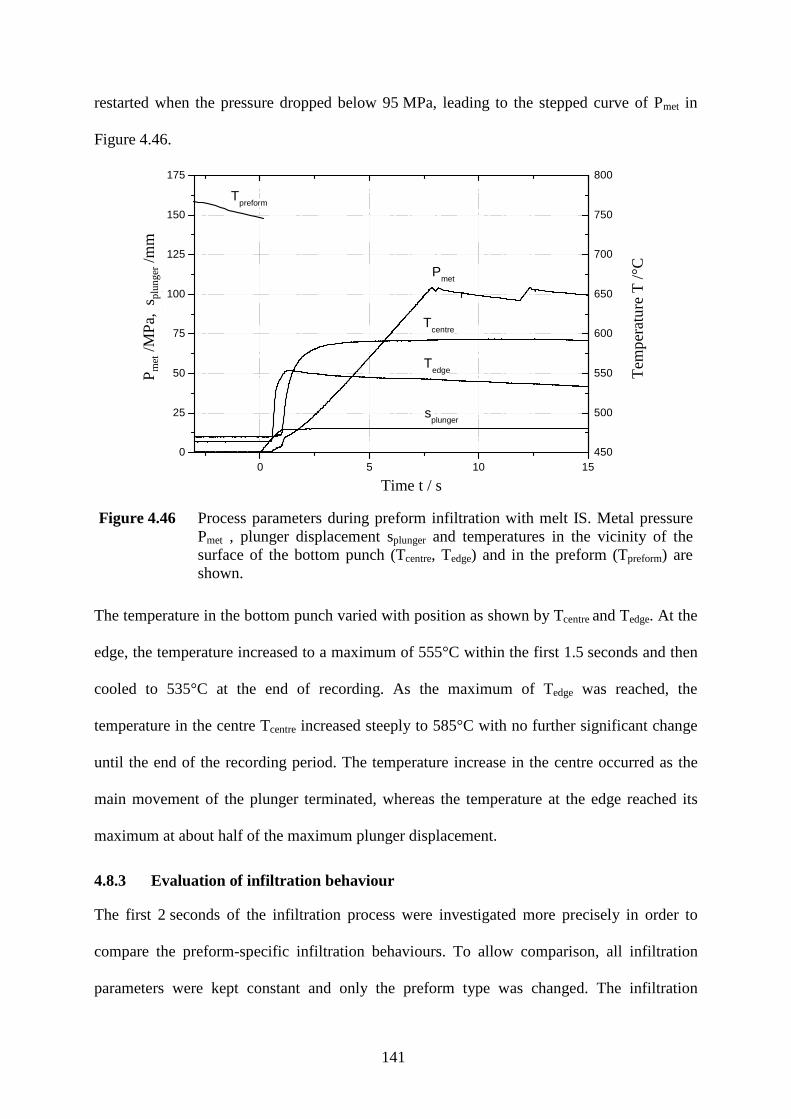
141
restarted when the pressure dropped below 95 MPa, leading to the stepped curve of Pmet in
Figure 4.46.
0 5 10 150
25
50
75
100
125
150
175
Tpreform
splunger
Tedge
Tcentre
Pmet
Pm
et (
MP
a)
spl
unge
r (m
m)
Time t (s)
450
500
550
600
650
700
750
800
Tem
pera
ture
T (
°C)
Time t / s
Tem
per
atu
re T
/°C
Pm
et/M
Pa,
sp
lun
ger/
mm
Figure 4.46 Process parameters during preform infiltration with melt IS. Metal pressure Pmet , plunger displacement splunger and temperatures in the vicinity of the surface of the bottom punch (Tcentre, Tedge) and in the preform (Tpreform) are shown.
The temperature in the bottom punch varied with position as shown by Tcentre and Tedge. At the
edge, the temperature increased to a maximum of 555°C within the first 1.5 seconds and then
cooled to 535°C at the end of recording. As the maximum of Tedge was reached, the
temperature in the centre Tcentre increased steeply to 585°C with no further significant change
until the end of the recording period. The temperature increase in the centre occurred as the
main movement of the plunger terminated, whereas the temperature at the edge reached its
maximum at about half of the maximum plunger displacement.
4.8.3 Evaluation of infiltration behaviour
The first 2 seconds of the infiltration process were investigated more precisely in order to
compare the preform-specific infiltration behaviours. To allow comparison, all infiltration
parameters were kept constant and only the preform type was changed. The infiltration
142
pressure was recorded as a function of the preform saturation curves were recorded and
examples are given in Figure 4.47 for TOPC10 and AOPC20 preforms infiltrated with IS.
The saturation point was taken to be the point at which the maximum pressure of 100 MPa
was first reached and then the volume intruded calculated by displacement. Displacements
above this point came from solidification shrinkage and were about 6% by volume for IS (1).
-0.2 0.0 0.2 0.4 0.6 0.8 1.00.1
1.0
10.0
100.0
AOPC20 TOPC10
Pre
ssur
e P
met (
MP
a)
Saturation S ()
Pre
ssur
e P me
t/M
Pa
Saturation S
Figure 4.47 Infiltration curves of the preforms AOPC20 and TOPC10 when infiltrating with molten IS alloy.
After the point of complete saturation was determined, the melt volume necessary for full
infiltration was subtracted, leading to the zero point equivalent to no saturation. This point
corresponded to the starting point of melt intrusion into the preform. This procedure was
applied to the data determined during infiltration of AOPC20 and TOPC10 with the IS alloy.
The infiltration curves in Figure 4.47 showed two regions of unsteady filling. The first region
was below the saturation of 0.1 where a steep increase was observed up to a pressure of about
1 and 2 MPa for AOPC20 and TOPC10 preforms respectively. A second region in which the
143
gradient of the curve changed was observed above a saturation of approximately 0.8. Here a
steep pressure increase occurred up to the maximum present infiltration pressure of 100 MPa.
The investigations showed that infiltration curves may be subdivided into three stages:
1. Initiation of infiltration up to a saturation of 0.1
2. Steady increase in pressure over the saturation range of 0.1 to 0.8
3. Steep increase in pressure towards full saturation of 1.0
The analysis of the infiltration curves was therefore subdivided into these three stages.
4.8.4 Initiation of preform infiltration with Al-Si alloy IS
The first step of the preform infiltration was characterised by the pressure to initiate filling,
designated as the threshold pressure P0. In order to determine this parameter, the first 2 to
5.7 mm of infiltration depth was plotted as a function of the applied pressure as presented in
Figure 4.48. The depth calculations were based on the assumption of infiltration on five sides
of the preform, as was found in the constant pressure experiments (section 4.7).
In accordance to Darcy´s law (103), the infiltration depth is a square root function of the applied
metal pressure Pmet. Therefore a linear behaviour was expected in plots of L² against Pmet. The
data were fitted to a linear equation with a slope of a and an intercept on the pressure axis
of P0. As shown in Figure 4.48, the behaviour was close to linear with the exception of
AGPC15 and TOPC10, where a transient behaviour was observed.
The preform type affected the pressure axis intercept and the slope of the fitted lines. The
values of the slope a and the threshold pressure P0 are summarized in Table 4.5. The lowest
threshold pressure of 0.65 MPa and the steepest curve were found for AODY30. The slopes of
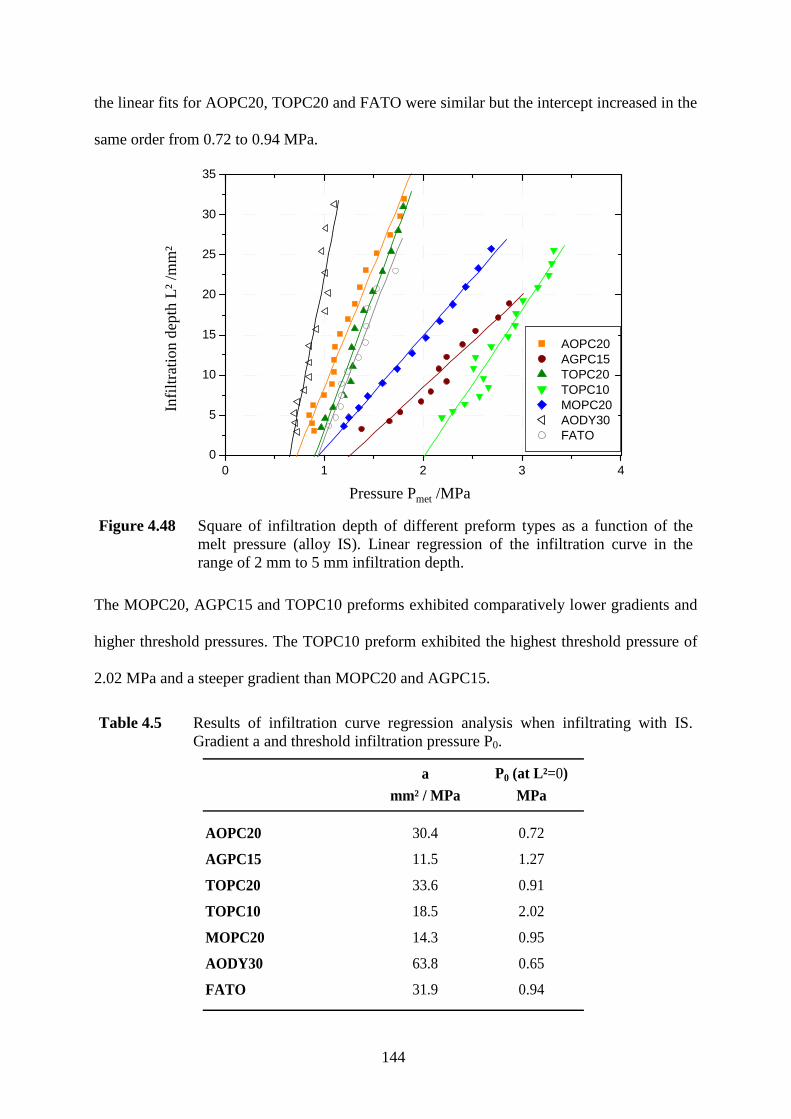
144
the linear fits for AOPC20, TOPC20 and FATO were similar but the intercept increased in the
same order from 0.72 to 0.94 MPa.
0 1 2 3 40
5
10
15
20
25
30
35
AOPC20 AGPC15 TOPC20 TOPC10 MOPC20 AODY30 FATO
Infil
trat
ion
dept
h L²
(m
m²)
Pressure Pmet
(MPa)Pressure Pmet /MPa
Infil
trat
ion
dep
th L
²/m
m²
Figure 4.48 Square of infiltration depth of different preform types as a function of the melt pressure (alloy IS). Linear regression of the infiltration curve in the range of 2 mm to 5 mm infiltration depth.
The MOPC20, AGPC15 and TOPC10 preforms exhibited comparatively lower gradients and
higher threshold pressures. The TOPC10 preform exhibited the highest threshold pressure of
2.02 MPa and a steeper gradient than MOPC20 and AGPC15.
Table 4.5 Results of infiltration curve regression analysis when infiltrating with IS. Gradient a and threshold infiltration pressure P0.
a P0 (at L²=0)mm² / MPa MPa
AOPC20 30.4 0.72
AGPC15 11.5 1.27
TOPC20 33.6 0.91
TOPC10 18.5 2.02
MOPC20 14.3 0.95
AODY30 63.8 0.65
FATO 31.9 0.94
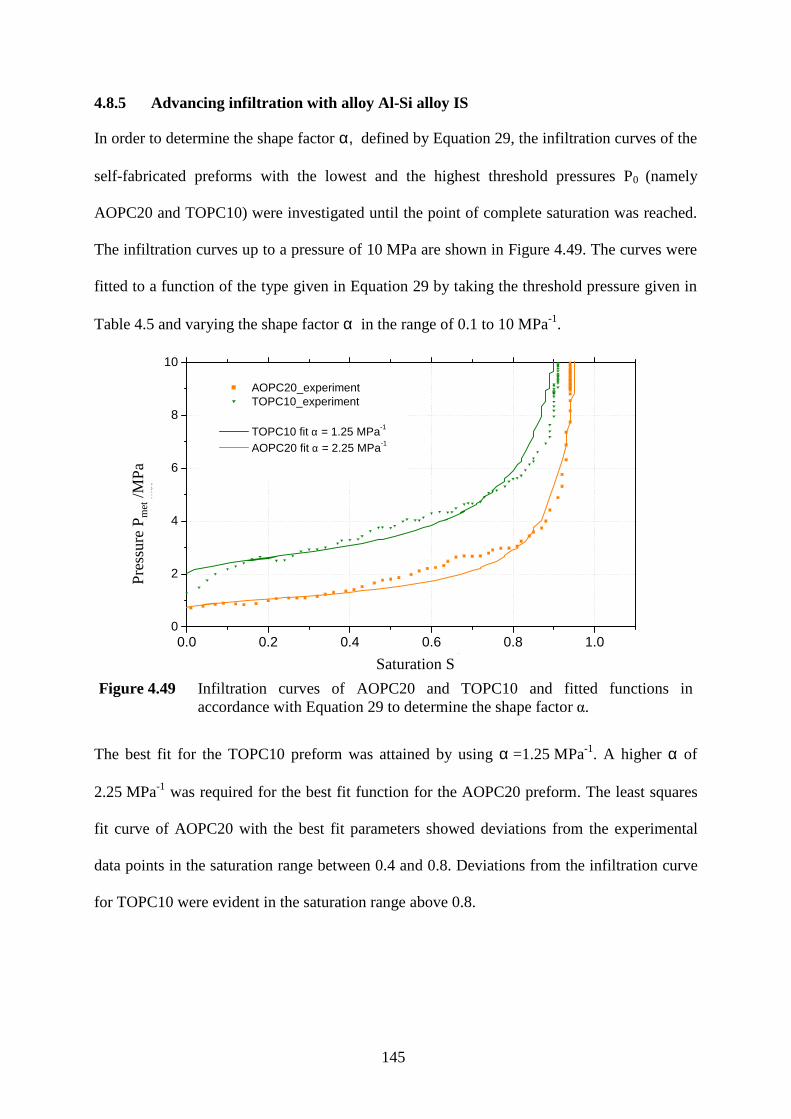
145
4.8.5 Advancing infiltration with alloy Al-Si alloy IS
In order to determine the shape factor α, defined by Equation 29, the infiltration curves of the
self-fabricated preforms with the lowest and the highest threshold pressures P0 (namely
AOPC20 and TOPC10) were investigated until the point of complete saturation was reached.
The infiltration curves up to a pressure of 10 MPa are shown in Figure 4.49. The curves were
fitted to a function of the type given in Equation 29 by taking the threshold pressure given in
Table 4.5 and varying the shape factor α in the range of 0.1 to 10 MPa-1.
0.0 0.2 0.4 0.6 0.8 1.00
2
4
6
8
10
AOPC20_experiment TOPC10_experiment
TOPC10 fit α = 1.25 MPa-1
AOPC20 fit α = 2.25 MPa-1
Pre
ssur
e P
met (
MP
a)
Saturation ()
Pre
ssur
e P me
t/M
Pa
Saturation S
Figure 4.49 Infiltration curves of AOPC20 and TOPC10 and fitted functions in accordance with Equation 29 to determine the shape factor α.
The best fit for the TOPC10 preform was attained by using α =1.25 MPa-1. A higher α of
2.25 MPa-1 was required for the best fit function for the AOPC20 preform. The least squares
fi t curve of AOPC20 with the best fit parameters showed deviations from the experimental
data points in the saturation range between 0.4 and 0.8. Deviations from the infiltration curve
for TOPC10 were evident in the saturation range above 0.8.
146
4.8.6 Non destructive testing of MMC infiltrated with alloy IS
Non-destructive X-ray computer tomography was conducted on the infiltrated MMC samples
to detect defects resulting from processing. In order to determine the MMC properties with
minimum influence of internal defects, the aim was to have a structure as homogenous as
possible.
As an example, virtual cross-sectional views in the X-Y and Y-Z planes, which were
generally taken from the respective centre planes of the MMC, were extracted from the three
dimensional computer tomography data and are shown for the TOPC20IS MMC in Figure
4.50 and Figure 4.51 for different infiltration tool set-ups. The light areas represent the
infiltrated preform and the darker areas the pure infiltration Al-Si alloy IS. The central linear
discontinuity in the X-Y plane of Figure 4.51 was an artefact resulting from the reconstruction
algorithms, and was visible to a greater extent in Figure 4.51 than in Figure 4.50.
In the MMC infiltration process, the preform was initially placed on the bottom punch. It
remained in this position throughout infiltration. Even though it had to be assumed that the
preform floated as a result of differences between its bulk density and the melt density partial
premature solidification at the edge between the bottom punch and the die wall, as indicated
in the temperature measurements in 4.8.2, prevented the melt flowing under the preform and
therefore floating was impeded. The right hand side of the Y-Z plane views of the virtual cuts
in Figures 4.50 and 4.51 represent the X-Y plane of the preform which was initially in contact
with the bottom punch.
In the first infiltration tool, the bottom punch was completely made of tool steel as shown
schematically in Figure 4.50. In the X-Y plane, darker areas were visible in the region close to
the centre of the MMC, indicating material with lower X-ray absorption. Metallographic
characterisation attributed the inhomogeneities to non-infiltrated coarse pores formed by the
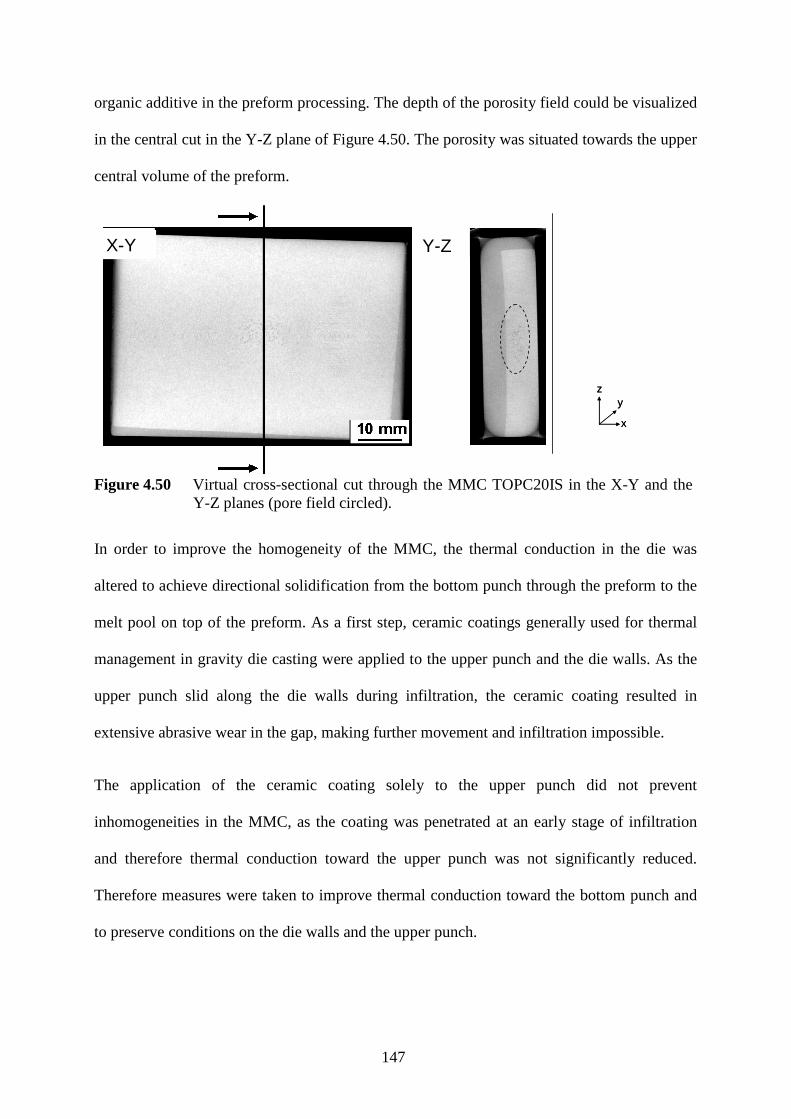
147
organic additive in the preform processing. The depth of the porosity field could be visualized
in the central cut in the Y-Z plane of Figure 4.50. The porosity was situated towards the upper
central volume of the preform.
X-Y Y-Z
zy
x
zy
x
Figure 4.50 Virtual cross-sectional cut through the MMC TOPC20IS in the X-Y and the
Y-Z planes (pore field circled).
In order to improve the homogeneity of the MMC, the thermal conduction in the die was
altered to achieve directional solidification from the bottom punch through the preform to the
melt pool on top of the preform. As a first step, ceramic coatings generally used for thermal
management in gravity die casting were applied to the upper punch and the die walls. As the
upper punch slid along the die walls during infiltration, the ceramic coating resulted in
extensive abrasive wear in the gap, making further movement and infiltration impossible.
The application of the ceramic coating solely to the upper punch did not prevent
inhomogeneities in the MMC, as the coating was penetrated at an early stage of infiltration
and therefore thermal conduction toward the upper punch was not significantly reduced.
Therefore measures were taken to improve thermal conduction toward the bottom punch and
to preserve conditions on the die walls and the upper punch.
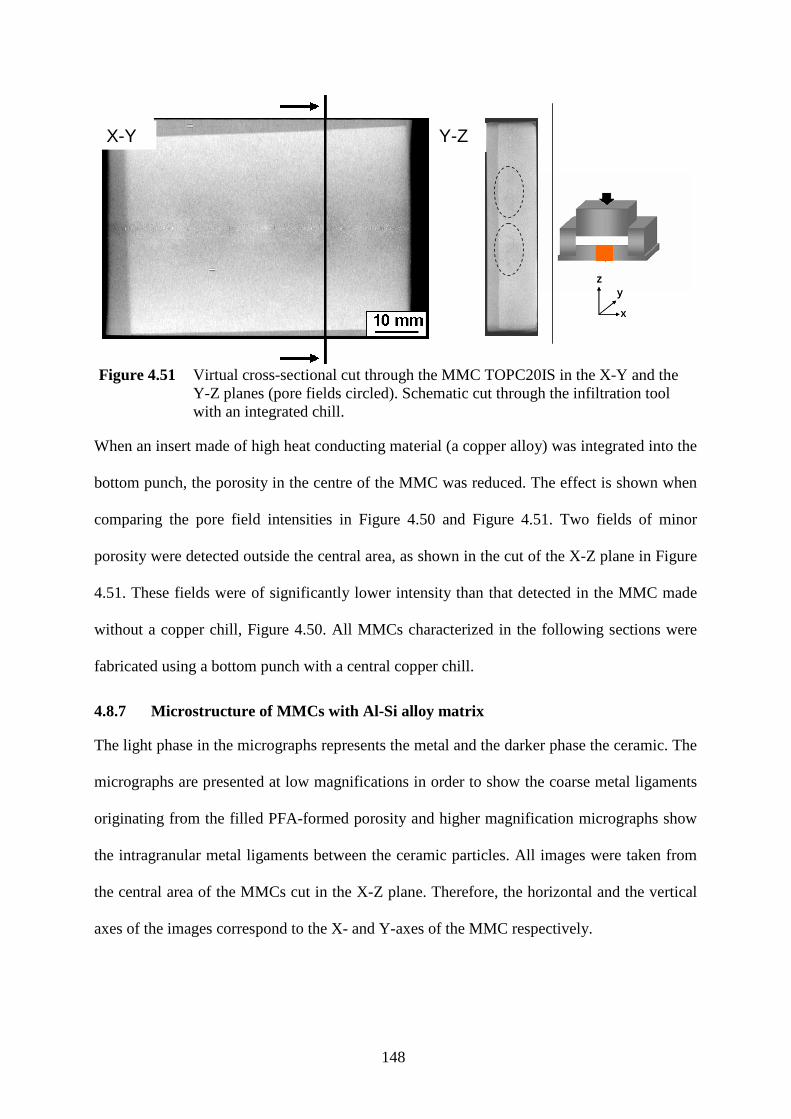
148
X-Y Y-Z
zy
x
zy
x
Figure 4.51 Virtual cross-sectional cut through the MMC TOPC20IS in the X-Y and the
Y-Z planes (pore fields circled). Schematic cut through the infiltration tool with an integrated chill.
When an insert made of high heat conducting material (a copper alloy) was integrated into the
bottom punch, the porosity in the centre of the MMC was reduced. The effect is shown when
comparing the pore field intensities in Figure 4.50 and Figure 4.51. Two fields of minor
porosity were detected outside the central area, as shown in the cut of the X-Z plane in Figure
4.51. These fields were of significantly lower intensity than that detected in the MMC made
without a copper chill, Figure 4.50. All MMCs characterized in the following sections were
fabricated using a bottom punch with a central copper chill.
4.8.7 Microstructure of MMCs with Al-Si alloy matrix
The light phase in the micrographs represents the metal and the darker phase the ceramic. The
micrographs are presented at low magnifications in order to show the coarse metal ligaments
originating from the filled PFA-formed porosity and higher magnification micrographs show
the intragranular metal ligaments between the ceramic particles. All images were taken from
the central area of the MMCs cut in the X-Z plane. Therefore, the horizontal and the vertical
axes of the images correspond to the X- and Y-axes of the MMC respectively.

149
The low magnification micrographs of the alumina-reinforced MMCs AOPC20IS, AOPF20IS
and AGPC15IS in Figure 4.52 a), b) and c) respectively show an apparently predominant
fraction of the ceramic phase. The large metallic areas developed from the filling of the
coarse pores in the preforms derived from the pyrolysed pore forming additive. In AOPF20IS,
where carbon fibres were used to form the coarse porosity, the elongated shape of this PFA is
clearly shown in the circled area in Figure 4.52 b). Additionally, the metal phase areas were
larger and more distinct compared to AOPC20IS (a) and AGPC15IS (c), indicating that the
initial green part contained carbon fibre agglomerates (arrows).
(b) AOPF20IS(a) AOPC20IS
(c) AGPC15IS
Figure 4.52 Optical micrographs (low magnification) of the MMC materials based on
alumina preforms: AOPC20IS, AOPF20IS and AGPC15IS.

150
The metal filling the intragranular regions was visible at higher magnifications as shown in
Figure 4.53 a) to c). Furthermore, the Si precipitates as well as the grey Fe-containing phases
were resolved. The finest Si-precipitates were found in AGPC15IS where they were round
and sub-micron in size. Here the interstices between the ceramic particles were relatively
small in the sub-micron range and had a fuzzy appearance. It is presumed that the larger
transparent areas were agglomerates of the glassy binder added to the ceramic slurry to bond
the particles in this preform. The metal phase in the interstices of AOPF20IS (Figure 4.53 b)
and AOPC20IS (Figure 4.53 a) was more distinct and the interstices were larger compared to
AGPC15IS.
(b) AOPF20IS(a) AOPC20IS
(c) AGPC15IS
Figure 4.53 Optical micrographs (high magnification) of the MMC materials based on
alumina preforms: AOPC20IS, AOPF20IS and AGPC15IS.
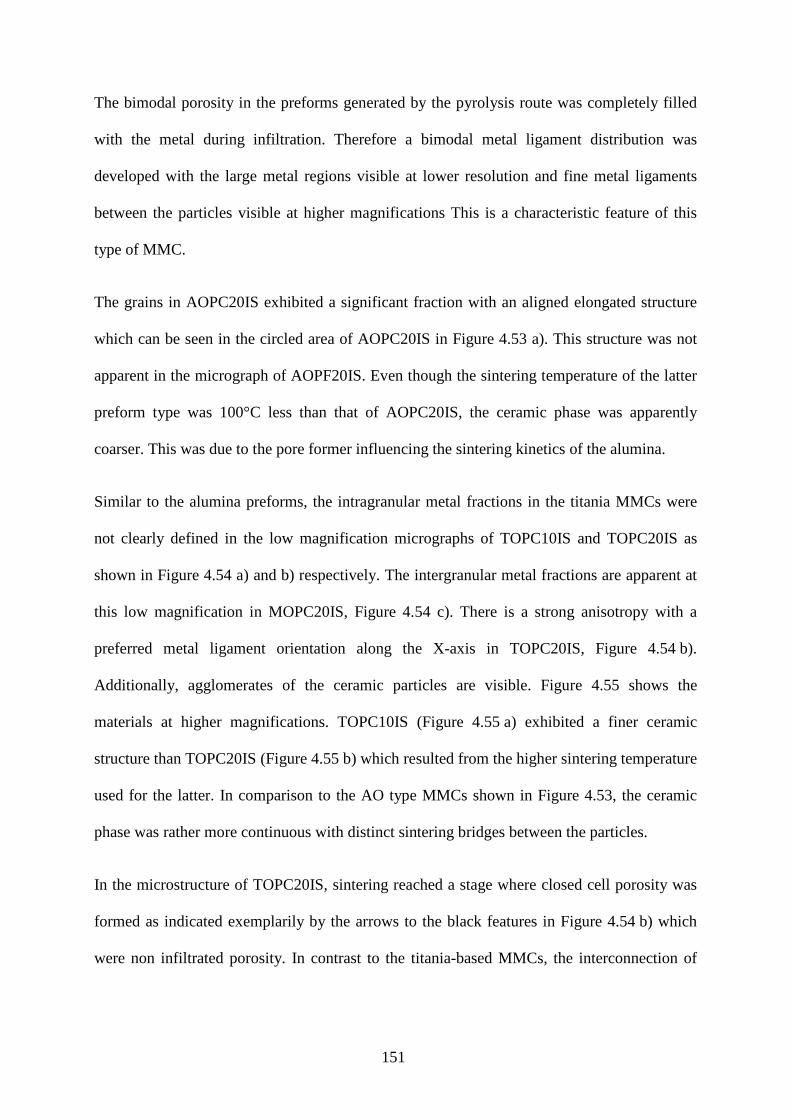
151
The bimodal porosity in the preforms generated by the pyrolysis route was completely filled
with the metal during infiltration. Therefore a bimodal metal ligament distribution was
developed with the large metal regions visible at lower resolution and fine metal ligaments
between the particles visible at higher magnifications This is a characteristic feature of this
type of MMC.
The grains in AOPC20IS exhibited a significant fraction with an aligned elongated structure
which can be seen in the circled area of AOPC20IS in Figure 4.53 a). This structure was not
apparent in the micrograph of AOPF20IS. Even though the sintering temperature of the latter
preform type was 100°C less than that of AOPC20IS, the ceramic phase was apparently
coarser. This was due to the pore former influencing the sintering kinetics of the alumina.
Similar to the alumina preforms, the intragranular metal fractions in the titania MMCs were
not clearly defined in the low magnification micrographs of TOPC10IS and TOPC20IS as
shown in Figure 4.54 a) and b) respectively. The intergranular metal fractions are apparent at
this low magnification in MOPC20IS, Figure 4.54 c). There is a strong anisotropy with a
preferred metal ligament orientation along the X-axis in TOPC20IS, Figure 4.54 b).
Additionally, agglomerates of the ceramic particles are visible. Figure 4.55 shows the
materials at higher magnifications. TOPC10IS (Figure 4.55 a) exhibited a finer ceramic
structure than TOPC20IS (Figure 4.55 b) which resulted from the higher sintering temperature
used for the latter. In comparison to the AO type MMCs shown in Figure 4.53, the ceramic
phase was rather more continuous with distinct sintering bridges between the particles.
In the microstructure of TOPC20IS, sintering reached a stage where closed cell porosity was
formed as indicated exemplarily by the arrows to the black features in Figure 4.54 b) which
were non infiltrated porosity. In contrast to the titania-based MMCs, the interconnection of
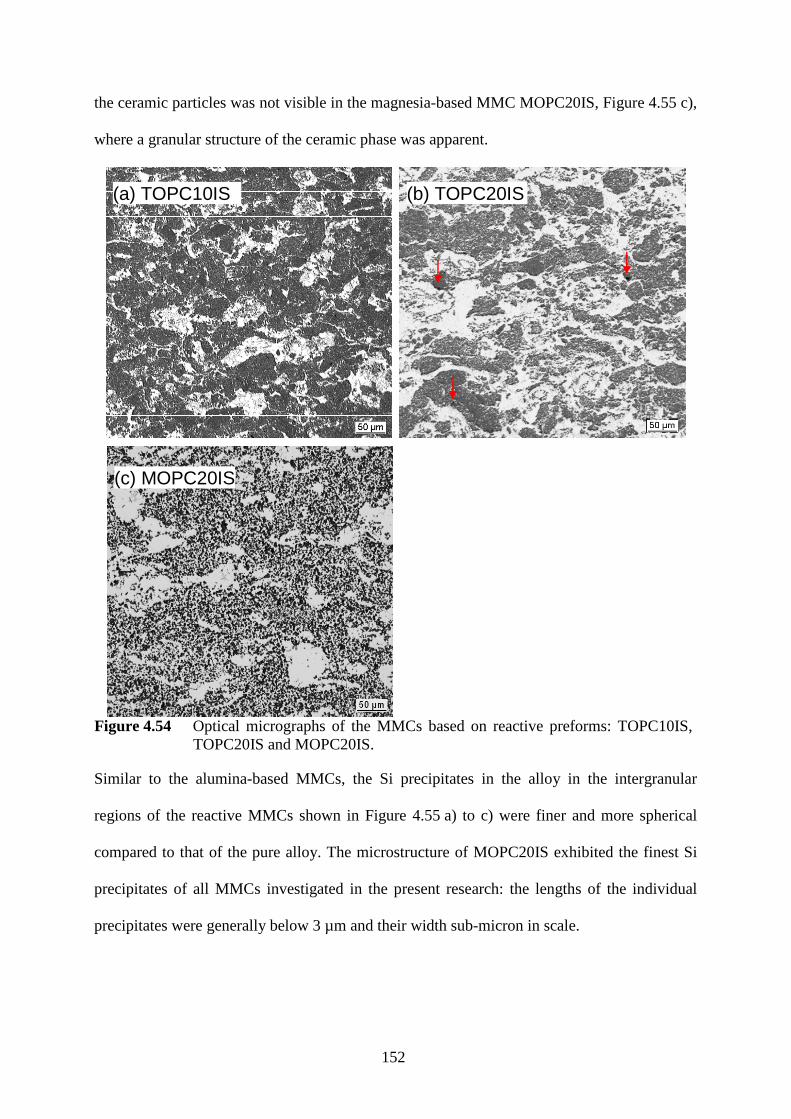
152
the ceramic particles was not visible in the magnesia-based MMC MOPC20IS, Figure 4.55 c),
where a granular structure of the ceramic phase was apparent.
(b) TOPC20IS(a) TOPC10IS
(c) MOPC20IS
Figure 4.54 Optical micrographs of the MMCs based on reactive preforms: TOPC10IS,
TOPC20IS and MOPC20IS.
Similar to the alumina-based MMCs, the Si precipitates in the alloy in the intergranular
regions of the reactive MMCs shown in Figure 4.55 a) to c) were finer and more spherical
compared to that of the pure alloy. The microstructure of MOPC20IS exhibited the finest Si
precipitates of all MMCs investigated in the present research: the lengths of the individual
precipitates were generally below 3 µm and their width sub-micron in scale.
153
The sintering temperatures of the MOPC20 preforms were varied. The MMC microstructures
resulting from preforms sintered at the two extreme temperatures, namely 1300°C and 800°C,
and infiltrated with the alloy IS are shown in Figure 4.56 a) and b). The microstructure in
terms of the size and shape of the MgO ceramic phase differed significantly. The structure of
the MOPC20IS made with a preform sintered at 1300°C in Figure 4.56 a) exhibited a coarse
ceramic phase with particle diameters in the range of 2 to 10 µm.
(b) TOPC20IS(a) TOPC10IS
(c) MOPC20IS
Figure 4.55 Optical micrographs of the MMCs based on reactive preforms: TOPC10IS,
TOPC20IS and MOPC20IS.
In contrast, the MOPC20IS fabricated using a preform sintered at 800°C (Figure 4.56 b) had a
significantly finer ceramic structure, with grain sizes in the sub-micron range. The
intragranular region showed some areas where the light metal phase infiltrated the small pores
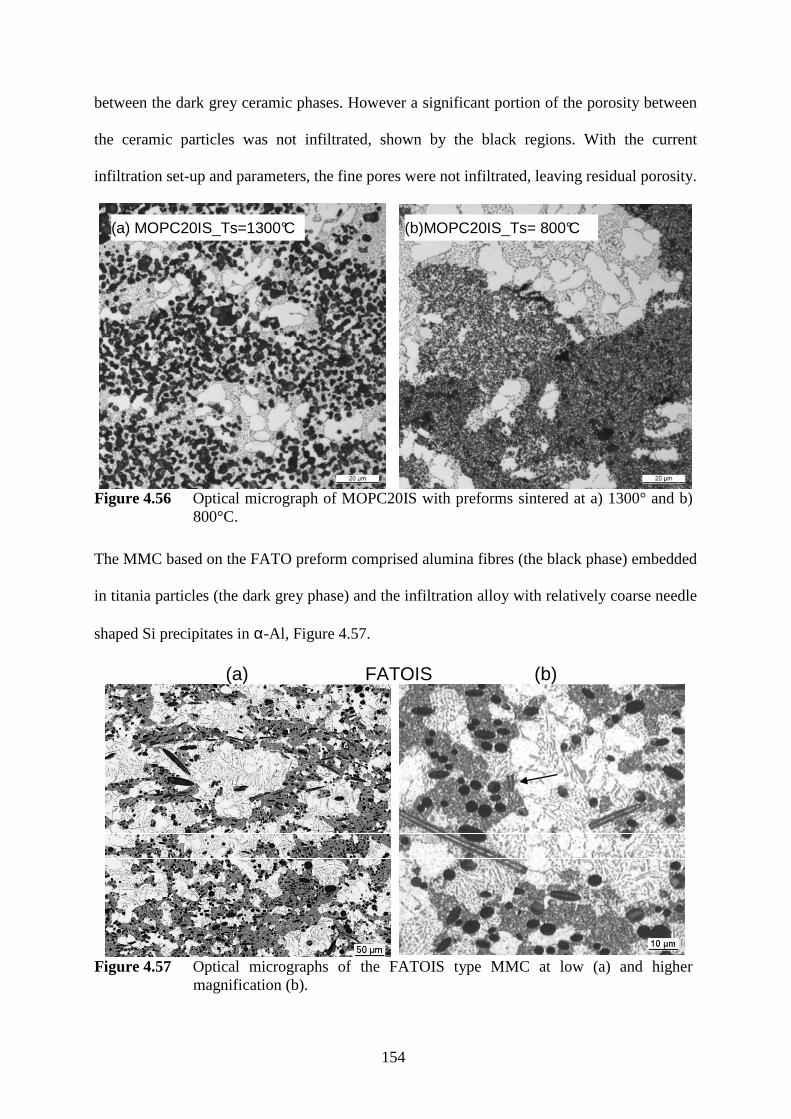
154
between the dark grey ceramic phases. However a significant portion of the porosity between
the ceramic particles was not infiltrated, shown by the black regions. With the current
infiltration set-up and parameters, the fine pores were not infiltrated, leaving residual porosity.
(a) MOPC20IS_Ts=1300°C (b)MOPC20IS_Ts= 800°C
Figure 4.56 Optical micrograph of MOPC20IS with preforms sintered at a) 1300° and b)
800°C.
The MMC based on the FATO preform comprised alumina fibres (the black phase) embedded
in titania particles (the dark grey phase) and the infiltration alloy with relatively coarse needle
shaped Si precipitates in α-Al, Figure 4.57.
FATOIS (b)(a)
Figure 4.57 Optical micrographs of the FATOIS type MMC at low (a) and higher
magnification (b).
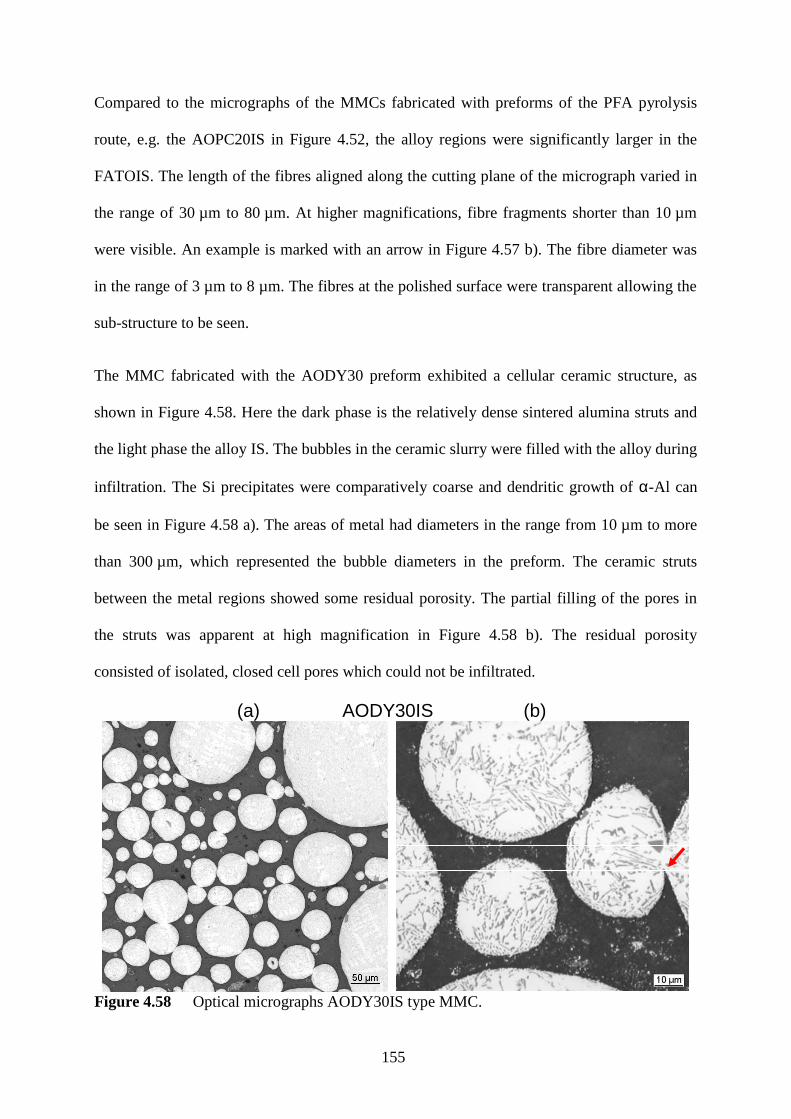
155
Compared to the micrographs of the MMCs fabricated with preforms of the PFA pyrolysis
route, e.g. the AOPC20IS in Figure 4.52, the alloy regions were significantly larger in the
FATOIS. The length of the fibres aligned along the cutting plane of the micrograph varied in
the range of 30 µm to 80 µm. At higher magnifications, fibre fragments shorter than 10 µm
were visible. An example is marked with an arrow in Figure 4.57 b). The fibre diameter was
in the range of 3 µm to 8 µm. The fibres at the polished surface were transparent allowing the
sub-structure to be seen.
The MMC fabricated with the AODY30 preform exhibited a cellular ceramic structure, as
shown in Figure 4.58. Here the dark phase is the relatively dense sintered alumina struts and
the light phase the alloy IS. The bubbles in the ceramic slurry were filled with the alloy during
infiltration. The Si precipitates were comparatively coarse and dendritic growth of α-Al can
be seen in Figure 4.58 a). The areas of metal had diameters in the range from 10 µm to more
than 300 µm, which represented the bubble diameters in the preform. The ceramic struts
between the metal regions showed some residual porosity. The partial filling of the pores in
the struts was apparent at high magnification in Figure 4.58 b). The residual porosity
consisted of isolated, closed cell pores which could not be infiltrated.
AODY30IS (b)(a)
Figure 4.58 Optical micrographs AODY30IS type MMC.
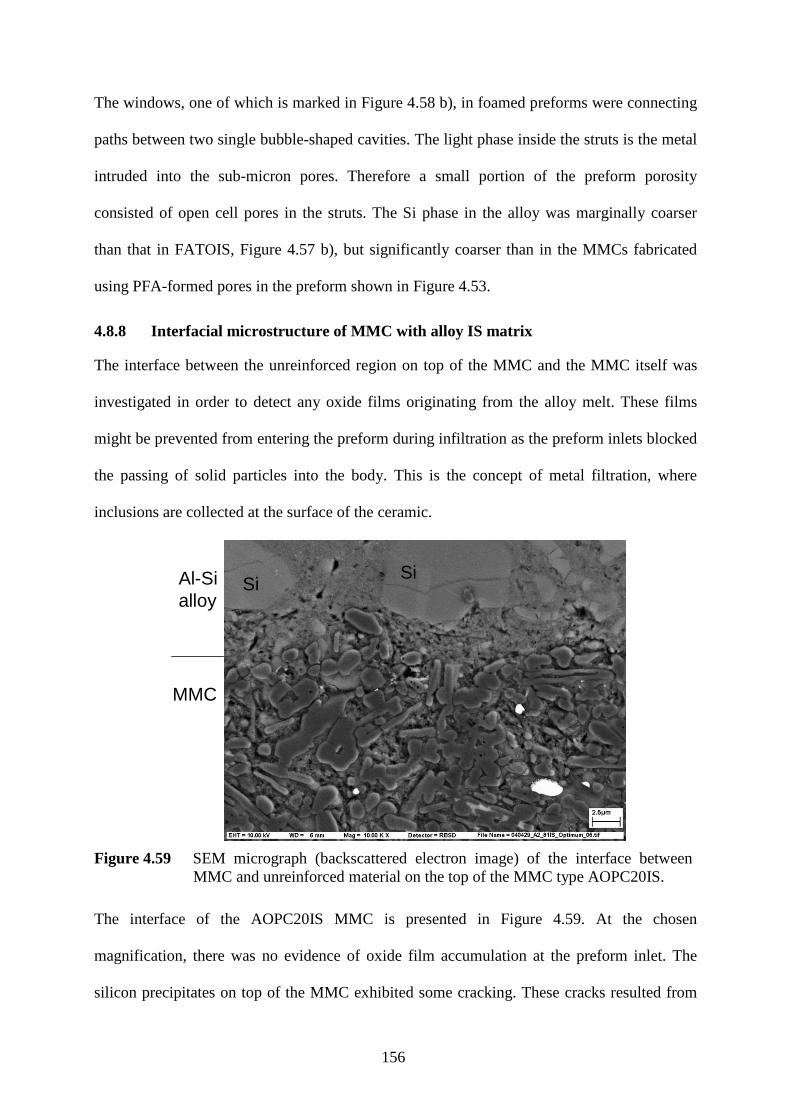
156
The windows, one of which is marked in Figure 4.58 b), in foamed preforms were connecting
paths between two single bubble-shaped cavities. The light phase inside the struts is the metal
intruded into the sub-micron pores. Therefore a small portion of the preform porosity
consisted of open cell pores in the struts. The Si phase in the alloy was marginally coarser
than that in FATOIS, Figure 4.57 b), but significantly coarser than in the MMCs fabricated
using PFA-formed pores in the preform shown in Figure 4.53.
4.8.8 Interfacial microstructure of MMC with alloy IS matrix
The interface between the unreinforced region on top of the MMC and the MMC itself was
investigated in order to detect any oxide films originating from the alloy melt. These films
might be prevented from entering the preform during infiltration as the preform inlets blocked
the passing of solid particles into the body. This is the concept of metal filtration, where
inclusions are collected at the surface of the ceramic.
SiSiAl-Si
alloy
MMC
Figure 4.59 SEM micrograph (backscattered electron image) of the interface between MMC and unreinforced material on the top of the MMC type AOPC20IS.
The interface of the AOPC20IS MMC is presented in Figure 4.59. At the chosen
magnification, there was no evidence of oxide film accumulation at the preform inlet. The
silicon precipitates on top of the MMC exhibited some cracking. These cracks resulted from
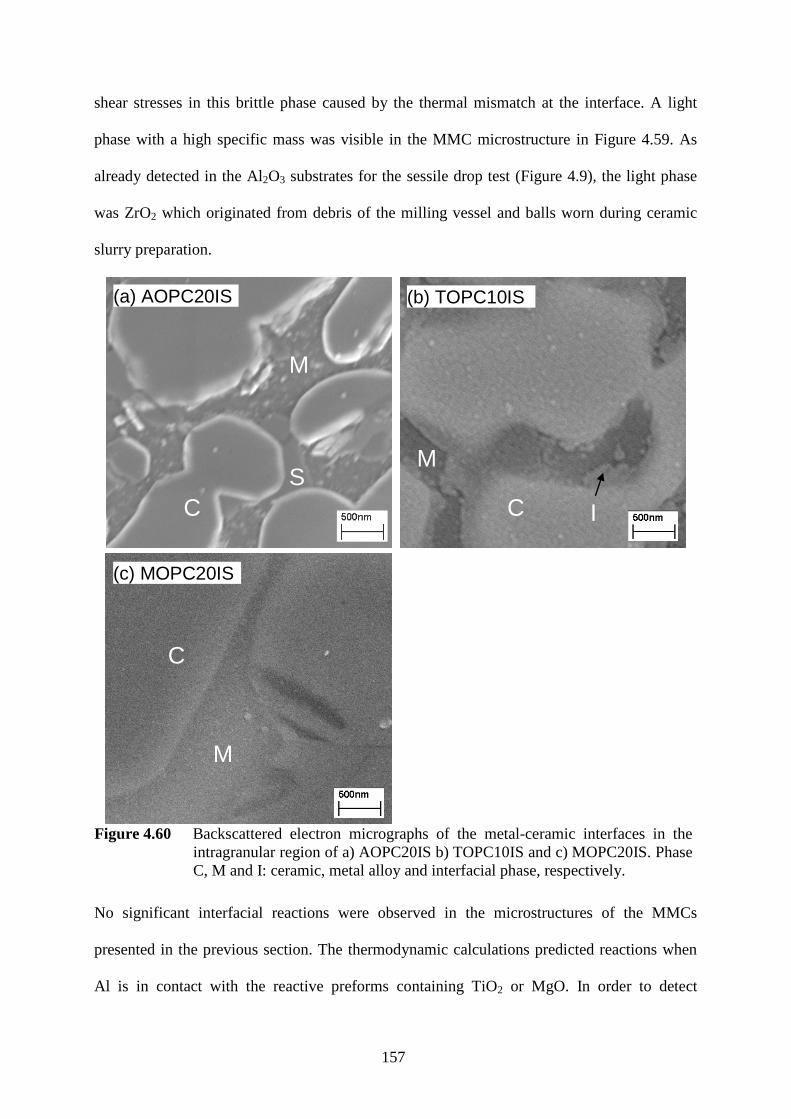
157
shear stresses in this brittle phase caused by the thermal mismatch at the interface. A light
phase with a high specific mass was visible in the MMC microstructure in Figure 4.59. As
already detected in the Al2O3 substrates for the sessile drop test (Figure 4.9), the light phase
was ZrO2 which originated from debris of the milling vessel and balls worn during ceramic
slurry preparation.
(a) AOPC20IS (b) TOPC10IS
(c) MOPC20IS
C
M
C
M
I
C
M
S
Figure 4.60 Backscattered electron micrographs of the metal-ceramic interfaces in the
intragranular region of a) AOPC20IS b) TOPC10IS and c) MOPC20IS. Phase C, M and I: ceramic, metal alloy and interfacial phase, respectively.
No significant interfacial reactions were observed in the microstructures of the MMCs
presented in the previous section. The thermodynamic calculations predicted reactions when
Al is in contact with the reactive preforms containing TiO2 or MgO. In order to detect
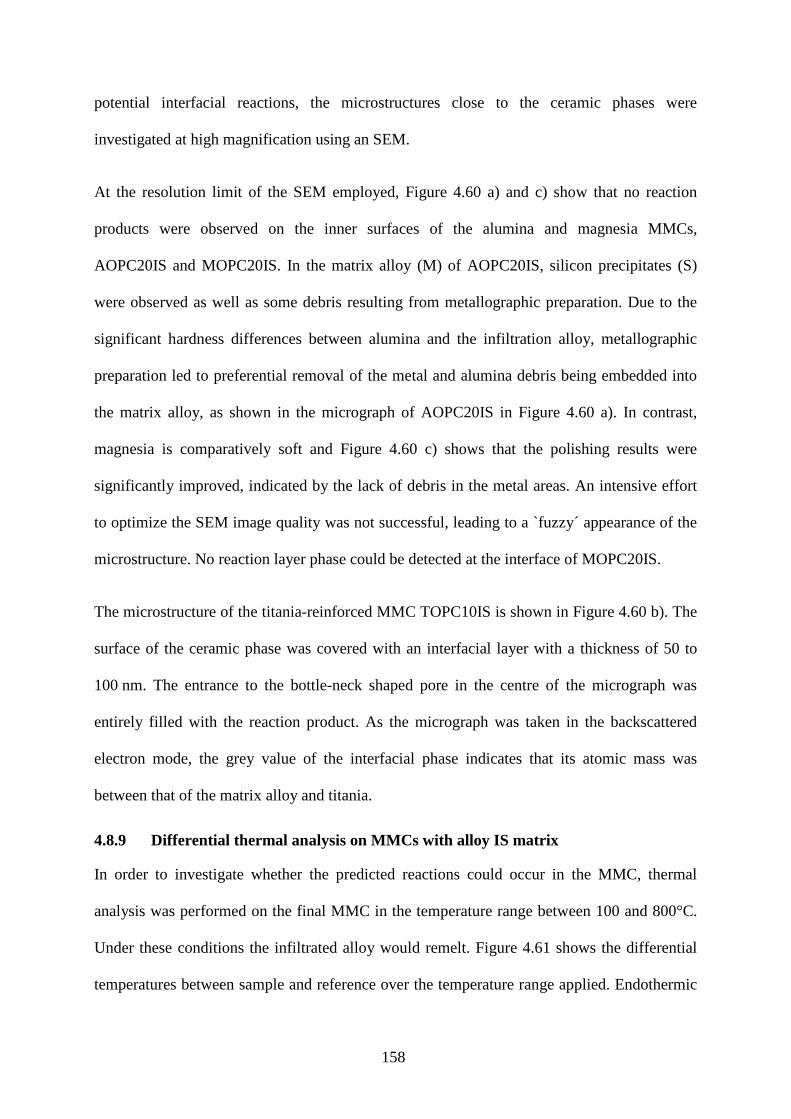
158
potential interfacial reactions, the microstructures close to the ceramic phases were
investigated at high magnification using an SEM.
At the resolution limit of the SEM employed, Figure 4.60 a) and c) show that no reaction
products were observed on the inner surfaces of the alumina and magnesia MMCs,
AOPC20IS and MOPC20IS. In the matrix alloy (M) of AOPC20IS, silicon precipitates (S)
were observed as well as some debris resulting from metallographic preparation. Due to the
significant hardness differences between alumina and the infiltration alloy, metallographic
preparation led to preferential removal of the metal and alumina debris being embedded into
the matrix alloy, as shown in the micrograph of AOPC20IS in Figure 4.60 a). In contrast,
magnesia is comparatively soft and Figure 4.60 c) shows that the polishing results were
significantly improved, indicated by the lack of debris in the metal areas. An intensive effort
to optimize the SEM image quality was not successful, leading to a `fuzzy´ appearance of the
microstructure. No reaction layer phase could be detected at the interface of MOPC20IS.
The microstructure of the titania-reinforced MMC TOPC10IS is shown in Figure 4.60 b). The
surface of the ceramic phase was covered with an interfacial layer with a thickness of 50 to
100 nm. The entrance to the bottle-neck shaped pore in the centre of the micrograph was
entirely filled with the reaction product. As the micrograph was taken in the backscattered
electron mode, the grey value of the interfacial phase indicates that its atomic mass was
between that of the matrix alloy and titania.
4.8.9 Differential thermal analysis on MMCs with alloy IS matrix
In order to investigate whether the predicted reactions could occur in the MMC, thermal
analysis was performed on the final MMC in the temperature range between 100 and 800°C.
Under these conditions the infiltrated alloy would remelt. Figure 4.61 shows the differential
temperatures between sample and reference over the temperature range applied. Endothermic
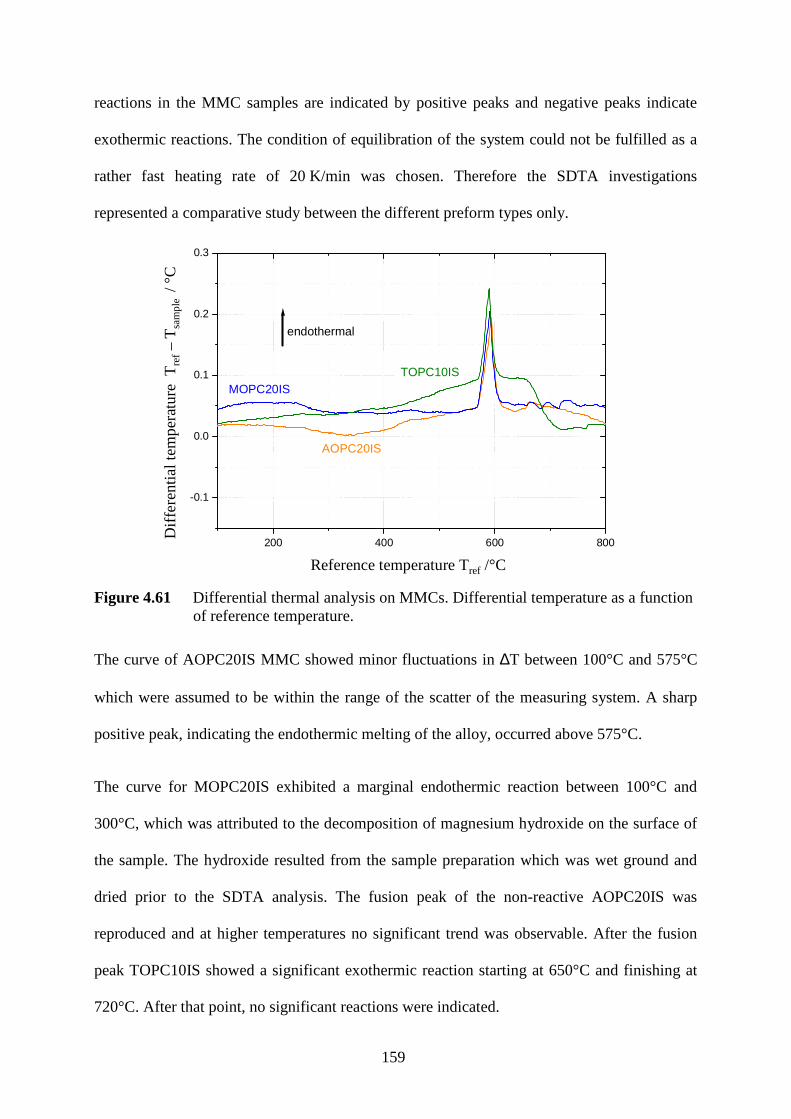
159
reactions in the MMC samples are indicated by positive peaks and negative peaks indicate
exothermic reactions. The condition of equilibration of the system could not be fulfilled as a
rather fast heating rate of 20 K/min was chosen. Therefore the SDTA investigations
represented a comparative study between the different preform types only.
200 400 600 800
-0.1
0.0
0.1
0.2
0.3
endothermal
TOPC10ISMOPC20IS
AOPC20IS
Diff
eren
tial t
empe
ratu
re T
ref-T
sam
ple
(°C)
Reference temperature Tref
(°C)
Diff
ere
ntia
l tem
per
atur
e T re
f–
T sa
mp
le/
°C
Reference temperature Tref /°C
Figure 4.61 Differential thermal analysis on MMCs. Differential temperature as a function of reference temperature.
The curve of AOPC20IS MMC showed minor fluctuations in ∆T between 100°C and 575°C
which were assumed to be within the range of the scatter of the measuring system. A sharp
positive peak, indicating the endothermic melting of the alloy, occurred above 575°C.
The curve for MOPC20IS exhibited a marginal endothermic reaction between 100°C and
300°C, which was attributed to the decomposition of magnesium hydroxide on the surface of
the sample. The hydroxide resulted from the sample preparation which was wet ground and
dried prior to the SDTA analysis. The fusion peak of the non-reactive AOPC20IS was
reproduced and at higher temperatures no significant trend was observable. After the fusion
peak TOPC10IS showed a significant exothermic reaction starting at 650°C and finishing at
720°C. After that point, no significant reactions were indicated.
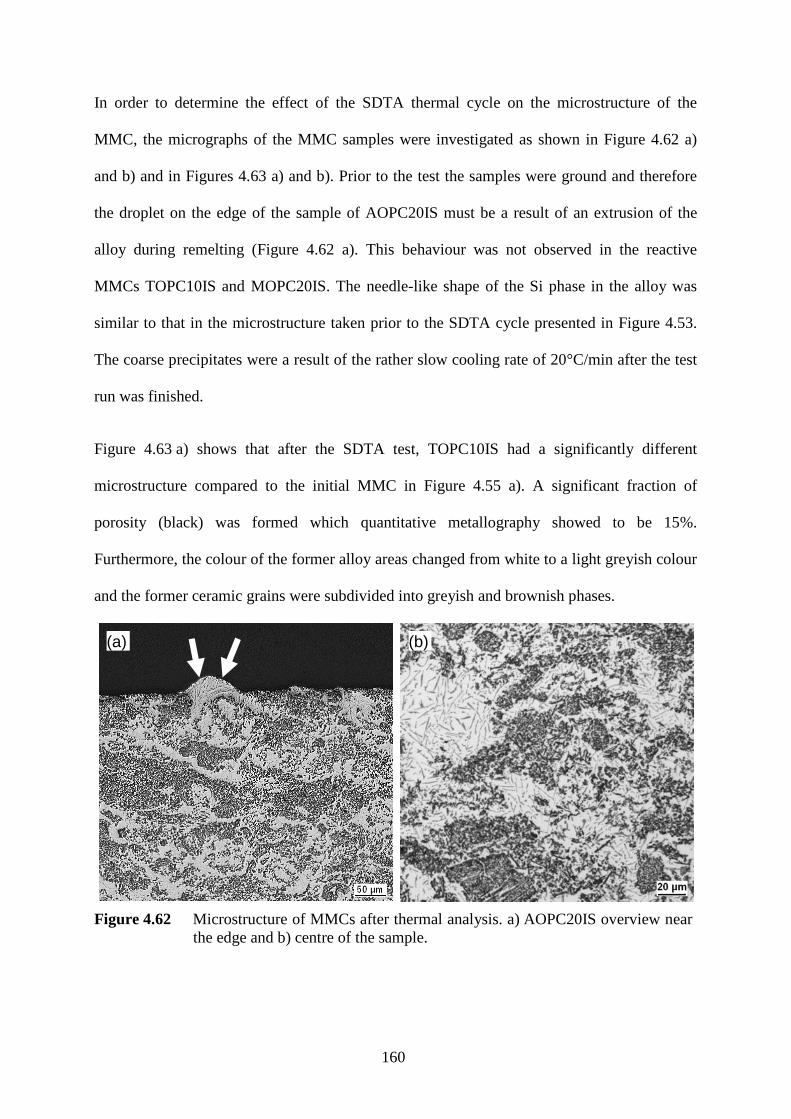
160
In order to determine the effect of the SDTA thermal cycle on the microstructure of the
MMC, the micrographs of the MMC samples were investigated as shown in Figure 4.62 a)
and b) and in Figures 4.63 a) and b). Prior to the test the samples were ground and therefore
the droplet on the edge of the sample of AOPC20IS must be a result of an extrusion of the
alloy during remelting (Figure 4.62 a). This behaviour was not observed in the reactive
MMCs TOPC10IS and MOPC20IS. The needle-like shape of the Si phase in the alloy was
similar to that in the microstructure taken prior to the SDTA cycle presented in Figure 4.53.
The coarse precipitates were a result of the rather slow cooling rate of 20°C/min after the test
run was finished.
Figure 4.63 a) shows that after the SDTA test, TOPC10IS had a significantly different
microstructure compared to the initial MMC in Figure 4.55 a). A significant fraction of
porosity (black) was formed which quantitative metallography showed to be 15%.
Furthermore, the colour of the former alloy areas changed from white to a light greyish colour
and the former ceramic grains were subdivided into greyish and brownish phases.
(a) (b)
Figure 4.62 Microstructure of MMCs after thermal analysis. a) AOPC20IS overview near the edge and b) centre of the sample.
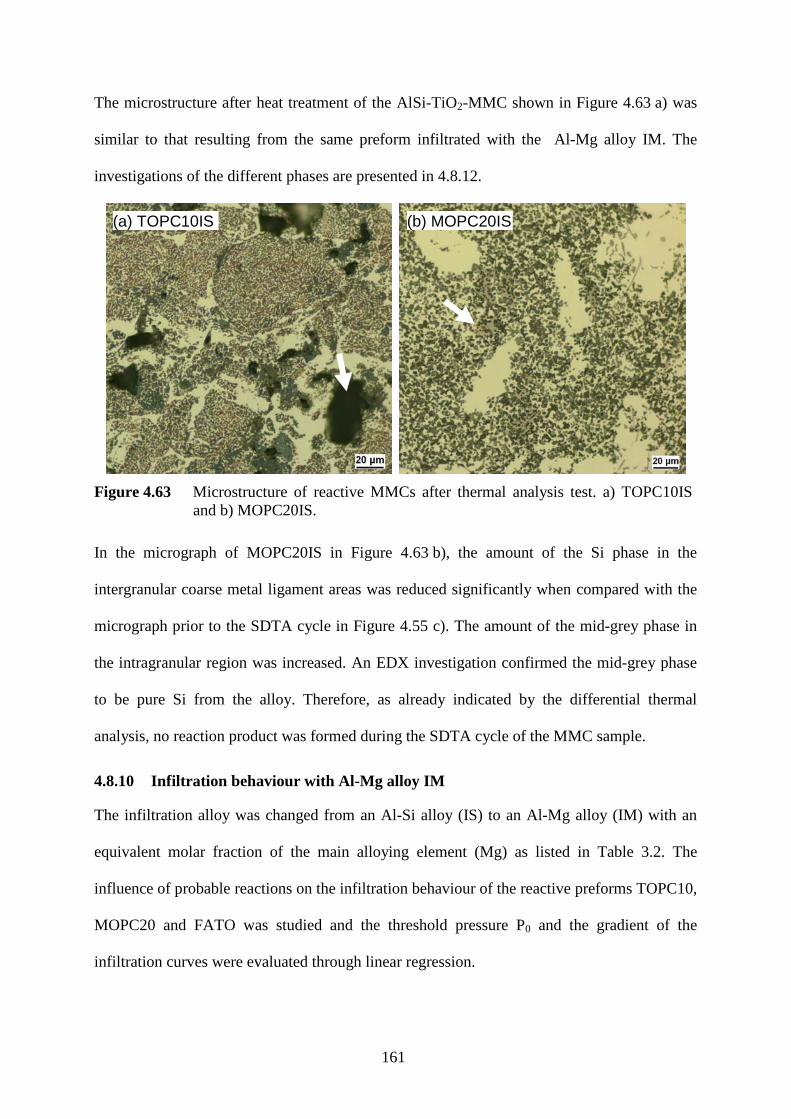
161
The microstructure after heat treatment of the AlSi-TiO2-MMC shown in Figure 4.63 a) was
similar to that resulting from the same preform infiltrated with the Al-Mg alloy IM. The
investigations of the different phases are presented in 4.8.12.
(a) TOPC10IS (b) MOPC20IS
Figure 4.63 Microstructure of reactive MMCs after thermal analysis test. a) TOPC10IS and b) MOPC20IS.
In the micrograph of MOPC20IS in Figure 4.63 b), the amount of the Si phase in the
intergranular coarse metal ligament areas was reduced significantly when compared with the
micrograph prior to the SDTA cycle in Figure 4.55 c). The amount of the mid-grey phase in
the intragranular region was increased. An EDX investigation confirmed the mid-grey phase
to be pure Si from the alloy. Therefore, as already indicated by the differential thermal
analysis, no reaction product was formed during the SDTA cycle of the MMC sample.
4.8.10 Infiltration behaviour with Al-Mg alloy IM
The infiltration alloy was changed from an Al-Si alloy (IS) to an Al-Mg alloy (IM) with an
equivalent molar fraction of the main alloying element (Mg) as listed in Table 3.2. The
influence of probable reactions on the infiltration behaviour of the reactive preforms TOPC10,
MOPC20 and FATO was studied and the threshold pressure P0 and the gradient of the
infiltration curves were evaluated through linear regression.
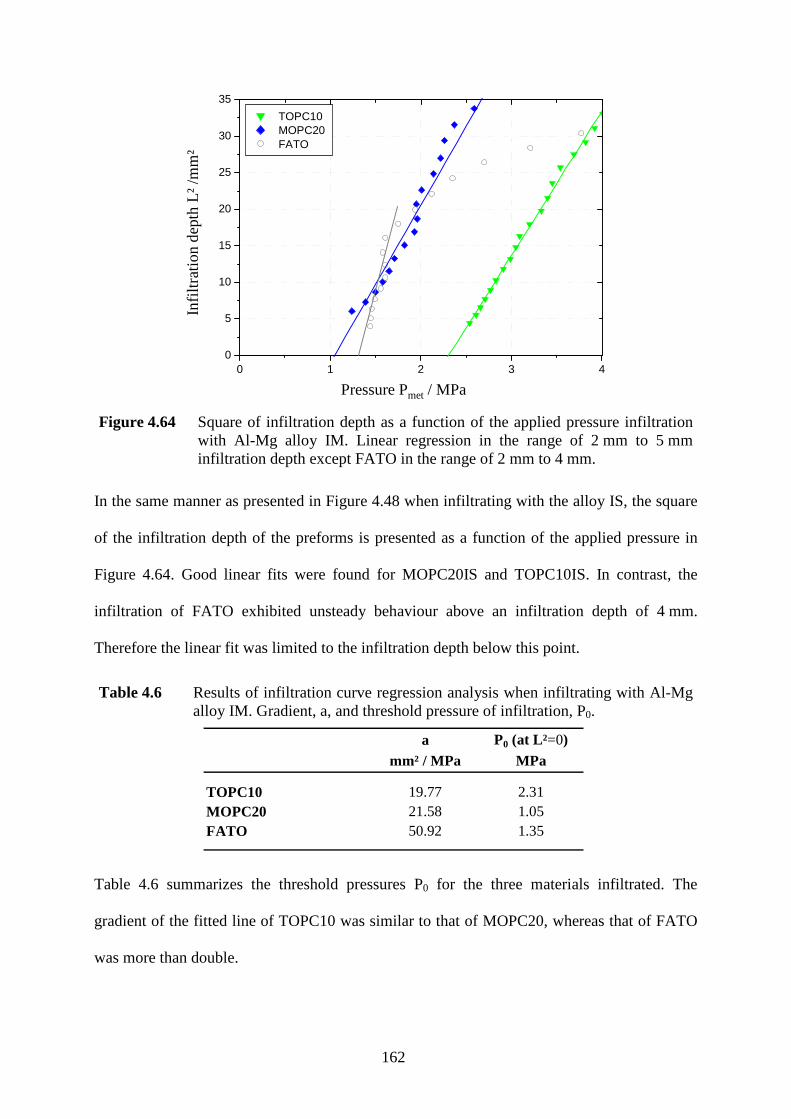
162
0 1 2 3 40
5
10
15
20
25
30
35
TOPC10 MOPC20 FATO
Infil
trat
ion
dept
h L²
(m
m²)
Pressure Pmet
(MPa)Pressure Pmet / MPa
Infil
trat
ion
dep
th L
²/m
m²
Figure 4.64 Square of infiltration depth as a function of the applied pressure infiltration with Al-Mg alloy IM. Linear regression in the range of 2 mm to 5 mm infiltration depth except FATO in the range of 2 mm to 4 mm.
In the same manner as presented in Figure 4.48 when infiltrating with the alloy IS, the square
of the infiltration depth of the preforms is presented as a function of the applied pressure in
Figure 4.64. Good linear fits were found for MOPC20IS and TOPC10IS. In contrast, the
infiltration of FATO exhibited unsteady behaviour above an infiltration depth of 4 mm.
Therefore the linear fit was limited to the infiltration depth below this point.
Table 4.6 Results of infiltration curve regression analysis when infiltrating with Al-Mg alloy IM. Gradient, a, and threshold pressure of infiltration, P0.
a P0 (at L²=0)mm² / MPa MPa
TOPC10 19.77 2.31MOPC20 21.58 1.05FATO 50.92 1.35
Table 4.6 summarizes the threshold pressures P0 for the three materials infiltrated. The
gradient of the fitted line of TOPC10 was similar to that of MOPC20, whereas that of FATO
was more than double.

163
4.8.11 Homogeneity of MMC infiltrated with alloy IM
The macrograph of the cross-section of the titania-reinforced MMC infiltrated with the Al-Si
alloy (TOPC10IS) is compared to that infiltrated with an Al-Mg alloy (TOPC10IM) in Figure
4.65. The dark phase corresponds to the MMC and the light one to the unreinforced metal.
2 µm5 mm2 µm5 mm
2 µm5 mm2 µm5 mm
X
Z
(a) TOPC10IS
(b) TOPC10IM
Figure 4.65 Cross section of titania MMCs infiltrated with Al-Si (TOPC10IS) and Al-Mg alloy (TOPC10IM). The rectangle in TOPC10IM shows the zone of detailed microstructural investigations.
When the preform was infiltrated with the Al-Si alloy (IS), the rectangular shape of the
preform was reproduced in the MMC cross section, Figure 4.65 a). Under the same infiltration
parameters, the Al-Mg alloy-infiltrated MMC exhibited large cracks filled with the matrix
alloy. These cracks were located towards the bottom of the MMC along the x-axis, as shown
in Figure 4.65 b). Further cracks occurred on top of the preform. A dark area was visible in
the centre of the MMC where the characteristic macroscopic MMC colour changed to an
optically different phase. A similar appearance was observed in the cross-section of the FATO
hybrid preform infiltrated with the alloy IM. The microstructure in the dark area was
investigated for both MMC types. For comparison, the microstructure of the MOPC20
preform infiltrated with the alloy IM was also investigated. Here the macroscopic structure
appeared similar to that of the same preform type infiltrated with the alloy IS.
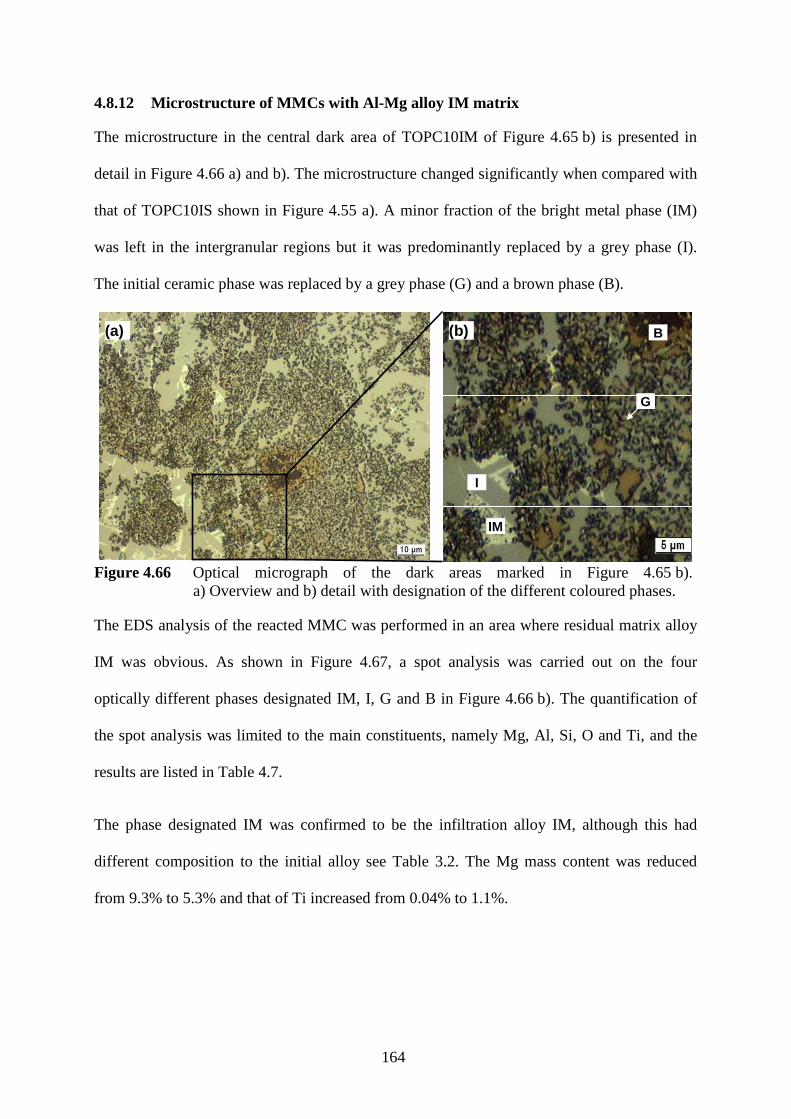
164
4.8.12 Microstructure of MMCs with Al-Mg alloy IM matrix
The microstructure in the central dark area of TOPC10IM of Figure 4.65 b) is presented in
detail in Figure 4.66 a) and b). The microstructure changed significantly when compared with
that of TOPC10IS shown in Figure 4.55 a). A minor fraction of the bright metal phase (IM)
was left in the intergranular regions but it was predominantly replaced by a grey phase (I).
The initial ceramic phase was replaced by a grey phase (G) and a brown phase (B).
(a) (b) B
IM
I
G
Figure 4.66 Optical micrograph of the dark areas marked in Figure 4.65 b).
a) Overview and b) detail with designation of the different coloured phases.
The EDS analysis of the reacted MMC was performed in an area where residual matrix alloy
IM was obvious. As shown in Figure 4.67, a spot analysis was carried out on the four
optically different phases designated IM, I, G and B in Figure 4.66 b). The quantification of
the spot analysis was limited to the main constituents, namely Mg, Al, Si, O and Ti, and the
results are listed in Table 4.7.
The phase designated IM was confirmed to be the infiltration alloy IM, although this had
different composition to the initial alloy see Table 3.2. The Mg mass content was reduced
from 9.3% to 5.3% and that of Ti increased from 0.04% to 1.1%.

165
BIM
I
G
2 µm10 µm2 µm10 µm
Figure 4.67 SEM micrograph of TOPC10IM in the reacted area and markers setting the location of the EDS spots IM, I, B and G.
The analysis at position I showed that the needle-shaped phase in Figure 4.66 consisted
mainly of Al and Ti with minor fractions of Mg and Si. Based on the relative mass contents in
Table 4.7, the molar ratio between Ti and Al was calculated to be 1:4. This indicates that this
phase consisted of a titanium aluminide with minor fractions of Si and Mg. As predicted by
the thermodynamic calculations and shown in the work of Beyer (53) the phase is TiAl3 with
traces of the main elements of the infiltration alloy Al, Mg and Si.
Table 4.7 Results of the EDS spot analysis performed on the phases shown in Figure 4.67.
O Mg Al Si Ti
IM 0.0 5.3 93.5 0.0 1.1
I 0.0 3.3 68.1 2.8 25.8
B 34.9 9.4 12.3 0.0 43.5
G 43.6 0.4 52.1 0.8 3.2
mass-%
The EDS analysis at spot B in Figure 4.67 showed that the brown phase in Figure 4.66 b)
consisted of predominantly Ti and O with minor fractions of Al and Mg. The molar ratio of
the main phases was 1Ti : 2.4 O indicating a mixture of the initial reinforcement TiO2 and a
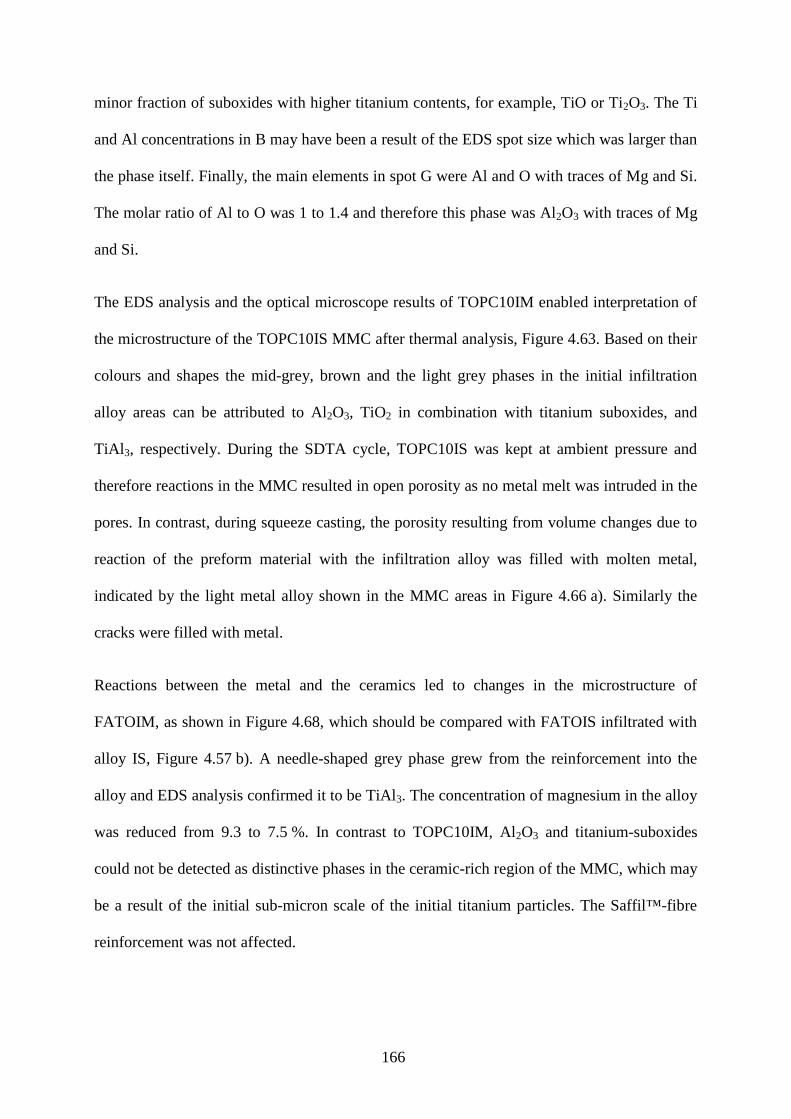
166
minor fraction of suboxides with higher titanium contents, for example, TiO or Ti2O3. The Ti
and Al concentrations in B may have been a result of the EDS spot size which was larger than
the phase itself. Finally, the main elements in spot G were Al and O with traces of Mg and Si.
The molar ratio of Al to O was 1 to 1.4 and therefore this phase was Al2O3 with traces of Mg
and Si.
The EDS analysis and the optical microscope results of TOPC10IM enabled interpretation of
the microstructure of the TOPC10IS MMC after thermal analysis, Figure 4.63. Based on their
colours and shapes the mid-grey, brown and the light grey phases in the initial infiltration
alloy areas can be attributed to Al2O3, TiO2 in combination with titanium suboxides, and
TiAl 3, respectively. During the SDTA cycle, TOPC10IS was kept at ambient pressure and
therefore reactions in the MMC resulted in open porosity as no metal melt was intruded in the
pores. In contrast, during squeeze casting, the porosity resulting from volume changes due to
reaction of the preform material with the infiltration alloy was filled with molten metal,
indicated by the light metal alloy shown in the MMC areas in Figure 4.66 a). Similarly the
cracks were filled with metal.
Reactions between the metal and the ceramics led to changes in the microstructure of
FATOIM, as shown in Figure 4.68, which should be compared with FATOIS infiltrated with
alloy IS, Figure 4.57 b). A needle-shaped grey phase grew from the reinforcement into the
alloy and EDS analysis confirmed it to be TiAl3. The concentration of magnesium in the alloy
was reduced from 9.3 to 7.5 %. In contrast to TOPC10IM, Al2O3 and titanium-suboxides
could not be detected as distinctive phases in the ceramic-rich region of the MMC, which may
be a result of the initial sub-micron scale of the initial titanium particles. The Saffil™-fibre
reinforcement was not affected.
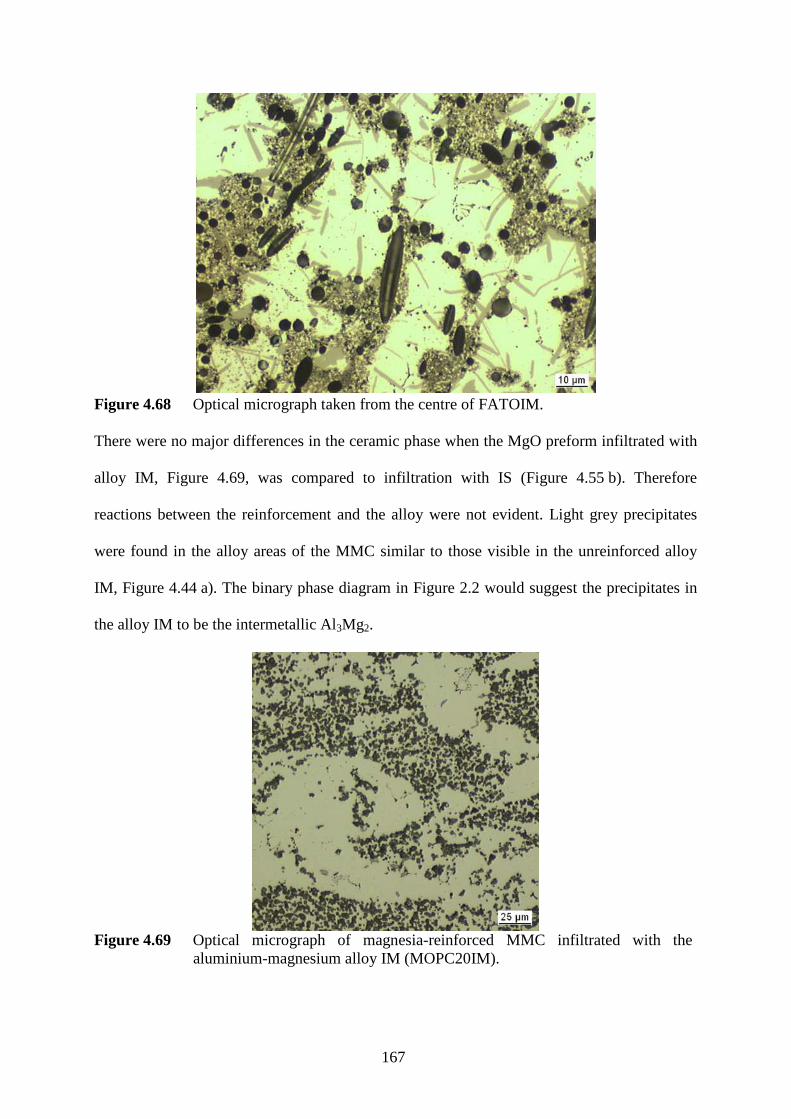
167
Figure 4.68 Optical micrograph taken from the centre of FATOIM.
There were no major differences in the ceramic phase when the MgO preform infiltrated with
alloy IM, Figure 4.69, was compared to infiltration with IS (Figure 4.55 b). Therefore
reactions between the reinforcement and the alloy were not evident. Light grey precipitates
were found in the alloy areas of the MMC similar to those visible in the unreinforced alloy
IM, Figure 4.44 a). The binary phase diagram in Figure 2.2 would suggest the precipitates in
the alloy IM to be the intermetallic Al3Mg2.
Figure 4.69 Optical micrograph of magnesia-reinforced MMC infiltrated with the
aluminium-magnesium alloy IM (MOPC20IM).

168
4.9. High pressure die casting infiltration
As well as squeeze cast infiltration, some preforms were infiltrated using high pressure die
casting. Two different infiltration modes were used which were characterised by significantly
different metal flow velocities at the ingate: the indirect squeeze casting (ISQC) and the high
pressure die casting (HPDC) mode. For each mode, four velocities were selected using a
natural logarithmic velocity graduation shown in Table 3.8. The resulting MMCs were
characterised in terms of their homogeneity and the relative compression of the preforms.
4.9.1 Homogeneity of MMC
The homogeneity of the MMCs was characterised using 3D X-ray computed tomography. In
the resulting virtual cuts, the light areas were the MMC, the grey areas the non-reinforced
metal alloy and the black areas were either porosity or the atmosphere surrounding the
sample. Prior to the 3D analysis, approximately 2 mm were milled off the castings along the
y-axis until the surface of the MMC was reached. As a result, no alloy coverage is visible on
top of the MMC in the XZ-plane in the virtual cuts. Each figure shows the virtual cuts of the
central layer in the MMC in all three cartesian coordinates, as defined in Figure 3.11.
The virtual cut in Figure 4.70 shows the internal structure of the AODY30 preform infiltrated
in the ISQC mode using a velocity v0 of 0.72 m/s. The parameter v0 is defined by Equation
24. In each plane, significant fractions of porosity and multiple cracking were detected in the
MMC. There was also porosity in the unreinforced alloy on top of the MMC.
Examination of the X-Y plane reveals the porosity in the MMC was predominantly
concentrated in a rectangular area 6 mm from the edges of the preform. The porosity was
subdivided into round pores with a diameter of up to 1.5 mm and pore agglomerations
exhibiting a cellular arrangement. The cracking of the preform was most obvious in this
plane.
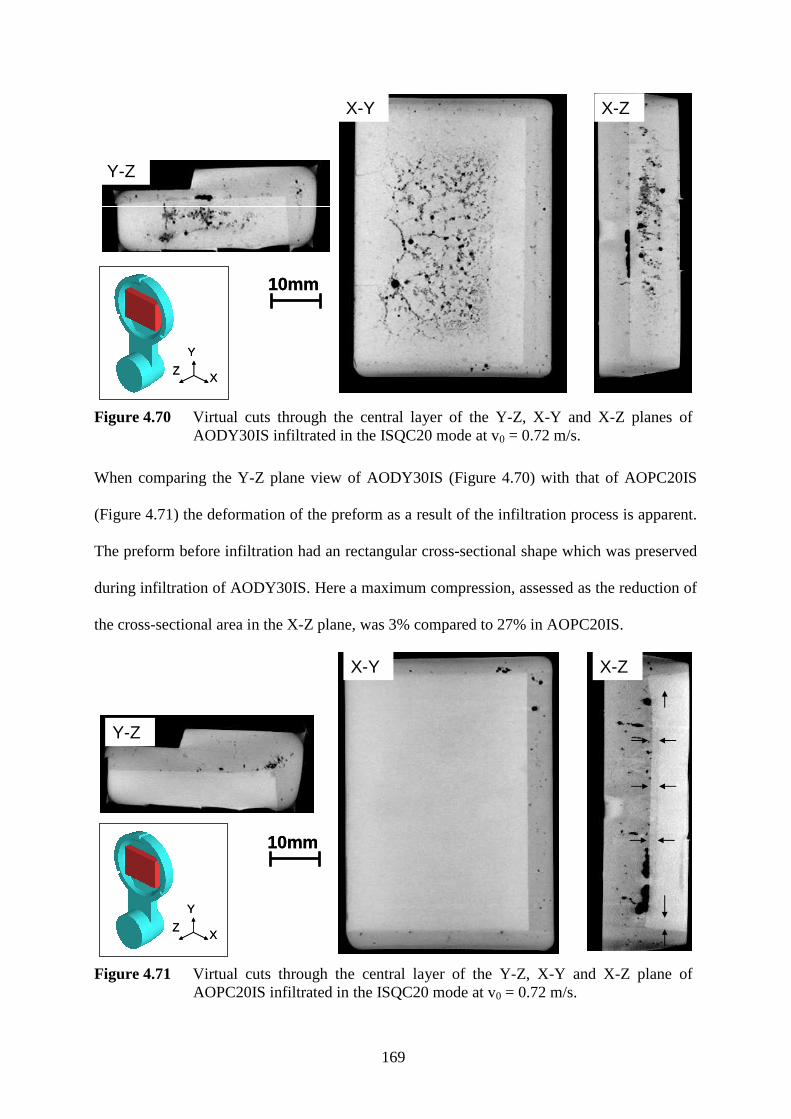
169
Y-ZY-Z
X-Y X-Z
10mm10mm
Y
ZX
Y
ZX
Figure 4.70 Virtual cuts through the central layer of the Y-Z, X-Y and X-Z planes of AODY30IS infiltrated in the ISQC20 mode at v0 = 0.72 m/s.
When comparing the Y-Z plane view of AODY30IS (Figure 4.70) with that of AOPC20IS
(Figure 4.71) the deformation of the preform as a result of the infiltration process is apparent.
The preform before infiltration had an rectangular cross-sectional shape which was preserved
during infiltration of AODY30IS. Here a maximum compression, assessed as the reduction of
the cross-sectional area in the X-Z plane, was 3% compared to 27% in AOPC20IS.
X-Y X-Z
Y-ZY-Z
10mm10mm
Y
ZX
Y
ZX
Figure 4.71 Virtual cuts through the central layer of the Y-Z, X-Y and X-Z plane of AOPC20IS infiltrated in the ISQC20 mode at v0 = 0.72 m/s.

170
In the Y-Z plane section in Figure 4.71 there was an increased fraction of porosity in the pure
infiltration alloy on top of the MMC compared to that in AODY30IS in Figure 4.70 and it was
mainly concentrated on and close to the surface of the MMC. The porosity originated from
shrinkage of the metal due to reduced metal flow during feeding after solidification started.
The voxel resolution of the 3D-CT was 64 µm and so finer porosity could not be detected by
this method. The MMC appeared uniform at this resolution.
Brightness was reduced in the outer volumes of the MMC since this material absorbed less X-
ray radiation than the inner volumes. This layer is marked in the X-Z plane view in Figure
4.71. The depth of this layer ranged between 2 mm and 3 mm in the z-and the y-directions
respectively. These layers are of different density and were found in all MMCs. They have
been compressed by more than 15%.
a)
b) c)
Z
X
Figure 4.72 Micrographs of TOPC10IS infiltrated in ISQC at 0.72 m/s in the X-Z plane. a) Overview with markers defining the position of the higher magnification micrographs b) and c). The lines in a) mark roughly the borderline between lighter and darker MMC areas.
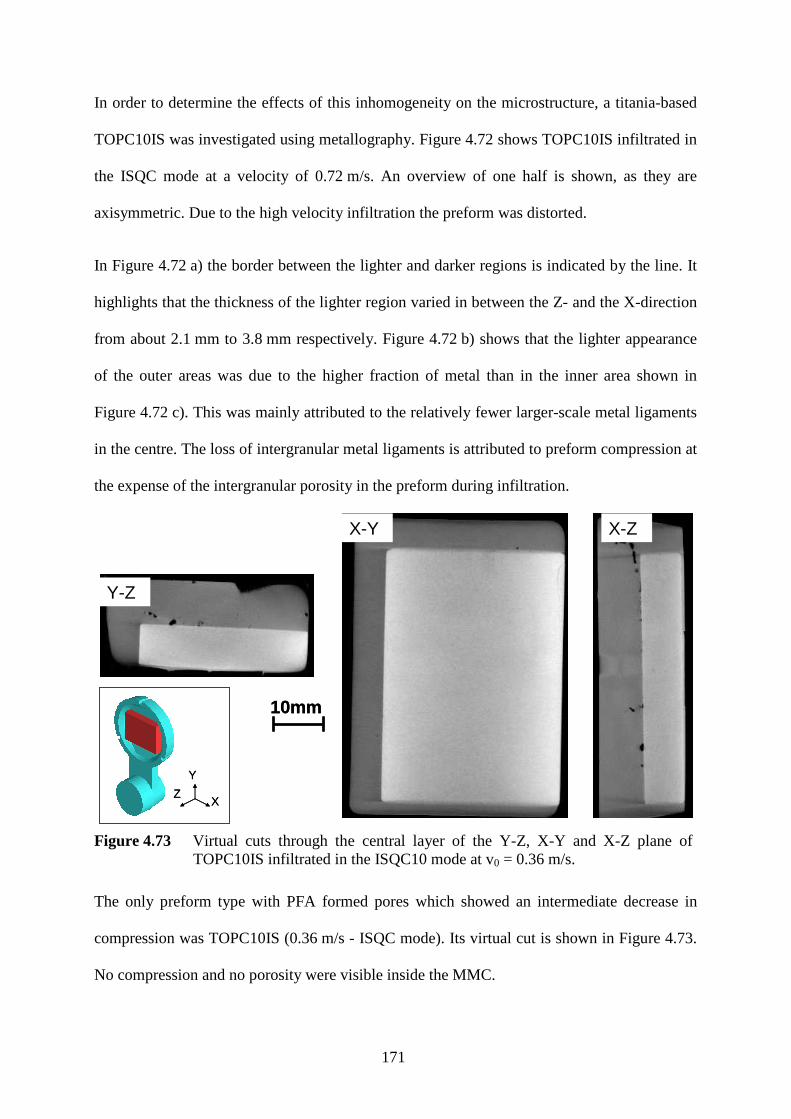
171
In order to determine the effects of this inhomogeneity on the microstructure, a titania-based
TOPC10IS was investigated using metallography. Figure 4.72 shows TOPC10IS infiltrated in
the ISQC mode at a velocity of 0.72 m/s. An overview of one half is shown, as they are
axisymmetric. Due to the high velocity infiltration the preform was distorted.
In Figure 4.72 a) the border between the lighter and darker regions is indicated by the line. It
highlights that the thickness of the lighter region varied in between the Z- and the X-direction
from about 2.1 mm to 3.8 mm respectively. Figure 4.72 b) shows that the lighter appearance
of the outer areas was due to the higher fraction of metal than in the inner area shown in
Figure 4.72 c). This was mainly attributed to the relatively fewer larger-scale metal ligaments
in the centre. The loss of intergranular metal ligaments is attributed to preform compression at
the expense of the intergranular porosity in the preform during infiltration.
X-Y X-Z
10mm10mm
Y
ZX
Y
ZX
Y-Z
Figure 4.73 Virtual cuts through the central layer of the Y-Z, X-Y and X-Z plane of TOPC10IS infiltrated in the ISQC10 mode at v0 = 0.36 m/s.
The only preform type with PFA formed pores which showed an intermediate decrease in
compression was TOPC10IS (0.36 m/s - ISQC mode). Its virtual cut is shown in Figure 4.73.
No compression and no porosity were visible inside the MMC.
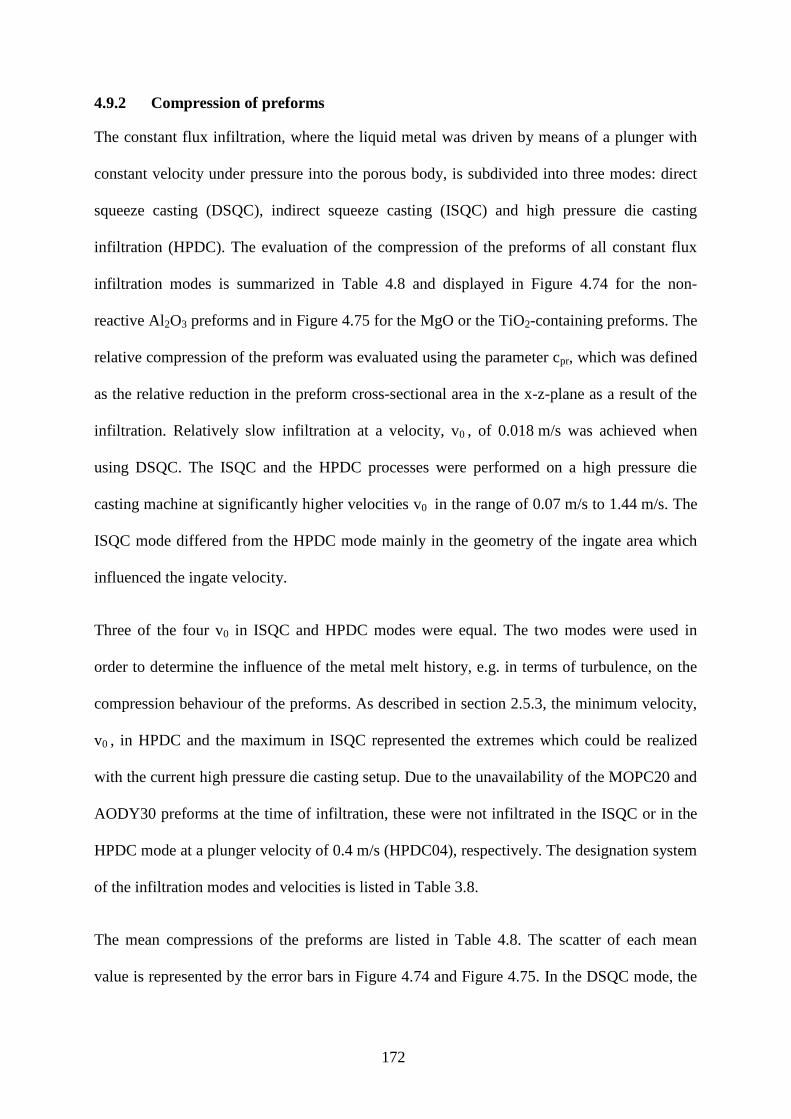
172
4.9.2 Compression of preforms
The constant flux infiltration, where the liquid metal was driven by means of a plunger with
constant velocity under pressure into the porous body, is subdivided into three modes: direct
squeeze casting (DSQC), indirect squeeze casting (ISQC) and high pressure die casting
infiltration (HPDC). The evaluation of the compression of the preforms of all constant flux
infiltration modes is summarized in Table 4.8 and displayed in Figure 4.74 for the non-
reactive Al2O3 preforms and in Figure 4.75 for the MgO or the TiO2-containing preforms. The
relative compression of the preform was evaluated using the parameter cpr, which was defined
as the relative reduction in the preform cross-sectional area in the x-z-plane as a result of the
infiltration. Relatively slow infiltration at a velocity, v0 , of 0.018 m/s was achieved when
using DSQC. The ISQC and the HPDC processes were performed on a high pressure die
casting machine at significantly higher velocities v0 in the range of 0.07 m/s to 1.44 m/s. The
ISQC mode differed from the HPDC mode mainly in the geometry of the ingate area which
influenced the ingate velocity.
Three of the four v0 in ISQC and HPDC modes were equal. The two modes were used in
order to determine the influence of the metal melt history, e.g. in terms of turbulence, on the
compression behaviour of the preforms. As described in section 2.5.3, the minimum velocity,
v0 , in HPDC and the maximum in ISQC represented the extremes which could be realized
with the current high pressure die casting setup. Due to the unavailability of the MOPC20 and
AODY30 preforms at the time of infiltration, these were not infiltrated in the ISQC or in the
HPDC mode at a plunger velocity of 0.4 m/s (HPDC04), respectively. The designation system
of the infiltration modes and velocities is listed in Table 3.8.
The mean compressions of the preforms are listed in Table 4.8. The scatter of each mean
value is represented by the error bars in Figure 4.74 and Figure 4.75. In the DSQC mode, the

173
deviations were 0.01 whereas larger scatter was observed for ISQC and HPDC modes. Here
the minimum scatter was 0.02 for the preforms exhibiting low compression such as AODY30,
and 0.05 for the preforms with largest compression, which was that of the FATO hybrids at an
infiltration velocity of 0.36 m/s in the HPDC mode. The preform geometry remained most
consistent in DSQC, with compressions ranging from 0.01 to 0.04 for AODY30 and FATO
preforms respectively. Taking into account the scatter, the preforms fabricated with a pore
forming additive had similar compressions expressed by cpr values of 0.02 for AOPC20 and
MOPC20 to 0.03 for TOPC10 and AGPC15.
Table 4.8 Evaluated mean relative compression cpr of preforms as a result of infiltration in DSQC, ISQC and HPDC modes and effect of the infiltration velocity.
DSQC
05 10 20 40 04 09 18 36
Superficial velocity vo (m/s)
0.018 0.18 0.36 0.72 1.44 0.07 0.18 0.36 0.72
AOPC20IS 0.02 0.21 0.22 0.26 0.33 0.07 0.18 0.26 0.28
AGPC15IS 0.03 0.10 0.09 0.17 0.23 0.05 0.10 0.11 0.14
TOPC10IS 0.03 0.07 0.04 0.15 0.14 0.14 0.22 0.22 0.23
MOPC20IS 0.02 0.04 0.11 0.14 0.17
FATOIS 0.04 0.12 0.17 0.23 0.29 0.08 0.31 0.40 0.39
AODY30IS 0.01 0.03 0.03 0.03 0.03 n.a. 0.05 0.05 0.05
ISQC HPDC
n.a.
compression cpr ()
In general, higher cpr were obtained in ISQC than in DSQC and HPDC infiltration. The only
exception was AODY30 which exhibited the lowest cpr of 0.03, combined with no significant
influence of infiltration velocity. This behaviour was attributed to the structure of the preform
with strong, predominantly dense, sintered struts and good permeability. Apart from a
discontinuity in TOPC10IS between 0.18 and 0.36 m/s in ISQC, all preforms showed a steady
increase or constant compression with increasing infiltration velocity. At the maximum
velocity of 1.44 m/s, AOPC20 and FATO showed maximum cpr of 0.33 and 0.29 respectively.
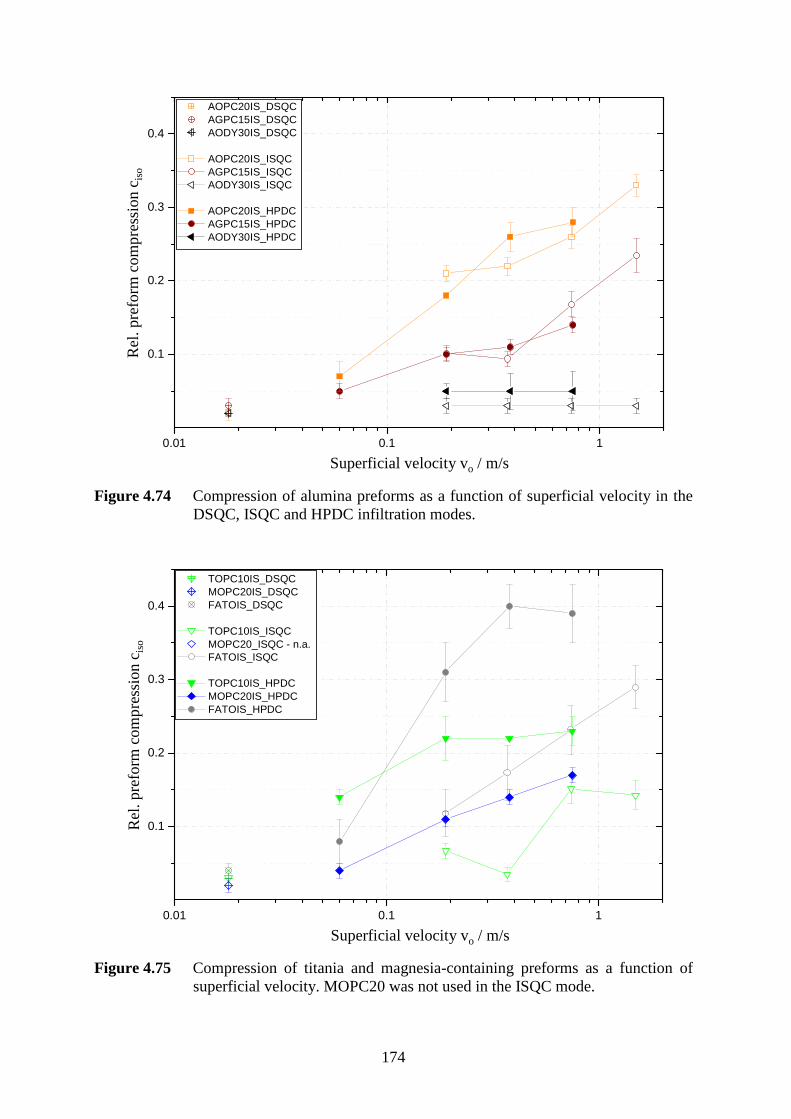
174
0.01 0.1 1
0.1
0.2
0.3
0.4
AOPC20IS_DSQC AGPC15IS_DSQC AODY30IS_DSQC
AOPC20IS_ISQC AGPC15IS_ISQC AODY30IS_ISQC
AOPC20IS_HPDC AGPC15IS_HPDC AODY30IS_HPDC
Rel
ativ
e pr
efor
m c
ompr
essi
on c
pr (
)
Superficial velocity v0 (m/s)Superficial velocity vo / m/s
Rel
. pre
form
com
pre
ssio
n c
iso
Figure 4.74 Compression of alumina preforms as a function of superficial velocity in the DSQC, ISQC and HPDC infiltration modes.
0.01 0.1 1
0.1
0.2
0.3
0.4
TOPC10IS_DSQC MOPC20IS_DSQC FATOIS_DSQC
TOPC10IS_ISQC MOPC20_ISQC - n.a. FATOIS_ISQC
TOPC10IS_HPDC MOPC20IS_HPDC FATOIS_HPDC
Rel
ativ
e pr
efor
m c
ompr
essi
on c
pr (
)
Superficial velocity v0 (m/s)Superficial velocity vo / m/s
Rel
. pre
form
com
pre
ssio
n c
iso
Figure 4.75 Compression of titania and magnesia-containing preforms as a function of superficial velocity. MOPC20 was not used in the ISQC mode.

175
There were minor differences in the compression of the Al2O3 preforms infiltrated in ISQC
compared to those infiltrated in HPDC at the three equivalent infiltration velocities (0.18, 0.36
and 0.72 m/s). Marginally higher compressions were found in the HPDC mode, although the
mean values lay in the scatter band of the compressions of ISQC. In contrast, the compression
of the reactive preforms between the infiltration modes was different, as shown in Figure
4.75. For example, the FATO preform showed significantly different compressions in the
three overlapping velocities of ISQC and HPDC. The compression in HPDC was more than
double that in ISQC at given velocity.
A similar trend was visible with the TOPC10 preforms. In the ISQC mode, compressions of
0.04 to 0.14 were found, compared to 0.22 to 0.23 in the HPDC mode. The sudden drop to a
low compression of 0.04 at a velocity 0.36 m/s in the ISQC mode did not occur in the HPDC
mode. As aforementioned, MOPC20 preforms were only infiltrated in DSQC and HPDC. In
the HPDC mode, this preform exhibited the lowest compression of all preforms fabricated
using a pore forming agent.
4.10. MMC properties
The mechanical and the tribological properties of the MMCs with an Al-Si alloy matrix were
assessed and compared to the properties of the pure alloy IS.
4.10.1 Influence of inhomogeneities on bending strength
The influence of inhomogeneities on the 4-point bending strength was investigated by
comparing the local bending strength along the x-axis of MMCs produced with the standard
infiltration tool with those produced using a copper chill insert in the bottom punch. The
bending strength was determined as described in 3.5.5. Each data point in Figure 4.76 is the
bending strength of a single bend test bar at the defined x-position. Both curves in Figure 4.76
showed a decrease in bending strength in the centre of the MMC but the extent of this
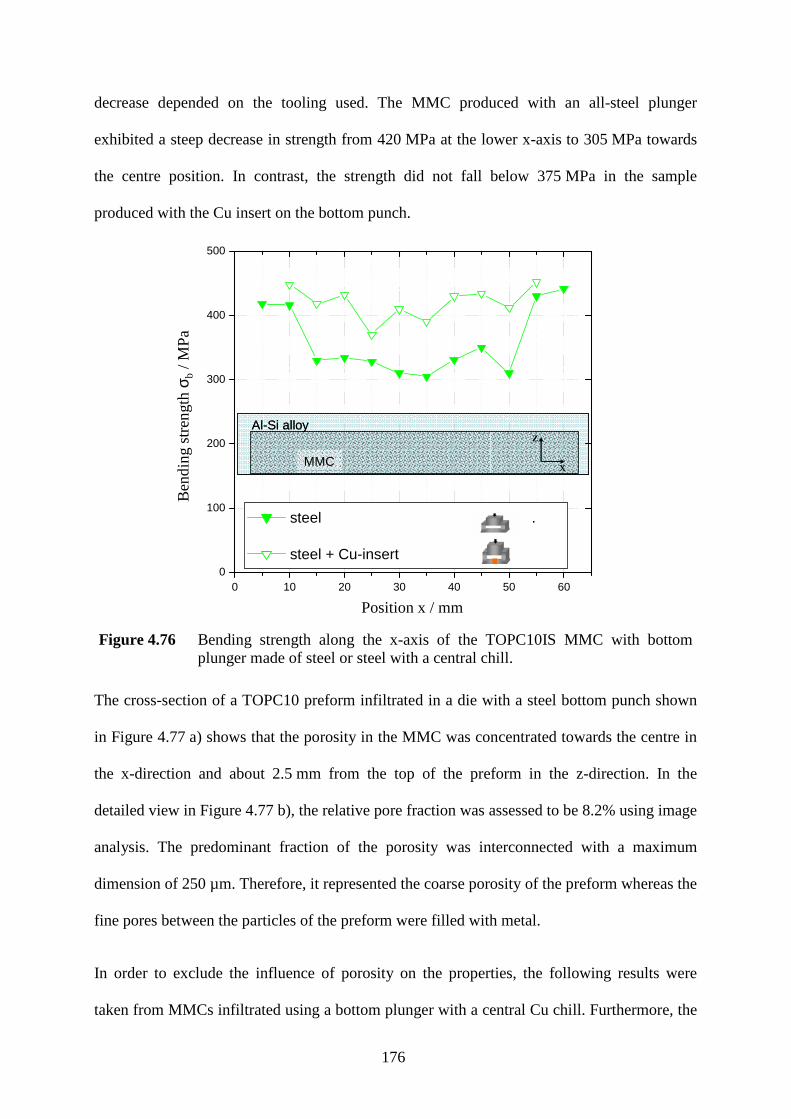
176
decrease depended on the tooling used. The MMC produced with an all-steel plunger
exhibited a steep decrease in strength from 420 MPa at the lower x-axis to 305 MPa towards
the centre position. In contrast, the strength did not fall below 375 MPa in the sample
produced with the Cu insert on the bottom punch.
Figure 4.76 Bending strength along the x-axis of the TOPC10IS MMC with bottom plunger made of steel or steel with a central chill.
The cross-section of a TOPC10 preform infiltrated in a die with a steel bottom punch shown
in Figure 4.77 a) shows that the porosity in the MMC was concentrated towards the centre in
the x-direction and about 2.5 mm from the top of the preform in the z-direction. In the
detailed view in Figure 4.77 b), the relative pore fraction was assessed to be 8.2% using image
analysis. The predominant fraction of the porosity was interconnected with a maximum
dimension of 250 µm. Therefore, it represented the coarse porosity of the preform whereas the
fine pores between the particles of the preform were filled with metal.
In order to exclude the influence of porosity on the properties, the following results were
taken from MMCs infiltrated using a bottom plunger with a central Cu chill. Furthermore, the
Al-Si alloy
MMCX
ZAl-Si alloy
MMCX
Z
0 10 20 30 40 50 600
100
200
300
400
500
steel .
steel + Cu-insert
Ben
ding
str
engt
h σ b
(MP
a)
Position x (mm)Position x / mm
Ben
din
g st
ren
gth σ
b/ M
Pa
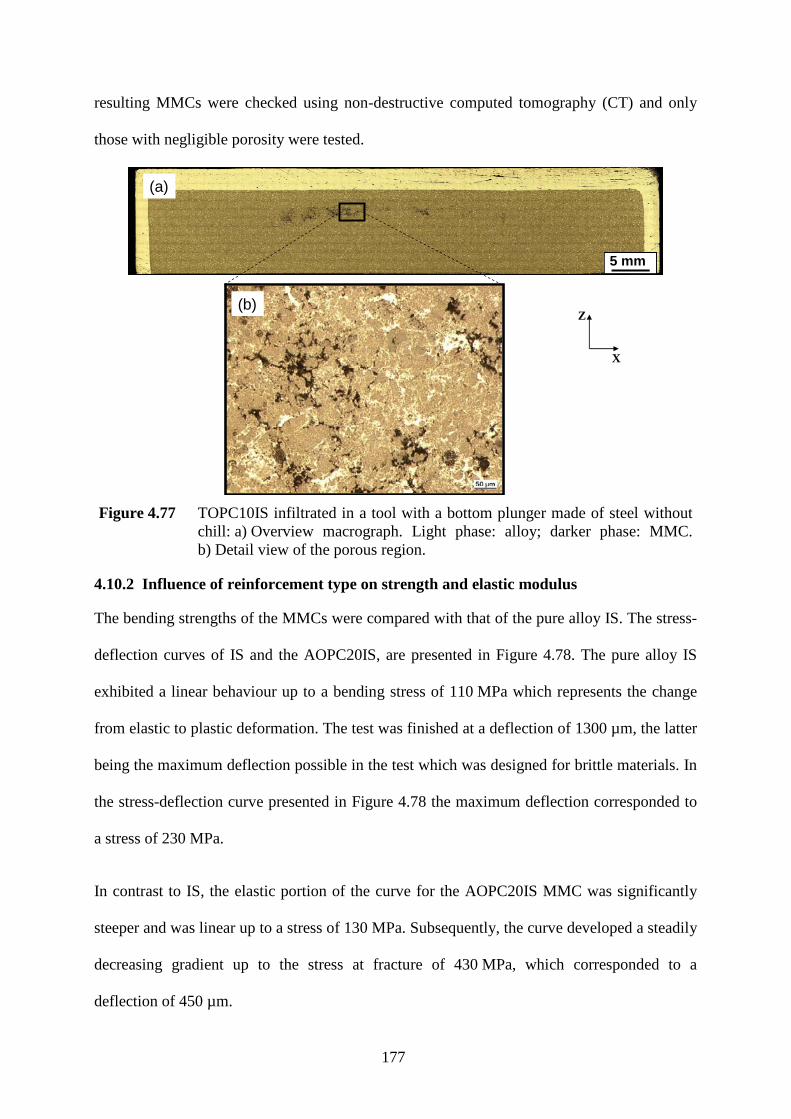
177
resulting MMCs were checked using non-destructive computed tomography (CT) and only
those with negligible porosity were tested.
(a)
(b)
X
Z
2 µm5 mm2 µm5 mm
Figure 4.77 TOPC10IS infiltrated in a tool with a bottom plunger made of steel without chill: a) Overview macrograph. Light phase: alloy; darker phase: MMC. b) Detail view of the porous region.
4.10.2 Influence of reinforcement type on strength and elastic modulus
The bending strengths of the MMCs were compared with that of the pure alloy IS. The stress-
deflection curves of IS and the AOPC20IS, are presented in Figure 4.78. The pure alloy IS
exhibited a linear behaviour up to a bending stress of 110 MPa which represents the change
from elastic to plastic deformation. The test was finished at a deflection of 1300 µm, the latter
being the maximum deflection possible in the test which was designed for brittle materials. In
the stress-deflection curve presented in Figure 4.78 the maximum deflection corresponded to
a stress of 230 MPa.
In contrast to IS, the elastic portion of the curve for the AOPC20IS MMC was significantly
steeper and was linear up to a stress of 130 MPa. Subsequently, the curve developed a steadily
decreasing gradient up to the stress at fracture of 430 MPa, which corresponded to a
deflection of 450 µm.
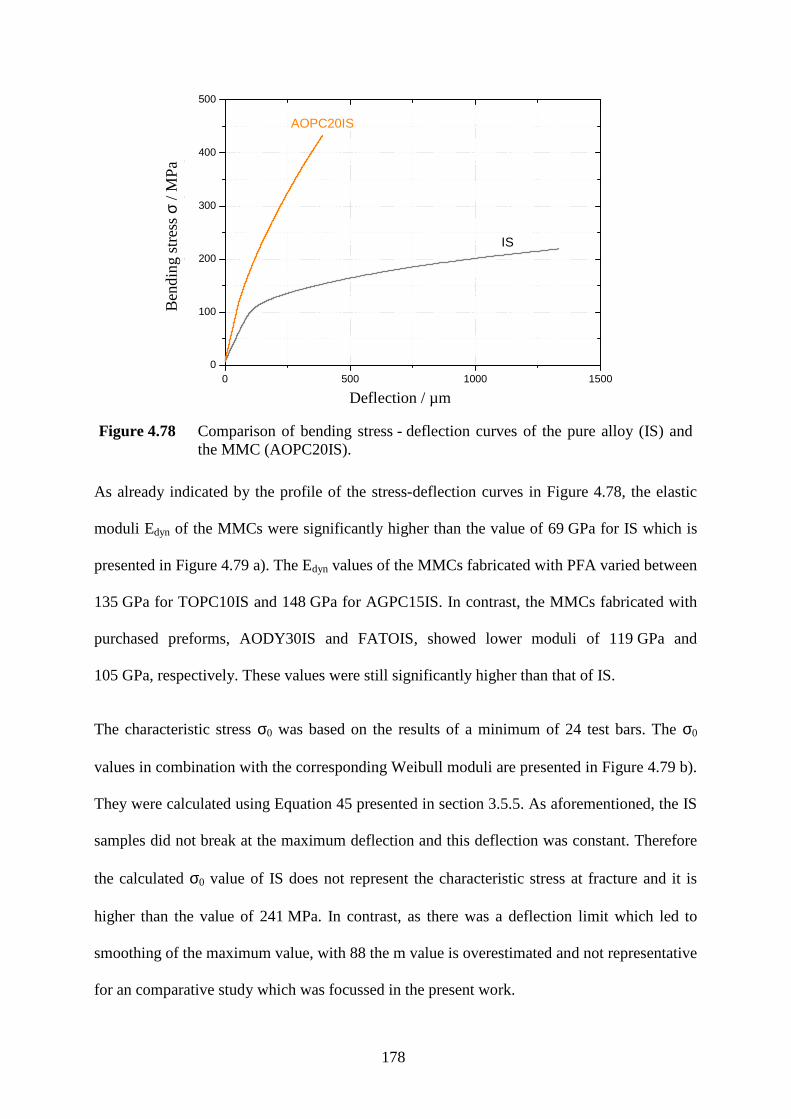
178
0 500 1000 15000
100
200
300
400
500
AOPC20IS
IS
Ben
ding
str
ess
(MP
a)
Deflection (µm)Deflection / µm
Ben
din
g st
ress
σ/ M
Pa
Figure 4.78 Comparison of bending stress - deflection curves of the pure alloy (IS) and the MMC (AOPC20IS).
As already indicated by the profile of the stress-deflection curves in Figure 4.78, the elastic
moduli Edyn of the MMCs were significantly higher than the value of 69 GPa for IS which is
presented in Figure 4.79 a). The Edyn values of the MMCs fabricated with PFA varied between
135 GPa for TOPC10IS and 148 GPa for AGPC15IS. In contrast, the MMCs fabricated with
purchased preforms, AODY30IS and FATOIS, showed lower moduli of 119 GPa and
105 GPa, respectively. These values were still significantly higher than that of IS.
The characteristic stress σ0 was based on the results of a minimum of 24 test bars. The σ0
values in combination with the corresponding Weibull moduli are presented in Figure 4.79 b).
They were calculated using Equation 45 presented in section 3.5.5. As aforementioned, the IS
samples did not break at the maximum deflection and this deflection was constant. Therefore
the calculated σ0 value of IS does not represent the characteristic stress at fracture and it is
higher than the value of 241 MPa. In contrast, as there was a deflection limit which led to
smoothing of the maximum value, with 88 the m value is overestimated and not representative
for an comparative study which was focussed in the present work.
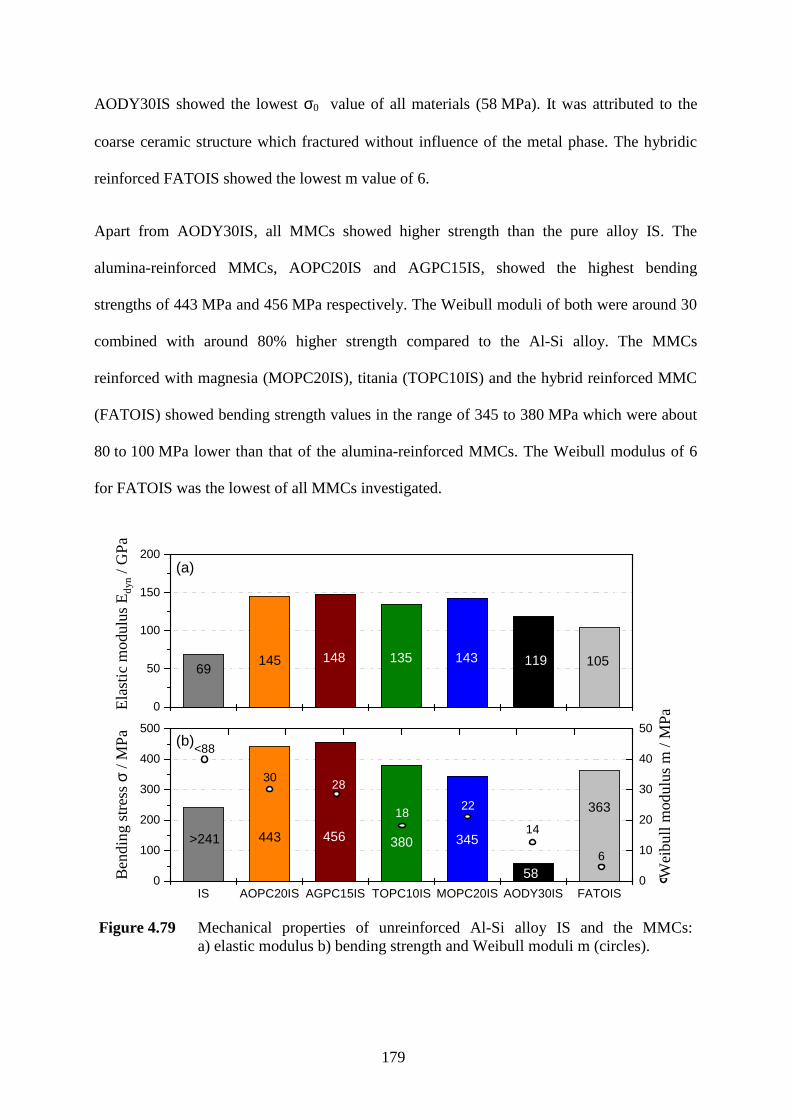
179
AODY30IS showed the lowest σ0 value of all materials (58 MPa). It was attributed to the
coarse ceramic structure which fractured without influence of the metal phase. The hybridic
reinforced FATOIS showed the lowest m value of 6.
Apart from AODY30IS, all MMCs showed higher strength than the pure alloy IS. The
alumina-reinforced MMCs, AOPC20IS and AGPC15IS, showed the highest bending
strengths of 443 MPa and 456 MPa respectively. The Weibull moduli of both were around 30
combined with around 80% higher strength compared to the Al-Si alloy. The MMCs
reinforced with magnesia (MOPC20IS), titania (TOPC10IS) and the hybrid reinforced MMC
(FATOIS) showed bending strength values in the range of 345 to 380 MPa which were about
80 to 100 MPa lower than that of the alumina-reinforced MMCs. The Weibull modulus of 6
for FATOIS was the lowest of all MMCs investigated.
IS AOPC20IS AGPC15IS TOPC10IS MOPC20IS AODY30IS FATOIS0
100
200
300
400
500
58Ben
ding
str
engt
h σ b (
MP
a)
0
50
100
150
200
363
345380456443>241
105119143135145 14869
(b)
(a)
Ela
stic
mod
ulus
E (
GP
a)
0
10
20
30
40
50
6
14
22
28
18
30
Wei
bull
mod
ulus
m<88
Wei
bull
mod
ulus
m /
MP
a
Ben
din
g st
ress
σ/ M
Pa
Ela
stic
mod
ulus
E dyn/ G
Pa
Figure 4.79 Mechanical properties of unreinforced Al-Si alloy IS and the MMCs: a) elastic modulus b) bending strength and Weibull moduli m (circles).

180
4.10.3 Influence of reinforcement type on fracture toughness
The fracture toughness of the MMCs was measured in bending using beam-shaped samples
with a V-notch as described in 3.5.5. The mean fracture toughness KIC of the MMCs varied
between 7.2 and 9.5 MPa·m1/2 except that of AODY30IS which was significantly lower, as
shown in Figure 4.80. The value of the latter had to be estimated, as the samples broke prior
to the end of the preloading phase of the test. The maximum preloading stress corresponded to
a KIC of 3.0 MPa·m1/2 and therefore KIC of AODY30IS was below this value.
In the unreinforced Al-Si alloy (IS), the required notch geometry could not be obtained using
the chosen notching device, as this was designed for brittle materials but produced a U-shaped
notch in the pure alloy. The general geometry criterion, where the notch root should have a
radius of less than 50 µm to minimize the influence of notch radius on KIC, could not be
achieved. Therefore the KIC values could not be evaluated for the pure alloy, whereas the
MMCs had a satisfactory notch geometry.
IS AOPC20IS AGPC15IS TOPC10IS AODY30IS FATOIS0
2
4
6
8
10
7.27.48.99.5
< 3
n.a.
Fra
ctur
e to
ughn
ess
KIC
(MP
a m
1/2 )
Fra
ctu
re to
ugh
nes
s K Ic/ M
Pa
m1
/2
Figure 4.80 Fracture toughness KIC of the MMCs.
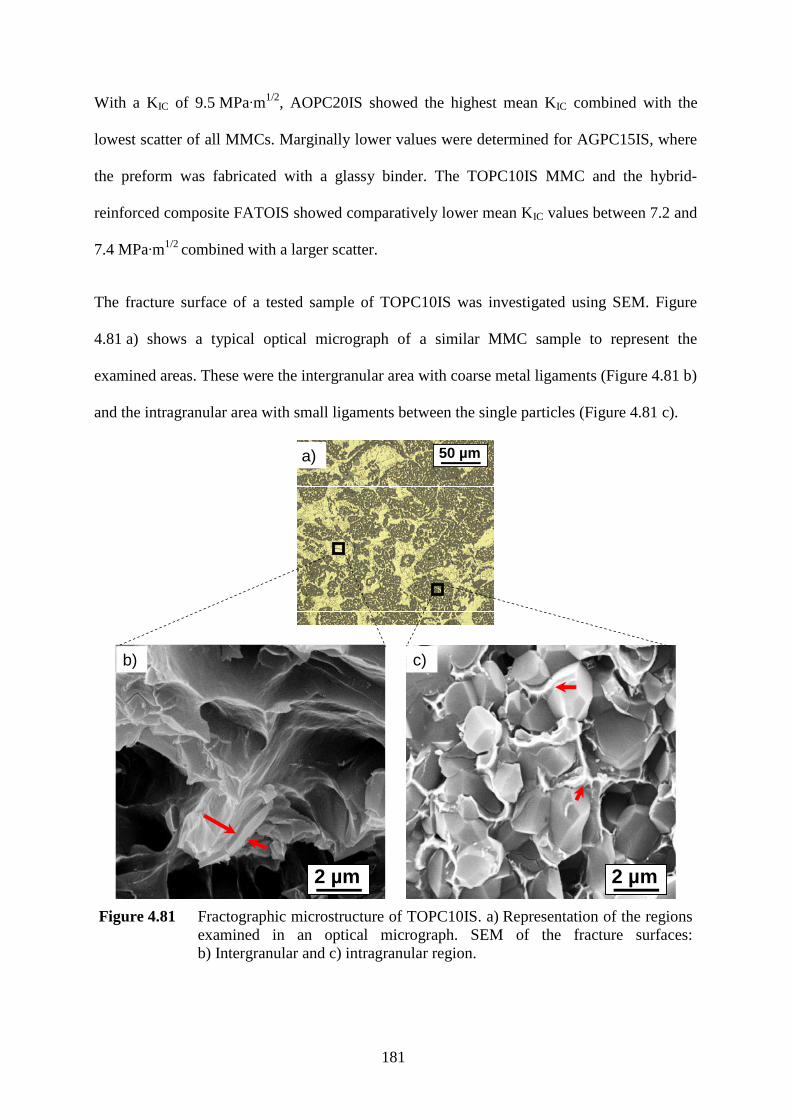
181
With a KIC of 9.5 MPa·m1/2, AOPC20IS showed the highest mean KIC combined with the
lowest scatter of all MMCs. Marginally lower values were determined for AGPC15IS, where
the preform was fabricated with a glassy binder. The TOPC10IS MMC and the hybrid-
reinforced composite FATOIS showed comparatively lower mean KIC values between 7.2 and
7.4 MPa·m1/2 combined with a larger scatter.
The fracture surface of a tested sample of TOPC10IS was investigated using SEM. Figure
4.81 a) shows a typical optical micrograph of a similar MMC sample to represent the
examined areas. These were the intergranular area with coarse metal ligaments (Figure 4.81 b)
and the intragranular area with small ligaments between the single particles (Figure 4.81 c).
2 µm2 µm2 µm2 µm2 µm2 µm2 µm2 µm
c)
a)
b)
2 µm50 µm2 µm50 µm
Figure 4.81 Fractographic microstructure of TOPC10IS. a) Representation of the regions examined in an optical micrograph. SEM of the fracture surfaces: b) Intergranular and c) intragranular region.
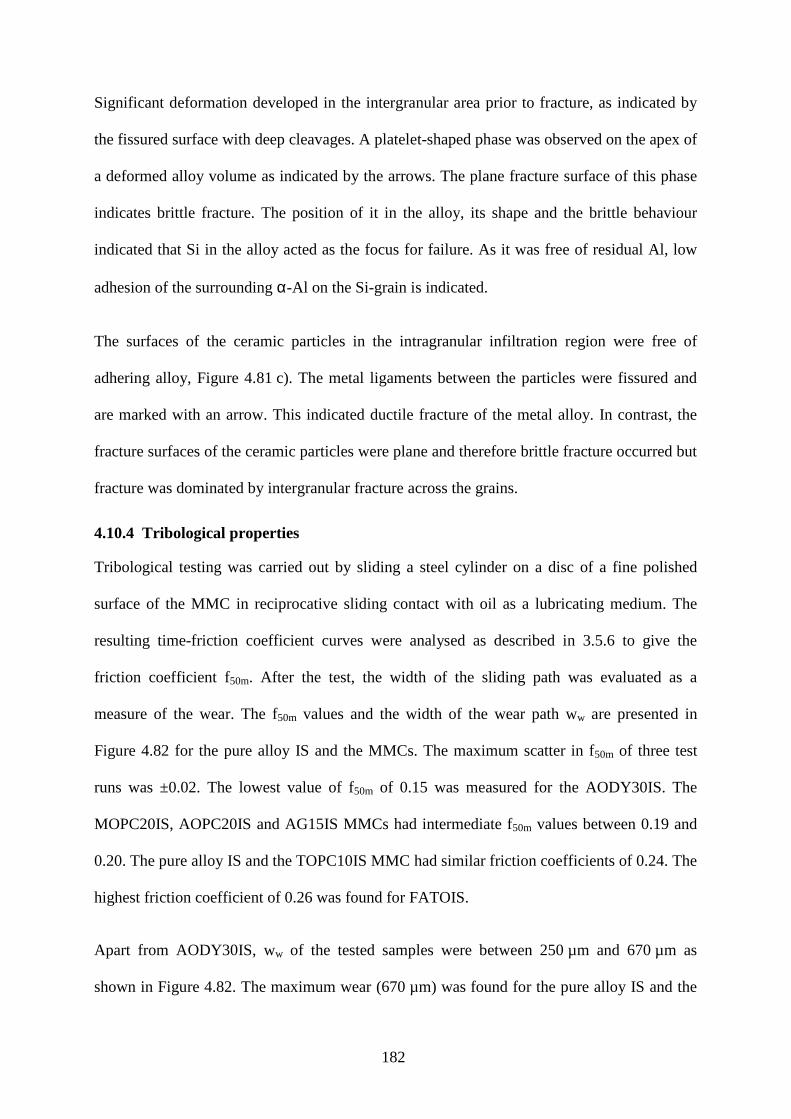
182
Significant deformation developed in the intergranular area prior to fracture, as indicated by
the fissured surface with deep cleavages. A platelet-shaped phase was observed on the apex of
a deformed alloy volume as indicated by the arrows. The plane fracture surface of this phase
indicates brittle fracture. The position of it in the alloy, its shape and the brittle behaviour
indicated that Si in the alloy acted as the focus for failure. As it was free of residual Al, low
adhesion of the surrounding α-Al on the Si-grain is indicated.
The surfaces of the ceramic particles in the intragranular infiltration region were free of
adhering alloy, Figure 4.81 c). The metal ligaments between the particles were fissured and
are marked with an arrow. This indicated ductile fracture of the metal alloy. In contrast, the
fracture surfaces of the ceramic particles were plane and therefore brittle fracture occurred but
fracture was dominated by intergranular fracture across the grains.
4.10.4 Tribological properties
Tribological testing was carried out by sliding a steel cylinder on a disc of a fine polished
surface of the MMC in reciprocative sliding contact with oil as a lubricating medium. The
resulting time-friction coefficient curves were analysed as described in 3.5.6 to give the
friction coefficient f50m. After the test, the width of the sliding path was evaluated as a
measure of the wear. The f50m values and the width of the wear path ww are presented in
Figure 4.82 for the pure alloy IS and the MMCs. The maximum scatter in f50m of three test
runs was ±0.02. The lowest value of f50m of 0.15 was measured for the AODY30IS. The
MOPC20IS, AOPC20IS and AG15IS MMCs had intermediate f50m values between 0.19 and
0.20. The pure alloy IS and the TOPC10IS MMC had similar friction coefficients of 0.24. The
highest friction coefficient of 0.26 was found for FATOIS.
Apart from AODY30IS, ww of the tested samples were between 250 µm and 670 µm as
shown in Figure 4.82. The maximum wear (670 µm) was found for the pure alloy IS and the
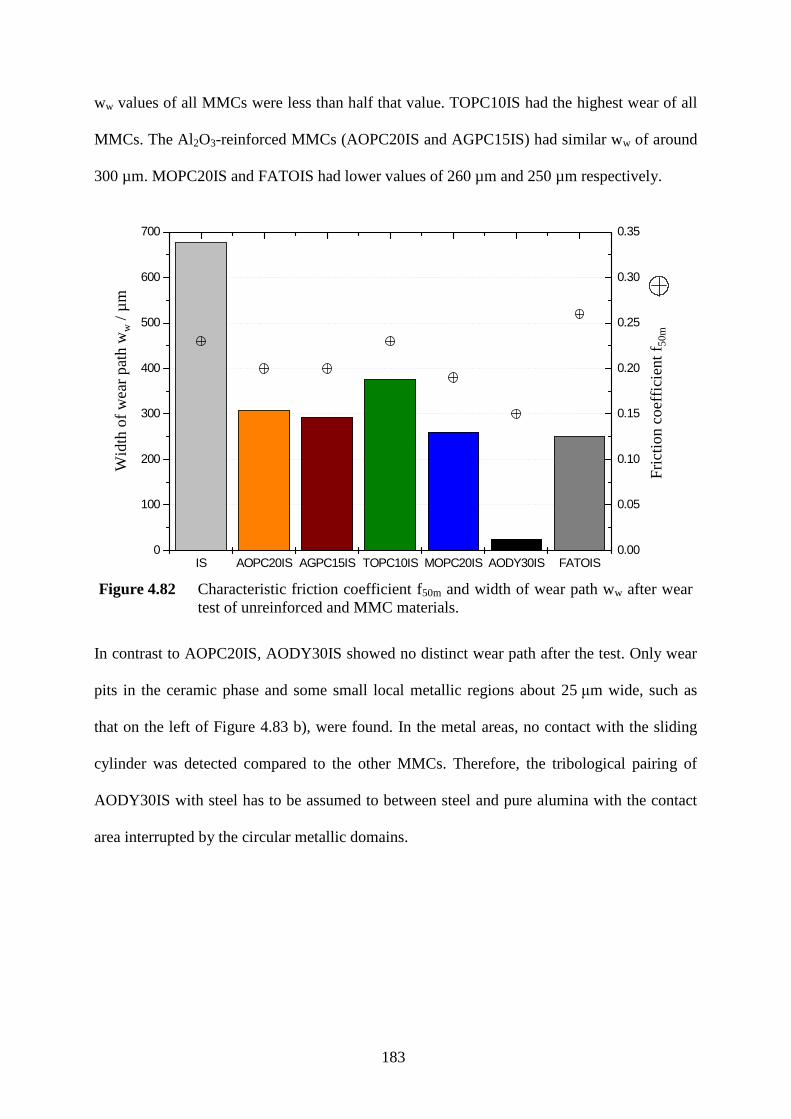
183
ww values of all MMCs were less than half that value. TOPC10IS had the highest wear of all
MMCs. The Al2O3-reinforced MMCs (AOPC20IS and AGPC15IS) had similar ww of around
300 µm. MOPC20IS and FATOIS had lower values of 260 µm and 250 µm respectively.
IS AOPC20IS AGPC15IS TOPC10IS MOPC20IS AODY30IS FATOIS0
100
200
300
400
500
600
700
Wid
th o
f wea
r pat
h w
w (µ
m)
0.00
0.05
0.10
0.15
0.20
0.25
0.30
0.35
Fric
tion
coef
ficie
nt f
50m (
)
Wid
th o
f we
ar p
ath
w w/
µm
Fric
tion
coe
ffici
ent f 5
0m
Figure 4.82 Characteristic friction coefficient f50m and width of wear path ww after wear
test of unreinforced and MMC materials.
In contrast to AOPC20IS, AODY30IS showed no distinct wear path after the test. Only wear
pits in the ceramic phase and some small local metallic regions about 25 µm wide, such as
that on the left of Figure 4.83 b), were found. In the metal areas, no contact with the sliding
cylinder was detected compared to the other MMCs. Therefore, the tribological pairing of
AODY30IS with steel has to be assumed to between steel and pure alumina with the contact
area interrupted by the circular metallic domains.
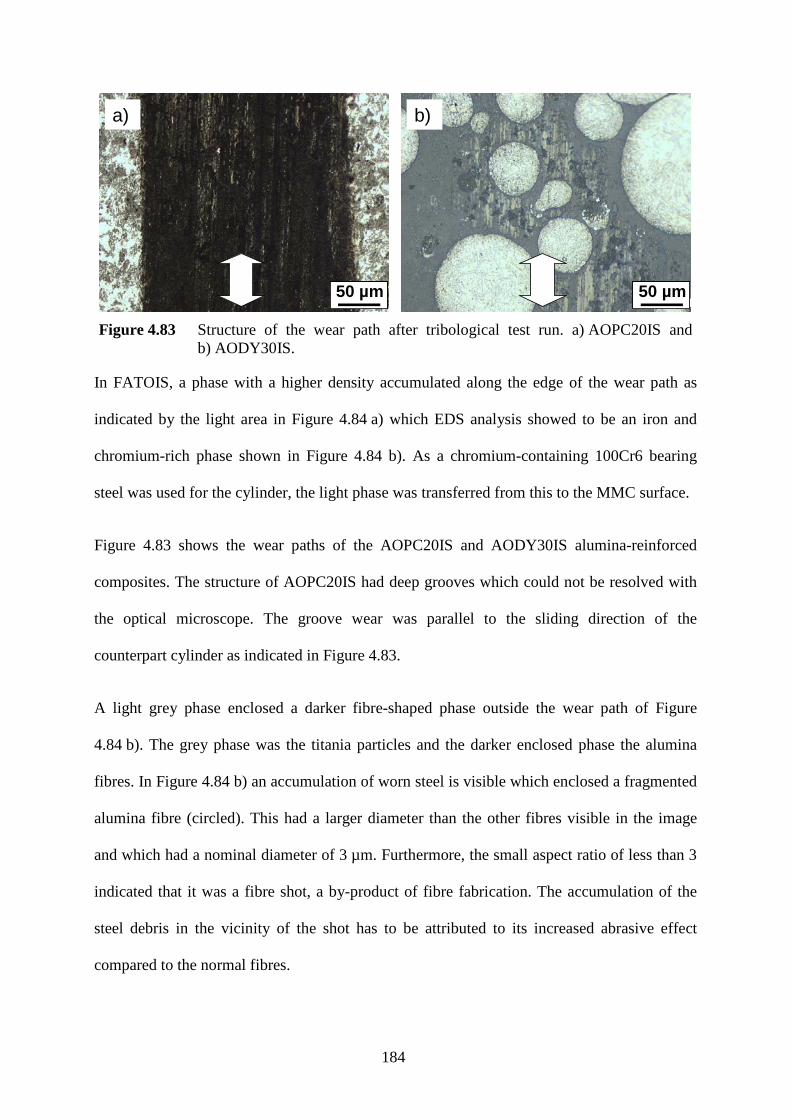
184
2 µm50 µm2 µm50 µm 2 µm50 µm2 µm50 µm
a) b)
Figure 4.83 Structure of the wear path after tribological test run. a) AOPC20IS and b) AODY30IS.
In FATOIS, a phase with a higher density accumulated along the edge of the wear path as
indicated by the light area in Figure 4.84 a) which EDS analysis showed to be an iron and
chromium-rich phase shown in Figure 4.84 b). As a chromium-containing 100Cr6 bearing
steel was used for the cylinder, the light phase was transferred from this to the MMC surface.
Figure 4.83 shows the wear paths of the AOPC20IS and AODY30IS alumina-reinforced
composites. The structure of AOPC20IS had deep grooves which could not be resolved with
the optical microscope. The groove wear was parallel to the sliding direction of the
counterpart cylinder as indicated in Figure 4.83.
A light grey phase enclosed a darker fibre-shaped phase outside the wear path of Figure
4.84 b). The grey phase was the titania particles and the darker enclosed phase the alumina
fibres. In Figure 4.84 b) an accumulation of worn steel is visible which enclosed a fragmented
alumina fibre (circled). This had a larger diameter than the other fibres visible in the image
and which had a nominal diameter of 3 µm. Furthermore, the small aspect ratio of less than 3
indicated that it was a fibre shot, a by-product of fibre fabrication. The accumulation of the
steel debris in the vicinity of the shot has to be attributed to its increased abrasive effect
compared to the normal fibres.
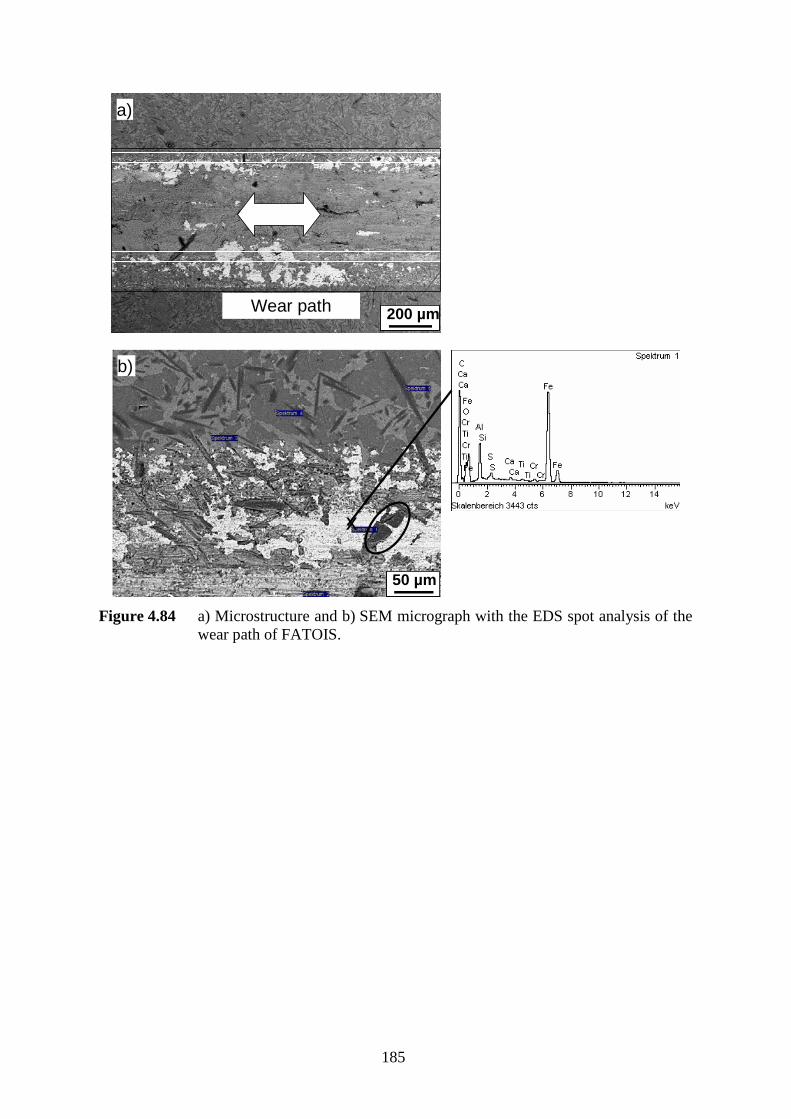
185
Wear path
2 µm50 µm2 µm50 µm
2 µm200 µm2 µm200 µm
a)
b)
x
Figure 4.84 a) Microstructure and b) SEM micrograph with the EDS spot analysis of the wear path of FATOIS.
186
5. DISCUSSION
First the properties of the MMCs are discussed and compared with those of the pure
infiltration alloy. Properties are influenced by the preform pore structure and its chemistry.
Residual porosity influences the performance and preform saturation is important and is
discussed. Finally, the results of preform infiltration experiments are compared to one
dimensional infiltration models.
5.1. Tailoring properties of preform MMCs
The main task in composite research is to combine the desirable properties of the different
phases. Even though high strength Al alloys are available for use up to a temperature of
150°C, above this point the mechanical properties reduce drastically. For MMCs consisting of
an Al alloy matrix with ceramic particles and/or fibres, the target is increased elastic modulus,
greater strength and wear resistance combined with sufficient failure tolerance at room and
elevated temperatures combined with an economic material synthesis process. The drastic
reduction is not observed in preform-based MMCs due to the interconnected phases.
Kniewallner (51) demonstrated for Saffil™ fibre-reinforced Al alloy MMCs that, if the room
temperature properties were superior to the pure alloy, the gap in properties is even larger at
elevated temperatures. This behaviour was assumed to be applicable for the MMCs produced
in the present research and therefore only room temperature properties were assessed.
5.1.1 Pure alloy properties
The chemical and mechanical properties of the pure alloy IS (EN AC-AlSi12Fe), a
commercial high pressure die casting (HPDC) alloy, are specified in EN 1706 (148). Here the
minimum mean tensile strength of HPDC materials is higher (240 MPa) than that of gravity
chill cast materials (150 MPa). The latter process is closest to direct squeeze casting

187
(DSQC) (135) which was applied in the present study for fabrication of the test samples. The
differences in strength are a result of the lower cooling rates found in gravity chill cast
material. A rate of 1°C/s was measured for DSQC (Figure 4.46), whereas 10 to 1000°C/s was
reported for HPDC (143). The higher cooling rates lead to finer microstructures and higher
strengths (143). The pure alloy IS had a calculated characteristic bending strength of 241 MPa.
Due to the limited deflection of the bending test set-up and the relatively high ductility of IS
the test bars did not break and therefore the calculated value did not represent σ0 which
calculation is based on the stress at fracture.
For an alloy similar to IS processed in indirect squeeze casting (ISQC) Kniewallner (51)
measured in the tensile tests a mean UTS of 190 MPa (Table 2.1). Kniewallner found
inhomogeneities such as oxides and gas inclusions in the fractured surface which led to
reductions in strength. No such defects were found in IS in the present work leading to higher
fracture strength values. Even though the actual σ0 of IS is higher than the calculated value
evaluated with limited deflection, the measured UTS (51) and the specified alloy values (148)
indicate that it is legitimate to assume that the real σ0 is higher but close to the value of
241 MPa and it was used for the comparative study. Nevertheless, in future work the bending
test set-up will have to be improved in order to allow testing of materials with higher ductility.
The limited deflection in the bending test further reduced the scatter in maximum stress
values of IS and therefore its Weibull modulus (m) of 88 is an overestimation and not
representative. It was reported that m values for the tensile strength of Al alloy castings lie
below 40 (6). For the present comparative study, the maximum value (m = 40) was used as it
represents a worst case regarding the comparison with m values of the MMCs, where all test
bars fractured prior to the deflection limit being reached.
188
The measured elastic modulus, Edyn , of IS of 69 GPa is marginally lower than recorded in the
li terature (166). For metallic materials, E is usually measured in tensile tests. For example
Kniewallner (51) found 75±3 GPa for an alloy similar to IS. The difference in modulus may be
the result of using the dynamic method which was originally developed for ceramic materials,
exhibiting higher moduli and lower damping. Nevertheless, the difference is acceptable and
the method was successfully applied to Al-MMCs (175).
The fracture toughness, KIC , of IS could not be measured using the single edge V-notch beam
(SEVNB) method (169), which is a standard method used for ceramics (149), because the
metallic character of the unreinforced alloy prevented the fabrication of an obligatory sharp
notch. The compact tension test method (CT) is usually used for metals and precracking is
performed using cyclic loading. No KIC values for HPDC Al alloys were found in the
li terature. Using the CT method, Chan et al. (176) reported values in the range of 12.0 to
17.8 MPa·m1/2 for gravity cast Al-7%Si-Mg. The lower values were for the as-cast condition
and the higher for the T6 condition. The solution heat treatment in the precipitation hardening
process of Al-Si-Mg alloys consists of prolonged holding at temperatures about 30-50°C
below the solidus. Here, not only solution of Mg takes place but also the morphology of Si is
changed from needle-like to a spherical shape. This shape transformation is reported to be
used to increase the elongation of casting alloys. As a result of this silicon spheroidization
treatment (SST), the elongation of an A356 alloy increased by 70% (177). The possibility of
spheroidization of the IS alloy was investigated and Figure 4.44 shows that the needle-like
shape was transformed into a globular one and therefore the KIC of the as-cast alloy may be
improved by heat treatment. However, as the target of the present work was a low cost
composite, heat treatment was not applied.
From Figure 4.81 b) it appears that cracking initiates at the interface of the needle-like Si-
precipitates. It can therefore be assumed that the KIC of IS is similar to that reported for as-

189
cast A356 (178) (12 MPa·m1/2). This is reasonable if other microstructural conditions were close
to that of A356 mentioned by Chan et al. (176). This may not be the case since the chemical
composition is different: apart from Si, the A356 contained 0.097 wt.% Fe, whereas the
infiltration alloy IS contained 0.76 wt.% Fe. Iron forms intermetallic phases which reduce the
elongation and toughness (6). Therefore IS may exhibit a KIC lower than 12 MPa·m1/2.
However, the microstructure of IS made by DSQC is finer than that of the gravity cast alloys
and so ultimately 12 MPa·m1/2 was assumed.
As aforementioned, the fracture toughness of a metal is generally determined using the CT
method. In this work, the SEVNB method was used to characterise MMCs with a metal per
cent by volume of 60-70%. Kounga-Njiwaa et al. (179) have compared the KIC of commercial
lead zirconate titanate (PZT) ceramics measured using CT and SEVNB. They stated that the
investigated PZT material, which was at the morphotropic phase boundary and doped with
nickel and antimony, show a similar stress-strain behaviour to metals. Quasi-plasticity was
found similar to that in the MMCs indicated by distinctive non-linear, quasi-plastic behaviour
shown in the curve of AOPC20IS in Figure 4.78. Furthermore the authors found that for PZT
the toughness calculated using the standard equations was 5% higher for the CT than in the
SEVNB test. Therefore, the SEVNB method was rated as an applicable method for MMC
characterisation which is comparable with KIC values tested with the CT method.
5.1.2 MMC properties in relation to the pure alloy
Figure 5.1 presents the values of the relative MMC performance as a ratio of that of the MMC
(PMMC) to that of IS (PIS). For the tribological properties, low wear and low friction
coefficients are considered favourable and therefore reciprocal values of width of the wear
path (ww) and the friction coefficient (f50m) were calculated and presented.
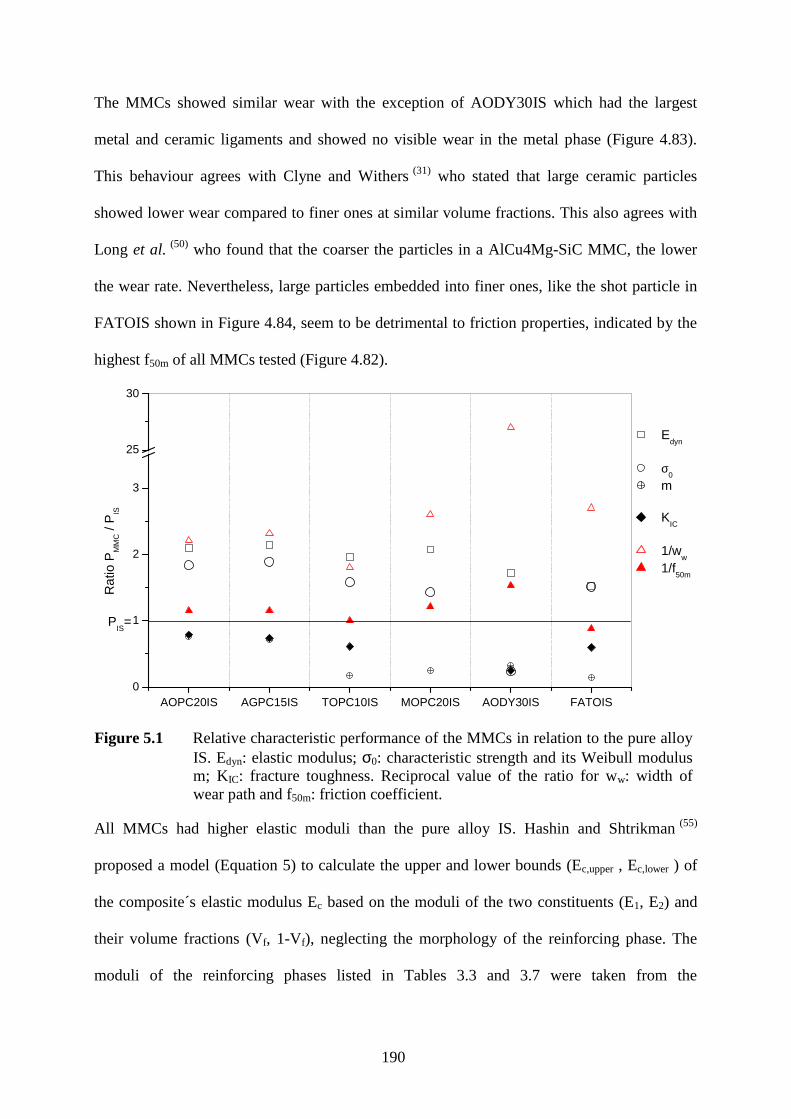
190
The MMCs showed similar wear with the exception of AODY30IS which had the largest
metal and ceramic ligaments and showed no visible wear in the metal phase (Figure 4.83).
This behaviour agrees with Clyne and Withers (31) who stated that large ceramic particles
showed lower wear compared to finer ones at similar volume fractions. This also agrees with
Long et al. (50) who found that the coarser the particles in a AlCu4Mg-SiC MMC, the lower
the wear rate. Nevertheless, large particles embedded into finer ones, like the shot particle in
FATOIS shown in Figure 4.84, seem to be detrimental to friction properties, indicated by the
highest f50m of all MMCs tested (Figure 4.82).
AOPC20IS AGPC15IS TOPC10IS MOPC20IS AODY30IS FATOIS0
1
2
3
25
30
PIS
=
Edyn
σ0
m
KIC
1/ww
1/f50m
Rat
io P
MM
C /
PIS (
)
Figure 5.1 Relative characteristic performance of the MMCs in relation to the pure alloy IS. Edyn: elastic modulus; σ0: characteristic strength and its Weibull modulus m; KIC: fracture toughness. Reciprocal value of the ratio for ww: width of wear path and f50m: friction coefficient.
Al l MMCs had higher elastic moduli than the pure alloy IS. Hashin and Shtrikman (55)
proposed a model (Equation 5) to calculate the upper and lower bounds (Ec,upper , Ec,lower ) of
the composite´s elastic modulus Ec based on the moduli of the two constituents (E1, E2) and
their volume fractions (Vf, 1-Vf), neglecting the morphology of the reinforcing phase. The
moduli of the reinforcing phases listed in Tables 3.3 and 3.7 were taken from the

191
literature (149). The moduli of the MMCs investigated (Edyn,MMC), those reported
elsewhere (51, 54) (FA13.5IS, FA20.0IS, AODY25), the predicted range of Ec and the values
calculated using the rule of mixture (EROM) are shown in Figure 5.2. FA13.5IS and FA20.0IS
were Saffil™ fibre reinforced MMCs with a matrix similar to IS and Vf of 0.135 and 0.20 (51)
respectively. The MMC based on a foamed preform (54) had a similar structure to AODY30IS
of the present work but a different ceramic volume fraction of 0.25 and is designated as
AODY25. As shown in Figure 5.2, the rule of mixtures overestimates (Ec,ROM) the moduli of
all MMCs. Hashin and Shtrikman (55) initially found similar trend issues and therefore
introduced their model which gave ranges of values which were lower than Ec,ROM.
AOPC20IS AGPC15IS TOPC10IS MOPC20IS AODY25 AODY30IS FATOIS FA20.0IS FA13.5IS0
50
100
150
200
250
Edyn, MMC
Ec,upper
Ec,lower
Ec,ROM
E (
GP
a)E
last
ic m
odu
lus
E /
GP
a
Figure 5.2 Comparison of experimental results of the MMCs moduli (Edyn,MMC) and predictions based on the rule of mixture (Ec,ROM) and upper (Ec,upper) and lower (Ec,lower) bound of Ec in accordance to Hashin and Shtrikman (55)
The alumina reinforced MMCs, AOPC20IS and AGPC15IS, showed good agreement with the
model of Hashin and Shtrikman (55), as indicated by the experimental values lying between
Ec,lower and Ec,upper. With a similar reinforcement chemistry, the model overestimates the
modulus of AODY30IS which can be attributed to the morphology of the ceramic phase or

192
interfacial debonding: Peng et al. (54) found that in preforms similar to AODY30, a gap was
formed along the metal-ceramic interface, attributed to feeding deficiencies during
solidification. By variation of the pressure holding times and the cooling schedule, they could
optimize the structural integrity of the MMC. In the present work, the optimization of the
preform infiltration process enabled the melt feeding into the preform cavities during
solidification to be maintained, resulting in dense MMCs as shown in Figure 4.52. Therefore
interfacial debonding was not present in AODY30IS as further shown by the microstructure in
Figure 4.58. As aforementioned the model matches the measured Ec for AOPC20IS and the
deviation in AODY30IS has to be attributed to the reinforcement morphology and its
distribution.
5.1.3 Influence of homogeneity
The porosity was reduced significantly when a chill was used in the DSQC tool to promote
directional solidification from the bottom punch towards the top tool. Therefore, the porosity
of castings made in the tool prior to modification can be attributed to insufficient feeding
during solidification. In HPDC the infiltration tool was not optimized in terms of directional
solidification and similar feeding defects were observed. Typical defects of this type are
shown in the macrostructures of AODY30IS in Figure 4.71 where the porosity was
concentrated in the centre. It is interesting to note that, when using similar processing
conditions, the AOPC20 preform gave a lower porosity in the MMC but large pores on top of
it (Figure 4.71) but compressed significantly more (22%) than AODY30 (3%). The
compression in AOPC20IS was at the expense of the larger pores, as shown exemplarily in
Figure 4.72 b) and c). The absence of porosity in the MMCs produced with the optimized
SQC tool, as well as in the AOPC20IS infiltrated in HPDC, is evidence that the gas in the
preform does not influence the infiltration results. Infiltration occurs from the top and the four
outer faces, forcing the air out of the preform through the bottom face.
193
Even though air is forced out of the preform, oxygen was consumed during infiltration due to
the high oxygen affinity of liquid Al and its alloys. When liquid Al is exposed to air, oxygen
is consumed to a large extent before nitrogen (8). Cappleman et al. (116) reported that due to the
kinetics of aluminium oxide formation a reaction leading to an alumina monolayer can keep
pace with a superficial velocity v0 up to 10-2 to 101־ m/s in Saffil™ fibre preform infiltration
with Al melts. In the present infiltration experiments v0 varied between 2·10-2 m/s and
1.44 m/s (Table 3.8) for DSQC and for the maximum velocity in ISQC, respectively.
Therefore oxide film formation on a newly formed melt surface seems probable during
DSQC. In contrast, at higher infiltration velocities, pure metal surfaces have to be assumed,
leading to oxide-free reinforcement contact. Therefore, for high infiltration velocities, a
separation layer between the reinforcement and the metal matrix is prevented, shown
schematically in Figure 2.17. This seems favourable in terms of interfacial bonding and the
resulting mechanical properties (31). Nevertheless, the present work concentrated on the
evaluation of mechanical properties of the MMCs produced in DSQC as the ISQC-infiltrated
MMCs were not free of infiltration defects.
The threshold velocities proposed by Cappleman (116) were based on Saffil™ fibre preforms.
The reinforcement morphologies in the present investigations were different and therefore a
simple calculation accounting for this was developed. Assuming that the die cavity was sealed
from the outer atmosphere, oxygen for Al oxidation is only supplied from inside the preform.
Assuming complete consumption of oxygen, coverage of at least a monolayer of aluminium
oxide between the reinforcing phase and the metal is reached when the specific area per unit
preform volume of newly formed aluminium oxide Sml is larger than the specific inner surface
per preform volume SpHg (Table 4.2):
pHgml SS > Equation 47
194
The area Sml was derived using data for the standard atmosphere at a given processing
temperature of 800°C (ρT,air, vf,O2) the molar mass fractions of oxygen in alumina
(3MO/MAl2O3), its density (ρAl2O3) and the nominal thickness of a monolayer of Al2O3 (dml) as:
OOAlml
f,OT,airtotOAlml Mρd
v ρΦMS
332
232= Equation 48
The O2 volume fraction of the standard atmosphere vf,O2 is reported as 0.2095 and the density
of air ρT,air at 800°C as 348 g/m³ (160). The mean pore volume fraction Φtot of the preforms
was 0.65. Using the density of Al2O3 in Table 3.3, neglecting probable differences in Al2O3
allotropy which was reported (6) to consist of amorphous γ-alumina rather than of α-alumina
immediately after reaction, and assuming a monolayer thickness of dml of 8·10-8 m (116), the
monolayer would cover an area of 3.2·104 m² per m³ of preform. When comparing this value
with the SpHg values of the preforms in the target volume content range presented in Table 4.2,
which were between 1.05·106 m²/m³ (MOPC20) and 6.5·106 m²/m³ (FATOIS), it is obvious
that these are more than two orders of magnitude larger. Based on these calculations, less than
3% of the newly formed liquid surface was oxidized with a monolayer of alumina and further
kinetic calculations were discarded. The ratio gets even lower when the air is expelled from
the preform during infiltration, as was obviously the case in the present preform infiltration
experiments. Therefore the predominant melt fraction had a non-oxidized contact with the
reinforcing phase. Nevertheless the residual air fraction inside the preform, consisting
predominantly of nitrogen, may be consumed by the melt to form AlN. Zheng and Reddy (8)
proposed that AlN formation does not start until the oxygen partial pressure is reduced to
10-17 Pa. This low value may not be reached in relatively fast infiltration and it is proposed
that nitride reactions are absent.

195
In summary, the large surface area of the particulate preforms is favourable in terms of clean
aluminium melt surfaces and hence pure Al-reinforcement interfaces are formed, resulting in
improved interfacial bonding and improved composite properties. This statement is probably
valid for inert systems such as AOPC20IS fabrication and may be the main factor leading to
its significantly higher strength compared to Saffil™ fibre-reinforced MMCs: AOPC20IS
showed a σ0 value of 443 MPa (Figure 4.79 b) whereas Saffil™ fibre-reinforced MMCs,
which were limited to a maximum ceramic volume fraction of 0.20 to 0.25, showed a
maximum tensile strength of 295 MPa (Table 2.1). The lower value may further be attributed
to the silicate binder obligatory in Saffil™ preform fabrication which is, as shown in Figure
2.13, distributed all along the fibre-matrix interface, leading to a brittle silicate interfacial
phase preventing pure metal Al-Al2O3(f) contact during infiltration. Further, the binder is
concentrated in the contact areas between the single fibres. Therefore the load transfer at the
contact points is restricted to the silicate binder. This configuration led to brittle failure of the
contact point and deterioration of the reinforcing network when the composite was extended.
Porosity of less than 3% by volume in a MMC significantly influences its strength. When
comparing the local strength of MMC before and after optimisation of the thermal conditions
of the infiltration tool presented in Figure 4.76, the strength was lowered by 100 MPa to
300 MPa due to the pores. An example of the microstructure is shown in Figure 4.77 a) where
metal filled the interparticle cavities but not the larger pores of the initial preform. Under
constant pressure infiltration at two different pressures, the large pores were filled prior to the
smaller ones as shown in Figure 4.43 a) and b). As similar behaviour was assumed under
DSQC, the porosity in the MMC has to be attributed to a post-infiltration effect i.e. shrinkage
of the metal during solidification. This is supported by the fact that the porosity was found in
the centre of the MMC. This position represented the hot spot of the originally fully-infiltrated
preform. The solidification started on the die walls and progressed toward the centre of the
196
MMC. Due to the solidification shrinkage, the melt extruded toward the direction of the
advancing solidification front, toward the outer areas of the MMC. The larger pore extrusion
phenomenon is in conflict with Washburn´s equation which is the basis of the mercury
porosimetry (Equation 21) and valid for non-wetting fluids in a porous network. According to
this, extrusion of the fluid would start from the smallest pores. If wetting occurs, the fluid is
retained in both the small and the large cavities. Nevertheless, non-wetting of the investigated
systems was demonstrated in the sessile drop experiments (Figure 4.6) as well in a
spontaneous infiltration test of a metal droplet on a preform sample, where no intrusions were
achieved during 30 min holding. In all experiments, wetting angles were larger than 90°.
Premature solidification of the metal phase in the small pores may be further assumed. Even
though a large surface area is offered to the melt in the intragranular region enabling easy
nucleation, the temperature gradient between the melt in the large pore channels and the
ceramics does not differ significantly. This inhibits the formation of nuclei on the surface of
the ceramics and therefore prevents premature solidification in the intragranular region.
The effect of hysteresis reported in the mercury intrusion (-extrusion) porosimetry (MIP)
literature (110) seems applicable to the aforementioned extrusion. The hysteresis term in MIP
describes the difference in the intrusion and extrusion curves shown in Figure 4.25 for the AO
and AOPC20 preforms. Leon (110) attributed the effect mainly to the structural hysteresis
characterised by the presence of bottle-neck shaped pores. The latter is characterised by the
intragranular region in Figure 4.60 a) and b). The AOPC20IS and TOPC10IS MMCs had
bottle-neck porosity which hinders extrusion of the melt out of the intragranular areas.
Therefore the hysteresis is most likely to result in the large pore extrusion phenomenon.
Some residual porosity was found in the ceramic struts of AODY30IS (Figure 4.58). To
produce fully-infiltrated MMCs, the melt had to enter all pores during infiltration which is

197
fulfilled when the total porosity Φtot is equal to the open cell porosity Φop. As summarized in
Table 4.1, the differences between Φtot and Φop (the closed cell porosities Φc) were in the
range of 0.2 to 2.0% for the preforms fabricated with pore forming agent (PFA) and measured
using the an method based on the Archimedes´ principle (159). The lower value was for
AOPC20 and the highest for AGPC15. The latter was sintered at relatively low temperatures
(1000°C) using a glassy frit. As AOPC20 was fabricated using similar powder without a frit,
the porosity of AGPC15 may be attributed to the closed cell pore formation during sintering.
No reactions were found between the frit and alumina, which would lead to inaccuracies in
bulk density and therefore unreliable porosity parameter calculations. However, the 2%
measured closed porosity was not found in the microstructure of the MMCs. This may be a
result of the fuzzy appearance of the reinforcing phase caused by the transparency of the
glassy frit. Alternatively, the porosity may have become closed during the metal infiltration.
Due to the fact that the MMC strength of AGPC15IS was higher than that of AOPC20IS and
that residual porosity has a detrimental effect on strength (exemplified by TOPC10IS in
Figure 4.77) closure of the residual porosity during infiltration has to be assumed. This is
supported by the fact that the frit softens at the preform preheating temperature (154) (800°C),
leading to plastic deformation of the preform. The high compression of AGPC15IS during
DSQC (Table 4.8) supports this hypothesis.
The Φc values were not confirmed by mercury intrusion porosimetry (MIP - section 4.6.2 -
Table 4.2). In identical preforms, the difference between total porosity, Φtot , and intruded
porosity, ΦHg , which is assumed to represent the closed cell porosity, was significantly higher,
between 4 and 9%. The maximum error in the measured intrusion volume was less
than 1% (153). According to Rootare and Prenzlow (109), the difference between the two values
resulted from the compression of the preform samples during mercury intrusion

198
measurements which resulted in a lower apparent total porosity. The amount of compression
is reported to correlate with the strength of the test sample (109). This corresponds to the
differences between Φtot and ΦHg. For example, Φtot-ΦHg was 9% in TOPC10 compared to 0%
for TO which was produced without PFA (Table 4.2). TO had a ceramic volume content of
56% compared to 38% in TOPC10 (38%). The strength of TO was correspondingly higher
than that of TOPC10 but was not evaluated in the present work. Beyer (53) reported the
bending strength of a titania preform similar to TO to be 27.7±2.3 MPa compared to a value
of 1.1 MPa found for TOPC10.
The foamed preform AODY30 exhibited a relatively high compression strength of 245 MPa
which was 35 times higher than that of FATO and 220 times higher than that of TOPC10
(Figure 4.33). Therefore, in a similar way to TO, a minor difference between Φtot and ΦHg
should have been found. However, 1% difference was measured, which has to be attributed to
closed cell porosity and not to preform compression. It is therefore concluded that MIP is not
a suitable method to determine closed cell porosity as the difference between Φtot and ΦHg is
an effect of both preform compression and effective closed cell porosity and could not be
attributed to individual parameters.
5.1.4 Influence of the ceramic structure
As reported by Legzdins et al. (41), brittle interfacial phases are detrimental to elastic and
plastic properties of the composite. It has been shown (Figure 4.60 a) that a non-contaminated
interface between the matrix and the reinforcing phase was achieved with the non-reactive
preform AOPC20. Nevertheless, it has also been shown that silicate binder additions in
similar volume fractions as those used in Saffil™ fibre preforms did not have a detrimental
influence on composite properties in particulate preforms. On the contrary, the higher σ0
values of AGPC15IS compared to AOPC20IS indicated an improved microstructure. This is

199
attributed to the finer reinforcement size of AGPC15IS compared to AOPC20IS, as shown by
comparing Figure 4.54 a) and c). In the AOPC20 preform, the alumina particles were sintered
at higher temperatures leading to coarser ceramic grains, whereas the liquid phase sintering at
lower temperatures (1000°C) preserved the initial grain size in AGPC15.
In general a small interparticle spacing is regarded as the main factor for improved
mechanical properties. This is supported by comparing AOPC20IS to AODY30IS which have
a similar chemical composition. The metal ligaments in AODY30IS were up to 300 µm long
compared to less than 40 µm in the intergranular regions and less than 3 µm in the
intragranular regions of AOPC20IS. For the latter composite, the strength and fracture
toughness were more than 7 and 3 times higher respectively. The relatively low mechanical
properties of MOPC20IS were a result of its coarser ceramic structure (Figure 4.56 a) which
may be improved in the future by lowering the preform sintering temperature. The latter
preform type offers a unique possibility to influence the grain size of the ceramics, which is
discussed in section 5.2.2.
The bend test and SEVNB bars measured 3 mm wide and 4 mm thick. The micrograph of
AODY30 in Figure 4.58 indicates that the bubble diameters were up to 300 µm and the strut
thickness between two single bubbles around 40 µm. Therefore, in the worst case of an
agglomeration of larger bubbles in the stressed region, just 6 bubbles and struts were loaded
on the tensile area of the beam sample, which makes the validity of the results questionable.
Therefore, testing samples of larger volume would be preferable. Nevertheless, the Weibull
modulus of 13 indicates a medium scatter in properties and therefore the results are
sufficiently reliable for the present comparative study.
200
5.1.5 Influence of reactions
No reactions were found in the microstructure of MOPC20IS when infiltrated (Figure 4.60 c)
and after thermal analysis (Figure 4.64 b). In contrast, the titania-reinforced MMCs showed
reactions in both the as-cast and the heat treated states, but with different amounts of reaction
products. After DSQC infiltration with IS, a 50- 100 nm thick reaction layer was visible
(Figure 4.60 c) whereas, when using the alloy IM in the reaction, the central area of the MMC
(Figure 4.65 b) reached thermodynamic equilibrium similar to that obtained after the thermal
analysis (Figure 4.63 a). As the oxidation of the melt surface was far from complete in the
present preform configurations, the difference in reaction behaviour between IS and IM was
not a result of the differences in melt oxide layer chemistry, which was reported to be MgO in
IM-type alloys (11) and Al2O3 in IS (6). It was attributed to the reactivity between the Mg in the
alloy and the TiO2 of the preform. In the centre, the exothermic reaction released sufficient
energy to maintain the reaction whereas, in the outer areas, the heat flow towards the die walls
prevented a temperature rise, leaving unreacted areas. This shows that the preform
technology, coupled with fast infiltration methods, enables the combination of phases far from
equilibrium which would not be achievable by techniques where the reinforcement is in
prolonged contact with the liquid alloy like gas pressure infiltration of the reinforcement,
where contact times of more than 100 s are required (103,132).
The elastic modulus Edyn of TOPC10IS, which was higher than the predicted upper bound
shown in Figure 5.2, was a further result of the reaction between TiO2 and Al, with a brittle
interfacial phase exhibiting a higher Edyn than the unreacted constituents (53). The metal
ligaments in TOPC10IS were finer than those in AOPC20IS, yet its strength was lower. This
is attributed to the reaction layer which consisted of TiAl3, titanium suboxides (TixOy) and
reaction-formed Al2O3 (53,94). This reaction layer reduced the strength and fracture toughness
due to brittle failure of the interface, as shown in Figure 4.81. In the case of fully-reacted
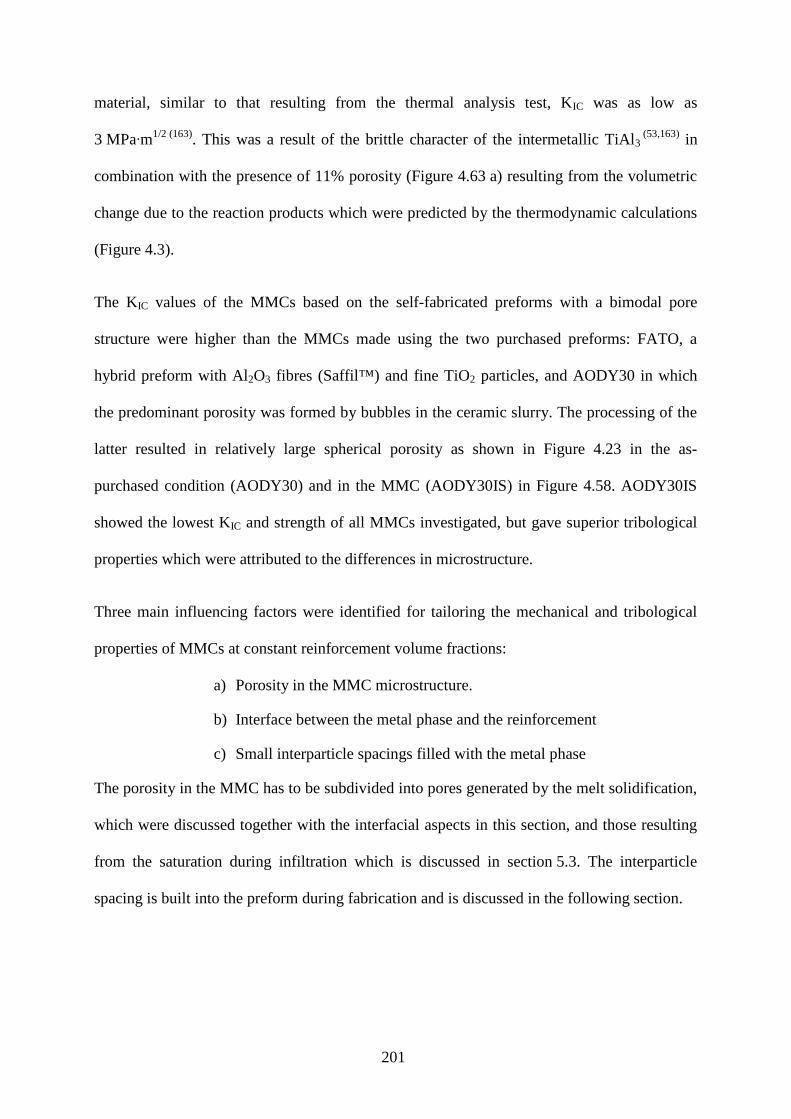
201
material, similar to that resulting from the thermal analysis test, KIC was as low as
3 MPa·m1/2 (163). This was a result of the brittle character of the intermetallic TiAl3 (53,163) in
combination with the presence of 11% porosity (Figure 4.63 a) resulting from the volumetric
change due to the reaction products which were predicted by the thermodynamic calculations
(Figure 4.3).
The KIC values of the MMCs based on the self-fabricated preforms with a bimodal pore
structure were higher than the MMCs made using the two purchased preforms: FATO, a
hybrid preform with Al2O3 fibres (Saffil™) and fine TiO2 particles, and AODY30 in which
the predominant porosity was formed by bubbles in the ceramic slurry. The processing of the
latter resulted in relatively large spherical porosity as shown in Figure 4.23 in the as-
purchased condition (AODY30) and in the MMC (AODY30IS) in Figure 4.58. AODY30IS
showed the lowest KIC and strength of all MMCs investigated, but gave superior tribological
properties which were attributed to the differences in microstructure.
Three main influencing factors were identified for tailoring the mechanical and tribological
properties of MMCs at constant reinforcement volume fractions:
a) Porosity in the MMC microstructure.
b) Interface between the metal phase and the reinforcement
c) Small interparticle spacings filled with the metal phase
The porosity in the MMC has to be subdivided into pores generated by the melt solidification,
which were discussed together with the interfacial aspects in this section, and those resulting
from the saturation during infiltration which is discussed in section 5.3. The interparticle
spacing is built into the preform during fabrication and is discussed in the following section.
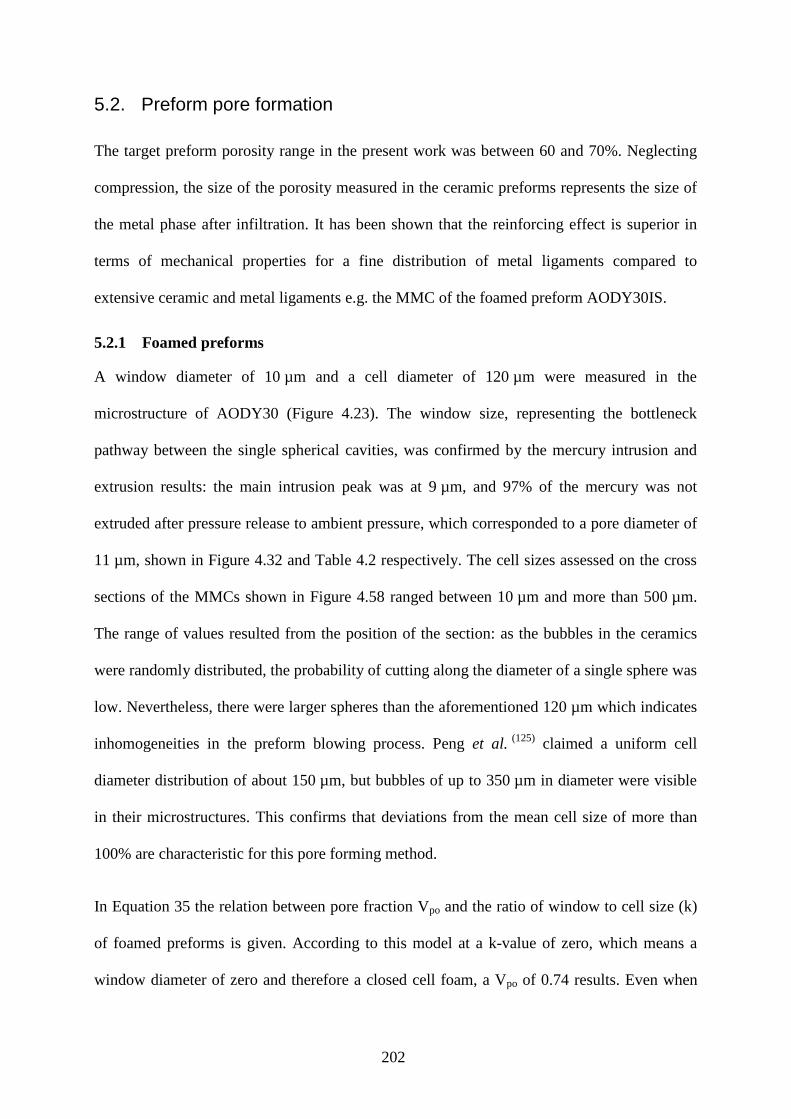
202
5.2. Preform pore formation
The target preform porosity range in the present work was between 60 and 70%. Neglecting
compression, the size of the porosity measured in the ceramic preforms represents the size of
the metal phase after infiltration. It has been shown that the reinforcing effect is superior in
terms of mechanical properties for a fine distribution of metal ligaments compared to
extensive ceramic and metal ligaments e.g. the MMC of the foamed preform AODY30IS.
5.2.1 Foamed preforms
A window diameter of 10 µm and a cell diameter of 120 µm were measured in the
microstructure of AODY30 (Figure 4.23). The window size, representing the bottleneck
pathway between the single spherical cavities, was confirmed by the mercury intrusion and
extrusion results: the main intrusion peak was at 9 µm, and 97% of the mercury was not
extruded after pressure release to ambient pressure, which corresponded to a pore diameter of
11 µm, shown in Figure 4.32 and Table 4.2 respectively. The cell sizes assessed on the cross
sections of the MMCs shown in Figure 4.58 ranged between 10 µm and more than 500 µm.
The range of values resulted from the position of the section: as the bubbles in the ceramics
were randomly distributed, the probability of cutting along the diameter of a single sphere was
low. Nevertheless, there were larger spheres than the aforementioned 120 µm which indicates
inhomogeneities in the preform blowing process. Peng et al. (125) claimed a uniform cell
diameter distribution of about 150 µm, but bubbles of up to 350 µm in diameter were visible
in their microstructures. This confirms that deviations from the mean cell size of more than
100% are characteristic for this pore forming method.
In Equation 35 the relation between pore fraction Vpo and the ratio of window to cell size (k)
of foamed preforms is given. According to this model at a k-value of zero, which means a
window diameter of zero and therefore a closed cell foam, a Vpo of 0.74 results. Even when
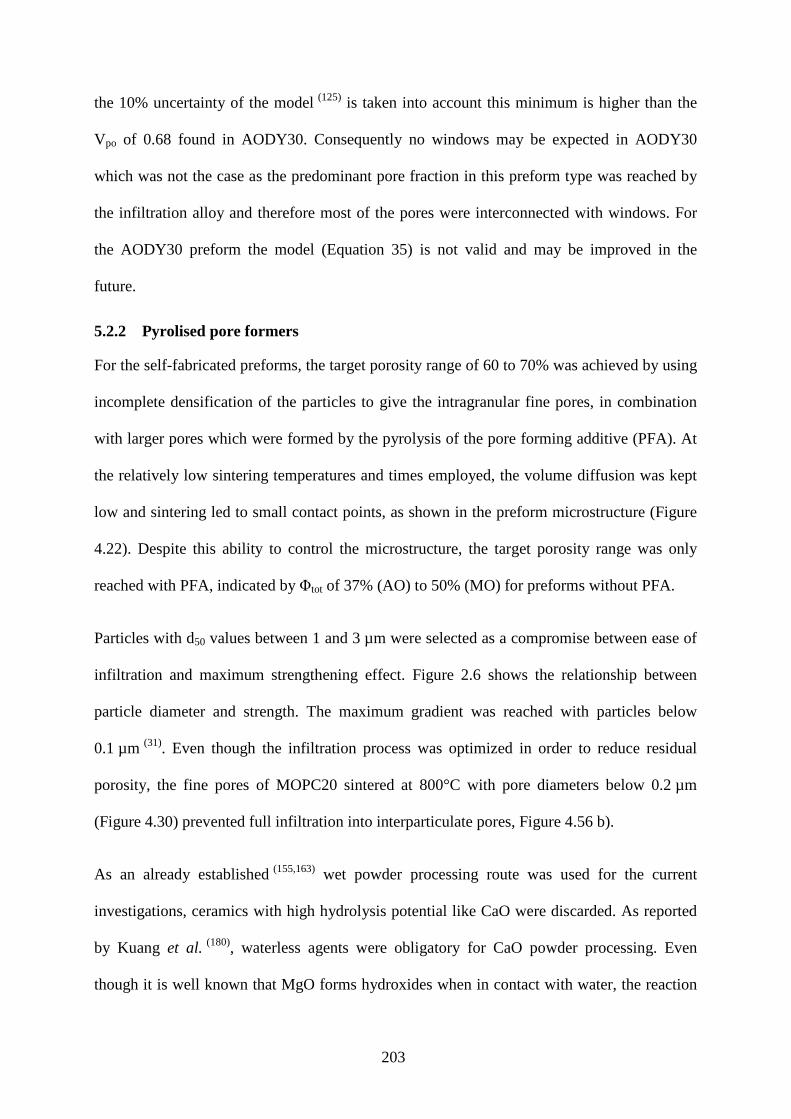
203
the 10% uncertainty of the model (125) is taken into account this minimum is higher than the
Vpo of 0.68 found in AODY30. Consequently no windows may be expected in AODY30
which was not the case as the predominant pore fraction in this preform type was reached by
the infiltration alloy and therefore most of the pores were interconnected with windows. For
the AODY30 preform the model (Equation 35) is not valid and may be improved in the
future.
5.2.2 Pyrolised pore formers
For the self-fabricated preforms, the target porosity range of 60 to 70% was achieved by using
incomplete densification of the particles to give the intragranular fine pores, in combination
with larger pores which were formed by the pyrolysis of the pore forming additive (PFA). At
the relatively low sintering temperatures and times employed, the volume diffusion was kept
low and sintering led to small contact points, as shown in the preform microstructure (Figure
4.22). Despite this ability to control the microstructure, the target porosity range was only
reached with PFA, indicated by Φtot of 37% (AO) to 50% (MO) for preforms without PFA.
Particles with d50 values between 1 and 3 µm were selected as a compromise between ease of
infiltration and maximum strengthening effect. Figure 2.6 shows the relationship between
particle diameter and strength. The maximum gradient was reached with particles below
0.1 µm (31). Even though the infiltration process was optimized in order to reduce residual
porosity, the fine pores of MOPC20 sintered at 800°C with pore diameters below 0.2 µm
(Figure 4.30) prevented full infiltration into interparticulate pores, Figure 4.56 b).
As an already established (155,163) wet powder processing route was used for the current
investigations, ceramics with high hydrolysis potential like CaO were discarded. As reported
by Kuang et al. (180), waterless agents were obligatory for CaO powder processing. Even
though it is well known that MgO forms hydroxides when in contact with water, the reaction
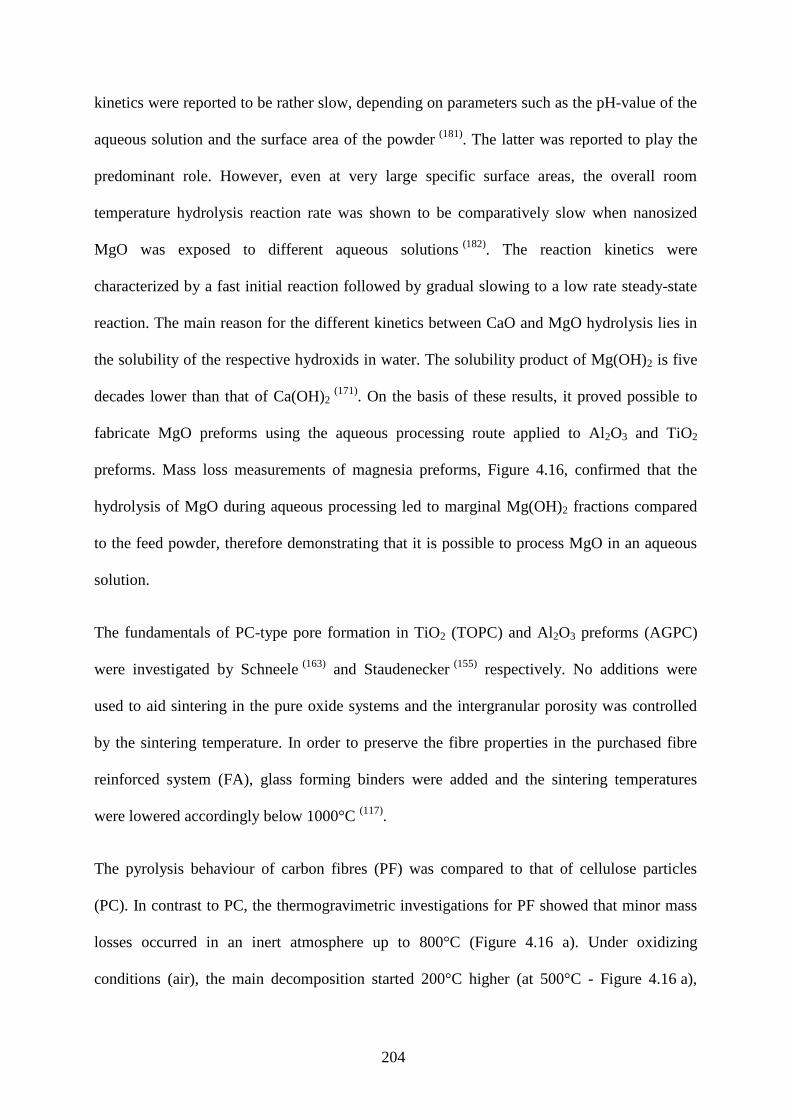
204
kinetics were reported to be rather slow, depending on parameters such as the pH-value of the
aqueous solution and the surface area of the powder (181). The latter was reported to play the
predominant role. However, even at very large specific surface areas, the overall room
temperature hydrolysis reaction rate was shown to be comparatively slow when nanosized
MgO was exposed to different aqueous solutions (182). The reaction kinetics were
characterized by a fast initial reaction followed by gradual slowing to a low rate steady-state
reaction. The main reason for the different kinetics between CaO and MgO hydrolysis lies in
the solubility of the respective hydroxids in water. The solubility product of Mg(OH)2 is five
decades lower than that of Ca(OH)2 (171). On the basis of these results, it proved possible to
fabricate MgO preforms using the aqueous processing route applied to Al2O3 and TiO2
preforms. Mass loss measurements of magnesia preforms, Figure 4.16, confirmed that the
hydrolysis of MgO during aqueous processing led to marginal Mg(OH)2 fractions compared
to the feed powder, therefore demonstrating that it is possible to process MgO in an aqueous
solution.
The fundamentals of PC-type pore formation in TiO2 (TOPC) and Al2O3 preforms (AGPC)
were investigated by Schneele (163) and Staudenecker (155) respectively. No additions were
used to aid sintering in the pure oxide systems and the intergranular porosity was controlled
by the sintering temperature. In order to preserve the fibre properties in the purchased fibre
reinforced system (FA), glass forming binders were added and the sintering temperatures
were lowered accordingly below 1000°C (117).
The pyrolysis behaviour of carbon fibres (PF) was compared to that of cellulose particles
(PC). In contrast to PC, the thermogravimetric investigations for PF showed that minor mass
losses occurred in an inert atmosphere up to 800°C (Figure 4.16 a). Under oxidizing
conditions (air), the main decomposition started 200°C higher (at 500°C - Figure 4.16 a),
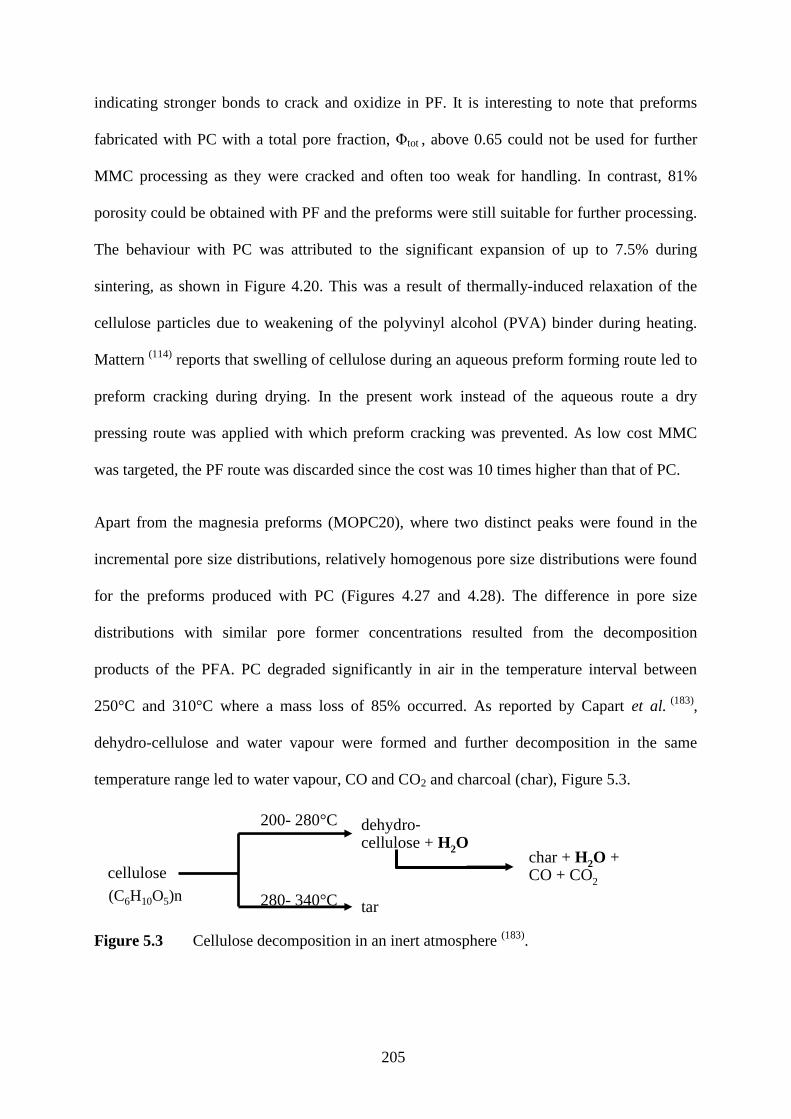
205
indicating stronger bonds to crack and oxidize in PF. It is interesting to note that preforms
fabricated with PC with a total pore fraction, Φtot , above 0.65 could not be used for further
MMC processing as they were cracked and often too weak for handling. In contrast, 81%
porosity could be obtained with PF and the preforms were still suitable for further processing.
The behaviour with PC was attributed to the significant expansion of up to 7.5% during
sintering, as shown in Figure 4.20. This was a result of thermally-induced relaxation of the
cellulose particles due to weakening of the polyvinyl alcohol (PVA) binder during heating.
Mattern (114) reports that swelling of cellulose during an aqueous preform forming route led to
preform cracking during drying. In the present work instead of the aqueous route a dry
pressing route was applied with which preform cracking was prevented. As low cost MMC
was targeted, the PF route was discarded since the cost was 10 times higher than that of PC.
Apart from the magnesia preforms (MOPC20), where two distinct peaks were found in the
incremental pore size distributions, relatively homogenous pore size distributions were found
for the preforms produced with PC (Figures 4.27 and 4.28). The difference in pore size
distributions with similar pore former concentrations resulted from the decomposition
products of the PFA. PC degraded significantly in air in the temperature interval between
250°C and 310°C where a mass loss of 85% occurred. As reported by Capart et al. (183),
dehydro-cellulose and water vapour were formed and further decomposition in the same
temperature range led to water vapour, CO and CO2 and charcoal (char), Figure 5.3.
Figure 5.3 Cellulose decomposition in an inert atmosphere (183).
cellulose
200- 280°C
280- 340°C
dehydroyo-cellulose + H2O
tar
char + H2O +CO + CO2
(C6H10O5)n
-
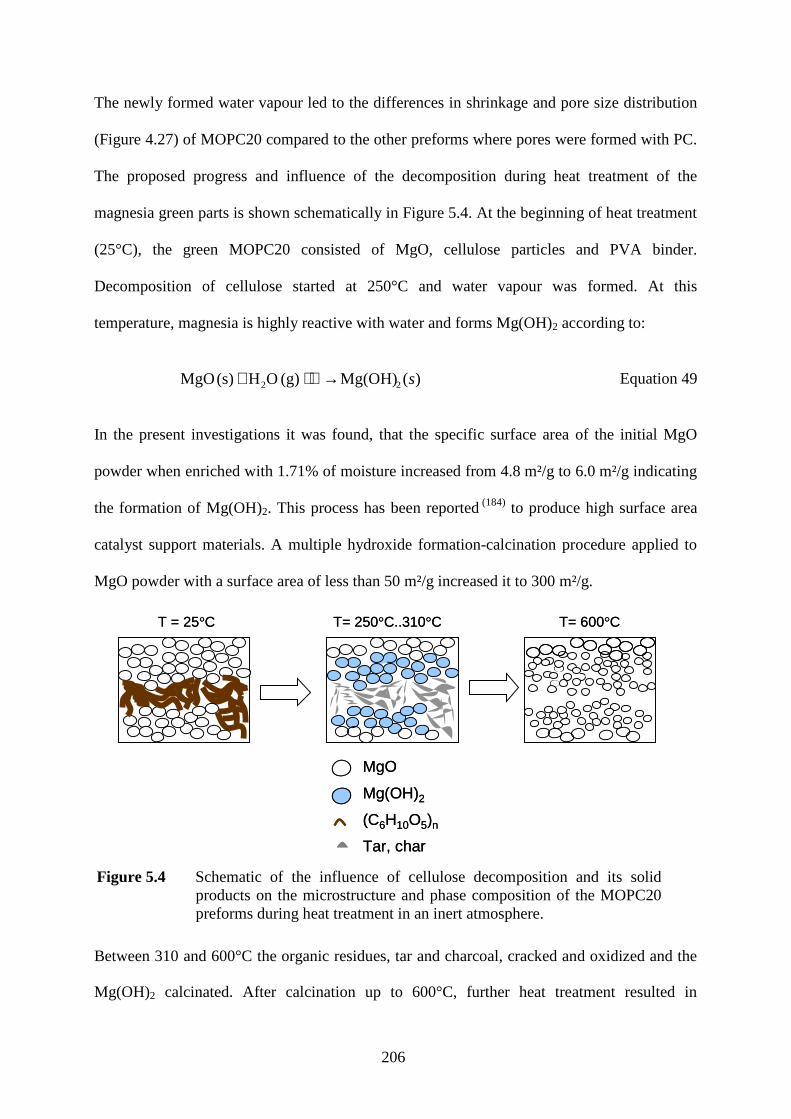
206
The newly formed water vapour led to the differences in shrinkage and pore size distribution
(Figure 4.27) of MOPC20 compared to the other preforms where pores were formed with PC.
The proposed progress and influence of the decomposition during heat treatment of the
magnesia green parts is shown schematically in Figure 5.4. At the beginning of heat treatment
(25°C), the green MOPC20 consisted of MgO, cellulose particles and PVA binder.
Decomposition of cellulose started at 250°C and water vapour was formed. At this
temperature, magnesia is highly reactive with water and forms Mg(OH)2 according to:
)(Mg(OH) (g) OH (s) MgO 22 s→+ Equation 49
In the present investigations it was found, that the specific surface area of the initial MgO
powder when enriched with 1.71% of moisture increased from 4.8 m²/g to 6.0 m²/g indicating
the formation of Mg(OH)2. This process has been reported (184) to produce high surface area
catalyst support materials. A multiple hydroxide formation-calcination procedure applied to
MgO powder with a surface area of less than 50 m²/g increased it to 300 m²/g.
T= 600°CT= 250°C..310°CT = 25°C T= 600°CT= 250°C..310°CT = 25°C
MgO
Mg(OH)2
(C6H10O5)n
Tar, char
MgO
Mg(OH)2
(C6H10O5)n
Tar, char Figure 5.4 Schematic of the influence of cellulose decomposition and its solid
products on the microstructure and phase composition of the MOPC20 preforms during heat treatment in an inert atmosphere.
Between 310 and 600°C the organic residues, tar and charcoal, cracked and oxidized and the
Mg(OH)2 calcinated. After calcination up to 600°C, further heat treatment resulted in

207
coarsening of the fine MgO, as indicated by a reduction in the SiHg at increased sintering
temperatures, Figure 4.31. The reason for the steep decrease from 3.78 m²/g to 0.70 m²/g
when the sintering temperature was increased from 1200 to 1300°C is unclear and may be
investigated in future.
The pore size distributions of the MOPC20 preforms sintered at 800°C and 1300°C in Figure
4.30 show a shift of the main peaks towards lower values and was attributed to the coarsening
of the ceramic particles and associated neck growth at higher sintering temperatures. It is
interesting to note that the large pore peak also shifts towards smaller pore sizes, as a result of
a reduction in the diameter of the PFA formed channels. Thus, there had to be a migration of
particles from the border toward the inside of the channel which was found in the
microstructure of the MMC in Figure 4.56 b). The migration was a result of the volume
increase as MgO reacted to Mg(OH)2 during the degradation of PC. The density of the oxide
is 3580 kg/m³ whereas that of the hydroxide is 2410 kg/m³ (160) which led to a volume increase
of 32.7%. The expansion was predominantly towards the cavity originally occupied by the
pore former. The particles remained in this arrangement after calcination. This was observed
in the MOPC20IS where the preform was sintered at 800°C (Figure 4.56 a). Sintering at
higher temperatures (e.g. 1300°C) led to coarsening of the particles due to volume diffusion.
Further migration from the PFA-formed cavity toward the intergranular regions occurred and
resulted in a shift of the large pore peak toward larger values.
5.3. Saturation of porous media
As shown in section 5.1, residual porosity is detrimental to the MMC properties. It is
therefore important to strive for full infiltration. A prerequisite for this is an open-cell
structure. In the preforms investigated in this thesis, the predominant fraction was accessible
to the fluid as the preforms had between 0.2 and 2.0% closed cell porosity.

208
In order to achieve minimum porosity during infiltration processing, the influencing factors
have to be known. During the constant pressure infiltration of SiC particle compacts, an
uneven infiltration front was found where larger pores were filled prior to the smaller
ones (103). Even though Darcy´s law is based on the saturated flow assumption, characterised
by a distinct infiltration front, Garcia-Cordovilla et al. (103) proposed it to be applicable to their
infiltration problem. Consequently, their modelling accuracy was rather poor. Dopler et
al. (113) also found unsaturated flow in Saffil™ fibre infiltration and reported that the dynamic
variable saturated flow infiltration of Saffil™ fibre preforms could be modelled accurately
using the saturation relation developed by van Genuchten (115) (Equation 29) which originated
from soil sciences.
Evidence of unsaturated flow was found in the preforms of the present investigation. This was
indicated in the saturation profiles of the constant pressure infiltrated AOPC20 preforms,
where a saturation gradient was visible (Figure 4.43). This was further supported by the shape
of the infiltration curves obtained in constant flux infiltration in the DSQC mode, shown for
IS infiltration in Figure 4.48. The non-linearity at higher saturations indicates Darcy´s law is
not fulfilled.
Table 5.1 Preform parameters of FA24 (105), AOPC20 and TOPC10 relevant for preform infiltration modelling..
FA24(105) AOPC20 TOPC10
Preform porosity Фtot 0.76 0.65 0.62
Specific permeability KSI 10-14·m² 96 23.7 13.1
Threshold pressure P0 106·Pa 0.25 0.72 2.02
Shape factor α 10-6·Pa-1 21 2.25 1.25
In order to solve Equation 29 for the present preforms, Φtot , P0 and the shape factor α have to
be known. The parameters were evaluated (Table 5.1) for AOPC20 and TOPC10 using their

209
characteristic DSQC infiltration curves, Figure 4.47. As a reference, data for a Saffil™ fibre
preform with 0.24 of ceramic volume fraction (FA24) were taken from Mortensen et al. (105).
With the latter values, Dopler et al. (113) successfully validated the unsaturated flow model.
Figure 5.5 shows the graphs of the calculated saturation function (Equation 29) between P0
and 100 MPa. By definition, P has to be larger than P0. Complete saturation (S=1) may never
be reached in preform infiltration whereas, in the saturated flow assumed in Darcy´s model, it
is by definition fully saturated behind and unsaturated in front of the infiltration front.
10-1 100 101 1020.00
0.10
0.20
0.80
0.85
0.90
0.95
1.00
Saffil FA24
AOPC20
TOPC10
Sat
urat
ion
(S)
Pressure P (MPa)Pressure P /MPa
Sat
urat
ion
S
Figure 5.5 Saturation S as a function of the applied pressure P, plotted using Equation 29 with parameters of FA24 (105) , AOPC20 and TOPC10 presented in Table 5.1.
FA24 showed a saturation of 0.99 at about 1 MPa whereas the same saturation in AOPC20
was reached at 10 MPa and in TOPC10 at 20 MPa. This was the result of the lower P0 and
higher shape factor α of FA24. In terms of technical applications, the fibre preform may be
infiltrated with relatively high saturation in the constant pressure gas pressure infiltration
(GPI) mode, whereas residual porosity has to be expected for AOPC20 and TOPC10 since the
maximum pressure of GPI is usually maintained below 15 MPa for safety reasons. Therefore,
infiltration methods with higher final pressures had to be used for the particulate preforms in
210
the present work. These pressures were delivered by plunger driven melt pressurisation such
as in squeeze (SQC) and high pressure die casting (HPDC) techniques which are constant flux
methods to a first approximation. The unsaturated flow model of Dopler et al. (113) originated
from water flow modelling in water reservoirs having a permeable soil base and were based
on a constant pressure mode. An adaption of the model to the constant flux mode is discussed
in the following section and validated with experimental preform infiltration results.
5.4. Modelling of fluid flow in preform infiltration
As reviewed by van Dam (185), Richards’ equation (Equation 30) has been predominantly used
in hydrogeology to model unsaturated dynamic water flow in soils but was recently adapted to
dynamic preform infiltration in the constant pressure (CP) mode by Dopler et al. (113). In
collaboration work with Pokora (186) and based on these two publications, a simple numerical
modelling tool has been derived and additionally an impermeable wall and the constant flux
mode have been introduced. In order to solve Equation 30, the model parameters have to be
evaluated experimentally, which is the main contribution of the author. The parameters were:
the saturation specific parameters P0 and α, the geometrical parameters such as preform
thickness and ceramic volume fraction (1−Φtot), and the relative and specific permeabilities Kr
and Ks. The dynamic fluid viscosity µ of the melt was set to 1.15·10-3 Pa·s for all calculations,
in accordance to Dopler et al. (113). In the following section, the factors influencing the
threshold pressure of infiltration P0, such as the wetting behaviour, and the specific
permeability Ks are considered and the implication of their use in the calculations.
Subsequently, the model is presented and its applicability is validated.
5.4.1. Reactivity of the metal-ceramic systems
Several research groups (71,87,88,103) have proposed that reactivity between the fluid and the
porous medium enhances wetting by reducing the wetting angle θ which, in accordance to
211
Equation 20, reduces P0. However, Beyer (53) and Mattern (114) proposed complete non-wetting
conditions (cosθ = -1) in TiO2 and Al2O3 preform infiltration with Al alloys.
The ∆G value in the systems at any given temperature and concentration is a measure of
reactivity. The temperature dependencies of the standard free energies of formation ∆G0 of
metal-metal oxide systems of the Me-MexOy type are usually presented in form of Ellingham-
Richardson-Jeffes diagram (89), of which an extract was given in Figure 2.11. At constant
temperature, oxides of Me-MexOy systems with higher ∆G0 values than that of Al-Al2O3 are
reduced by Al and therefore represent reactive systems. This is the case for the Si-SiO2, Ti-
TiO2 and Ti-TixOy, which are rated as reactive, in contrast to Al-MgO and Al-CaO whose
curves are below that of Al-Al2O3 and therefore no reaction with Al is expected. Experimental
results reported by Niu et al. (187) did not confirm the passivity of the Al-CaO system at
elevated temperatures. Here a CaO coating was dissolved partially by liquid Al, due to the
formation of AlCa2 intermetallics. Therefore statements about the non-reactivity of a given
metal - oxide ceramic system based on the position of the curve in Ellingham-Richardson-
Jeffes diagram are not sufficient for a full classification of the system.
Numerical thermodynamic modelling was considered to be a more accurate tool to classify
reactive systems. Using metal and ceramic data bases, the modelling of metal-ceramic
reactions with the FACTSAGE software led to accurate results for the Al-TiO2 system (94). In
the present work, this code was used to calculate the systems (section 4.1.1). For Al-CaO the
phases found in the experiments (187) were confirmed to be the most stable phases, Figure 4.2.
Further, the reactivity of the system was confirmed, indicated by a negative ∆G, Figure 4.1.
As shown in the thermodynamic calculations and reported by others (7,77), the Al-Al2O3
system is assumed to be non-reactive at temperatures below 800°C which are used for
preform infiltration. Similarly, Al-ZrO2 and Al-Y2O3 were identified as non-reactive,
212
indicated by zero values of the free energy of formation ∆G, Figure 4.1. Only the Al-Al2O3
was taken as a reference non-reactive system and the other non-reactive systems (Al-Y2O3,
Al -ZrO2) were not included in the present experiments.
It has been shown that the reduction of SiO2 with liquid Al can be used to synthesise Al(Si)-
Al 2O3 composites (77,23,101). The Si formed by reduction dissolved in the melt and subsequently
solidified to an Al-Si alloy matrix between the reaction-formed Al2O3. The pure Al-SiO2 was
not investigated due to the low mechanical performance of SiO2 (149), presumably resulting in
a low reinforcing effect of the resulting MMC. However, an alumina preform (AGPC15) with
silicate binder surfaces was investigated.
The thermodynamic calculations confirmed the high reactivity of the Al-TiO2 system. This
has been reported by others (53,155,163) aiming to synthesise ceramic-intermetallic composites
(CIC) consisting of reaction-formed Al2O3 in a TixAl y matrix. In contrast to the Al-SiO2
systems, reduction to metallic Ti was not observed experimentally. This conforms with the
thermodynamic calculations where TiO2 is partially reduced to form suboxides like TiO and
Ti2O3 in combination with the aluminides TiAl3 and TiAl, see section 4.1.1. Beyer (53) found
that the squeeze casting of an Al alloy into TiO2 preforms with a median grain size of 0.3 µm
resulted in strong exothermic reactions and temperature increases of up to 1300°C inside the
preform. Due to the drastic temperature increase, the viscosity and surface tension of the
alloy, whose temperature dependency is described by Equation 1, decreased significantly. As
a result of this heating, the die system could not be sealed by solidification and resulted in
hazardous spurting of the melt out of the tool. Thus, the processing of fine grain TiO2
preforms was considered to be uncontrollable. Beyer (53) also showed that macroscopic
reactions could be observed with TiO2 powders having a median grain size of 1 to
5 µm (155,163). A subsequent heat treatment up to 800°C with low heating rates led to consistent
213
composites comprising a Ti3Al matrix with embedded Al2O3 and Ti suboxides of the Ti2O3
and TiO type. In the present study, the resulting CIC composite was reproduced and this was
confirmed by differential thermal analysis on TOPC10IS composites (section 4.8.9).
In order to alter the reactivity of the ceramics in contact with molten Al, other oxide ceramics
were considered. The Al-MgO system exhibited low ∆G values, resulting from the reaction of
Al and MgO to the ternary spinel phase MgAl2O4 (Figure 4.2).
5.4.2. Static wetting
The sessile drop test was employed to investigate the influence of the substrate chemistry on
the static wetting behaviour of the Al-alloys (IM and IS) in contact with Al2O3 (AF),
TiO2 (TF) and MgO (MO). Fine grained powders and relatively high sintering temperatures
were used to produce substrates of maximum density. Residual porosity ranged between 1.9
and 4.9% (Table 4.1).
A vacuum furnace was used for the sessile drop test in which a minimum pressure of 10-3 Pa
could be achieved. The oxygen partial pressure pO2,calc in the sessile drop equipment was
estimated using FactSage thermodynamic software and input variables as close as possible to
the experimental set-up. Here residual oxygen was gettered using 100 g of Ti-sponge placed
directly on the heating coils whose energy input was controlled to give a substrate
temperature of 750°C. The furnace volume was 9 dm³ and was assumed to be completely
filled with the Ar flushing gas containing 1 volume part per million of oxygen. Calculations
were performed first taking into account Ti and the gas, second with the additional 2 g of Al
representing the alloy droplet and third with an additional 0.2 g of Mg, the alloying element in
IM. As the alloy had no contact with the Ti, the TixAl y and TixMgy phases were suppressed.
The calculated pO2,calc was 4.5·10-41 Pa for the first combination and 8.5·10-42 Pa for the
second and third variations. The latter similarity indicates that the Mg addition had no
214
influence on the pO2,calc. The lower value reported for Al indicates that Al oxidation takes
place prior to that of Ti. This may be the reason for the oxidation of a liquid alloy IS in sessile
drop tests prior to droplet formation. As proposed (83), oxidation may only be prevented with
metals such as Zr. The calculation also indicated that alumina is more stable than magnesia,
which further supports the reactivity of the Al-MgO system. Zhen et al. (76) reported the
maximum oxygen partial pressure to prevent oxidation of Al melts at 700°C to be 10-44 Pa.
This is lower than the calculated value of 8.5x10-42 Pa for the system with Al. However, as
oxide stability decreases at higher temperatures the value is plausible.
In contrast to the alloy IS (Al-12 wt.% Si), a droplet with a bright surface was formed (Figure
4.4) with the alloy IM (Al- 9 wt.% Mg) which was attributed to the different alloying element.
Anson et al. (19) reported a shell of Mg vapour surrounding liquid Al-Mg-Si alloys in high
vacuum experiments, which protected the melt from oxidation of Al. In the present
experiments it has to be assumed that oxidation of the metal droplet was prevented by
evaporation of Mg which led to a shielding atmosphere around the droplet and enabled the
formation of a droplet.
All systems were identified as non-wetting with no change in contact angle during the holding
period of 30 min. Sobczak et al. (80) found no decrease in wetting angle in the pure Al-Al2O3
system within this period. They found wetting angles of 120° to 123° which were
significantly smaller than those of 148° and 155° found for IM-Al2O3 in the present research.
The difference in wetting angle has to be attributed to the difference in the alloy chemistry
and pinning of the droplet´s triple line on the substrate by intrusions into the substrate´s
microporosity in combination with gravity-driven segregation of an iron rich phase. Figure
4.8 a) shows a micrograph of both phenomena.
215
The macroscopic wetting angle data indicate non-wetting behaviour and therefore
spontaneous infiltration into open pores is only possible by applying an external pressure. The
metallostatic pressure on the substrate due to the droplet height was calculated as 10-4 MPa.
By applying Washburn´s relation (Equation 21) in combination with the mean θst of 152° and
the surface tension γlv of the alloy IM of 0.871 N/m (19,20), the pressure required to fill a 2 µm
diameter pore was calculated to be 0.625 MPa. This is nearly 5 times higher than the
calculated metallostatic pressure. Despite this, some pore infiltration was observed and these
micro-intrusions must result from the wetting conditions on the micro-scale under the droplet.
In conclusion, the intrinsic wetting angle θintr has to be lower than 90° and therefore much
smaller than θst measured in the sessile drop test. Sobczak et al. (80) found the same behaviour
but at significantly higher process temperatures (>1000°C). Here evaporation of Al2O takes
place as a result of the high temperature (described by Equation 9). As a result, local rupture
of the oxide film at the microscopic asperities of the interface under the weight of the droplet
could facilitate the penetration of surface pores by the metal. This local loss of the oxide could
lower θintr at the pore/metal interface, thus allowing the metal to penetrate the pore under
conditions where the macroscopic θst based on the drop profile has a large obtuse value. The
enhanced wetting at lower temperatures (750°C) in the present experiments was a result of
evaporation of Mg which prevented oxidation of the droplet surface and therefore enhanced
wetting below the droplet.
In contrast to the micro-intrusions, segregation of the Fe-rich phase prevented movement of
the triple line. An example of the interface after the test is shown in Figure 4.9. No published
literature could be found for commercial casting alloy - ceramic wetting couples.
Flores et al. (145) published work on the purification of iron-contaminated Al alloys, stating
that the quarternary Al8FeMnSi2 intermetallic phase segregates to the melting furnace walls
216
during extended holding and acts as nuclei for further crystallization of Fe-rich phases,
resulting in a decrease of Fe in the liquid phase. Similarly, an Al-Fe-Mn-Si phase was found
on the substrate, Figure 4.9, which indicates that this phase solidified prior to the residual
droplet. As further indicated by the crack plane passing through the pure substrate, bonding
between the iron-rich phase and the substrate was stronger than the substrate´s tensile strength
which further supports adhesion forces between the Fe-rich phase and the substrate, resulting
in pinning of the droplet.
Taking into account the inaccuracy of angle measurement of ± 5°, similar wetting behaviour
was found when IM-AO was compared with the reactive systems IM-TO (TiO2) and IM-MO
(MgO). This has to be attributed to the segregation effect which prevents direct contact
between the substrate and the alloy.
In summary, in the sessile drop tests, Fe-rich intermetallics nucleated on Al2O3 and hindered
spreading of the droplet. Where the intermetallic layer was interrupted, the metal could
penetrate open porosity of the substrate. As a consequence, the measured θst did not represent
the wetting angle of an Al alloy melt on a ceramic substrate.
5.4.3. Dynamic wetting
Mortensen and Wong (121) stated that, even in optimised experimental conditions, the static
wetting angles were not able to describe wetting in dynamic preform infiltration and θst is not
equal to the dynamic wetting angle θdyn. Garcia-Cordovilla et al. (103) proposed a relation
between P0 and θdyn (Equation 20). In the present study the P0 values were determined from
the pressure-saturation curves in DSQC according their procedure and an example is shown in
Figure 4.48. In any given system, the bulk density of the ceramic phase ρp , the surface
tension of the infiltration alloy γlv, the ceramic phase volume fraction Vp and the specific
surface area Si were assumed to be constant during infiltration. Compression, which appeared
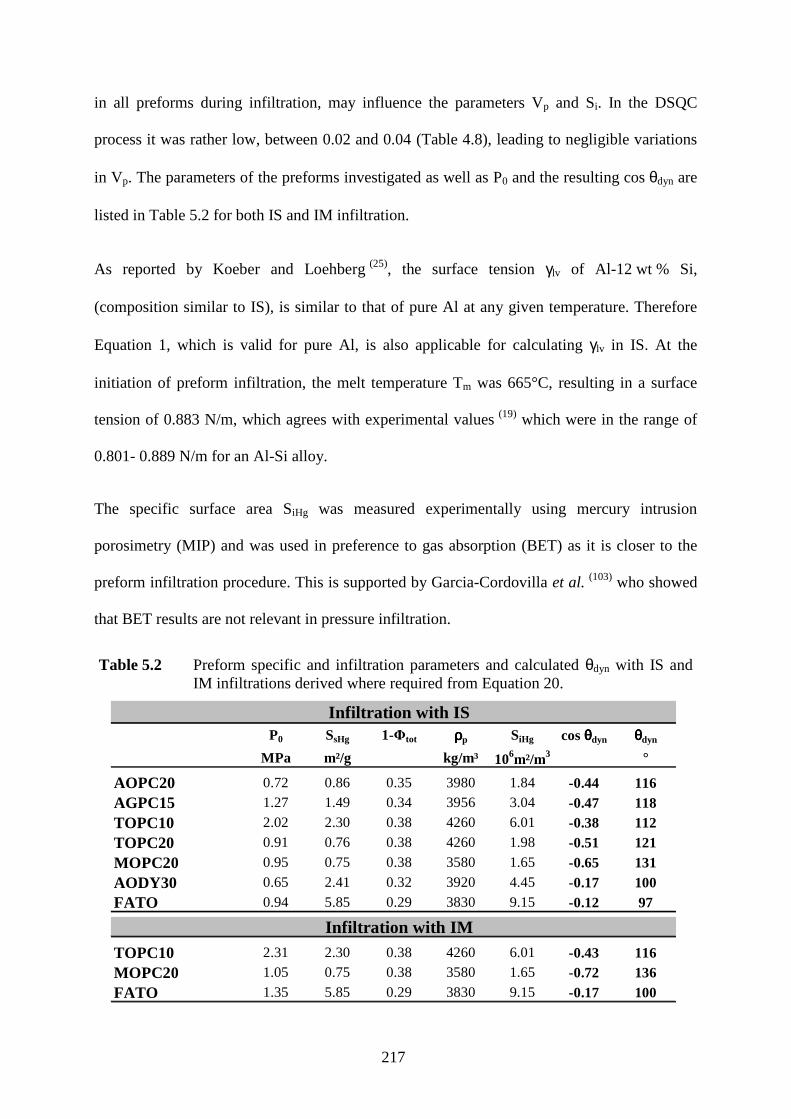
217
in all preforms during infiltration, may influence the parameters Vp and Si. In the DSQC
process it was rather low, between 0.02 and 0.04 (Table 4.8), leading to negligible variations
in Vp. The parameters of the preforms investigated as well as P0 and the resulting cos θdyn are
listed in Table 5.2 for both IS and IM infiltration.
As reported by Koeber and Loehberg (25), the surface tension γlv of Al-12 wt % Si,
(composition similar to IS), is similar to that of pure Al at any given temperature. Therefore
Equation 1, which is valid for pure Al, is also applicable for calculating γlv in IS. At the
initiation of preform infiltration, the melt temperature Tm was 665°C, resulting in a surface
tension of 0.883 N/m, which agrees with experimental values (19) which were in the range of
0.801- 0.889 N/m for an Al-Si alloy.
The specific surface area SiHg was measured experimentally using mercury intrusion
porosimetry (MIP) and was used in preference to gas absorption (BET) as it is closer to the
preform infiltration procedure. This is supported by Garcia-Cordovilla et al. (103) who showed
that BET results are not relevant in pressure infiltration.
Table 5.2 Preform specific and infiltration parameters and calculated θdyn with IS and IM infiltrations derived where required from Equation 20.
Infiltration with ISP0 SsHg 1-Φtot ρρρρp SiHg cos θθθθdyn θθθθdyn
MPa m²/g kg/m³ 106m²/m3 °
AOPC20 0.72 0.86 0.35 3980 1.84 -0.44 116AGPC15 1.27 1.49 0.34 3956 3.04 -0.47 118TOPC10 2.02 2.30 0.38 4260 6.01 -0.38 112TOPC20 0.91 0.76 0.38 4260 1.98 -0.51 121MOPC20 0.95 0.75 0.38 3580 1.65 -0.65 131AODY30 0.65 2.41 0.32 3920 4.45 -0.17 100FATO 0.94 5.85 0.29 3830 9.15 -0.12 97
Infiltration with IM
TOPC10 2.31 2.30 0.38 4260 6.01 -0.43 116MOPC20 1.05 0.75 0.38 3580 1.65 -0.72 136FATO 1.35 5.85 0.29 3830 9.15 -0.17 100
218
Compared to Hg, the Al melt may contain impurities or oxide films which are retained on the
preform in a similar manner to the effect of ceramic filters in the gating system of castings (6).
The pores of preforms are significantly smaller though and retention may block the entrances
to the pores. This effect was reported by Papworth and Fox (138) who observed delamination of
the metal phase on the top of the squeeze cast infiltrated MMC due to oxide film
agglomeration. In the present work, there was no evidence of this oxide layer retention effect
in the microstructural analysis of the interface (Figure 4.59) and therefore blocking effects
were discounted.
Preforms with PC did not have significant bimodality in their pore size distributions (Figure
4.27). This configuration was found suitable for dynamic wetting angle evaluation (103). With
a θdyn of 116°, the pure Al2O3 preform AOPC20 in contact with IS showed similar behaviour
to Al 2O3 with a silicate binder (AGPC15) which had a θdyn of 118°. Therefore, no significant
influence of the binder on θdyn was found.
For the study the binder content of AGPC15 was in the range of that used for Saffil™
preforms (118, 120). The θdyn values reported for pure Al into Saffil™ fibre preforms was in the
range of 102° to 111° (121) and therefore lower than that found for AGPC15 (118°). With
Saffil™ fibre preforms, a maximum ceramic volume fraction Vf of 0.25 is achievable which
is significantly less than the Vp of 0.35 of AGPC15. A trend of decreasing θdyn with lower Vf
was found (121). By a linear interpolation of their results in the θdyn(Vf) diagram to a Vf of 0.35,
a θdyn of 119° was found. Taking into account the scatter in θdyn, which was assessed as ± 3°
based on the scatter in P0 measurements of identical preforms, AGPC15 and Saffil™ fibre
preforms show similar θdyn.
219
The reactive preforms TOPC20 and MOPC20 infiltrated with alloy IS showed higher θdyn
than that found for AOPC20. In contrast, the TiO2 preform TOPC10 with identical chemical
composition but finer porosity and grains, showed lower θdyn than TOPC20. Reaction
products were only found in TOPC10IS as shown in Figure 4.60, which may explain this
variance. In contrast to Garcia-Cordvilla et al. (103) who stated that the reaction layer would
partially block the entrance and thereby increase P0 and θdyn, a lower θdyn was found in the
present investigations when a reaction layer was formed. This behaviour has to be attributed
to the aforementioned exothermic reaction and a resulting increase of the melt temperature,
possibly to 1300°C (53). Applying Equation 1 at this melt temperature, γlv is 0.650 N/m and
therefore 26% lower than at 665°C. The lower surface tension of the melt close to the ceramic
grain presumably acts as an lubricant, facilitating infiltration and leading to a lower θdyn than
observed in TOPC20, where no reactions were found.
Even though MOPC20 was rated as reactive, θdyn was significantly higher than in the AO-
type preforms. In contrast to the TiO2 preforms, no evidence of reaction products was found
in the infiltrated MMC microstructure (Figure 4.60 c) or post SDTA (Figure 4.63 b).
Therefore the predicted spinel phase MgAl2O4 was not formed which has to be attributed to its
kinetic inhibition (106,140). This agrees with Jonas et al. (106) who reported that Mg additions had
no significant influence for pressure infiltration of Al into Al2O3 preforms. However,
others (15,17,140) have proposed that MgAl2O4 formation is the key factor required to facilitate
infiltration of Mg-containing alloys in Al2O3. The present investigations concentrated on
AlMg alloy (IM) infiltrations into the reactive preforms TOPC10, FATO and MOPC20 as
here reactions were most probable. Similar to Jonas et al. (106), the change of the main alloying
element from Si (IS) to Mg (IM) showed only a marginal increase in θdyn of 3° to 5°. In
contrast to infiltration with IS, the reaction products Al2O3 and TiAl3 were formed in the TiO2
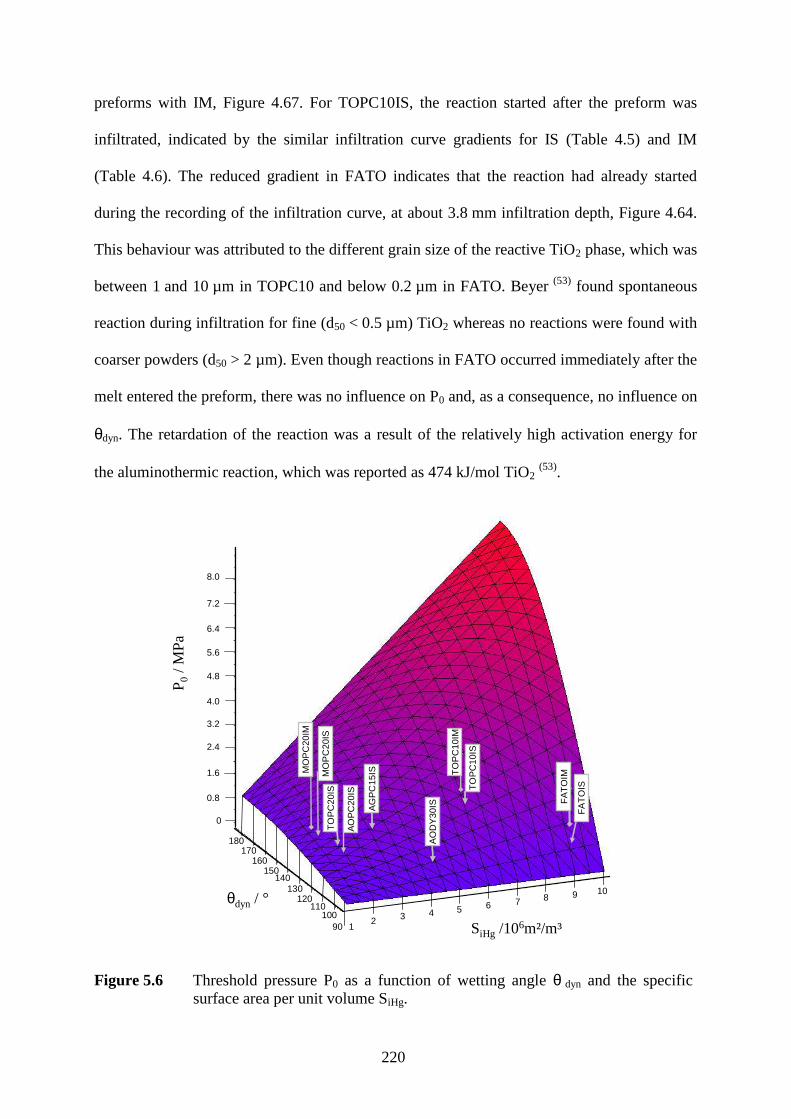
220
preforms with IM, Figure 4.67. For TOPC10IS, the reaction started after the preform was
infiltrated, indicated by the similar infiltration curve gradients for IS (Table 4.5) and IM
(Table 4.6). The reduced gradient in FATO indicates that the reaction had already started
during the recording of the infiltration curve, at about 3.8 mm infiltration depth, Figure 4.64.
This behaviour was attributed to the different grain size of the reactive TiO2 phase, which was
between 1 and 10 µm in TOPC10 and below 0.2 µm in FATO. Beyer (53) found spontaneous
reaction during infiltration for fine (d50 < 0.5 µm) TiO2 whereas no reactions were found with
coarser powders (d50 > 2 µm). Even though reactions in FATO occurred immediately after the
melt entered the preform, there was no influence on P0 and, as a consequence, no influence on
θdyn. The retardation of the reaction was a result of the relatively high activation energy for
the aluminothermic reaction, which was reported as 474 kJ/mol TiO2 (53).
2 3 465
7 8 9 10
110
130
150
170180
160
140
120
10090 1
θdyn (°)
P0
(MP
a)
SiHg (106·m2/m3)
0.8
0
1.6
2.4
3.2
4.0
4.8
5.6
6.4
7.2
8.0
AO
PC
20IS
TO
PC
20IS
TO
PC
20IS
AG
PC
15IS
AG
PC
15ISM
OP
C20
IS
FA
TO
IS
MO
PC
20IM
TO
PC
10IM
FA
TO
IMF
AT
OIM
AO
DY
30IS
AO
DY
30IS
TO
PC
10IS
TO
PC
10IS
P 0/ M
Pa
SiHg /106m²/m³
θdyn / °
Figure 5.6 Threshold pressure P0 as a function of wetting angle θ dyn and the specific surface area per unit volume SiHg.
221
As a summary, P0 is shown as a function of SiHg and θdyn in Figure 5.6. The surface in the 3D
cartesian coordinate system was calculated using Equation 20 on the assumption of a fixed
ceramic volume fraction Vp of 0.35 and fluid surface tension γlv of 0.883 N/m. Figure 5.6 also
shows the positions of the experimental preforms and infiltration data presented in Table 5.2.
From a technical standpoint it seems favourable to achieve low P0. To do so, it is necessary to
target low SiHg and θdyn. As shown in the present investigations, the latter could not be
influenced significantly, even though reactivity was observed. However, SiHg could be
influenced significantly by varying the preform processing conditions as demonstrated for
TOPC10 and TOPC20 by varying the PFA content and sintering temperature, Table 5.2. The
conditions were even stronger for MOPC20, where SiHg could be influenced by a factor of 8
by variation of sintering temperature (Figure 4.31). Variations in SiHg influenced ligament
sizes of the metal phase. Lowering of SiHg led to coarsening of the ligaments and, as discussed
in 5.1, to a lower mechanical performance. Therefore a compromise between low P0 and high
mechanical performance has to be found.
The assumption of complete non-wetting of non-reactive and reactive preforms (53,114) could
not be confirmed and may falsify modelling results. For example, AOPC20 has a θdyn of 115°
the cosine of which is equal to -0.44 and therefore 2.4 times lower than would be expected for
non-wetting (cos θdyn= -1). The difference in absolute values is significant for the AO
preforms. Assuming θdyn is identical to that of AOPC20, at SiHg of 9.96 m2/m3 (Table 4.2), P0
is equal to 4.0 MPa compared to 9.5 MPa for the complete non-wetting assumption.
The present investigations showed that even if reaction phases were observed in the resulting
MMC, the reaction had no influence on P0 due to the delayed initiation of the reaction.
Nevertheless, an interesting phenomenon in TOPC10 infiltration in ISQC has to be attributed
to reactions and its effect on reducing P0. Figure 4.75 shows that, for all but TOPC10, the
222
preform compression, cpr , increased with increasing v0. At a v0 of 0.36 m/s the preform
TOPC10 showed an intermediate low cpr, which was as low as that found for the slowest
infiltration (DSQC). The homogeneity of the resulting MMC was comparable or even better
than the MMC resulting from DSQC infiltration, as indicated by low void fractions shown by
comparing the CT-images in Figures 4.73 and 4.51.
An intermediate minimum of θstat was proposed in reactive systems (87), shown schematically
in Figure 2.10. This minimum is reached when the spreading velocity keeps pace with the
formation of the newly-formed interfacial phase. In ISQC_10, the preform TOPC10 was
infiltrated dynamically, where the pressurized melt was forced to fill the preform porosity and
therefore a θdyn has to be implemented. For TOPC10, SiHg was 6.01·106 m2/m3 (Table 5.2).
Therefore, with 38% porosity and for the standard preform size of 61 mm x 42 mm x 8 mm,
the overall preform inner surface area was 123 m2 and the overall pore volume 1.27·10-5 m3.
For ISQC_10 the latter was filled with a v0 of 2.8·10-3 m3s-1 (Table 3.8) which therefore took
4.5 ms. Assuming coverage of the entire inner surface area, the rate of new surface formation
dA/dt was 27.3 m2/ms. Taking into account the low porosity and the compression of the
preform, this is assumed ideal for easy infiltration in terms of low P0 and the shape factor α.
On the other hand, at similar v0 of 0.36 m/s (HPDC_18), the phenomenon of intermediate low
compression was not observed in HPDC infiltration of TOPC10. This has to be attributed to
the significantly higher turbulence in HPDC_18, indicated by a Weber number We of 2015,
compared to 252 for ISQC_10 during die filling. As reported by Campbell (6), in HPDC
significant amounts of oxide films are formed on liquid Al which increase with rising We. In
contrast to DSQC, in HPDC a massive amount of oxide film was formed and filtered on the
surface of the preform when the melt entered it. This is supported by the fact that, for
corresponding v0, the preform compression was higher in HPDC than in ISQC. Future work
should focus on the applicability of the model of Aksay et al. (87) on pressure infiltration of
223
reactive preforms in order to determine optimum v0 to SiHg combinations resulting in easy
infiltration and attain maximum MMC performance.
5.4.4. Preform permeability
The specific permeabilities of the preforms were investigated and compared to reported
Saffil™ fibre preform (FA) data (112). For FA, the reinforcement was reported to be aligned
perpendicular to the direction of fibre sedimentation during preform fabrication (119). This
results in a strong anisotropy in permeability and the parameter KSII along the fibres was
measured to be 2.4 times higher than KS┴ (in perpendicular direction) (113). Based on their
experimental results, a model was proposed (112) to predict the preform permeability of FA for
KSII (Equation 31) and KS┴ (Equation 32) directions, depending on the volume fraction (Vsf)
and mean radius (rsf) of the fibres. The permeabilities for the different directions as a function
of Vsf are shown in Figure 5.7. These were calculated for rsf of 0.5, 1.0 and 2.0 µm. This also
includes the measured data of this project (Table 4.4) and data reported for FA with Vsf of
0.24 (FA24) (112). The latter showed good agreement for a rsf value between 1 and 2 µm,
confirming the applicability of the model.
Similar to FA, an anisotropic permeability was found in the fabricated particulate preforms as
indicated by KSP to KSI ratios larger than unity (1.5 to 4.8 - Figure 4.38). KSP and KSI represent
the permeability in the perpendicular and in the plane direction within particulate preforms,
respectively. This behaviour results from the alignment of the pore formers PC or PF during
pressing and led to pores arranged along the X-Y plane of the preform. Consequently, the
main axes of the metal ligaments were aligned along the x- and y-directions of the resulting
MMCs. This is illustrated to good effect in TOPC20IS in Figure 4.54 (b).
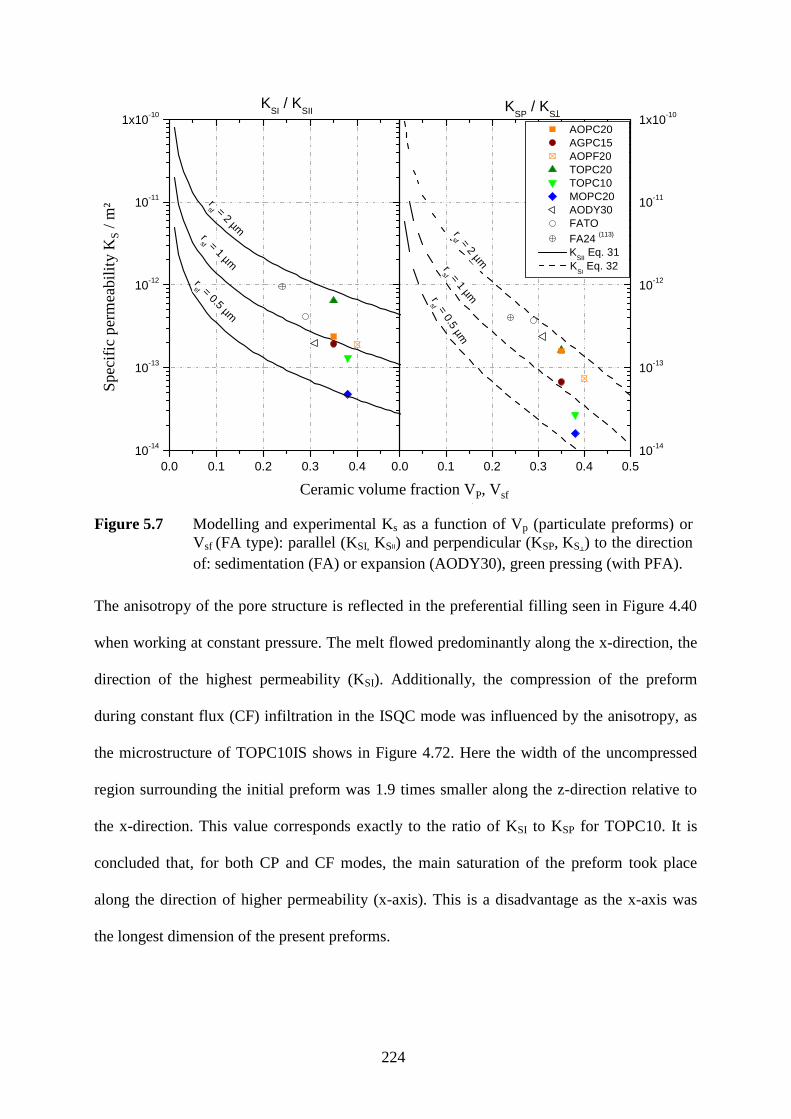
224
0.0 0.1 0.2 0.3 0.410-14
10-13
10-12
10-11
1x10⁻¹⁰
0.0 0.1 0.2 0.3 0.4 0.510-14
10-13
10-12
10-11
1x10⁻¹⁰
rsf = 0.5 µm
rsf = 1 µm
rsf = 2 µm
rsf = 1 µm
rsf = 2 µm
rsf = 0.5 µm
AOPC20 AGPC15 AOPF20 TOPC20 TOPC10 MOPC20 AODY30 FATO FA24 (113)
KSII
Eq. 31
KSP
/ KS
KSI
/ KSII
S
peci
fic P
erm
eabi
lity
KS (
m²)
Ceramic volume fraction Vp, V
sf ()
KSΙ
Eq. 32
Ceramic volume fraction VP, Vsf
Spe
cific
per
me
abili
ty K S
/ m²
Figure 5.7 Modelling and experimental Ks as a function of Vp (particulate preforms) or Vsf (FA type): parallel (KSI, KSII) and perpendicular (KSP, KS┴) to the direction of: sedimentation (FA) or expansion (AODY30), green pressing (with PFA).
The anisotropy of the pore structure is reflected in the preferential filling seen in Figure 4.40
when working at constant pressure. The melt flowed predominantly along the x-direction, the
direction of the highest permeability (KSI). Additionally, the compression of the preform
during constant flux (CF) infiltration in the ISQC mode was influenced by the anisotropy, as
the microstructure of TOPC10IS shows in Figure 4.72. Here the width of the uncompressed
region surrounding the initial preform was 1.9 times smaller along the z-direction relative to
the x-direction. This value corresponds exactly to the ratio of KSI to KSP for TOPC10. It is
concluded that, for both CP and CF modes, the main saturation of the preform took place
along the direction of higher permeability (x-axis). This is a disadvantage as the x-axis was
the longest dimension of the present preforms.
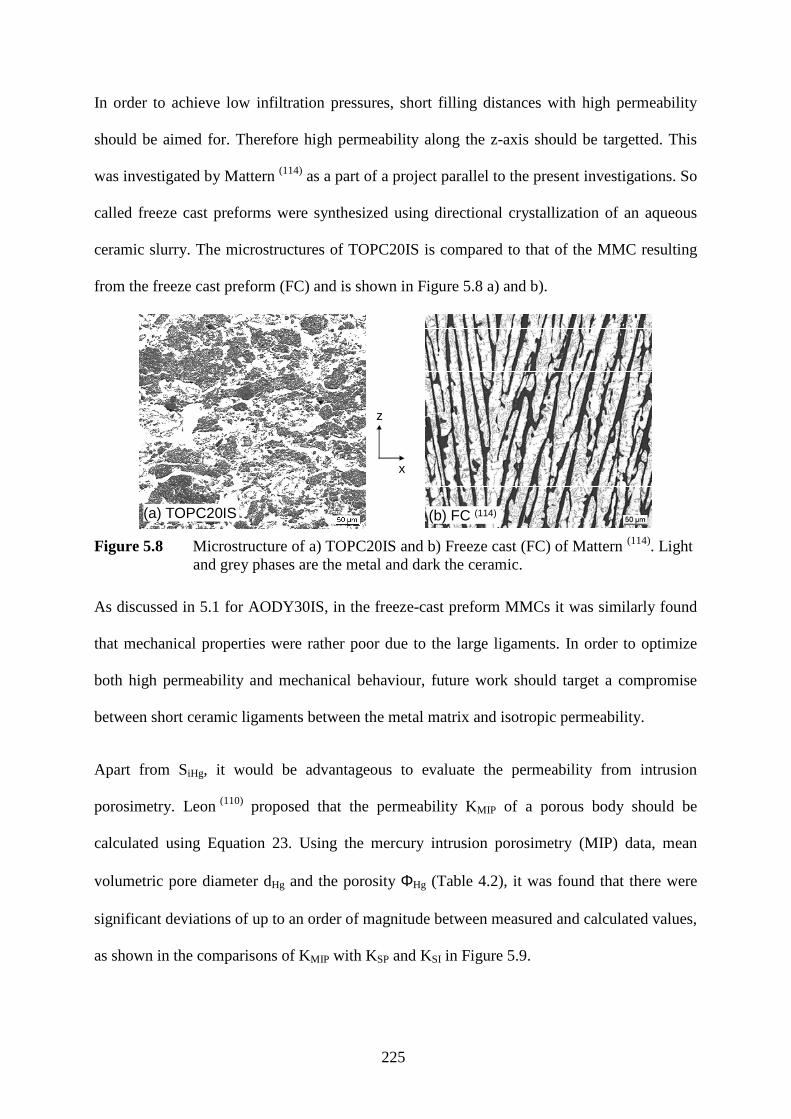
225
In order to achieve low infiltration pressures, short filling distances with high permeability
should be aimed for. Therefore high permeability along the z-axis should be targetted. This
was investigated by Mattern (114) as a part of a project parallel to the present investigations. So
called freeze cast preforms were synthesized using directional crystallization of an aqueous
ceramic slurry. The microstructures of TOPC20IS is compared to that of the MMC resulting
from the freeze cast preform (FC) and is shown in Figure 5.8 a) and b).
z
x
(a) TOPC20IS (b) FC (114)
Figure 5.8 Microstructure of a) TOPC20IS and b) Freeze cast (FC) of Mattern (114). Light and grey phases are the metal and dark the ceramic.
As discussed in 5.1 for AODY30IS, in the freeze-cast preform MMCs it was similarly found
that mechanical properties were rather poor due to the large ligaments. In order to optimize
both high permeability and mechanical behaviour, future work should target a compromise
between short ceramic ligaments between the metal matrix and isotropic permeability.
Apart from SiHg, it would be advantageous to evaluate the permeability from intrusion
porosimetry. Leon (110) proposed that the permeability KMIP of a porous body should be
calculated using Equation 23. Using the mercury intrusion porosimetry (MIP) data, mean
volumetric pore diameter dHg and the porosity ΦHg (Table 4.2), it was found that there were
significant deviations of up to an order of magnitude between measured and calculated values,
as shown in the comparisons of KMIP with KSP and KSI in Figure 5.9.
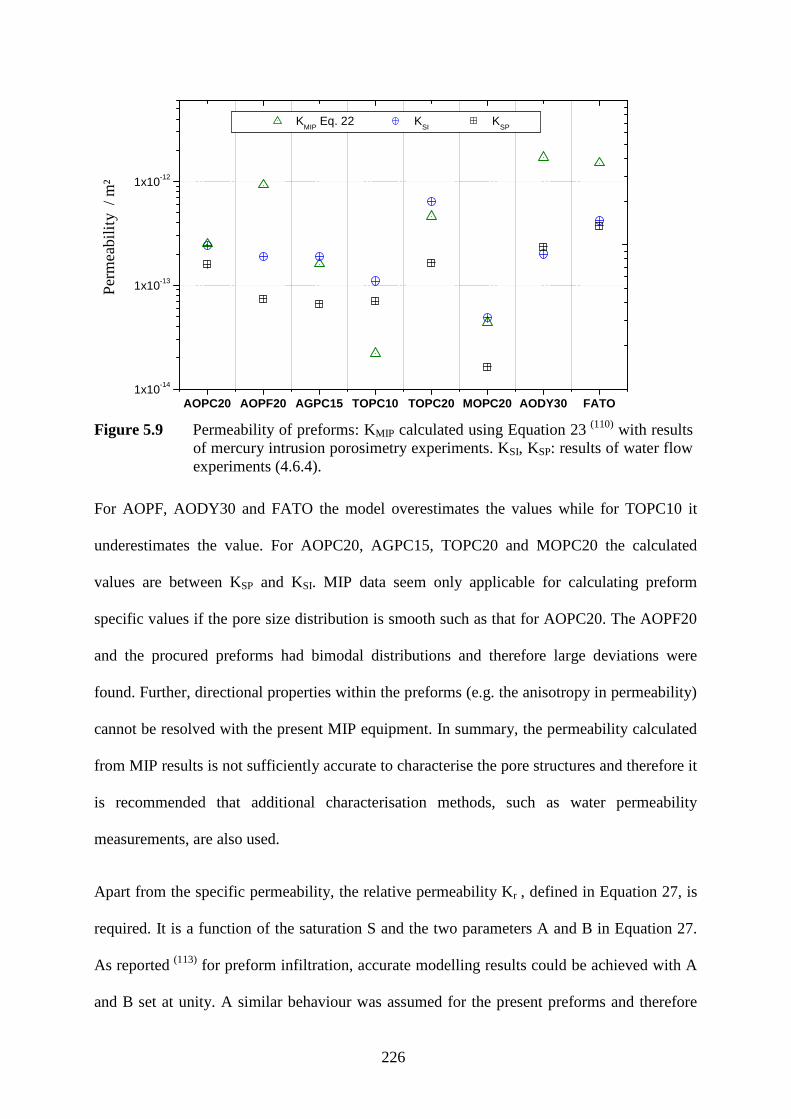
226
AOPC20 AOPF20 AGPC15 TOPC10 TOPC20 MOPC20 AODY30 FATO1x10-14
1x10-13
1x10-12
KMIP
Eq. 22 KSI
KSP
Per
mea
bilit
y (m
²)P
erm
eab
ility
/ m
²
Figure 5.9 Permeability of preforms: KMIP calculated using Equation 23 (110) with results of mercury intrusion porosimetry experiments. KSI, KSP: results of water flow experiments (4.6.4).
For AOPF, AODY30 and FATO the model overestimates the values while for TOPC10 it
underestimates the value. For AOPC20, AGPC15, TOPC20 and MOPC20 the calculated
values are between KSP and KSI. MIP data seem only applicable for calculating preform
specific values if the pore size distribution is smooth such as that for AOPC20. The AOPF20
and the procured preforms had bimodal distributions and therefore large deviations were
found. Further, directional properties within the preforms (e.g. the anisotropy in permeability)
cannot be resolved with the present MIP equipment. In summary, the permeability calculated
from MIP results is not sufficiently accurate to characterise the pore structures and therefore it
is recommended that additional characterisation methods, such as water permeability
measurements, are also used.
Apart from the specific permeability, the relative permeability Kr , defined in Equation 27, is
required. It is a function of the saturation S and the two parameters A and B in Equation 27.
As reported (113) for preform infiltration, accurate modelling results could be achieved with A
and B set at unity. A similar behaviour was assumed for the present preforms and therefore
227
Equation 27 leads to Equation 50, which was used for modelling dynamic preform infiltration
in the following section.
SKr = Equation 50
5.4.5. Dynamic preform infiltration model
In Richards’ model, phase changes during infiltration in the liquid or porous solid are
generally neglected and isothermal conditions are assumed. The latter was not the case for the
present experiments. In the constant flux infiltrations, a plunger was used to press the melt
into the pores of the preform. In order to achieve dense MMCs, pores in the sub-micron scale
had to be infiltrated. The gap between the plunger and the die was about 10 µm and, as a
result, when under isothermal conditions at temperatures above the solidus, the melt would be
forced out of this gap rather than filling the porosity. The gaps between the plunger and die
and the die parting line were sealed by solidifying the melt in the gap achieved by using die
temperatures below the metal solidus (143). The die was held at 250°C in HPDC and ISQC and
at 450°C in DSQC. The latter was still about 100°C below the solidus of the alloy IS and
sufficient as no melt was lost in any of the experiments.
The temperature profile recorded in the centre (Tcentre) near the preform during infiltration in
DSQC (Figure 4.46) and the measured solidus of 566°C of the alloy IS (Figure 4.45)
suggested that the melt was in the liquid state for more than 10 s inside the preform. In the
constant flux mode, infiltration took less than 1 s to fill the entire porosity of the preform and
therefore it was assumed that no premature solidification occurred. Therefore an isothermal
process of a rigid porous preform was assumed during infiltration modelling. Consequently,
momentum and energy balance equations became irrelevant and the solid metal fraction was
considered to be nil throughout.
228
As the predominant fluid flow was along the high permeability x-axis of the preforms
fabricated using pore forming agents (e.g. AOPC20), a one-dimensional flow was assumed
for the present simple infiltration model.
Richards’ equation for variably saturated soil water flow has a clear physical basis. Therefore,
it is generally applicable and can be used for fundamental research and scenario analysis. The
equation is difficult to solve because of its parabolic form in combination with strong non-
linearity of the soil hydraulic functions which relate water content, soil water pressure head
and hydraulic conductivity. The results depend largely on the structure of the numerical
scheme and the applied time and space steps (185). Special attention has to be paid to the
procedure with respect to the boundary conditions. Both finite difference and finite element
methods are used to solve Richards’ equation. In one dimensional modelling, the finite
difference approach is advantageous because it needs no mass lumping to prevent oscillations
and is easier to implement in numerical routines.
A mass conservative finite volume scheme was used to solve Richards’ equation. As shown in
Figure 5.10, fixed nodes and temporal spacing were used. The spatial and temporal
discretization was performed as shown graphically in Figure 5.10. The subscript i is the node
number which is increasing toward higher x-values whereas the superscript j is the time level
and ∆t j = t j+1 - t j. All the nodes were in the centre of the control volumes with
∆xu = xi1־ , ∆xl = xi - xi+1 and ∆xi the cell thickness. The spatial averages of K were calculated
as geometrical means on the border of the control volumes. The values of K and S were taken
at the old time level j (explicit linearization), which made it possible to calculate the new
pressure p and simultaneously p I j+1 without iteration. Details of the finite difference code
used for preform infiltration modelling have been published by Pokora (186).

229
q = 0x
known
unknowntim
etim
e
11−
−j
ip 1−jip 1
1−
+j
ip
jip 1−
jip j
ip 1+
11+
−j
ip 1+jip 1
1+
+j
ip
jt∆
1−∆ jt
ix∆
calculation of
pl ; Sl
Kr
Figure 5.10 Constant distance grid for 1D modelling of preform infiltration and model used for spatial and temporal discretization to solve Richards' equation (185).
Both constant pressure (CP) and constant flux (CF) infiltration modes were implemented into
the Preform 1D finite difference code. Pokora (186) adapted the code to the solution presented
by van Dam (185). The published work using Richards´ principles of unsaturated flow were for
the CP infiltration mode. The CF solution was derived in accordance to Sander (188). A
maximum infiltration distance of x = 0.03 m was assumed for modelling the linear preform
infiltration. In order to account for the collision of the two melt fronts in the centre at
x = 0.03 m, an impermeable (q = 0) boundary was introduced into the code. The result of the
Preform 1D calculations were the local pressure Ploc (x,t) and local saturation Sloc (x,t).
5.4.6. Validation of the infiltration model
Three different preforms were used to validate the infiltration model: FA24, a Saffil™ fibre
preform reported by Dopler et al. (113), and two particulate preforms, AOPC20 and TOPC10.
The latter two represented the two extremes in terms of threshold pressure P0 and specific
permeability Ks, which were a result of the different pore structures, particle sizes and
reactivity. The parameters for each preform are listed in Table 5.1.

230
In the CP mode, the Preform 1D code was validated using the reported FA24 preform
infiltration results (113) and compared to the saturated flow calculation results based on
Darcy´s law (Equation 27). Similar to Dopler et al. (113), an inlet pressure of 0.4 MPa and an
infiltration period of 21 s were used. Values of Ploc were calculated using the data in Table 5.1
and the results are shown in Figure 5.11 a) in combination with the isobar of the threshold
pressure P0, FA24 of FA24.
0.00 0.02 0.04 0.06 0.08
0.0
0.2
0.4
0.6
0.8
1.0
0.0
0.1
0.2
0.3
0.4(a)
(b) S
loc at P
loc(Eq. 29)
Sloc
Darcy at Pappl
(Eq. 24)
Experiment (Dopler et al. (113))
Loca
l pre
ssur
e P
loc (
MP
a)
Position x (m)
Pappl
= 0.4 MPat = 21 s
P0, FA24
Modelling Richards´ - Preform 1D
Loca
l sat
urat
ion
Slo
c ()
Position x / mm
Loca
l sa
tura
tion
S locLo
cal p
ress
ure
P loc/
MP
a
Figure 5.11 a) Modelling of local pressure Ploc of Saffil™ preform FA24 with Preform 1D. b) Resulting local saturation calculated using Equation 29 with experimental saturation data of Dopler et al. (113) (symbols) and in accordance to Darcy (Equation 24)
As the saturation function (Equation 29) was used, Sloc could be calculated from Ploc and the
result is presented in Figure 5.11 b). This also shows local saturation results based on Darcy´s
law and experimental results (113). It is obvious that the modelling results of the Richards´
model are close to the experimental results. With the Preform 1D tool the experiments of
Dopler et al. (113) could be reproduced satisfactorily. In contrast, full saturation up to a depth
231
of 0.023 m and nil saturation behind that point was found with Darcy´s model, demonstrating
its inaccuracy.
Having validated the Preform 1D code for Saffil™ fibre preforms (FA24), focus turned to
AOPC20. Based on the preform parameters listed in Table 5.1, the modelling results were
compared to the experimental results of local saturation after CP infiltration at different
pressures, as shown in Figure 5.12. As shown in Figure 5.11 b) the melt did not reach the end
of the FA 24 preform and therefore the end drag phenomenon could be omitted which is
similar to the experimental infiltration results of AOPC20 at a constant pressure of 0.8 MPa
shown in Figure 4.39. In contrast, at 1.2 MPa, the melt fronts contacted each other and
therefore influenced each other. In order to allow for this, the centre of the preform was set as
an impermeable boundary in the Preform 1D code which led to a time dependent increase in
saturation in front of it, as shown by the results at different infiltration times of 2, 4 and 16 s
in Figure 5.12. At an early stage, a negative gradient toward higher x-values was found,
whereas a homogenous saturation profile was reached at an extended pressurisation (16 s).
For applied pressures of 0.8 and 1.2 MPa at 16s, the calculated Sloc were homogenous at 0.23
and 0.61 respectively. At constant pressure, the respective saturation at the ingate (x = 0 m)
was similar for different infiltration times. As, by definition, the ingate pressure is constant in
the constant pressure mode, similar pressure and hence similar saturations were calculated for
all infiltration times at the ingate. This behaviour is expressed by the saturation function in
Equation 29 where all preform parameters were assumed to be constant during the entire
infiltration process apart from the applied pressure Pappl.
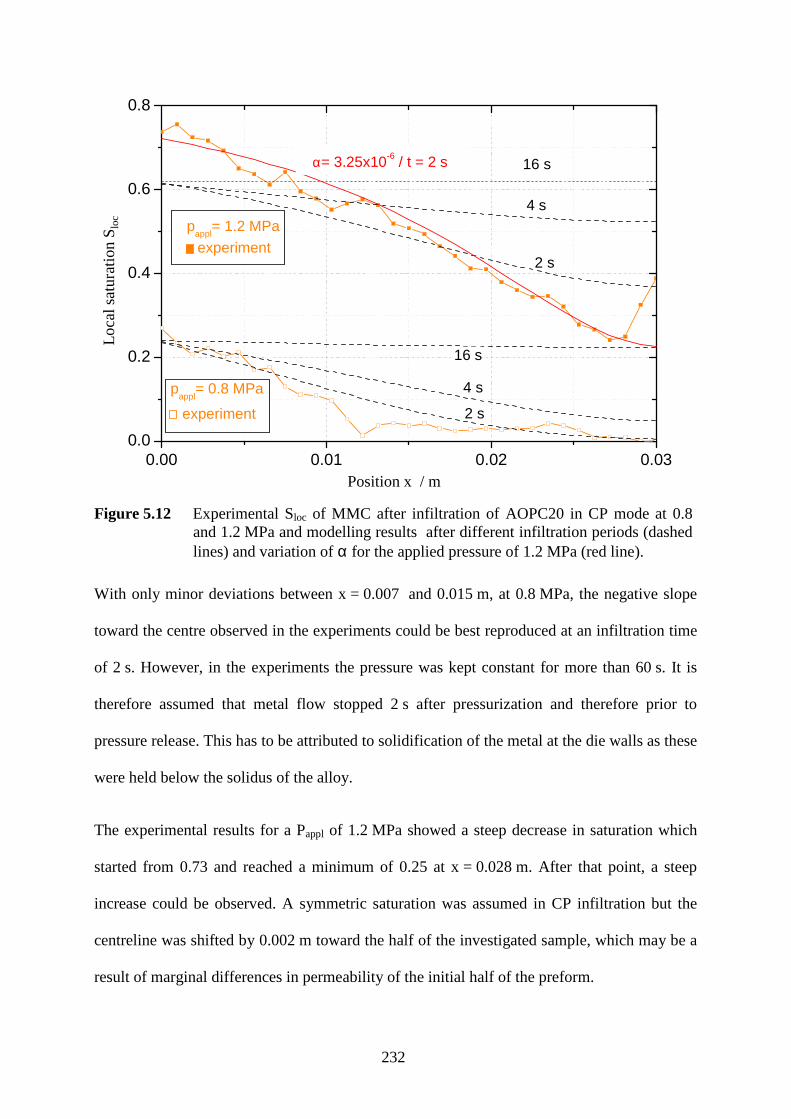
232
0.00 0.01 0.02 0.030.0
0.2
0.4
0.6
0.8
experiment
experiment
pappl
= 1.2 MPa
pappl
= 0.8 MPa
α= 3.25x10⁻⁶ / t = 2 s 16 s
16 s
2 s
4 s
2 s
4 s
Sat
urat
ion
Slo
c ()
Position x (m)Position x / m
Loca
l sa
tura
tion
S loc
Figure 5.12 Experimental Sloc of MMC after infiltration of AOPC20 in CP mode at 0.8 and 1.2 MPa and modelling results after different infiltration periods (dashed lines) and variation of α for the applied pressure of 1.2 MPa (red line).
With only minor deviations between x = 0.007 and 0.015 m, at 0.8 MPa, the negative slope
toward the centre observed in the experiments could be best reproduced at an infiltration time
of 2 s. However, in the experiments the pressure was kept constant for more than 60 s. It is
therefore assumed that metal flow stopped 2 s after pressurization and therefore prior to
pressure release. This has to be attributed to solidification of the metal at the die walls as these
were held below the solidus of the alloy.
The experimental results for a Pappl of 1.2 MPa showed a steep decrease in saturation which
started from 0.73 and reached a minimum of 0.25 at x = 0.028 m. After that point, a steep
increase could be observed. A symmetric saturation was assumed in CP infiltration but the
centreline was shifted by 0.002 m toward the half of the investigated sample, which may be a
result of marginal differences in permeability of the initial half of the preform.

233
The calculations at a Pappl of 1.2 MPa showed the best agreement with the experimental
results at t = 2 s. However here there were deviations with overestimation when x > 0.017 m
and underestimation at the surface (x = 0 m). As, by definition, the inlet saturation depends
directly on Pappl, higher pressures than the nominal 1.2 MPa may be assumed. However, as a
calibrated pressure system was used and the inlet saturation at 0.8 MPa could be modelled
accurately, another effect may be responsible for the mismatch, such as variation of the shape
parameter α during infiltration process. In order to achieve an improved fit of the
experimental results for the calculations α was altered in steps of 0.25·10-6 Pa-1 starting from
the original value of 2.25·10-6 Pa-1 . The best agreement was found at α = 3.25·10-6 Pa-1
(Figure 5.12.) and therefore a change in α during infiltration at the higher pressure of 1.2 MPa
seems likely. Variations in α may result from changes in the preform pore structure, such as
widening of the pores due to the forces from the intruding pressurized metal. However, such
widening would result in an expansion of the preform along the z-axis during the experiments.
This could not be measured as chipping occurred in the lowest part of the preform (originally
in contact with the bottom punch of the infiltration tool), presumably due to mechanical
stresses during infiltration and cooling. Variations in α and its effect on constant pressure
infiltration results should be investigated in more detail in the future work.
As the Preform 1D tool was found suitable to describe CP infiltration of FA and AOPC20, its
capability for CF mode was investigated. As reported in section 4.7, the DSQC infiltration
could not be stopped at an early stage in order to study partially filled preforms. However the
preform infiltration curves were recorded and the model was validated against these
experimental data (Figures 4.44 and 4.47). To do so the inlet pressure Pmet at x = 0 m was
calculated as a function of the integral saturation Sint for DSQC, in which v0 was measured as
0.017 m/s. This value and the specific parameters of the preforms AOPC20 and TOPC10

234
listed in Table 5.1 and 5.3 were used for the calculations. Figure 5.13 shows the experimental
infiltration curves and the calculated curves for saturated flow using Darcy equation
(Equation 24) and unsaturated flow using the Preform 1D code.
For saturated flow, the capillary backpressure at the inlet is a steady linear function, starting
from the P0 and leading to maximum pressures of 3.7 and 5.9 MPa for AOPC20 and TOPC10
respectively. Even though good agreement was found up to Sint of 0.8, the subsequent steep
increase in pressure was not reproduced. The deviations resulted from the saturated flow
assumption, which implies that a fully saturated melt front advances until the impermeable
wall is reached and at this point the preform is fully infiltrated.
0.0 0.2 0.4 0.6 0.8 1.00
2
4
6
8
10
AOPC20 Experiment TOPC10 Experiment
AOPC20 Darcy TOPC10 Darcy
AOPC20 Richards TOPC10 Richards
Inle
t pre
ssur
e P
met (
MP
a)
Preform saturation Sint
()
Inle
t pre
ssur
e P me
t/M
Pa
Preform saturation Sint
Figure 5.13 Experimental infiltration curves of AOPC20 and TOPC10 infiltrated with IS and modelling of infiltration curves using Darcy´s and Richards´ equations.
The Richards´ model showed the steep increase in pressure, similar to the experiments. This
asymptotic behaviour is a result of the phenomenon of unsaturated flow which, by definition,
leads to a decrease in permeability with increasing saturation. As long as the metal front
moved unhindered, both models led to equal Sint. When the metal fronts influenced each other
and the partial saturation had to be further increased, a steep increase in the applied pressure
235
resulted. This was the case for the Sint higher than 0.85 and 0.90 for TOPC10 and AOPC20,
respectively. In contrast to the CP mode, accurate modelling could be achieved in the CF
mode without variations in shape factor α, indicating a constant value for the entire
infiltration period.
It was demonstrated that Richards´ model was valid even in the dynamic CF infiltration mode.
Here, and for the constant pressure infiltrations, good agreement was observed with the
Preform 1D code, providing that all the relevant parameters were well characterised. It is
possible to use this tool to optimize the process parameters in order to minimize residual
porosity in the MMC and maintain the preform integrity.
236
6. CONCLUSIONS
1. An aqueous processing route and subsequent partial sintering can be used to produce
preforms from commercial Al2O3, TiO2 and MgO powders with a minimum ceramic
volume fraction (Vp) of 0.50 and open porosity between the grains (intragranular
porosity).
2. To achieve a lower Vp of 0.30- 0.40, a pore forming additive (PFA) was incorporated into
the slurry leading to a bimodal pore structure consisting of intragranular pores combined
with larger cavities obtained by pyrolysis of the PFA during sintering. As a result, the
target Vp could be reached by systematic variation of the processing parameters.
3. The lower limit of Vp for the cellulose pore former (PC) was 0.35, as below this value the
preform was too weak to use to produce a MMC. In contrast, substitution of PC with
carbon fibres (PF) allowed Vp to be lowered to 0.19.
4. A novel route for MgO preform and the subsequent MMC fabrication was investigated.
The combination of MgO with the pore former PC gave an intermediate magnesium
hydroxide during sintering. This offers the possibility for tailoring the preform specific
surface area. The surface area achieved was from 0.7 to 5.7 m²/g. The latter value is
higher than that of the starting powder.
5. By combining a conventional AlSi alloy matrix with the ceramic preform through melt
infiltration, a new material resulted with significantly enhanced mechanical and
tribological properties in comparison to monolithic alloys and Saffil™ fibre-reinforced
MMCs. Preform MMCs made from conventional fine powders with Vp < 0.40 have not to
the authors knowledge been previously reported in the literature.
6. MMCs with tensile strength and elastic modulus 1.9 times higher (456 MPa / 148 GPa)
than that of the pure infiltration alloy (241 MPa / 69 GPa) have been achieved.
Additionally, the wear resistance was more than twice that of the alloy, whereas fracture
toughness KIC was only marginally lowered by the reinforcement.

237
7. The interpenetration fineness, which is defined by the pore structure of the initial preform
and not Vp, plays a significant role on the MMC´s mechanical properties. Ceramic foam
MMCs with similar ceramic loading, exhibiting large alloy ligaments between ceramic
struts, gave mechanical properties lower than those of the pure alloy, but with superior
tribological properties.
8. The literature contains a significant body of information on chopped alumina fibre
preforms (Saffil™ - FA) where the upper limit of Vp was 0.25 and was therefore lower
than the present particulate preforms. As would be expected, the current particulate
preforms exhibited different infiltration behaviour. The specific permeability Ks was
lower whereas the threshold pressure P0 and infiltration curve shape factor α were higher,
which in combination impeded low pressure infiltration compared to FA.
9. Because of the factors outlined in the above paragraph, the pressure for full infiltration
was between 10 and 100 MPa which precluded constant pressure infiltration which is
usually limited to a pressure of 15 MPa. The solution was to use squeeze casting (SQC)
and high pressure die casting (HPDC) processes to achieve constant flux infiltration.
10. Similar to reported data on FA, the fabricated particulate preforms showed a process
related anisotropy in specific permeability Ks. In the direction of higher permeability, the
predominant one for fluid flow during melt infiltration, Ks ranged between 4.8 and
64.2·10-14 m2.
11. Reactivity between the infiltration alloy and the ceramics has a marginal influence on the
threshold pressure P0 , as demonstrated with the TiO2 preforms. The reaction started after
the majority of the porosity was infiltrated.
12. A novel method of characterizing the dynamic wetting of preforms by molten metal
during infiltration has been developed based on parameters obtained from mercury
intrusion porosimetry in combination with P0 evaluated from constant flux infiltration.
13. A representative dynamic wetting angle θdyn could be measured only in preforms which
had a homogenous pore size distribution, found in those fabricated with PFA. Here θdyn
238
ranged between 112 and 131° for the Al-Si alloy and 116 to 136° for the Al-Mg alloy
having similar molar fractions of the alloying element. The addition of Mg showed no
influence on wetting behaviour in the infiltration experiments even though the reactions
found in the microstructure were more pronounced than those found with the Al-Si alloy.
14. The static wetting angles θst found in the sessile drop tests of similar systems ranged
between 143 and 155° and therefore were significantly higher than θdyn and higher than
those reported for pure Al on the ceramics used. This was a result of the Fe content in the
alloy, leading to pinning of the droplet during holding on the substrate in combination
with micro-intrusions into the substrate. Therefore the values of θst were not representative
of the investigated systems.
15. High infiltration velocities and cooling rates in SQC and HPDC minimised the contact
time between the melt and the reinforcement and therefore reactive metal-ceramic systems
could be synthesised with minor reaction products, as shown for the AlSi-TiO2 system.
16. An increase in the infiltration velocity resulted in greater preform compression. At the
highest infiltration velocity, where the preform was infiltrated within 1 ms, the
compression of the fabricated preforms was 35%. In contrast, high strength, foamed
preforms were robust with low compression, but infiltration stresses resulted in severe
cracking of the ceramic struts.
17. In contrast to previous work on preform infiltration models, the saturated flow model
could not be confirmed in the present investigation, as unsaturated flow was found during
constant pressure infiltration.
18. Based on the hydrogeological unsaturated flow model of Richards and the preform
specific parameters, a one-dimensional flow code was applied successfully to simulate
preform filling behaviour during constant flux and constant pressure infiltration with an
impermeable centre boundary.

239
7. FUTURE WORK
The preform processing route with a cellulose pore former (PC) offers the unique
possibility of tailoring the pore structure of MgO preforms by taking advantage of the
hydrolysis of MgO. It offers the possibility of systematic variation of the grain size, pore
size distribution and specific surface area, which influence the infiltration relevant
parameters such as permeability and shape factor α. Furthermore the mechanical and
tribological properties will be influenced.
The highest porosity (81%) of all self-fabricated preforms could be achieved with carbon
fibres instead of cellulose incorporated in to the ceramic slurry. Their addition may be
interesting for future investigations aiming to reduce the ceramic fraction of preform-
MMCs below the lower limit of the present research (0.30).
As a result of the uniaxial green part pressing in combination with the pore former
geometry, the self-fabricated preforms had the highest permeability in the xy- plane and
therefore in the longer dimensions of the preforms . In order to get isotropic permeability,
isostatic pressing of the preform may be appropriate to facilitate infiltration.
Only for the reactive TOPC10 was an optimum between reaction rate and infiltration
behaviour was found in the dynamic ISQC mode. In order to get a better understanding,
the infiltration mode and parameters should be investigated further, which offers the
unique opportunity of high velocity infiltration in combination with consistent MMCs.
The bending test set-up will have to be improved to allow fracture of the non-reinforced
alloy. In order to get an deeper understanding of the mechanical properties of the MMCs
the microstructures should be investigated more thoroughly e.g. with TEM methods.

240
8. REFERENCES
1. Altenpohl, D.: Aluminium- und Aluminiumlegierungen, Springer-Verlag, (1965).
2. Clarke, D.R.: “Interpenetrating Phase Composites”, Journal of the American Ceramic Society, 75 (4), (1992), 739-759.
3. Newnham, R.E., Skinner, D.P. and Cross, L.E. : “Connectivity and Piezoelectric-pyroelectric Composites”, Material Research Bulletin, 13, (1978), 525-536.
4. Gruzelski, J.E. and Closset, B.M.: “The Treatment of Liquid Al-Si Alloys”, Proceedings of the American Foundrymen Society Conference, Des Plaines, IL, (1990), 13-15.
5. Saigal, A. and Berry, J.T. : “A Finite Element Method Analysis of the Effect of Chilling and Modification on Localized Yielding and Crack Initiation in AlSi-Alloys”, Transactions of the American Foundry Society, 92, (1984), 703-708.
6. Campbell, J. : Castings, Butterworth-Heinemann, Oxford, 2003.
7. Champion, J.A., Keen, B.J. and Sillwood, J.M. : “Wetting of Aluminium Oxide by Molten Aluminium and Other Metals”, Journal of Materials Science, 4, (1969), 39-49.
8. Zheng, Q. and Reddy, R.G.: “Mechanism of In Situ Formation of AlN in Al Melt Using Nitrogen Gas”, Journal of Material Sciences, 39, (2004), 141-149.
9. John, H. and Hausner, H. : “Influence of Oxygen Partial Pressure on the Wetting Behaviour in the System Al/Al 2O3”, J. of Materials Science Letters, 5, (1986), 549-551.
10. Gourmi, L. and Joud, J.C. : “Auger Electron Spectroscopy Study of Aluminium-Tin Liquid Systems”, Acta Metallurgica, 30, (1982), 1397-1405.
11. Ransley, C.E. and Neufeld, H. : “The Solubility of Hydrogen in Liquid and Solid Aluminium”, J. of the Institute of Metals, 74, (1948), 599-620.
12. McLeod, A.D. and Gabryel, C.M.: “Kinetics of the Growth of Spinel MgAl2O4, on Alumina Particulate in Aluminium-Alloys containing Magnesium”, Metallurgical Transactions A, 23A, (1992), 1279-1283.
13. Iida, T. and Gruthrie, R.I.L. : The Physical Properties of Liquid Metals, Clarendon press, Oxford (1988).
14. Silva, M.P. and Talbot, D.E.J. : “Oxidation of Liquid Aluminum-Magnesium Alloys”, Tech. Sessions, TMS Light Metals Committee, 118th Ann. Meeting, Las Vegas, Nevada, March 1989, 1035-1040.
15. Pai, B.C., Ramani, G. and Pillai, R.M. : “Role of Magnesium in Cast Aluminium Alloys Matrix Composites”, Journal of Materials Science, 30 (8), (1995), 1903-1911.
16. Urquhart, A.W.: “Novel Reinforced Ceramics and Metals: A Review of Lanxides´s Composite Technologies”, Materials Science and Engineering, A144, (1991), 75-82.
17. Rao, B.S. and Jayaram,V. : “New Technique for Pressureless Infiltration of Al Alloys into Al2O3 Preforms”, Journal of Materials Research, 16, (2001), 2906-2913.
18. Allen, B.C. : Liquid Metals, Chemistry and Physics, Marcel Dekker Inc., (1972).
19. Anson, J.P., Drew, R.A.L. and Gruzleski, J.E. : “The Surface Tension of Molten Al-Si-Mg Alloys under Vacuum and Hydrogen Atmospheres”, Metallurgical and Materials Transactions B, 30B, (1999), 1027-1032.
20. Keene, B.J. : “Review of Data for the Surface Tension of Pure Metals”, International Materials Reviews, 38 (4), (1993), 157-192.
21. Rocher, J.P., Quenisset, J.M. and Naslain, R. : “Wetting Improvement of Carbon or Silicon-Carbide by Aluminium Alloys based on a K2ZrF6 Surface-Treatment-Application to Composite-Material Casting”, Journal of Materials Science, 24 (8), (1989), 2697-2703.
241
22. Li, J.G., Coudurier, L. and Eustathopoulos, N. : “Wetting and Interfacial Energy in Liquid Metal-Ceramic Systems”, Journal of Materials Science, 24, (1989), 1109-1116.
23. Shen, P., Fujii, H., Matsumoto, T. and Nogi, K. : “The Influence of Surface Structure on Wetting of Alpha-Al2O3 by Aluminium in a Reduced Atmosphere”, Metallurgical and Materials Transactions A, 35A (2), ( 2004 ), 583-588.
24. Smith, J.W. : “Some Developments of Guggenheim's Simplified Procedure for Computing Electric Dipole Moments”, Transactions of the Faraday Society, 46, (1950), 394-400.
25. Koerber, K. and Loehberg, K. : “Oberflächen- und Grenzflächenenergien von Aluminium-Silicium-Schmelzen”, Gießereiforschung, 23 (4), (1971), 173-177.
26. Pech-Canul, M., Katz, R. and Makhlouf, M. : “The Role of Silicon in Wetting and Pressureless Infil-tration of SiC(p) Preforms by Aluminium Alloys”, Journal of Materials Science, 35, (2000), 2167-2173.
27. Hansen, M. : Binary Alloy Phase Diagrams, Mc Graw Hill, 1958.
28. Emadi, D., Gruzleski, J.E. and Toguri, J.M. : “The Effect of Na and Sr Modification on Surface Tension and Volumetric Shrinkage of A356 Alloy and their Influence on Porosity Formation”, Metallurgical Transactions B, 24B, (1993), 1055-1063.
29. Ibe, G. : “Grundlagen der Verstärkung in Metallmatrix-Verbundwerkstoffen”, Proceedings of the DGM Seminar: Metallische Verbundwerkstoffe - TU Clausthal- Germany, Ed. K.U. Kainer, (1994), 3-41.
30. Kaufmann, H., Auer-Knöbel, R. and Degischer, H.P. : “Elevated Temperature Properties of Short-fiber Reinforced AlSi9Cu3 Produced by Pressure Die-casting”, Zeitschrift für Metallkunde, 85, (1994), 241–248.
31. Clyne, W.E. and Withers, P.J. : An Introduction to Metal Matrix Composites, Cambridge University Press, 1993.
32. Das, S.K., Ballard, C.P., and Marikar, F. : “Metal Matrix Composites in the 1990s and Beyond- A Market Overview”, High performance composites for the 1990´s and beyond, TMS, (1991), 487-497.
33. Jolly, M.R. : “Opportunities for Aluminium Based Fibre Reinforced Metal Matrix Composites in Automotive Castings“, The Foundryman, 83 (11), (1990), 509-513.
34. Kainer, K.U. : “Partikel, Fasern und Kurzfasern zur Verstärkung von metallischen Werkstoffen ”, Proceedings of the DGM Seminar: Metallische Verbundwerkstoffe - TU Clausthal - Germany, Ed. K.U. Kainer, (1994), 43- 64.
35. Dwivedi, R.: “Development of Advanced Reinforced Aluminum Brake Rotors”, Society of Automotive Engineers - SAE, Paper 950264, (1995).
36. Beffort, O. : “Metal Matrix Composites (MMCs): Properties, Applications & Machining”, Presentation 6. International IWF-Colloquium, 18/19.04.2002, Egerkingen- Switzerland, (2002).
37. Biermann, D. and Meister, D. : “Spanende Bearbeitung von faser- und partikelverstärkten Leichtmetall-Verbundwerkstoffen”, Proceedings of the DGM Seminar: Metallische Verbundwerkstoffe - TU Clausthal - Germany, Ed. K.U. Kainer, (1994), 261- 283.
38. Zhaowei, Z. and Nguyen, P.H.: “Grinding of Al/Al2O3 composites”, Journal of Materials Processing, 123, (2002), 13-17.
39. Brown, A and Klier, E.M. : “Machinable MMC and Liquid Metal Infiltration Process for Making Same”; US-Patent 5511603, Chesapeake Composites Corporation, 1996.
40. Ejiofor, J.U. and Reddy, R.G. : “Developments in the Processing and Properties of Particulate Al-Si Composites”, JOM, 49 (11), (1997), 31-27.
41. Legzdins, C.F., Samarasekera, J.V. and Meech, J.A.: ” MMCX- An Expert System for Metal Matrix Composite Selection and Design”, Canadian Metallurgical Quarterly, 36 (3), (1997), 177-202.
42. Chawla, N. and Shen, Y.L. : “Mechanical Behaviour of Particle Reinforced Metal Matrix Composites”, Advanced Engineering Materials , 3 (6), (2001), 357-370.
242
43. Davis, L.C. and Allison, J.E. : “Residual Stresses and their Effects on Deformation Behaviour in Particle Reinforced MMC”, Metallurgical Transactions A, 24A, (1993), 2487-2496.
44. Shi, S.; Taya, M.; Mori, T. and Mura, T.: "Dislocation punching from spherical inclusions in a metal matrix composite", Acta Metallurgica et Materialia 40 (11) (1992), 3141-3148.
45. Corbin, S.F. and Wilkinson, D.S. : “Low Strain Plasticity in a Particulate MMC”, Acta Metallurgica and Materialia, 42, (1994), 1319- 1327.
46. Humphreys, F.J., Basu, A. and Djazeb, M.R. : “The Microstructure and Strength of Particulate Metal-Matrix Composites”, Conference Proceedings: MMC- Processing, Microstructure and Properties; 1991; Roskilde, Denmark, 51-66.
47. Taya, M. : “Strengthening Mechanism of Metal Matrix Composites”, Materials Transactions JIM, 32 (1), (1991), 1-19.
48. Wu, Y. and Lavernia, E.J. : “Strengthening Behaviour of Particulate Reinforced MMCs”, Scripta Metallurgica et Materialia, 27 (2), 173-178.
49. Long, S., Beffort, O., Cayron, C. and Kübler, J.: “Structure and Properties of SiCp/AlCuMg squeeze cast composites for structural applications ”, http://www.empa.ch/deutsch/fachber/abt126/1.3.hybrid/ 1.3.8.literatur_mmc/literatur/aluminium/particle_re/cimlss.pdf, 1-8, (1999).
50. Long, S., Beffort, O., Moret, G. and Thevoz, P. : “Processing of Al-based MMCs by Indirect Squeeze Infiltration of Ceramic Preforms on a Shot-Control High Pressure Die Casting Machine”, Aluminium, 76 (1-2), (2000), 82-89.
51. Kniewallner, L. : “Einsetzbarkeit des Druckgießverfahrens zur Herstellung von kurzfaserverstärkten Aluminium-Gußstücken”, Disseration Montanuniversität Leoben - Austria, 1992.
52. Prielipp, H., Knechtel, M., Claussen, N., Streiffer, S.K., Müllejans, H., Rühle, M. and Rödel, J. : “Strength an Fracture Toughness of Aluminum/Alumina Composites with Interpenetrating Networks”, Materials Science and Engineering, A197, (1995), 19-30.
53. Beyer, P. : Verstärkung von Al-Bauteilen durch lokale In-Situ Synthese von Al2O3/TixAly-Verbunden im Squeeze Casting, Fortschritt-Berichte VDI, Reihe 5: Grund- und Werkstoffe/Kunststoffe, Band 643, 2002.
54. Peng, H.X., Fan, Z., Evans, J.R.G. and Busfield, J. : “Microstructure of Ceramic Foams”, Journal of European Ceramic Society, 20 (7), (2000), 807-813.
55. Hashin, Z. and Shtrikman, S. : “A Variational Approach to the Theory of the Elastic Behaviour of Multiphase Materials”, Journal of Mechanical Physics of Solids, 11 (2), (1963), 127-140.
56. Feest, E.A. : “Interfacial Phenomena in Metal Matrix Composites”, Composites, 25 (2), (1994), 75-82.
57. Rack, H.J. and Ratnaparkhi, P. : “Damage Tolerance in Discontiniously Reinforced MMCs”, JOM, 40 (11), (1988), 55-62.
58. Gesing, A.J. and Burger, G. : “Crack Stability and Crack Velocity Considerations in Fracture of Metal-Ceramic Composites”, Processing of Ceramic and Metal Matrix Composites, Edited by H. Mostaghaci, Pergamon Press, New York (1989), 71-79.
59. Aradhya, K.S. and Surappa, M.K. : “Estimation of Mechanical Properties of 6061 Al-SiCp Composites using FEM methods”, Scripta Metallurgica et Materialia, 25, (1991), 817-823.
60. Couper, M.J. and Xia, K. : “Development of Microsphere Reinforced MMC”, Conference Proceedings: MMC-Processing, Microstructure and Properties, (1991), Roskilde- Denmark, 291-298.
61. Arsenault, R.J. and Shi, N.: “Dislocation Generation due to Difference between the Coeffients of Thermal Expansion”; Material Science and Engineering, 81 (1-2), (1986), 175-182.
62. Agrawal, P., Conlon, K., Bowman, K.J., Sun, C.T., Cichocki, F.R. and Trumble, K.P. : “Thermal Residual Stresses in Co-continuous Composites”, Acta Materialia, 51, (2003), 1143–1156.
63. Nogowizin, B. : “Druckgußlegierungen und ihre Eigenschaften”, Druckguss-Praxis, April 2003, 161-168.
243
64. Hoffmann, M., Skirl, S., Pompe, W. and Roedel, J.: “Thermal Residual Strains and Stresses in Al2O3/Al Composites With Interpenetrating Networks”, Acta Materialia, 47 (2), (1999), 565- 577.
65. Hoffmann, M., Fiedler, B., Emmel, T., Prielipp, H.; Claussen, N., Gross, D. and Roedel, J.: “Fracture Behaviour in Metal Fibre Reinforced Ceramics”, Acta Materialia, 45 (9), (1997), 3609-3618.
66. Evans, A.G.: “Design and Life Prediction Issues for High-Temperature Engineering Ceramics and their Composites”, Acta Materialia, 45 (23), (1997), 23-28.
67. Kolhe, R., Hui, C.Y., Ustundag, E. and Sass, S.L.: “Residual Thermal Stresses and Calculation of the Critical Metal Particle Size for Interfacial Crack Extension in Metal-Ceramic-Matrix Composites”, Acta Materialia, 44 (1), (1996), 279-287.
68. Knechtel, M., Prielipp, H., Müllejans, H., Claussen, N. and Rödel, J.: “Mechanical Properties of Al/Al2O3 and Cu/Al2O3 Composites with Interpenetrating Networks”, Scripta Metallurgica et Materialia, 31 (8), (1994), 1085- 1090.
69. Mizumoto, M., Murano, T. and Kagawa, A.: “Microstructure Control of Particle Reinforced MMC Fabricated by Low-Pressure Infiltration Process”, Journal of the Japan Institute of Metals, 66 (4), (2002), 371-376.
70. Young, T. : “An essay on the cohesion of fluids”, Phil. Transactions of the Royal Society London, 65 ,(1805), 98-102.
71. Naidich, J.V. : “Wettability of Solids by Liquid Metals”, Progress in Surface and Membrane Science, 14, (1981), 353-485.
72. Gallois, B.M. : “Wetting in Non-reactive Liquid Metal-Oxide Systems”, JOM, 49 (6), (1997), 48-51.
73. Diemer, M., Neubrand, A., Trumble, K.P. and Rödel, J. : “Influence of Oxygen Partial Pressure and Oxygen Content on the Wettability in the Copper-Oxygen-Alumina System”, Journal of the American Ceramic Society, 82 (10), (1999), 2825- 2832.
74. Kubaschewski, O. and Hopkins, B.E. : Oxidation of Metals and Alloys, Butterworth, London, 1968.
75. Rocha-Rangel, E., Becher, P.F. and Lara-Curzio, E. : “Reactive Wetting of Alumina by Molten Aluminium Alloys”, Materials Science Forum, 442, (2003), 97-102.
76. Shen, P., Fujii, H., Matsumoto, T. and Nogi ,K. : “Critical Factors Affecting the Wettability of Alpha-Alumina by Molten Aluminium”, Journal of the American Ceramic Society, 87 (7), (2004), 1265-1273.
77. Saiz, E. and Tomasia, A.P. : “Kinetics of Metal-Ceramic Composite Formation by Reactive Penetration of Silicates with Molten Aluminium”, Journal of the American Ceramic Society, 81 (9), 1998, 2381-2193.
78. Brewer, L. and Searcy, A.W. : “The Gaseous Species of the Al-Al2O3 System”, Journal of the American Ceramic Society, 73 (11), (1951), 5308-5314.
79. Nakae, H., Inui, R., Hirata, Y., and Saito, H. : “Effect of Surface Roughness on Wettability”, Acta Materialia, 46 (7), (1998), 2313-2318.
80. Sobczak, N., Asthana, R., Ksiazek, M., Radziwill, W. and Mikulowski, M. : “The Effect of Temperature, Matrix Alloying and Substrate Coatings on Wettability and Shear Strength of Al/Al2O3 Couples”,: Metallurgical and Materials Transactions A , 35A (3), (2004), 911-923.
81. Ksiazek, M., Sobczak, N., Mikulowski, M., Radziwill, W. and Surowiak, I. : “Wetting and Bonding Strength in Al/Al2O3 System”, Materials Science and Engineering A, 324 (1-2), (2002), 162-167.
82. Li, J.G. : “Wetting and Interfacial Bonding of Metals with Ionocovalent Oxides”, Rare Metals, 10 , (1992), 255-261.
83. John, H. and Hausner, H. : “Influence of Oxygen Partial Pressure on Wetting Behaviour in the System Al/Al 2O3”, Journal of Materials Science Letters, 5, (1986), 549-551.
84. Asthana, R. : “An Analysis for Spreading Kinetics of Liquid Metal on Solids”, Metallurgical and Materials Transactions A, 26 (5), (1995), 1307-1311.
244
85. Gennes, P.G. : “Wetting: Statics and Dynamics”, Reviews of Modern Physics, 57 (3-1), (1985), 827-863.
86. Asthana, R. : “Dynamic Wetting Effects during Infiltration of Metals”, Scripta Materialia, 38 (8), (1998), 1203-1210.
87. Aksay, I.A., Hoge, C.E. and Pask, J.A. : “Wetting under Chemical Equilibrium and Non-Equilibrium Conditions”, Journal of Physical Chemistry, 781(12), (1974), 1178-1183.
88. Laurent, V., Chatain, D. and Eustathopoulos, N. : “Wettability of SiO2 and Oxidized SiC by Aluminium”, Materials Science and Engineering A, 135, (1991), 89-94.
89. Schmalzried, H. and Navrotsky, A. : Festkörperthermodynamik, Verlag Chemie, Weinheim, 1975.
90. Landry, K., Rado, C., Voitovich, R. and Eustathopoulos, N. : “Mechanism of Reactive Wetting: The Question of Triple Line Configuration”, Acta Materialia, 45 (7), (1997), 3079-3085.
91. Kritsalis, P., Coudurier, L. and Eustathopoulos, N. : “Contribution to the Study of Reactive Wetting in the CuTi/Al2O3 System”, Journal of Material Science, 26, (1991), 3400-3408.
92. Kritsalis, P., Drevet, B., Valigna, N. and Eustathopoulos, N. : “Wetting Transitions in Reactive Metal/Oxide Systems “, Scripta Metallurgica et Materialia, 30 (9), (1994), 1127-1132.
93. Espié, L., Drevet, B. and Eustathopoulos, N. : “Experimental Study of the Influence of Interfacial Energies and Reactivity of Wetting in Metal/Oxide Systems”, Metallurgical and materials transactions A, 25A (4), (1994), 599-605.
94. Friedrich, B., Hammerschmidt, J. and Steophasius, J.-C.: “Aluminothermische Reduktion von Titandioxid”, Erzmetall 56 (2), (2003), 82-93.
95. Sobczak, N., Stobierski, L., Radziwill, W., Ksiazek, M. and Warmuzek, M. : “Wettability and Interfacial Reactions in Al/TiO2”, Surface and Interface Analysis, 36, (2004), 1067-1070.
96. Arpon, R., Narciso, J., Louis, E. and Garcia-Cordovilla, C. : “Interfacial Reactions in Al/TiC Particulate Composites Produced by Pressure Infiltration”, Materials Science and Technology, 19 (9), (2003), 1225-1230.
97. Odegard, C. and Bronson, A. : “The Reactive Liquid Processing of Ceramic-Metal Composites”, JOM, 49 (6), (1997), 52-54.
98. Weirauch, D.A. : “Interfacial Phenomena Involving Liquid Metals and Solid Oxides in the Mg-Al-O System”, Journal of Materials Research, 3 , (1988), 729-739.
99. Nakae, H., Fujii, H. and Sato, K. : “Reactive Wetting of Ceramics by Liquid Metals”, Materials Transactions JIM, 33 (4), (1992), 400-406.
100. Shen, P., Fujii, H., Matsumoto, T. and Nogi-K.: “Critical factors affecting the wettability of alpha-alumina by molten aluminium”, Journal of the American Ceramic Society 87 (7), (2004), 1265-1273.
101. Zhou, X.B., and Hosson, M. : “Reactive Wetting of Liquid Metals on Ceramic Substrates”, Acta Materialia, 44 (2), (1996), 421-426.
102. Mortensen, A. : “Interfacial Phenomena in the Solidification Processing of MMC”, Materials Science and Engineering, A135, (1991), 1-11.
103. Garcia-Cordovilla, C., Louis, E. and Narciso, J. : “Pressure Infiltration of Packed Ceramic Particulates by Liquid Metals”, Acta Materialia, 47 (18), (1999), 4461-4479.
104. Asthana, R. and Rohatgi, P.Z. : “Melt Infiltration of Silicon Carbide Compacts” Zeitschrift der Metallkunde, 83 (12), (1992), 887-892.
105. Mortensen, A. and Michaud, V. : “Infiltration of Preforms by a Binary Alloy: Part I. Theory”, Metallurgical Transactions A, 21A (7), (1990), 2534-2547.
106 Jonas, T.R., Cornie, J.A. and Russell, K.C. : “Infiltration and Wetting of Alumina Particulate Preforms by Aluminium and Aluminium-Magnesium Alloys”, Metallurgical and Materials Transactions A, 26A, (1995), 1491-1497.
245
107. Travitzky, N.A. and Shlayen, A. : “Microstructure and Mechanical Properties of Al2O3/Cu–O Composites Fabricated by Pressureless Infiltration Technique”, Materials Science and Engineering, A244, (1998), 154-160.
108. Cardinal, S., R’Mili, M. and Merle, P. : “Improvement of High Pressure Infiltration Behaviour of Alumina Platelet Preforms: Manufacture and Characterization of Hybrid Preforms”, Composites Part A, 29A, (1998), 1433–1441.
109. Rootare, H.M. and Prenzlow, C.F.: “Surface Areas from Mercury Porosimeter Measurements”, Journal of Physical Chemistry, 71 (8),(1967), 2733-2743.
110. Leon, C.A.: “New perspectives in mercury porosimetry”, Advances in Colloid and Interface Science 76-77, (1998), 341-372.
111. Bear, J. : Dynamics of fluids in porous media, Dover Publications, 1988.
112. Mortensen, A., Masur, L.J., Cornie, J.A. and Flemings, M.C. : “Infiltration of Fibrous Preforms by a Pure Metal: Part I – Theory”, Metallurgical Transactions A, 20A (11), (1989), 2535-2547.
113. Dopler, T., Modaressi, A. and Michaud, V. : “Simulation of Metal Matrix Composite Isothermal Infiltration Processing”, Metallurgical and Materials Transactions B, 31B (4), (2000), 225-234.
114. Mattern, A. : Interpenetrierende Metall-Keramik-Verbundwerkstoffe mit isotropen und anisotropen Al2O3-Verstärkungen, Dissertation of the University of Karlsruhe, 2004.
115. Genuchten-Van, M.T.: “A closed form equation for predicting the hydraulic conductivity of unsaturated soils”, Journal of the Soil Science Society of America, 44, (1980), 892-898.
116. Cappleman, G.R., Watts, J.F. and Clyne, T.W. : “The Interface Region in Squeeze-Infiltrated Composites containing Delta-Alumina Fibre in an Aluminium Matrix”, Journal of Materials Science, 20, (1985), 2159-2168.
117. Kang, C.G. and Yun, K.S. : “Fabrication of MMC by the Die Casting Technique and the Evaluation of their Mechanical Properties”, Journal of Materials Processing Technology, 62, (1996), 116-123.
118. Jolly, M.R. and Haour, G.: “Fibre Reinforcement of Aluminium by Squeeze Casting”, Proceedings of the Solidification Processing Conference, 21-24 Sept 1987, Sheffield, Ed. H. Jones and Beech, Institute of Metals, (1987), 505-509.
119. Hegeler, H., Buschmann, R. and Elstner, I. : “Herstellung von faserverstärkten Leichtmetallen unter Benutzung von faserkeramischen Formkörpern (Preforms)”, Proceedings of the DGM Seminar: Metallische Verbundwerkstoffe - TU Clausthal - Germany, Ed. K.U. Kainer, (1994), 101-116.
120. Requena, G., Lasagni, F. and Degischer, H.P. : “Lokale Verformung in diskontinuierlich verstärktem Aluminium”, Proceedings of the 14. Symposium Verbundwerkstoffe und Werkstoffverbunde, 02.-04. Juli 2003, Vienna – Austria , (2003), 171-176.
121. Mortensen, A. and Wong, T. : “Infiltration of Fibrous Preforms by a Pure Metal: Part III - Capillary Phenomena”, Metallurgical Transactions A, 21A, (1990), 2257-2263.
122. Michaud, M.J., Sommer, J.L. and Mortensen, A. : “Infiltration of a Fibrous Preform by a Pure Metal: Part V: Influence of Preform Compressibility”, Metallurgical and Materials Transactions A, 30 (2), (1999), 471-482.
123. Lange, F.F., Velamakanni, B. and Evans, A. : “Method for Processing Metal-Reinforced Ceramic Composites”, Journal of the American Ceramic Society, 73 (2), (1990), 388-393.
124. Cichocki, F.C., Trumble, K. and Rödel, J. : “Tailored Porosity Gradients via Colloidal Infiltration of Compression-Molded Sponges”, Journal of the American Ceramic Society, 81 (6), (1998), 1661-1664.
125. Peng, H.X., Fan, Z., Evans, J.R.G. and Busfield, J. : “Microstructure of Ceramic Foams”, Journal of European Ceramic Society, 20 (7), (2000), 807-813.
126. Xu, Y. and Chung, D.D.L. : “Low-Volume-Fraction Particulate Preforms for making Metal-Matrix Composites by Liquid Metal Infiltration”, Journal of Materials Science, 33 (19), (1998), 4707–4709.
246
127. Corbin, S.F., Lee, J. and Qiao, X. : “Influence of Green Formulation and Pyrolyzable Particulates on the Porous Microstructure and Sintering Characteristics of Tape Cast Ceramics”, Journal of the American Ceramics Society, 84 (1), (2001), 41-47.
128. Mattern, A., Oberacker, R. and Hoffmann, M. : “Multiphase Ceramics by Computer-Controlled Pressure Filtration”, Journal of the European Ceramic Society, 24 (10-11), (2004), 3219-3225.
129. Konopka, K., Wodzynski, M. and Szafran, M. : “Fabrication of Al2O3-Al Composites by Infiltration Method”, Proceedings of the 12th International Scientific Conference, Achievements in Mechanical and Material Engineering, Gliwice-Poland, (2003), 491-494.
130. Cayron, C. : TEM Study of Interfacial Reactions and Precipitation Mechanisms in Al2O3 Short Fiber or High Volume Fraction SiC Particle Reinforced Al-4Cu-1Mg-0.5Ag Squeeze-Cast Composites, Dissertation EPFL- Ecole Polytechnique Fédérale de Lausanne- Switzerland., 2000.
131. Nagata, S. and Matsuda, K. : “Effects of some Factors on the Critical Preheating Temperature of Particles in Producing Metal-Particle Composites by Pressure Casting”, Journal of the Japan Foundrymen Society, 53 (12), (1981), 35-43.
132. Otte, B. and Reichstein, S. : German Patent DE10202184C1, Lasernitrieren von Aluminiumbasis-Verbundwerkstoffen, 2003.
133. Molina, J.M., Saravanan, R.A., Arpon, R., Garcia-Cordovilla, C., Louis, E. and Narciso, J. : “Pressure Infiltration of Liquid Aluminium into Packed SiC Particulate with a Bimodal Size Distribution”, Acta Materialia, 50 (2), (2002), 247-257.
134. Weber, L., Grüningen, C. and Frigeni, N. : “Entwicklung neuer teilchenverstärkter MMCs mit Cu- und Ag-Matrix für hohe thermische Leitfähigkeit und geringe thermische Dehnung”, Proceedings of the 14. Symposium Verbundwerkstoffe und Werkstoffverbunde, July 2003, Vienna- Austria , (2003), 802-807.
135. Ghomashchi, M.R. and Vikhrov, A. : “Squeeze Casting: An Overview”, Journal of Materials Processing Technology, 101 (1-3), (2000), 1-9.
136. Catterjee, S. and Daas, A.A. : “Effects of Pressure on Solidification of some Commercial Aluminium-Base Casting Alloys”, The British Foundryman, 11, (1990), 420-427.
137. Epanchistov, O.G. : “Structure and Properties of Metals Solidified under High Pressure”, Russian Casting Production, 6, (1972), 34-37.
138. Papworth, A. and Fox, P.: “Oxide film casting defects in squeeze cast metal matrix composites”, Materials Letters 29, (1996), 209-213.
139. Eskin, D., Du; Q., Ruvalcaba, D. and Katgerman, L. : “Experimental Study of Structure Formation in Binary Al-Cu Alloys at Different Cooling Rates”, Materials Science and Engineering A; 405 (1-2), (2005), 1-10.
140. Levi, C.G., Abbaschian, G.J. and Mehrabian, R. : “Interface Interactions During Fabrication of Aluminium Alloy- Alumina Fiber Composites”, Metallurgical Transactions A, 9 (5), (1978), 697-702.
141. Campbell, J. : “The Concept of Net Shape for Castings”, Materials and Design, 21 (4), (2000), 373-380.
142. Fagschlunger, C., Eichlseder, W., Sonsino, C.M., Poetter, K., Brune, M. and Gaenser, H.P. : “Abschätzung der tolerierbaren Oxidhautgröße in schwingend belasteten Druckgussbauteilen”, Giesserei Rundschau, 52 (3-4), (2005), 60-66.
143. Brunhuber, E.: Praxis der Druckgussfertigung, Schiele und Schön, Berlin, 1991.
144. Khalifa, W., Samuel, F-H. and Gruzleski, J.E.: “Iron intermetallic phases in the Al corner of the Al-Si-Fe system”, Metallurgical and Materials Transactions A; 34A (2), (2003), 807- 825.
145. Flores, V., Sukiennik, M., Castillejos, E., Acosta, G and Escobedo, B.: “A kinetic study on the nucleation and growth of the Al8FeMnSi2 intermetallic compound for aluminum scrap purification”, Intermetallics, 6 (3), (1998), 217- 227.
146. Rasmussen, N.W., Hansen, P.N. and Hansen, S.F. : “High Pressure Die Casting of Fibre Reinforced Aluminium by Preform Infiltration”, Materials Science and Engineering A 135, (1991), 41-43.
247
147. Eriksson, G. and Hack, K. : “Chemsage: A Computer-Program for the Calculation of Complex Chemical-Equilibria”, Metallurgical Transactions B, 21 (6), (1990), 1013-1023.
148. European Standard EN 1706, Aluminium and aluminium alloys. Castings. Chemical composition and mechanical properties, 1998.
149. Munz, D. and Fett, T. : Ceramics, Springer-Verlag, 1999.
150: FACTSAGE: Thermodynamic Software package, Version 5.2, GTT Technologies, Aachen -Germany.
151. Kingery, W.D., Bowen, H.K. and Uhlmann, D.R. : Introduction to Ceramics, Wiley Interscience Publication, 1976.
152. Gmelin, L. : Handbuch der anorganischen Chemie, Deutsche Chemische Gesellschaft, 1976.
153. Micrometrics Corporation Georgia-USA: Operators Manual ASAP 2010, 1997.
154. DMC2, Data sheet 90263, Cerdec AG, Germany, 2001.
155. Staudenecker, D. : Entwicklung von porösen Keramik-Preforms und Herstellung von Metall-Keramik-Verbundwerkstoffen, Diploma Thesis FH Aalen- Germany, 2001.
156. SGL Carbon group, online data sheet: SIGRAFIL C – milled or pelletized carbon fiber, www.sgl-carbon.com, 12.04.2006.
157. J.Rettenmaier & Söhne GmbH+Co.KG, online data sheet: Arbocell P290, www.jrs.de. 13.04.2006.
158. Nagel, A., Staudenecker, D., Huchler, B., Mattern, A., Neubrand, A. and Ulrich, O.: Final report of the research project “Interpenetrierte Metall-Keramik-Verbundwerkstoffe (Preform-MMC) für thermisch und tribologisch hochbeanspruchte Leichtbauteile”, Hochschule Aalen - Germany, 2006.
159. German Standard DIN 51918: Bestimmung der Rohdichte nach der Auftriebsmethode und der offenen Porosität durch Imprägnieren mit Wasser, November 1986.
160. Lide, D.R. : CRC Handbook of Chemistry and Physics, 76th Edition, CRC Press, 1995.
161. German Standard DIN-ENV 658: Mechanische Eigenschaften von keramischen Verbundwerkstoffen bei Raumtemperatur, May 1993.
162. Sambrook, R. : US Patent: 20040094284, Dytech Corporation LTD; Bicontinious composites, 2004.
163. Schneele, T. : Gefügedesign zur Zähigkeitssteigerung von Metall-Matrix-Verbundwerkstoffen, Diploma thesis FH Aalen- Germany, 2001.
164. Nagel, A., Staudenecker, D., Huchler, B., Schneider, G., Pfeifer-Schäller, I., and Klein, F. : “Preform-Verstärkung von Druckgussteilen”, Proceedings of VDG Giessereisymposium-FH Aalen-Germany, 2003, 71-77.
165. Bernthaler, T., Nagel, A., Huchler, B., Barth, T., Schneider, G. and Smolej, V. : “Quantitative Gefügeanalyse und Eigenschaftskorrelation an Metall-Keramik-Verbundwerkstoffen”, Proceedings of DGM Metallographie-Tagung 2004, Düsseldorf –Germany , 44-60.
166. American Standard ASTM-E 1876-99, Standard Test Method for Dynamic Young´s Modulus by Impulse Excitation of Vibration, 1999.
167. European Standard EN 843-1, Monolithic Ceramics: Mechanical Properties at Room Temperature. Part 1: Bending test, 1997.
168. European Standard EN 843-5, Monolithic Ceramics: Mechanical Properties at Room Temperature. Part 5: Statistics, 1997.
169. Kübler, J.J. : Fracture Resistance Testing of Monolithic and Composite Brittle Materials, ASTM STP 1409, (Editors.: J.A. Salem, G.D. Quinn, M.G. Jenkins), American Society for Testing and Materials, West Conshohocken, PA, USA, 2002, 93-106
170. Optimol Triboligical Testing, Manual SRV II testint system, 2000.
248
171. Gmelin, L. : Handbook of Inorganic and Organometallic Chemistry, Online Version of MDL Information Systems GmbH, 2005. Gmelin Institut fuer Anorganische Chemie und Grenzgebiete der Max-Planck-Gesellschaft zur Foerderung der Wissenschaften, Version 4 - June 2005.
172. Quested, P.N., Dinsdale, A.T., Robinson, J, Mills, K.C. and Hunt, J.D.: “The Prediction of the Thermophysical Properties and the Solidification Path of Commercial Alloys”, preliminary version handed over to Richard Harding – University of Birmingham - to be published, 1-38.
173. Irmscher, S.: Dispersability of carbon fibres in a ceramic slurry, Student research project report, University of Applied Sciences Aalen, Germany, 2005.
174. Schumann, H. : Metallographie, Deutscher Verlag für Grundstoffindustrie, Leipzig, 1991.
175. Neubrand, A.: “Metall-Keramik-Verbundwerkstoffe für die Automobilindustrie”, Konstruktion, 9, (2006), 10-11.
176. Chan, K.S., Jones, P. and Wang, Q.: “Fatigue Crack Growth and Fracture Paths in Sand Cast B319 and A356 Aluminium Alloys”, Materials Science and Engineering A, 341 (1-2), (2003), 18-34.
177. Ogrisa, E., Wahlen, A., Lüchinger, H. and Uggowitzer, P.J.: “On the Silicon Spheroidization in Al–Si Alloys”, Journal of Light Metals, 2 (4), (2002), 263-269.
178. Ogrisa, E., Wahlen, A., Lüchinger, H. and Uggowitzer, P.J.: “On the Silicon Spheroidization in Al–Si Alloys“, Journal of Light Metals, 2 (4), (2002), 263-269.
179. Kounga Njiwaa, A.B., Fett, T., Lupascua, D.C. and Rödel, J.: “Effect of Geometry and Electrical Boundary Conditions on R-curves for LZT ceramics”, Engineering Fracture Mechanics, 73 (3) (2006), 309-317.
180. Kuang, J.P., Harding, R.A. and Campbell, J. : “Investigations into Refractories as Crucible and Mould Materials for Melting and Casting of Gamma-Ti-Al alloys”, Materials Science and Technology, 16 (11-12), (2000), 1007-1016.
181. Choudhary, V.R.; Pandit, M.Y.: "Surface Properties of Magnesium Oxide obtained from Magnesium Hydroxide: Influence on Preparation and Calcination Conditions of Magnesium Hydroxide”, Applied Catalyst 71 (2), (1991), 266-274.
182. Wagner, G.W., Bartram, P.W., Koper, O. and Klabunde, K.J.: “Reactions of VX, GD, and HD with nanosize MgO”, Journal of Physical Chemistry B 103 (16), (1999), 3225-3228.
183. Capart, R., Khezamia, L. and Burnhamb, A.K.: “Assessment of Various Kinetic Models for the Pyrolysis of a Microgranular Cellulose” , Thermochimica Acta, 417 (1), (2004), 79–89.
184. Gulkova, D., Solcova, O. and Sradzil, M.: “Preparation of MgO Catalytic Support in Shaped Mesoporous High Surface Area Form”, Microporous and Mesoporous Materials, 76 (1-3);. 2004, 137-149.
185. Dam, J.C.: Field-scale water flow and solute transport, Doctoral Thesis Wageningen University - The Netherlands, http://library.wur.nl/wda/dissertations/dis2836.pdf, 2000.
186. Pokora, E.: “Preform 1D: Modelling of variably saturated flow in particulate preforms"; Introdution to the finite difference code - Preform 1D”, ARGE Metallguss, Aalen-Germany, 2005.
187. Niu, J.P., Sun, F.X., Jin, T., Yong, K.N., Guan, H.R. and Hu, Z.Q.: “Investigation into Deoxidation during Vacuum Induction Melting of Nickel Base Alloys using CaO crucibles”, Materials Science and Technology, 19, (2003), 435-439.
188. Sander, G.C., Parlange, J.Y., Kühnel, V., Hogarth, W.L., Lockington, D. and O'Kane, J.P.J.: “Exact Nonlinear Solution for Constant Flux Infiltration”, Journal of Hydrology, 97 (3-4), (1988), 341-346.
Related Documents