sustainability Article Ownership Concentration and Performance Recovery Patterns in the European Union Alexandra Horobet 1, * , Lucian Belascu 2 ,S , tefania Cristina Curea 3 and Alma Pentescu 2 1 Department of International Business and Economics, Bucharest University of Economic Studies, 010374 Bucharest, Romania 2 Department of Management, Marketing and Business Administration, “Lucian Blaga” University of Sibiu, 550324 Sibiu, Romania; [email protected] (L.B.); [email protected] (A.P.) 3 Department of Financial and Economic Analysis and Valuation, Bucharest University of Economic Studies, 010374 Bucharest, Romania; [email protected] * Correspondence: [email protected] Received: 30 December 2018; Accepted: 11 February 2019; Published: 13 February 2019 Abstract: Our study addresses the link between ownership concentration and corporate performance in the manufacturing sector in the European Union in an economic environment stressed by the global financial and sovereign debt crises. This is, to our knowledge, the first attempt to tackle differences between companies with different origin-countries in EU from the perspective of ownership concentration and corporate performance in a period marked by the adverse impact of the global financial crisis. Ownership concentration is measured by the number of shareholders and the percentage of their individual and collective holdings, while performance is measured by accounting-based and market-based indicators. Our results, based on a detailed and methodical statistical analysis, show a clear division between Western and Eastern companies in terms of ownership concentration and performance, with an impact on businesses’ recovery patterns. Overall, there is a positive link between ownership concentration and corporate performance in the case of Western companies, but not for Eastern-based companies. Moreover, ownership concentration has supported business recovery in EU, but particularly for Western companies. On the other hand, our results suggest that market investors’ assessment of corporate performance is disconnected from business fundamentals and do not acknowledge the role of ownership concentration (either beneficial of detrimental) for performance assessment. Keywords: ownership concentration; corporate performance; European Union; recovery; crisis 1. Introduction Our research investigates the link between ownership structure and corporate performance in a large sample of EU-based companies from the manufacturing sector (NACE Code Rev.2. C-Manufacturing primary code) and focuses on the idiosyncrasies of this link for Western versus Eastern EU-based companies. This division is interesting given the different economic structures of the two parts of EU, i.e., the developed part that includes mature market economies and the emerging or developing one that includes countries that shared a communist past but are in the process of building, with more or less success, advanced economies. When we understand this division in terms of EU membership, the first are older member-countries of the EU (before 2004), while the latter are newer member-countries (they became members of the organization after 2004). Moreover, existing empirical evidences, as outlined in Section 2 of the paper, suggest that ownership structures might play an even more important role in the latter type of countries, and better corporate frameworks are beneficial for companies originating from here. Sustainability 2019, 11, 953; doi:10.3390/su11040953 www.mdpi.com/journal/sustainability

Welcome message from author
This document is posted to help you gain knowledge. Please leave a comment to let me know what you think about it! Share it to your friends and learn new things together.
Transcript
sustainability
Article
Ownership Concentration and Performance RecoveryPatterns in the European Union
Alexandra Horobet 1,* , Lucian Belascu 2 , S, tefania Cristina Curea 3 and Alma Pentescu 2
1 Department of International Business and Economics, Bucharest University of Economic Studies,010374 Bucharest, Romania
2 Department of Management, Marketing and Business Administration, “Lucian Blaga” University of Sibiu,550324 Sibiu, Romania; [email protected] (L.B.); [email protected] (A.P.)
3 Department of Financial and Economic Analysis and Valuation, Bucharest University of Economic Studies,010374 Bucharest, Romania; [email protected]
* Correspondence: [email protected]
Received: 30 December 2018; Accepted: 11 February 2019; Published: 13 February 2019�����������������
Abstract: Our study addresses the link between ownership concentration and corporate performancein the manufacturing sector in the European Union in an economic environment stressed bythe global financial and sovereign debt crises. This is, to our knowledge, the first attempt totackle differences between companies with different origin-countries in EU from the perspectiveof ownership concentration and corporate performance in a period marked by the adverse impactof the global financial crisis. Ownership concentration is measured by the number of shareholdersand the percentage of their individual and collective holdings, while performance is measured byaccounting-based and market-based indicators. Our results, based on a detailed and methodicalstatistical analysis, show a clear division between Western and Eastern companies in terms ofownership concentration and performance, with an impact on businesses’ recovery patterns.Overall, there is a positive link between ownership concentration and corporate performance in thecase of Western companies, but not for Eastern-based companies. Moreover, ownership concentrationhas supported business recovery in EU, but particularly for Western companies. On the other hand,our results suggest that market investors’ assessment of corporate performance is disconnected frombusiness fundamentals and do not acknowledge the role of ownership concentration (either beneficialof detrimental) for performance assessment.
Keywords: ownership concentration; corporate performance; European Union; recovery; crisis
1. Introduction
Our research investigates the link between ownership structure and corporate performancein a large sample of EU-based companies from the manufacturing sector (NACE Code Rev.2.C-Manufacturing primary code) and focuses on the idiosyncrasies of this link for Western versusEastern EU-based companies. This division is interesting given the different economic structures of thetwo parts of EU, i.e., the developed part that includes mature market economies and the emerging ordeveloping one that includes countries that shared a communist past but are in the process of building,with more or less success, advanced economies. When we understand this division in terms of EUmembership, the first are older member-countries of the EU (before 2004), while the latter are newermember-countries (they became members of the organization after 2004). Moreover, existing empiricalevidences, as outlined in Section 2 of the paper, suggest that ownership structures might play an evenmore important role in the latter type of countries, and better corporate frameworks are beneficial forcompanies originating from here.
Sustainability 2019, 11, 953; doi:10.3390/su11040953 www.mdpi.com/journal/sustainability
Sustainability 2019, 11, 953 2 of 31
The research has three specific objectives, as follows: (i) to identify potential differences in theoverall performance of Western versus Eastern EU-based companies depending on their degree ofownership concentration, particularly after the global financial crisis of 2007–2009; (ii) to investigatepotential dissimilarities in the link between ownership structure and performance between WesternEU-based companies and Eastern EU-based companies; (iii) to study the patterns of economic recoveryof these companies after the crisis in a framework shaped by different ownership structures.
We describe the corporate performance of these companies by four widely-used financialindicators, accounting-based and market-based, each reflecting specific aspects of corporate activitiesand results, while the degree of ownership concentration is taken into account through anIndependence indicator provided by Bureau van Dijk that has scarcely been used in the literature sofar and considers the number of shareholders and the percentage of their individual and collectivecorporate holdings. Our thorough statistical analysis, detailed in Section 3 of the paper, is grounded onthe study of financial indicators’ distributions and their parameters over nine years and 2512 companies,and is accompanied by tests that objectify the link between ownership concentration and corporateperformance mitigated by the companies’ EU regions of origination.
To our knowledge, our research is the first to offer insight into the relationship between ownershipconcentration and corporate performance in the European Union after the global financial crisis of2007–2009, but also to evidence the patterns of business recovery within the EU after a turmoil period.The findings of our research point towards the existence of a clear difference between Western andEastern-based companies from the perspective of the link between ownership concentration andperformance, including patterns of businesses’ recovery. Specifically, ownership concentration is adifferentiating factor for the performance of Western-based companies, but not for the performance ofEastern-based companies; as such, Western companies with higher degrees of ownership concentrationhave enjoyed better accounting and market-based performance in the years following the financialturmoil of 2007–2009 and, to some extent, a higher level of ownership concentration has beenable to support quicker business recovery after the crisis. At the same time, our results reveal amarket “myopia” effect, reflected by the separation between performance as indicated by businessfundamentals and market valuation, visible in both cases of companies (Western and Eastern-based),but with a stronger point for Eastern-based companies.
The next section of our paper outlines the main pillars of the theoretical background of ourresearch and the most important evidenced results in the literature. Section 3 presents the data andresearch methodology, Section 4 shows and discusses the main results, and Section 5 concludes.
2. Theoretical Background and Empirical Evidences
One of the central and favorite topics in the corporate governance and financial managementresearch refers to the link between ownership structure and corporate performance, as a specificconcern derived from the agency theory. As such, research on this topic has flourished particularlyafter the publication of Jensen [1] and Demsetz [2], but overall with more attention paid to the natureof ownership—i.e., family versus non-family firms—than to the degree of ownership concentration.Moreover, the existing literature shows less concern about the relationship between ownership andperformance in the case of emerging economies, including those that are now part of the EuropeanUnion. At the same time, only recent investigations have tackled the issue of performance andownership in economic downturns or in stressed economic environments after major crises.
The crisis that originated in the United States’ financial sector at the end of 2007 and spreadtowards the European Union in 2008 represented a major shock for the real economy, by itsdramatic negative impact on corporate performance, subsequently reflected in stock returns.Moreover, the European Union confronted itself with a second crisis in 2009–2011, as a result ofunsustainable government debt in part of the countries that are members of the European andMonetary Union (EMU)—Greece, Ireland, Italy, Portugal and Spain. The rise in bond yield spreadsfor government-issued securities has led to the augmentation of volatility in financial markets,

Sustainability 2019, 11, 953 3 of 31
with negative impact on asset prices [3] and corporate performance. There is research that documentsthis negative impact of high levels of government debt on businesses through higher borrowingcosts [4] and by crowding out credit to the private sector, generating lower investment and growth [5].
The agency theory’s assumptions that business owners’ interests towards profit maximizationor shareholders’ value, on one hand; and managers’ interests towards increased compensation,lower levels of effort, preferred expenses and so on, on the other hand, collide, are well knownto scholars interested in corporate governance. The empirical research that attempted to confirm orcontradict these assumptions is extremely diverse and has focused on the consequences of the existingconflict between owners and shareholders, but also on the mechanisms and tools available to andused by shareholders in order to control managers and induce a conduct that maximizes shareholders’value, and not advantages to managers. In studies concentrated on managerial propensity towardsdiversification as detrimental for shareholders’ returns, the seminal paper of Amihud and Lev [6]concluded that large block shareholders are more likely to discourage the engagement of managementin mergers and acquisitions that reduce shareholders’ value; their results have been supported byother research [7–10], although Lane et al. [11] have contradicted these findings. The other stream ofresearch based on agency theory is more concerned with mechanisms available to shareholders aimedat inducing managers to maximize profits and shareholders’ value, building on the assumption thatlarge shareholders and, more generally, a more concentrated ownership, are able to reduce excessivediversification and enhance corporate performance, by a stricter management monitoring [12–14].Thus, Dzingai and Fakoya [15] find that effective corporate governance through a small effectiveboard and monitoring by an independent board result in increased firm financial performance.Still, Fama and Jensen [16] suggest that concentrated ownership above a certain level might prove tobe counterproductive, as it may entrench managers and expropriate the wealth of smaller, minorityshareholders. Their findings are confirmed by Morck et al. [17], Claessens et al. [18] or Benedsenand Nielsen [19]. More recently, Salvionni et al. [20] militate for sustainable corporate governancestructures that are valuable for shareholders and show that such structures reflect the differencesbetween insider and outsider ownership patterns.
Building on these contributions, literature has provided so far mixed answers to the question ofwhether a more concentrated ownership leads to improved corporate performance, showing that thelink between ownership and performance is intermediated by specific conditions and circumstances.Moreover, Demsetz [2] argues that the ownership structure of the firm is “an endogenous outcome ofcompetitive selection in which various cost advantages and disadvantages are balanced to arrive atan equilibrium organization of the firm” [2] (p. 384). A review of the main conceptual motivesbehind both a positive and a negative relationship between ownership concentration and firmperformance is provided by Wang and Shailer [21]. Thus, the positive relationship is based on(i) interest alignment between shareholders and managers—i.e., large shareholders may increasefirm value through more efficient management monitoring, but also by influencing managementdecisions directly; (ii) substitution of legal protection, particularly when a country’s legal system isweak; and (iii) signaling of commitment to bailout or not to expropriate, also with more effect oncountries with weak legal systems. On the other hand, ownership concentration has a number ofdetriments, leading to a negative relationship between concentrated ownership and performance,such as (i) increased conflicts of interest between controlling and minority shareholders; (ii) a negativeimpact on the firm’s ability to raise capital and manage risk—i.e., ownership concentration mayinduce a higher firm dependence on the controlling shareholders’ wealth or internal financing, as wellas reduced portfolio diversification and risk-bearing efficiency; (iii) a negative influence on othercorporate governance mechanisms—i.e., entrenching controlling shareholders or their representativesin management positions instead of employing better qualified outsiders may lead to reducedmonitoring efficiency of board of directors.
In this framework, a number of circumstances seems to mitigate the relationship betweenthe degree of ownership and performance, i.e., the level of concentration itself, the ownership
Sustainability 2019, 11, 953 4 of 31
identity and the performance measures, and they are interconnected. From the perspective ofownership concentration level, Demsetz and Lehn [22] show that there is an insignificant relationshipbetween ownership concentration and performance measured by accounting profitability; theirresults are supported by subsequent literature [23,24]. On the other hand, when market measuresof performance are used in the empirical literature, such as price-to-earnings ratio (PER), Tobin Qor market-to-book value, the results appear to indicate a positive relationship between ownershipconcentration and performance [12,25]. From this perspective, the study of Thomsen and Pedersen [26]challenges previous results by finding evidence on a bell-shaped relationship between ownershipshares, on one hand, and return on assets and market-to-book values, on the other hand, but theauthors do not identify any such effect when sales growth is considered as a performance indicator.Thus, they conclude that “ownership structure affects the priority attached to profit vs. growthobjectives” [26] (p. 702). On the other hand, the same study enforces the importance of the ownershipidentity, as a significant effect of ownership concentration on market-to-book value is found when thelargest owner is an institutional investor.
Ownership identity is a critical factor that determines firm performance and the literature onthe ownership nature and performance has been developed along the different types of significantshareholders: institutional investors, banks, families, foreign shareholders and insider ownership,with rather mixed results, which should not be surprising, given the argument by Thomsen andPedersen [26] that each type of ownership comes with different objectives and attributes that haveparticular implications for firm strategy and corporate performance.
The growing volume of corporate equity controlled by institutional investors and the resultingmore active role played by institutional investors in companies’ management has generated increasedinterest in the relationship between ownership and corporate performance. The most importantfeatures of institutional investors that control the link between ownership and performance stem fromtheir relative specialization as shareholders and their concrete measures of performance employed,connected to shareholder value and liquidity [26]. Thus, although in many cases they are not themajority shareholder, their presence as shareholders may pressure the other shareholders to take actionand determine managers to act in shareholders’ interest; moreover, they tend to have a preference forfirms that already have good corporate governance practices [27–29]. Generally, studies find positivelinks between the involvement of institutional investors and firm performance, fueled by institutionalinvestors’ pressures on management to align their decision to shareholders’ interests [30], higher boardremuneration and incentives for executives [31] and more efficient monitoring of managers [32].
Transforming managers in shareholders (i.e., insider ownership) is a solution proposed by Famaand Jensen [16] with the aim of aligning managers’ interest to the shareholders’ ones; subsequentstudies confirm that this type of ownership reduces the differences between managers and shareholders’goals and lowers agency costs [33,34]. The direct consequence is a positive relationship between insiderownership and corporate performance, as identified by Kaserer and Moldenhauer [35] or Bohrenand Odegaard [36], but the optimal level of insider ownership that leads to this positive relationshipdepends on company size, industry and firm performance [37]. On the other hand, there are studiesthat find a less convincing relationship between insider ownership and performance, such as Demsetzand Lehn [22].
A well-researched type of ownership and its implications on corporate performance is familyownership, often in the context of family as owner and manager at the same time; one critical attributeof this ownership is the wealth level of the family and, subsequently, its long-term commitment tofirm survival and success. The results are maybe less convincing than expected in terms of the familyownership impact and performance. On one hand, research supports the expropriation hypothesisat the expense of minority shareholders [16,38,39], particularly when shareholder protection is lowand control is high [40]. On the other hand, various studies find no influence of family ownership onperformance [27,41]. Also, Anderson and Reeb [42] investigate the S&P500 firms and conclude thatfamily firms perform better than nonfamily firms, thus contradicting the expropriation hypothesis and
Sustainability 2019, 11, 953 5 of 31
suggesting that family ownership is an effective organizational structure. Their results are confirmedby Chu [43] for Taiwan, by Cai et al. [44] for China, or by Isakov and Weisskopf [45] for Switzerland,but also by Barontini and Caprio [46] in a study on 675 publicly-traded corporations from 11 countriesin Continental Europe.
Foreign ownership seems to be an attribute of more performing companies, compared to localownership, building on the specific advantages of multinational companies explained by the renownedOLI (ownership-location-internalization) paradigm of Dunning [47,48]. In this framework, ownershipadvantages refer to tangible and intangible assets of the firm and materialize in the company’sability to transfer them over the border as part of the multinational company’s operations [49].Moreover, these advantages may be the benefit of being part of a network of affiliates, but, in allcases, the industry in which the company operates, its size, parent country and multinationality levelmitigate the relationship between foreign ownership and the performance gap between locally- versusforeign-owned companies [50,51]. Empirical research on the relationship between foreign ownershipand firm competitiveness and performance (measured by labor productivity, wages, profitability etc.)has generally indicated improved results for foreign-owned companies. For example, Grasseni [52] usesquantile regressions for the investigation of performance gaps between Italian domestic companies andforeign-owned firms between 1995 and 1997 and finds significant better performance for foreign-ownedfirms only in terms of higher wages and lower indebtedness, but not higher labor productivity, whileno conclusive result is obtained for profitability. On the other hand, Bentivogli and Mirenda [53]investigate the existence of a “foreign ownership premium” for domestic Italian companies acquiredby foreign companies between 2007 and 2013 and the results are positive in terms of profitabilityand financial safety, but only for companies operating in the services sector. In a larger scope studyon foreign-owned and domestic-owned companies in 34 transition and non-transition economies,Chacar et al. [54] confirm the improved performance associated to foreign ownership, but showthat a longer period of collaboration between a local affiliate and its foreign owner strengthens thissuperior performance.
Bank ownership plays an important role in some EU economies, such as Germany, but alsoin China, whereby banks provide privileged financial services to the companies they own (in theform of better access to capital, better financing costs, but also services that are less available tocommon customers) [55]. The empirical research on the relationship between bank ownershipand corporate performance is again mixed in terms of results, but Lin et al. [55] suggest that thisrelationship is intermediated by the institutional background; as such, Lin et al. [55] find that, for China,an emerging economy, companies where banks are the leading shareholders witness relatively pooroperating performance. On the other hand, studies on developed economies suggest a more positiveinfluence of bank ownership on corporate performance [56]. Moreover, studies on developed countriesdemonstrate that banks can provide improved monitoring of corporate borrowers and enhance firmperformance [57,58].
Government ownership is a special category, due to the likely pursuance of different objectivesthan maximization of shareholders’ value by the main owners; the literature indicates that governmentstend to enforce low output prices or employment as corporate objectives, thus encouraging a non-profitmaximizing behavior [59]. On the other hand, government ownership might create privileges forfirms in terms of access to credit or lower cost of capital, somehow in a similar manner to bankownership [26]. Empirical research has delivered so far inconclusive results on this topic, though.For example, Ang and King [60] find that Singaporean government-linked companies have highervaluations and better corporate governance than a control group of non-government-linked-companies.In the same vein, Sun and Tong [61] find that government ownership has a positive impact on partiallyprivatized state-owned enterprises in China, but the relationship is nonlinear and shows an invertedU-shape. At the other end, Bradbury [62] finds that government computer services in New Zealandhave recorded improved financial performance after moving from a government department to anautonomous agency, “which is consistent with the hypotheses concerning the deregulation of the

Sustainability 2019, 11, 953 6 of 31
product and labor markets and changes to the governance structure” (p. 157). In the same direction,Correia and Marques [63] study water utilities companies in Portugal, all owned entirely or partiallyby the government, and find that the average level of efficiency in these companies is higher whendirected by private management.
While the majority of academic studies has examined the causality linkages between ownershipand performance particularly for developed countries, the literature that has tackled this issue inthe case of developing or emerging economies is more recent, but its results seem to contradict atleast some of the findings for mature economies. The literature builds on the reality that developingeconomies, but also developed economies outside the Anglo-American part of the world, tend tohave more concentrated ownership [32,64], but also that corporate governance structures are typicallydominated by family ownership and high insider ownership [65,66]. As such, shareholders’ higherincentives towards management monitoring might be able to ease the conflict postulated by the agencytheory, but the substantial control of large shareholders over the business might be a source of newerconflicts, given the propensity of these shareholders in the direction of using firm resources in anunjustifiable manner from the perspective of firm objectives (in the form of excessive compensation,special dividends, related-party transactions), coupled with negative effects at the level of minorityshareholders [42].
The research focusing on developing economies considers that ownership structure plays a keyrole in corporate governance in these countries, even more important than the one in developedeconomies. As Zeitun and Tian [67] state, factors of various nature (economic, social, political andcultural) influence the corporate ownership structures around the world, but they may be ratherdifferent in developing economies, which limits the use of empirical models already calibratedfor developed economies [68]. At the same time, Claessens and Yurtoglu [69] show that bettercorporate frameworks benefit firms from emerging economies through increased performanceand more favorable treatment of all stakeholders. In a meta-study on ownership concentrationand corporate performance in emerging countries, based on 42 primary studies, [21] identify“substantial and robust negative underlying relations across countries” (p. 222), but also significantheterogeneity in the relationship between ownership concentration and performance from one countryto another. This heterogeneity is explained, in the authors’ views, by different levels of macroeconomicenvironment and shareholder protection. An interesting issue is raised by Aluchna and Kaminsky [70]in relation to research on emerging markets: Are the changes in ownership as a result of privatizations,economic and social reforms and the emergence of newly founded companies able to generate bettercorporate performance and firm value? Their study focused on Poland, an EU member now, but witha communist past and an economy with a significant degree of ownership concentration—they find astatistically significant negative relationship between ownership concentration and return on assets(ROA). At the same time, they do not find any significant evidence between financial investors andstate ownership, on one hand, and corporate performance, on the other hand, but there is a positivelink between ownership by industry investor and ROA. They thus confirm the previous study of Bedoand Acs [71].
Another research direction that received less interest in the academic literature refers to theinfluence of crises on the relationship between ownership and performance and, related to it, the abilityof firms with different ownership structures to recover after economic downturns. Only a fewpapers tackled this topic, but their results indicate that ownership concentration helped companiesto record better performance during the crises. Alfaro and Chen [72] compare the role of foreignownership during the global financial crisis with the non-crisis years for 12 million establishmentsin 53 countries, and using the annual percentage change in sales as performance measure theyconclude that foreign ownership mattered during the turbulent times, as multinational subsidiariesrecorded better performance than local peers; on the other hand, during the non-crisis years, the effectof foreign ownership on performance is insignificant. Listed Australian firms are examined bySaleh et al. [73] and the results show that companies with a higher ownership concentration recorded
Sustainability 2019, 11, 953 7 of 31
better performance measured by ROA and ROE for both family and non-family firms before andduring the recent global financial crisis. The impact of ownership on Indonesian firms’ performancein the 1997 and 2008 financial crises is studied by Hanafi et al. [74]; the authors find that ownershipconcentration is beneficial for performance, with a plus for large firms, in whose case the connectionbetween ownership concentration and firm value is stronger. Unfortunately, the impact of ownershipconcentration on firms’ recovery after crises has not been studied so far, and our research fills this gapfor EU companies.
Overall, regardless of the countries they tackle, the studies on corporate ownership and firmperformance differ in many attributes, such as performance measures used (accounting measuresversus market measures of performance), samples of companies used (listed versus non-listedcompanies, government versus privately-owned companies, small or big companies etc.), and researchmethodologies employed (multiple regressions, panel regressions, quantile regressions, surveys,stochastic frontier analysis benchmarking etc.), so it is not surprising to see their conflicting results.Demsetz and Villalonga [75] discuss the heterogeneity of these results and conclude that “the marketresponds to forces that create suitable ownership structures for firms, and this removes any predictablerelation between empirically observed ownership structures and firm rates of return” (p. 230).Given this predicament, our paper departs from the methodologies employed in the previous studiesand proposes a straightforward but thorough manner of investigating the relationship betweenownership concentration and corporate performance, by considering a classification of ownershipconcentration provided by Bureau van Dijk (BvD).
3. Data and Research Methodology
The data covers the period between 2008 and 2016, with annual frequency, and was collectedfrom the ORBIS Database provided by BvD. All data is in euro. Overall, a number of 3506 companieswith financial information available for at least one year during the analysis time interval wereincluded under the C-Manufacturing NACE primary code, but we have excluded unlisted anddelisted, as well as companies whose independence indicator calculated by BvD was mentioned as“U”—unknown. The final sample included 2512 companies listed on various European exchanges(as of 15 March 2018). Table 1 below shows the distribution of these companies according to theirorigin countries (i.e., the countries where companies’ headquarters are located) and Table A1 in theAppendix A shows the specific industry within the manufacturing sector of these companies, the latterbased on the declared NACE main 2-digit code. Countries have been included in one of our mainsamples, Western and Eastern-based companies, depending on their economic status (i.e., developedversus emerging markets) and past economic history. The number of companies from each industry isvariable, from 8 (C33-Repair and installation of machinery and equipment) to 286 (C26-Manufactureof computer, electronic and optical products).
Table 1. Companies’ distribution in samples based on their origin country.
Number of Companies Origin Countries
Western EU 1878
Austria (25); Belgium (55); Cyprus (16); Denmark (39); Finland (70);France (299); Germany (261); Greece (84); Ireland (39); Italy (125);
Luxembourg (17); Malta (1); Netherlands (58); Portugal (17);Spain (64); Sweden (290); United Kingdom (418)
Eastern EU 634Bulgaria (85); Croatia (63); Czech Republic (5); Estonia (5);
Hungary (14); Latvia (16); Lithuania (10); Poland (219);Romania (188); Slovakia (20); Slovenia (9)
Total EU 2512
The 2512 companies included in our final sample have been divided into four distinct categories,depending on their degree of ownership concentration, as indicated by the specific BvD Independenceindicators. The BvD Independence indicators, which consider the number of shareholders and
Sustainability 2019, 11, 953 8 of 31
the percentage of their individual and collective holdings, are noted by letters A, B, C, D and U,each signifying a different degree of ownership concentration, with supplementary clarifications thatrefer to the reliability of the attributed indicator to specific companies (see Table 3). As observablefrom the definitions of these indicators in Table 2, moving from A to D designates more concentratedcompanies from the ownership perspective.
Table 2. BvD independence indicators.
Indicator and Degreeof OwnershipConcentration
Main Significance Supplementary Clarifications
ALow ownershipconcentration
Independent companies—thosewith known recorded
shareholders, each of them havingless than 25% of direct or total
ownership of the company
A+—Companies with six or more shareholdersand/or companies in whose case the sum of direct
ownership is above 75%A—Companies with 4 or 5 shareholders and/or
companies that are the ultimate owners of anothercompany (given that the information is included in a
source), even when its shareholders arenot mentioned.
A−—Companies with 1 to 3 shareholders
BMedium-low
ownershipconcentration
Companies with known recordedshareholders with ownerships
below 50%, but with one or moreshareholders with ownership
percentages above 25%
B+, B and B−—allocated similarly to Aclarifications above
CMedium-high
ownershipconcentration
Companies with known recordedshareholders that have a total orcalculated ownership above 50%
C+—Companies with a sum of direct percentage ofownership is 50.01% or higher
C—Also assigned to companies in whose case anultimate owner is mentioned in a source, although its
ownership percentage is unknown
DHigh ownership
concentrationCompanies with a recorded shareholder that has a direct ownership above 50%
U Companies with an unknown degree of ownership concentration
The performance of companies included in our sample has been described by a number of fourwell-known financial indicators, each reflecting specific aspects of corporate activities and results,as presented in Table 3. Certainly, more indicators might be used to characterize financial performance,but we have decided to include in the analysis indicators that capture managerial performance thatmight be enforced by significant shareholders, as well as indicators that shed light on the capitalmarket assessment of this performance. Moreover, we have decided to exclude indicators thatare industry-dependent, as is the case with asset utilization efficiency (such as assets turnover) oroperational profitability [76–78].
Table 3. Financial performance indicators.
Performance Area Indicator Calculation
Economic profitability—overallmanagement’s performance 1. Return on assets (ROA) ROA =
Net pro f it a f ter taxNet revenue
Shareholder profitability—returnavailable to shareholders 2. Return on equity (ROE) ROE =
Net pro f it a f ter taxShareholders′s equity
Investment performance—returnobtained from invested capital 3. Return on invested capital (ROIC) ROIC =
Net operating pro f it a f ter taxCapital invested
Market assessment of corporateperformance—shows how capitalmarket investors value a firm’s
activity and operations
4. Tobin’s Q ratio (TQ) TQ =Market capitalization
Total assets

Sustainability 2019, 11, 953 9 of 31
Table 4 shows the number of companies in each sample depending on the firms’ origincountry—Western EU and Eastern EU, respectively—and their degree of ownership concentration.We notice that, as expected, the number of companies that are Western-based is higher than thenumber of companies from the Eastern part of EU, for all indicators included in our analysis. At thesame time, for Western EU companies, the categories based on A and D values of the independenceindicator dominate the samples (they have cumulative weights of approximately 70% in the totalnumber of companies), while B and D companies dominate the Eastern EU samples (with weightsbetween 70 and 75% in the total number of companies. This makes these three categories ofcompanies—with a highly concentrated ownership (D value) and with lower levels of ownershipconcentration (A and B value)—the most important in our research. Rather interesting, the groupsof companies with a medium-low level of ownership concentration, included in the C category ofthe independence indicator, hold a small weight in the overall number of companies and, as a result,we will show more prudence when interpreting the findings referring to these companies, particularlywhen the number of companies included is very small (i.e., below 20).
Our research proceeded as follows: (i) for each sample based on the four financial indicators,we describe their distributions by the mean (simple average), standard deviation and skewness-acrossthe four subsamples given by their degree of ownership concentration (or independence indicators),for each of the nine years included in our timeframe (2008–2016), and for Western and Eastern-basedsamples, respectively; (ii) we study variations in performance between companies with differentdegrees of ownership concentration and observe variations in corporate performance over time andbetween Western and Eastern-based companies; (iii) we implement analysis of variance (ANOVA)and calculate t-tests for independent samples for means between groups of companies with differentdegrees of ownership concentration; and (iv) we conduct the Kolmogorov-Smirnoff two samples test,a nonparametric that tests the hypothesis that two samples were drawn from different populationsand compares the distributions of companies from the two EU regions (West and East). The last twosteps of our research support the findings in the previous steps, by statistically endorsing or rejectingthem, and objectifies the observed link between ownership concentration and corporate performance.
Table 4. Company distribution in samples based on independence, financial indicators and companies’countries of origin within the EU.
Samples ROA ROE ROIC TQ
W E W E W E W E
A 504 29 514 29 463 20 486 22B 326 51 302 47 288 30 293 38C 39 9 39 8 37 6 40 7D 338 63 321 60 303 34 325 26
Total 1207 152 1176 144 1091 90 1144 93
W—Western EU, E—Eastern EU.
4. Results and Discussion
Our research is the first to explore the relationship between ownership concentration and corporateperformance in the European Union after the global financial crisis of 2007–2009, but also during thesovereign debt crisis of 2010–2011. Moreover, it sheds light on the influence of ownership concentrationon performance for the two main categories of countries within the EU, i.e., older EU members thatare developed and mature economies and newer EU emerging and developing countries. Before 1990,the Eastern part of the EU, characterized by centrally-planned economies and businesses owned by thestate, was out of reach for Western investors, but the transition to capitalism of these countries showedthe perspective of long-term growth. At the same time, as Healey [79] shows, this transition has beenaccompanied and mitigated by various political, economic, social and technological factors, including
Sustainability 2019, 11, 953 10 of 31
high rates of inflation and debt, low productivity and political instability, particularly during the ‘90s.As the presence of Western companies in the Eastern part of the Europe became stronger throughforeign direct investments, in a framework of liberalization of economic systems, the performancegap between the West and the East diminished, but is still present and uneven across countries.The accession to EU of Eastern countries became thus a paramount step that capitalized on theseprospects for economic growth and development—the enlargement process of the EU towards the Eaststarted in 2004 with nine Eastern countries (Czech Republic, Estonia, Hungary, Latvia, Lithuania, Malta,Poland, Slovakia and Slovenia) and continued in 2007 (Bulgaria and Romania) and 2013 (Croatia).As a result of their membership to EU, these economies and their businesses benefited from the freemovement of goods, services, labor and capital, as a fundamental pillar of the organization, but theyhave not managed to get the most out of it in a similar manner.
The period after the global financial crisis of 2007–2009 was a difficult one for all EU businessesregardless of the industry, as reflected by their unstable performance over the years, until 2016,shown by all indicators included in our research. This means that EU firms’ recovery after the crisiswas a strained process, also by taking into account the difficult and tense years 2010 and 2011, markedby the sovereign debt crisis at EU level. At the same time, there are marked differences betweenperformance patterns between 2008 and 2016 for firms from the two parts of the EU tackled in ouranalysis, Western and Eastern ones, as Eastern-based companies seem to have been more affected bythe financial turmoil that Western ones. Moreover, these differences are even more accentuated whenwe take into account firms’ ownership concentration, at least for some of the performance indicatorsused in our research.
We do not address the issue of industry effect on performance and focus only on industriesfrom the manufacturing sector. The results discussed below reveal, in our opinion, interesting thethought-provoking patterns of firm performance within EU, on one hand, as well as dissimilarities inthe relationship between ownership concentration and performance, on the other hand, in the twocategories of countries. In this section, we present the results of our research on the performancedifferences between EU companies with various degrees of ownership concentration at two levels:the Western EU countries level and the Eastern EU countries level. As mentioned above, there arereasons to believe that ownership concentration has different effects on companies from the two partsof EU and, as we present our results, these differences will be outlined and discussed.
4.1. Analysis of performance based on Return on assets (ROA)
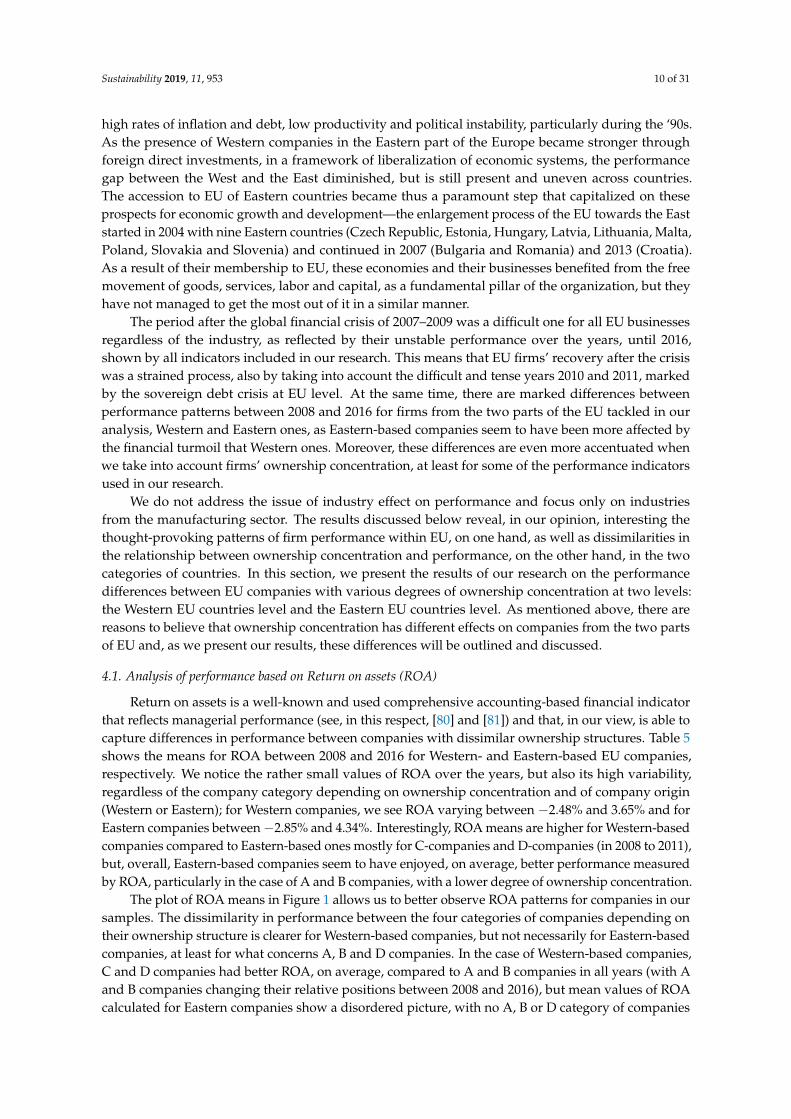
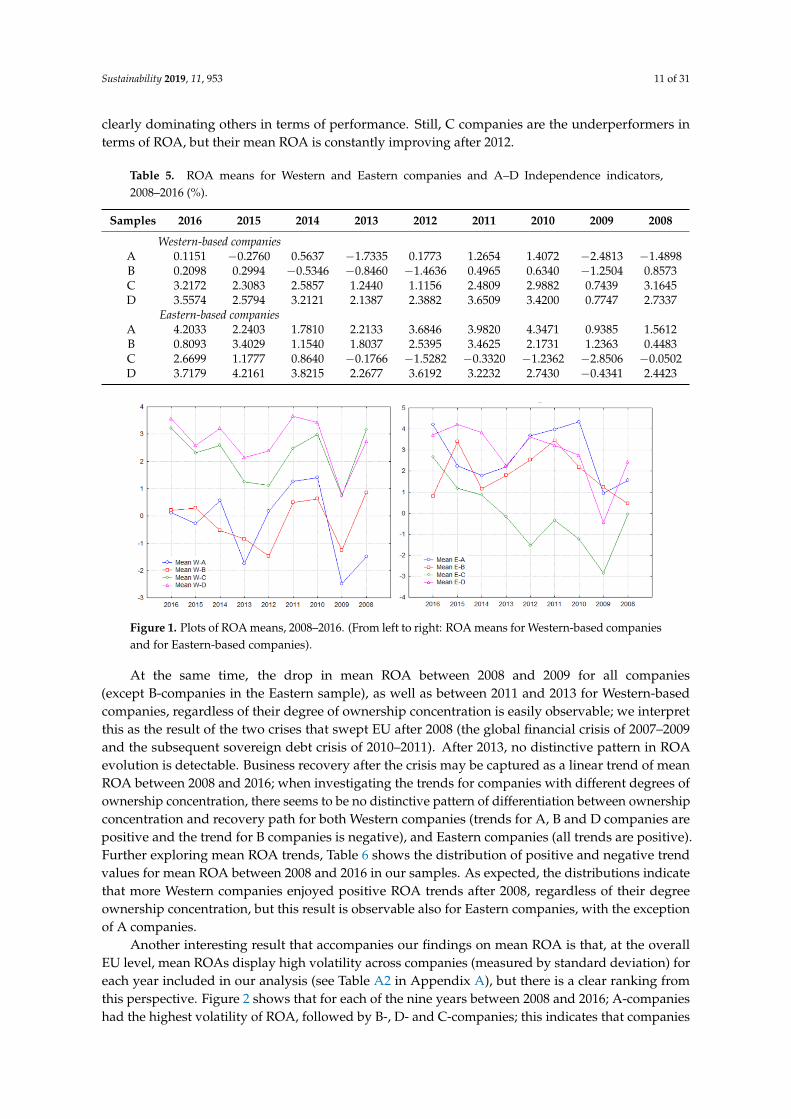
Return on assets is a well-known and used comprehensive accounting-based financial indicatorthat reflects managerial performance (see, in this respect, [80] and [81]) and that, in our view, is able tocapture differences in performance between companies with dissimilar ownership structures. Table 5shows the means for ROA between 2008 and 2016 for Western- and Eastern-based EU companies,respectively. We notice the rather small values of ROA over the years, but also its high variability,regardless of the company category depending on ownership concentration and of company origin(Western or Eastern); for Western companies, we see ROA varying between −2.48% and 3.65% and forEastern companies between−2.85% and 4.34%. Interestingly, ROA means are higher for Western-basedcompanies compared to Eastern-based ones mostly for C-companies and D-companies (in 2008 to 2011),but, overall, Eastern-based companies seem to have enjoyed, on average, better performance measuredby ROA, particularly in the case of A and B companies, with a lower degree of ownership concentration.
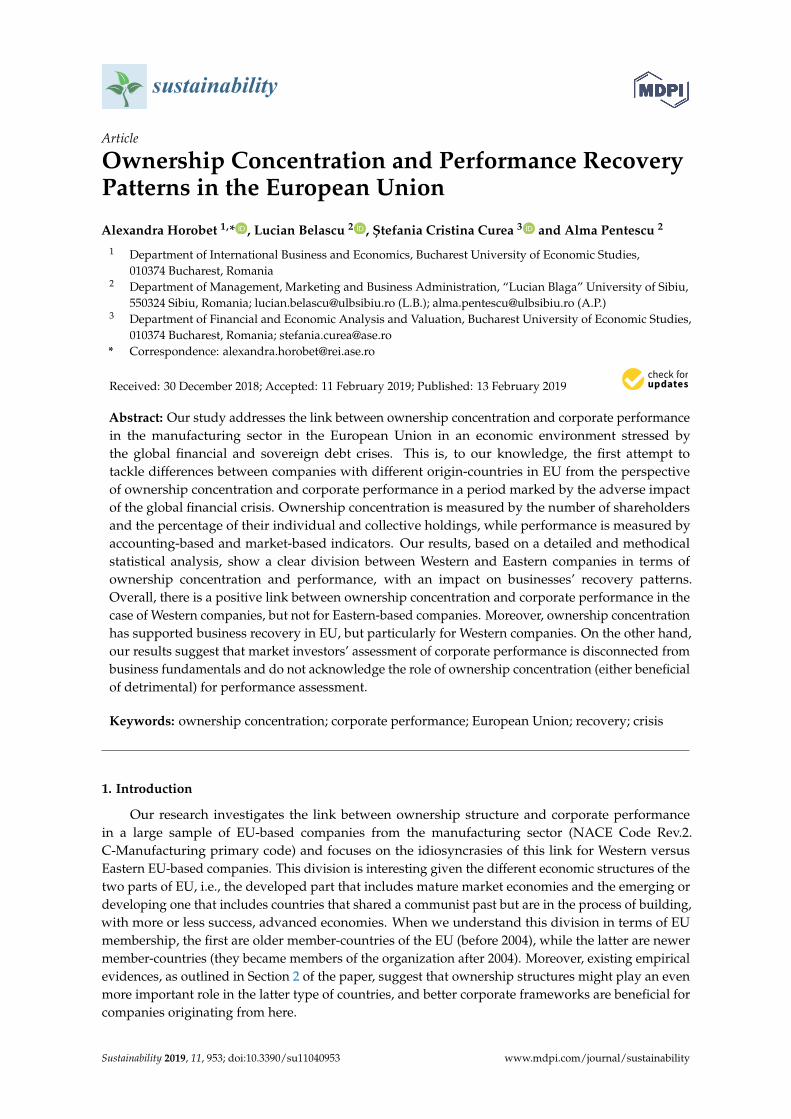
The plot of ROA means in Figure 1 allows us to better observe ROA patterns for companies in oursamples. The dissimilarity in performance between the four categories of companies depending ontheir ownership structure is clearer for Western-based companies, but not necessarily for Eastern-basedcompanies, at least for what concerns A, B and D companies. In the case of Western-based companies,C and D companies had better ROA, on average, compared to A and B companies in all years (with Aand B companies changing their relative positions between 2008 and 2016), but mean values of ROAcalculated for Eastern companies show a disordered picture, with no A, B or D category of companies
Sustainability 2019, 11, 953 11 of 31
clearly dominating others in terms of performance. Still, C companies are the underperformers interms of ROA, but their mean ROA is constantly improving after 2012.
Table 5. ROA means for Western and Eastern companies and A–D Independence indicators,2008–2016 (%).
Samples 2016 2015 2014 2013 2012 2011 2010 2009 2008
Western-based companiesA 0.1151 −0.2760 0.5637 −1.7335 0.1773 1.2654 1.4072 −2.4813 −1.4898B 0.2098 0.2994 −0.5346 −0.8460 −1.4636 0.4965 0.6340 −1.2504 0.8573C 3.2172 2.3083 2.5857 1.2440 1.1156 2.4809 2.9882 0.7439 3.1645D 3.5574 2.5794 3.2121 2.1387 2.3882 3.6509 3.4200 0.7747 2.7337
Eastern-based companiesA 4.2033 2.2403 1.7810 2.2133 3.6846 3.9820 4.3471 0.9385 1.5612B 0.8093 3.4029 1.1540 1.8037 2.5395 3.4625 2.1731 1.2363 0.4483C 2.6699 1.1777 0.8640 −0.1766 −1.5282 −0.3320 −1.2362 −2.8506 −0.0502D 3.7179 4.2161 3.8215 2.2677 3.6192 3.2232 2.7430 −0.4341 2.4423
Sustainability 2019, 11, x FOR PEER REVIEW 11 of 32
Western-based companies A 0.1151 −0.2760 0.5637 −1.7335 0.1773 1.2654 1.4072 −2.4813 −1.4898 B 0.2098 0.2994 −0.5346 −0.8460 −1.4636 0.4965 0.6340 −1.2504 0.8573 C 3.2172 2.3083 2.5857 1.2440 1.1156 2.4809 2.9882 0.7439 3.1645 D 3.5574 2.5794 3.2121 2.1387 2.3882 3.6509 3.4200 0.7747 2.7337
Eastern-based companies A 4.2033 2.2403 1.7810 2.2133 3.6846 3.9820 4.3471 0.9385 1.5612 B 0.8093 3.4029 1.1540 1.8037 2.5395 3.4625 2.1731 1.2363 0.4483 C 2.6699 1.1777 0.8640 −0.1766 −1.5282 −0.3320 −1.2362 −2.8506 −0.0502 D 3.7179 4.2161 3.8215 2.2677 3.6192 3.2232 2.7430 −0.4341 2.4423
The plot of ROA means in Figure 1 allows us to better observe ROA patterns for companies in our samples. The dissimilarity in performance between the four categories of companies depending on their ownership structure is clearer for Western-based companies, but not necessarily for Eastern-based companies, at least for what concerns A, B and D companies. In the case of Western-based companies, C and D companies had better ROA, on average, compared to A and B companies in all years (with A and B companies changing their relative positions between 2008 and 2016), but mean values of ROA calculated for Eastern companies show a disordered picture, with no A, B or D category of companies clearly dominating others in terms of performance. Still, C companies are the underperformers in terms of ROA, but their mean ROA is constantly improving after 2012.
Figure 1. Plots of ROA means, 2008–2016. (From left to right: ROA means for Western-based companies and for Eastern-based companies).
At the same time, the drop in mean ROA between 2008 and 2009 for all companies (except B-companies in the Eastern sample), as well as between 2011 and 2013 for Western-based companies, regardless of their degree of ownership concentration is easily observable; we interpret this as the result of the two crises that swept EU after 2008 (the global financial crisis of 2007–2009 and the subsequent sovereign debt crisis of 2010-2011). After 2013, no distinctive pattern in ROA evolution is detectable. Business recovery after the crisis may be captured as a linear trend of mean ROA between 2008 and 2016; when investigating the trends for companies with different degrees of ownership concentration, there seems to be no distinctive pattern of differentiation between ownership concentration and recovery path for both Western companies (trends for A, B and D companies are positive and the trend for B companies is negative), and Eastern companies (all trends are positive). Further exploring mean ROA trends, Table 6 shows the distribution of positive and negative trend values for mean ROA between 2008 and 2016 in our samples. As expected, the distributions indicate that more Western companies enjoyed positive ROA trends after 2008, regardless of their degree ownership concentration, but this result is observable also for Eastern companies, with the exception of A companies.
Figure 1. Plots of ROA means, 2008–2016. (From left to right: ROA means for Western-based companiesand for Eastern-based companies).
At the same time, the drop in mean ROA between 2008 and 2009 for all companies(except B-companies in the Eastern sample), as well as between 2011 and 2013 for Western-basedcompanies, regardless of their degree of ownership concentration is easily observable; we interpretthis as the result of the two crises that swept EU after 2008 (the global financial crisis of 2007–2009and the subsequent sovereign debt crisis of 2010–2011). After 2013, no distinctive pattern in ROAevolution is detectable. Business recovery after the crisis may be captured as a linear trend of meanROA between 2008 and 2016; when investigating the trends for companies with different degrees ofownership concentration, there seems to be no distinctive pattern of differentiation between ownershipconcentration and recovery path for both Western companies (trends for A, B and D companies arepositive and the trend for B companies is negative), and Eastern companies (all trends are positive).Further exploring mean ROA trends, Table 6 shows the distribution of positive and negative trendvalues for mean ROA between 2008 and 2016 in our samples. As expected, the distributions indicatethat more Western companies enjoyed positive ROA trends after 2008, regardless of their degreeownership concentration, but this result is observable also for Eastern companies, with the exceptionof A companies.
Another interesting result that accompanies our findings on mean ROA is that, at the overallEU level, mean ROAs display high volatility across companies (measured by standard deviation) foreach year included in our analysis (see Table A2 in Appendix A), but there is a clear ranking fromthis perspective. Figure 2 shows that for each of the nine years between 2008 and 2016; A-companieshad the highest volatility of ROA, followed by B-, D- and C-companies; this indicates that companies

Sustainability 2019, 11, 953 12 of 31
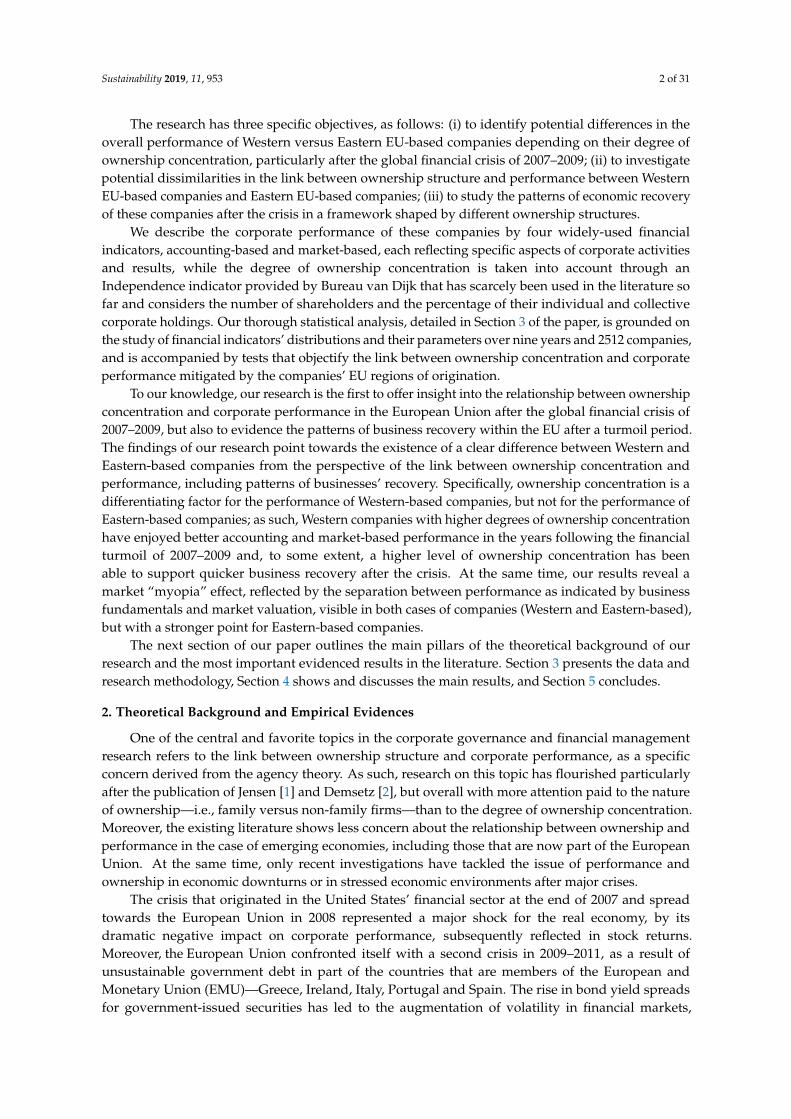
with a lower ownership concentration had, on average, more volatile ROA than companies with moreconcentrated ownership. The same result is also observed for Western-based companies, but not forEastern-based companies. In the latter case, no company category based on ownership concentrationdominates the others, but we notice the high variations in standard deviations of ROA for all companycategories between 2008 and 2016, maybe with the interesting exception of B-companies between 2010and 2013.
Table 6. Trends and number of positive and negative trend values for mean ROA, 2008–2016 (% of totalnumber of companies).
Sample Western-Based Companies Eastern-Based Companies
Trend Positive Negative Trend Positive Negative
A 0.1392 58.33% 41.67% 0.1262 48.28% 51.72%B −0.0270 50.31% 49.69% 0.0708 50.98% 49.02%C 0.0477 58.97% 41.03% 0.4554 66.67% 33.33%D 0.1130 56.21% 43.79% 0.3376 57.14% 42.86%
Another result worth mentioning is the similar range of volatility for Western- and Eastern-basedcompanies between 2008 and 2016, although there are notable differences between companies withvarious degrees of ownership concentration. As such, the range of volatilities across the years wasapproximately three times higher for Eastern companies with lower levels of ownership concentrationcompared to similar Western companies—12.362 against 3.823 for A companies and 8.531 against 3.422for B companies—and almost two times higher for C and D companies—6.199 compared to 4.197,and 8.162 compared to 4.665, respectively. This suggests a more difficult recovery of Eastern companieswith more dispersed ownership compared to their Western peers, based on a higher ROA instabilitybetween 2008 and 2016.
Sustainability 2019, 11, x FOR PEER REVIEW 12 of 32
Table 6. Trends and number of positive and negative trend values for mean ROA, 2008–2016 (% of total number of companies).
Sample Western-based companies Eastern-based companies
Trend Positive Negative Trend Positive Negative A 0.1392 58.33% 41.67% 0.1262 48.28% 51.72% B −0.0270 50.31% 49.69% 0.0708 50.98% 49.02% C 0.0477 58.97% 41.03% 0.4554 66.67% 33.33% D 0.1130 56.21% 43.79% 0.3376 57.14% 42.86%
Another interesting result that accompanies our findings on mean ROA is that, at the overall EU level, mean ROAs display high volatility across companies (measured by standard deviation) for each year included in our analysis (see Table A2 in Appendix), but there is a clear ranking from this perspective. Figure 2 shows that for each of the nine years between 2008 and 2016; A-companies had the highest volatility of ROA, followed by B-, D- and C-companies; this indicates that companies with a lower ownership concentration had, on average, more volatile ROA than companies with more concentrated ownership. The same result is also observed for Western-based companies, but not for Eastern-based companies. In the latter case, no company category based on ownership concentration dominates the others, but we notice the high variations in standard deviations of ROA for all company categories between 2008 and 2016, maybe with the interesting exception of B-companies between 2010 and 2013.
Another result worth mentioning is the similar range of volatility for Western- and Eastern-based companies between 2008 and 2016, although there are notable differences between companies with various degrees of ownership concentration. As such, the range of volatilities across the years was approximately three times higher for Eastern companies with lower levels of ownership concentration compared to similar Western companies—12.362 against 3.823 for A companies and 8.531 against 3.422 for B companies—and almost two times higher for C and D companies—6.199 compared to 4.197, and 8.162 compared to 4.665, respectively. This suggests a more difficult recovery of Eastern companies with more dispersed ownership compared to their Western peers, based on a higher ROA instability between 2008 and 2016.
Figure 2. Plots of ROA standard deviations, 2008–2016 (From left to right: ROA standard deviations for Western-based companies and for Eastern-based companies).
The distribution of ROA skewness between positive and negative values across the nine years included in our analysis is presented in Table 7, while Table A3 in the Appendix shows skewness values for all samples and years. Of the 36 skewness values for each sample (nine years multiplied by 4 company categories), the overwhelming majority are negative (33 for Western-based companies and 30 for Eastern-based companies). This suggests, on one hand, that more companies had ROA higher than the mean for a majority of years for each company category, but also that companies with very small ROA values compared to the mean are present in almost all samples. When comparing
Figure 2. Plots of ROA standard deviations, 2008–2016 (From left to right: ROA standard deviationsfor Western-based companies and for Eastern-based companies).
The distribution of ROA skewness between positive and negative values across the nine yearsincluded in our analysis is presented in Table 7, while Table A3 in the Appendix A shows skewnessvalues for all samples and years. Of the 36 skewness values for each sample (nine years multipliedby 4 company categories), the overwhelming majority are negative (33 for Western-based companiesand 30 for Eastern-based companies). This suggests, on one hand, that more companies had ROAhigher than the mean for a majority of years for each company category, but also that companies withvery small ROA values compared to the mean are present in almost all samples. When comparing theWestern and Eastern samples, negative skewness is more present, particularly for companies with lessconcentrated ownership; on the other hand, Eastern companies with more concentrated ownership had
Sustainability 2019, 11, 953 13 of 31
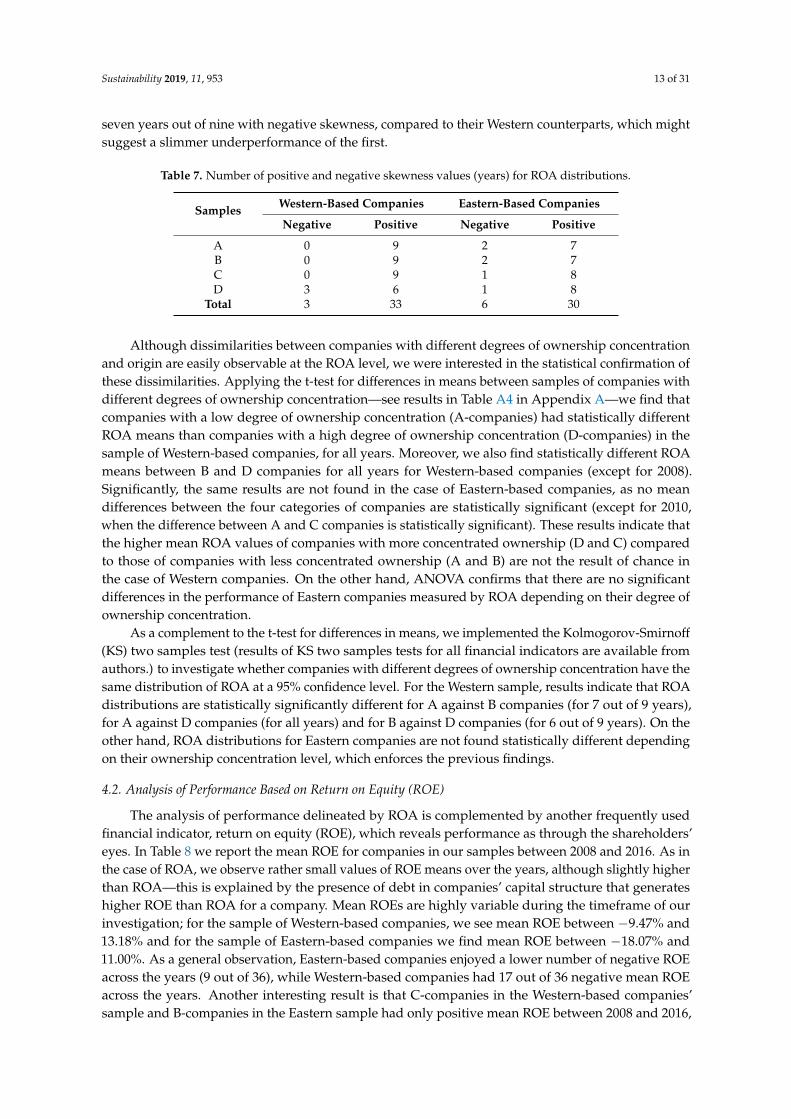
seven years out of nine with negative skewness, compared to their Western counterparts, which mightsuggest a slimmer underperformance of the first.
Table 7. Number of positive and negative skewness values (years) for ROA distributions.
Samples Western-Based Companies Eastern-Based Companies
Negative Positive Negative Positive
A 0 9 2 7B 0 9 2 7C 0 9 1 8D 3 6 1 8
Total 3 33 6 30
Although dissimilarities between companies with different degrees of ownership concentrationand origin are easily observable at the ROA level, we were interested in the statistical confirmation ofthese dissimilarities. Applying the t-test for differences in means between samples of companies withdifferent degrees of ownership concentration—see results in Table A4 in Appendix A—we find thatcompanies with a low degree of ownership concentration (A-companies) had statistically differentROA means than companies with a high degree of ownership concentration (D-companies) in thesample of Western-based companies, for all years. Moreover, we also find statistically different ROAmeans between B and D companies for all years for Western-based companies (except for 2008).Significantly, the same results are not found in the case of Eastern-based companies, as no meandifferences between the four categories of companies are statistically significant (except for 2010,when the difference between A and C companies is statistically significant). These results indicate thatthe higher mean ROA values of companies with more concentrated ownership (D and C) comparedto those of companies with less concentrated ownership (A and B) are not the result of chance inthe case of Western companies. On the other hand, ANOVA confirms that there are no significantdifferences in the performance of Eastern companies measured by ROA depending on their degree ofownership concentration.
As a complement to the t-test for differences in means, we implemented the Kolmogorov-Smirnoff(KS) two samples test (results of KS two samples tests for all financial indicators are available fromauthors.) to investigate whether companies with different degrees of ownership concentration have thesame distribution of ROA at a 95% confidence level. For the Western sample, results indicate that ROAdistributions are statistically significantly different for A against B companies (for 7 out of 9 years),for A against D companies (for all years) and for B against D companies (for 6 out of 9 years). On theother hand, ROA distributions for Eastern companies are not found statistically different dependingon their ownership concentration level, which enforces the previous findings.
4.2. Analysis of Performance Based on Return on Equity (ROE)
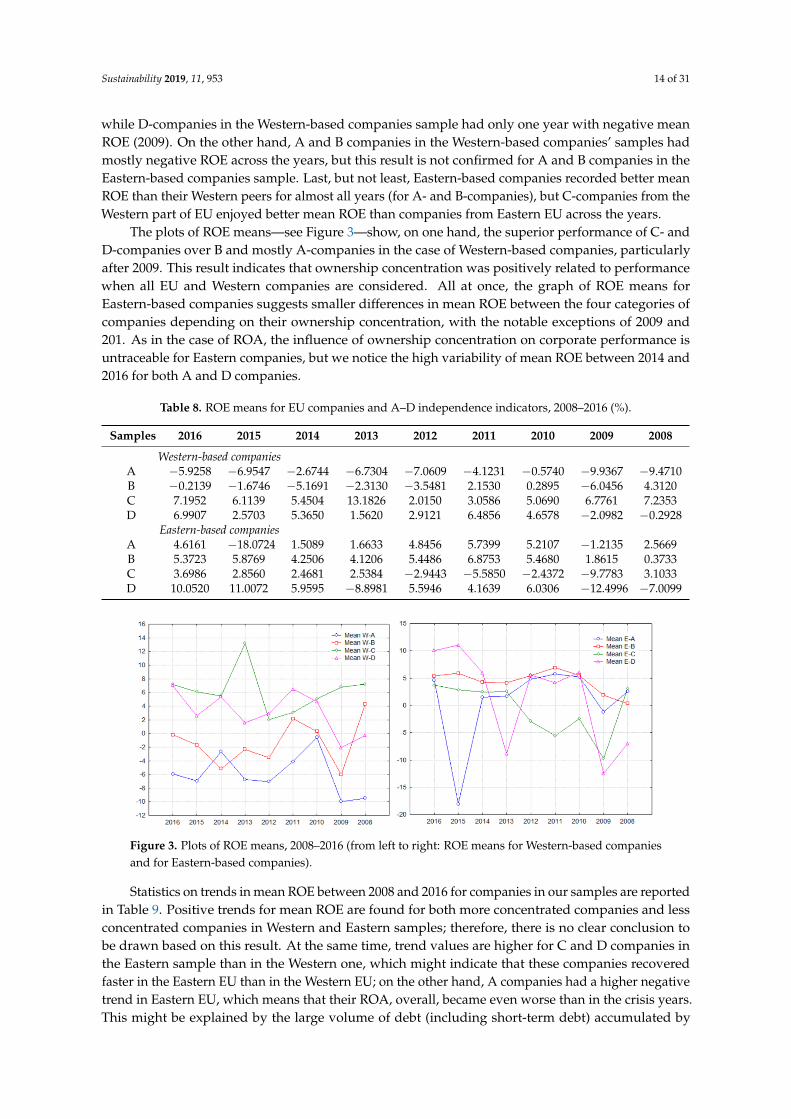
The analysis of performance delineated by ROA is complemented by another frequently usedfinancial indicator, return on equity (ROE), which reveals performance as through the shareholders’eyes. In Table 8 we report the mean ROE for companies in our samples between 2008 and 2016. As inthe case of ROA, we observe rather small values of ROE means over the years, although slightly higherthan ROA—this is explained by the presence of debt in companies’ capital structure that generateshigher ROE than ROA for a company. Mean ROEs are highly variable during the timeframe of ourinvestigation; for the sample of Western-based companies, we see mean ROE between −9.47% and13.18% and for the sample of Eastern-based companies we find mean ROE between −18.07% and11.00%. As a general observation, Eastern-based companies enjoyed a lower number of negative ROEacross the years (9 out of 36), while Western-based companies had 17 out of 36 negative mean ROEacross the years. Another interesting result is that C-companies in the Western-based companies’sample and B-companies in the Eastern sample had only positive mean ROE between 2008 and 2016,
Sustainability 2019, 11, 953 14 of 31
while D-companies in the Western-based companies sample had only one year with negative meanROE (2009). On the other hand, A and B companies in the Western-based companies’ samples hadmostly negative ROE across the years, but this result is not confirmed for A and B companies in theEastern-based companies sample. Last, but not least, Eastern-based companies recorded better meanROE than their Western peers for almost all years (for A- and B-companies), but C-companies from theWestern part of EU enjoyed better mean ROE than companies from Eastern EU across the years.
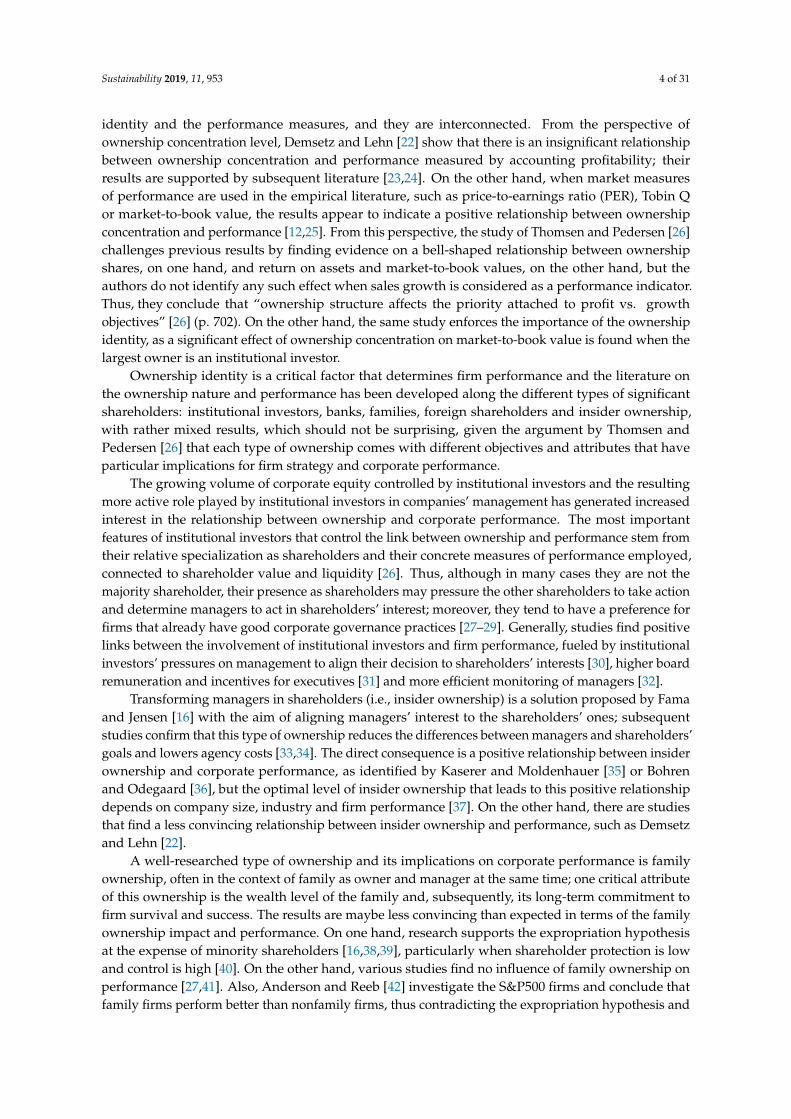
The plots of ROE means—see Figure 3—show, on one hand, the superior performance of C- andD-companies over B and mostly A-companies in the case of Western-based companies, particularlyafter 2009. This result indicates that ownership concentration was positively related to performancewhen all EU and Western companies are considered. All at once, the graph of ROE means forEastern-based companies suggests smaller differences in mean ROE between the four categories ofcompanies depending on their ownership concentration, with the notable exceptions of 2009 and201. As in the case of ROA, the influence of ownership concentration on corporate performance isuntraceable for Eastern companies, but we notice the high variability of mean ROE between 2014 and2016 for both A and D companies.
Table 8. ROE means for EU companies and A–D independence indicators, 2008–2016 (%).
Samples 2016 2015 2014 2013 2012 2011 2010 2009 2008
Western-based companiesA −5.9258 −6.9547 −2.6744 −6.7304 −7.0609 −4.1231 −0.5740 −9.9367 −9.4710B −0.2139 −1.6746 −5.1691 −2.3130 −3.5481 2.1530 0.2895 −6.0456 4.3120C 7.1952 6.1139 5.4504 13.1826 2.0150 3.0586 5.0690 6.7761 7.2353D 6.9907 2.5703 5.3650 1.5620 2.9121 6.4856 4.6578 −2.0982 −0.2928
Eastern-based companiesA 4.6161 −18.0724 1.5089 1.6633 4.8456 5.7399 5.2107 −1.2135 2.5669B 5.3723 5.8769 4.2506 4.1206 5.4486 6.8753 5.4680 1.8615 0.3733C 3.6986 2.8560 2.4681 2.5384 −2.9443 −5.5850 −2.4372 −9.7783 3.1033D 10.0520 11.0072 5.9595 −8.8981 5.5946 4.1639 6.0306 −12.4996 −7.0099
Sustainability 2019, 11, x FOR PEER REVIEW 14 of 32
across the years. Another interesting result is that C-companies in the Western-based companies’ sample and B-companies in the Eastern sample had only positive mean ROE between 2008 and 2016, while D-companies in the Western-based companies sample had only one year with negative mean ROE (2009). On the other hand, A and B companies in the Western-based companies’ samples had mostly negative ROE across the years, but this result is not confirmed for A and B companies in the Eastern-based companies sample. Last, but not least, Eastern-based companies recorded better mean ROE than their Western peers for almost all years (for A- and B-companies), but C-companies from the Western part of EU enjoyed better mean ROE than companies from Eastern EU across the years.
The plots of ROE means—see Figure 3—show, on one hand, the superior performance of C- and D-companies over B and mostly A-companies in the case of Western-based companies, particularly after 2009. This result indicates that ownership concentration was positively related to performance when all EU and Western companies are considered. All at once, the graph of ROE means for Eastern-based companies suggests smaller differences in mean ROE between the four categories of companies depending on their ownership concentration, with the notable exceptions of 2009 and 201. As in the case of ROA, the influence of ownership concentration on corporate performance is untraceable for Eastern companies, but we notice the high variability of mean ROE between 2014 and 2016 for both A and D companies.
Table 8. ROE means for EU companies and A-D independence indicators, 2008–2016 (%).
Samples
2016 2015 2014 2013 2012 2011 2010 2009 2008
Western-based companies A −5.9258 −6.9547 −2.6744 −6.7304 −7.0609 −4.1231 −0.5740 −9.9367 −9.4710 B −0.2139 −1.6746 −5.1691 −2.3130 −3.5481 2.1530 0.2895 −6.0456 4.3120 C 7.1952 6.1139 5.4504 13.1826 2.0150 3.0586 5.0690 6.7761 7.2353 D 6.9907 2.5703 5.3650 1.5620 2.9121 6.4856 4.6578 −2.0982 −0.2928
Eastern-based companies A 4.6161 −18.0724 1.5089 1.6633 4.8456 5.7399 5.2107 −1.2135 2.5669 B 5.3723 5.8769 4.2506 4.1206 5.4486 6.8753 5.4680 1.8615 0.3733 C 3.6986 2.8560 2.4681 2.5384 −2.9443 −5.5850 −2.4372 −9.7783 3.1033
D 10.0520 11.0072 5.9595 −8.8981 5.5946 4.1639 6.0306 −12.499
6 −7.0099
Figure 3. Plots of ROE means, 2008–2016 (from left to right: ROE means for Western-based companies and for Eastern-based companies).
Statistics on trends in mean ROE between 2008 and 2016 for companies in our samples are reported in Table 9. Positive trends for mean ROE are found for both more concentrated companies and less concentrated companies in Western and Eastern samples; therefore, there is no clear conclusion to be drawn based on this result. At the same time, trend values are higher for C and D
Figure 3. Plots of ROE means, 2008–2016 (from left to right: ROE means for Western-based companiesand for Eastern-based companies).
Statistics on trends in mean ROE between 2008 and 2016 for companies in our samples are reportedin Table 9. Positive trends for mean ROE are found for both more concentrated companies and lessconcentrated companies in Western and Eastern samples; therefore, there is no clear conclusion tobe drawn based on this result. At the same time, trend values are higher for C and D companies inthe Eastern sample than in the Western one, which might indicate that these companies recoveredfaster in the Eastern EU than in the Western EU; on the other hand, A companies had a higher negativetrend in Eastern EU, which means that their ROA, overall, became even worse than in the crisis years.This might be explained by the large volume of debt (including short-term debt) accumulated by
Sustainability 2019, 11, 953 15 of 31
Eastern-based EU companies in the turbulent years of the crisis and then recession. As in the case ofROA, trends are split in half between positive and negative in the Western sample, which indicates thelack of a sustained positive or negative performance of a specific company category. At the same time,as a confirmation of the previous statement referring to the recovery of Eastern companies, we noticethat almost two-thirds of Eastern companies in the B, C and D categories had positive ROE trends.
Table 9. Number of positive and negative trend values for ROE, 2008–2016 (% of total numberof companies).
Samples Western-Based Companies Eastern-Based Companies
Trend Positive Negative Trend Positive Negative
A 0.0247 54.86% 45.14% −0.8977 51.72% 48.28%B 0.9485 49.34% 50.66% 0.4475 76.60% 23.40%C −0.0428 51.28% 48.72% 0.9703 62.50% 37.50%D −0.1760 52.96% 47.04% 2.0927 61.67% 38.33%
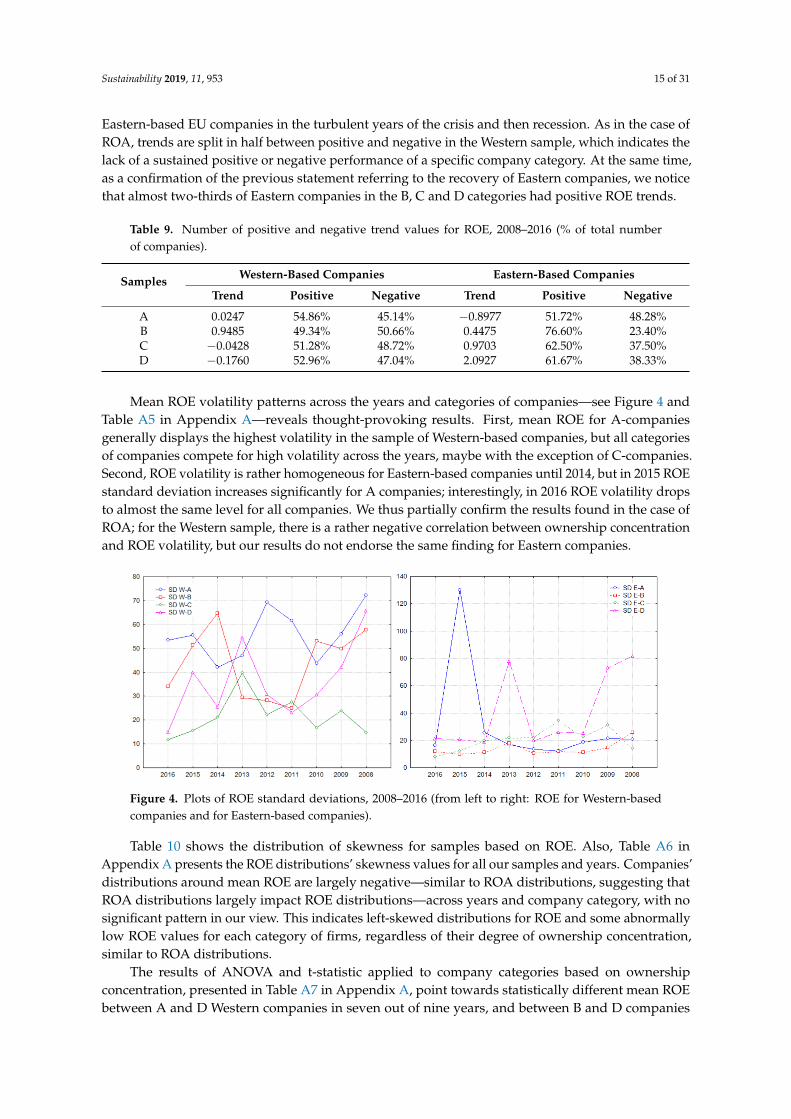
Mean ROE volatility patterns across the years and categories of companies—see Figure 4 andTable A5 in Appendix A—reveals thought-provoking results. First, mean ROE for A-companiesgenerally displays the highest volatility in the sample of Western-based companies, but all categoriesof companies compete for high volatility across the years, maybe with the exception of C-companies.Second, ROE volatility is rather homogeneous for Eastern-based companies until 2014, but in 2015 ROEstandard deviation increases significantly for A companies; interestingly, in 2016 ROE volatility dropsto almost the same level for all companies. We thus partially confirm the results found in the case ofROA; for the Western sample, there is a rather negative correlation between ownership concentrationand ROE volatility, but our results do not endorse the same finding for Eastern companies.
Sustainability 2019, 11, x FOR PEER REVIEW 15 of 32
companies in the Eastern sample than in the Western one, which might indicate that these companies recovered faster in the Eastern EU than in the Western EU; on the other hand, A companies had a higher negative trend in Eastern EU, which means that their ROA, overall, became even worse than in the crisis years. This might be explained by the large volume of debt (including short-term debt) accumulated by Eastern-based EU companies in the turbulent years of the crisis and then recession. As in the case of ROA, trends are split in half between positive and negative in the Western sample, which indicates the lack of a sustained positive or negative performance of a specific company category. At the same time, as a confirmation of the previous statement referring to the recovery of Eastern companies, we notice that almost two-thirds of Eastern companies in the B, C and D categories had positive ROE trends.
Table 9. Number of positive and negative trend values for ROE, 2008–2016 (% of total number of companies).
Samples
Western-based companies Eastern-based companies Trend Positive Negative Trend Positive Negative
A 0.0247 54.86% 45.14% −0.8977 51.72% 48.28% B 0.9485 49.34% 50.66% 0.4475 76.60% 23.40% C −0.0428 51.28% 48.72% 0.9703 62.50% 37.50% D −0.1760 52.96% 47.04% 2.0927 61.67% 38.33%
Mean ROE volatility patterns across the years and categories of companies—see Figure 4 and Table A5 in Appendix—reveals thought-provoking results. First, mean ROE for A-companies generally displays the highest volatility in the sample of Western-based companies, but all categories of companies compete for high volatility across the years, maybe with the exception of C-companies. Second, ROE volatility is rather homogeneous for Eastern-based companies until 2014, but in 2015 ROE standard deviation increases significantly for A companies; interestingly, in 2016 ROE volatility drops to almost the same level for all companies. We thus partially confirm the results found in the case of ROA; for the Western sample, there is a rather negative correlation between ownership concentration and ROE volatility, but our results do not endorse the same finding for Eastern companies.
Figure 4. Plots of ROE standard deviations, 2008–2016 (from left to right: ROE for Western-based companies and for Eastern-based companies).
Table 10 shows the distribution of skewness for samples based on ROE. Also, Table A6 in Appendix presents the ROE distributions’ skewness values for all our samples and years. Companies’ distributions around mean ROE are largely negative—similar to ROA distributions, suggesting that ROA distributions largely impact ROE distributions—across years and company category, with no significant pattern in our view. This indicates left-skewed distributions for ROE and some abnormally low ROE values for each category of firms, regardless of their degree of ownership concentration, similar to ROA distributions.
Figure 4. Plots of ROE standard deviations, 2008–2016 (from left to right: ROE for Western-basedcompanies and for Eastern-based companies).
Table 10 shows the distribution of skewness for samples based on ROE. Also, Table A6 inAppendix A presents the ROE distributions’ skewness values for all our samples and years. Companies’distributions around mean ROE are largely negative—similar to ROA distributions, suggesting thatROA distributions largely impact ROE distributions—across years and company category, with nosignificant pattern in our view. This indicates left-skewed distributions for ROE and some abnormallylow ROE values for each category of firms, regardless of their degree of ownership concentration,similar to ROA distributions.
The results of ANOVA and t-statistic applied to company categories based on ownershipconcentration, presented in Table A7 in Appendix A, point towards statistically different mean ROEbetween A and D Western companies in seven out of nine years, and between B and D companies

Sustainability 2019, 11, 953 16 of 31
in four out of nine years. At the same time, no systematically statistically significant differencesbetween A and B companies or B and C companies are found—t-statistics have values indicatingsignificant differences in only a few years in our timeframe. As in the ROA case, no such statisticallysignificant differences in mean ROE are found in the Eastern-based companies’ sample. These resultspoint towards a positive correlation between ownership concentration and performance measuredby ROE for companies from mature EU economies, but also indicate that the influence of ownershipconcentration on the performance of companies from newer and developing EU economies doesnot exist.
Table 10. Number of positive and negative skewness values for ROE distributions.
Samples Western-Based Companies Eastern-Based Companies
Positive Negative Positive Negative
A 0 9 0 9B 1 8 1 8C 1 8 0 9D 0 9 2 7
Total 2 34 3 33
For what concerns the results of the KS two sample test, they confirm the findings when ROAwas used as a performance indicator; as such, for Western-based companies, ROE distributions aredifferent in a statistically significant way for A against D companies (for all years), for A against Bcompanies (in six out of nine years) and also for B against D companies (in four out of nine years).At the same time, ROA distributions for Eastern-based companies indicate that companies cannot bedifferentiated on the basis of their ownership concentration when performance is at stake.
4.3. Analysis of Performance Based on Return on Invested Capital (ROIC)
Return on invested capital (ROIC) is the return that shows how well a company is using itsavailable capital for investments, i.e., its equity and debt. This is one of the key ratios followedby capital market investors, along with ROA and ROE, as it provides them with needed insightinto a company’s ability to generate operating or “core” income and profits from the used capital.The companies included in our two major samples (Western and Eastern EU companies) enjoyedvarious mean ROIC between 2008 and 2016, as shown in Table 11, but the most important observationis that all categories of companies (depending on their origin and ownership concentration level),with only one exception (C-companies in the Eastern sample, for 2012) had positive ROIC for all yearsin our timeframe. At the same time, mean ROIC seems to have been highly variable from one year tothe other; for Western-based companies between 0.13% and 12.19%, and for Eastern-based companiesbetween −1.35% and 14.75%. At the same time, C-companies in Western EU countries enjoyed higherROIC than their peers in Eastern EU countries in all years, but A and B Eastern-based companiesperformed better than their Western peers in all years. This might show a higher propensity towardsinvesting in the Eastern part of the EU and a quicker recovery after the crisis, but might also be aneffect of smaller average size of Eastern-based companies—this is connected to higher investmentrates, as corporate finance theory and empirical evidences show [82].
Figure 5 shows the graphical representation of results in Table 11; the dominance of C andparticularly D-companies over B and A-companies in the Western sample for all the years includedin our analysis is clear, but also a fluctuating mean ROIC for all categories of companies, in bothsamples. On the other hand, the mean ROIC plot for Eastern-based companies shows a completelydifferent landscape; in a similar fluctuating ROIC framework, no dominance of a specific companycategory over the others in terms of ownership concentration is observable—given the small size ofthe C-companies sample, it is prudent to not interpret ROIC values for these companies as necessarilyshowing an underperformance. This enforces the results obtained for ROA and ROE: companies withmore concentrated ownership were able to generate superior performance in the years after the crisis

Sustainability 2019, 11, 953 17 of 31
and even during a crisis (the 2010–2011 sovereign debt crisis) compared to companies with moredispersed ownership, but only in mature EU economies. For the Eastern part of EU, such positiverelationship between ownership concentration and performance is not observable.
Table 11. ROIC means for EU companies and A–D Independence indicators, 2008–2016 (%).
Samples 2016 2015 2014 2013 2012 2011 2010 2009 2008
Western-based companiesA 1.8655 0.5810 2.4779 1.0508 2.2354 4.7422 5.0884 0.8202 0.1360B 4.0552 3.4282 4.8946 4.5289 1.3095 4.5564 5.5209 1.8603 5.9694C 11.4174 12.1078 12.1960 8.9760 8.0057 8.5635 8.2741 3.4166 11.2853D 10.2994 7.8348 11.4249 7.5318 7.8853 10.4658 9.6754 9.0843 9.3945
Eastern-based companiesA 8.7865 11.0544 10.3973 5.4602 11.3607 12.7659 12.4186 7.3653 11.4317B 10.1859 10.0516 7.0892 9.5137 10.0737 10.7291 9.0777 9.9992 13.3250C 4.0233 1.9418 1.7795 1.3655 −1.3567 1.7047 0.9828 −0.4210 9.4855D 0.8941 11.4453 8.7338 10.6777 8.6389 9.3604 7.8595 4.3715 14.7589
Sustainability 2019, 11, x FOR PEER REVIEW 17 of 32
C 11.4174 12.1078 12.1960 8.9760 8.0057 8.5635 8.2741 3.4166 11.2853 D 10.2994 7.8348 11.4249 7.5318 7.8853 10.4658 9.6754 9.0843 9.3945
Eastern-based companies A 8.7865 11.0544 10.3973 5.4602 11.3607 12.7659 12.4186 7.3653 11.4317 B 10.1859 10.0516 7.0892 9.5137 10.0737 10.7291 9.0777 9.9992 13.3250
C 4.0233 1.9418 1.7795 1.3655 −1.3567 1.7047 0.9828 −0.4210
9.4855
D 0.8941 11.4453 8.7338 10.6777 8.6389 9.3604 7.8595 4.3715 14.7589
Figure 5 shows the graphical representation of results in Table 11; the dominance of C and particularly D-companies over B and A-companies in the Western sample for all the years included in our analysis is clear, but also a fluctuating mean ROIC for all categories of companies, in both samples. On the other hand, the mean ROIC plot for Eastern-based companies shows a completely different landscape; in a similar fluctuating ROIC framework, no dominance of a specific company category over the others in terms of ownership concentration is observable—given the small size of the C-companies sample, it is prudent to not interpret ROIC values for these companies as necessarily showing an underperformance. This enforces the results obtained for ROA and ROE: companies with more concentrated ownership were able to generate superior performance in the years after the crisis and even during a crisis (the 2010–2011 sovereign debt crisis) compared to companies with more dispersed ownership, but only in mature EU economies. For the Eastern part of EU, such positive relationship between ownership concentration and performance is not observable.
Figure 5. Plots of ROIC means, 2008–2016 (from left to right: ROIC means for Western-based companies and for Eastern-based companies).
Table 12 confirms EU companies’ difficulties in finding investment opportunities that generate interesting and growing ROIC after 2008, regardless of their origin countries. As such, with the exception of C and D companies, but only in the Western sample, all other categories of companies recorded negative trend values for mean ROIC after 2008. Moreover, Table 12 also shows a different picture of trend distribution in ROIC terms compared to ROA and ROE among companies in our samples, as A, B and D companies have all higher percentages of companies with negative ROIC trends between 2008 and 2016 in the Western sample. Moreover, similar companies in the Eastern EU sample had a significantly higher percentage of companies with downward trends (60%, 56% and 58%, respectively), which is visible in the overall evolution of ROIC for these companies in Figure 5. As for C-companies the percentage of companies with a positive trend is significantly higher compared to companies with downward trends for Western-based companies (64.86%), but in the Eastern sample, C-companies are equally divided between positive and negative trends.
Table 12. Number of positive and negative trend values for ROIC, 2008–2016 (% of total number of companies).
Western-based companies Eastern-based companies
Figure 5. Plots of ROIC means, 2008–2016 (from left to right: ROIC means for Western-based companiesand for Eastern-based companies).
Table 12 confirms EU companies’ difficulties in finding investment opportunities that generateinteresting and growing ROIC after 2008, regardless of their origin countries. As such, with theexception of C and D companies, but only in the Western sample, all other categories of companiesrecorded negative trend values for mean ROIC after 2008. Moreover, Table 12 also shows a differentpicture of trend distribution in ROIC terms compared to ROA and ROE among companies in oursamples, as A, B and D companies have all higher percentages of companies with negative ROICtrends between 2008 and 2016 in the Western sample. Moreover, similar companies in the Eastern EUsample had a significantly higher percentage of companies with downward trends (60%, 56% and 58%,respectively), which is visible in the overall evolution of ROIC for these companies in Figure 5. As forC-companies the percentage of companies with a positive trend is significantly higher compared tocompanies with downward trends for Western-based companies (64.86%), but in the Eastern sample,C-companies are equally divided between positive and negative trends.
Table 12. Number of positive and negative trend values for ROIC, 2008–2016 (% of total numberof companies).
Samples Western-Based Companies Eastern-Based Companies
Trend Positive Negative Trend Positive Negative
A −0.0452 48.81% 51.19% −0.1810 40.00% 60.00%B −0.0706 48.26% 51.74% −0.2932 28.00% 56.00%C 0.5810 64.86% 35.14% −0.2251 50.00% 50.00%D 0.0073 52.15% 47.85% −0.5195 41.18% 58.82%
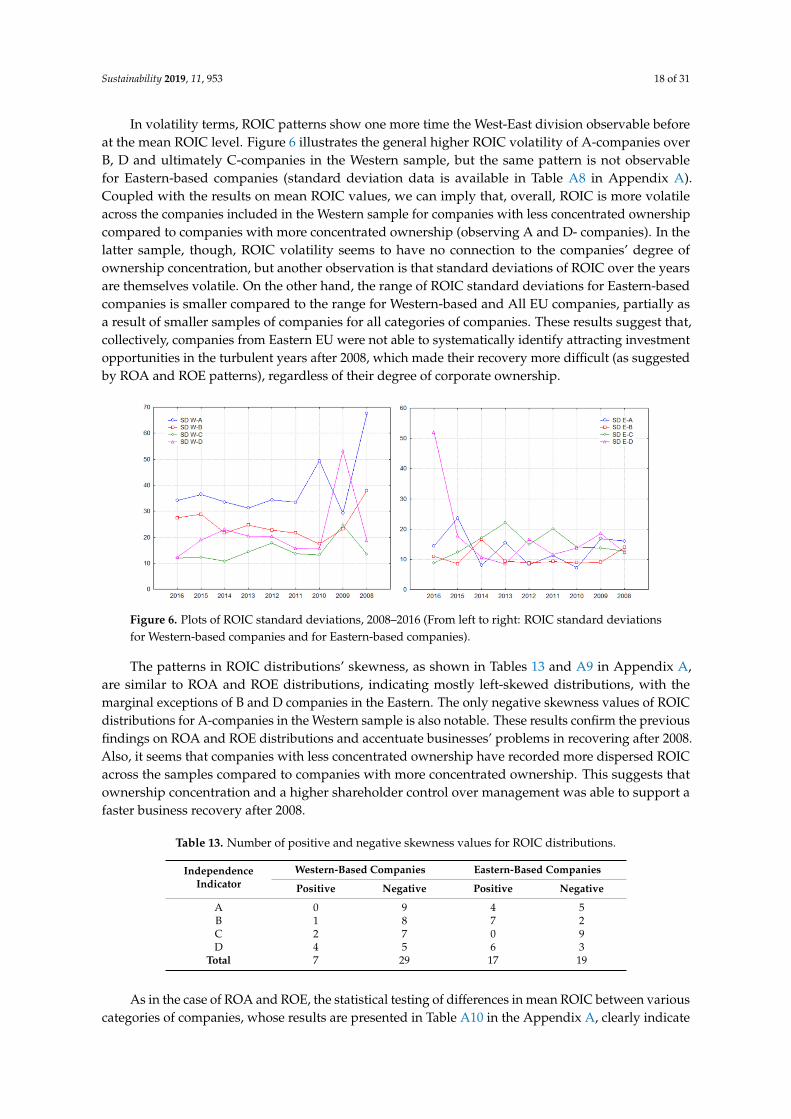
Sustainability 2019, 11, 953 18 of 31
In volatility terms, ROIC patterns show one more time the West-East division observable beforeat the mean ROIC level. Figure 6 illustrates the general higher ROIC volatility of A-companies overB, D and ultimately C-companies in the Western sample, but the same pattern is not observablefor Eastern-based companies (standard deviation data is available in Table A8 in Appendix A).Coupled with the results on mean ROIC values, we can imply that, overall, ROIC is more volatileacross the companies included in the Western sample for companies with less concentrated ownershipcompared to companies with more concentrated ownership (observing A and D- companies). In thelatter sample, though, ROIC volatility seems to have no connection to the companies’ degree ofownership concentration, but another observation is that standard deviations of ROIC over the yearsare themselves volatile. On the other hand, the range of ROIC standard deviations for Eastern-basedcompanies is smaller compared to the range for Western-based and All EU companies, partially asa result of smaller samples of companies for all categories of companies. These results suggest that,collectively, companies from Eastern EU were not able to systematically identify attracting investmentopportunities in the turbulent years after 2008, which made their recovery more difficult (as suggestedby ROA and ROE patterns), regardless of their degree of corporate ownership.
Sustainability 2019, 11, x FOR PEER REVIEW 18 of 32
Samples Trend Positive Negative Trend Positive Negative
A −0.0452 48.81% 51.19% −0.1810 40.00% 60.00% B −0.0706 48.26% 51.74% −0.2932 28.00% 56.00% C 0.5810 64.86% 35.14% −0.2251 50.00% 50.00% D 0.0073 52.15% 47.85% −0.5195 41.18% 58.82% In volatility terms, ROIC patterns show one more time the West-East division observable before
at the mean ROIC level. Figure 6 illustrates the general higher ROIC volatility of A-companies over B, D and ultimately C-companies in the Western sample, but the same pattern is not observable for Eastern-based companies (standard deviation data is available in Table A8 in Appendix). Coupled with the results on mean ROIC values, we can imply that, overall, ROIC is more volatile across the companies included in the Western sample for companies with less concentrated ownership compared to companies with more concentrated ownership (observing A and D- companies). In the latter sample, though, ROIC volatility seems to have no connection to the companies’ degree of ownership concentration, but another observation is that standard deviations of ROIC over the years are themselves volatile. On the other hand, the range of ROIC standard deviations for Eastern-based companies is smaller compared to the range for Western-based and All EU companies, partially as a result of smaller samples of companies for all categories of companies. These results suggest that, collectively, companies from Eastern EU were not able to systematically identify attracting investment opportunities in the turbulent years after 2008, which made their recovery more difficult (as suggested by ROA and ROE patterns), regardless of their degree of corporate ownership.
Figure 6. Plots of ROIC standard deviations, 2008–2016 (From left to right: ROIC standard deviations for Western-based companies and for Eastern-based companies).
The patterns in ROIC distributions’ skewness, as shown in Table 13 and Table A9 in Appendix, are similar to ROA and ROE distributions, indicating mostly left-skewed distributions, with the marginal exceptions of B and D companies in the Eastern. The only negative skewness values of ROIC distributions for A-companies in the Western sample is also notable. These results confirm the previous findings on ROA and ROE distributions and accentuate businesses’ problems in recovering after 2008. Also, it seems that companies with less concentrated ownership have recorded more dispersed ROIC across the samples compared to companies with more concentrated ownership. This suggests that ownership concentration and a higher shareholder control over management was able to support a faster business recovery after 2008.
Table 13. Number of positive and negative skewness values for ROIC distributions.
Independence indicator
Western-based companies
Eastern-based companies
Positive Negative Positive Negative A 0 9 4 5
Figure 6. Plots of ROIC standard deviations, 2008–2016 (From left to right: ROIC standard deviationsfor Western-based companies and for Eastern-based companies).
The patterns in ROIC distributions’ skewness, as shown in Tables 13 and A9 in Appendix A,are similar to ROA and ROE distributions, indicating mostly left-skewed distributions, with themarginal exceptions of B and D companies in the Eastern. The only negative skewness values of ROICdistributions for A-companies in the Western sample is also notable. These results confirm the previousfindings on ROA and ROE distributions and accentuate businesses’ problems in recovering after 2008.Also, it seems that companies with less concentrated ownership have recorded more dispersed ROICacross the samples compared to companies with more concentrated ownership. This suggests thatownership concentration and a higher shareholder control over management was able to support afaster business recovery after 2008.
Table 13. Number of positive and negative skewness values for ROIC distributions.
IndependenceIndicator
Western-Based Companies Eastern-Based Companies
Positive Negative Positive Negative
A 0 9 4 5B 1 8 7 2C 2 7 0 9D 4 5 6 3
Total 7 29 17 19
As in the case of ROA and ROE, the statistical testing of differences in mean ROIC between variouscategories of companies, whose results are presented in Table A10 in the Appendix A, clearly indicate
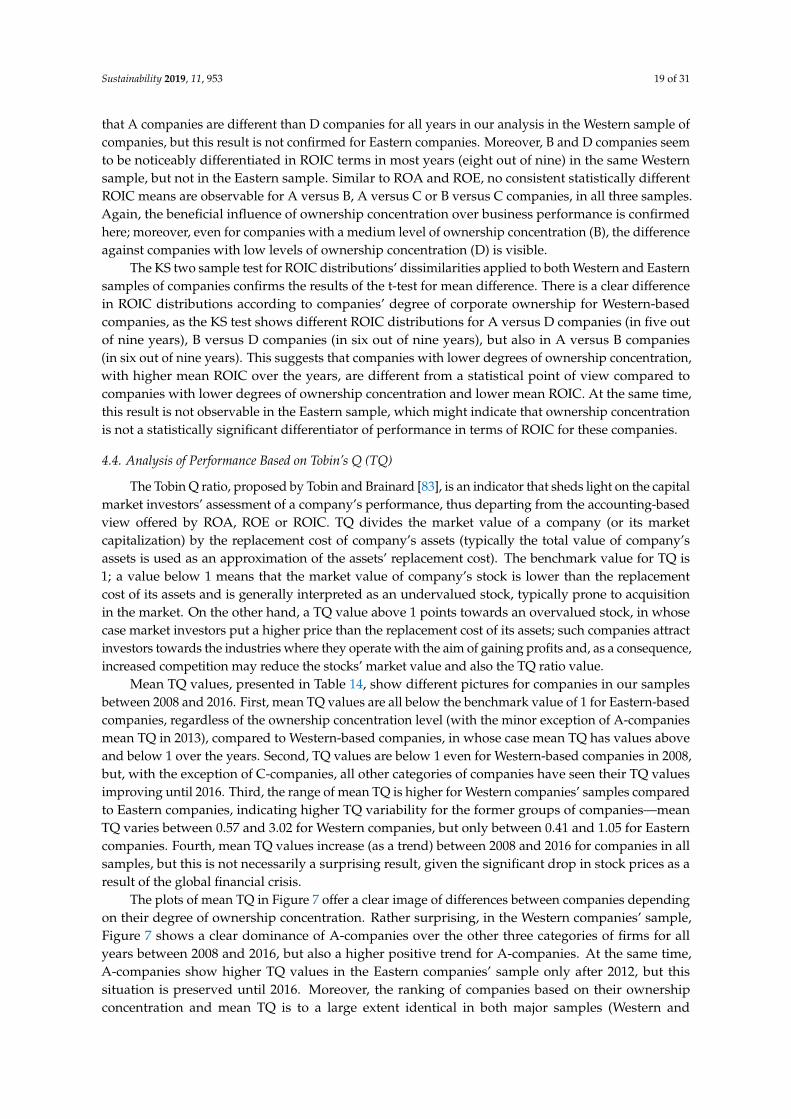
Sustainability 2019, 11, 953 19 of 31
that A companies are different than D companies for all years in our analysis in the Western sample ofcompanies, but this result is not confirmed for Eastern companies. Moreover, B and D companies seemto be noticeably differentiated in ROIC terms in most years (eight out of nine) in the same Westernsample, but not in the Eastern sample. Similar to ROA and ROE, no consistent statistically differentROIC means are observable for A versus B, A versus C or B versus C companies, in all three samples.Again, the beneficial influence of ownership concentration over business performance is confirmedhere; moreover, even for companies with a medium level of ownership concentration (B), the differenceagainst companies with low levels of ownership concentration (D) is visible.
The KS two sample test for ROIC distributions’ dissimilarities applied to both Western and Easternsamples of companies confirms the results of the t-test for mean difference. There is a clear differencein ROIC distributions according to companies’ degree of corporate ownership for Western-basedcompanies, as the KS test shows different ROIC distributions for A versus D companies (in five outof nine years), B versus D companies (in six out of nine years), but also in A versus B companies(in six out of nine years). This suggests that companies with lower degrees of ownership concentration,with higher mean ROIC over the years, are different from a statistical point of view compared tocompanies with lower degrees of ownership concentration and lower mean ROIC. At the same time,this result is not observable in the Eastern sample, which might indicate that ownership concentrationis not a statistically significant differentiator of performance in terms of ROIC for these companies.
4.4. Analysis of Performance Based on Tobin’s Q (TQ)
The Tobin Q ratio, proposed by Tobin and Brainard [83], is an indicator that sheds light on the capitalmarket investors’ assessment of a company’s performance, thus departing from the accounting-basedview offered by ROA, ROE or ROIC. TQ divides the market value of a company (or its marketcapitalization) by the replacement cost of company’s assets (typically the total value of company’sassets is used as an approximation of the assets’ replacement cost). The benchmark value for TQ is1; a value below 1 means that the market value of company’s stock is lower than the replacementcost of its assets and is generally interpreted as an undervalued stock, typically prone to acquisitionin the market. On the other hand, a TQ value above 1 points towards an overvalued stock, in whosecase market investors put a higher price than the replacement cost of its assets; such companies attractinvestors towards the industries where they operate with the aim of gaining profits and, as a consequence,increased competition may reduce the stocks’ market value and also the TQ ratio value.
Mean TQ values, presented in Table 14, show different pictures for companies in our samplesbetween 2008 and 2016. First, mean TQ values are all below the benchmark value of 1 for Eastern-basedcompanies, regardless of the ownership concentration level (with the minor exception of A-companiesmean TQ in 2013), compared to Western-based companies, in whose case mean TQ has values aboveand below 1 over the years. Second, TQ values are below 1 even for Western-based companies in 2008,but, with the exception of C-companies, all other categories of companies have seen their TQ valuesimproving until 2016. Third, the range of mean TQ is higher for Western companies’ samples comparedto Eastern companies, indicating higher TQ variability for the former groups of companies—meanTQ varies between 0.57 and 3.02 for Western companies, but only between 0.41 and 1.05 for Easterncompanies. Fourth, mean TQ values increase (as a trend) between 2008 and 2016 for companies in allsamples, but this is not necessarily a surprising result, given the significant drop in stock prices as aresult of the global financial crisis.
The plots of mean TQ in Figure 7 offer a clear image of differences between companies dependingon their degree of ownership concentration. Rather surprising, in the Western companies’ sample,Figure 7 shows a clear dominance of A-companies over the other three categories of firms for allyears between 2008 and 2016, but also a higher positive trend for A-companies. At the same time,A-companies show higher TQ values in the Eastern companies’ sample only after 2012, but thissituation is preserved until 2016. Moreover, the ranking of companies based on their ownershipconcentration and mean TQ is to a large extent identical in both major samples (Western and

Sustainability 2019, 11, 953 20 of 31
Eastern): A-companies have the highest TQ means, followed by D, C and B-companies, but forEastern-based companies, this ranking is observable only after 2013. These patterns show a negativeinfluence of ownership concentration over market-based performances, particularly for Westerncompanies, and seem to suggest that market investors value more companies with more dispersedshareholders. But this comes in contradiction to the results offered by accounting-based indicatorsof performance presented before (ROA, ROE and ROIC), which implies a decoupling of marketassessment of performance from the accounting measurement of performance. This is not necessarily asurprising result, as existing empirical evidences support only to some extent the relationship betweenmarket-based performance and businesses fundamentals. Although Santos and Soukiazis [84] find thatAmerican companies with a solid and good performance, both in terms of business and managementquality—measured by return on assets, earnings per employee and earnings per share—are morelikely to have higher price quality ratings in the US markets where they operate, it is well-knownthat a study by Fama and French [85] has shown that size firm size and the ratio between book andmarket value are reliable predictors of stocks’ returns, and their ability to characterize the cross-sectionof stock returns in a sample of US firms is higher than of other accounting-based measures, such asleverage. More recently, Figelman [86] suggested that market investors may not collectively recognizeearnings’ manipulation by firms, as large companies with poor past returns and high levels of ROEsignificantly disappoint both the market and companies with poor past returns, but with low ROE. Forthe case of emerging Eastern European economies, Horobet and Belascu [87] find that fundamentalperformance is positively linked to Romanian companies’ market performance but the influence maybe observed only at the level of simpler indicators, such as stock returns, which might indicate a ratherlow financial maturity of investors present on the market and an inadequate adjustment of returns tothe risk that may be detected from companies’ financial reports.
Table 14. TQ means for EU companies and A–D Independence indicators, 2008–2016.
IndependenceIndicator 2016 2015 2014 2013 2012 2011 2010 2009 2008
Western-based companiesA 1.6464 1.6851 1.6294 3.1022 1.4615 1.2533 1.5154 1.1996 0.8130B 1.0603 1.3267 0.7862 0.8080 0.7126 0.7040 0.9104 0.8273 0.6270C 0.7354 0.8103 0.7889 0.7518 0.6140 0.5713 0.6389 0.6055 0.7492D 1.1788 1.1783 1.0917 1.1138 1.0737 1.0445 1.0343 0.9231 0.7029
Eastern-based companiesA 0.9216 0.8869 0.9540 1.0539 0.7283 0.6149 0.7856 0.7652 0.5447B 0.7079 0.6552 0.6789 0.7595 0.5878 0.4716 0.6233 0.5777 0.4052C 0.5373 0.5227 0.5681 0.6009 0.6514 0.5491 0.7921 0.5046 0.4390D 0.8543 0.8606 0.8212 0.8552 0.6925 0.6392 0.7880 0.6487 0.4350
Sustainability 2019, 11, x FOR PEER REVIEW 21 of 32
Figure 7. Plots of TQ means, 2008–2016 (from left to right: TQ means for Western-based companies and for Eastern-based companies).
The results for trend values reported in Table 15 support and enforce the previous findings. As evidenced by mean TQ values between 2008 and 2016, TQ trends for companies in all our samples are positive, indicating the overall growth of market capitalization after 2008. Interestingly, while Western companies with more concentrated ownership (D) recorded higher value of trends compared to companies with less concentrated ownership (A), in the Eastern EU, we note similar values of trends for A and D companies (around 0.4); this result suggests that market-based recovery was faster in the Western EU for companies with concentrated ownership, but in the Eastern part of EU, there seems to be no necessary link between TQ evolution and ownership concentration. Another interesting result that accompanies the positive trends is that, except for A-companies in the Eastern sample, a significant majority of companies, regardless of the sample, have seen their TQ values improving between 2008 and 2016, as indicated by the percentages for positive trends. The highest percentages of companies with positive trends belong to the A and D categories in the Western sample (71.46% and 71.38%, respectively), as well as to the C-category in the Eastern sample (71.43%). On the other hand, 54.55% of companies in the A category from the Eastern sample recorded negative trends in their TQ values.
Table 15. Number of positive and negative trend values for TQ, 2008–2016 (% of total number of companies).
Samples Western-based companies Eastern-based companies
Trend Positive Negative Trend Positive Negative A 0.1128 72.22% 27.78% 0.0441 45.45% 54.55% B 0.0514 58.02% 41.98% 0.0307 60.53% 39.47% C 0.0173 62.50% 37.50% 0.0009 71.43% 28.57% D 0.0476 71.38% 28.62% 0.0433 69.23% 30.77%
For what concerns TQ volatility over time, Figure 8 and Table A11 in Appendix show rather homogeneous companies from the TQ perspective in all categories in the Western samples, with the exception of A-category in 2013, but more heterogeneous groups of companies in the Eastern sample, particularly after 2012 and with a stronger point for A and B categories. Besides, TQ volatility indicates a clear ranking of companies based on their categories for the Eastern sample (TQ volatility increases from C to D, B and A companies), but given the rather similar TQ values for companies in the other two samples, such ranking is difficult to observe for them. Therefore, it is difficult to infer about any systematic link between TQ volatility and ownership concentration, regardless of the samples; still, it seems that, although companies with less concentrated ownership enjoyed higher mean TQ values after 2008, these means came together with a higher TQ dispersion across companies included in the samples.
Figure 7. Plots of TQ means, 2008–2016 (from left to right: TQ means for Western-based companiesand for Eastern-based companies).
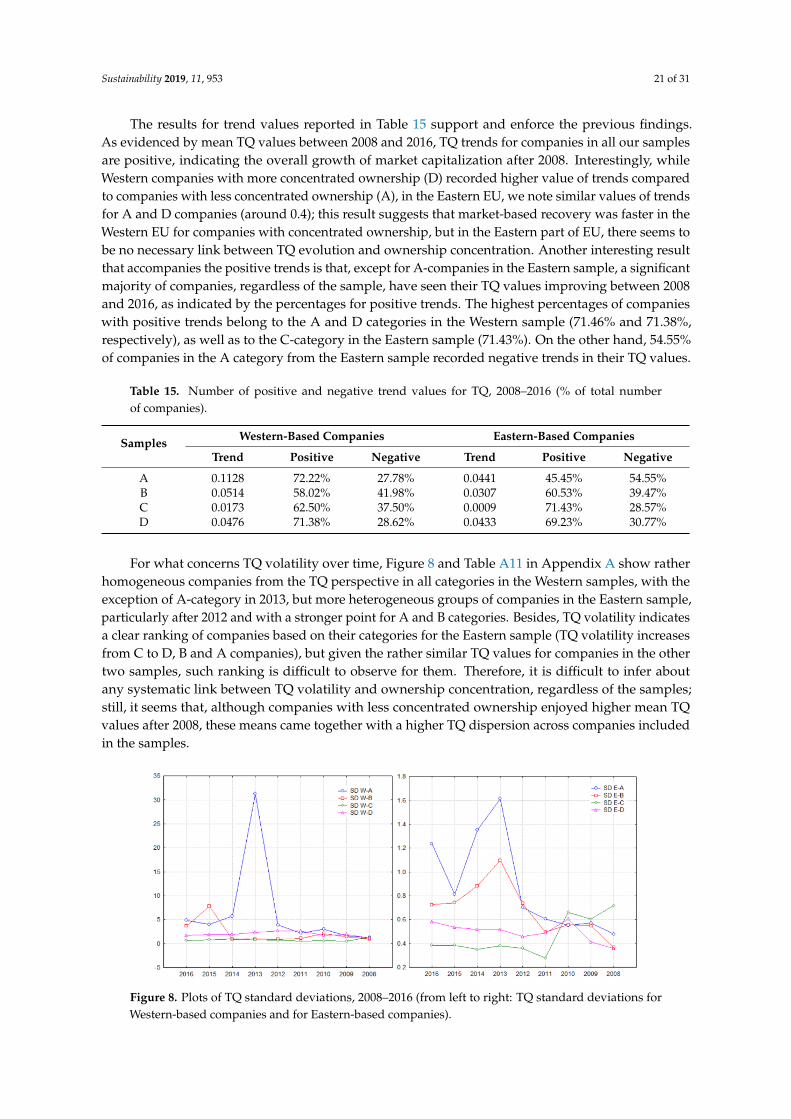
Sustainability 2019, 11, 953 21 of 31
The results for trend values reported in Table 15 support and enforce the previous findings.As evidenced by mean TQ values between 2008 and 2016, TQ trends for companies in all our samplesare positive, indicating the overall growth of market capitalization after 2008. Interestingly, whileWestern companies with more concentrated ownership (D) recorded higher value of trends comparedto companies with less concentrated ownership (A), in the Eastern EU, we note similar values of trendsfor A and D companies (around 0.4); this result suggests that market-based recovery was faster in theWestern EU for companies with concentrated ownership, but in the Eastern part of EU, there seems tobe no necessary link between TQ evolution and ownership concentration. Another interesting resultthat accompanies the positive trends is that, except for A-companies in the Eastern sample, a significantmajority of companies, regardless of the sample, have seen their TQ values improving between 2008and 2016, as indicated by the percentages for positive trends. The highest percentages of companieswith positive trends belong to the A and D categories in the Western sample (71.46% and 71.38%,respectively), as well as to the C-category in the Eastern sample (71.43%). On the other hand, 54.55%of companies in the A category from the Eastern sample recorded negative trends in their TQ values.
Table 15. Number of positive and negative trend values for TQ, 2008–2016 (% of total numberof companies).
Samples Western-Based Companies Eastern-Based Companies
Trend Positive Negative Trend Positive Negative
A 0.1128 72.22% 27.78% 0.0441 45.45% 54.55%B 0.0514 58.02% 41.98% 0.0307 60.53% 39.47%C 0.0173 62.50% 37.50% 0.0009 71.43% 28.57%D 0.0476 71.38% 28.62% 0.0433 69.23% 30.77%
For what concerns TQ volatility over time, Figure 8 and Table A11 in Appendix A show ratherhomogeneous companies from the TQ perspective in all categories in the Western samples, with theexception of A-category in 2013, but more heterogeneous groups of companies in the Eastern sample,particularly after 2012 and with a stronger point for A and B categories. Besides, TQ volatility indicatesa clear ranking of companies based on their categories for the Eastern sample (TQ volatility increasesfrom C to D, B and A companies), but given the rather similar TQ values for companies in the othertwo samples, such ranking is difficult to observe for them. Therefore, it is difficult to infer aboutany systematic link between TQ volatility and ownership concentration, regardless of the samples;still, it seems that, although companies with less concentrated ownership enjoyed higher mean TQvalues after 2008, these means came together with a higher TQ dispersion across companies includedin the samples.Sustainability 2019, 11, x FOR PEER REVIEW 22 of 32
Figure 8. Plots of TQ standard deviations, 2008–2016 (from left to right: TQ standard deviations for Western-based companies and for Eastern-based companies).
Contrasting with previous indicators’ distributions, TQ distributions’ skewness are always positive, for all samples (based on companies’ home countries and their degree of ownership concentration)—see Table 16 and Table A12 in Appendix. This result indicates only the presence of right-skewed distributions, as well as of companies with abnormally high TQ in all samples and years and highpoints the optimistic market valuation of all companies, with no link to ownership concentration.
Table 16. Number of positive and negative skewness values for TQ distributions.
Independence indicator
Western-based companies
Eastern-based companies
Positive Negative Positive Negative A 9 0 9 0 B 9 0 9 0 C 9 0 9 0 D 9 0 9 0
Total 36 0 36 0
Table A13 in the Appendix shows the results of t-statistics for differences in means between various categories of companies differentiated by their ownership concentration. Here, we do not observe the clear-cut differentiation noticed in the similar tables for ROA, ROE or ROIC, with the rather soft exception of B- and D-companies, in whose case t-statistic values indicate significantly different means for four out of nine years (2011 to 2014), but only in the Western companies’ samples. In all the other cases, TQ means, although different by computation, are not statistically identified as being different. We may imply from here that, overall, market investors do not clearly differentiate between companies with higher or lower ownership concentration, although financial results indicate a superiority of more concentrated ownership businesses over the others.
Moreover, the KS two sample test for differences in TQ distributions indicates clear and statistically different dissimilar distributions for Western companies with lower versus higher degrees of ownership concentration, but not for Eastern-based companies. As such, the test identifies differences in TQ distributions between A and D, A and C, but also A and B companies (in all or almost all years), which seems to point toward the recognition of a negative ownership concentration influence on corporate performance by market investors, but only for Western-based companies.
The last point that deserves to be revealed regarding ownership concentration and companies’ recovery patters after 2008 is illustrated by the correlation between financial indicators’ values on a yearly basis (i.e. 2016 against 2015, 2015 against 2014, etc.). Table 17 presents the average values of the Spearman correlation coefficients between 2008 and 2016; all values are positive, which suggests that, on average, better performance in a given year was followed by better performance in the
Figure 8. Plots of TQ standard deviations, 2008–2016 (from left to right: TQ standard deviations forWestern-based companies and for Eastern-based companies).
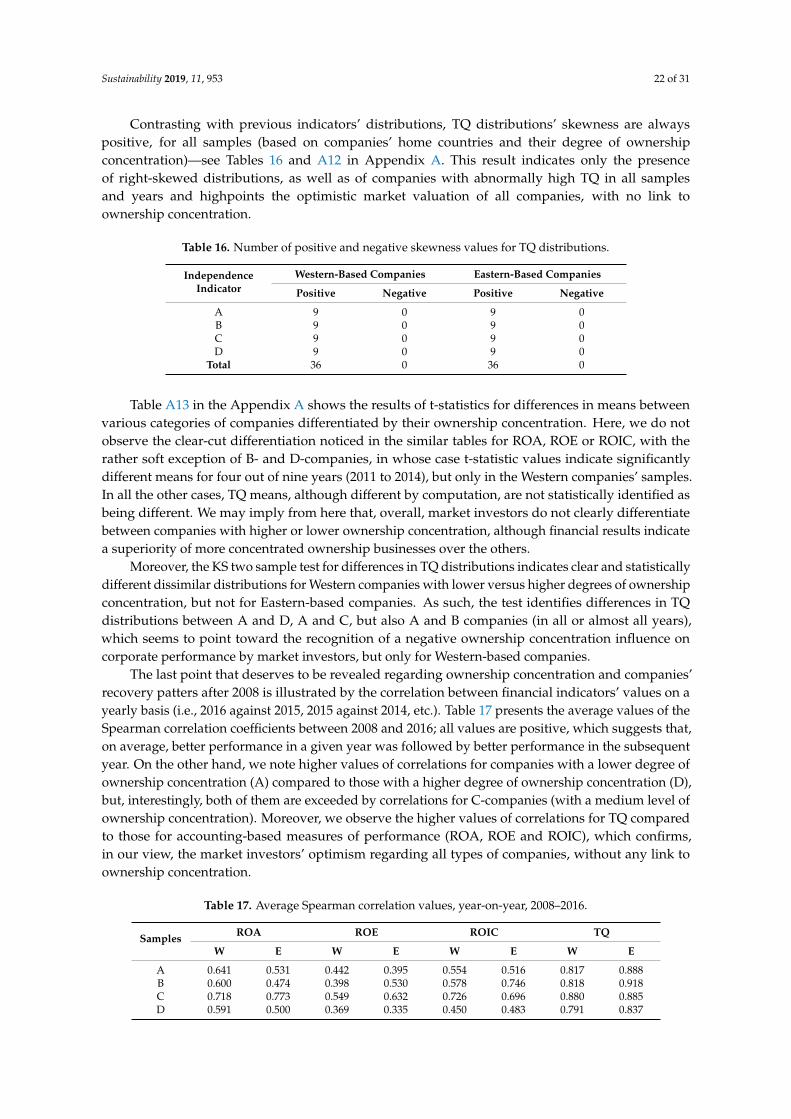
Sustainability 2019, 11, 953 22 of 31
Contrasting with previous indicators’ distributions, TQ distributions’ skewness are alwayspositive, for all samples (based on companies’ home countries and their degree of ownershipconcentration)—see Tables 16 and A12 in Appendix A. This result indicates only the presenceof right-skewed distributions, as well as of companies with abnormally high TQ in all samplesand years and highpoints the optimistic market valuation of all companies, with no link toownership concentration.
Table 16. Number of positive and negative skewness values for TQ distributions.
IndependenceIndicator
Western-Based Companies Eastern-Based Companies
Positive Negative Positive Negative
A 9 0 9 0B 9 0 9 0C 9 0 9 0D 9 0 9 0
Total 36 0 36 0
Table A13 in the Appendix A shows the results of t-statistics for differences in means betweenvarious categories of companies differentiated by their ownership concentration. Here, we do notobserve the clear-cut differentiation noticed in the similar tables for ROA, ROE or ROIC, with therather soft exception of B- and D-companies, in whose case t-statistic values indicate significantlydifferent means for four out of nine years (2011 to 2014), but only in the Western companies’ samples.In all the other cases, TQ means, although different by computation, are not statistically identified asbeing different. We may imply from here that, overall, market investors do not clearly differentiatebetween companies with higher or lower ownership concentration, although financial results indicatea superiority of more concentrated ownership businesses over the others.
Moreover, the KS two sample test for differences in TQ distributions indicates clear and statisticallydifferent dissimilar distributions for Western companies with lower versus higher degrees of ownershipconcentration, but not for Eastern-based companies. As such, the test identifies differences in TQdistributions between A and D, A and C, but also A and B companies (in all or almost all years),which seems to point toward the recognition of a negative ownership concentration influence oncorporate performance by market investors, but only for Western-based companies.
The last point that deserves to be revealed regarding ownership concentration and companies’recovery patters after 2008 is illustrated by the correlation between financial indicators’ values on ayearly basis (i.e., 2016 against 2015, 2015 against 2014, etc.). Table 17 presents the average values of theSpearman correlation coefficients between 2008 and 2016; all values are positive, which suggests that,on average, better performance in a given year was followed by better performance in the subsequentyear. On the other hand, we note higher values of correlations for companies with a lower degree ofownership concentration (A) compared to those with a higher degree of ownership concentration (D),but, interestingly, both of them are exceeded by correlations for C-companies (with a medium level ofownership concentration). Moreover, we observe the higher values of correlations for TQ comparedto those for accounting-based measures of performance (ROA, ROE and ROIC), which confirms,in our view, the market investors’ optimism regarding all types of companies, without any link toownership concentration.
Table 17. Average Spearman correlation values, year-on-year, 2008–2016.
Samples ROA ROE ROIC TQ
W E W E W E W E
A 0.641 0.531 0.442 0.395 0.554 0.516 0.817 0.888B 0.600 0.474 0.398 0.530 0.578 0.746 0.818 0.918C 0.718 0.773 0.549 0.632 0.726 0.696 0.880 0.885D 0.591 0.500 0.369 0.335 0.450 0.483 0.791 0.837

Sustainability 2019, 11, 953 23 of 31
5. Conclusions
Our research adds to the conflicting results of academic literature on the link between ownershipconcentration and corporate performance by proposing a straightforward but insightful mannerof investigating the relationship between ownership concentration and corporate performance atthe EU level; moreover, this relationship is studied for companies in the two different parts of theEU: The Western developed one and the Eastern developing one. The thorough statistical analysisundertaken has shown thought-provoking results that induce the conclusion that there is a cleardivision between Western and Eastern-based companies from the perspective of the connectionbetween ownership concentration and performance, including here patterns of businesses’ recoveryafter the global financial crisis and the sovereign debt crisis.
When accounting-based measures are considered (ROA, ROE and ROIC), their mean valuesshow high variability from one year to another, regardless of the origin-country of the companiesand their degree of ownership concentration. At the same time, ownership concentration is acritical differentiator factor of performance when accounting-based indicators are used, but onlywhen we analyze the All EU and Western samples; such differentiation is not statistically significantfor Eastern-based companies. Thus, Western-based companies with a higher degree of ownershipconcentration (either high or medium-high) dominate companies with lower degrees of ownershipconcentration in terms of ROA, ROE and ROIC over the entire 2008–2016 period included in ouranalysis. Moreover, companies included in the high and medium-degree of ownership concentrationsamples display lower volatility of performance compared to companies with lower degrees ofownership concentration.
The results obtained in the case of Western-based companies for the link between ownershipconcentration and accounting-measured performance contradict the findings of Demsetz and Lehn [22]that show a lack of a significant relationship between the degree of ownership concentration andaccounting-measured profit rates for a large sample of 511 US companies, while firm size and profitrate instability are better explanatory variables of the variation in ownership structure. In the caseof Swedish companies, Bergström and Rydqvist [23] also shows that higher levels of ownershipconcentration are accompanied by higher firm size and lower levels of firm-specific risk. For the case ofemerging countries, our results are not aligned with the findings of Wang and Shailer [21] that identifya negative relation between ownership concentration and firm performance across countries, but alsowith those of Alouchna and Kaminsky [70], which identify a negative correlation between ownershipconcentration by the majority shareholder and ROA and is seen as an expropriation rationale ofblockholders. Moreover, Machek and Kubícek [88] suggest that higher ownership concentrationsupports performance for companies from the Czech Republic, but only to a certain extent, and thatperformance is maximal when a controlling owner exists. At the same time, it should be noted that ourstudy has not investigated the identity of owners as a determinant factor for business performance,but only the degree of ownership concentration; thus, our results are not directly contrastable againstthe few existing literature contributions for emerging economies.
Overall, ownership concentration has supported to some extent business recovery after the crisis,but this result is evidenced particularly for ROA—our results are thus in line with the literatureon ownership concentration and performance during economic downturns. Thus, we support theconclusions of Saleh et al. [73] for Australian firms’ performance patterns during the global financialcrisis and those of Hanafi et al. [74], identify a positive relationship between ownership concentrationand business performance in the case of US companies during the 1997 and 2008 crises. These resultsmay be explained by the higher commitment of more concentrated ownership companies to protectingtheir businesses and allocating capital to profitable investments during difficult times, which is alsorecognized by market investors.
When we switch the focus from accounting-based performance to market-assessed performance(by using Tobin Q as a performance measure), we see that market investors seem to place higher valueon less concentrated ownership rather than higher ownership concentration. Moreover, this market
Sustainability 2019, 11, 953 24 of 31
“myopia” is disconnected from business fundamentals (as reflected in ROA, ROE and ROIC), as TobinQ is on average growing trends for all companies (regardless of their origin and/or ownershipconcentration). From here, one may imply that market investors are preoccupied only about thefuture of these companies (and this is correct), but also that they do not acknowledge the role ofownership concentration (either beneficial of detrimental) for performance assessment, not evenin developing economies; thus, our results seem to contradict the conclusions of Claessens andYurtoglu [69], indicating that better corporate frameworks are not necessarily reflected in the superiorperformance of companies from emerging economies.
Our research certainly has limits; one of the most important resides in the use of independenceindicators as a measure of ownership concentration, given the large samples generated based on thedefinition of these indicators. At the same time, the paper should be regarded as a starting pointtowards describing and understanding the intricate relationship between ownership concentration andcorporate performance within the European Union and to showing that the developed and emergingregions of the EU might display contrasting features in terms of this relationship. Thus, the simple,but not simplistic division between Western and Eastern companies, accompanied by consistentstatistical testing, is able to offer a wider perspective on corporate performance. This researchdeserves to be continued by a more thorough investigation at the corporate level by taking intoaccount the major investor’s identity, business size, sectoral idiosyncrasies and specific origincountries. Moreover, more sophisticated models that address the connection between ownershipconcentration and performance may be used with the goal of clarifying our results and of offeringsupplementary insight.
Author Contributions: Conceptualization, A.H. and S.C.C.; data curation, L.B. and A.P.; formal analysis, A.H., L.B.and S.C.C.; methodology, A.H. and S.C.C.; validation, A.P.; writing—original draft, A.H. and L.B.; writing—review& editing, A.P.
Funding: This research received no external funding.
Conflicts of Interest: The authors declare no conflict of interest.
Appendix A
Table A1. Sample companies’ distribution based on their industry.
Industry (2-Digit NACE Code) No. of Companies
10-Manufacture of food products 16311-Manufacture of beverages 87
12-Manufacture of tobacco products 1213-Manufacture of textiles 56
14-Manufacture of wearing apparel 7415-Manufacture of leather and related products 12
16-Manufacture of wood and of products of wood and cork, except furniture;manufacture of articles of straw and plaiting materials 34
17-Manufacture of paper and paper products 8218-Printing and reproduction of recorded media 103
19-Manufacture of coke and refined petroleum products 2020-Manufacture of chemicals and chemical products 139
21-Manufacture of basic pharmaceutical products and pharmaceutical preparations 26322-Manufacture of rubber and plastic products 56
23-Manufacture of other non-metallic mineral products 8824-Manufacture of basic metals 145
25-Manufacture of fabricated metal products, except machinery and equipment 28426-Manufacture of computer, electronic and optical products 286
27-Manufacture of electrical equipment 11828-Manufacture of machinery and equipment n.e.c. 268
29-Manufacture of motor vehicles, trailers and semi-trailers 6930-Manufacture of other transport equipment 67
31-Manufacture of furniture 4032-Other manufacturing 127
33-Repair and installation of machinery and equipment 8Total 2512
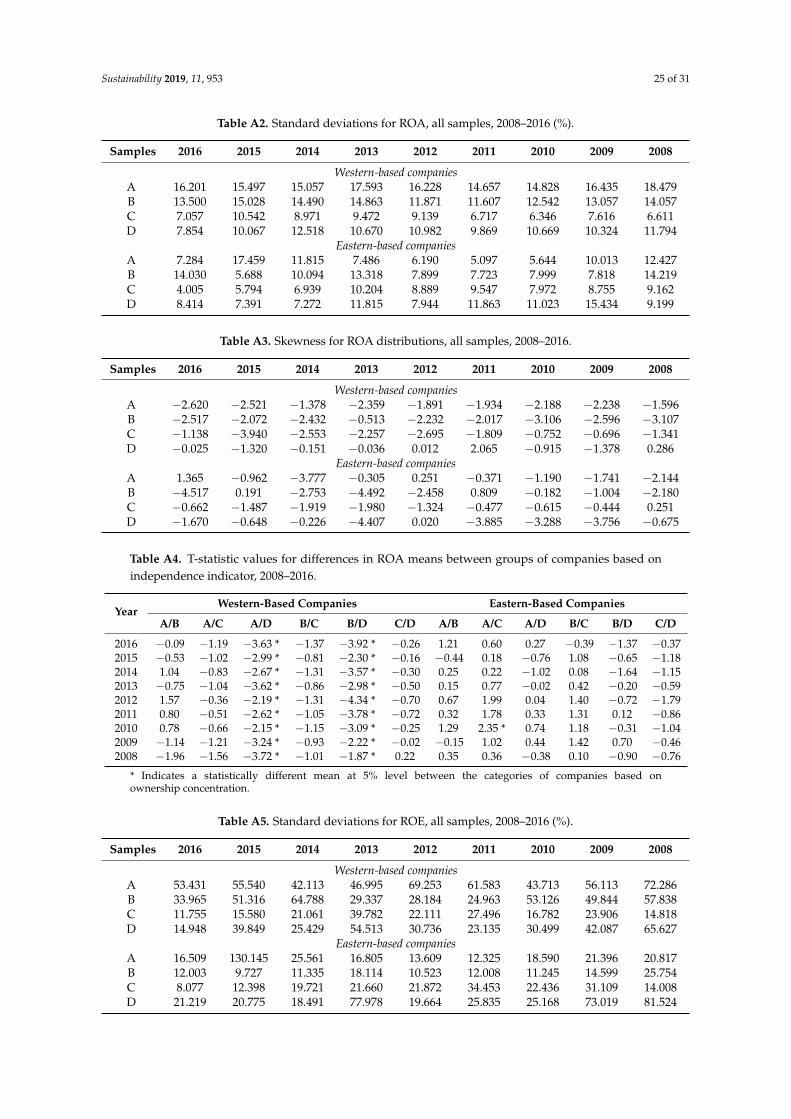
Sustainability 2019, 11, 953 25 of 31
Table A2. Standard deviations for ROA, all samples, 2008–2016 (%).
Samples 2016 2015 2014 2013 2012 2011 2010 2009 2008
Western-based companiesA 16.201 15.497 15.057 17.593 16.228 14.657 14.828 16.435 18.479B 13.500 15.028 14.490 14.863 11.871 11.607 12.542 13.057 14.057C 7.057 10.542 8.971 9.472 9.139 6.717 6.346 7.616 6.611D 7.854 10.067 12.518 10.670 10.982 9.869 10.669 10.324 11.794
Eastern-based companiesA 7.284 17.459 11.815 7.486 6.190 5.097 5.644 10.013 12.427B 14.030 5.688 10.094 13.318 7.899 7.723 7.999 7.818 14.219C 4.005 5.794 6.939 10.204 8.889 9.547 7.972 8.755 9.162D 8.414 7.391 7.272 11.815 7.944 11.863 11.023 15.434 9.199
Table A3. Skewness for ROA distributions, all samples, 2008–2016.
Samples 2016 2015 2014 2013 2012 2011 2010 2009 2008
Western-based companiesA −2.620 −2.521 −1.378 −2.359 −1.891 −1.934 −2.188 −2.238 −1.596B −2.517 −2.072 −2.432 −0.513 −2.232 −2.017 −3.106 −2.596 −3.107C −1.138 −3.940 −2.553 −2.257 −2.695 −1.809 −0.752 −0.696 −1.341D −0.025 −1.320 −0.151 −0.036 0.012 2.065 −0.915 −1.378 0.286
Eastern-based companiesA 1.365 −0.962 −3.777 −0.305 0.251 −0.371 −1.190 −1.741 −2.144B −4.517 0.191 −2.753 −4.492 −2.458 0.809 −0.182 −1.004 −2.180C −0.662 −1.487 −1.919 −1.980 −1.324 −0.477 −0.615 −0.444 0.251D −1.670 −0.648 −0.226 −4.407 0.020 −3.885 −3.288 −3.756 −0.675
Table A4. T-statistic values for differences in ROA means between groups of companies based onindependence indicator, 2008–2016.
YearWestern-Based Companies Eastern-Based Companies
A/B A/C A/D B/C B/D C/D A/B A/C A/D B/C B/D C/D
2016 −0.09 −1.19 −3.63 * −1.37 −3.92 * −0.26 1.21 0.60 0.27 −0.39 −1.37 −0.372015 −0.53 −1.02 −2.99 * −0.81 −2.30 * −0.16 −0.44 0.18 −0.76 1.08 −0.65 −1.182014 1.04 −0.83 −2.67 * −1.31 −3.57 * −0.30 0.25 0.22 −1.02 0.08 −1.64 −1.152013 −0.75 −1.04 −3.62 * −0.86 −2.98 * −0.50 0.15 0.77 −0.02 0.42 −0.20 −0.592012 1.57 −0.36 −2.19 * −1.31 −4.34 * −0.70 0.67 1.99 0.04 1.40 −0.72 −1.792011 0.80 −0.51 −2.62 * −1.05 −3.78 * −0.72 0.32 1.78 0.33 1.31 0.12 −0.862010 0.78 −0.66 −2.15 * −1.15 −3.09 * −0.25 1.29 2.35 * 0.74 1.18 −0.31 −1.042009 −1.14 −1.21 −3.24 * −0.93 −2.22 * −0.02 −0.15 1.02 0.44 1.42 0.70 −0.462008 −1.96 −1.56 −3.72 * −1.01 −1.87 * 0.22 0.35 0.36 −0.38 0.10 −0.90 −0.76
* Indicates a statistically different mean at 5% level between the categories of companies based onownership concentration.
Table A5. Standard deviations for ROE, all samples, 2008–2016 (%).
Samples 2016 2015 2014 2013 2012 2011 2010 2009 2008
Western-based companiesA 53.431 55.540 42.113 46.995 69.253 61.583 43.713 56.113 72.286B 33.965 51.316 64.788 29.337 28.184 24.963 53.126 49.844 57.838C 11.755 15.580 21.061 39.782 22.111 27.496 16.782 23.906 14.818D 14.948 39.849 25.429 54.513 30.736 23.135 30.499 42.087 65.627
Eastern-based companiesA 16.509 130.145 25.561 16.805 13.609 12.325 18.590 21.396 20.817B 12.003 9.727 11.335 18.114 10.523 12.008 11.245 14.599 25.754C 8.077 12.398 19.721 21.660 21.872 34.453 22.436 31.109 14.008D 21.219 20.775 18.491 77.978 19.664 25.835 25.168 73.019 81.524

Sustainability 2019, 11, 953 26 of 31
Table A6. Skewness for ROE distributions, all samples, 2008–2016.
Samples 2016 2015 2014 2013 2012 2011 2010 2009 2008
Western-based companiesA −5.421 −5.822 −4.051 −4.229 −7.517 −6.985 −4.634 −7.492 −5.771B −4.220 −8.767 −9.106 −4.572 −2.915 −2.871 −13.669 −7.611 5.857C −0.207 −2.474 −3.759 2.693 −2.057 −2.192 −1.678 −3.014 −0.727D −0.906 −6.545 −8.767 −14.789 −5.715 −2.924 −5.308 −8.927 −7.854
Eastern-based companiesA −2.503 −5.178 −4.381 −1.483 −2.149 −2.173 −4.283 −1.842 −1.920B −0.545 −0.830 −0.349 −4.056 −1.678 0.868 −0.363 −1.798 −2.201C −1.197 −1.858 −2.435 −2.306 −1.776 −1.735 −1.716 −1.579 −0.292D 4.148 2.098 −0.937 −4.077 −0.182 −1.241 −3.526 −4.456 −6.258
Table A7. T-statistic values for differences in ROE means between groups of companies based onindependence indicator, 2008–2016.
YearWestern-Based Companies Eastern-Based Companies
A/B A/C A/D B/C B/D C/D A/B A/C A/D B/C B/D C/D
2016 −1.67 −1.53 −4.23 * −1.35 −3.46 * 0.08 −0.23 0.14 −1.26 0.36 −1.42 −0.862015 −1.35 −1.46 −2.67 * −0.94 −1.16 0.55 −1.26 −0.42 −1.70 1.14 −1.57 −1.262014 0.67 −1.19 −3.09 * −1.02 −2.70 * 0.02 −0.64 −0.01 −0.90 0.55 −0.51 −0.602013 −1.47 −2.58 * −2.33 * −2.97 * −1.10 1.29 −0.59 0.12 0.75 0.47 1.16 0.362012 −0.84 −0.81 −2.43 * −1.19 −2.73 * −0.18 −0.22 1.53 −0.42 2.10 * −0.34 −1.502011 −1.69 −0.72 −2.96 * −0.21 −2.25 * −0.86 −0.40 1.82 0.16 2.32 * 0.48 −1.282010 −0.25 −0.80 −1.88 −0.56 −1.27 0.08 −0.08 1.32 −0.25 2.07 * −0.27 −1.232009 −1.00 −1.85 −2.15 * −1.58 −1.07 1.29 −0.74 1.17 0.74 2.09 * 1.23 −0.032008 −2.82 * −1.44 −1.85 −0.31 0.93 0.71 0.39 0.08 0.63 −0.17 0.61 0.31
Table A8. Standard deviations for ROIC, all samples, 2008–2016 (%).
Samples 2016 2015 2014 2013 2012 2011 2010 2009 2008
Western-based companiesA 34.1600 36.4959 33.5590 31.3064 34.4187 33.3534 49.3911 29.2508 67.5643B 27.5131 28.8615 21.6783 24.7202 22.7467 21.6435 17.3953 23.1813 37.9351C 12.0193 12.3064 10.7913 14.4205 17.7448 13.6469 13.2295 24.6969 13.4304D 12.2872 18.9955 22.9733 20.4535 20.2730 15.6212 15.6001 53.2351 18.6865
Eastern-based companiesA 14.3675 23.6548 7.9906 15.4558 8.2324 11.2968 7.2208 16.7990 16.0133B 10.9721 8.4843 16.5709 9.3591 8.8191 9.3000 8.8544 8.9980 13.9439C 8.8245 12.3454 17.0771 22.1479 14.9717 20.0709 13.9808 13.6878 12.6764D 52.0406 17.6709 10.7035 8.4021 16.6071 11.5959 13.7200 18.5927 12.2627
Table A9. Skewness for ROIC distributions, all samples, 2008–2016.
Samples 2016 2015 2014 2013 2012 2011 2010 2009 2008
Western-based companiesA −5.104 −4.424 −5.069 −3.845 −4.178 −4.390 −13.871 −1.925 −5.497B −3.275 −4.281 −2.491 0.779 −4.100 −2.610 −1.635 −3.679 −7.662C 0.078 −0.386 0.609 −0.114 −2.969 −2.050 −1.153 −3.556 −0.511D 1.410 −3.339 5.665 -0.248 −2.101 0.381 −0.788 15.009 −0.819
Eastern-based companiesA −0.362 0.343 0.505 −1.098 0.934 −1.288 0.321 −1.638 −2.236B 0.725 0.036 −2.676 0.739 0.380 1.786 −0.019 0.571 1.289C −0.474 −1.389 −2.313 −1.898 −0.933 −0.746 −1.040 −0.779 −0.743D −5.559 1.816 0.286 0.222 0.581 0.134 −0.625 −1.986 0.956

Sustainability 2019, 11, 953 27 of 31
Table A10. T-statistic values for differences in ROIC means between groups of companies based onindependence indicator, 2008–2016.
YearWestern-Based Companies Eastern-Based Companies
A/B A/C A/D B/C B/D C/D A/B A/C A/D B/C B/D C/D
2016 −0.92 −1.69 −4.13 * −1.61 −3.59 * 0.52 −0.44 0.76 0.65 1.33 0.96 0.142015 −1.12 −1.91 −3.19 * −1.81 −2.20 * 1.33 0.16 0.90 −0.08 2.04 * −0.33 −1.252014 −1.09 −1.75 −4.06 * −2.01 * −3.55 * 0.20 0.81 1.75 0.61 0.72 −0.44 −1.322013 −1.60 −1.53 −3.19 * −1.07 −1.61 0.42 −1.24 0.52 −1.53 1.55 −0.28 −1.822012 0.40 −1.01 −2.58 * −1.72 −3.71 * 0.03 0.46 2.73 * 0.48 2.60 * 0.22 −1.542011 0.08 −0.69 −2.79 * −1.10 −3.82 * -0.71 0.64 1.75 0.85 1.78 0.31 −1.522010 −0.14 −0.39 −1.57 −0.93 −3.06 * −0.52 1.38 2.71 * 1.24 1.86 0.28 −1.212009 −0.51 −0.53 −2.76 * −0.38 −2.12 * −0.64 −0.79 1.03 0.44 2.43 * 1.39 −0.712008 −1.34 −1.00 −2.33 * −0.84 −1.40 0.60 −0.48 0.27 −0.92 0.65 −0.46 −1.00
Table A11. Standard deviations for TQ, all samples, 2008–2016 (%).
Samples 2016 2015 2014 2013 2012 2011 2010 2009 2008
Western-based companiesA 4.881 3.989 5.719 31.274 3.888 2.205 3.043 1.631 1.306B 3.667 7.817 0.908 0.952 0.894 1.085 2.120 1.479 0.942C 0.623 0.819 0.970 0.831 0.686 0.524 0.585 0.497 1.340D 1.675 1.875 1.921 2.365 2.661 2.651 1.763 1.917 1.128
Eastern-based companiesA 1.237 0.812 1.352 1.613 0.701 0.606 0.552 0.571 0.480B 0.725 0.741 0.884 1.098 0.735 0.496 0.557 0.549 0.366C 0.384 0.385 0.350 0.381 0.359 0.278 0.661 0.603 0.718D 0.583 0.535 0.517 0.515 0.457 0.488 0.606 0.413 0.357
Table A12. Skewness for TQ distributions, all samples, 2008–2016.
Samples 2016 2015 2014 2013 2012 2011 2010 2009 2008
Western-based companiesA 14.750 11.411 19.210 21.703 14.586 6.682 8.822 3.772 7.199B 15.493 16.678 2.983 3.326 2.962 6.002 12.013 8.700 5.372C 1.448 2.055 3.435 2.771 1.902 1.338 1.857 1.619 3.682D 5.322 5.743 6.893 9.891 9.265 9.433 4.834 9.071 6.286
Eastern-based companiesA 3.080 1.385 3.328 3.551 1.877 2.067 0.418 0.495 1.198B 2.237 2.630 3.043 4.325 3.854 2.298 1.816 1.680 1.522C 0.947 1.169 0.239 1.022 0.252 0.823 1.666 2.538 2.465D 0.992 0.481 0.437 0.255 0.921 1.904 1.568 1.177 2.879
Table A13. T-statistic values for differences in TQ means between groups of companies based onindependence indicators, 2008–2016.
YearWestern-Based Companies Eastern-Based Companies
A/B A/C A/D B/C B/D C/D A/B A/C A/D B/C B/D C/D
2016 1.78 1.18 1.66 0.56 −0.53 −1.66 0.85 0.80 0.25 0.60 −0.86 −1.352015 0.85 1.38 2.14 * 0.42 0.33 −1.23 1.13 1.14 0.13 0.46 −1.21 −1.562014 2.50 * 0.93 1.63 −0.02 −2.48 * −0.98 0.95 0.74 0.46 0.32 −0.74 −1.222013 1.25 0.47 1.14 0.36 −2.07 * −0.96 0.84 0.73 0.59 0.38 −0.41 −1.212012 3.25 * 1.38 1.57 0.67 −2.21 * −1.09 0.73 0.28 0.21 −0.22 −0.65 −0.222011 3.98 * 1.95 1.22 0.76 −2.05 * −1.12 0.99 0.28 −0.15 −0.40 −1.34 −0.462010 2.99 * 1.82 2.58 * 0.80 −0.79 −1.41 1.09 −0.03 −0.01 −0.72 −1.12 0.022009 3.20 * 2.29 * 2.20 * 0.94 −0.69 −1.04 1.26 1.04 0.82 0.32 −0.56 −0.742008 2.13 * 0.30 1.24 −0.73 −0.90 0.24 1.27 0.45 0.91 −0.19 −0.32 0.02

Sustainability 2019, 11, 953 28 of 31
References
1. Jensen, M.C.; Meckling, W.H. Theory of the firm: Managerial behavior, agency costs and ownership structure.J. Financ. Econ. 1976, 3, 305–360. [CrossRef]
2. Demsetz, H. The structure of ownership and the theory of the firm. J. Law Econ. 1983, 26, 375–390. [CrossRef]3. Aboura, S.; Wagner, N. Extreme Asymmetric Volatility: Stress and Aggregate Asset Prices. J. Int. Financ.
Mark. Inst. Money 2016, 41, 47–59. [CrossRef]4. Agca, S.; Celasun, O. Sovereign debt and corporate borrowing costs in emerging markets. J. Int. Econ. 2012,
88, 198–208. [CrossRef]5. Broner, F.; Erce, A.; Martin, A.; Ventura, J. Sovereign debt markets in turbulent times: Creditor discrimination
and crowding-out effects. J. Monet. Econ. 2014, 61, 114–142. [CrossRef]6. Amihud, Y.; Lev, B. Risk reduction as a managerial motive for conglomerate mergers. Bell J. Econ. 1981, 12,
605–617. [CrossRef]7. Oswald, S.L.; Jahera, J.S., Jr. The influence of ownership on performance: An empirical study.
Strateg. Manag. J. 1991, 12, 321–326. [CrossRef]8. Hoskisson, R.E.; Johnson, J.R.A.; Moesel, D.D. Corporate divestiture intensity in restructuring firms: Effects
of governance, strategy and performance. Acad. Manag. J. 1994, 37, 1207–1238. [CrossRef]9. Zhang, H.; Gao, S.; Seiler, M.J.; Jiawei, C. Ownership Structure, Diversification, and Corporate Performance
Based on Structural Equation Modeling. J. Real Estate Portf. Manag. 2016, 22, 63–73. [CrossRef]10. Schmidt, C.; Fahlenbrach, R. Do exogenous changes in passive institutional ownership affect corporate
governance and firm value? J. Financ. Econ. 2017, 124, 285–306. [CrossRef]11. Lane, P.J.; Cannella, A.A., Jr.; Lubatkin, M.H. Agency problems as antecedents to unrelated mergers and
diversification: Amihud and Lev reconsidered. Strateg. Manag. J. 1998, 19, 555–578. [CrossRef]12. Lloyd, W.P.; Hand, J.H.; Modani, N.K. The effect of the degree of ownership control on firm diversification,
market value, and merger activity. J. Bus. Res. 1987, 15, 303–312. [CrossRef]13. Maury, B.; Pajuste, A. Multiple large shareholders and firm value. J. Bank. Financ. 2005, 29, 1813–1834.
[CrossRef]14. Yeh, T. Large Shareholders, Shareholder Proposals, and Firm Performance: Evidence from Japan. Corp. Gov.
2014, 22, 312–329. [CrossRef]15. Dzingai, I.; Fakoya, M.B. Effect of Corporate Governance Structure on the Financial Performance of
Johannesburg Stock Exchange (JSE)-Listed Mining Firms. Sustainability 2017, 9, 867. [CrossRef]16. Fama, E.F.; Jensen, M.C. Separation of ownership and control. J. Law Econ. 1983, 26, 301–325. [CrossRef]17. Morck, R.; Shleifer, A.; Vishny, R. Management ownership and market valuation: An empirical analysis.
J. Financ. Econ. 1988, 20, 293–315. [CrossRef]18. Claessens, S.; Djankov, S.; Fan, J.P.H.; Lang, L.H.P. Disentangling the Incentive and Entrenchment Effects of
Large Shareholdings. J. Financ. 2002, 57, 2741–2771. [CrossRef]19. Benedsen, M.; Nielsen, K.M. Incentive and entrenchment effects in European ownership. J. Bank. Financ.
2010, 34, 2212–2229. [CrossRef]20. Salvionni, D.M.; Gennari, F.; Bosetti, L. Sustainability and Convergence: The Future of Corporate Governance
Systems? Sustainability 2016, 8, 1203. [CrossRef]21. Wang, K.; Shailer, G. Ownership concentration and firm performance in emerging markets: A meta-analysis.
J. Econ. Surv. 2015, 29, 199–229. [CrossRef]22. Demsetz, H.; Lehn, K. The Structure of Corporate Ownership: Causes and Consequences. J. Polit. Econ. 1985,
93, 1155–1177. [CrossRef]23. Bergström, C.; Rydqvist, K. The determinants of corporate ownership: An empirical study on Swedish data.
J. Bank. Financ. 1990, 14, 237–253. [CrossRef]24. Pedersen, T.; Thomsen, S. European Patterns of Corporate Ownership: A Twelve-Country Study. J. Int.
Bus. Stud. 1997, 28, 759–778. [CrossRef]25. Gürsoy, G.; Aydogan, K. Equity Ownership Structure, Risk Taking, and Performance: An Empirical
Investigation in Turkish Listed Companies. Emerg. Mark. Financ. Trade 2002, 38, 6–25.26. Thomsen, S.; Pedersen, T. Ownership structure and economic performance in the largest European companies.
Strateg. Manag. J. 2000, 21, 689–795. [CrossRef]
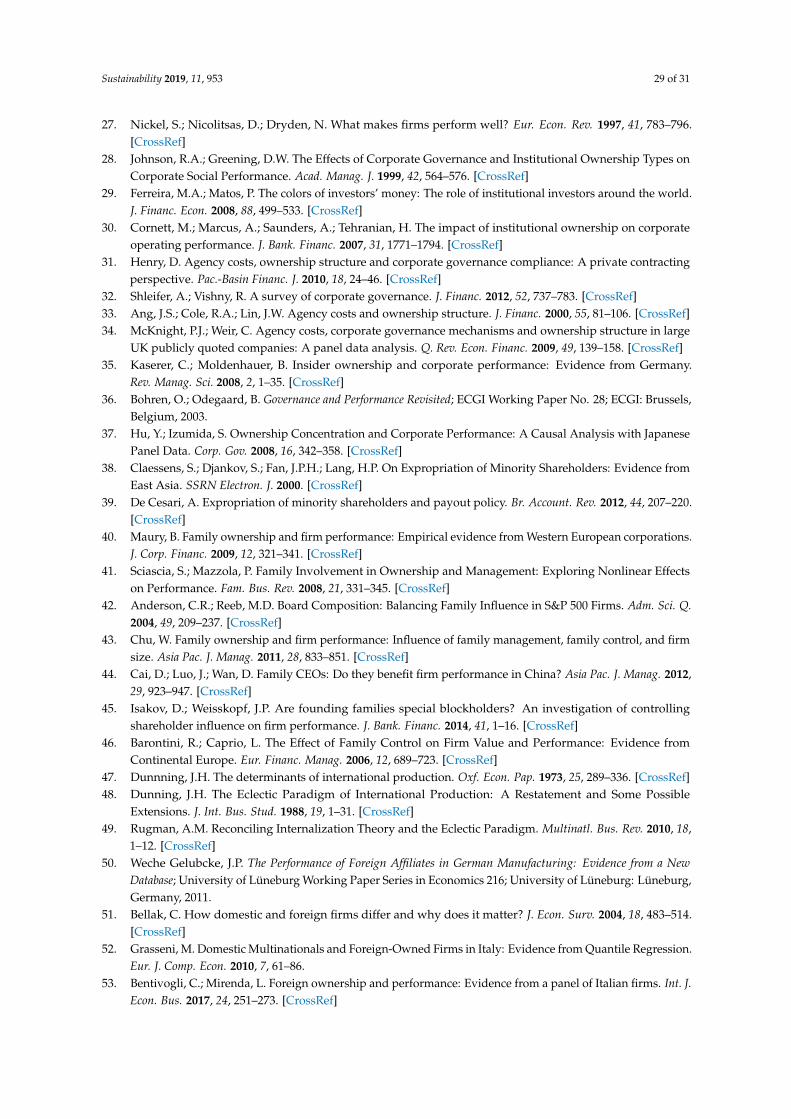
Sustainability 2019, 11, 953 29 of 31
27. Nickel, S.; Nicolitsas, D.; Dryden, N. What makes firms perform well? Eur. Econ. Rev. 1997, 41, 783–796.[CrossRef]
28. Johnson, R.A.; Greening, D.W. The Effects of Corporate Governance and Institutional Ownership Types onCorporate Social Performance. Acad. Manag. J. 1999, 42, 564–576. [CrossRef]
29. Ferreira, M.A.; Matos, P. The colors of investors’ money: The role of institutional investors around the world.J. Financ. Econ. 2008, 88, 499–533. [CrossRef]
30. Cornett, M.; Marcus, A.; Saunders, A.; Tehranian, H. The impact of institutional ownership on corporateoperating performance. J. Bank. Financ. 2007, 31, 1771–1794. [CrossRef]
31. Henry, D. Agency costs, ownership structure and corporate governance compliance: A private contractingperspective. Pac.-Basin Financ. J. 2010, 18, 24–46. [CrossRef]
32. Shleifer, A.; Vishny, R. A survey of corporate governance. J. Financ. 2012, 52, 737–783. [CrossRef]33. Ang, J.S.; Cole, R.A.; Lin, J.W. Agency costs and ownership structure. J. Financ. 2000, 55, 81–106. [CrossRef]34. McKnight, P.J.; Weir, C. Agency costs, corporate governance mechanisms and ownership structure in large
UK publicly quoted companies: A panel data analysis. Q. Rev. Econ. Financ. 2009, 49, 139–158. [CrossRef]35. Kaserer, C.; Moldenhauer, B. Insider ownership and corporate performance: Evidence from Germany.
Rev. Manag. Sci. 2008, 2, 1–35. [CrossRef]36. Bohren, O.; Odegaard, B. Governance and Performance Revisited; ECGI Working Paper No. 28; ECGI: Brussels,
Belgium, 2003.37. Hu, Y.; Izumida, S. Ownership Concentration and Corporate Performance: A Causal Analysis with Japanese
Panel Data. Corp. Gov. 2008, 16, 342–358. [CrossRef]38. Claessens, S.; Djankov, S.; Fan, J.P.H.; Lang, H.P. On Expropriation of Minority Shareholders: Evidence from
East Asia. SSRN Electron. J. 2000. [CrossRef]39. De Cesari, A. Expropriation of minority shareholders and payout policy. Br. Account. Rev. 2012, 44, 207–220.
[CrossRef]40. Maury, B. Family ownership and firm performance: Empirical evidence from Western European corporations.
J. Corp. Financ. 2009, 12, 321–341. [CrossRef]41. Sciascia, S.; Mazzola, P. Family Involvement in Ownership and Management: Exploring Nonlinear Effects
on Performance. Fam. Bus. Rev. 2008, 21, 331–345. [CrossRef]42. Anderson, C.R.; Reeb, M.D. Board Composition: Balancing Family Influence in S&P 500 Firms. Adm. Sci. Q.
2004, 49, 209–237. [CrossRef]43. Chu, W. Family ownership and firm performance: Influence of family management, family control, and firm
size. Asia Pac. J. Manag. 2011, 28, 833–851. [CrossRef]44. Cai, D.; Luo, J.; Wan, D. Family CEOs: Do they benefit firm performance in China? Asia Pac. J. Manag. 2012,
29, 923–947. [CrossRef]45. Isakov, D.; Weisskopf, J.P. Are founding families special blockholders? An investigation of controlling
shareholder influence on firm performance. J. Bank. Financ. 2014, 41, 1–16. [CrossRef]46. Barontini, R.; Caprio, L. The Effect of Family Control on Firm Value and Performance: Evidence from
Continental Europe. Eur. Financ. Manag. 2006, 12, 689–723. [CrossRef]47. Dunnning, J.H. The determinants of international production. Oxf. Econ. Pap. 1973, 25, 289–336. [CrossRef]48. Dunning, J.H. The Eclectic Paradigm of International Production: A Restatement and Some Possible
Extensions. J. Int. Bus. Stud. 1988, 19, 1–31. [CrossRef]49. Rugman, A.M. Reconciling Internalization Theory and the Eclectic Paradigm. Multinatl. Bus. Rev. 2010, 18,
1–12. [CrossRef]50. Weche Gelubcke, J.P. The Performance of Foreign Affiliates in German Manufacturing: Evidence from a New
Database; University of Lüneburg Working Paper Series in Economics 216; University of Lüneburg: Lüneburg,Germany, 2011.
51. Bellak, C. How domestic and foreign firms differ and why does it matter? J. Econ. Surv. 2004, 18, 483–514.[CrossRef]
52. Grasseni, M. Domestic Multinationals and Foreign-Owned Firms in Italy: Evidence from Quantile Regression.Eur. J. Comp. Econ. 2010, 7, 61–86.
53. Bentivogli, C.; Mirenda, L. Foreign ownership and performance: Evidence from a panel of Italian firms. Int. J.Econ. Bus. 2017, 24, 251–273. [CrossRef]

Sustainability 2019, 11, 953 30 of 31
54. Chacar, A.S.; Celo, S.; Thams, Y. The Performance of Multinational Affiliates versus Domestic Firms. J. Manag.Policy Pract. 2010, 11, 47–59.
55. Lin, X.; Zhang, Y.; Zhu, N. Does bank ownership increase firm value? Evidence from China. J. Int.Money Financ. 2009, 28, 720–737. [CrossRef]
56. Kang, J.-K.; Shivdasani, A. Firm performance, corporate governance, and top executive turnovers in Japan.J. Financ. Econ. 1995, 38. [CrossRef]
57. Kang, J.-K.; Shivdasani, A.; Yamada, T. The effect of bank relations on investment decisions: An investigationof Japanese takeover bids. J. Financ. 2000, 55, 2197–2218. [CrossRef]
58. Krozner, R.S.; Strahan, P.E. Bankers On Boards: Monitoring, Conflicts Of Interest, And Lender Liability.J. Financ. Econ. 2001, 62, 415–452. [CrossRef]
59. Arrow, K.J. The Organization of Economic Activity: Issues Pertinent to the Choice of Market versusNon-Market Allocation. In The Analysis and Evaluation of Public Expenditures: The PBB-System; Joint EconomicCommittee, 91st Cong., 1st Session; U.S. Government Printing Office: Washington, DC, USA, 1969.
60. Ang, J.S.; King, D.K. Government ownership and the performance of government-linked companies:The case of Singapore. J. Multinatl. Financ. Manag. 2006, 16, 64–88. [CrossRef]
61. Sun, Q.; Tong, W.H.S.; Tong, J. How Does Government Ownership Affect Firm Performance? Evidence fromChina’s Privatization Experience. J. Bus. Financ. Account. 2003, 29, 1–27. [CrossRef]
62. Bradbury, M. Government Ownership and Financial Performance in a Competitive Environment: Evidencefrom the Corporatization of the New Zealand Government Computing Services. Asia Pac. J. Manag. 1999, 16,157–172. [CrossRef]
63. Correia, T.; Marques, R.C. Performance of Portuguese water utilities: how do ownership, size, diversificationand vertical integration relate to efficiency? Water Policy 2011, 13, 343–361. [CrossRef]
64. Chakrabarti, R.; Megginson, W.; Yadav, P.K. Corporate governance in India. J. Appl. Corp. Financ. 2008, 20,59–72. [CrossRef]
65. Masulis, R.; Pham, P.; Zein, J. Family Business Groups around the World: Financing Advantages, ControlMotivations, and Organizational Choices. Rev. Financ. Stud. 2011, 24, 3556–3600. [CrossRef]
66. Young, M.N.; Peng, M.W.; Ahlstrom, D.; Bruton, G.D.; Jiang, Y. Corporate Governance in EmergingEconomies: A Review of the Principal–Principal Perspective. J. Manag. Stud. 2011, 45, 196–220. [CrossRef]
67. Zeitun, R.; Tian, G.G. Does ownership affect a firm’s performance and default risk in Jordan? Corp. Gov. Int.J. Bus. Soc. 2007, 7, 66–82. [CrossRef]
68. Wellalage, N.H.; Locke, S. Ownership structure and firm financial performance: Evidence from panel data inSri Lanka. J. Bus. Syst. Gov. Ethics 2012, 7, 52–65. [CrossRef]
69. Claessens, S.; Yurtoglu, B.B. Corporate Governance in Emerging Markets: A Survey. Emerg. Mark. Rev. 2012,15, 1–33. [CrossRef]
70. Aluchna, M.; Kaminski, B. Ownership structure and company performance: A panel study from Poland.Balt. J. Manag. 2017, 12, 485–502. [CrossRef]
71. Bedo, Z.; Acs, B. The impact of ownership concentration, and identity on company performance in the USand in Central and Eastern Europe. Balt. J. Manag. 2007, 2, 125–139. [CrossRef]
72. Alfaro, L.; Chen, M.X. Surviving the Global Financial Crisis: Foreign Ownership and EstablishmentPerformance. Am. Econ. J. Econ. Policy 2012, 4, 30–55. [CrossRef]
73. Saleh, A.S.; Halili, E.; Zeitun, R.; Salim, R. Global Financial Crisis, Ownership Structure and Firm FinancialPerformance: An Examination of Listed Firms in Australia. Stud. Econ. Financ. 2017, 34, 447–465. [CrossRef]
74. Hanafi, M.H.; Setiyono, B.; Sanjaya, I.P.S. Ownership structure and firm performance: Evidence from thesubprime crisis period. Corp. Gov. Int. J. Bus. Soc. 2018, 18, 206–219. [CrossRef]
75. Demsetz, H.; Villalonga, B. Ownership structure and corporate performance. J. Corp. Financ. 2001, 7, 209–233.[CrossRef]
76. Selling, T.I.; Stickney, C.P. The Effects of Business Environment and Strategy on a Firm’s Rate of Return onAssets. Financ. Anal. J. 1989, 45, 43–52. [CrossRef]
77. Fairfield, P.M.; Lombardi Yohn, T. Using Asset Turnover and Profit Margin to Forecast Changes in Profitability.Rev. Account. Stud. 2001, 6, 371–385. [CrossRef]
78. Gupta, M.C.; Huefner, R.J. A Cluster Analysis Study of Financial Ratios and Industry Characteristics.J. Account. Res. 1972, 10, 77–95. [CrossRef]
Sustainability 2019, 11, 953 31 of 31
79. Healey, N.M. The transition economic of central and eastern Europe: A political, economic, social andtechnological analysis. Columbia J. World Bus. 1994, 29, 62–70. [CrossRef]
80. Henderson, A.D.; Raynor, M.E.; Ahmed, M. How long must a firm be great to rule out chance? Benchmarkingsuperior sustained performance without being fooled by randomness. Strateg. Manag. J. 2012, 33, 387–406.[CrossRef]
81. Raynor, M.E.; Ahmed, M.; Henderson, A.D. A Random Search for Excellence. Why “GreatCompany” Research Delivers Fables and Not Facts; Deloitte University Press. Available online:https://www2.deloitte.com/insights/us/en/topics/operations/a-random-search-for-excellence-why-great-company-research-delivers-fables-not-facts.html (accessed on 12 February 2019).
82. Brealey, R.; Myers, S.; Allen, F. Principles of Corporate Finance, 12th ed.; McGraw Hill Education: New York,NY, USA, 2016; pp. 115–116, ISBN 9781259144387.
83. Tobin, J.; Brainard, W. Asset Markets and the Cost of Capital. In Economic Progress, Private Values, andPublic Policy: Essays in Honor of William Fellner; Nelson, R., Balassa, B., Eds.; North Holland: Amsterdam,The Netherlands; New York, NY, USA, 1977; pp. 235–262, ISBN 0720405157.
84. Santos, D.D.; Soukiazis, E. The Links between the Companies’ Market Price Quality and That of itsManagement and Business Quality: A System Panel Data Approach. Int. J. Financ. Manag. 2016, 6,28–38. [CrossRef]
85. Fama, E.F.; French, K.R. The Cross-Section of Expected Stock Returns. J. Financ. 1992, 47, 427–465. [CrossRef]86. Figelman, I. Interaction of Stock Return Momentum with Earnings Measures. Financ. Anal. J. 2007, 63, 71–78.
[CrossRef]87. Horobet, A.; Belascu, L. Interactions between fundamental analysis and market performance for Romanian
companies: A panel data approach. Econ. Comput. Econ. Cybern. Stud. Res. 2012, 3, 5–24.88. Machek, O.; Kubícek, A. The relationship between ownership concentration and performance in
Czech Republic. J. Int. Stud. 2018, 11, 177–186. [CrossRef]
© 2019 by the authors. Licensee MDPI, Basel, Switzerland. This article is an open accessarticle distributed under the terms and conditions of the Creative Commons Attribution(CC BY) license (http://creativecommons.org/licenses/by/4.0/).
Related Documents